Sustainable Bridges - DIVA
492
Sustainable Bridges Assessment for Future Traffic Demands and Longer Lives
-
Upload
khangminh22 -
Category
Documents
-
view
0 -
download
0
Transcript of Sustainable Bridges - DIVA

Sustainable BridgesAssessment for Future Traffic Demands and Longer Lives


Dolnośląskie Wydawnictwo Edukacyjne
Wrocław 2007
Sustainable BridgesAssessment for Future Traffic Demands and Longer Lives
Edited by
Jan BieÒWroc≥aw University of Technology, Poland
Lennart ElfgrenLuleå University of Technology, Sweden
Jan OlofssonSkanska Sverige AB, Sweden

This book has been published with support from the Integrated Project “Sustainable Bridges – Assessment for Future Traffic Demands and Longer Lives” (TIP3-CT-2003-001653) within the 6th Framework Programme of EU.
The information in the present book does not necessarily reflect either the position or views of the European Commission. Edited and reviewed by Jan Bień, Lennart Elfgren, Jan Olofsson Editorial Board Jan Olofsson, Sweden Lennart Elfgren, Sweden Brian Bell, UK Björn Paulsson, Sweden Ernst Niederleithinger, Germany Jens Sandager Jensen, Denmark Glauco Feltrin, Switzerland Björn Täljsten, Sweden Christian Cremona, France Risto Kiviluoma, Finland Jan Bień, Poland Technical editors Dorota Rawa, Paweł Rawa Layout Zdzisław Majewski Cover design Sławomir Pęczek, EDITUS Cover photographs Paweł Rawa Copyright © by authors, 2007 ISBN 978-83-7125-161-0 Printed by Wrocławska Drukarnia Naukowa PAN ul. Lelewela 4, 53-505 Wrocław, Poland Published by Dolnośląskie Wydawnictwo Edukacyjne ul. Ojca Beyzyma 20b, 53-204 Wrocław, Poland e-mail: [email protected] www.dwe.wroc.pl

5
Table of contents
Foreword . . . . . . . . . . . . . . . . . . . . . . . . . . . . . . . . . . . . . . . . . . 9
1. Railway bridges in Europe The need of R&D for existing structures . . . . . . . . . . . . . . . . . . . . . . . . . . . G. Dalton
13
UIC project on assessment, inspection and maintenance of masonry arch railway bridges . . . Z. Orbán
19
Sustainable Bridges – A European Integrated Research Project. Background and overview . . . . . J. Olofsson, L. Elfgren, B. Bell, B. Paulsson, E. Niederleithinger, J.S. Jensen, G. Feltrin, B. Täljsten, C. Cremona, R. Kiviluoma, J. Bień
29
2. Initial data gathering and the railway partners’ role
How the project priorities were established . . . . . . . . . . . . . . . . . . . . . . . . . . B. Bell
53
The railway partners’ role in “Sustainable Bridges” . . . . . . . . . . . . . . . . . . . . . . B. Paulsson
65
3. Inspection, testing and assessment of bridge condition
NDT of masonry arch bridges – international practice . . . . . . . . . . . . . . . . . . . . . M. Forde
73
New methods for inspection and condition assessment . . . . . . . . . . . . . . . . . . . . . E. Niederleithinger, R. Helmerich, J.R. Casas
83
A guideline for railway bridge inspection and condition assessment including the NDT toolbox . . . R. Helmerich, J. Bień, P. Cruz
93
Railway bridge defects and degradation mechanisms . . . . . . . . . . . . . . . . . . . . . J. Bień, K. Jakubowski, T. Kamiński, J. Kmita, P. Rawa, P. Cruz, M. Maksymowicz
105
Inspection of reinforced concrete bridges . . . . . . . . . . . . . . . . . . . . . . . . . . . . B. Buhr Jensen, T. Pedersen, T. Frølund
117
Inspection of steel bridges . . . . . . . . . . . . . . . . . . . . . . . . . . . . . . . . . . . C. Kammel, R. Helmerich
127
Portable electrochemical technique for evaluation of corrosion situation on reinforced concrete . . . R. Bäßler, A. Burkert, T. Frølund
137
Sustainable Bridges – Assessment for Future Traffic Demands and Longer Lives

6
4. New advanced tools for bridge monitoring Structural monitoring system for concrete structures . . . . . . . . . . . . . . . . . . . . . . H. Budelmann, K. Hariri
149
A new sensor for crack detection in concrete structures . . . . . . . . . . . . . . . . . . . . P. Cruz, A.D. de León
159
Guidelines and current developments for the use of Fibre Bragg Grating Sensors in the rail industry . . . . . . . . . . . . . . . . . . . . . . . . . . . . . . . . . . . . . . . W. Boyle, F. Kerrouche, J. Leighton
169
A new time of flight sensor for measuring strain in large structures . . . . . . . . . . . . . . . T. Aho, J. Kinnunen, V. Lyöri, A. Kilpelä, G. Duan, J. Kostamovaara
181
Acoustic emission techniques using wireless sensor networks . . . . . . . . . . . . . . . . . C.U. Grosse, M. Krüger, P. Chatzichrisafis
191
Inertial exciter as a tool for dynamic assessment of railway bridges . . . . . . . . . . . . . . . J. Zwolski, J. Krzyżanowski, P. Rawa, W. Skoczyński, J. Szymkowski
201
Corrosion monitoring in concrete structures . . . . . . . . . . . . . . . . . . . . . . . . . . T. Frølund, R. Sørensen
211
5. Bridge performance and resistance for higher loads and speeds
Guideline for load and resistance assessment of existing European railway bridges . . . . . . . . J.S. Jensen, J.R. Casas, R. Karoumi, M. Plos, C. Cremona, C. Melbourne
221
Capacity assessment of European railway bridges. Limit states and safety formats . . . . . . . . J.R. Casas, E. Brühwiler, A. Herwig, J. Cervenka, G. Holm, D. Wiśniewski
231
Updated rail traffic loads and dynamic amplification factors . . . . . . . . . . . . . . . . . . . . . E. Brühwiler, A. Herwig
243
Structural assessment of concrete railway bridges . . . . . . . . . . . . . . . . . . . . . . . . . . . M. Plos, K. Gylltoft, K. Lundgren, J. Cervenka, S. Thelandersson, L. Elfgren, A. Herwig, E. Brühwiler, E. Rosell
251
Improved assessment methods for static and fatigue resistance of old metal railway bridges . . . . . . C. Cremona, A. Patron, S. Hoehler, B. Eichler, B. Johansson, T. Larsson
261
The analysis and assessment of masonry arch bridges . . . . . . . . . . . . . . . . . . . . . . . . C. Melbourne, J. Wang, A. Tomor
273
Safety assessment of railway bridges by non-linear analysis . . . . . . . . . . . . . . . . . . . . . J. Cervenka, V. Cervenka, Z. Janda
283
Bayesian updating, a powerful tool for updating engineering models using results of testing and monitoring . . . . . . . . . . . . . . . . . . . . . . . . . . . . . . . . . . . . . . . . . L. Neves, D. Wiśniewski, P. Cruz
293
6. Advanced technologies of railway bridge rehabilitation
Rehabilitation of railway bridges . . . . . . . . . . . . . . . . . . . . . . . . . . . . . . . . . . . . B. Täljsten, A. Carolin, R. Helmerich
303
Repair and strengthening of railway bridges – guideline . . . . . . . . . . . . . . . . . . . . . . . A. Carolin, B. Täljsten, H. Pedersen
313
Quality assurance of CRFP-strengthened reinforced concrete structures using automated thermographic investigation . . . . . . . . . . . . . . . . . . . . . . . . . . . . . . . . . . . . . . . R. Helmerich, M. Röllig, A. Schultz, J. Vielhaber
321

Mineral based bonding of CFRP to strengthen concrete structures . . . . . . . . . . . . . . . . . B. Täljsten, T. Blanksvärd, A. Carolin
331
Near Surface Mounted Reinforcement (NSMR) to strengthen concrete structures . . . . . . . . B. Täljsten, A. Carolin
341
CFRP strengthening of the Örnsköldsviks bridge – field test . . . . . . . . . . . . . . . . . . . . . B. Täljsten, M. Bergström, O. Enochsson, L. Elfgren
355
Investigation of steel I-beams strengthened with CFRP plate . . . . . . . . . . . . . . . . . . . . D. Linghoff, M. Al-Emrani
365
Durability increase of bonded CFRP-steel joints via appropriate surface preparation . . . . . . . M. Feldmann, J. Naumes
377
7. Practical implementation of the project results Bridge monitoring demonstrations in the Sustainable Bridges Project – synthesis of results . . . R. Kiviluoma
389
Low power wireless sensor network for long term structural health monitoring . . . . . . . . . . R. Bischoff, J. Meyer, G. Feltrin
397
Dynamic parameters of old steel railway bridge monitored by vibration tests . . . . . . . . . . . J. Zwolski, P. Rawa, M. Gładysz, A. Roszkowski
409
Field testing of old bridges . . . . . . . . . . . . . . . . . . . . . . . . . . . . . . . . . . . . . . . . C. Cremona, J. Bień, L. Elfgren
423
Dynamic amplification factors for a riveted steel bridge. Assessment by monitoring of the Keräsjokk Bridge in northern Sweden . . . . . . . . . . . . . . . . . . . . . . . . . . . . . . O. Enochsson, T. Larsson, L. Elfgren, A. Kronborg, B. Paulsson
435
Testing to failure of a reinforced concrete railway trough bridge in Örnsköldsvik, Sweden . . . . L. Elfgren, O. Enochsson, A. Puurula, H. Thun, B. Paulsson, B. Täljsten
445
Advanced methods of testing and analysis of old masonry bridge in Oleśnica . . . . . . . . . . . T. Kamiński, C. Trela
461
Instrumentation of the Avesnes/Helpe bridge . . . . . . . . . . . . . . . . . . . . . . . . . . . . . C. Cremona, R. Leconte, G. Feltrin, B. Weber, J. Bień, P. Rawa, J. Zwolski, L. Dieleman
473
Author index . . . . . . . . . . . . . . . . . . . . . . . . . . . . . . . . . . . . . . . 489


Foreword At present we have great challenges as inhabitants of the Earth. We are living in a society
with cheap fossil energy and an expanding urban population. This exerts high demands on the infrastructure in the form of railways, roads and buildings of different kinds. However, we do not know if cheap energy will be available in the same way in the future. At the same time climate seems to be changing and becoming more unstable and unreliable. This is probably to some extent due to the expanding human use of energy and release of greenhouse gases.
To help our society to be more sustainable, it is important to retain and use what we already have where possible, rather than investing in new structures. Instead of tearing down old, often beautiful, railway bridges and replacing them with new ones, we need to preserve and upgrade them by using better assessment, monitoring and strengthening methods. This was the aim of the European Integrated Research Project “Sustainable Bridges – Assessment for Future Traffic Demands and Longer Lives” when it was accepted for funding by the European Commission. The project established the following three specific goals:
• increase the transport capacity of existing railway bridges by allowing higher axle loads (up to 33 tons) for freight traffic at moderate speeds or by allowing higher speeds (up to 350 km/hour) for passenger traffic with low axle loads,
• extend the residual service lives of existing bridges by up to 25%, • enhance management, strengthening, and repair systems,
and has been running since December 2003. It will complete its work by the end of November 2007 and the conference being held in Wrocław, Poland on October 10–11, 2007 is its major dissemination activity.
A consortium consisting of 32 partners drawn from railway undertakings, consultants, contractors, research institutes and universities has carried out the project, which has a gross budget of more than 10 million Euros. Material for this book has been collected not only from the partners in the project, but also from other experts, in order to give a broad picture of the challenges and the available tools.
We heartily welcome everyone to Wrocław and the conference. We hope this book will provide a good overview of the work that has been done and of the main results. We have come a long way towards our goals. However, there is much work to be done to test and implement the methods presented. We therefore hope that this book will inspire the readers to utilise our guidelines and report their opinion to the authors. There will certainly be a need for development and further work in order to increase the capacity and service life of existing bridges.
Jan Olofsson Lennart Elfgren Jan Bień Project Coordinator Scientific Leader Dissemination Leader


Railway bridges in Europe


The need of R&D for existing structure
13
The need of R&D for existing structures
Gerard DALTON This paper will point out the importance of R&D for existing structures. Today and tomorrow existing structures are dominating. Only a small part of the bridge stock is replaced every year. At the same time the society expects that the Infrastructure Managers shall meet new demands. These demands are for higher speeds, higher axle loads, increased availability, less disturbance and reduced maintenance costs. Also environmental and aesthetic considerations have to be considered. Therefore R&D for existing structures is of great importance for the society and the Infrastructure Managers to meet future needs.
1. BACKGROUND
There are probably in excess of a half million railway bridges in the geographical area covered by the 27 Member states in the European Union and EFTA countries (Norway and Switzerland). More than half of these bridges are of Masonry Arch construction ranging, from small culverts to large imposing structures that will remain part of the lasting heritage of the railways for some time to come.
Throughout the development of the railways since the 1830’s, railway engineers have taken advantages of new advances in material technology, changing from stone to reinforced and pre-stressed concrete and from cast iron to wrought iron and then to many improved grades of structural steel. Each railway period has also seen new forms of construction, employing different protective systems.
This rich and enduring heritage of structural forms requires Railway Bridge Engineering to be understood in its widest context, covering preservation and conservation, materials technology, prefabrication and assembly, connections and welding, protective systems, dynamic loading and impact protection and the integration of all this knowledge to achieve an optimum life cycle balance.
The particularly restrictive access limitations placed on railway engineers, both in terms of topography and operational hindrance, demands the most appropriate and timely intervention to maintain, restore, strengthen or renew structures.
Sustainable Bridges – Assessment for Future Traffic Demands and Longer Lives

1. Railway bridges in Europe
14
For all these reasons, research into the technology of railway bridges must consider both the context within which the engineers must exercise their function and the duty cycles which the structures must endure.
An understanding of these factors leads one to appreciate the need for continuing research and development into these areas, many of which are specific to the railway environment. The large value of the existing bridge inventory also demonstrates the return on investment that can be achieved from well focused research. While there are no exact figures on the overall value of the entire European bridge inventory, a rough assessment can be made.
Among the countries that participated in the investigation carried out by Work Package 1 (WP1) of the Sustainable Bridges project, the number of bridges was approximately 220,000. Given that the cost per meter for a new built bridge may be 30.000 € for a single track bridge and approximately 50.000 € for a double track bridge and taking an average span of 20 metres long it is easy to appreciate that we are talking of a huge asset value of several billions of Euros. The situation for tunnels is similar. In 2002, the total tunnel length among the former EU 15-members, Norway and Switzerland was estimated at nearly 4000 km.
Historically R&D attention has been focused, to a large extent, on new bridges and tunnels. There has also been a focus on road bridges and tunnels, due to the expansion in the road sector during the last thirty years. This means that R&D into existing railway bridges needs to be the subject of special attention.
2. THE NEED OF R&D FOR EXISTING STRUCTURES
Before outline some specific topics for possible future research it is worthwhile highlighting some of the different aspects of maintaining the existing railway bridge heritage.
2.1. Preservation and Conservation
Experience shows that many bridges remain in active service for longer than originally contemplated. This arises due to a number of factors, such as:
• reserve of strength, due to original conservative design assumptions, • lower cumulative traffic load, than anticipated at time of design, • existing traffic volumes, or other operational considerations, inhibit major intervention
and favour extending the practical life of the existing structures, • some mid-life strengthening or enhancement may have been carried out, • budgetary consideration may necessitate a more closer scrutiny of the intrinsic life of the
structures to obtain maximum life extension, • heritage considerations may prevent the replacement of the structure. Consequently, railway engineers must preserve the bridge asset base, in an optimum way,
paying particular attention to structures that need to be conserved in a manner that will allow them to continue to serve their function, without material alteration to their appearance or architectural integrity.
2.2. Materials Technology
The contrasting age and range of construction materials in the entire stock of railway bridges places special importance on an understanding of materials and the potential application of new technology. In some case this involves the utilisation of old and new materials in a composite way in order to achieve the most economical solution. Innovative

The need of R&D for existing structures
15
utilisation of modern materials, such as Fibre-Reinforced Polymers (FRP), reinforced earth, under sleeper pads and ballast matting will demand continuing research and development to adapt their use for specific rail applications.
2.3. Prefabrication and Assembly
The installation and repair of railways bridges in the track, with minimum restrictions to existing rail traffic, has necessitated particular forms of construction to be adopted that are not normally required in other transport fields. Site access often dictates that individual bridge elements are restricted in weight to enable them to be lifted or slid into position. The use of this form of construction means that railway engineers must obtain satisfactory strength and performance from the overall structure through the assembly of individual elements.
2.4. Connections and welding
For the reasons stated in section 2.3, many railways bridges achieve their overall strength, performance and durability through the inter-connection of prefabricated elements, such as rail bearers, cross girders and lattice structures. The oldest stock of bridges have relied on riveting and bolting to achieve structural integrity while more recent structures have incorporated welded plates, high-strength steel bar and cables in their fabrication.
2.5. Protective systems
The restricted access to many railways bridges, in terms of their isolated geographical location and the difficulty of inspection of many parts of their structures, due to coverage with ballast or other materials, places a special importance on protective systems such as waterproofing layers and metal coatings. The application of such systems, during or between intervals of rail traffic, requires constant research for new solutions to ensure satisfactory performance and durability.
2.6. Dynamic load
Railway bridges are subject to particular stresses due to dynamic loading from various configurations of rolling stock and possible out-of tolerance conditions of vehicles and track.
The transition from softer soil conditions to a more rigid structural form also presents challenges for the design and maintenance of bridge approaches.
2.7. Accidental impact
Bridges supporting tracks, over or under roads, suffer the risk of road vehicle impact and innovative ways to avoid or avert the worst effects of such damage is an important issue requiring ongoing attention.
3. NEW DEMANDS ON THE INFRASTRUCTURE MANAGERS (How UIC has responded)
The demand for increased speed on many existing lines is common in Europe. The adoption of higher speeds necessitates special considerations when it comes to the assessment of the strength of existing bridges. The UIC project, BRIDCAP, has considered how to measure and evaluate dynamic effects on bridges. UIC has also carried out studies on aerodynamics, which exert a greater influence at speeds in excess of 200 km/h.

1. Railway bridges in Europe
16
Figure 1. Forsmo bridge. This bridge was upgraded to 30 tonnes axle load in 2005. The upgrading was done during 21 timeslots
UIC has also produced several leaflets connected with higher axle loads such as in relation to the Testing and approval of railway vehicles from the point of view of their dynamic behaviour – Safety – Track fatigue – Ride quality, the classification of lines for axle loads up to 25 tonnes and the specifications of track components when the axle loads are more than 22, 5 tones.
Increased availability and less operational hindrance is an increasingly important question, due to a resurgence of railway traffic in Europe. Several European railways have had their all-time highest levels of traffic during 2005 and 2006. Therefore the need for more available capacity for operations is of high priority. To address this, UIC has been active in the signalling area (ERTMS) and in more durable forms of track construction (such as ballastless track) and maintenance approaches (use of Under Sleeper Pads and ballast mats) and studying capacity management.
Reduction in maintenance costs is also vital. Therefore UIC has been active in many projects during recent years. One example is the EU project INNOTRACK. Together with the industry the focus is to reduce maintenance costs.
During the last twenty years, environmental and aesthetic considerations have become more important and are designed into new projects. Sustainable development is now demanded as a natural part of everyday life. Infrastructure Managers have to fulfil these demands. Some classically constructed bridges represent an important historical heritage and have to be maintained. The UIC Masonry Arch Bridge project has considered such aspects.
4. COMMON EUROPEAN R&D IS NECESSARY
Today, most Infrastructure Managers have reduced the size of their organisations. The reduction of staff has been significant in many railways in Western Europe. At the same time, the continuing high cost of infrastructure provision is partly shaped by the maintenance of specialist technology and the varying age of the parts of the railway

The need of R&D for existing structures
17
system. The situation can be partly addressed through increased international cooperation and shared costs with other IMs. This is the reason why more and more R&D needs to be carried out in cooperation in Europe and the Sustainable Bridges project is a good example of a collaborative approach.
UIC is today involved in approximately 25 EU-projects. This indicates that involvement in joint research in EU projects is now an integral part of UIC’s European activities. It is UIC’s opinion that international cooperation can and should be increased. In this regard, the following topics would have common appeal for future research, having been identified by our Panel of Structures Engineers:
a) Research on detailed solutions for the repair of masonry arch bridges. b) Minimising cost and traffic interruption during maintenance and reinvestment work. c) The use of prefabricated elements in rail bridges. d) Noise reduction on existing steel bridges. e) Temporary bridges and the embankments and foundations supporting temporary
bridges. f) Research for strengthening and repair methods to extend life and bearing capacity. g) Advanced Monitoring systems (AMS) for existing railway bridges. h) Further studies on the dynamic behaviour of existing structures. i) Research on “Good design practice” for water proofing and anti corrosion systems
of existing bridges. Further research should be based on the results of “Sustainable Bridges” and efforts will
be necessary to transform the information and results into guidelines which are easy to handle for practitioners in the railways. The important results of research should transfer into the common knowledge of railways. It is clear that innovative approaches to whole life cost optimisation are essential in the management of the inventory of bridges within the European railway network.
5. THE UTILISATION AND MAINTENANCE OF THE OUTPUT FROM EU PROJECTS
To initiate and to realise international R&D-projects there is a need of networks. In UIC there is a Panel of Structure Experts (PoSE) established for bridges and tunnels. The PoSE has been working effectively for many years and today consists of members from nearly 30 countries. The group continues to produce many valuable leaflets and other technical documents, many of which have been utilised in the new Eurocodes.
Today the PoSE group is active in four main areas concerning bridges and tunnels: • exchange of information, • initiation of R&D-projects, • coordination of R&D-projects, • input to Eurocodes. The PoSE group played an important role when the Sustainable Bridges (SB) project was
created. Personal contacts between the members of a number of interested IMs permitted the formation of a strong team, who already knew each other. This has been very positive for SB. During the realisation of SB good coordination has been achieved with UIC projects, such as BRIDCAP and Masonry Arch bridges.
The PoSE-group has also been active through liaison partners in SB. A continuous information exchange between the PoSE and SB has taken place during recent years. The PoSE members have also continuously been invited to SB workshops.

1. Railway bridges in Europe
18
If the work of the SB project is to retain its applicability, in a changing technology field, the output will need to be maintained and updated. UIC is willing to support SB to maintain the results of this project.
6. CONCLUSIONS
The Sustainable Bridges project has been working in an important discipline, which has been a neglected area of common research to date.
The results will accordingly be beneficial to Infrastructure Managers and their Structures Experts but will need to be maintained and updated, over time.
The body of work created and the future research effort will help to provide inspiration to address the demands of the rail business for more available capacity and less operational hindrance during essential works.
The current work and future research and development will complement the ongoing activities of the Panel of Structures Experts in UIC.
UIC project on assessment, inspection and maintenance of masonry arch railway bridges
19
UIC project on assessment, inspection and maintenance of masonry arch railway bridges
Zoltán ORBÁN Masonry arch bridges represent a large proportion of the railway bridge stock. Many of them belong to the civil engineering heritage of the railways, therefore their management require careful consideration. Maintenance strategies should promote solutions that are directed towards their preservation and restoration by relying on their existing structural capacity and give preference to stabilization rather than their substitution or replacement. The paper introduces the results of an international project entitled “Improving assessment, optimisation of maintenance and development of database for masonry arch railway bridges”. The project is organised by the International Union of Railways (UIC) with the participation of 14 railway administrations and many consultant institutions, spanning a period of 4 years. The principle objective of the project is to collect and develop tools that help optimising the life-cycle management of masonry arch bridges, help reducing their maintenance costs and promote an effective exchange of good practice between the railway administrations.
1. INTRODUCTION
1.1. General introduction
Masonry arch bridges form an integral part of the railway infrastructure. They are the oldest structure types in the railway bridge population with thousands still in service.
In order that the railways accommodate increased axle loads, train speeds and a greater volume of freight traffic, it is necessary to assess the load carrying capacity of existing masonry arch bridges. Assessment of masonry arch bridges is difficult as there is little knowledge or experience of design of these structures to modern standards, and much of the structure is hidden from view.
To provide confidence in the assessment result, reliable input parameters are required for their calculations. Accordingly effective inspection and measuring methods to establish the parameters are necessary. As well as the predominant use of visual inspections, and destructive investigation there is a tendency in recent years towards using non-destructive testing techniques.
Sustainable Bridges – Assessment for Future Traffic Demands and Longer Lives

1. Railway bridges in Europe
20
The current condition of masonry arch bridges varies from good to very bad, although statistics show that there are a relatively large number of bridges in a medium or bad condition with a tendency for accelerated deterioration. Accordingly there is a potential doubt as to the adequacy of masonry bridges to withstand increased axle loads, train speeds and a greater volume of freight traffic.
Contrary to doubts masonry arch bridges are proving durability with life-cycle costs significantly more economical than for the majority of other structure types. In addition, they belong to the civil engineering heritage of the railways, and their substitution or refurbishment requires careful consideration with maintenance strategies adopted to promote solutions that preserve and restore these structures instead of their replacement.
1.2. Project description
A study group was set up in 2002 by the International Union of Railways (UIC) in order to establish information on the ‘state-of-the-art’ of masonry arch railway bridges. The work was initiated by the Hungarian Railways and during the preparatory stage 13 more railway organisations joined the project. Currently the following railway administrations are involved in the project: MAV (Hungary, task leader) DB (Germany), SNCF (France), NR (UK), ÖBB (Austria), SBB (Switzerland), JBV (Norway), CD (Czech Republic), REFER (Portugal), RENFE (Spain), RFI (Italy), Japan Rail-RTRI (Japan), PKP (Poland), IR (India).
The work is carried out in close collaboration between the partaking railway administrations and consultant institutions from various countries such as: Obvis Ltd. (UK), University of Sheffield (UK), Ines Ingenieros Consultores (Spain), University of Genoa (Italy), Wroclaw University of Technology (Poland), Ingenieurbüro A. Pauser (Austria), Hochschule Bremen (Germany), Brno University of Technology (Czech Republic), University of Pécs and Orisoft Engineering Consulting (Hungary).
The project has been divided into two phases. The preparatory phase the masonry arch bridge stock has been reviewed and the state-of-the-art practices of their assessment, inspection and maintenance summarised. It has been concluded that there were no internationally accepted tools available for the reliable assessment of the load carrying capacity of masonry arch bridges and that a lack of guidance has retarded the widespread application of up-to-date inspection and maintenance procedures.
The objectives and tasks of the follow-up phase have been put together according to the conclusions of this preparatory phase.
The following work packages have been identified in the programme: • WP1: development of assessment tools for masonry arch bridges, • WP2: optimized inspection and monitoring of masonry arch bridges, • WP3: optimized maintenance and repair of masonry arch bridges, • WP4: development of information database for masonry arch bridges. The project is funded over a period of 4 years starting from January 2003. Guides have
been developed for the assessment, inspection and maintenance of masonry arch bridges. An Information System & Database has been developed on the Internet to be a reservoir for knowledge on masonry arch bridges and to provide a platform for the railway administrations to consult and share information.
2. INTRODUCTION OF THE MASONRY ARCH RAILWAY BRIDGE POPULATION
A survey has been carried out to give an overview on the number, characteristics and condition of masonry arch railway bridges in the participating railway administrations. The statistics were compiled about the total masonry arch bridge population of the railways including culverts with a span not exceeding 2 m.

UIC project on assessment, inspection and maintenance of masonry arch railway bridges
21
Some conclusions derived from these statistics are summarised as follows: • The railways participating in the project possess more than 200,000 masonry arch
bridges and culverts on their lines which is approximately 60%, a significant proportion, of their total bridge stock (UIC Report, 2004). The highest numbers of arches inclusive of culverts have been reported from France (cca. 78,000 – 77% of total bridge stock), Italy (56,888 – 95%), Germany (cca. 35,000 – 39%), India (20,967 – 18%), UK (17,867 – 47%) and Portugal (11,746 – 90%).
• Bridges and culverts with short spans represent the majority of masonry arch structures (according to the survey approximately 60% of the bridge spans are under 2 m, approximately 80% are under 5 m and there are only 8,5% of arches exceeding 10 m span).
• The majority of masonry arch bridges are single-span structures (approx. 85%). • The majority of masonry arch bridges (approx. 70%) are between 100 and 150 years old.
There is also a significant proportion (approx. 12%) of bridges more than 150 years old. • The shapes of masonry arches are generally not recorded by the railway administrations.
The limited information has prevented any conclusions being drawn with regard to the shape of arches, except that semi-circular deep arches are the most common type.
• The vast majority of masonry arch bridges are in good and medium condition (approximately 85%) but there is significant proportion in a poor or very poor condition.
3. WP1: ASSESSMENT OF MASONRY ARCH BRIDGES
3.1. General
Assessment of masonry arch bridges is a difficult task as there is no widely accepted and reliable structural assessment procedure. Structural behaviour of masonry arches depends on several parameters but there is little experience of the effect of changes in such parameters and masonry arches have internal elements that are extremely difficult to investigate.
Several methods are available for the assessment of masonry arch bridges. These include simple conservative methods (such as MEXE) and recently developed computerized methods (such as adaptations of the mechanism method and FEM systems). Besides their particular limitations, conservative methods often underestimate the load carrying capacity, which may result in uneconomical or unnecessary mitigation measures being taken to maintain or replace bridges. Conversely the use of sophisticated new methods is generally hindered by the difficulty in provision of input parameters or prolonged data processing.
The use of advanced computerised techniques in the analysis of masonry arch bridges is a relatively new concept. Several computational techniques have been developed for this purpose including 1D frame or 2D and 3D non-linear finite element (FE) models, discrete element- -based (DE) models and combined finite element-discrete element models (FE/DE). These methods were developed to describe the complex nature of arch deformation, cracking processes and arch- -backfill interaction phenomena. Assessment of serviceability is becoming more and more important with increasing traffic volumes on masonry arches. There is however no suitable method for the serviceability assessment of masonry arches nor any criteria against which such an assessment could be made. Other shortcomings of existing methods are their inability to (or complicatedly) describe the effects of structural defects and strengthening intervention.
The objective of WP1 was to develop simple, reliable and user-friendly new assessment methods for masonry arches, improve existing ones and provide guidance for assessor engineers to the application of these integrated methodologies. A multi-level assessment procedure has been recommended starting from the most simple and conservative ‘rule of thumb’ approach towards high-level analysis tools.

1. Railway bridges in Europe
22
3.2. Revision of the MEXE method
The method is based on elastic principles where a two-pinned, parabolic arch static system is assumed to have a limited compressive strength of 13 tons per square foot (cca. 1.4 N/mm2). The load capacity is calculated using empirical formulas with the application of subjectively estimated modifying factors referring to the geometry and material condition of the bridge (UIC Code 778-3R). These modifying factors are determined principally by visual inspection of the bridge.
The equations involved in the MEXE method do not represent the behaviour of a real arch, but represent the best approximation that was achievable without computers when the method was developed. Because of its simplicity and quickness the method is still widely used for the assessment of railway and highway masonry arches.
UIC Code 778-3R gives guidelines for the use of the MEXE method. Experience and latest research show that in a large number of situations the method seriously underestimates the actual load-carrying capacity of the bridges. On the other hand in some other cases MEXE has been found to provide non-conservative results. The method is generally used as a first sieve for the initial assessment and preliminary determination of load capacity. As MEXE can provide unreliable values for the load carrying capacity of masonry arches, some railway administrations proposed modifications to the method in order to achieve better conformity with their experience.
A review therefore has been undertaken of the MEXE method (Harvey, 2007a). The review included reworking the basic analysis that underpins MEXE and comparing the MEXE results with output from other methods.
3.3. Rule of thumb method
An assessment method based on the load capacity being directly related to the geometrical properties of the span, rise, and ring thickness of an arch has been developed (Harvey, 2007b).
In comparison with the alternative empirical method (MEXE), this method should deliver realistic results at no increased costs.
The concept for this method is that the assessment is quick and may be carried out by artisan bridge examiners when on site inspecting the condition of the arch. The aim is to enable the majority of arches with sufficient load carrying capacity to be identified with minimum work, and thereby permit assessment engineers to concentrate their efforts on those bridges which are not so obviously adequate for the task.
3.4. Pauser’s method for the assessment of semi-circular arches
Pauser’s method (Ingenieurbüro A. Pauser, 2005a) is a simple analysis tool that may be used for the assessment of both single and multi-span arches with haunching, whether constructed in brick or stone. The method is best suited for the assessment of single span semi-circular arches. The method is based on the analysis of the arch at its ultimate limit state of load-bearing capacity, considering only that part which may be realistically assumed to act as an arch.
The computed value for arch capacity is considered conservative as the method neglects tensile stresses, the contribution of the spandrel wall and a soil model amplifying load capacity is not used.
3.5. RING masonry arch analysis software
A new version of the widely used RING masonry arch bridge analysis software (Gilbert, 2007) has been developed in collaboration with UIC.
RING 2.0 uses computational limit analysis techniques to estimate the ultimate load carrying capacities of bridges. A two-dimensional analysis is performed with the constituent

UIC project on assessment, inspection and maintenance of masonry arch railway bridges
23
masonry blocks of a bridge being modelled explicitly. These blocks are assumed to be rigid but are separated by masonry joints (contact surfaces) at which rocking, crushing and/or sliding failures are permitted to take place. Backfill material, if present in a bridge, whilst not modelled explicitly, is assumed to disperse live loads and to provide passive restraint.
To facilitate the assessment of railway bridges RING 2.0 includes within the software railway loading models and distribution of railway loads through the track and ballast modelled in accordance with relevant UIC leaflets.
3.6. High-level assessment of masonry arch bridges
High-level assessment of arches are generally based on finite element or discrete element models. The high-level assessment is generally only necessary when a structure is found to have insufficient load capacity using a lower level assessment method, or the assessment includes analysis of the effects of damages on load capacity.
The Guide to High-level Assessment (Brencich and Gambarotta, 2006) is aimed to provide a guidance for assessor engineers on the procedure of high-level assessment of masonry arch bridges by the use of commercially available finite element software packages.
The proposed assessment procedures include incremental non linear step – wise analyses performed on beam – like models and analysis on simplified 2D or 3D models. Parametric and case studied are discussed showing the validity limits of the different approaches.
3.7. Guide to the assessment of masonry arch bridges
A guide has been developed for the whole process of masonry arch bridge assessment (Harvey, 2007c). The sections of the guide deal with: Construction, Behaviour, Deterioration, Loading (including load distribution), Inspection, Assessment and Reporting. The core section on assessment is further divided into: Basic Principles, Modelling approaches, Three- -dimensional effects, Levels of analytical tools and Complexities.
In order to determine the adequacy of a particular arch structure with the minimum degree of effort, the assessment should be carried out in levels of increasing refinement and complexity, with the initial level being based on the most conservative distributions of loads and analytical assumptions. If the structure is shown to be inadequate in relation to the required load carrying capacity at this level, assessment work should continue, with subsequent levels seeking to remove conservatism in the assessment where this can be justified.
4. WP2: INSPECTION AND MONITORING
4.1. General
Several inspection methods have been used to investigate the condition or to determine the structure of masonry arch bridges. The most common method is still the pure visual inspection. Destructive testing is also used although there is a tendency in recent years towards using non-destructive testing techniques.
Most assessment procedures require the masonry strength and some other mechanical properties as the major input parameters for assessment. Destructive Testing (DT) of masonry bridges is therefore necessary in many instances, although it is noted that the results of most destructive tests are affected by significant uncertainties and they may provide only local information on some part of the structure, and cannot be directly extended to the whole bridge.

1. Railway bridges in Europe
24
Semi-Destructive Testing (SDT) methods are based on in-situ localised measurements and considered as surface or small penetration techniques which can provide only qualitative information on the masonry condition and be used only for preliminary investigation.
While conventional DT methods focus mainly on the mechanical characteristics of the materials, Non-Destructive Testing (NDT) methods can provide an overall qualitative view on the arch condition. NDT methods on the one hand seem to be most promising tools for the inspection of masonry arch bridges but on the other hand need a great deal of further study and research. The number of references and projects that have utilized NDT methods on masonry arches is very low and only a few calibration tests have been carried out. Consequently correlation of NDT data with the mechanical properties of the structure is considered limited at present. Nevertheless NDT usually requires an expert with sufficient skills to carry out the measurements and interpret the results so that the significance of data is recognized and that data is not used inappropriately. This ‘strong reliance’ upon the non-engineer specialist is generally not acceptable to the railway administrations. There is thus a need for close collaboration between bridge engineers and NDT specialists and to provide information for bridge engineers on the use of these specific testing methods.
Monitoring systems are occasionally installed on masonry arch railway bridges in order to follow the evolution of damage patterns such as cracks or deformations. The knowledge of this evolution can help preventing more serious damage or a total collapse of the structure. Monitoring may also provide information that can be used to determine the root causes of the defects. These may be from visual inspection or electronic data collection.
Load tests are carried out only in special cases on masonry arch bridges. However load tests are considered to provide the ‘most reliable information’ on the real structural behaviour.
The objective of WP2 was to give an overview on the available testing methods of masonry arch bridges and to give recommendations for the use of the methods and for the utilization of measured data.
4.2. Determination of material properties by destructive tests
A procedure for the determination of masonry compressive strength has been developed (Ingenieurbüro A. Pauser, 2005b). The procedure includes tests on the composite masonry and tests on its components. The characteristic value of masonry compressive strength are determined according to the number of samples and the coefficient of variation of measured data. For mortars, a punch test has been developed where a 10-to-25 mm thick mortar sample embedded in-between two layers of gypsum is tested.
4.3. Non-destructive testing of masonry arch bridges
Masonry arch bridges rarely have accurate or sometimes any drawings of their construction or early repair details. The internal structure of arch bridges may be unknown from external appearance, and may include features such as haunching at support, vaulting, internal spandrel walls, ribs or the presence of saddle over the arch barrel. It may, therefore, be difficult to determine the physical dimensions of the main structural elements of the bridge. Moreover, materials used for the abutment, barrel, spandrel and backfill are variable, and interact. This inadequate knowledge of geometry and materials used complicates the problem of accurate modelling of behaviour. Further complication is the possibility of ring separation or the presence of other hidden defect and irregularities such as voids in the granular backfill immediately above the extrados, areas of reduced density and stiffness in the fill adjacent to the

UIC project on assessment, inspection and maintenance of masonry arch railway bridges
25
extrados, and cracking in the arch ring. Bridge repairs and strengthening require sufficient knowledge on existing defects and their causes too. Hence it is essential that some information of the internal structure and condition of a bridge is obtained before any remedial work or strengthening can be carried out. In this respect NDT methods can play an important role both in the inspection and assessment process and later when the result of the strengthening process has to be checked.
The objective of a testing programme can be to quantify the parameters that are required for the assessment procedure or to provide information for the evaluation of condition. As a large variety of methods is available the choice of the most appropriate method for a specific problem can be rather complex.
Recommendations have been worked out (The University of Pécs, 2006), based on the results of a test programme carried out and the experience of the railway administrations, on the use and optimal selection of NDT methods for specific inspection purposes of masonry arch bridges.
4.4. Catalogue of Damages
A visual examination is the first vital step in an effective maintenance regime. An incorrect diagnosis may lead to other mistakes, like the implementation of unnecessary repairs. Sometimes, a lack of understanding of the behaviour of “masonry” materials makes diagnosis of causes of damage in arches difficult. In other cases if insufficient information is obtained in the inspection additional inspections will need to be carried out, thus increasing the inspection costs. Lastly, this lack of understanding can lead to an overestimate of the risk of collapse when the risk is negligible.
The Catalogue of Damages (Ozaeta and Martín-Caro, 2006) was developed using the experience of the railway administrations partaking in the project. The Catalogue is considered to be a tool to provide assistance with the inspection of masonry arch bridges. The scope of the Catalogue is limited to damages that could be detected by visual inspection of masonry arch bridges.
4.5. Load test of masonry arch bridges
If none of the analytical methods yields a sufficient result, consideration may be given to the use of an experimental approach to assess the load carrying capacity of masonry arch bridges. A calculated assessment presumes that together with the geometry, foundations and load, all essential material properties and status is known or estimated and that it is possible to describe the load transfer realistically in mathematical terms. An experimental approach evaluates the physical reality and should lead to a higher permissible working load as a rule.
Load tests may be used to verify serviceability, the load carrying safety factor and/or to calibrate an analytical model (e.g. FEM).
A suitable procedure is the application of loads to the structure and the simultaneous monitoring of the load-carrying behaviour, particularly deformations and strains as well as micro-crack formation.
One method for load testing utilises trains crossing the arch. Nevertheless, uncertainty may still remain if the load carrying safety factor has to be proofed by analytical extrapolation.
An alternative experimental non-destructive approach is to determine the load carrying capacity utilising a heavy counterweight and hydraulic load application. An external variable loading is used to reach a target load, including the necessary margin of safety, without infringing limit state criteria. On the basis of the measurements taken, either the structural

1. Railway bridges in Europe
26
safety is proofed or a critical load level is identified. This limit is characterised by the first signs of damage and is synonymous with the actual state of deterioration.
A guideline has been developed for the load tests of masonry arch bridges (Steffens and Gutermann, 2006). Measurements carried on selected masonry arches are evaluated in respect to coincidence with analysis results.
5. WP3: MAINTENANCE AND REPAIR
5.1. General
Masonry arches belong to the civil engineering heritage of the railways, therefore their substitution or refurbishment requires careful consideration. Total replacement of deteriorating masonry bridges is economically not feasible. The solution must therefore lie in optimised maintenance and repair strategies. Repairs to masonry bridges should take account of the existing structural capacity and replacement need only be carried out when it has been demonstrated that the existing load capacity is insufficient.
A fundamental requirement is that any maintenance and rehabilitation intervention should maintain the structural integrity of the arch and be physically, chemically and mechanically compatible with the existing structure. Strengthening works that do not take account of the fundamental modes of structural behaviour are unlikely to be beneficial.
The objective of WP3 was to give an overview on the available conventional repair and strengthening methods of masonry arches, demonstrate new methods of strengthening and to develop a methodology for the degradation modelling of arches to help their life-cycle management and intervention planning.
5.2. Repair and strengthening of arches
A survey was carried out to collect and evaluate the maintenance and repair solutions available for masonry arches in the participating railway administrations. These include methods for the restoration of waterproofing and drainage (such as drainpipes placed through the barrel, restoration of drainpipes; concrete saddle over the arch with bonded waterproofing; unbounded waterproofing on extrados; injection of arch barrel), methods for the restoration and strengthening of arch barrels (e.g. injection of arch barrel; RC shotcrete lining under the arch; concrete saddle over the arch; stitching of cracks and low pressure grouting; supporting barrel with steel rings), methods for the restoration and strengthening of abutments, piers and foundations (e.g. underpinning through the abutment; scour protection, stitching and grouting of abutment cracks; installation of props or invert slab; injection of soil under foundations) and methods for the restoration of 3D integrity of arches (tying with rods and patrass plates; tying spandrel walls to new saddle on barrel; load dispensing concrete slab over the arch).
Important aspects to be taken into account in the design of masonry arch repairs (Ozaeta, Martín-Caro, Brencich, 2007):
• the most frequent cause of damage to masonry bridges is inadequate drainage of water thus repair strategies should always include the restoration of waterproofing and drainage systems;
• most serious damage to arches arises from foundation problems and special attention should be given to their proper maintenance and repair;
• repair and strengthening techniques should provide sufficient resistance against foreseeable future loads and effects (e.g. increases in axle loads, speeds, dynamic effects, and physical- -chemical effects, etc.).

UIC project on assessment, inspection and maintenance of masonry arch railway bridges
27
5.3. Expert Tool for degradation modelling
An Expert Tool (Bień, Kamiński, Rawa, 2006) has been developed for modelling and analysis of masonry arch bridges with damages. The aim of work was to provide guideline for the numerical modelling of masonry arch damages and work out a methodology which can be applied in knowledge-based expert tools supporting evaluation of bridge condition, estimation of expected service life as well as ranking and maintenance planning of existing bridges.
A pilot version of a computerised expert tool entitled Masonry Bridge Damage Evaluator (MyBriDE) supporting evaluation of degradation level for masonry bridges has also been developed. The system is able to analyse the influence of the most common damage types, such as strength reduction, longitudinal fracture and loss of material, on the carrying capacity of typical masonry bridges.
6. NEW UIC LEAFLET ON MASONRY ARCH BRIDGES
The UIC leaflet on the assessment of masonry arch bridges is currently under revision and will be extended by utilising the deliverables of the project. The work is expected to be concluded in 2007.
The leaflet is intended to provide railway infrastructure owners, maintenance managers, bridge inspectors and consulting engineers with guidance on the inspection, assessment and maintenance of masonry arch bridges.
7. SIGNIFICANCE OF FURTHER RESEARCH
The deliverables developed in the current phase of the project are based on our current understanding of masonry arch bridges. Many significant matters have however been identified where there remains insufficient knowledge of the characteristics and structural behaviour of arch bridges to permit development of appropriate guidance.
Behaviour of masonry arch bridges under long-term service loads and the derivation of their serviceability limits are one of the important areas that require further research. There is a need for a predictive life-cycle management and maintenance planning of masonry arch bridges that is based on knowledge of the actual level of safety arising from a sufficient understanding to identify the degradation process, an appropriate system of acceptability criteria and the knowledge of the foreseeable effects and costs of intervention.
8. INFORMATION DATABASE
Further information on masonry arch railway bridges can be found on the Database of the project at: http://masonry.uic.asso.fr
The Database is intended to form a reservoir for existing knowledge of management processes and data applicable to masonry arches and to provide a platform to enable the railway administrations and other users to consult and share information.
ACKNOWLEDGEMENTS
The author wishes to thank the financial support of the railway administrations and the professional help of their representatives and other consultants participating in the project. The enormous help of Keith Ross (Network Rail) in reviewing and editing the reports is greatly acknowledged.

1. Railway bridges in Europe
28
REFERENCES Bień, J., Kamiński, T., Rawa, P. (2006): Technology and pilot version of expert tool supporting the evaluation of the degradation level for masonry bridges with damages. UIC Report.
Brencich, A., Gambarotta, L. (2006): Guide to the high-level assessment of masonry arch bridges. UIC Report (draft).
Gilbert, M. (2006): Guide to use of RING 2.0 for the assessment of railway masonry arches. UIC Report.
Harvey, W.J. (2007a): Review of the MEXE method. UIC Report (draft).
Harvey, W.J. (2007b): Rule of thumb method for the assessment of arches. UIC Report (draft).
Harvey, W.J. (2007c): Guide to the assessment of masonry arch bridges. UIC Report (draft).
Ingenieurbüro A. Pauser (2005a): Guide to the high-level assessment of masonry arch bridges. UIC Report.
Ingenieurbüro A. Pauser (2005b): Guide to the destructive testing of masonry bridges. UIC Report.
Ozaeta, R.G., Martín-Caro, J.A. (2006): Catalogue of Damages for Masonry Arch Bridges. UIC Report.
Ozaeta, R.G., Martín-Caro, J.A., Brencich, A. (2007): Guide to the execution and control of masonry arch repairs. UIC Report (draft).
Steffens, K., Gutermann, M. (2006): Guide to the load test of masonry arch bridges. UIC Report.
The University of Pécs (2006): Recommendations to the non-destructive testing of masonry arch bridges (ed. Orbán, Z.). UIC Report (draft).
UIC Code 778-3R (1994): Recommendations for the assessment of the load carrying capacity of existing masonry and mass-concrete arch bridges, Paris.
UIC Report. (2004): Assessment, Reliability and Maintenance of Masonry Arch Bridges (ed. Orbán, Z., UIC Masonry Arch Bridges Study Group). State-of-the-Art Research Report of the International Union of Railways, Paris.

Sustainable Bridges – A European Integrated Research Project. Background and overview
29
Sustainable Bridges – A European Integrated Research Project. Background and overview
Jan OLOFSSON, Lennart ELFGREN, Brian BELL, Björn PAULSSON,
Ernst NIEDERLEITHINGER, Jens S. JENSEN, Glauco FELTRIN,
Björn TÄLJSTEN, Christian CREMONA, Risto KIVILUOMA & Jan BIEŃ This paper describes the Integrated Research Project “Sustainable Bridges”. The Project aims to help European railways to meet the European Commission’s wish to see greatly increased use of the European railway network. This can only be achieved by allowing higher axle loads on freight vehicles and by increasing the maximum permissible speed of passenger trains. In turn, any necessary work on the existing bridge stock to help in meeting this challenge must be undertaken without causing unnecessary disruption to the carriage of goods and passengers, and without compromising the safety and economy of the working railway. This is the overall goal of Sustainable Bridges.
The Project has developed improved methods for computing the safe carrying capacity of bridges and better engineering solutions that can be used in upgrading bridges that are found to be in need of attention. Other results will help to increase the remaining life of existing bridges by recommending strengthening, monitoring and repair systems.
A consortium, consisting of 32 partners drawn from railway bridge owners, consultants, contractors, research institutes and universities, has carried out the Project, which has a gross budget of more than 10 million Euros. The European Commission’s 6th Framework Programme has provided substantial funding, with the balancing funding coming from the Project partners. Skanska Sverige AB has provided the overall co-ordination of the Project, whilst Luleå Technical University has undertaken the scientific leadership; the remaining co-authors are the work package leaders within the Project.
1. INTRODUCTION
The European Commission has stated that it wishes to see a large increase in the use of the European railway network over the next thirty years. It has challenged the railway administrations to plan for a three-fold increase in freight traffic and a 30% increase in passenger traffic over this period. In order to meet this challenge it is important to ensure that existing railway bridges will behave properly under increased loads and higher speeds, and to upgrade them as necessary.
Sustainable Bridges – Assessment for Future Traffic Demands and Longer Lives

1. Railway bridges in Europe
30
The needs in this respect are similar throughout Europe even though the bridges themselves can be quite different. The resources available in each country are, however, too small to deal effectively with such a major challenge. Hence, co-ordinated activities are needed to ensure that widely accepted, pan European solutions are available to bridge owners. For this reason, an “Expression of Interest” was sent to the European Commission in June 2002 when the 6th Framework Program was planned. The “Expression of Interest” was complied by a small group of people who became the core members of the final consortium. They had earlier, unsuccessfully, tried a somewhat similar proposal in the 5th Framework Program. However, this time the call in December 2002 contained a theme specifically regarding Railway Transport Infrastructure, and work began to form a project proposal. A first meeting took place at the Airport in Copenhagen on February 18, 2003, followed by telephone meetings and a second meeting et the Airport in Brussels on March 24, 2003, two weeks before the proposal was to be submitted. The proposal was rated favourably and a hearing took place in Brussels on May 26, 2003, with five of the core members present. After negotiations during the summer the Integrated European Research Project “Sustainable Bridges” was approved by the European Commission for funding through the 6th Framework programme and began its work in December 2003 with a first General Assembly meeting in Barcelona. The Project will be finalised in November 2007. The Project’s aim has been to provide better and more consistent guidelines for the assessment, monitoring, testing and strengthening of railway bridges across Europe.
Figure 1. A train with iron ore is passing a typical railway concrete trough bridge on Malmbanan in northern Sweden. The wish to reduce transport costs by allowing higher axle loads and heavier trains is one of the objects of the “Sustainable Bridges” Project which was inspired by Swedish investigations (Paulsson et al., 1997; Elfgren et al., 2007)

Sustainable Bridges – A European Integrated Research Project. Background and overview
31
2. MAIN PROJECT OBJECTIVES AND ACHIEVEMENTS
The overall goal of the Project was to facilitate the delivery of improved bridge capacity without compromising the safety and economy of the working railway.
The main objectives of the Project were to: • Increase the carrying capacity of existing bridges to permit axle loads of up to 33 tonnes
for freight traffic at moderate speeds (say up to 100 km/h). • Increase the capacity for passenger traffic with low axle loads (up to about 17 tonnes) by
permitting the maximum speeds to be increased up to 350 km/h. • Increase the residual lifetime of existing bridges by up to 25%. • Enhance strengthening and repair systems. The activities within the Project have focused on the functional requirements of railway
bridges in order to achieve increased capacities and/or increased residual service life and to provide enhanced, strengthening and repair systems. The activities have also addressed efficient condition monitoring systems. The objectives, which are outlined below as they appeared in the Project bid for European Commission funding, are in line with ERRAC (2002). The individual work package leaders, supported by the Project management team, have kept these objectives under constant review to ensure that they continue to meet the needs of the European railway administrations. Being an Integrated Project, it was possible for the Project team to modify the programme objectives and deliverables, and to reallocate resources within the agreed overall budget and Project duration, when this became necessary.
2.1. Increased allowable loads and speeds
There is a need for European railway bridges to carry increased loads (either heavier axles on freight trains or increased dynamic effects from faster passenger trains) and allow higher speeds, thus enhancing line capacity for both passenger and freight traffic. This demand can in many cases be met through better structural assessment, better understanding of the true behaviour of the structure, strengthening as necessary or by monitoring critical parameters. A probabilistic approach for loads and resistance is one example of a new generation of methods that can be developed and applied.
Codes for the design of bridges have been developed gradually and consider all the uncertainties that are present during the design and construction phases of a structure. These codes are also often used for the evaluation of existing bridges. However, far better information on material and structural properties is available for an existing structure than for one under construction. Nevertheless, the design uncertainty factors are often applied when assessing existing structures. Many bridges can be allowed to carry greater loads and faster trains if improved codes, more appropriate factors and methods for assessment are used.
One example is the Iron Ore Line “Malmbanan”, which is a line for the transportation of iron ore from northern Sweden to the coast of Norway. Here the axle load was increased from 25 to 30 tons after a thorough assessment procedure. Some bridges could carry the increased load in their existing states while others had to be strengthened, see (Paulson et al., 1997; Paulsson, 1998). The great potential for capacity improvement made available by better methods and procedures for assessment was recognized. In Figure 1 an example is given of a bridge that was monitored and assessed to allow higher loads (Elfgren et al., 2007).
The following achievements have been made: New methods for the structural assessment of existing bridges have been developed in
order to obtain better approximations of the real structural capacity.

1. Railway bridges in Europe
32
The new methods have been used to assess existing bridges in order to verify their validity and to demonstrate how they may be used.
Guidance and background material for a guideline for assessment has been developed.
2.2. Increased residual service life
Deterioration is an unavoidable part of the ageing process of all structures. This is not a problem if the rate of deterioration can be kept at an acceptably low level. Many factors affect this rate, some of which can be controlled or eliminated even after the structure has been built. Heavy traffic or an aggressive environment can, for example, accelerate deterioration processes. Deterioration may result in the need for repairs and even reduce load carrying capacity. Many modern structures are more prone to chemical degradation and suffer from higher rates of deterioration than their older counterparts. For example the effects of alkali- -silica reaction, chloride ingress and carbonation coupled with low concrete cover and poor quality materials has resulted in increased rates of deterioration and premature replacement of many concrete bridges. Information and research has been undertaken to further refine existing techniques for quantifying the condition of a structure and determining its rate of deterioration. New monitoring and strengthening strategies have been developed.
Figure 2. Suggested System for use of non-destructive testing (NDT) methods in assessing the structural capacity of bridges according to a procedure proposed in the Guidelines developed in the Project for “Inspection and Condition Assessment” (SB-ICA, 2007) and “Load and Resistance Assessment” (SB-LRA, 2007)
Phase IV
Doubts
Engineer alone
Inspector alone
Doubtsconfirmed?
visual inspectionactual codesVerification of plansSimple NDT-methods
increased axle loadsdoubts on construction plansaccident, deterioration,regullar inspection
Phase ISite visit
Study of documentsSimple check
Phase IIInvestigations
AnalysisSimple check
Update loadsdeterministic
approach
Engineer aloneSpecializedlaboratoriesSpecialists
Phase IIISite visits, discussionsand consensus within
the team
Safe?Large
consequen-ces?
Probabilisticapproach
Do nothing
Intensifymonitoring
Reduce loads Demolishstructure
Strengthenstructure
yes
yesno
yes no
no
Engineertogether with team
of experts
Visual inspection Basic NDT
Advanced NDT, update of construction plans
Extensive NDT, automated methods, advanced data processing
Visual inspection Simple NDT
Routine inspections every, every third year resp. Main (general) inspection after 5–6 years, most bridges do not need more than regularly inspections
Phase IV

Sustainable Bridges – A European Integrated Research Project. Background and overview
33
The maintenance of existing structures can best be planned on the basis of objective information about its current state. As transport infrastructure is the largest asset in developed countries, budget planning must be done well in advance, so that the infrastructure can be properly maintained to ensure the safety of the many people using it. Non-Destructive Testing (NDT) methods are widely used in many industries. Aircraft, nuclear facilities, chemical plants and other safety critical installations are tested regularly and their continued operation depends to a great extent on the results of non-destructive tests. Also, as an integral part of quality assurance and quality control, NDT is an indispensable tool. In most countries, visual inspection is the preferred NDT method for the rating of bridges, which form a major part of any transport infrastructure. In this Project echo methods (impulse radar, ultrasonic echo, impact echo), laser spectroscopy, electrochemical methods and active Infra-Red Thermography have been developed so that they can be used for automated large area measurements. The Project has also investigated the integration of these NDT methods with MDT (Minor Destructive Testing) sensors for combined use in on site monitoring as well as for testing and quality assurance. In Figure 2 an example is given of a procedure for NDT and assessment of the load-carrying capacity.
The following achievements have been made: • Scanning applications and combined echo methods have been developed for condition
assessment of concrete bridges. • Easy-to-handle systems have been developed for quality assurance of repair and
strengthening. • Techniques for soil profile investigation under traffic have been developed. • Models for the progressive development of reinforcement corrosion have been
elaborated. • New research results have been verified by application to real structures. • The verified results are presented in an NDT manual for railway bridges.
2.3. Enhanced strengthening, and repair systems
The number of bridges in the European railway network and the increasing proportion that require rehabilitation means that the direct cost of the engineering work necessary to maintain the network at a satisfactory level is high. Hence there is a need for rational methods for deciding how maintenance budgets should be allocated and repair methods chosen in order to ensure cost effectiveness. Determining the most appropriate maintenance strategy for a stock of bridges is a complex matter, since there are a large number of factors that determine the most economic strategy. These include:
• The condition of a structure and its load carrying capacity. • Maintenance measures available and their effectiveness, durability, cost and disruptive
effect on traffic using the structure. • Access to the structure. • Traffic management costs and traffic flow rates. • Time available for maintenance activities. • Costs accruing from improvements such as strengthening or bridge widening. • Implications for safety and traffic flow (if the work is postponed). • Sensitivity of the local environment. • Subsoil and support. By taking all these factors into account it becomes possible to establish an outline for
a program for the maintenance work, optimised to achieve a standard condition at a minimum

1. Railway bridges in Europe
34
whole life cost. Guidelines recommend the most appropriate engineering solutions for typical bridge problems.
3. RAILWAY OWNERS PRELIMINARY PRIORITY LIST
One of the initial Project tasks was to survey the major railways in Europe so that the “technical” focus could be on the most important problems reported. The data from the survey covers over 220,000 bridges owned by 17 different railways and is considered to be representative of the well in excess of 300,000 railway bridges across Europe. The main findings from this survey are summarised below; full details are given in (Bell, 2007).
The proportion of bridges in the four main type categories is: • arches 41%, • concrete beam bridges 23%, • steel beam bridges 22%, • steel/concrete composite bridges 14%. More than 35% of the bridges are more than 100 years old, while only 11% are less than 10
years old. Small span bridges are dominating, with 62% of the bridges spanning less than 10 m, while only 5% have spans larger than 40 m.
The railway owners listed the following top ten priority research areas: • better assessment tools, • non-disruptive maintenance methods, • verification of theoretical dynamic factors for both design and assessment, • use of new materials, • system for diagnosis and maintenance needs selection, • ageing/deterioration of concrete bridges, • indirect inspection and monitoring dynamics for evaluation/crack detection in metallic
bridges, • repair and waterproofing of concrete, • better testing methods for existing bridges, • serviceability of arches.
4. WORK PACKAGES AND RESULTS
The work has been implemented through 9 “technical” work packages that are described in detail below (with the individual Work Package Leaders identified in brackets). The relationship between the different work packages is shown diagrammatically in Figure 3. There is also a separate management work package for overall co-ordination of the Project, see chapter 6.3.
4.1. Work Package 1. Start-up and Classification (Network Rail, United Kingdom)
Work Package 1 formed the foundation for the Project work. Information on the existing European railway bridge stock and the maintenance problems associated with each main type of bridge was gathered from rail authorities in Europe and data relating on going research was obtained from railway organizations such as the International Union of Railways (UIC) and the European Rail Research Advisory Council (ERRAC). The information gathered has guided the direction of the main work.

Sustainable Bridges – A European Integrated Research Project. Background and overview
35
WP 1 Start-up and
Classification
WP 4 Loads,
Capacity and Resistance
WP 2 Guidance and
Review
WP 6 Repair and
Strengthening
WP 3 Condition
Assessment and Inspection
WP 7 Demonstration Field Testing of
Old Bridges
WP 5 Monitoring
WP 8 Demonstration Monitoring on New Bridges
WP 9 Training and
Dissemination
Figure 3. Overview of structure and interrelation between Work Packages
4.2. Work Package 2. Guidance and Review (Banverket, Sweden)
Work Package 2 used the outputs from Work Package 1 to guide the direction of the main work and reviewed and assessed the scientific results and progress towards the overall objectives. Most importantly, WP2 nominated one railway representative, in some cases assisted by a second railway, to act as a link with each “scientific” Work Package. This link person acted as a mentor to the researchers and ensured that the research activities stayed on track. These responsibilities are listed in Table 1.
Table 1 Oversight of WPs by railway partners
Work Package Lead railway Support railway WP3 DB – WP4 NR – WP5 DB – WP6 BV – WP7 SNCF NR WP8 RHK BV WP9 PKP –

1. Railway bridges in Europe
36
All the deliverables from the Project are listed in Table 2. With the exception of those purely internal to the Project (such as work plans) most can be downloaded from the website www.sustainablebridges.net. Work Package 2 has also been responsible for arranging the five meetings of the General Assembly of the Project.
4.3. Work Package 3. Condition Assessment and Inspection (BAM, Germany)
The objectives of Work Package 3 were to identify the common types of materials deterioration, examine the behaviour of deteriorated bridges and supply information on modern methods of determining bridge condition. New reliable deterioration models enable more efficient use of resources in bridge maintenance and provide valuable information for calculating the bearing capacity of a bridge or for deciding if it can be strengthened. A focus was on the improvement and applicability of NDT in bridge inspection. Different methods and techniques have been collected and compared and new innovative techniques developed and adapted specifically for application to railway bridges (SB-ICA, 2007). A toolbox of applicable NDT techniques (paper and web based) was developed and connected to a defect catalogue. Several methods developed in WP3 have been applied at test bridges in WP 6, 7 and 8.
4.4. Work Package 4. Loads, Capacity and Resistance (COWI A/S, Denmark)
Work Package 4 has focused on load and capacity assessment of railway bridges. The main objective of this work package was to provide bridge evaluators with the most advanced knowledge regarding methods, models and tools that can be used in the assessment of existing concrete, metallic and masonry railway bridges. This includes systematized step-level assessment methodology, advanced safety formats (e.g. probabilistic or simplified probabilistic) refined structural analysis (e.g. non-linear or plastic, dynamic considering train-bridge interaction), better models of loads and resistance parameters (e.g. probabilistic and/or based on the results of measurements) and methods for incorporation of the results from monitoring and on-site testing (e.g. Bayesian updating).
The main output from the work performed within WP4 is a “Guideline for Load and Resistance Assessment of Existing European Railway Bridges” (SB-LRA, 2007), that aims to permit for the passage of heavier and faster trains without the need for maintenance or strengthening. This has been made possible due to development of improved methods to assess the actual load on a bridge and to assess the resistance, in part taking into account the actual condition of the bridge found using the methods described in SB-ICA (2007), and/or the outputs from the monitoring techniques found in SB-MON (2007).
4.5. Work Package 5. Monitoring (EMPA, Switzerland)
Any cost efficient assessment, maintenance and strengthening process requires specific information about the current behaviour of a structure. Autonomously operating and remotely accessible monitoring technologies have the potential to provide this information economically. The objective of Work Package 5 was to develop and test innovative monitoring concepts and technologies for railway bridges. The activities were focussed on fatigue assessment, dynamic behaviour and crack detection.
The focus of the technical development was on fibre optic technologies and wireless sensor networks. For applications in railway bridges, optical fibre sensors are very attractive because of their high immunity to electromagnetic fields, their long-term stability and their robustness

Sustainable Bridges – A European Integrated Research Project. Background and overview
37
in harsh environments. Wireless sensor networks, essentially a computer network consisting of many small, intercommunicating computers equipped with one or several sensors, provide the great advantage of easy and fast deployment, self-configuration and scalability. These features have the potential to dramatically reduce the costs of monitoring. In addition, a method for assessing the dynamic properties of railway bridges with a shaker was developed. All these technologies were tested in field tests performed within Work Package 7 and 8.
Furthermore, guidelines were drafted that specify the planning and implementation of general and specific monitoring activities (e.g. fatigue, dynamic behaviour). With the goal to accelerate the transfer to market, guidelines were also drafted describing the usage of each novel technology developed within this WP (SB-MON, 2007).
4.6. Work Package 6. Repair and Strengthening (LTU, Sweden)
The assessment performed using SB-LRA (2007) may show that the bridge should be repaired or strengthened. This has been the main area of interest of WP6 “Repair and Strengthening”, whose main objectives have been to find technical, environmentally stable and financially economic repair and strengthening methods that keep disruption to the traffic on existing railway structures to a minimum. Here a “toolbox” has been put together of different repair and strengthening methods, which specifically cover the needs of railway bridges, embankments and transition zones (SB-STR, 2007).
For example, fibre reinforced polymers (FRPs) can be used for the repair and strengthening of bridges. For the efficient application of these systems a good bond between the FRP strengthening material and the “parent” bridge structure has to be guaranteed. Both un-stressed and pre-stressed systems have been investigated, developed as necessary and tested for use on both concrete and steel railway bridges. Particular effort has been addressed to successfully researching a novel mineral based FRP strengthening system for use on concrete bridges. In addition the use of systems such as fibre optic sensors within the FRP, which may provide the means to monitor a repair or strengthening over time, has been investigated in co-operation with WP5.
Investigations have also been undertaken into the geotechnical aspects of bridge foundations and embankment/abutment transition zones (where the change in stiffness can create maintenance problems), concentrating on the long-term subsoil behaviour below railway structures.
4.7. Work Package 7. Field-Testing of Bridges (LCPC, France)
Work Package 7 was established to demonstrate the efficiency and the applicability of the scientific and technical results issued from WPs 3, 4, 5 and 6 and hence started somewhat later than the other WPs in the Project. A number of demonstration bridges were identified from questionnaires sent to the different WPs and to the bridge owners and three were actually used in the Project.
The first bridge (Avesnes/Helpe, France – provided by SNCF) showed problems characteristic to old steel riveted bridges (fatigue cracks and degradation of riveted connections). It was scheduled to be replaced during the lifetime of the Project, so could be used for in service testing prior to removal and more detailed, partially destructive, testing after removal to a site close to its original position. The in service testing lasted several days and was intended to assess residual fatigue life for WP4. The second stage, after removal and relocation of the bridge, was to simulate real defects and to perform dynamic tests described in SB-ICA (2007). The results of the testing are described in SB-7.2 (2007).

1. Railway bridges in Europe
38
The second bridge (Örnsköldsvik, Sweden – provided by BV) was a reinforced concrete bridge scheduled to become redundant due to the building of a new railway and which needed to be demolished due to the low headroom and poor road alignment provided to the roadway crossed by the bridge. The chance to perform a full-scale test to failure such as this does not occur very frequently; however on the occasions where such tests have been carried out in the laboratory a very high load capacity has been obtained see (Paulsson et al., 1997). This bridge was in good condition and was used principally to investigate the shear capacity of an RC bridge. To ensue that an ultimate shear failure occurred FRP flexural strengthening was undertaken under the guidance of WP6. Prior to the ULS test the bridge was tested under simulated service conditions both before and after strengthening to verify some of the outputs from both WP4 and WP6 and both NDT testing and monitoring were carried out using techniques developed in WP3 and WP5. The results of these tests are fully reported in SB-7.3 (2007).
The third bridge, a semi circular brick arch on the Oleśnica – Chojnice line in Poland (provided by PKP), was tested “in service”, principally using trains specially provided for the purpose. Due to the importance of masonry arches throughout Europe WP3 undertook extensive work on this bridge to demonstrate NDT methods capable of determining material and backfill properties (which are quite often unknown) and to measure deflections under live load. In addition WP4 used different novel modelling and calculation methods to determine the bridge’s safe capacity. The results of these tests are fully reported in SB-7.4 (2007).
After a crucial period for identifying bridges and defining tests, Work Package 7 was able to provide demonstration bridges all the Work Packages. The results have helped to verify the major developments created in the Project.
4.8. Work Package 8. Monitoring of Bridges (WSP, Finland)
Work Package 8 concentrated on bridge monitoring systems, bringing together several multidisciplinary activities. Demonstrations were conducted on 5 bridges, each of which had different objectives and used different monitoring systems. One of the main tasks has been to build, test and evaluate systems that can be used easily and hence encourage the widespread usage of structural monitoring. Key factors include reduction of system costs; complexity and size; and the time needed for installation.
These were addressed through the demonstration of: • “automation-based” monitoring systems (incorporating wireless internet connections and
vandal proof installations), • a prototype wireless sensor network (developed in WP5) for long term monitoring, • a new excitation device for modal parameter identification, • practical assessment utilizing the short-tem monitoring. In two cases the monitoring was used to help the owning railway administration decide on
a strategy to permit an actual increase in permitted axle load, which was the first real use of any outputs from the Project.
The exploitation possibilities of the systems demonstrated are wide; especially on the case of smaller bridges where conventional monitoring systems are too costly and complex for the practical needs of bridge engineers. In the near future bridge management systems may consist on two bridge groups – un-instrumented and instrumented bridges. Bridge assessment service providers are likely to use structural monitoring as a standard tool to improve the quality of their service to bridge owners. The work of WP8 is reported in SB-8.2 (2007).

Sustainable Bridges – A European Integrated Research Project. Background and overview
39
4.9. Work Package 9. Training and Dissemination (Wrocław University of Technology, Poland)
Work Package 9 has been responsible for the dissemination of the knowledge produced by the Project and for training practitioners in its use.
Owners, consultants, and contractors, especially small and medium enterprises, need to be trained in the new methods and procedures developed through the Project. To achieve this, the Project developments have been disseminated beyond the consortium through papers in scientific and technical journals (about 30), conference papers and presentations (over 140), the authorship of books presenting selected results of the Project (6) and other lectures, presentations and posters (over 40). There was also a special Sustainable Bridges session at the IABMAS’06 conference in Porto 2006 (Cruz et al., 2006). Research activities within the Project led to some 15 PhD awards at the universities involved in the Project. In addition, all the Project results will be presented at a major international conference “Sustainable Bridges” organised in Wrocław (Poland) to coincide with the end of the Project. The main results of the Project will be published in the book “Sustainable Railway Bridges for Higher Speeds and Loads”, published in conjunction with the final conference.
During the period of the Project the following workshops, attended by a total of about 160 participants, were organised:
• WP3 Workshop – Inspection and Condition Assessment of Railway Bridges, 23–24 October 2006, BAM Headquarters, Berlin, Germany;
• WP4 Workshop – Load and Resistance Assessment of Railway Bridges, 21–22 May 2007, COWI’s head office, Kongens Lyngby, Denmark;
• WP5 Workshop – Monitoring of Railway Bridges, June 25–26, 2007, EMPA, Dübendorf, Switzerland;
• WP6 Workshop – Repair and Strengthening of Railway Bridges, March 26–27 2007, Luleå University of Technology, Sweden.
These workshops were interactive, with the participants hearing presentations and participating in laboratory demonstrations and then giving their views on the developments presented. This in turn enabled the Deliverables to be modified prior to finalisation to ensure that they are as useful as possible to practitioners. Presentation material from these workshops can be viewed at www.sustainablebridgesnet.
Work Package 9 has also led discussions with regulatory and code writing bodies in an attempt to have any major advances quickly reflected in modified publications and has been responsible for overseeing the Project public web site and intranet.
5. GUIDELINES AND OTHER DELIVERABLES
5.1. Guidelines
Five guidelines have been produced, one overall guideline (SB-GUIDE, 2007), and four guidelines for each one of the main research areas within the Project:
• SB-ICA (2007): Guideline for Inspection and Condition Assessment of Railway Bridges. • SB-LRA (2007): Guideline for Load and Resistance Assessment of Railway Bridges. • SB-MON (2007): Guideline for Monitoring of Railway Bridges. • SB-STR (2007): Guideline for use of Repair and Strengthening methods for Railway Bridges. The guidelines were subject to an external expert review to ensure accuracy, consistency
and usability. They are intended to serve as a complement to the new set of European codes: EC0 Basis of Structural Design, EN 1990 (2002); EC1 Actions on structures, EN 1991-1

1. Railway bridges in Europe
40
(2006), EN 1991-2 (2003); EC2 Design of concrete structures, EN 1992-2 (2005); EC3 Design of steel structures, EN 1993-2 (2006); EC4 Design of composite steel and concrete structures, EN 1994-2 (2005); EC5 Design of timber structures, EN 1995-2 (2004); EC6 Design of masonry structures, EN 1996-1 (2005); and EC7 Geotechnical design, EN 1997-1 (2004).
5.2. Deliverables
There has been a rigorous system of peer review for all Deliverables within each WP to ensure scientific accuracy and the railway owner partners have reviewed each deliverable to assess its readability to non specialists, usability and applicability to real life situations.
Table 2 lists of all the Deliverables in the Project. Initially they were identified with a “D” (for Deliverable) followed by a Work Package number. However, the “D” has now been changed to the more informative “SB” (for Sustainable Bridges). With the exception of those purely internal to the Project, the Deliverables will be made available on the Project web site.
Table 2. Deliverables in the Project Sustainable Bridges
Number Work Package and Deliverable name Year WP1 Start up and classification SB-1.1 Detailed Work plan for WP 1 2004 SB-1.2 European Railway Bridge Demography 2004 SB-1.3 European Railway Bridge Problems 2004 SB-1.4 Railway Bridge Research. 2005 SB-1.5 Legislative and Regulatory Issues that could prevent Advances… 2005 WP2 Guidance and Review SB-2.1 Comments to Working Plans 2006 SB-2.2 Assessment of Progress 2007 SB-2.3 Reports from General Assembly meetings 2007 WP3 Condition Assessment and Inspection SB-3.1 Actualised Work Plan 2004 SB-3.2 Inventory on condition assessment methods 2004 SB-3.3 Condition Assessment Procedures 2005 SB-3.4 Steel bridges. Stress measurements 2005 SB-3.5 Combination of radar data of different polarisation 2004 SB-3.6 Scanning system for concrete surfaces 2006 SB-3.7 Impact-echo system for crack depth measurement 2007 SB-3.8 Tomography 2007 SB-3.9 Electrochemical methods for corrosion 2006 SB-3.10 Steel bar corrosion. Review and lab tests 2007 SB-3.11 FE modelling of concrete attacked by corrosion 2007 SB-3.12 Steel bar corrosion. Lab tests 2006 SB-3.13 Foundations. Non destructive test (NDT) methods 2005 SB-3.14 Embankments. Cross hole tomography 2006 SB-3.15 Overall Report 2007 SB-3.16 Guideline for Inspection and Condition Assessment, SB-ICA 2007 SB-3.17 Tests on bridges 2007

Sustainable Bridges – A European Integrated Research Project. Background and overview
41
Number Work Package and Deliverable name Year WP4 Loads, Capacity and Resistance SB-4.1 List of contents for guideline 2004 SB-4.2 Guideline for Load and Resistance Assessment, SB-LRA 2007 SB-4.3 Background document for loads and dynamic effects 2007 SB-4.4 Background document for safety and probabilistic modelling sub-group 2007 SB-4.5 Background document for concrete bridges 2007 SB-4.6 Background document for metal bridges 2007 SB-4.7 Background document for masonry arch bridges 2007 WP5 Monitoring SB-5.1 Review and evaluation of monitoring technique. 2007 SB-5.2 Guideline for Monitoring, SB-MON 2007 SB-5.3 Prototype – crack sensor sheet – optical fibres 2007 SB-5.4 Prototype – fibre optic grating sensor 2007 SB-5.5 Prototype – MEMS 2007 SB-5.6 Prototype – shaker for vibration tests 2007 SB-5.7 Prototype – wireless communication network 2007 SB-5.8 Prototype – smart data processing 2007 SB-5.9 Prototype – TOF fibre optic sensor 2007 WP 6 Repair and Strengthening SB-6.1 Guideline for use of Repair and Strengthening Methods, SB-STR. 2007 SB-6.2 Background documents 2007 SB-6.3 Field testing 2007 SB-6.4 Quality Assurance 2007 WP7 Demonstration – Field Testing of Bridges SB-7.1 Detailed Implementation Plan 2006 SB-7.2 Riveted steel bridge, France 2007 SB-7.3 Concrete bridge, Sweden 2007 SB-7.4 Masonry arch bridge, Poland 2007 WP8 Demonstration – Monitoring of Bridges SB-8.1 Detailed implementation plan for demonstrating basic monitoring system 2007 SB-8.2 Demonstration of bridge monitoring, intermediate report 2007 SB-8.3 Demonstration of bridge monitoring, final report 2007 WP9 Training and Dissemination SB-9.1 Programme of the book “Railway Bridge Damages” 2004 SB-9.2 “Sustainable Railway Bridges for Higher Speeds and Loads” 2007 SB-9.3 International Conference “Sustainable Bridges” – book of proceedings 2007 SB-9.4 Final report on dissemination activities 2007 SB-9.5 Project Web Site 2007

1. Railway bridges in Europe
42
6. PARTICIPANTS AND ORGANISATION
6.1. General
A consortium of 32 members, drawn from 12 countries that are geographically representative of the whole of Europe, and consisting of railway bridge owners, consultants, contractors, research institutes and universities, has carried out the Project, see Figure 4. The organisation has been based on quick, efficient decision-making and decentralized responsibility among the 10 core partners and 22 additional partners. The membership of the consortium consists of bridge owners (25%), contractors (9%), consultants (9%), research institutes (19%) and universities (38%). They represent the whole supply chain from user to producer/designer/developer. The relatively high number of research institutes and universities reflects the fact that research on existing structures is often carried out at academic institutions in collaboration with owners. Contractors and consultants, on the other hand, have traditionally tended to focus on the construction of new structures rather than on maintenance of existing ones, which has been the responsibility of the owning organisation. Nevertheless some consultants, particularly in Denmark and the UK, are now involved in both construction of new structures and maintenance of existing structures. By demonstrating the economic benefit of maintaining and upgrading existing bridges to owners, this Project will increase the interest from both contractors and consultants in this important field.
Figure 4. Participating countries

Sustainable Bridges – A European Integrated Research Project. Background and overview
43
The consortium brings together experience of the different types of difficulties facing European railways. In central Europe, flooding from big rivers crossing a flat landscape is a major problem, whereas frost damage predominates in northern Europe and degradation due to fast running water features in Alpine regions. There are also different demands on railway lines; intensive and heavy iron ore traffic crossing the wilderness of northern Sweden and intense passenger traffic in the densely populated areas of central Europe and the UK. In those countries where the railway administration is responsible for highway bridges heavier and even more intense traffic roads create additional difficulties.
6.2. Participants
The Project participants, listed by country and showing the main personnel involved are: Czech Republic: – Cervenka Consulting (Vladimir and Jan Cervenka). Denmark: – COWI A/S (Jens Sandager Jensen, Mette Sloth, Dawid
Wiśniewski, Birit Buhr, Thomas Frølund). Finland: – Finnish Road Administration (Timo Tirkkonen), – Finnish Rail Administration (RHK, Harri Yli-Villamo), – University of Oulu (Timo Aho), – WSP Finland Ltd (Risto Kiviluoma). France: – Société Nationale des Chemins des Fer Français (SNCF, Didier
Martin, Benjamin Barbier), – Laboratoire Central des Ponts et Chaussées (LCPC, Christian
Cremona, Alberto Patron). Germany: – Deutsche Bahn AG (Martin Muncke, Britta Schewe), – Bundesanstalt für Materialprüfung (BAM, Ernst Niederleithinger,
Rosemarie Helmerich), – Universität Stuttgart (Christian Grosse, Markus Krüger), – Rheinisch-Westfälische Technische Hochschule (Gerhard
Sedlacek). Norway: – Norut Technology A/S (Geir Horrigmoe). Poland: – PKP Polish Railway Lines (Maciej Sawicki, Kazimierz
Szadkowski), – Wrocław University of Technology (Jan Bień, Paweł Rawa,
Jan Kmita, Jarosław Zwolski, Tomasz Kamiński, Krzysztof Jakubowski, Zygmunt Kubiak).
Portugal: – Universidade do Minho (Paulo Cruz, Łukasz Topczewski, Abraham Diaz de Leon).
Spain: – Universitat Politècnica de Catalunya (Joan Ramon Casas). Sweden: – Skanska Sverige AB (Ingvar and Jan Olofsson (Coordinators),
Hans Hedlund), – Banverket (Björn Paulsson, Katarina Kieksi), – Swedish Road Administration (Ebbe Rosell), – Luleå University of Technology (Lennart Elfgren (Scientific
Leader), Bernt Johansson, Thomas Olofsson, Björn Täljsten, Ola Enochsson, Tobias Larsson, Arvid Hejll, Håkan Thun),
– Chalmers University of Technology (Kent Gylltoft, Mario Plos, Mohammad Al-Emrani),
– Royal Institute of Technology (Håkan Sundquist, Raid Karoumi), – Lund University of Technology (Sven Thelandersson),

1. Railway bridges in Europe
44
– Swedish Geotechnical Institute (Göran Holm), – Sto Scandinavia AB (Otto Norling), – Designtech Projektsamverkan AB (Pär Johansson, Patrik
Svanerudh). Switzerland: – Eidgenössische Materialprüfungsanstalt (EMPA, Glauco Feltrin,
Jonas Meyer, Richard Bischoff), – Ecole Polytechnique Federal de Lausanne (EPFL, Eugene
Brühwiler, Andrin Herwig). United Kingdom: – Network Rail (Brian Bell), – City University (William Boyle), – University of Salford (Clive Melbourne, Adrienn Tomor,
Jinyan Wang).
6.3. Organisation Structure and Management
The organisation structure of the Consortium has comprised the following: a) The General Assembly is the ultimate decision-making body of the Consortium and is
open to all Project participants. Each contractor has nominated one voting representative to the GA, with decisions being made using simple majority voting. The General Assembly has met in Barcelona in December 2003, in Stockholm in June 2004, in Berlin in June 2005 and in Guimaraës in July 2006 (see Figure 5). The last meeting will take place in conjunction with the final conference in Wrocław in October 2007.
Figure 5. Participants at the 4th General Assembly Meeting in Guimarães, July 2006
b) The Executive Board consists of 5 representatives drawn from the Management Team and is the supervisory body for the execution of the Project. It reports to, and has been accountable to, the General Assembly. The Executive Board has met twice a year in connection with General Assembly and Management Team meetings.

Sustainable Bridges – A European Integrated Research Project. Background and overview
45
c) The Co-ordinator is the intermediary with the European Commission, and through the Manager is responsible for the overall physical and financial management of the Project. The Manager reported and has been accountable to the Executive Board.
d) The Scientific Leader is the co-ordinator of the scientific contents of the Project. The Scientific Leader has reported to the Manager and is a member of the Management Team.
e) The Management Team consists of the Coordinator, the Scientific Leader and the nine Work Package Leaders. They have met physically two to four times a year; in Copenhagen and Barcelona during 2003; in Stockholm, Paris, and Zürich during 2004; in Paris, Berlin, Edinburgh (see Figure 6), and Göteborg during 2005; in Porto and Helsinki during 2006; and in Abisko in 2007 with the final meeting planned to take place in Wrocław after the Conference. In between telephone conferences have been held as necessary, usually about every other month.
g) Work Package Leaders have been responsible for the scientific output from their work packages and for ensuring that the agreed budgets have not been exceeded. They have also undertaken to the re-allocation of resources between sub tasks to meet emerging needs and priorities and prepared the annual reports and future work plans in accordance with the EU contract requirements.
Figure 6. The Management Team during their meeting in September 2005 at the Forth Railway Bridge (built 1882-87) near Edinburgh. Top row: Ian Heigh, Network Rail (Project Manager for the Forth Bridge refurbishment programme); Jens Sandager Jensen, COWI; Björn Paulsson, Banverket; Risto Kiviluoma, WSP; Jan Olofsson, Skanska; and Rosemarie Helmerich, BAM. Front row: Paweł Rawa, Wrocław University of Technology; Brian Bell, Network Rail; and Björn Täljsten and Lennart Elfgren, Luleå University of Technology. Not present: Ernst Niderleithinger, BAM; Christian Cremona, LCPC; and Jan Bień, Wrocław University of Technology

1. Railway bridges in Europe
46
6.4. Cooperation with other projects
As the number of arch bridges in Europe is quite considerable, co-operation with the UIC Project I/03/U/285 “Assessment, Reliability and Maintenance of Masonry Arch Bridges” has been initiated. Co-operation with other UIC work streams has been provided by the active participation in the Project of two members of the UIC Structures’ Experts Panel. Other participants were members of the EU 5th Framework Networks, SafRelNet (Safety and Reliability), SAMCO (Structural Assessment, Monitoring and Control), ReHabCon (Concrete Rehabilitation) and ConRepNet (Concrete Repairs) and domestic networks such as the UK’s SIMoNet (Structural Integrity Monitoring), SMARTnet (Arch Bridges) and NGCC (Composites in Construction).
In addition many of the partner railways are undertaking, or participating in, on going research in areas relevant to the Project and, as far as they have been able, have shared the outputs of ongoing research. For example, PhD students at Surrey University and the Royal Institute of Technology (Stockholm) who were sponsored by Network Rail and Banverket, respectively, presented the results of their investigations into fatigue in riveted railway bridges and strains and deflections of old arch bridges to WP4 meetings.
6.5. Coordination of the Project
A good rapport and close cooperation between the Contractors and within the Management Team (MT) has been established through frequent contacts between the different groups and individuals and more formal meetings at various levels (individual WP, combined WPs, EB, MT and GA).
In a large Integrated Project such as this it is important that large amounts of material can easily be exchanged between partners and to keep an organised structure for all Project information. A Project intranet site was established behind the public web site (www.sustainablebridges.net), where large reports may be up- and downloaded during both the updating phase and the internal review process. The technical work has been managed mainly within the Work Packages and through organised interchange of information between the Work Packages.
Meetings at management level have been important for managing of the Project and for the coordination activities at Project level. Because of the unusually large Project organisation, there has been a need for frequent meetings between the members of the Management Team. Contractors used to working in smaller Projects, with limited coordination activities, have found that coordination and non-technical activities have demanded more attention than had been anticipated.
The need for discipline with regard to fulfilment of tasks and delivery on time by all participants is particularly important in large Projects with many participating contractors. Many of the activities are interrelated and progress in one area will often depend on results being delivered from other areas. Hence, the managing, coordinating and administrative activities are more demanding and require more attention than in minor projects, this has also reflected in the Project costs as discussed in 6.6.
6.6. Budget and financing.
The budget for the Project exceeds 10 million Euros for the full period of four years, of which the European Commission will contribute up to 6,9 million Euros. The budget has been derived from an over-all Project Implementation Plan covering the four-year Project period and detailed Implementation Plans for consecutive 18 months periods.

Sustainable Bridges – A European Integrated Research Project. Background and overview
47
Positive engagement from participants, which is needed to effectively carry out a large project like this, has meant that costs for coordination, support, review and management will overdraw the maximum level of Management funding set to 7% of the total budget. The high management costs are also partly caused by the unexpected large amount of work and costs in connection with the financial reporting. However, the requirement for costly external audit certificates, which were required annually from each partner under the original contract with the EC, was eased for most partners after the first year.
6.7. Reviews by EC
The Project has been reviewed by EC after completion of each Project year. Two technical experts, Dermot O´Dwyer from Ireland and Patrick van Honacker from Belgium, were appointed by the EC to go through the deliverables and comment on them. The reviewers prepared lists of questions on the documents submitted, which were sent to the Management Team, who in turn provided written answers prior to a meeting held at the offices of EC Director General for Research in Brussels, see Figure 7. Many useful comments and suggestions have been received over the four years of the Project and a number of specific demands were made; for instance after year one a major revision of the Implementation plan was called for to include more effort on masonry bridges and after year three an over-all guideline, SB-Guide (2007), was requested.
Figure 7. The third Technical Review Meeting in Brussels, February 7, 2007. From left: Patrick van Honacker, Reviewer; Brian Bell, Network Rail; Joost De-Bock, EC Project Officer; Jan Olofsson, Coordinator, Skanska; Dermot O’Dwyer, Reviewer; Jens Sandager Jensen, COWI; and Björn Paulsson, Banverket (photo: Lennart Elfgren)
The financial review, which also takes place after each Project year, has unfortunately always
started up very late, leading to late payment. This has caused problems for many partners, especially SMEs who could be dependant on the EC funding to carry out their work. It is therefore our hope that the EC will, in the future, ensure that the financial review runs in parallel with the technical review by starting it immediately after the Project reports are delivered.
The financial documents are also difficult to fill in correctly, even for authorised external auditors. This has caused a lot of extra work for the coordinator when collecting signed originals from all partners, as many documents need to be changed, signed and sent in again. The consequences of this have been that some Project partners have not been able to produce the required papers in time, because the deadline to deliver the Project reports is only 45 days

1. Railway bridges in Europe
48
after the end of each Project year, which in our case happens to include the Christmas and New Year period. For future projects we hope that the instructions on how to fill in the financial documents will be clearer to help avoid the most common mistakes made by the partners and their auditors.
7. CONCLUSIONS
The Project has been very successful, despite the inevitable loss of a number of individuals during its 4-year duration due to retirement or job moves. Not only have the main objectives been reached – increased capacity and life extension of European Railway Bridges through new and refined methods and the preparation of tool-boxes for inspection, assessment and strengthening – networks have also been formed between railway owners, contractors, consultants and universities. Finally, friendship has grown between individuals promoting a more integrated, human and efficient Europe.
ACKNOWLEDGEMENTS
Acknowledgements are given to the European Commission and the Project Officers, Joost De-Bock and William Bird, the Reviewers, Dermot O’Dwyer and Patrick van Honacker, and their colleagues for active and encouraging support to this important Project within the Sixth Framework programme.
Acknowledgements are also given to the European railway bridge owners and their representatives and to all the European partners participating in the Project. Thanks are also due to all who have worked hard on the Project and taken it to their hearts. This not only includes the researchers, but also the secretaries, administrators and technicians who have not been so visible, but who were necessary for success.
Further information on the Project and the Project organization can be found on the Project web site, www.sustainablebridges.net.
REFERENCES Bell, B. (2007): How the project priorities were established. In: “Sustainable Bridges – Assessment for Future Traffic Demands and Longer Lives”, eds. Bień, J., Elfgren, L., Olofsson, J., Dolnośląskie Wydawnictwo Edukacyjne, Wrocław 2007.
Cruz, P.J.S., Frangopol, D.M., Neves, L.C., eds. (2006): Bridge Maintenance, Safety, Management, Life-Cycle Performance and Cost. Proc 3rd Int. Conf. on Bridge Maintenance, Safety and Management, IABMAS’06, Porto, Portugal, 16-19 July 2006, Taylor & Francis Group, London. ISBN 0 415 40315 4.
Elfgren, L., Enochsson, O., Täljsten, B., Paulsson, B. (2007): Sustainable Railway Bridges with Higher Axle Loads: Monitoring Examples from Northern Sweden. In: “High Tech in Heavy Haul” Proceedings. International Heavy Haul Conference. Specialist Technical Session. Kiruna, Sweden, June 11-13, 2007, eds. Nordmark, Th., and Larsson-Kråik, P.-O., IHHA Inc, 2808 Forest Hills Court, 23454- -1236 Virginia Beach, VA, USA, pp. 159-166. ISBN 978-91-633-0607-5.
EN 1990 (2002): Eurocode 0: Basis of Structural Design. European Standard, Brussels: CEN.
EN 1991-1 (2006) Eurocode 1: Actions on structures – Part 1: General Actions. Seven Parts. European Standard, Brussels: CEN.
EN 1991-2 (2003): Eurocode 1: Actions on structures – Part 2: Traffic loads on bridges. European Standard, Brussels: CEN.
EN 1992-2 (2005): Eurocode 2: Design of concrete structures – Part 2: Concrete bridges – Design and detailing rules. European Standard, Brussels: CEN.

Sustainable Bridges – A European Integrated Research Project. Background and overview
49
EN 1993-2 (2006): Eurocode 3: Design of steel structures – Part 2: Steel bridges. European Standard, Brussels: CEN.
EN 1994-2 (2005): Eurocode 4: Design of composite steel and concrete structures – Part 2: General rules and rules for bridges. European Standard, Brussels: CEN.
EN 1995-2 (2004): Eurocode 5: Design of timber structures – Part 2: Bridges. European Standard, Brussels: CEN.
EN 1996-1 (2005): Eurocode 6: Design of masonry structures – Part 1-1: General rules for reinforced and unreinforced masonry structures. European Standard, Brussels: CEN.
EN 1997-1 (2004): Eurocode 7: Geotechnical design – Part 1: General rules. European Standard, Brussels: CEN.
ERRAC (2002): Strategic Rail Research Agenda 2020. European Rail Research Advisory Council, ERRAC, September 2002. 25+54 pp. Available from: http://www.errac.org/reftexts.htm
Paulsson, B. (1998): Assessing the track costs of 30 tonne axle loads. Railway Gazette International, Vol. 154, No. 11, 1998. pp 785-788 (3 pages). See also Lundén, Roger1998. LKAB invests in 30 tonne axle loads. Railway Gazette International, Vol. 154, No. 9, 1998. pp 585-588 (3 pages).
Paulsson, B., Töyrä, B., Elfgren, L., Ohlsson, U., Danielsson, G. (1997): Increased Loads on Railway Bridges of Concrete. Advanced Design of Concrete Structures (Ed. by K Gylltoft et al.), Cimne, Barcelona, 1997. pp. 201-206 (ISBN 84-87867-94-4).
SB-7.2 (2007): Field Test of a Riveted Metallic Bridge in Avesnes/Helpe, France. Deliverable 7.2 in Sustainable Bridges – a project within EU FP6. Available from: www.sustainablebridges.net [cited 30 Sept. 2007].
SB-7.3 (2007): Field Test of a Concrete Bridge in Örnsköldsvik, Sweden, Deliverable 7.3 in Sustainable Bridges – a project within EU FP6. Available from: www.sustainablebridges.net [cited 30 Sept. 2007].
SB-7.4 (2007): Field Test of a Masonry Arch Bridge in Oleśnica in Poland. Deliverable 7.4 in Sustainable Bridges – a project within EU FP6. Available from: www.sustainablebridges.net [cited 30 Sept. 2007].
SB-8.2 (2007): Demonstration of Bridge Monitoring. Deliverable 8.2 in Sustainable Bridges – a project within EU FP6. Available from: www.sustainablebridges.net [cited 30 Sept. 2007].
SB-GUIDE (2007): User Guide for Railway Bridges. Prepared by Sustainable Bridges – a project within EU FP6. Deliverable SB-9.2. Available from: www.sustainablebridges.net [cited 30 Sept. 2007].
SB-ICA (2007): Guideline for Inspection and Condition Assessment of Railway Bridges. Prepared by Sustainable Bridges – a project within EU FP6. Deliverable SB-3.16 Available from: www.sustainablebridges.net [cited 30 Sept. 2007].
SB-LRA (2007): Guideline for Load and Resistance Assessment of Railway Bridges. Prepared by Sustainable Bridges – a project within EU FP6, Deliverable SB-4.2. Available from: www.sustainablebridges.net [cited 30 Sept. 2007].
SB-MON (2007): Guideline for Monitoring of Railway Bridges. Prepared by Sustainable Bridges – a project within EU FP6. Deliverable SB-5.2. Available from: www.sustainablebridges.net [cited 30 Sept. 2007].
SB-STR (2007): Guide for use of Repair and Strengthening methods for Railway Bridges. Prepared by Sustainable Bridges – a project within EU FP6. Deliverable SB-6.1 Available from: www.sustainablebridges.net [cited 30 Sept. 2007].


Initial data gathering and the railway partners’ role


How the project priorities were established
53
How the project priorities were established
Brian BELL This paper initially outlines the work plan included in the Sustainable Bridges project submission to the European Union and how that was modified in the light of emerging experience. It then goes on to describe the initial data gathering exercise and to analyse the results of a survey of the major European railway administrations. The internal dissemination of the survey results is then described and how this caused a re-alignment of project priorities in some areas is discussed.
1. INTRODUCTION
During the initial discussions within the Sustainable Bridges consortium an outline work plan was agreed which split the work into ten work packages (nine technical and one management) each with a different leader relevant to the general topic of the Work Package. Work Package 1 was intended to last for the initial 12 months of the project and to gather basic data on the European railway bridge stock, the maintenance regimes employed by the European railway administrations and their perceived research needs. The work package members consisted of the 6 railway partners – BV (Sweden), DB (Germany), NR (Great Britain), PLK (Poland), RHK (Finland), SNCF (France) – and Lulea Technical University, with leadership of this work package being entrusted to Network Rail. This paper describes the initial work plan, the work of Work Package 1 and how the work in the other Work Packages was modified in the light of the findings of WP1.
2. THE INITIAL WORK PLAN
In the original proposal submission for the Sustainable Bridges project to the EU and also the subsequent signed contract the main objectives of the project were defined as:
• To increase the transport capacity of existing bridges by allowing axle loads up to 33 tons for freight traffic at moderate speeds or for speeds up to 350 km/hour for lighter passenger traffic.
• To increase the residual service lives of existing bridges by up to 25%. • To enhance management, strengthening, and repair systems for existing bridges
Sustainable Bridges – Assessment for Future Traffic Demands and Longer Lives

2. Initial data gathering and the railway partners’ role
54
and the work of Work Package 1 was described in the following way: This Work Package will form the foundation for the rest of the work in the project.
Information will be gathered from rail authorities in Europe and from railway organizations such as the International Union of Railways (UIC) and the European Rail Research Advisory Council (ERRAC). The information gathered will guide the project regarding the direction of the main work, especially after the initial 18-month period.
The Work Package was subdivided into four tasks, each of which was to be managed by the Work Package leader:
• WP1.1. Management of Work Package and liaison with WP 2. • WP1.2. Make contact with all European railway administrations and UIC to obtain:
o statistics on age of bridge stock and construction materials; o details of existing computer based bridge management, inventory and decision support
systems; o details of important maintenance problems, monitoring and inspection techniques
in use. • WP1.3. Undertake web searches and personal contact with leading bridge researchers
worldwide to obtain details of unpublished and on going bridge related research. • WP1.4. Undertake dialogue with regulatory authorities to ascertain any legal or regulatory
objections to the adoption of new technology and planned to produce 4 deliverables:
• D1.1. Detailed work plan with allocation of personnel. • D1.2. A report on the age profile and condition of existing European railway bridges,
transition zones and embankments, subdivided by construction material. • D1.3. A report detailing construction and maintenance problems, subdivided onto those
that are of pan-European relevance and those that are local to a particular country or region.
• D1.4. A report identifying research in hand or unpublished that is likely to provide valuable background information for further effort by other Work Packages and the priority bridge research areas as perceived by European railway administrations.
It was proposed that all these deliverables would be kept confidential to the project (SB Consortium and EU, 1993).
3. WP1 PROCESS
3.1. Initial ideas
From the very early meetings to prepare the Sustainable Bridges bid, it was realised that the small number of railway owners represented in the consortium would not be able to give a fully representative view of the problems affecting railway bridges across Europe. The bid thus allowed, within the activities of WP1, for a survey of all major European railways.
There was initial uncertainty about whether this survey should be based on face-to-face interviews, telephone interviews or the use of a questionnaire. During contract negotiations with the EU the funding available to the project was reduced from the original bid figure and, in order to reserve as much funding as possible for RTD activities, it was decided that face to face interviews would not be feasible.
Hence, either telephone based interviews or the use of a questionnaire were the options taken forward to the kick off meting held in Barcelona on 30 November 2003.

How the project priorities were established
55
3.2. Barcelona meeting
At the kick off meeting, the railway partners agreed that the best format for the railway survey would be a questionnaire, distributed electronically to selected railways by nominated “partner” railways within the Sustainable Bridges consortium. The leaders of WPs 3 to 9 were asked to let WP1 have details of the initial information that they would require to enable them to make an early start to their work.
The railway partners agreed to meet in early January 2004 in Frankfurt, under the joint auspices of WP1 and WP2, to finalise the creation of the questionnaire and to choose the railways to be asked to provide data. In addition the “technical” Work Packages (WP3, WP4, WP5 and WP 6) arranged a joint meeting in Paris in late January 2004 at which WP1 agreed to make a presentation of its initial findings.
To enable WP1 to make a meaningful presentation to the Paris meeting each railway partners agreed to provide basic statistical data on bridge type, maintenance problems and a list their current research activities to the WP leader by the end of December 2003.
3.3. Frankfurt meeting
At the Frankfurt meeting the initial returns from the railway partners, processed into a Power Point presentation were analysed and discussed, and it was agreed that the leader of WP1 could present these initial findings to the Paris meeting mentioned above. Since two of the WP members were attending the UIC (Union Internationale des Chemins de Fer) Structures Experts’ meeting in Paris they agreed to brief that meeting on the aims of the Sustainable Bridges project and to seek the assistance of the UIC Structures Experts in completing the questionnaire.
The following split of responsibilities for data gathering was agreed: • BV – Denmark, Norway; • DB – Switzerland and Austria; • NR – Spain, Portugal, Republic of Ireland, Northern Ireland; • PLK – Czech Republic, Slovakia, Hungary, Croatia, Slovenia; • RHK – Latvia, Lithuania; • SNCF – Italy, Belgium, Holland. The meeting agreed that following topic areas, incorporating requests received from other
WP leaders, should be included in the questionnaire: • Statistics of bridge stock: (number, type, typical span range <10 m; 10–40 m; >40 m,
age of superstructure). • Problem areas: can be connected to the structure type – include piers (including
columns), substructure, abutment, foundation, bearings. Give some lines to write additional information.
• Current research activities financed from Railway owners: give “tick” options to categorise by different areas such as new materials, surface coatings, design, assessment, and lines for other research, split between theoretical and applied.
• Research wish list (5 areas with highest priority). • Existing codes and standards for existing railway bridges. There was some discussion about creating a questionnaire for on line completion. The
initial decision was to proceed on that basis but subsequent enquiries into costs showed that it would be uneconomic, since only 24 questionnaires were to be used (six to WP1 members and 18 to other railways).

2. Initial data gathering and the railway partners’ role
56
3.4. Paris meeting
Following the Frankfurt meeting outlined above, a first draft of the questionnaire was prepared, and circulated initially to the WP1 members. After incorporating minor corrections, a modified draft questionnaire was circulated to all the other WP leaders, with a request that they propose further amendments no later than the close of the Paris meeting.
A presentation made to the Paris meeting outlined the initial findings from the partner returns. This suggested that masonry arch bridges had insufficient project effort when compared with other bridge types, whilst the effort in relation to concrete bridges could be over generous.
3.5. Questionnaire circulation and response levels
Following further minor amendments to the questionnaire the final version was placed on the project intranet on 4 February 2004. The six partner railways then approached their 18 nominated contact railways, requesting return of the completed questionnaires by the end of February. Regrettably, there was a quite considerable delay in obtaining completed questionnaires, with seven of the railways originally approached failing to respond by the final cut off date of early May. It is fortunate that all the “non responders” are relatively small railways and the absence of their returns did not prejudice the validity of the conclusions drawn from the survey.
The completed returns had a good geographic spread across Europe, spanning from Italy in the South to Finland in the North and from Poland in the East to the Irish Republic in the West, and represented all the major European railways. They also successfully covered several different European climates; hot dry Mediterranean; colder Alpine/Nordic and wet/warm Atlantic seaboard.
An Excel spreadsheet was drawn up to record the data as it was received and three successive versions were placed on the project intranet site between late March and early May 2004. A Power Point presentation was prepared to give the results then available to a meeting of WP6 in Stockholm in March 2004, which was updated for a presentation to WP4 in Copenhagen in April 2004. In addition, at these WP meetings the basic Excel spreadsheet was made available so that the WP leaders could analyse the data in a way more appropriate to their needs, should they so desire.
All the completed questionnaires received were placed on the project intranet site, so that all partners could interrogate the data in a way relevant to their work. The final spread sheet, contains information on over 220,000 railway bridges and was made available to all partners on the project intranet site in May 2004.
4. SUBSEQUENT ALERATIONS TO THE WORK PLAN
As work progressed it was agreed to add a further deliverable, D1.5 – provisionally titled “Regulatory blockers”, to formally report the work undertaken in sub task 1.4 and as a result the responsibility for D1.4 was taken over by Lulea Technical University under the direction of Prof Lennart Elfgren. These alterations were accepted by the first General Assembly and included in the revised implementation plan submitted to the EU as part of the first project year reporting. This slightly delayed the finalisation of the major deliverables D1.2 and D1.3, which meant that they were technically delivered by WP2 in early 2005. It was also agreed that D1.4 should be maintained and updated right up to the end of the project, but when it became apparent that the scientific work within the project was sufficiently advanced the report was finalised towards the end of the third project year (2006). The Management Team also decided that they wanted too see as much project material as possible in the public domain

How the project priorities were established
57
for the benefit of other researchers so it was also agreed that the main deliverables (D1.2, D1.3 and D1.4) would be made publicly available and they were placed on the project home page during 2006.
5. WP1 RESULTS IN DETAIL
Work package 1 produced a total of five project deliverables, two of which are internal to the project and three of which are available for public viewing in the WP1 area on the project web site. These are summarised below.
5.1. Deliverable D1.1
This was an internal deliverable which described the organisation of the work package, the effort required to produce each deliverable and the anticipated time scales for each piece of work. It was produced at the end of the first month of the project.
5.2. Deliverable D1.2 – European Railway Bridge Demography
This report gives statistical data from the 220,000 bridges included in the survey. A summary of the main outputs (which forms the main body of the deliverable) is given below; detailed tables etc. can be found the appendix to the report (Bell, 2004a).
5.2.1. Data quality
Before presenting the main highlights, it is probably as well to comment on the quality of the data received. Unfortunately, there is no way of independently checking the data produced in response to the questionnaire but, generally, the data appears to be of high quality. However, there are question marks around some of the returns; for instance the data suggests that in excess of 1,800 concrete bridges are over 100 years old, nearly 500 masonry arch bridges are less than 20 years old and over 2,000 steel/concrete composite bridges are over 100 years old. These questionable figures represent 4%, 1% and 7% of the respective totals for each type and are not significant in any subsequent analysis of the data.
Information relating to the age of substructures has been more difficult to obtain, with only three returns containing any data in this area. This limited sample suggests that over 60% of substructures are in excess of 100 years old and a further 20% are aged between 50 and 100 years. It was considered appropriate to regard these values as representative for the purposes of the project. However, they are probably statistically on the low side, since it is normal railway practice to only replace bridge superstructures and the majority of railway routes in Europe are in excess of 100 years old.
5.2.2. Bridge types
The overall picture of European railway bridges is: • 23% are concrete, • 21% are metallic, • 41% are arches, • 14% have steel/concrete composite or encased beams construction. From the returns, it was not possible to determine material type for some 2,400 bridges,
which is about 1% of the total number of bridges included in the survey. This very low rate of error means that the data can be considered to properly reflect the European railway bridge stock.

2. Initial data gathering and the railway partners’ role
58
Of the 50,000 concrete bridges reported: • 78% are reinforced, • 21% are either pre stressed or post tensioned. NOTE: For a small number of bridges it was not possible to determine from the returns the
sub type within the overall concrete category. Of the 47,000 metallic bridges reported: • 3% are cast iron, • 24% are wrought iron, • 53% are steel. NOTE: For 20% it was not possible to determine from the returns the sub type within the
overall metallic category, but it was assumed that the split would be similar to the percentages quoted above for each sub type.
Of the 90,000 arch bridges reported: • 52% have brick arch barrels, • 33% have stone barrels. NOTE: The remaining 15% either have concrete barrels, or the construction material
was not specified on the questionnaire. It is was assumed that concrete barrels will equate to no more than 5% of the total, with the remaining 10% split 52:33 between brick and stone.
Data relating to over 30,000 steel/concrete or encased beam bridges was received. This data has not been split down between these two sub types.
5.2.3. Bridge age profile
The overall picture reported shows that: • 11% of the bridges surveyed are less than 20 years old, • 22% are between 20 and 50 years old, • 32% are between 50 and 100 years old, • 35% are over 100 years old. For concrete bridges: • 25% are less than 20 years old, • 55% are between 20 and 50 years old, • 16% are between 50 and 100 years old, • 4% are over 100 years old (this is doubtful, please see comment in 5.2.1 above). For metallic bridges: • 10% of are less than 20 years old, • 22% are between 20 and 50 years old, • 40% are between 50 and 100 years old, • 28% are over 100 years old. For masonry arches: • 1% are less than 20 years old (this is doubtful, see comment in 5.2.1 above), • 1% are between 20 and 50 years old (this is also doubtful, see comment in 5.2.1 above), • 34% are between 50 and 100 years old, • 64% are over 100 years old. For steel/concrete or encased beam bridges: • 25% are less than 20 years old, • 33% are between 20 and 50 years old, • 35% are between 50 and 100 years old, • 7% are over 100 years old (this is doubtful, please see comment in 5.2.1 above).

How the project priorities were established
59
5.2.4. Bridge span profile
In dealing with spans, the data requested specified the size of individual spans in multi span bridges, rather than the full length of such bridges. The overall situation appears to be that:
• 62% of the bridges surveyed span less than 10 m, • 34% span between 10 m and 40 m, • 6% span more than 40 m. For concrete bridges the breakdown is: • 63% span less than 10 m, • 33% span between 10 m and 40 m, • 4% span more than 40 m. Metallic bridge spans break down as: • 45% span less than 10 m, • 44% span between 10 m and 40 m, • 11% span more than 40 m. Masonry arch bridges are generally short span with the split being: • 75% span less than 10 m, • 24% span between 10 m and 40 m, • 1% span more than 40 m. For steel/concrete or encased beam bridges: • 47% span less than 10 m, • 48% span between 10 m and 40 m, • 5% spans more than 40 m.
5.3. Deliverable D1.3 – European Railway Bridge Problems
This report contains an analysis of the text based information received in the survey. Once again a summary of the main outputs (which forms the main body of the deliverable) is given below; detailed spread sheets can be found the appendix to the report (Bell, 2004b).
5.3.1. Survey returns
The nature of the questions asked in relation to this deliverable means that the answers are, at least in part, subjective. This means that they represent the views or opinions of the person answering the questionnaire, rather than necessarily representing the “corporate” position of the railway approached and cannot be independently checked.
It is interesting, in view of the foregoing, that there is a great measure of agreement on maintenance problems and research priority areas, which, fortunately, agree closely with the preliminary results drawn from the initial returns of the partner railways mentioned in 3.4 above. This is probably because there is not a great variation in bridge types, ages and span lengths across the railways surveyed for this exercise.
The data is presented in outline below under a number of heading that were relevant to the Sustainable Bridges project In analysing the results outlined below and in the spreadsheets in the appendix, the following definitions have been used:
• Maintenance means any physical work undertaken to a bridge within the more detailed categories “rehabilitation”, “strengthening” or “replacement”.
• Rehabilitation means returning the bridge as nearly as possible to its original condition and carrying capacity.
• Strengthening means improving the carrying capacity beyond that for which the bridge was originally designed.

2. Initial data gathering and the railway partners’ role
60
• Replacement means either the replacement of the superstructure or the total replacement of the bridge, either in its original position or in a new position.
There has not been a detailed investigation of “replacement” activities, since the focus of the Sustainable Bridges project relates to the life extension of existing bridges with the minimum of interruption to the traffic using the bridge. Replacement cannot normally achieve this objective, although it will continue to be a necessary activity as bridges reach the end of their natural life.
5.3.2. Current maintenance activities
The railways surveyed were asked to report their current maintenance activities sub divided between arch bridges, metallic bridges, concrete bridges and concrete/steel composite bridges. These type categories were then further sub divided between rehabilitation, strengthening and replacement activities.
The intention was to record the relative percentages of each activity, with the total of all activities adding to 100%. This would have established the relative importance of all maintenance activities currently in use. However, the question was not framed in an unambiguous way and most returns gave the relative importance of each maintenance activity within each bridge sub type. This means that it has been virtually impossible to determine the relative importance of different bridge types in terms of maintenance activity/spend. Nevertheless the headline results are given below:
• The major current maintenance activity on concrete bridges is rehabilitation, with strengthening also featuring quite highly in a number of cases. Replacement is the major maintenance activity on concrete bridges for two of the respondent railways in Eastern Europe.
• The major current maintenance activity on metallic bridges is rehabilitation, with strengthening and replacement also featuring quite highly in a number of cases. There are no discernible regional trends in the variation of activity.
• The major current maintenance activity on masonry arch bridges is rehabilitation, with replacement also featuring quite highly in a number of cases. A small amount of strengthening activity is also being undertaken. There are no discernible regional trends in the variation of activity.
• The major current maintenance activity on other arch bridges (assumed mainly to be concrete) is rehabilitation, with replacement also featuring quite highly in a number of cases. A small amount of strengthening activity is also being undertaken. There are no discernible regional trends in the variation of activity.
• The major current maintenance activity on steel/concrete composite bridges appears to be either rehabilitation or replacement. Virtually no strengthening activity is being undertaken. There is little middle ground; a railway is either rehabilitating or replacing such bridges. Most replacement activity is being undertaken in central Europe, whilst rehabilitation is the norm in most other areas.
5.3.3. Current maintenance problems
The railways surveyed were asked to indicate their current maintenance problems with both superstructures and substructures (including bridge ends/transition zones), irrespective of how the problem was physically resolved. The replies were analysed, by simply counting the number of “ticks” recorded against each problem, for sub structures and superstructures and then recorded separately for each major bridge type (superstructures) and element (substructures). This analysis is discussed in more detail below:

How the project priorities were established
61
• For bridge superstructures waterproofing is a major maintenance problem and is not limited to one particular type of bridge. For concrete beam bridges the major problems are corrosion of pre-stressing tendons; reinforcement corrosion and cracking/spalling of cover concrete, whilst wrought iron and steel beam bridges suffer from corrosion and fatigue cracking and masonry arches see materials degradation coupled with cracking. Maintenance problems with other bridge types (cast iron, non masonry arches and composite) do not feature greatly in the returns and in most cases the reported problems mirror those of their beam counterparts (concrete spalling, materials degradation etc.).
• For bridge substructures and transition zones the biggest maintenance issue appears to be the seizure or fracture of bearings, whilst settlement is the major issue with abutments, foundations and transition zones and scour features highly for bridges with abutments or piers in, or close to, rivers.
5.3.4. Current rehabilitation methods
In order to assess the relative importance of rehabilitation methods currently in use, the railways surveyed were asked to prioritise their activities in this field. Six activities stand out as being the most important currently in use. These are (in approximate order of importance):
• painting of metalwork, • concrete repairs, • patch repair of damaged brickwork/masonry, • patch repairing of corroded metalwork, • waterproofing, • pointing of brickwork/masonry.
5.3.5. Current strengthening methods
In order to assess the relative importance of strengthening methods currently in use, the railways surveyed were asked to prioritise their activities in this area. Unlike the rehabilitation activities discussed above there is a less clear-cut split between more important and less important. Two activities are clearly very important:
• replacement of metallic structural members, • concrete saddling of arches. The following are less important, but still widely used: • arch reinforcement, • underpinning of foundations, • addition of new metallic members, • underlining of arches, • increasing the cross section of concrete members, • soil improvement.
5.3.6. Research priorities
Finally, the railways surveyed were asked to give five priority research topics/outcomes from the Sustainable Bridges project. As this information was not in a standard format it was listed and combined where it seemed appropriate to do so. These results were recorded on a “block chart” under the following main headings:

2. Initial data gathering and the railway partners’ role
62
• assessment, • inspection/monitoring, • repair/maintenance, • bridge management, • new build. It is clear that the main priority need relates to assessment, with better assessment rules and
confirmation of dynamic factors both scoring very highly, with one or the other being mentioned by virtually all respondents.
No other theme attracted the same level of response, but: • better inspection/diagnosis tools, • the repair of concrete structures, • the use of new materials in both maintenance and new build
all appear to be important topics for investigation to the respondents.
5.4. Deliverable D1.4 – Railway Bridge Research
This report details the results of web based searches into ongoing bridge related research in 2004/5, enhanced by personal knowledge and direct communication with researchers around the world. Brief highlights are given below and the full report can be found at Stenlund, Nilsson and Elfgren (2005).
The main body of the report consists of a series of tables listing institutions, companies and organisations currently reporting active bridge related research. The listings are divided initially by the following material categories:
• concrete, • steel, • masonry, • wood, • all materials
and then further sub divided among these main and sub headings: • Design and/or assessment:
o loads, o shear and torsion analysis, o thermal stresses, o seismic analysis & design, o stability, o fatigue, o assessment.
• Production. • Monitoring:
o structural behaviour, o loads and stresses, o deformation, o dynamic effects/vibration.
• Maintenance: o life cycle analysis, o repair & strengthening, o durability, o structural damages, o degradation/corrosion.

How the project priorities were established
63
A further table presents data by country, with in some cases quite lengthy text explaining the aims of each institution surveyed. In addition a number of important publications are listed.
Finally the report analyses the trends revealed from the survey data by counting “hits” against the sub categories outlined above. The main research topics appear to be:
• assessment, • structural behaviour, • repair and strengthening, • dynamic effects and vibration, • life cycle analysis.
5.5. Deliverable D1.5
This was the other internal deliverable, which detailed organisations (mainly standard setting and regulatory bodies) with which Work Package 9 should make contact with a view to ensuring the adoption of the project developments.
6. IMPLEMENTATION OF WP1 OUTPUTS
The WP1 surveys confirmed the importance of the majority of the work planned, particularly with regard to resistance (strength or capacity) assessment, dynamic amplification factors, non-destructive testing, monitoring and the development of new strengthening techniques.
One of the major need areas identified during the survey work (the repair of concrete structures) was not included in the work carried out by Sustainable Bridges. This decision was made because two of the railway partners (BV and NR) were separately involved with 5th Framework projects dealing with concrete refurbishment (ReHabCon and ConRepNet) and could bring relevant outputs into the project.
The only major issue to be addressed was that masonry arch bridges featured more largely in the European railway bridge stock than had been anticipated during the preparation of the project proposal and the subsequent contract negotiations. The management team thus decided to allocate more effort to masonry bridges than had been originally intended. This meant withdrawing resources from other less essential areas and did cause some difficulties as, in a lot of cases, researchers had already been recruited to undertake all the work originally planned. There was also a shortage of academic expertise in masonry arch bridges within the project. Under the EU rules governing the work, the introduction of new expert partners to cover the additional work on masonry arches would have meant publicly advertising for expressions of interest and then interviewing suitable candidate institutions. This would have delayed the investigation into masonry arches, which could have seriously jeopardised a successful outcome for the project, so it was decided to provide additional resources to the existing partners with the relevant expertise. Whilst not causing the same delay as the introduction of a totally new partner, this extra work has certainly held back the completion of some of the final project deliverables.
7. CONCLUSIONS
European railway bridges are generally quite old, but there are major regional variations in the mix of bridge types. Most railway bridges have relatively short spans and are maintained in a traditional way, using tried and tested methods. All the railways surveyed have a well-established regime of inspections and, although the intervals between

2. Initial data gathering and the railway partners’ role
64
inspections vary between railways, annual visual inspections and six yearly detailed inspections are the norm.
The adoption of changed priorities within the project, mainly as a result of the work of WP1, but also as a result on the annual EU reviews, shows the flexibility afforded to the Management Team within an “integrated project”. The final results of the project are more attuned to the declared needs of the railway fraternity than would otherwise have been the case and it is expected that take up of the outputs will be more enthusiastic as a result of the work of WP1.
ACKNOWLEDGEMENTS
The work described above would not have been possible without the active support of the railway administrations within the project and the willingness of the other European railways to share their data and thoughts with the project. Special thanks are due to Bjorn Paulsson and Katarina Kieski (BV), Martin Muncke (then with DB), Britta Schulke (now Britta Schewe) (DB), Lennart Elfgren (LTU), Maciej Sawicki (then with PLK), Harri Yli Villamo (RHK) and Didier Martin (SNCF) for their efforts.
REFERENCES Bell, B. (2004a): European Railway Bridge Demography. Sustainable Bridges project deliverable D1.2. Available from: http//www.sustainablebridges.net/WP1
Bell, B. (2004b): European Railway Bridge Problems. Sustainable Bridges project deliverable D1.3. Available from: http//www.sustainablebridges.net/WP1
SB Consortium and EU (1993): Sustainable Bridges Contract FP6-PLT-001653.
Stenlund, A., Nilsson, M. and Elfgren, L. (2005): Railway Bridge Research. Sustainable Bridges project deliverable D1.5. Available from: http//www.sustainablebridges.net/WP1

The railway partners’ role in “Sustainable Bridges”
65
The railway partners’ role in “Sustainable Bridges”
Björn PAULSSON This paper describes the railway partners’ role in “Sustainable Bridges” (SB) and how the project was guided. The main part of this work was carried out in WP2 of SB. The way SB was guided can be separated into four activities. The first is to work with the right questions. This was done mostly in WP1 and is described in the previous paper. The second was to support the researchers with practical and relevant railway knowledge. This activity also gave input so that unnecessary work could be avoided and also to make demonstrations possible with test objects. The third activity was to review documents. Here WP2 worked intensively during the whole project with a lot of efforts. These work has had the following effect namely to assure the quality of the deliverables and to steer the result so that the important questions where addressed in a proper way. The fourth and maybe the most important activity have been to make the result easier to implement. Dissemination is not enough today with a situation with end-users having slimmed organisations. This last question has been focused on during the total project but especially the last two years.
1. BACKGROUND
The railways of today have challenges to meet. There are new demands like increased speeds, higher axle loads, increased availability and less operational hindrance not only on our new lines but also on the existing net. At the same time there is a demand on the railways to reduce maintenance costs. These new demands mean practically a need for new knowledge.
Bridges is an important part of the railway system. The above mentioned demands are also put on the bridge stock. Railway bridge technique is often complex due to age and important dynamic forces.
Sustainable Bridges is focused on existing railway bridges with the following overall objectives:
• increase the transport capacity of existing bridges, • increase the residual service life of existing bridges, • enhance management, strengthening and repair systems.
Sustainable Bridges – Assessment for Future Traffic Demands and Longer Lives

2. Initial data gathering and the railway partners’ role
66
It has been important to have this in mind form especially the railway partners side so that you understand the objective and needs in the guidance work.
WP2 has also made yearly written reports to give both EU and all project participants an overview of how the project objectives are met. The main focus for the railway owners when commenting is to ensure that the overall objectives are met and that the results from the project are of use and possible to implement.
Last but not least environmental and esthetic must be considered. The railway bridges of today represent an important heritage for the future.
The railway owner group has been active during the project with reviewing reports, giving technical comments, by participating in work package meetings and the General Assembly. The organisation of such a large project with a group being responsible for the guidance and review of the project results has shown to be very useful.
Figure 1. The picture shows the different work packages and WP2
The group of partners from the railways in WP2 have been the following railways: • Deutsche Bahn (DB) from Germany, • Network Rail (NR) from UK, • Banverket (BV) from Sweden,
WP 1 Start-up and
Classification
WP 4 Loads,
Capacity and Resistance
WP 2 Guidance and
Review
WP 6 Repair and
Strengthening
WP 3 Condition
Assessment and Inspection
WP 7 Demonstration Field Testing
WP 5 Monitoring
WP 8 Demonstration
Monitoring
WP 9 Training and
Dissemination

The railway partners’ role in “Sustainable Bridges”
67
• SNCF from France, • PLK from Poland, • RHK from Finland.
2. SUPPORT WITH RAILWAY KNOWLEDGE
Support the researchers and the industry with practical and relevant railway knowledge was also done continuously by the railways. Practically a railway was appointed out liaison partner to a specific WP. See table below.
Previous research concerning railway bridges has had small proportions compared with road bridges. This means that the academics knowledge about railway bridges has not been sufficient. The reason for this is mainly that railway research has taken place in-house in the railways or that the railways have used research from the road bridge experience. The other fact is that railway technique is both wide and deep means that the academics needs support with railway technique to perform in a good way. In SB a system with liaison partners where set up. In the table below you can see which railway that supported witch WP. Table 1. Shows the liaison railway partner to different work packages
Work package WP3 WP4 WP5 WP6 WP7 WP8 WP9
Liaison Railway DB NR DB BV SNCF RHK PLK
This activity also gave input so that unnecessary work could be avoided. Some technique,
that was proposed, was impossible to use because of specific railway conditions. Examples on this were electrical environment and technique that needed longer track availability.
This activity also to make demonstrations possible with test objects. The difficulties to secure demonstration objects are big. Therefore the support of the railway has been a condition to do demonstrations. The test bridges in WP7 and WP8 are examples on this.
3. REVIEWING DELIVERABLES
The third activity was to review documents. Here WP2 worked intensively during the whole project. A lot of efforts where put in. These work has had the following effect namely to assure the quality of the deliverables and to steer the result so that the important questions where addressed in a proper way.
The number of deliverables in SB has been 115. Of these 5 has been in WP1 describing the the previous situation. 14 has been administrative deliverables from WP2 and 8 from WP9 describing the dissemination process. The rest 88 has been technical deliverables that has been reviewed by WP2. Many deliverables has been delivered several times because they where delivered as draft versions in a early stage. The deliverables have also been delivered at the same time according to the time schedule of SB. This has meant that the review process had to be well planned.

2. Initial data gathering and the railway partners’ role
68
The review comments have not only been technical. It has been a tool to make the deliverables clearer and easier to read.
Of the deliverables there are four guidelines. These documents have been paid special attention to. Hear extra reviewing have been carried out in order to give them the best quality and make them easier to implement. I will come back to this in the next chapter.
In order to achieve the above WP2 early in the project pointed out that it is important to make sure that the quality is as good as possible. Therefore WP2 brought forward routines to make the review process efficient and coordinated with the rest of the project. It was not a police matter. A dialogue has to be established. The responsibility for the result was still the WP-leaders. Special routines were produced to ensure that the quality of reviewing was sufficient and that the review process was nor delaying the project.
The list of general comments prepared in year 1 by WP2 has been used as a check list when making deliverables in the rest of the project. The overall quality of the deliverables has been good. A common structure was also achieved and the technical deliverables nearly all start with a summary which explains the progress and the contribution to reach the goals of the project.
WP2 has reviewed both technical reports and draft guidelines. If a guideline is accompanied by a large background document the review group has focused on the text in the main guideline to be able to use the limited review efforts as seen best for the project.
The review has also taken into account the European perspective. This has been pointed out during the review process.
4. DISSEMINATION AND IMPLEMENTATION
WP9 is the partner who has the responsibility for dissemination in SB. But is is also important that all participants in SB takes their responsibility for their own parts so that WP9 can do a good job.
On the four workshops the railway partners have invited other railways to participate. Here the UIC group Panel of Structure Experts (PoSE) have played an important role. This group represents more than 25 European railway bridge experts.
PoSE have also been continuously informed from the result from SB. It is a known fact that it is not until the result is implemented the benefits for the organisation
comes. In SB the railways have paid a lot of efforts to this question. This work has mainly been on the four guidelines in the SB.
To make the result from WP3 easier to implement it was important to first clarify the target group for the result. When this was done the next step was to have a good discussion with representatives from the target group. A good example for this interaction was in the workshop “Condition assessment and inspection” in Berlin organized by BAM. The workshop had 40 attendees incl. Sustainable Bridges Partners. We reached 18 railway representatives from 11 railway organizations. WP3 was given positive feedback on presentations, discussion and demonstration.
The result is a guideline that is valuable and easy to use. For example the Non Destructive Tool box (NDT) have a 1-page information sheets/method where the bridge engineer easy can se what field of application the specific methods have and also a short description of the method’s followed by some information of limitation.
The guideline from WP4 for Load and Resistance Assessment of Existing European Railway Bridges is the guideline from WP4. This is a comprehensive document – 419 pages in the final draft version. The target group for this document is the design category in the railways and consultants.

The railway partners’ role in “Sustainable Bridges”
69
Figure 2. The Kalix river bridge. Some of the rivets in the side spans have been replaced with bolts and the steel didn’t fulfil the requirements for fracture toughness. Already using the first step “Initial assessment” with “Site visit”, “Study of documents” and “Simple calculations” made it possible to run 25 tonnes axle loads
The document is by its nature not easy to use. Therefore the structure in the document is the
same as in the new Euro codes. This means that it can be referred to from national documents that are using the Euro code structure.
It is also planned to use the document on bridges already under 2007 so that the implementation can start. On the Haparanda bridges it was planned to use the document. These bridges showed to be to near the level for acceptance so it was not a good test on the document.
Based on the evaluation of existing monitoring techniques WP5 will develop a guideline on monitoring of railway bridges. This will include suitable and reliable methods and procedures for implementation of monitoring systems.
The importance of cost effective technologies and the special use in railway environment is clear to all participants of this WP. Most of the techniques used today cannot be used on railway bridges easily so far, because of obstacles such as accessibility and signalling. One of the main problems of monitoring in the railway network is clearly understood: reliable low cost sensors with a high availability are needed.
Railway owners will save money in the future thanks to the extensive work by WP5 of evaluating monitoring methods that assure reliable measurements and enable the user to have a continuous output of relevant data at low costs and dependable interpretation of results. This will be the best guarantee to get the result implemented.
The guideline from WP6 is a document that is easy to use. For example the best practice guide that will be part of the guideline D6.1 is constructed in a similar way as the NDT toolbox from WP3. It makes it easy to use for the end-users.
In the guideline a system has been developed a system that we call “Graphical Index”. This is a way of choosing the right repair/strengthening method out from a graphical sketch of different bridges. This method/system is then described in detail and when applicable referred to a “Best Practice” example that can be followed.

2. Initial data gathering and the railway partners’ role
70
Demonstration on railway bridges is also an important way of dissemination and implementation. In WP7 for bridges has been tested. The same goes for WP8 where different monitoring systems have been tested and verified.
5. CONCLUSIONS
The conclusions could be made in four statements: • In Sustainable Bridges the work has been focused on real needs from the railways. • Railway knowledge has continuously been incorporated into SB through appointed liaison
partners. • The quality of the deliverables is high due to the intense review done. • The result from SB has been made easier to implement.

Inspection, testing and assessment of bridge condition

NDT of masonry arch bridges – international practice
73
NDT of masonry arch bridges – international practice
Michael FORDE This paper reviews international practice in the NDT of masonry arch bridges. Many key problem areas of masonry arch bridges have been identified and appropriate NDT techniques targeted. NDT is now an established tool for the investigation of masonry bridges. Some of the techniques used on concrete were capable of being transferred to new masonry, but necessarily to masonry arch bridges, with their special features. It has been shown that the most useful techniques are low frequency sonic echo, sonic transmission and sonic tomography, plus the selected use of ground penetrating radar (GPR). Examples and quantifications are given in the paper.
1. INTRODUCTION
Masonry arch bridges form an important part of the railway infrastructure in the EU. They are a critical part of the transportation system in the UK, since they comprise over 40 per cent of the bridge stock in current use. In total, there are over 50,000 masonry arch bridges in the UK. The largest single owner of masonry arch spans in the UK is the railway operating company, Network Rail. Many road bridges were originally designed for horse drawn traffic and although they are carrying loads greatly in excess of those for which they were designed, they are showing little sign of distress.
In the USA there are relatively few masonry arch bridges. Long span railway bridges in the USA and Canada tend to be older metallic structures. Since most masonry arch bridges tend to be greater than 100 years old, many were destroyed within the countries involved in the civil wars in Europe during the middle of the 20th century.
As masonry arch bridges are so reliable, they tend to be neglected – compared to concrete bridges. However with the increase in rail interoperability across the enlarged EU, there is increasing attention being paid to the evaluation and maintenance of masonry arch bridges – hence, the increased attention being paid to the NDT of these bridges.
Sustainable Bridges – Assessment for Future Traffic Demands and Longer Lives

3. Inspection, testing and assessment of bridge condition
74
2. ISSUES WITH MASONRY ARCH BRIDGES & NDT TECHNIQUES
Bridge Engineers face numerous problems when assessing both brick and stone masonry arch bridges and their adjacent wing walls and retaining walls. Examples of problems to be identified and appropriate NDT techniques include: Sonic Transmission and Sonic Tomography as well as Ground Penetrating Radar.
2.1. Sonic Transmission and Sonic Tomography
Sonic Transmission and sonic tomography remain relatively early and yet extremely effective techniques for assessing many aspects of masonry arch bridges. Such as:
• Quality of masonry – assessment of the quality varying from high quality to deteriorated low quality lime mortar masonry where the joints have been significantly washed out. This aspect is best assessed by using transmission velocities derived from low frequency hammer impacts of around 500 Hz, with a modally tuned hammer (Figure 1).
Figure 1. Transmission modes for sonic wave tests: a) direct, b) semidirect, c) indirect The interpretation of the resultant velocities is as given in Table 1 below.
Table 1. Relationship between velocities and masonry quality
Material Velocity (m ⋅ s–1) Material quality
Brick masonry 3,500 Good Brick masonry 2,000 Poor – mortar missing? Granite masonry 3,000 Good Sandstone masonry 2,000 Good Sandstone masonry 1,000 Moderate – some lime mortar missing Sandstone masonry 500 Very poor – much mortar missing Granular fill 1,000 Dense Granular fill 500 Loose or with high porosity due to fines wash-out Granular fill 500 Loose or with high porosity due to fines wash-out
< 500 Some voiding No
transmission Major void
a) b) c)

NDT of masonry arch bridges – international practice
75
• Identification of the geometric shape of masonry structures behind spandrel walls and wing walls – in particular identification of the hidden shape of springers on a masonry arch. Figure 2 shows the elevation of Lauder Bridge and Figure 3 shows the interpretation of the sonic transmission and reflection data.
Figure 2. Lauder bridge elevation
Figure 3. Lauder bridge cross-section

3. Inspection, testing and assessment of bridge condition
76
• Identification of the thickness of a masonry arch ring – frequently partially hidden by the spandrel walls and not always apparent from the voussoir. The thickness of the voussoir could be determined either by sonic time domain reflections or by using GPR – as below.
• The identification of areas of soil fill behind spandrel walls, wing walls and retaining walls and other parts of bridges – can be detected from the overall transmission velocity through a bridge. This can be corrected or calibrated from an estimate of the thickness of the brick or stone wall. Identifying whether a masonry bridge structure is cellular or “solid” – the latter could be soil fill or “solid” masonry.
• Identification of the location of voids areas of weakness in masonry arch bridges and other types of masonry structures, in order to aid the engineer in choosing where to undertake remedial. measures, such as grouting and tieing. The area of voiding could be determined using sonic transmission testing as above, perhaps enhanced using tomographic modelling – see Figure 5.
2.2. Ground Penetrating Radar (GPR)
The basic principles of ground penetrating radar are well established (Forde & McCavitt, 1993). The propagation of an electromagnetic radar pulse and the consequent time domain trace are well illustrated by Annan (1992) – see Figure 4.
As seen in the left part of Figure 4, an electromagnetic pulse is emitted from a bow-tie antenna with 60 degree cone of emission. The reflected signal is received by a second bow-tie in either a separate antenna box, or in the same antenna box. As the pulsing radar antenna is moved from left to right a 2-D radargram is built up – right part of Figure 4. Once the electromagnetic velocity is calibrated then a depth scale can be incorporated into the radargram.
Figure 4. Principle of impulse radar and Time Domain or Radargram plot after (Annan, 1992)
• Identification of the thickness and shape of masonry gravity wing walls and retaining walls to enable stability analyses to be undertaken can be undertaken using GPR – see Figure 5. Low frequency antennas must be used due the problem of clutter, but this means that the resolution for minor defects such as missing mortar is not available. Also the first detectable defect was established to at λ/3 (where λ = wavelength).

NDT of masonry arch bridges – international practice
77
Figure 5. Masonry arch wing walls
• Identification of the composition of any concrete backing to a masonry wing wall or retaining wall if present.
• Identification of the composition of any clay backing above a masonry arch. • Identification of any concrete saddle above a masonry arch. • Identification of any delamination between multiple rings of a brick masonry arch bridge.
3. ADVANCES IN NDT
The ultimate aim of most Civil Engineering NDT is to achieve the highest quality of visual. imaging of the relevant internal features of a structure. Medical ultrasonics and NMR have provided excellent images and so has aircraft ultrasonic imaging of metallic structures. In the Civil Engineering NDT community, concrete has seen more developments than masonry, perhaps because the material is more widely used and there are more problems.
Three of the leaders in masonry NDT imaging include: BAM, Berlin, Germany (Maierhofer et al., 2005), Politecnico di Milano, Italy and the University of Edinburgh (Forde and McCavitt, 1994).
BAM has focused on issues related to data fusion, particularly with respect to concrete structures – fusing impact echo, shear wave ultrasonics and GPR. In order to achieve credible data fusion precision robotic readings are needed. Hand operated systems did not give appropriate precision (Niederleithinger, 2006). Results on data fusion of masonry structures have not been published. A substantial reference to the BAM NDT Toolbox is available on the internet (www.bam.de/ZfPbau-kompendium.htm).
Whole structure dynamic testing of masonry arch bridges (Armstrong et al., 1995) has proved difficult, but more effective on metallic and concrete bridges than masonry arch structures. Gentile (2006) has given an excellent example of such an investigation on a concrete arch bridge.
Acoustic emission has proved increasing successful on concrete beams and bridges (Ohtsu and Watanabe, 2001), but more challenging on masonry structures (Shigeishi et al., 2001).
3.1. Sonic Tomography
Low frequency sonic tomography of masonry arch bridges has been developed at the University of Edinburgh (Colla et al., 1997; BA 86/06, 2006). See Figures 6 and 7, relating to

3. Inspection, testing and assessment of bridge condition
78
Figure 6. Elevation of North Middleton Bridge
Figure 7. Sonic tomographic reconstruction of data taken from the abutment of North Middleton Bridge North Middleton Bridge in the Scottish Borders, where A = abutment face, U = upstream wing wall; and D = downstream wingwall.
By using a fuzzy logic tomographics software program, areas of very low velocity can be idetntified. These coincide with a cellular construction for reducing the mass on the bridge foundations. This is a key area as Colla (1997) showed that many stone masonry arch bridges were deliberately constructed with a hollow cellular structure to minimise the loading on the foundations. Modern structural engineers are often tempted to grout up voids!
3.2. Moisture detection using conductivity equipment
Moisture ingress to masonry arch bridges can prove problematical for two reasons (a) washout of the soil backfill; and (b) erosion of the lime mortar in stone masonry arch bridges or mortar in brick arch rings. The erosion of mortar in brick masonry arch rings can cause debonding between the multiple rings and hence a significant loss of strength.

NDT of masonry arch bridges – international practice
79
One of the techniques available for qualitatively assessing moisture content of masonry arch bridges is to measure the conductivity using a meter, such as the Geonics EM38 – Figure 8. The results from such a study on Middleton North Bridge are shown in Figure 9.
Figure 8. EM38 Conductivity meter
Figure 9. Conductivity distribution on downstream side up to 1.5 m depth – pink represents high conductivity and blue low conductivity

3. Inspection, testing and assessment of bridge condition
80
3.3. GPR testing of masonry bridges
The key issue with respect to stone masonry relates to clutter or scattering of the radar signal. due to the size of the individual pieces of masonry and the heterogeneous nature of the lime mortar (Padaratz and Forde, 1995). Earlier work demonstrated that in the example shown in Figure 5, where masonry blocks were approximately 100 mm square, that the maximum centre frequency had to be less than 200 MHz – hence the adoption of the 500 MHz antenna. From Table 2 below, this gives a minimum detectable depth of target of around 40 mm (based on λ/3) and a resolution of around 60 mm (based on λ/2). Table 2. GPR Propagation through masonry
Material εr Frequency
(MHz) Velocity (cm/ns)
Wavelength (cm)
Resolution (cm)
Zmin
(cm) Penetration
(cm)
Stone 5.69 900 12.55 13.9 7 4.6 low
Stone 5.69 500 12.55 25.1 12.6 8.4 medium
Stone 5.69 100 12.55 125.5 62.8 41.8 High
εr = dielectric constant (real)
A current study at the University of Edinburgh is focused on identifying ring separation in brick masonry arch bridges, using numerical. analysis validated by experiments at both the University of Edinburgh and the University of Salford. Early findings indicate that mortar gaps can be identified quite clearly, whereas hairline delaminations are more challenging (Diamanti et al., 2007).
4. DISCUSSION OF WORLD PRACTICE
The NDT research and practice activity in masonry has been considerably lower than the activity relating to concrete. To some extent this is a reflection of the reliability and durability of masonry. Considerable work has been undertaken by the masonry conservation community led by Professor Luigia Binda e.g. (Binda et al., 1999; Binda et al., 2003; Binda et al., 2006). Key areas of activity have involved correlating sonic tomography with radar investigations. Infrared thermography has been used to determine delaminations in the brick masonry and the renderings. These investigations have then be combined into an interpretation, rather than the datafusion used by the BAM group on concrete. The UK Highways Agency has produced an Advisory Note on the NDT assessment of bridges: BA86/06 (2006), which summarises UK practice.
General trends can be drawn from the work of the international community.
4.1. Stone masonry arch bridges
• Sonic testing involving: sonic echo; sonic transmission and sonic tomography is most effective.
• Low frequency radar (GPR) can be effective for identifying larger features. • Infra-red thermography may have a role in detecting hidden features and delaminations.
4.2. Brick masonry arch bridges
• Sonic testing involving sonic echo, sonic transmission and sonic tomography, is very effective.

NDT of masonry arch bridges – international practice
81
• Radar (GPR) can be very effective at relatively high frequencies, in the reflection and transmission modes; and also when undertaking radar tomography in both 2-D and 3-D.
• Infra-red thermography is more effective on brick masonry than stone masonry. Impact echo (Sansalone and Street, 1997) is more suited to high quality modern masonry,
than stone masonry. Similarly with ultrasonics, where the low power, higher frequency signals are rapidly attenuated (Komeyli-Birjandi et al., 1984).
5. CONCLUSIONS
NDT is now an established tool for the investigation of masonry bridges. For the NDT testing of stone masonry arch bridges: • Sonic testing involving: sonic echo; sonic transmission and sonic tomography is most
effective. • Low frequency radar (GPR) can be effective for identifying larger features. • Infra-red thermography may have a role in detecting hidden features and
delaminations. For the NDT testing of brick masonry arch bridges: • Sonic testing involving: sonic echo; sonic transmission and sonic tomography is very
effective. • Radar (GPR) can be very effective at relatively high frequencies, in the reflection
and transmission modes; and also when undertaking radar tomography in both 2-D and 3-D.
• Infra-red thermography is more effective on brick masonry than stone masonry.
ACKNOWLEDGEMENTS
This work was undertaken through the funding of the EPSRC, Network Rail and the Highways Agency. The technical. input of Mr Brian Bell, Network Rail, Dr Parag Das, OBE, formerly the Highways Agency, plus many former PhD students including Dr Colla, is gratefully acknowledged.
REFERENCES Annan, A.P. (1992): Ground penetrating radar – workshop notes. Sensors & Software Inc., Canada, p. 128.
Armstrong, D.M., Sibbald, A., Fairfield, C.A., Forde, M.C. (1995): Modal Analysis for Arch Bridge Integrity Assessment, NDT & E International, 28, No. 6, pp. 377-386.
BA86/06 (2006): Bridge Advice Note: “Advice Notes on the Non-Destructive Testing of Highway Structures”, The Highways Agency, London, www.standardsforhighwyas.co.uk, p. 247.
Binda, L., Saisi, A., Tiraboschi, C. (1999): Application of sonic tests to the diagnosis of damaged and repaired structures, Proc. Int. Conf. Structural. Faults & Repair-99, London, July 1999, CD-Rom, Engineering Technics Press, ISBN 0-947644-41-5.
Binda, L., Lualdi, M., Saisi, A., Zanzi, L., (2003): The complementary use of on site non destructive tests for the investigation of historic masonry structures, Proc. 9th North American Masonry Conference 9NAMC, Clemens, South Carolina, pp. 978-989.
Binda, L., Cantini, L., Condoleo, P., Saisi, A., Zanzi, L. (2006): Investigation on the pillars of the Syracuse Cathedral. in Sicily, Proc. 11th Int. Conf. Structural. Faults & Repair-2006, Assembly Rooms, Edinburgh, 13-15 June 2006, Engineering Technics Press, CD-Rom, ISBN 0-947644-59-8.

3. Inspection, testing and assessment of bridge condition
82
Colla, C. (1997): Non-destructive testing of masonry arch bridges, PhD thesis, University of Edinburgh, September 1997, p. 272.
Colla, C., Das, P.C., McCann, D.M., Forde, M.C. (1997): Sonic, electromagnetic & impulse radar investigation of stone masonry bridges, NDT & E International, Vol. 30, No. 4, pp. 249-254.
Colla, C., Forde, M.C., Das, P.C., McCann, D.M., Batchelor, A.J. (1997): Radar tomography of masonry arch bridges, Proc. 7th Int. Conf. Structural. Faults & Repair-97, Edinburgh, 8-10 July 1997, Vol. 1, Engineering Technics Press, pp. 143-151.
Colla, C., McCann, D.M., Das, P.C., Forde, M.C. (1996): Non-contact NDE of masonry structures and bridges, Proc. 3rd Conf. on Nondestructive Evaluation of Civil Structures and Materials, University of Colorado at Boulder, 8-11 September 1996, pp. 441-454.
Diamanti, N., Giannopoulos, A., Forde, M.C. (2007): Investigating masonry arch bridges using GPR, Railway Engineering-2007, Proc. 9th Int. Conf., University of Westminster, London, June 2007, Engineering Technics Press, UK, CD-Rom, ISBN 0-947644-61-10.
Forde, M.C., McCavitt, N. (1993): Impulse radar testing of structures, Proc. Instn Civ Engrs Structs & Bldgs, 1993, 99, February, pp. 96-99.
Forde, M.C., McCavitt, N. (1994): Sonic NDT and Radar Testing of Masonry, Br. J. NDT, 36, No. 3, March 1994, pp. 140-147.
Gentile, C. (2006): Dynamic characteristics of an historic arch bridge, Proc. 11th Int. Conf. Structural. Faults & Repair-2006, Assembly Rooms, Edinburgh, 13-15 June 2006, Engineering Technics Press, CD-Rom, ISBN 0-947644-59-8.
Komeyli-Birjandi, F., Forde, M.C., Whittington, H.W. (1984): Sonic Investigation of Shear Failed Reinforced Brick Masonry Walls, Masonry International, 1, No. 3, November 1984, pp. 33-40.
Maierhofer, C., Zanzi, L., Knupfer, B., Johansson, B., Modena, C. (2005): Results and research methodologies of Onsiteformasonry, EU contract EVK4-CT-2001-00060, Final. Report, CD-Rom, Ed: C. Koepp, BAM, 2005.
Niederleithinger, E., Helmerich, R., Streicher, D., Stoppel, M., Wiggenhauser, H. (2006): Automated non-destructive investigation of railway bridge condition, Proc. 11th Int. Conf. Structural. Faults & Repair- -2006, Assembly Rooms, Edinburgh, 13-15 June 2006, Engineering Technics Press, CD-Rom, ISBN 0- -947644-59-8.
Ohtsu, M., Watanabe, H. (2001): Quantitative Damage Estimation of Concrete by Acoustic Emission, Construction and Building Materials, Vol. 15, No. 5-6, pp. 217-224.
Padaratz, I.J., Forde, M.C. (1995): A theoretical. evaluation of impulse radar wave propagation through concrete, J. Non-destructive Testing & Evaluation, 12, pp. 9-32.
Sansalone, M.J., Streett, W.B.(1997): Impact-echo, Ithaca, NY Bullbrier Press.
Shigeishi, M., Colombo, S., Broughton, K.J., Rutledge, H., Batchelor, A.J., Forde, M.C. (2001): Acoustic emission to assess and monitor the integrity of bridges, Construction and Building Materials, Elsevier Science, Vol. 15, No. 1, 2001, pp. 35-49.
www.bam.de/ZfPbau-kompendium.htm

New methods for inspection and condition assessment
83
New methods for inspection and condition assessment
Ernst NIEDERLEITHINGER, Rosemarie HELMERICH,
& Joan Ramon CASAS In a few countries, bridge condition assessment procedures include non-destructive testing techniques, but regular application and integration is still rare. Main reasons are a lack of knowledge at the bridge authorities, cost and time consumption and difficulties in data interpretation. The EC funded integrated project “Sustainable Bridges” looks at optimisation of NDT for railway bridges and new ways for combining conventional and modern methods. Among other topics we have developed automated measurement systems, and end user method database.
1. INTRODUCTION
To fulfil future traffic demands the European railway network companies have to increase the capacity and durability of their bridge stock in terms of speed, axle load and life span. Another requirement are low maintenance costs. For these goals an improved inspection, condition assessment, reassessment of load capacity, repair end strengthening methods are demanded. As the currently used tools are insufficient in may cases, the European Commission has funded the integrated project “Sustainable Bridges”(Olofsson and Elfgren, 2004). The consortium consists of 32 partners from 12 countries.
The project was guided and reviewed by major European railway companies. This has assured that effort was spent on problems of real interest. For example in the last decade NDT research was concentrated on concrete structures. But a big part of the railways bridge stock is old small span masonry bridges.
One of the workpackages was aimed to improve inspection and condition assessment procedures with a focus on NDT methods. Improvement of techniques, automatisation and data processing are important tasks. But main aim was to make the research results available to and useful for railway companies and engineers in the condition assessment process.
Sustainable Bridges – Assessment for Future Traffic Demands and Longer Lives

3. Inspection, testing and assessment of bridge condition
84
2. STATE OF THE ART
Currently, some bridge authorities in Europe use condition rating for maintenance planning and asset management. Usually they collect data from inspections as input for the economic management of their bridge stock or planning repair and strengthening measures. In the majority of cases, they do not use it as input into load and resistance assessment.
Only a few European railways or highway owners use frequently more than simple NDT- -methods in inspection and condition assessment.
NDT-assessment methods for steel structures are developed in more detail, because of their outstanding importance, e.g. in pressure vessels industry or in structures for power plants or for application in aerospace. Countless standards are available for NDT-assessment of steel structures, but only a few in railway authorities. The railway guideline for the assessment of existing railway bridges made of steel in Switzerland includes proposals for NDT-methods for assessment of defects in existing steel bridges.
Some highway agencies, e.g. in Germany and the UK, give refined information about the use of NDT for reinforced concrete bridges.
For the NDT-assessment of the more complicated matrix and composite structures of reinforced concrete or masonry railway bridges, research results and recommendations obtained during the last 15 years exist, but no standards for use in bridge assessment procedures in the majority of countries. Data processing and image presentation is often insufficient and not clear interpretable for the railway authorities. In many cases, specialised laboratories can do only feasibility studies with more refined inspections, which are necessary in case of heavy safety problems.
In Europe, railway owners follow national rules for bridge inspection and condition assessment. The collected data does not have the same basis, format, terminology and documentation quality, e.g. for the decision making process in the trans-European Railway Network.
The bridge condition is normally assessed via the condition rating or condition index, as a measure of the bridge condition by comparison with others. The condition index should be, at least, and indicator valid for:
1. Primary ranking to screen the most deteriorated bridges. 2. Obtaining the capacity reduction factor (or condition factor) for use in the capacity
assessment of the bridge. 3. Assessing the tendencies of deterioration processes and providing a rough estimation of
the expected service life using the condition rating calculated at successive time intervals.
In addition, in some particular cases, the condition rating includes also economical issues and in this case is also an indicator to be used for the optimum management of the bridge stock.
Although the procedures for assessing the bridge condition and calculating the condition rating differ among themselves from country to country, the basic steps to reach the final result are always very similar and may be summarized as follows:
1. Supervision of the bridge by inspection. Normally, three levels of inspection are recognized as necessary: superficial, general and major inspection. The time interval between each inspection type differs from country to country.
2. Calculation of the bridge condition based on rating of essential bridge elements or on the cumulative evaluation of detected damage types. The bridge is divided in different elements or components. In the case where a quantitative assessment is done, the calculation must consider the nature and cause of the damage and the intensity and extent of each damage type.

New methods for inspection and condition assessment
85
The review of the methods used by different owners and administrations, both of highway and railway infrastructure, has highlighted the following items (Casas 2004):
1. All administrations have a systematic inspection procedure (normally divided in 3 levels), but not all use the results of the inspection in a comprehensive and objective way to derive a condition rating, either numerical (in the range from 1 to 10, 1 to 100, …) or grammatical (poor, fair, acceptable, good, …).
2. At the present time, all administrations and transportation agencies use the visual inspection as the main source of relevant data to carry out the condition assessment.
3. Only in a reduced number of countries (UK, USA, Czech Republic, Slovenia) the code or guideline for the load capacity assessment is using directly the final result of the condition assessment in the capacity rating process.
4. There are basically two approaches to the evaluation of the condition of the whole structure based on the condition assessment of its elements. The first is based on a cumulative condition rating, where the most severe damage on each element is summed for each span of the superstructure, each part of the substructure, the carriage way and accessories. The final result is the condition rating for the structure, which can be used for a preliminary prioritisation of the structure. The second method uses the highest (or lowest depending on the measuring scale) condition rating of the bridge components as the condition rating for the structure itself.
5. Each administration and/or country is using different condition rating techniques. Such situation may derive in the fact that the same bridge, assessed by two engineers from different countries can be rated with different grades.
6. A clear division exists between methods that are purely subjective, those based on simple scoring, by assigning a number of deficiency points to the inspected structural member, in compliance with the rules adopted for the classification and evaluation of damage, and those where the final condition rating is obtained via a calculation where the rating of a set of selected essential damage types is done based on the report by the inspector. In those methods where a quantitative value is obtained based on results of inspection, such inspection must record at least:
• the type of damage and its effect on the safety and/or durability of the affected member,
• effect of the affected structural member on the safety and/or durability of the whole structure,
• extent of the damage, • intensity of the damage.
7. Most methods divide the whole bridge in several parts or components and these components into elements. In some cases there is no clear or objective indication how to pass from the condition of the individual elements to the global condition rating of the bridge and this is made by the engineering judgement of the inspector.
Even more important than the condition index for a reliable management of the bridge stock, is the calculation or modelling of the condition index deterioration with time. Numerous models have been developed which describe the transition of a variety of condition states over time. Many of the models are based on a linear deterioration of condition states (Hearn et al., 1995). Condition state transition models often conflict and the analyst must use judgment to choose a model which best applies to the structure at hand. Markov chains can be used to model condition ratings based on the data from large numbers of bridges using transitional probabilities. Jiang and Sinha (1989) used Markov chains to model the condition of bridge substructures in Indiana. Similarly, Cesare et al. (1992) used Markov chains to model many bridge elements in New York State using

3. Inspection, testing and assessment of bridge condition
86
a database of 850 bridges and 2,000 individual spans. Actually, most of the existing BMS use the Markov chain approach to model condition deterioration over time (Thompson et al., 1998; Hawk and Small, 1998; Söderqvist and Veijola, 1998).
3. TRENDS IN NDT INSPECTION METHODS
3.1. New methods and instruments
The state of the art in NDT in civil engineering has reached a high level in the last decade. The aim of this project was not to invent new methods but to fit existing ones to the need of the railways. Other papers in this volume document some of the developments done in the project. Some examples are:
• Impact Echo for detection of hidden cracks. • Advanced tomographic methods for masonry and concrete. • Improvement of radar methods. • Methods for detection of chloride ingress and reinforcement corrosion. • Embankment tomography. All improved methods have been tested at well documented railway bridges for demonstration
purposes or railway engineer training.
fron ts ide backs ide
T 1
T 25
0 10 20 30 40 50 60 70 80 90 100
0
10
20
30
40
50
60
70
80
90
100
110
120
9.3
9.4
9.5
9.6
9.7
9.8
9.9
10
10.1
10.2
back
side
[cm
]
front
side
[cm
]
velocity [cm/ns]
cross section [cm] Figure 1. Radar Tomography at a concrete bridge pillar delineating different concrete properties. Left: measurements of University of Minho and BAM. Right: Velocity tomogram (vertical section) 3.2. Automatisation
A major problem for the application of NDT at railway bridges is the relatively high time (and thus cost) consumption compared to simple visual inspection. The access to the elements to be inspected is often difficult, traffic mustn’t be interrupted and interference to signalling or communication cables must be avoided.
To ease operation and to decrease the time needed per measurement point we have developed several automatic scanning systems (Stoppel, 2005; Streicher, 2005). The can operate 24 hours a day / 7 days a week with minimized supervision needs. They can be applied inside or outside of structures on vertical or horizontal faces, flat or slightly curved. The systems are much faster (factor 2–5 depending on sensors used), positioning accuracy and repeatability are much better. The “human factor” in NDT application is minimized.

New methods for inspection and condition assessment
87
Almost all measurement devices which can be computer controlled can be adopted to the system. At the moment we use 900 MHz and 1.5 GHz radar, ultrasonic echo and impact echo sensors. A camera or an airbrush marking system can also be mounted. The system has been tested at a German railway bridge under traffic (Figure 2) and has shown its excellent applicability and reliability. The results showed only minor influence of traffic vibrations to measured data and no interference to signalling and communication.
The newest version developed during the project is suction mounted and needs no scaffolding during operation (Figure 3). It was successfully test at a railway bridge in Örndsköldsvik, Sweden.
Figure 2. Scanning system at a German railway bridge
Figure 3. Suction mounted NDT scanner with double US head at Swedish railway bridge in Örnsköldsvik
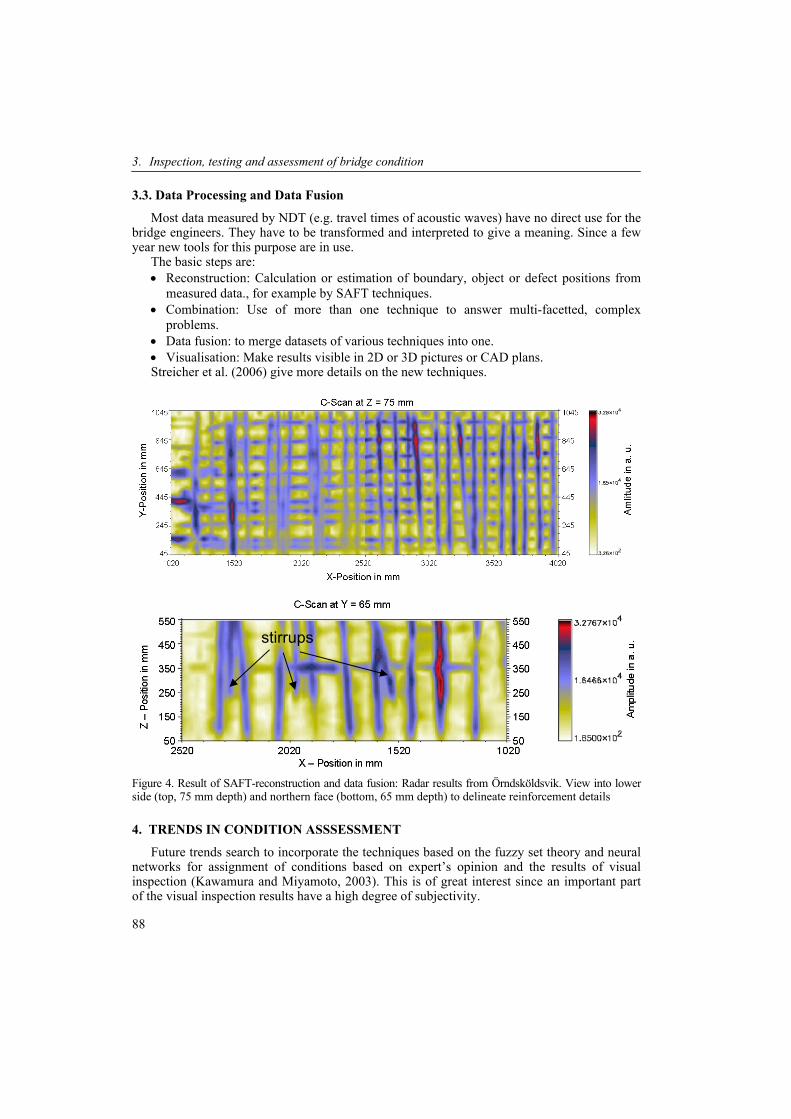
3. Inspection, testing and assessment of bridge condition
88
3.3. Data Processing and Data Fusion
Most data measured by NDT (e.g. travel times of acoustic waves) have no direct use for the bridge engineers. They have to be transformed and interpreted to give a meaning. Since a few year new tools for this purpose are in use.
The basic steps are: • Reconstruction: Calculation or estimation of boundary, object or defect positions from
measured data., for example by SAFT techniques. • Combination: Use of more than one technique to answer multi-facetted, complex
problems. • Data fusion: to merge datasets of various techniques into one. • Visualisation: Make results visible in 2D or 3D pictures or CAD plans. Streicher et al. (2006) give more details on the new techniques.
Figure 4. Result of SAFT-reconstruction and data fusion: Radar results from Örndsköldsvik. View into lower side (top, 75 mm depth) and northern face (bottom, 65 mm depth) to delineate reinforcement details
4. TRENDS IN CONDITION ASSSESSMENT
Future trends search to incorporate the techniques based on the fuzzy set theory and neural networks for assignment of conditions based on expert’s opinion and the results of visual inspection (Kawamura and Miyamoto, 2003). This is of great interest since an important part of the visual inspection results have a high degree of subjectivity.
stirrups

New methods for inspection and condition assessment
89
Recently, the possibility of using the condition assessment database to quantify bridge deterioration instead of using mathematical models based on the physics of deterioration processes has been also addressed. In fact, considering that the condition rating at different service times has provided a time-stamped data series, statistical analysis may be an effective way of converting data into a kind of “knowledge” that can be used later on to predict deterioration (Wang et al., 2007)
The use of non-destructive testing, monitoring and health monitoring in bridge condition assessment as an alternative and supplement to the actual procedure based on visual inspection is another area of increasing activity. This has been also investigated in the Workpackage 5 of the project. The development of sensors based on fibre optics technology, among others, has been of paramount importance in this sense (Casas and Cruz, 2003; Villalba and Casas, 2004) and application to real bridges is everyday increasing (Matos et al., 2005). Two main topics are of major interest in this area:
1. How to deal with the measuring errors, uncertainty and noise inherent to the different sensors and measuring techniques in the way that they do not derive in misleading decisions concerning bridge condition. Such data is not readily available for most techniques, is often difficult to obtain, and remains a ripe area for continued research.
2. How to integrate the data from the point-in time- NDT and continuous monitoring in the assessment of the condition state. The works by Faber and Sorensen (2002), Enright and Frangopol (1999) and Rafiq (2005) show that the best way is the use of Bayesian- -updating techniques. In Workcpackage 4 of the SB project this possibility has been considered and therefore introduced in the final Guideline on Load and Capacity Assessment. However, inspection must not be abandoned to have a purely monitoring scheme. In fact, inspection provides information of the entire structure at a specific point in time, whereas monitoring can provide information at a particular location for the entire service life. Combining the two possibilities will lead to obtain the maximum information about the performance of existing structures.
Contrary to the USA, where since long time ago a unified condition assessment procedure exists for all States (FHWA, 1988, 2002), in Europe, at this moment, the countries within the European Union have their own condition assessment method. This is clearly a paradox situation taking into account that traffic may cross from country to country without any limitation. Therefore the harmonization between countries is needed in order to set common basis and guidelines for the load and capacity assessment of trans-national infrastructures. In this sense, in the framework of the SB project, an attempt is made to the definition of a condition assessment procedure. The methodology is based on a proposed taxonomy of the geometric models and a suitable strategy for damage classification and numerical quantification of bridge damages (Bień, 2004).
5. CONCLUSIONS
The Workpackage 3 of the EC funded integrated project has developed at lot of tools and methods, mainly NDT to be used in bridge inspection and condition assessment. The NDT Toolbox will probably very useful for the European railways to integrate NDT techniques into the inspection routines and optimise the condition assessment process.
As the railways in the project decided to keep their national bride management systems, damage taxonomies and inspection and assessment procedure, the next step will be do adopt the project results to the specific national needs.

3. Inspection, testing and assessment of bridge condition
90
ACKNOWLEDGEMENTS
The contribution of all partners and their co-workers in Workpackage 3 of the EC funded integrated project “Sustainable Bridges” are deeply acknowledged.
REFERENCES BAST/BAM (2003): RI-EBW-PRÜF ZfP-Kompendium.
Bień, J. (2004): Taxonomy of bridge models in Bridge Management Systems. In E. Watanabe, D.M. Frangopol, T. Utsunomiya (eds), Bridge Maintenance, Safety, Management and Cost (CD-ROM), Proc. of IABMAS´04, Kyoto, 19-22 October 2004. Rotterdam: Balkema.
Casas, J.R., Cruz, P. (2003): Fiber optic sensors for bridge monitoring. Journal of Bridge Engineering, 8(6): 362-373.
Casas, J.R. (2004): Updated inventory on condition assessment procedures for bridges. Deliverable D3.2. SUSTAINABLE BRIDGES. 6th Framework program. Sustainable Development. European Union. Brussels. (http://www.sustainablebridges.net).
Cesare, M.A., Santamaria, C., Turkstra, C., Vanmarcke, E.H. (1992): Modeling Bridge Deterioration With Markov Chains. Journal of Transportation Engineering, 118 (6): 820-833.
Enright, M.P., Frangopol, D.M. (1999): Condition prediction of deteriorating concrete bridges using Bayesian updating. Journal of Structural Engineering, 125 (10): 1118-1125.
Faber, M.H., Sorensen, J.D. (2002): Indicators for inspection and maintenance planning of concrete structures. Structural Safety, 24: 377-396.
FHWA (1988): Recording and coding guide for the structure inventory and appraisal of the Nation’s bridge. FHWA-ED-89-044, Federal Highway Administration, U.S. Department of Transportation, Washington DC.
FHWA (2002): Federal Highway Administration, National Bridge Inspection Standards, Internet site: http://www.fhwa.dot.gov/tndiv/brinsp.htm, US Department of Transportation, Washington DC.
Hawk, H., Small, E.P. (1998): The BRIDGIT Bridge Management System. Structural Engineering International, 8(4): 309-314.
Hearn, G., Frangopol, D.M., & Szanyi, T. 1995. Report on Bridge Management Practices in the United States. Boulder: University of Colorado.
Helmerich, R., Bień, J., Cruz, P. (2007): A guideline for railway bridge inspection and condition assessment including the NDT-toolbox. In: “Sustainable Bridges – Assessment for Future Traffic Demands and Longer Lives”, eds. Bień, J., Elfgren, L., Olofsson, J., Dolnośląskie Wydawnictwo Edukacyjne, Wrocław 2007.
Jiang, M., Sinha, K.C. (1989): Bridge Service Life Prediction Model Using the Markov Chain. Transportation Research Record, 1223.
Kawamura, K., Miyamoto, A. (2003): Condition state evaluation of existing reinforced concrete bridges using neuro-fuzzy hybrid system. Computers and Structures, 81: 1931-1940.
Kohl, Ch., Krause, M., Maierhofer, Ch., Wöstmann, J., Wiggenhauser, Ch. (2005): Datenfusion komplementärer Impuls-Echo Verfahren zur zerstörungsfreien Untersuchung von Betonbauteilen. DACH-Jahrestagung, Salzburg, 2005.
Maksymowicz, M., Cruz. P., Bień, J., Helmerich, R. (2006): Concrete railway bridges – Taxonomy of degradation mechanisms identified by NDT methods. Proc 3rd Int. Conf. on Bridge Maintenance, Safety and Management, IABMAS’06, Porto, Portugal, 16-19 July 2006, Taylor & Francis Group, London. ISBN 0 415 40315 4.

New methods for inspection and condition assessment
91
Matos, J., Casas, J.R., Figueiras, J. (2005): A new methodology for damage assessment of bridges through instrumentation: application to the Sorraia river bridge. Structure and Infrastructure Engineering, 1(4): 239-252.
Olofsson, J., Elfgren, L.: Sustainable Bridges. www.sustainablebridges.net
Rafiq, M.I. (2005): Health monitoring in proactive reliability management of deteriorating concrete bridges. Ph.D. Thesis. The University of Surrey. School of Civil Engineering.
Söderqvist, M., Veijola, M. (1998): The Finnnish Bridge Management System. Structural Engineering International, 8 (4): 315-319.
Streicher, D., Algernon, D., Kohl, Ch., Krause, M., Maierhofer, Ch., Wiggenhauser, H. (2006): Development and combined application of NDT echo-methods for the investigation of post tensioned concrete bridges. Proc 3rd Int. Conf. on Bridge Maintenance, Safety and Management, IABMAS’06, Porto, Portugal, 16-19 July 2006, Taylor & Francis Group, London. ISBN 0 415 40315 4.
Streicher, D., Wiggenhauser, H., Holst, R., Haardt, P. (2005): Zerstörungsfreie Prüfung im Bauwesen: Automatisierte Messungen mit Radar, Ultraschallecho und Impact-Echo an der Fuldatalbrücke. Beton- und Stahlbetonbau, 100 (2005) 3, S. 216-224.
Thompson, P.D., Small, E.P., Johnson, M., Marshall, A.R. (1998): The Pontis Bridge Management System. Structural Engineering International, 8(4): 303-308.
Villalba, V., Casas, J.R. (2004): Structural Health monitoring of post-tensioned bridges and structures based on fiber optics. In C. Boller and W.J. Staszewski (eds.), Proceedings of the second European Workshop on Structural Health Monitoring, Munich, Destech Publications, Inc., 177-184.
Wang, X., Nguyen, M., Foliente, G., Ye, L. (2007): An approach to modelling concrete bridge condition deterioration using a statistical causal relationship based on inspection data. Structure and Infrastructure Engineering, 3 (1): 3-15.


A guideline for railway bridge inspection and condition assessment including the NDT toolbox
93
A guideline for railway bridge inspection and condition assessment including the NDT toolbox
Rosemarie HELMERICH, Jan BIEŃ & Paulo CRUZ The member states of the European Union organise the regular inspection and condition assessment of their railway infrastructure asset on national level. Advanced non-destructive testing is not included as part of most regular railway bridge inspection rules. The paper presents a guideline for inspection and condition assessment of railway bridges promoting especially non-destructive testing (NDT) methods. Besides the state of the art, the guideline summarises the latest steps of research, performed within the project Sustainable Bridges (SB) and documented as background documents. Based on the owners needs, the guideline gives hints for application of NDT to all bridge types including subsoil and foundations. The guideline proposes, how to implement the refined non-destructive inspection tools for concrete bridges, metal and masonry arch bridges. For the use by bridge owners decision makers or inspectors during inspections the bridge defect catalogue and the NDT toolbox with one page information about the available non-destructive testing techniques should be useful.
1. INTRODUCTION
1.1. Bridge condition assessment
Realistic estimation of the condition of the ageing existing railway bridge stock requires detailed knowledge of the current situation based on inspection results. The railway bridge owners, represented by their infrastructure departments, usually apply their own national procedures for regular inspections and/or condition assessment. Both, inspections and condition assessment systems, are typically part of national bridge management or asset management systems. In most of the countries, the basic annual inspections are mainly based on visual inspections from underneath a bridge. Often, internal conditions or beginning degradation processes inside the quite well appearing structure cannot be detected early enough. Refined inspections on touching distance are usually made once in five to ten years. Advanced NDT techniques, in contrast to simple methods as Schmidthammer, are not included as part of most regular railway bridge inspection procedures. Application of advanced testing techniques
Sustainable Bridges – Assessment for Future Traffic Demands and Longer Lives

3. Inspection, testing and assessment of bridge condition
94
requires specialised and experienced personnel. But even for simple methods, the physical background must be comprehensively known to the users.
In the presented Guideline the term bridge condition assessment is used in a very general meaning as an expression describing a set of activities undertaken to characterise current state of bridge structure. The most frequently considered aspects of bridge condition can be listed as follows:
• Bridge condition assessment (rating) – evaluation of the local and/or global state (technical condition) of a bridge in the form of numerical or linguistic rating based on a predefined scale.
• Load capacity assessment – activities undertaken to determine the ability of a bridge to carry load based on the structure technical parameters and degradation level.
• Safety assessment – process of evaluation of remaining bridge safety measured in terms of partial safety index, reliability index or probability of failure.
• Durability assessment – process of evaluation of remaining lifetime of a bridge. • Serviceability assessment – evaluation based on the criteria governing normal use of
a bridge as a part of the transportation system. All procedures of bridge condition assessment are usually based on the results of inspections
and take into account defects as well as degradation processes identified in the considered bridge. General classification of typical defects and also classification of degradation mechanisms are proposed in the Guideline.
1.2. The Railway owners needs
Many of the member states and railway infrastructure owners miss assessment rules to estimate the current resistance of an existing railway bridge, since only Eurocodes for new structures are introduced as assessment rules. The Sustainable bridges project enhances assessment methods to better estimate the safety of existing railway bridges in order to withstand future traffic demands as higher axle loads in freight traffic or faster passenger trains.
The objectives of the work package 3 within the project focussed in particular on the enhancement of non-destructive testing (NDT) methods, NDT-equipment and modelling of defects and deterioration for reinforced and prestressed concrete railway bridges. In the first phase of the project, an analysis of the European bridge stock by the railway bridge owners revealed, that better assessment methods are not only required for reinforced and prestressed concrete bridges, but that many masonry arches suffer from deterioration and need to be in the focus of research as well as steel bridges made of old materials. In detail the following needs resulting from maintenance problems were formulated as problems for the topic inspection and condition assessment:
• Better inspection tools to identify in reinforced concrete bridges: o reinforcement corrosion, o early detection and description of cracks and spalling (incl. concrete cover), o defects in tendon ducts (incl. corrosion), o carbonation, o waterproofing defects.
• Better inspection tools for detection in steel bridges: o corrosion and delamination, o fatigue cracking, o loose connections, o coating defects, o brittle fracture.

A guideline for railway bridge inspection and condition assessment including the NDT toolbox
95
• Better inspection tools for identification in masonry arch bridges: o material degradation, o cracking, o ring separation, o waterproofing defects, o fracture of stones or bricks.
The Guideline presents deterioration modelling, defect description and non-destructive testing methods addressed to the problems listed above.
2. RESEARCH IN THE WORK PACKAGE INSPECTION AND CONDITION ASSESSMENT
As consequence after the bridge stock analysis, additionally to the technical research topics formulated in the proposal of the project planning, a guideline for inspection and condition assessment was developed for all bridge materials, which includes both, the state of the art and the new research results as refined data acquisition, new measurement set-ups and data processing.
During the work with 12 European partners, was realised, that a common terminology is not available for railway bridge infrastructure tasks. English is a largely unknown language to bridge inspecting people, especially in the new member states in Eastern Europe. Even in English speaking countries it is not easy to find unique terms for the same meaning of defects. Therefore, Annex 1 contains a first initiative to propose terms and definitions with focus on NDT and inspection open to be completed and updated. Annex 1: Terminology and Definitions, focuses on non-destructive testing, inspection and condition assessment. The Railway Bridge Defect Catalogue (Annex 2) presents classification of typical defects for all basic bridge types. The NDT Toolbox provides information about non-destructive testing procedures to railway bridge inspectors in compact and comprehensive one-page information in Annex 3.
The guideline with the annexes, see scheme in Figure 1, can be transferred to the railway community in a more generic way and may be used as a internationally recommended knowledge supplementary to their national inspection and assessment rules. The guideline consists of two major parts: a more general first part with the analysis of the current situation in railway bridge inspection and condition assessment and the second part is related to material specific issues. The material specific part is focused on material specific NDT-test requirements and presents NDT-methods appropriate for various bridge materials.
Annex 1: Terminology and Definitions Background
documents:
Annex 2: Railway Bridge Defect Catalogue Technical research
deliverables
Guideline for Inspection and Condition Assessment
Annex 3: NDT Toolbox D3.2-D3.17
Figure 1. Structure of the Guideline for Inspection and Condition Assessment

3. Inspection, testing and assessment of bridge condition
96
The deliverables with the detailed results of technical research are forming the background documents. The attached databases are assumed to help European railway organisations in development of condition assessment procedures by implementation of the advanced tools presented in the Guideline and in the background documents:
• Standard testing of bridges and modelling of defects: o inventory on condition assessment and inspection (Casas, 2004), o condition evaluation: Proposal of a unified condition assessment procedure (Bień et
al., 2005), o condition assessment and inspection of steel railway bridges.
• Verification of construction plans and localisation of inhomogeneities: o evaluation program to combine radar data of different polarisation (Stoppel et al.,
2006), o prototype of 2D-scanning system for automated measurements Impact Echo techniques
for crack depth measurement (Krüger et al., 2007), o prototype of radar tomography system (Cruz et al., 2007).
Figure 2. Examples for developed equipment: 2-D scanning system for automated NDT-measurement (left photo – BAM 2004) impact-echo-depth measurement (right photo – UStutt 2007)
• Steel corrosion in RC-bridges and electro-chemical measurement methods: o Electrochemical Techniques to detect to corrosion stage of reinforcement in concrete
structures (Bäßler, 2005), see Figure 3,
Figure 3. Result of the potential field measurement (Helmerich, 2007)

A guideline for railway bridge inspection and condition assessment including the NDT toolbox
97
Figure 4. Application of automated measurement with advanced NDT-sensors to a German railway bridgeImpulse radar, Ultrasonic-echo and impact-echo sensors measured the same area with precise geometriccorrelation. Data fusion was carried out with the obtained data
o review of laboratory test results on the effects of steel bar corrosion (Horrigmoe et al., 2007),
o finite element modelling of reinforced concrete structures attacked by corrosion (Horrigmoe et al., 2007),
o optimum setup for a LIBS system for application on site (Wilsch et al., 2006). • Assessment of pile foundations and subsoil:
o NDT methods for existing foundations (Niederleithinger et al., 2005), o investigation and testing embankments in the transission zone (Holm, 2006).
• Application and Demonstration, see Figure 4 (Streicher, 2006).
3. INSPECTION AND CONDITION ASSESSMENT TOOLS
3.1. Procedures
The guideline discusses European concepts for inspection and condition assessment of railway bridges based on the analysis of the state of the art and describes also defects and degradation processes. The deterioration rate and aging effects of bridge structures depend strongly on the quality of design, execution quality, the bridge maintenance level and in-service conditions. Advanced non-destructive testing is mostly applied in inspections special, usually called in because of doubts or increased user requirements. NDT-based evaluation helps to discover internal voids and inhomogeneity, independent, whether they were caused during construction or in-service, e.g. due to continuous deterioration. Advanced NDT have reached to the level, that materials characteristics or internal inhomogeneity can be investigated quite quickly and more reliable than a decade before. Automated data acquisition using non-destructive echo methods offer high geometrical correlation, thus the images resulting from different NDT-methods can be overlaid to discover hidden construction defects, characterize in-depth damage from impacts as lorry or ship impact or the extend of environmental impact such as earthquake, flooding or thunderstorms to the inner structure.
Figure 5 shows the various levels of inspections proposed in the Guideline. Most bridges of the asset will probably never be investigated more than in regular inspections, usually performed by visual methods or by means of simple NDT techniques. Even for visual inspection it is necessary to educate the inspector, so that he understands the most important deterioration processes and knows critical details in different bridge types.

3. Inspection, testing and assessment of bridge condition
98
Figure 5. Levels for use of NDT in inspection or in phase-wise reassessment
Simple inspections are e.g. the application of the tapping test in concrete bridges, ultrasonic thickness measurement in steel bridges or the use of the Schmidt-hammer. Even for simple methods, the inspector should know the physical background. Thus he should know, e.g., that the Schmidthammer delivers realistic values only for young concrete. The propagating carbonation near the surface falsifies the result and pretends higher compression strength.
If refined information about the inner structure is needed, combination of advanced NDT- -data obtained in special inspections or during reassessment increases the accuracy of the result.
3.2. NDT Toolbox
With the increasing age of the bridge stock, the need for better condition evaluation tools increases. Referring to the analysis of the railways in 2004, only 33% of the European bridges is younger than 50 years, with decreasing tendency. The decision making infrastructure responsible persons and the inspectors need more information about appropriate testing non-destructive and minor-destructive testing methods for railway bridges.
A NDT-toolbox presents applicable NDT-methods for bridge inspection including the most important information about their application, as physical principle, education needed for use, influence on the traffic, time consumption, a.s.o. Non-destructive testing methods have been continuously improved. Data sets can be now acquired automatically, reconstructed and fused. In the end, the inner conditions can be visualised in images. Usually, each material type requires other sensors. Homogeneous steel is much easier to investigate then concrete. Concrete is actually a composite material consisting of aggregates, differing in size and other parameters on one side and cement matrix on the other side. Porosity, humidity, beginning deterioration
Phase IV
Doubts
Engineer alone
Inspector alone
Doubtsconfirmed?
visual inspectionactual codesVerification of plansSimple NDT-methods
increased axle loadsdoubts on construction plansaccident, deterioration,regullar inspection
Phase ISite visit
Study of documentsSimple check
Phase IIInvestigations
AnalysisSimple check
Update loadsdeterministic
approach
Engineer aloneSpecializedlaboratoriesSpecialists
Phase IIISite visits, discussionsand consensus within
the team
Safe?Large
consequen-ces?
Probabilisticapproach
Do nothing
Intensifymonitoring
Reduce loads Demolishstructure
Strengthenstructure
yes
yesno
yes no
no
Engineertogether with team
of experts
Visual inspection Basic NDT
Advanced NDT, update of construction plans
Extensive NDT, automated methods, advanced data processing
Visual inspection Simple NDT
Routine inspections every, every third year resp. Main (general) inspection after 5–6 years, most bridges do not need more than regularly inspections
Phase IV

A guideline for railway bridge inspection and condition assessment including the NDT toolbox
99
influence the results. Thus, all methods are presented with respect to the material. The methods can be distinguished after their physical background as:
• acoustical methods (e.g. impact echo, Ultrasonic echo or transmission), • electro-magnetic (e.g. reinforcement detectors, impulse radar), • electrochemical (e.g. potential field, Galvapulse), • radiography a.o. The Figure 7 shows the description of a one page information about impact echo and ultrasonic
echo using an array with dry point contact transducers. These sensors can be applied to a concrete surface using automated scanning equipment at the same time (Stoppel, 2006). Echo methods have the additional advantage, that only one side of a bridge must be accessible. A software is currently prepared supporting the NDT-toolbox. The software links typical defects in railway bridges with appropriate methods. The link leads to the one page information, which can be printed, if necessary.
Figure 6. Example for the software supported NDT-toolbox (html), where inspectors can find defects and NDT-tools either using a search by levels or graphical index

3. Inspection, testing and assessment of bridge condition
100
Figure 7. Examples for one page information of the impact echo and ultrasonic-echo method
4. MATERIAL SPECIFIC RECOMMENDATIONS TO INSPECTION AND ASSESSMENT
4.1. General recommendations
In the presented Guideline for concrete, steel and masonry bridges as well as for foundations and transition zones the following aspects of inspection and condition assessment are described:
• characteristic degradation processes and defects, • typical weak elements and connections, • inspection procedures, • recommended testing methods. Main attention is paid to NDT techniques and special requirements for their application are
described. Even well developed NDT-methods need a two-step validation procedure for the estimation of the accuracy. Reference specimens can be used for the validation of the method itself in a first step in the laboratory or by applying standardised validation specimens taken on-site, e.g. for application of ultrasonic-echo or radiography to steel bridges. For some methods, the wave propagation in air can be used for calibration. Certain accuracy with standard deviation is received to characterise the method.
In a second step, the influence of the material characteristic, given by the physical parameters of the material in this special bridge, its age and deterioration has to be estimated on site. For the purpose of calibration e.g. of ultrasonic wave propagation, electric characteristics or electromagnetic parameters, minor destructive tests can be carried out, such as coring, drilling
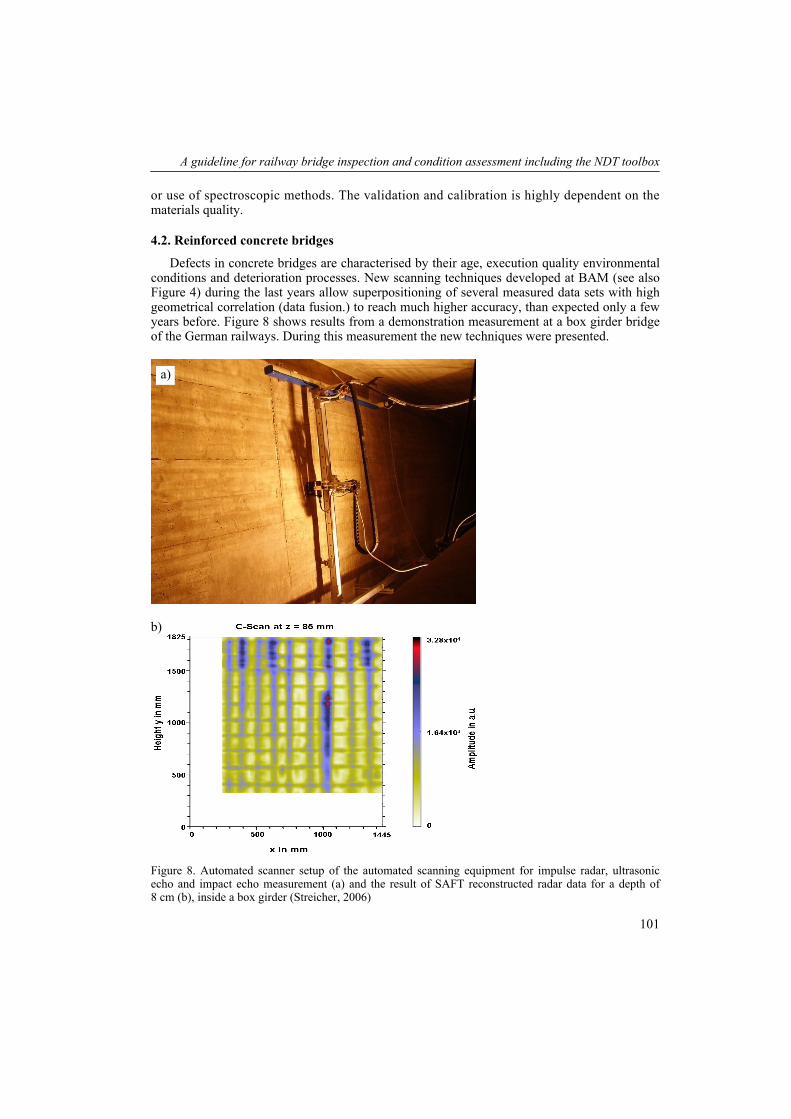
A guideline for railway bridge inspection and condition assessment including the NDT toolbox
101
or use of spectroscopic methods. The validation and calibration is highly dependent on the materials quality.
4.2. Reinforced concrete bridges
Defects in concrete bridges are characterised by their age, execution quality environmental conditions and deterioration processes. New scanning techniques developed at BAM (see also Figure 4) during the last years allow superpositioning of several measured data sets with high geometrical correlation (data fusion.) to reach much higher accuracy, than expected only a few years before. Figure 8 shows results from a demonstration measurement at a box girder bridge of the German railways. During this measurement the new techniques were presented.
Figure 8. Automated scanner setup of the automated scanning equipment for impulse radar, ultrasonic echo and impact echo measurement (a) and the result of SAFT reconstructed radar data for a depth of 8 cm (b), inside a box girder (Streicher, 2006)
a)
b)

3. Inspection, testing and assessment of bridge condition
102
More detailed information about special inspection of reinforced concrete bridges with focus on the corrosion level by potential field measurement (see Figure 3) is given in (Buhr et al., 2007).
4.3. Steel bridges
The durability of steel bridges is mainly affected by corrosion and fatigue. That’s why the inspector has to care for hidden corrosion and fatigue critical details. In case of doubts a special inspection can be called in. Non-destructive testing for steel bridges is well developed in other industries. Many experiences can be transferred from pipeline or pressure vessel testing or aeronautics to steel bridges. Inspection requirements for steel bridges, estimation of inspection intervals and the acceptability of flaws in steel structures are described in the paper (Kammel et al., 2007).
4.4. Masonry arch bridges
The application of non-destructive testing to a masonry arch bridge was carried out as part of the bridge testing in WP7. The guideline presents both, traditional testing and latest research results as feasibility tests with radar tomography (Cruz and Topczewski, 2007). Time consuming and cost intensive NDT would be carried out only during special inspections, called in in case of doubts or during reassessment. Special inspections can than be accompanied by displacement measurements for calibration of the static system.
4.5. Subsoil and foundation
Foundations are important elements of bridge structure. Failure of a foundation system may lead to failure of the bridge. The behaviour of the transition zone is also vital for the performance of the whole bridge system. Defects or insufficiencies in bridge foundations, embankment foundations, fill and subsoil can often not be inspected visually without excavation. However, settlements, twist and cracks in the superstructure are indicators of problems and should be regarded during inspection. Scour and other erosion problems as well as differential settlements between bridge abutments and transition zones are often more obvious. They can and should be regarded during visual inspection (Holm, 2006).
Methods for the investigation of foundation were enhanced within the EU-project RUFUS. These results were incorporated into the Guideline and NDT Toolbox (Niederleithinger, 2005).
4.6. Proposals for railway bridge owners
The future way for inspections should be based on flexible planning of inspection intervals. Among other parameters, these flexible intervals shall be based on parameters referring to the age, bridge type and deterioration level of a bridge. The importance of the bridge in the railway traffic network and the type of traffic crossing and under passing the bridge should be taken into account. For this structure, a classification of lines can be of help. At the moment the European network is not ready to apply flexible inspection, since the preconditions in the national organisations are too different.
Furthermore, the training level of inspectors should be comparable. Specialised laboratories can perform tests or training courses or workshops for inspectors. Completing the training or workshops for inspectors, e.g. disseminating the results of the project Sustainable Bridges, specialists, can be called in for special tasks to any bridge of the European Union.

A guideline for railway bridge inspection and condition assessment including the NDT toolbox
103
5. CONCLUSIONS
The SB-guideline for inspection and condition assessment summarises the latest level of research in the field of non-destructive testing and presents data processing tools. Hints for application by owners or specialised laboratories are given for use in inspection and bridge condition assessment. Annexes to the guideline and background documents give detailed information. Since all non-destructive testing methods have to fulfil special requirements for the application to the special material of the bridge in service, training courses for bridge inspectors are highly recommended. Training courses can contain information on the bridge inventory, material specific deterioration processes and defects, fatigue critical details and special inspections including non-destructive testing for super and substructure.
ACKNOWLEDGEMENTS
The support of the research within the project sustainable bridge funded by the European Commission within the 6th Framework Programme is acknowledged. We thank all partners in the Workpackage 3: Inspection and condition assessment. Without their valuable work, the guideline would not have been realised additionally to the scientific research.
REFERENCES Baessler, R. et al. (2006): WP3-04-T-D-050302-D3.9-EC techniques: Electrochemical Techniques to detect corrosion stage of reinforcement in concrete structures, BAM, SB3.9.
Bień, J., Rawa, P. et al. (2005): WP3-10-T-041006-D-D3.3 Condition evaluation: Proposal of a unified condition assessment procedure, SB3.3, WUT.
Buhr Jensen, B., Pedersen, T., Frølund, T. (2007): Inspection of reinforced concrete bridges. In: “Sustainable Bridges – Assessment for Future Traffic Demands and Longer Lives”, eds. Bień, J., Elfgren, L., Olofsson, J., Dolnośląskie Wydawnictwo Edukacyjne, Wrocław 2007.
Casas, Joan R. (2004): WP3-28+10-T-040731-D-D3.2 Inventory on Condition Assessment: Inventory on Condition Assessment and inspection, UPC, with annex by Bień, J. et al. SB3.2.
Cruz, P., Topczewski, L. (2007): WP3-27-T-050210-D-D3 8 Radar Tomography: Prototype of radar tomography system, Uminho, SB3.8.
Helmerich, R. et al. (2007): WP3-04-T-061220-D-Y3 D3.15 Guideline for inspection and condition asessment.doc, BAM, SB3.15.
Helmerich, R., Niederleithinger, E. (2007): WP3-04-T-051007-D-D3.16 NDT-toolbox, BAM, SB3.16.
Holm, G. (2006): WP3-T-F-D3.14 Embankments and transition zones, SGI, SB3.14.
Horrigmoe, G., Saether (2007): WP3-20-T-D-050216-D3.10-LabtestsSteel-bar-corrosion: Review of laboratory test results on the effects of steel bar corrosion, Norut Technology, SB3.10.
Horrigmoe, G., Saether (2007): WP3-20-T-D-041006-D3.11-FEM for corrosion: Specifications for finite element modelling of reinforced concrete structures attacked by corrosion, Norut Technology, SB3.11.
Kammel, C. (2005): WP3-19-T-D-051020-D3.4-steel-bridges: Condition assessment and inspection of steel railway bridges, including stress measurement in riveted, bolted and welded structures, RWTH, SB3.4.
Kammel, C., Helmerich, R. (2007): Inspection of steel bridges. In: “Sustainable Bridges – Assessment for Future Traffic Demands and Longer Lives”, eds. Bień, J., Elfgren, L., Olofsson, J., Dolnośląskie Wydawnictwo Edukacyjne, Wrocław 2007.

3. Inspection, testing and assessment of bridge condition
104
Krüger, M. (2007): WP3-18-T-050328-D-D3 7 Impact-Echo: Report on Impact Echo techniques for Crack depth measurement, Ustutt, SB3.7.
Niederleithinger, E. (2005): WP3-04-T-050317-D-D3.13 Foundations: Report on optimization of NDT methods for existing foundations.doc, BAM, SB3.13.
Stoppel, M. et al. (2006): WP3-04-T-041216-D-D3.6 2Dscanning system: Prototype of 2D-scanning system for automated measurements on concrete surfaces with impulse radar, ultrasonic echo and impact echo, BAM, SB3.6.
Streicher, D. (2006): WP3-04-T-061220-F-D3.17 Demonstration of measurements using impulse-radar, ultrasonic-echo and impact echo on a pre-stressed concrete railway bridge in Duisburg, Germany., BAM, SB3.17.
Trela, C. et al. (2004): WP3-04-T-041216-D-D3.5: Evaluation program to combine radar data of different polarisation, BAM, SB3.5.
Wilsch, G., Weritz, F. (2006): WP3-04-T-D-050207-D-D3.12 LIBS setup: Report on optimum setup for a LIBS system for application on site, BAM, SB3.12.

Railway bridge defects and degradation mechanisms
105
Railway bridge defects and degradation mechanisms
Jan BIEŃ, Krzysztof JAKUBOWSKI, Tomasz KAMIŃSKI, Jan KMITA,
Paweł RAWA, Paulo CRUZ & Maciej MAKSYMOWICZ Development of cooperation within European Union stimulates intensive integration between all components of European transportation system. One of the important fields of integration is railway bridge engineering, a part of railway transportation system. Proposed classification of degradation mechanisms against their effects as bridge structure defects can be a basis for the unified assessment of bridge condition. Presented terminology and classifications elaborated in the European research project “Sustainable Bridges” can be useful in condition assessment by bridge inspectors as well as in knowledge-based computer tools supporting evaluation procedures in the advanced Bridge Management Systems. Identified relationships between degradation processes and defects can be used for optimization of bridge infrastructure maintenance and management.
1. INTRODUCTION
Problems connected with degradation processes of railway bridges are becoming more and more important issue in almost all European countries. During years of operation bridge structures are exposed to numerous degradation influences causing various types of defects and finally reducing bridge condition.
Bridge condition appraisal is based on the identification of structure defects and comparison of current and designed values of bridge technical and operational parameters. The applied methodologies of defects’ classification and evaluation of their influence on bridge condition are fundamental for the assessment process. In each country bridge owners and administrators develop and use their own system, but at the same time international integration and cooperation within the European Union requires a harmonisation of the systems leading to comparable results of the condition assessment procedures (Bień et al., 2004).
Presented approach to classification of typical bridge defects and degradation mechanisms as well as proposed terminology should be considered as a part of international discussion. Common hierarchical classification of railway bridge defects is offered for basic structural
Sustainable Bridges – Assessment for Future Traffic Demands and Longer Lives

3. Inspection, testing and assessment of bridge condition
106
materials (concrete, steel and masonry bridges) taking into account the material specific effects. On the other hand the degradation mechanisms causing defects are identified, defined and presented in three groups: chemical, physical and biological mechanisms. Relationships between the degradation mechanisms with the observed defects are shown for each of the considered structural materials. Presented terminology and classification systems can be used during the bridge inspections and also in knowledge-based computer tools supporting evaluation procedures in the advanced Bridge Management Systems.
Definitions of the basic terms used in this paper are as follows: • bridge condition – general term describing current state of bridge structure, • defect – each effect diminishing (reducing) bridge condition, • degradation mechanism – a phenomenon causing defect (defects) to construction, • degradation process – combination of degradation mechanisms.
2. CLASSIFICATION OF BRIDGE DEFECTS
General conception of hierarchical classification of the railway bridge defects (Figure 1) is based on the effect criterion – related to the results of the degradation mechanisms actions. The defects can be identified by visual methods as well as by means of various more advanced testing methods, mainly NDT techniques (Helmerich and Niederleithinger, 2006), applied during bridge inspections and presented in the Guideline for Condition Assessment and Inspection of Railway Bridges (Niederleithinger et al., 2006).
Figure 1. Conception of hierarchical classification of railway bridge defects
In the proposed classification six basic types of bridge defects are distinguished and are presented – in alphabetical order – in Table 1:
• contamination – appearance of any type of dirt, rubbish or not designed plant vegetation, • deformation – geometry changes incompatible with the design, with changes of mutual
distances of structure points,

Railway bridge defects and degradation mechanisms
107
Table 1. Basic types of railway bridge defects
Structural material
Def
ect
Concrete Steel Masonry
Con
tam
inat
ion
Def
orm
atio
n D
eter
iora
tion
Dis
cont
inui
ty
Dis
plac
emen
t Lo
ss o
f mat
eria
l

3. Inspection, testing and assessment of bridge condition
108
• deterioration – disadvantageous changes of physical and/or chemical structural features in relation to designed values,
• discontinuity – not designed break in the structure material continuity, • displacement – change of the structure component (components) location incompatible
with the design but without deformation of the structure, also restrictions in designed displacement capabilities,
• loss of material – decrease of designed amount of structure material. The main defect types (level I in Figure 1) are the same for all structural materials
(concrete, steel, masonry). Examples of main types of bridge defects are presented in Table 1. Details of the hierarchical classification of the railway bridge defects for all basic types of
the structural materials are presented in the next parts of the paper. The entire classification with photographical illustrations of the defects is presented in the Railway Bridge Defect Catalogue placed in Annex 2 to the Guideline (Niederleithinger et al., 2006).
3. DEGRADATION MECHANISMS
Taking into account nature of the degradation processes, the following main groups of degradation mechanisms can be distinguished:
• chemical mechanisms – causing degradation of bridge structures as a result of chemical reactions,
• physical mechanisms – diminishing condition of bridge structures by influence of physical phenomena,
• biological mechanisms – reducing condition of bridge structures by influence of biological phenomena.
Classification of basic degradation mechanisms identified in railway bridges is presented in Figure 2.
Figure 2. Degradation mechanisms of railway bridges

Railway bridge defects and degradation mechanisms
109
The most frequent chemical degradation mechanisms can be defined as follows (in alphabetical order):
• alkali-aggregate reaction – the mechanism caused by presence of aggregates and alkali, which leads to an expansive reaction and deterioration of concrete,
• carbonation – mechanism where carbon dioxide, from the atmosphere, enters to concrete and reacts with the hydroxides to form carbonates and water,
• corrosion – oxidation of metal causing deterioration and/or losses of material, • crystallization – formation of crystal phase of salts in pores of structural material leading
to defects due to volume increase of forming crystals, • leaching – mechanism of the concrete components dissolving by water, • oil and fat influence – reaction of oils and/or fats with the calcium hydroxide in concrete, • salt and acid actions – chemical reactions mainly of compounds of sulphur, chlorine,
nitrogen and magnesium with structural material. In the group of physical mechanisms the following main processes causing degradation of
concrete bridge can be distinguished: • creep – inelastic strains caused by long-time load, • fatigue – mechanism of sequential degradation of material caused by repeated cyclic
loads, • influence of high temperature – phenomenon caused by fire on or under the structure, • freeze-thaw action – mechanisms caused by the expansion of pore water due to freezing, • modification of foundation conditions – mechanism causing changes of structure geometry
and redistribution of internal forces because of foundation movement, • overloading – exceeding of the acceptable designed values of the bridge loads, • shrinkage – mechanism caused by constraints of element deformation, • water penetration – incompatible with design presence of water usually caused by
inefficiency of drainage and/or waterproofing system. Biological degradation mechanisms form the smallest but important group of processes
diminishing condition of all railway bridges. The following main processes can be listed: • accumulation of dirt or rubbish – mechanism of organic and non-organic contaminants
gathering caused by environmental and/or human activities, • living organisms activity – mechanism causing defects as a result of living organisms
(bacteria, plants, animals) actions. All described degradation mechanisms can be also classified taking into account duration of
the degradation processes. The following groups can be distinguished: • incidental processes – when the degradation process is very short (duration even below
a second), e.g. overloading by collision or by earthquake, • short-time processes – acting during hours or days, e.g. influence of extreme fire
temperature, foundation displacement because of scour during flood, • long-time processes – majority of considered degradation processes.
4. MATERIAL SPECIFIC DEFECTS AND DEGRADATION MECHANISMS
4.1. Concrete bridges
Relationships between the degradation mechanisms and the basic types of defects specific for concrete bridges, based on analysis of many practical cases, are presented in Table 2 as proposed by Maksymowicz et al. (2006). Shown results confirm complicated nature of degradation processes very often consisting of two or more interacting degradation mechanisms.

3. Inspection, testing and assessment of bridge condition
110
Table 2. Degradation mechanisms in relation to defects of concrete railway bridges
Chemical Physical Biological Degradation mechanisms
Defect type
Alk
ali –
Agg
rega
te
Rea
ctio
n (A
AR
) C
arbo
natio
n C
orro
sion
C
ryst
alliz
atio
n Le
achi
ng
Oil
and
fat i
nflu
ence
Sa
lt an
d ac
id a
ctio
ns
Cre
ep
Fatig
ue
Free
ze-th
aw a
ctio
n In
fluen
ce o
f hig
h
tem
pera
ture
M
odifi
catio
n of
fo
unda
tion
cond
ition
s
Ove
rload
ing
Shrin
kage
Wat
er p
enet
ratio
n
Acc
umul
atio
n of
di
rt or
rubb
ish
Livi
ng o
rgan
ism
s ac
tivity
Contamination Deformation Deterioration Discontinuity Displacement Loss of material
Classification of typical defects identified in the bridge concrete structures are presented
below in Table 3. Presented hierarchical system of classification enables selection of the required level of precision in defect identification and description.
The names of most of the defects presented in Table 3 (as well as in Table 5 and Table 7) can be understood literally, some of them, however, require definitions that are proposed as follows:
• absorbability increase – an increase in the material tendency to absorb water, • adhesion reduction – a decrease in adhesion of protective coating to the structure
element, • aggressive/neutral contamination – inorganic dirtiness provoking/not provoking chemical
or physical reaction of the structure, • calcium hydroxide reduction – a decrease in the calcium hydroxide content in the structural
material, • crack – a discontinuity of the material perpendicular to the element surface, ranging a part
of cross-section, the following crack orientations can be distinguished: o irregular – forming a network of discontinuities without a dominating direction, o longitudinal – parallel (±10º) to the element longitudinal axis, o skew – oriented 10–80º to the element longitudinal axis, o transverse – perpendicular (±10º) to the element longitudinal axis,
• deflection – a deformation of the structure element caused by bending forces, without the deformation of the element cross-section,
• delamination – a discontinuity of the structure material parallel to the element surface, including a ring separation in multi-ring arches,
• embrittlement increase – a decrease in material plasticity, • fading – a loss of colour and/or brightness, • fracture – a discontinuity of the material perpendicular to the element surface ranging
the whole cross-section, dividing it into separate parts, • frost-resistance reduction – a decrease in the structure material frost-resistance according
to the designed value, • penetrating contamination – organic contamination (e.g. plants, bacteria) penetrating deep
into the structure,

Railway bridge defects and degradation mechanisms
111
Table 3. Hierarchical classification of defects of railway concrete bridges
CLASSIFICATION OF CONCRETE BRIDGE DEFECTS LEVEL I LEVEL II LEVEL III LEVEL IV
Aggressive Inorganic Neutral Penetrating Concrete
Organic Superficial Aggressive Inorganic Neutral Penetrating
Contamination
Protection Organic Superficial
Concrete DeflectionDeformation Protection DeflectionCalcium hydoxide reduction pH factor reduction Modification of
chemical features Salt concentration increase Absorbability increase Elastic modulus change Embrittlement increase Frost-resistance reduction Permeability increase Porosity increase
Concrete Modification of physical features
Strength reduction Calcium hydoxide reduction pH factor reduction Modification of
chemical features Salt concentration increase Adhesion reduction Embrittlement increase Fading Frost-resistance reduction Permeability increase
Protection Modification of physical features
Porosity increase Bond reduction
Deterioration
Reinforcement and prestressing system
Modification of physical features Strength reduction
Irregular Longitudinal Skew Crack
Transverse Delamination
Concrete
FractureCrackDelaminationProtection FractureCrack
Discontinuity
Reinforcement and prestressing system Fracture
RotationExcessive TranslationRotation
Displacement Limited
TranslationConcrete Protection Loss of
material Reinforcement and prestressing system

3. Inspection, testing and assessment of bridge condition
112
• permeability increase – an increase in the structure material vulnerability to passing through of water,
• pH factor reduction – an increase in carbon dioxide in concrete producing carbonates and the resulting pH value decrease,
• rotation/translation – rotational/translational displacement of the structure or its part without a deformation,
• salt concentration increase – an increase in the salt content according to the designed values, i.e. nitrogen compounds, chlorides, sulphates, magnesium or ammonium compounds,
• slip – a deformation of the structure element caused by shear forces, without the deformation of the element cross-section,
• strength reduction – a decrease in the structural material strength in respect of the designed values; especially compressive and shear strengths,
• superficial contamination – organic contamination located on the surface of the structure, • swell – an increase in the volume of structural material.
4.2. Steel bridges
In the steel bridges like in the concrete bridge structures defining of the relationships between defects and degradation mechanisms is not simple, because one defect can be caused by few mechanisms and at the same time one mechanism can cause various defects of the structure. On the other hand competently defined connections between observed defects and degradation processes can be very useful as practical tool supporting bridge owners in creation of the optimal maintenance strategy. Attempt to description of the relationships between the main types of defects and basic degradation mechanisms occurring in the railway steel bridges is presented in Table 4 according to Bień and Jakubowski (2006).
Table 4. Degradation mechanisms in relation to defects of steel railway bridges
Chemical Physical Biological Degradation mechanism
Defect type C
orro
sion
Fatig
ue
Influ
ence
of
high
te
mpe
ratu
re
Mod
ifica
tion
of
foun
datio
n co
nditi
ons
Ove
rload
ing
Acc
umul
atio
n
of
dirt
or ru
bbis
h Li
ving
or
gani
sms
activ
ities
Contamination
Deformation
Deterioration
Discontinuity
Displacement
Loss of material Classification of typical defects identified in the bridge steel structures are presented in
Table 5. Definitions of the terms used in the classification are explained in chapter 4.1. Proposed four-level system of defect classification enables selection of the required precision in defect identification and classification.

Railway bridge defects and degradation mechanisms
113
Table 5. Hierarchical classification of defects of steel railway bridges
CLASSIFICATION OF STEEL BRIDGE DEFECTS LEVEL I LEVEL II LEVEL III LEVEL IV
Aggressive Inorganic Neutral Penetrating Contamination Steel construction
Organic Superficial
Deflection Distortion Basic component Torsion Deflection Bolted/riveted
connector Torsion Deflection
Deformation
Welded connector Torsion Hardness reduction Impact resistance reduction Basic component Modification of
physical features Strength reduction Loosening Bolted/riveted
connector Modification of physical features Strength reduction
Adhesion reduction Embrittlement increasing Fading Protection Modification of
physical features Thickness reduction
Deterioration
Welded connector Modification of physical features Strength reduction
Irregular Longitudinal Skew
Crack
Transverse Delamination
Irregular Longitudinal Skew
Basic component
Fracture
Transverse Crack Bolted/riveted
connector Fracture Crack Delamination Protection Fracture
Longitudinal Crack Transverse Longitudinal
Discontinuity
Welded connector Fracture Transverse Rotation Excessive Translation Rotation Displacement
Limited Translation Basic component Bolted/ riveted connector Protection
Loss of material
Welded connector

3. Inspection, testing and assessment of bridge condition
114
4.3. Masonry bridges
Identification of degradation mechanisms and processes occurring in masonry bridges is complicated because of complex nature of the structures. Composite action of bricks or stones, joints and backfill requires very precise analysis of degradation phenomena.
Usually there is no simple way of defining the relationships between defects and degradation mechanisms, because almost each defect can be caused by a few mechanisms or their combination. The most frequent relationships between the main types of defects and basic degradation mechanisms – based on the analysis of many practical cases – are presented in Table 6 according to Bień and Kamiński (2007).
Table 6. Degradation mechanisms in relation to defects of masonry railway bridges
Chemical Physical Biological Degradation mechanisms
Defect type C
arbo
natio
n
Cry
stal
lizat
ion
Leac
hing
Sa
lt an
d ac
id
actio
ns
Fatig
ue
Free
ze-th
aw
actio
n In
fluen
ce o
f hig
h
tem
pera
ture
M
odifi
catio
n
of fo
unda
tion
cond
ition
s
Ove
rload
ing
Shrin
kage
Wat
er p
enet
ratio
n
Acc
umul
atio
n
of d
irt o
r rub
bish
Li
ving
org
anis
ms
activ
ity
Contamination Deformation Deterioration Discontinuity Displacement Loss of material
The detailed classification including all types of masonry bridge defects is shown in
Table 7. For all main types of defects – except displacement – at the second level of the
Table 7. Hierarchical classification of defects of masonry railway bridges
CLASSIFICATION OF MASONRY BRIDGE DEFECTS LEVEL I LEVEL II LEVEL III LEVEL IV
Aggressive Inorganic Neutral Penetrating Backfill
Organic Superficial Aggressive Inorganic Neutral Penetrating Masonry
Organic Superficial Aggressive Inorganic Neutral Penetrating
Contamination
Protection Organic Superficial
Backfill Deflection Deflection Slip Masonry Swell
Deformation
Protection Deflection

Railway bridge defects and degradation mechanisms
115
CLASSIFICATION OF MASONRY BRIDGE DEFECTS (CONT.) LEVEL I LEVEL II LEVEL III LEVEL IV
Backfill Modification of physical features
Calcium hydroxide reduction pH factor reduction
Modification of chemical features
Salt concentration increase Absorbability increase Elastic modulus change Embrittlement increase Frost-resistance reduction Permeability increase Porosity increase
Brick/stone Modification of physical features
Strength reduction Calcium hydroxide reduction pH factor reduction
Modification of chemical features
Salt concentration increase Absorbability increase Elastic modulus change Embrittlement increase Frost-resistance reduction Permeability increase Porosity increase
Joint Modification of physical features
Strength reduction Calcium hydroxide reduction pH factor reduction
Modification of chemical features
Salt concentration increase Absorbability increase Adhesion reduction Embrittlement increase Fading Frost-resistance reduction Permeability increase
Deterioration
Protection Modification of physical features
Porosity increase Irregular Longitudinal Skew Crack
Transverse Delamination
Irregular Longitudinal Skew
Masonry
Fracture
Transverse Crack Delamination
Discontinuity
Protection Fracture Rotation Displacement Excessive Translation
Backfill Brick/stone Joint
Loss of material
Protection

3. Inspection, testing and assessment of bridge condition
116
classification, structure components afflicted with a defect are indicated. Detailed sub-types of the masonry bridge defects are distinguished on the lowest level of the presented classification. Definitions of the terms used in the classification are explained in chapter 4.1.
5. CONCLUSIONS
Presented classifications of bridge defects and degradation mechanisms together with the testing methods described in the Guideline (Niederleithinger et al., 2006) create a basis for a consistent identification and description of the railway bridge defects as well as for comparable assessment of their condition, e.g. (Bień et al., 2004; Bień and Kamiński, 2006). Defined relationships between degradation mechanisms and defects should help in optimisation of the maintenance strategies and in reliable foresight of the bridge infrastructure lifetime.
Presented solutions can be considered as a part of European discussion concerning common methodology of advanced bridge condition assessment and forecasting.
ACKNOWLEDGEMENTS
The support of the research within the project Sustainable Bridges funded by the European Commission within the 6th Framework Programme is acknowledged. We thank all project partners for valuable discussions and comments during preparation of the proposed solutions.
REFERENCES Bień, J., Rawa, P., Jakubowski, K., Kamiński, T., Maksymowicz M. (2004): Deliverable D3.3 – Possibilities of unification of bridge condition evaluation. Sustainable Bridges – Assessment for Future Traffic Demands and Longer Lives.
Bień, J., Kamiński, T. (2006): Numerical modelling of damaged masonry arch bridges. In: P.J.S. Cruz, D.M. Frangopol and L.C. Neves (eds). Bridge Maintenance, Safety, Management, Life-Cycle Performance and Cost; Proc. of the 3rd Intern. Conf., 16-19 July 2006.
Bień, J., Kamiński, T. (2007): Damages to masonry arch bridges – proposal for terminology unification. ARCH’07 – 5th International Conference on Arch Bridges, 12-14 September 2007.
Bień, J., Jakubowski, K. (2006): Hierarchical Classification of Damages of Steel Railway Bridges, 6th International Symposium on Steel Bridges. ECCS, Prague, Czech Republic.
Helmerich, R., Niederleithinger, E. (2006): D3.16 NDT-toolbox for the Inspection of Railway Bridges. Sustainable Bridges – Assessment for Future Traffic Demands and Longer Lives.
Maksymowicz, M., Cruz, P., Bień, J., Helmerich, R. (2006): Concrete Railway Bridges – Taxonomy of Degradation Mechanisms Identified by NDT Methods. Proc 3rd Int. Conf. on Bridge Maintenance, Safety and Management, IABMAS’06, Porto, Portugal, 16-19 July 2006, Taylor & Francis Group, London. ISBN 0 415 40315 4.
Niederleithinger, E. et al. (2006): D3.15 Guideline for Condition Assessment and Inspection of Railway Bridges. Sustainable Bridges – Assessment for Future Traffic Demands and Longer Lives.

Inspection of reinforced concrete bridges
117
Inspection of reinforced concrete bridges Birit BUHR JENSEN, Torben PEDERSEN & Thomas FRØLUND Currently, in principle operation and maintenance of bridges in Denmark follow two steps: a general inspection and a special investigation. The general inspection comprises a visual inspection, where visual signs of deterioration are registered. Where deterioration is detected a special investigation is called for. The typical damage which calls for special inspections are often visual signs of corrosion on bridge piers and decks, water leakage as a result of a defective bitumen membrane, etc.
One of the challenges in connection with the special inspections lies in determining the cause of the deterioration, the extent in deterioration together with the deterioration rate. Where chloride-induced corrosion is concerned visual investigation can be subject to a high degree of uncertainty. In this connection potential mapping together with calibration against break-ups can be a strong non-destructive testing (NDT) tool in finding the actual extent in corrosion. When combined with corrosion rate measurements, the deterioration rate can be estimated and used e.g. where there is a need to postpone repairs.
Where deck structures and other structures are concerned, it is of vital importance to evaluate the integrity of the structure together with the extent of possible damage caused by frost actions and alkali silica reactions.
The present paper describes the principal, general and special inspections in more detail together with examples on the use of NDT. Examples covering potential mapping are presented together with corrosion rate measurements to evaluate the extent in corrosion and the corrosion rate. Also, the use of impulse response testing as a strong tool in evaluating the extent in flaws will be presented. The potential mapping and impulse response testing are strong NDT tools which help the engineer to get a good overview of corrosion and deteriorations besides what can be visually registered.
Also the use of other testing methods is briefly presented, and two case stories given where the potential mapping/corrosion rate measurements and impulse response testing has been applied beneficially.
1. INTRODUCTION
Bridges and tunnels are an integrated part of the railway infrastructure. Due to the fact, that the volume of bridges in Denmark becomes older and at the same time the load pattern is altered with higher frequency of train passages and with higher axle loads, it is foreseen, that
Sustainable Bridges – Assessment for Future Traffic Demands and Longer Lives

3. Inspection, testing and assessment of bridge condition
118
more damages may occur. If the damages are not discovered in due time, they may develop to severe damages, which on long term may affect the safety of the structures.
The main objective during operation and maintenance of the bridges and tunnels is that the safety level is maintained at an acceptable level while, at the same time, the operation is conducted in an economic optimum way for society.
There are a number of factors which influence the strategy selected for operation and maintenance of the individual construction. Among these are political aspects, budgets, the environment, aesthetics and signs of deterioration and repair methods.
It is the task of the construction management to take all of these factors into consideration in connection with the operation of the structures.
The overall safety of the structures is sought to be maintained by regular inspections, and a high quality level of repair works is required.
The description of how the inspections are conducted is, to a large extent, based on the principles followed by the Danish State Railway (named “Banestyrelsen”) and the Danish Road Directorate (“VD”); more details can be found e.g. in (Lauridsen and Larsen, 1998).
1.1. Routine inspections
The main objective of conducting inspections (routine, general and special) is to supervise that the safety level is maintained. Moreover, the inspections are conducted in order to monitor changes in the condition of the structure, in this connection register deficiencies/flaws. The general inspections aim at giving the construction administrator the required information regarding the technical and economical basis for planning operation, maintenance and rehabilitation works to secure the anticipated service life of the structure.
The routine inspections can be sub-divided into two groups: • normal routine inspection, • extended routine inspection. The normal routine inspection is conducted together with the regular railway section inspection
following the inspection intervals of the current railway section, e.g. 1–2 times a week. The extended routine inspection should be conducted 1–2 times a year. These inspections
also comprise crossing passages, as the inspections are also used to plan and supervise the level of cleaning and maintenance. Subsequently, extended inspections can be relevant in connection with special incidences such as derailment, collisions, heavy rainfall and high tides.
1.2. General inspection
General inspections are conducted with the primary aim of providing the basis for when to start activities. A general inspection is a thorough visual and systematic examination of all parts of a structure.
General inspections should be conducted with intervals of 1–6 years as it will thus be possible to follow the rate of deterioration and thereby implement corrective measures at the optimum time. The interval depends on the actual condition of the structure and from experience this provides a high level of safety and at the same time it minimizes the number of inspections needed.
The inspections are normally conducted by personnel with knowledge of statics as well as of deterioration mechanisms. Thereby the evaluation can be conducted on site which reduces the number of data to be reported. In other words, only significant damage will be reported.
From the inspection an evaluation is given of the condition of the structural elements of the structure based on the observed damage. Based on the assessments the need of conducting a special inspection is evaluated.

Inspection of reinforced concrete bridges
119
1.3. Special inspections
The objective of the special inspection is to provide a more detailed basis compared to the general inspection in order to prioritise larger rehabilitation works, including the replacement of structural parts and remedial works to ensure the overall safety level of the structure. Special inspections are normally conducted on the basis of feedback from the general inspection. The special inspection is conducted by specialists (engineers) and is only conducted when required, hence there are no fixed intervals between these.
The special inspection is divided into two parts: • an economic special inspection, • a technical special inspection. By the economic special inspection a conceptual design is set forward, preferably with
different rehabilitation strategies for the structure. The individual strategy is described including the extent of repair, repair methods, time schedule and repair costs. An economic special inspection should always be conducted before a large repair job is commenced. An example of a combined technical and economical special inspection is given in (Buhr and Stoltzner, 2005).
The technical special inspection is normally conducted in order to elucidate deterioration extent and cause(s) of deterioration. Normally samples are collected including break-ups on structural parts supplemented with laboratory testing. A technical special inspection can also include periodic measurements and investigations as a result of collision, flooding, etc. In addition a load capacity evaluation can be included in the technical special investigation.
When COWI conduct technical special investigations on medium to large bridges and tunnels the investigation activities normally comprise:
Visual inspections, where signs of deterioration together with the extent of deterioration are registered:
• delamination survey using a hammer or Impulse Response testing, • covermeter survey. Potential mapping, possibly in connection with corrosion rate measurements including
break-ups for calibration of actual reinforcement condition. Sample collection, dust samples and cores, typically: 1. Laboratory analysis including chloride analysis and petrographic analysis, typically. 2. Reporting.
1.4. Some challenges in special investigations
The challenge in connection with special inspections often lies in determining the cause of the deterioration, the extent of the deterioration together with the deterioration rate. When visual inspections are conducted, the extent of deterioration caused by corrosion and spalling is determined. The cause of corrosion is very often frost, alkali-silica reactions and chlorides. Corrosion where chlorides are concerned can take place with only a small volume increase of the corroding steel, and limited visual signs of corrosion could be the result. Following this, a determination of the extent of corrosion based on a visual inspection can be subject to high uncertainty.
Where chlorides are concerned, a traditional repair strategy is often applied, where chloride containing concrete is removed, reinforcement cleaned and new concrete cast. This method is often not durable as chlorides will be present also in adjacent areas to the repair in sufficient quantity to allow for new corrosion, e.g. (Holst and Buhr, 2004).
Repair strategies that are more durable can be: 1. Removal of a sufficient amount of chloride-infected concrete to stop corrosion from taking place. 2. Cathodic protection, where only delaminated concrete has to be removed.

3. Inspection, testing and assessment of bridge condition
120
Over the years potential mapping has proved to be a rational tool for detecting the extent of corrosion. In combination with corrosion rate measurements an estimate of the deterioration rate can be found, and the consequences of postponing repairs can be evaluated.
Special investigations are based on the anticipation that the structure to be investigated complies with its actual design. However, this is not always the case. Where the amount, distribution and cover of the reinforcement are concerned a covermeter or break-ups are used to check this. From experience, there are cases where the structure is defective with construction flaws, which cannot be detected using the traditional hammer tapping test. Similarly, where frost and alkali-silica reactions have caused deterioration, the extent in deterioration should be evaluated in a reliable way. Here Impulse Response testing has proved to be a strong tool in checking the extent of delaminations and flaws.
In the following chapters potential mapping and corrosion rate measurements used in connection with a condition assessment is presented together with examples of where impulse response testing has been used.
2. APPLICATION OF POTENTIAL MAPPING AND CORROSION RATE FOR EVALUATING CORROSION RISK AND CORROSION EXTENT
As an example of a special investigation including different NDT methods a bridge in the Copenhagen area has been chosen. The bridge is exposed to deicing salts from above and to groundwater from the sides. The bridge was constructed in 1922 with a width of 9.6 m but was expanded 5.5 m at both sides to a total width of 20.6 m. The reinforcement in the expansions was found not to be in electrical continuity with the reinforcement of the original bridge.
Figure 1. Bridge constructed in 1922, expanded in 1942
Different investigations were carried out: Visual inspection, half-cell potential mapping, corrosion rate measurement, concrete cover by covermeter and calibration against break- -ups/drilling, inspection of exposed reinforcement for calibration of half-cell potentials and corrosion rate at expected passive and active areas, core drilling for petrography and concrete dust sampling to determine the chloride concentration at different locations and different depths below surface.

Inspection of reinforced concrete bridges
121
2.1. Visual inspection
Visual inspection was carried out on all bridge constructions, but only the concrete investigations are dealt with in this paper.
In general, the concrete was very moist although draining of the ground above the bridge had been installed 12 years before the special investigations. Areas with depositions, dripstones and fine cracks were found in both the original concrete as well as in the expanded bridge concrete. Rust deposits were only seen at a few locations at the lower parts of the arch.
2.2. Half-cell potential mapping
Half-cell potential measurements were carried out from the bottom of the arch up to two metres height of the total width of the bridge. The potential mapping principle and details on the corrosion rate measurement equipment used in the presented example (the Galvapulse equipment) can be found in (Frølund et al., 2000; Klinghoffer et al., 1997; Danish Patent 171925B1., 1997).
As no electrical continuity was found across the casting joint between the original reinforcement and the expanded bridge areas the half cell potential measurements were divided into 3 areas, see Figure 2.
Field 1 Field 2 Field 3
Break up
Chloride test Coring
Figure 2. Sketch of the lower part of the bridge arch seen from the railway showing half-cell potential mapping fields, location of break- -ups, chloride sampling and coring
Figure 3. Half-cell potential map. Areas with possible corrosion are shown in yellow and red colours
1942 1922 1942

3. Inspection, testing and assessment of bridge condition
122
Core samples, break-ups, chloride profiles and corrosion rate measurements were performed in corroding and passive areas in accordance with the half-cell potential map.
2.3. Petrography of cores
Two cores were drilled, one in the concrete from 1922 and one in the concrete from 1942. The concrete of both cores was analysed for carbonation, alkali/silica reactivity, leaching and cracks.
Carbonation was found to a maximum depth of 2 mm, except along a crack where carbonation was found to a maximum depth of 44 mm. Leaching was not found to be a general problem except along coarse cracks, where deposits were found at the concrete surface. No alkali/silica reactivity was found.
2.4. Concrete cover
The depth was measured with a covermeter of the total bridge width at a level of app. 1 m above ground level. Average cover depth of the original bridge was 32 mm and of the expanded areas 42 mm.
2.5. Chloride profiles
At two places in each of the 3 potential mapping areas chloride samples were collected and analysed at the depths of 0–30 mm, 30–60 mm and 60–90 mm below surface, yielding a total of 18 samples. Chlorides were found in all samples in the reinforcement depth, typically at a level of 0.02% Cl- by weight of concrete. The chloride concentration near the leaking casting joint was above the generally used threshold value for corrosion of 0.05% Cl- of the concrete weight (0.09–0.23%) in the actual exposure environment. This corresponded well with observations of active corrosion in break-up measurements of high corrosion rates were found, see Figure 4.
HC-potentials vs. Corrosion rates
0
2
4
6
8
10
12
14
16
18
20
-400 -350 -300 -250 -200 -150 -100 -50 0
mV vs. Ag/AgCl
Cor
r.rat
e, µ
A/cm
2
Figure 4. Example of the correlation between half-cell potentials and corrosion rates in two areas with different chloride concentrations
0.19% Cl− Break-up showing active corrosion
Dry low chloride area

Inspection of reinforced concrete bridges
123
2.6. Conclusion from the special bridge investigations
In general, the investigations show that there is no severe reinforcement corrosion except along the leaking casting joints. If chloride penetration is not stopped more general corrosion problems are expected. As the chloride threshold value is believed to be somewhat depending on the oxygen/moisture level a strategy where the structure is dried out could accelerate the break down of corrosion passivity. A repair strategy including cathodic protection was recommended. The solution resulted in few traffic interruptions, and hence proved feasible technically and financially.
3. IMPULSE RESPONSE TESTING USED AS TOOL FOR DELAMINATION AND FLAW DETECTION
In connection with special investigations of two twin bridges, the Borrevejle Vig bridges, cracks have been detected at the soffit of the deck slab. In relation to an ongoing load carrying capacity evaluation of these bridges, it has been important to know whether the concrete of the deck slab can be considered intact or not. To verify this “Impulse Response” testing was carried out.
3.1. Application
Impulse Response testing is an acknowledged and well-documented acoustic measurement method. The method was developed in the early 1960’s and was, at first, extensively used in the aircraft industry, where it has been an effective tool in detecting defects in metallic components. The Impulse Response method has later (in the late 1960’s) been adopted in concrete investigations. In the beginning it was used for pile testing only but, later, theory has been developed to cover three-dimensional objects. After the major fire in the Channel Tunnel between England and France “Impulse Response” testing was used to define the transition between damaged and undamaged concrete.
The Impulse Response testing method is efficient in detecting structural defects in concrete structures, in pavements on bridges and in connection with foundation problems on runways in airports. In particular, the Impulse Response method is efficient for the detection of:
• delaminations in concrete structures, • voiding in/beneath/behind concrete slabs, floors, etc., • low-density concrete (honey-combing), • debonding of asphalt concrete overlays, • foundation problems at runways.
3.2. Principle
The Impulse Response method uses a special low-strain hammer impact sending a stress wave into the structure. The frequency range from the impact covers 0–1 kHz. A geophone is held in close contact with the structure and close to the point of impact. The response from the reflected sound wave picked up by the geophone is “recorded” by a data logger together with the direct impact response from a load cell built in the hammer. A FFT analysis is made with regard to both the geophone response and the hammer response. This makes it possible in an objective way to compare the frequency/energy spectrum contained in the reflected signal with the frequency/energy spectrum in the impulse from the hammer impact. The analysis ends up with the response from a “unit hammer impact”.

3. Inspection, testing and assessment of bridge condition
124
3.3. Analysis of test results
As the response from the geophone is “the influence from a unit-hammer-impact”, it is possible to make a comparison and quantify the measurement results. During analysis several independent parameters are taken into account:
• average mobility, • dynamic stiffness, • mobility slope (peak value/average value), • voids ratio, • mobility x slope. The results from the analysis are plotted into a number of graphical “colour contour plots”, and
from these the final analysis and evaluation are made. In connection with the evaluation, potential defects are described together with their nature (reduced slab thickness, honey-combing, poor adhesion, insufficient support, etc.). The results are calibrated against the actual conditions by core drilling.
Figure 5. The twin bridges to the left and impulse response testing to the right
Figure 6. Single point analysis showing hammer and geophone response and frequency spectrum

Inspection of reinforced concrete bridges
125
3.4. Measurements
A number of impulse response measurements were conducted. An example of test results are shown in Figure 7.
Figure 7. Plot showing mobility slope for Borrevejle Vig bridge deck. The results cover an area of approx. 6 x 6 m
3.5. Results
To a large extent the “average mobility” is higher from what is normally seen for corresponding structures. This can indicate a porous concrete. In cases where there is a general high “mobility” covering the entire frequency spectrum, this can indicate the presence of a crack pattern (covering the spectrum from larger distributed cracks to fine intimate cracks).
Significant “peaks” have been found on the “mobility spectrum” and can be an indication of delamination. Considerable areas where the “mobility slope” has been found to be in a critical range, the values indicated by “mobility slope” exceeded approx. 3. A system of cracks and flaws as a result of poor compaction could result in such a response.
The results indicate that considerate problems concerning the structural integrity/condition can be expected.
3.6. Verification/calibration
As with any other remote sensing method, it is recommended to verify/calibrate the measurements by drilling e.g. Ø 75 mm cores and to inspect the actual conditions.

3. Inspection, testing and assessment of bridge condition
126
Figure 8. Example showing flaws in core used as calibration for Impulse Response testing
4. CONCLUSION
The “Danish” approach to bridge condition assessments has been presented. The concept of this approach, where different kinds of NDT-methods are utilized, has been developed over years by the Danish State Railway (“Banestyrelsen”) and by the Danish Road Directorate (“VD”). Used on a regular basis for these assessments, these NDT tools are supportive and elucidating tools for the overall evaluation of the bridge condition, the deterioration extent and rate. “Potential mapping”, “corrosion rate measurements” and “impulse response testing” have been dealt with in more detail and are considered important tools in this connection as they provide a good overview of the structure condition.
REFERENCES Buhr, B., Stoltzner, E. (2005): Service life prediction, re-evaluation and optimum repair strategy, ICCRRR, Cape Town.
Danish Patent 171925B1. 1997.
Frølund, T., Klinghoffer, O., Poulsen, E. (2000): Rebar Corrosion Rate Measurements for Service Life Estimates. ACI Fall convention 2000. Toronto, Canada.
Holst, J., Buhr, B. (2004): The Langeland Bridge, Denmark, Pilot project using cathodic protection as basis for overall repair strategy, CSSE/ASCCT Symposium “Durability and Maintenance of Concrete Structures”, Dubrovnik 2004, Croatia.
Klinghoffer, O., Rislund, E., Frølund, T., Elsener, B., Schiegg, Y., Böhni, H. (1997): Assessment of Reinforcement Corrosion by Galvanostatic Pulse Technique. Proc. Int. Conf. on Repair of Concrete Strictures, Svolvaer, Norway, 1997, pp. 391-400.
Lauridsen, J., Larsen, E.S. (1998): Quality objectives for the operation and maintenance of bridges and tunnels, Symposium: Operation and maintenance of large infrastructure projects, Denmark.
Inspection of steel bridges
127
Inspection of steel bridges
Christian KAMMEL & Rosemarie HELMERICH Provisions for inspection of steel railway bridges differ in the European countries. Only in particular cases NDT-assessment methods are utilized for inspection of steel bridges whereas they already are conventional methods in other industrial applications. An overview of existing condition assessment and inspection procedures for old steel railway bridges throughout Europe is presented in this paper and a new generally applicable system for survey and inspection using sequential intervals of routine, standard and general inspection each with different levels of in-depth examination is proposed. This paper also provides guidance on the selection and application of methods for assessing the significance of imperfections including innovative NDT techniques primarily tailored to old steel railway bridges. The objective of this paper is related to Sustainable Bridges work package WP3 “Condition Assessment and Inspection”, deliverable D3.4 “Report on investigation on steel bridges/elements, including stress measurements in riveted, bolted and welded structures” and deliverable D.3.15 “Guideline for inspection and condition assessment of railway bridges”.
1. INTRODUCTION
European provisions for assessing imperfections in existing metallic structures like old steel railway bridges are needed to meet the requirements of the owners in terms of durability, traffic and public safety. The technology is being applied by many industries for materials selection, design and fabrication and particularly in-service assessment using existing methods. Of particular interest for the application of condition assessment of existing steel railway bridges are the procedures which are given by:
• BS 7910 (1999), • SINTAP (1999), based on ECA (Engineering Critical Assessment) methods, • CEN/TR TC121/WG14 (2004), • Ril 805 of Deutsche Bahn (2003), • prEN 1090-2 (2007).
Sustainable Bridges – Assessment for Future Traffic Demands and Longer Lives

3. Inspection, testing and assessment of bridge condition
128
Application of ECA for assessment of crack growth, corrosion, wear and tear and other deterioration detected during routine in-service inspection is a well-established practice which is utilized in BS 7910, SINTAP and CEN/TR TC121/WG14. In-service inspection is facilitated by the fact that deterioration usually results in well-defined imperfections of a single type and often localised (e.g. fatigue cracks). This permits application of special procedures for non- -destructive testing, able to give quantitative information on the size of the imperfections. The deterioration may be monitored during a number of inspections in order to follow the growth of cracks, the progress of corrosion, etc.
NDT-assessment methods for steel structures have been well-developed in the past decades, because of their outstanding importance, e.g. in pressure vessels industry or in structures for power plants or for application in aerospace. Standards are available for NDT-assessment of steel structures, but only a few in railway authorities.
For the inspection and condition assessment of steel bridges the most important non- -destructive methods are:
• methods applied in industry or mechanical engineering, • the state of the art of methods already common in use during the inspection of existing
steel bridges, • new developed methods or methods enhanced within the project Sustainable bridges. It is impossible to apply NDT-methods to all surfaces and details of the bridges. Predominant
causes and identification of defects in critical details are important tasks before deciding about the scope of the NDT-measurement in the different inspection levels, especially in the reassessment phases II or III.
The predominant defects of steel structures are corrosion and fatigue. Heavy corroded members have reduced remaining cross section area, which can be estimated by means of ultrasonic-echo testing. US-method is not applicable to wrought iron because of the layered structure and can not assess sandwiched plates in built-up sections. In most cases, fatigue defects appear as fatigue cracks and may occur in primary or in secondary elements of a bridge. The detailed assessment has to focus the application of NDT to the more essential cracks in primary elements. Since fatigue defects are – besides poor detailing or environmental impact – predominantly caused by the cyclic load spectra during the service life, consequently, existing steel bridges suffer more from fatigue and accumulate more defect, the older they are.
A defect study, including a refined inspection plan, should always include the analysis of details that are weak to fatigue and the results of the visual inspection. In the defect study, the application of NDT-methods should focus on weak details, to answers two main aspects:
• identification of a crack during inspection or special inspection, • identification of the cause of the crack. Strain measurement or monitoring (Feltrin et al., 2007) of the bridge under defined loading
or under traffic can help to focus the NDT-assessment to the most critical details and thus, to refine inspection plans.
The analysis of the causes of detected fatigue defects often demands a detailed assessment of the details of the steel structure (WP4). In particular, it is important to distinguish between unloaded defects and cracks resulting from the original fabrication process (with no crack propagation that will occur and the cracks may remain harmless throughout the structures life) on one hand and propagating cracks in structural elements exposed to significant cyclic loading on the other hand. Thus, if the expert or professional bridge engineer can observe during inspection an opening and closing of a crack under cyclic traffic load, it is likely to be a fatigue crack.

Inspection of steel bridges
129
Another aspect is the acceptability of a fatigue crack with regard to the consequence of failure related to the main structure (Kammel et al., 2005). This is the aspect of redundancy and safety risk. A fatigue crack, initiated in a secondary element, e.g. caused by restraint, is usually not of major importance for a hazard scenario of a structure. Fatigue cracks in primary elements, as main or cross girders, may be of high risk for a break down of a bridge and for lives of people being on or in these structures.
2. SCOPE OF INSPECTION
2.1. Routine surveillance (by track staff and train drivers)
The routine survey takes place always if the track personal or trains are passing the bridge during regular work. It is just visual inspection from the ground level or from knowing sound differences during passing the bridge. It is not planned regularly and not documented. In case of any doubts or visible noticeable problems, a documentation has to be done and measures, e.g. a special inspection needs to be initiated.
2.2. Routine inspection (once a year)
The routine inspection is also referred to as basic inspection/routine visual examination. The preparation of the annual inspection includes the reading of the previous inspections. The inspection is performed from the ground level. The inspector visually checks:
• main girders – truss, web, box girders (cracking, heavy corrosion, displacement, vegetation, drainage system),
• cross girders (cracks, displacement, connection to the main girder as much as visible from the ground),
• general condition (corrosion, vegetation, coating), • retaining wall condition and check of the bearing (expansion joints), • embankment condition (erosion, displacement, earth slip). Techniques: Annual inspection is a pure visual inspection. Only photographs are taken to
complete the written documentation. Documentation: The bridge documentation or bridge book (paper or better digital) should
be taken to the site. All observations have to be documented handwritten or digital in the bridge book. The program must guarantee, that once written documents can not be changed. Additional information is given regarding inspectors name, education, training level and even daily condition of the inspector, eye quality (human factor), firm, phone, date, weather temperature, humidity, frost (environmental factor). Thus, the inspector can be asked in case of any doubts, later.
Measures: Simple measures as removal of graffiti, cutting vegetation can be initiated by the inspector. If heavy defects were found (heavy losses, heavy humidity, impact, broken masonry or even destruction of the embankment) which could affect the structural safety, traffic safety or durability, a special inspection must be initiated to clarify measures to be undertaken.
2.3. Standard inspection (3rd year after general inspection)
The preparation of the basic inspection includes the reading of the previous inspections. The inspector needs also basic equipment for inspection as laptop, binocular, lightening, photo- and video camera. The standard inspection is performed from the ground level. The visual

3. Inspection, testing and assessment of bridge condition
130
inspection is the initial tool for all inspection types. It is more refined than in the annual inspection:
• main girders – truss, web, box girders (cracking, heavy corrosion, displacement, vegetation, drainage system),
• cross girders (cracks, displacement, connection to the main girder as much as visible from the ground),
• general condition (corrosion, vegetation, coating), • retaining wall condition and check of the bearing (expansion joints), • embankment condition (erosion, displacement, earth slip). Techniques: Standard inspection is also a visual inspection. Photographs are taken to completing
the written documentation. The inspector has to take sets of common non-destructive inspection tools (hammer, meter tape 50 m, heavy corrosion: US-equipment for measuring remaining plate thickness).
Documentation: same as for routine inspection. Measures: same as for routine inspection.
2.4. General inspection / Routine detailed examination (once in 6 years)
The first general inspection is the acceptance inspection after the completion of the bridge. General inspections need experienced bridge engineers, able to observe and analyse defects. Some countries require load tests to remove residual welding stresses. The preparation of the general inspection begins with reading the available documentation of previous inspections. The planning is usually available already in the beginning of the year. The general inspection has to be announced in time to the safety personnel of the line and the infrastructure owner:
• order security posts for the time of inspection in the track level (over – or under bridge), • order lift vehicle or other equipment reaching from the upper level to the bottom of the
slab/ barrel, • plan a second educated inspector, • take laptop, binocular, meter tape (50m), lightening, photo- and videocamera, ladder,
drilling machine. The inspection is performed in touching distance with “hands on detail”. The inspector
checks the girders and connections visually. Special focus is laid on fracture critical non redundant details and details with high detail category:
• tapping the rivet heads in details with a hammer, • corrosion between plates in built up cross sections with big distance between the
connections, • dirt and humidity (possible corrosion after cleaning the detail), • bracing system (possible high load cycles resulting from frozen bearings or joints), • general condition (leakage, corrosion, coating), • embankment condition (erosion, displacement, earth slip). Techniques: General inspection is the inspection for all details of a bridge. Simple inspection
has to be performed by the inspector and his observer, and additionally e.g. a person from the authorities. The tests to be performed are:
• ultrasonic test for the estimation of remaining plate thickness, coating thickness, coating delamination,
• magnetic particle test (MT) or colour penetrant (PT) tests can be used in case cracks are found.
Documentation: same as for routine inspection. Measures: same as for routine inspection.

Inspection of steel bridges
131
3. IDENTIFICATION AND ACCEPTABILITY OF DEFECTS
3.1. General
Most of the non-destructive testing methods are standard tests in industry and in the energy sector. The application to steel bridges is known state of the art from literature. Simple methods, as measurement of the remaining thickness of corroded members with easy-to-use hand hold ultrasonic equipment are used in regularly inspections.
The implementation of the linear fracture mechanic approach (FMA) for estimation of safe service intervals in the early 1990ies (Hensen, 1992) increased the necessity of more detailed detection of initial fatigue cracks even in sandwiched elements. The detected initial crack is an input value for the FMA. Application to inspection and assessment of existing steel bridges is recommended e.g. in (Sedlacek et al., 2001) and (Kühn et al., 2007).
Some possibilities to identify the reason of detected failures, e.g. to be fatigue cracks, are summarised. Some of the fatigue failures are identified during regular inspection. In particular, it is important to distinguish between original defects, which will remain harmless throughout the structures life, and fatigue cracks, able to propagate. These cracks propagate, if they are exposed to cyclic loading from traffic including the dynamic effects, temperature differences or even from wind load. Significantly is, that the fatigue crack is opening and closing under cyclic loading and hence it is likely to be a fatigue crack.
The additional aspect is the acceptability of fatigue cracks concerning their effect on the whole structures stability. This is the aspect of redundancy. A fatigue crack, initiated in a secondary element, e.g. caused by restraint, is usually not responsible for a hazard scenario of a structure. Fatigue cracks in main elements, as main bridge girders, may be of high risk for a collapse of a structure and for lives of people being on or in the structures. These aspects are of importance in the estimation of service intervals using fracture mechanic approach (FMA).
The objective of measurements of loads or loads effects is to gain information on the real structural system, the static and dynamic loading of the structure in order to reduce the uncertainties associated with the static calculations made in design or made in an assessment. The main areas of possible knowledge improvement can be summarised as follows:
• verification of the real structural system and system details: type of connection, real bearing conditions, sensitivity to fatigue, etc. The calculation model is to be optimised for re-calculation,
• dynamic behaviour of a structure (estimation of dynamic amplification due to traffic and wind),
• changes in structural response after local damage (e.g. buckling of members after colli-sion).
Fitness-for-service acceptance criteria are given by Hensen (1992) based on a calculation method for the necessary strengthening measures for members under tension or bending stresses to increase their resistance against crack growth and the required cross section for strengthening of riveted girders, see also (Kammel et al., 2005).
3.2. Recommended testing methods during Inspection
A summary of recommended testing methods for steel railway bridges is given in Table 1. Examples of applied MT and RT method for crack detection are shown in Figure 1.

3. Inspection, testing and assessment of bridge condition
132
Table 1. Summary of recommended testing methods for steel railway bridges
NDT- -Method
Investigated details
Limitation in use, Accuracy of the method incl. Cha-racteristics of the material
Railway specifc issues / Traffic interruption
Time for 1 point/1 m or 1 m2
Remarks
Visual Contamination, loss of material, destruction, displacements, cracks
Cracks < 0,1 mm, only surface observation
No, except upper side of slabs below ballast
Main inspection MI (man days) Once in 6 years l < 10 m 2 days l < 30 m 8 days l < 50 m 30 days l < 100 m 35 days l > 100 m 42 days Simple Inspection (once a year) 0,7 of MI
Depends on span Time accord. to highway bridge inspection in Germanys
Acoustic Emission (AT)
Propagating cracks, 2D/3D- -Localisation of active surface + subsurf. cracks
Not for stable (not propaga-ting) cracks ~ 10% of the distance between sensors
No restrictions if below the track, Influenced by inhomogen., grain size, temperature
Database needed, long term data aquisition
Research level
Eddy current test (ECT) + GPS
Voids in thin layers, head checks
Max depth 10 mm, local resolution 2 mm
No restrictions if system on grinding train
Very fast test train speed – 100 km/h
Follow rail-way safety measures if use of hand tool
Magnetic particle test (MT)
Surface cracks, check of rivet holes after rivet removal, before subseq. bolting
Not for use on sun exposed surfaces or in bright light, only magnetic steel width > 0,1 mm length > 1 mm
No restrictions if below the track
Fast Documen-tation only with photo-raphy
Colour penetration test (PT)
Surface dracks Remove old colour width > 0,1 mm length > 1 mm
Surface preparation + application + 30 min for colour developer
Documen-tation only with photo-raphy
Radio-graphy (RT)
Internal voids, subsurf. cracks in sandwiched elements
Max. investigated plate thickness: 70 mm
Safety requirem. for radiation, no interference with signalling
Depends on source age
Last phase (3rd) in re-ssessment
Ultrasonic echo (UT)
Weld roots testing, remaining plate thickness, thickness of surface coating
E.g. use of reference grooves for calibration: width x depth: 0,11 mm x 0,95 mm depth/width ratio: < 25
No restrictions for elements below the track, follow safety measures, if on track level, no interference with signalling.
Point measurement < 1 min (+ surface preparation)
General in-spection, in all phases of the re-ssessment as needed
Ultrasonic array (UT- -array)
Internal void depth + lateral dimensions, defects inhomogeneity
Multi-channel systems for adaptation to special tasks
No restrictions for elements below the track, follow safety measures if on track level
Last phase (3rd) in re-ssessment

Inspection of steel bridges
133
a) b)
Figure 1. Examples of crack detection: a) using MT, b) using RT
The final draft of the coming execution standard for steel products EN 1090-2 contains the European state-of-the-art for execution, inspection, testing and corrections of steel railway bridges and comprises detailed acceptance criteria as well as requirements for inspection, maintenance and repair. Therefore, for condition assessment of old steel railway bridges the given acceptance criteria are of particular interest. The following subchapters summarize the recommendations of this standard.
3.3. Inspection of components
Inspection of corrosion protection should be done in accordance with EN ISO 12944-7, for paints and varnishes according to ISO 19840. Defects to be detected are excessive corrosion, loss of surface treatment, remaining thickness of the surface coating (zinc, paint etc.). For detection they can be metered by magnet-inductive devices, if coating is non-ferromagnetic (alternative ultrasonic, eddy current method).
Actions for correction are: • assessment with reduced cross section; • if necessary, calculation of strengthening measures for members to increase their
resistance against crack growth; • replacement by new members or components.
3.4. Inspection of bolted connections
Basic inspection of bolted connections is done visually and hence can reveal typical bolt defects such as:
• missing bolt/nut, • residual gaps max. 2 mm, • excessive corrosion, • bolt protrusion less than one full thread pitch. Further inspection concerns the bolt preload. Here the defect is loss of preload due to
relaxation and settlement. Inspection is carried out by application of a specific torque moment while the further rotation angle of the nut is inspected. A defect can be discarded rotation at 110% of specified minimum preloading force is less than 15°.
Alternatively the so-called “combined ultrasonic method” for direct measurement of preload forces is available. This method was developed by the Fraunhofer-Institute for non-destructive testing in Saarbrücken, Germany. Basis of this method is a combined measurement of longitudinal and transversal ultrasonic waves. Although the running distance of both waves varies uniformly with a change in preload, in contrast to that the running time

3. Inspection, testing and assessment of bridge condition
134
varies differently with a change of bolt tension stresses. In consequence, the bolt strain can be determined directly from a simultaneous measuring of the running time of the longitudinal and transversal waves, even if the initial bolt length is unknown. For more information see (Kammel et al., 2005).
Both for bolt groups and for groups of rivets, the sequential inspection method according to ISO 2859-5 is recommended at all levels of inspection. This standard contains requirements for random sample tests and gives a method for establishing sequential sampling plans. The purpose is to give rules based on progressive determination of inspection results. Tests are of type A in general with a minimum of 5 and maximum of 16 bolt assemblies to be inspected; and of type B in case of significant effects of fatigue with a minimum of 14 and maximum of 40 bolt assemblies to be inspected.
The horizontal axis is the number of bolt assemblies inspected and the vertical axis the number of defective assemblies. The lines on the graph define three zones: the acceptance zone, the refusal zone and the uncertainty zone. As long as the inspection result is in the uncertainty zone the inspection is continued until the cumulative plot emerges into either the acceptance zone or the refusal zone. The examples in Figure 2 are:
A. The 4th and 8th bolts were found defective. Inspection was continued until crossing the vertical truncation line. The result is acceptance of the bolt tightening operation, subject to corrective actions on the two defective bolts.
R. The 2nd, 6th and 12th bolts were found defective. Exit from the uncertainty zone is into the refusal zone. The result is negative and the inspection is extended to 100% of the bolt assemblies.
1: Refusal zone 2: Uncertainty zone 3: Acceptance zone 4: Number of assemblies inspected 5: Number of defective assemblies
Figure 2. Example of sequential inspection diagram
Actions for correction are: • retightening up to 110% of specified minimum preloading force, • replacement by new bolt assemblies in combination with a check of holes for cracks, pits
or hole distortion and if appropriate, reaming of holes with larger diameter.

Inspection of steel bridges
135
3.5. Inspection of riveted connections
The inspection and repairs of hot rivets should be done in the following way: The number of rivets inspected overall in a structure shall be at least of 5%, with a minimum of 5. Heads of driven rivets should be visually inspected and should satisfy the following acceptance criteria (in some cases provisions for detection of non-conformities will not be available):
• the rivet heads shall be centered. The head eccentricity relative to the shank axis shall not exceed 0,15 d0 where d0 is the hole diameter,
• the rivet heads shall be well formed and shall not show cracks or pits, • the rivets shall be in satisfactory contact with the assembled parts both at the outer
surface of the plies and in the hole. No movement or vibration shall be detected when the rivet head is lightly tapped with a hammer,
• a small well-formed and centered lip may be accepted if only a small number of rivets in the group is concerned,
• outer faces of plies free of indentation by the riveting machine may be specified. Inspection of satisfactory contact shall de done by lightly ringing the rivet head with a ham-
mer of 0,5 kg. The inspection is carried out in a sequential fashion according to the sequential method for bolt tightening inspection described above to a sufficient number of rivets until either the acceptance or the refusal conditions for the relevant sequential type are met for the relevant criteria.
Replacement criteria are required for defective hot rivets. Defects in riveted connections may originate from fabrication or may be induced during service life by corrosion. Rivets with defects that originate from fabrication usually are not critical, because they have been in service since assembly without any negative effects. On the other hand rivet defects induced by corrosion are of particular concern. Typical fabrication defects of riveted connections are listed.
The influence of rivet deterioration, i.e. rivet head corrosion, on the pre-stress and fatigue effectiveness is investigated. Based on the results of numerical investigation and experimental tests according the fatigue effectiveness and the rivet head corrosion two limit criteria could be established (ultimate limit of the load-bearing capacity for the rivet head and a serviceability limit for the riveted connection).
REFERENCES
Banverket (S): Defect catalogue, delivered March 2007.
Bischoff, R., Meyer, J., Feltrin, G. (2007): Low power wireless sensor network for long term structural health monitoring. In: “Sustainable Bridges – Assessment for Future Traffic Demands and Longer Lives”, eds. Bień, J., Elfgren, L., Olofsson, J., Dolnośląskie Wydawnictwo Edukacyjne, Wrocław 2007.
BS 7910 (1999): Guide on methods for assessing the acceptability of flaws in metallic structures. British Standards Institution, London, UK.
CEN/TR TC121/WG14 (2004): Welding – methods for assessing imperfections in metallic structures, Draft European Technical Report, Brussels: CEN.
EN 444 (1994): Non-destructive testing. General principles for radiographic examination of metallic materials by X-and gamma rays. European Standard, Brussels: CEN.
EN 571 (1997): Non-destructive testing – Penetrant testing. European Standard, Brussels: CEN.
EN 970 (1997): Non-destructive examination of fusion welds – Visual examination. European Standard, Brussels: CEN.

3. Inspection, testing and assessment of bridge condition
136
EN 1290 (2002): Non-destructive examination of welds – Magnetic particle examination of welds. European Standard, Brussels: CEN.
EN 1435 (2002): Non-destructive testing of welds – Radiographic testing of welded joints + Corrigenda (2004). European Standard, Brussels: CEN.
EN 1711 (2000): Non-destructive examination of welds – Eddy current examination of welds by complex plane analysis. European Standard, Brussels: CEN.
EN 1713 (2002): Non-destructive testing of welds – Ultrasonic testing – Characterization of indications in welds. European Standard, Brussels: CEN.
EN 1714 (2002): Non destructive testing of welds – Ultrasonic testing of welded joints. European Standard, Brussels: CEN.
EN 10160 (1999): Ultrasonic testing of steel flat product of thickness equal or greater than 6 mm (reflexion method). European Standard, Brussels: CEN.
EN 12062 (2002): Non-destructive testing of welds – General rules for metallic materials. European Standard, Brussels: CEN.
EN ISO 6507 (2005): Metallic materials. Vickers hardness test. European Standard, Brussels: CEN.
EN ISO 9018 (2003): Destructive tests on welds in metallic materials – Tensile test on cruciform and lapped joints. European Standard, Brussels: CEN.
EN ISO 12944-7 (1998): Paints and varnishes – Corrosion protection of steel structures by protective paint systems – Part 7: Execution and supervision of paint work. European Standard, Brussels: CEN.
Hensen, W. (1992): Grundlagen für die Beurteilung der Weiterverwendung alter Stahlbrücken, Dissertation, published in: Schriftenreihe Stahlbau, Vol. 21, RWTH Aachen.
ISO 2859-5 (2005): Sampling procedures for inspection by attributes – Part 5: System of sequential sampling plans indexed by acceptance quality limit (ALQ) for lot-by-lot inspection. ISO Standard.
ISO 19840 (2004): Paints and varnishes — Corrosion protection of steel structures by protective paint systems on rough surfaces – Measurement and acceptance criteria for the dry film thickness on rough surfaces. ISO Standard.
Kammel, C. et al. (2005): WP3-19-T-D-051020-D3.4-steel-bridges: Condition assessment and inspection of steel railway bridges, including stress measurement in riveted, bolted and welded structures, Sustainable Bridges WP3, Report, RWTH Aachen.
Kühn, Nussbaumer, Helmerich et al. (2007): Assessment of Existing Steel Structures – Recommendation for Estimation of Remaining Fatigue Life, 1st Edition, publication planned, ECCS – Technical Committee 6 – Fatigue.
prEN 1090-2 (2007): Execution of steel structures and aluminium structures – Part 2: Technical requirements for steel structures – Stage 49. Draft European Standard, Brussels: CEN.
Ril 805 (2003): Tragsicherheit bestehender Brückenbauwerke, DB Netz AG.
Sedlacek, Hirt, Tschumi, Muncke et al. (2001): Unified safety assessment of existing steel bridges (Vereinheitlichter Sicherheitsnachweis für bestehende Stahlbrücken, in German), DB-SBB, RWTH, BAM, EPFL-ICOM.
SINTAP (1999): Structural Integrity Assessment Procedures for European industry, Final report and procedure documents available through Mr. S.E. Webster, Corus, Swindon Technology Centre, Moorgate, Rotherham, S60 3AR, UK.

Portable electrochemical technique for evaluation of corrosion situation on reinforced concrete
137
Portable electrochemical technique for evaluation of corrosion situation on reinforced concrete
Ralph BÄSSLER, Andreas BURKERT & Thomas FRØLUND Within several EU-Projects different monitoring systems have been evaluated regarding their suitability for reduction of the inspection and maintenance costs as well as the traffic impairments. One part dealt with portable techniques for assessment of reinforcement corrosion. During this work potential field mapping and a portable equipment based on the galvanostatic pulse method (GPM) were tested and compared in different situations at laboratory and on-site conditions. This paper deals with the results and analysis of the GPM measurements performed at laboratory and on-site conditions in comparison to results of potential mapping. Additionally results of average corrosion rates determined by weight loss and galvanostatic pulse technique were compared. Special attention was paid to the comparability of instrument readings to real behavior. The limitation and applicability of the technique on real structures have been evaluated on a bridge. Finally, the necessary precautions, which need to be taken when the on site data are used for service life prediction of structures, are discussed.
1. INTRODUCTION Generally steel is protected permanently against corrosion by the alkaline pore water envi-
ronment. At unfavorable conditions (carbonation, chloride ingress) the passive layer on the steel surface can be destroyed. First the resulting corrosion products could be incorporated in the pore structure of concrete without significantly visible changes at the concrete surface. Later secondary damages caused by corrosion, like cracks and delaminations at the structure, can occur due to volume increase of corrosion products.
In order to initiate necessary rehabilitation measures at the right moment from the safety as-pect as well as the economic point of view non-destructively determined information on the current corrosion behaviour of the reinforcing steel have a high importance (Bäßler et al., 2000; Raupach, 2000). For that various electrochemical measurement techniques are available, like measurement of corrosion potential (ASTM, 1991; DGZfP, 1990; SIA, 1993; Mietz et al., 1998; Elsener, 1999) determination of short-circuit currents on corrosion cells, and external controlled electrochemical investigations.
Sustainable Bridges – Assessment for Future Traffic Demands and Longer Lives

3. Inspection, testing and assessment of bridge condition
138
Because in passive conditions the rebar potentials can fluctuate in a wide range depending on different parameters. In some potential areas a clear classification of active (corroding) or passive conditions is not possible. In such cases measurements by Galvanostatic Pulse Method (GPM) might be supportive (Frølund et al., 2002; Klinghoffer et al., 2000). By this technique a short anodic DC-current impulse is applied to the reinforcement using a counter electrode. Evaluation of the potential change, recorded simultaneously at the steel, enables a much better classification regarding the situation at the reinforcement. However the applicability is being discussed controversially (Andrade et al., 2000; Tang, 2005; Tang and Malmberg, 2005; Bäßler et al., 2003; Nygaard et al., 2005).
2. EXPERIMENTAL SETUP
2.1. Cube specimens
In order to investigate influencing parameters (caused by the concrete) on the electrochemi-cal measurements pre-corroded reinforced concrete specimens (30 cm x 30 cm x 20 cm) made of different concrete mixtures were used. They varied in strength and water/binder-ratio. Further parameters, which affect the corrosion processes directly, like chloride content and concrete cover, were varied too.
Reinforcement made of ordinary carbon steel and a diameter of 10 mm was used. Each specimen contained 3 or 6 reinforcing bars.
In June 2001 the specimens were exposed to natural environment, in order to pre-corrode for almost 3 years before measurements started in 2004, and to provide strongly developed corrosion processes on some specimens. In freshly cast concrete occurring corrosion processes are different than such in “old” hardened concrete, and therefore they are not really comparable.
2.2. Reinforced concrete plate
In order to test the different methods on a system close to on-site conditions a steel rein-forced concrete plate (10 m x 4 m) was used. Beside ducts, various reinforcements (of different diameter and density) and defined damaged zones this plate contains special reinforcing steel bars for corrosion investigations. The steel rebars have 8 mm diameter and a spacing of 3 cm. Concrete cover is 4.5 cm.
In order to have contact to the reinforcement during the electrochemical measurements, the rebars were connected to the outside at the vertical side of the plate. The plate was produced in July 2002 using common concrete.
Due to the environmental conditions corrosion of reinforcement would not be expected. Therefore in March 2004 some initialization spots were installed in order to induce corrosion locally. At 7 selected points holes (diameter 20 mm, depth approx. 45 mm) were drilled down to the reinforcement. By filling each with 15 g NaCl and water critical corrosion conditions could be achieved. The water level in each hole was kept constant at the maximum for 2 days. After the solution was consumed almost completely by the concrete the holes were closed by repair mortar. Afterwards the area was post-treated for 18 days by wetting and covering with plastic foil.
2.3. Real bridge in Örnsköldsvik
In order to test limitations found on the concrete plate measurements were performed on a bridge in Örnsköldsvik (Sweden) (Figure 1). On the northern wall a potential map and GPM- -map was recorded after localizing the reinforcement. Significant locations were marked for future core extraction in order to determine chloride content, possible carbonation and real corrosion stage of reinforcement.

Portable electrochemical technique for evaluation of corrosion situation on reinforced concrete
139
2 m2 m
5 m5 m Figure 1. Bridge in Örnsköldsvik and measurement field
3. RESULTS
3.1. Potential measurements on cube specimen Before measuring the potentials on the cube specimens the time to achieve stable potential
values was determined by preliminary tests. For that potential-time curves were recorded after attaching the reference electrode on the concrete. Stable values could be achieved after approximately 5 minutes. On strongly dried surfaces, which can occur after long drying periods or storage of specimens inside, the time to stable potentials can increase significantly. The following investigations were performed after achieving stable potentials.
At the cube specimens potential measurements were performed for 30 months. Large deviations of potentials have been observed, following seasonal changes (Table 1).
No conclusions can be drawn regarding corrosion progress from the potential time course with time. Furthermore the chloride free specimens and specimens containing 1% chloride showed similar potential values. By GPM it should be checked whether a distinction can be made using such technique.
Table 1. Potential variations (not temperature compensated)
Potential [mV] vs. MnO2 Specimen 30.08.02 28.10.02 24.06.03 02.12.03 22.06.04 09.12.04
121 (4% Cl-) −565 −530 −427 −654 −429 −570 221 (4% Cl-) −546 −508 −444 −700 −456 −600 223 (4% Cl-) −536 −513 −425 −648 −438 −570 155 (0% Cl-) −330 −167 −116 −258 −115 −290 255 (0% Cl-) −375 −214 −197 −361 −137 −260 245 (1% Cl-) −401 −242 −225 −311 −199 −240 256 (1% Cl-) −423 −376 −216 −411 −205 −330 146 (2.5% Cl-) −513 −389 −346 −321 −405 −560 246 (2.5% Cl-) −502 −383 −384 −553 −419 −580 236 (2.5% Cl-) −541 −488 −394 −642 −425 −550

3. Inspection, testing and assessment of bridge condition
140
3.2. GPM on cube specimens
Selected results of GPM-measurements on specimens are shown in Table 2. First measure-ments were performed where all 3 rebars were connected, a situation like on-site. Than each single rebar was measured.
Table 2. Pulse measurements at 3 selected specimens vs. Ag/AgCl
Specimen Rebars Open Circuit
Potential [mV] Current
[µA] ∆EC
[mV]∆EP
[mV]RC
[kΩ] RP
[kΩ] Icorr
[µA] Icorr
[mA/m²]
155 3 −106 20 22 21 1.1 1.05 51 16
center −85 10 15 33 1.5 3.3 16 5
left −80 10 14 32 1.4 3.2 16 5 0% Cl- cover 1 cm right −90 10 14 31 1.4 3.1 17 5
245 3 −1 100 113 13 1.1 0.13 200 64
center +7 100 116 16 1.2 0.16 163 52
left +3 100 111 16 1.1 0.16 163 52 1% Cl- cover 4 cm right +22 100 114 20 1.4 0.2 130 41
223 3 −414 300 172 18 0.6 0.06 433 140
center −416 300 176 19 0.6 0.06 433 140
left −456 300 136 18 0.5 0.06 433 140 4% Cl- cover 1 cm right −397 300 111 12 0.4 0.04 650 200
The concrete resistance values (Rc) of specimens 155 and 245 are in the same range,
whereas the value of specimen 223 is clearly lower. For comparison of the concrete resistances, beside the chloride contents the different cover depths needs to be considered. No influence of the amount of contacted rebars on the concrete resistance could be observed.
The polarization resistances (RP) of specimens 155 and 245 are clearly different. At speci-men 233 the RP–values are again clearly smaller and show the strongest corrosion activity, as expected. In order to calculate the current density only polarization of the rebar area un-derneath the measurement head was considered. Assuming that this area corrodes uniformly or is passive, the corrosion rate can be predicted basing on these current density values. So it is possible to distinguish corrosion stage of specimens having similar potential values by pulse measurements.
Comparing the results measured at single rebars to connected rebars it is obvious that at specimen 155 the values for single rebars are only1⁄3 of those obtained at connected rebars. At specimen 245 the values of single rebars are just a bit smaller, and at specimen 223 no sig-nificant difference could be observed.
Within further measurements various factors were investigated, which could affect the results of GPM-measurements. Using the internal reference electrode the resistance values are that small, that the Ohmic part of the potential shift is only 2–3 mV, and can be neglected (Table 3). However the values of polarization resistances showed no significant change.

Portable electrochemical technique for evaluation of corrosion situation on reinforced concrete
141
Table 3. Pulse measurements on specimen 223 – influence of temperature on the obtained values
Surface temperature Measured value
1°C 15°C
open circuit potential [mV, vs. Ag/AgCl] −402 −442
current [µA] 150 300
∆EΩ [mV, vs. Ag/AgCl] 159 161
∆EP [mV, vs. Ag/AgCl] 14 14
RC [kΩ] 1.06 0.54
RP [kΩ] 0.09 0.05
Icorr [µA] 289 520
Icorr [µA/cm²] 13 24
In order to evaluate whether the predicted corrosion current densities correlate to the real
mass losses GPM-measurements were performed monthly at the specimens. This is essential, because the results reflect only moment values which can change by external conditions or progressing depassivation. By integrating the obtained values during 30 months the mean corrosion current density during the whole exposure time can be determined.
By Faradays law the mass loss was calculated. After 30 months of free weathering the re-bars of 4 cube specimens were removed, etched and the mass determined. So the real mass loss could be achieved. In Table 4 the mean corrosion current densities determined by GPM, the so predicted and the real mass losses of the specimens are summarized. Although the predicted values are slightly higher, they are still in the range of the real mass losses.
Table 4. Predicted and real mass losses on reinforcing bars after 30 months exposure
Mass Loss [g/m²y] Specimen
Mean Corrosion Current Density [mA/m²] predicted measured
156 (1% Cl-, 1 cm cover) 40 353 187 145 (1% Cl-, 4 cm cover) 15 131 81 136 (2.5% Cl-, 1 cm cover) 40 353 225 123 (4% Cl-, 1 cm cover) 50 443 472
3.3. Potential mapping on the steel reinforced concrete plate
In order to determine the potential between the reference electrode and the reinforcement the ion transfer between electrode and reinforcement needs to be assured. This is achieved by a wet sponge placed at the head of the electrode. The ion transfer depends on the concrete resistance (electrolyte). Therefore the moisture ingress caused by the sponge has a severe influence on the results. The moisturization time depends on the situation at the beginning and the absorbability of the concrete surface. One indication of secure measurement conditions is a stable potential, which does not change during 5 minutes. By continuous potential measurements it could be determined that stable potentials could be measured on the plate after approximately 30 minutes. By this method the potential maps shown in Figure 2 were obtained.

3. Inspection, testing and assessment of bridge condition
142
Before initialization of corrosion spots the rebar potential was measured globally using a 0.5 M Ag/AgCl electrode and evaluated (left upper part).
Approximately 3 weeks after initialization of corrosion spots the measurement was performed again. In the area of applied chloride deteriorations a significant potential shift could be ob-served (right upper part). The potential is up to 400 mV more negative than the not deteriorated part. Slightly positive potentials in some edge areas were measured, which were caused by the beginning drying out of the concrete surface. This can be detected by a slight colour change of the concrete from dark grey to light grey. Further investigations confirm that such changes could cause potential shifts up to 50 mV.
Further the potential mapping was repeated regularly every 4 weeks. In order to determine the actual steel potentials the surface was completely moisturized at all following measurements. Exemplary results after 5 and 16 months are shown in the lower parts of Figure 2.
0 m
0.2 m
0.4 m
0.6 m
0.8 m
1.0 m
-100--50 -50-0 0-50
Potential [mV] vs. 0.5 M Ag/AgCl
Initialization spots
0 m
0.2 m
0.4 m
0.6 m
0.8 m
1.0 m
-450--400 -400--350 -350--300-300--250 -250--200 -200--150-150--100 -100--50 -50-00-50
Potential [mV] vs. 0.5 M Ag/AgCl
Initialization spots
2.0 m 1.8 m 1.6 m 1.4 m 1.2 m 1.0 m 0.8 m 0.6 m 0.4 m 0.2 m 0 m0 m
0.2 m
0.4 m
0.6 m
0.8 m
1.0 m
-450--400 -400--350 -350--300-300--250 -250--200 -200--150-150--100 -100--50 -50-0
Potential [mV] vs. 0.5 M Ag/AgCl
0 m 1.8 m 1.6 m 1.4 m 1.2 m 1.0 m 0.8 m 0.6 m 0.4 m 0.2 m 0 m0 m
0.2 m
0.4 m
0.6 m
0.8 m
1 m
-450--400 -400--350 -350--300-300--250 -250--200 -200--150-150--100 -100--50 -50-00-50
Potential [mV] vs. 0.5 M Ag/AgCl
Figure 2. Potential maps on the concrete plate at different times (before and 3 weeks after initiation, after 5 and 16 months natural weathering)
3.4. GPM-measurements on steel reinforced concrete plate
On the concrete plate pulse measurements were performed at 4 different locations. Meas-urement point 1 is directly above the initiation spot. The measurement points 2 and 3 are 25 resp. 60 cm away from the active corroding spot.
In order to evaluate the influence of a larger corroding area on the GPM-results measurement point 4 was above one of 4 initiation spots located only 10 cm away from each other.
As counter electrode first a ring made of zinc, surrounding a 78 cm² area, was used. At each measurement point a large amount of measurements was performed. On one hand site the re-producibility was assured, but on the other hand suitable values of pulse current height had to be determined. Selected results, where a polarization of 10 to 20 mV was achieved, are shown in Table 5. Using these results polarization resistances and than the values of corrosion current were calculated.

Portable electrochemical technique for evaluation of corrosion situation on reinforced concrete
143
Table 5. Pulse measurements on the steel reinforced concrete plate, potentials vs. Ag/AgCl, counter electrode A = 78 cm²
No. Open Circuit
Potential [mV] IPulse [µA] ∆EΩ [mV] ∆EP [mV] RC [kΩ] RP [kΩ] Icorr [µA]
MP1-001 −288 100 217 11 2.17 0.11 236 MP1-002 −289 100 216 11 2.16 0.11 236 MP1-003 −290 150 243 17 1.62 0.17 153 MP2-001 +54 30 173 6 5.77 0.20 260 MP2-002 +54 40 231 11 5.78 0.28 186 MP2-003 +59 50 298 12 5.96 0.24 217 MP3-001 +60 50 218 8 4.36 0.16 325 MP3-002 +60 50 216 10 4.32 0.20 260 MP3-003 +60 100 435 19 4.35 0.19 274 MP4-001 −334 100 124 12 1.24 0.12 217 MP4-002 −333 100 127 12 1.27 0.13 200 MP4-003 −332 150 189 16 1.26 0.11 236
Between the different measurement points clear differences of the concrete resistance
were observed. At the initiation spots the values are around 1 to 2 kΩ, whereas at other locations they are around 4 and 6 kΩ. At polarization resistances only little differences were found. At passive locations they are slightly higher than at active locations. If the corrosion current is calculated, no significant differences between the measurement points can be detected. At this stage the values were not area related because the size of the really active area is not known.
3.4.1. Measurements on the Örnsköldsvik bridge
On the northern wall measurements were performed in 25 cm increments. Potential mapping (Figure 3, left) has shown potential values between −200 to +100 mV (vs. Ag/AgCl). Local areas of lower potential suggesting increased possibility of corrosion were found and verified by GPM (15/2 Figure 3, right).
1 2 3 4 5 6 7 8 9 10 11 12 13 14 15 16 171
2
3
4
5
6
7
8-200--150 -150--100 -100--50 -50-0 0-50 50-100
1 2 3 4 5 6 7 8 9 10 11 12 13 14 15 16 171
2
3
4
5
6
7
80-1 1-2 2-3 3-4 4-5 5-6 6-7 7-8 8-9 9-10
Figure 3. Potential map and GPM-results on northern wall of Örnsköldsvik bridge (potential values in mV vs. Ag/AgCl; current density values in µA/cm²)
Chloride profiles made by Volhart-Titration on taken cores provided values of 0.02–0.07 Mass% of the concrete weight.

3. Inspection, testing and assessment of bridge condition
144
4. DISCUSSION
4.1. Results on the cube specimens
The potentials increased within 2 years after specimens production. This might be caused by a relatively slow formation of stable surface layers respectively a further layer growth on the reinforcing steel. However, the formation of oxide layer on unalloyed steels in alkaline environment is spontaneous, but the layer can be destroyed for instance by chlorides. In order to permanently exclude the corrosion reactions the oxide layer needs to have a sufficient thickness and stability. This probably is reached 2 years after production of the cube specimens.
By evaluation of seasonally varying results it can be stated that the potentials measured on the surface provide a good reflection of the reinforcement potential. It is essential to moisturize the concrete surface completely and for a sufficient time. Experiences showed, that moisturization times of around 30 minutes are necessary to achieve stable potential values. Furthermore the temperature has to be above the freezing point. Frozen water on the concrete surface respectively in the contact sponge causes different conductivity values, which can influence the potential measurements. If these requirements are fulfilled the rebar potential can be measured very precisely.
By galvanostatic pulse measurements the corrosion behaviour of different specimens could be distinguished. This was also possible at specimens where the potential measurements did not show signs of active corrosion. Beside of distinction of active and passive reinforcement further differences regarding corrosion rate could be detected. Furthermore it could be observed, that the amount of measured rebars in a passive specimen has a significant influence on the measurement result. The main reason probably is a large spread of the applied electrical field.
Obviously on passive specimens it is not possible to limit the potential field to the measurement area. Therefore a much larger area is polarized than considered for the calculations of current density. On active specimens these problems do not occur. Here the polarization is obviously concentrated to the area underneath the measurement head, and the further away located reinforcement areas do not contribute. Considering the complex influencing values on the measurement results and the uncertainties of determination of the rally polarized area the predicted mass losses show a quite acceptable correlation to the real values. Therefore for laboratory applications the GPM is a good tool to evaluate the corrosion behaviour. A continuous monitoring for a long time period enables tendency predictions regarding corrosion rate and its changes with time.
4.2. Results on the steel reinforced concrete plate
By potential mapping on the steel reinforced concrete plate the implemented initialization spots can clearly be detected. The detectability of local corrosion spots does not depend on the moisture conditions on the surface. However the potential differences between active and passive areas remain almost at the same level. For measurements in dry conditions it is very important, that the time between touching the electrode and measuring the potential has to be constant. Otherwise seeming potential differences could be generated, which do not allow conclusions regarding corrosion behavior. Preferably the values should be read immediately after touching the electrode, because the following potential shift can be very different. A dependency of moisture in the contact sponge, the pressing pressure and the absorption behavior of the concrete is possible.
If the real potential values of the reinforcement should be determined a sufficient moisturization time of approximately 30 minutes is required. The adjustment of stable conditions can be detected by continuous potential measurements.
In opposite to the potential mapping the galvanostatic pulse measurements on the plate did not show satisfactory results. By the obtained results already qualitatively no distinction can be made between active and passive reinforcement. The main problem is that the passive areas appear to be

Portable electrochemical technique for evaluation of corrosion situation on reinforced concrete
145
non-polarizable and so the impression of an actively corroding area occur. Considering the results of the cube specimens, polarization of a large area, which cannot be reduced to a local measurement point, is supposed to be the main reason. Furthermore electrons can flow from the large surrounding to the measurement location, so actually no polarization can be achieved. A separated investigation of active and passive reinforcement areas is impossible in on-site conditions.
4.3. Results on the Örnsköldsvik bridge
Values determined by both techniques are very low and stand for low to no corrosion. For verification cores taken from positions 15/2 (highest possibility of corrosion), 7/3 (possibility of local effect) and 9/6 (no corrosion) have been evaluated by chloride profile and visual inspection of reinforcement. The very low chloride contents determined are a good explanation for the very low corrosion rates. Also the inspected reinforcement showed almost no sign of corrosion.
5. CONCLUSIONS
By measurements in laboratory conditions a very good evaluation of the reinforcement cor-rosion behavior could be shown. In potential ranges, where a clear assignment to passivity or activity could not be made, a better evaluation could be achieved using galvanostatic pulse measurements (GPM). The comparison of results obtained by regular pulse measurements for a long time period to the measured mass losses shows a sufficient correlation. It can be stated, that GPM is suitable for evaluation of the corrosion rate on small specimens. Due to the un-known actually corroding area severe misjudgments of the corrosion rate can result, if a clear localized corrosion attack occur.
On the test plate also a good qualitative evaluation of the corrosion stage could be achieved using potential mapping. Here it turned out that relatively small corrosion spots only can be detected by a narrow measurement grid.
The detection of polarization resistance by GPM did not lead to meaningful results. An evaluation of corrosion behaviour is therefore impossible. So the usability of GPM in on-site conditions is not given. Only for the determination of concrete cover resistance the GPM can be used. Here the results could clearly be related to the initialization spots, and a good repro-ducibility of the results could be achieved. As expected, the results were not essentially influ-enced by the pulse current height.
Concluding it can be stated that potential mapping can be performed independent on the moisture situation on the surface. However at each measurement point uniform conditions needs to be assured. Measurements on almost dry surface only allow an evaluation of potential differences but not of the reinforcement potential itself. If the real reinforcement potential should be evaluated a sufficient moisturization of the surface has to be provided. The achievement of stable potentials has to be checked by permanent potential measurements before starting the actual potential mapping. Usually 20 to 30 minutes should be sufficient. During the whole measurement a uniform moisturization situation has to be provided. For longer measurements, where quick drying out could occur, a remoisturization might be necessary.
For GPM-measurements stable conditions by a sufficient moisturized surface is absolutely es-sential. Such measurements are only meaningful if it can be assured, that no potential shift occurs during the measurement. A complete moisturization of the whole surface is not required. Only the respective measurement point has to have potential stability and comparable conditions.
The GPM-technique is applicable if corrosion conditions on the object are relatively uniform. Only very local corrosion spots on an almost passive structure limit the usability of the achieved values. The limitation and applicability of the technique on real structures have been evaluated on a bridge without significant corrosion.

3. Inspection, testing and assessment of bridge condition
146
It comes out that by this technique potentially dangerous areas can be located. However a life time prognosis of a structure requires long-term monitoring considering a huge variety of influencing parameters, and should be performed by experienced specialists.
6. OUTLOOK
Due to the differences of gathered own and literature results it is necessary to evaluate the limitations on real structures. Right now there is a big skepticism in terms of correct applicability of corrosion rate measurement devices. These techniques are being evaluated on park decks and bridges as well as in special laboratory approaches.
ACKNOWLEDGEMENTS
This work was founded by different research projects of the European Commission within the 4th and 6th framework. Authors gratefully thank for the support.
REFERENCES Andrade, C., Martínez, I., Alonso, C., Fullea, J. (2002): New advanced techniques for on-site measurements of reinforcement corrosion…, IABMAS 2002, Barcelona, paper 78. ASTM (1991): Standard Test Method for Half-Cell Potentials of Uncoated Reinforcing Steel in Concrete, ASTM C876-91, American Society for Testing and Materials, West Conshohocken, Philadelphia, USA. Bäßler, R., Burkert, A., Frølund, T., Klinghoffer, O. (2003): Various aspects for usage of GPM-portable equipment for determination of corrosion stage of concrete structures, NACE Internat. Conf. Corrosion, San Diego, paper 03388. Bäßler, R., Mietz, J., Raupach, M., Klinghoffer, O. (2000): Corrosion Monitoring sensors for durability assessment of reinforced concrete structures, Proc. Materials Week, München. DGZfP (1990): Merkblatt für elektrochemische Potentialmessungen zur Ermittlung von Bewehrungsstahl-korrosion in Stahlbetonbauwerken, (B3), Deutsche Gesellschaft für Zerstörungsfreie Prüfung e.V., Berlin. Elsener, B. (1999): Zerstörungsfreie Diagnose der Korrosion von Stahl in Beton: Potentialmessung, Betonwiderstand und Korrosionsgeschwindigkeit, in: Schwarz, W. (ed.); Korrosion von Bewehrungsstahl in Beton, WTA Schriftenreihe Heft 19, AEDIFICATIO Verlag GmbH Freiburg, Zürich, pp. 31-50. Frølund, T., Jensen, F.M., Bäßler, R. (2002): Smart Structures: Determination of corrosion rate by means of the Galvanostatic Pulse Technique, IABMAS 2002, Barcelona, paper 144. Klinghoffer, O., Shaw, P. G., Pedersen, T. K., Frølund, T. (2000): Non-destructive methods for condition assessment of prestressed cables and reinforcement corrosion, Proc. Materials week, München, pp. 1-17. Mietz, J., Elsener, B., Polder, R. (1998): Corrosion of reinforcement in Concrete, in: Proc. EUROCORR 97, EFC No. 25, London. Nygaard, P.V., Geiker, M.R., Møller, P., Sørensen, H.P., Klinghoffer, O. (2005): Eurocorr 2005, Lisbon, paper 234. Raupach, M. (2000): Korrosionsüberwachungssysteme für neue und bestehende Stahlbetonbauwerke, Betoninstandsetzung, pp. 139-144. SIA (1993): Durchführung und Interpretation der Potentialmessung an Stahlbetonbauten, Interessen-gemeinschaft Potentialmessung Stahlbeton (IG Pot), Schweizerischer Ingenieur- und Architekten-Verein, February 1993, Merkblatt 2006. Tang, L. (2005): A rapid technique for detecting corrosion of steel in reinforced concrete, Proceedings ICCRRR 2005, Cape Town, p. 375. Tang, L., Malmberg, B. (2005): Assessment of reinforced concrete in a concrete highway tunel, Proceedings ICCRRR 2005, Cape Town, p. 409.

New advanced tools for bridge monitoring


Structural monitoring system for concrete structures
149
Structural monitoring system for concrete structures
Harald BUDELMANN & Karim HARIRI Within the collaborative research centre CRC 477 “Structural Monitoring” at the Technical University Braunschweig components of an analysis and assessment system for structural monitoring of concrete structures is under way. Main components of the system are a reliability- -based system assessment tool, prognostic models of degradation and new sensoring techniques. The system assessment tool is based on the reliability method; its task is to find out weak points of a structure being first responsible for a possible failure. If prognostic models of degradation are combined with monitoring an improved accuracy of prognosis can be achieved. To get relevant monitoring data from a structure a new generation of sensors is being developed. These three parts of a structural monitoring system are presented in the contribution. The methods mentioned before are tested and demonstrated at a real scale prestressed concrete bridge, serving as an experimental structure. The experimental bridge structure is presented and the first results of the probabilistic system analysis are sketched finally.
1. INTRODUCTION
Innovative management systems for civil structures allocate maintenance resources to deteriorating structures. A life-cycle cost analysis (LCA) provides a convenient means for decision makers to compare alternative management solutions using economic terms. The fundamental goal is to improve the condition, safety, and long-term performance of a structure or of a group of structures with reduced life-cycle costs. Most of the existing methodologies are based on life-cycle cost minimization. Several models have been developed in the last decade, e.g. (Frangopol and Liu, 2005; Nishijima and Faber, 2006).
Since civil structures are quite complex and the number of influences to be included is large, probabilistic treatment becomes indispensable for assessment of structural performance (condition, safety, life cycle cost). Generally the usefulness of a LCA depends on the quality of information on structures concerning their current state and the development of further degradation (Liu and Frangopol, 2005). In particular, the actual structural capacity under deterioration should be accurately modelled.
Reinforced and, in particular, prestressed concrete structures of civil infrastructure are affected by load, environment and several chemical attacks as well. Their long-term safe,
Sustainable Bridges – Assessment for Future Traffic Demands and Longer Lives

4. New advanced tools for bridge monitoring
150
efficient and economical use requires current knowledge of remaining service life. Modern methods of structural monitoring achieve important contributions for the prediction of the realistic life time and the prolongation of the service life of civil engineering structures. A comprehensive monitoring system is under way at the TU Braunschweig. It is precondition for and part of a life-cycle management tool. Figure 1 points up the framework how to integrate such a structural health monitoring system into life-cycle management (Messervey et al., 2006).
Figure 1. Framework for integration of structural health monitoring in life cycle management (Messervey et al., 2006)
Within a collaborative research project at the Technical University Braunschweig new sensor techniques, prognostic models of degradation and a reliability-based system assessment tool have been developed to an advanced stage. The actual task is to bring them together in order to provide an analysis and assessment system for structural monitoring of concrete structures which can be used for LCA in future. The main components of the system are introduced in this paper: a reliability-based system assessment tool prognostic models of degradation and new sensoring techniques Finally a experimental full scale bridge structure and its application for system analysis is presented.
2. DEGRADATION MODELING OF CONCRETE STRUCTURES
Any structure holds an initial resistance inventory against degradation, recapitulating expressed by the initial value of performance p0. This initial performance is the result of
Model the Structure and Select its Failure Modes
Develop Limit State Equations
Input Data on Random Variables
Calculate Reliability Index (β), and Predict its Time Variation
Perform Sensitivity Analysis
Select Monitoring Solution
Monitor Structure to Validate its Predicted
Performance
Model Accurate?
Mod
ify D
ata
on
Ran
dom
V
aria
bles
No
Pareto Optimization of Maintenance Options
Asset Manager

Structural monitoring system for concrete structures
151
planning, construction, quality control etc., including individual deficiencies. During its service life any structure degrades. The degradation process to be expected, covering different deterioration processes, must be estimated in advance for the purpose of any life-cycle management. Monitoring is needed to win current condition data to achieve improvement of prognosis. The forecasted gradient of degradation is the basis for any maintenance decision. Figure 2a shows a principal example of structural degradation.
Figure 2. a) Degradation of performance of a structure during service life, based on (Frangopol et al., 2005); b) Development of corrosion induced deterioration and limit states, based on (Tuutti, 1982)
More than 50% of maintenance and repairing measures at concrete bridges in Germany are necessary because of corrosion damages. The deterioration processes induced by corrosion of reinforcement is developing in at least two overriding periods of time (Tuutti, 1982), Figure 2b. The deterioration processes generate a cumulative loss of resistance p0 – p(t). The first period is called incubation period or initiation phase. This period ends at the point of time when depassivation of reinforcement is starting. At this point the serviceability limit state (SLS) is reached. Several deterioration processes may proceed during the first period: such as dissolving acid attack, sulphate attack, carbonation of concrete cover or chloride ingress.
Time development of incubation can be monitored in-situ by help of suited sensors within the first period in the reinforcing steel neighbourhood, e.g. in the concrete cover or inside grouted ducts. The corrosion affecting parameters would be e.g. moisture, salt-content (chloride, sulphates, etc.), pH value (carbonation) and temperature. Alarm values resp. threshold values of corrosion-relevant parameters must a priori be specified for the evaluation of the corrosion danger.
In the second phase, the damage period, corrosion of reinforcement is developing, leading to a final failure of the structure (ultimate limit state, ULS). Today there are only limited monitoring methods available to observe type, place, intensity and extend of corrosion procedure or of corrosion induced damages. First direct measuring procedures are being developing, i.e. (Hariri et al., 2003).
The time development of the processes, mentioned above, generally can be calculated by help of numerical models. A number of forecasting models for the processes of the first phase (initiation period) has been developed and is increasingly going into practice. However, forecasting models for the second phase (destruction period), taking into account the different consequences of steel corrosion on concrete members (for example crack development, concrete spalling, failure of reinforcing element or of rc-member) still are in a early phase of development.
p0
p(t)
p
time t
structural degradation p0 – p(t) (damage depth)
1
2 3
4
Initiation Destruction /corrosion
monitoring/progn. of: penetration of CO2, Cl, acid attack
corrosion/fracture monitoring/ prognosis
a) b)

4. New advanced tools for bridge monitoring
152
3. PROBABILISTIC SYSTEM ANALYSIS OF CONCRETE STRUCTURES
A framework for reliability-based system assessment based on data from structural health monitoring (SHM) is developed within CRC 477 (Klinzmann et al., 2006). Its main objective is the optimization of SHM measures by help of probabilistic methods. It concentrates on the individual assessment of a structure based on results from SHM. The basis of the framework is a probabilistic model of the structure (PROBILAS), which can be formulated after a thorough anamnesis. In the anamnesis the engineer identifies typical weak points and failure paths of the structure and includes them into the model. Then the assessment process proposed by the framework can be started. The overall procedure is shown in Figure 3.
Monitoring
MonitoringPlan Assessment
of data
FirstReliabilityAnalysis Inspection
Plan
InitialInspection
Modifikation of Probabilistic
Model
Reliability Analysis(Actual State +
Prognosis)
Assessment
Model Calibration
End ofUsability
Probabilistic Model
(Limit-state functions, Fault tree, Stochastic model )
Figure 3. Structural evaluation process of the probabilistic model framework (Klinzmann et al., 2006)
The framework utilizes first and second order reliability methods (FORM/SORM) as calculation procedure for system reliability analyses. Before the probabilistic model can be used for calculation, it should be calibrated using data from inspection and/or quality control. Afterwards, the phase of continuous assessment of the structure is started. In this phase, the actual state of the structure as well as the expected performance in future are considered in the reliability analysis. Data from the SHM process is included if available. Based on the results of these analyses, further decisions concerning inspection and monitoring can be made. The phase of continuous assessment ends when the reliability of the structure falls below a target reliability level. The elements of the system analysis tool named PROBILAS, developed at the TU Braunschweig, is described more in detail in (Hosser et al., 2006).
4. PROGNOSTIC MODELING OF DETERIORATION PROCESSES OF CONCRETE STRUCTURES
Forecasting models, describing the durability or the degradation processes resp. of a structure or of a group of structures, are indispensable components of a life-cycle management system. Forecasting models for networks of structures usually are physically simple probabilistic models. Such models cannot consider data from monitoring, decisions
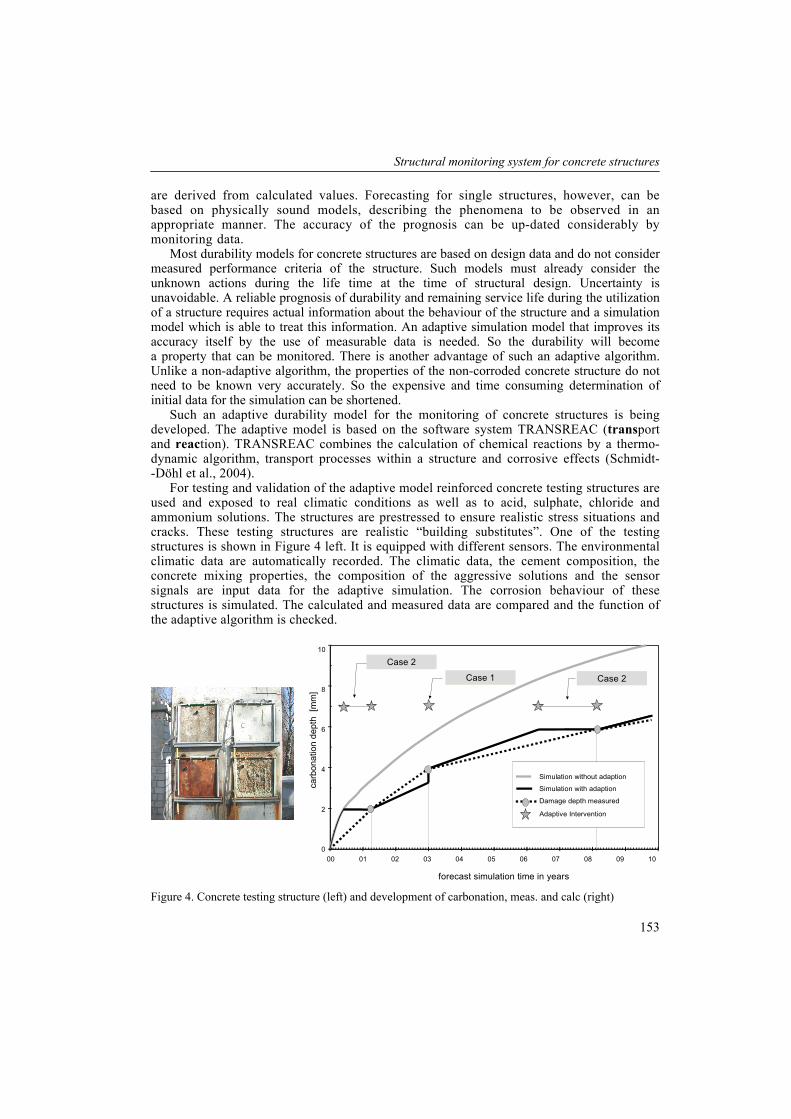
Structural monitoring system for concrete structures
153
are derived from calculated values. Forecasting for single structures, however, can be based on physically sound models, describing the phenomena to be observed in an appropriate manner. The accuracy of the prognosis can be up-dated considerably by monitoring data.
Most durability models for concrete structures are based on design data and do not consider measured performance criteria of the structure. Such models must already consider the unknown actions during the life time at the time of structural design. Uncertainty is unavoidable. A reliable prognosis of durability and remaining service life during the utilization of a structure requires actual information about the behaviour of the structure and a simulation model which is able to treat this information. An adaptive simulation model that improves its accuracy itself by the use of measurable data is needed. So the durability will become a property that can be monitored. There is another advantage of such an adaptive algorithm. Unlike a non-adaptive algorithm, the properties of the non-corroded concrete structure do not need to be known very accurately. So the expensive and time consuming determination of initial data for the simulation can be shortened.
Such an adaptive durability model for the monitoring of concrete structures is being developed. The adaptive model is based on the software system TRANSREAC (transport and reaction). TRANSREAC combines the calculation of chemical reactions by a thermo-dynamic algorithm, transport processes within a structure and corrosive effects (Schmidt- -Döhl et al., 2004).
For testing and validation of the adaptive model reinforced concrete testing structures are used and exposed to real climatic conditions as well as to acid, sulphate, chloride and ammonium solutions. The structures are prestressed to ensure realistic stress situations and cracks. These testing structures are realistic “building substitutes”. One of the testing structures is shown in Figure 4 left. It is equipped with different sensors. The environmental climatic data are automatically recorded. The climatic data, the cement composition, the concrete mixing properties, the composition of the aggressive solutions and the sensor signals are input data for the adaptive simulation. The corrosion behaviour of these structures is simulated. The calculated and measured data are compared and the function of the adaptive algorithm is checked.
0
2
4
6
8
10
00 01 02 03 04 05 06 07 08 09 10
forecast simulation time in years
carb
onat
ion
dept
h [m
m]
Simulation without adaption
(Chaper 5.2.1, case 2)
(Chaper 5.2.1, case 1) (Chaper 5.2.1, case 2)
Simulation with adaption
Damage depth measured
Adaptive Intervention
Case 2
Case 2Case 1
Figure 4. Concrete testing structure (left) and development of carbonation, meas. and calc (right)

4. New advanced tools for bridge monitoring
154
Figure 4 right shows an example for the adaptive simulation of concrete carbonation. The walls used for computation have been concreted in 1987. Since then they have been stored in outdoor climate being documented at regular intervals. The figure shows the carbonation depth as a function of time. The dotted line connects the observed carbonation depths at certain points of time. The light line shows the calculation result for the case that the model parameters have not been up-dated by adaptive action. The solid black line shows the calculation corrected in an adaptive approach. It is evident from the graph that at the beginning the calculated carbonation development overestimates the real carbonation progress until the point of time when the first adaptive correction was performed. The adaptive algorithm reduces the velocity of any additional mass transport (case 2). At the second event of comparison the calculated development of carbonation depth is behind reality. So the adaptive intervention accelerates the reaction (case 1) until the calculated event is synchronized with the real event. Later again a decelerating correcting is necessary (case 2). It can be seen that with a limited number of adaptive interventions the forecast quality can be improved considerably.
5. SENSOR TECHNIQUES FOR THE FIRST AND SECOND MONITORING LEVEL
5.1. General remarks
Monitoring of a concrete structure covers both the initiation phase during which transport and possibly reaction processes occur in the concrete cover or inside the duct and the destruction phase being responsible for corrosion and cracking of reinforcing or prestressing steel elements. The phases have been defined in chapter 2. Since the mechanisms of deterioration in the first and second monitoring level are quite different, also the sensors and monitoring concepts differ. Figure 5 proposes a schematic for a corrosion monitoring strategy.
ElectrochemicalSensors & Probes
NDT / NDE
EnvironmentalFactors
CorrosionDetection
CorrosionActivity
SignalConditioning,
Instumentation,Data-Logging
Analysisand
DecisionMaking
Chemical Sensors
Non DestructiveSensors
1 MonitoringLevel:
st
2 MonitoringLevel:
nd
Figure 5. Schematic of a corrosion monitoring strategy for the 1st and 2nd corrosion monitoring level
5.2. Sensors for the initiation phase
At the first monitoring level at which the preconditions for corrosion of the reinforcing or prestressing steel elements are proceeding in their vicinity (concrete cover or grouting mortar), following processes are of relevance for monitoring:
• Observation of ingressing substances or of condition alterations: e.g. moisture content, chloride-concentration, pH-value.
• Observation of changes of material properties: e.g. electrical conductivity, impedance. • Observation of corrosion of “substitute sensors” in the vicinity: e.g. thin steel wires. Several new sensor concepts have been developed in the CRC 477, see (Blumentritt et al., 2006),
qualified for the measuring of the moisture content or pH-value of concrete inside the concrete.

Structural monitoring system for concrete structures
155
The electrochemical parameter corrosion potential or current and concrete impedance can be measured in varying depths of rc- or pc-structures by means of galvanic probes or “watch dog sensors”. This electrochemical sensing principle was implemented at miniature sensors by our research group. Several small size sensing elements (only a few cm’s) made from a plastic circuit board were developed.
Figure 6. Different layouts of corrosion “substitute sensors”: Filament sensor mounted at a plastic board made with SMD-resistances as multiplier (left) and sensor with prefabricated mortar slices for bore-hole instrumentation (Ø 20 mm) at existing structures (right)
An example of an innovative type of corrosion sensor is the “filament” sensor. A prototype for application during construction is depicted in Figure 6 left and for borehole instrumentation at existing structures in Figure 6 right. Thin (0.065–0.5 mm) iron made wires are mounted at a plastic board at different depths within the concrete cover of the steel element. If the depassivation (chloride) front reaches the sensor the thin wires will corrode one by one very fast corresponding to the transport progress. In laboratory tests the time span until the rupture of the wire took only hours to a few days. By measuring the transition ohmic resistance the local rupture can be monitored easily. The erratic change of resistance due to corrosion of the wire amounts to 3 to 4 decades. Examples are given in (Holst et al., 2006).
5.3. Sensors for the destruction phase
Destruction phase means the corrosion process of a steel element itself. A direct monitoring of a corrosion process of steel members embedded in concrete or grouting mortar is a difficult task and not yet realized to practice.
Figure 7. Skin-effect for corrosion monitoring (lab test at a single wire in a concrete beam corroded by impressed current, with the amplitude of reflection coefficient – beam and bar length 3 m, free corrosion length 1 cm)
A microwave reflection method seemed to be promising from lab tests (Hariri et al., 2003). In this method the surface of the steel serves as a good conductor for alternate currents. With increasing frequency the primary current is concentrated towards the surface due to eddy currents, called skin effect. The ousting process is illustrated in the left part of Figure 7. The skin phenomenon generally can be used for the interrogation of defects in the surface area such
equivalent conducting layer
surface of conductor
1 cm
xz H0
1 cm
I (x)
δ
-18-16-14-12-10-8-6-4-20
0.004 0.006 0.008 0.010 0.012 0.014 0.016 0.018 0.020 0.022 0.024skin penetration depth [mm]
refle
ctio
n co
effic
ient
S11
[dB
]
d=100% = 7mm, start of corrosiond=96%d=92%d=24%- before fracture
d = residual bar diameter

4. New advanced tools for bridge monitoring
156
as corrosions notches, at which a part of the generated RF-wave is reflected back towards the signal source. The amplitude and the shift of the reflected signal include the information.
In the right part of Figure 7 the measured reflection coefficient at a 3 m long concrete beam is depicted. At a certain point of the beam a single wire was corroded in an accelerated test. The integral information concerning the corrosion status correlates with the amplitude and the shift of the minima of the reflection parameter. On the other hand the measured signal is an interfered signal depending also from tendon’s environment and several other influencing parameters which can not be controlled in real structural members. Thus the method seems to be limited to well defined situations, such as at monostrands or ground anchors. An overview on several new corrosion monitoring methods is given in (Hariri et al., 2003; Holst et al., 2006).
6. SYSTEM TESTING AND VALIDATION AT A FULL SCALED SUBSTITUE STRUCTURE
6.1. Experimental full scale pc-bridge structure
A real scale prestressed concrete bridge was constructed, serving as an experimental structure. This structure provides typical structural situations in a realistic manner. The object is to examine under conditions close to real structures the combined use of reliability analysis in order to find weakpoints (critical failure paths) and to decide on the places where sensors should be applied on. Furthermore an object is to prove the practical operability and usefulness of new sensors and of adaptive prognostic models for concrete degradation.
18,5 m512400
150
180
8050
50
200360
588100
2 ground anchors
12 transverse tendons
8050
2x2 longitudinal tendonslongitudinal section
ground level
2x4 ext. tendons(for loading)
(15m deep)
Figure 8. Longitudinal section of the experimental bridge (top) and prestressing procedure (bottom)
The designed structure provides typical structural situations in a realistic manner. It consists of a double-T cross section with a height of 80 cm and has a total length of 17 m with a span of 13 m and a cantilever of 4 m as depicted in Figure 8. In longitudinal as well as in transverse direction the bridge is prestressed, with internal or external tendon profile, with or without bond. So prestressing techniques as known from conventional motorway bridges have been included. Traffic load is applied via hydraulic actuators respectively via additional prestressing
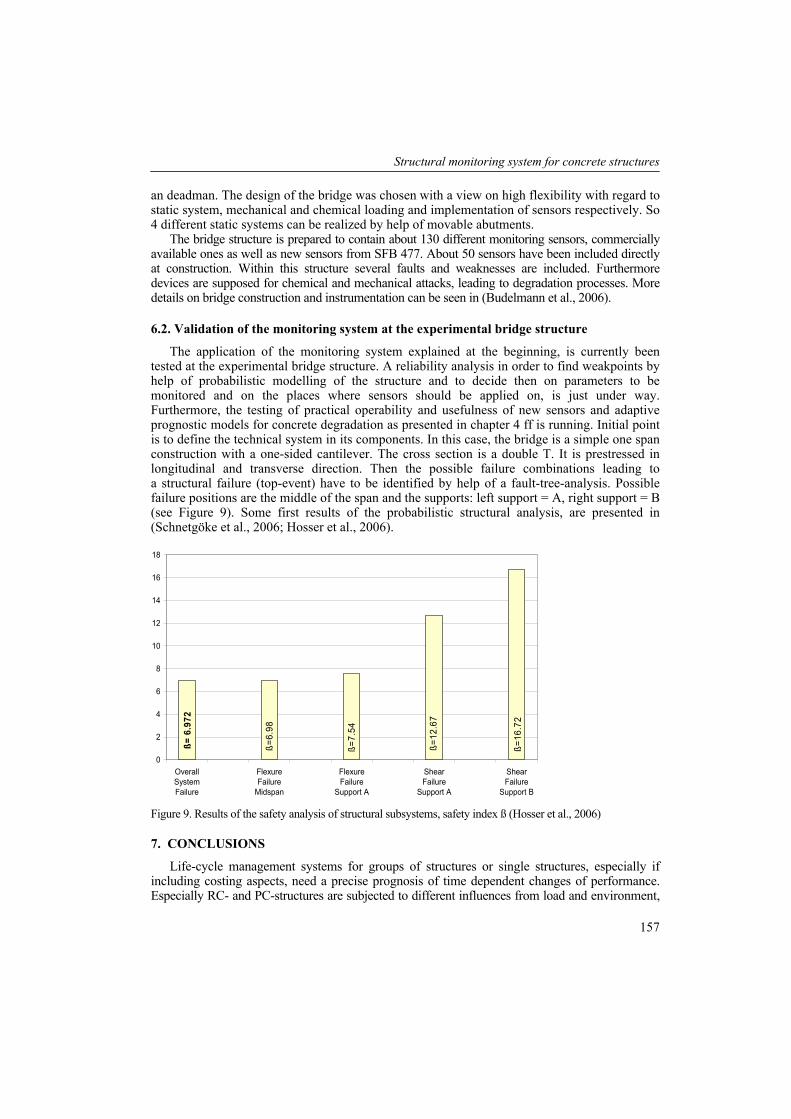
Structural monitoring system for concrete structures
157
an deadman. The design of the bridge was chosen with a view on high flexibility with regard to static system, mechanical and chemical loading and implementation of sensors respectively. So 4 different static systems can be realized by help of movable abutments.
The bridge structure is prepared to contain about 130 different monitoring sensors, commercially available ones as well as new sensors from SFB 477. About 50 sensors have been included directly at construction. Within this structure several faults and weaknesses are included. Furthermore devices are supposed for chemical and mechanical attacks, leading to degradation processes. More details on bridge construction and instrumentation can be seen in (Budelmann et al., 2006).
6.2. Validation of the monitoring system at the experimental bridge structure
The application of the monitoring system explained at the beginning, is currently been tested at the experimental bridge structure. A reliability analysis in order to find weakpoints by help of probabilistic modelling of the structure and to decide then on parameters to be monitored and on the places where sensors should be applied on, is just under way. Furthermore, the testing of practical operability and usefulness of new sensors and adaptive prognostic models for concrete degradation as presented in chapter 4 ff is running. Initial point is to define the technical system in its components. In this case, the bridge is a simple one span construction with a one-sided cantilever. The cross section is a double T. It is prestressed in longitudinal and transverse direction. Then the possible failure combinations leading to a structural failure (top-event) have to be identified by help of a fault-tree-analysis. Possible failure positions are the middle of the span and the supports: left support = A, right support = B (see Figure 9). Some first results of the probabilistic structural analysis, are presented in (Schnetgöke et al., 2006; Hosser et al., 2006).
0
2
4
6
8
10
12
14
16
18
OverallSystemFailure
FlexureFailure
Midspan
FlexureFailure
Support A
ShearFailure
Support A
ShearFailure
Support B
ß= 6
.972
ß=16
.72
ß=12
.67
ß=7.
54
ß=6.
98
Figure 9. Results of the safety analysis of structural subsystems, safety index ß (Hosser et al., 2006)
7. CONCLUSIONS
Life-cycle management systems for groups of structures or single structures, especially if including costing aspects, need a precise prognosis of time dependent changes of performance. Especially RC- and PC-structures are subjected to different influences from load and environment,

4. New advanced tools for bridge monitoring
158
which lead to deterioration processes. A reliable prognosis of deterioration processes, e.g. of carbonation or chloride ingress or of subsequent steel corrosion, needs updating by monitoring.
A monitoring system for concrete structures is presented in this contribution. Main components of the system being presented are a reliability-based system assessment tool, prognostic models of degradation and new sensoring techniques. The system assessment tool is based on the reliability method; its task is to find out weak points of a structure being first responsible for a possible failure. It is shown in the paper, how the components are linked together.
REFERENCES
Blumentritt, M., Brodersen, O., Flachsbarth, J. et al. (2006): Novel Sensor Systems for Structural Health Monitoring. Proceedings of 3rd European Workshop on Structural Health Monitoring, Granada, Spain, July 7-9.
Budelmann, H., Hariri, K., Holst, A. (2006): A Reale Scale PC Bridge for Testing and Validation of Monitoring Methods. 3rd. Int. Conference IABMAS`06. Porto, Portugal, July 16-19.
Frangopol, D.M., Liu, M. (2005): Life-cycle analysis and optimization of civil infrastructure under uncertainty, Third Probabilistic Workshop on Technical Systems and Natural Hazards, K. Bergmeister, D. Rickeenmann, & A. Strauss, eds. Vienna. November 24-25: 23-30.
Hariri, K., Holst, A.; Wichmann, H.-J., Budelmann, H. (2003): Assessment of the State of Condition of Prestressed Concrete Structures with Innovative Measurement Techniques. Structural Health Monitoring Journal, Vol. 2, No. 2, June 2003, 179-185.
Holst, A., Wichmann, H.-J., Hariri, K., Budelmann, H. (2006): Monitoring of Tension Members of Civil Structures – New Concepts and Testing. Proceedings of 3rd European Workshop on Structural Health Monitoring , Granada, Spain, July 7-9.
Hosser, D., Klinzmann, C., Schnetgöke, R. (2006): A Framework for reliability-based system assessment based on structural health monitoring. Structure and infrastructure engineering, accepted for publication.
Klinzmann, C., Schnetgöke, R., Hosser, D. (2006): Framework for the optimization of structural health monitoring on a probabilistic basis. Proceedings of 3rd European Workshop on Structural Health Monitoring, Granada, Spain, July 7-9.
Liu, M., Frangopol, D.M. (2005): Multiobjective maintenance planning optimization for deteriorating bridges considering condition, safety, and life-cycle cost, Journal of Structural Engineering, ASCE, 131(5): 833-842.
Messervey, T.B., Frangopol, D.M., Estes, A.C., (2006): Reliability-based life-cycle bridge management using structural health monitoring, 3rd Int. Conference IABMAS`06, Porto, Portugal, July 16-19.
Nishijima, K., Faber, M.H. (2006): A budget management approach for societal infrastructure projects.
Schmidt-Döhl, F., Rigo, E., Bruder, S., Budelmann, H. (2004): Chemical attack on mineral building materials, features and examples of the simulation program Transreac, presented at the 2nd International Conference Lifetime-Oriented Design Concepts, Bochum, Germany, March 1-3.
Schnetgöke, R., Klinzmann, C., Hosser, D. (2005): Structural Health Monitoring of a Bridge Using Reliability Based System Assessment, Proceedings of the 5th International Workshop on Structural Health Monitoring, Stanford University, USA., September 12-14.
Tuutti, K. (1982): Corrosion of steel in concrete, Stockholm: Swedish Cement and Concrete Research Institute. In: CBI Research, No. Fo 4:82.

A new sensor for crack detection in concrete structures
159
A new sensor for crack detection in concrete structures
Paulo CRUZ & Abraham D. de LEÓN The condition of many important concrete structures can be partially assessed through the detection and monitoring of cracking. Crack detection in bridges is usually based on visual inspection. This procedure is time consuming, expensive, and unreliable; therefore, the use of cracking sensors is highly recommended. Nevertheless, most existing sensors are quite limited in their ability to detect and monitor cracks. This paper reports the development and applications of a distributed optical fibre crack sensor. This sensor does not require prior knowledge of the crack locations, which is a significant advance over existing crack monitoring techniques. Moreover, several cracks can be detected, located and monitored with a single fibre.
1. INTRODUCTION
The appearance of widespread failures in bridges has highlighted the importance of effective monitoring systems which are able to identify structural problems at an early stage. The potential of monitoring systems to reduce operational maintenance costs by identifying problems at an early stage is clearly significant (Casas and Cruz, 2003).
This paper presents a new fibre optic sensor for crack monitoring. The sensor simply consists of a polymeric plate with an embedded optical fibre that can be glued or embedded in a structural element. The principle is that, once a crack forms in a structural element, the bonded polymeric plate will crack in the same location and direction and a fibre intersecting the crack at an angle other than 90º has to bend to stay continuous (Figure 1). This perturbation in the fibre is very abrupt, and thus it can be considered a micro bending. This micro bending results in a sharp drop in the optical signal. From the magnitude of the drop the crack opening can be obtained if a calibration model is available. This technique was initially proposed by Leung and Elvin (1997). A method for applying the sensor to existing structures was recently proposed and it involves the use of a Sensor Plate (Olson, 2002).
To achieve the requirements in the monitoring of cracks on bridges a new sensor plate was developed by the authors within the aim of the Sustainable Bridges Project. The challenges in
Sustainable Bridges – Assessment for Future Traffic Demands and Longer Lives

4. New advanced tools for bridge monitoring
160
Figure 1. Principle of operation of the sensor
performing the new sensor to attain the necessary mechanical properties requirements to be feasible in practice are discussed in the present paper.
In this research, the plate sensor was made from a thermosetting polyester resin. The resin curing was studied and different additives were added to the polymer to obtain different grades of resistance and brittle mechanical behaviour of the sensor. The results obtained provide guidelines for modifying the polymeric material to assure that the plate breaks for thinner or wider cracks. The choice of polyester for making the sensor plate is based on its high performance and competitive price. Polyester is durable and capable of withstanding environmental attacks including chemical attack from pollution, severe cold and ice, or desert heat.
To gather the necessary parameters and to characterize the mechanical behaviour of the polymeric plate, several tension tests were carried out using a servo-controlled test machine, following the recommendations of ISO 527-1 (1993). The influence of the environmental temperature on variations in tensile properties was analysed (Cruz et al., 2003). The ductile behaviour of polyester observed in the tension tests can be useful to ensure that the sensor only detects cracks with a considerable width. On the other hand, to assure that the sensor detects thin cracks, it is important to assure that the plate is brittle.
The failure behaviour of the polymeric plate can be controlled by the incorporation of fine particles (granite, calcareous, metakaolin, quartz, river sand, and abrasives) and measured with a direct tensile test. The results of the tension tests, carried out in specimens with different particle size distribution, geometry and density of the materials added, demonstrate that it is possible to increase the sensitivity of the sensor effectively (Cruz et al., 2004).
To guarantee the accurate behaviour of the sensor, it is important to establish a correct bonding procedure. Consequently, the bond between the plate and the concrete was evaluated through pull-off tests. In this work, the use of two adhesives was studied: polyester and epoxy resin. In this work, a bonding procedure involving the pre-treatment of the sensor plate for a strong bond to the concrete surface was established. To measure and to improve the adhesion of the sensor plate to the concrete, pull-off tests were performed.
A detailed description of the sensing principles, the thermal and mechanical properties of the polyester, the mechanical properties of modified polymeric materials, and the experimental analysis of the bond properties, can be found in (Cruz et al., 2006).
The present paper gives an insight to the most important aspects of the sensor fabrication, of the calibration tests and of the procedures to apply the sensor. Furthermore the use of the sensor in the multiple cracks monitoring on RC beams and the field implementation of the sensor in the Övik Bridge, in the north of Sweden, is described with detail.
Change in fibre direction Fibre optic
Signal in and out
Cracks
Fibre bends to stay continuous as crack propagates
I
Position
Crack location After cracking

A new sensor for crack detection in concrete structures
161
2. SENSOR FABRICATION
Instead of pour the polymer with the fibre placed inside a 254 µm diameter steel wire, coated with releasing agent, it is placed in the mould at the desired angle. Next polymer is cast into the mould and allowed to cure. Once the polymer is fully cured it is removed from the mould. Then the steel wire is also removed and the optical fibre can be placed into the hole left by the steel wire. This way the inopportune break of the optic fibre related with a possible adherence between the optical fibre and the surrounding polymeric matrix is avoided.
3. SENSOR CALIBRATION
There are different ways in which the calibration of prototypes of crack sensor can be made. In this study, instead of using an Optical Time Domain Reflectometer (OTDR) a power meter to measure the loss in forward power transmission was used. The reasons for this choice were: the simplicity and accuracy of the power meter and the fact that the location of the crack was known in advance.
Several calibrations were performed to understand and to predict the behaviour of the sensor under different operating conditions. The calibration tests were done using the mechanical simulator of cracking developed by Olson (2003). This simulator was designed so that the crack opening could be measured using a Linear Variable Differential Transformer (LVDT). The testing stage has a fixed part and a moving part. The moving part rests on two hardened steel rods and has four precision ball bearings to keep it aligned and moving with very little friction. The specimen is clamped onto the stage by tightening the screws. The engine turns the reaction nut that moves against the reaction block and therefore pulls the main rod that opens the testing stage.
4. PROCEDURES FOR SENSOR APPLICATION
The establishment of a strong bond of the plate to the concrete surface is an important prerequisite for the successful performance of the sensor. For a successful bonding application, the strength of the substrate surface is equally as important as a clean and dry surface, the absence of contaminants, and the best profile that can be achieved. Surface blasting with hand held mechanical equipment can be used to attain a uniform surface texture and to remove the laitance (the weak alkaline surface residue), dirt, and dust until coarse aggregates are exposed (Figure 2, left part). Any oil and/or grease contamination on the concrete must also be removed prior to bonding (Figure 2, right part).
Figure 2. Surface blasting and cleaning
Moreover, to have better compatibility with the adhesive surface pre-treatment of the sensor plate is recommended. An effective pre-treatment of the plate includes a fine blasting with sand paper and cleaning with pure acetone, to remove any contaminant like oils, dirt, and release agents.

4. New advanced tools for bridge monitoring
162
5. MONITORING OF MULTIPLE CRACKS ON RC BEAMS SUBJECTED TO MONOTONIC AND CYCLIC LOADS
To assess the efficacy of the sensor to detect and localize the formation of simultaneous cracks in different locations a couple of tests on RC beams were performed (León et al., 2006). The beams have the following dimensions: 2.00 m length, 0.40 m depth and 0.20 m wide. Near the centre span of each beam, there were two pairs of 20 mm notches separated by 40 cm at both lateral faces. The purpose of notching the beams was to define the initial location of cracking. Two LVDT’s were employed to monitor the crack openings. The LVDT’s attachment was designed to monitor the opening of the crack at the level of the optical fibre sensor. The specimen loading was accomplished under displacement control at 0.5 mm/sec. Regarding the loading condition, the RC beams were given alphabetic designations A and B. Beam A was subjected to cyclic loading, while beam B was subjected to monotonic loading.
Table 1. Young’s modulus and stress at maximum load
E [GPa] σ [MPa] Sand 200 1.59 22.14 A1200 1.85 25.42 Pol2a1 0.81 41.00
To detect and compare the crack measurements in the same location two sensor plates made
with different additives in the polymeric mixture were placed in series along the fibre, and they were strategically attached in parallel along the tension face at the centre span of the RC beams (Beam A: Plate made with Sand 200 at 20% in density volume and Abrasive A1200 at 20% in density volume with an embedded fibre at 30º; Beam B: Plate made with pure polyester (Pol2a1) and filler of Abrasive A1200 at 20% in density volume with an embedded fibre at 45º). Table 1 summarizes the mechanical properties of these materials.
Figure 3 shows the implemented configuration of installed sensors and overall connections for beam A.
Figure 3. Configuration of installed sensors and overall connections on beam A
The configuration of beam A has included a reusable mechanical splice (TS125) between sensors. To eliminate the reflection induced by the Mechanical Splice (MS), beam B did not include any mechanical splice. 3M single-mode optical fibre was implemented in all configurations and sensors, with a High Resolution OTDR (OFM 20) using a wavelength at 850 nm in Rayleigh operation. The OTDR was linked to the sensors with a mechanical splice (FMS-025) through a spool of fibre, to avoid loss of crack signals due to the strong reflection created at the bulkhead connection, which was made using a fibre pigtail with an APC connector.
Figure 4 shows the initial screen of the OTDR for beam A and B, respectively. In both figures, the approximate location of the beams and sensors are indicated. Figure 4a highlights
OTDR (OFM 20)
Sand 200
MS (FMS-025)
Aprox. 4.0 – 6.0 m
A1200
MS (TS125)
End of fiber
3 m patchcordwith APC connector
Spool of fiber (3M 850nm)
Aprox. 2.0 – 3.0 m
Tension face of the RC beam
Sensors with optical fiber at an angle of 30º

A new sensor for crack detection in concrete structures
163
the insertion loss and Fresnel reflection of the reusable mechanical splice TS125. According to Figure 3, this event can be considered as a location reference between sensors. From Figure 4b it can be noted that the spool of optical fibre for the beam B is shorter.
0 5 10 15 20 25 30 35 40 45 50Distance from bulkhead, m
Approximate location of the beam
Spool of optical f iber before the beam
0 5 10 15 20 25 30 35 40 45 50Distance from bulkhead, m
Approximate location of the beam
Spool of optical f iber before the beam
Insertion loss and Fresnel ref lection of MS TS125
Figure 4. Entire OTDR screen capture showing no cracks: a) on beam A, b) on beam B
Three cycles of loading and unloading were performed. To assure proper data acquisition the maximum loading was maintained for intervals of 25 minutes, since the acquisition can be programmed with the OTDR to be executed in real time after locating the cracks.
The control of the sensor’s response could be observed when the plate made with Abrasive A1200 showed only two cracks. The third crack after the Fresnel reflection in Figure 5a corresponds to the cracking of plate made with Sand 200. After unloading and starting of the third cycle of loading the optical fibre was broken in the plate of Abrasive A1200. To continue monitoring the cracks the plate of Sand 200 was activated by linking the spool of fibre directly to the reusable mechanical splice (TS125). Figure 5b shows the enlarged OTDR screen showing four cracks in the beam location. The second and third drops of intensity are approximately 2.90 and 1.30 dB, corresponding to the 2.50 mm and 1.60 mm of crack opening measured by the LVDT’s.
40 40.2 40.4 40.6 40.8 41 41.2 41.4 41.6 41.8 42 42.2 42.4 42.6 42.8 43 43.2
Aprox. crack location
Fresnel ref lection of MS TS125End of f iber
Aprox. 2.90 dB (2.50 mm)Aprox. 1.30 dB (1.60 mm)
Aprox. 1.11 dB (not measured)
Distance from bulkhead, m
Aprox. 0.70 dB (not measured)
0000000
34 35 36 37 38 39 40 41 42 43 44 45 46 47Distance from bulkhead, m
Aproximate location of transducer A1200
Cracks
Figure 5. OTDR screen capture showing the location of cracks on beam A: a) general view, b) details
Based on examination of the results and visual observations throughout the test, the undesirable breakage of the optical fibre was developed by fatigue, when the crack was opened and closed by an opening bigger than 2.0 mm.
Figure 6a shows the final location and size of cracks on beam A. From this figure it can be concluded that the plate made with filler of Abrasive A1200 exhibit a better behaviour compared to the plate made with Sand 200 which presents more irregular failure planes.
1st Crack(0.7 dB Loss)
2nd Crack(2.9 dB Loss)
3rd Crack(1.3 dB Loss)
4th Crack(1.1 dB Loss)
1st Crack
2nd Crack
Beam Failure
Figure 6. Final location and size of cracks: a) on beam A, b) on beam B
a) b)
a) b)
a) b)

4. New advanced tools for bridge monitoring
164
Experimentation on beam B corresponds to the opening of cracks under a monotonic loading until failure. Six consecutive increments of loading and final unloading were performed. Figure 7 shows the OTDR screen capture of cracking condition of the beam B after the third increment of loading.
0
0
0
0
0
0 5 10 15 20 25 30 35 40 45 50Distance from bulkhead, m
Approximate location of the beam
Spool of optical f iber before the beam Crack
Figure 7. OTDR screen capture showing the location of cracks on beam B
By visual inspection (during test) it was found that there was only one opening crack at the bottom face. The location of the first and second intensity drops corresponded to the crack crossing the plate made with A1200 and pure Pol2a1, respectively. Notice that for beam B two different polymeric plates were placed in series along the fibre and attached in parallel along the centre span. Figure 6b shows the final location and size of cracks on beam B.
Figure 8 shows the comparison between experimental calibration curves of optical power loss versus crack opening obtained by Olson (2002) and results from the present experimental program. Regarding sensitivity the standard error for sensors with the optical fibre at an angle of 30º and 45º were 0.32 and 0.30 respectively. Based on the results, for quantitative measurements at high sensitivity it is recommended to use a fibre at an angle of 45º when 3M optical fibre operating wavelength of 850 nm is considered. Otherwise, the sensor at an angle of 30º can be used only to detect and locate the formation of cracks.
0.00
1.00
2.00
3.00
4.00
5.00
6.00
7.00
0.00 0.20 0.40 0.60 0.80 1.00 1.20 1.40 1.60 1.80 2.000.00
1.00
2.00
3.00
4.00
5.00
6.00
7.00
0.00 0.20 0.40 0.60 0.80 1.00 1.20 1.40 1.60 1.80 2.00
Crack Opening (mm)
Ligh
t Pow
er L
oss
(dB
)
45º inclination
30º inclination30° inclination
45° inclination
Opt
ical
pow
er lo
ss, d
B
0.00 0.20 0.40 0.60 0.80 1.00 1.20 1.40 1.60 1.80 2.00
7.00 6.00 5.00 4.00 3.00
2.00 1.00 0.00
Beam A (1st crack)
Beam B (A1200)
Beam A (2nd crack)
Beam B (Pol2a1)
Crack opening, mm Figure 8. Comparison between experimental calibration curves of optical power loss versus crack opening and results from experimental program (Olson, 2002)
6. FIELD IMPLEMENTATION OF THE SENSOR PLATE
The field implementation of the sensor plate is the culmination and presentation of the research done to develop and test the novel technology for active monitoring of cracks in civil structures. The main purpose of this implementation is to demonstrate the capability of the sensor plate to detect cracks and measure the crack opening at the centre span of slabs and beams of concrete railway bridges.
The field implementation of the sensor plate was considered a success based on the experience and results achieved. It was demonstrated that the procedure proposed to install the sensor plate is easy and solves the problem of undesirable fibre loops bonding outside the plate. It was also observed that the transducer plate with Abrasive A1200 remains dormant if

A new sensor for crack detection in concrete structures
165
the cracks do not open by more than 75 microns. After concluding the destructive test, the proposed wiring configuration allowed the recovery of data acquisition when the fibre was broken by one of the cracks due to in-plane shear loads. The results demonstrated that it is possible to detect multiple cracks and measure their openings simultaneously using a conventional OTDR.
The Övik Bridge was built in 1955 in Örnsköldsvik, a city located in the north of Sweden. This bridge was part of an old railway line which has already been replaced by a new one. The bridge is a concrete frame structure with two spans of approximately 12 m. The cross sections consist of two lateral prestressed beams linked with the slab (Figure 9).
The destructive test on the Övik Bridge was coordinated by Luleå University Technology with the participation of several partners of the Sustainable Bridges Project involved in WP7. Demonstration of the sensor plate was carried out by University of Minho with the objective of detecting and measuring the opening of cracks.
Figure 9. Load configuration of failure test over Övik Bridge: a) front view, b) cross section
The failure test of Övik Bridge was divided into two phases. Firstly, before any intervention, the general condition of the Övik Bridge was considered satisfactory without apparently severe damage. Some loss of concrete cover was detected in the bottom slab due to the impact of wood freight lorries. This kind of damage was not considered relevant. On the first phase, the bridge was loaded to reach the Serviceability Limit State. The test procedure consisted of placing a steel beam at the mid-length of one of the spans and loading the slab through the ballast as indicated in Figure 9. Tendons located at the two beam edges were loaded using two hydraulic jacks. A bending shear failure was expected in the joint between the slab and the longitudinal beams when the tendon load between 1 to 2 MN was applied.
On the second phase, the same load configuration shown in Figure 9 was adopted. Nevertheless the load was applied directly to the concrete beams after removing the supporters that were in contact with the ballast. A shearing failure in the beams was expected when the tendon load was between 6 to 10 MN, which corresponded to the Ultimate Limit State.
The wiring configuration was set for single crack monitoring in view of the spatial resolution of the available OTDR. Figure 10 shows the wiring configuration proposed for field test when the mini OTDR AQ7250 was implemented. To detect and compare the measurements of the sum of crack openings of several cracks in the same transducer plate, two plates with the optical fibre at an angle of 15º and 30º and 20% in density of Abrasive 1200 as additive in the polymer were placed in series along the fibre. They were strategically attached longitudinally along the tension surface at the centre span of the slab and one of the beams of the concrete bridge.

4. New advanced tools for bridge monitoring
166
Aprox. 3 m Aprox. 3 m
Spool of f iber w ith f iber pigtail and PC
connector
Mechanical SplicesFMS-025
Spool of f iber
End of f iber Sensor Plates
15 degrees30 degrees
Figure 10. Wiring configuration proposed for field test using the mini OTDR AQ7250
In the wiring configuration proposed (Figure 10) the fibre was connected to the mini OTDR AQ7250 through a 3 m fibre pigtail with a PC connector. The wiring configuration includes three cylinders of 4 km. The purpose of the first and last cylinders are to isolate the back reflection of the connection with the OTDR and that of the end of the optical fibre. The third cylinder is to separate the back reflection and loss at the fibre ends of mechanical splices from the loss at different transducers.
The acquisition was done remotely from the site where the sensors were installed. Figure 11 shows the localization of sensor plates over expected failure regions of the slab and beam.
Figure 11. Localization of sensors on expected failure region at slab and beam: a) sensors under the slab, b) sensors under the beam
Through the first phase of the failure test of the Övik Bridge, the sensor plates were placed at the centre span of the slab. After loading the slab through the ballast a bending shear failure was expected to occur in the joint between the slab and the longitudinal beams. However, only narrow random cracks were found to spread on the bottom of the slab in the loading region. The types of cracks were predominantly mixed-mode resulting from combined flexure and shearing mode of loading. Since the sensor plates were located at the expected failure region, it was observed that the transducer plate with Abrasive 1200 could bridge the cracks and remain dormant if they did not open by more than 75 microns.
On the second phase the load was applied directly to the concrete beams after removing the support in contact with the ballast. A shearing failure in the beams and deck occurred near the centre span when the loading reached the predicted Ultimate Limit State of the bridge
a) b)

A new sensor for crack detection in concrete structures
167
(approximately at 10 MN). Expecting this failure, the sensor plates were placed close to the position where the load was applied, to detect the cracks that initially opened in a direction perpendicular to the crack plane. When the loading reached 4.5 MN cracks started to appear at arbitrary locations along the deck but essentially perpendicular to the spanning direction and close to the position where the loading was applied. After finishing the second phase six cracks between the sensors were formed and data acquisition was interrupted because fibre breakage occurred in the transducer with the 15º optical fibre due to in-plane shearing caused by the sliding of two crack surfaces on one another. Nevertheless, with the wiring configuration proposed, it was possible to recover the acquisition by focusing on the transducer plate with the optical fibre at an angle of 30º.
Figure 12 shows images of the screen using the emulation software AQ7931B to determine the reference and integrated loss in the post-processing of acquired data. Figure 12a shows the reference loss of 1.088 dB from the sensor at 30º before the second phase of the failure test was started. Figure 12b shows the interruption of the acquisition because of the rupture of the optical fibre in the sensor at 15º. Figure 12c shows the integrated loss of 11.403 dB from the sensor at 30º after completing the second phase. a) b) c)
Figure 12. Images of the screen using the emulation software AQ7931B: a) reference loss, b) interruption of the acquisition, c) integrated loss
By a simple subtraction of the integrated and reference losses a net optical power loss of 10.315 dB is obtained. By knowing the mean theoretical calibration model for the implemented sensor and assuming the same angle of crack direction for all cracks, the measured value corresponding to the total optical power loss was 1.19 mm with an absolute and relative error of 1.053% and 0.833% regarding the input range and true integrated size of crack opening.
7. CONCLUSIONS
This paper provides an overview of the challenges in the development and improvement of a novel fibre optic sensor to monitor flexural and tensile cracks on concrete structures. The proposal and studies about new alternatives concerning the material to make the sensor plate, the fabrication process and the bonding procedures to attach the sensor to the concrete were presented.

4. New advanced tools for bridge monitoring
168
The primary objectives of this paper were: to examine the methodology of the sensor in detecting and localizing the formation of cracks in various locations; and to demonstrate the implementation of the sensor in monitoring flexural cracks on RC beams subjected to sustained and repeated loading.
ACKNOWLEDGEMENTS
The present work was supported by the Research Project “Sustainable Bridges” (FP6-PLT- -01653), funded by the Community’s Sixth Framework Programme. The information presented in this paper reflects only the author’s views and the Community is not liable for any use that may be made of the information contained therein.
REFERENCES Casas, J.R., Cruz, P.J.S. (2003): Fiber optic sensors for bridge monitoring. Journal of Structural Engineering, ASCE, 8(6): 362-373.
Cruz, P.J.S., León, A.D., Nunes, J.P., Leung, C.K.Y. (2006): Design and mechanical characterization of fibre optic plate sensor for cracking monitoring, Sensors and Materials, Vol. 18, No. 6, pp. 283-299.
Cruz, P.J.S., León, A.D., Leung, C.K.Y. (2004): An innovative fiber optic sensor for cracking detection and monitoring, IABMAS´04 – 2nd International Conference on Bridge Maintenance Safety and Management, Kyoto, Japan, October 19-22 (in CD-Rom).
Cruz, P.J.S., León, A.D., Leung, C.K.Y. (2003): Fibre Optic Sensors for Cracking Detection and Monitoring, Eurosensors – 17th European Conference on Solid-State Transducers, Guimarães, September 21-24, pp. 969-972.
ISO 527-1 (1993): Plastics – Determination of tensile properties – Part 1: General principles, International Organization for Standardization.
León, A.D., Cruz, P.J.S., Wan, K.T., Leung, C. (2006): New method for detecting and measuring cracks on concrete using fiber optic sensors, Third International Conference on Bridge Maintenance, Safety and Management, July 16-19, Porto, Portugal (in CD-Rom).
Leung, C., Elvin, N. (1997): Micromechanics Based Design of Optical Fiber Crack Sensor, Intelligent Civil Engineering Materials and Structures, ASCE, 150-163.
Olson, N.G. (2002): Mechanical and optical behavior of a novel optical fiber crack sensor and an interfer-ometric Strain Sensor. PhD Thesis, Massachusetts Institute of Technology, September.

Guidelines and current developments for the use of Fibre Bragg Grating Sensors in the rail industry
169
Guidelines and current developments for the use of Fibre Bragg Grating Sensors in the rail industry
William BOYLE, Fateh KERROUCHE & James LEIGHTON This paper provides guidelines for the specification, design, installation and operation of Fiber optic Bragg Grating Sensors (FBGS) systems for measurement and analysis of strain in structural integrity and load monitoring in the Rail Industry. The guide discusses the available instrumentation and compares the performance and cost of FBGS with established measurement methods and where FBGS will be more appropriate. The paper concludes that FBGS performance offers immediate advantages over electrical strain sensor technology at a comparable cost and with superior performance and the advantages of chemical resistance and immunity to electromagnetic interference as generated by the power systems in the Rail industry. FBG sensors can be used to monitor the strains in railway bridges and railway track that will arise with the High-speed and heavy traffic trains envisaged for renovation of the European rail network as is under study in the FP6 “Sustainable Bridges” EU project to improve capacity of railway bridges in Europe.
1. INTRODUCTION
Fiber Optic Bragg Gratings are a development from the optical telecommunication industry where “there are recognized as one of the most significant enabling technologies for fiber optic communications in the last decade” (CRC, 2005). Since there inception there has been an extensive R & D effort to explore the potential of FBG as strain and temperature sensors. This effort has lead to a mature and robust measurement technology by 2005, that uses ‘c’ band, 1500 nm-based FBGS with WDM interrogation technology for strain and temperature sensors and this technology is now fairly mature (Doyle, n.d.; FBGS, n.d.).
FBGS commercial systems are also now available at costs that are comparable to more conventional electrical strain monitoring using resistive foil gauges and ubiquitous in the industry for over half a century. FBGS have three very considerable advantages in strain monitoring; small sensor diameter (< 0.125 mm), immunity to electrical interference, and the large number of sensors that can be multiplexed into a single (< 1.0 mm) small diameter optical Fiber cable. This has
Sustainable Bridges – Assessment for Future Traffic Demands and Longer Lives

4. New advanced tools for bridge monitoring
170
enabled FBGS to enter and dominate niche markets in the material science of construction materials and more recently in monitoring strain in smart composite structures (Laurin Publishing, n.d.).
However despite the technical advantages of FBGS uptake of this technology has been slow for more general structural integrity monitoring. This is partly due to the fact that FBGS technology has only recently become competitive in cost and possibly more so because of the inevitable lag time between development of a technology and its take up by engineers in the field. However the engineer will find that many aspects of employing FBGS are similar to the application of electrical strain sensors, for example; in the planning of the measurement locations, the use of durable adhesives, and in the analysis of data. An understanding of these more general aspects of stain measurement in integrity monitoring will be assumed in the guidelines for the purpose of brevity. This document will address the aspects of implementing FBGS that are different to electrical strain sensors. With the issue with these guidelines and it is hoped this may encourage the structural engineer to employ FBGS for themselves in their own work.
The guidelines discuss the following aspects in implementing FBGS: • The key properties of fiber optic Bragg grating sensors. • Instrumentation for interrogating FBGS using Wavelength Division Multiplexing
(WDM). • The transfer of strain from structural materials to FBGS. • Adhesion of gratings to structural surfaces or via transducer surfaces. • Embedding FBGS in fibre composite materials (Carbon and Glass). • Installation topology. • Arrays size of BG sensors: This is a balance between the number of sensors and the dynamic
range of each sensor. • Case Examples: Several case examples taken from the experience of the author will be used
to exemplify points in the guide. • FP5 Millennium Project; Steel Box section with concrete floor. • EPSRC FARADAY; ‘West Mill’ composite road bridge. • FP6 Sustainable Bridges. • Development of compact interrogation systems for Bragg sensors.
2. THE MEASUREMENT PRINCIPLE
A fibre Bragg grating is a periodic modification of the refractive index of the core of optical Fiber written usually in a single mode fibre with a UV light interference pattern (Kersey et al., 1997; Grattan and Meggit, 2000). The structure of the resulting fibre Bragg grating is depicted in Figure 1.
Figure 1. Fibre Bragg grating with its periodic modified refractive index in the core
The combined strain and temperature sensor response (given by a single combined Bragg wavelength shift, ∆λB) can be represented by the linear relationship in Equation 1:

Guidelines and current developments for the use of Fibre Bragg Grating Sensors in the rail industry
171
εερζαβλβλ ∆−+∆+=
∆)1()( T (1)
where ∆ε is change in strain, ∆T is the change in temperature, α (= 0.55 × 10⁻⁶/°C) is the fibre linear thermal coefficient, ξ (= 8.3 × 10⁻⁶/°C) is the thermo-optic coefficient and ρe (= 0.26) the strain-optic coefficient. Once these coefficients are known for the specific type of fibre on to which the FBG sensor is written, the sensing method is self-calibrating and it allows drift-free long-term strain and temperature measurements.
3. INTERROGATION OF THE SENSORS
The most widely used method for interrogating FBGS is with Wavelength Division Multiplexing (WDM) whereby an array of serially connected sensors is interrogated by narrow-band light obtained from a broad band source via a Fabre-Perot Spectrometer that sweeps over the wavelength of the gratings in the array. Each sensor in the array reflect light back at a particular wavelength depending on its strain and temperature and this reflected light is detected using a PIN photo-detector diode. This arrangement is depicted in Figure 2.
Schematic of FBG sensor system
Spectral signature measurement: - absolute, reproducible, free of intensity fluctuation
Spatially multiplexed multi-channel WDM architecture
Figure 2. Schematic of WDM Multiplexed Multi-Channel FBG Interrogation System Architecture
Figure 3 shows an 8 channel fibre Bragg sensor interrogation unit as constructed in the Labs at City University as representative of the technology available in 2007. This incorporates a 20 mW 1520–1560 nm broad (band) wavelength source, Fabre-Perot spectrometer, 8-way optical fibre splitter, 8 PIN photo-diode detectors, an 8-analogue channel digital sampling processor and a windows PC for data storage, analysis and transfer and control of the system via the internet. Many systems use Lab-view based programming as does this one.
The wavelength of the sensors and thereby the strain and temperature measurements are determined by estimating the position of peaks in optical spectra obatined from light reflected back from each array of sensors as depicted in Figure 4. The accuracy of this depends for the most part on very accurate synchronised control of the timing of spectrometer and the data acquisition.

4. New advanced tools for bridge monitoring
172
Figure 3. x8 Channel Fibre Bragg Grating Interrogation System
Figure 4. Optical spectra from 8 fibre Bragg grating Sensors (the saw-tooth wave form is the voltage used to actuate the Fabre-Perot spectrometer; the gratings shown had different reflectivity to allow investigation of the dependence of wavelength accuracy on grating signal peak height)
In the system depicted this is accomplished using an ADWIN–litetm DSP. This results in an
accuracy of ~5 nS in the timing of the measurements. This assures that accuracy of measurement is not limited by the acquisition method, but by other factors.
4. THE TRANSFER OF STRAIN FROM THE STRUCTURE TO FBGS
4.1. General aspects and cable assemblies
In their raw state, fibre Bragg grating sensors typically consist of 0.5 m lengths of 125 µm diameter single-mode optical fibre with a 0.8–1.0 cm long Bragg grating in the 6–8 µm fibre core

Guidelines and current developments for the use of Fibre Bragg Grating Sensors in the rail industry
173
near the centre of the length of fibre. Fibre is normally coated with 1.0 mm sleaving away from the gratings. As with electrical foil sensors gratings can be attached to the surface of a coupon substrate to produce a strain transducer that is later glued to the structure surface for strain measurements.
Many manufacturers of interrogation units have designed and can supply prefabricated strain transducers where the FGB is attached or embedded in a composite or steel transducer. It is also practical to attach sensors directly to the polished structure surface gives assured strain transfer of nearly 100%. This section of the report discusses the attachment of FBGS directly to Steel, Concrete and Composite structures.
To employ the grating as a strain sensor the grating and some length of fibre on either side is glued to the polished surface of a structure using low viscosity epoxy resin or cyano-acrylate glues. Good strain transfer between the fibre Bragg gratings and the structure requires similar conditions to that for electrical-resistance strain gauges. Most important is the preparation of a flat smooth surface to glue the sensors to that is resistant to corrosion and the ingress of humidity. Sensors are normally covered with an impermeable layer of silicone to form a flexible but resistant barrier to the elements. Fibre can be spliced together to form a continuous length using an electric arc fibre fusion splicer, as used in the optical telecommunications industry. The cables assemble required to address 64 fibre Bragg sensors will consist of x8 1.0 mm diameter fibre in a protective sheaf of typically 0.5 cm diameter. Placement of sensors on the same serially connected sensor array is constrained by the length of the sensors, ~8 mm long, a straight length of ~25 mm of fibre on each side of the sensor and a minimum radius of curvature on fiber bends of ~25 mm.
4.2. Attachment of FBGS onto steel plate
Figure 5 shows optical Bragg grating sensors together with electrical strain sensors attached to a steel surface in a humidity controlled box section of a Norwegian road bridge (2001). Notice that the area of steel under both the FBG sensors and electrical sensor has been buff polished to remove the metal oxide. Compare the cabling required for the three electrical strain sensors with the single optical fibre required to the three optical sensors. Here the optical sensors are bonded directly to the polished steel surface with cyano-acrylate glue and covered with silicone filler.
Figure 5. 3-directional rosette Fibre Bragg Grating 3 attached to steel structure with cyano-acrylate glue (also in figure: 3-directional electrical strain sensor)

4. New advanced tools for bridge monitoring
174
4.3. Steel rebars
Steel rebars that are keyed into concrete structures to provide strengthening can readily be employed as strain transducers by attaching FGB sensors along their length. Here the smooth edge on the rebar is polished and the sensors glued and then protected by a clip-on carbon fibre composite, Figure 6 (Cranfield University) against compressive strain across the fiber radius and finally protected by a layer of silicone resin Figure 7. Such rebar sensor transducers can be used in monitoring foundation piles of load bearing concrete beams and panels. Also they may have application in reinforcing and measuring the integrity of masonry structures.
Figure 6. Carbon composite protection sheathing
Figure 7. Scheme for using FBGS on rebars
4.4. Composite structures
FBGS can be glued, using cyano-acrylate or epoxy, to the surface or in channels milled in reinforcement composite panels or rods incorporated at the build stage or later to repair or enhance the load bearing capacity of structures.
Figure 8 shows an example of gratings attached to carbon fiber composite Panels. The figure also shows gratings attached to the surface of buffed smooth concrete. This is acceptable for short term measurements, however concrete is relatively hydroscopic and uptake for water in

Guidelines and current developments for the use of Fibre Bragg Grating Sensors in the rail industry
175
Figure 8. Fibre Bragg sensors on polished concrete and re-enforcement carbon composite panels
the concrete will affect the peal strength of the bond between the grating and the concrete that may result in creep or detachment of the sensor.
Figure 9 shows a rosette of three gratings attached to glass fibre sections of a composite bridge structure. The gratings are protected from lateral strain by carbon fibre shims as depicted in Figure 10 as are the optical fibers to the devices. The whole assemble of fibre and protection is less than 2.0 mm thick and this allows the sensors to be incorporated in the composite epoxy glue between the sections of the bridge as shown in Figure 11.
Figure 9. FBGS Rosette on Glass Composite Surface (protected by Carbon Composite conduit)

4. New advanced tools for bridge monitoring
176
Figure 10. Carbon fibre protection of grating sensor from lateral strain
Figure 11. Location of FBG sensors between interlinked glass fibre bridge sections
4.5. Composite fibre reinforcement rods
Composite fibre re-enforcement rods have applicaction in repair and performance enhancement of existing strucure as well as application in monitoring new structures.
Figure 12 and 13 shows FBGS Carbon Rods embedded in 18 metre long carbon fire rods used to reenforce concrete structures in a bridge loading test. A groove, ~2 mm wide and ~1 mm deep, is cut into the centre of a square cross section of 10 mm of carbon fiber rod in order to accommodate fiber optic as shown in Figure 12. The fibres were glued with low viscosity Cyano- -Acrylate and then covered with epoxy.
Figure 12. Application of epoxy resin over fibre sensors incorporated in carbon fibre rod

Guidelines and current developments for the use of Fibre Bragg Grating Sensors in the rail industry
177
Figure 13. Schematic for FGB sensors in carbon fibre rod
FBGS can also be embedded in Glass fibre rods and used as embedded transducers in concrete structures as shown in Figure 14. Composite rods may possibly be of use in monitoring masonry structures. The beams were constructed and used in accelerated corrosion test in Luleå University.
Figure14. 12 meter long concrete beams incorporating glass fibre rods with arrays of 8 FBGS each
5. SEPARATION OF STRAIN AND TEMPERATURE
FBGS also respond to temperature and the separation of strain from temperature is not trivial. The temperature of the structure at the point of strain measurement also requires measurements. This can be achieved by with a FBGS that is isolated from the strain of the structure but is thermally connected to the structure. An example of this can be seen in Figure 15. Here the strain isolated FBGS is attached to steel plate and the expansion coefficient of the combined steel and fiber assemble used to estimate the strain component due to temperature.

4. New advanced tools for bridge monitoring
178
Figure 15. Showing FBGS strain sensors with strain isolated FBGS attached to steel plate but in thermal contact with the structure
6. INSTALLATION TOPOLOGY
FBGS can sensibly be deployed in arrays of between 1 and over 100 giving timed stamped strain and temperature measurements. As expected the more FBGS the slower the interrogation other things being equal. Two main factors currently limit measurement rate, the scan rate of the FP cavity and the speed of computing the position of peaks in the optical spectra returned from the arrays of FBGS. However with the introduction of tunable lasers (instead of FP spectrometers) in newer commercial system measurement rates are now sufficient for dynamic monitoring (> 10 samples per second) for system with many sensors (> 50). Further the measurement rates for commercial systems with just a few sensors is now greater than 1000 samples per second per sensor.
For the structural engineer installing sensors, the most important facts to consider are that the spectral range of the interrogation system, the strain range required for each sensor, and the fact that the optical fibers can be spliced together with little increase in fibre diameter. For applications where only moderate maximum strains are expected, 80 FBGS can be deployed in one array, with a strain range of ±250 uS for each sensor. For an application requiring ±2500 uS per sensor then the same optical fiber channel will only accommodate 8 sensors. Thus there is a balance between the number of sensors and the dynamic range of each sensor.
7. COMPACT AND SMALL SYSTEM DEVELOPMENT
We have found the larger systems developed for the Sustainable Bridges Project and for previous programmes, as shown in Figure 3, somewhat cumbersome and difficult to use in the field because of their weight (20–40 kg) and size (0.25–0.5 meters cubed). We have addressed this with the development of modular systems where the components of the system are packaged into subunits.
Figure 16 shows the system units for the compact system. These consist of an broadband LED source weight 1 Kg (~20 cm x 11 cm x 6 cm), a 8-channel optical detector unit 2 kg (25 cm x x 18 cm x 10 cm) and a computer system in combination with a Fabre Perot Spectrometer and Digital Sampling Processor 3 Kg, and size (30 cm x 28 cm x 7 cm). The system also requires small external mains to DC power supplies. This compact system is designed to have all the capability of the larger system shown in Figure 3. It has the advantages of being much more easily transported for example in hand luggage and is more easily installed in small enclosures, for example in a box section of a bridge.

Guidelines and current developments for the use of Fibre Bragg Grating Sensors in the rail industry
179
Figure 16. The compact system components: LED, detection module and compact PC unit with optical spectrometer
We are also developing a small 2-channel system which consists of two small units a LED source and a spectrometer and detector board. Each of these units is 10 cm x 10 cm x 20 cm. Figure17 shows this prototype system in use during the installation of Bragg grating sensors into carbon-fibre rods for installation to reinforce a concrete railway bridge. The system consists of the small black box and the circuit in the pink lined cardboard box. Figure 18 shows the optical spectra from the instrument.
Figure 17. Shows use of the small system used in installing sensors into carbon fibre rods (on the near table can be seen the laptop for analyzing the optical spectra from the sensors, a small black box containing the spectrometer and detector electronics and in the pink cardboard box the LED broadband source)
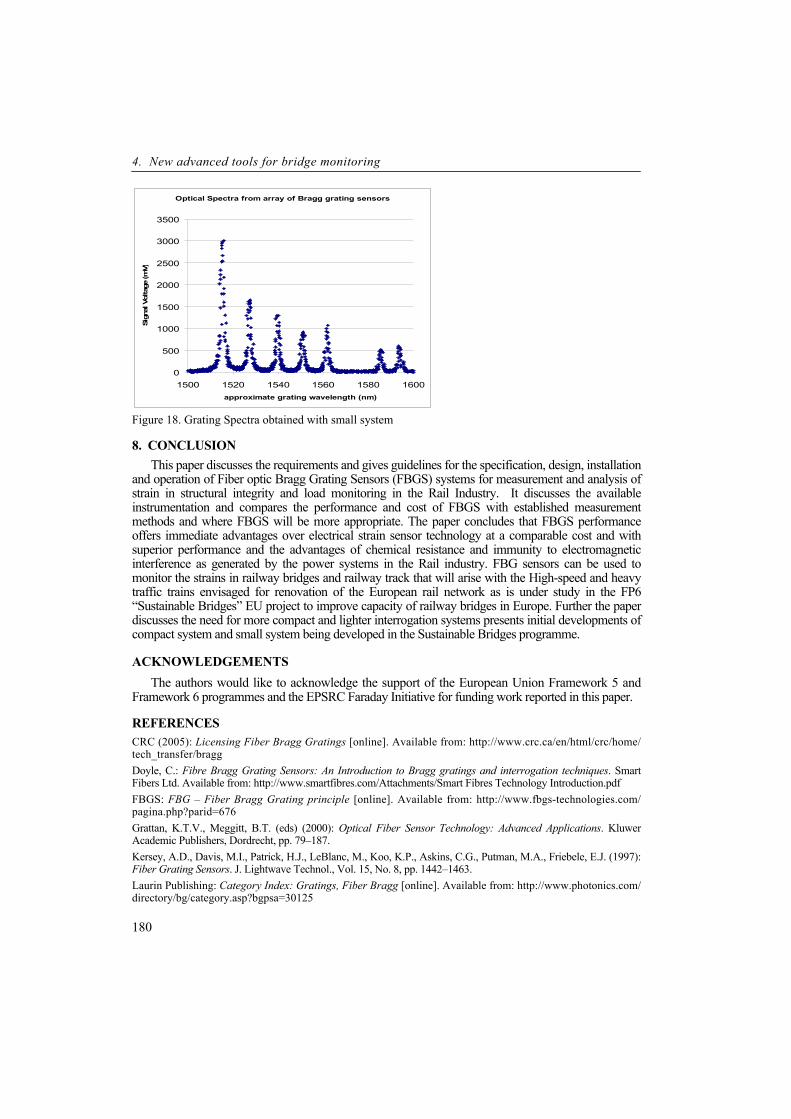
4. New advanced tools for bridge monitoring
180
Optical Spectra from array of Bragg grating sensors
0
500
1000
1500
2000
2500
3000
3500
1500 1520 1540 1560 1580 1600approximate grating wavelength (nm)
Sign
al V
olta
ge (m
V)
Figure 18. Grating Spectra obtained with small system
8. CONCLUSION This paper discusses the requirements and gives guidelines for the specification, design, installation
and operation of Fiber optic Bragg Grating Sensors (FBGS) systems for measurement and analysis of strain in structural integrity and load monitoring in the Rail Industry. It discusses the available instrumentation and compares the performance and cost of FBGS with established measurement methods and where FBGS will be more appropriate. The paper concludes that FBGS performance offers immediate advantages over electrical strain sensor technology at a comparable cost and with superior performance and the advantages of chemical resistance and immunity to electromagnetic interference as generated by the power systems in the Rail industry. FBG sensors can be used to monitor the strains in railway bridges and railway track that will arise with the High-speed and heavy traffic trains envisaged for renovation of the European rail network as is under study in the FP6 “Sustainable Bridges” EU project to improve capacity of railway bridges in Europe. Further the paper discusses the need for more compact and lighter interrogation systems presents initial developments of compact system and small system being developed in the Sustainable Bridges programme.
ACKNOWLEDGEMENTS The authors would like to acknowledge the support of the European Union Framework 5 and
Framework 6 programmes and the EPSRC Faraday Initiative for funding work reported in this paper.
REFERENCES CRC (2005): Licensing Fiber Bragg Gratings [online]. Available from: http://www.crc.ca/en/html/crc/home/ tech_transfer/bragg Doyle, C.: Fibre Bragg Grating Sensors: An Introduction to Bragg gratings and interrogation techniques. Smart Fibers Ltd. Available from: http://www.smartfibres.com/Attachments/Smart Fibres Technology Introduction.pdf FBGS: FBG – Fiber Bragg Grating principle [online]. Available from: http://www.fbgs-technologies.com/ pagina.php?parid=676 Grattan, K.T.V., Meggitt, B.T. (eds) (2000): Optical Fiber Sensor Technology: Advanced Applications. Kluwer Academic Publishers, Dordrecht, pp. 79–187. Kersey, A.D., Davis, M.I., Patrick, H.J., LeBlanc, M., Koo, K.P., Askins, C.G., Putman, M.A., Friebele, E.J. (1997): Fiber Grating Sensors. J. Lightwave Technol., Vol. 15, No. 8, pp. 1442–1463. Laurin Publishing: Category Index: Gratings, Fiber Bragg [online]. Available from: http://www.photonics.com/ directory/bg/category.asp?bgpsa=30125

A new time of flight sensor for measuring strain in large structures
181
A new time of flight sensor for measuring strain in large structures
Timo AHO, Jukka KINNUNEN, Veijo LYÖRI,
Ari KILPELÄ, Guoyong DUAN & Juha KOSTAMOVAARA This paper describes a fiber-optic interrogation device based on a pulsed time-of flight (TOF) for the structural health monitoring of bridge decks. The apparatus is capable of measuring time delays between wideband reflectors, such as connectors, along a fiber path with a spatial resolution of about 3 ns (0.3 m). By using a fiber loop sensor with a reference fiber, it is possible to achieve a strain precision below 1 µstrain and a measurement frequency of 4 Hz. System performance proved adequate for the study of both static and dynamic phenomena in a bridge deck. Application areas include measuring integral strain and its derivatives such as cracks, deflections and displacements. In engineering calculations the elongation of the TOF sensor has been interpreted with rotation angle in the beam which produces stresses for each distance from the deflection curve to the edges of the bridge. The measurements of the cracks can be observed directly using a shorter sensor.
1. INTRODUCTION
1.1. Measurement principles
The TOF measurement system consists of a laser transmitter, receiver, timing dis-criminator, time-to-digital converter (TDC), programmable logic circuit (FPGA) and computer, as shown in Figure 1. During a measurement sequence, a short optical pulse is sent into a single-mode fibre which has wideband, low-reflectivity semitransparent reflectors, such as fibre-optic connectors, to produce timing pulses. Reflected pulses are detected by the receiver from which they are transferred to the timing discriminator, which changes the alternating analogue timing pulses it receives to accurate digital pulses for the TDC, used to measure time delays between the pulses. These measurement data are processed by the FPGA to enable
Sustainable Bridges – Assessment for Future Traffic Demands and Longer Lives

4. New advanced tools for bridge monitoring
182
TRANSMITTER
PULSE TO FIBER
FPGA
TIMINGDISCRIM-INATOR
TIME-TODIGITAL
CONVERTER(TDC)
RECEIVER
REFLECTIONSFROM FIBER
COMPUTERMONITORING
OSCILLO-SCOPE
Figure 1. Block diagram of the TOF measurement system dynamic measurements. In this system, the computer serves as a mass storage and user interface, while the oscilloscope is used only for monitoring purposes.
Figure 2 presents the TOF measurement principle with several sensors connected in series. Each sensor consists of a sensor fibre and an equally long reference fibre. Reflectors are attached at the fibre ends, for example, R1, R2 and R3, as shown with the dashed lines. The actual sensor fibre is in tension, while the reference fibre is loosely attached. The role of the reference fibre is to eliminate common mode errors arising from temperature effects, for instance.
A measurement result is achieved as a subtraction of the time delay between the sensor and reference fibre, for example, ∆tSTART1→ STOP1 – ∆tSTART2→ STOP2. The strain (εj) in the j-th sensor is derived by:
1 1 21 ( )
2 (1 )j j j j j
j
t tnl ac
ε → − − → −= ⋅ ∆ − ∆+
(1)
where (∆tj → j-1) represents a change in the pulse delay between the start and stop pulses of the sensor fibre, (∆tj-1 → j-2) is a change in the pulse delay between the start and stop pulses of the reference fibre, c is the speed of light in vacuum, n is the fibre’s group refractive index (∼1.47), lj is the length of the sensor and reference fibres and a is the strain-optic coefficient (∼ –0.2).

A new time of flight sensor for measuring strain in large structures
183
Figure 2. TOF Measurement principle and photograph of TOF interrogation device
1.2. Long-Gage sensor
A long-gage TOF sensor consists of optical fibers, a protective plastic tube and two mounting boxes, as shown in Figure 3. The plastic tube includes two fibers, a strain fiber and a reference fiber, which are connected in series by means of fiber optic connectors. Of the two fibers, the strain fiber is in tension (ε = 0.5%), while the reference fiber is loosely coupled. Essentially, the reference fiber is used to eliminate common mode errors, such as temperature effects on the refractive index.
The fiber used is a standard single-mode fiber with a polyamide coating and it is attached by gluing with Loctite Hysol 9481 glue on an aluminium mounting piece with separate grooves for the strain and reference fibers. The height of the mounting piece is such that the egress of the fibers is exactly in the middle of the plastic tube. This is done to avoid contact between the tube and the strain fiber, which may cause errors. Located in the mounting piece is a screw for attaching the sensor on the structure to be measured.
The long-gage TOF sensor measures integral strain between attachment points, making measurement precision in units of µStrain directly proportional to sensor length (because basically the measurement unit is time). Using a fixed sensor length allows precision to be improved by coiling excess fiber between attachment points so that several fiber loops are subject to tension. Precision is directly improved in relation to the number of loops. This type of fiber loop structure is shown in Figure 4 on right, upper row.
R1 R2
SINGLE MODE FIBER
TOF
R3 REFERENCE FIBER
SENSOR FIBER
RN-2 RN-1
RN
START 1 STOP1 / START 2
SENSOR (1)
SENSOR (N/3)
STOP 2
REFERENCE FIBER
SENSOR FIBER
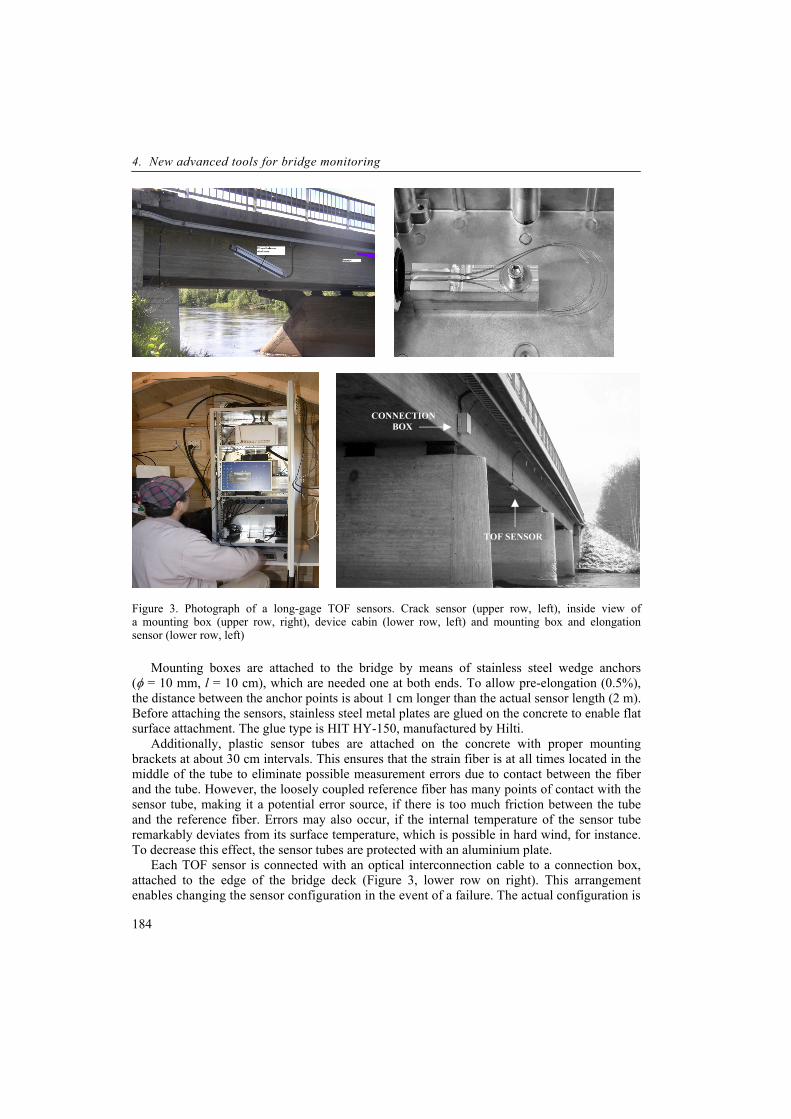
4. New advanced tools for bridge monitoring
184
Figure 3. Photograph of a long-gage TOF sensors. Crack sensor (upper row, left), inside view of a mounting box (upper row, right), device cabin (lower row, left) and mounting box and elongation sensor (lower row, left)
Mounting boxes are attached to the bridge by means of stainless steel wedge anchors (φ = 10 mm, l = 10 cm), which are needed one at both ends. To allow pre-elongation (0.5%), the distance between the anchor points is about 1 cm longer than the actual sensor length (2 m). Before attaching the sensors, stainless steel metal plates are glued on the concrete to enable flat surface attachment. The glue type is HIT HY-150, manufactured by Hilti.
Additionally, plastic sensor tubes are attached on the concrete with proper mounting brackets at about 30 cm intervals. This ensures that the strain fiber is at all times located in the middle of the tube to eliminate possible measurement errors due to contact between the fiber and the tube. However, the loosely coupled reference fiber has many points of contact with the sensor tube, making it a potential error source, if there is too much friction between the tube and the reference fiber. Errors may also occur, if the internal temperature of the sensor tube remarkably deviates from its surface temperature, which is possible in hard wind, for instance. To decrease this effect, the sensor tubes are protected with an aluminium plate.
Each TOF sensor is connected with an optical interconnection cable to a connection box, attached to the edge of the bridge deck (Figure 3, lower row on right). This arrangement enables changing the sensor configuration in the event of a failure. The actual configuration is
CONNECTION BOX
TOF SENSOR
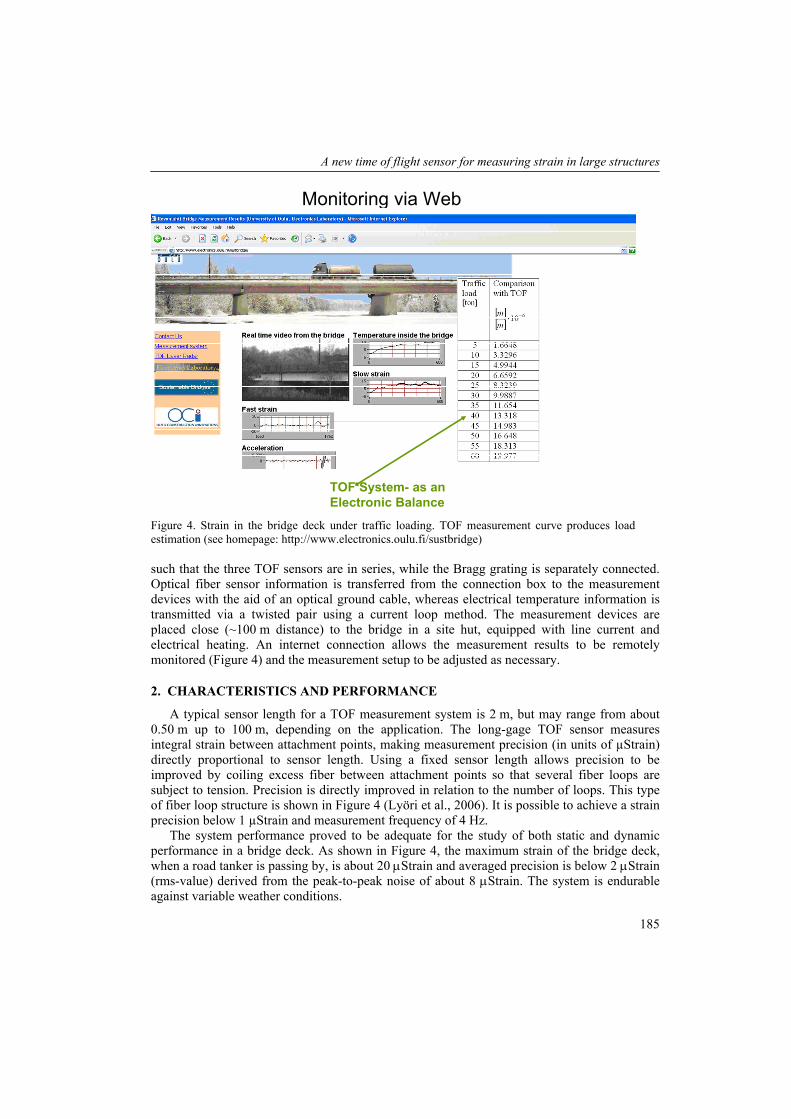
A new time of flight sensor for measuring strain in large structures
185
g
TOF System- as an Electronic Balance
Figure 4. Strain in the bridge deck under traffic loading. TOF measurement curve produces load estimation (see homepage: http://www.electronics.oulu.fi/sustbridge) such that the three TOF sensors are in series, while the Bragg grating is separately connected. Optical fiber sensor information is transferred from the connection box to the measurement devices with the aid of an optical ground cable, whereas electrical temperature information is transmitted via a twisted pair using a current loop method. The measurement devices are placed close (~100 m distance) to the bridge in a site hut, equipped with line current and electrical heating. An internet connection allows the measurement results to be remotely monitored (Figure 4) and the measurement setup to be adjusted as necessary.
2. CHARACTERISTICS AND PERFORMANCE
A typical sensor length for a TOF measurement system is 2 m, but may range from about 0.50 m up to 100 m, depending on the application. The long-gage TOF sensor measures integral strain between attachment points, making measurement precision (in units of µStrain) directly proportional to sensor length. Using a fixed sensor length allows precision to be improved by coiling excess fiber between attachment points so that several fiber loops are subject to tension. Precision is directly improved in relation to the number of loops. This type of fiber loop structure is shown in Figure 4 (Lyöri et al., 2006). It is possible to achieve a strain precision below 1 µStrain and measurement frequency of 4 Hz.
The system performance proved to be adequate for the study of both static and dynamic performance in a bridge deck. As shown in Figure 4, the maximum strain of the bridge deck, when a road tanker is passing by, is about 20 µStrain and averaged precision is below 2 µStrain (rms-value) derived from the peak-to-peak noise of about 8 µStrain. The system is endurable against variable weather conditions.
Monitoring via Web

4. New advanced tools for bridge monitoring
186
The apparatus is capable of measuring time delays between wideband reflectors, such as connectors, along a fiber path with a precision of about 280 fs (rms-value) and a spatial resolution of about 0.30 m (3 ns) in a measurement time of a 25 ms.
Each TOF sensor was connected with an optical interconnection cable to a connection box, attached to the edge of the bridge deck (Figure 3). This arrangement enables changing the sensor configuration in the event of a failure. Optical fiber sensor information was transferred from the connection box to the measurement devices with the aid of an optical ground cable, whereas electrical temperature information was transmitted via a twisted pair using a current loop method. The measurement devices were placed close to the bridge in a site hut, equipped with line current and electrical heating. An internet connection allowed the measurement results to be remotely monitored and the measurement setup to be adjusted as necessary.
3. NEW STEP FOR STRUCTURAL INTERPRETETION WITH TOF SENSOR
3.1. Instructions for TOF installations and calculations
1. The location of the TOF sensor must be always between Mmax and M0. 2. The calibration of the bridge must be done with TOF measurements and known load in
order to define Esys of the bridge (integral modulus of elasticity). 3.2. Example of TOF measurements and results from structural analysis
The essential input data for TOF-analysis in Siikajoki-bridge (integrally homogenous structure) consist of the following data: measurements of elongations of TOF sensor, length of the sensor, weight of the load and velocity of the load. The bridge data consist of the cross section area of the bridge. With help of these data the following calculations can be carried out:
Figure 5. TOF-measurement result
1. The location of the truck in the point of the maximum strain
m 14s 3600sm70000
s 72.0 =⋅ gives the point of the maximum moment to be 7 m and the
points for TOF-sensors ends can be calculated for the deformation analysis. 2. µm40m 2µs20TOF =⋅=∆L gives Esystem = 27.5 GPa.

A new time of flight sensor for measuring strain in large structures
187
3. The calculated deflection of the bridge was about 0.5 mm with 60 t load. 4. Connection of the measurements to structural calculations. Example of Stress Analysis due to bending and reaction force (with dead weights and traffic
load of 60 tons between 0–20 m) is displayed in the Figure 6. The corresponding dislocations
Figure 6. Stresses [Pa] 0–20 m, 196300 analyzed points in calculations, position of calculated neutral axis, and corresponding inner comparison of deflection for the bridge. Cracks can be seen under the bridge by the maximum curvature and moment

4. New advanced tools for bridge monitoring
188
can be seen as well. Load model is uniformly distributed and the maximum moment lies in the point of 7 m. The load effect can be compared with static load in the exact measurement moment with extremely exact elongation results of TOF measurements.
Span width is 20 m at end of the continuous bridge. Two symmetrical parts are situated between 0–14 m. Length of the last part is 6 m and it ends at the support. The most crucial feature in the calculations are as follows: exact definitions of dislocations via rotation calculations in each point in the bridge, general distribution of stresses in each point in the bridge. Compressive stress can be seen in blue colour and tensile stress has been described in red colour. The calculations can be validated with measurements of TOF sensor explained in the Figure 7.
Figure 7. Results of TOF sensor measurements and forces as well as TOF sensor
Half of the moment curve presented in Figure 7 has been calculated with the additional
truck load 60 tons. Each red vertical line represents all deformations in this specific cross- -section of the bridge and for that additional load of 60 tons. Compression and elongation decrease in this moment of loading case in the direction along the bridge. For instance the first vertical line represents the compression value on the upper edge of the bridge; correspondingly the lowest value of the red line represents the tension value. Shear force must be taken account

A new time of flight sensor for measuring strain in large structures
189
to find out such a low values of deformations of 20 µS. Moment and shear are working together in this measurement of TOF sensor.
The position of the neutral axis can be defined in real time monitoring with help of a calculations method in each condition of loading.
4. USAGE
The TOF sensors with necessary interrogation unit connected to data transfer network can be adapted for measuring beams in tension, beams in compression and beams in deflection. The two first measurement applications can produce direct results about structural behavior from a dynamic and a static loading condition. The measurements of deflection need rotation calculation for definition of vertical deflection. Stresses can be analyzed with the Exact Point Method (Kinnunen, 2007). The development of cracks can be observed by mounting the sensors perpendicular the crack line or supposed crack line. Usage of TOF sensors with maintenance monitoring systems can produce information from long term deformation of the structures under loading. The registered information can be compared with initial values of deflections and elongations. This information will help in renovation planning of critical points. The exact results from the dislocations, elongations and deflections can be compared with laboratory tests and produce consistent explanations from loadings and capacity of bridges. The elastic behavior of the structure and stress strain relationship can be mentioned as an example. Even backward calculations are possible with the help of sensor data. The existing bridges can be the objects of backward calculations in assessment of fatigue phenomena. The performance of the new bridges can be set in real time monitoring. The measurements of the development of permanent deformations can be detected and compared with critical values.
The usage of sensors in bridges needs calibration with known loadings and traffic velocities of the trains. This can be done in connection with TOF sensor mounting process of a bridge. Product development of mounting operations for sensors is useful. Furthermore TOF sensor can be replaced with more inexpensive laser measurement methods in steel bridges with larger deflections. A very promising and challenging effort of structural analysis has been carried out applying new assumptions and methods which connect TOF measurements and structural calculations.
5. CONCLUSIONS
The idea of TOF measurement is to express measurements of traffic loads causing deformation effects in the bridge, reveal overloads in each part of the bridge with help of calculations and act as a part of living laboratory in the bridge. This will open new innovative steps in design and analysis of structures.
ACKNOWLEDGEMENTS
This study has been carried out in Sustainable Bridge Project with contribution of Oulu University Strategic Research programmes on construction engineering and construction technology.

4. New advanced tools for bridge monitoring
190
REFERENCES
Kinnunen, J. (2006): Exact Parametric Differential Equations of Plane Section Rotations for Beams with Small and Large Deformations. Luleå. Luleå University of Technology. Department of Civil and Environmental Engineering. Division of Structural Engineering. 2006:022 CIV-ISSN 1402-1617. 19 p.+ app. 29 p.
Lyöri, V., Kilpelä, A., Duan, G., Kostamovaara, J., Aho, T. (2006): Monitoring of a bridge-deck using long-gage optical fiber sensors with a pulsed TOF measurement technique. In: Cruz, P., Fragopol, D., Neves, L. (eds.). IABMAS. Bridge Maintenace, Safety, Management, Life-Cycle Performance and Cost. Porto 16-19 July 2006. pp. 905-906. London, Leiden & New York, Philadelphia, Singapore. Taylor & Francis 905.906. ISBN 10 (Book+CD-ROM): 0415403154.
Lyöri, V., Kilpelä, A., Duan, G., Mäntyniemi, A., Kostamovaara, J. (2007): Pulsed time of Flight radar for Fiber optic Strain Measurement sensing. Review of Scientific Instruments 78.1024705 (2007).

Acoustic emission techniques using wireless sensor networks
191
Acoustic emission techniques using wireless sensor networks
Christian U. GROSSE, Markus KRÜGER & Panagiotis CHATZICHRISAFIS The inspection of building structures is currently made by visual inspection or by wired sensor techniques, which are relatively expensive, vulnerable to damage, and time consuming to install. In contrast, wireless sensor networks are easy to deploy and flexible in application so that the network can adjust to the individual structure. Different sensing techniques can be used with such a network, but acoustic emission techniques have been rarely utilized. With the use of acoustic emission (AE) techniques it is possible to detect internal structural damage from cracks propagating during the routine use of a structure. Most of the existing AE data analysis techniques are not appropriate for the requirements of a wireless network, especially power consumption. Sensors with low price are required for AE systems to be accepted.
To fully utilize the power of the acoustic emission technique on large, extended structures, recording and analysis techniques need more advanced algorithms to handle and reduce the immense amount of data generated. These new algorithms are developed using a new concept called Acoustic Emission Array Processing. As a first step, beamforming and source discrimination techniques were tested as well as a method based on a modified velocity spectral (VESPA) process. Hardware questions are also addressed, e.g., the network combines multi-hop data transmission techniques with efficient data pre-processing in the nodes. Using these techniques, AE monitoring of large structures in civil engineering becomes very efficient including the sensing of temperature, moisture, strain and other data continuously.
1. INTRODUCTION
One of the most common passive monitoring systems involves acoustic monitoring, called the acoustic emission technique (Grosse and Ohtsu, 2007). The emissions are elastic waves generated in conjunction with energy release during crack propagation and internal deformations in materials. Micro-structural changes or displacements occur very rapidly and can be produced by a wide variety of mechanisms, from small-scale changes within a crystal lattice structure to growth of macro-cracks due to stress changes. As stress waves propagate
Sustainable Bridges – Assessment for Future Traffic Demands and Longer Lives

4. New advanced tools for bridge monitoring
192
through a medium, the waveform shape is formed by the characteristics of the source, and affected by properties of the host material, and eventually the geometry of the host medium.
The primary tasks of an implemented AE system in wireless sensor networks consists of signal detection, denoising, localization and other data analysis and signal characterization techniques as described in the following. The interpretation will presumably be limited to an indication of a “zone of interest” for further investigation. Since concrete structures often show a large number of cracks it is expected that pre-existing cracks will be recorded as well as new cracks and also friction. Since the following techniques deal partly with algorithms enable for the discrimination of sources one have to keep in mind that the problem in situ can usually be reduced to record and to analyse deviations from a “usual behaviour”. Additionally, the users might know which part of a structure is critical and which not. New cracks can be a dangerous sign. However, older cracks can lead to corrosion and should be recorded as well. In all cases the described techniques should not be used as the only technique to observe a structure. Wireless techniques should be applied mainly to support visual inspection methods – at least in the beginning.
2. BASICS OF ACOUSTIC EMISSION TECHNIQUES IMPLEMENTED IN WIRELESS SENSOR NETWORKS AND FIELD TESTS
The discrimination between noise and signals (from structure deterioration) is essential for failure monitoring. The environment (e.g. for railway bridges) is assumed to be very noisy. A noise analysis must be conducted using conventional hardware and sensors (broadband sensors) to characterize the frequency bands of noise at different bridges. In general this should be done during field tests for concrete, masonry and steel bridges separately.
As a first test, equipment was installed for wireless as well as wired measurements of crack opening and acoustic emissions during load at a large test facility made out of pre-stressed reinforced concrete (Figure 1 and Figure 2) called ”Concerto” at the Technical University of Braunschweig in Brunswick, Northern Germany. A second test at a slightly smaller structure made out of steel reinforced concrete of the University of Stuttgart was conducted as well, but is not shown in detail here. The implemented acoustic emission (AE) technique will be described in the following as well as preliminary results of the data evaluation.
The first test specimen was constructed by the Universität Braunschweig to investigate longterm behaviour and deterioration processes by continuous monitoring. It has dimensions similar to that of a bridge as shown in Figure 1 and Figure 5. In cooperation with the Universität Braunschweig, the test specimen was loaded at discrete intervals by manually driven hydraulic jacks so that concrete cracking at the midspan was observed. During the bending test, acoustic emissions were recorded by two PC-based Transient-recorders and also by wireless sensors (here just the 1-channel version) using a threshold trigger. One transient recorder was used for the sensor array for testing beamforming techniques. The array used in this experiment was a cross-shaped array with eight sensors that was optimized to operate on signals up to 25 kHz. The number of events recorded is displayed in the lower left corner of Figure 5 while the cracks were observed visually and marked for the time of the experiment.
The acoustic emissions were recorded using eight broadband ultrasound sensors. The sensor setup (the “array”) was optimized with respect to the frequencies of interest. Primarily this was done in order to obtain better resolutions and less interference using the conventional interpolation beamformers that were investigated. The aperture size of this array is smaller than the array in the “Ramp” experiment by about a factor of 2.2.
A total of 2458 datasets were recorded during the test with each dataset comprised of eight waveforms. The number of recorded datasets in relation to experiment size can be seen in the

Acoustic emission techniques using wireless sensor networks
193
Figure 1. A view on the bridge-like structure in the “Concerto” experiment in Brunswick
lower left part of Figure 5. The loading was introduced to the structure by hand driven oil pumps operated by a worker who was sitting on top of the structure. The manual operation caused several acoustic events that were also recorded during the test and which represent the acoustic emissions that are classified as pure noise or acoustic events strongly influenced by noise.
Figure 2. Large test bridge in Brunswick equipped with wireless AE sensors (left) and with wireless displacement sensors (right)
The second test was conducted at a reinforced access ramp at the Universität Stuttgart. Since this structure is regularly subjected to little ambient noise only, the influence of larger traffic noise to acoustic emission monitoring was studied using a forklift truck that crossed the access ramp during some of the AE tests. A standard test source called “Hsu-Nielsen source” according to ASTM E 976-99 (break of a pencil lead, which is very similar to an acoustic event caused by concrete cracking) was used to simulate acoustic events. These relatively weak signals have been clearly recorded in a distance of up to 10 m with good to excellent signal-to-noise ratio. Even under the severe noise condition caused by the forklift truck the AE signals could be discriminated. The AE signals were obtained using an 8-channel AE array in an epicentral distance of 4.10 m (low noise) and in 6.90 m (with

4. New advanced tools for bridge monitoring
194
forklift truck noise). The results of these preliminary noise tests along with details of the setup were published by Grosse et al. (2007).
2.1. Network setup and sensor techniques
It is essential to match the analogue signal conditioning methods to the hardware and sensor techniques used. The concept is based on a wireless monitoring system with MEMS sensors (Micro-Electro-Mechanical-Systems) or hybrid sensors as described earlier (Krüger et al., 2005; Grosse et al., 2006). Each mote is composed of one or more sensors, a data acquisition and processing unit, a wireless transceiver and a battery power supply (Krüger et al., 2005; Grosse and Reinhardt, 2007). The acquisition and processing unit usually is equipped with a low power microcontroller offering an integrated analogue to digital converter (ADC) and sufficient data memory (RAM) to store the measurements. This unit also incorporates signal conditioning circuitry interfacing the sensors to the ADC.
Establishment of a correlation between data and structural performance is difficult and should be based on the data interpretation expertise of the user, implying a natural application of Bayesian statistics. This combination can be done even in terms of a pre-processing of data in the mote or in a cluster of motes. This is the main advantage to telemetric systems using all the data. Intelligent data processing in the motes or clusters enables pattern recognition algorithms, which can additionally reduce the power consumption. Therefore, only meaningful data are transmitted to the sink.
It is expected that the correlation of the recorded AE data with the data obtained by each sensor (temperature, humidity, strain, etc.) will lead to further understanding of structural behavior. For example a cross-check of AE activity with increasing strain or with a sudden or abnormal increase of the ambient or inner structure temperature can give further insight into structural state. Such sensor data correlations will also decrease the amount of data transmitted after implementing intelligent data processing and correlation algorithms.
2.2. AE signal discrimination
Two algorithms have been developed and tested to discriminate between signal and noise. Laboratory tests showed that the cross-correlation of signals originating from similar parts of a structure show a high correlation. Based on detailed knowledge of the structure, certain regions can be monitored directly by storing in memory the values of cross correlation between the actually recorded signal and one or more reference signals, which are permanently stored in the EPROM called “signal squared coherence” (Grosse et al., 2004), giving a simple figure of signal similarities. Only the correlation coefficient (coherence value) for each correlated reference signal, the event time and the “name” of the mote recording it have to be transmitted wirelessly. In the central processing unit a correlation of these data with real coordinates can be done. If several “hits” are recorded, an alarm message can be transferred to the operator. It is easy to discriminate signal types using this transform in combination with an array localization algorithm as described in (Grosse et al., 2007; Grosse and Ohtsu, 2007). However, one has to consider that travel path effects which overpower the fracture process, govern the AE waveform.
To demonstrate the following data processing technique in a clear way, typical examples of AE waveforms are presented in Figure 3. The signals were first classified manually according to their respective interpretational value. Signals that have good signal-to-noise ratio and can be clearly identified as acoustic events due to cracking were denoted as Category-1 signals for their primary importance for interpretation. Signals with moderate signal-to-noise ratio were

Acoustic emission techniques using wireless sensor networks
195
labelled as Category-2 signals. Category-2 signals have to be interpreted with greater care because significant multi-path components and reflections may be included or the signals are affected by noise from the environment. The third type of signals was labelled as Category-N, because the signals classified into this category typically include noise or interferences and are not worth interpreting.
500 1000 1500 2000 2500 3000 3500 4000-0.1
00.1
Category-1 Signal
(a)
500 1000 1500 2000 2500 3000 3500 4000-0.05
00.05
Category-2 Signal
(b)
500 1000 1500 2000 2500 3000 3500 4000-0.04
00.04
Category-N Signal
(c)
s(n)u(n)
Figure 3. Typical examples of recorded signals s(n) that are classified as Category-1, Category-2 and Category-3 – type signals measured at the “Concerto” test setup (blue). The Category-1 type signal was taken from the first waveform of the dataset 2200, the Category-2 type signal from the third waveform of dataset 259 and the Category-N signal is the first waveform of dataset 8 from the “Concerto” experiment. The sampling interval of all waveforms was 1 µs. Furthermore typical u(n) functions are plotted in red. The u(n) functions in this plots were normalized according to energy content in order to provide a more direct comparison of the functions
Two different types of property spaces were chosen to classify the recorded waveforms. The first was a power spectrum estimate of the waveforms obtained through the formula
∑−
=
−=
1
0
π2
)()(N
l
Njlk
ii elskS (1)
where si(n) denotes the nth signal sample at sensor i and N denotes the number of samples observed.

4. New advanced tools for bridge monitoring
196
The second type used a modified Hinkley’s transform which is obtained subtracting a trend from the squared signal’s amplitude – a technique similar to the one that was used to detect onset times of AE signals earlier (Grosse and Reinhardt, 1999). By comparing the incoming energy levels of the signals from the different sets by time it is evident that most of the energy in the Category-1 type signals will arrive earlier than in the other two categories. Incoming power can be compared to an assumed constant power influx that would result in the same energy for a given observation length of N samples. Mathematically this is stated as
∑ ∑=
=
=
=
−=nl
l
Nl
liii ls
Nnlsnu
1 1
22 )()()( (2)
here again si(n) denotes the nth signal sample at sensor i and N denotes the number of samples observed. The function u(n) is thus a measure of the incoming power in relation with a constant power influx.
Because of the large variations in energy of the recorded signals, all waveforms were normalized according to energy in both property spaces. Effectively this made the term to the right of the minus sign in Eq. 2 redundant. Some examples for typical u(n) functions are provided also in Figure 3.
The classification criteria, according to which the different signals are grouped, were obtained by training the K-means algorithm as it was developed by Strintzis (1999), which is one of the most widely used algorithms for clustering (Charalampidis, 2005; Ruspini, 1969). The Euclidean distance between the resulting vectors of the corresponding property space was used as the norm to compare the similarity of the waveforms. K-means was assumed to have converged if the combined squared value of the distance between all subsequent computed centers was less than 0.001.
At first, signal waveforms with a sampling rate of 1 MHz were used and calculation was made on a PC. For this classification scheme the power spectra of the signals were then estimated by taking the absolute values of the FFT, and the resulting values served as the coordinates of the corresponding signal in this property space. The training set for the K-means and the initial centers were selected first by manual analysis (MA). The set was composed of several waveforms that were considered as Category-1, Category-2 and Category-N. After three iterations K-means provided a set of new centers that were used to classify the signals that were recorded. This classification scheme was named for short Km-220K.
Table 1. The conditional probabilities of assigning a record to one of the signal categories by MA when the same record was previously assigned to the same or a different category by Km-220K
Category-1 (Km-220K) Category-2 (Km-220K) Category-N (Km-220K)
Category-1 (MA) 0.88 0.27 0.03
Category-2 (MA) 0.10 0.72 0.07
Category-N (MA) 0.002 0.01 0.90 One hundred signals of each category were then chosen by a random number generator and
classified according to MA. The conditional probabilities of a record to be classified into one of the preselected sets by MA when it was previously classified by Km-220K into a specific set are given in the Table 1.

Acoustic emission techniques using wireless sensor networks
197
Because of the quite good overlap of Km-220K and MA for identifying records, Km-220K was used as a reference for the development of subsequent classifiers that used smaller bandwidths and smaller sampling rates. Signals with smaller sampling rates are indicated for wireless applications were energy requirements must be kept low and the operating signal processing algorithms have to perform well using as few operations as possible. The lower sampling rates of the signals resulted in worse discrimination possibilities, and thus it was decided to test the different classification schemes. Training K-means with one hundred records of each set of signals that were classified previously by Km-220K and using as property space the power spectrum of digitally filtered signals to approximate 20 KHz and sampled with 40 KHz resulted in a sensitive but not very specific classification scheme that was named Km-0-20K. Many of the Category-N signals were classified as Category-1. This classification scheme had a mismatch probability to pass a Category-N signal as a Category-1 or Category-2 of approximately 0.03 – a 60 percent reduction of what would be possible without classifying the signals. A second classification scheme was constructed using as property space the u(n) functions, and the K-means algorithm was trained with a similar training set as described previously. The signals that were used in this classification scheme were digitally filtered to approximate frequency content from 7 KHz to 20 KHz and subsampled to an effective sampling rate of 40 KHz. With this scheme a quite specific classification was possible in discriminating noise from relevant AE but having the restriction not to be able to discriminate Category-1 and Category-2 type signals well. This classification scheme was named Km-u-10-20K. The mismatch probability of a Category-N signal to pass as a relevant Category-1 or Category-2 event was for the Km-u-10-20K classification scheme less than 0.02. This is about 90 percent reduction of what could be expected without post processing the signals. In both classification schemes the possibility to misclassify a relevant acoustic emission as a not relevant signal subjected to noise (Category-N) was low. For the Km-0-20K this probability was 0.004 while for the Km-u-10-20K this probability was about 0.019.
It is obviously possible to apply both classification schemes in order to have a highly specific classifier that discriminates also Category-1 and Category-2 signals well. The estimates of the angular directions of the incoming waves were obtained using a conventional interpolation delay-and-sum beamformer for planar waves and uniform weights (Johnson and Dugeon, 1993). The principle of array technology was first applied in electric engineering e.g. for antenna arrays and is also used in seismology. A more detailed overview in theory and applications of array seismology is given in (Capon, 1969; Rost and Thomas, 2002; Schweitzer et al., 2002). In the beamformer which was used here the delays are computed for an assumed direction of arrival for all apparent velocities of the incoming wave and the corresponding signals are delayed according to the computations performed. In the case when the true direction of arrival (backazimuth) of the incoming wave matches the assumed one, the signals add coherently and a maximum in energy is obtained. If the computed delays are denoted by
icτ∆ the output of the delay-and-sum beamformer can be stated mathematically in continuous time as
,)()(1∑=
∆−=sN
iicic tsty τ (3)
at which again si(n) denotes the nth signal sample at sensor i and Ns denotes the number of sensors in the array and yc(t) is the beam formed according to a reference point c.

4. New advanced tools for bridge monitoring
198
Figure 4. A typical beam that is formed by beamforming signals that were recorded with an ULA for all possible angles of arrival, for a wave that approaches the array at an azimuth of zero degrees and an elevation of ninety degrees, on the axis of the array
Figure 5. Top: Cross sections of the bridge like structure. In the upper right part the position of the array is marked. In the lower left part the number of recorded events is displayed per experiment time. Each time a higher load was applied an increase in the hitrate was observed. The lower right part shows the results from the beamforming (backazimuth) and classification of the events
Time [h]
Hitr
ate
(sum
)
382
1800512400
245150
180
25
8050
50 5
200
360
588
538100
2 Erdanker12 Querspannglieder
8050
5
25
2x2 LängsspanngliederLage der Spannglieder längs und querLängsschnitt
GOK
Longitudinal Section Sensor Array longitudinal steeltendons
cross steel tendons
2 ground ankers for loading
0 0.5 1 1.5 2 2.5 3 3.5 4 4.5 5
500
1000
1500
2000

Acoustic emission techniques using wireless sensor networks
199
An example of the energy levels computed for an incoming wave that arrives at an elevation of ninety degrees and an azimuth of zero degrees is shown in Figure 4. The energy levels were obtained theoretically for a uniform linear array (ULA) with omnidirectional elements and a spacing of 50 mm at a frequency of 15 kHz. The incoming wave in this picture arrives on the axis of the aperture and has a velocity of 2000 m/s. The name beamformer originates from this pattern that resembles a beam.
With the discrete time interpolation beamformer which was used, the theoretical delays were rounded in order to obtain discrete time shifts, and thus accepting some aberration from the theoretical delay-and-sum beamformer. The results for the beamforming and a classification using the Km-220K are shown in Figure 5 (bottom right) for an interpolated sampling interval of 1.7 µs.
3. CONCLUSIONS
It was found that classification of the acoustic waveforms, which are sampled with lower sampling frequencies, is a challenging task. Linear classification schemes seem to have difficulties on signals with lower sampling frequencies. While some algorithms are able to discriminate relevant acoustic emissions from noisy signals adequately (Km-0-20K) other algorithms do better in discriminating acoustic emissions with low noise from pure noise signal (Km-u-7-20K). Based on the service that is demanded, several implementation schemes are possible, and the combination of classification schemes that operate on different property spaces should be considered. Using time domain interpolation beamformers, the direction of the cracks can be adequately estimated, if adequate interpolations intervals are chosen. Performance and computational complexity of the algorithms are in direct relation with the aperture size, the number of sensors and the interpolation intervals. All signal processing algorithms, like the classifiers mentioned or the beamforming techniques are used essentially to extract useful data out of the recorded signals.
As a result a small amount of data has to be transmitted wirelessly, e.g. time, signal class, amplitude or direction of the source. However, signal classification is a difficult task with respect to the large variety of aspects that influence the waveform of an acoustic event that is subject of monitoring. Thus signal classification of acoustic emissions on bridges will probably need a training phase as well as calibration and adjustment of the monitoring system.
ACKNOWLEDGEMENTS
This paper bases partly on the report that has been drafted on the basis of Contract No. TIP3-CT-2003-001653 of the European Community. Most of the work described was funded by the EU during the project “Sustainable Bridges – Assessment for Future Traffic Demands and Longer Lives”. The help of Gerhard Bahr and Greg McLaskey is gratefully appreciated as well as the collaboration with the Institut für Baustoffe, Massivbau und Brandschutz (IBMB) of the Universität Braunschweig (Brunswick, Germany).
REFERENCES Capon, J. (1969): High-Resolution Frequency-Wavenumber Spectrum Analysis, Proceedings of the IEEE 57 (8), pp. 1408-1418.
Charalampidis, D. (2005): A modified K-means Algorithm for Circular Invariant Clustering, IEEE Transactions on pattern analysis and machine intelligence, Vol. 27, No. 12, pp. 1856-1865.
Grosse, C.U., Reinhardt, H.W. (1999): Entwicklung eines Algorithmus zur automatischen Lokalisierung von Schallemissionsquellen. Die Materialprüfung 41.

4. New advanced tools for bridge monitoring
200
Grosse, C.U., Finck, F., Kurz, J.H., Reinhardt, H.W. (2004): Improvements of AE technique using wavelet algorithms, coherence functions and automatic data analysis techniques, J. of Constr. and Build. Mat., 18 (3), pp. 203-213.
Grosse, C.U., Glaser, S.D., Krüger, M. (2006): Condition monitoring of concrete structures using wireless sensor networks and MEMS. Proc. SPIE, Vol. 6174, Smart Structures and Materials: Sensors and Smart Structures Technologies for Civil, Mechanical, and Aerospace Systems (eds. Masayoshi Tomizuka, Chung-Bang Yun, Victor Giurgiutiu), pp. 407-418.
Grosse, C.U., Gehlen, C., Glaser, S.D. (2007): Sensing methods in civil engineering for an efficient construction management in Advances in Construction Materials. Springer publ., Heidelberg 2007, pp. 553-566.
Grosse, C.U., Ohtsu, M. (eds.) (2007): Basics and Applications of Acoustic Emission Testing in Civil Engineering, Springer publ., Heidelberg, p. ca. 420 (in print).
Grosse, C.U., Reinhardt P.J (2007): A new concept for bridge monitoring using a wireless sensor network. International Conference “Concrete Platform 2007”, Belfast 19/20 April 2007. pp 271-284.
Johnson, D., Dudgeon, D.(1993): Array Signal Processing, Prentice Hall Signal Processing Series, ISBN: 0-13-048513-6.
Krüger, M., Grosse, C.U., Marrón, P.J. (2005): Wireless Structural Health Monitoring using MEMS. In: W.M. Ostachowicz et al. (eds). Damage Assessment of Structures, 4–6 July 2005, Proc. Intern. Symp., Gdańsk, Poland, Zürich: Trans Tech.
Krüger, M., Grosse, C.U., Kurz, J.H. (2006): Acoustic emission analysis techniques for wireless sensor networks used for structural health monitoring. In: IABMAS'06 – Third International Conference on Bridge Maintenance, Safety and Management. July 16-19, 2006. Porto: Taylor & Francis.
Krüger, M., Grosse, C.U. (2007): Beitrag zur intelligenten Bauwerksüberwachung mit drahtlosen Sensornetzwerken. In: Bautechnik. Ernst&Sohn, Volume 84, Issue 7 (July 2007), pp. 502-508.
Kurz, J.H. (2006): Verifikation von Bruchprozessen bei gleichzeitiger Automatisierung der Schallemissions-analyse an Stahl- und Stahlfaserbeton, Doctoral Thesis, Institute of Construction Materials, Stuttgart University, 2006.
Rost, S., Thomas, C. (2002): Array Seismology: Methods and Applications, Reviews of Geophysics 40 (3), 1008, doi: 10.1029/2000RG000100.
Ruspini, E. (1969): A New Approach to Clustering, Information Control, Vol. 15, No. 1, pp. 22-32.
Schweitzer J., Fyen J., Mykkelveit S., Kvaerna, T. (2002): Chapter 9: Seismic Arrays, In: P. Bormann (ed.), New Manual of Seismological Observatory Practice. Vol. 1 GeoForschungsZentrum Potsdam, Germany, p. 51.
Strintzis, M. (1999): Pattern Recognition (in Greek), Kyriakidis Bros. Publishing, ISBN: 960-343-290-3.

Inertial exciter as a tool for dynamic assessment of railway bridges
201
Inertial exciter as a tool for dynamic assessment of railway bridges
Jarosław ZWOLSKI, Józef KRZYŻANOWSKI, Paweł RAWA,
Wacław SKOCZYŃSKI & Janusz SZYMKOWSKI Accurate and precise identification of modal parameters of railway bridges is crucial for results of the bridge monitoring based on vibration tests. In this paper a monitoring system consisting of exciting and measuring hardware and developed control software was described. The principles of modal parameters identification and methodology of bridge monitoring by repeating vibration tests are presented together with the system application to tests of a railway bridge. Comparison of tests results with use of exciter and freight trains passing the bridge as a sources of excitation confirmed efficiency of the monitoring system.
1. INTRODUCTION
For structures along railway lines – and especially high-speed lines – all dynamic issues are very important. The base for theoretical and experimental dynamic analyses of structures is modal analysis and its results: modal frequencies, damping ratios and mode shapes. Modal models consisting of these quantities are extensively used in various fields:
• damage detection – some types of damages (e.g. material losses, cracks, loosening of connections) influence stiffness of the bridge structure and consequently cause changes of the modal parameters – the changes of the modal parameters can be investigated by means of vibration tests;
• model updating – on the basis of precise experimental data collected during vibration tests the methodology of structure modelling and assessment can be improved and applied in analysis of new built and existing structures;
• sensitivity analysis – answer the question: what should be changed in structure (add a mass, a stiffener or a damper, modify boundary conditions) to change structure modal parameters and consequently to improve performance – decrease vibration amplitudes, cut down on noise etc.
Successes of these analyses strongly depend on accurate and precise identified modal models of structure. For high accuracy of results of modal analysis independency of excitation characteristics is required. When an excitation technique commonly used for bridges is applied
Sustainable Bridges – Assessment for Future Traffic Demands and Longer Lives

4. New advanced tools for bridge monitoring
202
(e.g. vehicles passing the bridge) the influence of the excitation characteristics (e.g. mass of the moving train, boogies suspension properties etc.) on vibrations parameters is habitually neglected. Precision of the results of modal estimation is often identified as resolution of spectra in frequency domain what directly depends on the data acquisition time. The second aspect of precision is repeatability of the results obtained in consecutively executed tests.
In this paper technology of bridge vibration tests by means of inertial exciter is presented. Practical application of the technology is illustrated by comparison of modal parameters of a railway bridge identified with application of moving freight trains and using a rotational eccentric mass (REM) exciter. The comparison is focused on accuracy and precision of results achieved by application of the two excitation techniques and presents practical aspects of field tests of bridges.
A research team from Wrocław University of Technology (WUT) taking part in the project “Sustainable Bridges – Assessment for Future Traffic Demands and Longer Lives” worked out a method of railway bridges testing with use of a rotational mass exciter (SB5.6 Shaker, 2007). The testing system consisting of a measuring device with sensors, computer, exciter and controllable inverter works under control of software MANABRIS. Taking advantage of such characteristic of tests with exciter as repeatability, force control and measurement, precision and accuracy in structure’s modal parameters estimation – the testing system can be exploited not only for single tests of bridges (Bień and Zwolski, 2007) but also for bridge monitoring (SB8.2 Demo, 2007).
2. MODAL PARAMETERS IDENTIFICATION
Identification of modal parameters characterizing a bridge structure can be done using two approaches: theoretical and experimental. The first method assumes creation of a theoretical (the most often numerical) model of the analyzed structure and execution of Theoretical Modal Analysis (TMA). Customarily it is carried out by means of computational software based on Finite Element Method (FEM). Results are obtained in form of eigenfrequencies and eigenmodes (mode shapes). The experimental approach relies on analysis of data measured during test when the structure’s vibrations are excited by various forces. The algorithm of data processing and analysis depends on the technique of excitation of the structure vibrations. When the excitation forces are measured during the experiment the method of data processing is called Experimental Modal Analysis (EMA) and the only practically usable source of excitation is an exciter. If other techniques of excitation are used: moving vehicles, normal traffic, wind, waves, microtremors etc. the acting forces are immeasurable and the method is called Operational Modal Analysis (OMA).
In EMA the modal parameters are identified from Frequency Response Functions (FRF) determined using measurements of excitation force and structure’s responses in the following formula (Ewins, 1999):
)(
)()(1
ω
ωω
FF
XF
G
GH = (1)
where: )(1 ωH – estimator of the FRF, )(ωXFG – cross-spectrum of the measured
displacement, velocity or accelerations with the measured excitation force, )(ωFFG – auto-
-spectrum of the measured excitation force, ω – frequency. For FRF estimation the spectra
)(ωXFG and )(ωFFG are averaged taking into account results of few experiments repetitions.

Inertial exciter as a tool for dynamic assessment of railway bridges
203
Figure 1. Various exciters for bridge testing: a) rotational eccentric mass (REM) exciter (Zwolski, 2007), b) vertical, driven by electrohydraulic actuator (Krämer, De Smet and Peeters, 1999), c) horizontal, driven by electrohydraulic actuator (Ye, Fanjiang and Yanev, 2005), d) sequence impulse exciter (Bień et al., 2004)
Exciters are mechanical devices generating forces of various types: harmonic (sinusoidal), sweep (harmonic with tuned frequency), random etc. and enabling measurement of the force during experiments. The most known devices from literature are driven by electric motor, hydraulic or pneumatic actuator or electromagnet. Some examples of exciters are presented in Figure 1.
This method of FRF identification assumes application of a broadband excitation technique: in theory white noise excitation and in practice Gaussian random, pseudo random, sweep or impulse excitation. In the case of application of harmonic excitation the FRF values calculated using formula (1) are valid for the excitation frequency only. For FRF identification within selected frequency range the harmonic excitation is executed at predefined values of frequency and discrete values of FRF are calculated for each excitation frequency. The procedure is called Stepped Sine Test (SST) and usually is perceived as a time consuming but very precise method. A supplementary technique is used for mode shape identification (MSI) – at steady-state resonance excitation (with the determined resonance frequency) sensors are moved from point to point. The amplitude and phase of the acquired signals in proportion with the reference signal from one or more fixed sensor enables identification of the investigated mode shape.
a) b)
c) d)

4. New advanced tools for bridge monitoring
204
On the basis of FRF identified for all structure degrees of freedom (DOF) all modal parameters are determined using one or more methods of estimation. Many of them are based on curve-fit algorithms applied to the FRF directly in frequency domain or after its transformation to time domain by Inverse Fourier Transform (IFT). The most effective methods of modal estimation are presented by Ewins (1999) as well as by Maia and Silva (1997).
3. MONITORING SYSTEM
The idea of monitoring of the bridge condition based on observation and tracking of its modal properties, known as Structural Health Monitoring (SHM), was described e.g. by Brownjohn et al. (2004). Similar premises were a genesis of the railway bridge monitoring system which enables assessment of structure condition based on results of repeated testing sessions.
The monitoring system developed by the research team from WUT consists of (Figure 2): • REM exciter, programmable inverter & force sensors, • portable computer, • control software MANABRIS – see Figure 3, • measuring device & response sensors, • portable power generators, • measuring device & temperature and humidity sensors.
Figure 2. Elements of the monitoring system (SB5.6 Shaker, 2007)
When a REM exciter is used identification of modal parameters of the monitored structure can be performed in two ways:
• by execution of the tests sequence employing the harmonic signals stepped over a range of frequencies – SST & MSI together with so known damping estimation techniques as Half Power Bandwidth Method or Logarithmic Decrement Method,
• by execution of the sweep test repeated several times and averaging the results. Values of resonance frequencies and mode shapes should be compared with the values
obtained in theoretical modal analysis and should be used for calibration of the model of structure. Sets of results, calculated and measured, are both stored in a database of a dedicated computer-based system. In this way the results of initial testing session create bases for monitoring process. Each next testing session is carried out in the same manner and with the same testing setup – the test parameters are taken from the structure’s database (Figure 4).

Inertial exciter as a tool for dynamic assessment of railway bridges
205
Figure 3. Software MANABRIS – graphic interface during excitation and measurement: a) chart with the measured values, b) list of monitored sensors with currently acquired value and signal stationarity control, c) list of the scheduled excitations in SST (step 0.1 Hz, 24000 samples each excitation), graphical control of the excited frequency and progress bars of test (Zwolski, 2007)
Comparison of the structure modal parameters obtained during current test session with the results from the previous sessions enables concluding about technical condition of the monitored structure. The lack of any significant changes of the compared parameters means that there is no changes of the construction technical condition and a date of the next monitoring session can be planned (if monitoring is still needed). Considerable differences of compared modal parameters mean that the structure technical condition has changed. In such a situation the following levels of condition assessment can be applied:
• elementary level – changes of modal parameters are evaluated on the basis of the first few vibration modes to make a decision if the structure requires additional detailed inspections or tests because its condition is reduced;
• advanced level – changes of modal parameters are investigated on the basis of all available vibration modes what can enable identification of damage or structural modification type as well as damage parameters (location, intensity etc.); this information is used for a more precise evaluation of structure condition.
Analysis on the advanced level gives more valuable results but it is of course more time- and cost-consuming than the elementary-level analysis.
The testing system and all incorporated procedures of test execution and data processing came under detailed examination focused on efficiency, accuracy and precision of the method and applied equipment (Bień et al., 2006). One of those tests is presented in chapter 4.
a) b)
c)

4. New advanced tools for bridge monitoring
206
Figure 4. Procedure of bridge condition monitoring based on the vibration tests (SB5.6 Shaker, 2007)
4. EXAMPLE OF VIBRATION TEST – OBJECTIVES AND SETUP
The tests objectives were assumed as follows: • calibration of the measuring parameters (sampling frequency, period of data acquisition,
etc.), • test of the control software MANABRIS focused on its stability and usefulness in field
tests, • check of efficiency of all procedures implemented in the software used for test execution
and preliminary data processing, • evaluation of the influence of real field conditions (traffic in the neighbourhood,
operation in strong electric field etc.) on the system efficiency, • estimation of time required for vibration tests (time of train traffic disruption), • comparison of tests results with application of train passage and exciter as excitation
sources.

Inertial exciter as a tool for dynamic assessment of railway bridges
207
Figure 5. Bridge over Ślęza River in Wrocław during tests: a) general view from upstream side, b) view along the track with the exciter on the top, c) sketch of sensors location
For the system performance tests a steel simple supported bridge was chosen – Figure 5. The bridge is located in Wrocław over Ślęza River and carries one track on the ballasted deck made of orthotropic steel plate. The span length is 31.0 m and the structure is skewed.
Program of the tests consisted of: • test with sweep excitation tuned exponentially in range 3–24 Hz, acquisition time 212 sec.,
sampling frequency 800 Hz – 3 repetitions, • test with sweep excitation tuned linearly in range 3–24 Hz, acquisition time 316.75 sec.,
sampling frequency 800 Hz – 2 repetitions, • SST with harmonic excitation in range 3–13.2 Hz with step from 0.016 to 0.032 Hz and
with variable acquisition time from 31 to 62 sec., • test with passage of freight train – 5 repetitions. In the tested system a REM exciter is applied as a source of excitation (Figure 1a). To
collect response of the structure and a set of inductive accelerometers and LVDT’s was used (Figure 5c) together with data acquisition system Spider8 manufactured by Hottinger Baldwin Messtechnik.
Time of data acquisition in SST was 2 hours, in sweep tests 11 minutes (the same for both types of tuning) and for the tests with train passages – total acquisition time was 5 minutes. Time for installation, equipment check out and bridge tests with the exciter was short due to tight time between scheduled trains. Whole testing session took around 6 hours and 5 persons took part in the work. Uncomplicated installation of the exciter on the rails was possible thank to special wheels enabling easy transportation as well as simple crank device which aided location of the exciter on the supporting frame in the testing position.
Results of all tests were processed in software MANABRIS. For all sweep tests FRF’s were determined by averaging results of repetitions and for SST values of response functions were
a) b)
c)

4. New advanced tools for bridge monitoring
208
calculated for 121 frequency steps in the predefined range – Figure 6. In the case of tests with trains two separate autospectra were calculated:
• for whole signal record, neglecting the difference between forced vibration during the train passage and free vibration after the train has passed the bridge – labelled “forced vibrations” in Figure 6,
• for the sections of signal acquired after the train passage – labelled “free vibrations” in Figure 6.
The obtained modal parameters are presented in Table 1. Their estimation regarding the tests with exciter was done using methods: Peak Picking (PP), Circle Fit (CF) and Line Fit (LF) – for details of the methods see (Ewins, 1999; Maia and Silva, 1997). Vibration frequencies identified in the tests with trains was found by means of PP method.
The comparison of the obtained FRF’s and autospectra lead to the following remarks: • General shape of all determined FRF’s is consistent; in the range 3–15 Hz using PP method
5 modes were identified with frequencies: 4.029 Hz, 4.674 Hz, 8.956 Hz, 11.627 Hz and 14.525 Hz (average values for all estimation methods of modal parameters are given in Table 1).
• Technique of harmonic excitation enables determination of FRF with the highest coherence and the lowest noise. FRF’s determined in the tests with both sweep excitations have the finest resolution (0.0047 Hz at the exponential sweep and 0.0032 Hz at the linear sweep) but in the range of low frequencies (below 4 Hz) and between resonances there is noise observed of remarkable intensity. It is caused probably by low excitation energy in low frequency range what is characteristic of REM exciters. Increasing the number of repetitions and averages as well as increasing the time of sweep excitations would be an effective means to cut down on intensity of noise in the FRF between resonances.
0.00
0.05
0.10
0.15
0.20
0.25
2.6 3.6 4.6 5.6 6.6 7.6 8.6 9.6 10.6 11.6 12.6 13.6 14.6 15.6
Frequency [Hz]
abs(H
a) [m/Ns2]
0.00
0.20
0.40
0.60
0.80
1.00
Autospectrum [m2/s4]
exponential sweep
linear sweep
harmonic
forced vibrations
free vibrations
4.291 Hz
4.677 Hz
11.613 Hz
14.557 Hz
4.6 Hz
14.6 Hz
4.030 Hz
9.030 Hz
Figure 6. Comparison of FRF’s determined in tests with exciters and autospectra obtained in tests with trains passages – results for A02 sensor (refer to Figure 5c)

Inertial exciter as a tool for dynamic assessment of railway bridges
209
Table 1. Comparison of modal parameters obtained in the tests with train passages (DAE) and with the exciter (DAM) – identification using methods PP, CF and LF
DAE test Forced
vibrations Free
vibrations DAM test
PP PP CF LF Mode No.
fr [Hz]
fr [Hz]
fr [Hz]
ζr [%]
fr [Hz]
ζr [%]
1 – – 4.030 – – 4.027 1.1% 2 4.291 4.6 4.677 4.656 1.0% 4.689 1.0% 3 – – 9.030 8.965 3.9% 8.874 5.0% 4 – – 11.613 11.647 3.9% 11.622 3.8% 5 – 14.6 14.557 14.508 2.5% 14.511 2.1%
• Passages of trains excited structure’s vibration in the range of low frequencies – the dominant frequency during the train passage is 4.291 Hz and it is lower than the frequency identified from accelerance by 0.386 Hz (9%). Free vibrations frequency for the first mode is equal to 4.6 Hz, what is close to the result of the tests with the exciter but the resolution of the autospectra is only 0.2 Hz.
• In the frequency range between 6.6 Hz and 8.0 Hz in the autospectra some peaks are visible which are not confirmed by the tests with the exciter. The result can be interpreted as the effect of forced vibrations induced by boogies’ wheels passing the rail joints. The presence of the peaks makes the interpretation of the results as well as modal parameters identification more difficult.
5. CONCLUSIONS
Results of all preliminary calibrations and examinations of the monitoring system carried out in frame of the research done by WUT taking into account results of the presented test can be commented as follows:
• The results of the tests showed that application of trains passages as a source of excitation in modal tests of this bridge is inefficient due to mass of the train decreasing natural frequency of the span during the passage and due to quite high damping values of the bridge and consequently very short time of free vibration after passage what implies low resolution of spectra.
• Active vibrations excitation by means of exciter makes modal parameters identification less dependent on structural damping than free vibration tests. In the case of structures with high damping the acquisition time of valuable signal after the impulse excitation is short what implies low resolution of characteristics in frequency domain.
• The main advantage of the testing method using exciters is that the accuracy of modal parameters identification is independent of the excitation source characteristics. Use of exciter enables recording the exciting force and structure response in time series of any length. Results of tests have shown that this excitation technique has such a properties as repeatability, precision, controllability of the excitation force and high signal-to-noise ratio what makes the technique a desirable tool in bridge monitoring based on vibration tests.

4. New advanced tools for bridge monitoring
210
• The developed software MANABRIS enables execution of all described tests in semi- -automatic manner with precise control of all required parameters. Implemented graphic user interface and procedures for preliminary data processing are useful during field tests due to direct control of the measured data.
• Proposed architecture of the testing system seems to be useful and comfortable to use. Integration of all tasks in one software application enables using one computer to control the inverter, the exciter and the measuring device. The portable power generator enables carrying out tests independently of local power sources.
ACKNOWLEDGEMENTS
This research is sponsored by EC within 6 Framework Project “Sustainable Bridges – Assessment for Future Traffic Demands and Longer Lives”. This support is greatly acknowledged.
REFERENCES
Bień, J., Krzyżanowski, J., Rawa, P., Zwolski, J. (2004): Dynamic Load Tests In Bridge Management, Archives of Civil and Mechanical Engineering, Vol. 4, No. 2, pp. 63–78.
Bień J., Krzyżanowski J., Rawa P., Skoczyński W., Szymkowski J., Zwolski J. (2006): System for monitoring of steel railway bridges based on forced vibration tests, Proc 3rd Int. Conf. on Bridge Maintenance, Safety and Management, IABMAS’06, Porto, Portugal, 16-19 July 2006, Taylor & Francis Group, London. ISBN 0 415 40315 4.
Bień, J., Zwolski, J. (2007): Dynamic Tests in Bridge Monitoring – Systematics and Applications, 25th International Modal Analysis Conference, Orlando, Florida, USA.
Brownjohn, J., Tjin, S.-C., Tan, G.-H., Tan, B.-L., Chakraboorty, S. (2004): A Structural Health Monitoring Paradigm for Civil Infrastructure, 1st FIG International Symposium on Engineering Surveys for Construction Works and Structural Engineering, Nottingham, United Kingdom.
Ewins, D.J. (1999): Modal Testing: Theory, Practice and Application, Research Studies Press Ltd., Letchworth, Hertfordshire, UK (2nd Edition).
Krämer, C., De Smet, C.A.M., Peeters, B. (1999): Comparison of ambient and forced vibration testing of civil engineering structures. Proceedings of 17th International Modal Analysis Conference, Kissimmee, FL, USA, pp. 1030–1034.
Maia, N.M.M., Silva, J.M.M. (1997): Theoretical and Experimental Modal Analysis, Research Studies Press Ltd., Hertfortshire.
SB5.6 Shaker (2007): Prototype of exciter for vibration tests and concept of monitoring system, Background document D5.6 to SB-Monitor (2007): Guideline for Monitoring of Railway Bridges. Prepared by Sustainable Bridges – a project within EU FP6. Available from: www.sustainablebridges.net [cited 30 November 2007].
SB8.2 Demo (2007): D8.2 Demonstration of bridge monitoring, Prepared by Sustainable Bridges – a project within EU FP6. Available from: www.sustainablebridges.net [cited 30 November 2007].
Ye, Q., Fanjiang, G.-N., Yanev, B. (2005): Investigation of the Dynamic Properties of the Brooklyn Bridge, Sensing Issues in Civil Structural Health Monitoring, Farhad Ansari (ed.), Springer, Netherlands, pp. 65–72.
Zwolski, J. (2007): Identification of Bridge Structures’ Modal Parameters Applying Exciters. PhD Thesis 5/2007, Wrocław: Institute of Civil Engineering, Wrocław University of Technology, pp. 313 [cited 31 September 2007].

Corrosion monitoring in concrete structures
211
Corrosion monitoring in concrete structures
Thomas FRØLUND & Ruth SØRENSEN The use of corrosion monitoring systems is still relatively new. The first steps were taken in the late 80ties where build-in sensors for new reinforced concrete structures were developed. These corrosion sensors have been extensively used for large infrastructure structures in Denmark e.g. the Great Belt Link and Copenhagen Metro.
In the late 90ties the principle from the build-in sensors were transferred to corrosion sensors for existing structures (post-mounted sensors). With these sensors the ingress of the “corrosion front” into the concrete cover can be measured.
The experience from using these post-mounted sensors is still limited, but they seem very promising. The present paper is based on the experience from post-mounted sensors on two larger marine bridges in Denmark. The paper includes description of the principle of the sensors, the sensors, the data collection, interpretation of data and the use in service life models.
1. INTRODUCTION
Traditionally, an evaluation of the corrosion risk for reinforced concrete structure has been based on visual inspection supported by measurements e.g. half-cell potential measurement and determination of chloride profiles.
Deterioration due to chloride induced reinforcement corrosion takes place below the concrete surface, and the bridge owner may well be unaware of the need for investments in maintenance building up inside his structure.
Visual inspection will only show when corrosion is developing to a degree where corrosion products are deposited at the concrete surface, not when there is a risk that it will initiate. Half- -cell potential measurements are difficult to evaluate, especially for wet structures, and the method only predicts the corrosion risk in the propagation phase when degradation is developing. The longer deterioration is allowed to develop without being discovered the higher becomes the costs of structural rehabilitation.
Based on measured chloride profiles and a service life model, the time to onset of corrosion can be estimated. One of the input parameters to the service life model is the chloride threshold
Sustainable Bridges – Assessment for Future Traffic Demands and Longer Lives

4. New advanced tools for bridge monitoring
212
value. Unfortunately this value is not a well defined; it depends among other on the v/c-ratio, the alkalinity of the concrete and the availability of oxygen. Due to this the estimated time is subject to significant uncertainty.
When the results from a corrosion monitoring system are used to update the service life model the uncertainty can be reduced. Information about the corrosion state (passive/active) at a certain depth and at a certain time can be used in the model, although the information of passivity has not the same value or weight as the information of active corrosion.
In contrary to conventional visual inspection, a corrosion monitoring system will provide the owner with detailed information about the current deterioration state in his structure. The corrosion monitoring technique will ensure detection of the critical initial stages of deterioration and unacceptable rates of deterioration can be detected at an early stage, allowing the owner to make cost-optimal maintenance decisions.
2. PRINCIPLE OF CORROSION SENSORS
The corrosion monitoring systems are based on the following theoretical considerations: • reinforcement embedded in healthy concrete is passivated, • when passivation of the reinforcement is destroyed (e.g. due to carbonation or ingress of
aggressive substances into the concrete) corrosion is initiated, which involves a decrease in the half-cell potential of the rebar,
• when two pieces of metal at different potentials are connected a current will flow, • a passivated rebar will easily be polarized by an impressed current, while a corroding
rebar will not be considerably affected, • electric current as well as the ability to polarize a steel structure can be measured and
these can be used as indicators for initiation of reinforcement corrosion.
2.1. Three electrode setup
A standard corrosion sensor setup consists of: a piece of black steel (steel sensor), a piece of a noble metal (counter electrode) and a reference electrode placed in the cover to the reinforcement within a concrete structure and in direct contact with the concrete matrix, see Figure 2.
With these three electrodes a number of measurements are possible among other macro-cell current, corrosion rate, half-cell potentials and electric resistance.
Where the measurement of the macro-cell current or the corrosion rate is the primary measurements, the half-cell potential measurements and the electric resistance measurements are supportive measurements.
The macro-cell current between the steel electrode and the counter electrode can be measured by connecting these electrodes over a Zero Resistance Ammeter (ZRA).
When the black steel electrode is passive the macro-cell current will be close to zero due to the negligible difference in the electrode potentials, while a significant macro-cell current will be generated, if the black steel electrode is active corroding due to the difference in electrode potentials.
If the steel electrode surface area is small, the size of the macro-cell current will be small (the noise to signal ratio is high), in these cases it is adequate to use corrosion rate measurements as replacement for macro-cell current measurements. The corrosion rate is measured by e.g. the GalvaPulse technique where the steel is impressed with an electric current, and the steel sensors ability to be polarized is determined.

Corrosion monitoring in concrete structures
213
In practice a corrosion monitoring sensor includes a number of black steel sensors located in the concrete cover at varying depths, together with the counter electrode and the reference electrode. When the macro-cell current or the corrosion rate exceeds a trigger value at the outermost steel sensor, the passivation has been destroyed for this sensor, and corrosion has been initiated. When there is a signal from the next outermost steel sensor this sensor has been activated and corrosion has been initiated in this depth, etc. In this manner, the ingress of the “corrosion front” into the concrete cover can be followed. This is illustrated in Figure 1.
Rei
nfor
cem
ent
corro
sion
S1
S2
S3
S4
Time
Depassivation depth
Sig
nal 1
Sig
nal 4
Reinforcement
Concrete surface Rei
nfor
cem
ent
corro
sion
S1
S2
S3
S4
Time
Depassivation depth
Sig
nal 1
Sig
nal 4
Reinforcement
Concrete surface
Figure 1. Principle of detecting the ingress of the “corrosion front” into the cover to the reinforcement
Hence, the corrosion monitoring system ensure detection of critical initial stages of deterioration and unacceptable rates of deterioration is detected at an early stage.
3. MARINE BRIDGES
Bridge piers of two large coastal bridges have been monitored in the period from 2001 to 2003 with post-mounted corrosion sensors. The bridges were opened for traffic in 1981 and 1985 respectively. The purpose of the monitoring was:
• to determine the chloride threshold value, • to detect the corrosion depth in the cover, to update the service life model. In general the same sensor setup has been used for both bridges. The sensors were located
in two and three depths in the concrete cover at different levels above seawater level. Each sensor includes 8 carbon steel electrodes (each with an active surface area of approximately 8 cm2), 1 counter electrode for each set of steel electrodes (the counter electrode is a ribbon of titanium coated with mixed metal oxide, and mounted around the reference electrode), 1 permanent embeddable reference electrode (ERE20, Manganese/Manganese dioxide) and 1 connection to the reinforcement.

4. New advanced tools for bridge monitoring
214
Data logger
Cl- / CO2
reinforcement
counterelectrode
steel electrode
reinforcementconnection
reference electrode
control box
Data logger
Cl- / CO2
reinforcement
counterelectrode
steel electrode
reinforcementconnection
reference electrode
control box
Figure 2. Principle of post mounted corrosion monitoring system
The corrosion sensors are placed in predrilled holes in close contact to the concrete and sealed to avoid any chloride diffusion along the electrical wires. The symmetric setup allows reference and counter electrode to be placed with the same distance to the corrosion sensor making resistance measurement comparable. All electrical connections were lead into the hollow pier shaft easy accessible from the inside of the bridge.
Figure 3. The photo to the right shows sensors for determination of the corrosion risk, at top the reference electrode with the counter electrode and at bottom 2 steel sensors. The photo to the left shows a pier with the monitoring system installed

Corrosion monitoring in concrete structures
215
After 1 year of exposure the sensors from this bridge pillar already give interesting information of the corrosion rate in different levels and depths into the concrete. It is obvious from the data in Figure 4 that oxygen is the limiting factor in the corrosion process in the splash zone area.
0
1
2
3
4
5
6
0 20 40 60 80 100 120 140 160Hight above mean water level, cm
Icor
r, µA
/cm
2
20mm35mm50mm
Figure 4. Alssund Bridge. Corrosion rates at different levels above seawater and depths in concrete cover. For visualization purpose the measured values have been connected by a curve, which may not give the correct relation
0
1
2
3
4
5
6
7
8
9
0 20 40 60 80 100 120 140 160Hight abowe mean water level, cm
Icor
r, µA
/cm
2
35mm50mm
Figure 5. Faroe Bridges. Corrosion rates at different levels above seawater and depths in concrete cover. For visualization purpose the measured values have been connected by a curve, which may not give the correct relation

4. New advanced tools for bridge monitoring
216
The highest corrosion rates are found in level 90 cm, where the oxygen concentration is higher due to a less humid environment compared to lower heights above mean water level.
It is planned to make automated data sampling to give information on the corrosion rate behaviour over the year and to determine the chloride levels at sensor depths to estimate the chloride threshold value and hereby improve the life time models.
4. EVALUATION OF MEASUREMENTS
4.1. Half-cell potentials
The steel potential is dependent of the corrosion state of the steel, the oxygen level around the steel and the pH (Pourbaix, 1966).
According to ASTM C 876-91 the following guidelines can be used for evaluation of half- -cell potential measurements on concrete structures. Table 1. These values are valid when measured against a Cu/CuSO4 electrode (CSE)
Half-cell potential Evaluation Less than −350 mV High corrosion risk Between −350 and –200 mV Medium corrosion risk Above −200 mV Low corrosion risk
These values are only true for dry/semi-dry structures where oxygen diffusion is not limited
by water filled pore structures or very dense concrete and where the concrete is not carbonated. In wet or very dense concrete structures the access of oxygen is limited and this will affect the half-cell potential to more negative values (the passivity can not be maintained), but the lack of oxygen will on the other hand stop the risk of corrosion although the potential is low.
In carbonated concrete the pH value can decrease to levels where the corrosion risk will be high at potentials above −200 mV vs. CSE. In addition to this it is important to take into consideration that the half-cell potential measured by the reference electrode on the concrete surface or at a distance from the reinforcement/corrosion sensor may be very different from that measured adjacent to the reinforcement.
4.1.1. Evaluation of the noble counter electrode half-cell potential
The noble counter electrode is normally a platinum plated titanium rod or a mixed metal oxide plated titanium mesh. Both are corrosion resistant, but their half-cell potentials are dependant of the oxygen level. With limited access to oxygen their potential will drop often to lower potentials than the steel corrosion sensors and hence their use as part of a macro-cell is not possible. The information from the noble electrodes half-cell potential values does however give important information on the oxygen level and therefore the possibility to evaluate steel half-cell potentials.
4.2. Corrosion rates
Due to the half-cell potential evaluation problems, and the need of quantifying the corrosion process, galvanostatic pulse measurements have been applied to the corrosion sensors using the noble electrode as a counter electrode supplied with an ERE20 reference electrode.
Experience from on-site investigations has led to the following evaluation of corrosion rates by the GalvaPulse equipment.

Corrosion monitoring in concrete structures
217
Table 2. Evaluation of corrosion rates
Corrosion rates Evaluation Less than 0.5 µA/cm2 Negligible Between 0.5 and 5 µA/cm2 Slow Between 5 and 15 µA/cm2 Moderate Above 15 µA/cm2 High
4.3. Macro cell currents
The best way of measuring the macro-cell currents are by using a zero resistance ammeter (ZRA) at currents larger than 1 µA. This fact rules out the possibility of making macro cell currents at the corrosion risk sensors with very limited steel surface area of the steel corrosion sensors and therefore a bad signal to noise relationship.
Experience from The Copenhagen Metro, the Great Belt Link and other large structures show however that macro-cell current suffer from the same oxygen problem as the half-cell potentials. The driving force in the macro-cell is the potential difference between the steel corrosion sensors and the noble metal electrode (counter electrode). In dry and semi dry concrete, where oxygen is available, the counter electrode will act as cathode and the steel corrosion sensors as anodes. When a steel corrosion sensor starts corroding, its half-cell potential drops but the noble electrode remains at the same potential. The potential difference decreases as well as the corresponding macro cell current. The macro-cell current technique is a very sensitive technique to detect the corrosion initiation.
In wet and dense concrete lacking of oxygen access the noble “cathode” drops to a lower potential than the steel corrosion sensors and the macro-cell current will flow in the opposite direction giving no information on the sensors corrosion state.
4.4. Alternating Current (AC) resistance
In systems where current is due to both electron and ion flow only AC-resistance techniques can be used. The resistance values between reference electrode and corrosion sensors give information on the reliability of the half cell potential readings. Resistances above 50–100 kΩ indicate a very dry environment for corrosion monitoring setup and unreliable potentials, but it also indicates that the concrete is very dry and that the corrosion risk is therefore very low. If the resistances between the counter electrode and the steel corrosion sensors are low and the resistance between the reference electrode and the steel corrosion sensors is high indicates reference electrode problems e.g. bad contact to the concrete. The different resistance measurements give useful information of electric connections and humidity changes in the structure.
5. UPDATE OF SERVICE LIFE MODELS
A methodology for estimating the residual service life of our existing structures is an essential parameter in rational operation and maintenance. Service life models for chloride ingress and carbonation are available. It is outside the scope of this paper to describe these models, but information can be seen in among other (DuraCrete, 2000; Maage et al., 1999; Mejlbro, 1996; Tang, 1996).
When updating an expected structural service life the actual as-built information on concrete cover, concrete homogeneity, exposure conditions and resulting chloride ingression are important input parameters in the durability models used to estimate the service life in the actual situation.

4. New advanced tools for bridge monitoring
218
The assumed chloride threshold value and the expected future ingress rate of chloride are of great importance in the estimated remaining service life before onset of corrosion.
Modern reliability based models for evaluating the residual service life of structures need factual data of the key parameters of the ongoing chloride ingress. The value of such an approach is that the uncertainty associated with the data of the different input parameters can be included in the probabilistic calculations. This enables a factual calculation of the level of reliability associated with the service life predictions, changing “educated guesswork” to factual information on uncertainties associated with the predictions. In order to reach a reliable service life prediction, data from post-mounted corrosion sensors have to be included to update the ingress models and to estimate more accurately the chloride threshold value for onset of corrosion. Further information can be seen in (Sloth et al., 2006).
6. CONCLUSION
In order to reach a reliable service life prediction, data from post-mounted corrosion sensors have to be included to update the ingress models and to estimate more accurately the chloride threshold value for onset of corrosion. The experience from using these sensors is still limited, but the results so far seems very promising.
REFERENCES Danish Patent 171925B1. 1997. DuraCrete (2000): General Guidelines for Durability Design and Redesign, Doc. no. BE95-1347/R15, Feb. 2000. Frølund, T., Klinghoffer, O., Poulsen, E. (2002): Rebar Corrosion Rate Measurements for Service Life Estimates. ACI Fall convention 2000, Toronto, Canada. Klinghoffer, O., Rislund, E., Frølund, T., Elsener, B., Schiegg, Y., Böhni, H. (1997): Assessment of Reinforcement Corrosion by Galvanostatic Pulse Technique. Proc. Int. Conf. on Repair of Concrete Strictures, Svolvaer, Norway, 1997, pp. 391–400. Klinghoffer, O., Goltermann, P., Bässler, R. (2002): Smart Structures: Embeddable sensors for use in the integrated monitoring systems of concrete structures, IABMAS 2002, Barcelona, Spain. Maage, M., Halland, S., Carlsen J.E. (1999): Chloride penetration into concrete with light weight aggregates. Report FoU Lightcon 3.6, STF22 A98755 SINTEF, Norge 1999. Mejlbro (1996): The complete solution of Fick's second law of diffusion with time-dependent diffusion coefficient and surface concentration. Durability of Concrete in Saline Environment, Cementa, Sverige 1996. Pourbaix, M. (1966): Atlas of electrochemical equilibria in aqueous solutions. Pourbaix, M.: Atlas of electrochemical equilibria in aqueous solutions. Raupach, M. (2002): Smart Structures: Development of sensors to monitor corrosion risk for the reinforcement of concrete bridges, IABMAS 2002, Barcelona, Spain. Raupach, M.: Corrosion Behaviour of the Rinforcement under On-site-Conditions. 15th International Corrosion Congress, Frontiers in Corrosion Science and Technology. Granada. Sloth, M., Sørensen, R., Maglica, A. (2006): The Öland Bridge – a case study for probability based service life assessment. Proceedings for Third International Conference on Bridge Maintenance, Management and Safety. Porto. Sørensen, R., Frølund, T.: Sustainable Bridges. wp5-05-T-051027-RE-D5.2 S2. Guideline for corrosion monitoring (not yet published). Tang, L. (1996): Chloride transport in concrete – Measurement and prediction. Chalmers University of Technology. Publication P-96:6.

Bridge performance and resistance for higher loads and speeds


Guideline for load and resistance assessment of existing European railway bridges
221
Guideline for load and resistance assessment of existing European railway bridges
Jens S. JENSEN, Joan R. CASAS, Raid KAROUMI,
Mario PLOS, Christian CREMONA & Clive MELBOURNE Many of the European railway bridges are getting close to the end of their service life. At the same time the railway operators demand higher axle loads for freight trains and higher speeds for passenger trains. This requires new and better approaches for assessing both the railway loads and the resistance of railway bridges. The main objective of the “Guideline for load and resistance assessment of existing European railway bridges” is to provide bridge evaluators with the most advanced knowledge regarding methods, models and tools that can be used in the assessment of existing railway bridges in order to get a realistic evaluation of their load carrying capacity and also more accurate evaluation of their remaining service life. This paper gives the general overview of the whole Guideline. Nevertheless, the major focus is placed on the innovative elements proposed in the Guideline, which have been developed due to several research activities performed within WP4.
1. INTRODUCTION
The “Guideline for Load and Resistance Assessment of Existing European Railway Bridges”, presented herein, has been prepared within the work package WP4 of the Sustainable Bridges project, named “Loads, Capacity and Resistance”, one of the nine work packages WP1 to WP9 dealing with relevant tasks for increasing the capacity and service life of existing railway bridges. The main objective of the work package WP4 was to establish a “state-of-the-art” practice for assessing the load and resistance of existing railway bridges in Europe and to develop a guideline for best practice of load and resistance assessment including the future “state-of-the-art”. The latter includes the development of methods to assess the actual load on a bridge and to assess the resistance taking into account the measures of the actual condition of the bridge, which has been identified in WP3 “Condition Assessment and Inspection”, and the results of the monitoring, provided by WP5 “Monitoring”. The assessment performed using this Guideline may give the basis for the decision regarding repair or strengthening of
Sustainable Bridges – Assessment for Future Traffic Demands and Longer Lives

5. Bridge performance and resistance for higher loads and speeds
222
a bridge which has been the main area of interest of the work package WP6 “Repair and Strengthening”.
The main objective of this Guideline is to provide bridge evaluators with the most advanced knowledge regarding methods, models and tools that can be used in the assessment of existing railway bridges. This includes systematized step-level assessment methodology, advanced safety formats (e.g. probabilistic or simplified probabilistic) refined structural analysis (e.g. non-linear or plastic, dynamic considering train-bridge interaction), better models of loads and resistance parameters (e.g. probabilistic and/or based on the results of measurements) and methods for incorporation of the results form monitoring and on-site testing (e.g. Bayesian updating).
The following paragraphs provide the information regarding several topics related to assessment of railway bridges presented in the Guideline.
2. ASSESSMENT PROCEDURE
Assessment of an existing railway bridge with the purpose of re-qualifying the bridge for increased loading and/or for prolonging the service life may be seen as an adaptive, step-level process of refining the state of knowledge regarding the present and the future state of the bridge and its behaviour. An assessment may involve a review of project documentation, inspection of the structure, testing of materials, testing of structural performance, refined numerical analysis and planning of future inspections.
The decision on whether or not to collect more information is always based on the existing information (prior information) and the expected reduction of the life cycle cost obtained on the basis of the additional information. Depending on the actually achieved knowledge (posterior information) it may or may not turn out to be feasible to refine further the state of knowledge. Also, in the same manner, the re-qualification actions (strengthening and repairs) may be evaluated, compared and selected. It should, however, be noticed that economical considerations alone, may not be sufficient for re-qualification purposes as explicit requirements to the safety of the bridge are often dictated by legislation.
Figure 1 shows the step-level procedure recommended in the Guideline for using in the process of assessment of existing railway bridges. Considering the above discussed topics, in the presented procedure, the knowledge about the bridge is established and refined in an adaptive manner according to the actual needs.
3. REQUIREMENTS
The requirements refer to the safety criteria and safety levels behind the assessment and the service life. The requirements for safety are divided into requirements to the safety format and to the safety level. The Guideline adopts the safety concept most commonly used in bridge engineering for design or capacity assessment: the limit state (LS) approach (Nowak and Collins, 2000). The main objective is to facilitate as much as possible the task to the bridge evaluator that is more experienced in the design rules for new bridges than in the assessment of existing structures. Because of that, the safety concepts in the Guideline follow wherever is possible the available documents for mechanical and durability design of new structures (Eurocodes, ISO Standards, FIB Model Code for Service Life Design). The adoption of different safety formats is proposed in parallel with the use of less or more advanced levels of assessment. This is based on the philosophy of assessment assumed in the Guideline: to divide the assessment in different levels or phases with increasing level of sophistication (see Figure 1). In the simplest case, the assessment carried out at a member level is enough to

Guideline for load and resistance assessment of existing European railway bridges
223
ensure the correct performance of the bridge. In this case, the “usual” safety format based on the use of partial safety factors and a linear analysis as in the design codes is used. However, different safety formats become necessary when assessing the particular bridge where partial safety factors provided by codes are not applicable or available, or when assessing the bridge at a system/structural level, where more advanced analysis methods are mandatory (e.g. non- -linear analysis, system reliability analysis, etc.). At the component/member level the proposed safety formats are: partial safety factor, full probabilistic and simplified probabilistic (Mean Load Method). At the system/structural level, a modified partial safety factor format, including the system effect, a full probabilistic format and two simplified probabilistic approaches are proposed. The objective of the simplified formats is to reduce as much as possible the number of non-linear analysis to be carried out and therefore to simplify the process. One of them is based on the measure of bridge redundancy, whilst the other is based on the plastic analysis, defining the so-called moment redistribution factor and can be applied to the case of continuous bridge structures (Casas et al., 2007).
Figure 1. Flow diagram for reassessment of existing bridges
The safety level is also considered at a member and system approach. The proposed target reliability levels proposed in different countries and by different international bodies (Eurocode, ISO) are presented in the Guideline, jointly with the most significant assumptions behind them. In this way, the engineer responsible for the assessment can choose the most

5. Bridge performance and resistance for higher loads and speeds
224
suitable safety level for each specific case into consideration. Because bridge assessment is highly case-specific, the Guideline does not just propose a value to be adopted for the safety level as a general value, but gives information and guide how to fix this level for each case under study.
Similar to safety, the requirements about service life (durability) are assessed on the basis of a limit states format. The safety level and reliability requirements for service life might be different from the requirements for structural safety due to economic, social and sustainability considerations and the level of knowledge of the technical history of the bridge in question. The differentiation of target safety indices for service life might be more pronounced than in the case of structural failure, depending on the wishes of the client (LIFECON, 2004). Basically, a full probabilistic format and a partial safety factor approach are recommended for the durability assessment, according to the principles and methods presented in FIB (2006). In this way, a similar treatment is given to both mechanical and durability limit states. This results in a more simplified process for the user. Related to the service life requirements appear the degradation models. The Guideline also states the minimum requirements that the degradation models to be used in the assessment should accomplish and criteria for selecting the degradation model more suitable for each specific use are also presented.
A methodology for the fatigue service life assessment of existing railway bridges is also presented. The procedure also proceeds by stages using both deterministic and probabilistic methods of increasing sophistication including the following steps: (1) simplified deterministic method, (2) simplified probabilistic method, (3) consideration of monitoring, (4) detailed probabilistic method. The aim of the first stage is just to identify the fatigue critical members of the structure.
Several examples are presented in the annexes of the Guideline to guide the reader how to practically implement the most advanced reliability-based assessment methods.
4. LOADS AND DYNAMIC EFFECTS
In order to safely increase axle loads and speeds on existing railway bridges, the railway managers need better understanding of the risks associated with changes in loads and speeds. These changes often result in changed dynamic behaviour for bridges. The principal factors which influence dynamic behaviour are:
• the train speed across the bridge, • the span L of the element and influence line length for deflection of the element being
considered, • the natural frequencies of the whole structure and relevant elements of the structure and
the associated vertical mode shapes along the line of the track, • the number of axles, axle loads and the spacing of axles, • the mass of the structure, • the damping of the structure, • vertical imperfections in the track, • vehicle imperfections (e.g. wheel flats, out of round wheels, suspension defects), • the unsprung/sprung mass and suspension characteristics of the vehicle, • regularly spaced supports of the deck slab and track (cross girders, sleepers etc.), • the dynamic characteristics of the track. (ballast, sleepers, track components etc.). The topic of railway bridge dynamics is a complex field outside the everyday experience of
many engineers. Requirements and useful guidance on carrying out dynamic calculations are given in section 6.4 of the Eurocode EN1991-2, in UIC Leaflet 776 – 2R, and in the report ERRI D214/RP9 which summarize the work of ERRI Committee D214. The requirements are

Guideline for load and resistance assessment of existing European railway bridges
225
given in these documents for the design of new structures and can therefore be conservative in some circumstances leading to structures failing their assessments. For these situations it can be beneficial to undertake a bridge specific dynamic analysis supported by site monitoring of the dynamic behaviour of the bridge in order to enable more refined predictions of dynamic load effects for an individual structure. The following is an illustrative example:
Design codes contain often very simplified models for the load distribution. Such assumptions are acceptable for new bridges and give usually safe values. For existing bridges considering a more sophisticated load distribution taking into account the contribution of the track can increase the load capacity, decrease the vertical deck acceleration and the deflections. Comparisons between theoretical values (without any stiffness of the track) and measured values of bridge frequencies show that the theoretical values underestimate the frequency. For this reason, it is expected that the critical speed at resonance can be increased with adequate consideration of the load carrying contribution of the track.
The working group on loads, in the Sustainable Bridges project, has accordingly initiated the following main research projects:
• dynamic behaviour and dynamic amplification factors for bridge elements, • assessment of actual loads using Bridge-Weigh-In-Motion (B-WIM). Based on results from above research topics, recommendations for the assessment of
existing railway bridges, in relation to loads and dynamic effects, will be reported in a chapter of the Guideline which is dedicated to this. The general purpose of the recommendations is to provide advice on:
• dynamic behaviour of railway bridges in general, • bridge parameters to be used for dynamic analysis, • loading and load distribution, • train models to be used, • methods of analysis, • how to use site measurements with dynamic calculations to refine dynamic loading, • how to use site measurements to establish critical bridge parameters such as damping,
natural frequencies, and influence lines, • how new measurement methods can be used to obtain bridge specific train loading. By utilizing these recommendations, the engineer should be able to make improved
predictions of load effects in the structure prior to permitting new traffic and/or increased speeds.
5. CONCRETE BRIDGES
Today, many concrete bridges are replaced or strengthened because their reliability cannot be guaranteed based on the structural assessments made. The assessments are commonly made using analysis models developed for design, which are based on linear response for structural analysis and simplified methods for resistance determination. In the guideline, methods for improved assessment are presented. The use of such methods are needed to be able to meet the future demands on the existing concrete railway bridges: to extend their residual service lives at the same time as they are subjected to higher axle loads, higher railway speeds and heavier traffic intensity.
For concrete bridges, the Guideline focus on advanced methods for the enhanced assessment level that goes beyond the methods normally used in design, see Figure 1. Special attention is given to non-linear analysis since it provides the greatest potential to reveal increased load carrying capacity. Assessment of concrete bridges on initial and intermediate levels follows the code of practise, is assumed to be well known to the experienced bridge engineer performing
5. Bridge performance and resistance for higher loads and speeds
226
bridge assessments, and is not treated in the Guideline. The work is described more in detail in (Plos et al., 2007).
An enhanced evaluation of a concrete bridge is best made step by step as an integrated part of the decision process. Here, calculations and structural analyses are made in continuous interaction with investigations of the bridge properties and condition. The most appropriate methods must be chosen for each bridge individually, with respect to the objective of the assessment and the weaknesses of the bridge. The decisions whether to proceed with the assessment must be made with respect to the cost for and the potential to succeed with it.
For enhanced bridge assessment, a careful determination of the bridge properties is required. For existing bridges, important aspects are the bridge condition and a realistic modelling of the boundary condition and the construction sequence. For concrete bridges, the in-situ material properties are of particular interest. Consequently, a methodology to assess and interpret the in- -situ strength properties of reinforced concrete bridges was developed. This includes concrete as well as reinforcement and prestressing steel, and material parameters for deterministic as well as for fully probabilistic assessment is treated.
Advanced methods for structural analysis are presented. System level analysis on different levels with respect to the material response is described. Recommendations regarding redistribution of sectional moments and forces obtained from linear analysis were developed within the project. Advanced local resistance analysis is treated, e.g. regarding combined shear, torsion and bending interaction.
One main objective for the work on concrete bridges was to facilitate the use of non-linear analysis for structural assessment. Non-linear analysis is the method for structural analysis that provides the greatest potential to discover any additional sources for load carrying capacity. This has been showed through practical applications for a number of bridges, see e.g. (Plos, 2002). Furthermore, it gives an improved understanding of the structural response, forming a better basis for assessment decisions. Consequently, non-linear analysis with Finite Element Methods (FEM) is described and recommendations for practical applications are given.
Another main objective was to provide methods for assessing the remaining structural resistance of deteriorated concrete bridges. The effect of corrosion is treated comprehensively. Based on tests and detailed non-linear FE analysis, an overview of the effect of corrosion on bond properties for reinforcement was developed. Recommendations are given for assessment of anchorage capacity in bridges with corroding reinforcement.
The residual life time of railway bridges is often limited by fatigue. However, the methods used when determining the fatigue safety and residual life time are often very conservative and rely on a narrow knowledge basis, compared to most other domains of structural concrete. In the project, a methodology for improved assessment of the fatigue safety for existing concrete bridges was developed. Here, the emphasis is on evaluation of the remaining fatigue life of short-span bridges and secondary elements.
6. METAL BRIDGES
A very important part of the bridges in the European railway networks are metallic bridges. Many have been constructed during the last 75 years (some of them are much older). The increasing volume of traffic and axle weight of trains mean that for many bridge structures the loads today are much higher than those envisaged when they were designed. In the context of the Sustainable Bridges Project a research program to develop improved assessment methods for existing metallic bridges has been started. Four research activities are under development. The activities concerns the Material properties of metal railway bridges (Hoehler, 2005), the Fatigue on riveted structures (Larsson, 2005), the Updated assessment methods for riveted

Guideline for load and resistance assessment of existing European railway bridges
227
structures (Johansson, 2005), and the Use of non-destructive tests (NDT) for load capacity reassessment (Patron, 2005). A summary description of these research activities is presented in the following paragraphs.
6.1. Material properties of metal railway bridges
This activity concerns the creation of a data bank with information about material properties of steel and iron used in old existing railway bridges. The knowledge of the material properties of existing metal bridges is essential for the resistance assessment and the determination of the remaining lifetime of the bridge. For old metal bridges, that were build between 1870 and 1940 in particular, the material parameters are in many cases non available. Yet, especially the old bridges require more exact and efficient assessment methods that call for a precise description of the material. The most important material parameters to assess the resistance of a structure towards design loads and environmental actions during the structure’s lifetime are strength and toughness. Concerning durability and strengthening matters also aspects as workability (e.g. weldability) and resistance against corrosion effects are also relevant. The essential parameters that are required to characterize the metal of a bridge are then:
• chemical composition, • strength properties under static loading and fatigue properties, • toughness properties, • fracture mechanical properties (fracture toughness and crack growth parameters). The construction of the database is based on the collection of material parameters existing
in the literature and also on the collection of material data from more than 120 existing test samples of old bridges from Sweden, France and Germany. As a result of this research, recommendations for data acquisition by individual testing will also be included on the guideline.
6.2. Fatigue on riveted structures
Fatigue related failures are the most common cause of failure of riveted bridges. Riveted structures were constructed over a period of more than 100 years up to the 1950s. There are thousands of riveted bridges in Europe still in service. Economically its not justified to replace a bridge when it reaches the end of its design life. Often the design life it’s an arbitrary value and there is considerable reserve. An important amount of service life may be justified by a better knowledge of the fatigue behaviour of riveted connections. This research activity concerns the development of new assessment methods for load capacity of riveted structures from a fatigue point of view. The research is focused on the following aspects:
• literature overview of the researches conducted on fatigue loaded structures and current design codes,
• definition of the fatigue limit state, • study of the fatigue threshold, • evaluation of the remaining structural capacity.
6.3. Updated assessment methods for riveted structures
Most of design rules for steel structures, for instance those in Eurocode 3, are applicable also to riveted structures. However some information is missing on how to deal with the special case when elements are intermittently connected unlike welded structures that are connected continuously. One such issue is how to define the cross section class of a riveted

5. Bridge performance and resistance for higher loads and speeds
228
member. One question that is not covered in a reasonable way is the distance between rivets in the stress direction. Another is to quantify the positive effect of restraint to local buckling provided by the connecting angles. The research of answers to those questions is the objective of this investigation.
The shear resistance of a web is often governed by buckling. For riveted bridges the web and the flanges are connected with angles and it is not obvious how to define the slenderness of the web and the effective web area. A method for calculating the shear resistance of riveted beams is under development.
The traditional method for assessing the resistance of steel bridges is based on elastic analysis. When the ultimate limit state resistance is insufficient it is possible study the plastic capacity of cross sections formed by riveted slender plates. Design codes do not attribute any plastic deformation capacity to such girders. However, several studies have shown that under certain conditions there is a useful amount of plastic deformation capacity also in slender girders. This deformation capacity can be utilized to verify extra capacity reserves in old bridges by allowing partial moment redistribution. A method for utilizing a limited redistribution bending based on beam theory will be proposed.
6.4. Use of non-destructive tests (NDT) for load capacity reassessment
Since the 1950s welding becomes a useful procedure for assembling components of metallic bridges. In welded joints cracks are often localized at the welding. Indeed the welding process induces some defects which help small cracks to appear. These defects can grow under cyclical loading and can induce the joint failure, and depending of the redundancy degree of the bridge can lead to the failure. Inspections allow detection of this crack before the failure and repair actions will consequently depend on the type of structure and its degree of redundancy. Two objectives were clearly identified within this research:
• an objective for reliability assessment by a probabilistic approach of load resistance of welded steel bridges,
• an objective for the development of a specific inspection methodology in order to control the failure risk due to fatigue and rupture, and thus to be used as a decision- -making procedure.
The answer to these objectives will be relevant only if it is possible to calibrate the models with statistical data. This concerns the parameters of mechanical models (Paris law, rupture criterion, etc) and the performance of crack detection methods (detection threshold, POD curves, etc). The proposed approach is probabilistic-based and concerns a joint model of crack propagation and rupture. The performance of typical NDT methods used in bridge inspections is also evaluated considering field conditions, and characterized in probabilistic terms. The different types of inspections are then considered to update the reliability levels of different existing bridges.
7. MASONRY ARCH BRIDGES
A survey of the existing European railway bridges has established that over 40% of the bridges are masonry arch bridges and that about 60% of these bridges are over 100 years old. This therefore presents a major problem for the bridge owners when considering future trends in loading and management strategies.
Unlike other types of bridge, masonry arch bridges depend upon mass and geometry to maintain a stable compressive structural form. Their proven longevity is as much dependent upon the particulate nature of the bridge as the durability of the materials that form the individual elements.

Guideline for load and resistance assessment of existing European railway bridges
229
In recent years, there has been a renewed interest in the behaviour of masonry arch bridges. Extensive research programmes, particularly in the UK, have added much to our understanding but there are still significant areas of uncertainty which have restricted any attempts to improve assessment methods.
It was established at the beginning of the Sustainable Bridges project that it was unlikely that the traditional method of assessment, the MEXE method, would be capable of predicting the load carrying capacity of masonry arch bridges subjected to step changes in the loading regime. Recent developments in analytical techniques and advances in bespoke and commercial FE and DE software has led to the accumulation of a sufficient body of experience to enable greater confidence in the output of such methods. This is not to say that total reliance on such methods is justified. All such methods should carry a “health” warning which is based upon engineering commonsense.
Firstly, a holistic approach should be taken. In the past, over reliance has been made on determining the carrying capacity of the arch barrel modelled as a 2 dimensional structural element supported on rigid abutments.
Secondly, defects were taken into account by including factors that relied upon “experienced” engineering judgement – these were not even based upon experimental evidence let alone any analytical work.
Thirdly, the long term performance of masonry under cyclic loading is not well understood. Any step change in the loading regime raises this as an issue. Traditionally, it is accepted that the general stress levels in the masonry structural elements of an arch bridge are low compared with the “as built” material properties. With the passage of time this may no longer be the case. Internal and external changes in the material condition can have a significant effect upon their mechanical properties. Additionally, the accumulated effect of millions of axle loads may mean that the bridge fabric is reaching a more vulnerable stage of its residual life.
In order to develop improved guidance for the resistance assessment, a programme of research has been initiated that seeks to address the above issues. It was acknowledged at the outset that sufficient analytical tools existed to enable the assessing engineer to analyse a masonry arch bridge. Where help was needed was in the input data, modelling and the interpretation of output.
Five areas of research were identified. These were: • modelling of the load path from the axle to the extrados of the arch barrel, • modelling of the effects of defects, • studying the behaviour of masonry under cyclic loading, • determining the load carrying capacity using a probabilistic approach, • studying the soil-structure interaction. The output from the above research and others concurrent research activity have been
incorporated into the guideline which contains details of a new “SMART” assessment method that sets out a procedure which will give the bridge owners greater confidence in their asset management systems.
8. CONCLUSIONS
This paper presents the Guideline developed within work package WP4 of the Sustainable Bridges project working with load and resistance assessment of existing European railway bridges. The guideline, which is the first of its kind, is providing the basis for a significant step forward in the efficiency in management of railway bridges in Europe with focus on both load and resistance at both line level, bridge level and bridge element level. Irrespective of the user being a railway bridge owner, a consulting engineer, a research institute or a contractor.

5. Bridge performance and resistance for higher loads and speeds
230
REFERENCES Casas, J.R., Brüwhiler, E., Cervenka, J., Holm, G., Wiśniewski, D. (2007): Capacity assessment of European railway bridges. Limits states and safety formats. In: “Sustainable Bridges – Assessment for Future Traffic Demands and Longer Lives”, eds. Bień, J., Elfgren, L., Olofsson, J., Dolnośląskie Wydawnictwo Edukacyjne, Wrocław 2007.
ERRI Committee D214/RP9 (1999): Rail Bridges for speeds > 200km/h. Final Report. Part A: Synthesis of the results of D214 Research, ERRI, Utrecht, 362 pp.
FIB (2006): FIB Model Code for Service Life Design. Bulletin d’Information N. 34. Federation Internationale du Beton. Lausanne.
Hoehler, S. (2005): Material properties of Metal Railway Bridges. Background document for guideline for load and resistance assessment of existing European railway bridges, WP4-S-R-001, RWTH Aachen, Germany.
Johansson, B. (2005): Updated assessment methods for riveted structures. Background document for guideline for load and resistance assessment of existing European railway bridges, WP4-S-R-003, LTU, Sweden.
Larson, T. (2005): Fatigue on riveted structures. Background document for guideline for load and resis-tance assessment of existing European railway bridges, WP4-S-R-002, LTU, Sweden.
LIFECON (2004): Life cycle management of concrete infrastructures for improved sustainability. Competitive and Sustainable Growth Program. EU, Brussels (http://www.vtt.fi/rte/strat/projects/lifecon).
Nowak, A.S., Collins, K.R. (2000): Reliability of Structures. New York, McGraw-Hill.
Patron, A. (2005): Use of NDT methods for load capacity reassessment. Background document for guide-line for load and resistance assessment of existing European railway bridges, WP4-S-R-004, LCPC, France.
Plos M. (2002): Improved Bridge Assessment using Non-linear Finite Element Analyses. Bridge Mainte-nance, Safety and Management, Proceedings of the First International Conference on Bridge Mainte-nance, Safety and Management, IABMAS 2002, Barcelona, Spain, 14–17 July, 2002, Publication of International Center for Numerical Methods in Engineering (CIMNE), Barcelona, 8 pp.
Plos, M., Gylltoft, K., Lundgren, K., Cervenka, J., Thelandersson, S., Elfgren, L., Herwig, A., Brühwiler, E., Rosell, E. (2007): Structural assessment of concrete railway bridges, In: “Sustainable Bridges – Assessment for Future Traffic Demands and Longer Lives”, eds. Bień, J., Elfgren, L., Olofsson, J., Dolnośląskie Wydawnictwo Edukacyjne, Wrocław 2007.
prEN 1991-2 (2001): Traffic Loads on Bridges.
UIC Leaflet 776 – 2R (2003): Design requirements for rail-bridges based on interaction phenomena be-tween train, track, bridge and in particular speed.

Capacity assessment of European railway bridges. Limit states and safety formats
231
Capacity assessment of European railway bridges. Limit states and safety formats
Joan R. CASAS, Eugen BRÜHWILER, Andrin HERWIG,
Jan CERVENKA, Göran HOLM & Dawid WIŚNIEWSKI This paper deals with a summary description of the main safety criteria and requirements adopted in the Deliverable D4.2 “Guideline for Load and Resistance Assessment of Existing European Railway Bridges” developed in the WP4 of the SUSTAINABLE BRIDGES project. A brief summary of the proposed methodology for the fatigue service life assessment of existing railway bridges is also presented. Finally, a probabilistic approach to the prediction of long- -term behaviour of the subsoil in the transition zones of bridge abutments is presented. A more complete and detailed description of the general basis and criteria summarized here, can be found in the background document SB4.4 Safety (2007).
1. INTRODUCTION
One of the main issues related to a Guideline for assessment is to decide on the safety formats that shall be used in the assessment and on the philosophy behind these formats. The safety issues to consider are not only those related to structural aspects, but also dealing with durability and service life design. The paper explains the criteria, boundary conditions and requirements adopted in the definition of the safety format as appear in the Guideline and defines the basis and criteria that can be used to set the required safety level when assessing existing railway bridges. The safety level is worked out in the form of a target value of the reliability index for the Ultimate, Serviceability and Fatigue Limit States. Because bridge assessment is highly case-specific, the Guideline does not just propose a value to be adopted for the safety level, but gives information and guide how to fix this level for each case under study. Due to their relevance for railway bridges, a specific treatment within the safety issues is devoted to the subjects of fatigue assessment and the long-term behaviour of approaches and embankments. These issues are developed from a probability based approach, in agreement with the proposed philosophy of safety assessment adopted in the Guideline.
Sustainable Bridges – Assessment for Future Traffic Demands and Longer Lives

5. Bridge performance and resistance for higher loads and speeds
232
2. SAFETY CRITERIA
2.1. Safety format
The Guideline adopts the safety concept which is commonly used in bridge engineering for design or capacity assessment: the limit state (LS) approach (Nowak and Collins, 2000). The adoption of different safety formats is proposed in parallel with the use of less or more advanced levels of assessment. In the simplest case, the assessment carried out at a member level is enough to ensure the correct performance of the bridge. In this case, the “usual” safety format based on the use of partial safety factors and a linear analysis, as in the design codes, is used. However, different safety formats become necessary when assessing the particular bridge where partial safety factors provided by codes are not applicable or when assessing the bridge at a system/structural level, where more advanced analysis methods are mandatory (e.g. non- -linear analysis, system reliability analysis, etc.).
Component/member level assessment
The same general principles as provided by current standards for the design of new structures are adopted in the Guideline as the basis for the member level assessment of existing bridges. Considering the fact that the Eurocodes (EN’s) will be in the next future the standards for the design of new bridges in Europe, the safety principles assumed there (EN-1990, 2001) are also used as the basis in the Guideline for assessment of existing structures and bridges at a “normal” level. According to that, the safety format adopted for the assessment at a component level is the Partial Safety Factor Method as specified by the following equation:
nnSnnSnSnRc SSSR γγγφφ ...2211 ++≥ (1)
where: Rn is the nominal resistance of the section, Sni is the nominal value of i-th action or action effect (dead load, live load, etc.), ΦR is the resistance factor (taking into account the uncertainty of mechanical and geometrical parameters describing the section resistance as well as the uncertainty of the resistance model itself), Φc is the condition factor (related to the actual condition of the bridge derived from the condition assessment) and γSi is the partial safety factor of i-th load (taking to account the uncertainty in the estimation of actions or actions effects).
In the absence of calibrated partial safety factors for resistance and actions, direct probabilistic methods (full probabilistic format) should be applied with the target reliability levels defined according to the values of the reliability indices β (Nowak and Collins, 2000) presented in section 2.2 (Table 1). The higher suitability on direct use of reliability methods for bridge assessment than in design is due to the fact that in the last case, a better balance between the replacement costs and the continued operation can be done via a risk assessment and a life-cycle cost analysis.
Because the direct use of full advanced reliability methods can be time-consuming, a simplified method, the Mean Load Method is proposed as an alternative method. The reliability index in this method is evaluated as follows:
2/122
_
_
)( SR VVS
RLN
+=β (2)

Capacity assessment of European railway bridges. Limit states and safety formats
233
where:_
R is the mean value of resistance,_S is the mean value of total-load effect, VR is the
coefficient of variation of resistance and VS is the coefficient of variation of total-load effect.
In this case, only the mean value and standard deviation of resistance and actions is necessary. The random variables are assumed as long-normally distributed. The Guideline contains the information how to obtain in an easy way for the evaluator, the statistical parameters of resistance (R, VR) for the most common cases of bridges encountered in the European railway network (SB4.4 Safety, 2007).
System/structural level assessment
As most bridges consist of a system of interconnected components and members, the reliability of the single component/member may, but do not have, to be representative for the whole bridge. The ability of a structural system, particularly a bridge system, to carry the loads after the failure of one of its members is called redundancy. The redundancy level can be only assessed through non-linear structural analysis, allowing the partial or total damage in some members. As a consequence, the safety formats required for the system/structural level assessment are significantly more complicated and they are rarely used in the design of new structures. However, in the assessment of existing bridges the reliability methods for structural systems and corresponding safety formats should be used, especially when the component/member level checks fail and higher, more accurate levels of assessment are foreseen. Different ways to check the safety of the system are proposed depending on the degree of previous knowledge about the structural behaviour of the system. In the case that the bridge as a system has a known or easily predictable response, the non-linear analysis is not necessary and the Guideline proposes to use a reliability assessment based just on the results of the component/member level analysis. The applicable safety formats are similar to those described by equation (1) and incorporating a new factor ΦS that accounts for the system behaviour of the bridge. However in many cases the behaviour of the bridge is unknown and difficult to predict, especially when dealing with existing, deteriorated structures. Therefore the reliability assessment of the structure has to be performed based on the results of non-linear analysis. In this case, similarly to the member level assessment, 3 different safety formats have been worked out: semiprobabilistic (partial safety factor method), fully probabilistic (probabilistic non-linear analysis) and simplified probabilistic. At the system level, additionally, the global resistance safety factor is also introduced. The fully probabilistic analysis coupled with nonlinear FEM is the most accurate method of reliability analysis of structural systems. However, it requires huge computational effort even when using advanced reliability techniques especially thought for this type of applications as for example Latin Hypercube, Response Surface, Directional Sampling, etc. (SB4.4 Safety, 2007). Due to this fact some simplified methods of probabilistic non-linear analysis proposed by Ghosn and Moses (1998) and Sobrino and Casas (1994) have been adopted and slightly modified to be applicable for the assessment of existing railway bridges. The general idea of those methods is to use the information from sectional probabilistic analysis and combine them with results of a limited number of deterministic nonlinear analyses. The proposed two simplified probabilistic methods applicable to the system level assessment allow: 1) the adoption of the more advanced reliability-based assessment techniques, but with a simplified format that becomes more understandable for the practical evaluator engineer with no specific background on probabilistic methods, and 2) the possibility of taking into account the system behaviour without having to solve a huge number of non-linear problems. The method of Ghosn and

5. Bridge performance and resistance for higher loads and speeds
234
Moses is based on the concept of redundancy and assume that a bridge may be considered safe from a system viewpoint if:
1. It provides a reasonable safety level against first member failure (member). 2. It does not produce large deformations under regular traffic conditions (serviceability). 3. It does not reach its ultimate system capacity under extreme loading conditions
(ultimate). 4. It is able to carry some traffic loads after damage or the loss of a main load-carrying
member (damage). The incorporation of system behaviour to the safety assessment in the mentioned method is
done by the relative reliability indices, ∆βi, which are defined as the difference between the safety indices for the system and the safety index for the member. In order to guarantee the bridge safety, the obtained relative reliability indices must be greater than the corresponding target values and, at the same time, the member safety has to be ensured too. Therefore, the safety format should take the form:
etulttetmembertetultultmemberult argargarg ββββββ =+∆≥=+∆
etservtetmembertetservtservmemberserv argargarg ββββββ =+∆≥=+∆ (3) etdamagetetmembertetdamagetdamagememberdamage argargarg ββββββ =+∆≥=+∆
The target values of the relative reliability indices ∆βi and the reliability index for the member are presented in section 2.2 (Tables 1 and 2). The values of the reliability indices, for an analysed bridge, corresponding to member failure and to serviceability, ultimate and damage condition limit states are defined as follows:
221
LLLF
TRAINmember
LLLF
σσβ
+
−= (4)
22LLLF
TRAINfserv
LLLF
σσβ
+
−= (5)
22LLLF
TRAINuult
LLLF
σσβ
+
−= (6)
22LLLF
trainddamage
LLLF
σσβ
+
−= (7)
where 1LF , fLF , uLF and dLF are the mean values of the load factors corresponding to first member failure, reaching the serviceability limits, reaching the ultimate limit state and reaching the damaged condition limit state (see Figure 1). TRAINLL and trainLL are respectively the mean values of the load factor describing maximum expected lifetime load and the maximum expected load in the period between subsequent inspections. LFσ and LLσ are the standard deviations of 1LF and TRAINLL respectively. Detailed description of the above introduced parameters is presented in the Guideline and in (SB4.4 Safety, 2007).
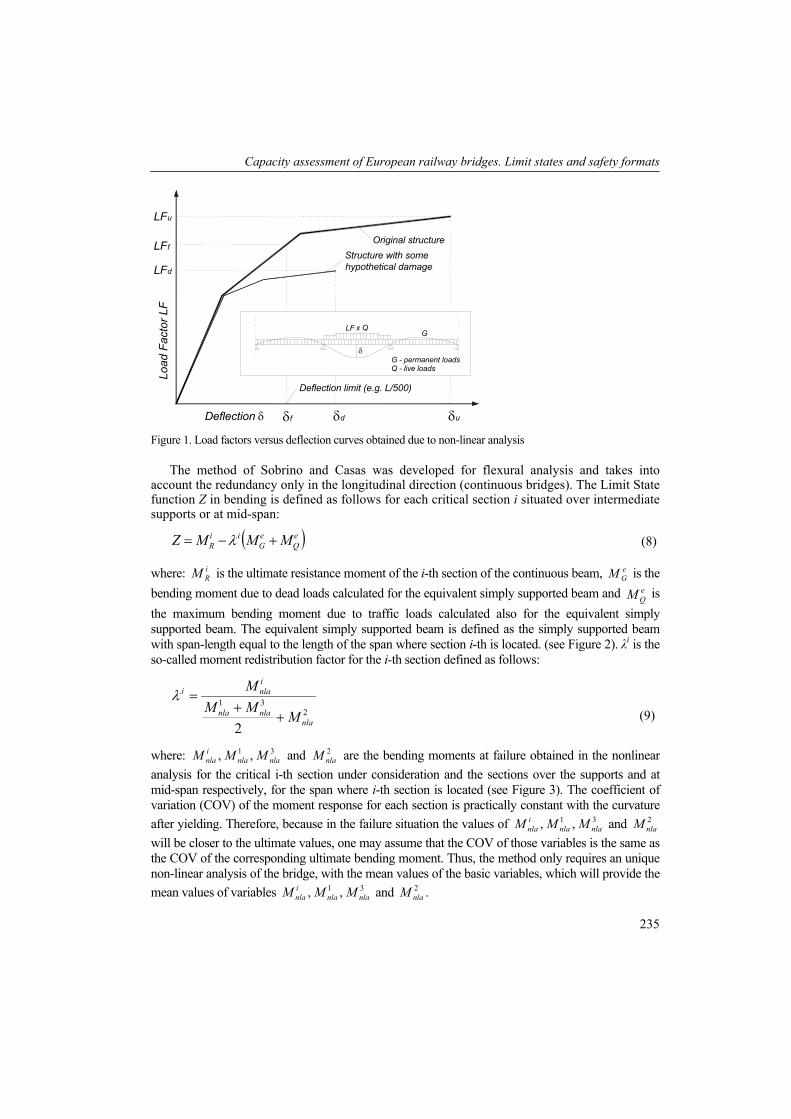
Capacity assessment of European railway bridges. Limit states and safety formats
235
Deflection δ
Load
Fac
tor L
F
δ
Gx QLF
LFd
LFf
LFu
δuδdδf
Deflection limit (e.g. L/500)
Original structureStructure with some hypothetical damage
G - permanent loadsQ - live loads
Figure 1. Load factors versus deflection curves obtained due to non-linear analysis
The method of Sobrino and Casas was developed for flexural analysis and takes into account the redundancy only in the longitudinal direction (continuous bridges). The Limit State function Z in bending is defined as follows for each critical section i situated over intermediate supports or at mid-span:
( )eQ
eG
iiR MMMZ +−= .λ (8)
where: iRM is the ultimate resistance moment of the i-th section of the continuous beam, e
GM is the bending moment due to dead loads calculated for the equivalent simply supported beam and e
QM is the maximum bending moment due to traffic loads calculated also for the equivalent simply supported beam. The equivalent simply supported beam is defined as the simply supported beam with span-length equal to the length of the span where section i-th is located. (see Figure 2). λi is the so-called moment redistribution factor for the i-th section defined as follows:
231
.
2 nlanlanla
inlai
MMMM
++
=λ (9)
where: 31 ,, nlanlainla MMM and 2
nlaM are the bending moments at failure obtained in the nonlinear analysis for the critical i-th section under consideration and the sections over the supports and at mid-span respectively, for the span where i-th section is located (see Figure 3). The coefficient of variation (COV) of the moment response for each section is practically constant with the curvature after yielding. Therefore, because in the failure situation the values of 31 ,, nlanla
inla MMM and 2
nlaM will be closer to the ultimate values, one may assume that the COV of those variables is the same as the COV of the corresponding ultimate bending moment. Thus, the method only requires an unique non-linear analysis of the bridge, with the mean values of the basic variables, which will provide the mean values of variables 31 ,, nlanla
inla MMM and 2
nlaM .

5. Bridge performance and resistance for higher loads and speeds
236
Figure 2. Definition of equivalent simply supported beam
Figure 3. Bending moments at failure state obtained due to non-linear analysis
2.2. Safety level
The safety levels are considered separately for the member and the system level assessment. The proposed target reliability levels proposed in different countries and by different international bodies (Eurocode, ISO) are presented, jointly with the most significant assumptions regarding reference period, cost of failure, cost of safety measure, type of failure and the inspection level. In this way, the engineer responsible for the assessment can choose the most suitable safety level for each specific case into consideration. As an example, in Table 1 are presented some values adopted in different works for the member level. The design values in table 1 are proposed for the case of moderate consequences of failure and reference period of 1 year. The target values for the relative reliability indices, which allow to define the target reliability index for the system level assessment (see equation 3) are presented in Table 2.
Table 1. Target values of the reliability index at member level for ULS, moderate consequences of failure and reference period of 1 year proposed in different countries and International Bodies
Canada USA Eurocode JCSS Denmark ISO
Design 3.75 3.75 4.7 4.2 4.2 4.7
Assessment 3.25 2.5 – – 4.2 4.7
Q* - live loads provoking bridge failure G - permanent loads
Q*G
nla2M
M 3nlanla
1M
M1 3M
M 2
GQ
G or QeM
G or Q
Equivalent simply supported beam
Real structure
G - permanent loadsQ - live loads

Capacity assessment of European railway bridges. Limit states and safety formats
237
Table 2. Target values of the relative reliability indices (Ghosn and Moses 1998)
∆βult ∆βser ∆βdamage
Superstructure 0.85 0.25 −2.70
Substructure 0.50 0.50 −2.0
3. FATIGUE
3.1. Concept
Examination of the fatigue safety of a railway bridge may be necessary as a result of observations (displacements, deformations), changes in traffic conditions (increase of rail traffic loads) or when a defined service life is reached.
A rational and appropriate procedure for the examination of fatigue safety proceeds by stages using both deterministic and probabilistic methods of increasing sophistication including the following steps : (1) Simplified deterministic method, (2) Simplified probabilistic method, (3) Consideration of monitoring, (4) Detailed probabilistic method.
The aim of the first stage is to identify the fatigue critical members of the structure. The probability of fatigue fracture of a structural detail or element is assessed in stages 2 and 4. The probability of crack detection during inspection and monitoring is evaluated in stage 3, and subsequently linked to the (calculated) probability of fatigue fracture to obtain the probability of failure:
( )ectionfatfail ppp det1−⋅= (10)
where: failp – probability of failure, fatp – probability of fatigue fracture, detp – probability of detection.
The probability of failure can also be expressed by means of the reliability index according to the standard normal distribution. Finally the reliability of a structural element is compared to the target value:
ettfail argββ ≥ (11)
where: failβ – reliability index with respect to failure, ett argβ – target reliability index for fatigue.
3.2. Simplified deterministic method
The fatigue safety of all fatigue vulnerable construction details may be expressed by the fatigue safety ratio defined below:
a) with respect to the fatigue limit (a limit below which no crack propagation will occur):
0.1max
≥∆
∆=
σγσ fatD
fatn (12)

5. Bridge performance and resistance for higher loads and speeds
238
where: fatn – fatigue safety ratio, Dσ∆ – fatigue limit of the investigated construction detail, fatγ – fatigue resistance coefficient, maxσ∆ – maximum fatigue stress effect (stress range), b) with respect to the fatigue strength (fatigue damage (crack propagation) will accumulate if a part of the spectrum of stress cycles is above the fatigue limit):
0.1≥∆
∆=
e
fatcfatn
σγσ
(13)
where: cσ∆ – fatigue strength at 2 million cycles (fatigue category), eσ∆ – (equivalent) fatigue load effect referred to 2 million cycles. Based on this deterministic method, the bridge members are compared, and a ranked list
identifying fatigue critical details is established. Details with 0.1<fatn require further investigation. Fatigue safety is verified if 0.1≥fatn .
The fatigue resistance coefficient fatγ may be assumed according to risk-based considerations. If the considered detail is redundant causing local failure, a smaller coefficient may be assumed compared to a fatigue hazard scenario where fatigue failure of the detail is leading to collapse of an element or the whole structure.
3.3. Simplified probabilistic method
The reliability index for fatigue failure of a structural detail or element is examined as follows:
22
)(
ER
futERfat
ss
Nmm
+
−=β (14)
where: Rm – mean of the fatigue strength (= RC s2log +∆σ ), )( futE Nm – mean of fatigue load effect as a function of the number of future trains
futN , Rs – standard deviation of the fatigue strength, Es – standard deviation of the fatigue load effect.
The reliability index fatβ as a function of the number of future trains futN is calculated. If the probability of crack detection due to monitoring (inspections) is not considered, thus
detp = 0; it follows from the above equation that fatfail pp = or fatfail ββ = . The reliability index is now compared to the target value ett argβ .
There are two ways to influence the calculated reliability index: (1) to optimize and focus monitoring on the fatigue relevant construction detail, considering thus the probability of crack detection, and (2) to refine the assumptions and calculate fatp using a detailed probabilistic method.

Capacity assessment of European railway bridges. Limit states and safety formats
239
3.4. Consideration of monitoring
The condition of a railway bridge is monitored by regular inspection at least every 5 years throughout its service life. The monitoring of construction details identified as being fatigue vulnerable makes it possible to increase safety of the bridge. According to the above equation in Section 3.1, a construction detail with a theoretical probability of fracture above the target value can remain in service when the probability of crack detection (based on a specific monitoring technique) and the inspection interval are taken into account.
Appropriate monitoring techniques (including detailed inspections) allow for determining the probability of detection of a fatigue damage indicator (usually a crack). Depending on the accessibility of a construction detail to be monitored, the reliability and precision of the monitoring technique applied as well as the interval of inspection or measurement of a specific structural property, values for the probability of detection of an anomaly due to fatigue damaging may be determined and justified for use in the fatigue safety check.
3.5. Detailed probabilistic method
For the detailed probabilistic analysis, refined rail traffic models for the past and future are needed. The rail traffic in the past may be based on statistical data and other relevant information regarding the number of trains and towed loads. The rail traffic model for the future considers the expected traffic in terms of number of trains and expected axle loads for the investigated line.
The determination of the remaining fatigue life is refined by combining damage accumulation and crack propagation calculations:
The fatigue damage accumulation theory according to Miner is based on the fatigue strength curves (S-N curves, Wöhler lines). It is widely accepted and many results are available. Also the probability density functions of the fatigue strength of construction details are sometimes known. A classification system is available for the details (for both in steel and reinforced concrete).
Fatigue crack propagation calculation in steel may be conducted using fracture mechanics (Paris’ law for stable crack propagation). Crack propagation for each stress range is calculated and the influence of each stress cycle on crack propagation can be analyzed. However, appropriate fracture mechanics parameters for individual construction details are often not well known.
Further explanation on the fatigue assessment can be found in (SB4.4 Safety, 2007).
4. SETTLEMENT AT BRIDGE TRANSITION ZONES
Another issue related to a Guideline for assessment is the evaluation of long-term settlements in the bridge transition zone. For the assessment of existing railway bridges, it is important to take a holistic approach that takes into account the bridge structure as well as the foundation soil. Whereas the bridge structure is supported on stiff foundations, the transition zone adjacent to the bridge is often supported on the native soft soil and inherently settles more than the bridge. Differential settlements in the bridge transition zone have been identified as the major contributory factor in the deterioration of the track geometry at these locations (ERRI, 1999). As soon as differential settlements begin to develop, the variations of the dynamic train/track forces increase and this speeds up the track deterioration process. Problems associated with settlements in the bridge transition zone have an adverse effect on the safety, reliability, and economy of the railway line; for

5. Bridge performance and resistance for higher loads and speeds
240
example, ERRI (1999) states that maintenance within the transition zone is required five times more than for other track locations. The extent of the problems that develop within the transition zone is dependent upon the train load and velocity, and the foundation soil stiffness.
Described in this section is a simplified prediction method to evaluate settlements in the soft subsoil in the transition zones with a probabilistic approach. The method is applicable to soft subsoils; settlements can occur also in the ballast, sub-ballast and the embankment fill; however, such settlements are not considered herein. The method is only discussed briefly in this article; for a detailed description of the method, see (SB4.4 Safety, 2007).
The predictive method is to be used to calculate the magnitude of the future settlements to get a basis for evaluating if the future settlements are acceptable or not. 4.1. New predictive method
The settlement of soft soil due to loading is governed by three different mechanisms: (1) immediate elastic/plastic deformation, (2) consolidation time-dependent deformations due to dissipation of pore water, and (3) “creep” deformation, which occurs long-term under constant stress levels. The predictive method presented herein is based upon the approach developed by Alén (1998). The method is based upon the hypothesis that the time dependent deformation in soft clay can be described sufficiently by the three separate physical phenomena. The settlement behaviour of soils is time dependent and is greatly affected by the low permeability of the soft soil. In many cases, creep deformations of very soft soils occur over a very long period of time and do not reach a final magnitude during the lifetime of a structure.
A spreadsheet has been developed in order to implement the predictive method. The method requires the following geotechnical parameters: surcharge, or embankment, pressure (q), natural water content of the soft soil (w %), elastic compression modulus of the soft soil (M), permeability of the soft soil (k), total thickness of the soft soil layer (H), and drainage distance for the soft soil layer (L).
The geotechnical parameters are determined based on laboratory and field tests at the project site. It is important to have good quality data for the input parameters. No specialized method is required but standardised geotechnical testing methods should be used. The geotechnical parameters may represent the average values for the soil profile. However, uncertainties of input parameters can be accounted for by using probabilistic distributions, and a statistical method, such as a Monte Carlo simulation, can be used to perform the calculation in a number of iterations. Sensitivity analyses have indicated that the results are most affected by the natural water content and permeability of the soft soil.
4.2. Example application
The predictive method was used at an embankment at Lilla Mellösa, Sweden, which was constructed over 20 years ago. The predictive method was used for this case to provide an example of similar calculations that may be performed for a transition zone at a railway embankment. The geotechnical parameters for the site are shown in Table 3.
The long-term behaviour of the site was evaluated. A comparison between measured and calculated settlements is presented in Figure 4. The calculations were performed both with and without considering the long-term creep effects, and by the statistical approach (Monte Carlo simulation). As can be seen in Figure 4, the results of the analytical predictive method provide

Capacity assessment of European railway bridges. Limit states and safety formats
241
a good match to the measured data at the site. The method may then be used to predict future settlements at the site over time due to changes in either the soil conditions or loading conditions at the site.
Table 3. Geotechnical parameters for Lilla Mellösa, 20 years after construction
Distribution Mean value Standard deviation Lower limit Upper limit
Embankment load, q (kPa) Normal 20 2 – –
Modulus, M (kPa) Lognormal 250 30 –200 –
Permeability, k (m/s) Uniform 8 x 10⁻¹⁰ – 3 × 10⁻¹⁰ 3 × 10⁻⁹
Water content, wN (%) Lognormal 90 20 60 130
Total layer thickness, H (m) Triangular 13,5 – 13 14
Drainage length, L (m) Uniform 6,75 – 6 8
0.00
0.10
0.20
0.30
0.40
0.50
0.60
0.70
0.80
0.90
1.00
0.0 0.1 1.0 10.0 100.0
Tim e (year)
Sett
lem
ent (
m)
Model excl creepModel incl creepMeasuredMonte Carlo simulation
Figure 4. Measured and calculated settlement in Lilla Mellösa, Sweden
4.3. Recommended use
The proposed new simplified method can be used to evaluate the long-term settlements in soft subsoil below railway embankments. Promising results have been achieved with this new simplified prediction method in comparing it with measured and calculated settlements for a number of embankments. The method can be applied to the assessment of the behaviour of transition zones at existing railway bridges. The method is to be used as a first step in the assessment to calculate the magnitude of the future settlements. If the calculated settlements are too large to be acceptable, then strengthening measures should be performed.

5. Bridge performance and resistance for higher loads and speeds
242
5. CONCLUSIONS
The assessment of existing railway bridges can be carried out with different levels of accuracy and complexity. The safety formats proposed in the Guideline wish to provide to the user sufficient relevant information on the available possibilities when faced with the assessment of an existing railway bridge. In this way, the safety formats are structured and presented on a increasing level of complexity, from the partial safety factor to full probabilistic analysis. Depending on the results derived from the gradual application of the available methods, decisions can be taken on future investigations to be performed. This is in accordance with the philosophy of assessment levels incorporated in the Guideline.
REFERENCES
Alén (1998): On Probability in Geotechnics: Random calculation models exemplified on slope stability analysis and ground-superstructure interaction. Doctoral Thesis, Department of Geotechnical Engineering, Chalmers University of Technology, Göteborg.
EN-1990 (2001): Basis of Structural Design. European Standard, Brussels: CEN.
ERRI (European Rail Research Institute) (1999): State of the Art Report, Bridge Ends, Embankment Structure Transition. ERRI Report D 230.1/RP3, Utrecht, 100 pp.
Ghosn, M., Moses, F. (1998): Redundancy in Highway Bridge Superstructures. NCHRP Report N. 406. Washington: Transportation Research Board.
Nowak, A.S., Collins, K.R. (2000): Reliability of Structures. New York: McGraw-Hill.
SB4.4 Safety (2007): Safety and Probabilistic Modelling. Background document D4.4 to SB-Resistance (2007) “Guideline for Load and Resistance Assessment of Railway Bridges”. Prepared by Sustainable Bridges – a project within EU FP6. Available from: www.sustainablebridges.net [cited 30 November 2007].
Sobrino, J.A., Casas, J.R. (1994): Random system response of reinforced and prestressed concrete bridges. In: Schueller, Shinozuka & Yao (eds), ICOSSAR’93, Proceedings of the International Conference on Structural Safety and Reliability, 985–988. Rotterdam, Balkema.

Updated rail traffic loads and dynamic amplification factors
243
Updated rail traffic loads and dynamic amplification factors
Eugen BRÜHWILER & Andrin HERWIG Updated rail traffic loads and dynamic amplification factors are derived for the deterministic verification of structural safety, serviceability and fatigue safety of existing railway bridges. Line class factors allow updating of the rail traffic action effect considering the given line class. Realistic dynamic amplification factors are deduced from both elastic and plastic structural behaviour of bridge elements at limit states. The present rational approach will most likely provide the basic and rational tool to demonstrate that most existing railway bridges fulfil the requirements of structural and fatigue safety as well as serviceability of current and future increased rail loads.
1. INTRODUCTION AND BASIC APPROACH
The objective of the examination of existing railway bridges is to show that for realistic traffic loads the requirements are fulfilled regarding:
• the Ultimate Limit State ULS (involving ultimate resistance and stability of the structure) through verification of the structural safety,
• the Serviceability Limit State SLS (involving functionality, comfort of persons, appearance) through the verification of the serviceability,
• the Fatigue Limit State FLS through the verification of the fatigue safety. Updated rail traffic models are needed for all three kinds of verification. This paper
presents a rational approach to define updated rail traffic loads considering line classes and dynamic amplification factors based on realistic structural behaviour at the various limit states.
The basic approach of updating action effects of rail traffic consists in a separate consideration of (static) loads Q (axle and line loads), and forces due to dynamic rail traffic effects. The updated action effect Eupdated is obtained according to equation 1. (In the case of structural safety verification, Eupdated needs to be multiplied with the load factor (γQ = 1.45)).
Sustainable Bridges – Assessment for Future Traffic Demands and Longer Lives

5. Bridge performance and resistance for higher loads and speeds
244
)( 71,UICkLCiupdated QEE ⋅⋅= αϕ (1)
The action effect of (static) rail loads is due to the Load Model UIC71 (without considering the factor Φ) which is multiplied with the line class factor αLC to account for the railway line class valid for the considered bridge. This static action effect is the same irrespective of the limit state to be verified.
Forces occurring in the bridge structure due to dynamic rail traffic action are expressed by the dynamic amplification factor ϕi (amplifying the static load effect) which depends on the limit state considered, e.g. ULS, SLS or FLS.
In the following, the line class factor αLC and the dynamic amplification factor ϕi are derived.
2. LINE CLASS FACTOR
Railway infrastructure operators categorize their lines into international line classes according to UIC code 700-O “Classification of lines and resulting load limits for wagons”; a reference carriage with axle geometry and axle loads is defined for each line class (Figure 1). Trains of an unlimited number of reference carriages create an effect that covers the effect of all allowed carriages on the given railway line class.
Figure 1. Reference carriages for line classes C3, D4, E4 and E5 (P: axle load; p: line load)
The line class factor is determined as the ratio between the maximum static action effect
due to the reference carriage and the maximum action effect of Load Model UIC71 (Figure 2). Action effects due to unloading are neglected. The factor Φ inherent to Load Model UIC71 is omitted since dynamic action effects are taken into account by the dynamic amplification factor ϕi according to Section 3.
Two static systems are considered; a simply supported single span beam and a continuous beam of two equal spans. The two span beam covers the action effect of multi span girders. These two static systems cover all possible statically determined (isostatic) and undetermined systems of structural bridge elements.

Updated rail traffic loads and dynamic amplification factors
245
Unlimited number of reference carriages Q[kN] = P[to]*g[m/s2]
Load model UIC71
LC Emax(UIC) α =
A B
L
A B C
L L
LCEmax(LC) α =
L
E=moments and shear forces at the cross sections of interest
Figure 2. Determination of the line class factor The maximum static effects of each reference carriage and the Load Model UIC71 are
obtained by numerical simulations where the load configurations are moved by small increments over the beam, and the action effect (moments, shear forces) for the cross sections of interest (at mid-span, over the intermediate support) are calculated. Figures 3 and 4 show the results represented as diagrams which can be readily used to read off the line class factor as a function of the span (ranging between 2 and 70 meters) of a given structural element.
Figure 3. Line class factors for moments and shear forces for single span beams (M: moment at mid-span, V: shear force at support)
E = moments and shear forces at the cross sections of interest

5. Bridge performance and resistance for higher loads and speeds
246
Figure 4. Line class factors for moments and shear forces for the two span beam representing continuous multi-span systems. (MB: moment at intermediate support, VB: shear force at intermediate support, VA: shear force at end support, M+ positive moment)
Two important issues need to be addressed when applying line class factors: 1. Measurements of real rail traffic loads indicate that axle loads higher than the ones covered
by the load models occur occasionally. For example, (SBB, 2000) reports for the determinant case of a railway line with frequent and heavy freight traffic that 0.2% of all measured axle loads were up to a maximum of 10% higher than the admissible axle load. Accordingly, a factor of about 1.1 should be considered to account for overloaded axles. Since overloaded axles occur as single events this factor should however be limited to short spans, i.e. ranging from 2 to about maximum 10 m. More investigation is needed to investigate this issue.
2. The above derived line class factors are valid for bridge elements that predominantly carry in the longitudinal direction. Structural elements, such as cross girders, transverse stiffeners of orthotropic decks or steel reinforcement in reinforced concrete deck slabs, predominantly carry in the transverse direction. For these elements, the action effect of the maximum single axle load has to be considered. Consequently, the following line class factors need to be taken for transverse elements: αLC = 0.8, 0.9 and 1.0 for line classes C3, D4 and E4/5 respectively.
3. DYNAMIC AMPLIFICATION FACTOR
In order to obtain realistic dynamic amplification factors, the corresponding structural behaviour at the various limit states (i.e. ULS, SLS, FLS) has to be considered. While at SLS and FLS the structural bridge behaviour is elastic, structural safety verification at ULS is

Updated rail traffic loads and dynamic amplification factors
247
usually performed considering plastic behaviour of cross sections and structural elements. As a consequence, dynamic amplification factors are derived in the following for plastic and elastic structural behaviour respectively.
3.1. Plastic structural behaviour at ULS with significant deformation capacity
At ultimate limit state ULS, structural elements in reinforced and prestressed concrete and in steel provide significant plastic deformation due to yielding of the steel. In statically undetermined systems, the plastic deformation capacity of the structural elements is usually not fully consumed by internal redistribution of cross sectional forces. In this case, deformation induced by dynamic forces may also be dissipated by the structural element.
However, in contrast to earthquake engineering, the so-called “gravity effect” consumes a considerable part of the total dissipation capacity of the structure. Both the forces due to traffic loads and gravity forces due to permanent loads act in the same direction, both leading to (external) work (energy) that the structural elements has to dissipate by plastic deformation (Figure 5). Strain-hardening behaviour in the structural response is advantageous in particular for cases where the static action effect is close to the yielding point of the force-deformation curve.
with gravity effect
Ein
m·g
displacement
force Ein
dissipation capacity compensated by gravity loads (equilibrium !)
m·g
∆max
Figure 5. “Gravity effect” and dissipation of energy in the structural response (shown as force vs. displacement curve)
Ludescher (2003) and Herwig (2007) showed by means of simple dynamic models how the external work (energy) due to dynamic action effects (i.e. impact-like events, excitation by track irregularities) is easily dissipated in common structural elements before the element fully fails (fractures). Theses studies show among others that:
• the most unfavourable scenario for bridge elements is the impact-like excitation of passing vehicles by singular irregularities,
• bridge elements will most probably always fail in bending after significant plastic deformation if subjected to excessive dynamic traffic action effects. More brittle failure mechanisms like predominant shear failures are less likely to occur,
• the required dissipation capacity increases with the intensity of the excitation and the stiffness of the vehicle, and decreases with the stiffness of the structure,
• marked strain hardening in the structural response increases significantly the dissipation potential,
• resonance oscillation energy may also be dissipated by plastic deformations of the structural element.

5. Bridge performance and resistance for higher loads and speeds
248
The calculations indicate that only a small partition of the remaining dissipation capacity (after taking into account energy dissipation due to the gravity effect and internal redistribution) is needed to dissipate the energy due to dynamic rail traffic action effects. In reality, even less dissipation energy is necessary as the bridge structure changes its dynamic properties in terms of fundamental frequency after yielding and early plastic deformations, which leads to high damping before the virtual elastic stationary state is reached.
From these investigations follows that in the case of plastic structural behaviour at ULS the maximum static action effect due to train loads does not need to be amplified by a factor for considering dynamic rail traffic action effects, or:
ϕULS = 1.0
This is valid for most structural elements showing significant plastic deformation at ultimate limit state, i.e. structural elements in reinforced and prestressed concrete as well as in steel. Reliable numerical models are today available to conduct nonlinear analyses of structures (Plos et al., 2007) with the objective to determine the structural response necessary to evaluate the deformation capacity.
3.2. Structural behaviour at ULS with small deformation capacity
For failure modes with small deformation, i.e. punching of slabs or other shear-type failure modes, it is prudent to assume some amplification factor that implies relevant characteristics of elastic dynamic structural behaviour (see also 3.3) as well as the following items:
• Only extremely high single carriage loads cause ULS relevant scenarios. This means that the amplification factor depends on the determinant length Lϕ, i.e. the longer Lϕ the smaller the amplification factor ϕULS.
• In addition, many investigations show (f.ex. also in (Ludescher, 2004; Herwig, 2006) that dynamic amplification is smaller with higher acting load.
• The main cause of dynamic effects is due to track irregularities. Assuming that the track is maintained periodically, the amplification factor should consider track irregularities typical for the quasi permanent state.
As a consequence, the amplification factor for failure modes with small deformation at ULS as shown in Figure 6 is suggested based on the forgoing considerations.
1.0
1.1
1.2
1.3
1.4 ϕULS
0 10 20 30 40 50 Lϕ [m]
Figure 6. Dynamic amplification factor for failure modes with small deformation

Updated rail traffic loads and dynamic amplification factors
249
3.3. Elastic structural behaviour at SLS and FLS
Dynamic amplification factors for elastic structural behaviour at SLS and FLS are given in EN 1991-2 Appendices C and D; the corresponding formula considers the superposition of the effect of two main parameters involved, i.e. (1) train velocity and (2) track irregularity which are both described by one formula for ϕ′ (train velocity) and for ϕ″ (track irregularity).
These formulas have been derived in the past as “envelope curves” from dynamic bridge measurements and dynamic analyses considering trains including also average or light weight carriages which often provide the highest dynamic amplification effects. However, in the present case, the effect of high carriage weight on dynamic amplification is of interest only since the dynamic amplification factor is multiplied with the highest (static) load. From this follows that the formulas in EN 1991-2 yield unrealistically high dynamic amplification factors.
Amplification factors for high traffic loads are distinctly lower than for trains with lighter carriages as has been shown by many investigations. In particular, wheel force amplification and corresponding action effects (forces) in the bridge element due to track irregularities decrease with increasing weight of carriage (Herwig, 2006; Ludescher, 2004):
• In the case of dynamic amplification due to excitation from train movement (train velocity), maximum dynamic effects occur only with regular axle spacing in narrow velocity domains. Other velocities lead to moderate dynamic effects. Here the effect of carriage weight is less pronounced.
• In the case of dynamic effects due to track irregularities, one needs to consider that the track quality varies over time, and since the overloaded carriage (as leading action) is an occasional event, it is reasonable to consider track irregularities as a quasi-permanent state.
As a consequence and since the static load considered in the SLS and FLS verifications is extreme (high), the dynamic amplification factor according to EN 1991-2 are reduced accordingly as follows:
• At serviceability limit state SLS, it must be taken into account that occasional values of dynamic action effects need to be considered since insufficient serviceability could lead to train derailment and thus to a safety problem. Based on the foregoing considerations, the following dynamic amplification factor ϕSLS is suggested:
''3.0'1 ϕϕϕ ++=SLS with 'ϕ and ''ϕ according to EN 1991-2 (2)
• At fatigue limit state FLS, frequent values of dynamic action effects are considered to represent service load conditions. Based on the foregoing considerations, the following dynamic amplification factor ϕFLS is suggested:
)''3.0'(5.01 ϕϕϕ ++=FLS with 'ϕ and ''ϕ according to EN 1991-2 (3)
Finally, it should be noted that dynamic amplifications due to both train velocity and track irregularities should actually not just be added to obtain the total dynamic amplification factor, since it is rather unlikely that the maximum dynamic effect of both effects occurs at the same time for the occasional case of a carriage with maximum load. Equations 2 and 3 are thus rather conservative.
4. CONCLUSION AND OUTLOOK
Updated rail traffic loads and dynamic amplification factors are derived for the deterministic verification of structural safety, serviceability and fatigue safety of existing railway bridges. Line class factors are determined for updating the rail traffic action effect

5. Bridge performance and resistance for higher loads and speeds
250
considering the given railway line class. Realistic dynamic amplification factors are deduced considering both elastic and plastic structural behaviour of bridge elements at limit states.
The present rational approach is simple and reasonably conservative. It most likely provides the basic tool to demonstrate – in an efficient manner – that most existing railway bridges fulfil the requirements of structural and fatigue safety as well as serviceability for both present and future (increased) rail loads.
The present approach is applicable for most railway bridges. In special cases, rail traffic measurements, nonlinear analyses to determine the structural response or dynamic numerical simulations for frequent train configurations could be performed to determine specific load models and dynamic amplification effects for particular bridge structures.
(The present approach is currently integrated into the Swiss Codes on “Maintenance of existing structures” to be released in 2008 in Switzerland.)
REFERENCES EN-1990 (2001): Basis of Structural Design. European Standard, Brussels: CEN.
EN1991-2 (2003): Eurocode 1: Actions on structures – Part 2: Traffic loads on bridges. European Standard, Brussels: CEN.
Frýba, L. (1996): Dynamics of Railway Bridges, London: T. Telford.
Frýba, L., Pirner, M. (1998): Load tests and modal analysis of bridges, Engineering Structures 23 (2001) pp. 102-109.
Herwig, A. (2006): Consideration of the effect of increased train loads for the fatigue examination of concrete bridges, In Thomas Vogel, Nebojša Mojsilovi, Peter Marti (editors), 6th International PhD Symposium in Civil Engineering, Zurich, 23-26 August, SP-015, Zurich: IBK Publikation.
Herwig, A., Reinforced concrete bridges under increased rail traffic loads – load carrying behaviour, fatigue behaviour and safety measures, Dissertation (in preparation).
Ludescher, H. (2004): Berücksichtigung von dynamischen Verkehrslasten beim Tragsicherheitsnachweis von Strassenbrücken, EPFL - DGC - MCS, Lausanne, Thèse N° 2894, Switzerland.
Plos, M. et al. (2007): Structural Assessment of Concrete Railway Bridges, In: “Sustainable Bridges – Assessment for Future Traffic Demands and Longer Lives”, eds. Bień, J., Elfgren, L., Olofsson, J., Dolnośląskie Wydawnictwo Edukacyjne, Wrocław 2007.
SBB (2000): Schweizerische Bundesbahnen, Messungen von Belastungsspektren 1993-1999, Bericht 2.Februar 2000, (in German, unpublished, personal communication).
SB4.3.3 (2007): Dynamic railway traffic effects on bridge elements, Background document D4.3.3 to “Guideline for Load and Resistance Assessment of Railway Bridges”. Prepared by Sustainable Bridges – a project within EU FP6. Available from: www.sustainablebridges.net
UIC (2004): UIC Code 700: Classification of lines and resulting load limits for wagons, 9th edition of 1.7.87 and 2 Amendments, revision 2003/4.
UIC (2006): UIC Code 776-I: Loads to be considered in Railway Bridge design, Paris: International Union of Railways.

Structural assessment of concrete railway bridges
251
Structural assessment of concrete railway bridges
Mario PLOS, Kent GYLLTOFT, Karin LUNDGREN,
Jan CERVENKA, Sven THELANDERSSON, Lennart ELFGREN,
Andrin HERWIG, Eugen BRÜHWILER & Ebbe ROSELL The aim of the work presented here was to provide enhanced assessment methods that are able to prove higher load carrying capacities and longer service lives for existing concrete railway bridges. One main objective was to develop methods for non-linear analysis since this provides the greatest potential to discover any additional sources for load carrying capacity, and gives an improved understanding of the structural response. Another main objective was to provide methods for assessing deteriorated concrete bridge. Recommendations are given regarding the effect of reinforcement corrosion, particularly on anchorage capacity. Furthermore, a methodology for improved assessment of the remaining fatigue life of short-span concrete bridges and secondary elements is presented. Other topics treated are evaluation of material properties, simplified methods for structural analysis and the bending-shear-torsion interaction.
1. INTRODUCTION
For a sustainable development in Europe, there is a need to at least double the railway transports in the coming 20 years. In order to reach this, the residual service lives of existing concrete bridges need to be extended, at the same time as they are subjected to higher axle loads, higher railway speeds and heavier traffic intensity. Today, many concrete bridges are replaced or strengthened because their reliability cannot be guaranteed based on the structural assessments made. The objective of the work presented here was to provide enhanced assessment methods that are able to prove higher load carrying capacities and longer service lives for existing concrete railway bridges.
The work accomplished was a part of the EU-project Sustainable Bridges. The results are implemented in the Guideline for Load and Resistance Assessment of Existing European Railway Bridges that was developed within the project, see SB-LRA (2007). The guideline is based on the current state-of-the-art, but improved knowledge was developed in a few prioritised areas: material properties in existing bridges, advanced methods for structural analysis and assessment of deteriorated bridges with respect to fatigue and corrosion. This paper focus on the research performed, which is reported more in detail in a background document to the guideline, see SB4.5 (2007).
Sustainable Bridges – Assessment for Future Traffic Demands and Longer Lives

5. Bridge performance and resistance for higher loads and speeds
252
Improved methods for determination of in-situ material properties in existing concrete bridges are presented, also for fully probabilistic assessment. System analysis on different levels is described and recommendations for redistribution of sectional moments and forces from linear FE analysis were developed. Advanced methods for local resistance analysis are presented, e.g. regarding combined shear, torsion and bending interaction.
One main objective was to facilitate the use of non-linear analysis for structural assessment. Non-linear analysis provides the greatest potential to discover any additional sources for load carrying capacity, and gives an improved understanding of the structural response, forming a better basis for assessment decisions.
Another main objective was to provide methods for assessing the remaining structural resistance of deteriorated concrete bridges. Recommendations are given on the effect of corrosion on the anchorage capacity of reinforcement. Furthermore, a methodology is presented for improved assessment of the fatigue safety for existing concrete bridges. Here, the emphasis is on evaluation of the remaining fatigue life of short-span bridges and secondary elements.
2. EVALUATION OF MATERIAL PROPERTIES
The purpose of assessment of material properties is to obtain the best possible information about the relevant resistance parameters for a specific bridge. It is also important to describe the uncertainties associated with each parameter e.g. in terms of expected variability. Important bases for evaluation are the material specifications from the original construction as well as testing of current in-situ properties for the materials in the existing bridge structure. For railway bridges dynamic effects on strength and stiffness properties are of interest. Relevant data for modelling of such effects are given in the guidelines for the materials mentioned above.
2.1. Concrete
A proper description of mechanical properties for concrete as a basis for structural analysis is a complex matter for the following reasons:
• A number of different strength parameters are needed. • Material properties change with age, due to continuous hardening. • Results from testing of strength depend on size and design of the test specimens used. • The in-situ strength in the finished structure is different from that obtained by testing of
standardized specimens. The guideline gives recommendations for assessment of concrete properties based on
original strength class specifications combined with the effect of continued hydration, which leads to increased strength at higher age. Recommendations are also given about interpretation of in-situ testing to obtain reliable updated information about strength in the existing structure. The basic reference property for concrete is uniaxial compressive strength. Other properties of interest in non-linear structural analyses are elastic modulus, uniaxial tensile strength, fracture energy, bond strength, ultimate compressive strain and strain at peak compressive stress. These are often estimated from empirical relations between the property and the compressive strength.
2.2. Steel reinforcement
Given the specified grade of reinforcing steel, the yield strength fy can usually be estimated with rather good precision. The variability can be reduced if test results are available for samples taken from the structure, in particular if it is known that the steel in the structure originates from the same producer and/or batch. Other properties of interest for reinforcing

Structural assessment of concrete railway bridges
253
steels are tensile strength and strain at ultimate load. These are defined in relation to the yield strength and depend on the ductility class for the steel.
2.3. Prestressing steel
The mechanical properties relevant for prestressing steels are tensile strength fpt, proof strength fp0.1, effective elastic modulus Ep and strain at maximum stress, εpu. Nominal strength values are generally specified by manufacturers of prestressing steel products. The variability is different for different types of products such as wires, bars and strands, and such information may in a given case be available from the suppliers. In some cases results from strength tests of the prestressing steels used during construction are available. Such results can be used to estimate the mean values of strength, proof stress and ultimate strain. The variability may also be estimated from such data. Generic information about variability of prestressing steel properties is to some extent given in the guidelines.
3. REDISTRIBUTION OF MOMENTS AND FORCES FROM LINEAR ANALYSIS
FE structural analysis can rationalise and improve bridge assessment and design, in particular for complicated geometries where modelling in three dimensions is required. Due to moving loads and the large amount of different load cases, linear analysis is normally used for bridges. Linear analysis often leads to high stress concentrations, e.g. at point supports or slab- -column connections. These are often expressed as concentrated cross-sectional moments and shear forces. However, the stress concentrations obtained through linear analyses of concrete bridges do often not exists in reality, mainly due to the cracking of the concrete and yielding of reinforcement.
The objective of this part of the project was to develop general recommendations for how unrealistic concentrations of cross-sectional moments and shear forces, obtained by linear FE analysis, can be re-distributed for assessment of concrete bridges. The study was focused on slab bridges and on the moments and shear forces at concentrated supports. In particular, it was studied how re-distribution of the linear cross-sectional moments can be made in lateral direction, within cross-sections perpendicular to the reinforcement direction.
The study showed two conceptually different reasons for unrealistic concentrations of cross-sectional moments and shear forces in linear FE analysis; these are due to geometrical and material simplifications, respectively.
Concentrations of cross-sectional moments and forces occur due to geometrical simplifications typically where slabs are modelled with shell elements that are connected to a column or supported in a single node. By using sufficiently dense element mesh and by using cross-sectional moments and forces from the critical cross-sections around the column or support, these problems can be overcome. The FE mesh should be chosen so that there are at least two first-order (or one second-order) shell element between the support node and the critical cross-section. The location of the critical cross-section depends on the failure mode. For example, for a cast connection between the slab and a column, the critical cross-section for the bending moment in the slab is along the surface of the column. The often very high peak values for the moments and shear forces obtained inside the critical cross-sections, in a linear analysis, have no physical meaning and can be ignored.
Concentrations of cross-sectional moments and forces due to material simplifications originate from that the materials are assumed to have linear response in the analysis while, in reality, both concrete and reinforcement have a very non-linear behaviour. When the concrete cracks and the reinforcement yields, the cross-sectional moments and shear forces

5. Bridge performance and resistance for higher loads and speeds
254
will re-distribute. In ultimate limit state, the moment distribution will be governed by the moment capacity obtained by the reinforcement, provided that the slab has sufficient rotation capacity.
In a case study, a typical two span slab bridge supported on columns and with different reinforcement design was analysed through non-linear FE analysis. The case study showed that the distribution between support and span reinforcement content, as well as the overall lateral reinforcement distribution across the bridge cross-sections, have a larger influence on the required plastic rotations needed to form a mechanism, than the more local distribution between the reinforcement over and in-between the columns. It was found that, when assessing the load-carrying capacity of an existing bridge using 3D FE analysis, a substantial lateral re-distribution must be allowed to avoid excessive under-estimation of the capacity. It is important that this re-distribution is made so that it resembles the actual reinforcement distribution and, hence, the real response of the concrete structure.
4. BENDING-SHEAR-TORSION INTERACTION
Earlier, bending, torsion and shear was treated as separate actions in the design of a cross section. With the advent of the truss analogy and the modified compression field theory it became clear that the forces interact, see e.g. (Collins and Mitchell, 1991). This way of thinking is now introduced in the Eurocodes.
Using the theory of plasticity and the assumption of yielding of all longitudinal and transverse reinforcement before concrete compression failure, simple closed interaction surfaces can be obtained, see e.g. (Elfgren et al., 1974). For a common case with compression in the top of a member, an interaction formula may be derived as:
12
0
2
00
=
+
+
TT
VV
MM (1)
Here M, V, and T represent the bending moment, the shear force and the torsion moment respectively, while M0, V0, and T0 are the capacities of a section loaded in pure bending, pure shear or pure torsion respectively.
More detailed results can be obtained with the modified compression field theory where the successive increase of stresses can be studied in a section with the program Response-2000, see (Bentz, 2000). The torsion stresses are usually added to the stresses of the vertical shear forces. The torsion-bending-shear interaction has been studied for several Swedish bridges, see e.g. (Puurula et al., 2004).
5. ASSESSMENT OF CONCRETE BRIDGES BY NON-LINEAR ANALYSIS
Non-linear analysis is the most realistic method for improved assessment of existing structures. It removes the inconsistency included in standard design approaches where the check of cross-section is done using non-linear material assumptions while the cross-sectional forces are determined based on purely linear analysis. However, in contrary to linear analysis, it puts higher demand on the engineer as well as it may require considerable computational resources. For practical applications, numerical computational methods such as the finite element method (FEM) must be used.
Non-linear analysis is a rather general term that encompasses many methods and approaches.

Structural assessment of concrete railway bridges
255
• Geometric non-linearity takes into account large deformation or strains. In most civil engineering structures this is not a dominant source of non-linearity with the exception of various buckling problems.
• Material non-linearity considers the non-linear material response such as steel or reinforcement yielding, concrete, steel or masonry cracking, and concrete crushing.
A complete response of a structure to a given imposed loading can be obtained by such an analysis including stages of crack propagation in the pre-peak serviceability state, the failure load and failure mode and the post-peak behaviour. The model can be described on three levels, as shown in Figure 1, each involving certain approximations:
• Structure. In the stiffness approach the structural geometry is reduced into a system of finite elements, boundary conditions and loading. The structural response is described by the equilibrium matrix equation, where U are discrete displacements, K is a stiffness matrix and P are loading forces.
• Finite element. A shape of the displacement function in terms of nodal displacements (reflected in the matrix B) is assumed and used together with the material stiffness D to calculate the element stiffness matrix k.
• Constitutive relations. They define the behaviour of the material in terms of stress-strain relations, function F(σ,ε), in a material point and corresponding material stiffness D. They reflect the non-linear material effects and failure, such as the concrete cracking or the reinforcement yielding.
Figure 1. Main steps of a non-linear analysis
The above formulation is typically incremental. The forces, displacements, strains and stresses are linearized increments within each load step.
The first two levels of the structural model in Figure 1 are well known from applications in other fields of engineering, and can be solved with required accuracy, just providing sufficiently fine meshes and adopting reasonable shape functions in finite elements. The third level, the constitutive modelling of specific properties of reinforced concrete, especially their derivation from experiments, represents a difficult task, because material behaviour can not be easily separated form its structural context. In order to verify the validity of nonlinear models, the performance of programs is often confronted with experiments in bench mark tests, e.g. (Bonnard and Gardel, 1994; Margoldova et al., 1998).

5. Bridge performance and resistance for higher loads and speeds
256
Figure 2. Crack opening law (left). Strain softening law (middle). Crack band L (right)
Since cracking is the most important property of brittle materials such as masonry, concrete or rock, a variety of crack models have been proposed: the discrete crack, the embedded crack and the smeared crack model. The smeared crack model is present in some form in most commercial finite element codes. A real discrete crack is simulated by a band of localized strains as illustrated in Figure 2. Due to the energy formulation, this model is objective and its dependency on the finite element mesh size is substantially reduced (Cervenka and Margoldova, 1995). This was confirmed by numerous studies, for example by those about shear failure published in (Cervenka, 1998). Nowadays, nonlinear analysis represents a powerful tool for the estimation of remaining load-carrying capacity of existing structures. Typical result from such a non-linear analysis of a railway bridge with localized failure zone is shown in Figure 3, (Cervenka et. al., 2007).
Figure 3. Example of a typical crack localization in a non-linear finite element analysis
6. EFFECT OF REINFORCEMENT CORROSION ON BOND AND ANCHORAGE
The volume increase that takes place when reinforcement in concrete corrodes causes splitting stresses in the concrete. Thereby, the bond between the reinforcement and the concrete is influenced. This effect has been studied both experimentally and theoretically by many researchers. In the work done within this project, the effect of corrosion on the bond between reinforcement and concrete was investigated and described in a systematic way. Literature studies of experimental work were combined with axisymmetric finite element analyses of different cases. A frictional model for the bond between reinforcement and concrete was used, together with a model describing the volume increase due to the corrosion, see (Lundgren, 2005a,b).
Studies of the mechanisms of bond and the effect of corrosion show that it is the same basic mechanisms that are active for both ribbed and smooth bars. However, the basic mechanisms are of different magnitude, and therefore different mechanisms determine the behaviour. Generally, the bond capacity of smooth bars is less than for ribbed bars, mainly because the capacity of smooth bars is limited by the limited ability of the bar to generate normal stresses at slip. Therefore corrosion, as long as it does not crack the cover, can increase the bond capacity of smooth bars to about the level of ribbed bars. For ribbed bars, corrosion might increase the

Structural assessment of concrete railway bridges
257
bond capacity, but only to a minor extent. High corrosion levels will damage the bond, especially if transverse reinforcement is not supplied.
An overview of the effect of corrosion on bond is shown in Figure 4. The scales in the bond-slip curves are varying, to make all graphs clearly visible. The scales in the maximum bond stress versus corrosion level graphs are, however, intended to be the same, to enable comparisons. Naturally, this summary is a simplification; for example, if the amount of transverse reinforcement is small, the behaviour will become close to that of specimens without transverse reinforcement.
Ribbed bars Smooth bars
Transverse reinforcement
No transverse reinforcement
Transverse reinforcement
No transverse reinforcement
Cover cracks
Reinforcement type
Transverse reinforcement
At uncorroded pull-out
No cracks
Cover cracks
No cracks
Cover cracks
No cracks
Cover cracks
No cracks
Effect of corrosion
Small bond
decrease or appr. equal
Bond decrease already for low
corrosion
Small bond
increase until cover
cracks, then appr.
equal or slight
decrease
Bond decrease
Large bond
increase until cover
cracks, then appr.
equal or slight
increase
Small bond
increase until cover
cracks, then
abrupt decrease
of capacity and
ductility
Large bond
increase until cover
cracks, then
decrease of both capacity
and ductility
Bond stress versus slip: uncorroded corr., precracking corr., postcracking
Bond increase
Maximum bond stress versus corrosion level
(arrow indicates cover cracking)
Figure 4. Overview of the effect of corrosion on bond
From the overview, recommendations were worked out for judgements concerning how serious corrosion is when assessing existing concrete structures. Each case with respect to reinforcement type and detailing was graded compared to statements regarding when corrosion will become critical: before the cover cracks, when the cover cracks, or first at a later stage, see Figure 5. The recommendations are developed to give guidance for bridge owners of how to judge results from inspections and corrosion measurements, and what measures that need to be taken.
Critical already for smaller corrosion levels than what causes cracking of the cover Critical when corrosion causes cracking of the cover
Mainly area reduction that is critical
Corrosion becomes more critical for
anchorage
Corrosion becomes less critical for
anchorage
Ribbed bars, no transverse reinforcement
Smooth bars, no transverse reinforcement
Ribbed bars, transverse reinforcement
Smooth bars, transverse reinforcement
Figure 5. Overview of how critical corrosion is for the anchorage capacity

5. Bridge performance and resistance for higher loads and speeds
258
7. REMAINING FATIGUE LIFE OF REINFORCED CONCRETE BRIDGES
7.1. General
The aim of performing a proof of fatigue safety is to demonstrate that the fatigue effects of (higher) rail traffic loads will not impair the safety of the structure during its intended service life. For railway bridges, proof of fatigue safety is generally required for all structural elements, and in particular for those subjected directly to wheel loads.
Current knowledge of fatigue behaviour of reinforced concrete suggests that the fatigue safety examination of reinforced concrete elements of existing railway bridges includes in principle a fatigue safety check of the steel reinforcement, and existing knowledge in fatigue behaviour of steel structures can be adopted. Fatigue failure of concrete is very unlikely to occur if the concrete is in good condition, i.e. concrete is not suffering from any deterioration mechanism (cracking) due to bar corrosion, frost or alkali-aggregate reaction.
Consequently, a rational methodology for the assessment of fatigue safety is based on the three following study areas taking advantage of the fact that the bridge is existing: (1) study of the bridge structure and evaluation of reinforcement detailing, (2) inspection of the existing bridge and study of the past performance, and (3) fatigue safety check. In the following, each of the three study areas is briefly discussed.
7.2. Evaluation of the bridge structure and reinforcement detailing
If the principles of good fatigue design practice were followed when the bridge was built and if the bridge is in good condition, then the check of structural safety will be usually determinant. However, in cases where low fatigue strength can be expected for the steel reinforcement, this is possibly not the case, and a fatigue safety check is essential here.
The main objective of the study of the bridge structure and the detailing of the reinforcement is thus to detect fatigue vulnerable spots. Such fatigue vulnerable spots are predominantly present at locations where the rules of “good” fatigue resistant design have not been respected.
Grouping types of reinforcement into fatigue categories in accordance with code provisions allows recognizing types of reinforcement with low fatigue strength. Fatigue vulnerable reinforcement details include, for example, all welded reinforcement, mechanically connected reinforcing bars, anchorages for and coupler between prestressing elements or reinforcement bars showing significant corrosion.
7.3. Bridge inspection and monitoring
Fatigue fracture of reinforcement bars may be preceded by cracking of the concrete cover. For example, the fatigue failure of a deck slab is characterized by a distinct crack pattern that is formed depending on the state of the fatigue damaged reinforcement bars. Also, the deflection of fatigue damaged reinforced concrete elements may significantly increase when important fatigue damage has occurred. As a consequence, bridge inspection and monitoring of fatigue vulnerable elements should focus on the detection of crack patterns and deformations.
7.4. Fatigue safety check
The fatigue safety of a structure is proven if the following condition is satisfied:
0.1,
, ≥=fatd
fatd
ER
n (2)

Structural assessment of concrete railway bridges
259
where n is the fatigue safety index, Rd, fat is the examination value for the fatigue resistance (including a partial safety factor), and Ed, fat is the examination value for the fatigue action effect (without partial safety factor).
The fatigue safety check is made separately for reinforcing steel and concrete, but may also be performed using the overall structural response of a fatigue vulnerable element.
Proof for reinforcing steel: The fatigue safety check is performed first with respect to the fatigue limit and then with respect to the equivalent stress range.
Proof for concrete: In the determination of stresses in concrete due to fatigue loading it must be considered that such calculated stress values only represent an approximation of effective stresses. Also, reliable fatigue damage accumulation method is still lacking. Consequently, it is not possible to perform a rigorous and reliable fatigue safety check for concrete. Fortunately, proof of fatigue safety by calculation is not required for normal stresses in concrete if inspection shows that the concrete is in good condition.
Proof with respect to ultimate load: Fatigue testing revealed that relevant fatigue damage only occurs if the level of fatigue solicitation is beyond 50% and 40% of the ultimate load for predominant bending and shear fatigue loading respectively. From this follows that no fatigue failure of the structural element will occur if the following condition is fulfilled under predominant bending and shear fatigue, respectively:
0.15.0
max,
≥⋅
=fat
ultfat F
Fn 0.14.0
max,
≥⋅
=fat
ultfat F
Fn (3a, 3b)
Fult is the ultimate load of the structural element as obtained. It is determined by means of a non-linear structural analysis using nominal values of material properties and considering partial safety factors (resistance coefficients).
8. CONCLUSIONS
The research activities presented were performed as a part of the European research project Sustainable Bridges in order to obtain an improved basis for the Guideline for Load and Resistance Assessment of Existing European Railway Bridges, SB-LRA (2007), which was developed within the project. The work provides methods for enhanced assessment of existing railway bridges. The use of more advanced analysis methods, such as non-linear analysis, will lead to that higher load carrying capacities can be proven, but also to an improved understanding of the structural response, forming a better basis for decisions in the assessment. Recommendations are given for assessment of corroded concrete bridges, and the improved methods for fatigue assessment will lead to increased remaining service lives.
REFERENCES
Bentz, E.C. (2000): Sectional Analysis of Reinforced Concrete Members. A thesis submitted in conformity with the requirements for the degree of Doctor of Philosophy, Graduate Department of Civil Engineering, University of Toronto, Toronto 2000, pp. 187 + 118, www.ecf.utoronto.ca/~bentz
Bonnard, Gardel (1994): Bench Mark on Numerical Analysis of Concrete Structures. Bonnard & Gardel, Neuchatel, Switzerland, 1994.
Cervenka, J., Cervenka, V., Janda, Z. (2007): Safety Assessment of Railway Bridges by Nonlinear Analysis, In: “Sustainable Bridges – Assessment for Future Traffic Demands and Longer Lives”, eds. Bień, J., Elfgren, L., Olofsson, J., Dolnośląskie Wydawnictwo Edukacyjne, Wrocław 2007.

5. Bridge performance and resistance for higher loads and speeds
260
Cervenka, V. (1998): Simulation of shear failure modes of R/C structures. In: Computational Modelling of Concrete Structures (Euro-C 98), eds. R. de Borst, N. Bicanic, H. Mang, G. Meschke, A.A. Balkema, Rotterdam, The Netherlands, 1998, pp. 833-838.
Cervenka, V., Margoldova, J. (1995): Tension Stiffening Effect in Smeared Crack Model. In: Engineering Mechanics, Ed. S. Sture, ACSE, New York, USA, ISBN 0-7844-0083-0,1995, pp. 655-658.
Collins, M.P., Mitchell, D. (1991): Prestressed Concrete Structures. Prentice Hall, Englewood Cliffs, N.J., USA 1991, 766 pp. ISBN 0-13-691635-x. Reprinted by Response Publications, Toronto 1997, p. 766, ISBN 0-9681958-0-6.
Elfgren, L., Karlsson, I., Losberg, A. (1974): Torsion - bending – shear intertaction for reinforced concrete beams. Journal of the Structural Division, American Society of civil Engineers (ASCE), Vol. 100, No. ST 8, Proc. Paper 10749, New York, August 19784, pp. 1657-1676.
Jensen, J.S., Casas, J.R., Karoumi, R., Plos, M., Cremona, C., Melbourne, C. (2007): Guideline for load and resistance assessment of existing European railway bridges, In: “Sustainable Bridges – Assessment for Future Traffic Demands and Longer Lives”, eds. Bień, J., Elfgren, L., Olofsson, J., Dolnośląskie Wydawnictwo Edukacyjne, Wrocław 2007.
Lundgren, K. (2005a): Bond between ribbed bars and concrete. Part 1: Modified model. Magazine of Concrete Research, Vol. 57, No. 7, September, pp. 371-382.
Lundgren K. (2005b): Bond between ribbed bars and concrete. Part 2: The effect of corrosion. Magazine of Concrete Research, Vol. 57, No. 7, September, pp. 383-396.
Margoldova, J., Cervenka, V., Pukl, R. (1998): Applied Brittle Analysis. Concrete Engineering International, 8 (2) 1998, pp. 65-69.
Puurula, A. (2004): Assessment of Prestressed Concrete Bridges Loaded in Combined Shear, Torsion and Bending. Licentiate Thesis 2004:43, Luleå: Division of Structural Engineering, Luleå University of Technology, pp. 103 + 144. Available from: http://epubl.ltu.se/1402-1757/2004/43/index.html [cited 31 November 2006].
SB-LRA (2007): Guideline for Load and Resistance Assessment of existing European Railway Bridges. Prepared by Sustainable Bridges – a project within EU FP6. Available from: www.sustainablebridges.net
SB4.5 (2007): Non-Linear Analysis and Remaining Fatigue Life of Reinforced Concrete Bridges. Background document D4.4.2 to “Guideline for Load and Resistance Assessment of Railway Bridges”. Prepared by Sustainable Bridges – a project within EU FP6. Available from: www.sustainablebridges.net

Improved assessment methods for static and fatigue resistance of old metal railway bridges
261
Improved assessment methods for static and fatigue resistance of old metal railway bridges
Christian CREMONA, Alberto PATRON, Susan HOEHLER,
Björn EICHLER, Bernt JOHANSSON & Tobias LARSSON This paper presents the recommendations and advices proposed for the assessment of old riveted structures within the set of guidelines developed in the Sustainable Bridges Integrated Project. The proposed assessment methods focuses on fatigue and ultimate load limit states. Three main topics are developed. For the first one, emphasis is given to the analysis of material properties in connection with fatigue of riveted structure. The second topic is associated with the development of new assessment methods for load capacity of riveted structures. This concerns the study of plastic capacity of cross sections formed by riveted slender plates. The third item is then related to the assessment of fatigue life of riveted and welded bridges. Several advices are also given concerning assessment improvement based on new data information.
1. INTRODUCTION
A very important part of the bridges in the European railway networks are metallic bridges, and have been building during the last 75 years (some of them are much older). The increasing volume of traffic and axle weight of trains mean that for many structures the loads today are much higher than those envisaged when they were designed. This paper presents the recommendation and the advanced methods established to develop improved assessment methods for existing metallic bridges in the context of the Sustainable Bridges Project.
The knowledge of the material properties of existing metal bridges is essential for the resistance assessment and the determination of the remaining lifetime of old metallic bridges. Furthermore, old bridges require more exact and efficient assessment methods that call for a precise description of the material. Among the problems met in metal bridges and material properties estimation, fatigue is the most common cause of failure. To be able to make accurate assessments of existing bridges, it is important to know the behaviour of bridges exposed to fatigue, and how the old materials behave due to cyclic exposure. The main question answered herein is how to make a safe estimation concerning the remaining life in service.
Sustainable Bridges – Assessment for Future Traffic Demands and Longer Lives

5. Bridge performance and resistance for higher loads and speeds
262
The possible traffic load on steel rail bridges is usually limited by the fatigue resistance, but for certain situations the static resistance has also to be checked. Most design rules for steel structures, for instance those in Eurocode 3, are applicable also to riveted structures. However, some information is missing on how to deal with the special case that elements are intermittently connected in contrast welded structures that are connected continuously. As the traditional methods for assessing the resistance of steel bridges are based on elastic analysis, a method for utilizing a limited redistribution of bending moments based on beam theory is proposed.
This paper presents a summary of the different recommendations and advices proposed in “Guidelines for Load and Resistance Assessment of Existing European Railway Bridges” of the “Sustainable Bridges” project, and related to metallic bridges.
2. BASIS FOR ASSESSMENT
In contrast to road metal bridges most of the metal railway bridges are composed of old structures, with the very recent construction of composite structures during the past twenty years. One of the challenges for the development of assessment guidelines applied to metal bridges is certainly the performance appraisal of old riveted structures. The assessment of old metal bridge performance must include an overall conventional safety evaluation for all the joints and all the structural components versus the actual operating conditions. The evaluation has the purpose to identify the risks to predict in terms of stability, strength and fatigue, and to localize the hot spots for which failure due to damages and undetected cracks could lead to bridge collapse. These investigations have to be based on a full set of drawings, highlighting all the details of the structure, and all the parts which have been repaired or upgraded. These elements must provide all the information necessary to handle at least a static calculation. Experience shows that this basic knowledge is rarely available and requires often a special investigation. Most of the documents do not exist, are incomplete, or do not represent the actual structure! As a matter of fact, these old bridges oftentimes call for an enhanced assessment which requires a precise description of the material.
The assembling technique of riveting was to drive a hot rivet through the parts that were to be connected. The rivet was then formed by hammering the shank to form another head. When the rivet cooled the material contracted which created a compressive force on the assembled parts, called clamping force. The magnitude of the force differed significantly between rivets depending on the persons conducting the riveting. When replacing damage or missing rivets in structures, high strength bolts can be used. From investigations on the clamping force of rivets, it was found that the mean clamping stress was 100 MPa with a standard deviation of 40 MPa in the rivets. The amount of clamping force obtained by rivets is much smaller than that of bolts but it seems still to be enough to improve the fatigue endurance. Methods of producing rivet holes in old bridge structures were drilling, punching, sub drilling and reaming, and punching and reaming. The surface conditions of rivet holes are believed to be an influencing factor on the fatigue life of riveted structures. Opinions concerning the method best suited for producing rivet holes are not unanimous. The investigations concerning small scale fatigue endurance depending on the hole preparation method do not indicate any differences of the fatigue life.
Foundation and support conditions can be assessed from the available documents. This information is used in initial assessment in connection with the elements (inspection, tests) which have been performed on that bridge. For intermediate assessment, it is recommended to properly assess the support conditions. Dynamic experimental investigations (dynamic testing) can provide valuable information. Some degrees-of-freedom locking

Improved assessment methods for static and fatigue resistance of old metal railway bridges
263
or unlocking, which can be assumed from the drawings, may not be appropriate and have to be modified. Information about settlement or bridge supports has to be considered when obtaining the total actions in the bridge under assessment, particularly in the case of highly redundant structures.
3. MATERIAL PROPERTIES
In view of maintaining as many bridges as possible questions for the remaining lifetime must be considered. This is especially the case where design loads must be adjusted to meet modern traffics. Any safety assessment for an old bridge requires the knowledge of the structural resistance and therefore the information of the material properties.
The early metal bridges, until the end of the 19th century, were fabricated mostly of wrought (puddle) iron, next to cast iron. Early mild steels succeeded cast and puddle iron as structural material from approximately 1895. A more detailed identification scheme taking into account typical characteristics concerning chemical compound, microstructure and strength properties can be found in (D4.3.6, 2007).
Fatigue phenomenon has puzzled researchers for over 200 years. The problem with fatigue attracted attention with the use of metal in structures. The fatigue endurance is one of the major influencing factors concerning the service life for old metal bridges. The technique of riveting bridges is obsolete and not practised today for steel structures. Due to this, knowledge concerning riveted structures ability to withstand fatigue has not been investigated to the same extent as for modern structures assembled by welding. Clamping force, corrosion, hole preparation and material properties largely influence fatigue performance. The information in this section is retrieved from (D4.3.6, 2007). Figure 1 synthesizes fatigue results on primary girders or stringers in bridges tested by means of 3- or 4-points bending tests. The referred stress range is the net section stress range. The endurances of many of the tests were found to be lower than predicted by detail category c∆σ = 71 N/mm2. Tests with heavy corrosion were removed to separate its influence. The effect of corrosion and notches lowers the fatigue endurance by several detail categories. The detail category of a distribution should be, according to EC EN 1993-1-9, the 5% fractile with a 75% significance level. From these results one can see that an acceptable fit is achieved with the 5% fractile and C = 71 for N ≤ 5 · 106 cycles for plate girders. Results of the endurance of truss girders seem to be lower than plate girders, which may be a result of higher bearing stresses. The recommendation is to use C = 63 for load bearing members in trusses.
Investigations concerning the constant amplitude limit (N > 5 · 106 cycles) and the cut off limit (N > 1 · 108 cycles) are time consuming and expensive. Thus only a few investigations have been conducted on low stress ranges at 40 to 60 MPa. From the evaluation of the full scale tests fatigue endurance conducted with variable stress range, it appears that the level for no fatigue accumulation (cut off limit) can be raised from 28.7 MPa to 40 MPa. A constant stress range below 52.3 MPa does not provide cracking in components according to the evaluated tests. This is only valid providing that there is no severe corrosion or damage present on the structural components. The cut off limit of 40 MPa is reasonably verified for girders together with C = 71. For trusses there is no experimental evidence and as the detail category is 63 for trusses the cut off limit cannot be extrapolated. If a fracture mechanics model is used, it is important to express the capability of a crack to grow by the fatigue crack growth threshold. If the stress intensity range K∆ at the crack tip is below a threshold value thK∆ , then the crack will likely remain dormant. Investigations and studies tend to prove that this threshold level ranges from 3 to 11 MPa ⋅m1/2. Nevertheless, these values have to be considered with care because of the large scatter.

5. Bridge performance and resistance for higher loads and speeds
264
10000 100000 1000000 10000000 100000000 1000000000Number of cycles
10
100
1000
Stre
ss ra
nge
[MP
a]
Plate girdersBrühwiler [11]Åkesson [4]Mang et al [3]Rabemanantso et al [10]Zainudin [9]Helmerich [14]Al-Emrani [8]Fisher [5]Adamson [15]C = 71C = 63
10000 100000 1000000 10000000 100000000 1000000000
10
100
1000
Plate girders5% frac plate girdersmean plate girders
Figure 1. Fatigue strength of plate girders
Corrosion is a problem for metal structures. Unless treated with some kind of protection, the resistance of structural details will decrease due to corrosion. Concerning old metal bridges some degree of corrosion will always be present due to the assembling technique with layered parts making corrosion protection hard to perform and maintain. A reduction of area of 20% is exceptional and it is not recommended to accept it. Nevertheless, the fatigue endurance is improved when the plate girders that had been classified as heavily corroded were removed. The fatigue life will not be influenced in the same way if the corrosion damage is located at the compressed flange rather at the tension flange. Especially corrosion near rivets increases the local stress levels which lead to lower fatigue endurance. The rough surfaces due to corrosion acts as a stress raiser which can cause the growth of cracks, the amount of corrosion that can be allowed before it becomes a larger stress raiser than the rivet holes can however not be established. It should be kept in mind that the ductile parts of old steel are located at the surface of plates and angles. A corroded structure will have a reduced cross section consisting of more brittle material which increases the risk of a brittle fracture especially in low working temperatures.

Improved assessment methods for static and fatigue resistance of old metal railway bridges
265
4. OPERATING CONDITIONS AND BRIDGE CONDITION
When assessing the structural performance of metal bridges, resistance and fatigue have to be analyzed. Except if some overloads have been applied to the bridge, and reported, design or actual extreme configurations can be applied for assessing the ultimate strength. For fatigue assessment, the procedure would require the knowledge of the fatigue cycles applied to the different details. This information is generally not readily available. Some studies tend to prove that the eventual fatigue damage accumulated for old structures until the end of WWII is negligible in comparison to the cycles applied during the past 50 years. This is consistent with the finding that the cut off limit for stress range is 40 MPa. A simplified procedure in Germany exists for the remaining service life assessment based on fatigue damage accumulation using S-N-lines. The verification implemented in the DB-Guideline 805 (RiL805, 2002) results in a remaining service life for non-welded constructions.
The analysis of the bridge condition provides an essential information regarding the performance of the bridge. In particular, for metal bridges, reporting cracks and repairs provides valuable information. In (D.3.4, 2007), guidelines for inspection according to prEN 1090-2 are given for bolted and riveted connections. The number of rivets inspected overall in a structure shall be at least of 5%, with a minimum of 5. Heads of driven rivets shall be visually inspected and shall satisfy several acceptance criteria (in some cases provisions for detection of non- -conformities will not be available) according to (D.4.2, 2007).
5. MODELLING AND ANALYSIS
5.1. Bridge behaviour
Fracture critical members represent the most sensitive parts in old metal bridges. It is therefore essential to analysis the bridge behaviour in terms of failure consequences. This helps to identify the most critical parts and to reduce the analysis to these hot spots. This risk analysis will help to identify the failure consequences for the critical bridge components for different calculation conditions and is required for intermediate assessment. The critical components are those for which their failure could lead to a global structural collapse (D.4.2, 2007). The critical components which are subjected to tensile stresses, must be checked, except if they are subject to low stresses (< 0.20fy) or if they are sufficiently redundant. The evaluation has to be done for different combinations of permanent loads, traffic loads and temperature conditions. 5.2. Structural analysis
Modern standards for design of steel structures like Eurocode 3 cover riveted structures but they do not give complete information. Old design standards on the other hand are quite incomplete concerning instability phenomena and they are covering elastic design only. Here Eurocode 3 will be taken as the starting point and some additional information relevant for riveted structures will be developed. The cross section classes in Eurocode 3 are essential in defining the resistance to bending moment and axial compression. They are defined for rolled or welded sections but those definitions are not sufficient for riveted girders. First the maximum distance between rivets in the stress direction has to be defined. Further, there are some beneficial effects of confinement of plates in certain cases.
The traditional method for assessing the resistance of steel bridges is based on elastic analysis. This approach is appropriate for initial assessment analysis at ULS and for assessing

5. Bridge performance and resistance for higher loads and speeds
266
fatigue cycles. But for intermediate and advanced assessment, if the resistance in ULS is insufficient it is possible that allowing for plastic deformations gives a more favourable answer. This is very obvious if the girders are stocky enough for using plastic hinge analysis. This is rarely the case but also more slender girders have some plastic deformation capacity, which can be utilised for a limited redistribution of moments in the girders. 5.3. Cross section classes for riveted elements
Cross section classes are defined in Eurocode 3-1-1 in order to describe the behaviour of a girder in bending or axial compression with respect to effects of local buckling. The cross section class is governed by the slenderness of elements in compression expressed as width over thickness, see Table 2. The thickness creates no problem but the width is not defined in Eurocode 3 for typical riveted cross sections (Figure 2).
bibf
b w
bi
b wb w
bf
I-girder or truss diagonal I-girder Truss chord
Figure 2. Examples of riveted cross sections and definition of width for calculating plate slenderness
For an outstand flange of single angles as in the left part of Figure 2 it is reasonable to apply the normal definition of width for an outstand flange in an I-girder, which is from the free edge to the start of the fillet. The width of the web for the first and second parts of Figure 2 is suggested to be taken as that clear width between the angles, because the web is clamped between the angles. This is however not the case for the truss chord in Figure 2 because it has an angle on one side only. For this case it is suggested to use the centre distance between the rivet rows as width. The I-girder in the middle of Figure 2 has a flange plate which contains an outstand flange and also an internal flange with the terminology from Eurocode 3. The definitions of their width as taken from the centre lines of rivet rows are slightly conservative. For the condition that the plate only can buckle in one direction the rules for composite plates from EC4-2 are applicable. They are shown in Table 1 in which the limitations for Class 2 and 3 are from EC4-1 and the ones for Class 1 are estimated values. As the rivets are discrete connections between the plates and angles there is a need to check also the longitudinal distance between the rivets. A review of old design rules has shown that the longitudinal distance is not likely to exceed 12 times the plate thickness. This will be sufficient for Class 1 sections. The definition of cross section classes has to be made in initial assessment procedure.

Improved assessment methods for static and fatigue resistance of old metal railway bridges
267
Table 1. Upper limits to spacing of rivets in plates subject to compression supported by web and angles
Direction Flange Class 1 Class 2 Class 3
Transverse to the direction of compressive stress
outstand flange: interior flange:
≈10tε ≈40tε
14tε 45tε
20tε 50tε
In the direction of compressive stress outstand & interior flange: ≈12tε 22tε 25tε
5.4. Redistribution of bending moments in girders
In case the girder has all cross sections in class 1 normal plastic hinge analysis can be used. In addition there is a requirement that the girder should remain elastic in SLS. This check may be done considering residual moments after unloading from ULS state. This checking is performed in phase I assessment. If one or more cross sections are in class 2, 3 or 4 the deformation capacity of the plastic hinges has to be considered in phase II assessment. This deformation capacity depends on the slenderness of the web and the compression flange. By choosing a lower level of moment in the hinge say 09MRd a higher rotation capacity is gained. The analysis of the girder can in the simplest method be to assume a constant moment MRef at the pier until either the available rotation capacity is reached or the sagging bending moment reaches its elastic resistance. In case the girder has all cross sections in class 1 normal plastic hinge analysis can be used for verification of the resistance in ULS. The rotation capacity as given in (D.4.2, 2007) is only applicable under the following conditions:
• the girder is an I-girder, • the rotation takes place at an internal support, • the girder has no significant fatigue cracks and sufficient toughness not to suffer brittle
fracture, • the shear force at the support is smaller than 80% of the resistance, • the bottom flange is prevented from lateral torsional buckling. The calculations can be done with a simple FE-program for elastic beam analysis provided
that it includes rotation springs with defined moment (hinge with friction). If the computer program can handle non-linear problem the analysis can be made in one run.
In addition to the check of hogging bending the girder has to be checked for sagging bending in the spans. The rotation capacity of slender girders in sagging bending has not been studied much and it can be expected to be less favourable than in hogging bending. For that reason it is suggested that the check for sagging bending is done with elastic analysis.
6. SERVICE LIFE ASSESSMENT
For initial assessment, fatigue life is evaluated by using Miner cumulative damage law in conjunction with Wöhler curves. Determination of the remaining fatigue life of a structure exposed to a varied stress range can also be obtained by calculating an equivalent stress range. The remaining life is then determined by comparison of that stress to the valid Wöhler curve (detail category). The reference value (71) is used for this purpose. The cut off limit can be taken as 40 MPa. For intermediate assessment, enhanced methods beyond the conventional design and assessment procedures as required in Eurocode 3 for the resistance assessment of old steel railway bridges must be introduced. As alternative methods fracture mechanical models can be applied that allow a more detailed assessment.

5. Bridge performance and resistance for higher loads and speeds
268
If the visible initial crack length a0 is assumed or measured and if the critical crack length acrit is determined, one can calculate the maximum permissible number of load cycles for a steel member under a certain fatigue load. This maximum permissible number of load cycles defines the period in which a crack growth under fatigue loads starting with an initial crack length a0 to a critical length acrit. For that the maximum permissible number of load cycles gives a hint on the residual service life of the structure/member and on its resistance. One advantage of this procedure is that the accumulated damage due to past traffic is satisfied by the assumption of the crack of the defined crack size. After the calculation of maximum permissible number of load cycles two cases can occur:
1. The maximum permissible number of load cycles is higher than the number of load cycles occurring between two inspections.
2. The maximum permissible number of load cycles is lower than the number of load cycles occurring between two inspections.
In the first case the structure/member has a proven sufficient resistance against crack initiation and crack growth. However, in the second case the resistance is insufficient and either the inspection interval must be decreased or the assessed structure/member has to be strengthened. For the determination of the maximum permissible number of load cycles the most common formula in fracture mechanics calculations is the so-called Paris-equation. The material constants C and m for normal old steels can be taken from the reference values if no further information is available. Figure 3 shows the result of a crack growth calculation from the Paris law. The maximum permissible number of load cycles N can be determined by subtracting the number of load cycles N0 related to the initial crack length a0 from the number of load cycles Ncrit related to the critical crack length acrit.
Figure 3. Result of a crack growth calculation

Improved assessment methods for static and fatigue resistance of old metal railway bridges
269
To simplify the fracture mechanics calculation, tabulated values derived from Hensen’s analysis (Hensen, 1992), are proposed. For the number of load cycles N based on crack growth calculations and material properties (phase I reference data, or phase II material testing), three different geometric models (plates under cyclic tension loads with through cracks on each side, with a through crack only on one side and with a through crack in the middle of the plate) are introduced. These models are linked to a catalogue of typical riveted connections in old structures for the assessment of angles. Similar catalogues also exist for web plates, bottom flanges and U-profiles. Nine different cyclic stress level ∆σ (10, 15, 20, 25, 30, 40, 50, 60, 80 N/mm²) are used and a modified geometrical correction function derived from a function according to handbooks of stress intensity factors is considered. The initial crack size a0 underneath a rivet head is (if not measured differently) assumed with a0 = radius of the rivet head + 5 mm.
For the determination of the maximum permissible number of load cycles Nper on the basis of tabulated values the following principally approach can be used:
1. Determination of the relevant crack configuration in relation to the relevant structural detail. Annex I in (Hensen, 1992) can be used.
2. Determination of the relevant cyclic stress level ∆σ for the component. 3. Perform a crack growth calculation or chose of the relevant table (Hensen, 1992, Annex
A4 to A6) related to the results of 1. and 2. 4. Estimation of the plate width of the geometric model in relation to the relevant structural
detail using (Hensen, 1992, Annex I). 5. Definition of the initial crack length by either measurement or assumption. 6. Determination of the critical crack length using by performing a fracture mechanical
assessment (criterion KI ≤ KIC, where KIC can be derived from reference values JC) or by using tabulated values e.g. (Hensen, 1992, Annex A1 to A3).
7. Determination of the number of load cycles N0 related to the initial crack length a0 and the number of load cycles Ncrit related to the critical crack length acrit using the relevant table, see also point 3.
8. The subtraction of the number of load cycles N0 from the number of load cycles Ncrit leads to the maximum permissible number of load cycles Nper.
As mentioned before two cases can be occurring: a) The maximum permissible number of load cycles Nper is higher than the number of load
cycles Ninsp occurring between two inspections. In this case the structure/member has a sufficient robustness against crack initiation and crack growth.
b) The maximum permissible number of load cycles Nper is lower than the number of load cycles Ninsp occurring between two inspections. Here the robustness is insufficient and either the inspection interval must be decreased or the assessed structure/member has to be strengthened.
A procedure how to calculate necessary strengthening measures for members under tension or bending stresses to increase their resistance against crack growth and their remaining service life is given for example in (D.3.4, 2007).
For advanced assessment analysis, a probabilistic analysis of fatigue damage can be performed. To do so, it is necessary to introduce statistical distributions and statistical parameters for performing the reliability analysis. A probabilistic approach provides the sensitivity of the element lifetime according to the parameters variability. It is recalled that a fracture mechanics model is required for this phase III analysis, the probabilistic calculations being only introduced to handle parameters variability, but not model errors.

5. Bridge performance and resistance for higher loads and speeds
270
7. IMPROVEMENT OF THE STRUCTURAL MODEL
Stringer-to-floor beam connections (double angle connections) are designed to carry shear forces alone. Nevertheless, they are subjected to secondary bending moments, and the usual assumption is that they provide sufficient rotational flexibility (without developing appreciable moment). Such an assumption is justifiable for Ultimate Limit State, but moments have to be considered for fatigue assessment. It requires Finite Element calculations in order to assess these secondary bending moments (Al-Emrani, 2005). Such an analysis is recommended for advanced assessment. This improved assessment model can be also be pertinent when repairs have to be taken into consideration. For advanced assessment, finite element calculations and reliability analysis can be jointly performed.
8. IMPROVEMENT OF BASIC INFORMATION
8.1. Material properties
It is recommended to limit any testing as far as possible and to material parameters that may influence the assessment result in a great manner. Tests should only be performed to gain the most important values, such as chemical analysis, mechanical properties: yield strength and ultimate tensile strength and fracture toughness. Testing of fatigue properties as well as fracture mechanical threshold values is expensive and may not lead to beneficial results. The application of reference values is recommended.
The number of tests to carry out depends on the available information of the bridge material and on the type of assessment. From the assessment type it can be distinguished whether the data must be gained:
• Globally for the structure, requiring information about all metals applied (increase of loads on the whole structure must be secured). If no a priori information, no less than 5 samples should be extracted, covering different parts of the structure, in order to receive representative results. The characteristic values are evaluated from the test results.
• Locally for a selected member, so that only this member needs to be investigated (cracks detected on specific hot spots, deterioration on single spots). If no a priori information, no less than 3 samples should be extracted from a less critical member of the same lot. The characteristic values are evaluated from the test results.
In order to limit the amount of destruction on an existing structure it is necessary to extract samples as small and compact as possible. If several material parameters need to be determined the extraction of cylindrical bore cores is suggested which allow the fabrication of several small scale test specimens. One 60 mm-core provides enough material to fabricate either 2 tensile tests (minimum B 5x25), or 1 tensile test B 5x25 and a modified SENB3-test specimen for the fracture mechanical test, or 1 tensile test B 5x25 and a charpy-v-notch test specimen. The remaining pieces of the core can be used for the chemical analysis and investigations of microstructure and hardness. Figure 4 shows how the material can be segmented (Helmerich, 2005).
For the extraction of samples cut-off-wheels or saws are suitable. Welding torches are not recommended in order to avoid embrittling and ageing effects by the inserted torch heat.
For advanced assessment, in particular when probabilistic calculations are performed, it is necessary to have probability functions as well as statistical parameters. It is therefore recommended from intermediate assessment updating to perform tests able to fit statistical parameters.
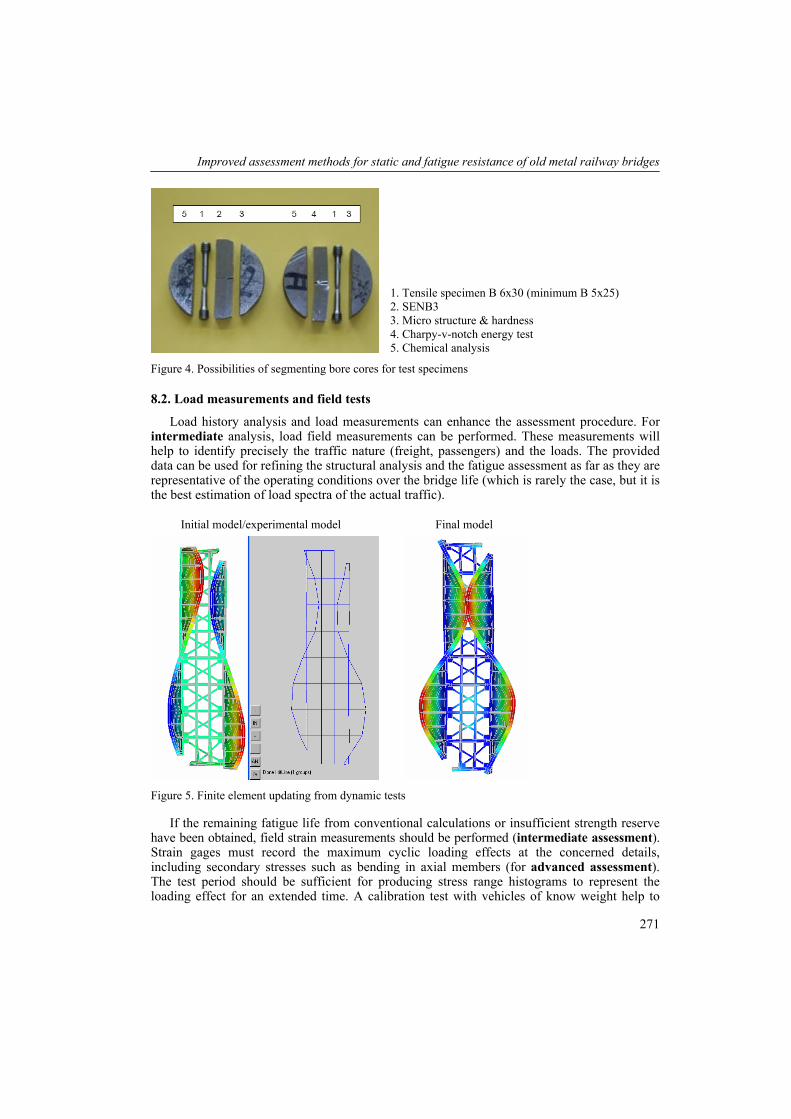
Improved assessment methods for static and fatigue resistance of old metal railway bridges
271
Figure 4. Possibilities of segmenting bore cores for test specimens
8.2. Load measurements and field tests
Load history analysis and load measurements can enhance the assessment procedure. For intermediate analysis, load field measurements can be performed. These measurements will help to identify precisely the traffic nature (freight, passengers) and the loads. The provided data can be used for refining the structural analysis and the fatigue assessment as far as they are representative of the operating conditions over the bridge life (which is rarely the case, but it is the best estimation of load spectra of the actual traffic). Initial model/experimental model Final model
Figure 5. Finite element updating from dynamic tests
If the remaining fatigue life from conventional calculations or insufficient strength reserve have been obtained, field strain measurements should be performed (intermediate assessment). Strain gages must record the maximum cyclic loading effects at the concerned details, including secondary stresses such as bending in axial members (for advanced assessment). The test period should be sufficient for producing stress range histograms to represent the loading effect for an extended time. A calibration test with vehicles of know weight help to
1. Tensile specimen B 6x30 (minimum B 5x25) 2. SENB3 3. Micro structure & hardness 4. Charpy-v-notch energy test 5. Chemical analysis

5. Bridge performance and resistance for higher loads and speeds
272
establish relationships between strain responses and vehicle weight and location for all the gages. From the data, the effective stress range from a truncated histogram (by eliminating truncation stress range) can be used for an initial/intermediate assessment procedure.
Field tests can only provide information regarding the weak parts of the bridge. In particular, dynamic testing will help to redefine support conditions and structural stiffness, especially if a model updating is performed (Figure 5).
9. CONCLUSIONS
This paper has presented the general recommendations and advices prescribed in the “Guidelines for Load and Resistance Assessment of Existing European Railway Bridges” (D.4.2, 2007) of the “Sustainable Bridges” project, related to metallic bridges. More details can be found in the guidelines and in deliverable D.3.4 (2007) where calculation procedures for necessary replacing rivets and strengthening measures are detailed and explained. Further details can also be found in the deliverable D.4.3.6 (2007).
REFERENCES Al-Emrani, M. (2005): Fatigue performance of stringer-to-floor-beam connections in riveted railway bridges, Journal of Bridge Engineering, 10(2), pp. 179–185.
D4.3.6 (2007): Background documents: Improved Assessment Methods for Static and Fatigue Resistance of old steel railway bridges, Project “Sustainable Bridges – Assessment for Future Traffic Demands and Longer Lives”.
D3.4 (2007): Kammel, C. et al., Technical Report, Project “Sustainable Bridges – Assessment for Future Traffic Demands and Longer Lives”.
Helmerich, R. (2005): Alte Stähle und Stahlkonstruktionen, Forschungsbericht 271, Berlin.
Hensen, W. (1992): Grundlagen für die Beurteilung der Weiterverwendung alter Stahlbrücken, PhD Dissertation, RWTH Aachen.
RiL805 (2002): Guideline 805 of German railways: Structural safety of existing railway bridges, DB Netz AG.

The analysis and assessment of masonry arch bridges
273
The analysis and assessment of masonry arch bridges
Clive MELBOURNE, Jinyan WANG & Adrienn TOMOR Although current masonry arch bridge assessment methods are able to predict the ultimate carrying capacity of the bridge with some confidence, serious concern was identified with respect to predicting long-term behaviour and residual life. A new assessment procedure SMART (Sustainable Masonry Arch Resistance Technique) has been introduced. The method provides a multi-level approach incorporating all the current methods of assessment/analysis and gives clear guidance on the philosophy that governs the determination of the safe working loads and ultimate load carrying capacity. Limit states are discussed and a new permissible limit state specific for masonry is proposed. From that the method enables the permissible working loads, long-term behaviour and residual life of the bridge to be found. This can be used to prioritise conflicting maintenance demands on limited budgets. The method is based upon recent research related to the long-term fatigue performance of masonry arch bridges subjected to cyclic loading.
1. INTRODUCTION
There are probably approaching a million masonry arch bridges worldwide. All are ageing and most are carrying loads well in excess of those envisaged by their builders. A recent survey (Sustainable Bridge Project) revealed that approximately 40% of the European Railway bridge stock comprises masonry arch bridges and that over 60% of these are over 100 years old. The maintenance and assessment of these bridges is a constant concern for the bridge owners.
Throughout Europe the current assessment methods fall broadly into three categories: the semi-empirical MEXE method (including a number of modified versions); limit analysis methods based upon a ‘mechanism’ approach; and solid mechanics methods (including finite element analyses and discrete element analyses).
A new approach to the assessment of masonry arch bridges is presented that not only gives a more realistic assessment of current capacity but also gives an indication of residual life and hence could be used to prioritise conflicting maintenance demands on limited budgets.
Sustainable Bridges – Assessment for Future Traffic Demands and Longer Lives

5. Bridge performance and resistance for higher loads and speeds
274
2. LIMIT STATE
In determining the ULS (collapse load) the bridge owner is assured of the ultimate capacity but little else. Based upon field tests in the 1980’s, two modes of failure were reported – the formation of a mechanism comprising hinges (4 in number for a single span bridge) and a ‘snap-through’ failure. These modes of failure were, to some extent, pre-determined by the nature of the loading system (a full-width ‘knife edge load’ applied at about the quarter span). The loading was applied monotonically through to failure.
It is at this point that it is very important to appreciate that although there is some general agreement as to the definition of the ULS as the condition at which a collapse mechanism forms in the structure or its supports, no such agreement exists for other limit states. There are three other limit states that have to be considered, namely: the serviceability, fatigue and durability limit states respectively (SLS, FLS, DLS). Although it may be fairly easy to differentiate between these limit states for metal and reinforced and prestressed concrete bridges, it is not so easy for masonry arch bridges. The SLS is usually determined against criteria of crack width, deflection, vibration, etc. In the case of the masonry arch bridge it is difficult to set meaningful limits for these. Clearly, it would be unacceptable to have a rail deflection of a magnitude which could derail a train. However, rail deflection will not be solely dependent upon the arch flexibility and will be subject to the same limitations set for the entire system. The FLS is quite specific for metal and reinforced and prestressed concrete bridges, it includes failure caused by fatigue or other time dependent effects. The DLS refers to the assessment of remaining service life in the context of environmental parameters. There is a strong case to bring these three limit states together for the purposes of masonry arch bridges. Bridges owners usually want to know two things: is the bridge strong enough to carry its working loads and what is its residual life. This can be achieved by assessing the ULS and what might best be called the Permissible Limit State (PLS). The PLS may be defined as the limit at which there is a loss of structural integrity which will measurably affect the ability of the bridge to carry its working loads for the expected life of the bridge. As can be seen, this brings together the critical elements of the other limit states to give a unique assessment tool for masonry arch bridges. The process involves the calculation of the stress ranges that the bridge experiences for each of the modes of behaviour and their cumulative effects in the context of an S-N curve. The current state of knowledge means that the S-N curves for each mode of behaviour/failure will be conservative and may reduce to a permissible stress (endurance limit stress), but as experience and confidence in the method grows these will be replaced by S-N curves similar to those currently used for other materials.
3. THE ‘SMART’ ASSESSMENT METHOD
Any structural assessment method follows a similar algorithm, the Sustainable Masonry Arch Resistance Technique (SMART) is no different. This is shown in Figure 1. Where masonry arch bridges differ from many other types of bridges is that there is little current experience of the design and construction of such structures (Recently, the Highways Agency, UK. has issued a Design Memorandum which gives guidance on the Design of Unreinforced Masonry Arch Bridges).
It is vital that any assessment method takes a holistic approach; the form of construction, materials, loading etc should all be taken into account. All too often the assessment focuses upon the barrel with lesser regard to its interaction with the other elements of the bridge – when they, themselves, may be critical. Currently, Network Rail uses a modified version of MEXE as a first step in the assessment. If this yields a capacity which is too low or the type and nature of the bridge excludes its application, alternative methods of analysis and assessment are permitted.

The analysis and assessment of masonry arch bridges
275
The ‘SMART’ method is based upon a more holistic approach that considers: the form of construction; material properties; Limit States; actions (i.e. current and historical loading and deformation induced stresses); analysis and modes of failure. The method gives an assessment of the bridge’s working and ultimate load capacity and an insight into its residual life.
1) Geometry, construction (Incl. foundations, backfill, etc.)
2) Loading
3) Materials
4) Structural analysis
Possible failure modes Influenced by Mechanism Arch geometry
Ring separation Longitudinal shear strength of inter-ring mortar joint
Crushing Compressive strength of masonry Sliding Shear strength of radial mortar joint Others Tensile strength, backfill properties, etc.
5) Ultimate Limit states ( ULS)
For all possible failure modes
6) Permissible Limit states ( PLS)
For all possible modes of behaviour Fatigue properties of materials defined through the S-N diagrams
7) Assessment of carrying capacity and life expectancy (e.g. application of Miner’s rule)
Figure 1. SMART assessment procedure
In the course of the research it became apparent that the current methods of assessment lack a single multi-level (initial, intermediate, enhanced) approach that includes all the current methods of assessment/analysis and gives clear guidance on the philosophy that governs the determination of the safe working loads and ultimate load carrying capacity.
The SMART (Sustainable Masonry Arch Resistance Technique) assessment method achieves this. The 7 steps in the method are presented as following:
Stage 1. Geometry and construction The first step in the SMART assessment, as well as in any other assessment method, is to
determine the form of construction and geometry of the bridge. It is very important at the outset to dispel the idea that all masonry arch bridges are of similar construction – nothing could be further to the truth. The different types of construction have evolved over centuries of trial and error and technological development. As a structural form the arch can be traced back
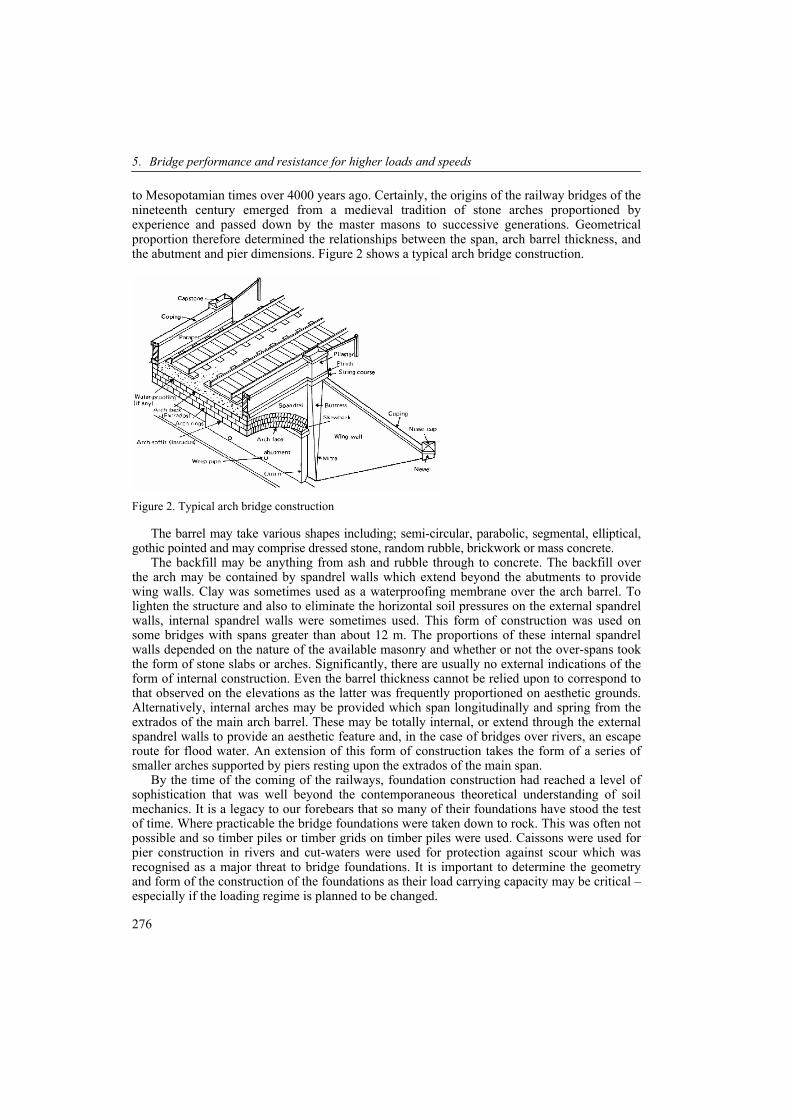
5. Bridge performance and resistance for higher loads and speeds
276
to Mesopotamian times over 4000 years ago. Certainly, the origins of the railway bridges of the nineteenth century emerged from a medieval tradition of stone arches proportioned by experience and passed down by the master masons to successive generations. Geometrical proportion therefore determined the relationships between the span, arch barrel thickness, and the abutment and pier dimensions. Figure 2 shows a typical arch bridge construction.
Figure 2. Typical arch bridge construction
The barrel may take various shapes including; semi-circular, parabolic, segmental, elliptical, gothic pointed and may comprise dressed stone, random rubble, brickwork or mass concrete.
The backfill may be anything from ash and rubble through to concrete. The backfill over the arch may be contained by spandrel walls which extend beyond the abutments to provide wing walls. Clay was sometimes used as a waterproofing membrane over the arch barrel. To lighten the structure and also to eliminate the horizontal soil pressures on the external spandrel walls, internal spandrel walls were sometimes used. This form of construction was used on some bridges with spans greater than about 12 m. The proportions of these internal spandrel walls depended on the nature of the available masonry and whether or not the over-spans took the form of stone slabs or arches. Significantly, there are usually no external indications of the form of internal construction. Even the barrel thickness cannot be relied upon to correspond to that observed on the elevations as the latter was frequently proportioned on aesthetic grounds. Alternatively, internal arches may be provided which span longitudinally and spring from the extrados of the main arch barrel. These may be totally internal, or extend through the external spandrel walls to provide an aesthetic feature and, in the case of bridges over rivers, an escape route for flood water. An extension of this form of construction takes the form of a series of smaller arches supported by piers resting upon the extrados of the main span.
By the time of the coming of the railways, foundation construction had reached a level of sophistication that was well beyond the contemporaneous theoretical understanding of soil mechanics. It is a legacy to our forebears that so many of their foundations have stood the test of time. Where practicable the bridge foundations were taken down to rock. This was often not possible and so timber piles or timber grids on timber piles were used. Caissons were used for pier construction in rivers and cut-waters were used for protection against scour which was recognised as a major threat to bridge foundations. It is important to determine the geometry and form of the construction of the foundations as their load carrying capacity may be critical – especially if the loading regime is planned to be changed.

The analysis and assessment of masonry arch bridges
277
It is very important to collect information that defines the boundary conditions of the bridge. The geometrical data and construction details should therefore include the embankments etc. on the approach to the bridge as well as the dimensions of the obstacles over which the bridge carries its traffic. (If the obstacle is a river, then its geomorphology should be considered with particular reference to flood conditions and scour history).
All masonry arch bridges have some defects. Most of these may be of a minor nature and so do not affect carrying capacity. However, they cannot be dismissed and should be faithfully recorded. Routine maintenance, like re-pointing, can mask historical or even new movement of the masonry. It is important that prior to re-pointing, cracks are recorded and their cumulative effect assessed.
Stage 2. Loading Dead loads are essential for the stability of masonry arch bridges. It is important to consider
accurately the weight and distribution of the bridge and its superimposed dead loads. This may be significantly affected by the internal construction, for example where the original internal voids between longitudinal spandrel walls have been filled. The application of load factors should take into account whether or not the dead load is beneficial.
Specific guidance on the load type, magnitudes, positions, frequency, etc. may be taken from the standard appropriate for the specific bridge.
Current assessment methods use deterministic approaches to represent the load regime that the bridge experiences. More recently, probabilistic approaches have been proposed.
To date, the value and dispersal of load through the fill has been based upon equivalent static values and ‘classical’ geotechnical dispersal. This view is now being tested against a background of proposed increases in train speeds and axle loadings. Preliminary conclusions of numerical modelling of an embankment incorporating a ‘rigid’ arch opening subjected to train loadings at various speeds suggest that the horizontal pressure changes are concentrated in a zone in the vicinity of the ballast/backfill interface (D4.7.2). Additionally, large scale laboratory tests have been undertaken to study the fundamental nature of the soil-structure interaction with granular and cohesive backfills. Initial findings have indicated the extent of the backfill that is mobilised at failure and the limited interaction at the permissible limit state (Gilbert et al. 2006, D4.7.1).
Stage 3. Materials The third step is to consider the construction materials and their basic properties. It is
beyond the scope of this paper to consider the properties of all of the materials and their combinations that might be found in masonry arch bridges. The main materials used in masonry construction include a variety of bricks and stone units, typically separated by bed and vertical joints comprising some type of mortar. In the case of dressed stone voussoir arches the interface with the mortar is conducive to good bonding and the percentage of mortar per unit volume is usually less than 2%. In multi-ring brickwork arches, this percentage rises to approximately 20% whilst the bonding becomes problematic. Additionally the brick bonding between the rings is important and if no headers are provided then ring separation is increasingly possible. This will result in tangential cracks, loss of continuum behaviour and hence reduction of the carrying capacity. Finally, a random rubble arch may have up to 40% volume of mortar with the consequential reduction in strength. The response of masonry to loads is influenced by the way in which these materials have been used in the bridge construction, their original physical characteristics and any subsequent changes, including deterioration. On this last point, it should be remembered that the majority of the masonry arch bridge stock is now in excess of one hundred years old. Guidance on the macroscopic material properties is given in current assessment ‘codes’, but little guidance is available if more sophisticated analyses are judged necessary.

5. Bridge performance and resistance for higher loads and speeds
278
The MEXE method deals with material properties in an empirical way by modifying the carrying capacity derived for the ‘standard’ case to take account of the actual condition and nature of the bridge. All other methods require the assessing engineer to make some assumptions regarding the properties of the constituent materials. These range, depending upon the method of analysis, from simplifying assumptions like infinite stiffness and strength in compression and no tensile strength to very sophisticated mathematical models which consider interface bond and non-linear behaviour of heterogeneous assemblages. What is important is that the ramifications of any limitations and/or assumptions that are made when applying the chosen approach to the problem are fully recognised. The more sophisticated FE techniques should include a parametric study, as many of the parameters which have to be defined in the mathematical model cannot be measured in the real structure. The determination of the material properties of the bridge present the assessing engineer with many problems (Edgell, 2005). There has been some development in NDT methods (www.sustainablebridges.net) but detailed evaluation of in situ properties and their variation is still some way off. At present, a deterministic approach is adopted, although methodologies for probabilistic techniques are being tested as part of the European Sustainable Bridges project (www.sustainablebridges.net).
The basic properties include the elastic modulus, density, compressive and tensile strengths, bond strengths and shear strength. Other properties include thermal coefficient, viscous deformation, fatigue properties. Although some of these are well understood in the case of modern brickwork, the same is not true for historic brickwork and stone masonry. Consequently, a good deal of experience and judgment is needed to arrive at realistic estimates. Of equal importance are the properties of the backfill and surfacing materials and the form and condition of the foundations.
As a major addition to earlier assessments, the SMART method includes an assessment of the long-term performance of the bridge. This requires the description of the fatigue properties of the masonry (see Stage 6).
Stage 4. Structural analysis Putting the MEXE method to one side for the time being – except to note that in the context
of the SMART method, it would be considered to be a PLS. It may be said that all the alternative methods are preoccupied with the ULS.
The advantage of considering ULS mechanisms is that the calculated failure load is not influenced by either the small geometrical changes that occur during loading or the initial stress state. The mechanism analysis is based upon an arch barrel comprising a rigid material, infinitely strong in compression but with no tensile strength, (however, most programs nowadays allow for a finite strength). The backfill may be treated as anything from a vertical dead load only through to sophisticated soil mechanics models. Analyses rarely go beyond a 2D analysis. FE and DE analyses have been undertaken and reported in the literature. All too often they depend on the selection of values for parameters that cannot be measured.
A major concern, however, is that as the mechanism, FE and DE programs develop further and greater confidence in the accuracy of their output is claimed (and may be justified in some cases), then the proposed working loads will be increased based, as it is currently, on half the ULS capacity. The worry is that this enhanced working load may be above the endurance limit for the fabric of the bridge. There are recent examples of bridges that have rapidly deteriorated when the loading regime has experienced a step change in axle loading which has taken the working load stresses above the endurance limit. It is therefore recommended that working loads are NOT calculated as a fixed fraction of the ULS capacity but in the context of the PLS capacity.
Where the SMART method has a major departure from current methods is in considering the analysis associated with the PLS. In this analysis, it is recognised, as Barlow so graphically demonstrated in 1846, that there are an infinite number of thrust line trajectories – the analyst only has to identify one that does not violate the stress criteria for stability to be demonstrated.

The analysis and assessment of masonry arch bridges
279
The major stumbling block has always been that the initial stress state is not known with any certainty. However, we do know that the bridge is still standing and therefore must be in, at least, a statically determinate state.
The bridge is analysed using a structural idealisation that takes its condition into account. For example, hinges may be assumed at the springings and crown; or that hinges occur at each of the springings and one of the hinges is on a roller; etc. It is interesting to consider the MEXE method at this stage. This method is based on work by Pippard who idealised the arch barrel as a 2-pinned parabolic arch loaded at the crown. The load capacity was determined based on stress criteria (1.4 N/mm² in compression and 0.7 N/mm² in tension). He had effectively decided that the arch would have retained one redundancy based upon field observations and common engineering sense as he had ignored the stiffening effects of the backfill and the spandrel and wing walls. Additionally, with the passage of time, any initial crown cracking will have autogenously healed (and the intrados will have been repointed) – anyway the method takes into account the condition of the mortar joints. The important point is that the method considers the working loads. It follows that it is only those bridges for which the idealisation is not valid that the MEXE method is suspect – these would include bridges where the relative stiffness of the abutments is suspect i.e. small spans with insubstantial abutments, flat spans, etc or where the idealisation is inappropriate i.e. skew spans.
Stage 5. ULS An Ultimate Limit State (ULS) analysis is usually undertaken using either a mechanism
type and/or an FE/DE approach. In the latter cases, some attempt can be made to monitor the structural response as the load increases, registering when hinges occur etc. It is very important to be aware that the modelling (particularly the material properties) may preclude the formation of some modes of failure. Additionally, validation of the analysis is usually undertaken using the UK field tests from the 1980’s. These data relate to bridges that were tested in a particular way and for which very few parameters were accurately recorded. Also, the bridge construction usually was not known prior to the tests and which in most cases proved to be critical in determining the bridge failure mode and load. It is recommended that before applying an FE/DE program to any bridge that it be validated using the most relevant test bridge available and undertaking a parametric sensitivity exercise. Further, the idealisation should take into account the foundation conditions and the backfill for a distance of at least 1.5 times the depth from the traffic surface to the founding level.
The crude method of determining the working capacity by using half the ULS capacity is NOT recommended. This is based upon the 1980’s UK field tests where it was observed that the initial “elastic” response of the bridge to the quarter span KEL extended to approximately half the failure load. But this type of loading may not be the critical loading at working loads – Pippard may be correct in considering the crown loading as the critical case for the working load.
Stage 6. PLS The Permissible Limit State (PLS) in the context of the definition requires the assessing
engineer to determine whether or not the endurance limit stress for the fabric of the bridge has been exceeded. It should be remembered that this should include the full range of modes of behaviour i.e. not just flexural stresses in the barrel but also shear stresses in multi-ring brickwork arches, radial shear stresses, soil bearing stresses etc.
There has been recent work at Cardiff (Roberts et al., 2006) and Salford (Melbourne et al., 2004, D4.7.1) which has confirmed that brickwork exhibits fatigue behaviour and that S-N type curves can be drawn for such materials. This has opened up the possibility of considering fatigue issues in the context of predicting residual life and working load regimes (x axles at y kN plus w axles at z kN, etc.).
In order to quantify the fatigue performance of possible modes of failure of the masonry (i.e. crushing, tensile cracks, shear cracks which will initiate the various modes of failure of the

5. Bridge performance and resistance for higher loads and speeds
280
structure), a series of S-N curves are proposed. For example, the properties of the masonry in compression can be represented by Equation (1).
NBASult
SS logmax2 −=
×∆ (1)
where: A and B are empirically determined constants, N is the number of cycles of loading that develop a change in stress of ∆S which experiences a maximum stress Smax Compared to the ultimate strength of Sult (Roberts et al., 2006).
With the experimental data from Cardiff and Salford, Casas et al have suggested the corresponding S-N curves for the combined compression-bending action (as in the case of single ring arches) and the shear action in the unit-mortar interface (in the case of multi-ring arches), details are presented elsewhere (D4.7.4).
In the absence of reliable S-N type curves it will mean that for the time being permissible stresses will have to be used to determine the load. To allow the bridge to operate above this level may not result in immediate failure or any short-term deterioration but will mean that there is a long – term concern.
Stage 7. Residual Life
Currently it is assumed that the ‘safe’ capacity for masonry is around 50% of the ultimate load carrying capacity. This value should be compared to the PLS which is determined using the S-N curves (or the permissible stresses if the S-N curve is not available) to ensure that no accumulative damage is likely to occur below the 50% mark.
It is also important to realise that the different modes of behaviour (and their associated induced levels of stress) are not mutually exclusive i.e. the load that induced punching shear is the same load that will be inducing simultaneously longitudinal shear, flexure, tension, compression, etc.
The number of cycles the structure can experience prior to any mode of failure may be investigated using Equation (1). This requires realistic values for the stress ranges and the maximum stresses to be determined for the arch under each range of loading. This can help to indicate the effect of any change in the loading regime on the life expectancy of the bridge. For example, if the slope of the S-N curve for the compressive strength of brickwork is only 0.05, a change in the stress range parameter may have a large effect on the number of cycles to failure.
It can therefore be seen that if the range in the stress level increases from, for example, 0.25 Sult to 0.5 Sult and as a consequence the Smax increases to 0.75 Sult then the maximum number of cycles to failure reduces (if A = 0.7 and B = 0.05) reduces from approximately 107 to 101.75 with the consequential reduction in residual life. This is particularly significant when the line traffic regime is changed, for example, by increasing the number and axle loading of freight trains.
Subsequently the number of cycles to failure under the range of stress levels should be compared with the number of cycles the structure has experienced with the help of Miner’s Rule (see Equation (2)) where n1 etc are the actual number of events in each designated stress range and N1 etc are the number of such events at the corresponding stress range that would cause failure.
1...2
2
1
1 <++Nn
Nn (2)
The SMART assessment method can therefore give an estimate of residual life of the bridge and thus enable a more informed management of the bridge stock.
The 7 steps in the SMART method for the proposed three levels assessment procedure are summarized in Table 1.

The analysis and assessment of masonry arch bridges
281
Table 1. The SMART Assessment Method
INITIAL INTERMEDIATE ENHANCED 1) GEOMETRY & CONSTRUCTION
Basic dimensions for MEXE assessment
Full geometrical survey
Full geometrical survey
2) LOADING Determined from nomogram/charts
UIC loading or equivalent
UIC loading or equivalent
3) MATERIALS Identified and condition assessed
Field tests and samples
Extensive field tests and sampling
4) STRUCTURAL ANALYSIS
No analysis requied for MEXE assessment. Basic 2D analysis
Mechanism method plus consideration of other modes of failure (e.g. ring separation) Statically determinate analysis to establish stresses
Mechanism method and FE/DE methods including sophisticated material and soil material properties
5) ULS N/A Check that the failure load is greater than the factored loading
Check that the failure load is greater than the factored loading
6) PLS Determined by the application of factors to the initial permited axle loading
Check that the working loads do not induce stresses greater than permissible stresses
Check that the working loads do not induce stresses that are greater than the permissible stresses – if the do then probilistic techniques may be used to consider risk or if S-N type curves are available for the critical stress parameters then this can be considered (see residual life)
7) RESIDUAL LIFE
Not determined Not determined Determination possible using enhanced material property parameters (S-N type curves) and/or probabilistic techniques
4. DISCUSSION
It is suggested that the SMART method can currently be applied as a methodology which identifies potential critical parameters. The SMART method differs from existing methods in as much as it considers long-term behaviour and attempts to quantify residual life. However, at this stage, the S-N curve type information is only available for specific laboratory-based research programmes and consequently, at present, the application of the method relies on the use of permissible stresses unless specific data are available. It may be that due to the variability in the mechanical properties of the materials and construction details of masonry arch bridges that a probabilistic approach to structural performance might be more achievable.
It should be noted that initially even the most sophisticated FE model will behave elastically at low stress levels. Additionally, once cracking is recorded in the FE model then the assessing engineer should consider the effect that this will have on the residual life of the bridge.
Currently available ultimate limit state analytical techniques can be used to determine the ultimate carrying capacity. However, it is important that the structural idealisation incorporates all the possible modes of failure. If certain modes of failure are not included (e.g. ring-separation, abutment movement, snap-through, etc), then the analysis may over-estimate the carrying capacity. Movement of abutments, voussoir slippage, internal construction etc all influence the working load

5. Bridge performance and resistance for higher loads and speeds
282
stress regime and hence whether or not critical stress levels are being exceeded at normal operational levels of loading. This is very important when considering the residual life of the bridge.
5. CONCLUSIONS
Current assessment methods were considered. Although they were found to be able to predict ultimate carrying capacities with some confidence, serious concern was identified with respect to predicting long term behaviour and residual life.
A new assessment procedure was presented (SMART) which differs from existing methods in as much as it brings together all the existing assessments methods into a single methodology that considers not only the load carrying capacity but also long-term behaviour and residual life. However, at this stage, the S-N curve type information is only available for specific laboratory-based research programmes and consequently, at present, the application of the method relies on the use of permissible stresses. It may be that due to the variability in the mechanical properties of the materials and construction details of masonry arch bridges that a probabilistic approach to structural performance might be more achievable. In any case, either methodology is compatible with the assessment algorithm.
It is suggested that the SMART method can currently be applied as a methodology which identifies potential critical parameters. In the example presented in the paper, the longitudinal shear stress was identified as the critical parameter in the determination of permissible axle loads using a range of simple elastic idealisation and comparing the analytical output with the ultimate load carrying capacity.
REFERENCES Edgell, G. (Ed) (2005): The Testing of Ceramics in Construction. Whittles Publishing Limited, Stoke-on- -Trent, 2.
Gilbert, M. et al. (2006): An experimental study of soil-arch interaction in masonry bridges. IABMAS ‘06 – Third International Conference on Bridge Maintenance, Safety and Management, pp. 779-780.
Highway structures: Design (substructures and special structures), materials. Special structures. Unreinforced masonry arch bridges. DMRB Vol. 2, Section 2, Part 14 (BD 91/04), Highways Agency, The Stationary Office, London.
McKibbins, L., Melbourne, C. et al. (2006): Masonry arch bridges: condition appraisal and remedial treatment. CIRIA C656.
Melbourne, C., Tomor, A.K. et al. (2004): Cyclic Load Capacity and Endurance Limit of Multi-Ring Masonry Arches, Arch Bridges IV Conference Proceedings, pp. 375-384. Roberts, T.M., Hughes, T.G. et al. (2006): Quasi-static and High Cycle Fatigue Strength of Brick Masonry. Construction and Building Materials 20, pp. 603-614.
SB4.7.1. (2007): Structural assessment of masonry arch bridges. Background document D4.7.1 to “Guideline for Load and Resistance Assessment of Railway Bridges”. Prepared by Sustainable Bridges – a project within EU FP6. Available from: www.sustainablebridges.net
SB4.7.2. (2007): Numerical analyses of load distribution and deflections in railway bridge transition zones due to passing trains. Background document D4.7.4 to “Guideline for Load and Resistance Assessment of Railway Bridges”. Prepared by Sustainable Bridges – a project within EU FP6. Available from: www.sustainablebridges.net
SB4.7.4. (2007): Potentiality of probabilistic methods in the assessment of masonry arches, Background document D4.7.4 to “Guideline for Load and Resistance Assessment of Railway Bridges”. Prepared by Sustainable Bridges – a project within EU FP6. Available from: www.sustainablebridges.net

Safety assessment of railway bridges by non-linear analysis
283
Safety assessment of railway bridges by non-linear analysis
Jan CERVENKA, Vladimir CERVENKA & Zdenek JANDA
New safety format suitable for assessment of railway bridges using non-linear analysis are required due to the global nature of such approach. Safety formats based on partial factors, global factors and probabilistic analysis are discussed. Their performance is compared on four examples ranging from statically determinate structures with bending mode of failure up to indeterminate structures with shear failure.
1. INTRODUCTION
In recent years, more engineers use non-linear analysis while making assessment of old existing structures or when designing new ones. This evolution is supported by rapid increase of computational power as well as by new capabilities of the available software tools for numerical simulation of structural performance.
The code provisions on the other hand provide very little guidance how to use the results of a non-linear analysis for structural assessment or design. The safety formats and rules that are usually employed in the codes are tailored for classical assessment procedures based on beam models, hand calculation or linear analysis and local section checks. On the other hand, non- -linear analysis is by its nature always a global type of assessment, in which all-structural parts, or sections, interact. Until recently the codes did not allow applying the method of partial safety factors for non-linear analysis, and therefore, a new safety format was expected to be formulated. Certain national or international codes have already introduced new safety formats based on overall/global safety factors to address this issue. Such codes are, for instance, German standard DIN 1045-1 (1998) or Eurocode 2 EN 1992-2 (2005). This paper will try to compare several possible safety formats suitable for non-linear analysis: partial factor method, global format based on EN 1992-2 (2005) and fully probabilistic method. A new alternative safety format is also proposed by the authors, which is based on a semi-probabilistic estimate of the coefficient of variation of resistance. Within the European project sustainable bridges the presented approaches were applied to the assessment of railway bridges.
Sustainable Bridges – Assessment for Future Traffic Demands and Longer Lives

5. Bridge performance and resistance for higher loads and speeds
284
Standard assessment procedure based on partial safety factors usually involves the following steps:
1. Linear elastic analysis of the structure considering all possible load combinations. Results are actions in some critical sections, which could be referred as design actions and can be written as:
niSinSd SSE γγ ++= ...11 (1)
They include safety provisions, in which the nominal loads Sni are amplified by appropriate partial safety factors for loading γSi, where index i stands for load type, and their combinations.
2. Design resistance of a section is calculated using design values of material parameters as:
mkddd fffrR γ/...),,( == (2)
The safety provision for resistance is used on the material level. The design value of material property fd is obtained from the characteristic value fk by its reduction with an appropriate partial safety factor γm.
3. Safety check of limit state is performed by design condition, which requires, that design resistance is greater then design action:
d dE R< (3)
Note, that in the partial safety factor method the safety of material criteria in local points is ensured. However, the probability of failure, i.e. the probability of violation of the design criteria (3) is not known.
The final steps of the verification process often involve assessment of serviceability conditions, i.e. deflections, crack width, fatigue, etc. In certain cases, these serviceability conditions might be the most important factors affecting the assessment conclusions.
In the above outlined procedure, the non-linear analysis should be applied in step 1 to replace the linear analysis. Following the current practice an engineer will continue to steps 2, 3 and perform the section check using the internal forces calculated by the non-linear analysis. This is a questionable practice due to the following reasons. If design values for material parameters are used in the non-linear analysis, then very unrealistic, i.e. degraded, material is assumed. In statically indeterminate structures, this may result in quite unrealistic redistribution of forces, which may not be necessary on the conservative side. Furthermore, in the non-linear analysis material criteria are always satisfied implicitly by the employed constitutive laws. Therefore, it does not make sense to continue to step 3 and perform section checks. Instead, a global check of safety should be performed on a higher level and not in local sections. This is the motivation for the introduction of new safety formats for non-linear analysis.
Another important factor is that non-linear analysis becomes useful when it is difficult to clearly identify the sections to be checked. This occurs in structures with complicated geometrical forms, with opening, special reinforcement detailing, etc. In such cases, usual models for beams and columns are not appropriate, and non-linear analysis is a powerful alternative.
The above discussion shows that it would be advantageous to check the global structural resistance to prescribed actions rather than checking each individual section. The safety format

Safety assessment of railway bridges by non-linear analysis
285
based on global assessment is more suitable for assessment approaches based on non-linear analysis. This approach can bring the following advantages:
a) The nonlinear analysis checks automatically all locations and not just those selected at critical sections.
b) The global safety format gives information about the structural safety and redundancy. This information is not available in the classical approach of section verification.
c) The safety assessment on global level can bring, on one hand, more economic solution by exploiting reserves due to more comprehensive design model, on the other hand, the risk of unsafe structures is reduced.
However, the above enthusiastic statements should be accepted with caution. There are many aspects of the assessment process, which require engineering judgment. Also many empirical criteria must be met as required by codes. Therefore, a global safety assessment based on non-linear analysis should be considered as an additional advanced tool, which should be used, when standard simple models are not sufficient.
The non-linear analysis offers an additional insight into the structural behaviour, and allows engineers to better understand their structures. On the other hand, non-linear analysis is almost always more demanding then a linear analysis, therefore an engineer should be aware of its limits as well as benefits. Other disadvantage is that the force super-position is not valid anymore. The consequence is that a separate non-linear analysis is necessary for each combination of actions.
Finally, a note to terminology will be made. The term for global resistance (global safety) is used here for assessment of structural response on higher structural level then a cross section. In technical literature, the same meaning is sometimes denoted by the term overall. The term global is introduced in order to distinguish the newly introduced check of safety on global level, as compared to local safety check in the partial safety factor method. This terminology has its probabilistic consequences as will be shown further in the paper. The proposed global approach makes possible a reliability assessment of resistance, which is based on more rational probabilistic approach as compared to partial safety factors.
2. SAFETY FORMATS FOR NON-LINEAR ANALYSIS
2.1. Design variable of resistance
Our aim is to extend the existing safety format of partial factors and make it compatible with nonlinear analysis. First we introduce a new design variable of resistance R = r(f, a, ..., S). Resistance represents a limit state. In a simple case this can be a single variable, such as loading force, or intensity of a distributed load. In general this can represent a set of actions including their loading history. We want to evaluate the reliability of resistance, which is effected by random variation of basic variables f – material parameters, a – dimensions, and possibly others.
The resistance is determined for a certain loading pattern, which is here introduced by the symbol of actions S. It is understood that unlike material parameters and dimensions, which enter the limit state function r as basic variables, the loading is scalable, and includes load type, location, load combination and history. It is the objective of the resistance R to determine the loading magnitude for given loading model.
Random variation of resistance is described by a statistical distribution characterized by following parameters: Rm – mean value of resistance, Rk – characteristic value of resistance, i.e. 5% kvantile of the resistance, Rd – design value of resistance.

5. Bridge performance and resistance for higher loads and speeds
286
The design condition is defined in analogy with partial safety factor method by Eq.(3). In general, Ed and Rd represent set of actions and the limit state is a point in a multi-
-dimensional space, respectively. It is therefore useful to define a resistance scaling factor kR, which describes safety factor with respect to the considered set of design actions. In the simplified form, considering one pair of corresponding components it can be described as:
Rd
Rk
E= (4)
Then, the design condition (3) can be rewritten as:
R Rkγ < (5)
where γR is required global safety factor for resistance. Factor kR can be used to calculate the relative safety margin for resistance
1R Rm k= − (6)
The task now remains to determine the design resistance Rd The following methods will be investigated and compared:
a) ECOV method, i.e. estimate of coefficient of variation for resistance. b) EN 1992-2 method, i.e. estimate of Rd using the overall safety factor from Eurocode 2
EN 1992-2. c) PSF method, i.e. estimate of Rd using the partial factors of safety. d) Full probabilistic approach. In this case Rd is calculated by a full probabilistic non-
-linear analysis. Furthermore, the limit state function r can include some uncertainty in model formulation.
However, this effect can be treated separately and shall not be included in the following considerations.
It should be also made clear, that we have separated the uncertainties of loading and resistance (and their random behaviour). Our task is reduced to describe the resistance side of design criterion (3).
2.2. ECOV method – estimate of coefficient of variation
This method is newly proposed by the authors. It is based on the idea, that the random distribution of resistance, which is described by the coefficient of variation VR, can be estimated from mean Rm and characteristic values Rk. The underlying assumption is that random distribution of resistance is according to lognormal distribution, which is typical for structural resistance. In this case, it is possible to express the coefficient of variation as:
1 ln1.65
mR
k
RVR
=
(7)
Global safety factor γR of resistance is then estimated as:

Safety assessment of railway bridges by non-linear analysis
287
exp( )R R RVγ α β= (8)
where αR is the sensitivity (weight) factor for resistance reliability and β is the reliability index. The above procedure enables to estimate the safety of resistance in a rational way, based on the principles of reliability accepted by the codes. Appropriate code provisions can be used to identify these parameters. According to Eurocode 2 EN 1991-1, typical values are β = 4.7 (one year) and αR = 0.8. In this case, the global resistance factor is:
exp( 3.76 )R RVγ ≅ − (9)
and the design resistance is calculated as:
/d m RR R γ= (10)
The key factor in the proposed method is to determine the mean and characteristic values Rm, Rk. It is proposed to estimate them using two separate nonlinear analyses using mean and characteristic values of input material parameters, respectively.
( ,...) , ( ,...)m m k kR r f R r f= = (11)
The method is general and reliability level β and distribution type can be changed if required. The advantage of this approach is that the sensitivity to individual parameters such as for instance steel or concrete strength can be estimated. The disadvantage is the need for two separate non-linear analyses.
2.3. EN1992-2 method
Design resistance is calculated from
( , ..., ) /d ym cm RR r f f S γ= % % (12)
Material properties used for resistance function are shown in table above. The global factor of resistance shall be γR = 1,27. The evaluation of resistance function is done by nonlinear analysis assuming the material
parameters according to the above rules.
2.4. PSF method – partial safety factor estimate
Design resistance Rd can be estimated using design material values as:
SfrR dd ...,(= ) (13)
In this case, the structural analysis is based on extremely low material parameters in all locations. This may cause deviations in structural response, e.g. in failure mode. It may be used as an estimate in absence of a more refined solution.

5. Bridge performance and resistance for higher loads and speeds
288
2.5. Full probabilistic analysis
Probabilistic analysis is a general tool for safety assessment of reinforced concrete structures, and thus it can be applied also in case of non-linear analysis. A limit state function can be evaluated by means of numerical simulation. In this approach the resistance function r(r) is represented by non-linear structural analysis and loading function s(s) is represented by action model. Safety can be evaluated with the help of reliability index β, or alternatively by failure probability Pf taking into account all uncertainties due to random variation of material properties, dimensions, loading, and other.
Probabilistic analysis based on numerical simulation include following steps: 1. Numerical model based on non-linear finite element analysis. This model describes the
resistance function r(r) and can perform deterministic analysis of resistance for a given set of input variables.
2. Randomisation of input variables (material properties, dimensions, boundary conditions, etc.). This can also include some effects of actions, which are not in the action function s(s) (for example pre-stressing, dead load, etc.). Random properties are defined by random distribution type and its parameters (mean, standard deviation, etc.). They describe the uncertainties due to statistical variation of resistance properties.
3. Probabilistic analysis of resistance and action. This can be performed by numerical method of Monte Carlo-type of sampling, such as LHS sampling method. Results of this analysis provide random parameters of resistance and actions, such as mean, standard deviation, etc. and the type of distribution function for resistance.
4. Evaluation of safety using reliability index β or probability of failure. Probabilistic analysis can be also used for determination of design value of resistance
function r (r) expressed as Rd. Such analysis involves the steps (1) to (3) above and Rd is determined for required reliability β or failure probability Pf.
Table 1. Material parameters used in EN1992-2 method
1.1ym ykf f=% Steel yield strength
1.1pm pkf f=% Prestressing steel yield strength
1.1 scm ck
c
f fγγ
=% Concrete compressive strength, where γs and γc are partial safety factors for steel and concrete respectively. Typically this means that the concrete compressive strength should be calculated as
0.843cm ckf f=%
2.6. Nonlinear analysis
Examples in this paper are analysed with program ATENA for non-linear analysis of concrete structures. ATENA is capable of a realistic simulation of concrete behaviour in the entire loading range with ductile as well as brittle failure modes as shown in papers by Cervenka (1998, 2002). The numerical analysis is based on finite element method and non-

Safety assessment of railway bridges by non-linear analysis
289
-linear material models for concrete, reinforcement and their interaction. Tensile behaviour of concrete is described by smeared cracks, crack band and fracture energy, compressive behaviour of concrete is described by damage model with hardening and softening. In the presented examples the reinforcement is modelled by truss elements embedded in two- -dimensional isoparametric concrete elements. Nonlinear solution is performed incrementally with equilibrium iterations in each load step.
3. EXAMPLES OF APPLICATION
The performance of presented safety formats will be tested on several examples ranging from simple determinate structures with bending failure mode up to statically indeterminate structures with shear failure modes. Example 1: simply supported beam in bending
Simply supported beam is loaded by a uniform load. The beam has a span of 6 m, rectangular cross/-section of h = 0.3 m, b = 1 m. It is reinforced with 5 ∅ 14 along the bottom surface. The concrete type is C30/37 and reinforcement has a yield strength of 500 Mpa. The failure occurs due to bending with a reinforcement yielding.
Figure 1. Beam geometry with distributed design load for example 1
Example 2: deep shear beam Continuous deep beam with two spans. It corresponds to one of the beams that were tested
at Delft university by Asin (1998). It is a statically indeterminate structure with a brittle shear failure. Example 3: bridge pier
This example is chosen in order to verify the behaviour of the various safety formats in the case of a problem with second order effect (i.e. geometric nonlinearity). This example is adopted from a practical bridge design in Italy that was published by Bertagnoli et al. (2004). It is a bridge pier loaded by normal force and moment at the top.
Figure 2. Deam beam geometry for the example 2

5. Bridge performance and resistance for higher loads and speeds
290
a) b) Figure 3. Example 4: a) the geometry of the example 2, the bridge pier with second order effect, b) railway bridge frame structure
Example 4: railway bridge frame structure The bridge frame structure in Sweden fails by a combined bending and shear failure. It is
an existing bridge that was strengthened by fibre carbon bars, and subjected to a field test up to failure by a single load in the middle of the left span.
The examples are shown in to Figure 3. In the non-linear analysis, the load is gradually increased up to failure. Typical result from such an analysis is shown in Figure 4 for the case of the example 1. The figure shows the beam response for increasing load using various safety methods presented in Section 2. The straight dashed line represents the load-carrying capacity given by standard design formulas based on beam analysis by hand calculation and critical section check by partial factor method. The other curves corresponds to the analyses with different material properties as specified by the safety format approaches that are presented in Section 2. The curve denoted as PSF, thus corresponds to the partial factor method from Section 2.4, in which the used material parameters are multiplied by the corresponding factors of safety.
The response curve EN1992-2 is obtained from an analysis, where the material parameters are given by Section 2.3. For the ECOV method (Section 2.2), two separate analyses are needed: one using mean material properties, and one with characteristic values. The results from these two analyses are denoted by the labels “Mean” and “Char.” respectively. The ultimate load carrying capacities from each analysis are then used to estimate the design resistanceRd. For all examples the calculated design resistances are shown in Table 2. The design resistances are normalized with respect to the values obtained for PSF method to simplify the comparison.

Safety assessment of railway bridges by non-linear analysis
291
For each example, a full probabilistic analysis was also performed. Each probabilistic analysis consists of several (at least 32 to 64 analyses) non-linear analysis with different material properties.
0
20
40
60
80
100
120
140
0 20 40 60 80Deflection [mm]
Max
imal
Mom
ent [
kNm
/m] .
EN1992-1
PSF
EN1992-2
Mean
Char.
Figure 4. Load-displacement diagrams for bending example 1 Table 2. Comparison of calculated values for design resistance using various safety formats
PSF ECOV EN 1992-2 Probabilistic
Example 1 Bending
/ PSFd dR R
1.0
1.0
0.95
0.96
Example 2 shear beam
/ PSFd dR R
1.0
1.02
0.98
0.98
Example 3 bridge pier
/ PSFd dR R
1.0
1.06
0.98
1.02
Example 4 bridge frame
/ PSFd dR R
1.0
0.97
0.93
1.01

5. Bridge performance and resistance for higher loads and speeds
292
4. CONCLUSIONS
The paper presents a comparison of several safety formats for an assessment based on non-linear analysis. A new method for verification of ultimate limit state suitable for reinforced concrete design based on non-linear analysis is described. The new method is called ECOV (Estimate of Coefficient Of Variation). The proposed method can capture the resistance sensitivity to the random variation of input variables, and thus it can reflect the effect of failure mode on safety. It requires two non-linear analyses with mean and characteristic values of input parameters respectively. Other safety formats suitable for non-linear analysis that are based on global resistance are presented. They are: the approach proposed by EN 1992-2, fully probabilistic analysis and a simple approach based on design values of input parameters, i.e. characteristic parameters reduced by partial safety factors. The last approach is usually not recommended by design codes, but practicing engineers often overlook this fact, and use this approach if a non-linear analysis is available in their analysis tools. The consequences are investigated in this paper.
The discussed safety formats are tested on four examples. They include ductile as well as brittle modes of failure and second order effect (of large deformation). For the investigated range of problems, all the methods provide quite reliable and consistent results.
Based on the limited set of examples the following conclusions are drawn: a) The proposed EVC method gives consistent results compare to other approaches. b) The PSF method, which uses input parameters with partial safety factors appears to be
sufficiently reliable and it is a natural extension of the classical approach to the modern design methods based on non-linear analysis.
c) Fully probabilistic analysis is sensitive to the type of random distribution assumed for input variables or resistance. It can provide additional load-carrying capacity if statistical properties of the analysed system are known or can be accurately estimated.
The methods are currently subjected to further validation by authors for other types of structures and failure modes.
The research presented in this paper was in part resulting from: Grant no. 1ET409870411 of the Czech Academy of Sciences, European project Sustainable bridges TIP3-CT-2003- -001653. The financial support is greatly appreciated.
REFERENCES Asin, M. (1999): The Behaviour of Reinforced Concrete Continuous Deep Beams. Ph.D. Dissertation, Delft Univeristy Press, The Netherlands, 1999, ISBN 90-407-2012-6.
Bertagnoli, G., Giordano, L., Mancini, G. (2004): Safety format for the nonlinear analysis of concrete structures. STUDIES AND RESEARCHES – V. 25, Politechnico di Milano, Italy.
Cervenka, V. (1998): Simulation of shear failure modes of R/C structures. In: Computational Modeling of Concrete Structures (Euro-C 98), eds. R. de Borst, N. Bicanic, H. Mang, G. Meschke, A.A. Balkema, Rotterdam, The Netherlands, 1998, pp. 833-838.
Cervenka V. (2002): Computer simulation of failure of concrete structures for practice. 1st Fib Congress 2002 Concrete Structures in 21 Century, Osaka, Japan, Keynote lecture in Session 13, pp. 289-304.
DIN 1045-1 (1998): Tragwerke aus Beton, Stahlbeton und Spannbeton, Teil 1: Bemessung und Konstruktion, German standard for concrete, reinforced concrete and pre-stressed concrete structures.
EN 1992-2, (2005): Eurocode 2 – Design of concrete structures – Concrete bridges – Design and detailing rules.

Bayesian updating, a powerful tool for updating engineering models…
293
Bayesian updating, a powerful tool for updating engineering models using results of testing and monitoring
Luis NEVES, Dawid WIŚNIEWSKI & Paulo CRUZ Many of the European railway bridges are getting close to the end of their service life. At the same time the railway operators demand higher axle loads for freight trains and higher speeds for passenger trains. This requires new and better methods, models and tools that can be used in the assessment of existing bridges, which will let to more realistic evaluation of their load carrying capacity and also more accurate evaluation of their remaining service life. This paper presents a mathematical approach that allows to incorporate the results of testing or monitoring in the assessment of existing structures.
1. INTRODUCTION
Validation and updating (if necessary) of the assumptions made when deriving theoretical models of resistance and loading for bridge assessment, can be achieved by testing and monitoring. The term “testing” is usually associated with a point in time (discrete) observation of the bridge behaviour, whereas “monitoring” refers to the continuous or repetitive (long- -term) observation of the bridge response by means of sensors that are usually permanently installed on the bridge.
The available testing and monitoring methods can provide information on different parameters regarding the structure itself and the loads acting on the structure. The provided information about the structure itself can be at different detail level including material level, element level, and structural level. On the other hand, the performed measurements can provide information about required parameters directly, for example measuring the concrete compressive strength on cores retrieved from the structure, or indirectly by using correlation with some other parameters (e.g. surface hardness). In the assessment of existing railway bridges the amount of information obtained indirectly can be much bigger due to availability of various non-destructive testing methods. The procedures and methodologies of using indirectly obtained information in the assessment should be different than those for directly obtained information due to different level of confidence to the obtained results. The Bayesian updating
Sustainable Bridges – Assessment for Future Traffic Demands and Longer Lives

5. Bridge performance and resistance for higher loads and speeds
294
approach, presented in this paper, allows the consideration of the difference in the level of confidence for the results of performed test or monitoring and, in its general form, is suitable for most of the possible structural engineering applications.
2. BACKGROUND
When destructive or non-destructive tests, monitoring, or load tests are performed, new information becomes available. This new information can be used in the safety or durability assessment of a structure, resulting in a reduction in uncertainty on the assessment or, in some cases, leading to significant changes in the values of the parameters used.
In current practice, this data is directly included in the assessment considering that it is perfectly accurate, disregarding previous information available. However, in most cases, the new information can not be assumed to be absolutely accurate, as uncertainty exists on both the results obtained due to the tests and on the relation between those and the safety of the structure.
For example, when the compressive strength of concrete is analysed in an existing structure using the Schmidt Hammer test, in most cases, for several tests performed, the results will differ significantly. This occurs for two main reasons. First, the properties of concrete change from element to element within the same structure, second, even if the test is repeated at the same point, the results will differ as a consequence of small changes in the execution of the test. In other words, the uncertainty in measured results arises from uncertainty in the material properties and from lack of accuracy of the testing methodology.
In a Bayesian updating framework, both sources of uncertainty are considered in a consistent manner, resulting in a more reliable indication of the real properties of materials and/or better resistance models leading finally to more accurate assessment of a structure (Box and Tiao, 1973).
3. UPDATING OF SINGLE RANDOM PROPERTY
Due to the cost of non-destructive or destructive tests, these are only performed after all available data was collected and analyzed. As a consequence, before performing such tests, the bridge engineer is already capable of estimating the most significant parameters necessary for the analysis of the structure. This estimative can have different levels of confidence, depending on the data available, experience with similar structures, and previous analysis of the structure. This initial knowledge will be denoted as prior, since it is acquired before any test is carried out.
Due to the nature of this information, it is usually associated with large uncertainty. The main objective of performing destructive or non-destructive tests is to reduce this uncertainty, and adjust the values obtained.
Defining the property under analysis (e.g., concrete compressive strength) by θ, it is possible (using existing codes or previous experience) to define a probability density function for this variable as:
( )θθ θf~ (1)
If no information exists on the property so-called a non-informative prior can be used. This is simply a function that is constant for all possible values of the property θ.
As an example, a case where the results of a test are described by a variable x can be considered. Knowing the nature of the test, the probability of the observation being made can be calculated for each value of the parameter θ. For example, if cores from several concrete

Bayesian updating, a powerful tool for updating engineering models…
295
elements using a concrete of class C30 are tested, it is possible to measure the probability of each result of the core compressive strength. If this work is repeated for several cores, the distribution for values of the unknown parameter θ can be found. It must be noted that this information can be found in the literature for the most common tests.
The posterior distribution of the unknown variable θ can be found through expression:
( ) ( ) ( )
( ) ( )∫∞+
∞−=
=
∏⋅
∏⋅=
θθ
θθθ
θθ
θθθ
|
|
|1
|1
ixni
ixni'
xff
xfff (2)
The denominator of the above expression serves only as a normalization parameter, so that the area below the function is 1. It is, therefore, not important at this stage. As a result, the expression (2) can be replaced by:
( ) ( ) ( )θθθ θθθ ||1 ixni
' xfff =∏⋅∝ (3)
The first term of expression (3) refers to the prior distribution probability. The second term describes the likelihood of a certain value of x being output from the test, for a certain value of the parameter θ. For example, represents the probability of a concrete with compressive strength θ yielding a core resistance x, when tested. Direct use of this equation can be made for relatively simple cases. For more complex situations simulation can be employed.
An example of typical results obtained using this methodology is presented in Figure 1. The prior distribution represents knowledge before carrying out the test. Considering that it is based on limited information, it is associated with significant dispersion. The likelihood distribution is associated with a smaller dispersion, meaning that it refers to a test with high accuracy. The posterior distribution represented shows a dispersion between the two previous curves, meaning that execution of the test implies a significant reduction in the dispersion of the parameter (e.g., concrete compressive strength) under analysis. Moreover, since the test yielded a result different from the mean of the prior distribution, there is a small shift in the mean of the parameter.
0 10 20 30 40 50 600
0.05
0.1
0.15
0.2
0.25
Likelihood
Posterior
Prior
Parameter
Prob
abilit
y D
ensit
y Fu
nctio
n
Figure 1. Comparison of Prior, likelihood and posterior distributions
′
′

5. Bridge performance and resistance for higher loads and speeds
296
Considering the most common case, in which a structural parameter with Gaussian distribution is investigated, the characteristic values of this parameter, using the results of tests, can be found using following equation:
11k vdx m t sn
= − ⋅ +
(4)
where n is the number of samples or tests, m is the mean value obtained from tests and prior knowledge, s is the standard deviation obtained from tests and prior knowledge and tvd is the coefficient of the Student distribution dependent on the sample size, prior standard deviation, and probability of occurrence as given in Table 1.
Table 1. Parameter tvd for normal distributed variables
Probability Degrees of freedom, ν = n – 1
F (–β) 1 2 3 5 7 10 20 50 ∞ 0.10 3.08 1.89 1.64 1.48 1.42 1.37 1.33 1.30 1.28 0.05 6.31 2.92 2.35 2.02 1.89 1.81 1.72 1.68 1.64 0.01 31.8 6.97 4.54 3.37 3.00 2.76 2.53 2.40 2.33 0.005 63.7 9.93 5.84 4.03 2.50 3.17 2.84 2.68 2.58 0.001 318 22.33 10.21 5.89 4.78 4.14 3.55 3.26 3.09
If the standard deviation is known from past experience than ν = ∞, and s should be replaced by the known standard deviation, σ.
If no prior information exists on the problem, the standard deviation and the mean are given by the sample mean and standard deviation as:
nx
m i∑= (5)
( )∑ −= 21 mxn
s i (6)
When prior information exists, the updated mean and standard deviation must conjugate the two sources of information. For example, it can be considered that prior information indicates that the parameter has a normal distribution with unknown mean and standard deviation. Prior information gives an estimative on the values of the mean and standard deviation in terms of the expected values and uncertainty. In other words, prior information gives a belief on the distribution of the parameter. Since this belief is not certain, it is defined in a probabilistic form. Defining the expected value and the coefficient of variation of the prior mean as m(µ') and V(µ′), the expected value and the coefficient of variation of the prior standard deviation are given by m(σ′) and V(σ′). This prior can be considered equivalent to n′ associated with a parameter v′ as (Rücker et al., 2006):
( )( ) ( )
21
=
'V'm'mn'
µµσ (7)

Bayesian updating, a powerful tool for updating engineering models…
297
( )[ ]21
21
'Vν'
σ= (8)
Continuing, the Equation (4) changes to:
( ) ( )n"
"mt"mxk11'' +⋅−= σµ ν (9)
where m(µ″) is the updated expected mean value, m(σ″) is the updated standard deviation, n″ is the number of samples, and tv″ is the updated coefficient of the Student distribution as given in Table 1.
The updated mean, m(µ″), updated standard deviation, m(σ″), updated number of samples n″ and updated v″ are:
n'nn" += (10)
( ) ( )n"
'mn'mn"m µµ ⋅+⋅= (11)
=+>++
=001
n'ifv'vn'ifv'v
v" (12)
( ) ( ) ( )[ ] [ ] ( )"
"m"nmns'm'n'm'"mν
µνµσνσ22222 ⋅−⋅+⋅+⋅+⋅= (13)
4. UPDATING OF UNCERTAIN RELATIONS
In civil engineering, it is quite common that a measured parameter depends of a large number of uncertain basic variables. For example, the deflection at mid-span of a bridge can be measured with certain accuracy, although it depends on a large set of parameters including the load applied, the type of concrete, the geometry of the structure and the resistance of critical cross sections. The probability of an analyzed event (e.g. structure failure, initiation of corrosion, etc.) can be updated considering a measured property I as:
( ) ( )( )
|P F I
P F IP I
∩= (14)
where F represent the analysed event, and I the observed event. The analysis of this type of problems can become extremely complex due to the possible
existence of correlation between the different parameters. However, an analysis performed using Monte-Carlo simulation is relatively simple. For example, when considering a structural problem where the probability of failure of some structure is computed using simulation, this analysis will yield the probabilistic distribution of a set of results for different levels of loading. Some of these results can be measured in the real structure, although these measurements will always include some degree of error. Denote the measured quantity by θ, the new probability of failure can be defined as:
( )0 ( | )( | )
i if
i
I g p xp
p xθ
θ≤
= ∑∑
(15)
where I is the identity function, and p(xi/θ) is the probability of one of the results (e.g. displacement) associated with the sample xi occurring.
More information regarding upgrading uncertain relations can be found in (Faber, 2000).

5. Bridge performance and resistance for higher loads and speeds
298
5. EXAMPLE OF APPLICATION
In the following example the results of tests on the mechanical properties of materials are used to improve the models of the material properties of concrete used in the assessment. This is made using the analytical expressions described in section 3.
For the purpose of this example, it has been considered that to assess the compressive strength of concrete a set of 3 tests were performed, which yields to the following results: 30.1 MPa, 25.4 MPa, and 32.5 MPa. The mean and standard deviation of the observed values are:
MPa33.29== ∑nXi
m (16)
MPa61.31
)( 2
=−−
=n
mXs i (17)
Considering no prior information exists, the characteristic value of the compressive strength is given by the Equation 9 where tvd is taken from Table 1. In the present case, for a percentile of 5%, tvd is equal to 2.92 for v = n – 1 = 2. Consequently, Equation 9 becomes:
1 11 29.33 2.92 3.61 1 17.2 MPa3k vdx m t s
n = − ⋅ + = − ⋅ + =
(18)
Another approach to this problem is based on the use of Bayesian probabilities. It can be considered that the resistance of concrete follows a normal distribution, with unknown mean and standard deviation. Since the mean and standard deviation are unknown, they can be treated as random variables.
Although no prior information exists on the class of concrete used, the standard deviation of the concrete strength is generally quite constant, and it can be assumed close to 3 MPa. This is to say that the standard deviation of the resistance is a random variable with mean 3 MPa. Since we believe this value is quite consistent, it can be assumed that it is associated with a low coefficient of variation (e.g., 0.1 = 10%, see Table 2). For simplicity, it can be also assumed that the standard deviation follows a normal distribution.
On the other hand, no prior information exists on the mean, as any class of concrete could have been used. For this reason it can be assumed that the mean of the resistance is also defined by a normal variable with mean equal to 30 MPa, and a very high coefficient of variation (e.g., 10 = 1000%, see Table 2). Such a large coefficient of variation is close to saying that any value is reasonable, considering no information exists.
Table 2. Prior information on the compressive strength of concrete
Compressive strength of concrete
Prior mean Prior standard deviation
Mean [MPa] Coef. of var. Mean [MPa] Coef.of var.
m(µ′) V(µ′) m(σ′) V(σ′)
30 10 3 0.1
The distributions of the mean and standard deviation of the concrete compressive resistance based on prior knowledge only are shown in Figure 1.

Bayesian updating, a powerful tool for updating engineering models…
299
0
0.002
0.004
0.006
0.008
0.01
0.012
0.014
0 10 20 30 40 50 60
Mean resistance [MPa]
Pro
babi
lity
0
0.2
0.4
0.6
0.8
1
1.2
1.4
0 1 2 3 4 5 6 7
Standard deviation of the resistance [MPa]
Pro
babi
lity
(a) Mean resistance (b) Standard deviation of resistance
Figure 2. Mean and standard deviation of compressive resistance of concrete
Now, the prior knowledge can be combined with the results of tests. Using the mean value and the standard deviation of the observed values defined in Equations 16 and 17, Equations 7 and 8 can be rewritten as follows:
( )( ) ( ) 0~
101
3031'
2
=
=
'V'm'mn
µµσ (19)
( ) [ ]2 21 1 1 1' 502 2 0.1'V
νσ
= = =
(20)
In other words, the prior knowledge is equivalent to zero tests (since no information on the mean exists, but to 50 degrees of freedom, since the standard deviation is relatively well known).
The prior information can be now combined with the results of tests. The equivalent number of tests is the sum of the number of tests associated with prior knowledge and real tests:
n″ = n + n′ = 3 + 0 = 3 (21)
The updated expected value of the mean is the weighted average of the means of prior knowledge and tests:
( ) ( ) 33.293
30033.293=
⋅+⋅=
⋅+⋅=
n"'mn'mn"m µµ (22)
In other words, since there was no prior information on the mean value, the updated mean value is a result of tests alone.
The updated degrees of freedom are given by:
' 1 ' 0'' 2 50 52
' ' 0if nif n
ν νν
ν ν+ + >
= = + = + = (23)
′′
′
′′
″′′

5. Bridge performance and resistance for higher loads and speeds
300
The updated expected value of the standard deviation is given by:
( ) ( ) ( )[ ] [ ] ( )
[ ] [ ] 026.352
33.29333.29361.32300350 22222
22222
=⋅−⋅+⋅+⋅+⋅=
⋅−⋅+⋅+⋅+⋅="
"m"nmns'm'n'm'"mν
µνµσνσ (24)
As can be seen, the prior information on the standard deviation as a significant effect on the updated distribution. The results obtained are summarized in Table 3.
Table 3. Expected values of mean and standard deviation resulting from tests, prior information and Bayesian updating
Compressive strength of concrete Expected mean Expected st. dev. Number of samples Degrees of freedom m(µ′) m(σ′) n ν Tests 29.33 3.61 3 2 Prior 30 3 0 50 Posterior 29.33 3.026 3 52
As a result, the new characteristic value can be computed as:
''1 1'' '' 1 29.33 1.68 3.026 1 23.48 MPa'' 3k vx m t s
n = − ⋅ + = − ⋅ + =
(25)
6. CONCLUSIONS In this paper, the use of Bayesian updating in the assessment of existing structures is
described. Bayesian updating is a consistent tool to combine different sources of uncertain information, as are results of non-destructive tests or engineering judgement. As the results of the example show, even very limited and initially considered useless information, as is the case of the diffuse available information on the expected standard deviation of the compressive strength of concrete, can be extremely useful in updating the information on this property. Although the mean value is unchanged, a significant reduction in the standard deviation occurs, leading to a significantly lower characteristic value.
As signalized in this paper, Bayesian updating is a powerful tool which can be used in the assessment of existing bridges, both to upgrade the theoretical or empirical engineering models, when some data obtained due to test or monitoring are available, but also to combine experts judgement with results of tests. As described most problems are much more complex than that presented in the paper, and use of simulation is often necessary.
REFERENCES Box, G., Tiao, G. (1973): Bayesian Inference in Statistical Analysis. New York, Addison-Wesley. Faber, M.H. (2000): Reliability based assessment of existing structures, Progress in Structural Engineering and Materials, 2 (2), pp. 247-253. Rücker, W., Hille, F., Rohrmann, R. (2006): Guideline for the Assessment of Existing Structures, SAMCO Final Report.
″ ″″″

Advanced technologies of railway bridge rehabilitation


Rehabilitation of railway bridges
303
Rehabilitation of railway bridges
Björn TÄLJSTEN, Anders CAROLIN & Rosemarie HELMERICH The presented work in work package 6 is a part of the European funded research project Sustainable Bridges (www.sustainblebridges.net). The objectives of this project are to: Increase the transport capacity of existing bridges by allowing axle loads up to 33 tons for freight traffic with moderate speeds or for speeds up to 350 km/h for passenger traffic with low axle loads. Increase the mean residual service lives of existing bridges with up to 25%. The project contains 9 work packages, where WP6 deals with new and innovative repair and strengthening methods for railway bridges. All work-packages are correlated. However in this paper the work carried out in work package 6 and how development of environmental friendly and non disturbing repair and strengthening methods may enhance management, strengthening and repair systems is presented.
1. INTRODUCTION
European railway bridge stock consist mainly of 4 major bridge types, with age ranging form extremely old masonry arch bridges, middle-age metallic bridges and newly built concrete and composite (steel/concrete) bridges. Small span lengths, less than 10 m, are dominating. Furthermore railways typically assess serviceability as rout bases. Traffic interruptions need to be avoided almost entirely. Many of the existing bridges are in need prolonged life considering the design life when built. In addition it is not uncommon that the owner wishes to increase the speed, weight and traffic volume on the already busy routes. If these situations occur a thoroughly structural investigation is needed. First the remaining capacity is calculated, preferable with methods that consider real material data and loads. If uncertainties regarding for example boundary conditions exist monitoring might be needed. Nevertheless, if calculations and monitoring shows that the load carrying capacity is not enough strengthening can be one alternative to replace the structure. There are numerous different methods to strengthen existing structures of concrete, metal or masonry and the
Sustainable Bridges – Assessment for Future Traffic Demands and Longer Lives

6. Advanced technologies of railway bridge rehabilitation
304
strengthen method chosen is largely dependent on the environment, type of original design, existing object, estimated future use and so on.
In a sustainable society, the transportation work carried out by rail ought to be larger than today. In order to enable such an increase, the capacity of existing railway bridges needs to be increased too. This is also the objective of the project “Sustainable Bridges – Assessment for Future Traffic Demands and Longer Lives”. There are three specific goals: 1) increase the transport capacity of existing bridges by allowing higher axle loads (up to 33 tons) for freight traffic with moderate speeds or by allowing higher speeds (up to 350 km/h) for passenger traffic with low axle load, 2) increase the residual service lives of existing bridges with up to 25% and 3) enhance management, strengthening, and repair systems.
A consortium consisting of 32 partners is carrying out the project. The gross budget is more than 10 million Euros. The partners represent the whole supply chain from user to producer/ designer/developer. They are drawn from bridge owners (25%), consultants (9%), contractors (9%), research institutes (19%) and universities (38%). Skanska Teknik AB, Sweden, is providing the overall co-ordination of the project, whilst Luleå University of Technology, Sweden, is undertaking the scientific leadership. The consortium brings together experience of the different types of difficulties facing European railways. In central Europe, flooding from big rivers crossing a flat landscape is a major problem, whereas frost damage predominates in northern Europe and degradation due to fast running water features in alpine regions. There are also different demands on railway lines; intensive and heavy iron ore traffic crossing the wilderness of northern Sweden and intense passenger traffic in the densely populated areas of central Europe and the UK. In those countries where the railway administration is responsible for highway bridges heavier and even more intense traffic roads create additional difficulties. This paper presents mainly the part considering repair and strengthening systems for railway bridges.
2. REPAIR AND STRENGTHENING OF RAILWAY BRIDGES
Many of the railways in use today were once built for completely other conditions than those we are facing today, especially when it comes to train speed, axis loads, and traffic intensity. Authorities, the Industry, and also the EU today require the train speeds and axis loads to be possible to increase. As a direct impact, existing railways must be assessed and possibly strengthened in order to meet the requirements on stability, settlements and induced vibrations. The following criteria’s have been set up within WP6 – they follow mainly criteria’s that have been set up by the Swedish railway authority Banverket; Strengthening works under traffic conditions must comply with regulations from the rail authority. Design of the strengthening should be carried out with reference to the function of the construction, e.g. to improve stability conditions, to reduce settlements or to reduce induced vibrations. Strengthening works should be possible to carry out under “on-going traffic conditions” with minimal impact on accessibility to the railway tracks and without, or with only marginal, reduction of train speed and axis loads. Strengthening should have minimal impact on the position of the railway tracks. Strengthening methods must be cost effective. Strengthening methods must also be as harmless as possible to the environment. Strengthening works shall be carried out without damaging existing constructions, e.g. tracks, ties, ballast material, under ballast material, electric wires, signals, drainage equipments, etc. Each strengthening method must have a control program in which precautions, safety aspects, control measurements during installation, and verification after installation are covered. Strengthening should reduce the necessary amount of maintenance work during the life time of the construction, e.g. due to changes of the position of the railway tracks.

Rehabilitation of railway bridges
305
If strengthening works should be carried out from the track (work within the track area), the following additional criteria apply: Installation should be carried out on railways closed for traffic and under limited time (may vary from authority to authority). Machines to be used must be adjusted to comply with “Free space along the railway line”. Strengthening works must be possible to carry out without removing the existing tracks, ties, ballast material, electric wires, signals, drainage equipment, etc.
When step-wise strengthening works are applied, it must be possible to use the railway line according to predefined conditions regarding axis load and train speed after each completed strengthening step. Discrepancies in the position of the tracks may not exceed limits set up by the Railway Organization when the railway is opened again for traffic after each completed strengthening step. Strengthening works may not contaminate the ballast material. If the ballast material is contaminated, it must be changed or washed/cleaned. In WP6 the strengthening methods studied has the above mention criteria’s in common, even though in some cases deviations might exists.
3. SUSTAINABLE BRIDGES – WORK PACKAGE 6
3.1. General
Work Package 6 – Repair and Strengthening of Railway Bridges, focus on a “toolbox” for Repair and Strengthening methods. WP6 consists of four main deliverables; “D6.1 Repair and Strengthening of Railway Bridges – Guideline”. In this deliverable a guide how to repair and strengthen existing railway bridges in Europe will be put together. Existing processes, systems and methods are included in the guideline as references. New developed method together with best practice methods are in particular addressed through a graphical index, method descriptions and case studies.
The second main deliverable is “D6.2 Research report regarding repair and strengthening of railway bridges in Europe”. In this deliverable a summary of research and testing together with state of the art reports are conducted. The majority of the research is focused on new and innovative repair and strengthening methods. The third deliverable is “D6.3 Field testing regarding strengthening of an existing railway bridges”. This deliverable presents full-scale testing of a strengthened railway concrete trough bridge and also testing strengthening of the sub-soil by using anchored sheet pile walls. The forth and final deliverable is “D6.4 Workmanship and Quality Control of CFRP Strengthened Structures”. Here in particular emphasis is placed on workmanship and quality control during the repair and strengthening process. A method to follow up the quality of the bonding works has been further developed in the project – the use of thermography.
In WP6 there are 13 partners from all over Europe; From Sweden; Luleå University of Technology, Sto Scandinavia, Chalmers University of Technology, Skanska Teknik AB, Swedish Geotechnical Institute (SGI) and Banverket. From Norway; Norut Teknologi AS, from United Kingdom; Salford University and City University, from Germany, Federal Institute for Materials Research and Testing (BAM) and Rheinisch Westfälische Tech. Hochschule (RWTH), Switzerland is represented by Swiss Federal Laboratories for Materials Testing and Research (EMPA) and finally from Denmark, COWI AS. All partners have different roles in the project and form sub-groups working together. In the coming sections are the content of the deliverables and consequently, work carried out in WP6 briefly described.
3.2. Repair and strengthening guide
The work in this part of the project forms the base for research and field applications. Here the real strengthening need for existing railway bridges in Europe are considered based on national specific conditions. The work carried out in D6.2, D6.3 and D6.4 is also partly incorporated into this section.

6. Advanced technologies of railway bridge rehabilitation
306
In this section a structure what is denoted “graphical index” for repair and strengthening of railway bridges has been put together, this structure divide the bridge into building parts and components, a top down approach is adopted, where the component is lifted out from the structure and its particular strengthening need is considered, for example different methods to strengthen a concrete beam in flexure and shear. An important work in D6.1 is to put together a Method Description Manual for suitable repair and strengthening methods for railway bridges. Here is only new and relatively unknown repair and strengthening methods considered, for example CFRP strengthening of metallic structures. The Method Description is supported by several case studies presented in detail. The guide shall be seen as a living document to be updated with new information.
3.3. Research report regarding repair and strengthening of railway bridges in Europe
The majority of the work in WP6 has been placed on exhaustive literature reviews and laboratory testing. Most of this work has been carried out in D6.2. This deliverable is divided into 8 sub-deliverables covering different strengthening methods for railway bridges.
Concrete as well as metallic and masonry arch bridges are covered in the study even though focus has been placed on concrete bridges. Also methods how to strengthen the subsoil around a railway bridge structure are considered in the study. From a general survey of many different strengthening methods, a few were found to be possible to apply under on-going traffic conditions. A more detailed study of these methods led to the conclusion that FRP strengthening and external post-tensioning was suitable to increase a structures load carrying capacity. To improve the behaviour of the soil the Dry Deep Mixing Method (Lime-Cement column method) was considered to be suitable. The sub-deliverables in D6.2 are; D6.2.1 Repair and strengthening methods of the ballast, embankment and subsoil, D6.2.2 Combined CFRP Strengthening and Cathodic Protection, D6.2.3 Thermography system for the quality assurance of bonding of fibre reinforced polymers for typical FRP strengthening system, D6.2.4 Strengthening metallic structures with advanced composites, D6.2.5 Strengthening of concrete structures using mineral based composites, D6.2.6 Strengthening of structures with external pre-stressing systems, D6.2.7 Integrated sensor systems for FRP repair and strengthening and D6.2.8 Strengthening of Masonry arch bridges. In this section a brief summary of the work in each of the sub-deliverables will be presented, beginning with D6.2.1.
The Lime-Cement column method is a competitive strengthening method which can be used to strengthen the subsoil below existing railway embankments without having to remove either the track or the embankment. Compared with many other strengthening methods, the Lime-Cement column method is very competitive from an economical point of view. The effect of Lime-Cement columns increases with time as there is a continuous increase in strength. However, different geotechnical conditions under the embankment might require different strengthening methods. There are several methods, which we still have limited experience from, but which might be interesting to develop, e.g. electro-kinetic stabilization with additives, compensation grouting, and simplified embankment piling. These methods require, however, further investigations.
The use of Carbon Fibre Reinforced Polymers (CFRP) is a method that promises to be one of the most attractive alternatives for strengthening and repair of concrete structures. Among many useful properties, carbon fibres are highly conductive and as such could be used as an integral part of a cathodic protection (CP) system as well as a strengthening system. Indeed, carbon fibres and carbon particles are already being used as current distributors and electric conductivity enhancers in CP systems today. However, available systems only offer marginal strengthening to the structures. Although CP is recognized and well established as an efficient repair method for reinforcement corrosion, it is not able to re-establish or improve the load carrying capacity of the

Rehabilitation of railway bridges
307
structure. As a result, other structural repair and strengthening techniques must also be utilized when the structural capacity of the structure or structural element is reduced. It would consequently be beneficial to develop a system which combine both strengthening and corrosion protection. Among many useful properties, carbon fibres are also highly conductive and as such can be used as an integral part of a cathodic protection. Carbon fibres are also used to increase the current conductivity of cement mortars used in CP-systems (Bertolini et al., 2004; Brousseau and Glendon, 1997). However, in order to achieve a durable combined system of strengthening and cathodic protection, which is based on carbon fibres, it is necessary to overcome problems associated with the degradation of carbon fibres in anode systems.
The next sub-deliverable presented is not a strengthening method, rather an assessment method, thermography, to investigate possible air entrapments or debonding for CFRP strengthened structures. This work is carried out at BAM in Berlin, Germany. Two types of thermography can be discerned, active or passive thermography. Passive thermography is a tool to visualise the distribution of temperatures on the surfaces of structures. Passive thermography is not using any additional internal or external heating system. Active thermography for sub-surface evaluation requires homogeneous external heating or cooling, to produce a temperature gradient during the cooling/warming up process, after the source is switched off. Depending on the materials thermal properties, the type of heat impulse is chosen to get information about a distinct depth. An infrared (IR) camera visualises the thermal contrast on the surface, which is given the lateral positions of the voids. Therefore, also the assessment of structures with external CFRP-reinforcement is possible. In (Blaschko, 2001; Brink et. al., 2001; Maierhofer et. al., 2002), an introduction into infrared thermography for non-destructive evaluation is given. Infrared thermography is characterised by its fast inspection rate, secure use and non-contact applicability. The penetration depth of the method is limited depending also on heat pulse and thermal properties. Usually, in concrete structures a maximum penetration depth of 10 cm can be obtained. In this project three main categories are investigated, the first one deal with existing analytical and numerical analyzes, the second part concerning experiences from laboratory tests, and the third part presents information provided from strengthened structures performed in the field. The experimental tests that so far has been carried out confirm the results from the analytical and numerical analyzes, which indicate that it is possible to increase the global strength and/or stiffness of beams using bonded CFRP.
CFRP strengthening of metallic structures is also considered in the project. This work is mainly carried out at Chalmers University of Technology in Gothenburg, Sweden. Steel bridges are sensitive to fatigue loading. Since fatigue failure is depending on the load cycles over the time, consequently bridges suffer more from fatigue the older the bridges are. In many European countries, more than 50% of the bridge stock is older than 65 years. Bridge maintenance and remedial measures will gain mayor importance with having the tight budgetary situation of the public sector in the background.
The Railway companies usually exchange bridge members, if they find damages during regularly inspection or inspection because of special request after accidents or other reasons.
In general, welding of structural members made of wrought iron, puddle steel or early mild iron (rimmed steel) has to be prevented. The tests, which are carried out in laboratories together with the experiences from strengthening schemes performed on bridge girders out in the field shows that retrofitting of girders with CFRP will provide increases in both strengthening and stiffness in serviceability limit state. Choice of cross-sectional area of the CFRP plate and its stiffness will influence the global improvements of the girder. In addition, the material properties of the adhesive will determine the effect of the strengthening. Today, it is possible to produce CFRP plates with stiffness above 400 GPa, which is an increase of

6. Advanced technologies of railway bridge rehabilitation
308
stiffness by a factor two compared with ordinary steel. With this high stiffness, it is possible to increase the global stiffness of the girder in service limit state (SLS). Experiments at Chalmers University of Technology in Sweden is performed to study the ability for bonded CFRP plates attached to cracked steel members, to resist fatigue. The result shows that the bond lines have good resistance of fatigue and it will decrease the stresses at the crack tip. Due to the high strength of CFRP materials, it is demonstrated that prestressing of the CFRP plate will increase the effect of strengthening.
In WP6 also a new innovative strengthening method is introduced, this is the use of cementitious bonding agents in combination with advanced composite materials, which here is denoted MBC (Mineral Based Composites). Tests have been carried out at Luleå University of Technology in Sweden, and it has been found that slabs and small scale beams strengthen with CFRP grids and bonded to concrete with a cementitious bonding agent are comparable to a slab strengthen with epoxy bonded carbon fibre sheets and a slab with increased steel reinforcement. The effectiveness of the strengthening system can most certainly be increased but this demands further study on the mortar compound and the design of the carbon fibre grid. A different design of the grid and the grid surface can prevent or postpone splitting of the mortar at the grid level. The hand lay-up method used in the laboratory is an easy way to apply the mortars but in larger scale the technique has to be refined, e.g. spraying. The tests were considered promising, and are now being followed up with more comprehensive research where larger scale structures will be tested and more accurate study of the bond behaviour is to be carried out.
An important strengthening method studied in D6.2 is external prestressing. External prestressing refers to a post-tensioning method in which tendons are placed on the outside of a structural member. It is an attractive method in rehabilitation and strengthening operations because, it adds small weight to the original structure, its application poses normally little disturbance to the client and it allows monitoring, re-stressing and if needed replacement of tendons.
Normally steel tendons are used. However there might be a problem with corrosion in the steel that forces the use of steel protection on the external tendons, for example grease and plastic sheeting. This problem can be resolved by the use of FRP materials. It is important to stress that FRP and steel has different material properties and different behaviour when loaded. Experimental tests have shown that the load-displacement relationship of concrete beams reinforced with FRP has almost the same behaviour as beam reinforced with steel, (Mutsuyoshi et. al., 1991). When it comes to CFRP tendons the anchorage of the tendons is still the critical area. Anchoring systems have been developed but there is still work to be done in making an anchorage system that works as easily as the wedge system for steel tendons. Tests have been carried out on large concrete beams. Here, three rectangular, #10 mm, NSMR rods have been used, with no prestressing.
The rod were bonded in a rectangular sawed groove with a cross section of 15 x 15 mm. Comparisons are made with a reference beam without strengthening, and with a concrete beam strengthened with externally prestressed steel cables. The load-deflection curves from the test are shown in Figure 1. The material data, test configuration and results from test are recorded for in Table 1.
Table 1. Data from tests with strengthen T-beams
Beam Configuration fcc [MPa]
fct [MPa]
Pf [kN]
δf [mm]
A Reference 47.0 3.9 114.2 42.5 B Prestressed steel 54.0 4.0 315.3 149.0 C Non prestressed NSMR 53.0 4.0 302.0 74.0

Rehabilitation of railway bridges
309
0 40 80 120 160 200Mid-span displacement, d, [mm]
0
50
100
150
200
250
300
350
400
Tota
l loa
d, P
, [kN
]
Reference BeamPrestressed steelNon prestressed NSMR
Figure 1. Load-deflection for concrete beams strengthen with NSMR
The test is designed so that the NSMR strengthened beam and the beam strengthened with external cables fail at the same load. However, it can be found from the load-deflection diagram in figure 1 that the beams strengthened with prestressed external cables had a more ductile failure envelope.
Another area in D6.2 that has been studied is the possibility to follow-up a strengthen structure over time. Therefore have we investigated the use of integrated sensors in the CFRP material. In this project integrated Fibre Bragg Gratings (FBG) has been used. The FBG strain sensor is formed from a periodic perturbation in the refractive index of the fibre core. When broadband light is coupled into the optical fibre FBG sensor, a reflection peak centred around a specific wavelength called Bragg-wavelength will be obtained which depends on the refractive index and the period of the grating, which both change due to mechanical and thermal effects applied to the fibre sensor.
In this work, results from experiments carried out at City University in London, UK, with surface bonded and embedded FBG strain sensors are presented with comparative data obtained from surface bonded resistive strain gauges. From the results it can be seen that use of embedded fibre Bragg grating sensors for strain monitoring has been demonstrated to be as good as surface bonding in relation to strain transfer and sensitivity with added benefits of sensor protection for long term harsh environment use.
Following these promising results presented here, the current research work is directed at embedding Fibre Bragg grating sensors in carbon composite structures of various thicknesses during the composite protrusion stage. The objective of this work is to produce smart carbon rods, which could either be flexible, or ridged elements for repair and strengthening applications of concrete as well as masonry structures and other fibre reinforced composite materials.
The final sub-deliverable in D6.2 is flexural strengthening of masonry arches using composites to enhance the stiffness of the arch but also increased brittleness. For reinforced arches the initial cracks in the critical (high tensile stress) region occur at higher loads compared to unreinforced arches because of the ability of the bond between the glass fibre and masonry to transfer tensile stresses. Once the bond strength is reached an initial crack occurs and the glass fibre acts as bridging over the crack and transfers tensile stresses through the

6. Advanced technologies of railway bridge rehabilitation
310
bond back into the stiffer (masonry) part. This can happen as long as there is sufficient bond between the glass fibre and masonry. Once the bond between the FRP and masonry is broken down in the cracked region, cracks will similarly occur at other locations. Although in the experiments no cracks have been observed prior to final failure, acoustic emission recordings did clearly indicate cracking in the brickwork during load application. Cracks were however held together by the glass fibre sheet and were prevented from developing hinges. All reinforced arches failed by ring separation. A limited extent of delamination over a few individual bricks under the points of load application was observed which however did not propagate and was not responsible for failure. There was no (tensile) failure of the reinforcement itself. The lower than expected static load capacity of the 3 m arches has highlighted the pronounced danger of FRP strengthening if it is used when its consequences are not well understood. Masonry arches can fail by a number of different ways, such as four- -hinge mechanism, ring separation, sliding, crushing, etc. Each mode of failure has its own load capacity and the arch will fail by what ever is the lowest. Capacity of the arch is therefore the capacity of the failure mode which is the lowest. Any reinforcement technique, e.g. FRP sheet at the intrados, is designed to change the way the arch behaves with the aim of reinforcing certain weaknesses. It is however inevitable, that by changing one aspect of the arch’s behaviour, others are also modified and so will the associated capacity with each mode of failure. The presence of the FRP sheet in the current tests has changed (increased) the load capacity of the four-hinge mechanism but simultaneously changed (reduced) the capacity of the ring separation failure.
3.4. Field testing regarding strengthening of an existing railway bridge
The last part in the project is the field testing. The first part covers strengthening and testing of a railway concrete trough bridge located in Örnsköldsvik in Sweden. A unique opportunity came up. The existing railway line was going to be replaced with a new one and the bridge became obsolete. The purpose of the project was o investigate the shear capacity of the bridge. To avoid an uninteresting bending failure, the bottom beams were strengthened with Near Surface Mounted Reinforcement (NSMR) consisting of Carbon Fibre Reinforced Polymers (CFRP). The bridge tested is a 50 year old two-span concrete bridge. The bridge was tested to failure to demonstrate and test new and refined methods developed in the project regarding procedures for condition assessment and inspection, load carrying capacity, measurement and strengthening. The bridge was built in 1955. It has two spans of 12 m. In one of the spans a loading beam made of steel was placed in the centre of the span. The loading beam was then pulled down with cables injected to the bedrock beneath the bridge. Usually models for the load carrying capacity are tested in the laboratory in reduced scale.
There are very few other concrete bridges which have been tested to failure in order to check their ultimate behaviour and this project demonstrate the use of SHM in full scale testing. The strengthening was successful and the results from the tests shows that the used design and FE-models underestimate the shear capacity considerably.
The strengthening of the bridge was very successful and a stress of approximately 1950 MPa was calculated from strain readings in the CFRP rods.
Furthermore, very high shear stresses, approximately 10 MPa were transferred from the CFRP rods to the concrete in the bonded slots. At failure a very distinct fish bone pattern had developed in the concrete and the end location of the rods. It was found from the test that it is very difficult to predict the ultimate behaviour of the bridge even though it was mapped in detail before the monitoring and testing was carried out. The second filed test carried out in WP6 was investigation of a strengthening scheme for the subsoil. At railway bridges, there is

Rehabilitation of railway bridges
311
a large difference in stiffness between the portion of the track on the bridge and the portion in the transition zone. Unlike the bridge, which is supported on stiff foundations, the transition zone is supported on the subsoil and inherently settles more than the bridge.
Settlements in the transition zone will lead to the “jump & bump” phenomenon. This phenomenon will increase the loads in the transition zone and the loads on the bridge.
When increasing the train axle loads and speeds, it is important to evaluate the stability of the embankment in the transition zone. The stability is to a large extent governed by the strength of the subsoil, especially below the embankment. The “jump & bump” phenomena develops due to settlements within the transition zone. As soon as differential settlements begin to develop (i.e. the bump), the railway traffic seems to “jump” between the stiff structure and the less stiff transition zone. As a result, the variations of the dynamic train/track forces increase and this speeds up the track deterioration process further.
Ideally, soil improvement works should be performed with minimal impact on the railway traffic and without, or with only marginal, reduction of train speed and axle loads. There is a need for methods that can be used to improve the subsurface soils within the transition zone. Based on an inventory of possible methods and an appropriate site for a field test the method anchored sheet pile walls was selected to be performed at Vitmossen in Sweden. The field test was performed in 2005. Extended monitoring was made up to 6 months after the improvement phase. The filed test shows that:
• traffic was possible all the time, • rail adjustments were necessary but did not mean any problem for the traffic, • the monitoring during 6 month period after the improvement phase indicates that the
long-term settlements of embankment and track are very small, • the method was possible to use even where there were large objects in the embankment fill
(boulders, stone and possible old tree remains), • important to investigate the subsoil conditions and the composition of the embankment fill, • continuous monitoring of the track geometry and the position of catenaries shall be
performed.
3.5. Workmanship and quality control of CFRP strengthened structures
In this last deliverable a Manual for workmanship and quality and assurance systems for repair and strengthening of railway bridges in Europe is put together. This manual is to large extent based on the work in the earlier described deliverables but also in the findings from the field tests.
The requirements and quality controls are firstly applicable to concrete structures but large parts can also be used for other building materials such as steel, brick, wood etc. The requirements that are put on execution have a direct effect on the final strengthening result. Apart from workmanship, knowledge about the working environment and handling of the products included in the strengthening system is essential; here the material supplier in many cases can give good advice and support. The workmanship requirements and handling suggestions have their base in field works that the author has taken part in during the last ten years in FRP strengthening of concrete structures.
4. CONCLUSION/DISCUSSION
In this paper the work carried out in the European funded project Sustainable Bridges and in particular in WP6 Repair and Strengthening of Railway Bridges has been presented. The project is still ongoing and the presented findings are still preliminary even though a large extent of the planned laboratory testing already has been carried out. However, one important

6. Advanced technologies of railway bridge rehabilitation
312
finding in the project is that only minor priorities have been given methods that do not disturb the rail traffic – traditional methods are often used. In this project focus has been placed on new and innovative methods that do not disturb the traffic flow and at the same time are environmental friendly and cost effective. In addition to this a quality assessment manual and a Best Practice Manual are put together. At the moment the WP6 project is in the phase of planning full scale testing on real bridges.
ACKNOWLEDGEMENTS
The authors first of all want to acknowledge the European Union for funding the research in the project Sustainable Bridges, without this funding the work presented here would not have been possible. Also the Swedish Rail Administration, Banverket, shall be acknowledged for their support during the test project. Finally all partners in WP6 should be acknowledge – without your hard work and effort there would not have been any results whatever out of the project.
REFERENCES Bertolini, L. et al. (2004): Effectiveness of a conductive cementitious mortar anode for cathodic protection of steel in concrete. Cement and Concrete Research, 34, pp. 681-694.
Blaschko, M. (2001): Zum Tragverhalten von Betonbauteilen mit in Schlitze eingeklebten CFK-Lamellen, Theses TU München, 8/2001.
Brink, A., Maierhofer, C., Röllig, M., Wiggenhauser, H. (2001): Auswertungsmethoden der Impuls-Thermografie zur Ortung von Fehlstellen in Betonstrukturen, in: Thermografie-Kolloquium 2001, 22.09.2001, Unversität Stuttgart, DGZfP-Berichtsband auf CD 77, Vortrag 14.
Brousseau, R.J., Glendon, B.P. (1997): Proprietary and carbon fiber modified overlays in the cathodic protection of reinforced concrete, ACI Materials Journal, July-August 1997, pp. 306-310.
Maierhofer, Ch., Brink, A. Röllig, M., Wiggenhauser, H. (2002): Anwendung der Impuls-Thermografie als quantitatives zerstörungsfreies Prüfverfahren im Bauwesen, In: DGZfP-Jahrestagung 6.-8. Mai 2002 in Weimar, DGZfP-Berichtsband BB 80-CD, Vortrag 45, Berlin.
Mutsuyoshi, H., Machida, A., Sano, M. (1991): Behaviour of prestressed concrete beams using FRP as external cable, Japan Concrete Institute, Vol. 13.

Repair and strengthening of railway bridges – guideline
313
Repair and strengthening of railway bridges – guideline
Anders CAROLIN, Björn TÄLJSTEN & Henning PEDERSEN This paper presents how a range of suitable strengthening method can be selected from the vast number of existing methods via a guideline. The guideline considers the structural system, type of problem and relevant circumstances. In the guideline, only methods that can be considered as new and investigated in the project Sustainable Bridges are at this moment introduced. However, the guideline can easily be updated with additional methods and systems following the same suggested approach. Furthermore, the guideline’s precision in suggesting strengthening methods can be improved by use of future experience from real applications and development of different strengthening methods.
1. INTRODUCTION
1.1. General
One of the important deliverables from WP6 is “D6.1 – Repair and Strengthening of Railway Bridges – Guideline”. The purpose with this guideline is to assist the railway owners when deciding strengthening measures for railway bridges of concrete, steel or masonry. In addition, also possible strengthening measures for the subsoil are discussed. In this paper the main outline on how the guideline is organized will be presented. The proposed method of organizing the guideline takes its standpoint in the structural part of a bridge or a bridge component that needs to be strengthened. The guideline serves as a help to graphically navigate in the wide selection of repair and strengthening methods covered by Sustainable Bridges, work package 6 – repair and strengthening. The method itself is connected to what here has been denoted a graphical index, method description and case studies. For each bridge type and element, a sketch is presented and locations for different common strengthening problems are highlighted. A method description and a case study are connected to the problem, which clearly explains how the strengthening problem can be solved. The method description give a detailed description of the strengthening method referred to, equipment used, benefits and drawbacks. Also a cost estimate of the method is given in the method description. In the case studies different field applications of the method descriptions are presented.
Sustainable Bridges – Assessment for Future Traffic Demands and Longer Lives

6. Advanced technologies of railway bridge rehabilitation
314
How the graphical index should be used is demonstrated in section 1.3. The method description and the case studies follow a template and it would be easy to add new methods or case studies to the guideline following these templates. However, when adding new methods it is suggested that an expert within that area is consulted. It is also suggested that when a strengthening project is finished, the template for the case study is filled in and a new case-study is then added to the guideline (database). In some cases the guideline also refers to other references such as a code, a research report or other useful documents that we recommend the reader to study further.
1.2. Outline
One general idea during all of the work has been to highlight strengthening methods that are environmental friendly, not disturbing the ongoing traffic and at the same time being cost competitive. Focus has also been given to creating a guideline easy to handle for the end users and possible to upgrade over time. The guideline has been limited to methods and strengthening systems known to the authors or developed within the project. Methods or methods that can be considered well known to the railway owners, or can be considered to be well known in the construction industry, have not been brought into the guideline. Furthermore the reason for strengthening is not discussed in this report, i.e. increased load carrying capacity, durability issues, production and design faults etc.
1.3. How to use the graphical index
In this section a brief description on how to use the graphical index is given. Consider the concrete bridge in Figure 1. The bridge consists of a superstructure built up by three reinforced concrete T-beams placed adjacent, which carries the track including ballast. During ordinary inspection aligned cracks have been found in the webs of the two girders close to the supports. It is then assumed that these cracks lead to a need of strengthening. The guideline can then be used for finding a strengthening method in the following way:
Figure 1. Concrete bridge with typical problem areas marked
First, it is clear the bridge is built from Reinforced concrete. The same type of bridge is found within the guideline. By studying the figure in the guideline and corresponding tables for marked codes, the letter “C” is found as the code for the problem.
A table in the guideline, see Figure 2, gives the definition for code C. The found inclined cracks indicate in this case deficient shear bearing capacity. The concrete has not crushed. Hence,
B
A
D
C A

Repair and strengthening of railway bridges – guideline
315
additional shear bearing capacity might be achieved with additional reinforcement with a control of compressive capacity with higher amount of reinforcement. The Table gives a variety of possible strengthening methods. Depending on experience, skill and knowledge each of the methods is further studied. Information for the possible methods are presented in the Method Description (MD), see Figure 3, where the strengthening method itself is described in more detail.
Figure 2. Explanation of code C for concrete structures
In this particular case, when considering different methods, it might be found that “External CFRP, MD01” and “MBC, MD04” will be the most suitable solutions in this case. However, when also the case studies were studied it was found that a similar problem had been solved by external CFRP with NSMR /Near Surface Mounted Reinforcement) and following case study, “CS02”.
Method Description Case Study Case Study cont.
Figure 3. Example of Method description and case study
With the desired outcome and similarities from this case study this method was here considered being the most preferable strengthening method. The next step from here is to follow the procedures for design and production planning. How this can be done is not presented in this guideline, but it easy quite easy to extend the guideline with this additional information if

6. Advanced technologies of railway bridge rehabilitation
316
necessary. After the project is conducted it is strongly recommended that the template for “Case Study” is filled in and saved as a new case study for experience and future use.
2. GRAPHICAL INDEX
The in the project called graphical index, consists of sketches of bridges and code letters which will be described in the following.
2.1. Figures
The most common bridge types are listed and sorted into three categories; reinforced concrete bridges, metallic bridges and masonry arch bridges. Each category is then further divided into types, i.e. beam, truss, box girder, arches, and so on as applicable for each category of bridges. However, not all bridges will be covered by this approach so typical elements such as beams, slabs and columns etc are also presented. For composite bridges, e.g. concrete slab on steel girders, guidance from both reinforced concrete and steel bridges may be applicable. For each bridge type and element, a sketch is presented in figures. In Figure 4 an example of concrete bridge and metallic bridge is presented. When using the graphical index, the presented sketches must not describe the real bridge exactly but the structural principles should be equivalent.
Figure 4. Example of reinforced concrete box girder bridge and metallic truss bridge
For several sketches, also details, sections or side views are presented with typical cracks or problems indicated. One such example is presented in Figure 5 where an arch bridge is presented and a close up view is used where some possible cracks are highlighted. In the graphical index, codes are given for the problem areas.
Figure 5. Reinforce concrete arch bridge including details with a selection of possible cracks marked

Repair and strengthening of railway bridges – guideline
317
For components, both concrete and metallic, the loading is also shown to differ between beams and columns for example. In Figure 6, a metallic and a concrete beam are presented with typical loads and support forces shown.
Figure 6. Example of two bridge components, metallic and concrete beam
Also for the components, codes are given for possible problem areas. In addition to bridges, repair and strengthening needs and possible methods to solve this are also given for the sub soil and foundations, as presented in Figure 7.
Figure 7. Explanation of code C for concrete structures
2.2. Code Letters
In the sketches of bridges and bridge components, locations for common problems are marked with a letter. In connection to the sketches for each bridge typed based on material, explanations for each letter are given in tables. For concrete structures, code letters are used several times in different figures and also in the same figure when the problem is found in more than one location. Different code letters may still be used for the same structural problem when found at different locations, bridge types or bridge components. This is only done when the access or possibility of applying the strengthening method differs significantly. By using this approach, the amount of code letters is limited and possible to overview.
In the tables where the descriptions of each code are given, an explanation of the code is first presented. Explanations include; summary of structural problem, signs of the problem and in some cases other comments. In the table, possible strengthening methods are listed. For each method, references for further information are given. The references are typically given for a method description, a case study and other references. Method descriptions and case studies are found later in the guideline and will also be further described in present paper. Other references will also be described in the following.
Subsoil Foundation

6. Advanced technologies of railway bridge rehabilitation
318
2.3. Composite bridges
Even though found, composite bridges are not so common for railway bridges. Solutions for problems related to each part of a composite bridge, can be found by studying the graphical index for that structural components and material. The composite action between two materials, problems related and possible solutions are not discussed within the guideline mainly because the small number of composite bridges used in railways.
3. METHOD DESCRIPTION
Most of the methods presented have a method description in the guideline. The method description documents follow a template to facilitate comparison between different methods. In the template, the name and number of the method description is firstly given. Then the objectives with the method are given, i.e. for what kind of applications the method is normally used for. General description of the method together with a description of how the work is undertaken gives after that a rather good understanding of the method itself and how it may be applied.
Following this rather general introduction of the method, more details of the method are given. Necessary traffic regulations are presented in a general way and unique prerequisites are listed. The important issue of method related environmental consideration is briefly described.
The important issue of cost for the construction, traffic and maintenance related to the strengthening work is given for the typical case. These costs are highly case dependent and affect each other, i.e. reduction of costs for traffic disturbance may increase costs for construction and vice versa. In conjunction to this, necessary equipment and materials are given. For some methods a list of codes, standards and handbooks are given.
At the later part of the method description, advantages and disadvantages are summarised together with a list of alternative methods. If any other information remains, that is given as comments at this stage. At the end, sketches and photos are given to give an idea of how the strengthening looks like and is working.
4. CASE STUDIES
A case study gives an example of best practice of the method. Each method may have one or more case studies but may also be left without such documentation depending on available information. It would also be possible that case studies give examples of worst practice of the method, even though it is not included at this moment. Also the case study documents follow a template, which is similar to the one for method description where general information is changed for project specific information from an undertaken case.
After presenting which method that has been used a project definition with main objectives is given. Then rehabilitation work and traffic management is briefly described. In the case study, the used standard and codes are presented.
Relevant alternatives to the used method are given together with other object specific comments. Since the project is undertaken, descriptive drawings and photos should exist and a selection is therefore included in the case study. Finally, construction period and contact information to the client, designer and contractor is given.
5. OTHER REFERENCES
The complete description of any cannot be use in a guideline. Therefore, for each method references are given to other sources of information. In other Sustainable bridges reports, other than the guideline on Repair and strengthening of railway bridges, extensive information on

Repair and strengthening of railway bridges – guideline
319
different methods has been presented and references to this material are made for each method. In the guideline, other references also relates to documents outside sustainable bridges which then are presented.
6. COMMENTS
When a structure is strengthened, this is usually done in the ultimate limit state (ULS). However, many of the strengthening methods that are described in this document will also be applicable when measures are needed in the service limit state (SLS), for example decreased crack sizes for concrete structures or increased stiffness for structural components. The presented document should be seen as a living, with possibility to add on Method descriptions and Case studies. It is suggested that the structure of this report is adopted for an electronically version with links to method descriptions, case studied and other documents. Such data base can easily be updated with new experience and case studies. Other documents could for example be design help or specific help with complicated production issues. However, this has not been possible to accomplish within the current project.
ACKNOWLEDGEMENTS
The work in D6.1 has been accomplished by the following partners: Swedish Geotechnical Institute (SGI), Sweden, Luleå University of Technology (Ltu), Sweden, Norut Teknologi AS, Norway, Chalmers University of Technology, Sweden, Sto Scandinavia AB (STO), Sweden, COWI – Denmark, Salford University (SAL) – United Kingdom, Banverket (BV), Sweden, City University, United Kingdom, Bundesanstalt für Materialforschung und – prufung (BAM), Germany, Rheinisch-Westfälische Technische Hochschule (RWTH), Germany, Swiss Fed Inst f Materials Testing and Research (EMPA), Switzerland and Skanska Sverige AB – Sweden which all have contributed to the work presented in this paper and to the Sustainable bridges report Repair and strengthening of railway bridges – Guideline.
REFERENCES American Concrete Institute: ACI 440.2R-02 (2002): Guide for the Design and Construction of Externally Bonded FRP Systems for Strengthening Concrete Structures, American Concrete Institute (ACI) Committee 440, technical committee document.
American Concrete Institute: ACI 440.1R-03 (2003): Guide for the Design and Construction FRP Systems for Strengthening Concrete Structures, American Concrete Institute (ACI) Committee 440, technical committee document.
Busel, J.P. (editor) (2000): Product Selection Guide: FRP Composite Products for Bridge Applications MDA, The Market Development Alliance of the Composites Industry, First Edition, pp. 264.
Dolan, C.W., Bakis, C.E., Nanni, A. (2001): Design recommendations for concrete structures prestressed with FRP tendons FHWA, DTFH61-96-C-00019, Final Report, August 2001.
fib Bulletin No. 14 (2001): Technical Report: Externally bonded FRP reinforcement for RC structures, International Federation of Structural Concrete, Lausanne.
FRP composites: Life Extension and Strengthening of Metallic Structures: ICE Design and Practice Guide.
German General Guideline (1998): Richtlinie für das Verstärken von Betonbauteilen durch Ankleben von unidirektionalen kohlenstoffaserverstärken Kunststofflamellen, Fassung, Deutsches Institut für Bautechnik, Berlin, September 1998.

6. Advanced technologies of railway bridge rehabilitation
320
Japan Building Disaster Prevention Association (JBDPA) (1999): Seismic Retrofitting Design and Construction Guidelines for Existing Reinforced Concrete (RC) Buildings with FRP Materials, in Japanese.
Japan Society of Civil Engineers (JSCE): Recommendation for Design and Construction of Concrete using Fiber Reinforced Material, JSCE Concrete Engineering Series 23, Research Committee on Continuous Riber Reinforced Materials, Tokyo, Japan.
Neale, K. (2001): Strengthening Reinforced Concrete Structures with Externally-Bonded Fibre Reinforced Polymers (FRP), ISIS Manual No. 4, The Canadian Network of Centers of Excellence on Intelligent Sensing for Innovative Structures – ISIS, Winnipeg, Manitoba.
Rehabcon Manual (2004): Strategy for maintenance and rehabilitation in concrete structures, EU-Project Rehabcon.
Rizkalla, S., Mufti, A. (2001): Reinforcing Concrete Structures with Fibre Reinforced Polymers (FRP), ISIS Manual No. 3, The Canadian Network of Centers of Excellence on Intelligent Sensing for Innovative Structures – ISIS, Winnipeg, Manitoba.
Schnerch, D., Dawood, M., Sumner, E., Rizkalla, S. (2006): Design Guidelines for Strengthening of Steel-Concrete Composite Beams with High Modulus CFRP Materials, accepted for publication in the Proceedings of the 7th International Conference on Short and Medium Span Bridges, Montreal, Quebec, Canada, August 23-25, 2006.
SIA E166 (2004): Draft of Swiss Code for post-strengthening of reinforced concrete, timber, masonry and steel by applying steel or FRP.
Täljsten, B. (2006): FRP Strengthening of Existing Concrete Structures Design Guideline, Luleå University of Technology, Sweden, Fourth edition.
The Concrete Society (UK): Technical Report No. 55 (2000): Design guidance for strengthening concrete structures using fibre composite materials.

Quality assurance of CRFP-strengthened reinforced concrete structures…
321
Quality assurance of CRFP-strengthened reinforced concrete structures using automated thermographic investigation
Rosemarie HELMERICH, Mathias RÖLLIG,
Andreas SCHULTZ & Johannes VIELHABER Quality assurance is an increasing important tool for control of the execution of both, new structures and strengthening measures. The better the execution quality and the quality of strengthening measures, the better more reliable are structural resistance and durability. Non- -destructive testing shall be the preferred tool especially for owners to control the execution quality as well as the current condition of a bridge. The proposed quality control system for near surface mounted structural rehabilitation measures of concrete bridges is based on active thermography. Thus, debonding caused due to insufficient workmanship and loosening in- -service can be visualized by a different cooling down behaviour of the surface after external heating. Validation tests on specimens with defined voids of known geometry confirmed the accuracy of the procedure in a first step. The procedure for heating the inspected surface was optimized and the measurement procedure was automated during the European Project Sustainable Bridges. The set-up of a thermography-prototype was tested at larger concrete beams which were loaded in a four-point bending test.
1. THE PROBLEM
1.1. Background
Advanced non-destructive testing (NDT) is still the exception to the rule in bridge engineering, albeit NDT-inspection concepts have been fully accepted in industry since many years. There, NDT-methods are well developed and established, e.g. in automotive or aircraft industries. Railway companies often do not know how much they can benefit from non- -destructive evaluation. NDT can be applied during regular and special inspections of railway bridges as well as in quality control of rehabilitation measures. For the evaluation of strengthened concrete structures, the specific parameters of the inhomogeneous concrete require investigation systems adapted to the conditions on site.
Sustainable Bridges – Assessment for Future Traffic Demands and Longer Lives

6. Advanced technologies of railway bridge rehabilitation
322
Thus, a two step approach is necessary. In a first step the accuracy of the method is tested, and in a second step, the calibration for the material on-site is needed.
This paper presents laboratory tests performed by the Federal Institute for Materials Research and Testing, Berlin in close cooperation with the Laboratory for Structural Engineering of the University of Applied Science, Potsdam. There, as mentioned above, the intended measurement procedure was tested in a first step. In a next step, the automated equipment was developed and applied during the four point bending tests of strengthened concrete beams. A procedure using active thermography was proposed as quality assessment tool. The method was further developed and optimized for this special application in one of the workpackages within the Research Project Sustainable Bridges, funded by the European Commission in its sixth framework program.
1.2. Typical defects
Reinforced concrete bridges in general are not maintenance-free for 120 years, as was widely anticipated during their erection. Many of them show severe damages already after 25 to 30 years in service, either due to insufficient construction quality, low maintenance level, extreme loading, moisture inside the concrete or because of harsh environmental conditions. Deteriorated bridge structures need cost-intensive rehabilitation to remain in service. The incremental increase of axle load in railway traffic as well as on highways requires strengthening measures to upgrade even bridges, that are in good condition. Measures, that help to reverse such decline will bring far reaching benefit.
In service, harsh environmental effects causing corrosion of the reinforcement, later cracking and spalling of the concrete, alkali aggregate reaction, fire attack or load effects, can lead to deterioration of concrete structures and require rehabilitation, e.g. using CFRP. For early detection the failing cross-sections of the strengthened system, the acceptable size of the delaminations has to be defined. The applied quality control method should detect the least upper acceptable failure.
In Europe, a unified standard about acceptability of flaws in CFRP-plate bonding does not exist. In the USA, the Committee 440 of the American Concrete Institute (ACI) requires the evaluation of delamination and voids between multiple plies or between CFRP and concrete, see (Ekenel et al., 2004). Following the ACI 440.2R-02 requirements, the American rules demand the detectability of a minimum defect size of 1300 mm2. This defines also the requirement to an NDT-system for detection of such defects.
1.3. The strengthening method
Carbon fiber reinforced polymers (CFRP) are an appropriate material for bridge repair or subsequent strengthening measures. The quality control of the application and in-service performance of the added external reinforcement is of major importance for the durability of the structure. CFRP is provided as sheets, woven fabric or plates depending on the requested remedial measure. Plates are externally bonded to surfaces either to strengthen damaged structural concrete elements or to increase their resistance in flexure or shear. Hence, they provide an additional external flexural or shear reinforcement.
The bond quality between concrete and CFRP is crucial to transfer shear and bending load from the CFRP-layer into the structural elements. Some countries, as Germany, demand official approvals to allow the application of CFRP to structures in civil engineering, others refer to advices in books, published by specialists. Some European railway owners still have concerns about the durability and thermal resistance of remedial measures by CFRP. They decided not to allow the application of CFRP to upgrade their railway infrastructure at all.

Quality assurance of CRFP-strengthened reinforced concrete structures…
323
Standardization of both, of the application and of the quality control, is not harmonized in Europe. Pullout test is widely applied, as the only required but destructive standard test for quality control of the application quality. In Germany e.g. the pullout test should exceed at least 1.5 MPa, the defect should be initiated inside the concrete and not inside the adhesive. Humidity on the concrete surface > 4% is not allowed. The surface temperature shall not exceed 40°C in service.
Already at the production site, the CFRP-plates themselves were running through a quality control process. Therefore, they are assumed to be free of voids in the tests described below.
The bond quality at the interface to concrete may be reduced due to rough concrete surfaces. Individual measures are undertaken from different producers as e.g. sandblasting, to overcome the problem and to increase the bond quality. The CFRP-system, applied by the Sustainable-Bridges-project partner STOScandinavia, consists, besides the two component adhesive and CFRP-plates, 100 x 14 mm, of a primer (see Figure 1) to overcome the influence of an uneven surface.
During the application, defects or adhesive porosity can be caused e.g. by aged or insufficient processed components, insufficient thin layers of the adhesives or by air inclusions (see Figure 2).
22.0
29.4
Tem
pera
ture
in o C
Figure 1. Use of a primer to reduce the influence of the uneven surface
Figure 2. Bond defect and designed defects over the plate length of the block specimen, visualized in thermographic contrastimages of data collected during the cooling down phase
1.4. Characteristics of the used materials
The characteristic parameters of CFRP-plates as tension strength; Youngs-modulus or direction of fibers can be modulated depending on the basic materials and the task to fulfill. Compared to steel they have a much higher resistance against corrosion caused under harsh environmental and service conditions. Special resins were developed for different applications. Since the chosen test set-up of the four-point bending test had a main tension direction, unidirectional CFRP-plates were chosen for strengthening the precracked RC-beam. Table 1 shows the material characteristics of the applied materials.

6. Advanced technologies of railway bridge rehabilitation
324
Table 1. Characteristics of the used materials
Parameter StoBPE 1410E (CFRP) Concrete test specimens Pull-out test
Cross section in mm2 100 x 1.4 100 x 100 x 100 Ø 50 mm
Elasticity < 1,2%
Compression strength 57.7 N/mm2
Density 2.32 g/cm3
Tension strength > 2500 N/mm2 Min. 2.76 N/mm2
Max. 3.80 N/mm2
1.5. Choice of the most appropriate Non-Destructive Testing (NDT) method
Any kind of near surface defects such as voids or debonding between the CFRP-plates and the adhesive or between adhesive and concrete probably reduces the structural integrity and the performance. Therefore, the quality control of the workmanship during application and in- -service-inspection for early detection of debonding between the strengthening system and the structural element is very important. Visual inspection does not always show early signs of a beginning deterioration process. The infrastructure owners have a vested interest in non-destructive and non-traffic interrupting methods. Besides simple tests as tap-test, the following advanced NDT methods, are appropriate to detect delamination between concrete structural elements and CFRP-plates applied with epoxy resin as adhesive:
• Active thermography with different surface heating procedures (Maierhofer et al., 2002). • Impact-echo, (but not promising, since the interface is too close to the surface). • Radar (Buyukozturk et al., 2003). • Ultrasonic-echo. The most effective and fast applicable tests are using active thermography, since no direct
contact to the surface is required. In thermal images, characterizing the behaviour of the heated surface can be recorded.
The distance of the thermocamera and heating unit to the surface depends on the thermal and digital resolution of the thermocamera as well as of the heating source itself, providing a uniformly heated area. These parameters have been optimized.
1.6. Application and validation of active thermography
Quality assurance is an increasing important tool for control of the execution of both, new structures and strengthening measures. The better the execution quality and the quality of strengthening measures, the better more reliable are structural resistance and durability. Non- -destructive testing shall be the preferred tool especially for owners to control the execution quality as well as the current condition of a bridge. The proposed quality control system for near surface mounted structural rehabilitation measures of concrete bridges is based on active thermography. Active thermography means, that the surface is first externally heated. An infrared camera is used to record the transient temperature development of the surface during the cooling down process. Thus, damages are visualized by a different surface temperature. Validation tests on specimens with defined failures confirmed the accuracy of the procedure. Active thermography is appropriate to detect both, defects caused during CFRP-application or

Quality assurance of CRFP-strengthened reinforced concrete structures…
325
in-service damages. The procedure for heating the inspected surface was optimized and the measurement procedure was automated during the European Project Sustainable Bridges. The set-up of a thermography-prototype was tested at larger concrete beams which were loaded in a four-point bending test.
In the project, active thermography was chosen for detection of CFRP-plate debonding. Impulse-thermography is a fast and non-contact introduced non-destructive testing method for damage detection in near surface regions. The surface of a structure is heated by using either an internal or external heat source (Arndt et al., 2004). Different heat sources as radiator, halogen light and flashlight were applied and the results compared, to select the most effective heating variant. Investigated parts of the structure were heated up and the transient heat flux was observed by recording the temperature change at the surface as a function of time.
The differences between temperature transient curves at surface positions above non-defect regions and above inhomogeneities are expected to include information about the defect parameters like depth, lateral size and the type of material. Therefore, the main parameters as thermal conductivity, density and specific heat capacity of all components, the CFRP-plate, the adhesive and the concrete, and the heating time are influencing the recorded data.
2. LABORATORY TESTS
2.1. Specimens
Two types of specimens were designed for the optimization of the bond quality control. For validation and analysis for the most appropriate thermographic method, a block specimen containing artificial voids was used. The CFRP-plates, later used for the strengthening of the reinforced concrete beams, too, a grid and rods were applied to the surface. Different methods to produce the voids are known from literature, e.g. (Maierhofer et al., 2002).
Although blowed-in air is the most comparable method to reality, it is not convenient for validation of methods, since the size of a planned air bubbles cannot be controlled. Therefore, voids were simulated by patches made of self-adhesive foamed rubber tape and polystyrene having sizes between 1 cm2 and 50 cm2. The thickness of the small polystyrene patches was only 1 mm. The thickness of the foam rubber tape was 3 mm. Figure 2 shows the thermographic image of the block specimen with the applied CFRP-plates. Designed defects could be detected very well as shown in Figure 2, left as areas with enhanced surface temperature after a heating time of 1 min using infrared radiators.
A load test series was planned to follow the bond behaviour of the applied CFRP-plates. For this, two reinforced concrete beams with a length of 5.20 m each were constructed and preloaded until cracking. Two 100 mm STO BPE 1410 CFRP-plates were externally mounted parallel to the surface on the top of the beams. The stepwise-obtained data during loading were visualized in thermographic images. To obtain more detailed information on the depth profile of the possible debonding, the digital data can be evaluated by processing the phases and/or amplitudes of the thermo waves.
2.2. Pretest and rehabilitation
The Partner in the EU-project, STO-Scandinavia, applied the CFRP-plates following the quality plan for surface preparation and application to the Precracked beams. The application of a primer reduced the influence of surface roughness to a minimum (see Figure 1). After the primer was captured, the surface was ideally plain. No additional

6. Advanced technologies of railway bridge rehabilitation
326
surface preparation was necessary. The easy installation of the plates with a two component adhesive on epoxy resin basis followed after hardening of the primer on the next day.
2.3. Load tests
Two concrete beams with relatively low shear reinforcement ratio were loaded in four- -point-bending tests until cracking. After unloading, a repair system, consisting of primer, adhesive and CFRP-plates was applied. The load was applied from underneath the beam. The test set-up was chosen top-down for avoiding cracked concrete parts damaging the thermocamera and the heating unit. This scenario is not expected during field testing. The scheme of the four-point bending test set-up and the strengthening principle are shown in the drawing in Figure 3 and 4.
Since the reinforcement had been reduced in accordance with structures, built in the sixties and seventies, the debonding was expected in the 1/3 points of the beams. In advance, the reinforced concrete beam was calculated with and without additional CFRP-strengthening. The real load-displacement behaviour in the test followed almost precisely the calculation of the loading, performed with the program ATENA. ATENA 3D was developed by the Sustainable Bridges project partner Červenka Consultings, with components for the assessment of CFRP- -strengthened reinforced concrete structures.
As a first step, the load was increased to the level of the preloading. Each load step was followed by thermographic evaluation. The load steps were reduced from 50 kN on 25 kN after reaching the resistance of the unstrengthened structure and to only 10 kN, after the first shear cracks developed, bending cracks opened and the online load-displacement-curve, reached a significant reduction of the stiffness. Figure 5 shows the failure mode at a cross-section with noticeable shear cracks, crossing the existing flexural cracks (left) and the cross section after failure (right).
The latest thermographic measurements focussed on these cross sections only. The load steps were than reduced to only 5 kN. Because of safety reasons, the load was reduced to approximately 3/4 of the current load level during the thermographic evaluation. A Plexiglas wall was saving the testing personnel. The strengthened beam failed, after the load was doubled compared to the calculation of a beam without additional external reinforcement. After the system failed, the remaining load was at about 50% of the maxi-mum load.
Figure 3. Test set-up for preloading to create bending cracks

Quality assurance of CRFP-strengthened reinforced concrete structures…
327
Figure 4. Strengthening of the precracked beam using CFRP-plates, squares show critical areas for failure
Figure 5. Beginning debonding process with direction of the debonding (left) and failure (right)
2.4. Thermographic measurement system
The first total load test was performed with radiator heating after defined increase of loading. A reliable control or comparability of the homogeneity of the surface heating was not possible. Two people were necessary for the manual surface heating of a chosen section. For future investigations, the system will be enhanced and automated for application during a second load test.
After testing alternative heating variants as radiator, halogen light and flashlight heating, at the block specimen with designed defects, the preferred heating was selected. For the future investigations flashlight will be the most promising procedure. Two flashlights and the thermocamera are mounted concurrently in a scanning unit, fixed to a rail. Software was developed to automatically control the scanner together with the camera/flash unit. Without any other external contribution the measurement is started and performed along sections of 30 cm. Thus, 14 measurements are required for a total length of the investigated area of the beam.
A linear scanning unit, composed of a thermocamera, flashlights and rail construction with software for an automated procedure were developed.

6. Advanced technologies of railway bridge rehabilitation
328
2.5. Automated procedure
During the last years, BAM was developing a automated 2-dimensional modular system for application of NDT-methods to surfaces of interest. In the first phase of the project, the system was enhanced and tested for application to railway-bridges (Helmerich et al., 2005). In first tests the scanning system was applied to demonstrate the accordance with requirements of the railways to answer special questions of post-tensioned railway bridges.
The modular scanning system was completed by the thermography components. Special software for the application of active thermography for the linear scanning procedure was developed. Figure 6 shows the prototype of the scanning system with thermocamera and two flashlights.
Figure 6. Test of the prototype of the linear scanning system
3. RESULTS
3.1. Survey of the workmanship
The application quality (workmanship) can be successfully visualized by heating the surface of an externally strengthened structure. The method allows controlling, whether air inclusions accumulate the heat below the surface. The defect is visualized as a hot spot on the thermographic image. In Figure 2, typical bond failures are visualized. Designed failures were used to choose the most appropriate heating procedure and to validate the quality control procedure.
Even small defects of 1 cm2 between concrete and CFRP-plate were detected. The lateral accuracy of the defect was detected with a precision of almost +10% perpendicular to the carbon fiber direction in the plates. The higher conductivity in fiber direction leads to an overestimation of the failure extension in longitudinal direction up to 100%. The edges of an

Quality assurance of CRFP-strengthened reinforced concrete structures…
329
inclusion blurred. The application of new developed mathematic filters, as e.g. moving average filters, may increase the contrast of the obtained image in future.
3.2. Control of the in-service condition of CFRP-bonding
In the presented laboratory tests, the strengthening of reinforced concrete beams, using 2 parallel CFRP-plates, resulted in a doubled resistance of the beams. The debonding of the CFRP-plates was detectable in thermographic images before the failure occurred. The debonding of the whole plate happened immediately. Both plates were failing almost at the same time. After failure, the load was reduced to the theoretical bearable load of the concrete beam without the additional CFRP-reinforcement. The debonding occurred in both beam tests in the concrete and not in the adhesive or in the plate. The thermographic system can be used to detect debonded areas of external reinforcement. The debonding began in both performed laboratory tests not earlier than approximately 5% of the failure load.
Figure 7. Debonded plates in the 1/3 points of the beams: left: photograph, middle: directly recorded after heating BeamI, right: typical thermoimage
4. SUMMARY AND OUTLOCK
Flash heating and thermographic measurement of debonded areas is a fast and non-contact method for the quality control and evaluation of strengthening and rehabilitation measures using external CFRP-reinforcement. A prototype of an automated scanning system has been developed and was tested with success. The testing method does not require traffic interruption. Even small defects from 1 cm2 are detectable. The procedure was applied to concrete beams in laboratory. It is planned to apply active thermography in combination with other methods to reduce the time consumption.
REFERENCES Arndt, R., Hillemeier, B., Maierhofer, Ch., Rieck, C., Röllig, M., Walter, A. (2004): Non-destructive localisation of voids and inhomogeneity in structural elements, in: Zerstörungsfreie Ortung von Fehlstellen und Inhomogenitäten in Bauteilen mit der Impuls-Thermografie, Bautechnik 10, pp. 786-793. Berlin, Ernst & Sohn (in German).
26.0
47.5
Tem
pera
ture
in o C

6. Advanced technologies of railway bridge rehabilitation
330
Buyukozturk, O., Park, J., Au, Ch. (2003): Non-Destructive Evaluation of FRP-Confined Concrete Using Microwaves, DGZfP (Ed.), International Symposium Non-Destructive Testing in Civil Engineering (NDT-CE) in Berlin, Germany, 16.-19. September, Proceedings on BB 85-CD, V85.
Ekenel, M., Stephen, V., Myers, J.J., Zoughi, R. (2004): Microwave NDE of RC Beams Strengthened with CFRP Laminates Containing Surface defects and Tested Under Cyclic Loading, Proc. 16th World Conference on Nondestructive Testing. August 30-September 3, 2004, Montreal, Canada.
Helmerich, R. Niederleithinger, E. (2005): Non-Destructive Techniques for the Condition Assessment of Railway Bridges. Proc. Intern. Conf. On Concrete Repair, Retrofit and Rehabilitation, Rotterdam, Balkema, Netherlands.
Helmerich, R., Röllig, M., Maierhofer, C. (2005): Quality assurance using active thermography, SB-D6.2.3.
Helmerich, R., Röllig, M. Maierhofer, C. Schultz, A. (2006): Bond control in CFRP-strengthened RC- -structures using Thermography, IABSE Conference Copenhagen, in preparation.
Maierhofer, Ch., Brink, A., Röllig, M., Wiggenhauser, H. (2002): Transient thermography for structural investigation of concrete and composites in the surface near region, Infrared Physics & Technology, 43, pp. 271-278.

Mineral based bonding of CFRP to strengthen concrete structures
331
Mineral based bonding of CFRP to strengthen concrete structures
Björn TÄLJSTEN, Thomas BLANKSVÄRD & Anders CAROLIN
Strengthening of concrete structures with epoxy bonded carbon fiber reinforced polymers (CFRP) has been proved to be a good strengthening technique. However, this strengthening technique with epoxy adhesives do contain some disadvantages such as diffusion closeness, thermal incompatibility to the base concrete, working environment and minimum application temperature. Some of these drawbacks can be overcome by substituting the epoxy to a polymer reinforced mortar as the bonding agent. This work presents a study with CFRP strengthened concrete beams. In this case the epoxy has been replaced with a mineral based composite (MBC). The results from the study indicates that the MBC strengthening system do achieve very good composite action and strengthening effects. These results warrant for further research and improvement of the MBC strengthening system The project was a part of the European funded research project Sustainable Bridges (www.sustainblebridges.net).
1. INTRODUCTION
Large parts of the infrastructure in the world are in need of repair or strengthening. There are numerous reasons for this; higher traffic loads/flows, construction and design errors, the structure has reached its designed lifetime and so on. One way of strengthening a concrete structure is to apply carbon fiber reinforced polymers (CFRP) with an epoxy adhesive as a bonding agent in different ways (Nordin, 2003; Carolin, 2001, 2003). There are certain disadvantages while using epoxy resins as a bonding agent, i.e. diffusion closeness, thermal incompatibility, working environment and the minimum temperature of assemble. The two first aspects includes freeze and thaw problems, the third indicates the allergic reactions which can arise for the labours if not proper protective garments are used. The last aspect refers to the required minimum assembly temperature, which can be a problem in colder climates. It is therefore of interest to replace the epoxy adhesive with a mineral based bonding agent, e.g. polymer modified mortars with similar properties as the base concrete and who is more working environmental friendly.
A combination between the polymer modified mortar and fiber reinforced polymers (FRP) can be used for repair and strengthening of civil structures (Carolin, 2001; Becker, 2003; Wiberg, 2003).
Sustainable Bridges – Assessment for Future Traffic Demands and Longer Lives

6. Advanced technologies of railway bridge rehabilitation
332
Mineral Based Composites (MBC) is such a combination. MBC is a composite material which is made by replacing a part or all of the cement hydrate binder of conventional mortar or concrete with polymers and by strengthening the cement hydrate binder with polymers and with the addition of conventional FRP it becomes a high performance strengthening system.
There are different categories of strengthening such as flexural, torsion, confinement, shear and so on, Täljsten (2002). There are also different types of geometries for the FRP. This paper will investigate shear strengthening of RC beams with mineral based bonding agents and CFRP. Shear strengthening of concrete beams with carbon fibre composite and polymer modified cement mortars is a part of an ongoing research project at Luleå University of technology. Significant studies on concrete strengthening have been conducted at Luleå University of technology. Shear strengthening of concrete members with epoxy bonding agents has during the recent years been thoroughly evaluated (Carolin and Täljsten, 2005a,b; Rödsaetre, 1999; Aboudrar and Johansson, 1998; Mattsson, 1999). The dimensions of the strengthened concrete beams in this study were chosen according to the concrete beams in previous studies (Carolin and Täljsten, 2005a; Aboudrar and Johansson, 1998). There are also vast reference materials from all of the earlier studies.
2. MATERIAL AND TEST SPECIMENS
In this study a total of three concrete beams were strengthened and tested. The concrete beams are showed in Figure 1. All of the concrete surfaces were sand blasted. The concrete beams are reinforced in such a way that shear failure will occur at one known shear span. The design of the steel reinforcement is described in detail, see Figure 1. This design of the reinforcement are motivated by the fact that due to the lack of shear reinforcement in one span, the beams only needs monitoring in this span. The utilized materials are:
• Concrete beam (see Figure 1). • Surface primer (to enhance the bond strength between base concrete and mortar). • Polymer modified mortar, two different mortars were used (see Table 1). • Carbon FRP (CFRP) with a grid geometry (see Figure 2).
2.1. Reinforcement
All of the concrete beams are reinforced with twelve Ø 16 steel bars at bottom and two Ø 16 at the top of the beam, this design will prevent bending failure. The shear reinforcement contains of Ø 10 steel bars with the distance 50 mm at the supports and Ø 12 with the distance 100 mm in one of the shear spans. The densification of the shear reinforcement over the supports is supposed to prevent peeling failures and secure anchorage of the main reinforcement. Figure 1 shows the design of the reinforcement in the concrete beams.
P/2 P/2
2 Ø16
12 Ø16
Stirrups at support Ø10
4500
250 1250 1500 1250 250
Stirrups in one shear span Ø12 s100
180
500
Figure 1. Reinforcement scheme and test set-up for concrete test specimens

Mineral based bonding of CFRP to strengthen concrete structures
333
2.2. Polymer modified mortars
Two polymer modified mortars as bonding agents were evaluated. The mortars in this test program are mortars that have shown good bonding and strengthening capabilities based on the results from previous pilot studies on mineral based flexural strengthening on concrete beams (Johansson, 2005). The mechanical properties for these mortars are recorded in Table 1. Both mortars are one component, cement based and polymer reinforced. Mortar 2 has the advantage that it may be applied by dry spraying.
Table 1. Strength properties for the evaluated polymer modified mortars in (Johansson, 2005)
Mortar Compressive strength, 28 days, [MPa]
Tensile strength 28 days, [MPa]
Used for specimen
Mortar 1 45 9 Beam 1A Mortar 2 77 11 Beam 2
2.3. Carbon FRP grid
The carbon FRP grid used in the experiments is a two dimensional grid. Figure 2 shows a photograph of the grid and the mechanical properties are shown in Table 2. The distance between the longitudinal and transverse carbon fiber strips are 40 mm in average.
Figure 2. The two dimensional carbon FRP grid with traditional strain gauges attached
Table 2. Mechanical properties of the carbon fibre grid
CFRP Tensile strength [MPa]
Modulus of elasticity[MPa]
Strain at failure[‰]
Carbon content [g/m2]
Grid 3800 284 15.0 159 2.4. Refinement of test specimens
The surface of the concrete beams were sand blasted and prior to the application of the strengthening system the surface were treated with a steel brush and pressurized air to remove dust from the surface. Before the polymer modified mortars were applied, the surface was primed with a silt-up product which prevents the moisture transport from the wet mortar to the dry base concrete. This ensures good bonding between the polymer modified mortar and the base concrete. The polymer modified mortars and the carbon fiber grid were applied in the same manor as in (Johansson, 2005). After casting the strengthening system it is important to

6. Advanced technologies of railway bridge rehabilitation
334
keep the strengthening system moisturized for about 4 days, this is mainly to prevent shrinkage crack formations. The strengthening system is only applied on the left shear span in Figure 1 since the concrete beams are heavily shear reinforced in the other span.
3. TEST SET-UP (EXPERIMENTAL PROGRAM)
The test set-up for the shear strengthening tests a shown in Figure 1. All tests are performed in four-point beam bending. The first stage of analysis will comprise of measuring load capacity, deflection, support settlement, strengthening effect, internal and external strain measurement of the strengthened concrete beams. Internal strain measurements consist of traditional strain gauge measurement on the steel reinforcement and the CFRP grid. External strain measurement will be conducted with photometric strain measurement. The load, deflection and support settlement measurements are illustrated in Figure 3.
LVD
T
LVD
T
LVD
T
250 250
2000 2000
P
Figure 3. Test set-up for four-point beam bending, units in mm 3.1. Traditional strain gauge measurement
Strain measurements on the CFRP grid were conducted with strain gauges (SG). A more detailed scheme over the emplacement of the strain gauges on the CFRP grid in the strengthening system can be seen in Figure 4 and Figure 5. Applied strain gauges have the width of 2 mm and are protected with a waterproof coating.
All strain gauges were bonded to the CFRP grid. All of the strain gauges were placed at a 30° angle from the point load based on experience from previous tests.
2
46
810
1214
1820
22
135791113151719
16
100 1620
250 1250P/2
Figure 4. Points for Strain gauge measurement Figure 5. Photo of strain gauges in the strengthening system

Mineral based bonding of CFRP to strengthen concrete structures
335
3.2. Photometric strain measurement
Photographic measurement entails taking photos of an, from a scientific point of view, interesting area. The photos are taken prior to loading and at certain load intervals during the loading of the beams. All photos are then analyzed by computer software and strains are then calculated by comparing the difference between the photographs at different loads. For the software to work properly and give adequate results the photographed area needs to be given pattern by one of several existing methods. In this case the strengthened area will be given a random pattern by using an epoxy adhesive to adhere white and black sand (0,55:0,45). The method was speckle pattern correlation and is further described elsewhere (Carolin et al., 2004).
The loading was paused at every 20 kN and the beam was photographed before loading continued. The photographic equipment consisted of a digital camera with a maximum resolution of 3504 x 2336 pixels and a professional lightning set. The results from the speckle pattern correlation analysis can be plot as shear strains, principal strains or strains in any arbitrary direction. Example of applied pattern of sand is found outside analyzed area in Figure 9.
3.3. Previous strengthening applications
Previous research on similar concrete beams strengthened with epoxy adhesives and carbon fiber composites has been going on since the late 1990s. Therefore vast reference materials exist. Capacities for unstrengthened concrete beams can be seen in Table 3 along with some of the previous strengthening applications.
The concrete beams in Table 3 have the same dimensions and reinforcement as the parent beams in this study, but they were strengthened with carbon fiber sheets and epoxy resin as the bonding agent, for further reading see (Carolin and Täljsten, 2005a).
Table 3. Mean values of strength for earlier studies (Carolin and Täljsten, 2005a)
Type of beam Compressive strength, [MPa]
Tensile strength [MPa]
Ultimate failure load [kN]
Reference beam 46 and 67 2.9 and 3.6 238* and 252* Fibre direction 0° 59 3.5 307 Fibre direction 45° 53 and 71 3.5 and 3.8 514 and 610 Fibre direction 90° 52 and 59 3.7 and 3.5 512 and 596
*Pre-cracked beams, loading disrupted at the first shear crack.
4. RESULTS
4.1. Load and mid-point deflection
Figure 6 shows the load and midpoint deflection for the unstrengthened and strengthened concrete beams. There are no large differences in stiffness and failure loads for the two different polymer modified mortars in the strengthening system.
The behaviour during the load steps was similar for all of the strengthened concrete beams. Initial cracks in the concrete and strengthening material appeared as small bending cracks in the load range of 280–320 kN. Visual shear cracks first appeared in the load range of 320–380 kN, All of the strengthened beams exhibited distinguished noises prior to the failure of the beam. These noises first appeared at; 475 kN for the beam Mortar 1:A (failure load

6. Advanced technologies of railway bridge rehabilitation
336
493 kN), 480 kN for the beam Mortar 1:B (failure load 484 kN) and for the beam Mortar 2 at 466 kN (failure load 474 kN). All of the strengthened beams failure modes were the same with propagating shear cracks in the polymer modified mortar and finally a brittle failure and rapture of the vertical tows in the carbon fiber grid. After failure of the strengthened concrete beams the outer layer of the polymer modified mortar was separated from the underlying layer of the mortar. This splitting occurrence does not regard the entire strengthened surface. Figure 7 shows typical failure for beams with polymer modified mortar as bonding agent.
Reference
Mortar 1:A
Mortar 1:B
Mortar 2
0
100
200
300
400
500
600
0 5 10 15 20 25 30 35Mid-point deflection [mm]
Load
[kN
]
Figure 6. Load and midpoint deflection for strengthened and unstrengthened concrete beams
Figure 7. Failure of beam: Mortar 1:A
4.2. Traditional strain measurement
All of the applied strain gauges were mounted at a line located approximately 30° from one of the point load distributor. The ultimate shear crack missed the line of applied strain gauges. The transverse strains for beam Mortar 1:B at the load steps 420, 480 and 483 kN are recorded in Figure 8. All of the transverse strain gauges (SG) measures low strains for the first load steps. The strains in the carbon fiber strips are starting to increase at the total load of 300 kN. The strain gauges in the middle region of the strengthened area display high strains. This is in full agreement with the occurrence of the initial shear cracks.
The distinguished noises mentioned in earlier concur with the fast increase in strains for transverse strain gauges. However the maximum strain levels for the transverse strain gauges only reaches about 7‰ and the failure elongation for the carbon fiber grid is 15‰.

Mineral based bonding of CFRP to strengthen concrete structures
337
420 kN 480 kN 483 kN
0
50
100
150
200
250
300
350
400
450
500
0 1000 2000 3000 4000 5000 6000 7000
CFRP strain [10-6]
Hei
ght o
f bea
m [m
m]
Figure 8. Transverse strain measurement on the carbon fibre grid at different load steps
4.3. Photometric strain measurement
During test, results from the photometric measurements are not present. The photos are analysed after tests are finished and not until then strains can be found. Except for this, photometric measurements are superior to strain gauges for this kind of research since the whole area is covered as well as all directions. In Figure 9 strains in y-direction from beam Mortar 1:B are presented for the load 480 kN. Light colours correspond to high strains. As can be found in Figure 9, strains are not uniformly distributed over the cross-section. Strains are not only concentrated to the forming shear crack but also to the midsection of this crack in good agreement with theory presented by Carolin and Täljsten (2005b). From the measurements the highest strains in the vertical tows of the grid are slightly more than 15‰.
Figure 9. Photometric strains (y-direction) for the load step 480 kN
Mortar 1:B 480 kN

6. Advanced technologies of railway bridge rehabilitation
338
5. MBC STRENGTHENING COMPARED TO EPOXY BASED STRENGTHENING
Figure 10 shows a comparison of both the mineral based strengthening and shear strengthening of similar concrete beams with unidirectional carbon fiber sheets and an epoxy bonding agent. The carbon content in the CFRP sheets is 200 g/m2 and the fiber direction was 90° from the horizontal plane. The results from the epoxy bonded carbon fibre sheets are from previous pilot studies (Aboudrar and Johansson, 1998; Hägglund, 2003; Carolin and Täljsten, 2005a).
Both the epoxy based and the mineral based strengthening systems shows similar behaviour in initial increase in stiffness and load bearing capacity. There are very small differences in failure load between the mineral based strengthening system and the epoxy based strengthening system (Aboudrar and Johansson, 1998). But the strengthening system in (Hägglund, 2003) shows somewhat higher failure load. However, it most be pointed out that there are differences in between the mineral based and epoxy based strengthening system. Besides the two different bonding agents the design of the CFRP differs from a grid in the mineral based strengthening system to a sheet in the epoxy based strengthening system. The carbon fiber amount between the sheet and the grid is also different with higher amount of fibers in the CFRP sheet.
Reference
Mortar 1:A
Mortar 1:B
Mortar 2
Aboudrar et al. (1998)
Hägglund (2003)
0
100
200
300
400
500
600
0 5 10 15 20 25 30 35Mid-point deflection [mm]
Load
[kN
]
Figure 10. Load and midpoint deflection for mineral based and epoxy based strengthening
6. CONCLUSION/DISCUSSION
A significant shear strengthening effect was achieved by the presented and tested strengthening system. Good bond and composite action between the concrete beam and the strengthening system was obtained. The presented strengthening system was not complicated to install even though the possibility of spraying the mortar to mount the strengthening system was not evaluated in this study. The mineral based bonding agent did provide such good anchorage that fibre rupture in the used carbon fibre grid was achieved. The elongation at failure of the carbon fibre grid where 15‰. Prior to final failure, distinguished noises where recorded from the strengthening system which is explained by local failures of the grid structure.
During undertaken tests, strain gauges were used for monitoring of studied beam in real time. However, strain gauges only show strains at the gauges local locations and for tests presented the gauges were not able to capture maximum strains in shear span. The photometric

Mineral based bonding of CFRP to strengthen concrete structures
339
measurements did not provide real time measurements but did provide very useful and important information on strain distribution over the shear span. Readings from photometric measurements and from strain gauges were in accordance.
Ongoing tests are focusing at different parameters and theirs influence on the shear strength of strengthened beams. These studies and the results will be published in a near future.
ACKNOWLEDGEMENTS
The authors first of all want to acknowledge the European Union for funding the research in the project Sustainable Bridges, without this funding the testing would not have been possible. Also the Swedish Road Administration, SBUF and Skanska AB shall be acknowledged for their support during the test project.
REFERENCES
Aboudrar, A., Johansson, A. (1998): Betongbalkar förstärkta med kolfiberkomposit: En under-sökning av böj-och tvärkraftskapacitet (in Swedish). Luleå, Master thesis, Luleå University of Technology.
Becker, D. (2003): Betongplattor förstärkta med kolfiberkomposit (in Swedish). Luleå, Master thesis, Luleå University of Technology.
Carolin, A. (2001): Strengthening of Structures with CFRP. Luleå, Licentiate thesis, Luleå University of Technology.
Carolin, A. (2003): Carbon Fibre Reinforced Polymers for Strenghtening of Structural Elements. Luleå, Doctoral thesis, Luleå University of Technology.
Carolin, A., Olofsson, T., Täljsten, B. (2004): Photographic Strain Monitoring for Civil Engineering, Procedings of the second international conference on FRP Composites in Civil Engineering CICE 2004, pp. 593-600.
Carolin, A., Täljsten, B. (2005a): Experimental study on strengthening for increased shear bearing capacity, J. of Comp for Constr., Vol. 9, No. 6, pp. 488-496.
Carolin, A., Täljsten, B. (2005b): Theoretical study on strengthening for increased shear bearing capacity, J. of Comp for Constr., Vol. 9, No. 6, pp. 497-506.
Hägglund, A. (2003): Betongbalkar förstärkta med kolfiberkomposit: Tvärkraft (In Swedish). Luleå, Master thesis, Luleå University of Technology.
Johansson, T. (2005): Strengthening of concrete structures by Mineral Based Composites. Luleå, Research report, Luleå University of Technology.
Mattsson, P. (1999): Betongbalkar förstärkta med kolfiberkomposit: tvärkraftskapacitet vid utmattnings- -belastning (in Swedish). Luleå, Master thesis, Luleå University of Technology.
Nordin, H. (2003): Fibre Reinforced Polymers in Civil Engineering. Luleå, Licentiate thesis, Luleå Universisty of Technology.
Rödsaetre, J. (1999): Skaerkraftstudie av betongbjelker forsterket med karbonfiberkompositt (in Norwegian). Luleå, Master thesis, Luleå University of Technology.
Täljsten, B. (2002): FRP Strengthening of Existing Concrete Structures: Design Guidelines. Luleå, Luleå Universisty of Technology.
Wiberg, A. (2003): Strengthening of Concrete Beams Using Cementitious Carbon Fibre Composites. Stockholm, Doctoral thesis, Royal Institute of Technology. TRITA-BKN. Bulletin 72.


Near Surface Mounted Reinforcement (NSMR) to strengthen concrete structures
341
Near Surface Mounted Reinforcement (NSMR) to strengthen concrete structures
Björn TÄLJSTEN & Anders CAROLIN The worldwide ageing infrastructure has captured the interest of many researchers and organisations to find alternative materials and techniques to restore deteriorated and deficient structures. Advanced composites have received great attention as materials of choice for a variety of application in repair and strengthening projects, in particular for external boned laminates and sheets. During the last five years also an increase of Near Surface Mounted Reinforcement (NSMR) for strengthening purposes has emerged. This paper gives a brief overview of the NSMR strengthening technique from research to applications in field. In particular experience from Sweden will be highlighted. The project was a part of the European funded research project Sustainable Bridges (www.sustainblebridges.net).
1. INTRODUCTION
Beyond the costs and visible consequences associated with continuous retrofit and repair of such structural components are the real consequences related to losses in production and overall economies related to time and resources caused by delays and detours. As we move into the twenty-first century, the renewal of our lifelines becomes a critical issue.
To keep a structure at the same performance level it needs to be maintained at predestined time intervals. If lack of maintenance has lowered the performance level of the structure, need for repair up to the original performance level may be required. In cases when higher performance levels are needed, upgrading can be necessary. Performance level means load carrying capacity, durability, function or aesthetic appearance. Upgrading refers to strengthening, increased durability, and change of function or improved aesthetic appearance. In this paper, mainly strengthening is discussed, and in particular strengthening with Near Surface Mounted Reinforcement (NSMR).
In recent years the development of the plate bonding repair technique has been shown to be applicable to many existing strengthening problems in the building industry. This technique may be defined as one in which composite sheets or plates of relatively small thickness are
Sustainable Bridges – Assessment for Future Traffic Demands and Longer Lives

6. Advanced technologies of railway bridge rehabilitation
342
bonded with an epoxy adhesive to, in most cases, a concrete structure to improve its structural behaviour and strength. The sheets or plates do not require much space and give a composite action between the adherents. The adhesive that is used to bond the fabric or the laminate to the concrete surface is a two-component epoxy adhesive. The old structure and the new bonded-on material create a new structural element that has a higher strength and stiffness than the original.
The basic ideas related to the use of FRPs (Fibre Reinforced Polymers) for structural strengthening, along with examples of application, have been presented by Triantafillou (1998). The most common way to strengthen structures has been for flexural strengthening and confinement but also shear strengthening is quite common. The most used bonding method is to place sheets or laminates on the surface of the structure.
Over the last 10–15 years, extensive research has been carried out on the use of external FRP strengthening of concrete structures and the technique has also been implemented to a large number of structures worldwide. A further development of the plate bonding method has shown that it is favourable to place the laminates in the concrete cover of the structure. This method can be designated Near Surface Mounted Reinforcement (NSMR). In Figure 1, a schematic comparison between NSMR and traditional external plate bonding is shown. Normally the energy to debond a NSMR rod is comparable much higher than for external FRPs.
Figure 1. Comparison between external plate bonding and NSMR
The use of Near Surface Mounted Reinforcement for strengthening of concrete structures is
not a new invention. A type of NSMR was used in the 1940s, where steel reinforcement was placed in sawed slots in the concrete cover and in additional concrete cover that is cast onto the structure (Asplund, 1949).
Here steel bars were placed in slots and then the slots were grouted. It has also been quite common to use steel bars, fastened to the outside of the structure, covered with shotcrete. However, in these applications it is often difficult to obtain a good bond to the original structure, and in some cases, it is not always easy to cast the concrete around the whole steel reinforcing bars. From the 1960s the development of strong adhesives, such as epoxies, for the construction industry moved the method further ahead by bonding the steel bars in sawed slots in the concrete cover. However, due to the corrosion sensitivity of steel bars an additional concrete cover is still needed. For these applications, epoxy coated steel bars have also been used. However, it has been shown that over time, epoxy coated steel bars are not always corrosion resistant for various reasons that will not be discussed here. The use of steel NSMR cannot be said to have shown great success. More recent applications of stainless steel bars for the strengthening of masonry buildings and arch bridges have also been documented Garrity, (2001). Stainless steel remove the major problem with corrosion, however, still problems with bond issues, weight and relative thick concrete covers remain. By using CFRP (Carbon Fiber Reinforced Polymer) NSMR some of these drawbacks that steel NSMR possess can be

Near Surface Mounted Reinforcement (NSMR) to strengthen concrete structures
343
overcome. CFRP NSMR does not corrode, so thick concrete covers are not needed. Secondly, the CFRP laminate can be tailor-made for near surface applications and moreover, the lightweight of the CFRP laminates makes them easy to mount. Finally, depending on the form of the laminate air voids behind the laminates can be avoided. Both epoxies and systems using high quality cement mortar can be used. Compared to traditional external bonded FRP strengthening, NSMR systems have a number of advantages: the amount of site installation work may be reduced. Full-scale tests and field applications have shown that the pre-treatment when using plate bonding can be work intensive and therefore often costly. In traditional plate bonding the laitance layer must be removed and the aggregates shall be exposed before adhesive and the FRP can be applied. This to ensure satisfactory bond between the FRP and the structure. In most cases this may be done by sandblasting and is neither complicated nor expensive. However, if the surface has irregularities, for instance from formwork, or if the grinding or more powerful surface may be necessary, which then may drift up the costs. For NSMR no surface treatment is needed, except sawing and cleaning the slots. Compared to laminates or sheets the NSMR bars can also easily be prestressed. In addition fire, vandalism and environmental loads may also harm the FRP. A damage of the external bonded reinforcement can give serious problems and eventual failure of the strengthening component. The use of NSMR can avoid these situations and the FRP will be more protected from outer damages. However, the largest advantage of NSMR can probably be found in increased force transfer compared to external bonded FRP.
2. NSMR MATERIALS AND SYSTEMS
2.1. Systems
In most studies and applications CFRP NSMR has been used to strengthen concrete structures, but there is also examples where GFRP NSMR has been used for concrete, even though the predominantly use of GFRP in near surface applications has been for timber and masonry. However, in this paper only the use for concrete structural strengthening is discussed.
In principal three different NSMR systems are used, shown in Figure 2. The first system is using NSMR laminates placed on their ends and bonded in sawed slots in the concrete cover. The second system is more adapted to NSMR strengthening and is using rectangular bars bonded in sawed grooves in the concrete cover. The third system is using round bars, normally used as traditional internal FRP reinforcement for new built concrete structures.
The round bars are normally provided with dents or ribs on their surface. Also these bars are bonded in sawed slots in the concrete cover. All three systems possess benefits and drawbacks. System (a) has the benefit that it normally uses traditional laminates for external plate bonding. In addition, single bladed saws can be used for the slots. Another more advantage is that the effective bond area is large. Drawbacks may be that the reinforcement area for each laminate is low, typical 1.4 x 30 mm, and is also limited by the thickness of the concrete cover. In addition quite many slots have to be made to ensure enough reinforcement area.
System (b) has a big advantage since it normally can be placed within most concrete covers. Typical cross section of the rectangular NSMR rod is 10 x 10 mm. Further more the shape of the rod makes it very suitable to bond in pre sawed grooves. A possible drawback is that normally twin bladed saws need to be used.
System (c) has similar advantages and disadvantages as system (b), an additional advantage is that more commercially products are available for this system since round bars I commonly used to reinforce new built concrete structures. A possible drawback is that air voids are easier created behind the bars and that the usage of adhesive is higher.

6. Advanced technologies of railway bridge rehabilitation
344
Figure 2. Different NSMR systems
2.2. Bonding material
The groove filler is the medium for transfer of stresses between the FRP bar and the concrete (De Lorenzis and Teng, 2007). In terms of structural behaviour, its most relevant mechanical properties are the tensile and shear strength and its Young’s modulus. An additional material parameter that is very important, especially from application point of view, is the viscosity. Often the strengthening is carried out underside and up and therefore the viscosity needs to be such as it stays in the groove, but at the same time floats out and cover the NSMR reinforcement.
The most common and probably best performing groove filler is a two-component paste like epoxy. The use of cement paste or mortar has been tried out as replacement, or complement, to the epoxy. Similar strengthening results have been shown by Nordin (2003), and in particular in cases when the bar is sanded prior bonding. Advantages with cement grout or mortar to epoxy are lower cost, better work environment, that it can be applied on moist surfaces and down to only a few plus degrees. A drawback is that micro cracks may be created during hardening and in particular if cyclic loading is present, for example traffic.
2.3. Dimension and placement of grooves
The dimension and placement of the groove or slits are mainly govern by five factors; the type of NSMR system that is going to be used, the available equipment to make the grooves and the thickness of the concrete cover. In addition to this the thickness of the filling material also affects the final size of the groove. The distance, sf, between the NSMR bars or laminates will also affect the strengthening performance. The most important of the above parameters is probably the distance to the existing steel reinforcement. Under no circumstances must the existing steel be damaged.

Near Surface Mounted Reinforcement (NSMR) to strengthen concrete structures
345
Therefore hg shall always be less than c, normally 10 mm is sufficient to avoid damage of the steel reinforcement and control of the concrete cover shall always follow planning of the chosen strengthening system. Normally a groove size 2–3 mm larger than the NSMR bar is recommended for epoxy adhesive systems and approximately 4–5 mm for cement paste or mortar systems (Nordin, 2003; De Lorenzis, 2002; Blaschko, 2003).
From bond tests on NSMR laminates, Blaschko (2003, 2001) indicated that a minimum of about 20 mm of cb was required to avoid splitting failure of the concrete corner, and for cb larger than 30 mm, no cracks were observed in the concrete at bond failure. Tests by De Lorenzis (2002) on NSMR spirally wound bars indicated that the distance between the grooves, sf. shall not be less than approximately 5 times the groove diameter to avoid concrete cover splitting. However, with considerations of the different systems used for NSMR strengthening much of this area is still open for research.
2.4. Work process
As for all strengthening works where bonding is included the performance of the final results is strongly dependent on the execution of the strengthening work.
In practical execution for NSMR strengthening the following steps must in general be performed. Firstly, slots needs to be sawed in the concrete cover, with the depth depending on the NSMR product used and the depth of concrete cover to the existing steel bars. If a stiff rail is used as support for the saw the grooves will become straight and are possible to make also on rough surfaces. This is in particular important if the grooves are sawed from the under side – which is quite common for flexural strengthening. Careful cleaning of the slots after sawing using high-pressurized water, approximately; 100–150 bars is recommended. No saw mud is allowed in the slot at time for bonding.
If an epoxy system is used, the slot must be dry before bonding. If a cement system is used it is generally recommended that the existing surfaces are wet at the time of concrete mortar casting. The material supplier’s recommendation shall be followed. Adhesive is applied in the slot, or with a cement system, cement mortar is applied in the slot. The NSMR laminates are mounted in the slot and the excess adhesive or cement mortar is removed with a spatula or similar.
3. FLEXURAL STRENGTHENING WITH NSMR
As for external FRP plate bonding strengthening for flexure has been the most common way to use NSMR. By De Lorenzis and Teng (2007) a very comprehensive summary of tests carried out on concrete members strengthened with NSMR has been reported. They stresses that all existing tests of the strengthened beams, slabs and columns indicate that the NSMR improved the ultimate load and the load at yielding of the steel reinforcement, as well as the post-cracking stiffness. Some tests reported included identical beams strengthened with equivalent amounts of FRP provided as either externally bonded or NSMR reinforcement. In all cases, the NSMR reinforcement performed more efficiently, as debonding of the NSMR reinforcement occurred at a higher strain or did not occur (Hassan and Rizkalla, 2003a; El-Hacha and Rizkalla, 2004; Hassan and Rizkalla, 2002). A study by El-Hacha and Rizkalla (2004), where equivalent FRP reinforcement ratio of round bars or laminates strengthened reinforced concrete beams have been performed. In comparison the laminates performed better by tensile rupture as to debonding of the round bars. This as a result of the higher local bond strength and larger lateral surface to cross-sectional ratio of the NSMR laminates.
Since 1996 several laboratory tests with NSMR in flexure have been carried out at Luleå University of Technology, Division of Structural Engineering. In the test presented epoxy

6. Advanced technologies of railway bridge rehabilitation
346
bonded and grout bonded rectangular NSMR rods were used to strengthen reinforced concrete beams. The beams were tested in four point bending, a more detailed presentation of the tests can be found by Täljsten and Carolin (2001) and Carolin et al. (2001). In the static four point bending test, four rectangular concrete beams were manufactured, three were strengthened and one served as a reference beam. The geometry and loading conditions are shown in Figure 3. Also the placement of the slots can be seen in Figure 3.
Figure 3. NSMR beams tested in flexure
The size of the slots for epoxy bonded rods is 15 x 15 mm and for the cement grout bonded
rods 20 x 20 mm. The slots were sawed 55 mm from the side of the beam, and symmetrically placed. All of the beams were loaded in deformation-controlled mode with a head displacement of 0.6 mm/min. Measurements were taken of the load, mid-span, settlement at the support and strains in the laminates. Crack distributions and widths were recorded at every 10 kN. The NSMR laminates were manufactured by vacuum infusion at SICOMP AB and measurements after tests showed a fiber content of 50% in the laminates. Both epoxy bond and cement grout bond NSMR 10 mm square rods were used. Before the grout bonded rods were placed in the pre sawn slots the surfaces was pre-treated by bonding quartz sand to them.
The CFRP had a Young’s modulus of approximately 115 GPa and a strain at failure corresponding to 1.8%. The concrete compressive and tensile strength was measured to 60.7 MPa and 3.6 MPa respectively. The adhesive used, BPE® Lim 465, had the following material properties; Young’s modulus, Ea = 7.0 GPa, compressive strength, fca = 103 MPa and tensile strength, fta = 31 MPa with a viscosity of 28 Pas. The mortar used, Bemix High Tech 305, had the following material properties; compressive strength fcc = 60 MPa after 28 days, dmax = 0.2, with a tixotropic consistency. Recommended application thickness is 0–5 mm.
The load deflection curves from the tests are presented in Figure 4. It can clearly be noticed that Beam E4, as expected, has the best failure envelope, where failure was by rupture of the

Near Surface Mounted Reinforcement (NSMR) to strengthen concrete structures
347
rod. Beam E3 and Beam C3 follow each other up to the level where an anchorage failure arises in the cement grout for Beam C3. In Beam C3 cracks parallel to the laminates appeared and while the load increased the mortar started to fall down from the beam. Beam E3 showed a more ductile behaviour but also suffered an anchorage failure.
0 20 40 60 80 100Deflection, d, [mm]
0
40
80
120
160
200
Load
, [kN
]
Beam C3
Beam E3
Beam E4
Reference Beam
Figure 4. Load deflection curves from pilot series carried out in Sweden
It must be realized that the study is limited and too many conclusions can not be drawn
from the results. However, the tests performed shown were considered promising and the area worthy of future research.
A study by Barros and Fortes (2005) on RC beams strengthened for flexure with thin CFRP laminates, 10 x 1.45 mm, bonded into slits in the concrete cover. The Young’s modulus of the laminates was 160 MPa with a tensile strength of approximately 2740 MPa. The adhesive used was a two component could cured epoxy adhesive with a stiffness corresponding to 5.0 GPa. The tested beams showed a considerably increase in the load carrying capacity.
Compared to the non strengthened reference beams an average load increase at ultimate of 90% was obtained. At failure the deflections were in the range of non-strengthen beams and the failure were ductile.
Hassan and Rizkalla (2003b) has presented a very interesting work on beams strengthened with NSMR. In the test series CFRP laminates with the dimension 1.2 x 25 mm with a Young’s modulus and a tensile ultimate strength of 150 GPa and ca 2000 MPa, respectively. The laminates were bonded in pre-sawed 5 x 25 mm large groves by epoxy injection (the epoxy was injected before the laminates were placed in the groove). Eight different embedment lengths, from 150 to 1200 mm, were investigated. Based on the findings of their investigation, the draw the following conclusions; use of NSMR laminates substantially increases both stiffness and strength of the concrete beams. The debonding loads increased by increasing the embedment length, but at the same time the deflection at failure decreased. At most a 50% increase in load carrying capacity was found in comparison between the reference beams.
Also a theoretical model to predict the shear stress was developed. And the proposed model for debonding provided sufficient evidence and confidence in predicting debonding loads.
d

6. Advanced technologies of railway bridge rehabilitation
348
4. PRESTRESSING WITH NSMR
There are four main advantages to prestress the CFRP strengthening material: 1) better utilization of the strengthening material, 2) decreased crack size and mean crack distance, 3) unloading of the steel reinforcement and 4) higher steel yielding loads.
In the service limit state decreased crack size will be very beneficial for a concrete structure. Smaller crack sizes and distance between the cracks will most likely increase the durability as well as the stiffness of the structure. The largest advantage with prestressing the strengthening material is probably the increased steel-yielding load.
Studies has shown almost 50% increase in steel yielding compared to unstrengthen structures and up to 25% compared to not prestressed strengthened structures (Wight et al., 1995; Nordin et al., 2001).
Figure 5 shows the typical behaviour of beams loaded with four-point bending. The values are from the study by Nordin et. al. (2001) but other studies show the same behaviour (Wight et al., 1995; El-Hacha et al., 2001). Figure 5 shows three important stages, concrete cracking, steel yielding and the ultimate load at failure. A non-prestressed strengthened beam has about the same cracking load as a non-strengthened beam, where the beam with prestressed strengthened FRP has about twice the load depending on the prestress. For steel yielding the strengthening effect is almost double for prestressed strengthening compared to not prestress (Wight et al., 1995), this effect is of course also dependent on the level of prestress applied.
0 10 20 30 40 50 60 70
Midspan deflection [mm]
0
20
40
60
80
100
120
140
Load
[kN
]
a
bc
B
A
Figure 5. Prestressed NSMR
When strengthening with non-prestressed CFRP it is often the strain in the steel reinforcements
or the compressive stress in the concrete that are the limiting factors. Even if the strengthening material carries larger parts of the load, the steel reinforcement may yield or the concrete may be crushed. This also imply a low utilization of the FRP laminate, NSMR or sheet used. A low utilization of the CFRP product implies higher costs for the client. It would therefore in many

Near Surface Mounted Reinforcement (NSMR) to strengthen concrete structures
349
situations be beneficial if the structure could be unloaded before strengthening. This is not always possible, however, if the CFRP material can be prestressed the stress on the steel and the concrete will be decreased, which gives better utilizations of the FRP material and in addition lower deflections of the structure.
In Figure 6a theoretical stress and strain distribution for a concrete beam with prestress, but without external loads, is shown. In Figure 6b is the strain distribution of a strengthened beam without prestressed FRP (continuous line) and with prestressed FRP (dotted line). Shown in Figure 6c is the stress distribution for a beam strengthened without prestress and in Figure 6d a beam with prestressed FRP is shown.
Figure 6. Prestressed NSMR
When prestressing for strengthening purposes there is also a reduction of crack widths.
Research in the area of strengthening with prestressed FRP has mainly been carried out with FRP plates, such as failure modes (Garden and Hollaway, 1998), short-time behaviour of prestressed FRP (Triantafillou and Deskovic, 1991; Triantafillou et al., 1992), flexural rehabilitation (Quantrill and Hollaway, 1998), prestressing system (El-Hacha et al., 2003) just to mention a few. Tests have been carried out tests on concrete beams prestressed with CFRP sheets at room and low temperatures (El-Hacha et al., 2001). EMPA in Switzerland has also done research in the area of prestressed laminates (Meier, 2001). The results from these tests show a significant increase in flexural stiffness and ultimate capacity compared to unstrengthened control beams. They also point out that the flexural behaviour of the strengthened beams is not adversely affected by reduced temperature (–28ºC), and prestressed CFRP sheets could be used to increase and restore the original strength of damaged concrete beams under extreme environmental conditions. Tests reported on severely damaged concrete slabs strengthened with CFRP shows that both higher load capacities and reduced deflections could be achieved with prestressed CFRP sheets in comparison with non-prestressed sheets (Wight and Erki, 2001). A prestressed CFRP plate or sheet has a compressive effect on the base of the beam, which tends to confine the concrete, resulting in a reduction in the amount of shear cracking which then prevent initializing failures in the shear spans. As a result, the failure surface is shifted downwards, appearing to occur most readily at the adhesive/CFRP interface or within the bottom layers of the concrete (Garden and Hollaway, 1998). One of the most important advantages when strengthening a structure with prestressing members is the reduction of stress in existing tensile steel reinforcement. This should indicate an increase of the fatigue behaviour of the members in the structure (Garden and Hollaway, 1998; Wight and Erki, 2001).

6. Advanced technologies of railway bridge rehabilitation
350
5. SHEAR STRENGTHENING WITH NSMR
NSMR has so for mostly been used for flexural strengthening. However, NSMR FRP reinforcement is also effective in increasing the shear capacity of reinforced concrete beams (De Lorenzis and Teng, 2007). Only a few studies have been published for shear strengthening of NSMR. De Lorenzis and Nanni (2001) carried out eight tests on large size T-beams, of which six had no internal stirrups. In these tests round CFRP ribbed bars were used. The bars where bonded with epoxy. Variables tested were bar spacing, angle of inclination and anchorage of the bars in the compressive zone (the flange). Both with and without internal stirrups the NSMR reinforcement provided an increase in shear strength. The strengthening effect was more pronounced when no internal stirrups were used. The tests also stressed the importance of anchoring the NSMR bars in the flange.
Barros and Dias (2003) tested concrete beams of different sizes with no internal steel stirrups. A number of these beams were strengthened with CFRP NSMR laminates of different inclination, while the rest were strengthened in shear with equivalent amounts of externally bonded FRP reinforcement. The strengthening effect were reported to 20–80% and all NSMR had a larger load carrying capacity in comparison with external bonded FRP.
Barros et. al. (2006) also report additional tests on shear strengthening of concrete beams, where external bonded FRP, internal steel stirrups and NSRM placed in grooves have been compared All beams strengthening with the same reinforcement ratio. They addresses that the use of NSMR in pre-sawed grooves were more effective than external bonding. The maximum load and the corresponding deflection of this technique were 9% larger and 16% smaller than the comparable values registered in the beam reinforced with steel stirrups of equivalent shear reinforcement ratio. Beyond these structural benefits, it was verified that this technique was easier and faster to apply than the one based on wrapping the beam with sheets of CFRP.
6. ANCHORAGE FOR NSMR
Anchoring of the end zones has been one of the biggest concerns when concrete structures are strengthened with externally FRP sheets or plates. It have has for some design been necessary to mechanically anchor the FRP at the ends to prevent peeling failures. Different techniques using bolted metal plates have been tested as well as decreased thickness of the FRP at the ends to lower the stresses in the concrete-FRP interface. The results have proven efficient. Multi-layer application of FRP has been tested to achieve a different prestressing profile on the concrete beam (Wight et al., 1995).
Also for NSMR applications the bond to the concrete plays essential parts if full utilization of the strengthening system should be possible utilize. Several investigations of necessary anchor lengths to efficiently transfer the force between the strengthening material and concrete have been carried out. The most extensive research has been done with laminates (Täljsten, 1994; Täljsten, 1997; Chen and Teng, 2001), but research with fabrics and NSMR rods (De Lorenzis, 2004; De Lorenzis et al., 2004) have been carried out.
There are many factors that can affect the anchor length of a bonded strengthening material. It is important to investigate and understand what anchor length that is needed to create a secure bond. But it is also important to gain knowledge and understanding of how different parameters affect the anchorage such as material properties.
When strengthening with rods bonded in grooves the bond behaviour is to some extent different then when using external plate bonding, often the bond behaviour for NSMR is superior compared to laminates or sheets, mainly due to the fact that a larger bond area in relation to the reinforcement ratio is achieved.

Near Surface Mounted Reinforcement (NSMR) to strengthen concrete structures
351
In addition the problems with end peeling are a minor concern for NSMR systems since the shear stresses is being controlled by the adhesive on the sides of the rod.
A very interesting study by De Lorenzis and Nanni (2002) concluded that three possible anchorage failure modes exist for NSMR, these are; splitting of the epoxy cover, cracking of the concrete surrounding the groove and pull-out of the FRP, sometimes in combination. A fourth failure mode has been identified by Nordin (2003), namely FRP rupture. The last failure mode has been observed for beams strengthened in flexure using both non- and prestressed systems.
As for external FRP plate bonding there exist a critical anchor length above which longer anchor lengths do not contribute to the force transfer. The critical anchor length may be different depending on the NSMR system used. For example tests performed by Blaschko (2001, 2003) showed that full development of the tensile capacity in the laminate was achieved with a relative short bond length equal to approximately 150 mm.
Sena and Barros (2004) predicted a development length of about 90 mm or less than 10 times the laminate height. Tests performed by Täljsten and Nordin (2006) showed that for rectangular NSMR rods a development length corresponding to approximately 150 mm was obtained, or approximately 15 times diameter of the bar. Consequently there seems to exist different anchor lengths depending on the systems used. In addition to this existing bond models do not cover all different methods but are focused on either laminates, round bars or rectangular bars (Hassan and Rizkalla, 2003b; Ollers, 2005; De Lorenzis, 2004).
7. FUTURE RESEARCH AND DEVELOPMENT
External FRP plate bonding has now almost been used for 20 years and to a large extent a fundamental understanding how to design for flexure, shear, column wrapping and anchorage exist and are used in various guidelines and codes. In addition to this the number of applications can be counted to many thousands worldwide. The knowledge and understanding of the different NSMR systems are not as well investigated, in particular when one consider the different systems used. However, from carried out research it is clear that the NSMR systems often are superior external bonded FRP systems in almost every aspect. Despite this additional research in this field is important. In particular the following areas can be addressed; prestressing; anchorage and detailing. Also the field of punching shear would be interesting to investigate. It has been shown that by prestressing a considerably higher utilization of the FRP systems can be obtained. However, design models, proper anchoring and prestressing devices needs to be developed. In addition to this, a more fundamental understanding of the bond transfer between the NSMR laminates or rods must be established. Still, no model cover all systems discussed in this paper. From a practical point of view, the execution work and detailing is essential. The execution work covers practical issues such as grooving and bonding and is probably best developed by contractors, preferably in collaboration with universities.
Other areas that might be of interest are fire and impact resistance. Here NSMR systems most likely will show to perform advantageous compared to external bonded FRP.
8. SUMMARY AND CONCLUSIONS
This paper discusses the use of NSMR (Near Surface Mounted Reinforcement) for strengthening of concrete structures. From the literature studied and the preformed tests it is clear that NSMR strengthening is superior to traditional external FRP plate bonding. Not only can larger utilizations level be obtained, but also some of the problems related to peeling or debonding failures may be avoided.

6. Advanced technologies of railway bridge rehabilitation
352
Several types of NSMR systems exist, where laminates bonded on its edge, round or rectangular FRP bars are most common. Usually an epoxy adhesive is used to provide bond between the FRP and the concrete, but there are also examples where cement mortar has been used for bonding.
ACKNOWLEDGMENTS
The authors first of all want to acknowledge the European Union for funding the research in the project Sustainable Bridges, without this funding the testing would not have been possible. Also Skanska AB and SBUF (The Development Fund of the Swedish Construction Industry). The authors also want to express my thanks to Tech. Lic. Håkan Nordin who has carried out most of the presented research work.
REFERENCES Asplund, S.O. (1949): Strengthening Bridge Slabs with Grouted Reinforcement, Journal of the American Concrete Institute, Vol. 20, No. 6, January, pp. 397-406.
Barros, J.A.O., Dias, S. (2003): Shear strengthening of reinforced concrete beams with laminate strips of CFRP. In: Proceedings CCC2003, Cosenza, Italy, 2003, pp. 289-294.
Barros, J.A.O., Fortes A.S. (2005): Flexural strengthening of concrete beams with CFRP laminates bonded into slits, J. Cement & Concrete Composites, 27 (2005), pp. 471-480.
Barros, J.A.O., Ferrerira, D.R.S.M., Fortes, A.S., Dias S.J.E. (2006): Assessing the effectivness of embedding CFRP laminates in the near surface for structural strengthening, Journal for Construction and Building Materials, 20 (2006), pp. 478-491.
Blaschko, M.A. (2001): Zum Tragverhalten von Beetonbauteilen mit in Schlitze eingeklbten CFK-Lamellen, Doctoral Thesis, ISSN 0941-925X, pp. 150 (In German).
Blaschko, M.A. (2003): Bond behaviour of CFRP strips glued into slits. In proceedings FRPRCS-6, Singapore, World Scientific, 2003, pp. 205-214.
Carolin, A., Nordin, H., Täljsten, B. (2001): Concrete beams strengthened with near surface mounted reinforcement of CFRP, International Conference on FRP Composites in Civil Engineering, Vol. 2, J.G. Teng (Ed). ISBN: 0-08-043945-4, pp. 1059-1066.
Chen, J.F., Teng, J.G. (2001): Anchorage strength for FRP and steel plates bonded to concrete, J. Struc. Eng. ASCE 2001, 127 (7), pp. 784-791.
De Lorenzis, L. (2002): Strengthening of RC structures with near surface mounted FRP rods. PhD Thesis, Department of Innovation Engineering, University of Lecce, Italy, 2002.
De Lorenzis, L. (2004): Anchorage length of near surface mounted FRP bars for concrete strengthening – analytical modelling, ACI Struc. J., 2004, 101 (3), pp. 375-386.
De Lorenzis, L., Lundgren, K., Rizzo, A. (2004): Anchorage length of near surface mounted FRP bars for concrete strengthening – experimental investigation and numerical modelling, ACI Struc J., 2004, 101 (2), pp. 269-278.
De Lorenzis, L., Nanni, A. (2001): Shear strengthening of reinforced concrete beams with NSM fibre-reinforced polymer rods. ACI Struc Journal, 2001, 98, pp. 60-68.
De Lorenzis, L., Nanni, A. (2002): Bond between NSM fibre-reinforced polymer rods and concrete in structural strengthening, ACI Struct. J., 2002, 99 (2), pp. 123-132.
De Lorenzis, L., Teng, J.G. (2007): Near-surface mounted FRP reinforcement: An emerging technique for strengthening structures, Composites, part B: Engineering, 38 (2007), pp. 119-143.

Near Surface Mounted Reinforcement (NSMR) to strengthen concrete structures
353
El-Hacha, R., Wight, G., Green, M. (2001): Long-term behaviour of concrete beams strengthened with prestressed CFRP sheets at room and low temperatures, Conf. Proceedings: Concrete Under Severe Conditions – Environment and Loading, University of British Columbia, Vancouver June 18-20, 2001, Edt. Banthia, N., Sakai, K. and Gjörv, O.E., ISBN 0-88865-782-X, pp. 1817-1826.
El-Hacha, R., Gren, M., Wight, G. (2003): Innovative System for Prestressing Fiber-Reinforced Polymer Sheets, ACI Structural Journal, May-June 2003, pp. 305-313.
El-Hacha, R., Rizkalla, S.H. (2004): Near-surface mounted fibre reinforced polymer reinforcement for flexural strengthening of concrete structures, ACI Struct. J., 2004, 101 (5), pp. 717-726.
Garden, H.N., Hollaway, L.C. (1998): An experimental study of the failure modes of reinforced concrete beams strengthened with pre-stressed carbon composite plates, Composites, Part B, pp. 411-424.
Garrity, S.W. (2001): Near Surface reinforcement of masonry arch highway bridges, Proceedings of the 9th Canadian Masonry Symposium, Fredericton, Canada, CD-ROM.
Hassan, T., Rizkalla S. (2002): Flexural strengthening of prestressed bridge slabs with FRP systems, PCI J., 2002, 47, pp. 76-93.
Hassan, T., Rizkalla, S. (2003a): Investigation of bond in concrete structures strengthened with near surface mounted carbon fibre reinforced polymer strips, ASCE J. Compos. Constr., 2003, 7 (3), pp. 248-257.
Hassan, T., Rizkalla, S. (2003b): Investigation of bond in concrete structures strengthened with near surface mounted carbond fibre reinforced polymer strips, Journal of Composites for Construction, 2003, 7 (3), pp. 248-257.
Meier, U. (2001): Poststrengthening with CFRP strips: 10 years of practical experience, ACUN-3 Technology Convergence in Composite Applications, UNSW, Sydney 2001.
Nordin, H., Täljsten, B., Carolin, A. (2001): Concrete beams strengthened with prestressed near surface mounted reinforcement (NSMR), International Conference on FRP Composites in Civil Engineering, Vol. 2, J.-G. Teng (Ed). ISBN: 0-08-043945-4, (2001), pp. 1067-1075.
Nordin, H. (2003): Fibre Reinforced Polymers in Civil Engineering – Flexural Strengthening of Concrete Structures with Prestressed Near Surface Mounted CFRP Rods, Luleå, Luleå Univeristy of Technology, Division of Structural Engineering, Licentiate thesis, 2003, 25, ISBN 91-89580-08-7.
Ollers, E. (2005): Peeling failure in beams strengthened by plate bonding – A design proposal, Universitat Politècnica de Catalunya, Doctoral Thesis, Barcelona, September 2005.
Quantrill, R.J., Hollaway, L.C. (1998): The flexural rehabilitation of reinforced concrete beams by the use of prestressed advanced composite plates, Composites Science and Technology, 58, 1998, pp. 1259-1275.
Sena, C.J.M., Barros, J.A.O. (2004): Modeling of bond between near-surface mounted CFRP laminate strips and concrete, Comput. Struct., 2004, 82 (17-19), pp. 1513-1521.
Täljsten, B. (1994): Plate Bonding, Strengthening of Existing Concrete Structures with Epoxy Bonded Plates ,of Steel or Fibre reinforced Plastics, Doctoral Thesis, 1994, 152D, Div. of Structural Engineering, Luleå University of Technology, ISSN 0348-8373, 308.
Täljsten, B. (1997): Strengthening of Beams by Plate Bonding, Journal of Materials in Civil Engineering, November 1997, pp. 206-212.
Täljsten, B., Carolin, A. (2001): CFRP – Strengthening. Concrete Beams Strengthened with Near Surface Mounted CFRP Laminates, Fibre reinforced plastics for reinforced concrete structures, FRPRCS-5, Cambridge (Edited by Chris Burgoyne), pp. 107-116.
Täljsten, B., Nordin, H. (2006): Investigation of anchor lengths for bonded near surface mounted reinforcement – to be submitted.

6. Advanced technologies of railway bridge rehabilitation
354
Triantafillou, T.C. (1998): Shear Strengthening of Reinforced Concrete Beams Using Epoxy-Bonded FRP Composites, ACI Structural Journal, Vol. 95, No. 2, March-April, pp. 107-115.
Triantafillou, T.C., Deskovic, N. (1991): Innovative Prestressing with FRP Sheets: Mechanics of Short-Term Behavior, Journal of Engineering Mechanics, 1991, Vol. 117, pp. 1652-1672.
Triantafillou, T.C., Deskovic, N., Deuring M. (1992): Strengthening of Concrete Structures with Prestressed Fibre Reinforced Plastic Sheet. ACI Structural Journal, 89, 3, pp. 235-244.
Wight, G., Erki, M.A. (2001): CFRP strengthening of severely damaged reinforced concrete slabs, Conf. Proceedings: Concrete Under Severe Conditions – Environment and Loading, University of British Columbia, Vancouver June 18-20, 2001, Eds. Banthia N., Sakai K. and Gjörv O.E., ISBN 0-88865-782-X, pp. 2191-2198.
Wight, R.G., Green, M.F., Erki, M.A. (1995): Post-strengthening conrete beams with pre-stressed FRP sheets, Non-metallic (FRP) Reinforcement for Concrete Structures, 1995, ISBN 0 419 20540.

CFRP strengthening of the Örnsköldsviks bridge – field test
355
CFRP strengthening of the Örnsköldsviks bridge – field test
Björn TÄLJSTEN, Markus BERGSTRÖM,
Ola ENOCHSSON & Lennart ELFGREN This paper presents a full-scale test on a strengthened railway concrete trough bridge. A unique opportunity came up. The existing railway line was going to be replaced with a new one and the bridge became obsolete. The purpose of the project was to investigate the shear capacity of the bridge. To avoid an uninteresting bending failure, the bottom beams were strengthened with Near Surface Mounted Reinforcement (NSMR) consisting of Carbon Fibre Reinforced Polymers (CFRP). The project was a part of the European funded research project Sustainable Bridges (www.sustainblebridges.net). The bridge tested is a 50 year old two-span concrete bridge located in Örnsköldsvik in northern Sweden. The bridge was tested to failure to demonstrate and test new and refined methods developed in the project regarding procedures for condition assessment and inspection, load carrying capacity, measurement and strengthening. The bridge was built in 1955. It has two spans of 12 m. In one of the spans a loading beam made of steel was placed in the centre of the span. The loading beam was then pulled down with cables injected to the bedrock beneath the bridge. Usually models for the load carrying capacity are tested in the laboratory in reduced scale. There are very few other concrete bridges which have been tested to failure in order to check their ultimate behaviour and this project demonstrate the use of SHM in full scale testing. The strengthening was successful and the results from the tests shows that the used design and FE-models underestimate the shear capacity considerably.
1. INTRODUCTION
State evaluation in existing structures is normally done by visual inspection, however they provide rather uncertain and limited information and even though more sophisticated inspections methods are available Structural Health Monitoring (SHM) of structures is still a relatively unfamiliar term for civil engineering applications. Monitoring is the act of acquiring, processing and communicating information about a structure over a period of time with a high level of automation. The objective of SHM is to monitor the in-situ behaviour of a structure
Sustainable Bridges – Assessment for Future Traffic Demands and Longer Lives

6. Advanced technologies of railway bridge rehabilitation
356
accurately and efficiently, to assess its performance under various service conditions, to detect damage or deterioration, and to determine the health or condition of the structure, (Hejll, 2007; Mufti, 2001).
The SHM system should be able to provide, on demand, reliable information pertaining to the safety and integrity of a structure. The information can then be used to improve existing guidelines or codes and form a base for bridge maintenance and management strategies.
Structural health monitoring may also be a very interesting tool to investigate the real behaviour of a structure, its design and its ultimate load carrying capacity. In addition if the existing design codes and guidelines should be improved or if a structures real behaviour and performance should be understood filed tests in the ultimate limit stage is necessary. However, this is only possible in cases when we can apply destructive testing, i.e. testing up to failure, of structural components or the real structure. It has often been shown, see for example (Täljsten, 1994) that the capacity of existing concrete structures often exceeds the design capacity considerably. In this paper a full-scale test of a railway bridge is presented where the used of SHM is essential for a proper understanding and modelling of the structural behaviour. In this project the Örnsköldsviks bridge was obsolete due to a new railway line and it was decided to test the bridge with consideration to its shear capacity. However, for all reasonable placement of the load a bending failure would arise, therefore a decision about strengthening was taken.
2. BACKGROUND
In the European funded project Sustainable Bridges the main objective are to increase the transport capacity and service life of existing railway bridges in Europe. In order to demonstrate new and refined methods developed in the program, a field tests of an existing bridges were carried out during June 2006. The bridge presented here is a two-span concrete trough bridge located in Örnsköldsvik in northern Sweden. A photo of the bridge before testing is shown in Figure 1.
Figure 1. Photo of the railway bridge in Örnsköldsvik before testing, photo L. Elfgren
It was of interest to investigate the shear capacity in the beams of the bridge. However, to avoid bending failure, it was decided to strengthen the main girders with NSMR (Near Surface Mounted Reinforcement) CFRP (Carbon Fibre Reinforced Polymer) rods. The procedure for assessment, strengthening and testing is described in the test below.
The bridge is a reinforced concrete railway trough bridge with two spans 12 + 12 m, see Figure 2, where the elevation and a plan of the bridge is shown. The bridge was built in 1955 and has now been taken out of service due to the building of a new high-speed railway, the Botnia Line.

CFRP strengthening of the Örnsköldsviks bridge – field test
357
The bridge was planned to be demolished in 2006 and the idea was to load it to failure before that in order to test its remaining ultimate load carrying capacity after a service period of 50 years. The concrete design quality is K40 which corresponds to a compressive strength of 40 MPa measured on 200 mm cubes. The dominant steel reinforcement is φ 16 and φ 25 mm, of quality Ks400 with a nominal yield strength of 400 MPa, the real material data was measured and are recorded below.
Figure 2. Elevation and plan of the bridge
The maximum design bending moments and shear forces according to the original
calculations from 1954 was an axle load of 250 kN and a shear force of 2.3 MN where of 0.7 MN due to the dead load. The maximum mid span moment of M = 3.6 MNm, whereof 0.8 MNm from dead load. The maximum bending moment and shear force capacity before strengthening in mid span due to the Swedish concrete codes can roughly be estimated to 10.8 MNm and 4.9 MN respectively. A FE-analys carried out gave an estimated shear force capacity of 7.8 MN.

6. Advanced technologies of railway bridge rehabilitation
358
3. TEST SET UP
The bridge was tested with a vertical point load in the northern mid span, see Figure 3, where the steel beam across the bridge is where the load is applied. Of greatest interest was to investigate the shear capacity of the bridge beams. To obtain this it was necessary to strengthen the bridge for flexure, this is described more in detail below. Three tests were carried out.
In test 1, the through slab was loaded through the ballast to check the distribution of loads through the ballast and the load-carrying capacity of the slab. In test 2 the two main beams were tested before strengthening up to the cracking load and in test 3 the two main beams were tested after strengthening up to failure. The two first tests were carried out in the service limit state (SLS) and the last test in the ultimate limit state (ULS). The load was statically applied by pulling the bridge down with large hydraulic jacks mounted on stay cables anchoraged 9 m into the bedrock beneath the bridge.
Figure 3. Test site and test set up
Before testing a thorough investigation was undertaken. The investigation included non-
-destructive testing of the concrete and the placement of the reinforcement, measurements of actual material properties of the steel in the reinforcement bars and of the concrete etc. Also a very detailed planning for both the strengthening work and the monitoring was carried out, for example deflections and strains in concrete, reinforcement bars the carbon fibre composite was to be followed during the loading process.
4. INSPECTION AND CONDITION ASSESSMENT
The bridge was inspected in 2005 before it was chosen. When the decision to test the bridge had been made it was inspected again, first by Luleå University of Technology and later by BAM, Germany, and COWI, Denmark. In this paper only some general comments are given to the inspection and assessment. Concrete cores with a diameter of 100 mm were drilled out of the bridge in May 2006. From the main beams four cores were drilled out. They were tested in June 2006 it was found that the mean compressive concrete strength was higher in the wing than the mean value for the two beams of the bridge. The mean value for the two beams was tested to 68.5 MPa with a standard deviation o 8.0 MPa.
Cross Beam where the load is applied

CFRP strengthening of the Örnsköldsviks bridge – field test
359
The mean axial tensile strength for both beams was 3.1 MPa with a standard deviation of 0.4 MPa. Three of the tested reinforcement bars (diameter of 16 mm) had a mean yield stress, of 403 MPa with a standard deviation of 15 MPa. The mean value of the yield stress for the bars with the diameter 25 mm was 404 MPa with a standard deviation of 10 MPa measured from three specimens. Defects and deterioration was tested by BAM and COWI. In general it can be said that the bridge was in a good condition although it had some damages from impact from heavy traffic.
5. MONITORING
In this particular project the bridge was heavily monitored with many different types of sensors, for example; electrical strain sensors on concrete, steel and CFRP bars, LVDT (Linear Voltage Displacement Transducers) for measuring the displacements at various locations and curvature, laser deflection meters for measuring the mid-displacement, accelerometers, fibre optic crack sensors and fibre optic strain (Bragg) sensors. The sensor placement and a description of the sensors related to CFRP strengthening are presented in Figure 4.
Sensor Denotation Description 1 CoT4E Strain on concrete, mid section, east-beam 2 StB4E Strain on steel reinforcement, mid section, east beam 3 CaB4E Strain on NSMR rod, mid-section, east beam 4 DlB4E Deflection, longitudinal curvature, east beam 5 CoT4W Strain on concrete, mid-section, west beam 6 StB4W Strain on steel reinforcement, mid-section, west beam 7 CaB4W Strain on NSMR rod, mid-section, west beam 8 DlB4W Deflection, longitudinal curvature, east beam 9 CaB7E1 Strain on NSMR rod at the cur off end 10 CaB7E2 Strain on NSMR rod at the cur off end 11 CaB7E3 Strain on NSMR rod at the cur off end
Figure 4. Placement and type of sensors – not all results from the sensors are reported

6. Advanced technologies of railway bridge rehabilitation
360
It is not possible in this paper to report from all placements of the gauges nor the final result from the testing since data is still under evaluation. Nevertheless, the result from strengthening is evaluated and a part of this result will be presented. For the performance of the strengthening system and the effects of it were analyzed by analyzing four quantities; load, strain, curvature and stiffness. The strain distribution was established by applying strain gauges both on the compressed concrete, tensile steel reinforcement and the CFRP rod.
The compatibility in the strengthened cross section could thereby be viewed upon as well as the individual strain in each material. This setup makes it also possible to compare the steel strain at a particular load level before and after strengthening. Further, the curvature is calculated from the distribution and it could be compared to the curvature measured with the external curvature measurement from the LVDT monitoring.
6. STRENGTHENING
The chosen strengthen method was Near Surface Mounted Reinforcement (NSMR) rectangular bars of Carbon Fibre Reinforced Polymers (CFRP) which then were mounted by bonding in sawed out groves in the slab, the size of the grooves where 15 x 15 mm. This configuration does not interfere with the existing steel reinforcement. Research at Luleå University of Technology has shown that this method is superior compared to externally bonded FRP plates (Nordin, 2004) and the method has also been used in several field applications in Sweden, both in buildings and bridges. In this particular case rectangular bars with a cross section of 10 x 10 mm were used. The rods chosen where provided by Sto Scandinavia AB with the brand name Sto FRP Bar M10C. The modulus of elasticity for the rods was 250 GPa with a strain at failure of 11‰, the material data is given by he material manufactured but has also been confirmed in lab (Nordin and Täljsten, 2006). The adhesive used for bonding was Sto BPE Lim 567 (A+B) a cold cured two component tixotropic epoxy adhesive with a modulus of adhesive of 6.5 GPa and a bond strength of approximately 20–22 MPa. The bonding process are described more in detail below.
Groows are being sawed Final grooves
Figure 5. Making of grooves in the beams, photo B. Täljsten The strengthening design is based on calculations regarding the bridges original capacity,
which was estimated to approximately 6 MN for the actual placement of the load. To obtain a shear failure the bridge needed to be loaded up to approximately 8 MN. The strengthening design provided an additional capacity of 3–4 MN, i.e. approximately a 25–35% increase in flexure. The additional 4 MN corresponded to 18 CFRP rods, 9 per beam, with a length of 10.0 m. These rods consisted of a high quality carbon fibre with the modulus of elasticity of 250 GPa and a strain at failure of approximately 11‰.

CFRP strengthening of the Örnsköldsviks bridge – field test
361
In Figure 7 the placement of the CFRP rods are shown. As can be seen in this figure the rods are placed in the soffit of the bridge beams with a centric distance of 100 mm between the rods. The strengthening work was divided into three steps, before strengthening, during strengthening and after strengthening. Where planning of proper scaffolding and its placement was the first thing that was carried out. The next step was to mark for the placement of the NSMR rods and mounting the railing for the saw system. Then the grooves were sawn up and properly cleaned so all cement debris was washed out from the grooves. The next step was to divide the work site into different stations; one station for the rods, one station for mixing the adhesive, one station for construction waste etc. The process during strengthening can be explained stepwise. Since all CFRP rods were protected with peel-ply this had to be removed first. The adhesive was mixed and applied in the grooves. The next step was then to mount the CFRP rods in the grooves. The adhesive was let harden three days at 20°C (average) before testing. In Figure 6 mounting of one of the rods and the final result after strengthening are shown.
Mounting of CFRP rods Final strengthening result
Figure 6. NSMR strengthening, photo B. Täljsten The bonding was controlled due to voids and other cavities by tapping the bonded area with
a hammer. No voids were found and the strengthening construction work was considered successful. The work site was finally cleaned from all waste and adhesive remainders.
Figure 7. Placement of the rods in the soffit of the bridge beams

6. Advanced technologies of railway bridge rehabilitation
362
7. FIELD TESTING AND TEST RESULTS
The test carried out can not directly be translated into train load. However, it is still interesting to make a rough comparison with the design axel load and the loading of the slab before strengthening since this loading is closes to a real train load on the bridge. A train bogie consists of two axels, that gives an approximately weight of 0.4 MN. The loading carried out on the slab can consider to be in the service limit state. Here the bridge was loaded up to 1.7 MN, see Figure 8. At this level the crack widths was measured to approximately 0.2–0.4 mm and the stress in the steel was measured to approximately 80 MPa. Consequently the service performance was considerably higher than the design load. The failure was an expected shear failure, shown in Figure 9 – the failure arose almost simultaneously in both beams at a load of 11.5 MN, considerably higher than the analysis for the hand calculation, 4.9 MN and from the FE-analysis 7.8 MN.
0 1000 2000 3000 4000 5000 6000
Time [s]
0
2
4
6
8
10
12
Load
[MN
]
SlabBeam-PreBeam-Main
Figure 8. Load time curves from all three tests Figure 9. Shear failure in the east beam
At this level the tensile steel was yielding in the beams and considerably strain (stress) was
taken up in the CFRP rods, see Figure 10. The strain in the CFRP corresponds approximately to a stress of 1950 MPa. Furthermore it was shown, see Figure 11, that we had a slip in the rod at load levels near failure. This can also be seen in Figure 12 where a typical fish bone pattern had developed close to the rods.
-2000 0 2000 4000 6000 8000
Carbon Fibre Strain [µm/m]
0
2
4
6
8
10
12
Load
[MN
]
CaB4-10E-3CaB5-10E-3CaB7ECaB7-5ECaB7-10E
-4000 -2000 0 2000 4000 6000 8000 10000 12000
Strain [µm/m]
0
130
Depth [mm]9 MN10 MN11 MN11.7 MN11.2 MN
2.0 MN4.0 MN6.0 MN8.0 MN
Figure 10. Strain in carbon fibre east beam Figure 11. Strain readings in mid section
A calculation of the shear stress from the measured strain at the end of the rod shows
that it was possible to transfer as high shear stresses as 10 MPa into the concrete from the

CFRP strengthening of the Örnsköldsviks bridge – field test
363
CFRP rods. The curvature in the mid section was calculated for different load levels from Figure 11 and the stiffness as a function of the load has been plotted in Figure 13 where the stiffness decrease in the beams clearly can be noticed. From this measurement is it obvious that the curvature can be used as a parameter to follow the performance of a structure or a structure component.
0 4 8 12
Load [MN]
0
10000
20000
30000
40000
Stiff
ness
[GN
m]
Stiffness east sideStiffness west side
Figure 12. Fish bone pattern in concrete Figure 13. Stiffness decrease in mid section
8. DISCUSSIONS AND CONCLUSIONS
In the current paper a full scale test up to shear failure of a concrete trough bridge is presented. It was of primary interest to investigate the shear capacity of the bridge beams. However, for all reasonable placement of the load a bending failure would occur. To avoid this, the bridge beams was strengthened for flexure with NSMR CFRP rectangular rods. Extensive monitoring was carried out, both before and after strengthening. For the Örnsköldsviks bridge the analytical design model, the Swedish concrete code, underestimate the shear capacity of the bridge beams with approximately 100% and the FE-model with approximately 50%. The strengthening of the bridge was very successful and a stress of approximately 1950 MPa was calculated from strain readings in the CFRP rods.
Furthermore, very high shear stresses, approximately 10 MPa were transferred from the CFRP rods to the concrete in the bonded slots. At failure a very distinct fish bone pattern had developed in the concrete and the end location of the rods. It was found from the test that it is very difficult to predict the ultimate behaviour of the bridge even though it was mapped in detail before the monitoring and testing was carried out. The study stresses the importance of using SHM for evaluation of existing design models and the behaviour of real structures and it will be very interesting and challenging to evaluate the result from the bridge further.
9. FUTURE RESEARCH
There is a great challenge to use SHM for understanding our existing structures. A large amount of information can be obtained through monitoring in the SLS. However, it is important also to carry out SHM in the ULS. By this it is possible to obtain very detailed information about the tested structure. In the near future we will continue to evaluate the test result and to make more accurate models of the bridge.

6. Advanced technologies of railway bridge rehabilitation
364
ACKNOWLEDGEMENTS
The authors first of all want to acknowledge the European Union for funding the research in the project Sustainable Bridges, without this funding the testing would not have been possible. Also the Swedish Rail Administration, Banverket, shall be acknowledged for their support during the test project. Finally all personnel taking part in the work, especially laboratory technicians should be acknowledge – without your hard work and effort there would not have been any testing at all.
REFERENCES Hejll, A. (2007): Civil Structural Health Monitoring – Strategise, Methods and Applications, Doctoral Thesis, 2007:10, Luleå University of Technology, ISBN: 978-91-85685-08-0.
Mufti, A. (2001): Guidelines for Structural Health Monitoring, Design Manual, ISIS Canada, No. 2, ISBN 0-9689006-0-7.
Nordin, H. (2003): Fibre Reinforced Polymers in Civil Engineering – Flexural Strengthening of Concrete Structures with Prestressed Near Surface Mounted CFRP Rods, Licentiate Thesis, Luleå University of Technology, ISBN: 91-89580-08-7.
Nordin, H., Täljsten B. (2006): Concrete Beams Strengthened with Prestressed Near Surface Mounted CFRP, Journal of Composites for Construction, Vol. 10, No. 1, February 1, 2006, pp. 60-68.
Täljsten, B. (1994): Plate Bonding, Strengthening of Existing Concrete Structures with Epoxy Bonded Plates of Steel of Fibre Reinforced Plastics, Doctoral Thesis 1994:152D, ISSN 0348 – 8373, Department of Structural Engineering, Luleå University of technology, 1994.

Investigation of steel I-beams strengthened with CFRP plate
365
Investigation of steel I-beams strengthened with CFRP plate
Dag LINGHOFF & Mohammad AL-EMRANI The research work presented in this paper presents investigations conducted on steel I-beams strengthened with adhesively bonded carbon-fibre-reinforced-polymers (CFRP). The investigations are carried out using three different methods of analysis; analytical solutions, laboratory tests and FE analyses. The study was carried out as a parametric study where the CFRP plates with different material and geometrical properties were used along with two different types of adhesive. The aim with the investigation was to study how various material properties of the strengthening material affect the behaviour of the strengthened steel I-beams. Additionally, the magnitude and distribution of the interfacial shear and peeling stresses in the strengthened beams were analysed. The results show that it is possible to increase the capacity of the strengthened steel beams with up to about 18%. The analyses of the interfacial stresses showed that the magnitude of the interfacial stresses have a great variation in the distribution over the width of the bond line. They also indicate that the interfacial shear stress in the bond line may reach their maximum value at other locations than at the ends of the CFRP plate.
1. INTRODUCTION
The interest for using alternative methods for strengthening or repair of metallic beams in infrastructures has increased during the resent years. Using advanced composite material, such as carbon-fibre-reinforced-polymers (CFRP), has been an attractive alternative and research has been carried out the last decade to obtain a good knowledge about this strengthening system. CFRP plates have previously been used for strengthening concrete structures. The properties of the CFRP material are also advantageous for use in strengthening of steel structures. The CFRP plate has high strength in relation to its weight, and the application of the strengthening system is less labour intensive and faster executed compared with traditional strengthening and rehabilitation techniques, see e.g. (Luke, 2001; Miller, 2001; Linghoff, 2006; Schnerch et al., 2005; Sebastian, 2003; Sen et al., 2001). Most of the research work has been conducted on unsymmetrical steel sections, with the compression zone increased by either additional steel material or a concrete slab. Analytical models have been developed to calculate
Sustainable Bridges – Assessment for Future Traffic Demands and Longer Lives

6. Advanced technologies of railway bridge rehabilitation
366
the capacity of the strengthened steel beam, and to predict the magnitude and distribution of the interfacial stresses in the bond line, see for example (Cadei et al., 2004; Schnerch et al., 2006; Smith et al., 2001; Deng et al., 2004; Stratford et al., 2006). The aims of the research work described in present paper were to investigate the behaviour of double symmetric steel sections strengthened with CFRP plates in both serviceability limit state and ultimate limit state, and to analyse the interfacial shear and peeling stresses in the bond line. The used methods for this study comprise analytical modelling and computation, a series of laboratory tests and FE analysis. The investigation was conducted as a parametric study on steel I-beams strengthened with CFRP plates bonded to the tension flange. The used CFRP plates had different material and geometrical properties, where each of the analysed beams had its own unique configuration.
2. MATERIAL AND GEOMETRICAL PROPERTIES OF THE ANALYSED BEAMS
The investigated steel beams had an HEA 180 cross-section and a total length of 2000 mm. Material tests were carried out on steel specimens taken from the beams tested in laboratory, and the obtained yield strength for the steel material was about 330 MPa and the Young’s modulus was 212 GPa. The beams were provided with stiffeners over the supports and below the load application points. The free span of the beams was 1800 mm and the length of the CFRP plates were 1600 mm. The properties of the CFRP plates are given in Table 1.
Table 1. Material and geometrical properties of the CFRP plates and adhesives used in the tests
Materials Dimensions [mm] ft [MPa] E [GPa]
CFRP 1 1,4 x 81 3300 200
CFRP 2 1,8 x 50 1500 330
CFRP 3 2,4 x 60 3100 165
Adhesive 1 Thickness: ~2 – 7
Adhesive 2 Thickness: ~2 30 4,5
Four different configurations of the strengthened system were used and are described in Table 2. In three of the analysed beams the CFRP plates were bonded to the lower surface of the tension flange. The position of the CFRP plates for each of the analysed beams is given in Table 2, where the location of the position numbers is illustrated in the figure besides the table. The beams were simply supported and loaded in four-point bending.
Table 2. Configuration of the plates in the strengthened beams
Test specimen CFRP plate Adhesive Position
Beam Ref – – –
Beam 1-2 CFRP 3 Adhesive 2 1
Beam 1-3 CFRP 1 Adhesive 1 1
Beam 1-4 CFRP 1 Adhesive 1 1 and 2
Beam 1-5 CFRP 2 Adhesive 1 1
2
1
2
1

Investigation of steel I-beams strengthened with CFRP plate
367
3. ANALYTICAL SOLUTIONS
3.1. Global analyses
Simplified analyses were performed using Matlab to calculate the difference in stiffness and moment capacity depending on quantity and stiffness of the used CFRP plates. The solution is based upon equilibrium and deformation conditions over the section of the beam. The moment – rotation or moment – strain relationship for each beam is obtained incrementally with the strains in the CFRP plate as a governing parameter. For each strain increment, the stress distribution along the cross-section of the beam and the corresponding moment are calculated, see Figure 1. The figure also illustrates the stress distribution over the height of the steel section, and it can be seen that after the steel has reached yielding, the position of the neutral axis (NA) is altered to maintain equilibrium as the magnitude of the applied load increases.
Figure 1. Load-strain relationship for an unstrengthened beam (curve A) and a strengthened beam (curve B). The stress distributions over the height of the steel section at different loads are also plotted
Assumptions made in this solution are: • Steel is an ideally linear elastic-plastic material. • Both the CFRP plate and the adhesive are assumed to be linear elastic until failure. • Linear strain distribution through the whole depth of the cross-section. • Full interaction between steel and plate (i.e. perfect bond between the CFRP plate and
steel substrate). All different configurations of the strengthened beams used in the laboratory tests and the
FE analyses are calculated and based upon this analytical solution.
3.2. Local analyses
The forces and thus the deformations, which are acting over the strengthened section, will cause interfacial stresses in the bond line. These interfacial stresses may cause debonding between the steel substrate and the CFRP plate why these stresses must be considered in the design process.
The magnitude and distribution of the interfacial shear and peeling stresses were predicted for all investigated strengthened beams by using an available analytical solution (Smith et al., 2001).

6. Advanced technologies of railway bridge rehabilitation
368
4. FE-MODEL
The software ABAQUS 6.4.1 was used for all processes in the FE analyses. In the FE- -model, the steel beam, adhesive and CFRP plate were all modelled with 20-nodes solid elements (C3D20R). These three parts were merged to one part, which gave full interaction between the parts. The non-linear material model assigned to the steel beam was obtained from material tests on specimens taken from the beams tested in laboratory. The adhesive and the CFRP plate were modelled as linear elastic materials. To decrease the computational effort the longitudinal and transversal symmetry planes were used, which resulted in that only one quarter of the beam had to be modelled. The geometrical model created for the FE analyses is shown in Figure 2. The analytical calculations, carried out for designing of the strengthening systems, indicate that high interfacial stresses could be present in the regions near the ends of the CFRP plates. The geometry of the strengthened beam in the FE-model was therefore meshed with different density in different regions, where the regions nearest to the ends of the CFRP plate were meshed with a quite dense mesh. A convergence study was conducted to find the least accurate mesh density in these regions.
The effect of residual stresses and initial imperfections caused by the fabrication process was not included in the FE-model. The load was applied as a pressure over an area corresponding to the load application in the laboratory tests. Through the non-linear analysis, loading was done according to a schedule, which was determined and managed in prescribed steps.
Figure 2. Geometry of the FE-model
5. LABORATORY TESTS
5.1. Preparation of specimens
All beams that should be strengthened were sand blasted over the area where the CFRP plate should be applied, and then cleaned properly with Acetone. The cleaned surface was then immediately coated with a primer to prevent oxidation of the steel.
To minimize the presence of air gaps inside the adhesive, when the CFRP plate was attached to the steel substrate, the adhesive was applied to the CFRP plate in a V-shape, see Figure 3.

Investigation of steel I-beams strengthened with CFRP plate
369
Adhesive
CFRP laminate
Figure 3. CFRP plate with adhesive, shaped in a V-section, applied on the upper surface
The CFRP plate was then immediately attached to the steel flange. To secure that a uniform thickness of the adhesive was achieved thin strips were used along the CFRP plate. These strips acted as supports to the hard roller used to press the CFRP plate against the steel substrate. A space was left between the CFRP plate and the strips to get room for the overabundance of the adhesive, when the CFRP plate was pressed towards the steel.
5.2. Test setup
The beams were tested in four-point bending with two point loads applied sym-metrically with reference to the mid-span of the beam, with a distance of 220 mm in between. Loading was deformation controlled and the deflection in mid-span was measured by an LVDT.
Each beam was provided with strain gauges (SG), which were applied to locations according to Figure 4. By using strain gauges on the CFRP plates, at the locations near the ends and near the mid-span, the stress distribution along the bond line could be derived. To capture the strain distribution in the area of predicted concentrated shear stresses near the end of the bond line a series of ten strain gauges, with 1 mm in between, was attached on the CFRP plate. Strain gauges were also applied attached over the height of the steel section to measure the strain distribution.
LVDT
LVDT LVDTP P
1800
110
1600
Section A-A: SG positions over the cross-section
SG positions along the CFRP laminate
10 SG with 1mm spacing
A
A
Figure 4. Illustration of test setup

6. Advanced technologies of railway bridge rehabilitation
370
6. RESULTS
6.1. Load-bearing capacity
The results from the three methods show that the increase in stiffness for the strengthened beams compared with the unstrengthened beams was insignificant. A maximum increase in moment capacity of about 18% was obtained for those beams strengthened with high strength CFRP plates. These beams showed also the highest ductility. The results from the laboratory test concerning the global behaviour of the investigated beams are shown in Figure 5.
Figure 5. Load-strain behaviour of the beams tested in laboratory
Beam 1-2 was also strengthened with high strength CFRP plates, but for this beam failure occurred quite early. The failure mode for this beam was debonding between the primer and the steel substrate, which indicate that the adhesiveness between the primer and the steel substrate was poor. For all other tested beams the decisive failure modes were rupture of the plate. Beam 1-4 was strengthened on both upper and lower side of the tension flange and show thus a stiffer behaviour compared with beam 1-3. When Beam 1-4 failed the CFRP plate attached to the upper surface of the flange was still intact. Beam 1-5, which was strengthened with a high modulus CFRP plate showed the lowest ductility, but had the same stiffness as Beam 1-4.
Table 3 shows numerical difference in percent between the maximum failure load and maximum deflection for the different tested beams compared to the capacity of the reference beam. For the reference beam, the reference value of “failure” is defined as when the strain in Table 3. Numerical results for the tested beams in percentage of the capacity of the reference beam
CFRP plate Beam
ft [MPa] MOE [GPa] Area [mm2] DP (load) Dd (deflection)
1-2 3100 165 288 2% –56% 1-3 3300 200 192 17% 34% 1-4 3300 200 288 18% 12% 1-5 1500 450 170 2% –56%

Investigation of steel I-beams strengthened with CFRP plate
371
the mid-span of the beam has reached 2.0%, and for the strengthened beams when the CFRP plate reached failure, either by rupture or debonding. A negative value means that the specific beam cannot reach 50 mm in deflection, which corresponds to 2.0% in strain of the most tensioned part in the reference beam at the longitudinal midpoint.
A comparison between the results obtained from the analytical solutions, laboratory tests and FE analyses is shown in Figure 6 fir one of the investigated beams. The results from the laboratory tests were used to validate the FE-model and from the figure below it can be seen that the results have a good agreement. The discrepancy between the two results appear in the region where the steel has reached yielding, and depends on the presence of residual stresses which were not taken into consideration in the FE-model. The difference between the analytical solution and the other two is due to use of different material models. In the analytical solution a bi-linear material model was used (see the schematic stress-strain plot in Figure 6), which caused the more conservative behaviour as can be seen in the figure below.
0
100
200
300
400
0 1000 2000 3000 4000 5000 6000Microstrain
Load
[kN
]
FE analysisLaboratory testAnalytical solution
Figure 6. Left; Comparison of the load-strain behaviour obtained from the laboratory test, FE analysis and analytical solution for one of the investigated beams. Right; Schematic plot of the used material models used in the analyses
It was discussed previous that the neutral axis in the cross-section will move after plasticity, and this behaviour was captured in all three methods. Figure 7a and Figure 7b show the results for one of the investigated beams, from the analytical solution and from the FE analysis, respectively. From both figures it can be seen that the plasticity level in tension will reach a maximum and then start to decrease at higher loads. This shows that when the compression area continues to increase, the tension area of the steel section has to decrease, and more of the tensile forces have to be carried by the CFRP plate. For a double-symmetric steel beam, which has to be strengthened by bonding CFRP plate to the tension flange to increase the load-bearing capacity, the strengthening effect will be limited by the capacity of the beam to carry compression stresses. A theoretical maximum strengthening effect is obtained when the steel section has reached yielding in compression over its whole height and all tension is carried by the CFRP plate. To further increase the load-bearing capacity the compression part of the section has also to be strengthened to delay the movement of the neutral axis downwards.

6. Advanced technologies of railway bridge rehabilitation
372
a) b)
-400 00
40
80
120
160
Normal stress [MPa]
Section
CG
-200 200 400
Hei
ght o
f the
cro
ss-
sect
ion
[mm
]
0
40
80
120
160
-400 -200 0 200 400
170kN270kN300kN330kN360kN
Normal stress [MPa] Figure 7. Distribution of normal stresses over the height of the steel section obtained from: a) analytical solution, b) FE analysis, for one of the investigated beams
7. INTERFACIAL STRESSES
Analytical calculations of the interfacial shear and peeling stresses have been conducted using an analytical solution developed by Smith et al. (2001). A comparison between the analytical results and the results from the laboratory tests showed an overall agreement, but the measured data hade some disparities, due to errors in the experimentally recorded data, see (Linghoff, 2006). The interfacial stresses in the bond line, analysed with FE method, were extracted along a line in the mid-thickness of the adhesive. A convergence study of the FE- -model was conducted, which comprised change in the size of the element in the region located near the end of the bond line.
In the FE analyses it was found that the interfacial shear stress distribution over the width of the bond line was not constant, which otherwise is the assumption adopted in the analytical solutions. The distribution of shear stress along the width of the bond line is given in Figure 8, for a load level below that causing yielding in the beam.
Figure 8. Shear stress distribution over the width of the bond line, obtained from FE analysis and analytical calculation

Investigation of steel I-beams strengthened with CFRP plate
373
The maximum shear stress appears at the inner edge of the bond line, and will then decrease towards the outer end except for the area nearest to the outer CFRP plate edge, where the shear stress show a small increase. In the same figure the results from the analytical solution, developed by Smith et al. (2001) are plotted. The maximum shear stress at the inner edge of the CFRP plate is seen to exceed the analytical calculated value. One reason for this difference is that the steel I-section has different stiffness over the width of the cross-section, which is not considered in the analytical solution.
Additionally, the longitudinal distribution of shear stresses near the end of the CFRP plate obtained from the FE analyses were compared with the results from the analytical calculations. The results are shown in Figure 9a and Figure 9b. a) b)
0
1
2
3
4
5
6
7
0 10 20 30 40 Distance from end of bond line [mm]
She
ar s
tres
s [M
Pa]
170kN-FEM 300kN-FEM 170kN-Analyt 300kN-Analyt
0
1
2
3
4
5
0 10 20 30 40Distance from end of bond line [mm]
She
arst
ress
[MP
a]
170kN-FEM
300kN-FEM
170kN- Analyt
300kN- Analyt
Figure 9. Interfacial shear stress distribution near the end of the bond line, obtained from FE analyses and analytical solution: a) inner edge, b) mid
The results are plotted along the bond line, with start at the end of the CFRP plate, at two different locations along the width of the bond line, and for two different load levels. Figure 9a shows that the higher magnitude of the interfacial shear stress from the FE analysis, at the inner edge of the bond line, continues even after the maximum value of the interfacial shear stress has been reached, compared with the results from the analytical solution. When analysing the results as the mid of the width of the bond line, the analytical solution gives a higher value of the interfacial shear stress compared with the FE-results, and here the decrease in distribution is almost the same. Therefore, the behaviour of the interfacial shear stress, which is shown in Figure 8, does not only occur at the end, it will also continue along the bond line.
The available low-order analytical solutions for prediction of the interfacial stresses in the bond line are developed based on the theory of elasticity. In Figure 10 the interfacial shear stress from the analytical solution and the FE analysis are plotted as a function of magnitude of applied load, for one of the investigated beams. The extracted values were taken near the end of the bond line and at a width where the results from the two analyses coincident, c.f. the discussion about distribution along the width of the bond line in connected to Figure 8 above. The figure shows that the results from the FE analysis and the analytical solution matches almost over the whole load range, and are not affected by the yielding in the steel beam near the mid-span, which starts at an magnitude of the applied load of about 200 kN.
Also the interfacial peeling stresses varied in magnitude along the width of the bond line. The FE analysis showed, as for the interfacial shear stress, higher peeling stress near the inner

6. Advanced technologies of railway bridge rehabilitation
374
edge of the bond line compared to the analytical solution, which also for the interfacial peeling stresses assumes a uniform distribution along the width of the bond line.
The interfacial shear stress distributions near the mid-span of the strengthened beams have been extracted from the FE analysis and are plotted in Figure 11 for one of the investigated beams. The plotted curves represent the interfacial shear stress distributions for an applied load above the load level causing yielding in the steel beam. The form of the interfacial shear stress distribution shown in the figure was typical for all strengthened beams. In portions of the beam where the steel has undergone large plastic deformations it is practically only the CFRP plate that is able to transfer the tensile forces in the flange. Successive yielding causes the area for the maximum interfacial shear stress near mid-span to move along the bond line, as the yielded portion in the steel beam propagates towards the support. This effect is shown in Figure 10. The FE model was not created with any failure criterions, and that is why the interfacial shear stress in the plot was able to reach such high values.
Distance from the midspan [mm]
270kN300kN330kN360kN
-20
-10
0
10
20
30
40
0 100 200 300 400She
ar s
tress
[MP
a]
Figure 10. Interfacial shear stress distributions in the bond line near mid-span for different load levels. The results are obtained from FE analyses
8. CONCLUSIONS
The results from the conducted investigation of steel I-beams strengthened with bonded CFRP plates show that both global and local behaviour can be reflected by using a 3D FE- -model. With addition of initial deformation and residual stresses in the FE-model, the results would fit even better in the region where the steel reaches yielding. Additional conclusions from the present investigation are summarised below:
• The FE analyses and the laboratory tests showed that it is possible to increase the load- -bearing capacity of a double-symmetric steel section up to about 18%. For further increase in load-bearing capacity the compressed flange has to be strengthened to.
• The most preferable behaviour of the strengthened steel beam, both with respect to moment capacity and ductility, was obtained for the beams where high strength CFRP plates were used.
• Experiences from the laboratory tests showed that it was hard to obtain measured strain values without small disturbances. This disturbances produce large fluctuations in the distribution of the shear stress obtained from derivations of the measured strains.

Investigation of steel I-beams strengthened with CFRP plate
375
• The FE analyses showed that the interfacial stresses vary along the width of the bond line, with the maximum value in the position closest to the web plate, where the stiffness in the flange is highest.
• The shear stress development, in a point where the results from FE analysis and simplified analytical calculation coincident, as a function of applied load will be equal until a very high load is reached. This gives indication of that the analytical solution can be valid even after the steel has reached yielding.
• In the plastic phase of the strengthened beam, the maximum value of the interfacial shear stress near the mid-span of the beam will move along the bond line towards the supports as the area of yield increases. The magnitude of the interfacial shear stress may widely override the capacity of the adhesive for high loads.
ACKNOWLEDGEMENTS
The European Union project “Sustainable Bridges” is gratefully acknowledged for sponsoring this research work.
REFERENCES Cadei, J.M.C., Stratford, T.J., Hollaway, L.C., Duckett, W.G. (2004): Strengthening metallic structures using externally bonded fibre-reinforced polymers, CIRIA, Publication C595.
Linghoff, D. (2006): Strengthening steel beams with adhesively bonded composites laminates, Thesis for the degree of licentiate of engineering, Chalmers University of Technology, Göteborg, Sweden.
Linghoff, D., Al-Emrani, M. (2006): Performance of steel beams strengthened with CFRP laminate – Laboratory test, Submitted to Composite Part B: Engineering.
Luke, S. (2001): The use of carbon fibre plates for the strengthening of two metallic bridges of an historic nature in the UK, Proceedings of the International Conference on FRP Composites in Civil Engineering, Hong Kong.
Miller, T.C., Chajes, M.J., Mertz, D.R., Hastings, J.N. (2001): Strengthening of a steel bridge girder using CFRP plates, Journal of bridge engineering, November/December.
Schnerch, D., Dawood, M., Rizkalla, S. (2006): Design Guidelines for the use of HM strips: Strengthening of Steel Concrete Composite Bridges With High Modulus Carbon Fiber Reinforced Polymer Strips, North Carolina State University, Technical report, (IS-06-02).
Schnerch, D., Stanford, K., Sumner, E., Rizkalla, S. (2005): Bond behaviour of CFRP strengthened steel bridges and structures, Proceedings of International Symposium on Bond Behaviour of FRP in structures – BBFS 2005, Chen and Teng, ed.
Sebastian, W.M. (2003): Laboratory investigation into debonding failure of FRP-plated beams, Report Network Rail, UK, August.
Sen, R., Liby, L., Mullins, G. (2001): Strengthening steel bridge sections using CFRP laminates, Composites: Part B, 32, pp. 309-322.
Smith, T.G., Teng, J.G. (2001): Interfacial stresses in plated beams, Engineering Structures, 23, pp. 857-871.
Stratford, T., Cadei, J. (2006): Elastic analysis of adhesion stresses for the design of a strengthening plate bonded to a beam, Construction and Building Materials, 20, pp. 34-45.


Durability increase of bonded CFRP-steel joints via appropriate surface preparation
377
Durability increase of bonded CFRP-steel joints via appropriate surface preparation
Markus FELDMANN & Johannes NAUMES Bonded CFRP laminates become more and more important in the sustainability of old buildings and bridges. As the bonding is the most sensitive part of these strengthening systems, a special focus should be set on its durability. In particular as polymers are known to be susceptible to ageing and deterioration under extreme environmental conditions. The present document gives some general recommendation about an appropriate gluing procedure for CFRP-metal joints, describes two possible surface preparation methods and presents some international testing procedures for accelerated ageing tests. Finally an ageing test is presented, which has been performed on 71 single shear lap CFRP-steel samples. The aim of this test series was to determine the effect of different surface preparation methods on the ageing of bonded CFRP-steel joints. In this light, a conventional surface pretreatment method has been compared to a new, innovative one, the SACO method. During the tests a special focus has been set on the bond-line corrosion, which means that no corrosion protection has been applied to simulate the ageing behaviour under any absence or destruction of the protective coating. The laboratory tests show that the surface preparation method has a significant influence on the bondline corrosion progress.
1. INTRODUCTION
Bonded CFRP laminates become more and more important in the sustainability of old buildings and bridges. Therefore a lot of laboratory and field tests have been performed in the last years to analyse and optimise this modern reinforcement system. In addition to the traditional repair and strengthening methods, such as replacement or reinforcement via additional steel members, this system consequently has become part of the applied rehabilitation methods in many countries. Beside the research of the mechanical properties of such advanced strengthening systems, a focus should be set on its durability. Concerning the long-term performance of FRP repair and strengthening systems environmental influences play a very important role. Extreme temperatures, humidity, aggressive exposure, UV-radiation and
Sustainable Bridges – Assessment for Future Traffic Demands and Longer Lives

6. Advanced technologies of railway bridge rehabilitation
378
their combinations can extremely shorten the lifetime of each component. The aim of this paper, is to highlight the effect of different surface preparation methods on the ageing of bonded CFRP-steel joints. It gives some general information about adequate testing procedures and names two preferable surface preparation method. The results of an accelerated ageing test on 71 aged single shear lap tests will be discussed at the end of this paper.
2. GLUING PROCEDURE
Gluing has many advantages compared to conventional joining methods such as bolting or welding, e.g.:
• the possibility to join different kinds of materials, • no heat introduction into the base material, • no sectional weakening due to drill holes. Besides these advantages it has to be mentioned that gluing is a very labour intensive and
sensitive technique. The way of implementation is a decisive factor for the quality and durability of the bonding. Like welding, bonding should only be done by special skilled workers.
The main working steps of the installation of a CFRP repair and strengthening system can be summarized as follows:
1. Cleaning of the metal surface. To remove any dust, paint or un-sound material on the bonding surface, the steel member has to be mechanically cleaned. Recommended methods are sandblasting up to a roughness of at least Sa 2-1 ⁄2 or SACO treatment. This first mechanical surface preparation is accomplished by a chemical cleaning of the bonding surface to remove all dirt and debris using acetone or any other appropriate cleaning agent.
2. Application of primer. To optimise the adherence between steel and adhesive and to avoid any corrosion on the steel surface until the adhesive will be applied, the steel surface has to be treated with a thin layer of polar primer. This special coating is usually based on the later on applied adhesive and forms part of the bonding system. Therefore the used primer has to be chosen according to the recommendation of the adhesive producer to assure the maxi-mum adherence between steel and adhesive.
3. Cleaning of CFRP. Depending on the used strengthening system the CFRP surface may be cleaned with acetone before bonding. Some producers protect the laminate surface with a special protection layer, which has to be removed before bonding. In such cases cleaning via acetone may not be necessary. (Consult the manufacturer information).
4. Preparation of the adhesive. During the whole bonding procedure absolute cleanliness is required to avoid any contamination of the adhesive. In case of a two component adhesive new stirring rods and cups should be used for each mixture. Special attention has to be paid on the right component ratio and a sufficient stirring to assure the optimal bonding performance.
5. Application of the adhesive. After curing of the primer and accomplishing step 4 and 5, the adhesive can be applied. To reach a high homogeneity of the adhesive layer without any air locks, the adhesive should be applied single sided (preferentially on the CFRP side) and in a triangular shape (triangular cross-section).

Durability increase of bonded CFRP-steel joints via appropriate surface preparation
379
6. Assembling. Once the adhesive has been applied, the CFRP plate or laminate has to be placed during the potlife time of the adhesive. Like all steps before, the assembling has to be carried out with great care to avoid any contamination or air-locks. Therefore the CFRP should be attached carefully in one working step, which means that an adequate number of workers and fixing equipment has to be available. Any detaching or replacing may cause grave air inclusions or contamination of the adhesive.
3. SURFACE PREPARATION BEFORE BONDING
3.1. General
To gain a strong and durable adhesive bond, surface treatment and accurate bonding plays a very important role. In particular if its application takes place onsite. Bad surface preparation and bonding with contaminated adhesive can lead to premature debonding of the CFRP sheets. Due to that reason the adequate surface preparation of the substrate should be done with great care. Two recommended surface preparation methods are described in the following.
3.2. Blast cleaning
If no other pre-treatment method has been arranged, one of the surface preparation methods listed in ISO 8504 should be used. The document of ISO 8504 describes the general principles for the selection of methods for the preparation of steel surfaces before coating with paints and related products. It can be devolved to the requirements for bonding.
The surface roughness characteristics of blast-cleaned steel substrates is regulated by ISO 8503. This document specifies the requirements for ISO surface profile comparators which are intended for visual and tactile comparison of steel substrates that have been blast-cleaned with either shot abrasives. ISO surface profile comparators are use in assessing, on site, the roughness of surface before the application of paints and related products or other protective treatments. Surfaces of steel members which are prepared for bonding should be cleaned up to a roughness of at least Sa 2-1 ⁄2.
3.3. SACO method
SACO is a physical-chemical surface preparation method which is used for the pre-treatment of metal surfaces before bonding. The aim is the cleaning (SAndblasting) and COating of the surface at the same time. The SACO treated metal surface results in a very thin and good adherent layer of polar primer. Afterwards primer and adhesive are applied as usual. As precondition for this method all assembly components have to be previously cleaned from rough impurity and rust.
Afterwards the pre-cleaned metal surface is blasted with the special coated corundum (cp. Table 1A). Due to corundum impact on the surface it is cleaned and roughened similar to common sandblasting (cp. Table 1B). During the impact parts from the corundum coating are transferred to the steel surface (cp. Table 1C). After the detachment of the corundum particle the impact area is left coated with a very thin layer of polar primer (cp. Table 1D).
After SACO-blasting the surface is coated with the normal primer which causes a chemical reaction with the adhesive layer applied shortly after.

6. Advanced technologies of railway bridge rehabilitation
380
Table 1. Schematic of the SACO method (Dilthey et al., 2005)
A) Blasting by accelerated corundum particle with special primer coating
B) Cleaning of the steel surface due to the impact of corundum particle, similar to common sandblasting
C) Transfer of the primer coating from the corundum particle to the steel surface
D) Primer coated steel surface after detachment of corundum particle
4. STANDARD TESTS FOR ACCELERATED AGEING
4.1. General
At the beginning of an accelerated ageing program attention should be focused on the de-termination of critical degradation mechanisms. Subsequently a testing procedure with one or more environmental degradation factors can be chosen. For CFRP strengthened steel-members four different environment conditions are essential in terms of deterioration:
1. High relative air humidity. 2. Aggressive exposure (e.g. saltwater). 3. UV-radiation. 4. Elevated and reduced temperature. For each exposure the influence on every material component is different. Polymers such as
epoxies e.g. age faster under elevated temperature and UV-radiation than steel, which on the other hand is very sensitive to aggressive environments such as salt-water. Alternating temperature can also accelerate the progress of ageing especially on composites with different coefficients of thermal expansion.
To accelerate the ageing process of materials, different test methods have been developed in the last year. The most important tests include the salt fog test, condensation test and corrosion tests in condensation climates. These tests can be carried out individually or combined. After the ageing process the residual ultimate strength of the specimens is tested and compared to the results of unaged reference specimens. A selection of relevant international standards is given in the following.
steel steel
steel steel
primer coated corundum particle
primer coated corundum particle
detached corundum particle
primer
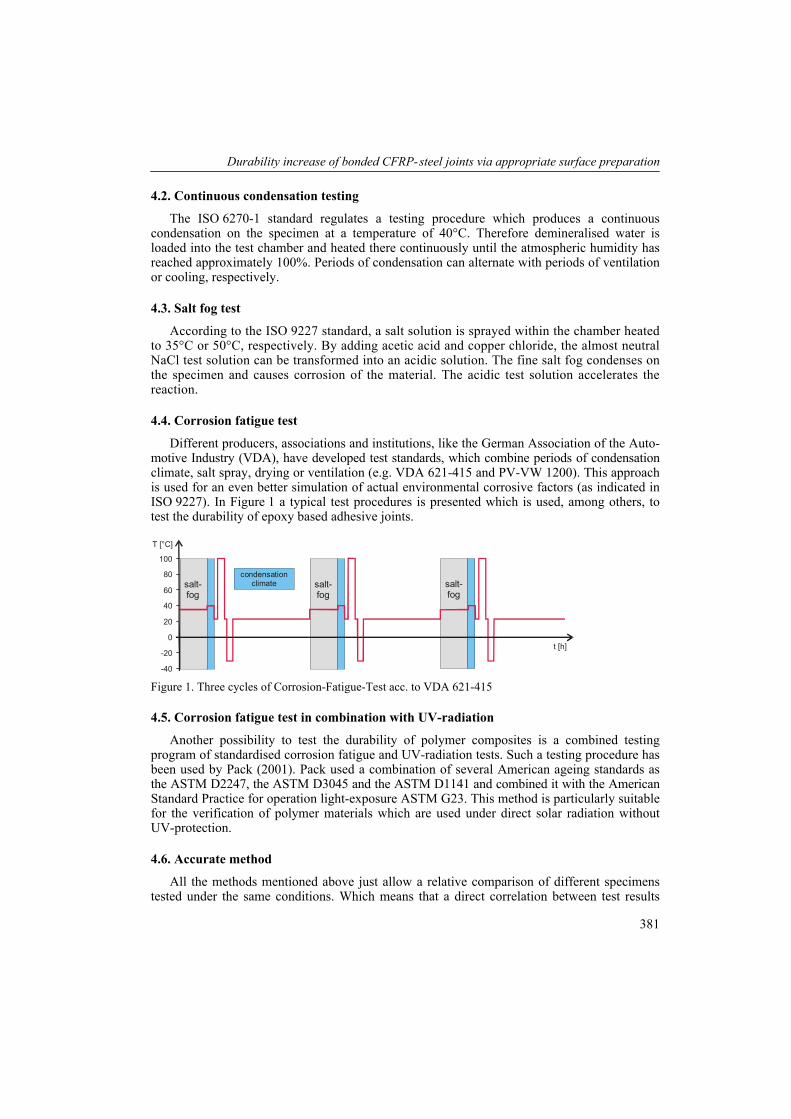
Durability increase of bonded CFRP-steel joints via appropriate surface preparation
381
4.2. Continuous condensation testing
The ISO 6270-1 standard regulates a testing procedure which produces a continuous condensation on the specimen at a temperature of 40°C. Therefore demineralised water is loaded into the test chamber and heated there continuously until the atmospheric humidity has reached approximately 100%. Periods of condensation can alternate with periods of ventilation or cooling, respectively.
4.3. Salt fog test
According to the ISO 9227 standard, a salt solution is sprayed within the chamber heated to 35°C or 50°C, respectively. By adding acetic acid and copper chloride, the almost neutral NaCl test solution can be transformed into an acidic solution. The fine salt fog condenses on the specimen and causes corrosion of the material. The acidic test solution accelerates the reaction.
4.4. Corrosion fatigue test
Different producers, associations and institutions, like the German Association of the Auto-motive Industry (VDA), have developed test standards, which combine periods of condensation climate, salt spray, drying or ventilation (e.g. VDA 621-415 and PV-VW 1200). This approach is used for an even better simulation of actual environmental corrosive factors (as indicated in ISO 9227). In Figure 1 a typical test procedures is presented which is used, among others, to test the durability of epoxy based adhesive joints.
salt-fog
salt-fog
salt-fog
condensationclimate
-40
40
-20
20
60
80
100
0t [h]
T [°C]
Figure 1. Three cycles of Corrosion-Fatigue-Test acc. to VDA 621-415
4.5. Corrosion fatigue test in combination with UV-radiation
Another possibility to test the durability of polymer composites is a combined testing program of standardised corrosion fatigue and UV-radiation tests. Such a testing procedure has been used by Pack (2001). Pack used a combination of several American ageing standards as the ASTM D2247, the ASTM D3045 and the ASTM D1141 and combined it with the American Standard Practice for operation light-exposure ASTM G23. This method is particularly suitable for the verification of polymer materials which are used under direct solar radiation without UV-protection.
4.6. Accurate method
All the methods mentioned above just allow a relative comparison of different specimens tested under the same conditions. Which means that a direct correlation between test results

6. Advanced technologies of railway bridge rehabilitation
382
and real behaviour can only be drawn with a lot of experience. In most cases no general equation to calculate the real durability exists.
To make a direct correlation between the durability under real and laboratory conditions, two further methods are possible. One is the simulation of the real seasonal changes of the environment in an accelerated manner. (Myers et al., 2001) report on an ageing program with alternating cycles of freeze/thaw, extreme temperatures and relative humidity (cp. Figure 2). These cycles were selected to simulate the seasonal changes in an environment similar to the climate in continental Europe or Midwest USA. A correlation can be given directly according to the chosen acceleration factor.
Figure 2. Representative of one exposure cycle (Myers et al., 2001)
Another way to calculate the ageing of a material in a more general way is to analyse separately the different possible degradation mechanisms and environmental factors. Whereas ageing can be broadly categorized by three primary mechanisms: chemical, physical and mechanical. The interaction, if any, between these three areas is dependent on two variables: material characteristics and ageing environments. By testing the influence of each single environment on the distinct mechanisms separately, a more precise correlation between test-results and reality can be determined. A general degradation function can then be made by applying the principle of superposition, in which different analytical approaches (dependent on the influences which have to be superposed) have to be used. This makes the determination of the durability of a complex system, with different composites, under various environmental influences exceedingly difficult.
For most polymeric materials, the quantitative impact of temperature on mechanical proper-ties is embodied in the time-temperature superposition principle (TTSP). The TTSP, illustrated graphically in Figure 3, indicates that the compliance curves at different temperatures are related to one another by a simple shift on the log time scale. This result implies that the relaxation times for a material, which represent the ease of motion of different segments of the polymer chain, are all scaled by temperature in an identical manner. The relaxation times for a given material are short at high temperatures, long at low temperatures, and can be calculated relative to those at a reference temperature by a simple temperature shift factor aT (acc. to the Arrhenious Equation and WLF-equation, respectively). Further information can be found in the literature, see e.g (Gates, 2003).

Durability increase of bonded CFRP-steel joints via appropriate surface preparation
383
Figure 3. Illustration of time-temperature superposition for isothermal creep compliance curves where tR and TR are the reference time and temperature respectively (Gates, 2003)
The higher the difference between real and testing (reference) temperature, the faster the ageing effect during the test. In this process the maximum possible testing temperature is governed by the maximum allowed operating temperature of each composite member. In case of composite materials with different coefficients of thermal expansion high temperature may change the degradation mechanism from a chemical into a mechanical one, which limits again the maximum testing temperature and thus the time acceleration factor.
5. LABORATORY TESTS
5.1. General
In the following the results of a standardized ageing test, which has been performed by the authors on 71 single shear lap samples, will be discussed. At 29 of this CFRP-steel specimens the surfaces have been prepared by conventional sandblasting up to a roughness of SA 2-1 ⁄2. The surfaces of the remaining specimens have been treated with the mentioned SACO method, see also section 3.2.
5.2. Testing procedure
As corrosion-fatigue test (modified VDA-test: max T = 80°C, min T = –20°C, two cycle per week, cp. Figure 1) has been chosen, which combined periods of condensation climate, drying and freezing as well as salt spray. The so arranged aggressive environment caused very quickly extensive corrosion on the metal strips. Figure 4 shows the specimens in the climate chamber after one cycle of the modified VDA treatment (7 days). According to field reports ten weeks of this modified VDA-test correspond to 5–10 years of normal environmental influences in middle Europe.
After 1, 3, 6 and 10 weeks of corrosion-fatigue test the ultimate resistance of a set of 16 specimens has been determined by a simple tensile test, see right picture in Figure 4. Finally this results have been compared to the tensile strength of reference, unaged specimens.

6. Advanced technologies of railway bridge rehabilitation
384
Figure 4. Corroded specimens after one week of VDA treatment and test rig with clamped specimen
To countercheck the measured values of shear strength a second focus has been set on the visual interpretation of the fracture surfaces. In dependence of the exposure time a change in the failure mode could be observed. With increasing exposure time the proportion of bond-line corrosion and adhesion fracture increased. To quantify at least the area of bond-line corrosion as accurate as possible, a simple photo-grammetric measurement method has been used. Therefore pictures with the fracture surface of all specimens have been converted into two-colour-pictures, followed by a colour-ratio calculation. The example shown in Figure 5 gives an impression of the described procedure. For the given example the percentage of black pixels in the right picture, which corresponds more or less to the area of bond-line corrosion, has been determined to 29%.
Figure 5. Determination of the percentage of bond-line corrosion via colour analysis
5.3. Results
The results of all tests are summarized in the following diagram, see Figure 6. It shows the mean of the maximum shear stress for each set in function of the exposure time. The broken line indicates the results of the specimens treated with SACO, the continuous line indicates those of the sandblasted specimens. In addition to the ultimate shear strength the mean of bondline corrosion (in percentage of the bonding area) is given for each set.

Durability increase of bonded CFRP-steel joints via appropriate surface preparation
385
All sets
0.0
2.0
4.0
6.0
8.0
10.0
12.0
14.0
16.0
0 7 14 21 28 35 42 49 56 63 70 77time [d]
τ [N/mm²]
mean of area of bondline corrosionmean of aged SACO specimensmean of aged Sa 2-1/2 specimens
~3.2 %
~1.5 %
~11.6 %
~3.7 %
~29.8 %
~9.9 %
~9.9 %
~52.1 %
~21.5 %
Figure 6. Mean of ultimate shear strength and area of bondline corrosion in function of time and surface preparation method (Feldmann et al., 2006)
It can be seen, that those specimens treated with the SACO method in general reached a higher shear strength and had less problems with bondline corrosion than those which have been simply sandblasted. This good result can be confirmed by the analyses of the fracture surfaces of the tested specimens. A clear tendency can be identified, that those bonding surfaces which have been prepared via SACO method were less susceptible to bondline corrosion than those which have been simply sandblasted, cp. also Table 2.
Table 2. Representative examples of the fraction area after different climate load cycles
after 1 week after 3 weeks after 6 weeks after 10 weeks
SA 2-1 ⁄2
SACO

6. Advanced technologies of railway bridge rehabilitation
386
6. SUMMARY AND CONCLUSION
Some general recommendation about an appropriate gluing procedure for CFRP-metal joints have been given and two possible surface preparation methods have been described. Furthermore a brief overview of some international testing procedures for accelerated ageing tests have been given.
The described test series of 71 samples confirms a general sensitivity of bonded steel CFRP joints to environmental exposure and shows of the advantage of a modern surface preparation method over conventional sandblasting. The reduction of the ultimate resistance of the aged specimens compared to the unaged specimens was mainly caused by bondline corrosion. On the average, SACO treated specimens were 2.7-times less sensitive to bondline corrosion than simply sandblasted specimens, which of cause resulted in a higher ultimate shear strength of such specimens. In general the following conclusions can be drawn:
1. A good surface preparation and an accurate bonding procedure is essential for the durability of a bonded joint.
2. Like welding, bonding should only be done by special skilled workers. 3. To reach a better adherence between steel surface and adhesive the application of new
surface preparation methods, which combine cleaning and coating of the steel surface in one working step, should be considered.
4. In general a coating of the whole reinforcement via a durable protection paint is highly recommended.
5. In case of absence or destruction of any protective coating, bondline corrosion leads to a increasing deterioration of the bonding.
6. The part of the bonding area which is affected by bondline corrosion is completely inoperative, which means that a direct correlation between ultimate strength and percentage of corroded bonding area can be drawn.
7. The bondling corrosion progress can be decelerated to nearly a third by the use of advanced surface preparation techniques such as the mentioned SACO method.
It has to be mentioned that such ageing tests only can point out tendencies and that no precise correlation between real and accelerated ageing can be drawn. In particular if the real environmental conditions are not exactly known. Nevertheless such tests are essential for the comparison of different fabrication methods or materials.
REFERENCES Dilthey, U., Schleser, M. (2005): Oberflächenbehandlungen beim Kleben von Metallen und Kunststoffen, Institut für Schweißtechnik und Fügetechnik, RWTH Aachen University.
Feldmann, M., Naumes, J., Kradjian, A. (2006): Strengthening and Repair of Steel Bridges using FRP – Durability under extreme Environmental Infuences, Lehrstuhl für Stahlbau und Leichtmetallbau, RWTH Aachen, Sustainable Bridges Report – D.6.2.4, 2006.
Gates, T.S. (2003): On the Use of Accelerated Test Methods for Characterization of Advanced Composite Materials, Langley Research Center, Hampton, Virginia, NASA/TP-2003-212407.
Myers, J.J., Murthy, S.S, Micelli, F. (2001): Effect of combined environmental cycles on the bond of FRP sheets to concrete, Composites in Construction, 2001 International, Conference, Porto, Portugal, October 10-12, 2001.
Pack, J.R. (2001): Environmental Durability Evaluation of Externally Bonded Composites, Doctoral thesis, B.S., University of Cincinnati.

Practical implementation of the project results


Bridge monitoring demonstrations in the Sustainable Bridges Project – synthesis of results
389
Bridge monitoring demonstrations in the Sustainable Bridges Project – synthesis of results
Risto KIVILUOMA Bridge monitoring demonstrations in the Sustainable Bridges Project are conducted on five bridges. Work on each of the bridges has altering objectives and different monitoring technologies are used. In the project, bridge monitoring is used as phrase for sensor based continuous measurement on a real structure. In contrast to field testing, the fundamental aim of bridge monitoring is to do measurements over elongated time period, or by repeating the measurements in regular intervals, in order to get full understanding of the trends in studied phenomena, measurement uncertainties and possible changes in structure’s performance. Monitoring systems demonstrated in the project include: monitoring with prototype of automation based monitoring system; long-term continuous monitoring with traditional computer-based instrumentation; monitoring with prototype wireless sensor network; structural dynamics monitoring with prototype shaker system for railway bridges; and short-term monitoring with conventional laboratory instruments. The mentioned prototype systems are developed within the project. At the sensor level, a project-borne prototype of fibre-optic strain sensor is demonstrated at one of the bridges. This paper summarises the work and make synthesis of results. Exploitation considerations are also addressed.
1. INTRODUCTION
Increasing number of researchers and bridge engineers consider bridge monitoring as immerging and promising tool for bridge research, maintenance, assessment and addressing real-time traffic safety issues. New major big bridges, including also railway bridges, frequently consists provisions for monitoring systems. As far as monitoring is concerned, in the Sustainable Bridges Project the object is different, as it is dealing with existing European railway bridge stock. Majority of the bridges are small with span length less than 40 m. These bridges are named as “ordinary” in the present paper. For ordinary bridges, bridge monitoring
Sustainable Bridges – Assessment for Future Traffic Demands and Longer Lives

7. Practical implementation of the project results
390
is only occasionally used for research purposes. Present monitoring system happens to be too expensive and complex for widespread usage. Furthermore, organizations responsible for bridge maintenance have well-established maintenance procedures and bridge management systems, which are based on routine visual inspections. Cost-level of bridge instrumentation and usage of monitoring clearly exceed the cost of visual inspections, and it seems evident that structural monitoring could not, and is not aiming to, replace visual inspections.
Response of ordinary bridges for live load is small. Permissible deflection of a track on a railway bridge with span 10 m is of order 1 to 4 mm (UIC 776-3, 1989). This is small in a sense that probably vibration transmitted from embankments and deformation of the track and ballast are as important as displacement of the bridge deck. This implies that if, e.g., bridge engineer would be interested on strains in the bridge caused by the trains, useable sensor need to have high accuracy.
Present progress in technology of monitoring systems supports objectives of the Sustainable Bridges Project. Issues like axle-load upgrades and utilization of unused or “hidden” load-bearing capacity means that real behaviour of bridges in real loading conditions needs to be known better than before, improved calculation methods needs to be created and innovative strengthening methods needs to be tested. Finally, design norms and legislation needs to be updated so that bridge owners are able to use the results. From research point of view, structural monitoring is promising tool for all this. On practise level, progress would be slow unless structural monitoring could be used in wide extend and for ordinary bridges; and not only by researchers but also by bridge engineers. Fortunately, monitoring systems become more and more affordable due to general development in information and communication technology. Systems reduce in size, making them easier to apply for vandal proof installation and long-term unattended operation. Wireless Internet connections make remote controlling easy. This is to say that next generation bridge monitoring systems are about to be penetrate to bridge management routines in next years.
Above considerations have been reflected in the bridge monitoring demonstration of the project in a sense, that the main objective has been in improvement of monitoring systems and sensor technologies towards general objectives of the project. Minor effort have been put for obtaining experimental evidence of the accuracy or usefulness of the assessment methods developed elsewhere inside the project. Successfulness of the bridge monitoring demonstrations in the project could be ranked mainly by the issue whether or not the demonstrated technologies eases or facilitates the utilization of the structural monitoring, whenever bridge engineer consider monitoring as an option to complement assessment. The way of thinking here is that the bridge expert, who is delivering the service for the bridge owner, starts utilizing the bridge monitoring to improve quality of the associated service. The important questions what to measure and what to do with all data should not be addressed to bridge owner, but will be handled by the service provider. Here, it seems evident that bridge owners don’t want to invest on, own and operate monitoring systems themselves unless the results are clearly known to support their primary needs.
2. BACKGROUND CONSIDERATIONS
Details of the European railway bridge demography are invented in the project (SB1.2 Demography, 2004). Only 5% of the bridges are having span length more than 40 m. The line- -level assessment of bridges is important for railway owners, meaning that the all bridges on certain railway line needs to be assessed in the case of changes like axle-load and train speed

Bridge monitoring demonstrations in the Sustainable Bridges Project – synthesis of results
391
increase. A typical railway line consists hundreds of ordinary bridges. One of the main issues in assessment for new demands is: which bridges need to be replaced, which might benefit from renovation, which might benefit of strengthening and which could be left as they are. Another important issue is the budget constraint. Line-level upgrade is expensive and may not be covered by normal annual budget of the railway organization. When extra budget money is available, bridges which are known to need replacement in near future are replaced. The role of bridge monitoring is this case could be that with real-time surveillance and improved assessment methods one may be able to postpone the works to the most suitable onset. It is evident that if one wish to take benefit of bridge monitoring in greater extend, the monitoring systems should be useful for wide-spread usage, on an affordable budget and in sort time-schedule. Furthermore, the parameters to be monitor should support practical engineering calculations done by the bridge experts. This means monitoring basic engineering parameters like dynamic factors, peak stresses, strain signatures, load redistribution to the main girders etc.
On busy railway lines, the need of avoiding traffic breaks is essential. In this case, the problems of an individual bridge may become important. It will be a benefit, if bridge monitoring could be utilized as one tool to proof its proper condition to avoid unnecessary repair works.
Present limitations for widespread utilization of structural monitoring systems include issues like:
• price, • size and complexity of the systems, • time requirement of installation, • technical limitations of the systems, • availability for multiple installations, • system reliability, • extensive efforts and specialist skills needed in data post processing, • vandal-resistance of the system, • results could not be used in all cases, as design codes and legislation do not take into
account the possibilities of monitoring. Summary of technical data of the demonstration bridges is shown in Table 1. In the project,
the objectives for development of widespread usage of bridge monitoring are addressed in Demonstration Bridges 1, 3 and 4. Demonstration Bridge 2 is used mainly for new sensor technologies and Demonstration Bridge 5 for practical decision making for studying axle load increase.
3. SUMMARY OF WORKS
Bridge monitoring demonstrations within the Sustainable Bridges Project have been started by choosing the priorities, demonstration bridges and evaluating the interfaces and needs for other works inside the project. Beside this, development of prototype systems have been started already in the beginning of the project, due to envisaged long product development cycle of the new technologies. After selection of the demonstration bridges, objectives on each of the bridges have been finalized, and responsible project partner has been chosen to each. These include WSP Finland Ltd; University of Oulu; Swiss Federal Laboratories for Materials Testing and Research; Wroclaw University of Technology; and Luleå University of Technology for demonstration bridges 1 to 5, respectively. The technologies demonstrated

7. Practical implementation of the project results
392
Table 1. Bridge monitoring demonstration bridges of the Sustainable Bridges Project
Demonstration Bridge 1
Demonstration Bridge 2
Demonstration Bridge 3
Demonstration Bridge 4
Demonstration Bridge 5
Name and country
Temmesjoki bridge, Finland
Siikajoki Bridge, Finland
“Schwerzen-bach bridge”, Switzerland
“Opole Wschodnie – Wrocław Brochów line” bridge, Poland
Keräsjok Bridge, Sweden
Spans 52 m 20 + 25 + 25 + + 20 m
10 m 6 x 11 m 40 m
Type Riveted steel truss railway bridge
Continuous concrete box girder road bridge
Concrete slab railway bridge
Riveted steel girder railway bridge
Riveted steel truss railway bridge
Superstructure built year
1948 1956 1982 1909 1911
Tracks 1 2 for vehicles 2 2 (one in use) 1
Ballast no – yes no no
Present axle load
22.5 t 30 t 22 t 22.5 t 22.5 t
Electrification 25 kV AC 50 Hz
– yes yes no
Typical passenger train speed on the bridge
140 km/h – 80 km/h 50 km/h 60 km (for freight trains)
Traffic characteristics
Passenger trains every two hours Freight trains every hour
Vehicles 6000–12000 per day Special heavy transports occasionally
Passenger trains every half hour Freight trains every one hour
Passenger and Freight trains couple of times a day
Freight trains couple of times a day
Description of condition
Good for present load. Need for 25 t axle load and speeds 160–200 km/h
To be strengthened by post tensioning in next years
Good Bad. Rusted and extra supports added. Waiting for replacement
Good, needs to survive next 5 years for 25 t axle load

Bridge monitoring demonstrations in the Sustainable Bridges Project – synthesis of results
393
have reflected the other tasks of the responsible partner within the project and partner’s own capabilities. Viewpoints of private companies, universities and research organizations are mixed, to form about homogenous Sustainable Bridges viewpoint to be presented for the end user of the project, i.e. for the European railways and for road bridge owners. Monitoring demonstrations of the project are described in single document (SB8.2 Demo, 2007).
On Demonstration Bridge 1, a project-borne prototype of automation based monitoring system is demonstrated. System is based on commercially easily available components. It has no moving parts, is operated though wireless Internet connection, and has small size making it easy for vandal-proof installation. Previous bottleneck of available measurement speed is removed. The system is successfully programmed to measure and store data up to 1000 samples per second, which is well high enough for vibration and strain measurements of all kinds of bridges. The development of the system, and alike others elsewhere, is the key for wide-spread utilization of bridge monitoring systems.
Demonstration Bridge 2 is used to demonstrate traditional computer-based long term monitoring system with container, and a prototype of specific fibre-optic strain-measurement sensor. Compared to existing sensors, this elongated size sensor prototype, developed in the project, shows improved functionality when measuring averaged strains over the concrete surface. It will, e.g., enhance the strain measurements of any small bridges and parts of bigger bridges whose deformation under normal traffic load is small. Accurate strain measurements have wide usage in engineering calculations and assessing the live loads on the bridge.
Demonstration Bridge 3 is used to determine reliable input for testing the reinforcement bar fatigue analysis model developed in the project. Various advanced field measurement techniques are demonstrated in the context of small and stiff railway bridge, whose response under live load is minimal. The team working with the bridge conducted also demonstration on the wireless sensor network prototype developed in project. This is done in various bridges including Demonstration Bridges 1 and 5. The prototype is optimized for usage of railway bridges. Especially, a train passing is handled as one event to be stored first into the local memory, before time-consuming data transmission to data collection unit is invoked. Usage of wireless sensor network technologies eases the installation of the monitoring system, promoting easier application of monitoring systems wherever needed.
Demonstration Bridge 4 is used to demonstrate monitoring by means of repeated measurements. It will focus on testing of portable shaker system developed in the project. It is used for identification of bridge’s modal parameters (natural frequencies, damping and mode shapes). System has merit on monitoring these in efficient way. The use of the system on detecting structural damages is studied.
Demonstration Bridge 5 stands for actual railway line upgrade, and will focus on practical problem solving assisted by monitoring. Special reference is made to true dynamic factors measured from the bridge. In the present case, verification of this basic design parameter has been the key issue in showing that the bridge can bear the axle load upgrade.
4. RESULTS SYNTHESIS
Work has demonstrated significant progress beyond the present state-of-the-art and towards project aims in following areas:
• demonstration of automation-based monitoring system for low cost and widespread useable monitoring system,
• demonstration of wireless sensor network for low cost and quickly installable monitoring system,

7. Practical implementation of the project results
394
• collection of data to be used by bridge engineers’ in structural calculations. In the present demonstrations, this include mainly dynamic excitation factors,
• collection of data to understand trends in the data due to environmental load (temperature etc).
Minor, but yet significant progress has been demonstrated in: • fibre-optic sensors for strain monitoring from concrete surface, • use of easily transportable shaker system to monitor bridge’s basic dynamic characteristics
of railway bridges, • use of bridge monitoring to obtain supporting information for field testing, especially
rebar corrosion activity measurements, which is found to be heavily affected on environmental conditions during the measurement day,
• verification that noise issues are not detrimental on electrified railway lines. The work has been less successful in issues related to:
• demonstration of some project-borne sensor prototypes for monitoring purposes. These sensors have been demonstrated in field tests instead, and it seems evident that further development is needed for those to be easily usable for monitoring purposes,
• usage of repeated dynamic measurement to detect practical damages or deterioration of bridges vs. the efforts needed. With international perspective, this technique seems to fit better for big bridges, whose dynamic characteristics are not greatly depended on hardly model able nonlinearities like friction and contact problems in various structural members.
5. EXPLOITATION CONSIDERATIONS
Present demonstration work allows comparison of cost level of the systems and the cost breakdown of the structural monitoring service. Indicative considerations are given in Table 2. They support the view obtained in the project:
• in short tern monitoring, no substantial difference exist between the costs of the services employing various technologies, especially in the case the service provider is sited close the object;
• automation based monitoring systems and wireless sensor networks will roughly half the present costs of long-term structural monitoring.
Cost level of structural monitoring is such that bridge management systems may in next years consist on two bridge groups for instrumented and not instrumented bridges. Size of the instrumented bridge group may be expected to be of order 5 to 100 bridges per owning organization. Usage of instrumented bridges is to improve accuracy of models per bridge type, record loading histories at railway line level or give real-time safety information of individual bridges. In the context of road bridges, this types of considerations have already been taken, e.g., in the Long Term Bridge Performance Project in the United States and in the national monitoring projects in Finland (Kiviluoma, 2007). For railway bridges, it may be expected that bridge monitoring not only continues as tool for the research organizations, but will also penetrate to assessment work conducted by consultants. Fatigue assessments could already now be conducted by utilizing monitoring. Next step might be to accept use of true dynamic factors obtained though monitoring. This may be further expanded to other design parameters, which are to be based on bridge-specific monitoring results rather than statistical values found in design codes. It should be, however, bear in mind that railways have to be conservative due to legislation to guarantee safety of pedestrians, workers and third parties. Thereof, the spreading of bridge monitoring to railway bridge

Bridge monitoring demonstrations in the Sustainable Bridges Project – synthesis of results
395
Table 2. Cost level of the various demonstrated monitoring technologies
Automation based monitoring system
Conventional long-term monitoring system with container
Structural monitoring with wireless sensor networks
Repeated modal parameter measurements with excitator
Repeated field testing
Product development effort for the service provider
12 man months and software licenses High
4 man months and software licenses Medium
24 man months High
12 man months Medium
3 man months and software licenses Medium
Cost level of equipments with typical sensors
Low Medium Low Medium Medium
Cost of installation for short-term monitoring
half day on the bridge Low
3 days on the bridge Low
half day on the bridge Low
half day on the bridge Low
2 days on the bridge Low
Cost of installation for long-term monitoring (including power)
Low Medium Low Low Medium
Operation, analysis and post-processing effort: short-term monitoring
0.5 man month Low
2 man months Medium
0.5 man month Low
2 man months Medium
2 man months Medium
Operation, analysis and post-processing effort: long-term monitoring
1 man month Low
3 man months High
1 man month Low
1 man month Medium
3 man months High
Proximate overall cost of the short- -term monitoring service
Low Medium Low Medium Medium
Proximate overall cost of the long- -term (one year) monitoring service
Medium High Medium Medium High
Key: High cost level ≥ 50 000 Euro. Medium cost level = 20 000–50 000 Euro. Low cost level is < 20 000 Euro.

7. Practical implementation of the project results
396
maintenance is dependant on how possibilities of bridge monitoring are taken into account in updates of design standards. Furthermore, time needed for acceptance procedures of various instruments to be used on railway environment should be taken into account.
REFERENCES Kiviluoma, R. (2007): Automation based structural monitoring systems for ordinary bridges. Proc. Improving Infrastructure Worldwide, IABSE symposium, Weimar, Germany Sept 19-21, 2007. Abstract 2 p.; paper on CD 7 p.
SB1.2 Demography (2004): European Railway Bridge Demography. Prepared by Sustainable Bridges – a project within EU FP6. Deliverable D1.2.
SB8.2 Demo (2007): Demonstration of bridge monitoring. Prepared by Sustainable Bridges – a project within EU FP6. Deliverable D8.2.
UIC 776-3 (1989): Deformation of bridges, Paris: International Union of Railways.

Low power wireless sensor network for long term structural health monitoring
397
Low power wireless sensor network for long term structural health monitoring
Reinhard BISCHOFF, Jonas MEYER & Glauco FELTRIN The objective of this paper is to present a prototype wireless sensor network for monitoring of civil engineering structures. The network consists of several autonomous remote sensor nodes distributed over a structure, representing the data sources, and a base station (data logging and configuration unit), representing the data sink in the network. Each node is equipped with several sensors, a data acquisition and signal processing unit as well as a radio transceiver. The acquired data is pre-processed on the sensor node before it is sent to the base station. The aggregated data can be accessed remotely over the Internet. Software tools permit to administrate the network and re-schedule measurement tasks remotely. The acquired data is stored in a relational database that can be accessed and updated by different data query and visualization tools. A sensor network has been deployed on a bridge to evaluate the performance of the system. The deployed system monitors the tension force of cable stays as well as temperature, humidity and node voltage.
1. INTRODUCTION
1.1. Wired monitoring systems
Basically every structural health monitoring (SHM) system is made up of various sensors measuring specific physical parameters, a data acquisition unit and a storage device to save the acquired data. Traditional SHM systems show a star like topology where each deployed sensor is connected via long cable runs to a central computer acting as data acquisition and storage device. The installation of such systems tends to be time consuming and expensive. Especially in the field of civil engineering where the structures are typically large, the sensors can be located long way away from the data acquisition unit resulting in high installation costs. In particular for medium term applications, which are the rule in bridge assessment, the installation costs have shown to be a major issue preventing a broad application of monitoring techniques. Furthermore, long cable runs are prone to pick up noise reducing the effective accuracy of the acquired data and claiming for expensive high quality cables. Moreover, these
Sustainable Bridges – Assessment for Future Traffic Demands and Longer Lives

7. Practical implementation of the project results
398
cables are susceptible to mechanical damage involving considerable maintenance effort and offer a limited flexibility in terms of rearrangement of sensors and scalability. The adoption of wireless sensor networks (WSN) techniques to SHM applications promises to overcome these drawbacks.
1.2. Challenges of wireless monitoring systems
The elimination of the cables connecting the sensors to the central logging unit solves the cable related problems mentioned above. However, new WSN related challenges arise. Particularly the resources to power the wireless sensing devices (motes) are highly affected by the absence of cables. In fact, the motes have to be powered by autonomous sources like batteries or solar cells which are severely limited in capacity. The limited energy resources on each mote present the most restricting factor in designing and implementing WSN based monitoring systems. Therefore, novel monitoring and measurement as well as communication strategies taking into account the limited energy resources have to be developed and tested.
In terms of power consumption, wireless data transmission is much more expensive than data processing. In order to extend system lifetime it is preferable to pre-process the raw sensor readings to reduce the data items needed to be transmitted to the base station. Many recent WSN based SHM systems transmit the raw data to the base station and analyze them in the traditional centralized way (Kim et al., 2006; Mechitov et al., 2006). Without introducing huge batteries, this is not a viable solution if a system lifetime of several months to years is targeted. For medium and long term monitoring applications distributed analysis algorithms have to be introduced which allow for a decentralized data reduction or even condition assessment. 2. WIRELESS SENSOR NETWORKS
A monitoring system using wireless sensor networks is made up of many tiny intercommunicating computers (Culler et al., 2004). Each tiny computer represents a node of the network. These nodes are called sensor nodes or motes. The motes are self-contained units typically consisting of a power supply with limited capacity, a radio transceiver, a micro controller and one or more sensors.
2.1. Node hardware
The sensor nodes are the fundamental components of a wireless sensor network. In order to enable WSN based SHM applications the sensor nodes have to provide the following basic functionality (see Figure 1):
1. Signal conditioning and data acquisition for different sensors. 2. Temporary storage of the acquired data. 3. Processing of the data. 4. Analysis of the processed data for diagnosis and, potentially, alert generation. 5. Self monitoring (e.g. supply voltage). 6. Scheduling and execution of the measurement tasks. 7. Management of the sensor node configuration (e.g. changing the sampling rate,
reprogramming of data processing algorithms). 8. Reception, transmission and forwarding of data packets. 9. Coordination and management of communication and networking. To provide the functionality described above, a sensor node is composed of one or more
sensors, a signal conditioning unit, an analog to digital conversion module (ADC), a processing unit with memory, a radio transceiver and a power supply (see Figure 2).

Low power wireless sensor network for long term structural health monitoring
399
Figure 1. Basic functionality of a sensor node
Figure 2. Hardware components and structure of a sensor node. Sensor node inside a rugged and waterproof aluminum box for long-term outdoor deployments
Various hardware platforms for wireless sensor networks are available today and new ones emerge regularly. This diversity offers the possibility to choose a platform which best fits the needs of a specific application. Tmote from Moteiv Corporation (Polastre et al., 2005), the platform that was used in this project, is a popular WSN platform. Many comparable platforms with similar hardware setups exist today. Many of these platforms are based on the Texas Instruments microcontroller family MSP430 and the Chipcon radio CC2420.

7. Practical implementation of the project results
400
This platform allows for interfacing different sensors not requiring specific signal conditioning. In addition to this WSN board, several specific sensor boards were developed for interfacing sensors requiring a specific signal conditioning circuitry (e.g. strain gauges). These sensor boards are connected to the WSN board.
If the sensor nodes are actually deployed in the field, especially in harsh environments like civil structures or construction sites, they have to be protected against chemical and mechanical impacts. Therefore an adequate packaging of the hardware is required (see Figure 2).
2.2. Software
The software running on each mote establishes the wireless network, organizes the communication between the motes, synchronizes the network, acquires measurements, performs data processing and generates alerts if particular conditions are met. The software is implemented as TinyOS components (Levis et al., 2005). Various WSN software frameworks exist. They are not full-blown operating systems, since they lack of a powerful scheduler, memory management and file system support, and are highly tailored to the limited node hardware. However, they are widely referred to as WSN operating systems.
TinyOS is one of the most widespread operating systems. TinyOS is written in NesC (Gay et al., 2003), an extension to the C language which supports event-driven component based programming. The basic concept of component based programming is to decompose the program into functionally self-contained components. These components interact by exchanging messages trough specific interfaces. The components act event-driven. Events can originate from the environment (a certain sensor reading exceeds a threshold) or from other components, triggering a specific action. The main advantage of this component based approach is the reusability of components. NesC as well as TinyOS are both Open Source projects supported by a fast growing community.
The basic network functionality is provided by low level network management components that operate independently from the actual monitoring application. These components are responsible for establishing the wireless links between adjacent nodes, for building the routing tree, and for network wide time synchronization. From an application point of view, it is not important how this is achieved. The monitoring application, which is built on top of these modules, only has to have the possibility to send and receive data and to have access to global time information. This allows for a flexible exchange of communication and time synchronization components.
A scheduler component forms the core of the actual monitoring application. It manages the data acquisition performed by the mote. Its clock is synchronized to the global time. The scheduler configures the measurement and data processing parameters like sampling rates, filter coefficients, thresholds, etc. and triggers the data acquisition at the scheduled time. In addition to sensor measurements like temperature, humidity and acceleration, information about the internal state of each mote (battery voltage) as well as communication parameters of the sensor network (e.g. routing tree) are monitored.
3. DATA PROCESSING
3.1. General aspects
Data processing is happening on two levels: on the mote and at the control center where the data is stored and post-processed. Data processing on motes arises for two reasons, limited energy resources and low bandwidth, whereby the second results from the first one. The
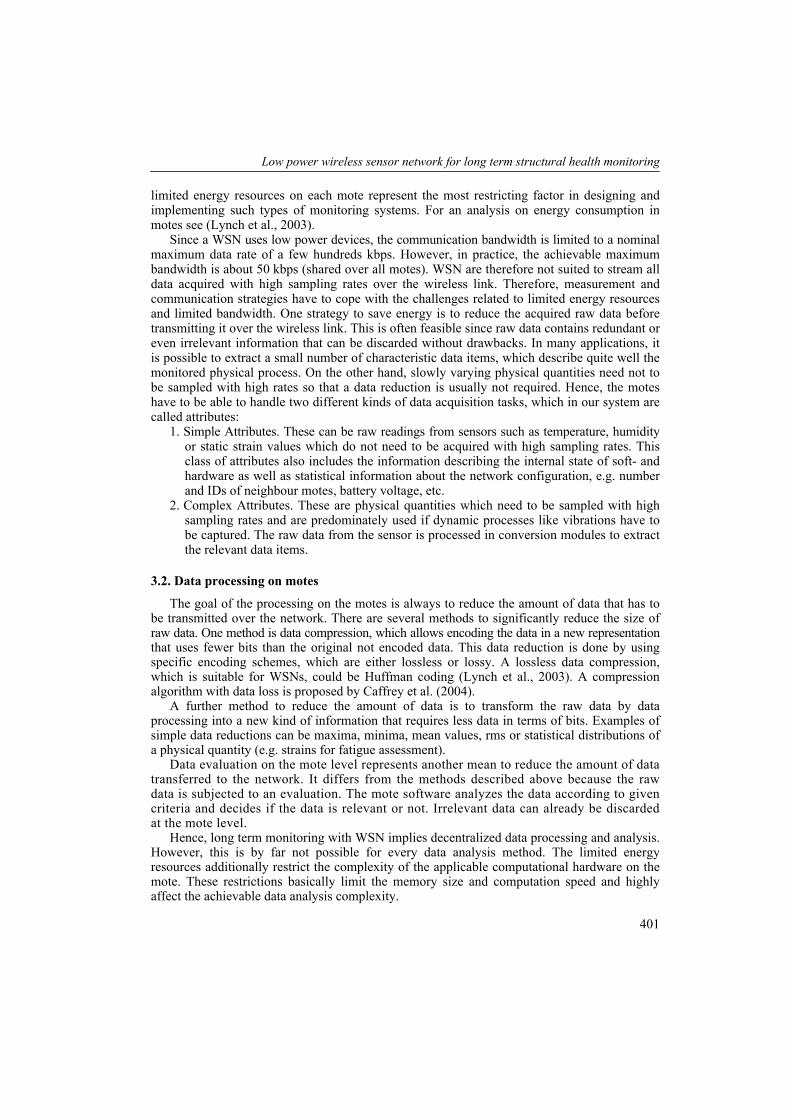
Low power wireless sensor network for long term structural health monitoring
401
limited energy resources on each mote represent the most restricting factor in designing and implementing such types of monitoring systems. For an analysis on energy consumption in motes see (Lynch et al., 2003).
Since a WSN uses low power devices, the communication bandwidth is limited to a nominal maximum data rate of a few hundreds kbps. However, in practice, the achievable maximum bandwidth is about 50 kbps (shared over all motes). WSN are therefore not suited to stream all data acquired with high sampling rates over the wireless link. Therefore, measurement and communication strategies have to cope with the challenges related to limited energy resources and limited bandwidth. One strategy to save energy is to reduce the acquired raw data before transmitting it over the wireless link. This is often feasible since raw data contains redundant or even irrelevant information that can be discarded without drawbacks. In many applications, it is possible to extract a small number of characteristic data items, which describe quite well the monitored physical process. On the other hand, slowly varying physical quantities need not to be sampled with high rates so that a data reduction is usually not required. Hence, the motes have to be able to handle two different kinds of data acquisition tasks, which in our system are called attributes:
1. Simple Attributes. These can be raw readings from sensors such as temperature, humidity or static strain values which do not need to be acquired with high sampling rates. This class of attributes also includes the information describing the internal state of soft- and hardware as well as statistical information about the network configuration, e.g. number and IDs of neighbour motes, battery voltage, etc.
2. Complex Attributes. These are physical quantities which need to be sampled with high sampling rates and are predominately used if dynamic processes like vibrations have to be captured. The raw data from the sensor is processed in conversion modules to extract the relevant data items.
3.2. Data processing on motes
The goal of the processing on the motes is always to reduce the amount of data that has to be transmitted over the network. There are several methods to significantly reduce the size of raw data. One method is data compression, which allows encoding the data in a new representation that uses fewer bits than the original not encoded data. This data reduction is done by using specific encoding schemes, which are either lossless or lossy. A lossless data compression, which is suitable for WSNs, could be Huffman coding (Lynch et al., 2003). A compression algorithm with data loss is proposed by Caffrey et al. (2004).
A further method to reduce the amount of data is to transform the raw data by data processing into a new kind of information that requires less data in terms of bits. Examples of simple data reductions can be maxima, minima, mean values, rms or statistical distributions of a physical quantity (e.g. strains for fatigue assessment).
Data evaluation on the mote level represents another mean to reduce the amount of data transferred to the network. It differs from the methods described above because the raw data is subjected to an evaluation. The mote software analyzes the data according to given criteria and decides if the data is relevant or not. Irrelevant data can already be discarded at the mote level.
Hence, long term monitoring with WSN implies decentralized data processing and analysis. However, this is by far not possible for every data analysis method. The limited energy resources additionally restrict the complexity of the applicable computational hardware on the mote. These restrictions basically limit the memory size and computation speed and highly affect the achievable data analysis complexity.

7. Practical implementation of the project results
402
4. FIELD TEST
4.1. Instrumentation of the Stork Bridge
An application that illustrates very well the paradigm of decentralized data reduction in WSN is cable tension force monitoring of stay cable bridges. Cable stay forces can be monitored by means natural frequency estimation based on vibration measurements. By using an appropriate cable model, the relation between the natural frequencies and the tensile cable force can be described. Since each cable can be monitored independently, a completely distributed analysis algorithm can be adopted. More details about the method can be found in (Feltrin et al., 2006).
The field test was performed on the Stork Bridge, which is displayed in Figure 3. The Stork Bridge is a two span cable stayed road bridge with a total length of 124 m. The pylon, which is situated in the middle of the bridge, is 36.6 m high. The bridge has 24 cables. Two of them are made of carbon fiber reinforced plastic. The natural frequency monitoring was performed on 6 cables. In addition, air temperature, humidity, supply voltage, rms of accelerations, and routing information was monitored on each sensor node. The scope of the field test was to evaluate the stability of the overall system, the robustness of the different software components, the effects of environmental parameters (temperature, humidity, and electromagnetic interferences), the interference between data processing and basic network functionality, the power consumption, and the remote configuration tools.
Before deploying the monitoring system, a preliminary investigation was performed. The six cable stays were instrumented with high precision accelerometers wired to a 24-bit high precision data recorder and the ambient vibrations of the cables were recorded. One cable was additionally instrumented with a low cost MEMS accelerometer, which was later used with the WSN, to evaluate its performance in recording ambient vibrations. The acquired data was processed using a standard frequency spectrum procedure for estimating the natural frequencies of the six cables and for identifying the vibration modes with the highest vibration level. This information was used to select the natural frequencies to be tracked by the WSN and to design the band pass filters.
Figure 3. View of the Stork Bridge in Winterthur, Switzerland

Low power wireless sensor network for long term structural health monitoring
403
4.2. Overall structure of the monitoring system
The structure of the WSN monitoring system that has been deployed on the bridge is composed of three subsystems (see Figure 5). The first subsystem is the WSN that consists of 7 sensor nodes: 6 sensor nodes mounted on the cables, labelled as C21 to C26, and the root node, labelled as C0, which is situated under the bridge deck at the abutment (Figure 4). A view to a network node mounted on a cable and to the root node below the bridge is shown in Figure 6. The root node is connected via USB to the base station, which was placed inside the abutment. The base station is powered via the mains supply.
The second subsystem is the remote control center that collects all data generated by the WSN and is responsible for the long term storage of the data. It implements the data visualization and representation tools. Furthermore, this subsystem provides an interface to the operator to observe, control and configure the WSN remotely. This subsystem was located at the Empa site in Duebendorf, at a distance of 16 km from the Stork Bridge. The access to the WSN, database and Internet connection is provided by software modules written in Java.
Figure 4. Elevation of the Stork Bridge displaying the six instrumented cables and the location of the base station with the root node
On site (Stork Bridge)
Mote C21
Mote C22
Mote C23
Mote C24
Mote C25
Mote C0
UI Admin
UI User
Status Monitor
DatabaseBase Stat ion
Mote C26
UMTS Uplink
Remote Cont rol
Winterthur Dübendorf
Figure 5. Logical structure of the monitoring system of the Stork Bridge

7. Practical implementation of the project results
404
Figure 6. Views of a sensor node mounted on a cable and the root node in the bridge abutment below the bridge deck
The third subsystem forms the communication link between the WSN deployed on the bridge and the remote control center. This link is established via the base station using a standard wireless UMTS connection. The base station is implemented using an industrial embedded PC and a Aircard 850 from Sierra Wireless (UMTS, EDGE, GPRS, GSM capable, PCMCIA connector) with possibility to attach an external antenna in case that the base station is hidden in the structure or is in an inconvenient place to set up a connection. Secure shell (ssh) is used for the secure transmission of the data and the remote login. Further software packages running on the base station are a NTP-client (Network Time Protocol) to get the current time from time servers in the Internet and a firewall to only allow connections from a known IP range.
4.3. Results
Figure 7 displays the natural frequencies of the cables C24, C25 and C26 of the Stork Bridge during a period of 60 days. The natural frequencies were estimated every minute from ambient vibration data using the algorithm described by Feltrin et al. (2006). The typical rms magnitude of the ambient vibration data was 4 to 20 mg. The computation of the natural frequency lasts approximately 8 seconds. The algorithm was implemented in a series of subtasks to enable concurrent processes (e.g. time synchronization) to access the CPU. The three bands displayed in Figure 7 demonstrate that the algorithm generates estimations with a significant scattering. The accuracy of frequency estimations is within 5–10%, which is a direct consequence of the low level of accelerations and the short data blocks used for estimating the natural frequency (mean of 10 frequency estimations from blocks of 50 samples, which correspond to 2 … 2.5 cycles).
A more accurate estimation of the natural frequency is obtained by using a moving average filter with a span of 200 samples (black curves inside the bands). Relatively small variations of natural frequencies are still detectable. This data processing step was done at the remote control center with data retrieved from the data base. For monitoring of cable tension, the accuracy is good enough, since only significant changes are of concern for ensuring structural safety of the bridge.
Figure 8 shows the decay of battery voltage and the temperature on sensor node C26 over a 60 day period. It clearly depicts the dependency of battery capacity on temperature. The voltage

Low power wireless sensor network for long term structural health monitoring
405
Figure 7. Natural frequencies of the three cables C24, C25 and C26 of the Stork Bridge during a period of 60 days
Figure 8. Battery voltage and temperature measured on the cable C26 during a period of 20 days
graph consists of two lines. This effect is due to the fact that the battery voltage drops about 100 mV when the radio chip is turned on. Since voltage measurements are not synchronized to this switching, some measurements are taken when the radio is on and some when it is off. The voltage drop within 30 days is approximately 0.2 V. The theoretical life time of the WSN is approximately 3 months. This life time can easily be extended by a factor two or three by simply extending the time between natural frequency estimations or by decreasing the duty cycle (the ratio of the system on-time in a given period of time to the period of time). The voltage jump at day 29 is due to the replacement of batteries.
The graphs shown in Figure 7 and Figure 8 reveal data losses during some time intervals. The causes of these losses are manifold: data from the sensor nodes is lost during its transportation to the base station, stability issues in the communication software on the sensor nodes which lead to communication link break down, bugs in the software that render the base station irresponsive and block the reception of the data packets from the sensor nodes, and UMTS link breakdown caused by the telecommunication provider. The tests demonstrate that

7. Practical implementation of the project results
406
data loss is intrinsically linked with WSN since a lossless communication protocol would be too energy consuming for field applications.
Figure 9 displays the frequency distribution of the number of valid data packets within an hour of the cables C26 and C22 that were recorded at the remote control center during the 60 days period. For cable C26, most of the time (56.1%), 59 packets out of 60 arrived at the control center. In 5.1% of the time no data was recorded (all packets were lost). The same figures of the cable C22, which is farther away from the base station, are 57% with 57 packets out of 60 and 18.7% of the time with no data records. As expected, the data loss increases with increasing distance to the base station. Moreover, the frequency distributions demonstrate that the wireless network is either up with a high reception rate (greater than 90%) or totally down. The case of an intermediate reception rate occurs very infrequently.
0 20 40 60 800
10
20
30
40
50
60
70
# of packets per hour
Rat
io o
f tim
e pe
riod
[%] Sensor node C26
0 20 40 60 800
10
20
30
40
50
60
70
# of packets per hour
Sensor node C22
Figure 9. Frequency distribution of the number of valid data packets acquired within an hour of the cables C26 and C22
5. CONCLUSIONS
The field test on the Stork Bridge demonstrates that long term monitoring with a WSN is feasible. The success is heavily based on a significant reduction of raw data. This is achieved by decentralized data processing. The algorithms have to be optimized to fit the rather restricted memory size and computation speed of the motes. Furthermore, the experience on the Stork Bridge demonstrates that a well balanced computational resource distribution between data processing and basic network functionality has to be achieved. Charging the processor with too long, one shot data processing tasks resulted in a highly unstable WSN with significant data loss or frequent system break down.
Data loss is intrinsically linked with WSN since a lossless communication protocol would be too energy consuming for field applications. The field test shows that nodes communicating over a direct link with the root node have smaller data loss. These nodes displayed also a smaller power consumption than the nodes communicating over a hop. This result does not fit with the theory, since in a multi-hop network, the nodes that are close to the base station are expected to consume more energy because they operate as relay station for the data packets arriving from the remote nodes. This contradiction shows that further research is needed to improve our understanding on how data intensive multi-hop sensor networks operate under field conditions.
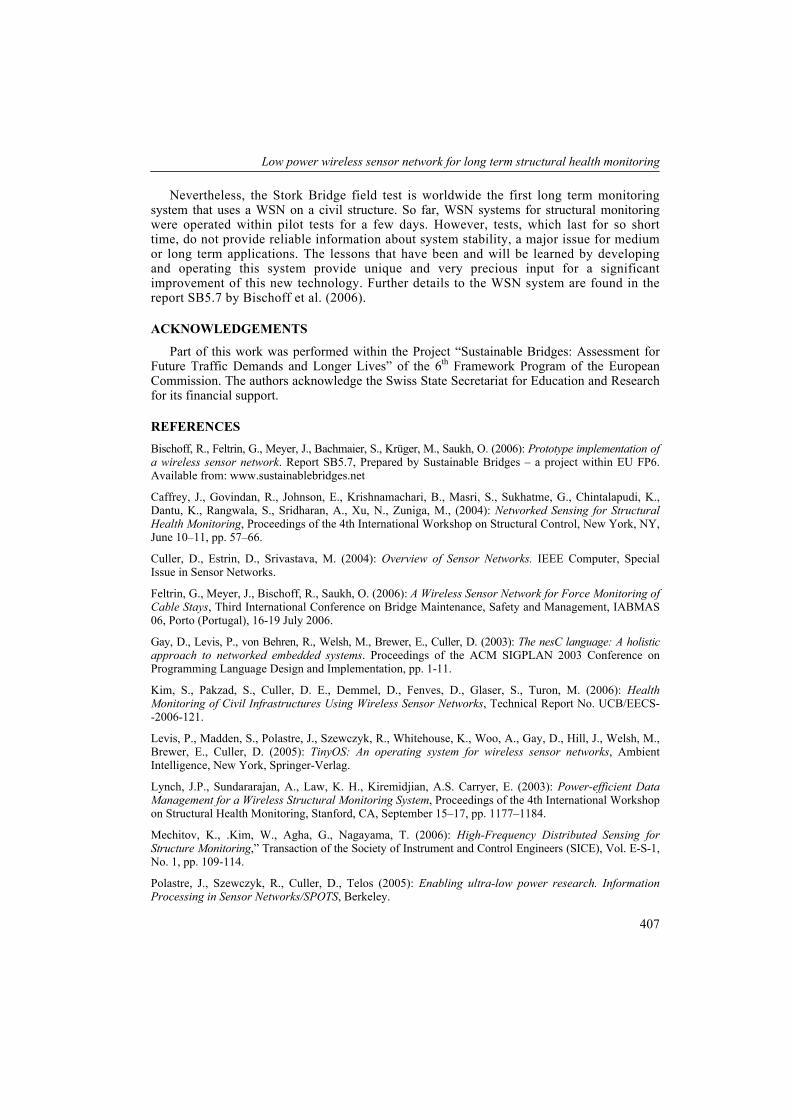
Low power wireless sensor network for long term structural health monitoring
407
Nevertheless, the Stork Bridge field test is worldwide the first long term monitoring system that uses a WSN on a civil structure. So far, WSN systems for structural monitoring were operated within pilot tests for a few days. However, tests, which last for so short time, do not provide reliable information about system stability, a major issue for medium or long term applications. The lessons that have been and will be learned by developing and operating this system provide unique and very precious input for a significant improvement of this new technology. Further details to the WSN system are found in the report SB5.7 by Bischoff et al. (2006).
ACKNOWLEDGEMENTS
Part of this work was performed within the Project “Sustainable Bridges: Assessment for Future Traffic Demands and Longer Lives” of the 6th Framework Program of the European Commission. The authors acknowledge the Swiss State Secretariat for Education and Research for its financial support.
REFERENCES Bischoff, R., Feltrin, G., Meyer, J., Bachmaier, S., Krüger, M., Saukh, O. (2006): Prototype implementation of a wireless sensor network. Report SB5.7, Prepared by Sustainable Bridges – a project within EU FP6. Available from: www.sustainablebridges.net
Caffrey, J., Govindan, R., Johnson, E., Krishnamachari, B., Masri, S., Sukhatme, G., Chintalapudi, K., Dantu, K., Rangwala, S., Sridharan, A., Xu, N., Zuniga, M., (2004): Networked Sensing for Structural Health Monitoring, Proceedings of the 4th International Workshop on Structural Control, New York, NY, June 10–11, pp. 57–66.
Culler, D., Estrin, D., Srivastava, M. (2004): Overview of Sensor Networks. IEEE Computer, Special Issue in Sensor Networks.
Feltrin, G., Meyer, J., Bischoff, R., Saukh, O. (2006): A Wireless Sensor Network for Force Monitoring of Cable Stays, Third International Conference on Bridge Maintenance, Safety and Management, IABMAS 06, Porto (Portugal), 16-19 July 2006.
Gay, D., Levis, P., von Behren, R., Welsh, M., Brewer, E., Culler, D. (2003): The nesC language: A holistic approach to networked embedded systems. Proceedings of the ACM SIGPLAN 2003 Conference on Programming Language Design and Implementation, pp. 1-11.
Kim, S., Pakzad, S., Culler, D. E., Demmel, D., Fenves, D., Glaser, S., Turon, M. (2006): Health Monitoring of Civil Infrastructures Using Wireless Sensor Networks, Technical Report No. UCB/EECS- -2006-121.
Levis, P., Madden, S., Polastre, J., Szewczyk, R., Whitehouse, K., Woo, A., Gay, D., Hill, J., Welsh, M., Brewer, E., Culler, D. (2005): TinyOS: An operating system for wireless sensor networks, Ambient Intelligence, New York, Springer-Verlag.
Lynch, J.P., Sundararajan, A., Law, K. H., Kiremidjian, A.S. Carryer, E. (2003): Power-efficient Data Management for a Wireless Structural Monitoring System, Proceedings of the 4th International Workshop on Structural Health Monitoring, Stanford, CA, September 15–17, pp. 1177–1184.
Mechitov, K., .Kim, W., Agha, G., Nagayama, T. (2006): High-Frequency Distributed Sensing for Structure Monitoring,” Transaction of the Society of Instrument and Control Engineers (SICE), Vol. E-S-1, No. 1, pp. 109-114.
Polastre, J., Szewczyk, R., Culler, D., Telos (2005): Enabling ultra-low power research. Information Processing in Sensor Networks/SPOTS, Berkeley.


Dynamic parameters of old steel railway bridge monitored by vibration tests
409
Dynamic parameters of old steel railway bridge monitored by vibration tests
Jarosław ZWOLSKI, Paweł RAWA,
Małgorzata GŁADYSZ & Andrzej ROSZKOWSKI
Monitoring of dynamic parameters of railway bridges (resonance frequencies, damping and modeshapes) can offer valuable information on structure condition and its changes during bridge operation. This kind of monitoring technology developed in frame of the international Integrated Project “Sustainable Bridges” is described in this paper. Applied equipment – including a prototype of shaker – as well as elaborated dedicated software are also shown. Practical application of the testing technology is shown on the example of almost 100-years old steel railway bridge. Possibility of damage detection by means of the presented monitoring technology is presented and discussed.
1. TESTED STRUCTURE
Presented bridge is a typical railway structure representative for large region of Central and East Europe. The bridge has been selected for testing and demonstration of technology of dynamic properties monitoring as a representative short-span steel railway bridge. Problems related often with this kind of bridge can be listed as follows:
• high acceleration amplitudes due to low structural mass, relatively high stiffness and low damping,
• riveted connections are susceptible to fatigue, • cracks, if exist, are often difficult to detect during visual inspection. The bridge is located in south-west part of Poland (near Wrocław) and consists of two
superstructures, which use the same substructure (SB8.2 Demo, 2007). One of the superstructures is no longer used and its track has been removed. Each open-deck superstructure is constructed of two riveted steel plate girders and consists of 6 simply supported spans, rectangular in plane. Theoretical length of each span is 11.28 m. The bridge was constructed in 1909 and one of the original superstructures is still in service. The bridge is shown in Figure 1 and schematic drawing of the tested span – in Figure 2.
Sustainable Bridges – Assessment for Future Traffic Demands and Longer Lives
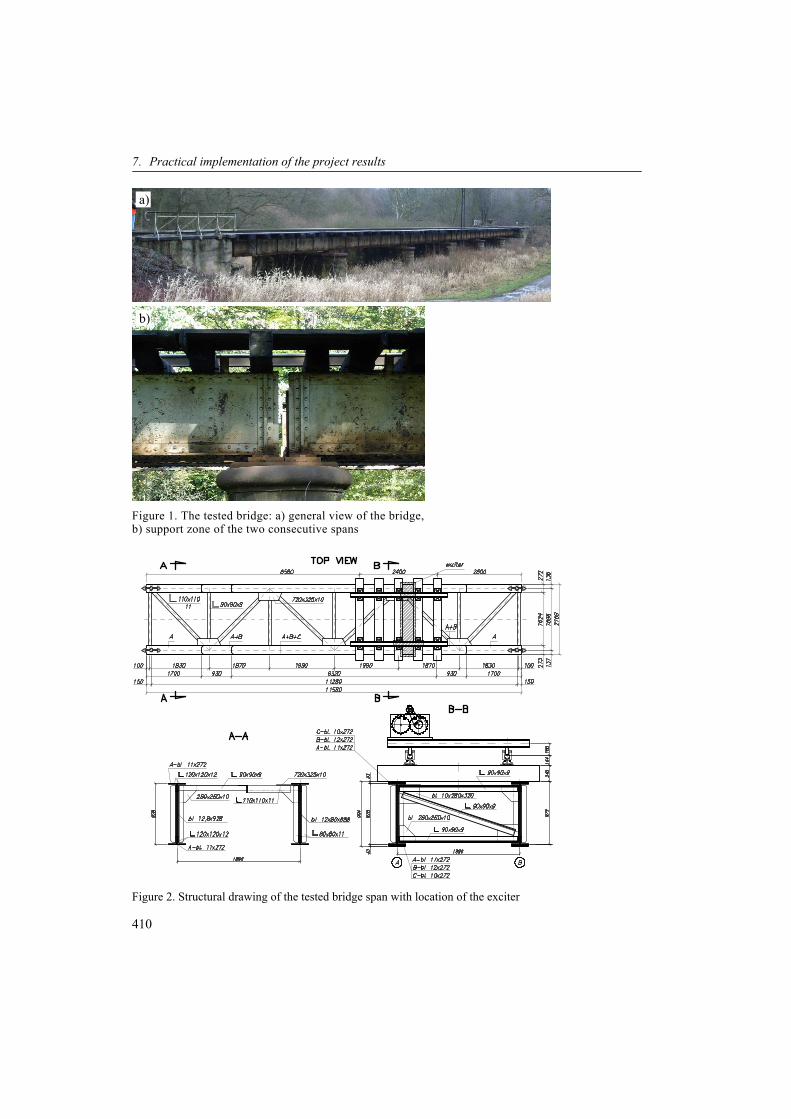
7. Practical implementation of the project results
410
Figure 1. The tested bridge: a) general view of the bridge, b) support zone of the two consecutive spans
Figure 2. Structural drawing of the tested bridge span with location of the exciter
b)
a)

Dynamic parameters of old steel railway bridge monitored by vibration tests
411
2. MONITORING SYSTEM
Components of the monitoring system (SB5.6 Shaker, 2007) based on vibration tests are presented in Figure 3. Entire equipment set consists of the excitation system (rotating unbalanced mass exciter, inverter and power generator) and the measuring system (data acquisition system, set of sensors, personal computer and power generator). The system was examined in course of laboratory and field tests and results are presented by Bień et al. (2006). Details of the exciter mounting system are presented in Figure 4.
Figure 3. Architecture of monitoring system: 1) tested structure, 2) exciter, 3) personal computer controlling
excitation parameters and measuring process, 4) measuring device, 5) programmable inverter, 6) power
generator (230 V), 7) power generator (380 V)

7. Practical implementation of the project results
412
Figure 4. Exciter during the tests: mounting elements and bow-shaped dynamometers
The control application used for test preparation and execution was a multi-functional software MANABRIS (Zwolski, 2007) which provides (Figure 5):
• effective and stable communication between inverter and computer as well as between data acquisition device and computer,
• possibility of configuration of the measuring device: general configuration of the device parameters, every channel individual measurement parameters, storage of the configuration data in the monitoring system database,
• acquisition of the measured signal from gauges mounted on the tested structure and from the dynamometers used in the exciter, storage the measurement data in the monitoring system database,
• preliminary processing of the measured data, calculation of FRF,
• visualization of the tests results.
The software is dedicated to the devices used in the monitoring system developed by team of Wrocław University of Technology (WUT) however, other measurement devices or exciters can be also controlled by means of this program.
The monitoring system was designed taking into account various local condition on site and from the usability point of view the system was optimized to be modular, portable and independent of local source of power. The modularity is assured by the type of the measuring device designed to work with various types of sensor: LVDT, accelerometer, strain gauge, thermometer etc., the portability – by equipping all heavy elements of system with suitable wheels, handles, facilities for easy and safe configuration (e.g. parts of exciter on the supporting frame) etc. Independence of local power sources is assured by the portable power generators supplying all devices in stable power. The time of the system installation depends on local conditions, however for a skilled team consisting of 3 persons it ranges from 2 to 3 hours. Such a configuration of the monitoring system enables simple moving it from one bridge to another.
The measuring system is wired thus the range of operation is defined by the length of cables – in the case of accelerometers it is 50 m. For typical railway bridge structures the range is sufficient – the distance between the most distant sensors can be nearly 100 m. The manufacturer of the measuring device and the sensors recommend the transmitting cables of length up to 200 m.

Dynamic parameters of old steel railway bridge monitored by vibration tests
413
Figure 5. The main window of MANBRIS after data processing from Stepped Sine Test: left – the main tree of the project with the executed excitations; upper right – chart of identified accelerance; bottom right – table with absolute values of accelerance
3. TESTING PROGRAMME AND PROCEDURE
Main objectives of the presented vibration tests of the old steel railway bridge were defined as follows:
• proving the monitoring system efficiency, stability and ergonomics with special attention paid to the excitation system and to the control software MANABRIS,
• demonstrating the system performance in accurate identification of modal parameters of the tested structure,
• calibration of the measuring parameters as sampling frequency, period of data acquisition, density of the measuring points grid etc.,
• identification of the resonance frequencies, damping and mode shapes of the structure in its original state using the developed software and the detailed data processing procedures implemented in form of MATLAB scripts and functions,
• study of the changes of modal parameters of the structure caused by artificially introduced damages,
• assessment of practical applicability of the system to bridge monitoring and possibility of decreasing of basic visual inspection intensity,
• evaluation of the influence of the real field conditions (traffic on the parallel structure, operation in the strong electric field etc.) on the system efficiency,
• assessment of time required for vibration tests (train traffic disruption time).

7. Practical implementation of the project results
414
The comprehensive analysis programme consisted of many steps with the following main components:
• testing of the technique of bridge excitation by means of prototype shaker developed for railway bridges (efficiency of connections to rails, excitation force measurements etc.),
• examination of techniques of test programming and control as well as data acquisition and on-line processing in field conditions,
• building of FEM models of the structure to carry out the theoretical modal analysis for prediction of natural frequencies and mode shapes,
• experimental identification of modal parameters of the bridge structure: natural frequencies, mode shapes and modal damping ratios,
• comparison of experimental results with FEM model behaviour and model adjustment accordingly to test results,
• analysis of influence of various intensity and location of damage on modal properties of the bridge by trial of damage detection algorithms application based on results of repeated modal tests.
The arrangement of displacement and acceleration gauges as well as the location of the exciter (see Figure 6) and the range of excitation frequency has been designed on the basis of theoretical analysis.
Figure 6. Testing equipment configuration during Stepped Sine Test
During all testing sessions the following quantities were measured: • accelerations in vertical direction, • accelerations in transverse horizontal direction, • displacement in vertical direction, • displacement in horizontal longitudinal direction,

Dynamic parameters of old steel railway bridge monitored by vibration tests
415
• displacement in horizontal transverse direction, • excitation forces, • air temperature. General scheme of the testing procedure is presented in Figure 7. Entire monitoring session
was divided into the following tests: • Stepped Sine Test (SST): investigation of Frequency Response Functions for all designed
measuring points and quantities, • Logarithmic Decrement Method (LDM): estimation of modal damping coefficients by
means of free vibration test, • Mode Shape Identification (MSI): estimation of mode shapes at the identified resonance
frequencies. The three tests are usually performed consecutively in the presented order due to fact that
results of SST determine a base for the next two tests.
Figure 7. Procedures applied for investigation of resonance frequencies, modal damping coefficients and mode shapes of the tested structure
4. IDENTIFICATION OF STRUCRUTRE DYNAMIC PARAMETERS
Numerical analysis of the structure was carried out by means of FEM supported by Robot Millennium software (developed by RoboBAT). In the FEM model of the span the section of railway track and the exciter were included. Results of this analysis are shown in Figure 8.

7. Practical implementation of the project results
416
Figure 8. Results of FEM analysis of the steel span: a) the 1st mode shape, b) the 2nd mode shape, c) the 3rd mode shape
In the first mode shape horizontal movements of the span dominate, however some torsional displacements of the girders are also visible. The second mode shape is typical first bending mode of the span in vertical direction and the third mode shape is the first torsional mode of the span. Obtained theoretical results have been used for planning of the experimental tests.
b)
a)
c)

Dynamic parameters of old steel railway bridge monitored by vibration tests
417
5. DETECTION OF DEFECTS
To analyse the bridge sensitivity on structural defects the structure was modified by local disconnection of structural elements. On the basis of the FEM model analysis three damage scenarios were designed (D1 to D3 in Figure 9). The damages simulated loosening or loss of rivets in connections between stiffeners and the main girders (see Figure 10).
Figure 9. Location of the introduced damages
Figure 10. Damage D1: a) the bolts installed in place of the rivets, b) dismantled connection
For each damage and for the undamaged state (damage D0) the monitoring session was conducted. In each session SST and MSI tests were carried out. Comparison of the results for vertical vibrations obtained for four condition states of the structure is presented in Figure 11. Absolute values of accelerance for the sensor A00 (vertical
D3 – connection between the
horizontal brace and the main
girder
D2 – connection
between the sloped
element and the
main girder
D1 – connection
between the
horizontal
element and the
main girder
a) b)

7. Practical implementation of the project results
418
direction – see Figure 6) show resonance frequency shift as well as variation in response amplitude due to the introduced damages. The same behaviour can be observed in Figure 12 presenting results of measurement in horizontal transverse direction (sensor A02 in Figure 6).
0.0
0.5
1.0
1.5
2.0
2.5
3.0
3.5
4.0
3.0 5.0 7.0 9.0 11.0 13.0 15.0 17.0 19.0 21.0 23.0Frequency [Hz]
abs(accelerance) [m/kNs2]
Damage D0
Damage D1
Damage D2
Damage D3
Figure 11. Comparison of accelerance for vertical movements for consecutive damage states
0.0
0.1
0.2
0.3
0.4
0.5
0.6
0.7
0.8
0.9
3 5 7 9 11 13 15 17 19 21 23Frequency [Hz]
abs(accelerance) [m/kNs2]
Damage D0
Damage D1
Damage D2
Damage D3
Figure 12. Comparison of accelerance for horizontal movements for consecutive damage states

Dynamic parameters of old steel railway bridge monitored by vibration tests
419
Table 1. Modal parameters identified for all damage states
Damage D0 Damage D1 Damage D2 Damage D3
Vibration fr [Hz]
ζr [%]
fr [Hz]
ζr [%]
fr [Hz]
ζr [%]
fr [Hz]
ζr [%]
horizontal 10.142 1.3% 10.287 1.6% 10.235 2.0% 10.186 3.0%
torsional 18.000 2.6% 17.918 3.4% 17.300 4.9% 16.270 5.0%
vertical 20.339 3.6% 20.240 – 19.636 3.1% 19.834 4.9%
0 2 4 6 8 100
0.5
1
1.5
2
2.5
3
0
2
4
6
8
10
0
1
2
3
-1
-0.5
0
0.5
1
1.5
2
0 2 4 6 8 10-0.5
0
0.5
1
1.5
2
z
Figure 13. Modeshapes identified in experimental modal analysis for undamaged state: a) 1st horizontal bending mode, b) 1st torsional mode, c) 1st vertical bending mode
The identified values of resonance frequency – fr and ratio of critical damping – ζr are compared with those identified at undamaged state. The three identified modeshapes are
a)
b)
c)

7. Practical implementation of the project results
420
presented in Figure 13. Identification of modal parameters was carried out using the following methods: Peak Picking, Circle Fit and Line Fit and average values are given in Table 1. Details of the methods are described by Maia and Silva (1997). For all structure condition states the modeshapes were visually similar thus for their qualitative comparison some special correlation tools were used. Usually applied formulas are called MAC and COMAC (Ewins, 1999) and serve for examination of linear correlation of modal models identified at undamaged and damaged states.
In the case of only few identified modes of structure damage detection is commonly carried out on the basis of the identified modeshapes because global parameters as natural frequencies and damping are insensitive to structural damage location. For damage detection a new tool called UNCOMAC is proposed by Zwolski (2007) calculated using the following formula:
( ) ( )∑∑∑
==
=
⋅
−=N
r
e
kr
N
r
t
kr
N
r
e
kr
t
kr
k
1
2
1
2
1
2
1UNCOMAC
ψψ
ψψ (1)
where: k – structure degree of freedom (DOF), r – mode number, N – number of modes, e
krψ –
modeshape of the undamaged structure, t
krψ – modeshape of the damaged structure.
Values of UNCOMAC can be presented on the grid of experimental DOF’s what enables clear identification of parts of structure with uncorrelated modeshapes what finally can be used as indication of damage. Application of the correlation tool for damage detection in case of the monitored bridge is presented in Figure 14. The highest UNCOMAC values indicate the parts of the structure affected by the introduced structural modification in the case of model D1 and D2 while for the model D3 the uncorrelation is spread on whole structure and damage location is difficult.
6. CONCLUSIONS
The exciter prototype and the measuring system has been proven to perform satisfactorily in the tests carried out on the presented railway bridge. All planned test has been executed successfully and the obtained results are reliable and of satisfactory accuracy. Entire system, especially the exciter and the measuring device worked in lower temperatures without any noticeable problems. Any unfavourable influence of field conditions (strong electric field, railway traffic control signals etc.) on the monitoring system was not observed during the tests. The measuring system was supplied with electricity by portable generators what makes the system independent of local sources of power. The system efficiency was confirmed also during tests of road bridges (Bień and Zwolski, 2007).
The control application MANABRIS performed correctly and stable in all experiments. During the tests some remarks were collected according to the data processing procedures and based on them some improvements in functionality were implemented.
Time required for one monitoring session is about 5–8 hours depending mainly on size of the bridge and practical skills of the operating team. Time of data acquisition in SST is about 2–3 hours, time for MSI tests depend mainly on the number of measuring points and number of available sensors. In the case of the presented bridge tests the time was 2 hours and 20 minutes.
Dynamic parameters of old steel railway bridge monitored by vibration tests
421
Figure 14. UNCOMAC values for damage states: a) model D1, b) model D2, c) model D3 (the detached elements are marked)
Regarding the system precision in modal parameters identification it can be concluded that in field conditions resolution of 0.008 Hz can be achieved. The parameters of the inverter applied for the exciter control are crucial for this value. The precision of the system can be improved using an inverter with higher resolution. Accuracy of modal parameters estimation obtained in tests using exciter is higher than for other typically used techniques of excitation due to independence the results of excitation parameters (e.g. mass of the applied trains or suspension system of boogies) or structure damping (in free vibration tests accuracy depends on time of valuable signal acquisition after the excitation stops).
Successful application of the monitoring system for damage detection is conditional upon high precision of results of structure modal identification at damaged and undamaged state as well as upon an efficient tool for model correlation. The proposed formula called UNCOMAC enables models correlation of undamaged and damaged state and can be used as a tool in damage detection. For more effective damage location it is recommended to apply several correlation tools in sequence. More damage detection algorithms are presented e.g. by Doebling et al. (1996), Maia and Silva (1997), Kim and Stubbs (2002).
a)
b)
c)

7. Practical implementation of the project results
422
ACKNOWLEDGEMENTS
This research is funded by EC within 6 Framework Project “Sustainable Bridges – Assessment for Future Traffic Demands and Longer Lives”. This support is greatly acknowledged. Authors wish to express appreciation to the team of PKP PLK S.A.: Zygmunt Kubiak, Jerzy Cząstkiewicz and Czesław Kwiatkowski for the support during the tests of the riveted steel bridge.
REFERENCES
Bień, J., Krzyżanowski, J., Rawa, P., Skoczyński, W., Szymkowski, J., Zwolski, J. (2006): System for monitoring of steel railway bridges based on forced vibration tests, Proc 3rd Int. Conf. on Bridge Maintenance, Safety and Management, IABMAS’06, Porto, Portugal, 16-19 July 2006, Taylor & Francis Group, London. ISBN 0 415 40315 4.
Bień, J., Krzyżanowski, J., Rawa, P., Zwolski, J. (2004): Dynamic Load Tests In Bridge Management, Archives of Civil and Mechanical Engineering, Vol. 4, nr 2, pp. 63–78.
Bień, J., Zwolski, J. (2007): Dynamic Tests in Bridge Monitoring – Systematics and Applications, 25th International Modal Analysis Conference, Orlando, Florida, USA.
Doebling, S.W., Farrar, C.R., Prime, M.B., Shevitz, D.W. (1996): Damage Identification and Health Monitoring of Structural and Mechanical Systems from Changes in Their Vibration Characteristics. A Literature Review, Los Alamos National Laboratory, LA-13070-MS.
Ewins, D.J. (1999): Modal Testing: Theory, Practice and Application, Research Studies Press Ltd., Letchworth, Hertfordshire, UK (2nd Edition).
Kim, J.-T., Stubbs, N. (2002): Improved damage identification method based on modal information, Journal of Sound and Vibration, No. 252 (2), pp. 223-238.
Maia, N.M.M., Silva, J.M.M. (1997): Theoretical and Experimental Modal Analysis, Research Studies Press Ltd, Hertfortshire.
SB5.6 Shaker (2007): Prototype of exciter for vibration tests and concept of monitoring system, Background document D5.6 to SB-Monitor (2007): Guideline for Monitoring of Railway Bridges. Prepared by Sustainable Bridges – a project within EU FP6. Available from: www.sustainablebridges.net [cited 30 November 2007].
SB8.2 Demo (2007): D8.2 Demonstration of bridge monitoring, Prepared by Sustainable Bridges – a project within EU FP6. Available from: www.sustainablebridges.net [cited 30 November 2007].
Zwolski, J. (2007): Identification of Bridge Structures’ Modal Parameters Applying Exciters. PhD Thesis 5/2007, Wrocław: Institute of Civil Engineering, Wrocław University of Technology, pp. 313, [cited 31 September 2007].

Field testing of old bridges
423
Field testing of old bridges
Christian CREMONA, Jan BIEŃ & Lennart ELFGREN This paper presents the activities performed in the work package WP7 of the Sustainable Bridges project. This work package has for main objective to demonstrate the pertinence and the applicability of the scientific and technical results from work packages 3, 4, 5 and 6 of the same project. It details first how the demonstration bridges have been identified according to the Sustainable Bridges project scope and details the general aspects of each experimental activity. Further information can be found in companion papers.
1. INTRODUCTION
Work package 7 (WP7) of the Integrated Project “Sustainable Bridges” has for main objective to demonstrate the pertinence and the applicability of the scientific and technical results from work packages 3, 4, 5 and 6. To be successful, the work package had to fulfil two conditions to be successful. The first issue was to offer to the other work packages the opportunity to test techniques and methods developed within the project. The second condition was to provide demonstrated answers to the most important problems faced by bridge owners or managers. Consequently, to be efficient, the bridges were only instrumented and tested as soon as several developments in other work packages became available.
To be meaningful, the work process involved in WP7 has been to propose two questionnaires to bridge managers and work package teams; these questionnaires had helped on one hand to determine the categories of problems or bridges necessary to be analysed in terms of structural and conditions assessment (including repair and monitoring), and on the other hand, to list the main techniques and methods issued from the project which require to be evaluated on site. Along with these questionnaires, a bridge data sheet was proposed to the bridge owners wishing to provide case studies. This data sheet synthesizes the characteristics of the structure and was forwarded to the work package teams for comments and appraisal. Three bridges were identified, respectively in France, in Poland and in Sweden as corresponding to three major families of bridges: riveted, masonry and concrete structures.
Sustainable Bridges – Assessment for Future Traffic Demands and Longer Lives

7. Practical implementation of the project results
424
2. BRIDGES IDENTIFICATION
As mentioned previously, two questionnaires have been proposed; the first one is dedicated to bridge owners and the second one to the work package teams in charge of the development of techniques and methods. The questionnaires were elaborated in order to provide easy-to-use answers.
The questionnaire for bridge owners or managers introduces two sets of questions. The fist set is related to the categories of bridges which will require, from their point of view, needs and improvements for structural or condition assessment. These categories can be constituted by very old bridges: masonry bridges, bolted or riveted steel bridges are structures which are no longer built today and call for specific actions. But they can be more recent bridge categories for which some further studies are necessary in order to assess their serviceability or structural safety in a more or less short period of time. Composite bridges with two main girders, or prestressed concrete may be such families. The questionnaire distinguishes categories and problems; the determination of concrete grouting quality is for instance a general problem, as well as fatigue on welded joints. Furthermore, within a bridge family, an important problem may occur which require further investigations. It is why the questionnaire separates bridge categories and problems.
The questionnaire for the work package teams had for objective to identify the methods and techniques which have to be tested on site. According to the project progress, it was expected that the work package teams were able to list a series of developments they wanted to demonstrate, even if the studies were not yet finished.
The bridge data sheets had two objectives. If a bridge owner or manager was interested in proposing a bridge to test, he was requested to provide a completed data sheet with the questionnaire. The bridge data sheet includes several characteristics regarding the bridge, but also the reasons why it can be a good candidate for project demonstration. The bridge owner had therefore to explain his choice and eventually the techniques and methods he should have liked to test on the bridge. The second objective of the bridge data sheets was firstly to check the opportunity of the proposal according to the project developments, and secondly to list the possible techniques and methods which can be tested on this case study. Due to these two reasons, the bridge data sheets were first completed by the candidate bridge owner and then amended by the work package teams.
The questionnaire for work package teams has for aims to identify the methods and techniques which have to be tested on site. The principles of the questionnaires have been presented to the work package leaders during a management team meeting. The questionnaires have been then released to work package 2 in charge to contact with bridge owners and work package leaders for further comments. The questionnaires have been posted on the project web site on September 2004. At the end of the process, several proposals have been made by BAM, WUT, LTU, SNCF, BV, PKP, DB. Global answers from WP3-4-5 have been provided, and several meetings were scheduled in 2005 in order to precise needs and requirements.
From the questionnaires, the following bridges have been identified as covering several problems already identified in work package 1:
• One steel bridge (SNCF) – Avesnes/Helpe bridge: this bridge is very characteristic of problems met in old steel bridges (cracks and degradations of riveted connections). Due to its bad condition, this bridge is going to be replaced and SNCF is proposing to keep it and to offer the possibility to perform tests, in particular dynamic ones.
• One prestressed concrete bridge (BV) – Örnsköldsvik bridge: this bridge is not in bad condition but the track is expected to be enlarged. The bridge will be demolished and replaced by a new one. The structure can be used for assessing load carrying capacity (ULS).

Field testing of old bridges
425
• One masonry bridge (PKP) – Oleśnica bridge: the bridge is composed of one span and is still in operation.
Figure 1–3 present general views of these bridges.
Figure 1. Avesnes-sur-Helpe bridge (SNCF)
Figure 2. Oleśnica bridge (PKP)
Figure 3. Örnsköldsvik bridge (BV)

7. Practical implementation of the project results
426
3. AVESNES BRIDGE
SNCF has proposed for study a riveted steel bridge located in the north of France (Figure 4), which presents two interesting features:
• This bridge was in service until August 15th, 2005; it was able to instrument to collect data under normal traffic conditions.
• This bridge was expected to be demolished after its replacement by a new bridge; instead to demolish it, SNCF proposed to move it close to the railway station for further tests, including damage simulation tests.
The different work package 7 and management team meetings concluded that this bridge presented a good opportunity to test, mainly due to the fact that it is representative of very typical old steel bridges in Europe.
Figure 4. Avesnes bridge – general views
The Avesnes bridge is one of the two riveted steel bridges crossing the Helpe river (KP94.090) and belonging to the Fives to Hirson line (Figure 5). The characteristics of the bridge deck are given in Table 1. The track is equipped by U50 rails and wood rail ties with clamp joints and flanges.
Table 1. Avesnes bridge characteristics
Span 20.00 m Skewed span 21.07 m Total length 23.00 m Deck thickness 0.75 m Deck weight ~80.00 T
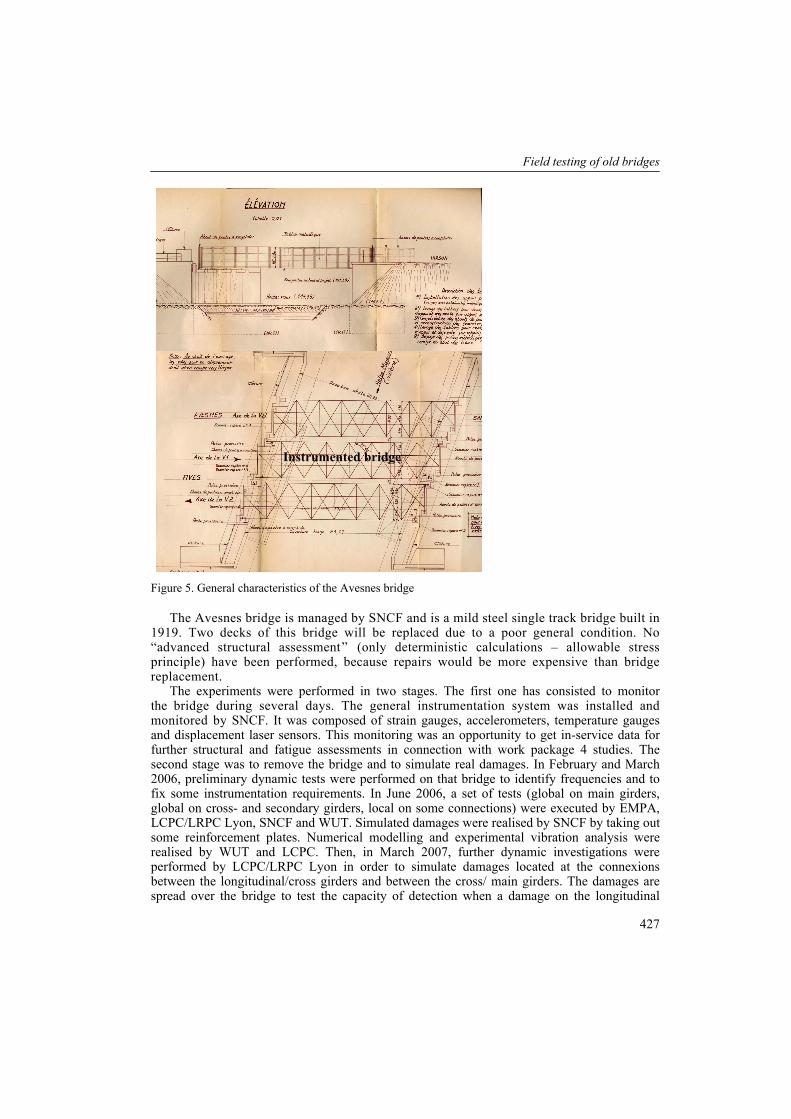
Field testing of old bridges
427
Figure 5. General characteristics of the Avesnes bridge
The Avesnes bridge is managed by SNCF and is a mild steel single track bridge built in 1919. Two decks of this bridge will be replaced due to a poor general condition. No “advanced structural assessment” (only deterministic calculations – allowable stress principle) have been performed, because repairs would be more expensive than bridge replacement.
The experiments were performed in two stages. The first one has consisted to monitor the bridge during several days. The general instrumentation system was installed and monitored by SNCF. It was composed of strain gauges, accelerometers, temperature gauges and displacement laser sensors. This monitoring was an opportunity to get in-service data for further structural and fatigue assessments in connection with work package 4 studies. The second stage was to remove the bridge and to simulate real damages. In February and March 2006, preliminary dynamic tests were performed on that bridge to identify frequencies and to fix some instrumentation requirements. In June 2006, a set of tests (global on main girders, global on cross- and secondary girders, local on some connections) were executed by EMPA, LCPC/LRPC Lyon, SNCF and WUT. Simulated damages were realised by SNCF by taking out some reinforcement plates. Numerical modelling and experimental vibration analysis were realised by WUT and LCPC. Then, in March 2007, further dynamic investigations were performed by LCPC/LRPC Lyon in order to simulate damages located at the connexions between the longitudinal/cross girders and between the cross/ main girders. The damages are spread over the bridge to test the capacity of detection when a damage on the longitudinal
Instrumented bridge

7. Practical implementation of the project results
428
girder is far from the sensors, a damage on the longitudinal girder is close to a sensor on the end of the sensors grid, a damage on the longitudinal girder is close to a sensor in the centre of the sensors grid, a damage on the cross girder close is to a sensor, and a damage on the cross girder is far from the sensors. Figure 6 provides a general view of the activities performed on the Avesnes bridge and the connection with the other work packages. Further details can be found in a companion paper.
WP1: survey WP7: questionnaireBridge owner/WPsBridge owner
WP5: dynamic assessment
WP4: short-term monitoringStrains at hot points
(refined analysis) - SNCF
WP4: short-term monitoringLoading measurements
(refined analysis) - SNCF
Modal identification - LCPC
Time09/2004
06/2005
06/2005
02-03/2006
WP5: monitoringClassical - SNCF
WP4: dynamic assessmentModal comparison
(calibrated model) - LCPC
04/2006
WP1: survey WP7: questionnaireBridge owner/WPsBridge owner
WP5: dynamic assessment
WP4: short-term monitoringStrains at hot points
(refined analysis) - SNCF
WP4: short-term monitoringLoading measurements
(refined analysis) - SNCF
Modal identification - LCPC
Time09/2004
06/2005
06/2005
02-03/2006
WP5: monitoringClassical - SNCF
WP4: dynamic assessmentModal comparison
(calibrated model) - LCPC
04/2006WP4: dynamic assessmentModal comparison
(calibrated model) - LCPC
04/2006
Time
WP4: dynamic assessmentDamage detection
(feasibility study) - LCPC
05-06/2006
WP5: dynamic assessmentDamage detectionEMPA/LCPC/WUT
06/2006
WP4: assessmentPhase I – III
(methodology) – LCPC
bibf
b w
08/200607/2007
WP5: dynamic assessment 05/2007
Figure 6. WP7 activities related to Avesnes bridge (part 2)

Field testing of old bridges
429
4. OLEŚNICA BRIDGE
Bridge is located in Poland (Figure 7), around 30 km from Wrocław city. The reference point is 1.727 km on Oleśnica – Chojnice line. Obstacles are local road and small brook. There are two tracks on the bridge, one is still in service and second one has been removed. The bridge has been built in 1875 and is composed of a circular arch barrel with radius 4.97 m. The arch is made of brick and the backfill material is unknown. Some details can be found in Table 2.
Table 2. Oleśnica bridge characteristics
Horizontal clearance 9.93 m Width 8.55 m Vertical clearance 5.84 m Arch radius 4.87 m
Figure 7. General characteristics of the Oleśnica bridge
The bridge presents typical masonry arch damages, the most important being salt concentration increase, destruction and material losses and longitudinal cracks (Figure 8).
On both spandrel walls of the bridge losses in blocks and joints were filled up with concrete and new brick units. The tests performed on the Oleśnica bridge had for objectives to check and

7. Practical implementation of the project results
430
Figure 8. Some damages of the Oleśnica bridge
to demonstrate new and refined methods for measurement, and analysis of masonry railway bridges. The first goal of the study was demonstration of application possibilities and effectiveness of non-destructive and semi-destructive methods in examination of existing old bridge structures. Realisation of the tests was especially important and practical due to lack of any documentation or original drawings. Therefore the desirable test results were measurements of the geometry and the material properties and the examination of the structural behaviour under live loads. The second one was the presentation of various numerical methods in analysis of the given structure with application of the results from the field tests. For this purpose, several experimental techniques were applied: deformation measurements, radar measurements, electrical tests, coring and thermography. Numerical analyses involved comparative calculations of the ultimate and admissible axle load by means of various methods (MEXE, RING, Archie-M, 2D and 3D FEM), a parametric study of geometric and material properties by selected methods (RING, Archie-M), and the calculation with typical railway loads (RING, Archie-M).
After condition assessment by WUT, a first series of non destructive tests (radar, conductivity, thermography) were performed by BAM and WUT in November 2005 and in June 2006. A second series of tests were realized in October 2006. The Oleśnica agenda is described on Figure 9. Further details can be found in a companion paper presented in this conference.
Figure 9. WP7 activities related to Oleśnica bridge

Field testing of old bridges
431
5. ÖRNSKÖLDSVIK BRIDGE
Two of the objectives of the project Sustainable Bridges are to increase the transport capacity and service life of existing bridges. In order to demonstrate new and refined methods developed in the project, one of the identified bridges was a two-span concrete bridge located in Örnsköldsvik in northern Sweden.
Figure 10. General characteristics of the Örnsköldsvik bridge
The bridge was built in 1955 and has now been taken out of service due to the building of a new high-speed railway, the Botnia Line. The bridge was planned to be demolished in 2006 and the idea was to load it to failure before that in order to test its remaining ultimate load carrying capacity after a service period of 50 years. Figure 10 provides some general characteristics of that bridge.
The concrete quality is K400 which corresponds to a compressive strength of 40 MPa measured on 200 mm cubes. The steel reinforcement is mostly φ 16 and φ 25 mm of quality Ks40 with a nominal yield strength of 400 MPa. The bridge was designed for an axle load of 250 kN. The maximum shear force is 2.3 MN whereof 0.7 MN from dead load. The maximum mid span moment is 3.6 MNm, whereof 0.8 MNm from dead load. The support moment is –4.7 MNm, where of –1.5 MN.m from the dead load. The bending moment capacity in mid span can be roughly be evaluated to 9.5 MNm. The shear force is carried by inclined bars close to the supports and by the concrete in the central parts. The shear capacity is roughly 1.4 MN in the mid span and 4.2 MN close to the supports.

7. Practical implementation of the project results
432
The bridge was proposed to be tested with a vertical point load P in the mid span (Figure 11). The loading may lead to a combined bending and shear failure which might be interesting to evaluate and compare with code predictions (BBK94, CEB-FIP, EC2-1, EC2-2), and with more refined models such as developed in work package 4.
Figure 11. Proposed loading arrangement on the Örnsköldsvik bridge
The planning included measurements of actual material properties of the steel in the reinforcement bars and of the concrete. Deflections and strains in reinforcement bars were to be followed during the loading process in order to check deformations and sectional forces. It will also be possible to check actual concrete cover values and possible corrosion of the reinforcement bars. The tests performed on the Örnsköldsvik bridge had for objectives to check and to demonstrate new and refined methods for measurement, analysis and strengthening of reinforced concrete railway bridges. After a COWI inspection, several measurement systems were considered. Before the loading sequence, non destructive tests were realised by BAM: radar, ultrasonic tests. Then, some core drillings were made to assess the material properties. Several measurements systems were then installed to monitor the structural behaviour: reinforcement sensors (LTU), fiber optic crack sensors (Uminho), laser measurements (LTU). Strengthening (LTU) was done in order to improve bending resistance and to offer the opportunity to induce shear failure. The Örnsköldsvik agenda is described on Figure 12.

Field testing of old bridges
433
WP3: Sensors mountingcrack, reinforcement sensors
LTU/Uminho
Time
06-07/2006
WP3/WP4: slab testsDynamic, static,
LTU/Uminho
07/2006
WP6: strengtheningLTU
06-07/2006
WP4: assessmentPhase I – III
LTU/Cervenka/Chalmers
07/200602/2007
0
10
20
30
40
50
60
70
80
90
100
110
120
130
0 500 1000 1500 2000 2500 3000 3500 4000
Slab
Time Övik2 (Platta 1 U1.bin)
26 Ftg A1 Ö 30 Ftg A5 V
Figure 12. WP7 activities related to Örnsköldsvik bridge
6. CONCLUSIONS
After a crucial period for identifying bridges and defining tests, work package 7 was able to provide demonstration bridges and related data for the full set of work packages. This information will be valuable for assessing methods and techniques developed within the project but will be also very useful for the scientific and technical community. Companion papers will detail the most important issues from the various tests performed on each bridges.


Dynamic amplification factors for a riveted steel bridge…
435
Dynamic amplification factors for a riveted steel bridge. Assessment by monitoring of the Keräsjokk Bridge in northern Sweden
Ola ENOCHSSON, Tobias LARSSON, Lennart ELFGREN, Anders KRONBORG & Björn PAULSSON Measurements were carried out in order to improve an assessment of a riveted steel bridge from 1911. Dynamic Amplification factors, DAF, were estimated for different parts of the bridge by measurements of deflections and strains for a train passing over the bridge with different speeds. The measured dynamic amplification factors were considerably lower than the corresponding ones calculated according to available codes. Due to this it was possible to increase the axle load on the bridge from 22.5 to 25 tons.
1. BACKGROUND AND SCOPE The Haparanda railway line in northern Sweden has been assessed in order to increase its
load-carrying capacity from 22.5 to 25.0 tons’ axle load to enable more efficient transports of iron products for the industry in the region. The line starts in Haparanda/Tornio, on the border between Finland and Sweden, and goes towards Boden some 130 km in South-West direction. The total length of the line is 165 km, see Figure 1.
Figure 1. The Haparanda Line. Small red dots show the location of five steel bridges along the line with low load-carrying capacity. The big red circle indicates the location of the Keräsjokk Bridge
Sustainable Bridges – Assessment for Future Traffic Demands and Longer Lives

7. Practical implementation of the project results
436
There are plans to build a new railway line in five to ten years, so the present line only needs to last that long. More information about the Swedish Rail Network can be found in (BV-NS, 2007).
According to an initial assessment according to BVH (2000), some of the bridges did not fulfil all requirements to allow the higher axle load. Most serious was that some of the primary members (stringers and floor beams) would exceed their fatigue capacity. One of the contributing reasons was the size of the dynamic amplification factor (DAF) in the existing assessment code. Initial calculations for the five bridges generally gave a DAF of about 10% for the main trusses, 30% for the floor beams and 37% for the stringers. Due to a possible benefit from an estimation of the actual dynamic amplification factor at different structural levels, structure level (main truss) and member level (stringer and floor beam), it was decided to estimate the DAF by monitoring. The toughness of the steel material was also tested for some of the bridges.
One of the bridges, the one over Keräsjokk, has been chosen to demonstrate some of the assessment and monitoring methods developed within the Sustainable Bridges project. For this bridge, the initial assessment showed that the fatigue capacity of the web joints in the floor beams would exceed their capacity.
The Keräsjokk Railway Bridge is a riveted steel truss bridge built in 1911, see Figure 2 and 3. The truss is of a so called open truss type and have a length of 31.6 m in one span. There is no ballasting, the wooden sleepers lies directly on the stringers, see Figure 3. The non-electrified single track has a gauge width of 1435 mm and carries nowadays only freight trains.
Figure 2. The Keräsjokk Bridge on the Haparanda Line in northern Sweden seen from the north
Figure 3. Critical web joint in one of the floor beams

Dynamic amplification factors for a riveted steel bridge…
437
2. MONITORING SYSTEM
The instrumentation consisted of optical laser displacement sensors (Noptel PSM 200) and Linear Varying Differential Transducers (LVDTs) for deflection measurements and strain gauges (SG) for strain measurements. For acquisition of the data, a MGCplus from Hottinger Baldwin Messtechnik (HBM) was used. Different boards can be connected to the system and in this particular case three multi-channel amplifier boards, ML 801 were used together with connection boards either for measuring strain or displacements with LVDTs (AP 810 or 815) or displacements with laser (AP 801). The collected data was stored on an ordinary laptop computer. HBM’s software, Catman was used to calibrate the monitoring system and to control the acquisition system, i.e. to convert voltage to relevant units, set the trigger and pre-trigger. The monitoring system was installed and dismantled from the bridge at each occasion (except the strain gauges which were mounted permanently by spot welding).
3. TEST SETUP AND PROGRAM
Two series of measurements were carried out during the summer of 2006, on the 30th of May and the 2nd of August. Additional measurements were carried out by the Swiss Federal Institute for Materials Testing and Research, EMPA in July 2007. The instrumentation is illustrated in Figure 4–5 and some results are presented in section 4.
A B D CEast
Haparanda Morjärv
West
Figure 4. Measuring points at the Keräsjokk bridge. Global horizontal and vertical displacements were measured in point A and B (truss) with optical laser displacement sensors and local vertical displacements in point C and D (stringer and floor beam) with LVDTs i.e. relatively to light-weight trusses supported in its ends to the connection beams. Finally, local flexural and normal strains were measured in points C and D in the mid-section of the stringer and the floor beam, respectively (only in August)
Figure 5. Vertical and horizontal displacement measurements were carried out at the movable support and at mid span with optical laser displacement sensors (Noptel PSM 200). Note that the sensor’s distance in height from the bearing implies that rotations are registered together with translations in vertical and longitudinal directions .i.e. the result at the support gives not a correct DAF

7. Practical implementation of the project results
438
Figure 6. Spot welded strain gauges (Kyowa KCW-5-120-G10-11G3M35) for measurement of flexural and eventual normal strain in a stringer and a floor beam
4. MONITORING RESULTS
Displacements and strains have been monitored for different train speeds in order to evaluate the actual dynamic amplification factor (DAF) for various parts of the bridge. The results from the monitoring have also been used to calibrate a finite element model (FE-model) in order to estimate a more realistic load-carrying capacity.
4.1. Displacements
The amplification of the displacements due to passing trains is studied for the main truss in Table 1 and Figure 7.
Local deflections of the stringer and the floor beam were also measured with LVDTs, see SB-D8.2 (2007).
Table 1. Maximal registered global deflections (peak values for the main truss) with the laser equipment, see also Figure 7. Dynamic amplification factors due to deflections in midspan at different speeds are given in parenthesis as dynamic-to-static displacement-ratios. The static value is represented by a speed of 5 km/h
Test No
Speed [km/h]
Mid span, vertical deflection
[mm]
Support, vertical deflection
[mm]
2 ≈ 5 11.9 (1.00) 1.3
4 ≈ 20 11.4 (0.96) 1.3
3 ≈ 40 11.7 (0.98) 1.8
1 ≈ 60 13.1 (1.10) 2.2
5 ≈ 60 11.7 (0.98) 2.1
Stringer
1
2
Floor beam
3
4, 5
6
4
5

Dynamic amplification factors for a riveted steel bridge…
439
Figure 7. Vertical and horizontal movements at the support and in the midspan of the bridge, see also Figure 5. A train passes the 30th of May 2006 loaded with steel slabs at (a) 5 km/h and at (b) 60 km/h
4.2. Strain measurements
Some selected results from the strain measurements are shown in Figure 8–9. Figure 8 shows that the strain in the midsection of the stringer consists of both axial and flexural strain. This when the strain in tension is twice as big as in compression. The floor beam on the other hand shows only slightly higher strain levels in compression than in tension.
Figure 8. Examples of measured strains in midsection of a stringer and a floor beam, see Figure 6 for location of strain gauges. Strain in (a) top (SG1 Web, top) and bottom (SG2 Web, bot) of the web in a stringer, and in (b) top (SG3 Web, top) and bottom of the web (4 Web, bot), in the bottom angle (5 Angle, bot) and in the bottom flange (SG6 Flange, bot) in a floor beam. 2 August 2006, speed 5 km/h
Figure 9 shows the maximum sectional strain in the midsection of the stringer at different speeds due to global and local bending. The global bending of the main truss generates a normal force in the stringer and the local bending of the stringer generates a moment in the stringer. In Table 2 the total strain is divided into flexural and axial strain by simply considering the difference between tension and compression. The table shows peak values of sectional strain at different speeds together with the estimated DAF. The DAFs are given as dynamic-to-static strain-ratios where the static value is represented by a speed of 5 km/h. It can
0 5 10 15 20 25 30
Time [s]
0 20 40 60 80 100 120 140 160 180
Time [s]
-4-202468
101214
Dis
plac
emen
t [m
m]
Mid, vert.
Sup, long. Mid, long. Sup, vert.
0 20 40 60 80 100 120 140 160 180 200
Time [s]
-75-50-25
0255075
100125
Stra
in [µ
m/m
]
0 20 40 60 80 100 120 140 160 180 200
Time [s]
-150
-100
-50
0
50
100
150
200
SG1 Web, top
SG 2 Web, bot
SG 3 Web, top
SG 6 Flange, bot; 4 Web, bot & 5 Angle, bot

7. Practical implementation of the project results
440
be seen that highest amplification (13%) in the stringer appears at about 40 km/h, mainly due to local bending, see Table 3. However, it can also be seen that the largest contribution to the amplification of the traffic load affect is caused by flexural bending locally in the stringer at a speed of 60 km/h. It can also be seen that the largest total contribution from both flexural and axial strain is found at 60 km/h but the total value for the contribution at 40 km/h is almost as big.
Figure 9. Maximum sectional strain due to local and global bending in the midsection of a stringer at different speeds. The local bending generates a moment and the global bending of the truss a normal force in the stringer
Table 2. Peak values of sectional strain in midsection of a stringer, see also Figure 8 and 9. Dynamic amplification factors for different speeds are given in parenthesis as dynamic-to-static strain-ratios. The static value is represented by a speed of 5 km/h. The maximum DAF is marked red
Test No
Speed [km/h]
Flexural strain [µm/m]
Axial strain [µm/m]
7 ≈ 5 ±74.81 (1.00) 51.42 (1.00)
8 > 5 ±75.54 (1.01) 47.78 (0.93)
5 ≈ 20 ±76.44 (1.02) 55.97 (1.09)
6 > 20 ±77.52 (1.04) 52.63 (1.02)
4 ≈ 40 ±84.48 (1.13) 62.29 (1.21)
9 > 40 ±75.24 (1.01) 55.86 (1.09)
3 ≈ 60 ±78.72 (1.05) 74.80 (1.45)
-60 -40 -20 0 20 40 60 80 100 120
Strain [µm/m]
-355
0
355Level arm [mm] 5 km/h> 5 km/h20 km/h> 20 km/h40 km/h> 40 km/h59 km/h
SG 1: Web, top
SG 2: Web, bot

Dynamic amplification factors for a riveted steel bridge…
441
Table 3. Dynamic part of the developed strain in the midsection of a stringer for each sectional forces, compare to Figure 8 and 9 and Table 2
Test No
Speed [km/h]
Flexural and axial strain
[µm/m]
Axial strain
[µm/m]
Flexural strain
[µm/m]
7 ≈ 5 0 0 0
8 > 5 −1.09 −1.82 0.73
5 ≈ 20 3.91 2.28 1.64
6 > 20 3.31 0.61 2.71
4 ≈ 40 15.11 5.44 9.68
9 > 40 2.65 2.22 0.43
3 ≈ 60 15.60 11.69 3.91
Figure 10 shows the sectional strain mainly due to local bending of the floor beam, but
there exists also a small contribution from a compressive normal force. The force is believed depend on lateral bending of the arch inwards the bridge, due to the loading of the whole bridge. The magnitude of the normal force is highly influenced of the lateral stiffness of the arch.
In Table 4 peak values of the sectional strain in midsection of the floor beam is shown together with the estimated DAFs at different speeds. It can be seen that the traffic load is not amplified at any speed.
Figure 10. Sectional strain due to local bending in the midsection of a floor beam at different speeds, see also Figure 8. It can be seen that the contribution from a normal force is close to zero in this case
-150 -100 -50 0 50 100 150 200
Strain [µm/m]
-460
0
460Level arm [mm] 5 km/h> 5 km/h20 km/h> 20 km/h40 km/h> 40 km/h59 km/h
SG 3: Web, top
SG 4: Web, bot SG 5: Angle, bot SG 6: Flange, bot

7. Practical implementation of the project results
442
Table 4. Peak values of sectional strain in midsection of a floor beam, see also Figure 8 and 10. Dynamic amplification factors for different speeds are given in parenthesis as dynamic-to-static strain-ratios. The static value is represented by a speed of 5 km/h
Test No
Speed [km/h]
Web, top (SG3)
[µm/m]
Web, bot (SG4)
[µm/m]
Angle, bot (SG5)
[µm/m]
Flange, bot (SG6)
[µm/m]
7 ≈ 5 −137.97 (1.00) 119.14 (1.00) 113.33 (1.00) 160.51 (1.00)
8 > 5 −134.33 (0.97) 117.17 (0.98) 109.01 (0.96) 156.33 (0.97)
5 ≈ 20 −135.71 (0.98) 119.67 (1.00) 113.52 (1.00) 159.59 (0.99)
6 > 20 −138.21 (1.00) 118.29 (0.99) 110.07 (0.97) 157.15 (0.98)
4 ≈ 40 −133.55 (0.97) 118.11 (0.99) 110.47 (0.97) 155.56 (0.97)
9 > 40 −133.18 (0.97) 120.31 (1.01) 114.95 (1.01) 161.33 (1.01)
3 ≈ 60 −133.41 (0.97) 119.06 (1.00) 113.61 (1.00) 158.71 (0.99)
4.3. Evaluation of results
The results indicate that the bridge performs in a satisfactory way also for the higher loads.
5. CALCULATIONS
5.1. Finite element model A finite element model was established and updated with help of the results from the
monitoring, see Figure 11. Three dimensional beam elements (consider also torsion) were used to simulate the truss members.
Figure 11. Three dimensional beam model, shown with deformed solids i.e. each beam is graphically illustrated with its defined cross section
The cross section for each individual member is defined with its real shape i.e. the cross section for individual beams is stepwise changed, calculated and compared to the monitored results. The influence of several parameters are investigated like the existent of diagonal braces between the flanges in the diagonals and the arch beams in the main truss, various cross sections along the beams, the beams boundary conditions in the connections, support conditions, the rail and the sleepers, and the distribution of the axle load and. The wind and the break bracers are modelled and calculated in its real level i.e. eccentric in comparison to the truss line.

Dynamic amplification factors for a riveted steel bridge…
443
5.2. Analytical calculations
Calculations were also performed according the Eurocode 3 and the recommendations in SB-LRA (2007), see SB-8.2 (2007).
6. COMPARISON
Deflections from the calculations and the measurement are compared in Table 5 and the magnitude of the dynamic amplification factors are compared in Table 6. Table 5. Comparison of vertical deflections of the main truss, stringer and the floor beam from calculations and measurements
Main truss [mm]
Stringer [mm]
Floor beam [mm] Bridge
Calc. Meas. Calc. Meas. Calc. Meas.
Stryckån 34 * 20 2 * – 1.1 * –
Kalix River 34 * 21 2 * – 1.1 * –
Stråkan 23 * 15 0.5 * – 0.9 * 0.9
Kukasjokk 17 * (13) 12 0.8 * – 3.0 * –
Keräsjokk 17 * (13) 13 0.8 * 1.2 3.0 * 1.9 * The number for the main truss represents a value from the initial calculation and includes
probably deflections due to the worst load combination consisting of the worst load cases. The value in brackets represents the deflection from the refined calculation of the Keräsjokk bridge, considering only the traffic load.
Table 6. Comparison of dynamic amplification factors (DAFs) at a speed of 60 km/h from calculations and measurements with optical laser based displacement sensors (Laser) and strain gauges (SG)
Main truss Stringer Floor beam Bridge
Calc. Laser Calc. SG Calc. SG
Stryckån 1.07 1.02 1 1.36 – 1.29 –
Kalix River 1.07 1.06 1.36 – 1.29 –
Stråkan 1.11 1.08 2 1.37 – 1.36 –
Kukasjokk 1.10 1.05 1.37 – 1.30 –
Keräsjokk 1.10 1.10 1.37 3 1.16 1.30 4 1.00 1 At a speed of approx. 50 km/h. 2 Less loaded. 3 1.18 at specific control of cumulative damage. 4 1.11 at specific control of cumulative damage.
7. SUMMARY AND CONCLUSIONS
Different DAFs were estimated for different types of members in the bridge. The DAFs estimated from the strain measurements are slightly smaller than those estimated from the displacements. This is believed be due to dissipation of energy in for example the joints of the

7. Practical implementation of the project results
444
members. Hence, the most reliable values of DAFs are found to be estimated from the strain measurements. The measured DAFs for the individual beams are found to be significant smaller than the ones calculated according to the code formulas.
For the main truss the magnitude of the measured and the calculated DAF are found to be nearly equal or somewhat smaller for the measured one.
It is found that the number of stress cycles in an assessment of the fatigue capacity, for this type of bridge, loaded by this particular train, can for the stringer beam be estimated to be equal to half the number of bogies in the wagons plus the number of bogies in the locomotive plus one for the last axle in the train (= Number of wagons + number of bogies in the locomotive + 1) that have passed the bridge during the working life of this particular type of train. For the floor beam it can be estimated to be equal to half the number of bogies (= Number of vehicles). In general, this means that a complete stress cycle (from zero to peak value to zero) only can be formed from one bogie if the length of the considered part is shorter than the distance between the centre of the first and the last bogie in adjacent vehicles. In this case, the length of the considered part of the stringer is equal to its total length (the stringer is loaded as long as a bogie moves along the stringer), For the floor beam the length is equal to the two stringers connected to the considered floor beam (the floor beam is loaded as long as a bogie moves along one of the two stringers connected to the considered floor beam).
Finally, the test of the toughness and the measurement gave that the bridge can carry the higher axle load of 250 kN.
ACKNOWLEDGEMENTS
The northern region of Banverket has supported the work. The Swiss Federal Institute for Materials Testing and Research, EMPA has tested a developed wireless system during additional strain measurements in 2007. The system is developed by EMPA and the University of Stuttgart in the project “Sustainable Bridges”, see SB-MON (2007).
REFERENCES BVH (2000): Evaluation of Railway Bridges. (Bärighetsberäkning av järnvägsbroar. In Swedish). Handbok BVH 583.11. Banverket, CB, Borlänge 2000-03-01, pp. 108 + 6 app.
BV-NS (2007): Network Statement 2008. Banverket, Borlänge, Sweden, pp. 91, www.banverket.se [cited 26 June 2007]. Enochsson, O., Elfgren, L. (2006): Riveted Steel Bridges along The Haparanda Line. Measurement and Evaluation of the Dynamic Amplification Factor. To be published.
EN1991-2 (2003): Eurocode 1: Actions on structures – Part 2: Traffic loads on bridges. European Standard, Brussels: CEN.
Frýba, L. (1996): Dynamics of Railway Bridges. Thomas Telford, London 1996, pp. 330, ISBN 0-7277- -2044-9.
SB-LRA (2007): Guideline for Load and Resistance Assessment of Railway Bridges. Prepared by Sustainable Bridges – a project within EU FP6, Available from: www.sustainablebridges.net [cited 30 August 2007].
SB-MON (2007): Guideline for Monitoring. Prepared by Sustainable Bridges – a project within EU FP6, Available from: www.sustainablebridges.net. [cited 30 August 2007].
SB-8.2 (2007): Demonstration of Bridge Monitoring. Deliverable 8.2 in Sustainable Bridges – a project within EU FP6, Available from: www.sustainablebridges.net. [cited 25 August 2007].

Testing to failure of a reinforced concrete railway trough bridge in Örnsköldsvik, Sweden
445
Testing to failure of a reinforced concrete railway trough bridge in Örnsköldsvik, Sweden
Lennart ELFGREN, Ola ENOCHSSON, Arto PUURULA,
Håkan THUN, Björn PAULSSON & Björn TÄLJSTEN A reinforced concrete railway trough bridge has been loaded to failure in order to test new and refined methods developed in the European Research Project “Sustainable Bridges”. Procedures have been tested for inspection and condition assessment, load carrying capacity assessment, monitoring, and strengthening. In the final test, a failure in combined shear, bending and torsion was reached for an applied mid span load of 11.7 MN. This was close to what was predicted by the methods developed in the project and 20 to 50% higher than predictions based on common codes and models.
1. INTRODUCTION
Two of the objectives of the Integrated Research Project “Sustainable Bridges” in the European Framework Program 6, are to increase the transport capacity and service life of existing bridges. In order to demonstrate new and refined methods developed in the project, field tests of existing bridges have been carried out. One of them was a two-span concrete bridge in Sweden; see Figures 1–5. The bridge was loaded to failure to test new and refined methods regarding procedures for Inspection and Condition Assessment, SB-ICA (2007) from WP 3, Load and Resistance Assessment, SB-LRA (2007) from WP 4, Monitoring, SB-MON (2007) from WP 5, and Strengthening, SB-STR (2007) from WP 6. For cost reasons, not many full scale tests to failure are carried out on bridges; two earlier Swedish tests are reported by Täljsten (1994) and Plos (1995).
The bridge was located in northern Sweden, in Örnsköldsvik, a city named to honour Per Abraham Örnsköld who was County governor in the area from 1762. The name literally means Eagle Shield Bay and can be pronounced “Earn’sholds’veek”.
The bridge was a reinforced concrete railway trough bridge with two spans 12 + 12 m. It was built in 1955 and was taken out of service in 2005 due to the building of a new high-speed railway, the Botnia Line. The bridge was planned to be demolished in 2006 and the idea was to load it to failure before that in order to test its remaining ultimate load carrying capacity after a service period of 50 years.
Sustainable Bridges – Assessment for Future Traffic Demands and Longer Lives

7. Practical implementation of the project results
446
Figure 1. Map with bridge location in central Örnsköldsvik in northern Sweden
Figure 2. Photo of the railway bridge in Örnsköldsvik looking South one year before testing
5800 11919 12174 6400
36293
>4500
Figure 3. Elevation of the bridge in Örnsköldsvik with landfill removed at NE wing beams

Testing to failure of a reinforced concrete railway trough bridge in Örnsköldsvik, Sweden
447
Ornskoldsvik Mellansel
6000
2000
6000
22501750
22501750
73°17''
R=3
00m
R=40m
loading beam
N
north sidewalk line
south sidewalk line
Figure 4. Plan of the bridge in Örnsköldsvik. The supports are numbered 1, 2, and 3 starting from the left
4:1 4:1
2830 2830
spm
.
Concrete piles (end bearing)
61461423 1693 1693 1423
2900
350
1100
623 623 4900
700
+2.65
+1.95
Figure 5. Sections of the bridge in Örnsköldsvik
2. GEOMETRY AND LOADS
The geometry is given in Figures 3–5 and in the original drawings from 1954 in SB-7.3 (2007). The bridge was designed for an axle load of 250 kN. Maximum design bending moments and shear forces according to the original calculations from 1954 give section forces according to Figure 6. The maximum shear force is V = 2.3 MN whereof 0.7 MN from dead load. The maximum mid span moment is M = 3.6 MNm, whereof 0.8 MNm from dead load. The support moment is −4.7 MNm, whereof −1.5 MNm from dead load.

7. Practical implementation of the project results
448
B C D
A E
6.5
12.4 12.4
V [MN]2.3
0.44
-0.46
0.73
-0.73
-2.3
-3.83
-1.51 -1.0
M [MNm] -4.67
-1.51
0.47
3.6
-1.01
+0.76
Figure 6. Design shear force (V) and bending moment (M) diagrams for one span of the bridge. Shaded areas indicate the influence of the dead load
The bending moment capacity in mid span can be roughly be evaluated to 9.5 MNm. The shear force is mainly carried by inclined bars close to the supports and by stirrups in the central parts.
The bridge was proposed to be tested with a vertical point load P in the mid span, see Figure 7. This loading may lead to a combined bending and shear failure which might be interesting to evaluate and compare with code predictions from BBK04 (2004), CEB-FIP (1999), EN 1992-1-1 (2004), EN 1992-2 (2005), and with more refined models in (SB-LRA, 2007; Bentz, 2000; Enochsson et al., 2004; Puurula, 2004). In order to avoid a premature bending failure and to check newly developed strengthening methods, the bridge was strengthened in bending before the final test with bars of Carbon Fibre Reinforced Polymer, CFRP, see (SB-6.3, 2007; Täljsten et al., 2007).
P
anchor
Possible bending-shear failure
Figure 7. Proposed loading arrangement with a jack supported by anchors injected into the rock (some 10 m below the bridge foundation slabs). A possible combined bending-shear failure close to the load point is indicated
The planning included measurements of actual material properties of the steel in the reinforcement bars and of the concrete. Deflections and strains in reinforcement bars were followed during the loading process in order to check deformations and sectional forces. It was also possible to check actual concrete cover values and possible corrosion of the reinforcement bars.

Testing to failure of a reinforced concrete railway trough bridge in Örnsköldsvik, Sweden
449
3. INSPECTION AND CONDITION ASSESSMENT
The bridge was inspected in 2005 before it was decided to carry out the full-scale loading test. When the decision had been made the bridge was inspected again, first by LTU and later by BAM and COWI, see (SB-7.3, 2007; Bässler et al., 2007). In general it can be said that the bridge was in a good condition with almost no reinforcement corrosion although the concrete cover had some scars from the heavy traffic, see Figure 8. The location of the reinforcement was confirmed with 2D radar scanning and with ultrasonic measurements.
Figure 8. Timber lorry passing under the bridge. Photo by BAM
The original 1955 concrete quality was Swedish K400 with a compressive strength of 40 MPa (400 kP/cm2) measured on 200 mm cubes. This corresponds roughly to EC class C28/35. By 2006 the concrete had increased in strength to C55/67. The reinforcement was mostly φ 16 and φ 25 mm of quality Ks40 with nominal yield strength of 400 MPa. The bridge slab was before the final testing to failure strengthened with 9 + 9 = 18 Sto FRP Bar M10C with a length of 10 m, a cross section of 10 × 10 mm with Ef = 250 GPa and εr = 11‰.
Several methods have been used to test and evaluate the different material parameters, see SB-LRA (2007) and SB-7.3 (2007). In Table 1 a summary is presented which is used in the analysis of the bridge. First initial properties are given based on the original drawings and simple estimations. Characteristic values refer to the 95% percentile of the strength values and to about a 50% percentile of the elasticity values. The design values in the ultimate limit state (ULS) are based on the characteristic values divided by partial coefficients ηγmγn, where ηγm is 1.5 for concrete, 1.15 for reinforcement steel, 1.05 for elasticity; and γn is the safety factor with regard to injury of people, in this case safety class 3, which gives the factor γn = 1.2. Mean properties are given based on tests during 2006.
First the concrete properties are given: the compressive strength, fc [MPa], the modulus of elasticity, Ec [GPa], the tensile strength, ft [MPa], and the fracture energy, GF [Nm/m]. Then the steel properties are given: the yield stress, fsy = Reh [MPa], the ultimate strength, fsu = Rm [MPa], and the modulus of elasticity, Es [GPa]. Definitions and details are given in SB-7.3 (2007).

7. Practical implementation of the project results
450
Table 1. Summary of material properties
Concrete Steel
Stage Type of value fc
[MPa]
Ec
[GPa]
ft
[MPa]
GF
[Nm/m]
fsy = Reh
[MPa]
fsu =Rm
[MPa]
Es
[GPa]
φ16: 410 b) φ16: 500 c) φ16: 200 c) Characteristic 31a) 32 a) 1.8 a) –
φ25: 390 b) φ25: 500 c) φ25: 200 c)
φ16: 297.1 φ16: 362 φ16: 158.7
Initial properties
(These values are assumed or taken from original drawings)
Design in ULS d) 17.2 25.4 1.0 –
φ25: 282.6 φ25: 362 φ25: 158.7
φ16: 441
(12) φ16: 738
(2.4) φ16: 192.1
(23.3) Mean properties based on tests
(Standard deviations are given in parenthesis)
Mean
68.5
(8) 25.4
(1.7)
tension
2.2
(0.5)
uni-axial
154
(82)
φ25: 411(8.2)
φ25: 706 (22.6)
φ25: 198.3 (31.5)
a) The concrete compressive strength is according to BVH (2005) obtained from the concrete class used in the bridge, i.e. 400 (K400), which corresponds to the concrete class K40. K40 is approximate equivalent to the strength class C28/35 in Eurocode which has a characteristic compressive strength of 27 MPa, a tensile strength of 1.8 MPa and a E-modulus of 32 GPa (BBK04, 2004). Since the bridge is more than 10 years old the compressive strength can according to BVH (2005) be increased with 15% from 27 MPa to 1.15 × 27 = 31 MPa.
b) The characteristic yield strengths are taken from BVH (2005), section 4.3.3. The bridge also contained some Ø10 mm bars. Their properties are assumed to be the same as the Ø16 mm bars.
c) According to BHB-M (1994) the minimum ultimate stress is 500 MPa. According to BBK04 (2004) the characteristic value of the E-modulus is 200 GPa.
d) The design value = characteristic value / (ηγmγn), where ηγm is 1.5 for concrete and γn is the safety factor with regard for injury to people, in this case safety class 3, which gives the factor 1.2. For reinforcement steel ηγm is 1.15 and for the E-modulus ηγm is 1.05 according to BBK04 (2004).
4. PREDICTED LOAD-CARRYING CAPACITY
4.1. Eurocode 2
According to Eurocode 2 (EN 1992-1-1, 2004), the shear resistance VRd is calculated with a truss model to:
VRd,s = Asw fywd (z cot θ ) / s (Equation 6.8 in Eurocode 2)
where: Asw – the cross sectional area of the reinforcement (804 mm2, 4 Ø16, two hoops), fywd – the design yield strength of the shear reinforcement (see Table 1), z – the inner level arm (900 mm = 0.9d), θ – the angle between the concrete compression strut and the beam axis (min 21.8), s – the spacing of the stirrups (300 mm). Initial design values give VRd,s = 1792 kN and mean values give VRd,s = 2659 kN for one beam.

Testing to failure of a reinforced concrete railway trough bridge in Örnsköldsvik, Sweden
451
If instead the actual crack angle θ ≈ 30° is used we will get VRd,s = 1241 for initial design values and VRd,s = 1842 for mean values. As the bridge consists of two beams the value for the whole beam will twice as high.
The same results are obtained with the new model in (BBK 04, 2004) based on the EC2 truss model. The old model in (BBK 04, 2004) where a concrete term is added to a reinforcement term (“addition theory”) gives somewhat lower values.
4.2. Modified Compression Field Theory
The Modified Compression Field Theory, MCFT, was developed at the University of Toronto by Michael Collins and co-workers, see e.g. (Collins et al., 1978, 1987, 1996). A useful program, Reponse 2000, has been developed by Bentz (2000).
Mean values for material properties gives VRd,s = 2649 kN if the influence of the moment and the normal force is considered.
4.3. Linear Elastic 3D-model
The bridge has been modelled by Skanska AB with finite element analysis using Lusas software version 14.0-5. The model can be seen in Figure 9 and some results in Figure 10.
Figure 9. Three dimensional linear elastic model by Skanska using Lusas
Figure 10. Deflections under point load according to Lusas

7. Practical implementation of the project results
452
The maximum shear force will appear in the northeast beam leading to support 2 (the mid- -bridge support between the two spans in Figure 10) for 2P = 5.8 MN for initial design material properties and in the southwest beam leading to support 3 for 2P = 8.8 MN for mean material properties. In these linear elastic analyses the torsion moments have been treated separately for each beam. When they are transformed to a pair of vertical shear forces in the beam they add up to 30% to the shear force.
If, instead, the total torsion moment in the bridge mid span section is transformed into one upward shear force in one beam and one downward shear force in the other, the additional shear force due to torsion is reduced to about 13% giving a corresponding increase in the load-bearing capacity.
4.4. Nonlinear 2D-model
A non-linear two-dimensional analysis was performed by Cervenka Consulting using the program Atena. Some results can be seen in Figures 11–13.
Figure 11. Finite element model with Atena
Krok 138, Trhliny: v prvcích, <5.000E-04; ...), otevření: <-2.616E-05;9.801E-03>[m], Sigma_N: <-6.345E+00;2.114E+00>[MPa], Sigma_T: <-2.17
Figure 12. Detailed Crack Pattern at Peak Load, Cracks Larger than > 0.5 mm, by Janda and Cervenka

Testing to failure of a reinforced concrete railway trough bridge in Örnsköldsvik, Sweden
453
0
2
4
6
8
10
12
0 20 40 60 80 100 120 140
Deflection in midspan [mm]
Load
[MN
]
Exper. westExper. eastOrig. FE before strength.Orig. FE after strength.Eurocode 2FE new param.
Figure 13. Load – displacement diagram according to a non-linear 2D FEM-analysis with Atena. The green curves indicate initial analyses without considering the stirrups under the point loads. The dark green curve gives the influence of the CFRP strengthening. The red curve includes the effect of both stirrups and strengthening
4.5. Comparison between different models
The results according to the different models are summarized in Table 2. It can be seen that non-linear methods as Atena and Response gives higher values which are closer to the test value, than the methods based on linear elastic models and Euro code 2.
Table 2. Shear capacity VR and load-carrying capacity 2P according to different models
Method fyd [MPa] θ [o] VR [MN] 2P [MN] EC2, design, θmin + Lusas, 3D linear FEM 297 21.8 3.58 5.8 EC2, mean, θmin + Lusas, 3D linear FEM 441 21.8 5.32 8.8 EC2, mean, θreal + Lusas, 3D linear FEM 441 30 3.68 6.1 Response, nonlinear section analysis 441 5.29 8.7 Atena, 2D nonlinear FEM 430 20–30 6.15 10.8 Test 441 ~30 11.7
5. MONITORING
The monitoring system consisted mainly of (a) strain gauges spot welded to the reinforcement, (b) an optical laser displacement sensor (Noptel PSM 200) and (c) Linear Varying Differential Transducers (LVDTs) for deflection measurements. Measurements were mainly made under the point loads and close to the supports along lines 1, 4 and 7, see Figure 14. Examples of measured deflections are given in Figure 15. The University of Minho and City University also tested newly developed fibre-optic sensors for crack detection and accelerometers for modal identification and damage detection, see (SB-7.3, 2007; Cruz and Diaz de Leon, 2007).
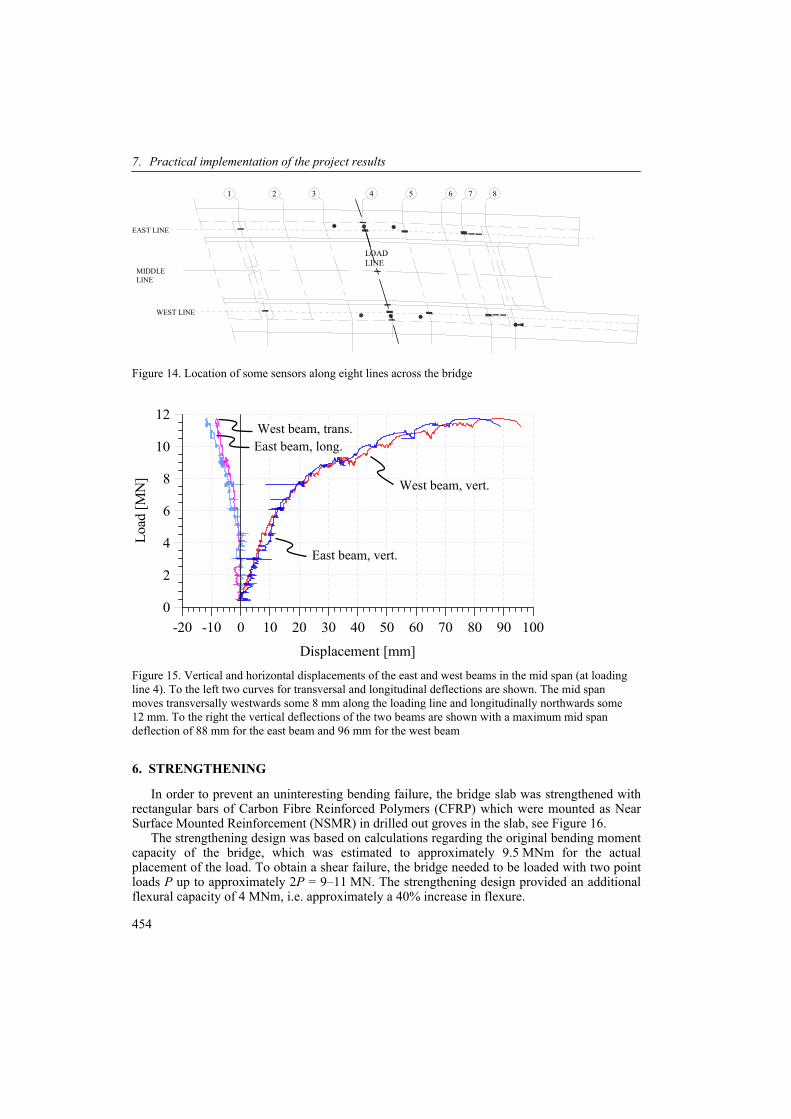
7. Practical implementation of the project results
454
LOAD LINE
2 1 4 5 6 83 7
MIDDLE LINE
EAST LINE
WEST LINE
Figure 14. Location of some sensors along eight lines across the bridge
Figure 15. Vertical and horizontal displacements of the east and west beams in the mid span (at loading line 4). To the left two curves for transversal and longitudinal deflections are shown. The mid span moves transversally westwards some 8 mm along the loading line and longitudinally northwards some 12 mm. To the right the vertical deflections of the two beams are shown with a maximum mid span deflection of 88 mm for the east beam and 96 mm for the west beam
6. STRENGTHENING
In order to prevent an uninteresting bending failure, the bridge slab was strengthened with rectangular bars of Carbon Fibre Reinforced Polymers (CFRP) which were mounted as Near Surface Mounted Reinforcement (NSMR) in drilled out groves in the slab, see Figure 16.
The strengthening design was based on calculations regarding the original bending moment capacity of the bridge, which was estimated to approximately 9.5 MNm for the actual placement of the load. To obtain a shear failure, the bridge needed to be loaded with two point loads P up to approximately 2P = 9–11 MN. The strengthening design provided an additional flexural capacity of 4 MNm, i.e. approximately a 40% increase in flexure.
-20 -10 0 10 20 30 40 50 60 70 80 90 100
Displacement [mm]
0
2
4
6
8
10
12
Load
[MN
]
East beam, vert.
East beam, long.West beam, trans.
West beam, vert.

Testing to failure of a reinforced concrete railway trough bridge in Örnsköldsvik, Sweden
455
Figure 16. Grooves and mounting of Near Surface Mounted Reinforcement (NSMR)
The additional 4 MNm corresponded to 18 CFRP rods, 9 per beam, with a length of 10.0 m. The rods chosen where provided by Sto Scandinavia AB with the brand name Sto FRP Bar M10C. These rods consisted of a high quality carbon fibre with the modulus of elasticity of 250 GPa and a strain at failure of approximately 11‰. The rods were placed in the soffit of the bridge beams with a centric distance of 100 mm between the rods. The strengthening procedure is further described in (SB-6.3, 2007; Täljsten et al., 2007). See also the guideline SB-STR (2007).
7. RESULTS FROM FINAL LOADING OF THE BEAMS
A preliminary test with loading on the ballast on top of the slab was carried out on July 5th
2006, see Figure 17. A first loading of the beams was then carried out on July 8th before strengthening. After strengthening, the final test was carried out on July 10th. Load-time diagrams for the three tests are given in Figure 18.
The most critical beam for a shear failure according to the 3D linear elastic analysis is the NE beam just outside the concentrated load towards the mid support 2 (NE2). However, almost as critical is the SW beam just outside the concentrated load towards the end support 3 (SW3).
If the torsion moment is considered to be taken by a pair of shear forces in the two beams this will be changed and SW3 will be the most strained beam. The other beams, NE3 and SW2, are much less loaded in a linear elastic analysis, which means that before a real failure can take place (with the test set-up including both beams) there must be non-linear load redistribution in the structure.
In the real test the “non-linear” shear failure came towards end support 3 and included both beams (NE3 and SW3).
1 1 2 2
Figure 17. Test on top of ballast (1) and on beams (2). The strain was measured on the longitudinal reinforcement bars to the left

7. Practical implementation of the project results
456
Figure 18. Load-time relationships from all three tests: (1) Loading of slab, (2) preloading of beam (before strengthening) and (3) main load test of beam (after strengthening)
8. FAILURE
In Figure 19 and Figure 20 the failure of the bridge is shown. Before failure the longitudinal bottom steel bars yielded, see Figure 21. The final failure was caused by rupture in the stirrups crossing the inclined shear crack in Figure 20.
Figure 19. Ultimate shear-bending failure
0 1000 2000 3000 4000 5000 6000
Time [s]
0
2
4
6
8
10
12
Load
[MN
]
1) Loading of slab2) Preloading of beam
3) Main load test of beam

Testing to failure of a reinforced concrete railway trough bridge in Örnsköldsvik, Sweden
457
Figure 20. Detail of vertical 16 mm stirrup after yielding failure in a position where it bends around a longitudinal 25 mm bar
Figure 21. Strain profile in Line 4 under point loads (left) with bottom reinforcement in tension exceeding the yield strain 2200 µε and under Line 7 (right) with bottom reinforcement in compression. The effective depth to the reinforcement is not given in scale in order to increase the visibility. This means that the neutral layer is not showed at the correct level, but this does not affect the internal relations of the strain. Note the difference in scales between the figures
9. CONCLUSIONS
Procedures have been tested for inspection and condition assessment, load carrying capacity, monitoring, and strengthening of a 50 year old reinforced concrete railway trough bridge. In the final test, a failure in combined shear, bending and torsion was reached for an applied mid span load of 11.7 MN. This was close to what was predicted by the methods developed in the project and 20 to 50% higher than other predictions based on common codes and models. All the predictions were on the safe side and the failure was initiated by rupture of as stirrup after yielding in both stirrups and longitudinal reinforcement.
-4000 -2000 0 2000 4000 6000 8000 10000 12000
Strain [µm/m]
0
130
Depth [mm]
9 MN10 MN11 MN11.7 MN11.2 MN
2.0 MN4.0 MN6.0 MN8.0 MN
-1400-1200-1000 -800 -600 -400 -200 0 200 400
0
130
Depth [mm]

7. Practical implementation of the project results
458
ACKNOWLEDGEMENTS
The authors gratefully acknowledge support and contributions from: Banverket, BAM, Botniabanan, CityU, Cervenka Consulting, COWI, DTU, LTU, Nordisk Spännarmering, Saviona University, Skanska Sverige, STO, UMINHO, Örnsköldsviks kommun and the European Commission. Acknowledgements are also due all individuals who have contributed to the result.
Figure 22. Participants in the final loading to failure in front of the NE beam
REFERENCES Bäßler, R., Burkert, A., Frølund, T. (2007): Portable electrochemical technique for evaluation of corrosion situation on reinforced concrete. In: “Sustainable Bridges – Assessment for Future Traffic Demands and Longer Lives”, eds. Bień, J., Elfgren, L., Olofsson, J., Dolnośląskie Wydawnictwo Edukacyjne, Wrocław 2007, 10 pp.
BBK 04 (2004): Boverkets Handbok om Betongkonstruktione BBK04. (Design Rules for Concrete Structures. In Swedish) Updated Web version Boverket, Karlskrona 2007, 271 pp., ISBN 91-7332-687-9. Available from: www.boverket.se/upload/publicerat/bifogade%20filer/2004/boverkets_handbok_om_betongkonstruktioner_BBK_04.pdf [cited 2007-08-25].
Bentz, E.C. (2000): Sectional Analysis of Reinforced Concrete Members. A thesis submitted in conformity with the requirements for the degree of Doctor of Philosophy, Graduate Department of Civil Engineering, University of Toronto, Toronto 2000, 187 + 118 pp. Four programs are presented in the thesis: Membrane –2000 for plates; Response-2000 for beams and columns; Triax-20000 for 3D blocks; and Shell-2000 for shells with out-of-plane forces. Available from: www.ecf.utoronto.ca/~bentz [cited 2007-08-25].

Testing to failure of a reinforced concrete railway trough bridge in Örnsköldsvik, Sweden
459
BHB-M (1994): Betonghandbok – Material (Concrete Handbook – Materials. In Swedish). 2nd Ed. Svensk Byggtjänst, Stockholm. 1127 pp., ISBN 91-7332-709-3.
BVH (2005): Evaluation of Concrete Railway Bridges. (Bärighetsberäkning av järnvägsbroar. In Swedish). Handbok BVH 583.11. Banverket, CB, Borlänge 2005-06-01. 108 pp. + 9 app.
CEB-FIP (1999): CEB-FIP Model Code 1990. Design Code, Comité Euro-International du Béton, Sprint- -Druck, Stuttgart 1999, 324 pp., ISBN 2-88394-042-8.
Collins, M.P. (1978): Towards a rational theory for RC members in shear. J. Struct. Div. Proc. ASCE, ST4 (104) 1978, pp. 649-666 (Disc.: ST3 (105), pp. 690-691).
Collins, M.P., Michell, D. (1987, 1991): Prestressed Concrete Basics. Canadian Prestressed Concrete Institute, Canada, 1987, ISBN 0-9691816-6-3. Collins, Revised version (1991): Prestressed Concrete Structures. Prentice Hall, Englewood Cliffs, N.J., USA 1991, 766 pp. ISBN 0-13-691635-x. Reprinted by Response Publications, Toronto 1997, 766 p, ISBN 0-9681958-0-6.
Collins, M.P., Mitchell, D., Adebar, P., Vecchio, F.J (1996): A General Shear Design Method. ACI Structural Journal, Detoit, Vol 93, No 1, Paper 93-S5, January-February 1996, pp. 36-45. Regarding code development see also Elstner, RC and Hognestad, E (1957): Laboratory investigation of rigid frame failure. ACI Journal, Vol. 53, No. 1, Jan. 1957, pp. 637-668.
Cruz, P., Diaz de Léon, A. (2007): A new sensor for crack detection in concrete structures. In: “Sustainable Bridges – Assessment for Future Traffic Demands and Longer Lives”, eds. Bień, J., Elfgren, L., Olofsson, J., Dolnośląskie Wydawnictwo Edukacyjne, Wrocław 2007, 10 pp.
EN 10080 (2005): Steel for reinforcement of concrete – Weldable reinforcing steel – General. EN10080:2005 (E). European Committee for Standardization, May 2005. 71 pp.
EN 12390-3 (2001): Testing hardened concrete – Part 3: Compressive strength of test specimens. European Standard, Brussels: CEN.
EN 1991-1 (2006): Eurocode 1: Actions on structures – Part 1: General Actions. Seven Parts. European Standard, Brussels: CEN.
EN 1991-2 (2003): Eurocode 1: Actions on structures – Part 2: Traffic loads on bridges. European Standard, Brussels: CEN.
EN 1992-1-1 (2004): Eurocode 2: Design of concrete Structures – Part 1-1 General rules and rules for buildings. European Standard, Brussels: CEN.
EN 1992-2 (2005): Eurocode 2: Design of concrete structures - Part 2: Concrete bridges - Design and detailing rules. European Standard, Brussels: CEN.
Enochsson, O., Puurula, A., Elfgren, L. (2004): Beräkning av betongbroars bärförmåga. Interaktion mellan tvärkraft, vridmoment och böjning i Källösundsbron (Assessment of the Load Carrying Capacity of Concrete Bridges. Interaction between torsion, shear and bending in the Källösund Bridge. In Swedish) Technical Report 2004:15, Luleå: Division of Structural Engineering, Luleå University of Technology, 116 pp. Available from: http://epubl.ltu.se/1402-1536/2004/15/LTU-TR-0415-SE.pdf [cited 2007-08-25].
Plos, M. (1995): Application of Fracture Mechanics to Concrete Bridges. Finite Element Analysis and Experiments. Ph D Thesis. Publication 95:3, Chalmers university of Technology, Division of Concrete Structures, 57 + 70 pp.
prEN 13971 (2006): Assessment of in-situ compressive strength in structures and precast concrete components. Final draft. prEN 13791:2006:E. European Committee for Standardization, June 2006. pp. 28. Note that this is a draft version of the standard.
Puurula, A. (2004): Assessment of Prestressed Concrete Bridges Loaded in Combined Shear, Torsion and Bending. Licentiate Thesis 2004:43, Luleå: Division of Structural Engineering, Luleå University of Technology. Available from: http://epubl.ltu.se/1402-1757/2004/43/index.html

7. Practical implementation of the project results
460
SB-CAI (2007): Guideline for Condition Appraisal and Inspection of Railway Bridges. Prepared by Sustainable Bridges – a project within EU FP6. Available from: www.sustainablebridges.net [cited 30 November 2007].
SB-D4.5 (2007): Non-Linear Analysis and Remaining Fatigue Life of Reinforced Concrete Bridges. Background document D4.5 to “Guideline for Load and Resistance Assessment of Railway Bridges”. Prepared by Sustainable Bridges – a project within EU FP6. Available from: www.sustainablebridges.net [cited 30 November 2007].
SB-LRA (2007): Guideline for Load and Resistance Assessment of Railway Bridges. Prepared by Sustainable Bridges – a project within EU FP6, Available from: www.sustainablebridges.net [cited 30 November 2007].
SB-MON (2007): Guideline for Monitoring of Railway Bridges. Prepared by Sustainable Bridges – a project within EU FP6. Available from: www.sustainablebridges.net [cited 30 November 2007].
SB-STR (2007): Guide for use of Repair and Strengthening methods for Railway Bridges. Prepared by Sustainable Bridges – a project within EU FP6. Available from: www.sustainablebridges.net [cited 30 November 2007].
SB-6.3 (2007): Field test. Strengthening of the Örnsköldsviks Bridge with Near Surface Mounted CFRP Rods. Prepared by Sustainable Bridges – a project within EU FP6. Available from: www.sustainablebridges.net [cited 30 November 2007].
SB-7.3 (2007): Field Test of a Concrete Bridge in Örnsköldsvik, Sweden. Prepared by Sustainable Bridges – a project within EU FP6. Available from: www.sustainablebridges.net [cited 25 August 2007].
Täljsten, B. (1994): Plate Bonding. Strengthening of Existing Concrete Structures with Epoxy Bonded Plates of Steel or Fibre Reinforced Plastics. PhD thesis 1994:152 D. Division of Structural Engineering, Luleå University of Technology, 2nd Ed 1994, 8 p.
Täljsten, B., Bergström, M., Enochsson, O., Elfgren, L. (2007): CFRP strengthening of the Örnsköldsvik bridge – field test. In: “Sustainable Bridges – Assessment for Future Traffic Demands and Longer Lives”, eds. Bień, J., Elfgren, L., Olofsson, J., Dolnośląskie Wydawnictwo Edukacyjne, Wrocław 2007, 10 pp.

Advanced methods of testing and analysis of old masonry bridge in Oleśnica
461
Advanced methods of testing and analysis of old masonry bridge in Oleśnica
Tomasz KAMIŃSKI & Christiane TRELA The paper presents a complex approach to testing and analysis of masonry railway bridge in Oleśnica in Poland which was selected as a demonstration structure within Sustainable Bridges Project. The applied methods of testing and some of their results are presented. FE model of the bridge created on the basis of the data obtained from the tests is described and the numerical output is compared with the field loading test results.
1. INTRODUCTION
Masonry arch bridges comprise still a significant group of structures belonging to the transportation network in the whole Europe. However their condition is permanently deteriorating due to recently increasing traffic demands including higher speeds and axle loads. These facts increase the need of advanced testing and accurate analysis of masonry arch bridges. The application of modern techniques can help in precise investigation and evaluation of the actual condition and load carrying capacity of the structures. The most desired techniques are those, which do not disturb the structure or the traffic on it. These requirements fulfil non-destructive testing (NDT) methods that are useful also in cases when no basic data on the bridge, like structural geometry or material properties, are available.
An exemplary approach to the solution of the problem including all of the issues mentioned above will be shown in application to 130-year-old masonry bridge in Oleśnica in Poland (Bień et al., 2007a). The structure was chosen for this extensive survey as a typical railway masonry bridge representative for majority of such structures in this part of Europe. Besides no technical data on the bridge existed so far what was a real challenge to the researchers to cope with such an inconvenient but common problem. The aim of the paper is to present an advanced and complex investigation composed of three main consecutive stages:
• NDT testing providing basis data on geometry and material properties, • FE analysis based on data received from NDT tests presenting bridge behaviour under
service and the ultimate load, • validation of the numerical analysis by means of the field load test.
Sustainable Bridges – Assessment for Future Traffic Demands and Longer Lives

7. Practical implementation of the project results
462
In the works being described international team was involved including: Federal Institute for Materials Research and Testing (BAM) from Germany, IDS company form Italy, Wrocław University of Technology (WUT) and Polish Railway Lines (PKP PLK S.A.) from Poland.
2. METHODS OF TESTING
2.1. Testing programme
Within the scope of the bridge survey 7 main groups of testing activities (described in details by Helmerich and Niederleithinger (2006) were carried out: geometrical measurements, georadar tests, electrical conductivity measurement, endoscopy, thermography, geotechnical tests and laboratory tests on masonry and soil samples. The survey covered most of the structural components of the bridge together with a part of the soil adjacent to the structure.
2.2. Geometrical measurements
Measurement of the basic geometry of the structure was carried out mainly by means of opto-electronic measuring system (Figure 1a) and drilling the control holes in masonry elements and in the fill (Figure 12a). The former method enabled precise measurement of the external, visible geometry, the latter let to disclose covered by the fill structural elements and their dimensions. Additionally some other techniques like georadar tests or endoscopy supported this investigation. The geometric data of the accessible part of the bridge are visualized in 3D drawings using CAD-software (Figure 1b).
Figure 1. Geometrical measurements: a) opto-electronic system, b) received 3D drawing of the bridge
2.3. Georadar tests
Ground Penetrating Radar (GPR) measurements were carried out with various antennas (500, 900 and 1500 MHz) to identify basic geometrical dimensions of the bridge and constructional details and to evaluate the condition of the masonry like mechanical damages (e.g. cracks or voids) and variation in the moisture content. The tests were performed with the SIR-20 radar system from GSSI Inc. by manual moving of a bistatic antenna (Figure 2a) or by using an automated 2D radar scanning system (Figure 2b). Different parts of the bridge like the southern abutment (Figure 3), arch barrel from intrados (Figure 2a) and from the top of the bridge (Figure 5a, b) were investigated with the radar reflection measurements. From this extensive investigations carried out from 2005 to 2007 only some selected results are presented here. The radargram of measurement on the top of the bridge is shown in Figure 4.
a) b)

Advanced methods of testing and analysis of old masonry bridge in Oleśnica
463
Figure 2. The radar measurements: a) longitudinal (red) and transverse (blue) profiles at the ceiling with 900 MHz antenna, b) testing with automated 2D radar scanning system with 1.5 GHz antenna
Figure 3. Radar measurements performed from 2005 to 2007 at the southern abutment and wing walls
Figure 4. Radargram of the 500 MHz antenna over the bridge with the schematic contour of the bridge (measurement campaign 2005); red lines indicate strong reflection zones
The strong reflection zones in the radargram can be identified as a concrete cover of the arch for drainage purpose with inclination angles α ≈ 4° and β ≈ 1° (Figure 5c). The course of the concrete cover was visible with 500 MHz antenna from the top of the bridge (Figure 4) and additionally with the 900 MHz antenna from under the arch barrel.
a) b)

7. Practical implementation of the project results
464
α β
Figure 5. Radar measurement: a) test carried out in 2005, b) test carried out in 2006, c) localised concrete cover (blue) over the arch barrel with marked inclination angles
In Figure 6 the horizontal profile H5 (according to Figure 3) at the south abutment and the results of the moisture content estimation of some core samples of the boreholes L1, L2 and L3 (according to Figure 8) on the height of 1.2 m are shown. Strong reflections and time delays of the reflection horizons correlate well with the increased moisture content in these areas, especially in the area between 5.5 and 7.5 m and near the surface at 1 m.
Figure 6. Radargram of the horizontal profile H5 with the 500 MHz antenna and results of the moisture content estimation on certain core samples
2.4. Electrical conductivity measurements
These kind of geoelectrical measurements were performed to detect voids or structural anomalies in masonry elements and backfill and to evaluate moisture content. Two different
Figure 7. Electrical conductivity measurements: a) electrodes with the remote units (SIP 256C) along profile SIP 3, b) 4-Punkt light (Lippmann) field equipment, c) active electrodes
a) b) c)
a) b) c)

Advanced methods of testing and analysis of old masonry bridge in Oleśnica
465
geoelectrical systems were applied (Figure 7). At the first two measurement campaigns a frequency dependent electrical resistivity set – Radic-Research SIP 256C – with medical Ag/AgCl electrodes (Figure 7a) or steel pike electrodes for soil investigation were applied. In 2007 in the first ever application a new electrical resistivity set – Lippmann 4-Punkt light – was used (Figure 7b, c).
The measurements were carried out at the southern part of the bridge and on the top of the bridge in parallel and transverse direction to the railway track. In Figure 8 results from the southern abutment are shown.
In 2005 profile SIP 4 at a medium height of 1.20 m above ground was investigated using the SIP 256c equipment. The 25 electrodes were equally installed at separations of 35 cm. The inversion result at 1.25 Hz measurement is illustrated in Figure 9.
The resistivity magnitude section (Figure 9a) shows relatively high resistivities near the surface down to approx. 0.6 m. This resistive layer thins some 10 cm towards the end of the profile. Parallel to the surface and behind the more resistive section follows a much better conductor. The bottom part of the more conductive layer is not resolved in the profile.
The corresponding resistivity phase section is given in Figure 9b. Basically the entire section is very lowly polarizable having phases only around –1 mrad or less. Towards the far end of the profile, and matching hence very well with the thinning resistive layer, the phases increase by a factor of 3.
Summarizing it must be noticed that the electrical measurements per se are very consistent throughout the years and as well using different devices. The data quality obviously varies between profiles, but the RMS error ranges generally between 5 and 10%, which can be considered satisfactory. The electrical resistivity data and moisture analyses of the drill cores extracted in the investigated area match qualitatively. Structurally damaged areas (cracks) could not be resolved conclusively.
Figure 8. Locations of SIP measurement area and boreholes on the south abutment and wing wall

7. Practical implementation of the project results
466
Figure 9. Electrical resistivity inversion results measured at 1.25 Hz in 2005 along the southern abutment: a) resistivity magnitude, b) resistivity phase. Anomalous areas are marked
2.5. Endoscopy
The endoscopy was applied to the bridge at the southern abutment. An example of the test performance is visible in Figure 10a. Application of endoscopy in positions L4 (according to Figure 8) revealed a cavity. Behind 12 cm layer of bricks a cuboid chamber (1.05 x 0.5 x x 0.8 m) was detected (Figure 10b). This cavity was regarded as a former explosion chamber. Similar different bricks were noticed in two other regularly distant areas of the south abutment and on the opposite side – on the northern abutment – nearly at the same three positions what supported the correctness of the concluded explosion chamber.
Application of the endoscopy enabled also evaluation of the bricks and mortar joint material in deeper areas of masonry. The material was found to be in a good and constant condition (Figure 10c). It was also applied in the borehole no. 6 (Figure 12a) to confirm thickness of the abutment.
Figure 10. Endoscopy: a) measurement at borehole L4, b) view into the borehole L4, c) endoscopic image of an internal area of masonry
a) b) c)
a)
b)

Advanced methods of testing and analysis of old masonry bridge in Oleśnica
467
2.6. Thermography
Application of the thermography to the analysed structure had a limited scope. It however revealed possibility to detect some anomalies in the structural material. The test was carried out by means of thermographical camera – FLIR Systems ThermaCAM P65 (Figure 11a). Example of the test results for standard and thermographical view of the arch barrel are presented in Figure 11b and Figure 11c respectively. In the figures some bricks with different properties can be noticed. The method enabled also detection of the moist parts of the arch barrel which suggested presence of damaged parts of waterproofing over it.
Figure 11. Thermography: a) test performance, b) standard photo, c) thermographical image
2.7. Geotechnical field tests
The geotechnical field measurements (Batog et al., 2007) included: drilling of 5 holes (no. 1–5 in Figure 12a) in the fill on the structure, digging over the arch barrel crown (hole no. 0) and the dynamic penetration test (at locations no. 1 and 2) carried out by means of an automated penetrometer (Figure 12b). The aim of the drilling was to investigate the unknown profile of the bridge (Figure 12a) and to take the soil samples (Figure 13b). As the result of the penetration test the soil compaction was evaluated which was used later as auxiliary data for lab testing (presented in the next section) of other geotechnical parameters of the taken soil samples. The received average degree of the soil compaction ID was equal to 0.46.
Figure 12. a) investigated profile of the bridge with drilled holes, b) the dynamic penetration test
2.8. Laboratory tests on masonry and soil samples
Investigations were applied to masonry core samples, soil samples and salt efflorescence probes taken from the bridge (Figure 13). The locations of the core sampling on the structure are also presented in Figure 8. Salt efflorescence was taken from the spandrels and near the
a) b) c)
a) b)

7. Practical implementation of the project results
468
Figure 13. Taking samples of: a) masonry core ∅150 mm from the abutment, b) soil from the top of the bridge, c) salt efflorescence from the intrados of the arch barrel
arch face edges of the bridge. The masonry core samples were subjected to a few types of the
tests including measurement of masonry material properties and evaluation of water content and chemical composition for masonry. The following material properties were estimated: bulk density γM = 18.5 kN/m3, the average compressive strength fcM = 3.5 MPa and the distribution of water content on depth of selected core samples. The tests of the soil samples revealed variation of the material from non-cohesive sand to low-cohesive sand with clay. The average properties of the fill are as follows: water content 12.8%, bulk density γS = 20 kN/m3, modulus of elasticity ES = 38 MPa, Poisson’s ratio ν = 0.32, angle of internal friction φ = 30° and cohesion c = 15°.
To analyse which types of salt damage the masonry different methods of the chemical composition estimation were applied to the probes. For the element analysis methods like Micro X-ray Fluorescence Spectrometry and Laser Induced Breakdown Spectroscopy (LIBS) anion chromatography were applied. Investigation of the crystalline structure were carried out by the X-ray diffractometer – SEIFERT XRD3000 PTS system – on a finely ground salt efflorescence probe.
The qualitative analysis was based on comparison of expected reflections of known material compositions and estimated on reflections during the measurement in the X-ray diffractometer (Figure 14). The investigated material is identified as calcite CaCO3. Calcite at the masonry surface generally refers to horizontal cracks in more than two mortar joints lying upon each other (Blaich, 1999). Rainy water penetrates the open cracks and dissolves the compounds of calcite from the mortar.
The applied analytical chromatography, based on separation and measurement of the relative proportions of analytes in a mixture, was carried out as analysis of anions on an aqueous solution of a mortar probe. The measurements were performed with the ICS 90 system of Dionex. The estimated contents of chloride, nitrate and sulphate in the mortar probe was regarded as comparatively small for such an old bridge.
Figure 14. Result of a phase analysis by electron diffraction: peaks of measured reflections in dependence of angle 2 Theta (blue line) correlate well with the expected reflections of calcite (red line)
a) b) c)

Advanced methods of testing and analysis of old masonry bridge in Oleśnica
469
3. FE ANALYSIS OF THE STRUCTURE VERIFIED WITH LOAD TESTS
3.1. FE modelling & analysis
For the analysed bridge three-dimensional (3D) finite element (FE) model was created by WUT. Material properties and the geometrical data of the model were established on the basis of the laboratory and field tests presented in previous section. The model was verified with field tests by means of measurements of deformation under service load.
The proposed 3D model represented the main identified structural components of the bridge: arch barrel, spandrel walls, backing and fill (Figure 15a). The arch barrel was rigidly supported along its springings. Along the longitudinal edges of the arch the spandrel walls were modelled. The walls were extended beyond the arch to some distance where they were rigidly supported along their bottom surfaces. Over the arch barrel and between the spandrel walls the fill was modelled. At all boundaries between the fill and the other components the contact surfaces were used which transfer compressive and shear but tensile forces.
A specific technique for modelling of masonry (proposed by Kamiński (2007)) was applied to the arch barrel. The masonry arch was divided into even segments representing parts of masonry, each including several bricks and mortar joints. The linear-elastic segments were separated by mortar joints with nonlinear material with properties determined by the lab tests. The spandrel walls were modelled as a homogenized masonry material.
Figure 15. FE analysis: a) model of the bridge with removed part of the spandrel wall, b) relationship between vertical displacement u of the arch barrel in quarter point under the track axis and axle load P
The loads applied in two consecutive steps took into account self weights of all elements and the railway live loading. The live load considered only a single boogie (600 kN) of the applied engine located at 1/4 or 1/2 of the span assuming relatively low influence of the other boogie on the arch barrel behaviour. The boogie acted by means of three rigid plates (50 x 300 cm) representing pressure from three axles distributed through the track structure.
Two types of analysis with the presented model were performed: under the service load (section 3.2) which was than compared with the real load tests and under the ultimate load (section 3.4) which could be used for evaluation of the load carrying capacity of the structure and the safety margin corresponding to the real railway load (according to Bień et al., (2007b)).
3.2. Field load tests
For validation of the model presented in the previous chapter the field tests were performed. As the load a typical engine ET-22 (of 120 tonnes weight) was applied. During the
a) b)Spandrel walls
Arch barrel Backing
Loading plates
Fill

7. Practical implementation of the project results
470
tests deformation of the arch barrel under traffic load was monitored. The displacement measurements were carried out by means of three independently working systems:
1. Laser measurements below the axis of the track in the middle of the span (L1) – operated by BAM.
2. Microradar measurements from 2 different radar positions in 5 points of the middle cross sections (R1-R5) and in 2 points in quarter point sections (R6, R7) – operated by IDS.
3. LVDT measurements in 3 points in the middle of the span (D1-D3) – operated by WUT. Additionally accelerations of selected points (A1-A4) were monitored by WUT. Configuration of the measurement points for all the systems are shown in Figure 16a.
Figure 16. Load test: a) location of the measurement points together with the engine load positions, b) measurement during the loading, c) radar, d) laser equipment for deformation measurement
During the test the static load was applied in three configurations: one of the engine boogie located in 1/4, 1/2 and 3/4 of the span. The load configurations (numbered 1, 2 and 3) are also presented in Figure 16a. In each location the engine was standing still until stabilization of the structure deformation was confirmed.
3.3. Comparison of analytical and experimental results
Deformation of the arch barrel resulting from analysis under service load is presented and compared with directly measured values. The calculated and measured displacements of the arch barrel points located along the crown cross-section and the longitudinal profile under the track axis are presented in Figure 17 and Figure 18 respectively. Although, the points monitored with LVDT gauges were located 50 cm away from the crown cross-section they are also presented in Figure 17 as expected to be similar to the other ones. Just two different locations of the load are distinguished: at L/4 and L/2. Due to symmetry of the structure and load configurations both cases with the engine located at 1/4 and 3/4 of the span are treated as the same case. Thus the average displacements from the cases for symmetrically corresponding points are presented. Horizontal components of the displacements are given in Figure 17. Figure 18 shows vertical and horizontal displacements along the longitudinal vertical profile.
d)
b)
c)
a)

Advanced methods of testing and analysis of old masonry bridge in Oleśnica
471
Figure 17. Vertical displacements of the arch barrel points at the crown cross-section under the load located at: a) L/4, b) L/2. Radar located on the side of the bridge
Figure 18. Displacements of the arch barrel points along the longitudinal profile under the track axis for load located at: a) L/4, b) L/2. Radar located under the bridge
3.4. Limit state analysis of the bridge
Result of analysis with the ultimate load in the form of the relationship between the vertical displacement u of a quarter point of the arch barrel under the track axis and the applied single axle load P is presented in Figure 15b. The maximum load achieved during the analysis, deemed as the ultimate load, is equal to Pult = 7147 kN at the corresponding displacement uult = 18.7 mm. Complex mode of failure of the arch barrel shows Figure19.
Figure 19. Deformed shape of the arch barrel presenting the mode of failure and the crack pattern

7. Practical implementation of the project results
472
4. CONCLUSIONS
The testing methods applied to the bridge revealed various unknown previously data about the structure. The geometrical measurements provided precise description of the bridge geometry. The georadar tests indicated presence of a concrete cover over the arch (confirmed later by the geotechnical tests) and evaluated the moisture content in masonry. The electrical conductivity tests showed some anomaly in an area of the southern abutment. By means of endoscopy the explosion chambers were surveyed and together with thermography the quality and consistency of the masonry condition were estimated. The lab tests provided the crucial data on the masonry and soil used later in the numerical model. Applied FE model of the bridge provided results of the deformation under service load comparable to those measured during the field tests (the relative difference is equal to 15% on average). Results of the defor-mation measurement received by means of the applied methods are satisfactorily consistent and the relative differences between the values of vertical displacement did not exceed 10% on average. Application of three independent methods based on completely different technologies provided mutual control of the measurements and confirmed their correctness.
The presented investigations carried out on the masonry bridge in Oleśnica can be regarded as very successful. The discovered information enabled creation of a precise numerical model giving results compatible with the field load tests and providing evaluation of the load carrying capacity of the bridge. Experiences gained from such tests can be used as a basis for creation of the recommendations for masonry bridge survey. The whole venture confirmed high potential of the international cooperation in solving of such multi-tool and multi-phase tasks.
ACKNOWLEDGEMENTS
The support of the research within the project Sustainable Bridges funded by the European Commission within the 6th Framework Programme is acknowledged. In the field test campaigns and laboratory investigations the following groups (with leaders of the works indicated) were participating: BAM (Ernst Niederleithinger), IDS (Giulia Bernardini), PKP PLK S.A. (Zygmunt Kubiak) and WUT represented by Institute of Civil Engineering (Jan Bień), Institute of Geotechnics and Hydroengineering (Andrzej Batog) and Institute of Building Engineering (Henryk Nowak). The commitment the leaders and their all co-workers is honestly appreciated. All calculation were carried out by means of ABAQUS 6.5 using license of WCSS at Wrocław University of Technology which is also gratefully acknowledged.
REFERENCES Batog, A., Kupis, R., Pochrań, Z. (2007): Badania polowe i laboratoryjne gruntów nasypowych na wiadukcie kolejowym w Oleśnicy. Wrocław University of Technology, Report No. U 328 (in Polish).
Bień, J. et al. (2007a): D7.4. Demonstration bridge C: masonry arch structure. Prepared by Sustainable Bridges – a project within EU FP6, Available from: www.sustainablebridges.net
Bień, J., Kamiński, T., Rawa, P. (2007b): D4.7.3. Methods of analysis of damaged masonry arch bridges. Prepared by Sustainable Bridges – a project within EU FP6, Available from: www.sustainablebridges.net
Blaich, J. (1999): Bauschäden Analyse und Vermeidung, Fraunhofer IRB Verlag, EMPA (in German).
Helmerich, R., Niederleithinger, E. (2006): D3.16. NDT-toolbox for the Inspection of Railway Bridges. Prepared by Sustainable Bridges – a project within EU FP6, Available from: www.sustainablebridges.net
Kamiński, T. (2007): Three-dimensional modelling of masonry arch bridges based on predetermined planes of weakness ARCH’07 – 5th International Conference on Arch Bridges. Madeira, Portugal.

Instrumentation of the Avesnes/Helpe bridge
473
Instrumentation of the Avesnes/Helpe bridge
Christian CREMONA, Renaud LECONTE,
Glauco FELTRIN, Benedikt WEBER, Jan BIEŃ,
Paweł RAWA, Jarosław ZWOLSKI & Luc DIELEMAN This paper details the different instrumentations installed on the Avesnes/Helpe bridge between 2005 and 2007 in France for recording its structural response and its loading conditions during a two-days monitoring campaign (June 2005), for performing dynamic assessments (March 2006) and for detecting damages (June 2006, March 2007). The first series of tests were performed when the bridge was still operated by the French railways SNCF. In August 2005, the bridge was removed from operating conditions and conserved for research and demonstration purposes within the “Sustainable Bridges” project.
1. INTRODUCTION
The Avesnes bridge is one of the two riveted steel bridges crossing the Helpe river (KP94.090) and belonging to the Fives to Hirson line (Figure 1). The characteristics of the bridge deck are given in Table 1. The track is equipped by U50 rails and wood rail ties with clamp joints and flanges.
Table 1. Avesnes bridge characteristics
Span 20.00 m Skewed span 21.07 m Total length 23.00 m Deck thickness 0.75 m Deck weight ~80.00 T
The Avesnes bridge is managed by SNCF and is a mild steel single track bridge built in
1919 (Figure 2). Two decks of this bridge will be replaced due to a poor general condition. No “advanced structural assessment” (only deterministic calculations – allowable stress principle) have been performed, because repairs would be more expensive than bridge replacement.
Sustainable Bridges – Assessment for Future Traffic Demands and Longer Lives

7. Practical implementation of the project results
474
Figure 1. Avesnes bridge – general views
Figure 2. General characteristics of the Avesnes bridge
The experiments were performed in two stages. The first one has consisted to monitor the bridge during several days. The general instrumentation system was installed and monitored by SNCF. It was composed of strain gauges, accelerometers, temperature gauges and displacement laser sensors. This monitoring was an opportunity to get in-service data for further structural and fatigue assessments in connection with work package 4 studies. The second stage was to remove the bridge and to simulate real damages. In February and March 2006, preliminary dynamic tests were performed on that bridge to identify frequencies and to fix some instrumentation requirements. In June 2006, a set of tests (global on main girders, global on cross- and secondary girders, local on some connections) were executed by EMPA, LCPC/LRPC Lyon, SNCF and WUT. Simulated damages were realised by SNCF by taking out some reinforcement plates. Numerical modelling and experimental vibration analysis were realised by WUT and LCPC. Then, in March 2007, further dynamic investigations were performed by LCPC/LRPC Lyon in order to simulate damages located at the connexions between the longitudinal/cross girders and between the cross/ main girders. The damages are spread
Instrumented bridge
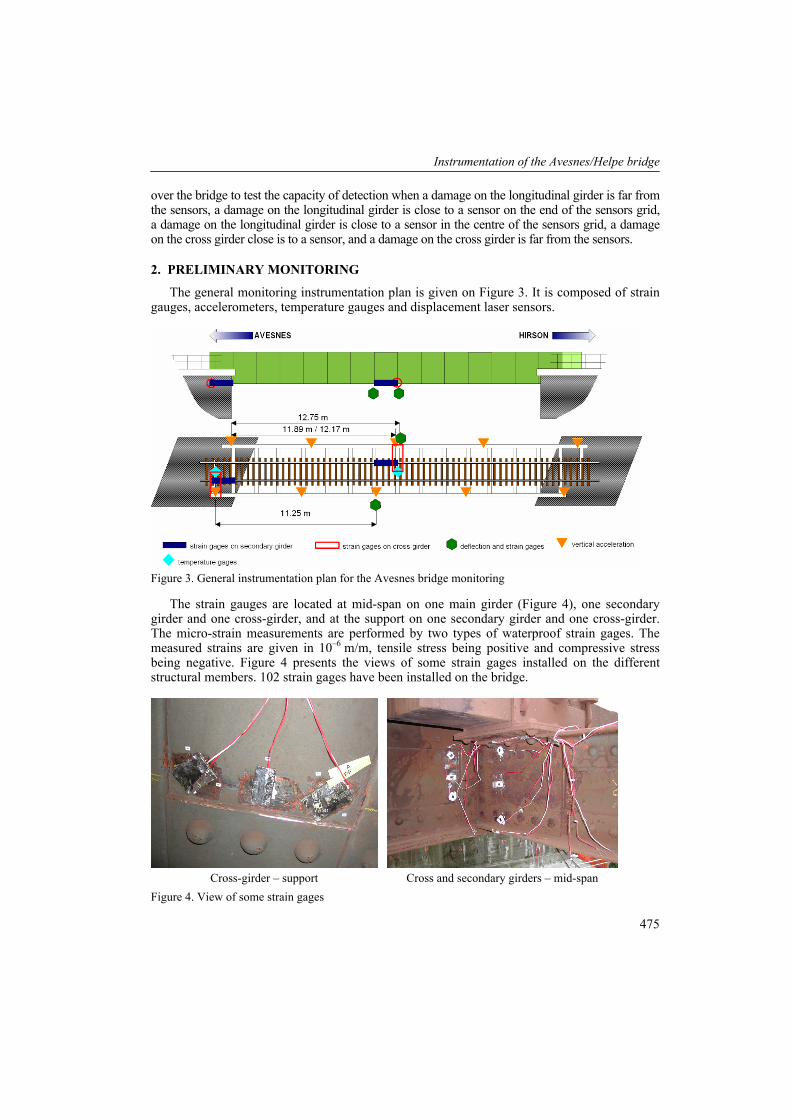
Instrumentation of the Avesnes/Helpe bridge
475
over the bridge to test the capacity of detection when a damage on the longitudinal girder is far from the sensors, a damage on the longitudinal girder is close to a sensor on the end of the sensors grid, a damage on the longitudinal girder is close to a sensor in the centre of the sensors grid, a damage on the cross girder close is to a sensor, and a damage on the cross girder is far from the sensors.
2. PRELIMINARY MONITORING
The general monitoring instrumentation plan is given on Figure 3. It is composed of strain gauges, accelerometers, temperature gauges and displacement laser sensors.
Figure 3. General instrumentation plan for the Avesnes bridge monitoring
The strain gauges are located at mid-span on one main girder (Figure 4), one secondary girder and one cross-girder, and at the support on one secondary girder and one cross-girder. The micro-strain measurements are performed by two types of waterproof strain gages. The measured strains are given in 10–6 m/m, tensile stress being positive and compressive stress being negative. Figure 4 presents the views of some strain gages installed on the different structural members. 102 strain gages have been installed on the bridge.
Cross-girder – support Cross and secondary girders – mid-span
Figure 4. View of some strain gages

7. Practical implementation of the project results
476
The vertical accelerations are recorded by piezo-electrical sensors IMI 326A03±5 g. The accelerometers are placed on the main girders on the extrados bottom flange (Figure 5). They are located at mid-span, at quarter-span, and at the support. The accelerations are given in g. 10 accelerometers have been installed on the bridge.
The deflection at mid-span is measured by laser sensors (Figure 6, NAIS LM100). The deflections are given in mm. 2 sensors have been installed on the bridge. The deflection is measured from the new bridge under construction, which will replace the Avesnes bridge, and from the second riveted bridge located nearby the instrumented one.
Figure 5. Instrumentation plan – accelerometers
4 temperature gages have been installed on the bridge at mid-span and at the support (Avesnes). Temperatures are given in °C.
Wheel loads are measured by Q-bridges (1 for each rail) located upstream. The principle of Q-bridges is to assess the shear differences between two rail sections (Figure 7). The loads are given in kN. Q-bridges are made of two rosettes (KFW 5 D16 – Kyowa – 5 mm width). The Q- -bridges are located at 29.00 m from the bridge entrance.
Triggered data acquisition has been performed with three high-speed data acquisition systems. Each train crossing produces three data files, one for each acquisition system. A synchronisation channel is common for all the systems. The sampling frequency is 600 Hz. Figure 8 provides some examples of recorded data.
Figure 6. Reference bridge – displacement laser sensors
Accelerometer

Instrumentation of the Avesnes/Helpe bridge
477
Figure 7. Q-bridge gages
a) Strain measurements b) Acceleration measurements
Figure 8. Example of measurements
By applying Eurocode 1 convoys, it is possible to show that joints in the longitudinal girders have reached their service lifetime and that joints in cross-girders are close to. It is not possible to assess damage from measurements because the joints have been reinforced by fish joints. Using the fracture mechanics model as described in WP4 guidelines, it can be shown that if a 5 mm crack is detected outside a rivet hole, then the critical crack size is reached between 1 and 2 years. This explains that the damage is growing very quickly in this type of structures.
3. DYNAMIC TESTS
In August 2005, the bridge was removed (Figure 9) from operation and was conserved in the Avesnes railway station for dynamic tests in order to assess the technique capabilities to detect damages. This section presents the principle of these dynamic tests and the results of the non-destructive campaign to obtain the dynamic parameters (frequencies, damping ratios and mode shapes).

7. Practical implementation of the project results
478
Figure 9. General view of the bridge
3.1. Preliminary tests
The first tests were made in February 2006. Four accelerometers were used in two setups for seven measurement points with one reference point at mid-span. Theses tests are used to study the first frequencies of the structure, to design the full instrumentation and to confirm the results with a very simple numerical model. For all these tests, the accelerations were recorded by piezo-electrical sensors (KISTLER© 8752A50). The transducers were attached to the structure by means of magnetic mountings. The preliminary tests were performed to check if the ambient railway traffic was satisfactory to excite the structure and to verify the frequencies for the three vertical modes.
Freq. (Hz) Mode shape
8.33/ /10.4
44.4
92.3
Figure 10. Preliminary tests – Bending modes
For these tests, the acquisition parameters were a sampling frequency at 1200 Hz, and a cut off analogical filter at 100 Hz. 29 tests were recorded. The range of the accelerations is very low with values at the bearing up to 7.10–3 m/s² or 0.7 mg. The decrease of the accelerations, between the bearing and the mid-span, highlights that the passage of the trains is the source of a lot of vibration in the foundations. So the excitation coming at the supports induces a lot of displacements of the bearings for all the mode shapes. This “noise” is a problem to study the dynamic behaviour of the bridge because it pollutes the structural response. The results of the

Instrumentation of the Avesnes/Helpe bridge
479
three vertical frequencies and mode shapes founded are given on Figure 10. For these three bending modes we show respectively one, two and three lobs. The analysis of the transverse sensor at mid-span gives a lot of frequencies. The random excitation explains this result. Two frequencies are better identified than the other ones and the values are respectively 11.6 Hz and 14.4 Hz.
More tests with another excitation were necessary to avoid this problem of displacement of the supports. Thus, the second campaign consisted in deforming the bridge with a jack and releasing the pressure to have a forced excitation of the structure.
3.2. First campaign
The general instrumentation was made in March 2006; it is given on Figure 11. It is composed of accelerometers and temperature gauges. 16 accelerometers were used in six setups for 72 points of measuring with 4 reference points. The vertical accelerometers were dispatched along the structure at each connection between:
• the main girder and the cross-girder, • the longitudinal girder and the cross-girder. The transversal accelerometers were dispatched along the main-girders on the top and on
the bottom of the beam at each connection with the cross-girders. Figure 11 shows the different setups and the different positions of these transducers.
Figure 11. Instrumentation plan – accelerometers
The acquisition parameters were a sampling frequency at 600 Hz, and a cut off analogical filter at 100 Hz. No significant modification due to temperature effects was noticed during the tests The range of the accelerations is higher than those induced by the trains during the first campaign. The dynamic behaviour is more appropriate with larger vibrations at mid-span than at the bearing. The maximal value is about 0.5 m/s². The first results of the dynamic tests from March 2006 are that the main structural behaviour is not mainly a global one but a local
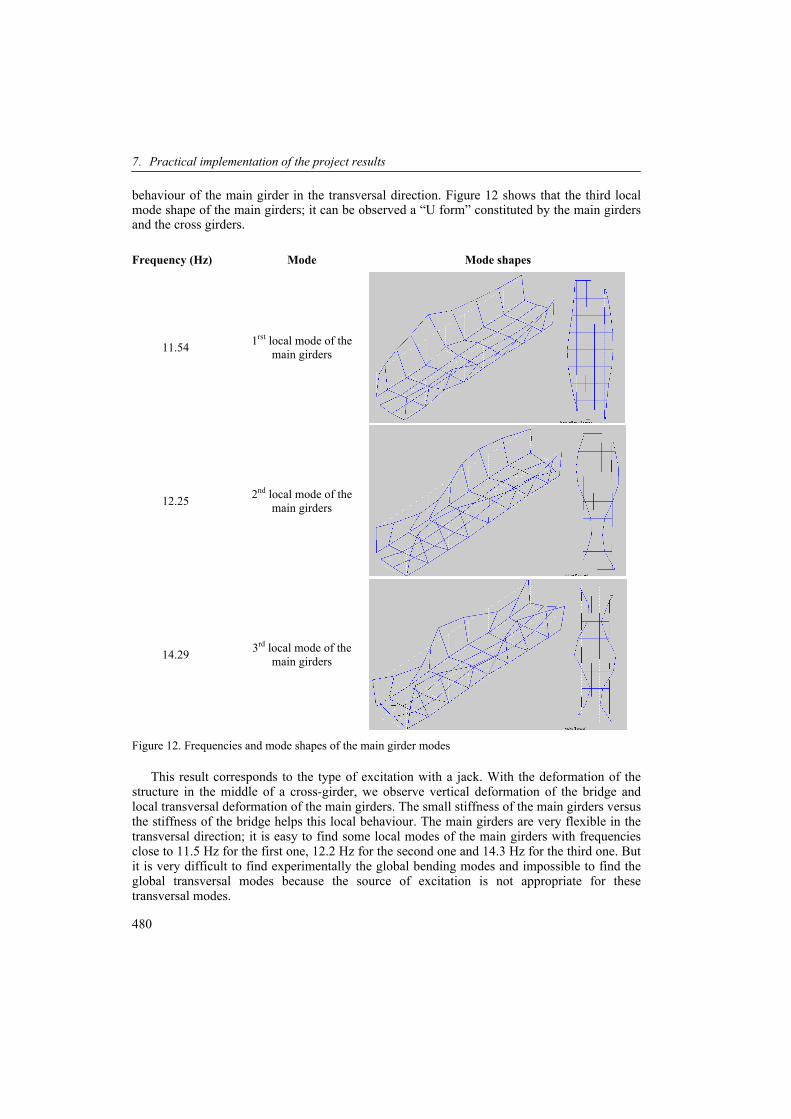
7. Practical implementation of the project results
480
behaviour of the main girder in the transversal direction. Figure 12 shows that the third local mode shape of the main girders; it can be observed a “U form” constituted by the main girders and the cross girders.
Frequency (Hz) Mode Mode shapes
11.54 1rst local mode of the main girders
12.25 2nd local mode of the main girders
14.29 3rd local mode of the main girders
Figure 12. Frequencies and mode shapes of the main girder modes
This result corresponds to the type of excitation with a jack. With the deformation of the structure in the middle of a cross-girder, we observe vertical deformation of the bridge and local transversal deformation of the main girders. The small stiffness of the main girders versus the stiffness of the bridge helps this local behaviour. The main girders are very flexible in the transversal direction; it is easy to find some local modes of the main girders with frequencies close to 11.5 Hz for the first one, 12.2 Hz for the second one and 14.3 Hz for the third one. But it is very difficult to find experimentally the global bending modes and impossible to find the global transversal modes because the source of excitation is not appropriate for these transversal modes.

Instrumentation of the Avesnes/Helpe bridge
481
3.3. Second campaign
The third instrumentation made in June 2006 is given on Figure 13. It is composed of accelerometers and temperature gauges. For this second campaign, made in collaboration with the EMPA (Swiss Federal Laboratories for Materials Testing and Research – Switzerland) and the WUT (Wrocław University of Technology – Poland), 24 accelerometers were used in one setup for the study of the longitudinal girders and in 5 setups for the study of the behaviour of a cross section. The dynamic behaviour of the structure was studied with a jack set acting with a 18 t load under a cross-girder near the mid-span of the structure for the tests of March 2006 and a 21 t load for the tests of June 2006 (Figure 13a). The pressure was released letting the bridge vibrating.
Figure 13. Jack under cross-girder (a); behaviour of the structure with the jack (b)
The deformation of the structure is mainly in the vertical direction but with the very high stiffness of the connexion between the main girders and the cross girders, the main girders are deformed in the transversal direction (Figure 13b). It seems that this excitation is satisfactory to study the dynamic behaviour of the Avesnes bridge. Regarding the history of the structure, the damages were concentrated at the connection between the longitudinal girders and the cross girders. In 1979 and 1980 some damages were observed and some longitudinal girders were changed. In 2003, the inspectors noticed:
observed crack on the bottom of the longitudinal girder web, observed movements when trains were on the bridge + crack, observed rupture of the longitudinal girder web and movements, doubts about crack on the top of the longitudinal girder web.
For these reasons, all the connections were strengthened by fish joints and today, there is no more initial connection.
During the campaign of June 2006, the damages order was: • the struck of a fish joint in an undamaged area to observe the behaviour of an initial
configuration, • the struck of the fish joint ( ), • the struck of the fish joint ( + ), • the struck of the fish joint ( + + ), • the struck of the fish joint ( + + + ),

7. Practical implementation of the project results
482
Figure 14. Location of the damages
and at least re-erection of the fish joint + + + by the SNCF team. The location of the damages to are reported on Figure 14.
Figure 15 presents a comparison between some undamaged mode shapes identified by the Frequency Domain Decomposition (FDD) method and the random decrement technique with the Ibrahim time Domain method (WUT/LPC results). The frequencies are presented in Table 2 (WUT results). WUT measurements are performed on the top of the main girders while LPC measurements are made on the longitudinal girders. Table 2. List of identified natural frequencies
Damage 0 Damage 1 Damage 2 Damage 3 Damage 4 Mode number (global)
Frequency [Hz]
Mode 1 3.845 3.809 3.845 3.809 3.772
Mode 2 6.116 6.116 6.116 6.079 5.933
Mode 3 7.654 7.654 7.617 7.617 7.214
Mode 4 8.423 8.423 8.459 8.313 7.947
Mode 6 8.789 8.789 8.826 8.752 8.789
Mode 7 10.693 10.693 10.730 10.657 10.547
Mode 8 11.462 11.462 11.499 11.426 11.462
Mode 9 12.195 12.195 12.195 12.158 12.158
Mode 10 13.037 13.037 13.000 12.927 12.854
Mode 11 14.319 14.319 14.319 14.246 14.246
Damage Damage struck of an undamaged area 0
Damage
Position of the jack Damage

Instrumentation of the Avesnes/Helpe bridge
483
Frequency Mode Mode shapes
8.33 Hz 8.42 Hz
1rst bending mode of the structure
11.54 Hz 11.46 Hz
1rst local mode of the main girders
14.29 Hz 14.31 Hz
3rd local mode of the main girders
Figure 15. Mode shapes from June 2006 tests
In parallel to these tests, EMPA realised further investigations in order to assess if the damage produces detectable changes in the vibration signature of an individual longitudinal girder (damage detection), if the location of damage can be identified by analysing the changes in the vibration signature (damage location), and how direct and indirect excitation sources influence the changes of the vibration signature. The test set-up is shown in Figure 16. The vibration measurements were performed with 12 sensors model Kistler 8636C10 (piezoelectric accelerometers, sensitivity: 0.5 V/g, amplitude range: ±10 g, frequency range: 1 Hz to 4 kHz). Small sensors with medium sensitivity were chosen to avoid saturation shortly after hitting the girder with an instrumented impact hammer. The girder was excited using instrumented (load cell) impact hammers (Figure 17). A medium-size impact hammer PCB 086D20 (hammer mass: 1.1 kg, frequency range: 1 kHz, amplitude range: 22 kN,) was used to hit the top flange of the longitudinal girder in three positions: on the left-hand side, in the middle and on the right-hand side of the girder. The positions on the left and right-hand side of the girder were at a distance of 60 cm from the girder end. Additional tests were made using a large size impact hammer model PCB 086D50 (hammer mass: 5.5 kg, frequency range: 0.75 kHz, amplitude range: 22 kN). The excitation points of the large impact hammer were on the top flange of the cross girder exactly at the joint between longitudinal and cross girders. The excitation points were not located at the joints, which were adjacent to the instrumented longitudinal girder.
240250240220280250260230250250220 1515
2720
A1A2A3A5A6A7A8A9A10 A4A11A12
Figure 16. Location of accelerometers along the girder

7. Practical implementation of the project results
484
Figure 17. Small and large hammers
Damage produces clear changes in the vibration signature of individual longitudinal girders,
and the location of damage can be determined in a qualitative way. For direct excitation, damage produces a frequency shift for the local girder modes while, for indirect excitation, it diminishes the amplitudes of local modes. While damage clearly manifests itself in the identified transfer functions and some qualitative conclusion can be drawn, it is not obvious how to interpret the results in a more analytical way. Except for the global modes which are hardly affected by damage, the transfer functions do not show well defined peaks that can clearly be associated with individual modes. Peaks appear rather wide, either due to high damping or because of the presence of several closely-spaced natural frequencies due to the complexity of the structure. It is, therefore, not believed that classical methods that rely on comparison of individual modes will lead to dependable damage detection. 3.4. Third campaign
From the results of the second campaign, it was decided to analyse cross-girders responses for the dynamic structural behaviour with a reduced instrumentation (16 accelerometers spread over half of the cross-girders – Figure 18). The sensors are located on the continuous cross girders.
Figure 18. Instrumentation plan and damage locations (third campaign)
Larger damages than in the numerical simulations have been considered. They were located at the connexions between the longitudinal/cross girders and the cross/ main girders. For the connexions between the longitudinal and the cross girders, these damages consist in (Figure 19a):

Instrumentation of the Avesnes/Helpe bridge
485
1. removing a fish joint, 2. cutting of the longitudinal girder on 35 mm, 3. cutting of the longitudinal girder on 70 mm, 4. cutting of the longitudinal girder on 120 mm, 5. cutting of the longitudinal girder on 230 mm, 6. cutting of the longitudinal girder on 280 mm, 7. cutting of the longitudinal girder on 385 mm. For the connexion between the cross and the main girders (Figure 19b), the damages
consist in cutting the cross girder on 35 mm to 480 mm in 6 steps (35/70/120/250/380/ /480 mm). a) Longitudinal/cross girder b) Cross/main girder
Figure 19. Examples of damages
The damages are spread over the bridge to test the capacity of detection when (Figure 15): • a damage on the longitudinal girder is far from the sensors, • a damage on the longitudinal girder is close to a sensor on the end of the sensors grid, • a damage on the longitudinal girder is close to a sensor in the centre of the sensors grid, • a damage on the cross girder close is to a sensor, • a damage on the cross girder is far from the sensors.

7. Practical implementation of the project results
486
Damage A
Damage B
Damage C
Cross girder 1
Cross girder 2
Cross girder 3
Cross girder 4
Mode 1 Mode 2 Mode 3 Damage A vs undamaged structure
Mode 1 Mode 1 Mode 3 Damage A & B vs undamaged structure
Modes 1, 3 and 4 Mode 3 Mode 4 Damage A, B & C vs undamaged structure
Figure 20. Results from the comparison between damage states (longitudinal girders)

Instrumentation of the Avesnes/Helpe bridge
487
As explained previously, natural frequencies and mode shapes are not sensitive parameters for damage detection. For the three first damages, the modifications are not significant. In conclusion, the experimental results show that only the most important damages give a little decrease for one frequency, which is not satisfactory to detect damage. In general, it is the same for the mode shapes but when the damage is located at the end of the main girder, mode shapes are more affected and it is possible to localize this damage but not the other ones. Consequently, as for the numerical approach, the idea is to continue the study by using damage indexes based on the mode shapes.
Three damage indexes give interesting results, all based on modal curvatures: the “Strain energy Method”, the “Mode Shape Curvature Method” and the “Flexibility Curvature”. The analysis of the three frequencies around 8.33 Hz, 12.2 Hz and 40 Hz provides efficient results and if all the damages and all modes cannot always detect and localize the damages, the correlation between all the results for one damage stage allows to detect a problem and to localize it (Figure 20). Figure 21 presents some results obtained from the analysis of the cross- -girders. These results are very promising since they show efficiency and accuracy in the damage detections. It is nevertheless essential to extract damage indexes for the individual mode shapes separately and not in global way.
A vs undamaged – Mode 2 A & B vs undamaged – Mode 3 A, B & C vs undamaged – Mode 3
A & B vs A – Mode 1 A, B & C vs A & B – Mode 1 A, B & C vs A & B – Mode 3
Figure 21. Results from the comparison between damage states (cross-girders)
4. CONCLUSIONS
This paper has presented the different experimental investigations realized on the Avesnes bridge. Further analyses are still under progress, but it can drawn from the preliminary results that damage detection methods are very promising techniques and can be positively used on this family of bridges.


489
Author index
Aho, T., University of Oulu, Finland, 181 Al-Emrani, M., Chalmers University
of Technology, Göteborg, Sweden, 365 Bäßler, R., Federal Institute for Materials Research
and Testing (BAM), Germany, 137 Bell, B., Network Rail Infrastructure Ltd.,
United Kingdom, 29, 53 Bergström, M., Luleå University of Technology,
Sweden, 355 Bień, J., Wrocław University of Technology,
Poland, 29, 93, 105, 423, 473 Bischoff, R., Swiss Federal Laboratories for
Materials Testing and Research (EMPA), Switzerland, 397
Blanksvärd, T., Luleå University of Technology, Sweden, 331
Boyle, W., City University, United Kingdom, 169 Brühwiler, E., Ecole Polytechnique Fédérale de
Lausanne (EPFL), Switzerland, 231, 243, 251 Budelmann, H., Technical University
Braunschweig, Germany, 149 Buhr Jensen, B., COWI A/S, Denmark, 117 Burkert, A., Federal Institute for Materials
Research and Testing (BAM), Germany, 137 Carolin, A., Luleå University of Technology,
Sweden, 303, 313, 331, 341 Casas, J.R., Technical University of Catalunya,
Spain, 83, 221, 231 Cervenka, J., Cervenka Consulting,
Czech Republic, 231, 251, 283 Cervenka, V., Cervenka Consulting,
Czech Republic, 283 Chatzichrisafis, P., Materialprüfungsanstalt
Universität Stuttgart, Germany, 191 Cremona, C., Laboratoire Central des Ponts
et Chaussées, France, 29, 221, 261, 423, 473 Cruz, P., University of Minho, Portugal, 93, 105,
159, 293
Dalton, G., UIC Paris, France, 13 Dieleman, L., SNCF, France, 473 Duan, G., University of Oulu, Finland, 181 Eichler, B., Rheinisch-Westfälische Technische
Hochschule Aachen (RWTH), Germany, 261 Elfgren, L., Luleå University of Technology,
Sweden, 29, 251, 355, 423, 435, 445 Enochsson, O., Luleå University of Technology,
Sweden, 355, 435, 445 Feldmann, M., Rheinisch-Westfälische
Technische Hochschule Aachen (RWTH), Germany, 377
Feltrin, G., Swiss Federal Laboratories for Materials Testing and Research (EMPA), Switzerland, 29, 397, 473
Forde, M., University of Edinburgh, United Kingdom, 73
Frølund, T., COWI A/S, Denmark, 117, 137, 211
Gładysz, M., Wrocław University of Technology,
Poland, 409 Grosse, C.U., Materialprüfungsanstalt Universität
Stuttgart, Germany, 191 Gylltoft, K., Chalmers University of Technology,
Göteborg, Sweden, 251 Hariri, K., Technical University Braunschweig,
Germany, 149 Helmerich, R., Federal Institute for Material
Research and Testing (BAM), Germany, 83, 93, 127, 303, 321
Herwig, A., Ecole Polytechnique Fédérale de Lausanne (EPFL), Switzerland, 231, 243, 251
Hoehler, S., Rheinisch-Westfälische Technische Hochschule Aachen (RWTH), Germany, 261
Holm, G., Swedish Geotechnical Institute, Sweden, 231
Sustainable Bridges – Assessment for Future Traffic Demands and Longer Lives

490
Jakubowski, K., Wrocław University of Technology, Poland, 105
Janda, Z., Czech Technical University, Prague, Czech Republic, 283
Jensen, J.S., COWI A/S, Denmark, 29, 221 Johansson, B., Luleå University of Technology,
Sweden, 261 Kamiński, T., Wrocław University of Technology,
Poland, 105, 461 Kammel, C., Rheinisch-Westfälische Technische
Hochschule Aachen (RWTH), Germany, 127 Karoumi, R., Royal Institute of Technology,
Sweden, 221 Kerrouche, F., City University, United Kingdom,
169 Kilpelä, A., University of Oulu, Finland, 181 Kinnunen, J., University of Oulu, Finland, 181 Kiviluoma, R., WSP Finland Ltd., Finland, 29, 389 Kmita, J., Wrocław University of Technology,
Poland, 105 Kostamovaara, J., University of Oulu, Finland, 181 Kronborg, A., Banverket Borlänge, Sweden, 435 Krüger, M., Materialprüfungsanstalt Universität
Stuttgart, Germany, 191 Krzyżanowski, J., Wrocław University
of Technology, Poland, 201 Larsson, T., Luleå University of Technology,
Sweden, 261, 435 Leconte, R., Laboratoire Central des Ponts
et Chaussées, France, 473 Leighton, J., City University, United Kingdom, 169 de León, A.D., University of Minho, Portugal, 159 Linghoff, D., Chalmers University of Technology,
Göteborg, Sweden, 365 Lundgren, K., Chalmers University of Technology,
Göteborg, Sweden, 251 Lyöri, V., University of Oulu, Finland, 181 Maksymowicz, M., University of Minho,
Portugal, 105 Melbourne, C., University of Salford, United
Kingdom, 221, 273 Meyer, J., Swiss Federal Laboratories for Materials
Testing and Research (EMPA), Switzerland, 397 Naumes, J., Rheinisch-Westfälische Technische
Hochschule Aachen (RWTH), Germany, 377 Neves, L., Universidade Nova de Lisboa, Portugal
(formerly at University of Minho, Portugal), 293 Niederleithinger, E., Federal Institute for Material
Research and Testing (BAM), Germany, 29, 83 Olofsson, J., Skanska Sverige AB, Sweden, 29
Orbán, Z., MÁV Hungarian Railways, Hungary, 19
Patron, A., Laboratoire Central des Ponts
et Chaussées, France, 261 Paulsson, B., Banverket Borlänge, Sweden
and UIC Paris, France, 29, 65, 435, 445 Pedersen, H., COWI A/S, Denmark, 313 Pedersen, T., COWI A/S, Denmark, 117 Plos, M., Chalmers University of Technology,
Göteborg, Sweden, 221, 251 Puurula, A., Luleå University of Technology,
Sweden, 445 Rawa, P., Wrocław University of Technology,
Poland, 105, 201, 409, 473 Röllig, M., Federal Institute for Material Research
and Testing (BAM), Germany, 321 Rosell, E., Swedish Road Administration,
Sweden, 251 Roszkowski, A., Wrocław University
of Technology, Poland, 409 Schultz, A., University of Applied Sciences,
Potsdam, Germany, 321 Skoczyński, W., Wrocław University
of Technology, Poland, 201 Sørensen, R., COWI A/S, Denmark, 211 Szymkowski, J., Wrocław University
of Technology, Poland, 201 Täljsten, B., Luleå University of Technology,
Sweden, 29, 303, 313, 331, 341, 355, 445 Thelandersson, S., Lund University of Technology,
Sweden, 251 Thun, H., Luleå University of Technology,
Sweden, 445 Tomor, A., University of the West of England,
United Kingdom, 273 Trela, C., Federal Institute for Material Research
and Testing (BAM), Germany, 461 Vielhaber, J., University of Applied Sciences,
Potsdam, Germany, 321 Wang, J., University of Salford, United Kingdom,
273 Weber, B., Swiss Federal Laboratories for Materials
Testing and Research (EMPA), Switzerland, 473 Wiśniewski, D., COWI A/S, Denmark (formerly
at University of Minho, Portugal), 231, 293 Zwolski, J., Wrocław University of Technology,
Poland, 201, 409, 473