RIVERFRONT PARK BRIDGES - City of Spokane
67
RIVERFRONT PARK BRIDGES INSPECTION AND ANALYSIS TRIANGLE TRUSS BRIDGE NOVEMBER 14, 2014 | Final Report With Revisions – 12/22/2014
-
Upload
khangminh22 -
Category
Documents
-
view
3 -
download
0
Transcript of RIVERFRONT PARK BRIDGES - City of Spokane

RIVERFRONT PARK BRIDGES INSPECTION AND ANALYSIS
TRIANGLE TRUSS BRIDGE NOVEMBER 14, 2014 | Final Report
With Revisions – 12/22/2014
This Page Intentionally Left Blank
Riverfront Park Bridges Inspection and Analysis Triangle Truss Bridge Revised – 12/22/2014 i
TRIANGLE TRUSS BRIDGE
November 14, 2014- With Revisions – 12/22/2014
Prepared for
City of Spokane
Steve Hansen, Senior Engineer
Prepared by
Kpff Consulting Engineers
Marijean Frymoyer, PE
Project Engineer / Inspection Team Leader
Sub-consultants
SWCA Environmental Consultant
Eileen Heideman
Architectural Historian
Table of Contents
Bridge Inspection and Analysis Report
1. Bridge Description.........................................................................1
2. Document Review..........................................................................1
3. Evaluation Procedures ..................................................................1
4. Evaluation Findings........................................................................2
5. Conclusions and Recommendations.............................................3
6. Permits and Cultural Resource Requirements...............................4
Appendix A
Bridge Inspection Form
Key Photographs
Bridge Component Labeling System
Appendix B
Bridge Improvement Details
Cost Estimate
Appendix C
Load Rating Results & Calculations
Appendix D
Photograph Log
Photograph Contact Sheet
Riverfront Park Bridges Inspection and Analysis Triangle Truss Bridge Revised – 12/22/2014 1
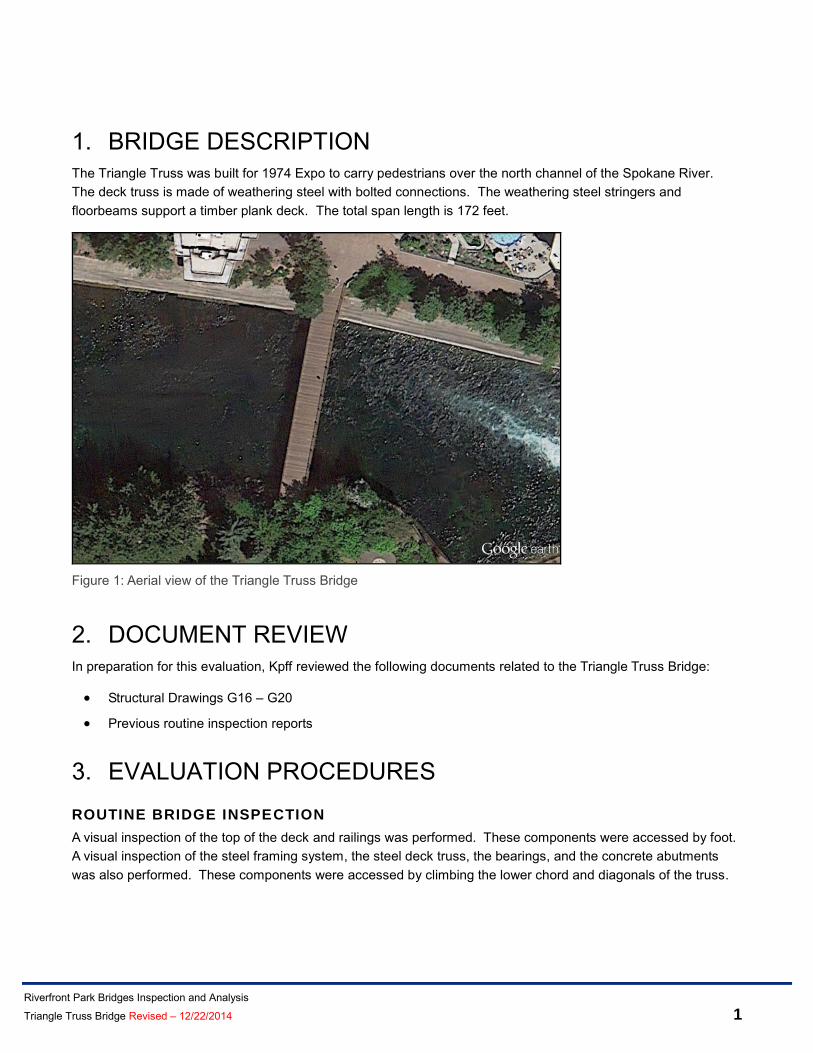
1. BRIDGE DESCRIPTION
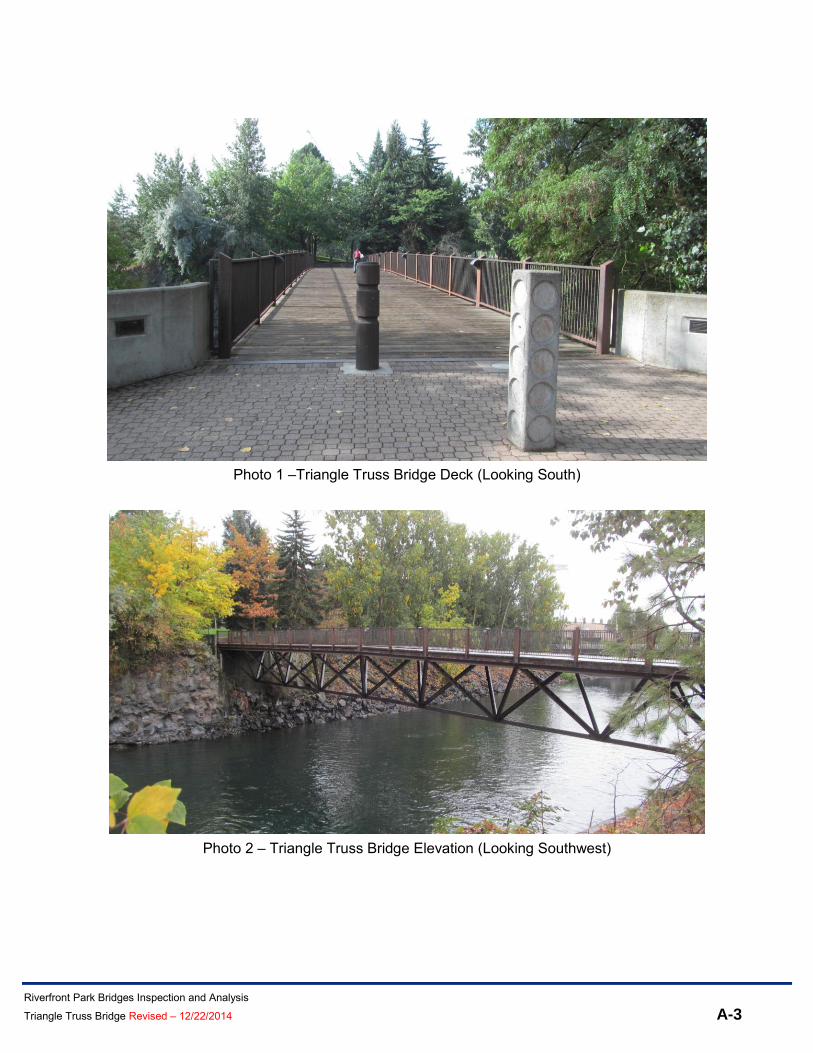
The Triangle Truss was built for 1974 Expo to carry pedestrians over the north channel of the Spokane River.
The deck truss is made of weathering steel with bolted connections. The weathering steel stringers and
floorbeams support a timber plank deck. The total span length is 172 feet.
Figure 1: Aerial view of the Triangle Truss Bridge
2. DOCUMENT REVIEW
In preparation for this evaluation, Kpff reviewed the following documents related to the Triangle Truss Bridge:
Structural Drawings G16 – G20
Previous routine inspection reports
3. EVALUATION PROCEDURES
ROUTINE BRIDGE INSPECTION
A visual inspection of the top of the deck and railings was performed. These components were accessed by foot.
A visual inspection of the steel framing system, the steel deck truss, the bearings, and the concrete abutments
was also performed. These components were accessed by climbing the lower chord and diagonals of the truss.

Riverfront Park Bridges Inspection and Analysis Triangle Truss Bridge Revised – 12/22/2014 2
STRUCTURAL ANALYSIS
The timber deck, steel stringers, floorbeams, and truss were load rated using the LRFR method. The analysis
was performed using SAP2000. A uniform pedestrian live load of 90 psf and the H10 design vehicle were used in
the analysis. The analysis assumed that there was only one vehicle on the bridge at a time and the vehicle load
did not act concurrently with the uniform pedestrian live load. Impact was not included in the analysis. A rating
factor (RF) greater than or equal to 1.0 means that the bridge can safely carry the loads under investigation.
4. EVALUATION FINDINGS
BRIDGE INSPECTION
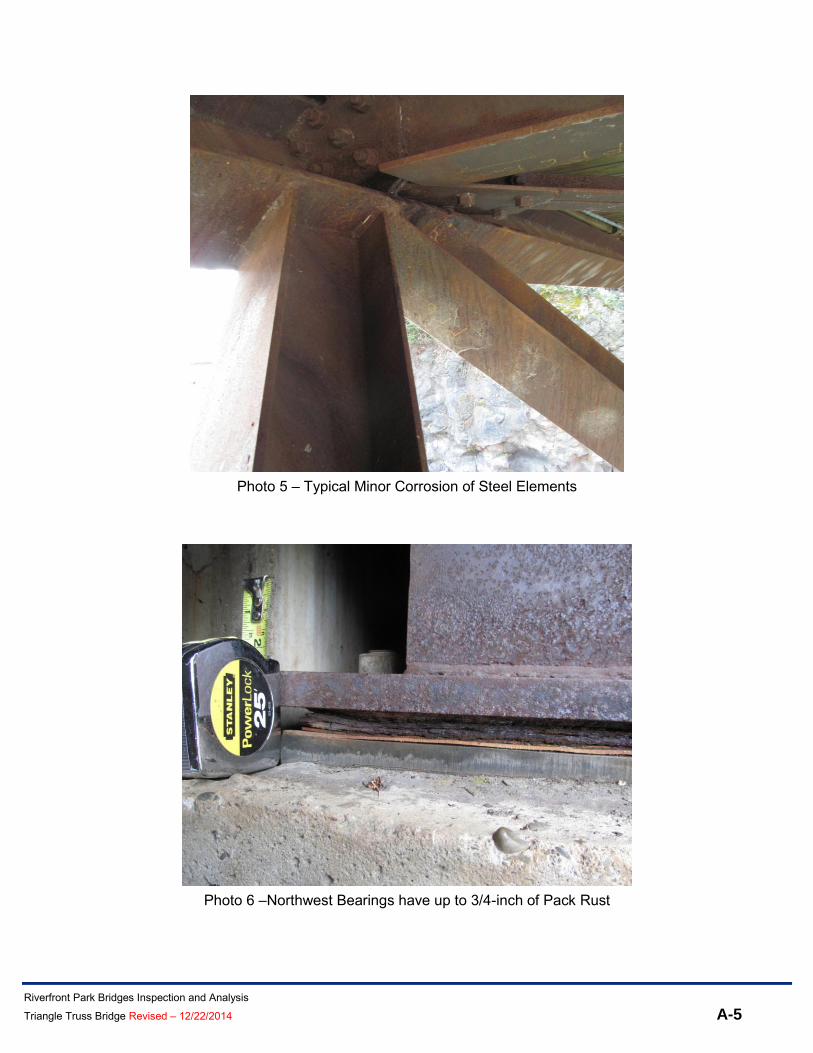
The steel components are in good condition with only minor surface rust; there was no measurable surface loss.
All of the steel connections are intact. The bearing plates are corroded and have up to 3/4-inch of pack rust. The
timber deck has evidence of normal wear and tear, including missing bolts. The north embankment is sloughing
and is filling in material around the truss’ lower panel point.
The bridge inspection report, bridge component labeling system, and photographs and are included in Appendix A.
STRUCTURAL ANALYSIS
The load rating analysis is reported as a Rating Factor (RF). The RF is the ratio of available capacity in each
primary superstructure component over the specified live load combination under investigation. Based on
AASHTO specifications, a RF less than 1.0 is interpreted to mean that one or more of the superstructure
components do not meet current minimal capacity code standards and consideration should be given to either
strengthening the subject component(s), or posting a sign identifying a maximum allowable load for the structure
linked to the actual RF of the structure. Rating factors greater than 1.0 are interpreted to mean that all of the
superstructure components have sufficient capacity to safely support the load under investigation, per the
AASHTO specifications.
The controlling rating factor is dependent on the timber deck fully bracing the compression (top) flange of the steel
stringers. The design drawings show a positive connection between the timber deck, the timber longitudinal
nailers, and the steel stringers. This connection could not be inspected, but, assuming it is still intact, the timber
deck provides enough rigidity to brace the top flange of the stringers.
For the pedestrian load case, the controlling RF = 1.25. The controlling component is the diagonal truss
members. For the vehicle load case, the controlling RF = 0.16 for timber deck members in poor condition. The
controlling component is the deck in flexure. The timber deck is not designed to carry vehicle loads, which
reflects the low rating factor for the AASHTO H10 design vehicle. The City Parks Department should ensure that
the bollards at the abutments remain in place to prevent vehicles from driving across the bridge.
The load rating calculations are included in Appendix C.

Riverfront Park Bridges Inspection and Analysis Triangle Truss Bridge Revised – 12/22/2014 3
5. CONCLUSIONS AND RECOMMENDATIONS
If the current condition is maintained, this bridge will serve the community indefinitely.
In general, structural steel components that support bridges are conducive to corrosion from environmental
conditions such as water, moisture, salts, air pollution, dirt and plants, bird droppings, and bird nests. The more
these items are kept a bay the longer the bridge will last. Maintenance is critical, especially in the form of
cleaning and removing debris, bird nests, and droppings from anyplace on the structure they can or do collect.
The Triangle Bridge structural components, despite experiencing minor levels of corrosion over the past 30 years,
have performed quite well. Currently, there is no reason to suspect that this bridge will not be in service for at
least another 50 years and much longer if inspected and maintained on a regular basis.
The steel used for this bridge is weathering steel. Its protective coat is a result of a thin film of rust. It is an
excellent system for this environment. However, if this protection system appears to degrade over time, painting
the bridge becomes an option which can easily buy another 20 to 30 years of service life.
Maintenance of a few items, discussed below, will also help preserve the bridge and improve safety for the public
BEARINGS
The bearing plates should be cleaned of all debris and surface rust and should be treated with a protective
paint system.
TIMBER DECK
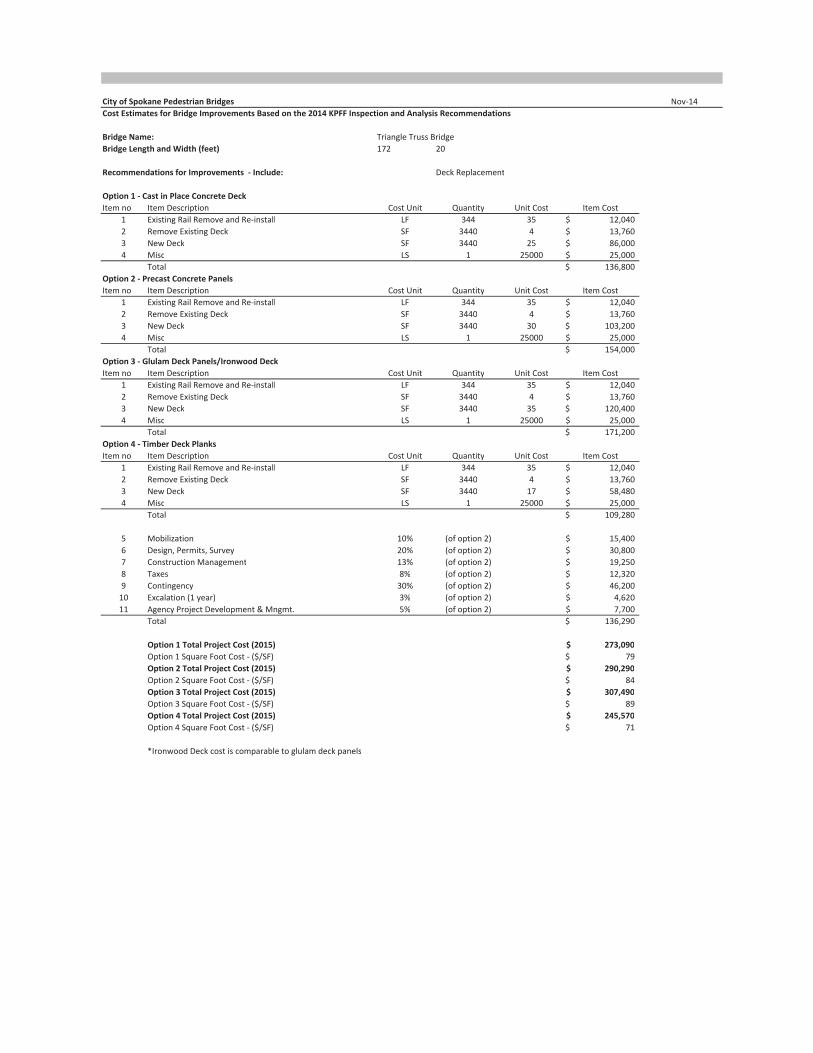
The twisted and deteriorated boards and missing bolts should be replaced. Alternatively, the City could consider
replacing the timber deck with a different material with a longer lifespan. By using a colored concrete mix with a
special stamp or form liner, the concrete deck options could resemble a timber plank deck. Appendix B includes
typical details and a cost comparison of different deck replacement options. The total estimated cost of the deck
replacement, dependant on the material selected, is between $241,000 and $303,000. A timber deck
replacement in kind has a lifespan of approximately 10 years. The concrete deck, glulam deck panels, and
Ironwood deck have a lifespan of approximately 50 to 75 years.
STEEL TRUSS
The soil should be removed around panel point “L8” to provide 1 foot of clearance below the truss. This will
improve load path clarity and reduce the potential for moisture-driven deterioration of the steel. The debris should
be removed from the bottom chord panel points.
EROSION
The City should consider placing concrete slope protection at the north abutment to prevent further sloughing of
the embankment.

Riverfront Park Bridges Inspection and Analysis Triangle Truss Bridge Revised – 12/22/2014 4
FUTURE INSPECTIONS AND ANALYSIS
A routine walk-through inspection should be performed every two years. KPFF has provided inspection forms,
which, if utilized on a continual basis will provide an invaluable record of the bridge condition and areas of
continual problems over time, and thereby help inform the best way to care for the bridge over the next 75 years
and preserve the City's investment in its infrastructure. The bridge will not need to be re-analyzed unless the
bridge will be used in a manner different than considered during the original design, or there is significant
deterioration to the primary structural elements.
6. PERMITS AND CULTURAL RESOURCE REQUIREMENTS
PERMITS
An environmental permit matrix was prepared by SWCA Environmental Consultants for the Riverfront Park
Bridges. The proposed bridge improvement work may require the following permits or approvals:
Hydraulic Project Approval permit from the Washington Department of Fish and Wildlife.
State Environmental Policy Act Threshold Determination from the City of Spokane
Critical Areas Review from the City of Spokane
Shoreline Substantial Development Permit from the City of Spokane
More information can be found in SWCA’s report.

Riverfront Park Bridges Inspection and Analysis Triangle Truss Bridge Revised – 12/22/2014 Appendix A
APPENDIX A
PAGE
BRIDGE INSPECTION FORM . . . . . . . . . . . . . . . . . . . . . . . . . . . . . . . . . . . . . . . . . . . . . . . . . . . . . . . . . . . . . . A-1
LIST OF PHOTOGRAPHS PHOTO DESCRIPTION PAGE
1 Triangle Truss Bridge Deck (Looking South) ......................................................................... A-3
2 Triangle Truss Bridge Elevation (Looking Southwest) ........................................................... A-3
3 Cracked and Split Timber Deck Planks .................................................................................. A-4
4 Missing Bolts in Timber Deck Planks ..................................................................................... A-4
5 Typical Minor Corrosion of Steel Elements ............................................................................ A-5
6 Northwest Bearings have up to 3/4-inch of Pack Rust .......................................................... A-5
7 Soil has Built Up around L8 Panel Point and Debris
has Collected at Lower Truss Panel Points ........................................................................... A-6
PAGE
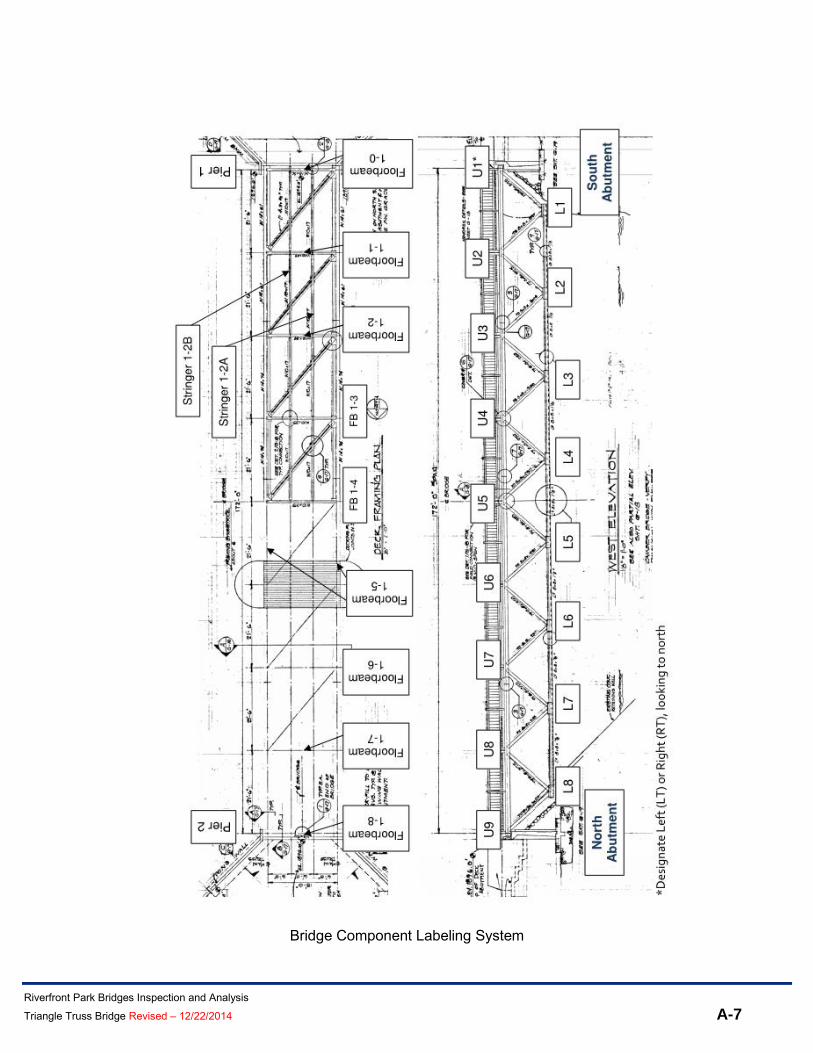
BRIDGE COMPONENT LABELING SYSTEM . . . . . . . . . . . . . . . . . . . . . . . . . . . . . . . . . . . . A-7

CITY OF SPOKANE PEDESTRIAN BRIDGE INSPECTION FORM
A-1
Description of Bridge
Summary of Condition and Critical Findings
Summary of Recommendations
Summary of Bridge Condition
Bridge Component No. of
Compon.
% of **
Condition Rating*
Comments 8 – 7
Good 6 – 5
Fair 4 – 3
Poor
1
2
3
4
5
6
7
8
9
10
11
12
13
*See Page 2 for detailed descriptions **Condition rating percentages are based on the % of area, length, or each of the bridge components inspected.
GENERAL NOTES
Bridge No.
Bridge Name Bridge Location
Inspection Date Inspector(s) Agency
Access Method Weather
Load Rating Date Live Load Pedestrian Vehicle
Load Rating Factor(s) Ped. Veh. Controlling
Component
Pedestrian Vehicle
A-2
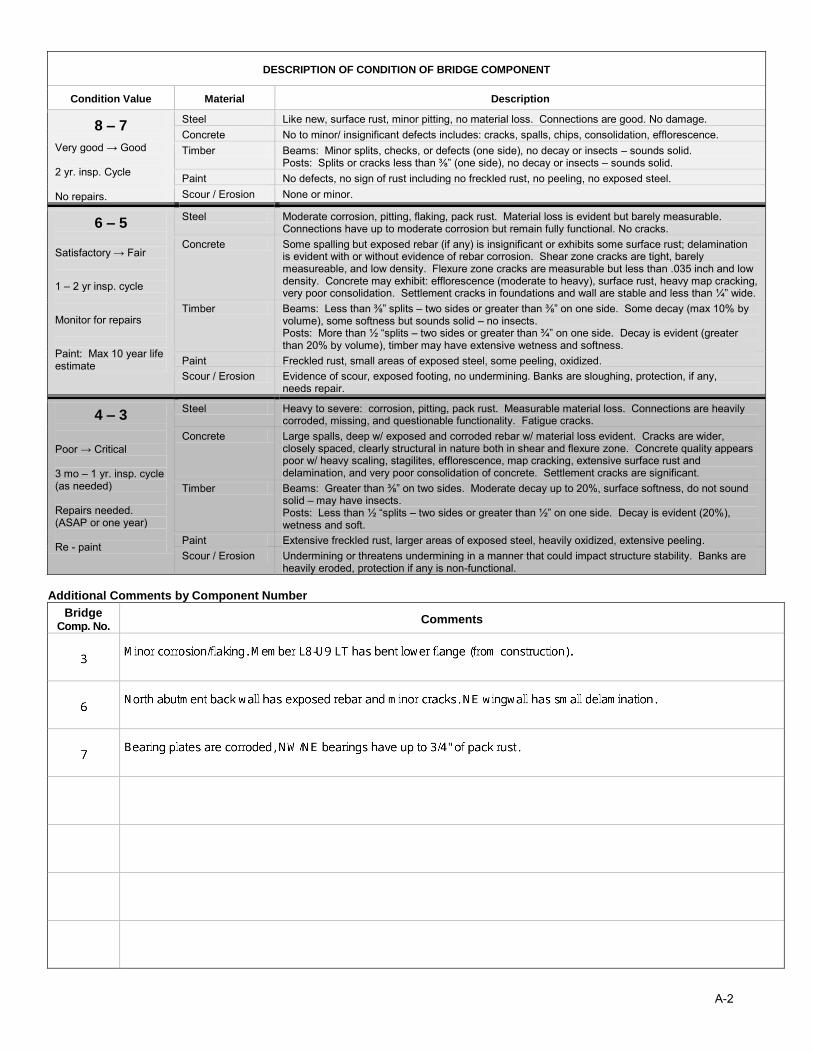
DESCRIPTION OF CONDITION OF BRIDGE COMPONENT
Condition Value Material Description
8 – 7
Very good → Good 2 yr. insp. Cycle No repairs.
Steel Like new, surface rust, minor pitting, no material loss. Connections are good. No damage.
Concrete No to minor/ insignificant defects includes: cracks, spalls, chips, consolidation, efflorescence.
Timber Beams: Minor splits, checks, or defects (one side), no decay or insects – sounds solid. Posts: Splits or cracks less than ⅜” (one side), no decay or insects – sounds solid.
Paint No defects, no sign of rust including no freckled rust, no peeling, no exposed steel.
Scour / Erosion None or minor.
6 – 5
Satisfactory → Fair
1 – 2 yr insp. cycle
Monitor for repairs
Paint: Max 10 year life estimate
Steel Moderate corrosion, pitting, flaking, pack rust. Material loss is evident but barely measurable. Connections have up to moderate corrosion but remain fully functional. No cracks.
Concrete Some spalling but exposed rebar (if any) is insignificant or exhibits some surface rust; delamination is evident with or without evidence of rebar corrosion. Shear zone cracks are tight, barely measureable, and low density. Flexure zone cracks are measurable but less than .035 inch and low density. Concrete may exhibit: efflorescence (moderate to heavy), surface rust, heavy map cracking, very poor consolidation. Settlement cracks in foundations and wall are stable and less than ¼” wide.
Timber Beams: Less than ⅜” splits – two sides or greater than ⅜” on one side. Some decay (max 10% by volume), some softness but sounds solid – no insects. Posts: More than ½ “splits – two sides or greater than ¾” on one side. Decay is evident (greater than 20% by volume), timber may have extensive wetness and softness.
Paint Freckled rust, small areas of exposed steel, some peeling, oxidized.
Scour / Erosion Evidence of scour, exposed footing, no undermining. Banks are sloughing, protection, if any, needs repair.
4 – 3
Poor → Critical 3 mo – 1 yr. insp. cycle (as needed) Repairs needed. (ASAP or one year) Re - paint
Steel Heavy to severe: corrosion, pitting, pack rust. Measurable material loss. Connections are heavily corroded, missing, and questionable functionality. Fatigue cracks.
Concrete Large spalls, deep w/ exposed and corroded rebar w/ material loss evident. Cracks are wider, closely spaced, clearly structural in nature both in shear and flexure zone. Concrete quality appears poor w/ heavy scaling, stagilites, efflorescence, map cracking, extensive surface rust and delamination, and very poor consolidation of concrete. Settlement cracks are significant.
Timber Beams: Greater than ⅜” on two sides. Moderate decay up to 20%, surface softness, do not sound solid – may have insects. Posts: Less than ½ “splits – two sides or greater than ½” on one side. Decay is evident (20%), wetness and soft.
Paint Extensive freckled rust, larger areas of exposed steel, heavily oxidized, extensive peeling.
Scour / Erosion Undermining or threatens undermining in a manner that could impact structure stability. Banks are heavily eroded, protection if any is non-functional.
Additional Comments by Component Number
Bridge Comp. No.
Comments
Riverfront Park Bridges Inspection and Analysis Triangle Truss Bridge Revised – 12/22/2014 A-3
Photo 1 –Triangle Truss Bridge Deck (Looking South)
Photo 2 – Triangle Truss Bridge Elevation (Looking Southwest)

Riverfront Park Bridges Inspection and Analysis Triangle Truss Bridge Revised – 12/22/2014 A-4
Photo 3 – Cracked and Split Timber Deck Planks
Photo 4 – Missing Bolts in Timber Deck Planks
Riverfront Park Bridges Inspection and Analysis Triangle Truss Bridge Revised – 12/22/2014 A-5
Photo 5 – Typical Minor Corrosion of Steel Elements
Photo 6 –Northwest Bearings have up to 3/4-inch of Pack Rust

Riverfront Park Bridges Inspection and Analysis Triangle Truss Bridge Revised – 12/22/2014 A-6
Photo 7 – Soil has Built Up around L8 Panel Point and debris has collected at Lower Truss
Panel Points
Riverfront Park Bridges Inspection and Analysis Triangle Truss Bridge Revised – 12/22/2014 A-7
Bridge Component Labeling System

Riverfront Park Bridges Inspection and Analysis Triangle Truss Bridge Revised – 12/22/2014 Appendix B
APPENDIX B
IMPROVEMENT DETAILS
COST ESTIMATES

DESCRIPTION PROFILE ONLY
PLAN&PROFILEBY
REVISED:
DATE
COUNCILACCEPT
TOFROMBY PROJ.DATE
REVISIONSE.F.N. . U.S.N.BYDATE PROJ
AS BUILT EFN:
PROJECT NAME:
ORIGINAL DRAWING.BAR IS ONE INCH ON
TYPE OF IMPROVEMENT:
CITY PROJECT NUMBER PLAN NUMBER
BRIDGE NAME:
(509) 625-6700
DRAWN:
CHECKED:
APPROVED:
DATES
CITY OF SPOKANE, WASHINGTONDEPARTMENT OF ENGINEERING SERVICES
808 WEST SPOKANE FALLS BLVD.SPOKANE, WASHINGTON 99201-3343
VERTICAL
HORIZONTAL
FILE NO.CBM NO.
DATEORD. NO.TOFROM
GRADE ORDINANCE LISTIF NOT ONE INCH ONTHIS SHEET, ADJUST
SCALES ACCORDINGLY
NAVD88 = (OLD CBM ELEV.) - (13.13)
BENCH MARK LOCATION
NAVD88 ELEV.
NAVD88 DATUM
AS OF JANUARY, 2000 USE NORTH AMERICAN VERTICAL DATUM OF 1988 (NAVD88)
CALL BEFORE YOU DIG 1-800-424-5555
SCALE
-- -----/--/---
-
--
AS SHOWN
HT 11/14MLF 11/14TW 11/14MLF 11/14
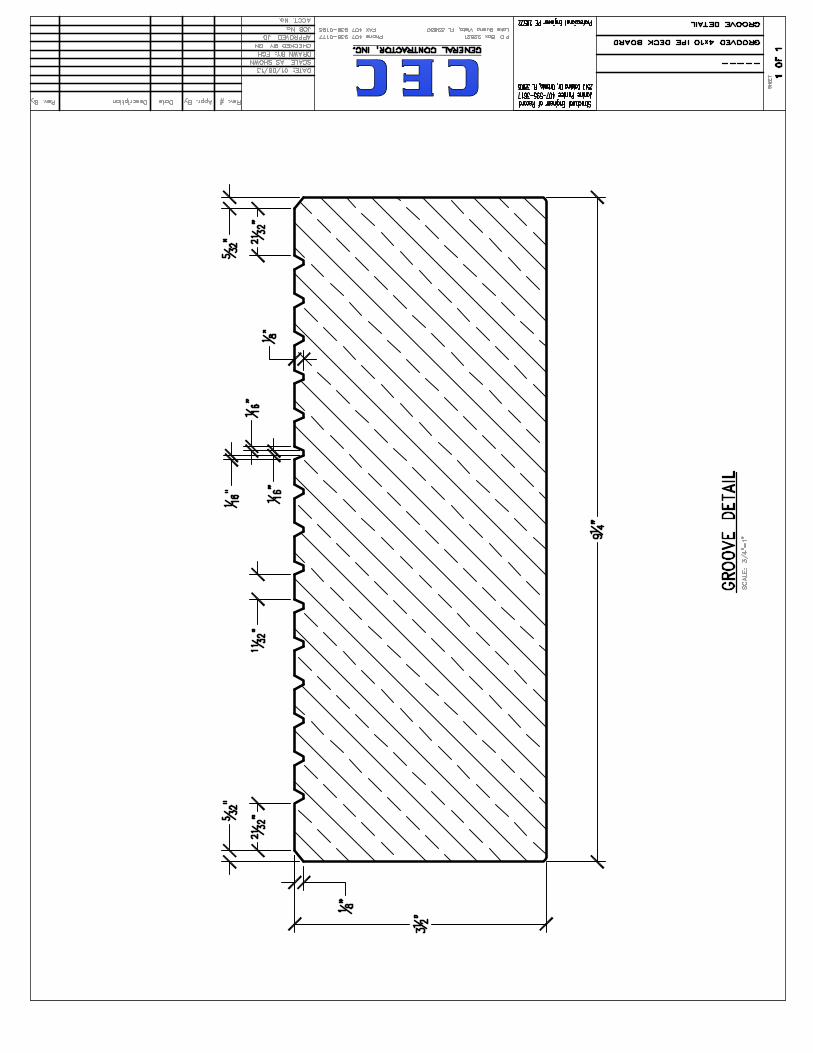
DECK REPLACEMENT2013186
BRIDGE
1 of 1--
Marijeanf
Text Box
Glulam Deck Panels
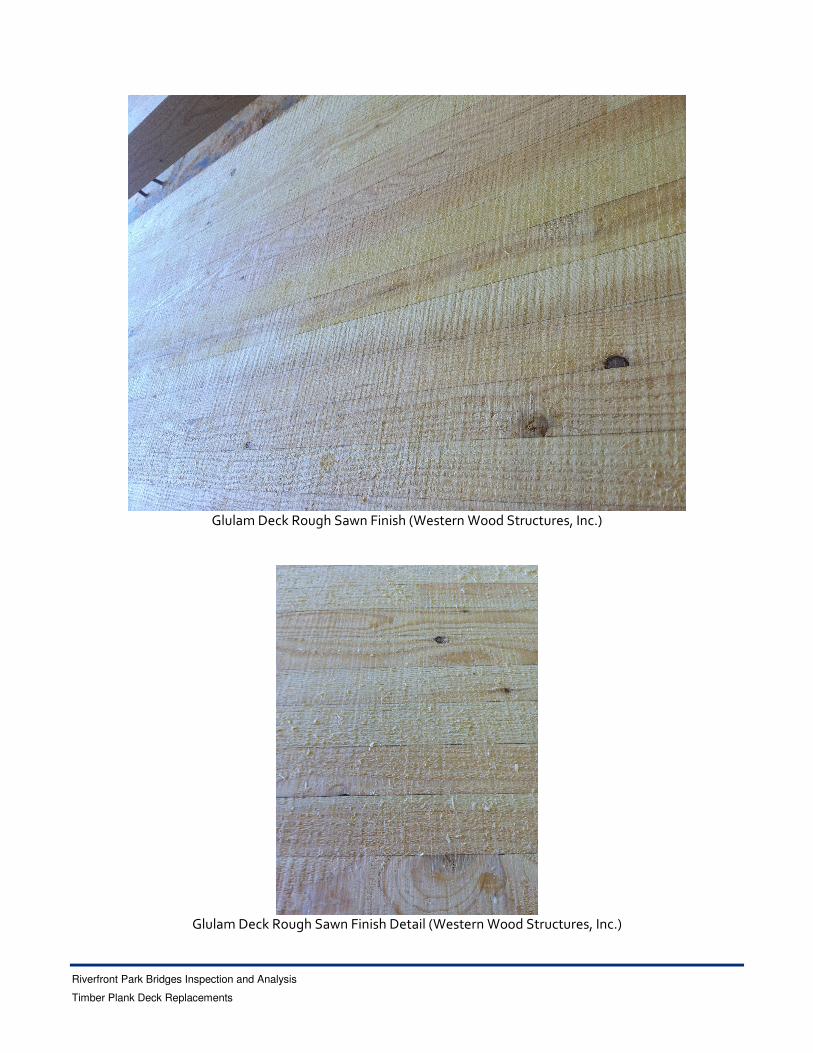
Riverfront Park Bridges Inspection and Analysis
Timber Plank Deck Replacements
Glulam Deck Rough Sawn Finish (Western Wood Structures, Inc.)
Glulam Deck Rough Sawn Finish Detail (Western Wood Structures, Inc.)

Phone: 414-445-8989 www.ironwoods.com
Bridge Decking and Rail Components

Phone: 414-445-8989 www.ironwoods.com
Bridge Decking and Rail Components
Designers, manufacturers and their customers have long recognized the aesthetic, life
cycle performance and environmental benefits associated with naturally durable
hardwoods like Iron Woods® Ipe in bridge construction.
A stream anchor from the Margarita was found with a well-preserved wooden stock. An
analysis by Forest Products Laboratories of the U.S. Department of Agriculture showed
that it was made of a wood known as ipe or lapacho. On its crown are several well-
preserved inscriptions: the date, 1618, and a foundry mark.
140 years – That’s Durability

Phone: 414-445-8989 www.ironwoods.com
Bridge Decking and Rail Components
An environmentally superior alternative to Treated Wood, PVC or Composites… products carrying the ‘Green By Nature™ ‘Build with Conscience’ Certificate of Compliance meet a specific set of Controlled Wood, Chain of Custody, Life Cycle Analysis and Due Diligence criteria that support environmental sustainability initiatives as follows…. All of the material carrying the Green By Nature Certificate of Compliance have been verified as
being, legally harvested, transported, exported, imported and documented in compliance with all
country of origin, international and domestic laws, rules, regulations and treaties pertaining to the
fair and legal trade of forest products including but not limited to the U.S. Department of
Agriculture Lacey Act, ITTA (International Tropical Timber Trade Agreement), CITES
(Convention On The International Trade of Endangered Species), and U.S. Buy American Act as
per Green By Nature Controlled Wood Chain Of Custody Policies and Procedures.
Additionally, material carrying the Green By Nature Certificate of Compliance, are derived from a
naturally occurring, renewable and sustainable resource base and are harvested from forests
that have not been converted to plantations or where civil rights are violated. These materials are
100% organic and grown without the use of genetic modification or chemical fertilization and are
regenerated naturally or by seeding and replanting. The natural service life of these materials
exceeds their natural growth cycle. These materials trap and store carbon and they are able to
be reclaimed, reused or recycled. These materials do not require for service any petroleum
based or inorganic chemical treatments adhesives or coatings. These materials do not require for
service any specialized handling storage or disposal procedures and generate zero post-
industrial or post-consumer non-biodegradable waste. These materials are also safe for human
and animal contact and meet Low VOC emission standards and meet International Building
Code and International Residential Code requirements for naturally durable wood.

Phone: 414-445-8989 www.ironwoods.com
Bridge Decking and Rail Components
The following is a summary of technical information designed to assist in the material
selection and specification process.
Technical Data - Iron Woods® Ipe
Features Iron Woods® Ipe
Composition Naturally Durable Hardwood Untreated
Species Tabebuia spp. (Lapacho Group)
Surface Dressed / Profiled / Roughsawn
Color Natural
Installation Stainless Steel Fasteners
Max overhand beyond joist 6"
Weight per net bf AD 18%+ (avg) 5.5 - 6 lbs
Weight per net bf KD 18% - (avg) 5 - 5.5 lbs
Lengths To 20'
Property Description ASTM Standard Iron Woods® Ipe
Modules of Elasticity ASTM D-143 3145000 psi
Bending Strength ASTM D-143 22.475 psi
Compression Parallel to Grain ASTM D-143 13,140 psi
Compression Perpendicular to Grain ASTM D-143 3,595 psi
Shear Parallel to Grain ASTM D-143 2,290 psi
Screw Pull Out
Avg. 1102 lbs Max Load
Coefficient of Friction - Leather ASTM C1028-89 Dry - .55 FP / Wet .79 FP (ADA Compliant)
Coefficient of Friction - Neolite ASTM C1028-89 Dry - .73 FP / Wet .69 FP (ADA Compliant)
Surface Burning ASTM E-84 (1989) NFPA Class A, UBC Class 1
Flame Spread (20 minutes) ASTM E-84 (1989) 0
Phone: 414-445-8989 www.ironwoods.com
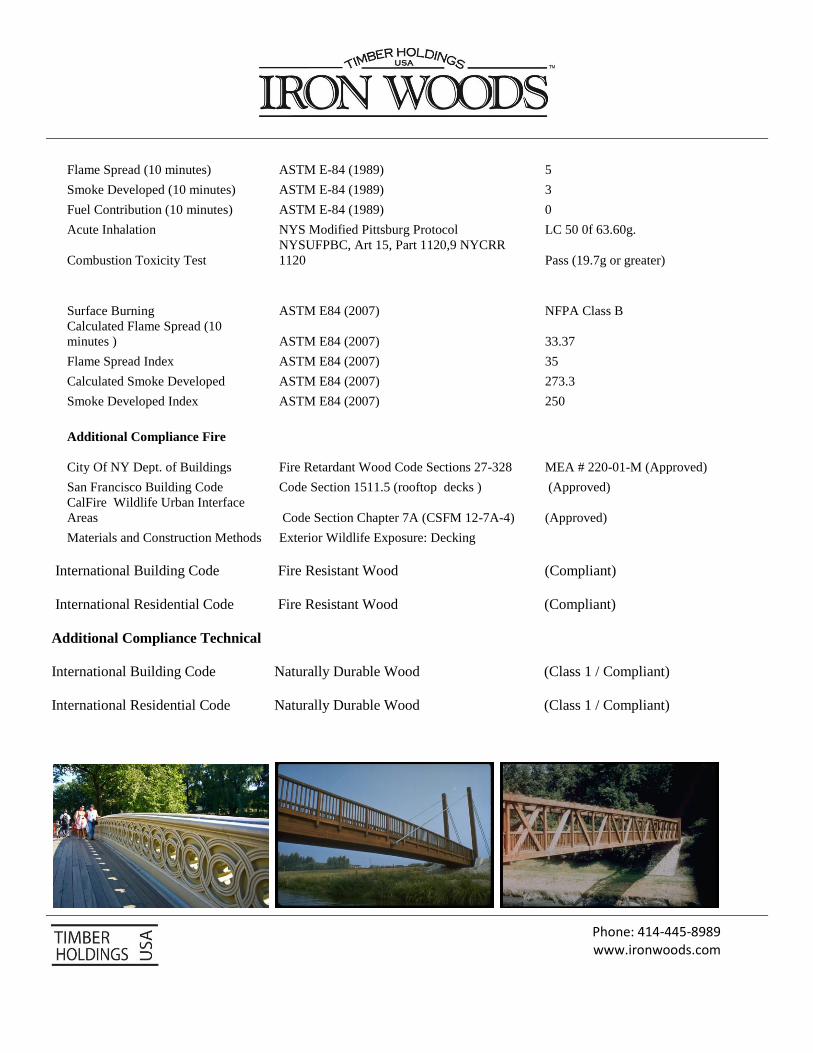
Flame Spread (10 minutes) ASTM E-84 (1989) 5
Smoke Developed (10 minutes) ASTM E-84 (1989) 3
Fuel Contribution (10 minutes) ASTM E-84 (1989) 0
Acute Inhalation NYS Modified Pittsburg Protocol LC 50 0f 63.60g.
Combustion Toxicity Test
NYSUFPBC, Art 15, Part 1120,9 NYCRR
1120 Pass (19.7g or greater)
Surface Burning ASTM E84 (2007) NFPA Class B
Calculated Flame Spread (10
minutes ) ASTM E84 (2007) 33.37
Flame Spread Index ASTM E84 (2007) 35
Calculated Smoke Developed ASTM E84 (2007) 273.3
Smoke Developed Index ASTM E84 (2007) 250
Additional Compliance Fire
City Of NY Dept. of Buildings Fire Retardant Wood Code Sections 27-328 MEA # 220-01-M (Approved)
San Francisco Building Code Code Section 1511.5 (rooftop decks ) (Approved)
CalFire Wildlife Urban Interface
Areas Code Section Chapter 7A (CSFM 12-7A-4) (Approved)
Materials and Construction Methods Exterior Wildlife Exposure: Decking
International Building Code Fire Resistant Wood (Compliant)
International Residential Code Fire Resistant Wood (Compliant)
Additional Compliance Technical
International Building Code Naturally Durable Wood (Class 1 / Compliant)
International Residential Code Naturally Durable Wood (Class 1 / Compliant)

CUMARU
CUMARU
Species: Dipteryx OdortaCommon names: Cumaru, Brazilian Teak, TonkaGeneral Characteristics: Heartwood is reddish-brown to light yellowish-brown. Sapwood is distinct and narrow. It has a low to medium luster with a fine texture and an interlocking grain. Cumaru has a waxy or oily feel; and though it has no distinctive taste, it may have a vanilla-like odor. It is rated as easy to air season with a slight tendency to check and with moderate warping.Durability: The timbers have a reputation for being very durable.Working Properties: Slightly abrasive, responds
well to planing and other machining operations.
Good nailing, screwing and gluing properties.
Uses: Common applications include heavy construction, decking, dock fenders, flooring, railroad crossties and tool handles.
Cumaru is a golden to reddish brown species of tropical hardwood with similar technical properties to Ipe with exception of its resistance to marine borers.
How does Iron Woods® Cumaru compare to other lumber and decking products?
Cumaru CCA-Treated Pine Composite/PVC DeckingType Hardwood Softwood Plastic Wood
Maintenance Low High Low
Decay Resistance High Varies Varies
Termite Resistance High Varies Varies
Strength High Medium Low
Movement in Service Medium-Low High High
Fire Rating Class High Varies Low
Weight per cu. ft. 67lbs. 35lbs. 60 to 64lbs.
Bending Strength 22,400 9,900 - 14,500 1,423 - 4,500
E-modulus 3,010,000 1,170,000 - 1,510,000 175,000 to 480,000
Shear Strength 2,395 1,370 561 - 1,010
Hardness 3,340 690 940 - 1,390
Strength & Durability
Similar in appearance to Ipe, it can at times be difficult to differentiate to the less trained eye. Cumaru does however have a more coarse and interlocking grain which results in a slightly lower dimensional stability requiringKiln-drying in dimensions in under 2” nominal in both storage and application. Cumaru is currently being usedheavily in the commercial boardwalk industry in 2x4 and 2x6 decking as a lower cost alternative to IPE and wheremarine borers is not an issue.
USA
CUMARU
IRON WOODS® Cumaru
Cumaru (Diperyx odorata)
Strength & Durability
“Iron Woods... Its Only Natural”

USA
Cumaru
TIMBERHOLDINGS U
SA
w w w . i r o n w o o d s .com© 2012 IPE is a product of Timber Holdings USA.
414-445-8989
Finishing
Green by Nature
Green by Nature products meet a specific set of Life Cycle environmental criteria defined as: * Product derived froma naturally occuring, renewable and sustainable resources. * Not endangered or at risk as per CITES (Convention On the International Trade of Endangered Species) * Not harvested from forest areas where traditional or civil rights are violated, converted for plantations or non-forest use. * Harvested legally and sourced in compliance with all international laws and regulations pertaining to the trade of plant products and more specifically in U.S. Department of Agriculture “Lacey Act Compliant”. * 100% organic, grown without the use of genetic modification or chemical fertilization. * Service life exceeds natural growth cycle, sequesters and stores carbon throughout its life cycle. * Generates zero post industrial and post consumer non-biodegradable waste. * Does not require for service, any specialized handling, storage or disposal procedures. Generates zero post industrial and post consumer non-biodegradable waste. * Does not require petroleum based or inorganic chemicals treatments, safe for human and animal contact and meets low VOC emmission standards.To learn
more about Green By Nature Certificationgo to www.greenbynature.com
Green nature™ B
Y
™
Availability
Cumaru is sold in two varieties: yellow and red and is typically sold mixed. Cumaru is best used in applications such as commercial decking, boardwalks, bridges, benches and exterior construction.Decking – 1x4, 1x6, 5/4x6, 2x4, 2x6 Timbers – up to 12x12 by special order only.
All other dimensions up to 12x12 clear of heart center are special order only.
We recommend coating Cumaru to assist the acclimation process and reduce checking. For best performance, coat all four sides and the ends of each board before installation. Use high-quality penetrating oil or water-based exterior sealers that contain mildewcides, fungicides, and UV inhibitors. Ask your local dealer about factory finishing. “See Installation Guide for Pre Installation Handling and Storage Requirements”
������������ �� � ������������ � ������
������������ ����������� ������ � ������� ������� �������������� ���������� ��!�����" ���� ��������
����� �#�� $ .������.� ������
����� �% ���������&�����'� �( ��� ��
" ���� ������������������ � �����)����!*� $� &��7�������#���
7�������)����������!�� ������ � �8 �
%��#��� %��#�&� ������� '� ��(��� )�����* (����'� � %��#�'� �
� <�� �����������#������������ ��� 4- "�� "� ��0���1��������������������
� ��#����<�� �����&��7 - "��� � �"0�5�1��������������������
" ����&��7 - "��� �� 950���1��������������������
� ?� � 4 � ����� ��0���1��������������������
.���� �"509��1������������������
7�������)��� ���������� � ���� !�
%��#��� %��#�&� ������� '� ��(��� )�����* (����'� � %��#�'� �
� <�� �����������#������������ ��� 4- "�� "� ��0���1��������������������
� ��#����<�� �����&��7 - "��� � �"0�5�1��������������������
" ����&��7 - "��� "� ��"0���1������������������
� ?� � 4 � ����� ��0���1��������������������
.���� ���0���1������������������
7�����4�)�9!*!���8 ����� !�:����3����8 �
%��#��� %��#�&� ������� '� ��(��� )�����* (����'� � %��#�'� �
� <�� �����������#������������ ��� 4- "�� "� ��0���1��������������������
� ��#����<�� �����&��7 - "��� � �"0�5�1��������������������
" ����&��7 - "��� "� ���0���1������������������
� ?� � 4 � ����� ��0���1��������������������
.���� ���0���1������������������
7�������)�+��6 ��8 ���!���
%��#��� %��#�&� ������� '� ��(��� )�����* (����'� � %��#�'� �
� <�� �����������#������������ ��� 4- "�� "� ��0���1��������������������
� ��#����<�� �����&��7 - "��� � �"0�5�1��������������������
" ����&��7 - "��� �� �90�9�1��������������������
� ?� � 4 � ����� ��0���1��������������������
.���� ��/0�9�1������������������
� ?�!���@���� ��A +�$���������, ��0���1��������������������
5 &� ���0�2�#�� 0� ���* ��A +�$���������, "�09��1��������������������
� '�� ��������?���#��� �"A +�$���������, �/0���1��������������������
9 .�� � 9A +�$���������, ��0"��1��������������������
/ '���������* "�A +�$���������, �50���1��������������������
�� <��������+��*�, "A +�$���������, �05��1����������������������
�� :����*�2�B����&������#����;�?��#�C �A +�$���������, �0���1����������������������
.��� �"50�/�1������������������
7�������+���!����, ��������'���-( �14.�/�2�����������������
��������� D���-����'� ����+1E -, �/1����������������������������
7�������+���!����, ��������'���-( �/�.�/�2�����������������
��������� D���-����'� ����+1E -, 9�1����������������������������
7�����4�+���!����, ��������'���-( 4�1.�/�2�����������������
�������"� D���-����'� ����+1E -, 9/1����������������������������
7�������+���!����, ��������'���-( ��-.-1�2�����������������
��������� D���-����'� ����+1E -, ��1����������������������������
G%�������&��7��� ��� ���#�!����������#����7�����

Riverfront Park Bridges Inspection and Analysis Triangle Truss Bridge Revised – 12/22/2014 Appendix C
APPENDIX C
LOAD RATING RESULTS AND CALCULATIONS

Riverfront Park Bridges Inspections & Analysis Triangle Truss Rev.1
Structural Analysis – Load Rating Summary
LRFR Bridge Rating Summary
Strength I – Rating Factors (RF):
Pedestrian Vehicle Inventory Operating Inventory Operating
Deck (Moment) RF 5.18 6.72 0.16 0.21
Controlling Point Deck, Between Stringers Deck, Between Stringers
Steel (Axial) RF 1.25 1.62 1.08 1.40
Controlling Point Diagonals Stringers
Maximum Wheel Live Load: Inventory = 0.16*8,000 lb = 1268 lb Operating = 0.21*8,000 lb = 1643 lb
Pedestrian = 90 psf uniform distributed load Vehicle = H-10 Truck
(16,000 lb. front axle, 4,000 lb. rear axle, 14’ axle spacing)
Figures C3.1-1 and C3.1-2 from the LRFD Guide Specifications for the Design of Pedestrain Bridges (December 2009) give a visual representation of the uniform pedestrian live load.
C - 1Revised 12/22/2014

Riverfront Park Bridges Inspections & Analysis Triangle Truss Rev.1
Structural Analysis - Load Rating Design Parameters:
Steel Yield Stress, fy = 50 ksi Modulus of Elasticity, E = 29,000 ksi Timber Deck Pine
G = 0.5 σ = 8.8 psf
Dead Loads Superstructure self weight Railing (SAP2000 Load Combination – Dead Envelope) Live Loads Pedestrian Uniform Load = 90 psf (SAP2000 Load Combination – Pedestrian Envelope) Vehicle Load = 20,000 lb H-10 Truck (SAP2000 Load Combination – Moving Vehicle Envelope) Impact is not included Pedestrian and Vehicle Loads do not act concurrently
Analysis Methods: The bridge geometry and section properties were modeled in SAP2000 based on the “As Built” drawings. These drawings showed that tube members were used for the diagonals, however during the inspection these members were found to be wide flange beams. Measurements were taken in the field to determine the sizing of the diagonals. The moment, shear, and axial demands due to dead loads and live loads were exported from SAP2000 to Excel. The moment, shear, and axial capacities were calculated in Excel. The Strength I rating factors were calculated in Excel using the peak demands in each element type. The visual bridge inspection completed on August 14, 2014 found the deck to be in poor condition. All other superstructure components were shown to be in good condition. The condition rating factor, φc, is equal to 1.0 for good members and 0.85 for the poor deck. The system rating factor, φs is equal to 1.0 for the deck due to its redundant nature, but 0.85 for all other members. The Strength I Load Rating checks flexure, shear, and axial capacities, as well as combined concurrent moment and axial capacity. Each member except the deck was checked individually and compared to the demands given in the SAP2000 model. The deck demands from the SAP2000 model were not used as these demands were instead calculated in Excel.
C - 2Revised 12/22/2014

Triangle Truss Bridge Undeformed
C - 3Revised 12/22/2014

Triangle Truss Bridge Extruded View
C - 4Revised 12/22/2014
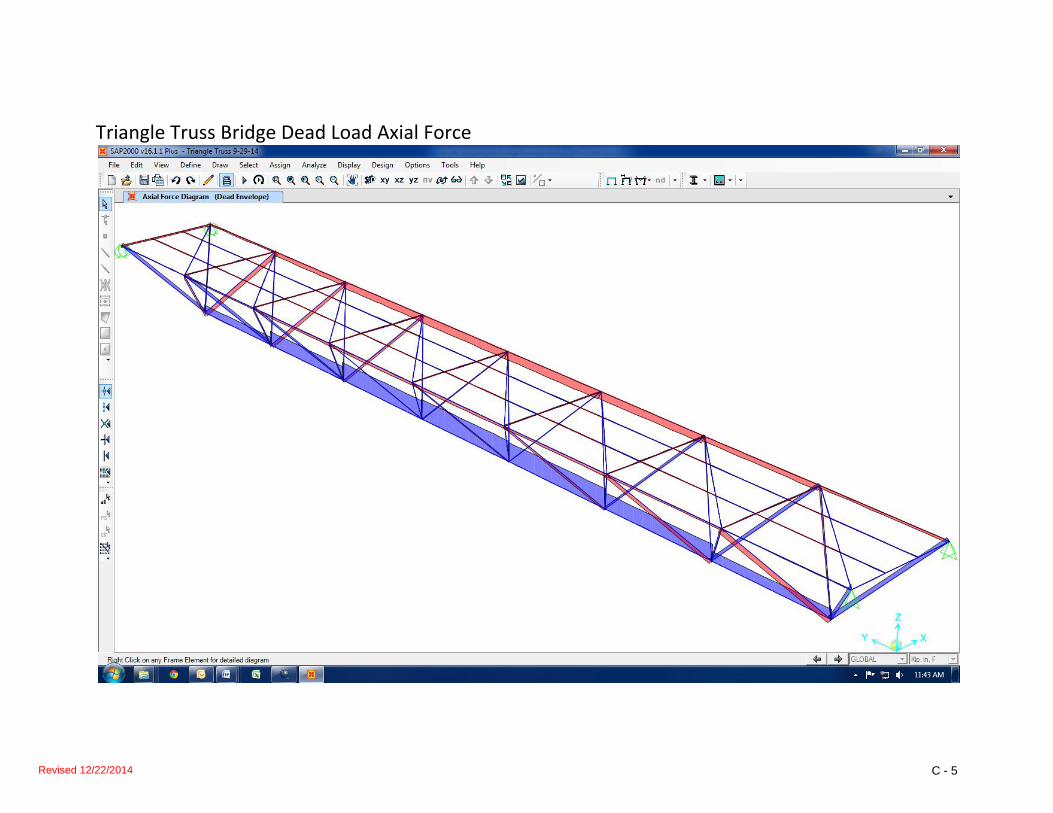
Triangle Truss Bridge Dead Load Axial Force
C - 5Revised 12/22/2014

Triangle Truss Bridge Pedestrian Moment
C - 6Revised 12/22/2014

Triangle Truss Bridge Vehicular Shear
TC - 7Revised 12/22/2014

Timber Deck
Triangle Truss Load Rating (LRFR Method)
Timber Plank Decking G 0.55 NDS Table 11.3.2A
Pine γwater 62.4 pcf
wplank 7.375 in γtimber 34.3 pcf
dplank 3.375 in σtimber 9.65 psf
Check timber planks as simple spans between steel stringers
Stringer Spacing Lc-c 6 ft
Nailer Beam bbeam 5.5 in
Clear Spacing Lclear 5.54 ft
Dead Loads Self Weight of deck is only dead load
Weight Wdeck = wplank*σtimber = 5.93 plf
Moment Mdeck = W*L2/8 = 22.8 lb-ft
Shear Vdeck = W*L/2 = 16.4 lb
Live Loads Pedestrian and Vehicular loads act seperately
Pedestrian: PL 90 psf AASHTO LRFD Ped Bridge 3.1
Weight WPL = PL*wplank = 55.3 plf
Moment MPL = W*L2/8 = 212 lb-ft
Shear VPL = W*L/2 = 153 lb
Vehicular: LL H10 Truck AASHTO LRFD Ped Bridge 3.2
wheel 1 8 k
wheel 2 2 k
for planks under 10" wide, reduce wheel load by wplank/10" AASHTO 4.6.2.1.3
Wwheel 5900 lb
Weight distribute wheel load over 20" tire width AASHTO 3.6.1.2.5
WLL = Wwheel / 20" = 3540 plf
Moment place wheel load at midspan of plank
R = Wwheel/2 = 2950 lb reaction at stringer
a = (L-20")/2 = 1.94 ft
MLL = R*(a+R/2WLL) = 6945 lb-ft
Shear place wheel load at distance from support = min(3d, 1/4L)
3d 0.844 ft
1/4L 1.385 ft
b = L - min(3d, 1/4L) = 4.70 ft
VLL = Wwheel*b/L = 5002 lb
(Use maximum wheel load)
AASHTO
4.6.2.2.2
Page 1 of 27
11/17/2014
By Joel Petersen-GauthierC - 8Revised 12/22/2014

Timber Deck
Capacity
Moment
ΦMn = ΦFb*S*CL AASHTO 8.6.2-1
Φflexure 0.85 AASHTO 8.5.2.2
CL 1 AASHTO 8.6.2
S = bplank*dplank2/6 = 14.0 in
3
Fb = Fbo*CKF*CM*CF*Cfu*Ci*Cd*Cλ AASHTO 8.4.4.1
Fbo 1.2 ksi AASHTO Table 8.4.1.1.4-1 - No. 1
CKF 2.94 AASHTO 8.4.4.2 - format conversion factor
CM 0.85 AASHTO 8.4.4.3 - wet service factor
CF 1 AASHTO 8.4.4.4 - size factor
Cfu 1.05 AASHTO 8.4.4.6 - flat use factor
Ci 0.8 AASHTO 8.4.4.7 - incising factor
Cd 1.15 AASHTO 8.4.4.8 - deck factor
Cλ (Str-I) 0.8 AASHTO 8.4.4.9 - time effect factor
Fb = 2.32 ksi
ΦMn = 2299 lb-ft
Shear
ΦVn = ΦFv*b*d/1.5 AASHTO 8.7-2
Φshear 0.75 AASHTO 8.5.2.2
Fv = Fvo*CKF*CM*Ci*Cλ AASHTO 8.4.4.1
Fvo 0.175 ksi AASHTO Table 8.4.1.1.4-1 - No. 1 & Btr
CKF 3.33 AASHTO 8.4.4.2 - format conversion factor
CM 0.97 AASHTO 8.4.4.3 - wet service factor
Ci 0.8 AASHTO 8.4.4.7 - incising factor
Cλ (Str-I) 0.8 AASHTO 8.4.4.9 - time effect factor
Fv = 0.36 ksi
ΦVn = 4507 lb
Rating Factors
(C - γDCDC - γDWDW +/- γPP)
γLLLL(1+IM)RF = AASHTO MBE 6A.4.2.1-1
Page 2 of 27
11/17/2014
By Joel Petersen-GauthierC - 9Revised 12/22/2014

Timber Deck
CStr-I = ΦcΦsΦnRn AASHTO MBE 6A.4.2.1-2
ΦcΦs ≥ 0.85 AASHTO MBE 6A.4.2.1-3
Φs 1 AASHTO MBE 6A.4.2.4
γDC 1.25
γLL inv. 1.75
γLL op. 1.35
IM 0 AASHTO LRFD Ped. Bridge Manual 3.2
Max wheel load = Pwheel*RFvehcile
Flexure
Condition Good Fair Poor
Φc 1 0.95 0.85
C [lb-ft] 2299 2184 1954
RFpedestrian inventory 6.11 5.80 5.18
RFpedestrian operating 7.92 7.52 6.72
RFvehicle inventory 0.19 0.18 0.16
RFvehicle operating 0.24 0.23 0.21
Max wheel load (inv.) [lb] 1495 1419 1268
Max wheel load (op.) [lb] 1938 1840 1643
Shear
Condition Good Fair Poor
Φc 1 0.95 0.85
C [lb] 4507 4282 3831
RFpedestrian inventory 16.7 15.9 14.2
RFpedestrian operating 21.7 20.6 18.4
RFvehicle inventory 0.51 0.49 0.44
RFvehicle operating 0.66 0.63 0.56
Max wheel load (inv.) [lb] 4100 3894 3483
Max wheel load (op.) [lb] 5315 5048 4514
Page 3 of 27
11/17/2014
By Joel Petersen-Gauthier MC - 10Revised 12/22/2014

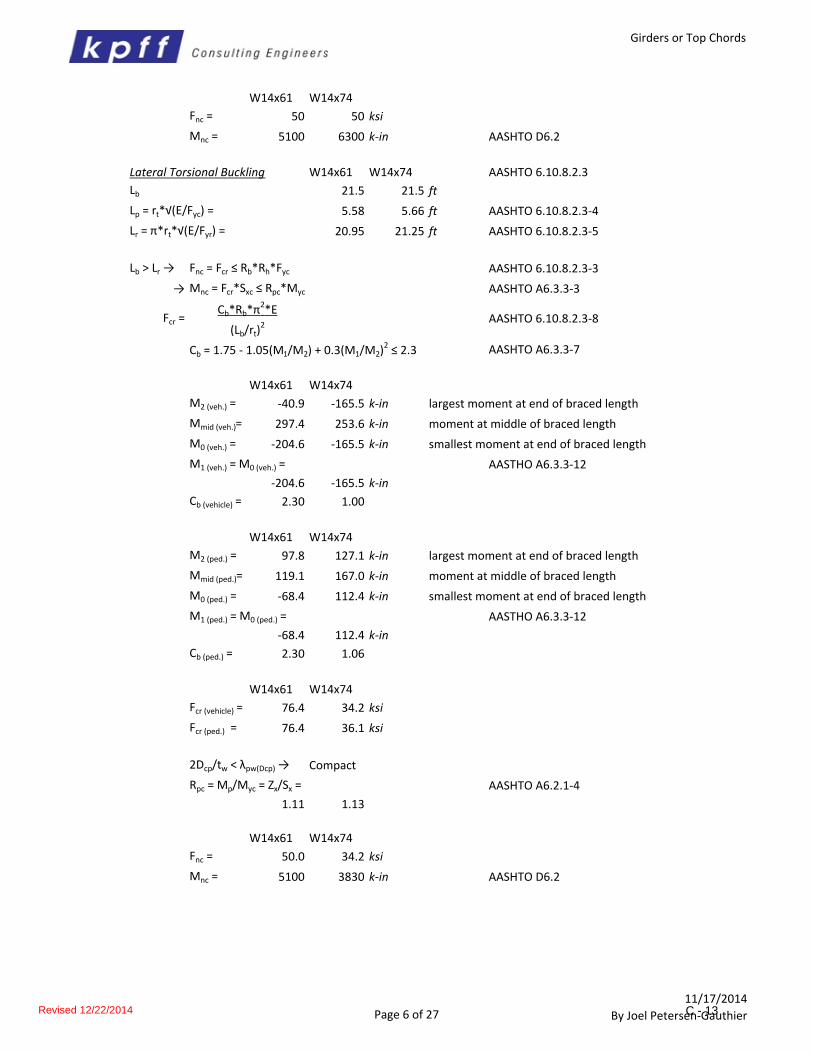
Girders or Top Chords
Triangle Truss Load Rating (LRFR Method)
Girders/Top Chords
L 172 ft
Spacing 18 ft
wtrib. 9.83 ft
Floorbeam Spacing 21.5 ft
Size 0'<L<43' : W14x61 43'<L<midspan' : W14x74
Ag 17.9 in2 Ag 21.8 in
2
bf 10 in bf 10.1 in
tf 0.645 in tf 0.785 in
rt AISC 2.78 in rt AISC 2.82 in
rt AASHTO 2.77 in rt AASHTO 2.80 in
d 13.9 in d 14.2 in
D 12.6 in D 12.6 in
Dc 4.41 in Dc 4.42 in
tw 0.375 in tw 0.45 in
Sx 92.1 in3 Sx 112 in
3
Sy 21.5 in3 Sy 26.6 in
3
Zx 102 in3 Zx 126 in
3
Zy 32.8 in3 Zy 40.5 in
3
Ix 640 in4 Ix 795 in
4
Iy 107 in4 Iy 134 in
4
Fyc 50 ksi
Fyt 50 ksi
Fyf 50 ksi
Fyw 50 ksi
Fyr 35 ksi
E 29000 ksi
Rotation 36.87 ° (measured from vertical, about the longitudinal axis)
Dead Loads W14x61 W14x74 (from SAP2000 Model)
M33 max 49.2 72.6 k-in
M22 max 41.4 32.8 k-in
Shear Vmax 1.16 1.21 k
Axial Pmax 40.0 69.6 k (compression)
Live Loads Pedestrian and Vehicular loads act seperately
Pedestrian: PL 90 psf AASHTO LRFD Ped Bridge 3.1
Weight WPL = PL*wtrib. = 885 plf
Moment
Page 4 of 27
11/17/2014
By Joel Petersen-GauthierC - 11Revised 12/22/2014

Girders or Top Chords
W14x61 W14x74 (from SAP2000 Model)
M33 max 119.1 167.0 k-in
M22 max 93.0 63.7 k-in
Shear Vmax 2.61 2.48 k
Axial Pmax 97.3 168.5 k (compression)
Vehicular: LL H10 Truck AASHTO LRFD Ped Bridge 3.2
wheel 1 8 k
wheel 2 2 k
wheel spacing 6 ft
axle spacing 14 ft
W14x61 W14x74 (from SAP2000 Model)
M33 max 297.4 253.6 k-in
M22 max 232.7 174.2 k-in
Shear Vmax 7.01 6.92 k
Axial Pmax 15.9 23.5 k (compression)
Capacity
Local Buckling Resistance W14x61 W14x74 AASHTO 6.10.8.2.2
λf = bfc/2tfc = 7.75 6.43 AASHTO 6.10.8.2.2-3
λpf = 0.38*√(E/Fyc) = 9.15 9.15 AASHTO 6.10.8.2.2-4
λrf = 0.56*√(E/Fyr) = 13.49 13.49 AASHTO 6.10.8.2.2-5
λf < λpf → Fnc = Rb*Rh*Fyc AASHTO 6.10.8.2.2-1
→ Mnc = Rpc*Myc AASHTO A6.3.2-1
Myc = Fyc*Sx AASHTO D6.2
Rb 1 AASHTO 6.10.1.10.2
Rh 1 AASHTO 6.10.1.10.1 (constructability is not checked)
W14x61 W14x74
Myc 4605 5600 k-in
Dcp 6.305 6.315 in AASHTO D6.3.2
λrw AASHTO A6.2.1-3
λpw(Dcp) 93.31 89.93 AASHTO A6.2.1-2
2Dcp/tw 33.63 28.07
2Dcp/tw < λpw(Dcp) → Compact
Rpc = Mp/Myc = Zx/Sx =
1.11 1.13AASHTO A6.2.1-4 & A6.2.2-4
Moment
Moment
137.3
Page 5 of 27
11/17/2014
By Joel Petersen-GauthierC - 12Revised 12/22/2014
Girders or Top Chords
W14x61 W14x74
Fnc = 50 50 ksi
Mnc = 5100 6300 k-in AASHTO D6.2
Lateral Torsional Buckling W14x61 W14x74 AASHTO 6.10.8.2.3
Lb 21.5 21.5 ft
Lp = rt*√(E/Fyc) = 5.58 5.66 ft AASHTO 6.10.8.2.3-4
Lr = π*rt*√(E/Fyr) = 20.95 21.25 ft AASHTO 6.10.8.2.3-5
Lb > Lr → Fnc = Fcr ≤ Rb*Rh*Fyc AASHTO 6.10.8.2.3-3
→ Mnc = Fcr*Sxc ≤ Rpc*Myc AASHTO A6.3.3-3
Cb = 1.75 - 1.05(M1/M2) + 0.3(M1/M2)2 ≤ 2.3 AASHTO A6.3.3-7
W14x61 W14x74
M2 (veh.) = -40.9 -165.5 k-in largest moment at end of braced length
Mmid (veh.)= 297.4 253.6 k-in moment at middle of braced length
M0 (veh.) = -204.6 -165.5 k-in smallest moment at end of braced length
M1 (veh.) = M0 (veh.) = AASTHO A6.3.3-12
-204.6 -165.5 k-in
Cb (vehicle) = 2.30 1.00
W14x61 W14x74
M2 (ped.) = 97.8 127.1 k-in largest moment at end of braced length
Mmid (ped.)= 119.1 167.0 k-in moment at middle of braced length
M0 (ped.) = -68.4 112.4 k-in smallest moment at end of braced length
M1 (ped.) = M0 (ped.) = AASTHO A6.3.3-12
-68.4 112.4 k-in
Cb (ped.) = 2.30 1.06
W14x61 W14x74
Fcr (vehicle) = 76.4 34.2 ksi
Fcr (ped.) = 76.4 36.1 ksi
2Dcp/tw < λpw(Dcp) → Compact
Rpc = Mp/Myc = Zx/Sx = AASHTO A6.2.1-4
1.11 1.13
W14x61 W14x74
Fnc = 50.0 34.2 ksi
Mnc = 5100 3830 k-in AASHTO D6.2
AASHTO 6.10.8.2.3-8Fcr =Cb*Rb*π
2*E
(Lb/rt)2
Page 6 of 27
11/17/2014
By Joel Petersen-GauthierC - 13Revised 12/22/2014

Girders or Top Chords
Tension Flange Flexural Resistance
Fnt = Rh*Fyt AASHTO 6.10.8.3-1
Mnt = Rpt*Myt AASHTO A6.4-1
Myt = Fyt*Sx AASHTO D6.2
W14x61 W14x74
Myt 4605 5600 k-in
2Dcp/tw < λpw(Dcp) → Compact
Rpt = Mp/Myt = Zx/Sx = AASHTO A6.2.1-5
1.11 1.13
W14x61 W14x74
Fnt = 50 50 ksi
Mnt = 5100 6300 k-in AASHTO D6.2
Minimum Flexural Resistance
ΦMn 33 = Φf*min(Mnc,Mnt)
Φf 1 AASHTO 6.5.4.2
W14x61 W14x74
ΦMn 33 = 5100 3830 k-in
Weak Axis Flexure AASHTO 6.12.2.2.1
λpf = 0.038*√(E/Fyf) = 0.915 in AASHTO 6.10.8.2.2-4
λrf = 0.83*√(E/Fyf) = 20.0 in AASHTO 6.10.8.2.2-5
W14x61 W14x74
λf = bf/(2tf) = 7.75 6.43 in AASTHO 6.12.2.2.1-3
λpf < λf < λrf →
Mn = [1 - (1 - Sy/Zy)((λf - λpf)/(0.45*sqrt(E/Fyf)))]FfyZy AASHTO 6.12.2.2.1-2
Φf 1 AASHTO 6.5.4.2
W14x61 W14x74
ΦMn 22 = 1284 1671 k-in
Unstiffened Web Shear Resistance AASHTO 6.10.9.2
ΦVn = ΦvVcr = ΦvCVp
Φv 1 AASHTO 6.5.4.2
W14x61 W14x74
Vp = 0.58*Fyw*D*tw = 137.1 164.8 k AASHTO 6.10.9.2-2
D/tw 33.6 28.1
k 5 5
1.12*√(E*k/Fyw) = 60.3 60.3
if D/tw < 1.12*√(E*k/Fyw) → C=1
C 1 1
W14x61 W14x74
ΦVn = 137.1 164.8 k
Page 7 of 27
11/17/2014
By Joel Petersen-GauthierC - 14Revised 12/22/2014

Girders or Top Chords
Tensile Reistance AASHTO 6.8.2.1
ΦPn = Φy*Fy*Ag
Φy 0.95 AASHTO 6.5.4.2
W14x61 W14x74
ΦPn = 850 1036 k
Compression Resistance AASHTO 6.9.4.1.1
K 0.75 AASHTO 4.6.2.5
Φc 0.9 AASHTO 6.5.4.2
π2E*Ag
(K*l/rs)2
Po = QFyAg AASHTO 6.9.4.1.1
W14x61 W14x74
k AASHTO Table 6.9.4.2.1-1
b 5 5.05 in
t 0.645 0.785 in
b/t 7.75 6.43
k*√(E/Fy)
Q 1.0 1.0 AASHTO 6.9.4.2
W14x61 W14x74
Pe 1057 1325 k
Po 895 1090 k
Pe/Po = 1.18 1.22
Pe/Po > 0.44 →
Pn = (0.658^(Po/Pe))Po
W14x61 W14x74
Pn = 628 773 k
W14x61 W14x74
ΦPn = 565 695 k
Rating Factors
AASHTO MBE 6A.4.2.1-1
(Impact for vehicles only)
CStr-I = ΦcΦsΦnRn AASHTO MBE 6A.4.2.1-2
ΦcΦs ≥ 0.85 AASHTO MBE 6A.4.2.1-3
Φs 0.85 AASHTO MBE 6A.4.2.4
RFM+A =
AASHTO 6.9.4.1.2-1Pe =
13.5→ Nonslender
0.56
AASHTO 6.9.4.1.1-1
AASHTO MBE Appendix H6A pg. 6-
73
γLLLL(1+IM)
if Pu/Pr > 0.2 :
1 - γDC[PDC/Fr + (8/9)*δb*(MDC/Mr)]
γLL[PLL+IM/Pr + (8/9)*δb*(MLL+IM/Mr)]
RFgeneral =(C - γDCDC - γDWDW +/- γPP)
Page 8 of 27
11/17/2014
By Joel Petersen-GauthierC - 15Revised 12/22/2014
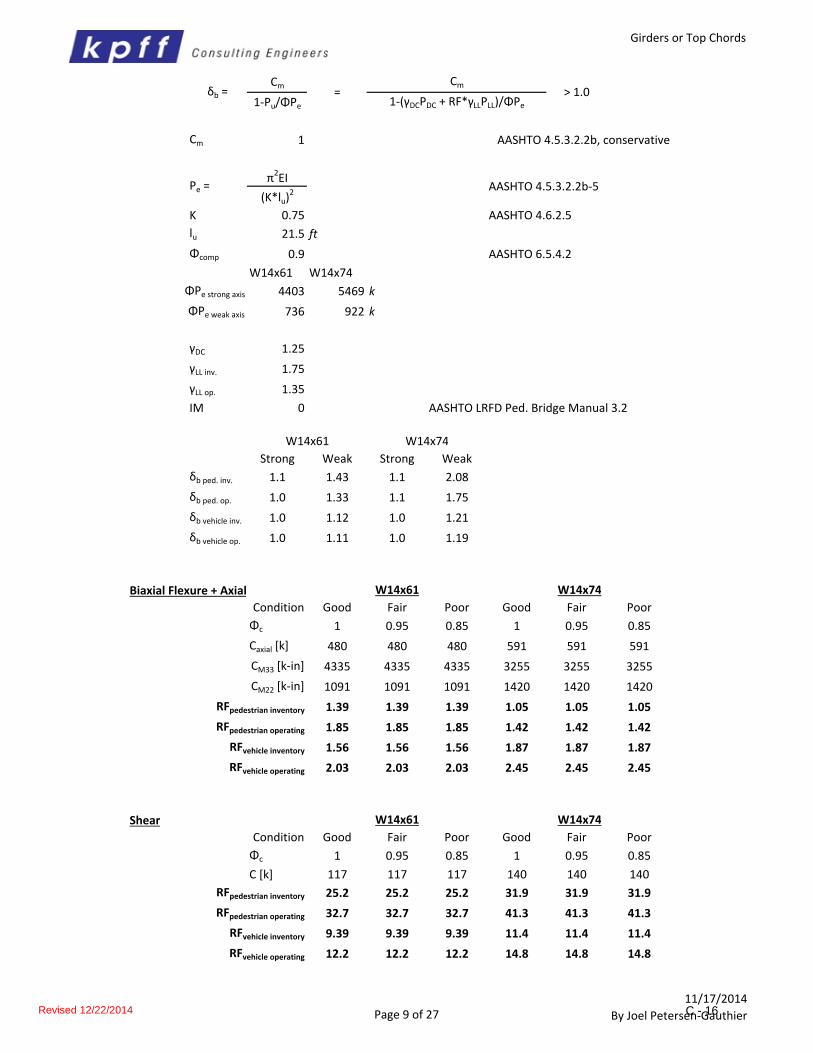
Girders or Top Chords
Cm
1-Pu/ΦPe
Cm 1 AASHTO 4.5.3.2.2b, conservative
π2EI
(K*lu)2
K 0.75 AASHTO 4.6.2.5
lu 21.5 ft
Φcomp 0.9 AASHTO 6.5.4.2
W14x61 W14x74
ΦPe strong axis 4403 5469 k
ΦPe weak axis 736 922 k
γDC 1.25
γLL inv. 1.75
γLL op. 1.35
IM 0 AASHTO LRFD Ped. Bridge Manual 3.2
Strong Weak Strong Weak
δb ped. inv. 1.1 1.43 1.1 2.08
δb ped. op. 1.0 1.33 1.1 1.75
δb vehicle inv. 1.0 1.12 1.0 1.21
δb vehicle op. 1.0 1.11 1.0 1.19
Biaxial Flexure + Axial
Condition Good Fair Poor Good Fair Poor
Φc 1 0.95 0.85 1 0.95 0.85
Caxial [k] 480 480 480 591 591 591
CM33 [k-in] 4335 4335 4335 3255 3255 3255
CM22 [k-in] 1091 1091 1091 1420 1420 1420
RFpedestrian inventory 1.39 1.39 1.39 1.05 1.05 1.05
RFpedestrian operating 1.85 1.85 1.85 1.42 1.42 1.42
RFvehicle inventory 1.56 1.56 1.56 1.87 1.87 1.87
RFvehicle operating 2.03 2.03 2.03 2.45 2.45 2.45
Shear
Condition Good Fair Poor Good Fair Poor
Φc 1 0.95 0.85 1 0.95 0.85
C [k] 117 117 117 140 140 140
RFpedestrian inventory 25.2 25.2 25.2 31.9 31.9 31.9
RFpedestrian operating 32.7 32.7 32.7 41.3 41.3 41.3
RFvehicle inventory 9.39 9.39 9.39 11.4 11.4 11.4
RFvehicle operating 12.2 12.2 12.2 14.8 14.8 14.8
δb =
W14x61 W14x74
Pe =
W14x61 W14x74
AASHTO 4.5.3.2.2b-5
> 1.0=1-(γDCPDC + RF*γLLPLL)/ΦPe
Cm
W14x61 W14x74
Page 9 of 27
11/17/2014
By Joel Petersen-GauthierC - 16Revised 12/22/2014

Stringers
Rev. 1
Triangle Truss Load Rating (LRFR Method)
Stringers
L 21.5 ft Braces frame in at 1/3 or 2/3 length
Spacing 6 ft
wtrib. 6 ft
Size W10x17 Fyc 50 ksi
bf 4.01 in Fyt 50 ksi
tf 0.33 in Fyw 50 ksi
rt AISC 1.04 in Fyr 35 ksi
rt AASHTO 1.06 in E 29000 ksi
d 10.1 in
D 9.44 in
Dc 3.30 in (Assuming 35% of web is in compression)
tw 0.24 in
Sx 16.2 in3
Zx 18.7 in3
Dead Loads
Moment Mmax 51.0 k-in
Shear Vmax 0.79 k
Live Loads Pedestrian and Vehicular loads act seperately
Pedestrian: PL 90 psf AASHTO LRFD Ped Bridge 3.1
(from SAP2000 Model)
Page 10 of 27
11/17/2014
By Joel Petersen-Gauthier
Pedestrian: PL 90 psf AASHTO LRFD Ped Bridge 3.1
Weight WPL = PL*wtrib. = 540 plf
Moment Mmax 374.4 k-in
Shear Vmax 5.81 k
Vehicular: LL H10 Truck AASHTO LRFD Ped Bridge 3.2
wheel 1 8 k
wheel 2 2 k
wheel spacing 6 ft
axle spacing 14 ft
Moment Mmax 461.5 k-in
Shear Vmax 8.69 k
Capacity
Local Buckling Resistance AASHTO 6.10.8.2.2
λf = bfc/2tfc = 6.08 AASHTO 6.10.8.2.2-3
λpf = 0.38*√(E/Fyc) = 9.15 AASHTO 6.10.8.2.2-4
λrf = 0.56*√(E/Fyr) = 13.49 AASHTO 6.10.8.2.2-5
(from SAP2000 Model)
(from SAP2000 Model)
Page 10 of 27
11/17/2014
By Joel Petersen-GauthierTC - 17Revised 12/22/2014

Stringers
Rev. 1
λf < λpf → Fnc = Rb*Rh*Fyc AASHTO 6.10.8.2.2-1
→ Mnc = Rpc*Myc AASHTO A6.3.2-1
Myc = Fyc*Sx AASHTO D6.2
Rb 1 AASHTO 6.10.1.10.2
Rh 1 AASHTO 6.10.1.10.1 (constructability is not checked)
Myc 810 k-in
Dcp 4.72 in AASHTO D6.3.2
λrw 137.3 AASHTO A6.2.1-3
λpw(Dcp) 84.67 AASHTO A6.2.1-2
2Dcp/tw 39.33
2Dcp/tw < λpw(Dcp) → Compact
Rpc = Mp/Myc = Zx/Sx = 1.15 AASHTO A6.2.1-4 & A6.2.2-4
Fnc = 50 ksi
Mnc = 935 k-in AASHTO D6.2
Bracing Check bracing strength of timber deck planks AISC 6.3.1a
Pbr = 0.008*Mr*Cd/ho (Required brace strength) AISC A-6-5
ho 9.77 in (Distance between flange centroids)
Cd 1 (For bending single curvature)
Mr 871 k-in (Factored moment with LRFD factors)
Pbr = 0.714 k
Page 11 of 27
11/17/2014
By Joel Petersen-Gauthier
Pbr = 0.714 k
ΦPn = Φ*Fc*Ag*Cp AASHTO 8.8.2-1
Φcomp. 0.9 AASHTO 8.5.2
Ag actual 24.89 in2
Deck condition factor 0.5 (to reduce strength)
Ag reduced 12.45 in2
Fc = Fco*CKF*CM*CF*Ci*Cλ AASHTO 8.4.4
Fco 1.45 ksi AASHTO Table 8.4.1.1.4-1 - No. 1
CKF 2.78 AASHTO 8.4.4.2 - format conversion factor = 2.5/Φ
CM 0.8 AASHTO 8.4.4.3 - wet service factor, ≤ 4" thick
CF 1.05 AASHTO 8.4.4.4-1, Size Effect Factor, 8" width & Fco
Ci 0.8 AASHTO 8.4.4.7 - incising factor
Cλ (Str-I) 0.8 AASHTO 8.4.4.9 - time effect factor
Fc 2.17 ksi
Page 11 of 27
11/17/2014
By Joel Petersen-GauthierC - 18Revised 12/22/2014

Stringers
Rev. 1
Cp = (1+B)/2c - √(((1+B)/2c)2 - B/c) ≤ 1 AASHTO 8.8.2-2
KcE 0.52 AASHTO 8.8.2
K 1 AASHTO 4.6.2.5 (assume pinned-pinned)
L 72 in (Stringer spacing)
Le = KL = 72 in AASHTO 8.8.2
Eo 1500 ksi AASHTO Table 8.4.1.1.4-1 - No. 1
E = Eo*CM*Ci AASHTO 8.4.4.1-6
= 960 ksi
FcE = KcE*E*d2/Le
2 AASHTO 8.8.2-4
= 1.10 ksi
B = FcE/Fc ≤ 1 AASHTO 8.8.2-3
= 0.51
c 0.8 AASHTO 8.8.2, for sawn lumber
Cp 0.44
ΦPn 10.6 k
βbr = 1/Φ*(4*Mr*Cd)/(Lb*ho) (Required brace stiffness) AISC A-6-6
Φ 0.75
Lb 172 in (length between steel braces)
βbr 2.77 k/in
ktimber planks = Ared.*E/L (timber stiffness)
Page 12 of 27
11/17/2014
By Joel Petersen-Gauthier
ktimber planks = Ared.*E/L (timber stiffness)
= 165.9 k/in
ΦPn ≥ Pbr & kplanks ≥ βbr → Deck/nailer effec]vely braces stringers, LTB not considered
Tension Flange Flexural Resistance
Fnt = Rh*Fyt AASHTO 6.10.8.3-1
Mnt = Rpt*Myt AASHTO A6.4-1
Myt = Fyt*Sx = 810 k-in AASHTO D6.2
2Dcp/tw < λpw(Dcp) → Compact
Rpt = Mp/Myt = Zx/Sx = 1.15 AASHTO A6.2.1-5
Fnt = 50 ksi
Mnt = 935 k-in AASHTO D6.2
Minimum Flexural Resistance
ΦMn = Φf*min(Mnc,Mnt)
Φf 1 AASHTO 6.5.4.2
ΦMn = 935 k-in
Page 12 of 27
11/17/2014
By Joel Petersen-GauthierC - 19Revised 12/22/2014

Stringers
Rev. 1
Unstiffened Web Shear Resistance AASHTO 6.10.9.2
ΦVn = ΦvVcr = ΦvCVp
Φv 1 AASHTO 6.5.4.2
Vp = 0.58*Fyw*D*tw = 65.7 k AASHTO 6.10.9.2-2
D/tw 39.3
k 5
1.12*√(E*k/Fyw) = 60.3
if D/tw < 1.12*√(E*k/Fyw) → C=1
C 1
ΦVn = 65.7 k
Rating Factors
CStr-I = ΦcΦsΦnRn AASHTO MBE 6A.4.2.1-2
ΦcΦs ≥ 0.85 AASHTO MBE 6A.4.2.1-3
Φs 1 AASHTO MBE 6A.4.2.4
γDC 1.25
γLL inv. 1.75
RF =(C - γDCDC - γDWDW +/- γPP)
AASHTO MBE 6A.4.2.1-1γLLLL(1+IM)
Page 13 of 27
11/17/2014
By Joel Petersen-Gauthier
γLL inv. 1.75
γLL op. 1.35
IM 0 AASHTO LRFD Ped. Bridge Manual 3.2
Max wheel load = Pwheel*RFvehcile
Flexure
Condition Good Fair Poor
Φc 1 0.95 0.85
C [k-in] 935 888 795
RFpedestrian inventory 1.33 1.26 1.12
RFpedestrian operating 1.72 1.63 1.45
RFvehicle inventory 1.08 1.02 0.91
RFvehicle operating 1.40 1.32 1.17
Page 13 of 27
11/17/2014
By Joel Petersen-GauthierMC - 20Revised 12/22/2014

Stringers
Rev. 1
Shear
Condition Good Fair Poor
Φc 1 0.95 0.85
C [k-in] 65.7 62.4 55.8
RFpedestrian inventory 6.37 6.05 5.40
RFpedestrian operating 8.26 7.84 7.00
RFvehicle inventory 4.25 4.04 3.61
RFvehicle operating 5.51 5.23 4.67
Page 14 of 27
11/17/2014
By Joel Petersen-GauthierPage 14 of 27
11/17/2014
By Joel Petersen-GauthierC - 21Revised 12/22/2014
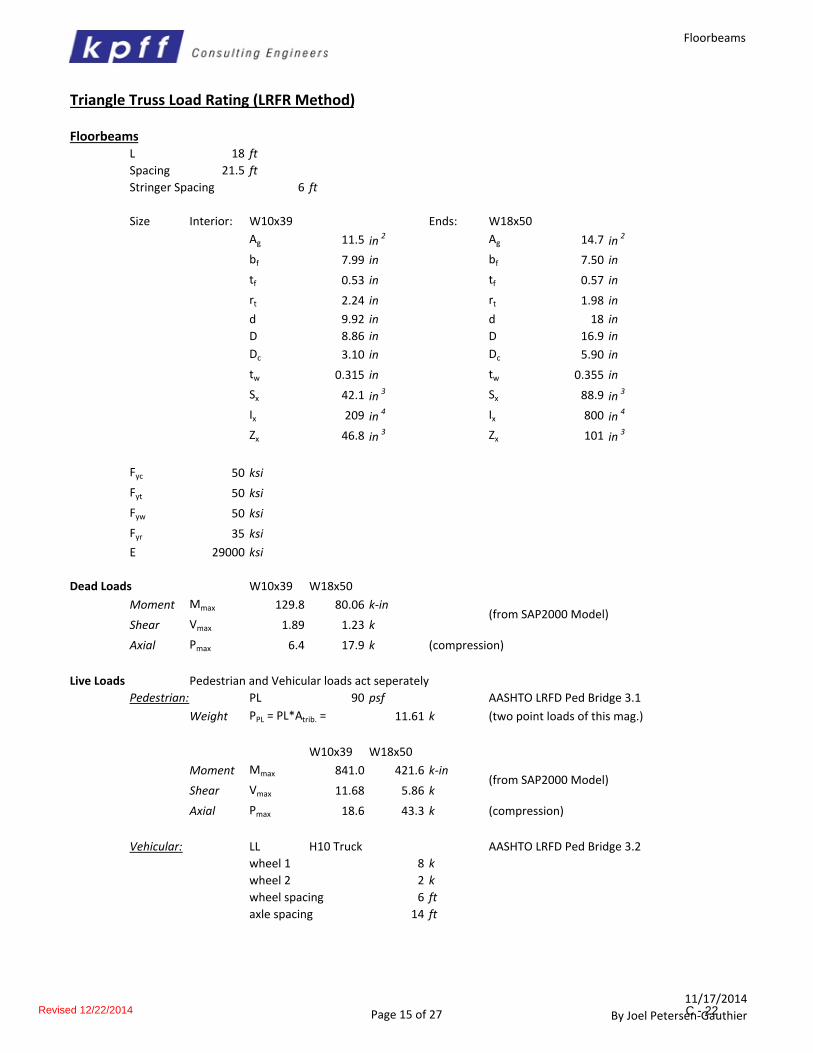
Floorbeams
Triangle Truss Load Rating (LRFR Method)
Floorbeams
L 18 ft
Spacing 21.5 ft
Stringer Spacing 6 ft
Size Interior: W10x39 Ends: W18x50
Ag 11.5 in2 Ag 14.7 in
2
bf 7.99 in bf 7.50 in
tf 0.53 in tf 0.57 in
rt 2.24 in rt 1.98 in
d 9.92 in d 18 in
D 8.86 in D 16.9 in
Dc 3.10 in Dc 5.90 in
tw 0.315 in tw 0.355 in
Sx 42.1 in3 Sx 88.9 in
3
Ix 209 in4 Ix 800 in
4
Zx 46.8 in3 Zx 101 in
3
Fyc 50 ksi
Fyt 50 ksi
Fyw 50 ksi
Fyr 35 ksi
E 29000 ksi
Dead Loads W10x39 W18x50
Moment Mmax 129.8 80.06 k-in
Shear Vmax 1.89 1.23 k
Axial Pmax 6.4 17.9 k (compression)
Live Loads Pedestrian and Vehicular loads act seperately
Pedestrian: PL 90 psf AASHTO LRFD Ped Bridge 3.1
Weight PPL = PL*Atrib. = 11.61 k (two point loads of this mag.)
W10x39 W18x50
Moment Mmax 841.0 421.6 k-in
Shear Vmax 11.68 5.86 k
Axial Pmax 18.6 43.3 k (compression)
Vehicular: LL H10 Truck AASHTO LRFD Ped Bridge 3.2
wheel 1 8 k
wheel 2 2 k
wheel spacing 6 ft
axle spacing 14 ft
(from SAP2000 Model)
(from SAP2000 Model)
Page 15 of 27
11/17/2014
By Joel Petersen-GauthierC - 22Revised 12/22/2014

Floorbeams
W10x39 W18x50
Moment Mmax 617.4 626.2 k-in
Shear Vmax 8.58 8.70 k
Axial Pmax 6.9 6.2 k (compression)
Capacity
Local Buckling Resistance W10x39 W18x50 AASHTO 6.10.8.2.2
λf = bfc/2tfc = 7.54 6.58 AASHTO 6.10.8.2.2-3
λpf = 0.38*√(E/Fyc) = 9.15 9.15 AASHTO 6.10.8.2.2-4
λrf = 0.56*√(E/Fyr) = 13.49 13.49 AASHTO 6.10.8.2.2-5
λf < λpf → Fnc = Rb*Rh*Fyc AASHTO 6.10.8.2.2-1
→ Mnc = Rpc*Myc AASHTO A6.3.2-1
Myc = Fyc*Sx AASHTO D6.2
Rb 1 AASHTO 6.10.1.10.2
Rh 1 AASHTO 6.10.1.10.1 (constructability is not checked)
W10x39 W18x50
Myc 2105 4445 k-in
Dcp 4.43 8.43 in AASHTO D6.3.2
λrw AASHTO A6.2.1-3
λpw(Dcp) 92.49 87.88 AASHTO A6.2.1-2
2Dcp/tw 28.13 47.49
2Dcp/tw < λpw(Dcp) → Compact
Rpc = Mp/Myc = Zx/Sx =
1.11 1.14
W10x39 W18x50
Fnc = 50 50 ksi
Mnc = 2340 5050 k-in AASHTO D6.2
Lateral Torsional Buckling W10x39 W18x50 AASHTO 6.10.8.2.3
Lb 6 6 ft
Lp = rt*√(E/Fyc) = 4.50 3.97 ft AASHTO 6.10.8.2.3-4
Lr = π*rt*√(E/Fyr) = 16.88 14.9 ft AASHTO 6.10.8.2.3-5
Lp < Lb < Lr →
Fnc = Cb[1-(1-Fyr/(RhFyc))((Lb-Lp)/(Lr-Lp))]RbRhFyc < RbRhFyc AASHTO 6.10.8.2.3-2
Mnc = Cb[1-(1-(Fyr*Sxc)/(RpcMyc))((Lb-Lp)/(Lr-Lp))]RpcMyc < RpcMyc AASHTO A6.3.3-2
Cb = 1.75 - 1.05(M1/M2) + 0.3(M1/M2)2 ≤ 2.3 AASHTO 6.10.8.2.3-7
(from SAP2000 Model)
137.3
AASHTO A6.2.1-4 & A6.2.2-4
Page 16 of 27
11/17/2014
By Joel Petersen-GauthierC - 23Revised 12/22/2014
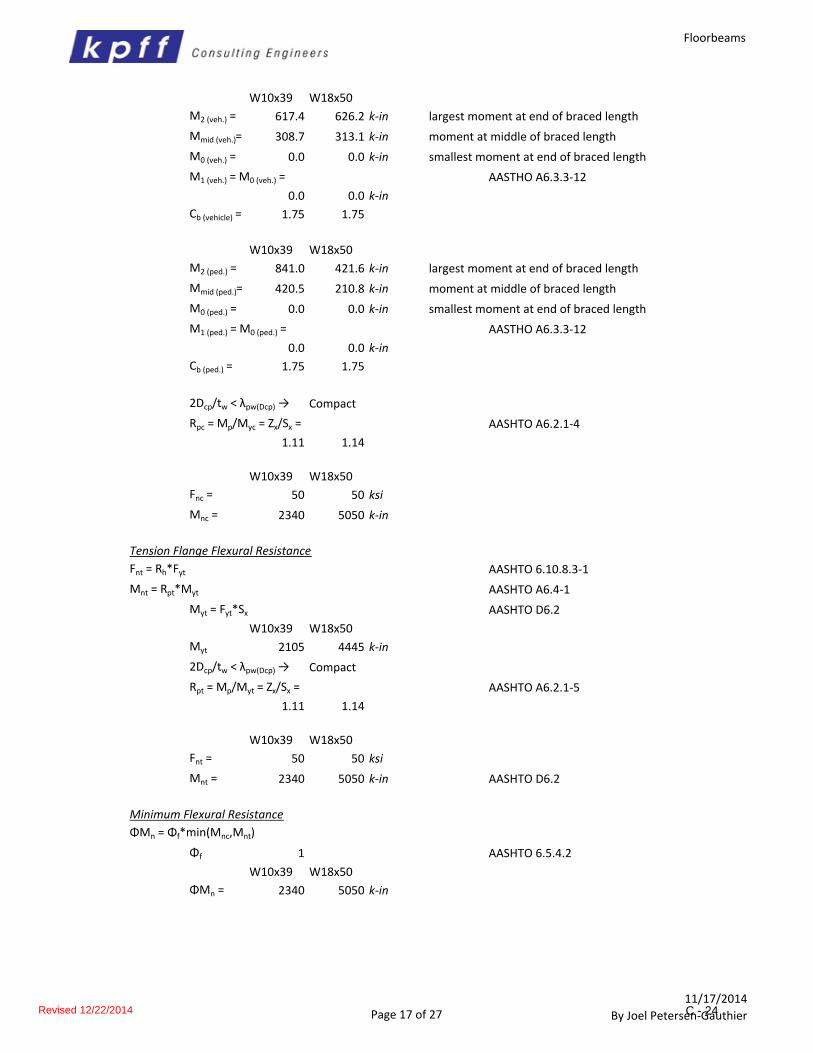
Floorbeams
W10x39 W18x50
M2 (veh.) = 617.4 626.2 k-in largest moment at end of braced length
Mmid (veh.)= 308.7 313.1 k-in moment at middle of braced length
M0 (veh.) = 0.0 0.0 k-in smallest moment at end of braced length
M1 (veh.) = M0 (veh.) = AASTHO A6.3.3-12
0.0 0.0 k-in
Cb (vehicle) = 1.75 1.75
W10x39 W18x50
M2 (ped.) = 841.0 421.6 k-in largest moment at end of braced length
Mmid (ped.)= 420.5 210.8 k-in moment at middle of braced length
M0 (ped.) = 0.0 0.0 k-in smallest moment at end of braced length
M1 (ped.) = M0 (ped.) = AASTHO A6.3.3-12
0.0 0.0 k-in
Cb (ped.) = 1.75 1.75
2Dcp/tw < λpw(Dcp) → Compact
Rpc = Mp/Myc = Zx/Sx = AASHTO A6.2.1-4
1.11 1.14
W10x39 W18x50
Fnc = 50 50 ksi
Mnc = 2340 5050 k-in
Tension Flange Flexural Resistance
Fnt = Rh*Fyt AASHTO 6.10.8.3-1
Mnt = Rpt*Myt AASHTO A6.4-1
Myt = Fyt*Sx AASHTO D6.2
W10x39 W18x50
Myt 2105 4445 k-in
2Dcp/tw < λpw(Dcp) → Compact
Rpt = Mp/Myt = Zx/Sx = AASHTO A6.2.1-5
1.11 1.14
W10x39 W18x50
Fnt = 50 50 ksi
Mnt = 2340 5050 k-in AASHTO D6.2
Minimum Flexural Resistance
ΦMn = Φf*min(Mnc,Mnt)
Φf 1 AASHTO 6.5.4.2
W10x39 W18x50
ΦMn = 2340 5050 k-in
Page 17 of 27
11/17/2014
By Joel Petersen-GauthierC - 24Revised 12/22/2014

Floorbeams
Unstiffened Web Shear Resistance AASHTO 6.10.9.2
ΦVn = ΦvVcr = ΦvCVp
Φv 1 AASHTO 6.5.4.2
W10x39 W18x50
Vp = 0.58*Fyw*D*tw = 80.9 173.6 k AASHTO 6.10.9.2-2
D/tw 28.1 47.5
k 5 5
1.12*√(E*k/Fyw) = 60.3 60.3
if D/tw < 1.12*√(E*k/Fyw) → C=1
C 1 1
W10x39 W18x50
ΦVn = 80.9 173.6 k
Tensile Reistance AASHTO 6.8.2.1
ΦPn = Φy*Fy*Ag
Φy 0.95 AASHTO 6.5.4.2
W10x39 W18x50
ΦPn = 546 698 k
Compression Resistance AASHTO 6.9.4.1.1
K 0.75 AASHTO 4.6.2.5
Φc 0.9 AASHTO 6.5.4.2
π2E*Ag
(K*l/rs)2
Po = QFyAg AASHTO 6.9.4.1.1
W10x39 W18x50
k AASHTO Table 6.9.4.2.1-1
b 3.995 3.75 in
t 0.530 0.570 in
b/t 7.54 6.58
k*√(E/Fy)
Q 1.0 1.0 AASHTO 6.9.4.2
W10x39 W18x50
Pe 629 629 k
Po 575 735 k
Pe/Po = 1.09 0.86
Pe/Po > 0.44 →
Pn = (0.658^(Po/Pe))Po
W10x39 W18x50
Pn = 392 451 k
AASHTO 6.9.4.1.1-1
Pe = AASHTO 6.9.4.1.2-1
0.56
→ Nonslender13.5
Page 18 of 27
11/17/2014
By Joel Petersen-GauthierC - 25Revised 12/22/2014
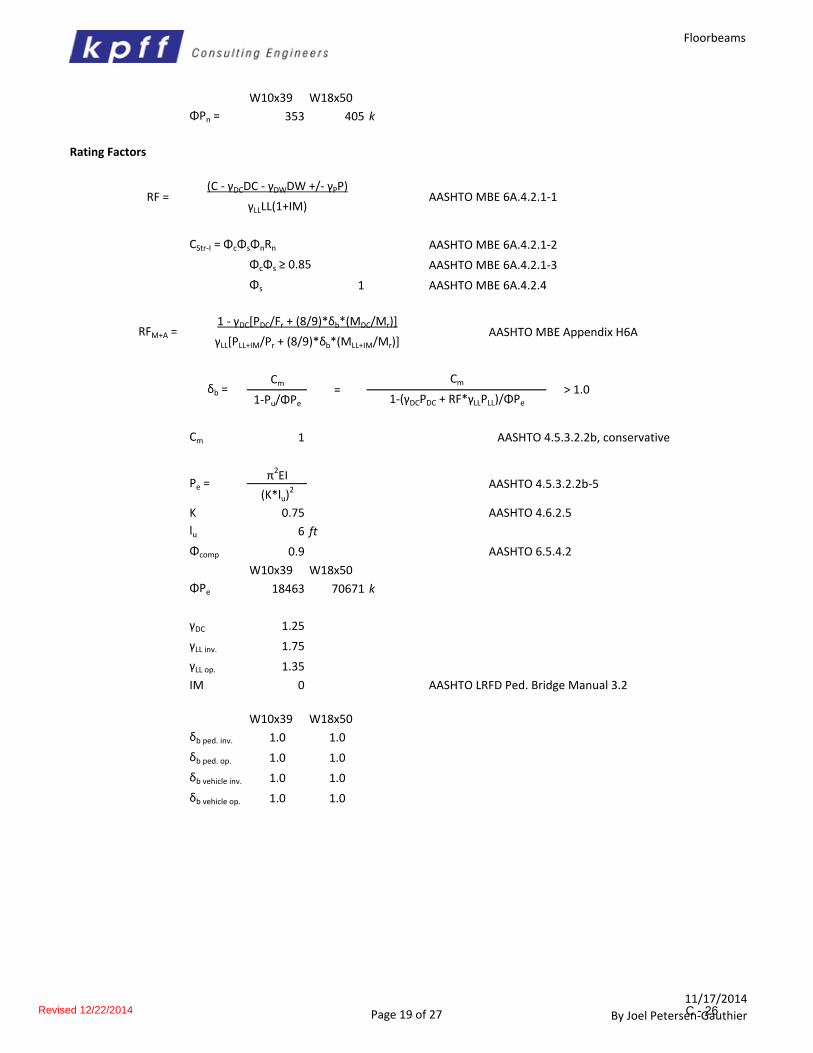
Floorbeams
W10x39 W18x50
ΦPn = 353 405 k
Rating Factors
CStr-I = ΦcΦsΦnRn AASHTO MBE 6A.4.2.1-2
ΦcΦs ≥ 0.85 AASHTO MBE 6A.4.2.1-3
Φs 1 AASHTO MBE 6A.4.2.4
Cm
1-Pu/ΦPe
Cm 1 AASHTO 4.5.3.2.2b, conservative
π2EI
(K*lu)2
K 0.75 AASHTO 4.6.2.5
lu 6 ft
Φcomp 0.9 AASHTO 6.5.4.2
W10x39 W18x50
ΦPe 18463 70671 k
γDC 1.25
γLL inv. 1.75
γLL op. 1.35
IM 0 AASHTO LRFD Ped. Bridge Manual 3.2
W10x39 W18x50
δb ped. inv. 1.0 1.0
δb ped. op. 1.0 1.0
δb vehicle inv. 1.0 1.0
δb vehicle op. 1.0 1.0
RF =(C - γDCDC - γDWDW +/- γPP)
AASHTO MBE 6A.4.2.1-1γLLLL(1+IM)
RFM+A =1 - γDC[PDC/Fr + (8/9)*δb*(MDC/Mr)]
AASHTO MBE Appendix H6AγLL[PLL+IM/Pr + (8/9)*δb*(MLL+IM/Mr)]
δb = =Cm
> 1.01-(γDCPDC + RF*γLLPLL)/ΦPe
Pe = AASHTO 4.5.3.2.2b-5
Page 19 of 27
11/17/2014
By Joel Petersen-GauthierC - 26Revised 12/22/2014

Floorbeams
Flexure
Condition Good Fair Poor Good Fair Poor
Φc 1 0.95 0.85 1 0.95 0.85
C [k-in] 2340 2223 1989 5050 4798 4293
RFpedestrian inventory 1.48 1.40 1.24 6.71 6.37 5.68
RFpedestrian operating 1.92 1.82 1.61 8.70 8.25 7.37
RFvehicle inventory 2.02 1.91 1.69 4.52 4.29 3.83
RFvehicle operating 2.61 2.47 2.19 5.86 5.56 4.96
Flexure + Axial
Condition Good Fair Poor Good Fair Poor
Φc 1 0.95 0.85 1 0.95 0.85
Caxial [k] 353 335 300 405 385 345
Cflex. [k-in] 2340 2223 1989 5050 4798 4293
RFpedestrian inventory 1.40 1.33 1.17 2.92 2.77 2.45
RFpedestrian operating 1.82 1.72 1.52 3.79 3.59 3.18
RFvehicle inventory 2.06 1.94 1.72 4.21 3.98 3.53
RFvehicle operating 2.67 2.52 2.23 5.46 5.16 4.58
Shear
Condition Good Fair Poor Good Fair Poor
Φc 1 0.95 0.85 1 0.95 0.85
C [k] 80.9 76.9 68.8 174 165 148
RFpedestrian inventory 3.84 3.65 3.25 16.8 15.9 14.2
RFpedestrian operating 4.98 4.73 4.21 21.8 20.7 18.5
RFvehicle inventory 5.24 4.97 4.43 11.3 10.7 9.59
RFvehicle operating 6.79 6.44 5.74 14.7 13.9 12.4
W10x39
W10x39 W18x50
W10x39 W18x50
W18x50
Page 20 of 27
11/17/2014
By Joel Petersen-GauthierTC - 27Revised 12/22/2014
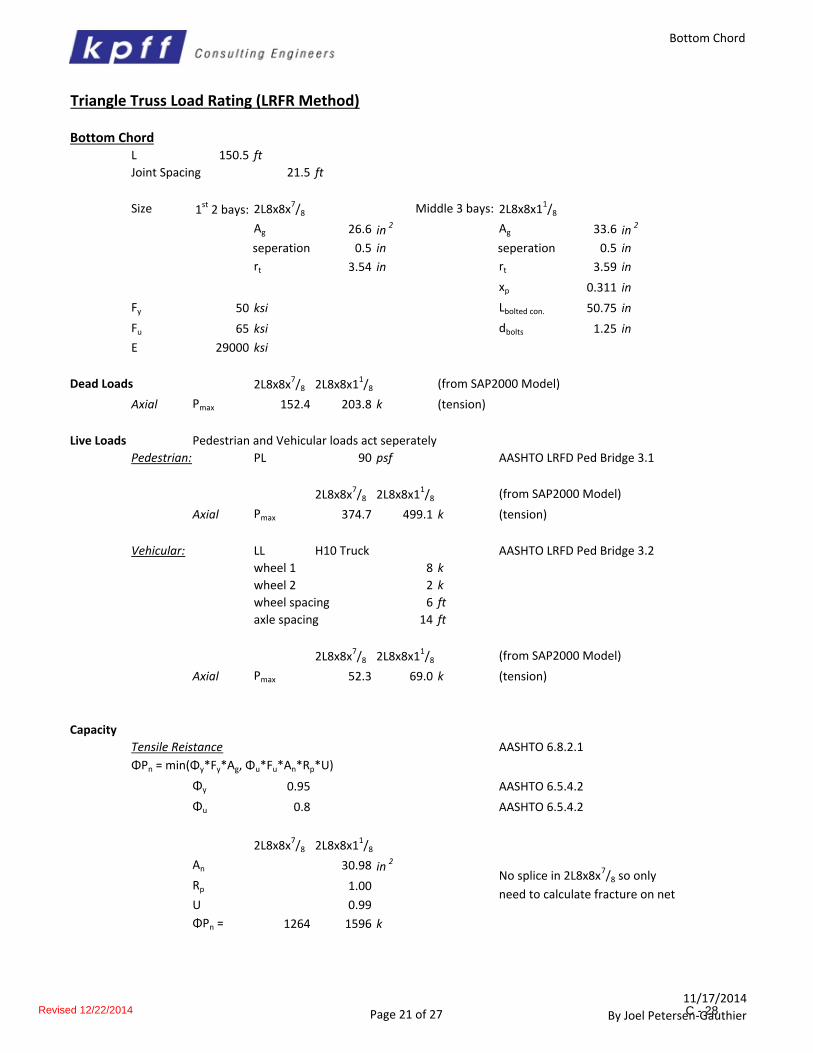
Bottom Chord
Triangle Truss Load Rating (LRFR Method)
Bottom Chord
L 150.5 ft
Joint Spacing 21.5 ft
Size 1st
2 bays: 2L8x8x7/8 Middle 3 bays: 2L8x8x1
1/8
Ag 26.6 in2 Ag 33.6 in
2
seperation 0.5 in seperation 0.5 in
rt 3.54 in rt 3.59 in
xp 0.311 in
Fy 50 ksi Lbolted con. 50.75 in
Fu 65 ksi dbolts 1.25 in
E 29000 ksi
Dead Loads 2L8x8x7/8 2L8x8x1
1/8 (from SAP2000 Model)
Axial Pmax 152.4 203.8 k (tension)
Live Loads Pedestrian and Vehicular loads act seperately
Pedestrian: PL 90 psf AASHTO LRFD Ped Bridge 3.1
2L8x8x7/8 2L8x8x1
1/8 (from SAP2000 Model)
Axial Pmax 374.7 499.1 k (tension)
Vehicular: LL H10 Truck AASHTO LRFD Ped Bridge 3.2
wheel 1 8 k
wheel 2 2 k
wheel spacing 6 ft
axle spacing 14 ft
2L8x8x7/8 2L8x8x1
1/8 (from SAP2000 Model)
Axial Pmax 52.3 69.0 k (tension)
Capacity
Tensile Reistance AASHTO 6.8.2.1
ΦPn = min(Φy*Fy*Ag, Φu*Fu*An*Rp*U)
Φy 0.95 AASHTO 6.5.4.2
Φu 0.8 AASHTO 6.5.4.2
2L8x8x7/8 2L8x8x1
1/8
An 30.98 in2
Rp 1.00
U 0.99
ΦPn = 1264 1596 k
No splice in 2L8x8x7/8 so only
need to calculate fracture on net
Page 21 of 27
11/17/2014
By Joel Petersen-GauthierC - 28Revised 12/22/2014

Bottom Chord
Rating Factors
CStr-I = ΦcΦsΦnRn AASHTO MBE 6A.4.2.1-2
ΦcΦs ≥ 0.85 AASHTO MBE 6A.4.2.1-3
Φs 0.85 AASHTO MBE 6A.4.2.4
γDC 1.25
γLL inv. 1.75
γLL op. 1.35
IM 0 AASHTO LRFD Ped. Bridge Manual 3.2
Axial
Condition Good Fair Poor Good Fair Poor
Φc 1 0.95 0.85 1 0.95 0.85
C [k] 1074 1074 1074 1357 1357 1357
RFpedestrian inventory 1.35 1.35 1.35 1.26 1.26 1.26
RFpedestrian operating 1.75 1.75 1.75 1.64 1.64 1.64
RFvehicle inventory 9.65 9.65 9.65 9.13 9.13 9.13
RFvehicle operating 12.5 12.5 12.5 11.8 11.8 11.8
2L8x8x7/8 2L8x8x11/8
AASHTO MBE 6A.4.2.1-1γLLLL(1+IM)
RF =(C - γDCDC - γDWDW +/- γPP)
Page 22 of 27
11/17/2014
By Joel Petersen-GauthierC - 29Revised 12/22/2014

Diagonals
Triangle Truss Load Rating (LRFR Method)
Diagonals
L 18.45 ft
Size End 8: W8x35 Middle 16: W8x31
Ag 10.3 in2 Ag 9.12 in
2
bf 8.02 in bf 8 in
tf 0.495 in tf 0.435 in
rs 2.28 in rs 2.26 in
Fy 50 ksi
E 29000 ksi
Dead Loads W8x35 W8x31 (from SAP2000 Model)
Pmax tension 41.7 20.5 k
Pmax comp. 39.6 17.8 k
Live Loads Pedestrian and Vehicular loads act seperately
Pedestrian: PL 90 psf AASHTO LRFD Ped Bridge 3.1
W8x35 W8x31 (from SAP2000 Model)
Pmax tension 99.8 45.6 k
Pmax comp. 99.5 45.6 k
Vehicular: LL H10 Truck AASHTO LRFD Ped Bridge 3.2
wheel 1 8 k
wheel 2 2 k
wheel spacing 6 ft
axle spacing 14 ft
W8x35 W8x31 (from SAP2000 Model)
Pmax tension 22.2 16.2 k
Pmax comp. 22.2 16.3 k
Capacity
Tensile Reistance AASHTO 6.8.2.1
ΦPn = Φy*Fy*Ag
Φy 0.95 AASHTO 6.5.4.2
W8x35 W8x31
ΦPn = 489 433 k
Compression Resistance AASHTO 6.9.4.1.1
K 0.75 AASHTO 4.6.2.5
Φc 0.9 AASHTO 6.5.4.2
Axial
Axial
Axial
Page 23 of 27
11/17/2014
By Joel Petersen-GauthierMC - 30Revised 12/22/2014

Diagonals
π2E*Ag
(K*l/rs)2
Po = QFyAg AASHTO 6.9.4.1.1
W8x35 W8x31
k AASHTO Table 6.9.4.2.1-1
b 4.01 4 in
t 0.495 0.435 in
b/t 8.10 9.20
k*√(E/Fy)
Q 1.0 1.0 AASHTO 6.9.4.2
W8x35 W8x31
Pe 556 483 k
Po 515 456 k
Pe/Po = 1.08 1.06
Pe/Po > 0.44 →
Pn = (0.658^(Po/Pe))Po
W8x35 W8x31
Pn = 349 307 k
W8x35 W8x31
ΦPn = 314 277 k → Compression Controls
Rating Factors
CStr-I = ΦcΦsΦnRn AASHTO MBE 6A.4.2.1-2
ΦcΦs ≥ 0.85 AASHTO MBE 6A.4.2.1-3
Φs 0.85 AASHTO MBE 6A.4.2.4
γDC 1.25
γLL inv. 1.75
γLL op. 1.35
IM 0 AASHTO LRFD Ped. Bridge Manual 3.2
Axial
Condition Good Fair Poor Good Fair Poor
Φc 1 0.95 0.85 1 0.95 0.85
C [k] 267 267 267 267 267 267
RFpedestrian inventory 1.25 1.25 1.25 3.07 3.07 3.07
RFpedestrian operating 1.62 1.62 1.62 3.98 3.98 3.98
RFvehicle inventory 5.59 5.59 5.59 8.59 8.59 8.59
RFvehicle operating 7.25 7.25 7.25 11.1 11.1 11.1
W8x35 W8x31
AASHTO 6.9.4.1.1-1
RF =(C - γDCDC - γDWDW +/- γPP)
AASHTO MBE 6A.4.2.1-1γLLLL(1+IM)
Pe = AASHTO 6.9.4.1.2-1
0.56
→ Nonslender13.5
Page 24 of 27
11/17/2014
By Joel Petersen-GauthierC - 31Revised 12/22/2014

Crossbracing
Triangle Truss Load Rating (LRFR Method)
Crossbracing
L 9.35 ft
Size 2L4x3x3/8 SLBB
Ag 4.98 in2
b 4 in
tf 0.375 in
rs 1.79 in
Fy 50 ksi
E 29000 ksi
Dead Loads
Pmax tension 3.58 k
Pmax comp. 3.74 k
Live Loads Pedestrian and Vehicular loads act seperately
Pedestrian: PL 90 psf AASHTO LRFD Ped Bridge 3.1
Pmax tension 8.32 k
Pmax comp. 8.73 k
Vehicular: LL H10 Truck AASHTO LRFD Ped Bridge 3.2
wheel 1 8 k
wheel 2 2 k
wheel spacing 6 ft
axle spacing 14 ft
Pmax tension 13.0 k
Pmax comp. 13.9 k
Capacity
Tensile Reistance AASHTO 6.8.2.1
ΦPn = Φy*Fy*Ag
Φy 0.95 AASHTO 6.5.4.2
ΦPn = 237 k
(from SAP2000 Model)
Axial
Axial
Axial
(from SAP2000 Model)
(from SAP2000 Model)
Page 25 of 27
11/17/2014
By Joel Petersen-GauthierC - 32Revised 12/22/2014

Crossbracing
Compression Resistance AASHTO 6.9.4.1.1
K 0.75 AASHTO 4.6.2.5
Φc 0.9 AASHTO 6.5.4.2
π2E*Ag
(K*l/rs)2
Po = QFyAg AASHTO 6.9.4.1.1
k 0.56 AASHTO Table 6.9.4.2.1-1
b 2 in
t 0.375 in
b/t 5.33
k*√(E/Fy) 13.5
Q 1.0 AASHTO 6.9.4.2
Pe 645 k
Po 249 k
Pe/Po = 2.59
Pe/Po > 0.44 →
Pn = (0.658^(Po/Pe))Po
Pn = 212 k
ΦPn = 191 k → Compression Controls
Rating Factors
CStr-I = ΦcΦsΦnRn AASHTO MBE 6A.4.2.1-2
ΦcΦs ≥ 0.85 AASHTO MBE 6A.4.2.1-3
Φs 0.85 AASHTO MBE 6A.4.2.4
γDC 1.25
γLL inv. 1.75
γLL op. 1.35
IM 0 AASHTO LRFD Ped. Bridge Manual 3.2
Axial
Condition Good Fair Poor
Φc 1 0.95 0.85
C [k] 162 162 162
RFpedestrian inventory 10.3 10.3 10.3
RFpedestrian operating 13.4 13.4 13.4
RFvehicle inventory 6.48 6.48 6.48
RFvehicle operating 8.39 8.39 8.39
AASHTO 6.9.4.1.1-1
RF =(C - γDCDC - γDWDW +/- γPP)
AASHTO MBE 6A.4.2.1-1γLLLL(1+IM)
W8x35
Pe = AASHTO 6.9.4.1.2-1
→ Nonslender
Page 26 of 27
11/17/2014
By Joel Petersen-GauthierC - 33Revised 12/22/2014

Summary
Rev. 1
Triangle Truss Load Rating (LRFR Method)
Summary
*Timber decking is in poor condition → Φc = 0.85
*All other members are in good condition → Φc = 1
*M+A = Combined axial and bending
Force Inventory Operating Force Inventory Operating
Moment 5.18 6.72 Moment 0.16 0.21
M+A 1.39 1.85 M+A 1.56 2.03
Moment 1.33 1.72 Moment 1.08 1.40
M+A 1.40 1.82 Moment 2.02 2.61
Axial 1.26 1.64 Axial 9.13 11.8
Axial 1.25 1.62 Axial 5.59 7.25
Axial 10.3 13.4 Axial 6.48 8.39
Maximum Wheel Load (Inventory): 1268 lb
Maximum Wheel Load (Operating): 1643 lb
Controlling Rating
Factor & Failure Force
Pedestrian Vehicle
Timber Deck
Girders/Top Chords
(timber decking governs)
Stringers
Floorbeams
Bottom Chord
Diagonals
Crossbracing
Page 27 of 27
11/17/2014
By Joel Petersen-GauthierC - 34Revised 12/22/2014

Riverfront Park Bridges Inspection and Analysis Triangle Truss Bridge Revised – 12/22/2014 Appendix D
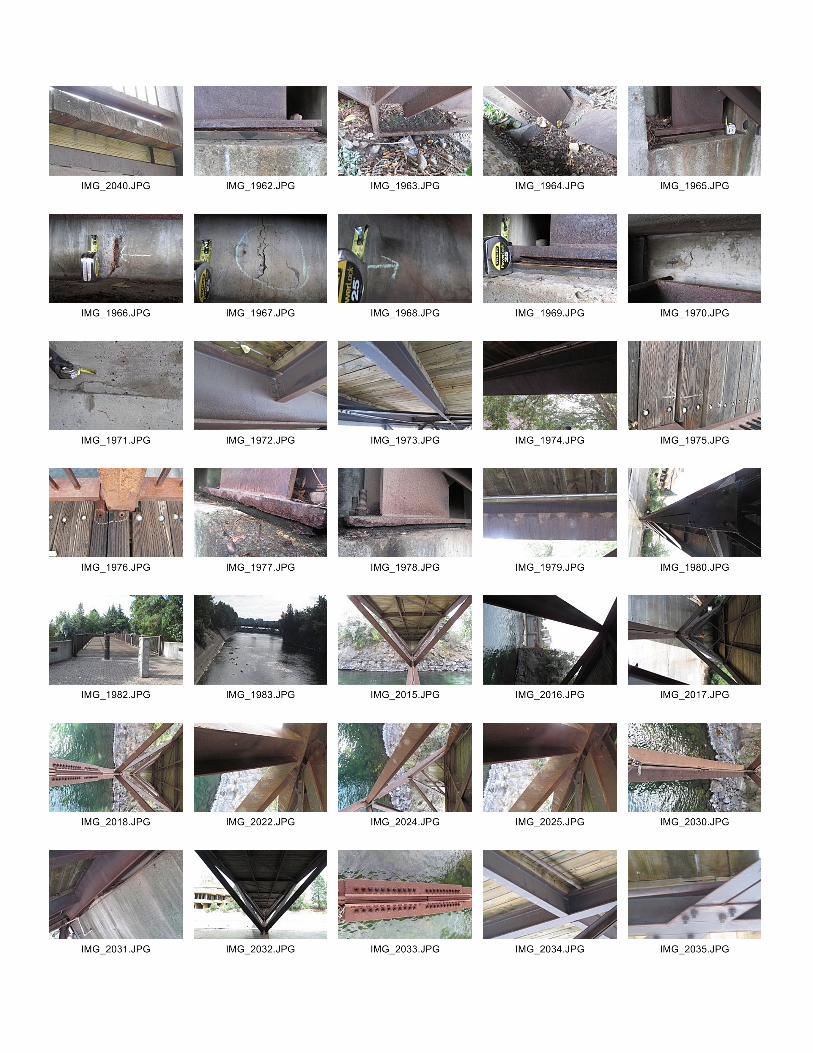
APPENDIX D
PHOTOGRAPH LOG
PHOTOGRAPH CONTACT SHEET

Project By
Location Date
Client
Bridge Name: Triangle Truss (Lou Barbieri)
Date of Inspection:
By
MF
MF
MF
MF
MF
MF
MF
MF
MF
MF
MF
MF
MF
MF
MF
MF
MF
MF
MF
MF
MF
MF
MF
JPG
JPG
Riverfront Park Bridges Inspection MLF Sheet No.
Spokane 8/14/2014 1 OF 1
City of Spokane Job No.
Inspection Photo Log 114176.12
8/13/2014
Photo No. Location Notes
1962 Pier 2, West Bearing Pack rust and debris
1963 L8 Debris in and below panel point L8
1964 L8 Debris in and below panel point L8
1965 Pier 2, West Bearing Pack rust and debris
1966 Pier 2, Backwall Exposed rebar in backwall
1967 Pier 2, Backwall Cracks/spalls in backwall
1968 Pier 2, Backwall Crack in backwall
1969 Pier 2, East Bearing Pack rust
1970 Pier 2, Backwall Exposed rebar
1971 Pier 2, East Wingwall Delamination
1973 MF
1972
1974
1976
1975
1977 Pier 1, West Bearing Up to 1/4" pack rust1978 Pier 2, East Bearing 1/4" pack rust
1979 Pier 1 Corrosion in top chord
1980 General Bottom chord
1982 Deck Deck, Looking south
1983 Elevation Elevation, Looking east
2015 General Truss
2016 General Truss
2017 General Truss
2018 General Truss
2022 U4, RT Top chord has moderate corrosion
2024 General Truss panel points collecting debris
Deck Twisted planks
Deck Missing bolts
General Flaking, corrosion of floorbeam, stringer, top chord of truss
JPG
JPG
JPG
JPG
JPG
JPG
MF
MF
MFMF
MF
MF
2024 General Truss panel points collecting debris
2025 U3, RT Top chord has moderate corrosion
2030 General Truss, bottom chord
2031 Floorbeam 1-0 Corrosion on top flange
2032 General Truss
2033 General Truss, splice
2034 Deck Splits in longitudinal deck member
2035 Deck Splits in longitudinal deck member
2037 Deck Splits in longitudinal deck member2038 L8-L9 Bent flange (from construction?)
2039 Deck Split members
2040 Deck Split members
Triangle
Marijeanf
Text Box
Triangle Truss Bridge Photographs

Marijeanf
Text Box
Triangle Truss Bridge Photographs