Seismic assessment of masonry arch bridges
12
Engineering Structures 31 (2009) 1777–1788 Contents lists available at ScienceDirect Engineering Structures journal homepage: www.elsevier.com/locate/engstruct Seismic assessment of masonry arch bridges Luca Pelà a,* , Alessandra Aprile a , Andrea Benedetti b a ENDIF Department, University of Ferrara, Via Saragat 1, 44100 Ferrara, Italy b DISTART Department, University of Bologna, Viale del Risorgimento 2, 40136 Bologna, Italy article info Article history: Received 7 January 2008 Received in revised form 10 November 2008 Accepted 11 February 2009 Available online 20 March 2009 Keywords: Masonry arch bridges Non-linear analysis Pushover analysis Displacement-based design Performance based seismic design Seismic assessment of existing bridges Control node Energy-based pushover analysis Energy equivalent displacement abstract In this paper, the seismic performance of existing masonry arch bridges is evaluated by using nonlinear static analysis, as suggested by several modern standards such as UNI ENV 1998-1 2003, OPCM 3274 2004, and FEMA 440 2005. The use of inelastic pushover analysis and response spectrum approaches becomes more difficult when structures other than the framed ones are investigated. This paper delves into the application of this methodology to masonry arch bridges by presenting two particular case studies. The need for experimental tests in order to calibrate the materials and the dynamic properties of the bridge is highlighted, in order to correctly model the most critical regions of the structure. The choice of the control node in the pushover analysis of masonry arch bridges and its influence on seismic safety evaluation is investigated. The ensuing discussion emphasizes important results, such as the unsuitability of the typical top node of the structure for describing the bridge seismic capacity. Finally, the seismic safety of the two bridges under consideration is verified by presenting an in-depth vulnerability analysis. © 2009 Elsevier Ltd. All rights reserved. 1. Introduction Unreinforced masonry structures are found in many earthquake- prone countries. Nowadays, particular attention is paid to existing masonry arch bridges because of their great importance for na- tional road and rail networks. In fact, the majority of the bridges in the European railway network, as well as a large part of those in the road system, consist of masonry structures. Therefore, their assessment is strongly needed by railway and local administrative authorities. In the last 25 years, several procedures have been developed in order to predict the behaviour of masonry arch bridges. The difficulty in representing the behaviour of the material and the resistant skeleton requires the use of a simplified but effective structural model. The developed methodologies, which could be based on Limit Analysis [1–4] and nonlinear incremental techniques [5–7], usually refer to bi-dimensional arches. Improved bi-dimensional models, which take into account the arch–fill interaction, have also been developed [8–11]. In addition, three-dimensional FEM models [12,13] allow both a complete description of the bridge geometry and detailed * Corresponding author. Tel.: +39 0532 974943; fax: +39 0532 974870. E-mail address: [email protected] (L. Pelà). constitutive models. Unfortunately, only a few studies available today concern themselves with the seismic assessment of masonry bridges [14]. Structural analysis in earthquake engineering is an involved task, because the activated structural behaviour is typically nonlinear, the structural system is usually complex, and the input data (structural properties and ground motions) are random and uncertain. In principle, nonlinear time-history analysis is the most suitable seismic evaluation tool, but such an approach cannot be considered common practice yet. Moreover, dynamic nonlinear analysis is strongly dependent on the input parameters’ uncertainty and has a high computational cost, which must be considered when complex structures are analysed. The methods suggested by the great majority of the codes dealing with existing buildings are based on the assumption of linear elastic structural behaviour and do not provide information about real strength, ductility and energy dissipation. They also fail to predict the expected damage in quantitative terms. At the moment, the most rational analysis methods for practical applications seem to be the simplified inelastic analysis procedure, which combines the nonlinear static (pushover ) analysis and the response spectrum approaches. Procedures derived from this method have been recently introduced in several modern codes [15–19], in which great attention is given to the new performance-based design philosophy. 0141-0296/$ – see front matter © 2009 Elsevier Ltd. All rights reserved. doi:10.1016/j.engstruct.2009.02.012
Transcript of Seismic assessment of masonry arch bridges

Engineering Structures 31 (2009) 1777–1788
Contents lists available at ScienceDirect
Engineering Structures
journal homepage: www.elsevier.com/locate/engstruct
Seismic assessment of masonry arch bridgesLuca Pelà a,∗, Alessandra Aprile a, Andrea Benedetti ba ENDIF Department, University of Ferrara, Via Saragat 1, 44100 Ferrara, Italyb DISTART Department, University of Bologna, Viale del Risorgimento 2, 40136 Bologna, Italy
a r t i c l e i n f o
Article history:Received 7 January 2008Received in revised form10 November 2008Accepted 11 February 2009Available online 20 March 2009
Keywords:Masonry arch bridgesNon-linear analysisPushover analysisDisplacement-based designPerformance based seismic designSeismic assessment of existing bridgesControl nodeEnergy-based pushover analysisEnergy equivalent displacement
a b s t r a c t
In this paper, the seismic performance of existing masonry arch bridges is evaluated by using nonlinearstatic analysis, as suggested by several modern standards such as UNI ENV 1998-1 2003, OPCM 32742004, and FEMA 440 2005. The use of inelastic pushover analysis and response spectrum approachesbecomes more difficult when structures other than the framed ones are investigated. This paper delvesinto the application of this methodology to masonry arch bridges by presenting two particular casestudies. The need for experimental tests in order to calibrate the materials and the dynamic propertiesof the bridge is highlighted, in order to correctly model the most critical regions of the structure. Thechoice of the control node in the pushover analysis of masonry arch bridges and its influence on seismicsafety evaluation is investigated. The ensuing discussion emphasizes important results, such as theunsuitability of the typical top node of the structure for describing the bridge seismic capacity. Finally, theseismic safety of the two bridges under consideration is verified by presenting an in-depth vulnerabilityanalysis.
© 2009 Elsevier Ltd. All rights reserved.
1. Introduction
Unreinforcedmasonry structures are found inmany earthquake-prone countries. Nowadays, particular attention is paid to existingmasonry arch bridges because of their great importance for na-tional road and rail networks. In fact, the majority of the bridgesin the European railway network, as well as a large part of thosein the road system, consist of masonry structures. Therefore, theirassessment is strongly needed by railway and local administrativeauthorities.In the last 25 years, several procedures have been developed
in order to predict the behaviour of masonry arch bridges.The difficulty in representing the behaviour of the materialand the resistant skeleton requires the use of a simplifiedbut effective structural model. The developed methodologies,which could be based on Limit Analysis [1–4] and nonlinearincremental techniques [5–7], usually refer to bi-dimensionalarches. Improved bi-dimensional models, which take into accountthe arch–fill interaction, have also been developed [8–11]. Inaddition, three-dimensional FEM models [12,13] allow botha complete description of the bridge geometry and detailed
∗ Corresponding author. Tel.: +39 0532 974943; fax: +39 0532 974870.E-mail address: [email protected] (L. Pelà).
0141-0296/$ – see front matter© 2009 Elsevier Ltd. All rights reserved.doi:10.1016/j.engstruct.2009.02.012
constitutive models. Unfortunately, only a few studies availabletoday concern themselveswith the seismic assessment ofmasonrybridges [14].Structural analysis in earthquake engineering is an involved
task, because the activated structural behaviour is typicallynonlinear, the structural system is usually complex, and the inputdata (structural properties and ground motions) are random anduncertain.In principle, nonlinear time-history analysis is themost suitable
seismic evaluation tool, but such an approach cannot be consideredcommon practice yet. Moreover, dynamic nonlinear analysis isstrongly dependent on the input parameters’ uncertainty and has ahigh computational cost, whichmust be consideredwhen complexstructures are analysed.The methods suggested by the great majority of the codes
dealing with existing buildings are based on the assumption oflinear elastic structural behaviour and do not provide informationabout real strength, ductility and energy dissipation. They also failto predict the expected damage in quantitative terms.At themoment, themost rational analysismethods for practical
applications seem to be the simplified inelastic analysis procedure,which combines the nonlinear static (pushover) analysis andthe response spectrum approaches. Procedures derived fromthis method have been recently introduced in several moderncodes [15–19], in which great attention is given to the newperformance-based design philosophy.

1778 L. Pelà et al. / Engineering Structures 31 (2009) 1777–1788
Fig. 1. View of the two structures: (a) S. Marcello Pistoiese Bridge; (b) CutiglianoBridge.
In this paper, the analyses of two real case studies are workedout in detail in order to highlight the performance of differentsafety evaluation formats.The results obtained point to the need for a careful character-
ization of the material, since the variability of the mechanical pa-rameters describing the masonry behaviour heavily influences theresults of the nonlinear static analysis.In conclusion, the present work reveals that the choice of
the control node position in the pushover analysis can modifyin a significant way the slope of the capacity curve, but that itsinfluence in the safety margin evaluation is not so great. Althoughfor the examined cases the centre of mass appears to be the bestcompromise choice, further analyses are needed to confirm thisresult.
2. Geometrical data and materials
The bridges considered in this paper (Fig. 1) are situated about30 km northwest of Pistoia (Italy), in two villages called S. MarcelloPistoiese and Cutigliano, respectively. They are both triple-archedstone bridges, built after the Second World War to cross theLima river in the Tuscany region. The first one has brick-madevaults, while the second one has concrete-made vaults. Sandstoneblocks from the rocks of the surroundings were adopted for theconstructions. Lime mortar was used for the deeper parts of thebridges; concrete mortar was used for all visible surfaces and forthe bricks of the first bridge vaults.The foundations of the piers are reinforced concrete footings on
high load bearing capacity rocks. Thewastematerial obtained fromexcavation of the foundations constitutes the fill above the vaultsand between upstream and downstream spandrel walls.
Table 1Geometrical data of the S. Marcello Pistoiese Bridge.
S. Marcello Pistoiese Bridge
Total length 72.50 mWidth 5.80 mHeight over the mean water level 23.25 mParapets height 1.00 mArches number 3
Piers
Width 5.80 mLength 7.20 mHeight 10.00 m
Main arch
Span 21.50 mRise at midspan 10.75 m
Brick vault thickness At the springing 2.20 mAt the key 0.90 m
Stone cornice thickness 0.30 m
Total arch thickness At the springing 2.50 mAt the key 1.20 m
Depth of the fill at the crown 1.30 m
Lateral arches
Span 8.00 mRise at midspan 4.00 mBrick vault thickness 0.40 mStone cornice thickness 0.20 mTotal arch thickness 0.60 mDepth of the fill at the crown 1.90 m
Table 2Geometrical data of the Cutigliano Bridge.
Cutigliano Bridge
Total length 82.50 mWidth 7.40 mHeight over the mean water level 16 mDeck gradient 5%Arches number 3
Piers
Width 3.50 mLength 7.00 m
Height Upper pier 3.50 mLower pier 2.50 m
Dosserets above the piers
Width 3.50 mLength 7.00 mHeight 1.50 m
Structural arches
Span 16.50 mRise at midspan 8.25 m
Concrete vault thickness At the springing 1.00 mAt the key 0.70 m
Depth of the fill at the crown 0.65 m
The main geometrical data of the bridges are summarized inTables 1 and 2; more information is given in Figs. 2 and 3.
3. Identification and modelling of material properties
The material properties were assessed according to laboratoryand field testing results. Seven stone cores were drilled fromthe bridges and were subjected to compression or splitting tests(Fig. 4), in order to evaluate the stone elastic modulus, thecompressive and tensile strength. The laboratory tests results(Table 3) showed the good mechanical properties of the stoneelements. The scatter of test results of different specimens isconsiderable, for the particular case of the compressive strength.This fact is due to the material heterogeneity and to the differentconditions of degradation of the extracted stones. In the case

L. Pelà et al. / Engineering Structures 31 (2009) 1777–1788 1779
Fig. 2. S. Marcello Pistoiese Bridge: (a) frontal view and longitudinal section; (b) transversal sections.
Fig. 3. Cutigliano Bridge: (a) longitudinal section; (b) transversal sections.
of masonry, it is quite typical to obtain a large dispersion ofdata both for artificial and natural blocks [3,23]. In the case ofnatural elements, the sedimentation geometry of the quarry is
the factor of greatest influence; in the case of artificial ones,clay composition and oven temperature give rise to the observedstatistical variations.

1780 L. Pelà et al. / Engineering Structures 31 (2009) 1777–1788
Fig. 4. Laboratory tests: (a) compression test; (b) compression test with elasticmodulus evaluation; (c) splitting test.
Table 3Laboratory tests results on stone specimens: compression test; compression testwith elastic modulus evaluation; splitting test.
Mechanical characteristic Specimen Test result (MPa)
Compressive strength
C1 100.3C2 52.0C3 44.9M1 86.0
Elastic modulus M1 14528
Tensile strengthB1 13.2B2 15.6B3 14.6
The assessment of the characteristic strength of the existingmortar was carried out by way of the penetrometric mechanical
in situ test [20]; the results provided a characteristic strength ofabout 0.3 MPa.Furthermore, the bridges were subjected to on-site non-
destructive tests, based on the dynamic response analysis toimpelling force. Such an experimental approach allows for theidentification of the principal dynamic characteristics of thestructure, in order to set the mechanical parameters and therestraint conditions of the numerical model. An impelling forcewas transversally applied to each bridge next to the middle archcrown. In this position, an accelerometer was placed in order torecord the consequent horizontal acceleration values (Figs. 2(a)and 3(a)).For sake of data identification, three-dimensional finite element
models were worked out using eight-node or six-node brick solidelements. The FEM code Straus7 [21] was used for the analysis;this software is typically used by designers and professionals forstructural analysis. The masonry was modelled as a homogeneousmaterial so that average response properties are considered.The comparison between experimental and numerical results
in terms of vibration frequencies and modal shapes allowed forthe calibration of the mechanical parameters and the restraintconditions of the finite element model [22]. Figs. 5 and 6 showthe acceleration signals recorded in the proximity of the middlearch crown (a), with the respective power spectral density (b) andmodal shape numerically determined (c).In the case of the S. Marcello Pistoiese Bridge, the impelling
force applied at the middle arch crown excites only the mode withfrequency equal to about 4 Hz (Fig. 5(b)), which is the first mode inthe transversal direction of the bridge (Fig. 5(c)).Fig. 6(b) shows thenatural frequency spectrumof the Cutigliano
Bridge. In this case, the impelling force excites the modes withnatural frequency equal to about 6 and 23 Hz. The CutiglianoBridge is stiffer than the S. Marcello one because it has concrete-made vaults. It is also important to remember that the CutiglianoBridge is not symmetrical. Fig. 6(c) shows the modal shape 4,corresponding to a frequency equal to 23.1 Hz.By considering the laboratory and dynamic tests, the values
of the mechanical structural parameters to be adopted in thenumerical models were selected (Table 4). In particular, in theanalysis all the materials’ secant Young’s moduli were set equal toone half of the determined dynamic ones [23].Since only twomechanical parameters were extracted from the
tests, a two-parameter model is sufficient for the description ofthe material’s behaviour. A Drucker–Prager model with pressuresensitive elastic–plastic material, with associated flow rule andisotropic behaviour, is thus selected to represent the materials(masonry, concrete, backfill) of the bridges.The nonlinear analyses were performed making use of the
Drucker–Prager failure criterion since it brings considerableadvantages from the analytical and computational point of viewdue to its smooth failure surface. This two-parameter modelpermits us to express the friction angle φ and the cohesion cin terms of the uniaxial tensile strength ft and the compressivestrength fc [24] explicitly. The parameter valueswere computed for
Table 4Structural parameters adopted in the numerical models of the bridges: material density (γ ), Young’s modulus (E), and Poisson ratio (v).
Bridge Material γ (kg/m3) E (MPa) ν (−)
S. Marcello Pistoiese
Masonry of stone and lime mortar (piers, spandrel walls, abutments, parapets) 2200 5000 0.2Masonry of stone and concrete mortar (arch cornice) 2200 6000 0.2Masonry of bricks and concrete mortar (vaults) 1800 5000 0.2Backfill 1800 500 0.2
CutiglianoMasonry of stone and lime mortar (piers, spandrel walls, abutments, parapets) 2200 5000 0.2Concrete (dosserets and vaults) 2400 12000 0.2Backfill 1800 500 0.2

L. Pelà et al. / Engineering Structures 31 (2009) 1777–1788 1781
Fig. 5. Dynamic on-site test of the S. Marcello Pistoiese Bridge: (a) registered horizontal acceleration; (b) power spectral density of the dynamic response; (c) Mode 1:Frequency= 3.998 Hz.
each different tested material and implemented in the numericalmodels.For the backfill, we assumed φ = 20◦, c = 0.05 MPa, while
for bricks and concrete mortar masonry φ· = 55◦, c = 0.05 MPa;these values were chosen as those suggested by Italian guide-lines [17] and following engineering judgement. The concrete ofthe Cutigliano Bridge vault was characterized by φ· = 55◦ andc = 1.15 MPa.Concerning the sandstone blocks masonry, which constitutes
the major part of the bridge structure, no significant specimencould be extracted and tested; furthermore, the usual homogeniza-tion formulas are not useful for random textured masonry. There-fore, a parametric studywas performed as a risk assessment tool inorder to consider the strength parameters ft and fc as average prop-erties of the homogeneous continuum representing the behaviourof the masonry composite material.In particular, since the range of strength ratios in masonry
compounds is limited, the masonry tensile strength ft and theratio ft/fc betweenmasonry tensile and compressive strengthwereselected as the main variables of the investigation.The Drucker–Prager’s constants of the stone masonry consid-
ered for the analysis were computed for different values of ft (0.2,0.3 and 0.4 MPa) and ft/fc (1/10, 1/15 and 1/20), chosen on thebasis of common experience. The obtained parameter values arereported in Table 5.The soil reaction at the pier footing was modelled with
particular elements, called cut-off bars, which properly accountfor the plastic behaviour of these critical sections. Cut-off bars
Table 5Drucker–Prager’s parameters φ and c for stone masonry corresponding to theconsidered values of the uniaxial tensile strength ft and the compressive strengthfc of the homogenized continuum [24].
Tensilestrength ft(MPa)
Strengthsratio ft/fc(−)
Compressivestrength fc (MPa)
Frictionangle φ(deg)
Cohesion c(MPa)
0.21/10 2 55 0.321/15 3 61 0.391/20 4 65 0.45
0.31/10 3 55 0.471/15 4.5 61 0.581/20 6 65 0.67
0.41/10 4 55 0.631/15 6 61 0.771/20 8 65 0.89
present an elastic–plastic constitutive law, with different yieldingstrength in traction and compression. These elements are definedby fixing axial stiffness and cut-off values (maximum permissibletension and compression forces), so that they can simulate the soilreaction beneath the plinth. This expedient permits us to localizethe damage at the pier end for a better numerical control when thelimit state of overturning is about to be approached.
4. Pushover analysis
In recent years, displacement-based methodologies such asthe pushover analysis have been proven to be consistent in the

1782 L. Pelà et al. / Engineering Structures 31 (2009) 1777–1788
Fig. 6. Dynamic on-site test of the Cutigliano Bridge: (a) registered horizontal acceleration; (b) power spectral density of the dynamic response; (c) Mode 4: Frequency=23.1 Hz.
seismic evaluation of existing buildings. In recent codes [15–18],the use of such nonlinear methods has been extended to the caseof unreinforced masonry buildings.In this article, an application of this tool is studied for the
particular case of masonry arch bridges. Recent studies on thisstructural typology showed that the simplified method, underthe usual restricting hypotheses of the pushover analysis, slightlyoverestimates in a conservative way the displacement obtained bynonlinear dynamic direct integrations [14].Standard pushover analysis may not detect the structural
weaknesses, which are generated when the structure dynamiccharacteristics change after the formation of the first local plasticmechanism [25,26]. The adaptive pushover analysis [27] allows usto account for the reduction in the structural stiffnesswhich occursduring an earthquake, but it requires more computational effortand its application to masonry structures is not straightforward.The document FEMA 440 [18] presents an in-depth review of theresearch on nonlinear static seismic analysis procedures.For the masonry bridges under consideration here, a prelimi-
nary natural frequency analysis was carried out in order to deter-mine the bridges’ resonant frequencies and themode shapes. Theseanalyses showed the prevailing influence of the first mode of vi-bration on the dynamic behaviour of the structures. Since the firstmode shape occurs in the transversal direction (Z), the most crit-ical failure mechanism takes place for forces acting orthogonal tothe plane containing the pier axes.Pushover analyses were performed by applying to each
bridge a monotonically increasing pattern of transversal forces,representing the inertial forceswhichwould be experienced by thestructure during the ground shaking.
The loading is imposed in a two-step sequence making useof a numerical model characterized by material and geometricnonlinearity. In the first step, the vertical (permanent) load isapplied and in the subsequent steps the lateral loads are addedin an incremental way. The maximum capacity of the structurecorresponds to the situation in which a further lateral loadincrement is impossible. In particular, such a force-controlledloading does not allow for a detection of the softening branchof the response. The more appropriate displacement-controlledprocedures are not always permitted by the common commercialfinite element programs.The selection of an appropriate lateral load distribution is
a key factor of the pushover analysis, since the loads shouldrepresent the inertial forces acting on the structure during theearthquake. In the present work, lateral forces proportional to themass distribution are used.The capacity of the structure is described by the curve of the
base shear force versus the displacement at a suitable controlpoint. Therefore, a complex structural behaviour is converted intothe response of an equivalent nonlinear single degree of freedom(SDOF) system, permitting a direct comparison with the seismicdemand in terms of the response spectrum.The rules for the conversion, however, are still in debate. A
discussion on the selection of the control node will be postponeduntil Section 6.Fig. 7 shows the effectiveness of the static nonlinear method in
pointing out the parameter sensitivity of the model, with relationto the compressive and tensile strength of the masonry material.Fig. 7(a) and (b) represent the effect of both the above-mentionedparameters on the seismic capacity of the San Marcello Pistoiese

L. Pelà et al. / Engineering Structures 31 (2009) 1777–1788 1783
Fig. 7. Pushover curves for the S. Marcello Pistoiese Bridge: (a) influence of the compressive strength fc ; (b) influence of the tensile strength ft .
Bridge. The set of these curves is obtained by posing the centreof the mass of the structure as control point. In Section 6, otherchoices will be presented, discussed and compared.
5. Seismic performance analysis: Theoretical background
The seismic performance evaluation is carried out by makinguse of the N2 method, as developed by Fajfar [25,26]. Today thisprocedure is reported by several modern codes, like Eurocode8 [15] and the New Seismic Italian Code [16,17]. The N2 method isan advancement with respect to the Freeman ‘‘Capacity Spectrummethod’’ [28,29], further applied in FEMA 356 [19] and FEMA440 [18].The method presented in this work is formulated in the
acceleration–displacement (AD) format. Following this approach,
the capacity of the structure is directly comparedwith the demandof the earthquake ground motion on the structure. The selectedformat makes possible a graphical interpretation of the procedureand explicates the relationships among the basic parameterscontrolling the seismic response.The capacity of the structure is represented by a global
force–displacement curve, obtained as reported in Section 4. Thebase shear forces and displacements are respectively convertedinto spectral accelerations and spectral displacements of anequivalent SDOF system. These spectral values allow drawing thecapacity diagram.With regard to the seismic demand, the elastic spectra reported
in the codes [15–17] were converted into inelastic spectra withconstant ductility, using simplified relations given by Vidic et al.

1784 L. Pelà et al. / Engineering Structures 31 (2009) 1777–1788
[30] in terms of the ductility factor µ and the ductility dependentreduction factor Rµ (see also [31]).The inelastic demand in terms of accelerations and displace-
ments is given by the intersection point of the capacity diagramwith the demand spectrum corresponding to the ductility demandµ. At this point, called the performance point, the ductility factordetermined on the capacity diagrammust be equal to the value as-sociated with the intersecting demand spectrum.Recently, the N2 method has been proposed for the seismic
analysis ofmasonry structures;manyworks found in the literatureconcerning masonry buildings [31] and arch bridges [14] explainthe effectiveness of this procedure for these peculiar constructionclasses. Furthermore, recent studies on bridges similar to theones studied in this work show that the simplified methodslightly overestimates in a conservative way the displacementobtained by nonlinear dynamic analysis; this trend is monotonicand proportional to the increase of the earthquake peak groundacceleration [14].This topic however is still debated in the literature and many
researchers are actually working to obtain comparisons by meansof advanceddynamic nonlinear analyses.With the aimof gatheringexperimental evidence, the authors have recently started anexperimental laboratory investigation on scaled masonry bridgemodels.
6. Choice of the control node in the pushover analysis
The choice of the control point best suited for outlining thebuilding capacity curve is a complex task, strongly connectedto the selection of the structure equivalent SDOF system.Several suggestions have been proposed for concrete [32] andmasonry [31] buildings, but in the particular case of arch bridgesthe equivalence is not straightforward.The N2 method recommends choosing the control point at the
roof level and such an instruction seems coherent and logical,because it permits control of a node that certainly is situated abovethe level where the failure mechanism occurs.Moreover, recent studies [33,34] use a displacement value
computed from the work done in the pushover analysis toestablish the capacity curve, in contrast to the use of theroof displacement adopted in conventional procedures. Such anenergy-based approach allows one to avoid the errors of the SDOFsystem capacity curve due to significantly higher modes in themulti-degree of freedom (MDOF) system, when disproportionateincreases and even outright reversals in the roof displacementoccur.For masonry historical buildings, an exhaustive theoretical
study is not available and thus, according with the N2 method, thecontrol node is usually assumed to be on the top of the structure.For the sake of argument, some works concerning the pushoveranalysis of a typical three-nave bay of gothic cathedrals [35,36] canbe mentioned. In these studies, the point is considered to be at thetop of the central nave.Referring to the particular case of masonry arch bridges, some
authors defined the capacity curve considering the displacementof a node situated at the same height of the seismic forces gyrationcentre [14]. If the lateral loads are set proportional to the massdistribution, the point clearly will be located at the bridge’s centreof mass.In the present work, the influence of the control node position
on the seismic safety evaluation has been checked by usingdifferent selection rules. In this comparison, the numerical modelof the S. Marcello Pistoiese Bridge was considered; the masonrycompressive strength fc was assumed to be equal to 4.5 MPa andthe tensile strength ft equal to 0.3 MPa.
Fig. 8. Pushover curves for the S. Marcello Pistoiese Bridgemaking reference to thetop of the structure displacement (TOP), the centre of mass displacement (CM) andthe virtual energy equivalent displacement (EN).
In the pushover analyses, three different control node positionswere investigated. Two positions are real, situated respectively atthe middle span of the bridge deck and at the centre of mass (at anelevation of 15.8 m, see Fig. 2).The third position is virtual and calculated by means of the
Energy Approach [37,38]. Since the structural inelastic behaviourof the MDOF system is essentially governed by energy concepts,the Energy Approach defines a suitable virtual energy equivalentdisplacement. The energy equivalent displacement can be used toestimate an SDOF capacity curve,which reproduces the total elasticand plastic energy accumulated by the whole structure (MDOFsystem) during the pushing procedure. The energy equivalentdisplacement does not correspond to a particular point of theMDOF model, but it is the virtual value which equals theenergy capacities of both models. When the Energy Approachprocedure is applied, the area of the capacity curve of the SDOFsystem reproduces exactly the deformation energy of the MDOFsystem [37,38].Fig. 8 shows the three capacity curves obtained by making
reference to the top of the structure displacement (TOP), the centreof mass displacement (CM) and the virtual energy equivalentdisplacement (EN). As can be easily seen, the energy equivalentdisplacement yields the stiffest capacity curve, while the topdisplacement obviously provides the highest values on the x-axis,since it is the maximum displacement of the bridge at every stepof the analysis.The ultimate displacements were determined for each case
mentioned and called, respectively, du,TOP , du,CM and du,EN : thecorresponding obtained valueswere 0.125m, 0.065mand0.044m.The performance point displacements dp,TOP , dp,CM and dp,EN werealso defined by comparing the capacity curves with the demandsresulting from the ground motions defined by Italian SeismicCode [16,17]. Several seismic classes were investigated: the first,the second and the third, respectively, associated with a groundacceleration value of ag equal to 0.35g , 0.25g and 0.15g . Twoground amplification factors were considered equal to 1 and 1.25;they refer respectively to ground types A (rock or other rock-likegeological formations) and B (deposits of very dense sand, gravel,or very stiff clay).The obtained results are summarized in Table 6, where the
safety factors du/dp are also indicated. The same table also reportsthe comparison with the ultimate displacements du,N2 obtained bymeans of the rigorous procedure suggested by the N2 method [25,26]. Themeans and the coefficient of variation (C.O.V.) values of thefour different safety factors calculated for each seismic demand arealso indicated.

L. Pelà et al. / Engineering Structures 31 (2009) 1777–1788 1785
Table 6Performance displacements (dp) and safety factors (du/dp) obtained for the different control node positions: top, centre of mass, energy equivalent, N2 method.
Spectrum Performance point Safety factordp,TOP (m) dp,CM (m) dp,EN (m) dp,N2 (m) (du/dp)TOP (–) (du/dp)CM (–) (du/dp)EN (–) (du/dp)N2 (–) Mean (-) C.O.V. (%)
3-A 0.024 0.016 0.012 0.018 5.21 4.06 3.67 4.06 4.25 13.63-B 0.037 0.022 0.015 0.022 3.38 2.95 2.93 3.32 3.15 6.52-A 0.040 0.027 0.020 0.031 3.13 2.41 2.20 2.35 2.52 14.12-B 0.062 0.039 0.028 0.038 2.02 1.67 1.57 1.92 1.79 10.11-A 0.055 0.038 0.029 0.042 2.27 1.71 1.52 1.74 1.81 15.51-B 0.087 0.056 0.042 0.053 1.44 1.16 1.05 1.38 1.26 12.6
Fig. 9. Comparison between the safety factors du/dp determined considering thetop displacement (TOP), the centre of mass displacement (CM), the virtual energyequivalent displacement (EN) and the N2 displacement (N2).
Fig. 10. Cutigliano Bridge performance points for different seismic levels andground types (ft = 0.3 MPa, ft/fc = 1/15).
Fig. 9 shows the graphical comparison between the safetyfactors du/dp, which are determined considering the top dis-placement, the centre of mass displacement, the virtual energyequivalent displacement and the N2 displacement. The respectivevalues (du/dp)TOP , (du/dp)CM , (du/dp)EN and (du/dp)N2 are referredto pertinent demand spectra.As can be easily seen, the choice of the top displacement always
leads to the highest estimate of the safety factor. The usual choiceof this particular node in the pushover analyses [35,36] does notseem suitable, because it implies a more flexible structure, whichcould be supported only by accounting for higher damping values.The determination of the N2 displacement is quite time-
consuming for a mass-distributed structure and the procedureseems conceptuallymore adequate to the case of framed structureswhere the masses could be considered lumped at the storeys.
Intuitively, the choice of the centre of mass or the choice of theenergy equivalent displacement permits one to study the responseofmore representative points. In fact, the virtual energy equivalentdisplacement is related to an energy equivalent SDOF system witha height lower than the elevation of the centre of mass a lowerelevation than the one of the mass centre (see Fig. 8). Since thecentre of mass is located above the pier top, it is possible toconclude that these two nodes could be considered relevant forsuch type of bridges, for which the drift of the piers dominates theout of plane collapse displacement shape, in a manner similar to acantilever column.By comparing the aforementioned process with the other two
approaches, the choice of the centre of mass or the choice ofthe energy equivalent displacement leads to lower estimates ofthe safety factor. Fig. 9 also shows that the values of (du/dp)CMand (du/dp)EN come out quite similar even when different seismicdemand levels are considered. In any case, the energy equivalentdisplacement always provides the lowest estimate of the safetyfactor.For an assigned probabilistic distribution of the seismic
demand, the rigorous probabilistic definition of the bridge seismicsafety should require the determination of the probabilisticdistribution of the safety factor values by varying the selectionof the control node in the pushover analyses. A suitable idealprocedure could consider the probabilistic distribution of thesafety factors du/dp corresponding to a regular grid of severalcontrol points, but such a procedure could be very time-consumingand there is no proof that the optimum point can be found.However, in the present work, the small set of control pointsadopted leads to a moderate variability of the results, despite thefact that they are located at different elevations. This fact canbe easily noticed in Table 6, where the coefficients of variationappear small. Since the estimate of the safety factor that providesthe maximum safety margin should be the minimum of theones investigated, i.e. the safety factor related to the energydisplacement, in the next section the centre of mass displacementwill be preferred to assess seismic safety. In fact, the choice of thecentre of mass of the bridge is very near to the energy equivalentresults, but has a clearer geometrical interpretation and requiresless computational effort.
7. Seismic performance analysis results
The bridges analysed herein are situated in the third categoryseismic zone, with ground acceleration peak value ag = 0.15g , asderived by the classification maps of the Italian Seismic Code [16].However, these bridge structures are particularly diffuse in Italy
and the obtained results can be easily generalized and appliedto other similar masonry arch bridges. Therefore, the structuralcapacity was compared with the demand of earthquake groundmotions related to first, second and third category seismic zonesand with reference to ground types A and B.In Figs. 10 and 11 the graphical representation of the executed
study is reported for both the cases of the Cutigliano Bridge andthe S.Marcello Pistoiese Bridge. A bilinear elastoplastic idealization
1786 L. Pelà et al. / Engineering Structures 31 (2009) 1777–1788
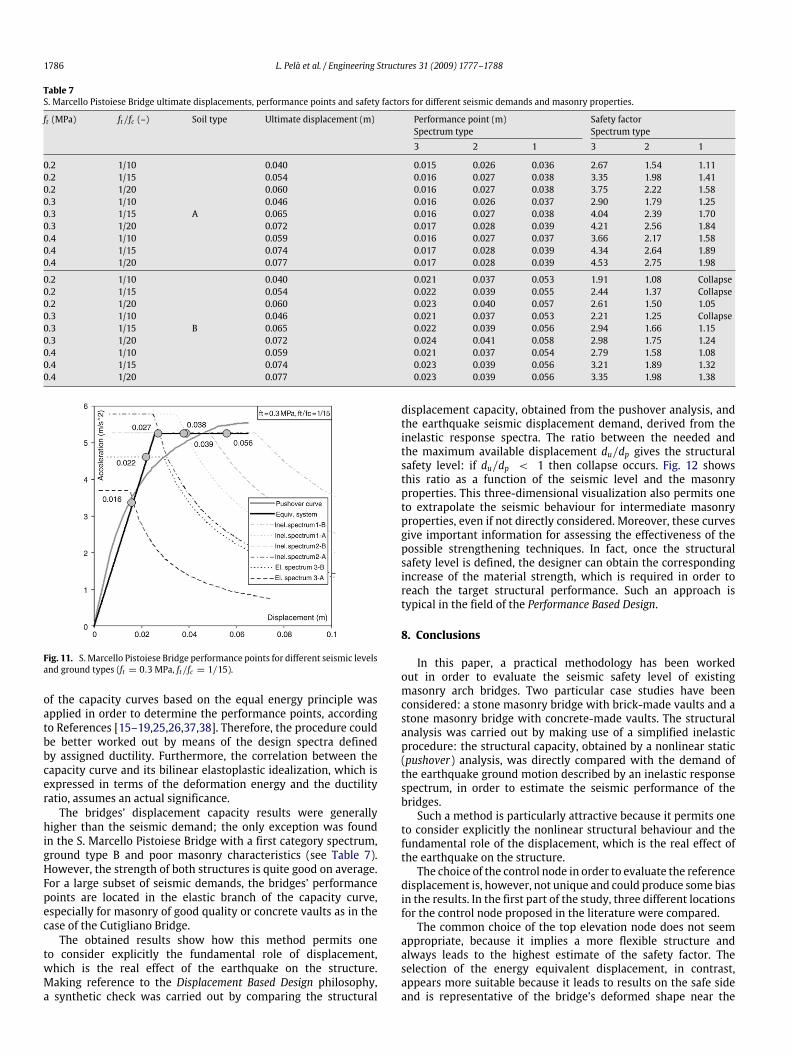
Table 7S. Marcello Pistoiese Bridge ultimate displacements, performance points and safety factors for different seismic demands and masonry properties.
ft (MPa) ft/fc (–) Soil type Ultimate displacement (m) Performance point (m) Safety factorSpectrum type Spectrum type3 2 1 3 2 1
0.2 1/10
A
0.040 0.015 0.026 0.036 2.67 1.54 1.110.2 1/15 0.054 0.016 0.027 0.038 3.35 1.98 1.410.2 1/20 0.060 0.016 0.027 0.038 3.75 2.22 1.580.3 1/10 0.046 0.016 0.026 0.037 2.90 1.79 1.250.3 1/15 0.065 0.016 0.027 0.038 4.04 2.39 1.700.3 1/20 0.072 0.017 0.028 0.039 4.21 2.56 1.840.4 1/10 0.059 0.016 0.027 0.037 3.66 2.17 1.580.4 1/15 0.074 0.017 0.028 0.039 4.34 2.64 1.890.4 1/20 0.077 0.017 0.028 0.039 4.53 2.75 1.98
0.2 1/10
B
0.040 0.021 0.037 0.053 1.91 1.08 Collapse0.2 1/15 0.054 0.022 0.039 0.055 2.44 1.37 Collapse0.2 1/20 0.060 0.023 0.040 0.057 2.61 1.50 1.050.3 1/10 0.046 0.021 0.037 0.053 2.21 1.25 Collapse0.3 1/15 0.065 0.022 0.039 0.056 2.94 1.66 1.150.3 1/20 0.072 0.024 0.041 0.058 2.98 1.75 1.240.4 1/10 0.059 0.021 0.037 0.054 2.79 1.58 1.080.4 1/15 0.074 0.023 0.039 0.056 3.21 1.89 1.320.4 1/20 0.077 0.023 0.039 0.056 3.35 1.98 1.38
Fig. 11. S. Marcello Pistoiese Bridge performance points for different seismic levelsand ground types (ft = 0.3 MPa, ft/fc = 1/15).
of the capacity curves based on the equal energy principle wasapplied in order to determine the performance points, accordingto References [15–19,25,26,37,38]. Therefore, the procedure couldbe better worked out by means of the design spectra definedby assigned ductility. Furthermore, the correlation between thecapacity curve and its bilinear elastoplastic idealization, which isexpressed in terms of the deformation energy and the ductilityratio, assumes an actual significance.The bridges’ displacement capacity results were generally
higher than the seismic demand; the only exception was foundin the S. Marcello Pistoiese Bridge with a first category spectrum,ground type B and poor masonry characteristics (see Table 7).However, the strength of both structures is quite good on average.For a large subset of seismic demands, the bridges’ performancepoints are located in the elastic branch of the capacity curve,especially for masonry of good quality or concrete vaults as in thecase of the Cutigliano Bridge.The obtained results show how this method permits one
to consider explicitly the fundamental role of displacement,which is the real effect of the earthquake on the structure.Making reference to the Displacement Based Design philosophy,a synthetic check was carried out by comparing the structural
displacement capacity, obtained from the pushover analysis, andthe earthquake seismic displacement demand, derived from theinelastic response spectra. The ratio between the needed andthe maximum available displacement du/dp gives the structuralsafety level: if du/dp < 1 then collapse occurs. Fig. 12 showsthis ratio as a function of the seismic level and the masonryproperties. This three-dimensional visualization also permits oneto extrapolate the seismic behaviour for intermediate masonryproperties, even if not directly considered. Moreover, these curvesgive important information for assessing the effectiveness of thepossible strengthening techniques. In fact, once the structuralsafety level is defined, the designer can obtain the correspondingincrease of the material strength, which is required in order toreach the target structural performance. Such an approach istypical in the field of the Performance Based Design.
8. Conclusions
In this paper, a practical methodology has been workedout in order to evaluate the seismic safety level of existingmasonry arch bridges. Two particular case studies have beenconsidered: a stone masonry bridge with brick-made vaults and astone masonry bridge with concrete-made vaults. The structuralanalysis was carried out by making use of a simplified inelasticprocedure: the structural capacity, obtained by a nonlinear static(pushover) analysis, was directly compared with the demand ofthe earthquake ground motion described by an inelastic responsespectrum, in order to estimate the seismic performance of thebridges.Such a method is particularly attractive because it permits one
to consider explicitly the nonlinear structural behaviour and thefundamental role of the displacement, which is the real effect ofthe earthquake on the structure.The choice of the control node in order to evaluate the reference
displacement is, however, not unique and could produce some biasin the results. In the first part of the study, three different locationsfor the control node proposed in the literature were compared.The common choice of the top elevation node does not seem
appropriate, because it implies a more flexible structure andalways leads to the highest estimate of the safety factor. Theselection of the energy equivalent displacement, in contrast,appears more suitable because it leads to results on the safe sideand is representative of the bridge’s deformed shape near the

L. Pelà et al. / Engineering Structures 31 (2009) 1777–1788 1787
Fig. 12. Ratios between the needed and the maximum available displacement du/dp for different masonry properties of the S. Marcello Pistoiese Bridge: (a) third categoryseismic zone, ground type A vs. ground type B; (b) second category seismic zone, ground type A vs. ground type B; (c) first category seismic zone, ground type A vs. groundtype B.
collapse. A compromise choice is the centre of mass of the bridge,which is very near to the energy equivalent results but has a clearergeometrical interpretation and requires less computational effort.Although available commercial software has actually many
limitations, the methodology defined in the present work seemsto be suitable for a careful seismic assessment of existing bridgeswithout resorting to specialised packages. In particular, the seismicsafety of the S. Marcello Pistoiese Bridge and the CutiglianoBridge was demonstrated by ascertaining that their displacementcapacities are higher than the seismic demands of the sites inwhich they are located, for the whole range of the masonrymaterial properties that bound the actual ones.
Acknowledgements
The authors gratefully acknowledge the financial support ofMIUR–Cofin 2004081027_003. The authors also acknowledge thePistoia County Administration, in the persons of Eng. PaoloMazzoni and Eng. Paolo Bellezza. Finally, the authors wish to thankLinda Leprotti for her helpful collaboration.
References
[1] Heyman J. The masonry arch. Chichester: Ellis Horwood; 1982.
[2] Gilbert M, Melbourne C. Rigid-block analysis to masonry arches. Struct Eng1994;72:356–61.
[3] Hughes TG, BlacklerMJ. A reviewof theUKmasonry assessmentmethods. ProcInst Civil Eng 1995;110:373–82.
[4] Boothby T. Collapse modes of masonry arch bridges. J Br Masonry Soc 1995;9(2):62–9.
[5] Molins C, Roca P. Capacity of masonry arches and spatial frames. J Struct Eng1988;124:653–63.
[6] Brencich A, De Francesco U. Assessment of multi-span masonry Arch bridges.Part I: A simplified approach, Part II: Examples and applications. J Bridge EngASCE 2004;9(November):582–98.
[7] Audenaert A, Fanning P, Sobczak L, Peremans H. 2-D analysis of arch bridgesusing an elasto-plastic material model. Engrg Struct 2008;30:845–55.
[8] Thavalingam A, Bicanic N, Robinson JI, Ponniah DA. Computational frameworkfor discontinuousmodelling ofmasonry arch bridges. Comput Struct 2001;79:1821–30.
[9] Gilbert M. RING masonry arch analysis software [last update: 29.04.05].http://www.shefr.ac.uk/ring.
[10] Cavicchi A, Gambarotta L. Collapse analysis of masonry bridges taking intoaccount arch–fill interaction. Eng Struct 2005;27:605–15.
[11] Cavicchi A, Gambarotta L. Lower bound limit analysis of masonry bridgesincluding arch–fill interaction. Engrg Struct 2007;29:3002–14.
[12] Fanning PJ, Boothby TE. Three-dimensional modelling and full-scale testing ofstone arch bridges. J Comput Struct 2001;79(29–30):2645–62.
[13] Fanning PJ, end Sobczak L, Boothby TE, Salomoni V. Load testing and modelsimulations for a stone arch bridge. Bridge Struct 2005;1(4).
[14] Resemini S. Vulnerabilità sismica dei ponti ferroviari ad arco in muratura. Tesidi Dottorato. XV Ciclo, Genova; 2003.

1788 L. Pelà et al. / Engineering Structures 31 (2009) 1777–1788
[15] UNI ENV 1998-1 (Eurocode 8). Design of structures for earthquake resistance,Part 1: General rules, seismic actions and rules for buildings. December 2003.
[16] Ordinanza P.C.M. 3274. Primi elementi in materia di criteri generali per laclassificazione sismica del territorio nazionale e di normative tecniche per lecostruzioni in zona sismica. Release 9/9/2004 [in Italian].
[17] Ordinanza P.C.M. 3431. Ulteriori modifiche ed integrazioni alla OrdinanzaPCM 3274 Primi Elementi in Materia di Criteri Generali per la ClassificazioneSismica del Territorio Nazionale e di Normative Tecniche per le Costruzioni inZona Sismica. Release 3/5/2005 [in Italian].
[18] FEMA 440. Improvement of nonlinear static seismic analysis procedures.Washington (DC), Federal Emergency Management Agency, June 2005.
[19] FEMA 356. Prestandard and commentary for the seismic rehabilitationof buildings. Washington (DC): Federal Emergency Management Agency;November 2000.
[20] Gucci N, Barsotti R. A non-destructive technique for the determination ofmortar load capacity in situ. Mater Struct 1995;28:276–83.
[21] G+D Computing ©. Straus 7 user’s manual. Sidney (Australia): G+ DComputing; 1999. HSH srl, Padova, Italy.
[22] Brencich A, Sabia D. Experimental identification of a multi-span masonrybridge: The Tanaro bridge. Construct Building Mater 2008;22:2087–99.
[23] Aprile A, Benedetti A, Grassucci F. Assessment of cracking and collapse for oldbrick masonry columns. J Struct Eng 2001;127(12):1427–35.
[24] Chen WF. Plasticity in reinforced concrete. New York: Mc Graw-Hill BookCompany.
[25] Fajfar P. Structural analysis in earthquake engineering — a breakthrough ofsimplified nonlinear methods. In: Proceeding of 12th European conference onearthquake engineering. 2002.
[26] Fajfar P. A nonlinear analysis method for performance-based seismic design.Earthq Spectra 2000;16(3):573–92.
[27] Gupta B, Kunnath SK. Adaptive spectra-based pushover procedure for seismicevaluation of structures. Earthquake Spectra 2000;16(2):367–92.
[28] Freeman SA, Nicoletti JP, Tyrrell JV. Evaluation of existing buildings for seismic
risk—Acase study of Puget soundnaval shipyard. In: Proceeding ofUSnationalconference on earthquake engineering. 1975.
[29] Freeman SA. Development and use of capacity spectrum method. In:Proceeding of sixth U.S. national conference on earthquake engineering 1998.
[30] Vidic T, Fajfar P, FischingerM. Consistent inelastic design spectra: Strength anddisplacement. Earthq Eng Struct Dynam 1994;23:502–21.
[31] Lagomarsino S, Galasco A, Penna A. Pushover and dynamic analysis of U.R.M.buildings by means of a non-linear macro-element model. In: Proceeding ofthe international conference on earthquake loss estimation and risk reduction.2002.
[32] Mwafy AM, Elnashai AS. Static pushover versus dynamic collapse analysis ofRC buildings. Eng Struct 2001;23:407–24.
[33] Hernández-Montes E, Kwon O-S, Aschheim M. An energy-based formulationfor first andmultiple-mode nonlinear static (pushover) analyses. J EarthquakeEngrg 2004;8(1):69–88.
[34] Tjhin T, Aschheim M, Hernández-Montes E. Estimates of peak roof displace-ment using ‘‘equivalent’’ single degree of freedom systems. J Struct Eng 2005;131(3):517–22.
[35] Martínez G, Roca P, Caselles O, Clapés J. Characterization of the dynamicresponse for the structure of Mallorca cathedral. In: Proceeding of 5thinternational conference on structural analysis of historical constructions.2006.
[36] Irizarry J, Podestà S, Resemini S. Capacity curves of monumental-heritageelements: The Santa Maria del Mar Church in Barcelona. In: Proceeding ofinternational conference on earthquake loss estimation and risk reduction.2002.
[37] Parducci A, Comodini F, MezziM. Approccio Energetico per le Analisi Pushover[in Italian]. XI national congress ‘‘L’ingegneria Sismica in Italia’’. Genova, Italy;2004.
[38] Parducci A, Comodini F, Lucarelli M, Mezzi M, Tomassoli E. Energy-basednon linear static analysis. In: Proceeding of the first European conference onearthquake engineering and seismology. 2006.