INNOVATIVE SYSTEM FOR SEISMIC RESISTANT MASONRY ...
399
UNIVERSITY OF BELGRADE FACULTY OF CIVIL ENGINEERING Marko M. Marinković INNOVATIVE SYSTEM FOR SEISMIC RESISTANT MASONRY INFILLS IN REINFORCED CONCRETE FRAME STRUCTURES Doctoral Dissertation Belgrade, 2018
-
Upload
khangminh22 -
Category
Documents
-
view
0 -
download
0
Transcript of INNOVATIVE SYSTEM FOR SEISMIC RESISTANT MASONRY ...

UNIVERSITY OF BELGRADE
FACULTY OF CIVIL ENGINEERING
Marko M. Marinković
INNOVATIVE SYSTEM FOR SEISMIC
RESISTANT MASONRY INFILLS IN
REINFORCED CONCRETE FRAME
STRUCTURES
Doctoral Dissertation
Belgrade, 2018

УНИВЕРЗИТЕТ У БЕОГРАДУ
ГРАЂЕВИНСКИ ФАКУЛТЕТ
Марко М. Маринковић
ИНОВАТИВНИ СИСТЕМ ЗА
СЕИЗМИЧКИ ОТПОРНУ ЗИДАНУ
ИСПУНУ У АРМИРАНОБЕТОНСКИМ
РАМОВСКИМ КОНСТРУКЦИЈАМА
докторска дисертација
Београд, 2018

Supervisors: Prof. Dr.-Ing. Christoph Butenweg
Center for Wind and Earthquake Engineering, RWTH Aachen
University, Germany
Prof. Rastislav Mandić
University of Belgrade, Faculty of Civil Engineering
Members of the commitee: Prof. Dr.-Ing. Christoph Butenweg
Center for Wind and Earthquake Engineering, RWTH Aachen
University, Germany
Prof. Rastislav Mandić
University of Belgrade, Faculty of Civil Engineering
Associate prof. Ratko Salatić
University of Belgrade, Faculty of Civil Engineering
Dr. Paolo Morandi, senior researcher
EUCENTRE, Department of Structures and Infrastructures, Pa-
via, Italy
Associate prof. Zoran Mišković
University of Belgrade, Faculty of Civil Engineering
Defense date: ____________________

Мојој породици,
За љубав, инспирацију и безусловну подршку.
To my family,
For your love, inspiration and unconditional support.

i
Acknowledgements
Many individuals and institutions have contributed to the research reported in this thesis. In
the following paragraphs, I would like to express my most sincere gratitude and appreciation
for them.
The biggest gratitude goes to my supervisor Prof. Dr.-Ing. Christoph Butenweg. I would like
to thank him for providing me with all the resources I needed to conduct my doctoral
research, for his trust and his exceptional guidance. Thanks to him I learned how to approach
challenging problems with an open mind and resolve them with analytical thinking.
Discussing the research dilemmas and findings gave me different perspectives and helped me
to successfully overcome the challenges I was facing. His devotion to this research subject is
without a doubt inspirational. I benefited immensely from working and exchanging ideas with
him. Some of the best moments among many, happened while working together on the
development of the INODIS system. These moments will stay in my memories forever.
Special thanks is also addressed to Prof. Rastislav Mandić for valuable support and
constructive discussions during the work on the thesis.
I would like to express a very great appreciation to associate prof. Ratko Salatić for
introducing me to the topic of infilled frames during my master thesis. Additionally, I wish to
thank him for sharing his knowledge and working with me in the field of dynamics of
structures and earthquake engineering, but also for constructive discussions we had.
The experimental tests have been conducted as a part of the European project INSYSME
(Innovative Systems for Earthquake Resistant Masonry Enclosures in RC Buildings). It was
my great pleasure and honor to work with all the partners in the project and I would like to
thank the SDA-engineering GmbH for providing me with this opportunity. The financial
support from the Arbeitsgemeinsachaft Mauerziegel im Bundesverband der Deutschen
Ziegelindustrie e.V. is gratefully acknowledged. In addition, I wish to thank Dr. Udo Meyer
and Dr. Thomas Fehlhaber for their valuable suggestions and support during the execution of
the INSYSME project. Furthermore, I would like to thank Prof. Ekkehard Fehling, Dr.
Thomas Hahn and M.Sc. Thomas Pfetzing and all the laboratory staff from Kassel University
for the execution of the experimental tests. I am grateful to Mr Ruppik and all the people from
the laboratories of the Instituts für Ziegelforschung Essen e.V. for their help in the execution
of the tests. Furthermore, a big gratitude goes to Mr Gücker and the company, BSW
Berleburger Schaumstoffwerk GmbH, for providing the elastomer material for the tests.

ii
The financial support of the program SEEFORM (South Eastern European Graduate School
for Master and PhD) is gratefully acknowledged.
I would also like to especially thank my friend and colleague Marko Radišić for his great
effort in helping me with programming short codes in MATLAB in order to be able to better
evaluate experimental results. Many thanks to my colleagues from the Department of
engineering mechanics and theory of structures, especially to Miloš Jočković, Emilija
Damnjanović, Nevenka Kolarević, Miroslav Marjanović and Nikola Blagojević. I express my
deep gratitude to all of them for covering my duties during my research stays in Germany, and
for the memorable moments we shared. Also, I would like to thank to my colleagues and
friends Marko Orešković and Nikola Tošić for their valuable support and advices.
I would like to express my appreciation to all the members of the Chair of Structural Analysis
and Dynamics (LBB) at RWTH Aachen University. I am particularly grateful to my friends
Thomas Kubalski, Florian Kieser and Philipp Michel, who made my research stays in Aachen
so enjoyable. Particularly, I would like to thank Thomas Kubalski for the useful discussions
and common work on the topic, and for many great moments outside of the office.
The proof reading of the text of the thesis was done by my best friend Marko Radović, and I
want to thank him for his help, but even more for all the great moments we have shared, and I
hope that our friendship brings us many more of those moments in the years to come.
I would like to thank Britta, Lasse, Jan, Nils and Sören for hosting me during my stays in
Germany and making me feel as a part of the family.
Finally, I would like to thank my family for everything they have done for me. First to my
parents, Mile and Ljilja, who made sure I always had everything I ever needed. You gave me
love and encouraged me at each step of my life. Thank you for everything you taught me! Big
gratitude goes to my brother Milan, his wife Marijana and my nephew Mihailo. Thank you for
your love and support! Milan, since the beginning you have been a role model to me, and you
will always be a great example to follow and the source of wisdom to learn from.
Most of all, I wish to thank my wife Marija and my daughter Ana for giving me the strength
and inspiration. Your love, patience, and continuous support gives me the power to always go
further in life! Thank you very much for your understanding, for all the beautiful moments we
shared and most importantly, for your love!
Belgrade, 2018 A good person can never fail.
Marko Marinković Miodrag Marinković (my father)

iii
Захвалност
Велики број појединаца и институција допринео је истраживању приказаном у овој
дисертацији. У наредном делу желео бих да изразим моју искрену захвалност свима
њима.
Највећу захвалност дугујем мом ментору професору Кристофу Бутенвегу. Желео бих да
му се захвалим што ми је обезбедио све што ми је било потребно како бих спровео
истраживање везано за моју докторску дисертацију. Такође, му се захваљујем на
указаном поверењу и његовом изузетном менторству. Захваљујући њему сам научио
како да приступим захтевним проблемима и да их решим логичким размишљањем.
Дискусије са њим о дилемама и резултатима истраживања пружиле су ми нове погледе
и помогле ми да успешно решим све изазове са којима сам се суочио. Његова преданост
овом истраживању је несумњиво била инспиративна за мене. Могу рећи да сам пуно
научио кроз рад и размену идеја са њим. Једни од најбољих тренутака, међу многима,
су били у току рада на развијању решења (INODIS систем). Ове тренутке ћу заувек
памтити.
Посебна захвалност је упућена професору Растиславу Мандићу за драгоцену подршку и
конструктивне дискусије у току израде дисертације.
Желим да изразим велику захвалност професору Ратку Салатићу што ме је увео у
област рамова са зиданом испуном, још за време израде мастер рада. Поред тога, желим
да му захвалим за сво пренето знање и за рад са мном у области динамике конструкција
и земљотресног инжењерства, али такође и за све разговоре које смо водили.
Експериментална истраживања су спроведена као део европског пројекта INSYSME
(Innovative Systems for Earthquake Resistant Masonry Enclosures in RC Buildings). Било
ми је велико задовољство и част да радим са свим учесницима пројекта и желео бих да
захвалим компанији SDA-engineering GmbH што ми је пружила ову прилику.
Захваљујем се Немачкој асоцијацији произвођача опекарских производа (ZIEGEL e.V.)
за финансијску подршку. Такође, желео бих да се захвалим др Уду Мајеру и др Томасу
Фелхаберу за њихове драгоцене предлоге и подршку током INSYSME пројекта. Затим
бих хтео да се захвалим профеосру Екехарду Фелингу, др Томасу Хану и Томасу
Фецингу, као и свом особљу лабораторије Универзитета у Каселу за извођење
експеримената. Захвалан сам господину Рупику и свом особљу лабораторије Института
за испитивање опекарских производа (IZF Essen e.V.) за помоћ у спровођењу
експеримената. Велику захвалност дугујем господину Гукеру и компанији BSW
Berleburger Schaumstoffwerk GmbH што је обезбедила еластомер за тестове.

iv
Искренo сам захвалан за финансијску подршку програма SEEFORM (South Eastern
European Graduate School for Master and PhD).
Посебно се захваљујем свом пријатељу и колеги Марку Радишићу за помоћ у прављењу
кратких програма у MATLAB-у, који су ми помогли да боље анализирам
експерименталне резултате. Велику захвалност дугујем колегама са Катедре за
Техничку механику и теорију конструкција, посебно Милошу Јочковићу, Емилији
Дамњановићу, Невенки Коларевић, Мирославу Марјановићу и Николи Благојевићу.
Нарочито сам им захвалан што су обављали све моје дужности за време мојих боравака
у Немачкој, али и за бројне савете и заједничке тренутке. Такође, хтео бих да захвалим
пријатељима и колегама Марку Орешковићу и Николи Тошићу за њихову драгоцену
подршку и савете.
Желим да изразим своју захвалност свим члановима Катедре за грађевинску статику и
динамику (LBB) RWTH Универзитета у Ахену. Посебно сам захвалан мојим
пријатељима Томасу Кубалском, Флориану Кизеру и Филипу Михелу, који су учинили
да време проведено у Ахену буде узбудљиво. Нарочито желим да захвалим Томасу
Кубалском на корисним разговорима и заједничком раду на овој теми, али још више за
многе лепе тренутке ван канцеларије.
Лектуру текста дисертације је урадио мој најбољи друг Марко Радовић, и хтео бих да
му се захвалим за то, као и за све лепе тренутке које смо имали и које ћемо сигуран сам
тек имати.
Желео бих да се захвалим Брити, Ласеу, Јану, Нилсу и Зурену што су ми отворили врата
свог дома и што су учунили да се осећам као део породице.
На крају, хтео бих да се захвалим својој породици за све што је учинила за мене. Прво
својим родитељима, Милету и Љиљи, који су се побринули да имам све што ми је
потребно. Дали сте ми љубав и подршку при сваком кораку мог живота. Хвала вам за
све што сте ме научили! Велику захвалност дугујем свом брату Милану, његовој
супрузи Маријани и мом братанцу Михаилу. Хвала вам на љубави и подршци! Хвала
мом брату Милану, мом вечитом узору, који ће увек бити пример који ћу следити и неко
од кога ћу учити!
Највећу захвалност дугујем мојој супрузи Марији и ћерки Ани, за снагу и инспирацију
коју ми дају. Ваша љубав, стрпљење и подршка ми дају подстрек да увек идем даље!
Хвала вам за разумевање, све лепе тренутке и најважније вашу љубав!
Београд, 2018 Добар човек не може да пропадне.
Марко Маринковић Миодраг Маринковић (мој отац)

v
INNOVATIVE SYSTEM FOR SEISMIC RESISTANT MASONRY INFILLS
IN REINFORCED CONCRETE FRAME STRUCTURES
Abstract
Reinforced concrete (RC) structures with masonry infill walls constitute a significant portion
of buildings, since their use is common in many countries due to the good performances of
infills with respect to, temperature, noise, moisture, fire and durability. Therefore, RC
structures with masonry infill walls are a popular form of construction in seismic regions too.
Although, infill walls are mostly considered as non-structural elements and thus are typically
neglected in the design process, the observations after earthquakes have shown that they
interact with the structural system during seismic actions and that the traditional infill walls,
connected with the mortar to the surrounding frame, are vulnerable to earthquake motions.
Beside economic loss due to the repair or reconstruction of some infills, repair of damages to
structural system, equipment, rental and relocation costs and general income losses,
sometimes the consequences were total collapses of buildings and loss of human lives.
Therefore, a huge effort has been made to consider the interaction of the structural system
with the infill walls, but due to the complexity of the infill wall behaviour, no practical design
procedures or solutions have been developed.
This thesis presents the INODIS system (Innovative Decoupled Infill System) that makes
seismic resistant masonry infills in RC frames structures. This system decouples infill wall
form the surrounding frame through a circumferential arrangement of the U-shaped elastomer
placed between the infill panel and the frame columns and beams. This allows for relative
displacements between the frame and infill, without damaging an infill and simultaneously
enabling a support for the out-of-plane loads.
The behaviour of the decoupling system is investigated through the tests on system
components and on a RC frames filled with hollow clay bricks subjected to separate and
combined in-plane and out-of-plane loads. These test results are compared to the results
obtained from tests on RC frames with and without traditional infills. The experimental
results showed quite brittle behaviour of traditional infills as well as significant reduction of
resistances for sequentially applied loading and even higher reductions of the seismic
resistance if the loads are applied simultaneously. This was all solved with the application of
the INODIS system, which helped in reaching high in-plane drifts without experiencing
damage in infill wall and at the same time providеd reliable connection for the out-of-plane

vi
loading. Additionally, viscoelastic behaviour of elastomers provided high level of energy
dissipation and improvеd damping capacity of the infilled frame.
The experimental data has been used to validate the numerical micro-model. The developed
numerical model describes the inelastic behaviour of the system, as indicated by the obtained
results of the overall structural response as well as the formation of damage in the infilled
wall. Satisfactory agreement was found between experimental and numerical results. The
validated models have been used in parametric studies to identify the significant parameters
influencing the behaviour of infilled frames with the INODIS system. The parametric study
and experimental findings have been used to develop the design concept for the practical
application of the INODIS system. Economic analysis of the solution showed the negligible
increase of initial costs, thus it can be concluded that the INODIS systems presents practically
applicable solution.
Keywords: Earthquakes, INODIS, RC frames, Masonry infill walls, In-plane, Out-of-plane,
Combined, Simultaneous loading, Finite element analysis, Parametric study.
Field of science: Civil and Structural Engineering
Subdivision: Engineering Mechanics and Theory of Structures
UDC number: 624.012.45:624.042.7(043.3)

vii
ИНОВАТИВНИ СИСТЕМ ЗА СЕИЗМИЧКИ ОТПОРНУ ЗИДАНУ
ИСПУНУ У АРМИРАНОБЕТОНСКИМ РАМОВСКИМ
КОНСТРУКЦИЈАМА
Резиме
Армиранобетонске (АБ) конструкције са зиданом испуном се врло често користе у
грађевинарству. Због добрих својстава у погледу трајности, термичких карактеристика,
добре изолације од буке, влаге, ватре, њихова изградња је уобичајена у многим
земљама. С обзиром на то, АБ конструкције са зиданом испуном су присутне и у
сеизмички активним подручијима. Иако се зидана испуна сматра неконструктивним
елементом који се обично занемарује у прорачуну, уочено је да је традиционална зидана
испуна, повезана са околним рамом преко малтера, подложна значајном оштећењу при
дејству земљотреса. Поред економских губитака услед поправки и поновне изградње
испуне, присутни су и трошкови поправке оштећења носећег система, опреме,
трошкови пресељења станара, као и губици потенцијалне добити. Последице понекад
могу да буду и катастрофалне, односно може доћи до тоталног рушење конструкција и
губитка људских живота. Због тога се улаже значајан напор како би се интеракција
испуне и носећег система узела у обзир на коректан начин у прорачуну. Међутим због
комплексности понашања зидане испуне, до сада није предложен ни један практично
примењив прорачунски концепт.
У овој дисертација представљен је систем INODIS (Innovative Decoupled Infill System)
чијом применом зидана испуна у АБ конструкцијама постаје сеизмички отпорна. Овај
систем се заснива на уградњи еластомера између зидане испуне и околног рама. На овај
начин се омогућавају релативна померања рама у односу на испуну, без оштећивања
испуне а истовремено се пружа потпора за оптерећење управно на раван зида.
Експериментално су испитане све компоненте АБ рамова са зиданом испуном и
предложеним иновативним системом. Затим су експериментално испитани АБ рамови
са зиданом испуном од шупљих опекарских блокова и примењеним системом INODIS.
Испитивани су случајеви са оптерећењем у равни испуне као и оптерећењем управно на
раван испуне, посебно и у комбинацији. Ови експериментални резултати су упоређени
са резултатима експерименталних тестова на АБ раму без испуне и АБ раму са
традиционалном зиданом испуном. Резултати су показали изузетно крто понашање
традиционалне испуне, као и значајно смањење носивости при секвенцијално нанетом

viii
оптерећењу и још веће смањење сеизмичке носивости када су оптерећења нанета
истовремено. Ово је све решено применом INODIS система, који је омогућио да се
достигну велике вредности релативног међуспратног померања без појаве оштећења у
испуни и у исто време пружио поуздану везу за прихватање оптерећења управно на
раван зида. Такође, вискоеластично понашање еластомера допринело је повећању
дисипације енергије и побољшању нивоа пригушења система.
Добијени експериментални подаци су искоришћени за валидацију нумеричког модела.
Развијени нумерички модел може да опише нелинеарно понашање система, што је и
показано задовољавајућим поклапањем експерименталних и нумеричких резултата у
одговору конструкције, као и формирању оштећења у испуни. Валидирани модел је
искоришћен за параметарску анализу како би се идентификовали кључни параметри
који утичу на понашање рамова са зиданом испуном и INODIS системом. Параметарска
анализа и експериментални резултати су искоришћени за развијање прорачунског
концепта за практичну примену INODIS система. Економска анализа предложеног
система је показалa незнатно повећање иницијалних трошкова, тако да се може
закључити да INODIS систем представља практично примењиво решење.
Кључне речи: Земљотреси, INODIS, АБ рамови, Зидана испуна, Оптерећење у равни,
Оптерећење ван равни, Комбиновано оптерећење, Симултано оптерећење, Метод
коначних елемената, Параметарска анализа.
Научна област: Грађевинарство
Ужа научна област: Техничка механика и теорија конструкција
УДК број: 624.012.45:624.042.7(043.3)

ix
Contents
Acknowledgements ..................................................................................................................... I
Захвалност ............................................................................................................................... III
Abstract ..................................................................................................................................... V
Резиме ..................................................................................................................................... VII
Contents .................................................................................................................................... IX
List of figures .......................................................................................................................... XV
List of tables ...................................................................................................................... XXVII
Notation .............................................................................................................................. XXIX
1 Introduction ..................................................................................................................... 1
1.1 Application of masonry infilled walls ......................................................................... 2
1.2 Background and motivation ........................................................................................ 4
1.3 Objectives of the research ......................................................................................... 12
1.4 Methodology of the research..................................................................................... 13
1.5 Scope of the thesis .................................................................................................... 14
2 Literature review .......................................................................................................... 16
2.1 Introduction ............................................................................................................... 17
2.2 Seismic behavior of infill walls ................................................................................ 17
2.2.1 In-plane behavior of infill walls ......................................................................... 17
2.2.2 Out-of-plane behaviour of infill walls ............................................................... 20
2.2.3 Behaviour of infills under prior in-plane or out-of-plane damage
(sequential loading) ............................................................................................ 22
2.2.4 Behaviour of infills under simultaneous in-plane and out-of-plane loading ..... 24
2.3 Experimental research studies on RC frames with masonry infills .......................... 27
2.3.1 In-plane .............................................................................................................. 27
2.3.1.1 Monotonic loading ..................................................................................... 27
2.3.1.2 Cyclic loading ............................................................................................ 29
2.3.1.3 Pseudodynamic tests .................................................................................. 31
2.3.1.4 Shake table tests ......................................................................................... 32
2.3.2 Out-of-plane ....................................................................................................... 33
2.3.3 Influence of sequential loading on in-plane and out-of-plane resistance ........... 36
2.3.4 Simultaneous in-plane and out-of-plane experimental tests .............................. 40
2.3.5 Openings ............................................................................................................ 41
2.4 Numerical modelling of masonry infill ..................................................................... 43
2.4.1 Micro-modelling ................................................................................................ 45

x
2.4.2 Smeared homogeneous models .......................................................................... 47
2.4.3 Macro-modelling ................................................................................................ 48
2.4.3.1 Strut approach ............................................................................................ 49
2.4.3.1.1 Strut width .............................................................................................. 53
2.4.3.1.2 Strut strength........................................................................................... 55
2.4.3.1.3 Strut stiffness and lateral stiffness of infill ............................................. 57
2.4.3.1.4 Taking into account effect of openings ................................................... 58
2.4.3.1.5 Force-displacement behaviour of the strut and hysteretic models ......... 60
2.4.3.1.6 Hysteretic models ................................................................................... 61
2.4.3.2 Fiber approach ............................................................................................ 62
2.5 Analytical solutions .................................................................................................. 64
2.5.1 In-plane capacity ................................................................................................ 64
2.5.2 Out-of-plane capacity ......................................................................................... 65
2.5.3 Simultaneous in- and out-of-plane loading ........................................................ 71
2.6 Design rules and recommendations in codes and standards ..................................... 72
2.6.1 European norms – Eurocode 8 (EN 1998-1, 2004) ............................................ 72
2.6.2 Italian National Code (NTC, 2008) .................................................................... 74
2.6.3 Canadian Standard for Masonry Structures (CSA S304-14, 2014) ................... 75
2.6.4 American Building Code Requirements for Masonry Structures (MSJC,
2013) .................................................................................................................. 75
2.6.5 Federal Emergency Management Agency reports and recommendations
(FEMA 273, 274, 306, 310, 356) ....................................................................... 77
2.6.6 New Zealand Standard for Masonry Structures (NZS 4230, 2004) ................... 79
2.6.7 Serbian Technical norm for masonry walls (PTNZZ, 1991) ............................. 79
2.6.8 Russian code (SNIP-II-7-81, 2001) ................................................................... 80
2.6.9 Greek Aseismic Code (EAK, 2000) ................................................................... 80
2.6.10 Drift limits from other national codes ................................................................ 81
2.7 Solutions for improvement of behaviour of infill walls ............................................ 81
2.7.1 Strengthening of infill walls rigidly attached to the frame ................................ 83
2.7.2 Infill walls with ductile behaviour ..................................................................... 86
2.7.3 Decoupling systems ........................................................................................... 89
2.7.4 Hybrid systems ................................................................................................... 98
2.7.5 Shortcomings of the proposed solutions .......................................................... 100
2.8 Summary ................................................................................................................. 101
3 Proposed system .......................................................................................................... 104
3.1 Description .............................................................................................................. 105

xi
3.2 Construction steps ................................................................................................... 109
3.2.1 Construction steps of the IMES system ........................................................... 109
3.2.2 Construction steps of the INODIS system ....................................................... 110
3.3 Summary ................................................................................................................. 112
4 Experimental tests on system components ............................................................... 114
4.1 Introduction ............................................................................................................. 115
4.2 Tests on concrete ..................................................................................................... 116
4.3 Tests on reinforcement steel ................................................................................... 117
4.4 Tests on mortar ....................................................................................................... 117
4.5 Tests on masonry units ............................................................................................ 120
4.6 Tests on masonry assemblies .................................................................................. 121
4.7 Tests on components for decoupling the masonry infill ......................................... 122
4.7.1 Tests on elastomer ............................................................................................ 122
4.7.1.1 Static compression tests in the range of high strains ................................ 123
4.7.1.2 Cyclic compression tests .......................................................................... 125
4.7.1.3 Shear tests ................................................................................................. 125
4.7.2 Tests on shear anchor connection (IMES system) ........................................... 126
4.7.2.1 Test setup and instrumentation ................................................................. 127
4.7.2.2 Geometry and construction of specimens ................................................ 128
4.7.2.3 Test results ................................................................................................ 128
4.7.3 Tests on U-shaped connections of elastomers (INODIS system) .................... 129
4.7.3.1 Preparation of the test specimens ............................................................. 131
4.7.3.2 Test configurations ................................................................................... 133
4.7.3.3 Column connection – Test C .................................................................... 133
4.7.3.4 Column connection – Test CG10MM ...................................................... 134
4.7.3.5 Column connection – Test CG15MM ...................................................... 136
4.7.3.6 Column connection – Test CG20MM ...................................................... 137
4.7.3.7 Beam connection – Test B ....................................................................... 138
4.7.3.8 Beam connection – Test BG7.5MM ........................................................ 139
4.7.3.9 Beam connection – Test BG10MM ......................................................... 140
4.7.3.10 Beam connection – Test BG15MM ......................................................... 141
4.7.3.11 Beam connection – Test BRP ................................................................... 142
4.7.3.12 Column connection – Test CRP ............................................................... 143
4.7.3.13 Beam connection – Test BAACRP .......................................................... 144
4.7.3.14 Beam connection – Test BCSRP .............................................................. 146
4.8 Summary of the tests on the system components ................................................... 148

xii
5 Experimental tests on infilled frames........................................................................ 152
5.1 Description of the experimental program ............................................................... 153
5.2 Description of the test set-up .................................................................................. 153
5.3 Test specimens ........................................................................................................ 156
5.4 Description of the instrumentation .......................................................................... 161
5.5 Experimental results ................................................................................................ 165
5.5.1 Bare frame – Test A ......................................................................................... 167
5.5.2 Traditionally infilled RC frame ........................................................................ 169
5.5.2.1 Test BO .................................................................................................... 169
5.5.2.2 Test BI ...................................................................................................... 171
5.5.2.3 Test BIO ................................................................................................... 177
5.5.2.4 Summary .................................................................................................. 181
5.5.3 Infilled RC frame with the IMES system ......................................................... 184
5.5.3.1 Test CO .................................................................................................... 184
5.5.3.2 Test CI ...................................................................................................... 187
5.5.3.3 Test CIO ................................................................................................... 192
5.5.3.4 Summary .................................................................................................. 194
5.5.4 Infilled RC frame with the INODIS system – Test DIO .................................. 196
5.5.4.1 Phase 1 – In-plane load ............................................................................ 198
5.5.4.2 Phase 2 – Out-of-plane load ..................................................................... 198
5.5.4.3 Phase 3 – Simultaneous loading ............................................................... 199
5.5.4.4 Phase 4 – Simultaneous loading ............................................................... 200
5.5.4.5 Phase 5 – Simultaneous loading ............................................................... 203
5.5.4.6 Summary .................................................................................................. 206
5.5.5 Comparison of the experimental results ........................................................... 208
5.5.5.1 In-plane behavior ...................................................................................... 209
5.5.5.2 Out-of-plane behaviour ............................................................................ 212
5.5.5.3 Simultaneous in-plane and out-of-plane loading ..................................... 213
5.5.5.4 Stiffness degradation ................................................................................ 216
5.5.5.5 Energy dissipation .................................................................................... 218
5.5.5.6 Equivalent viscous damping ratio ............................................................ 222
5.6 Summary ................................................................................................................. 225
6 Numerical analysis ...................................................................................................... 234
6.1 Introduction ............................................................................................................. 235
6.2 Description of the model ......................................................................................... 235
6.2.1 Finite element mesh ......................................................................................... 235

xiii
6.2.2 Geometry .......................................................................................................... 237
6.2.3 Loads and boundary conditions ....................................................................... 238
6.2.4 Contact/Interface definition ............................................................................. 239
6.2.5 Materials definition .......................................................................................... 241
6.2.5.1 Concrete ................................................................................................... 242
6.2.5.2 Masonry .................................................................................................... 246
6.2.5.3 Reinforcement .......................................................................................... 248
6.2.5.4 Elastomer .................................................................................................. 248
6.3 Small specimen tests ............................................................................................... 249
6.3.1.1 Tests on concrete ...................................................................................... 249
6.3.1.2 Reinforcement .......................................................................................... 250
6.3.1.3 Vertical compression of masonry assembly ............................................. 250
6.3.1.4 Static compression tests on elastomer ...................................................... 253
6.3.1.5 Shear tests on elastomer ........................................................................... 254
6.3.1.6 Tests on U-shaped elastomer connection ................................................. 255
6.4 Numerical simulations of experimental tests on infilled frames ............................ 258
6.4.1 In-plane simulation of the bare frame (Test A) ................................................ 258
6.4.2 In-plane plane simulation of the traditional infill (Test BI) ............................. 261
6.4.3 In-plane simulation of the IMES system (Test CI) .......................................... 263
6.4.4 In-plane simulation of the INODIS system (Test DIO) ................................... 264
6.4.5 Combined in-plane and out-of plane simulation .............................................. 266
6.5 Summary ................................................................................................................. 269
7 Parametric analysis ..................................................................................................... 271
7.1 Parametric analysis program ................................................................................... 272
7.1.1 Friction coefficient of sliding surfaces ............................................................. 272
7.1.2 Infill wall with or without elastomer at the bottom ......................................... 273
7.1.3 Stiffness of bottom elastomer .......................................................................... 274
7.1.4 Stiffness of the first layer of the U-shaped elastomer ...................................... 274
7.1.5 Stiffness of the second layer of the U-shaped elastomer ................................. 275
7.1.6 Stiffness of the first layer of U-shaped elastomer at the beam/column ........... 276
7.1.7 Thickness of elastomer ..................................................................................... 276
7.1.8 Vertical load ..................................................................................................... 277
7.1.9 Height to length ratio ....................................................................................... 278
7.1.10 Infill thickness .................................................................................................. 279
7.1.11 Masonry infill stiffness (frame to infill stiffness ratio) .................................... 280
7.1.12 RC frame stiffness (frame to infill stiffness ratio) ........................................... 281

xiv
7.1.13 Reinforcement ratio .......................................................................................... 281
7.1.14 Concrete class .................................................................................................. 282
7.1.15 Short column case ............................................................................................ 283
7.2 Combination of all the influential parameters......................................................... 284
7.3 Results of the main parametric study ...................................................................... 287
7.4 Summary ................................................................................................................. 288
8 Design concept and economic analysis ...................................................................... 289
8.1 Design concept ........................................................................................................ 290
8.1.1 In-plane verification ......................................................................................... 291
8.1.2 Out-of-plane verification .................................................................................. 297
8.1.3 Combined in- and out-of-plane verification ..................................................... 300
8.2 Economic feasibility of the INODIS system........................................................... 301
8.3 Summary ................................................................................................................. 306
9 Conclusions and future work ..................................................................................... 307
9.1 Conclusions ............................................................................................................. 308
9.2 Recommendations for future work ......................................................................... 314
References ............................................................................................................................. 316
Appendix A – Force-displacement curves from parametric study .................................. 347
Appendix B – Input data for material models in Abaqus ................................................ 350
Curriculum vitae ..................................................................................................................... 359
Биографија аутора ................................................................................................................ 360
Изјава о ауторству ................................................................................................................ 361
Изјава o истоветности штампане и електронске верзије докторског рада ..................... 362
Изјава о коришћењу ............................................................................................................. 363

xv
List of figures
Figure 1.1 Typical construction of infill walls in RC frame structures ...................................... 2
Figure 1.2 Different masonry units used for infill walls ............................................................ 3
Figure 1.3 Number of deaths per disaster type from 1996-2015 (CRED and UNISDR, 2015) 5
Figure 1.4 a) Number of deaths and economic losses from great natural catastrophes from
1950-1999 (Bachmann, 2002) and b) number of fatal earthquakes per decade of 20th
century
(Coburn and Spence, 2003) ........................................................................................................ 5
Figure 1.5 Number of deaths due to earthquakes divided by cause a) for the first half and b)
second half of the 20th
century (Coburn and Spence, 2003) ...................................................... 6
Figure 1.6 a) Influence of change of dynamic characteristics on seismic response and b)
comparison of roof-top accelerations of a bare and infilled frame (Charleson, 2012) .............. 7
Figure 1.7 a) X cracked infill wall (Braga et al., 2011) and b) horizontal and vertical
separation cracks between frame and infill with the horizontal cracks in infill joints (Dazio et
al., 2009) ..................................................................................................................................... 8
Figure 1.8 a) Separation of infill wall from the frame and b) corner crushing with the overall
corner damage (Tasligedik, 2014) .............................................................................................. 9
Figure 1.9 a) Damaged infill in Italy: Emilia Romagna (2012) and b) L‘Aquila (Dazio et al.,
2009) ......................................................................................................................................... 10
Figure 1.10 a) Short column failure during 2011 Christchurch earthquake (Tasligedik, 2014)
and b) 2009 L‘Aquila earthquake (Dazio et al., 2009) ............................................................. 11
Figure 1.11 Soft storey collapse of a building in 2009 L‘Aquila earthquake: a) backside and b)
frontside (Dazio et al., 2009) .................................................................................................... 11
Figure 2.1 In-plane failure modes of infill walls (El-Dakhakhni et al., 2003) ......................... 18
Figure 2.2 Out-of-plane failure modes of infill walls (Kubalski et al., 2017) ......................... 20
Figure 2.3 a) Arching mechanism and b) rigid-body mechanism ............................................ 22
Figure 2.4 In-plane pushover curves for different level of out-of-plane load (Hashemi and
Mosalam, 2007) ........................................................................................................................ 25
Figure 2.5 Experimental results of bidirectional testing of infilled RC frames from Flanagan
and Bennett (1999b) ................................................................................................................. 38
Figure 2.6 Specimen after testing under simultenous load (Flanagan and Bennett, 1999b) .... 41
Figure 2.7 Numerical modelling approaches for masonry infill .............................................. 45
Figure 2.8 Diagonal compression strut and equivalent strut (Liberatore and Mollaioli, 2015)50
Figure 2.9 Proposed macro models with different orientations and number of struts. For
simplicity, struts in only one direction are shown (Sattar, 2013) ............................................. 51
Figure 2.10 Four-node panel element proposed by Crisafulli and Carr (2007) ....................... 52
Figure 2.11 (a) Macro-models proposed by Cavaleri and Di Trapani (2014) and (b) Calio and
Panto (2014) ............................................................................................................................. 53
Figure 2.12 Force-displacement curve for the equivalent strut a) Bertoldi et al. (1996) and b)
(Dolsek and Fajfar, 2008) ......................................................................................................... 61
Figure 2.13 Force-displacement response of the strut proposed by a) Klingner and Bertero

xvi
(1976) and b) Andreaus et al. (1985) ........................................................................................ 62
Figure 2.14 a) Masonry strut hysteretic response and b) shear cyclic relationship (Crisafulli,
1997) ......................................................................................................................................... 62
Figure 2.15 Proposed fiber-section infill model (Kadysiewski and Mosalam, 2009) .............. 63
Figure 2.16 Out-of-plane mechanism: a) development of arching mechanism and b) idealized
three-pin arch (Asteris et al. 2017) ........................................................................................... 69
Figure 2.17 Approaches for improvement of behaviour of infilled frame under earthquake
loading ...................................................................................................................................... 82
Figure 2.18 Gap at the top a) before and b) after filling with polyurethane foam ................... 82
Figure 2.19 Specimens tested by Calvi and Bolognini (2001) ................................................. 84
Figure 2.20 a) Details of the proposed solution and b) out-of-plane resisting mechanism (Preti
et al., 2015) ............................................................................................................................... 86
Figure 2.21 a) Details of the proposed solution and b) out-of-plane resisting mechanism (Preti
et al., 2015) ............................................................................................................................... 87
Figure 2.22 a) Schematic presentation of DRES system and b) rubber deformable joint
(Verlato et al., 2016) ................................................................................................................. 88
Figure 2.23 a) Schematic presentation of the proposed system and details of the system: 1.C-
shape unit; 2.mortar bed-joints; 3.sliding joints; 4.clay units; 5.interface joints; 6.shear keys;
7.plaster (Morandi et al., 2016) ................................................................................................ 89
Figure 2.24 Isolated infill walls from RC frame with gaps (Aliaari and Memari, 2005) ........ 90
Figure 2.25 Behaviour of infilled frame structures with top and side gaps (Riddington, 1984)
.................................................................................................................................................. 91
Figure 2.26 a) Application of separation gap and b) separation gaps between infill and
columns and beam (Charleson, 2012) ...................................................................................... 93
Figure 2.27 Connection details of separation gaps between infill and frame (Charleson, 2012)
.................................................................................................................................................. 93
Figure 2.28 Two connection that provide out-of-plane support and at the same in-plane
separation (Charleson, 2012) .................................................................................................... 94
Figure 2.29 Column-isolated masonry infill wall with steel connectors (Kuang and Wang,
2014) ......................................................................................................................................... 96
Figure 2.30 Hybrid Masonry Frames: a) Type I, b) Type II and c) Type III (Abrams and Biggs,
2012) ......................................................................................................................................... 99
Figure 2.31 a) Steel connector plate, b) steel fuse connector and c) steel stud connector
(Abrams and Biggs, 2012) ....................................................................................................... 99
Figure 3.1 Force-displacement curves for bare, infilled and decoupled frame ...................... 106
Figure 3.2 Front view and vertical and horizontal section of the IMES system, with the
perforated brick and elastomer strips prepared for installation (INSYSME, 2017a) ............. 107
Figure 3.3 Details of the INODIS system .............................................................................. 108
Figure 3.4 a) Prefabricated RC frame with elastomer at columns and upper beam and b)
installed anchors ..................................................................................................................... 109
Figure 3.5 a) First layer of normal thick mortar and b) brick with shear anchors and elastomer

xvii
................................................................................................................................................ 110
Figure 3.6 Placing plastic bars at the columns and the upper beam ....................................... 110
Figure 3.7 Applying a sliding surfaces on the plastic bars ..................................................... 111
Figure 3.8 Placing U-shaped elastomers at the columns and top beam of the RC frame ...... 111
Figure 3.9 Three strips of elastomer at the bottom beam and gluing the first row of bricks on
the elastomer .......................................................................................................................... 112
Figure 3.10 Brick up the wall in a usually way but with gluing the edge bricks to the
elastomer ................................................................................................................................ 112
Figure 3.11 Gluing the last row and finalized wall ................................................................ 112
Figure 4.1 a) Concrete cylinder and cube specimens and b) stress-strain curve from the
compression test ..................................................................................................................... 117
Figure 4.2 Placing mortar on bottom beam in order to have perfect levelling while placing
first row of bricks ................................................................................................................... 118
Figure 4.3 a) Determination of elastic modulus and b) compressive strength of the mortar
(INSYSME, 2017a) ................................................................................................................ 119
Figure 4.4 a) Determination of slump and b) flexural strength of the mortar (INSYSME,
2017a) ..................................................................................................................................... 119
Figure 4.5 a) MZ70 brick and b) bricks in oven (INSYSME, 2017a) ................................... 120
Figure 4.6 a) Determining compressive strength of the masonry units and b) damaged brick
after the test ............................................................................................................................ 121
Figure 4.7 a) Determination of bond strength of the mortar-unit interfaces and b) bond failure
at the end of the test ................................................................................................................ 122
Figure 4.8 Compression tests on specimen Regufoam® 400 and Regupol® 480 ................. 123
Figure 4.9 Density of tested elastomer specimens ................................................................. 124
Figure 4.10 Stress-strain diagram of the tested elastomers at a) higher and b) lower strains 124
Figure 4.11 Stress-strain curves of the Regufoam® and Regupol® elastomers under cyclic
load ......................................................................................................................................... 125
Figure 4.12 Shear test on elastomer: a) test setup and b) loaded specimen ........................... 126
Figure 4.13 Stress-strain curves of shear tests on the Regufoam® and Regupol® elastomers
................................................................................................................................................ 126
Figure 4.14 Drawing of the test setup with the location of displacement transducers ........... 127
Figure 4.15 Test setup (INSYSME, 2017a) ........................................................................... 128
Figure 4.16 Types of connection tested: a) type 1; b) type 2 and c) type 3 (INSYSME, 2017a)
................................................................................................................................................ 128
Figure 4.17 a) Deformation of the elastomer during the test and b) splitting of the brick in a
case of connection type 3 (INSYSME, 2017a) ...................................................................... 129
Figure 4.18 Test setup for the connection of the U-shaped elastomer to the columns ........... 130
Figure 4.19 Test setup for the connection of the U-shaped elastomer to the top beam ......... 130
Figure 4.20 a) Regufoam® 400, b) glue application on Regufoam® 400 and c) Regufoam®
510 .......................................................................................................................................... 131

xviii
Figure 4.21 Preparation process: a) prepared specimens for testing the column and b) beam
connection .............................................................................................................................. 131
Figure 4.22 a) Packages of Keraflex® and b) Regupur® glues ............................................. 132
Figure 4.23 a) Application of Keraflex® and b) Regupur® .................................................. 132
Figure 4.24 a) Preparation of the concrete plate used for testing beam connection and b)
plastic profile attached to concrete plate used for testing column connection ....................... 132
Figure 4.25 a) Force-displacement curve of the Test C and b) split brick at the end of the test
................................................................................................................................................ 134
Figure 4.26 Deformations at different load levels of the Test C ............................................ 134
Figure 4.27 a) Force-displacement curve of the Test CG10MM-a and CG10MM-b and b) split
brick at the end of the test ...................................................................................................... 135
Figure 4.28 Deformations at different load levels of the Test CG10MM-a ........................... 135
Figure 4.29 Deformations at different load levels of the Test CG10MM-b ........................... 136
Figure 4.30 a) Force-displacement curve of experimental tests CG15MM and b) damaged
brick at the end of the test ...................................................................................................... 136
Figure 4.31 Deformations at different load levels of the Test CG15MM .............................. 137
Figure 4.32 a) Force-displacement curve of the Test CG20MM and b) partly delaminated
sliding surfaces at the end of the test ...................................................................................... 137
Figure 4.33 Deformations at different levels of displacements of the Test CG20MM .......... 138
Figure 4.34 a) Force-displacement curve of the Test B and b) specimen at the end of the test
................................................................................................................................................ 139
Figure 4.35 Deformations at different load levels of the Test B ............................................ 139
Figure 4.36 a) Force-displacement curve of the Test BG7.5MM and b) specimen at the end of
the test .................................................................................................................................... 139
Figure 4.37 Deformations at different load levels of the Test BG7.5MM ............................. 140
Figure 4.38 a) Force-displacement curve of the Test BG10MM and b) specimen at the end of
the test .................................................................................................................................... 141
Figure 4.39 Deformations at different load levels of the Test BG10MM .............................. 141
Figure 4.40 a) Force-displacement curve of the Test BG15MM and b) specimen at the end of
the test .................................................................................................................................... 142
Figure 4.41 Deformations at different load levels of the Test BG15MM .............................. 142
Figure 4.42 a) Force-displacement curve of the Test BRP and b) specimen at the end of the
test .......................................................................................................................................... 143
Figure 4.43 Deformations at different load levels of the Test BRP ....................................... 143
Figure 4.44 a) Force-displacement curve of the Test CRP and b) specimen at the end of the
test .......................................................................................................................................... 144
Figure 4.45 Deformations at different load levels of the Test CRP ....................................... 144
Figure 4.46 BAACRP and BCSRP specimens before the test ............................................... 145
Figure 4.47 a) Force-displacement curve of the Test BAACRP b) and specimen at the end of
the test .................................................................................................................................... 145

xix
Figure 4.48 Deformations at different load levels of the Test BAACRP ............................... 146
Figure 4.49 a) Force-displacement curve of the Test BCSRP and b) specimen at the end of the
test .......................................................................................................................................... 146
Figure 4.50 Deformations at different load levels of the Test BCSRP .................................. 147
Figure 4.51 Summary of force displacement curves for the test on U-shaped connections for
the a) column and b) beam situation ...................................................................................... 147
Figure 5.1 a) View of the test set-up and b) section A-A (INSYSME, 2017b) ...................... 154
Figure 5.2 In-plane test set-up ................................................................................................ 154
Figure 5.3 Out-of-plane test set-up ........................................................................................ 155
Figure 5.4 Steel beam for transfer of vertical forces to the columns ..................................... 156
Figure 5.5 a) Elastomeric bearings for reduction of stress concentrations and b) hinges for
eliminating vertical force and bending moment at the left end of the load introduction beam
................................................................................................................................................ 156
Figure 5.6 Transportation and delivery of the RC frames ...................................................... 157
Figure 5.7 Dimensions and reinforcement of the RC frame (test A, BI/BO and BIO)
(INSYSME, 2017b) ................................................................................................................ 157
Figure 5.8 Dimensions and reinforcement of the RC frame (test CI/CO, CIO and DIO)
(INSYSME, 2017b) ................................................................................................................ 158
Figure 5.9 Reinforced concrete frame with masonry infill made of MZ70 bricks ................ 159
Figure 5.10 Infilled frame for the DIO test with the INODIS system ................................... 160
Figure 5.11 Details of the INODIS system used for the DIO test: a) top beam connection, b)
column connection and c) bottom beam connection .............................................................. 160
Figure 5.12 Instrumentation and measuring points for the test A (INSYSME, 2017b) ......... 162
Figure 5.13 Instrumentation and measuring points for the test BI (INSYSME, 2017b) ........ 162
Figure 5.14 Instrumentation and measuring points for the test CI (INSYSME, 2017b) ........ 163
Figure 5.15 Instrumentation and measuring points for the test BO (INSYSME, 2017b) ...... 163
Figure 5.16 Instrumentation and measuring points for the test CO (INSYSME, 2017b) ...... 163
Figure 5.17 Instrumentation and measuring points for the test BIO (INSYSME, 2017b) ..... 164
Figure 5.18 Instrumentation and measuring points for the test CIO (INSYSME, 2017b) ..... 164
Figure 5.19 Instrumentation and measuring points for the test DIO (INSYSME, 2017b) .... 164
Figure 5.20 a) Optical measurement system and b) circular pads glued onto the surface of the
test specimen presenting measuring points for optical measurement system ........................ 165
Figure 5.21 Load protocol of the Test A ................................................................................ 167
Figure 5.22 Hysteretic curve and envelope for the in-plane loading of the Test A ................ 168
Figure 5.23 a) Cracks in the frame top corner and b) at the base of the columns .................. 168
Figure 5.24 Load protocol for out-of-plane loading of the Test BO ...................................... 169
Figure 5.25 a) Force-displacement curve for out-of-plane loading of the Test BO and b) side
view of the wall deformation in the out-of-plane direction of the vertical section on the free
edge of the wall ...................................................................................................................... 170

xx
Figure 5.26 a) Side view of the wall deformation in the out-of-plane direction at the start and
b) at the end of the fourth load cycle ...................................................................................... 170
Figure 5.27 Local failure of the bricks at the top and bottom of the wall at the end of the Test
BO .......................................................................................................................................... 171
Figure 5.28 a) Out-of-plane deformation of the wall and b) damage within the wall at the end
of the Test BO ......................................................................................................................... 171
Figure 5.29 Load protocol for sequential in- and out-of-plane loading of the Test BI .......... 172
Figure 5.30 Hysteretic curve and envelope for the first in-plane loading phase of the Test BI
................................................................................................................................................ 172
Figure 5.31 a) Opening of bed joints and b) stepwise cracks in compressed diagonal and
cracks in the bricks ................................................................................................................. 173
Figure 5.32 Force-displacement curve for the out-of-plane loading of the Test BI ............... 174
Figure 5.33 Deformation of the wall in the out-of-plane direction at the end of the first in-
plane loading phase (drift: 1.25%): a) top view and b) side view .......................................... 174
Figure 5.34 Top view: deformation of the frame and out-of-plane infill movement due to the
eccentric loading of the infill wall .......................................................................................... 175
Figure 5.35 Deformation of the wall in the out-of-plane direction under maximum out-of-
plane load of 3 kN/m2: a) top view and b) side view ............................................................. 175
Figure 5.36 a) Damaged mortar connection between infill wall and concrete beam and b)
splitting of the brick ............................................................................................................... 175
Figure 5.37 Hysteretic curve and envelope for the first and second in-plane loading phase of
the Test BI .............................................................................................................................. 176
Figure 5.38 Deformation of the wall in the out-of-plane direction at the end of the BI test: a)
top view and b) side view ....................................................................................................... 176
Figure 5.39 a) Diagonal cracks in the wall and b) opening of bed joints ............................... 177
Figure 5.40 a) Failure of the brick in the upper corner of the wall and b) damage of the
backside of the wall at the end of the whole loading protocol ............................................... 177
Figure 5.41 Load protocol for simultaneous in- and out-of-plane loading of the Test BIO .. 178
Figure 5.42 a) Hysteretic curve and envelope for the in-plane loading and b) force-
displacement curve for out-of-plane loading ......................................................................... 178
Figure 5.43 Deformation of the wall in the out-of-plane direction at 0.3% of in-plane drift: a)
top view and b) side view ....................................................................................................... 179
Figure 5.44 Deformation of the wall in the out-of-plane direction at the end of the BIO test
(drift: 1.00%): a) top view and b) side view .......................................................................... 179
Figure 5.45 Side view of the wall deformation in the out-of-plane direction for combined
loading for the vertical section in the centre of the wall along the height of the wall ........... 180
Figure 5.46 a) Damage of the infill, b) failure of the brick at the top and c) tilting of the infill
panel at the end of the Test BO .............................................................................................. 180
Figure 5.47 a) Comparison of hysteretic curves and envelopes for in-plane loading of the Test
BI and BIO and b) force-displacement curves for out-of-plane loading for the Tests BO, BI
and BIO .................................................................................................................................. 181

xxi
Figure 5.48 Interaction diagram with the trend line based on test results .............................. 182
Figure 5.49 Displacement of measurement points 1006 and 2018 in the in-plane direction
during the Test BI ................................................................................................................... 183
Figure 5.50 a) Infill with arching effect and b) tilting of the wall in case of a gap................ 184
Figure 5.51 Load protocol for out-of-plane loading of the Test CO ...................................... 185
Figure 5.52 Force-displacement curve for the out-of-plane loading of the Test CO ............. 185
Figure 5.53 Side view of the wall deformation in the out-of-plane direction a) at the 3rd
cycle
and b) at the end of the 6th
load cycle ..................................................................................... 186
Figure 5.54 a) Failure pattern and b) gaping of bed joint in the wall at the end of Test CO .. 186
Figure 5.55 Load protocol for sequential in- and out-of-plane loading of the Test CI .......... 187
Figure 5.56 Hysteretic curve end envelope for the first loading phase of the Test CI ........... 188
Figure 5.57 a) Gapping and b) highly compressed elastomers at corners .............................. 188
Figure 5.58 a) Formation of stairstep cracks and b) cracks in the blocks at 2.1% of drift ..... 188
Figure 5.59 Force-displacement curve for the out-of-plane loading of the Test CI ............... 189
Figure 5.60 Deformation of the wall in the out-of-plane direction under maximum out-of-
plane load of 6 kN/m2: a) top view and b) side view ............................................................. 189
Figure 5.61 Cracks in the wall under maximum out-of-plane load of 6 kN/m2 ..................... 190
Figure 5.62 Hysteretic curve and envelope for the first and second in-plane loading phase of
the Test CI .............................................................................................................................. 191
Figure 5.63 a) Cracks in the wall and b) damage of the backside of the wall at the end of Test
CI ............................................................................................................................................ 191
Figure 5.64 Load protocol for simultaneous in- and out-of-plane loading of the Test CIO .. 192
Figure 5.65 a) Hysteretic curve end envelope for the in-plane loading and b) force-
displacement curve for out-of-plane loading ......................................................................... 193
Figure 5.66 Side view of the wall deformation in the out-of-plane direction a) at 0.3% of drift
and b) at the end of the CIO test ............................................................................................. 193
Figure 5.67 a) Complete failure of the brick in right bottom corner and b) failure of the bricks
on connection with the right column ...................................................................................... 194
Figure 5.68 a) Front view and b) damage of the masonry wall on the backside at the end of the
test CIO .................................................................................................................................. 194
Figure 5.69 a) Comparison of hysteretic curves and envelopes for in-plane loading of the Test
CI and CIO and b) force-displacement curves for out-of-plane loading for the Tests BO, BI
and BIO .................................................................................................................................. 195
Figure 5.70 Load protocol of the Test DIO ............................................................................ 197
Figure 5.71 Hysteresis curve and the envelope curve for the phase 1 of the Test DIO ......... 198
Figure 5.72 Force-displacement curve for phase 2 of the Test DIO ...................................... 199
Figure 5.73 Side view of the wall deformation in the out-of-plane direction a) at the 5 kN/m2
of out-of-plane load and b) at the end of the phase 2 of the DIO test .................................... 199
Figure 5.74 Hysteresis curve and the envelope curve for the phase 3 of the Test DIO ......... 200

xxii
Figure 5.75 Hysteresis curve and the envelope curve for the phase 4 of the Test DIO ......... 201
Figure 5.76 a) Top view of the deformation in the out-of-plane direction for the horizontal
section in the middle height of the wall and b) side view of the deformation in the out-of-
plane direction for the vertical section in the middle length of the wall ................................ 201
Figure 5.77 a) Appearance of the first crack in the wall and b) cracks in the wall at the end of
phase 4 .................................................................................................................................... 202
Figure 5.78 Deformation of the frame with the compressed diagonal, detachment and cracks
occurred .................................................................................................................................. 202
Figure 5.79 a) Gap formation in the corner of the frame and b) uplift of the wall base ........ 203
Figure 5.80 Force-displacement curve for simultaneous load of 6.25 kN/m2 and 1% of in-
plane dirft ............................................................................................................................... 204
Figure 5.81 Hysteresis curve and the envelope curve for the phase 5 of the Test DIO ......... 204
Figure 5.82 a) Damage of the front side and b) of the backside of the wall at the end of the
DIO test .................................................................................................................................. 205
Figure 5.83 Intact glued connection between the U-shaped elastomers and bricks at the end of
test .......................................................................................................................................... 206
Figure 5.84 a) Strong glued connection between the U-shaped elastomers and bricks and b)
between two layers of elastomer ............................................................................................ 206
Figure 5.85 Cracked frame at the end of the test ................................................................... 206
Figure 5.86 a) Hysteretic curve and envelope for the in-plane loading and b) force-
displacement curve for out-of-plane loading of the Test DIO ................................................ 207
Figure 5.87 a) Comparison of the in-plane hysteretic curves and b) envelopes for all the
phases of the Test DIO ........................................................................................................... 207
Figure 5.88 Cracks in the frame at the end of the DIO test .................................................... 208
Figure 5.89 a) Hysteresis curves and envelope curves with the comparison to the bare frame
envelope for the first and b) third loading phase of the Test DIO .......................................... 209
Figure 5.90 a) Hysteresis curves and the envelope curves with the comparison to the bare
frame envelope for the fourth and b) fifth loading phase of the Test DIO ............................. 210
Figure 5.91 a) Hysteresis curves and b) envelopes with the comparison to the bare frame
envelope for the first loading phase of the Test BI, CI and DIO up to 1.25% of drift ........... 212
Figure 5.92 a) Out-of-plane force-displacement curves and b) side view of the out-of-plane
deformations for the maximum loads for the second loading phase of the BI, CI and DIO test
................................................................................................................................................ 212
Figure 5.93 a) Hysteresis curves and b) envelopes with the comparison to the bare frame for
the BIO and CIO test and for the third, fourth and fifth loading phases of the DIO test ....... 214
Figure 5.94 a) Force-displacement curves and b) side view of the out-of-plane deformations
for 5 kN/m2 of out-of-plane load and interstorey drifts of 1.0% (BIO and CIO) and 1.8%
(DIO) ...................................................................................................................................... 214
Figure 5.95 Initial in-plane stiffness of the tested specimens ................................................ 217
Figure 5.96 a) Change of secant stiffness and b) tangential stiffness of the tested specimens
................................................................................................................................................ 217

xxiii
Figure 5.97 a) Tangential stiffness ratio of the tested infilled frames and bare frame and b) of
the DIO test and bare frame ................................................................................................... 217
Figure 5.98 a) Cumulative dissipated energy and b) energy dissipation for increasing drifts 218
Figure 5.99 Energy dissipated per each cycle of specimen a) A; b) BI; c) BIO; d) CI; e) CIO
and f) DIO .............................................................................................................................. 219
Figure 5.100 a) Cumulative dissipated energy and b) energy dissipation for increasing drifts
up to 1.25% of drift ................................................................................................................ 220
Figure 5.101 a) Cumulative dissipated energy for simultaneously loaded specimens BIO, CIO
and DIO and b) energy dissipation for increasing drifts up to 1.0% of drift.......................... 221
Figure 5.102 a) Cumulative dissipated energy for bare frame up to 1.8% of drift and fourth
phase of the DIO test and b) for the first, third and fourth phase of the DIO test .................. 221
Figure 5.103 Definition of dissipated and stored energy ....................................................... 222
Figure 5.104 Equivalent viscous damping for increasing drifts ............................................. 223
Figure 5.105 Change of the equivalent viscous damping ratio per each cycle for specimen a)
A; b) BI; c) BIO; d) CI; e) CIO and f) DIO ........................................................................... 224
Figure 5.106 Change of the equivalent viscous damping ratio for increasing drifts a) up to
1.25% for specimens A, BI, CI and DIO and b) for BIO, CIO and 3rd
phase of the DIO
specimen ................................................................................................................................. 224
Figure 6.1 a) 8-node 3D solid element b) 2-node 3D truss element (Abaqus, 2013) c) Mesh
size optimization (Minaie, 2009) ........................................................................................... 237
Figure 6.2 Geometry and finite element mesh of the numerical model of infilled frame ...... 237
Figure 6.3 Smooth amplitude ................................................................................................. 238
Figure 6.4 a) Traction separation response with exponential damage evolution and b) mixed-
mode response in cohesive interactions (Abaqus, 2013) ....................................................... 240
Figure 6.5 Yield surface of the CDP model in a) plane stress and b) deviatoric plane,
corresponding to different values of Kc (Abaqus, 2013) ........................................................ 242
Figure 6.6 Response of concrete to uniaxial loading in a) compression and b) tension
(Abaqus, 2013) ....................................................................................................................... 243
Figure 6.7 Stress-strain curve for concrete in compression ................................................... 245
Figure 6.8 Stress-displacement curve for the concrete in tension (Hordijk, 1992) ................ 245
Figure 6.9 a) Stress-strain curves for compression and b) for tension (Stavridis & Shing,
2010) ....................................................................................................................................... 248
Figure 6.10 Typical stress-strain curve for elastomeric foam materials (Abaqus, 2013) ....... 249
Figure 6.11 Stress-strain curves for masonry unit for a) compression and b) tension ........... 251
Figure 6.12 a) Numerical model and b) tensile strain of the vertical compression test on the
masonry assembly .................................................................................................................. 252
Figure 6.13 Comparison of experimental and numerical stress-strain curves ....................... 252
Figure 6.14 a) Elastomer compression tests setup and b) numerical model assembly .......... 253
Figure 6.15 Comparison between experimental and numerical stress-strain curves for a)
Regufoam® 270 and b) Regufoam® 400 and Regufoam® 510 ............................................ 253

xxiv
Figure 6.16 Comparison between experimental and numerical stress-strain curves for a)
Regufoam® 570 and Regufoam® 680 and b) Regupol® 480 and Regupol® 550 ................ 254
Figure 6.17 a) Stress-strain curves for shear behavior of elastomer and b) numerical model 254
Figure 6.18 Comparison of experimental and numerical results for simple shear test .......... 255
Figure 6.19 Models for a) column and b) beam connections without gaps ........................... 256
Figure 6.20 Simulated and experimental load-displacement curves for the a) beam (Test B)
and b) column (Test C) connection without gap .................................................................... 257
Figure 6.21 Simulated and experimental load-displacement curves for the a) beam connection
with gap of 10 mm (Test BG10MM) and b) column connection with gap of 20 mm (Test
CG20MM) .............................................................................................................................. 257
Figure 6.22 Simulated and experimental load-displacement curves for the beam connection
made of Regupol® material (Test BRP) ................................................................................ 257
Figure 6.23 Stress-strain curves for concrete a) compression and b) tension ........................ 259
Figure 6.24 Damage curves for concrete a) compression and b) tension .............................. 260
Figure 6.25 a) Comparison of the force-displacement curves and b) deformed shape with the
tensile damage distribution at 3.5% of drift ........................................................................... 260
Figure 6.26 Comparison of force-displacement curves a) for the first in-plane loading phase
up to 1.25% of drift b) for the whole test ............................................................................... 261
Figure 6.27 a) Deformed shape with compression damage distribution (5 times scaled
deformation) and b) experimental crack pattern at 1.25% of in-plane drift ........................... 262
Figure 6.28 a) Deformed shape with compression damage distribution (5 times scaled
deformation) and b) experimental crack pattern at 2.1% of in-plane drift ............................. 262
Figure 6.29 a) Comparison of experimental and numerical force-displacement curves and b)
comparison with the bare frame and traditionally infilled frame ........................................... 264
Figure 6.30 a) Deformed shape with compression damage distribution (5 times scaled
deformation) and b) experimental crack pattern at the maximum load ................................. 264
Figure 6.31 Comparison of experimental and numerical force-displacement curves a) for the
phase 1 of the test and b) simulation results up to a drift level of 5.70% .............................. 265
Figure 6.32 a) Deformed shape with compression damage distribution at cracking initiation
and b) at 4% of in-plane drift (5 times scaled deformation) .................................................. 265
Figure 6.33 Deformed shape with a) compressed elastomer on one side and b) gap between
infill column on the other side at 5.5% of in-plane drift ........................................................ 266
Figure 6.34 Contact stresses at a) out-of-plane loading and b) combined loading ................ 267
Figure 6.35 Contact stresses for a) in-plane loading, b) out-of-plane loading, c) in- and out-of-
plane loading with the full contact and d) with a gap at the top ............................................ 268
Figure 6.36 Contact stresses at a) out-of-plane loading and b) combined loading for infilled
frame with the INODIS system (OOP=5 kN/m2 and IP=2%) ................................................ 269
Figure 7.1 Force-displacement curves for different friction coefficients ............................... 273
Figure 7.2 Force-displacement curves for an infill wall with the INODIS system with and
without elastomer at the bottom ............................................................................................. 273
Figure 7.3 Force-displacement curves for an infill wall with the INODIS system with different

xxv
stiffness of the elastomer at the bottom .................................................................................. 274
Figure 7.4 Force-displacement curves for an infill wall with the INODIS system with different
stiffnesses of the first layer ..................................................................................................... 275
Figure 7.5 Force-displacement curves for an infill wall with the INODIS system with different
stiffnesses of second layer of the U-shaped elastomer ........................................................... 275
Figure 7.6 : Force-displacement curves for an infill wall with the INODIS system with
different stiffnesses of the first layer for the beam or column connection U-shaped elastomer
................................................................................................................................................ 276
Figure 7.7 Force-displacement curves for an infill wall with the INODIS system with different
thicknesses of U-shaped elastomer ........................................................................................ 277
Figure 7.8 a) Force-displacement curves for different vertical load levels and b) curves of
infill contribution .................................................................................................................... 278
Figure 7.9 a) Force-displacement curves for an infill wall with and without INODIS system
for different h/l ratios and b) deformed shape with damage distribution at maximum load
capacity (INODIS- h/l=0.9).................................................................................................... 278
Figure 7.10 Deformed shape with damage distribution for a) INODIS - h/l=0.6 and b)
INODIS- h/l=2 at maximum load capacity (5 times scaled deformation) ............................. 279
Figure 7.11 Force-displacement curves for different infill thicknesses ................................. 279
Figure 7.12 Force-displacement curves for different material characteristics of the bricks .. 280
Figure 7.13 Deformed shape with the compression damage distribution at maximum load
capacity for a) Infill 1 and b) Infill 2 (5 times scaled deformation) ....................................... 280
Figure 7.14 Force-displacement curves for different frame cross sections ............................ 281
Figure 7.15 Force-displacement curves for different frame reinforcement ratios ................. 282
Figure 7.16 Force-displacement curves for different concrete classes .................................. 283
Figure 7.17 Force-displacement curves for short infill walls ................................................. 284
Figure 7.18 Deformed shape with damage distribution at 1.8% of drift for a) traditional infill
b) infill with the INODIS system ........................................................................................... 284
Figure 7.19 Combination of parameters in the main parametric study for h/l=0.6 ................ 286
Figure 7.20 Force-displacement curves for h/l=2 for a) INODIS 1 and b) INODIS 2 with the
thickness of the 1st layer of 35 mm ........................................................................................ 287
Figure 8.1 Design concept for infill walls with the INODIS system ..................................... 291
Figure 8.2 Determination of stiffness ratio between bare frame and infilled frame with the
system INODIS ...................................................................................................................... 293
Figure A.1: Force-displacement curves for h/l=2 and a) INODIS 1 and b) INODIS 2 with the
thickness of the 1st layer of 15 mm ........................................................................................ 347
Figure A.2: Force-displacement curves for h/l=2 and a) INODIS 1 and b) INODIS 2 with the
thickness of the 1st layer of 25 mm ........................................................................................ 347
Figure A.3: Force-displacement curves for h/l=0.9 and a) INODIS 1 and b) INODIS 2 with
the thickness of the 1st layer of 15 mm................................................................................... 347
Figure A.4: Force-displacement curves for h/l=0.9 and a) INODIS 1 and b) INODIS 2 with
the thickness of the 1st layer of 25 mm................................................................................... 348

xxvi
Figure A.5: Force-displacement curves for h/l=0.9 and a) INODIS 1 and b) INODIS 2 with
the thickness of the 1st layer of 35 mm................................................................................... 348
Figure A.6: Force-displacement curves for h/l=0.6 and a) INODIS 1 and b) INODIS 2 with
the thickness of the 1st layer of 15 mm................................................................................... 348
Figure A.7: Force-displacement curves for h/l=0.6 and a) INODIS 1 and b) INODIS 2 with
the thickness of the 1st layer of 25 mm................................................................................... 349
Figure A.8: Force-displacement curves for h/l=0.6 and a) INODIS 1 and b) INODIS 2 with
the thickness of the 1st layer of 35 mm................................................................................... 349

xxvii
List of tables
Table 2.1 Parameter approximation (Angel et al., 1994) ......................................................... 68
Table 2.2 Maximal area of non-structural walls in m2 ............................................................. 80
Table 4.1 Components tested.................................................................................................. 115
Table 4.2 Mean values of the material properties for the concrete ........................................ 117
Table 4.3 Mean values of the material for the reinforcement steel ........................................ 117
Table 4.4 Mean values of the material properties for the thin-bed mortar ............................. 118
Table 4.5 Mean values of the material properties for the normal mortar ............................... 118
Table 4.6 Mean values for the slump and air content for the mortar types ............................ 119
Table 4.7 Mean values for the dimensions, web thickness and plan parallelism of the units 120
Table 4.8 Mean values for the face flatness, gross dry and net dry density, percentage of voids
elastic modulus and compressive strength for the masonry units .......................................... 121
Table 4.9 Mean values for the bond strength of the mortar-unit interfaces, compressive
strength and elastic modulus of the three-brick specimen and flexural strength of small
masonry walls ......................................................................................................................... 122
Table 4.10 Static and dynamic elastic modulus of the elastomer ........................................... 123
Table 4.11 Mean values of physical characteristics of the tested specimens ......................... 124
Table 4.12 Mean values of physical and mechanical characteristics of the shear tested
specimens ............................................................................................................................... 126
Table 4.13 Capacity of the connection types .......................................................................... 129
Table 4.14 Summary of the experimental tests ...................................................................... 133
Table 4.15 Load bearing capacity of the U-shaped elastomer connection ............................. 148
Table 5.1 Overview of the tested specimens .......................................................................... 153
Table 5.2 Overview of the experimental program .................................................................. 166
Table 5.3 In-plane drifts of the test A ..................................................................................... 167
Table 5.4 Out-of-plane load of the Test BO ........................................................................... 169
Table 5.5 In-plane drifts of the Test BI................................................................................... 172
Table 5.6 In-plane drifts of the Test BIO ................................................................................ 178
Table 5.7 Out-of-plane load of the Test CO ........................................................................... 185
Table 5.8 In-plane drifts of the Test CI................................................................................... 187
Table 5.9 In-plane drifts of the Test CIO ................................................................................ 192
Table 5.10 Load phases in the loading protocol of the DIO test ............................................ 197
Table 5.11 In-plane drifts of the Test DIO .............................................................................. 197
Table 6.1 Smooth amplitude ................................................................................................... 238
Table 6.2 Adopted plasticity parameters for CDP model, for concrete frame and masonry units
................................................................................................................................................ 242

xxviii
Table 6.3 Material property values used for masonry unit and interaction ............................ 251
Table 6.4 Material characteristics of the plastic profile ......................................................... 256
Table 6.5 Material property values used for concrete and reinforcement steel ...................... 259
Table 6.6 Comparison of numerical and experimental results on bare frame ........................ 261
Table 6.7 Comparison of numerical and experimental results on traditionaly infilled frame 263
Table 6.8 Comparison of numerical and experimental results on infilled frame with the IMES
system ..................................................................................................................................... 264
Table 7.1 Infill brick material characteristics ......................................................................... 280
Table 7.2 Reinforcement ratios used in the numerical models............................................... 282
Table 8.1 Summary of the drift limits when cracking started ................................................ 294
Table 8.2 ULS drift limits for all the models ......................................................................... 295
Table 8.3 Stiffness ratio between bare frame and infilled frame with the system INODIS ... 296
Table 8.4 Calculation of costs for the traditional infill wall ................................................... 303
Table 8.5 Calculation of costs for the INODIS system applied to the DIO specimen ........... 303
Table 8.6 Calculation of costs for the INODIS 1 system (15mm) ......................................... 303
Table 8.7 Calculation of costs for the INODIS 1 system (25mm) ......................................... 303
Table 8.8 Calculation of costs for the INODIS 1 system (35mm) ......................................... 304
Table 8.9 Calculation of costs for the INODIS 2 system (15mm) ......................................... 304
Table 8.10 Calculation of costs for the INODIS 2 system (25mm) ....................................... 304
Table 8.11 Calculation of costs for the INODIS 2 system (35mm) ....................................... 304

xxix
Notation
Roman upper case letters
Am Area of the infill panel in the horizontal plane
Ao Opening area
Ap Infill panel area
Ec Modulus of elasticity of concrete
Ed Modulus of elasticity of infill in strut direction
Ediss Dissipated energy
Em Modulus of elasticity of masonry
Es Modulus of elasticity of reinforcement steel
Esto Stored energy
Eu Modulus of elasticity of brick
GF Fracture energy
Gm Shear modulus of masonry
CnG Fracture energy in the normal direction
CsG Fracture energy in the shear direction
CtG Fracture energy in the shear direction
H Frame height
Ib Moment of inertia of a beam
Ic Moment of inertia of a column
Jb Torsion constant of a beam
Jc Torsion constant of a column
L Frame length
R1 Reduction factor for prior in-plane loading
R2 Reduction factor accounting the flexibility of the boundary conditions
R3 Reduction factor accounting the effect of openings

xxx
Wa Weight of the wall
Wed Design lateral load per unit area of infill
Roman lower case letters
d Length of infill wall diagonal
fc Concrete compression strength
fcm Mean compressive strength of concrete determined by testing cylinders at the age of 28
days
fctm Mean value of axial tensile strength of concrete at the age of 28 days
fct,split Splitting tensile strength
fm Masonry compression strength
fmd Design compressive strength of the masonry in the direction of the arch thrust
fmt Masonry tensile strength
fu Ultimate tensile strength of reinforcement material
fxk1 Characteristic flexural strength of masonry having a plane of failure parallel to the bed
joints
fxk2 Characteristic flexural strength of masonry having a plane of failure perpendicular to the
bed joints
fxd Design flexural strength of masonry
fy Yield strength of reinforcement material
h Infill wall height
hb Beam height
hu Height of unit
knn Normal stiffness of contact interaction
kss Shear stiffness of contact interaction
ktt Shear stiffness of contact interaction
l Infill wall length

xxxi
la is the length or the height of the wall between supports capable of resisting the arch thrust
t Infill wall thickness
tj Mortar joint thickness
tn Normal traction
ts Shear traction
tt Shear traction
qu Maximum lateral pressure
uc Fracture crack opening
w Strut width
Greek upper case letters
Δ Maximum in-plane inter-storey drift
Δcr Cracking drift
Δinf Mid-height deflection normal to the infill plane
θ Angle of the infill diagonal with respect to the horizontal
Greek lower case letters
α Length of contact between the infill and the frame
γf Importance coefficient
γm Partial safety factor for materials
εc Total compressive strain
εc1 Strain at peak stress
plc Equivalent compressive plastic strain
εcuD Compressive strain in the concrete at point ―D‖ of sinusoidal descending part of stress-
strain curve (upper point)
εcuE Compressive strain in the concrete at point ―E‖ of sinusoidal descending part of stress-
strain curve (lower point)

xxxii
εcr Strain at the maximum tensile strength
εt Total tensile strain
plt Equivalent tensile plastic strain
λ Length of contact between the infill and the frame
μ Friction coefficient
ν Poisson‘s ratio
ξeq Equivalent viscous damping ratio
Sub-script
c Concrete
m Concrete
u Ultimate strength (resistance)
y Yield strength (resistance)
Rd Design value of resistance
Rk Characteristic value of resistance
Ru Ultimate resistance
Abbreviations
CDP Concrete
DLS Damage Limitation State
ULS Ultimate Limit State
FEA Finite Element Analysis
EC2 EN1992-*, Eurocode 2
EC6 EN1996-*, Eurocode 6
EC8 EN1998-*, Eurocode 8

1 INTRODUCTION
Bad times have a scientific value. These are occasions a good learner would not miss.
Ralph Waldo Emerson

Marko M. Marinković Innovative system for seismic resistant masonry
infills in reinforced concrete frame structures
2
1.1 Application of masonry infilled walls
Masonry construction has been very common construction technique over the whole
world. Clay bricks have been employed for at least 10,000 years. They were made from
sun-dried bricks and widely used in Babylon, Egypt, Spain, South America, United
States and elsewhere (Drysdale et al., 1994). Older buildings mostly consist of
unreinforced masonry (URM) walls. In modern construction, masonry walls are used
extensively to fill concrete or steel and internal and external frames due to high impact
resistance and heat and sound insulation properties. These walls are called masonry
infill walls and they represent the most traditional enclosure system since they have
demonstrated reasonable performance and durability with respect to temperature, noise,
moisture and fire. Reinforced concrete (RC) structures constitute a significant portion of
the building inventory. The need to arrange infill walls in framed structures naturally
arises by the necessity to create a separation between internal space of buildings and
external environment. In fact, the use of masonry infill walls offers an economical and
durable solution. They are easy to build, attractive for architecture and have a very
efficient cost-performance. Therefore, the use of masonry infill walls in RC frame
structures (Figure 1.1) is common in many countries and is a highly used constructive
technology in residential and commercial buildings.
Figure 1.1 Typical construction of infill walls in RC frame structures
Construction of masonry infilled RC frames is relatively simple. First the bounding
frame (columns and upper and lower beams or slabs) is casted of reinforced concrete.
During the construction of the bounding frame at the upper storeys, the masonry infills

Chapter 1 Introduction
3
can be constructed in the lower storeys. This construction sequence allows the roof or
floor to be constructed prior to the masonry being laid, allowing for rapid and
independent construction of subsequent storeys or application of roofing material. In
this method of construction, no load transfer between frame and infill is expected under
the gravity loads. However, due to earthquake induced lateral loads, infill walls are
activated and the resistance to lateral load is achieved through a composite action until
the appearance of first cracks.
a) b) c)
d) e) f)
Figure 1.2 Different masonry units used for infill walls
The combination of different masonry units made of different materials (Figure 1.2),
together with various mortars, lead to the existence of many solutions to fill the frame
structure. The most common material used for the construction of masonry infills, are
the ceramic bricks, made of clay, soon followed by concrete blocks, autoclaved aerated
concrete (AAC), calcium silicate (CS) etc. Regarding the use of clay units, masonry
infills made of solid bricks were mostly used until they started to be replaced by clay
blocks. Generally, the thickness of enclosure walls increased in the last years due to
mechanical and thermo/acoustic requirements. Since the present trends in
thermo/acoustic isolation of the buildings, units with high percentage of holes are more
in use providing an increased isolation capacity. Therefore, the units on Figure 1.2b, c
and d present modern unit types filled with isolation material, thus providing high
isolation capacity and at the same time increasing the speed of construction since there
is no need for adding additional isolation material on outer side of the wall.

Marko M. Marinković Innovative system for seismic resistant masonry
infills in reinforced concrete frame structures
4
Regarding the European use of masonry units, clay is the most common material used in
most European countries. As for other materials, the two that stand out are the aggregate
concrete (dense and lightweight), and autoclaved aerated concrete. It should be noted
that the use of stone to build infill walls is not common in European countries. Another
material with reduced use is calcium silicate, with notable consumption in Germany.
There are units of solid brick, with vertical holes, and horizontal holes. Solid bricks are
used mostly to build veneers and sometimes, but now very rarely, they are used in single
leaf walls. The shape of the holes of the bricks is generally rectangular, and they usually
do not have interlocking. In relation to the joints, these are made of mortar, in most cas-
es, with a thickness of 10 mm on average, for the horizontal or the vertical joint. In
Germany the thin layer joints are commonly used to make horizontal joints and vertical
joints are left unfilled making dry joint interlocking connection with tongue and grove
(Figure 1.2b, c and d). Generally neither reinforcements, nor connectors are used in the
walls. In conclusion, in Europe the most frequently used structural type is the RC frame
system and precast frame system. The most frequently used type of walls, are the single
leaf and cavity walls, where the most common material used are clay units.
1.2 Background and motivation
Earthquake presents one of the strongest and widespread natural disasters. Its effects
can be disastrous and therefore a large number of people is involved in different
activities with the aim to prevent or reduce the consequences of earthquake activities.
Figure 1.3 and Figure 1.4a show that earthquakes have caused huge loss of life and
economic activity over the last 65 years. This is consistent with the data from Coburn
and Spence (2003) showed in Figure 1.5. These figures suggest that approximately
750,000 people died due to earthquakes in 50 years. It is alarming that this number has
already been reached in the last 20 years (Figure 1.3). This is even more upsetting since
the number of earthquakes causing fatalities is increasing almost each decade (Figure
1.4b). In line with the increasing casualties are also the costs related to earthquakes
(Figure 1.4a) that represent more than the 1/3 of the costs from all the natural disasters.
Coburn and Spence (2003) estimated that the damage caused by earthquakes in the 20th
century was approximately $1 trillion in today‘s dollars and the costs keep growing due
to population increase and the increase in property values affected by earthquakes.

Chapter 1 Introduction
5
Figure 1.3 Number of deaths per disaster type from 1996-2015 (CRED and UNISDR, 2015)
a) b)
Figure 1.4 a) Number of deaths and economic losses from great natural catastrophes from 1950-
1999 (Bachmann, 2002) and b) number of fatal earthquakes per decade of 20th century (Coburn
and Spence, 2003)
All of these facts are important for the topic of this thesis since reinforced concrete
frames with masonry infill walls are a popular form of construction in seismic regions
worldwide. However, construction practice from the middle of the 20th century up until
today has not been helpful with respect to infilled frames. As a result, today we have RC
frame structures with infill walls designed without considering seismic action.
Afterwards, in the 1970s, there was an increase in the number of floors in buildings.
Also, spans and size of the openings increased and sometimes the ground floor was left
without walls, to provide wide space for garages, shops, hotel halls etc. All this

Marko M. Marinković Innovative system for seismic resistant masonry
infills in reinforced concrete frame structures
6
increased the vulnerability of masonry infilled RC frames.
a) b)
Figure 1.5 Number of deaths due to earthquakes divided by cause a) for the first half and b)
second half of the 20th century (Coburn and Spence, 2003)
Additionally, due to the complexity of the problem and the absence of a realistic, yet
simple analytical model, infill walls within frame buildings have been generally
considered as non-structural elements and thus have been typically neglected in the
design process. However, the observations made after major earthquakes (Duzce
(Turkey, 1999), L‘Aquila (Italy, 2009), Lorca (Spain, 2011), Christchurch (New
Zealand, 2011), Emilia-Romagna (Italy, 2012)) have shown that infill walls interact
with the structural system during seismic actions, thus influencing the dynamic
characteristics of a structure (Figure 1.6a) and modifying the behaviour of the structure
significantly (Figure 1.6b). Since thefailure of infill walls, either in-plane or out-of-
plane frequently occurs during earthquakes the limitation of damages in infill walls is a
very important public safety issue. The failure to do so may cause injuries or even
casualties, sometimes caused by an earthquake which may not be as strong as the design
one. Also, the damage of infills may be significant from the economic point of view due
to the repair or reconstruction of some infills, repair of damages to structural system,
non-structural components, equipment, rental and relocation costs and general income
losses. These negative effects have devastating impact on the economy for a longer
period as is observed by Langenbach, R. (1992), who described the situation in Oakland
(California), three years after the Loma Prieta earthquake in 1989. He pointed out that
the extensive damage was suffered mostly in new steel and concrete frame buildings
with infill walls.
Comite Euro-International Du Beton (1996) reported that infill increases the stiffness of
the bare frame 4 to 20 times, which means that infills cannot be neglected in the design
process due to the increase in lateral stiffness and thus the decrease of natural period of

Chapter 1 Introduction
7
vibration of the frame, which in turn leads to increased accelerations and inertia forces
(Figure 1.6b). The same effect is present for the whole structure, depending on the
number of storeys, infill walls, thickness of the infills, presence of openings etc. Field
observation after the April 25th
earthquake in Nepal showed that infills produced
significant increase of stiffness that influenced the natural frequencies of the structure
(Varum et al., 2017). Depending on the predominant periods of the structure, decrease
in natural period due to infill may produce increase or decrease of the expected seismic
response (Figure 1.6a). When infill wall fails, wholly or partially, natural period of the
structure changes. Additionally, the high forces previously attracted and carried by the
infilled frame, will be suddenly transferred to the more flexible and weak bare frame.
a) b)
Figure 1.6 a) Influence of change of dynamic characteristics on seismic response and b) com-
parison of roof-top accelerations of a bare and infilled frame (Charleson, 2012)
Without infill walls a bare frame deflects under horizontal forces by bending in its col-
umns and beams. However, due to their low drift capacity of 0.2–0.3% (Tasligedik and
Pampanin, 2016) and rather stiff and brittle in-plane response, infill panels achieve its
maximum load capacity very fast which is followed by a sudden decrease of strength.
Therefore, it can be concluded that infills suffer damage under low inter-storey drift
values. Infill wall increases the strength of infilled frame, but it highly decreases its duc-
tility, which conflicts with ductile seismic design (Tasligedik and Pampanin, 2016).
These problems are even more pronounced due to the fact that a large number of char-
acteristics influences the behaviour of infilled frames and on top of that, their values
differ in a high range (Parisi and Augenti, 2012).

Marko M. Marinković Innovative system for seismic resistant masonry
infills in reinforced concrete frame structures
8
a) b)
Figure 1.7 a) X cracked infill wall (Braga et al., 2011) and b) horizontal and vertical separation
cracks between frame and infill with the horizontal cracks in infill joints (Dazio et al., 2009)
Due to the deformation of frame members, a compression strut forms within the infill in
the direction of one diagonal, while simultaneously, a parallel diagonal tension crack
opens caused by elongation along the opposite diagonal. After reversed cycles of
movement induced by earthquake, cracks in the shape of letter X occur (Figure 1.7a).
This is the most common type of crack that appears in infill. Depending on the strength
of the infill as well as stiffness ratio between frame and infill, H/L ratio of infill and
other geometrical and mechanical parameters, different types of infill damage can
appear (Figure 1.7 and Figure 1.8). They are explained in detail in Section 2.2. Many
reports (Sezen et al., 2003; Dazio et al., 2009; Braga et al., 2011; Mahfredi et al., 2014)
show the observations that masonry infills cannot accommodate the high deformability
of RC frames without experiencing a rather brittle response characterized by sudden
decrease of resistance, thus resulting in severe damage, possibly even disintegration or
partial collapse of the wall. This is also confirmed by FEMA 154 (2002) which gives the
worst Basic Structural Hazard Score to the concrete frame buildings with URM infill
walls. El-Dakhakhni (2002) concluded that URM infill walls have a poor performance
record even in moderate earthquakes. This suggests that the damage of masonry infills
may contribute significantly to economic losses and cause considerable threats to
human lives, even in the case of infills in newly constructed buildings (Hermanns et al.,
2012). Vicente et al. (2012) and Hermanns et al. (2012) pointed out that there is an
urgent need for improvements in the current approach for the verification and detailing
of singular points of infills, especially in order to prevent out-of-plane failure.

Chapter 1 Introduction
9
a) b)
Figure 1.8 a) Separation of infill wall from the frame and b) corner crushing with the overall
corner damage (Tasligedik, 2014)
Beside in-plane damage of infill walls, they can experience failure in out-of-plane
direction. These failures are responsible for creating additional damage not just to the
infill walls but also by causing injury or even casualties around the buildings, which is
especially dangerous for those who manage to exit the building during the earthquake or
rescue workers entering buildings. This happens as a consequence of their weak
connection with the surrounding frame and/or because of their large slenderness. In
2011 Lorca earthquake in Spain, most of casualties were caused by masonry infills and
parapets falling down from the floors of RC buildings. Insufficient connection was
reported (Decanini et al., 2005) as the reason for many damaged infills during
earthquakes. Defective joints between the infill and the upper beam can trigger the
tilting of the panel (Figure 1.9a). This is expected at upper storeys due to the amplified
floor accelerations. However, in some situations (Figure 1.9b) complete out-of-plane
failure of masonry infills occurs at the ground or first storey, as observed after the 2012
Emilia Romagna (Italy) and 2016 Central Italy earthquakes. This can be attributed to the
damage produced by in-plane shear forces at the bottom storeys, thus increasing the
out-of-plane vulnerability of the infills (Pasca et al., 2017). Therefore, it is extremely
important to consider that out-of-plane vulnerability of masonry enclosures increases
with the previous in-plane damage (Hak et al., 2012). Not only previous in-plane
loading causes damage of infill/frame connection, but also workmanship can
significantly affect the out-of-plane behaviour of the specimen by disturbing their
boundary conditions (Akhoundi et al., 2016).

Marko M. Marinković Innovative system for seismic resistant masonry
infills in reinforced concrete frame structures
10
a) b)
Figure 1.9 a) Damaged infill in Italy: Emilia Romagna (2012) and b) L‘Aquila (Dazio et al.,
2009)
Other collapse mechanisms due to the infill/frame interaction occur when infill walls do
not fully fill the frame i.e. when infill panel is shorter than the column. This is not so
rare in practice as a result of infill walls with windows at the top, or as a result of infill
damage during earthquakes (corner crushing or loss of top part of the infill). This cre-
ates a problem by increasing of local shear demand on columns (Haldar et al., 2013;
Milanesi et al., 2018), while additionally free length of the column is too short to allow
for the development of ductile plastic hinges. In this case, the columns experience the
shear failure (Figure 1.10) which is brittle and can lead to partial building collapse. Ad-
ditionally, sliding failure of a masonry infill can also lead to the short column failure;
therefore RC tie beam at mid-height of the infill should not be used as the strengthening
measure because it can modify the failure mode (from diagonal cracking to shear sliding
along a horizontal joint). Guevara and Garcia (2005) reported on unsuccessful attempts
to improve the seismic performance of short reinforced concrete columns, concluding
that the best solution is to avoid them.
An additional shortcoming of traditional infill walls is that particular attention has to be
given to the arrangement of infills. Unless infill walls are symmetrically placed in plan
their high stiffness against seismic force changes the location of the Centre of
Resistance causing large torsional eccentricity resulting in torsion of the building.
Moreover, irregular distribution of infills over the height of buildings produces strong
differences in strength and stiffness between storeys being the potential cause of a soft
storey mechanism (Figure 1.11). Additionally, even if infill walls are regularly

Chapter 1 Introduction
11
distributed both in plan and along the height, during earthquakes some of the walls may
fail while others remain intact. This also modifies the stiffness distribution and causes
unpredicted torsional or soft storey effects. Many studies have highlighted the poor
performance of framed structures with irregular arrangement of infill panels, both in
plan and in elevation (Fardis and Panagiotakos, 1997; Masi, 2003; Verderame et al.,
2011). This also means that any modification of infill walls in their number or
arrangement in both plan and vertical direction should be done with engineering advice
(Charleson, 2012). Since it can‘t be expected that infills are going to be regularly
distributed in plan and vertically, this presents strong shortcoming of traditional infills.
a) b)
Figure 1.10 a) Short column failure during 2011 Christchurch earthquake (Tasligedik, 2014)
and b) 2009 L‘Aquila earthquake (Dazio et al., 2009)
a) b)
Figure 1.11 Soft storey collapse of a building in 2009 L‘Aquila earthquake: a) backside and b)
frontside (Dazio et al., 2009)
Beside all negative aspects of traditional infill walls, some studies have proven that the
masonry infill walls, can positively affect the seismic behaviour of reinforced concrete
buildings. Liberatore et al. (2004) observed that infills can significantly increase the
energy dissipation capacity and decrease the maximum displacements. However, it is

Marko M. Marinković Innovative system for seismic resistant masonry
infills in reinforced concrete frame structures
12
necessary to avoid the possible negative effects of the frame/infill interaction that cause
excessive damage of both masonry infill walls and RC frames. It is questionable
whether this can be achieved in everyday practice. Charleson (2012) confirms beneficial
effect of infills, but just in cases of low rise buildings, infills without big openings,
continuous infill panels from foundation to roof and symmetrically placed in plan. He
added that most infill walls do not satisfy these criteria and thus may introduce
weaknesses in structures.
It is clear that RC frames with masonry infills are highly vulnerable to earthquake
excitations but even so they are commonly used all over the world, as well as in the
areas with the high seismic activity. This produces frequent reporting of infill damage
during past earthquakes. Therefore, there is huge motivation to find the solution to
improve the behaviour of masonry infills.
1.3 Objectives of the research
The first objective of the research is the systematization in one place of the knowledge
about seismic behavior of infill walls assessed through experimental and numerical
studies as well as analytical solutions for the design of infills, which some of them are
inserted in international recommendations and national codes. This should provide an
opportunity to potential readers to find all the necessary information to understand the
state-of-art in this field. By summarizing solutions for improvement of behaviour of
infills that are proposed so far, all the advantages and shortcomings are presented, thus
showing the gaps that justify this research.
The second objective is to develop the solution for damage reduction of infill walls
under the seismic loading and elimination of their brittle failure. This solution will be
used for façades and internal partitions in reinforced concrete frame structures.
Therefore, it should prevent any damage of both infills and structural system and at the
same time keep excellent performance of masonry infills with respect to temperature,
noise, moisture, fire and durability. This system is expected also to fulfil the
requirements for the design of new buildings, but also the retrofit of existing buildings
to conform to the new seismic codes.
The third objective is to plan and implement experimental program that includes tests
on system components and on infilled frames. It will be adequately designed to include

Chapter 1 Introduction
13
in a measurable and controlled way the influence of the main parameters affecting the
behaviour of RC frames with infill walls constructed in the traditional way and by
applying the proposed system. Experimental results should be useful for analytical and
comparative purposes. Afterwards, analysis and evaluation of the experimental results
will be performed.
In parallel with the experimental program, numerical analysis using finite element
model will be performed. In the first step development and validation of numerical
model against experimental results is planned. Later on, comprehensive parametric
study will be conducted with the aim to give useful conclusions that will be used for
derivation of design concept for the proposed system.
In the end, a simple, yet, accurate technique for the design of infilled frame structures
with the proposed system will be proposed. The technique should be systematic in order
to produce design aids and application recommendations that can be used in everyday
practice.
1.4 Methodology of the research
Analysis of literature will be performed to present current state-of-art on infilled frames.
Experimental works will be performed such as: standard material tests, tests on system
components and separate, sequential and simultaneous in-plane and out-of-plane tests
on infilled frames.
Advanced 3D finite element (FE) models of standard material tests, tests on system
components and infilled frames tests will be built and calibrated based on experimental
results. Numerical analyses with explicit dynamic solver and damage material models
will be used which leads to the most realistic prediction of the real behaviour of the
specimens.
Parametric study will be performed using the previously developed and validated FE
models.
Analytical methods will be used, based on FE analyses and experimental results to
develop the concept for the design of infilled RC frame structures with the proposed
system.

Marko M. Marinković Innovative system for seismic resistant masonry
infills in reinforced concrete frame structures
14
1.5 Scope of the thesis
The content of the thesis is organized in nine chapters.
Chapter 1, i.e. the current chapter, provides the general background and motivation for
the research, presenting the problems related to the behaviour of masonry infilled RC
frames. This chapter also presents the objectives of the thesis and the methodology and
outline of the thesis.
Chapter 2 presents the literature review of the topic of the thesis, which includes
description of seismic behaviour of infills and summary of knowledge resulting from
experimental and numerical campaigns as well as different approaches for numerical
modelling of infills. This chapter also provides a brief summary of the design of infills
from international recommendations and national codes as well as a short report on the
proposed solutions for masonry infills.
Chapter 3 provides an overview of the proposed system together with a description of
its general characteristics and steps for its construction.
Chapter 4 presents tests on system components and standard material tests. Procedures
and results from material properties tests and system components tests are shown.
Chapter 5 shows experimental test campaign on infilled RC frames. In-plane and out-
of-plane loads have been applied separately, sequentially and simultaneously.
Evaluation of the results and comparison of the behaviour, performances and force and
drift capacities of the traditional infill and infill with the proposed system has been
presented.
Chapter 6 deals with the nonlinear numerical analysis, first on system components in
order to calibrate the material models and afterwards calibration of infilled frames
against experimental results has been performed.
Chapter 7 includes results of the parametric study performed using the validated
numerical model of infilled frame with the proposed system. Effects of important
material and geometrical characteristics of infill wall, RC frame and system components
were investigated. The conclusion about the parameters that influence the behaviour of
infills with the proposed system was used to perform comprehensive parametric study
with the aim to derive design concept for the proposed system.

Chapter 1 Introduction
15
Chapter 8 describes the design concept and gives recommendations for engineering
practice and application of the proposed system. It also gives the simple economic
analysis of the proposed system.
Chapter 9 presents the main conclusions of the thesis and possible further research in
this filed.

2 LITERATURE REVIEW
To read without reflecting is like eating without digesting.
Edmund Burke

Chapter 2 Literature review
17
2.1 Introduction
The behaviour of infilled frames has been the subject of investigations conducted by
researchers throughout the whole world. Since the middle of the 20th
century intensive
work has been done, but due to the actuality of the topic the research interest in the
seismic response of masonry infills has increased notably in the recent years (Asteris et
al., 2013). This chapter presents an overview of previous research, which is of signifi-
cance for examination of behaviour of RC infilled frames. In some parts also the studies
carried on steel infilled frames were presented due to the additional information and
results that could help to draw useful conclusions. Firstly, research regarding the seismic
behaviour of infill walls is presented, which is classified according to the direction in
which infill walls are loaded during the earthquakes. In this section an overview of be-
haviour modes and damage patterns that appeared in previous earthquakes is summa-
rized with the aim to help in better understanding the behaviour of infill walls during
earthquakes. Afterwards, a review of experimental tests is carried out and the findings
are given in order to get additional information about the behaviour of infill walls with
different types of masonry, geometry, load histories etc. Since numerical investigations
are a powerful tool for additional research and parametric studies that cannot be covered
by experimental tests, overview of proposed approaches for modelling of masonry in-
filled RC frames and its components is presented. As a starting point for the develop-
ment of design rules for infilled RC frames in this thesis, so far proposed recommenda-
tions by several design codes and standards are summarised. Additional attention is also
given to the already proposed solutions for improvement of behaviour of infill walls
under the earthquake load, since the work in this direction increased in recent years.
2.2 Seismic behavior of infill walls
This section describes the behaviour of infills under earthquake loading by explaining
different failure modes under separate, sequential and simultaneous in-plane and out-of-
plane loads that appear during earthquakes.
2.2.1 In-plane behavior of infill walls
The behaviour of masonry infilled frames subjected to in-plane lateral loads was
investigated by a number of researchers, both numerically and experimentally. In this

Marko M. Marinković Innovative system for seismic resistant masonry
infills in reinforced concrete frame structures
18
section, description of the in-plane behaviour of infills together with the main findings
influencing their in-plane response under earthquake excitation is summarized.
In-plane behaviour of infilled frames can be separated into three phases, where the first
phase relates to small displacements and is characterized by the large initial stiffness,
when compared to the bare frame. At this phase there are no cracks, therefore infilled
frame behaves as a monolithic composite system. It is worth mentioning that many
researchers (Kappos and Ellul, 2000; Kose, 2009; Ricci et al., 2011; Asteris et al., 2015)
recognized increase in stiffness and thus change in period of structure due to the infills.
Change in fundamental period of the structure is especially investigated within the first
phase, when the system is in elastic range. Effects of different parameters on the
fundamental period of RC buildings with infills were investigated with the aim to derive
simplified formulas that could be implemented in codes and used in every day design.
With the continued application of the load, opening of the first cracks starts, which leads
to the decreasing of lateral stiffness. This phase also presents the beginning of the
inelastic behaviour. During this phase loaded diagonal of the panel gets compressed,
while in the non-loaded diagonal corners formation of gaps between the frame and the
infill is present due to the difference in the deformation mode between the infill and the
frame. This phase lasts until the failure mode when the system will reach the maximum
load capacity. In phase three, the behaviour is dependent on the model of failure of infill
and the behaviour of the frame. Now the infilled frame shows a large dissipation of
energy when subjected to cyclic loadings. Sliding and cracking of infill contributes the
most to the energy dissipation. With continued increase in the drift, at each cycle, the
value of strength and stiffness tend to decrease until the level of damage in the infill is
so high that its contribution to the system is negligible.
a) b) c) d)
Figure 2.1 In-plane failure modes of infill walls (El-Dakhakhni et al., 2003)
The behaviour of masonry infills for in-plane loads was examined by many researchers
(Mehrabi et al., 1996; Al-Chaar et al., 2002; Shing and Mehrabi, 2002; Drysdale and

Chapter 2 Literature review
19
Hamid, 2005; Stylianidis, 2012; Morandi et al., 2014; Hak et al., 2017), amongst others,
and, according to Paulay and Priestley (1992), Crisafulli (1997) and El-Dakhakhni et al.
(2003), can be described by four failure modes of infill panel (Figure 2.1): Compression
failure in the corners (a) or in the middle of the infill (b), shear failure in the middle of
the wall along a mortar joint (c) and diagonal tensile failure (d).
Compression failure in the corners or corner crushing failure mode (Figure 1.8b)
appears due to the failure of the compression strut. It is manifested with the crushing of
compressed corners and it is associated with weak infills surrounded by strong columns
and beams with weak infill-frame interface joints (Asteris et al., 2011).
Damage in the centre of the infill appears due to the buckling of the infill panel and
reveals as a crushing of the centre of the wall. This mode usually occurs in slender
infills, where in-plane loading is accompanied by out-of-plane deformations.
Shear failure along the bed joint is the mechanism that occurs quite often when low
quality mortar is used, but also when infill aspect ratio is low. In this mechanism the
cracking occurs along one or more bed joints.
Diagonal tensile failure (Figure 1.7a) occurs on the diagonal compression strut and
consists of cracks that propagate along the bed and head joints, generally forming a
stepped diagonal crack. This mode can appear in a case when the bricks are stronger
than the mortar. In contrary, bricks may crack too. Mixed mode of the diagonal cracking
and shear sliding may appear.
Additionally failure mode of the infilled frame can be related to the frame failure, which
consists of the formation of plastic hinges in columns and beams, or in the column/beam
joints due to the increased bending or shear forces brought by masonry infills to the
frames (Liauw and Kwan, 1984 and 1984b; Mehrabi et al., 1996; Milanesi et al., 2018).
This mode occurs when frame is weak and the infill is quite strong.
It is worth mentioning that separation of the infill from surrounding frame does not
mean failure of infill, but it influences on the behaviour of the system (Figure 1.7b and
Figure 1.8a).
The appearance of the different modes of failure depends on a number of factors such as
geometry of the specimen, thickness of the infill, material properties of both frame and

Marko M. Marinković Innovative system for seismic resistant masonry
infills in reinforced concrete frame structures
20
infill and stress state induced in the panel. For example, Mauro (2008) concluded that
the failure mode with the highest strength is compression failure in the corners,
followed by diagonal and horizontal sliding cracks. On the other hand El-Dakhakhni et
al. (2003) indicated that only compression failure in the corners and shear sliding along
the bed joints are of practical importance, since the damage in the centre of the infill
occurs very rarely and diagonal cracking should not be considered to be structural mode
of failure because after its appearance infill walls are capable of resisting more loads.
2.2.2 Out-of-plane behaviour of infill walls
After seismic behaviour of infilled frames in direction of the wall plane is summarized
in a previous section, in this section behaviour of infill walls in out-of-plane direction is
discussed. The behaviour of infill walls under out-of-plane loads was examined by
McDowell et al. (1956a,b), Dawe and Seah (1989b), Angel et al. (1994), Vougioukas
(2012), Asteris et al. (2017) and Walsh et al. (2017). The tilting of the entire panel out of
the frame (Figure 1.9a) was identified as a global failure mode (Figure 2.2a). Based on
the yield line theory, further typical failure modes occur according to the existing
boundary conditions. Failure modes for a two-sided support in a vertical direction, a
two-sided support in a horizontal direction and a four-sided support are illustrated as
examples in Figure 2.2b-d).
a) b) c) d)
Figure 2.2 Out-of-plane failure modes of infill walls (Kubalski et al., 2017)
The fall of the infill walls in out-of-plane, during an earthquake, may be due to the three
factors:
- previous or simultaneous in-plane load;
- inertial forces caused by the seismic acceleration;
- relative displacements of the top and bottom of the wall due to drifts.

Chapter 2 Literature review
21
Although cracks, resulting from the in-plane actions, have great influence on the out-of-
plane behaviour, in this section it is referred to the studies and to situations where there
is no previous damage on infill walls. Therefore, beside prior in-plane damage, out-of-
plane capacity can suffer large reductions due to the ineffective connection of an infill
wall with the surrounding frame caused by poor quality of execution (Manfredi and
Masi, 2014) or due to the mortar shrinkage.
Based on the experimental results, Dawe and Seah (1989b) concluded that the
behaviour of the infill wall under out-of-plane pressure could be divided into four
phases depending on the applied load and the displacement obtained. In the first phase
linear elastic behaviour until the opening of the first crack is present. Appearance and
propagation of initial cracks characterize the second phase, which is followed by the
development of the arching effect in the third phase. This lasts until the degree of
crushing of the masonry increases so much that the load decreases until the collapse,
which presents the end of the fourth phase.
Important aspect of out-of-plane behaviour of infill walls is its interaction with the
surrounding frame. If an infill wall is in full contact with the frame, which acts as a rigid
support, behaviour of infill walls is characterized by a phenomenon called ―arching
action‖ or ―arching effect‖. The research showed that the arching action is governed by
a compressive strength of the wall, panel dimensions (slenderness), boundary conditions
between the infill and the frame and stiffness of the surrounding frame. Formation of
arching mechanism can increase the out-of-plane capacity of masonry infills
significantly, in some cases, 2 to 3 times higher than its flexural capacity. According to
Drysdale et al. (1999) this phenomenon is responsible for the resistance of walls built to
be much higher than the empirical values of calculation principles. Depending on the
condition of the infill/frame connection out-of-plane response of infill walls can be
governed by an arching or rigid-body mechanism (Figure 2.3). Arching appears in a
case when the connection is sufficient and undamaged, while rigid-body mechanism
appears if a connection is weakened, either by prior in-plane damage or due to the bad
execution. Due to this kind of lack of connections between the infill and the surrounding
frame, during the 2009 L‘Aquila, Italy, earthquake (M=6.3), damage to RC frames was
often restricted to exterior infill walls and interior partitions, varying from small cracks
to collapse (Braga et al., 2011; Decanini et al., 2012). Another example of out-of-plane

Marko M. Marinković Innovative system for seismic resistant masonry
infills in reinforced concrete frame structures
22
collapse due to defective joints between the infill and the upper beam appeared during
the 1999 Athens, Greece, earthquake (M=5.9), when tilting of the panels was observed
(Decanini et al. 2005).
Figure 2.3 a) Arching mechanism and b) rigid-body mechanism
Asteris et al. (2017) gave a comprehensive literature review of the capacity models
developed for the prediction of the out-of-plane response of infilled frames and based
on the typical crack patterns observed after out-of-plane experimental tests that
concluded that the behaviour of the infill can be described with the arching mechanism
in both vertical and horizontal direction depending on the flexibility of the surrounding
frame. Therefore, the out-of-plane response of infill walls depends on the compressive
strength of masonry rather than tensile strength and the out-of-plane capacity rapidly
decreases with the increase in the slenderness ratio of the wall. That means that the
collapse of an infill panel occurs when the masonry reaches the compression limit or
when the frame is no longer able to provide the necessary confinement. Due to the
reduced thickness of the partition walls, a height/thickness ratio is large making them
vulnerable to the out-of-plane inertia forces. Additionally, masonry infill walls made of
hollow bricks may lose boundary condition for arching mechanism due to the crash of
the bricks at the top and bottom of the wall.
2.2.3 Behaviour of infills under prior in-plane or out-of-plane damage (sequential
loading)
Although out-of-plane collapse is expected on the upper storeys of buildings, due to
higher expected accelerations, damage survey after L‘Aquila earthquake in 2009
showed that the greatest damage is located on the lower storeys (Braga et al., 2011).

Chapter 2 Literature review
23
Since out-of-plane overturning collapse was frequently observed it can be concluded
that the out-of-plane overturning effects are in fact increased by the horizontal in-plane
deflection, which causes the separation from the upper beam. Additionally, the collapse
due to the out-of-plane mechanisms has to be assigned to the cracking damage due to
in-plane drifts, which are generally greater at lower storeys than those experienced at
the upper storeys in RC frame structures. Due to the in-plane action, which reduces the
connection effectiveness with the structural members, infill walls can suffer early dam-
age. In fact, in-plane actions can cause disconnection of the infill panels from structural
elements, reducing their seismic capacity (Hanoun et al., 2017). Moreover, due to the
high in-plane stiffness, masonry infill walls attract a large amount of in-plane forces,
when the structure is subjected to the earthquake excitation. Even after moderate earth-
quakes, a typical x-pattern of cracks may occur, thus weakening infills and making them
vulnerable to possible further earthquakes. Therefore the out-of-plane collapse may also
occur as a consequence of a prior in-plane damage experienced by the infills in previous
earthquakes (Asteris et al., 2017). Moreover, in-plane damage can reduce the out-of-
plane capacity of infill panels leading to their collapse causing severe risk for life safety.
First to comment on the influence of in-plane stresses on out-of-plane resistance were
Paulay and Priestley (1992), who stated that out-of-plane resistance highly reduces as
the stiffness of the boundary conditions of the infill wall decreases. Since appearance of
gaps between panels and frames is a common situation in practice, due to the shrinkage
and separation between panels and frames under in-plane loading, they concluded that
these gaps and/or damage in panels caused by in-plane stresses will cause that mem-
brane action in out-of-plane direction does not develop. Considering this, they conclud-
ed that unreinforced infill walls should not be considered as satisfactory elements of
structure. Recently this problem was studied numerically by Di Trapani et al. (2017),
where authors concluded that wall damage due to in-plane loads can significantly re-
duce out-of-plane resistance of an infill wall. This influence especially depends on the
slenderness (height/thickness) of the wall, where more slender wall suffers a more sig-
nificant loss of out-of-plane resistance. But the authors concluded that this is significant
only when previous in-plane drift exceeds 0.75%, in contrary the effect is almost the
same regardless of the slenderness ratio.
Pasca et al. (2017) showed examples of damage on infilled RC frames after the 2012
Marko M. Marinković Innovative system for seismic resistant masonry
infills in reinforced concrete frame structures
24
Emilia (Italy) and 2016 Central Italy earthquakes, where it was observed that failure of
infills took place at the lower storeys of buildings. Authors attributed this to the fact that
in-plane shear forces are larger at the bottom storeys, thus producing the damage which
increases the out-of-plane vulnerability of the infills. Therefore, it is concluded that out-
of-plane damage cannot be related only to out-of-plane floor accelerations, which are
generally higher at the upper storeys, but it is necessary to take into account the
interaction between in-plane and out-of-plane loads.
Also FEMA 274 (1997) stated that although it is expected that due to the out-of-plane
inertia forces infill walls at upper floors fail, it is more likely for out-of-plane failure to
occur after an infill panel is damaged due to the prior in-plane loading.
2.2.4 Behaviour of infills under simultaneous in-plane and out-of-plane loading
During any seismic event, simultaneous in-plane and out-of-plane loads on masonry
infill walls are always imposed. There have been less studies dedicated to the behaviour
of infill walls in the out-of-plane direction, compared to those regarding the in-plane
behaviour, and even fewer studies have discussed the effects of a combination of in-
plane and out-of-plane actions, which is the most realistic action on infill walls during
an earthquake (Dona et al., 2017). It is extremely important to consider that out-of-plane
vulnerability of masonry enclosures increases with in-plane damage due to seismic
loads since in the case of a real building response the masonry infills would be
subjected simultaneously to in-plane and out-of plane seismic actions (Hak et al. 2012).
Furthermore, Al-Chaar (2002) pointed out that the effects of out-of-plane loading cannot
be neglected when analysing the in-plane capacity of an infilled structure, because the
in-plane capacity can be significantly reduced if large out-of-plane loads exist.
Hashemi and Mosalam (Hashemi and Mosalam, 2007) conducted an in-plane shaking
table test on a ¾ scaled reinforced concrete infilled frame, subsequently used to cali-
brate a numerical model that was developed to include out-of-plane loading. Then the
calibrated model was used for parametric study to investigate influence of simultane-
ously applied in- and out-of-plane loads. Results are presented as a family of in-plane
pushover curves (Figure 2.4), where it can be seen that increasing out-of-plane force
significantly reduces in-plane resistance force and deformation capacity. Obviously
there is strong interaction between in-plane and out-of-plane loadings, which strongly

Chapter 2 Literature review
25
influence capacity of infill wall when subjected to simultaneous in- and out-of-plane
loading. It should be noted that the fundamental assumption of their numerical model is
that the infill is hinge-connected to the reinforced concrete, thus preventing a movement
of the infill relative to the frame.
Figure 2.4 In-plane pushover curves for different level of out-of-plane load (Hashemi and
Mosalam, 2007)
Kadysiewski and Mosalam (2009) improved the model by proposing a fiber-section
model (MG-model) which considers both the in-plane and the out-of-plane responses of
the infill, as well as their interaction. The proposed infill model is used for simulation of
a five-storey RC moment frame building with infill under different ground acceleration
time histories. Results showed that the interaction between the in-plane and out-of-plane
strengths increases the vulnerabilities of the structure, and may need to be considered in
structural engineering practice. Furthermore, Mosalam and Gunay (2015) showed that
when in-plane and out-of-plane interaction was considered in the model, together with
the infill element removal, it was possible to capture soft-storey formation during earth-
quake shaking. Authors added that in a building with torsional irregularities, in-plane
demand in one direction can significantly affect out-of-plane behavior in the other direc-
tion due to storey torsional effects.
Kuang and Yuen (2010) investigated combined in and out-of-plane loading on masonry
infill walls with the different level of out-of-plane pressure (5, 10 and 20 kN/m2). They
concluded that even small initial out-of-plane deflection is significantly magnified by
the secondary moment induced by the diagonal compressive force, as a result of P-delta

Marko M. Marinković Innovative system for seismic resistant masonry
infills in reinforced concrete frame structures
26
effect. More recently Yuen and Kuang published series of papers (Yuen and Kuang,
2013; 2014; 2015 and Yuen et al., 2016) with the topic related to the modelling of
masonry infilled RC frames and analysis of their behaviour under earthquake bi-
directional loading. They pointed out that interaction effect of in-plane and out-of-plane
loads should be properly considered especially in the case of infilled frames with
irregular and discontinuous infill panels. Also, they showed that the effect of the
interaction of in- and out-of-plane loads depends largely on the infill/frame interaction
and is more severe in a case of infill walls with the openings. Furthermore, out-of-plane
displacements as well as effects on the frame structure are increased.
Furtado and Rodrigues (2014) and Furtado et al. (2015a,b) presented simplified macro-
model that takes into account the out-of-plane behaviour of the infill panels and the
corresponding in-plane and out-of-plane interaction. This numerical model also allows
the removal of elements during an earthquake simulation. The model is implemented in
the computer software OpenSees (Mckenna et al., 2010) and used for studying the
interaction of in- and out-of-plane loads on infill walls by simulating the building with
and without infill walls. The 3D models were subjected to incremental dynamic analysis
(IDA). A significant difference was observed between the model that considers just in-
plane loading and the one that includes in- and out-of-plane interaction. Hence, it can be
concluded that there is a need to consider the out-of-plane behaviour of infills in the
seismic safety assessment of RC infilled structures.
Longo et al. (2016) presented the work carried out by using the macro-model developed
by Mosalam and Günay (2015) and implemented it in OpenSees (Mckenna et al., 2010).
After previous calibration with experimental results (Calvi and Bolognini, 2001; Da
Porto et al., 2013) the authors used this model for analysis under bidirectional ground
motions scaled to be compatible with Eurocode 8 (EN 1998-1, 2004) elastic spectra.
Results of the analysis show that until first cracks out-of-plane displacement of the wall
is quite small. However, after appearance of the first cracks fur in-plane movement of
the frame out-of-plane displacements of the infill walls increased significantly,
especially in the lower two storeys. Also, authors identified that these numerical results
are consistent with observations of damage to infill walls on similar buildings in recent
earthquakes and concluded that the most important parameters that can affect infill wall
expulsion are associated with the condition of the connections between the panels and
Chapter 2 Literature review
27
the surrounding frame. They explained that when frame building is excitated by an
earthquake, resulting lateral displacement causes the URM infill walls to detach from
the surrounding frame, which can happen even for relatively low intensity earthquakes
(Decanini et al., 2004; Luca et al., 2013), and at early stages of a seismic event.
Additional important aspect in case of simultaneous loading is the formation of the di-
agonal compression strut within the rigidly attached masonry infill accompanied with
the detachment of the infill wall from the surrounding frame in the opposite direction.
This goes in a line with findings of many authors (Stafford Smith and Carter, 1969;
Saneinejad and Hobbs, 1995) who worked on calculation approaches for the contact
length between frame and infill. All studies and approaches showed that the detached
parts of the masonry infill without contact to the frame are quite vulnerable to out-of-
plane loading. Although damages and collapses of infill walls caused by alternating and
simultaneous in- and out-of-plane loading have been observed in past and recent earth-
quakes, clear design rules in the codes are still missing.
2.3 Experimental research studies on RC frames with masonry infills
From the middle of the 20th
century infilled frames started to be in the focus of many
experimental studies. At the beginning, infilled frames were mainly investigated by
means of in-plane tests. Afterwards, out-of-plane tests were also conducted. Influence of
openings and global and local effects on the frame have also been studied. More recent-
ly, influence of prior in- and out-of-plane loading on the in- and out-of-plane capacity of
infills has been investigated. And finally, behaviour under simultaneously applied load-
ings in both directions has been studied in just a couple of experimental campaigns. In
this section, literature review of the experimental work carried on the traditionally in-
filled frames is presented.
2.3.1 In-plane
2.3.1.1 Monotonic loading
First experimental studies on infilled frames were performed by Thomas (1953), who
applied monotonically increasing load in the direction of the frame plane. At the same
time, Polyakov (1956) reported a test program on infilled RC frames carried out from
1948 to 1953. Polyakov performed a number of large-scale tests investigating the ef-

Marko M. Marinković Innovative system for seismic resistant masonry
infills in reinforced concrete frame structures
28
fects of the type of masonry units, mortar mixes, admixtures, methods of load applica-
tion (monotonic or cyclic), and the effect of openings. Polyakov described that at the
beginning of lateral loading, the frame and infill behave monotonically until infill starts
to separate at the interface with the frame. Afterwards, compressed diagonal starts to
shorten while the tension diagonal extends in the length until the crack along the com-
pressed diagonal appears. In the following steps, appearance of more diagonal cracks
continues followed by widening of old ones until the appearance of large cracks, when
specimen experiences failure. Based on these observations, he suggested that the infilled
frame system can be considered as a braced frame with a compression diagonal strut
representing the infill wall. In a subsequent paper, Polyakov (1960) described experi-
ments performed on a three-bay, three-storey model steel frame infilled with masonry.
Further on, Holmes (1961 and 1963), showed test results of steel frames with concrete
infills, while observations of the tests carried out by Stafford Smith (1962 and 1966) led
to the conclusion that, the wall could be replaced by an equivalent diagonal strut.
Fiorato et al. (1970) tested reinforced concrete frames infilled with brick masonry under
static lateral in-plane loading. Influence of different variables on the behaviour of in-
filled frames was investigated. Authors observed that the vertical loads increase the
frame lateral strength and stiffness as well as the shear capacity of the infill due to the
stiffening and strengthening of the columns and confinement of infill. It was noted that
the horizontal sliding failure of masonry infill introduces a short-column effect, causing
damage of the columns. Therefore, it was concluded that masonry infill can increase the
stiffness and strength but causes a decrease of the ductility of concrete frames. At the
same time, Mainstone (1971) showed that initial lack of fit between the infill and the
frame and variation in the elastic properties and strength of the infill can result in a wide
variation in behaviour. Later on, Dawe and Seah (1989a) tested a total amount of twen-
ty-eight large scale, single bay, single storey steel frames with and without masonry
infills. Different parameters such as infill/frame interface conditions, openings and joint
reinforcement were varied and in-plane capacity was measured. Based on the results of
experimental campaign conducted on five 1/2 scale and single storey frames with dif-
ferent number of bays (3 single-bay frames, 1 double-bay frame, and 1 triple-bay
frame), Al-Chaar (1998) concluded that for multiple bay frames the stiffness increases

Chapter 2 Literature review
29
with the increase of the number of infilled bays and most of the damage in the infill
walls will take place in the infill wall located near the loaded side.
2.3.1.2 Cyclic loading
Esteva (1966) conducted the first cyclic test on infill frames. Afterwards, considerable
researches have been conducted in order to quantify the in-plane strength of infilled
frames. Leuchars and Scrivener (1976) showed that infill panel significantly increases
the stiffness of the frame structure, but at the same time brings less ductile and faster
degrading stiffness behaviour. Klingner and Bertero (1976) and Brokken and Bertero
(1981) found that the infills increase stiffness of the frames, but as soon as cracking
occurs, which was found to happen very early, lateral stiffness decreases significantly
(up to 80%). Authors also concluded that the addition of the infills brings large increase
of the stiffness with respect to the increase of the mass, therefore fundamental period of
the structure decreases significantly. Also infills significantly increase the strength but
at the same time highly decrease deformation capacity of the infilled frames. Later on,
Žarnić and Tomaževič (1984, 1985 and 1988) summarised the results of their experi-
mental and analytical investigations on masonry infilled RC frames. Results show that
the infill increased the stiffness of the system by up to 22 times and lateral resistance in
average 2.5 times. However, cracking of infill already at 0.2% of drift is observed.
Schmidt (1989b) tested RC frames with brick infills that had relatively weak mortar
joints. During the test slippage along the mortar joint appeared which led to the for-
mation of plastic hinges at the top and bottom sections of the columns. Due to this kind
of behaviour, the increase of the lateral strength due to infill is not very significant.
Similar as Žarnić and Tomaževič (1984, 1985 and 1988), Pires and Carvalho (1992)
observed highly brittle behaviour with a loss of stiffness due to masonry infill cracking
already at about 0.1% drift, when also maximum strength was reached. After this point,
the strength decreased almost linearly to about 50% of the maximum strength at a drift
of 1%.
Mehrabi et al. (1994 and 1996) presented test campaign on fourteen half-scale, single
storey, single bay, weak and strong RC frame specimens infilled with hollow and solid
concrete masonry units, which were used to simulate strong and weak infill. Results
show that the specimens with strong frames and strong infill exhibited much better

Marko M. Marinković Innovative system for seismic resistant masonry
infills in reinforced concrete frame structures
30
behaviour, due to the fact that the strong panels provided better energy-dissipation
capacity for stronger frames. Different failure modes were observed for different
combinations of weak/strong panels and weak/strong frames. It was reported that infill
panels with lower aspect ratios (h/l =1/2) sustained higher lateral loading than those of
higher aspect ratio (h/l=2/3). As expected, higher vertical loads increased the
confinement of the specimens, which led to increase of the stiffness and lateral load.
However, the influence of vertical load distribution between the columns and the beams
was insignificant. The researchers also noticed that the specimens subjected to cyclic
loading showed lower resistance and faster degradation than those subjected to
monotonic loading. Authors noted that for specimens tested in this study, the nonlinear
behaviour was usually initiated by the separation at the frame/infill interface. Similar
comparison has been done by Haider (1995), whose main findings are that the infills
significantly increase the strength, stiffness and energy dissipation of the infilled
frames. Furthermore, infills surrounded with the stiffer frames, exhibit better behaviour
in terms of smaller stiffness degradation and better energy dissipation when compared
to infills with relatively flexible columns. It was shown that smaller aspect ratio
decreases strength and energy dissipation without influencing stiffness. Author pointed
out that after separation from the frame, infill panels become vulnerable to the falling
out-of-plane. Later on, Bergami (2007) showed the presence of infill increased the
maximum strength by about 1.8 times and the initial stiffness by about 9.4 times. It was
observed that the infill strongly affects the frame collapse mechanism by progressive
development of plastic hinges in the frame and sudden damage development in the
infill. Therefore, one of the main conclusions of the work was that codes should be
revised in order to make engineers aware of the importance of including non-structural
infills in design and assessment procedures.
Stavridis (2009) showed that infill started to separate from the frame already at 0.06%
of in-plane drift, while the peak resistance was reached at 0.25%. Due to the
development of cracks in infill, both columns failed in shear after opening of shear
cracks at the top and bottom of the columns. Increase of base shear strength and lateral
stiffness, but decrease of in-plane drift capacity by about two times when compared
with the bare frame test was the results of the test conducted by Pujol and Fick (2010).
Authors also added that measures for preventing out-of-plane failure of the infill and

Chapter 2 Literature review
31
shear failure of the columns should be applied. Further on, Stylianidis (2012)
investigated the influence of a big variety of parameters (infill materials, aspect ratio,
infill thickness, reinforcing of infills, connection to the surrounding frame, geometry,
relative stiffness and strength etc.) affecting the behaviour of infilled frames. It was
observed that the contribution of the infills to the strength, stiffness and energy
dissipation capacity depends on the strength of the infill wall in relation to that of the
frame. Authors also found that the increase of infill thickness caused small and not
proportional increase of strength, initial stiffness and energy dissipation. Furthermore,
aspect ratio didn‘t influence the strength, stiffness and energy dissipation of the bare
frames, but with its increase enhancement of these values was observed in a case of
infilled frames. It was also found that axial load on the columns almost doubles strength
in both bare and infilled frames.
Results of the test performed by Žovkić et al. (2013) show that first stiffness reduction
and maximum capacity were reached at 0.1% and 0.35% of drift, respectively. Until the
stage of 0.75% of drift, masonry infill had suffered severe damage and soon after, at 1%
of drift, RC frame took over most of the load on itself. The same was confirmed by Di
Trapani (2014) who showed that all specimens experienced significant stiffness
degradation, especially after the peak strength.
2.3.1.3 Pseudodynamic tests
Negro and Verzeletti (1996) conducted pseudo-dynamic tests on a full scale four storey
RC building with different infill configurations. In the first test, two external frames
were completely filled in all four storeys, while in the second test, infills at the first sto-
rey were not constructed. Results show that the presence of infill significantly changed
the response of the structure and the irregularities in the panels resulted in unacceptably
large damage to the frame.
Mosalam et al. (1997a,b,c) showed that corner crushing appears in the case of weak
blocks, while stronger blocks caused mortar cracking. Authors also concluded that the
bay number affects strength more than the stiffness. It is also observed that the interface
between the frame and the infills presents a place of weakness.
Later on, Manos et al. (2000) investigated the earthquake response of multi-storey
scaled 2D and 3D RC frame structures with and without infill under base motion simu-

Marko M. Marinković Innovative system for seismic resistant masonry
infills in reinforced concrete frame structures
32
lating an earthquake excitation. Results show a large increase in the fundamental fre-
quency due to infill walls, but this increase was rapidly reduced due to brittle behaviour
and damage of infills. Similar findings came out from the pseudo-dynamic tests per-
formed by Colangelo (2005). Results show that infills bring initial stiffness increase, but
with the first cracking of the infill, stiffness decreases to nearly 20% of its initial value.
The displacement ductility demand increases or remains similar to that of bare frames,
but additional load concentrated on the frame appears.
2.3.1.4 Shake table tests
Since the shake table tests are expensive and require sophisticated laboratory equipment
and skilled staff, a limited number of shake table experiments have been performed on
infilled frame structures. Fardis et al. (1999) are among the researchers who have con-
tributed to such studies. They performed a shake table tests on single bay, two storey
RC frame with eccentric arrangement of masonry infills. The frame was subjected to
bidirectional ground accelerations. Results showed that a plan-irregular infill distribu-
tion caused torsional effects and increasing load on the corner columns.
Žarnić et al. (2001) executed two shake table tests on reduced scale 1:4, one and two
storey RC frame buildings. During the first series of the loading, the cracks mostly
developed in masonry infills, since the infills were made of relatively strong bricks laid
in weak mortar. Due to the development of cracks and damages in infills and frames,
change in the first natural frequency of the model was noticed during the testing. Also,
structural imperfection of model due to non-symmetric development of cracks in infills
caused the rotation of model around its vertical axis.
Shake table test from Lee and Woo (2002) showed significant increase of stiffness and
inertia forces in a case of infilled frame, when compared to the bare frame. Similarly,
Hashemi and Mosalam (2006) shake table test results confirm that infill wall stiffened
the structure, thus shortened the fundamental period, but increased the dissipated energy
and damping of the structure.
Furthermore, Stavridis (2009) presented the results of the shake table tests of a 2:3
scale, three-storey, two-bay, RC frame infilled with unreinforced masonry panels with
and without openings. Results showed that walls with openings are much more vulnera-
ble to collapse than solid walls. Furthermore, authors pointed out that the out-of-plane

Chapter 2 Literature review
33
loading was absent in this study, which would accelerate the failure of the infills wall
once they are damaged by in-plane loading.
Lourenco et al. (2016) performed shake table test of three 1:1.5 scaled RC buildings
infilled with unreinforced masonry and reinforced masonry using bed joint reinforce-
ment or reinforced plaster. Specimen with the URM infill behaved very badly, with the
all the walls of the first storey collapsing out-of-plane by rotating as rigid bodies. Also,
due to the interaction with the infill walls, specimen exhibited a soft storey collapse
mechanism. Specimen with the bed joint reinforcement did not collapse, but it was un-
reparabily damaged. The last model, with the reinforced plaster had the least damage
and it was the only one not developing hinges in RC columns.
Penava and Sigmund (2017) presented the results of the shake table tests of a 1:2.5
scale, three-storey RC structure with the two longitudinal frames in the direction of
earthquake excitation and three transverse bays perpendicular to the direction of earth-
quake excitation. RC frames were infilled with unreinforced masonry panels with and
without openings. The first damage observed was at the ground floor walls, where sepa-
ration at the contact with the top beam appeared. With the increased excitation, top row
of the bricks was demolished and falling out-of-plane. The same separation at the con-
tact with the top beam was noticed in infills at the upper floors, but damage and falling
of the bricks didn‘t appear with the increasing sequences.
2.3.2 Out-of-plane
During an earthquake, masonry infill walls are subjected to out-of-plane loads due to
the mass and inertia of the wall. Therefore, an important aspect of the behaviour of
infilled frames is the performance of the masonry infill under out-of-plane loads. The
observations during earthquake events showed that out-of-plane collapse of masonry
infills may occur even during seismic events of low or moderate intensity, causing both
casualty risks and unfavourable situations affecting the overall structural response
(Pasca et al., 2017). Despite the great importance of preventing the enclosure of out-of-
plane collapse, only few experimental investigations were conducted before the last
decade when a number of researches on the out-of-plane behaviour increased. Some of
the principal research activities carried out in this field are summarised below.
First experimental campaign of out-of-plane behaviour of infilled frames was reported

Marko M. Marinković Innovative system for seismic resistant masonry
infills in reinforced concrete frame structures
34
by McDowell et al. (1956a,b). Authors tested 17 brick beams with different lengths and
widths having a thickness of 21 cm. Results showed that the ultimate static load is
inversely proportional to the square of the span length and that specimens behaved as
three-hinged arch between the two supports. Also, one of the earliest studies on the out-
of-plane behaviour of infill walls was done by Monk (1958) who tested structural clay
masonry using blast loading. Experiments conducted by Monk (1958) and Gabrielsen
and Wilton (1974) showed qualitatively that the out-of-plane strength of infills bounded
by flexible frames was less than that of the infills bounded by rigid frames.
Gabrielsen et al. (1975) tested a series of full scale infilled panels, also under the blast
loading. In the experimental campaign, the gaps of 0.1 inch (2.54 mm) and 0.2 inch
(5.08 mm) were considered. Results showed a symmetrical three-hinged arch was
formed in an infill with tight rigid supports, while the infill with gaps needed to displace
more in order to engage the support thus creating an unsymmetrical arch as shown in
Figure 2.3.
The out-of-plane strength of URM infill walls due to arching has been the subject of
several studies (Anderson, 1984; Drysdale and Essawy, 1988; Hill, 1994), which
showed that arching is influenced by many parameters and boundary condition i.e.
infill/frame connection being one of the most important.
Tests performed by Dawe and Seah (1989b) show that both the flexural stiffness and
torsional stiffness of frame had an effect on the out-of-plane strength of infills, which
was used as a basis for the authors to propose an equation to include this effect in the
assessment of the out-of-plane strength of infills. They reported that the presence of the
opening produced no significant decrease in ultimate load, but the ductility was
significantly reduced. Authors concluded that the central strips are not as significant as
perimeter strips in developing arching action, therefore relative small central opening
does not reduce the arching strength significantly. It is also shown that fully restrained
panels have an ultimate load capacity 4–5 times higher than the capacity of infills with
gaps or where the slipping of the interfaces occurred.
After conducting experimental tests, Angel et al. (1994) concluded the arching action
and thus ultimate load was reduced for infill panels having a large slenderness ratio.
This study indicated that if the slenderness ratio of infills was reduced in half (h/t ratios

Chapter 2 Literature review
35
of 34 to 17), the out-of-plane strength of the infills is highly increased. Authors
concluded that for the infills with a slenderness ratio larger than 30, arching action had
significantly less effect on the out-of-plane resistance of masonry infills.
Similar was showed in a test from Flanagan and Bennett (1999b), who concluded that
the increase of thickness causes increase of resistance.
More recently, the concern for the out-of-plane behaviour has been growing also due to
observation of damage after earthquakes. Some researchers conducted shaking table due
to the fact that shaking tables present the best way to obtain the seismic response of a
structure by simulating a specific recorded ground motion tests. Dafnis et al. (2002)
studied the effect of gap resulted from shrinkage of the mortar, on the arching behaviour
and stability of brick masonry walls. It was observed that no significant difference was
found in the behaviour of the walls with the complete joint and those with the partially
filled joint, while a horizontal gap in the upper mortar joint caused an increase of the
relative displacements, leading to the tilting of the panel. However, for small gaps (< 3
mm) the arching action was still developed, but the gapped specimen experienced a
larger deformation than the non-gapped specimen before the arching action developed
and additionally the out-of-plane capacity was smaller. Masonry wall with the
unsupported top behaved as a cantilever, cracking at the horizontal joint within the first
brick layer at the bottom. One of the specimens was built with a central opening with
about 7.6% of the wall area with no gap on top. It was reported that the opening did not
alter the dynamic response of the wall and no local effect around the opening especially
at corners was reported. As a final conclusion authors stated that due to the shrinkage of
the mortar, gaps develop at the top of the walls shortly after construction and in the
event of an earthquake the walls cannot withstand the out-of-plane forces and they
collapse due to the lack of adequate binding at the top.
Tu et al. (2010) executed shake table test on infilled frame showing that at the first stage
of base excitation, vertical edges at contact with the frame fully cracked, while the top
edge had minor crack. With the following phases, infill panels showed arching, but top
and bottom edges fully cracked, which was followed with the separation of the panel
from the frame. Furthermore, reversed Y-shaped cracks appeared in the wall. Also,
concrete columns experienced cracks and crushing at the base. At the end of the test

Marko M. Marinković Innovative system for seismic resistant masonry
infills in reinforced concrete frame structures
36
infill panel fully cracked and fell out of the frame, due to the inertial force caused by the
self-weight. Authors concluded that panel thickness or slenderness together with the
boundary conditions of the panel are the main factors influencing out-of-plane
behaviour.
Results of the shake-table tests performed by Rabinovitch and Madah (2011) showed
that the model with the lower axial compression experienced significantly larger out-of-
plane displacements in comparison with the specimen with the higher axial
compression.
Komaraneni et al. (2011) studied three infilled frames with the solid clay bricks and
reported that the slender walls (h/t=23) experienced larger out-of-plane drifts and higher
amplification of acceleration at mid-height in contrast to less slender walls (h/t=11).
This supports the fact that the slenderness is one of the main factors influencing the out-
of-plane behaviour of infill walls.
Akhoundi et al. (2016) found that the presence of center opening of 13% area of the
infill decreased the initial stiffness by 12% while no significant reduction in the out-of-
plane strength was observed. Authors pointed out that workmanship can change the
collapse pattern of the infill by non-proper filling of the gap between top of the infill
and RC frame with the mortar and thus disabling one way or two way arching
mechanism. This shows that fill of the top gap with the mortar is a critical point for the
behaviour of an infill walls.
Out-of-plane capacity of infill walls was also studied by some authors (Fricke et al.,
1992; Walsh et al., 2017) on walls in a real building. Walsh et al. (2017) tested a total of
19 URM infill walls located in six buildings in New Zealand. A test showed that restrain
at the vertical edges of the wall has as a result two-way arching, thus significantly
improving out-of-plane capacity.
2.3.3 Influence of sequential loading on in-plane and out-of-plane resistance
Observations from last earthquakes showed that infill walls which have previously
sustained larger in-plane drift movements, possess a significantly reduced out-of-plane
resistance that has to be accounted for in the verifications required for non-structural
elements at the ultimate limit state (Morandi et al., 2013). Reduction of out-of-plane

Chapter 2 Literature review
37
resistance due to in-plane damage can thus result in the partial or complete collapse of
the infill walls. These issues are paid increasing attention by the scientific community,
and in this chapter, several recent international studies analysing the influence of prior
in-plane damage on reduction of the out-of-plane capacity of masonry infill walls and
vice versa, are summarized. This chapter presents experimental studies and results
where infilled frames were sequentially subjected to in-plane and out-of-plane loading.
Angel et al. (1994) and Shapiro et al. (1994) investigated specimens, first loaded in-
plane to twice the deflection which caused initial cracking in the infill and then
monotonically increasing out-of-plane load was applied. Results show that the drift
value corresponding to the first crack on the infill panels is in the range 0.031-0.195%,
respectively for the lower and the higher considered compressive strength values of the
masonry panel, which are in the range 3.5-22.9 MPa. The resistance of the infill panel
showed a significant decrease by reducing the out-of-plane strength approximately by
half. Results also show that the decrease of the out-of-plane capacity due to previous in-
plane damage is more significant for infill walls with large slenderness ratios. However,
authors added that if the walls maintain good connections with the surrounding frame
after in-plane loading, the out-of-plane strength of the infills is still considerable.
Flanagan and Bennett (Flanagan and Bennett, 1999b) also studied the behaviour of
masonry infill walls, for combined actions in- and out-of-plane. In the first case,
specimen was loaded in the in-plane direction to a certain value, removed and out-of-
plane pressure was applied until failure. To investigate the opposite influence, first load
in out-of-plane direction to a certain value was applied and then removed so the in-plane
force until failure can be applied. Results show a strong reduction in out-of-plane load
capacity (up to 80% of the peak load) and at the same time highly increasing out-of-
plane deformations of the wall in a case where prior in-plane loading was subjected. It
can be concluded that the application of the damage in-plane, before testing in the out-
of-plane direction, leads to a loss of stiffness of masonry infill with larger deformations
and smaller resistance when compared with undamaged panels. Figure 2.5 presents the
summary of results of the experimental campaign conducted by the authors, where
interaction between in-plane and out-of-plane load (Figure 2.5a) and in-plane drift and
out-of-plane load (Figure 2.5b) is shown. These results show that when first 78% of out-
of-plane load capacity was applied, 33% of in-plane drift level reduction was noted with

Marko M. Marinković Innovative system for seismic resistant masonry
infills in reinforced concrete frame structures
38
non-changed in-plane load capacity (in comparison to the pure in-plane loading). In the
opposite case, when first in-plane loading with the value of 79% of its load capacity was
applied, out-of-plane load capacity is reduced by almost 19%, together with the increase
of out-of-plane displacement to 168% (in comparison to the pure out-of-plane loading).
This shows higher strength reduction and out-of-plane deformation increase when first
in-plane load is applied. Reduction in in-plane deformation capacity is noted in the
opposite case.
a) b)
Figure 2.5 Experimental results of bidirectional testing of infilled RC frames from Flanagan and
Bennett (1999b)
Calvi and Bolognini (2001, 2004, 2007) performed experimental tests on frames infilled
with hollow clay bricks (60% of voids) which were loaded first in-plane up to different
level of drifts (0.1-0.4% and 1.2%) and then subjected to out-of-plane load until the
walls collapsed. It is observed that out-of-plane capacity was reduced by 73% and 82%,
respectively for the mentioned levels of prior in-plane drifts. At the same time out-of-
plane ultimate displacement increased 2.5 times in a case of 0.4% of prior in-plane drift.
Beside evident high influence of in-plane damage on out-of-plane performances,
authors also point out that although it is correct to assume higher inertia forces on non-
structural elements at upper storeys due to the amplification effects, since the in-plane
damage tends to concentrate at lower storeys, the critical situation for out-of-plane
resistance may derive from a combination of level of out-of-plane force and reduced
strength due to the in-plane damage.
Pereira et al. (2012) also investigated the influence of the previous damage on the out-
of-plane strength reduction. Authors strongly pointed out that the damage at the
interface between frame and infill, due to the in-plane loading, caused weak out-of-
plane resistance and fast failure of the specimens. This was especially pronounced in a

Chapter 2 Literature review
39
case of traditional specimen, with the effects such as large percentage of the upper
bricks with partial or total damage and complete movement of the infill wall as a
cantilever out of the frame. Second specimen with the bed joint reinforcement exhibited
also total damage of the upper units, while only the third specimen (with the external
reinforcement) kept the structural integrity with the damage in the interface at the top
but with small damage inside the wall.
Another relevant experimental study has been performed by da Porto et al. (2013), who
tested the out-of-plane behaviour of reinforced and unreinforced infill walls, under
various levels of damage caused by in-plane loading. Unfortunately there is no
reference wall tested just in out-of-plane direction in order to derive the strength
reduction, but results of the analysis showed significant out-of-plane strength reduction
when previous in-plane drift level was increased from 0.5% up to 1.2%. This effect was
more pronounced in a case of thin infill walls. According to the results, authors
concluded that limitation of in-plane drift at 0.5%, to prevent excessive damage to non-
structural elements, given by the Italian building code (NTC8, 2008), is especially
critical for thin masonry infills.
Results of similar investigation was presented by Morandi et al. (2014) and Hak et al.
(2014), who tested three fully infilled specimens at three levels of in-plane drift, equal
to 1.50%, 2.50% and 1.00% respectively. Results clearly show the substantial
degradation of stiffness and strength in the out-of-plane direction for increasing values
of previous in-plane drift.
Furtado et al. (2015d and 2016) also presented an experimental campaign on three full
scale masonry infill walls. Results show high out-of-plane strength reduction (4 times)
in a case of previously damaged infill panel in comparison with the specimen without
previous in-plane damage. This comes mostly from the detachment of the infill panel
from the surrounding RC frame which was observed already at 0.20% of in-plane drift.
This produced typical rigid body behavior of the panel and its moving in out-of-plane
direction, especially pronounced at the top of the infill. Authors noticed that also
specimens without previous in-plane damage experienced detachment between the infill
panel and the surrounding RC frames.

Marko M. Marinković Innovative system for seismic resistant masonry
infills in reinforced concrete frame structures
40
Walsh et al. (2017) conducted experimental tests on a URM infill walls located in six
buildings in New Zealand. Infill walls were damaged by saw cutting 50 mm deep
‗cracks‘ into the wall‘s compression side prior to out-of-plane testing. Results showed
that in-plane damage reduced out-of-plane capacity up to 40%, pointing out that URM
infills boundary conditions play an important role in an infill wall performance.
2.3.4 Simultaneous in-plane and out-of-plane experimental tests
When an earthquake occurs, infill walls are subjected to the combination of the in-plane
and out-of-plane loads. Therefore, in order to better understand, the real behaviour of
masonry infilled frame, it is necessary to study the behaviour of infill walls under simul-
taneously applied in- and out-of-plane loading. Even so, most of the studies dealing
with masonry infills have focused on either the in-plane or the out-of-plane behaviour,
and clearly oversimplifying and underestimating the simultaneously loaded infils. This
is somehow expected due to the difficulties in both experimental setups and theoretical
modelling.
Only few authors conducted experimental tests combining the in-plane and out-of-plane
actions on the wall. As already mentioned in Chapter 2.3.3, study carried out at
University of Illinois at Urbana-Champaign and published in Shapiro et al. (1994) and
Angel et al. (1994), was compiled out of a series of tests on a one-storey, single-bay
ductile reinforced concrete frame which was infilled with varying thicknesses of brick
and concrete block masonry. Besides investigating the effects of in-plane cracks on the
out-of plane strength, they tested simultaneously loaded infill walls. Authors concluded
that the simultaneous application of in-plane and out-of-plane load slightly increases the
initial out-of-plane stiffness, but had little effect on out-of-plane strength. At the first
moment this shows that simultaneous load doesn‘t have negative influence on load
bearing capacity, but it is important to point out that in-plane drifts of specimens tested
were 0.062% and 0.25% which is not a representative in-plane loading condition.
As mentioned in Chapter 2.3.3, a similar experimental study was carried out by
Flanagan and Bennett (1999b) on brick infills in steel frames. Besides investigating
influence of previous in-plane damage on the out-of-plane resistance and vice versa,
they also tested infill panels loaded simultaneously in the in-plane and out-of-plane
directions by holding the in-plane deformation and applying the out-of-plane pressure

Chapter 2 Literature review
41
until failure was reached. Figure 2.6 shows highly damaged masonry panel at the end of
the test, where complete failure of the bottom course tiles can be noticed. In the case
when the infilled frame is subjected to simultaneous application of in-plane and out-of-
plane forces, a 42% drop in the in-plane load capacity of the infill wall when it is
subjected to out-of-plane pressure equal to 57% of its capacity is noticed, reaching just
0.42% of in-plane drift that presents around 1/3 of the in-plane drift capacity of the
specimen (Figure 2.5). It can be observed that a wall experienced significant loss of
ultimate strength in a case of simultaneous load, therefore it can be concluded that there
is strong interaction between both loading directions.
Figure 2.6 Specimen after testing under simultenous load (Flanagan and Bennett, 1999b)
Unfortunately, there were no recent experimental tests on infill walls subjected
simultaneously to in- and out-of-plane load, only just few studies on URM walls. One
of them presents an experimental investigation aimed at determining the in-plane and
out-of-plane capacity interaction of masonry walls and it was reported in
Najafgholipour et al (2013, 2014). The test results indicated noticeable interaction
between the in-plane shear and out-of-plane bending strengths of brick walls. Test
results were also used to validate numerical model for wall panels. Then the effects of
different geometric and material properties on the combined in-plane/out-of-plane
capacity interaction were numerically investigated. The results showed that the wall
aspect ratio highly influences the level of interaction.
2.3.5 Openings
Although it is very common that infill walls have opening, either doors or windows,

Marko M. Marinković Innovative system for seismic resistant masonry
infills in reinforced concrete frame structures
42
significantly larger number of researchers studied behaviour of fully infilled frames
under an earthquake loading than infilled frames with openings. Common observation
of the authors studied infill with openings was that openings reduce the lateral strength
and stiffness of the fully infilled structures. In this section some of these research
studies are summarized.
Fiorato et al. (1970) performed tests on one storey, one bay; five storey, one bay; two
storey three bay infilled frames with openings. Authors observed that wall with the
opening is less stiff with the lower strength due to the reduced wall area. It was
concluded that, this reduction is not proportional to the reduction of the area of the wall,
but it is dependent on the size and position of the opening, which was also observed by
Mallick and Garg (1971), who showed that presence of openings can reduce lateral
stiffness up to 85-90% and lateral strength by 75%.
Liauw (1972) observed that when area of opening is higher than 50% of panel area,
structural stiffness is almost the same as the stiffness of the bare frame. The same was
concluded by Dawe and Young (1985) and Dawe and Seah (1989a), who found that
presence of door openings reduces initial stiffness, especially in the case of central door.
Kakaletsis and Karayannis (2009) also stated that the infilled frames are affected more
by the presence of door openings than windows. Furthermore, Mansouri et al. (2013)
investigated different shape (door and window), size and location (eccentric and central)
of openings and observed that openings reduce ductility, strength, and stiffness of the
infilled frame. This effect is more pronounced in a case of door.
After experimental tests conducted by Mosalam et al. (1997a), authors concluded that
openings in infill walls result in more ductile behaviour, smaller initial stiffness and
cracking strength and change in the cracking pattern and failure mode. Later on, Al-
Chaar et al. (2002) showed that the initial stiffness and ultimate capacity of the infilled
frame with the openings are smaller when compared with the fully infilled frame. The
same effect is observed in the tests performed by Anil and Altin (2007). Authors also
observed the possibility for the short column behavior.
Chiou et al. (1999) reported that the presence of the partial height wall decreases the
ultimate lateral load capacity of the system by 47%. Authors added that the partial
height wall induces a short column effect and leads to a severe failure of the column.

Chapter 2 Literature review
43
Blackard et al. (2009) found that the presence of openings reduces the capacity of in-
filled frame, but the peak plateau of the infill with openings is more ductile than for the
solid infill.
Results of the test campaign presented by Stavridis (2009) show that presence of win-
dow openings in infill reduces the stiffness but has little effect on the strength of the
infilled frame. Author concluded that panels with the opening could experience a col-
lapse due to the weak arching effect.
Sigmund and Penava (2014) found at drift levels higher than 1%, the presence of open-
ings lowered the energy dissipation capacity of the system. It was also observed that the
failure mechanism is highly dependent on the location and size of the opening.
Zhai et al. (2016) presented results of the tests on four full-scale single-storey, single-
bay infilled frames with or without openings. Since the result showed that the central
window opening reduced the lateral stiffness and strength, they concluded that the cen-
tral window opening improved the global lateral force displacement response of the
infilled frame due to the better distribution and slower propagation of cracking than the
solid wall.
Tu et al. (2016) tested a full-sized RC frame with a door opening under cyclic in-plane
load. Soon after the loading start, panel and frame separated and continued to deform
separately. Specimen with the infill wall and door experienced significantly higher
strength and stiffness than the bare frame, but strong decrease in drift capacity.
2.4 Numerical modelling of masonry infill
The behaviour of the masonry infill walls has been studied both experimentally and
analytically. Experimental programs are usually quite expensive, while numerical
models, once validated, do offer an efficient approach for the investigation of numerous
parameters influencing the seismic behaviour. The desire to represent and predict the
behaviour of infilled frames, led to the development and implementation of numerical
models in the last 50 years. Nevertheless, modelling the behaviour of infilled frames is a
challenging task due to the large number of parameters involved, which must be taken
into account, and the uncertainties associated with these parameters. However, the
presence of modern computer softwares and powerful computing machines help the

Marko M. Marinković Innovative system for seismic resistant masonry
infills in reinforced concrete frame structures
44
numerical analysis.
Essentially there are two approaches for modelling, one that consists of defining micro
models, and another that consists of creating macro models (Mauro, 2008). Some
models presented in the literature are developed to represent and predict the behaviour
of a whole infilled frame, or the main features of the infilled frame. Other models only
serve to evaluate the stiffness in the elastic domain, while the more advanced ones are
able to cover the degradation of stiffness and strength in order to simulate the nonlinear
behaviour.
While studying the literature, the following levels of modelling have been extracted:
Micro-modelling – Analysis of ―micro-models‖ requires modelling of the frame
elements, the masonry bricks, mortar, as well as interface between the bricks and mortar
and between the wall and the frame. According to Lourenҫo (1996), masonry micro-
model can be performed as detailed micro-modelling or simplified micro-modelling.
The first modelling scheme (Figure 2.7a) implies bricks and mortar joints to be
discretized using continuum elements, with mortar joint and interface between the units
and mortar presented by discontinuous elements. The highly nonlinear behaviour of the
masonry infill wall, including the bricks and mortar, makes this level of modelling very
challenging. This type of modelling requires calibration of a high number of parameters
for the material constitutive laws, but it allows tracing the developed stresses and cracks
within the wall. It gives a quite accurate representation of infill walls‘ behaviour;
therefore it is often used to take into account local effects for understanding the
interaction between RC frame and masonry infills. However, it is impractical for global
analysis due to the large computational effort in terms of time and material properties to
be inputted into the model. The second scheme (Figure 2.7b) simplifies the problem by
merging mortar joint and the interface into an average interface of a zero-thickness. The
units are hereby extended to the geometry of the mortar joints and the behaviour of the
mortar and the contact is assigned to interface elements between the masonry units. This
model is less accurate than the previous one, but it saves time in computation and is
capable of representing the behaviour of infilled frames quite accurately.
Smeared homogeneous modelling approach – In this approach masonry units, mortar
joints and interfaces form together one homogenous part (Figure 2.7c) presented with
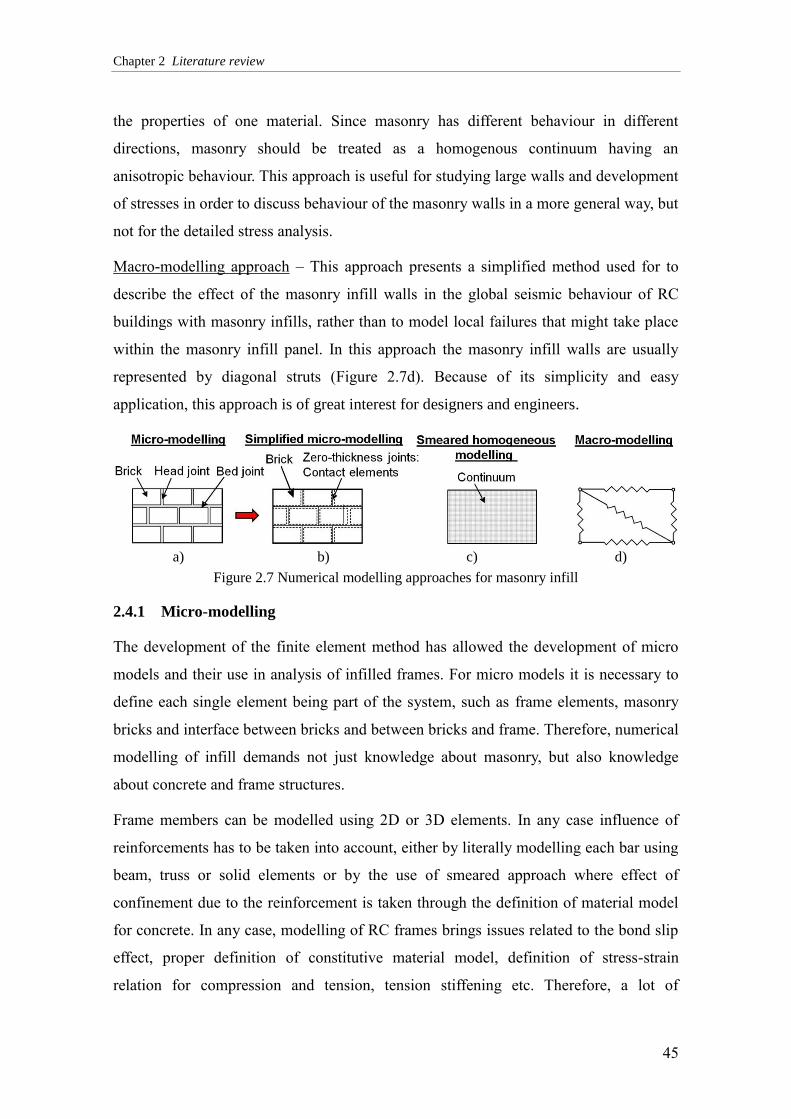
Chapter 2 Literature review
45
the properties of one material. Since masonry has different behaviour in different
directions, masonry should be treated as a homogenous continuum having an
anisotropic behaviour. This approach is useful for studying large walls and development
of stresses in order to discuss behaviour of the masonry walls in a more general way, but
not for the detailed stress analysis.
Macro-modelling approach – This approach presents a simplified method used for to
describe the effect of the masonry infill walls in the global seismic behaviour of RC
buildings with masonry infills, rather than to model local failures that might take place
within the masonry infill panel. In this approach the masonry infill walls are usually
represented by diagonal struts (Figure 2.7d). Because of its simplicity and easy
application, this approach is of great interest for designers and engineers.
a) b) c) d)
Figure 2.7 Numerical modelling approaches for masonry infill
2.4.1 Micro-modelling
The development of the finite element method has allowed the development of micro
models and their use in analysis of infilled frames. For micro models it is necessary to
define each single element being part of the system, such as frame elements, masonry
bricks and interface between bricks and between bricks and frame. Therefore, numerical
modelling of infill demands not just knowledge about masonry, but also knowledge
about concrete and frame structures.
Frame members can be modelled using 2D or 3D elements. In any case influence of
reinforcements has to be taken into account, either by literally modelling each bar using
beam, truss or solid elements or by the use of smeared approach where effect of
confinement due to the reinforcement is taken through the definition of material model
for concrete. In any case, modelling of RC frames brings issues related to the bond slip
effect, proper definition of constitutive material model, definition of stress-strain
relation for compression and tension, tension stiffening etc. Therefore, a lot of

Marko M. Marinković Innovative system for seismic resistant masonry
infills in reinforced concrete frame structures
46
researchers analysed numerical model for the reinforced concrete and proposed different
approaches. One of the possibilities is to use a smeared crack model with a
homogeneous material (Schmidt, 1989a; Mosalam et al., 1997c). Smeared crack
elements experience problems with a stress-locking that does not allow for proper
modelling of the shear cracks (Rots and de Borst, 1987; Lotfi and Shing, 1991). As a
solution to this issue, Stavridis and Shing (2010) proposed a model where combination
of smeared crack and zero-thickness interface elements connected with the steel bars is
used to model reinforced concrete section.
Besides proper modelling of bare frame, appropriate model that can represent nonlinear
behaviour of masonry has to be applied. Therefore, much effort has been given to the
development of material models for masonry units. Using finite element approach
masonry infill walls can be presented with either two-dimensional or three-dimensional
finite elements. Mallick and Severn (1967) were one of the first to study infilled frames
using finite element method, where authors gave special attention to the modelling of
interface between frame and infill. Page (1978) and Rots (1991) modelled masonry
units with continuum elements and mortar joints by means of interface elements.
Afterwards, Lotfi and Shing (1994) proposed zero-thickness interface element to
represent the mortar joints, while Mehrabi and Shing (1997) developed a smeared crack
finite element model to analyse the behaviour of RC frames infilled with solid and
hollow concrete masonry units in which the effect of the mortar joint was accounted for
by using constitutive model that incorporates the increase of contact stress due to joint
closing and plastic compaction of mortar joint. After definition of one interface model
for both the interface between frame and infill and the interface along mortar joints and
the second one that simulates the bond-slip behaviour of reinforcing bars in concrete,
authors used defined models to successfully represent failure modes and the lateral
strengths of the experimentally tested infilled frames. At the same time, Lourenco and
Rots (1997) developed an elastoplastic interface model that is able to combine plasticity
for tension, shear and compression. This model capable of representing masonry
behaviour for monotonic loading, was expanded by Oliveira and Lourenco (2004) with
the two yield surfaces in order to incorporate nonlinear unloading/reloading behaviour
that appears under cyclic loading. On the contrary, Asteris (2003) did not use interface
element for defining contact between infill and frame, but he developed a step-by-step

Chapter 2 Literature review
47
procedure that considers the contact length by means of a separation criterion. More
recently Stavridis (2009) and Stavridis and Shing (2010) proposed a model combining
smeared and discrete crack approaches to capture different failure modes of the infilled
frames. The masonry units were modelled using the smeared-crack elements as well as
the RC frame. Interface element was defined for mortar joints, but also for the middle of
the brick in order to capture possible crack of the brick. Soon after, Koutromanos et al.
(2011) extended the model by implementing smeared-crack model able to account for
cyclic loading in combination with the already defined cohesive crack interface model.
More recently, Zhai et al. (2016) and Nasiri and Liu (2017) used simplified micro-
modelling approach to validate the numerical model using experimental results
presented in the same paper while the Yuen et al. (2016) implemented user-subroutines
in order to better represent the behaviour of infilled frames.
2.4.2 Smeared homogeneous models
In the case of homogeneous models, bricks, mortar joints and the bricks–mortar
interface are smeared in an isotropic or anisotropic homogeneous continuum. For this
approach it is necessary to use a suitable material constitutive law in order to properly
represent the mechanical behaviour of masonry. Dhanasekar and Page (1986) proposed
a nonlinear orthotropic model to simulate the behaviour of infilled frames. After its
validation against experimental results, the model was used in a parametric study which
resulted in a conclusion that shear and the tensile strengths of the masonry infill have a
significant influence in the load-deflection behaviour, the ultimate strength and the
failure mode. Some authors (Schmidt, 1989a) used simple smeared crack model to
simulate the behaviour of infills. Lotfi and Shing (1991) proposed a smeared finite
element formulation based on plasticity concepts for brittle materials and isotropic
behaviour for the uncracked masonry and nonlinear orthotropic constitutive models for
cracked masonry. As already mentioned, the drawback of this approach is that it cannot
realistically represent brittle shear behaviour of the panel. Lourenço (1996) made a step
forward in a use of continuum model, with a combination of plastic and anisotropic
behaviour, by adopting Hill type yield criteria in compression and a Rankine type
criteria in tension. Mosalam et al. (1997c) used a smeared crack model with a
continuum and homogeneous material obtained through a homogenization process to

Marko M. Marinković Innovative system for seismic resistant masonry
infills in reinforced concrete frame structures
48
simulate an experimental test of infilled frame. Asteris (2003) used anisotropic material
to study infilled frames with the openings. Basic characteristic of his approach is that
the infill-frame interaction is taken into account only in compressed zones. More
recently, some authors (Mohyeddin et al., 2013) modelled infill with the use of a 3D
discrete finite element, while others (Pelà et al., 2013; Milani and Bertolesi, 2017)
developed homogeneous models for the analysis of masonry walls that could be
extended for the modelling of masonry infills.
2.4.3 Macro-modelling
During the long period of studying the behaviour of infilled frames, there have been
different proposals for macro-modelling approach. Using the strut to model the infill is
undoubtedly the most accepted and the most studied approach. However, several
researches have proposed different ways to account for the masonry infill wall. Mallick
and Severn (1967) introduced an iterative technique whereby the points of separation
between the frame and the infill, as well as the stress distribution along the length of
contact between the frame and the infill, were obtained as an integral part of the
solution. For frame modelling beam elements were used, while plane stress rectangular
elements were employed for the infill. Barua and Mallick (1977) used finite element
technique to analyse infilled frames in a similar way as proposed by Sachanski (1960),
but Barua and Mallick allowed for the separation between the infill and frame and
included the effect of slip. Liauw (1972) adopted a method for analysing the infilled
frame through using an equivalent frame to represent the infilled system. Later on,
Dawe and Charalambous (1983) presented a finite element technique where standard
beam and membrane elements were used to model the frame and the infill wall,
respectively. The interface between the frame and the infill was modelled with rigid
links. Seah (1998) suggested the numerical model, in which the steel frame was
modelled using elastic beam-column elements connected with nonlinear rotational,
shear, and normal springs, while elastic plane stress elements connected by a series of
springs representing the mortar joints were used for representing the masonry wall.
Although the model was sophisticated enough to account for the variation in contact
lengths and the failure of mortar joints due to shear, tension or compression, it gave
positive results only up until the failure.

Chapter 2 Literature review
49
It is worth mentioning that the simplest approach of modelling infilled frames is by
analysing just bare frames and using derived factors for taking into account presence
and effect of infill walls (Hak et al., 2017). This approach is attractive because of its
simplicity, but comprehensive experimental and numerical studies on more precise
models have to be conducted in order to derive reliable factors.
In the last couple of years, fiber elements have been used with success in some studies,
therefore this approach and the strut approach have been selected to be summarized in
this work.
2.4.3.1 Strut approach
Modelling an infill wall with the use of a diagonal strut is attractive because of the
obvious advantages in terms of simplifying the computational effort and efficiency. The
idea of modelling an infill masonry panel using one or a few beam elements, being able
to simulate the overall effect of the masonry panel in the structure response, has been
studied from the first observations from Polyakov (1960). Based on observation of the
infill boundary separation, he suggested that the infilled frame system is equivalent to a
braced frame with a compression diagonal strut replacing the infill wall. Since then
many analytical studies were presented with proposals of strut models. Over the last
years, many models have been proposed with the aim of improving the model to better
predict and reproduce the mechanical properties of the infill, such as strength, stiffness,
collapse mechanism and the hysteresis behaviour.
In the work of Polyakov (1963), it was the first time that the concept of equivalent
diagonal strut was introduced, although at the almost same time, Holmes (1961)
proposed a method for predicting the deformations and strength of infilled frames based
on the equivalent diagonal strut concept. He assumed that the infill wall acts as a
diagonal compression strut, as shown in Figure 2.8, of the same thickness and elastic
modulus as the infill with a width equal to one-third the diagonal length.
Then Stafford Smith and Carter (1969) concluded that the lateral stiffness of an infilled
frame may be obtained by statically analysing the equivalent pin-jointed frame in which
the infill is replaced by an equivalent diagonal strut. This is confirmed by Liauw and
Kwan (1984), who observed that under lateral loads tensile corners are subjected to very
little stresses and only the diagonal region is really effective in the bracing action. Also,

Marko M. Marinković Innovative system for seismic resistant masonry
infills in reinforced concrete frame structures
50
Paulay and Priestley (1992) suggested treating the infill walls as diagonal bracing
members connected by pins to the frame members. After performing experimental study
and a non-linear FE analyses, Saneinejad and Hobbs (1995) concluded that when
mechanical properties of infills are known pin-jointed equivalent diagonal struts can be
used to transform infilled frames into equivalent braced frames in order to simply but
effectively study the behaviour of infilled frames.
Figure 2.8 Diagonal compression strut and equivalent strut (Liberatore and Mollaioli, 2015)
Al-Chaar (2002) introduced the strut model eccentrically pin-connected to the column at
certain distance from the face of the beam, in order to take into account infill forces
acting on the columns.
The equivalent diagonal strut approach can model the global force-displacement
behaviour of the infilled frame, but model of the infill wall with just one single strut
element is not capable of properly taking into account the change in the bending
moment and shear diagram along the column length due to the presence of the panel
(Crisafulli, 1997) and therefore it is ineffective in modelling the complex behaviour of
infilled frames as reported by Asteris (2008). To overpass this limit, several researchers
developed models with different orientations and number of struts. Syrmakezis and
Vratsanou (1986) employed five parallel compressive struts in each direction (Figure
2.9a) in order to study the effect of the infill/frame contact length on the moment
distribution of the frame. Žarnić and Tomažević (1988) conducted a series of cyclic tests
and based on their experimental results proposed a model with an equivalent
compressive strut which is not directly connected to the node connecting the column
and the upper beam but it is in the offset from the diagonal (Figure 2.9b). Schmidt
(1989a) increased the number of the struts and proposed the model with offsets at both

Chapter 2 Literature review
51
ends as illustrated in Figure 2.9c. Chrysostomou (1991) and Chrysostomou et al. (2002)
proposed a model with three parallel compressive struts (one diagonal and two off-
diagonal) in each direction (Figure 2.9d). The off-diagonal struts were positioned at
critical locations along the frame members associated with the position of the formation
of a plastic hinge in a beam or a column.
a) b) c) d)
Figure 2.9 Proposed macro models with different orientations and number of struts. For simplic-
ity, struts in only one direction are shown (Sattar, 2013)
El-Dakhakhni et al. (2003, 2004) proposed a similar model like Chrysostomou (1991)
and Chrysostomou et al. (2002), but with the off diagonal struts which are not parallel.
The total area of the diagonal strut is divided into three parts, where off diagonal struts
have one quarter of the area and the middle strut was taken to have one half of the area.
Since the masonry presents an orthotropic material, they took into account the change of
modulus of elasticity of the masonry in terms of its angle of inclination. However, the
proposed macro-model was capable of simulating some of El-Dakhakhni (2002)
experimental test results but not all of them.
The struts models presented are not able to describe horizontal shear sliding of infilled
frame directly but indirectly through relation between shear and diagonal force.
Therefore, the task of improving the strut equivalent model continued with several other
studies. One of the most complex and accurate models was developed by Crisafulli
(1997), who proposed a triple strut model to take into account tension failure, and for
shear horizontal sliding failure, he used the idea proposed by Leuchars and Scrivener
(1976). More recently, Crisafulli and Carr (2007) proposed a modified model (Figure
2.10) presented as a four-node panel element that is connected to the frame at the beam-
column joints. This panel element contains internally the model from Crisafulli (1997),
which has two parallel struts and a shear spring in each direction. The limit of the model
is that it is not able to properly predict the bending moment and shear forces in the
surrounding frame. This model is implemented in program RUAMOKO (Carr, 2000)

Marko M. Marinković Innovative system for seismic resistant masonry
infills in reinforced concrete frame structures
52
and in SeismoStruct (Seismosoft, 2013).
Figure 2.10 Four-node panel element proposed by Crisafulli and Carr (2007)
Rodrigues et al. (2010) developed the model where each panel is represented by four
struts with rigid behaviour and a central shear element where the hysteretic nonlinear
behaviour is concentrated. The model was enhanced by Furtado and Rodrigues (Furtado
et al., 2015a,b) to perform the studies on the interaction between in-plane and out-of-
plane behaviour of the infilled frames. This macro model is able to consider the
influence of the in-plane damage on the out-of-plane behaviour, but the shortcoming is
that force-displacement curve of the masonry infill shear wall must be known in
advance of modelling. Also, the proposed model fails in capturing the behaviour of
partial height walls.
More recently, other models for the diagonal strut with the improved capabilities have
been introduced. For example, Cavaleri and Di Trapani (2014) proposed a single strut
model in each diagonal, modelled with the multilinear plastic link elements and rigid-
link elements near to beam-column joints (Figure 2.11a). In the same year, Calio and
Panto (2014) have proposed similar but a more complex model based on the modelling
of the entire interface between the panel and the frame through a large number of axial
and shear springs, as shown in Figure 2.11b. The basic idea of the proposed approach is
to approximate the in-plane nonlinear response of masonry walls by an equivalent
discrete quadrilateral element constituted by four rigid edges connected by four hinges
and two diagonal nonlinear springs. Rigid edges of the quadrilateral element are
connected with the surrounding frame through the nonlinear springs which are
orthogonal to the panel side, and an additional longitudinal spring which controls the
relative motion in the direction of the panel edge. Although, its mechanical simplicity,

Chapter 2 Literature review
53
the model is able to simulate the main collapse mechanisms of infilled frames. The
model was later improved by its spatial extension to three-dimensional macro-element
in order to account the behaviour of the wall in the out-of-plane direction too (Panto et
al., 2017).
a) b)
Figure 2.11 (a) Macro-models proposed by Cavaleri and Di Trapani (2014) and (b) Calio and
Panto (2014)
Many other authors (Bazan and Meli, 1980; Durrani and Luo, 1994; Hendry, 1981;
Kappos et al., 1998; Hak et al., 2012) and codes (FEMA 306 (1998); CSA S304.1-04,
2004) suggested the use of the strut approach to model infill walls in order to analyse
the behaviour of infilled frames under lateral load.
2.4.3.1.1 Strut width
In order to use the strut for representing an infill, characteristics such as strut width,
stiffness and force-displacement relation have to be defined. One of the first to propose
the width of the strut elements was Holmes (1961), who suggested infills to be modelled
with the strut element characterized by the same material and thickness of the panel
with a width defined as a third of the panel‘s diagonal length. In 1962, Smith (1962)
conducted an extensive experimental campaign on infilled steel frames, adjusting the
ratio proposed by Holmes (1961) with lower values: w/d = 0.10÷0.25. Priestley and
Calvi (1991) and Paulay and Priestley (1992) used the same approach just defining the
effective strut width to be a quarter of the wall‘s diagonal length..
In the following years, Stafford-Smith and Carter (1969) studied a more sophisticated
formulation for the evaluation of the width of the equivalent strut and they found that
the effective width of infill was found to be dependent on the length of contact between
the infill and the frame, α, which itself was found to be highly dependent on the relative
panel-to-frame-stiffness parameter, λ. This parameter was later used by many authors to

Marko M. Marinković Innovative system for seismic resistant masonry
infills in reinforced concrete frame structures
54
define effective width of the strut. First, Mainstone (1971) based on the experimental
work of Mainstone and Weeks (1970) proposed empirical equation for the calculation of
the equivalent strut width, which was later modified in Mainstone (1974). Since this
formula has been accepted by many researchers (Fardis and Calvi, 1994; Al-Chaar,
2002; Klingner and Bertero, 1978) it was also included in FEMA 274 (1997) and FEMA
306 (1998). More recently, Tucker (2007) modified the approach from Mainstone
(1974) proposing the equation in the similar manner. Furthermore, based on the results
of Buonopane and White (1999) which show that Mainstone‘s equation (Mainstone
1974) underestimates the stiffness of infilled frames, Chrysostomou and Asteris (2012)
modified the equation from Mainstone (1974) for calculating equivalent strut width.
Bazan and Meli (1980) introduced the dimensionless parameter β to define the effective
strut width, which is dependent on the modulus of elasticity and shear modulus. Tassios
(1984) used the same approach.
It should be pointed out that Stafford-Smith and Carter (1969) defined contact length α
to be dependent on the characteristics of a column, but since they have studied squared
panels, the same contact length appears between the beam and infill, which is not
realistic in a case of non-squared panels. Therefore, Hendry (1981) proposed a relation
for the equivalent width of the diagonal based on the distribution of stress on the infill
under lateral load.
Liauw and Kwan (1984) concluded that h∙cosθ is an effective part of the panel activated
under lateral load; therefore they suggested defining the equivalent strut width as a
fraction of h∙cosθ.
For definition of the equivalent strut width, Decanini and Fantin (1987) and Bertoldi et
al. (1993) used the relative stiffness parameter, λ, proposed by Stafford-Smith and
Carter (1969) and two constants K1 and K2 that are dependent on the relative stiffness
parameter, λ.
Durrani and Luo (1994) conducted finite element analysis in order to derive equation
for calculation of effective width of the diagonal strut, which they expressed in term of
effective width factor γ.
Bennett et al. (1996) used the analytical approach developed by Flanagan (1994) to
propose and equation for calculating the strut width, depending on the empirical

Chapter 2 Literature review
55
constant, C, that varies with the in-plane displacement and is an indicator of the damage
of the infill. Afterwards, Flanagan and Bennett (1999a and 2001) used experimental
results from Dawe and Seah (1989a) and Mehrabi et al. (1994) to find the best fit for the
values of C. They concluded that the values of C are similar for all types of masonry.
Bennett et al. (1996) proposed that for infills with the offset from the column centrelines
only the portion of the infill enclosed by the bounding frame should be included in
calculation of the area of the equivalent strut and the capacity. Additionally, authors
suggested that contact length alpha should be limited to 20% of the infill height, in
order to avoid unreasonably high stiffness of the infill in a case of very stiff columns.
They also recommended that the moment of inertia for both beams and columns should
be taken as 50% of gross moment inertia. Later on, the Masonry Standards Joint
Committee (MSJC, 2013) proposed an equation for calculation of strut width, which
presents modification of the Bennett et al.‘s (1996) equation.
More recently, Amato et al. (2008) gave expression for calculating equivalent strut
width which takes into account the influence of vertical load on columns and modulus
of elasticity of infill in strut direction.
Pradhan et al. (2014) proposed an expression for determining equivalent strut width by
taking into account height of masonry wall as well as the height of frame, which makes
this approach suitable for use for partially infilled frames.
2.4.3.1.2 Strut strength
As is the case for the width of the strut, many proposals for the strength are given in
order to determine the capacities for the various failure modes that infill walls can
experience. Most of the researches didn‘t give the equations for all the failure modes,
considering the omitted ones as negligible. Holmes (1961) concluded that, at the infill
failure, the lateral deflection of the infilled frame is small compared to the flexibility of
the corresponding bare frame; therefore the frame members remain elastic up to the
failure of infill. He first derived the equation to determine the ultimate lateral load
capacity of the infilled frame and then he extracted strut resistance force. Afterwards,
Stafford-Smith and Carter (1969) suggested the equation for calculating compressive
failure (corner crushing) force of the compressed diagonal. Beside corner crushing
force, Mainstone (1971) gave also the expression for defining the diagonal cracking

Marko M. Marinković Innovative system for seismic resistant masonry
infills in reinforced concrete frame structures
56
strength (tensile failure). Later on, Hendry (1981) proposed an expression for the
calculation of horizontal load which infill wall can withstand before shear sliding failure
mode appears and an expression for compression load that equivalent diagonal strut can
carry.
One of the important advantages of the approach proposed by Decanini and Fantin
(1987) and Bertoldi et al. (1993) for the calculation of strut strength is its ability to
account for all failure mechanisms. This was also done by Stafford-Smith and Coull
(1991).
Priestley and Calvi (1991) and Paulay and Priestley (1992) suggested that it can be
assumed that infill panel doesn‘t carry vertical load due to gravity effects, because it is
impossible to construct tight connection of the top of the wall and RC beam. Therefore,
vertical force acting on the infill will come only from the vertical component of the
diagonal compression force. This is taken into account in the expression they proposed
for calculating shear sliding resistance. They also recognized compression failure of
diagonal strut as a failure that can be used as an ultimate capacity value, which however
depends on the compressive strength and vertical contact length between panel and
column. As a third mode of failure, they suggested a diagonal tension cracking to be
taken due to the possibility to damage an infill wall in a way that it weakness it
regarding to the out-of-plane load.
Bennett et al. (1996) used experimental results from Flanagan (1994), Dawe and Seah
(1989a), Mehrabi et al. (1994), Hendry and Liauw (1994) and Benjamin and Williams
(1958) to derive the relation for calculation of diagonal cracking resistance. They came
to the conclusion that corner crushing capacity doesn‘t change because of frame
properties and geometry. They also suggested equation for calculating diagonal
cracking.
cracking strength.
FEMA 306 (1998) adopted an expression for equivalent strut width based on the work
of Mainstone (1974) and relative panel-to-frame-stiffness parameter, λh according to
Stafford-Smith and Carter (1969) to calculate the compression failure of the equivalent
diagonal strut (corner crushing mode). Using the recommendation of Saneinejad and
Hobbs (1995), FEMA 306 (1998) also gave expression for calculation of diagonal

Chapter 2 Literature review
57
tension strength of infill panel. FEMA 306 (1998) also suggests Mohr-Coulomb failure
criteria to be used to assess strut force which would present the initial sliding shear
capacity of the infill.
Al-Chaar (2002) proposed the expressions for determining the load required reaching
masonry infill crushing strength and the load required to reach the masonry infill shear
strength.
Based on the comparison of analytical strength methods with the experimental results,
Tucker (2007) derived equations for cracking and ultimate strength of brick infills,
while Pradhan (2014) suggested an equation for the calculation of diagonal compression
failure force.
2.4.3.1.3 Strut stiffness and lateral stiffness of infill
Stiffness of the infilled frame consists of a bare frame stiffness and infilled wall stiff-
ness. However, this expression is valid in linear range, until the appearance of the first
crack. Calculation of the initial stiffness of the frame is less problematic than the calcu-
lation of the stiffness of the infilled wall. Since the most common approach for consid-
ering infill walls is presenting it with the strut, many authors calculated initial lateral
stiffness of the infill wall by considering the stiffness of the strut as:
2cosm
m
w tEK
d
(2.1)
Bertoldi et al. (1993) considered this stiffness as secant stiffness, while he defined an
initial stiffness as 4 times higher (Figure 2.12).
However, some authors proposed the methods for calculating the infill stiffness in a
different way, without considering struts. Fiorato et al. (1970), using a simple method
based on a cantilever beam model, where the section was composed of a reinforced
concrete and masonry, proposed the following equation to calculate the lateral stiffness
of the system:
1
1 1
sh fl
K
K K
(2.2)
Where:

Marko M. Marinković Innovative system for seismic resistant masonry
infills in reinforced concrete frame structures
58
m m
sh
GAK
h
(2.3)
3
cfl
b
3 IEK
h
(2.4)
Where h is height of the infill panel, Aw is horizontal section area of the infill panel, Gw
is shear modulus of the masonry, Ec is modulus of elasticity of the concrete, hb is height
of the composite beam and I is moment of inertia of the composite beam. Fardis (1996)
proposed the initial stiffness to be calculated using just the Equation (2.3)
2.4.3.1.4 Taking into account effect of openings
As mentioned in section 2.3.5, openings reduce stiffness and strength of infills.
Therefore, in order to use diagonal struts for modelling of infill walls and at the same
time to take into account effect of the openings, a relationship between the stiffness and
strength reduction of the infill and the openings parameters has to be found. This is
usualy done by defining the factor that reduces the strut width or that directly reduces
stiffness or strength calculated for a full infill panel. Mostly this factor presents a ratio
of the area of the opening and the infill panel.
One of the first to propose the reduction factor to be used for taking into account
openings was Polyakov (1956), who suggested that the expression is valid for the case
when the height of an opening is smaller than 65% of infill height and opening area is
smaller than 60% of panel area. In the similar way, Sachanski (1960) and Imai and
Miyamoto (1989) proposed the expression for the strut width reduction factor.
Based on the numerical study, Durrani and Luo (1994) proposed the equation for
calculating reduction factor that takes into account openings in infills, for both stiffness
and strength. Authors stated that in a case when opening goes through the whole height
or width of the infill panel, the effect of infill should be neglected. According to Al-
Chaar (2002), if the area of the opening is greater than 60% of the panel area, influence
of infills can be neglected.
Papia et al. (2003) proposed simple reduction factor that takes into account size of the
openings in the height and the length of the wall. Based on the work from Dawe and
Seah (1989a), New Zealand Society for Earthquake Engineering (NZSEE, 2006)
recommends a simplified reduction factor for the strength and the initial stiffness of

Chapter 2 Literature review
59
infill. For the case when opening exceeds 2/3 of the bay length, influence of the infill on
the system can be neglected. Mondal and Jain (2008) used finite element analysis to
derive the reduction factor to calculate initial stiffness, for the case of central window
opening. Authors suggested that in a case of an opening, which is smaller than 5% of
the infill, effect of opening on the initial lateral stiffness of infilled frames should be
ignored, while for the case of openings bigger than 40% of the area of the infill the
effect of infill on the initial lateral stiffness of infilled frame may be neglected.
After experimental study on infilled steel frames with the openings, Tasnimi and
Mohebkhah (2011) proposed a reduction factor for the equivalent diagonal strut width
and stated that for the case when area of opening is higher than 40% of area of the infill
wall influence of infill should be neglected.
Decanini et al. (2012) also gave recommendations for calculating unique reduction
factor for both stiffness and strength, but with taking into account the presence and type
of reinforcing elements around openings. A non strengthened opening is considered an
opening without lintel bands or steel reinforcement; a partially strengthened opening has
at least the upper edge of the opening strengthened by a lintel band; a strengthened
opening has at least two opposite edges of the opening strengthened by two lintel bands
or by a lintel band and a steel bar.
Asteris et al. (2012) investigated the reduction of the stiffness of infilled frames due to
the presence of openings. First, a finite element technique proposed by Asteris (2003)
was used to derive variation of reduction factor as a function of the opening percentage.
Results show that increase in opening percentage leads to a decrease of the lateral
stiffness of infilled frames, but in a case of openings exceeding 50% of infill area
reduction factor λ is almost constant. Also, it was concluded that the effects of the
openings are more significant when they are on the compression strut. Effect of the
opening on the fundamental period was also investigated; showing that even with 50%
of openings there is a significant difference in fundamental period in comparison to the
bare frame. In line with this, an increase of opening percentage leads to increase of top
displacement and a decrease of base shear force. Recently, Asteris et al. (2016)
conducted an extensive numerical investigation in order to derive an analytical
expression for the determination of the equivalent strut width that takes into account the

Marko M. Marinković Innovative system for seismic resistant masonry
infills in reinforced concrete frame structures
60
effect of the vertical load acting on the frame, the infill aspect ratio, the opening
percentage and the geometrical–mechanical characteristics of the infilled frame. Result
of this study is the strut width reduction factor, which fits with the equation proposed by
Asteris et al. (2012).
Mohammadi and Nikfar (2013) used experimental data from literature to derive a reduc-
tion factor for stiffness and strength which are valid for opening area smaller than 40%.
Mansouri et al. (2014) also proposed two reduction factors, one for the stiffness and
another one for the strength. Su et al. (2016) proposed the equation for the stiffness and
strength reduction factor by fitting the experimental data from literature. Authors added
that this equation can be used in the case of opening not exceeding 50% of infill area.
2.4.3.1.5 Force-displacement behaviour of the strut and hysteretic models
Definition of constitutive relations for the strut is necessary in order to implement a
strut model in software for structural calculations. The types of constitutive models
required to set the strut models depend on the type of analysis (linear elastic or
nonlinear) and the type of loading (monotonic, cyclic or dynamic). In the case of elastic
linear analysis, it is only necessary to define the area, the length and the modulus of
elasticity, but to consider the nonlinear behaviour of struts, full relationship between the
axial force and displacement has to be defined. Additionally, hysteretic behaviour has to
be incorporated if cyclic loads are applied. In this section, recommendations for force-
displacement curves for the strut presenting an infill wall in a frame under monotonic
loading will be summarized.
Bertoldi et al. (1993) were one of the first to propose force-displacement relationship
(Figure 2.12a) for the equivalent strut defining initial stiffness, hardening and softening
branch followed with the residual strength. Similarly, Panagiotakos and Fardis (1996)
used the experimental results (Panagiotakos and Fardis, 1994) on masonry walls, bare
RC structures and the corresponding infilled frames to propose a nonlinear force-
displacement relationship to describe the response of equivalent struts. Dolsek and Fa-
jfar (2008) defined a similar relation with the tri-linear response for the strut including
an elastic, hardening and softening branch, but with the key difference of assuming zero
residual strength (Figure 2.12b). They modified an empirical equation proposed by
Žarnić and Gostić (1997) to compute the ultimate strength of the masonry infill panel,

Chapter 2 Literature review
61
while the lateral cracking strength was assumed to be 60% of the ultimate strength.
More recently, Shing and Stavridis (2014) proposed force-displacement envelope simi-
lar to that proposed by Panagiotakos and Fardis (1996). Important difference is that this
curve should be calibrated with a detailed nonlinear finite element analysis or according
to the procedure which was derived for structures that have non-ductile RC frames and
strong infill walls.
a) b)
Figure 2.12 Force-displacement curve for the equivalent strut a) Bertoldi et al. (1996) and b)
(Dolsek and Fajfar, 2008)
2.4.3.1.6 Hysteretic models
In order to run dynamic nonlinear analysis the hysteretic behaviour of the material must
be established. In literature just a few hysteretic models for diagonal strut can be found,
because most researchers studied the behaviour of infill masonry under monotonic
loading, but also due to the fact that the modelling of hysteretic behaviour increases not
only the computational complexity but also the uncertainties of the problem. One of the
early attempts was conducted by Klingner and Bertero (1976). They proposed a
nonlinear hysteretic response for the equivalent diagonal strut model represented in an
axial force-axial deformation relation which considers the strength degradation and
reloading stiffness deterioration as shown in Figure 2.13a. More recently, Cavaleri et al.
(2005) improved the hysteresis law proposed by in Klingner and Bertero (1978) by
introducing a detailed force–displacement law accounting for cyclic or monotonic
behaviour of an equivalent strut, calibrated against experimental results. Andreaus et al.
(1985) proposed a model for the analysis of masonry structure under monotonic and
cyclic loadings which is able to simulate ultimate strength, stress-strain softening and
material degradation (Figure 2.13b). One of the most commonly used models was
proposed by Crisafulli (1997) and Crisafulli and Carr (2007). This model that takes into

Marko M. Marinković Innovative system for seismic resistant masonry
infills in reinforced concrete frame structures
62
account the non-linear response of the masonry in compression, tension and shear
(Figure 2.14).Other authors (Chrysostomou, 1991; Madan et al., 1997; Combescure and
Pegon, 2000 etc.) also worked on developing hysteretic rules for infilled masonry.
a) b)
Figure 2.13 Force-displacement response of the strut proposed by a) Klingner and Bertero
(1976) and b) Andreaus et al. (1985)
a) b)
Figure 2.14 a) Masonry strut hysteretic response and b) shear cyclic relationship (Crisafulli,
1997)
2.4.3.2 Fiber approach
Hashemi and Mosalam (Hashemi and Mosalam, 2007) used an in-plane shaking table
test on a 3:4 scaled reinforced concrete infilled frame to calibrate a numerical three
dimensional strut-and-tie model that was developed to include both in- and out-of-plane
loading. Model has two diagonal struts, one in each direction. Each of the two diagonal
struts is modelled by four pin-connected compression-only fiber-section beam elements.
The mid-span nodes of the diagonal struts are connected by a tension-only link in the
out-of-plane direction. Authors proposed the interaction curve for in-plane and out-of-
plane force, but they strongly stressed that the curve presents results which are specific
to the configuration, geometry, and material properties of the studied test structure and
should not be used as a generalized interaction relationship. Later on, Kadysiewski and

Chapter 2 Literature review
63
Mosalam (2009) improved the model by proposing a fiber-section model (MG-model)
with the single strut which consists of two elastic beam-column elements aligned along
one diagonal and with hinges at the extremities (Figure 2.15). The diagonal strut has
tensile and compressive strength to provide resistance in both loading directions. The
fibre sections have the fibres aligned perpendicularly to the wall and their definition
controls the combined in- and out-of-plane response of the macro-element in terms of
forces. The constitutive relationship of the fibres is elasto-plastic. Model is suitable for
use in nonlinear time history analyses and it was implemented in OpenSees finite
element program (McKenna et al., 2010).
Figure 2.15 Proposed fiber-section infill model (Kadysiewski and Mosalam, 2009)
In 2015 Mosalam and Günay (2015) refined and implemented the model (MG-model)
in OpenSees. They introduced the capability to remove the macro-element representing
an infill panel when it exceeds the interaction curve. Although, all the models proposed
by this group of authors represent a step forward, they are limited because they do not
account explicitly for the arching action. Also, the model proposed by Kadysiewski and
Mosalam (2009), provides a single strut macro-model resisting both in tension and
compression. This configuration is not representing the actual force distribution of the
system and of the internal forces in the frame. Moreover, the proposed models were
validated with only FE numerical studies, thus it is not certain that the interaction
relationship can be applied for different geometries, material characteristics, types of
bricks, frame/infill stiffness ratio etc. Therefore it cannot be used for general purpose
analysis.
Dona et al. (2017) modified the model from Mosalam and Günay (2015) by having two

Marko M. Marinković Innovative system for seismic resistant masonry
infills in reinforced concrete frame structures
64
equivalent struts both of them similarly defined as MG-model (Mosalam and Günay,
2015) but with half resistance. Instead of elasto-plastic behaviour, hysteretic behaviour
with softening was adopted and calibrated against experimental results for subsequent
in- and out-of-plane loading (Calvi and Bolognini, 2001; Da Porto et al., 2013).
Removal of the element wasn‘t used, because the model already simulates the stiffness
and strength degradation up to zero.
Asteris et al. (2017) proposed the model comprising of a two diagonals constituted by
nonlinear fiber-section elements. Instead of standard elements, fiber elements are to be
used for equivalent struts. The diagonals are characterized by an assigned concrete-type
constitutive law. Since the stiffness matrix of the element couples moments and axial
forces, the model is able to account for an arching mechanism. Missing point of the
approach is that potential local shear failure of columns due to the local increase of
shear forces is not included. Di Trapani et al. (2017) further developed the approach by
defining a four-strut macro element that can account both in- and out-of-plane
resistance. Diagonal struts are used to model in-plane resistance, while all four struts
contribute to the out-of-plane resistance. For definition of fiber-section elements,
authors used concrete-type stress-strain relation according to Kent-Park model (Kent
and Park, 1971) with the tensile strength assumed to be zero. Parameters of the curve
are determined by calibrating them against backbone curve formed using
recommendation from Shing and Stavridis (2014). A model has been validated against
experimental data giving good matching. This model represents a step forward,
although the material properties of the diagonal struts are determined by trial and error
approach.
2.5 Analytical solutions
In this section, proposals from different authors for calculation of parameters needed for
verification of infill walls are summarized.
2.5.1 In-plane capacity
Usually, a masonry infill wall is simulated by diagonal strut(s) joining the corners of
frame's columns together, but some authors have proposed simplified analytical ap-
proaches for analysing infilled frames such as the one proposed by Sachanski (1960).

Chapter 2 Literature review
65
He proposed an analytical model in which he analysed contact forces between the frame
and the infill by forming and solving the equations for the compatibility of displace-
ments of the frame and the infill. Having found the contact forces, he then proposed a
stress function for the stress analysis of the infill. In his approach, infills are assumed to
be isotropic, homogeneous and elastic which can‘t be attributed to the masonry infills.
Also, Holmes (1963), based on test results of model steel frames with concrete infills,
proposed semi-empirical method to predict the behaviour of infilled frames subjected to
lateral and vertical loadings. Wood (1978) has used plastic analysis to find the collapse
loads of infilled frames, while Liauw and Kwan (1983, 1984b and 1985a) studied the
effect of the connectors between the masonry panel and bare frame and proposed the
analytical expressions to calculate the maximum shear force that system can support.
They have also simplified the technique from Wood (1978) to analyse multi-storey in-
filled frames by proposing four types of failure mechanisms, which involve plastic
hinges in frame members and the crushing of infill at loaded corners. Series of equa-
tions, involving parameters such as beam and column strength, the aspect ratio of the
wall as well as its mechanical properties, were derived to give the ultimate load capacity
regarding various modes of failure. Continuing to present the analytical models, there is
proposal made by Mehrabi et al. (1994). These authors took into account five failure
mechanisms, as the most likely to occur and suggested expressions for calculation of
each resisting force of the system. Authors wanted to extend the approach proposed by
Liauw and Kwan (1984a), into a more general analytical method containing parameters
such as cohesion, friction, dimensions and material characteristics of frame members
and infill wall.
Although these analytical approaches can be useful, they have limited application
regarding h/l ratio, geometry, infilling brick type etc. Therefore, their use in practice has
been omitted.
2.5.2 Out-of-plane capacity
Due to the mass and inertia of the wall during the earthquake excitation, infill walls are
subjected to out-of-plane loads, which can be approximated as uniformly distributed.
Although earthquakes present dynamic load, in practice buildings are commonly ana-
lysed using equivalent static forces. Therefore, out-of-plane capacity of masonry infills

Marko M. Marinković Innovative system for seismic resistant masonry
infills in reinforced concrete frame structures
66
is generally determined by calculating the maximum uniform lateral pressure causing
the collapse of the panel.
First methods for analysing infilled walls subjected to out-of-plane loads were based on
elastic methods (Lawrence, 1979). These approaches, such as determination of maxi-
mum lateral pressure qu, derived from Timoshenko theory (Timoshenko and Woinow-
sky-Krieger, 1959) use tensile strength fmt as the governing parameter:
2
16
mt
u
fq
h
t
(2.5)
Where β1 is a coefficient depending on the aspect ratio of the panel and its restrain con-
ditions. Since this approach overestimates the stiffness other researches proposed to take
into account two way action by using yield line analysis (Hendry, 1973; Hendry and
Kheir, 1976). Among them, the approach from Haseltine (Haseltine, 1976; Haseltine et
al., 1977) is based on flexural tensile strength fkx2 orthogonal to the bed joints as the
governing parameter:
2
2
6
xk
u
m f
fq
h
t
(2.6)
where a is a bending coefficient based on the panel shape and restraint conditions, γm is
safety coefficient related to the materials ranging between 2.5 and 3.5 and γf presenting
importance coefficient taking values between 1.1 and 1.4. Drysdale and Essawy (1988)
also suggested the yield line approach to determine the out-of-plane strength of masonry
walls.
Shortcoming of these approaches was that flexural or tensile strength was considered as
the governing parameter, and it is active only until the cracking of the masonry. As such,
it is not suitable for out-of-plane analysis after cracking. Experiments (Anderson, 1984;
Dawe and Seah, 1989b) showed that after cracking, infill wall deforms and in-plane
membrane forces occur in the wall (Figure 2.16a). Thus, showing that an infill panel
exhibits an arching type of behaviour under out-of-plane loading (Flanagan and Ben-
nett, 1999c), proving that the predominant resisting mechanism appears due to the arch-
ing action.
The first formulation based on the arching theory was proposed by (McDowell et al.,

Chapter 2 Literature review
67
1956a,b) and it can be referred to as a one-way arching mechanism incorporating
compressive strength of masonry instead of tensile strength. Several theories based on
these assumptions followed. Researchers also recognized that two-way action should be
considered in the models. Following the comprehensive experimental campaign on steel
frames infilled by hollow concrete block masonry, where also influence of the supports
deformability and masonry infills with openings were studied, Dawe and Seah (1989b)
developed empirical relationship for uniform lateral load capacity, with the assumption
that the load resistance is based on the two-way arc when the panel bends. Thus, they
have proposed the following equation for the case when the panel is connected on three
sides and free at the top:
0.75 2
2.5
4.5m
u
f tq
l
(2.7)
and when the panel is connected on all four sides:
0.75 2
2.5 2.54.5
u mq f t
l h
(2.8)
Where fm is masonry compressive strength (kPa), t is panel thickness (mm), l is panel
length (mm), h is panel height (mm), α is coefficient, which must be less than or equal
to 75 in the case of panels with three connected edges and free at the top and less than
or equal to 50 in all other cases and β is also coefficient, which must be less than or
equal to 50. These two coefficients are calculated as follows:
0.25
21c c c c hh G JE I
h (2.9)
0.25
21c b c c hl G JE I
h (2.10)
Where Ic and Ib are moments of inertia of the column and beam (mm4), respectively, Jc
and Jb are torsion constants of column and beam (mm2), respectively, Ec and Gc are
modulus of elasticity and shear modulus (MPa) of the frame components.
Angel et al. (1994) and Shapiro et al. (1994) made a step further by proposing a simple
equation for out-of-plane strength based not just on the compressive strength of mason-
ry and the slenderness ratio, but also on the amount of in-plane damage, and the stiff-
ness of the bounding frame. Based on the experimental results from tests on infills pre-
viously damaged by in-plane, analytical model was proposed based on idealization of an

Marko M. Marinković Innovative system for seismic resistant masonry
infills in reinforced concrete frame structures
68
infill panel as a strip panel fully restrained between two rigid supports. Two failure
modes were identified; one appears due to high compressive strain at the supports and
center of the wall, occurring in the case of low h/t ratios. The second one appears in a
case of high h/t ratio manifesting as the snap through of the panel. A critical slenderness
ratio distinguishing the two possible failure modes was determined. According to this
formulation, the ultimate out-of-plane load (qu) could be evaluated as follows:
1 22 m
u
fq R R
h
t
(2.11)
Where R1 presents reduction factor for prior in-plane loading (taken from Table 2.1), R2
reduction factor accounting the flexibility of the boundary conditions and λ presenting
dimensionless parameter dependent on the h/t ratio (Table 2.1). R1 and R2 factors are
calculated according to the following expressions:
1 1R for 1.0cr
(2.12)
2
1 1.08 0.015 0.00049 0.000013crh h h
Rt t t
for 1.0cr
(2.13)
142 0.357 2.49 10EIR
for 5.74∙1012
≤ EI ≤ 25.83∙1012
Nmm2 (2.14)
R2=1 for EI > 25.83∙1012
Nmm2 (2.15)
Where EI is flexural stiffness of the smallest member of the confining frame at the panel
edge with no continuity. In the previous equations, Δ is the maximum in-plane inter-
storey drift experienced by the infilled frame and Δcr is the cracking drift. For values of
h/t between 10 and 30, which presents common slenderness ratios, data are fitted to an
exponential function (Flanagan and Bennett, 1999c):
0.0985
0.154h
te
(2.16)
Table 2.1 Parameter approximation (Angel et al., 1994)
h/t λ R1 for corresponding ratio Δ/Δcr
1 2
5 0.129 0.997 0.994
10 0.060 0.946 0.894
15 0.034 0.888 0.789
20 0.021 0.829 0.688
25 0.013 0.776 0.602
30 0.008 0.735 0.540
35 0.005 0.716 0.512
40 0.003 0.727 0.528

Chapter 2 Literature review
69
a) b)
Figure 2.16 Out-of-plane mechanism: a) development of arching mechanism and b) idealized
three-pin arch (Asteris et al. 2017)
Al-Chaar (2002) improved the method proposed by Angel et al. (1994) and Shapiro et
al. (1994) by considering presence of openings, beside possible existing infill damage
and flexibility of the surrounding frame:
1 2 32om
u
fq R R R
h
t
(2.17)
Where λ0 is slenderness parameter as per Table 2.1, but defined until h/l ratio equal to
25, since the approach is valid up to this value. And reduction factors are calculated as:
82 0.4 0.71 10 c cR E I
(2.18)
3
51
4
o
p
AR
A
(2.19)
Where Ic presents smaller moment of inertia between Ib and Ic (in.4) and for elements
with EcIc greater than 9.0∙106 k-in.
2, or elements having infill panels in all four sur-
rounding neighbouring frames, R2 may be taken as unity. While infills with openings of
less than 20 % of the total area of the panel may be assumed to be fully infilled for the
out-of-plane evaluation (R3 = 1) and reduction factor for existing panel damage R1 must
be taken from Table 2.1.
The same method derived by Angel et al. (1994) and Shapiro et al. (1994) has been
adopted by FEMA 273 (1997) and FEMA 356 (2000), but with small changes:
20.7
m
u
fq
h
t
(2.20)
Where λ2 represents slenderness ratio that takes the same values as λ from Table 2.1,

Marko M. Marinković Innovative system for seismic resistant masonry
infills in reinforced concrete frame structures
70
until h/l ratio equal to 25. Asteris et al. (2017) provided a plot of λ2 values in order to
derive a possible best fitting equation as:
1.41
2 1.38h
t
(2.21)
FEMA 273 (1997) and FEMA 356 (2000) also provide the following expression to
determine mid-height deflection normal to the plane, Δinf, of the infill as:
inf
2
0.002
1 1 0.002
h
t
h h
t
(2.22)
Flanagan and Bennett (1999c) compared experimental results from Thomas (1953),
Anderson and Bright (1976), Dawe and Seah (1989b), Fricke et al. (1992), Angel et al.
(1994) and Flanagan and Bennett (1999b) with the analytical expressions developed by
Dawe and Seah (1989b), Angel et al. (1994). As a result they concluded that the
empirical method proposed by Dawe and Seah (1989b) should be the basis for
evaluation of the out-of-plain strength of infill walls. Therefore, they modified the
numerical constant 4.5 into 4.1 and recommended a uniform lateral load capacity of an
infill wall to be determined as:
0.75 2
2.5 2.54.1
u mq f t
l h
(2.23)
Where if h/t is <8, the thickness of the infill should be considered as 1/8 of the infill
height and the parameters α and β were simplified by eliminating the terms of torsional
stiffness of the frame members and calculated as:
0.25
2150c c hE I
h (2.24)
0.25
2150c b lE I
h (2.25)
They also modified the recommendation from FEMA 273 (1997) and FEMA 356 (2000)
for mid-height deflection:
inf
2
0.002
1 1 0.001
h
t
h h
t
(2.26)
Based on the three-pin arch idealization of the wall under out-of-plane load (Figure

Chapter 2 Literature review
71
2.16b), Eurocode 6 (EN 1996-1-1, 2005) also proposes an expression for calculating
lateral strength of URM walls, which is similar to the expression from FEMA 273
(1997) and FEMA 356 (2000):
2
u md
a
tq f
l
(2.27)
Where t is the thickness of the wall, fmd is the design compressive strength of the
masonry in the direction of the arch thrust, la is the length or the height of the wall
between supports capable of resisting the arch thrust.
Morandi et al. (2013) used the approach of Eurocode 8 (EN 1998-1, 2004) to calculate
out-of-plane demand pressure acting on infill walls under earthquake excitation and
proposed the following expression to determine lateral pressure resistance, depending
on the slenderness ratio and the masonry vertical compressive strength:
2
0.72u md
tq f
h
(2.28)
But the authors pointed out that the expression for lateral pressure resistance may be
appropriate for undamaged infills while a previous damage of infill walls under in-plane
loading has to be considered not only for the assessment of existing buildings, but also
in the design of new RC structures with masonry infills. Therefore, authors used exper-
imental study results from Calvi and Bolognini (Calvi and Bolognini, 2001) to estimate
out-of-plane strength reduction due to previously imposed in-plane drift. They proposed
an out-of-plane strength reduction coefficient βa and expression for out-of-plane re-
sistance of a previously damaged infill due to the in-plane loading:
2
0.72 au md
tq f
h
(2.29)
Where the reduction coefficient, βa, is defined as a function of the expected in-plane
drift demand. Additionally, authors assumed that the full contact between the infill and
the surrounding structure is preserved and the arching action remains active.
2.5.3 Simultaneous in- and out-of-plane loading
Al-Chaar (2002) pointed out that effects of out-of-plane loading cannot be neglected
when analyzing the in-plane capacity of an infilled structure and vice versa. Therefore,
the following interaction formula that takes this into account was proposed, with the

Marko M. Marinković Innovative system for seismic resistant masonry
infills in reinforced concrete frame structures
72
remark that when the out-of-plane demand is less than or equal to 20% of the out-of-
plane capacity, the in-plane capacity should not be reduced:
2
1 51
4 4
r d d
c c c
OP OPIP
OP OPIP
(2.30)
Where IPr is the in-plane capacity considering out-of-plane loading, IPc is the in-plane
capacity found from the section on general procedures for evaluating the capacity of
infilled frames using pushover analyses, OPd is the out-of-plane demand placed on the
infilled frame and OPc is the out-of-plane capacity found from the section on out-of-
plane strength evaluation.
2.6 Design rules and recommendations in codes and standards
This section reviews the parts related to the RC frames with infill walls from the
available codes and standards.
2.6.1 European norms – Eurocode 8 (EN 1998-1, 2004)
Eurocode 8 (EN 1998-1, 2004) contains general remarks and provisions related to the
infill walls traditionally connected to the frame. In section (EN 1998-1, §4.2.2) it is de-
fined that the total contribution to lateral stiffness of all secondary seismic members
should not exceed 15% of all primary seismic members. Since infills are considered as a
common case of non-structural elements (EN 1998-1, § 5.2.3.6.5), this relates to them
too. In this section it is also stated that all the members being part of the lateral force
resisting system, should be modelled in the structural analysis and designed and detailed
for earthquake resistance. This is specifically defined in section (EN 1998-1, §4.3.1.8)
where it is stated that infill walls which contribute significantly to the lateral stiffness
and resistance of the building should be taken into account in the model.
Eurocode 8 (EN 1998-1, 2004) specifies that irregular distribution of infill in plan
should be avoided; otherwise spatial models with infills included should be used for the
analysis. In a case when infills are not regularly distributed but do not create strong ir-
regularity, a factor of 2 should be used in order to take into account the effects of the
accidental eccentricity. Also, irregularities in elevation should be taken into account by
increasing seismic action effects in the vertical elements.

Chapter 2 Literature review
73
Furthermore, it is prescribed that ’’appropriate measures should be taken to avoid brit-
tle failure and premature disintegration of the infill walls (in particular of masonry
panels with openings or of friable materials), as well as the partial or total out-of-plane
collapse of slender masonry panels”. Therefore, Eurocode 8 (EN 1998-1, 2004) gives
the maximum allowed drifts, for DLS verifications as:
- δr∙ν < 0.005h, for rigidly attached infills
- δr∙ν < 0.0075h, for ductile infills
- δr∙ν < 0.010h, for decoupled infills.
Where:
δr is the interstorey drift; h is the storey height and ν is a reduction coefficient (EN
1998-1, § 4.4.3.2.2).
Eurocode 8 (EN 1998-1, 2004) does not recognize the difference for behaviour factor
value in a case of bare RC frame or infilled RC frame. But in a case of steel buildings,
upper limit of reference values of behaviour factors for systems regular in elevation are
given in Table 6 (EN 1998-1, § 6.3.2), where it can be seen that in a case of infills
isolated from the moment frame, behaviour factor can be taken the same as for bare
moment frame.
It is recommended that the local effects due to the frame/infill interaction shall be taken
into account. Shear capacity of columns is required to be checked for shear forces
generated by the diagonal strut action of masonry infills by taking a strut width to be a
fraction of the panel‘s diagonal length.
The code does not provide any recommendation for the calculation of both in- and out-
of-plane infill resistance. With regard to the out-of-plane safety verification, Eurocode 8
(EN 1998-1, 2004) gives directions for the calculation of seismic demand, whereas no
capacity model is provided, although resistance (Equation (2.27)) based on arching ac-
tion suggested in Eurocode 6 (EN 1996-1-1, 2005) may be used. In order to prevent out-
of-plane collapse of walls, the code recommends that a particular attention should be
given to masonry panels with slenderness ratio greater than 15. Furthermore, it suggests
measures for the improvement of both in-plane and out-of-plane behaviour by applying
light wire meshes, wall ties fixed to the columns and concrete posts and belts.

Marko M. Marinković Innovative system for seismic resistant masonry
infills in reinforced concrete frame structures
74
In the code it is stated that the infill panels with more than one significant opening or
perforation should be disregarded in models for analyses. Additionally, large openings
must be trimmed with belts and posts.
2.6.2 Italian National Code (NTC, 2008)
The seismic design provisions for RC structures in the current Italian National Code
(NTC, 2008), mostly comply with the Eurocode 8 (EN 1998-1, 2004), but provide less
detailed recommendations for masonry infilled RC frames. It is stated in the code that
non-structural elements, which contribute significantly to the lateral stiffness and
resistance of the building, such as infill walls, should be taken into account, but no clear
suggestions on how to do it are given.
According to NTC (2008) provisions infill walls are checked using interstorey
displacements derived from bare frame models and compared with the Damage Limit
State (DLS) drifts. For Ultimate Limit States (ULS) out-of-plane verification of infill
walls and resistance verification of the frame elements is carried out. Even though not
clearly stated in the code, the drift verifications are commonly carried out on the bare
frame structural configuration.
Similar interstorey drift limits prescribed by Eurocode 8 (EN 1998-1, 2004) are indicat-
ed by Italian code (NTC, 2008):
- δr < 0.005h for infill walls rigidly connected to the frame
- δr ≤ 0.010h for infill walls designed not to be damaged, due to their deformabil-
ity or their connections to the structure.
Additionally, Italian code also prescribes a specific verification for public important
buildings such as schools, hospitals etc., by specifying that inter-storey drift must be
smaller than 2/3 of previously described drifts. In both Eurocode 8 (EN 1998-1, 2004)
and NTC (2008) codes, no specific previsions are prescribed with respect to the ultimate
performance of infill walls. The effects of seismic action on non-structural elements
should be determined by applying a horizontal force as in Eurocode 8 (EN 1998-1,
2004). The same as in Eurocode 8 (EN 1998-1, 2004) no specific recommendations for
the calculation of the infill both in- and out-of-plane resistances are provided. It is only
stated that appropriate measures should be taken to avoid brittle failure and possible

Chapter 2 Literature review
75
out-of-plane expulsion of non-structural elements.
NTC (2008) considers the vertical and/or horizontal irregular distribution of infill walls,
suggesting that accidental eccentricity should be doubled in order to take into account
irregular distribution in plan.
2.6.3 Canadian Standard for Masonry Structures (CSA S304-14, 2014)
The Canadian Standard allows three construction and design approaches for masonry
infill walls:
1. Frame and infill composite action – when the masonry infill shear wall is in full
contact, bonded and tied with the surrounding frame. In this case masonry infill
shear walls participate in carrying vertical, lateral and out-of-plane loads.
Therefore, increase of stiffness due to the infill should be taken into account.
2. Participating infill – when infill is not bonded and tied to the frame, but it does
not have openings and no gaps between the masonry infill and the surrounding
frame. In this case it is suggested an infill to be modelled with the diagonal strut.
3. Isolated infill – when infill walls are separated from the frame structure by a gap
created by vertical movement joints along the sides and a horizontal movement
joint under the slab or beam. In that case, masonry infill is a nonloadbearing
wall and cannot be treated as a shear wall. But the Standard does not provide
any guidance for the design in this case.
The standard recognizes shear sliding, diagonal shear failure and compression failure in
diagonal strut as three in-plane failure mechanisms and provides design equations for
them. On the contrary, no specific provision for the out-of-plane strength calculation of
infill walls is provided.
2.6.4 American Building Code Requirements for Masonry Structures (MSJC,
2013)
Building Code Requirements for Masonry Structures (MSJC Code; or TMS 402/ACI
530/ASCE 5) classifies masonry infill walls into two categories: Participating and Non-
Participating infill walls. Participating infills form a composite structural system with
the bounding frame, increasing the strength and stiffness of the system. In that sense,

Marko M. Marinković Innovative system for seismic resistant masonry
infills in reinforced concrete frame structures
76
participating infill walls contribute in resisting lateral loads. Participating infills can be
either mortared tight to the bounding frame so that the infill receives lateral loads
immediately as the frame displaces, or the built with a gap between infill panel and the
frame. In this case, a gap has to be less than 3/8 in. (9.5 mm), according to MSJC Code
Section B3.1.2.1. If the gap fulfils this requirement, the infill can be considered as a
participating infill wall and the code requires reduction in the strength and stiffness by
50%.
According to MSJC (2013) participating infill walls should be analysed using an
equivalent strut, whose thickness is the net thickness of infill; and whose elastic
modulus is the elastic modulus of the infill. The equations for calculating the in-plane
capacity of the infill wall are provided by the code.
The out-of-plane design of participating infills is based on two-way arching of the
infills, using the approach developed by Dawe and Seah (1989b) and equation (2.23)
proposed by Flanagan and Bennet (1999c). Gaps between the frame and infill reduce the
arching mechanism to a one-way arch and should be considered by taking α and/or β to
be zero. The maximum slenderness ratio (h/t) of the participating infill is limited to 30
in order to insure construction stability of the wall, while the maximum thickness
allowed for calculation for the out-of-plane capacity is one-eighth of the infill height.
In the case of partial infills and infills with openings, the MSJC (2013) does not
consider infill walls as a part of the lateral-force resisting system, because structures
with partial-height infills have typically not performed well during seismic events.
However, due to the fact that partial height infill walls attracts additional load to the
column, which can result in shear failure of the column, their effect on the surrounding
frame has to be considered.
The MSJC (2013) also takes into account additional localized forces due to the presence
of infills and it provides guidance on the design loads applied to the bounding frame
members in this case.
Volumetric changes in the masonry infill material that may occur over time due to
normal temperature and moisture variations should be taken into account. Shrinkage of
concrete masonry infill material may open gaps between the infill and the bounding
frame that need to be addressed. Guidance for these volumetric changes is provided in

Chapter 2 Literature review
77
the MSJC Code Section 1.7.5.
Non-participating infills are designed and detailed to be structurally isolated from the
lateral force-resisting system by structural gaps between the infill and the bounding
frame. These isolation joints must be at least 3/8 in. (9.5 mm) and sized to accommodate
the expected design displacements of the bounding frame. It is recommended that such
gaps should be filled with uncompressible materials fulfilling other code requirements
such as weather protection, air infiltration, sound and thermal insulation etc. The MSJC
Code (2013) states that non-participating infill walls should only be designed to resist
the out-of-plane loading, according to the MSJC Code sections for reinforced or
unreinforced masonry (Section 3.2 for unreinforced infill and Section 3.3 for reinforced
infill). Since non-participating infills support only out-of-plane loads, they can be
constructed with full panels, partial height panels, or panels with openings, but the
effects on the surrounding frame must be included in the design.
The MSJC Code (2013) suggests using connectors attached to the bounding frame and
spaced at a maximum of 4 ft (1.22 m) along the supported perimeter of the infill, but
these connectors are not permitted to transfer in-plane loads from the bounding frame to
the infill. Research (Dawe and Seah, 1989a) has shown that when connectors transmit
in-plane loads they create regions of localized stress and can cause premature damage to
the infill, which reduces the infill's out-of-plane capacity.
2.6.5 Federal Emergency Management Agency reports and recommendations
(FEMA 273, 274, 306, 310, 356)
FEMA reports published in the United States consider the infill walls to contribute in
the resistance of lateral load. The values presented in these recommendations are
different than what is present in the MSJC (2013). In particular, FEMA 306 (1998)
provides guidance on damage classification and performance analysis of infilled frames
under earthquakes. Infilled panels are categorized according to material and geometric
configurations. It recognizes and describes the following behaviour modes of infilled frame:
a) Bed-joint sliding
b) Diagonal cracking
c) Corner compression
d) Out-of-plane failure

Marko M. Marinković Innovative system for seismic resistant masonry
infills in reinforced concrete frame structures
78
e) Frame components failure
A single equivalent-strut approach (two struts per panel for reversed cyclic loading
analysis, one across each diagonal) is recommended to be used for design and
evaluation of infilled frame structures. Such an approach has been also adopted by
FEMA 273 (1997). The width of the diagonal strut that simulates the masonry infill
wall‘s stiffness was based on the work performed by Mainstone and Weeks (1970) and
Mainstone (1971 and 1974). FEMA 306 (1998), the same as MSJC (2013), considers
only the column‘s stiffness for calculation of the width of the strut. Similar to the
Canadian Standard (CSA S304-14, 2014), this design manual proposes equations for
calculating resistance of the wall for the same failure mechanisms (i.e.: diagonal tension
cracking, sliding shear failure and compression failure in the diagonal strut).
Opposite to Eurocode 8 (EN 1998-1, 2044) and Italian code (NTC, 2008), FEMA 356
(2000) provides a clearer definition of how to consider infills in structural models. It
allows the use of a finite element model for the infill panel or, alternatively, the
introduction of a diagonal struts. Nonlinear static and dynamic procedures are
acceptable too. Also, local interaction effects are accounted since it is specified that
beams and columns adjacent to infills should have sufficient strength to support local
shear effects arising from the infill/frame interaction. In the FEMA 356 (2000) four
performance levels are defined as Operational, Immediate Occupancy, Life Safety and
Collapse Prevention levels, with its own acceptance criteria. If infill walls do not meet
these acceptance criteria, rehabilitation measures are suggested, such as complete
removal of infill wall from the frame, or providing gaps between the frame and the
infill.
FEMA 274 (1997) gives an option to separate the infill from the concrete frame by
filling the joint between them with the flexible jointing material and suggesting that
joint thickness should be at least equal to the interstorey drift. It is also recommended
that partial infills should not be used, because they can cause non-ductile shear failure
of the concrete columns.
FEMA 310 (1998) recommends that infill walls should be connected to the frame in
order to resist out-of-plane forces. Limit values for slenderness ratio are given and they
vary from 8 to 16 depending on the performance level and on the seismic zone.

Chapter 2 Literature review
79
According to FEMA 356 (2000), unreinforced infill panels with slenderness ratios
smaller than 25 and are in full contact with the surrounding frame elements, and frame
components have sufficient stiffness and strength to resist thrusts from arching actions
can be verified under out-of-plane seismic forces by considering arching action
according to the Equation (2.20).
Usually in the codes, in- and out-of-plane design of infill walls is considered separately,
but in FEMA 306 (1998), the verification for combined in-plane and out-of-plane
actions has been included using the approach from Angel et al. (1994).
2.6.6 New Zealand Standard for Masonry Structures (NZS 4230, 2004)
In this section New Zealand standard for masonry structures (NZS 4230, 2004) and
Recommendations of a New Zealand Society for Earthquake Engineering (NZSEE)
study group on earthquake risk buildings (NZSEE, 2006) are summarized.
According to NZSEE Recommendations (2006) infills:
a) can have significant contribution to the structural response and it is expected that
they suffer significant damage;
b) can have significant contribution to the structural response, but they stay in elas-
tic range;
c) does not affect the structural response.
In the first case possibility for appearance of soft storey mechanism have to be taken
into account, while in the second case ductility capacity should be set to 1 with the infill
acting as a shear element connecting the columns. For the third case, infill walls are
either so brittle to fail under even moderate earthquakes or are completely isolated from
the surrounding frame. As a result, stiffness of infill walls does not play any role in the
overall stiffness of the frame, thus infills are not considered in the analysis and design
procedure. It is also mentioned that in a case of isolated infill wall short column effect is
insignificant.
2.6.7 Serbian Technical norm for masonry walls (PTNZZ, 1991)
Serbian Technical norm for masonry walls (PTNZZ, 1991) considers infill walls as non-
structural elements if:

Marko M. Marinković Innovative system for seismic resistant masonry
infills in reinforced concrete frame structures
80
a) The wall height is less than 3.5 m;
b) If the length of single and double wythe walls without the voids is less than 40t,
where t is its thickness;
c) If the length of double wythe walls with the voids is less than 30t, where t is its
thickness. And the wythes are connected;
d) If openings are smaller than 10% of its area;
e) If wall is constructed using cement mortar;
f) And if the surface area is smaller than specified in Table 2.2.
Table 2.2 Maximal area of non-structural walls in m2
Wall type 3-sided wall and
4th side is free 4-sided wall
Wall with the an-
chors on 3 sides
and 4th side is free
Wall with the an-
chors on all 4 sides
Single wythe
wall with the
thickness
higher than 19
cm
18 22 24 32
Double wythe
wall 14 16 18 24
This norm defines that non-structural elements does not have to be statically verified,
but it does not give any recommendation how to calculate infill walls if they do not ful-
fil the above mentioned requirements.
2.6.8 Russian code (SNIP-II-7-81, 2001)
The Russian code (SNIP-II-7-81, 2001) recommends isolating the non-structural walls
from the frame by providing separation gap having minimum thickness of 20 mm. It is
also suggested that soft material should be added in this gap. In order to prevent out-of-
plane failure it is suggested to use steel profiles.
2.6.9 Greek Aseismic Code (EAK, 2000)
Greek code for Seismic Resistant Structures (EAK, 2000) contains specific measures,
aiming at reducing damages of the infills such as the requirement that the interstorey
drift in any storey should not exceed 0.5%. It is noted that the unfavourable interaction
between the frames and the infills should be avoided. Also, it is required that the struc-
tural system is appropriately formed in its plan, in-elevation, as well as in structural de-
tailing. Specifically, it is suggested to avoid irregularities due to infills caused by non-

Chapter 2 Literature review
81
symmetric arrangement of infills in-plan (concentration of the infills on one side of the
structure), which could lead to non-uniform distribution of the mass of the structure and
thus produce torsional deformations of the building. The code suggests avoiding an ab-
rupt change (discontinuity) in stiffness in vertical direction. Also, it is advisable to avoid
partial infill walls. If there is an open storey, it is compulsory to provide sufficient RC
shear walls to restore stiffness and strength that would be provided by infills. After all
these requirements it is logical that also it is not allowed to modify the arrangement of
infills in a building without adequate calculation done by a structural engineer.
2.6.10 Drift limits from other national codes
Mexican Norm for Masonry Structures (Mexican Code, 2004) limits the interstorey drift
for infill walls to 0.6%. Peru National Building Code (NBC, 2003) allows drifts for
reinforced concrete structures to be 0.7%. According to this it can be considered as one
of the most stringent provisions in the world. This means that also infill walls inside RC
frames have to fulfil this requirement. FEMA E-74 (2011) summarizes codes and
standards related to the non-structural components, including the Peruvian code. Here it
is stated that masonry infill walls in standard school constructions must be isolated from
the concrete frame, adding that schools fulfilling this criteria have experienced no
damage in recent earthquakes in Peru. Chilean code for buildings (NCh 433. of 96,
1996) was found in FEMA E-74 (2011) summary of codes and standards related to the
non-structural components. Here it is stated that drift must be smaller than 0.3% for
shear wall building with rigidly attached masonry infill, while for unbraced frames with
isolated infill maximum drift allowed is 0.75%.
2.7 Solutions for improvement of behaviour of infill walls
As it is described so far, a huge effort has been made in order to investigate, both
experimentally and numerically, the behaviour and influence of infill walls on RC
frames. In that sense, also different solutions for improvement of the behaviour of infills
have been developed and proposed. They can be classified into the three approaches
depending on the degree of confinement of the masonry wall within the frame (Figure
2.17).

Marko M. Marinković Innovative system for seismic resistant masonry
infills in reinforced concrete frame structures
82
a) b) c)
Figure 2.17 Approaches for improvement of behaviour of infilled frame under earthquake load-
ing
The first approach goes into the direction of making a stronger infill having rigid
connection to the frame, thus being a load-bearing element (Figure 2.17a). Second
approach is based on keeping the infill walls rigidly attached to the frame, or slightly
disconnected, but at the same time increasing the deformability of the infill wall using
special construction measures in the wall (Figure 2.17b). The basic intention is to
provide ductile behaviour to the infill walls. And the third approach is to separate the
frame and infill so that deformations in the frame do not generate any force in the infill
(Figure 2.17c), thus allowing relative displacements between the wall and the frame to
occur without interactions. These systems are providing decoupling of the infill wall
and the frame.
a) b)
Figure 2.18 Gap at the top a) before and b) after filling with polyurethane foam
Eurocode 8 (EN 1998-1, 2004) also recognizes these three main techniques (EN 1998-1,
§4.4.3.2) that can be employed in the construction of the infill walls and specifies dif-
ferent limits to the inter-storey drift of 0.5%, 0.75% and 1.0% respectively for the three
approaches. Since three approaches are described in a general form without giving any
reasonable design approach, the traditional way to install masonry infills rigidly at-
tached to the frame is still the most common approach, thus keeping the problems of

Chapter 2 Literature review
83
traditional infills. One of the problems is contact between frame and infill, especially at
the top of the infill. The daily practise is to fill the remaining gaps with mortar, polyure-
thane foam (Figure 2.18) or mineral wool. However, filling the gaps is usually not suc-
cessful due to shrinkage, settlements and imprecise workmanship and also does not pro-
vide sufficient boundary conditions/connections for out-of-plane loading.
In the following subsections, solutions proposed so far are briefly described with their
main implications.
2.7.1 Strengthening of infill walls rigidly attached to the frame
The rigid attachment of masonry infills to the frame is the traditional approach in most
of the countries all over the world. It makes masonry infills to become a part of the lat-
eral load bearing system with all unfavourable interaction effects. If the masonry infill is
rigidly attached to the frame, it is necessary to either increase the number of frames with
infill walls or to improve the behaviour of the infill walls by additional measures. The
first option includes some disadvantages such as adding significant weight to the build-
ing, which in turn may require foundation adjustments. Furthermore valuable space is
lost to the framing elements, and in some cases disturbance of the occupants may occur.
Additionally the rigidly attached infills increase the stiffness substantially, which lead to
much higher inertia forces under seismic loading. Finally the higher number of walls
will increase the retrofitting costs in case of a seismic event with structural damages.
The behaviour of rigidly attached infill walls can be improved with the use of a several
retrofitting techniques with the aim to increase the strength of masonry infills. Braga et
al. (2011) added extra reinforced concrete elements in the middle of the walls, connect-
ed to the columns. Thus reducing the slenderness of the wall and stabilizing the infill
panels. However, the costs for the execution at the building site are high, because the
casting of the beams needs to be carried out by handcraft.
Another option is to better connect the walls to the surrounding frame by using dowels
(Moretti et al., 2014) or shear connectors (Mallick and Severn, 1968). An alternative is
to attach additional layers to the outer surfaces of the infill wall. A standard procedure
for multi-wythe walls consists of removing one wythe and replacing it by a layer of
reinforced concrete. Since this presents time consuming technique, the walls can be
strengthened by jacketing with the use of sprayed concrete or cement (Kyriakides, 2011)
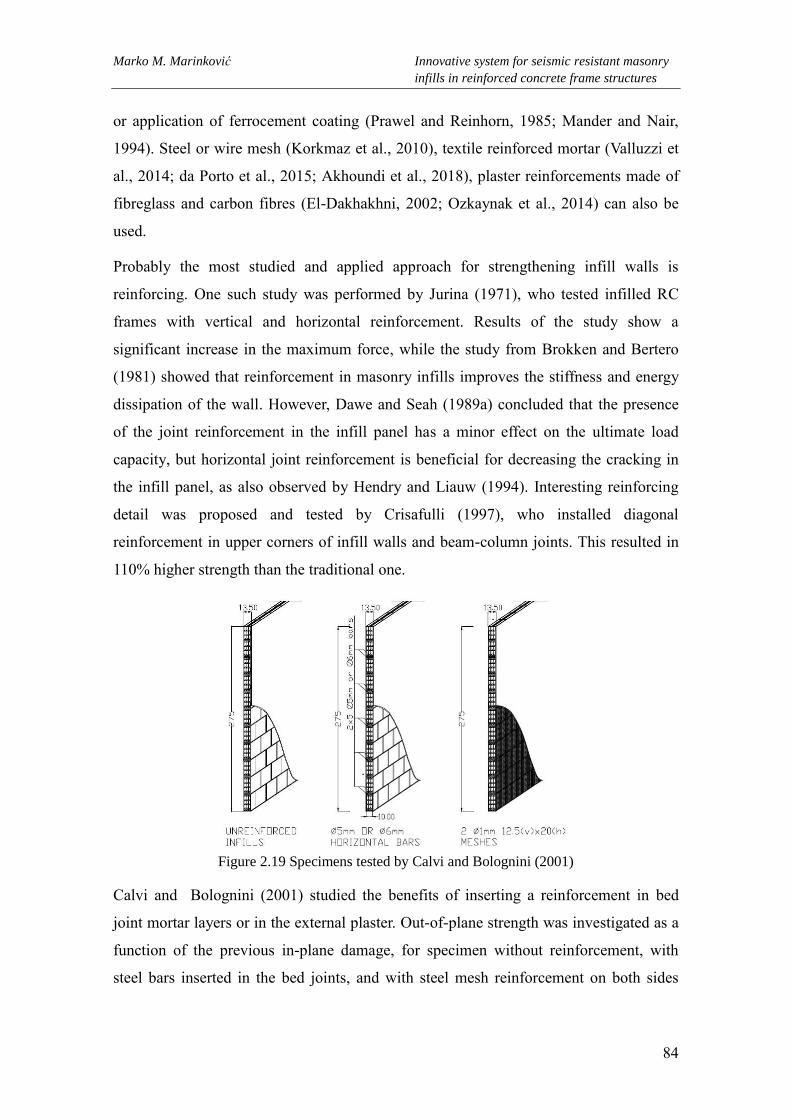
Marko M. Marinković Innovative system for seismic resistant masonry
infills in reinforced concrete frame structures
84
or application of ferrocement coating (Prawel and Reinhorn, 1985; Mander and Nair,
1994). Steel or wire mesh (Korkmaz et al., 2010), textile reinforced mortar (Valluzzi et
al., 2014; da Porto et al., 2015; Akhoundi et al., 2018), plaster reinforcements made of
fibreglass and carbon fibres (El-Dakhakhni, 2002; Ozkaynak et al., 2014) can also be
used.
Probably the most studied and applied approach for strengthening infill walls is
reinforcing. One such study was performed by Jurina (1971), who tested infilled RC
frames with vertical and horizontal reinforcement. Results of the study show a
significant increase in the maximum force, while the study from Brokken and Bertero
(1981) showed that reinforcement in masonry infills improves the stiffness and energy
dissipation of the wall. However, Dawe and Seah (1989a) concluded that the presence
of the joint reinforcement in the infill panel has a minor effect on the ultimate load
capacity, but horizontal joint reinforcement is beneficial for decreasing the cracking in
the infill panel, as also observed by Hendry and Liauw (1994). Interesting reinforcing
detail was proposed and tested by Crisafulli (1997), who installed diagonal
reinforcement in upper corners of infill walls and beam-column joints. This resulted in
110% higher strength than the traditional one.
Figure 2.19 Specimens tested by Calvi and Bolognini (2001)
Calvi and Bolognini (2001) studied the benefits of inserting a reinforcement in bed
joint mortar layers or in the external plaster. Out-of-plane strength was investigated as a
function of the previous in-plane damage, for specimen without reinforcement, with
steel bars inserted in the bed joints, and with steel mesh reinforcement on both sides

Chapter 2 Literature review
85
(Figure 2.19). From the results, the authors concluded that both reinforcement details
improved the infilled frame response, while reinforcing mesh in plaster improved both
in-plane and out-of-plane response of the infill wall by increasing the value of
acceleration required to produce collapse in the out-of-plane direction, even when
masonry panels suffered in-plane damage.
Da Porto et al. (2013) investigated the effect of both horizontal and vertical
reinforcement on out-of-plane resistance after in-plane loading. Results show that out-
of-plane strength and initial stiffness of reinforced infill walls was higher than that of
unreinforced walls. The presence of embedded reinforcement contributed to the
reduction of the global damage, thus reducing strength deterioration due to the increase
of in-plane drift.
Partners from the INSYSME research project (INSYSME, 2016), NTUA Athens and
University of Minho, also developed systems which are based on the use of vertical and
horizontal reinforcement for improving the behaviour of infilled frames (Silva et al.,
2016 and Vintzileou et al., 2016).
It is worth mentioning that many techniques for strengthening and retrofit of URM
walls can be applied for masonry infill walls. In this section only measures applied on
masonry infill walls were summarized. Although some of the strengthening measures
can reduce damage of the infill walls, they are rather complex and its application
demands design to take the presence of the infill explicitly into account, which is very
complicated due to the complex behaviour of infill walls. It has to be pointed out, that
stiffening of infill walls changes the fundamental period of vibration of the structure and
leads to an increased seismic demand. It is worth noting that the increased strength of
infill walls may intensify the interaction stresses acting on the structural elements and
thus a proper design of the critical sections is required. Furthermore, particular attention
should be paid to the enclosure distribution in plan and elevation in order to avoid
torsional or soft storey mechanism due to irregular stiffness distribution. Furthermore,
due to influence of infill walls on the RC frame such as increase of frame moments and
shear demand on the columns, measures for strengthening of surrounding RC frame
(jacketing of columns, composite overlays, grout injection etc.) are necessary to be
applied. Also in terms of direct monetary losses, it may be more beneficial to consider

Marko M. Marinković Innovative system for seismic resistant masonry
infills in reinforced concrete frame structures
86
the retrofitting of the main structural elements contributing to the expected loss, rather
than applying strengthening and stiffening measures that may actually worsen the
situation when speaking in terms of Expected Annual Loss (O‘Reilly and Sullivan,
2017).
2.7.2 Infill walls with ductile behaviour
In the second approach, the infills are designed as elements with high deformation
capabilities to absorb the displacements of the load bearing frame structure. The main
advantage of this approach consists in the reduction of interaction stresses and at the
same time increase of damping level, thanks to the dissipative action of deformable or
sliding elements.
Considering this fact, Mohammadi and Akrami (2010, 2011) improved the
deformability of the wall through the integration of a horizontal sliding plane consisting
of two prestressed steel plates with which the maximum wall forces can be controlled
using friction. They experimentally investigated the system and observed that crushing
at the lower boundary of the wall can occur, if the amount of friction is not properly
adjusted. In addition, at high drift levels, the system may induce shear failure at RC
columns which is possibly the most dangerous aspect of these types of solutions.
a) b)
Figure 2.20 a) Details of the proposed solution and b) out-of-plane resisting mechanism (Preti et
al., 2015)
Another notable research study is the one carried out by Preti et al. (2012, 2015 and
2016) and Bolis et al. (2016). They proposed a solution consisting of several horizontal
sliding surfaces in the wall that simultaneously take in-plane loading by sliding and the

Chapter 2 Literature review
87
out-of-plane forces using lateral shear connectors (Figure 2.21). To ensure sliding,
polyethylene sheets were placed on the upper surface of the sliding planks. A gap
between the infill and top beam was left, in order to avoid the risk of progressive
increase in friction force, thus eliminating the possibility for activation of arching
mechanism in vertical direction. To prevent the infill wall to move in out-of-plane
direction, special shear keys were installed between the RC columns and the infill wall.
a) b)
Figure 2.21 a) Details of the proposed solution and b) out-of-plane resisting mechanism (Preti et
al., 2015)
Experimental tests on the infilled frames with the proposed system confirmed high
displacement capacity (up to 2.5% of drift) with negligible damage by significantly
reducing the stiffness and the maximum strength for drift levels below 1%. The
shortcoming of this approach is that the sliding mechanism for the masonry sub-
portions at the joints was triggered for very small values of drift (less than 0.1%), which
can produce damage and horizontal sliding cracks under low lateral loads such as wind.
Also, at higher drift levels sliding of masonry sub-panels produce concentrated and high
frame-infill contact forces, which can harm columns and especially openings.
Preti and Bolis (2017) presented the solution which is based on the similar concept,
where the wall was subdivided by vertical sliding surfaces which allow the individual
parts of the wall to slide and rotate independently. The out-of-plane loads in this case
are resisted vertically through the shear connectors. Reason to divide infill wall in
vertical sub-panels was to avoid concentration of forces at the contact between frame
and infill sub-panels, which appeared in horizontally divided infill. Experimental results
on masonry infills showed that vertically divided infill obtained higher stiffness and

Marko M. Marinković Innovative system for seismic resistant masonry
infills in reinforced concrete frame structures
88
damage reduction. Obviously, proposed system reduces infill activation and increases
system ductility, but its rather complicated construction process which involves
complex installation of shear keys presents aggravating issue of application of the
solution. Another problem for the placement of horizontal sliding surfaces is openings,
around which the additional framing elements have to be installed.
The approach of Preti et al. (2012, 2015 and 2016) served as a basis for the
development of more sophisticated systems. University of Padova and ANDIL (Italian
Association of Clay Bricks and Roofing Tiles Producers) proposed (Verlato et al., 2016
and Calabria et al., 2016) a construction system named DRES (Damage Reduction
Enclosure System). The system introduces special horizontal rubber joints in the infill
wall (Figure 2.22). In addition, the system has two rubber joints between the masonry
infill and the RC columns characterized by low compression stiffness. Authors
investigated infilled frames with the proposed system and the results show that DRES
system reduced the stiffness and damage of the infilled frame during in-plane
deformations, thus enabling good out-of-plane performances, in terms of both strength
and initial stiffness. However, this solution can experience the same problems as the
system proposed by Preti et al. (2012, 2015 and 2016) such as sliding of the masonry
sub-portions at very small values of drift as well as sliding of masonry sub-panels that
can produce concentrated and high frame-infill contact forces at higher drift levels,
which can affect columns and especially openings.
a) b)
Figure 2.22 a) Schematic presentation of DRES system and b) rubber deformable joint (Verlato
et al., 2016)
A similar system with additional shear keys and C-shaped units (Figure 2.23) for
increasing the out-of-plane resistance has been proposed (Milanesi et al., 2016; Morandi
et al., 2016) by researcher group from the University of Pavia. The infill wall is also
divided into horizontal parts, which are able to slide one on each other through suitable

Chapter 2 Literature review
89
"sliding joints" (Figure 2.23). A comparison in terms of in-plane performance between a
traditional non-engineered infill solution and proposed system has shown a strong
reduction of the level of damage. Critical aspects of the solution are out-of-plane
effectiveness of the solution in a case of openings and complexity in construction.
a) b)
Figure 2.23 a) Schematic presentation of the proposed system and details of the system: 1.C-
shape unit; 2.mortar bed-joints; 3.sliding joints; 4.clay units; 5.interface joints; 6.shear keys;
7.plaster (Morandi et al., 2016)
The solutions presented here definitively present advantageous way of thinking and
innovative approaches with the aim to reduce the level of damage to both structural and
non-structural elements. Furthermore, the sliding and rocking of sub-panels provide
higher damping levels, which have a positive effect on the overall structural behaviour.
However, problems that can arise at high drift levels, such as shear failure at reinforced
concrete present the most dangerous aspect of these type of solutions. Additionally,
issues related to the out-of-plane loads, and connections proposed may not easily be
addressed in practical applications (i.e., design and construction). Therefore, the
proposed solutions are not successfully introduced into the practice, because they are
expensive and difficultly to apply. Finally it has to be pointed out, that the proposed
measures require a detailed design, which is not an easy task because of the complex
sliding behaviour depending on the distribution of compression forces within the wall.
2.7.3 Decoupling systems
The third approach considers the complete in-plane isolation of non-structural elements
from the supporting structure, so to allow frame deformation and at the same time
postponed infill activation. The simplest way to separate them in-plane is to create gaps
between infills and frames. However, in order to ensure an adequate out-of-plane
strength of non-structural elements, the implementation of special devices is required to

Marko M. Marinković Innovative system for seismic resistant masonry
infills in reinforced concrete frame structures
90
restrain the displacements in the out-of-plane direction. In this way, the non-structural
elements do not affect the structural behaviour. Thus, the advantages of this approach in
the design process are clear, since the eventual implementation of such a system alter
only marginally the current design practice. This approach has experienced development
only in the last couple of years, but enough to have examples in practice in recent
constructions (Figure 2.24). The in-plane detachment between a frame and infill panel
can be obtained through the insertion of highly deformable materials. In addition, non-
infill walls can be reinforced to provide adequate strength against out-of-plane actions.
Figure 2.24 Isolated infill walls from RC frame with gaps (Aliaari and Memari, 2005)
As mentioned, the approach of decoupling comes from the idea to prevent the activation
of the infill wall during in-plane deflections of the frame and therefore to make it as a
real non-structural element. Logically first tries were based on investigating a gap
between infill wall and frame, since infilled frame structures may, for a variety of
reasons, have gaps between the frame and the infill. The gaps can appear
unintentionally due to the shrinkage or poor construction or they may be deliberately
introduced to improve the behaviour of the infill walls. Initial gaps between the infill
and the bounding frame due to shrinkage and settlement of the infill or defects in
masonry workmanship are common occurrence. These gaps could be located at either
the beam-infill interface, or column-infill interface, or both. Since the total elimination
of gaps is not realistic, it is thus important to evaluate the effect of gap on the system
behaviour and strength.
This was the reason for the test carried out by Kadir (1974), where he wanted to check
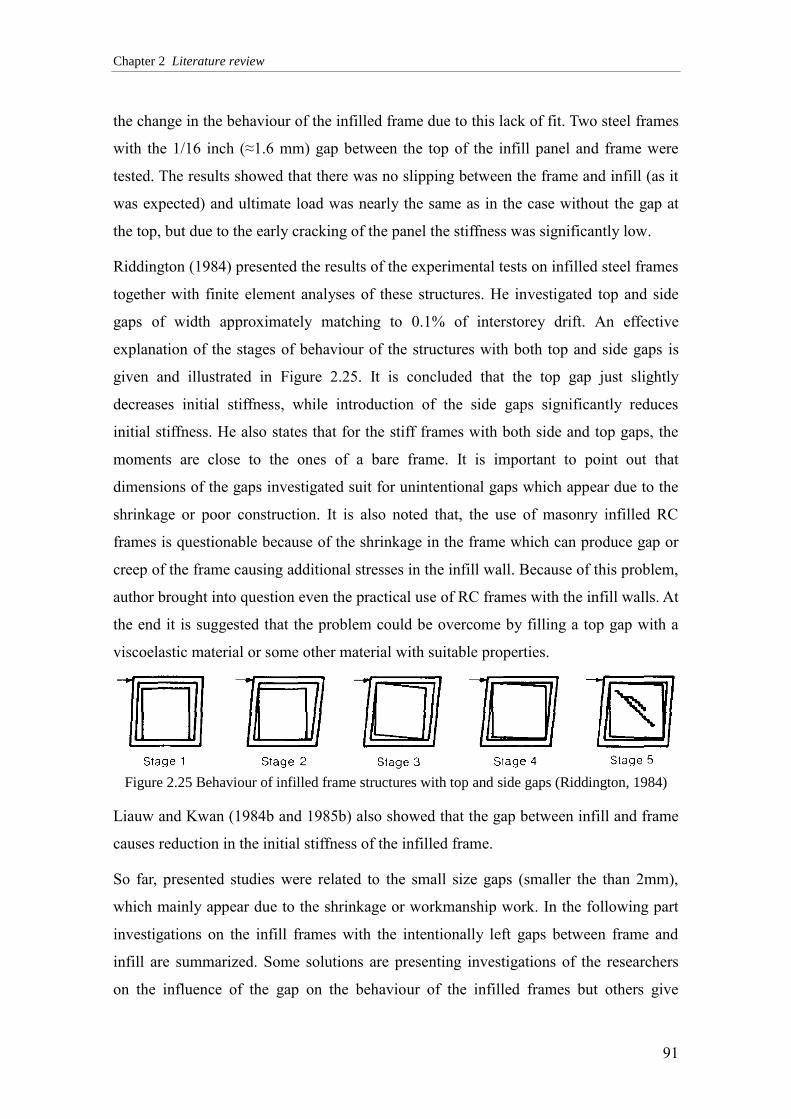
Chapter 2 Literature review
91
the change in the behaviour of the infilled frame due to this lack of fit. Two steel frames
with the 1/16 inch (≈1.6 mm) gap between the top of the infill panel and frame were
tested. The results showed that there was no slipping between the frame and infill (as it
was expected) and ultimate load was nearly the same as in the case without the gap at
the top, but due to the early cracking of the panel the stiffness was significantly low.
Riddington (1984) presented the results of the experimental tests on infilled steel frames
together with finite element analyses of these structures. He investigated top and side
gaps of width approximately matching to 0.1% of interstorey drift. An effective
explanation of the stages of behaviour of the structures with both top and side gaps is
given and illustrated in Figure 2.25. It is concluded that the top gap just slightly
decreases initial stiffness, while introduction of the side gaps significantly reduces
initial stiffness. He also states that for the stiff frames with both side and top gaps, the
moments are close to the ones of a bare frame. It is important to point out that
dimensions of the gaps investigated suit for unintentional gaps which appear due to the
shrinkage or poor construction. It is also noted that, the use of masonry infilled RC
frames is questionable because of the shrinkage in the frame which can produce gap or
creep of the frame causing additional stresses in the infill wall. Because of this problem,
author brought into question even the practical use of RC frames with the infill walls. At
the end it is suggested that the problem could be overcome by filling a top gap with a
viscoelastic material or some other material with suitable properties.
Figure 2.25 Behaviour of infilled frame structures with top and side gaps (Riddington, 1984)
Liauw and Kwan (1984b and 1985b) also showed that the gap between infill and frame
causes reduction in the initial stiffness of the infilled frame.
So far, presented studies were related to the small size gaps (smaller the than 2mm),
which mainly appear due to the shrinkage or workmanship work. In the following part
investigations on the infill frames with the intentionally left gaps between frame and
infill are summarized. Some solutions are presenting investigations of the researchers
on the influence of the gap on the behaviour of the infilled frames but others give

Marko M. Marinković Innovative system for seismic resistant masonry
infills in reinforced concrete frame structures
92
practical solutions for decoupling of infilled wall.
Yanev and Mcniven (1985) carried out shaking table test at the Earthquake Engineering
Research Center, University of California at Berkeley, in order to study the effect of gap
between the columns and infill panel. One-half inch (≈1.27 cm) gap existed on the sides
between the wall and the frame and it was filled with the foam rubber. Results showed
that infill wall didn‘t contribute to the stiffness of the system and remained intact for the
small motion intensities. However, for the intensity corresponding to a major
earthquake, the frame deformed significantly and the infill wall was readily destroyed. It
was noted that the influence of the foam rubber on the response behaviour was minimal.
The authors concluded that the gap left between infill and frame should be filled with
the material which has such stiffness that the force it activates is smaller than required
to destroy the partition.
Valiasis and Stylianidis (1989) tested infilled RC frames with infills not connected to
the surrounding frames and the results show that at small lateral drifts the infill didn‘t
increase the strength of the structure. However at higher drifts strength was increased up
to 50%. Dawe and Seah (1989a) showed that 20 mm gap at the top between the infill
and frame produces the reduction of stiffness by 50% and the ultimate strength by 60%.
Results of Flanagan (1994) show that a gap of 1inch (=2.54 cm) between column and
infill didn‘t cause reduction of ultimate load, it only occurred at a higher level of drift.
Aliaari and Memari (2005 and 2007) proposed and investigated the performance of an
isolation system for masonry infill walls named Seismic infill wall isolator sub-frame
(SIWIS). The isolator was designed to fail at a specified load limit after which the
behaviour turned suddenly into bare frame behaviour, thus allowing the masonry infill
walls to contribute to the in-plane stiffness of the structure at lower levels of lateral load
and preventing damage to the masonry walls by isolating the infill panels from the
frame as the lateral loads increase. It can be concluded that the fuse mechanism
successfully isolated the infill panels from the test frame, preventing damage to the
brick masonry material. However, the fuses are designed to plastify in case of a seismic
event, afterwards they have to be replaced, which is costly and time consuming.
Additionally the method was tested experimentally in 2007 (Aliaari and Memari, 2007)
and it was observed that the SIWIS added a very brittle nature to the global behaviour,

Chapter 2 Literature review
93
which may be considered to be an undesirable effect, thus it can be concluded that the
system is not well developed for practical applications.
a) b)
Figure 2.26 a) Application of separation gap and b) separation gaps between infill and columns
and beam (Charleson, 2012)
Figure 2.27 Connection details of separation gaps between infill and frame (Charleson, 2012)
Charleson (2012) pointed out the problem of a ―short column‖ which can appear in a
case of non-structural partial-height masonry infills which are in a rigid contact with the

Marko M. Marinković Innovative system for seismic resistant masonry
infills in reinforced concrete frame structures
94
columns. As a solution he proposed an application of separation gap to prevent ―short
column‖ configuration (Figure 2.26a). He also noted that the separation just from the
columns is not enough because the infills prevent beams from bending when the
building sways. Therefore, he suggested introduction of gaps of a sufficient width
(Figure 2.26b), which has to be calculated by the structural engineer. He points out that
due to the poor performance of infill walls in past earthquakes in seismically active
countries such as Japan, USA and New Zealand this concept starts to become a practice.
He also summarized some typical connection details of separation gaps (Figure 2.27)
saying that the application of this kind of solution brings issues such as acoustic
isolation, fire protection and aesthetic qualities.
Figure 2.28 Two connection that provide out-of-plane support and at the same in-plane separa-
tion (Charleson, 2012)
Author stresses out that another concern related to these connections is that by
separating the infill for in-plane movement, the wall becomes vulnerable to out-of-plane
forces; therefore some measures have to be installed in order to prevent out-of-plane
failure. Author presents two options, where the first one considers infill wall to be built
as a cantilever wall from its base. He comments that this is hard to achieve because the
floor structure beneath may not be strong enough to resist the bending moments from
the wall but also infill wall itself may not be strong enough or may require excessive
vertical reinforcing. Second option is presented on Figure 2.28, where two possible
structural details for solving this problem are presented. Shortcomings of these two
solutions are that first one requires use of L-shaped steel profiles, which increase the
costs and cause problems with the plastering. The second option can‘t be used for
hollow bricks and the gap of 50 mm at the top creates problems with acoustics and fire
protection.

Chapter 2 Literature review
95
An alternative option is to provide steel U-profile section to span between columns and
in that way to give support to the wall due to the out-of-plane forces and at the same
time to enable sliding in the direction of the plane of the wall. Again the shortcoming is
acoustic isolation due to the air gaps on the sides, but also if the distance of the columns
is high then strengthening of the steel channel must be done.
Kuang and Wang (2014) proposed a solution with an air gap between the masonry infill
and the columns and a traditional connection at the top (Figure 2.29). Steel connectors
are placed in the bed joints and connected to the columns in order to prevent the out-of-
plane failure of the wall. Test results show that the gaps can effectively isolate the infill
the frame. This connection is costly and just applicable with time consuming handwork.
Therefore, it can be summarized that the basic idea seems reasonable, but the execution
at site is not possible without further modifications. Crucial points are also sound and
thermal insulation along the proposed air gap. Additionally, steel connectors placed in
the bed joints and connected to the columns provide the restrain in the in-plane
direction, thus damaging the infill. Similar effect was experienced for the solution
proposed and investigated by Jiang et al. (2015), who studied the behaviour of masonry
infilled RC frames with the vertical and horizontal gaps of the width of 20 mm between
the infill wall and the surrounding frame. The gaps were filled with the polystyrene
plates. In order to prevent out-of-plane failure tie steel bars were anchored in the
column and embedded into the bed joints. Although the idea of the solution was to
isolate the infill wall from the frame, inserting tie connection bars introduced significant
restrain also in in-plane direction. This resulted that the damage occurred in the infill
wall at an earlier stage than expected. Authors concluded that the flexible connections of
the masonry infilled RC frames cause unfavorable problems, therefore further
improvement should be done.
Tasligedik (2014, 2015) developed the solution for steel and timber framed drywalls,
but then the solution was tested on URM infill walls too (Tasligedik et al., 2014;
Tasligedik and Pamapnin 2016). The infill is divided vertically in three parts thus
enabling individual rocking of panel instead of single shear dominated infill wall. By
introducing gaps between the parts of the infill, a delay in formation of a strut was
achieved. Infill panels are placed in steel sub-frame that is attached to the surrounding
structural frame, thus providing a restrain for the out-of-plane load through the

Marko M. Marinković Innovative system for seismic resistant masonry
infills in reinforced concrete frame structures
96
anchorage connection. Due to this, the solution is rather complicated and expensive for
practical application.
Figure 2.29 Column-isolated masonry infill wall with steel connectors (Kuang and Wang, 2014)
Tsantilis and Triantafillou (2018) presented the results of experimentally and
numerically investigated RC frames with infill panels isolated using thin layers of
cellular materials. Experimental results show that in a case of the frame isolated with
two vertical joints the activation of the infill occurred at displacement levels
approximately equal to the joint thickness, while in the frame isolated with joints
around the perimeter activation occurred at displacement levels nearly four times the
joint thickness. This was due to the capability of the fully isolated specimen that have
the vertical uplift and down lift and that rotate similarly to a rocking mechanism.
Experimental and numerical results show that masonry panels of the traditionally
infilled frames exhibit much more severe damage than the isolated ones, therefore it can
be concluded that the proposed technique has a high potential in reducing infill-frame
interactions and damage of the infills. However, the solution doesn‘t provide any out-of-
plane restrain.
At the same time (Peng et al., 2018) presented the results of experimental tests of an
infilled RC frame with the polystyrene plate of 30 mm thick placed in between frame
and infill. Comparison of behaviour of infilled frames with flexible and rigid connection
show that flexible connection reduced strength and stiffness of the specimen, but
increased energy dissipation at higher drifts.
Beside the authors who proposed solutions for decoupling, other authors (Furtado et al.
2016) also recognized the potential and suggested the decoupling of infills as a good

Chapter 2 Literature review
97
solution. Paulay and Priestley (1992) defined isolation of infill panels as one of the
options to solve unfavourable behaviour of infill walls under earthquakes. They
suggested adding a flexible strip between frame and panel, filled with the highly
deformable material such as polystyrene. It was stressed that in this case isolated panels
must be connected to the frame in order to carry out-of-plane forces, adding that this is
not an easy task. Bennett et al. (1996) in their report, about the performance of masonry
infills during the Northridge earthquake, noticed that several parking garages in
Northridge area had concrete frames separated from the concrete masonry infills by
half-inch to one-inch joint filled with styrofoam. So, already at that time examples of
constructions with decoupled infill walls appeared, with the intention to isolate infill
walls from the frame and avoid any interaction between them. It is prestressed that the
gap should be large enough so the columns would not activate the infill. Additionally
special attention should be given to adequately anchoring of infill wall against out-of-
plane movement, since due to the gap, arching mechanism cannot develop. At the end
of the report they gave the recommendations for the isolated infills saying that a gap
should be sufficient so that seismic drifts can take place without the frame contacting
the infill. Also they stressed that isolated infills need to have out-of-plane anchorage
and they pointed out that this is quite difficult because at the same time there is a need
for free in-plane movement. Any restrain against in-plane movement would cause
significant force transfer, which can lead to premature activation of the infill and
localized masonry failure, which can further cause loss of out-of-plane support.
Therefore, they concluded that isolated infills require careful detailing allowing in-plane
slip and providing out-of-plane support. The behaviour of the system with the gaps
between RC frame and infill walls was also elaborately described by Mauro (2008),
where he pointed out that in the first phase the system behaviour is dominated by the
presence of gaps, thus the beginning of the force-displacement curve of the system will
have a lower initial stiffness, close to the stiffness of the bare frame. As the drift
increases, and the bare frame comes into contact with the masonry panel, stiffness tends
to increase and the force shall be transmitted by a strut mechanism through the masonry
panel. Griffith (2008), after summarizing the research done in the field of behaviour of
RC frames with infill walls, pointed out that infill walls and especially partial-height
infill walls often cause columns to experience non-ductile shear failures, therefore he

Marko M. Marinković Innovative system for seismic resistant masonry
infills in reinforced concrete frame structures
98
suggested adding a sufficient gap between the infill and the column face to prevent
interaction.
The decoupling solutions summarized here have been used rarely in practice because
they are uneconomical due to the high material and installation costs of the built-in
parts, even though the benefits of isolation have been proven beyond a doubt. Therefore,
this approach presents the correct method, with the only drawback being that additional
work in solutions development has to be done. In any case, the new guidelines for infill
masonry walls should be drawn to improve their seismic performance and they should
definitively contain rules for decoupling of infill panels from the surrounding RC frame
as a good possibility.
2.7.4 Hybrid systems
Additional category, hybrid systems are based on combination of more than one
approach described above. For example, in the USA in the recent years, hybrid systems
developed for concrete masonry infills in steel frames were proposed (Biggs, 2007;
Abrams and Biggs, 2012). They are classified in three hybrid wall types: Type I, Type II
and Type III (Figure 2.30). Type I walls have gaps at the columns and the top of the
wall, that allow lateral drift at the columns or vertical deflection at the top. The framing
supports the full weight of the masonry walls and other gravity loads. Type II walls
have gaps at the columns and are built tight at the top of the wall and Type III walls are
built tight at the columns and the top of the wall. For Type II and III, the masonry walls
share the vertical loads with the frame. These hybrid systems present combination of
decoupling and strengthening of the masonry by reinforcing it. Hybrid masonry presents
the concept for buildings that incorporates the in-plane strength and stiffness of
reinforced concrete masonry with the ease of erecting conventional steel framing. The
idea of the authors was to simplify the construction of framed buildings with masonry
infill and at the same time use the masonry infill as the bracing. Also, the benefit of this
system is that if a column is damaged, the gravity loads are transferred to the masonry
or if the masonry is damaged, the gravity load transfers to the frame.

Chapter 2 Literature review
99
a) b) c)
Figure 2.30 Hybrid Masonry Frames: a) Type I, b) Type II and c) Type III (Abrams and Biggs,
2012)
Three possible solutions for connecting a steel frame to a masonry panel in order to
transfer in-plane lateral shear forces and to provide out-of-plane restrain, are proposed.
These include: plate connectors, fuses, and headed stud connectors (Figure 2.31). The
connector can either be bolted or welded to the steel girder. The ductility of the plates is
relatively high as is their energy dissipation, however because the vertical reinforcement
in the masonry panel is expected to yield at a smaller lateral force than the strength of
these plates, nonlinear deformations of the plates will not occur.
a) b) c)
Figure 2.31 a) Steel connector plate, b) steel fuse connector and c) steel stud connector (Abrams
and Biggs, 2012)
With respect to the steel fuse connector, the strength of the fuse is low enough that the
flexural or shear strength of a reinforced masonry panel will not be reached and thus the
nonlinear inelastic behaviour of the fuse will be realized. Authors stated that such fuses
are quite ductile and thus an excellent energy dissipater. As an alternative to steel plate
connectors, steel headed stud connectors can be welded to the bottom of the beam
flange as shown in Figure 2.31c. These studs are embedded in grout to provide a firm
connection with the masonry. Because there is no gap between the bottom of the beam

Marko M. Marinković Innovative system for seismic resistant masonry
infills in reinforced concrete frame structures
100
and the top of the panel, this detail is appropriate for Type II and Type III. A similar
detail can be used to connect the steel columns to the side edges of a masonry panel for
Type III. With this connection, system ductility is dependent upon the wall design and
detailing.
Asselin et al. (2012) proposed the system with a horizontal gap at the top and steel fuse
plates. The fuses are providing out-of-plane support and are designed to plastify in case
of a strong seismic event. Afterwards they have to be replaced, which is costly and time
consuming. Although the energy dissipation has a positive influence on the overall
structural behaviour, the system is not well developed for practical applications.
In the hybrid systems presented here the infill wall is subjected to vertical as well as
horizontal loads, but highly concentrated stresses in contact to the frame are avoided by
means of the gaps to the columns. Proposed hybrid system was developed for steel
frames and concrete masonry infill walls and it would be difficult to modify it in a way
that it can be applied for RC frames and especially for hollow clay masonry. Also,
system requires masonry to be reinforced which limits the application to the different
types of masonry. Another big issue within this system is application of the bolts
through the masonry in order to connect the steel plates. These bolts can bring stress
concentrations in already highly brittle masonry blocks, which can lead to the damage
of the infill walls and even complete failure of the system. Additional weak point of the
system is the out-of-plane resistance in case of simultaneous in-plane and out-of-plane
loading.
2.7.5 Shortcomings of the proposed solutions
In the previous sections, comments on the proposed solutions are given. Many solutions
bring the benefit to the behaviour of infills under the earthquakes. Furthermore, some
solutions are important to be understood because they show the potential of the
approach, but so far no complete solution is proposed that solves the problems of the
behaviour of the masonry infill walls under earthquake excitations that is not expensive,
complicated and that is practically applicable. All solutions presented and discussed
have some shortcomings, which are shortly summarized as follows:
they are not effective for simultaneous in-plane and out-of-plane load;

Chapter 2 Literature review
101
they are too complicated and expensive for practical application;
they are not applicable for walls with variable openings;
their application is problematic with respect to flexible room use;
they are not applicable to all types of bricks;
they have problems with sound insulation;
they have problems with thermal insulation;
they have problem with the verification of the out-of-plane stability;
they require reinforcing of masonry infill panel;
they bring stress concentrations and localization;
they have to be replaced after an earthquake.
2.8 Summary
A detailed literature review for the seismic behaviour of infills under in-plane, out-of-
plane and simultaneous loading was presented in this chapter. It is clear that the infill
walls effect the seismic behaviour of RC frames, however it has not been fully
understood to date. All the authors agree that the presence of walls changes the
resistance, stiffness, ductility and deformation capacity of infilled frames, but not to big
extent. Different failure modes are recognized for both in-plane and out-of-plane
direction, depending on the big variety of parameters such as frame/infill stiffness ratio,
masonry compression strength, slenderness, height/length ratio etc. It is recognized that
infills adversely affect the proper frame behaviour imposing unexpected damage to
boundary columns and they may collapse in out-of-plane direction threatening human
life. Partial or complete collapse of the infill walls significantly affects the lateral load
resistance and seismic performance of RC frames. Influence of prior damage of infill
but also infill/frame connection, to the strength and deformation capacity is observed by
many authors. Only recently did the behaviour under simultaneous loading start to be
investigated.
The performance of infilled frames under lateral loadings has been experimentally
investigated by a number of researchers. Effects of the relative strength and stiffness of
an infill to the frame, panel aspect ratio, lateral load history, vertical load etc. have been
investigated. High stiffness and strength accompanied with the noticeable brittle
behaviour at low in-plane drifts is observed. The studies on the dynamic properties of

Marko M. Marinković Innovative system for seismic resistant masonry
infills in reinforced concrete frame structures
102
masonry infilled RC frames through pseudo-dynamic tests or shaking table tests reveal
that infill walls are effective in increasing the base shear but reducing the displacement
demand of the structure. Activation of arching effect in the out-of-plane direction was
noticed, thus high out-of-plane strengths can be reached. Both in-plane and out-of-plane
capacities are significantly reduced when infills are subjected to prior damage. This is
even more pronounced in a case of simultaneous loading. Incomplete filling of the space
between frame and infill with mortar or detachment from the tensioned diagonal,
together with the infill damage due in-plane movement of the frame cause this
reduction. Therefore, there is a need for a reliable connection of frame and infill panel.
Openings reduce both stiffness and strength of infills, with the door making the
strongest reduction. The review clearly demonstrated that much research is still needed
to gain better understanding of the behaviour of masonry infilled frames under
simultaneous in- and out-of-plane loading.
In order to extend the experimental investigations, numerical models for studying infill
walls were developed. From the presented review, it can be seen that modelling
approaches proposed differ in the level of details with which geometry and material
behaviour are presented. Representing the structural behaviour of masonry infilled
frames is complex due to the high number of parameters and phenomena involved, as
well as due to the considerable uncertainty involved in many of those parameters. For
detailed studies micro models are suitable, but for the global behaviour use of simplified
modelling approaches is seen to be more practical. Strut approach is the most used
approach; therefore many suggestions for calculating its characteristics are given.
Although a big number of micro and macro models for infilled frames have been
proposed most of them consider only in-plane actions. Recently, introduction of in-
plane and out-of-plane interaction has been done either by using diagonal strut models
with the improved capabilities or fiber models.
Guidelines for the design of these types of walls in different codes/standards were also
presented. Most of the codes have recognized that also non-structural elements need to
be designed for earthquake actions. Some of the current Codes/Standards provide
design provisions for masonry infill shear walls, but these provisions are restricted to
ideal cases that are hard to achieve. If there are rules for the infill design they are either
related to just in-plane or out-of-plane behaviour of walls. However, seismic loads

Chapter 2 Literature review
103
mostly impose simultaneous loading demands on. Thus, there is a need to reconsider
design equations by taking into account bidirectional effects. Some codes give limits for
the drifts for buildings with the infill walls, but there is no consensus between them.
Definitely, the significance of specific measures for the damage control of masonry
infills has been widely recognised; however, code procedures for the design of new
buildings currently provide only few recommendations for non-structural elements, still
being in many aspects insufficient, incomplete or not clearly defined. For example, New
Zealand standard for masonry structures (NZS 4230, 2004) introduces the initial gaps
between infill walls and frame in order to weaken the frame/infill interaction.
Furthermore, American Building Code Requirements for Masonry Structures (MSJC,
2013) has defined the nonparticipating infills as the preferable alternative by applying
the in-plane isolation joints with at least 9.5 mm of thickness. Therefore, it can be
assumed that the decoupling approach is very likely to develop into a preferred design
approach for infilled frames in seismic codes.
Also, solutions proposed for improvement of behaviour of infill walls are summarized,
starting with the strengthening methods that should make infills walls stronger
preserving rigid connection to the frame. This way, infills are a part of load-bearing
system with all unfavourable interaction effects, thus their presence has to be taken
explicitly into account during the design. However, this is very complicated due to the
complex behaviour of infill walls. As an alternative infill walls with high deformation
capabilities can be used. This is mostly achieved by dividing the wall in a couple of
segments, thus reducing interaction stresses. Nevertheless, issues related to the shear
failure of the surrounding frame as well as out-of-plane loads are present. Furthermore,
its expensive and complicated application prevents the application in practice. Several
studies have been performed recently whose intention was to decouple infill or partition
walls from the structural system. The decoupling can be realized by introducing gaps
between frame and infill and placing soft material between them. However, generally
these solutions tend to have a problem with the verification of the out-of-plane stability,
thermal and acoustic isolation. Summarized solutions present a strong base of
knowledge and experience that can be used for development of the system with which
the required seismic safety can be reliably achieved and at the same time its cost
effectiveness and simple application will push it use in practice.

3 PROPOSED SYSTEM
Doubt is the father of invention.
Ambrose Bierce

Chapter 3 Proposed system
105
3.1 Description
As summarized in Chapter 2, infill walls in reinforced concrete frame buildings cause
an ‗increase‘ in lateral stiffness, strength, and energy dissipation capacity. Whether this
behaviour is favourable or not, the infill walls are usually the first elements to be
damaged in seismic events. Reports (Villaverde, 1997) showed that the cost related to
the failure of a non-structural component in a building may easily exceed the
replacement cost of a building, due to the loss of inventory, loss of business, repair and
reconstruction costs, downtime, injuries and casualties. These facts have pushed
research and development of solutions that disable these negative effects resulting from
the interaction between the masonry infill walls and concrete structures. Beside
experimental tests on RC infilled frames and development of appropriate design
approach for traditional infills, investigations in the direction of development of
innovative solutions have been conducted. In this context, the European Project
INSYSME (Innovative Systems for Earthquake Resistant Masonry Enclosures in RC
Buildings) has been funded within the 7th Framework Programme by the European
Commission. This research is part of this project and its aim was developing a
constructive measure that solves the above mentioned problems and provides its simple
application in practice, thus enabling engineers to apply the system easily and without
any complicated numerical models.
As already explained in section 2.7, currently no masonry infill systems are available on
the market, which are cost effective and fulfil the various requirements. The objective of
the study was the development of a new system for the improvement of seismic safety
of infills made of bricks. The boundary conditions for the development of the system
were a high level of seismic safety for separate and combined in-plane and out-of-plane
loads, practical installation at the construction site, universal applicability on different
various types of brick, and high economic efficiency. To fulfil these requirements, a
solution in which the infill and frame are decoupled was selected because strengthening
the infill with additional reinforcement and special connection elements is
uneconomical and represents a shift in wall construction methods towards reinforced
concrete construction. Furthermore, strengthening the infill stands in contradiction to
the use of modern energy-efficient bricks with high percentage of holes and low
strengths. Two systems, IMES (Innovative Masonry Enclosure System) and INODIS

Marko M. Marinković Innovative system for seismic resistant masonry
infills in reinforced concrete frame structures
106
(Innovative Decoupled Infill System), for improving the seismic behaviour of masonry
infilled reinforced concrete frames were developed. The INODIS system is the subject
of this thesis, since it presents a sufficient and effective solution for infill walls and the
IMES system is the intermediate solution which helped in the development of the
INODIS system. The purpose of both systems is to decouple frame and infill instead of
improving the load-bearing capacity by means of expensive and supplementary
reinforcing elements and strengthening measures. In order to explain the conceptual
idea of this research, an example of diagram with force-displacement curves for bare,
infilled and decoupled frame is given in Figure 3.1. The conceptual idea is to decouple
infill by applying elastomers between RC frame and infill panel such that the brittle
behaviour of the infill walls will be avoided. This way activation of infill walls due to
RC frame in-plane deformations is postponed to higher drifts, thus disabling high
stresses in both RC frame and infill wall. The elastomer bearings are designed to allow
the design drift of the RC frame without inducing damages to the infill wall. Therefore,
the damage to infill walls at moderate seismic events will be prevented and the energy
dissipation will occur due to the hyperelastic behaviour of elastomers instead of
damaging the infill walls. By varying the stiffness and thickness of the elastomer it is
quite easy to adapt the systems to different levels of earthquakes loadings. Moreover,
due to the viscoelastic behaviour of the elastomeric joints, overall damping capacity of
the building is enhanced. However, the load transfer mechanism of out-of-plane load is
limited by decoupling, and to overcome this, alternative mechanisms for the out-of-
plane load transfer have been proposed.
Figure 3.1 Force-displacement curves for bare, infilled and decoupled frame
Both IMES and INODIS aim to prevent premature failure and to improve the overall
structural dynamic behaviour of RC structures with masonry infill. During the

Chapter 3 Proposed system
107
INSYSME project first IMES system was developed, which presented the intermediate
solution which helped in development of the INODIS system as the final successful
solution. Experimental tests (section 5.5) confirmed shortcomings of anchorage system
applied within IMES, especially in the case of simultaneously applied in- and out-of-
plane loading. Results and findings on the IMES system pushed the improvement and
development of the final successful solution presented as the INODIS system.
Within the IMES system elastomer strips (Figure 3.2) are placed between columns and
infill panel and top beam and infill, while layer of mortar is placed on the upper face of
the bottom beam pn which the bricks are laid. Out-of-plane load transfer is realized with
special fasteners spanning in horizontal direction. The fasteners present a combination
of elastomers, shear anchors with longitudinal movement capability and perforated
bricks. Shear anchors are placed in both columns within plastic connector that allows
longitudinal movement. The connection of the shear bolts to the MZ70 brick is realized
by means of a side opening in one outer cell of the brick (Figure 3.2). This cell is filled
with elastomer in which the shear bolt is inserted. Anchors are placed in first, third,
fifth, seventh and ninth row of bricks, thus providing horizontal spanning of the wall.
Figure 3.2 shows a front view and a vertical and horizontal section of the wall as well as
the connection detail of a RC frame with the IMES system.
Figure 3.2 Front view and vertical and horizontal section of the IMES system, with the perforat-
ed brick and elastomer strips prepared for installation (INSYSME, 2017a)

Marko M. Marinković Innovative system for seismic resistant masonry
infills in reinforced concrete frame structures
108
The basic idea of the INODIS system (Figure 3.3) is a decoupling of infill masonry and
RC frame in in-plane direction combined with the out-of-plane protection measures
along the edges of the infill panel. It aims to raise the in- and out-of-plane resistance by
means of dissipative and sliding connections along the contact areas of the infill to the
RC frame. INODIS decouples the infill wall and RC frame with the U-shaped
elastomers placed at the top and along the vertical edges of an infill, together with the
elastomer divided in three strips at the bottom of an infill. The U-shaped elastomers are
designed to allow the design drift of the reinforced concrete frame without inducing
damages to the infill wall. Furthermore the viscoelastic bearings enhance the overall
damping capacity of the building. The deformation capacity of the elastomer is chosen
according to the design needs in order to separate the infill wall from imposed in-plane
deformations of the concrete frame.
Section A-A
Section B-B
Section C-C
Figure 3.3 Details of the INODIS system
Plastic profiles are attached by metal nails or screws to the surrounding frame while U-
shaped elastomers are glued to the masonry infill on one side and placed around plastic
profiles on the other side, thus preventing the out-of plane failure. At the bottom the

Chapter 3 Proposed system
109
connection is realized by a subdivision of the elastomer into three strips. The middle
strip is glued to the concrete and the outer strips are glued to the bottom of the bricks.
This arrangement avoids the ―walking‖ of the wall in the out-of-plane direction. First
layer of the U-shaped elastomer is made of a soft elastomer in order to decouple infill
walls against in-plane movement of the RC frame, while second layer is made of a
stiffer elastomer so that out-of-plane movement is prevented (Figure 3.3). The interfaces
along the columns and top beam are furnished with sliding surfaces to avoid any
unfavourable interaction in case of in-plane movements of the RC frame. INODIS
system improves the in-plane and out-of-plane resistance and prevents failures of
masonry infills under unfavourable combinations of in-plane and out-of-plane loading.
Figure 3.3 shows the arrangement of the system with the connection details of INODIS.
3.2 Construction steps
In this section step by step execution of the systems is described. All the steps were
planned in advance, before constructing the infilled frames for the tests, and now can be
used as a standard in a practice.
3.2.1 Construction steps of the IMES system
The construction process of the IMES system starts with a prefabricated RC frame
(Figure 3.4 left). Before casting the frame, the plastic connectors for the anchors have to
be placed accurately (Figure 3.4 right).
a) b)
Figure 3.4 a) Prefabricated RC frame with elastomer at columns and upper beam and b) in-
stalled anchors
The elastomer is fixed on both columns and the upper beam using the wire for the

Marko M. Marinković Innovative system for seismic resistant masonry
infills in reinforced concrete frame structures
110
fastening that can be removed after completing (Figure 3.4b). The first layer of mortar is
placed on the lower beam (Figure 3.5a). It has a normal thickness to balance unevenness
of the concrete structure. The first brick to be placed has a shear anchor with the
elastomer (Figure 3.5b). Therefore, first the steel anchor with the elastomer has to be
placed into the brick. With the other end, the shear anchors are inserted into the
connector. Then, the brick can be placed onto the mortar. All further steps correlate to a
typical bricklaying of a masonry wall with thin mortar layers in bed joints and without
any mortar in head joints.
a) b)
Figure 3.5 a) First layer of normal thick mortar and b) brick with shear anchors and elastomer
3.2.2 Construction steps of the INODIS system
The construction process of the INODIS system starts with a nailing or screwing plastic
bars to the columns and the upper beam of the RC frame (Figure 3.6).
Figure 3.6 Placing plastic bars at the columns and the upper beam
In order to minimize friction effects, the sliding surfaces are glued on the plastic
profiles, concrete and the preassembled U-shaped elastomer (Figure 3.7). In the next
working step the U-shaped elastomers are placed around the plastic profiles at the

Chapter 3 Proposed system
111
columns and the top beam. The elastomers are fixed by adhesive strips that are removed
during the construction of the wall (Figure 3.8).
The connection at the bottom is realized by subdivision of an elastomeric strip of higher
stiffness into three strips. The middle strip is glued to the concrete frame and the outer
strips are glued to the bottom of the bricks (Figure 3.9). The arrangement of the
elastomers at the bottom avoids stress concentrations with brittle failures of the bricks
and the glued middle strip serves as an out-of-plane support.
On top of each finished row thin layer mortar is applied using a special infeed slide. The
head joints are executed dry without any mortar application. The outer bricks in contact
to the elastomer are glued during the erection with glue comprised of one component
(Figure 3.10).
Figure 3.7 Applying a sliding surfaces on the plastic bars
Figure 3.8 Placing U-shaped elastomers at the columns and top beam of the RC frame
The finalization of the wall construction is executed by gluing the top bricks to the
upper elastomer. The gluing process is supported by wooden wedges, placed between
the concrete frame and the elastomer. After finishing the placement of all bricks, the

Marko M. Marinković Innovative system for seismic resistant masonry
infills in reinforced concrete frame structures
112
construction of the wall is finished (Figure 3.11).
Figure 3.9 Three strips of elastomer at the bottom beam and gluing the first row of bricks on the
elastomer
Figure 3.10 Brick up the wall in a usually way but with gluing the edge bricks to the elastomer
Figure 3.11 Gluing the last row and finalized wall
3.3 Summary
As many studies have shown that behaviour of infilled frames is highly influenced by
infill/frame interaction, proposed system presents the solution for the problems that
occur during earthquakes. Two proposed systems for decoupling of infill walls from the
surrounding frame are described with their components and construction steps for their
application. Aim of the INODIS system is to provide a predictable in-plane response
together with a stable and reliable out-of-plane response. The design strategy is to
reduce the infill activation inside the structural frame, which is provided by a strong

Chapter 3 Proposed system
113
reduction of the masonry in-plane stiffness and infill/frame interaction. Application of
the INODIS system makes an infill wall a real non-structural element by decoupling it
from the RC frame. Construction steps of the INODIS system are quick and easy thus
providing its wide applicability in construction practice. Since reinforced concrete
frame structures, infilled with masonry panels, are widespread and commonly employed
worldwide, there is a huge market for application of the INODIS system.

4 EXPERIMENTAL TESTS
ON SYSTEM COMPONENTS
If you wish to reach the highest, begin at the lowest.
Pubilius Syrus

Chapter 4 Experimental tests on system components
115
4.1 Introduction
In order to design and better understand the behaviour of infilled RC frames under
earthquake loading, it is required to have detailed knowledge about the material and
mechanical properties of the different components used. These properties are helpful in
describing the mechanical and deformation behaviour of the infill masonry walls under
in-plane, out-of-plane and vertical load, as well as combinations of these loads.
Table 4.1 Components tested
Component Material used Sec-
tion Type of test Reference standard
Concrete C30/37 4.2
Compression strength DIN EN 12390-3
Splitting tensile strength DIN EN 12390-6
Elastic modulus DIN 1048-5
Reinforcement
steel B500 4.3
Yield strength DIN EN ISO 15630-1
Tensile strength DIN EN ISO 15630-1
Elastic modulus DIN EN ISO 15630-1
Mortar ZP99 and M5 4.4
Slump DIN EN 1015-3
Air content DIN EN 1015-7
Compression strength DIN EN 1015-11
Flexural tensile strength DIN EN 1015-11
Elastic modulus On the basis of DIN
1048-5
Masonry unit MZ70 4.5
Dimensions, web thickness and
plan parallelism DIN EN 772-16
Flatness of faces DIN EN 772-20
Percentage of voids DIN EN 772-3
Net dry and gross dry density DIN EN 772-13
Compression strength DIN EN 772-1
Elastic modulus Non-existent
Masonry
assembley MZ70 and ZP99 4.6
Bond strength by bond wrench
method DIN EN 1052-5
Compression strength On the basis of DIN
EN 1052-1
Elastic modulus On the basis of DIN
EN 1052-1
Flexural tensile strength in two
directions DIN EN 1052-2
Elastomer
Regufoam® 400
Regufoam® 510
Regufoam® 570
Regufoam® 680
Regupol® 480
Regupol® 550
4.7.1
Static elastic modulus On the basis of DIN
EN 826
Dynamic elastic modulus On the basis of DIN
53513
Anchor
connection Type 3
4.7.2 Shear test Non-existent
U-shaped
elastomer
Regufoam® 400
Regufoam® 510
Regupol® 480
Regupol® 550
4.7.3 Shear test Non-existent

Marko M. Marinković Innovative system for seismic resistant masonry
infills in reinforced concrete frame structures
116
Therefore, material and mechanical properties of masonry units and mortar, concrete
and reinforcement, as well as elastomer and shear anchors connections are derived by
conducting material tests and tests of small subassemblies which are described in this
chapter. The components used for the RC infilled frame tests are listed in Table 4.1
together with the overview of the entire test program on systems components. Basic
idea of the research was to use already existing materials. Therefore from the large
variety of masonry units available in Germany, MZ70 brick has been selected to be used
for constructing infill walls. As the material properties of mortar and concrete are more
scattered, these properties are determined for each infilled frame tested. Samples of
reinforcement steel and elastomer were used to explore tensile and compression
strength, respectively. The connection with shear anchors and elastomers between the
RC frame and infill was tested in detail using the test simulating out-of-plane loading.
Also U-shaped elastomer connection with RC frame through contact with plastic
profiles was tested in order to investigate the out-of-plane resistance of the connection.
In the following sections, the testing procedures and the experimental results are
presented.
4.2 Tests on concrete
The concrete samples were taken during the casting of the RC frames and they are
tested in order to get the values for compression strength fc, elastic modulus Ec and
splitting tensile strength fct,split. The reference specimens used (Figure 4.1a) were
cylinder with a diameter of 150 mm and a height of 300 mm (for Ec and fct,split), as well
as cubes with a length of 150 mm (for fc). The following Table 4.2 shows the mean
values for the concrete material properties. Since the frames for the BO and CO test
were not loaded, they were reused for the tests BI and CI. Therefore, the elastic modulus
and the splitting tensile strength for the BI and CI tests can be taken the same as the
values for BO and CO tests. It is important to mention that the requested strength class
for concrete for RC frames was C30/37 while tests on concrete samples resulted in
much higher values for compressive strength (Figure 4.1a), probably due to the long-
time curing in water. Therefore, it can not be considered that RC frames have these
values.

Chapter 4 Experimental tests on system components
117
a) b)
Figure 4.1 a) Concrete cylinder and cube specimens and b) stress-strain curve from the com-
pression test
Table 4.2 Mean values of the material properties for the concrete
Test Compression strength Elastic modulus Splitting tensile strength
fc [MPa] no. Ec [GPa] no. fct,split [MPa] no.
A 63.0 4 32.558 3 4.20 3
BI 52.4 3 29.342 3 3.25 3
CI 67.9 3 29.785 3 3.80 3
BO 59.6 1 - -
CO 68.0 1 - -
BIO 48.0 3 29.164 3 3.72 3
CIO 61.2 3 28.138 3 3.22 3
DIO 55.1 3 30.167 3 3.94 3
4.3 Tests on reinforcement steel
The material properties of the reinforcement steel usually have small scatter, for this
reason material samples were tested only once (for RC frame used in DIO test) and not
for each RC frame. The yield strength fy, elastic modulus Es and tensile strength ft were
determined by specimens with a length of 300 mm for different diameters. The mean
values are listed in Table 4.3.
Table 4.3 Mean values of the material for the reinforcement steel
Diameter
[mm]
Yield strength Elastic modulus Tensile strength
fy [MPa] no. Es [GPa] no. ft [MPa] no.
8 537 2 196.00 2 669 3
10 547 3 195.38 3 679 3
12 530 3 194.53 3 626 3
14 548 3 207.86 3 641 3
4.4 Tests on mortar
The thin-bed mortar was used for bed joints, while head joints were left unfilled.
Normal mortar was used for infill/frame connection in traditional systems for filling the
gap between infill wall and surrounding frame. Normal mortar was also used for IMES
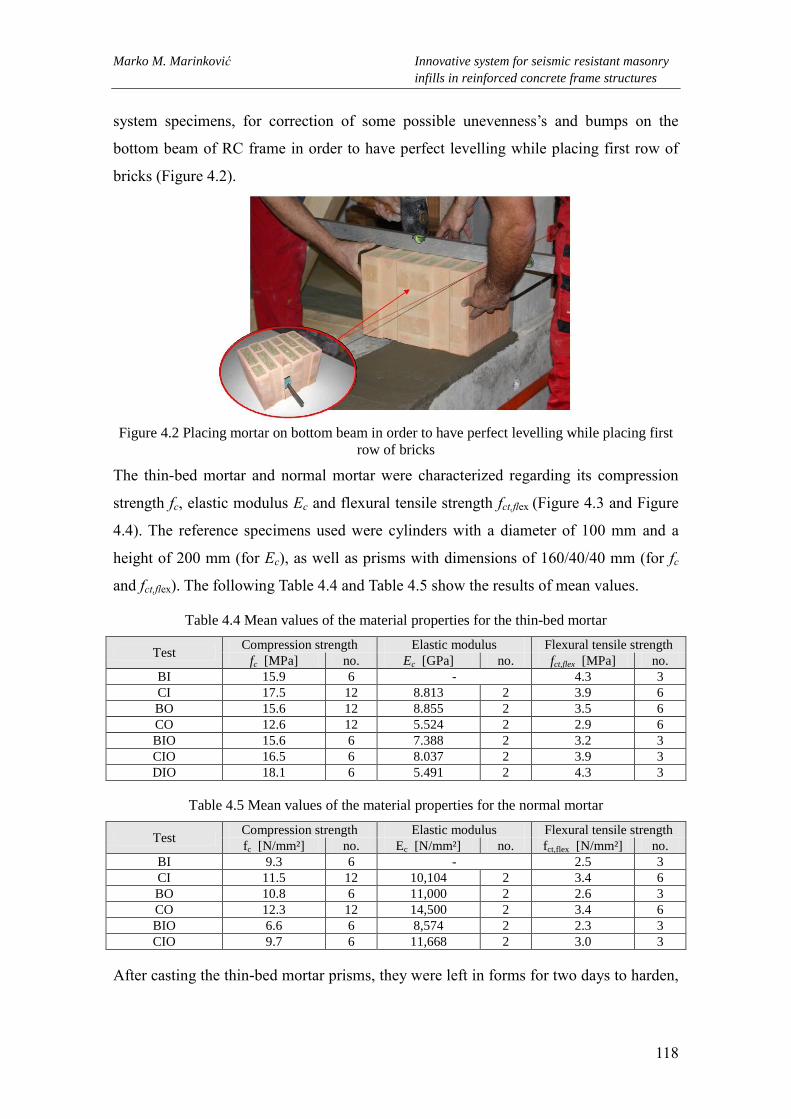
Marko M. Marinković Innovative system for seismic resistant masonry
infills in reinforced concrete frame structures
118
system specimens, for correction of some possible unevenness‘s and bumps on the
bottom beam of RC frame in order to have perfect levelling while placing first row of
bricks (Figure 4.2).
Figure 4.2 Placing mortar on bottom beam in order to have perfect levelling while placing first
row of bricks
The thin-bed mortar and normal mortar were characterized regarding its compression
strength fc, elastic modulus Ec and flexural tensile strength fct,flex (Figure 4.3 and Figure
4.4). The reference specimens used were cylinders with a diameter of 100 mm and a
height of 200 mm (for Ec), as well as prisms with dimensions of 160/40/40 mm (for fc
and fct,flex). The following Table 4.4 and Table 4.5 show the results of mean values.
Table 4.4 Mean values of the material properties for the thin-bed mortar
Test Compression strength Elastic modulus Flexural tensile strength
fc [MPa] no. Ec [GPa] no. fct,flex [MPa] no.
BI 15.9 6 - 4.3 3
CI 17.5 12 8.813 2 3.9 6
BO 15.6 12 8.855 2 3.5 6
CO 12.6 12 5.524 2 2.9 6
BIO 15.6 6 7.388 2 3.2 3
CIO 16.5 6 8.037 2 3.9 3
DIO 18.1 6 5.491 2 4.3 3
Table 4.5 Mean values of the material properties for the normal mortar
Test Compression strength Elastic modulus Flexural tensile strength
fc [N/mm²] no. Ec [N/mm²] no. fct,flex [N/mm²] no.
BI 9.3 6 - 2.5 3
CI 11.5 12 10,104 2 3.4 6
BO 10.8 6 11,000 2 2.6 3
CO 12.3 12 14,500 2 3.4 6
BIO 6.6 6 8,574 2 2.3 3
CIO 9.7 6 11,668 2 3.0 3
After casting the thin-bed mortar prisms, they were left in forms for two days to harden,

Chapter 4 Experimental tests on system components
119
then the forms were removed and the specimens were left in the laboratory at a
temperature of approximately 20 °C and a relative humidity of 65 % till the date of the
test. The hardened mortar compression strength properties were determined according
to DIN EN 1015-11 (2007) and elastic modulus was determined (Figure 4.3) based on
the DIN 1048-5 (1991). Small cylinders having a diameter of 100 mm and height of 200
mm were cast using mortar from the same mixture and were stored as described.
a) b)
Figure 4.3 a) Determination of elastic modulus and b) compressive strength of the mortar (IN-
SYSME, 2017a)
a) b)
Figure 4.4 a) Determination of slump and b) flexural strength of the mortar (INSYSME, 2017a)
Table 4.6 Mean values for the slump and air content for the mortar types
Code Mortar
application
Water / Mortar
[%]
Slump
[cm]
Air content
[%]
Zp99 Capping 31.3 17.1 12.7
Dipping 39.1 22.7 9.9
Poroton Capping 64.7 17.3 21.9
The characteristic properties of the fresh and hardened mortar were determined for each
series of small walls constructed for the flexural tensile tests. The determination of the
fresh mortar properties was conducted according to DIN EN 1015-3 (2007) and DIN

Marko M. Marinković Innovative system for seismic resistant masonry
infills in reinforced concrete frame structures
120
EN 1015-7 (1998). The Table 4.6 gives the mean values of the slump and the air content
of each mortar type.
4.5 Tests on masonry units
Since for infill walls MZ70 bricks (Figure 4.5a) were used, they were characterized by
measuring dimensions, web thickness, plan parallelism, flatness of faces, percentage of
voids, net dry and gross dry density, compression strength and elastic modulus. Six
packets of bricks were delivered to the laboratory and 30 bricks were taken randomly
without considering the quality of the bricks. The bricks that were damaged by transport
were not considered. These units are thermal insulating clay brick with mineral wool
insulation material inside the vertical holes of the brick. From the previously chosen 30
units, six units were taken randomly for the determination of dimensions, web
thickness, plane parallelism and flatness of surfaces. After this, the insulation filling was
taken out and the units were left in an oven (Figure 4.5b) with a temperature of 105 ± 5
°C until reaching the weight consistency for determining the percentage of voids, the
gross dry and the net dry of the masonry units. The values were determined according to
the reference standards in Table 4.1. The following Table 4.7 gives the mean values of
the dimensions (length/depth/height) and the web thickness as well as the maximum
values of the plan parallelism of each masonry unit.
Table 4.7 Mean values for the dimensions, web thickness and plan parallelism of the units
Dimensions
L/T/H [mm]
Exterior web thickness Sum of web thickness Plan parallel-
ism
[mm] longitudinal
[mm]
transverse
[mm]
longitudinal
[%]
transverse
[%]
251.6/364.2/249.1 14.5 8.8 29.6 10.7 0.58
a) b)
Figure 4.5 a) MZ70 brick and b) bricks in oven (INSYSME, 2017a)

Chapter 4 Experimental tests on system components
121
The Table 4.8 gives the maximum values of the face flatness and the mean values of the
gross dry and net dry density, percentage of voids, elastic modulus and compressive
strength determined in vertical and longitudinal direction, tested according to the
reference standards (Table 4.1). A cap of cement paste was cast on the upper and lower
surfaces of the brick units before the compression tests were conducted in order to get
plane surfaces and to avoid concentration of stresses due to surface irregularities (Figure
4.6) while shows brick after the test.
Table 4.8 Mean values for the face flatness, gross dry and net dry density, percentage of voids
elastic modulus and compressive strength for the masonry units
Face
flatness
[mm]
Gross dry
density
[kg/m3]
Net dry
density
[kg/m3]
Voids
[%]
Elastic modulus Compression strength
Vertical
direction
[GPa]
Longitudinal
direction
[GPa]
Vertical
direction
[MPa]
Longitudinal
direction
[MPa]
0.14 553 1467 62.3 10.71 8.36 6.3 4.8
a) b)
Figure 4.6 a) Determining compressive strength of the masonry units and b) damaged brick after
the test
4.6 Tests on masonry assemblies
The bond strength of the mortar-unit interface, the compressive strength and elastic
modulus of the three-brick test as well as flexural strength parallel and perpendicular to
the bed joints were investigated and the mean values are presented in Table 4.9.
Ten samples have been constructed and tested for determining the bond strength of the
mortar-unit interface using the bond wrench method as shown in Figure 4.7. The
compression strength and the elastic modulus were determined on three-brick
assembley using three specimens based on the DIN EN 1052-1 (1998). In order to
determine flexural strength of masonry walls, the four-point bending tests were carried
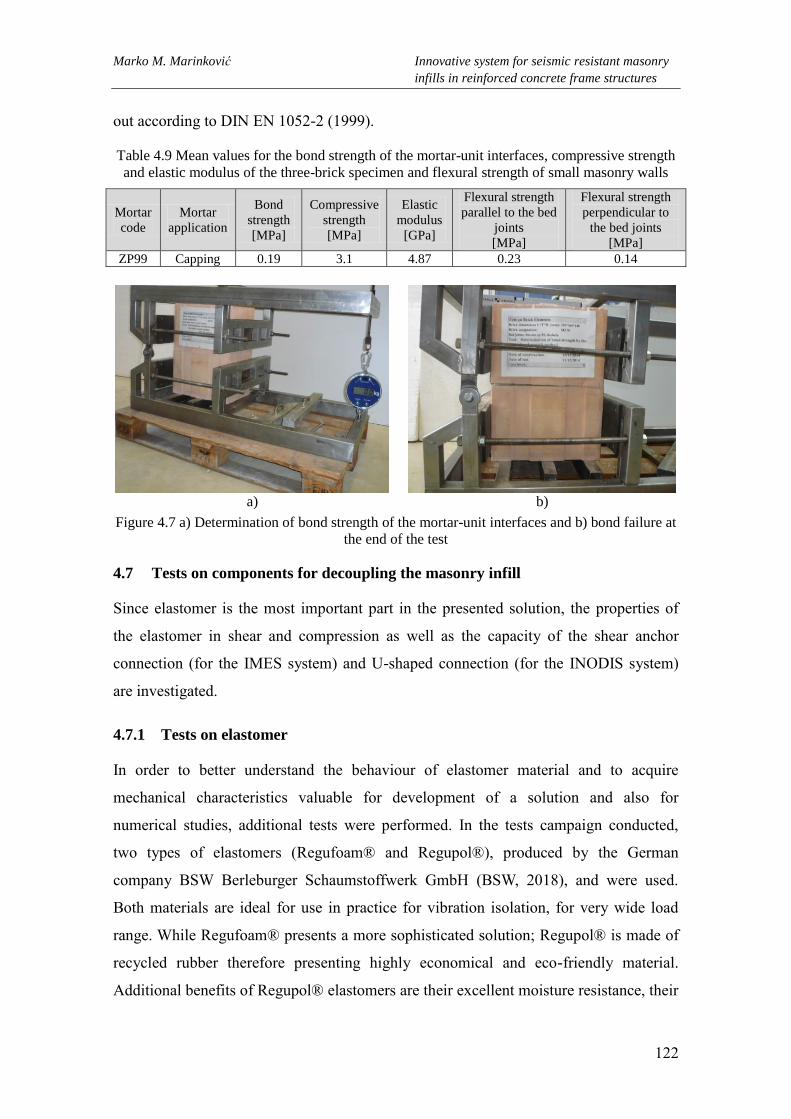
Marko M. Marinković Innovative system for seismic resistant masonry
infills in reinforced concrete frame structures
122
out according to DIN EN 1052-2 (1999).
Table 4.9 Mean values for the bond strength of the mortar-unit interfaces, compressive strength
and elastic modulus of the three-brick specimen and flexural strength of small masonry walls
Mortar
code
Mortar
application
Bond
strength
[MPa]
Compressive
strength
[MPa]
Elastic
modulus
[GPa]
Flexural strength
parallel to the bed
joints
[MPa]
Flexural strength
perpendicular to
the bed joints
[MPa]
ZP99 Capping 0.19 3.1 4.87 0.23 0.14
a) b)
Figure 4.7 a) Determination of bond strength of the mortar-unit interfaces and b) bond failure at
the end of the test
4.7 Tests on components for decoupling the masonry infill
Since elastomer is the most important part in the presented solution, the properties of
the elastomer in shear and compression as well as the capacity of the shear anchor
connection (for the IMES system) and U-shaped connection (for the INODIS system)
are investigated.
4.7.1 Tests on elastomer
In order to better understand the behaviour of elastomer material and to acquire
mechanical characteristics valuable for development of a solution and also for
numerical studies, additional tests were performed. In the tests campaign conducted,
two types of elastomers (Regufoam® and Regupol®), produced by the German
company BSW Berleburger Schaumstoffwerk GmbH (BSW, 2018), and were used.
Both materials are ideal for use in practice for vibration isolation, for very wide load
range. While Regufoam® presents a more sophisticated solution; Regupol® is made of
recycled rubber therefore presenting highly economical and eco-friendly material.
Additional benefits of Regupol® elastomers are their excellent moisture resistance, their

Chapter 4 Experimental tests on system components
123
rot-proof properties, their ozone resistance and their permanent elasticity even after
frost-thaw cycles. Since it is made by recycling and old rubbers, it does not have a
problem with ageing.
4.7.1.1 Static compression tests in the range of high strains
The designation of the elastomers, their static and dynamic elastic modules and the
dimensions of the specimens (Table 4.10) are provided by the company BSW
Berleburger Schaumstoffwerk GmbH (BSW, 2018) that produces elastomers used in
this research. Tests are carried out in laboratory at UniKassel.
Table 4.10 Static and dynamic elastic modulus of the elastomer
Type of
elastomer
Static elastic modulus
[MPa]
Dynamic elastic modulus
[MPa]
Dimensions
L / T / H [mm]
Regufoam® 270 0.25 – 0.45 0.60 – 1.05 300 / 300 / 25
Regufoam® 400 0.6 – 1.0 1.2 – 2.0 300 / 300 / 25
Regufoam® 510 1.1 – 1.7 2.2 – 3.7 300 / 300 / 25
Regufoam® 570 2.6 – 2.7 5.1 – 6.3 160 / 120 / 25
Regufoam® 680 2.0 – 2.9 6.8 – 10.0 160 / 120 / 25
In order to get the values of stiffness of elastomers in the range of high strains, static
compression tests were performed in laboratory at UniKassel (Figure 4.8). Specimens
were subjected to a monotonic compressive load with a velocity of 0.4 mm/s. These
tests were important to get the information needed for numerical simulations, since it is
expected that elastomers experience high compressions for higher drift ranges.
According to this it was important to have the information about the stiffness of
elastomers in high strain ranges in order order to simulate, more realistically, the
transfer of stresses from frame to the infill. Mean values of physical characteristics of
the tested specimens are given in Table 4.11 and density comparison in Figure 4.9.
Figure 4.8 Compression tests on specimen Regufoam® 400 and Regupol® 480

Marko M. Marinković Innovative system for seismic resistant masonry
infills in reinforced concrete frame structures
124
Table 4.11 Mean values of physical characteristics of the tested specimens
Type of
elastomer
Dimensions
L / T / H [mm]
Surface area
[mm²]
Density
[g/cm3]
Regufoam® 270 248.8 / 249 / 24.9 61950 0.229
Regufoam® 400 249.4 / 249.1 / 24.74 62115 0.352
Regufoam® 510 249.4 / 249.2 / 24.8 62154 0.460
Regufoam® 570 248.8 / 249 / 24.9 62331 0.561
Regufoam® 680 249.7 / 249.9 / 25.1 62389 0.637
Regupol® 480 251.9 / 251.8 / 26.3 63425 0.545
Regupol® 550 250.8 / 250.5 / 25.2 62833 0.698
Figure 4.9 Density of tested elastomer specimens
From the Figure 4.10a it can be concluded that stiffness of elastomers is highly
increased in higher strain ranges. Also, it is helpful to notice that behaviour of recycled
rubber materials (Regupol®) is similar to the more sophisticated Regufoam®
elastomers. The only difference is that at the beginning Regupol® samples have even
lower stiffness then Regufoam® (Figure 4.10b), but at higher strains it increases faster.
For both materials, obvious hyperelastic behaviour can be seen, which was one of the
main reasons to choose this type of material.
a) b)
Figure 4.10 Stress-strain diagram of the tested elastomers at a) higher and b) lower strains

Chapter 4 Experimental tests on system components
125
4.7.1.2 Cyclic compression tests
In order to investigate the hyperelastic behaviour of the elastomers used in experiments,
cyclic compression tests were carried out in laboratory at UniKassel. Cyclic loads were
applied in three ramp-like cycles with a velocity of 0.4 mm/s. Both diagrams in Figure
4.11 indicate a high degree of stiffening depending on the type of elastomer at higher
compressive strains. Furthermore, the viscoelastic material behaviour with energy
dissipation is very easy to see in the diagram for cyclical loading and unloading, which
is an additional beneficial effect, besides decoupling, of using elastomers for this
connection. Instead of dissipation of energy through the plastification (damage and
cracks) in infill, energy is dissipated with viscoelastic behaviour of the elastomer.
Figure 4.11 Stress-strain curves of the Regufoam® and Regupol® elastomers under cyclic load
4.7.1.3 Shear tests
Since U-shaped connection of elastomer used in the INODIS system is loaded not just
with compression but also with shear due to the out-of-plane seismic loadings acting on
the infill, shear testing of elastomer was conducted in the laboratory of BSW. Figure
4.12a presents test setup, where it can be seen that elastomers were glued to the steel
plates. Side plates were used to introduce restrain in translation and middle plates were
used to introduce the load to the elastomer by assigning displacement in longitudinal
direction of the plates. There was no force applied perpendicular to the steel plates. On
Figure 4.12b loaded specimen is presented. Mean values of physical and mechanical
characteristics of the tested specimens are given in Table 4.12.
Figure 4.13 can be used for the evaluation of which type of elastomer should be applied
for the second layer of U-shaped connection in the INODIS system. Also, these curves
are important input for numerical simulations and evaluation of behaviour of the

Marko M. Marinković Innovative system for seismic resistant masonry
infills in reinforced concrete frame structures
126
INODIS system. It is valuable noticing that behaviour of recycled rubber materials
(Regupol®) is similar to the sophisticated Regufoam® elastomers. The only difference
is that Regufoam® samples have almost linear behaviour up to the tested level of shear
strain (γ=30%) while stress-strain curves of Regupol® specimens have slight parabolic
shape.
a) b)
Figure 4.12 Shear test on elastomer: a) test setup and b) loaded specimen
Table 4.12 Mean values of physical and mechanical characteristics of the shear tested specimens
Type of
elastomer
Dimensions
L / T / H [mm]
Shear modulus
[N/mm²]
Shear stress at 25% of
shear strain
[N/mm²]
Regufoam® 150 50 / 50 / 2x12.5 0.04 0.01
Regufoam® 510 50 / 50 / 2x12.5 0.61 0.15
Regufoam® 990 50 / 50 / 2x12.5 2.47 0.62
Regupol® 200 50 / 50 / 2x25 0.09 0.02
Regupol® 480 50 / 50 / 2x15 0.27 0.07
Regupol® 1000 50 / 50 / 2x10 1.65 0.41
Figure 4.13 Stress-strain curves of shear tests on the Regufoam® and Regupol® elastomers
4.7.2 Tests on shear anchor connection (IMES system)
While decoupling RC frame and masonry infill with the elastomers, special care should

Chapter 4 Experimental tests on system components
127
be given to out-of-plane resistance of infill wall. For the IMES system, tested with
specimens CO, CI and CIO, an alternative load transfer mechanism in the form of shear
anchor connection placed on one end in RC frame and on the other end connected to the
elastomer that is placed in masonry units, is tested. Setup of this connection was quite
suitable for the masonry unit MZ70. Although this connection can be used also for
different types of bricks, it needs a hole for installation of anchors with elastomer.
4.7.2.1 Test setup and instrumentation
For the test setup, the frame made of steel I-sections, which simulated the fixed support
of the shear anchor into the RC frame is constructed (Figure 4.14). In order to create a
setup (Figure 4.15) as close to the reality as possible, the test specimens consisted of
three masonry units. The brick placed in the middle was loaded by the hydraulic
cylinder, while two bricks on the side contained shear anchors. In order to minimize the
effects of friction, the test specimens were placed on a sliding layer. Tests were
conducted as a displacement controlled with a constant speed of load application. The
deformation of the specimen was measured by displacement transducers (Figure 4.14).
Figure 4.14 Drawing of the test setup with the location of displacement transducers

Marko M. Marinković Innovative system for seismic resistant masonry
infills in reinforced concrete frame structures
128
Figure 4.15 Test setup (INSYSME, 2017a)
4.7.2.2 Geometry and construction of specimens
The test specimens consisted of three bricks, as already described. The side bricks were
made of MZ70 units by opening a chamber. Three different types of connection bricks
were considered (Figure 4.16). To eliminate stress concentrations in the bricks, the steel
shear anchors with a diameter of 16 mm were placed within the elastomer Regufoam®
680. The distance between the surface of the masonry unit and the fixed support was 25
mm. For the Type 1 connection, elastomer was placed through the whole height of the
chamber, but in a smaller chamber, while for the Type 2 connection longer chamber was
used. And Type 3 connection was made of elastomer having the quadratic cross section
with the same dimension as the width of the chamber. This elastomer was placed in a
smaller chamber.
a) b) c)
Figure 4.16 Types of connection tested: a) type 1; b) type 2 and c) type 3 (INSYSME, 2017a)
4.7.2.3 Test results
The maximum load-bearing capacity and the corresponding elastomer deformation
(mean values) of the different connection types are shown in Table 4.13. Furthermore,
the maximum shear-bearing capacity of the masonry unit MZ70 without opened
chamber was determined also and is called type 0. First, type 0 connection was tested,
followed by the tests on the type 3 and type 1 connection. Since the type 1 connection

Chapter 4 Experimental tests on system components
129
had a significantly lower load-bearing capacity than type 3, the type 2 with an
apparently even lower load-bearing capacity has not been tested. It should be noted that
in all the tests for all types of connections, brick was the part that always broke (Figure
4.17b) at the point when maximum load capacity was reached, due to its low shear
(splitting) strength. Figure 4.17a clearly shows deformability of the elastomer during the
test.
Table 4.13 Capacity of the connection types
Type of con-
nection
Capacity of connection
Force [kN] Deformation [mm] no.
0 2.14 - 2
1 1.30 3.36 4
3 1.84 5.50 6
a) b)
Figure 4.17 a) Deformation of the elastomer during the test and b) splitting of the brick in a case
of connection type 3 (INSYSME, 2017a)
4.7.3 Tests on U-shaped connections of elastomers (INODIS system)
INODIS uses U-shaped connections build-up of two different types of elastomers. For
the DIO test the U-shaped elastomers were assembled by gluing stripes of elastomers
together. Afterwards, U-shaped elastomers were placed on the frame, around plastic
profiles, and glued to the bricks on the circumference of the infill. During the out-of-
plane loading of infill, the U profiles made of elastomers are subjected to shear and
bending forces. The circumferential U-shaped elastomer strips must be able to safely
absorb these forces. The load is transferred by the flange of the U profile to the
circumferential plastic profile. In this case, various load situations can arise due to
simultaneously occurring in-plane frame displacements. The critical load situations are
those in which the frame separates from the elastomer, forming gaps. In this case the
flange of the U profile is subjected to an eccentric load.

Marko M. Marinković Innovative system for seismic resistant masonry
infills in reinforced concrete frame structures
130
In order to test the glue bond and the load bearing capacity of the U-shaped elastomer,
experimental campaign on small specimen tests was conducted. Experimental tests were
performed on a brick for the connection situations corresponding to the frame columns
and frame top beam. In the experiments, the elastomer U profiles were glued on both
sides of the bricks and subjected to the shear load using a loading plate. Figure 4.18
shows the test setup for the connection to the columns in which the elastomer is glued to
the smooth sides of the brick. This corresponds to how the elastomer strips are glued in
the wall because the first brick in each row has smooth surfaces for gluing. Figure 4.19
shows the test setup for the connection to the beam in which the 250 mm wide
elastomer strip, which corresponds to the support width of 250 mm used in the wall
tests, is glued to the top and bottom of the brick where the holes are located. Like in the
wall tests, the elastomer strips and bricks are glued together using the one-component
glues Keraflex® and Regupur® provided by BSW Berleburger Schaumstoffwerk
GmbH (BSW, 2018). Preparation and testing of the specimens was performed in the
laboratory of Institut für Ziegelforschung Essen e.V. (IZF).
Figure 4.18 Test setup for the connection of the U-shaped elastomer to the columns
Figure 4.19 Test setup for the connection of the U-shaped elastomer to the top beam

Chapter 4 Experimental tests on system components
131
4.7.3.1 Preparation of the test specimens
The specimens are prepared in several working steps, described as follows. The
preparation starts with the application of Regufoam® 400 (250/250/25 mm) to the brick
surfaces, whereas the glue is applied to the elastomer (Figure 4.20). The next step is the
application of the second layer of elastomers (100/250/25 mm and 100/250/12.5 mm)
made of Regufoam® 510. For beam case just 25 mm thick Regufoam® 510 is applied,
while for column case both 25 mm and 12.5 mm Regufoam® 510 are applied one on
each other. Finally Figure 4.21 shows the applied elastomeric connections to both sides
of the brick MZ70. Important to mention is that two types of glue are used, Keraflex®
and Regupur® (Figure 4.22), in order to choose the best one for final test on the infilled
frame. Basic difference was that Regupur® is more liquid than Keraflex® (black
colour), therefore it was more difficult to apply it with spatula which was used for
application of both glues (Figure 4.23).
a) b) c)
Figure 4.20 a) Regufoam® 400, b) glue application on Regufoam® 400 and c) Regufoam® 510
a) b)
Figure 4.21 Preparation process: a) prepared specimens for testing the column and b) beam con-
nection

Marko M. Marinković Innovative system for seismic resistant masonry
infills in reinforced concrete frame structures
132
a) b)
Figure 4.22 a) Packages of Keraflex® and b) Regupur® glues
a) b)
Figure 4.23 a) Application of Keraflex® and b) Regupur®
A concrete plate rigidly connected to the plastic profile was used to provide the support
and present the concrete frame. Figure 4.24a shows the preparation of the concrete plate
and Figure 4.24b illustrates the final arrangement of the plastic profile with sliding
surfaces glued on the plastic profile and concrete plate.
a) b)
Figure 4.24 a) Preparation of the concrete plate used for testing beam connection and b) plastic
profile attached to concrete plate used for testing column connection

Chapter 4 Experimental tests on system components
133
4.7.3.2 Test configurations
In total twelve specimens were tested under various test configurations. Table 4.14
summarizes the tests and the corresponding boundary conditions. All tests were
executed with a low pre-stress, because this condition represents the most unfavourable
load transfer and will take place, if frame and infill masonry are partially detached.
Usually it can be expected, that a gapping occurs in the corner regions of the wall in the
higher deformation range of the frame. The movement of the plastic profile together
with the frame is simulated by gaps, which are realized by adding wooden plates with
differing thickness in the contact area between the elastomers and the concrete plates.
Since the most important elements of the connections are the glued surfaces affected by
shear and bending stresses. Therefore the focus was set on the behaviour of the
elastomers and glued connections. As already mentioned, two types of elastomer were
tested, Regufoam® and Regupol®. Additionally, in order to verify applicability of the
solution to other types of bricks, tests of U-shaped elastomers with the autoclaved
aerated concrete (AAC) and calcium silicate (CS) brick were also performed.
Table 4.14 Summary of the experimental tests
No. Test Name Connection
type
Gap/Contact
width
Elastomer
type Glue
Contact-concrete
plate at the bottom
1 C Column 0/30 mm Regufoam® Keraflex® no
2 CG10MM-a Column 10/20 mm Regufoam® Keraflex® no
CG10MM-b Column 10/10 mm Regufoam® Keraflex® yes
3 CG15MM Column 15/15 mm Regufoam® Keraflex® no
4 CG20MM Column 20/10 mm Regufoam® Keraflex® no
5 B Beam 0/25 mm Regufoam® Keraflex® no
6 BG7.5MM Beam 7.5/17.5 mm Regufoam® Keraflex® no
7 BG10MM Beam 10/15 mm Regufoam® Regupur® no
8 BG15MM Beam 15/10 mm Regufoam® Keraflex® no
9 BRP Beam 0/25 mm Regupol® Keraflex® no
10 CRP Column 0/25 mm Regupol® Keraflex® no
11 BAACRP Beam 0/20 mm Regupol® Keraflex® no
12 BCSRP Beam 0/25 mm Regupol® Keraflex® no
4.7.3.3 Column connection – Test C
The test C was carried for a column connection without the gap between the elastomer
and concrete plate. Since the thickness of the plastic profile was 30 mm, this mean that
also the contact width is 30 mm. Up to a load level of 8.5 kN no damage of the
connections was observed. After exceeding 8.5 kN, the brick failed with a vertical
splitting crack, probably because of the bending (Figure 4.25b). Figure 4.25a shows the

Marko M. Marinković Innovative system for seismic resistant masonry
infills in reinforced concrete frame structures
134
force-displacement curve, where displacement was measured at the place of load
application (middle of the length of the brick). From the diagram it can be seen that
specimen has almost linear behaviour, probably due to the characteristic of elastomer of
having high elastic deformations. In Figure 4.26 behaviour of the connection at different
levels of deformation is shown, where it can be seen that elastomer together with glued
connection is capable of withstanding high level of deformations and that limit capacity
was governed by the brick.
a) b)
Figure 4.25 a) Force-displacement curve of the Test C and b) split brick at the end of the test
d = 3.4 mm (1 kN) d = 8.0 mm (2 kN) d = 13.8 mm (3.7 kN) d = 42.4 mm (8.5 kN)
Figure 4.26 Deformations at different load levels of the Test C
4.7.3.4 Column connection – Test CG10MM
The test CG10MM was carried out with the gap of 10 mm, provided by placing wooden
plates of 10 mm thickness in between the elastomer and concrete support. Since
thickness of the plastic was 3 cm, this setup reduced the contact width between
elastomer and plastic to 20 mm, creating a less favourable situation. The reason for
testing this situation and also other specimens with gap was because of gapping that
appears between U-shaped elastomer and plastic profile in the higher deformation
ranges due to the movement of the plastic profile together with the frame.

Chapter 4 Experimental tests on system components
135
a) b)
Figure 4.27 a) Force-displacement curve of the Test CG10MM-a and CG10MM-b and b) split
brick at the end of the test
d = 10.5 mm (2.5 kN) d = 22.7 mm (4.5 kN) d = 28.3 mm (5.4 kN)
Figure 4.28 Deformations at different load levels of the Test CG10MM-a
On Figure 4.27a it can be seen that up to a load level of 5.4 kN no damage of the
connections and the brick was observed, except slight appearance of delamination of
glued connection between Regufoam® 400 and brick (Figure 4.28). At this load level
the test was stopped, because the wooden plate at the bottom was compressed between
the elastomer and the concrete plate. The lower wooden plate was removed to avoid any
beneficial influences caused by the clamping effect. Afterwards the experimental test
was repeated without the wooden plate at the bottom (CG10MM-b). At the level of 6.6
kN, delamination of glued connection between Regufoam® 400 and brick was more
pronounced (Figure 4.29) but still not effecting the overall connection. At the force of
7.7kN crack in the brick appeared. The force dropped down at this point but soon after
started to rise, because of contact of the brick and plate underneath. This can be seen on
Figure 4.27a as almost vertical part of the CG10MM-b curve. At this point the test was
stopped. The final damage of the brick at about 8.0 kN is presented by a side view in
Figure 4.27b, while Figure 4.28 and Figure 4.29 illustrate the behaviour of the

Marko M. Marinković Innovative system for seismic resistant masonry
infills in reinforced concrete frame structures
136
connection at different levels of deformation, where it can be seen that elastomer
together with glued connection is capable of withstanding high level of deformations
and that limit capacity was governed by the brick.
d = 30.7 mm (6 kN) d = 41.5 mm (6.6 kN) d = 54.2 mm (7.5 kN)
Figure 4.29 Deformations at different load levels of the Test CG10MM-b
4.7.3.5 Column connection – Test CG15MM
The test CG15MM was carried out with the gap of 15 mm, provided by placing wooden
plates of 15 mm thickness in between the elastomer and concrete support. This setup
reduced the contact width between elastomer and plastic to 15 mm, creating a less
favourable situation.
a) b)
Figure 4.30 a) Force-displacement curve of experimental tests CG15MM and b) damaged brick
at the end of the test
Figure 4.30a shows the force-displacement curve, while Figure 4.31 illustrates the
behaviour of the connection at different levels of deformation. Up to a load level of 4
kN no damage of the connections and the brick was observed. At 4.5 kN slight
appearance of delamination of glued connection between Regufoam® 400 and brick is
observed (Figure 4.30b). At the load level of 4.8 kN, the reduction of the slope of the
force-displacement started (Figure 4.30). At the force of 5.15 kN crack in the brick

Chapter 4 Experimental tests on system components
137
appeared. At the same time small delamination between two parts of elastomers was
noticed. The force started to decrease and soon after the test was stopped. The final
damage of the brick and deformation of the elastomer at about 5.15 kN is presented in
Figure 4.31.
d = 11.9 mm (2.5 kN) d = 23.7 mm (4 kN) d = 49.0 mm (5.15 kN)
Figure 4.31 Deformations at different load levels of the Test CG15MM
4.7.3.6 Column connection – Test CG20MM
The test CG20MM was carried out with the gap of 20 mm, provided by placing wooden
plates of 20 mm thickness in between the elastomer and concrete support. Since
thickness of the plastic was 3 cm, this setup reduced the contact width between
elastomer and plastic to 10 mm, creating an even more unfavourable situation than for
the previous tests.
a) b)
Figure 4.32 a) Force-displacement curve of the Test CG20MM and b) partly delaminated
sliding surfaces at the end of the test
Figure 4.32a shows the force-displacement curves and Figure 4.33 illustrates the
behaviour of the connection at different levels of deformation. Up to the force of around
5 kN, which corresponds to the displacement of the brick of 29 mm, no substantial

Marko M. Marinković Innovative system for seismic resistant masonry
infills in reinforced concrete frame structures
138
damage of the connections and the brick was observed (Figure 4.33). Only the sliding
surfaces delaminated along the boundaries caused by the strong deformations of the
elastomers in the higher displacement range (Figure 4.32b). It has to be pointed out, that
the glued connection was not damaged although the load was applied near to the glued
joint. After this point there is a dropdown of the force, because there was delamination
in glue connection between the brick and Regufoam®400 (Figure 4.33). The force
dropped down to around 4500N and started to increase a little bit until 4900N. After that
decrease of the force was followed with the increase of displacement. In Figure 4.32a it
can be seen that up to 30 mm connection is in the linear range. After exceeding a 30 mm
of displacement, the connection was able to keep the load level of about 5 kN up to a
deformation of about 48 mm, after which a drop down of the force can be observed.
d = 5.9 mm (1 kN) d = 12.4 mm (2 kN) d = 22.3 mm (3.5 kN) d = 29.0 mm (4.9 kN)
Figure 4.33 Deformations at different levels of displacements of the Test CG20MM
4.7.3.7 Beam connection – Test B
The test B was carried for a column connection without the gap between the elastomer
and concrete plate. Since the thickness of the plastic profile was 25 mm, this means that
also the contact width is 25 mm.
Up to a load level of about 3.8 kN no substantial damage of the connections and the
brick was observed. After exceeding this load level horizontal crack appeared at the left
side of the top of the brick and after a short drop down of the force, the force continued
to increase (Figure 4.34a). At around 5.57 kN crack appeared on the other side of the
brick too (Figure 4.34b) which caused sudden decrease of the force, although glued
connection wasn‘t harmed and the capacity of the connection was still not reached.
Figure 4.35 illustrates the behaviour of the connection at different load levels, where it
can be seen that there is no damage at the glued connection at all.

Chapter 4 Experimental tests on system components
139
a) b)
Figure 4.34 a) Force-displacement curve of the Test B and b) specimen at the end of the test
d = 5.4 mm (1.5 kN) d = 13.5 mm (3.8 kN) d = 23.5 mm (5.5 kN)
Figure 4.35 Deformations at different load levels of the Test B
4.7.3.8 Beam connection – Test BG7.5MM
The test BG7.5MM was carried out with the gap of 7.5 mm, provided by placing
wooden plates of 7.5 mm thickness in between the elastomer and concrete support. This
setup reduced the contact width between elastomer and plastic to 17.5 mm.
a) b)
Figure 4.36 a) Force-displacement curve of the Test BG7.5MM and b) specimen at the end of
the test
At the force of about 3.5 kN first crack in the brick was observed. This was followed by

Marko M. Marinković Innovative system for seismic resistant masonry
infills in reinforced concrete frame structures
140
a sudden decrease of force, but soon after force started to increase again with the slope
almost the same as until this moment (Figure 4.36a). Force continued to increase up to
the load level of around 5.4 kN when upper web of the brick completely failed (Figure
4.36b) which led to the sudden decrease of force. Figure 4.37 illustrates the behaviour
of the connection at different load levels. It is important to notice that at the end of the
test neither elastomer to elastomer glued connection nor the glued connection between
elastomer and brick was harmed (Figure 4.36b).
d = 6.3 mm (1.5 kN) d = 13.7 mm (3 kN) d = 31.2 mm (5.3 kN)
Figure 4.37 Deformations at different load levels of the Test BG7.5MM
4.7.3.9 Beam connection – Test BG10MM
The test BG10MM was carried out with the gap of 10 mm, provided by placing wooden
plates of 10 mm thickness in between the elastomer and concrete support. This setup
reduced the contact width between elastomer and plastic to 15 mm. It is important to
mention that this specimen was prepared using Regupur® glue instead of Keraflex®.
Up to a load level of about 4.33 kN no substantial damage of the connections and the
brick was observed. After exceeding this load level the web of the brittle failure of the
brick occurred (Figure 4.38b), but the capacity of the connection was still not reached.
Figure 4.38a shows the force-displacement curve where it can be seen that until the drop
down of the curve, caused by the brick failure, connection was in linear range. Figure
4.39 illustrates the behaviour of the connection at different load levels. From the test
results and pictures it can be observed that Regupur® glue performed very well, maybe
even better than Keraflex® glue, so it can be concluded that both glues can be used
satisfactorily for gluing two elastomers, even having different stiffnesses, and also for
gluing elastomers to the brick.

Chapter 4 Experimental tests on system components
141
a) b)
Figure 4.38 a) Force-displacement curve of the Test BG10MM and b) specimen at the end of
the test
d = 2.6 mm (0.5 kN) d = 10.1 mm (2 kN) d = 28.3 mm (4.5 kN)
Figure 4.39 Deformations at different load levels of the Test BG10MM
4.7.3.10 Beam connection – Test BG15MM
The test BG15MM was carried out with the gap of 15 mm, provided by placing wooden
plates of 15 mm thickness in between the elastomer and concrete support. Since
thickness of the plastic was 25 mm while Regufoam® 510 had thickness of 25 mm, this
setup reduced the contact width between elastomer and plastic to 10 mm.
Up to a load level of about 2.5 kN no substantial damage of the connections and the
brick was observed. After exceeding this load level connection between elastomers
started to unglue (Figure 4.41, middle). This was followed by slight decrease of the
slope of the force-displacement curve (Figure 4.40a). After this, force continued to
increase up to the load level of around 3.8 kN, when horizontal crack appeared on both
sides of the top of the brick (Figure 4.40b). This led to the smooth decrease of the force
followed with the increase of displacement. Figure 4.41 illustrates the behaviour of the
connection at different levels of deformation.

Marko M. Marinković Innovative system for seismic resistant masonry
infills in reinforced concrete frame structures
142
a) b)
Figure 4.40 a) Force-displacement curve of the Test BG15MM and b) specimen at the end of
the test
d = 10.2 mm (2 kN) d = 13.4 mm (2.5 kN) d = 29.1 mm (3.75 kN)
Figure 4.41 Deformations at different load levels of the Test BG15MM
4.7.3.11 Beam connection – Test BRP
In further development of the solution it was decided that Regufoam® elastomers could
be substituted with Regupol® elastomers with the same or similar characteristics. This
would provide reduction of costs for the INODIS system and additionally, since
Regupol® is made of recycled ruber, an eco-friendly solution. Therefore, two additional
tests with the same setup for beam and column case were carried out.
For the preparation of the specimens the same procedure was followed as explained in
Chapter 4.7.3.1., having in mind that for the first layer of U-shaped elastomer Regupol®
480 was used instead of Regufoam® 400 and for the second layer Regupol® 550
instead of Regufoam® 510.
The test B5RP was carried out without any gap, since thickness of the plastic was 25
mm while Regupol® 550 had the same thickness. Figure 4.42a shows the force-
displacement curve and Figure 4.43 illustrates the behaviour of the connection at

Chapter 4 Experimental tests on system components
143
different levels of deformation. Up to a load level of 4 kN no damage of the connections
and the brick was observed. At this point two cracks in the brick appeared (Figure
4.42b) and a sudden drop of the force was noticed. Soon after, the test was stopped.
a) b)
Figure 4.42 a) Force-displacement curve of the Test BRP and b) specimen at the end of the test
d = 3.75 mm (1.5 kN) d = 12.4 mm (3.5 kN) d = 15.5 mm (4 kN)
Figure 4.43 Deformations at different load levels of the Test BRP
4.7.3.12 Column connection – Test CRP
The test CRP was carried out without the gap, but the contact width between elastomer
and plastic was reduced to 25 mm, because the thickness of the plastic profile used in
this test was 25 mm. Thickness of the upper layer of the U-shaped elastomer for this test
was 40 mm, while the same elastomer materials and their arrangement as for the BRP
tests were used.
Figure 4.44a shows the force-displacement curve and Figure 4.45 Deformations at
different load levels of the Test CRP
Figure 4.31 Figure 4.45 illustrates the behaviour of the connection at different load
levels. Up to a load level of 3.7 kN no damage of the connections and the brick was
observed. Then, the slope of the force-displacement curve started to decrease, due to the

Marko M. Marinković Innovative system for seismic resistant masonry
infills in reinforced concrete frame structures
144
small delamination appeared between two elastomers. At 4.1 kN delamination
increased. At the level of 4.175 kN, force-displacement curve started to decrease. Soon
after, the test was stopped. The final damage and deformation of the elastomer at the
end of the test is presented in Figure 4.44b. From the delaminated elastomers at the end
of the test it can be seen that the glued connection wasn‘t carried out satisfactorily. So it
can be concluded that this was the reason for delamination. It is certain that this would
not happen in factory production. Even in this case of poorly built connection,
resistance loads reached are very high.
a) b)
Figure 4.44 a) Force-displacement curve of the Test CRP and b) specimen at the end of the test
d = 5.2 mm (1.5 kN) d = 14.1 mm (3 kN) d = 30.0 mm (4.175 kN)
Figure 4.45 Deformations at different load levels of the Test CRP
4.7.3.13 Beam connection – Test BAACRP
In order to investigate the applicability of the solution on different types of bricks, two
additional tests were carried out using autoclaved aerated concrete (AAC) and calcium
silicate (CS) brick. In both cases Regupol® was used. These two bricks have smaller
width (AAC-7.5 cm and CS-10 cm) and they present common brick used for

Chapter 4 Experimental tests on system components
145
partition/separation walls. Therefore, these two tests can present investigation of
application of the INODIS system on partition/separation walls, plus testing its
application on different types of the brick. In this sense it was decided just to apply two
strips of elastomer leaving the space between them. That means that the first layer of
elastomer, which was so far applied in all experiments, was not applied. Elastomers
were applied on the side of the brick as it would be applied for the connection between
the top of the partition wall and beam (Figure 4.46).
Figure 4.46 BAACRP and BCSRP specimens before the test
In a case of the AAC brick, two strips of elastomer Regupol® 550 having the thickness
of 20 mm and width of 20 cm were glued to the brick. Since the thickness of the plastic
profile used in this test was 25 mm, full thickness of elastomer was activated.
a) b)
Figure 4.47 a) Force-displacement curve of the Test BAACRP b) and specimen at the end of the
test
Figure 4.47a shows the force-displacement curve and Figure 4.48 illustrates the
behaviour of the connection at different load levels. Up to a load level of 3.4 kN no
damage of the connections and the brick was observed. Then the brick suddenly cracked
in one corner and soon after the crack in complete length of the brick formed (Figure

Marko M. Marinković Innovative system for seismic resistant masonry
infills in reinforced concrete frame structures
146
4.47b). At this point the test was stopped. From the Figure 4.47b it can be concluded
that the glued connection is so strong that the parts of the brick were torn down and
stayed glued on the elastomer.
d = 2.9 mm (2 kN) d = 4.5 mm (3 kN) d = 5.9 mm (3.4 kN)
Figure 4.48 Deformations at different load levels of the Test BAACRP
4.7.3.14 Beam connection – Test BCSRP
In the case of CS brick, two strips of elastomer Regupol® 550 having the width of
30mm and thickness of 15 mm were first glued to each other and then to the brick.
Since the thickness of the plastic profile used in this test was 25 mm and total thickness
of the elastomer was 30 mm, the contact width was 25 mm.
a) b)
Figure 4.49 a) Force-displacement curve of the Test BCSRP and b) specimen at the end of the
test
Figure 4.49a shows the force-displacement curve and Figure 4.50 illustrates the
behaviour of the connection at different load levels. Up to a load level of 5.5 kN no
damage of the connections and the brick was observed. Then slight delamination of the
connection between elastomer and the brick appeared. Force continued to rise up to 6.6
kN when higher delamination was noticed and force started slowly to decrease. Soon
after this point the test was stopped. The final damage of the connection at the end of

Chapter 4 Experimental tests on system components
147
the test is presented in Figure 4.49b.
d = 7.4 mm (2 kN) d = 15.5 mm (5.5 kN) d = 23.4 mm (6.6 kN)
Figure 4.50 Deformations at different load levels of the Test BCSRP
a) b)
Figure 4.51 Summary of force displacement curves for the test on U-shaped connections for the
a) column and b) beam situation
A total of twelve tests were conducted without a prestressed loading, and with and
without applying the load eccentrically, which presents the critical load situation in
which the frame separates and gaps form between the frame and the infill. In none of
the tests on MZ70 brick failure of the glued connection between the elastomer and brick
or two elastomers appeared first because the failure of the brick governed the load
capacity. Only in the case of the CG20MM test, sliding surface damaged before the
failure of the brick. Table 4.15 and Figure 4.51 show a summary of the load bearing
capacities achieved in the each test. For the case of specimens made of MZ70 bricks the
smallest load bearing capacity of 3.8 kN was determined for the connection situation at
the top beam for the maximum gap of 15 mm and the reduced contact length of 10 mm
(Test BG15MM). Assuming a four-sided bearing system, this results in an ultimate out-
of-plane load of 23.0 kN/m2 for the test on an infilled frame with an infill panel area of
7 m2. For the self-weight of the wall of 1.4 t, this means that the very high accelerations

Marko M. Marinković Innovative system for seismic resistant masonry
infills in reinforced concrete frame structures
148
of up to 11.5g can be absorbed by INODIS connection. This presents a lower bound
because on the one hand the ultimate load of the elastomeric connection had not been
reached yet and on the other hand the lowest value for the load bearing capacity, at
which the gap along the entire circumference is greatest, was used in the calculation. It
is important to point out that these load bearing values present levels of the out-of-plane
load on the infill wall that U-shaped elastomer connection glued to the brick can
withstand. Of course the out-of-plane resistance of an infill wall is related to this
characteristic of the connection but other factors should also be considered (arching
effect, strength of the brick etc.).
The smallest load bearing capacity for partition walls of 3.4 kN was determined for the
case of AAC brick, which is much thinner and lighter than infill walls. Therefore, even
the force is smaller than for the case of infill walls made of MZ70 bricks, the out-of-
plane acceleration that this wall can withstand is around 56g, which is quite high due to
its small self-weight.
Table 4.15 Load bearing capacity of the U-shaped elastomer connection
No. Test Name Connection
type
Gap/Contact
width
Elastomer
type Glue
Load
[kN]
Pressure
on the
wall
[kN/m2]
a [g]
1 C Column 0/30 mm Regufoam® Keraflex® 8.50 51.4 26.0
2 CG10MM-a Column 10/20 mm Regufoam® Keraflex®
8.00 48.4 24.5 CG10MM-b Column 10/20 mm Regufoam® Keraflex®
3 CG15MM Column 15/15 mm Regufoam® Keraflex® 5.15 31.1 15.7
4 CG20MM Column 20/10 mm Regufoam® Keraflex® 4.92 29.7 15.0
5 B Beam 0/25 mm Regufoam® Keraflex® 5.57 33.7 17.0
6 BG7.5MM Beam 7.5/17.5 mm Regufoam® Keraflex® 5.40 32.6 16.5
7 BG10MM Beam 10/15 mm Regufoam® Regupur® 4.33 26.2 13.2
8 BG15MM Beam 15/10 mm Regufoam® Keraflex® 3.80 23.0 11.6
9 BRP Beam 0/25 mm Regupol® Keraflex® 4.00 24.2 12.2
10 CRP Column 0/25 mm Regupol® Keraflex® 4.20 25.4 12.8
11 BAACRP Beam 0/20 mm Regupol® Keraflex® 3.40 20.6 56.0
12 BCSRP Beam 0/25 mm Regupol® Keraflex® 6.60 39.9 108.7
4.8 Summary of the tests on the system components
The main objective of the described test campaign on system components and
assemblages was to investigate the mechanical properties of constitutive materials and
their mutual interaction. This was important in order to choose the best material type
and characteristics for the INODIS system, but also to provide additional information
for wider use of solution. Additionally, tests conducted on small specimens provided

Chapter 4 Experimental tests on system components
149
valuable results for understanding the behaviour of the overall system, but also for
calibration and validation of numerical models needed for further parametric studies.
Tests on concrete, reinforcing steel, thin-bed mortar and the normal mortar and masonry
units were conducted under standardized procedures and were used for extracting
usually needed values such as compressive and tensile strength, modulus of elasticity
etc. This data was mostly used to characterize the components and for calibration of
numerical models. Important to mention is brittle behaviour of clay unit for both
vertical and horizontal compression loads, due to the high percentage of voids (63%).
Results of the tests on masonry assemblages gave important base for calibration of
numerical models, especially for modelling bond strength between the units.
Mechanical characteristics of the masonry assembly under compression load present
extremely valuable data for modelling the units and infill wall itself, since the modelling
approach is based on assigning compressive strength of the masonry assembly to the
unit and not taking unit strength as it is.
After finishing the tests on the ―traditional‖ components of the infill walls, tests on
components for decoupling the masonry infill walls from the frame are conducted. First
elastomer specimens were tested under static compression tests. This provided better
understand of hyperelastic behaviour of elastomers. Since the characteristics of
elastomer showed that it is from 5-50 thousand times softer than contacting concrete
and masonry, it was obvious that under the high drift levels elastomer is going to enter
in high compression ranges. Therefore, specimens were tested up to the limits of the
testing machines, showing that after 60-70% of compression strain stiffness of
elastomer rises strongly. These results showed that up to 50-60% of compression strain
of elastomer, it will transfer just small amount of loads to the infill wall due to the
movement of the frame. Thus, providing high decoupling capability for infill wall.
Since the infill frame specimens were subjected to the cyclic loading conditions it was
important to investigate behaviour of elastomers under cyclic compression loading.
Results of these tests gave additional value to the application of elastomers as a measure
for decoupling, because the loops of hysteretic curves under cyclic loading of elastomer
showed that during the earthquake it can be expected that some energy would be spent
on viscoelastic behaviours of elastomers. This is a big step forward from the situation in

Marko M. Marinković Innovative system for seismic resistant masonry
infills in reinforced concrete frame structures
150
traditional masonry infill where energy is spent on plastic deformations (cracking and
damage) of infill walls. Shear tests on elastomers together with the compression tests
provided important comparison between different types of elastomers tested, so it can
be chosen which type to be used in order to provide in-plane decoupling and at the same
time small out-of-plane displacements of the infill wall.
Tests on shear anchors inserted in elastomers, used for IMES system, showed that shear
strength of the brick is rather low therefore the use of this kind of connection for hollow
clay bricks is questionable.
For understanding the behaviour of components of INODIS system and its details it was
very important to investigate U-shaped elastomer and its glued connection to the brick.
The focus of investigation in these tests was the glued connection of elastomer to
elastomer and elastomer to the brick and capacity of this connection. In this sense, the
so called "column" connection does not reflect the real situation on the wall level since
the load was applied in the direction parallel to the brick holes and in reality out-of-
plane load is applied in direction perpendicular to the holes. This was done in order to
test the glued connection and to reach higher load levels, which definitively would not
be possible if the load was applied in the direction perpendicular to the holes. Also
parameters such as type of elastomer, width and thickness of elastomers, type of glue,
stiffness of elastomers, contact width of the elastomer and plastic profiles, influence of
sliding surfaces on the shear behaviour of the connection and type of the brick were
investigated, trying to assess the behaviour of the connection under different loading
and contact conditions on the infill wall level. All the specimens tested showed the
capability of the connection to resist 4-10 times higher loads when applied in the
experiments on the wall level. This is important information showing that this
connection can be used in regions with high seismicity level. Both types of glue used
proved themselves as powerful so no damage on the glued connections appeared except
in the case of CRP test where this connection was poorly constructed (the glue was
missing). But even in this case delamination happened at high load levels. Only in the
BCSRP tests where calcium silicate brick was used, limit of the connection was reached, by
damaging of elastomers. In all other tests brick cracked before damage limits of the
elastomer of glued connections were reached.
It is interesting to point out that in all tests after removing the load from the brick,

Chapter 4 Experimental tests on system components
151
specimen moved up in the starting position, without permanent deformations on
elastomer connections. This leads to the conclusion that elastomer connections have a
great capacity of elastic behaviour.
For practical applicability of the solution, it is important to conclude that elastomers
made of Regupol®, which is much cheaper than Regufoam®, the same level of loads
are reached without any damage to the connection, even when slightly stiffer material
for Regupol® was used. Proved efficient applicability and behaviour of the solution to
the other types of the bricks supports the use of the INODIS system in construction
practice.

5 EXPERIMENTAL TESTS
ON INFILLED FRAMES
The roots of education are bitter, but the fruit is sweet.
Aristotle

Chapter 5 Experimental tests on infilled frames
153
5.1 Description of the experimental program
Within the European project INSYSME (2016), funded under the 7th Framework
Program by the European Commission and aimed at developing innovative systems for
masonry enclosure walls, new innovative systems were developed and analysed.
Experimental program was conducted at the University of Kassel, where a total of eight
tests were performed (Table 5.1). Description of the test and their results are described
in this chapter.
Table 5.1 Overview of the tested specimens
Specimen Description
A Test of bare frame
BI Test of the traditional infill subjected to the sequential in-plane load and out-of-
plane load and then an in-plane load once again
CI Test of the infill with the IMES system subjected to the sequential in-plane load and
out-of-plane load and then an in-plane load once again
BO Test of the traditional infill loaded in out-of-plane direction
CO Test of the infill with the IMES system loaded in out-of-plane direction
BIO Test of the traditional infill subjected to the simultaneous load in in-plane and out-
of-plane direction
CIO Test of the infill with the IMES system subjected to the simultaneous load in in-
plane and out-of-plane direction
DIO Test of the infill with the INODIS system subjected to the sequential but also to the
simultaneous load in in-plane and out-of-plane direction
5.2 Description of the test set-up
Since experimental testing campaign includes both in-plane and out-of-plane loading,
equipment and instrumentation had to be built to fulfil planned testing procedures.
Therefore test setup has been specifically constructed for the INSYSME tests at
UniKassel testing facilities. Figure 5.1 shows drawings of the equipment and
instrumentation setup, while Figure 5.2 present test setup prior to the experimental test.
In-plane tests were performed through the application of horizontal increasing cyclic
displacements by reaching each displacement amplitude three times. Due to the
configuration of the three hydraulic jacks, both vertical and horizontal forces as well as
bending moments can be applied to the test specimen in its plane (Figure 5.2). The
vertical forces can be transferred directly to the columns of the RC frame by a load
introduction beam made of steel (Figure 5.4) simulating the vertical load from upper
storeys of a real structure. Horizontal forces resulting due to earthquake action can be
transferred by the same load introduction beam to the top beam of the frame.

Marko M. Marinković Innovative system for seismic resistant masonry
infills in reinforced concrete frame structures
154
a) b)
Figure 5.1 a) View of the test set-up and b) section A-A (INSYSME, 2017b)
Figure 5.2 In-plane test set-up
For reduction of stress concentrations, elastomeric bearings are used for the load
introduction (Figure 5.5a). In order to enable a well-defined loading of the test
specimen, independently of the resulting deformations, the load introduction beam has
to be connected to the horizontal hydraulic cylinder such that undesired restraint is
avoided. This is achieved by hinges eliminating vertical force and bending moment at
the left end of the load introduction beam (Figure 5.5b).To avoid a horizontal rigid body

Chapter 5 Experimental tests on infilled frames
155
motion of the whole test specimen, a horizontal fixation in the middle of the bottom
beam were used. To prevent the frame uplift due to high values of the global
overturning moment ties near both ends connect the lower beam to the strong floor of
the laboratory.
Figure 5.3 Out-of-plane test set-up
Figure 5.1 also shows steel reaction frame that has been designed for the out-of-plane
tests, to present the self-equilibrium system together with supporting panel and anchors
connecting RC frame at the top and base to the steel reaction frame. For out-of-plane
loading, four airbags were placed between supporting panel and infill wall (Figure 5.3),
which under increased pressure in airbags present a stiff support. That way, all the
deformation appears only in infill wall. With the equal distribution of four airbags
almost constantly distributed loading can be applied on the area of the infill wall.
Capacity limit of the airbags is 50 kN/m². The reaction panel on the backside of the
airbags is connected to the beams of the RC frame by threaded bars. Hence, the forces
remain inside the system consisting of test specimen and reaction plate so that no
overturning or sliding at the base of the frame can be expected. Each threaded bar has
been equipped with a force transducer so that the overall out-of-plane load can be
measured. To ensure that the threaded bars have continuous contact to both the reaction
panel on one side and to the frame on the other side, they are being prestressed before
start of the test to a preload of about 5 kN and subsequently unloaded to approximately
0.5 kN. For the tests with combined and simultaneous loading in- and out-of-plane, the
connections to the threaded bars have been designed as moveable in parallel to the plane
of the wall. The hydraulic air bags only allow compression loading. Therefore, loading

Marko M. Marinković Innovative system for seismic resistant masonry
infills in reinforced concrete frame structures
156
from one side only could be simulated. Since a failure of infill wall falling down at the
exterior side of a building appears to be more dangerous, only outward oriented loading
from inside of the building has been simulated.
Figure 5.4 Steel beam for transfer of vertical forces to the columns
a) b)
Figure 5.5 a) Elastomeric bearings for reduction of stress concentrations and b) hinges for elim-
inating vertical force and bending moment at the left end of the load introduction beam
5.3 Test specimens
The reinforced concrete frames have been designed according to DIN EN 1992-1-1
(2011) and DIN EN 1998-1 (2010) considering the German national annexes for
ductility class L. As a design basis, the results from the analysis for the exterior frame of
a five storey frame structure with regular geometry and stiffness distribution are taken.
Furthermore, the capacity of the testing setup had to be considered such as capacity of
the hydraulic actuators. Columns were designed to have 25/25 cm quadratic cross
section with the 1.48% of longitudinal reinforcement and 0.63% and 0.42% of

Chapter 5 Experimental tests on infilled frames
157
transverse reinforcement in corners and middle section respectively. Height of the beam
is 25 cm and the width 45 cm with the 1.05% of longitudinal reinforcement and 0.35%
and 0.23% of transverse reinforcement in corners and middle section respectively.
Figure 5.6 Transportation and delivery of the RC frames
Figure 5.7 Dimensions and reinforcement of the RC frame (test A, BI/BO and BIO) (IN-
SYSME, 2017b)

Marko M. Marinković Innovative system for seismic resistant masonry
infills in reinforced concrete frame structures
158
RC frames were prefabricated and then delivered to the laboratory for testing at
UniKassel (Figure 5.6). The dimensions and the reinforcement of the test specimen A,
BO/BO and BIO are shown in Figure 5.7. In order to install decoupling elastomer on the
circumference of infill, dimensions of RC frames for innovative systems specimens
(CO, CI, CIO and DIO) are slightly changed (Figure 5.8).
Figure 5.8 Dimensions and reinforcement of the RC frame (test CI/CO, CIO and DIO) (IN-
SYSME, 2017b)
Traditional infilled frame is constructed in a usual way of bricklaying, and it is just as
important to mention that for bed joints thin layer mortar was used, while head joints
were made as dry joint connection without mortar. As in all test specimens, MZ70 brick
was used. Figure 5.9 illustrates that the MZ70 monolithic exterior wall brick with a
thickness of 36.5 cm protrudes outwards over the columns (25/25 cm). This corresponds
to the current installation situation since external insulation is also applied to the frame.

Chapter 5 Experimental tests on infilled frames
159
Figure 5.9 Reinforced concrete frame with masonry infill made of MZ70 bricks
Within IMES system, 2.5 cm thick elastomer strips (Figure 3.2) are placed between
columns and infill panel and top beam and infill, while layer of mortar is placed on the
upper face of the bottom beam and then bricks are laid. The anchors are on one end
installed in the bricks within the combination with elastomers and on the other end they
are also placed in the columns within plastic connector that allows longitudinal
movement. Anchors are placed in first, third, fifth, seventh and ninth row of bricks, thus
providing horizontal spanning of the wall. Figure 3.2 shows a front view and a vertical
and horizontal section of the complete wall as well as a connecting detail of a RC frame
with infill wall and the IMES system.
For pure out-of-plane tests (BO and CO) infill walls were constructed with the 5 cm gap
between frame and infill panel on one side. That way infill wall is considered as three-
sided panel that should present infill wall with the opening (door) on one side.
Figure 5.10 shows the specimen used for DIO test, while Figure 5.11 presents details of
connections between frame and infill. MZ70 brick with a thickness of 36.5 cm
protrudes over the column dimensions ( 250/250 mm) by 11.5 cm , the same as for the
traditional infill. Regufoam® 400 having 2.5 cm of thickness was used for the first layer
of the U-shaped elastomer and Regufoam® 510 was used for the second layer.

Marko M. Marinković Innovative system for seismic resistant masonry
infills in reinforced concrete frame structures
160
Figure 5.10 Infilled frame for the DIO test with the INODIS system
a) b) c)
Figure 5.11 Details of the INODIS system used for the DIO test: a) top beam connection, b)
column connection and c) bottom beam connection
U-shaped elastomer attached to the top beam had a second layer with the thickness of
2.5 cm, while U-shaped elastomer at the columns had 3.75 cm thick second layer. Left
and right side of the second layer of U-shaped elastomer had the width of 10 cm,
leaving the 5 cm gap between them. Sliding surfaces with the thickness of 2-4mm, were

Chapter 5 Experimental tests on infilled frames
161
glued to the U-shaped elastomer, concrete frame and plastic profiles, thus reducing this
gap to 4 cm. Therefore, plastic profile had the width of 4 cm and the thickness at the top
beam of 2.5 cm and at the columns 3 cm. Middle strip of bottom elastomer made of
Regufoam® 570 with the width of 5 cm and thickness of 2.5 cm was first glued, to the
frame. Afterwards, two side strips of the same material and thickness, just with the
width of 10 cm were placed on the bottom frame beam and glued to the first row of the
brick.
5.4 Description of the instrumentation
Forces and deformations of the hydraulic cylinders are recorded by the integrated
displacement and force transducers. The force capacity of the two vertical hydraulic
jacks amounts to ± 400 kN each. The maximum stroke amounts to ± 125 mm. For
horizontal loading a cylinder with a maximum force capacity of ± 320 kN and a stroke
limit of ± 150 mm was used. The deformations of the test specimen in both horizontal
and vertical direction were measured by inductive transducers LVDTs named W1 to W9
at wall top and bottom. These displacement transducers are fixed to an independent
measuring frame. Furthermore, the deformations in diagonal direction are captured by
cable potentiometers S3 and S4 (for test A additionally with S1 und S2). The following
Figure 5.12 to Figure 5.19 depict the positions of the transducers for each test. In the
tests of the innovative solutions (tests CI/CIO–IMES and test DIO–INODIS), the
compressive strains of the elastomers as well as the opening of the joint between RC
frame and the infill wall are recorded by LVDTs W16 until W21. For all the tests except
bare frame (Test A) the deformations of frame and infill were also captured
independently by an optical measurement system (Figure 5.20a). To make the
measuring points identifiable for the system, circular pads (Figure 5.20b) are glued onto
the surface of the test specimen (see blue squares in Figure 5.13 to Figure 5.19). Since
the system uses 2 cameras, not only the in-plane deformations but also the out-of-plane
displacements were recorded. Deformations measured with the trancducers and
hydraulic trancuders are compared with the values measured with the optical
measurement system, in order to prove the reliability of both systems. In all the tests,
differences between the measured values were neglectable. In order to allow crack
visibility, the specimen was painted with a thin layer of white paint, which was the only

Marko M. Marinković Innovative system for seismic resistant masonry
infills in reinforced concrete frame structures
162
surface finishing. In addition, the masonry infills are being protected from a sudden
falling out by securing it with the four tension belts (Figure 5.20b) which are being
positioned at a distance of 5 cm from the exterior wall surface. The belts are attached to
the columns of the frame and have a capacity of 10 kN. However, they are only slightly
prestressed by hand.
Figure 5.12 Instrumentation and measuring points for the test A (INSYSME, 2017b)
Figure 5.13 Instrumentation and measuring points for the test BI (INSYSME, 2017b)

Chapter 5 Experimental tests on infilled frames
163
Figure 5.14 Instrumentation and measuring points for the test CI (INSYSME, 2017b)
Figure 5.15 Instrumentation and measuring points for the test BO (INSYSME, 2017b)
Figure 5.16 Instrumentation and measuring points for the test CO (INSYSME, 2017b)

Marko M. Marinković Innovative system for seismic resistant masonry
infills in reinforced concrete frame structures
164
Figure 5.17 Instrumentation and measuring points for the test BIO (INSYSME, 2017b)
Figure 5.18 Instrumentation and measuring points for the test CIO (INSYSME, 2017b)
Figure 5.19 Instrumentation and measuring points for the test DIO (INSYSME, 2017b)

Chapter 5 Experimental tests on infilled frames
165
a) b)
Figure 5.20 a) Optical measurement system and b) circular pads glued onto the surface of the
test specimen presenting measuring points for optical measurement system
5.5 Experimental results
For easier comparison, presenting the experimental results is subdivided in four
sections. First, section 5.5.1 is related to the in-plane test on the bare frame (Specimen
A). Then second section describes experimental tests on the traditionally infilled frame
(Specimens BI, BO and BIO). Afterwards, results associated with the infilled frame
with the IMES system (Specimens CI, CO and CIO) are presented. Finally, results of
the tests on the infilled frame with the INODIS system (Specimen DIO) are shown.
Results and comparison of the DIO test with all previous tests are presented in section
5.5.5 of this chapter.
Table 5.2 gives an overview of the experimental campaign. All specimens were made in
full scale. At the start of each test the vertical force was applied and increased until 200
kN per column and it was held constant throughout the whole duration of the tests. The
horizontal in-plane loading was applied by displacement control in sinusoidal cycles.
The duration of each cycle amounts to 60 s and, hence, can be considered as quasi
static. The amplitude was increased with three load cycles for each amplitude level until
failure or reaching a maximal interstorey drift angle of 3.5 %, which presents
displacement capacity of the horizontal cylinder. The interstorey drift was based on a
storey height of h = 2.75 m. The behavior of the test specimens subject to horizontal in-
plane loading can be illustrated most effectively by force vs. drift hysteresis diagrams.
The restoring force consists of the contribution from the horizontal hydraulic cylinder as
well of the horizontal force components of the vertical cylinders which experience a
certain inclination due to the applied horizontal displacements. The horizontal

Marko M. Marinković Innovative system for seismic resistant masonry
infills in reinforced concrete frame structures
166
displacement of the test specimen is being measured at the upper beam of the RC frame.
The interstorey drift is then being calculated after subtraction of the horizontal rigid
body motion as measured at the lower beam of the frame.
Table 5.2 Overview of the experimental program
A: Bare
frame
Loading
protocol A: IP
Sketch
of the
tested
speci-
men
B: Tradi-
tionally
infilled
frame
Loading
protocol BI: IP - OOP - IP BO: OOP BIO: OOP + IP
Sketch
of the
tested
speci-
men
C:
Infilled
frame with
the IMES
system
Loading
protocol CI: IP - OOP - IP CO: OOP CIO: OOP + IP
Sketch
of the
tested
speci-
men
D:
Infilled
frame with
the INODIS
system
Loading
protocol
DIO: IP; OOP; OOP +
IP
Sketch
of the
tested
speci-
men
Bare frame is tested under in-plane load (IP) in order to determine the capacity of the
RC frame. In the BI and CI test, the frame is subjected to a sequential in-plane load, and
out-of-plane load and then an in-plane load once again (IP–OOP–IP) in order to
examine influence of prior damage on infill capacity. Out-of-plane tests were performed
to investigate the behavior of the masonry infills under out-of-plane loading and to
assess their load capacity as well as the capacity of the connection to the RC frame. The
horizontal load perpendicular to the wall was controlled manualy using pneumatic
control system. During loading, the out-of-plane deformation measured in the middle of
the infill wall was recorded continiosly with transducer LVDT W15 (Figure 5.13 to
Figure 5.19). The first test has been conducted for a masonry infill wall traditionally
connected to the frame via mortar. It has been denoted as BO. The second test specimen
represents the infilled frame with the system IMES and is called CO. In both tests, an

Chapter 5 Experimental tests on infilled frames
167
out-of-plane (OOP) load is applied whereby a gap is present on one side of the panel in
order to depict an opening with an unfavourable effect, i.e. the frame is supported on
three sides. Simultaneous application of in- and out-of-plane loading (Specimen BIO,
CIO and DIO) has been performed in a way that first the out-of-plane has been
increased until 5 kN/m². According to the technical possibilities, the pressure in the
airbags/pillows has been kept as constant as possible afterwards. Afterwards, the
horizontal in-plane loading was applied by displacement control in a sinusoidal cycles.
The amplitude was increased stepwise by keeping the out-of-plane loading constant.
5.5.1 Bare frame – Test A
In order to identify the contribution of the RC frame to the resistance capacity, first a
reference test without masonry infill has been performed (bare frame-specimen A). As it
is described on Figure 5.21 and Table 5.3, load has been assigned as a sinusoidal cyclic
displacement up to 3.5% of inter-storey drift.
Stage Drift [%] Stage Drift [%]
1 0.018 12 1.00
2 0.036 13 1.25
3 0.055 14 1.50
4 0.073 15 1.80
5 0.10 16 2.10
6 0.20 17 2.40
7 0.30 18 2.70
8 0.40 19 3.00
9 0.50 20 3.25
10 0.60 21 3.50
11 0.80
Figure 5.21 Load protocol of the Test A Table 5.3 In-plane drifts of the test A
As can be seen from the graph in Figure 5.22, the RC bare frame has a horizontal load
capacity of about 120 kN at the drift angle of 2.0 %. The restoring force increases
steadily until reaching this maximum value. For the maximum value of the applied drift
of about 3.5 %, the resistance decreases until about 95 kN in the positive direction and
90 kN in the negative direction (Figure 5.22).
Wile conducting the test, an error of the test control occurred when the second load
cycle with amplitude of 2.7 % was applied. As a consequence, the horizontal load
cylinder moved to its end position in negative direction. Hence, a pre-damage of the
R/C frame must be considered for the subsequent cycles at amplitudes of 3.0 and 3.5 %.

Marko M. Marinković Innovative system for seismic resistant masonry
infills in reinforced concrete frame structures
168
The development of the hysteresis clearly shows this effect. Clearly, the pre-damage has
a more pronounced effect on the resistance in the negative load direction. The force
resistance in positive direction, however, seems to be affected insignificantly until
reaching the maximum drift angle of 3.5%.
The degradation of stiffness is caused mainly by cracking of concrete and later on by
yielding of the reinforcement. According to Figure 5.23 the deformations are
concentrated near the upper and lower ends of the columns near the positions of the
maximum absolute bending moments as expected. Due to the larger cross section
dimensions, the beams show a less pronounced cracking pattern than the columns.
Furthermore, the continuous support of the lower beam on the strong floor has led to
much less cracking in the lower beam. Failure of the test specimen could be observed
due to the formation of plastic hinges at top and bottom ends of the columns.
Figure 5.22 Hysteretic curve and envelope for the in-plane loading of the Test A
a) b)
Figure 5.23 a) Cracks in the frame top corner and b) at the base of the columns

Chapter 5 Experimental tests on infilled frames
169
5.5.2 Traditionally infilled RC frame
5.5.2.1 Test BO
As described in Figure 5.24 and Table 5.4 out-of-plane loads is applied in four cycles.
Amplitudes of the following cycles were increased until failure of the wall. As already
described, vertical forces of 200 kN have been applied by each vertical cylinders at the
start of the tests. This value has been force controlled and kept constant over the
duration of the tests.
The behaviour of the test specimens can be illustrated most effectively by force-
displacement diagrams using the sum of all 10 force transducers versus the measured
deflection in the center of the wall using displacement transducer LVDT W15 (Figure
5.15).
Stage Load
[kN/m2]
1 14.85
2 22.14
3 23.86
4 18.93
Figure 5.24 Load protocol for out-of-plane loading of the
Test BO
Table 5.4 Out-of-plane load of the
Test BO
The masonry infill specimen BO was able to activate a maximum resistance of about
170 kN, corresponding to a uniformly distributed load of about 24 kN/m² (Figure
5.25a). The corresponding horizontal deflection at the center of the wall amounts to
about 4 mm at this point. At the start of loading, the masonry infill shows a high
stiffness, while stable arching effect initially occurs in the wall at the third load cycle.
The resistance of the infill appears to be limited by sudden contact failure between RC
frame and the uppermost and the lowest row of bricks. This results in a tilting of the
wall (Figure 5.26a) as well as an overloading and splitting of the bricks in the top infill
row (Figure 5.27); hence, the boundary condition on the top of the wall is completely
lost. Due to the support on three sides, the free edge undergoes the largest deflections,
especially at the top (Figure 5.25b). When forth cycle of the load was applied, complete

Marko M. Marinković Innovative system for seismic resistant masonry
infills in reinforced concrete frame structures
170
damage of the wall occurred with very sudden and fast increase of displacement (Figure
5.26b) with a small increase of the load. This caused the right side of the wall to go out
of the plane of the frame (Figure 5.28). As expected the gap on the right side influenced
the failure mode of the wall, having high deformations of the right side of the wall while
deformations of the left side stayed almost intact (Figure 5.26b). Apparently, loss of
connection/support at the top and bottom lead to the loss of capability to form arching
mechanism, which further lead to the sudden and brittle failure of the right side of the
wall. This kind of behaviour shows that traditional connection of infill walls with the
frame through the mortar presents a weak place for the infilled frames.
a) b)
Figure 5.25 a) Force-displacement curve for out-of-plane loading of the Test BO and b) side
view of the wall deformation in the out-of-plane direction of the vertical section on the free edge
of the wall
a) b)
Figure 5.26 a) Side view of the wall deformation in the out-of-plane direction at the start and b)
at the end of the fourth load cycle

Chapter 5 Experimental tests on infilled frames
171
Figure 5.27 Local failure of the bricks at the top and bottom of the wall at the end of the Test
BO
a) b)
Figure 5.28 a) Out-of-plane deformation of the wall and b) damage within the wall at the end of
the Test BO
5.5.2.2 Test BI
Masonry infill traditionally connected to the surrounding RC frame with a mortar
connection has been tested in-plane as described in section 5.2. First specimen was
unfortunately destroyed suddenly, because one of the transducers connected to the
actuator jammed and actuator pushed the beam very fast up to the limit. This caused
immediate collapse of infill wall and heavy damage in RC frame, so this test had to be
repeated with the new specimen built using new RC frame and infill wall. As described
in Figure 5.29 in-plane and out-of-plane loads are sequentially applied. The test begins

Marko M. Marinković Innovative system for seismic resistant masonry
infills in reinforced concrete frame structures
172
with an in-plane sine load up to an interstorey drift of 1.25%. The in-plane load is then
stopped and a gradual out-of-plane loading and unloading takes place up to an
equivalent surface load of 3 kN/m2. After removing the out-of-plane load, a sinusoidal
in-plane load up to a maximum interstorey drift of 2.1% is applied (Table 5.5). As
already described, vertical forces of 200 kN have been applied by each vertical
cylinders at the start of the tests. This value has been force controlled and kept constant
over the duration of the tests.
Stage Drift
[%] Stage
Drift
[%]
1 0.018 12 1.00
2 0.036 13 1.25
3 0.055 14 1.50
4 0.073 15 1.80
5 0.10 16 2.10
6 0.20
7 0.30
8 0.40
9 0.50
10 0.60
11 0.80
Figure 5.29 Load protocol for sequential in- and out-of-plane
loading of the Test BI Table 5.5 In-plane drifts of the
Test BI
Figure 5.30 Hysteretic curve and envelope for the first in-plane loading phase of the Test BI
First part of the in-plane cyclic load was applied until 34.38 mm of displacement which
corresponds to 1.25% of in-plane drift. At the beginning, infill acts in a linear manner
up to a load of 110 kN. A reduction in stiffness occurs in the further cycles as a result of
initial cracks that occur in the wall and opening of bed joints (Figure 5.31a). Afterwards,
the restoring forces increase steadily but with decreased stiffness up to force of around

Chapter 5 Experimental tests on infilled frames
173
225 kN (Figure 5.30). At this point strongly visible stepwise cracks in diagonal direction
of the infill wall were noticed together with the big crack in bed joint on the top of the
brick at the middle bottom of the wall and cracks in some bricks on the diagonal (Figure
5.31b).
a) b)
Figure 5.31 a) Opening of bed joints and b) stepwise cracks in compressed diagonal and cracks
in the bricks
After reaching 1.25% of in-plane drift and having notable cracks in the infill wall, in-
plane loading was stopped and frame returned to the zero position. Then out-of-plane
load was applied using airbags as described in section 5.2. Pressure in airbags was
increased and decreased in cycles until reaching out-of-plane capacity of 21 kN which
corresponds to a constant load of about 3 kN/m² while producing a maximum
deformation of 29 mm (Figure 5.32). From the very beginning of the application of out-
of-plane loading it was noticed that during unloading, deformations did not decrease so
that significant residual deformations remained. The deformations due to the preceding
in-plane loading are not showed in Figure 5.32, which means that there was already 3
mm of out-of-plane displacement due to the previous in-plane test. Displacements
measured with Optical measurement system (Figure 5.20), as explained in section 5.4,
are used to compile deformed shape of the wall, after first in-plane loading phase (IP1).
Figure 5.33a illustrates the out-of-plane deformations for five horizontal sections across
the length of the wall, while Figure 5.33b illustrates the out-of-plane deformations for
five vertical sections across the height of the wall following completion of the first
loading phase. The deformation sequences clearly demonstrate a tilting effect on the
wall which measures approximately 1.5 cm at the top of the wall. This effect is a result

Marko M. Marinković Innovative system for seismic resistant masonry
infills in reinforced concrete frame structures
174
of the repeated eccentric load of the infill masonry wall which, for reasons of energy
efficiency, protrudes over the column dimensions by 11.5 cm (Figure 5.34). The
eccentricity causes an alternating rotation which successively leads to an out-of-plane
movement.
Figure 5.32 Force-displacement curve for the out-of-plane loading of the Test BI
a) b)
Figure 5.33 Deformation of the wall in the out-of-plane direction at the end of the first in-plane
loading phase (drift: 1.25%): a) top view and b) side view
The displacements at the maximum loading in the direction perpendicular to the wall
plane are shown in Figure 5.35 where deformed shape of infill wall is presented. It can
be seen from Figure 5.36a, that in-plane load damaged mortar connection of the infill
wall and concrete beam so out-of-plane load produced tilting of the infill wall and
moving out-of-plane as a rigid body. This proves that the weakness of the traditional
system is in the contact between RC frame and infill wall. A sufficient contact closure is
particularly difficult when dealing with the highly thermally-insulating bricks with the
percentage of voids being 62.3%; thus, extreme care is needed to uniformly fill them
with mortar. Also with application of out-of-plane load splitting of the brick at the top

Chapter 5 Experimental tests on infilled frames
175
corner (Figure 5.36b) occurred which contributed to the failure of infill wall. This
additionaly weakend the connection between frame and infill and increased the tilting of
the infill wall in out-of-plane direction. Therefore for solving this problem attention
should be paid.
Figure 5.34 Top view: deformation of the frame and out-of-plane infill movement due to the
eccentric loading of the infill wall
a) b)
Figure 5.35 Deformation of the wall in the out-of-plane direction under maximum out-of-plane
load of 3 kN/m2: a) top view and b) side view
a) b)
Figure 5.36 a) Damaged mortar connection between infill wall and concrete beam and b) split-
ting of the brick
In Figure 5.37 complete hysteresis, presenting both first and second in-plane loading
results, is shown. The restoring forces increased steadily but with decreased stiffness
until reaching a plateau with a maximum resisting force of approximately 240 kN at an
interstorey drift of 1.5 %. At the maximum drift of 2.1 %, the resistance still amounts to

Marko M. Marinković Innovative system for seismic resistant masonry
infills in reinforced concrete frame structures
176
about 180 kN. The deformation behaviour as well as the failure is being dominated by
opening and closing of bed joints (Figure 5.39b) as well as failure of the bricks. In
Figure 5.39a, the diagonal stairstep cracks, through bed joints and head joints at a large
value, are well visible. The failure of the bricks starts near the upper frame corners
(Figure 5.40a) and seems to carry on to the middle of the wall with increasing drift
values. The damage to the bricks occurs mainly on the backside of the specimen (Figure
5.40a). This is somehow expected since the brick is 36.5 cm wide and columns are just
25 cm wide, therefore other side of the wall presented by the part of the bricks that are
not in contact with frame is less damaged. The front side of the specimen, however,
does not show such a pronounced damage which might lead to a wrongly positive
assessment of the remaining load bearing capacity.
Figure 5.37 Hysteretic curve and envelope for the first and second in-plane loading phase of the
Test BI
a) b)
Figure 5.38 Deformation of the wall in the out-of-plane direction at the end of the BI test: a) top
view and b) side view
When out-of-plane load was removed, out-of-plane displacements continued to increase

Chapter 5 Experimental tests on infilled frames
177
highly under second in-plane load (Figure 5.38). At the end of the test, the specimen
had some additional in-plane capacity, but regarding out-of-plane direction it was
completely unstable. It can be assumed that smaller amount of out-of-plane load would
cause the wall to fall out-of-plane. The test was stopped because of the safety of the
laboratory staff and equipment.
a) b)
Figure 5.39 a) Diagonal cracks in the wall and b) opening of bed joints
a) b)
Figure 5.40 a) Failure of the brick in the upper corner of the wall and b) damage of the backside
of the wall at the end of the whole loading protocol
5.5.2.3 Test BIO
In the BIO test out-of-plane first applied and increased until reaching 5 kN/m².
According to the technical possibilities, the pressure in the airbags/pillows has been
kept as constant as possible afterwards. Next, in-plane loading was applied by

Marko M. Marinković Innovative system for seismic resistant masonry
infills in reinforced concrete frame structures
178
displacement control and in sinusoidal cycles. Due to the considerable deflection in out-
of-plane direction, the out-of-plane pressure was reduced to 2.5 kN/m² (Figure 5.41).
Load protocol and in-plane drift amplitudes are shown in Figure 5.41 as well as in Table
5.6.
Stage Drift [%]
1 0.018
2 0.036
3 0.055
4 0.073
5 0.10
6 0.20
7 0.30
8 0.40
9 0.50
10 0.60
11 0.80
12 1.00
Figure 5.41 Load protocol for simultaneous in- and out-of-plane
loading of the Test BIO Table 5.6 In-plane drifts of
the Test BIO
a) b)
Figure 5.42 a) Hysteretic curve and envelope for the in-plane loading and b) force-displacement
curve for out-of-plane loading
The resulting hysteresis curve in Figure 5.42a demonstrate a maximum horizontal force
of 225 kN at an interstorey drift of 0.65%. The resistance was increasing steadily until
drift angle of approximately 0.05 %, when a significant decrease in stiffness can be
observed. After reaching the peak of the force deflection curve, the horizontal forces
drastically decrease. After having performed one cycle of 0.8% of in-plane loading,
pressure in the pneumatic airbags decreased and with recovering pressure to the value of
5kN/m2 the wall continued to move out-of-plane. Shortly after starting the next cycle,
the infill is again pushed out even more, which causes an increase of the airbags volume

Chapter 5 Experimental tests on infilled frames
179
and, thus, a reduction of the pressure load from the airbags. After this point, last in-
plane cycle was performed with 2.5 kN/m2 of out-of-plane pressure and then, due to the
extensive increase of out-of-plane displacements (Figure 5.42a and Figure 5.44), it was
decided to stop with the test.
It is important to mention that first out-of-plane load of 5 kN/m2 was applied, before
starting with in-plane cycles. At this point out-of-plane displacements were negligible.
They remained small until 0.3% (8.25 mm) of in-plane drift, when notable out-of-plane
displacements started to appear (Figure 5.43).
a) b)
Figure 5.43 Deformation of the wall in the out-of-plane direction at 0.3% of in-plane drift: a)
top view and b) side view
a) b)
Figure 5.44 Deformation of the wall in the out-of-plane direction at the end of the BIO test
(drift: 1.00%): a) top view and b) side view
At the beginning, highest displacements were in the middle (arching mechanism), but
slightly higher on the left side than on the right side of the wall. Figure 5.45 illustrates
the increase in deformations throughout the in-plane load cycles with a side view for a
vertical section in the centre of the wall along the height of the wall. For small applied
interstorey drifts, it can clearly be seen that the deformations correspond to the bending

Marko M. Marinković Innovative system for seismic resistant masonry
infills in reinforced concrete frame structures
180
line of an arching effect. An interstorey drift of only 0.3% results in a displacement of
2.5 mm at wall mid-height. In the following load cycles, the arching effect is
substantially decreased due to the loss of the support boundary conditions and the infill
reacts with sudden and rapidly increasing out-of-plane deformations. The bending line
now corresponds to a tilting movement of the infill superimposed on a rigid body
movement caused by the loss of the boundary conditions on both the top as well as the
base of the wall. The out-of-plane deformations at a drift of 0.8% already measure 8.5
cm. Furthermore, in the last in-plane cycles (drift=1.00%), out-of-plane load was
reduced to 2.5 kN/m2, and even then the displacements of the left side of the wall and at
the top highly increased, followed by quite high out-of-plane displacements at the
bottom (Figure 5.44).
Figure 5.45 Side view of the wall deformation in the out-of-plane direction for combined load-
ing for the vertical section in the centre of the wall along the height of the wall
a) b) c)
Figure 5.46 a) Damage of the infill, b) failure of the brick at the top and c) tilting of the infill
panel at the end of the Test BO
The test had to be aborted shortly afterwards as the wall deformations uncontrollably
increased. The reasons for such high out-of-plane displacements at the top and bottom
of the infill wall are the loss of the arching mechanism and the loss of the horizontal

Chapter 5 Experimental tests on infilled frames
181
support due to the frame deformation. In-plane cyclic loading damages the mortar
connection between the upper brick and the frame which caused the movement to start
at the top. This tilting movement is initiated by a combined friction and brick failure in
the contact between the top of the infill and the bottom of the beams of the reinforced
concrete frame (Figure 5.46).
5.5.2.4 Summary
Figure 5.47a provides a comparison of the in-plane hysteretic curves for BI and BIO
tests. The curves show that the infilled frames generate horizontal forces that are almost
the same (BI: 240 kN, BIO: 255 kN), but at different levels of interstorey drift (BI: 1.5
%, BIO: 0.65 %). In contrast, the maximum drifts are significantly different (BI: 2.1 %,
BIO: 1.0%). According to this, the maximum loads are achieved more rapidly in the
case of combined loads and the deformation capacity decrease by a factor of
approximately 2. Also, the loss of resistance in the post peak range is more pronounced
for Test BIO than for Test BI.
a) b)
Figure 5.47 a) Comparison of hysteretic curves and envelopes for in-plane loading of the Test
BI and BIO and b) force-displacement curves for out-of-plane loading for the Tests BO, BI and
BIO
The comparison of the out-of-plane force-deformation curves in Figure 5.47b also
illustrates severe differences. The BO test exhibits an extremely high load capacity of
24 kN/m2
for a wall supported on three sides and subjected to the pure out-of-plane
load. In contrast, the load capacity drops to 3–5 kN/m2 when the in- and out-of-plane
loads are applied sequentially (Test BI) or in combination (Test BIO). This corresponds
to a reduction by a factor of 5–8 although the infill panels in the BI and BIO tests were
supported on four sides.

Marko M. Marinković Innovative system for seismic resistant masonry
infills in reinforced concrete frame structures
182
Figure 5.48 presents pairs of values of the interstorey drift and the out-of-plane load
from experiments on traditionally infilled frames. The resulting trend line of the
interaction curve is convex, which shows significant interaction of in- and out-of-plane
loading. This illustrates the importance of taking the interaction between the two load
directions into consideration, when determining the load and deformation capacities of
infilled frames. The interaction curve presents the results of the tested specimens and
cannot be directly transferred to other frame dispositions.
Figure 5.48 Interaction diagram with the trend line based on test results
Comparison of the results of the tests on the RC frames filled with highly thermally-
insulating bricks have illustrated that the load bearing and deformation capacities are
highly reduced in the case of sequentially or simultaneously applied in- and out-of-
plane load. The results show that these capacities are dependent on the existing contact
between the infill and the frame. The contact is particularly important at the connection
of the infill with the upper frame beam as the out-of-plane loads are primarily accepted
in a vertical direction via the arching effect. A basic requirement for this is the existence
of normal forces which are due to the support by the frame in its plane. The infill
masonry, thus, is practically prestressed by the compression forces and will behave
stiffer. Hence, it may reach the ultimate resistance at lower values of interstorey drift.
Furthermore, the eccentric position of the resulting normal forces might have an effect
on the capacity of the masonry infill and thus on the total resistance. Also, gap
formations may even occur during construction as a result of shrinkage effects, poor
execution or settling effects of the mortar when dealing with bricks with a high
percentage of voids. These effects reduce the out-of-plane load capacity. The contact
between frame and infill can also be damaged by the cyclic movement of the frame that
occurs during sequential and combined loading. Figure 5.49 shows displacements of

Chapter 5 Experimental tests on infilled frames
183
measurement point 2018 on infill and 1006 on the frame (Figure 5.13). These two
points are in vertical alignment, therefore it can be seen that displacements of the frame
are 4-10 mm bigger than displacements of infill wall. This definitively produced
damage of mortar connection.
A specific situation occurs when the infill is subjected to a combined in- and out-of-
plane load. In this case, the boundary conditions for the formation of the arching effect
change due to the in-plane frame deformations. Figure 5.50a shows the situation for a
pure out-of-plane loading with the formation of a stable arching effect and the
compression points between the frame beams and the infill. Figure 5.50b illustrates the
deformed reinforced concrete frame in which the struts can no longer form vertically
due to the detachment between the frame and infill. This may lead to a reduction of
contact zone and normal force and the infill will fail earlier. The BI and BIO tests
showed that, in such cases, it is more likely that the wall will experience a tilting
movement in the out-of-plane direction that corresponds to a rigid body movement.
Figure 5.49 Displacement of measurement points 1006 and 2018 in the in-plane direction during
the Test BI
Clearly, the combination of in-plane load, which leads to the loss of mortar connection
between frame and infill wall, with the out-of-plane inertial load lead to the huge
reduction of the deformation capacity, making this kind of connection unreliable for use.
As Paulay and Pristley (1992) stated, these gaps and/or damage in panel caused by in-
plane stresses will cause that membrane action in out-of-plane direction won‘t develop.
Considering this, they concluded that unreinforced infill walls should not be considered
as satisfactory element of structure. Therefore, it can be concluded that RC frames filled
with hollow masonry blocks, traditionally connected to the frame, are not safe to be

Marko M. Marinković Innovative system for seismic resistant masonry
infills in reinforced concrete frame structures
184
used, under simultaneous earthquake load, without additional measures.
a) b)
Figure 5.50 a) Infill with arching effect and b) tilting of the wall in case of a gap
5.5.3 Infilled RC frame with the IMES system
5.5.3.1 Test CO
Specimens C present infilled RC frame with the applied Infill Masonry Enclosure
system (IMES), where masonry infill wall is decoupled from the RC frame by
elastomers and restrained for out-of-plane loads with anchors. Detailed description of
the system is given in Chapter 3. As described in Figure 5.51 and Table 5.7 out-of-plane
loads are applied in six cycles. Amplitudes of the following cycles were increased until
failure of the wall. As already described, vertical forces of 200 kN have been applied by
each vertical cylinders at the start of the tests. This value has been force controlled and
kept constant over the duration of the tests.
The behaviour of the test specimens can be illustrated most effectively by force-
displacement diagrams using the sum of all 10 force transducers versus the measured
deflection in the center of the wall using displacement transducer LVDT W15 (Figure
5.15).

Chapter 5 Experimental tests on infilled frames
185
Stage Load
[kN/m2]
1 4.64
2 6.50
3 8.14
4 10.10
5 11.00
6 10.57
Figure 5.51 Load protocol for out-of-plane loading of the Test CO Table 5.7 Out-of-plane
load of the Test CO
The masonry infill with the system IMES is able to activate a maximal resistance
perpendicular to the wall plane of about 77 kN according to Figure 5.52. This
corresponds to approximately 11 kN/m² of surface pressure load. The pertinent
deflection at wall center amounts to approx. 27 mm, from which 17 mm are recovered
after the last unloading. Specimen has experienced small permanent deformations,
which can be seen on the hysteretic curve (Figure 5.52) where the returning curve
always goes in the direction of zero displacements in the first three cycles. Then, next 3
cycles produce 2 mm of permanent displacement at the centre of the wall, while only
the last cycle produces high increase of permanent displacement (10 mm).
Figure 5.52 Force-displacement curve for the out-of-plane loading of the Test CO
Until reaching a force of 57 kN, the stiffness is high and almost constant. The
subsequent sudden drop of about 5 kN can be attributed to reaching the flexural strength
in direction parallel to the bed joint followed by opening of the bed joint in the middle

Marko M. Marinković Innovative system for seismic resistant masonry
infills in reinforced concrete frame structures
186
height of the wall (Figure 5.54). The following increase of the resistance continues until
about 18 mm, after this point there is an increase of displacement without increase of
load until 25mm when decrease of resistance started to be significant.
a) b)
Figure 5.53 Side view of the wall deformation in the out-of-plane direction a) at the 3rd
cycle
and b) at the end of the 6th load cycle
a) b)
Figure 5.54 a) Failure pattern and b) gaping of bed joint in the wall at the end of Test CO
For the first out-of-plane load cycles highest displacement was at the top, probably
because of elastic behaviour of elastomer. However, these displacements were too small
(less than 2 mm), and can therefore be neglected. From the 3rd
cycle, (around 8kN/m2)
the displacement in the middle started to increase and the formation of the arching
mechanism can be seen (Figure 5.53a). Until the end of the test (27mm-11 kN/m2)
displacements in the middle height of the wall stayed dominant. As can be seen from
Figure 5.53b, the deflections increase towards the free edge (as expected because of the

Chapter 5 Experimental tests on infilled frames
187
gap on the right side). It should be noticed that the displacements at the top and the
bottom of infill wall were increasing with each cycle of out-of-plane loading. This again
confirms that reliable support for out-of-plane loading should be applied also at the top
and bottom of an infill wall.
5.5.3.2 Test CI
As described in Figure 5.55, specimen was first loaded just in-plane up to a level of
2.4% of drift, then just out-of-plane up to a certain level of out-of-plane displacement
and then again just in-plane up to the limit of actuator (Table 5.8), since the ultimate
limit wasn‘t reached.
Stage Drift
[%] Stage
Drift
[%]
1 0.018 12 1.00
2 0.036 13 1.25
3 0.055 14 1.50
4 0.073 15 1.80
5 0.10 16 2.10
6 0.20 17 2.40
7 0.30 18 2.70
8 0.40 19 3.00
9 0.50 20 3.25
10 0.60 21 3.50
11 0.80
Figure 5.55 Load protocol for sequential in- and out-of-plane
loading of the Test CI Table 5.8 In-plane drifts of
the Test CI
At first part of the in-plane cyclic load up to 2.4% of drift, specimen acted almost
linearly as it can be seen on Figure 5.56. Starting with a drift angle of 0.6 %, it can be
seen that some of the bed joints slightly open. However, the hysteresis does not show a
temporary decrease of resistance. Hence, the influence on the stiffness appears to be
marginal. On the hysteresis (Figure 5.56) three slopes of the envelope curve could be
noticed. First slope until 35mm (1.2% of drift) and then second (slightly lower slope)
from 35-50mm (1.2-1.78% of drift) and then from 50 mm (1.78% of drift) third slope of
the envelope curve with the increased stiffness. In the first part just frame and elastomer
are activated, since elastomer a much lower stiffness in comparison with surrounding
frame and infill wall. Second (lower) slope of the curve is probably related to the
hyperelastic behaviour of elastomer, where elastomer has lower stiffness at this
compression stage. After this point, the stiffness of elastomer rises as it becomes more

Marko M. Marinković Innovative system for seismic resistant masonry
infills in reinforced concrete frame structures
188
compressed, which leads to the full activation of the infill and appearance of the
stairstep cracks in infill diagonal direction (Figure 5.58b). Force at this point is around
200 kN and drift is 2.4%.
Figure 5.56 Hysteretic curve end envelope for the first loading phase of the Test CI
a) b)
Figure 5.57 a) Gapping and b) highly compressed elastomers at corners
a) b)
Figure 5.58 a) Formation of stairstep cracks and b) cracks in the blocks at 2.1% of drift

Chapter 5 Experimental tests on infilled frames
189
At 41.25 mm of displacement (1.5% of drift) gap in upper corners of the specimen
between elastomer and infill wall can be seen. Figure 5.57 shows gapping on one side
and highly compressed elastomer on the other side at 2.4% of drift. This confirms that
the deformation of the frame is accepted by the softness of the elastomer. At 57.75 mm
of displacement (2.1% of drift) cracks appeared in some blocks (Figure 5.58b).
Figure 5.59 Force-displacement curve for the out-of-plane loading of the Test CI
a) b)
Figure 5.60 Deformation of the wall in the out-of-plane direction under maximum out-of-plane
load of 6 kN/m2: a) top view and b) side view
From the test results it can be seen that the masonry infill is able to carry an out-of-
plane total load of 42 kN (corresponding to a constant distributed loading of about 6
kN/m²) while deforming to 31 mm (Figure 5.59). The restoring force increases steadily
together with the deformation in the center of the wall, but upon unloading, a significant
part of the deformation is reversible. The residual deformation after the last loading
cycle amounts to only 8 mm. The deformations from the preceding loading cycles are
not shown in Figure 5.59. Therefore, the hysteresis curve starts at 4 mm, which has
displacement in the center of the wall after first in-plane load (IP1), while displacements

Marko M. Marinković Innovative system for seismic resistant masonry
infills in reinforced concrete frame structures
190
of all other points, measured with optical measurement system, are so small that they
can be neglected. From the out-of-plane displacements of the wall (Figure 5.60), it can
be observed that arching mechanism is activated in both directions. This is confirmed
with the distribution of the cracks in the wall (Figure 5.61). Maximum displacements
are in the center of the wall, and they are increasing from the periphery to the inside.
There is small movement of the top of the wall in the out-of-plane direction but these
displacement values are negligible, and they start to appear at the level of load of 30 kN
(4.3 kN/m2) and continue to increase after that. Therefore, this shows the need to put
some anchorages or any other measure for prevention of out-of-plane deformation, at
the connection of the top of the infill wall and the upper beam.
Figure 5.61 Cracks in the wall under maximum out-of-plane load of 6 kN/m2
The infilled frame with the IMES system was able to withstand a maximum in-plane
shear force of 210 kN at a pertinent drift of 2.75 % (Figure 5.62). At the beginning of
the second in-plane loading phase, in-plane force increased for the first cycle and started
to decrease afterwards, but not rapidly (around 10 kN=5% per amplitude cycle). For the
maximum applied drift angle of 3.5 % the resistance still amounts to about 160 kN.
After reaching a drift angle of about 3.0 %, several stairstep cracks appear (Figure
5.63a) and noise from falling pieces of brick fragments was present. Out-of-plane
displacement also started to rise and that was highly pronounced in the next amplitude
causing a rapid decrease of resistance (Figure 5.62). Brick failure first occurs at the
corners followed by the failure of the bricks at the bottom as well (Figure 5.63a).Out-of-
plane displacements continued to increase substantially until the end of the test, causing
the displacement at the bottom of the wall in the middle of the width of the wall to

Chapter 5 Experimental tests on infilled frames
191
become the highest. The damage concentrates on the backside of the wall, while the
front side shows much less damage (Figure 5.63b).
Considering the larger amplitude of interstorey drift, it can be assumed that the
resistance of the reinforced concrete frame has been fully activated, showing cracks
similar to the test A. The surrounding elastomers absorbed a part of the horizontal
displacements and, thus, lead to much less damage of the masonry infill wall. The load
versus deformation behaviour in the ascending branch, hence, can be regarded as a
combination of the frame, the elastomers and the masonry infill. In the descending
branch, however, the behaviour is mainly affected by damage of the masonry infill.
Figure 5.62 Hysteretic curve and envelope for the first and second in-plane loading phase of the
Test CI
a) b)
Figure 5.63 a) Cracks in the wall and b) damage of the backside of the wall at the end of Test CI

Marko M. Marinković Innovative system for seismic resistant masonry
infills in reinforced concrete frame structures
192
5.5.3.3 Test CIO
For the CIO test, the same load protocol was applied as for the BIO test, with the only
difference being that out-of-plane loading, due to the considerable deflection in out-of-
plane direction, has been earlier (at drift=0.5%) reduced from 5 kN/m² to 2.5 kN/m².
Load protocol and in-plane drift amplitudes are shown in Figure 5.64 as well as in Table
5.9.
Stage Drift [%]
1 0.018
2 0.036
3 0.055
4 0.073
5 0.10
6 0.20
7 0.30
8 0.40
9 0.50
10 0.60
11 0.80
12 1.00
Figure 5.64 Load protocol for simultaneous in- and out-of-plane
loading of the Test CIO
Table 5.9 In-plane drifts
of the Test CIO
The test specimen CIO, prepared according to the principles explained in section 3.2.1
was able to activate a maximum in-plane resistance of about 130 kN under the
simultaneous in- and out-of-plane loading when reaching a drift angle of about 0.90 %
(Figure 5.65a). At the beginning steady increase of resistance occurs, but soon after
having reached a drift angle of about 0.3 % stiffness started to decrease, continuing until
the end of the test (drift 1.0%). Although cycles until this point did not lead to a
decrease of the in-plane resistance, extreme out-of-plane displacements (Figure 5.66b)
have been the reason for the decision to stop the test.
It is important to mention that first out-of-plane load of around 5kN/m2 was applied,
before starting with in-plane cycles. At this point out-of-plane displacements were
negligible. From 0.1% (2.75 mm) of in-plane drift notable out-of-plane displacements
(around 5-7 mm) started to appear. With the next amplitudes, out-of-plane
displacements at the bottom suddenly started to be higher than at the top and continued
to increase especially in the left side of the wall (Figure 5.66a). This caused the wall to
start to move out-of-plane at 0.3% of drift, because the arching effect was reduced.

Chapter 5 Experimental tests on infilled frames
193
a) b)
Figure 5.65 a) Hysteretic curve end envelope for the in-plane loading and b) force-displacement
curve for out-of-plane loading
a) b)
Figure 5.66 Side view of the wall deformation in the out-of-plane direction a) at 0.3% of drift
and b) at the end of the CIO test
After passing an interstorey drift of 0.3 %, the deflections in out-of-plane direction
increased significantly. The first cracks in bed-joints but also brick at the right bottom
corner (Figure 5.67a) appeared at the next cycle (0.4%=11 mm). With this, pressure in
the pneumatic airbags decreased and with recovering the pressure to the value of
5kN/m2 wall continued to move out-of-plane. In-plane cycles of 0.5% of drift pushed
the infill even more, which causes an increase of the airbags volume and, thus, a
reduction of the pressure load from the airbags. After this point, next in-plane cycles
were performed with 2.5 kN/m2 of out-of-plane pressure, but with each in-plane cycle
out-of-plane movement increased rapidly (Figure 5.65b) causing a step-by-step failure
of the upper connection bricks too (Figure 5.67b). It is obvious that the remaining edge
brick units along the column as well as along the bottom beam fail due to excessive
shear load and overcome of tensile splitting capacity of the brick. The deformations of
the masonry infill look like a rigid body movement according to the Figure 5.66. Both
top and especially bottom of infill wall have high out-of-plane displacements. Although

Marko M. Marinković Innovative system for seismic resistant masonry
infills in reinforced concrete frame structures
194
the infill wall does not show any cracks in the inner area and looks more or less intact
(Figure 5.68a), additional out-of-plane loading could not be accepted, since connection
of the wall to the frame is destroyed (Figure 5.68b).
a) b)
Figure 5.67 a) Complete failure of the brick in right bottom corner and b) failure of the bricks
on connection with the right column
a) b)
Figure 5.68 a) Front view and b) damage of the masonry wall on the backside at the end of the
test CIO
5.5.3.4 Summary
Figure 5.69a provides a comparison of the in-plane hysteretic curves for CI and CIO
tests. It can be seen that specimen CIO shows a slightly higher initial stiffness. Similar
as for the traditionally infilled frames (specimens B), the higher stiffness might be
caused by the prestressing effect due to the arch action from out-of-plane loading. With

Chapter 5 Experimental tests on infilled frames
195
increasing interstorey drift, it loses stiffness and reaches a similar resistance as test
specimen CI at the point of maximum applied drift. The curves show that the infilled
frames generated maximal horizontal forces that are quite different (CI: 200 kN,
CIO: 130 kN), at also different levels of interstorey drift (CI: 2.4 %, CIO: 0.90 %). It is
important to note that the maximum drifts are significantly different (CI: 3.5 %, CIO:
1.0 %). According to this, the deformation capacity of the CIO specimen decreased by a
factor of around 3.9.
a) b)
Figure 5.69 a) Comparison of hysteretic curves and envelopes for in-plane loading of the Test
CI and CIO and b) force-displacement curves for out-of-plane loading for the Tests BO, BI and
BIO
The comparison of the out-of-plane force-deformation curves in Figure 5.69b also
illustrates severe differences. When loading the system in out-of-plane direction only,
the IMES system has a capacity of about 11 kN/m² of uniformly distributed loading.
After the pre-damage due to loading in-plane, the out-of-plane resistance is reduced to
about one half (about 6 kN/m²) although a two way load bearing to all four edges still
has been possible. In Figure 5.69b, it can be seen that displacement reached at the
maximum strength in a case of CO specimen is almost two times smaller than for CIO
specimen. Also specimen CIO experienced permanent displacement from the very
beginning of application of out-of-plane load, while CO specimen always had elastic
displacements until the last cycle of load.
Reason for the reduction of out-of-plane capacity in a case of specimen CI, were the
preceding in-plane loading cycles, which reached high level of in-plane drift and which
caused the tensile strength of the masonry to exceed in some areas. This became visible
by the opening of the bed-joints, which in turn lead to a reduction of bending stiffness
of the masonry infill and, hence, to larger out-of-plane deformations.

Marko M. Marinković Innovative system for seismic resistant masonry
infills in reinforced concrete frame structures
196
High reduction of in-plane deformation capacity in a case of CIO test is a strong
indicator of unfavourable effect of simultaneous in- and out-of-plane load. Decrease of
the reached drift in comparison to CI specimen undoubtedly shows that this effect has to
be taken into account. It is important to point out that at the beginning of CIO test, first
out-of-plane load of 5 kN/m2 was applied and the specimen was completely intact, but
as soon as in-plane displacement reached 0.3% of drift significant cracks in wall started
to appear. Although the system with anchors (IMES) was helpful in increasing capacity
for just in-plane (Test CI) and out-of-plane load (Test CO), when simultaneous load was
applied specimen reached almost the same in-plane displacement capacity as traditional
system (specimen BIO). This happened because of the unfavourable situation that
appears under simultaneous in- and out-of-plane loading, as explained for the traditional
system (section 5.5.2.4). The only difference in this situation is that anchors of the
IMES system take out-of-plane loading and keep the connection between frame and
infill. However, due to the gapping and reduction of contact areas, load concentrates at
the compressed corners which result in high stress concentration to the anchor brick
connection. Also, during this load combination not all the anchors are activated, so the
out-of-plane load is being carried by the smaller number of anchors, thus the load is
more concentrated. Additionally, hollow brick used for infill walls is highly brittle and
its splitting and shear capacity are so low that for this brick, which is commonly used in
modern buildings, different type of connection with the frame has to be used.
5.5.4 Infilled RC frame with the INODIS system – Test DIO
In contrast to the above-mentioned tests A, B and C, for the INODIS system all three
load types (in-plane, out-of-plane and simultaneous in- and out-of-plane) are
investigated on one specimen (DIO). As described before, vertical forces of 200 kN
have been applied on each column at the start of the test. This value has been force
controlled and kept constant over the duration of the tests. An overview of the total test
is given in Figure 5.70. The load protocol can be divided into the five phases as
described in Table 5.10, while amplitude steps for in-plane loading are depicted in Table
5.11.

Chapter 5 Experimental tests on infilled frames
197
Table 5.10 Load phases in the loading protocol of the DIO test
Phase 1 Increasing in-plane sinusoidal load up to a maximum interstorey drift of 1.25% (34.375 mm).
Phase 2 Constant out-of-plane load of 5kN/m2 (35 kN).
Phase 3 Simultaneous load: Increasing in-plane sinusoidal load up to a maximum interstorey drift of
1.0% (27.5 mm) and a constant out-of-plane load of 1.5 kN/m2 (10.5 kN).
Phase 4 Simultaneous load: Increasing in-plane sinusoidal load up to a maximum interstorey drift of
1.8% (49.5 mm) and a variable out-of-plane load varying from 2.5 to 5.0 kN/m2 (10.5 kN).
Phase 5
Simultaneous: Increasing in-plane sinusoidal load starting with a interstorey drift of 1.0%
(27.5 mm) up to a maximum interstorey drift of 3.25% (89.375 mm). The out-of-plane load
starts at an initial of 6.25 kN/m2 (43.63 kN) and is then reduced to 1.5 kN/m
2 (10.5 kN).
Table 5.11 In-plane drifts of the Test DIO
Stage Phase 1
Drift [%]
Phase 3
Drift [%]
Phase 4
Drift [%]
Phase 5
Drift [%]
1 0.018 0.018 0.018 1.00
2 0.036 0.036 0.036 1.00
3 0.055 0.055 0.055 1.25
4 0.073 0.073 0.073 1.50
5 0.10 0.10 0.10 1.80
6 0.20 0.20 0.20 2.10
7 0.30 0.30 0.30 2.40
8 0.40 0.40 0.40 2.70
9 0.50 0.50 0.50 3.00
10 0.60 0.60 0.60 3.25
11 0.80 0.80 0.80 -
12 1.00 1.00 0.60 -
13 1.25 - 0.80 -
14 - - 1.00 -
15 - - 1.25 -
16 - - 1.00 -
17 - - 1.25 -
18 - - 1.50 -
19 - - 1.80 -
20 - - 1.50 -
21 - - 1.80 -
22 - - - -
Figure 5.70 Load protocol of the Test DIO

Marko M. Marinković Innovative system for seismic resistant masonry
infills in reinforced concrete frame structures
198
5.5.4.1 Phase 1 – In-plane load
Under pure in-plane loading up to the drift of 1.25 % no damage and cracks appear in
the bricks and bed joints. The masonry infill remained completely intact while the test
was carried out. Out-of-plane displacements are negligible. The hysteresis curves and
the envelope curve of the first loading phase are shown in Figure 5.71, where it can be
seen that the resistance increases harmoniously and steadily up to the maximum force of
125 kN which corresponds to 1.25% of drift. Hysteretic loops present energy that is
spent on viscoelastic behaviour of elastomer.
Figure 5.71 Hysteresis curve and the envelope curve for the phase 1 of the Test DIO
5.5.4.2 Phase 2 – Out-of-plane load
In the phase 2 of the test, out-of-plane load has been increased until reaching 5 kN/m²
(35 kN). The corresponding deformation increase is approximately 5.8 mm (6.2 mm -
0.4 mm) in the center of the infill (Figure 5.72). The deformations from the preceding
loading cycles are not shown, so the hysteresis curve starts at 0.9 mm. The deformation
drop at the start of the test occurred during the application of the vertical loads. The
linear hysteresis up to the maximum indicates a fully intact masonry infill, which is also
confirmed by visual observations. During the load removal, a difference in the
hysteresis can be seen, which can be explained by the viscoelastic properties of the U-
shaped elastomer connection. The residual deformation after the test is approximately
1.8 mm (2.2 mm - 0.4 mm). At the end of this phase, the masonry infill was apparently
intact. Figure 5.73 shows displacements of the wall measured with the optical
measurement system. The maximum deformations of about 8 mm occur at the top of the
wall due to the low stiffness of the elastomer strips. The maximum deformations on the

Chapter 5 Experimental tests on infilled frames
199
base of the wall are about half as large. Figure 5.73b shows that after removing the
load, the system returns to its original position and only negligible deformations remain.
Figure 5.72 Force-displacement curve for phase 2 of the Test DIO
a) b)
Figure 5.73 Side view of the wall deformation in the out-of-plane direction a) at the 5 kN/m2 of
out-of-plane load and b) at the end of the phase 2 of the DIO test
5.5.4.3 Phase 3 – Simultaneous loading
Phase 3 was introduced as a testing phase which represents simultaneous load
combination derived from the codes (Section 4.3.3.5 of Eurocode 8). This combination
is in accordance with recommendation for combination of the effects of the components
of the seismic action (Section 4.3.3.5 of Eurocode 8), where it is stated that 30% of a
force in one direction should be applied together with the horizontal force in
perpendicular direction. Therefore, first out-of-plane surface load of 1.5 kN/m2 (10.5
kN) was applied and then in-plane displacement increasing from 0 to 1% of drift. Linear
behaviour of the specimen can be seen Figure 5.74, which presents in-plane hysteresis
of phase 3. Hysteretic loops present energy that is spent on viscoelastic behaviour of
elastomer. This combination of out-of-plane and in-plane load produced very small out-

Marko M. Marinković Innovative system for seismic resistant masonry
infills in reinforced concrete frame structures
200
of-plane displacements (less than 2 mm) causing no damage of the specimen at all.
Figure 5.74 Hysteresis curve and the envelope curve for the phase 3 of the Test DIO
5.5.4.4 Phase 4 – Simultaneous loading
Reason for Phase 4 of the test was the same as Phase 3, combined application of two
perpendicular loads. In this case, variable out-of-plane load varying from 2.5 to 5.0
kN/m2 was applied together with increasing in-plane load. First, out-of-plane surface
load of 5 kN/m2 (34.5 kN) was applied and then in-plane displacement rising from 0-
0.5% of drift. Afterwards, simultaneous application of in-plane displacement was
increasing from 0.6% up to 1.8% (49.5 mm) and out-of-plane load changing each two
amplitudes of the in-plane displacement. This means that each two amplitudes of in-
plane displacements were first applied together with 2.5 kN/m2
(17.5 kN) of out-of-
plane load and then the same two in-plane amplitudes were repeated together with 5
kN/m2 (34.5 kN) of out-of-plane load (Figure 5.70). The reason to stop at 1.8% of in-
plane drift was because of the need to replace testing instrumentation, since the
construction of the load cells was designed for a maximum drift angle of 1.8 %.
Until in-plane drift of 1.8 % specimen behaved linearly (Figure 5.75), due to the elastic
deformations of U-shaped elastomer connection. During the first cycle of in-plane drift
of 1.8 % in combination with an out-of-plane loading of 5.0 kN/m², together with the
first sound of cracking, a horizontal crack was noticed in the third bed joint from the
bottom of infill (Figure 5.77a). During the third cycle, furthermore, the vertical crack
arose on the right side of the wall, through the units (Figure 5.77b). From this point
onwards the out-of-plane deformation started to increase (Figure 5.76). Until this point
displacements of the wall were less than 10 mm. After the load is removed, some of the

Chapter 5 Experimental tests on infilled frames
201
deformations caused by the formation of cracks remain in the wall, but the deformations
in the hyperelastic elastomers reverse for the most of the wall (Figure 5.76).
Figure 5.75 Hysteresis curve and the envelope curve for the phase 4 of the Test DIO
a) b)
Figure 5.76 a) Top view of the deformation in the out-of-plane direction for the horizontal sec-
tion in the middle height of the wall and b) side view of the deformation in the out-of-plane
direction for the vertical section in the middle length of the wall
Figure 5.77b shows the damage pattern with the horizontal crack above the third row of
bricks and the vertical crack along the third row of bricks from the right. Formation of
these cracks is caused by the combined stress and strain of in-plane and out-of-plane
loading. Both cracks appear when the frame deformed towards the right. Figure 5.78
shows the resulting load situation with the diagonal compression strut and the areas of
the frame that are detached. The first crack in the horizontal direction arose due to the
reduction of the clamping effect at the base of the wall as a result of the frame
deformation on the unloaded side of the infill. This leads to an increase in the bending
stresses from out-of-plane load until the flexural strength of the masonry is exceeded. In
the next load cycle, the vertical crack in wall appears because the clamping effect is

Marko M. Marinković Innovative system for seismic resistant masonry
infills in reinforced concrete frame structures
202
reduced in the unloaded upper right corner of the frame and again the bending stresses
due to the out-of-plane load exceeds the flexural strength of the masonry. The wall does
not move out-of-plane due to the circumferential support provided by the elastomers. In
spite of the crack formation, the wall stays stable in the frame.
a) b)
Figure 5.77 a) Appearance of the first crack in the wall and b) cracks in the wall at the end of
phase 4
Figure 5.78 Deformation of the frame with the compressed diagonal, detachment and cracks
occurred
During the test, gaping at the upper corners but also at the bottom corners (Figure 5.79)
appeared, showing rigid body rotation of the whole infill wall due to the deformation of
the elastomers and not the wall itself. The gap formation in the unloaded corners of the
frame (Figure 5.78) was measured continuously during of the test using LVDTs (Figure
5.19) and resulted in maximum values for the fourth loading phase of 17 mm for the

Chapter 5 Experimental tests on infilled frames
203
upper column section, 6 mm for the lower column section, 15 mm for the frame top
beam, and 10 mm for the uplift from the base of the frame. The values specified are
smaller than the maximum permissible displacements of 30 mm for the column section,
25 mm for the frame top beam, and 25 mm for the base of the wall.
a) b)
Figure 5.79 a) Gap formation in the corner of the frame and b) uplift of the wall base
5.5.4.5 Phase 5 – Simultaneous loading
At the end of phase 4, the limit for possibility to apply in-plane and out-of-plane load at
the same time and to measure the out-of-plane force with load cells was reached.
Therefore, it was decided to stop with the experiment and to replace the load cells by
threaded rods. Before this was done it was decided to test the specimen under even
higher out-of-plane load of 6.25 kN/m2 (43.63 kN) in combination with in-plane
displacement of 27.5 mm, which represents 1.0% of in-plane drift. First out-of-plane
surface load was applied and then two cycles of in-plane displacement up to the 1.0% of
drift. Under this loading combination, specimen behaved linearly and showed that it still
had high strength and deformation capacity, although at the end of phase 4, specimen
had cracks in bed joints and a couple of units. This can be assigned to the U-shaped
connection of the INODIS system, which with hyperelastic behaviour of elastomers
provides deformation capability and postpones the start of damage under in-plane
loading. Linear behaviour of specimen confirms that up until higher drift ratios most of
the deformations of the frame are transferred to the elastomers.
Due to the cracks developed at the end of phase 4 out-of-plane deformability of
specimen is increased, respectively out-of-plane strength of the wall is decreased
causing higher displacements of the wall (Figure 5.80), but still having reversible
displacements, due to the elastomer connection.

Marko M. Marinković Innovative system for seismic resistant masonry
infills in reinforced concrete frame structures
204
Figure 5.80 Force-displacement curve for simultaneous load of 6.25 kN/m2 and 1% of in-plane
dirft
When the load cells were replaced by threaded rods, an out-of-plane surface loading of
1.5 kN/m² was applied simultaneously with the in-plane drift increasing from 1.0% until
3.25%. Thus, the real out-of-plane loading can only be determined via the air pressure
and the surface of the airbags.
Figure 5.81 shows the hysteresis curves for the fifth loading phase up to the maximum
interstorey drift of 3.25% together with the envelope curve. The hystereses are also
stable and wide in this high range of in-plane drifts. Maximum in-plane resistance of
150 kN was reached at an interstorey drift angle of 2.2 %, followed by the slow fall of
the in-plane resistance to 135 kN at the maximum drift angle of 3.25 %.
Figure 5.81 Hysteresis curve and the envelope curve for the phase 5 of the Test DIO
Figure 5.82 shows the damage pattern after completion of the fifth load phase. In
general, the crack paths match those detected in the damage pattern of the fourth phase,
but in this case they are much more evident. It should be pointed out, that even after
high in-plane displacements were applied together with the various combinations with

Chapter 5 Experimental tests on infilled frames
205
out-of-plane load, infill wall was highly damaged but it didn‘t fall out-of-plane, and
instead remained stable, which is very important from the side of safety. Similar damage
pattern can be seen on the backside of the wall (Figure 5.82b), where the bricks are
damaged up and down from the bed joint which was sliding and also in vertical
direction in the right part of the wall. It is very important to note that glued connection
of U-shaped elastomer and bricks remained intact until the very end of the test (Figure
5.83), which shows that this kind of connection is reliable. This is also confirmed when
the wall was demolished after the test, in order to investigate the parts of the INODIS
system in a more detailed manner. It is interesting to mention that even when the wall
was already damaged during the test, it was very difficult to completely demolish it by
pushing it out-of-plane with the forklift maschine. Figure 5.84a shows parts of the
bricks still remaining glued to the elastomer after demolishing the wall, even causing
the splitting the bricks and tearing the elastomers, but not losing glued connection. Also
layers of elastomers remained glued (Figure 5.84b). This shows that glued connection of
elastomers and brick is stable and reliable. Also plastic profiles easily kept intact. Also,
RC frame was highly damaged with a lot of cracks (Figure 5.85), due to high level of
drifts reached. This shows that the INODIS system transferred the attribute of critical
element from infill wall to the frame.
a) b)
Figure 5.82 a) Damage of the front side and b) of the backside of the wall at the end of the DIO
test

Marko M. Marinković Innovative system for seismic resistant masonry
infills in reinforced concrete frame structures
206
Figure 5.83 Intact glued connection between the U-shaped elastomers and bricks at the end of
test
a) b)
Figure 5.84 a) Strong glued connection between the U-shaped elastomers and bricks and b)
between two layers of elastomer
Figure 5.85 Cracked frame at the end of the test
5.5.4.6 Summary
Figure 5.86a presents in-plane hysteresis, while Figure 5.86b presents out-of-plane
hysteresis of all the phases of the test on the INODIS system submitted on the specimen

Chapter 5 Experimental tests on infilled frames
207
DIO. Taking into account the total test, the INODIS system is able to withstand a
maximum in-plane shear of 155 kN at 1.8 % of drift. The resistance increases
harmoniously and steadily up to the maximum. During the test, no damage of the
masonry infill was observed until high levels of in-plane drifts. The force of nearly 180
kN in the first cycle of in-plane load at the drift of 1.8% is neglected (it is probably a
wrong record of the equipment), due to the fact that the maximum horizontal force of
the second and third cycles corresponds to the maximum force in negative direction. For
the maximum applied drift angle of 3.25 % the resistance still amounts to about 140 kN.
In-plane hysteretic curve shows a high level of drift reached until the first crack in infill
(Damage Limit State-DLS) and until failure of infill wall (Ultimate Limit State-ULS).
Also wide hysteretic loops show that the high amount of energy is dissipated. This is
possible due to the viscoelastic behaviour of elastomers used for the INODIS system.
a) b)
Figure 5.86 a) Hysteretic curve and envelope for the in-plane loading and b) force-displacement
curve for out-of-plane loading of the Test DIO
a) b)
Figure 5.87 a) Comparison of the in-plane hysteretic curves and b) envelopes for all the phases
of the Test DIO
Figure 5.87 shows the in-plane hystereses and envelopes of the System INODIS,

Marko M. Marinković Innovative system for seismic resistant masonry
infills in reinforced concrete frame structures
208
subdivided into test phases. It can be seen that all the phases of the test have similar
initial stiffness. This can be explained with the fact that at the beginning deformation of
the frame is taken by the elastomers and not transferred to the infill wall. The stiffness
of the envelope of phase 5 is slightly smaller due to the cracks in the RC frame. On the
basis of this fact, it can be concluded that the out-of-plane loading has no or only a
small effect on the in-plane resistance of the DIO specimen.
Figure 5.86b shows out-of-plane curve for all the phases of the DIO test, where it can be
seen that higher out-of-plane displacements are related to phase 5 of the DIO test. But
even at this level of out-of-plane displacements in the center of the wall, connection of
the infill with the frame through the U-shaped elastomers stayed strong and intact
(Figure 5.83). This was the reason for the wall to stay stable and not to present the
danger of falling out.
Cracks and damage of the RC frame at the end of the DIO test (Figure 5.88) show that
cracks in frame developed in a similar way as in a bare frame (Figure 5.23), which
proves the efficiency of the INODIS system in the decoupling of infill wall and frame.
Figure 5.88 Cracks in the frame at the end of the DIO test
5.5.5 Comparison of the experimental results
In the following sections, a comparison between the behaviour of infilled frame with the
INODIS system and traditionally infilled frame and infilled frame with the IMES
systems is shown for in-plane loading, out-of-plane loading and simultaneous in-plane
and out-of-plane loading.

Chapter 5 Experimental tests on infilled frames
209
5.5.5.1 In-plane behavior
In the following, the behaviour is illustrated by the hysteresis diagrams of the
experiments as well as with a simplified procedure for the evaluation by using envelope
curves. Therefore, the corresponding resistance of the infill has been evaluated as the
difference between the response of the infilled frame and of the corresponding bare
configuration. Such approach allows a consistent comparison of the experimentally
obtained infill properties in terms of strength, stiffness and deformation capacity to
similar results for other masonry typologies.
First, the behaviour of DIO specimen with the bare frame (Test A) is compared. The
hysteresis curve and the envelope curve of the first loading phase are shown in Figure
5.89a. The hysteresis curves are stable and no damage occurs in the infill up to the
interstorey drift of 1.25%. In addition, the envelope curve of the bare frame (Test A) and
the load contribution of the infill as the difference of the two envelope curves are
shown. Difference of the envelope curves is calculated using short code made in
MATLAB. The small load contribution of 20.6 kN at an interstorey drift of 1.25%
shows that the infill is only activated to a small degree.
a) b)
Figure 5.89 a) Hysteresis curves and envelope curves with the comparison to the bare frame
envelope for the first and b) third loading phase of the Test DIO
In the third loading phase, a combination of in-plane and out-of-plane loads is applied
simultaneously. Even when subjected to this combined load, the infill remains
undamaged. Figure 5.89b shows the hysteresis curves for the first and third loading
phases. A comparison of the curves shows that the influence of the out-of-plane load of
1.5 kN/m2 does not have a large impact.
The hysteresis curves and the envelope curve of the fourth loading phase are shown in

Marko M. Marinković Innovative system for seismic resistant masonry
infills in reinforced concrete frame structures
210
Figure 5.90a. In addition, the envelope curve of the bare frame (Test A) and the load
contribution of infill as well as the difference of the two envelope curves are shown.
The small level of load contribution of 30.7 kN at an interstorey drift of 1.5% shows
that the infill is only activated to a small degree even when subjected to a combined
loading and for large interstorey drift.
a) b)
Figure 5.90 a) Hysteresis curves and the envelope curves with the comparison to the bare frame
envelope for the fourth and b) fifth loading phase of the Test DIO
Figure 5.90b shows the hysteresis curves for the fifth loading phase up to the maximum
interstorey drift of 3.25% together with the envelope curve. The hystereses are also
stable and wide in this high range of in-plane drifts. In addition, the envelope curve of
the bare frame (Test A) is shown. The frame with the INODIS system and masonry infill
is able to withstand a 1.3 times higher horizontal force (A: 120 kN, Dio: 155 kN). Also,
the drift angle at maximum in-plane loading is almost the same (A: 2.0%, Dio: 1.8%).
In both tests, the restoring force increases steadily until reaching the maximum value.
After reaching the maximum horizontal force of the test DIO, both hystereses are
approximately parallel with a distance of about 30 kN. When the curves are compared,
it can also be noticed that the initial stiffness of the bare frame is matching with the
initial stiffness with the infilled frame with the INODIS system. Only phase 5 of the
DIO test has smaller initial stiffness when compared to the bare frame, which is due to
the repeated and numerous applications of loads beforehand that led to the formation of
cracks in the frame. Therefore, it can be concluded that damage in the frame started
sooner than damage in the infill wall, which confirms the successfulness of the
application of the INODIS system, by transferring the critical criteria for design from
the infill wall to the frame. As the interstorey drift increases, though, the infill is
gradually activated. At the end of the fifth loading phase, the load contribution of the

Chapter 5 Experimental tests on infilled frames
211
infill is 38 kN in the positive loading direction. Even for the whole range of interstorey
drifts, the envelope curve for the infilled frame is close to the envelope curve of the bare
frame. Due to this it can be concluded that natural frequencies of the bare frame and
infilled frame with the INODIS system are almost the same, which presents one of the
most important benefits of the INODIS system. This makes the design and calculation
of the RC frame buildings with infill walls more simple, certain and reliable.
Figure 5.91a shows the comparison of the hysteresis curves for the first loading phase in
tests BI, CI and DIO up to the interstorey drift of 1.25%. Infilled frame in the first
loading phase of the CI test was subjected up to the 2.4% of drift, while BI and DIO
specimens were subjected up to 1.25% of drift. Therefore, for the purpose of
comparison the part of the CI curves just until 1.25% is going to be shown. It can be
seen that the infill with the INODIS system has the lowest stiffness and a much lower
horizontal force of 130 kN arises in comparison to 225 kN for the traditionally infilled
frame. The hysteresis curves for the DIO test are wide and exhibit a constant stiffness in
the loading and unloading stages. In the contrast to this, the hysteresis curves for the
traditional infill (Test BI) are narrower and exhibit a decreasing stiffness. CI specimen
has similar behaviour and is almost matching the curves of the DIO specimen.
Figure 5.91b shows the envelope curves of the hystereses for tests A, BI, CI, and DIO
together with the contribution curves for the BI, CI and DIO tests. The curves show that
the envelope curves for tests A and DIO are very close to each other and that the load
supported by the infill is only 26 kN. Contribution curve for CI test is slightly stiffer
than the curve from DIO test. It is obvious that there is a high difference in initial
stiffness and continuous and smooth rise of the resistance in a case of DIO and CI
specimen in contrast to the sudden drops of the load in the case of BI specimen. This
indicates that the infill is only activated to a small degree due to the deformation
capability of the elastomers.
Also BI specimen showed relatively strong resistance of the infill, which led to the more
shear cracks in the RC columns, caused by the activation of the infill strut. This proved
that possibility for occurrence of shear failure mechanisms is high in the case of strong
infills and it should be prevented through adequate measures such as decoupling
through elastomers, which solved this problem in the case of DIO and CI specimen.

Marko M. Marinković Innovative system for seismic resistant masonry
infills in reinforced concrete frame structures
212
a) b)
Figure 5.91 a) Hysteresis curves and b) envelopes with the comparison to the bare frame enve-
lope for the first loading phase of the Test BI, CI and DIO up to 1.25% of drift
5.5.5.2 Out-of-plane behaviour
Since the INODIS system has not been tested up to the limits under out-of-plane load
and DIO specimen is supported on four sides, comparison of the out-of-plane behavior
of the INODIS system with the traditional system (Test BO) and the IMES system (Test
CO) is not possible. However, comparison of out-of-plane behaviour after previous in-
plane behaviour is possible and for BI, CI and DIO test will be presented here. For BI
and BIO test, out-of-plane load is applied after previous in-plane drift of 1.25%, while
in CI test previous drift level was 2.4%. These experiments give valuable information
about the influence of prior in-plane loading on out-of-plane capacity.
a) b)
Figure 5.92 a) Out-of-plane force-displacement curves and b) side view of the out-of-plane de-
formations for the maximum loads for the second loading phase of the BI, CI and DIO test
Figure 5.92a shows the force-displacement curves of the out-of-plane deformations at
the centre of the wall for the second loading phase of the BI, CI and DIO test. The load
in BI and CI test was applied in 8 cycles and in one cycle in the DIO test. In the BI and
CI test, the ultimate load was reached in the eighth cycle at a value of 3 kN/m2 and 6

Chapter 5 Experimental tests on infilled frames
213
kN/m2, respectively. Both specimens experienced high out-of-plane deformations in
comparison to the DIO specimen with no cracks formed during the out-of-plane load of
5 kN/m2.
Displacements perpendicular to the wall in the case of CI specimen were mostly in
elastic range without reaching high values of residual displacement (BI: 24 mm / CI: 8
mm / DIO: 1.8 mm), although CI and BI specimens reached almost the same maximal
out-of-plane displacement. This can be explained due to the elastomer connection and
its elastic behaviour. BI specimen had high values of residual displacement increasing at
each cycle, even though in the case of CI previous in-plane load was applied up to 2.4%
of drift in contrast to the BI test where it was only 1.25%. Therefore, it seems that in the
case of BI test damage due to the in-plane loads earlier applied (section 5.5.2.1)
damaged the connection between infill and frame and produced out-of-plane
displacements of the traditional infill greater by a factor of 5, when compared to the
DIO specimen. Figure 5.92b shows the side view of the deformations measured in all
three tests for the maximum out-of-plane loads in five vertical cross-sections along the
height of the wall. The cross-section shows the tilting of the traditional infill in test BI
with deformations of up to 100 mm at the top of the wall, in comparison to the
negligible deformations in the DIO test. At the maximum of out-of-plane load on
specimen CI, displacements at the top of the wall were small, while displacements at the
bottom due to the mortar connection were larger (around 10 mm). This probably
occurred because of brittleness of mortar which was slightly damaged by the in-plane
load. Fortunately, on the top there was an elastomer, otherwise the connection of the
infill wall and the frame would be destroyed by the in-plane load as in the case of
traditional specimen BI. For CI specimen, from the beginning until the end of phase 2,
highest displacement was in the middle, showing that arching mechanism was activated
in contrast to the BI specimen where it was not possible to activate arching mechanism
since connection of the infill wall and frame at the top was damaged. Due to the U-
shaped elastomer connection on all four sides on the infill wall, DIO specimen
experienced 5 times smaller displacements when compared to the CI specimen.
5.5.5.3 Simultaneous in-plane and out-of-plane loading
Figure 5.93 shows the hysteresis curves for BIO and CIO test and for the third, fourth

Marko M. Marinković Innovative system for seismic resistant masonry
infills in reinforced concrete frame structures
214
and fifth loading phases of the DIO test, because these phases include both in-plane and
out-of-plane loading. These curves show again the low stiffness and small amount of
force absorbed by the infilled frame with the INODIS system. CIO specimen activated
an infill wall much less than BIO specimen, but again more than DIO. The contribution
curve of the infill in the DIO test illustrates that the activation of the infill is delayed and
begins at an interstorey drift of 0.6%. At this drift, the traditional infill in the BIO test
has almost reached its maximum load. Furthermore, the comparison shows that the
maximum deformability of the traditionally infilled RC frame (BIO) and infilled frame
with the IMES system (CIO) is already reached at 1.0% while the DIO specimen with
the INODIS system reaches a maximum interstorey drift of 3.25%.
a) b)
Figure 5.93 a) Hysteresis curves and b) envelopes with the comparison to the bare frame for the
BIO and CIO test and for the third, fourth and fifth loading phases of the DIO test
a) b)
Figure 5.94 a) Force-displacement curves and b) side view of the out-of-plane deformations for
5 kN/m2 of out-of-plane load and interstorey drifts of 1.0% (BIO and CIO) and 1.8% (DIO)
Also, an important difference is that the masonry infill of DIO specimen is not pushed
out of the wall plane in contrast to the BIO and CIO. This is due to the fact that along
the circumferential support of infill wall, only small out-of-plane deformations are

Chapter 5 Experimental tests on infilled frames
215
visible and the bricks are apparently intact, which is not the case for BIO and CIO
where bricks in contact with the frame experienced splitting and high level of damage.
Therefore, the reason to stop the BIO and CIO test was high out-of-plane displacements,
while DIO test was performed up to the limit of testing equipment. DIO can absorb
smaller maximum shear force than the specimen BIO, but higher than CIO (BIO: 255
kN, CIO: 130 kN, DIO: 155 kN), at the greater interstorey drift (BIO: 0.65 %, CIO:
0.9%, Dio: 1.8% %). Also contribution of the INODIS system is a couple of times
smaller than in a case of the IMES system and even more so when compared to the
traditional system.
Figure 5.94a shows the force-displacement curves for the BIO and CIO test and the
third and fourth loading phases of the DIO test for the out-of-plane deformations at the
centre of the wall. In the BIO and CIO test, a constant out-of-plane load of 5 kN/m2 is
applied in combination with an increasing sinusoidal in-plane load with a maximum
interstorey drift of 1.0%. In the DIO test, the out-of-plane load is varied between 2.5
and 5.0 kN/m2, whereby the maximum interstorey drift for the third and fourth phase is
1.8%. A comparison of the results shows that the deformations for the infilled RC frame
with the INODIS system were smaller by a factor of about 3-5 times and the infill stays
stable, while the load for the BIO and CIO test infill drops further and further because
the wall moves out of the frame. For both specimens, BIO and CIO, sudden increase of
the deflections could be observed, accompanied by a reduction of the out-of-plane
loading shortly after start of the in-plane cycles. In the case of simultaneous loading of
BIO specimen, out-of-plane resistance is reduced to 12.5%. The same happened in the
case of the IMES system, but the resistance was reduced first to 50% and then to 25%.
Also, in the case of BIO and CIO specimens damage started already at small drifts (0.3-
0.4%) and at the drift of 1.0% they were completely destroyed. In contrast, specimen
DIO experienced first crack at the 1.8% of drift.
Figure 5.94b shows the side view of the deformations measured in both tests for an out-
of-plane load of 5 kN/m2 and interstorey drifts of 1.0% (BIO) and 1.8% (DIO). Results
show the rigid body movement with tilting of the traditional infill wall in the BIO test
with deformations of up to 120 mm at the top of the wall and 140 mm at the bottom of
the CIO specimen, in comparison to the much smaller deformations in the DIO test even
though the interstorey drift was 1.8 times higher. It can be observed that infill

Marko M. Marinković Innovative system for seismic resistant masonry
infills in reinforced concrete frame structures
216
deformation reflects activation of arching effect in the case of DIO specimen. BIO and
CIO specimens experienced high out-of-plane deformations at both the bottom and the
top of infill wall, because of the reduction of contact areas and the change of boundary
conditions that are important for the formation of the arching effect, due to the in-plane
frame deformations, as explained in section 5.5.2.4. U-shaped connection of elastomers
used in the INODIS system successfully prevents this behaviour, which in a real case of
an earthquake presents a huge risk for the public.
5.5.5.4 Stiffness degradation
In the following section, in-plane stiffness values for tested specimen are summarized
and compared. Calculation of stiffness for the specimens experimentally tested was
done using short code made in MATLAB. Figure 5.95 shows the initial stiffness of the
test specimens A, BI, BIO, CI, CIO and DIO. The stiffnesses of the test specimens A, CI
and DIO are very close to each other since the infill at first is not activated because it is
decoupled by the elastomers. Stiffness of the CIO specimen is around 2 times higher
than the stiffness of the bare frame. This is due to the simultaneous in- and out-of-plane
loading. This effect is also seen in the case of traditional infill (Test BIO), but not in the
case of the INODIS system (Test DIO). This confirms that application of the INODIS
system successfully decouples infill wall from the surrounding frame for all loading
combinations.
Change of secant and tangential stiffness of the tested specimens is presented in Figure
5.96. The evolution of the secant stiffness at each level of lateral drift is calculated using
the secant stiffness of the peak value determined at each positive and negative hysteretic
loop. The secant stiffness at each lateral drift is defined as the slope of the line
connecting the origin to the point corresponding to the maximum force obtained in the
first cycle of force-displacement diagram. Tangential stiffness degradation was assessed
as the slope of the line connecting the point of the envelope with the previous point.
While the stiffnesses of the bare frame A and the infilled frames CI, CIO and DIO
decrease slowly and moderately, the stiffness of the traditional infill abruptly decreases
as the interstorey drift increases. Figure 5.96b confirmed that the degradation of
stiffness for the BIO specimen is so fast that the tangential stiffness quickly changes its
sign to negative. CIO specimen also for small level of drifts exhibits stiffness

Chapter 5 Experimental tests on infilled frames
217
degradation. However, its initial stiffness is 6 times smaller than for the BIO specimen,
thus stiffness degradation is somewhat slower. It is observed that the stiffness
degradation exhibits similar path in the positive and negative directions, for specimens
A, CI, CIO and DIO.
Figure 5.95 Initial in-plane stiffness of the tested specimens
a) b)
Figure 5.96 a) Change of secant stiffness and b) tangential stiffness of the tested specimens
a) b)
Figure 5.97 a) Tangential stiffness ratio of the tested infilled frames and bare frame and b) of the
DIO test and bare frame
Figure 5.97 shows the ratio of tangential stiffness of the tested infilled frames and the
bare frame, at the corresponding drift. Ratio for the BIO specimen is not showed on the

Marko M. Marinković Innovative system for seismic resistant masonry
infills in reinforced concrete frame structures
218
diagram, because it has the values going from -25 to 27, for the corresponding drift. For
small level of drifts, BI specimen has 7 times higher tangential stiffness than the bare
frame, but this ratio drops rapidly to the values between 1 and 2. CI and CIO specimens
have almost the same ratio ranging from 1-2 at the beginning. Afterwards, stiffness of
the CIO specimen drops, while CI specimen experiences stiffness ratio increase up to 5-
7 times and then sudden decrease around 2% of drift. Figure 5.97b presents only the
ratio of stiffness for the DIO specimen, in order to be able to clearly see the values. It
can be seen that the ratio goes from 1 to 2 for the big range of drifts until 1.8%. At this
point first damage in infill wall appeared followed by a decrease of stiffness ratio at the
end of the load phase 4. It is important to notice is the stiffness recovery at the
beginning of the load phase 5. This can be attributed to the U-shaped elastomers, which
provide satisfactory and reliable connection to the infill walls, even for the aftershocks.
5.5.5.5 Energy dissipation
The ability of a structure to dissipate the seismic input energy is an accurate measure of
its expected seismic performance. The cumulative dissipated energy is determined as
the sum of the area enclosed by each hysteretic loop. For this, the short code made in
MATLAB was used. The cumulative dissipated energy for all the specimens tested
under in-plane loading is given in Figure 5.98a, while energy dissipated during the in-
plane testing for increasing lateral drifts is presented in Figure 5.98b. Here, energy
dissipated versus in-plane drifts for specimen DIO is not presented, because load
protocol (Figure 5.70) for this test contains repeated cycles for the same drifts due to the
combination of different loading situations. Figure 5.99 shows energy dissipated per
each cycle for all the tested specimens.
a) b)
Figure 5.98 a) Cumulative dissipated energy and b) energy dissipation for increasing drifts

Chapter 5 Experimental tests on infilled frames
219
a) b)
c) d)
e) f)
Figure 5.99 Energy dissipated per each cycle of specimen a) A; b) BI; c) BIO; d) CI; e) CIO and
f) DIO
The deformation energy for test DIO has been computed to be almost 290000 Nm,
which is much higher than in the other tests. Especially BIO and CIO tests dissipated
the least energy. In the CI test significant amount of energy is dissipated. If compared
with the bare frame, which was subjected to the same level of in-plane drift it can be
concluded that around 55000 Nm of energy is more dissipated in the case of CI
specimen. This can be attributed to the infill damage, but also to the energy spent on
viscoelastic behaviour of elastomers. Figure 5.99 confirms that BI, BIO and CIO
specimen performed the worst from all the specimens, by spending the least of energy.
This proves again that traditionally infilled frames are not suitable for earthquake

Marko M. Marinković Innovative system for seismic resistant masonry
infills in reinforced concrete frame structures
220
loading and also infilled frame with the IMES system does not present a proper solution
for infilled frame with the simultaneously applied in- and out-of-plane load.
Since different combinations of in- and out-of-plane loading have been used in load
protocols for specimen testing, especially for the DIO test, it is suitable to compare the
energy dissipation per loading phases. According to that, Figure 5.100 shows energy
dissipated in the first phase of the DIO and BI test and A and CI tests until 1.25% of
drift. Until this level of drift pure in-plane loading has been applied. It can be seen that
dissipated energies are around the same level, with the DIO specimen dissipated the
most, while not experiencing any damage. On the contrary, infill wall of the BI
specimen already experienced some damage, but even so it dissipated slightly less
energy than the DIO specimen. Energy dissipation of A, CI and DIO specimen is the
same until 0.8% of drift when it decreased a slightly for specimens A and CI, while
continuing to increase in the same trend for specimen DIO. This can be attributed to the
energy dissipation on viscoelastic behaviour of elastomers.
a) b)
Figure 5.100 a) Cumulative dissipated energy and b) energy dissipation for increasing drifts up
to 1.25% of drift
Figure 5.101a shows comparison of dissipated energy in the BIO, CIO and third, fourth
and fifth phase of the DIO tests, which present simultaneously loaded specimens. It is
clear that the infilled frame with the INODIS system dissipated considerably more
(around 10 times more) energy than BIO and CIO specimen. This presents the
comparison of dissipated energy until the infill failure, which shows the benefit of use
of the INODIS system. Given that in phases 3 to 4 of the DIO test there is no damage of
the infill wall that means that the whole system stayed in elastic range, because the
energy is spent on viscoelasticity of elastomer and frame plastification. During the third

Chapter 5 Experimental tests on infilled frames
221
and fourth loading phase of DIO specimen, infill stayed without any cracks until the last
cycle of loading. Even in that case dissipated energy is higher than for the case of BIO
and CIO (Figure 5.101a). If comparison of dissipated energy is done until 1% of drift
(Figure 5.101b), it can be seen that BIO and CIO specimens spent more energy, but they
reached ultimate limit states in comparison to the DIO specimen who didn‘t experience
even any minor crack in the first load phase.
a) b)
Figure 5.101 a) Cumulative dissipated energy for simultaneously loaded specimens BIO, CIO
and DIO and b) energy dissipation for increasing drifts up to 1.0% of drift
a) b)
Figure 5.102 a) Cumulative dissipated energy for bare frame up to 1.8% of drift and fourth
phase of the DIO test and b) for the first, third and fourth phase of the DIO test
In order to estimate the level of energy spent on viscoelastic behaviour of elastomers,
dissipated energy for the phase 4 of the DIO test and for the bare frame (Test A) are
compared. Since in the phase 4 of the DIO test specimen is subjected to the in-plane
drift up to 1.8%, comparison with the bare frame is done until 1.8% of drift (Figure
5.102a). It can be noted that the difference in energy dissipated is quite high. This
energy can be recognized as the energy dissipated on viscoelasticity of the elastomers.
As a summary, Figure 5.102b shows energy dissipated in the first, third and fourth

Marko M. Marinković Innovative system for seismic resistant masonry
infills in reinforced concrete frame structures
222
phase of the DIO test. This represents considerably high level of the energy spent, under
various load combinations that can appear during an earthquake, without damaging the
infill wall. Therefore, it can be concluded that extreme level of energy can be dissipated
in earthquakes if INODIS system is applied.
5.5.5.6 Equivalent viscous damping ratio
In order to additionally asses the behaviour of the tested infilled frames, equivalent
viscous damping ξeq ratio was calculated for each cycle, based on the following
equation:
2
diss
eq
sto sto
E
E E
(5.1)
where Ediss is the dissipated energy calculated as the sum of the areas enclosed in the
hysteretic loop for each cycle stoE and stoE
are the stored energy calculated as the area
of triangles generated from connecting the origin point to maximum and minimum load
of each cycle, respectively (Figure 5.103).
Figure 5.103 Definition of dissipated and stored energy
Accordingly, the evolution of the equivalent viscous damping ratios has been
determined for the tested specimens and plotted against the imposed drifts (Figure
5.104), based on an estimation from the experimentally obtained load-displacement
loops considering the first, the second and the third cycle at each target displacement
and calculating the equivalent damping ratio on the basis of the average of the results of
three cycles. Although the evaluation of the damping has been computed for all the
applied cycles, the plots of the following figures begin from a drift of 0.1% (13th
cycle),
since the values of damping at very low level of in-plane displacement demand are not
considered realistic, given that the lateral response of the frame is not characterized by
any significant hysteretic dissipation with the risk of providing ratios between the

Chapter 5 Experimental tests on infilled frames
223
dissipated energy of the cycle over the elastic energy being unrealistically high.
Figure 5.104 Equivalent viscous damping for increasing drifts
For the bare frame (specimen A) and infilled frame with the IMES system (specimen
CI), the equivalent viscous damping increases substantially from about 8% up to 18%
and 14%, respectively, starting from drifts larger than 2.0% up to a drift of 3.50%. For
the traditionally infilled frame (specimen BI) the damping, lies in the range between 6%
and 10%, only increasing after 1.5% of drift up to about 10%. For the traditionally
infilled frame (specimen BIO) the damping, after a first sharp decrease from 16% to
8%, increases up to 15% at the drift of 1%. The damping of the infilled frame with the
IMES system (specimen CIO) is higher than for specimen CI and remains between
about 10% and 12%. Since different combinations of in- and out-of-plane loading have
been used in load protocols for testing the DIO test, the change of the equivalent
viscous damping per each load cycle presented in Figure 5.105 shows the change of
equivalent viscous damping ratio per each cycle, where it can be seen that equivalent
viscous damping for the DIO specimen takes values from 9% up to 20%. This gives the
attribute of the highest dissipative specimen to the DIO specimen with the INODIS
system. Equivalent viscous damping is also presented for the first phase of the DIO and
BI test and A and CI tests until 1.25% of drift (Figure 5.106a). It can be seen that
highest level of damping relates to the DIO specimen, having the values almost two
times higher than BI specimen at 1% of drift. Also, the values are higher around 50%
when compared to the bare frame, indicating the positive effect of the elastomers of the
INODIS system. Comparison of the values for the equivalent viscous damping (Figure
5.106b), for the same loading conditions, confirm once again the beneficial effect of
applied elastomers as a decoupling measure of the infilled frame.

Marko M. Marinković Innovative system for seismic resistant masonry
infills in reinforced concrete frame structures
224
a) b)
c) d)
e) f)
Figure 5.105 Change of the equivalent viscous damping ratio per each cycle for specimen a) A;
b) BI; c) BIO; d) CI; e) CIO and f) DIO
a) b)
Figure 5.106 Change of the equivalent viscous damping ratio for increasing drifts a) up to
1.25% for specimens A, BI, CI and DIO and b) for BIO, CIO and 3rd
phase of the DIO specimen

Chapter 5 Experimental tests on infilled frames
225
5.6 Summary
Eight tests were performed with the purpose to investigate the behaviour of reinforced
concrete frames with masonry infill walls constructed using tongue and groove highly
thermally-insulating hollow clay bricks. One bare frame (marked with the letter A) was
tested in order to be able to extract the results of contribution of different infill systems.
Three systems were investigated under in-plane, out-of-plane and simultaneous load.
System marked with the letter B presents traditional system where connection of infill
wall and RC frame is conducted by filling the gap with mortar. Specimens with the
letter C present the IMES system, where elastomers are used in combination with steel
anchors to reduce in-plane damage and prevent the infill wall to fall out-of-plane. And
the system marked with the letter D presents the third type of connection (the INODIS
system), where U-shaped elastomers are used to decouple infill wall from the frame, but
at the same to prevent any damage due to the out-of-plane load.
The tests were performed in a specially produced test frame in which the vertical and
horizontal loads were applied to the reinforced concrete frame via hydraulic cylinders.
The out-of-plane loads were applied using airbags, which ensures a uniform application
of the load. Forces and deformations of the hydraulic cylinders are recorded by the
integrated displacement and force transducers, while the deformations of the test
specimens in both horizontal and vertical direction were measured by inductive
displacement transducers (LVDTs) and by cable potentiometers in diagonal direction.
Optical measurement system was also employed to obtain vector displacements of
marked points on the infill wall and frame.
The focus of the experimental study was the improvement of the understanding of the
cyclic response of three types of connections of masonry infill walls and RC frame.
Furthermore, the focus was placed on the examination of the interaction between the in-
and out-of-plane loads and comparison of the behaviour between traditionally infilled
RC frames, infilled RC frames with the IMES system and infilled RC frames with the
INODIS system.
Furthermore, particular attention has been devoted to the analysis of the infill
performance, resulting in the identification of the characteristic failure mode. In
particular, the development of a diagonal stepwise crack pattern due to shear sliding in

Marko M. Marinković Innovative system for seismic resistant masonry
infills in reinforced concrete frame structures
226
the bed joints and slight opening of the dry head joints followed by the creation of
diagonal cracks on the masonry units has been identified at different drift levels. Based
on a simplified representation of the average infill response and observations during the
test, the drift levels and load resistance have been found.
The tests yielded the following results:
A Test:
o Larger cross section dimensions of the beams led to much less cracking
in the beams, thus the specimen experienced the failure due to the for-
mation of plastic hinges at top and bottom ends of the columns.
o The frame test confirmed the principally high deformation capability of
the RC frame even though it was dimensioned and constructively de-
signed in accordance with the lowest ductility class L according to DIN
EN 1998-1 (2010).
BO Test:
o When subjected to an out-of-plane load, an extremely high load capacity
of 24 kN/m2
for a wall supported on three sides is achieved due to the
wall thickness of 36.5 cm. Until the load capacity is reached the masonry
infill shows a high stiffness and stable arching effect. A friction and brick
failure then suddenly occurs on the top of the wall which, due to the sup-
port on three sides, results in the free edge of the wall undergoing the
largest deflections, especially at the top.
BI Test:
o First phase of the in-plane loading up to 1.25% of drift produced cracks
in bed joints and some bricks on the diagonal. This sequential load in
three phases (IP-OOP-IP) produces the reduction of the out-of-plane load
capacity by a factor of 8 due to the damage to the circumferential mortar
joint and the lack of arching effect.
o Additionally, the eccentric loading of the infill leads to a successive rigid
body movement of the wall out of the frame (Figure 5.34). Following the

Chapter 5 Experimental tests on infilled frames
227
out-of-plane load phase, the out-of-plane movement of the wall increases
uncontrollably.
o In-plane load damaged mortar connection of the infill wall and concrete
beam so out-of-plane load produced tilting of the infill wall and moving
out-of-plane as a rigid body. This proves that the weakness of the tradi-
tional system is contact between RC frame and infill wall, due to the fact
that a sufficient contact closure is particularly difficult when dealing with
the highly thermally-insulating bricks with the percentage of voids being
62.3%; thus, extreme care is needed to uniformly fill them with mortar.
o Application of the out-of-plane load produced splitting of the brick at the
top corner (Figure 5.36b), which contributed to the failure of the infill
wall.
BIO Test:
o Test BIO: For a combined load, a traditional infill only achieved a max-
imum interstorey drift of 1.0%. The wall behaves in a very brittle man-
ner, and failure comes in the form of movement of the infill out of the
frame triggered by the damage to the connection joints and the variable
boundary conditions that depend on the interstorey drift due to the small-
er and eccentrically arranged contact areas.
o Simultaneous application of in- and out-of-plane load provides the reduc-
tion of out-of-plane load capacity by a factor of 5 and the maximum in-
plane drift drops to 1.0%.
o Out-of-plane displacements correspond to a tilting movement of the infill
superimposed on a rigid body movement caused by the loss of the
boundary conditions on both the top as well as the base of the wall. The
out-of-plane deformations reach 12 cm at the top and 6 cm at the bottom
of the infill.
o The failure is caused by an uncontrollable movement of the wall out of
the frame which is increased by damage to the circumferential mortar

Marko M. Marinković Innovative system for seismic resistant masonry
infills in reinforced concrete frame structures
228
joint and bricks. Due to this, the test had to be aborted shortly afterwards
as the wall deformations uncontrollably increased.
CO Test:
o Specimen showed high and almost constant stiffness until activating sig-
nificant level of out-of-plane surface pressure load of 11 kN/m². Due to
the opening of the bed joint in the middle height of the wall, increase of
displacement without increase of load occurred until 25 mm when de-
crease of resistance started to be significant.
o The displacements at the top and the bottom of infill wall were increas-
ing with the each cycle of out-of-plane loading, showing that reliable
support for out-of-plane loading should be applied also at the top and
bottom of an infill wall.
CI Test:
o In the first in-plane loading phase up to 2.4% of drift, specimen acted
almost linearly. In the region of the diagonal, bed joints slightly opened,
even so the hysteresis does not show a temporary decrease of resistance.
o It is observed that due to the surrounding elastomer in CI specimen it
was succeeded to ―postpone‖ activation of infill and to increase DLS
(damage limit state) as well as ULS (ultimate limit state), so the
appearance of diagonal cracks in specimen CI started later and it is less
pronounced in comparison to the BI specimen. The easiest way to see the
effect of decoupling due to the elastomer connection is through the
contribution curves. At the same time when maximal contribution of the
infill wall in a case of BI specimen amounts 125 kN contribution of the
infill wall and surrounding elastomer is around 50 kN. Also, maximal
contribution of specimen CI was reached much after when compared to
specimen BI.
o Previous in-plane loading up to the drifts of 2.4 % produced significant
out-of-plane resistance degradation, equal to approximately 50%.
o At the beginning of out-of-plane loading, a significant part of the

Chapter 5 Experimental tests on infilled frames
229
deformation is reversible having maximal displacements in the center of
the wall.
o Second in-plane loading phase produced out-of-plane displacement to
start to rise causing a rapid decrease of resistance in-plane.
CIO Test:
o A comparable response was observed during the simultaneous load tests
of the specimens BIO and CIO, which were subjected to 5kN/m2 of out-
of-plane load and simultaneously cyclic displacements of in-plane drift
of 1.0 %, resulting in correspondingly more extensive damage, as well as
sudden drop of out-of-plane resistance.
o Failure of the edge bricks along the column as well as along the bottom
beam caused the increase of out-of-plane deformations of the masonry
infill. Rigid body movement with especially high displacements at the
top and bottom of infill wall was observed.
o Although the infill wall does not show any cracks in the inner area of the
wall, additional loading could not be accepted, since connection of the
wall to the frame is destroyed. This showed that the IMES system with
the anchors connection between frame and infill does not present suitable
solution for simultaneously applied in- and out-of-plane loading.
DIO Test:
o DIO specimen was subjected to 5 load phases, combining just in-plane
loading, out-of-plane loading and their combinations and simultaneous
application. First four phases infill wall passed with the crack in the last
loading cycles of the fourth phase, reaching the in-plane drift of 1.8%.
o The DIO test yields a maximum interstorey drift of 3.25% for sequential
and combined loads. The infill wall does not move out of the frame due
to the U-shaped elastomers. Damage only occurs in the infill in the
combined load situation at high in-plane drifts. Also, no damage is
observed in the connection areas or to the elastomers.
o The detailed comparison of the results of the conducted tests shows that

Marko M. Marinković Innovative system for seismic resistant masonry
infills in reinforced concrete frame structures
230
with the INODIS system, the infill is activated only after a long delay
and even then the load contribution of the infill is low, also at the
interstorey drifts of 3.25%. This significantly reduces the stresses in the
infill, and therefore the damage in the infill.
o The tests show that sequential and combined in-plane and out-of-plane
loads can be safely absorbed by the U-shaped elastomers in combination
with the plastic profiles connected to the frame.
o When compared to the B and C specimens, DIO infill experienced
around 5 times smaller out-of-plane displacements, even when it reached
more than 3 times higher in-plane drifts.
o It is also important to note that the arching behaviour of the specimen
was activated in all phases of the DIO test. And it stayed active until the
very end of the test. Thus showing that U-shaped elastomers provide
stable connection for the development of the arching effect.
o Only the INODIS system seems to be able to show the good behaviour
even with simultaneous in-plane and out-of-plane loading. Both,
traditional system (B specimens) and the IMES system (C specimens)
have large deficiencies with simultaneous in-plane and out-of-plane
loading.
o Additional advantages of the system can be found in the prevention of
stress concentrations in the contact areas to the frame and in the energy
dissipation due to the hyperelastic behaviour of elastomers.
o It is also very important to note that initial stiffness of the DIO specimen
is in line with the initial stiffness of the bare frame. This means that
natural frequency of the bare frame and infilled frame with the INODIS
system are almost the same, which represents one of the most important
benefits of the INODIS system. This makes the design and calculation of
the RC frame buildings with infill walls more simple, certain and
reliable.

Chapter 5 Experimental tests on infilled frames
231
o Additionally, viscoelastic behaviour of elastomers provides high level of
energy dissipation, without having an infill damaged. And at the same
time enhancing damping capacity of the infilled frame.
Based on the experimental results, the significant conclusions can be summarised as
follows:
The in-plane response of the infilled frames (B and C) was found to be
characterised by quick and rather high degradation of strength. This is even
more pronounced by the influence of out-of-plane load especially when assigned
simultaneously.
The out-of-plane capacity of the infilled frames (B and C) is highly influenced
by in-plane drifts. Even out-of-plane load resistance is extremely high, small in
plane drifts can lead to a substantial reduction of the out-of-plane capacity. The
results demonstrate clearly the significant degradation of stiffness and strength
in the out-of-plane direction for increasing values of previous in-plane drift and
related damage, in particular related to relatively high levels of drift and
extensive preceding damage.
The connection joints located between the infill and the frame that are filled with
mortar are damaged when exposed to prior loads and can lead to a reduced arch-
ing effect and, as a result, to a lower out-of-plane load capacity.
The complete filling of the upper joint with mortar becomes particularly im-
portant as this is the prerequisite for establishing the arching effect in the vertical
direction. The out-of-plane capacity is fully dependent on the quality of filling
with mortar. But a complete filling cannot be assumed in practice for the follow-
ing reasons: shrinkage effects, difficult mortar application in a small gap be-
tween frame and infill and workmanship quality. Especially, when dealing with
bricks with a high percentage of voids, great care is required when filling the
mortar that is difficult to implement due to reasons of time and cost. During the
test specimen BO experienced larger displacements on the top of the infill than
on the bottom. This shows that the mortar connection of an infill wall and con-
crete beam is a weak spot. The same has been observed in testing of the speci-
men BI where after first phase of in-plane load mortar connection of an infill

Marko M. Marinković Innovative system for seismic resistant masonry
infills in reinforced concrete frame structures
232
wall and concrete beam was damaged which caused that out-of-plane load pro-
duce tilting of the infill wall and falling out-of-plane as a whole part.
The modern hollow brick with 60% of openings can‘t be used for traditional ma-
sonry, because it is nearly impossible to satisfactorily fill the gaps with mortar
on construction side.
Also, combination of anchors and brick in a case of simultaneous loading does
not produce good results, because of load concentration.
The test results highlight substantial differences between a separate and com-
bined application of the loads. The load transfer is significantly more complex
when dealing with combined loads. The boundary condition, for the infill panel,
changes depending on the in-plane drift level and leads to an eccentric arrange-
ment and a decrease in the contact areas. The local load concentrations in the
connecting bricks increases and the occurring eccentricities can lead to a succes-
sive rigid body movement of the wall out of the frame.
Also, under simultaneous in-plane and out-of-plane load, even small initial out-
of-plane deflection can be significantly magnified by in-plane load.
When taking all of the test results into consideration, a convex interaction curve
(Figure 5.48), which illustrates a severe reduction of the out-of-plane load ca-
pacity, becomes apparent.
The effect of simultaneous in-plane and out-of-plane loads should be considered
when accessing the performance of RC infilled frames in design practice. But
due to the fact that the decrease of capacity and contact length is not controlla-
ble, traditional infill is not a reliable solution.
Therefore, as an alternative, it appears to be prudent to supplement the tradition-
al construction of infill walls by implementing new innovative systems with
which the required seismic safety can be successfully achieved.
INODIS proved itself as an effective solution for infill walls by providing no
damage in the wall up to the high interstorey drifts, even in the experimental
case where highly brittle bricks and strong thin layer mortar was used.

Chapter 5 Experimental tests on infilled frames
233
INODIS also provides reduction of the stresses within the infill masonry and on
contact with the frame, due to the elastomer, cause stresses to be smeared on
higher length of infill wall.
Additionally, application of the INODIS system leads to the reduction of the
seismic action by means of distributed energy dissipation.
One of important conclusions can be derived from phase 5 of the test on the DIO
specimen. Namely, after the infill wall was damaged in the previous loading
phase, the wall could still withstand outstanding level of in-plane drifts with the
simultaneous out-of-plane load. This shows that the INODIS system provides
the possibility for infill to withstand not just strong earthquakes but also after-
shocks even when it is damaged. This is due to the fact that INODIS system
connections based on elastomers is stable, reliable and with its hyperelastic be-
haviour provides deformation capability all over again.
Besides the fact that the INODIS system provides less damage and resulting in
lower costs, due to the capability to withstand additional earthquakes and after-
shocks, it also gives important increase in safety during the after earthquakes in-
spections.
All of this indicated that the INODIS system used for decoupling of infill wall
and RC frames is a supreme and powerful solution for these kinds of structures.

6 NUMERICAL ANALYSIS
Anybody who has been seriously engaged in scientific work of any kind realizes that over the entrance to
the gates of the temple of science are written the words: 'Ye must have faith.'.
Max Planck

Chapter 6 Numerical analysis
235
6.1 Introduction
The behaviour of infilled reinforced concrete frames under horizontal load is
investigated both experimentally and numerically. In order to extend the results obtained
in the experimental campaign, a numerical study has been carried out. After
comprehensive literature overview (see section 2.4) about the approaches for modelling
the masonry infilled RC frames, for the purpose of this study, two approaches are used
for numerical analyses. First, simplified micro-modelling approach is used for
simulating experimental tests and later on for parametric study. Second, smeared
homogenized model is used for presenting load transfer for the case of simultaneously
applied in- and out-of-plane loading.
In this section, first a calibration of micro model using small specimen tests on system
components has been carried out. Afterwards, these material parameters were used for
simulations of experimental tests on infilled frames in order to validate the numerical
model. At the end, smeared homogenized model is used to explain the unfavourable
conditions that appear under simultaneous loading.
6.2 Description of the model
A three dimensional finite element model was developed to determine the strength,
lateral displacement and stress distribution throughout the infill wall. Finite element
analyses were conducted using software Abaqus (2013). This software has proven to be
effective in treating material and geometric nonlinearity. Some simplifications are
introduced in the model, such as not taking into account bond slip effect directly by
defining interaction between reinforcement and concrete. Also material model used for
bricks does not take into consideration orthotropic behaviour of masonry and mortar
joints were modeled using interaction contact between the bricks instead of full size
continuum elements. However, model was able to satisfactorily represent behaviour of
traditionally infilled frames and infilled frame with the INODIS system under
monotonic loading. Both detailed and global analyses were successfully performed
using the developed model.
6.2.1 Finite element mesh
Elements available in Abaqus library (Figure 6.1a,b) were used to model the masonry

Marko M. Marinković Innovative system for seismic resistant masonry
infills in reinforced concrete frame structures
236
infilled frames. According to recommendations (Abaqus, 2013), three-dimensional 8-
node hexahedral continuum finite elements, with the reduced integration (C3D8R) are
most appropriate for the explicit dynamic analyses. The downside of 3D modelling is
the large number of elements in the model which requires a longer time for analysis.
C3D8R elements were used to model concrete frames and masonry blocks. This
element has three translational degrees of freedom for each node in the global directions
and is capable of performing nonlinear analyses involving contact, plasticity and large
deformations. The reduced integration scheme for these elements is based on a single
point uniform strain formulation where the strains are obtained as average strain over
the element volume. Using reduced integration will basically mean it will take less time
to run the analysis, which is significant for large scale problems. Therefore, in some
cases, particularly for nonlinear problems it is actually advisable to use reduced
integration instead of full integration. In order to prevent hourglassing of solid elements
with reduced integration, default hourglass control was included in element definition.
For reinforcement, truss elements (T3D2) have been used and they are embedded in
solid concrete elements. This truss element has two translation degrees of freedom, one
at each node and can carry only tensile or compressive loads without having resistance
to bending. The embedment leads to a constraint of the translational degrees of freedom
at the node of the truss elements to the interpolated values of the corresponding degrees
of freedom of the solid elements.
At the beginning, a number of simulations were performed in order to find the size of
elements for which the accuracy of the results and analysis time are in balance. Not only
because of computational time, but also due to accuracy, it is not advisable to use small
elements. This is because numerical errors due to the size and number of elements
govern the results and error can increase as shown in Figure 6.1c (Minaie, 2009).
Strain-softening behaviour of the material brings strong mesh dependency of the finite
elements resulting in that the energy dissipated decreases upon mesh refinement. To
overcome this, Abaqus (Abaqus, 2013) recommends introduction of a characteristic
length into the formulation by expressing the softening part of the constitutive law as a
stress-displacement relation. The geometry and the meshing of the model are shown in
Figure 6.2.

Chapter 6 Numerical analysis
237
a) b) c)
Figure 6.1 a) 8-node 3D solid element b) 2-node 3D truss element (Abaqus, 2013) c) Mesh size
optimization (Minaie, 2009)
6.2.2 Geometry
RC frame is represented with its actual geometry and size, except for the base of the
frame which is not modelled. Since RC base of the frame is quite stiff and strong, for
the purpose of reducing of computational costs, it was modelled with the rigid base
presented with the discrete rigid plate (Figure 6.2). Each reinforcement bar and stirrups
is modelled and incorporated in an assembly as a separate part with its exact length and
position as shown in Figure 6.2.
Figure 6.2 Geometry and finite element mesh of the numerical model of infilled frame
As explained, the simplified micro-modelling technique is used for the numerical
model, where masonry units are extended from all directions by half the thickness of the
mortar joint. Interaction between the units representing the mortar joint behaviour is
defined. This interaction is used as the crack source as well as the units modelled using

Marko M. Marinković Innovative system for seismic resistant masonry
infills in reinforced concrete frame structures
238
smeared crack approach. Masonry units were modelled as solid elements without holes,
although blocks used in experimental campaign are hollow blocks. Effect of holes is
taken into account through material definition, by assigning material characteristics of
masonry assembly to the units.
6.2.3 Loads and boundary conditions
In order to be as close as possible to the real experimental conditions, external loads and
constraints have been defined with special care. All the steps were defined as Dynamic
(Explicit) divided in three phases: gravity, vertical load and horizontal displacement (in-
plane load) or pressure perpendicular to the wall (out-of-plane load). First, gravity load
has been defined in order to take into account the weight of the model components.
Afterwards, vertical load of 200 kN per column has been applied on the columns top
surface. These first two steps have been applied in all simulations. In the third step, the
upper beam horizontal displacement has been applied to a shell plate (Figure 6.2) being
in contact with the end of the beam. Displacement is defined as a boundary condition of
a steel plate having defined U1 displacement in direction of the frame plane. Out-of-
plane load was applied as a pressure load over the infill surface. All the loads were
applied as monotonically increasing, using smooth amplitude (Figure 6.3 and Table 6.1)
in order to avoid sudden ramp loading effects. Duration of the gravity steps was defined
to be 0.1s, vertical loading on the columns 0.3s and in-plane or out-of-plane loading
step having a length of 1s. In all loading steps, geometric nonlinearity has been
assigned.
Time/Frequency Amplitude
0 0
1 1
Figure 6.3 Smooth amplitude Table 6.1 Smooth amplitude
Fixed boundary condition (BC) was assigned to the reference point (RP) of the rigid

Chapter 6 Numerical analysis
239
plate, which was then tied to the bottom of the columns. Also, out-of-plane
displacement of the frame (U3) has been constrained in order to prevent out-of-plane
movement of the frame during perpendicular loading on the infill.
6.2.4 Contact/Interface definition
All the joints between the bricks, both vertical and horizontal, as well as joints between
the frame and infill have been defined using general contact with the specified
interaction properties. Three interaction properties have been defined, with the first
defined as global property assignment to the all elements that are in contact. For this
interaction, ―hard‖ contact normal behaviour is defined which minimizes the penetration
of the slave surface into the master surface at the constraint locations and does not allow
the transfer of tensile stress across the interface. Together with the ―hard‖ contact,
penalty friction formulation with the friction coefficient being 0.6 has been assigned to
the global property assignment. This means that just compression stresses and frictional
forces are transferred, when the surfaces are in contact, without having any tensile
strength. Since head joints did not have mortar applied, global property assignment has
been used for them. Other interactions have been assigned as individual contact
property assignments that override global assignments for the surfaces assigned.
Second interaction property was defined to represent bed joint behaviour and it was
assigned to the horizontal surfaces of the bricks being in contact. This interaction
property, beside ―hard‖ contact and penalty friction assignment, contains surface-based
cohesive interaction. Surface-based cohesive behaviour offers capabilities that are very
similar to cohesive elements that are defined using a traction-separation law, but
surface-based cohesive behaviour is easier to define and is suitable for situations in
which the interface thickness is negligibly small. Since in experimental campaign, thin
layer mortar of 0.5’3mm thickness has been used, this approach is chosen as the
appropriate one. The traction-separation model (Figure 6.4a) in Abaqus (Abaqus, 2013)
assumes initially linear elastic behavior and uncoupled stiffness expressed as follows:
0 0
0 0
0 0
n nn
s ss
t tt
t k
t kt k
t k
(6.1)
Where t is the nominal traction stress vector, consisting of three components: tn, ts, tt

Marko M. Marinković Innovative system for seismic resistant masonry
infills in reinforced concrete frame structures
240
which represent the normal and the two shear tractions. The corresponding separations
are denoted by δn, δs, δt. knn, kss and ktt are the normal stiffness and the two shear
stiffnesses.
Traction separation model behaves linearly until it reaches maximum tensile and shear
stresses assigned to as damage initiation criterion, which refers to the beginning of
degradation and eventual failure of the bond between two cohesive surfaces. The
quadratic traction criterion for damage initiation is selected as follows:
2 2 2
0 0 01n n n
n s t
t t t
t t t
(6.2)
where 0nt , 0
st , 0tt are the peak values of the contact stress when separation is either
purely normal to the interface or purely in the first or second shear direction,
respectively.
The third phase is the damage evolution law describing the rate at which the cohesive
stiffness is degraded once the corresponding damage initiation criterion is reached. The
energy-based exponential mixed mode evolution power law (Benzeggagh and Kenane,
1996) as shown in Figure 6.4b is selected, which is defined as:
sC C C Cn s n
T
GG G G G
G
(6.3)
where Gs=Gs+Gt, GT=Gn+Gs and CnG , C
sG and CtG are the fracture energies in the
normal and the two shear directions and η is a cohesive property parameter specified to
be 2.
a) b)
Figure 6.4 a) Traction separation response with exponential damage evolution and b) mixed-
mode response in cohesive interactions (Abaqus, 2013)
The third interaction property defined is the interface between the masonry panel and

Chapter 6 Numerical analysis
241
the bare frame, modelled with the interaction property adopted to represent the bed
joint, but being weaker as suggested by Mehrabi and Shing (1997) since they normally
have lower quality (Koutromanos et al., 2011). After failure of the cohesion, only
friction force developed from the Coulomb-friction model is left between different
elements.
As described, the behaviour of the interface before damage is linear elastic with normal
and shear stiffnesses calculated according to the modified equation proposed by Nazir
and Dhanasekar (2014):
u mnn
u mu j u
E Ek
h t hE E
(6.4)
2 1
nnss ss
kk k
(6.5)
where Eu and Em are modulus of elasticity of brick unit and masonry, respectively.
Height of unit is denoted as hu and joint thickness as tj.
The value of 0.19MPa for maximum tensile stress assigned to as damage initiation
criterion ( 0nt ) is taken from experimental bond strength test. Maximum shear stresses (
0st , 0
tt ) are defined by trial and error in the calibration process on masonry assembly.
Values used are ranging from 0.15-0.7 MPa, as suggested in the literature for thin layer
mortar (Brameshuber et al., 2016). For damage evolution, values for fracture energies
are also determined during the calibration process on masonry assembly. Friction
coefficient, μ, was calibrated in order to get the best fit with the experimental results.
All the values that are available from experimental data can be taken, but in the absence
of such data, the values of these parameters have to be determined indirectly by trial and
error in the calibration process on masonry assembly.
6.2.5 Materials definition
For material definition, built-in material models in Abaqus (2013) were used to describe
the behaviour of concrete, masonry units, reinforcing steel and elastomer. Their
description with the recommendations for some values for materials is presented in the
following sections.

Marko M. Marinković Innovative system for seismic resistant masonry
infills in reinforced concrete frame structures
242
6.2.5.1 Concrete
Similar to the approach used by Stavridis and Shing (2010), smeared crack models are
enforced on the concrete and brick elements. The constitutive model adopted for
concrete is the concrete damage plasticity (CDP) model for quasi-brittle material
implemented in Abaqus (2013). The model is a continuum, plasticity-based, damage
model suitable for quasi brittle materials.
a) b)
Figure 6.5 Yield surface of the CDP model in a) plane stress and b) deviatoric plane, corre-
sponding to different values of Kc (Abaqus, 2013)
Table 6.2 Adopted plasticity parameters for CDP model, for concrete frame and masonry units
Dilation angle Eccentricity
Concrete 36 0.1 1.16 0.667
Masonry units 30 0.1 1.16 0.667
The model uses the yield function of Lubliner et al. (1989), with the modifications
proposed by Lee and Fenves (1998) to account for different evolution of strength under
tension and compression. A non-associated potential flow rule is assumed in the CDP
model. The yield surface in the plane stress and deviatoric conditions are shown in
Figure 6.5. Determination of the yield surface and flow rule parameters for concrete and
masonry requires accurate biaxial and triaxial tests on the materials, which are beyond
the scope of this research. However, the available literature showed low sensitivity to
these parameters (Nasiri and Liu, 2017). Therefore, the values used in this study (Table
6.2) were determined indirectly in the calibration process, and by use of common values
recommended in the literature (Kupfer et al., 1969; Lee and Fenves, 1998; Jankowiak
and Lodygowski, 2005; Pavlović, 2013).

Chapter 6 Numerical analysis
243
The elastic response is assumed to be linear and isotropic. It can be assessed through the
use of modulus of elasticity and Poisson‘s ratio. Modulus of elasticity is taken from the
experimental tests, while the value of 0.2 is used for Poisson‘s ratio as suggested in
Eurocode 8 (EN 1998-1, 2004). As for the plastic part, it requires the definition of
stress-strain curves to be assigned for compression and tension in combination with
plasticity parameters. CDP model assumes that the main two failure mechanisms are
tensile cracking and compressive crushing of the concrete material. The stress-strain
relations under uniaxial tension and compression (Figure 6.6) are defined as in the
following equations, respectively:
01 plt t t td E (6.6)
01 plc c c cd E (6.7)
Where E0 is the initial elastic stiffness and εt as well as εc are the total tensile and
compressive strains of the material, while plt and pl
c are the equivalent plastic strains.
a) b)
Figure 6.6 Response of concrete to uniaxial loading in a) compression and b) tension (Abaqus,
2013)
CDP model allows to describe separately the nonlinear tensile and compressive
behaviour of plain concrete. In compression, the stress-strain curve is first linear until
0.4fcm according to Eurocode 2 (EN 1992-1-1, 2004). Beyond this point, concrete is in
the plastic region in which plastic strain is input to define the stress-strain relationship
in the finite element model in Abaqus (Abaqus, 2013). For this part, expression given in
Eurocode 2 (EN 1992-1-1, 2004) is used, which can be regarded as a specialisation of
the non-linear stress-strain curve according to Sargin (1971):

Marko M. Marinković Innovative system for seismic resistant masonry
infills in reinforced concrete frame structures
244
2
1 2
c
cm
k
kf
(6.8)
Where εc1 is the strain at peak stress, while η and k are determined according to the
following equations:
1
c
c
(6.9)
11.05 c
cm
cm
k Ef
(6.10)
This curve is defined only up to the nominal ultimate strain. To reach experimental
levels of deformation, the curve is extended (Figure 6.8) with respect to the equation
proposed by Pavlović (2013):
sin
1 2
sin2
tD
tE
c c cm
tE
f
(6.11)
Where μ presents relative coordinate defined as:
c cuE
cuE cuD
(6.12)
Where εcuD=3.5‰ and εcuE =3%. Factor α=fcm/fcuE and factors αtD and αtE governing
tangent angles of sinusoidal part after point D are calibrated to match the best fit with
the experimental results and β=fcm/fcuD.
The behaviour in tension is defined using a fracture energy criterion and a stress-
displacement curve instead of a stress-strain curve (Figure 6.8). The relationship
between the crack width and the corresponding tension stress is based on an equation
proposed by Hordijk (1992):
2
2 3
1
3
1 11c
c
u
uc
cctm
t ecu
ue
u
uc
f
uc
(6.13)
Where fctm presents maximum tensile strength and c1 = 3, c2 = 6.93. In Figure 6.8b, uc
corresponds to the critical crack opening when tensile stress drops to zero, therefore uc
can be considered as the fracture crack openingu . The maximal crack opening, uc, is
calculated according to Hordijk (1992) with respect to the fracture energy GF and
maximum tensile strength fctm:

Chapter 6 Numerical analysis
245
5.14 /F ctmcu G f (6.14)
The fracture energy of concrete is calculated according to CEB-FIP Model Code 2010
(MC10) (CEB-FIP, 2010) by using the following relation:
0.18 0.18
0.7 73 1.3 73Fcm cmGf f
(6.15)
Herein fcm is the mean compressive strength.
Figure 6.7 Stress-strain curve for concrete in compression
Figure 6.8 Stress-displacement curve for the concrete in tension (Hordijk, 1992)
This model for reinforced concrete considers independently the concrete behaviour from
the rebar. Effects associated with the rebar/concrete interface, such as bond slip and
dowel action, are modelled approximately by introducing ―tension stiffening‖ into the
concrete material to simulate load transfer across cracks through the rebar. In this way
effects of the reinforcement interaction with concrete are simulated in a simple manner.
Tension stiffening data are given in terms of the cracking displacement taking into
account characteristic length for finite elements, therefore stress-displacement curve for
tension defined as described above takes into account tension stiffening. In this way,

Marko M. Marinković Innovative system for seismic resistant masonry
infills in reinforced concrete frame structures
246
residual strength of RC element, coming from bond-slip effect, sliding of reinforcement
and friction, is taken into account indirectly.
To account for different damage characteristics in tension and compression, the
degradation of the elastic stiffness due to the cracking is characterized by two damage
variables, namely dt and dc, which are assumed as functions of the inelastic strains. The
damage parameters are equal to zero for undamaged material and equal to one for
completely damaged material. The damage parameters are calculated using an
exponential function as proposed by Lee and Fenves (1998):
in
ca
c ed
1 (6.16)
inta
t ed
1 (6.17)
Where ac and at are parameters for the uniaxial compression and tension respectively,
and can be calibrated to match the best fit with the experimental results.
When tensile damage, dt, is specified, Abaqus (2013) automatically converts the
cracking displacement values to ―plastic‖ displacement values using the following
relationship:
0
01
t tpl ckt t
t
d lu u
d E
(6.18)
Where l0 is assumed to be one unit length, l0=1. Also for compression, Abaqus (2013)
automatically converts the inelastic strain values to plastic strain values using the
following relationship:
01
pl in
c cc c
c
d
d E
(6.19)
Abaqus (2013) will issue an error message if the calculated plastic strain or ―plastic‖
displacement values are negative and/or decreasing with increasing cracking
strain/displacement, which typically indicates that the compression/tensile damage
curves are incorrect.
6.2.5.2 Masonry
Non-linear model used for masonry allows for the effects of cracking and crushing of
masonry units as isotropic homogeneous elements. The smeared crack concrete model
was used to represent the behaviour of masonry wall. The same as for concrete material,

Chapter 6 Numerical analysis
247
the constitutive model for masonry used in this study is concrete damage plasticity
(CDP) model. Stavridis and Shing (2010) recommended that the material characteristics
of masonry units based on that of masonry prisms should be used, rather than that of
individual brick units. This approach has been accepted in this study. Also, a modified
approach according to Stavridis and Shing (2010) is used to generate the required stress
curves in both compression and tension (Figure 6.9). For compression, linear elastic
behaviour is defined from point A until point B (Figure 6.9). Strain at point B is
determined as intersection point of linear elastic curve and curve proposed by Stavridis
and Shing (2010) as defined in the following equation:
2
21 1
2m
f
(6.20)
Where ε1 is strain at maximal stress, fm. After this point, plastic behaviour of concrete
starts and until point D is defined with this equation. From point D, stress-strain curve is
defined with the following equation:
1 1sin 1
m Df
E
D e
(6.21)
Where ζD and ε2 are stress and strain at point D, and they are together with the
coefficient α determined in calibration process to provide best fit with the experimental
results. This equation is very suitable for calibration process, because increase/decrease
of residual strength of bricks i.e. infill can be easily accomplished.
The curve for tension is defined using the approach from Stavridis and Shing (2010):
1
1
cr
mtf
t tmtef r r
(6.22)
Where εcr is the strain at the maximum tensile strength, fmt. The parameters rt and α1
define the slope of the applied curve and have to be calibrated using experimental
results. As suggested by Stavridis and Shing (2010), for calibration process is
recommended to define tension using displacement instead of strain. Therefore, the
crack opening displacement is calculated using the following approach proposed by
Almansa et al. (2014):

Marko M. Marinković Innovative system for seismic resistant masonry
infills in reinforced concrete frame structures
248
cr
eq
u
l (6.23)
Herein, leq is the length of the regarded finite element.
a) b)
Figure 6.9 a) Stress-strain curves for compression and b) for tension (Stavridis & Shing, 2010)
6.2.5.3 Reinforcement
The reinforcing steel is represented by an elasto-plastic material using Von Mises
criterion, characterised by a isotropic hardening behaviour. Plasticity part of material
behaviour is assigned with true stress and strain instead of engineering stress and strain,
as suggested in Abaqus (2013). If ζnom is engineering stress and εnom engineering strain
then true stress and strain are calculated according to equations:
1true nom nom (6.24)
ln 1true nom (6.25)
truepl true
E
(6.26)
true
true
E
(6.27)
The total strain, ε, is expressed in terms of elastic, εel, and plastic strain, εpl, that the
element will experience:
el pl (6.28)
The same as for concrete, plastic part of the behavior is assigned to the CDP model.
6.2.5.4 Elastomer
Elastomer material used for decoupling infill wall from the RC frame is rubber-based
material, with hyperelastic behaviour. This material is characterized with the small
stiffness and elastic response up to large strains, which can be the best described with

Chapter 6 Numerical analysis
249
the hyperelastic behavior. Since the material used is highly compressible, it can be
characterized as elastomeric foam. Therefore, it was decided to use hyperfoam material
available in Abaqus (2013) to model its behaviour. Uniaxial and shear test data from
small scale tests on elastomers have been assigned to the hyperfoam material. Figure
6.10 shows typical compressive stress-strain curve of elastomeric foam materials,
having three phases. At first, material behaves elastically in a range of small strains (up
to 5%). Afterwards, material experiences almost constant stress at the plateau of
increasing deformation. In the third phase, densification of material occurs with the fast
increase of stress. This behaviour is characteristic for compressive loading, while tensile
deformation is similar for small strains but it differs for large strains. Tensile behavior of
elastomeric foams won‘t be described because in the INODIS system elastomer
experiences only compression.
Figure 6.10 Typical stress-strain curve for elastomeric foam materials (Abaqus, 2013)
6.3 Small specimen tests
Experimental tests on small specimens were used for calibration procedure in process
for determination of values for material characteristics of FE model in software package
Abaqus (2013). These values are later used in section 6.4 and Chapter 7 for simulations
on infilled frames.
6.3.1.1 Tests on concrete
Since requested strength class for concrete for RC frames was C30/37 and tests on
concrete samples gave much higher values for compressive strength, all parameters for
definition of concrete material for numerical model were calibrated on the bare frame
specimen (Test A). Adopted values are shown in section 6.4.1, Table 6.5.

Marko M. Marinković Innovative system for seismic resistant masonry
infills in reinforced concrete frame structures
250
6.3.1.2 Reinforcement
Since reinforcement is modelled using truss elements, there is no need for calibration on
one bar. Values for material characteristics, needed to define steel material for
reinforcement in Abaqus (2013), are calibrated on the bare frame specimen (Test A).
Adopted values are shown in section 6.4.1, Table 6.5.
6.3.1.3 Vertical compression of masonry assembly
All the data available from experimental tests on small scale specimens were assigned
to the model, while not available values were calibrated using vertical compression test
on masonry assembly. Therefore, vertical compression test on masonry assembly was
used for calibration of masonry material used for bricks in the model and the interaction
between the bricks. As already described (section 6.2.5.2), to indirectly account for the
3D brick/mortar interaction effect, the compressive behaviour of the elements modelling
the brick should be calibrated with compression tests of masonry prisms (Stavridis i
Shing, 2010). Therefore, compressive strength and modulus of elasticity of masonry
assembly are assigned to brick units. The tensile strength of the masonry units is
assumed to be 10% of its compressive strength (Drysdale et al., 1999). Material
property values used for masonry units and the interaction are summarized in Table 6.3,
where it can be seen which values are taken directly from the experiment, calculated
according to the recommendation from the literature or calibrated. Stress curves
generated for masonry units are presented on Figure 6.11, while plasticity parameters
for definition of CDP model were taken as described in
Table 6.2. For calculating of initial stiffness of bed joint interaction, all the values for
the Equation (6.4) and (6.5) are taken from experimental tests on small specimens.
Thickness of thin layer joint is taken to be 2 mm. During calibration process it was
needed to take 10 times smaller shear stiffness than calculated, in order to get
satisfactory behaviour. Results from the bond strength test were used directly to define
tensile strength of contact interface between the bricks. Since experimental campaign
didn‘t consider determination of bed joint behaviour through direct shear test or triplet
test, parameters for definition of interface between bricks are calibrated on masonry
assembly models, using the range of values recommended in the literature
(Brameshuber et al., 2016). For damage evolution, values for fracture energies are also

Chapter 6 Numerical analysis
251
determined within the calibration process on masonry assembly. Interaction between the
masonry panel and the bare frame is modelled with the interaction property adopted to
represent the bed joint with the values calibrated on the BI test simulation (section
6.4.2). As described in section 6.2.4, head joints didn‘t have mortar, thus global property
interaction having ―hard‖ contact normal behaviour and penalty friction formulation
with the friction coefficient being 0.6 has been used for them.
Table 6.3 Material property values used for masonry unit and interaction
Unit Value Source Bed joint
Interaction Value Source
Frame/infill
Interaction
Val-
ue Source
E
[GPa] 4.87
Experi-
ment
knn
[GPa/m] 35.2 Calculated
knn
[GPa/m] 35.2 Calculated
fm’
[MPa] 3.1
Experi-
ment
kss
[GPa/m] 1.48 Calculated kss [GPa/m] 1.48 Calculated
εm,el
[‰] 0.25 Calibrated ktt [GPa/m] 1.48 Calculated ktt [GPa/m] 1.48 Calculated
ε1
[‰] 1.2 Calibrated tn [MPa] 0.19
Experi-
ment tn [MPa] 0.06 Calculated
ζD
[MPa] 2.76 Calibrated ts [MPa] 0.15 Calibrated ts [MPa] 0.05 Calibrated
ε2
[‰] 1.6 Calibrated tt [MPa] 0.15 Calibrated tt [MPa] 0.05 Calibrated
α [-] 1.1 Calibrated Gn [N/m] 20 Calibrated Gn [N/m] 1 Calibrated
ac [-] 320 Calibrated Gs [N/m] 20 Calibrated Gs [N/m] 10 Calibrated
ft’
[MPa] 0.31 Calculated Gt [N/m] 20 Calibrated Gt [N/m] 10 Calibrated
εcr
[‰] 0.0637 Calculated η [-] 2 Calibrated η [-] 2 Calibrated
rt [-] 0.05 Calibrated μ [-] 0.7 Calibrated μ [-] 0.7 Calibrated
α1 [-] 250 Calibrated
at [-] 350 Calibrated
leq
[m] 0.05 Calibrated
ν [-] 0.19 Calibrated
a) b)
Figure 6.11 Stress-strain curves for masonry unit for a) compression and b) tension
Model representing vertical test on masonry assembly was made as similar as possible

Marko M. Marinković Innovative system for seismic resistant masonry
infills in reinforced concrete frame structures
252
to the experimental test. It is consisted of three bricks connected with the described
contact characteristics for bed joint. Two rigid steel plates were used, lower one to
represent fixed bottom and upper one as a loading plate (Figure 6.12a). Fixed boundary
condition is assigned to the reference point of the rigid bottom plate, while for the
reference point of the upper plate all degrees of freedom were fixed except vertical
displacement, which was assigned as a loading. ―Hard‖ contact for normal behaviour
and penalty friction were assigned as contact between the steel plates and bricks.
Friction coefficient of 0.7 was used in the model. Reaction and displacement at upper
plate were measured in order to get force-displacement i.e. stress-strain curves. Figure
6.13 shows the comparison of the simulation and experimental results, while Figure
6.12b presents tensile strain distribution within the masonry. The comparison clarifies
that the simulation results are satisfactory.
a) b)
Figure 6.12 a) Numerical model and b) tensile strain of the vertical compression test on the ma-
sonry assembly
Figure 6.13 Comparison of experimental and numerical stress-strain curves

Chapter 6 Numerical analysis
253
6.3.1.4 Static compression tests on elastomer
In order to calibrate hyperfoam model for elastomer material, numerical model
simulating static compression test was used (Figure 6.14). Two strong steel plates were
modelled, with one representing base of the compression machine being fixed at the
bottom. Second plate presents upper plate with the all degrees of freedom fixed except
vertical displacement, which was assigned as a loading. ―Hard‖ contact for normal
behaviour and penalty friction were assigned as contact between the steel plates and
elastomer. Friction coefficient of 0.75 was used in the model. For uniaxial test data,
exact curves from experimental test were assigned, so it was just needed to calibrate
strain energy potential order. After ranging from 1 to 6, it was obvious that the best fit
with the experimental results gives the value of 2 assigned for strain energy potential
order. Reaction and displacement at upper plate were measured in order to get force-
displacement i.e. stress-strain curves. Figure 6.15 and Figure 6.16 present diagrams
showing a good match between experimental and numerical curves.
a) b)
Figure 6.14 a) Elastomer compression tests setup and b) numerical model assembly
a) b)
Figure 6.15 Comparison between experimental and numerical stress-strain curves for a)
Regufoam® 270 and b) Regufoam® 400 and Regufoam® 510

Marko M. Marinković Innovative system for seismic resistant masonry
infills in reinforced concrete frame structures
254
a) b)
Figure 6.16 Comparison between experimental and numerical stress-strain curves for a)
Regufoam® 570 and Regufoam® 680 and b) Regupol® 480 and Regupol® 550
6.3.1.5 Shear tests on elastomer
Since just Regufoam® 510 and Regupol® 480 were submitted to the shear test, only
stress-strain curves for these two materials were available. In order to perform
parametric study changing first and second layer of U-shaped elastomer, it was needed
to estimate the shear-strain curves for other materials used in the study. These curves
were approximately assessed by simply dividing or multiplying stress values of the
shear-strain curves of Regufoam® 510 and Regupol® 480 (Figure 6.17a). Stresses were
divided/multiplied by factor representing the ration of modulus of elasticity. In this
section just experimentally tested materials were simulated in order to check and
calibrate the approach for definition of hyperfoam material used for simulating
elastomer material.
a) b)
Figure 6.17 a) Stress-strain curves for shear behavior of elastomer and b) numerical model
Model consists of four rigid plates that are tied to the elastomers (Figure 6.17b). Fixed
boundary conditions were assigned to the reference point of one middle plate, while
displacement in the longitudinal direction of the second middle plate was assigned to its

Chapter 6 Numerical analysis
255
reference point. All four rigid plates are tied to the elastomers. Material is defined by
assigning shear stress-strain curves from experimental test to the hyperfoam material
using strain energy potential order of 2.
Figure 6.18 shows good matching of numerical and experimental results. This confirms
that for defining shear behaviour of elastomer stress-strain curves from experiments can
be used, using the same strain energy potential order as for the uniaxial test data.
Figure 6.18 Comparison of experimental and numerical results for simple shear test
6.3.1.6 Tests on U-shaped elastomer connection
The intention of these small scale experimental tests was to check glued connection
between elastomers and elastomer and brick. The test showed that these connections are
strong and definitively not the critical place for any possible damage. During the tests
on U-shaped elastomer connection, both shear and uniaxial strength of elastomer were
activated, therefore simulations of these experiments on U-shaped elastomer connection
were used to check and calibrate stress-strain curves and definition of hyperfoam
material, when both shear and compression of elastomer is activated. Also, just
Regufoam® 510 and Regupol® 480 shear stress-strain curves were available from
experiments, while shear stress-strain curves for other elastomers were assessed by
simply dividing/multiplying stresses of available curves by factor representing the
ration of modulus of elasticity. Therefore, simulation of U-shaped tests with other
elastomers is used to check this approach for estimation of not available shear-strain
curves.
Six models were made, in order to simulate column and beam case with and without
gap and with Regufoam® or Regupol® material. Model representing test on U-shaped
connection made of elastomer was made as similar as possible to the experimental test.

Marko M. Marinković Innovative system for seismic resistant masonry
infills in reinforced concrete frame structures
256
It consists of one brick placed to simulate column or beam case (Figure 6.19). Since
experiments showed that glued connection between elastomers and bricks and between
two elastomers behave perfectly without damage, it was decided to model it with the tie
connection. For the same reason, two parts of the elastomer were modelled as one part
having two sections, in order to assign different material characteristics of the first and
second layer of elastomer. Two concrete plates, as in experiment, were tied to the
plastic profiles. Both concrete plates had fixed boundary conditions, while vertical
displacement was applied directly on the brick. Concrete was modelled as an elastic
material with modulus of elasticity of 30 GPa and Poisson‘s ratio being 0.2. Since the
intention of this simulation model is to check the definition of shear behaviour assigned
to hyperfoam material and not to simulate local failure of the brick, the brick was
modelled as an elastic part having modulus of elasticity and Poisson‘s ratio as in the
Table 6.3. Material characteristics assigned to plastic profile are the same as given by
the producer (Table 6.4) with the Poisson‘s ratio being 0.35. ―Hard‖ contact for normal
behaviour and penalty friction were assigned as contact between the concrete plates and
elastomer and plastic and elastomer. Friction coefficient of 0.1 was used in the model to
account for sliding surfaces. Reaction and displacement of the brick were measured in
order to get force-displacement curves.
Table 6.4 Material characteristics of the plastic profile
Material Density
[g/cm3]
Modulus of elasticity
E [N/mm²]
Yield stress
[N/mm²]
Strain at yield stress
[%]
Plastic profile (PVC-CAW) 1.44 3300 5.27 4
a) b)
Figure 6.19 Models for a) column and b) beam connections without gaps

Chapter 6 Numerical analysis
257
a) b)
Figure 6.20 Simulated and experimental load-displacement curves for the a) beam (Test B) and
b) column (Test C) connection without gap
a) b)
Figure 6.21 Simulated and experimental load-displacement curves for the a) beam connection
with gap of 10 mm (Test BG10MM) and b) column connection with gap of 20 mm (Test
CG20MM)
Figure 6.22 Simulated and experimental load-displacement curves for the beam connection
made of Regupol® material (Test BRP)
Figure 6.20 shows the comparison of the simulation and experimental results. The
comparison confirms that defined curves for shear behaviour of elastomer give good
match with the experimental results in a sense of stiffness. Good matching with the
experimental results is also confirmed for the case when contacting surface between

Marko M. Marinković Innovative system for seismic resistant masonry
infills in reinforced concrete frame structures
258
elastomer and plastic profile is reduced due to the gap and for the both Regufoam® and
Regupol® materials (Figure 6.21 and Figure 6.22). With this numerical analysis shear-
strain curves for Regufoam® 400 and and Regupol® 550, made with the simple
estimation using factor representing ratio of modulus of elasticity, were confirmed as
correct. Therefore, it can be assumed that shear-strain curves for other materials are
valid to be used in infilled frame models. Also, this numerical analysis confirmed that
definition of hyperfoam material used for U-shaped elastomer connection can be done
with the stress-strain curves from uniaxial and simple shear test data.
6.4 Numerical simulations of experimental tests on infilled frames
In order to validate the modelling approach described in section 6.2, experimental tests
on infilled frames described in Chapter 5 are simulated. Calibrated and validated models
are later used in Chapter 7 for parametric studies. Since the parametric study was used
for simulating in-plane behaviour of infilled frames with the INODIS system, numerical
model was only validated against in-plane experimental tests, although they include also
out-of-plane loading steps that are simulated too. Also, out-of-plane design concept is
based on the simple mechanical model and analytical solution; therefore there was no
need for out-of-plane simulations on the micro model.
6.4.1 In-plane simulation of the bare frame (Test A)
The bare frame model was the first analysed FE model. Bare frame is modelled
according to the explanation given in section 6.2. This model was used for concrete
material as well as reinforcement material calibration. The properties of the concrete
and of the reinforcement steel used in the FE model are reported in Table 6.5, where it
can be seen which values are taken directly from the experiment, calculated according
to the recommendation from the literature or calibrated. As already mentioned,
requested strength class for concrete for RC frames was C30/37, but tests on concrete
samples gave much higher values for compressive strength which when used in
numerical model highly overestimated stiffness and strength of the bare frame.
Therefore it was decided, for definition of concrete material, to use properties of
concrete strength class C30/37. Only modulus of elasticity was taken from experimental
results. All other values are taken and calculated as described in section 6.2.5.1. Stress
and damage evolution curves generated for concrete material are presented on Figure

Chapter 6 Numerical analysis
259
6.23 and Figure 6.24, respectively. Plasticity parameters for definition of CDP model
were taken as described in
Table 6.2. As explained in section 6.2, full bonding between concrete and steel is
considered and simulated using embedded element constraint. This formulation has
been proven satisfactory for monotonic behaviour of reinforced concrete (Alfarah et al.,
2017).
Table 6.5 Material property values used for concrete and reinforcement steel
Concrete Value Source Reinforcement steel Value Source
Ecm [GPa] 32.558 Experiment Es [GPa] 200 Experiment
fcm [MPa] 38 Calibrated Poisson‘s ratio 0.3 Calculated
εc,el [‰] 0.47 Calculated fy [MPa] 540 Experiment
fc,el [MPa] 15.2 Calculated fu [MPa] 650 Experiment
εc1 [‰] 2.2 Calculated εu [%] 10 Calibrated
k [-] 1.9792 Calculated
εc,uD [‰] 3.5 Calculated
fcuD [MPa] 24.28 Calculated
εcuE [%] 3.0 Calibrated
α [-] 30 Calibrated
αtD [-] 0.45 Calibrated
αtE [-] 0.96 Calibrated
β [-] 1.56 Calculated
fctm [MPa] 2.9 Calculated
εt,el [‰] 0.089 Calculated
c1[-] 3 Calibrated
c2 [-] 6.93 Calibrated
GF [N/m] 183 Calculated
uc [mm] 0.33 Calculated
ac [-] 160 Calibrated
at [-] 500 Calibrated
leq [m] 0.05 Calibrated
Poisson‘s ratio 0.2 Calculated
a) b)
Figure 6.23 Stress-strain curves for concrete a) compression and b) tension

Marko M. Marinković Innovative system for seismic resistant masonry
infills in reinforced concrete frame structures
260
a) b)
Figure 6.24 Damage curves for concrete a) compression and b) tension
Material used for reinforcement steel is elasto-plastic isotropic material and values for
material characteristic are calibrated on the bare frame specimen and shown in Table
6.5. The same characteristics are assigned to all bar diameters. Modulus of elasticity
was taken from experimental results as an average value from different bar diameters.
The same was done for the yield and tensile strength.
a) b)
Figure 6.25 a) Comparison of the force-displacement curves and b) deformed shape with the
tensile damage distribution at 3.5% of drift
As shown in Figure 6.25a, the obtained force-displacement curve is close to the one of
experimental test results. A very good matching is succeeded in terms of stiffness
decrease. According to the Table 6.6, the differences for the forces and drifts when infill
cracking started, maximum force is reached and at the maximal displacement are quite
small. Experimental values in the Table 6.6 are extracted from positive envelope. Figure
6.25b shows bare frame deformed shape with the tensile damage distribution showing
position of cracks in concrete. The cracks are distributed as observed and described in
experiment evaluation in section 5.5.1, showing satisfactory matching. Damage is

Chapter 6 Numerical analysis
261
concentrated at the top and bottom ends of the columns near the positions of the
maximum bending moments. Due to the larger cross section dimensions, the beam
shows a less pronounced cracking pattern than the columns. Failure of the test specimen
could be observed due to the formation of plastic hinges at top and bottom ends of the
columns. Such a mechanism is found to be very similar to the one observed during the
tests.
Table 6.6 Comparison of numerical and experimental results on bare frame
Cracking initiation Max. load Max. displacement
F [kN] drift [%] F [kN] drift [%] F [kN] drift [%]
Experiment 53 0.29 120 2.0 95 3.5
Simulation 55 0.28 115.5 1.85 94 3.5
Difference [%] 3.77 3.45 3.75 7.5 1.05 -
6.4.2 In-plane plane simulation of the traditional infill (Test BI)
The second numerical analysis was performed on the traditionally infilled frame model.
For the numerical simulation of the tests, the masonry has been modelled using the
parameters calibrated through the FE analyses conducted on the vertical compression
test on masonry assembly, as described in section 6.3.1.3. Infilled frame model is
assembled using bare frame model and just adding bricks and defining interaction
between the bricks and infill panel and frame, using the values from Table 6.3.
Numerical model of infilled frame of the BI test is presented on Figure 6.2.
a) b)
Figure 6.26 Comparison of force-displacement curves a) for the first in-plane loading phase up
to 1.25% of drift b) for the whole test
Loading protocol applied was the same as in experimental test, first in-plane
displacement up to 1.25% of drift was applied, followed by the out-of-plane pressure
load of 3 kN/m2 and then after removing it application of second in-plane loading up to
2.1% of drift. Figure 6.26a shows comparison of pure in-plane loading results up to

Marko M. Marinković Innovative system for seismic resistant masonry
infills in reinforced concrete frame structures
262
1.25% of drift, while Figure 6.26b shows in-plane force-displacement curves for the
whole test.
a) b)
Figure 6.27 a) Deformed shape with compression damage distribution (5 times scaled defor-
mation) and b) experimental crack pattern at 1.25% of in-plane drift
a) b)
Figure 6.28 a) Deformed shape with compression damage distribution (5 times scaled defor-
mation) and b) experimental crack pattern at 2.1% of in-plane drift
Figure 6.27 and Figure 6.28 present damage distribution in the infill together with the
cracks distribution from the experiment, at the 1.25% and 2.1% of in-plane drift.
Damage distribution at the end of the test is spreaded all over the wall and level of
damage is higher, than at the 1.25% of drift, which is in a line with what was observed
during the experimental test. Table 6.7 shows that difference in force and displacement
values between experimental and numerical results is negligible. Experimental values in
the Table 6.7 are extracted from positive envelope. Again, it can be seen that the
numerical analysis output was close to the test results in terms of initial stiffness,
stiffness degradation and force-displacement (Figure 6.26) as well as deformed shape

Chapter 6 Numerical analysis
263
and damage distribution (Figure 6.27 and Figure 6.28). Figure 6.27 and Figure 6.28
show a comparison between the experimental and analytical crack patterns, where it can
be seen that the results of the FE analysis is able to capture the position and direction of
cracks, although it cannot predict in a precise way some of the minor cracks.
Table 6.7 Comparison of numerical and experimental results on traditionaly infilled frame
Cracking initiation Max. load Max. displacement
F [kN] drift [%] F [kN] drift [%] F [kN] drift [%]
Experiment 110 0.06 240 1.50 180 2.1
Simulation 108 0.06 239 1.54 205 2.1
Difference [%] 1.8 0 0.42 2.67 13.9 -
6.4.3 In-plane simulation of the IMES system (Test CI)
Experimental tests on infilled frames with the IMES system showed good behaviour in
a case of just in-plane or just out-of-plane loading. Circumferential elastomers improved
in-plane behaviour of infill wall by postponing damage to higher drift levels. Out-of-
plane load capacity was reduced due to the weaker boundary conditions. However, for
the case of simultaneously applied in- and out-of-plane loading the behaviour was
disastrous, showing that anchor connection is not the good solution. Therefore, infilled
frames with the IMES system weren‘t modelled in detail (anchor connection was
omitted), instead CI experiment was modelled just as another test used for validation of
infilled frame model with elastomers. Good thing with CI experiment is that it was
loaded up to 3.5% of drift, so it was used to confirm the validity of the numerical model
at high level of drifts.
Numerical model was made using the model for BI test, just 2.5 cm of Regufoam® 400
elastomer was added at the top and sides. Material for elastomer is defined as explained
in section 6.3.1.4. The model was loaded just in-plane up to 3.5% of drift.
Results of the analysis are shown on Figure 6.29, Figure 6.30 and Table 6.8.
Experimental values in the Table 6.8 are extracted from the positive envelope. The
results acquired from numerical analysis show again that numerical model is capable to
predict with enough precision the stiffness, the peak lateral force and the overall
behaviour of the specimen, as illustrated in Figure 6.29, where it can be seen that the
force-displacement curve from the analysis matches quite accurately the envelope of the
test. Figure 6.29b shows the effect of decoupling and how the infill wall is much less

Marko M. Marinković Innovative system for seismic resistant masonry
infills in reinforced concrete frame structures
264
and later activated when compared to the traditional infill.
a) b)
Figure 6.29 a) Comparison of experimental and numerical force-displacement curves and b)
comparison with the bare frame and traditionally infilled frame
a) b)
Figure 6.30 a) Deformed shape with compression damage distribution (5 times scaled defor-
mation) and b) experimental crack pattern at the maximum load
Table 6.8 Comparison of numerical and experimental results on infilled frame with the IMES
system
Cracking initiation Max. load Max. displacement
F [kN] drift [%] F [kN] drift [%] F [kN] drift [%]
Experiment 145 1.2 210 2.75 160 3.5
Simulation 155 1.15 200 2.7 170 3.5
Difference [%] 6.9 4.16 4.76 1.8 6.25 -
6.4.4 In-plane simulation of the INODIS system (Test DIO)
In this section infilled frame with the INODIS system is simulated under in-plane
loading. In experiment DIO specimen was loaded in couple of phases combining in- and
out-of-plane loading, as explained in section 5.5.3.4. The first loading phase was pure
in-plane loading, and it was used to validate numerical model of the INODIS system
(Figure 6.31a). Afterwards, model was simulated up to around 5.70% of in-plane drift

Chapter 6 Numerical analysis
265
(Figure 6.31b) in order to investigate what would happen if in experiment test specimen
was loaded up to this level. It can be seen that numerical model predicts very well
stiffness and strength of an infilled frame with the INODIS system. Figure 6.31b shows
that the cracking initiation and at the same time maximum load capacity of an infilled
frame with the INODIS system will appear at 2.8% of in-plane drift giving 195 kN of
force resistance. This high level of in-plane drift reached can be explained with the
contribution curve showing that activation of the infill is postponed to the high drift
levels.
a) b)
Figure 6.31 Comparison of experimental and numerical force-displacement curves a) for the
phase 1 of the test and b) simulation results up to a drift level of 5.70%
a) b)
Figure 6.32 a) Deformed shape with compression damage distribution at cracking initiation and
b) at 4% of in-plane drift (5 times scaled deformation)
Damage of infill wall (Figure 6.32a) occurs due to the crack openings, which leads to
the abrupt drop of the resistance force. Afterwards, residual strength of an infill is
activated due to the fact that contact between frame and infil is soft and not hard as in
traditional infill. U-shaped elastomers around infill allow for reconsolidation of infill
bricks (Figure 6.32b) after occurrence of cracks which brings additional capacity to the

Marko M. Marinković Innovative system for seismic resistant masonry
infills in reinforced concrete frame structures
266
infill. It can also be seen that cracks in RC frame appeared much sooner than in the infill
(Figure 6.32b), which proves that when the INODIS system is applied it is enough to
properly design structural frame system as it is the usual practice today.
Figure 6.33 shows horizontal section just under the top beam of deformed infilled frame
with INODIS system (view from the top). On Figure 6.33b deformed infilled frame with
INODIS system is shown, where it can be seen that even at very high in-plane drifts
(5.70%) there is still contact between plastic profile and U-shaped elastomer. This
provides reliable boundary condition for out-of-plane loads, which is not the case for
traditionally infilled frame and gap between infill and column appears already at small
in-plane drifts. This gap presents a loss of contact between infill and frame, making
infill corners of traditional infills vulnerable to out-of-plane loads. Figure 6.33a shows
compressed elastomer in the other top corner.
a) b)
Figure 6.33 Deformed shape with a) compressed elastomer on one side and b) gap between in-
fill column on the other side at 5.5% of in-plane drift
6.4.5 Combined in-plane and out-of plane simulation
Developed numerical model is not capable to adequately represent infill walls subjected
simultaneously to in- and out-of-plane loads. Therefore smeared homogenized model is
employed for simulating this loading condition in order to explain load transfer and
behavior of infill under unfavourable conditions that appear under simultaneous loading
and not to assess exact values of drift and resistance force.
Numerical model was used to simulate BIO and DIO specimens under combined
loading. CIO test wasn‘t modelled since in experiment the same disastrous behaviour as
in BIO tests was observed, which showed that anchors are not sufficient measure for
combined loading. Infill wall is modelled with the one part presenting infill panel,

Chapter 6 Numerical analysis
267
instead of each brick connected with the interaction as it was done so far. This model
does not make a distinction between individual units and joints but treats masonry as a
homogeneous and isotropic continuum. The same material as for the brick is used for
infill panel part, with the same characteristics. All other characteristics are defined as for
the detailed model. First out-of-plane load of 5 kN/m2 is applied followed by in-plane
displacements applied at the top beam.
Figure 6.34a illustrates the distribution of the contact stress when out-of-plane load is
applied and Figure 6.34b shows the same for a combined loading. It can be seen that the
contact surfaces form in accordance with the arching effect when subjected to an out-of-
plane load and in an eccentric manner when exposed to a combined loading.
a) b)
Figure 6.34 Contact stresses at a) out-of-plane loading and b) combined loading
The contact stress distributions for the different load situations are qualitatively
illustrated in Figure 6.35. The contact area for an in-plane load with the load dissipation
via the diagonal compression strut is shown in Figure 6.35a, where it can be seen that
contact is reduced to some part of the infill width/height. This was observed by many
researchers and it is first investigated by Stafford Smith and Carter (1969), and
afterwards by Hendry (1981), Crisafulli (1997) and Al-Chaar et al. (2002). In Figure
6.35b, the contact stresses correspond to the support areas of the compression arch that
form in both directions of the wall with the four-sided support in case of out-of-plane
loading. Figure 6.35c qualitatively illustrates the contact stresses that form when loads
are applied in both directions. In this case, the forces in the compression struts have to
be dissipated via reduced contact areas and the arching effect is eliminated. Finally,
Figure 6.35d illustrates the contact stress distribution in the case when there is a top gap,

Marko M. Marinković Innovative system for seismic resistant masonry
infills in reinforced concrete frame structures
268
which produces a tilting movement of the wall when exposed to a combined load. In
this case, the diagonal compression strut runs diagonally through the corner points on
the inner side and outer of the wall.
a) b)
c) d)
Figure 6.35 Contact stresses for a) in-plane loading, b) out-of-plane loading, c) in- and out-of-
plane loading with the full contact and d) with a gap at the top
The contact stress distributions show that the contact areas become smaller when
exposed to combined loads which results in the loads that are placed on the bricks in the
contact areas becoming significantly greater. In the BIO and CIO tests, this has led to
local failure in the contact area due to the cracking and splitting of the bricks. A further
important aspect of the combined load transfer is the eccentric formation of the contact
area which, when subject to cyclical in-plane loads, can lead to a successive out-of-
plane infill movement. This effect has already been described in section 5.5.2.2 for the
BI test and is illustrated in Figure 5.34. This effect is amplified in the event of a
diagonal compression strut when a tilting movement occurs in the wall (Figure 6.35d).
This was one of the reasons to design the INODIS system having U-shaped elastomer,
which has the second layer of elastomer that prevents loss of contact between infill and
frame as it can be seen on Figure 6.33. Figure 6.36 confirms that contact areas remain
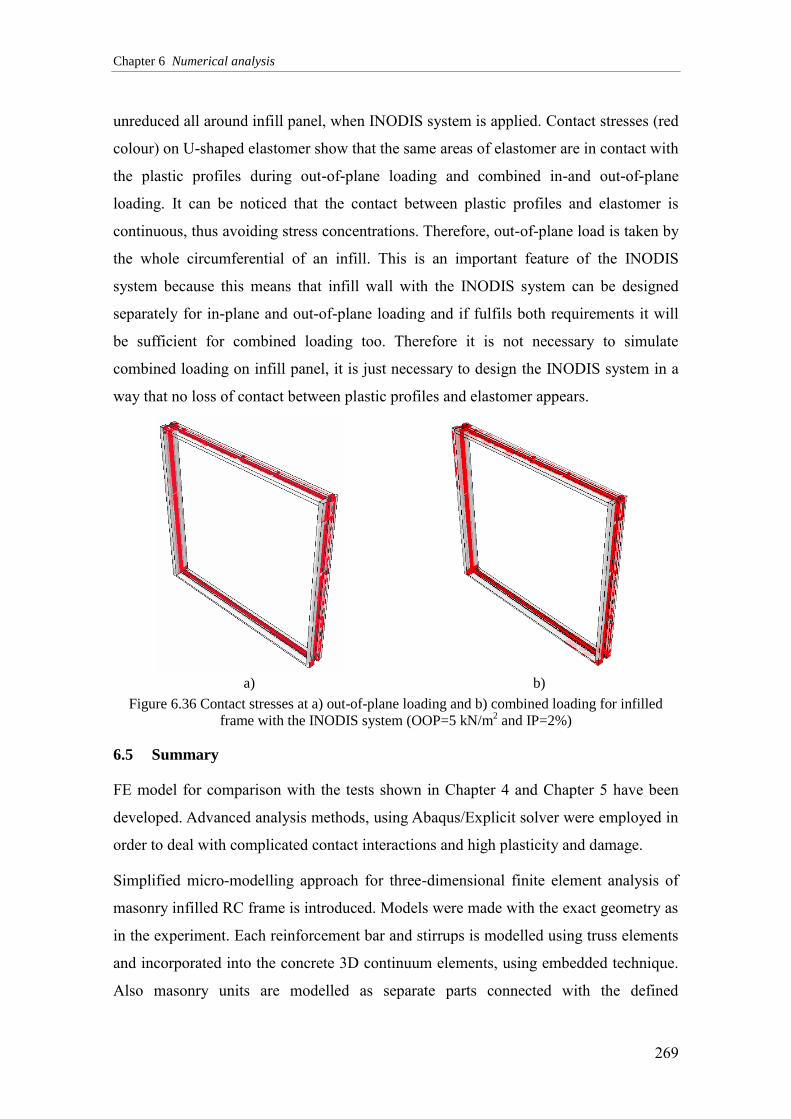
Chapter 6 Numerical analysis
269
unreduced all around infill panel, when INODIS system is applied. Contact stresses (red
colour) on U-shaped elastomer show that the same areas of elastomer are in contact with
the plastic profiles during out-of-plane loading and combined in-and out-of-plane
loading. It can be noticed that the contact between plastic profiles and elastomer is
continuous, thus avoiding stress concentrations. Therefore, out-of-plane load is taken by
the whole circumferential of an infill. This is an important feature of the INODIS
system because this means that infill wall with the INODIS system can be designed
separately for in-plane and out-of-plane loading and if fulfils both requirements it will
be sufficient for combined loading too. Therefore it is not necessary to simulate
combined loading on infill panel, it is just necessary to design the INODIS system in a
way that no loss of contact between plastic profiles and elastomer appears.
a) b)
Figure 6.36 Contact stresses at a) out-of-plane loading and b) combined loading for infilled
frame with the INODIS system (OOP=5 kN/m2 and IP=2%)
6.5 Summary
FE model for comparison with the tests shown in Chapter 4 and Chapter 5 have been
developed. Advanced analysis methods, using Abaqus/Explicit solver were employed in
order to deal with complicated contact interactions and high plasticity and damage.
Simplified micro-modelling approach for three-dimensional finite element analysis of
masonry infilled RC frame is introduced. Models were made with the exact geometry as
in the experiment. Each reinforcement bar and stirrups is modelled using truss elements
and incorporated into the concrete 3D continuum elements, using embedded technique.
Also masonry units are modelled as separate parts connected with the defined

Marko M. Marinković Innovative system for seismic resistant masonry
infills in reinforced concrete frame structures
270
interaction the mortar joint behaviour.
Concrete damage plasticity model was used for the concrete and masonry material
models, while hyperfoam material model is employed for modelling an elastomer.
Separate definition of compression and tension for concrete and masonry materials has
been done, using the stress-strain curves for the compression and stress-displacement
curves for the tension. Softening part of the stress-strain curve for the compression of
masonry has been developed (Equation 6.21) to be very suitable for calibration process,
because increase/decrease of residual strength of bricks i.e. infill can be easily
accomplished. For defining the hyperfoam material uniaxial test data and shear stress-
strain curves from experimental test are used. For the reinforcement material an elasto-
plastic material model characterised by an isotropic hardening behaviour is used.
The material models were first calibrated on the small scale specimen tests on masonry
and elastomer components. Concrete and reinforcement material are calibrated on the
bare frame test (Test A). Afterwards, tests on infilled frames are simulated, showing that
the model can effectively predict the load-displacement response of the structures and
the crack damage of masonry infill wall with the satisfactory accuracy.
Developed numerical model is not capable to adequately represent infill walls under
simultaneous in- and out-of-plane loads. Therefore, for simulating BIO and DIO
specimens smeared homogenized model is employed. This was useful in order to
explain load transfer and behaviour of infill under the unfavourable conditions that
appear during simultaneous loading.
The model does not take into account orthotropic behaviour of masonry and is not
capable to satisfactorily represent cyclic behaviour of infilled frames. However, it
provides very good matching under monotonic loading. Therefore, the same analysis
technique and model parameters are used for parametric study shown in Chapter 7.

7 PARAMETRIC ANALYSIS
It’s not that I’m so smart, it’s just that I stay with problems longer.
Albert Einstein

Marko M. Marinković Innovative system for seismic resistant masonry
infills in reinforced concrete frame structures
272
7.1 Parametric analysis program
After being properly calibrated and validated through experimental data, the developed
numerical model presented in Chapter 6 is used for an extensive parametric study
presented in the following. The parametric study is performed on infilled frames with
the INODIS system to analyse their behaviour with respect to the variation of
mechanical characteristics, mechanical properties and boundary conditions. The results
of the parametric study are used to provide a basis for the derivation of a practical
design concept. The following parameters of the infill frames with INODIS system are
varied in detail:
Thickness of the elastomers
Mechanical properties of the elastomers
Level of axial loading
Strength of the infill masonry/variation of unit and mortar strength
Wall geometry (height/length and height/thickness ratio
Cross sections of beams and columns
Reinforcement ration of the frame
The parametric study is executed in two consecutive steps: First, an initial parametric
study was conducted on the experimentally tested frame to identify the key influencing
parameters. Therafter the main parametric study is carried out with variation of the key
influencing parameters. The results of the parametric studs are summarized and
presented in diagrams and tables, which are further used to derive the design concept.
7.1.1 Friction coefficient of sliding surfaces
As described in Chapter 3, the INODIS system applied in experimental campaign
contained sliding surfaces glued on the concrete frame, plastic profiles and elastomers.
They were installed to reduce a transfer of shear forces during in-plane loading. For the
sliding surfaces, a double-layer film with PTFE sliding pads with a coefficient of
friction of 0.1 was assigned in the validated model (Section 6.4.4). The simulations are
carried out for friction coefficients of 0.02 and 0.7 in order to check the influence of a
rather low friction and the situation without any sliding surface.

Chapter 7 Parametric analysis
273
Figure 7.1 shows no significant differences between the results with friction coefficients
of 0.02 and 0.1. The increase of stiffness and maximum base shear obtained for a
friction coefficient of 0.7 is insignificant. The result shows clearly, that an application of
sliding surfaces in the INODIS system is not required.
Figure 7.1 Force-displacement curves for different friction coefficients
7.1.2 Infill wall with or without elastomer at the bottom
In order to check the necessity to install an elastomer at the bottom of the infill,
simulations of an infill with the U-shaped elastomer at columns and top beam, with and
without and elastomer at the bottom has been performed. The comparison in Figure 7.2
shows that the specimen without elastomeric support at the bottom is much stiffer and
the maximum load is reached quickly. Thus, the infill is faster activated and cracking in
infill starts earlier (at 2% of drift). The simulation results are confirmed by the
experimental results of the CI specimen without an elastomer at the bottom and plain
elastomers on three sides with 2.5 cm thickness. Similar to the simulation results, the
response is stiffer and maximum load is reached earlier.
Figure 7.2 Force-displacement curves for an infill wall with the INODIS system with and with-
out elastomer at the bottom

Marko M. Marinković Innovative system for seismic resistant masonry
infills in reinforced concrete frame structures
274
From the out-of-plane behaviour of the CIO specimen (Section 5.5.3.3 and Section
5.5.5.3) it can be seen that the application of the elastomer at the bottom is even more
important to avoid out-of-plane displacements. It can be concluded that the elastomeric
support at the bottom is needed and improves the behaviour of the INODIS system.
7.1.3 Stiffness of bottom elastomer
Since it was concluded in the previous section that the application of the elastomer
improves the efficiency of the INODIS system, the influence of elastomer stiffness is
further investigated. In the DIO test, Regufoam® 570 was used for the elastomer at the
bottom of the infill. This type of elastomer is approximately 10 stiffer than Regufoam®
400 (Table 4.10 and Figure 4.10) which is used for the first layer at the columns and top
beam. The numerical simulation was carried out with the stiffest elastomer Regufoam®
680 at the bottom, 10 times stiffer than Regufoam® 570. Figure 7.3 illustrates that the
increases stiffness of the elastomer at the bottom does not influence the behaviour of the
INODIS system. However, a higher stiffness of the elastomer at the bottom will increase
the formation of the arching effect in case of out-of-plane loading. Therefore the main
parametric study will be carried out with the stiffer elastomer Regufoam® 680.
Figure 7.3 Force-displacement curves for an infill wall with the INODIS system with different
stiffness of the elastomer at the bottom
7.1.4 Stiffness of the first layer of the U-shaped elastomer
Figure 7.4 shows the force-displacement curves for an infilled frame with the INODIS
system, if different types of elastomers are used for the first layer of the U-shaped
connection, both at columns and top beam. Figure 7.4 shows that for all types of
elastomers the infill activation is delayed and the maximum load capacity is reached at

Chapter 7 Parametric analysis
275
high drift values. After exceeding the drift at the maximum load capacity cracking
within the infill takes place. The lower the stiffness of the elastomer, the lower the
maximum base shear and the slower the infill is activated. The results show, that the
choice of the first layer is quite important as the influence on the force-displacement
curve is clearly visible.
Figure 7.4 Force-displacement curves for an infill wall with the INODIS system with different
stiffnesses of the first layer
7.1.5 Stiffness of the second layer of the U-shaped elastomer
Since the U-shaped elastomer of the INODIS system consists of two layers, the
influence of stiffness of the second layer of elastomer, both at columns and top beam, is
studied. In the experimental test Regufoam® 510 was used for the second layer, thus the
initial DIO model contains this type of elastomer. Additional simulations are executed
using the stiffest elastomer (Regufoam® 680) and the softest elastomer (Regufoam®
270), while keeping the Regufoam® 400 for the first layer.
Figure 7.5 Force-displacement curves for an infill wall with the INODIS system with different
stiffnesses of second layer of the U-shaped elastomer
Figure 7.5 depicts that the influence of the stiffness of the second layer on the overall

Marko M. Marinković Innovative system for seismic resistant masonry
infills in reinforced concrete frame structures
276
response is much smaller. It can be concluded that the characteristics of the first layer of
U-shaped elastomer should be in focus during the design of the INODIS system for the
case of in-plane loading. It is recommended to chose the second layer much stiffer to
provide reliable boundary conditions to avoid out-of-plane movements of the masonry
infill.
7.1.6 Stiffness of the first layer of U-shaped elastomer at the beam/column
Figure 7.6 shows the change in the force-displacement curves when the first layer of the
U-shaped elastomer is changed at the beam or column. The stiffest elastomer
Regufoam® 680 was applied instead of Regufoam® 400, while Regufoam® 510 was
kept for the second layer as was used in experimental tests. Figure 7.6 shows the the
initial stiffness and the activation is more influenced in case of a higher elastomeric
stiffness along the columns. At really high drifts of more than 3%, the influence of of
the beams is more pronounced and lead to an increase of the base shear. However, as
ductile reinforced concrete frames are usually designed for drifts up to 2% (FEMA 356,
2000), it is more important to adjust the stiffness of the elastomers placed along the
columns. The higher stiffness for the elastomers at the top beams should be chosen in
order to increase the formation of an arching effect in vertical direction under out-of-
plane loading.
Figure 7.6 : Force-displacement curves for an infill wall with the INODIS system with different
stiffnesses of the first layer for the beam or column connection U-shaped elastomer
7.1.7 Thickness of elastomer
Three additional models with the elastomers at columns having thicknesses of 15, 25
and 35 mm for the first layer are simulated. The thickness of the second layer was taken
to be the same as for the first layer, while the thickness of the top beam elastomer is

Chapter 7 Parametric analysis
277
calculated as 2/3 of thickness of column elastomer. This results in total thicknesses of
30, 50 and 70 mm of the decoupling element along the columns. The thickness of the
plastic profile is equal to the thickness of the second elastomeric layer. The elastomer at
the bottom is modelled with the same thickness as the thickness of the first layer
elastomer at the top beam. Figure 7.7 shows that the thickness of elastomer changes the
initial stiffness and the drift when infill cracking starts. Hence, the thickness of the first
layer is one key parameter for the design to reach the required drift demand governed by
the frame structure.
Figure 7.7 Force-displacement curves for an infill wall with the INODIS system with different
thicknesses of U-shaped elastomer
7.1.8 Vertical load
In the following the influence of the vertical load level on the columns is investigated.
In the experimental tests each column was subjected with vertical loads of 200kN,
simulating loads from upper stories of a building. Additional simulations are carried out
with the vertical forces of 50kN and 400kN per column. Figure 7.8a shows the increase
of maximum load level for higher vertical loads, especially in the case of traditionally
infilled frames. This effect is less pronounced in a case of infills with the INODIS
system, which is more detailed clarified with the curves presenting the contribution of
the infill walls (Figure 7.8b). Since the bare frame model was simulated up to around
3.7% of drift, the curves for the contribution of the infill are presented up to this level.
Figure 7.8b shows that the force-displacement curves for different vertical load levels
do not significantly influence the initial stiffness and the maximum load up to drifts of
about 2.5%. At higher drift levels the contribution decreases coused by the increasing
geometrical stiffness of the RC frame. It can be summarized, that the the vertical load

Marko M. Marinković Innovative system for seismic resistant masonry
infills in reinforced concrete frame structures
278
level does not have a significant influence on the force-displacement curve and can be
neglected within the main parametric study.
a) b)
Figure 7.8 a) Force-displacement curves for different vertical load levels and b) curves of infill
contribution
7.1.9 Height to length ratio
Since the literature review (Chapter 2) showed that the failure mode of infill wall
changes for different aspect ratios. Therefore the influence of the aspect ratio, defined as
the height to length ratio, is investigated in the following. The experimentally tested
infilled frames had a length of 302 cm and a height of 275 cm, with the infill wall
having a length of 277 cm and a height of 252 cm. In this parametric study, two
additional frames having the same height and being shorter (150 cm) and longer (450
cm) are investigated. Given that, the aspect ratios of infill walls are: 2, 0.9 and 0.6. With
these aspect ratios the behaviour of short, square and long walls is investigated.
a) b)
Figure 7.9 a) Force-displacement curves for an infill wall with and without INODIS system for
different h/l ratios and b) deformed shape with damage distribution at maximum load capacity
(INODIS- h/l=0.9)
Force-displacement curves for different h/l ratios, for both traditionally infilled frames
and frames with the INODIS system are presented in Figure 7.9. Obviously, the

Chapter 7 Parametric analysis
279
occurrence of infill cracking as well as maximum load and corresponding drift levels
are changing in accordance with the variation of the h/l ratio. This happens due to the
change in failure modes for different h/l ratios (Figure 7.9b, Figure 7.10). Shorter infill
walls are dominated by rocking while longer walls are characterized by shear transfer.
However, for all aspect ratios the INODIS system postpones the activation of the infill
to the higher drift levels, but the contribution of the infill at higher drift levels is clearly
influenced by the h/l ratio.
a) b)
Figure 7.10 Deformed shape with damage distribution for a) INODIS - h/l=0.6 and b) INODIS-
h/l=2 at maximum load capacity (5 times scaled deformation)
7.1.10 Infill thickness
The RC frames tested in experiments were filled with highly thermal-insulating MZ70
bricks with a thickness of 36.5 cm. In order to investigate the influence of the infill
thickness on the behaviour of infilled frames with the INODIS system, the
experimentally investigated infill frame is simulated with bricks of 24 cm.
Figure 7.11 Force-displacement curves for different infill thicknesses
Figure 7.11 shows the influence of the thickness on the results due to in-plane loading.
The comparison shows, that the initial stiffness and behaviour up to a drift level of 1.7%

Marko M. Marinković Innovative system for seismic resistant masonry
infills in reinforced concrete frame structures
280
is quite similar, but the maximum load is reduced for the infill with a thickness of
24 cm. It can be summarized, that the thickness of the infill must be considered within
the design of the INODIS system.
7.1.11 Masonry infill stiffness (frame to infill stiffness ratio)
In order to investigate influence of the frame to infill stiffness ratio on the behaviour of
infilled frames with the INODIS system, an infill with a masonry compressive strength
of 1.0 MPa and a modulus of elasticity of 1.0 GPa is simulated and compared to the
results of the validated numerical model (Chapter 6) with a compressive strength of 3.1
MPa and a modulus of elasticity of 4.87 GPa (Table 7.1).
Model E [GPa]
Infill 3.1 4.87
Infill 2 1.0 1.0
Figure 7.12 Force-displacement curves for dif-
ferent material characteristics of the bricks Table 7.1 Infill brick material characteristics
a) b)
Figure 7.13 Deformed shape with the compression damage distribution at maximum load capac-
ity for a) Infill 1 and b) Infill 2 (5 times scaled deformation)
Figure 7.12 shows that initial stiffness of the infilled frame with the INODIS system is
not influenced by the stiffness of the infill, but the maximum load and the drifts with
occurrence of first damages are different. This is due to the different failure modes
(Figure 7.13) governed by strength of the masonry. Infill 1 shows damage and gapping
of the joints while Infill 2 experiences brick failures without joint opening. It can be
concluded, that the stiffness ratio can be neglected as long as the infill is not activated.

Chapter 7 Parametric analysis
281
After the activation of the infill, the strength ratio plays an important role and must be
considered. The level of influence depends on the choice of the thickness and stiffness
of the elastomers, governing the degree of decoupling between frame and infill.
7.1.12 RC frame stiffness (frame to infill stiffness ratio)
Beside the infill stiffness and the dimensions of the RC frame, the cross sections of the
columns and the top beam influence the frame to infill stiffness ratio. The
experimentally tested frame had columns of 25x25cm and a top beam of 25/45cm. To
study the influence of the frame stiffness, an additional simulation with quadratic cross
sections of 35x35 cm for columns and top beam iscarried out.
Figure 7.14 shows that the increase of the column dimensions leads to an increase of the
initial stiffness and maximum load. However, the contribution of the infill is postponed
in both cases and on a rather low level (Figure 7.14). It can be also observed that in both
cases, initial stiffness of the bare frame and infilled frame with the INODIS system is
the same. It can be concluded, that the frame stiffness is an important parameter as it
directly influences the maximum load capacity of the bare frame and the displacement
demand generated by the RC frame system.
Figure 7.14 Force-displacement curves for different frame cross sections
7.1.13 Reinforcement ratio
Another characteristic investigated is the reinforcement ratio of the RC frame.
Reinforcement ratio of experimentally tested frame was 1.48% and 1.05% for columns
and beam, respectively. Two additional simulations are executed, where only the cross
sections of the longitudinal bars were changed, giving the reinforcement ratios as

Marko M. Marinković Innovative system for seismic resistant masonry
infills in reinforced concrete frame structures
282
presented in the Table 7.2. From Figure 7.15 it can be concluded that change of the
reinforcement ratio influences the bare frame response but the maximum drift levels of
the infilled frame with the INODIS system are still compareable. Thus, this parameter
will be neglected in the main parametric study. However, the displacement demand of
the frame system is highly influenced by the choice of the ductility class according to
Eurocode 8 (EN 1998-1, 2004). If the ductility class DCL is chosen, it can be expected
that the INODIS system is able to avoid any infill damages as the displacements are
small. If the frame is designed for a higher ductility class, the system postpones and
reduces the contribution of the infill.
Model Column Beam
RR1 1.09% 0.77%
RR2 1.48% 1.05%
RR3 1.93% 1.37%
Figure 7.15 Force-displacement curves for different frame rein-
forcement ratios
Table 7.2 Reinforcement
ratios used in the numerical
models
7.1.14 Concrete class
The influence of concrete strength on the behaviour of infilled frames with the INODIS
system has been also investigated. Numerical model presenting experimental test has a
concrete class C30/37. A second model with concrete class C35/45 was used to
investigate the effect of changing the concrete class on the drift limits of an infilled
frame with the INODIS system. Figure 7.16 shows that the concrete class slightly
increases the stiffness of the model, but it does not influence the drift level when
cracking of infill starts.

Chapter 7 Parametric analysis
283
Figure 7.16 Force-displacement curves for different concrete classes
7.1.15 Short column case
In the case when infill wall in a reinforced concrete frame is shorter than the column
height, the short column effect can occur during an earthquake shaking. As it can be
seen in section 1.2, this form of damage is frequently observed in many earthquakes.
Therefore, this kind of infilled frame setup is numerically studied on traditionally
infilled frame and infilled frame with the INODIS system. The situation when an infill
wall has an opening in the upper part within the whole length of the wall is simulated.
Two models are made, one with the opening having the height of 75 cm and second one
with the opening of 125 cm of height. This makes an infill walls having contact with the
frame in the 70% and 50% of its height.
On Figure 7.17 it can be seen that the INODIS system decouples RC frame and infill
walls producing less stiff response compared to the traditionally infilled frames. In this
way, the INODIS system reduces the level of shear forces on the frame, which is the
main governing parameter for the damage of columns due to the short column effect.
INODIS system also postpones start of damage in infill walls too. Figure 7.18 shows
damage distribution for the case when infill wall has the half of the full height. It can be
seen that damage in infill wall with the INODIS system hasn‘t even started, while
traditional infill is already heavily damaged. It should also be noticed that level of
damage in frame columns in a case of the INODIS system is only influenced by the
deformation of RC frame in contrary to the traditionally infilled frame where damage of
columns is increased due to the stiff contact with the infill wall.

Marko M. Marinković Innovative system for seismic resistant masonry
infills in reinforced concrete frame structures
284
Figure 7.17 Force-displacement curves for short infill walls
a) b)
Figure 7.18 Deformed shape with damage distribution at 1.8% of drift for a) traditional infill b)
infill with the INODIS system
7.2 Combination of all the influential parameters
After the evaluation of the result of the initial parametric studies presented in the
previous sections of this chapter, significant are identified and combined for the
consecutive main parametric study. It can be summarized that the number of significant
parameters is smaller in comparison to traditional infills. However, the main parametric
study still includes a total number of 144 numerical models. Finally, the following
parameters are considered and combined:
Height to length ratio of an infill wall:
a) h/l=2;
b) h/l=0.9;
c) h/l=0.6.;
RC frame stiffness:

Chapter 7 Parametric analysis
285
a) Frame 1 – RC used in the experimental tests with cross sections of the
columns and the top beam of 25/25 cm and 45/25 cm, respectively;
b) Frame 2 – RC with cross sections of the columns and the top beam of
35/35 cm;
Mean compressive strength of masonry:
a) fm=1 MPa;
b) fm=3.1 MPa;
Thickness of the masonry infill:
a) tm=24 cm;
b) tm=36.5 cm;
Elastomer type:
a) INODIS 1 – U-shaped elastomer with two layers. Regufoam® 400 and
Regufoam® 680 are chosen for the first and second layer, respectively;
b) INODIS 2 – INODIS 2 – U-shaped elastomer with two layers. Regupol®
480 and Regupol® 550 are chosen for the first and second layer respec-
tively;
Thickness of the elastomer for the first layer:
a) te=15 mm;
b) te=25 mm;
c) te=35 mm;
The first layer thickness refers to the thickness of the first layer of the U-shaped
elastomer at the columns. The thickness of the second layer and layers at the top and
bottom beam are calculated as explained in Section 7.1.7. With Regufoam® 680 and
Regupol® 550 materials with higher stiffnesses are chosen for the second layer to
prevent out-of-plane movements, as it was proven in Section 7.1.5, that the beneficial
in-plane behaviour of the INODIS system is not influenced by a higher stiffness of the
second layer. In that way, in-plane behaviour loading stays unchanged, but stronger
arching effect under out-of-plane loading is provided. Regufoam 680 and Regupol 550
are also applied at the bottom of the two systems. Figure 7.19 shows the chart of the
combination of parameters in the parametric study for the aspect ratio of h/l=0.6. The
same models were simulated for h/l=0.9 and h/l=2.0.
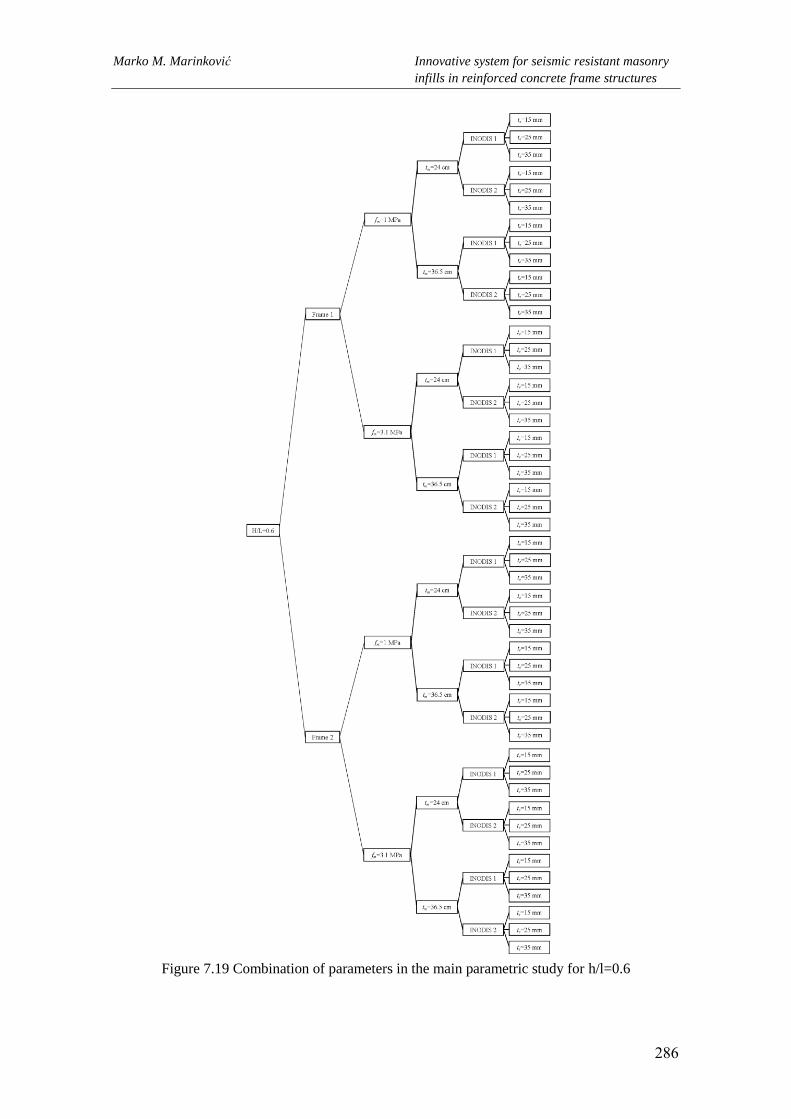
Marko M. Marinković Innovative system for seismic resistant masonry
infills in reinforced concrete frame structures
286
Figure 7.19 Combination of parameters in the main parametric study for h/l=0.6

Chapter 7 Parametric analysis
287
7.3 Results of the main parametric study
Results of the numerical simulations are presented on Figure 7.20, as one example of
the results, while the force-displacement curves for all other models are given in
Appendix A. Notation of model numbers is given in Table 8.1. On all the diagrams it
can be observed that infilled frames with the bigger frame cross sections (Frame 2) can
withstand higher loads. Also, infilled frames with the thicker elastomers can reach
higher drift levels without infill cracking, as expected.
a) b)
Figure 7.20 Force-displacement curves for h/l=2 for a) INODIS 1 and b) INODIS 2 with the
thickness of the 1st layer of 35 mm
From the results the following conclusions can be drawn:
infill wall with the lower masonry compressive strength assigned to the bricks in
the numerical model, experience cracking of the bricks in comparison to the
infill wall with the stronger bricks where cracking occurs in mortar joints;
for all 144 combinations of parameters extremely high drifts are reached;
infilled frames with the stiffer RC frame (Frame 2) produced more than 2 times
higher maximum load capacity;
longer infilled frames (h/l=0.6) experienced mostly faster decrease of load
resistance after reaching maximum load capacity;
longer infilled frames (h/l=0.6) mostly experienced bed joint shear sliding
failure, while quadratic (h/l=0.9) and short infilled frames (h/l=2) usually
experienced cracking in the diagonal of the infill panel;
INODIS 1 and INODIS 2 systems produced almost the same behaviour of
infilled frames, with the frames with the INODIS 2 system having slightly lower
initial stiffness;
for infills with the 36.5 cm of thickness cracking started at the same time or at
Marko M. Marinković Innovative system for seismic resistant masonry
infills in reinforced concrete frame structures
288
slightly higher drifts as for infills with the thickness of 24 cm;
as expected, infilled frames with the thicker elastomer reached maximum load
capacity and cracking initiation at higher drift levels, due to the postponed infill
activation.
7.4 Summary
The simulation model calibrated and validated through the experimental results of the
test DIO has been used to determine the key influence parameters governing the
behaviour of infilled frames with the INODIS system. Parameters related to the INODIS
system such as necessity to have sliding surfaces, elastomer at the bottom of an infill,
stiffness/type and thickness of U-shaped elastomer are initially investigated.
Two variations of the INODIS system are chosen for the main parametric study.
INODIS 1 with Regufoam® and INODIS 2 made of Regupol® material. Also,
parameters related to the RC frame and infill characteristics (vertical load, geometry of
frame and infill, column and beam sections, reinforcement ratio, class of concrete, infill
thickness and strength) are analysed. Additionally, short column effect is investigated
and important finding is derived that the INODIS system solves the problem with the
short column effect, by eliminating its negative influence on the frame.
Based on the sensitivity studies by varying single parameter, a comprehensive
parametric study with 144 numerical simulations, considering combinations of the
identified key influencing parameters, is carried out. For each numerical simulation a
force-displacement curves is extracted, used as the base for the derivation of the design
concept.

8 DESIGN CONCEPT AND
ECONOMIC ANALYSIS
I learned a dozen languages, studied literature and arts, spent my best years in libraries reading every-
thing that came my way, and though I sometimes felt I was losing time, I quickly realized it was the best
thing I ever did.
Nikola Tesla

Marko M. Marinković Innovative system for seismic resistant masonry
infills in reinforced concrete frame structures
290
8.1 Design concept
In the following the design concept for infilled frames with the system INODIS is
presented. The development of the design concept is based on the results of the
experimental tests (Chapter 5) and the parametric study presented in Chapter 7.
The experimental tests presented in Chapter 5 showed that out-of-plane capacity of
traditional infill walls is quite high due to the arching effect, but can be highly reduced
due to previous in-plane loading and even more reduced in case of combined in- and
out-of-plane loading. The main reasons, already explained and summarized in Chapter 5
and Chapter 6, are: Previous damage of the infill, damage of the mortar connection
between frame and infill and loss of connection between infill and frame under
combined in- and out-of-plane loading.
The experimental test DIO shows much lower interaction effects between the in-plane
and out-of-plane response of the infill panel, if the system INODIS is installed. It was
observed, that the force-displacement curve for pure in-plane loading matches
completely the experimental curves of sequentially, simultaneously and combined in-
and out-of-plane loading up to drift values of 1.8% (Figure 6.31b), as the infill panel
was completely undamaged. This confirms that almost no interaction between in-plane
and out-of-plane takes place as long as the infill is not damaged through crack
formations. This fact clarifies that the INODIS system makes masonry infill walls a real
non-structural elements up to drift levels which are mostly sufficient for the design of
RC structures in all ductility classes. The proposed solution decouples infill and frame
by absorbing the frame deformations and providing reliable support conditions for the
transfer of the out-of-plane loads to the frame.
Based on these facts, the design of the system INODIS can be divided into in-plane and
out-of-plane verification. First, type and thickness of the elastomer are chosen to fulfil
in-plane requirements, while separately the out-of-plane load capacity is checked. The
design shall be carried out to meet the design objectives for the damage limitation state
(SLS) and the ultimate limit state (ULS). The limit states for the system INODIS are
defined in terms of drift limits. The damage limitation state corresponds to the
maximum drift that can be absorbed by the system without any damage in the masonry
infill. The ultimate limit state is the maximum in-plane drift characterized by the drop

Chapter 8 Design concept and economic analysis
291
down of the wall capacity to 80%. Figure 8.1 shows the design flow chart of the system
INODIS considering both DLS and ULS.
Figure 8.1 Design concept for infill walls with the INODIS system
8.1.1 In-plane verification
Using the results of the parametric study presented in section 7.2, drifts when infill
cracking starts are extracted from all the numerical models and summarized in Table
8.1. The drifts from Table 8.1 present the Damage Limitation State (DLS) values. The
definition of the Ultimate Limit State (ULS) drift values is much more difficult, but the
force-displacement curves in Figure 7.20 and Appendix A show for all simulated
specimens really high drift levels. Such high drift values are usually not utilized through
the design of the RC frames. The drift values for the ULS are determined at the point,
where the maximum load capacity drops down to 80%. As the maximum drifts are quite
high, it can be expected that the infill decoupled with the system INODIS will be
undamaged or just slightly damaged even at the ULS. This is again a step forward with
respect to traditionally infilled frames, which experience heavy damages at rather low
drift levels. Therefore it is contradictory to fill RC frames designed for moderate or high
ductility and behaviour factors between 3 and 6 in full contact with highly brittle
masonry (Hak et al., 2012a). The drift limits given in Table 8.2 are based on nonlinear

Marko M. Marinković Innovative system for seismic resistant masonry
infills in reinforced concrete frame structures
292
calculations and shall be reduced by a safety factor of γ=1.5. If the information of the
drift limits for ULS and DLS are known in a tabulated form, the design can be carried
out with the following consecutive working steps:
a) Calculation of the drift demand at DLS and ULS using an adequate two or three
dimensional building models.
b) Selection of the table rows with the h/l ratio of the infill panel, as well as cross
sections of the frame components.
c) According to corresponding masonry compressive strengths and infill thickness,
six (three for INODIS 1 and three for INODIS 2) drift limits for DLS and ULS
are provided.
d) The thickness and type of the elastomer shall be chosen to fulfil the drift de-
mands of ULS and DLS.
e) Once the type of the INODIS system and the thickness of the first layer of elas-
tomer at the column is chosen, all other values can be easily calculated. The se-
cond layer is designed to have the same thickness as the first one. The thickness
of the first layer of the elastomer at the top beam is adopted to be 2/3 of the
thickness of the column elastomer. The same proportion for the thickness of the
second layer of elastomer is applied for the beam elastomer. The thickness of the
bottom elastomer is also taken as 2/3 of the thickness of the first layer of the
column elastomer.
f) The width of the first layer corresponds to the smaller width of the column/beam
and width of the infill wall. The same value is taken for the total width of the
three strips at the bottom beam, where the middle elastomer can always be taken
as 5 cm. Since the width of the plastic profile is in all cases 5 cm, the width of
the remaining two parts of the second layer of the U-shaped elastomer at the
columns and top beam can be easily calculated to have the same size.
g) The thickness of the plastic profiles is the same as the thickness of the second
layer of the U-shaped elastomer.
The drift demands for the design of the infill walls must be calculated with appropriate
two or three-dimensional models. Therefore it is important to define the stiffness of the
calculation models properly. Therefore, the stiffness ratios between the bare and infilled
frames with the system INODIS are checked and summarized in Table 8.3 for all 144

Chapter 8 Design concept and economic analysis
293
models. The usual practice for RC structures is a stiffness reduction to 50% for taking
into account the formation of cracks during an earthquake excitation. This simplification
still allows the use of linear calculations instead of complex nonlinear analyses. As the
influence of the decoupled infill on the stiffness is rather low, the initial stiffness of the
system INODIS is calculated using the same rigorous approach. The stiffness is
calculated as shown in Figure 8.2. At first, the intersection point of the curve
representing 50% of the initial bare frame stiffness and the force-displacement curve of
the bare frame is determined. Then, the stiffness of the system INODIS is determined
for the drift at the intersection point and the corresponding point on the force-
displacement curve of the frame with the system INODIS.
The results summarized in Table 8.3 show, that the increase of stiffness in most of the
variants is negligible and will not lead to a substantial increase of the fundamental peri-
od. The results in Table 8.3 clarify, that the increase of the stiffness is slightly higher in
case of 15 mm thick 1st layer of elastomer and configuration ―Frame 1‖ with a cross
section of 25/25 cm for the columns. As it can be expected, that a 25/25 cm cross-
section can be regarded as a lower bound for the frame dimensions in practise, the in-
crease of stiffness through the activation of the infill can be neglected within the linear
calculations. Furthermore, the system INODIS 2 lead to a smaller increase in stiffness
due to the fact that the material Regupol® has a lower stiffness at smaller strains com-
pared to the material Regufoam®. Overall, it can be summarized that it is sufficient to
calculate the drift demand by means of a bare frame model.
Figure 8.2 Determination of stiffness ratio between bare frame and infilled frame with the sys-
tem INODIS

Marko M. Marinković Innovative system for seismic resistant masonry
infills in reinforced concrete frame structures
294
Table 8.1 Summary of the drift limits when cracking started
h/l
infill
ratio
Frame
type
Masonry
compressive
strength fm
[MPa]
Infill
thickness
[cm]
1
st layer
thickness 15 mm 25 mm 35 mm No.
INODIS
type
2.0
Frame 1
1.0
24 INODIS 1 1.05% 1.10% 1.65% 1
INODIS 2 1.10% 1.35% 1.85% 2
36.5 INODIS 1 0.80% 1.35% 2.05% 3
INODIS 2 0.95% 1.45% 2.25% 4
3.1
24 INODIS 1 1.05% 1.85% 2.75% 5
INODIS 2 1.05% 1.80% 2.75% 6
36.5 INODIS 1 1.30% 2.35% 3.80% 7
INODIS 2 1.35% 2.45% 3.80% 8
Frame 2
1.0
24 INODIS 1 1.20% 1.55% 1.85% 9
INODIS 2 1.10% 1.75% 2.15% 10
36.5 INODIS 1 1.20% 1.55% 2.10% 11
INODIS 2 1.25% 1.75% 2.35% 12
3.1
24 INODIS 1 1.05% 2.45% 3.05% 13
INODIS 2 1.20% 2.45% 2.95% 14
36.5 INODIS 1 1.20% 2.15% 3.30% 15
INODIS 2 1.25% 2.15% 3.30% 16
0.9
Frame 1
1.0
24 INODIS 1 0.80% 1.10% 1.35% 17
INODIS 2 0.90% 1.20% 1.55% 18
36.5 INODIS 1 1.10% 1.45% 1.65% 19
INODIS 2 1.20% 1.65% 1.85% 20
3.1
24 INODIS 1 0.80% 1.20% 1.65% 21
INODIS 2 0.80% 1.30% 1.65% 22
36.5 INODIS 1 1.20% 1.85% 2.45% 23
INODIS 2 1.05% 1.65% 2.30% 24
Frame 2
1.0
24 INODIS 1 0.95% 1.05% 1.25% 25
INODIS 2 1.10% 1.35% 1.55% 26
36.5 INODIS 1 1.10% 1.25% 1.65% 27
INODIS 2 1.05% 1.35% 1.85% 28
3.1
24 INODIS 1 0.80% 1.20% 1.65% 29
INODIS 2 0.80% 1.25% 1.75% 30
36.5 INODIS 1 0.90% 1.35% 2.05% 31
INODIS 2 0.95% 1.35% 2.05% 32
0.6
Frame 1
1.0
24 INODIS 1 1.20% 1.55% 1.95% 33
INODIS 2 1.05% 1.55% 1.75% 34
36.5 INODIS 1 1.20% 1.65% 2.15% 35
INODIS 2 1.20% 1.75% 2.15% 36
3.1
24 INODIS 1 1.05% 1.55% 2.10% 37
INODIS 2 0.95% 1.35% 1.85% 38
36.5 INODIS 1 1.30% 1.80% 2.45% 39
INODIS 2 1.15% 1.75% 2.25% 40
Frame 2
1.0
24 INODIS 1 1.10% 1.25% 1.55% 41
INODIS 2 1.10% 1.20% 1.35% 42
36.5 INODIS 1 1.10% 1.25% 1.55% 43
INODIS 2 0.90% 1.35% 1.65% 44
3.1
24 INODIS 1 1.05% 1.55% 2.15% 45
INODIS 2 0.95% 1.35% 1.90% 46
36.5 INODIS 1 1.10% 1.65% 2.35% 47
INODIS 2 1.05% 1.55% 2.15% 48

Chapter 8 Design concept and economic analysis
295
Table 8.2 ULS drift limits for all the models
h/l
infill
ratio
Frame
type
Masonry
compressive
strength fm
[MPa]
Infill
thickness
[cm]
1
st layer
thickness 15 mm 25 mm 35 mm No.
INODIS
type
2.0
Frame 1
1.0
24 INODIS 1 4.40% 4.55% 4.45% 1
INODIS 2 4.40% 4.55% 4.55% 2
36.5 INODIS 1 4.35% 4.75% 4.70% 3
INODIS 2 4.35% 4.75% 4.75% 4
3.1
24 INODIS 1 5.50% 5.55% 5.65% 5
INODIS 2 5.55% 5.55% 5.65% 6
36.5 INODIS 1 5.55% 5.55% 5.65% 7
INODIS 2 5.60% 5.60% 5.65% 8
Frame 2
1.0
24 INODIS 1 4.90% 4.95% 5.00% 9
INODIS 2 4.95% 5.00% 4.95% 10
36.5 INODIS 1 4.95% 5.00% 5.05% 11
INODIS 2 5.05% 5.10% 5.05% 12
3.1
24 INODIS 1 5.50% 5.60% 5.60% 13
INODIS 2 5.50% 5.60% 5.65% 14
36.5 INODIS 1 5.50% 5.60% 5.65% 15
INODIS 2 5.55% 5.60% 5.65% 16
0.9
Frame 1
1.0
24 INODIS 1 4.25% 4.35% 4.45% 17
INODIS 2 4.45% 4.55% 4.70% 18
36.5 INODIS 1 3.90% 4.05% 4.15% 19
INODIS 2 3.85% 3.90% 4.15% 20
3.1
24 INODIS 1 3.45% >5.70% >5.70% 21
INODIS 2 4.35% 5.65% >5.70% 22
36.5 INODIS 1 3.10% 4.10% 5.60% 23
INODIS 2 3.30% 4.90% 5.50% 24
Frame 2
1.0
24 INODIS 1 4.15% 4.25% 4.40% 25
INODIS 2 4.10% 4.45% 4.45% 26
36.5 INODIS 1 3.95% 4.15% 4.45% 27
INODIS 2 4.10% 4.20% 4.65% 28
3.1
24 INODIS 1 4.65% 5.65% 5.65% 29
INODIS 2 5.60% 5.50% >5.70% 30
36.5 INODIS 1 5.65% 5.65% 5.65% 31
INODIS 2 4.70% 5.70% 5.70% 32
0.6
Frame 1
1.0
24 INODIS 1 4.20% 4.65% 5.00% 33
INODIS 2 4.25% 4.65% 5.15% 34
36.5 INODIS 1 3.75% 4.00% 4.60% 35
INODIS 2 4.15% 4.40% 4.80% 36
3.1
24 INODIS 1 3.30% 4.55% 5.25% 37
INODIS 2 4.70% 4.80% 5.50% 38
36.5 INODIS 1 3.30% 4.80% 5.50% 39
INODIS 2 3.30% 4.80% 5.30% 40
Frame 2
1.0
24 INODIS 1 4.35% 4.40% 4.45% 41
INODIS 2 3.35% 3.75% 4.15% 42
36.5 INODIS 1 4.25% 4.25% 4.30% 43
INODIS 2 3.85% 3.85% 4.45% 44
3.1
24 INODIS 1 4.20% 4.35% 4.45% 45
INODIS 2 4.00% 4.50% 4.65% 46
36.5 INODIS 1 3.45% 4.50% 5.55% 47
INODIS 2 3.75% 3.65% 3.45% 48

Marko M. Marinković Innovative system for seismic resistant masonry
infills in reinforced concrete frame structures
296
Table 8.3 Stiffness ratio between bare frame and infilled frame with the system INODIS
h/l
infill
ratio
Frame
type
Masonry
compressive
strength fm
[MPa]
Infill
thickness
[cm]
1
st layer
thickness 15 mm 25 mm 35 mm No.
INODIS
type
2.0
Frame 1
1.0
24 INODIS 1 1.20 1.20 1.10 1
INODIS 2 1.10 1.10 1.05 2
36.5 INODIS 1 1.20 1.20 1.10 3
INODIS 2 1.10 1.10 1.05 4
3.1
24 INODIS 1 1.25 1.15 1.10 5
INODIS 2 1.20 1.10 1.05 6
36.5 INODIS 1 1.25 1.15 1.10 7
INODIS 2 1.20 1.10 1.05 8
Frame 2
1.0
24 INODIS 1 1.15 1.15 1.10 9
INODIS 2 1.10 1.10 1.10 10
36.5 INODIS 1 1.15 1.15 1.10 11
INODIS 2 1.10 1.10 1.10 12
3.1
24 INODIS 1 1.15 1.15 1.10 13
INODIS 2 1.10 1.10 1.10 14
36.5 INODIS 1 1.15 1.15 1.10 15
INODIS 2 1.10 1.10 1.10 16
0.9
Frame 1
1.0
24 INODIS 1 1.30 1.20 1.15 17
INODIS 2 1.20 1.20 1.15 18
36.5 INODIS 1 1.30 1.25 1.20 19
INODIS 2 1.25 1.20 1.15 20
3.1
24 INODIS 1 1.40 1.30 1.20 21
INODIS 2 1.30 1.20 1.15 22
36.5 INODIS 1 1.40 1.30 1.20 23
INODIS 2 1.30 1.20 1.15 24
Frame 2
1.0
24 INODIS 1 1.10 1.05 1.03 25
INODIS 2 1.05 1.03 1.00 26
36.5 INODIS 1 1.10 1.05 1.03 27
INODIS 2 1.05 1.03 1.00 28
3.1
24 INODIS 1 1.15 1.10 1.05 29
INODIS 2 1.10 1.05 1.00 30
36.5 INODIS 1 1.15 1.10 1.05 31
INODIS 2 1.10 1.05 1.00 32
0.6
Frame 1
1.0
24 INODIS 1 1.35 1.20 1.15 33
INODIS 2 1.35 1.15 1.10 34
36.5 INODIS 1 1.40 1.20 1.15 35
INODIS 2 1.40 1.15 1.10 36
3.1
24 INODIS 1 1.35 1.20 1.15 37
INODIS 2 1.40 1.15 1.10 38
36.5 INODIS 1 1.40 1.20 1.15 39
INODIS 2 1.40 1.15 1.10 40
Frame 2
1.0
24 INODIS 1 1.15 1.10 1.05 41
INODIS 2 1.05 1.10 1.05 42
36.5 INODIS 1 1.15 1.10 1.05 43
INODIS 2 1.10 1.10 1.05 44
3.1
24 INODIS 1 1.15 1.10 1.05 45
INODIS 2 1.05 1.10 1.05 46
36.5 INODIS 1 1.15 1.10 1.05 47
INODIS 2 1.10 1.10 1.05 48

Chapter 8 Design concept and economic analysis
297
8.1.2 Out-of-plane verification
As the system INODIS decouples the in-plane movement of frame and infill, the
verification for out-of plane loading of the infill walls is carried out separately from the
verification for in-plane loading.
The experimental tests and numerical simulations under out-of-plane loading showed,
that the arching effect is reduced in comparison to traditional infilled frames due to the
soft circumferential elastomers. At a first glance, this appears to be a considerable
disadvantage compared to traditional infills, but it can be eliminated by taking a detailed
look at the interaction behaviour. The experimental and numerical investigations
clarified that it is quite questionable to count on the arching effect in case of sequential
or combined in- and out-of-plane loading for two reasons:
Firstly, at higher drifts gapping occurs and the contact between frame and infill is
limited to the compressed diagonally opposite corners. This does not allow the
generation of an arching effect under combined loading conditions and produces the
risks of out-of-plane movements.
Secondly, a damage of the joints between the frame and the infill takes place due to in-
plane loading and weakens the generation of the arching effect, which in turn can lead
to an undesired out-of-plane movements of the masonry infill.
Therefore, it can be concluded that relying on arching effect in infills walls is justified
only for pure out-of-plane loading and undamaged mortar joints between the frame and
infill. The uncontrollable interaction behaviour of traditional infill walls is corrected by
the system INODIS, which decouples the in-plane movements of frame and infill up to
a high drift level and provides stable and reliable boundary conditions for out-of-plane
loading by means of the circumferential plastic profile in combination with the U-
shaped elastomer. Even in case of higher in-plane drifts with gapping effects, out-of-
plane movements are prevented by the installed circumferential connection.
The proposed out-of-plane verification of the system INODIS is simple and covers all
situations of pure in-and out-of-plane loading, sequential loading and combined loading.
To be on the safe side for all types of loading sequences and conditions, a hinged
connection between the frame and the infill is assumed. This approach leads to
conservative results, but is reliable and applicable for any load combination. Keeping in

Marko M. Marinković Innovative system for seismic resistant masonry
infills in reinforced concrete frame structures
298
mind the devastating damages and collapses of infilled framed in past earthquakes it
seems reasonable to keep the design of the new system as simple as possible.
At the ultimate limit state (ULS), the design value of the moment applied Med, shall be
less than or equal to the design value of the moment of resistance of the wall MRd:
ed RdM M (8.1)
The design value of the moment applied can be calculated with respect to the support
boundary conditions using the bending moment coefficients according to Eurocode 6
(EN 1996-1-1, 2005). The calculation of the applied moment, Medi, may be taken as:
Plane of failure parallel to the bed joints, i.e. in the fxk1 direction:
21ed edW lM (8.2)
Plane of failure perpendicular to the bed joints, i.e. in the fxk2 direction:
22ed edW lM (8.3)
Herein l is the length of the wall between supports, Wed is the design lateral load per unit
area and α1 and α2 are the bending moment coefficients. The coefficients take account of
the degree of fixity at the edges of the walls (two-, three- or four sided support), the
height to length ratio of the walls and have to be determined with orthogonal ratio of the
design flexural strength of the masonry μ. The values of the bending coefficients α1 and
α2 may be obtained from Annex E of Eurocode 6 (EN 1996-1-1, 2005). Since the infill
wall with the INODIS system is considered to be simply supported on all 4 edges, the
wall support condition ―E‖ according to Appendix E of Eurocode 6 (EN 1996-1-1,
2005) should be applied. The design lateral load per unit area Wed can be calculated as
follows:
a
ed
FW
hl (8.4)
Where Fa represents the horizontal seismic force, acting at the centre of the wall,
calculated using the approach of Eurocode 8 (EN 1998-1, 2004) for non-structural
elements:
a a
a
a
W SF
q
(8.5)
Herein, Wa is the weight of the wall, qa is the behaviour factor of the wall applied in the
range between 1.5 and 2 and Sa is the seismic coefficient calculated as follows:

Chapter 8 Design concept and economic analysis
299
2
1
3 1
0.5
1 1
a
a
z
HSS
T
T
(8.6)
Where α is the ratio of the design ground acceleration on type A ground ag to the
acceleration of gravity g, S is the soil factor, z is the height from the foundation to the
centre of the mass of the element, H is the total height of the structure, Ta is the
fundamental period of vibration of the infill wall and T1 is the fundamental period of
vibration of the structure in the relevant direction. The fundamental period of vibration
of the infill wall must be calculated with respect to the support boundary conditions. In
case of a two-sided wall spaning in vertical direction, the period Ta can be calculated as
proposed by Morandi et al. (2013):
22 w
a
m wy
h mT
E I
(8.7)
where h is the infill height, mw is the mass of the infill per unit height, Em is the vertical
modulus of elasticity of masonry and Iwy the moment of inertia about the longitudinal
axis of the horizontal cross section of the panel. In case of three- and four-sided walls
the period Ta can be calculated using a finite element model or analytical solutions
(Leissa, 1969).
The out-of-plane capacity is calculated using the flexural strength of the wall. The de-
sign value of the lateral moment of resistance of a masonry infill MRd per unit height or
length is given by:
Rd xdZfM (8.8)
Herein, Z is the elastic section modulus of unit height or length of the wall and fxd is the
design flexural strength appropriate to the plane of bending, to be calculated from the
characteristic flexural strength fxk divided by the partial safety factor γm = 1.5. The
moment resistance must be calculated for the two planes of failures: In case of a plane
of failure parallel to the bed joints MRd is calculated with fxkl and in case of a plane of
failure perpendicular to the bed joints MRd is calculated with fxkl. The flexural strengths
fxk1 and fxk2, shall be determined from experimental tests on masonry or when the test
data are not available, the standard values from the Eurocode 6 (EN 1996-1-1, 2005)

Marko M. Marinković Innovative system for seismic resistant masonry
infills in reinforced concrete frame structures
300
can be taken. The resistances must be compared with the design values of moments Med1
and Med2.
The experimental test DIO (Section 5.5.4) and small specimen tests on the elastomeric
connections in Section 4.7.3 show a sufficient resistance of the U-shaped elastomers and
their connections to the frame through the plastic profile. For this reason further safety
verifications are not needed.
8.1.3 Combined in- and out-of-plane verification
The combined in- and out of plane loading acting on RC frames with infill walls can be
analysed by using the 30% rule according to Eurocode 8 (EN 1998-1, 2004). Following
this rule, the action effects due to the combination of the horizontal components of the
seismic action can be computed using the following combinations:
1.00 " "0.3Edx EdyE E (8.9)
0.3 " "1.0Edx EdyE E (8.10)
where ―+‖ implies ―to be combined with alternating signs‖, EEdx represents action
effects due to the seismic action in x-direction and EEdy in y-direction. The application
of this rule leads to the following load combinations.
Combination 1: 1.0∙IP ± 0.3∙OOP
The in-plane-drift is calculated by means of the two- or three dimensional linear
calculation models and compared to the permissible values given for DLS (Table 8.1)
and ULS (Table 8.2). The out-of-plane capacity can be verified using Equation 8.1,
which leads to an out-of-plane capacity of 10.7 kN/m2 (ag = 3g). The interaction of in-
plane and out-of-plane loading is rather low, since the infill wall was proofed in the DIO
test to withstand an out-of-plane loading of 5 kN/m2 (ag = 1.4g) combined with in-plane
drifts up to 1.8%.
Also for other wall ratios from the Table 8.1 and Table 8.2, the out-of-plane capacity is
sufficient even for the long wall (h/l = 0.6) and thickness of the wall being 24 cm. This
wall configuration can withstand 6.33 kN/m2 (ag = 1.8g) out-of-plane pressure, which
represents the smallest out-of-plane capacity from all 144 models. Since 30% of the full
out-of-plane pressure corresponds to 1.9 kN/m2, the interaction of in-plane and out-of-
plane loading is again negligble and the wall can fulfil the requirements of this load

Chapter 8 Design concept and economic analysis
301
combination by checking the in-plane capacity.
Combination 2: 0.3∙IP ± 1.0∙OOP
As in ―Combination 1‖, the in-plane-drift is calculated by means of the two- or three
dimensional linear calculation models and compared to the permissible values given for
DLS (Table 8.1) and ULS (Table 8.2), while out-of-plane capacity is verified using the
Equation 8.1. Since the ductile RC frames are usually designed for drifts up to 2%
(FEMA 356, 2000), in-plane drifts for this load combination are much lower than the
drifts for DLS given in Table 8.1 and ULS given in Table 8.2. Therefore, due to the
decoupling capability of the INODIS system, the infill wall will stay almost unactivated
in in-plane direction. This means that it is sufficient to carry out the out-of-plane
verification of the infill wall to satisfy the requirements of this load combination too.
8.2 Economic feasibility of the INODIS system
This section provides the information about the costs for the application of the INODIS
system. The costs of construction of the infill wall with the INODIS system have been
compared to the costs of realization of a traditional infill masonry wall. The economic
feasibility study is based on the experiences collected through the construction of the
masonry infill walls with reinforced concrete frames within the test campaign, literature
and web surveys as well as oral interviews with the most relevant material producers
from Germany. The consultations with the producers of the elastomers (BSW, 2018) led
to the decision to execute the cost calculation on the assumption of a series production
instead of a single-unit production of a masonry infill frame.
Furthermore it has been decided to perform the study for the experimentally tested DIO
specimen with the Regufoam® material, as it is used, but also for numerically
investigated systems INODIS 1 and INODIS 2. Since the design concept has been
developed for these two systems, calculation of costs for three thicknesses are estimated
in order to cover all the options from Table 8.1. This will provide sufficient information
for engineers in practice and for investors.
In the following tables, a simple comparison of the construction costs for the innovative
and traditional systems expressed in terms of € per square meter of wall area are
presented. The added-value of damage reduction if the innovative system is applied is

Marko M. Marinković Innovative system for seismic resistant masonry
infills in reinforced concrete frame structures
302
not considered. The evaluation of the costs has been carried out referring to an infill
masonry panel without openings, being 2.77 m long, 2.52 m high and 36.5 cm thick.
The regarded geometry corresponds to the dimensions of the infilled frame specimens
DIO tested in the experimental campaign. Additional 2 cm of plaster at each side of the
infill are considered, as it would be the case in practice.
The economic feasibility starts with the calculation of the costs for the traditional infill
wall. The costs are summarized in Table 8.4 and used to rate the costs of the INODIS
system. The increases of the construction costs for the INODIS system applied to the
regarded specimen DIO are summarized in Table 8.5. The resulting increase with
respect to the traditional solution is estimated to 53%. Table 8.6 to Table 8.11 present
the costs for application of the system INODIS 1 and INODIS 2. It can be seen that the
increase of costs for the system INODIS 1 compared to the traditional infill ranges
between 19 - 38% depending on the thickness of the decoupling element. This
percentage is even more reduced to 10-15%, for the case of the system INODIS 2. The
results clarify, that the usage of Regupol material used for the system INODIS 2 leads to
justifiable costs in comparison to the traditional system, especially if the substantial
damage reduction and lower amount for repair costs are considered. Furthermore the
risk of casualties and deaths are highly reduced. The simplest comparison would be the
case when during the earthquake traditional infill wall is damaged and infill wall with
the INODIS system stays intact. In that sense, the costs for traditional infill wall are
from 70-90% higher when compared to the INODIS 2 system. Keeping in mind the high
costs for repair or reconstruction after a seismic event, the choice of the two systems
with higher costs seems quite attractive for building owners. The costs are taken as the
values that are valid for production and installation costs in Germany. The costs to
install infill walls with or without the system INODIS needs to be calculated country-
specific as the prices for material and workmanship will differ. In doing so, it is possible
to get a realistic estimation of costs for different countries.

Chapter 8 Design concept and economic analysis
303
Table 8.4 Calculation of costs for the traditional infill wall
Working step Material Costs
[€]
Working hours
[h]
Personnel costs
[€]
Total costs
[€] [€/m2]
Bricking up 580 8 400 980 140
Internal plaster 195 28
External plaster 385 55
Total 1560 223
Table 8.5 Calculation of costs for the INODIS system applied to the DIO specimen
Working step Material Costs
[€]
Working hours
[h]
Personnel costs
[€]
Total costs
[€] [€/m2]
Hilti: Nails 20 1 50 70 10
Plastic profiles 40 0 0 40 6
Sliding surfaces 50 0.5 25 75 11
Placing
elastomers to the frame 614 0.5 25 639 92
Bricking up 580 8 400 980 140
Internal plaster 195 28
External plaster 385 55
Total 2384 341
Cost increase [%] 53
Table 8.6 Calculation of costs for the INODIS 1 system (15mm)
Working step Material Costs
[€]
Working hours
[h]
Personnel costs
[€]
Total costs
[€] [€/m2]
Hilti: Nails 20 1 50 70 10
Plastic profiles 20 0 0 20 3
Placing
elastomers to the frame 185 0.5 25 210 30
Bricking up 580 8 400 980 140
Internal plaster 195 28
External plaster 385 55
Total 1925 266
Cost increase [%] 19.3
Table 8.7 Calculation of costs for the INODIS 1 system (25mm)
Working step Material Costs
[€]
Working hours
[h]
Personnel costs
[€]
Total costs
[€] [€/m2]
Hilti: Nails 20 1 50 70 10
Plastic profiles 35 0 0 35 5
Placing
elastomers to the frame 300 0.5 25 325 47
Bricking up 580 8 400 980 140
Internal plaster 195 28
External plaster 385 55
Total 1990 285
Cost increase [%] 27.8

Marko M. Marinković Innovative system for seismic resistant masonry
infills in reinforced concrete frame structures
304
Table 8.8 Calculation of costs for the INODIS 1 system (35mm)
Working step Material Costs
[€]
Working hours
[h]
Personnel costs
[€]
Total costs
[€] [€/m2]
Hilti: Nails 20 1 50 70 10
Plastic profiles 45 0 0 45 6.5
Placing
elastomers to the frame 450 0.5 25 475 68
Bricking up 580 8 400 980 140
Internal plaster 195 28
External plaster 385 55
Total 2150 307.5
Cost increase [%] 37.9
Table 8.9 Calculation of costs for the INODIS 2 system (15mm)
Working step Material Costs
[€]
Working hours
[h]
Personnel costs
[€]
Total costs
[€] [€/m2]
Hilti: Nails 20 1 50 70 10
Plastic profiles 20 0 0 20 3
Placing
elastomers to the frame 37 0.5 25 62 9
Bricking up 580 8 400 980 140
Internal plaster 195 28
External plaster 385 55
Total 1712 245
Cost increase [%] 9.9
Table 8.10 Calculation of costs for the INODIS 2 system (25mm)
Working step Material Costs
[€]
Working hours
[h]
Personnel costs
[€]
Total costs
[€] [€/m2]
Hilti: Nails 20 1 50 70 10
Plastic profiles 35 0 0 35 5
Placing
elastomers to the frame 60 0.5 25 85 12
Bricking up 580 8 400 980 140
Internal plaster 195 28
External plaster 385 55
Total 1750 250
Cost increase [%] 12.1
Table 8.11 Calculation of costs for the INODIS 2 system (35mm)
Working step Material Costs
[€]
Working hours
[h]
Personnel costs
[€]
Total costs
[€] [€/m2]
Hilti: Nails 20 1 50 70 10
Plastic profiles 45 0 0 45 6.5
Placing
elastomers to the frame 90 0.5 25 115 16.5
Bricking up 580 8 400 980 140
Internal plaster 195 28
External plaster 385 55
Total 1790 256
Cost increase [%] 14.8

Chapter 8 Design concept and economic analysis
305
Although at the moment a rigorous economic analysis is out of the scope of this work, it
cannot be ignored that the innovative solution possesses costs of repairing after a
seismic event much lower (in some cases even negligible) in comparison with
traditional infill panels. It must be also taken into account that in new buildings the
construction of the infill wall represents only a small portion of the overall cost,
whereas in case of earthquake, the costs for reconstruction of the damaged non-
structural elements are significant, in particular considering the replace of all
installations and finishing.
In general, earthquake losses comprise costs for repairing the damage of structural and
non-structural components, loss of contents, rental and relocation costs, downtime,
business interruption, general income losses (especially for commercial buildings),
permits, injuries and human lives. Strong earthquakes that hit in recent years caused
huge negative economic impact due to the damage imposed to non-structural elements
and the indirect cost of disruption of use for repair or replacement (Miranda et al., 2012;
Baird et al., 2014). Some examples (FEMA E-74, 2011) show that total economic loss
due to the replacement and repair of non-structural walls can be higher than the
economic loss due to the damage of structural elements. In some cases this can amount
to up to 80–90% of the direct losses (Tiedeman, 1980). Taghavi and Miranda (2003)
divided the costs of non-structural components depending on the type of the building:
62% of total costs for offices, 70% for hotels, 48% for hospitals. These costs can even
exceed the replacement cost of a building (Villaverde, 1997). Furthermore, repair time
of non-structural components can be almost 1.5 times longer than structural repair
(Pencereci et al., 2018). Additionally, intangible losses due to the loss of culture, sense
of community and quality of life come more and more to the focus. Therefore, investors
must take the decision of additional seismic measures with respect to the investigations
and consequences. However, the decision should consider not only the increase of the
initial construction costs, but also the cost-benefit connected to the reduction of the
repair costs in case of seismic events. This goes in a line with the current trend in
evaluating investment practices in buildings to take into consideration the total life-
cycle costs rather than the initial construction costs. It can be expected that cost-benefit
analyses will gain more attention in near future, which will lead to more reasonable
decisions about seismic measures like the proposed system INODIS.

Marko M. Marinković Innovative system for seismic resistant masonry
infills in reinforced concrete frame structures
306
8.3 Summary
This Chapter presents the part of the thesis, which is of most importance to the
engineering practice. Based on the results of the experimental campaign and parametric
study presented in the previous chapters, the concept for the design of infill walls with
the INODIS system is derived. The approach is based on the design of the components
of the INODIS system, instead of the masonry infill wall. The design process is divided
in in-plane verification of the system and out-of-plane verification of the wall. First,
type and thickness of the U-shaped elastomer is chosen according to the geometrical
and mechanical characteristics of the infill wall and the drift is calculated using two or
three dimensional models. The calculation models can contain struts representing infills
in order to take them into account, or they can be represented by a bare frame structure.
The second case is justified if the stiffness of the infilled frame with the INODIS system
is only slightly higher than the stiffness of the bare frame. Otherwise, additional
stiffness contribution has to be taken into account by adding struts with an equivalent
stiffness.
When type and size of the U-shaped elastomers are chosen, the out-of-plane verification
of the infill wall can be carried out. This is done by using a simple analytical solution to
calculate out-of-plane resistance based on the flexural strength. The out-of-plane forces
can be calculated using the approach proposed in Eurocode 8 (EN 1998-1, 2004).
Additionally, an economic analysis of the INODIS system is presented. Higher up-front
costs in comparison to the traditional solution are insignificant, especially in the case of
the INODIS 2 system, which is made of Regupol material that is twice as cheap as
Regufoam and made from recycled rubbers, thus providing an eco-friendly solution.
Given that infill walls represent a small portion of costs in the construction of new
buildings and that the costs for reconstruction of the damaged infills during earthquakes
can sometimes be higher than the totel costs of investment, the application of the
INODIS systems provides a favourable solution for the investors. It minimizes damage
for both the building structure and its contents, thus reducing the risk of financial loss,
downtime, and casualties.

9 CONCLUSIONS AND FU-
TURE WORK
After climbing a great hill, one only finds that there are many more hills to climb.
Nelson Mendela

Marko M. Marinković Innovative system for seismic resistant masonry
infills in reinforced concrete frame structures
308
9.1 Conclusions
The research done within the scope of this thesis was motivated by the wish to improve
the devastating behaviour of RC frames with infill walls during earthquake excitation.
In particular, the thesis addressed the problem of damage to infills under in-plane, out-
of-plane and their sequential and simultaneous loading. The increased damage and
losses caused by the failure of infill during earthquakes were the main motivating
factors for the conducted research. Therefore, an effective solution for decoupling infill
walls from the surrounding frame was developed and experimentally investigated under
in-plane, out-of-plane and their sequential and simultaneous application. Afterwards, the
numerical model was developed and validated against experimental results. The
validated model was further used to study various configurations as a basis for the
development of the design concept.
Through the literature review, experimental works, numerical simulations, parametric
studies, analytical and feasibility studies and all investigations described in previous
chapters, the following conclusions can be summarized:
Awareness of damage caused by infills during earthquakes is on a considerable
level due to recent earthquakes that accelerate the research in this field. The
understanding of the seismic behaviour of infilled frames has been significantly
improved with respect to in-plane and out-of-plane loading. Numerous
experimental and numerical studies showed that the unfavourable effect of
traditional infills cannot be neglected in frame structures, but so far a complete
design concept is still not available. Some national codes incorporated infill
walls into the design, but mostly in a general manner, without precise formulas
and measures. Furthermore, in-plane and out-of-plane loading is always
considered separately, although recent studies show that their mutual interaction
and simultaneous application should be taken into account. Since the modelling
of traditional infills is quite complex, this is not an easy task. Therefore, many
studies aimed into the direction of developing the measures that should improve
the behaviour of infilled frames. So far, all the solutions fail to prove themselves
successful for simultaneous in- and out-of-plane loading and at the same time to
remain simple and practically applicable;

Chapter 9 Conclusions and future work
309
Experimental tests on system components indicated that rubber-based material
represents an adequate option for decoupling infills from a surrounding frame,
due to their high compressibility;
Furthermore, the viscoelastic behaviour of the elastomer presents a strong source
of energy dissipation during earthquakes;
Experiments also showed that glued connection between elastomers and
elastomer and brick are strong and reliable under different in-plane and out-of-
plane loading conditions;
An extremely high out-of-plane load capacity for a traditional infill was reached
for a three side supported wall. Sudden and brittle failure occurred at a high load
level due to sudden friction and brick failure at the top of the wall which
produced failure of the wall;
Specifically, the experimental results show that it is unlikely that out-of-plane
failure would occur for usual infill height-to-thickness aspect ratios of modern
high insulating masonry. If an out-of-plane failure is observed, then the
contribution from prior in-plane damage can be expected. This is confirmed by
means of the results of sequential loading protocols that produced a reduction of
the out-of-plane load capacity by a factor of 8 due to previous in-plane damage
of the circumferential mortar joint and the subsequent lack of arching effect;
The damage of the mortar joints between frame and infill and the eccentric
loading of the infill due to differing thicknesses of frame and infill produced an
countinious out-of-plane infill movement and a tilting of the wall. This confirms
that the weak spot of the traditional system is in the contact between RC frame
and infill wall. This connection is even more questionable in the case of hollow
bricks with a high percentage of voids;
Simultaneously applied in- and out-of-plane loading on traditional infill caused
the reduction of out-of-plane load capacity by a factor of 5 at rather low in-plane
drifts. The wall behaves in a very brittle manner and failure occurs due to the
movement of the infill out of the frame. This movement was triggered by the
damage to the connection joints and the destroyed boundary conditions caused
by smaller and eccentrically arranged contact areas;
The specimen CI with the system IMES with simple decoupling was a

Marko M. Marinković Innovative system for seismic resistant masonry
infills in reinforced concrete frame structures
310
successful solution for in-plane loading, by postponing the activation of the infill
and thus increasing DLS and ULS drift limits;
Although the IMES system proved to be successful for in-plane loading,
simultaneously applied in- and out-of-plane loads caused disastrous behaviour of
infill wall and brittle and fast failure was observed. The connecting bricks at the
contact to the columns split, causing a rigid body movement in out-of-plane
direction with high displacements at the top and bottom of the infill wall. The
results clarified that the IMES system with the steel anchor connection between
frame and infill does not present a suitable solution for simultaneously applied
in- and out-of-plane loading;
The U-shaped connection made of elastomers was proven as an adequate
measure for masonry infills under separate in-plane and out-of-plane loading, as
well as sequentially and simultaneously applied in- and out-of-plane loading.
The DIO test confirms this by reaching an interstorey drift of 3.25% for
sequential and combined loads, with infill damage but a still stable infill wall. It
is important to point out that infill/frame connections remained completely
undamaged;
The application of the U-shaped connection of the INODIS system led to a
delayed activation of the infill wall. The activation took place at higher drift
ratios, but even then the load contribution of the infill was low. This was
experimentally confirmed up to an interstorey drift of 3.25%;
The connection of the system INODIS showed a stable and continuous support
of the specimen through all phases of the DIO test. It remained active under
combined loading conditions and leads to sufficient out-of-plane support
conditions till the very end of the test;
Additional advantages of the system can be found in the prevention of stress
concentrations in the contact areas to the frame. This is achieved with the soft
elastomers placed circumferentially around the infill wall, thus avoiding
unfavourable interactions (e.g. short column effect, compression and shear
failure) between frame and masonry infill. Since the system INODIS solves the
problems with the unfavourable short column effects, it additionally reduces the
amount of reinforcement and work for its installation as requested for the critical

Chapter 9 Conclusions and future work
311
length in Eurocode 8 (EN 1998-1, 2004 - Section 5.9);
Additionally, viscoelastic behaviour of elastomers provides a high level of
additional energy dissipation, without any damages in the infill. And at the same
time enhancing damping capacity of the infilled frame and the overall building.
The system INODIS is especially beneficial in a case of thin layer joints in
masonry infills, since they produce less energy dissipation when compared to
the traditional 10 mm thick mortar joints. Furthermore, the modern construction
practice ejects the application of mortar in head joints, thus reducing energy
dissipation capacity further. The decreasing damping effect is avoided with the
application of the INODIS system, since the decoupling enables the activation of
damage in mortar joints. Therefore, the INODIS system supports the modern
and economic way of construction in the areas of high seismicity as well;
Decoupling with the INODIS system reduces the stiffness of the infills nearly to
the level of the bare frame. Thus providing just a slight decrease of the natural
frequency compared to the bare frame. Therefore, the induced seismic forces are
not increased as in a case of traditional infills. This makes the design and
calculation of the RC frame buildings with infill walls more simple, certain and
reliable;
When separately determining the out-of-plane capacity, current design concepts
assume intact boundary conditions and determine high load capacities due to the
activation of the arching effect. However, an implementation of these boundary
conditions in practice appears to be questionable. Furthermore, these boundary
conditions are not present in the event of combined loads and the in- and out-of-
plane failure modes are no longer separated. The development of a design
approach which includes the interaction of the load directions, the variable
boundary conditions in the contact area, the numerous further influencing factors
such as thickness of the infill, stiffness of the frame and infill, as well as the
characteristics of the used materials, is extremely complex. Therefore, a
reasonable alternative during the traditional erecting of infill walls with full-
contact to the frame is the implementation of decoupling systems to enhance the
seismic safety up to the required level;
The system INODIS also simplifies the design process for the RC frame since

Marko M. Marinković Innovative system for seismic resistant masonry
infills in reinforced concrete frame structures
312
interactions that cause damage do not need to be taken into account any more.
Therefore, in-plane and out-of-plane verification can be separately performed. In
the design process, the first step is the choice of the type and thickness of the
elastomers according to the in-plane drift demands. This enables the engineer to
control the drift level at which the infill will start to experience damages.
Secondly, the possible out-of-plane failure of the infill can be checked using the
simple expressions given in Section 8.1.2;
The system INODIS transforms the infill to a real non-structural component.
This simplifies and reduces the effort for the design of the reinforced concrete
frame;
Additionally, the shear forces seem to be distributed in a more uniform and
effective way inside the frame by using the INODIS system. In this way limit
states occur at higher displacements, thus the damage of the masonry infill
occurs after yielding of the frame;
The system INODIS is in line with the tendency of the codes that the seismic
reliability of the construction is ensured primarily by appropriate details and the
concept of construction, and less by complex numerical models and numerical
analysis;
The connection of the system INODIS ensures a safe and controllable failure
mechanism for the infill. Even at the high drift levels, the U-shape of the
elastomer keeps the infill wall together and disables a brittle failure;
The connections of the systems are relatively cheap and easily applicable;
The application of the proposed system INODIS may lead to a more efficient
design of building components and subsequent reduction in cost, time, energy,
solid waste and other resources associated with deconstruction, partial
reconstruction/replacement, or retrofit solutions that are costly and invasive.
This is in line with today‘s trends that the maintenance and sustainability of the
structures is of a primary concern;
The decoupling through the INODIS system helps in preventing the problems
associated with the asymmetric placement of masonry infills. Its application
disables stiffness concentration in one part of the building, thus preventing
eccentricities and soft story mechanism;

Chapter 9 Conclusions and future work
313
The results showed that the main reason for the numerous examples of seismic
damage to infill walls during earthquakes is attributed to the unstable boundary
conditions between frame and infill. However, a proper and precise execution of
these boundary conditions in practice using mortar appears to be more than
questionable. This problem is also solved with the application of the U-shaped
elastomer, which provides stable and reliable boundary condition;
The developed system is intended to be used both in new building construction
and in existing buildings to improve their seismic behaviour by replacing
traditional infills;
The effectiveness of the solution is presented here for hollow clay masonry
units, but the system INODIS is applicable to all types and sizes of bricks,
different masonry infill typologies and frame types (steel frames);
The transformation of the infills to real non-structural infill components allows a
flexible room use, which is very important during the life-cycle of a building.
The solution allows the change of the infill wall arrangement without additional
calculations and design. This is a common scenario in commercial buildings,
after a change of the occupants due to differing arrangement of walls;
The system INODIS 2, made of the material Regupol® that is couple of times
cheaper than Regufoam®, is a very attractive alternative material. It successfully
solves all the problems of the infilled frames and at the same time represents a
cheap and an eco-friendly solution;
Since the system INODIS 2 is made of Regupol®, whose main component is
recycled rubber, it does not have problems with the rubber ageing, thus the
characteristics stay unchanged during the life of construction;
The system INODIS enables a fast erection on site and allows the assembly to
be performed with a minimum of manpower, by enabling usual construction
steps in practice and site erection tolerances;
Additional benefit of this solution is that circumferential elastomer softens the
contact with the upper/lower beam/slab, thus allowing beam/slab deflection due
to shrinkage and creep or flexure during earthquakes without producing any
damage to the infills. This is even more pronounced in the case of beams/slabs
with high spans. The system INODIS is also capable to compensate small

Marko M. Marinković Innovative system for seismic resistant masonry
infills in reinforced concrete frame structures
314
relative movements caused by thermal changes and shrinkage of the masonry
associated with water loss of the units and mortar, moisture and freezing
expansion of brick, foundation movement and other differential movements.
9.2 Recommendations for future work
Two major contributions of this thesis are the confirmation of disastrous effects that
simultaneously applied in- and out-of-plane loading have on traditional infill walls and
the proposal of the solution that solves this issue. Therefore, this thesis opens a new
field for research from which many results useful for the practical application of the
developed decoupling approach can be developed.
Based on the conclusions drawn above, the following recommendations for future work
activities can be derived:
Since the INODIS system is already patented on the European level, it will be
further developed for market introduction. The next steps for the further
development of the system includes the optimization of the material selection
and construction process;
Parametric study must be extended in order to cover all reasonable values for the
parameters influencing the behaviour of the infills with the INODIS system,
such as strength of masonry units in order to cover all the Groups of units
defined in Eurocode 6 (EN 1996-1-1, 2005), frame cross section dimension,
stiffness and strength of mortar joints and h/l ratio of infill walls. The expected
results are design sheets, which can serve as a basis for the design in the
engineering practice;
Since openings are common in infill walls in practice, the effectiveness of the
system should be tested on infilled frames with the openings. This should be
done experimentally and numerically for in-plane and out-of plane loading and
all the relevant loading combinations;
Further work must be carried out to improve the understanding of the interaction
between in-plane and out-of-plane loading, to take into account the reduction of
the infill wall capacity;
Comprehensive economic analysis that takes into account all costs related to an
earthquake event and application of the developed system shall be carried out;

Chapter 9 Conclusions and future work
315
Furthermore, application and influence of the developed system on different
types of bricks (AAC, CS etc.) as well as on steel frames with infill walls should
be investigated;
Also, the application of the system can be expanded to double leaf and
prefabricated walls;
The system INODIS has the potential to reduce vibration effects. This can be
additionally investigated, as well as the examination of sound isolation and fire
protection;
Since the system INODIS has the potential to be used for partition/separation
walls, this should be further investigated;
Furthermore, the impact of the system INODIS on the development of a global
seismic response structure needs to be investigated. In this regard, a numerical
macro-model taking into account all the characteristics of the infills with the
INODIS system is currently under development;
Additional calculations using models on micro and macro level should be
carried out in order to derive design sheets for all infill situations;
The solution can be further developed to a product and incorporated BIM
modelling and automatically generated simulation models.

References
316
References
Abaqus (2013). User Manual. Version 6.13. Providence, RI, USA: DS SIMULIA Corp.
Abrams, D., and Biggs, D. (2012). Hybrid masonry seismic systems. In Proceedings of
the 15th International Brick and Block Masonry Conference.
Akhoundi, F., Vasconcelos, G., Lourenco, P., Silva, L. (2016). Out-of-plane response of
masonry infilled RC frames: Effect of workmanship and opening. 16th International
Brick and Block Masonry Conference, Pádua, Italy.
Akhoundi, F., Vasconcelos, G., Lourenço, P., Silva, L. M., Cunha, F., and Fangueiro, R.
(2018). In-plane behavior of cavity masonry infills and strengthening with textile re-
inforced mortar. Engineering Structures, 156, 145-160.
Al-Chaar, G. (1998). Non-Ductile Behaviour of Reinforced Concrete Frames with Ma-
sonry Infill Panels Subjected to In-Plane Loading. PhD thesis, University of Illinois
at Chicago, Chicago, USA.
Al-Chaar, G. (2002). Evaluating strength and stiffness of unreinforced masonry infill
structures (No. ERDC/CERL-TR-02-1). Engineer research and development center
champaign il construction engineering research lab.
Al-Chaar, G., Issa, M., and Sweeney, S. (2002). Behavior of masonry-infilled nonduc-
tile reinforced concrete frames. J.Struct.Eng., 128(8), 1055-1063.
Alfarah, B., López-Almansa, F., and Oller, S. (2017). New methodology for calculating
damage variables evolution in Plastic Damage Model for RC structures. Engineering
Structures, 132, 70-86.
Aliaari M. and Memari A. M. (2005). Analysis of Masonry Infilled Steel Frames with
Seismic Isolator Subframes. Engineering Structures, vol. 27, pp. 487-500.
Aliaari M. and Memari A. M. (2007). Experimental Evaluation of a Sacrificial Seismic
Fuse Device for Masonry Infill Walls. Journal of Architectural Engineering, vol. 13,
pp. 111-125.
Amato, G., Cavaleri, L., Fossetti, M., and Papia, M. (2008). Infilled frames: influence of
vertical loads on the equivalent diagonal strut model. Procedings of 14th WCEE,
Beijing, China. CD-ROM, Paper, 05-01.
Anderson, C. (1984). Arching action in transverse laterally loaded masonry wall panels.
Struct. Eng. 62(13).

References
317
Anderson, C., and Bright, N. J. (1976). Behaviour of non-loadbearing block walls under
wind loading. Concrete, 10(9), 27–30.
Andreaus U., Cerone M., D‘Asdia P. and Iannozzi F., (1985). A Finite Element Model
for the Analysis of Masonry Structures under Cyclic Actions. Proceedings of the
Seventh International Brick and Masonry Conference, Melbourne, Australia, Vol.1,
pp. 479-488.
Angel R., Abrams D., Shapiro D., Uzarski J. and Webster M. (1994). Behavior of Rein-
forced Concrete Frames with Masonry Infills. Cicil Engrg. Studies, Structural Re-
search Series No. 589, UILU-ENG-94-2005, Dept. of Civil Engineering, University
of Illinois at Urbana Champaign.
Anil, Ö., and Altin, S. (2007). An experimental study on reinforced concrete partially
infilled frames. Engineering Structures, 29(3), 449-460.
Asselin, R. E., Fahnestock, L. A., Abrams, D. P., Robertson, I. N., Ozaki-Train, R., and
Mitsuyuki, S. (2012). Behavior and design of fuse-based hybrid masonry seismic
structural systems. In Proceedings of the 15th World Conference on Earthquake En-
gineering, Lisbon, Portugal.
Asteris P.G., (2003). Lateral Stiffness of Brick Masonry Infilled Plane Frames. Journal
of Structural Engineering, Vol. 129(8), pp. 1071-1079.
Asteris P.G., Kakaletsis D.J., Chrysostomou C.Z. and Smyrou E. (2011). Failure modes
of infilled frames. Electronic Journal od Structural Engineering, 11(1):11-20.
Asteris, P. G. (2008). Finite element micro-modelling of infilled frames. Electronic
Journal of Structural Engineering, 8 1-11.
Asteris, P. G., Antoniou, S. T., Sophianopoulos, D. S., & Chrysostomou, C. Z. (2011).
Mathematical macromodelling of infilled frames: state of the art. Journal of Structur-
al Engineering, 137(12), 1508-1517.
Asteris, P. G., Cavaleri, L., Di Trapani, F., and Sarhosis, V. (2016). A macro-modelling
approach for the analysis of infilled frame structures considering the effects of open-
ings and vertical loads. Structure and Infrastructure Engineering, 12(5), 551-566.
Asteris, P. G., Cavaleri, L., Di Trapani, F., and Tsaris, A. K. (2017). Numerical model-
ling of out-of-plane response of infilled frames: State of the art and future challenges
for the equivalent strut macromodels. Engineering Structures, 132, 110-122.

Marko M. Marinković Innovative system for seismic resistant masonry
infills in reinforced concrete frame structures
318
Asteris, P. G., Cotsovos, D. M., Chrysostomou, C. Z., Mohebkhah, A. and Al-Chaar, G.
K. (2013). Mathematical micromodeling of infilled frames: state of the
art. Engineering Structures, 56, 1905-1921.
Asteris, P. G., Giannopoulos, I. P., and Chrysostomou, C. Z. (2012). Modeling of in-
filled frames with openings. The Open Construction and Building Technology Jour-
nal, 6(1), 81-91.
Asteris, P. G., Repapis, C. C., Tsaris, A. K., Di Trapani, F. and Cavaleri, L. (2015). Pa-
rameters affecting the fundamental period of infilled RC frame struc-
tures. Earthquakes and Structures, 9(5), 999-1028.
Bachmann, H. (2002). Seismic Conceptual Design of Buildings – Basic principles for
engineers, architects, building owners, and authorities.
Baird, A., Tasligedik, A. S., Palermo, A., and Pampanin, S. (2014). Seismic performance
of vertical nonstructural components in the 22 February 2011 Christchurch earth-
quake. Earthquake Spectra, 30(1), 401-425.
Barua, H. K., and Mallick, S. K. (1977). Behaviour of mortar infilled steel frames under
lateral load. Building and Environment, 12(4), 263-272.
Bazan, E., and Meli, R. (1980). Seismic analysis of structures with masonry walls.
In Proc., 7th World Conf. on Earthquake Engineering (Vol. 5, pp. 633-640). Tokyo:
International Association of Earthquake Engineering (IAEE).
Benjamin, J. R., and Williams, H. A. (1958). The Behavior of One Storey Brick Shear
Walls. J. Structure. Div., ASCE.
Bennett, R. M., Fischer, W. L., Flanagan, R. D., and Tenbus, M. A. (1996). Evaluation
and analysis of the performance of masonary infills during the Northridge earth-
quake (No. Y/EN--5493). Oak Ridge National Lab., TN (United States).
Benzeggagh, M. L., and Kenane, M. (1996). Measurement of mixed-mode delamination
fracture toughness of unidirectional glass/epoxy composites with mixed-mode bend-
ing apparatus. Composites science and technology, 56(4), 439-449.
Benzeggagh, M. L., and M. Kenane, Measurement of Mixed-Mode Delamination Frac-
ture Toughness of Unidirectional Glass/Epoxy Composites with Mixed-Mode Bend-
ing Apparatus. Composites Science and Technology, vol. 56, pp. 439–449, 1996.
Bergami, A.V. (2007). Implementation and experimental verification of models for non-
linear analysis of masonry infilled R. C. frames. Università degli Studi di Roma Tre.

References
319
Bertoldi, S. H. Decanini, L. D., and Gavarini, C. (1993). Telai tamponati soggetti ad
azione sismica, un modello semplificato: Confronto sperimentale e numerico (in Ital-
ian). Atti Del 6 Convegno Nazionale ANIDIS, pp. 815–824.
Biggs, D.T. (2007): Hybrid masonry structures. 10th North American Masonry Confer-
ence, St. Louis, Missouri, US.
Blackard, B., Willam, K., and Mettupalayam, S. (2009). Experimental observations of
masonry infilled reinforced concrete frames with openings. ACI Fall 2009 Conven-
tion, November 8, 2009 - November 12, American Concrete Institute, New Orleans,
LA, United states, 199-221.
Bolis, V., Stavridis, A., and Preti, M. (2016). Numerical Investigation of the In-Plane
Performance of Masonry-Infilled RC Frames with Sliding Subpanels. Journal of
Structural Engineering, 143(2), 04016168.
Braga, F., Manfredi, V., Masi, A., Salvatori, A. and Vona, M. (2011). Performance of
non-structural elements in RC buildings during the L‘Aquila, 2009 earth-
quake. Bulletin of Earthquake Engineering, 9(1), 307-324.
Brameshuber W., Graubohm M. and Saenger D. (2016), Prefabricated thin layers of
mortar for masonry. Proceedings of the 16th International Brick and Block Masonry
Conference, Padova, Italy, 26-30 June 2016.
Brokken S. T. and Bertero, V. V. (1981). Studies on effects of infills in seismic resistant
RC construction. University of California, Berkeley, UCB/EERC - 81/12, October.
BSW (2018). Vibration Technology Tech. Details - Regufoam® Vibration Isolation.
Buonopane S.G. and White R.N. (1999). Pseudodynamic Testing of Masonry Infilled
Reinforced Concrete Frame. Journal of Structural Engineering. Vol. 125(6) ,pp. 578-
589.
Calabria, A., Guidi, G., da Porto, F., and Modena, C. (2016). Innovative systems for
masonry infill walls based on the use of rubber joints: Finite element modelling and
comparison with in-plane tests.
Calio, I. and Panto, B. (2014). A macro-element modelling approach of Infilled Frame
Structures. vol. Computers and Structures, no. 143, pp. 91–107.
Calvi G. M. and Bolognini D. (2001). Seismic Response of Reinforced Concrete
Frames Infilled with Weakly Reinforced Masonry Panels. Journal of Earthquake En-
gineering, vol. 5, pp. 153-185.

Marko M. Marinković Innovative system for seismic resistant masonry
infills in reinforced concrete frame structures
320
Calvi, G. M., Bolognini, D., and Penna, A. (2004). Seismic performance of masonry-
infilled RC frames: benefits of slight reinforcements. Invited lecture to ―Sísmica
2004 - 6o Congresso Nacional de Sismologia e Engenharia Sísmica‖, 6, 14-16.
Carr, A. J. (2000). RUAUMOKO: Inelastic Dynamic Analysis, Department of Civil
Engineering, University of Canterbury, (http://www.ruaumoko.co.nz).
Cavaleri, L., and Di Trapani, F. (2014). Cyclic response of masonry infilled RC frames:
Experimental results and simplified modeling. Soil Dynamics and Earthquake Engi-
neering, 65, 224-242.
Cavaleri, L., Fossetti, M., and Papia, M. (2005). Infilled frames: developments in the
evaluation of cyclic behaviour under lateral loads. Structural Engineering and Me-
chanics, 21(4), 469-494.
CEB-FIP (2010). CEB-FIP Model Code 2010. Model code for concrete structures. In-
ternational Federation for Structural Concrete (fib).
Charleson, A. (2012). Seismic design for architects. Routledge.
Chiou, Y., Tzeng, J., and Liou, Y. (1999). Experimental and analytical study of masonry
infilled frames. Journal of Structural Engineering New York, N.Y., 125(10), 1109-
1117.
Chrysostomou C. Z., (1991). Effects of Degrading Infill Walls on the Nonlinear Seismic
Response of Two-Dimensional Steel Frames. Ph. D. Thesis, Cornell University, Itha-
ca.
Chrysostomou, C. Z., and Asteris, P. G. (2012). On the in-plane properties and capaci-
ties of infilled frames. Engineering structures, 41, 385-402.
Chrysostomou, C. Z., Gergely, P., and Abel, J. F. (2002). A six-strut model for nonlinear
dynamic analysis of steel infilled frames. International Journal of Structural Stability
and Dynamics, 2(03), 335-353.
Coburn, A. and Spence, R. (2003). Earthquake protection. John Wiley and Sons.
Colangelo, F. (2005). Pseudo-dynamic seismic response of reinforced concrete frames
infilled with non-structural brick masonry. Earthquake engineering and structural dy-
namics, 34(10), 1219-1241.
Combescure, D. and Pegon, P. (2000). Application of the local to global approach to the
study of infilled frame structures under seismic loading. Proc. of the 12th World
Conference on Earthquake Engineering, Auckland, New Zealand.

References
321
Comite Euro-International Du Beton-CEB, (1996). RC Frames under earthquake load-
ing - State of the art report, Thomas Telford, London.
CRED and UNISDR (2015) - https://www.unisdr.org/we/inform/publications/50589
Crisafulli, F. J., (1997). Seismic behaviour of reinforced concrete structures with mason-
ry infills. Department of Civil Engineering, University of Canterbury, Christchurch,
New Zealand.
Crisafulli, F.J. and Carr, A.J. (2007). Proposed macro-model for the analysis of infilled
frame structures. Bull NZ Soc Earthq Eng 40(2):69–77.
CSA S304.1-04. (2004). Design of masonry Structures S304.1-04. Canadian Standards
Association, 5060 Spectrum Way, Suite 100, Ontario, Canada.
Da Porto F., Guidi G., Dalla Benetta M. and Verlato N. (2013). Combined in-plane/out-
of-plane experimental behaviour of reinforced and strengthened infill masonry walls.
Proceedings of the 12th Canadian Masonry Symposium, Vancouver, British Colum-
bia.
Da Porto, F., Guidi, G., Verlato, N., and Modena, C. (2015). Effectiveness of plasters
and textile reinforced mortars for strengthening clay masonry infill walls subjected to
combined in-plane/out-of-plane actions/Wirksamkeit von Putz und textilbewehrtem
Mörtel bei der Verstärkung von Ausfachungswänden aus Ziegelmauerwerk, die
kombinierter Scheiben und Plattenbeanspruchung ausgesetzt sind. Mauerwerk, 19(5),
334-354.
Dafnis, A., Kolsch, H., and Reimerdes, H. (2002). Arching in masonry walls subjected
to earthquake motions. Journal of Structural Engineering, ASCE, 128(2): 153-159.
Dawe J. L. and Seah C. K. (1989b). Out-of-plane resistance of concrete masonry infilled
panels. Journal of the Canadian Society of Civil Engineering, Vol. 16, pp. 854-864.
Dawe J.L. and Young T.C. (1985). An investigation of factors influencing the behaviour
of masonry infill in steel frames subjected to in-plane shear. Proceedings of the 7th
International. Brick Masonry Conference, Melbourne, Australia.
Dawe, J. L., and Charalambous, P. D., (1983). Finite Element Analysis for Wall-Frame
Interaction. Proceedings, Eight International Loadbearing Brickwork Symposium,
British Ceramic Society, Stoke-on-Trent. UK.
Dawe, J. L., and Seah, C. K. (1989a). Behaviour of masonry infilled steel frames. Cana-
dian Journal of Civil Engineering, 16(6), 865-876.

Marko M. Marinković Innovative system for seismic resistant masonry
infills in reinforced concrete frame structures
322
Dazio, A., Beyer, K., Braune, F., Fritsche, S. and Mittaz, X. (2009). Das Mw= 6.3
Erdbeben von L‘Aquila am 6. April 2009. Report of SGEB-Erkundungsmissionvom,
15-18.
Decanini, L.D. and Fantin, G.E. (1987). Modelos simplificados de la mampostería in-
cluida en porticos. Características de rigidez y resistencia lateral en astado límite. In:
Jornadas Argentinas de Ingenierìa Estructural; 1987. p. 81736 [in Spanish].
Decanini, L.D., De Sortis, A., Goretti, A., Liberatore, L., Mollaioli, F. and Bazzurro, P.
(2004). Performance of Reinforced Concrete Buildings During the 2002 Molise, Ita-
ly, Earthquake. Earthq. Spectra 20: S221–S255.
Decanini, L.D., De Sortis, A., Liberatore, L. and Mollaioli, F. (2005). Estimation of
near-source ground motion and seismic behaviour of RC framed structures damaged
by the 1999 Athens earthquake. J. Earthq. Eng., 9(5), 609-635.
Decanini, L.D., Liberatore, L. and Mollaioli, F. (2012). Damage potential of the 2009
L‟Aquila, Italy, earthquake. J. Earthq. Tsunami, 6, 1-32.
Dhanasekar, M., and Page, A. W. (1986). The influence of brick masonry infill proper-
ties on the behavior of infilled frames. Proceedings of the Institute of Civil Engi-
neers, Part 2, 81, Dec., pp. 593-605.
Di Trapani, F. (2014). Masonry infilled RC frames: Experimental results and develop-
ment of predictive techniques for the assessment of seismic response (Doctoral dis-
sertation).
Di Trapani, F., Shing, P. B., and Cavaleri, L. (2017). Macroelement Model for In-Plane
and Out-of-Plane Responses of Masonry Infills in Frame Structures. Journal of
Structural Engineering, 144(2), 04017198.
DIN 1048-5:1991-06: ―Testing methods for concrete; hardened concrete, specially pre-
pared specimens‖, DIN Deutsches Institut für Normung e. V., Berlin, Germany.
DIN 53513:1990-03: ―Testing of rubber; determination of the visco-elastic properties of
rubber under forced vibration beyond resonance‖, DIN Deutsches Institut für
Normung e. V., Berlin, Germany.
DIN EN 1015-11:2007-05: ―Methods of test for mortar for masonry – Part 11: Determi-
nation of flexural and compressive strength of hardened mortar‖, DIN Deutsches In-
stitut für Normung e. V., Berlin, Germany.

References
323
DIN EN 1015-3:2007-05: ―Methods of test for mortar for masonry – Part 3: Determina-
tion of consistence of fresh mortar (by flow table)‖, DIN Deutsches Institut für
Normung e. V., Berlin, Germany.
DIN EN 1015-7:1998-12: ―Methods of test for mortar for masonry – Part 7: Determina-
tion of air content of fresh mortar‖, DIN Deutsches Institut für Normung e. V., Ber-
lin, Germany.
DIN EN 1052-1:1998-12: ―Methods of test for masonry – Part 1: Determination of
compressive strength‖, DIN Deutsches Institut für Normung e. V., Berlin, Germany.
DIN EN 1052-2:1999-10: ―Methods of test for masonry – Part 2: Determination of flex-
ural strength‖, DIN Deutsches Institut für Normung e. V., Berlin, Germany.
DIN EN 1052-5:2005-06: ―Methods of test for masonry – Part 5: Determination of bond
strength by the bond wrench method‖, DIN Deutsches Institut für Normung e. V.,
Berlin, Germany.
DIN EN 12390-3:2009-07: ―Testing hardened concrete – Part 3: Compressive strength
of test specimens‖, DIN Deutsches Institut für Normung e. V., Berlin, Germany.
DIN EN 12390-6:2010-09: ―Testing hardened concrete – Part 6: Tensile splitting
strength of test specimens‖, DIN Deutsches Institut für Normung e. V., Berlin, Ger-
many.
DIN EN 1992-1-1: Eurocode 2: Bemessung und Konstruktion von Stahlbeton- und
Spannbetontragwerken – Teil 1-1: Allgemeine Bemessungsregeln und Regeln für den
Hochbau, 2011.
DIN EN 1998-1: Eurocode 8: Auslegung von Bauwerken gegen Erdbeben – Teil 1:
Grundlagen, Erdbebeneinwirkungen und Regeln für Hochbauten, 2010.
DIN EN 772-1:2016-05: ―Methods of test for masonry units – Part 1: Determination of
compressive strength‖, DIN Deutsches Institut für Normung e. V., Berlin, Germany.
DIN EN 772-13:2000-09: ―Methods of test for masonry units – Part 13: Determination
of net and gross dry density of masonry units (except for natural stone)‖, DIN
Deutsches Institut für Normung e. V., Berlin, Germany.
DIN EN 772-16:2011-07: ―Methods of test for masonry units – Part 16: Determination
of dimensions‖, DIN Deutsches Institut für Normung e. V., Berlin, Germany.

Marko M. Marinković Innovative system for seismic resistant masonry
infills in reinforced concrete frame structures
324
DIN EN 772-20:2005-05: ―Methods of test for masonry units – Part 20: Determination
of flatness of faces of masonry units‖, DIN Deutsches Institut für Normung e. V.,
Berlin, Germany.
DIN EN 772-3:1998-10: ―Methods of test for masonry units – Part 3: Determination of
net volume and percentage of voids of clay masonry units by hydrostatic weighing‖,
DIN Deutsches Institut für Normung e. V., Berlin, Germany.
DIN EN 826:2013-05: ―Thermal insulating products for building applications – Deter-
mination of compression behaviour‖, DIN Deutsches Institut für Normung e. V., Ber-
lin, Germany.
DIN EN ISO 15630-1:2011-02: ―Steel for the reinforcement and prestressing of con-
crete – Test methods – Part 1: Reinforcing bars, wire rod and wire‖, DIN Deutsches
Institut für Normung e. V., Berlin, Germany.
Dolšek, M. and Fajfar, P. (2008). The effect of masonry infills on the seismic response
of a four-storey reinforced concrete frame - a deterministic assessment. Eng
Struct;30(7):1991–2001.
Dona M., Tecchio G., Domenicale L., Saler E., Minotto M. and Da Porto F. (2017). Di-
rectional effects on combined in-plane and out of plane seismic bhavior of masonry
infills. Proceedings of the 6th International Conference on Computational Methods in
Structural Dynamics and Earthquake Engineering, Rhodes Island, Greece, 15-17
June 2017.
Drysdale R.G., Hamid A.A., and Baker L.R. (1999). Masonry structures: behaviour and
design. The Masonry Society.
Drysdale, R. G., and Essawy, A. S. (1988). Out-of-plane bending of concrete block
walls. Journal of Structural Engineering, 114(1), 121-133.
Drysdale, R. G., and Hamid, A. A. (2005). Masonry Structures Behaviour and Design.
Canada Masonry Design Center, Mississauga, Ontario, Canada, 531-562.
Drysdale, R.G., Hamid, A.A., and Baker, L.R., 1994, Masonry Structures, Behavior and
Design, Prentice Hall Inc., Englewood Cliffs, 784 p.
Durrani, A.J., and Y.H. Luo. (1994). Seismic Retrofit of Flat-Slab Buildings With Ma-
sonry Infills. Proceedings from the NCEER Workshop on Seismic Response of Ma-
sonry Walls, Technical Report NCEER-94-0004 (National Center for Earthquake En-
gineering Research, 1 March 1994), pp 1-3 - 1-8.

References
325
El-Dakhakhni, W. W. (2002). Experimental and analytical seismic evaluation of con-
crete masonry-infilled steel frames retrofitted using GFRP laminates. PhD thesis,
Drexel University, United States – Pennsylvania.
El-Dakhakhni, W. W., Elgaaly, M., and Hamid, A. A. (2003). Three-strut model for con-
crete masonry-infilled steel frames. J.Struct.Eng.-ASCE, 129(2), 177-185.
El-Dakhakhni W.W., Hamid A.A. and Elgaaly M. (2004). Strength and stiffness predic-
tion of masonry infill panels. presented at the 13th World Conference on Earthquake
Engineering, Vancouver, B.C., Canada, 2004, vol. 3089.
EN 1992-1-1(2004). Eurocode 2: Design of concrete structures - Part 1-1: General rules
and rules for buildings. CEN, Brussels, Belgium.
EN 1996-1-1 (2005). Eurocode 6: Design of masonry structures. Part 1-1: General rules
for reinforced and unreinforced masonry structures (EN 1996-1). CEN, Brussels,
Belgium.
EN 1998-1 (2004). Eurocode 8: Design of structures for earthquake resistance. Part 1:
General rules, seismic actions and rules for buildings (EN 1998-1). CEN, Brussels,
Belgium.
Esteva, L. (1966). Behavior under alternating loads of masonry diaphragms framed by
reinforced concrete members. In Proc. International Symposium on the Effects of
Repeated Loading of Materials and Structures. RILEM, México City.
Fardis MN, editor (1996). Experimental and numerical investigations on the seismic
response of RC infilled frames and recommendations for code provisions.
ECOEST/PREC 8, Rep. No. 6. LNEC. Lisbon.
Fardis, M. N. and Panagiotakos, T. B. (1997). Seismic design and response of bare and
masonry-infilled reinforced concrete buildings part II: infilled structures. Journal of
Earthquake Engineering, 1(03), 475-503.
Fardis, M.N. and Calvi, M.C. (1994). Effects of infills on the global response o rein-
forced concrete frames,‖ Proceedings of the 10th European Conference on Earth-
quake Engineering, A.A. Balkema, Rotterdam, Vol. 4, pp. 2893-2898.
Fardis, M.N., Bousias, S.N., Franchioni, G. and Panagiotakos, T.B. (1999). Seismic re-
sponse and design of RC structures with plan-eccentric masonry infills. Earthquake
Eng. Struct. Dyn., 28(2), 173-191.

Marko M. Marinković Innovative system for seismic resistant masonry
infills in reinforced concrete frame structures
326
FEMA 154 (2002). Rapid visual screening of buildings for potential seismic hazards: A
handbook. Government Printing Office.
FEMA 273 (1997). NEHRP Guidelines for the seismic rehabilitation of buildings., pre-
pared by the Applied Technology Council (ATC-33 project) for the Building Seismic
Safety Council. Washington (DC): Federal Emergency Management Agency.
FEMA 274 (1997). NEHRP Commentary on the Guidelines for the Seismic Rehabilita-
tion of Buildings, prepared by the Applied Technology Council for the Building
Seismic Safety Council, published by the Federal Emergency Management Agency,
Washington, DC.
FEMA 306 (1998). Evaluation of Earthquake damaged concrete and masonry wall
buildings. Applied Technology Council (ATC-43 project), 555 Twin Dolphin Drive,
suite 550, Redwood city, California, USA.
FEMA 310. (1998). Handbook for the seismic evaluation of buildings—A prestandard.
Washington, DC: American Society of Civil Engineers.
FEMA 356. (2000). Prestandard and Commentary for the Seismic Rehabilitation of
Buildings. Federal Emergency Management Agency, Washington, D.C., U.S.A.
FEMA, E-74 (2011). Reducing the Risks of Nonstructural Earthquake Damage: A Prac-
tical Guide.
Fiorato, A.E, Sozen, M.A., and Gamble, W.L. (1970). An Investigation of the Interac-
tion of Reinforced Concrete Frames with Masonry Filler Walls. Report No. UILU-
ENG 70- 100, University of Illinois, Urbana-Champaign, IL.
Flanagan, R. D. (1994). Behavior of structural clay tile infilled frames. Ph.D. Disserta-
tion, The University of Tennessee, Knoxville, TN.
Flanagan, R. D., and Bennett, R. M. (1999a). In-plane behavior of structural clay tile
infilled frames. Journal of Structural Engineering New York, N.Y., 125(6), 590-599.
Flanagan, R. D., and Bennett, R. M. (1999b). Bidirectional behavior of structural clay
tile infilled frames. Journal of structural engineering, 125(3), 236-244.
Flanagan, R. D., and Bennett, R. M. (1999c). Arching of masonry infilled frames: Com-
parison of analytical methods. Practice Periodical on Structural Design and Construc-
tion, 4(3), 105-110.
Flanagan, R. D., and Bennett, R. M. (2001). In-plane analysis of masonry infill materi-
als. Pract.Periodical Struct.Des.Constr., 6(4), 176-182.

References
327
Fricke, K. E., Jones, W. D., and Huff, T. E. (1992). In situ lateral load testing of an unre-
inforced masonry hollow clay tile wall. Proc., 6th Can. Masonry Symp., University
of Saskatchewan, Saskatoon, Saskatchewan, 519–530.
Furtado A., Rodrigues H. and Arede A. (2015a). Modelling of masonry infill walls par-
ticipation in the seismic behaviour of RC buildings using OpenSees. Int. J. Adv.
Struct. Eng. IJASE, vol. 7, no. 2, pp. 117–127.
Furtado A., Rodrigues H., Arêde A. (2014). Numerical Modelling of Masonry Infill
Walls Participation in the Seismic Behavior of RC Buildings, presented at the Open-
Sees Days Portugal 2014 - OPD2014, Portugal.
Furtado A., Rodrigues H., Arede A. and Varum H. (2015b). Influence of the in Plane and
Out-of-Plane Masonry Infill Walls‘ Interaction in the Structural Response of RC
Buildings. Procedia Eng., vol. 114, pp. 722–729.
Furtado, A., Rodrigues, H., Arêde, A., and Varum, H. (2015c). Experimental Characteri-
zation of the In-plane and Out-of-Plane Behaviour of Infill Masonry Walls. Procedia
Engineering, 114, 862-869.
Furtado, A., Rodrigues, H., Arêde, A., and Varum, H. (2016). Experimental evaluation
of out-of-plane capacity of masonry infill walls. Engineering Structures, 111, 48-63.
Gabrielsen, B., and Wilton C. (1974). Shock tunnel tests of arched wall panels. Report
No 7030-19 URS Research Company, San Mateo, Ca.
Gabrielsen, B., Wilton C., and Kaplan K. (1975). Response of arching walls and debris
from interior walls caused by blast loading. Report No 7030-23, URS Research
Company, San Mateo, Ca.
Greek Aseismic Code. EAK (2000). Earthquake Planning and Protection Organisation
(EPPO), 257pp. (in Greek).
Griffith, M. (2008). Seismic retrofit of RC frame buildings with masonry infill walls:
literature review and preliminary case study. JRC Scientific and Technical Reports.
Guevara, T. and Garcia, L. (2005). The captive- and short-column effects. Earthquake
Spectra, 21:1, 141–160.
Haider, S. (1995). In-plane cyclic response of reinforced concrete frames with unrein-
forced masonry infills (Doctoral dissertation, Rice University).

Marko M. Marinković Innovative system for seismic resistant masonry
infills in reinforced concrete frame structures
328
Hak, S., Morandi, P., and Magenes, G. (2014). Out-of-plane experimental response of
strong masonry infills. In 2nd European Conference on Earthquake Engineering and
Seismology.
Hak, S., Morandi, P., and Magenes, G. (2017). Prediction of inter-storey drifts for regu-
lar RC structures with masonry infills based on bare frame modelling. Bulletin of
Earthquake Engineering, 1-29.
Hak, S., Morandi, P., Magenes, G. and Sullivan, T. J. (2012). Damage control for clay
masonry infills in the design of RC frame structures. Journal of Earthquake Engi-
neering, 16(sup1), 1-35.
Haldar, P., Singh, Y. and Paul, D. K. (2013). Identification of seismic failure modes of
URM infilled RC frame buildings. Engineering Failure Analysis, 33, 97-118.
Hanoun, M. H. A., Abrahamczyk, L., and Schwarz, J. (2017). Numerical simulation of
RC frame structures with infill walls under consideration of out-of-plane behavior.
Proceedings of the 16th World Conference on Earthquake, Santiago Chile, Chile, 09-
13 January 2017.
Haseltine, B. A., West, H. W. H. and Tutt, J. N. (1977). Design of walls to resist lateral
loads. Struct Eng;55(10):422–30.
Haseltine, B.A. (1976) Design of laterally loaded wall panels. Proceedings of the British
Ceramic Society, vol. 5(24). UK: Load Bearing Brickwork. Stoke-on-Trent; p. 115–
26.
Hashemi A. and Mosalam K.M. (2007). Seismic evaluation of reinforced concrete
buildings including effects of masonry infill walls, Pacific Earthquake Engineering
Research Center, University of California, Berkeley, PEER, Report 2007/100.
Hashemi, A., and Mosalam, K. M. (2006). Shake-table experiment on reinforced con-
crete structure containing masonry infill wall. Earthquake engineering and structural
dynamics, 35(14), 1827-1852.
Hendry AW, Kheir AMA. (1976) The lateral strength of certain brickwork panels. In:
Proceedings of the fourth international brick masonry conference, Brugge, Belgium.
Hendry AW. (1973). The lateral strength of unreinforced brickwork. Struct
Eng;51(2):43–50.
Hendry, A. (1981). Structural Brickwork. Macmillan, London.

References
329
Hendry, A. W., and Liauw, T. C. (1994). Tests on steel frames with reinforced masonry
infilling. In Proc. Br. Masonry Soc (Vol. 6, pp. 108-14).
Hermanns L., Fraile A., Alarcón E. and Álvarez R. (2012). Performance of masonry
buildings during the 2011 Lorca earthquake. Proceedings of the 15th World Confer-
ence on Earthquake Engineering, Lisbon, Portugal.
Hill, J. A. (1994). Out-of-plane response of unreinforced masonry infill frame panels.
In Technical Report (pp. 33-8). National Center for Earthquake Engineering Re-
search.
Holmes, M. (1961). Steel frames with brickwork and concrete infilling. Proceedings of
the Institution of Civil Engineers, 19(4), pp.473–478.
Holmes, M. (1963). Combined loading on infilled frames. Proceedings of the Institution
of Civil Engineers, 25(1), pp.31–38.
Hordijk, D.A. 1992. Tensile and tensile fatigue behavior of concrete; experiments, mod-
eling and analyses. In, Heron 37(1): 3-79.
Imai, H., and Miyamoto, M. (1989). Seismic Behavior of Reinforced Masonry Walls
with Small Opening. Proceedings of 5 Jornadas Chilenas de Sismología e Ingeniería
Antisísmica, 2, 965-973.
INSYSME (2016). Innovative systems for earthquake resistant masonry in reinforced
concrete buildings, http://www.insysme.eu.
INSYSME (2017a). Internal report. D5.1. Technical report on the experimental results
of materials and small masonry specimens.
INSYSME (2017b). Internal report. D5.3. Technical report with the experimental results
on masonry enclosures.
IZF (2018). Institut für Ziegelforschung Essen e.V.. Essen. Germany.
Jankowiak, T., and Lodygowski, T. (2005). Identification of parameters of concrete
damage plasticity constitutive model. Foundations of civil and environmental engi-
neering, 6(1), 53-69.
Jiang, H., Liu, X., and Mao, J. (2015). Full-scale experimental study on masonry in-
filled RC moment-resisting frames under cyclic loads. Engineering Structures, 91,
70-84.
Jurina L., (1971). Pareti in muratura soggette ad aioni sismiche. Rivista Costruire, n°
100.

Marko M. Marinković Innovative system for seismic resistant masonry
infills in reinforced concrete frame structures
330
Kadir, M. R. A., (1974). The Structural Behavior of Masonry Infilled Panels in Framed
Structures. Ph.D. Thesis, Department of Civil Engineering, University of Edinburgh.
Kadysiewski, S. and Mosalam, K. M. (2009). Modeling of unreinforced masonry infill
walls considering in-plane and out-of-plane interaction. Research, PEER 2008/102,
University of California.
Kakaletsis, D. J., and Karayannis, C. G. (2009). Experimental investigation of infilled
reinforced concrete frames with openings. ACI Struct.J., 106(2), 132-141.
Kappos, A. J. and Ellul, F. (2000). Seismic design and performance assessment of ma-
sonry infilled RC frames. In Proceedings of the 12th world conference on earthquake
engineering, paper (No. 989).
Kappos, A. J., Stylianidis, K. C., and Michailidis, C. N. (1998). Analytical models for
brick masonry infilled R/C frames under lateral loading. Journal of Earthquake Engi-
neering, 2(01), 59-87.
Kent, D. C., and Park, R. (1971). Flexural members with confined concrete. J. Struct
Eng., 97(ST7), 1969–1990.
Klingner R. and Bertero, V. (1978). Earthquake resistance of infilled frames. J Struct
Div 104:973–989.
Klingner, R.E. and Bertero,V.V. (1976). Infilled frames in earthquake resistant construc-
tion. Report No. EERC 76-32, University of California, Berkely.
Komaraneni, S., Rai, D. C., and Singhal, V. (2011). Seismic behavior of framed mason-
ry panels with prior damage when subjected to out-of-plane loading. Earthquake
spectra, 27(4), 1077-1103.
Korkmaz, S. Z., Kamanli, M., Korkmaz, H. H., Donduren, M. S., and Cogurcu, M. T.
(2010). Experimental study on the behaviour of nonductile infilled RC frames
strengthened with external mesh reinforcement and plaster composite. Natural Haz-
ards and Earth System Sciences, 10(11), 2305.
Kose M. M. (2009). Parameters Affecting the Fundamental Period of RC Buildings with
Infill Walls. Engineering Structures, vol. 31, pp. 93-102.
Koutromanos, I., Stavridis, A., Shing, P. B., and Willam, K. (2011). Numerical model-
ling of masonry-infilled RC frames subjected to seismic loads. Elsevier Ltd, Lang-
ford Lane, Kidlington, Oxford, OX5 1GB, United Kingdom, 1026-1037.

References
331
Koutromanos, I., Stavridis, A., Shing, P. B., and Willam, K. (2011). Numerical modeling
of masonry-infilled RC frames subjected to seismic loads. Computers and Struc-
tures, 89(11-12), 1026-1037.
Kuang, J. S. and Yuen, Y. P. (2010). Effect of out-of-plane loading on in-plane behav-
iour of unreinforced infilled RC frames. In Proceedings of 13th International Confer-
ence on Computing in Civil and Building Engineering, Nottingham, UK (pp. 513-
514).
Kuang, J. S., and Wang, Z. (2014). Cyclic load tests of rc frame with column-isolated
masonry infills. In Second European Conference On Earthquake Engineering And
Seismology, Istanbul AUG (pp. 25-29).
Kubalski, T., Butenweg, C., Marinković, M. & Klinkel, S. (2017). Investigation of the
seismic behaviour of infill masonry using numerical modelling approaches. 16th
World Conference on Earthquake Engineering. Santiago, Chile.
Kupfer, H., Hilsdorf, H. K., and Rusch, H. (1969). Behavior of concrete under biaxial
stresses. In Journal Proceedings (Vol. 66, No. 8, pp. 656-666).
Kyriakides, M. (2011). Seismic retrofit of unreinforced masonry infills in non-ductile
reinforced concrete frames using engineered cementitious composites (Doctoral dis-
sertation, Stanford University).
Langenbach, R. (1992). Earthquakes: A new look at cracked masonry. Civil Engineer-
ing, 62(11), 56.
Lawrence, S. J. (1979). Lateral loading of masonry infill panels: A literature review.
Tech. Rec. 454, Experimental Building Station, Sydney, Australia.
Lee, H. S., and Woo, S. W. (2002). Effect of masonry infills on seismic performance of
a 3-storey R/C frame with non-seismic detailing. Earthquake engineering and struc-
tural dynamics, 31(2), 353-378.
Lee, J., and Fenves, G. L. (1998). Plastic-damage model for cyclic loading of concrete
structures. Journal of engineering mechanics, 124(8), 892-900.
Leissa, A. W. (1969). Vibration of plates. Ohio State Univ Columbus.
Leuchars J. M. and Scrivener J. C. (1976). Masonry Infill Panels Subjected to Cyclic In-
Plane Loading. Bulletin of the New Zealand National Society for Earthquake Engi-
neering, Vol. 9, No. 2, pp. 122-131.

Marko M. Marinković Innovative system for seismic resistant masonry
infills in reinforced concrete frame structures
332
Liauw T. C. and Kwan K. H., (1984). New development in research of infilled frames.
8WCEE in San Francisco, 4, 623-630.
Liauw T. C. and Kwan K. H., (1984b). Nonlinear behaviour of non-integral infilled
frames. Computers and structures, 18(3), 551-560.
Liauw, T. C. (1972). An approximate method of analysis for infilled frames with and
without opening. Build. Sci., 7 233-238.
Liauw, T. C. and Kwan, K. H. (1985a). Unified Plastic Analysis for Infilled frames.
Journal of Structural Engineering, ASCE, 1985 Vol 111, No.7.
Liauw, T. C., and Kwan, K. H. (1985b). Static and cyclic behaviours of multistorey in-
filled frames with different interface conditions. Journal of Sound and Vibra-
tion, 99(2), 275-283.
Liauw, T. C., and Kwan, K. H., (1983). Plastic Theory of Non-Integral Infilled Frames.
Proceedings of the Institution of Civil Engineers, Part 2, Vol. 75, pp. 379-396.
Liberatore, L., and Mollaioli, F. (2015). Influence of masonry infill modelling on the
seismic response of reinforced concrete frames. Civil-Comp Proceedings, 108.
Liberatore, L., Decanini, L. and Liberatore, D. (2004), ―Seismic lateral deformation and
energy demands in bare and infilled RC frames‖, Proceedings of the 13th World
Conference on earthquake Engineering, 13th WCEE, paper 7007. Vancouver, Cana-
da.
Longo F., Wiebe L., da Porto F. and Modena C. (2016). Seismic response history analy-
sis including out-of-plane collapse of unreinforced masonry infill walls in RC frame
structures, Proceedings of the 16th International Brick and Block Masonry Confer-
ence, Padova, Italy, 26-30 June 2016.
Lotfi, H. R., and Shing, P. B. (1994). Interface model applied to fracture of masonry
structures. Journal of Structural Engineering New York, N.Y., 120(1), 63-80.
Lotfi, H., and Shing, P. (1991). An appraisal of smeared crack models for masonry shear
wall analysis. Comp. Struct., 41(3), 413-425.
Lourenço P.B., (1996). Computational Strategies for masonry Structures. Dissertation,
Delft University of Technology.
Lourenço, P. B., and Rots, J. G. (1997). Multisurface interface model for analysis of
masonry structures. Journal of engineering mechanics, 123(7), 660-668.

References
333
Lourenço, P. B., Leite, J. M., Paulo-Pereira, M. F., Campos-Costa, A., Candeias, P. X.,
and Mendes, N. (2016). Shaking table testing for masonry infill walls: unreinforced
versus reinforced solutions. Earthquake Engineering and Structural Dynam-
ics, 45(14), 2241-2260.
Lubliner, J., Oliver, J., Oller, S., and Onate, E. (1989). A plastic-damage model for con-
crete. International Journal of solids and structures, 25(3), 299-326.
Luca, F.D., Verderame, G.M., Gómez-Martínez, F. and Pérez-García, A. 2013. The
structural role played by masonry infills on RC building performances after the 2011
Lorca, Spain, earthquake. Bull Earthquake Eng 12: 1999–2026.
Mainstone, R. J. (1971). On the stiffnesses and strengths of infilled frames. Institution
of Civil Engineers, Proceedings, Vol. iv 57-90.
Mainstone, R. J. (1974). On the Stiffness and Strength of In-filled Frames. Proc. Sup-
plement, Trans. of Inst. Of Civil Eng. State Univ. of New York.
Mainstone, R. J., and Weeks, G. A. (1972). 27.-The Influence of a Bounding Frame on
the Racking Stiffnesses and Strengths of Brick Walls.
Mallick D. V. and Garg R. P., (1971). Effect of openings on the lateral stiffness of in-
filled frames. Proceedings of the Institution of Civil Engineers, Vol. 49, June.
Mallick, D. V., and Severn, R. T. (1968). Dynamic characteristics of infilled
frames. Proceedings of the Institution of Civil Engineers, 39(2), 261-287.
Mallick, D. V., and Severn, R. T., (1967). The Behavior of Infilled Frames under Static
Loading. Proceedings of the Institution of Civil Engineers, Vol. 38, pp 639-656.
Mander, J.B and Nair, B. (1994). Seismic Resistance of Brick-Infilled Steel Frames with
and without Retrofit. TMS journal February, 24-37.
Manfredi, V. and Masi, A. (2014). Combining in-plane and out-of-plane behaviour of
masonry infills in the seismic analysis of RC buildings. Earthquakes and Struc-
tures, 6(5), 515-537.
Manos, C. J., Thaumpta, J., and Bilal, Y., (2000). Influence of Masonry Infills on the
Earthquake Response of Multi-Story RC Structures. Proceedings of the 12th World
Conference on Earthquake Engineering, #112 on CD-ROM, New Zealand.
Mansouri, A., Marefat, M. S., and Khanmohammadi, M. (2014). Experimental evalua-
tion of seismic performance of low-shear strength masonry infills with openings in

Marko M. Marinković Innovative system for seismic resistant masonry
infills in reinforced concrete frame structures
334
reinforced concrete frames with deficient seismic details. The Structural Design of
Tall and Special Buildings, 23(15), 1190-1210.
Masi, A. (2003). Seismic vulnerability assessment of gravity load designed R/C
frames. Bulletin of Earthquake Engineering, 1(3), 371-395.
Mauro A. (2008). Behaviour of masonry infills under seismic loads: state of the art re-
view on the analysis techniques. University of Minho, Report 08-DEC/E-30.
McDowell, E. L., McKee, K. E., and Sevin, E. (1956a). ―Arching action theory of ma-
sonry walls.‖ J. Struct. Div., 82(ST2), 915/1–915/18.
McDowell, E. L., McKee, K. E., and Sevin, E. (1956b). ―Discussion of arching action
theory of masonry walls.‖ J. Struct. Div., 1067, 27–40.
McKenna, F., Scott, M.H., and Fenves, G.L. (2010). Nonlinear Finite Element Analysis
Software Architecture Using Object Composition. Journal of Computing in Civil En-
gineering, 24(1):95-107.
Mehrabi, A. B., and Shing, P. B. (1997). Finite element modelling of masonry-infilled
RC frames. Journal of Structural Engineering New York, N.Y., 123(5), 604-613.
Mehrabi, A. B., Shing, P. B., Schuller, M. P., and Noland, J. L. (1996). Experimental
evaluation of masonry-infilled RC frames. Journal of Structural Engineering New
York, N.Y., 122(3), 228-237.
Mehrabi, A.B., Shing, P.B., Schuller, M.P., and Noland, J.L. (1994). Performance of
Masonry-Infilled R/C Frames Under In- Plane Lateral Loads. Report No. CU/SR-94-
6, Dept. of Civil, Environmental, and Architectural Engineering, University of Colo-
rado, Boulder, CO.
Mexican Code. (2004). Complementary Technical Norms for Design and Construction
of Masonry Structures. Mexico City Building Code Ltd., Mexico City, Mexico.
Milanesi, R. R., Morandi, P. and Magenes, G. (2016). Innovative seismic solution for
clay masonry infills with sliding joints: experimental tests. In 16th International
Brick and Block Masonry Conference.
Milanesi, R. R., Morandi, P. and Magenes, G. (2018). Local effects on RC frames in-
duced by AAC masonry infills through FEM simulation of in-plane tests. Bulletin of
Earthquake Engineering, 1-28.

References
335
Milani, G., and Bertolesi, E. (2017). Quasi-analytical homogenization approach for the
non-linear analysis of in-plane loaded masonry panels. Construction and Building
Materials, 146, 723-743.
Minaie, E. (2009). Behavior and vulnerability of reinforced masonry shear walls [Ph.D.
thesis]. Drexel University.
Miranda, E., Mosqueda, G., Retamales, R., and Pekcan, G. (2012). Performance of non-
structural components during the 27 February 2010 Chile earthquake. Earthquake
Spectra, 28(S1), S453-S471.
Mohammadi, M. and Akrami, V., (2010). An engineered infilled frame: Behavior and
calibration. Journal of Constructional Steel Research, 66(6), pp.842–849.
Mohammadi, M., Akrami, V. and Mohammadi-Ghazi, R., (2011). Methods to Improve
Infilled Frame Ductility. Journal of Structural Engineering, 137(6), pp.646–653.
Mohammadi, M., and Nikfar, F. (2013). Strength and stiffness of masonry-infilled
frames with central openings based on experimental results. Journal of Structural
Engineering, 139(6), 974-984.
Mohyeddin, A., Goldsworthy, H. M., and Gad, E. F. (2013). FE modelling of RC frames
with masonry infill panels under in-plane and out-of-plane loading. Engineering
Structures, 51, 73-87.
Mondal, G., and Jain, S. K. (2008). Lateral stiffness of masonry infilled reinforced con-
crete (RC) frames with central opening. Earthquake spectra, 24(3), 701-723.
Monk, C.B. (1958). Resistance of structural clay masonry to dynamic forces. Research
Report No.7, Structural Clay Products Research Foundation, Geneva, Illinois.
Morandi, P., Hak, S. and Magenes, G. (2014). In-plane experimental response of strong
masonry infills. In 9th International Masonry Conference.
Morandi, P., Hak, S., and Magenes, G. (2013). Simplified out-of-plane resistance verifi-
cation for slender clay masonry infills in RC frames. In ANIDIS 2013-XV Convegno
di Ingegneria Sismica.
Morandi, P., Milanesi, R. R., and Magenes, G. (2016). Innovative seismic solution for
clay masonry infills with sliding joints: principles and details. In Proceedings of 16th
International Brick and Block Masonry Conference (pp. 26-30).
Moretti, M. L., Papatheocharis, T., and Perdikaris, P. C. (2014). Design of reinforced
concrete infilled frames. Journal of Structural Engineering, 140(9), 04014062.

Marko M. Marinković Innovative system for seismic resistant masonry
infills in reinforced concrete frame structures
336
Mosalam, K. M. and Günay, S. (2015). Progressive collapse analysis of reinforced con-
crete frames with unreinforced masonry infill walls considering in-plane/out-of-plane
interaction. Earthquake Spectra, 31(2), 921-943.
Mosalam, K. M., White, R. N., & Gergely, P. (1997). Static response of infilled frames
using quasi-static experimentation. Journal of Structural Engineering, 123(11), 1462-
4169.
Mosalam, K., White, R. N., and Gergely, P., (1997b). ―Seismic Evaluation of Frames
with Infill Walls Using Pseudo-dynamic Experiments‖. NCEER-97-0020.
Mosalam, K., White, R. N., and Gergely, P., (1997c). ―Computational Strategies for
Frames with Infill Walls: Discrete and Smeared Crack Analyses and Seismic Fragili-
ty‖. NCEER-97-0021.
MSJC (2013) - ACI 530-13/ASCE 5-13/TMS 402-13. Building Code Requirements for
Masonry Structures. United States: Masonry Standards Joint Committee.
Najafgholipour M.A., Maheri M.R. and Lourenço P.B. (2013). Capacity interaction in
brick masonry under simultaneous in-plane shear and out-of-plane bending loads.
Constr Build Mater 2013;38:619–26.
Najafgholipour, M. A., Maheri, M. R., and Lourenço, P. B. (2014). Definition of interac-
tion curves for the in-plane and out-of-plane capacity in brick masonry
walls. Construction and Building Materials, 55, 168-182.
Nasiri E. and Liu Y., (2016.) Experimental study of the effect of interfacial gaps on the
in-plane behaviour of masonry infilled RC frames, Proceedings of the 16th Interna-
tional Brick and Block Masonry Conference, Padova, Italy, 26-30 June 2016.
Nasiri, E., and Liu, Y. (2017). Development of a detailed 3D FE model for analysis of
the in-plane behaviour of masonry infilled concrete frames. Engineering Struc-
tures, 143, 603-616.
Nazir, S., and Dhanasekar, M. (2014). A non-linear interface element model for thin
layer high adhesive mortared masonry. Computers and Structures, 144, 23-39.
NBC (2003). National Building Code. Technical Standard for Buildings, E.030, Earth-
quake Resistant Design, Lima, Peru.
Negro, P. and Verzeletti, G. (1996). Effect of infills on the global behaviour of r/c
frames: energy considerations from pseudodynamic tests. Earthquake Engineering
and Structural Dynamics, Vol. 25(8), pp. 753-773.

References
337
NTC (2008). Decreto Ministeriale D.M. 14.1.2008. 2008. Nuove Norme Tecniche per le
Costruzioni. Gazzetta Ufficiale n. 29, 04.02.2008—Supplemento Ordinario n. 30 (in
Italian).
NZS 4230. (2004) New Zealand Standard, Design of Reinforced Concrete Masonry
Structures.
NZSEE (2006). Assessment and Improvement of the Structural Performance of Build-
ings in Earthquakes. New Zealand Society for Earthquake Engineering, Recom-
mendations of a NZSEE Study Group on Earthquake Risk Buildings, June 2006.
O‘Reilly, G. J., and Sullivan, T. J. (2017). Probabilistic seismic assessment and retrofit
considerations for Italian RC frame buildings. Bulletin of Earthquake Engineering, 1-
39.
Official Chilean Standard Nch 433. of 96 (1996) ―Earthquake Resistant Design of
Buildings‖. (In English). Instituto Nacional de Normalización INN. 43 pp.
Oliveira, D. V., and Lourenço, P. B. (2004). Implementation and validation of a constitu-
tive model for the cyclic behaviour of interface elements. Computers and struc-
tures, 82(17-19), 1451-1461.
Ozkaynak, H., Yuksel, E., Yalcin, C., Dindar, A. A., and Buyukozturk, O. (2014). Ma-
sonry infill walls in reinforced concrete frames as a source of structural damp-
ing. Earthquake Engineering and Structural Dynamics, 43(7), 949-968.
Page, A. W. (1978). Finite element model for masonry. Journal of the Structural Divi-
sion, 104(8), 1267-1285.
Panagiotakos, T.B. and Fardis, M.N., (1994). Proposed nonlinear strut model for infill
panels. 1st Year Progress Report of HCM-PREC8 Project: University of Patras.
Panagiotakos, T.B. and Fardis, M.N., (1996). Seismic response of infilled rc frames
structures. 11th World Conference on Earthquake Engineering, paper 225, (pp. 23-
28).
Pantò, B., Cannizzaro, F., Caliò, I., & Lourenço, P. B. (2017). Numerical and experi-
mental validation of a 3D macro-model for the in-plane and out-of-plane behavior of
unreinforced masonry walls. International Journal of Architectural Heritage, 11(7),
946-964.

Marko M. Marinković Innovative system for seismic resistant masonry
infills in reinforced concrete frame structures
338
Papia, M., Cavaleri, L., and Fossetti, M. (2003). Infilled frames: developments in the
evaluation of the stiffening effect of infills. Structural engineering and mechan-
ics, 16(6), 675-694.
Parisi, F. and Augenti, N. (2012). Experimental data analysis for mechanical modelling
of existing brick masonry structures. In Proc. of the 15th World Conference on
Earthquake Engineering.
Pasca, M., Liberatore, L. and Masiani, R. (2017). Reliability of analytical models for the
prediction of out-of-plane capacity of masonry infills. Structural engineering and
mechanics, 64(6), 765-781.
Paulay, T. and Priestley, M. J. N. (1992). Seismic Design of Reinforced Concrete and
Masonry Buildings. John Wiley and Sons, Inc., New York, NY, USA.
Pavlović, M. (2013). Resistance of bolted shear connectors in prefabricated steel-
concrete composite decks. University of Belgrade.
Pelà, L., Cervera, M., and Roca, P. (2013). An orthotropic damage model for the analy-
sis of masonry structures. Construction and Building Materials, 41, 957-967.
Pelà, L., Cervera, M., and Roca, P. (2013). An orthotropic damage model for the analy-
sis of masonry structures. Construction and Building Materials, 41, 957-967.
Penava, D., and Sigmund, V. (2017). Out-of-plane behaviour of framed-masonry walls
with opening as a result of shaking table tests. In 16th World Conference on Earth-
quake Engineering.
Pencereci K., Toprak E., Merrifield S., Paul N., Almufti I., and Anadolu K. (2018). Re-
silience-based seismic evaluation of an existing mid-rise commercial building in
Turkey, 16th European Conference on Earthquake Engineering, Thessaloniki,
Greece.
Peng, Q., Zhou, X., and Yang, C. (2018). Influence of connection and constructional
details on masonry-infilled RC frames under cyclic loading. Soil Dynamics and
Earthquake Engineering, 108, 96-110.
Penna, A., Calvi, G. M., and Bolognini, D. (2007). Design of masonry structures with
bed joint reinforcement. In Proceedings of the Portuguese Seminar ―Paredes de Al-
venaria: Inovação e Possibilidades Actuais‖, University of Minho and LNEC, Lis-
bon (pp. 21-40).

References
339
Pereira, M. P., Pereira, M. N., Ferreira, J. D., and Lourenço, P. (2012). Behavior of
damaged masonry infill panels in RC frames subjected to out of plane
loads. Architecture Civil Engineering Environment, 5(3), 83-98.
Pires, F. and Carvalho, E.C. (1992). The behaviour of infilled reinforced concrete
frames under horizontal cyclic loading. Proceedings of the 10th World Conference on
Earthquake Engineering, Madrid, A.A. Balkema, Rotterdam, Vol. 6, pp. 3419-3422.
Polyakov S.V., (1963). Masonry in framed buildings. National Lending Library for Sci-
ence and Technology, Yorkshire, U.K.
Polyakov, S. V. (1956). Masonry in Framed Buildings (Godsudarstvenoe Isdatel' stvo
Literatury Po Stroidal stvui Architecture. Moscow, 1956). Translated by G. L. Cairns
in 1963. National Lending Library for Science and Technology, Boston Spa, York-
shire, U.K.
Polyakov, S. V., (1960) On the Interaction between Masonry Filler Walls and Enclosing
Frame when Loaded in the Plane of the Wall. Earthquake Engineering. Earthquake
Engineering Research Institute, San Francisco, CA, pp. 36-42
Pradhan, P. M., Maskey, R. K., and Pradhan, P. L. (2014). Stiffness behavior and shear
effect in partially infilled reinforced concrete frames. Journal of Earthquake Engi-
neering, 18(4), 580-588.
Prawel S.P., and Reinhorn A.M., (1985). Seismic Retrofit of Structural Masonry using a
Ferrocement Overlay. Proceedings of the Third North American Masonry Conference
Preti, M., and Bolis, V. (2017). Masonry infill construction and retrofit technique for the
infill-frame interaction mitigation: Test results. Engineering Structures, 132, 597-
608.
Preti, M., Bettini, N., and Plizzari, G. (2012). Infill walls with sliding joints to limit in-
fill-frame seismic interaction: large-scale experimental test. Journal of Earthquake
Engineering, 16(1), 125-141.
Preti, M., Bolis, V., and Stavridis, A. (2016). Design of masonry infill walls with sliding
joints for earthquake structural damage control. In Proceedings of the 16th Interna-
tional Brick and Block Masonry Conference (IBMAC‘16).
Preti, M., Migliorati, L., and Giuriani, E. (2015). Experimental testing of engineered
masonry infill walls for post-earthquake structural damage control. Bulletin of Earth-
quake Engineering, 13(7), 2029-2049.

Marko M. Marinković Innovative system for seismic resistant masonry
infills in reinforced concrete frame structures
340
Priestley, M. N., and Calvi, G. M. (1991). Towards a capacity-design assessment proce-
dure for reinforced concrete frames. Earthquake Spectra, 7(3), 413-437.
PTNZZ (1991). Serbian Technical norm for masonry walls. Official Gazette of the Re-
public of Federal Republic of Yugoslavia, No. 87/91.
Pujol S. and Fick D. (2010). The Test of a Full-Scale Three-Story RC Structure with
Masonry Infill Walls. Engineering Structures, vol. 32, pp. 3112-3121, 2010.
Rabinovitch, O., and Madah, H. (2011). Finite element modeling and shake-table testing
of unidirectional infill masonry walls under out-of-plane dynamic loads. Engineering
Structures, 33(9), 2683-2696.
Reinhorn, A.M., Madan, A., Valles, R.E., Reichmann, Y. and Mander, J.B (1995). Mod-
eling of masonry infill panels for structural analysis. NCEER-95-0018. National
Center for Earthquake Engineering Research.
Ricci P., Verderame G. M. and Manfredi G. (2011). Analytical Investigation of Elastic
Period of Infilled RC MRF Buildings," Engineering Structures, vol. 33, pp. 308-319.
Riddington, J. R. (1984). The influence of intial gaps on infilled frame behav-
iour. Proceedings of the Institution of Civil Engineers, 77(3), 295-310.
Rodrigues, H., Varum, H. and Costa, A. (2010). Simplified Macro-Model for Infill Ma-
sonry Panels. J. Earthq. Eng., vol. 14, n. 3, pagg. 390–416.
Rots, J. G. (1991). Numerical simulation of cracking in structural mason-
ry. Heron, 36(2), 49-63.
Rots, J. G., and De Borst, R. (1987). Analysis of mixed-mode fracture in con-
crete. Journal of Engineering Mechanics, 113(11), 1739-1758.
Sachanski, S., (1960). Analysis of the Earthquake Resistance of Frame Buildings Taking
into Consideration the Carrying Capacity of the Filling Masonry. Proceedings of the
Second World Conference on Earthquake Engineering, Vol. 3, Tokyo, pp. 2127-2141.
Saneinejad, A., and Hobbs, B. (1995). Inelastic design of infilled frames. Journal of
Structural Engineering New York, N.Y., 121(4), 634-649.
Sargin, M. 1971. Stress-Strain Relationship for Concrete and the Analysis of Structural
Concrete Section. University of Waterloo.
Sattar, S. (2013). Influence of masonry infill walls and other building characteristics on
seismic collapse of concrete frame buildings (Doctoral dissertation, University of
Colorado at Boulder).

References
341
Schmidt, T. (1989a). An approach of modelling masonry infilled frames by the FE
method and a modified equivalent strut method. Annual Journal on Concrete and
Concrete Structures.‖ Darmstadt, Germany: Darmstadt University.
Schmidt, T. (1989b). Experiments on the nonlinear behaviour of masonry infilled rein-
forced concrete frames. Annual Journal on Concrete and Concrete Structures, 4, 185-
194.
Seah, C. K. (1998). A Universal Approach for the Analysis and Design of Masonry In-
filled Frame Structures. Ph.D. thesis, The University of New Brunswick, Canada,
December
Seismosoft (2013). SeismoStruct v6.0 - Verification Report. Available from URL:
www.seismosoft.com.
Sezen H., Whittaker A.S., Elwood K.J., Mosalam K.M. (2003). Performance of rein-
forced concrete buildings during the August 17, 1999 Kocaeli, Turkey earthquake,
and seismic design and construction practise in Turkey. Eng Struct;25:103–14.
Shapiro D, Uzarski J, Webster M, Angel R, Abrams D. (1994). Estimating out of plane
strength of cracked masonry infills, University of Illinois at Urbana- Champaign,
Civil Engineering Studies, Structural Research Series No. 588.
Shing P.B. and Mehrabi A.B. (2002). Behaviour and analysis of masonry-infilled
frames. Prog. Struct. Engng. Mater. 4, pp. 320-331.
Shing, P. B., and Stavridis, A. (2014). Analysis of seismic response of masonry-infilled
RC frames through collapse. ACI Struct. J., 297, 1–20.
Sigmund, V., and Penava, D. (2014). Influence of openings, with and without confine-
ment, on cyclic response of infilled rc frames—an experimental study. Journal of
earthquake engineering, 18(1), 113-146.
Silva, L., Vasconcelos, G., Lourenço, P., and Akhoundi, F. (2016). Experimental evalua-
tion of a constructive system for earthquake resisting masonry enclosure walls.
In Proceedings of the 16th International Brick and Block Masonry Conference (IB-
MAC 2016).
Smith, B. S. (1962). Lateral stiffness of infilled frames. Journal of the Structural Divi-
sion, 88(6), 183-226.
Smith, B. S. (1966). Behaviour of square infilled frames. J. Struct. Div., ASCE, 92 381-
403.

Marko M. Marinković Innovative system for seismic resistant masonry
infills in reinforced concrete frame structures
342
SNIP II-7-81 (2001). Construction in Seismic Areas. National Codes and Standards of
Russia.
Stafford Smith, B., and Carter, C. (1969). A method of analysis for infilled
frames. Proceedings of the institution of civil engineers, 44(1), 31-48.
Stafford-Smith, B., and Coull, H. (1991). Chapter 8: Infilled-Frame Structures. Tall
Building Structures: Analysis and Design, John Wiley and sons. Inc, New York,
USA, 168-183.
Stavridis, A. (2009). Analytical and experimental study of seismic performance of rein-
forced concrete frames infilled with masonry walls. University of California, San Di-
ego.
Stavridis, A., and Shing, P. B. (2010). Finite-element modelling of nonlinear behavior of
masonry-infilled RC frames. J.Struct.Eng., 136(3), 285-296.
Stylianidis, K. C. (2012). Experimental investigation of masonry infilled RC
frames. Open Constr Build Technol J, 6(1), 194-212.
Su, Q., Cai, G., and Cai, H. (2017). Seismic behaviour of full-scale hollow bricks-
infilled RC frames under cyclic loads. Bulletin of Earthquake Engineering, 15(7),
2981-3012.
Syrmakezis C. A. and Vratsanou V. Y. (1986). Influence of Infill Walls to RC Frames
Response. Proceedings of the 8th European Conference on Earthquake Engineering,
Lisbon, Portugal, Vol. 3, pp. 6.5/47-53.
Taghavi, S., and Miranda, E. (2003). Response assessment of nonstructural building
elements. Pacific Earthquake Engineering Research Center.
Tasligedik, A. S. (2014). Damage mitigation strategies for non-structural infill walls.
PhD thesis. Civil and Natural Resources Engineering Department. University of Can-
terbury, Christhurch/New Zealand, pp. 304.
Tasligedik, A. S., and Pampanin, S. (2016). Rocking Cantilever Clay Brick Infill Wall
Panels: A Novel Low Damage Infill Wall System. Journal of Earthquake Engineer-
ing, 1-27.
Tasligedik, A. S., Pampanin, S., and Palermo, A. (2014). An innovative low damage
seismic solution for unreinforced clay brick infill walls. 2nd European Conference on
Earthquake Engineering. Istanbul. Turkey. 2014.

References
343
Tasligedik, A. S., Pampanin, S., and Palermo, A. (2015). Low damage seismic solutions
for non-structural drywall partitions. Bulletin of Earthquake Engineering, 13(4),
1029-1050.
Tasnimi, A. A., and Mohebkhah, A. (2011). Investigation on the behavior of brick-
infilled steel frames with openings, experimental and analytical approaches.
Eng.Struct., 33(3), 968-980.
Tassios, T. P. (1984). Masonry infill and RC walls (an invited state-of the-art report). 3rd
Int. Symp. on Wall Structures, Centre for Building Systems, Research and Develop-
ment, Warsaw, Poland.
Thomas, F. G. (1953). The Strength of Brickwork. The Structural Engineer, Part 2, Vol.
36, pp. 35-41.
Tiedeman, H. (1980). A statistical evaluation of the importance of non-structural dam-
age to buildings. Proc., 7th World Conf. on Earthquake Engineering, Vol. 6, Interna-
tional Association of Earthquake Engineering (IAEE), Tokyo, 617–624.
Timoshenko, S. P., and Woinowsky-Krieger, S. (1959). Theory of plates and shells.
McGraw-hill.
Tsantilis, A. V. and Triantafillou, T. C. (2018). Innovative seismic isolation of masonry
infills using cellular materials at the interface with the surrounding RC
frames. Engineering Structures, 155, 279-297.
Tu Y.H., Chao Y.F., Chiou T.C. (2016). Lateral load experiment and comparison with
analytical model for in-filled masonry panels with openings in an RC frame.
In Proceedings of the 16th International Brick and Block Masonry Conference (IB-
MAC 2016).
Tu, Y. H., Chuang, T. H., Liu, P. M., and Yang, Y. S. (2010). Out-of-plane shaking table
tests on unreinforced masonry panels in RC frames. Engineering Structures, 32(12),
3925-3935.
Tucker, C. J. (2007). Predicting the in-plane capacity of masonry infilled frames. Ph.D.
Thesis, Tennessee Technological University, Cookeville, TN, US.
Valiasis T. N. and Stylianidis K. C., (1989) ―Masonry infilled R.C. frames under hori-
zontal loading. Experimental results‖. European Earthquake Engineering, 3(3),pp.
10-20.

Marko M. Marinković Innovative system for seismic resistant masonry
infills in reinforced concrete frame structures
344
Valluzzi, M. R., Da Porto, F., Garbin, E., and Panizza, M. (2014). Out-of-plane behav-
iour of infill masonry panels strengthened with composite materials. Materials and
structures, 47(12), 2131-2145.
Varum, H., Furtado, A., Rodrigues, H., Dias-Oliveira, J., Vila-Pouca, N. and Arêde, A.
(2017). Seismic performance of the infill masonry walls and ambient vibration tests
after the Ghorka 2015, Nepal earthquake. Bulletin of Earthquake Engineering, 15(3),
1185-1212.
Verderame, G.M., De Luca, F., Ricci, P. and Manfredi, G. (2011), ―Preliminary analysis
of a soft-storey mechanism after the 2009 L‘Aquila earthquake‖, Earthq. Eng. Struct.
Dyn., 40, 925-944.
Verlato, N., Guidi, G., da Porto, F., and Modena, C. (2016). Innovative systems for ma-
sonry infill walls based on the use of deformable joints: combined in-plane/out-of-
plane tests. In Proceedings of the 16th International Brick and Block Masonry Con-
ference.
Vicente, R. S., Rodrigues, H., Varum, H., Costa, A. and da Silva, J. A. R. M. (2012).
Performance of masonry enclosure walls: lessons learned from recent earth-
quakes. Earthquake engineering and engineering vibration, 11(1), 23-34.
Villaverde, R. (1997). Seismic design of secondary structures: state of the art. J Struct
Eng, ASCE;123(8):1011–9.
Vintzileou, E., Adami, C. E., and Palieraki, V. (2016). In-plane and out-of-plane re-
sponse of a masonry infill divided into smaller wallettes. In Proceedings of the 16th
International Brick and Block Masonry Conference (IBMAC 2016).
Vougioukas E. (2012). Out-of-Plane Response of Infill Masonry Walls, The Open Con-
struction and Building Technology Journal, 6, (Suppl 1-M20), 325-333.
Walsh, K. Q., Dizhur, D. Y., Giongo, I., Derakhshan, H., and Ingham, J. M. (2017). Ef-
fect of boundary conditions and other factors on URM wall out-of-plane behaviour:
Design demands, predicted capacity, and in situ proof test results. SESOC Jour-
nal, 30(1), 57.
Wood, R. H. (1978). Plasticity, composite action and collapse design of unreinforced
shear wall panels in frames. Proceedings of the Institution of Civil Engineers, 65(2),
381-411.

References
345
Yanev, B., and McNiven, H. D. (1985). An experimental program for studying the dy-
namic response of a steel frame with a variety of infill partitions. Earthquake Engi-
neering Research Center, College of Engineering, University of California.
Yuen Y.P. and Kuang J.S. (2013). Fourier-based incremental homogenisation of coupled
unilateral damageplasticity model for masonry structures. Int J Solids Struct 50(21–
22):3361–3374.
Yuen Y.P. and Kuang J.S. (2014). Masonry-infilled rc frames subjected to combined in-
plane and out-of-plane loading. Int J Struct Stab Dyn 14(2):1350066.
Yuen Y.P. and Kuang J.S. (2015). Nonlinear seismic responses and lateral force transfer
mechanisms of RC frames with different infill configurations. Eng Struct 91:125–
140.
Yuen, T. Y., Kuang, J. S. and Ali, B. S. M. (2016). Assessing the effect of bi-directional
loading on nonlinear static and dynamic behaviour of masonry-infilled frames with
openings. Bulletin of Earthquake Engineering, 14(6), 1721-1755.
Žarnić R. and Tomaževič M. (1985). Study of the behaviour of masonry infilled rein-
forced concrete frames subjected to seismic loading. Proceedings of Seventh Interna-
tional Brick Masonry Conference, Melbourne, Australia, Vol. 2, pp. 1315-1325.
Žarnić R. and Tomaževič M. (1988). An Experimentally Obtained Method for Evalua-
tion of the Behaviour of Masonry Infilled R/C Frames. Proceedings of the 9th World
Conference on Earthquake Engineering, Tokyo, Japan, Vol. VI, pp. 163-168.
Žarnić, R. and Tomaževič, M. (1984). The behaviour of masonry infilled reinforced
concrete frames subjected to cyclic lateral loading. Proceedings of the 8th World
Conference on Earthquake Engineering, San Francisco, Prentice-Hall, New Jersey,
Vol. 6, pp. 863-870.
Žarnić, R., and Gostič, S. (1997). Masonry infilled frames as an effective structural sub-
assemblage. Proceedings of the international workshop on seismic design methodol-
ogies for the next generation of codes. Rotterdam: Balkema. p. 335–46.
Žarnić, R., Gostič, S., Crewe, A. J., and Taylor, C. A. (2001). Shaking table tests of 1:4
reduced-scale models of masonry infilled reinforced concrete frame build-
ings. Earthquake engineering and structural dynamics, 30(6), 819-834.

Marko M. Marinković Innovative system for seismic resistant masonry
infills in reinforced concrete frame structures
346
Zhai, C., Kong, J., Wang, X., and Chen, Z. (2016). Experimental and Finite Element
Analytical Investigation of Seismic Behavior of Full-Scale Masonry Infilled RC
Frames. Journal of Earthquake Engineering, 20(7), 1171-1198.
Žovkić, J., Sigmund, V., and Guljaš, I. (2013). Cyclic testing of a single bay reinforced
concrete frames with various types of masonry infill. Earthquake engineering and
structural dynamics, 42(8), 1131-1149.

Appendix A – Force-displacement curves from parametric study
347
Appendix A – Force-displacement curves from parametric study
Force-displacement curves form parametric study from section 7.2 are summarized in
this Appendix.
a) b)
Figure A.1: Force-displacement curves for h/l=2 and a) INODIS 1 and b) INODIS 2 with the
thickness of the 1st layer of 15 mm
a) b)
Figure A.2: Force-displacement curves for h/l=2 and a) INODIS 1 and b) INODIS 2 with the
thickness of the 1st layer of 25 mm
a) b)
Figure A.3: Force-displacement curves for h/l=0.9 and a) INODIS 1 and b) INODIS 2 with the
thickness of the 1st layer of 15 mm

Marko M. Marinković Innovative system for seismic resistant masonry
infills in reinforced concrete frame structures
348
a) b)
Figure A.4: Force-displacement curves for h/l=0.9 and a) INODIS 1 and b) INODIS 2 with the
thickness of the 1st layer of 25 mm
a) b)
Figure A.5: Force-displacement curves for h/l=0.9 and a) INODIS 1 and b) INODIS 2 with the
thickness of the 1st layer of 35 mm
a) b)
Figure A.6: Force-displacement curves for h/l=0.6 and a) INODIS 1 and b) INODIS 2 with the
thickness of the 1st layer of 15 mm

Appendix A – Force-displacement curves from parametric study
349
a) b)
Figure A.7: Force-displacement curves for h/l=0.6 and a) INODIS 1 and b) INODIS 2 with the
thickness of the 1st layer of 25 mm
a) b)
Figure A.8: Force-displacement curves for h/l=0.6 and a) INODIS 1 and b) INODIS 2 with the
thickness of the 1st layer of 35 mm

Marko M. Marinković Innovative system for seismic resistant masonry
infills in reinforced concrete frame structures
350
Appendix B – Input data for material models in Abaqus
Concrete
*Material, name=Concrete
*Density
2482.,
*Elastic
3.2558e+10, 0.2
*Concrete Damaged Plasticity
36., 0.1, 1.16, 0.667, 0.
*Concrete Compression Hardening
1.52e+07, 0.
1.52021e+07, 3.3078e-05
1.65132e+07, 4.2807e-05
1.77861e+07, 5.3711e-05
2.02169e+07, 7.9049e-05
2.24942e+07, 0.0001091
2.46174e+07, 0.00014389
2.65862e+07, 0.00018342
2.84001e+07, 0.00022771
2.92488e+07, 0.00025164
3.00586e+07, 0.00027677
3.08294e+07, 0.00030309
3.15613e+07, 0.00033061
3.22541e+07, 0.00035933
3.29078e+07, 0.00038926
3.35222e+07, 0.00042038
3.40975e+07, 0.00045272
3.46335e+07, 0.00048625
3.51301e+07, 0.000521
3.55873e+07, 0.00055696
3.60051e+07, 0.00059412
3.63834e+07, 0.00063251
3.6722e+07, 0.0006721
3.70211e+07, 0.00071292
3.72805e+07, 0.00075495
3.75001e+07, 0.00079821
3.76799e+07, 0.00084268
3.78199e+07, 0.00088839
3.79199e+07, 0.00093531
3.798e+07, 0.00098347
3.8e+07, 0.0010329
3.79799e+07, 0.0010835
3.79197e+07, 0.0011353
3.78193e+07, 0.0011884
3.76787e+07, 0.0012427
3.74977e+07, 0.0012983
3.72763e+07, 0.0013551
3.70144e+07, 0.0014131
3.67121e+07, 0.0014724
3.63692e+07, 0.0015329
3.59857e+07, 0.0015947
3.55616e+07, 0.0016577
3.50966e+07, 0.001722
3.45909e+07, 0.0017876
Masonry
*Material, name=Masonry
*Density
550.,
*Elastic
4.87e+09, 0.15
*Concrete Damaged Plasticity
36., 0.1, 1.16, 0.667, 0.
*Concrete Compression Hardening
1.2175e+06, 0.
1.35625e+06, 2.1509e-05
1.54462e+06, 3.283e-05
1.72222e+06, 4.6361e-05
1.79025e+06, 5.2392e-05
2.04514e+06, 8.0054e-05
2.14225e+06, 9.3112e-05
2.325e+06, 0.00012259
2.56181e+06, 0.00017396
2.75556e+06, 0.00023418
2.90625e+06, 0.00030323
3.01389e+06, 0.00038113
3.07847e+06, 0.00046787
3.09462e+06, 0.00051455
3.1e+06, 0.00056345
3.09462e+06, 0.00061455
3.07847e+06, 0.00066787
3.05156e+06, 0.0007234
3.01389e+06, 0.00078113
2.96545e+06, 0.00084108
2.90625e+06, 0.00090323
2.83628e+06, 0.0009676
2.75556e+06, 0.0010342
2.69956e+06, 0.0010957
2.64604e+06, 0.0011567
2.59486e+06, 0.0012172
2.54588e+06, 0.0012772
2.49898e+06, 0.0013369
2.45403e+06, 0.0013961
2.41093e+06, 0.0014549
2.36958e+06, 0.0015134
2.32988e+06, 0.0015716
2.29174e+06, 0.0016294
2.25507e+06, 0.0016869
2.21981e+06, 0.0017442
2.18586e+06, 0.0018012
2.15318e+06, 0.0018579
2.12168e+06, 0.0019143
2.09132e+06, 0.0019706
2.06203e+06, 0.0020266
2.03376e+06, 0.0020824
2.02273e+06, 0.0021047
2.01549e+06, 0.0021194
1.9546e+06, 0.0022486

Appendix B – Input data for material models in Abaqus
351
3.40444e+07, 0.0018543
3.34569e+07, 0.0019224
3.28284e+07, 0.0019917
3.21589e+07, 0.0020623
3.14483e+07, 0.0021341
3.06966e+07, 0.0022072
2.99036e+07, 0.0022815
2.90694e+07, 0.0023572
2.81938e+07, 0.002434
2.72768e+07, 0.0025122
2.63184e+07, 0.0025916
2.53185e+07, 0.0026724
2.42769e+07, 0.0027543
2.13108e+07, 0.0029455
2.05186e+07, 0.0030398
1.9441e+07, 0.0032029
1.87864e+07, 0.003323
1.8221e+07, 0.0034404
1.72634e+07, 0.0036698
1.64581e+07, 0.0038945
1.57557e+07, 0.0041161
1.51285e+07, 0.0043353
1.45597e+07, 0.0045528
1.35546e+07, 0.0049837
1.26821e+07, 0.0054105
1.19087e+07, 0.0058342
1.12132e+07, 0.0062556
1.05811e+07, 0.006675
9.86428e+06, 0.007197
9.21542e+06, 0.007717
8.62365e+06, 0.0082351
8.08079e+06, 0.0087518
7.58048e+06, 0.0092672
7.11765e+06, 0.0097814
6.68817e+06, 0.010295
6.28865e+06, 0.010807
5.91623e+06, 0.011318
5.5685e+06, 0.011829
5.24339e+06, 0.012339
4.9391e+06, 0.012848
4.65406e+06, 0.013357
4.38691e+06, 0.013865
4.13643e+06, 0.014373
3.90153e+06, 0.01488
3.68123e+06, 0.015387
3.47468e+06, 0.015893
3.28107e+06, 0.016399
3.0997e+06, 0.016905
2.9299e+06, 0.01741
2.77109e+06, 0.017915
2.62271e+06, 0.018419
2.48425e+06, 0.018924
2.35526e+06, 0.019428
2.23529e+06, 0.019931
2.12396e+06, 0.020435
2.02088e+06, 0.020938
1.92571e+06, 0.021441
1.83813e+06, 0.021944
1.92994e+06, 0.0023037
1.90609e+06, 0.0023586
1.883e+06, 0.0024133
1.86064e+06, 0.0024679
1.83898e+06, 0.0025224
1.81798e+06, 0.0025767
1.79762e+06, 0.0026309
1.77786e+06, 0.0026849
1.75869e+06, 0.0027389
1.74008e+06, 0.0027927
1.722e+06, 0.0028464
1.70444e+06, 0.0029
1.68737e+06, 0.0029535
1.67077e+06, 0.0030069
1.65463e+06, 0.0030602
1.63892e+06, 0.0031135
1.62363e+06, 0.0031666
1.59424e+06, 0.0032726
1.57457e+06, 0.0033467
1.53984e+06, 0.0034838
1.51462e+06, 0.003589
1.4906e+06, 0.0036939
1.44583e+06, 0.0039031
1.40495e+06, 0.0041115
1.3675e+06, 0.0043192
1.33307e+06, 0.0045263
1.3013e+06, 0.0047328
1.24465e+06, 0.0051444
1.19564e+06, 0.0055545
1.15285e+06, 0.0059633
1.11516e+06, 0.006371
1.08173e+06, 0.0067779
1.04492e+06, 0.0072854
1.01267e+06, 0.0077921
984192., 0.0082979
958868., 0.0088031
*Concrete Tension Stiffening,
type=DISPLACEMENT
310000., 0.
309052., 2e-07
308578., 3e-07
307635., 5e-07
305288., 1e-06
302961., 1.5e-06
300652., 2e-06
296089., 3e-06
291600., 4e-06
287182., 5e-06
274349., 8e-06
266133., 1e-05
258177., 1.2e-05
246714., 1.5e-05
235793., 1.8e-05
228800., 2e-05
222029., 2.2e-05
212273., 2.5e-05
202979., 2.8e-05
197028., 3e-05

Marko M. Marinković Innovative system for seismic resistant masonry
infills in reinforced concrete frame structures
352
1.75782e+06, 0.022446
1.68452e+06, 0.022948
1.61794e+06, 0.02345
1.55784e+06, 0.023952
1.50397e+06, 0.024454
1.45612e+06, 0.024955
1.41407e+06, 0.025457
1.37762e+06, 0.025958
1.34658e+06, 0.026459
1.32078e+06, 0.026959
1.30002e+06, 0.02746
1.28417e+06, 0.027961
1.27305e+06, 0.028461
1.26652e+06, 0.028961
1.26444e+06, 0.029461
*Concrete Tension Stiffening,
type=DISPLACEMENT
2.9e+06, 0.
2.88813e+06, 2e-07
2.88222e+06, 3e-07
2.87042e+06, 5e-07
2.84114e+06, 1e-06
2.81217e+06, 1.5e-06
2.78349e+06, 2e-06
2.72702e+06, 3e-06
2.67173e+06, 4e-06
2.61761e+06, 5e-06
2.46204e+06, 8e-06
2.36387e+06, 1e-05
2.26997e+06, 1.2e-05
2.13687e+06, 1.5e-05
2.01267e+06, 1.8e-05
1.9346e+06, 2e-05
1.86015e+06, 2.2e-05
1.755e+06, 2.5e-05
1.65727e+06, 2.8e-05
1.59604e+06, 3e-05
1.50974e+06, 3.3e-05
1.45574e+06, 3.5e-05
1.42975e+06, 3.6e-05
1.37972e+06, 3.8e-05
1.3322e+06, 4e-05
1.31051e+06, 4.0948e-05
1.22364e+06, 4.5e-05
1.12838e+06, 5e-05
1.04487e+06, 5.5e-05
971691., 6e-05
907541., 6.5e-05
851247., 7e-05
801752., 7.5e-05
758113., 8e-05
719490., 8.5e-05
685144., 9e-05
654422., 9.5e-05
626758., 0.0001
578698., 0.00011
501741., 0.00013
438277., 0.00015
188453., 3.3e-05
182963., 3.5e-05
180284., 3.6e-05
175053., 3.8e-05
169988., 4e-05
167643., 4.0948e-05
158019., 4.5e-05
146976., 5e-05
136790., 5.5e-05
127392., 6e-05
118723., 6.5e-05
110725., 7e-05
103347., 7.5e-05
96541.1, 8e-05
90262.1, 8.5e-05
84469.6, 9e-05
79125.9, 9.5e-05
74196.3, 0.0001
58012.4, 0.00012
46290.8, 0.00014
37801.1, 0.00016
31652.2, 0.00018
31139.4, 0.000182
27198.6, 0.0002
23973.1, 0.00022
21636.8, 0.00024
19944.8, 0.00026
18719.3, 0.00028
17831.6, 0.0003
17188.8, 0.00032
16141.6, 0.00038
15707.5, 0.00045
15592.6, 0.0005
*Concrete Compression Damage
0., 0.
0.0069, 2.1509e-05
0.0105, 3.283e-05
0.0147, 4.6361e-05
0.0166, 5.2392e-05
0.0253, 8.0054e-05
0.0294, 9.3112e-05
0.0385, 0.00012259
0.0541, 0.00017396
0.0722, 0.00023418
0.0925, 0.00030323
0.1148, 0.00038113
0.139, 0.00046787
0.1518, 0.00051455
0.165, 0.00056345
0.1785, 0.00061455
0.1924, 0.00066787
0.2066, 0.0007234
0.2212, 0.00078113
0.236, 0.00084108
0.251, 0.00090323
0.2663, 0.0009676
0.2817, 0.0010342
0.2957, 0.0010957

Appendix B – Input data for material models in Abaqus
353
326991., 0.00019
276152., 0.00021
185888., 0.00025
114077., 0.00029
61046.9, 0.00033
40757.6, 0.00035
*Concrete Compression Damage
0., 0.
0.0053, 3.3078e-05
0.0068, 4.2807e-05
0.0086, 5.3711e-05
0.0126, 7.9049e-05
0.0173, 0.0001091
0.0228, 0.00014389
0.0289, 0.00018342
0.0358, 0.00022771
0.0395, 0.00025164
0.0433, 0.00027677
0.0473, 0.00030309
0.0515, 0.00033061
0.0559, 0.00035933
0.0604, 0.00038926
0.065, 0.00042038
0.0699, 0.00045272
0.0749, 0.00048625
0.08, 0.000521
0.0853, 0.00055696
0.0907, 0.00059412
0.0962, 0.00063251
0.102, 0.0006721
0.1078, 0.00071292
0.1138, 0.00075495
0.1199, 0.00079821
0.1261, 0.00084268
0.1325, 0.00088839
0.139, 0.00093531
0.1456, 0.00098347
0.1523, 0.0010329
0.1592, 0.0010835
0.1661, 0.0011353
0.1732, 0.0011884
0.1803, 0.0012427
0.1876, 0.0012983
0.1949, 0.0013551
0.2024, 0.0014131
0.2099, 0.0014724
0.2175, 0.0015329
0.2252, 0.0015947
0.233, 0.0016577
0.2408, 0.001722
0.2487, 0.0017876
0.2567, 0.0018543
0.2648, 0.0019224
0.2729, 0.0019917
0.281, 0.0020623
0.2893, 0.0021341
0.2975, 0.0022072
0.3058, 0.0022815
0.3094, 0.0011567
0.3226, 0.0012172
0.3355, 0.0012772
0.3481, 0.0013369
0.3603, 0.0013961
0.3722, 0.0014549
0.3839, 0.0015134
0.3952, 0.0015716
0.4063, 0.0016294
0.4171, 0.0016869
0.4277, 0.0017442
0.4381, 0.0018012
0.4482, 0.0018579
0.4581, 0.0019143
0.4677, 0.0019706
0.4772, 0.0020266
0.4864, 0.0020824
0.4901, 0.0021047
0.4925, 0.0021194
0.513, 0.0022486
0.5215, 0.0023037
0.5299, 0.0023586
0.538, 0.0024133
0.546, 0.0024679
0.5539, 0.0025224
0.5616, 0.0025767
0.5691, 0.0026309
0.5765, 0.0026849
0.5837, 0.0027389
0.5908, 0.0027927
0.5978, 0.0028464
0.6047, 0.0029
0.6114, 0.0029535
0.618, 0.0030069
0.6244, 0.0030602
0.6308, 0.0031135
0.637, 0.0031666
0.6491, 0.0032726
0.6573, 0.0033467
0.672, 0.0034838
0.6829, 0.003589
0.6934, 0.0036939
0.7132, 0.0039031
0.7317, 0.0041115
0.749, 0.0043192
0.7651, 0.0045263
0.7801, 0.0047328
0.8072, 0.0051444
0.8309, 0.0055545
0.8517, 0.0059633
0.8698, 0.006371
0.8857, 0.0067779
0.9028, 0.0072854
0.9174, 0.0077921
0.9297, 0.0082979
0.9402, 0.0088031
*Concrete Tension Damage,
type=DISPLACEMENT

Marko M. Marinković Innovative system for seismic resistant masonry
infills in reinforced concrete frame structures
354
0.3142, 0.0023572
0.3226, 0.002434
0.331, 0.0025122
0.3394, 0.0025916
0.3479, 0.0026724
0.3564, 0.0027543
0.3758, 0.0029455
0.3851, 0.0030398
0.401, 0.0032029
0.4124, 0.003323
0.4233, 0.0034404
0.4441, 0.0036698
0.4637, 0.0038945
0.4824, 0.0041161
0.5003, 0.0043353
0.5173, 0.0045528
0.5495, 0.0049837
0.5792, 0.0054105
0.6068, 0.0058342
0.6324, 0.0062556
0.6563, 0.006675
0.6838, 0.007197
0.7091, 0.007717
0.7322, 0.0082351
0.7535, 0.0087518
0.773, 0.0092672
0.7909, 0.0097814
0.8074, 0.010295
0.8226, 0.010807
0.8365, 0.011318
0.8493, 0.011829
0.8611, 0.012339
0.872, 0.012848
0.882, 0.013357
0.8912, 0.013865
0.8997, 0.014373
0.9075, 0.01488
0.9147, 0.015387
0.9214, 0.015893
0.9275, 0.016399
0.9331, 0.016905
0.9383, 0.01741
0.9431, 0.017915
0.9475, 0.018419
0.9516, 0.018924
0.9553, 0.019428
0.9588, 0.019931
0.962, 0.020435
0.9649, 0.020938
0.9676, 0.021441
0.9701, 0.021944
0.9724, 0.022446
0.9746, 0.022948
0.9765, 0.02345
0.9783, 0.023952
0.98, 0.024454
0.9816, 0.024955
0.983, 0.025457
0., 0.
0.0015, 2e-07
0.0022, 3e-07
0.0037, 5e-07
0.0073, 1e-06
0.0109, 1.5e-06
0.0146, 2e-06
0.0218, 3e-06
0.0289, 4e-06
0.036, 5e-06
0.0569, 8e-06
0.0705, 1e-05
0.084, 1.2e-05
0.1038, 1.5e-05
0.1231, 1.8e-05
0.1357, 2e-05
0.1481, 2.2e-05
0.1664, 2.5e-05
0.1843, 2.8e-05
0.196, 3e-05
0.2132, 3.3e-05
0.2244, 3.5e-05
0.23, 3.6e-05
0.241, 3.8e-05
0.2518, 4e-05
0.2569, 4.0948e-05
0.2781, 4.5e-05
0.3035, 5e-05
0.328, 5.5e-05
0.3515, 6e-05
0.3742, 6.5e-05
0.3961, 7e-05
0.4172, 7.5e-05
0.4375, 8e-05
0.4571, 8.5e-05
0.476, 9e-05
0.4942, 9.5e-05
0.5118, 0.0001
0.576, 0.00012
0.6317, 0.00014
0.68, 0.00016
0.722, 0.00018
0.7258, 0.000182
0.7584, 0.0002
0.79, 0.00022
0.8174, 0.00024
0.8413, 0.00026
0.8621, 0.00028
0.8801, 0.0003
0.8958, 0.00032
0.9315, 0.00038
0.958, 0.00045
0.9704, 0.0005

Appendix B – Input data for material models in Abaqus
355
0.9843, 0.025958
0.9855, 0.026459
0.9866, 0.026959
0.9876, 0.02746
0.9886, 0.027961
0.9895, 0.028461
0.9903, 0.028961
0.991, 0.029461
*Concrete Tension Damage,
type=DISPLACEMENT
0., 0.
0.0022, 2e-07
0.0033, 3e-07
0.0054, 5e-07
0.0108, 1e-06
0.0162, 1.5e-06
0.0216, 2e-06
0.0321, 3e-06
0.0426, 4e-06
0.0529, 5e-06
0.0831, 8e-06
0.1026, 1e-05
0.1216, 1.2e-05
0.1493, 1.5e-05
0.176, 1.8e-05
0.1933, 2e-05
0.2102, 2.2e-05
0.2348, 2.5e-05
0.2585, 2.8e-05
0.2739, 3e-05
0.2963, 3.3e-05
0.3108, 3.5e-05
0.3179, 3.6e-05
0.3319, 3.8e-05
0.3456, 4e-05
0.352, 4.0948e-05
0.3786, 4.5e-05
0.4097, 5e-05
0.4393, 5.5e-05
0.4672, 6e-05
0.4937, 6.5e-05
0.5188, 7e-05
0.5426, 7.5e-05
0.5652, 8e-05
0.5867, 8.5e-05
0.607, 9e-05
0.6264, 9.5e-05
0.6447, 0.0001
0.6788, 0.00011
0.7373, 0.00013
0.7851, 0.00015
0.8562, 0.00019
0.8824, 0.00021
0.9213, 0.00025
0.9473, 0.00029
0.9647, 0.00033
0.9711, 0.00035

Marko M. Marinković Innovative system for seismic resistant masonry
infills in reinforced concrete frame structures
356
Reinforcement
*Material, name=Reinforcement
*Density
7850.,
*Elastic
2e+11, 0.3
*Plastic
5e+08, 0.
5.4e+08, 0.05
Plastic
*Material, name=Plastic
*Density
1440.,
*Elastic
3.3e+09, 0.35
Elastomer
Material, name="Regufoam® 270"
*Density
229.,
*Hyperfoam, n=2, testdata
*Simple Shear Test Data
0.,0.,0.
5392.15, 0.0298, 0.
15196.1, 0.0904, 0.
24754.9, 0.1503, 0.
33088.3, 0.2103, 0.
40931.3, 0.2699, 0.
44607.8, 0.3, 0.
*Uniaxial Test Data
-1.43161e+06, -0.782258, 0.
-1.22492e+06, -0.777419, 0.
-796353., -0.758065, 0.
-583587., -0.73871, 0.
-389058., -0.708065, 0.
-270517., -0.668548, 0.
-185410., -0.616129, 0.
-133739., -0.551613, 0.
-100304., -0.45, 0.
-79027.4, -0.35, 0.
-75987.8, -0.265323, 0.
-69908.8, -0.195161, 0.
-63829.8, -0.103226, 0.
-45592.7, -0.0532258, 0.
-21276.6, -0.0233871, 0.
0., 0., 0.
*Material, name="Regufoam® 400"
*Density
250.,
*Hyperfoam, n=2, testdata
*Simple Shear Test Data
0., 0., 0.
12324.9, 0.0298, 0.
34733.9, 0.0904, 0.
56582.6, 0.1503, 0.
75630.3, 0.2103, 0.
93557.4, 0.2699, 0.
101961., 0.3, 0.
*Uniaxial Test Data
-8.11848e+06, -0.693564, 0.
-6.44076e+06, -0.692074, 0.
-4.99052e+06, -0.687624, 0.
-4.13744e+06, -0.685, 0.
-3.12796e+06, -0.677228, 0.
-1.91943e+06, -0.657921, 0.
-1.03791e+06, -0.619307, 0.
-568720., -0.552475, 0.
-398104., -0.49901, 0.
-270142., -0.400248, 0.
-213270., -0.288861, 0.
-184834., -0.226485, 0.
-170616., -0.123267, 0.
-99526.1, -0.0497525, 0.
0., 0., 0.
*Material, name="Regufoam® 510"
*Density
460.,
*Hyperfoam, n=2, testdata
*Simple Shear Test Data
0., 0., 0.
21568.6, 0.0298, 0.
60784.4, 0.0904, 0.
99019.6, 0.1503, 0.
132353., 0.2103, 0.
163725., 0.2699, 0.
178431., 0.3, 0.
*Uniaxial Test Data
*Material, name="Regufoam® 570"
*Density
561.,
*Hyperfoam, n=2, testdata
*Simple Shear Test Data
0., 0., 0.
42291.4, 0.0298, 0.
119185., 0.0904, 0.
194156., 0.1503, 0.
259516., 0.2103, 0.
321030., 0.2699, 0.
349865., 0.3, 0.
*Uniaxial Test Data

Appendix B – Input data for material models in Abaqus
357
-7.79202e+06, -0.611421, 0.
-6.53846e+06, -0.609331, 0.
-5e+06, -0.60376, 0.
-3.7037e+06, -0.594011, 0.
-2.70655e+06, -0.580084, 0.
-2.00855e+06, -0.559889, 0.
-1.55271e+06, -0.534819, 0.
-1.19658e+06, -0.5, 0.
-883191., -0.442201, 0.
-669516., -0.380919, 0.
-541311., -0.299443, 0.
-441595., -0.226323, 0.
-370370., -0.151114, 0.
-313390., -0.112117, 0.
-213675., -0.0731198, 0.
-56980., -0.0243733, 0.
0., 0., 0.
-8.04739e+06, -0.540964, 0.
-7.15166e+06, -0.536145, 0.
-5.81517e+06, -0.529518, 0.
-4.891e+06, -0.524096, 0.
-3.95261e+06, -0.515663, 0.
-3.1564e+06, -0.506024, 0.
-2.38863e+06, -0.486145, 0.
-1.84834e+06, -0.462048, 0.
-1.4218e+06, -0.429518, 0.
-1.13744e+06, -0.391566, 0.
-924171., -0.340964, 0.
-796209., -0.289157, 0.
-639810., -0.214458, 0.
-540284., -0.154217, 0.
-483412., -0.127108, 0.
-369668., -0.095181, 0.
-255924., -0.062048, 0.
-99526.1, -0.019277, 0.
0., 0., 0.
*Material, name="Regufoam® 680"
*Density
637.,
*Hyperfoam, n=2, testdata
*Simple Shear Test Data
0., 0., 0.
61624.6, 0.0298, 0.
173670., 0.0904, 0.
282913., 0.1503, 0.
378151., 0.2103, 0.
467787., 0.2699, 0.
509804., 0.3, 0.
*Uniaxial Test Data
-8.05285e+06, -0.496936, 0.
-6.67276e+06, -0.480223, 0.
-5.3455e+06, -0.467967, 0.
-4.31098e+06, -0.453482, 0.
-3.38616e+06, -0.440111, 0.
-2.43293e+06, -0.414485, 0.
-1.69309e+06, -0.37493, 0.
-1.29472e+06, -0.330362, 0.
-1.03862e+06, -0.286908, 0.
-882114., -0.23454, 0.
-711381., -0.179944, 0.
-583333., -0.129248, 0.
-398374., -0.0841226, 0.
-184959., -0.0428969, 0.
0., 0., 0.
*Material, name="Regupol 480"
*Density
545.,
*Hyperfoam, n=2, testdata
*Simple Shear Test Data
0., 0., 0.
6114.4, 0.01, 0.
14990.1, 0.0301, 0.
21301.8, 0.0485, 0.
32741.6, 0.0887, 0.
48126.2, 0.1509, 0.
64497., 0.2301, 0.
78698.2, 0.2995, 0.
*Uniaxial Test Data
-8.00893e+06, -0.61568, 0.
-5.98661e+06, -0.593873, 0.
-4.09821e+06, -0.572066, 0.
-2.34375e+06, -0.548806, 0.
-1.45982e+06, -0.527726, 0.
-870536., -0.487747, 0.
-562500., -0.429595, 0.
-348214., -0.343094, 0.
-241071., -0.273313, 0.
-174107., -0.186812, 0.
-133929., -0.135202, 0.
-80357.1, -0.0501558, 0.
0., 0., 0.
*Material, name=" Regupol 550"
*Density
698.,
*Hyperfoam, n=2, testdata
*Simple Shear Test Data

Marko M. Marinković Innovative system for seismic resistant masonry
infills in reinforced concrete frame structures
358
0., 0., 0.
12228.8, 0.01, 0.
29980.3, 0.0301, 0.
42603.6, 0.0485, 0.
65483.2, 0.0887, 0.
96252.4, 0.1509, 0.
128994., 0.2301, 0.
157396., 0.2995, 0.
*Uniaxial Test Data
-8.13076e+06, -0.510719, 0.
-7.34175e+06, -0.497478, 0.
-6.00446e+06, -0.47541, 0.
-4.35958e+06, -0.449559, 0.
-3.16939e+06, -0.424968, 0.
-2.50074e+06, -0.410467, 0.
-1.81872e+06, -0.388398, 0.
-1.32392e+06, -0.364439, 0.
-842496., -0.315259, 0.
-561664., -0.258512, 0.
-374443., -0.199243, 0.
-307578., -0.165826, 0.
-254086., -0.139975, 0.
-187221., -0.09836, 0.
-133730., -0.0491803, 0.
0., 0., 0.

Curriculum vitae
359
Curriculum vitae
Marko Marinković was born on July 04, 1988 in Belgrade,
where he completed his elementary and high school. He
enrolled Bachelor studies in structural engineering at the
Faculty of Civil Engineering, University of Belgrade in 2007
and graduated in 2011 with the average grade of 8.90/10 and a
grade 10 on his final project. He enrolled a Master programme
in structural engineering at the University of Belgrade, Faculty
of Civil Engineering in 2011 and graduated in 2012 with the average grade of 9.57/10
and a grade 10 on his final project titled ―Dynamic characteristics of reinforced concrete
frame structures with masonry infill‖. Marko began his PhD studies at the University of
Belgrade‘s Faculty of Civil Engineering in 2012. He passed all the exams envisioned by
the programme with an average grade of 9.63/10.
In the period from July till September 2011, he did an internship in Austria in the
company ALPINE Bau GmbH. As a scholarship holder of ,,Zoran Djindjic Foundation‖,
in the period from July until October 2012, he did an internship in Germany in the
company Herrenknecht AG.
Since January 2013 he has been working at the Faculty of Civil Engineering, University
of Belgrade as a teaching assistant, at the Chair of Engineering Mechanics and Theory
of Structures.
He is the author and co-author of several papers published in journals and proceedings
from conferences. Published papers present research results from the field of earthquake
engineering related to reinforced concrete buildings and masonry structures.
Since 2014, he has been participated as the Scholarship Holder in the international PhD
program SEEFORM (South Eastern European Graduate School for Master and PhD),
financed by DAAD. During the research stays at the RWTH Aachen University
(Lehrstuhl für Baustatik and Baudynamik, Center for Wind and Earthquake
Engineering) he worked on his thesis with Prof. Dr.-Ing. Christoph Butenweg.
Marko Marinković is fluent in written and spoken English and German. He is married
and has one child.

Биографија аутора
360
Биографија аутора
Марко Маринковић је рођен 04.07.1988. год. у Београду, где
је завршио основну школу и гимназију. Основне академске
студије на Грађевинском факултету Универзитета у Београду
уписао је 2007. год., а завршио у октобру 2011. године са
просечном оценом 8.90/10 и оценом 10 на дипломском раду.
Мастер академске студије на Грађевинском факултету
Универзитета у Београду уписао је 2011. год., а завршио у
јулу 2012. год. са просечном оценом 9.57/10 и оценом 10 на мастер раду под
насловом „Динамичке карактеристике армиранобетонских скелетних конструкција
са зиданом испуном―. Марко је 2012. год. уписао докторске академске студије на
Грађевинском факултету Универзитета у Београду. Положио је све испите
предвиђене програмом докторских студија са просечном оценом 9.63/10.
У периоду јул-септембар 2011. год. био је на стручној пракси у Аустрији
компанији ALPINE Bau GmbH. Као стипендиста ,,Фондације др Зоран Ђинђић‖, у
периоду од јула до октобра 2012. год. био је на стручној пракси у компанији
,,Herrenknecht AG‖ у Немачкој.
Од јануара 2013. год. ради на Грађевинском факултету Универзитета у Београду
као асистент-студент докторских студија, на Катедри за Техничку механику и
теорију конструкција.
Марко је аутор и коаутор више радова објављених у часописима и зборницима
радова са конференција. Публиковани радови презентују резултате истраживања у
области земљотресног инжењерства армиранобетонских и зиданих конструкција.
Од 2014. године као стипендиста учествује у међународном програму SEEFORM
(South Eastern European Graduate School for Master and Ph.D. Formation in
Engineering), који финансира DAAD. У оквиру тог програма је за време студијског
боравка код Prof. Dr.-Ing. Christopha Butenwega на RWTH Aachen Универзитету
радио на докторској тези.
Марко Маринковић течно говори и пише енглески и немачки језик. Ожењен је и
отац је једног детета.

Изјава о ауторству
Име и презиме аутора: Mарко Маринковић
Број индекса: 902/12
Изјављујем
да је докторска дисертација под насловом:
INNOVATIVE SYSTEM FOR SEISMIC RESISTANT MASONRY INFILLS IN
REINFORCED CONCRETE FRAME STRUCTURES
(на српском језику: ИНОВАТИВНИ СИСТЕМ ЗА СЕИЗМИЧКИ ОТПОРНУ
ЗИДАНУ ИСПУНУ У АРМИРАНОБЕТОНСКИМ РАМОВСКИМ
КОНСТРУКЦИЈАМА)
резултат сопственог истраживачког рада;
да дисертација у целини ни у деловима није била предложена за стицање друге
дипломе према студијским програмима других високошколских установа;
да су резултати коректно наведени и
да нисам кршио/ла ауторска права и користио/ла интелектуалну својину других
лица.
Потпис аутора
У Београду, 25.06.2018. године
_________________________

Изјава o истоветности штампане и електронске верзије
докторског рада
Име и презиме аутора: Марко Маринковић
Број индекса: 902/12
Студијски програм: Докторске студије - Грађевинарство
Наслов рада: INNOVATIVE SYSTEM FOR SEISMIC RESISTANT MASONRY
INFILLS IN REINFORCED CONCRETE FRAME STRUCTURES
Наслов рада на српском језику: ИНОВАТИВНИ СИСТЕМ ЗА СЕИЗМИЧКИ
ОТПОРНУ ЗИДАНУ ИСПУНУ У АРМИРАНОБЕТОНСКИМ РАМОВСКИМ
КОНСТРУКЦИЈАМА―
Ментори: Prof. Dr.-Ing. Christoph Butenweg Center for Wind and Earthquake Engineering, RWTH Aachen University, Ger-
many
Др Растислав Мандић, редовни професор
Универзитет у Београду, Грађевински факултет
Изјављујем да је штампана верзија мог докторског рада истоветна електронској верзији
коју сам предао/ла ради похрањена у Дигиталном репозиторијуму Универзитета у
Београду.
Дозвољавам да се објаве моји лични подаци везани за добијање академског назива
доктора наука, као што су име и презиме, година и место рођења и датум одбране рада.
Ови лични подаци могу се објавити на мрежним страницама дигиталне библиотеке, у
електронском каталогу и у публикацијама Универзитета у Београду.
Потпис аутора
У Београду, 25.06.2018. године
_________________________

Изјава о коришћењу
Овлашћујем Универзитетску библиотеку „Светозар Марковић― да у Дигитални
репозиторијум Универзитета у Београду унесе моју докторску дисертацију под насловом:
INNOVATIVE SYSTEM FOR SEISMIC RESISTANT MASONRY INFILLS IN
REINFORCED CONCRETE FRAME STRUCTURES (на српском језику:
ИНОВАТИВНИ СИСТЕМ ЗА СЕИЗМИЧКИ ОТПОРНУ ЗИДАНУ ИСПУНУ
У АРМИРАНОБЕТОНСКИМ РАМОВСКИМ КОНСТРУКЦИЈАМА ) која је моје
ауторско дело.
Дисертацију са свим прилозима предао/ла сам у електронском формату погодном за
трајно архивирање.
Моју докторску дисертацију похрањену у Дигиталном репозиторијуму Универзитета у
Београду и доступну у отвореном приступу могу да користе сви који поштују одредбе
садржане у одабраном типу лиценце Креативне заједнице (Creative Commons) за коју сам
се одлучио/ла.
1. Ауторство (CC BY)
2. Ауторство – некомерцијално (CC BY-NC)
3. Ауторство – некомерцијално – без прерада (CC BY-NC-ND)
4. Ауторство – некомерцијално – делити под истим условима (CC BY-NC-SA)
5. Ауторство – без прерада (CC BY-ND)
6. Ауторство – делити под истим условима (CC BY-SA)
(Молимо да заокружите само једну од шест понуђених лиценци.
Кратак опис лиценци је саставни део ове изјаве).
Потпис аутора
У Београду, 25.06.2018. године
____________________