Innovative tools CBS
47
Innovative Visual Tools for Data Editing Martijn Tennekes Edwin de Jonge, Piet Daas 24-26 September 2012
-
Upload
independent -
Category
Documents
-
view
4 -
download
0
Transcript of Innovative tools CBS

Innovative Visual Tools for DataEditing
Martijn TennekesEdwin de Jonge, Piet Daas
24-26 September 2012

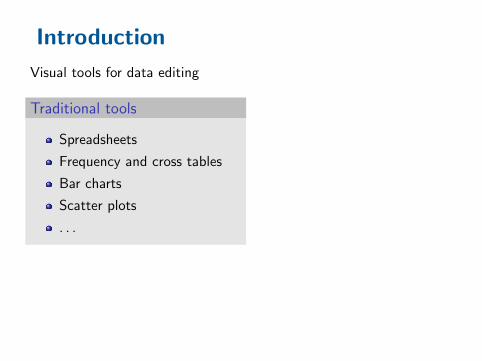
Introduction
Visual tools for data editing
Introduction
Visual tools for data editing
Traditional tools
Spreadsheets
Frequency and cross tables
Bar charts
Scatter plots
. . .

Introduction
Visual tools for data editing
Traditional tools
Spreadsheets
Frequency and cross tables
Bar charts
Scatter plots
. . .
Not always suitable for
Hierarchical data
Multivariate data
BIG data

Introduction
Visual tools for data editing
Traditional tools
Spreadsheets
Frequency and cross tables
Bar charts
Scatter plots
. . .
Not always suitable for
Hierarchical data
Multivariate data
BIG data

Introduction
Visual tools for data editing
Traditional tools
Spreadsheets
Frequency and cross tables
Bar charts
Scatter plots
. . .
Not always suitable for
Hierarchical data
Multivariate data
BIG data

Introduction
Visual tools for data editing
Traditional tools
Spreadsheets
Frequency and cross tables
Bar charts
Scatter plots
. . .
Not always suitable for
Hierarchical data
Multivariate data
BIG data

Introduction
Visual tools for data editing
Traditional tools
Spreadsheets
Frequency and cross tables
Bar charts
Scatter plots
. . .
Not always suitable for
Hierarchical data
Multivariate data
BIG data
Novel tools
Treemap
Tableplot

Introduction
Visual tools for data editing
Traditional tools
Spreadsheets
Frequency and cross tables
Bar charts
Scatter plots
. . .
Not always suitable for
Hierarchical data
Multivariate data
BIG data
Novel tools
Treemap
TableplotGrowth w.r.t. last year
−100% −80% −60% −40% −20% 0% 200% 400% 600% 800%
Total value added in the sector Manufacturing
151153
154
155
156
157
158
159
160
172 173
175
193
211
212221
222
241
243
244
245
246
247
262268
271272
274
275
281
282
283
284
285 286
287
291
292293
294
295
296297
300
311
312313315
316
321
322323
331 332
333334
341
342
351
352
353
354
361
362365
366
371
372
Food, beverages, and tobacco
Textiles
and
textile
products
Wood and woodproducts
Pulp, paper,publishing,and printingCoke, petroleum products,
and nuclear fuel
Chemicals, chemical products
Rubber andplastic products
Other non−metallicmineral products
Metals and metal products
Machinery andequipment n.e.c.
Electrical andoptical equipment
Transportequipment
N.e.c.
0%
10%
20%
30%
40%
50%
60%
70%
80%
90%
100%
row bins: 100
objects: 51621
log(turnover) turnover_cat
< 00(0, 10)[10, 100)[100, 1,000)[1,000, 10,000)[10,000, 100,000)[100,000, 1 mln)[1 mln, 10 mln)>= 10 mln
missing
log(employees) employees_cat
012−45−910−1920−4950−99100−199200−499500+
missing
legal_form
Natural person
Legal person
missing
sector
Agriculture Mining and quarryingManufacturingElectricity, gas, water supplyConstructionWholesale and retail tradeHotels and restaurantsTransp., storage, comm.Real est., renting, bus. act.Health and social workOth. comm., soc., pers.serv.
size
012−45−910−1920−4950−99100−199200−499500+

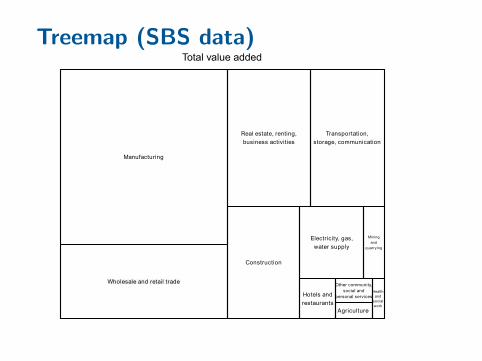
Treemap (SBS data)Total value added
Treemap (SBS data)Total value added
Agriculture
Mining
and
quarrying
Manufacturing
Electricity, gas,
water supply
Construction
Wholesale and retail trade
Hotels and
restaurants
Transportation,
storage, communication
Real estate, renting,
business activities
Healthand
socialwork
Other community,social and
personal services
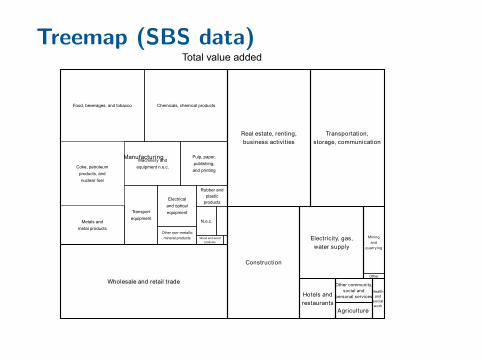
Treemap (SBS data)Total value added
Other
Food, beverages, and tobacco
Wood and woodproducts
Pulp, paper,
publishing,
and printingCoke, petroleum
products, and
nuclear fuel
Chemicals, chemical products
Rubber and
plastic
products
Other non−metallic
mineral products
Metals and
metal products
Machinery and
equipment n.e.c.
Electrical
and optical
equipmentTransport
equipmentN.e.c.
Agriculture
Mining
and
quarrying
Manufacturing
Electricity, gas,
water supply
Construction
Wholesale and retail trade
Hotels and
restaurants
Transportation,
storage, communication
Real estate, renting,
business activities
Healthand
socialwork
Other community,social and
personal services

Treemap (SBS data)
Growth w.r.t. last year−15% −10% −5% 0% 5% 10% 15% 20% 25%
Total value added
Other
Food, beverages, and tobacco
Wood and woodproducts
Pulp, paper,
publishing,
and printingCoke, petroleum
products, and
nuclear fuel
Chemicals, chemical products
Rubber andplastic
products
Other non−metallic
mineral products
Metals and
metal products
Machinery and
equipment n.e.c.
Electrical
and optical
equipmentTransport
equipmentN.e.c.
Agriculture
Mining
and
quarrying
Manufacturing
Electricity, gas,water supply
Construction
Wholesale and retail trade
Hotels andrestaurants
Transportation,storage, communication
Real estate, renting,business activities
Healthand
socialwork
Other community,social and
personal services

Treemap: zooming in
Growth w.r.t. last year−100% −80% −60% −40% −20% 0% 200% 400% 600% 800%
Total value added in the sector Manufacturing
151153
154
155
156
157
158
159
160
172 173
175
193
211
212221
222
241
243
244
245
246
247
262268
271272
274
275
281
282
283
284
285 286
287
291
292293
294
295
296297
300
311
312313315
316
321
322323
331 332
333334
341
342
351
352
353
354
361
362365
366
371
372
Food, beverages, and tobacco
Textiles
and
textile
products
Wood and woodproducts
Pulp, paper,publishing,and printingCoke, petroleum products,
and nuclear fuel
Chemicals, chemical products
Rubber andplastic products
Other non−metallicmineral products
Metals and metal products
Machinery andequipment n.e.c.
Electrical andoptical equipment
Transportequipment
N.e.c.

Treemap: densities
Turnover (in millions) per person employed0 1 2 3 4 5 6 7
Number of persons employed in the sector Manufacturing
151
152153
154
155
156
157
158
159
160
171172
173
176191
192
193
201204 205
211
212
221
222
223
241
242
243
244
245
246
247
251
262
263
266
267268
271
272
273274
275
281
282
283
284
285
286287
291292
293294295
297
300 311312
313
314
315
316
321
322
323
331
332 333
334335
341
342343
351
352353
354
361362
363
364365
366
371372
Food, beverages, and tobacco
Textiles andtextile products
Wood andwood
products
Pulp, paper, publishing, and printing
Coke,petroleumproducts,
and nuclearfuel
Chemicals,chemical products
Rubber andplastic products
Othernon−metallic
mineralproducts
Metals and metal products Machinery and equipment n.e.c.
Electrical and optical equipment
Transport equipment
N.e.c.

Treemap: trade statistics
Relative difference in % with import XX from NL
Export from NL to EU countries

Treemap
Useful to explore hierarchical data
Follows the top-down approach of data editing
Implementation in R:
Package treemapInteractive use is very limitedCan be used with other tools

Treemap
Useful to explore hierarchical data
Follows the top-down approach of data editing
Implementation in R:
Package treemapInteractive use is very limitedCan be used with other tools

Treemap
Useful to explore hierarchical data
Follows the top-down approach of data editing
Implementation in R:
Package treemapInteractive use is very limitedCan be used with other tools

Treemap
Useful to explore hierarchical data
Follows the top-down approach of data editing
Implementation in R:
Package treemapInteractive use is very limitedCan be used with other tools

Treemap
Useful to explore hierarchical data
Follows the top-down approach of data editing
Implementation in R:
Package treemapInteractive use is very limitedCan be used with other tools

Treemap
Useful to explore hierarchical data
Follows the top-down approach of data editing
Implementation in R:
Package treemapInteractive use is very limitedCan be used with other tools

Tableplot: SBS data (unprocessed)
objects:51621
turnover turnover_cat employees employees_cat legal_form sector size
1758 [1,000, 10,000) 17 10-19 Legal person Real est., renting, bus. act. 20-49
4 [10, 100) 3 2-4 Natural person Wholesale and retail trade 2-4
84 [10, 100) 1 1 Natural person Manufacturing 2-4
11778 [10,000, 100,000) 69 50-99 Legal person Wholesale and retail trade 50-99
10 [10, 100) 7 5-9 Legal person Health and social work 5-9
438 [100, 1,000) 4 5-9 Legal person Wholesale and retail trade 2-4
134 [100, 1,000) 3 1 Natural person Manufacturing 2-4
1394 [1,000, 10,000) 20 10-19 Legal person Real est., renting, bus. act. 10-19
164 [100, 1,000) 3 2-4 Natural person Real est., renting, bus. act. 2-4
21700 [10,000, 100,000) 76 50-99 Natural person Wholesale and retail trade 50-99
872 [100, 1,000) 14 10-19 Legal person Manufacturing 10-19
158 [100, 1,000) 4 2-4 Legal person Real est., renting, bus. act. 2-4
57120 [10,000, 100,000) 211 200-499 Legal person Manufacturing 100-199
9 [10, 100) 0 1 Natural person Wholesale and retail trade 1
99296 [10,000, 100,000) 127 100-199 Legal person Manufacturing 50-99
695 [100, 1,000) 5 2-4 Natural person Real est., renting, bus. act. 2-4
55618 [10,000, 100,000) 362 200-499 Legal person Manufacturing 200-499
1113 [1,000, 10,000) 17 10-19 Legal person Hotels and restaurants 10-19
7478 [1,000, 10,000) 3 5-9 Legal person Wholesale and retail trade 10-19
8662 [1,000, 10,000) 75 50-99 Legal person Transp., storage, comm. 100-199
8633 [1,000, 10,000) 36.08 20-49 Legal person Manufacturing 20-49
1028 [1,000, 10,000) 1 5-9 Legal person Wholesale and retail trade 20-49
183 [100, 1,000) 0.2 2-4 Natural person Wholesale and retail trade 2-4
25 [10, 100) 1.6 1 Natural person Real est., renting, bus. act. 1
7182 [1,000, 10,000) 82 50-99 Legal person Construction 10-19
2005 [1,000, 10,000) 3 0 Legal person Real est., renting, bus. act. 20-49
10398 [10,000, 100,000) 8 10-19 Legal person Real est., renting, bus. act. 100-199
2245 [1,000, 10,000) 34 20-49 Legal person Real est., renting, bus. act. 20-49
4903 [1,000, 10,000) 18 10-19 Legal person Wholesale and retail trade 20-49
68 [10, 100) -1 1 Legal person Real est., renting, bus. act. 2-4
... ... ... ... ... ... ...

Tableplot: SBS data (unprocessed)
objects:51621
turnover turnover_cat employees employees_cat legal_form sector size
8124110 [1 mln, 10 mln) 17172 500+ Legal person Transp., storage, comm. 500+
7375977 [1 mln, 10 mln) 1865 500+ Legal person Mining and quarrying 500+
5496033 [1 mln, 10 mln) 1366 500+ Legal person Electricity, gas, water supply 500+
4421226 [1 mln, 10 mln) 431 200-499 Legal person Wholesale and retail trade 200-499
4386360 [1 mln, 10 mln) 1036 500+ Legal person Manufacturing 500+
4275533 [1 mln, 10 mln) 136 100-199 Legal person Electricity, gas, water supply 100-199
4031636 [1 mln, 10 mln) 12 10-19 Legal person Wholesale and retail trade 20-49
4012386 [1 mln, 10 mln) 9187 500+ Legal person Manufacturing 500+
3909439 [1 mln, 10 mln) 1004 500+ Legal person Wholesale and retail trade 500+
3133380 [1 mln, 10 mln) 213 200-499 Legal person Wholesale and retail trade 200-499
3095844 [1 mln, 10 mln) 3747 500+ Legal person Wholesale and retail trade 500+
2931738 [1 mln, 10 mln) 491 200-499 Legal person Wholesale and retail trade 200-499
2883939 [1 mln, 10 mln) 3166 500+ Legal person Manufacturing 500+
2768831 [1 mln, 10 mln) 4113 500+ Legal person Manufacturing 500+
2272912 [1 mln, 10 mln) 1695 500+ Legal person Manufacturing 500+
2250557 [1 mln, 10 mln) 229 200-499 Legal person Wholesale and retail trade 50-99
2162875 [1 mln, 10 mln) 294 200-499 Legal person Wholesale and retail trade 200-499
2049469 [1 mln, 10 mln) 4124 500+ Legal person Real est., renting, bus. act. 500+
1952200 [1 mln, 10 mln) 1309 500+ Legal person Electricity, gas, water supply 500+
1945146 [1 mln, 10 mln) 336 200-499 Legal person Manufacturing 200-499
1840955 [1 mln, 10 mln) 415 200-499 Legal person Manufacturing 200-499
1724782 [1 mln, 10 mln) 168 100-199 Legal person Wholesale and retail trade 100-199
1721028 [1 mln, 10 mln) 2787 500+ Legal person Transp., storage, comm. 500+
1499374 [1 mln, 10 mln) 105 100-199 Legal person Electricity, gas, water supply 200-499
1406432 [1 mln, 10 mln) 943 500+ Legal person Wholesale and retail trade 500+
1361787 [1 mln, 10 mln) 710 500+ Legal person Manufacturing 500+
1329278 [1 mln, 10 mln) 5841 500+ Legal person Wholesale and retail trade 500+
1320454 [1 mln, 10 mln) 5032 500+ Legal person Manufacturing 500+
1318814 [1 mln, 10 mln) 30 20-49 Legal person Wholesale and retail trade 20-49
1316711 [1 mln, 10 mln) 2055 500+ Legal person Electricity, gas, water supply 500+
... ... ... ... ... ... ...

Tableplot: SBS data (unprocessed)
objects:51621
turnover turnover_cat employees employees_cat legal_form sector size

Tableplot: SBS data (unprocessed)0%
10%
20%
30%
40%
50%
60%
70%
80%
90%
100%
row bins:100
objects:51621
turnover turnover_cat employees employees_cat legal_form sector size
Tableplot: SBS data (unprocessed)0%
10%
20%
30%
40%
50%
60%
70%
80%
90%
100%
row bins:100
objects:51621
log(turnover) turnover_cat log(employees) employees_cat legal_form sector size

Tableplot: SBS data (unprocessed)0%
10%
20%
30%
40%
50%
60%
70%
80%
90%
100%
row bins:100
objects:51621
log(turnover) turnover_cat log(employees) employees_cat legal_form
Natural person
Legal person
missing
sector size

Tableplot: SBS data (unprocessed)0%
10%
20%
30%
40%
50%
60%
70%
80%
90%
100%
row bins:100
objects:51621
log(turnover) turnover_cat
< 00(0, 10)[10, 100)[100, 1,000)[1,000, 10,000)[10,000, 100,000)[100,000, 1 mln)[1 mln, 10 mln)>= 10 mln
missing
log(employees) employees_cat legal_form
Natural person
Legal person
missing
sector size

Tableplot: SBS data (unprocessed)0%
10%
20%
30%
40%
50%
60%
70%
80%
90%
100%
row bins:100
objects:51621
log(turnover) turnover_cat
< 00(0, 10)[10, 100)[100, 1,000)[1,000, 10,000)[10,000, 100,000)[100,000, 1 mln)[1 mln, 10 mln)>= 10 mln
missing
log(employees) employees_cat
012−45−910−1920−4950−99100−199200−499500+
missing
legal_form
Natural person
Legal person
missing
sector
AgricultureMining and quarryingManufacturingElectricity, gas, water supplyConstructionWholesale and retail tradeHotels and restaurantsTransp., storage, comm.Real est., renting, bus. act.Health and social workOth. comm., soc., pers.serv.
size

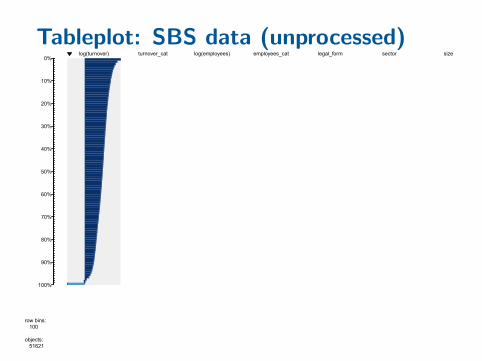
Tableplot: SBS data (unprocessed)0%
10%
20%
30%
40%
50%
60%
70%
80%
90%
100%
row bins: 100
objects: 51621
log(turnover) turnover_cat
< 00(0, 10)[10, 100)[100, 1,000)[1,000, 10,000)[10,000, 100,000)[100,000, 1 mln)[1 mln, 10 mln)>= 10 mln
missing
log(employees) employees_cat
012−45−910−1920−4950−99100−199200−499500+
missing
legal_form
Natural person
Legal person
missing
sector
Agriculture Mining and quarryingManufacturingElectricity, gas, water supplyConstructionWholesale and retail tradeHotels and restaurantsTransp., storage, comm.Real est., renting, bus. act.Health and social workOth. comm., soc., pers.serv.
size
012−45−910−1920−4950−99100−199200−499500+

Tableplot: SBS data (edited)0%
10%
20%
30%
40%
50%
60%
70%
80%
90%
100%
row bins: 100
objects: 51621
log(turnover) turnover_cat
< 00(0, 10)[10, 100)[100, 1,000)[1,000, 10,000)[10,000, 100,000)[100,000, 1 mln)[1 mln, 10 mln)>= 10 mln
missing
log(employees) employees_cat
012−45−910−1920−4950−99100−199200−499500+
missing
legal_form
Natural person
Legal person
missing
sector
Agriculture Mining and quarryingManufacturingElectricity, gas, water supplyConstructionWholesale and retail tradeHotels and restaurantsTransp., storage, comm.Real est., renting, bus. act.Health and social workOth. comm., soc., pers.serv.
size
012−45−910−1920−4950−99100−199200−499500+

Tableplot: SBS data (analysed)0%
10%
20%
30%
40%
50%
60%
70%
80%
90%
100%
row bins: 100
objects: 48847
log(turnover) turnover_cat
< 00(0, 10)[10, 100)[100, 1,000)[1,000, 10,000)[10,000, 100,000)[100,000, 1 mln)[1 mln, 10 mln)>= 10 mln
log(employees) employees_cat
012−45−910−1920−4950−99100−199200−499500+
missing
legal_form
Natural person
Legal person
sector
Agriculture Mining and quarryingManufacturingElectricity, gas, water supplyConstructionWholesale and retail tradeHotels and restaurantsTransp., storage, comm.Real est., renting, bus. act.Health and social workOth. comm., soc., pers.serv.
size
12−45−910−1920−4950−99100−199200−499500+

Tableplot: prodcom (large industries)0%
10%
20%
30%
40%
50%
60%
70%
80%
90%
100%
row bins: 100
objects: 5060
log(production_value) size_class
4
5
6
7
8
9
sector_BR
AABAELHOMEPATETRVO
missing
number_of_PCC
1
2
3
4
5
6−9
10+
frac_PCC_BR sector_mainPCC
AABAELHOMEPAServicesTETRVO
missing
sector_BR=sector_mainPCC
TRUE
FALSE
missing

Tableplot: prodcom (large industries)0%
10%
20%
30%
40%
50%
60%
70%
80%
90%
100%
row bins: 100
objects: 5060
production_value size_class
4
5
6
7
8
9
sector_BR
AABAELHOMEPATETRVO
missing
number_of_PCC
1
2
3
4
5
6−9
10+
frac_PCC_BR sector_mainPCC
AABAELHOMEPAServicesTETRVO
missing
sector_BR=sector_mainPCC
TRUE
FALSE
missing

Tableplot: virtual census0%
10%
20%
30%
40%
50%
60%
70%
80%
90%
100%
row bins: 100
objects: 16408487
Age Age groups
0 − 910 − 1920 − 2930 − 3940 − 4950 − 5960 − 6970 − 7980 − 8990 − 99100+
Gender
Male
Female
Marital status
Never married
Married
Widowed
Divorced
Civil partnership
Position in household
ChildInstitutionalLiving alonePartnership without childrenMarried without childrenPartnership with childrenMarried with childrenSingle−parentReference person in other hhOther
missing
Household size
123456 − 1011 or more
missing
Level of education
No formal educationPrimary educLow. Sec. educUpper Sec. educPost Sec. non−tertiary educBachelor / MasterNot applicable (persons < 15yr)PhD
missing
Activity status
Not applicableEmployedPensionStudentsOthersHomemakersUnemployed
missing

Tableplot: policy record administration0%
10%
20%
30%
40%
50%
60%
70%
80%
90%
100%
row bins:100
objects:20207271
log(Income_tax) Birth_year
1753...1923...1952...1981...2010
missing
Gender
1
2
missing
Sector
01110...27900...46732...69105...99000
missing
Collective_agreement
0...552...1283...2066...9999
missing
Risk_group
012345678912353799
missing
Wages Travel_costs Size
001021223040506071728182919293
missing
FTE

Tableplot
Useful to explore BIG multivariate data
Strange data patternsSelectivity of missing valuesCorrelation between variables
Implementation in R:
Package tabplotOld graphical user interface: package tabplotGTKInteractive web-based interface: package tabplotd3

Tableplot
Useful to explore BIG multivariate data
Strange data patternsSelectivity of missing valuesCorrelation between variables
Implementation in R:
Package tabplotOld graphical user interface: package tabplotGTKInteractive web-based interface: package tabplotd3

Tableplot
Useful to explore BIG multivariate data
Strange data patternsSelectivity of missing valuesCorrelation between variables
Implementation in R:
Package tabplotOld graphical user interface: package tabplotGTKInteractive web-based interface: package tabplotd3

Tableplot
Useful to explore BIG multivariate data
Strange data patternsSelectivity of missing valuesCorrelation between variables
Implementation in R:
Package tabplotOld graphical user interface: package tabplotGTKInteractive web-based interface: package tabplotd3

Tableplot
Useful to explore BIG multivariate data
Strange data patternsSelectivity of missing valuesCorrelation between variables
Implementation in R:
Package tabplotOld graphical user interface: package tabplotGTKInteractive web-based interface: package tabplotd3
Tableplot
Useful to explore BIG multivariate data
Strange data patternsSelectivity of missing valuesCorrelation between variables
Implementation in R:
Package tabplotOld graphical user interface: package tabplotGTKInteractive web-based interface: package tabplotd3

References
Tennekes, M., Jonge, E. de (2011) Top-down data analysiswith treemaps. Proceedings of the International Conferenceon Information Visualization Theory and Applications, IVAPP2011, Algarve, Portugal.
Tennekes, M., Jonge, E. de, Daas, P.J.H. (2013) Visualizingand Inspecting Large Datasets with Tableplots, Forthcomingin Journal of Data Science.
All R-packages are available on CRAN. Development sites:
treemap: code.google.com/p/treemap-package/tabplot: code.google.com/p/tableplot/tabplotd3 : code.google.com/p/tabplotd3/