
Dividends and abnormal return - CBS Research Portal
108
Dividends and abnormal return Can a change in the dividend corporate policy influence the stock’s return? A Master’s Thesis By Edoardo Toschi Vito Fasano MSc. Accounting, Strategy and Control Copenhagen Business School Academic Supervisor: Edward Vali Dep. of Accounting & Auditing, Copenhagen Business School September 14, 2018
-
Upload
khangminh22 -
Category
Documents
-
view
1 -
download
0
Transcript of Dividends and abnormal return - CBS Research Portal

Dividends and abnormal return
Can a change in the dividend corporate policy influence the stock’s return?
A Master’s Thesis By
Edoardo Toschi Vito Fasano
MSc. Accounting, Strategy and Control
Copenhagen Business School
Academic Supervisor: Edward Vali
Dep. of Accounting & Auditing, Copenhagen Business School
September 14, 2018

CBS | Copenhagen Business School | MSc ASC ii
The authors would like to thank our supervisor Edward Vali for always patiently listening to
our, at times, peculiar questions.

CBS | Copenhagen Business School | MSc ASC iii
Abstract
The purpose of this thesis is to analyze the correlation between the abnormal returns and the
dividend policy linked to the same security. The study will be addressed on an equity basket
made up of the 500 largest capitalization companies known as S & P 500. The time span used
will be that of the last twenty years in order to make our study current and possibly useful for
future investigations.
The analysis will include other determinants related to the business sphere in addition to the
specific one concerning the main variables above mentioned, in order to make it more
complete. Two points of view will be considered, managerial and investor. The first will focus
on the use of the dividend policy as a tool for channeling certain information from the
company to the stakeholders and at the same time as through these policies, they can try to
manage their stock price volatility. The second is linked to the theory of behavioral finance
and the clientele effect, underlining how investors with their way of acting different from the
market logic (misbehaving) and with well-defined preferences regarding dividends, influence
in a certain way the management on the definition of company dividend policies.
The starting hypothesis is that there is a positive correlation between changes in the dividend
policy and the generation of abnormal returns, pointing out that within the financial markets
there is no perfect incorporation of information. All this will be investigated through two linear
regressions based on a previous study by Baskin (1989).
The results stemming from the analysis have been inconsistent with each other. Indeed the
first regression has reported a positive correlation among the abnormal return and the

CBS | Copenhagen Business School | MSc ASC iv
variable related to the dividend. On the other hand, the second regression refuted our initial
hypothesis, with a negative correlation. The results are undermined by the narrowness and
incompleteness of the sample. Hence, our analysis can be discuss qualitatively and further
research can be useful to demonstrate empirically how the behavior of investor affect the
management’s decision concerning the definition of a dividend policy, and mostly, through a
more complete sample and a more in-depth analysis, try to find another piece of the puzzle.

CBS | Copenhagen Business School | MSc ASC v
Table of contents
List of tables ............................................................................................................................ vii
Introduction .............................................................................................................................. 2
Historical background ............................................................................................................ 3
Dividend ................................................................................................................................. 5
Dividend Payment Process ..................................................................................................... 7
Research Question .................................................................................................................. 8
Overview of the findings ...................................................................................................... 13
Outline .................................................................................................................................. 13
Limitations ........................................................................................................................... 14
Methodology ........................................................................................................................... 15
Literature .............................................................................................................................. 15
Theoretical approach ............................................................................................................ 16
Quantitative method: Regression Analysis .......................................................................... 17
Regression analysis set-up ................................................................................................... 18
Time frame of the analysis and the overfitting issue ........................................................... 21
Literature Review ................................................................................................................... 22
Irrelevance of dividend policy ........................................................................................... 22
Modigliani e Miller .......................................................................................................... 23
Black and Scholes ............................................................................................................ 25
Relevance of dividend policy ............................................................................................. 27
Based on the uncertainty of future dividends, The “Bird in the hand” Theory. ............... 28
Based on information content of dividends, The Signalling Theory ............................... 30
Abnormal return to support the Signalling Theory .......................................................... 33
Based on Agency Cost and Cash Flow Theory ................................................................ 35
The Clientele Effect ......................................................................................................... 38
Behavioral Finance ........................................................................................................... 42
Behavioral finance and dividend policy. Why firms pay dividends? ............................... 47
Impact of dividend policy on share price volatility and on firm risk ............................... 48
Data and Sample..................................................................................................................... 51
Standard & Poor’s 500 ......................................................................................................... 52
Dividends and Control variables Data ................................................................................. 54

CBS | Copenhagen Business School | MSc ASC vi
Descriptive statistics ............................................................................................................. 55
The multiple least square regression models ........................................................................ 55
1St regression model ......................................................................................................... 57
2nd regression model ......................................................................................................... 58
Sector Analysis ..................................................................................................................... 62
Analysis ................................................................................................................................... 64
Aim of the analysis ............................................................................................................... 64
Briefing of the research questions ........................................................................................ 65
Analysis development .......................................................................................................... 66
Hypothesis ............................................................................................................................ 67
Expectations about the regression coefficients .................................................................... 69
Results .................................................................................................................................. 71
1st regression function results ........................................................................................... 72
2nd regression function results .......................................................................................... 74
Regression functions per sectors ...................................................................................... 77
Correlation analysis .............................................................................................................. 79
Brief review of the analysis .................................................................................................. 81
Discussion ................................................................................................................................ 82
Conclusion ............................................................................................................................... 86
References ............................................................................................................................... 88
Appendices .............................................................................................................................. 92

CBS | Copenhagen Business School | MSc ASC vii
List of tables
Table 1 Data Sources ................................................................................................................ 52
Table 2 Summary output: Descriptive statistic ........................................................................ 55
Table 3 Regression Variables ................................................................................................... 62
Table 4 GICS sectors ................................................................................................................. 63
Table 5 First Regression: Summary Output ............................................................................. 72
Table 6 Results of the First Regression .................................................................................... 73
Table 7 First regression, lower and upper significance level ................................................... 73
Table 8 Second Regression. Summary Output......................................................................... 75
Table 9 Results of the Second Regression ............................................................................... 76
Table 10 Second regression, Upper and lower level of significance ...................................... 76
Table 11 Summary output. Sectors Analysis ........................................................................... 78
Table 12 Correlation Matrix ..................................................................................................... 80

CBS | Copenhagen Business School | MSc ASC viii

CBS | Copenhagen Business School | MSc ASC 1
"The harder we look at the dividend picture, the more it seems like a puzzle with pieces that
just don’t fit together" (Black, 1976).

CBS | Copenhagen Business School | MSc ASC 2
Chapter 1
Introduction
Despite the fact are decades that the academic world has focused its attention on the solution
of what many call the "dividend puzzle", going through theoretical models and empirical
research to arrive at a resolution, till today there are no theories or models that can
adequately and satisfactorily explain the reasons behind this phenomenon.
The distribution of dividends, to meet the interests of shareholders is still a very common
practice among listed companies, it is one of the most studied financial events on which there
are conflicting opinions. Despite, “the percentage of firms paying out dividends decreased
from 66.5% in 1978 to 20.8% in 1999, due in part to the changing characteristics of publicly
traded firms”1. This changing trend is due to variation of the publicly listed firm’s
characteristics in the recent years. In fact, the increasing number of new listed firms in the US
equity stocks market is mostly composed by small firms with high growth and investment
opportunities that have a lower propensity to pay-out dividends. Moreover, in the Fama and
French (2000) study, it is highlighted that due to the tax disadvantages of the dividends
compared to the share repurchase even the mature firms that used to have a higher
propensity to pay dividends had decreased their trend.
1 Fama, French, “Disappearing dividends: changing firm characteristics or lower propensity to pay?”, 2000

CBS | Copenhagen Business School | MSc ASC 3
However, on the relevance of the practice of dividends considerable discussions and
interpretations have been opened, the best known is the one attributable to the information
they carry with them. The Signalling Hypothesis suggests that there is an information
asymmetry between who is within the company, in this case the managers, and the users of
this information, or the shareholders. Thus, to cope with this gap, managers utilize the
dividends as a tool to transmit private information outside. The theories that have been
developed through the years are many, but they can be divided into two main areas. The first
one, which supports the irrelevance of the theory of dividends, theories that are placed in the
mid-twentieth century and which are the precursors of studies on dividends. These theories
are attributable to Modigliani and Miller and then to Black and Scholes, who laid the
foundations for future research. While, the second, are those that defend the importance of
dividend policies, and how they relate to and influence multiple key indicators of a company's
performance, these are more recent theories that use new models for the study of this
phenomenon, but which do not yet give a unique interpretation.
Historical background
The dividends were born about three hundred years ago in the Netherlands and in Great
Britain, when the first travel companies sell "venture in parts" to their investors. Given the
riskiness of trips that faced, the earning expectations were very high. The distribution of
dividends occurred only through travel profits and was not affecting the firm's capital; it was
immediately clear the importance of paying dividends for the satisfaction of the investors. This
belief, however, led many managers of joint stock companies, to support the payment of

CBS | Copenhagen Business School | MSc ASC 4
dividends despite not having enough resource to do it. Therefore, in 1720, the Bubble Act
passed in Great Britain, which limited the establishment of new joint stock companies.
In the United States the phenomenon had grown rapidly after the American revolution. But
at the beginning of the nineteenth century the dividend became a sort of liquidation rather
than a distribution of profits. In the following years, many fraudulent activities by managers
who wanted to keep high and constant the dividend stream continued to succeed, for that
reasons, in the first half of the century, the first government statutes on dividend payments
were promulgated and at the same time it became a common practice to limit the
responsibility of shareholders. In this period the preferred stocks were born, which initially
were used as a method for capital increase, thanks to the regulation and the definition of a
set of precise characteristics, have evolved into securities.
After the end of the Civil War in the United States, the restored confidence and the flourishing
recovery of the industrial sector caused investors to become more interested in securities and
this allowed the trading market to expand. It is on this thrust of the market and due to the
lack of other financially relevant methods that the valuation of a company, in that historical
period, was based only on the dividend history, in this way, the dividends have acquired
considerable importance.
Nevertheless, something changed at the turn of the twentieth century. In fact, the dividends
were still the first source of assessment for a company in the absence of other resources, but
for the first time the function of dividends, as a mechanism for transmitting information,
failed, just behind the great crisis of the 1929. The increase in dividend payments was reflected
in the increase in the stock price, but both did not go forward at the same pace, indeed the

CBS | Copenhagen Business School | MSc ASC 5
dividend payments was higher than the earnings and so many companies were forced to
resort to retained earnings until they were able to sustain these flows.
After the Second World War in the US despite the very high inflation, dividend payments and
the same policies remained unchanged confirming their importance for the market.
Dividend
The dividend is that part of the profits of the year that the shareholders’ meeting decides, on
the proposal of the administrative body, to distribute to the shareholders. Therefore, it is a
provision of part of the profits obtained during a fiscal year that, by virtue of a careful
evaluation, the Board of Directors proposes to distribute to the shareholders. It is, together
with the capital gain, a form of remuneration of the capital for the shareholders.
The company could also decide to not pay dividends, in order to seize particularly profitable
investment opportunities, or to heal past losses, or to meet liquidity needs allocating the
earning profits at the cash reserves.
The dividends can be of two types: ordinary and extraordinary. What differentiates them is
the ability of the company to be able to guarantee them over the long term; this therefore
means that ordinary dividends are those that the company believes it can provide in a stable
and lasting manner to its shareholders, while the extraordinary dividends are linked to events
that are generally unrepeatable or in any case not reasonably foreseeable, that shareholders
can not be sure to receive in the future with regularity.

CBS | Copenhagen Business School | MSc ASC 6
Therefore, it is clear that behind the decision to pay dividends there is a careful evaluation not
only of the business context but also of the external environment; this is because the
distribution of dividends is linked to an information capacity (Pettit 1997), directed to the main
stakeholders of the company, which in the case of ordinary dividends is reflected in the
company's ability to ensure a lasting dividend.
A company has two methods to distribute the money back to its shareholders: the dividends
or the share repurchases.
The company can buy-back its own shares within the limits of the distributable profits and the
available reserves resulting from the last regularly approved financial statements. The
realization of a buy-back operation produces effects on the perception of the company by the
market and can potentially convey a message that is, more or less consciously, transmitted
outside: it is therefore essential that the company is aware of the scope of its decision from a
strictly financial and communicative point of view. Hence, a purchase program of own shares
must first of all constitute an efficient way of distributing excess liquidity of the company and
must only be carried out following a careful analysis of the internal needs, taking into account:
- The liquidity necessary to the ordinary transactions;
- The functional liquidity needed to execute extraordinary acquisition transactions;
- Then, a portion of precautionary liquidity to deal with unexpected events and
exceptional needs.
On the other hand, the company can distribute dividends to all the shareholders who are
entitled to it. It concerns the distribution of the "excess" wealth of the company to the
shareholders. The dividend distribution is normally implemented when the company does not

CBS | Copenhagen Business School | MSc ASC 7
have investment opportunities with a return higher than the cost of capital, but it does
sometimes happen even whether there are profitable investment opportunities, to give a
signal to the external environment.
There are many types of dividends that differ mainly from the extent of the rights they grant
to the owner. There are in particular two main categories of stocks which differs from the
dividend rights that they give to their holders: the common stocks and the preferred stocks.
The latter guarantee the owner a preferential treatment in terms of settlement and pre-
emption in the payment (Horngren et al., 2011).
To conclude, the most important difference among these two methods of cash re-distribution
is that they are usually taxed differently, as dividends are considered personal income while
repurchases capital income. Indeed, usually the former has a higher taxation than the latter,
thus having a financial advantage. As the stocks analyzed in this paper are listed in the US
equity stock market and following the bilateral agreements to mitigate the problem of double
taxation investors are subject to different regimes, in the literature, therefore, it will be
assumed that the dividend is taxed more than capital gain.
Dividend Payment Process
There are four important dates in the process of paying a corporate dividend:
- Declaration date: This is the date on which the board of directors announces to the
shareholders and the market that the company will pay a dividend.

CBS | Copenhagen Business School | MSc ASC 8
- Ex-dividend date: This is the date on which the security is traded without its dividend.
In order to have the rights for the dividend, an investor must purchase the security at
least one day before this date. If, instead, the investor wants to sell a stock but do not
want to lose the dividend, this is the first day to sell. The ex-dividend day is the second
business day prior to the registration date.
- Record date: This is the date on which the company consults its records to know who
its shareholders are. An investor must be registered as a "holder of record" to have the
right to a dividend.
- Payment date: This is the date on which the company sends the dividend to the
registered shareholder. This date is usually placed a week or more after the
registration date, so that the company has enough time to make sure that all those
who have the right are paid correctly.
In this paper the focus will not be in any of these moments, but the collection of data will be
concentrated at the end of each months in a time frame of twenty years. In fact, the objective
is to identify the overall trend of the dividend payments of each firm to detect, through the
computation of specific ratios i.e. the dividend yield and the pay-out ratio, which of them tend
to pay higher or lower dividends and the variation in these trends.
Research Question
As it has been said in the previous paragraphs, the dividend theories have always been an
argument of discussion and a never-ending issue in the corporate finance matter. Particularly,
there have always been different and contrasting theories regarding the dividend policy of a

CBS | Copenhagen Business School | MSc ASC 9
company and its impact on the firm’s value. In the recent years there is a tendency within the
public listed companies to the increase of share repurchase to the disadvantages of the
dividend payment due to its tax drawback. Nevertheless, there are still a large number of firms
that keep issuing new dividends, why?
This paper will try to give an answer to this question, analysing the relevance and consistency
of abnormal returns with a variation of the company’s dividend policy. Thereby, whether an
increase or decrease of the dividend payments could lead to a stock’s return that exceed the
one expected, computed through the CAPM model. Therefore, it will be taken into account
the dividend policy applied and the risk linked to the stock, in accordance with Baskin (1989),
managers can control the stock price volatility through an adequate dividend policy, while
Allen and Rachim (1996) states that the pay-out ratio is the decisive determinant of the share
price.
There have already been many studies that tried to identify a correlation between the
dividend and the company’s stock price. In particular, Amihud and Murgia (1997) and Asquith
and Mullin Jr (1983) have pointed out that on the day in which the dividend is issued,
information is already available on the market and the stock returns is above average not only
on that day but also within 2/3 following days. This is in contrast with the market efficiency
hypothesis (EMH), which emphasizes that all known information, even the most private,
should be reflected in the price of a security. Therefore, it is assumed that investors can have
the same opportunities to obtain information from listed companies. Abnormal returns should
not exist for a long time. This is not the case in the real world. Some investors have specific
information about particular companies and are able to get this before others. However, this

CBS | Copenhagen Business School | MSc ASC 10
paper has focused its attention on the general level of the dividend payments of each firm and
its variation, not on the specific event of a dividend issue.
Also, the information asymmetry, which is usually present in the real world between managers
and stakeholders, entails that the dividend is often used by managers as a mean of
communication in order to reflect the company's future expectations about growth,
investment opportunities and profitability. Consistent with the signalling theory.
Moreover, this paper will try to explain the correlation between the change in the dividend
policy and the company’s abnormal stock return applying the “Behavioral finance theories”.
These theories seek to add psychological framework to the conventional economic theory to
unfold investor irrational behavior that lead to “wrong” investment decision. These irrational
behaviors are due to mental biases of which many investors suffer such as loss aversion and
ambiguity aversion. Thus, these misbehave could have some effect even in the dividend policy
theory, in fact, “it is argued that behavioral biases resulting from bounded investors rationality
identified by descriptive decision theory may be a main determinant of corporate dividend
policy, since firms adapt their policies in order to cater to investor demand” (“The behavioral
foundation of corporate dividend policy a cross-country analysis”; Breuer, Rieger, Soypak,
2014). One of the main literature’s contribution that goes in this direction is the “Bird in the
hand theory”, that asserts that some investors prefer to hold securities that pay dividends
instead of those that reinvest within the company, so they tend to build portfolios with specific
titles.
There are several objectives that aim to achieve this study by expanding a section of literature
a little bare, providing to both the main characters, managers and shareholders, additional

CBS | Copenhagen Business School | MSc ASC 11
information on dividend policies and all that is linked with them. The main objective is to
reinforce the literature that assume a positive correlation among the dividend payment
changing and the stock’s abnormal return. In order to define the advantages of a well-
structured dividend policy and how it can be used at specific times to address and channel
implicit information to shareholders directly involved, thus confirming the signalling
hypothesis.
Then, based on the Bird in the hand theory, the aim is to understand how accordingly to
dividend policy, investors tend to change their preferences or not, in relation to the Clientele
effect (Pettit). In particular, due to their behavioral biases, investors have different
preferences on the kind of stocks. Thus, according to the theory it would be expected different
clientele to prefer different companies in relation to the dividend policy practice that better
suit their preferences. Therefore, it will be explored how companies would employ a specific
dividend policy, keeping dividend pay-out ratio and dividend yield high and constant, to attract
the kind of investors that for cultural aspects and irrational behave have preference on this
type of stocks in this way ensuring an abnormal return on its stocks price.
In addition, following the study made by Michael Firth: “Dividend changes, abnormal return,
and intra-industry firm valuation” (1996), our research will be implemented with a sector
analysis to understand whether within the same sector there are specific correlation among
the stock’s abnormal return and the dividend payments variation.
Thus, taking into consideration all the above mentioned, the research question and the
relative sub-questions that will try to be answered throughout this paper are:

CBS | Copenhagen Business School | MSc ASC 12
● Does a positive correlation between dividend policy variation and stock abnormal
return exist? The positive correlation between the change in the corporate dividend
policy and the stock abnormal return could be due to the clientele effect?
o Could investors’ misbehaviors have a role in this correlation? Psychological
biases could influence their portfolio buildings making them pick up stocks with
high dividend payments? Could this affect corporate dividend policy
management?
o Looking at the industry sector, is it possible that some sector due to its specific
characteristics has a higher correlation between abnormal return and the
dividend policy variation?
To sum up, our study contributes to the literature on the correlation between the dividend
policy and the realization of returns that deviate from expected returns (i.e. abnormal). The
literature gap that it will be filled up is firstly temporal, because they will be used updating
data from recent times on the US equity market (1996-2015). Secondly, it will be explored
how this correlation could be used to implement a corporate strategy that relying on a well-
structured dividend policy it is able to appeal the specific investors that guarantee a satisfied
return on its stocks. In the end, they will be identified the differences among sectors in regard
to the relationship between the abnormal return and the dividend payment variation.

CBS | Copenhagen Business School | MSc ASC 13
Overview of the findings
The research question has been answered through the implementation of an analysis
supported by two linear regression equations. Our starting belief has been just partially
supported by the analysis. Indeed, the first regression results, without the control variables,
are in accordance with the main hypothesis of the paper i.e. there is a positive correlation
among the stock abnormal return and the increase of the dividend payments. While, the
second regression presents betas’ coefficients that are opposite to the first one, in fact they
assumed a negative relationship between the two phenomena. These opposite results are due
to the introduction of the control variables which with their influences on the dependent
variables have modify the overall results. Anyway, the introduction of these variables has
partially improved the ability of the model to explain the correlation among the phenomena
under investigation.
Outline
This chapter has given an overview that introduces the main topic of the thesis and defines
the limitations of the study. The remaining part of the work is structured as follow: the next
chapter, Chapter 2, it will be presented the methodology with which the study has been dealt
from a theoretical and empirical point of view, with an in-depth analysis of the regression
model used. Then, the Chapter 3 delves into the literature related to the dividend puzzle, while
the Chapter 4 discusses the collected data and the sample used. In Chapter 5 the results are
analyzed through a comparison with the initial hypotheses and the literature. Next, in Chapter
6 the results are discussed and inquired. Finally, in chapter 7 the conclusions of our study are
drawn.

CBS | Copenhagen Business School | MSc ASC 14
Limitations
As can be seen from the results of our research, a fundamental determinant was the quality
of the data collected. Therefore, the first limitation was to being able to rely only on a limited
use of platforms from which to extract the necessary data, in some situations the fact to be
bounded to them led to an incompleteness of the data that partially undermined our results.
To which is added a limit originated from the sample of data used by us, S & P 500, which
represents the set of the 500 companies with the highest capitalization. In fact, the index does
not optimally represent the basket of listed companies on which it could have been based the
studio, for a more truthful and complete portrait.
For a more accurate and complete analysis, a fundamental point missing in the study is the
presence of results from a survey on the perception and behavior of investors in front of their
investments, to confirm the hypothesis made on the behavioral finance issue and give a more
in-depth insight into the influence that they can make in determining dividend policies
through their misbehaving and their social norms. This analysis can therefore empirically only
shed a light on the power a dividend has on the return of a stock, not on how investors
influence the market and corporate decisions with their irrational decision.

CBS | Copenhagen Business School | MSc ASC 15
Chapter 2
Methodology
The main objective of the research is to investigate the relationship between stocks price’s
abnormal return and the variation of corporate dividend policy. Going more in depth the
purpose is to explore what effect has an increase or a decrease in the dividend payment
amount of a company on its stock’s price. Therefore, to see how the investors react to a
dividend policy changing and, whether, the agents’ reaction influenced by their psychological
biases could generate an abnormal return of the stocks.
Literature
The literature resources that have been employed in the research, were academic articles and
university textbook or handbook. That kind of sources have been enough to collect all the
information that were needed for the purpose of the analysis. Concerning the academic
articles, they have been gathered mostly online from the CBS library and inter alia through the
EBSCOhost research platform. Furthermore, the articles were all published in influential
economics journal among which the Journal of Finance, the Journal of Banking & Finance and
the Journal of Financial and Quantitative Analysis.
The main theoretical areas that have been master in the study are the Abnormal Return
theories, the Dividend Policy literature and the Behavioral Finance theories. Regarding the
first two doctrines, all the developed theories have been the results of decades of studies and
empirical analysis, while for what concern the behavioral studies they are more recent, but

CBS | Copenhagen Business School | MSc ASC 16
they also have a couple of decades of studies behind. Therefore, due to the extension of the
literature and the limits of these thesis it was impossible to depth all the theories. Accordingly,
in order to gain all the necessary knowledge and information to achieve the aim of the
analysis, the focus of the paper has been on the main theoretical points of the literature
mentioned before that have been studied and further developed.
Theoretical approach
The correlation between the variation of the dividend policy of a firm and the generation of
stock’s abnormal return has been approached from different angles through many theories.
After having considered the studies and the empirical analysis that have been made about the
abnormal return, the dividend policy and the behavioural finance theories, some hypothesis
have been elaborated.
The main hypothesis of the study is opposed to the Irrelevance of Dividends theories
developed by Modigliani and Miller and then by Black and Scholes (1974), that state that the
firm’s value is not connected to the corporate dividend policy. Conversely, it is aligned with
the studies that support the idea of the Relevance of Dividends, such as the Bird-in-the-Hand
theory (Gordon, 1963) and the Signalling Hypothesis, which assert the influence of dividends
on the company’s stock price. Moreover, the clientele effect and the psychological biases of
irrational investors, theorized by the behavioral finance studies, have been elaborated and
applied in the hypothesis development. In fact, it is argued that, keeping other variables
constant, an increase in the dividends payments of a firm, should lead to a stock’s return that
is above the expected return calculated with the Capital Asset Pricing Model (CAPM) i.e.

CBS | Copenhagen Business School | MSc ASC 17
generate an abnormal return. The reasons behind this hypothesis will be explicated further in
the next chapters of the paper.
Quantitative method: Regression Analysis
In order to prove the truthfulness of the hypothesis i.e. to find out a possible positive
correlation between the stocks abnormal returns and the increased dividend payment ratios,
it has been chosen to develop a quantitative analysis. The quantitative kind of analysis has
been selected because it serves as a useful evaluation instrument, that yield to reliable results.
In particular, within the quantitative analysis area, it has been implemented a regression
analysis. The regressions employed throughout this paper uses the Ordinary Least Square
estimation method (OLS), which allows for an estimation of the unknown parameters in a
linear regression model. The regression function will be explained in detail in the next
paragraph.
The aim of this paper is to test the effects of these phenomena empirically. Therefore, they
are necessary some variables to stand for the main factors under investigation i.e. the
abnormal return and the dividend policy variation.
First, to assess the dividend policies variation, it has been taken into consideration two
measures that will be explained more in depth in the following paragraphs: the dividend pay-
out ratio and the dividend yield. These two variables have different merits and weaknesses, in
fact they can be manipulated by firm’s management or they can vary due to other factors

CBS | Copenhagen Business School | MSc ASC 18
influences. Hence, it will be assumed that, despite the defects, these two measures are a good
proxy for the variation in the dividend payments level.
Next, to measure the stock abnormal return, it has been employed the Capital Asset Pricing
Model (CAPM). Thanks to this model’s features it is possible to compute the stock’s alpha, this
parameter, if positive, indicates the presence of a stock’s abnormal return. Even this variable
will be explained more in details in the next pages.
To sum up, utilizing the variables listed before, the main hypothesis of the research claim that:
an increase in the dividend yield or in the pay-out ratio of a firm should lead to an increase of
the stock’s abnormal return i.e. to an alpha that is major of zero.
Regression analysis set-up
Therefore, to perform a good and effective quantitative analysis, it has been developed a
multiple least square regression. In fact, the regression analysis with its own characteristics is
a useful tool that enables to relate the dependent variable of the function i.e. the abnormal
return with the two main dividend policy variables i.e. the dividend yield and the dividend pay-
out ratio. As a matter of fact, the dependent variable is the main variable which is trying to be
understood, while the independent ones are the factors that it is thought to have an impact
on the dependent variable. Thanks to the regression analysis is possible to sort out
mathematically which is the impact of the predictor variables on the abnormal return. Indeed,
through the estimation of the beta coefficients in the regression model is possible to analyze
the effect of the variation of these two main variables on the stock's abnormal return.
CBS | Copenhagen Business School | MSc ASC 19
Therefore, to unearth a positive or negative correlation between the independent and the
dependent variables.
Summing up, there are three principal variables involved in the regression functions of which
the analysis will try to find out the intercorrelations among each other’s:
- Abnormal return (Yi)
- Dividend yield (X1)
- Dividend pay-out ratio (X2)
Moreover, in addition to the two independent variables, following the recommendations
explicated by Baskin (1989) in its model, some control variables have been added in a second
regression function. Indeed, there are other factors that could have an impact on the share’s
abnormal return, thus, to catch the effects on the dependent variable of the latter that are
not related with the dividend policy variation, other variables have been included. Embodying
these variables in the regression function allow to estimate the real effect of the dependent
variables under investigation.
The control variables that have been incorporated are:
- Return on Equity (Z1)
- Asset Turnover (Z2)
- Firm size (Z3)
- Long-Term debt (Z4)
- Cash Ratio (Z5)

CBS | Copenhagen Business School | MSc ASC 20
In short, two regression functions were run to see how the effect of the dividend payment
variation on the abnormal returns varies which the inclusion or not of the control variables.
The first regression was built-up including only the dependent variable and the two dividend
policy variables (dividend yield and pay-out ratio), while in the second function were added
the control variables. In this way it is possible to see how the beta parameters of the
independent variables varies from the first to the second regression model.
Then, after the two regression were executed it has been elaborated a sector analysis. In
particular, the second regression will be run separately for each sectors of the US market,
following the GICS standard division. In this way, will be possible to identify the differences
between the sectors regarding the relationship among the variables under studied.
In the end, a correlation analysis between the explanatory variables in the model has been
run. This correlation analysis has been developed to analyze further whether the correlation
between the independents and the control variables could be as high as to generate
multicollinearity. In fact, in case of multicollinearity the ability of the “X” variables to predict
the “Y” one decrease due to the high intercorrelation among the predictor variables. This
could lead to a statistical inference that is not reliable, therefore, the regression coefficients
may not be estimated precisely, and the standard error is likely to be high because the
independent variables could not provide additional information on the dependent one.
Hence, the analysis would lose significance.

CBS | Copenhagen Business School | MSc ASC 21
Time frame of the analysis and the overfitting issue
The analysis has been implemented in a time frame of twenty years, from the 1st of January
1996 to the 1st of January 2015. The time frame was chosen as long in order to be able to gain
an amount of data that is enough to develop a statistically significant analysis. Furthermore,
the benefit to have a long-term period of analysis enable to avoid or, at least, to narrow the
misleading effects of unexpected, exceptional or occasional events on the main variables
under investigation. Indeed, macro-events such as global crisis, a sector crisis, a government
tax reform or micro-events as the sales increase or the issuance of new debt can have a
relevant effect on the company value and thereby on its stock’s price i.e. abnormal return.
Moreover, the use of a sample of quite big dimension helps to avoid the overfitting issue. The
overfitting is a statistical problem that arise when the model fit to much the set of data used
for the analysis. It could lead to misleading R-Squared values, regression coefficients and p-
value. For a relatively simple model as the one used in this study the over fit should not be a
problem, but it is otherwise smart to have an enough big sample that could eliminate any
chance of this issue.
CBS | Copenhagen Business School | MSc ASC 22
Chapter 3
Literature Review
In the following chapter it will be analyzed the literature related to the dividend policy and the
various implications and reflections it has on the main company dynamics and the most
important indicators related to it.
The economic literature concerning dividends is very rich, the opinions on the usefulness and
relevance are mixed and the fields of application in which the dividend or the dividend policy
has been studied are many, but still the various researches on the subject did not create a
common thought about its usefulness and use and above all how with it is possible to
manipulate the information on the stock market.
The chapter will be structured in several sections each of which represents one of the macro
categories in which the dividend policy has influence, each of them will report the most
important economic theories in this regard. The aim is to create a theoretical base that will be
the starting point to build the analysis that will enrich the existing literature thanks to the
availability of more complete and recent data.
Irrelevance of dividend policy
The dividend theories have always been an argument of discussion and a timeless issue in the
corporate finance matter. Particularly, there have always been different and contrasting

CBS | Copenhagen Business School | MSc ASC 23
theories regarding the dividend policy of a company and its impact on the firm’s value. There
are two conflicting views on the dividend policy: the one lead by the irrelevance theory of
Modigliani and Miller and Black and Scholes and on the other hand the branch of theories that
support the relevance of the dividend policy.
Modigliani e Miller
The Modigliani-Miller theorem is one of the fundamental elements of modern economic
theory. Their study was published when they were professors at the Graduate School of
Industrial Administration (GSIA) of Carnegie Mellon University. The final result was a
publication of an article in the American Economic Review in 1958, followed in the next years
by a follow-up discussing some of these issues. In their article, they showed how the value of
a company and the cost of capital would not have any relation to the financial structure. The
underlying thesis is that regardless of the proportion between debt and equity there is a
preservation of the value of investments2. Their theorem is based on four fundamental
assumptions:
- Perfect capital markets: it assumes that all the investors are rational, they have access to
free information, there are no floatation or transaction costs and no large investor to influence
the market price of the share.
- No taxes: there is no existence of taxes. Alternatively, both dividends and capital gains are
taxed the same.
2 J. B. Williams, The Theory of Investment Value, Amsterdam, North Holland Publishing, 1938, pp. 72 – 73.

CBS | Copenhagen Business School | MSc ASC 24
- Fixed investment policy: the company does not change its existing investment policy. This
means that new investment that are financed through retained earnings do not change the
risk and the rate of required return of the firm.
- No risk of uncertainty: all the investors are certain about the future market price and
dividends. This means that the same discount rate is applicable for all types of stocks in all
time periods.
Given these limitations to their method of study, the two scholars arrive at various
conclusions, the one that most interests the following paper is that according to them
dividends and capital gains are equivalent when an investor considers the return on
investment, and the only thing that affects on the valuation of a company are the earnings, a
direct consequence of the investment policy. Hence, according to this theory, investor
decisions do not need any other information, such as the dividend history or notions on the
dividend policy, apart from the investment policies of a company. M&M theory delves deeply
into the situation where dividends are irrelevant to investors. Indifferently if a company pays
dividends or not, investors are able to create their own cash flow through the sale of the stock
they hold. Similarly, if an investor does not need cash, he can reinvest his dividends. The
conclusion to this is that investor decisions are completely indifferent to the dividend policy.
These results are linked to the macro section of the financial behavior theories that study the
behavior of agents within the economy system and in business dynamics, these topics will be
addressed in the following paragraphs. On the other side, the M&M theory comes to the
conclusion that dividends are also irrelevant by the arbitrage argument, the dividend
distribution is balanced by external financing. The distribution of dividends affects the price
of the stock, decreasing it and nullifying the effect.

CBS | Copenhagen Business School | MSc ASC 25
This is one of the most important theory regarding the irrelevance of dividends, which at the
same time suffers due to the multiple limitations imposed by the assumptions made as a
premise of their study.
Black and Scholes
About 10 years after the first publication of Modigliani and Miller, two researchers of the
University of Chicago Booth School of Business, Fischer Black and Myron Scholes, still pursuing
the line of the irrelevance of dividends, start a study on the relationship between dividend
yield and the return of the stock so as to identify the effect of the dividend policy on the price
of the stock.
Over the years there have been many attempts to understand whether or not dividend policy
has any effect on the price of its shares, but nothing has been satisfactory. The most used
methodologies were cross-sectional tests, in which were very complicated to handle variables
different from the dividend policy and the accuracy of the estimates was not acceptable.
The two researchers then decide to apply a new methodology to this study. First of all, the
fact that the hypothesis about the dividend policy focuses too much on the price of the shares
of the company taken into consideration was very difficult. Instead, they apply a new vision
to the dilemma, focusing on expected returns, defined as the set of capital gains and
dividends. Secondly, they decide to use the CAPM (Capital Asset Pricing Model) version, in
which the original version represents the expected return of any security as a linear function
of its own β (Beta):

CBS | Copenhagen Business School | MSc ASC 26
𝐸(�̃�𝑖) = 𝑅 + [𝐸(�̃�𝑚) − 𝑅]β (1)
𝐸(�̃�𝑖)= the expected return on security i,
𝐸(�̃�𝑚)= the expected return on market portfolio,
𝑅 = the risk free short term interest rate,
𝛽= the covariance between �̃�𝑖 𝑎𝑛𝑑 �̃�𝑚, divided by the variance of �̃�𝑚.
In subsequent tests over the years the two researcher adapt the aforementioned equation to
their needs, first tie it to the dividend yield on stock i δi and the market δm, then Black decided
to make a further change and replace the R parameter in the CAPM formula (1) with γ0, which
is significantly higher than the short-term interest rate. Thus arriving to construct a new
equation:
𝐸(�̃�𝑖) = γ0 + [𝐸(�̃�𝑚) − γ0]βi + γ1(δi − δm)/δm
The application of this equation takes place in a set of 25 portfolios specifically built-up by the
two researchers following precise guidelines in order to avoid any kind of distortion of the
results and biases.
There were three basic conditions that had to be verified: the constructed portfolio must had
an expected return on the amount they wanted to estimate; the portfolios had to only use
information that was available at that time; and the portfolios must had the least possible
variance of returns. The portfolios consisted of securities listed on the New York Stock
Exchange between 1926 and 1966.

CBS | Copenhagen Business School | MSc ASC 27
The results of the study showed that in the different portfolios, composed of the aggregation
of securities with similar dividend yield and beta, they do not allow to show that a difference
in dividend yield leads to different stock returns. Then, they break down the results from the
point of view of the investors and from the corporate point of view. Stressing as for the former,
considering that taxes have not been taking into account in their studies, it is not essential to
pay attention to dividends to maximize their expected returns due to the fact that dividends
have not an impact on expected returns. From a corporate point of view, they concluded that
there is more freedom for management in choosing a dividend policy, without affecting the
stock price, using it at the same time in the period of scarcity of cash as a method to acquire
new capital.
Relevance of dividend policy
The following paragraphs will present all the theories supporting the relevance of the dividend
policy. The chapter will be structured in several sections.
In the previous paragraphs have been presented the two theories that have launched a branch
of new studies regarding this matter. Over time, the techniques and the tests have improved
and changed, bringing with them new and more complete conclusions to the dividend puzzle.
In spite of this, there have not been still a clarification of their usefulness or relevance.

CBS | Copenhagen Business School | MSc ASC 28
Based on the uncertainty of future dividends, The “Bird in the hand” Theory.
Investors and managers have different perspectives and information regarding the future of
the company they are interested in, and their interests are not always aligned towards the
same objective. All this results in an information asymmetry, which in turn transmits
uncertainty and imperfect information regarding the dividends. Moreover, it was highlighted
that investors have different attitudes and preferences regarding dividends and capital gains.
This is confirmed by the Bird-in-the-hand theory faced and empirically demonstrated by
Gordon3 and Diamonds4, which asserts that investors prefer a "Bird in the hand" or cash
dividend, than "two in the bush" i.e. future capital gain. This is because investors need to have
money in order to consume, so they will tend to prefer immediate cash. Thus, increasing the
payment of dividends, ceteris paribus, ideally would lead to an increase in company value,
because there is a better perception of the future flows. This theory has been much criticized
by Modigliani and Miller (1961) and by Bhattacharya (1979), who focus their attention on the
business risk, which in their opinion affects the level of dividends. According to the latter, in
fact, the riskiness of company cash flows affects dividend payments, and an increase in
dividends does not reduce the company's risk.
The research of Gordon (1959) was developed through a regression model using cross-
sectional sample of data from four sectors: chemical, food, steel and machine tools. In its
linear regression:
3 Gordon, Myron J., 1963, Optimal Investment and Financing Policy, Journal of Finance 18,
264-272. 4 Diamond, James J, 1967, Earnings Distribution and the Valuation of Shares: Some Recent Evidence,
Journal of Financial and Quantitative Analysis 2, 15-30.

CBS | Copenhagen Business School | MSc ASC 29
He relates P, the share price, with D, the dividends and R, the retained earnings. Finding out
that dividends have a greater impact on the share price than retained earnings. It
subsequently head to another conclusions in its study, asserting that the required rate of
return on a stock increases in fraction compared to retained earning, due to their future
uncertainty. In a follow study conducted in 1963 it also states that a higher dividend payout
decreases the cost of equity and the relative rate of return, likewise Fischer5 (1961) comes to
a similar conclusion.
However, the model was subjected to various criticisms that can be concentrated in four main
points. The first, states that Gordon does not take into account the variation of the risk present
in the four different sectors, since a high risk involves a low price and a low payout. Secondly,
the model does not consider the growth financed through external financing. Then, in the
short term the fluctuations in the income are reflected more in retained earnings, this affects
the equation in favor of dividends. Lastly, the dividend measure is generally more precise than
the one of the retained earnings, which is instead subjected to more approximation in the
accounting measurement methods.
The weaknesses of this theory had been improved in the following years through the study of
Diamond (1967), which introduced a ratio also for earning-prices. On a sample of 255
American companies, he applied the corrected Gordon model and concluded that it is not safe
5 Fisher G.R. (1961), Some Factors Influencing Share Prices, Economic Journal 71,121-141.

CBS | Copenhagen Business School | MSc ASC 30
to say that investors prefer dividends over retained earnings, and suggests a negative
relationship between company growth and dividend payout6.
Based on information content of dividends, The Signalling Theory
As it has been expressed earlier, one of the key points of market imperfection is the
informational asymmetries that occurred between the various agents. This problem underlies
three of the most important topics in which researchers seek an explanation for the dividend
policy. In the signalling model, the information gap between managers and company owners
uses unexpected changes in the dividend policy to try to address certain information. In the
agency cost theory the dividend policy, on the other hand, is used to align the interests of
agents with the one of the shareholders. While the two previous models are combined in the
cash flow theory, as dividend payments decrease the funds available for investments,
potentially damaging and potentially benefiting stakeholders.
In this section we will focus on the signalling model and the information contained within a
dividend.
According to M&M7, the share price is independent of dividend policies as the future flows
and development opportunities should already be contained within the price. They were
aware that changes in the payout would have influenced the price of a stock, associating this
phenomenon precisely with the fact that dividends were sources and means of information.
6 Fama and French (2001) found that firms with higher growth and investments tended to have lower payouts.
7 Modigliani and Miller.

CBS | Copenhagen Business School | MSc ASC 31
This shows precisely how there is a difference between private information within the
company and those available on the market. Nevertheless, they supported the EMH8 and
therefore claimed that only unexpected information could have influenced the stock price.
At the same time managers, who hold private information about the future of the company,
are urged to release this information in the most anonymous and indirect way possible, in
order to avoid any form of facilitation of competitors.
It is argued that a price reaction is rational to an announcement of a change in the dividend
policy9.
The studies that have taken place over the years have been multiple and have led to
ambiguous and little delineated conclusions. A group of researchers such as Fama, Fisher,
Jensen and Roll (1969), Pettit (1972, 1976), Griffin (1976), through separate insights, have
come to affirm that abnormal returns have matured after unexpected announcements of
changes in policies dividends.
Still, not of the same opinion have been the studies carried out by Ang (1975) and Gonedes
(1978) who have failed to demonstrate the above-mentioned thesis. A totally different
conclusions, instead, comes by Watts (1973) who asserts that transaction costs fully absorb
the abnormal returns generated by dividend policies.
In support of the thesis that dividends perform the function of transmitting information,
known internally to the company, towards the external audience, there are various studies,
8 Efficient-market hypothesis: is a theory in financial economics that states that asset prices fully reflect all
available information. A direct implication is that it is impossible to "beat the market" consistently on a risk-
adjusted basis since market prices should only react to new information. 9 Myers 1987.

CBS | Copenhagen Business School | MSc ASC 32
one of the most valid in that regard is the one of the two professors P. Asquith and D. W.
Mullins Jr.10. In the 1983 they published in the Journal of Business, a study on the impact of
dividends on the wealth of the shareholders. They analyzed 168 companies divided into two
basic categories, the first in which they placed the firms that had paid for the first time in their
history a dividend, while in the second there are the companies that after a period of 10 years
have resumed to paying out dividends. The aim was to investigate the relationship existing
between the announcement of the dividend and the market reaction to this announce. The
results showed an abnormal return much higher than all the previous studies, and at the same
time positively related to the magnitude of the initial payment. Also, the payment of dividends
after a 10-year break have been studied leading to the same results. It is therefore their
opinion that previous studies have underestimated the effect of the increase in dividends.
Moreover, given their results, they argued that both the first and the subsequent dividends
are consistent with the version that they transmit valuable and important information to
investors.
Another very relevant study for the literature is the one conducted by Amihud and Murgia
(1997)11 who, similarly, on a sample of 200 German companies listed on the Frankfurt Stock
Exchange, examine the reaction of the stock price to a dividend announcement. In their
analysis they make a comparison with the condition of the US, in which dividends are taxed
more than in Germany, they provide the basis for a plausible explanation of their informative
10
Asquith, Paul, and David W. Mullins, Jr., 1983, The impact of Initiating Dividend Payments on
Shareholders' Wealth, Journal of Business 56, 77-96.
11
Amihud, Yakov, and Maurizio Murgia, 1997, Dividends, Taxes, and Signaling: Evidence from
Germany, Journal of Finance 52, 397-408.

CBS | Copenhagen Business School | MSc ASC 33
value, since they are still widely distributed to shareholders. What instead opposed in
Germany, where the dividend is not commonly used. Nevertheless, the result of their study
confirms the validity of the dividends in transferring information to the outside, signal of a
future prospect of the company.
Recently, likewise, Travlos, Trigeorgis and Vafeas (2001), studying an emerging market,
contributed to the hypothesis of reporting dividends. They used a sample of 41 announcements
of cash dividend increases and 39 announcements of dividends in shares for companies listed
on the Cyprus stock exchange for the period 1985-1995, and examined the market reaction.
Travlos et al. have found a positive and significant anomalous returns both for cash dividend
increases and for dividend announcements in shares, interpreting their results as more consistent
with the reporting hypothesis.
Abnormal return to support the Signalling Theory
In support of the signalling theory, another section of the literature deal with the relationship
between changes in the dividend policy and the generation of stock’s abnormal returns on the
market. This association is rationalized by the acceptance of the dividend announcement or
payment in general as a means of transmitting information.
One of the most significant and recent studies has been carried out by Firth M., published in
the Journal of Financial and Quantitative Analysis in 1996, in which he examines how a
revelation of information through a dividend change announcement influences the earning
and the evaluation of the same company and if there are also implications among the
competitors belonging to the same sector. The methodology applied by the researcher

CBS | Copenhagen Business School | MSc ASC 34
consisted in calculating the abnormal returns of companies announcing an unexpected
payment of dividends and calculating at the same time any abnormal returns that occurred in
the same sector but in other companies. Yet, to make sure that the observation was valid, it
had to satisfy certain types of criteria12. The observations were collected between the 1980
and the 1991. Starting from a total of 1115 observations, with the skimming process lead by
the criteria of validity the sample was reduced to 649, in turn divided between increase and
decrease of dividends. To investigate the magnitude of the information transferred he adopts
a cross-sectional regression.
The results eventually indicate how unexpected dividends translate into stock price
adjustments. In particular, the increase in dividends results in abnormal positive results,
supporting the signal hypothesis.
Then, a substantial portion of the research is focused on the impact of a company's
announcement on the stock return of the other peers companies. The results indicate that
there is a slightly positive information transfer.
Another relevant study that investigated the impact of a dividend announcement on the stock
price, which has supported the thesis on dividend signalling is the research conducted by
Suwanna T. entitled the "Impacts of Dividend Announcement on Stock Return" , published in
the 2012. He studied the impact of these announcements in a sample of 60 Thai companies
listed on the Stock Exchange of Thailand during the period 2005-2010. What differentiate this
research from the previous ones is the fact that the focus is on a broader range of time, in
12
Dividend Changes, Abnormal Returns, and Intra-Industry Firm Valuations, Michael Firth The Journal of
Financial and Quantitative Analysis Vol. 31, No. 2 (Jun., 1996), pp. 189-211

CBS | Copenhagen Business School | MSc ASC 35
particular on the forty days around the announcement of the payment. Thus, he noted that
the price of the stock has moved up significantly after the announcement of the dividend. And
that in the same way the abnormal returns and the cumulative abnormal returns from the
market model are statistically significant. These results confirm the information content role
of the dividends and the impact on the share price.
Based on Agency Cost and Cash Flow Theory
The agency cost issues, i.e. the rising of costs attributable to the misalignment among the
company’s management and the company ownership, arose from the earliest corporations
and forms of ownership fragmented into shareholders, the most ancient were born three
hundred years ago and the problem still persist nowadays.
Under the M&M theory about the perfection of the capital market, the presence of a conflict
of interests between managers and shareholders was not contemplated, but obviously this
assumption is very disputable in reality. When the property is separate from management,
the managers are always imperfect agents for their principal (shareholders). This is the basis
of the agent cost problem, in which the interests of the managers are not aligned with that of
the owner ones, thus causing extra costs, such as the costs associated with monitoring the
behavior of the agents.
Modern agency theory tries to explain the corporate capital structure as the result of
minimizing agency costs. These costs are lower in the realities in which the managerial
ownership shares are high and therefore their interests are better aligned with the company

CBS | Copenhagen Business School | MSc ASC 36
objectives. Dividend payment can be a means by which to align interests and mitigate agency
costs.
Another source of agency costs could be the transfer of wealth between bondholders and
shareholders through the acceptance of a high risk and high return project by managers,
whose remuneration is linked to certain company objectives, or the consumption of in excess.
Dividend policies can influence these relationships in two ways. As for the exposure to the
conflict between shareholders and bondholders, it can be resolved through agreements that
regulate the priority of the claim13. The payment of a large amount of dividends could also
undermine the selection of positive NPV projects14. Therefore there is a need for agreements
in which maximum dividend payment ceilings are established in order not to undermine the
transfer of wealth between bondholders and shareholders. Although as Kalay (1982) suggests,
it is not the payment of dividends that is the greatest source that damages the wealth of
bondholders. Another way in which the dividend policy contributes to the reduction of agency
costs is through increased capital market control. The payment of dividends decreases the
funds available for investment opportunities, forcing managers to seek financing within the
capital market. The efficient function of monitors by capital markets allows a reduction in
costs that are not appropriate and at the same time the costs relating to the control of
ownership unbundling.
13
Jensen (1983a, 1983b) 14
Myers (1977)

CBS | Copenhagen Business School | MSc ASC 37
In support of this thesis two very important studies have been carried out one year after the
other. The first Holder, Langrehr and Hexter (1998)15 examined 477 American companies in
the decade between 1980 and 1990, concluding that ownership and dividend policy are
significantly and negatively correlated, while at the same time the number of shareholders
positively influences the payout.
In another study published a year later proposed by Saxena (1999)16, the researcher examines
a sample of 235 unregulated and 98 regulated companies listed on the NYSE in the period
between 1981 and 1990 going to confirm the results of his colleagues and therefore support
more the thesis of the agency cost hypothesis and highlighting how it is a determinant in
defining dividend policies.
The aforementioned hypothesis is connected to another strand examined by many
researchers, that of cash flow theory. According to which managers operating in the best
interests of shareholders should invest in all projects with profit opportunities. However, this
does not always happen, in fact, the inefficient use or excess waste of excess had already been
observed by Berle and Means (1932). Funds that advance after considering all possible
opportunities to positive NPV are a source of conflict of interests between managers and
shareholders. Therefore, the payment of dividends and interest on debts reduces the funds
available to managers, limiting their ability to invest in projects with marginal profitability or
for expenses that are not in line with company objectives.
15
Holder, Mark E., Frederick W. Langrehr, and J. Lawrence Hexter, 1998, Dividend Policy Determinants:
An Investigation of the Influences of Stakeholder Theory, Financial Management 27, 73-82.
16
Saxena, Atul K., 1999, Determinants of Dividend Payout Policy: Regulated Versus Unregulated Firms,
Working Paper, (State University of West Georgia).

CBS | Copenhagen Business School | MSc ASC 38
The Clientele Effect
Starting from the considerations of M&M (1961), who in their study had noted that the
clientele effect could play a fundamental role under some assumptions. They point out that
the choice of investors' portfolios could be influenced by some market imperfections, such as
the different taxation and transaction costs, so as to induce them to prefer mixes of capital
gains and dividends in the construction of their portfolios. They then underline how investors
pay close attention to the composition of the portfolio in order to minimize these market
imperfections. They also identify a certain tendency for investors to be attracted to stocks that
pay dividends. Allen et al. (2000) defines a model according to which institutional investors
are attracted to dividends because they are taxed less than retail investors17. Despite the fact
that M&M argued that the clientele effect could influence dividend policies in order to attract
a certain type of clientele, in their assumptions they envisaged a perfect market in which an
"as good as another" clientele, therefore, is the company's valuation that the dividend policy
was irrelevant.
The client effect theory explains how the price of a company's shares varies with the demand
and the objectives of investors reacting to different conditions of taxes, dividends, other
changes in internal policies or from behavioral preference. Moreover, all this theory supports
how a specific investor is attracted by different company policies according to their needs and
that as the latter changes they will adjust their stock accordingly. Shefrin and Thaler (1988)
17
Allen, Franklin, Antonio E. Bernardo, and Ivo Welch. 2000. A theory of dividends based on tax clienteles. Journal of Finance
55:6, 2499–536.

CBS | Copenhagen Business School | MSc ASC 39
argue that investors' personal life-cycle considerations determine the predilection for
dividends: Older investors favor dividend-paying stocks because they substitute for a regular
employment income.
In practice, investors always face different types of taxation depending on dividends or capital
gains, and in the trading of securities in the form of transaction costs or other types of fees.
For this reason, different types of investor customers are created. Dhaliwal, Erickson, and
Trezevant (1999) and Seida (2001) find empirical evidence that supports the existence of tax-
based clientele for dividend.
Based on a managerial survey, Brav, Graham, Harvey, and Michaely (2005) reports that
managers consider their investor preferences towards dividends when making dividend-
related decisions. In fact, companies that operate in high growth sectors tend to pay low
dividends by attracting investors who instead prefer price fluctuations, so they prefer capital
gains to dividends.
Specifically, if we talk about taxes, we can identify two types of investors on equal terms, those
that are in a low tax brackets and with a regular and fixed income which will tend to be
attracted by stocks that pay high dividends18. On the other hand, investors who are part of a
high tax bracket may find it advantageous to prefer companies that instead hold back their
capital. Elton and Gruber (1970) also present the case of completely indifferent customers,
i.e. those exempt from rates.
18
Han, Lee and Suk, 1999, Dhaliwal, Erickson and Trezevant, 1999, and Short, Zhang and Keasey, 2002.

CBS | Copenhagen Business School | MSc ASC 40
As far as transaction costs are concerned, the dividend policy can influence different clients
that change the allocation of their portfolios incur these costs. Small investors who rely on
dividend revenues for their consumption will certainly prefer stocks that pay dividends
regularly, as the costs associated with selling stocks may prove to be significant for them. On
the other hand, there are investors who do not need liquidity, prefer to build portfolios with
low payouts in order to avoid the transaction costs incurred in reinvesting dividends19.
Another effect of transaction costs that affects dividend policies is that companies often need
funds to finance new investment opportunities, so they have to issue new equity or finance
with other debt, but the costs for these two forms of funding are very high, so very often we
tend to opt for retained earnings, limiting the issue of dividends. Fazzari, Hubbard and
Petersen (1988) reported that, over the period of 1970 to 1984, the retained earnings
amounted to 71.1 percent of the total retention ratio of 60 percent.
The ambiguity underlying the dividend clientele Hypothesis is all reflected in the empirical
results tested in the literature that have produced very different results.
One of the most relevant papers on this time is certainly the one published by Pettit in 1977,
which investigates the extent to which transaction costs and taxes affect investors' portfolios.
In his study he uses the current positions of portfolios and demographics. What will result will
be that the variables that influence investors' choices will be the age and the difference in the
taxation of dividends and capital gains. In the model that develops Pettit two types of data are
aggregated, the set of portfolios of 2500 bank accounts between 1964 and 1970, with all the
movements that took place in those years. At the same time the owners of these accounts are
19
Bishop et al., 2000

CBS | Copenhagen Business School | MSc ASC 41
given a questionnaire to determine their demographic characteristics and their method of
making investment decisions, and their performance expectations. Thus, it constructs a linear
regression using the investor's time preferences, tax rates, and portfolios as variables, putting
them in relation to the replies of the questionnaire. Pettit found a positive relationship
between the age of investors and the return on dividends in their portfolios to a negative
relationship between the dividend yield and the income of investors. So this suggests to us as
older investors with low income tend to prefer portfolios that allow them to meet their
expenses, carefully avoiding transaction costs. At the same time, portfolios that have a low
systemic risk prefer a high payout, corroborating the hypothesis the tax-induced clientele
effect.
Using the same database Lewellen et al. (1978) found only very weak supportive evidence
of the clientele effect hypothesis. Scholz (1992) developed an empirical model to test the
DCH directly by examining individual investor portfolio data. He found that differential tax
treatment of dividends and capital gains influences investors’ decisions in choosing between
higher-or-lower-dividend yield portfolios, consistent with dividend/tax–clientele hypothesis.
As we have seen so far no model or empirical analysis has completely managed to define and
give a well-defined explanation of the phenomenon of dividends, a multitude of fields have
opened and discovered over the years leading to results that somehow bring us closer to a
truth . Very often, however, we tend not to consider a fundamental subject in these analyzes,
the investor, his perceptions, his feelings, his beliefs and his ways of behaving. In the next
section, we will delve into this aspect and how their behavioral and cognitive aspects influence
their own decisions and economic agents closely.

CBS | Copenhagen Business School | MSc ASC 42
Behavioral Finance
Investors' behavior is influenced by their attitude and social norms20. And until recently this
aspect had been ignored by many scholars because of the difficulty of introducing these issues
into purely empirical models21.
Ordinary investors are subject to uncertainty, a lack of judgment and a sense of objectivity
(Knight, 1964). They are oppressed by the constructs of society and this leads them to errors
in judgment and trading securities, not following a true logic. In confirmation of this, a large
group of investors in some way affects the aggregate activities of the market (Shiller, 1984).
Dividend policy is inconsistent with maximizing shareholder wealth and is best explained by
the addition of a socio-economic behavioral paradigm in economic models. Dividend payment
can be seen as the socio-economic repercussion of evolution the corporate asymmetric
information between managers and shareholders causes dividends to be paid to increase the
attractiveness of equity issues22.
Behavioral finance argues, unlike the traditional economics models, that financial phenomena
can be better understand assuming that agents are not homo economicus i.e. not fully
rational. In some occasions they act irrationally.
Instead, the traditional economics theories are using models in which agents are “rational”.
Thereby, they have clear preferences and they always choose to perform the action with the
20
Shiller, Robert J., 1984, Stock Prices and Social Dynamics, Brooldngs Papers on Economic Activity, 457-510. 21
Arbel, Avner, Steven Carvell, and Erik Postnieks, 1988, The Smart Crash of October 19th, Harvard Business
Review, 66, May-June, 124-136. 22
Frankfurter, George M. and William R. Lane, 1992, The Rationality of Dividends, International Review o f
Financial Analysis, 1, 115-129.

CBS | Copenhagen Business School | MSc ASC 43
optimal expected outcome for themselves from among all feasible actions. In this way when
they receive new information for example a dividend policy changing they follow Bayes’ law
updating immediately their belief correctly. These theories after years of application have
started to have some weaknesses and it has become clear that events about the aggregate
stock market and the individual trading behavior are not lightly understood in this framework.
(Barberis, Thaler, 2003)23
The behavioral finance theories are based on two main building blocks: cognitive psychology
and limits to arbitrage. Cognitive refers to the way the people think. People make errors in the
way they think, and this led to distortions. Limits to arbitrage refers to the circumstances in
which is possible for investor to make an arbitrage and in which one it is not feasible.
- Limits to arbitrage
If the agents are rational, the securities’ price are right, they equal their “fundamentals value”
i.e. Efficient Market hypothesis (EMH). In this situation no investors can earn an abnormal
return.
The behavioral finance theory stated that “some features of asset prices are most plausibly
interpreted as deviations from fundamental value, and that these deviations are brought
about by the presence of traders who are not fully rational”. Moreover, these deviations could
not be re-adjusted immediately by the rational agents as Friedman said because it is hard that
these mispricing are quickly disclosed by investors.
23
Barberis N., Thaler R., “A survey of Behavioral Finance”, Handbook of the Economics of Finance, 2003

CBS | Copenhagen Business School | MSc ASC 44
Even if the market is inefficient this does not necessarily mean that there are any abnormal
return taking for granted. Thaler and Barberis in their research have found out a series of
financial market phenomena that can be addressed as mispricing, some of them persistent.
These phenomena are: “twin shares”, “index inclusions” and “internet carve-outs”. Also, due
to the fact that the observed mispricing have not quickly disappeared and they remained
constant in the long time, the researchers have concluded that there are limits to arbitrage
because otherwise the mispricing would have been cancel out by the investors arbitrage
actions.
- Cognitive biases
Behavioral finance models explicated many psychological biases that influence people’s belief
and preferences. Next, they will be exploited just the principal cognitive biases that lead to
misbehaving.
● Overconfidence: investors tend to be overconfident about their beliefs. Agents think
their estimates regarding the future and their estimation of probabilities to be always correct,
but this led them to evaluation errors.
● Heuristics: are rules of thumb for example the 1/N rules that help to make decision
easier but could lead to biases.
● Optimism and wishful thinking: “most people display unrealistically rosy views of their
abilities and prospects” [Weinstein (1980)].
● Mental accounting: agents tend to divide decisions that should be combined.

CBS | Copenhagen Business School | MSc ASC 45
● Conservatism: when there are changing factors, some people tend to react slow to the
changes because they are anchored to the normal state of things. So, investors tend to
underreact to change.
● Representativeness: “People underweight long-term averages. Agents tend to put too
much weight on recent experience. This is sometimes known as the ‘‘law of small numbers.’’”(
Ritter J. R., “Behavioral finance”, Pacific-Basin Journal of finance, 2003).
● Anchoring: people when have to make estimates lay on a starting value that
successively adjust. Kahneman and Tversky (1974) have underlined that these adjustments
are insufficient because often agents “anchor” too much on the initial value.
● Framing: framing refers to the way in which an issue is posed for the decision maker.
In fact, the same matter exposed in different words, graphs etc. can have different effect on
the agent’s final decision.
● Ambiguity aversion: investors are afraid of circumstances in which they do not have a
clear approximation of the distribution of the probability of an event.
After having deepened all these psychological biases and taking into consideration the limits
to arbitrage, it will be listed a series of investors behaviors that are quite common in the
financial market nowadays.
- Insufficient diversification: as explicated in the Thaler and Barberis (2003) study there are a
large part of investors that hold a number of shares fewer than what is recommended by the
literature in order to have a good diversification effect. In fact, investors are subjected to the
“home bias” effect i.e. agent prefers to keep stocks of its own country, mostly due to their

CBS | Copenhagen Business School | MSc ASC 46
ambiguity aversion because investors find national shares more familiar. Nevertheless,
another explication for the home bias phenomena as suggested by the research of Coval and
Moskowitz (2001) could be the less cost of get information for local firms comparing to the
foreign ones. However, the ambiguity aversion remains a valid explanation to this misbehave.
- Naïve diversification: Bernartzi and Thaler (2001) discover that even when investors
diversify, they do it in a wrong way. In fact, people tend to follow heuristic strategies of
diversification such as the 1/n rule of thumbs.
- Excessive trading: “Barber and Odean (2000) analyze the trading activity from 1991 to 1996
of a group of investors and they found out that, taking into consideration the transaction costs,
the average return of the sample was below the benchmark. Thus, the underperformance is
due to excessive trading and the transaction costs. An explanation of this phenomenon is
relative to the overconfidence of the investors, because “ people believe that they have
information strong enough to justify a trade, whereas in fact the information is too weak to
warrant any action.”24
- The selling decision: different studies underlines that agents are reluctant to sell stocks
trading at a loss relative the purchase price. The prospect theory and framing could be two
possible explanations of this investor’s behavior.
The buying decision: Odean (1999) states that agents in the buying decision do not tend to
examine through all the listed shares but they tend to buy a stock that has caught their
attention due to their “extreme” past performance, good or bad. Therefore, they are mislead
by these extreme performance that catch their attention.
24
Barberis N., Thaler R., “A survey of Behavioral Finance”, Handbook of the Economics of Finance, 2003

CBS | Copenhagen Business School | MSc ASC 47
Behavioral finance and dividend policy. Why firms pay dividends?
In the last two decades, as shown by Fama & French (2000), the number of firms paying out
dividends have decreased. In fact, historically dividends have been taxed at a higher rate
respect the capital gain, therefore shareholders should prefer share repurchase comparing to
dividends. Nevertheless, there are still many companies that prefer this method to payback
their shareholders. Thus, why investors seem glad to receive a considerable part of their
return in the form of dividends? 25
To answer to these questions Shefrin and Statman (1984) in their research tried to address a
behavioral explanation. Firstly, they stated that investors prefer dividend in order to manage
to have a self-control on their spending. A second possibility was based on mental accounting,
indeed by setting up a dividend payment, firms help the agents to separate the gains from the
losses and thus to increase their utility. By making this segregation of the overall gain or losses
into different components, the utility for investors increase. In the end, Shefrin and Statman
state that dividends payment helps investors to avoid the regret of action that can led to more
desirable outcome. In our case the regret could be the selling of a stock to finance an
investment, but in the next period the share’s price has a rise of value.
Then, Baker and Wurgler (2002b) assert that variation in dividend policy could be due to
changing investor sentiment about dividend-paying firms. For example, when agents become
more risk averse they prefer firms paying out an higher amount of dividend because they think
that these firms are less risky (“bird in the hand” theory). Thus, whether the managers want
to maximize the short-run value they could change their company dividend policy in order to
25
Barberis N., Thaler R., “A survey of Behavioral Finance”, Handbook of the Economics of Finance, 2003

CBS | Copenhagen Business School | MSc ASC 48
satisfy the investor will. Also, Baker and Wurgler found some supportive evidence to their
hypothesis. In fact, they managed to demonstrate this phenomenon quantitatively through
the employment of some specific measures.
Corporate dividend policies vary substantially among different countries and among different
kind of firms within the same nation. The main reason traditionally addressed to these
diversities were explained by distinct tax systems, differences in the relevance of
informational asymmetries and cultural aspects.
However, in the last years, different academic researchers as Breuer, Rieger and Soypak have
started to argue about behavioural biases due to the irrationality of some investors that could
had have an influence on the changing corporate dividend policy.
Impact of dividend policy on share price volatility and on firm risk
As we have noted so far, the dividend policy and the implications of the changes applied to it,
have been much deepened in the literature trying to solve the many theories and distortions
in the market such as the agency cost, signalling theory, birth in the hand and the clientele
effect.
Similarly to the debate on the influence of the dividend policy on the price of a stock was
added a school of thought that analyzed and studied the relationship between dividend policy
and share price volatility or business risk.

CBS | Copenhagen Business School | MSc ASC 49
The volatility of a share price is the systemic risk26 that an investor faces in owning such an
action within his investment portfolio. Investors by nature are risk averse and therefore
volatility is an important parameter as it measures the risk to which an investor is exposed.
The riskiness of their investments can influence the valuation of a company's actions over the
long term. This makes the price volatility of an important stock both for the company and for
the investor.
It is on these new relationships that a new branch of studies develops, the most important of
which will be presented below.
M. Rozeff (1982) presents a model that allows to establish the optimal level of dividend payout
according to which increasing the dividends decreases the agency costs but increases the
transaction costs related to external financing. So he builds this model, through a cross-
sectional test, which reports dividend payout according to the equity held by internal
investors, past and future revenue growth, the company's beta and the number of common
stockholders. The results show that the dividend payout is negatively correlated to all the
variables except for the number of common stockholders, for which it is positively correlated.
In addition, it is noted that a higher beta involves a smaller dividend payout, since it involves
transaction costs for the acquisition of higher external financing and consequently less cash
availability and therefore for the distribution of dividends.
J. Baskin published in 1989 in the Journal of Portfolio Management a study entitled "Dividend
policy and the volatility of common stocks" in which he investigates the dividend policy as a
26
Systemic risk is the possibility that an event at the company level could trigger severe instability or collapse an
entire industry or economy.

CBS | Copenhagen Business School | MSc ASC 50
determinant of the volatility of the price of a security. The regression model developed by him
was basically based on the risk relationship of a security with two main dividend measures,
the dividend yield and the dividend payout ratio, to which he added control variables such as
earnings volatility, firm's size, debt and growth. He then applied this model to 2,344 American
companies in the period between 1967 and 1986 reporting a significant negative correlation
between the dividend yield and the stock price volatility. He suggests that the dividend policy
can be useful in controlling the risk of the share price. He said that if the dividend yield
increases by 1%, the annual standard deviation of the stock price movement decreases by
2.5%. But it can not be concluded that the dividend yield has a direct effect on volatility.
In 1996 a study published by Allen and Rachim27 based on 173 listed Australian companies, in
the period between 1972 and 1985, following the same model of Baskin, has opposite results
reporting a positive relationship between the stock price volatility and payout ratio. Asserting
that the payout ratio is one of the determinants of the price risk of an action.
In 2011, in support of Allen and Rachim's findings, a study was published by Hussainey et al.
Using the Baskin model, he examines the UK market, with which he confirms the results
obtained by their colleagues. Volatility and payout ratio. Has a negative relationship between
the share price and the volatility of the stock price, and has a significant positive impact on
the share price volatility.
27
Allen, E. D., and S. V. Rachim. "Dividend Policy and Stock Price Volatility: Australian Evidence." Journal of
Applied Economics 6 (1996): 175-188.

CBS | Copenhagen Business School | MSc ASC 51
Chapter 4
Data and Sample
The analysis is focused on the US stocks market and how the firms’ stocks price, listed on it,
react to the changing dividend policies. The choices of the US market it is not casual but is due
to its specific characteristics. In fact, the companies listed on it tend to have a history of
dividend payers, moreover the data of the US market are more easily available because
companies have more obligations regarding the publication of their financial statements and
related documentations.
The data sample needed to implement the regressions analysis and the correlation function
are secondary data. Indeed, all the data necessary to the analysis purposes were gathered
from two databases:
- Compustat – Capital IQ database;
- CRSP database.
These databases are taken from the Wharton Research Data Services (WRDS)28 website which
update its data daily, making it possible to gain a sufficient amount of data, reliable and up-
to-date.
28
Wharton Research Data Services (WRDS), University of Pennsylvania
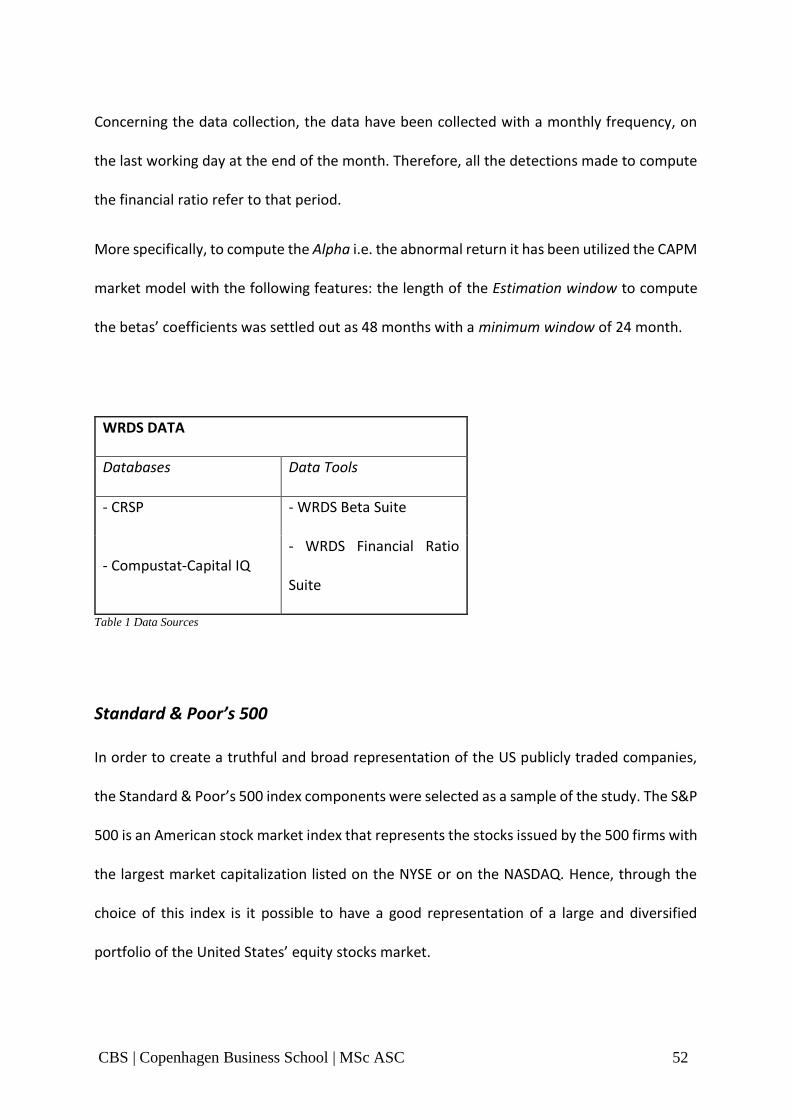
CBS | Copenhagen Business School | MSc ASC 52
Concerning the data collection, the data have been collected with a monthly frequency, on
the last working day at the end of the month. Therefore, all the detections made to compute
the financial ratio refer to that period.
More specifically, to compute the Alpha i.e. the abnormal return it has been utilized the CAPM
market model with the following features: the length of the Estimation window to compute
the betas’ coefficients was settled out as 48 months with a minimum window of 24 month.
WRDS DATA
Databases Data Tools
- CRSP - WRDS Beta Suite
- Compustat-Capital IQ - WRDS Financial Ratio
Suite
Table 1 Data Sources
Standard & Poor’s 500
In order to create a truthful and broad representation of the US publicly traded companies,
the Standard & Poor’s 500 index components were selected as a sample of the study. The S&P
500 is an American stock market index that represents the stocks issued by the 500 firms with
the largest market capitalization listed on the NYSE or on the NASDAQ. Hence, through the
choice of this index is it possible to have a good representation of a large and diversified
portfolio of the United States’ equity stocks market.

CBS | Copenhagen Business School | MSc ASC 53
The original sample of the Standard & Poor index includes 505 stocks issued by 500 large-cap
companies. They have been picked-up the firms’ stocks that were present in the index at the
30th May 2018. Of these 505 stocks just 268 were left in the sample, in fact some adjustments
were done.
First, the companies that operates in the financial sector as depicted by GICS (Global Industry
Classification Standard)29 i.e. banks, insurance companies and diversified financials were
excluded from the sample due to their own specific regulations on the dividend payments that
could have led to misleading results.
Moreover, it has been necessary a further data cleaning to mitigate the effect of market noises
and missing data. Therefore, the companies in the sample must have the following
characteristics to be included in the model:
- The firms must not operate in the financial sector because, as it has been mentioned
before, the firms due to their core business have many limitations on their dividend
policy management and they have to follow strict parameters;
- The stocks have to be present in the index for at least five years, in this way the firm’s
value has not fluctuated as much as to lead to misinterpretation of data;
- Each firm presented in the sample must have been listed in the Nasdaq or in the Nyse
for at least ten years.
The database is indexed through the Ticker symbol of the company. There have been some
issues because the ticker symbol is not unique and sometimes it varies in time, thereby it has
29
The Global Industry Classification Standard (GICS) was developed in 1999 by MSCI and S&P Global

CBS | Copenhagen Business School | MSc ASC 54
been added the PERMNO30 identification number, that is a unique identification code that
CRSP assigned to the companies’ stocks. The companies in the sample are listed in the Table
1 in the “Appendix”.
To conclude, it has to be considered that the S&P 500 index is not a perfect sample because it
only considers the largest assets from the U.S. stocks market, thus this gives origin to a
geographical and firm bias.
Dividends and Control variables Data
As it has been mentioned above, the principal stocks and firms’ characteristics needed to
reach the research’s goals, thus the fundamental variables involved in the regression analysis
are: the stocks abnormal return and the firm's’ dividend policies features i.e. the dividend
payout ratio and the dividend yield.
Regarding the first variable i.e. the stock abnormal return, the data were gathered from the
WRDS Beta Suite database, that is an effective tool that Wharton provides in order to calculate
stock’s loadings on different risk factors. To the study’s purpose it was chosen the monthly
return frame, that allow to compute the stock’s beta through the Capital Asset Pricing Model
(CAPM).
Secondly, to get the data necessary to calculate the dividend payments variables and the other
control variables, it was employed the WRDS Financial Ratio Suite. The Financial Ratio Suite is
30
PERMNO is a unique permanent security identification number assigned to CRPS to each security. The
PERMNO neither changes during an issue’s trading history, nor it is reassigned after an issue of ceases trading.
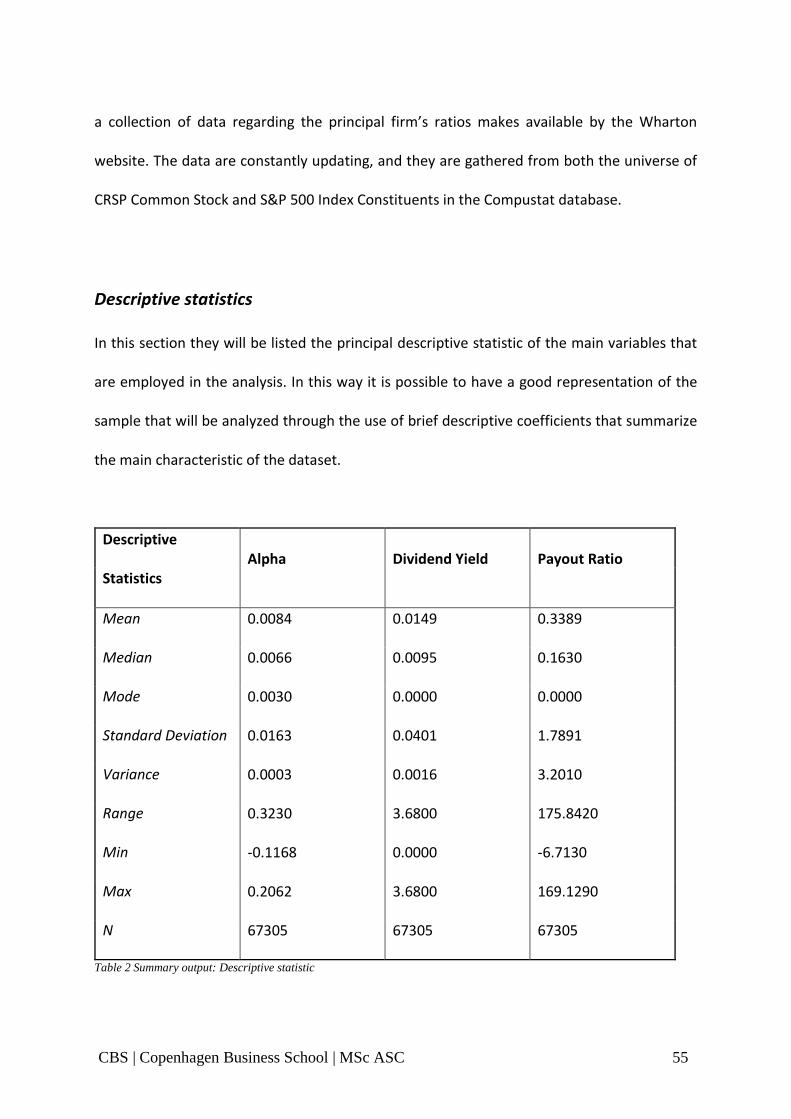
CBS | Copenhagen Business School | MSc ASC 55
a collection of data regarding the principal firm’s ratios makes available by the Wharton
website. The data are constantly updating, and they are gathered from both the universe of
CRSP Common Stock and S&P 500 Index Constituents in the Compustat database.
Descriptive statistics
In this section they will be listed the principal descriptive statistic of the main variables that
are employed in the analysis. In this way it is possible to have a good representation of the
sample that will be analyzed through the use of brief descriptive coefficients that summarize
the main characteristic of the dataset.
Descriptive
Statistics Alpha Dividend Yield Payout Ratio
Mean 0.0084 0.0149 0.3389
Median 0.0066 0.0095 0.1630
Mode 0.0030 0.0000 0.0000
Standard Deviation 0.0163 0.0401 1.7891
Variance 0.0003 0.0016 3.2010
Range 0.3230 3.6800 175.8420
Min -0.1168 0.0000 -6.7130
Max 0.2062 3.6800 169.1290
N 67305 67305 67305
Table 2 Summary output: Descriptive statistic

CBS | Copenhagen Business School | MSc ASC 56
The multiple least square regression models
The regressions model that have been implemented in this paper, have been executed
through the data analysis extension of Microsoft Excel. The model that has been applied to
this paper is a time series regression function that examines the same variables over multiple
time periods, in this case twenty years.
The regressions employed throughout this analysis uses the Ordinary Least Square estimation
method (OLS), which allows for an estimation of the beta coefficients in a linear regression
model. In the setting up of the model some assumptions have been made to simplify and make
the analysis clearer.
1) A fundamental assumption is that does not exist autocorrelation between any two
variables. In fact, in case this assumption is violated an underestimation of the
variance will rise leading to a less reliable significant tests that in this case become
useless.
2) Moreover, it has been assumed that the regression intercept passes through the
origin, therefore the intercept term is zero, in this way it is possible to avoid the
multicollinearity issue.
For this study, it has been chosen a significance level of 95% that will serve as the level to
estimate the statistically relevance of the analysis’ results. The significance level of 95% is
generally the most used and accepted level in the statistical and economic studies.

CBS | Copenhagen Business School | MSc ASC 57
In the following paragraphs, they have been presented the two multiple least square
regression and the sectors analysis that have been implemented for the paper purposes.
1St regression model
yi = β0 + β1 DIV YIELDi + β2 PAY-OUTi+ εi
The first regression function is a multiple least square regression build up to see how the stock
abnormal returns are correlate to the two main dividend variables: the dividend pay-out ratio
and the dividend yield. The function is structured as follow:
- Dependent variable:
● Abnormal return: it is measured monthly as the difference between the
expected price and the actual price. As a proxy of the abnormal return it has
been used the “α” factor computed from the CAPM model through the WRDS
Beta Suite database. In fact, alpha is a technical risk factor that is used as a
measure of performance. It indicates the excess return of a stock on what
should be its expected return.
- Independent variables:
● Dividend pay-out ratio

CBS | Copenhagen Business School | MSc ASC 58
The payout ratio shows the dividends as a fraction of the net income. It is
computed dividing the dividend per share for the earnings per share (earnings
before extras) for each year, utilizing the year’s end value. It is taken directly
from the WRDS Financial Ratio Suite database. This ratio takes in consideration
the variation of the dividend payments in relation to the amount of earnings,
thereby it does not consider the dividend payment alone, but it relates the
payment to the variation of the amount of earnings.
● Dividend yield
This ratio indicates the dividend rate as a fraction of the share price. It is computed
dividing the dividend per share for the share’s price. Thus, it displays the value
of the dividend payment in percentage of the share price using the price
average during the year. The ratio has been gathered from the WRDS Financial
Ratio Suite database.
2nd regression model
yi = β0 + β1 DIV YIELDi + β2 PAY-OUTi + β3 ROEi + β4 DEBTi + β5 CASHi + β6
ASSETTi + β7 SIZEi + εi

CBS | Copenhagen Business School | MSc ASC 59
The second regression function is an upgrade of the first one. In fact, they have been inserted
in the function some control variables to catch the effects of other factors on the main
variables under studied.
These variables have been plugged in the model to analyze and, at the same time, to cancel
out the misleading effect of other market or firm factors that could have an impact on the
corporate dividend policies or on the shares’ abnormal return.
Thanks to the regression coefficient of these variables, it is possible to obtain an estimate of
the impact of these other variables on the stock abnormal return and on the corporate
dividend policies. Moreover, with the introduction of these new variables it is possible to see
how the effects of the two main dependent variables vary respect to the first regression
function.
Thereby the model is constructed as follow:
- Dependent variable:
● Abnormal Return
- Independent variables:
● Dividend pay-out ratio
● Dividend Yield
- Control variables:
● Return on Equity

CBS | Copenhagen Business School | MSc ASC 60
The return on equity variable is calculated as the “net income as a fraction of average Book
Equity based on most recent two periods, where Book Equity is defined as the sum
of Total Parent Stockholders' Equity and Deferred Taxes and Investment Tax
Credit”.31 The ROE measures the profitability of a company. The stock return and
the divided policies could be influenced by the firm's’ profitability variation.
Therefore, it was introduced in the model a control variable to account for the
companies’ profitability.
● Asset turnover
The asset turnover ratio measures the efficiency of a company to generate sales or
revenue from its total asset investment. Hence, the ratio is computed considering
the sales as a fraction of the average total assets based on the most recent two
periods. The dividend policy of a company it is correlated with its investment and
growth opportunities; thus, a growing asset turnover rate could lead to a positive
change of the firm’s dividend policy (whether this is in line with the firm strategy).
For these reasons this variable was plugged in the regression function.
● Firm’ Size
In its study, Baskin (1989), suggests a correlation between the firm’s size and the stock
price volatility; hence, a size variable was embedded in the model. In order to have
a variable that could be a good proxy for the firms’ size, it was chosen the company
31
WRDS Industry Financial Ratio

CBS | Copenhagen Business School | MSc ASC 61
market value. Therefore, this variable is calculated multiplying the monthly price
per share by the total number of ordinary shares outstanding issued by the
company.
● Long-term Debt
The long-term debt variable indicates the corporate’s total long-term debt in relation to
the corporate’s invested asset. A variable that counts for the level of corporate
leverage has been included because the corporate level of debt is a fundamental
risk factor thereby it influences the corporate return. Thus, this variable, as
computed by WRDS Financial Ratio Suite, consists of all the interest-bearing
financial obligation (excluding the current debt i.e. due within one year) divided by
the total invested capital.
● Cash ratio
The cash ratio is calculated by WRDS Financial Ratio Suite as the cash and short-term
Investments as a fraction of current liabilities. This ratio assesses the liquidity
position of the company, thus, its ability to repay current debt but it also evaluates
the firm cash reserve and its capacity to pay out dividends. Therefore, a firm that
desire to pay out dividends constantly should have a low liquidity risk and
accordingly a high cash ratio.

CBS | Copenhagen Business School | MSc ASC 62
Variable category Variable name Regression
coefficient
Dependent Variable Abnormal Return Yi
Independent Variable Dividend Pay-Out
Dividend Yield
X1
X2
Control Variable
Return on Equity
Asset Turnover
Firm Size
Long-Term Debt
Cash Ratio
Z1
Z2
Z3
Z4
Z5
Table 3 Regression Variables
Sector Analysis
To conclude the analysis, it has been implemented a sector analysis. Thus, the second
regression function was executed more times keeping separately the different sectors in
which the firms operate. In other words, a regression analysis was run for each sector.
The analysis per sector allow to see how the correlation among the stock abnormal return
and the dividend policy variation ranges with the different sectors. Hence, make it possible to
understand in which sectors the thesis hypothesis work better and where they are not suited
in the contest.

CBS | Copenhagen Business School | MSc ASC 63
In order to identify the main sectors in which develop the analysis, it was utilized the GICS
(Global Industry Classification Standard) standard division. The sectors analysed in the study
can be found below in table 2.
GICS code Sector Nr. Stocks in the sample
10 Energy 25
15 Materials 21
20 Industrials 49
25 Consumer Discretionary 46
30 Consumer Staples 26
35 Health Care 28
40 Financials 1
45 Information Technology 39
50 Telecommunication
Services 3
55 Utilities 27
60 Real Estate 3
Table 4 GICS sectors
In the following chapters the analysis will be developed in depth and the regression results
will be shown and further studied and analyzed.

CBS | Copenhagen Business School | MSc ASC 64
Chapter 5
Analysis
Aim of the analysis
The aim of the study is to assess the relationship between the stock abnormal return and the
variation of the corporate dividend policy. Going more in depth, the analysis’ purpose is to
understand how the changing dividend policy of a firm impacts on the stock’s return; in
particular, whether this variation could be correlated with the rise of a stock’s abnormal
return. Therefore, the study seeks to find a relation, positive or negative, between the
abnormal return and the dividend payment. In an attempt to give an explanation of this
intercorrelation not only through the traditional dividend theories such as the signalling
theory, the bird in the hand model and the Modigliani & Miller theorem. But also, analysing
the correlation between these variables utilizing psychological and behavioral aspects of the
human kind, i.e. the Behavioral Finance Theories. Unluckily, this part of the analysis will be
indagated just theoretically because developing a quantitative analysis on this theme will be
too much complex.
Also, the study analyses this phenomenon through the differentiation by industry sector,
taking in consideration the intra-industry transfer of information studied by Firth (1996).
Therefore, researching for the same correlation between abnormal return and dividend policy
but dividing the companies in their reference sectors. In this way, it is allowed to do a
regression analysis per sectors and see how the researched correlation varies across different

CBS | Copenhagen Business School | MSc ASC 65
sectors. Thus, they have been identified 10 different sectors (table 2) and the regression
analysis have been repeated 10 times.
Furthermore, the research, with the help of the regression analysis results, will try to prove if
there are any possibilities for a company’s management to organize its dividend policy
strategy with the aim to attract specific segments of investors that due to their psychological
biases tend to prefer stocks that pay out more dividends instead of have the same return
through the capital gain or the share repurchase.
The next paragraphs will be organized as follow: first it will be briefly explained how the
analysis has been conduct, the statistical instrument and the data used to develop it. Then,
will be explicated a summary of the research questions and the relative hypothesis that have
been formulated to answer the questions. After, they will be listed the expectations about the
regression coefficients signs (positive or negative). At the end, the results of the analysis will
be showed i.e. the summary statistics of the regression functions, making it possible to
compare the expectations with the actual results. Then, the sector analysis will be explicated.
At the end, a brief conclusion about the research results will be developed to give a broad
overview of the final conclusion of the study.
Briefing of the research questions
The aim of this study is to achieve satisfactory and complete answers to the research question
and the sub-questions that were deepened in the first chapter of the paper. The questions can
be briefly summarized as follow:

CBS | Copenhagen Business School | MSc ASC 66
- Does a correlation between dividend policy and abnormal return exist? What is the
correlation between the change in the corporate dividend policy and the stock
abnormal return? Consequently, how dividend policy changing impact stock prices?
- Could investors’ misbehaviors have a role in this correlation? Psychological biases could
influence their portfolio buildings making them pick up stocks with high dividend
payments? Could this affect corporate dividend policy management?
- Looking at the industry sector, is it possible that some sector has a higher correlation
between abnormal return and the dividend policy variation?
Analysis development
As it has been described in the chapter regarding the methodology, in order to develop the
analysis, they were built-up two multiple square regression functions to elaborate on the
correlation between the dependent variable (abnormal return) and the independent variables
(dividend yield and dividend pay-out). The data needed to execute the regressions were
gathered from two different WRDS tools32 that draw their data from the Compustat – Capital
IQ and the CRPS database. Concerning the abnormal returns and the other variables they are
all monthly data.
32
WRDS Financial Ratio Suite and WRDS Beta Suite database
CBS | Copenhagen Business School | MSc ASC 67
At the beginning, the first regression without the control variable was run to gain information
on the correlation between the three main variables alone (abnormal return, dividend payout
and dividend yield). Then, the second regression with the control variables was executed to
analyse the impact of other variables on the dependent one and to see how the regression
coefficient changes from the first to the second function. To conclude, the industry sectors
analysis was built-up to master the differences between the sectors’ reactions to a change in
the dividend payments and therefore its impact on the stock abnormal return.
Hypothesis
In order to elaborate the thesis’ hypothesis, as it was deeply explained in the literature
overview chapter, they have been studied in depth the traditional dividend theories, inter alia
the “Signalling hypothesis”, the “Bird-in-the-hand” theory (Al-Malkawi 2007) and the
“clientele effect”. Moreover, the relation among the abnormal return and the dividends has
been analyzed employing the Behavioral finance theories; particularly, the psychological
biases, that influence the investment decision-making of the agents, theorized by Breuer,
Rieger and Soypak (2014) and by Barberis and Thaler (2003).
Therefore, through the examination of the traditional and non-traditional theories some
expectations about the researched questions have been elaborated and the following
hypothesis, regarding the analysis, have been produced:
1) It is argued that a correlation among a change in the dividend policy and the stock’s
abnormal return exists, and it is a positive correlation. In fact, it is expected that an

CBS | Copenhagen Business School | MSc ASC 68
increased in the dividend payout ratio or in the dividend yield should lead to a return
that exceed the one expected. This positive correlation between the dependent and
the independent variables is due to the clientele effect that arise because some
investors, not rational, prefer to construct portfolio made by shares that guarantee
higher dividend payments. For that reason, the investor is willing to pay more for that
kind of shares.
2) The second hypothesis starts from the assumption that not all investors are rational,
indeed some agents are driven by mental biases in their investment decision. Hence,
some investors have a preference for the firms that tend to pay higher dividends to
their shareholders. In this case, the demand for these kinds of shares will remain
constant over time even if, rationally, other companies would be more attractive due
to their higher capital gain or share repurchase. Because of that, the corporate
management of firms with certain characteristics, such as mature companies could
hold their level of dividend constant and high over time to attract that investors and
secure a certain level of stock return.
3) It is discussed that maybe within some sectors the interrelation among the variables is
stronger due to the characteristics of the companies in that sectors. In fact, maybe
there are sector in which the investment opportunities are fewer and the firms have
more capital to pay-out as dividends.

CBS | Copenhagen Business School | MSc ASC 69
Expectations about the regression coefficients
The hypothesis that have been elaborated in the previous paragraph, in addition to the
deepening of the relevant theories, allow to make estimates about the variables that are
included in the regression functions. Particularly, it is possible to have some expectations
about the regression coefficients i.e. whether the correlation between the dependent and the
independent variables is expected to be positive or negative.
The expectations are the following:
- Dividend payout: it is expected a positive correlation between the dividend pay-out
ratio and the stock's abnormal return. Indeed, an increase in the ratio indicates an
increase in the dividend payments. Thereby, according to clientele effect, that kind of
stocks should be more attractive for the investors that due to their mental biases such
as loss aversion prefers higher dividend payers’ firms. Also, due to the signalling
hypothesis, an increase in the ratio could be a positive signal for the investors. For all
these reasons agents are willing to pay more than the necessary to have in their
portfolio these shares, giving rise to an abnormal return.
- Dividend yield: the coefficient of this ratio it is expected to be positive as well. In fact,
as in the case of the dividend payout ratio, a raise of the dividend yield could be a signal
for an increase in the dividend payment. Thus, due to the same causes mentioned
before, the relation expected with the dependent variable is positive.

CBS | Copenhagen Business School | MSc ASC 70
- Return on Equity: following the results of the analysis done by Diaraya, Pagalung,
Habbe and Damayanti (2017) in their study, and La Porta et al. (2000) that was
asserting that more profitable firms tend to pay-out more dividends to send a signal
of their quality, the expected correlation between the ROE and the abnormal return is
positive.
- Asset Turnover: the asset turnover together with the ROE is another profitability ratio.
Many researchers have found a positive correlation between the asset turnover and
the stock abnormal return. Inter alia, it was considered the study made by Abdolreza
Ghasempour and Mehdi Ghasempour (2013).
- Firm Size: one the most known financial market anomaly, is the size anomaly originally
documented by Banz (1981)33. It states that small-firms (lower capitalization) have on
average higher returns than the large one. “Even when returns are adjusted for risk
using CAPM, there is still a consistent premium for the smaller-sized stocks”34. Hence,
the expected coefficient sign is negative, because with the increasing size the
abnormal return should decrease.
- Long-Term Debt: there is a clear effect of a rise of debt on the stock's return and
accordingly to the abnormal return. The effects of an increase in the long-term debt
are dual in the research that have been implemented so far. However, we lean forward
33Rolf Banz, “The relationship between return and market value of common stocks”, Journal of Financial
Economics (1981)
34Bodie, Kane, Marcus, “investments”, Global Edition, 10th, Mc Growth Hill Education

CBS | Copenhagen Business School | MSc ASC 71
the ECKBO (1986)35 version, in its study he states that there is a small but positive
correlation among the straight debt issuance and the stock's abnormal return.
Therefore, it is expected a negative correlation between the variables.
- Cash Ratio: also for the cash ratio the expectations are ambiguous. Therefore, it is not
possible to find a clear relationship that links the dependent variable with the cash
ratio one. Hence, for this variable there is not an expected sign for the regression
coefficient.
After having set out the expectations regarding the variables under investigation, in the next
paragraphs they will be presented the actual coefficients of the regression analysis that have
been produced through the analysis. In this way, it is allowed to see whether the assumptions
made in the hypothesis are aligned with the quantitative analysis developed. Thus, they will
verify the veracity of the hypothesis thought.
Results
In the following paragraphs, they will be presented and discussed the statistical results of the
different regression functions that have been implemented for the analysis' purposes. In this
section, the quantitative data produced will be analyzed, taking into consideration the
underlying theories, in order to understand whether the research questions could be
answered through the hypothesis that have been constructed.
35B.E. ECKBO, “Valuation effects of Corporate Debt Offerings”, Journal of Financial Economics 15 (1986)

CBS | Copenhagen Business School | MSc ASC 72
In order, they will be shown and commented the results from the first regression function, the
second regression function and finally the sector analysis results.
1st regression function results
The summary output of the first regression can be observed the table 2 and 3. The statistical
results confirm the previous expectations. In fact, looking at the regression coefficients in the
table 3 they are both positive. Going more in details, it is clear that the positive correlation
between the dividend yield and the abnormal return is greater than the one among the
dependent variable and the payout ratio. The beta’s coefficient of the dividend yield is about
0.2, indicating that an increase of 1 in the yield should imply an increase of a factor of 0.2 in
the stock’s return. Moreover, its p-value is lower than .001 meaning a high level of
significance. Regarding the second independent variable, the payout ratio, its value is positive
but is close to zero, entailing that the abnormal return is almost uncorrelated to it. Also, the
p-value is quite high, indicating a low significance of the coefficient.
Regression Statistic
R multiple 0.2604
R2 0.0678
R2 adjusted 0.0678
Standard Error 0.0115
Observation 41942
Table 5 First Regression: Summary Output

CBS | Copenhagen Business School | MSc ASC 73
However, observing the statistical global indicators, the low value of the R multiple and the R
Squared factors entails that the linear regression model is not well fitted in the scattered plot
of the observations. Indeed, a R Squared of about 7% indicate that the independent variables
are not able to explain significantly the variance of the dependent one. This could be due to
the low correlation between the dependent and the independent variables, to a not
completed sample construction because of the data missing or to the fact that just two
explicative variables are not enough for the model.
Coefficients Standard error t-stat p-value
Intercept 0 #N/D #N/D #N/D
Dividend Yield 0.1185 0.0023 52.2185 0.0000
PayOut Ratio 4.9E-05 3.5E-05 1.4E+00 0.1601
Table 6 Results of the First Regression
Lower 95% Upper 95%
Intercept #N/D #N/D
Dividend Yield 0.1141 0.1230
PayOut Ratio 0.0000 0.0001
Table 7 First regression, lower and upper significance level

CBS | Copenhagen Business School | MSc ASC 74
2nd regression function results
In the second linear regression they have been added some control variables in order to
investigate the effect of profitability, liquidity and financial structure factors on the correlation
between the main variables of interests.
The regression results are going against the initial hypothesis of the paper which was assumed
a positive correlation among the dividend variables and the abnormal return. Indeed, in the
second model with the control variables the betas’ coefficients signs are negative for both the
dividend yield and the payout ratio, and they are both statistically significative because the p-
value is close to zero. Notwithstanding, the pay-out ratio coefficient is almost null as in the
first regression, confirming the supposition of a possible low correlation among the latter and
the stock’s abnormal return. Concerning the dividend yield, the inverse relationship that has
emerged could be due to the effects of the control variables. In fact, the positive relationship
that was present in the first regression has been cancelled out and reversed by the latter.
As can be observed in table 4, the summary parameters of the regression improved compared
to the first one. In fact, the R multiple, the R2 and the R2 adjusted has increased, while the
standard error decreased, indicating a better explanatory power of the model that is not just
due to the higher amount of independent variables used. Therefore, the variability of the
dependent variable is better explained by the variation of the predictors one. However, the R
squared of 25% is still not enough high, indicating that the relation among the dividend policy
variation and the stock abnormal return is not as strong as depicted by the paper’s hypothesis.

CBS | Copenhagen Business School | MSc ASC 75
Regression Statistic
R multiple 0.4998
R2 0.2498
R2 adjusted 0.2497
Standard Error 0.0104
Observation 41942
Table 8 Second Regression. Summary Output
Regarding, the control variables parameters the results are in accordance with the
expectations unless for some exceptions. The ROE, the Asset Turnover and the cash ratio are
slightly positive correlated with the dependent variable, while the long-term debt that was
expected negative, is positive but close to zero. The firm size instead seems to be uncorrelated
with the generation of abnormal returns going against the size anomaly study developed by
Banz (1981). To conclude, all the coefficients are statistically significant i.e. the p-value are
lower than 0.005.

CBS | Copenhagen Business School | MSc ASC 76
Coefficients Standard error t-stat p-value
Intercept 0 #N/D #N/D #N/D
Dividend Yield -0.1196 0.0035 -34.6448 0.0000
PayOut Ratio -0.0002 0.0000 -5.1493 0.0000
ROE 0.0005 0.0001 4.9146 0.0000
Debt Ratio 0.0112 0.0002 46.4122 0.0000
Cash Ratio 0.0018 0.0001 24.5454 0.0000
Asset Turnover 0.0025 0.0000 50.5858 0.0000
Size 0.0000 0.0000 16.5858 0.0000
Table 9 Results of the Second Regression
Lower 95% Upper 95%
Intercept #N/D #N/D
Dividend Yield -0.1264 -0.1128
PayOut Ratio -0.0002 -0.0001
ROE 0.0003 0.0007
Debt Ratio 0.0107 0.0116
Cash Ratio 0.0016 0.0019
Asset Turnover 0.0024 0.0026
Size 1.4699E-14 1.8639E-14
Table 10 Second regression, Upper and lower level of significance

CBS | Copenhagen Business School | MSc ASC 77
Regression functions per sectors
In the sector analysis, it has been executed exactly the same regression model that has been
applied before. The regression has been run ten times, one for each sector, in this way was
possible to further analyzed the differences among sectors and to understand how the
relation between the variables under investigation varies depending on the type of sector.
Indeed, each company within the same sector has its specific characteristics and its own
investors that follow their preferences based on their risk aversion, psychological biases and
other factors.
Sector Analysis Summary Output
Sectors 10 15 20 25 30
R multiple 0.6694 0.6332 0.5244 0.6462 0.5798
R2 0.4481 0.4010 0.2750 0.4175 0.3362
R2 adjusted 0.4470 0.3998 0.2743 0.4169 0.3351
Standard Errors 0.0108 0.0104 0.0093 0.0098 0.0072
Observations 4026 3903 8451 6921 4611
Intercept 0 0 0 0 0
Dividend Yield -0.1773 -0.3934 -0.1650 -0.2460 -0.0583
PayOut Ratio 0.0000 0.0001 -0.0011 00000 -0.0001
ROE 0.0484 0.0260 0.0043 -0.0002 -0.0007
Debt Ratio 0.0134 0.0043 0.0055 0.0046 0.0077
Cash Ratio 0.0035 0.0056 0.0019 0.0098 0.0109

CBS | Copenhagen Business School | MSc ASC 78
Asset Turnover 0.0004 0.0045 0.0033 0.0038 0.0000
Size 0.0000 0.0000 0.0000 0.0000 0.0000
Sectors 35 45 50 55 60
R multiple 0.6443 0.5212 0.6683 0.7132 0.8825
R2 0.4151 0.2716 0.4466 0.5087 0.7787
R2 adjusted 0.4141 0.2703 0.4395 0.5079 0.7455
Standard Errors 0.0089 0.0126 0.0053 0.0064 0.0027
Observations 4387 4103 620 4843 77
Intercept 0 0 0 0 0
Dividend Yield -0.3393 -0.3771 -0.0446 -0.1921 -0.0024
Payout Ratio 0.0001 0.0001 0.0001 0.0001 -0.0009
ROE 0.0208 0.0336 -0.0079 0.0273 0.0303
Debt Ratio 0.0109 -0.0038 0.0260 0.0180 0.0115
Cash Ratio 0.0022 0.0006 0.0025 -0.0048 -0.0027
Asset Turnover 0.0011 0.0040 -0.0269 0.0022 -0.0168
Size 0.0000 0.0000 0.0000 0.0000 0.0000
Table 11 Summary output. Sectors Analysis
In table 8 are summarized the statistical results of the sector analysis, they are highlighted the
principal regressions parameters. First, it is observed that the R2 values are higher, entailing
that the statistical model, held separate for each sector, fit better the co-movements of the
variables, the explanatory variables variation can better explain the dependent variable
movements. Regarding the other parameters the tendency is similar to the overall one, the

CBS | Copenhagen Business School | MSc ASC 79
dividend yield coefficient that is negative in all the sectors and the payout ratio that is positive
but almost null. Still, the negative relationship among the dividend measures and the
abnormal return is stronger in some sectors i.e. the materials (15) and the information
technology (45). While, in the Consumer Staples (30) and in the Real Estate (60) sector the
relation seems to do not exist.
Correlation analysis
As it has been explained in the “Methodology” chapter, in the implementation of a regression
analysis there is the risk to the impend of the multicollinearity phenomenon among the
predictor variables. In case of multicollinearity, the relationship between the explanatory
variables is almost perfect and this imply a difficulty in the estimate of their individual
coefficients. Multicollinearity will result in incorrect conclusion about the relationship among
the dependent and the dependent variables, making the analysis lose its statistical
significance. Consequently, in order to detect the presence of this issue, it has been built-up a
correlation matrix. The correlation matrix highlights the correlation among each predictor
variables, in this way it is possible to observe the magnitude of the relation that links each pair
of variables and, whether this is too much strong, eliminate the variable that generate
multicollinearity.
Observing the correlation matrix in table 9, it can be concluded that there is not presence of
multicollinearity among variable under investigation because the absolute values of the

CBS | Copenhagen Business School | MSc ASC 80
correlations among the variables are sufficiently low. Indeed, the correlation coefficients
between the variables are in the norm.
Correlation Matrix
Dividend
Yield
Payout
Ratio ROE
Debt
Ratio
Cash
Ratio
Asset
Turnover
Siz
e
Dividend
Yield 1
Payout
Ratio 0.1328 1
ROE -0.0050 -0.0225 1
Debt Ratio 0.3705 0.0781 0.100
5 1
Cash Ratio -0.0933 -0.0161 0.034
4 -0.3433 1
Asset
Turnover -0.2874 -0.0429
0.056
3 -0.2888 -0.1037 1
Size 0.0322 -0.0033 0.045
1 -0.1556 0.1032 -0.0490 1
Table 12 Correlation Matrix

CBS | Copenhagen Business School | MSc ASC 81
Brief review of the analysis
The results of the analysis have not been aligned with the initial expectations, therefore the
hypothesis have been confuted. Indeed, the results of the two regression functions are
contrasting with each other. While the first regression seems to confirm the paper’s
hypothesis with the positive beta coefficients of both the dividend yield and the payout ratio,
the second one has produced negative dividends’ coefficients, assuming a possible inverse
relationship between the abnormal return and the dividend policy variation.
To conclude this chapter, it has been implemented a sector analysis. However, even the latter,
notwithstanding the fact that has highlighted many differences it has not produced any
evidence in favor of the principal hypothesis under investigation.

CBS | Copenhagen Business School | MSc ASC 82
Chapter 6
Discussion
The findings of this paper demonstrate that the correlation among the changing of the
dividend policy and the stock abnormal return is not as strong as it was supposed. Moreover,
the second regression that seems the model that best fit the statistical phenomenon, shows
a slightly negative relation between the dividend payments and the abnormal return, going
against the thesis’ main hypothesis of a positive relationship among the explanatory and the
outcome variables.
The thesis was assuming that, following the behavioral finance theories in particular the bird-
in-the-hand theory by Gordon, there are some investors that due to their psychological biases
such as loss aversion and ambiguity aversion prefer to buy firms’ stocks which ensure a
constant and high level of dividend payments. In this way the dividend payment could satisfy
the investors willingness and alleviate their “fears” because as Baker and Wurgler (2002)
stated, the firms that pay-out dividends are seen less risky by irrational investors. Through this
mechanism, they come to create group of clients (Clientele effect, Pettit, 1977) that due to
their preferences for higher dividend payers’ firms are willing to pay more than the necessary
for that kind of share. Namely, these investors are pricing the stocks more than their effective
value, generating an abnormal return. Because of this mechanism, the firms that have few
investments opportunities and have more capital to pay as dividend could choose a high-level
of dividend policy strategy to try to capture the above-mentioned niche of the market, in

CBS | Copenhagen Business School | MSc ASC 83
which stay the irrational investors, in order to guarantee themselves a higher stock return.
Hence, putting in effect this dividend policy even the companies that operates in more mature
sectors in which there are less investment opportunities could keep their company value at a
high-level.
Still, while the first regression coefficients are in accordance with the paper hypothesis,
showing a positive correlation between the dividend yield and the abnormal return; the
second one seems to be contrasting with the thesis’ solution to the research question. Indeed,
the second regression presents a negative beta for the dividend yield parameter, leading to a
possible contrast with the paper main hypothesis. As if the investors see the dividend payment
increase as a negative signal and following the signalling hypothesis they consider an higher
amount of dividends as a decrease in the investment and growth opportunity of the firm.
Nevertheless, both the models produced a R-multiple and R-squared coefficient that are quite
low, indicating that the correlation among the explanatory and the dependent variable is weak
as if the two phenomena were almost uncorrelated. This effect can be observed also in the
two scatter-plot outlined in the graphs 1 and 2. In fact, the graphs show that for both the
dividend yield and the payout ratio there is not a clear relationship with the abnormal return
variable.

CBS | Copenhagen Business School | MSc ASC 84
Figure 1: Scatter plot: Dividend Yield and Abnormal Return
Figure 2: Scatter plot: Payout Ratio and Abnormal Return

CBS | Copenhagen Business School | MSc ASC 85
Also, the third hypothesis linked with the differences among the sectors due to their various
characteristics seems to not be validated. In fact, looking at the sectors analysis, the results
are similar, showing that in the various sectors with few exceptions the relations among the
dividend and the return are thin. Thus, the companies that keep a constant and high dividend
payments policy, measured by the dividend yield and the payout ratio, do not benefit from
the investors misbehaving.
However, another interpretation of the results can be developed. Indeed, these results do not
exclude the positive effect of a well-structured corporate dividend policy on the firms’ value.
The bird-in-the-hand theory, the clientele effect and the other behavioral finance hypothesis
have not been discredited by this paper analysis. Their influences on the stocks return could
have been cancel-out or at least undermined by the rational investors actions. That is, this
corresponds with the efficient market hypothesis (EMH), the market is able to reflect all the
information almost immediately in the shares price i.e. the generation of consistent abnormal
return is not possible. Therefore, the other investors buy and sell actions could offset the
misbehave of the irrational agents.

CBS | Copenhagen Business School | MSc ASC 86
Chapter 7
Conclusion
The objective of our thesis was to shed light on the relevance of abnormal returns that are
generated by changes in the corporate dividend policy, at the same time theoretically analyze,
through a parallelism with the theory, the behavior of investors in their irrational way of
approaching the investment market. Empirically, specifically, if an increase or decrease in the
payout ratio can affect the expected return of the stock. The starting point was the main
hypothesis asserting that there is a positive correlation between the abnormal returns and
the changes in the dividend policy, a hypothesis on which two regression models were built,
following the model built by Baskin (1989). The literature presented to support this topic is
very broad, dividing into two major branches, those supporting the irrelevance of dividend
policies, theories that were developed by early researchers and that somehow paved the way
for future studies, and those that support the relevance of the dividend policy in influencing
the market and investor choices.
Our analysis has been based on a model consisting in two linear regressions, where from a
simpler regression that employs a relationship between abnormal return and two variables as
dividend yield and dividend payout, it has been made more complete adding other control
variables as Return on Equity, Asset Turnover, Firm size, Long-term debt. They have given
mixed results only partially supporting our thesis. The first regression demonstrates a positive
correlation between abnormal return and the two dividend variables, with a p-value lower

CBS | Copenhagen Business School | MSc ASC 87
than .001 indicating a great relevance of the results. Otherwise, in the second regression, in
which other variables have been added, the results are discordant, there is no positive
correlation for the variables related to the dividends, although they are statistically significant,
given the p-value close to zero. However, parameters such as R2 or R2 adjusted, while
increasing between the first and second regressions, has resulted not enough high to explain
the data, this can be interpreted by an incomplete and limited sample of data. At the end of
the research, we can see how the thesis supported by us at the beginning was partially refuted
by the results of our regressions, which adds another piece to the puzzle that is not yet
complete.
Although the research is based on a sample that does not take into account all the possible
scenarios of the market, being restricted to a niche of it, and despite the fragmented data
collected, this research could be the starting point for future researches that want to deepen
the correlation between abnormal returns and changes in the dividend policy, so that the
latter can be used at the corporate level as a tool to channel certain information to the market,
while from the investor's point of view, an evaluation criterion of a more valid and more
consistent stock.

CBS | Copenhagen Business School | MSc ASC 88
References
- Allen, E. D., and S. V. Rachim. "Dividend Policy and Stock Price Volatility: Australian
Evidence." Journal of Applied Economics 6 (1996): 175-188.
- Allen, Franklin, Antonio E. Bernardo, and Ivo Welch. 2000. A theory of dividends
based on tax clienteles. Journal of Finance 55:6, 2499–536.
- Amihud, Yakov, and Maurizio Murgia, 1997, Dividends, Taxes, and Signaling:
Evidence from Germany, Journal of Finance 52, 397-408.
- Arbel, Avner, Steven Carvell, and Erik Postnieks, 1988, The Smart Crash of October
19th, Harvard Business Review, 66, May-June, 124-136.
- Asquith, Paul and David W. Mullins, Jr., 1983, The Impact of Initiating Dividend
Payments on Shareholders’ Wealth, The Journal o f Business, 56, 77-96.
- B.E. ECKBO, “Valuation effects of Corporate Debt Offerings”, Journal of Financial
Economics 15 (1986).
- Baskin, Jonathan (1989), “Dividend policy and the volatility of common stocks”,
Journal of Portfolio Management, Vol. 15 Issue 3.
- Berkman, Koch, “DRIPs and the dividend pay-date effect”, journal of Financial and
Quantitative analysis, Vol. 52, No. 4, Aug. 2017, pp. 1765-1795.
- Bhattacharya, Sudipto, 1979, Imperfect Information, Dividend Policy, and "the Bird in
the Hand" Fallacy, Bell Journal o f Economics, 10, 259-270.
- Black F., Scholes M., 1973 “The effect of dividend yield and dividend policy on
common stock prices and returns”, Journal of Financial Economics 1
- Black, Fisher and Myron Scholes, 1974, The Effects of Dividend Yield and Dividend
Policy on Common Stock Prices and Returns, Journal o f Financial Economics, 1, 1-22.
- Bodie, Kane, Marcus, “investments”, Global Edition, 10th, Mc Growth Hill Education.
- Breadley, Myers, Allen, “Principles of Corporate Finance”, McGraw-Hill International
Edition, 12th edition.

CBS | Copenhagen Business School | MSc ASC 89
- Brennan, Michael J. and Anjan V. Thakor, 1990, Shareholder Preferences and Dividend
Policy, The Journal o f Finance, 45, 993-1018.
- Breuer W., Rieger M.O., Soypak K., “The behavioral foundations of corporate dividend
policy a cross-country analysis”, Journal of Banking & Finance, 2014.
- Diamond, James J, 1967, Earnings Distribution and the Valuation of Shares:
Some Recent Evidence, Journal of Financial and Quantitative Analysis 2, 15-30.
- Fama, Eugene F., and Kenneth R. French, 2001, Disappearing Dividends: Changing
Firm Characteristics or Lower Propensity to Pay?, Journal of Financial Economics 60,
3-43.
- Fama, Eugene F., Lawrence Fisher, Michael C. Jensen and Richard Roll, 1969, The
Adjustment of Stock Prices to New Information, International Economic Review, 10,
1-21.
- Fama, French; “Disappearing dividends: changing characteristics or low propensity to
pay?”, 2000.
- Faulkner, Harold Underwood, 1924, American Economic History, New York: Harper
and Brothers, Publishers.
- Firth, M., “Dividend Changes, Abnormal Returns, and Intra-Industry Firm Valuations”,
The Journal of Financial and Quantitative Analysis Vol. 31, No. 2 (Jun., 1996), pp.
189-211.
- Fisher G.R. (1961), Some Factors Influencing Share Prices, Economic Journal 71,121
141.
- Frankfurter, George M. and Jaisik Gong, 1992, Empirical Tests of a Dividend Signalling
Equilibrium Model, Unpublished working paper.
- Frankfurter, George M. and William R. Lane, 1992, The Rationality of Dividends,
International Review o f Financial Analysis, 1, 115-129.
- Gordon 1962, The Savings Investment and Valuation of a Corporation, The Review o f
Economics and Statistics, 44, 37-51.
- Gordon, Myron J., 1963, Optimal Investment and Financing Policy, Journal of
Finance 18, 264-272.

CBS | Copenhagen Business School | MSc ASC 90
- Han, Lee and Suk, 1999, Dhaliwal, Erickson and Trezevant, 1999, and Short, Zhang
and Keasey, 2002.
- Holder, Mark E., Frederick W. Langrehr, and J. Lawrence Hexter, 1998, Dividend
Policy Determinants: An Investigation of the Influences of Stakeholder Theory,
Financial Management 27, 73-82.
- Jensen, Michael C. and Black, Fischer and Scholes, Myron S., The Capital Asset Pricing
Model: Some Empirical Tests.
- Khaled Hussainey, Chijoke Oscar Mgbame, Aruoriwo M. Chijoke‐Mgbame, (2011)
"Dividend policy and share price volatility: UK evidence", The Journal of Risk Finance,
Vol. 12 Issue: 1, pp.57-68.
- Kyle a., Frank W., 2013 “Dividend policy and stock price volatility in the U.S. equity
capital market”, ASBBS Annual Conference, Volume 20, Number 1.
- Miller M. H., “Behavioral Rationality in Finance: The Case of Dividends”, The Journal
of Business, Vol. 59, No. 4, Part 2: The Behavioral Foundations of Economic Theory,
pp. S451-S468, 1986.
- Miller, Merton H. and Franco Modigliani, 1961, Dividend Policy, Growth, and the
Valuation of Shares, The Journal o f Business, 34, 411-433.
- Miller, Merton H., 1977, Debt and Taxes, The Journal o f Finance, 32, 261-275.
- Pettit, 1977, Taxes, Transaction Costs, and the Clientele Effects of Dividends, Journal
of Financial Economics, 5, 419-436.
- Ritter J., “Behavioral Finance”, Pacific-Basin Finance Journal, 2003.
- Rolf Banz, “The relationship between return and market value of common stocks”,
Journal of Financial Economics (1981).
-
- Rozeff, Michael S., 1982, Growth, Beta and Agency Costs as Determinants of Dividend
Payout Ratios, The Journal o f Financial Research, 5, 249-259.
- Saxena, Atul K., 1999, Determinants of Dividend Payout Policy: Regulated Versus
Unregulated Firms, Working Paper, (State University of West Georgia).

CBS | Copenhagen Business School | MSc ASC 91
- Shiller, Robert J., 1984, Stock Prices and Social Dynamics, Brooldngs Papers on
Economic Activity, 457-510.
- Travlos, Nickoaos, Leons Trigeorgis, and Nikos Vafeas, 2001, Shareholder Wealth
Effects of Dividend Policy Changes in an Emerging Stock Market: The Case of
Cyprus, Multinational Finance Journal 5, 87-112.

CBS | Copenhagen Business School | MSc ASC 92
Appendices
Appendix A
Table A1: list of the stocks utilized in the analysis, ordered by ticker symbol
Ticker
Global company key
Company name GICS
sector A 126554 AGILENT TECHNOLOGIES INC 35 AAP 145977 ADVANCE AUTO PARTS INC 25 AAPL 1690 APPLE INC 45 ABBV 16101 ABBVIE INC 35 ABC 31673 AMERISOURCEBERGEN CORP 35 ABT 1078 ABBOTT LABORATORIES 35 ADBE 12540 ADOBE SYSTEMS INC 45 ADI 1632 ANALOG DEVICES 45 ADM 1722 ARCHER-DANIELS-MIDLAND CO 30 ADP 1891 AUTOMATIC DATA PROCESSING 45 ADSK 1878 AUTODESK INC 45 AEE 10860 AMEREN CORP 55 AEP 1440 AMERICAN ELECTRIC POWER CO 55 AES 24216 AES CORP 55 AET 1177 AETNA INC 35 ALB 29751 ALBEMARLE CORP 15 ALK 1230 ALASKA AIR GROUP INC 20 AMAT 1704 APPLIED MATERIALS INC 45 AME 1598 AMETEK INC 20 AMGN 1602 AMGEN INC 35 AOS 9771 SMITH (A O) CORP 20 APA 1678 APACHE CORP 10 APC 11923 ANADARKO PETROLEUM CORP 10 APD 1209 AIR PRODUCTS & CHEMICALS INC 15 APH 14282 AMPHENOL CORP 45 ATVI 180405 ACTIVISION BLIZZARD INC 45 AVY 1913 AVERY DENNISON CORP 15
AWK 179437 AMERICAN WATER WORKS CO INC
55
BA 2285 BOEING CO 20 BAX 2086 BAXTER INTERNATIONAL INC 35 BBY 2184 BEST BUY CO INC 25 BLL 1988 BALL CORP 15 BMY 2403 BRISTOL-MYERS SQUIBB CO 35
BR 176928 BROADRIDGE FINANCIAL SOLUTNS
45
BWA 28742 BORGWARNER INC 25 CA 3310 CA INC 45 CAG 3362 CONAGRA BRANDS INC 30 CAH 2751 CARDINAL HEALTH INC 35 CAT 2817 CATERPILLAR INC 20 CCI 113490 CROWN CASTLE INTL CORP 60

CBS | Copenhagen Business School | MSc ASC 93
CF 163946 CF INDUSTRIES HOLDINGS INC 15 CHD 3026 CHURCH & DWIGHT INC 30 CHRW 65609 C H ROBINSON WORLDWIDE INC 20 CL 3170 COLGATE-PALMOLIVE CO 30 CLX 3121 CLOROX CO/DE 30 CMCSA
3226 COMCAST CORP 25
CMI 3650 CUMMINS INC 20 CMS 3439 CMS ENERGY CORP 55 CNP 5742 CENTERPOINT ENERGY INC 55 COG 20548 CABOT OIL & GAS CORP 10 COL 144066 ROCKWELL COLLINS INC 20 COO 3504 COOPER COMPANIES INC 35 COP 8549 CONOCOPHILLIPS 10 COST 29028 COSTCO WHOLESALE CORP 30 CPB 2663 CAMPBELL SOUP CO 30 CSCO 20779 CISCO SYSTEMS INC 45 CSX 2574 CSX CORP 20 CTAS 3062 CINTAS CORP 20 CTL 2884 CENTURYLINK INC 50 CVS 7241 CVS HEALTH CORP 35 CVX 2991 CHEVRON CORP 10 D 4029 DOMINION ENERGY INC 55 DAL 3851 DELTA AIR LINES INC 20 DG 4016 DOLLAR GENERAL CORP 25 DGX 64166 QUEST DIAGNOSTICS INC 35 DHR 3735 DANAHER CORP 35 DIS 3980 DISNEY (WALT) CO 25 DOV 4058 DOVER CORP 20 DPS 179700 DR PEPPER SNAPPLE GROUP INC 30 DRI 31846 DARDEN RESTAURANTS INC 25 DTE 3897 DTE ENERGY CO 55 DUK 4093 DUKE ENERGY CORP 55 DVN 14934 DEVON ENERGY CORP 10 ECL 4213 ECOLAB INC 15 ED 3413 CONSOLIDATED EDISON INC 55 EFX 4423 EQUIFAX INC 20 EIX 9846 EDISON INTERNATIONAL 55 EL 61567 LAUDER (ESTEE) COS INC -CL A 30 EMN 29392 EASTMAN CHEMICAL CO 15 EMR 4321 EMERSON ELECTRIC CO 20 EOG 16478 EOG RESOURCES INC 10 EQT 4430 EQT CORP 10 ES 7970 EVERSOURCE ENERGY 55 EXC 8539 EXELON CORP 55 EXPD 4494 EXPEDITORS INTL WASH INC 20 EXPE 126296 EXPEDIA GROUP INC 25 FAST 14225 FASTENAL CO 20
FBHS 188255 FORTUNE BRANDS HOME & SECUR
20
FCX 14590 FREEPORT-MCMORAN INC 15 FDX 4598 FEDEX CORP 20 FE 8099 FIRSTENERGY CORP 55 FIS 165993 FIDELITY NATIONAL INFO SVCS 45

CBS | Copenhagen Business School | MSc ASC 94
FL 11584 FOOT LOCKER INC 25 FLIR 28477 FLIR SYSTEMS INC 45 FLR 4818 FLUOR CORP 20 FLS 4108 FLOWSERVE CORP 20 FMC 4510 FMC CORP 15 FOXA 12886 TWENTY-FIRST CENTURY FOX INC 25 GD 5046 GENERAL DYNAMICS CORP 20 GE 5047 GENERAL ELECTRIC CO 20 GIS 5071 GENERAL MILLS INC 30 GLW 3532 CORNING INC 45 GM 5073 GENERAL MOTORS CO 25 GPC 5125 GENUINE PARTS CO 25 GPN 141913 GLOBAL PAYMENTS INC 45 GPS 4990 GAP INC 25 GT 5234 GOODYEAR TIRE & RUBBER CO 25 GWW 5256 GRAINGER (W W) INC 20 HAL 5439 HALLIBURTON CO 10 HAS 5518 HASBRO INC 25 HBI 175319 HANESBRANDS INC 25 HCA 22260 HCA HEALTHCARE INC 35 HD 5680 HOME DEPOT INC 25 HES 1380 HESS CORP 10 HFC 5667 HOLLYFRONTIER CORP 10 HII 186310 HUNTINGTON INGALLS IND INC 20 HLT 5643 HILTON WORLDWIDE HOLDINGS 25 HOG 12389 HARLEY-DAVIDSON INC 25
HON 1300 HONEYWELL INTERNATIONAL INC
20
HP 5581 HELMERICH & PAYNE 10 HPQ 5606 HP INC 45 HRB 2269 BLOCK H & R INC 25 HRL 5709 HORMEL FOODS CORP 30 HRS 5492 HARRIS CORP 20 HSY 5597 HERSHEY CO 30 HUM 27914 HUMANA INC 35 IBM 6066 INTL BUSINESS MACHINES CORP 45 IFF 6078 INTL FLAVORS & FRAGRANCES 15 INTC 6008 INTEL CORP 45 INTU 27928 INTUIT INC 45 IP 6104 INTL PAPER CO 15 IPG 6136 INTERPUBLIC GROUP OF COS 25 IRM 62374 IRON MOUNTAIN INC 60 ITW 5878 ILLINOIS TOOL WORKS 20 JBHT 5783 HUNT (JB) TRANSPRT SVCS INC 20 JNJ 6266 JOHNSON & JOHNSON 35 JNPR 121718 JUNIPER NETWORKS INC 45 JWN 7922 NORDSTROM INC 25 K 6375 KELLOGG CO 30 KLAC 6304 KLA-TENCOR CORP 45 KMB 6435 KIMBERLY-CLARK CORP 30 KMI 6310 KINDER MORGAN INC 10 KO 3144 COCA-COLA CO 30 KR 6502 KROGER CO 30 KSS 25283 KOHL'S CORP 25

CBS | Copenhagen Business School | MSc ASC 95
KSU 6335 KANSAS CITY SOUTHERN 20 LB 6733 L BRANDS INC 25 LEG 6649 LEGGETT & PLATT INC 25 LLY 6730 LILLY (ELI) & CO 35 LMT 6774 LOCKHEED MARTIN CORP 20 LNT 11554 ALLIANT ENERGY CORP 55 LOW 6829 LOWE'S COMPANIES INC 25 LRCX 6565 LAM RESEARCH CORP 45 LUV 9882 SOUTHWEST AIRLINES 20 M 4611 MACY'S INC 25 MA 160225 MASTERCARD INC 45 MAR 28930 MARRIOTT INTL INC 25 MAS 7085 MASCO CORP 20 MAT 7116 MATTEL INC 25 MCD 7154 MCDONALD'S CORP 25 MCHP 27965 MICROCHIP TECHNOLOGY INC 45 MCK 7171 MCKESSON CORP 35 MDLZ 142953 MONDELEZ INTERNATIONAL INC 30 MGM 14418 MGM RESORTS INTERNATIONAL 25 MKC 7146 MCCORMICK & CO INC 30 MLM 29733 MARTIN MARIETTA MATERIALS 15 MMM 7435 3M CO 20 MO 8543 ALTRIA GROUP INC 30 MOS 162129 MOSAIC CO 15 MPC 186989 MARATHON PETROLEUM CORP 10 MRK 7257 MERCK & CO 35 MRO 7017 MARATHON OIL CORP 10 MSFT 12141 MICROSOFT CORP 45 MSI 7585 MOTOROLA SOLUTIONS INC 45 MU 7343 MICRON TECHNOLOGY INC 45 NBL 7912 NOBLE ENERGY INC 10 NEE 4517 NEXTERA ENERGY INC 55 NEM 7881 NEWMONT MINING CORP 15 NI 7974 NISOURCE INC 55 NKE 7906 NIKE INC 25 NOC 7985 NORTHROP GRUMMAN CORP 20 NOV 63892 NATIONAL OILWELL VARCO INC 10 NRG 135990 NRG ENERGY INC 55 NSC 7923 NORFOLK SOUTHERN CORP 20 NTAP 61591 NETAPP INC 45 NUE 8030 NUCOR CORP 15 NVDA 117768 NVIDIA CORP 45 NWL 7875 NEWELL BRANDS INC 25 OKE 8151 ONEOK INC 10 OMC 4066 OMNICOM GROUP 25 ORCL 12142 ORACLE CORP 45 OXY 8068 OCCIDENTAL PETROLEUM CORP 10 PAYX 8402 PAYCHEX INC 45 PCG 8264 PG&E CORP 55 PEG 8810 PUBLIC SERVICE ENTRP GRP INC 55 PEP 8479 PEPSICO INC 30 PFE 8530 PFIZER INC 35 PG 8762 PROCTER & GAMBLE CO 30 PH 8358 PARKER-HANNIFIN CORP 20

CBS | Copenhagen Business School | MSc ASC 96
PKG 128978 PACKAGING CORP OF AMERICA 15 PKI 4145 PERKINELMER INC 35 PM 179621 PHILIP MORRIS INTERNATIONAL 30 PNW 1075 PINNACLE WEST CAPITAL CORP 55 PPG 8247 PPG INDUSTRIES INC 15 PPL 8455 PPL CORP 55 PSX 170841 PHILLIPS 66 10 PVH 8551 PVH CORP 25 PX 25124 PRAXAIR INC 15
PXD 14359 PIONEER NATURAL RESOURCES CO
10
QCOM 24800 QUALCOMM INC 45 RHI 2312 ROBERT HALF INTL INC 20 RL 64891 RALPH LAUREN CORP 25 RMD 31887 RESMED INC 35 ROP 24925 ROPER TECHNOLOGIES INC 20 ROST 9248 ROSS STORES INC 25 RSG 112168 REPUBLIC SERVICES INC 20 RTN 8972 RAYTHEON CO 20 SBUX 25434 STARBUCKS CORP 25 SCG 9445 SCANA CORP 55 SEE 9555 SEALED AIR CORP 15 SHW 9667 SHERWIN-WILLIAMS CO 15 SNA 9778 SNAP-ON INC 20 SO 9850 SOUTHERN CO 55 SRE 8272 SEMPRA ENERGY 55 SWK 10016 STANLEY BLACK & DECKER INC 20 SWKS 1327 SKYWORKS SOLUTIONS INC 45 SYK 10115 STRYKER CORP 35 SYMC 15855 SYMANTEC CORP 45 SYY 10247 SYSCO CORP 30 T 9899 AT&T INC 50 TAP 3505 MOLSON COORS BREWING CO 30 TGT 3813 TARGET CORP 25 TIF 13646 TIFFANY & CO 25 TJX 11672 TJX COMPANIES INC 25 TMK 10614 TORCHMARK CORP 40 TSCO 29736 TRACTOR SUPPLY CO 25 TSN 10793 TYSON FOODS INC -CL A 30 TSS 10631 TOTAL SYSTEM SERVICES INC 45 TXN 10499 TEXAS INSTRUMENTS INC 45 TXT 10519 TEXTRON INC 20
UAL 10795 UNITED CONTINENTAL HLDGS INC
20
UHS 11032 UNIVERSAL HEALTH SVCS INC 35 UNH 10903 UNITEDHEALTH GROUP INC 35 UNP 10867 UNION PACIFIC CORP 20 UPS 10920 UNITED PARCEL SERVICE INC 20 UTX 10983 UNITED TECHNOLOGIES CORP 20 V 179534 VISA INC 45 VAR 11115 VARIAN MEDICAL SYSTEMS INC 35 VFC 11060 VF CORP 25 VIAB 165675 VIACOM INC 25 VLO 15247 VALERO ENERGY CORP 10

CBS | Copenhagen Business School | MSc ASC 97
VMC 11228 VULCAN MATERIALS CO 15
VZ 2136 VERIZON COMMUNICATIONS INC
50
WDC 11399 WESTERN DIGITAL CORP 45 WEC 11550 WEC ENERGY GROUP INC 55 WM 14477 WASTE MANAGEMENT INC 20 WMB 11506 WILLIAMS COS INC 10 WMT 11259 WALMART INC 30 WY 11456 WEYERHAEUSER CO 60 WYNN 149318 WYNN RESORTS LTD 25 XEC 150699 CIMAREX ENERGY CO 10 XEL 7977 XCEL ENERGY INC 55 XLNX 22325 XILINX INC 45 XOM 4503 EXXON MOBIL CORP 10 XRAY 13700 DENTSPLY SIRONA INC 35 XYL 189491 XYLEM INC 20 YUM 65417 YUM BRANDS INC 25 ZTS 13721 ZOETIS INC 35

CBS | Copenhagen Business School | MSc ASC 98
Appendix B: Full regressions results
Table B2: First regression: Variance Statistics
VARIANCE ANALYSIS
df RSS MS F F significance
Regression 2 0.4055 0.2027 1525.3276 0.0000
Residual 41939 5.5745 0.0001
Total 41941 5.9799
Table B3: First Regression: Betas' coefficients and other
Coefficients Standard error t-stat p-value
Intercept 0 #N/D #N/D #N/D
Dividend Yield 0.1185 0.0023 52.2185 0.0000
PayOut Ratio 4.9E-05 3.5E-05 1.4E+00 0.1601
Lower 95% Upper 95%
Intercept #N/D #N/D
Dividend Yield 0.1141 0.1230
PayOut Ratio 0.0000 0.0001
Table B4: Second Regression: Variance Analysis
VARIANCE ANALYSIS
df RSS MS F F significance
Regression 7 1.4958 0.2137 1994.6560 0.0000
Residual 41935 4.4924 0.0001
Total 41942 5.9882

CBS | Copenhagen Business School | MSc ASC 99
Table B5: Second Regression: Betas' coefficients and other
Coefficients Standard error t-stat p-value
Intercept 0 #N/D #N/D #N/D
Dividend Yield -0.1196 0.0035 -34.6448 0.0000
PayOut Ratio -0.0002 0.0000 -5.1493 0.0000
ROE 0.0005 0.0001 4.9146 0.0000
Debt Ratio 0.0112 0.0002 46.4122 0.0000
Cash Ratio 0.0018 0.0001 24.5454 0.0000
Asset Turnover 0.0025 0.0000 50.5858 0.0000
Size 1.6669E-14 1.0050E-15 1.6586E+01 1.3884E-61
Lower 95% Upper 95%
Intercept #N/D #N/D
Dividend Yield -0.1264 -0.1128
PayOut Ratio -0.0002 -0.0001
ROE 0.0003 0.0007
Debt Ratio 0.0107 0.0116
Cash Ratio 0.0016 0.0019
Asset Turnover 0.0024 0.0026
Size 0.0000 0.0000

CBS | Copenhagen Business School | MSc ASC 100
Appendix C: Alpha computation
WRDS Beta suite compute the alpha coefficient through the CAPM market model as follow:
𝛼𝑖= 𝑅𝑖 − 𝐸(�̃�𝑖)
𝛼𝑖= abnormal return on security i;
𝑅𝑖= actual return on stock i;
𝐸(�̃�𝑖) = 𝑟 + [𝐸(�̃�𝑚) − 𝑟]β;
𝐸(�̃�𝑖)= the expected return on security i;
𝐸(�̃�𝑚)= the expected return on market portfolio;
𝑟 = the risk-free short-term interest rate;
𝛽= the covariance between �̃�𝑖 𝑎𝑛𝑑 �̃�𝑚, divided by the variance of �̃�𝑚.