
Essays on Stock Issuance - CBS Research Portal
233
Essays on Stock Issuance Kohl, Niklas Document Version Final published version Publication date: 2017 License CC BY-NC-ND Citation for published version (APA): Kohl, N. (2017). Essays on Stock Issuance. Copenhagen Business School [Phd]. PhD series No. 38.2017 Link to publication in CBS Research Portal General rights Copyright and moral rights for the publications made accessible in the public portal are retained by the authors and/or other copyright owners and it is a condition of accessing publications that users recognise and abide by the legal requirements associated with these rights. Take down policy If you believe that this document breaches copyright please contact us ([email protected]) providing details, and we will remove access to the work immediately and investigate your claim. Download date: 19. Apr. 2022
-
Upload
khangminh22 -
Category
Documents
-
view
2 -
download
0
Transcript of Essays on Stock Issuance - CBS Research Portal

Essays on Stock Issuance
Kohl, Niklas
Document VersionFinal published version
Publication date:2017
LicenseCC BY-NC-ND
Citation for published version (APA):Kohl, N. (2017). Essays on Stock Issuance. Copenhagen Business School [Phd]. PhD series No. 38.2017
Link to publication in CBS Research Portal
General rightsCopyright and moral rights for the publications made accessible in the public portal are retained by the authors and/or other copyright ownersand it is a condition of accessing publications that users recognise and abide by the legal requirements associated with these rights.
Take down policyIf you believe that this document breaches copyright please contact us ([email protected]) providing details, and we will remove access tothe work immediately and investigate your claim.
Download date: 19. Apr. 2022

Niklas Kohl
The PhD School in Economics and Management PhD Series 38.2017
PhD Series 38-2017ESSAYS ON
STOCK ISSUANCE
COPENHAGEN BUSINESS SCHOOLSOLBJERG PLADS 3DK-2000 FREDERIKSBERGDANMARK
WWW.CBS.DK
ISSN 0906-6934
Print ISBN: 978-87-93579-48-4 Online ISBN: 978-87-93579-49-1
ESSAYS ON STOCK ISSUANCE

Essays on Stock Issuance
Niklas Kohl
Supervisor: Søren Hvidkjær
PhD School in Economics and Management
Copenhagen Business School

Niklas KohlEssays on Stock Issuance
1st edition 2017PhD Series 38.2017
© Niklas Kohl
ISSN 0906-6934
Print ISBN: 978-87-93579-48-4 Online ISBN: 978-87-93579-49-1
“The PhD School in Economics and Management is an active national and international research environment at CBS for research degree studentswho deal with economics and management at business, industry and countrylevel in a theoretical and empirical manner”.
All rights reserved.No parts of this book may be reproduced or transmitted in any form or by any means,electronic or mechanical, including photocopying, recording, or by any informationstorage or retrieval system, without permission in writing from the publisher.

Preface
This dissertation is the result of my Ph.D. studies at the Department of
Finance at the Copenhagen Business School. It consists of summaries in
English and Danish, an introduction and three self-contained essays on the
long-run performance of �rms issuing new equity.
The dissertation, and my professional development at large, has bene-
�ted from the support and advice of many people. First and foremost, I
am indebted to my supervisor Søren Hvidkjær for his support and guidance
throughout the process. My secondary supervisor Ken Bechmann has read a
number of very preliminary draft and helped me sharpen ideas. Lasse Heje
Pedersen invited me to teach the course Hedge Fund Strategies together with
him, and helped me secure an internship at AQR Capital Management.
Moreover, I thank colleges, fellow Ph.D. students, and the numerous mas-
ter students, I have had the pleasure to teach and supervise, for making my
years at Copenhagen Business School so enjoyable.
There are things they don't teach you at a Business School - for example
how markets really work and how you make money on them. Fortunately, I
have spent time, actually a lot of time, hanging out with people who could
make op for this. Thorleif Jackson has taught me a lot about how you run a
small investment company and has introduced me to his network of investors
and fund managers. Numerous discussions with my business partner Jon
Forst has sharpened my understanding of, in particular, market making and
price dynamics in connection with corporate actions. I hope our joint struggle
to keep markets e�cient will remain joyful and pro�table.
i

Finally, I thank my family, parents, children and in particular Lene for
support throughout the process.
Niklas Kohl
Copenhagen, September 2017
ii

Summary
Summary in English
Stock Issuance and the Speed of Price Discovery
Firms which issue new equity subsequently have lower returns than other
�rms, but does the strength of the issuance e�ect vary in the cross section of
�rms? The essay shows, that US �rms with characteristics that makes them
�hard to value� have returns which are strongly related to their past issuance
activity, while the return of �easy to value� �rms are less related to their past
issuance activity. In most cases the di�erence between �hard to value� and
�easy to value� �rms are signi�cant.
As proxies for �hard to value�, I use three di�erent types of �rm char-
acteristics. First, I consider �rms for which relatively little information is
available as �hard to value�. Examples are �rms covered by few analysts and
small �rms. Second, I consider �rms with high levels of analyst disagreement
on stock price target, next quarter earnings per share and share recommen-
dation as �hard to value�. Third, �rms with expected cash�ows in the more
distant future are �hard to value�. These include �rms with low earnings,
high asset growth, and low dividend yield.
As one possible explanation, consistent with the empirical results, I pro-
pose a model with informed investors receiving a noisy value signal, and other
investors who infer value from past market prices. I analyze the price dy-
namics after informed investors have received a new value signal (for instance
an issue announcement), and show that prices will converge to fundamental
iii

value, but convergence will be slowest when the value signal is most noisy,
i.e. for �rms which are �hard to value�.
The Issuance E�ect in International Markets
The issuance e�ect �rst documented in the US market also exists in inter-
national markets, but does the strength of the issuance e�ect vary in the
cross section of markets? The essay shows that the issuance e�ect is stronger
in non-developed markets, i.e. markets not classi�ed as developed by MSCI,
than in developed markets. If �rms listed in non-developed markets are more
di�cult to value than �rms listed in developed markets, then the result is
consistent with the �hard to value� hypothesis advocated in the essay �Stock
Issuance and the Speed of Price Discovery�.
The empirical results are inconsistent with those reported by McLean
et al. (2009) who �nd a stronger issuance e�ect in more developed markets
than in less developed markets.1 My essay shows, how their results are not
robust to minor methodological changes. I propose an alternative approach,
which arguably is better suited to explore di�erences in the issuance e�ect in
the cross-section of markets. I show that this approach con�rms my empirical
results in several robustness tests.
Issue costs, �nancial and otherwise, are likely to be higher in less devel-
oped markets than in more developed markets. The essay proposes a model
of the relationship between issue costs, issuance behavior and average long-
run performance of issuers. Higher levels of issue costs predict lower issuance
activity and lower long-run returns for issuers, consistent with the empirical
�ndings.
1The list of references is found at the end of the section Introduction.
iv

Does Information Asymmetry Explain Issuer Underperformance?
A prominent behavioral explanation for the low long-run returns of �rms rais-
ing new equity through seasoned equity o�erings (SEOs) holds, that oppor-
tunistic �rms exploit information asymmetry at issue time to sell overvalued
equity Loughran and Ritter (1995). If this explanation holds, one would ex-
pect that the most overvalued issuers, and those which are least constrained
in the sense, that they do not need to issue to continue operations or service
current debt, have the best opportunities to exploit temporary windows of
mispricing. Therefore, issuers with these characteristics should experience
the lowest risk-adjusted returns subsequent to SEOs.
I derive proxies for overvaluation and issuer constrainedness and show,
empirically, that the most overvalued and least constrained US SEO �rms
have similar or higher risk-adjusted long-run returns relative to issuers with-
out these characteristics. Consequently, I �nd no evidence of information
asymmetry at issue time as explanation for long-run performance of SEO
�rms.
As an alternative explanation, I propose that information asymmetry is
particularly low at event time because of the information requirements on
issuing �rms and the incentives of issuers, investors, and intermediaries. In
this case, a possible explanation for the low returns subsequent to SEOs is,
that the marginal investor does not fully utilize all available information.
I measure the informational content of the SEO announcement using the
event return. Negative event returns are interpreted as �bad news� while
the rarer positive event returns are interpreted as �good news�. I show that,
empirically, event news, and in particular negative event news, predict long-
run return. This is consistent with the hypothesis that investors underreact
v

to available information, and that information is only gradually re�ected in
prices, and that this process is slowest for �bad news�.
Dansk Resumé
Aktieemissioner og Priskonvergens
Selskaber som emitterer nye aktier har efterfølgende lavere afkast end andre
selskaber, men er der forskel på styrken af �emittent e�ekten� mellem forskel-
lige typer af selskaber. Essayet viser en stærk sammenhæng mellem aktieud-
stedelse og efterfølgende afkast for selskaber som er svære at værdiansætte,
mens denne sammenhæng er meget svagere for selskaber som er lettere at
værdiansætte. I de �este tilfælde er forskellen mellem selskaber som er svære
at værdiansætte og selskaber som er lette at værdiansætte signi�kant.
Jeg bruger tre forskellige typer af proxier for �svær at værdiansætte�. For
det første, selskaber med relativt lidt tilgængelig information, for eksempel
selskaber som kun følges af få aktieanalytikere og små selskaber. For det
andet, selskaber hvor analytikerne er meget uenige om aktiens prismål, næste
kvartals indtjening og anbefaling på aktien. For det tredje, er selskaber med
forventet cash�ow langt ude i fremtiden sværere at værdiansætte. Eksempler
på disse er selskaber med lav indtjening, høj vækst i aktivmassen og lave eller
ingen udbytter.
Som en mulig forklaring, konsistent med de empiriske resultater, foreslår
jeg en model med informerede investorer, som modtager et værdisignal med
støj og andre investorer som udleder værdi fra observerede markedspriser.
Jeg analyserer prisdynamikken efter at informerede investorer har modtaget
et nyt værdisignal (for eksempel en emissionsmeddelelse), og viser at aktiens
vi

pris vil konvergere mod den fundamentale værdi, men at konvergensen vil
være langsomst når værdisignalet har mest støj, dvs. for selskaber som er
svære at værdifastsætte.
Emittent E�ekten på Internationale Markeder
Emittent e�ekten, som først blev påvist på det amerikanske marked, eksis-
terer også på internationale markeder (dvs. udenfor USA), men er der forskel
på styrken af e�ekten mellem forskellige markeder? Essayet viser at emittent
e�ekten er stærkere på ikke-udviklede markeder, dvs. markeder som ikke er
klassi�cerede som udviklede af MSCI, end på udviklede markeder. Hvis sel-
skaber noteret på ikke-udviklede markeder er sværere at værdiansætte end
selskaber noteret på udviklede markeder er dette resultat konsistent med
�svær at værdiansætte� hypotesen udviklet i mit essay �Aktieemissioner og
Priskonvergens�.
De empiriske resultater er inkonsistente med resultaterne i McLean et al.
(2009), som �nder at emittent e�ekten er stærkere på mere udviklende markeder
end på mindre udviklede markeder.2 Mit essay viser, at deres resultater ikke
er robuste i forhold til mindre metodemæssige ændringer. Jeg foreslår en
anden metode, som jeg mener er mere egnet til at vurdere emittent e�ekten
på tværs af markeder. Jeg viser at denne metode bekræfter mine resultater
i forskellige robusthedstest.
Emissionsomkostninger, �nansielle såvel som andre, et formodentlig hø-
jere på mindre udviklede markeder end på mere udviklede markeder. Essayet
foreslår en model for sammenhængen mellem emissionsomkostninger, emis-
sionsadfærd og emittenters gennemsnitlige langtids afkast. Højere emission-
2Se referencelisten i slutningen af afsnittet Introduction.
vii

somkostninger prædikterer lavere emissionsaktivitet og lavere langtids afkast
for emittenter, hvilket er konsistent med de empiriske resultater.
Forklarer Informationsasymmetri Emittenters Lave Afkast?
En prominent adfærdsteoretisk forklaring på det lave langtidsafkast for sel-
skaber som emitterer nye aktier er, at opportunistiske selskaber udnytter
informationsasymmetri på emissionstidspunktet til at sælge overvurderede
aktier (Loughran and Ritter, 1995). Hvis denne forklaring holder, må det for-
ventes, at de mest overvurderede emittenter, og de emittenter der er mindst
begrænsede for så vidt at de ikke behøver at emittere for at fortsætte deres
drift eller servicere kortfristet gæld, har de bedste muligheder for at udnytte
midlertidige vinduer af forkert prisfastsættelse. Derfor bør selskaber med
disse karakteristika have de laveste risikojusterede afkast efter emissionen.
Jeg udvikler proxier for overvurdering og begrænsethed og viser empirisk,
at de mest overvurderede og mindst begrænsede amerikanske emittenter har
samme eller højere risikojusteret afkast som emittenter uden disse karakter-
istika. Følgelig �nder jeg ikke belæg for at informationsasymmetri på emis-
sionstidspunktet forklarer langtidsafkast for emittenter.
Som alternativ forklaring foreslår jeg at informationsasymmetri er særligt
lav på emissionstidspunktet fordi emittenten skal opfylde informationsforplig-
telser og på grund af incitamenterne hos emittent, investorer og �nansielle
formidlere. I så fald er en mulig forklaring på det lave afkast efter emission,
at den marginale investor ikke udnytter al tilgængelig information fuldt ud.
Jeg måler informationsindholdet af emissionsmeddelelsen med afkastet ved
emissionsmeddelelsens o�entliggørelse. Negative afkast opfattes som �dårlige
nyheder� og de sjældnere positive afkast opfattes som �gode nyheder�. Jeg
viii

viser empirisk, at afkast ved emissionsmeddelelsens o�entliggørelse, og især
negative afkast, prædikterer langtidsafkast. Dette er konsistent med at in-
vestorer underreagerer på tilgængelig information, og at information kun
gradvist afspejles i aktiens pris, og at denne proces er langsomst for �dårlige
nyheder�.
ix


Contents
Preface i
Summary iii
Summary in English iii
Dansk Resumé vi
Introduction 1
Stock Issuance and the Speed of Price Discovery 9
1 Introduction 10
2 Asset Prices with Informed and Uninformed Investors 14
3 Empirical Strategy 21
4 Fama-MacBeth Regressions 27
5 Double Sorted Portfolio Returns 30
6 Returns Subsequent to SEOs 33
7 Conclusions 38
The Issuance E�ect in International Markets 71
1 Introduction 72
2 A Model of the Issuance Decision 75
xi

3 Data and Variables 79
4 Empirical Results 83
5 Conclusions 93
Does Information Asymmetry Explain Issuer Under-
performance? 113
1 Introduction 114
2 What Drives Issuer Underperformance? 118
3 Data and Variables 129
4 Returns Before and After Issue 135
5 Event Returns 136
6 Long-run Returns 137
7 Conclusions 151
xii

Introduction
This dissertation consists of three papers on stock issuance by listed �rms.
The study of stock issuance is important because one of the primary functions
of the stock market is to enable �rms to raise new equity to �nance invest-
ments or operations. This takes place through initial public o�erings (IPOs),
but even more importantly through new equity issues by �rms which are
already listed. According to Thomson Reuters (2017), global IPO activity in
2016 totaled $131 billion while seasoned equity o�erings (SEOs) raised $448
billion. McKeon (2015) shows that US-listed �rms raise a similar amount
in other issues. In total, global equity issuance activity raised around $1
trillion, and more than 80% of this was raised by listed �rms.
SEOs refer to cases where the �rm o�ers new shares for cash, usually to
a group of selected investors, or pro rata to all current shareholders. Typi-
cally, the issue consists of at least 3% new shares, although larger issues are
commonplace (McKeon, 2015). SEOs are events in the sense that the issue is
announced and one can study return pre-event, when the event occurs, and
post-event. Other issues, including the exercise of employee stock options,
other warrants and convertible bonds, are much more frequent than SEOs
but individually much smaller. These issues are not generally announced
when they occur, but can only be inferred from quarterly reports or other
�lings . New issues also occur in connection with stock-�nanced mergers
where the acquiring �rm purchases all or some stocks in the target �rm and
pays with its own stocks.
It is well known that �rms which issue new equity, on average, subse-
quently have high returns before the issue and low returns. In the third

paper, I show that the average US SEO �rms overperform, relative to the
stock market, by more than 60% the year before issue and underperform by
more than 20% over the three years subsequent to issue.
The appreciation before issue has a number of plausible explanations.
It could re�ect improved earnings prospects for the �rm. To utilize these,
increased investments might be necessary, hence the issue of new equity.
Alternatively, the appreciation could be due to a reduction in required re-
turn, either market wide or for the particular �rm, and either rationally or
otherwise. In any case, lower required returns mean that more investment
opportunities will move into positive net present value territory, hence the
�rm will invest more and issue more to �nance investments. Finally, if the
appreciation re�ects mispricing, and �rm management realize this, oppor-
tunistic �rms may try to exploit the situation and sell overpriced equity to
new investors to the bene�t of old investors, possibly including themselves.
In the case of issues due to the exercise of employee stock options (or other
derivatives), average high returns before issue follow from the fact that these
are only exercised when they are in-the-money. This is most likely to take
place after the stock has appreciated. From an investor's perspective, the
appreciation before issue is not interesting, because we do not know which
�rms will be next year's issuers.
The depreciation after issue is much more interesting. A key discussion
in �nancial economics is to what extent �nancial markets are e�cient in the
sense that prices re�ect available information. The majority of research on
returns subsequent to issue takes a stance on this, either arguing that the
low returns subsequent to issue are a �puzzle� which cannot be explained by
a fully rational model or that returns are explained by known risk factors �
2

or at least factors known to predict return in the cross-section of stocks, i.e.
there is no issuance puzzle. From an investor's perspective, the depreciation
after issue is of utmost importance: to the extent it re�ects a deviation
from market e�ciency, it provides trading opportunities. Even if it re�ects
exposure to rationally priced risk-factors, investors need to decide whether
and to what extent they wish to be exposed to this risk.
My three papers seek to explore and test existing explanations and pro-
pose new explanations for the low returns subsequent to issue. The majority
of previous research aims to show that issuers underperform or do not under-
perform on a risk-adjusted basis subsequent to issue. However, my papers
di�er, in that I investigate whether there are issuer characteristics which de-
termine which issuers are likely to underperform. This is a useful approach,
because the ability to characterize the types of issuers which underperform
may help us understand the reasons for the underperformance regardless of
whether these are behavioral or explained by risk. From an investment per-
spective, it is also useful because it highlights the issuers which should be
avoided or possibly shorted and the issuers which can safely be purchased.
The �rst paper Stock Issuance and the Speed of Price Discovery, focuses
on the issuance e�ect, i.e. the extent to which past issuance activity (in SEOs
or otherwise) predicts future return in the cross section of listed US �rms.
This has previously been performed by Ponti� and Woodgate (2008) using
the Fama and MacBeth (1973) methodology to measure the issuance e�ect.
They report that past issuance activity is a strong and signi�cant predictor
of future return in the cross section of �rms. The mentioned papers only
control for �rm size and �rm book-to-market ratio in the Fama-MacBeth
regressions. By now, it is well established that other factors predict future
3

return. I add asset growth and pro�tability. This is partly motivated by the
incorporation of these factors in the Fama French �ve-factor model Fama and
French (2015), but also by the fact that issuers and non-issuers are likely to
di�er substantially in terms of these characteristics. Firms issue for a reason
� and that reason is often because they need more equity due to poor prof-
itability or because they want to grow their asset base through investments.
Controlling for asset growth and pro�tability reduces the issuance e�ect sub-
stantially, i.e. a substantial part of the low return of issuers is explained by
the fact that they have high asset growth and low pro�tability. This is partly
in line with Bessembinder and Zhang (2013), who �nd that issuers and non-
issuers di�er in return-predicting characteristics beyond market value and
book-to-market ratio.
However, the important contribution of the paper is to study how the
issuance e�ect varies in the cross-section of �rms. The question is whether the
issuance e�ect is stronger for some types of �rm than for others. Empirically,
I show that the issuance e�ect is strong and signi�cant among �rms which
are �hard to value� but small and often insigni�cant among �rms which are
�easy to value�. I use three di�erent types of proxies for �hard to value� � the
amount of information available, the extent to which equity analysts agree
on �rm valuation, and whether expected cash-�ows are in the near or more
distant future. As one possible explanation, consistent with the empirical
results, I propose a model with informed investors receiving a noisy value
signal and other investors who infer value from past market prices. I study
the price dynamics after informed investors have received a new value signal
(for instance an issue announcement) and show that prices will converge to
4

fundamental value, but convergence will be slowest when the value signal is
most noisy, i.e. for �rms which are �hard to value�.
The second paper The Issuance E�ect in International Markets, considers
the issuance e�ect in international markets. If the issuance e�ect, at least
partly, re�ects some sort of market ine�ciency or friction, this might be
detectable in the cross section of international markets. It is natural to
hypothesize that the issuance e�ect should be stronger in less developed, and
presumably less e�ciently priced, markets than in more developed markets.
However, this hypothesis is at odds with the �ndings of McLean et al. (2009),
who �nd that the issuance e�ect is strongest in the most developed markets,
suggesting that this is because �rms in developed markets can easily issue
and repurchase equity. Therefore, in developed markets, it is easy to be
opportunistic and exploit temporary mispricings. In less developed markets,
issues and repurchases are more expensive and issues will only occur for
�primary reasons�, i.e. not to exploit mispricings.
I �nd this result troubling for two reasons. First, the reasoning assumes
that �rms get away with opportunistic behavior on a large scale in the most
developed markets. Second, it is not at all clear that �rms will refrain from
opportunistic issues just because it is expensive to issue. The paper ad-
dresses both these concerns. Theoretically, I show that issue costs do reduce
the frequency at which issues occur but do not prevent �rms from attempt-
ing opportunistic issues. In fact, theoretically, the relation is opposite. In
markets with high issue costs long-run issuer underperformance should be
stronger than in markets with low issue costs. Empirically, I show that the
methodology employed by McLean et al. (2009) is highly sensitive to seem-
ingly arbitrary methodological choices. I suggest an alternative methodology,
5

one which is arguably more suited to analyzing the issuance e�ect in the cross
section of markets. The empirical result is that the issuance e�ect is signif-
icantly stronger in non-developed markets than in developed markets. This
may be because of higher issue costs in non-developed markets, but the result
is also consistent with the �hard to value� hypothesis developed in my �rst
paper.
While the �rst two papers study the issuance e�ect, i.e. how issuance
activity, whatever the form, predicts future return, the third paper focuses
on SEOs. The purpose is to explore whether information asymmetry between
�rm management and investors at issue time can potentially explain long-run
performance. This idea is most explicitly advocated in Loughran and Ritter
(1995). If issuer underperformance is explained by opportunistic issues by
overvalued issuers this could potentially be detected with suitable proxies
for issuer overvaluation and proxies for whether issuers were in a position
where they could choose to issue or not to issue. The hypothesis is that �rms
which are less �nancially constrained have more room to be opportunistic in
their issuance behavior than �rms for which an issue is necessary to �nance
current operations or service current debt. Empirically, I �nd no support
for information asymmetry as an explanation for issuer underperformance,
because the most overvalued issuers and the least �nancially constrained
issuers do not have lower risk-adjusted long-run returns than less overvalued
and more constrained issuers.
The paper also considers the possibility that information asymmetry is
low at issue time. This is plausible due to information requirements in con-
nection with issues, �rms' incentives to attract interest in the issue, and
investors' and intermediaries' interest in conducting their own independent
6

research in connection with issues. Nonetheless, long-run underperformance
is possible if the marginal investor does not fully take the available infor-
mation into consideration. I show that this explanation is consistent with
empirical �ndings because event returns, and, in particular, negative event
return (�bad news� at event time), predict long-run returns. As always in
�nancial economics, empirical �ndings lend support for di�erent interpreta-
tions. My empirical �ndings are that certain types of issuers, those with little
information available, those which analysts disagree about , those with most
of their expected cash-�ows in the distant future, those which are listed in
less developed markets, and those which experience the most negative event
returns when they announce a SEO, are more likely to subsequently under-
perform on a risk-adjusted basis. One possible explanation, developed in the
�rst paper, is that some investors do not have or do not utilize all available
information, and the activities of more sophisticated investors, due to lim-
its of arbitrage, cannot immediately compensate fully for this, in particular
when the most sophisticated investors have the most negative valuation.
References
Bessembinder, H. and Zhang, F. (2013). Firm characteristics and long-run
stock returns after corporate events. Journal of Financial Economics ,
109 (1), 83 � 102.
Fama, E. F. and French, K. R. (2015). A �ve-factor asset pricing model.
Journal of Financial Economics , 116 (1), 1 � 22.
Fama, E. F. and MacBeth, J. D. (1973). Risk, return, and equilibrium:
7

Empirical tests. Journal of Political Economy , 81 (3), 607.
Loughran, T. and Ritter, J. R. (1995). The new issues puzzle. Journal of
Finance, 50 (1), 23 � 51.
McKeon, S. B. (2015). Employee option exercise and equity issuance motives.
SSRN.
McLean, D. R., Ponti�, J., and Watanabe, A. (2009). Share issuance and
cross-sectional returns: International evidence. Journal of Financial Eco-
nomics , 94 (1), 1 � 17.
Ponti�, J. and Woodgate, A. (2008). Share issuance and cross-sectional
returns. Journal of Finance, 63 (2), 921 � 945.
Thomson Reuters (2017). Global equity capital markets review. Webpage:
http://share.thomsonreuters.com/general/PR/ECM_4Q_2016_E.pdf.
8

Stock Issuance and the Speed of Price
Discovery
Niklas Kohl*
Abstract
Firms which issue new equity subsequently have lower returns than
other �rms. In this paper, I show that underperformance by issuers
is con�ned to �rms which are �hard to value�, while issuance activity
does not signi�cantly predict future returns for �easy to value� �rms.
�Hard to value� �rms include small cap, �rms with high dispersion in
analyst estimates and recommendations, and �rms with more distant
cash-�ows, such as �rms with low pro�tability, low dividend yield, or
high asset growth. Moreover, I show that only the negative component
of seasoned equity o�ering (SEO) event returns signi�cantly predicts
one-year post-SEO returns. These results are consistent with a model
in which informed investors receive noisy signals of fundamental value
and shorting is constrained or costly.
∗Department of Finance, Copenhagen Business School, Solbjerg Plads 3, 2000 Fred-eriksberg, Denmark. E-mail: nk.�@cbs.dk. I am grateful for comments and suggestionsreceived from Søren Hvidkjær, Nigel Barradale, Ken Bechmann, Lasse Heje Pedersen, Ja-nis Berzins as well as seminar participants at Copenhagen Business School and the NordicFinance Network PhD Workshop 2016 in Bergen. Any errors remain mine.
9

1 Introduction
Firms which issue new equity subsequently have lower returns than other
�rms. This has been shown in the context of seasoned equity o�erings
(Loughran and Ritter (1995)) as well as for equity issuance in general (Daniel
and Titman (2006), Ponti� and Woodgate (2008), Fama and French (2008b),
Fama and French (2008a)). Ponti� and Woodgate (2008) conclude that �...
post-SEO, post-repurchase, and post-stock merger return performance is part
of a broader share issuance e�ect�.
It is hardly surprising that �rms which announce an issue of new shares,
on average, experience negative abnormal event returns. It is more challeng-
ing to explain why low returns persist for a longer period. Early research fo-
cused on behavioral explanations. According to Loughran and Ritter (1995)
�rms issue equity when it is overvalued, but even if this is the case, an e�-
cient market would capture this in the event return, as shown by Myers and
Majluf (1984). Consequently, delayed price discovery must also be at work to
explain subsequent underperformance. Loughran and Ritter (1995) suggest
that �... companies announce stock issues when their stock is grossly over-
valued, the market does not revalue the stock appropriately, and the stock is
still substantially overvalued when the issue occurs.�. This explanation �nds
some empirical support in McLean et al. (2009), who �nd evidence of market
timing in international stock issues, and Ponti� and Woodgate (2008) who
conclude that �... it appears doubtful that these results can be explained
solely by a risk-based asset pricing model�.
More recent papers have focused on risk-based explanations. Bessem-
binder and Zhang (2013) �nd that the reported SEO underperformance is
10

due to imperfect control-�rm matching. When controlling for idiosyncratic
volatility, liquidity, momentum and investment, SEO abnormal returns be-
come insigni�cant. This is in line with Lyandres et al. (2008), who report
that around 75% of SEO underperformance is explained by an investment
factor. Fu and Huang (2015) document that abnormal returns following
stock repurchases and SEOs are insigni�cant during the period of 2003-2012.
According to the authors, this is because the pricing of stocks has become
more e�cient and �rms less opportunistic in their behavior.
In this paper, I �nd that a large portion of issuer performance is ex-
plained by exposure to factors beyond the Fama-French three factor model.
Nonetheless, some underperformance remains to be explained. I explore the
possibility that the negative abnormal returns associated with share issues
are due to investor underreaction to news conveyed in connection with the
issue. There may be several reasons for investor underreaction. For exam-
ple, investors may su�er from a conservatism bias (Barberis et al. (1998)),
investors may be inattentive during some time periods (Du�e (2010)), or
information may only di�use gradually among investors (Hong and Stein
(1999)). In Hong et al. (2000), the di�usion hypothesis is tested empiri-
cally as an explanation for momentum. Information di�usion is expected
to be slowest for small �rms, under-analyzed �rms and for negative news.
Empirically, small �rms, under-analyzed �rms and past losers show stronger
momentum than other �rms.
As a possible explanation for my empirical �ndings, I propose a model
in which some investors are informed in the sense that they observe a noisy
unbiased signal of the fundamental value whereas uninformed investors use
the last observed price as signal of the fundamental value. Trading takes
11

place when informed investors and uninformed investors disagree on value.
If the value signal received by informed investors remains constant, the price
will converge to an equilibrium price re�ecting the signal received by in-
formed investors. The speed of convergence to equilibrium depends on the
fraction of informed investors and the noise of the signal received. In partic-
ular, price discovery will be slowest for noisy signals and small numbers of
informed investors. Moreover, the model predicts that shorting constraints
will increase the speed of price discovery when the equilibrium price is above
current price, i.e. for �good news�, but decrease the speed of price discovery
when equilibrium price is below current price, i.e. for �bad news�.
I apply the model to the case of issuance and show that, empirically, only
�rms which are �hard to value� underperform signi�cantly subsequent to
stock issues. I consider three types of proxies for �hard to value�. First, �rms
for which less information is available are likely to be more di�cult to value
than �rms for which more information is available. For example, in Fama-
MacBeth regressions, past issuance activity signi�cantly predicts next month
return in the quintile of �rms followed by fewest analysts, excluding �rms not
followed by any analysts, while past issuance activity is insigni�cant for the
quintile of �rms followed by most analysts. t-statistics are -1.99 and -2.94
depending on controls. In the quintile of �rms with smallest market value,
past issuance is signi�cant with t-statistics of -5.68 and -5.72 but insigni�cant
in the quintile of �rms with highest market value.
Second, I consider dispersion in analyst estimates and recommendations
as proxies for di�culty to value. For example, in the quintile of �rms with the
highest dispersion in analyst price targets, past issuance activity signi�cantly
predicts next month return (t-statistics -2.50 and -2.70) but is insigni�cant
12

for the quintile of �rms with the lowest dispersion in analyst price targets.
Third, I consider �rms with more distant cash-�ows to be more di�cult to
value than �rms with cash-�ows in the closer future. As an example, past
issuance activity signi�cantly predicts next month return (t-statistics -2.17
and -2.73) in the lowest return on equity quintile but is insigni�cant among
the �rms with the highest return on cash-�ow.
I show these results in Fama-MacBeth regressions with past issuance ac-
tivity as a continuous variable as well as with dummy variables correspond-
ing to di�erent levels of issue activity and with double sorted calendar-time
portfolios. In most speci�cations, past issuance activity signi�cantly predicts
return for �hard to value� �rms but only rarely for �easy to value� �rms.
Moreover, I show that negative stock market reaction to SEO events, i.e.
�bad news�, in some speci�cations is signi�cantly associated with long-run
negative abnormal returns, whereas positive event returns, i.e. �good news�
is not associated with long-run abnormal returns.
The remainder of this paper is organized as follows. In Section 2, a
model of asset prices with informed and uninformed investors is presented
and predictions of the model in general and in the context of issuance are
discussed. The empirical strategy and data are presented in Section 3. I ap-
ply three di�erent methods. Results from Fama-MacBeth regressions (Fama
and MacBeth (1973)) and portfolios constructed based on two-dimensional
sorts are presented in Section 4 and Section 5. In Section 6, I analyze the
relation between event returns and long-run returns for SEO �rms. Section 7
concludes.
13

2 Asset Prices with Informed and Uninformed
Investors
This section presents a simple model of price discovery in a world with in-
formed and uninformed investors. Informed investors observe a noisy signal
of fundamental value while uninformed investors only observe the most re-
cent market value of a risky asset. The model shows that the speed of price
discovery depends on the fraction of informed investors and the level of noise
on the value signal. The latter provides motivation for the empirical �ndings
of this paper. Price discovery is slowest for assets which are hardest to value.
2.1 Model
Consider an economy with investors of which the fraction τ ∈ ]0, 1[, are
informed and 1− τ are uninformed. All investors have absolute risk aversion
parameter a. There is one risky asset in limited supply and a risk-free asset
with zero return in unlimited supply. Assets can be traded in any fraction.
Without loss of generality, I assume that the supply of risky assets equals
the number of investors. The risky asset is traded at discrete times and the
market clearing price is denoted Pt, t = 0, 1, 2, . . . .
Immediately before time t informed investors learn that the fundamen-
tal value of the risky asset is normally distributed with mean µi,t and time
independent variance σ2i > 0. Uninformed investors believe that the time
t value of the risky asset is normally distributed with mean µu,t and time
independent variance σ2u > 0. Uninformed investors calculate µu,t based on
the most recent observed price Pt−1. The reasons for this are given below.
By de�nition, investors' expected return on the risky asset is Et(R) =
14

µt−Pt
Ptwith variance Vart(R) = σ2
P 2t, where µt is µi,t for informed investors
and µu,t otherwise, and similarly σ is either σi or σu. Hence, their optimal
investment in the risky asset is Et(R)a Vart(R)
= Pt(µt−Pt)a σ2 .
While informed investors know µt and σ, uninformed investors believe
that the expected value of the risky asset is fully revealed by the last ob-
served price Pt−1 and that no other investors have information other than
themselves. Speci�cally, they assume that all investors are like themselves
and that the last observed price Pt−1 is consistent with investors' valuation.
Market clearing implies that each investor should hold one risky asset, i.e.
Pt−1(µu,t − Pt−1)
a σ2u
= Pt−1
with the solution
µu,t = Pt−1 + aσ2u (1)
In other words, uninformed investors believe that the value of the risky
asset equals the last observed price plus the risk premium they require for
holding the risky asset. While this belief is not consistent with rational expec-
tations, because it ignores the presence of informed investors, it is consistent
with the e�cient market hypothesis, in the sense that uninformed investors
assume that the last observed price incorporates all available information.1
Demand from informed investors plus demand from uninformed investors
must equal total supply. Hence, time t market clearing requires that2
1Uninformed rational expectations investors would realize that the price pathP0, P1, . . . Pt−1 contains information about the signals received by informed investors andwould take this information into account when forming their beliefs.
2Here, I utilize that there are nτ informed investors, n(1 − τ) uninformed investors,and a supply of n risky assets, where n is the number of investors. None of the resultsdepend on the size of n.
15

(1− τ)Pt(µu,t − Pt)
a σ2u
+ τPt(µi,t − Pt)
a σ2i
= Pt
with the solution
Pt = µu,t +stτ − Σaσ2
u
Σ(1− τ) + τ(2)
where Σ =σ2i
σ2udenotes the ratio between variance of valuation of informed
investors and uninformed investors. Σ measures the precision of the signal
received by informed investors relative to variance perceived by uninformed
investors. st = µi,t − µu,t is the time t spread between informed and un-
informed investors' expected value of the risky asset. If the signal received
by informed investors remains constant, i.e. µi,t = µi for t ≥ T a necessary
and su�cient condition for equilibrium is Pt = Pt−1. Insertion of this con-
dition and the uninformed investors' valuation formula from equation 1 in
equation 2 yields
Pt = Pt + aσ2u +
stτ − Σaσ2u
Σ(1− τ) + τ⇒ st = aσ2
u(Σ− 1) (3)
By de�nition, µi = µu,t + st. Inserting µu,t from equation 1 and st from
equation 3 and using the de�nition of Σ and the equilibrium condition Pt =
Pt−1 yields the equilibrium price P ∗ = µi−aσ2i . It depends only on informed
investors' expected value and variance. In equilibrium investors do not agree
on expected value unless Σ = 1, but any disagreement will be �o�set� by
disagreement on variance.
Consider a situation in which informed investors receive a new and con-
stant value signal µi,t = µi for t ≥ T . This creates a new equilibrium price,
16

but the question of interest is under what conditions and how fast this equi-
librium will be reached. Proposition 1 shows that Pt will always converge
linearly to the equilibrium price P ∗.
Proposition 1.
If µi,t = µi for all t ≥ T then Pt → P ∗ for t→∞
The rate of convergence is Σ(1−τ)Σ(1−τ)+τ
.
Proof.
See Appendix A.
By proposition 1, the rate of convergence depends only on Σ and τ . Since
the partial derivatives
∂γ
∂Σ=
τ − τ 2
Λ2> 0
∂γ
∂τ=−Σ
Λ2< 0
convergence is faster for higher fractions of informed investors τ and for lower
levels of noise of the value signal Σ received by informed investors.
We may augment the model with constraints on shorting. Some investors
may be unable or unwilling to short and those who can and will, may face
costs associated with shorting and limitations due to margin requirements
and lending fees.
If P ∗ > Pt−1 informed investors will be buyers and uninformed investors
will be sellers and potential shorters. If unconstrained uninformed investors
17

would have taken short positions, introduction of shorting constraints would
increase their demand and thus price. This, in turn, will increase µu,t above
what it would otherwise have been, and increase the demand from uninformed
investors until the shorting constraints are no longer binding.
An equilibrium where only informed investors hold the risky asset is not
possible. In such an equilibrium, uninformed investors must have negative
demand. This requires µu,t ≤ Pt. But by equation (1) µu,t = Pt−1 + aσ2u, so
an equilibrium is impossible when a > 0 and σ2u > 0. Consequently, shorting
constraints on uninformed investors will decrease their impact on prices, and
thus increase the speed of price discovery.
If P ∗ < Pt−1 the potential shorters are informed investors. If shorting
constraints are binding, prices will be higher than they would otherwise have
been, and the speed of price discovery will decrease. Even if shorting is
impossible, an equilibrium where only uninformed investors hold the risky
asset, and price discovery does not occur, is impossible. If uninformed in-
vestors hold all risky assets, market clearing implies that Pt = µu,t − aσ2u
1−τ =
Pt−1− τaσ2u
1−τ . Consequently, the price will decline provided a > 0, σ2u > 0, and
τ ∈ ]0, 1[.
Summing up, the model predicts that price discovery will always occur
but be slowest for shares traded by few informed investors and for shares
which are hard to value by informed investors. Shorting constraints will
increase the speed of price discovery for good news, i.e. when P ∗ > Pt, but
decrease the speed of price discovery for bad news, i.e. when P ∗ < Pt.
18

2.2 Application to Issuance
Large share issues, as well as share repurchases, are known to be information-
conveying events. This has been documented in numerous event studies
showing that SEO announcements, on average, are greeted with negative
abnormal event returns, whereas repurchase announcements are greeted with
positive abnormal event returns (see Eckbo et al. (2007) for a survey of studies
of SEOs and Peyer and Vermaelen (2009) for repurchases).
For the case of share issuance, McKeon (2015) shows that 90% of quar-
ters in which �rms issue new shares, the issuance was not initiated by the
�rm but rather by investors, in particular through the exercise of employee
stock options. These issues are generally small and unlikely to convey much
information. In contrast, larger issues, often associated with SEOs or stock
�nanced acquisitions, are �rm-initiated and likely to convey information.
The model outlined in Section 2.1, predicts that larger share issues will
be positively associated with future negative abnormal returns, because they
on average convey negative information. Smaller issues are less likely to be
associated with abnormal returns, as the information conveyed by smaller
issues, in particular investor-initiated issues, is limited. Empirically, this
is consistent with Fama and French (2008a) who �nd that large issues are
associated with signi�cant negative future abnormal returns, whereas small
issues are associated with insigni�cant positive future abnormal returns.
Repurchase announcements may convey substantial positive information,
but the model predicts that it will be absorbed by the market faster than
negative information. Hence, it is less likely that share repurchases will be
associated with signi�cant future abnormal returns.
A novel prediction of the model is that the speed of price discovery will be
19

slowest for �hard to value� �rms trading above their fundamental value, such
as �hard to value� �rms with large equity issues. As �hard to value� is not
directly observable, I consider three types of proxies for this property. First,
I consider �rms for which less information is publicly available. I measure
the amount of public information by the �rm's market value, because small
�rms disclose less information, and by the number of equity analysts following
a �rm. Second, I consider �rms with high disagreement in analyst opinion.
Here, I calculate dispersion in analyst price target, recommendation, and next
quarter EPS estimate. Third, partly inspired by Baker and Wurgler (2007),
I consider �rms with more distant cash-�ows. Firms with more distant cash-
�ows are harder to value, because there is more uncertainty associated with
the more distant future. Firms with distant cash-�ows are �rms with low
pro�tability, measured as return on equity, �rms with low dividend yield,
�rms with high asset growth, and �rms with low earnings to price ratio.
All these measures may arguably be proxies for di�culty to value, but
may also be correlated with other characteristics known to predict return.
In particular, market value, pro�tability, asset growth and the earnings to
price ratio are all known to predict return. As an example, the model pre-
dicts that low pro�tability issuers will underperform relative to issuers with
higher pro�tability because they are harder to value. But the underperfor-
mance may also be caused directly by the lower pro�tability. I address these
concerns in two ways. First, I also use proxies which are not obviously corre-
lated with return-predicting characteristics. Second, and more importantly,
in the Fama-MacBeth regressions in Section 4, I control for all the return-
predicting characteristics of the Fama and French (2015) �ve factor model as
well as momentum and in the double sorted portfolio regressions reported in
20

Section 5, I regress returns on the Fama French �ve factor returns.
3 Empirical Strategy
3.1 Measures of Issuance
My gross sample consists of all shares on the monthly CRPS �le during the
period from 1985 to 2014 for which price prc or alternate price altprc and
monthly return with and without dividends (ret and retx) are available.3
Following some previous research (including Eckbo et al. (2007), Fama and
French (2008a), and Bessembinder and Zhang (2013)), I leave out �nancial
�rms.4
To measure issuance activity, I monthly calculate the adjusted number of
shares using the number of shares outstanding (shrout) and the cumulative
factor to adjust shares (cfacshr) reported by CRSP. Observations for which
the number of shares and cumulative factor to adjust shares are not available
are dropped from the sample. Following Daniel and Titman (2006) net issue
over the past year is de�ned as
NetIssuet,t−12 = ln(AdjustedSharest)− ln(AdjustedSharest−12)
where AdjustedSharest is the time t adjusted number of shares. To distinguish
between positive issuance and negative issuance (repurchases), I de�ne
Issuet,t−12 = max(NetIssuet,t−12, 0)
3Here and in the following variable names in CRSP and Compustat and other databasesare given in courier.
4Some papers, including Loughran and Ritter (1995) and Daniel and Titman (2006)leave out utilities.
21

and
Repurchaset,t−12 = max(−NetIssuet,t−12, 0)
To simplify notation Issue, Repurchase, and NetIssue refer to Issuet,t−12,
Repurchaset,t−12, and NetIssuet,t−12, respectively.
In some empirical tests, �rm-month observations are sorted into issuance
portfolios on NetIssue value. These portfolios are denoted issue1, issue2,
issue3, issue4, and issue5, respectively. The breakpoints used are �xed to fa-
cilitate the interpretation of the portfolios. issue1 consists of net repurchasers
with NetIssue < −0.1%. issue2 is �zero-issuers� with −0.1% ≤ NetIssue <
0.1%. issue3, issue4, and issue5 are net issuers with NetIssue of at least
0.1%, 3% and 15%, respectively. The 3% breakpoint is motivated by McK-
eon (2015) who �nds that issues of at least 3% are typically �rm-initiated.
The 15% breakpoint is chosen to separate �rm-initiated issues in two groups
of approximately same size.
The number of �rms per NetIssue portfolio is shown in Figure 2. Figure 2
shows that zero-issuers have become less common and that the number of re-
purchasers varies strongly over time. In particular, it seems that the number
repurchasers spikes in the period after major stock downturns, for example
year 1988, after the dot-com bubble in year 2000, after the 2008 Financial
crisis, and after the August 2011 stock market fall. Since repurchase is mea-
sured over the past year, a possible interpretation is that some �rms utilize
the low valuations to repurchase own equity.
[Insert Figure 2 about here]
Table 1 provides statistics for each of the �ve NetIssue portfolios. In terms
22

of �rm-month observations, issue3, the portfolio with small positive issuance
activity, accounts for 36% of all observations. There are 20% repurchasers
(issue1), 15% zero-issuers (issue2) and 16% and 12% in issue4 and issue5,
the two groups with high issuance activity. Zero-issuers are, on average, the
smallest �rms, issuers are larger and repurchasers the largest �rms. BM is
highest for zero-issuers and lowest for �rms with high issuance activity. ROE
and EP are, as one would expect, monotonically decreasing in NetIssue while
AG in increasing in NetIssue.
[Insert Table 1 about here]
One of my empirical tests focuses on SEO �rms. I obtain information on
SEOs from the Thomson One Banker New Issues Database (SDC Platinum).
I selected Follow-On equity issues with total proceeds of at least 3% of the
total pre-issue market value. Most of the issues eliminated are o�erings
of shares by major shareholders. These issues may be large but are not
�rm-initiated and do not change �rm equity. The Figure 3% is motivated
by McKeon (2015), as discussed above. SEO observations are merged with
CRSP observations on cusip number and �rm name.
3.2 Proxies for hard to value
As discussed in Section 2.2, I use nine di�erent proxies for hard to value.
These proxies are calculated monthly. Market value, denoted MV, is cal-
culated from CRPS data. For �rms (permcos) with more than one share
class (more than one permno) issued, only the share class with the highest
market value is kept, but the �rm's market value is aggregated over all share
23

classes. Dividend yield, denoted Yield, over the past 12 months is calculated
as CRSP holding period return (ret) over the past 12 months less holding
period return without dividend (retx) over the past 12 months.
For the calculation of return on equity (ROE), asset growth (AG), and
earnings to price ratio (EP), accounting data from Compustat are used. I
use only data from annual reports. The most recent Compustat observation,
at least six months old and no more than two years older than the CRSP
observation, is used. AG is calculated as the relative change in assets (at)
over the past 12 months. ROE is calculated as net income (ni) divided by
book equity (ceq) and EP is calculated as net income divided by market
value. CRSP observations, for which Compustat accounting information
(assets, net income and book equity) is not available, are omitted.
Data on equity analysts and their recommendations are from the IBES
database. The most recent IBES observation, no more than one year old, is
used. The number of analysts with a next quarter earnings per share (EPS)
estimate is denoted #Analysts. Three measures of analyst disagreement are
calculated for �rms with at least two analyst observations. Dispersion in
analyst price target (PTG) is given by
Dptg =σptgµptg
where σptg and µptg is the standard deviation and mean of analyst price
targets reported by IBES. Dispersion in analyst recommendation (REC) Drec
is the standard deviation in recommendation, measured on a �ve-point scale,
reported by IBES. Dispersion in analyst expected next quarter earnings per
24

share EPS is scaled with price, i.e.
Deps =σepsP
where σeps is the standard deviation of analysts' next quarter EPS estimate
and P is the price per share. While CRSP observations without correspond-
ing accounting data are dropped, observations without analyst information
are kept in the sample. Figure 1 shows the number of �rms for which at least
one estimate of next quarter EPS, at least one price target, and at least one
recommendation, are available. EPS estimates start around the year 1985
and coverage gradually increases until around year 2000. Analyst recommen-
dations start becoming available from the year 1995 and price targets from
year 2000. By the end of the sample, more than 80% of the �rms have EPS
estimates, recommendations and price targets.
[Insert Figure 1 about here]
Since analyst recommendations and price targets are not available from
1985, the empirical test using analyst recommendations covers the period
1995-2014 while test using analyst price targets cover the period 2000-2014.
3.3 Empirical Tests
In order to explore to what extent the predictions of the model presented in
Section 2 can be con�rmed empirically, I have performed three types of tests.
First, in Section 4, I do one dimensional sorts on each of the nine vari-
ables proxying for hard to value and create quintile samples. Portfolios are
constructed monthly. As customary breakpoints are calculated using NYSE
25

�rms only. Within each quintile sample, I apply Fama-MacBeth regressions
(Fama and MacBeth (1973)) to determine whether issuance is signi�cantly
associated with next month returns for the �hard to value� quintile sample
as well as for the �easy to value� quintile sample.
Second, in Section 5, I create �ve by �ve double sorted portfolios. One
of the sort variables is NetIssue, sorted into portfolios as described in Sec-
tion 3.1, the other is one of the variables proxying for hard to value. With
nine di�erent proxy variables, this gives nine di�erent sets of �ve by �ve
portfolios. For each of the double sorted portfolios, value-weighted monthly
return is calculated and regressed on conventional market and factor returns
reported on the Kenneth French website. This is to determine whether the
spread in regression intercept between repurchasers (issue1) and larger is-
suers (issue5) di�ers between �rms which are �easy to value� and �rms which
are �hard to value�.
Third, in Section 6, I focus on �rms which, according to the Thomson
SDC database, have carried out a SEO. For SEO �rms, there has been an
SEO announcement, with an associated event return ER. ER can be de-
composed into its positive component, denoted ER+ = max(ER, 0) and its
negative component, denoted ER− = max(−ER, 0). I interpret ER as a
proxy for the information conveyed in the SEO announcement. On average,
it will be negative, but in the cross-section of �rms it will di�er, and for some
issuers it will be positive. By regressing one-year buy and hold abnormal re-
turns (BHAR), calculated from two weeks after the SEO to one year after the
SEO, on ER+ and ER−, I test whether bad news (ER−) and positive news
(ER+), respectively, predict one-year abnormal returns. Finally, I construct
monthly updated value-weighted calendar-time portfolios of issuers with pos-
26

itive event return and issuers with negative event returns. Portfolio returns
are regressed on conventional market and factor returns and I test whether
regression intercepts di�er from zero and between the two portfolios.
4 Fama-MacBeth Regressions
Table 2 reports full-sample Fama-MacBeth regressions of next month return
on �rm characteristics expected to explain return including the characteris-
tics Issue and Repurchase. Two market models are considered: a minimal
model with only the logarithm of ratio between book value and market value
(bm) and the logarithm of market value5 (mv) and a comprehensive model
which also includes return over the past 12 months excluding the last month
(MOM), return on equity (ROE), and asset growth (AG). All regressors,
except for mv and MOM are winsorized at their 1% and 99% fractiles, re-
spectively.
[Insert Table 2 about here]
As expected, ROE and AG are highly signi�cant. With both market
models Issue is also highly signi�cant, with a coe�cient of about -0.8. This
implies that a 10% increase in Issue is associated with a 8 bps reduction
in next month return. Repurchase is less signi�cant but with a higher re-
gression coe�cients (2.5 with bm and mv as independent variables and 1.3
if MOM, ROE and AG are included). Ponti� and Woodgate (2008), who
do not decompose NetIssue into Issue and Repurchase, report that in a uni-
variate regression a 15% increase in NetIssue is associated with a 33 bps
5i.e. bm = log(BM) and mv = log(MV )
27

decrease in next month return. This is equivalent to a regression coe�cient
of (numerically) 2.2 in my regressions.
In the rest of this section, �rm-month observations are sorted in quintile
portfolios based on variables proxying for hard to value. For each quintile
porfolio, I run separate value-weighted Fama-MacBeth regressions using the
same �rm characteristics as in Table 2. The purpose is to determine for
which samples Issue and Repurchase signi�cantly predict return.
With nine di�erent proxies for �hard to value�, �ve portfolios for each
of these and two market models, the number of regressions is 90. Table 3
provides a summary of the level of signi�cance of Issue and Repurchase for
the most easy and most hard to value quintile samples. In 15 of the 18 cases
Issue is signi�cant for the most �hard to value� quintile samples but never for
the most �easy to value� quintile samples. Repurchase is signi�cant in eight
cases for the hard to value samples and twice for the easy to value samples.
Table 4 reports the details of all 90 regressions.
[Insert Table 3 about here]
[Insert Table 4 about here]
The results reported are consistent with the predictions of the model
discussed in Section 2. Issue only predicts return signi�cantly for hard to
value �rms. Further, Issue is more frequently able to predict future return
than Repurchase. The latter is consistent with the prediction that price
discovery will be slower after bad news (stock issues) than after good news
(stock repurchases).
Fama-MacBeth regressions impose an a�ne relationship between expected
28

return and the independent variables, including Issue and Repurchase. If this
relationship has another functional form, as the discussion in Section 2.2 and
the empirical �ndings of Fama and French (2008b) suggest, it is not possible
to make inferences from di�erences in regression coe�cients between quintile
portfolios. To illustrate this point, I show, in Figure 3, the coe�cients as-
sociated with issue portfolio dummy variables in full-sample Fama-MacBeth
regressions. This regression is equivalent to the full-sample regressions re-
ported in Table 2, with the exception that Issue and Repurchase have been
replaced with dummy variables: issue1 for repurchasers and issue3, issue4
and issue5 for issuers using the same breakpoints as above. The base category
is zero-issuers.
The dummy variable associated with repurchases (issue1) as well as small
issues (issue3) is positive relative to the group of zero-issuers, i.e. repurchases
as well as small issues are associated with higher returns than zero-issues,
in line with �ndings reported in Fama and French (2008b). Larger issues
(issue4 and issue5) are associated with more negative returns. Only estimates
associated with issue5 are signi�cantly di�erent from zero (t-statistics of 2.21
and 2.23 respectively), but the results suggest that the relationship between
NetIssue and return may not be a�ne.
[Insert Figure 3 about here]
If easy to value �rms are less likely to do large issues than hard to value
�rms, it would be no surprise that Issue signi�cantly predicts return for hard
to value �rms but not for easy to value �rms. Since �cash-�ows in the more
distant future�, i.e. low pro�tability, low earnings to price ratio, and high
growth, are proxies for hard to value, this a very real concern, because these
29

types of �rms are more likely to issue than �rms with stronger current cash-
�ows. To address this concern, I repeat the Fama-MacBeth regressions within
separate samples sorted on variables proxying for hard to value, using issue
dummy variables issue1, issue3, issue4, and issue5 instead of Repurchase and
Issue.
The results of the issue dummy variable regressions are summarized in
Table 5. The table reports whether issue5 (Issue above 15%) and issue1
(Repurchase of at least 0.1%) are signi�cant relative to the base category
(zero-issuers). In 12 out of 18 cases of hard to value �rms, the return of large
issuers (issue5) is signi�cantly di�erent from the return of zero-issuers, while
this is never the case for easy to value �rms. The dummy variable associated
with repurchases (issue1) is signi�cant in 10 of 18 cases of hard to value �rms
and three times for easy to value �rms. These results are less signi�cant
than the results with Issue and Repurchase as regressors, suggesting that
the results reported in Table 3 are biased due to di�erent issuance activity
between the easy to value and the hard to value samples for some of the
proxies for hard to value.
[Insert Table 5 about here]
5 Double Sorted Portfolio Returns
Another concern with the assumptions of the Fama-MacBeth regressions is
that issuance may be correlated with other independent variables, as strongly
suggested by Table 1. If this is the case and expected return is not a�ne
in these independent variables, inference from comparisons between Fama-
30

MacBeth regressions on di�erent samples is a�ected. An alternative to Fama-
MacBeth regressions is to construct portfolios and regress portfolio returns on
the return on factors known to predict return. Speci�cally, I use the factor
returns available from Kenneth French's website. The advantage of this
approach is that it does not impose any functional form of the relationship
between return and independent variables.
Figure 4 illustrates the importance of the choice of market model in sort
portfolio tests. The �gure reports monthly α's of the �ve value-weighted port-
folios corresponding to issue1, issue2, issue3, issue4, and issue5 regressed on
the market excess return (panel A), the Fama French three factor returns (de-
noted FF3, panel B), and Fama French �ve factor returns plus momentum
return (denoted FF5+UMD, panel C). Market and FF3 α's decrease mono-
tonically from repurchasers to issuers. Controlling for pro�tability, growth
and momentum changes this picture fundamentally. FF5+UMD α's for re-
purchasers and zero-issuers are close to 0, while small and midsized issues are
associated with positive abnormal returns and only large issues are associated
with negative abnormal returns. This may partly explain why Bessembinder
and Zhang (2013) �nd that SEO underperformance disappears when con-
trols beyond book-to-market ratio and �rm size are added. Note, however,
that �rms with the largest issuance activity are much less a�ected by the
introduction of factors beyond market exposure, and have negative α's in all
cases.
[Insert Figure 4 about here]
Since my main interest is whether underperformance by issuers is con-
�ned to �rms which are hard to value, I have create double sorted portfolios
31

where NetIssue is one sort variable and the other sort variable is a proxy
for hard to value. For each of the double sorted portfolios, value-weighted
monthly return is calculated and regressed on the FF3 and the FF5+UMD
market models. The regression intercept αki,j is the abnormal return of the
intersection between NetIssue portfolio i and portfolio j of sort variable k.
For example, αMV1,1 is the abnormal return of a portfolio of small cap share re-
purchasers (issue1) and αROE5,1 is the abnormal return on a portfolio of small
cap �rms with high issuance activity (issue5). The variable of interest is
the di�erence in regression intercept between a portfolio of high issuers and
a portfolio of repurchasers, within the same quintile of the hard to value
variable. This di�erence is denoted the issuance spread
∆kj = αk1,j − αk5,j
For example, ∆MV1 is the di�erence in abnormal return between small cap
repurchasers and small cap issuers, while ∆MV5 is the same di�erence for large
cap �rms. I test whether the issuance spread is signi�cantly di�erent from
zero for �hard to value� portfolios as well as for �easy to value� portfolios.
Figure 5 depicts the monthly α's of value-weighted portfolios sorted on
NetIssue and MV regressed on FF5+UMD. Within the group of small cap
�rms, repurchasers have an α of 36 bp, while �rms with the largest issuance
activity (issue5) have an α of -22 bp. The di�erence between these is the
issuance spread ∆MV1 = 58 bps, which is signi�cant with a t-value of 3.13.
It can be interpreted as the abnormal return on an investment which is long
small cap repurchasers and short small cap large issuers. If α's are measured
relative to FF3, ∆MV1 = 110 bps with a t-value of 5.51. For large cap ∆MV
5
32

is -14 bps for the FF5+UMD model and 14 bps for the FF3 model, both of
these are insigni�cant.
Table 6 shows the issuance spread for the most easy to value and the
most hard to value �rms for each of the nine variables proxying for di�culty
to value and the two market models FF3 and FF3+UMD. For the easy to
value �rms, the issuance spread is only signi�cant in one case, while it is
signi�cant in 13 out of 18 cases for the hard to value �rms. Issuance spreads
are uniformly larger when returns are regressed on the FF3 model than when
regressed on the FF5+UMD model, again con�rming that some of the un-
derperformance of issuers is explained by exposure to the RMW, CMA and
UMD factors.
[Insert Table 6 about here]
6 Returns Subsequent to SEOs
This section focuses on �rms which, according to SDC Platinum, have carried
out an SEO. One advantage of focusing on SEOs is that we can calculate event
returns. Abnormal event returns can be taken as a proxy for the information
conveyed in connection with the issue. Most previous research �nds that
abnormal event returns on average are negative ((Eckbo et al., 2007)), but
occasionally they will be positive. These events convey positive information
about the issuing �rm. This enables me to test the model prediction, namely
that the speed of price discovery is faster for good news than for bad news,
cf. Section 2.
In the SDC Platinum database I select all SEOs (Follow-On o�erings)
33

by non-�nancial �rms between 1985 and 2014 where the proceeds from the
o�ering exceed 3% of the market value before the o�ering. SDC observations
are matched with CRSP and Compustat data using the cusip code and the
�rm name. Return information must be available in CRSP.
[Insert Figure 6 about here]
Figure 6 shows the value-weighted cumulated return of SEO �rms less
the market return from 10 trading days before the issue date (T ) until 10
trading days after the issue date6.
Before issues, issuers experience positive abnormal returns (relative to
the market) of around 1%. This is not necessarily surprising, as �rms may
chose to issue when they perceive their own shares to be performing strongly.
From the day before the issue to two days after the issue, SEO �rms expe-
rience negative abnormal event returns of about -1.6% followed by a partial
rebound. Motivated by Figure 6, I measure abnormal event returns over the
three-day period from close on day T − 2 to close on day T + 1, i.e.
ER = RSEOT−2,T−1 −RMkt
T−2,T−1
where RSEO and RMkt denote the return of the SEO �rm and the CRSP
value-weighted market return, respectively. Of the 11,481 SEO events, ER is
positive in 4,237 cases (37%). As a simple test of whether the news conveyed
at issue time is associated with future abnormal returns, I decompose ER
into its positive component ER+ = max(ER, 0) and its negative component
ER− = max(−ER, 0) and regress one-year buy and hold abnormal return
6If the issue date is a Saturday or a Sunday, T is the Friday before the issue.
34

BHAR on ER+ and ER−. As the relation between ER and BHAR may
not be piecewise linear, I also sort SEOs into quintiles based on ER and
regress BHAR on dummy variables associated with quintiles 1, 2, 3 and 5.
I chose quintile 4 as the base category, as this quintile contains SEOs with
zero abnormal event return.
BHAR is the return of the SEO �rm over some period less the return
of a benchmark investment over the same period. The literature on long
run abnormal returns has documented that results are very sensitive to the
actual calculation of BHAR, i.e. the choice of benchmark (Mitchell and
Sta�ord (2000), Eckbo et al. (2007), and Bessembinder and Zhang (2013)).
One stream of the literature uses the �matched �rm� approach, in which
the benchmark of a SEO �rm is another �rm, which is similar to the issuer
usually in terms of market value and book-to-market ratio, but Bessembinder
and Zhang (2013) show that issuers and non-issuers di�er in several other
characteristics known to predict return. According to the authors, these
di�erent characteristics explain the observed di�erences in post-issue return
and controlling for these di�erences there is no abnormal BHAR. In the
absence of a commonly agreed benchmark for calculation on BHAR, I chose
the simplest possible approach to calculating one-year BHAR as
BHAR = RSEOT+10,T+1y −RMkt
T+10,T+1y
As this is likely to be a biased estimate of true one-year abnormal return,
it is not suitable for inference on the absolute level of BHAR. However, it
may be more suited for making an inference about the relation between event
abnormal returns and long-run abnormal returns. Table 7 shows the result
35

of value-weighted regressions of BHAR on ER+ and ER− as well as on ER
quintile dummies.
A 1% increase in ER−, i.e. a 1% decrease in abnormal return event,
when abnormal event return is already negative, is associated with a 76 bps
decrease in one-year BHAR (t-value -5.78), while ER+ is insigni�cant. In
the regression with ER+ and ER− as regressors, the intercept is 1.55%,
indicating that zero or positive event return is associated with small posi-
tive BHAR. In the regression with ER quintile dummies, issuers with lowest
abnormal event returns have a 7.3% lower one-year BHAR (t-value -5.26).
Second and third quintiles also have signi�cantly lower BHARs of 5.33%
and 1.87% than the base category. Firms with the highest abnormal event
returns have positive BHARs of 2.8%. This is signi�cantly di�erent from
zero but not from the 1.55% intercept reported in the model with ER+ and
ER− as regressors. Both regressions support that negative event return is
signi�cantly associated with BHAR, while positive event returns are not.
[Insert Table 7 about here]
One may be concerned that the results presented above re�ect that ab-
normal event returns are correlated with other �rm characteristics known to
predict returns. It may, for example, be that the least pro�table SEO �rms
experience the lowest event returns. To address this concern, as well as the
methodological issues concerned with BHAR calculations and their distribu-
tion, I construct two calendar-time portfolios as suggested by Mitchell and
Sta�ord (2000).
One portfolio consists of �rms which have carried out an SEO with pos-
itive event returns ER during the past year. The other portfolio consists of
36

negative event return SEO �rms. In addition, I construct a long-short zero-
investment portfolio which is long SEO �rms with positive ER and short
SEO �rms with negative ER. The SEO calendar-time portfolios are updated
monthly and SEO �rms are included from the �rst complete month after
T + 10 (10 trading days after the issue) and for a total of 12, 24 or 36 con-
secutive months. I also construct portfolios of �rms which issued 12 to 23
months ago and 24 to 35 months ago, respectively. Value-weighted monthly
portfolio returns are regressed on FF3 as well as on FF5+UDM. Table 8
shows the results of these regressions.
[Insert Table 8 about here]
In panels A and B returns are regressed on FF3. The negative ER port-
folios have signi�cant αs between -49 bps and -56 bps for holdings periods of
one, two and three periods. The positive ER portfolios also have negative α's
but the long-short portfolios have signi�cant positive α's for holding periods
of one and two years. However, α is only signi�cant for the �rst year and
insigni�cant for the second and third year.
In panels C and D returns are regressed on FF5+UMD. Controlling for
RMW, CMA and MOM increases α for all SEO portfolios, re�ecting that
all portfolios have signi�cant negative exposure to RMW and CMA. Again,
this con�rms the �nding that the underperformance of issuers is partly ex-
plained by their low pro�tability and high asset growth. When regressed on
FF5+UMD issuers with positive ER have insigni�cant αs for all holding peri-
ods considered. However, negative ER issuers experience signi�cant negative
abnormal returns for two-year holding periods as well as during the second
year. The long-short portfolios also have positive, but insigni�cant, abnormal
37

returns for all holding periods. Even though t-statistics are less impressive
than for the BHAR regressions, these results con�rm that underperformance
subsequent to SEOs is stronger when the SEO conveyed �bad news� than
when it conveyed �good news�.
7 Conclusions
Firms which issue new equity subsequently have low returns. Some of this
performance can be explained by exposure to other risk factors beyond the
classical three Fama French factors, but some abnormal return remains to be
explained.
I propose a model in which some investors are uninformed, assuming
that the latest observed price re�ects fundamental value, whereas informed
investors receive a noisy value signal. Prices are set in competition between
uninformed and informed investors and I show that prices converge to an
equilibrium price dependent only on the value signal observed by informed
investors. The speed of price discovery depends on the noise embedded in
the signals received by informed investors, i.e. how easy the �rm is to value,
and will, in the presence of shorting constraints or limitations, be slowest for
�bad news�. I have applied this model to the case of issuance and derive two
predictions.
First, the model predicts that underperformance subsequent to stock is-
sues will be strongest for the �rms which are hardest to value. As proxies
for �hard to value�, I use measures of information available, analyst disagree-
ment, and more distant cash-�ows. Empirically, I show that �rms with these
characteristics do indeed underperform subsequent to issues, whereas �rms
38

without these characteristics do not underperform.
Second, the model predicts that underperformance will be strongest when
stock issues convey negative news. I use SEO event returns as proxy for the
news conveyed at issue, and empirically show that the negative component
of abnormal event returns is signi�cantly associated with negative buy and
hold abnormal returns, whereas the positive component of abnormal event
returns does not predict buy and hold abnormal returns. Moreover, I show
that a calendar-time portfolio of SEO �rms with negative abnormal event
returns have signi�cant negative abnormal return over some holding periods,
whereas a calendar-time portfolio of SEO �rms with positive abnormal event
returns have insigni�cant or numerically lower abnormal return subsequent
to the SEO.
39

References
Baker, M. and Wurgler, J. (2007). Investor sentiment in the stock market.
Journal of Economic Perspectives , 21 (2), 129 � 151.
Barberis, N., Shleifer, A., and Vishny, R. (1998). A model of investor senti-
ment. Journal of Financial Economics , 49 (3), 307 � 343.
Bessembinder, H. and Zhang, F. (2013). Firm characteristics and long-run
stock returns after corporate events. Journal of Financial Economics ,
109 (1), 83 � 102.
Daniel, K. and Titman, S. (2006). Market reactions to tangible and intangible
information. Journal of Finance, 61 (4), 1605 � 1643.
Du�e, D. (2010). Presidential address: Asset price dynamics with slow-
moving capital. Journal of Finance, 65 (4), 1237 � 1267.
Eckbo, E. B., Masulis, R. W., and Norli, O. (2007). Handbook of Corporate
Finance, Elsevier, vol. 1, chap. Security O�erings.
Fama, E. F. and French, K. R. (2008a). Average returns, b/m, and share
issues. Journal of Finance, 63 (6), 2971 � 2995.
Fama, E. F. and French, K. R. (2008b). Dissecting anomalies. Journal of
Finance, 63 (4), 1653 � 1678.
Fama, E. F. and French, K. R. (2015). A �ve-factor asset pricing model.
Journal of Financial Economics , 116 (1), 1 � 22.
Fama, E. F. and MacBeth, J. D. (1973). Risk, return, and equilibrium:
Empirical tests. Journal of Political Economy , 81 (3), 607.
40

Fu, F. and Huang, S. (2015). The persistence of long-run abnormal returns
following stock repurchases and o�erings. Management Science.
Hong, H., Lim, T., and Stein, J. C. (2000). Bad news travels slowly: Size,
analyst coverage, and the pro�tability of momentum strategies. Journal
of Finance, 55 (1), 265 � 295.
Hong, H. and Stein, J. C. (1999). A uni�ed theory of underreaction, mo-
mentum trading, and overreaction in asset markets. Journal of Finance,
54 (6), 2143 � 2184.
Loughran, T. and Ritter, J. R. (1995). The new issues puzzle. Journal of
Finance, 50 (1), 23 � 51.
Lyandres, E., Le, S., and Lu, Z. (2008). The new issues puzzle: Testing the
investment-based explanation. Review of Financial Studies , 21 (6), 2825 �
2855.
McKeon, S. B. (2015). Employee option exercise and equity issuance motives.
SSRN.
McLean, D. R., Ponti�, J., and Watanabe, A. (2009). Share issuance and
cross-sectional returns: International evidence. Journal of Financial Eco-
nomics , 94 (1), 1 � 17.
Mitchell, M. L. and Sta�ord, E. (2000). Managerial decisions and long-term
stock price performance. Journal of Business , 73 (3), 287.
Myers, S. C. and Majluf, N. S. (1984). Corporate �nancing and investment
decisions when �rms have information that investors do not have. Journal
of Financial Economics , 13 (2), 187 � 221.
41

Peyer, U. and Vermaelen, T. (2009). The nature and persistence of buyback
anomalies. Review of Financial Studies , 22 (4), 1693 � 1745.
Ponti�, J. and Woodgate, A. (2008). Share issuance and cross-sectional
returns. Journal of Finance, 63 (2), 921 � 945.
42
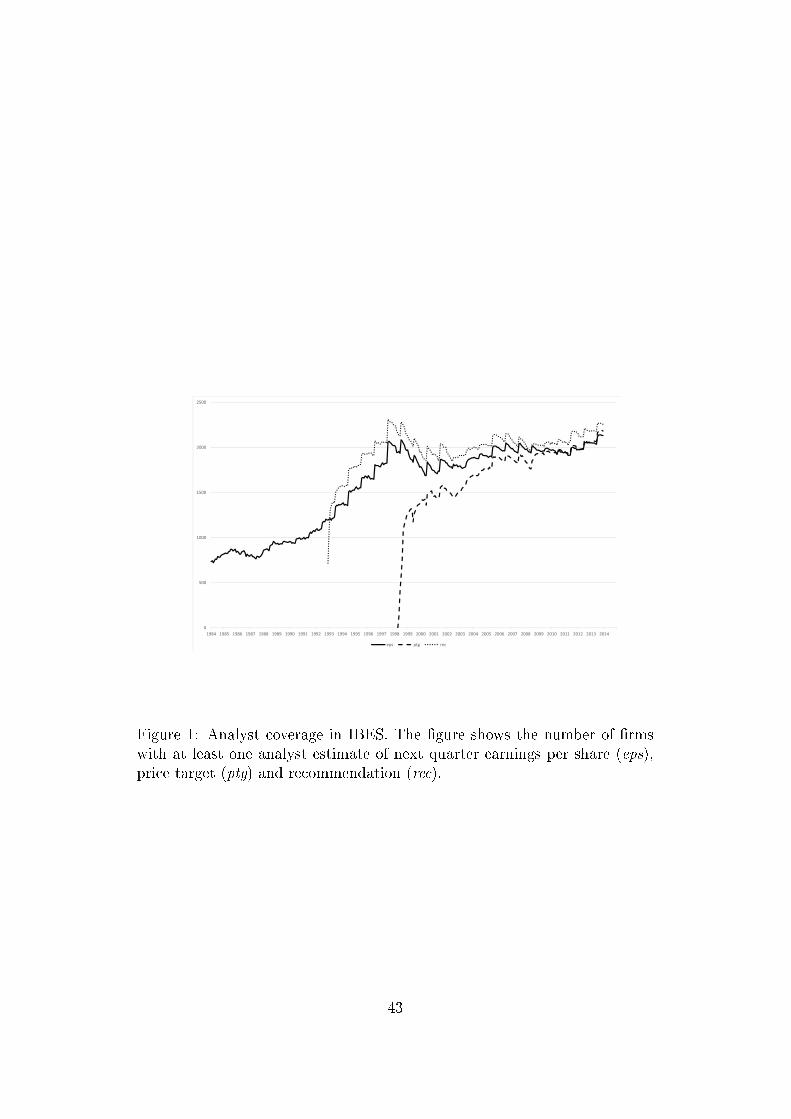
0
500
1000
1500
2000
2500
1984 1985 1986 1987 1988 1989 1990 1991 1992 1993 1994 1995 1996 1997 1998 1999 2000 2001 2002 2003 2004 2005 2006 2007 2008 2009 2010 2011 2012 2013 2014
eps ptg rec
Figure 1: Analyst coverage in IBES. The �gure shows the number of �rmswith at least one analyst estimate of next quarter earnings per share (eps),price target (ptg) and recommendation (rec).
43

0
200
400
600
800
1000
1200
1400
1600
1800
2000
1984 1985 1986 1987 1988 1989 1990 1991 1992 1993 1994 1995 1996 1997 1998 1999 2000 2001 2002 2003 2004 2005 2006 2007 2008 2009 2010 2011 2012 2013 2014
repurchases zero issues small issues mid issues large issues
Figure 2: Number of �rms per NetIssue group. Repurchasers have NetIssuebelow -0.1%, �zero-issuers� have NetIssue between -0.1% and 0.1%. Smallissues, mid issues and large issues, are net issuers, with NetIssue of at least0.1%, 3%, and 15%, respectively. During most of the period small issuer arethe largest group. The number of �zero-issuer� has gradually declined overthe period, while the number of repurchasers has been highly volatile.
44

‐0.4
‐0.3
‐0.2
‐0.1
0
0.1
0.2
repurchases small issues mid issues large issues
mv, bm, MOM, ROE, AG mv, bm
Figure 3: Coe�cient estimates in percentage of dummy variables associatedwith issue1, issue3, issue4 and issue5 in Fama-MacBeth regressions. Thevalue shows the monthly excess return, relative to the base category issue2
(�zero-issuers�). Control variables are log market value mv and log book-to-market ratio bm (red bars) and mv, bm, past year return MOM, returnon equity ROE, and past year asset growth AG (blue bars). Regardless ofcontrols, repurchasers and small issuers have insigni�cantly higher returnsthan �zero issuer�. Mid issuers have insigni�cantly lower returns while thelargest issuers have signi�cantly lower returns of about 30 bps monthly (t-value -2.2 in both speci�cations).
45

Panel A: α of portfolios sorted on NetIssue regressed on the CRSPvalue-weighted market return.
‐0.40‐0.30‐0.20‐0.100.000.100.200.30
Repurchases zero issues small issues mid issues large issues
Panel B: α of portfolios sorted on NetIssue regressed on the market return,SMB, and HML returns (FF3).
‐0.30
‐0.20
‐0.10
0.00
0.10
0.20
Repurchases zero issues small issues mid issues large issues
Panel C: α of portfolios sorted on NetIssue regressed on the market return,SMB, and HML, RMW, CMA and UMD returns (FF5+UMD).
‐0.30
‐0.20
‐0.10
0.00
0.10
0.20
Repurchases zero issues small issues mid issues large issues
Figure 4: Monthly α in per cent of value-weighted portfolios based on sortson NetIssue. Portfolios are formed monthly and portfolio excess returnsare regressed on the market return (panel A), FF3 returns (panel B), andFF5+UMD returns (panel C.). Repurchasers have NetIssue below -0.1%,�zero-issuers� have NetIssue between -0.1% and 0.1%. Small issues, mid issuesand large issues, are net issuers with NetIssue of at least 0.1%, 3%, and 15%,respectively. α decreases uniformly in issue group when controlling for market(panel A) and FF3 factors (panel B). When controlling for FF5+UMD, α ishighest for small issuers and lowest for large issuers.
46

large issues
mid issues
small issues
zero issues
repurchases
‐0.3
‐0.2
‐0.1
0
0.1
0.2
0.3
0.4
0.5
small cap2
34
large cap
Figure 5: Monthly α of value-weighted portfolios sorted independently onNetIssue and MV regressed on the FF5+UMD factors. Repurchasers haveNetIssue below -0.1%, �zero-issuers� have NetIssue between -0.1% and 0.1%.Small issues, mid issues and large issues, are net issuers with NetIssue of atleast 0.1%, 3%, and 15%, respectively. The sort on MV is based on quintilesfor NYSE �rms. Small cap repurchasers have an α of 36 bps, while small cap�rms with the largest issuance activity have an α of -22 bps. The di�erencebetween these is the issuance spread ∆MV
1 = 58 bps. For large cap ∆MV5 is
-14 bps.
47

‐1.00%
‐0.50%
0.00%
0.50%
1.00%
1.50%
T‐10 T‐9 T‐8 T‐7 T‐6 T‐5 T‐4 T‐3 T‐2 T‐1 T T+1 T+2 T+3 T+4 T+5 T+6 T+7 T+8 T+9 T+10
SEO abnormal return
Figure 6: Value-weighted average cumulative abnormal return of SEO �rmsbefore and after the issue date (T ). Abnormal returns are calculated as SEO�rm return less market return. On average issues occur on the backdrop ofalmost 1% abnormal return between T − 10 and T − 2. During the eventwindow from close on T −2 to close on T +1, issuers have negative abnormalreturns of -1.6%. Subsequently, there is a partial recovery.
48

Table1:
Firm
characteristicsforvalue-weightedportfoliossorted
onNetIssue.
RepurchasershaveNetIssuebelow
-0.1%,
�zero-issuers�
haveNetIssuebetween-0.1%
and0.1%
.Smallissues,mid
issues
andlargeissues,arenet
issuerswith
NetIssueof
atleast0.1%
,3%
,and15%,respectively.bm
isthelogarithm
ofbook-to-marketratio,Yieldisthepastyear
dividendyield,AGpastyear
assetgrow
th,ROEpastyear
return
onequity,EPearning-price
ratio,andMVmarketvalue
inmillion
USD.Portfolioaverages
arevalue-weighted,exceptforMV.
NetIssuegroup
NNetIssue
bmYield
AG
ROE
EP
MV
Repurchasers
271992
-0.033
-1.37
2.2%
9.9%
22.6%
5.6%
4.82
Zeroissuers
196354
0.000
-1.17
2.9%
11.7%
15.9%
4.4%
0.98
Smallissuers
488819
0.010
-1.34
1.9%
17.7%
13.2%
3.1%
1.95
Mid
issuers
220901
0.068
-1.57
1.4%
30.6%
8.0%
2.3%
1.47
Large
issuers
163997
0.387
-1.74
1.5%
48.0%
4.2%
0.9%
1.07
49
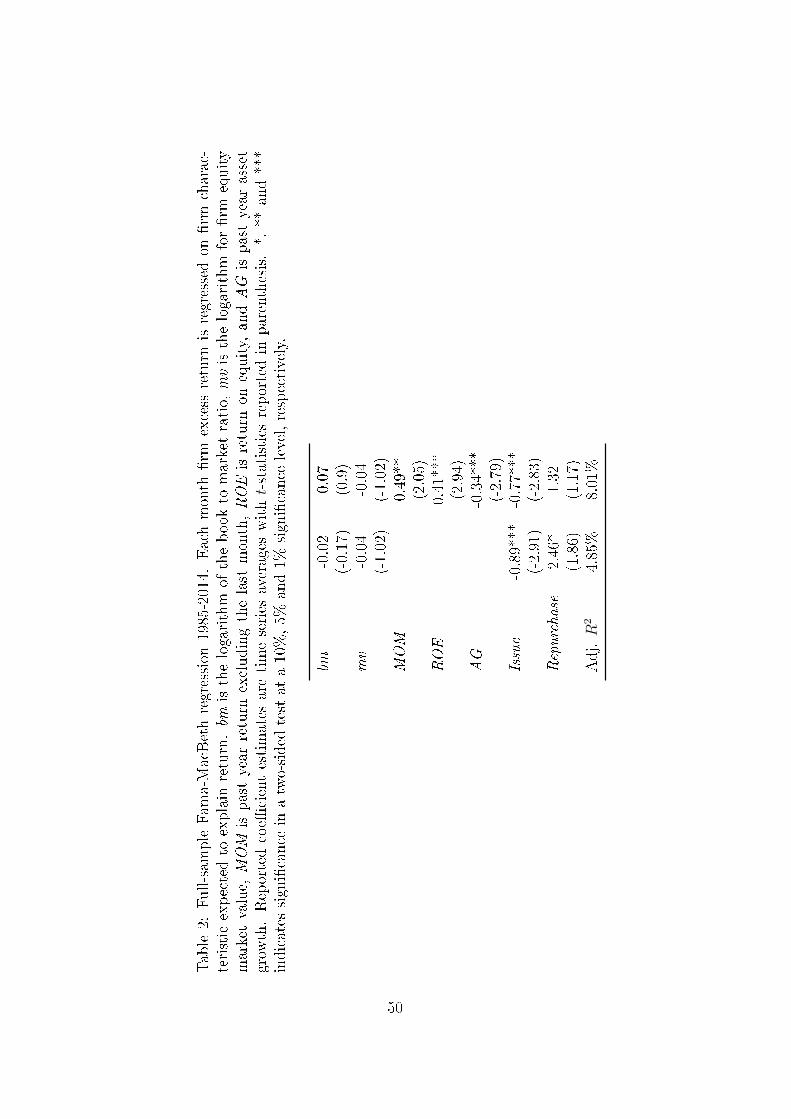
Table2:
Full-sam
pleFam
a-MacBethregression
1985-2014.
Eachmonth
�rm
excess
return
isregressedon
�rm
charac-
teristicexpectedto
explain
return.bm
isthelogarithm
ofthebook-to-marketratio,
mvisthelogarithm
for�rm
equity
marketvalue,
MOM
ispastyear
return
excludingthelast
month,ROEisreturn
onequity,
andAG
ispastyear
asset
grow
th.Reportedcoe�
cientestimates
aretimeseries
averages
witht-statistics
reportedin
parenthesis.*,
**and***
indicates
signi�cance
inatwo-sided
testat
a10%,5%
and1%
signi�cance
level,respectively.
bm-0.02
0.07
(-0.17)
(0.9)
mv
-0.04
-0.04
(-1.02)
(-1.02)
MOM
0.49**
(2.05)
ROE
0.41***
(2.94)
AG
-0.34***
(-2.79)
Issue
-0.89***
-0.77***
(-2.91)
(-2.83)
Repurchase
2.46*
1.32
(1.86)
(1.17)
Adj.R
24.85%
8.01%
50

Table3:
Levelofsigni�cance
ofIssue,i.e.
thepositivecomponent,ofNetIssueandRepurchase,i.e.
thenegativecomponent
ofNetIssue,inFam
a-MacBethregressionswith1-month
return
asdependentvariable.In
additionto
IssueandRepurchase
theindependentvariablesarelogbook-to-marketratiobm
,logmarketvaluemv,pastyear
return
MOM,return
onequity
ROE,andpastyear
assetgrow
thAGwhere�all�isspeci�ed.�Easy�and�Hard�refersto
themosteasy
tovaluequintile
andthemosthardto
valuequintile,respectively,forthegivensort
variable.*,
**and***indicates
signi�cance
ina
two-sided
testat
a10%,5%
and1%
signi�cance
level,respectively.Detailsof
regressionsarereportedin
Table
??
Issue
Repurchase
Quintile
Easy
Hard
Easy
Hard
Independentvariables
all
bm+mv
all
bm+mv
all
bm+mv
all
bm+mv
MV
***
***
Yield
***
***
**AG
***
***
***
ROE
*****
***
EP
***
***
**Deps
**#Analysts
*****
***
***
Drec
**Dptg
*****
****
51

Table4:
Fam
a-MacBethregressionswith1-month
return
asdependentvariable.For
each
oftheninevariablesproxying
forhardto
value,�rm
-month
observationsaresorted
inquintilesamples,andFam
a-MacBethregressionsarecarriedout
foreach
quintile
separately.
Eachsort
variable
isreportedin
separatepanels(Panel
Ato
I)In
additionto
Issueand
Repurchase
independentvariablesarelogbook-to-marketratiobm
,logmarketvaluemv,pastyear
return
MOM,return
onequityROE,andpastyear
assetgrow
thAG.t-statistics
arereportedin
parenthesis.*,
**and***indicates
signi�cance
inatwo-sided
testat
a10%,5%
and1%
signi�cance
level,respectively.Thesigni�cance
ofIssueandRepurchase
reported
inthistablearesummarized
inTable3.
PanelA:Portfoliossorted
byMV
Quintile
12
34
51
23
45
bm0.15
0.04
0.07
-0.03
-0.06
0.27***
0.13
0.18*
0.12
0.06
(1.51)
(0.31)
(0.58)
(-0.3)
(-0.52)
(3.04)
(1.38)
(1.85)
(1.22)
(0.64)
mv
-0.03
-0.15
-0.24
-0.08
-0.08
-0.03
-0.14
-0.25
-0.05
-0.05
(-0.35)
(-1.13)
(-1.48)
(-0.72)
(-1.42)
(-0.41)
(-1.17)
(-1.53)
(-0.51)
(-1.06)
MOM
0.63***
0.4**
0.52**
0.52**
0.52
(4.58)
(2.34)
(2.56)
(2)
(1.62)
ROE
0.12
0.21
0.23
0.7***
0.63**
(0.99)
(1.36)
(1.27)
(2.74)
(2.17)
AG
-0.68***
-0.54***
-0.44***
-0.19
-0.26
(-6.88)
(-4.51)
(-3.12)
(-1.31)
(-1.4)
Issue
-2.39***
-1.32***
-1.47***
-1.12**
-0.11
-1.83***
-1.1**
-1.19***
-0.97**
-0.32
(-5.72)
(-2.62)
(-3.08)
(-2.41)
(-0.21)
(-5.68)
(-2.42)
(-2.73)
(-2.2)
(-0.71)
Repurchase
1.17
3.38***
1.43
4.58***
2.5
0.02
2.65**
0.75
3.94***
0.78
(1.03)
(2.65)
(1.22)
(3.18)
(1.37)
(0.02)
(2.22)
(0.66)
(2.91)
(0.46)
Adj.R
21.5%
1.8%
2.3%
2.5%
5.4%
2.7%
3.5%
4.8%
6.0%
10.5%
52

PanelB:Portfoliossorted
byYield
Quintile
12
34
51
23
45
bm-0.15
-8.93
0.14
-0.03
0.12
0.04
0.46**
0.25**
0.12
0.29***
(-1.22)
(-1.03)
(1.01)
(-0.29)
(1.07)
(0.34)
(2.29)
(1.98)
(0.88)
(2.59)
mv
0.04
-0.01
-0.05
-0.08*
-0.02
0.04
0.16
-0.04
-0.04
-0.01
(0.65)
(-0.11)
(-0.85)
(-1.71)
(-0.48)
(0.67)
(1.61)
(-0.77)
(-0.94)
(-0.22)
MOM
0.76***
3.36**
0.51
0.22
0.39
(4.06)
(2.11)
(1.41)
(0.64)
(1.13)
ROE
0.29**
-0.54
1.03**
0.92**
1.18***
(2.42)
(-0.76)
(2.23)
(2.26)
(2.62)
AG
-0.41***
-0.15
-0.21
-0.24
-0.08
(-3.86)
(-0.36)
(-0.95)
(-0.94)
(-0.33)
Issue
-1.85***
-2.62
-0.9
-0.25
-0.15
-1.71***
-3.26*
-0.72
0.34
-0.21
(-4.86)
(-1.29)
(-1.17)
(-0.25)
(-0.24)
(-4.68)
(-1.71)
(-0.94)
(0.37)
(-0.38)
Repurchase
4.6**
13.11
5.81**
03.1
2.15
18.42
3.18
0.42
1.65
(2.47)
(0.84)
(2.19)
(0)
(1.38)
(1.28)
(1.26)
(1.27)
(0.18)
(0.8)
Adj.R
25.0%
10.8%
7.9%
9.7%
9.0%
7.5%
17.8%
13.5%
14.9%
16.4%
53

PanelC:Portfoliossorted
byAG
Quintile
12
34
51
23
45
bm0.11
-0.02
-0.01
0.01
-0.21
0.16*
0.07
0.12
0.21*
0.06
(1.02)
(-0.16)
(-0.06)
(0.06)
(-1.64)
(1.78)
(0.65)
(1.06)
(1.88)
(0.56)
mv
-0.02
-0.09*
-0.08*
-0.04
0.04
-0.02
-0.09**
-0.05
-0.06
0.06
(-0.39)
(-1.76)
(-1.69)
(-0.89)
(0.78)
(-0.35)
(-1.98)
(-1.16)
(-1.18)
(1.17)
MOM
0.31
0.21
0.27
0.42
0.9***
(1.48)
(0.74)
(0.94)
(1.47)
(3.27)
ROE
0.04
0.85**
0.8*
1.29***
0.54**
(0.27)
(2.09)
(1.84)
(3.53)
(2.53)
AG
0.56
-1.65
1.1
-0.05
-0.42***
(1)
(-0.57)
(0.38)
(-0.04)
(-4.08)
Issue
-0.02
-1.05
-1.33*
0.04
-1.3***
-0.33
-0.92
-0.83
0-0.97***
(-0.03)
(-1.37)
(-1.78)
(0.07)
(-3.36)
(-0.6)
(-1.26)
(-1.28)
(0)
(-2.62)
Repurchase
3.79**
3.86*
-0.68
2.35
3.23
3.3*
2.44
-1.01
1.37
1.84
(2.01)
(1.74)
(-0.32)
(1.03)
(1.08)
(1.89)
(1.16)
(-0.52)
(0.64)
(0.68)
Adj.R
27.1%
8.2%
7.8%
7.3%
7.3%
10.6%
13.0%
13.2%
11.7%
11.3%
54

PanelD:Portfoliossorted
byROE
Quintile
12
34
51
23
45
bm0.02
-0.1
0.06
0.15
0.06
0.21*
0.01
0.18
0.24
0.2*
(0.2)
(-0.6)
(0.36)
(0.82)
(0.51)
(1.93)
(0.08)
(1.15)
(1.39)
(1.71)
mv
-0.04
-0.11**
-0.07
-0.04
-0.03
-0.02
-0.11**
-0.04
-0.04
0(-0.79)
(-1.99)
(-1.34)
(-0.82)
(-0.53)
(-0.32)
(-2.06)
(-0.81)
(-0.9)
(-0.08)
MOM
0.79***
0.43
0.29
0.55*
0.57*
(4.16)
(1.55)
(0.96)
(1.95)
(1.88)
ROE
0.07
2.98
-2.5
1.86
0.66
(0.51)
(1.17)
(-0.58)
(0.61)
(1.22)
AG
-0.54***
-0.29*
-0.37*
-0.24
0.25
(-4.35)
(-1.88)
(-1.76)
(-0.93)
(0.89)
Issue
-1.19***
-0.98*
-0.65
-0.83
0.05
-0.93**
-0.6
-0.57
-0.76
-0.24
(-2.73)
(-1.75)
(-1.07)
(-1.05)
(0.07)
(-2.17)
(-1.21)
(-1)
(-1.1)
(-0.38)
Repurchase
4.83**
3.35
3.35
1.25
1.2
3.77*
3.42*
2.86
0.48
0.86
(2.25)
(1.54)
(1.59)
(0.62)
(0.58)
(1.84)
(1.7)
(1.36)
(0.25)
(0.47)
Adj.R
25.4%
7.5%
7.5%
9.0%
7.1%
8.6%
11.6%
12.6%
14.0%
13.4%
55

PanelE:Portfoliossorted
byEP
Quintile
12
34
51
23
45
bm-0.02
-0.14
-0.08
-0.15
0.05
0.2*
-0.05
0.47*
0.43
-0.08
(-0.2)
(-1.34)
(-0.67)
(-1.21)
(0.37)
(1.93)
(-0.29)
(1.89)
(1.47)
(-0.49)
mv
-0.06
-0.02
-0.07
-0.07
0-0.04
-0.01
-0.07
-0.06
-0.03
(-0.99)
(-0.45)
(-1.47)
(-1.36)
(-0.02)
(-0.63)
(-0.3)
(-1.42)
(-1.28)
(-0.5)
MOM
0.84***
0.61**
0.2
0.03
0.53
(4.42)
(2.37)
(0.56)
(0.08)
(1.28)
ROE
0.03
0.15
3.28**
3.11**
-0.39
(0.26)
(0.16)
(2.49)
(2.06)
(-0.55)
AG
-0.35***
-0.29
-0.44*
-0.07
-0.43*
(-2.62)
(-1.51)
(-1.79)
(-0.26)
(-1.76)
Issue
-1.23***
-0.85
0.78
-2.88**
-0.48
-1.13***
-0.63
0.7
-2.11**
-0.19
(-3.18)
(-1.54)
(0.95)
(-2.23)
(-0.55)
(-2.95)
(-1.24)
(0.92)
(-2.14)
(-0.22)
Repurchase
6.03**
-1.35
3.25
2.87
-0.02
3.86
-1.31
1.84
2.63
-0.48
(2.37)
(-0.48)
(1.49)
(1.18)
(-0.01)
(1.62)
(-0.52)
(0.86)
(1.26)
(-0.29)
Adj.R
26.0%
6.2%
7.4%
8.1%
8.0%
9.5%
10.8%
12.7%
13.9%
14.2%
56

PanelF:Portfoliossorted
byDeps
Quintile
12
34
51
23
45
bm-0.11
0.17
0.43***
0.35***
0.04
0.09
0.37***
0.47***
0.26**
0.01
(-0.69)
(1.4)
(3.52)
(2.79)
(0.23)
(0.55)
(2.94)
(3.82)
(2.25)
(0.07)
mv
-0.12**
-0.13**
-0.06
-0.02
-0.02
-0.08
-0.12**
-0.09
-0.03
-0.03
(-2.06)
(-2.31)
(-1.12)
(-0.29)
(-0.19)
(-1.47)
(-2.28)
(-1.62)
(-0.58)
(-0.36)
MOM
0.79***
0.47
0.16
-0.15
-0.01
(2.92)
(1.48)
(0.5)
(-0.48)
(-0.02)
ROE
0.58
1**
0.76*
-0.05
0.2
(1.11)
(2.21)
(1.83)
(-0.15)
(0.92)
AG
0.14
-0.33
-0.79***
-1.07***
-0.84***
(0.59)
(-1.5)
(-3.77)
(-4.87)
(-3.59)
Issue
-0.19
-0.07
-0.9
-0.75
-1.53**
-0.69
0.21
-0.12
-0.2
-1.05
(-0.22)
(-0.09)
(-1.13)
(-1.03)
(-2.03)
(-0.95)
(0.28)
(-0.17)
(-0.27)
(-1.41)
Repurchase
0.1
4.25**
2.48
3.81
5.31
0.33
2.33
1.47
3.93*
3.43
(0.04)
(2.15)
(1.06)
(1.62)
(1.6)
(0.12)
(1.29)
(0.67)
(1.67)
(1.11)
Adj.R
28.8%
8.0%
8.0%
7.4%
8.1%
15.1%
13.7%
13.0%
11.8%
12.5%
57

PanelG:Portfoliossorted
by#Analysts
Quintile
12
34
51
23
45
bm-0.04
-0.08
0.05
00
0.06
0.02
0.19*
-0.01
0.14
(-0.28)
(-0.65)
(0.42)
(0.03)
(0.01)
(0.55)
(0.23)
(1.65)
(-0.12)
(1.41)
mv
-0.14**
-0.18**
-0.13*
-0.11
-0.08
-0.13**
-0.17**
-0.12*
-0.11
-0.08
(-2.01)
(-2.37)
(-1.83)
(-1.54)
(-1.46)
(-2.05)
(-2.29)
(-1.82)
(-1.62)
(-1.51)
MOM
0.6***
0.37*
0.31
0.25
0.79**
(3.39)
(1.75)
(1.14)
(0.88)
(2.48)
ROE
0.29*
0.14
0.28
0.15
0.66**
(1.84)
(0.58)
(0.96)
(0.57)
(2.41)
AG
-0.71***
-0.5***
-0.69***
-0.49***
-0.36
(-4.16)
(-2.92)
(-3.69)
(-2.78)
(-1.61)
Issue
-1.79***
-0.73
-0.62
-1.27**
-0.81
-1.16**
-0.55
0.04
-1.04*
-0.96
(-2.94)
(-1.19)
(-1.01)
(-2.22)
(-1.14)
(-1.99)
(-0.93)
(0.07)
(-1.94)
(-1.48)
Repurchase
5.84***
3.63**
1.14
5.43***
1.64
4.76***
3.23*
0.24
4.15**
0.45
(3.66)
(2.02)
(0.61)
(2.99)
(0.83)
(3.14)
(1.88)
(0.14)
(2.49)
(0.24)
Adj.R
26.2%
6.8%
6.2%
7.2%
6.2%
8.7%
9.7%
9.7%
11.0%
11.3%
58

PanelH:Portfoliossorted
byDrec
Quintile
12
34
51
23
45
bm-0.01
-0.16
0.03
0.14
0.2
0.04
-0.08
0.21
0.16
0.24
(-0.05)
(-0.8)
(0.17)
(0.99)
(1.14)
(0.24)
(-0.54)
(1.59)
(1.2)
(1.47)
mv
-0.11
-0.04
-0.11
-0.02
0.03
-0.12
-0.04
-0.09
-0.02
0.01
(-1.34)
(-0.48)
(-1.58)
(-0.36)
(0.33)
(-1.42)
(-0.5)
(-1.37)
(-0.25)
(0.13)
MOM
-0.06
0.56
0.48
0.22
0.45
(-0.21)
(1.55)
(1.2)
(0.52)
(1.08)
ROE
0.42*
0.16
0.59
-0.09
0.31
(1.68)
(0.54)
(1.56)
(-0.25)
(0.85)
AG
-0.31
-0.31
-0.29
-0.29
0.17
(-1.35)
(-1.33)
(-1.23)
(-1.02)
(0.58)
Issue
-0.33
-1.05
-0.9
-2.11**
-1.15
-0.16
-1.19*
-1.02
-2.12***
-1.71**
(-0.42)
(-1.6)
(-1.13)
(-2.32)
(-1.16)
(-0.22)
(-1.76)
(-1.46)
(-2.64)
(-2)
Repurchase
3.6
5.56
2.09
1.84
3.1
2.27
3.54
1.26
1.47
3.07
(1.45)
(1.62)
(0.63)
(0.68)
(0.91)
(0.99)
(1.09)
(0.4)
(0.56)
(0.88)
Adj.R
27.5%
9.5%
8.3%
7.6%
9.2%
11.6%
14.5%
14.0%
13.3%
14.2%
59

PanelI:Portfoliossorted
byDptg
Quintile
12
34
51
23
45
bm0.15
0.26
0.28*
0.09
-0.02
0.19
0.32*
0.3*
0.21
-0.06
(1.02)
(1.62)
(1.69)
(0.43)
(-0.07)
(1.15)
(1.92)
(1.8)
(1.15)
(-0.27)
mv
-0.16**
-0.14**
-0.07
-0.01
-0.23*
-0.16**
-0.13**
-0.08
-0.02
-0.31**
(-2.37)
(-2.16)
(-0.8)
(-0.12)
(-1.87)
(-2.48)
(-2.01)
(-1.13)
(-0.17)
(-2.47)
MOM
-0.21
0.27
0.04
0.21
-0.36
(-0.45)
(0.56)
(0.08)
(0.44)
(-0.6)
ROE
0.49
0.83
1.01*
0.46
0.14
(0.84)
(1.47)
(1.86)
(1.32)
(0.42)
AG
-0.27
-0.66**
0.12
-0.48*
-0.47
(-1)
(-2.39)
(0.38)
(-1.75)
(-1.58)
Issue
-1.25
-0.19
-1.4
-0.07
-2.7***
-0.53
-0.22
-1.47*
0.42
-2.5**
(-1.57)
(-0.23)
(-1.44)
(-0.06)
(-2.63)
(-0.64)
(-0.26)
(-1.67)
(0.38)
(-2.46)
Repurchase
0.8
-4.01
1.54
6.8
11.73**
-0.32
-6.97**
0.25
6.61
11.96**
(0.22)
(-1.25)
(0.4)
(1.42)
(2.05)
(-0.09)
(-2.2)
(0.07)
(1.58)
(2.39)
Adj.R
29.7%
7.5%
8.2%
9.9%
7.4%
14.9%
13.5%
14.0%
14.7%
12.6%
60

Table5:
Levelofsigni�cance
ofthedummyvariablesassociated
withissue1
(repurchases)andissue5
(NetIssueofat
least
15%),respectively,in
Fam
a-MacBethregressionswith1-month
return
asdependentvariable.Thistableisequivalentto
Table
3exceptthat
Table
3reports
thesigni�cance
ofthecontinuousIssueandRepurchase
variableswhilethistable
reports
thesigni�cance
ofthedummyvariablesissue5
(large
issues)andissue1
(repurchases).
Inadditionto
Issueand
Repurchase
theindependentvariablesarebm
,mv,MOM,ROE,andAGwhere�all�isspeci�ed.�Easy�and�Hard�refers
tothemosteasy
tovaluequintileandthemosthardto
valuequintile,respectively,forthegivensortvariable.*,**
and
***indicates
signi�cance
inatwo-sided
testat
a10%,5%
and1%
signi�cance
level,respectively.
issue5
(Large
issues)
issue1
(Repurchases)
Quintile
Easy
Hard
Easy
Hard
Independentvariables
All
bm+mv
All
bm+mv
All
bm+mv
All
bm+mv
MV
***
***
****
Yield
*****
**
**AG
****
ROE
****
EP
**Deps
*#Analysts
***
***
Drec
****
**
Dptg
***
**
61

Table 6: Value-weighted returns on double sorted portfolios are regressed onFF3 and FF5+UMD factors. First sort variable is NetIssue while the secondsort variable is one of the nine proxies for �hard to value�. Figures reportedare the monthly issuance spreads in per cent for the most easy to value andthe most hard to value quintiles of the second sort variable, i.e. ∆k
1 and ∆k5,
where k is the second sort variable. An example may be 1.10 (�rst row to theright) ∆MV
1 = αMV1,1 − αMV
5,1 , i.e. the di�erence in abnormal return betweena portfolio of small cap repurchasers (issue1) and a portfolio of small capissuers (issue5) when return is regressed on FF3 factors. When regressedon FF5+UMD this issuance spread is 58 bps, as illustrated in Figure 5. t-statistics are reported in parenthesis and *, ** and *** indicates signi�cancein a two-sided test at a 10%, 5% and 1% signi�cance level, respectively.
Easy to value Hard to value
Second sort variable FF5+UMD FF3 FF5+UMD FF3
MV -0.14 0.14 0.58*** 1.10***(-0.59) (0.62) (3.13) (5.51)
Yield -0.15 -0.07 0.8*** 1.01***(-0.61) (-0.31) (3.49) (4.53)
AG 0.17 0.47* 0.34 0.62**(0.6) (1.68) (1.27) (2.4)
ROE -0.01 0.1 0.11 0.57**(-0.03) (0.39) (0.4) (2.08)
EP 0.36 0.41 0.41 0.72***(1.24) (1.44) (1.51) (2.72)
Deps -0.37 -0.04 0.54 0.98***(-1.26) (-0.14) (1.5) (2.79)
#Analysts -0.02 0.21 0.4 0.81***(-0.08) (0.85) (1.42) (2.88)
Drec 0.22 0.52 1.07*** 1.24***(0.61) (1.48) (2.67) (3.19)
Dptg -0.07 0.07 1.38** 1.69***(-0.22) (0.23) (2.57) (3.28)
62

Table 7: Value-weighted regressions of SEO one-year buy and hold abnormalreturns (BHAR) regressed on event return (ER), decomposed into its positiveand negative component, i.e. ER+ = max(ER, 0) and ER− = max(−ER, 0)and on event return dummies ER1, ER2, ER3 and ER5, corresponding to�rst, second, third and �fth quintile of event returns. Fourth quintile ischosen as base category because it contains issuers with zero. t-statistics arereported in parenthesis. *, ** and *** indicates signi�cance in a two-sidedtest at a 10%, 5% and 1% signi�cance level, respectively. ER
Intecept 1.55**(2.18)
ER+ -0.02-0.15
ER− -0.76**(-5.78)
ER1 -7.3***(-5.26)
ER2 -5.33***(-4.83)
ER3 -1.87**(-1.98)
ER5 2.8***(2.13)
Adj. R2 0.33% 0.53%N 10351 10351
63

Table8:
Monthly
SEO
portfolio
returnsregressedon
FF3(panelA
andB)andFF5+
UMD
(panelCandD)factors.
ER>
0istheportfolio
ofSEO
�rm
swithpositiveeventreturns,whereasER<
0istheportfolio
ofSEO
�rm
swith
negativeeventreturn.Pos-Neg
isazero-investmentportfolio
longSEO
�rm
swithpositiveeventreturn
andshortSEO
�rm
swithnegativeeventreturn.Periodrefers
totheperiodduringwhichaSEO
�rm
isincluded
intheportfolio,for
exam
ple[1,12]meansthat
SEO
�rm
sareincluded
intheportfolio
from
themonth
afterissueuntilandincludingthe
twelfthmonth
afterissue.t-statistics
arereportedin
parenthesis.*,**
and***indicates
signi�cance
inatwo-sided
test
ata10%,5%
and1%
signi�cance
level,respectively.
PanelA:One-,two-
andthree-year
SEOportfolioreturnsregressedon
FF3.
Period
[1,12]
[1,24]
[1,36]
ER>0
ER<0
Pos-Neg
ER>0
ER<0
Pos-Neg
ER>0
ER<0
Pos-Neg
α-0.06
-0.49**
0.43**
-0.32*
-0.56***
0.25*
-0.31**
-0.50***
0.20
(-0.28)
(-2.31)
(2.09)
(-1.89)
(-3.33)
(1.73)
(-2.02)
(-3.15)
(1.60)
Mkt
1.12***
1.19***
-0.07
1.13***
1.17***
-0.04
1.14***
1.18***
-0.04
(22.43)
(24.64)
(-1.53)
(29.13)
(30.06)
(-1.12)
(32.73)
(32.28)
(-1.43)
SMB
0.47***
0.54***
-0.07
0.40***
0.48***
-0.08*
0.34***
0.45***
-0.11***
(6.75)
(7.97)
(-1.03)
(7.44)
(8.84)
(-1.68)
(7.06)
(8.85)
(-2.77)
HML
-0.46***
-0.21***
-0.25***
-0.40***
-0.20***
-0.19***
-0.34***
-0.20***
-0.14***
(-6.34)
(-3.01)
(-3.65)
(-7.04)
(-3.60)
(-4.12)
(-6.80)
(-3.78)
(-3.53)
Adj.R
274.7%
75.8%
5.6%
82.2%
82.0%
6.3%
84.7%
83.8%
5.8%
64

PanelB:Second-andthird-yearSEOportfolioreturnsregressedon
FF3
[13,24]
[25,36]
ER>0
ER<0
Pos-Neg
ER>0
ER<0
Pos-Neg
α-0.59***
-0.73***
0.14
-0.24
-0.27
0.03
(-2.97)
(-3.83)
(0.74)
(-1.24)
(-1.29)
(0.16)
Mkt
1.14***
1.15***
-0.01
1.12***
1.17***
-0.05
(25.05)
(26.30)
(-0.13)
(25.10)
(23.92)
(-1.04)
SMB
0.33***
0.35***
-0.01
0.19***
0.45***
-0.26***
(5.26)
(5.70)
(-0.21)
(3.11)
(6.68)
(-3.81)
HML
-0.25***
-0.19***
-0.06
-0.13**
-0.21***
0.08
(-3.77)
(-2.98)
(-0.97)
(-1.99)
(-2.92)
(1.09)
Adj.R
275.4%
76.7%
0.4%
73.4%
74.1%
7.4%
65

PanelC:One-,two-
andthree-year
SEOportfolioreturnsregressedon
FF5+
UMD
[1,12]
[1,24]
[1,36]
ER>0
ER<0
Pos-Neg
ER>0
ER<0
Pos-Neg
ER>0
ER<0
Pos-Neg
α0.06
-0.20
0.25
-0.08
-0.28*
0.20
-0.05
-0.17
0.12
(0.27)
(-0.99)
(1.19)
(-0.45)
(-1.71)
(1.36)
(-0.33)
(-1.13)
(0.95)
Mkt
1.10***
1.11***
-0.02
1.06***
1.08***
-0.02
1.06***
1.08***
-0.02
(20.92)
(23.22)
(-0.32)
(26.00)
(27.30)
(-0.60)
(29.49)
(29.26)
(-0.49)
SMB
0.34***
0.35***
-0.02
0.29***
0.35***
-0.06
0.23***
0.32***
-0.09**
(4.69)
(5.39)
(-0.24)
(5.21)
(6.52)
(-1.26)
(4.60)
(6.33)
(-2.17)
HML
-0.15
0.26***
-0.40***
-0.10
0.16**
-0.26***
-0.08
0.13*
-0.21***
(-1.48)
(2.83)
(-4.11)
(-1.34)
(2.12)
(-3.83)
(-1.14)
(1.91)
(-3.60)
RMW
-0.50***
-0.72***
0.22**
-0.45***
-0.51***
0.07
-0.45***
-0.52***
0.08
(-4.93)
(-7.78)
(2.20)
(-5.72)
(-6.77)
(0.96)
(-6.48)
(-7.42)
(1.28)
CMA
-0.30**
-0.56***
0.26*
-0.40***
-0.51***
0.11
-0.36***
-0.49***
0.13
(-2.14)
(-4.38)
(1.88)
(-3.70)
(-4.85)
(1.14)
(-3.73)
(-4.94)
(1.54)
UMD
0.21***
0.21***
0.00
0.08**
0.10***
-0.02
0.05*
0.04
0.00
(4.84)
(5.21)
(0.08)
(2.28)
(2.94)
(-0.66)
(1.65)
(1.45)
(0.19)
Adj.R
277.6%
81.0%
6.7%
84.3%
85.0%
6.3%
86.8%
86.7%
6.8%
66

PanelD:Second-andthird-yearSEOportfolioreturnsregressedon
FF5+
UMD
[13,24]
[25,36]
ER>0
ER<0
Pos-Neg
ER>0
ER<0
Pos-Neg
α-0.20
-0.51***
0.30
-0.04
0.08
-0.12
(-1.03)
(-2.6)
(1.55)
(-0.22)
(0.35)
(-0.54)
Mkt
1.01***
1.06***
-0.05
1.07***
1.06***
0.00
(21.12)
(22.43)
(-1.02)
(21.87)
(20.46)
(0.04)
SMB
0.26***
0.34***
-0.08
0.11
0.35***
-0.25***
(3.93)
(5.29)
(-1.30)
(1.62)
(4.97)
(-3.29)
HML
0.00
-0.02
0.02
-0.07
-0.08
0.02
(-0.02)
(-0.20)
(0.17)
(-0.72)
(-0.86)
(0.17)
RMW
-0.35***
-0.10
-0.25***
-0.29***
-0.37***
0.09
(-3.80)
(-1.08)
(-2.76)
(-3.05)
(-3.72)
(0.81)
CMA
-0.51***
-0.43***
-0.08
-0.05
-0.22
0.17
(-3.96)
(-3.40)
(-0.62)
(-0.39)
(-1.62)
(1.19)
UMD
-0.10**
-0.07*
-0.03
-0.06
-0.14***
0.08*
(-2.56)
(-1.79)
(-0.80)
(-1.45)
(-3.18)
(1.73)
Adj.R
278.1%
78.0%
3.3%
74.4%
76.4%
9.0%
67

Appendix A
Proposition 1.
If µi,t = µi for all t ≥ T then Pt → P ∗ for t→∞
The rate of convergence is Σ(1−τ)Σ(1−τ)+τ
.
Proof
Let P ∗ = µi−Σaσ2u de�ne the equilibrium price. By (2) the market clearing
price is Pt = µt+stτ−Σaσ2
u
Σ(1−τ)+τ,∀t ≥ T . Since st+1 = µi,t+1−µu,t+1 = µi−Pt−aσ2
u
and µu,t+1 = Pt + aσ2u insertion in (2) yields
Pt+1 = µt+1 +st+1τ − Σaσ2
u
Σ(1− τ) + τ= Pt + aσ2
u +(µi − Pt − aσ2
u)τ − Σaσ2u
Σ(1− τ) + τ
with the de�nition Λ = Σ(1− τ) + τ
Pt − P ∗ = µt +stτ − Σaσ2
u
Λ−(µi − Σaσ2
u
)= (µt − µi) + st
( τΛ
)+ Σaσ2
u
(1− 1
Λ
)= st
( τΛ− 1
)+ Σaσ2
u
(1− 1
Λ
)
and
68

Pt+1 − P ∗ = Pt + aσ2u +
(µi − Pt − aσ2u)τ − Σaσ2
u
Λ−(µi − Σaσ2
u
)= Pt
(1− τ
Λ
)+ aσ2
u
(1 + Σ− Σ + τ
Λ
)+ µi
( τΛ− 1
)=
(µt +
stτ − Σaσ2u
Λ
)(1− τ
Λ
)+ aσ2
u
(Σ− Στ
Λ
)− µi
(1− τ
Λ
)=
(−st +
stτ − Σaσ2u
Λ
)(1− τ
Λ
)+ Σaσ2
u
(1− τ
Λ
)=
(1− τ
Λ
)(st
( τΛ− 1
)+ Σaσ2
u
(1− 1
Λ
))
The rate of convergence is de�ned as
γt =|Pt+1 − P ∗||Pt − P ∗|
= 1− τ
Λ=
Σ(1− τ)
Σ(1− τ) + τ
Since γt is constant for t ≥ T , Pt converges linearly to P ∗ provided that
|γt| < 1 which is the case for all τ ∈]0, 1[.
69

70

The Issuance E�ect in International Markets
Niklas Kohl*
Abstract
Equity issuance predicts future low returns, but the reasons for
this underperformance are disputed. I use an international sample and
show that the underperformance by issuers is smaller in developed mar-
kets than in other markets. This empirical result is consistent with the
�hard to value� theory which holds that underperformance is strongest
for �rms which are �hard to value� because informed investors are
more constrained in their ability to express negative information (Kohl,
2016). However, the result contradicts the �ndings of McLean et al.
(2009), who argue that the underperformance of issuers is strongest
in developed markets because lower issue costs induce issuers to ex-
ploit mispricings more frequently. To analyze this, I have developed a
model with issue costs and information asymmetry between issuer and
investors, where opportunistic issuers, to some extent, manage to sell
overpriced equity. The model predicts that issuer underperformance
is increasing in issue cost in line with the �ndings in this paper.
∗Department of Finance, Copenhagen Business School, Solbjerg Plads 3, 2000 Fred-eriksberg, Denmark. E-mail: nk.�@cbs.dk. I am grateful for comments and suggestionsreceived from Søren Hvidkjær, Nigel Barradale, and Ken Bechmann as well as seminarparticipants at Copenhagen Business School. Any errors remain mine.
71

1 Introduction
Firms which issue new equity underperform subsequently, relative to other
�rms. This phenomenon was �rst studied in the context of seasoned equity
o�erings (Loughran and Ritter (1995)). Later research has generalized this
result to issuance in general and shown that �rms which issue equity, on
average, subsequently underperform (Daniel and Titman (2006), Ponti� and
Woodgate (2008), Fama and French (2008b), Fama and French (2008a)).
McLean et al. (2009) show that this result also applies in international mar-
kets.
While the issuance e�ect, i.e. the underperformance by issuers, is well
documented, the reasons for underperformance are disputed. The classi-
cal behavioral explanation suggested by Loughran and Ritter (1995) is that
�rms announce issues when their equity is �grossly overvalued� and �the mar-
ket does not revalue the stock appropriately, and the stock is still substan-
tially overvalued when the issue occurs.� Ponti� and Woodgate (2008), more
cautiously, conclude that �... it appears doubtful that these results can be
explained solely by a risk-based asset pricing model� but do not suggest any
particular behavioral explanation and do not rule out that the underperfor-
mance could be explained by a transaction cost model.1
A risk-based explanation is given by Bessembinder and Zhang (2013)
who �nd that SEO underperformance is explained by risk factors including
idiosyncratic volatility, liquidity, momentum and investment. When control-
ling for these factors, the issuance e�ect becomes insigni�cant. A related
1Unfortunately, Ponti� and Woodgate (2008) do not specify what transaction costmodel they have in mind. In this paper, I show that issue transaction costs increasesubsequent underperformance, but only in the presence of a deviation from rational ex-pectations on the side of investors.
72

result is Lyandres et al. (2008) who report that about 75% of SEO underper-
formance is explained by an investment factor. Fu and Huang (2015) report
negative, but insigni�cant, abnormal returns following SEOs during the pe-
riod of 2003-2013. The authors suggest that this is because the pricing of
stocks has become more e�cient and �rms less opportunistic in their issuance
behavior.
McLean, Ponti�, and Watanabe (2009), in the following MPW, study
the issuance e�ect in the cross-section of countries. According to MPW, the
issuance e�ect is strongest �in countries with greater issuance activity, greater
stock market development, and stronger investor protection�. The authors
propose that this is because stock issuance and repurchases are cheaper in
these more developed markets. This enables �rms to be more opportunistic
in their issuance activity, whereas �In less developed markets where share
issuance is more costly, the bene�ts of market timing are exceeded by issuance
costs, and share issuance occurs only for primary reasons�.
Regardless of whether one views the issuance factor as a priced risk or a
mispricing, it may be a surprise that it is stronger in more developed, and
presumably more e�cient, markets than in less developed markets. This
surprise is the starting point of the present paper.
The empirical contribution of this paper is to recon�rm the existence
of the issuance factor in an international sample and, more importantly, to
show that the issuance factor is stronger in non-developed markets than in
developed markets. In order to do this, I proceed as follows. First, I repro-
duce some of MPW's �ndings, which appear to document that the issuance
e�ect is strongest in developed markets. Second, I discuss and demonstrate
how these results are not robust to changes in methodological choices. With
73

other speci�cations, results become insigni�cant or even change sign. Fi-
nally, I suggest another methodology, which arguably is more appropriate to
analyze the issuance e�ect in the cross-section of countries. I show that the
issuance e�ect is indeed stronger in non-developed markets than in developed
markets, as predicted by the model discussed above.
This result is consistent with the �hard to value� explanation advocated
in my paper, Kohl (2016), which holds that underperformance by issuers
is strongest for �rms that are harder for investors to value. Here I show
that the issuance e�ect, in the US market, is strongest for �small cap �rms,
�rms with high dispersion in analyst estimates and recommendations, and
�rms with more distant cash-�ows, such as �rms with low pro�tability, low
dividend yield, or high asset growth�. In the current paper I show that the
issuance factor is also stronger in �hard to value� non-developed markets than
in developed markets.
The theoretical contribution of this paper is to present an alternative or
complementary explanation for the stronger issuance factor in less developed
markets. Inspired by MPW's heuristic analysis of the relationship between
the ease at which equity can be issued and long-run issuer underperformance,
I extend the Myers and Majluf (1984) model of �rms' issuance decision with
issue costs. In addition, I augment the model with a deviation from rational
expectations on the side of investors.2 Not surprisingly, the model shows that
the introduction of issue costs reduces the frequency at which issues occur.
However, when issues occur, higher levels of issue costs increase long-run
issuer underperformance. The model predicts that less developed markets
2Although this is not in the spirit of Myers and Majluf (1984) investor mispricing isnecessary in order to be able to generate non-zero long-run returns in the model.
74

with higher issue costs, �nancial or otherwise, will have fever equity issues
(as shown by MPW) and larger underperformance subsequent to issue. These
predictions are in line with the empirical results obtained.
The remainder of this paper is organized as follows. In Section 2 an
extension of the Myers and Majluf (1984) model of �rms' issuance decision is
presented and analyzed. Section 3 describes and de�nes data and variables
used in the empirical study. The empirical results are presented in Section 4.
Section 5 concludes.
2 A Model of the Issuance Decision
In this Section I augment the Myers and Majluf (1984), henceforth MM,
model with issue costs and investor overvaluation. Issue costs should be
thought of as a proxy for market development and measure all costs, �nancial
or otherwise, associated with raising new equity. The underlying assumption
is that issue costs, on average, will be lower in more developed markets than
in less developed markets. Investor overvaluation is a necessary addition
to the model to generate long-run underperformance of issuers. I make no
assumptions on di�erences in the level of overvaluation between markets.
MM consider a �rm with assets in place with value a ≥ 0 and an invest-
ment opportunity with net present value of b ≥ 0, which cannot be post-
poned and which must be �nanced with new equity E > 0, raised from new
investors.3 Without loss of generality, I assume that the �rm has one share
outstanding and can issue new shares in any fraction. Firm management acts
3In MM, �rms may have �nancial slack S. E is the equity to be raised in excess of S toundertake the investment. Since �nancial slack plays no role in my model, I have omittedthis detail.
75

in the interests of old investors. Before event time, �rm management knows
the realizations of a and b, while investors only know the distribution of these.
The �rm's decision on whether or not to issue, and consequently forfeit the
investment opportunity, depends on the price p at which new equity can be
issued.
If the �rm does not issue, the per share fundamental value is a. If the
�rm does issue and invest, the number of shares increases with a factor p+Ep
and fundamental value per share will be p(a+b+E)p+E
. The �rm will issue if
and only if it increases per share fundamental value, i.e. the �rm issues if
and only if b > Epa − E. This situation is depicted in Figure 1. The �rm
will issue if (a, b) ∈ M ′, the region to the left and not issue if (a, b) ∈ M .
In MM, investors have rational expectations. Hence, the equilibrium price
must satisfy p∗ = E(a+ b | (a, b) ∈M ′).
[Insert Figure 1 about here]
The model predicts that event returns will be negative, except for de-
generate cases where issue always or never occurs, because the decision to
issue reveals negative information about the distribution of a + b, but, on
average, investors get a fair deal and purchase new equity at its expected
fundamental value.4 Consequently, long-run returns will be zero. I introduce
two innovations to the MM model.
First, to model costs in connection with the issue, monetary or otherwise,
4To see that event returns are negative, consider that the pre-event equilibrium price p0
is the issue probability weighted average of the price p∗ if an issue has been announced andthe price p− once it is known that an issue will not be announced. As shown in Figure 1,no issue implies that the expected value of a exceeds issue price, i.e. p− > p∗ ⇒ p∗ < p0
which shows that event return will be strictly negative, except for degenerate cases, withissue probability 0 or 1, where event return will be zero.
76

I introduce an issue cost of c. In order to raise new equity E issue proceeds
must be E + c. E and c are known by the �rm as well as investors. c a�ects
the �rm's issuance decision as �rms will only issue when b > E+cpa − E,
i.e. for �xed a, b must be caphigher than without issue costs for an issue to
occur. Issue costs will also a�ect the equilibrium price as investors will take
c into consideration. Every thing else being equal, issue costs will reduce the
equilibrium price which in turn will further reduce the issue probability.
Second, to enable the model to generate long-run negative returns, a
deviation from rational expectations is necessary. One way to achieve this
is to introduce a systematic bias in investors' valuation of assets in place
and the investment opportunity. In particular, I introduce the overvaluation
parameter µ ≥ 1. While the true density function of x = a + b is f(x)
investors believe the density function is fµ(x) where fµ(µx) = 1µf(x), i.e.
investors systematically overvalue a+ b by a factor µ. I denote the investors'
expected value Eµ, where the true expectation is E, i.e. Eµ(x) = (1+µ)E(x).
µ is known by the �rm and aside from the systematic overvaluation, investors
are rational. With overvaluation and issue costs, the equilibrium price is
p∗ = Eµ(ab) | (a, b) ∈M ′)− c = µE((a+ b) | (a, b) ∈M ′)− c
The MM model corresponds to the special case where c = 0 and µ = 1.
Overvaluation changes the right-hand side of the equilibrium equation. This
will increase equilibrium price and incite �rms to issue more frequently.
In general, closed form expressions for equilibrium price p∗ cannot be de-
rived but for any particular density function f , the equilibrium price can be
found iteratively, as described in MM. The idea is to guess an issue price, use
77

this to calculate the �rm's issuance policy (the de�nition of region M') and
use this to calculate, possibly through simulation, the investors' expected
valuation conditioned on issue. In the next iteration, this valuation is used
as issue price guess. This procedure will converge to an equilibrium price.
For some density functions, simulation can be omitted because investor val-
uations can be expressed in closed form, i.e. a closed form solution exists for∫M ′(a+ b) f(a+ b) da db. As an example, I have chosen to consider the case
where a and b are independent and uniformly distributed on [amin, amax] and
[0, bmax] respectively.
Figure 2 panel A considers the case with issue costs but without over-
valuation, where the value of assets in place a is between 20 and 40, the
value of the investment opportunity b between 0 and 10 and a new issue, if
any, must raise E = 20 plus issue costs c. The Figure shows issue price p∗,
issue probability, and - conditional on issue - event return, expected long-run
return, expected value of a and expected value of b as function of issue costs
c.5 In panel B µ = 1.1, i.e. investors overvalue assets in place and the value
of the investment opportunity by 10% and otherwise the same parameters as
in panel A.
As expected, issue price and issue probability decreases with increasing
issue costs and are at higher levels when investors overvalue the �rm. Event
return also decreases in issue costs because an issue is almost certain when
c is low, while an issue is more of a surprise at higher levels of c. Long-
run returns are zero without overvaluation. With overvaluation (panel B)
and no issue costs, long-run returns are around 9%. As issue costs increase
5The price before event time is∫M ′(µ(a+ b)− c) f(a+ b) da db+
∫M(µa) f(a+ b) da db.
Event return is the relative price change once an issue is announced. Long-run return isrelative price change once the realizations of a and b are revealed.
78

from 0 to 5 long-run underperformance increases to around 11%. This is
no coincidence. For any realization of (a, b) ∈M ′ investors expect per share
fundamental value to be µ(a+b)−c while true value is a+b−c. Consequently,
long-run return is
(a+ b− c)− (µ(a+ b)− c)µ(a+ b)− c
=(1− µ)(a+ b)
µ(a+ b)− c
which is decreasing in c for all µ > 1. Qualitatively similar results are
obtained with other a and b intervals, and other values of E and µ.6
[Insert Figure 2 about here]
The model shows that the introduction of issue costs will decrease issue
probability. When issues occur, the value of the investment opportunity b
will, on average, be higher. At a �rst glance, this may suggest that issues
more frequently occur for �primary reasons�, as suggested by MPW. However,
the average value of assets in place a is decreasing in issue costs. In fact,
the combined e�ect is that a+ b is decreasing in issue costs. This results in
more negative event returns when issues are announced and in more negative
long-run returns in the presence of investor overvaluation at event time.
3 Data and Variables
This study covers US as well as international markets. For US �rms, stock
return data and other stock data were obtained from the monthly CRSP �les
6For some parameter con�gurations event returns are positive and increasing in issuecosts with as well as without investor overvaluation. This happens when E is very smallrelative to c. In these cases, the choice to issue may primarily signal good news about b.Long-run returns remain decreasing in issue costs with investor overvaluation.
79

and accounting data were obtained from Compustat. For international �rms,
these data were obtained from Thomson Datastream. The international sam-
ple consists of all �rms followed by Worldscope.7 To determine the country
of �rms in the Datastream sample the variable ISIN_ISSUER_CTRY is used.
Firms for which this variable is not available and �rms for which it is US are
discarded from the Datastream part of the sample. All calculations are in
USD.
Some �rms have issued more than one class of ordinary equity. For these
�rms only the share class with highest aggregate market value is used, but
the market value of the �rm is calculated as the sum of market values for all
issued classes of ordinary shares.
Following Daniel and Titman (2006), Ponti� and Woodgate (2008), and
McLean et al. (2009), I calculate net issue over the past year as
NetIssuet,t−12 = ln(AdjustedSharest)− ln(AdjustedSharest−12)
where AdjustedShares t is the time t adjusted number of shares. For US
data, the adjusted number of shares is calculated using the the CRSP vari-
ables shrout and cfacshr whereas the adjusted number of shares in the
international sample is calculated from the Datastream variables nosh and
af. In both cases, the number of shares is adjusted for stock splits, stock
dividends as well as other corporate actions such as rights issues. Net issue
over the past two and three years, denoted NetIssue t,t−24 and NetIssue t,t−36,
respectively, is similarly calculated.
McKeon (2015) shows that the majority of issues are small investor-
7Worldscope is an international database of accounting and other fundamental dataprovided by Thomson Reuters.
80

initiated issues, for example in connection with the exercise of employee
stock options. These issues are less likely to convey any information about
the future stock return than �rm-initiated issues. He suggests distinguishing
between investor- and �rm-initiated issues using a 3% threshold. Previous
research shows that this is indeed important. Fama and French (2008a)
document that �rms conducting small issues have slightly higher returns
than zero-issuers while �rms with large issuance activity underperform sig-
ni�cantly. Consequently, I de�ne the indicator variables issueri as 1 if net
issue exceeds 0.03 over the past i years, and 0 otherwise.
In addition to NetIssue, a number of variables are known to predict fu-
ture return. MOM is the return over the past year excluding the past month.
cap is the logarithm of �rm market value.8 bm is the logarithm of the ratio
between book equity and market value. In some cases, I include observa-
tions for which bm cannot be calculated. To facilitate this, I follow MPW
and de�ne bm = 0 and bmdummy = 1 when bm cannot be calculated while
bmdummy = 0 for �rms with known bm value. Asset growth AG is calculated
as the relative change in book value of assets over the past year and return
on equity ROE is calculated as the net income relative to book equity for US
data. For international data, the Worldscope ROE variable wc08301 is used.
All accounting variables are lagged by at least six months and only annual
accounting values are used.9
Throughout this paper, it is required that cap, MOM, NetIssue and next
month return can be calculated. (�rm, month) observations for which this
is not possible are discarded from the sample. In some cases, observations
8In general, lower case variables are the logarithm of the original variable.9Since wc08301 reports current �scal year ROE it is lagged by 18 months.
81

without bm, AG and ROE are also discarded.
Figure 3 shows the number of �rms in the full sample per month while
Figure 4 shows the distribution between the largest countries. In the 80s
US �rms accounted for around three quarters of the all �rms and six devel-
oped markets (US, Japan, UK, Germany, France, and Canada) accounted
for 95% of all �rms. By 2014 the US accounted for less than 15% of all �rms
while the six mentioned countries accounted for a total of about 40%. This
development primarily re�ects the growing coverage of the Datastream and
Worldscope databases and shows that the early part of the sample is heavily
biased toward a small number of markets.
[Insert Figure 3 about here]
[Insert Figure 4 about here]
MPW study the relationship between the issuance factor and a number
of country-speci�c variables proxying for market development and investor
protection, including the frequency of stock issues, stock market liquidity,
GDP per capita, and a number of proxies for investor protection and earnings
management. I use some of these variables as reported by MPW. Moreover,
I distinguish between developed markets, which are the markets identi�ed as
MSCI as developed and non-developed markets, which are all other markets.10
10MSCI de�ne the following markets as developed; Canada, United States, Austria,Belgium, Denmark, Finland, France, Germany, Ireland, Israel, Italy, Netherlands, Norway,Portugal, Spain, Sweden, Switzerland, United Kingdom, Australia, Hong Kong, Japan,New Zealand, and Singapore. The majority of the other, i.e. non-developed, marketsconsidered in this study are classi�ed as emerging by MSCI.
82

4 Empirical Results
The empirical analysis consists of three parts. First, I reproduce some of
MPW's results on the issuance e�ect in the cross-section of markets. The
purpose is to demonstrate that, through the use of my dataset, I can largely
reproduce their results. Second, I show how the signi�cance and even sign
of the results presented by MPW are sensitive to particular methodological
choices. Finally, I propose a di�erent methodology, which arguably is more
suited to analyze the issuance e�ect in the cross-section of countries. Using
this methodology, I show that the issuance e�ect is stronger in non-developed
countries than in developed countries.
4.1 Reproduction of Selected Results from MPW
According to MPW, the issuance e�ect is stronger in developed markets than
in other markets. To show this, they use proxies for market development and
corporate governance. They report Fama-MacBeth regressions with next
month and next year return as dependent variables and factors known to
predict return, cap, bm, bmdummy and MOM, as well as NetIssue, a proxy
for market development or corporate governance and an interaction term
(NetIssue times the proxy for market development or corporate governance).
The regressor of primary interest is the interaction term. MPW show
that it estimates the marginal impact of the proxy in the issuance e�ect.
If, for example, a proxy for market liquidity times NetIssue is negative and
signi�cant, the inference is that an increase in the proxy for market liquidity
is associated with a signi�cantly stronger (more negative) issuance e�ect.
In MPW, the interaction term is generally signi�cant; for example, market
83

liquidity times NetIssue is signi�cantly negative. The inference is that the
issuance e�ect is more negative (stronger) in countries with higher market
liquidity.
In the reproduction, I follow MPW and winzorize regressors within coun-
try at the 1st and 99th percentiles. These percentiles are calculated for each
time period.11 For international data, but not US data, observations with
return below the 1st or above the 99th percentile are trimmed, i.e. removed
from the sample. McLean et al. (2009) motivate this with �... many of these
extreme observations appear to be the result of coding errors.�
The time period is June 1981 to July 2006. As MPW, for each (country,
date) combination, I require at least 50 observations. Otherwise, the obser-
vations associated with the (country, date) combination are discarded. This
concentrates the sample even further than suggested by Figure 4. In fact, the
early sample, in my reproduction, consists of only eight developed countries
and, by 1990, these eight countries still correspond to more than 96% of the
sample. MPW report a broader initial sample including �ve more countries
of which two (Philippines and South Africa) are not developed markets. One
reason for this di�erence may be that I have limited the sample to �rms
covered by Worldscope.
MPW propose a number of variables, broadly categorized under the head-
ings issuance activity, market development and governance, which may be
related to the magnitude of the issuance e�ect. I reproduce their results using
most of these with values as reported in MPW.12 Percentage with non-zero
issuance is the fraction of (�rm, month) observations with non-zero NetIs-
11McLean et al. (2009) do not specify whether they calculate the 1st and 99th percentilesfor each time period or for all observations for each country.
12McLean et al. (2009), Table 7.
84

sue and is considered a proxy for the cost of share issuance. A number of
marked development variables were originally introduced by La Porta et al.
(2006). Liquidity is the value of stocks traded scaled by GDP for the period
of 1996-2000 while Turnover is the value of stocks traded scaled by the total
market value. GDP is the logarithm of GDP per capita.
Governance variables used have their origin in La Porta et al. (1998).
Common law is an indicator variable with the value 1 for common law coun-
tries and 0 otherwise, measuring the degree of investor protection. accounting
is an index of accounting standards, where a higher value implies higher stan-
dards, liability and criminal measure how easily accountants, directors and
distributors can be pursued in civil and criminal courts, respectively. Higher
values indicate that this is easier. Investor protection is compiled from several
measures with higher values indicating higher levels of investor protection.
Higher values of earnings management indicate less reliable accounts.
MPW show that these measures, except for earnings management, are
almost uniformly positively correlated, while earnings management is neg-
atively correlated to the other measures. Countries with more developed
markets (more issuance activity, higher liquidity, higher turnover, and higher
per capital GDP) have higher legal standards, higher levels of investor pro-
tection and less earnings management.
Table 1 reports the results of Fama-MacBeth regressions with next month
return as dependent variable and the same regressors as in MPW. Consistent
with MPW I �nd cap, bm and MOM to be signi�cant in all regressions. The
regressor of primary interest is the interaction between NetIssue and variables
proxying for market development and corporate governance.
Figure 5 compares the t-value of the interaction variable reported by
85

MPW with my �ndings. As MPW, I �nd the interaction between NetIs-
sue and market development variables - fraction of non-zero issuers, market
liquity, market turnover and gdp - to be negative. Though my t-statistics
are lower, the interaction is also signi�cant in my sample except for non-zero
issuance. This suggests that higher level of market development is associated
with a stronger (more negative) issuance e�ect.
[Insert Table 1 about here]
[Insert Figure 5 about here]
In contrast to MPW, I do not �nd common law and accounting standards
to be signi�cant. For the legal variables Criminal and Liability as well as for
investor protection and earnings management my results have same sign as
those of MPW but only Criminal and investor protection are signi�cant.13
Taken in their entirety, the results are qualitatively aligned with the results
of MPW.
4.2 Sensitivity of the MPW results
The second part of my empirical results examine the impact of a number
of the methodological choices in MPW. The purpose is to demonstrate that
results, and consequently inference, is sensitive to these choices. Alternative
choices, which may be as justi�able as those made by MPW, destroy the
signi�cance, and in some cases even reverses the sign of results.
13The interaction between NetIssue and Criminal is positive and signi�cant in MPWas well as my �ndings. This implies, that the issuance e�ect is weaker (less negative) incountries where directors etc. can more easily can be pursued in criminal court. Thisresult is inconsistent with the predictions of MPW.
86

I consider the following empirical choices; First, MPW only report equal-
weighted Fama-MacBeth regressions. Since the vast majority of �rms are
small, especially in the MPW sample which includes �rms outside the World-
scope universe, equal-weighted results may re�ect phenomena which only or
primarily exist for small cap �rms.
Second, the early sample is dominated by US �rms and the representation
of �rms from non-developed economies is particularly low in the early sample.
For this reason, it is natural consider whether the results hold in a later period
with broader international coverage.
Third, the winzorization methodology employed by MPW may be dis-
puted. Though winzorization is justi�ed to eliminate the impact of outliers
and coding errors, it is not given that winzorization should be performed in-
dependently for each country. A particular concern is that winzorization at
the 1st and 99th percentiles will have no impact on samples (countries) with
at most 100 observations. This also holds for the trimming of the sample at
the 1st and 99th percentile next month return applied to non-US data. Trim-
ming is justi�ed as Ince and Porter (2006) show that Datastream contains
errors, resulting in implausibly large returns, but trimming independently by
country does not a�ect small sample countries. Further trimming of the in-
ternational data at the 99th percentile is likely to introduce a downwards bias
on international returns. On average, international observations are trimmed
above a monthly return of about 61%. Though this is a high return, it is far
from implausibly high, thus the vast majority of observations removed are
likely to be genuine observations.
Fourth, MPW only control for cap, bm and MOM. By now, it is well
established that controlling for investment and pro�tability is appropriate
87

when measuring the issuance e�ect ((Lyandres et al., 2008), (Bessembinder
and Zhang, 2013)) since a part of the issuance e�ect is explained by these
factors14.
In tests for robustness with respect to the four issues mentioned above, I
redo the regressions reported in Section 4.1 changing one issue at a time as
well as changing all four. For each regression, three t-statistics are presented:
The t-value report by MPV, the t-value reported in subsection 4.1 and t-value
with modi�ed methodological choices.
Figure 6 shows results with value-weighted Fama MacBeth regressions as
the only change while Figure 7 shows the period January 1990 to December
2014 as the only change (i.e. equal-weighted regressions). Both these changes
almost uniformly reduce the signi�cance of results, though the sign generally
remains unchanged.
[Insert Figure 6 about here]
[Insert Figure 7 about here]
Several modi�cations of the winzorization and trimming scheme are pos-
sible. In Figure 8, regressors are trimmed at their global 1st and 99th per-
centiles, instead of national calculation of winzorization values. As above,
international return observations are trimmed at their global 1st and 99th
percentiles. This approach, which also ensures winzorization and trimming
for countries with less than 100 observations, reduces the signi�cance of re-
sults.
14A �fth debatable choice by MPW is the choice to exclude observations from countrieswith less than 50 observations. Since country is not used in the Fama MacBeth regressions,there is no particular reason to exclude observations from countries with few observations.However, including these observations only has a minor impact on results.
88

Changes in trimming methodology may also increase signi�cance. Fig-
ure 9 shows results if all countries, including the US, are treated �equally�
in the sense that regressors are winzorized at their national 1st and 99th
percentiles while return observations are trimmed at their national 1st and
99st next month return percentiles. This approach, which ensures that ex-
treme returns are also trimmed for US data, increases the signi�cance of the
interaction variables, in most cases to the levels reported by MPV.15
[Insert Figure 8 about here]
[Insert Figure 9 about here]
In Figure 10, the sample is limited to observations for which bm, ROE
and AG are known, and these are used as controls in the Fama MacBeth
regressions (in addition to the regressors used in the previous regressions).
In most cases, this reduces the signi�cance of results.
Finally, in Figure 11, results with four simultaneous changes are reported.
Regressions are value-weighted using all controls including bm, ROE and AG.
The period spans January 1990 to December 2014. Regressors are winzorized
at their global 1st and 99th percentiles and international observations are
trimmed at their global 1st and 99th next month return percentiles. With
these choices, the sign of all interaction variables, except one, is reversed
relative to the results reported by MPW and the only signi�cant result is that
higher levels of earnings management are associated with a more negative
(stronger) issuance e�ect.
15Since percentiles are calculated per country no winzorization and trimming takes placefor countries with less than 100 observations, as discussed above.
89

[Insert Figure 10 about here]
[Insert Figure 11 about here]
4.3 The Issuance E�ect in the Cross-section of Coun-
tries
Aside from the issues raised above, the full sample Fama-MacBeth method-
ology may not be the best suited to explore how the di�erences in national
market characteristics interact with the issuance e�ect. One concern is that
the results are dominated by a relatively small sample of countries consist-
ing of the largest developed countries and China, India, Korea and Taiwan.
Consequently, the results are driven by as few as ten country observations.
With this small sample size, causal inference about the relationship between
country speci�c variables and the issuance e�ect is problematic.
Another concern is to what extent the proxies for market development
and corporate governance are indeed relevant proxies. As an illustration of
the latter topic, Figure 12 shows the turnover measure used by MPW as a
proxy for market development by MPV while Figure 13 shows the investor
protection proxy. One may argue that Taiwan, Pakistan, South Korea, Spain
and Turkey may not be the most developed markets in the world and some
may be surprised to learn that the markets with lowest investor protection
are Germany, Belgium, Mexico, Austria and Italy.
[Insert Figure 12 about here]
[Insert Figure 13 about here]
90

A di�erent approach is to treat each country as one data point and to
replace the market development and corporate governance proxies with the
somewhat simpler MSCI market classi�cation. For each country, I estimate
the issuance e�ect with country-speci�c value-weighted Fama-MacBeth re-
gressions in which I regress next month return on cap, bm, MOM, AG, ROE
as well as an indicator variable which takes the value 1 if the �rm's NetIssue
1,12 is at least 0.03. Motivated by McKeon (2015), I chose the value 0.03 to
distinguish between small investor-initiated issues and �rm-initiated issues,
which are more likely to convey information. I include AG and ROE as in-
vestment and pro�tability, by now, are known to predict return and because
Bessembinder and Zhang (2013), Lyandres et al. (2008), and Kohl (2016)
show that these factors partly explain the underperformance of issuers.
The time period is from January 1990 to December 2015. To be included
in the analysis, observations must have values for all regressors. Regressors
are winzorized at their global 1st and 99th percentiles and international ob-
servations are trimmed at their global 1st and 99th next month return. For
each (country, month) combination, I require at least 50 observations, of
which at least 10 must be issuers with NetIssue of at least 0.03. Moreover,
I require countries to have at least 120 monthly estimates to participate in
the sample. In robustness tests, I change some of these requirements.
Figure 14 reports the estimated issuance e�ect, i.e. the estimate associated
with issue1, for the 34 countries with su�cient observations. For developed
countries, past year issuance is associated with a signi�cant reduction in next
month return of 18 bps (t-value 3.70) while the reduction for non-developed
countries is 35 bps (t-value 4.66). The di�erence between developed and non-
developed countries of 17 bps is signi�cant in a two-sided test on a 10% level
91

with a t-value of 1.86. The nonparametric Mann-Whitney rank-sum test has
a z-score of 1.79.
[Insert Figure 14 about here]
Table 2 reports results of robustness tests. With equal-weighted regres-
sions the estimated underperformance of issuers increase to 32 bps for de-
veloped countries and 48 bps for non-developed countries, re�ecting that the
issuance e�ect is stronger for small cap than for large cap. The di�erence is
signi�cant, though not in the non-parametric test where the z-score drops to
1.52. The country sample size can be increased either by including all coun-
tries with at least 60 months observations or by measuring issue over the past
two or three years. Estimates of underperformance range from 9 to 15 bps
for developed market issuers, while issuers in other markets underperform
by 29 to 39 bps. In all cases, the di�erence is strongly signi�cant. If issue1
measures NetIssue above 0.01 more �rms are considered issuers. As shown by
McKeon (2015) many of these issues are not �rm-initiated, thus decreasing
the informational content of issue1. This is re�ected in the results, in partic-
ular the di�erence between developed and non-developed countries becomes
insigni�cant. Conversely, if issue1 is restricted to �rms with NetIssue above
0.05, the di�erence between developed and other countries becomes strongly
signi�cant. The di�erence is also strongly signi�cant if issue is measured
over the past three years with a 5% threshold. Finally, if I do not control for
AG and ROE or if issue is measured with the continuous NetIssue variable
instead of an indicator variable, the di�erence between developed and other
markets becomes insigni�cant.
For all speci�cations, issuers underperform signi�cantly relative to other
92

�rms and underperformance is always stronger in non-developed markets
than in developed markets. The di�erence is signi�cant in the baseline spec-
i�cation and signi�cance increases if issuance is measured over two or three
years or if the threshold for being issuer is increased to 5%.
[Insert Table 2 about here]
5 Conclusions
This paper analyzes the issuance e�ect in international markets. This is
important because it provides an out of sample test of the issuance e�ect
documented in the US market but also because the strength of the issuance
e�ect may vary systematically in the cross-section of countries. In particular,
I explore whether there is a di�erence in issuance e�ect between developed
markets and non-developed markets. The underlying assumption is that
developed markets, on average, are more e�cient and with fewer frictions,
and that this may have impact on �rms' issuance decisions as well as on
market prices.
I extend the Myers and Majluf (1984) model of �rms' issuance decisions
with issue costs and investor overvaluation. Theoretically, this shows that,
with higher issue costs, �rms will issue less frequently and only when they
have more valuable investment opportunities relative to markets with lower
issue costs. Perhaps more surprisingly, the model reveals that higher levels
of issue costs, in the presence of investor overvaluation, also reduces issuer
long-run returns, i.e. increases the issuance e�ect. This predicts that issues
will be most frequent in the most developed markets and that issuer long-run
93

underperformance will be strongest in non-developed markets. Empirically, I
show that the issuance e�ect is indeed signi�cantly stronger in non-developed
markets than in developed markets.
These results are at odds with �ndings reported by McLean et al. (2009)
who report that the issuance e�ect is stronger in more developed markets
because lower issue costs will induce �rms to be more opportunistic in their
issuance and repurchase behavior. I show how these �ndings are not robust
to methodological changes and propose an alternative test which, arguably,
is more suited to exploring variation in the issuance e�ect in the cross-section
of countries.
My �ndings are consistent with the �hard to value� theory, developed in
my paper, Kohl (2016), which holds that issuer underperformance is strongest
when informed investors are more constrained in their ability to express neg-
ative information because of uncertainty about fundamental value. In Kohl
(2016), I show that issuer underperformance is strongest for �rms with the
least information available, with cash-�ows in the more distant future and
where dispersion in analyst opinions is highest. This paper shows that issuer
underperformance is stronger in �hard to value� less developed markets than
in more developed, and presumably more e�cient, markets.
94

References
Bessembinder, H. and Zhang, F. (2013). Firm characteristics and long-run
stock returns after corporate events. Journal of Financial Economics ,
109 (1), 83 � 102.
Daniel, K. and Titman, S. (2006). Market reactions to tangible and intangible
information. Journal of Finance, 61 (4), 1605 � 1643.
Fama, E. F. and French, K. R. (2008a). Average returns, b/m, and share
issues. Journal of Finance, 63 (6), 2971 � 2995.
Fama, E. F. and French, K. R. (2008b). Dissecting anomalies. Journal of
Finance, 63 (4), 1653 � 1678.
Fu, F. and Huang, S. (2015). The persistence of long-run abnormal returns
following stock repurchases and o�erings. Management Science.
Ince, O. S. and Porter, R. B. (2006). Individual equity return data from
thomson datastream: Handle with care!. Journal of Financial Research,
29 (4), 463 � 479.
Kohl, N. (2016). Stock issuance and the speed of price discovery. SSRN.
La Porta, R., Lopez-de Silanes, F., and Shleifer, A. (2006). What works in
securities laws?. Journal of Finance, 61 (1), 1 � 32.
La Porta, R., Lopez-de Silanes, F., Shleifer, A., and Vishny, R. W. (1998).
Law and �nance. Journal of Political Economy , 106 (6), 1113.
Loughran, T. and Ritter, J. R. (1995). The new issues puzzle. Journal of
Finance, 50 (1), 23 � 51.
95

Lyandres, E., Le, S., and Lu, Z. (2008). The new issues puzzle: Testing the
investment-based explanation. Review of Financial Studies , 21 (6), 2825 �
2855.
McKeon, S. B. (2015). Employee option exercise and equity issuance motives.
SSRN.
McLean, D. R., Ponti�, J., and Watanabe, A. (2009). Share issuance and
cross-sectional returns: International evidence. Journal of Financial Eco-
nomics , 94 (1), 1 � 17.
Myers, S. C. and Majluf, N. S. (1984). Corporate �nancing and investment
decisions when �rms have information that investors do not have. Journal
of Financial Economics , 13 (2), 187 � 221.
Ponti�, J. and Woodgate, A. (2008). Share issuance and cross-sectional
returns. Journal of Finance, 63 (2), 921 � 945.
96

Figure 1: The issuance decision when �rm management knows the per sharevalue of assets in place a and the investment opportunity b and investorsonly know the distribution of these (Myers and Majluf, 1984). The solid linedepicts the case without issue costs. The issue price is p and the equity to beraised to invest is E. The �rm issue if b > E
pa−E, the upper-left region M'
and do not issue otherwise (region M). If b = 0, the �rm will issue if a < p.The dashed line depicts the case with issue cost c. Everything else beingequal, the value of the investment opportunity must be higher than in thecase without issue costs before the �rm choses to issue.
97

Panel A
Panel B
Figure 2: Equilibrium issue price p∗, probability of issue, event return, av-erage long-run return, and average a and b if the �rm issues, all as functionof issue costs c (on the x-axis). a is uniformly distributed on [20, 40], b on[0, 10], and equity to be raise in the issue E = 20. Qualitatively similar resultsare obtained with di�erent a and b intervals and di�erent E values.
98

0
5000
10000
15000
20000
25000
30000
35000
Figure 3: Number of monthly �rm observations in the full dataset.
0%
10%
20%
30%
40%
50%
60%
70%
80%
90%
100%
South Korea
India
China
Australia
France
Germany
UK
Canada
Japan
US
Figure 4: The largest countries as fraction of the full sample.
99

‐8
‐6
‐4
‐2
0
2
4
6
Non‐zeroissuance Market liquidity Turnover GDP Common law Accounting Criminal Liability
Investorprotection
Earningsmanagement
MPW MPW reproduction
Figure 5: Comparison of t-statistics of the interaction between NetIssue andvariables proxying for issuance activity, market development and corporategovernance reported by MPW and the results reported in this paper in Ta-ble 1 (where details of the regressions are reported). Taken in their entirety,the �ndings of MPW are con�rmed.
100

‐8
‐6
‐4
‐2
0
2
4
6
Non‐zeroissuance
Marketliquidity Turnover GDP Common law Accounting Criminal Liabililty
Investorprotect
Earningsmanagement
MPW MPW reproduction Value Weighted
Figure 6: Comparison of t-statistics for the interaction term, as reportedby MPW, from the reproduction of MPW reported in Table 1 and froma reproduction with value-weighted observations otherwise identical to thereproduction of Table 1. Value weighting generally reduces the signi�cance,but not the sign, of results.
101

‐8
‐6
‐4
‐2
0
2
4
6
Non‐zeroissuance
Marketliquidity Turnover GDP Common law Accounting Criminal Liabililty
Investorprotect
Earningsmanagement
MPW MPW reproduction 1990 ‐ 2014
Figure 7: Comparison of t-statistics for the interaction term, as reportedby MPW, from the reproduction of MPW reported in Table 1 and from areproduction using only data from the period of 1990-2014 (where interna-tional coverage is broader) and otherwise identical to the reproduction ofTable 1. Using a broader sample and shorter time period generally reducesthe signi�cance, but not the sign, of results.
102

‐8
‐6
‐4
‐2
0
2
4
6
Non‐zeroissuance
Marketliquidity Turnover GDP Common law Accounting Criminal Liabililty
Investorprotect
Earningsmanagement
MPW MPW reproduction Int'l Winzorization
Figure 8: Comparison of t-statistics for the interaction term, as reported byMPW, from the reproduction of MPW reported in Table 1 and from a re-production where regressors for international observations are winzorized attheir global (instead of national) 1st and 99th percentiles and otherwise iden-tical to the reproduction of Table 1. This generally reduces the signi�cance,but not the sign, of results.
103

‐8
‐6
‐4
‐2
0
2
4
6
Non‐zeroissuance
Marketliquidity Turnover GDP Common law Accounting Criminal Liabililty
Investorprotect
Earningsmanagement
MPW MPW reproduction US trimmed
Figure 9: Comparison of t-statistics for the interaction term, as reportedby MPW, from the reproduction of MPW reported in Table 1 and from areproduction where all regressors, also for US observations, are winzorizedat their national 1st and 99th percentiles and returns are trimmed at theirnational 1st and 99th percentiles, and otherwise identical to the reproductionof Table 1. In most cases this restores signi�cance to the level reported byMPW.
104

‐8
‐6
‐4
‐2
0
2
4
6
Non‐zeroissuance
Marketliquidity Turnover GDP Common law Accounting Criminal Liabililty
Investorprotect
Earningsmanagement
MPW MPW reproduction All controls
Figure 10: Comparison of t-statistics for the interaction term, as reportedby MPW, from the reproduction of MPW reported in Table 1 and from areproduction limited to observations with known bm, ROE, and AG wherethe latter two are included in the set of regressors, and otherwise identicalto the reproduction of Table 1. This generally reduces the signi�cance, butnot the sign, of results.
105

‐8
‐6
‐4
‐2
0
2
4
6
Non‐zeroissuance
Marketliquidity Turnover GDP Common law Accounting Criminal Liabililty
Investorprotect
Earningsmanagement
MPW MPW reproduction All changes
Figure 11: Comparison of t-statistics for the interaction term, as reportedby MPW, from the reproduction of MPW reported in Table 1 and from areproduction with four simultaneous changes. Regressions are value-weightedas in Figure 6. The time period is 1990-2014 as in Figure 7. Regressors arewinzorized at their global 1st and 99th percentiles as in Figure 8. The sampleis limited to observations with known bm, ROE, and AG where the latter twoare included in the set of regressors as in Figure 10. Except for one case thisreverses the sign of results and except for one case results are insigni�cant.
106

0
50
100
150
200
250
300
350
Figure 12: Turnover per country, as reported by MPW. Turnover is presum-ably a proxy for market development.
107

0
0.2
0.4
0.6
0.8
1
Figure 13: Investor protection per country, as reported by MPW.
108

‐1.0%
‐0.8%
‐0.6%
‐0.4%
‐0.2%
0.0%
0.2%
0.4%
Non‐developed Developed
Figure 14: The issuance e�ect for di�erent countries. The Figure showsthe estimated increase in next month return associated with issue1, i.e. for�rms with NetIssue 1,12 ≥ 0.03 when controlling for cap, bm, MOM, AGand ROE. The issuance e�ect is most negative (strongest) for non-developedmarkets but signi�cant for non-developed as well as developed markets. Thedi�erence between non-developed and developed markets is signi�cant on a10% level with a t-value of 1.86 and a Mann-Whitney rank-sum test z-scoreof 1.79
109

Table1:
Reproductionof
selected
resultsreportedin
McLeanet
al.(2009)
Table8panelsAandC.Equal-weightedFam
a-MacBethregressionsof
nextmonth
return
onlogmarketvaluecap,logbook-to-marketratiobm
,dummyassociated
with
missingbook-to-marketratiobm
dummy,pastyear
return
MOM,NetIssue,avariableproxyingforissuance
activity,market
developmentor
governance,andtheinteraction(product)betweentheproxyvariable
andNetIssue.
Theinteraction
variable
isthevariable
ofmaininterest
since
itmeasuresthemarginal
impactof
theproxyon
theissuance
e�ect.
The
samplecovers
upto
countriesover
theperiodfrom
July
1981
toJune2006.*indicates
signi�cance
ona10%
level,**
ona5%
level,and***on
a1%
level.t-statistics
aregivenin
parentheses.
Proxy
Non-zero
Market
Turnover
GDP
Common
Accounting
Criminal
Liability
Investor
Earnings
variable
issuance
liquidity
Turnover
GDP
law
protection
managem
ent
cap
-0.21***
-0.22***
-0.21***
-0.20***
-0.21***
-0.21***
-0.21***
-0.21***
-0.22***
-0.21***
(-4.08)
(-4.07)
(-3.93)
(-3.44)
(-4.00)
(-3.81)
(-3.73)
(-4.01)
(-4.09)
(-3.86)
bm
0.46***
0.46***
0.44***
0.44***
0.47***
0.43***
0.44***
0.44***
0.45***
0.48***
(6.81)
(6.66)
(6.19)
(6.01)
(6.74)
(5.70)
(5.76)
(6.17)
(6.52)
(6.57)
bmdummy
-0.29***
-0.30***
-0.30**
-0.25**
-0.35***
-0.32**
-0.37***
-0.34***
-0.32***
-0.36***
(-2.64)
(-2.65)
(-2.36)
(-2.07)
(-2.99)
(-2.54)
(-2.85)
(-2.93)
(-2.99)
(-3.18)
MOM
0.007***
0.007***
0.008***
0.007***
0.007***
0.007***
0.007***
0.007***
0.007***
0.008***
(5.37)
(5.6)
(5.76)
(5.57)
(5.46)
(5.32)
(5.52)
(5.30)
(5.40)
(5.53)
NetIssue
-0.21
-0.26
0.11
9.85***
-0.90***
-1.72*
-1.87***
-0.62*
-0.48***
-0.92***
(-0.59)
(-1.08)
(0.31)
(2.79)
(-3.38)
(-1.65)
(-4.61)
(-1.88)
(-2.95)
(-3.87)
Proxyvariable
-0.0003
-0.0006
-0.0014
-0.0311
-0.1689
-0.0153
-0.5025
0.0677
0.0001
0.0002
(-0.06)
(-0.35)
(-0.55)
(-0.17)
(-0.63)
(-1.18)
(-0.9)
(0.18)
(0.49)
(0.01)
Proxyvariable
-0.01
-0.01**
-0.01***
-1.03***
0.09
0.01
1.74***
-0.27
-0.001**
0.02
xNetIssue
(-1.17)
(-2.35)
(-2.68)
(-2.95)
(0.30)
(0.87)
(2.81)
(-0.66)
(-2.40)
(1.06)
AverageR
23.5%
3.5%
3.3%
3.1%
3.5%
2.9%
3.6%
3.1%
3.5%
3.8%
110

Table
2:Theissuance
e�ectis
estimated
foreach
countrywithFam
aMacBethregressions.
The�rstlinereports
the
baselinevalue-weightedregression,correspondingto
Figure
14,wherenextmonth
return
isregressedon
logmarketvalue
cap,logbook-to-marketratiobm
,return
onequityROE,assetgrow
thAGandthebinaryvariableissuer
1whichisonefor
�rm
swithNetIssueof
atleast3%
over
thepastyear.Acountryisincluded
inthesampleduringmonth
withat
least50
observationswithat
least10
issuersprovided
that
thisconditionismet
atleastduring120monthsin
theperiodJanuary
1990
toDecem
ber
2015.Subsequentlines
reportregressionseach
withonechange
relative
tothebaselineregression.The
Tablereports
theaverageestimateassociated
withissuer
1,i.e.thereductionin
nextmonth
return
forpastyear
issuers,
fordeveloped
andnon-developed
countries.
Thet-valueof
thedi�erence
betweendevelop
edandnon-developed
countries
isreportedalongwiththenon-param
etricMann-W
hitney
z-score.
Developed
Non-developed
Di�erence
countries
observations
issuer
t-value
issuer
t-value
t-value
z-score
Baseline
345302734
-0.18%
-3.70
-0.35%
-4.66
1.86
1.79
Equally
weightedregressions
345302734
-0.32%
-8.59
-0.48%
-5.94
1.85
1.52
60monthly
observations(insted
of120)
375333062
-0.15%
-2.56
-0.39%
-5.15
2.51
2.28
issuer
2(m
easuredover
2years)
355208577
-0.10%
-2.42
-0.29%
-5.63
2.76
2.34
issuer
3(m
easuredover
3years)
364887225
-0.09%
-2.44
-0.33%
-8.00
4.21
3.48
1%issuer
(insteadof
3%)
345329743
-0.16%
-4.56
-0.29%
-4.06
1.70
1.48
5%issuer
(insteadof
3%)
345281182
-0.17%
-2.76
-0.53%
-6.57
3.63
3.42
issuer
35%
(insteadifissuer
13%
)36
4885282
-0.10%
-2.46
-0.35%
-7.82
4.29
3.29
Nocontrol
forAG
andROE
345753697
-0.20%
-3.88
-0.33%
-5.28
1.56
1.62
NetIssue(insteadofissuer
1)
345302734
-0.008
-5.72
-0.013
-4.21
1.50
1.04
111

112

Does Information Asymmetry Explain Issuer
Underperformance?
Niklas Kohl*
Abstract
Firms which issue new equity have lower returns than other �rms
subsequent to issue. A prominent behavioral explanation holds that
opportunistic �rms exploit information asymmetry at issue time to
sell overvalued equity (Loughran and Ritter, 1995). However, this pa-
per shows that the most overvalued issuers, and those which are least
constrained in the sense that they do not need to issue to continue
operations or service current debt, have as high or higher long-run
run returns than other issuers. Instead, I show that event returns,
and in particular negative evnet returns (�bad news�) at event time
predicts long-run abnormal return. This result is consistent with in-
vestor underreaction to available information, rather than information
asymmetry at event time.
∗Department of Finance, Copenhagen Business School, Solbjerg Plads 3, 2000 Fred-eriksberg, Denmark. E-mail: nk.�@cbs.dk. I am grateful for comments and suggestionsreceived from Søren Hvidkjær and Ken Bechmann. Any errors remain mine.
113

1 Introduction
Listed �rms which issue new equity subsequently have low returns. This
has been documented in numerous studies, initially by Loughran and Rit-
ter (1995), in the context of seasoned equity o�erings (SEOs), and later in
the broader context of �rms which issue or retire equity, regardless of rea-
son ((Daniel and Titman, 2006), (Ponti� and Woodgate, 2008), (Fama and
French, 2008b), (Fama and French, 2008a), (McLean et al., 2009)).
The reasons for the low returns are, however, disputed. Loughran and
Ritter (1995), suggest that �rms announce issues when their equity is �grossly
overvalued� and �the market does not revalue the stock appropriately, and
the stock is still substantially overvalued when the issue occurs�. According
to the authors, their �... evidence is consistent with a market where �rms take
advantage of transitory windows of opportunity by issuing equity when, on
average, they are substantially overvalued�. Several more recent papers, in-
cluding Ponti� and Woodgate (2008), also fail to �nd risk-based explanations
for low returns post-issue.
A competing stream of literature argues that the apparent underperfor-
mance subsequent to issue is due to exposure to known risk factors or at
least known priced factors, which may or may not proxy for risk. Examples
include Eckbo et al. (2000), Lyandres et al. (2008), and Bessembinder and
Zhang (2013).
Billett et al. (2011) �nd that repeating issuers, regardless of the type
of security issued, underperform signi�cantly, while rare issuers do not. A
recent paper by Fu and Huang (2015) argues that signi�cant issuer underper-
formance has ceased to exists during the period of 2003-2012 because ��rms
114

become less opportunistic in stock repurchases and o�erings� due to �more
e�cient pricing of stocks�.
This paper contains two main results. First, I show that a large portion
of issuer long-run performance is explained by exposure to priced factors
beyond the Fama-French three factor model (Fama and French (1992), Fama
and French (1993)). However, some signi�cant underperformance remains
unexplained.
Second, and more importantly, I investigate whether issuer long-run un-
derperformance, as suggested by Loughran and Ritter (1995), is due to op-
portunistic �rms' exploitation of information asymmetry at event time. If
information asymmetry is high at event time opportunistic �rms may at-
tempt to exploit this and, unless investors have rational expectations, �rms
may be successful at it. Thus, information asymmetry in combination with
opportunistic issues and deviation from rational expectations at event time
may explain long-run underperformance.
As an alternative to this explanation, I consider the possibility that in-
formation asymmetry is low at event time. If information asymmetry is low
at event time, �rms will have less opportunity to be opportunistic in their
issuance behavior. Nonetheless, long-run underperformance is possible due
to investor underreaction at event time. There may be several reasons for
investor underreaction. Barberis and Thaler (2003) survey a number of psy-
chological biases which may a�ect how investors form their beliefs. In partic-
ular, conservatism, belief perseverance, and anchoring may all explain why
investors do not fully incorporate new information in prices immediately. Al-
ternatively, delayed price reactions (under- as well as overreaction) can occur
in models with gradual di�usion of information (Hong and Stein, 1999) and
115

models with inattentive investors (Du�e, 2010). Empirically delayed price
reaction is found in a number cases, including post earnings announcement
drift (Bernard and Thomas, 1989) and post dividend change announcement
drift (Michaely et al., 1995).
For these two possibilities, information asymmetry and investor underre-
action, I derive testable implications. Empirical results are consistent with
the investor underreaction hypothesis but not the information asymmetry
hypothesis. I �nd no empirical evidence of the exploitation of information
asymmetry because the most overvalued issuers and the least constrained
issuers, which do not need to issue to �nance operations or service current
debt, overperform or have similar performance compared to less overvalued
issuers and more constrained issuers. In contrast, I �nd that the market
does not fully absorb information conveyed at event time, in particular �bad
news� at event time. This causes long-run return predictability, in particular
when event returns are negative. To the best of my knowledge, this is a new
�nding.1
While early research focused on the performance of seasoned equity of-
fering (SEO) �rms, most recent work on the relation between issuance and
return considers the full cross-section of �rms to capture the impact of equity
issues and repurchases, regardless of reason. This approach has the advan-
tage of a much larger sample than studies focused on SEOs and, according
to Ponti� and Woodgate (2008), �... results are essentially una�ected by
data associated with seasoned equity o�erings ...�, documenting that the low
returns subsequent to SEOs �is part of a broader issuance e�ect�.
1Apart from the preliminary version of this result found in the �rst paper of thisdissertation.
116

However, McKeon (2015) shows that in around 90% of �rm-quarters
where new equity is issued, the �rm itself did not initiate any stock is-
sues. These are issues due to, for example, utilization of employee options
and other decisions beyond the control of the �rm. McKeon denotes these
investor-initiated issues as opposed to �rm-initiated issues, typically in the
form of SEOs, where the �rm takes initiative to issue new equity. McKeon
(2015) shows that relative issue size, i.e. proceeds of the issue relative to
�rm market value, is an empirically strong indicator of �rm-initiated issues
since quarters with a relative issue of at least 3% �nearly always contain a
�rm-initiated issue� whereas quarters with a relative issue of less than 2%
�almost never include a �rm-initiated component�.
Since the objective of this paper is to test whether information asymme-
try explain subsequent issuer performance, I limit the sample to situations
where this may possibly have occurred, i.e. to �rm-initiated issues. Limiting
the sample to SEOs has the further advantage that an announcement event
can be clearly identi�ed. I recon�rm that SEO announcements do, in fact,
convey information, since event returns are, on average, strongly signi�cantly
negative. To measure the �sign� of the information conveyed, I interpret neg-
ative event return as �bad news� and the less frequent positive event return
as �good news�. This enables me to determine to what extent information
conveyed at event time is fully incorporated in prices at event time.
The outline of the remainder of the paper is as follows. In Section 2, I
discuss what could drive issuer underperformance. I show how information
asymmetry at event time can cause underperformance at event time and
subsequently, and I present an alternative - that underperformance is caused
by underreaction to news at event time. Section 3 presents data and vari-
117

ables used. Section 4 presents average issuer returns before and after issue,
con�rming high abnormal return pre-issue, negative abnormal event return,
and negative abnormal return post-issue. In Section 5, event returns are
regressed on characteristics hypothesized to explain event return. Section 6
examines the explanations behind issuer long-run abnormal returns. Two
di�erent methodologies are applied. First, buy and hold abnormal returns,
calculated relative to di�erent factor models, are regressed on characteris-
tics hypothesized to explain long-run return. Second, issuers are sorted on
these characteristics and calendar-time portfolios of issuers, and long-short
calendar-time portfolios of issuers matched with non-issuers, are constructed.
Finally, Section 7 concludes.
2 What Drives Issuer Underperformance?
This section discusses possible reasons for issuer underperformance. Sec-
tion 2.1 explains how information asymmetry at event time may drive subse-
quent negative abnormal returns, while Section 2.2 explores how investor un-
derreaction, in the absence of information asymmetry, may drive subsequent
underperformance. Based on these two sections, hypotheses are presented
in Section 2.3. Two of the hypotheses concern the relation between issuer
overvaluation and whether the issuer is constained, respectively, and long-run
abnormal return. Proxies for issuer overvaluation and issuer constrainedness
are presented in Section 2.4 and 2.5.
118

2.1 Information Asymmetry
Information asymmetry as a driver of returns in connection with stock issues
was �rst proposed by Myers and Majluf (1984), henceforth MM, and is also
the driver for negative long-run returns in Loughran and Ritter (1995).2 To
understand the relationship between information asymmetry, issuance event
return and long-run return, consider the MM model. Firms have assets in
place with per share value a ≥ 0 and an investment opportunity with per
share net present value b ≥ 0, which cannot be postponed and which must
be �nanced with equity E, per share, raised from new investors.3 Firm
management acts in the interest of old shareholders. At event time �rm
management knows the realization of a and b, while investors only know the
distribution of a and b.
Figure 1 depicts the �rms' issuance decision. The �rms' choice of whether
to issue or not depends on a linear combination of the realization of a and
b. In particular, �rms will issue if a is su�ciently low or b is su�ciently
high. It is natural to think of this as two di�erent reasons to issue: to exploit
overvaluation or to pursue attractive investment possibilities. The issue price
is P ′ and new investors will experience positive post-issue returns if a + b
exceeds P ′ (the region in M ′ above the dotted line) and negative post-issue
returns otherwise (the region in M ′ below the dotted line). If investors have
rational expectations, the equilibrium price P ′ must be E(a+b|(a, b) ∈ I) and2While these two papers share the assumption that �rm management knows much more
than investors at event time, i.e. after an issue has been announced, they di�er in termsof whether investors realize this. In MM investors realize their ignorance and purchasenew equity at its expected value, taking into account that �rms are more likely to issuewhen they are overvalued than when they are undervalued. In Loughran and Ritter (1995)investors do not fully realize their ignorance and overpay for new equity.
3In MM, these values are not per share but for the entire �rm. Without loss of gener-ality, I assume the �rm has one share outstanding before issue and that the �rm can issueany fraction of shares.
119

average post-issue abnormal return will be 0. Accordingly, the MM model
predicts negative event return because the expected value of a+b conditioned
on (a, b) ∈ I is lower than the unconditional expectation of a+b, but does not
predict negative long-run returns because investors have rational expectation.
In order to generate long-run underperformance due to information asym-
metry, a deviation from rational expectations is required, i.e. if average post-
issue return is negative, it implies that investors pay too much for new equity
and, consequently, that the marginal investor does not fully incorporate the
impact of information asymmetry. Several behavioral biases may generate
this result including those which may generate underreaction, as discussed
in Section 1. Regardless of whether issuers, on average, underperform, the
MM model predicts that long-run return will be lowest for issuers with low
a+ b, i.e. overvalued issuers.
Moving beyond the MM model, some issuers may also have the ability
to issue during periods where the market value of their equity is particularly
high, as suggested by Loughran and Ritter (1995), McLean et al. (2009) and
Greenwood and Hanson (2012). Empirically, these issuers have particularly
low subsequent returns.
[Insert Figure 1 about here]
2.2 Investor Underreaction
In the above model information asymmetry, in combination with oppor-
tunistic issuers and some deviation from rational expectations on the side
of investors, explains negative average post-issue return. However, what if
120

information asymmetry between �rm management and issuers is low when
issues occur? There are both theoretical and empirical reasons to consider
this possibility.
Miller and Rock (1985), henceforth MR, consider a situation where in-
vestors know the distribution of current earnings but �rm management know
the actual realization. Future earnings depend on current investments and
the production function is concave. They develop a fully revealing signaling
equilibrium where �rms signal earnings with payouts.4 Since stock issues
are negative payouts, an issue signals low earnings. Investors interpret the
signal correctly and announcement returns will be positive or negative, de-
pending on whether the earnings signaled are higher or lower than investors'
(unobserved) expectations.
In terms of issuance, MR and MM di�er in two important ways. First,
while MM always predicts negative event returns, event returns may by pos-
itive in MR provided that the issue is smaller than expected by investors.
In this case, MR investors will interpret the issue as �god news�. Second,
while both models are rational expectations models with on long-run issuer
underperformance, the equilibrium in MR is fully revealing in the sense that
4Period t earnings are given by Xt = f(It−1) + εt, where f is the production function,It−1 previous period investments and εt a random increment with zero mean. It = Xt +Bt − Dt where Bt is time t �nancing and Dt payouts (dividends, stock repurchases orstock issues), respectively. At time t �rm management knows Xt but investors know onlyf(It−1). Firm management acts partly in the interest of investors who will sell their equitybefore Xt is revealed, i.e. those who want to maximize current share price, and partly inthe interest of investors who will stay invested, i.e. those who want the �rm to investoptimally. In the fully revealing equilibrium �rms use Dt to signal Xt. Payouts will behigher and investments lower than under the Fisher rule, but because f ′′ < 0 smallerdeviations from the Fisher rule will be cheaper, in term of lost future earnings, than largerdeviations. Hence, it will not be optimal for �rms with low earnings to pay as large payoutsas �rms with high earnings.
121

�rm management successfully eliminates the information asymmetry at event
time. This is not possible in the MM model.
Moving beyond MR, low or no information asymmetry at event time and
subsequent issuer underperformance can be reconciled if investors do not
fully incorporate available information in prices immediately. In this case,
there will be post announcement drift and event returns will predict long-
run returns. Moreover, among �rms with the most negative signals (largest
issues), �rms which fall short of investors' expectations will outnumber �rms
which exceed investors' expectations. Consequently, larger issues will be
associated with more negative event and long-run returns.5
Issues rarely occur without other news being released. Hence, payout (is-
sue size) is not the only signal captured by investors. First, there are legal and
stock exchange �ling, disclosure and prospectus requirements on information
which must be released in connection with an issue.6 Second, in addition to
the required information, �rms have an incentive to reduce the information
asymmetry as this will improve the pricing or probability of success of the
new issue. Roadshows and investor meetings are used for this purpose. Even
when �rms have some ability to conceal negative information, doing so may
not be optimal if the �rm expects to raise equity at future occasions. More-
over, concealing information or failure to supply relevant information may
lead to future lawsuits. Third, often issues involve investment banks who
underwrite or place the issue with their clients. These are hurt �nancially
or reputationally if the issue is overpriced. Consequently, they will conduct
5The prediction that larger issues are perceived more negatively than smaller issues isnot unique for the MR model. Krasker (1986) extends the MM with variable issue sizeand shows that event returns will be more negative for larger issues. A liquidity basedmodel would also predict that a larger issue would carry a larger price impact.
6See Eckbo et al. (2007) for a comprehensive review of the security o�ering process.
122

independent research on the issuer. Fourth, when an issue occur investors
will be particularly keen on acquiring available information and doing their
own independent research.
2.3 Hypotheses
Table 1 summarizes the two pathological cases of a world where all event
and post-event return is driven by information asymmetry at event time, as
discussed in Section 2.1, and a world without information asymmetry at event
time where all event and post-event return is driven by investor underreaction
to the issue, and possibly other news at event time, as discussed in Section 2.2.
[Insert Table 1 about here]
Both situations considered in Table 1 may, to some extent, explain em-
pirical �ndings. Firms may have some ability to credibly signal fundamental
value and investors some ability to reduce the information asymmetry. Some
information asymmetry may remain, and opportunistic �rms may try to ex-
ploit this and some may be successful at it. The empirical predictions of
the two situations can be used to test which best describes the real world. I
formalize this in the following hypotheses.
Hypothesis 1
If information asymmetry is high at event time and opportunistic issuers are
able to exploit this, then proxies for issuer overvaluation will be negatively
related to long-run abnormal return.
123

Hypothesis 2
If information asymmetry is high at event time and opportunistic issuers are
able to exploit this, then proxies for issuer constrainedness will be positively
related to long-run abnormal return.
Hypothesis 3
If investors underreact at event time, then event return and, in particular,
its negative component will be positively related to long-run abnormal return.
Hypothesis 4
If information asymmetry is large at event time or if investors underreact at
event time, then larger issues will be negatively related to long-run abnormal
return.
If the empirical results support Hypothesis 1 and 2, this can be taken
as evidence for information asymmetry as explanation for issuer underper-
formance. If the empirical results support Hypothesis 3, this can be taken
as evidence for investor underreaction as explanation for issuer underper-
formance. Hypothesis 4 does not enable to distinguish between these two
explanations as both predicts larger issues to be associated with lower long-
run returns.
In order to test these hypotheses, a measure of long-run abnormal return
is needed. This is discussed in Section 3. Hypothesis 1 requires a proxy for
issuer valuation. This is the topic of Section 2.4. Proxies for issuer con-
strainedness used to test Hypothesis 2 are discussed treated in Section 2.5.7
7Overvaluation and constrainedness are characteristics which are clearly di�cult to
124

Event return and the decomposition of event return into its positive and
negative component (Hypothesis 3) as well as the measure of large issues
(Hypothesis 4) is covered in Section 3.
2.4 Proxies for Overvaluation
Testing Hypothesis 1 requires a proxy for issuer overvaluation. Previous
research has suggested a number of proxies but no consensus seems to have
emerged.8 Lee et al. (1999), Dong et al. (2006), and Dong et al. (2012) use
the residual income model of Ohlson (1995) to measure overvaluation. The
residual income model states that the value of the equity of the �rm is its
book value plus the discounted value of any future income in excess of the
cost of equity of book value. 9 The calculated fundamental value is compared
to market value to determine the level of overvaluation. Dong et al. (2012)
use analyst expectations for the next three years' income and required return
is calculated with the CAPM model using market β estimated over the past
�ve years and 30 years past market excess return. Since 30 years market
excess return is not very volatile and the �rms' market value may incorporate
expected residual income for much more than three years, innovations in
the Dong et al. (2012) overvaluation measure will be highly correlated with
past return and the level of overvaluation will be highly correlated with the
market-to-book ratio.
observe. Results will depend on the quality of the proxies used. If empirical tests to notsupport Hypothesis 1 or 2, one cannot rule out, that this is due to inadequate proxies.
8This is hardly surprising. If it was easy to detect overvaluation, creating abnormalreturns would be much easier than empirical evidence suggests that it is.
9Vt = Bt +∞∑s=1
Et(RIt+s)(1+k)s , where Vt and Bt are fundamental value and book value,
respectively and k is required return on equity. Et(RIt+s) is the time t expectation ofresidual income de�ned as RIt = NIt − kBt−1, where NIt is time t net income.
125

Fu et al. (2013), using a method developed by Rhodes�Kropf et al. (2005),
run annual industry-speci�c cross-sectional regressions where the logarithm
of market value is regressed on the logarithm of log book value, net income
and �rm leverage measured in market values. The estimated regression coef-
�cients are used to calculate the fundamental value of individual stocks and
determine to what extent they are overvalued.10
Carlson et al. (2010) develop a model in which stock prices depend on
fundamental value, market-wide mispricing and stock-speci�c mispricing. In
their model, the normalized time t price of stock i, denoted Pit is the sum of
three independent components
Pit = biFt + St + uit
Here, bi is a parameter summarizing the importance of fundamentals relative
to sentiment for stock i, Ft and St are the marketwide fundamental and
sentiment factors, respectively, and uit the idiosyncratic misprising. They
use this model to make predictions for market β dynamics before and after
issue, but it may also be used to motivate that price Pit innovations is a
proxy for mispricing innovations (market-wide St or idiosyncratic uit) and
that abnormal return is a proxy for innovations in idiosyncratic mispricing
uit.
The market-to-book ratio is used as proxy for overvaluation in DeAngelo
et al. (2010) and Dong et al. (2006). The former also uses abnormal stock
return, calculated as issuer return less market return, prior to issue as proxies
for overvaluation. Akbulut (2013) uses managers' insider trading activity to
10Rhodes�Kropf et al. (2005) show that mergers occur in waves contemporaneous withmarket-wide overvaluations.
126

measure overvaluation. Some papers (DeAngelo et al. (2010), Loughran and
Ritter (1995), Baker and Wurgler (2002)) also use future stock return as
a proxy for overvaluation. Though this may be the ultimate measure of
overvaluation in other contexts, it can clearly not be used to predict future
abnormal return.
As the discussion above suggests, most proxies for overvaluation are
closely related to the market-to-book ratio or issuer return prior to issue.
Some proxies measure overvaluation relative to the market, while others con-
sider the possibility that the market may also be overvalued. In this paper,
I decompose issuer return before issue into return explained by exposure to
priced factors, market excess return, as well as other factors, and other re-
turn, which, for convenience I denote abnormal return. High market return
will be interpreted as a market-wide reduction in required return, which,
in turn, implies that investment opportunities, all else being equal, become
more attractive. Abnormal return will be interpreted a proxy for idiosyn-
cratic overvaluation.
Two salient empirical facts are consistent with these proxies. If idiosyn-
cratic overvaluation is independent of marketwide overvaluation, as in the
Carlson et al. (2010) model, the number of �rms with idiosyncratic overval-
uation is approximately constant over time, while the number of �rms with
attractive investment opportunities is positively related to aggregate market
valuation. This implies that aggregate issuance activity should be positively
related to past market return. Figure 2 shows the trailing 12-month number
of issuers and trailing 12-month market excess return. The number of issuers
is clearly increasing during the period. As noted by Ponti� and Woodgate
(2008), the relatively low number of SEOs in the early part of the sample
127

may re�ect limited coverage in SDC before approximately 1990. Despite this
the correlation between market excess return and number of issuers is 0.40
(t-value 9.1). Second, since overvalued �rms are more likely to issue, issuers
will, on average, have past positive abnormal returns. In Section 4, I show
that issuers have, on average, very high abnormal returns before issue. Both
these patterns have been known since Loughran and Ritter (1995).
[Insert Figure 2 about here]
2.5 Proxies for Constrainedness
Testing Hypothesis 2 requires a proxy for issuer constrainedness. Constrained-
ness implies that the issuers had to issue to continue operations, i.e. to �nance
operations or to service current debt. At the extreme, these �rms must raise
new equity to avoid bankruptcy and protect some value for current share-
holders. I denote these defensive issuers because they must issue to survive,
whereas other issuers choose to issue to pursue attractive investment possi-
bilities or exploit overpricing. In Section 3, I present a number of measures
for the extent to which an issuer is defensive. Most of these consider to what
extent the �rm can pay o� current debt with existing cash and cash�ow from
operations and the level of cash�ow from operations.11
Hypothesis 2 implies that defensive issuers will have higher long-run ab-
normal returns than other issuers. One may be concerned that other return-
predicting characteristics of defensive issuers systematically di�er from non-
defensive issuers. In particular, defensive issuers may have lower pro�tability.
Since high pro�tability, for example, measured as exposure to the Fama and
11Current debt is debt due within a year.
128

French (2015) RMW factor, is a strong return predictor, it is essential to con-
trol for this in abnormal return calculations. Another concern with the testa-
bility of Hypothesis 2 is that Baker et al. (2003) show that �. . . the e�ects of
stock market valuations (e�cient or otherwise) on investment are greater for
more �nancially constrained (�equity dependent�) �rms�. Since �rms which
issue when market valuations are high subsequently have particular low re-
turns (Loughran and Ritter, 1995), this could drive underperformance of
defensive issuers. Therefore, it is important to control for past market return
when the relation between defensiveness of the issuer and long-run return is
analyzed.
3 Data and Variables
3.1 SEO Sample
Daily and monthly stock returns are sourced from CRSP. Only ordinary eq-
uity is selected.12 The CRSP Compustat merge was used to obtain account-
ing data. Only annual accounting data are used and all accounting data are
lagged by at least six months. Daily and monthly market excess returns as
well as factor returns (SMB, HML, RMW, CMA, and WML), were collected
from Kenneth French homepage.
SEO events were gathered from the SDC Platinum database available
through Thomson One Banker. The sample contains all completed SEOs (in
SDC denoted Follow-On o�erings) with issue date in 2015 or earlier. The
relative issue size, i.e. proceeds raised divided by the market value before the
12First digit of the CRSP shrcd code is 1.
129

o�er, both as reported in SDC, is denoted Issue.13 Observations where Issue
cannot be calculated are discarded. Moreover, I require Issue to be at least
3%. This is to eliminate very small issues with limited information content.
It reduces the sample by around 8%, with limited impact on empirical results.
Issuers with pre-o�er valuation of less than $100 million in CPI adjusted
December 2015 prices are removed from the sample. This is to eliminate
phenomena which only exist in micro caps. It reduces the sample by around
11% with limited impact on most empirical results. Finally, �nancials and
insurance companies are eliminated from the sample.14
The SEO announcement date is the Original date reported by SDC.
I have, for a small sample of records, veri�ed that this date is indeed the
day the issue was announced. Occasionally, SDC records more than one
SEO event for a given �rm with a given announcement date. These di�erent
records typically represent issues in di�erent markets, to di�erent investor
groups or using di�erent issuance methods. In any case, these records are
merged into one SEO observation. CRPS and SDC observations are matched
based on their cusip number. The matched sample consists of 11,106 SEO
observations. Figure 2 shows how the number of observations, satisfying the
criteria mentioned, has evolved since 1980.
3.2 Abnormal return
Issuer abnormal returns are used in a number of sorts and regressions as a
dependent as well as an explanatory variable. In all cases, abnormal return
13Issue is calculated using the SDC variables Proceeds__Amt___sum__of_all_Mkts andMarket_Value_Before_Offer____mil. The latter is also used together with the CRSPCPIIND variable to calculate �rm market value at December 2015 prices.
14Issuers with Standard Industrial Classi�cation Code between 6000 and 6499.
130

over period p is calculated as
rpabn,MM = rpexcess −∑
i∈MM
βpi r
pi (1)
rpexcess is the return in excess of the risk-free rate. Market modelMM is a
set of return-predicting factors, rpi is the return of factor i over period p and
βpi is the estimated exposure to factor i. I primarily consider the Fama-French
�ve factor model (Fama and French, 2015), denoted FF5, but occasionally
also consider other models including the Fama-French three factor model,
denoted FF3, and CAPM.
For abnormal returns before and at issuance announcement event time,
factor loadings βpi are estimated using daily excess returns from one year
before announcement to one month before announcement. For abnormal
returns after issue, factor loadings are estimated using data from one month
after announcement to one year after announcement.15 In both cases, excess
returns are regressed on factor returns with three daily lags and the estimated
loading βpi is the sum of estimated loadings on the contemporaneous factor
return and the three lagged factor returns (the Dimson (1979) method).
Factor loadings are only estimated with at least 200 degrees of freedom in
the regressions, i.e. when �rm returns are available �almost daily�.16
Table 2 reports average FF5 estimated factor loadings before and after
issue. Consistent with Loughran and Ritter (1995), issuer market betas are
slightly above 1. βMkt is 1.10 before issue, increasing to 1.13 after. The
increase of 0.03 is small but statistically signi�cant, suggesting that issuers,
15In most cases the issue date is either the announcement data or the day after.16Estimating FF5 loadings requires 221 observations: one for the model intercept, �ve for
contemporaneous factor returns, 15 for lagged factor returns plus 200 degrees of freedom.
131

on average, do not issue to strengthen their balance sheet but rather to
invest. Consistent with results reported by Greenwood and Hanson (2012),
the average issuer is small cap. Issuers load heavily on SMB with βSMB of
0.81 before and 0.76 after. The decrease is as expected, since issues increase
the market value of the �rm. βHML decreases from -0.07 to -0.13, again
suggesting that issuers invest rather than strengthen their balance sheet.
This also applies to the decrease in the asset growth factor βCMA from -
0.07 to -0.15, i.e. issuers become more aggressive post-issue. Greenwood and
Hanson (2012) also report low issuer pro�tability. The table re�ects this,
with βRMW loadings of -0.31 before and -0.40 after issue.
[Insert Table 2 about here]
3.3 Dependent and Explanatory Variables in Regres-
sions
In the event regressions, Section 5, the dependent variable is abnormal event
returns, reventabn,FF5 calculated using equation 1 and event excess return reventexcess.
Regressors are past market excess return (r−n yearMkt , n ∈ {1, 2, 3}), measured
from one, two and three years before announcement to one month before an-
nouncement and issuer abnormal return prior to announcement (r−n yearabn,FF5, n ∈
{1, 2, 3}), measured from one, two and three years before to one month be-
fore announcement. Further regressors are issue = log(1 + Issue) and the
logarithm of equity market value (denoted mv).
In long-run abnormal return regressions reported in Section 6.1 one-,
two- and three-year post-announcement abnormal returns, denoted r1yearabn,FF5,
132

r2yearabn,FF5 and r3yearabn,FF5, respectively, are regressed on factors hypothesized to
explain (and predict) long-run return. The abnormal returns are calculated
from one month after announcement to one, two and three years after an-
nouncement using factor exposures estimated post-announcement and mar-
ket models FF5. In addition to the regressors mentioned above, abnormal
event return is used as regressor in long-run abnormal return regressions.
Further abnormal event return is decomposed into its positive and negative
component revent+abn,FF5 = max(reventabn,FF5, 0) and revent−abn,FF5 = max(−reventabn,FF5, 0).
The purpose of this is to determine whether positive event returns, i.e. �good
news� conveyed at event time, a�ect long-run returns di�erently than neg-
ative event returns, i.e. �bad news� conveyed at event time. In the entire
sample, 26% of the events have positive event return and the annual fraction
is almost always between 20% and 40% with a downward sloping trend over
the past 15 years.
In Section 6.1.2 long-run abnormal return is regressed on proxies for being
a defensive issuer, in addition to the explanatory variables mentioned above.
Table 3 summarizes characteristics related to whether the issue is likely to be
defensive. In all cases, low values are associated with more defensive issues.
The cash ratio CR measures the ratio between cash and current debt, i.e.
debt due within one year.17 To eliminate the impact of extreme observations,
the calculated cash ratio is projected on the interval [0, 5]. CR1 is a binary
variable measuring whether cash exceeds current debt.
[Insert Table 3 about here]
17CR is calculated using the Compustat variables ch and dlc lagged by at least sixmonths.
133

The cash and cash�ow ratio CCF is the ratio between cash plus operating
cash�ow and debt.18 CCF is projected on the interval [−5, 5]. The binary
variable CCF1 is one if cash plus operating cash�ow exceeds current debt,
and zero otherwise. The cash�ow yield CFY is the ratio between operating
cash�ow and issuer market value. The binary variable PosCF is 0 if operating
cash�ow is negative, and 1 otherwise.
Firms without any long-term debt are also likely to be defensive issuers
because the lack of any debt may be caused by inability to borrow. The
binary variable LTDebt is 0 for issuers without any long-term debt and 1
otherwise.19 Finally, dividend paying issuers, i.e. issuers which have paid
a dividend over the year before issue, are likely to be less defensive than
non-dividend paying issuers. PosDiv is 0 for issuers which have not paid a
dividend, and 1 otherwise.
A substantial number of issuers delist within three years after issue. In
long-run abnormal regressions, proceeds including delisting returns, as re-
ported by CRSP, is assumed to be reinvested in the market portfolio. In
unreported results, delisting �rms were omitted from the sample. This does
not change the results substantially. In the calendar-time portfolios, delisting
issuers are removed from portfolios at the �rst monthly rebalancing after the
delisting. Delisting returns, as reported by CRSP, are included in the last
monthly return.
18CCR is calculated using the Compustat variables ch, dlc, and oancf lagged by atleast six month.
19The Compustat variable dltt is used for long-term debt.
134

4 Returns Before and After Issue
This section brie�y reviews average issuer abnormal return before and after
issue, con�rming previous �ndings of high abnormal returns before issue and
negative abnormal returns post-issue. Figure 3 shows the average cumulated
abnormal return, using CAPM as market model, of issuers from 20 trading
days before announcement (day -20) to 20 trading days after announcement
(day 20). From day -20 to the day before announcement, cumulated abnormal
returns exceeds 5%. On the two subsequent days, i.e. the announcement
date and the day after, average abnormal returns are below -2% followed
by a rebound of about 0.75% over the next two weeks. All these results are
strongly signi�cant and the pattern does not change much if abnormal return
is calculated with respect to FF3 or FF5. The �gure motivates calculating
event returns over the two-day time window consisting of the announcement
date and the subsequent day.20
[Insert Figure 3 about here]
Figure 4 shows the abnormal return index of issuers, i.e. issuers hedged
with their exposures to the CAPM, FF3 and FF5 factors, respectively, from
12 months before announcement to 36 months after announcement normal-
ized at 100 on announcement date. Abnormal returns are almost 60% (from
around index 63 to index 100) the year before announcement regardless of
market model. After issue performance depends on market model. Control-
ling for market exposure only, issuers record abnormal returns of -22% on
average over three years in line with results reported by Loughran and Ritter
20In some cases, the announcement was made after close on the announcement date.Hence, the negative return on day t+ 1 cannot be interpreted as a delayed reaction.
135

(1995), but adding further controls, in particular the CMA and RMW fac-
tors of FF5 changes the picture somewhat. Over one year issuer abnormal
returns are insigni�cant 1% relative to FF5 and �only� -10% over three years.
As hinted by Table 2, the di�erence is chie�y explained by issuers negative
loading on the pro�tability factor RMW.
[Insert Figure 4 about here]
5 Event Returns
As motivated in Section 3, abnormal announcement event returns reventabn,FF5
are calculated as the abnormal return on the announcement date and the
subsequent trading day. Table 4 shows the results of regressions of abnormal
event returns (speci�cation 1 to 6) as well as excess event returns (speci�-
cation 7) on 1, 2, and 3 past years' market excess return, 1, 2 and 3 past
years' issuer abnormal return as well as log relative issue size issue and log
market value mv. Since event return periods may overlap, standard errors
are calculated using the Newey-West correction of standard errors for het-
eroscedasticity and autocorrelation using three lags. All regressors are nor-
malized (z-scores), hence regression intercepts can be interpreted as event
abnormal return.
Across speci�cations (1) to (6), FF5 abnormal event return is about -2.3%
and highly signi�cant. Past years' market excess return is only signi�cant
for market excess return over three years (speci�cation (3)) with a coe�cient
estimate of 0.2, i.e. a one standard deviation change in past three-year market
excess return is associated with about 20 bps higher event returns. If high
136

market return pre-issue is a proxy for attractive investment possibilities, one
would expect the coe�cient to be positive, as it is in all speci�cations.
Past years' abnormal return is signi�cant in most speci�cations with co-
e�cient estimates around 0.15, showing that one standard deviation higher
past year(s) abnormal return is associated with about 15 bps higher event
returns.
Relative issue issue is insigni�cant in all speci�cations, i.e. proceeds raised
relative to market value is not signi�cantly related to event return. Issuer
market value is signi�cant, with estimates between 0.32 and 0.35, i.e. larger
issuers have higher (less negative) event returns. This is consistent with
larger issuers being more analyzed, hence, on average, less information is
conveyed at announcement time.
All these conclusions are largely unchanged in regressions of raw event
returns (speci�cation 7) instead of abnormal event returns.
[Insert Table 4 about here]
6 Long-run Returns
This section analyzes to what extent issuer long-run returns can be explained
and predicted. There are two di�erent approaches frequently applied in the
literature. The Buy and Hold Abnormal Return (BHAR) method involves
measuring the buy and hold abnormal return issue by issue and trying to
explain these by issuer characteristics and other variables in regressions or
sorts. Issuer BHAR is either measured as the return di�erence between
the issuer and a comparable �rm (the matched �rm approach) or between
137

the issuer and a portfolio with the same risk characteristics as the issuer
(equation 1). In Section 6.1, I calculate BHAR using the latter approach,
with FF5 as market model and factor exposures estimated from one month
after announcement to one year after announcement because the matched
�rm approach, as pointed out by Eckbo et al. (2000) and Bessembinder and
Zhang (2013), makes it di�cult to control for exposure to factors beyond the
usual matching criteria of size and book-to-market ratio.
The calendar-time portfolio method involves forming portfolios, for exam-
ple, monthly, of �rms which have carried out an issue during the past year
(or two or three years). Portfolio excess returns are calculated and regressed
on factor excess returns to determine factor loadings and possible abnormal
returns. In Section 6.2, I construct long portfolios of all issuers as well as
long portfolios sorted on issuer characteristics. In Section 6.3, I construct
long-short portfolios, where each long position in an issuer is matched with a
short position in a non-issuer matched on market value and book-to-market
ratio.
With the calendar-time portfolio method, the weight assigned to each is-
sue depends on the number of contemporaneous issues. In particular, obser-
vations during a period with few issues receive a disproportionally high weight
and phenomena which are particularly strong during periods of heavy is-
suance activity may not be signi�cant. For this, and other, reasons, Loughran
and Ritter (2000) discard the calendar-time portfolios for having low power.
Fama (1998) and Mitchell and Sta�ord (2000) strongly advocate the calendar-
time approach due to inherent methodological problems in the BHAR ap-
proach including skewness of individual long-run returns and overlapping
return periods. Without taking a stance on this debate, I apply long-run
138

BHAR regressions in Section 6.1 and the calendar-time portfolio approach
in Section 6.2. However, results do not di�er qualitatively between the two
approaches, but the calendar-time portfolio approach show lower power, as
expected.
6.1 Long-run BHAR Regressions
In this section, the BHAR method is applied. In 6.1.1, abnormal return is
regressed on past market and past issuer abnormal return. Other explanatory
variables are event return, log market value and log issue size. This is to
test hypotheses 1, 3 and 4 which predict a relationship between long-run
abnormal return and issuer overvaluation, event return and relative issue size,
respectively. In 6.1.2, abnormal return is regressed on proxies for defensive
issues to determine whether defensive issuers, as Hypothesis 2 would suggest,
fare better than non-defensive issuers.
6.1.1 Past Market and Abnormal Returns
This section reports equally weighted regressions with BHAR one, two and
three years after announcement as dependent variable. Table 5 reports re-
sults using the FF5 market model for abnormal return calculation. Due to
overlapping return intervals and possibly heteroscedastic errors, standard er-
rors are calculated using the Newey and West (1987) correction. The number
of lags is calculated using the West (1994) approximation, which yields ten
lags.
[Insert Table 5 about here]
139

Panel A speci�cation (1) to (5) displays the result of one-year abnormal
return after issue BHAR1yearFF5 regressed on market excess return and issuer
abnormal return one, two and three years before announcement(r−n yearMkt and
r−n yearabn,FF5 respectively, n ∈ {1, 2, 3}), in both cases excluding the last month
before announcement. Regressors are normalized, hence the intercept can be
interpreted as abnormal return. Consistent with Figure 4, one-year abnor-
mal return is not signi�cantly di�erent from zero. While past market excess
return is insigni�cant, past abnormal return over one and two years is sig-
ni�cant, with coe�cient estimates between 2.46 and 2.93 showing that a one
standard deviation increase in pre-issue abnormal return is associated with
2.46% to 2.93% higher abnormal return the following year.
Speci�cation (6) shows that event abnormal return reventabn,FF5 is signi�cant
with a size comparable to pre-issue abnormal return. Relative issue issue is
insigni�cant, and log market value mv is strongly signi�cant. In speci�cation
(7) event return is decomposed into its positive and negative component.
This reveals a positive but insigni�cant relation between positive event return
and post-issue abnormal return and a strong signi�cant relation between
negative event return and post-issue abnormal return.21
Two- and three-year abnormal return regressions are reported in Panel B
and C. Abnormal return is signi�cantly negative, 4-5% over two years and
about 12% over three years. One- and two-year pre-issue excess market re-
turn becomes gradually more signi�cant. Two years after issue, past market
performance (r−1yearMkt and r−2yearMkt ) is negatively signi�cant in most speci�ca-
tions and three years after issue it is almost always signi�cant at the 1% level.
21The regression intercept in speci�cation (7) di�ers substantially from speci�cation (1)to (6) and cannot be interpreted as abnormal return due to the calculation of revent+abn,FF5
and revent+abn,FF5. This applies to Panels B and C as well.
140

Event return, but only its negative component, and log market value remain
signi�cant three years after issue. Relative issue, which was not signi�cant
after one year, becomes signi�cant and negative after two and three years,
i.e. large issues are associated with lower abnormal return during the second
and third year after issue.
If abnormal return pre-issue is a proxy for overvaluation and Hypothesis
1 holds, then positive abnormal return pre-issue should predict negative ab-
normal return post-issue. However, the empirical evidence contradicts this.
Cross-sectional momentum (Jegadeesh and Titman, 1993) may explain why
abnormal return one year before issue is positively related to abnormal re-
turn one year after issue, but the persistence of this relationship three years
after issue cannot be explained by momentum due to the long-term reversal
e�ect �rst documented by De Bondt and Thaler (1985). Consequently, the
results do not con�rm Hypothesis 1.
If high market excess return before issue is a proxy for low return re-
quirement, then the evidence suggests that �rms which issue, and possibly
invest, when required return is particular low subsequently underperform.
The underperformance is associated with, and possibly explained by, over-
valuation; not over-valuation of the issuer, but rather over-valuation at the
market level.
While Table 5 provides no support for information asymmetry as an ex-
planation for issuer long-run underperformance, the signi�cant relationship
between event abnormal return and long-run abnormal return con�rms Hy-
pothesis 3 and suggests some delayed reaction to information conveyed at
event time. Moreover, the fact that only the negative component of event
return signi�cantly predicts long-run abnormal return, supports the under-
141

reaction explanation since �good news� is absorbed by prices faster than �bad
news�. This is consistent with other research showing that negative informa-
tion is re�ected less readily than positive information (Hong et al. (2000)).
The signi�cant relationship between relative issue size issue and two- and
three-year abnormal return con�rms Hypothesis 4.
In unreported regressions BHAR and past abnormal return r−n yearabn has
been calculated using the FF3 and CAPM market models. As suggested by
Figure 4 abnormal return is signi�cantly negative over one, two, and three
years for FF3 as well as CAPM. Past market return remains negative and
signi�cant. Past issuer abnormal return is less signi�cant. Event return,
but only its negative component, remains strongly signi�cant. Issuer market
value is signi�cant at a 1% level in all speci�cations while relative issue size is
highly signi�cant for three-year BHAR but insigni�cant for one-year BHAR
in line with Table 5.
6.1.2 Defensive versus non-Defensive Issues
If opportunistic issuers exploit information asymmetry to issue overvalued
equity, they must have some ability to time their issues to a period where
they are overvalued. Accordingly, Hypothesis 2 predicts that less constrained
issuers subsequently underperform relative to issuers which are more con-
strained. Constrainedness is not directly observable. Instead I distinguish
between issuers who appear to be forced to issue to avoid bankruptcy (de-
noted defensive issuers) and issuers without this constraint (denoted non-
defensive issuers).
Table 6 reports regressions of one, two and three years buy-and-hold
abnormal returns on proxies for being being defensive, cf. Table 3, as well
142

as the regressors used in speci�cation (7) in Table 5, i.e. past-year market
excess return, past-year issuer abnormal return, the positive and negative
component of event return, issue, and mv. Over one year (Panel A) none
of the defensive issuer characteristics are signi�cant, but all have positive
coe�cient estimates, indicating that non-defensive issuers have higher returns
than defensive issuers over the year after issue. Over two years (Panel B)
and three years (Panel C), this pattern becomes clearer. Coe�cient estimates
remain positive, and over three years all characteristics with some relation to
operating cash�ow are signi�cant. Issuers with su�cient cash plus operating
cash�ow to cover current debt have 14% higher returns than issuers with
insu�cient cash and cash�ow, over the following three years. Issuers with
positive operating cash�ow have an 18% higher return than issuers with
negative cash�ow over the following three years. These results contradicts
that defensive issuers fare better than non-defensive issuers over the three
years after issue. Hence, there is no empirical evidence of Hypothesis 2.
[Insert Figure 6 about here]
Using FF3 or CAPM as market model increases the signi�cance of the
results reported in Table 6. Cash�ow related characteristics are generally
signi�cant for one-, two-, and three-year BHAR and longterm debt LTDebt
as well as dividend payments PosDiv is signi�cant for all BHAR periods and
in most cases on a 1% level. The stronger results using the FF3 and CAPM
market models is no surprise. Defensive issuers are likely to have weaker
pro�tability, and possibly faster asset growth, than other issuers. Without
controlling for these factors, the underperformance of defensive issuers be-
comes even stronger.
143

6.2 Issuer Calendar-time Portfolios
The results reported in Section 6.1 are consistent with Hypothesis 3, i.e.
investor underreaction to news at event time explain long-run underperfor-
mance of issuers. Hypotheses 1 and 2, i.e. information asymmetry and op-
portunistic issues as an explanation for long-run issuer underperformance,
found no empirical support. The results also support Hypothesis 4, which
is consistent with informations asymmetry as well as with investor under-
reaction. The purpose of this section is to con�rm these �ndings using the
calendar-time method. Section 6.2.1 considers the calendar-time portfolio of
all issuers while calendar-time portfolios constructed based on sorts on issuer
characteristics are reported in Section 6.2.2.
6.2.1 The Portfolio of All Issuers
Issuers are assigned to the calendar-time portfolio of all issuers from the
second month after announcement, i.e. if announcement date is January 29,
the �rm will be assigned to a portfolio from March. Portfolios are equal-
weighted, with monthly rebalancing and issuers remain in portfolios for one,
two and three years. Since the dataset contains relatively few issues prior
to 1980, portfolios are formed from January 1980. Figure 5 shows how $100
invested in a portfolio consisting of all issuers, with holding periods of one,
two and three years, respectively, has evolved. For comparison, the evolution
of $100 in the market portfolio is shown. While the value of an investment in
the market portfolio almost 50-doubles over the 36 years from 1980 to 2015,
the return on the issuer portfolios is between 574% and 1038%.
[Insert Figure 5 about here]
144

Figure 5 suggests that issuers have negative abnormal return, but Table 7
shows that this depends on the market model used. Consider the one-year
holding period portfolio. Speci�cation (1) and (2) show that relative to
CAPM and FF3 underperformance is strongly signi�cant at -44 bps and -
35 bps monthly, respectively. Controlling for pro�tability (RMW) and asset
growth (CMA) underperformance drops to an insigni�cant -15 bps, cf. spec-
i�cation (3). The portfolio has a signi�cant negative loading on the momen-
tum factor (WML). Controlling for this further reduces underperformance
to -10 bps. Two- and three-year holding period portfolios are considered in
Panel B and C. Consistent with Figure 4, issuer abnormal return is lower for
longer holding periods. Underperformance relative to FF5 is signi�cant at
-27 bps and -25 bps, respectively.
[Insert Table 7 about here]
These results are consistent with Lyandres et al. (2008) and Bessembinder
and Zhang (2013), who report that issuer underperformance, to a large ex-
tent, disappears when controlling for appropriate factors known to predict
return. The regressions also show that issuers on average have market βs
above one and are small cap, consistent Table 2. Loadings on RMW, CMA,
and WML are negative and strongly signi�cant.
The BHAR regressions of Section 6.1.1 showed that past market excess
return is negatively related to long-run issuer performance. Past market ex-
cess return is not a suitable portfolio sort variable because all issues at the
same time will simultaneously have the same past market excess return. In-
stead past market excess return, measured over the past year excluding the
last month, is included as an explanatory variable in the all issuers portfolio
145

return regressions reported in Table 8. For all holding periods, past mar-
ket excess return signi�cantly predicts issuer portfolio excess returns. An
increase in past year market excess return of 10% is associated with a 14 bps
lower monthly return in the portfolio where issuers are held for one year, 16
bps monthly if issuers are held for two years and 21 bps monthly if issuers
are held for three years. These results are in line with the BHAR return re-
gressions reported in Table 5, though the signi�cance of past market return
is stronger in the calendar time portfolio regressions for the shorter holding
periods.
[Insert Table 8 about here]
6.2.2 Portfolios Sorted on Issuer Characteristics
This section considers portfolios constructed by sorts on issuer characteristics
shown to predict post-issue return in Section 6.1. For each characteristic, the
monthly median value for issuers is calculated. Issuers with a characteristic
value below or at the median value are assigned to the �low� portfolio while
issuers with a characteristic value above the monthly median are assigned to
the �high� portfolio. This approach ensures that the low and high portfolios
contain approximately the same number of �rms, but the threshold for �being
high� varies over time. The exceptions to this is event return, where 0 is used
as breakpoint instead of median event return in order to create a �good news�
and a �bad news� portfolio, and CCR 1 where the �low� portfolio consists of
issuers with current debt in excess of cash plus operational cash�ow and the
�high� portfolio consists of issuers with less current debt.
Table 9 reports regressions of sort portfolio returns on the FF5 factors.
146

Results are reported for the low portfolio, the high portfolio and the self-
�nancing high-low portfolio and for holding periods of one, two, and three
years. The characteristics considered are pre-issue abnormal return r−1yearabn
(Panel A), event abnormal return reventabn (Panel B), relative issue issue (Panel
C) and market value mv (Panel D), cash plus cash�ow relative to current
debt CCR 1 (Panel E), and cash�ow yield CFY (Panel F). Firms with several
issues appear only once in the portfolio, but could potentially be included in
the �high� as well as the �low� portfolio, if the �rm, for example, has issued
with positive event return as well as with negative event return. Monthly
portfolio excess returns are regressed on factor returns to calculate abnormal
returns relative to FF5.
Table 9 Panel A, shows that the portfolio of high pre-issue abnormal re-
turn issuers has slightly higher abnormal returns than the portfolio of low
pre-issue abnormal return issuers. The di�erence is only signi�cant for one-
year holding periods with a t-value of 1.87. If returns are regressed on the
momentum factor WML in addition to the FF5 factors, the t-value drops to
1.27 (regression results not shown). The two- and three-year holding period
long-short portfolio has insigni�cant loadings on WML and insigni�cant ab-
normal returns with and without WML. These results are in line with the
results reported in Section 6.1 and do not support Hypothesis 1.
Panel B con�rms that issuers with negative event returns (reventabn ) signif-
icantly underperform issuers with positive event returns by 29 bps monthly
for one-year holding periods. For two- and three-year holding periods under-
performance drops to 19 and 12 bps, respectively, but remains signi�cant.
These results con�rm Hypothesis 3. Panel C con�rms that �rms with large
issues, relative to their market value, underperform relative to �rms with
147

smaller issues, as predicted by Hypothesis 4. Results are signi�cant at the
1% level. Panel D shows that larger issuers, in terms of mv, have signi�cantly
less negative abnormal returns than smaller issuers.
Panel E shows that �rms with low cash plus cash�ow relative to current
debt underperform issues with more cash or higher cash�ow. The di�erence
is insigni�cant for two- and three-year holding periods. Firms with low cash-
�ow yield (Panel F) have lower risk-adjusted returns but the di�erence is
insigni�cant except for two-year holding periods. These results are at odds
with Hypothesis 2 which holds that the least constrained issuers should have
the lowest return. Summing up, the regressions of calendar-time portfolios
sorted on issuer characteristics con�rm the �ndings of issuer BHAR reported
in Section 6.1, but as expected signi�cance decreases with the calendar-time
portfolio approach.
[Insert Table 9 about here]
6.3 Matched Firm Portfolios
As a �nal robustness check, I consider matched �rm portfolios, i.e. portfolios
of long positions in issuers and short positions in �rms matched with issuers.
Following Bessembinder and Zhang (2013), and previous research, issuers are
matched based on their market value and their book-to-market ratio. The
match is chosen as the �rm with the closest deviation in book-to-market
ratio among �rms with market value of at least 70% and at most 130% of
the issuer.
Match candidates must have been listed for at least �ve years and must
148

not have issued in a SEO during the past �ve years. Moreover match candi-
dates must satisfy the same conditions as issuers, cf. Section 3.1. The match
is based on �rm characteristics at the end of the second month prior to the
SEO announcement date. Section 6.3.1 considers portfolios of all issuers
matched with non-issuers while Section 6.3.2 considers matched portfolios
constructed based on issuer characteristic sorts.
6.3.1 The Matched Portfolio of All Issuers
Figure 6 shows the cumulated return of a self-�nancing long-short, equally
weighted, monthly updated long-short portfolio of SEO �rms matched with
non-SEO �rms, as described above. The issuer and its match are included
in the portfolio for one, two or three years unless the issuer or its match
is delisted. When this happens, both �rms are removed from the portfolio
by the end of the month where the delisting occurs. The �gure con�rms the
�ndings of Figure 5. Issuers have substantially lower returns than other �rms.
Over the period of 1980-2015 the monthly return di�erential is between 16
and 29 bps, depending on holding period. Controlling for exposure to the FF5
factors, the underperformance is 12 bps monthly and insigni�cant for one-
year holding periods and 22 bps monthly and highly signi�cant for holding
periods of two and three years (Table 10).
[Insert Figure 6 about here]
[Insert Table 10 about here]
149

6.3.2 Matched Portfolios Sorted on Issuer Characteristics
Table 11 reports on the performance of portfolios constructed as in Sec-
tion 6.2.2 except that they are self-�nanced portfolios consisting of long po-
sitions in issuers and short positions in matched �rms. Compared to Ta-
ble 9, risk-adjusted returns (regression intercepts) are very similar, and the
di�erences between �high� and �low� issuer characteristics mostly remain.
Coe�cient estimates change only slightly but, in some cases, signi�cance
decreases. This is because standard errors increase for two reasons. The
number of issuers in the portfolios decreases because occasionally the match
delists and, more importantly, the volatility of the match portfolio increases
total volatility.22
The spread in risk-adjusted return between issuers with high return before
issue and issuers with low return before issue increases by 15 to 20 bps and
moves into signi�cant territory (Panel A). The spread between positive event
return and negative event return issuers decreases by one to seven bps and
moves out of signi�cant territory (Panel B).23 The spread between issuers
with large issues and issuers with small issues increases by around 10 bps
and remains signi�cant (Panel C). The overperformance of issuers with large
market value relative to issuers with smaller market value decreases by a few
bps but remains signi�cant for holding periods of two and three years (Panel
D). The spread between issuers with su�cient cash and cash�ow to service
current debt, and those without, decreases and is only signi�cant for holding
22If a portfolio with idiosyncratic volatility σ is hedged with an other portfolio withidiosyncratic volatility σ, volatility of the hedged portfolio is
√2σ. The empirical results
show that volatility of the matched portfolios increases by less than a factor√2 suggesting
that the matches hedge factors beyond those captured by the FF5 model.23The di�erence between one-year holding period positive and negative event issuers
remains signi�cant in the FF3 model (t-value 1.80) as well as over the period 1995 - 2015(t-statistics 2.12 and 2.55 in the FF5 and FF3 models, respectively).
150

periods of two years (Panel E). Finally, the spread between high and low
cash�ow yield issuers only changes for three-year holding periods and only
by 7 bps.
All portfolios have small positive market exposure with market β's be-
tween 0.02 and 0.24 con�rming that issuers have higher market exposure
than their matches. By construction, SMB and HML exposure is relatively
low and with varying sign. RMW exposure is almost always negative and
signi�cant as one would expect because issuers tend to have low pro�tabil-
ity. CMA exposure has varying sign and is often insigni�cant. In aggregate,
the results obtained using long-short matched portfolios con�rm the �ndings
reported in previous sections.
[Insert Table 11 about here]
7 Conclusions
Firms which issue new equity in seasoned equity o�erings subsequently have
lower returns than other �rms. This is partly explained by exposure to factors
beyond the Fama and French (1993) three factor model, in particular negative
exposure to the pro�tability RMW factor of Fama and French (2015). Some
signi�cant underperformance remains unexplained. I investigate whether this
can be explained by exploitation of information asymmetry by opportunistic
issuers, as suggested by Loughran and Ritter (1995).
If this explanation holds, one would expect that the most overvalued
issuers, and those which are least constrained in the sense, that they do not
need to issue to continue operations or service current debt, have the best
151

opportunities to exploit temporary windows of mispricing. Therefore, issuers
with these characteristics should experience the lowest risk-adjusted returns
subsequent to SEOs. However, I �nd no empirical support for this, because
the most overvalued issuers and the least constrained issuers, which are most
likely to be opportunistic, do not underperform relative to other issuers.
One may be concerned, that this result is due to inadequate proxies for
overvaluation and constrainedness. This is a valid critique in the context
of overvaluation. For obvious reasons, overvaluation is hard to detect, and
there is no consensus on how to measure it in the literature. Constrainedness
is easier to identify. Here a concern is that the most constrained issuers, on
average, share other characteristics which predict low return. I address this
issue, at least partly, by controlling for pro�tability and asset growth. Even
with these controls, there is no evidence of lower returns for �rms with more
room to decide whether and when to issue.
If there is no evidence of information asymmetry as explanation for long-
run performance of SEO �rms, it is natural to consider, that information
asymmetry may be low at event time. From an empirical point of view, this
seems reasonable, because of the information requirements on issuing �rms
and the incentives of issuers, investors, and intermediaries. If information
asymmetry is low, a possible explanation for the low returns subsequent
to SEOs is, that the marginal investor does not fully utilize all available
information. Empirically, I �nd that event returns, and in particular negative
event returns, are signi�cantly related to issuer long-run returns. This result
is consistent with the hypothesis, that investors underreact to information
available at event time.
While issuer overvaluation, measured as issuer abnormal return prior to
152

issue, is not associated with long-run negative abnormal return, high market
valuation is associated with low returns post issue. High market valuations
may be interpreted as low required return or as marketwide overvaluation.
In either case, �rms which issue when stocks are particularly expensive, sub-
sequently have particularly low returns.
153

References
Akbulut, M. E. (2013). Do overvaluation-driven stock acquisitions really ben-
e�t acquirer shareholders?. Journal of Financial & Quantitative Analysis ,
48 (4), 1025 � 1055.
Baker, M., Stein, J. C., and Wurgler, J. (2003). When does the market mat-
ter? stock prices and the investment of equity-dependent �rms. Quarterly
Journal of Economics , 118 (3), 969 � 1005.
Baker, M. and Wurgler, J. (2002). Market timing and capital structure.
Journal of Finance, 57 (1), 1 � 32.
Barberis, N. and Thaler, R. (2003). Handbook of the Economics of Finance,
Elsevier, chap. A Survey Of Behavioral Finance.
Bernard, V. L. and Thomas, J. K. (1989). Post-earnings-announcement drift:
Delayed price response or risk premium?. Journal of Accounting Research,
27 (3), 1 � 36.
Bessembinder, H. and Zhang, F. (2013). Firm characteristics and long-run
stock returns after corporate events. Journal of Financial Economics ,
109 (1), 83 � 102.
Billett, M. T., Flannery, M. J., and Gar�nkel, J. A. (2011). Frequent is-
suers' in�uence on long-run post-issuance returns. Journal of Financial
Economics , 99 (2), 349 � 364.
Carlson, M., Fisher, A., and Giammarino, R. (2010). Seo risk dynamics.
Review of Financial Studies , 23 (11), 4026 � 4077.
154

Daniel, K. and Titman, S. (2006). Market reactions to tangible and intangible
information. Journal of Finance, 61 (4), 1605 � 1643.
De Bondt, W. F. M. and Thaler, R. (1985). Does the stock market overreact?.
Journal of Finance, 40 (3), 793 � 805.
DeAngelo, H., DeAngelo, L., and Stulz, R. M. (2010). Seasoned equity of-
ferings, market timing, and the corporate lifecycle. Journal of Financial
Economics , 95 (3), 275 � 295.
Dimson, E. (1979). Risk measurement when shares are subject to infrequent
trading. Journal of Financial Economics , 7 (2), 197 � 226.
Dong, M., Hirshleifer, D., Richardson, S., and Siew Hong, T. (2006). Does
investor misvaluation drive the takeover market?. Journal of Finance,
61 (2), 725 � 762.
Dong, M., Hirshleifer, D., and Teoh, S. H. (2012). Overvalued equity and
�nancing decisions. Review of Financial Studies , 25 (12), 3645 � 3683.
Du�e, D. (2010). Presidential address: Asset price dynamics with slow-
moving capital. Journal of Finance, 65 (4), 1237 � 1267.
Eckbo, B. E., Masulis, R. W., and Norli, O. (2000). Seasoned public o�er-
ings:resolution of the 'new issues puzzle'. Journal of Financial Economics ,
56 (2), 251 � 291.
Eckbo, E. B., Masulis, R. W., and Norli, O. (2007). Handbook of Corporate
Finance, Elsevier, vol. 1, chap. Security O�erings.
Fama, E. F. (1998). Market e�ciency, long-term returns, and behavioral
�nance. Journal of Financial Economics , 49 (3), 283 � 306.
155

Fama, E. F. and French, K. R. (1992). The cross-section of expected stock
returns. Journal of Finance, 47 (2), 427 � 465.
Fama, E. F. and French, K. R. (1993). Common risk factors in the returns
on stocks and bonds. Journal of Financial Economics , 33 (1), 3 � 56.
Fama, E. F. and French, K. R. (2008a). Average returns, b/m, and share
issues. Journal of Finance, 63 (6), 2971 � 2995.
Fama, E. F. and French, K. R. (2008b). Dissecting anomalies. Journal of
Finance, 63 (4), 1653 � 1678.
Fama, E. F. and French, K. R. (2015). A �ve-factor asset pricing model.
Journal of Financial Economics , 116 (1), 1 � 22.
Fu, F. and Huang, S. (2015). The persistence of long-run abnormal returns
following stock repurchases and o�erings. Management Science.
Fu, F., Lin, L., and O�cer, M. S. (2013). Acquisitions driven by stock
overvaluation: Are they good deals?. Journal of Financial Economics ,
109 (1), 24 � 39.
Greenwood, R. and Hanson, S. G. (2012). Share issuance and factor timing.
Journal of Finance, 67 (2), 761 � 798.
Hong, H., Lim, T., and Stein, J. C. (2000). Bad news travels slowly: Size,
analyst coverage, and the pro�tability of momentum strategies. Journal
of Finance, 55 (1), 265 � 295.
Hong, H. and Stein, J. C. (1999). A uni�ed theory of underreaction, mo-
mentum trading, and overreaction in asset markets. Journal of Finance,
54 (6), 2143 � 2184.
156

Jegadeesh, N. and Titman, S. (1993). Returns to buying winners and selling
losers: Implications for stock market e�ciency. Journal of Finance, 48 (1),
65 � 91.
Krasker, W. S. (1986). Stock price movements in response to stock issues
under asymmetric information. Journal of Finance, 41 (1), 93 � 105.
Lee, C. M. C., Myers, J., and Swaminathan, B. (1999). What is the intrinsic
value of the dow?. Journal of Finance, 54 (5), 1693 � 1741.
Loughran, T. and Ritter, J. R. (1995). The new issues puzzle. Journal of
Finance, 50 (1), 23 � 51.
Loughran, T. and Ritter, J. R. (2000). Uniformly least powerful tests of
market e�ciency. Journal of Financial Economics , 55 (3), 361 � 389.
Lyandres, E., Le, S., and Lu, Z. (2008). The new issues puzzle: Testing the
investment-based explanation. Review of Financial Studies , 21 (6), 2825 �
2855.
McKeon, S. B. (2015). Employee option exercise and equity issuance motives.
SSRN.
McLean, D. R., Ponti�, J., and Watanabe, A. (2009). Share issuance and
cross-sectional returns: International evidence. Journal of Financial Eco-
nomics , 94 (1), 1 � 17.
Michaely, R., Thaler, R. H., and Womack, K. L. (1995). Price reactions
to dividend initiations and omissions: Overreaction or drift?. Journal of
Finance, 50 (2), 573 � 608.
157

Miller, M. H. and Rock, K. (1985). Dividend policy under asymmetric infor-
mation. Journal of Finance, 40 (4), 1031 � 1051.
Mitchell, M. L. and Sta�ord, E. (2000). Managerial decisions and long-term
stock price performance. Journal of Business , 73 (3), 287.
Myers, S. C. and Majluf, N. S. (1984). Corporate �nancing and investment
decisions when �rms have information that investors do not have. Journal
of Financial Economics , 13 (2), 187 � 221.
Newey, W. K. and West, K. D. (1987). A simple, positive semi-de�nite, het-
eroskedasticity and autocorrelation consistent covariance matrix. Econo-
metrica, 55 (3), 703 � 708.
Ohlson, J. A. (1995). Earnings, book values, and dividends in equity valua-
tion. Contemporary Accounting Research, 11 (2), 661 � 687.
Ponti�, J. and Woodgate, A. (2008). Share issuance and cross-sectional
returns. Journal of Finance, 63 (2), 921 � 945.
Rhodes�Kropf, M., Robinson, D. T., and Viswanathan, S. (2005). Valuation
waves and merger activity: The empirical evidence. Journal of Financial
Economics , 77 (3), 561 � 603.
West, K. D. (1994). Automatic lag selection in covariance matrix estimation.
Review of Economic Studies , 61 (4), 631 � 653.
158

Figure 1: The issuance decision when �rm management know the per sharevalue of assets in place a and the investment opportunity b and investors onlyknow the distribution of these (Myers and Majluf, 1984). The �rm issue if(a, b) ∈M ′, the upper-left region and do not issue otherwise. The issue priceis P ′. MM show that the boundary between M and M ′ is given by the lineb = (E/P ′)a − E, where E is the per share equity to be raised to pursuethe investment opportunity. The dotted investor indi�erence line a+ b = P ′
marks the boundary between the realizations of (a, b) where investors get agood deal and a bad deal. If investors have rational expectations, they, onaverage, purchase equity at its fundamental value, i.e. in equilibrium P ′ mustbe the expected value of a + b conditioned on (a, b) ∈ M ′. If investors have�less than rational expectations�, i.e. the marginal investor does not fullyaccount for the impact of the informations asymmetry, P ′ and the dottedline will be shifted to the right and the expected value of a + b conditionedon (a, b) ∈ M ′ will be less than P ′ re�ecting an average post-issue negativereturn to investors.
159

‐60%
‐40%
‐20%
0%
20%
40%
60%
80%
0
100
200
300
400
500
600
700
Issuers Mkt‐Rf
Figure 2: Trailing 12-months number of issuers (left axis) and trailing 12-months market excess return (right axis). The correlation is 0.4 (t-value 9.1).The sample of issuers has been �ltered, as described in Section 3.
160
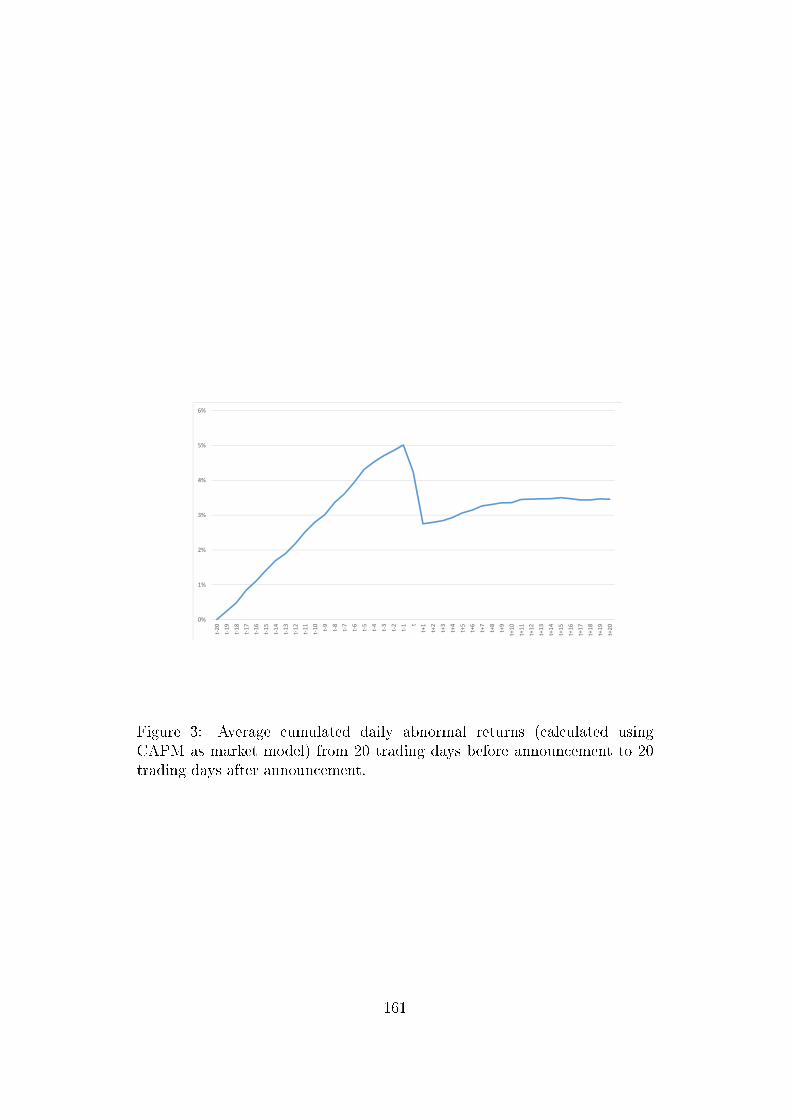
0%
1%
2%
3%
4%
5%
6%
t‐20
t‐19
t‐18
t‐17
t‐16
t‐15
t‐14
t‐13
t‐12
t‐11
t‐10 t‐9
t‐8
t‐7
t‐6
t‐5
t‐4
t‐3
t‐2
t‐1 t
t+1
t+2
t+3
t+4
t+5
t+6
t+7
t+8
t+9
t+10
t+11
t+12
t+13
t+14
t+15
t+16
t+17
t+18
t+19
t+20
Figure 3: Average cumulated daily abnormal returns (calculated usingCAPM as market model) from 20 trading days before announcement to 20trading days after announcement.
161

50
60
70
80
90
100
110
FF5 FF3 CAPM
Figure 4: Average abnormal return index (calculated using CAPM, FF3 andFF5 as market models) from 12 months before announcement to 36 monthsafter announcement, normalized at 100 on announcement day.
162

10
100
1000
10000
Mkt 1y 2y 3y
Figure 5: Return index of an equally weighted monthly rebalanced issuerportfolios and for the market portfolio normalized at 100 on January 1,1980. Issuers are included in the issuer portfolio from the second monthafter announcement and remain in the portfolio for one, two and three years,respectively.
163

‐1.4
‐1.2
‐1
‐0.8
‐0.6
‐0.4
‐0.2
0
0.2
0.4
1y 2y 3y
Figure 6: Cumulated return of a self-�nancing long-short, equally weighted,monthly updated long-short portfolio of SEO �rms matched with non-SEO�rms. Issuers and their matches are included in the issuer portfolio from thesecond month after announcement and remain in the portfolio for one, twoand three years, respectively.
164

Table
1:Com
parison
ofthesituationwherealleventandpost-eventreturn
isdrivenbyinform
ationasymmetry
(Sec-
tion
2.1)
andthesituationwithoutinform
ationasymmetry
ateventtimewherealleventandpost-eventreturn
isdriven
byinvestor
underreaction
totheissueandpossibly
other
new
sat
eventtime(Section
2.2).
Highinform
ationasymmetry
Low
inform
ationasymmetry
and
investor
underreaction
Inform
ationconveyed
Only
issue
Issueandother
new
sat
eventtime
Possiblereasonsto
issue
Investments
Investments
Overvaluation(opportunisticissues)
Tosignal
levelof
earnings
How
theannouncement
Indirectly.
Investorsinferthat
Directlythrough
inform
ationreleased
conveysvalue
�rm
valueislikely
tobelowbecause
Indirectlythrough
thesize
the�rm
issues
oftheissue
Eventreturns
Negativebecause
investorsinfer
Dependson
new
sconveyedrelative
tothat
expectedvalueislow
inveator
expectations.
Negativeif�bad
new
s�,
positiveif�goodnew
s�
Whichissuerssubsequently
Overvalued
issuers
Issuerswithnegativeeventnew
sunderperform
?Unconstrained
issuers
Firmswithlargeissues
Firmswithlargeissues
165

Table 2: Average Fama-French �ve factor loadings of issuers before and af-ter issue. Loadings are estimated using daily excess returns with three lags(the Dimson (1979) method). Before issue estimates are calculated from12 months before announcement to one month before announcement whilethe after issue estimates are calculated using data from one month after an-nouncement to 12 months after announcement. Standard errors are reportedin parenthesis. * indicates signi�cance on a 10% level, ** on a 5% level, and*** on a 1% level.
Before issue After issue Change
βMkt 1.10*** 1.13*** 0.03***(0.01) (0.01) (0.01)
βSMB 0.81*** 0.76*** -0.05***(0.01) (0.01) (0.02)
βHML -0.07*** -0.13*** -0.06**(0.02) (0.02) (0.02)
βCMA -0.07*** -0.15*** -0.09***(0.02) (0.02) (0.03)
βRMW -0.31*** -0.40*** -0.09***(0.02) (0.02) (0.03)
N 9344 10362
166

Table 3: De�nition of proxies for defensive issuers. In all cases, issuers withlower values are more defensive because they have less cash, lower operatingcash�ows, no long-term debt or do not pay dividends.
Variable Explanation Average Std. dev.
CR Cash ratio. Ratio between cash and current 3.01 2.15
debt (projected on [0, 5])CR1 0 if CR < 1, otherwise 1 0.68 0.47
CCR Cash and cash�ow ratio. Ratio between cash 2.66 3.24
plus operating cash�ow to current debt
(projected on [−5, 5])CCR1 0 if CCR < 1, otherwise 1 0.73 0.44
CFY Cash Flow Yield. Ratio between operating 0.04 0.20
cash�ow and market value
PosCF 0 if operating cash�ow negative, otherwise 1 0.68 0.47
LTDebt 0 if no long-term debt, otherwise 1 0.85 0.36
PosDiv 0 if not dividend paying, otherwise 1 0.38 0.49
167

Table
4:Abnormal
eventreturnsre
ven
tabn
,FF5,speci�cation
(1)to
(6),
andeventexcess
return
reven
tex
cess,speci�cation
(7),
in
percentregressedon
pastyears'marketexcess
return
r−nyea
rM
kt
,n∈{1,2,3},
pastyears'issuer
abnormal
return
r−nyea
rabn
,FF5,
n∈{1,2,3},
logrelative
issuesize
issueandlogmarketvaluemv.
Pastyears'marketandabnormal
return
arecalculated
from
12,24
and36
monthsbeforeannouncementto
onemonth
beforeannouncement.
Allregressors
arenormalized
(z-scores).Abnormal
returnsarecalculatedrelative
totheFF5marketmodel.New
ey-W
eststandarderrors
calculated
withthreelags
arereportedin
parenthesis.*indicates
signi�cance
ona10%
level,**
ona5%
level,and***on
a1%
level.
reven
tabn
,FF5
reven
tex
cess
(1)
(2)
(3)
(4)
(5)
(6)
(7)
Intercept
-2.28***
-2.28***
-2.28***
-2.26***
-2.26***
-2.29***
-2.19***
(0.08)
(0.08)
(0.08)
(0.09)
(0.09)
(0.08)
(0.08)
r−1yea
rM
kt
0.11
0.06
0.04
0.12
0.15
(0.13)
(0.14)
(0.16)
(0.13)
(0.13)
r−2yea
rM
kt
0.11
(0.12)
r−3yea
rM
kt
0.20*
(0.10)
r−1yea
rabn
,CAPM
0.14
0.16*
0.15
0.15*
0.16*
(0.09)
(0.09)
(0.09)
(0.09)
(0.10)
r−2yea
rabn
,CAPM
0.18**
(0.09)
r−3yea
rabn
,CAPM
0.15*
(0.09)
issue
0.00
0.09
(0.09)
(0.09)
mv
0.33***
0.32***
(0.08)
(0.08)
N9288
9288
9288
7756
6760
9288
9288
Adj.R
2(%
)0.04
0.04
0.09
0.04
0.01
0.22
0.21
168

Table 5: Buy and hold abnormal returns from one month after announce-ment to one year (Panel A), two years (Panel B) and three years (PanelC) after announcement, in percent, regressed on past years' market excessreturn r−n year
Mkt , n ∈ {1, 2, 3}, past years issuer abnormal return r−n yearabn,FF5,
n ∈ {1, 2, 3}, event abnormal return reventabn,FF5, the positive component of
event abnormal return revent+abn,FF5, the negative component of event abnormal
return revent−abn,FF5, log relative issue size issue, and log market value mv, Pastyear market and abnormal return are calculated from 12, 24, and 36 monthsbefore announcement to one month before announcement. Return after an-nouncement is calculated from one month after announcement to 12, 24 and36 months after announcement, respectively. Abnormal returns are calcu-lated relative to the FF5 market model. All regressors, except for revent+abn
and revent+abn , are normalized (z-scores). revent+abn and revent+abn is the positive andnegative, respectively, component of the normalized reventabn to make them nu-merically comparable to reventabn . Newey-West standard errors calculated withten lags are reported in parenthesis. * indicates signi�cance on a 10% level,** on a 5% level, and *** on a 1% level.
Panel A. One-year abnormal return BHAR1yearFF5
(1) (2) (3) (4) (5) (6) (7)
Intercept 0.21 0.21 0.27 0.12 -0.11 0.11 1.59
(0.69) (0.69) (0.69) (0.74) (0.77) (0.68) (1.06)
r−1yearMkt -0.15 0.12 -0.08 -0.07 -0.15
(0.62) (0.66) (0.69) (0.62) (0.62)
r−2yearMkt -0.17
(0.68)
r−3yearMkt 0.97
(0.74)
r−1yearabn,FF5 2.93*** 2.91*** 2.88*** 2.93*** 2.99***
(0.90) (0.90) (0.89) (0.89) (0.89)
r−2yearabn,FF5 2.46***
(0.85)
r−3yearabn,FF5 0.99
(0.89)
reventabn,FF5 2.67**
(1.26)
revent+abn,FF5 1.72
(2.46)
revent−abn,FF5 -3.55***
(1.29)
issue -1.09 -1.08
(0.81) (0.81)
mv 3.14*** 3.02***
(0.65) (0.66)
N 8649 8649 8649 7310 6389 8649 8649
Adj. R2 (%) 0.24 0.24 0.27 0.16 0.00 0.84 0.85169
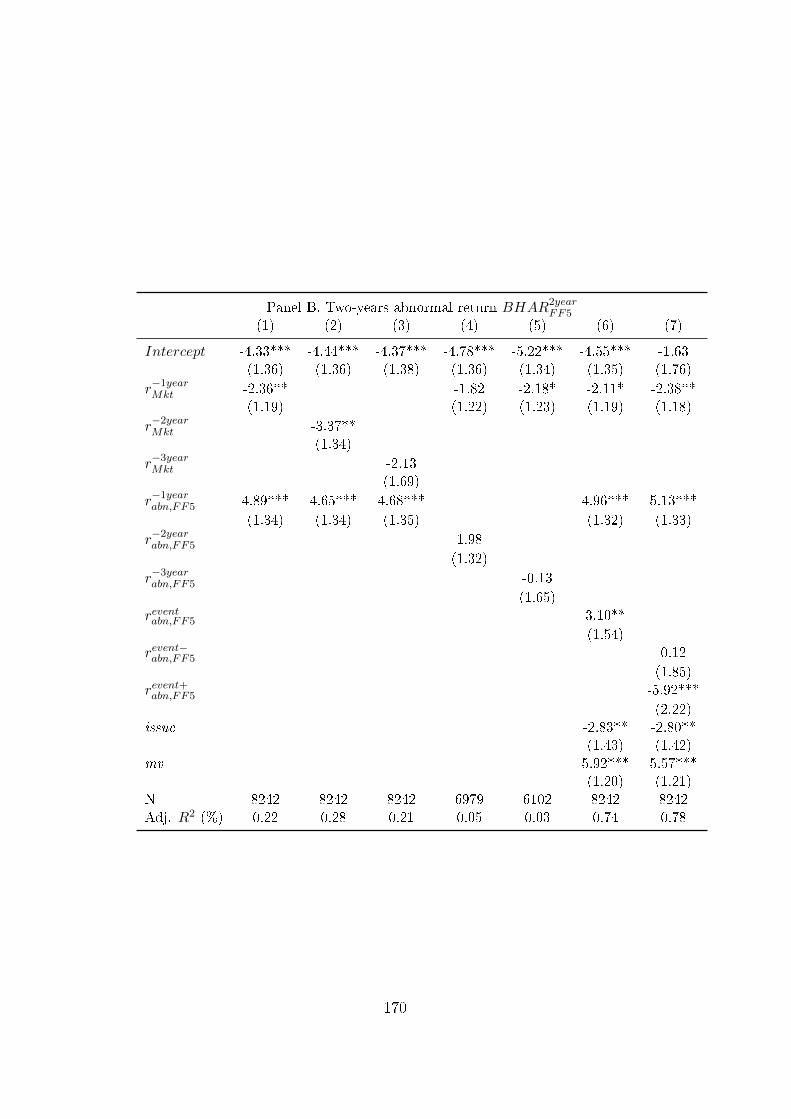
Panel B. Two-years abnormal return BHAR2yearFF5
(1) (2) (3) (4) (5) (6) (7)
Intercept -4.33*** -4.44*** -4.37*** -4.78*** -5.22*** -4.55*** -1.63
(1.36) (1.36) (1.38) (1.36) (1.34) (1.35) (1.76)
r−1yearMkt -2.36** -1.82 -2.18* -2.11* -2.38**
(1.19) (1.22) (1.23) (1.19) (1.18)
r−2yearMkt -3.37**
(1.34)
r−3yearMkt -2.13
(1.69)
r−1yearabn,FF5 4.89*** 4.65*** 4.68*** 4.96*** 5.13***
(1.34) (1.34) (1.35) (1.32) (1.33)
r−2yearabn,FF5 1.98
(1.32)
r−3yearabn,FF5 -0.13
(1.65)
reventabn,FF5 3.10**
(1.54)
revent−abn,FF5 0.12
(1.85)
revent+abn,FF5 -5.92***
(2.22)
issue -2.83** -2.80**
(1.43) (1.42)
mv 5.92*** 5.57***
(1.20) (1.21)
N 8242 8242 8242 6979 6102 8242 8242
Adj. R2 (%) 0.22 0.28 0.21 0.05 0.03 0.74 0.78
170

Panel C. Three-years abnormal return BHAR3yearFF5
(1) (2) (3) (4) (5) (6) (7)
Intercept -11.49*** -11.67*** -11.49*** -12.70*** -12.22*** -11.81*** -7.35***(1.88) (1.88) (1.89) (1.91) (1.98) (1.87) (2.28)
r−1yearMkt -5.06*** -4.34*** -4.21** -4.58*** -5.08***(1.55) (1.59) (1.65) (1.56) (1.57)
r−2yearMkt -6.02***(1.87)
r−3yearMkt -2.65(2.12)
r−1yearabn,FF5 6.10*** 5.56*** 5.55*** 6.21*** 6.55***
(1.75) (1.76) (1.77) (1.70) (1.72)
r−2yearabn,FF5 1.51
(1.61)
r−3yearabn,FF5 0.95
(1.91)reventabn,FF5 3.73*
(2.19)revent+abn,FF5 -1.29
(2.16)revent−abn,FF5 -8.61***
(3.19)issue -4.34*** -4.26***
(1.42) (1.40)mv 8.69*** 8.11***
(1.67) (1.66)N 7759 7759 7759 6574 5761 7759 7759Adj. R2 (%) 0.29 0.34 0.18 0.11 0.09 0.94 1.02
171
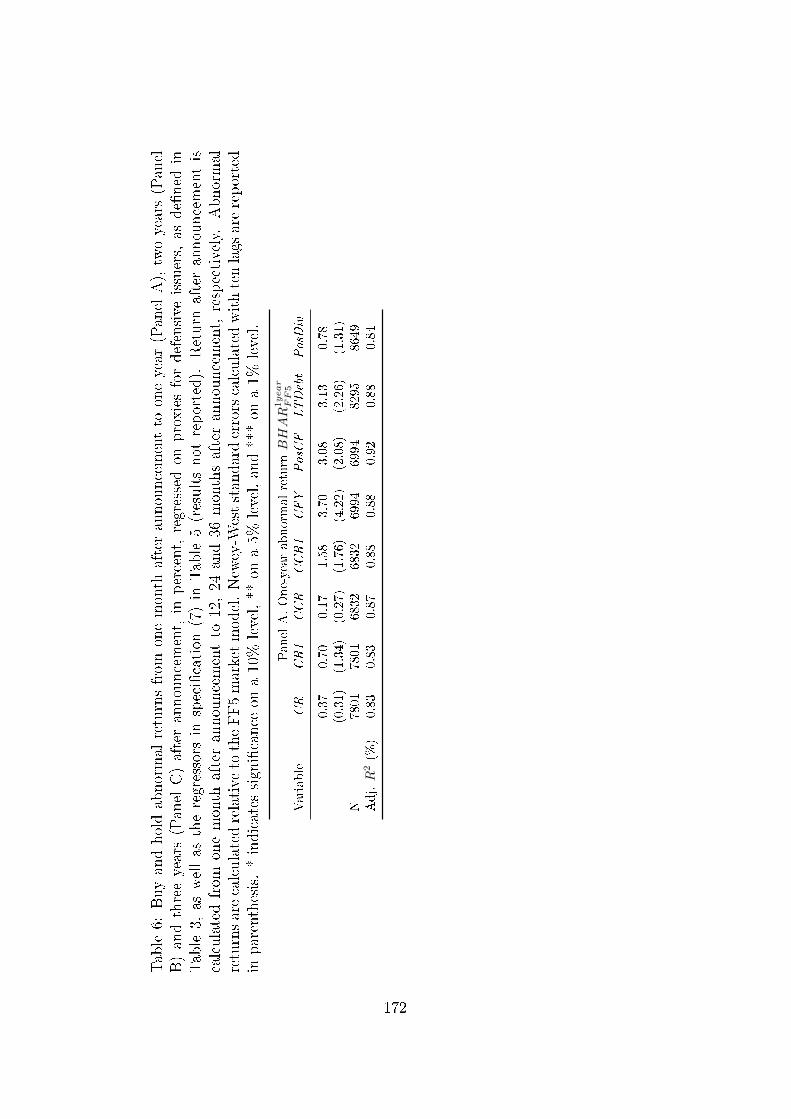
Table
6:Buyandholdabnormal
returnsfrom
onemonth
afterannouncementto
oneyear
(Panel
A),twoyears(Panel
B)andthreeyears(Panel
C)afterannouncement,
inpercent,
regressedon
proxiesfordefensive
issuers,
asde�ned
inTable
3,as
wellas
theregressors
inspeci�cation
(7)in
Table
5(resultsnot
reported).
Return
afterannouncementis
calculatedfrom
onemonth
afterannouncementto
12,24
and36
monthsafterannouncement,
respectively.Abnormal
returnsarecalculatedrelative
totheFF5marketmodel.New
ey-W
eststandarderrorscalculatedwithtenlags
arereported
inparenthesis.*indicates
signi�cance
ona10%
level,**
ona5%
level,and***on
a1%
level.
PanelA.One-yearabnorm
alreturnBHAR
1year
FF5
Variable
CR
CR1
CCR
CCR1
CFY
PosCF
LTDebt
PosDiv
0.37
0.70
0.17
1.58
3.70
3.08
3.13
0.78
(0.31)
(1.34)
(0.27)
(1.76)
(4.22)
(2.08)
(2.26)
(1.31)
N7801
7801
6832
6832
6994
6994
8295
8649
Adj.R
2(%
)0.83
0.83
0.87
0.88
0.88
0.92
0.88
0.84
172

PanelB.Two-year
abnormal
returnBHAR
2yea
rabn
,FF5
Variable
CR
CR1
CCR
CCR1
CFY
PosCF
LTDebt
PosDiv
0.98
2.47
0.78
7.82**
15.30**
4.35
4.95
2.42
(0.66)
(2.73)
(0.54)
(3.47)
(6.92)
(4.34)
(4.27)
(2.60)
N7416
7416
6449
6449
6601
6601
7901
8242
Adj.R
2(%
)0.78
0.75
0.86
0.90
0.89
0.84
0.77
0.78
PanelC.Three-year
abnormal
returnBHAR
3yea
rabn
,FF5
Variable
CR
CR1
CCR
CCR1
CFY
PosCF
LTDebt
PosDiv
0.83
1.05
1.75**
14.35***
18.82*
12.49**
7.99
4.33
(0.89)
(3.64)
(0.73)
(4.71)
(9.61)
(5.33)
(5.77)
(3.48)
N6966
6966
6003
6003
6138
6138
7435
7759
Adj.R
2(%
)0.95
0.94
1.18
1.22
1.10
1.28
0.97
1.03
173

Table 7: Monthly excess return of equally weighted portfolio of issuers re-gressed on factor returns from January 1980 to December 2015. Issuers areincluded in the portfolio for one year (Panel A), two years (Panel B) andthree years (Panel C) starting the second month after announcement. * in-dicates signi�cance on a 10% level, ** on a 5% level, and *** on a 1% level.
Panel A. One-year holding period.(1) (2) (3) (4)
Intercept -0.44*** -0.35*** -0.15 -0.10(0.16) (0.11) (0.10) (0.10)
Mkt-Rf 1.41*** 1.25*** 1.18*** 1.17***(0.04) (0.02) (0.02) (0.02)
SMB 0.81*** 0.75*** 0.76***(0.04) (0.04) (0.04)
HML -0.28*** -0.09* -0.16***(0.04) (0.05) (0.05)
RMW -0.27*** -0.23***(0.05) (0.05)
CMA -0.37*** -0.31***(0.07) (0.07)
WML -0.10***(0.02)
Adj. R2 (%) 78.43 91.02 92.04 92.37
174

Panel B. Two-year holding period.(1) (2) (3) (4)
Intercept -0.55*** -0.49*** -0.27*** -0.14(0.15) (0.11) (0.10) (0.09)
Mkt-Rf 1.37*** 1.23*** 1.15*** 1.13***(0.03) (0.02) (0.02) (0.02)
SMB 0.77*** 0.71*** 0.74***(0.04) (0.04) (0.03)
HML -0.23*** 0.00 -0.15***(0.04) (0.05) (0.04)
RMW -0.26*** -0.19***(0.05) (0.04)
CMA -0.46*** -0.33***(0.07) (0.06)
WML -0.21***(0.02)
Adj. R2 (%) 78.90 90.49 91.83 93.56
Panel C. Three-year holding period.(1) (2) (3) (4)
Intercept -0.49*** -0.46*** -0.25** -0.10(0.15) (0.11) (0.10) (0.09)
Mkt-Rf 1.34*** 1.22*** 1.15*** 1.12***(0.03) (0.02) (0.02) (0.02)
SMB 0.76*** 0.69*** 0.73***(0.04) (0.04) (0.03)
HML -0.14*** 0.05 -0.13***(0.04) (0.05) (0.04)
RMW -0.27*** -0.18***(0.05) (0.04)
CMA -0.37*** -0.21***(0.07) (0.06)
WML -0.26***(0.02)
Adj. R2 (%) 78.96 89.96 91.11 93.87
175
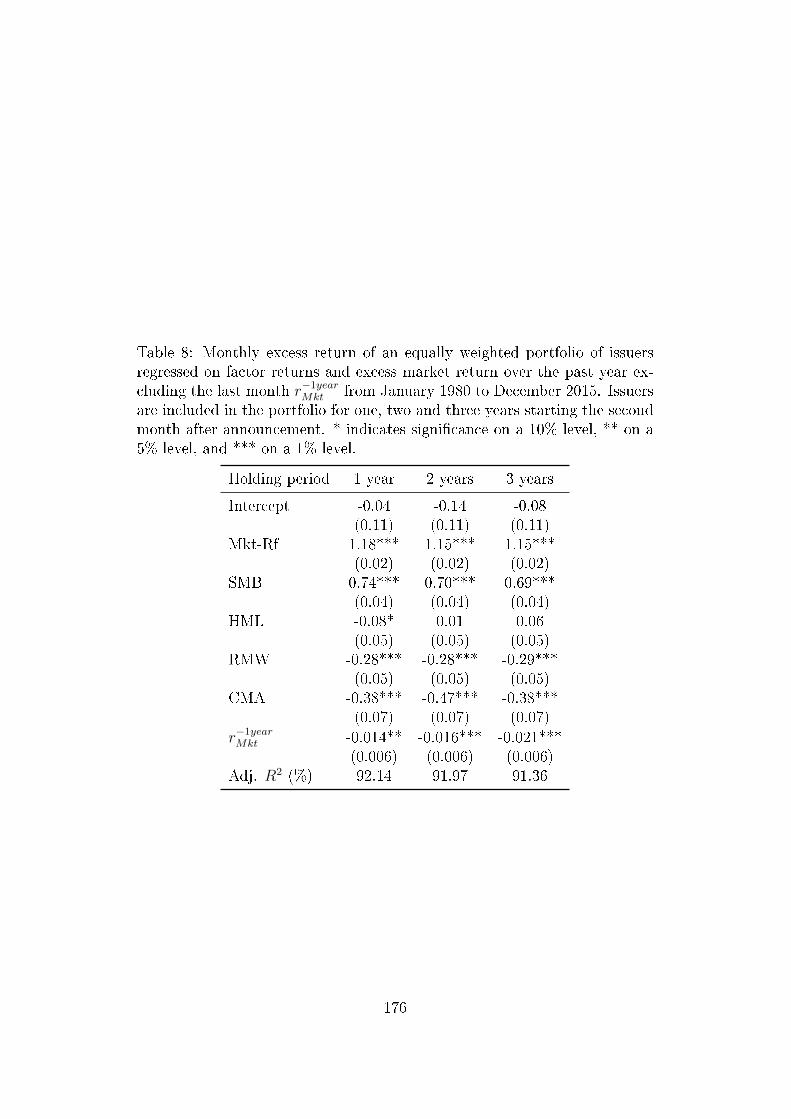
Table 8: Monthly excess return of an equally weighted portfolio of issuersregressed on factor returns and excess market return over the past year ex-cluding the last month r−1yearMkt from January 1980 to December 2015. Issuersare included in the portfolio for one, two and three years starting the secondmonth after announcement. * indicates signi�cance on a 10% level, ** on a5% level, and *** on a 1% level.
Holding period 1 year 2 years 3 years
Intercept -0.04 -0.14 -0.08(0.11) (0.11) (0.11)
Mkt-Rf 1.18*** 1.15*** 1.15***(0.02) (0.02) (0.02)
SMB 0.74*** 0.70*** 0.69***(0.04) (0.04) (0.04)
HML -0.08* 0.01 0.06(0.05) (0.05) (0.05)
RMW -0.28*** -0.28*** -0.29***(0.05) (0.05) (0.05)
CMA -0.38*** -0.47*** -0.38***(0.07) (0.07) (0.07)
r−1yearMkt -0.014** -0.016*** -0.021***(0.006) (0.006) (0.006)
Adj. R2 (%) 92.14 91.97 91.36
176

Table9:
Monthlyexcessreturn
ofequallyweightedportfolioofissuers,sorted
oncharacteristicsexpectedto
predictreturn,
fortheperiodof
January1980
toDecem
ber
2015.Returnsareregressedon
FF5factors.
Firmsareincluded
inportfolios
inthesecondmonth
afterannouncement.
Thebreakpointbetweenthe�low
�and�high�portfolio
isthemedianvalue
ofthesort
variable
duringthemonth
oftheannouncement(exceptforeventreturn
reven
tabn
where�low
�isnegativeevent
return
and�high�ispositiveeventreturn).
Firmsareincluded
inportfoliosfrom
thesecondmonth
afterannouncement
andremainin
theportfoliosforforone,twoandthreeyears.
PanelAreportsresultson
portfoliossorted
onpastabnormal
returnr−
1yea
rabn
,FF5,PanelBeventreturnsre
ven
tabn
,PanelClogrelative
issuesize,PanelD
logmarketvalue,PanelEcash
plus
cash�ow
relative
tocurrentdebtCCR
andPanelD
cash�ow
yield
CFY.*indicates
signi�cance
ona10%
level,**
ona
5%level,and***on
a1%
level.
PanelA.Sortvariable:r−
1yea
rabn
,FF5
1year
2years
3years
low
high
high-low
low
high
high-low
low
high
high-low
Intercept
-0.29**
-0.05
0.24*
-0.33***
-0.27**
0.06
-0.33***
-0.23**
0.10
(0.12)
(0.13)
(0.13)
(0.11)
(0.11)
(0.10)
(0.11)
(0.11)
(0.08)
Mkt-Rf
1.14***
1.21***
0.08**
1.12***
1.20***
0.08***
1.11***
1.20***
0.09***
(0.03)
(0.03)
(0.03)
(0.03)
(0.03)
(0.02)
(0.03)
(0.03)
(0.02)
SMB
0.64***
0.82***
0.18***
0.59***
0.81***
0.22***
0.58***
0.77***
0.19***
(0.04)
(0.05)
(0.05)
(0.04)
(0.04)
(0.03)
(0.04)
(0.04)
(0.03)
HML
0.15***
-0.26***
-0.41***
0.19***
-0.14***
-0.33***
0.24***
-0.09*
-0.34***
(0.06)
(0.06)
(0.06)
(0.05)
(0.05)
(0.04)
(0.05)
(0.05)
(0.04)
RMW
-0.19***
-0.25***
-0.07
-0.18***
-0.16***
0.02
-0.17***
-0.17***
0.00
(0.05)
(0.06)
(0.06)
(0.05)
(0.05)
(0.04)
(0.05)
(0.05)
(0.04)
CMA
-0.20**
-0.29***
-0.09
-0.20***
-0.44***
-0.24***
-0.16**
-0.36***
-0.19***
(0.08)
(0.09)
(0.09)
(0.07)
(0.08)
(0.07)
(0.07)
(0.08)
(0.05)
Adj.R
2(%
)86.64
89.57
33.11
88.41
90.75
45.72
88.43
90.82
53.61
177
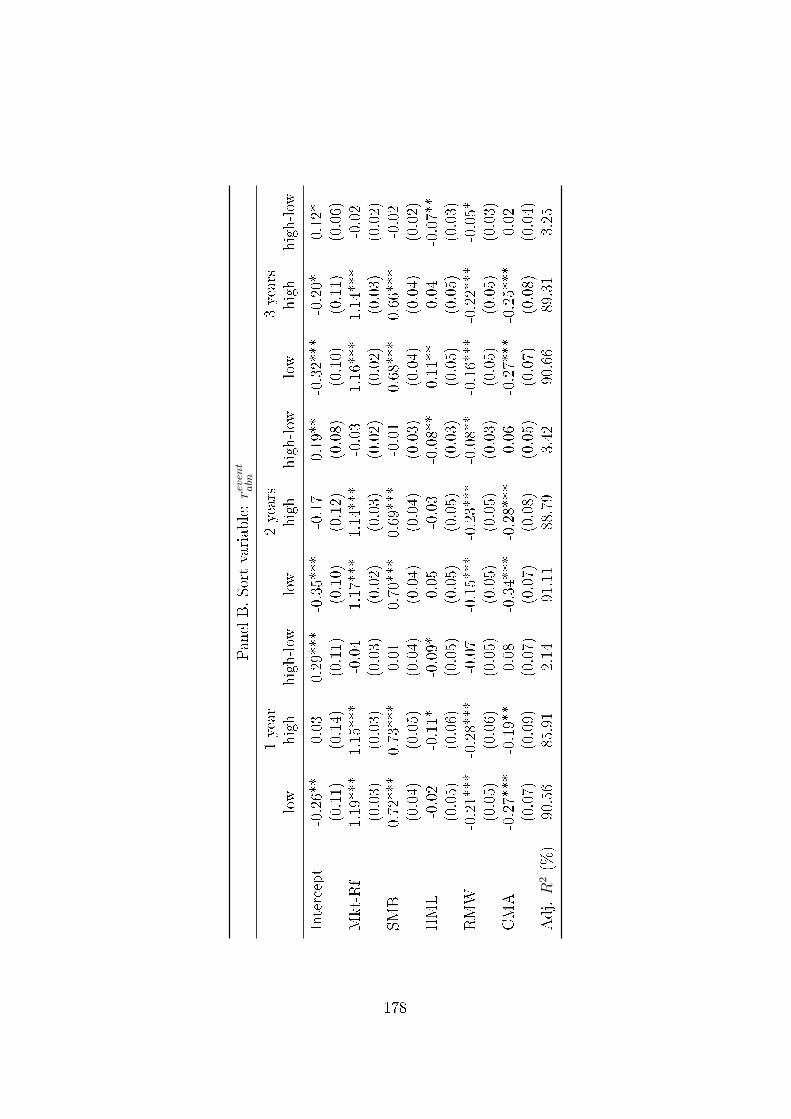
PanelB.Sortvariable:re
ven
tabn
1year
2years
3years
low
high
high-low
low
high
high-low
low
high
high-low
Intercept
-0.26**
0.03
0.29***
-0.35***
-0.17
0.19**
-0.32***
-0.20*
0.12*
(0.11)
(0.14)
(0.11)
(0.10)
(0.12)
(0.08)
(0.10)
(0.11)
(0.06)
Mkt-Rf
1.19***
1.15***
-0.04
1.17***
1.14***
-0.03
1.16***
1.14***
-0.02
(0.03)
(0.03)
(0.03)
(0.02)
(0.03)
(0.02)
(0.02)
(0.03)
(0.02)
SMB
0.72***
0.73***
0.01
0.70***
0.69***
-0.01
0.68***
0.66***
-0.02
(0.04)
(0.05)
(0.04)
(0.04)
(0.04)
(0.03)
(0.04)
(0.04)
(0.02)
HML
-0.02
-0.11*
-0.09*
0.05
-0.03
-0.08**
0.11**
0.04
-0.07**
(0.05)
(0.06)
(0.05)
(0.05)
(0.05)
(0.03)
(0.05)
(0.05)
(0.03)
RMW
-0.21***
-0.28***
-0.07
-0.15***
-0.23***
-0.08**
-0.16***
-0.22***
-0.05*
(0.05)
(0.06)
(0.05)
(0.05)
(0.05)
(0.03)
(0.05)
(0.05)
(0.03)
CMA
-0.27***
-0.19**
0.08
-0.34***
-0.28***
0.06
-0.27***
-0.25***
0.02
(0.07)
(0.09)
(0.07)
(0.07)
(0.08)
(0.05)
(0.07)
(0.08)
(0.04)
Adj.R
2(%
)90.56
85.91
2.14
91.11
88.79
3.42
90.66
89.31
3.25
178

PanelC.Sortvariable:issue
1year
2years
3years
low
high
high-low
low
high
high-low
low
high
high-low
Intercept
0.02
-0.33***
-0.36***
-0.10
-0.44***
-0.34***
-0.10
-0.41***
-0.31***
(0.12)
(0.12)
(0.11)
(0.11)
(0.11)
(0.08)
(0.11)
(0.11)
(0.07)
Mkt-Rf
1.15***
1.22***
0.07***
1.13***
1.17***
0.04**
1.13***
1.17***
0.04**
(0.03)
(0.03)
(0.03)
(0.03)
(0.03)
(0.02)
(0.03)
(0.03)
(0.02)
SMB
0.59***
0.91***
0.32***
0.55***
0.89***
0.34***
0.54***
0.86***
0.32***
(0.04)
(0.04)
(0.04)
(0.04)
(0.04)
(0.03)
(0.04)
(0.04)
(0.03)
HML
-0.07
-0.12**
-0.05
0.01
0.00
-0.01
0.05
0.05
0.00
(0.05)
(0.05)
(0.05)
(0.05)
(0.05)
(0.04)
(0.05)
(0.05)
(0.03)
RMW
-0.38***
-0.14***
0.24***
-0.34***
-0.17***
0.17***
-0.33***
-0.20***
0.13***
(0.05)
(0.05)
(0.05)
(0.05)
(0.05)
(0.04)
(0.05)
(0.05)
(0.03)
CMA
-0.40***
-0.34***
0.06
-0.44***
-0.48***
-0.04
-0.33***
-0.41***
-0.09*
(0.08)
(0.08)
(0.07)
(0.08)
(0.07)
(0.06)
(0.07)
(0.08)
(0.05)
Adj.R
2(%
)89.43
90.77
16.50
89.71
91.45
25.57
89.65
90.68
30.38
179

PanelD.Sortvariable:mv
1year
2years
3years
low
high
high-low
low
high
high-low
low
high
high-low
Intercept
-0.29**
-0.01
0.28**
-0.41***
-0.12
0.29***
-0.39***
-0.10
0.29***
(0.13)
(0.11)
(0.13)
(0.11)
(0.11)
(0.10)
(0.12)
(0.11)
(0.10)
Mkt-Rf
1.22***
1.13***
-0.09***
1.17***
1.13***
-0.04
1.15***
1.14***
-0.01
(0.03)
(0.03)
(0.03)
(0.03)
(0.03)
(0.02)
(0.03)
(0.03)
(0.02)
SMB
0.98***
0.50***
-0.48***
0.93***
0.48***
-0.45***
0.91***
0.47***
-0.44***
(0.05)
(0.04)
(0.05)
(0.04)
(0.04)
(0.04)
(0.04)
(0.04)
(0.04)
HML
-0.11*
-0.07
0.04
-0.07
0.08
0.15***
-0.02
0.13**
0.14***
(0.06)
(0.05)
(0.06)
(0.05)
(0.05)
(0.05)
(0.05)
(0.05)
(0.04)
RMW
-0.18***
-0.36***
-0.18***
-0.19***
-0.35***
-0.16***
-0.20***
-0.34***
-0.14***
(0.06)
(0.05)
(0.06)
(0.05)
(0.05)
(0.05)
(0.05)
(0.05)
(0.04)
CMA
-0.25***
-0.50***
-0.24***
-0.32***
-0.61***
-0.29***
-0.28***
-0.47***
-0.19***
(0.09)
(0.08)
(0.09)
(0.08)
(0.08)
(0.07)
(0.08)
(0.08)
(0.07)
Adj.R
2(%
)89.16
89.37
23.34
90.50
89.37
30.11
89.64
89.12
29.98
180
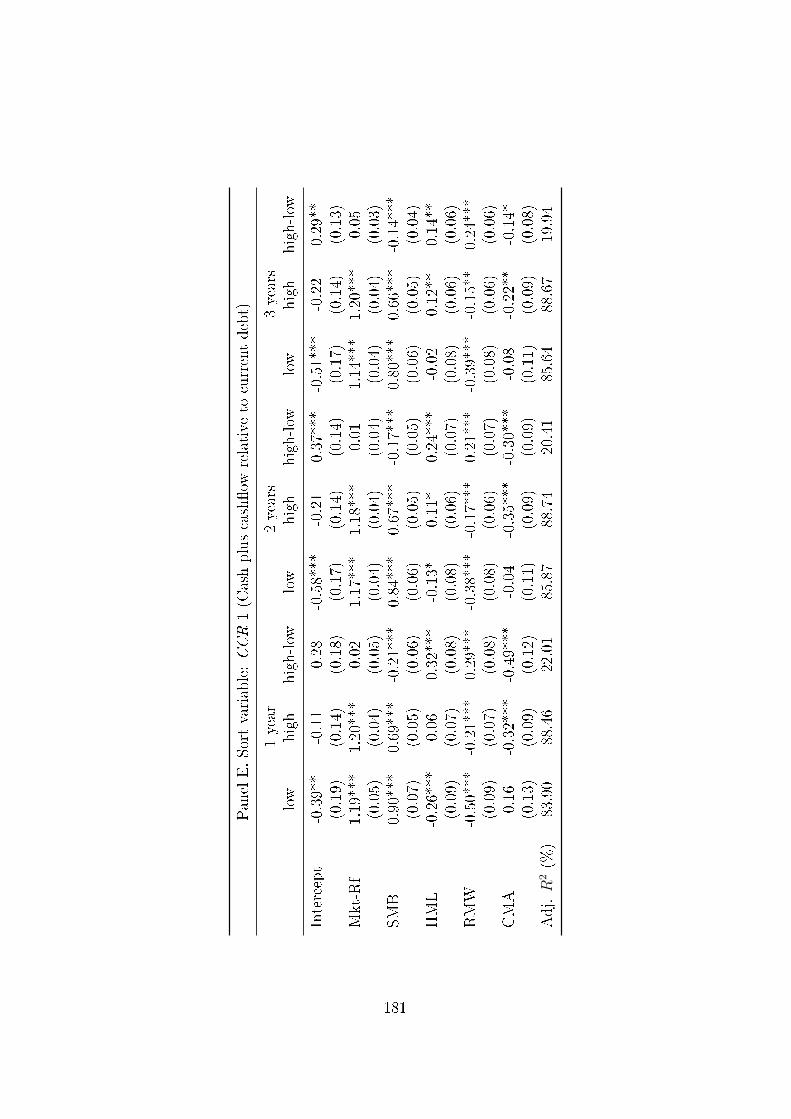
PanelE.Sortvariable:CCR1(C
ashpluscash�ow
relative
tocurrentdebt)
1year
2years
3years
low
high
high-low
low
high
high-low
low
high
high-low
Intercept
-0.39**
-0.11
0.28
-0.58***
-0.21
0.37***
-0.51***
-0.22
0.29**
(0.19)
(0.14)
(0.18)
(0.17)
(0.14)
(0.14)
(0.17)
(0.14)
(0.13)
Mkt-Rf
1.19***
1.20***
0.02
1.17***
1.18***
0.01
1.14***
1.20***
0.05
(0.05)
(0.04)
(0.05)
(0.04)
(0.04)
(0.04)
(0.04)
(0.04)
(0.03)
SMB
0.90***
0.69***
-0.21***
0.84***
0.67***
-0.17***
0.80***
0.66***
-0.14***
(0.07)
(0.05)
(0.06)
(0.06)
(0.05)
(0.05)
(0.06)
(0.05)
(0.04)
HML
-0.26***
0.06
0.32***
-0.13*
0.11*
0.24***
-0.02
0.12**
0.14**
(0.09)
(0.07)
(0.08)
(0.08)
(0.06)
(0.07)
(0.08)
(0.06)
(0.06)
RMW
-0.50***
-0.21***
0.29***
-0.38***
-0.17***
0.21***
-0.39***
-0.15**
0.24***
(0.09)
(0.07)
(0.08)
(0.08)
(0.06)
(0.07)
(0.08)
(0.06)
(0.06)
CMA
0.16
-0.32***
-0.49***
-0.04
-0.35***
-0.30***
-0.08
-0.22**
-0.14*
(0.13)
(0.09)
(0.12)
(0.11)
(0.09)
(0.09)
(0.11)
(0.09)
(0.08)
Adj.R
2(%
)83.90
88.46
22.01
85.87
88.74
20.41
85.64
88.67
19.94
181

PanelF.Sortvariable:CFY(C
ash�ow
yield)
1year
2years
3years
low
high
high-low
low
high
high-low
low
high
high-low
Intercept
-0.26
-0.12
0.14
-0.43***
-0.19
0.24*
-0.40**
-0.19
0.21
(0.18)
(0.14)
(0.17)
(0.16)
(0.13)
(0.14)
(0.17)
(0.12)
(0.14)
Mkt-Rf
1.27***
1.11***
-0.17***
1.23***
1.10***
-0.13***
1.24***
1.11***
-0.13***
(0.05)
(0.04)
(0.04)
(0.04)
(0.03)
(0.04)
(0.04)
(0.03)
(0.04)
SMB
0.93***
0.54***
-0.39***
0.88***
0.54***
-0.34***
0.84***
0.53***
-0.31***
(0.06)
(0.05)
(0.06)
(0.06)
(0.05)
(0.05)
(0.06)
(0.04)
(0.05)
HML
-0.29***
0.29***
0.58***
-0.24***
0.38***
0.61***
-0.16**
0.38***
0.54***
(0.08)
(0.06)
(0.08)
(0.08)
(0.06)
(0.06)
(0.08)
(0.06)
(0.06)
RMW
-0.54***
0.02
0.57***
-0.44***
0.02
0.45***
-0.39***
-0.01
0.39***
(0.08)
(0.06)
(0.08)
(0.08)
(0.06)
(0.06)
(0.08)
(0.06)
(0.06)
CMA
-0.14
-0.28***
-0.15
-0.23**
-0.34***
-0.11
-0.20*
-0.21***
-0.01
(0.11)
(0.09)
(0.11)
(0.11)
(0.09)
(0.09)
(0.11)
(0.08)
(0.09)
Adj.R
2(%
)88.44
84.70
62.79
88.63
86.27
66.08
87.64
87.14
63.38
182

Table 10: Monthly excess return of equally weighted portfolio of issuers re-gressed on factor returns from January 1980 to December 2015. Issuers areincluded in the portfolio for one year (Panel A), two years (Panel B) andthree years (Panel C) starting the second month after announcement. * in-dicates signi�cance on a 10% level, ** on a 5% level, and *** on a 1% level.
Panel A. One-year holding period.(1) (2) (3) (4)
Intercept -0.27*** -0.21** -0.12 -0.19*(0.11) (0.10) (0.11) (0.10)
Mkt-Rf 0.17*** 0.14*** 0.11*** 0.12***(0.02) (0.02) (0.03) (0.03)
SMB 0.02 -0.03 -0.05(0.04) (0.04) (0.04)
HML -0.16*** -0.12** -0.04(0.04) (0.05) (0.05)
RMW -0.17*** -0.22***(0.05) (0.05)
CMA -0.05 -0.12(0.07) (0.07)
WML 0.12***(0.02)
Adj. R2 (%) 10.81 15.05 17.66 22.60
183

Panel B. Two-year holding period.(1) (2) (3) (4)
Intercept -0.38*** -0.31*** -0.22*** -0.24***(0.09) (0.08) (0.09) (0.09)
Mkt-Rf 0.14*** 0.11*** 0.08*** 0.09***(0.02) (0.02) (0.02) (0.02)
SMB -0.02 -0.05* -0.06*(0.03) (0.03) (0.03)
HML -0.17*** -0.10** -0.08*(0.03) (0.04) (0.04)
RMW -0.13*** -0.14***(0.04) (0.04)
CMA -0.11* -0.13**(0.06) (0.06)
WML 0.03*(0.02)
Adj. R2 (%) 10.98 17.15 19.83 20.34
Panel C. Three-year holding period.(1) (2) (3) (4)
Intercept -0.36*** -0.31*** -0.22*** -0.22***(0.08) (0.08) (0.08) (0.08)
Mkt-Rf 0.13*** 0.10*** 0.08*** 0.08***(0.02) (0.02) (0.02) (0.02)
SMB -0.03 -0.06** -0.06**(0.03) (0.03) (0.03)
HML -0.13*** -0.06 -0.06*(0.03) (0.04) (0.04)
RMW -0.13*** -0.13***(0.03) (0.04)
CMA -0.13** -0.13**(0.05) (0.05)
WML -0.01(0.02)
Adj. R2 (%) 10.95 15.71 19.28 19.30
184
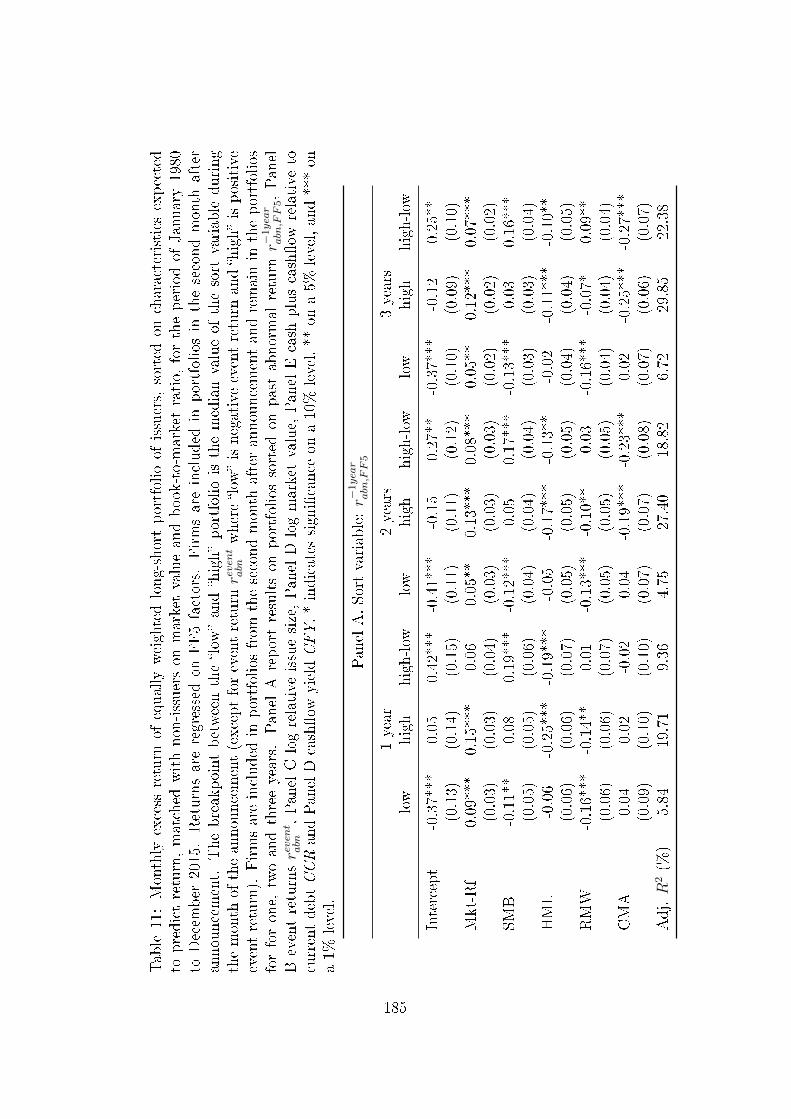
Table
11:Monthly
excess
return
ofequally
weightedlong-shortportfolio
ofissuers,
sorted
oncharacteristicsexpected
topredictreturn,matched
withnon-issuerson
marketvalueandbook-to-marketratio,
fortheperiodof
January1980
toDecem
ber
2015.Returnsareregressedon
FF5factors.
Firmsareincluded
inportfoliosin
thesecondmonth
after
announcement.
Thebreakpointbetweenthe�low
�and�high�portfolio
isthemedianvalueof
thesort
variable
during
themonth
oftheannouncement(exceptforeventreturnre
ven
tabn
where�low
�isnegativeeventreturn
and�high�ispositive
eventreturn).
Firmsareincluded
inportfoliosfrom
thesecondmonth
afterannouncementandremainin
theportfolios
forforone,
twoandthreeyears.
Panel
Areportresultson
portfoliossorted
onpastabnormal
return
r−1yea
rabn
,FF5,Panel
Beventreturnsre
ven
tabn
,Panel
Clogrelative
issuesize,Panel
Dlogmarketvalue,
Panel
Ecash
pluscash�ow
relative
tocurrentdebtCCRandPanelD
cash�ow
yield
CFY.*indicates
signi�cance
ona10%
level,**
ona5%
level,and***on
a1%
level.
PanelA.Sortvariable:r−
1yea
rabn
,FF5
1year
2years
3years
low
high
high-low
low
high
high-low
low
high
high-low
Intercept
-0.37***
0.05
0.42***
-0.41***
-0.15
0.27**
-0.37***
-0.12
0.25**
(0.13)
(0.14)
(0.15)
(0.11)
(0.11)
(0.12)
(0.10)
(0.09)
(0.10)
Mkt-Rf
0.09***
0.15***
0.06
0.05**
0.13***
0.08***
0.05**
0.12***
0.07***
(0.03)
(0.03)
(0.04)
(0.03)
(0.03)
(0.03)
(0.02)
(0.02)
(0.02)
SMB
-0.11**
0.08
0.19***
-0.12***
0.05
0.17***
-0.13***
0.03
0.16***
(0.05)
(0.05)
(0.06)
(0.04)
(0.04)
(0.04)
(0.03)
(0.03)
(0.04)
HML
-0.06
-0.25***
-0.19***
-0.05
-0.17***
-0.13**
-0.02
-0.11***
-0.10**
(0.06)
(0.06)
(0.07)
(0.05)
(0.05)
(0.05)
(0.04)
(0.04)
(0.05)
RMW
-0.16***
-0.14**
0.01
-0.13***
-0.10**
0.03
-0.16***
-0.07*
0.09**
(0.06)
(0.06)
(0.07)
(0.05)
(0.05)
(0.05)
(0.04)
(0.04)
(0.04)
CMA
0.04
0.02
-0.02
0.04
-0.19***
-0.23***
0.02
-0.25***
-0.27***
(0.09)
(0.10)
(0.10)
(0.07)
(0.07)
(0.08)
(0.07)
(0.06)
(0.07)
Adj.R
2(%
)5.84
19.71
9.36
4.75
27.40
18.82
6.72
29.85
22.38
185

PanelB.Sortvariable:re
ven
tabn
1year
2years
3years
low
high
high-low
low
high
high-low
low
high
high-low
Intercept
-0.24**
-0.02
0.22
-0.33***
-0.18
0.15
-0.29***
-0.17
0.11
(0.12)
(0.17)
(0.16)
(0.09)
(0.13)
(0.11)
(0.09)
(0.11)
(0.10)
Mkt-Rf
0.12***
0.11***
-0.01
0.09***
0.09***
0.00
0.08***
0.07***
-0.01
(0.03)
(0.04)
(0.04)
(0.02)
(0.03)
(0.03)
(0.02)
(0.03)
(0.02)
SMB
-0.01
-0.05
-0.04
-0.01
-0.09**
-0.08*
-0.02
-0.11***
-0.08**
(0.04)
(0.06)
(0.06)
(0.03)
(0.05)
(0.04)
(0.03)
(0.04)
(0.04)
HML
-0.09*
-0.27***
-0.17**
-0.08*
-0.15***
-0.08
-0.02
-0.12**
-0.10**
(0.06)
(0.08)
(0.08)
(0.04)
(0.06)
(0.05)
(0.04)
(0.05)
(0.04)
RMW
-0.16***
-0.16**
0.00
-0.11***
-0.14**
-0.02
-0.13***
-0.11**
0.03
(0.05)
(0.07)
(0.07)
(0.04)
(0.06)
(0.05)
(0.04)
(0.05)
(0.04)
CMA
-0.06
0.21*
0.27**
-0.11*
-0.01
0.10
-0.14**
-0.06
0.08
(0.08)
(0.11)
(0.11)
(0.06)
(0.09)
(0.08)
(0.06)
(0.07)
(0.07)
Adj.R
2(%
)14.57
8.33
1.85
15.57
10.02
1.32
16.19
11.30
2.83
186

PanelC.Sortvariable:issue
1year
2years
3years
low
high
high-low
low
high
high-low
low
high
high-low
Intercept
0.03
-0.33**
-0.36**
-0.08
-0.49***
-0.41***
-0.04
-0.48***
-0.43***
(0.13)
(0.15)
(0.16)
(0.10)
(0.12)
(0.12)
(0.09)
(0.10)
(0.10)
Mkt-Rf
0.10***
0.15***
0.05
0.07***
0.11***
0.04
0.06***
0.11***
0.05**
(0.03)
(0.04)
(0.04)
(0.02)
(0.03)
(0.03)
(0.02)
(0.02)
(0.02)
SMB
-0.05
0.03
0.08
-0.10***
0.02
0.12***
-0.09***
0.00
0.09**
(0.05)
(0.06)
(0.06)
(0.04)
(0.04)
(0.04)
(0.03)
(0.04)
(0.04)
HML
-0.16***
-0.13*
0.04
-0.16***
-0.04
0.11**
-0.12***
0.02
0.14***
(0.06)
(0.07)
(0.07)
(0.05)
(0.05)
(0.06)
(0.04)
(0.05)
(0.05)
RMW
-0.21***
-0.09
0.13*
-0.18***
-0.04
0.14**
-0.20***
-0.02
0.18***
(0.06)
(0.07)
(0.07)
(0.04)
(0.05)
(0.05)
(0.04)
(0.05)
(0.04)
CMA
0.00
0.05
0.05
-0.03
-0.14*
-0.11
-0.07
-0.18**
-0.11
(0.09)
(0.10)
(0.11)
(0.07)
(0.08)
(0.08)
(0.06)
(0.07)
(0.07)
Adj.R
2(%
)14.18
8.65
1.27
15.95
9.97
3.83
18.70
10.77
7.40
187

PanelD.Sortvariable:mv
1year
2years
3years
low
high
high-low
low
high
high-low
low
high
high-low
Intercept
-0.26*
-0.04
0.22
-0.38***
-0.18*
0.20*
-0.39***
-0.11
0.28***
(0.15)
(0.12)
(0.16)
(0.12)
(0.10)
(0.12)
(0.11)
(0.09)
(0.10)
Mkt-Rf
0.16***
0.09***
-0.07*
0.10***
0.08***
-0.02
0.10***
0.06***
-0.04
(0.04)
(0.03)
(0.04)
(0.03)
(0.02)
(0.03)
(0.03)
(0.02)
(0.03)
SMB
0.00
-0.03
-0.03
-0.02
-0.07*
-0.05
-0.03
-0.08**
-0.05
(0.05)
(0.04)
(0.06)
(0.04)
(0.04)
(0.04)
(0.04)
(0.03)
(0.04)
HML
-0.14**
-0.16***
-0.02
-0.09*
-0.12***
-0.03
-0.03
-0.08**
-0.05
(0.07)
(0.06)
(0.07)
(0.05)
(0.04)
(0.05)
(0.05)
(0.04)
(0.05)
RMW
-0.09
-0.22***
-0.13*
-0.04
-0.19***
-0.15***
0.00
-0.23***
-0.23***
(0.07)
(0.06)
(0.07)
(0.05)
(0.04)
(0.05)
(0.05)
(0.04)
(0.05)
CMA
0.17*
-0.12
-0.30***
0.00
-0.15**
-0.16*
-0.03
-0.20***
-0.17**
(0.10)
(0.08)
(0.11)
(0.08)
(0.07)
(0.08)
(0.07)
(0.06)
(0.07)
Adj.R
2(%
)7.91
18.11
4.13
6.49
21.50
4.63
5.75
26.24
9.93
188

PanelE.Sortvariable:CCR1(C
ashpluscash�ow
relative
tocurrentdebt)
1year
2years
3years
low
high
high-low
low
high
high-low
low
high
high-low
Intercept
-0.22
-0.20
0.02
-0.60***
-0.22**
0.38**
-0.50***
-0.26**
0.24
(0.23)
(0.14)
(0.22)
(0.17)
(0.11)
(0.17)
(0.15)
(0.11)
(0.15)
Mkt-Rf
0.12**
0.07**
-0.05
0.09**
0.03
-0.06
0.07*
0.07**
0.00
(0.06)
(0.04)
(0.06)
(0.05)
(0.03)
(0.04)
(0.04)
(0.03)
(0.04)
SMB
0.04
-0.05
-0.09
-0.01
-0.08**
-0.07
-0.02
-0.11***
-0.09*
(0.08)
(0.05)
(0.08)
(0.06)
(0.04)
(0.06)
(0.05)
(0.04)
(0.05)
HML
-0.36***
0.00
0.36***
-0.22***
-0.01
0.21***
-0.10
0.00
0.11
(0.10)
(0.06)
(0.10)
(0.08)
(0.05)
(0.08)
(0.07)
(0.05)
(0.07)
RMW
-0.12
-0.02
0.10
-0.06
0.00
0.06
-0.09
0.02
0.11
(0.10)
(0.06)
(0.10)
(0.08)
(0.05)
(0.08)
(0.07)
(0.05)
(0.07)
CMA
0.52***
-0.11
-0.63***
0.28**
-0.09
-0.37***
0.12
-0.05
-0.17*
(0.15)
(0.09)
(0.15)
(0.11)
(0.07)
(0.11)
(0.10)
(0.07)
(0.10)
Adj.R
2(%
)8.95
4.13
9.27
5.32
3.67
6.57
3.91
6.34
5.64
189

PanelF.Sortvariable:CFY(C
ash�ow
yield)
1year
2years
3years
low
high
high-low
low
high
high-low
low
high
high-low
Intercept
-0.26
-0.12
0.14
-0.42***
-0.18
0.24*
-0.44***
-0.15
0.29**
(0.20)
(0.14)
(0.19)
(0.16)
(0.12)
(0.14)
(0.14)
(0.10)
(0.13)
Mkt-Rf
0.24***
0.04
-0.20***
0.17***
0.03
-0.14***
0.17***
0.02
-0.15***
(0.05)
(0.04)
(0.05)
(0.04)
(0.03)
(0.04)
(0.04)
(0.03)
(0.04)
SMB
0.06
-0.12**
-0.18***
0.07
-0.14***
-0.21***
0.05
-0.16***
-0.21***
(0.07)
(0.05)
(0.07)
(0.06)
(0.04)
(0.05)
(0.05)
(0.04)
(0.05)
HML
-0.28***
0.00
0.27***
-0.25***
0.02
0.27***
-0.16**
0.03
0.19***
(0.09)
(0.07)
(0.09)
(0.07)
(0.05)
(0.07)
(0.06)
(0.05)
(0.06)
RMW
-0.34***
0.03
0.37***
-0.25***
0.01
0.26***
-0.18***
-0.05
0.13**
(0.09)
(0.07)
(0.09)
(0.07)
(0.05)
(0.07)
(0.06)
(0.05)
(0.06)
CMA
0.22*
-0.10
-0.32**
0.06
-0.09
-0.15
-0.04
-0.09
-0.05
(0.13)
(0.09)
(0.13)
(0.10)
(0.08)
(0.09)
(0.09)
(0.07)
(0.09)
Adj.R
2(%
)26.47
3.87
29.76
27.57
5.97
35.07
26.18
7.44
30.73
190

TITLER I PH.D.SERIEN:
20041. Martin Grieger Internet-based Electronic Marketplaces and Supply Chain Management
2. Thomas Basbøll LIKENESS A Philosophical Investigation
3. Morten Knudsen Beslutningens vaklen En systemteoretisk analyse of mo-
derniseringen af et amtskommunalt sundhedsvæsen 1980-2000
4. Lars Bo Jeppesen Organizing Consumer Innovation A product development strategy that
is based on online communities and allows some firms to benefit from a distributed process of innovation by consumers
5. Barbara Dragsted SEGMENTATION IN TRANSLATION
AND TRANSLATION MEMORY SYSTEMS An empirical investigation of cognitive segmentation and effects of integra-
ting a TM system into the translation process
6. Jeanet Hardis Sociale partnerskaber Et socialkonstruktivistisk casestudie af partnerskabsaktørers virkeligheds-
opfattelse mellem identitet og legitimitet
7. Henriette Hallberg Thygesen System Dynamics in Action
8. Carsten Mejer Plath Strategisk Økonomistyring
9. Annemette Kjærgaard Knowledge Management as Internal Corporate Venturing
– a Field Study of the Rise and Fall of a Bottom-Up Process
10. Knut Arne Hovdal De profesjonelle i endring Norsk ph.d., ej til salg gennem Samfundslitteratur
11. Søren Jeppesen Environmental Practices and Greening Strategies in Small Manufacturing Enterprises in South Africa – A Critical Realist Approach
12. Lars Frode Frederiksen Industriel forskningsledelse – på sporet af mønstre og samarbejde
i danske forskningsintensive virksom-heder
13. Martin Jes Iversen The Governance of GN Great Nordic – in an age of strategic and structural transitions 1939-1988
14. Lars Pynt Andersen The Rhetorical Strategies of Danish TV Advertising A study of the first fifteen years with special emphasis on genre and irony
15. Jakob Rasmussen Business Perspectives on E-learning
16. Sof Thrane The Social and Economic Dynamics of Networks – a Weberian Analysis of Three Formalised Horizontal Networks
17. Lene Nielsen Engaging Personas and Narrative Scenarios – a study on how a user- centered approach influenced the perception of the design process in
the e-business group at AstraZeneca
18. S.J Valstad Organisationsidentitet Norsk ph.d., ej til salg gennem Samfundslitteratur

19. Thomas Lyse Hansen Six Essays on Pricing and Weather risk
in Energy Markets
20. Sabine Madsen Emerging Methods – An Interpretive Study of ISD Methods in Practice
21. Evis Sinani The Impact of Foreign Direct Inve-
stment on Efficiency, Productivity Growth and Trade: An Empirical Inve-stigation
22. Bent Meier Sørensen Making Events Work Or, How to Multiply Your Crisis
23. Pernille Schnoor Brand Ethos Om troværdige brand- og virksomhedsidentiteter i et retorisk og
diskursteoretisk perspektiv
24. Sidsel Fabech Von welchem Österreich ist hier die
Rede? Diskursive forhandlinger og magt-
kampe mellem rivaliserende nationale identitetskonstruktioner i østrigske pressediskurser
25. Klavs Odgaard Christensen Sprogpolitik og identitetsdannelse i flersprogede forbundsstater Et komparativt studie af Schweiz og Canada
26. Dana B. Minbaeva Human Resource Practices and Knowledge Transfer in Multinational Corporations
27. Holger Højlund Markedets politiske fornuft Et studie af velfærdens organisering i perioden 1990-2003
28. Christine Mølgaard Frandsen A.s erfaring Om mellemværendets praktik i en
transformation af mennesket og subjektiviteten
29. Sine Nørholm Just The Constitution of Meaning – A Meaningful Constitution? Legitimacy, identity, and public opinion
in the debate on the future of Europe
20051. Claus J. Varnes Managing product innovation through rules – The role of formal and structu-
red methods in product development
2. Helle Hedegaard Hein Mellem konflikt og konsensus – Dialogudvikling på hospitalsklinikker
3. Axel Rosenø Customer Value Driven Product Inno-
vation – A Study of Market Learning in New Product Development
4. Søren Buhl Pedersen Making space An outline of place branding
5. Camilla Funck Ellehave Differences that Matter An analysis of practices of gender and organizing in contemporary work-
places
6. Rigmor Madeleine Lond Styring af kommunale forvaltninger
7. Mette Aagaard Andreassen Supply Chain versus Supply Chain Benchmarking as a Means to Managing Supply Chains
8. Caroline Aggestam-Pontoppidan From an idea to a standard The UN and the global governance of accountants’ competence
9. Norsk ph.d.
10. Vivienne Heng Ker-ni An Experimental Field Study on the

Effectiveness of Grocer Media Advertising Measuring Ad Recall and Recognition, Purchase Intentions and Short-Term
Sales
11. Allan Mortensen Essays on the Pricing of Corporate
Bonds and Credit Derivatives
12. Remo Stefano Chiari Figure che fanno conoscere Itinerario sull’idea del valore cognitivo
e espressivo della metafora e di altri tropi da Aristotele e da Vico fino al cognitivismo contemporaneo
13. Anders McIlquham-Schmidt Strategic Planning and Corporate Performance An integrative research review and a meta-analysis of the strategic planning and corporate performance literature from 1956 to 2003
14. Jens Geersbro The TDF – PMI Case Making Sense of the Dynamics of Business Relationships and Networks
15 Mette Andersen Corporate Social Responsibility in Global Supply Chains Understanding the uniqueness of firm behaviour
16. Eva Boxenbaum Institutional Genesis: Micro – Dynamic Foundations of Institutional Change
17. Peter Lund-Thomsen Capacity Development, Environmental Justice NGOs, and Governance: The
Case of South Africa
18. Signe Jarlov Konstruktioner af offentlig ledelse
19. Lars Stæhr Jensen Vocabulary Knowledge and Listening Comprehension in English as a Foreign Language
An empirical study employing data elicited from Danish EFL learners
20. Christian Nielsen Essays on Business Reporting Production and consumption of
strategic information in the market for information
21. Marianne Thejls Fischer Egos and Ethics of Management Consultants
22. Annie Bekke Kjær Performance management i Proces- innovation – belyst i et social-konstruktivistisk perspektiv
23. Suzanne Dee Pedersen GENTAGELSENS METAMORFOSE Om organisering af den kreative gøren
i den kunstneriske arbejdspraksis
24. Benedikte Dorte Rosenbrink Revenue Management Økonomiske, konkurrencemæssige & organisatoriske konsekvenser
25. Thomas Riise Johansen Written Accounts and Verbal Accounts The Danish Case of Accounting and Accountability to Employees
26. Ann Fogelgren-Pedersen The Mobile Internet: Pioneering Users’ Adoption Decisions
27. Birgitte Rasmussen Ledelse i fællesskab – de tillidsvalgtes fornyende rolle
28. Gitte Thit Nielsen Remerger – skabende ledelseskræfter i fusion og opkøb
29. Carmine Gioia A MICROECONOMETRIC ANALYSIS OF MERGERS AND ACQUISITIONS

30. Ole Hinz Den effektive forandringsleder: pilot, pædagog eller politiker? Et studie i arbejdslederes meningstil-
skrivninger i forbindelse med vellykket gennemførelse af ledelsesinitierede forandringsprojekter
31. Kjell-Åge Gotvassli Et praksisbasert perspektiv på dynami-
ske læringsnettverk i toppidretten Norsk ph.d., ej til salg gennem Samfundslitteratur
32. Henriette Langstrup Nielsen Linking Healthcare An inquiry into the changing perfor- mances of web-based technology for asthma monitoring
33. Karin Tweddell Levinsen Virtuel Uddannelsespraksis Master i IKT og Læring – et casestudie
i hvordan proaktiv proceshåndtering kan forbedre praksis i virtuelle lærings-miljøer
34. Anika Liversage Finding a Path Labour Market Life Stories of Immigrant Professionals
35. Kasper Elmquist Jørgensen Studier i samspillet mellem stat og
erhvervsliv i Danmark under 1. verdenskrig
36. Finn Janning A DIFFERENT STORY Seduction, Conquest and Discovery
37. Patricia Ann Plackett Strategic Management of the Radical Innovation Process Leveraging Social Capital for Market Uncertainty Management
20061. Christian Vintergaard Early Phases of Corporate Venturing
2. Niels Rom-Poulsen Essays in Computational Finance
3. Tina Brandt Husman Organisational Capabilities, Competitive Advantage & Project-
Based Organisations The Case of Advertising and Creative Good Production
4. Mette Rosenkrands Johansen Practice at the top – how top managers mobilise and use non-financial performance measures
5. Eva Parum Corporate governance som strategisk kommunikations- og ledelsesværktøj
6. Susan Aagaard Petersen Culture’s Influence on Performance Management: The Case of a Danish Company in China
7. Thomas Nicolai Pedersen The Discursive Constitution of Organi-
zational Governance – Between unity and differentiation
The Case of the governance of environmental risks by World Bank
environmental staff
8. Cynthia Selin Volatile Visions: Transactons in Anticipatory Knowledge
9. Jesper Banghøj Financial Accounting Information and
Compensation in Danish Companies
10. Mikkel Lucas Overby Strategic Alliances in Emerging High-
Tech Markets: What’s the Difference and does it Matter?
11. Tine Aage External Information Acquisition of Industrial Districts and the Impact of Different Knowledge Creation Dimen-
sions

A case study of the Fashion and Design Branch of the Industrial District of Montebelluna, NE Italy
12. Mikkel Flyverbom Making the Global Information Society Governable On the Governmentality of Multi-
Stakeholder Networks
13. Anette Grønning Personen bag Tilstedevær i e-mail som inter-
aktionsform mellem kunde og med-arbejder i dansk forsikringskontekst
14. Jørn Helder One Company – One Language? The NN-case
15. Lars Bjerregaard Mikkelsen Differing perceptions of customer
value Development and application of a tool
for mapping perceptions of customer value at both ends of customer-suppli-er dyads in industrial markets
16. Lise Granerud Exploring Learning Technological learning within small manufacturers in South Africa
17. Esben Rahbek Pedersen Between Hopes and Realities: Reflections on the Promises and Practices of Corporate Social Responsibility (CSR)
18. Ramona Samson The Cultural Integration Model and European Transformation. The Case of Romania
20071. Jakob Vestergaard Discipline in The Global Economy Panopticism and the Post-Washington Consensus
2. Heidi Lund Hansen Spaces for learning and working A qualitative study of change of work, management, vehicles of power and social practices in open offices
3. Sudhanshu Rai Exploring the internal dynamics of
software development teams during user analysis
A tension enabled Institutionalization Model; ”Where process becomes the objective”
4. Norsk ph.d. Ej til salg gennem Samfundslitteratur
5. Serden Ozcan EXPLORING HETEROGENEITY IN ORGANIZATIONAL ACTIONS AND OUTCOMES A Behavioural Perspective
6. Kim Sundtoft Hald Inter-organizational Performance Measurement and Management in
Action – An Ethnography on the Construction
of Management, Identity and Relationships
7. Tobias Lindeberg Evaluative Technologies Quality and the Multiplicity of Performance
8. Merete Wedell-Wedellsborg Den globale soldat Identitetsdannelse og identitetsledelse
i multinationale militære organisatio-ner
9. Lars Frederiksen Open Innovation Business Models Innovation in firm-hosted online user communities and inter-firm project ventures in the music industry – A collection of essays
10. Jonas Gabrielsen Retorisk toposlære – fra statisk ’sted’
til persuasiv aktivitet

11. Christian Moldt-Jørgensen Fra meningsløs til meningsfuld
evaluering. Anvendelsen af studentertilfredsheds- målinger på de korte og mellemlange
videregående uddannelser set fra et psykodynamisk systemperspektiv
12. Ping Gao Extending the application of actor-network theory Cases of innovation in the tele- communications industry
13. Peter Mejlby Frihed og fængsel, en del af den
samme drøm? Et phronetisk baseret casestudie af frigørelsens og kontrollens sam-
eksistens i værdibaseret ledelse! 14. Kristina Birch Statistical Modelling in Marketing
15. Signe Poulsen Sense and sensibility: The language of emotional appeals in
insurance marketing
16. Anders Bjerre Trolle Essays on derivatives pricing and dyna-
mic asset allocation
17. Peter Feldhütter Empirical Studies of Bond and Credit
Markets
18. Jens Henrik Eggert Christensen Default and Recovery Risk Modeling
and Estimation
19. Maria Theresa Larsen Academic Enterprise: A New Mission
for Universities or a Contradiction in Terms?
Four papers on the long-term impli-cations of increasing industry involve-ment and commercialization in acade-mia
20. Morten Wellendorf Postimplementering af teknologi i den
offentlige forvaltning Analyser af en organisations konti-
nuerlige arbejde med informations-teknologi
21. Ekaterina Mhaanna Concept Relations for Terminological
Process Analysis
22. Stefan Ring Thorbjørnsen Forsvaret i forandring Et studie i officerers kapabiliteter un-
der påvirkning af omverdenens foran-dringspres mod øget styring og læring
23. Christa Breum Amhøj Det selvskabte medlemskab om ma-
nagementstaten, dens styringstekno-logier og indbyggere
24. Karoline Bromose Between Technological Turbulence and
Operational Stability – An empirical case study of corporate
venturing in TDC
25. Susanne Justesen Navigating the Paradoxes of Diversity
in Innovation Practice – A Longitudinal study of six very different innovation processes – in
practice
26. Luise Noring Henler Conceptualising successful supply
chain partnerships – Viewing supply chain partnerships
from an organisational culture per-spective
27. Mark Mau Kampen om telefonen Det danske telefonvæsen under den
tyske besættelse 1940-45
28. Jakob Halskov The semiautomatic expansion of
existing terminological ontologies using knowledge patterns discovered

on the WWW – an implementation and evaluation
29. Gergana Koleva European Policy Instruments Beyond
Networks and Structure: The Innova-tive Medicines Initiative
30. Christian Geisler Asmussen Global Strategy and International Diversity: A Double-Edged Sword?
31. Christina Holm-Petersen Stolthed og fordom Kultur- og identitetsarbejde ved ska-
belsen af en ny sengeafdeling gennem fusion
32. Hans Peter Olsen Hybrid Governance of Standardized
States Causes and Contours of the Global
Regulation of Government Auditing
33. Lars Bøge Sørensen Risk Management in the Supply Chain
34. Peter Aagaard Det unikkes dynamikker De institutionelle mulighedsbetingel-
ser bag den individuelle udforskning i professionelt og frivilligt arbejde
35. Yun Mi Antorini Brand Community Innovation An Intrinsic Case Study of the Adult
Fans of LEGO Community
36. Joachim Lynggaard Boll Labor Related Corporate Social Perfor-
mance in Denmark Organizational and Institutional Per-
spectives
20081. Frederik Christian Vinten Essays on Private Equity
2. Jesper Clement Visual Influence of Packaging Design
on In-Store Buying Decisions
3. Marius Brostrøm Kousgaard Tid til kvalitetsmåling? – Studier af indrulleringsprocesser i
forbindelse med introduktionen af kliniske kvalitetsdatabaser i speciallæ-gepraksissektoren
4. Irene Skovgaard Smith Management Consulting in Action Value creation and ambiguity in client-consultant relations
5. Anders Rom Management accounting and inte-
grated information systems How to exploit the potential for ma-
nagement accounting of information technology
6. Marina Candi Aesthetic Design as an Element of Service Innovation in New Technology-
based Firms
7. Morten Schnack Teknologi og tværfaglighed – en analyse af diskussionen omkring indførelse af EPJ på en hospitalsafde-
ling
8. Helene Balslev Clausen Juntos pero no revueltos – un estudio
sobre emigrantes norteamericanos en un pueblo mexicano
9. Lise Justesen Kunsten at skrive revisionsrapporter. En beretning om forvaltningsrevisio-
nens beretninger
10. Michael E. Hansen The politics of corporate responsibility: CSR and the governance of child labor
and core labor rights in the 1990s
11. Anne Roepstorff Holdning for handling – en etnologisk
undersøgelse af Virksomheders Sociale Ansvar/CSR

12. Claus Bajlum Essays on Credit Risk and Credit Derivatives
13. Anders Bojesen The Performative Power of Competen-
ce – an Inquiry into Subjectivity and Social Technologies at Work
14. Satu Reijonen Green and Fragile A Study on Markets and the Natural
Environment
15. Ilduara Busta Corporate Governance in Banking A European Study
16. Kristian Anders Hvass A Boolean Analysis Predicting Industry
Change: Innovation, Imitation & Busi-ness Models
The Winning Hybrid: A case study of isomorphism in the airline industry
17. Trine Paludan De uvidende og de udviklingsparate Identitet som mulighed og restriktion
blandt fabriksarbejdere på det aftaylo-riserede fabriksgulv
18. Kristian Jakobsen Foreign market entry in transition eco-
nomies: Entry timing and mode choice
19. Jakob Elming Syntactic reordering in statistical ma-
chine translation
20. Lars Brømsøe Termansen Regional Computable General Equili-
brium Models for Denmark Three papers laying the foundation for
regional CGE models with agglomera-tion characteristics
21. Mia Reinholt The Motivational Foundations of
Knowledge Sharing
22. Frederikke Krogh-Meibom The Co-Evolution of Institutions and
Technology – A Neo-Institutional Understanding of
Change Processes within the Business Press – the Case Study of Financial Times
23. Peter D. Ørberg Jensen OFFSHORING OF ADVANCED AND
HIGH-VALUE TECHNICAL SERVICES: ANTECEDENTS, PROCESS DYNAMICS AND FIRMLEVEL IMPACTS
24. Pham Thi Song Hanh Functional Upgrading, Relational Capability and Export Performance of
Vietnamese Wood Furniture Producers
25. Mads Vangkilde Why wait? An Exploration of first-mover advanta-
ges among Danish e-grocers through a resource perspective
26. Hubert Buch-Hansen Rethinking the History of European
Level Merger Control A Critical Political Economy Perspective
20091. Vivian Lindhardsen From Independent Ratings to Commu-
nal Ratings: A Study of CWA Raters’ Decision-Making Behaviours
2. Guðrið Weihe Public-Private Partnerships: Meaning
and Practice
3. Chris Nøkkentved Enabling Supply Networks with Colla-
borative Information Infrastructures An Empirical Investigation of Business
Model Innovation in Supplier Relation-ship Management
4. Sara Louise Muhr Wound, Interrupted – On the Vulner-
ability of Diversity Management

5. Christine Sestoft Forbrugeradfærd i et Stats- og Livs-
formsteoretisk perspektiv
6. Michael Pedersen Tune in, Breakdown, and Reboot: On
the production of the stress-fit self-managing employee
7. Salla Lutz Position and Reposition in Networks – Exemplified by the Transformation of
the Danish Pine Furniture Manu- facturers
8. Jens Forssbæck Essays on market discipline in commercial and central banking
9. Tine Murphy Sense from Silence – A Basis for Orga-
nised Action How do Sensemaking Processes with
Minimal Sharing Relate to the Repro-duction of Organised Action?
10. Sara Malou Strandvad Inspirations for a new sociology of art:
A sociomaterial study of development processes in the Danish film industry
11. Nicolaas Mouton On the evolution of social scientific
metaphors: A cognitive-historical enquiry into the
divergent trajectories of the idea that collective entities – states and societies, cities and corporations – are biological organisms.
12. Lars Andreas Knutsen Mobile Data Services: Shaping of user engagements
13. Nikolaos Theodoros Korfiatis Information Exchange and Behavior A Multi-method Inquiry on Online
Communities
14. Jens Albæk Forestillinger om kvalitet og tværfaglig-
hed på sygehuse – skabelse af forestillinger i læge- og
plejegrupperne angående relevans af nye idéer om kvalitetsudvikling gen-nem tolkningsprocesser
15. Maja Lotz The Business of Co-Creation – and the
Co-Creation of Business
16. Gitte P. Jakobsen Narrative Construction of Leader Iden-
tity in a Leader Development Program Context
17. Dorte Hermansen ”Living the brand” som en brandorien-
teret dialogisk praxis: Om udvikling af medarbejdernes
brandorienterede dømmekraft
18. Aseem Kinra Supply Chain (logistics) Environmental
Complexity
19. Michael Nørager How to manage SMEs through the
transformation from non innovative to innovative?
20. Kristin Wallevik Corporate Governance in Family Firms The Norwegian Maritime Sector
21. Bo Hansen Hansen Beyond the Process Enriching Software Process Improve-
ment with Knowledge Management
22. Annemette Skot-Hansen Franske adjektivisk afledte adverbier,
der tager præpositionssyntagmer ind-ledt med præpositionen à som argu-menter
En valensgrammatisk undersøgelse
23. Line Gry Knudsen Collaborative R&D Capabilities In Search of Micro-Foundations

24. Christian Scheuer Employers meet employees Essays on sorting and globalization
25. Rasmus Johnsen The Great Health of Melancholy A Study of the Pathologies of Perfor-
mativity
26. Ha Thi Van Pham Internationalization, Competitiveness
Enhancement and Export Performance of Emerging Market Firms:
Evidence from Vietnam
27. Henriette Balieu Kontrolbegrebets betydning for kausa-
tivalternationen i spansk En kognitiv-typologisk analyse
20101. Yen Tran Organizing Innovationin Turbulent
Fashion Market Four papers on how fashion firms crea-
te and appropriate innovation value
2. Anders Raastrup Kristensen Metaphysical Labour Flexibility, Performance and Commit-
ment in Work-Life Management
3. Margrét Sigrún Sigurdardottir Dependently independent Co-existence of institutional logics in
the recorded music industry
4. Ásta Dis Óladóttir Internationalization from a small do-
mestic base: An empirical analysis of Economics and
Management
5. Christine Secher E-deltagelse i praksis – politikernes og
forvaltningens medkonstruktion og konsekvenserne heraf
6. Marianne Stang Våland What we talk about when we talk
about space:
End User Participation between Proces-ses of Organizational and Architectural Design
7. Rex Degnegaard Strategic Change Management Change Management Challenges in
the Danish Police Reform
8. Ulrik Schultz Brix Værdi i rekruttering – den sikre beslut-
ning En pragmatisk analyse af perception
og synliggørelse af værdi i rekrutte-rings- og udvælgelsesarbejdet
9. Jan Ole Similä Kontraktsledelse Relasjonen mellom virksomhetsledelse
og kontraktshåndtering, belyst via fire norske virksomheter
10. Susanne Boch Waldorff Emerging Organizations: In between
local translation, institutional logics and discourse
11. Brian Kane Performance Talk Next Generation Management of
Organizational Performance
12. Lars Ohnemus Brand Thrust: Strategic Branding and
Shareholder Value An Empirical Reconciliation of two
Critical Concepts
13. Jesper Schlamovitz Håndtering af usikkerhed i film- og
byggeprojekter
14. Tommy Moesby-Jensen Det faktiske livs forbindtlighed Førsokratisk informeret, ny-aristotelisk
τηθος-tænkning hos Martin Heidegger
15. Christian Fich Two Nations Divided by Common Values French National Habitus and the Rejection of American Power

16. Peter Beyer Processer, sammenhængskraft
og fleksibilitet Et empirisk casestudie af omstillings-
forløb i fire virksomheder
17. Adam Buchhorn Markets of Good Intentions Constructing and Organizing Biogas Markets Amid Fragility
and Controversy
18. Cecilie K. Moesby-Jensen Social læring og fælles praksis Et mixed method studie, der belyser
læringskonsekvenser af et lederkursus for et praksisfællesskab af offentlige mellemledere
19. Heidi Boye Fødevarer og sundhed i sen-
modernismen – En indsigt i hyggefænomenet og
de relaterede fødevarepraksisser
20. Kristine Munkgård Pedersen Flygtige forbindelser og midlertidige
mobiliseringer Om kulturel produktion på Roskilde
Festival
21. Oliver Jacob Weber Causes of Intercompany Harmony in
Business Markets – An Empirical Inve-stigation from a Dyad Perspective
22. Susanne Ekman Authority and Autonomy Paradoxes of Modern Knowledge
Work
23. Anette Frey Larsen Kvalitetsledelse på danske hospitaler – Ledelsernes indflydelse på introduk-
tion og vedligeholdelse af kvalitetsstra-tegier i det danske sundhedsvæsen
24. Toyoko Sato Performativity and Discourse: Japanese
Advertisements on the Aesthetic Edu-cation of Desire
25. Kenneth Brinch Jensen Identifying the Last Planner System Lean management in the construction
industry
26. Javier Busquets Orchestrating Network Behavior
for Innovation
27. Luke Patey The Power of Resistance: India’s Na-
tional Oil Company and International Activism in Sudan
28. Mette Vedel Value Creation in Triadic Business Rela-
tionships. Interaction, Interconnection and Position
29. Kristian Tørning Knowledge Management Systems in
Practice – A Work Place Study
30. Qingxin Shi An Empirical Study of Thinking Aloud
Usability Testing from a Cultural Perspective
31. Tanja Juul Christiansen Corporate blogging: Medarbejderes
kommunikative handlekraft
32. Malgorzata Ciesielska Hybrid Organisations. A study of the Open Source – business
setting
33. Jens Dick-Nielsen Three Essays on Corporate Bond
Market Liquidity
34. Sabrina Speiermann Modstandens Politik Kampagnestyring i Velfærdsstaten. En diskussion af trafikkampagners sty-
ringspotentiale
35. Julie Uldam Fickle Commitment. Fostering political
engagement in 'the flighty world of online activism’

36. Annegrete Juul Nielsen Traveling technologies and
transformations in health care
37. Athur Mühlen-Schulte Organising Development Power and Organisational Reform in
the United Nations Development Programme
38. Louise Rygaard Jonas Branding på butiksgulvet Et case-studie af kultur- og identitets-
arbejdet i Kvickly
20111. Stefan Fraenkel Key Success Factors for Sales Force
Readiness during New Product Launch A Study of Product Launches in the
Swedish Pharmaceutical Industry
2. Christian Plesner Rossing International Transfer Pricing in Theory
and Practice
3. Tobias Dam Hede Samtalekunst og ledelsesdisciplin – en analyse af coachingsdiskursens
genealogi og governmentality
4. Kim Pettersson Essays on Audit Quality, Auditor Choi-
ce, and Equity Valuation
5. Henrik Merkelsen The expert-lay controversy in risk
research and management. Effects of institutional distances. Studies of risk definitions, perceptions, management and communication
6. Simon S. Torp Employee Stock Ownership: Effect on Strategic Management and
Performance
7. Mie Harder Internal Antecedents of Management
Innovation
8. Ole Helby Petersen Public-Private Partnerships: Policy and
Regulation – With Comparative and Multi-level Case Studies from Denmark and Ireland
9. Morten Krogh Petersen ’Good’ Outcomes. Handling Multipli-
city in Government Communication
10. Kristian Tangsgaard Hvelplund Allocation of cognitive resources in
translation - an eye-tracking and key-logging study
11. Moshe Yonatany The Internationalization Process of
Digital Service Providers
12. Anne Vestergaard Distance and Suffering Humanitarian Discourse in the age of
Mediatization
13. Thorsten Mikkelsen Personligsheds indflydelse på forret-
ningsrelationer
14. Jane Thostrup Jagd Hvorfor fortsætter fusionsbølgen ud-
over ”the tipping point”? – en empirisk analyse af information
og kognitioner om fusioner
15. Gregory Gimpel Value-driven Adoption and Consump-
tion of Technology: Understanding Technology Decision Making
16. Thomas Stengade Sønderskov Den nye mulighed Social innovation i en forretningsmæs-
sig kontekst
17. Jeppe Christoffersen Donor supported strategic alliances in
developing countries
18. Vibeke Vad Baunsgaard Dominant Ideological Modes of
Rationality: Cross functional

integration in the process of product innovation
19. Throstur Olaf Sigurjonsson Governance Failure and Icelands’s Financial Collapse
20. Allan Sall Tang Andersen Essays on the modeling of risks in interest-rate and infl ation markets
21. Heidi Tscherning Mobile Devices in Social Contexts
22. Birgitte Gorm Hansen Adapting in the Knowledge Economy Lateral Strategies for Scientists and
Those Who Study Them
23. Kristina Vaarst Andersen Optimal Levels of Embeddedness The Contingent Value of Networked
Collaboration
24. Justine Grønbæk Pors Noisy Management A History of Danish School Governing
from 1970-2010
25. Stefan Linder Micro-foundations of Strategic
Entrepreneurship Essays on Autonomous Strategic Action
26. Xin Li Toward an Integrative Framework of
National Competitiveness An application to China
27. Rune Thorbjørn Clausen Værdifuld arkitektur Et eksplorativt studie af bygningers
rolle i virksomheders værdiskabelse
28. Monica Viken Markedsundersøkelser som bevis i
varemerke- og markedsføringsrett
29. Christian Wymann Tattooing The Economic and Artistic Constitution
of a Social Phenomenon
30. Sanne Frandsen Productive Incoherence A Case Study of Branding and
Identity Struggles in a Low-Prestige Organization
31. Mads Stenbo Nielsen Essays on Correlation Modelling
32. Ivan Häuser Følelse og sprog Etablering af en ekspressiv kategori,
eksemplifi ceret på russisk
33. Sebastian Schwenen Security of Supply in Electricity Markets
20121. Peter Holm Andreasen The Dynamics of Procurement
Management - A Complexity Approach
2. Martin Haulrich Data-Driven Bitext Dependency Parsing and Alignment
3. Line Kirkegaard Konsulenten i den anden nat En undersøgelse af det intense
arbejdsliv
4. Tonny Stenheim Decision usefulness of goodwill
under IFRS
5. Morten Lind Larsen Produktivitet, vækst og velfærd Industrirådet og efterkrigstidens
Danmark 1945 - 1958
6. Petter Berg Cartel Damages and Cost Asymmetries
7. Lynn Kahle Experiential Discourse in Marketing A methodical inquiry into practice
and theory
8. Anne Roelsgaard Obling Management of Emotions
in Accelerated Medical Relationships

9. Thomas Frandsen Managing Modularity of
Service Processes Architecture
10. Carina Christine Skovmøller CSR som noget særligt Et casestudie om styring og menings-
skabelse i relation til CSR ud fra en intern optik
11. Michael Tell Fradragsbeskæring af selskabers
fi nansieringsudgifter En skatteretlig analyse af SEL §§ 11,
11B og 11C
12. Morten Holm Customer Profi tability Measurement
Models Their Merits and Sophistication
across Contexts
13. Katja Joo Dyppel Beskatning af derivater En analyse af dansk skatteret
14. Esben Anton Schultz Essays in Labor Economics Evidence from Danish Micro Data
15. Carina Risvig Hansen ”Contracts not covered, or not fully
covered, by the Public Sector Directive”
16. Anja Svejgaard Pors Iværksættelse af kommunikation - patientfi gurer i hospitalets strategiske
kommunikation
17. Frans Bévort Making sense of management with
logics An ethnographic study of accountants
who become managers
18. René Kallestrup The Dynamics of Bank and Sovereign
Credit Risk
19. Brett Crawford Revisiting the Phenomenon of Interests
in Organizational Institutionalism The Case of U.S. Chambers of
Commerce
20. Mario Daniele Amore Essays on Empirical Corporate Finance
21. Arne Stjernholm Madsen The evolution of innovation strategy Studied in the context of medical
device activities at the pharmaceutical company Novo Nordisk A/S in the period 1980-2008
22. Jacob Holm Hansen Is Social Integration Necessary for
Corporate Branding? A study of corporate branding
strategies at Novo Nordisk
23. Stuart Webber Corporate Profi t Shifting and the
Multinational Enterprise
24. Helene Ratner Promises of Refl exivity Managing and Researching
Inclusive Schools
25. Therese Strand The Owners and the Power: Insights
from Annual General Meetings
26. Robert Gavin Strand In Praise of Corporate Social
Responsibility Bureaucracy
27. Nina Sormunen Auditor’s going-concern reporting Reporting decision and content of the
report
28. John Bang Mathiasen Learning within a product development
working practice: - an understanding anchored
in pragmatism
29. Philip Holst Riis Understanding Role-Oriented Enterprise
Systems: From Vendors to Customers
30. Marie Lisa Dacanay Social Enterprises and the Poor Enhancing Social Entrepreneurship and
Stakeholder Theory

31. Fumiko Kano Glückstad Bridging Remote Cultures: Cross-lingual
concept mapping based on the information receiver’s prior-knowledge
32. Henrik Barslund Fosse Empirical Essays in International Trade
33. Peter Alexander Albrecht Foundational hybridity and its
reproduction Security sector reform in Sierra Leone
34. Maja Rosenstock CSR - hvor svært kan det være? Kulturanalytisk casestudie om
udfordringer og dilemmaer med at forankre Coops CSR-strategi
35. Jeanette Rasmussen Tweens, medier og forbrug Et studie af 10-12 årige danske børns
brug af internettet, opfattelse og for-ståelse af markedsføring og forbrug
36. Ib Tunby Gulbrandsen ‘This page is not intended for a
US Audience’ A fi ve-act spectacle on online
communication, collaboration & organization.
37. Kasper Aalling Teilmann Interactive Approaches to
Rural Development
38. Mette Mogensen The Organization(s) of Well-being
and Productivity (Re)assembling work in the Danish Post
39. Søren Friis Møller From Disinterestedness to Engagement Towards Relational Leadership In the
Cultural Sector
40. Nico Peter Berhausen Management Control, Innovation and
Strategic Objectives – Interactions and Convergence in Product Development Networks
41. Balder Onarheim Creativity under Constraints Creativity as Balancing
‘Constrainedness’
42. Haoyong Zhou Essays on Family Firms
43. Elisabeth Naima Mikkelsen Making sense of organisational confl ict An empirical study of enacted sense-
making in everyday confl ict at work
20131. Jacob Lyngsie Entrepreneurship in an Organizational
Context
2. Signe Groth-Brodersen Fra ledelse til selvet En socialpsykologisk analyse af
forholdet imellem selvledelse, ledelse og stress i det moderne arbejdsliv
3. Nis Høyrup Christensen Shaping Markets: A Neoinstitutional
Analysis of the Emerging Organizational Field of Renewable Energy in China
4. Christian Edelvold Berg As a matter of size THE IMPORTANCE OF CRITICAL
MASS AND THE CONSEQUENCES OF SCARCITY FOR TELEVISION MARKETS
5. Christine D. Isakson Coworker Infl uence and Labor Mobility
Essays on Turnover, Entrepreneurship and Location Choice in the Danish Maritime Industry
6. Niels Joseph Jerne Lennon Accounting Qualities in Practice
Rhizomatic stories of representational faithfulness, decision making and control
7. Shannon O’Donnell Making Ensemble Possible How special groups organize for
collaborative creativity in conditions of spatial variability and distance

8. Robert W. D. Veitch Access Decisions in a
Partly-Digital WorldComparing Digital Piracy and Legal Modes for Film and Music
9. Marie Mathiesen Making Strategy Work An Organizational Ethnography
10. Arisa Shollo The role of business intelligence in organizational decision-making
11. Mia Kaspersen The construction of social and
environmental reporting
12. Marcus Møller Larsen The organizational design of offshoring
13. Mette Ohm Rørdam EU Law on Food Naming The prohibition against misleading names in an internal market context
14. Hans Peter Rasmussen GIV EN GED! Kan giver-idealtyper forklare støtte til velgørenhed og understøtte relationsopbygning?
15. Ruben Schachtenhaufen Fonetisk reduktion i dansk
16. Peter Koerver Schmidt Dansk CFC-beskatning I et internationalt og komparativt
perspektiv
17. Morten Froholdt Strategi i den offentlige sektor En kortlægning af styringsmæssig kontekst, strategisk tilgang, samt anvendte redskaber og teknologier for udvalgte danske statslige styrelser
18. Annette Camilla Sjørup Cognitive effort in metaphor translation An eye-tracking and key-logging study
19. Tamara Stucchi The Internationalization
of Emerging Market Firms: A Context-Specifi c Study
20. Thomas Lopdrup-Hjorth “Let’s Go Outside”: The Value of Co-Creation
21. Ana Alačovska Genre and Autonomy in Cultural Production The case of travel guidebook production
22. Marius Gudmand-Høyer Stemningssindssygdommenes historie
i det 19. århundrede Omtydningen af melankolien og
manien som bipolære stemningslidelser i dansk sammenhæng under hensyn til dannelsen af det moderne følelseslivs relative autonomi.
En problematiserings- og erfarings-analytisk undersøgelse
23. Lichen Alex Yu Fabricating an S&OP Process Circulating References and Matters
of Concern
24. Esben Alfort The Expression of a Need Understanding search
25. Trine Pallesen Assembling Markets for Wind Power An Inquiry into the Making of Market Devices
26. Anders Koed Madsen Web-Visions Repurposing digital traces to organize social attention
27. Lærke Højgaard Christiansen BREWING ORGANIZATIONAL RESPONSES TO INSTITUTIONAL LOGICS
28. Tommy Kjær Lassen EGENTLIG SELVLEDELSE En ledelsesfi losofi sk afhandling om
selvledelsens paradoksale dynamik og eksistentielle engagement

29. Morten Rossing Local Adaption and Meaning Creation in Performance Appraisal
30. Søren Obed Madsen Lederen som oversætter Et oversættelsesteoretisk perspektiv på strategisk arbejde
31. Thomas Høgenhaven Open Government Communities Does Design Affect Participation?
32. Kirstine Zinck Pedersen Failsafe Organizing? A Pragmatic Stance on Patient Safety
33. Anne Petersen Hverdagslogikker i psykiatrisk arbejde En institutionsetnografi sk undersøgelse af hverdagen i psykiatriske organisationer
34. Didde Maria Humle Fortællinger om arbejde
35. Mark Holst-Mikkelsen Strategieksekvering i praksis – barrierer og muligheder!
36. Malek Maalouf Sustaining lean Strategies for dealing with organizational paradoxes
37. Nicolaj Tofte Brenneche Systemic Innovation In The Making The Social Productivity of Cartographic Crisis and Transitions in the Case of SEEIT
38. Morten Gylling The Structure of Discourse A Corpus-Based Cross-Linguistic Study
39. Binzhang YANG Urban Green Spaces for Quality Life - Case Study: the landscape
architecture for people in Copenhagen
40. Michael Friis Pedersen Finance and Organization: The Implications for Whole Farm Risk Management
41. Even Fallan Issues on supply and demand for environmental accounting information
42. Ather Nawaz Website user experience A cross-cultural study of the relation between users´ cognitive style, context of use, and information architecture of local websites
43. Karin Beukel The Determinants for Creating Valuable Inventions
44. Arjan Markus External Knowledge Sourcing and Firm Innovation Essays on the Micro-Foundations of Firms’ Search for Innovation
20141. Solon Moreira Four Essays on Technology Licensing
and Firm Innovation
2. Karin Strzeletz Ivertsen Partnership Drift in Innovation Processes A study of the Think City electric car development
3. Kathrine Hoffmann Pii Responsibility Flows in Patient-centred Prevention
4. Jane Bjørn Vedel Managing Strategic Research An empirical analysis of science-industry collaboration in a pharmaceutical company
5. Martin Gylling Processuel strategi i organisationer Monografi om dobbeltheden i tænkning af strategi, dels som vidensfelt i organisationsteori, dels som kunstnerisk tilgang til at skabe i erhvervsmæssig innovation

6. Linne Marie Lauesen Corporate Social Responsibility in the Water Sector: How Material Practices and their Symbolic and Physical Meanings Form a Colonising Logic
7. Maggie Qiuzhu Mei LEARNING TO INNOVATE: The role of ambidexterity, standard, and decision process
8. Inger Høedt-Rasmussen Developing Identity for Lawyers Towards Sustainable Lawyering
9. Sebastian Fux Essays on Return Predictability and Term Structure Modelling
10. Thorbjørn N. M. Lund-Poulsen Essays on Value Based Management
11. Oana Brindusa Albu Transparency in Organizing: A Performative Approach
12. Lena Olaison Entrepreneurship at the limits
13. Hanne Sørum DRESSED FOR WEB SUCCESS? An Empirical Study of Website Quality
in the Public Sector
14. Lasse Folke Henriksen Knowing networks How experts shape transnational governance
15. Maria Halbinger Entrepreneurial Individuals Empirical Investigations into Entrepreneurial Activities of Hackers and Makers
16. Robert Spliid Kapitalfondenes metoder og kompetencer
17. Christiane Stelling Public-private partnerships & the need, development and management of trusting A processual and embedded exploration
18. Marta Gasparin Management of design as a translation process
19. Kåre Moberg Assessing the Impact of Entrepreneurship Education From ABC to PhD
20. Alexander Cole Distant neighbors Collective learning beyond the cluster
21. Martin Møller Boje Rasmussen Is Competitiveness a Question of Being Alike? How the United Kingdom, Germany and Denmark Came to Compete through their Knowledge Regimes from 1993 to 2007
22. Anders Ravn Sørensen Studies in central bank legitimacy, currency and national identity Four cases from Danish monetary history
23. Nina Bellak Can Language be Managed in
International Business? Insights into Language Choice from a Case Study of Danish and Austrian Multinational Corporations (MNCs)
24. Rikke Kristine Nielsen Global Mindset as Managerial Meta-competence and Organizational Capability: Boundary-crossing Leadership Cooperation in the MNC The Case of ‘Group Mindset’ in Solar A/S.
25. Rasmus Koss Hartmann User Innovation inside government Towards a critically performative foundation for inquiry

26. Kristian Gylling Olesen Flertydig og emergerende ledelse i
folkeskolen Et aktør-netværksteoretisk ledelses-
studie af politiske evalueringsreformers betydning for ledelse i den danske folkeskole
27. Troels Riis Larsen Kampen om Danmarks omdømme
1945-2010 Omdømmearbejde og omdømmepolitik
28. Klaus Majgaard Jagten på autenticitet i offentlig styring
29. Ming Hua Li Institutional Transition and Organizational Diversity: Differentiated internationalization strategies of emerging market state-owned enterprises
30. Sofi e Blinkenberg Federspiel IT, organisation og digitalisering: Institutionelt arbejde i den kommunale digitaliseringsproces
31. Elvi Weinreich Hvilke offentlige ledere er der brug for når velfærdstænkningen fl ytter sig – er Diplomuddannelsens lederprofi l svaret?
32. Ellen Mølgaard Korsager Self-conception and image of context in the growth of the fi rm – A Penrosian History of Fiberline Composites
33. Else Skjold The Daily Selection
34. Marie Louise Conradsen The Cancer Centre That Never Was The Organisation of Danish Cancer Research 1949-1992
35. Virgilio Failla Three Essays on the Dynamics of
Entrepreneurs in the Labor Market
36. Nicky Nedergaard Brand-Based Innovation Relational Perspectives on Brand Logics
and Design Innovation Strategies and Implementation
37. Mads Gjedsted Nielsen Essays in Real Estate Finance
38. Kristin Martina Brandl Process Perspectives on
Service Offshoring
39. Mia Rosa Koss Hartmann In the gray zone With police in making space for creativity
40. Karen Ingerslev Healthcare Innovation under
The Microscope Framing Boundaries of Wicked
Problems
41. Tim Neerup Themsen Risk Management in large Danish
public capital investment programmes
20151. Jakob Ion Wille Film som design Design af levende billeder i
fi lm og tv-serier
2. Christiane Mossin Interzones of Law and Metaphysics Hierarchies, Logics and Foundations
of Social Order seen through the Prism of EU Social Rights
3. Thomas Tøth TRUSTWORTHINESS: ENABLING
GLOBAL COLLABORATION An Ethnographic Study of Trust,
Distance, Control, Culture and Boundary Spanning within Offshore Outsourcing of IT Services
4. Steven Højlund Evaluation Use in Evaluation Systems – The Case of the European Commission

5. Julia Kirch Kirkegaard AMBIGUOUS WINDS OF CHANGE – OR FIGHTING AGAINST WINDMILLS IN CHINESE WIND POWER A CONSTRUCTIVIST INQUIRY INTO CHINA’S PRAGMATICS OF GREEN MARKETISATION MAPPING CONTROVERSIES OVER A POTENTIAL TURN TO QUALITY IN CHINESE WIND POWER
6. Michelle Carol Antero A Multi-case Analysis of the
Development of Enterprise Resource Planning Systems (ERP) Business Practices
Morten Friis-Olivarius The Associative Nature of Creativity
7. Mathew Abraham New Cooperativism: A study of emerging producer
organisations in India
8. Stine Hedegaard Sustainability-Focused Identity: Identity work performed to manage, negotiate and resolve barriers and tensions that arise in the process of constructing or ganizational identity in a sustainability context
9. Cecilie Glerup Organizing Science in Society – the conduct and justifi cation of resposible research
10. Allan Salling Pedersen Implementering af ITIL® IT-governance - når best practice konfl ikter med kulturen Løsning af implementerings- problemer gennem anvendelse af kendte CSF i et aktionsforskningsforløb.
11. Nihat Misir A Real Options Approach to Determining Power Prices
12. Mamdouh Medhat MEASURING AND PRICING THE RISK OF CORPORATE FAILURES
13. Rina Hansen Toward a Digital Strategy for Omnichannel Retailing
14. Eva Pallesen In the rhythm of welfare creation A relational processual investigation
moving beyond the conceptual horizon of welfare management
15. Gouya Harirchi In Search of Opportunities: Three Essays on Global Linkages for Innovation
16. Lotte Holck Embedded Diversity: A critical ethnographic study of the structural tensions of organizing diversity
17. Jose Daniel Balarezo Learning through Scenario Planning
18. Louise Pram Nielsen Knowledge dissemination based on
terminological ontologies. Using eye tracking to further user interface design.
19. Sofi e Dam PUBLIC-PRIVATE PARTNERSHIPS FOR
INNOVATION AND SUSTAINABILITY TRANSFORMATION
An embedded, comparative case study of municipal waste management in England and Denmark
20. Ulrik Hartmyer Christiansen Follwoing the Content of Reported Risk
Across the Organization
21. Guro Refsum Sanden Language strategies in multinational
corporations. A cross-sector study of fi nancial service companies and manufacturing companies.
22. Linn Gevoll Designing performance management
for operational level - A closer look on the role of design
choices in framing coordination and motivation

23. Frederik Larsen Objects and Social Actions – on Second-hand Valuation Practices
24. Thorhildur Hansdottir Jetzek The Sustainable Value of Open
Government Data Uncovering the Generative Mechanisms
of Open Data through a Mixed Methods Approach
25. Gustav Toppenberg Innovation-based M&A – Technological-Integration
Challenges – The Case of Digital-Technology Companies
26. Mie Plotnikof Challenges of Collaborative
Governance An Organizational Discourse Study
of Public Managers’ Struggles with Collaboration across the Daycare Area
27. Christian Garmann Johnsen Who Are the Post-Bureaucrats? A Philosophical Examination of the
Creative Manager, the Authentic Leader and the Entrepreneur
28. Jacob Brogaard-Kay Constituting Performance Management A fi eld study of a pharmaceutical
company
29. Rasmus Ploug Jenle Engineering Markets for Control:
Integrating Wind Power into the Danish Electricity System
30. Morten Lindholst Complex Business Negotiation:
Understanding Preparation and Planning
31. Morten Grynings TRUST AND TRANSPARENCY FROM AN ALIGNMENT PERSPECTIVE
32. Peter Andreas Norn Byregimer og styringsevne: Politisk
lederskab af store byudviklingsprojekter
33. Milan Miric Essays on Competition, Innovation and
Firm Strategy in Digital Markets
34. Sanne K. Hjordrup The Value of Talent Management Rethinking practice, problems and
possibilities
35. Johanna Sax Strategic Risk Management – Analyzing Antecedents and
Contingencies for Value Creation
36. Pernille Rydén Strategic Cognition of Social Media
37. Mimmi Sjöklint The Measurable Me - The Infl uence of Self-tracking on the User Experience
38. Juan Ignacio Staricco Towards a Fair Global Economic Regime? A critical assessment of Fair Trade through the examination of the Argentinean wine industry
39. Marie Henriette Madsen Emerging and temporary connections in Quality work
40. Yangfeng CAO Toward a Process Framework of Business Model Innovation in the Global Context Entrepreneurship-Enabled Dynamic Capability of Medium-Sized Multinational Enterprises
41. Carsten Scheibye Enactment of the Organizational Cost Structure in Value Chain Confi guration A Contribution to Strategic Cost Management

20161. Signe Sofi e Dyrby Enterprise Social Media at Work
2. Dorte Boesby Dahl The making of the public parking
attendant Dirt, aesthetics and inclusion in public
service work
3. Verena Girschik Realizing Corporate Responsibility
Positioning and Framing in Nascent Institutional Change
4. Anders Ørding Olsen IN SEARCH OF SOLUTIONS Inertia, Knowledge Sources and Diver-
sity in Collaborative Problem-solving
5. Pernille Steen Pedersen Udkast til et nyt copingbegreb En kvalifi kation af ledelsesmuligheder
for at forebygge sygefravær ved psykiske problemer.
6. Kerli Kant Hvass Weaving a Path from Waste to Value:
Exploring fashion industry business models and the circular economy
7. Kasper Lindskow Exploring Digital News Publishing
Business Models – a production network approach
8. Mikkel Mouritz Marfelt The chameleon workforce: Assembling and negotiating the content of a workforce
9. Marianne Bertelsen Aesthetic encounters Rethinking autonomy, space & time
in today’s world of art
10. Louise Hauberg Wilhelmsen EU PERSPECTIVES ON INTERNATIONAL COMMERCIAL ARBITRATION
11. Abid Hussain On the Design, Development and
Use of the Social Data Analytics Tool (SODATO): Design Propositions, Patterns, and Principles for Big Social Data Analytics
12. Mark Bruun Essays on Earnings Predictability
13. Tor Bøe-Lillegraven BUSINESS PARADOXES, BLACK BOXES, AND BIG DATA: BEYOND ORGANIZATIONAL AMBIDEXTERITY
14. Hadis Khonsary-Atighi ECONOMIC DETERMINANTS OF
DOMESTIC INVESTMENT IN AN OIL-BASED ECONOMY: THE CASE OF IRAN (1965-2010)
15. Maj Lervad Grasten Rule of Law or Rule by Lawyers?
On the Politics of Translation in Global Governance
16. Lene Granzau Juel-Jacobsen SUPERMARKEDETS MODUS OPERANDI – en hverdagssociologisk undersøgelse af forholdet mellem rum og handlen og understøtte relationsopbygning?
17. Christine Thalsgård Henriques In search of entrepreneurial learning – Towards a relational perspective on incubating practices?
18. Patrick Bennett Essays in Education, Crime, and Job Displacement
19. Søren Korsgaard Payments and Central Bank Policy
20. Marie Kruse Skibsted Empirical Essays in Economics of
Education and Labor
21. Elizabeth Benedict Christensen The Constantly Contingent Sense of
Belonging of the 1.5 Generation Undocumented Youth
An Everyday Perspective

22. Lasse J. Jessen Essays on Discounting Behavior and
Gambling Behavior
23. Kalle Johannes Rose Når stifterviljen dør… Et retsøkonomisk bidrag til 200 års juridisk konfl ikt om ejendomsretten
24. Andreas Søeborg Kirkedal Danish Stød and Automatic Speech Recognition
25. Ida Lunde Jørgensen Institutions and Legitimations in Finance for the Arts
26. Olga Rykov Ibsen An empirical cross-linguistic study of directives: A semiotic approach to the sentence forms chosen by British, Danish and Russian speakers in native and ELF contexts
27. Desi Volker Understanding Interest Rate Volatility
28. Angeli Elizabeth Weller Practice at the Boundaries of Business Ethics & Corporate Social Responsibility
29. Ida Danneskiold-Samsøe Levende læring i kunstneriske organisationer En undersøgelse af læringsprocesser mellem projekt og organisation på Aarhus Teater
30. Leif Christensen Quality of information – The role of
internal controls and materiality
31. Olga Zarzecka Tie Content in Professional Networks
32. Henrik Mahncke De store gaver - Filantropiens gensidighedsrelationer i
teori og praksis
33. Carsten Lund Pedersen Using the Collective Wisdom of
Frontline Employees in Strategic Issue Management
34. Yun Liu Essays on Market Design
35. Denitsa Hazarbassanova Blagoeva The Internationalisation of Service Firms
36. Manya Jaura Lind Capability development in an off-
shoring context: How, why and by whom
37. Luis R. Boscán F. Essays on the Design of Contracts and
Markets for Power System Flexibility
38. Andreas Philipp Distel Capabilities for Strategic Adaptation: Micro-Foundations, Organizational
Conditions, and Performance Implications
39. Lavinia Bleoca The Usefulness of Innovation and
Intellectual Capital in Business Performance: The Financial Effects of
Knowledge Management vs. Disclosure
40. Henrik Jensen Economic Organization and Imperfect
Managerial Knowledge: A Study of the Role of Managerial Meta-Knowledge in the Management of Distributed Knowledge
41. Stine Mosekjær The Understanding of English Emotion Words by Chinese and Japanese Speakers of English as a Lingua Franca An Empirical Study
42. Hallur Tor Sigurdarson The Ministry of Desire - Anxiety and entrepreneurship in a bureaucracy
43. Kätlin Pulk Making Time While Being in Time A study of the temporality of organizational processes
44. Valeria Giacomin Contextualizing the cluster Palm oil in Southeast Asia in global perspective (1880s–1970s)

45. Jeanette Willert Managers’ use of multiple
Management Control Systems: The role and interplay of management
control systems and company performance
46. Mads Vestergaard Jensen Financial Frictions: Implications for Early
Option Exercise and Realized Volatility
47. Mikael Reimer Jensen Interbank Markets and Frictions
48. Benjamin Faigen Essays on Employee Ownership
49. Adela Michea Enacting Business Models An Ethnographic Study of an Emerging
Business Model Innovation within the Frame of a Manufacturing Company.
50. Iben Sandal Stjerne Transcending organization in
temporary systems Aesthetics’ organizing work and
employment in Creative Industries
51. Simon Krogh Anticipating Organizational Change
52. Sarah Netter Exploring the Sharing Economy
53. Lene Tolstrup Christensen State-owned enterprises as institutional
market actors in the marketization of public service provision:
A comparative case study of Danish and Swedish passenger rail 1990–2015
54. Kyoung(Kay) Sun Park Three Essays on Financial Economics
20171. Mari Bjerck Apparel at work. Work uniforms and
women in male-dominated manual occupations.
2. Christoph H. Flöthmann Who Manages Our Supply Chains? Backgrounds, Competencies and
Contributions of Human Resources in Supply Chain Management
3. Aleksandra Anna Rzeznik Essays in Empirical Asset Pricing
4. Claes Bäckman Essays on Housing Markets
5. Kirsti Reitan Andersen Stabilizing Sustainability
in the Textile and Fashion Industry
6. Kira Hoffmann Cost Behavior: An Empirical Analysis of Determinants and Consequences of Asymmetries
7. Tobin Hanspal Essays in Household Finance
8. Nina Lange Correlation in Energy Markets
9. Anjum Fayyaz Donor Interventions and SME Networking in Industrial Clusters in Punjab Province, Pakistan
10. Magnus Paulsen Hansen Trying the unemployed. Justifi ca-
tion and critique, emancipation and coercion towards the ‘active society’. A study of contemporary reforms in France and Denmark
11. Sameer Azizi Corporate Social Responsibility in
Afghanistan – a critical case study of the mobile
telecommunications industry

12. Malene Myhre The internationalization of small and
medium-sized enterprises: A qualitative study
13. Thomas Presskorn-Thygesen The Signifi cance of Normativity – Studies in Post-Kantian Philosophy and
Social Theory
14. Federico Clementi Essays on multinational production and
international trade
15. Lara Anne Hale Experimental Standards in Sustainability
Transitions: Insights from the Building Sector
16. Richard Pucci Accounting for Financial Instruments in
an Uncertain World Controversies in IFRS in the Aftermath
of the 2008 Financial Crisis
17. Sarah Maria Denta Kommunale offentlige private
partnerskaber Regulering I skyggen af Farumsagen
18. Christian Östlund Design for e-training
19. Amalie Martinus Hauge Organizing Valuations – a pragmatic
inquiry
20. Tim Holst Celik Tension-fi lled Governance? Exploring
the Emergence, Consolidation and Reconfi guration of Legitimatory and Fiscal State-crafting
21. Christian Bason Leading Public Design: How managers
engage with design to transform public governance
22. Davide Tomio Essays on Arbitrage and Market
Liquidity
23. Simone Stæhr Financial Analysts’ Forecasts Behavioral Aspects and the Impact of
Personal Characteristics
24. Mikkel Godt Gregersen Management Control, Intrinsic
Motivation and Creativity – How Can They Coexist
25. Kristjan Johannes Suse Jespersen Advancing the Payments for Ecosystem
Service Discourse Through Institutional Theory
26. Kristian Bondo Hansen Crowds and Speculation: A study of
crowd phenomena in the U.S. fi nancial markets 1890 to 1940
27. Lars Balslev Actors and practices – An institutional
study on management accounting change in Air Greenland
28. Sven Klingler Essays on Asset Pricing with
Financial Frictions
29. Klement Ahrensbach Rasmussen Business Model Innovation The Role of Organizational Design
30. Giulio Zichella Entrepreneurial Cognition.
Three essays on entrepreneurial behavior and cognition under risk and uncertainty
31. Richard Ledborg Hansen En forkærlighed til det eksister-
ende – mellemlederens oplevelse af forandringsmodstand i organisatoriske forandringer
32. Vilhelm Stefan Holsting Militært chefvirke: Kritik og retfærdiggørelse mellem politik og profession

33. Thomas Jensen Shipping Information Pipeline: An information infrastructure to
improve international containerized shipping
34. Dzmitry Bartalevich Do economic theories inform policy? Analysis of the infl uence of the Chicago
School on European Union competition policy
35. Kristian Roed Nielsen Crowdfunding for Sustainability: A
study on the potential of reward-based crowdfunding in supporting sustainable entrepreneurship
36. Emil Husted There is always an alternative: A study
of control and commitment in political organization
37. Anders Ludvig Sevelsted Interpreting Bonds and Boundaries of
Obligation. A genealogy of the emer-gence and development of Protestant voluntary social work in Denmark as shown through the cases of the Co-penhagen Home Mission and the Blue Cross (1850 – 1950)
38. Niklas Kohl Essays on Stock Issuance

TITLER I ATV PH.D.-SERIEN
19921. Niels Kornum Servicesamkørsel – organisation, øko-
nomi og planlægningsmetode
19952. Verner Worm Nordiske virksomheder i Kina Kulturspecifi kke interaktionsrelationer ved nordiske virksomhedsetableringer i Kina
19993. Mogens Bjerre Key Account Management of Complex Strategic Relationships An Empirical Study of the Fast Moving Consumer Goods Industry
20004. Lotte Darsø Innovation in the Making Interaction Research with heteroge-
neous Groups of Knowledge Workers creating new Knowledge and new Leads
20015. Peter Hobolt Jensen Managing Strategic Design Identities The case of the Lego Developer Net-
work
20026. Peter Lohmann The Deleuzian Other of Organizational Change – Moving Perspectives of the Human
7. Anne Marie Jess Hansen To lead from a distance: The dynamic interplay between strategy and strate-
gizing – A case study of the strategic management process
20038. Lotte Henriksen Videndeling – om organisatoriske og ledelsesmæs-
sige udfordringer ved videndeling i praksis
9. Niels Christian Nickelsen Arrangements of Knowing: Coordi-
nating Procedures Tools and Bodies in Industrial Production – a case study of the collective making of new products
200510. Carsten Ørts Hansen Konstruktion af ledelsesteknologier og effektivitet
TITLER I DBA PH.D.-SERIEN
20071. Peter Kastrup-Misir Endeavoring to Understand Market Orientation – and the concomitant co-mutation of the researched, the re searcher, the research itself and the truth
20091. Torkild Leo Thellefsen Fundamental Signs and Signifi cance
effects A Semeiotic outline of Fundamental Signs, Signifi cance-effects, Knowledge Profi ling and their use in Knowledge Organization and Branding
2. Daniel Ronzani When Bits Learn to Walk Don’t Make Them Trip. Technological Innovation and the Role of Regulation by Law in Information Systems Research: the Case of Radio Frequency Identifi cation (RFID)
20101. Alexander Carnera Magten over livet og livet som magt Studier i den biopolitiske ambivalens