FY2011 Financial Report
29
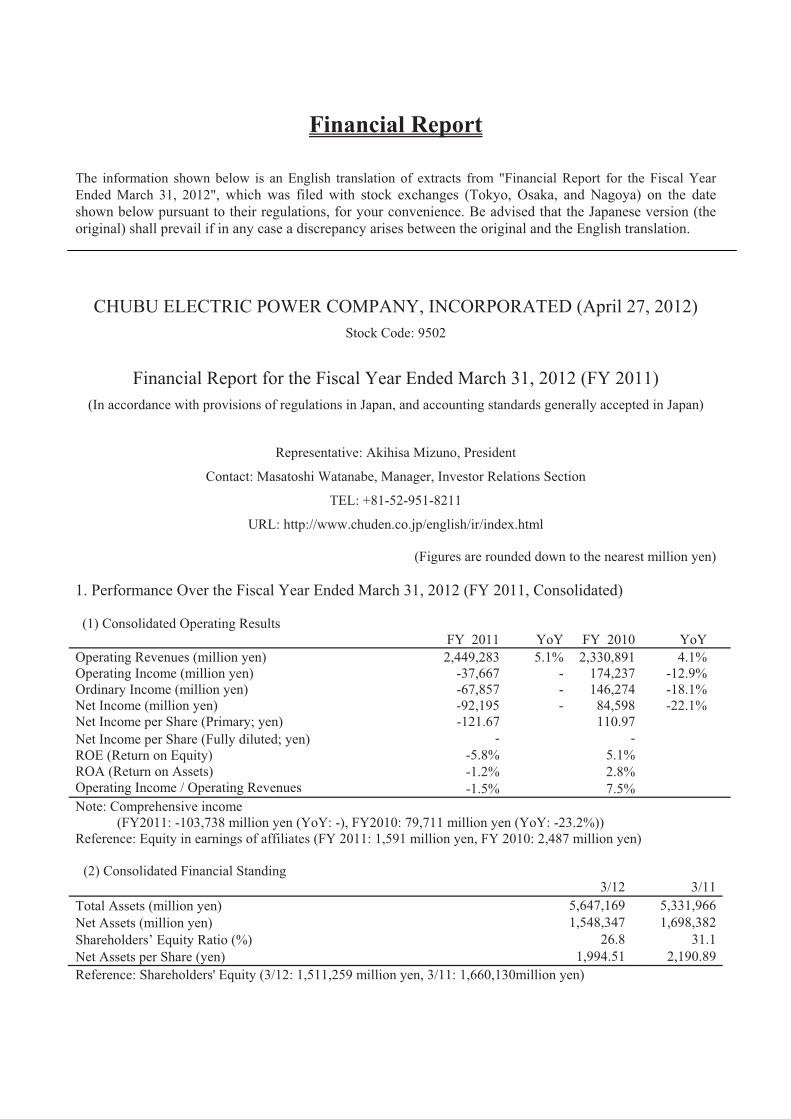
Financial Report The information shown below is an English translation of extracts from "Financial Report for the Fiscal Year Ended March 31, 2012", which was filed with stock exchanges (Tokyo, Osaka, and Nagoya) on the date shown below pursuant to their regulations, for your convenience. Be advised that the Japanese version (the original) shall prevail if in any case a discrepancy arises between the original and the English translation. CHUBU ELECTRIC POWER COMPANY, INCORPORATED (April 27, 2012) Stock Code: 9502 Financial Report for the Fiscal Year Ended March 31, 2012 (FY 2011) (In accordance with provisions of regulations in Japan, and accounting standards generally accepted in Japan) Representative: Akihisa Mizuno, President Contact: Masatoshi Watanabe, Manager, Investor Relations Section TEL: +81-52-951-8211 URL: http://www.chuden.co.jp/english/ir/index.html (Figures are rounded down to the nearest million yen) 1. Performance Over the Fiscal Year Ended March 31, 2012 (FY 2011, Consolidated) (1) Consolidated Operating Results FY 2011 YoY FY 2010 YoY Operating Revenues (million yen) 2,449,283 5.1% 2,330,891 4.1% Operating Income (million yen) -37,667 - 174,237 -12.9% Ordinary Income (million yen) -67,857 - 146,274 -18.1% Net Income (million yen) -92,195 - 84,598 -22.1% Net Income per Share (Primary; yen) -121.67 110.97 Net Income per Share (Fully diluted; yen) ROE (Return on Equity) ROA (Return on Assets) Operating Income / Operating Revenues - - -5.8% 5.1% -1.2% 2.8% -1.5% 7.5% Note: Comprehensive income (FY2011: -103,738 million yen (YoY: -), FY2010: 79,711 million yen (YoY: -23.2%)) Reference: Equity in earnings of affiliates (FY 2011: 1,591 million yen, FY 2010: 2,487 million yen) (2) Consolidated Financial Standing 3/12 3/11 Total Assets (million yen) 5,647,169 5,331,966 Net Assets (million yen) 1,548,347 1,698,382 Shareholders’ Equity Ratio (%) 26.8 31.1 Net Assets per Share (yen) 1,994.51 2,190.89 Reference: Shareholders' Equity (3/12: 1,511,259 million yen, 3/11: 1,660,130million yen)
-
Upload
khangminh22 -
Category
Documents
-
view
0 -
download
0
Transcript of FY2011 Financial Report
Financial Report
The information shown below is an English translation of extracts from "Financial Report for the Fiscal Year Ended March 31, 2012", which was filed with stock exchanges (Tokyo, Osaka, and Nagoya) on the date shown below pursuant to their regulations, for your convenience. Be advised that the Japanese version (the original) shall prevail if in any case a discrepancy arises between the original and the English translation.
CHUBU ELECTRIC POWER COMPANY, INCORPORATED (April 27, 2012) Stock Code: 9502
Financial Report for the Fiscal Year Ended March 31, 2012 (FY 2011) (In accordance with provisions of regulations in Japan, and accounting standards generally accepted in Japan)
Representative: Akihisa Mizuno, President
Contact: Masatoshi Watanabe, Manager, Investor Relations Section
TEL: +81-52-951-8211
URL: http://www.chuden.co.jp/english/ir/index.html
(Figures are rounded down to the nearest million yen)
1. Performance Over the Fiscal Year Ended March 31, 2012 (FY 2011, Consolidated)
(1) Consolidated Operating Results FY 2011 YoY FY 2010 YoY Operating Revenues (million yen) 2,449,283 5.1% 2,330,891 4.1%Operating Income (million yen) -37,667 - 174,237 -12.9%Ordinary Income (million yen) -67,857 - 146,274 -18.1%Net Income (million yen) -92,195 - 84,598 -22.1%Net Income per Share (Primary; yen) -121.67 110.97 Net Income per Share (Fully diluted; yen) ROE (Return on Equity) ROA (Return on Assets) Operating Income / Operating Revenues
- --5.8% 5.1% -1.2% 2.8% -1.5% 7.5%
Note: Comprehensive income (FY2011: -103,738 million yen (YoY: -), FY2010: 79,711 million yen (YoY: -23.2%)) Reference: Equity in earnings of affiliates (FY 2011: 1,591 million yen, FY 2010: 2,487 million yen)
(2) Consolidated Financial Standing 3/12 3/11
Total Assets (million yen) 5,647,169 5,331,966Net Assets (million yen) 1,548,347 1,698,382Shareholders’ Equity Ratio (%) 26.8 31.1Net Assets per Share (yen) 1,994.51 2,190.89Reference: Shareholders' Equity (3/12: 1,511,259 million yen, 3/11: 1,660,130million yen)
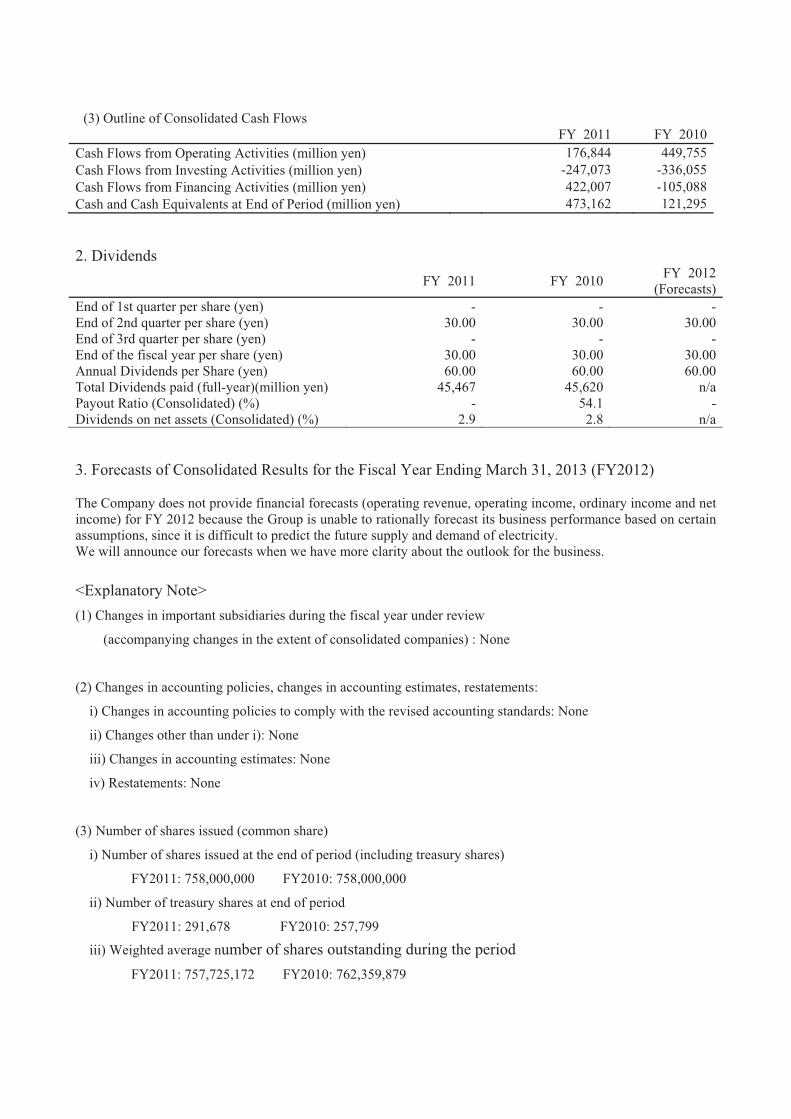
(3) Outline of Consolidated Cash Flows FY 2011 FY 2010
Cash Flows from Operating Activities (million yen) 176,844 449,755Cash Flows from Investing Activities (million yen) -247,073 -336,055Cash Flows from Financing Activities (million yen) 422,007 -105,088Cash and Cash Equivalents at End of Period (million yen) 473,162 121,295
2. Dividends FY 2011 FY 2010 FY 2012
(Forecasts)End of 1st quarter per share (yen) - - -End of 2nd quarter per share (yen) 30.00 30.00 30.00End of 3rd quarter per share (yen) - - -End of the fiscal year per share (yen) 30.00 30.00 30.00Annual Dividends per Share (yen) 60.00 60.00 60.00Total Dividends paid (full-year)(million yen) 45,467 45,620 n/aPayout Ratio (Consolidated) (%) - 54.1 -Dividends on net assets (Consolidated) (%) 2.9 2.8 n/a
3. Forecasts of Consolidated Results for the Fiscal Year Ending March 31, 2013 (FY2012)
The Company does not provide financial forecasts (operating revenue, operating income, ordinary income and net income) for FY 2012 because the Group is unable to rationally forecast its business performance based on certain assumptions, since it is difficult to predict the future supply and demand of electricity. We will announce our forecasts when we have more clarity about the outlook for the business.
<Explanatory Note> (1) Changes in important subsidiaries during the fiscal year under review
(accompanying changes in the extent of consolidated companies) : None
(2) Changes in accounting policies, changes in accounting estimates, restatements:
i) Changes in accounting policies to comply with the revised accounting standards: None
ii) Changes other than under i): None
iii) Changes in accounting estimates: None
iv) Restatements: None
(3) Number of shares issued (common share)
i) Number of shares issued at the end of period (including treasury shares)
FY2011: 758,000,000 FY2010: 758,000,000
ii) Number of treasury shares at end of period
FY2011: 291,678 FY2010: 257,799
iii) Weighted average number of shares outstanding during the period FY2011: 757,725,172 FY2010: 762,359,879

<Reference> Non-Consolidated Results 1. Performance Over the Fiscal Year Ended March 31, 2012 (FY 2011, Non-Consolidated)
(1) Operating Results FY 2011 YoY FY 2010 YoYOperating Revenues (million yen) 2,295,153 5.4% 2,178,286 4.5%Operating Income (million yen) -50,476 -% 157,877 -12.3%Ordinary Income (million yen) -77,433 -% 131,039 -16.8%Net Income (million yen) -94,638 -% 75,847 -28.8%Net Income per Share (Primary; yen) -124.88 99.48 Net Income per Share (Fully diluted; yen) - -
(2) Financial Standing 3/12 3/11
Total Assets (million yen) 5,375,261 5,033,619Net Assets (million yen) 1,344,775 1,485,674Shareholders’ Equity Ratio (%) 25.0% 29.5%Net Assets per Share (yen) 1,774.60 1,960.45 Reference: Shareholders' Equity 3/12: 1,344,775 million yen 3/11: 1,485,674 million yen
2. Forecasts of Non-Consolidated Results for the Fiscal Year Ending March 31, 2013 (FY 2012)
The Company does not provide financial forecasts (operating revenue, operating income, ordinary income and net income) for FY 2012 because the company is unable to rationally forecast its business performance based on certain assumptions, since it is difficult to predict the future supply and demand of electricity. We will announce our forecasts when we have more clarity about the outlook for the business.
Explanations Regarding Appropriate Use of the Forecasts, and Other Special Remarks The forecasts are based on information available as of the date of this announcement is made. There is a
possibility that actual results materially differ by various causes in the future.

1
The Attached Document
<Table of Contents>
Operating results
I. Analysis regarding operating results
………………… 2
II. Analysis regarding financial standing
………………… 6
III. Profit allocation policy and dividends for the fiscal year under review, and the fiscal year to come
………………… 9
IV. Business and other risks
………………… 10
Consolidated Financial Statements
1. Consolidated Balance Sheets
…………………14
2. Consolidated Statements of Income and Consolidated Statements of Comprehensive Income
Consolidated Statements of Income
…………………15
Consolidated Statements of Comprehensive Income
………………… 16
3. Consolidated Statements of Changes in Net Assets
………………… 17
4. Consolidated Statements of Cash Flows
………………… 19
Non-Consolidated Financial Statements
1. Non-Consolidated Balance Sheets
………………… 20
2. Non-Consolidated Statements of Income
………………… 22
3. Non-Consolidated Statements of Changes in Net Assets
…………………24
2
Operating Results
I. Analysis Regarding Operating Results
1. Results for the Period under Review The Japanese economy during FY 2011 on the whole continued to gradually recover, because production and
exports regained momentum after the restoration of supply-chain disruptions, despite difficult circumstances right
after the Great East Japan Earthquake and negative impacts from the floods in Thailand and the yen’s
appreciation mid-year. Such trends were noticeable in the Chubu region.
In response to a request by the prime minister, we suspended operation of all reactors at the Hamaoka Nuclear
Power Station in May 2011. The suspension put heavy burdens on our business operations as a whole including
our ability to stably supply electricity and procure fuels.
In these circumstances, for income, although electricity sales volume has declined, operating revenue has
increased by 118.3 billion yen from the previous fiscal year to 2,449.2 billion yen, because of such factors as
increase in electricity sales revenues due to increase in fuel adjustment charge. Ordinary revenue was 2,470.2
billion yen, a year-on -year increase of 121.8 billion yen.
Meanwhile, as for expenses, significant increase in fuel expenses due to suspension of operation at Hamaoka
Nuclear Power Station in the electric power business and other issues contributed ordinary expenses to increase
336.0 billion yen to 2,538.0 billion yen.
As a result of the above, we recorded an ordinary loss of 67.8 billion yen, a 214.1 billion yen decline compared
with the previous fiscal year.
(Production and Sales) <Electric Power Business>(1) Electricity Sales
Electricity sales have decreased by 2.3% to 127.9 TWh - due to such factors as decrease in air conditioning
demand by cooler air temperature over the summer compared with previous year, and power saving.
[Demand from Customers under Regulation]
Demand for electric lighting has decreased by 3.7% to 35.9TWh, due to such factors as decrease in air
conditioning demand by cooler air temperature over the summer compared with previous year, and power
saving. Demand for electric power has decreased by 5.0% to 6.4TWh, because of decrease in number of
contracts, and decrease in air conditioning demand affected by temperature.
[Demand from Customers under Liberalization]
Demand for commercial power has decreased by 5.9% to 22.2TWh due to decrease in air conditioning demand
affected by temperature and power saving. Electricity sales for industrial customers amounted to 63.4
3
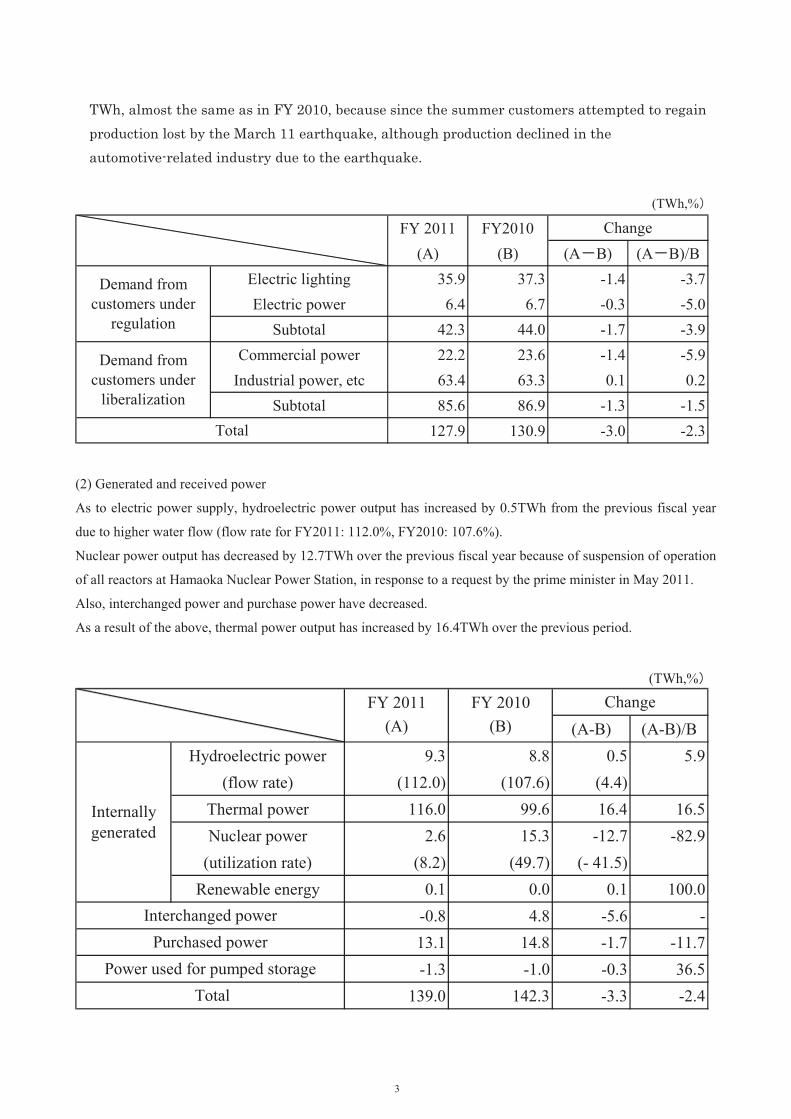
TWh, almost the same as in FY 2010, because since the summer customers attempted to regain production lost by the March 11 earthquake, although production declined in the automotive-related industry due to the earthquake.
(TWh,%
FY 2011 FY2010(A) (B) (A B) (A B)/B
Electric lighting 35.9 37.3 -1.4 -3.7Electric power 6.4 6.7 -0.3 -5.0
Subtotal 42.3 44.0 -1.7 -3.9Commercial power 22.2 23.6 -1.4 -5.9
Industrial power, etc 63.4 63.3 0.1 0.2Subtotal 85.6 86.9 -1.3 -1.5
127.9 130.9 -3.0 -2.3
Change
Total
Demand fromcustomers under
regulation
Demand fromcustomers under
liberalization
(2) Generated and received power
As to electric power supply, hydroelectric power output has increased by 0.5TWh from the previous fiscal year
due to higher water flow (flow rate for FY2011: 112.0%, FY2010: 107.6%).
Nuclear power output has decreased by 12.7TWh over the previous fiscal year because of suspension of operation
of all reactors at Hamaoka Nuclear Power Station, in response to a request by the prime minister in May 2011.
Also, interchanged power and purchase power have decreased.
As a result of the above, thermal power output has increased by 16.4TWh over the previous period.
(TWh,%
FY 2011 FY 2010(A) (B) (A-B) (A-B)/B
Hydroelectric power 9.3 8.8 0.5 5.9(flow rate) (112.0) (107.6) (4.4)
Thermal power 116.0 99.6 16.4 16.5Nuclear power 2.6 15.3 -12.7 -82.9
(utilization rate) (8.2) (49.7) (- 41.5)Renewable energy 0.1 0.0 0.1 100.0
-0.8 4.8 -5.6 -13.1 14.8 -1.7 -11.7-1.3 -1.0 -0.3 36.5
139.0 142.3 -3.3 -2.4Power used for pumped storage
Total
Change
Internallygenerated
Interchanged powerPurchased power
4
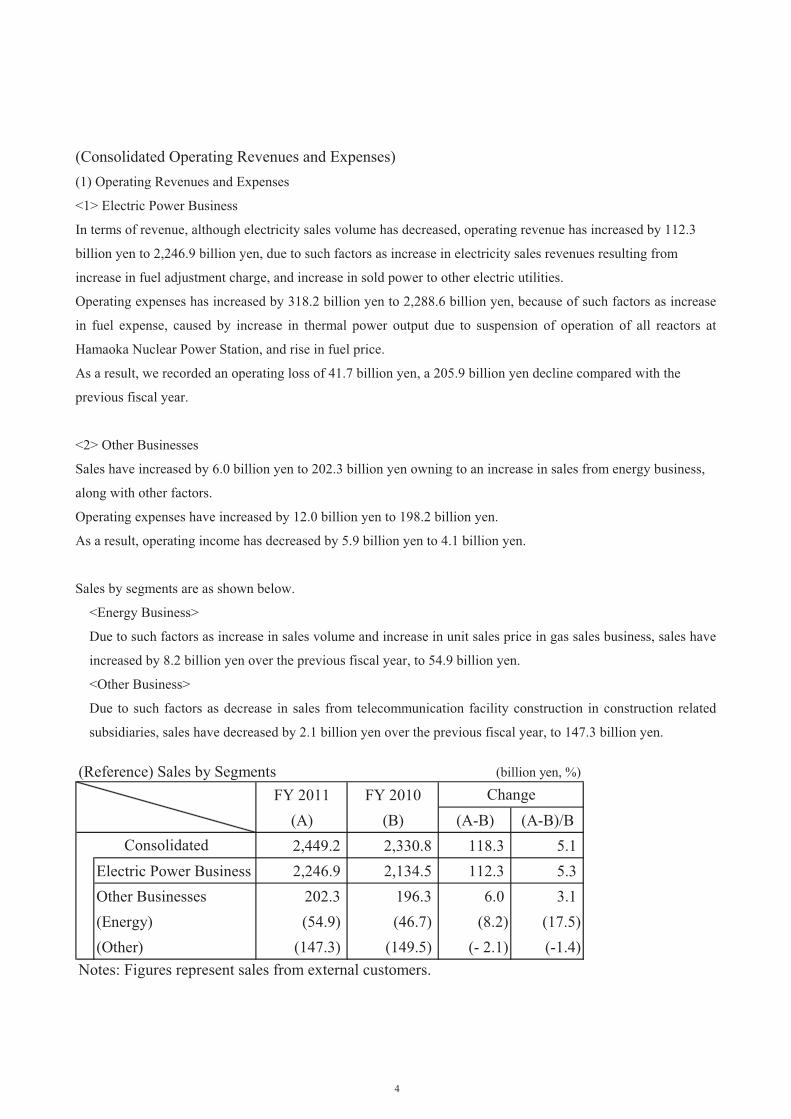
(Consolidated Operating Revenues and Expenses) (1) Operating Revenues and Expenses
<1> Electric Power Business
In terms of revenue, although electricity sales volume has decreased, operating revenue has increased by 112.3
billion yen to 2,246.9 billion yen, due to such factors as increase in electricity sales revenues resulting from
increase in fuel adjustment charge, and increase in sold power to other electric utilities.
Operating expenses has increased by 318.2 billion yen to 2,288.6 billion yen, because of such factors as increase
in fuel expense, caused by increase in thermal power output due to suspension of operation of all reactors at
Hamaoka Nuclear Power Station, and rise in fuel price.
As a result, we recorded an operating loss of 41.7 billion yen, a 205.9 billion yen decline compared with the
previous fiscal year.
<2> Other Businesses
Sales have increased by 6.0 billion yen to 202.3 billion yen owning to an increase in sales from energy business,
along with other factors.
Operating expenses have increased by 12.0 billion yen to 198.2 billion yen.
As a result, operating income has decreased by 5.9 billion yen to 4.1 billion yen.
Sales by segments are as shown below.
<Energy Business>
Due to such factors as increase in sales volume and increase in unit sales price in gas sales business, sales have
increased by 8.2 billion yen over the previous fiscal year, to 54.9 billion yen.
<Other Business>
Due to such factors as decrease in sales from telecommunication facility construction in construction related
subsidiaries, sales have decreased by 2.1 billion yen over the previous fiscal year, to 147.3 billion yen.
(Reference) Sales by SegmentsFY 2011 FY 2010
(A) (B) (A-B) (A-B)/B2,449.2 2,330.8 118.3 5.1
Electric Power Business 2,246.9 2,134.5 112.3 5.3Other Businesses 202.3 196.3 6.0 3.1(Energy) (54.9) (46.7) (8.2) (17.5)(Other) (147.3) (149.5) (- 2.1) (-1.4)
Notes: Figures represent sales from external customers.
Consolidated
Change(billion yen, %)
5
(2) Ordinary income (loss)
Non-operating income has increased by 3.4 billion yen over the previous fiscal year to 20.9 billion yen. In
combination with sales, the ordinary revenue in total has increased by 121.8 billion yen over the previous fiscal
year, to 2,470.2 billion yen.
Meanwhile, non-operating expenses have increased by 5.7 billion yen to 51.1 billion yen. Combined with
operating expenses, total ordinary expenses have increased by 336.0 billion yen year on year, to 2,538.0 billion
yen.
As a result, we recorded ordinary loss of 67.8 billion yen, a 214.1 billion yen decline compared with the previous
fiscal year.
(3) Net income (loss)
In this fiscal year, we recorded an extraordinary income of 9.0 billion yen as "settlement received" from a lawsuit
for damages caused by a failed low-pressure turbine blade at Unit 5 of the Hamaoka Nuclear Power Station.
Also, we recorded an extraordinary loss of 17.2 billion yen as "loss on transition to a defined contribution pension
plan" with the revision of retirement benefit scheme.
In addition to the above, with the promulgation of the Act regarding reduction of the income tax rate, the reversal
of deferred tax assets was reflected in income taxes. As a result, net income decreased by 176.7 billion yen from
the previous fiscal year, forcing us to post a net loss of 92.1 billion yen.
2. Outlook for the Next Period The Company does not provide financial forecasts (operating revenue, operating income, ordinary income and net
income) for FY 2012 because the Group is unable to rationally forecast its business performance based on certain
assumptions, since it is difficult to predict the future supply and demand of electricity.
We will announce our forecasts when we have more clarity about the outlook for the business.
6
II. Analysis Regarding Financial Standing
(1) Summary of Assets, Liabilities and Net Assets
<1> Assets
Noncurrent assets decreased from the previous year-end by 91.0 billion yen to 4,786.2 billion yen due to the
progress of depreciation, along with other causes.
Current assets have increased by 406.2 billion yen to 860.8 billion yen due to such factors as increase in cash and
deposits and short-term investments.
As a result of the above, total assets have increased by 315.2 billion yen to 5,647.1 billion yen compared with the
previous year end.
<2> Liabilities
Total liabilities have increased by 465.2 billion yen from the end of the previous fiscal year to 4,098.8 billion yen,
due to such factors as increase in interest-bearing debt.
<3> Net assets
Total net assets have decreased by 150.0 billion yen from the end of the previous fiscal year to 1,548.3 billion yen
due to such factors as dividend payouts and net loss.
As a result, the shareholders' equity ratio was 26.8%.
7
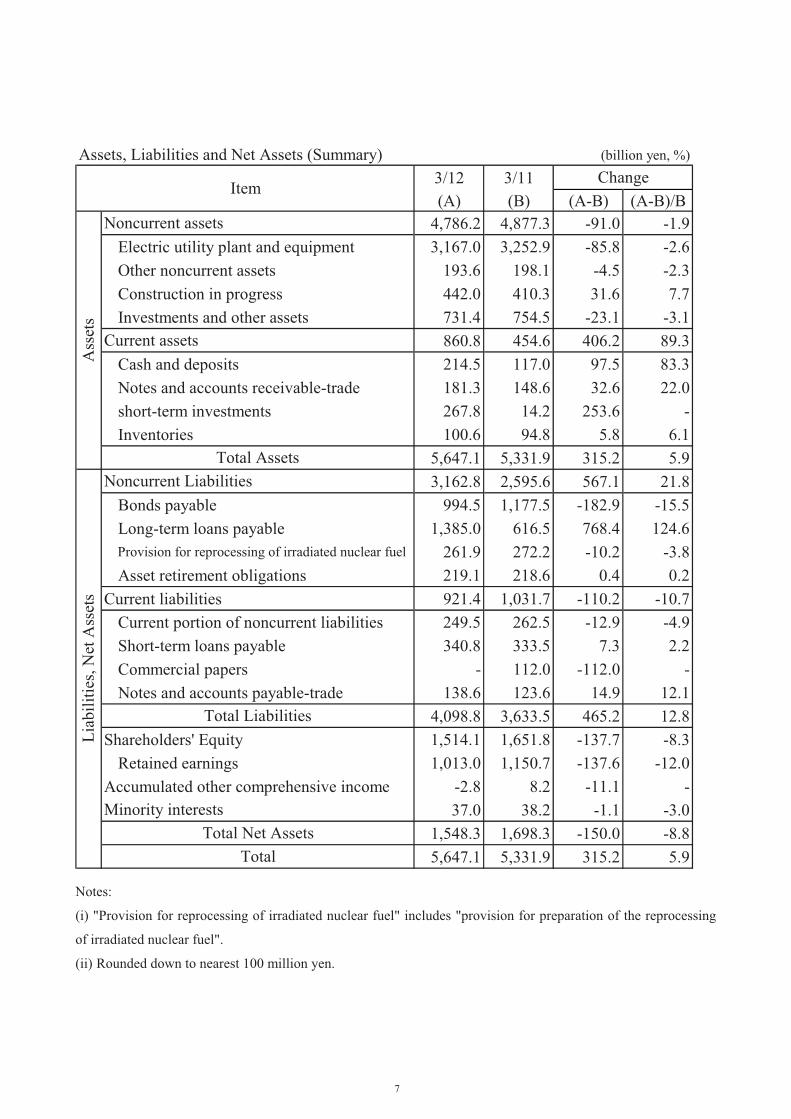
3/12 3/11(A) (B) (A-B) (A-B)/B
4,786.2 4,877.3 -91.0 -1.9Electric utility plant and equipment 3,167.0 3,252.9 -85.8 -2.6Other noncurrent assets 193.6 198.1 -4.5 -2.3Construction in progress 442.0 410.3 31.6 7.7Investments and other assets 731.4 754.5 -23.1 -3.1
860.8 454.6 406.2 89.3Cash and deposits 214.5 117.0 97.5 83.3Notes and accounts receivable-trade 181.3 148.6 32.6 22.0short-term investments 267.8 14.2 253.6 -Inventories 100.6 94.8 5.8 6.1
5,647.1 5,331.9 315.2 5.93,162.8 2,595.6 567.1 21.8
Bonds payable 994.5 1,177.5 -182.9 -15.5Long-term loans payable 1,385.0 616.5 768.4 124.6Provision for reprocessing of irradiated nuclear fuel 261.9 272.2 -10.2 -3.8Asset retirement obligations 219.1 218.6 0.4 0.2
Current liabilities 921.4 1,031.7 -110.2 -10.7Current portion of noncurrent liabilities 249.5 262.5 -12.9 -4.9Short-term loans payable 340.8 333.5 7.3 2.2Commercial papers - 112.0 -112.0 -Notes and accounts payable-trade 138.6 123.6 14.9 12.1
4,098.8 3,633.5 465.2 12.8Shareholders' Equity 1,514.1 1,651.8 -137.7 -8.3
Retained earnings 1,013.0 1,150.7 -137.6 -12.0Accumulated other comprehensive income -2.8 8.2 -11.1 -
37.0 38.2 -1.1 -3.01,548.3 1,698.3 -150.0 -8.85,647.1 5,331.9 315.2 5.9
(billion yen, %)
Liab
ilitie
s, N
et A
sset
s
Total
Assets, Liabilities and Net Assets (Summary)
Noncurrent Liabilities
Item
Ass
ets
Total Assets
Total Liabilities
Minority interestsTotal Net Assets
Change
Noncurrent assets
Current assets
Notes:
(i) "Provision for reprocessing of irradiated nuclear fuel" includes "provision for preparation of the reprocessing
of irradiated nuclear fuel".
(ii) Rounded down to nearest 100 million yen.
8
(2) Summary of Consolidated Cash Flows
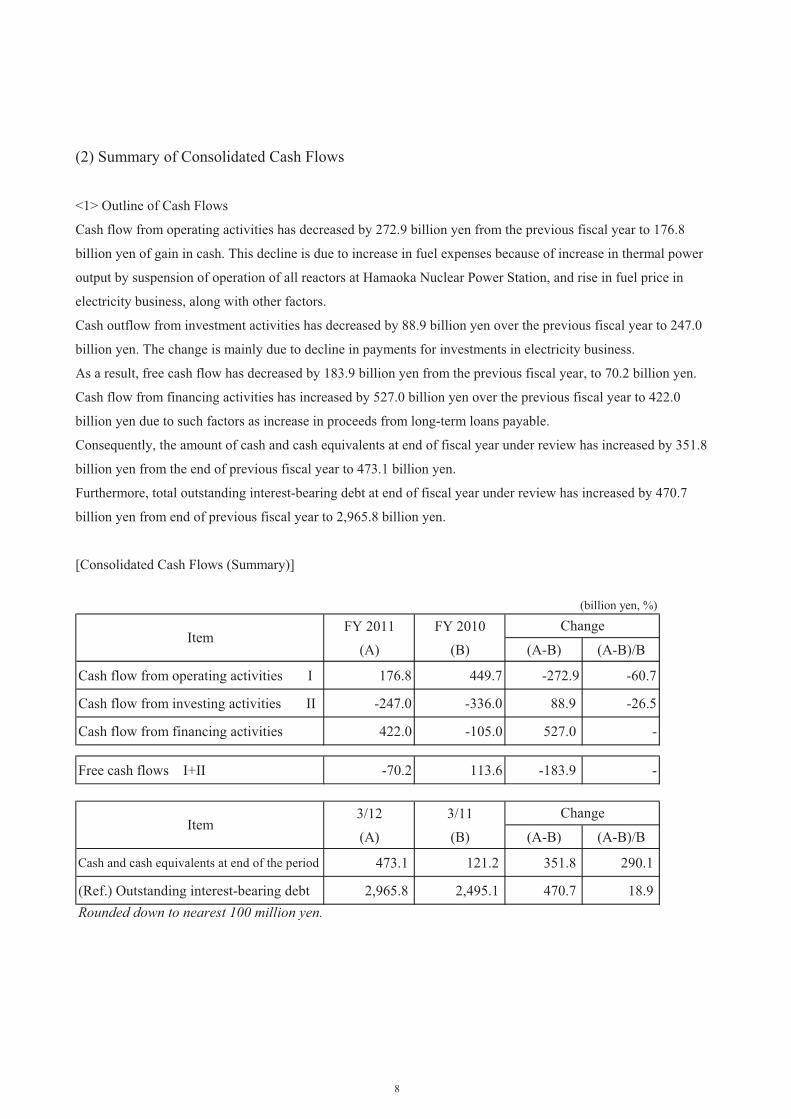
<1> Outline of Cash Flows
Cash flow from operating activities has decreased by 272.9 billion yen from the previous fiscal year to 176.8
billion yen of gain in cash. This decline is due to increase in fuel expenses because of increase in thermal power
output by suspension of operation of all reactors at Hamaoka Nuclear Power Station, and rise in fuel price in
electricity business, along with other factors.
Cash outflow from investment activities has decreased by 88.9 billion yen over the previous fiscal year to 247.0
billion yen. The change is mainly due to decline in payments for investments in electricity business.
As a result, free cash flow has decreased by 183.9 billion yen from the previous fiscal year, to 70.2 billion yen.
Cash flow from financing activities has increased by 527.0 billion yen over the previous fiscal year to 422.0
billion yen due to such factors as increase in proceeds from long-term loans payable.
Consequently, the amount of cash and cash equivalents at end of fiscal year under review has increased by 351.8
billion yen from the end of previous fiscal year to 473.1 billion yen.
Furthermore, total outstanding interest-bearing debt at end of fiscal year under review has increased by 470.7
billion yen from end of previous fiscal year to 2,965.8 billion yen.
[Consolidated Cash Flows (Summary)]
(billion yen, %)
FY 2011 FY 2010(A) (B) (A-B) (A-B)/B
Cash flow from operating activities I 176.8 449.7 -272.9 -60.7
Cash flow from investing activities II -247.0 -336.0 88.9 -26.5
Cash flow from financing activities 422.0 -105.0 527.0 -
Free cash flows I+II -70.2 113.6 -183.9 -
3/12 3/11(A) (B) (A-B) (A-B)/B
Cash and cash equivalents at end of the period 473.1 121.2 351.8 290.1
(Ref.) Outstanding interest-bearing debt 2,965.8 2,495.1 470.7 18.9Rounded down to nearest 100 million yen.
Change
ItemChange
Item
9
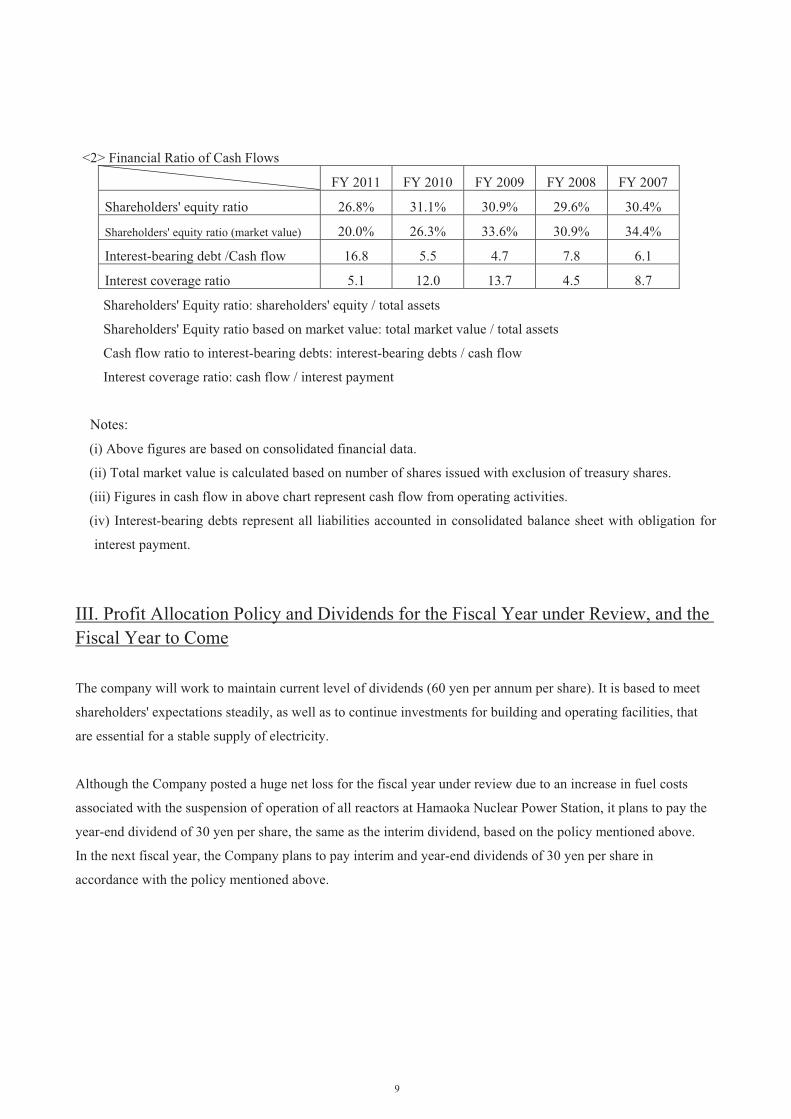
<2> Financial Ratio of Cash Flows
FY 2011 FY 2010 FY 2009 FY 2008 FY 2007
Shareholders' equity ratio 26.8% 31.1% 30.9% 29.6% 30.4%
Shareholders' equity ratio (market value) 20.0% 26.3% 33.6% 30.9% 34.4%
Interest-bearing debt /Cash flow 16.8 5.5 4.7 7.8 6.1
Interest coverage ratio 5.1 12.0 13.7 4.5 8.7
Shareholders' Equity ratio: shareholders' equity / total assets
Shareholders' Equity ratio based on market value: total market value / total assets
Cash flow ratio to interest-bearing debts: interest-bearing debts / cash flow
Interest coverage ratio: cash flow / interest payment
Notes:
(i) Above figures are based on consolidated financial data.
(ii) Total market value is calculated based on number of shares issued with exclusion of treasury shares.
(iii) Figures in cash flow in above chart represent cash flow from operating activities.
(iv) Interest-bearing debts represent all liabilities accounted in consolidated balance sheet with obligation for
interest payment.
III. Profit Allocation Policy and Dividends for the Fiscal Year under Review, and the Fiscal Year to Come
The company will work to maintain current level of dividends (60 yen per annum per share). It is based to meet
shareholders' expectations steadily, as well as to continue investments for building and operating facilities, that
are essential for a stable supply of electricity.
Although the Company posted a huge net loss for the fiscal year under review due to an increase in fuel costs
associated with the suspension of operation of all reactors at Hamaoka Nuclear Power Station, it plans to pay the
year-end dividend of 30 yen per share, the same as the interim dividend, based on the policy mentioned above.
In the next fiscal year, the Company plans to pay interim and year-end dividends of 30 yen per share in
accordance with the policy mentioned above.
10
IV. Business and Other Risks
Of all the variables affecting the Chubu Electric Group’s performance and financial standing, the primary factors
most likely to have a major effect on investors’ decisions are listed below.
Forward-looking statements in this report are based on facts and conditions as of the date of this report (on April
27, 2012). Actual results may differ, affected by the government’s future energy policy and revision of electricity
business system.
(1) Risks of the economic environment <1> Economic and weather conditions
In the electric power business, which is at the core of the Chubu Electric Group's business, the volume of
electricity sales fluctuates due to economic and weather trends, and consequently, the performance of the Chubu
Electric Group could potentially be affected.
In addition, the amount of yearly precipitation affects the amount of hydro electric power output, which impacts
our power-generating costs. Chubu Electric, however, has set aside a reserve for fluctuation in water levels, which
allows the company to make a certain adjustment against such impact within balance of the reserve, thus limits
the effect on performance.
<2> Changes in fuel prices, etc.
As Chubu Electric Group depends on imports of such fuels as liquefied natural gas (LNG), coal and crude oil
from overseas, fuel expense in electricity businsess could be affected by fuel prices and fluctuations in the
currency exchange market. However, since the fluctuations of fuel prices within certain range could potentially be
reflected in electricity rates under "Fuel-cost Adjustment System", the impact of these factors on performance
should be mitigated.
Meanwhile, performance of the Chubu Electric Group could also potentially be affected by the fluctuation in fuel
expenses in the cases where: fuel becomes difficult to procure, for example, because of fluctuating supply and
demand, supplier facility and/or operational issues, or changes in the political situation.
<3> Changes in interest rates
The balance of interest-bearing debts at the Chubu Electric Group stood at 2,965.8 billion yen at the end of March
2012, an amount equivalent to 52.5% of our total assets. Interest payments on this debt are susceptible to market
interest rates, and thus, the group's performance could potentially be affected. Of these interest-bearing debts,
however, 88.3% comes from long-term funds (bonds and long-term loans), and most of these funding were
procured at fixed interest rates. So the effect of interest rate changes is considered limited.
Part of the corporate pension plan assets, held by our group, could potentially affect the group’s performance as
their market value fluctuates in tandem with movements in stock prices and interest rates, among other factors.
11
(2) Risks associated with Chubu Electric Group business activities <1> Suspension of electricity generating facilities
The Company has suspended operation of all reactors at the Hamaoka Nuclear Power Station. Taking into
account the nuclear power plant accident caused by the Great East Japan Earthquake and subsequent tsunami, we
have been taking measures to further strengthen the plant’s safety, such as measures against tsunami including
installing breakwater walls, enhancing buildings’ water-resistance, and reinforcing emergency measures. We have
also been improving disaster prevention measures including strengthening the disaster prevention system in case
of an accident at the nuclear plant, improving and strengthening disaster prevention materials/equipment, and
deepening cooperation between the central government and local governments around the plant. Furthermore,
because we plan to appropriately take in new knowledge presented by findings of the Tokyo Electric Power
Fukushima Daiichi Nuclear Power Station Accident Investigation Commission and studies by the Central Disaster
Prevention Council, the possibility exists that we will need to take additional measures based on the new
knowledge.
The Company is putting all its efforts into ensuring the stable supply of electricity after suspension of operation of
all reactors at the Hamaoka Nuclear Power Station. Specifically, we have taken various measures to meet demand,
such as resuming operations of thermal power units under long-term planned shutdown, while requesting our
customers to save electricity. Our performance is expected to be affected by a substantial increase in fuel costs
due to replacement of nuclear power with thermal power.
Providing the complete power supply system from power generation to distribution, the Chubu Electric Group
strives to develop and maintain optimum facilities that ensure stable delivery of high quality electricity
economically, while working to establish disaster-resistant systems by taking measures against large-scale
earthquakes. However, if supply facilities of the Company or other power companies from which we receive
power supply are shut down because of a large-scale disaster, an accident or terrorism and an obstacle to fuel
procurement, our operational results may be affected.
<2> Nuclear power back-end costs, etc.
The back-end business of nuclear power takes an extremely long time period and has many uncertainties. To
prepare for the future backend costs, based on the rules set by the government, Chubu Electric has set aside
provision for reprocessing of irradiated nuclear fuel and provision for preparation of the reprocessing of irradiated
nuclear fuel.
Even so, the costs of nuclear fuel cycles, including back-end costs, may vary depending on regulatory reform,
changes in estimates of future expenses (mandated and voluntary), the operating status of reprocessing facilities.
As a result, company performance may potentially be affected.
<3> Changes in the competitive environment
Since the start of partial liberalization of electric power retailing in March 2000, the scope of liberalization has
12
gradually expanded. The establishment of a more competitive and open electricity market will continue to be
studied in discussions about reviewing the framework of the electricity power industry. In the whole energy
market, the supply-demand structure could substantially change toward the realization of a new energy mix, such
as expanded use of renewable energy, further proliferation of natural gas, and dramatic promotion of energy
savings.
Given this situation, the Chubu Electric Group is exerting its maximum effort to enhance business efficiency, and
is conducting proactive sales initiatives to respond precisely to customer needs. Even so, future amendments in
regulations and changes to supply- demand structure could potentially have an effect on our performance.
<4> Regulatory amendments for global environment protection, etc
Global warming issues have caught more attention from global society. The group has recognized growing
importance to contribute to the achievement of "low carbon society" through taking measures actively toward
reduction of CO2 emission in electric power business.
Based on above recognition, the group has established the “Chubu Electric Power Group Basic Environmental
Policy”. Under its detailed protocol designated as "Action Plan", the group is working systematically to use
resources efficiently and reduce the burden on the environment. However, the group’s performance could
potentially be affected by the future trend of tightening environmental regulations, among other factors.
<5> Businesses other than electric power
The Chubu Electric Group focuses on electricity, gas and on-site energy supply as its core business areas. We are
engaged in a wide range of businesses, including overseas energy business, taking advantage of our accumulated
know-how in domestic businesses, constructions for expanding and securing electricity-related facilities, and
manufacturing of materials and equipment for our core businesses. These businesses are subject to changing
business environments, including increasing competition with other enterprises, and could potentially affect
performance if they fail to produce the results expected by the Chubu Electric Group.
(3) Other risks <1> Compliance
The Chubu Electric Group strives for strict compliance by establishing the Chubu Electric Group Compliance
Basic Policy, which relates to compliance with laws, regulations and social rules. If any event against compliance
occurs within or in connection with the organization, the reputation of the Chubu Electric Group may be damaged
and its operational results may be adversely affected.
<2> Information leaks
The Chubu Electric Group comply with the relevant laws, maintains internal systems and establishes rules on
information handling to ensure proper management of personal and other critical information. We have also
increased information system security as well as employee training for this purpose.

13
However, in case information leak occurs and the direct cost of responding to the situation and loss of public trust
in the Group arises, the group performance could potentially be affected.
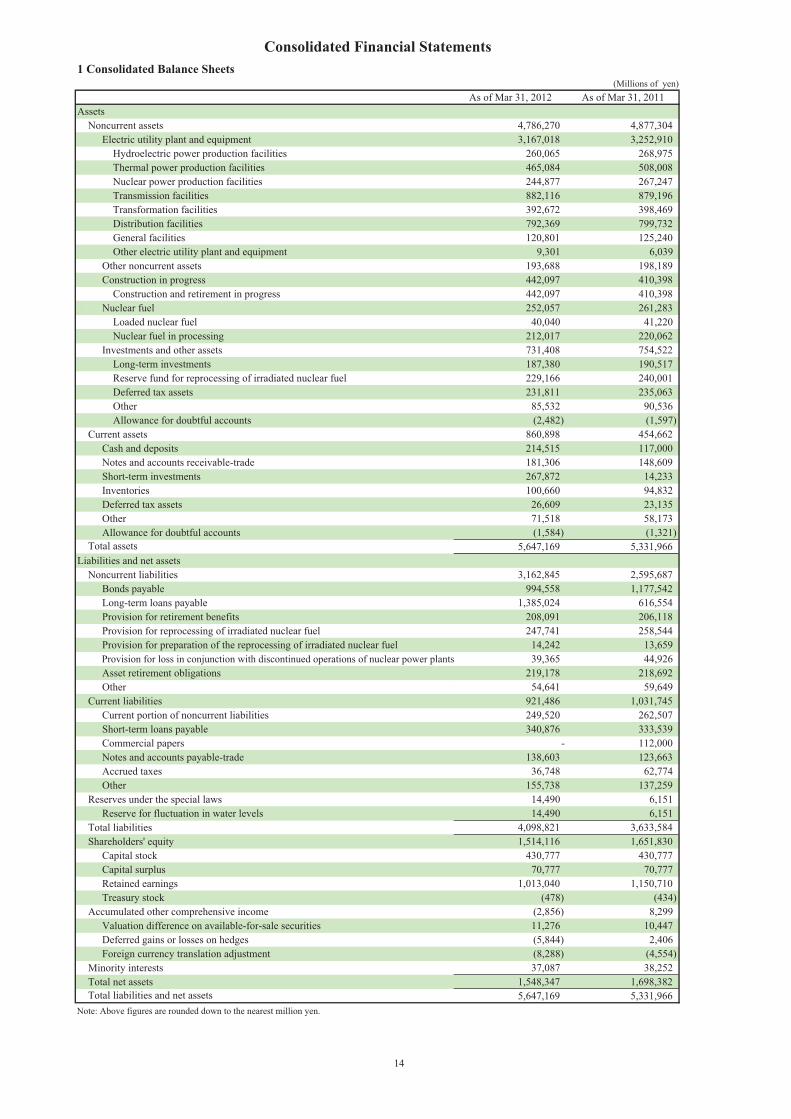
(Millions of yen)As of Mar 31, 2012 As of Mar 31, 2011
4,786,270 4,877,3043,167,018 3,252,910
Hydroelectric power production facilities 260,065 268,975Thermal power production facilities 465,084 508,008Nuclear power production facilities 244,877 267,247Transmission facilities 882,116 879,196Transformation facilities 392,672 398,469Distribution facilities 792,369 799,732General facilities 120,801 125,240Other electric utility plant and equipment 9,301 6,039
193,688 198,189442,097 410,398
Construction and retirement in progress 442,097 410,398252,057 261,283
Loaded nuclear fuel 40,040 41,220Nuclear fuel in processing 212,017 220,062
731,408 754,522Long-term investments 187,380 190,517Reserve fund for reprocessing of irradiated nuclear fuel 229,166 240,001Deferred tax assets 231,811 235,063Other 85,532 90,536Allowance for doubtful accounts (2,482) (1,597)
860,898 454,662214,515 117,000181,306 148,609267,872 14,233100,660 94,832
26,609 23,13571,518 58,173(1,584) (1,321)
5,647,169 5,331,966
3,162,845 2,595,687994,558 1,177,542
1,385,024 616,554208,091 206,118247,741 258,544
14,242 13,65939,365 44,926
219,178 218,69254,641 59,649
921,486 1,031,745249,520 262,507340,876 333,539
- 112,000138,603 123,663
36,748 62,774155,738 137,259
14,490 6,15114,490 6,151
4,098,821 3,633,5841,514,116 1,651,830
430,777 430,777Capital surplus 70,777 70,777
1,013,040 1,150,710(478) (434)
(2,856) 8,29911,276 10,447(5,844) 2,406
Foreign currency translation adjustment (8,288) (4,554)37,087 38,252
1,548,347 1,698,3825,647,169 5,331,966
Note: Above figures are rounded down to the nearest million yen.
Consolidated Financial Statements
Assets
1 Consolidated Balance Sheets
Noncurrent assetsElectric utility plant and equipment
Other noncurrent assetsConstruction in progress
Nuclear fuel
InventoriesDeferred tax assetsOtherAllowance for doubtful accounts
Investments and other assets
Current assetsCash and depositsNotes and accounts receivable-tradeShort-term investments
Long-term loans payableProvision for retirement benefitsProvision for reprocessing of irradiated nuclear fuelProvision for preparation of the reprocessing of irradiated nuclear fuel
Total assetsLiabilities and net assets
Noncurrent liabilitiesBonds payable
Current portion of noncurrent liabilitiesShort-term loans payableCommercial papersNotes and accounts payable-trade
Provision for loss in conjunction with discontinued operations of nuclear power plants
OtherCurrent liabilities
Asset retirement obligations
Total liabilitiesShareholders' equity
Accrued taxesOther
Reserves under the special lawsReserve for fluctuation in water levels
Total liabilities and net assets
Valuation difference on available-for-sale securitiesDeferred gains or losses on hedges
Minority interestsTotal net assets
Capital stock
Retained earningsTreasury stock
Accumulated other comprehensive income
14
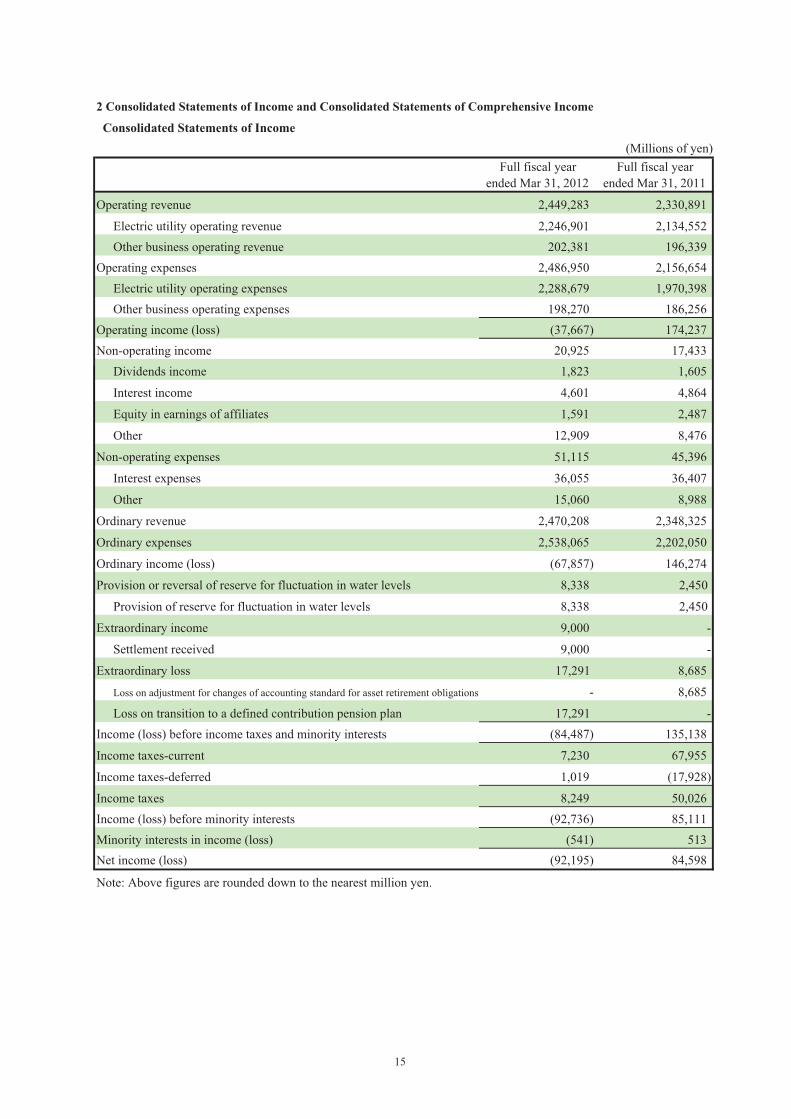
(Millions of yen)Full fiscal year
ended Mar 31, 2012Full fiscal year
ended Mar 31, 2011
Operating revenue 2,449,283 2,330,891
Electric utility operating revenue 2,246,901 2,134,552Other business operating revenue 202,381 196,339
Operating expenses 2,486,950 2,156,654Electric utility operating expenses 2,288,679 1,970,398Other business operating expenses 198,270 186,256
Operating income (loss) (37,667) 174,237Non-operating income 20,925 17,433
Dividends income 1,823 1,605
Interest income 4,601 4,864
Equity in earnings of affiliates 1,591 2,487
Other 12,909 8,476
Non-operating expenses 51,115 45,396
Interest expenses 36,055 36,407
Other 15,060 8,988
Ordinary revenue 2,470,208 2,348,325
Ordinary expenses 2,538,065 2,202,050
Ordinary income (loss) (67,857) 146,274
Provision or reversal of reserve for fluctuation in water levels 8,338 2,450
Provision of reserve for fluctuation in water levels 8,338 2,450
Extraordinary income 9,000 -
Settlement received 9,000 -
Extraordinary loss 17,291 8,685
- 8,685
17,291 -(84,487) 135,138
Income taxes-current 7,230 67,955
Income taxes-deferred 1,019 (17,928)
Income taxes 8,249 50,026(92,736) 85,111
(541) 513Net income (loss) (92,195) 84,598
Note: Above figures are rounded down to the nearest million yen.
Loss on transition to a defined contribution pension planIncome (loss) before income taxes and minority interests
Income (loss) before minority interestsMinority interests in income (loss)
2 Consolidated Statements of Income and Consolidated Statements of Comprehensive Income
Loss on adjustment for changes of accounting standard for asset retirement obligations
Consolidated Statements of Income
15
(Millions of yen)Full fiscal year
ended Mar 31, 2012Full fiscal year
ended Mar 31, 2011
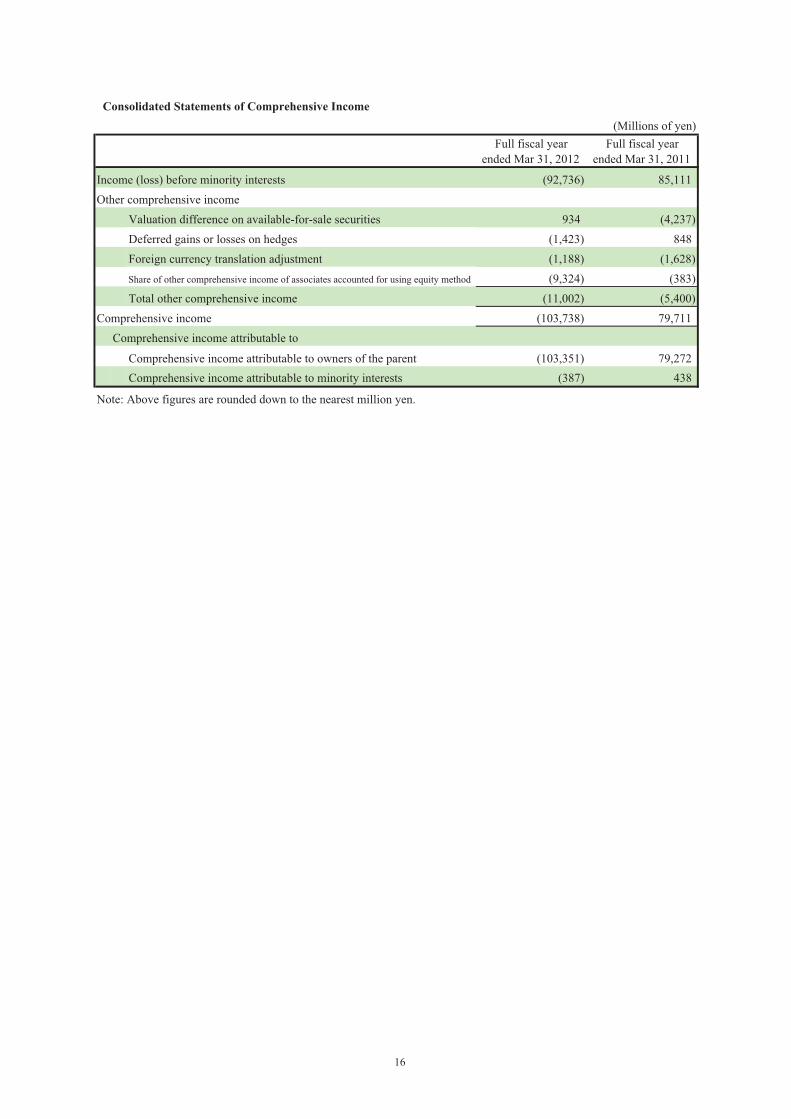
Income (loss) before minority interests (92,736) 85,111Other comprehensive income
Valuation difference on available-for-sale securities 934 (4,237)(1,423) 848(1,188) (1,628)(9,324) (383)
(11,002) (5,400)Comprehensive income (103,738) 79,711
Comprehensive income attributable to
Comprehensive income attributable to owners of the parent (103,351) 79,272Comprehensive income attributable to minority interests (387) 438
Note: Above figures are rounded down to the nearest million yen.
Consolidated Statements of Comprehensive Income
Share of other comprehensive income of associates accounted for using equity method
Deferred gains or losses on hedgesForeign currency translation adjustment
Total other comprehensive income
16

(Millions of yen)Full fiscal year
ended Mar 31, 2012Full fiscal year
ended Mar 31, 2011Shareholders' equity
Capital stockBalance at the beginning of current period 430,777 430,777Changes of items during the period
Total changes of items during the period - -Balance at the end of current period 430,777 430,777
Capital surplusBalance at the beginning of current period 70,777 70,777Changes of items during the period
Total changes of items during the period - -Balance at the end of current period 70,777 70,777
Retained earningsBalance at the beginning of current period 1,150,710 1,122,724Changes of items during the period
Dividends from surplus (45,469) (45,772)Net income (loss) (92,195) 84,598Retirement of treasury stock - (10,780)Disposal of treasury stock (4) (1)Change of scope of consolidation - (58)Total changes of items during the period (137,669) 27,985
Balance at the end of current period 1,013,040 1,150,710Treasury stock
Balance at the beginning of current period (434) (302)Changes of items during the period
Purchase of treasury stock (61) (10,953)Retirement of treasury stock - 10,780Disposal of treasury stock 16 42Total changes of items during the period (44) (131)
Balance at the end of current period (478) (434)Total shareholders' equity
Balance at the beginning of current period 1,651,830 1,623,976Changes of items during the period
Dividends from surplus (45,469) (45,772)Net income (loss) (92,195) 84,598Purchase of treasury stock (61) (10,953)Retirement of treasury stock - -Disposal of treasury stock 11 40Change of scope of consolidation - (58)Total changes of items during the period (137,714) 27,854
Balance at the end of current period 1,514,116 1,651,830
3 Consolidated Statements of Changes in Net Assets
17
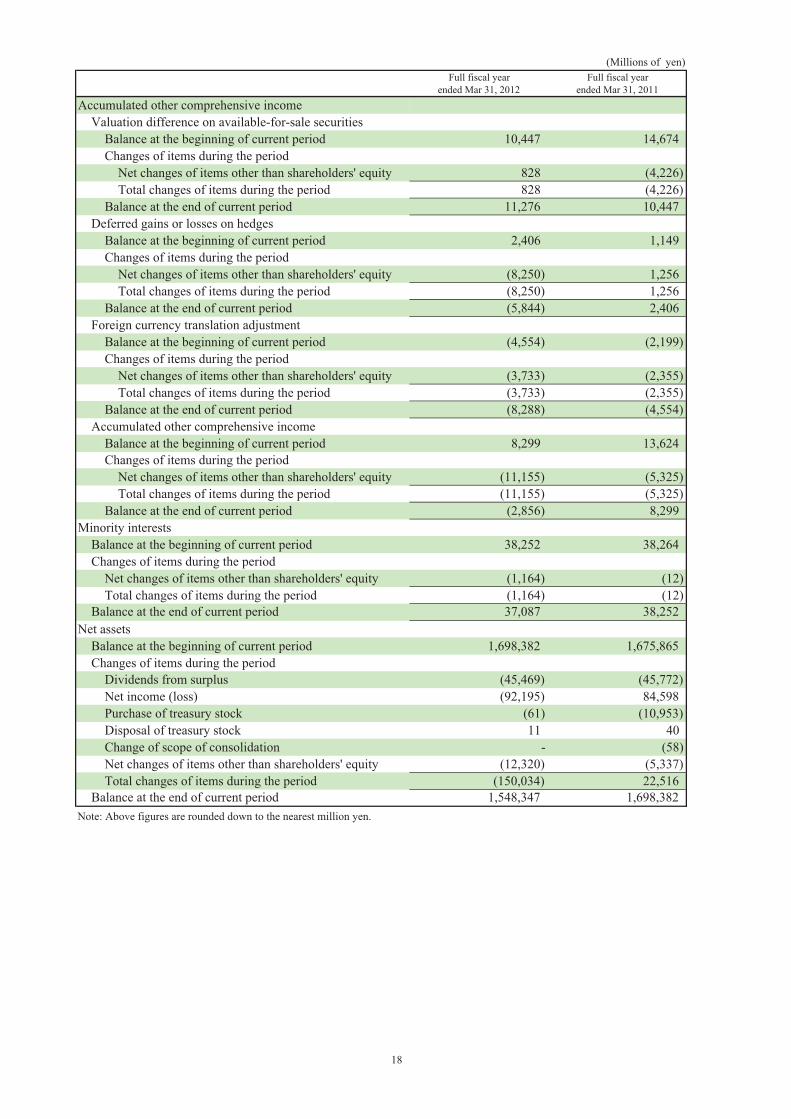
(Millions of yen)Full fiscal year
ended Mar 31, 2012Full fiscal year
ended Mar 31, 2011Accumulated other comprehensive income
Valuation difference on available-for-sale securitiesBalance at the beginning of current period 10,447 14,674Changes of items during the period
Net changes of items other than shareholders' equity 828 (4,226)Total changes of items during the period 828 (4,226)
Balance at the end of current period 11,276 10,447Deferred gains or losses on hedges
Balance at the beginning of current period 2,406 1,149Changes of items during the period
Net changes of items other than shareholders' equity (8,250) 1,256Total changes of items during the period (8,250) 1,256
Balance at the end of current period (5,844) 2,406Foreign currency translation adjustment
Balance at the beginning of current period (4,554) (2,199)Changes of items during the period
Net changes of items other than shareholders' equity (3,733) (2,355)Total changes of items during the period (3,733) (2,355)
Balance at the end of current period (8,288) (4,554)Accumulated other comprehensive income
Balance at the beginning of current period 8,299 13,624Changes of items during the period
Net changes of items other than shareholders' equity (11,155) (5,325)Total changes of items during the period (11,155) (5,325)
Balance at the end of current period (2,856) 8,299Minority interests
Balance at the beginning of current period 38,252 38,264Changes of items during the period
Net changes of items other than shareholders' equity (1,164) (12)Total changes of items during the period (1,164) (12)
Balance at the end of current period 37,087 38,252Net assets
Balance at the beginning of current period 1,698,382 1,675,865Changes of items during the period
Dividends from surplus (45,469) (45,772)Net income (loss) (92,195) 84,598Purchase of treasury stock (61) (10,953)Disposal of treasury stock 11 40Change of scope of consolidation - (58)Net changes of items other than shareholders' equity (12,320) (5,337)Total changes of items during the period (150,034) 22,516
Balance at the end of current period 1,548,347 1,698,382Note: Above figures are rounded down to the nearest million yen.
18

(Millions of yen)Full fiscal year
ended Mar 31, 2012Full fiscal year
ended Mar 31, 2011Net cash provided by (used in) operating activities
Income (loss) before income taxes and minoroty interests (84,487) 135,138Depreciation 289,451 284,046Decommissioning costs of nuclear power units 738 3,709Amortization of nuclear fuel 1,180 7,202Loss on retirement of noncurrent assets 10,113 8,636Loss on adjustment for changes of accounting standard for asset retirement obligations - 8,685Increase (decrease) in provision for retirement benefits 1,973 1,390Increase (decrease) in provision for reprocessing of irradiated nuclear fuel (10,802) (3,902)Increase (decrease) in provision for other reprocessing of irradiated nuclear fuel 583 933Increase (decrease) in provision for loss in conjunction with discontinued operaitions of nuclear power plants (5,561) (892)Increase (decrease) in reserve for fluctuation in water levels 8,338 2,450Interest and dividends income (6,424) (6,469)Interest expenses 36,055 36,407Settlement received (9,000) -Decrease (increase) in reserve fund for reprocessing of irradiated nuclear fuel 10,835 3,214Decrease (increase) in notes and accounts receivable-trade (32,503) (1,434)Decrease (increase) in inventories (5,827) (583)Increase (decrease) in notes and accounts payable-trade 14,952 10,739Other 13,238 82,877Subtotal 232,855 572,151Interest and dividends income received 8,303 9,632Interest expenses paid (34,916) (37,387)Settlement package received 9,000 0Income taxes paid (38,396) (94,641)Net cash provided by (used in) operating activities 176,844 449,755
Net cash provided by (used in) investing activitiesPurchase of noncurrent assets (266,938) (269,621)Payments of investment and loans receivable (8,607) (89,440)Collection of investment and loans receivable 13,638 15,371Other 14,835 7,635Net cash provided by (used in) investing activities (247,073) (336,055)
Net cash provided by (used in) financing activitiesProceeds from issuance of bonds - 89,697Redemption of bonds (139,100) (146,374)Proceeds from long-term loans payable 825,600 161,420Repayment of long-term loans payable (112,406) (194,267)Increase in short-term loans payable 379,187 411,320Decrease in short-term loans payable (370,529) (398,297)Proceeds from issuance of commercial papers 154,000 791,000Redemption of commercial papers (266,000) (760,000)Purchase of treasury stock (61) (10,953)Cash dividends paid (45,369) (45,709)Cash dividends paid to minority shareholders (499) (455)Other (2,814) (2,468)Net cash provided by (used in) financing activities 422,007 (105,088)
Effect of exchange rate change on cash and cash equivalents 88 (455)Net increase (decrease) in cash and cash equivalents 351,866 8,155Cash and cash equivalents at beginning of this period 121,295 113,140
473,162 121,295Note: Above figures are rounded down to the nearest million yen.
4 Consolidated Statements of Cash Flows
Cash and cash equivalents at end of this period
19
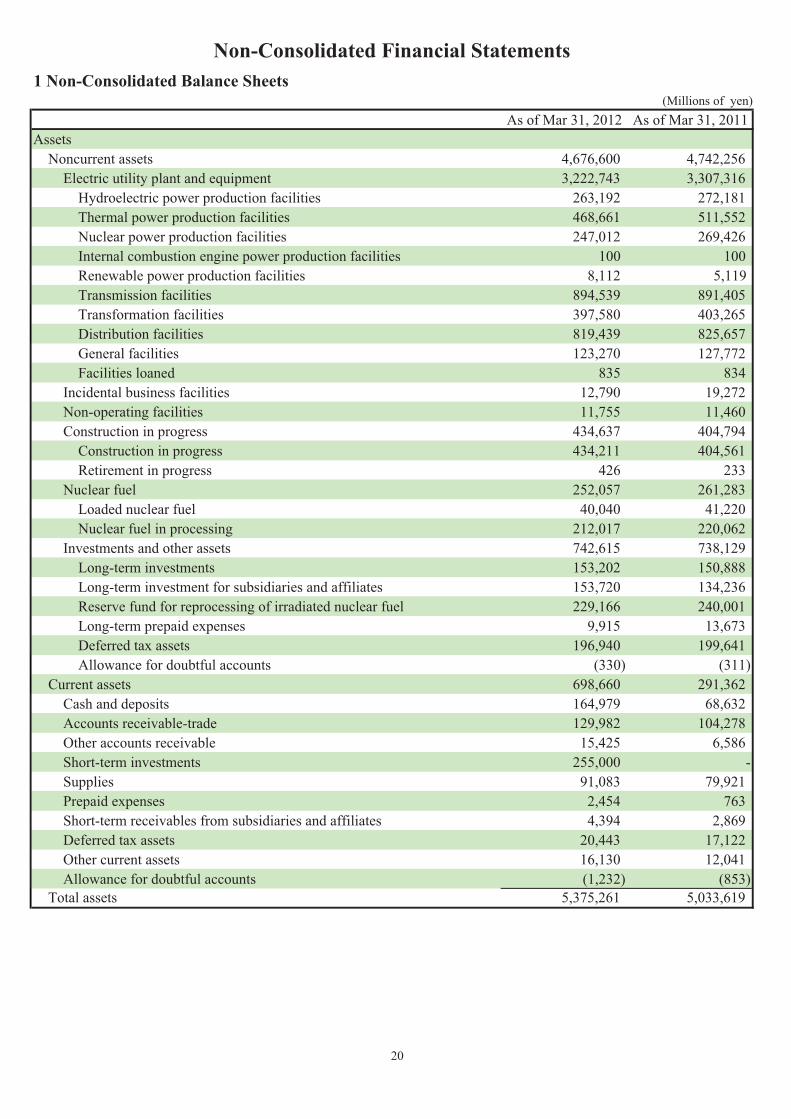
(Millions of yen)As of Mar 31, 2012 As of Mar 31, 2011
Noncurrent assets 4,676,600 4,742,256Electric utility plant and equipment 3,222,743 3,307,316
Hydroelectric power production facilities 263,192 272,181Thermal power production facilities 468,661 511,552Nuclear power production facilities 247,012 269,426Internal combustion engine power production facilities 100 100Renewable power production facilities 8,112 5,119Transmission facilities 894,539 891,405Transformation facilities 397,580 403,265Distribution facilities 819,439 825,657General facilities 123,270 127,772Facilities loaned 835 834
Incidental business facilities 12,790 19,272Non-operating facilities 11,755 11,460Construction in progress 434,637 404,794
Construction in progress 434,211 404,561Retirement in progress 426 233
Nuclear fuel 252,057 261,283Loaded nuclear fuel 40,040 41,220Nuclear fuel in processing 212,017 220,062
Investments and other assets 742,615 738,129Long-term investments 153,202 150,888Long-term investment for subsidiaries and affiliates 153,720 134,236Reserve fund for reprocessing of irradiated nuclear fuel 229,166 240,001Long-term prepaid expenses 9,915 13,673Deferred tax assets 196,940 199,641Allowance for doubtful accounts (330) (311)
Current assets 698,660 291,362Cash and deposits 164,979 68,632Accounts receivable-trade 129,982 104,278Other accounts receivable 15,425 6,586Short-term investments 255,000 -Supplies 91,083 79,921Prepaid expenses 2,454 763Short-term receivables from subsidiaries and affiliates 4,394 2,869Deferred tax assets 20,443 17,122Other current assets 16,130 12,041Allowance for doubtful accounts (1,232) (853)
5,375,261 5,033,619
Non-Consolidated Financial Statements1 Non-Consolidated Balance Sheets
Assets
Total assets
20
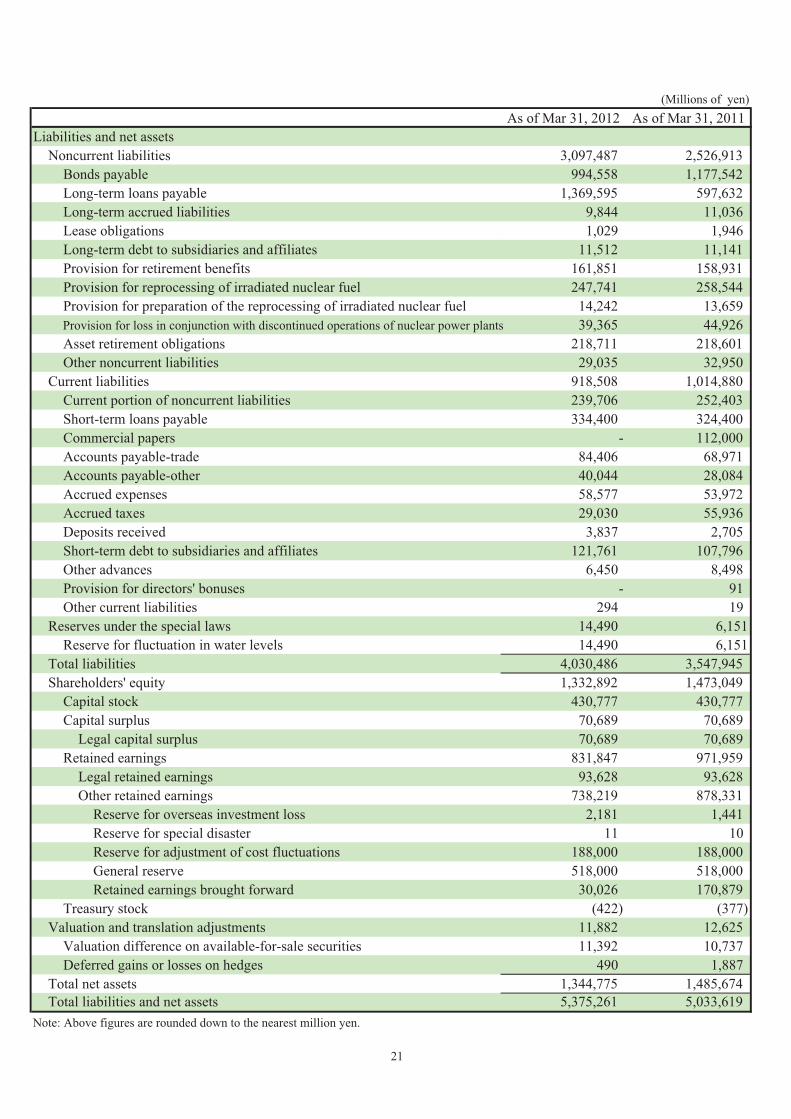
(Millions of yen)As of Mar 31, 2012 As of Mar 31, 2011
Liabilities and net assetsNoncurrent liabilities 3,097,487 2,526,913
Bonds payable 994,558 1,177,5421,369,595 597,632
9,844 11,0361,029 1,946
11,512 11,141161,851 158,931247,741 258,544
14,242 13,65939,365 44,926
218,711 218,60129,035 32,950
Current liabilities 918,508 1,014,880Current portion of noncurrent liabilities 239,706 252,403Short-term loans payable 334,400 324,400Commercial papers - 112,000Accounts payable-trade 84,406 68,971Accounts payable-other 40,044 28,084Accrued expenses 58,577 53,972Accrued taxes 29,030 55,936Deposits received 3,837 2,705Short-term debt to subsidiaries and affiliates 121,761 107,796Other advances 6,450 8,498Provision for directors' bonuses - 91Other current liabilities 294 19
Reserves under the special laws 14,490 6,151Reserve for fluctuation in water levels 14,490 6,151
Total liabilities 4,030,486 3,547,945Shareholders' equity 1,332,892 1,473,049
Capital stock 430,777 430,777Capital surplus 70,689 70,689
Legal capital surplus 70,689 70,689Retained earnings 831,847 971,959
Legal retained earnings 93,628 93,628Other retained earnings 738,219 878,331
Reserve for overseas investment loss 2,181 1,441Reserve for special disaster 11 10Reserve for adjustment of cost fluctuations 188,000 188,000General reserve 518,000 518,000Retained earnings brought forward 30,026 170,879
Treasury stock (422) (377)Valuation and translation adjustments 11,882 12,625
Valuation difference on available-for-sale securities 11,392 10,737Deferred gains or losses on hedges 490 1,887
Total net assets 1,344,775 1,485,6745,375,261 5,033,619
Note: Above figures are rounded down to the nearest million yen.
Provision for retirement benefitsLong-term debt to subsidiaries and affiliatesLease obligations
Other noncurrent liabilitiesAsset retirement obligationsProvision for loss in conjunction with discontinued operations of nuclear power plantsProvision for preparation of the reprocessing of irradiated nuclear fuel
Total liabilities and net assets
Long-term loans payableLong-term accrued liabilities
Provision for reprocessing of irradiated nuclear fuel
21

(Millions of yen)Full fiscal year
ended Mar 31, 2012Full fiscal year
ended Mar 31, 2011
Operating revenue 2,295,153 2,178,286
Electric utility operating revenue 2,248,551 2,136,246
Residential 786,829 777,999
Commercial and industrial 1,374,777 1,315,179
Sold power to other utilities 48,341 12,460
Sold power to other suppliers 7,270 2,243
Transmission revenue 9,429 5,803
Settlement revenue among utilities 167 214
Other electricity revenue 21,406 22,016
Revenue from loaned facilities 329 329Incidental business operating revenue 46,601 42,039
Operating revenue-gas supply business 43,943 35,820Operating revenue-other businesses 2,658 6,219
Operating expenses 2,345,630 2,020,408Electric utility operating expenses 2,297,370 1,982,944
47,705 47,2411,267,706 867,992
100,931 128,06241 25
1,235 80638,504 53,214
169,950 154,989114,904 124,06372,970 73,464
200,314 205,02368,804 72,330
32 35139,418 181,05448,596 49,65126,821 25,255
(568) (265)Incidental business operating expenses 48,259 37,464
Operating expenses-gas supply business 45,925 34,353Operating expenses-other businesses 2,334 3,111
Operating income (loss) (50,476) 157,877
Thermal power production expenses
Transformation expenses
Renewable power production expenses
Distribution expensesSelling expenses
Purchased power from other suppliersPurchased power from other utilities
Hydroelectric power production expenses
Internal combustion engine power production expenses
2 Non-Consolidated Statements of Income
Nuclear power production expenses
Transferred cost of electricity for construction and incidental business
Transmission expenses
Enterprise taxElectric power development promotion taxGeneral and administrative expensesCost of loaned facilities
22
(Millions of yen)Full fiscal year
ended Mar 31, 2012Full fiscal year
ended Mar 31, 2011
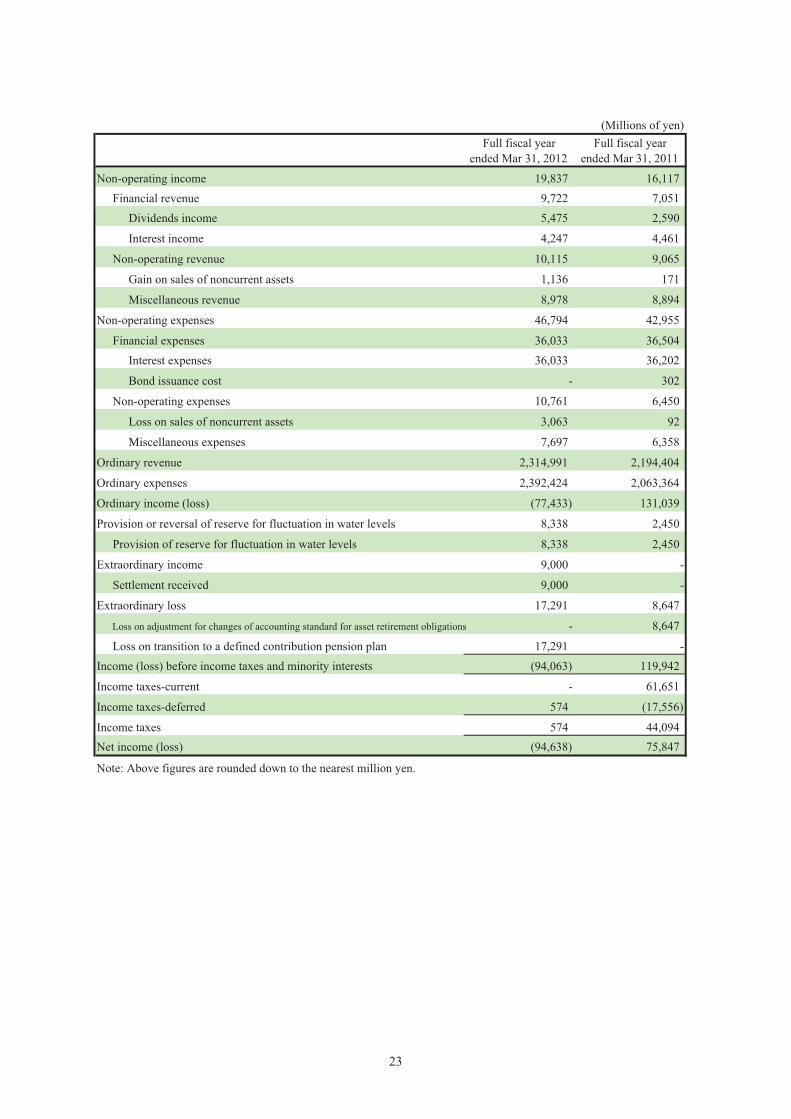
Non-operating income 19,837 16,117Financial revenue 9,722 7,051
Dividends income 5,475 2,590
Interest income 4,247 4,461
Non-operating revenue 10,115 9,065
Gain on sales of noncurrent assets 1,136 171
Miscellaneous revenue 8,978 8,894
Non-operating expenses 46,794 42,955
Financial expenses 36,033 36,504Interest expenses 36,033 36,202
Bond issuance cost - 302
Non-operating expenses 10,761 6,450
Loss on sales of noncurrent assets 3,063 92
Miscellaneous expenses 7,697 6,358
Ordinary revenue 2,314,991 2,194,404
Ordinary expenses 2,392,424 2,063,364
Ordinary income (loss) (77,433) 131,039
Provision or reversal of reserve for fluctuation in water levels 8,338 2,450
Provision of reserve for fluctuation in water levels 8,338 2,450
Extraordinary income 9,000 -
Settlement received 9,000 -
Extraordinary loss 17,291 8,647
- 8,647
17,291 -Income (loss) before income taxes and minority interests (94,063) 119,942
Income taxes-current - 61,651
Income taxes-deferred 574 (17,556)
Income taxes 574 44,094Net income (loss) (94,638) 75,847
Note: Above figures are rounded down to the nearest million yen.
Loss on adjustment for changes of accounting standard for asset retirement obligations
Loss on transition to a defined contribution pension plan
23
(Millions of yen)Full fiscal year
ended Mar 31, 2012Full fiscal year
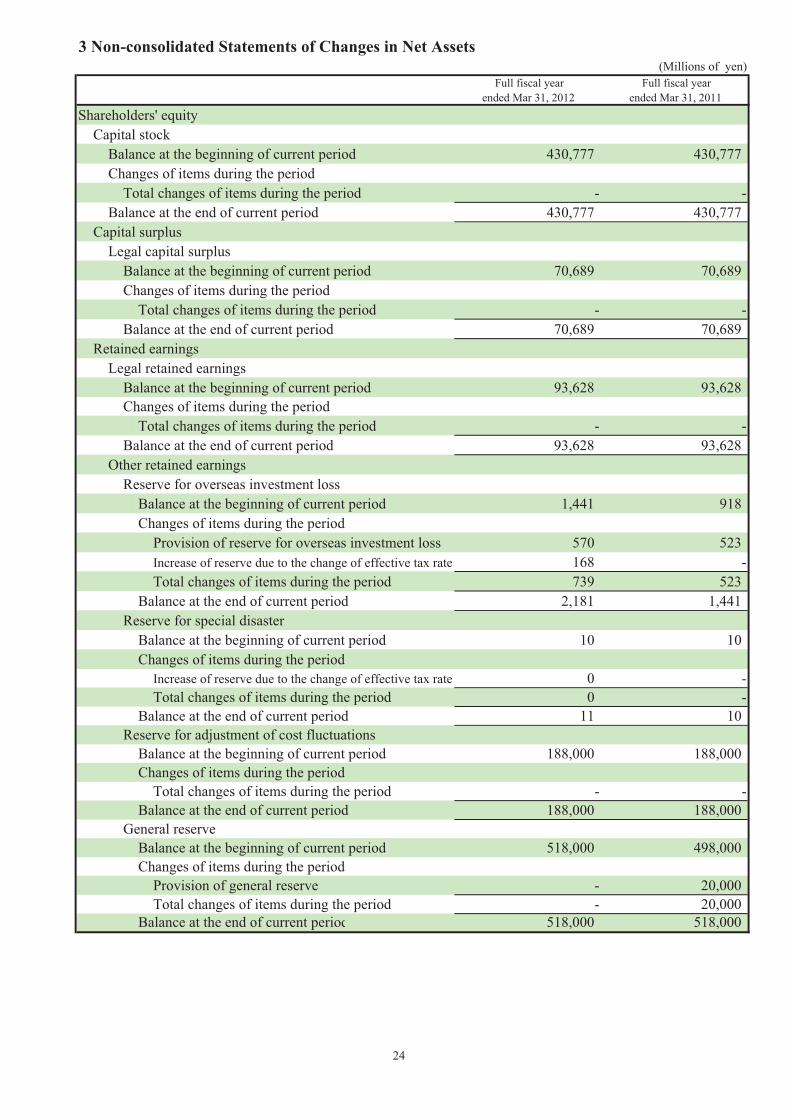
ended Mar 31, 2011Shareholders' equity
Capital stockBalance at the beginning of current period 430,777 430,777Changes of items during the period
Total changes of items during the period - -Balance at the end of current period 430,777 430,777
Capital surplusLegal capital surplus
Balance at the beginning of current period 70,689 70,689Changes of items during the period
Total changes of items during the period - -Balance at the end of current period 70,689 70,689
Retained earningsLegal retained earnings
Balance at the beginning of current period 93,628 93,628Changes of items during the period
Total changes of items during the period - -Balance at the end of current period 93,628 93,628
Other retained earningsReserve for overseas investment loss
Balance at the beginning of current period 1,441 918Changes of items during the period
Provision of reserve for overseas investment loss 570 523Increase of reserve due to the change of effective tax rate 168 -Total changes of items during the period 739 523
Balance at the end of current period 2,181 1,441Reserve for special disaster
Balance at the beginning of current period 10 10Changes of items during the period
Increase of reserve due to the change of effective tax rate 0 -Total changes of items during the period 0 -
Balance at the end of current period 11 10Reserve for adjustment of cost fluctuations
Balance at the beginning of current period 188,000 188,000Changes of items during the period
Total changes of items during the period - -Balance at the end of current period 188,000 188,000
General reserveBalance at the beginning of current period 518,000 498,000Changes of items during the period
Provision of general reserve - 20,000Total changes of items during the period - 20,000
518,000 518,000
3 Non-consolidated Statements of Changes in Net Assets
Balance at the end of current period
24
(Millions of yen)Full fiscal year
ended Mar 31, 2012Full fiscal year
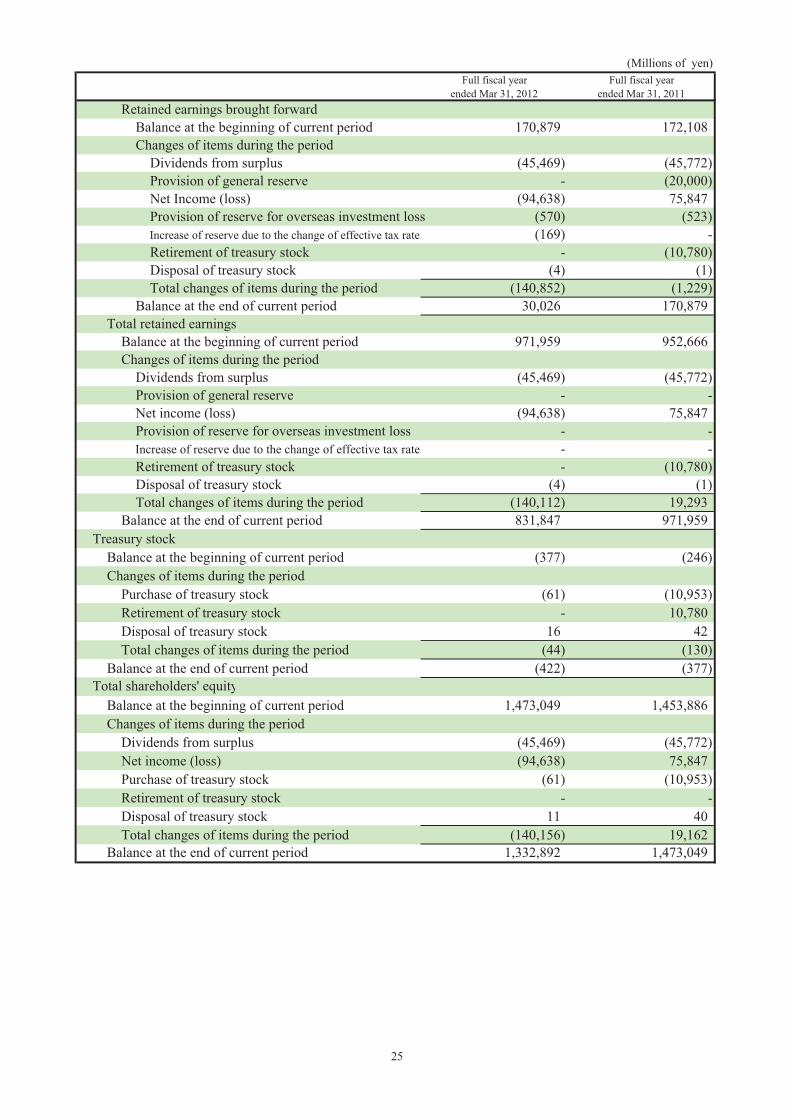
ended Mar 31, 2011Retained earnings brought forward
Balance at the beginning of current period 170,879 172,108Changes of items during the period
Dividends from surplus (45,469) (45,772)Provision of general reserve - (20,000)Net Income (loss) (94,638) 75,847Provision of reserve for overseas investment loss (570) (523)Increase of reserve due to the change of effective tax rate (169) -Retirement of treasury stock - (10,780)Disposal of treasury stock (4) (1)Total changes of items during the period (140,852) (1,229)
Balance at the end of current period 30,026 170,879Total retained earnings
Balance at the beginning of current period 971,959 952,666Changes of items during the period
Dividends from surplus (45,469) (45,772)Provision of general reserve - -Net income (loss) (94,638) 75,847Provision of reserve for overseas investment loss - -
- -Retirement of treasury stock - (10,780)Disposal of treasury stock (4) (1)Total changes of items during the period (140,112) 19,293
Balance at the end of current period 831,847 971,959Treasury stock
Balance at the beginning of current period (377) (246)Changes of items during the period
Purchase of treasury stock (61) (10,953)Retirement of treasury stock - 10,780Disposal of treasury stock 16 42Total changes of items during the period (44) (130)
Balance at the end of current period (422) (377)Total shareholders' equity
Balance at the beginning of current period 1,473,049 1,453,886Changes of items during the period
Dividends from surplus (45,469) (45,772)Net income (loss) (94,638) 75,847Purchase of treasury stock (61) (10,953)Retirement of treasury stock - -Disposal of treasury stock 11 40Total changes of items during the period (140,156) 19,162
1,332,892 1,473,049Balance at the end of current period
Increase of reserve due to the change of effective tax rate
25
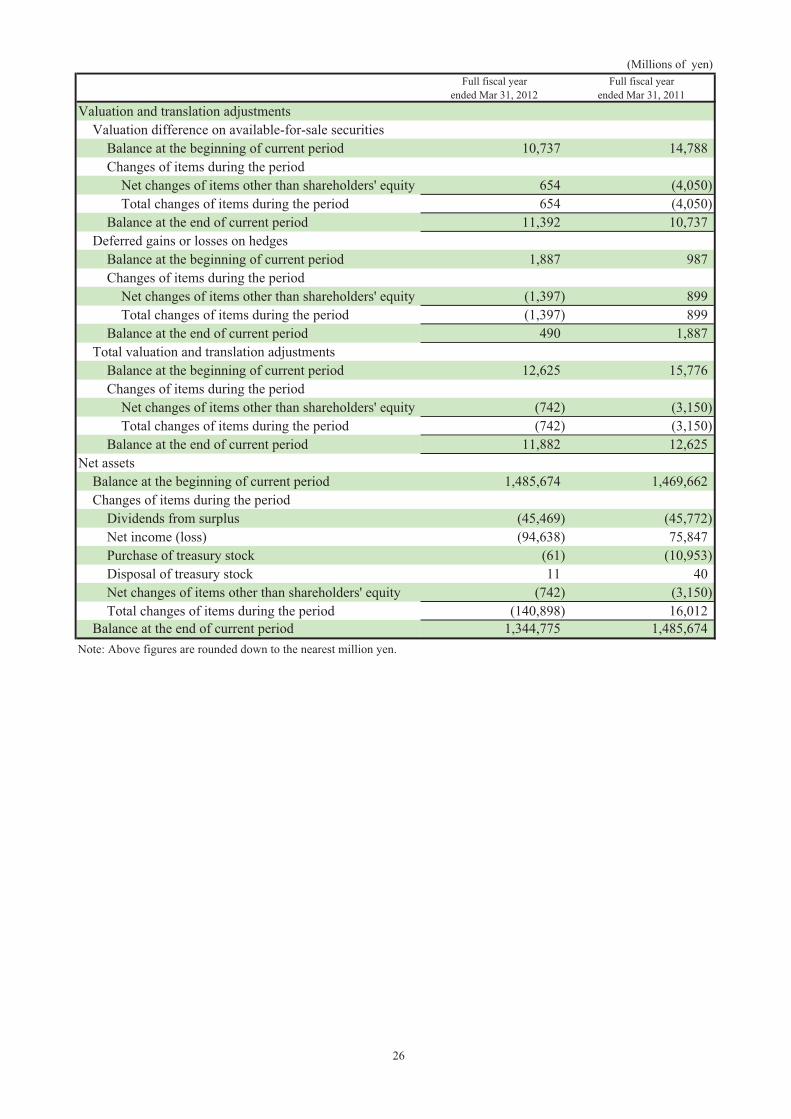
(Millions of yen)Full fiscal year
ended Mar 31, 2012Full fiscal year
ended Mar 31, 2011Valuation and translation adjustments
Valuation difference on available-for-sale securitiesBalance at the beginning of current period 10,737 14,788Changes of items during the period
Net changes of items other than shareholders' equity 654 (4,050)Total changes of items during the period 654 (4,050)
11,392 10,737Deferred gains or losses on hedges
Balance at the beginning of current period 1,887 987Changes of items during the period
Net changes of items other than shareholders' equity (1,397) 899Total changes of items during the period (1,397) 899
490 1,887Total valuation and translation adjustments
Balance at the beginning of current period 12,625 15,776Changes of items during the period
Net changes of items other than shareholders' equity (742) (3,150)Total changes of items during the period (742) (3,150)
11,882 12,625Net assets
Balance at the beginning of current period 1,485,674 1,469,662Changes of items during the period
Dividends from surplus (45,469) (45,772)Net income (loss) (94,638) 75,847Purchase of treasury stock (61) (10,953)Disposal of treasury stock 11 40Net changes of items other than shareholders' equity (742) (3,150)Total changes of items during the period (140,898) 16,012
1,344,775 1,485,674Note: Above figures are rounded down to the nearest million yen.
Balance at the end of current period
Balance at the end of current period
Balance at the end of current period
Balance at the end of current period
26