FINANCIAL REPORT - Lectra
129
47 FINANCIAL REPORT 2014
-
Upload
khangminh22 -
Category
Documents
-
view
4 -
download
0
Transcript of FINANCIAL REPORT - Lectra

47
FINANCIAL REPORT
2014

48 – Financial Report 2014

49
Dear Shareholders,
This Management Discussion and Analysis reports on the company’s operations and fi nancial results, as well as on those of all of its subsidiaries, for its 41st fi scal year, ended December 31, 2014.It is separate from the report of the Board of Directors to the Ordinary Shareholders’ Meeting of April 30, 2015 (available in French only), which, in addition, discusses in detail the fi nancial statements and other disclosures relating to the parent company, Lectra SA, presents its report on the Group’s corporate social and environmental responsibility information in the framework of the “Grenelle II” Act and the reasons underlying the draft resolutions submitted for approval by the shareholders.To make the discussion of revenues and earnings as meaningful as possible, detailed comparisons between 2014 and 2013 are based on 2013 exchange rates (“like-for-like”) unless stated otherwise.
1. SUMMARY OF EVENTS AND PERFORMANCE IN 2014
The company indicated on February 11, 2014 that the year was likely to be both diffi cult and unpredictable. Macroeconomic, geopolitical and monetary conditions were complex in the course of the year (see chapter 2).
Growth in Orders for New Systems — Improved Product Mix
Overall, orders for new systems amounted to €94.3 million, up €10.5 million (+13%) relative to 2013: +16% for new software licenses, +7% for CAD/CAM equipment and +39% for training and consulting. Geographically, the situation is highly contrasted. Orders in Europe increased by 39% — with growth exceeding 50% in the Germany and Eastern Europe region, Italy and France — and those in Asia-Pacifi c by 25%, with 45% growth in China. They dropped by 21% in the Americas and by 18% in the rest of the world (North Africa, South Africa, Turkey, the Middle East, etc.). Orders were up in all market sectors: +12% in the fashion and apparel market, +9% in the automotive market, +3% in furniture and +73% in other industries. These markets accounted for 49%, 36%, 8% and 7% of total orders respectively.
Income from Operations and Net Income Above the Company’s Minimum Objective
The company’s objective communicated in its fi nancial report on February 11, 2014 was to generate minimum revenues of approximately €214 million (+7% relative to 2013) for the fi scal year, income from operations of around €18 million (+10%), an operating margin of 8.3% (increasing slightly), and net income of around €12.5 million (unchanged at actual exchange rates, excluding 2013 non-recurring items). While, at actual exchange rates, revenues for 2014 (€211.3 million) are 1% lower than this objective, income from operations (€19.8 million) is €1.8 million ahead and operating margin (9.4%) is 1.1 percentage points higher, thanks to an improved sales mix, improved margins and lower-than-expected overhead costs. Net income (€14.4 million) exceeds the objective by €1.9 million.
Growth in Revenues — Sharp Increase in the Order Backlog
Revenues from new systems sales (€88.6 million) rose by 5% compared to 2013. This is less than the amount for new orders booked (€94.3 million). Consequently the order backlog of €19.6 million at December 31, 2014 was up sharply relative to the January 1 fi gure of €13.2 million.Recurring revenues (€122.8 million) increased by €5.3 million (+5%). Revenues from recurring contracts increased by 4% and revenues from spare parts and consumables by 5%. The increase in the gross margin on recurring revenues alone covered more than 80% of the increase in fi xed overhead costs.Total revenues (€211.3 million) were up by 5% relative to 2013. Revenues increased 10% in Europe and 8% in Asia-Pacifi c, but decreased 6% in the Americas. These three regions accounted for 46% (including 8% for France), 23% and 24% of revenues respectively. Revenues from the rest of the world (7% of total revenues) decreased by 3%. In 2013, these regions accounted for 44% (including 8% for France), 22%, 27% and 7% of total revenues respectively.
MANAGEMENT DISCUSSION AND ANALYSIS OF FINANCIAL CONDITION AND RESULTS OF OPERATIONS
50 – 2014 Financial Report Management discussion and analysis
Growth in Income from Operations and in the Operating Margin Before Non-Recurring Items — Continuation of Investments for the Future
Income from operations before non-recurring items was €19.8 million. Like-for-like, it was up €2.4 million (+14%) relative to 2013. At actual exchange rates, it increased by €2.3 million (+13%). This increase stems from the growth in revenues from new systems sales (€2.6 million), in recurring revenues (€4.1 million), and in gross profi t margins (€1.5 million). These positive impacts were partly offset by the natural increase in fi xed overhead costs (€1.9 million), and the increase in investments for the future related to the company’s transformation plan (€3.9 million). The impact of exchange rate variations on income from operations before non-recurring items for the year was virtually nil.The operating margin before non-recurring items was 9.4%, up 0.7 percentage points like-for-like and 0.8 percentage points at actual exchange rates. Expenditures corresponding to investments for the future (€13.6 million) had a negative impact of 1.8 percentage points on the operating margin before non-recurring items relative to 2013 and represented 6.4 percentage points relative to 2011, i.e. before the transformation plan’s inception and investments for the future totaling €50 million over the period 2012-2015.Income from operations for 2013 included the €11.1 million non-recurring income refl ecting receipt of the outstanding amount in the litigation against Induyco, and the €0.7 million goodwill impairment on Lectra Spain.Net income reached €14.4 million, up €1.9 million (+15%) compared with net income before non-recurring items of €12.5 million in 2013.
Strong Increase in Free Cash Flow Before Non-Recurring Items
Free cash fl ow amounted to €19 million (€6.5 million in 2013 excluding receipt of the €11.1 million non-recurring income refl ecting receipt of the outstanding amount in the litigation against Induyco). Excluding non-recurring items, the increase was €12.6 million.Free cash fl ow was boosted by the receipt of the 2010 (French) research tax credit amounting to €5.7 million.
A Zero-Debt Company, Shareholders’ Equity and Net Cash Position Further Strengthened
At December 31, 2014, consolidated shareholders’ equity amounted to €94.1 million (+12%). Cash and cash equivalents totaled €43.5 million (+47%) and the net cash position was positive at €43.1 million (+50%), after payment of the €6.6 million dividend declared in respect of fi scal 2013.Financial borrowings have been reduced to €0.4 million. They correspond to interest-free government advances to help fi nance R&D programs, the fi nal repayment being scheduled for March 31, 2015.
Subsidiary Opened in South Korea
In April 2014, the company formed a new subsidiary, Lectra Korea, in South Korea, in order to accelerate its development in Asia.After China, South Korea is one of the spearheads of Lectra’s expansion in Asia, especially in the automotive industry and in the fashion and apparel industries, where South Korean fi rms increasingly rank among the world’s leaders. Lectra has been operating in the country for more than twenty-fi ve years, represented until then by an exclusive agent.
Acquisitions and Partnerships
The company made no acquisitions in 2014 apart from the purchase of the activity of the former agent in South Korea and did not enter into any new strategic partnership agreements.
2. STRATEGIC ROADMAP FOR 2013-2016:
SECOND PROGRESS REPORT
In its fi nancial report of February 12, 2013, the company published its strategic roadmap for 2013-2015 as well as a broad outline of its transformation plan and investments for the future representing €50 million over the period 2012-2015. Global growth proved slower than forecast, in 2013, and the hoped for rise in business confi dence failed to materialize. Consequently, the company’s revenues and results fell behind the roadmap. Given the uncertain macroeconomic conditions of 2014, the company stated in its February 11, 2014, report that it would be prudent
51
to consider that it would only reach in 2016 the fi nancial objectives it had set for 2015. The roadmap had, accordingly, been extended to the period 2013-2016.The year 2014 was the third year of the transformation plan and investments for the future and the second year of the strategic roadmap, which are recalled in full below as communicated in the February 12, 2013 report, each chapter being followed by a second progress report, coming after last year’s report.
A Long-Term Strategy
Formulated at the end of 2009 with a view to emerging strengthened from the crisis, to prepare for the new post-crisis challenges and seize resulting opportunities, the 2010-2012 strategic roadmap proved its effectiveness and demonstrated the strength of Lectra’s business model and the company’s resilience. On the strength of its success, the company framed a new roadmap for 2013-2015 to enable it to fully realize its growth potential at the end of 2012.Continuing to focus on a long-term strategy, its overriding objectives remain unchanged: accentuate Lectra’s technological leadership and the high value of its product and service offer; strengthen its competitive position and its long-term relationships with customers; accelerate organic growth; boost profi tability by regularly increasing the operating margin; and generate free cash fl ow in excess of net income (assuming that the French research tax credit and the competitiveness and employment tax credit recognized in the year, are received or used) thus self-fi nancing its future growth.
Progress ReportThese fi ve strategic objectives remain unchanged.
Building for the Future in the New Post-Crisis Economic Order
Eight economies (Brazil, Russia, India, China, South Korea, Indonesia, Mexico and Turkey) are expected to account for half of global growth in the present decade. Following China’s example, their growth models will increasingly be driven by their domestic markets, greater added value and companies’ quest for higher margins. Lectra is well armed to turn this new economic order into a vehicle for dynamic growth. The other half of global
growth will still take place in developed countries, where the Group already has a signifi cant market share.From this dual-growth perspective, the company will benefi t from its premium positioning, sustained by the new generations of all of its solutions, enhanced technological leadership, high performing services, the expertise of its staff in their customers’ businesses, and its growing importance as a supplier to major global customers as it supports them in their drive for competitiveness, primarily targeting the Group’s top 3,000 customers and providing dedicated resources for the top 300. Lectra is the only player in its industry supplying a complete high value offer across all its geographical markets and market sectors, giving its customers a unique long-term competitive advantage.Five accelerators will drive Lectra’s growth: emerging countries, together with the industrial revival in the United States and other developed countries; the automotive market — an industry currently experiencing far-reaching technological and geographical change; the leather market, thanks to the revolutionary new range of Versalis automated cutters; PLM for fashion and apparel offering collaborative solutions facilitating collection management; and, fi nally, 3D technology for fashion and apparel, the new universal product development solution.
Progress ReportThe different countries’ contributions to growth in Lectra’s activity appear today to vary widely, depending on the change in their respective situation and potential for the Group since 2013.Of the eight economies forecast to account for half of global growth in the current decade, China alone is expected to represent a third of potential growth in Lectra’s activity over the next two years and into the medium term, followed by South Korea. Looking further ahead, Brazil, Mexico and Turkey — where Lectra already holds a strong position, but where the current economic situation is diffi cult — are expected to increase their contribution.The main contribution from developed countries will come from the United States, Germany, Italy and France, gradually picking up momentum in the medium term.The automotive market’s share is expected to increase further, under the combined impact of expanding markets in emerging countries, the rising proportion of leather-

52 – 2014 Financial Report Management discussion and analysis
upholstered car interiors, and the growing use of airbags, in 2015-2016 as well as in the medium term.Growth in the leather market will be essentially concentrated in the automotive sector, with slower uptake of new technologies in the furniture and fashion markets.In the fashion and apparel markets, market globalization, the rise in consumption in the emerging countries and in internet sales are all expected to boost sales of PLM software as of 2015-2016. On the other hand, adoption of 3D technology could proceed more slowly than forecast, but will pick up in the medium term. This technology represents an unavoidable revolution for businesses and will prompt a radical rethink of their development methods so that they can take full advantage of the benefi ts it brings.Consequently, the three growth accelerators for 2015 and 2016 will be China, the automotive market and PLM for fashion and apparel.
Deliberately Cautious Macroeconomic Assumptions
The roadmap assumed that macroeconomic conditions would be as weak as in 2012, consistent with growth forecasts for 2013 and 2014 known on February 12, 2013, while allowing for an upturn in business confi dence. After all, businesses will need to adapt and build for their own future within these conditions, which will gradually encourage them to resume their investment decisions.As the very strong rebound in orders in 2010 and the fi rst half of 2011 showed, companies in the different geographical markets and market sectors served by Lectra will need to accelerate their investment plans or make good the investments they have postponed over several years and acquire the technologies necessary to boost their competitiveness and growth. The crisis and its further developments have amplifi ed the challenges they face.
Progress ReportIn its report of February 11, 2014, the company stated that the coming year was likely to be both diffi cult and unpredictable. The latest growth forecasts for 2014 and 2015 confi rmed signs of a partial upturn in some developed countries, the United States and Japan in particular, while Europe continued to accumulate structural diffi culties and could face defl ation.
At the same time, growth in certain emerging countries was revised downward. Finally, certain currency risks were likely to increase, with the gradual tightening of U.S. monetary policy and the likely depreciation of the emerging currencies.While most of these expectations proved founded, a number of unforeseen events combined to worsen the macroeconomic and geopolitical environment, including wars in Ukraine and the Middle East, the oil price slump, the Greek and Russian crisis, etc. Sharply lower interest rates, expanding consumption in emerging countries, China notably, and the proven competitiveness of German and U.S. industries were among the positive factors.For Lectra, the euro’s fall since midsummer 2014 against the dollar and the Chinese yuan in particular is a major event. Variations in the exchange rate between December 31, 2013, and December 31, 2014, were signifi cant: the dollar appreciated 13.6% against the euro (from $1.38/€1 to $1.21/€1) and the Chinese yuan rose 12.4% (from CNY 8.35/€1 to CNY 7.43/€1). Over and beyond its positive impact for Group customers in Europe (while the negative impact for China and the United States is expected to be limited), should this decline prove durable, it will mechanically boost the company’s revenues and results signifi cantly in 2015 and 2016.
Clear and Ambitious Financial Goals
The main goals for 2016 contained in the strategic roadmap are (like-for-like variations):
– revenue growth of 33% or greater over the period 2013-2016;
– a 15% operating margin (before non-recurring items) in 2016;
– more than doubling income from operations (before non-recurring items) and net income in four years.These goals are supported by a determination to maintain a tight grip on key operating ratios, by preserving a security ratio (i.e. the percentage of annual fi xed overhead costs covered by gross profi t on recurring revenues) equal to or greater than 75%. They are founded on organic growth and are based on the exchange rates of February 1, 2013, in particular $1.35/€1.If these goals were met, income from operations before non-recurring items would be multiplied by nearly four in 2016 relative to 2007, the last pre-crisis year, and

53
the operating margin (before non-recurring items) would rise by nearly 10 percentage points, on an actual basis.The company had indicated that, given the uncertainties at a time when forecasting is diffi cult, it may review these goals over the course of this three-year period.
Progress ReportWhile orders and revenues from new systems again fell behind the roadmap for the year in 2014, recurring revenues, on the other hand, have grown faster than expected. At actual exchange rates, revenues are close to pre-crisis levels (€216.6 million in 2007 when the euro/dollar exchange rate had been more or less at the same rate at $1.37/€1). The company’s business model has been strengthened, with recurring revenues exceeding their 2007 level by €21.1 million (+21%) and representing 58% of revenues against 47%. The acceleration of the growth in revenues of new systems in 2015 and 2016 should lead them to exceed their 2007 level in 2016, with the aim of having an equal weighting to that of recurring revenues. The profi tability ratios (especially the overall gross profi t margin and operating margin) were better than expected, with a particularly robust 79% security ratio.Fixed overhead costs other than investments for the future were below budget and all other metrics were in line or better than expected.As stated in chapter 14, Business Trends and Outlook, the company maintains the fi nancial goals it has set for 2016 unchanged.
Far-Reaching Company Transformation Plan and Investments for the Future
Faced with the scale of the economic crisis in 2008-2009, the company reduced its fi xed overhead costs by nearly 20%, bringing them down from €124 million in 2007 to €100 million in 2010. Its 2010-2012 roadmap called for a second transformation phase in order to build its new post-crisis structure.Innovation, human capital united around a strong corporate culture built on core values, uncompromised ethics in conducting business, and proximity to customers continue to drive Lectra’s leadership. On the strength of its results, the company decided at the end of 2011 to
give precedence to its long-term strategy rather than to short-term profi tability, by devoting the requisite fi nancial resources to this goal.This three-point plan will cover the period to 2015, comprising:
– a major recruitment plan devoted to strengthening sales and marketing teams, which will grow from 220 people at the end of 2011 to 330, and from 16% to 22% of the total workforce (with a doubling of the number of sales people);
– the addition of 40 software R&D engineers in Bordeaux-Cestas, bringing the total R&D workforce to 260 engineers;
– accelerated investment in marketing. If the recruitment program is executed in full, Lectra’s workforce should rise by around 200 to 1,540 by end 2015. This is equivalent to the pre-crisis level of 1,551 in 2007, but with resources reallocated to core strategic activities and the most promising geographical markets and market sectors, as well as increasing effi ciency and improving skills and performance. These investments for the future will represent a cumulative €50 million over the period 2012-2015, fully expensed, while their benefi ts will only be felt progressively. Fixed overhead costs will continue to be limited to around €130 million in 2015, versus €102 million in 2011, before the launch of the transformation plan. Adjusting for infl ation, the level of fi xed overhead costs in 2015 would be below that of 2007.
Progress ReportThe increase in costs relating to the transformation plan in 2014 (€3.9 million) accounted for two thirds of the increase in total fi xed overhead costs (€5.8 million), compared with 2013. Moreover, given the new recruitments, the Group devoted a signifi cant part of its budget, €3.7 million, or 4% of its total payroll costs, on training its teams.Overall, as of December 31, 2014, Lectra’s workforce has increased by 136 since the end of 2011 to 1,474 employees, 13% of which joined the company in 2014 and 31% since the start of the plan. The sales and marketing teams totaled 287 (+73 persons), 24% of which joined the Group in 2014 and 56% since the launch of

54 – 2014 Financial Report Management discussion and analysis
the plan. The total number of consultants was 69 (+33), while the total for the R&D teams came to 260 (+42). The transformation plan has resulted in a strengthening of Lectra’s consulting, marketing and software R&D teams, for which the recruitment program was completed at the end of 2014.Investment in marketing has served to enhance Lectra’s image and raise its profi le, thanks in particular to its new lectra.com website, which has been online since December 2014, increasingly rich customer testimonials, and a global communications campaign in the fashion and apparel markets. This investment effort will be maintained and bolstered in 2015.The main focus of the far-reaching overhaul and strengthening of Lectra’s sales teams have been the Corporate functions, North America, China, and the Germany and Eastern Europe region. Recruitment generally was behind schedule at the end of 2014, and the overall situation was mixed. Only hiring for Corporate functions and in China has been completed. The corresponding plan was reviewed at the end of the year, on one hand, to readjust the breakdown of new hires over the company’s geographic and market sectors and, on the other hand, to increase the number of pre-sales consultants, given the growing strategic importance for the company’s customers in investing in Lectra’s technologies. The company now expects its sales and marketing teams — including the pre-sales consultants — to have expanded from 232 people at the end of 2011 to 360 at December 31, 2015, and from 17% to 23% of the total headcount. The transformation plan will have enabled a reallocation of resources toward the most strategically important activities as well as the geographical markets and market sectors with the greatest growth potential. The total Group headcount will be 1,540 as planned.The transformation plan will be completed at the end of 2015, and the corresponding investments for the future will total €50 million over the period 2012-2015, as initially planned. Finally, fi xed overhead costs will be limited to around €133 million in 2015, based on the chosen parity of $1.25/€1 for the year. The infl ation-adjusted level for 2015 will be less than in 2007, as anticipated.
Fully Internally Funded Development
The company’s annual free cash fl ow should continue to exceed net income (assuming utilization or receipt of the research tax credit and the competitiveness and employment tax credit applicable in France), enabling it to pursue its policy of paying dividends to shareholders while fi nancing its future development.Its goal is to be free of all fi nancial debt.Lectra will pursue its dividend-payment policy. Barring further changes to the taxation of dividends in France, the total dividend is expected to represent a payout ratio of around 33% of net income (excluding non-recurring items), the remaining 67% serving to self-fi nance the company’s growth. This ratio could exceptionally rise to or exceed 50% until the investments for the future have produced their full impact, insofar as they are already taken into account in the computation of net income and free cash fl ow.Lastly, besides the Liquidity Agreement, the company will not implement any share buyback plan. It will preserve its cash in order to fi nance future targeted acquisitions in the coming years, should the right opportunities arise on favorable terms, while its organic growth continues to be fi nanced internally thanks to its business model.
Progress ReportThe balance sheet at the end of 2014 is stronger than expected.
3. CONSOLIDATED FINANCIAL STATEMENTS FOR 2014
With an average parity of $1.33/€1, the U.S. dollar remained stable compared with 2013 ($1.33/€1). The same was true for the Chinese yuan. Other currencies, particularly those of emerging countries (the Turkish lira, Brazilian real, Indian rupee, Mexican peso, and the Russian ruble), suffered a major fall against the euro. Overall, currency movements mechanically decreased revenues by only €0.9 million (–0.4%) and income from operations by €48,000 (–0.2%) at actual exchange rates compared with like-for-like fi gures.
55
Revenues
Revenues totaled €211.3 million, up 5% (+4% at actual exchange rates) compared with 2013.
Revenues from New Systems Sales Revenues from new software licenses (€21.8 million) rose by €1.9 million (+9%) and accounted for 10% of total revenues, as in 2013.CAD/CAM equipment revenues (€54.3 million) decreased 1% and accounted for 26% of total revenues (27% in 2013). Revenues from training and consulting increased by 25% to €10.4 million and represented 5% of total revenues (4% in 2013).Overall, revenues from new systems sales (€88.6 million) were up by €3.9 million (+5%). They represented 42% of total revenues, as in 2013.
Revenues from Recurring Contracts and Spare Parts and Consumables Recurring revenues (€122.8 million) increased by €5.3 million (+5%). They accounted for 58% of total revenues, as in 2013. Revenues from recurring contracts — which contributed to 58% of recurring revenues and 34% of total revenues — totaled €71.5 million, a 4% increase:
– revenues from software evolution and online services contracts (€41.6 million), up 4% compared with 2013 and representing 20% of total revenues;
– revenues from CAD/CAM equipment maintenance and online services contracts (€29.9 million), which increased by 4% and contributed 14% of total revenues. Revenues from spare parts and consumables (€51.3 million), meanwhile, increased by 5%. They represented 24% of total revenues, as in 2013.
Order Backlog
At December 31, 2014, the order backlog for new systems (€19.6 million) was up €6.4 million relative to December 31, 2013, at actual exchange rates.This backlog comprised orders for new software licenses and CAD/CAM equipment totaling €13.7 million — of which €9.4 million is for shipment in Q1 2015, and €4.3 million over the rest of the year — and €5.9 million for training and consulting, to be delivered as projects are carried out, mostly from the second quarter.
Gross Profi t
Gross profi t amounted to €155.7 million. Like-for-like, its €10 million increase relative to 2013 is €0.8 million higher than the growth in revenues, an outstanding performance. The overall gross profi t margin was 73.7%. Like-for-like, it increased by 1.6 percentage points due to improved gross profi t margins on the different product lines and to the change in the sales mix: with a rise in the share of software and of training and consulting in total revenues, and a fall in that of CAD/CAM equipment.Personnel expenses and other operating expenses incurred in the execution of service contracts or in training and consulting are not included in the cost of goods sold but are recognized in selling, general, and administrative expenses.
Overhead Costs
Total overhead costs were €136 million, up €7.6 million (+6%) compared with 2013. The breakdown is as follows:
– €122 million in fi xed overhead costs, up €5.8 million (+5%). Investments for the future related to the company’s transformation plan represented €13.6 million, or 11% of total fi xed overhead costs;
– €14 million in variable costs, up €1.8 million (+15%), due to a rise in variable compensation resulting from the growth in activity and income, and from an increase in subcontracted services.R&D costs are fully expensed in the period and included in fi xed overhead costs. They increased by 14% to €21.7 million and represented 10.2% of revenues (€19.1 million and 9.4% for 2013). After deducting R&D grants, the research tax credit and the portion of the competitiveness and employment tax credit applicable in France and recognized in the year, net R&D costs amounted to €13.5 million (€12.5 million in 2013). They include a €0.7 million reversal of provisions related to the research tax credit, following a decision by the French Council of State (Conseil d’État, the supreme court for administrative justice), validating the inclusion of profi t-sharing expenses (intéressement and participation, applicable to the parent company Lectra SA exclusively) in the basis for computation of the research tax credit.

56 – 2014 Financial Report Management discussion and analysis
Income from Operations and Net Income
Income from operations reached €19.8 million. Compared with income from operations before non-recurring items of 2013, it increased €2.4 million (+14%) like-for-like, and rose €2.3 million (+13%) at actual exchange rates. Financial income and expenses represented a net charge close to zero. Foreign exchange gains and losses generated a net loss of €0.4 million.After an income tax expense of €5 million, net income reached €14.4 million (€12.5 million for 2013 excluding non-recurring items). Net earnings per share were €0.48 on basic capital and €0.47 on diluted capital (€0.43 and €0.42 in 2013 excluding non-recurring items).
Free Cash Flow
Free cash fl ow amounted to €19 million (€17.6 million for 2013 after including a non-recurring receipt of €11.1 million). There were no non-recurring items in 2014. Excluding non-recurring items, free cash fl ow increased by €12.5 million.The amount of €19 million results from cash fl ow provided by operating activities of €25.8 million (including a €7.9 million decrease in the working capital requirement), and cash fl ow used for capital expenditures of €6.7 million. The 2010 research tax credit (€5.7 million) has been received. The research tax credit (€6.8 million) and the competitiveness and employment tax credit (€0.8 million) for 2014, and the reversal of provisions of €0.7 million were accounted for but not received. If the tax credits received had been equal to the amount recognized, free cash fl ow would have been €21.7 million, exceeding net income by €7.3 million.
Shareholders’ Equity
At December 31, 2014, consolidated shareholders’ equity reached €94.1 million (€83.8 million at December 31, 2013) after payment on May 7 of the €6.6 million dividend (€0.22 per share) declared in respect of fi scal 2013. The fi gure for shareholders’ equity is calculated after deduction of treasury shares held under the Liquidity Agreement and valued at their acquisition cost of €0.1 million (€0.1 million at December 31, 2013).
Cash and cash equivalents totaled €43.5 million (€29.5 million at December 31, 2013) and fi nancial borrowings have been reduced to €0.4 million (€0.9 million at December 31, 2013). Consequently, the net cash position was €43.1 million (€28.6 million at December 31, 2013).The working capital requirement amounted to €0.1 million. It has included the receivable of €23 million on the French tax administration (Trésor public) corresponding to the research tax credit recognized since fi scal year 2011, and the competitiveness and employment tax credit since 2013, neither of which has yet been received or offset against income tax. Restated for this receivable, the working capital requirement was negative at €22.9 million, a key feature of the Group’s business model.It should be noted that, when these tax credits cannot be deducted from corporate income tax, they are treated as a receivable on the French tax administration. If unused in the ensuing three years, they are repaid to the company in the course of the fourth year. Thus, the 2010 research tax credit was repaid to the company in October 2014.
4. RISK FACTORS – MANAGEMENT OF RISKS
This chapter describes the main risks facing the company with regard to the specifi c characteristics of its business, of its structure and its organization, of its strategy and its business model. It further describes how the company manages and prevents these risks, depending on their nature.The chapter has been organized to identify risk factors specifi c to the Group. They have been arranged by order of priority, according to whether they are of high, secondary, or low importance. Risks in 2014 were more or less identical to those described in the 2013 Management Discussion.
Identifi cation of Risks
For internal controls to be effective, the Group needs to be able to identify and assess the risks to which it is subject, namely the possible occurrence of an event whose consequences could affect the company’s human capital, assets, environment, goals, together with its

57
activity, fi nancial condition, fi nancial results (or its ability to achieve its goals) or reputation. These risks are identifi ed by means of a continuous process, taking into account the changes in the Group’s external environment together with the organizational changes rendered necessary by the evolving nature of its markets and the macroeconomic environment. This process is overseen by the Finance Division and the Legal Affairs Department, with input from all Group operating and corporate departments. As in previous years, the Audit Committee has reviewed risks liable to have a signifi cant adverse impact on the company’s human capital, assets, environment, goals, together with its activity, fi nancial condition, or fi nancial results (or its ability to achieve its goals), or reputation, and considers that there are no other signifi cant risks than the ones discussed below.The key factor protecting the Group against macroeconomic environment risks is its business model, and in particular:
– a balance of risks, which benefi t from natural hedging by the distribution of business activity over market sectors and geographical markets with cycles that are different from each other, and by the very large number of customers throughout the world;
– a balanced revenue mix between revenues from new systems sales, the company’s growth driver, and revenues from recurring contracts, spare parts and consumables, a key factor in the company’s stability, that provide a cushion in periods of diffi cult economic conditions.The gross profi t generated by recurring revenues alone covers more than 75% of annual fi xed overhead costs.In addition, the business model is geared to generating free cash fl ow in excess of net income — assuming utilization or receipt of the annual research tax credit and competitiveness and employment tax credit applicable in France — enabling the Group to fi nance its future growth out of its own cash, with its structurally negative working capital requirement after restatement of the claim on the French Administration (Trésor public) in respect of the research tax credit and the competitiveness and employment tax credit not received (see note 14 to the consolidated fi nancial statements).
Finally, uncompromising ethics in the conduct of business and respect for each individual are part of the company’s core values.
4.1. Macroeconomic Environment Risks
The solutions marketed by the Group represent a sometimes sizable investment for its customers. Decisions depend in part on the general macroeconomic environment and on the state of the sectors of activity in which the customers operate. They could scale back or defer their investment decisions when global economic growth slows or when a particular sector suffers a downturn or is in crisis. The Group is consequently exposed to the global economic cycle.
Risks Connected with the State of the Global Economy
The degraded macroeconomic environment has been the chief risk affecting the Group since the onset of the economic and fi nancial crisis in 2008. This unprecedented crisis has severely impaired the situation of countries the world over and companies in all sectors. The resulting sharp slowdown in activity among many Group customers, the deterioration of their fi nancial performance, their uncertain outlook, and their reduced access to credit making it hard for them to fi nance their investments have meant that many companies have taken steps to reduce costs, cut back or temporarily halt production, close plants, and freeze investments.The economic, fi nancial, and monetary crisis, of an uncertain scale and duration persisted in 2013 and 2014 and could continue into subsequent years (see chapters 2 and 14). At the same time, a risk of defl ation emerged in the Eurozone in 2014, which could further deteriorate the macroeconomic environment in Europe.The constant shift between good and bad news, a lack of visibility, and companies’ growing concerns over when a lasting economic recovery is going to take place will weigh more heavily on their investment decisions — and hence on Group revenues and earnings — than the deteriorating macroeconomic conditions.
58 – 2014 Financial Report Management discussion and analysis
Risks Related to Geographic Markets and Market Sectors
Apart from periods of severe economic crisis, the risks associated with the company’s business activity are naturally hedged by the international reach of the company’s sales and services, and by their range over a number of market sectors (chiefl y fashion and apparel, and automotive, which respectively accounted for 47% and 39% of revenues from new systems sales in 2014, for a combined total of 86%) with different business cycles and growth rates, serving to offset these risks.The far-reaching changes being brought about by globalization, such as relocation and repatriation of production, are resulting in revenue loss in one country and gains in another, albeit with a possible time lag. Thanks to its strong presence in the major emerging countries, forecast to generate half of total global growth in the present decade, the Group is well placed to turn this into a vehicle for dynamic growth. The other half of global growth is expected to take place in developed countries where the Group has a historical presence and a large market share.In 2014, almost 50% of total revenues were generated in 5 countries: United States (12%), China (11%), Italy (11%), France (8%), and Mexico (7%).The other two European countries that have suffered severely from the downturn in their economies, Portugal and Spain, accounted for 4% and 3% respectively. While revenues were stable in France, Italy, Portugal and Spain registered revenue growth of 10%, 13% and 2%, respectively. Greece’s share of revenue is immaterial. The same applies to Russia.
4.2. Economic and Operational Risks Specifi c to the Company’s Business
Lectra designs, produces, and markets full-line technological solutions — comprising software, CAD/ CAM equipment, and associated services — specifi cally designed for industries that use large volumes of fabrics, leather, technical textiles, and composite materials. It addresses a broad array of major global markets, including fashion and apparel, automotive (car seats and
interiors, airbags), furniture and a wide variety of other industries, such as aeronautical, marine industries and wind power.
Innovation Risks
This activity demands continuous creativity and a steadfast search for innovation. The Group needs to retain its technological leadership in its historical business of CAD/CAM software and equipment and related services, which now account for the vast bulk of its revenues. The Group is the world number one in this sector, with an estimated market share of around 25-30%. In addition, it faces competition from the global software leaders in the new area of Product Lifecycle Management (PLM) for the fashion and apparel sector, which is expected to be a growth driver in the medium term.The company invests heavily in research and development, which accounts for more than 10% of revenues in 2014, before deduction of the research tax credit and the share of the competitiveness and employment tax credit applicable in France and possible subsidies linked to certain R&D programs. Despite the quality of its engineers and of the project development process, some programs may carry a risk of technical or commercial failure, or may be delayed. In this event, the Group could lose its technological leadership and thus become more exposed to competition.As a corollary of this policy, the company must ensure both that its innovations are not copied and that its products do not infringe third parties’ intellectual property. Moreover, it needs to protect itself against software piracy, which could curb its growth in certain countries.It has a dedicated team of intellectual property specialists that takes both offensive and defensive measures with regard to patents. Working with the Legal Affairs department, this team tracks down pirated copies of its software and takes the necessary legal action to protect the company’s rights.R&D expenditures are fully expensed in the year. Consequently, the Group’s technology assets are valued at zero in the statement of fi nancial position, and there is therefore no risk of impairment.

59
Production Risks
Maintaining Lectra’s R&D and production in France has enabled the Group to meet three challenges, namely: to compete with the low-cost products of its international competitors that had relocated to China and those of its Asian competitors; to boost its competitiveness in the face of a persistently weak U.S. dollar against the euro; and, fi nally, to boost its margins. The decision has also served to protect its intellectual property. This risk-protection strategy was made possible only through innovation. The Group intends to keep its R&D and production in France.A substantial portion of the manufacturing of the equipment the company markets is subcontracted, with Lectra providing only the research, development, fi nal assembly, and testing of the equipment that it produces and sells. The technical, logistic, or fi nancial failure on the part of an important subcontractor could result in delays or defects in equipment shipped by the company to its customers. To reduce this risk to a minimum, subcontractors undergo technological, industrial, and fi nancial scrutiny of their situation and performance, prior to selection and then continuously. The assessment is then updated at regular intervals, the frequency depending on the criticality of the product supplied by the subcontractor.Moreover, the Group may face global shortages of certain components or parts used in the manufacture or maintenance of its products. This risk of a supply chain breakdown could affect its capacity to fulfi ll customers’ orders. This is reviewed continuously, and buffer inventories are maintained of the parts and components concerned, depending on the likely risk of shortage.There is little risk of the Group being unable to respond to a rapid growth in sales of CAD/CAM equipment and shipments of spare parts and consumables, since the Bordeaux-Cestas (France) manufacturing site has suffi cient capacity to increase its output by 50% with no major new investment and around 50 additional staff members. It should be borne in mind that the economic value of the land and buildings comprising the Bordeaux-Cestas site currently exceeds its historical cost of €10.9 million,
but that the site fi gures in the statement of fi nancial position for a net value of €4.2 million only. Therefore there is no risk of an impairment charge.
4.3. Market Risks
Because of its international presence, foreign exchange risk is the principal market risk to which the Group is exposed.It is Group policy to manage these risks conservatively, refraining from any form of speculation, by means of hedging instruments.
Specifi c Foreign Exchange Risks
A substantial proportion of revenues is denominated in various currencies whose fl uctuations against the euro constitute a foreign exchange risk for the Group. The mechanical and competitive effects on the Group’s fi nancial statements of fl uctuations in these currencies against the euro are particularly large since the site, where the fi nal assembly and testing of the equipment it produces and markets is carried out, is located in France and since most of its subcontractors are located in the Eurozone. The Group is especially sensitive to variations in the U.S. dollar/euro exchange rate, as well as in other currencies, in particular the Chinese yuan owing to its progressive decorrelation from the dollar, as well as to the growing volume of activity in China, and the major role it now plays in the Group’s competitiveness with regard to certain of its Chinese competitors or international competitors whose products are manufactured in China.In 2014, 49% of the Group’s consolidated revenues, 83% of its cost of sales, and 70% of its overhead expenses were denominated in euros. These percentages were respectively 31%, 9%, and 13% for the U.S. dollar. The Chinese yuan represented 7% of revenues (a portion of revenues made in China being invoiced in U.S. dollars or in other currencies). Other currencies each represented less than 4%; individually, their share of the cost of sales is negligible and less than 5% of overhead costs.

60 – 2014 Financial Report Management discussion and analysis
Currency fl uctuations impact the Group at two levels:
a) impact on competitive position: the Group sells its products and services in global markets. It competes primarily with its main competitor, a U.S. company that currently manufactures its equipment in China, as do the majority of the Group’s other competitors. As a result, their production costs are primarily in Chinese yuan, while those of the Group are in euros. Meanwhile, sales prices in many markets are in U.S. dollars or euros. The exchange rates between these three currencies have, therefore, a competitive impact;
b) currency translation impact:– on the income statement, as accounts are consolidated in euros, revenues, gross profi t, and income from operations of a subsidiary conducting its business in a foreign currency are mechanically affected by exchange rate fl uctuations when translated into euros; – on balance sheet positions, this refers primarily to foreign currency accounts receivable, in particular to those between the parent company Lectra SA and its subsidiaries, and it corresponds to the variation between exchange rates at collection date and those at billing date. This impact is recognized in “Foreign exchange income/loss” in the income statement.
Currency risk is borne by the parent company. The Group seeks to protect all of its foreign currency receivables and debts as well as future cash fl ows against currency risk on economically reasonable terms. Hedging decisions take into account currency risks and trends where these are likely to signifi cantly impact the Group’s fi nancial condition and competitive situation. The bulk of foreign currency risk concerns the U.S. dollar.The Group generally seeks to hedge the risk arising in respect of its net operational exposure to the U.S. dollar (revenues less all expenses denominated in U.S. dollars or strongly correlated currencies) by purchasing dollar puts (calls euros / puts dollars) or by forward currency contracts, when justifi ed by the cost of the hedge. Sensitivity to U.S. dollar fl uctuations and other currencies is shown in note 33 to the consolidated fi nancial statements. The Group’s statement of fi nancial position
exposure is monitored in real time; it utilizes forward currency contracts to hedge all relevant receivables and debts.
Interest-Rate Risks
The Group now no longer has any fi nancial debt and therefore has no interest-rate risk exposure.The remainder of its debt (€0.4 million at December 31, 2014) consists of interest-free repayable public subsidies to fund R&D programs.
Stock Market Risks
The Group holds no interests in listed companies other than its own shares held under a Liquidity Agreement (see note 15.2 to the consolidated fi nancial statements), and is therefore not subject to stock market risk.
4.4. Customer Dependency Risks
Each year, revenues from new systems, accounting for 42% of total revenues in 2014, are generated by around 2,000 customers and comprise both sales to new customers and extensions to or the renewal of existing customers’ installed bases. Revenues from recurring contracts, accounting for around 34% of 2014 total revenues, are generated on almost 5,500 Lectra’s customers. Finally, sales of spare parts and consumables, which account for 24% of 2014 total revenues, are generated on a large proportion of the installed CAD/CAM equipment.There is thus no material risk of dependence on any particular customer or group of customers, as no individual customer represented more than 7% of consolidated revenues over the last three-year period, and the company’s 10 largest customers represented less than 20% of revenues combined, and the top 20 customers less than 25%.
4.5. Legal and Regulatory Risks
The Group markets its products in more than 100 countries through a network of 32 sales and services subsidiaries, supplemented by agents and distributors in countries where it does not have a direct presence. Consequently, it is subject to a very large number of legal, customs, tax, and social regulations in these countries.

61
While the company’s internal control procedures provide reasonable assurance of compliance with the prevailing laws and regulations, unexpected or sudden changes in certain rules (particularly regarding the establishment of trade barriers), as well as political or economic instability in certain countries, are all liable to impact the revenues and results of the Group.From a tax point of view, there are many intra-Group fl ows requiring the existence of a transfer pricing policy compliant with French, local, and international guidelines (in particular the OECD). Adequate documentation setting forth Group policy in this regard has been put in place.R&D activity benefi ts from the French research tax credit (crédit d’impôt recherche), which in 2014 represented €6.8 million, or 31% of the total corresponding expense, 34% of income from operations, and 47% of net income. Any signifi cant reduction or abrogation of this tax credit would have an impact on Group income. The changes introduced by the December 29, 2014 Budget Act for 2015 (loi de fi nances pour 2015) and the Supplementary Budget Acts of August 8 and December 29, 2014 for 2014 (loi de fi nances rectifi cative pour 2014) have had no impact on the benefi ts of the research tax credit for the company. Stabilization of the research tax credit mechanism for the duration of the current French President’s fi ve-year term of offi ce is one of 35 concrete measures to which the Government is committed within the framework of the National Pact for Growth, Competitiveness and Employment (Pacte national pour la croissance, la compétitivité et l’emploi).The parent company, Lectra SA, was the subject of a tax audit for the years 2010, 2011 and 2012, which was completed in 2014. The tax arrears notifi ed by the tax administration are immaterial. The bulk of these amounts concern arrears already notifi ed on the occasion of the previous tax audit, which had been contested by the company and were already provisioned at December 31, 2013.In the normal course of its business, the Group may be involved in various disputes and lawsuits. The Group considers that there are no governmental, judicial, or arbitral proceedings, including all proceedings of which the Group has knowledge, pending or which could threaten it, for which no provision has been made in the fi nancial statements and liable, either individually
or severally, to have material impacts on the fi nancial condition or earnings of the Group.Finally, the company is listed on Euronext and is therefore subject to stock market regulations, particularly those of the Autorité des Marchés Financiers (AMF), the French Financial Markets Authority.
4.6. Human Resources Risks
The Group’s performance depends primarily on the competence and expertise of its personnel, the quality of its management and its capacity to unite its teams in addressing the Group’s strategic challenges. Any departure within the management team or of certain experts could affect the company’s operations and fi nancial results, given its size, the breadth of its international reach, the array of market sectors covered, and the components of its business. The Group anticipates these risks by recruiting experienced candidates capable of fi lling positions left vacant, and through a continuous drive to transfer skills. The mission of the human resources staff is to limit these risks through four main policies: to attract and retain suitably qualifi ed key personnel to ensure the competitiveness, growth and profi tability of the company; to motivate the Group’s teams by applying principles of fairness in compensation based on the recognition of merit and performance; to sustain the development of skills; organize and encourage the transfer of experience thanks to an ambitious and continuous training policy; emphasizing the high degree of fl exibility and adaptability of the Group’s organization to changes in its markets by continuously reshaping its organization.Despite weak and uncertain macroeconomic conditions, the Group decided to focus on long-term strategy, rather than on short-term profi tability. In September 2011, it stepped up its transformation plan, the main pillar of which is an ambitious recruitment program lasting until the end of 2015, and will aim primarily at bolstering its sales and marketing teams, and its software R&D teams, while remaining within tight budget constraints (see chapter 2). The transformation plan implies a major investment by management and human resources teams, continuous performance assessment and improvement, training,
62 – 2014 Financial Report Management discussion and analysis
and coaching programs. Measures taken in this regard focus on four main themes, namely: an intensifi ed effort to develop the knowledge and skills of the marketing, sales and customer support teams; sustained internal communications aimed at sharing the company’s strategy and challenges; the development of projects capable of unifying different themes aimed at optimizing processes, improving methods investment in information systems, focused on sales activity development and tracking strategic objectives, coupled with state-of-the-art IT infrastructures and high-performance networks the world over. The Group places a high premium on compliance with existing labor regulations wherever it operates. It regularly audits its subsidiaries to ensure they are compliant with local laws and regulations. Its active policy of transparency in the disclosure of information and in managing its labor relations is one means allowing the Group to create a positive social climate, enabling the company to underpin its development and deal constructively with economic uncertainty. Signifi cant efforts have been made to identify and evaluate risks, thanks to targeted action plans to ensure that all company activities are carried out safely, in particular in R&D and manufacturing activities as well as maintenance interventions. This general process is overseen by a safety committee and implemented by a safety engineer, with the active involvement of management, via accident prevention campaigns, training, and concrete means to increase safety. For example, the company has implemented computer-assisted goods handling aids in all parts of the manufacturing shop; it has banned the use of chemicals that present a cancer hazard; and it has installed automatic defi brillators at its Paris and Bordeaux-Cestas (France) sites and provides training in their use.Thanks to its accident prevention policy, Lectra has achieved a very good record, with accident frequency and severity rates respectively seven and fi ve times below national indicators in France.
4.7. Credit Risks
The Group is exposed to credit risks in the event of customer insolvency or default. This risk is heightened
in the context of the economic crisis and can negatively impact Group profi t.The Group has succeeded in keeping the scale of losses in connection with this risk at a historically low level, representing less than 1% of annual revenues, thanks to the terms of payment it applies, with in particular down payments required at the time of the order and upon shipment, and annual or quarterly payment in advance for recurring contracts.The Group pays close attention to the security of payment for the systems and services delivered to its customers. It notably manages this risk via a range of customer risk management procedures, which include preventively analyzing its customers’ solvency and provide for the strict and systematic application of several measures for dealing with customers in arrears. Sales to countries subject to high economic or political risks are for the most part guaranteed by irrevocable letters of credit confi rmed by one of the Group’s banks or by bank guarantees. Furthermore, the Group’s dependence on one or more customers with the potential signifi cantly to impact Group profi t in the event of default is limited (see paragraph 4.4 above).The Group applies a very strict policy in the recognition of impairment on accounts receivable deemed at risk.
4.8. Liquidity Risks
The risk that the Group may have to contend with a short-term cash shortage is close to zero. The Group’s balance sheet has been fundamentally transformed in recent fi scal years, with a positive net cash of €43.1 million (cash and cash equivalents totaled €43.5 million and fi nancial borrowings €0.4 million) and shareholders’ equity of €94.1 million at December 31, 2014. The Group’s free cash represents a substantial and suffi cient liquidity reserve.
4.9. Counterparty Risks
The Group’s exposure to counterparty risks arises from its cash holdings and contracts entered into within the framework of its policy on foreign exchange risk hedging.The Group’s cash surpluses consist exclusively of interest-bearing sight accounts held with blue-chip
63
international banks. The foreign exchange risk-hedging contracts are negotiated exclusively in France with the company’s three banks. The corresponding asset values are monitored regularly.
4.10. Information Systems Risks
The Group is exposed to various risks in connection with its information systems and the extensive use made of them, which is essential to the company’s operations.With respect to the security of information systems, the Group has put in place a business continuity plan incorporating resources designed to guarantee a coherent and rapid restoration of critical data and applications in the event of an incident. Foremost among these means is the replication of systems in real time in a backup room, physical protection of technical facilities (with a generator, surge protector, redundant climate control, and a permanently monitored fi re control system on constant alert), and daily backup on tapes (regularly stored in an offsite safe in a remote building). Virtual server, cluster, and storage bay replication technologies all serve to guarantee very rapid deployment of the business continuity plan.In addition, the different means of communication in place (including an international private network, remote access solutions, and videoconferencing) enable all employees to exchange and share information in a totally secure environment, regardless of location and mode of connection. Moreover, the Group verifi es its information security processes and procedures. It regularly conducts internal audits and commissions a specialized company to assess the security of its facilities every three years. These joint exercises allow it to maintain a high level control over the security of its information system.Finally, the Group fosters awareness among its staff and trains them in the application of and compliance with security procedures. Access to IT resources is centralized in a single directory, under the exclusive control of a dedicated team.
4.11. Insurance and Risk Cover
The parent company, Lectra SA, oversees the management of risks and the writing of insurance programs for the Group as a whole. Lectra SA’s Legal
Affairs department formulates Group policy with respect to the evaluation of its risks and their coverage, and coordinates the administration of insurance contracts and claims with respect to legal liability, property damage, and damages and losses incurred during transportation.The Group exercises its judgment when assessing risks incurred in the conduct of its business, the utility or otherwise of writing insurance cover with an outside insurer and the cost of the guarantees provided. It may therefore decide to review this policy at any time.The Group works through international brokers whose network has the capacity to assist it throughout its different geographies. Insurance programs are written with reputable insurers of suffi cient size and capacity to provide cover and administer claims in all countries. At regular intervals, when programs come due for renewal, the Group invites competing insurance companies to submit bids in order to secure the best possible terms and conditions.The guarantees provided by these programs are calculated on the basis of estimated possible losses, the guarantee terms generally available on the market, notably for companies of comparable size and characteristics to Lectra, and depending on insurance companies’ proposals.The Group has taken the following insurance coverage:
– legal liability, business continuity, post-delivery, and professional liability (Errors and Omissions in the United States);
– directors and offi cers liability; – property damage; – transported goods.
The Group manages uncertainty with respect to general liability by means of a contractual policy that excludes its liability for indirect damage and limits its liability for direct damage to the extent allowed by applicable regulations. General liability cover is capped at €25 million per claim and per year.Given the use made of the equipment commercialized by it, the Group is exposed to the risk of injury to its customers’ employees while operating certain items of equipment supplied by it. It therefore takes all appropriate steps to ensure that these meet the strictest personnel safety standards — a major and constant concern of the Group; however, there is no

64 – 2014 Financial Report Management discussion and analysis
such thing as zero risk. The Group’s product liability insurance contract covers it against adverse monetary consequences arising from claims that could result from its sales of systems or provision of services.The property damage program provides for payment of claims for material damage to buildings or physical assets in accordance with the declared value of each of its sites worldwide, which the Group reports annually. The program comprises additional guarantees to fi nance the continuity or reorganization of activity following a loss event. Special emphasis is placed on protecting the Bordeaux-Cestas (France) site, which houses research and development and production activities as well as critical services for the Group as a whole. The program notably comprises “business continuity” cover against fi nancial loss in the event of a major accident affecting the Bordeaux-Cestas site and jeopardizing the continuity of all or part of the Group’s business. This program is backed up by risk prevention measures at this site.
5. OFF-BALANCE SHEET ITEMS
Off-Balance Sheet Commitments Relating to the Group Financing
The parent company, Lectra SA, provided a total of €2.2 million at December 31, 2014 (€2.3 million at December 31, 2013) in sureties to banks, mainly to guarantee loans made by the latter to the company’s subsidiaries and in guarantees given to customers or to lessors. These sureties were previously authorized by the Board of Directors, as required under article L. 225-34 al. 4 of the French Commercial Code. Exchange risk hedging instruments of balance sheet positions at December 31, 2014 were comprised of forward sales or purchases of foreign currencies (mainly U.S. dollars, British pounds and Hong Kong dollars) for a net total equivalent value (sales minus purchases) of €7.5 million (€1.9 million at December 31, 2013).
Off-Balance Sheet Commitments Relating to Operating Activities
The only off-balance sheet commitments relating to operating activities concern normal offi ce, motor vehicle and offi ce equipment leasing and rental contracts, which
may be cancelled in accordance with contract terms. These commitments are discussed in the notes to the consolidated fi nancial statements.
6. APPROPRIATION OF EARNINGS
As recommended by the Board of Directors, the company resumed in 2011 its dividend payment policy.In its report on fi scal year 2012, the Board stated that, barring further changes to the taxation of dividends in France, the total dividend is expected to represent a payout ratio of around 33% of net income (excluding non-recurring items), the remaining 67% serving to fi nance the company’s growth internally. Exceptionally, this ratio could rise to or exceed 50% until the investments for the future have produced their impact in full, insofar as they are already taken into account in the computation of net income and free cash fl ow.The Board of Directors has proposed to increase the dividend to €0.25 per share, in respect of fi scal 2014. The gross dividend represents a payout ratio of 53% of 2014 net income and a yield of 2.7% based on the December 31, 2014 closing share price.Subject to approval by the annual Shareholders’ Meeting of April 30, 2015, the dividend will be made payable on May 7, 2015.
7. SHARE CAPITAL – OWNERSHIP – SHARE PRICE
PERFORMANCE
Change in Share Capital
At December 31, 2014, the share capital totaled €30,329,114, divided into 30,329,114 shares with a par value of €1.00.Share capital has increased by €664,699 due to the creation of 664,699 shares since January 1, 2014, resulting from the exercise of stock options (an increase of €0.7 million in share capital together with a total share premium of €2.2 million).On February 17, 2014, Schroder Investment Management Ltd (UK), acting on behalf of its funds and clients under management, reported that it had increased its shareholding above the threshold of 10% of the company’s capital stock and voting rights on February 12, and that at that date it held 10.14% of the capital stock and 10.01% of the voting rights. Schroder Investment

65
Management Ltd also indicated that it held an additional 2% of the company’s capital on behalf of clients who have retained the exercise of their voting rights. On February 10, 2015, Schroder Investment Management Ltd (UK) reported that it had, on February 5, decreased its shareholding below the threshold of 10% of the company’s voting rights, then on February 13, that it had also decreased its shareholding below the threshold of 10% of the company’s capital stock, and that at that date it held 9.53% of the capital stock and 9.42% of the voting rights.On February 10, 2015, Delta Lloyd Asset Management NV (Netherlands), acting on behalf of its funds and clients under management, also reported that it had decreased its shareholding below the threshold of 10% of the company’s capital stock and voting rights, and that, on February 9, it held 9.77% of the capital stock and 9.65% of the voting rights. No other crossing of statutory thresholds has been notifi ed to the company since January 1, 2014. At the date of publication of this report, and to the company’s knowledge, the main shareholders are:
– André Harari and Daniel Harari, who together hold 36.4% of the capital and 36.0% of the voting rights;
– Schroder Investment Management Ltd (UK) and Delta Lloyd Asset Management NV (Netherlands), which each hold more than 5% (but less than 10%) of the capital and the voting rights, on behalf of investment funds and clients under management.No other shareholder has reported holding more than 5% of the share capital and voting rights.
Treasury Shares
At December 31, 2014, the company held less than 0.1% of its own shares in treasury shares, solely within the framework of the Liquidity Agreement managed by Exane BNP Paribas. All of the information required under article L. 225-211 of the French Commercial Code concerning purchases and sales by the company of its own shares is presented in chapter 10 below.
Granting of Stock Options — Potential Capital Stock
The Extraordinary General Shareholders Meeting of April 30, 2014 authorized the creation of a new stock option plan for a maximum of 1.8 million options for
the same number of shares with a par value of €1.00, in accordance with the conditions described in the report of the Board of Directors to said meeting and in its fi rst resolution, and automatically terminated the authority given to it by the Extraordinary Shareholders’ Meeting of April 27, 2012. The exercise price may not be less than the average opening price of Lectra shares listed for the 20 stock market trading sessions preceding the options’ grant date.
2014 Stock Option PlanOn June 16, 2014, the Board of Directors granted 625,912 options, at an exercise price of €8.50 per share to 118 benefi ciaries in respect of the fulfi llment of their annual performance targets set for 2014, corresponding to a maximum number of options. The defi nitive number of options is equal to the maximum number of options granted in 2014 multiplied by the percentage fulfi llment of targets set for each benefi ciary for 2014. The options representing the difference between those initially granted and those actually granted in response to actual performance by the benefi ciaries in 2014 are cancelled and placed at the disposal of the Board of Directors.The calculations of actual performance in 2014 based on the Group’s consolidated fi nancial statements have reduced the number of options to 246,848 and the number of benefi ciaries to 117. 377,884 options have ceased to be valid on grounds of non-fulfi llment of 2014 performance targets and 1,180 options due to the departure of one benefi ciary. The Board of Directors also granted 61,744 options at an exercise price of €8.50 per option to 43 winners of the 2013 Lectra Worldwide Championship, of which 944 options ceased to be valid due to the departure of two benefi ciaries.Altogether, the Board of Directors thus granted a maximum of 687,656 options to 145 benefi ciaries, reduced to 307,648 options and 143 benefi ciaries, in respect of the 2014 stock option plan, at the date of publication of this report.All of the options granted concerned Group employees. The only two executive directors, André Harari and Daniel Harari, have held no stock options since 2000.These options vest over a period of four years from January 1, 2014 and are conditional upon the benefi ciary’s

66 – 2014 Financial Report Management discussion and analysis
presence in the Group at the end of each annual period (the benefi ciary being required to retain links with the company or with one of its affi liates in the form of an employment contract or as an executive director). The options are subject to a four-year lock-up period applicable to all the benefi ciaries of these plans. They are valid for a period of eight years from the date of granting.
Options Outstanding at December 31, 2014664,699 options of the different stock option plans outstanding at December 31, 2013 were exercised in 2014. 458,963 options (including 380,008 options granted in 2014) have ceased to be valid, 48,275 of which following the departure of their benefi ciaries, and 410,688 options on grounds of non-fulfi llment of 2013 or 2014 targets.At December 31, 2014, 238 employees are benefi ciaries of options; 201 employees are benefi ciaries of 2,060,074 options outstanding and 37 former employees still held 61,363 options (respective fi gures at December 31, 2013 are: 210, 182, and 28). At the same date, the maximum number of shares liable to comprise the capital stock, including all new shares that may be issued following the exercise of stock options outstanding and eligible for the subscription of new shares, is 32,450,551, consisting of:
– capital stock: 30,329,114 shares; – stock options: 2,121,437 options.
Each stock option gives the benefi ciary the right to acquire one new share with a par value of €1.00, at the exercise price decided by the Board of Directors on the date of granting (adjusted to take account of the public stock buyback tender offer of May 2007). If all of the options were exercised, regardless of whether these are fully vested or have not yet vested, and regardless of their exercise price relative to the market price of Lectra shares at December 31, 2014, the company’s capital (at par value) would increase by a total of €2,121,437, associated with a total additional paid-in capital of €10,190,814. No subsidiary of Lectra has opened a stock option or stock purchase plan.The notes to the consolidated fi nancial statements contain full details of the vesting conditions, exercise prices, and exercise dates and conditions of all outstanding stock options at December 31, 2014.
The Board of Directors’ special report, as mandated under article L. 225-184 of the French Commercial Code, is provided in a separate document (available in French only).
Absence of Bonus Shares
The company has not granted any bonus shares, and no plan for such shares has been submitted for approval to the Shareholders’ Meeting.Consequently, the Board of Directors has not prepared a special report on the granting of bonus shares as provided under article L. 225-197-4 of the French Commercial Code.
Share Price Performance and Trading Volumes
After rising 75% in 2013, Lectra’s share price gained a further 10% in 2014, closing at €9.14 on December 31, 2014. The share price recorded a low of €7.01 on October 16 and a high of €9.45 on December 18. The CAC 40 index fell by 1% in 2014 and the CAC Mid & Small index gained 8%. According to Euronext statistics, the number of shares traded (6.8 million) was down 16%, and trading volumes (€54.9 million) were up 15% compared with the same period of 2013.Lectra confi rmed, in its press release of April 3, 2014 that it is eligible for inclusion in French SME equity savings plans “PEA-PME” qualifying for tax relief specifi cally applicable to investments in European small- and mid-cap companies.Lectra’s shares were transferred to Compartment B of Euronext on January 29, 2014, joining Euronext’s new EnterNext PEA-PME 150 index.
8. CORPORATE GOVERNANCE – CORPORATE SOCIAL
AND ENVIRONMENTAL RESPONSILIBITY POLICY
The company has set itself the objective of implementing the best corporate governance practices.
Executive Directors’ Compensation
The MEDEF and AFEP published a set of recommendations on October 6, 2008, concerning the compensation of executive directors of companies whose shares are listed for trading on a regulated

67
market, for the guidance of compensation committees (these recommendations now being consolidated into the AFEP-MEDEF Code). These recommendations:
– spell out principles for setting the compensation of executive directors of listed companies;
– prohibit the simultaneous holding of a position as executive director and an employment contract;
– place a cap on one-time termination payments (“golden parachutes”) to two years’ compensation, and abolish the granting of indemnities in the event of voluntary resignation and in the event of failure;
– strengthen the rules governing pension plans and place a cap on additional pension benefi ts;
– make stock option plans for executive directors conditional on the extension of such option plans to all employees or to the existence of mechanisms entitling all employees to a share of profi ts;
– terminate the granting of bonus shares unrelated to performance to executive directors; the latter should also purchase shares at market price additional to any performance-related shares granted to them;
– make compensation policies more transparent by means of a standardized disclosure format.The French Government further called on the Boards of Directors of the companies concerned to formally accept these recommendations and to ensure that they are enforced rigorously.In response to this demand, the company issued a statement on November 28, 2008, declaring that:
– it had already been in spontaneous compliance with these recommendations for many years with regard to André Harari and Daniel Harari in their respective capacities as Chairman of the Board of Directors and Chief Executive Offi cer. In particular, they have never combined their positions as executive directors with an employment contract, are not entitled to any component of compensation, indemnity, or benefi t owed or liable to be owed to them in virtue of a termination or change of their functions, or to any supplementary pension plan (retraite chapeau) or additional defi ned benefi t pension plan, stock options or bonus shares;
– it had decided to adopt the recommendations issued jointly by the AFEP and the MEDEF as the code of corporate governance to which the company shall
voluntarily refer in matters of compensation of its executive directors, and to comply with its provisions or, should any of these provisions be deemed inappropriate with respect to the specifi c circumstances of the company, to explain the reasons for not applying them, as prescribed in article L. 225-37 of the French Commercial Code.
Consultation of Shareholders on Compensation of Executive Directors The June 2013 amended version of the AFEP-MEDEF Code introduced new recommendations on corporate governance, including a procedure for the consultation of shareholders (say on pay) on the following items of individual executive directors’ compensation, namely:
– fi xed portion; – annual variable portion and, where applicable,
the multi-year variable portion with targets contributing to the setting of said variable portion;
– exceptional compensation; – stock options, performance-based shares and all other
items of long-term compensation; – start-of-contract or termination payments; – additional pension entitlements; – fringe benefi ts of all nature.
Shareholders are therefore invited to give their advice on the compensation of the company’s Chairman of the Board and the Chief Executive Offi cer, solely comprising the following components: the fi xed portion, the annual variable portion together with the targets contributing to its determination as well as fringe benefi ts of all nature. Details of these components are provided in the paragraphs on “Policy Governing the Compensation of Executive Directors” and “Details of Individual Compensation Paid to Each Executive Director”, below. None of the following components of compensation apply to the company: executive directors’ compensation does not contain any multi-year variable portion or exceptional compensation, stock options, performance-related shares or other long-term component of compensation, indemnity relating to the taking up or termination of their functions, or supplementary retirement plan.This consultation of shareholders is the subject of the eighth and ninth resolutions of the annual Shareholders’ Meeting of April 30, 2015. In the event of a negative vote, the Board of Directors, acting on the opinion of

68 – 2014 Financial Report Management discussion and analysis
the Compensation Committee, is required to vote on the matter and to publish immediately on the company’s website a statement indicating how it intends to respond to the wishes of the shareholders.The shareholders were invited to vote on this question for the fi rst time at the Ordinary Shareholders’ Meeting on April 30, 2014, approved the resolution concerning the Chairman of the Board of Directors with a 97.4% vote, and unanimously approved the resolution concerning the Chief Executive Offi cer.
Policy Governing the Compensation of Executive Directors This subject is discussed in detail in the report of the Chairman on internal control procedures and risk management and on corporate governance appended to this report in chapter 3, Principles and rules adopted by the Board of Directors to determine the compensation and benefi ts in kind granted to Executive Offi cers.The sole executive directors (dirigeants mandataires sociaux) are André Harari, Chairman of the Board of Directors, and Daniel Harari, Chief Executive Offi cer.They are not under any employment contract to the company and they are not the benefi ciaries of any special arrangement or specifi c benefi ts concerning deferred compensation, severance compensation, or pension liabilities committing the company to pay any form of indemnity or benefi t in the event of termination of their functions, or at the time of their retirement, or more generally subsequent to the termination of their functions. The compensation policy, as decided by the Board of Directors, is strictly identical for the Chairman and for the Chief Executive Offi cer since the separation of their functions in 2002, as was previously the case. In particular, it takes into account the specifi c duties of the Chairman of the Board of Directors, who devotes the necessary time to these duties. The specifi c duties of the Chairman of the Board of Directors are set out in the internal rules of the Board in chapter 1.5, Chairman’s specifi c duties. Consistent with the prescriptions of the Internal Rules and Procedures, he holds no directorship in other companies. Acting in concert, the Chairman and the Chief Executive Offi cer are jointly accountable for the outcome of the strategy pursued by the Group under their leadership.
Their signifi cant stake in the capital ensures their interests are strongly aligned with those of the shareholders and the fi nancial performance of the Group.Their compensation comprises a fi xed portion and an annual variable portion. It does not include any multi-year variable portion. The company does not award them bonuses in any form.This policy is clear, consistent with the long-term strategy, objectives and challenges of the Group and directly linked to its performance. It has proved its worth both in tough years and in years of record profi ts. Thus, over the ten-year period from 2004-2013, the actual compensation has been on average 95% of the amount tied to fulfi llment of the annual targets. This percentage varied between 56% and 160% between 2007 and 2013.Each year the Board of Directors fi rst determines the amount of target-based total compensation for the year. Total target-based compensation has remained unchanged at €475,000 for the eight fi scal years 2005 through 2012. The fi xed portion has been unchanged since 2003 (€190,000). At its meeting on February 12, 2013, the Board decided to increase the total compensation of the Chairman of the Board of Directors and the Chief Executive Offi cer progressively over three years to €600,000 conditional upon fulfi llment of annual targets, i.e. to: €520,000 in 2013, €560,000 in 2014, and €600,000 in 2015. The fi xed portion of this compensation was increased to €208,000 in 2013 (+9.5% relative to 2013), €224,000 in 2014 (+7.6% relative to 2013), and €240,000 in 2015 (+7.1% relative to 2014). The Board now intends to apply this principle of revision every three years. Conditional upon the fulfi llment of annual targets, variable compensation is equal to 60% of total compensation. Variable compensation is set in accordance with the following four clear and complementary quantitative criteria (to the exclusion of any qualitative criteria) expressed in terms of annual targets, refl ecting the company’s strategy of profi table sales activity and earnings growth and determined according to clear criteria.In its meeting of February 11, 2014, the Board had maintained the four performance criteria defi ned

69
since 2011, with, however, a change in the relative weighting of each one, to give particular importance to the realization of the company’s strategy of profi table sales activity growth: (i) a criterion measuring the contributive value of growth in sales activity (accounting for 50%); (ii) consolidated income before tax, excluding net fi nancial expense and non-recurring items (accounting for 30%); (iii) consolidated free cash fl ow excluding net fi nancial expense, non-recurring items, income tax, and after restatement of certain items (accounting for 10%); and (iv) a criterion measuring the contributive value of recurring contracts (accounting for 10%).For each of these four criteria, the corresponding variable compensation is equal to zero below certain thresholds; if annual targets are met, it is 100%; and it is capped at 200% if annual targets are exceeded. Between these thresholds, it is calculated on a linear basis. The results are then weighted for each criterion. Only the annual targets and corresponding thresholds are revised each year on the basis of Group targets for the fi scal year.Consequently, variable compensation is equal to zero if none of these thresholds is met, and is capped at 200% of target-based variable compensation if the annual targets are exceeded on all criteria and result in the ceiling of 200% for each of them.Total compensation is therefore comprised between 40% and 160% of the total target-based compensation.Annual targets are set by the Board of Directors based on the recommendations of the Compensation Committee. The Committee is responsible for ensuring that the rules for setting the variable portion of compensation each year are consistent and in line with the evaluation of executive directors’ performance, with progress made in implementing the company’s medium-term strategy, general macroeconomic conditions, and in particular those of the geographic markets and market sectors in which the company operates. After the close of each fi scal year, the Committee verifi es the annual application of these rules and the fi nal amount of variable
compensation, on the basis of the audited fi nancial statements.These criteria and targets apply also to the three members of the Executive Committee who are not executive directors, and to around fi fteen managers of the parent company Lectra SA; only the relative weighting given to each criterion and the portion relating to target-based variable compensations, which is set individually for each manager, vary. For the Chief Financial Offi cer and the Chief Human Capital Offi cer, Chief Information Offi cer, both of whom are members of the Executive Committee, together with certain managers of their teams, the weighting of criteria is the same as for the Chairman of the Board of Directors and the Chief Executive Offi cer. For the Executive Vice President Sales, the fourth member of the Executive Committee, and for certain managers on his team, the criterion serving to measure the contributive value of growth in sales activity accounts for 70%, the criterion serving to measure the contributive value of recurring contracts accounts for 20% and consolidated income before tax for 10% (the consolidated free cash criterion is excluded from the calculation).In 2014, the percentage obtained for each of the four criteria is as follows: (i) 71% for the contributive value of growth in sales activity (37% in 2013); (ii) 71% for the consolidated income before tax (90% in 2013); (iii) 200% for the consolidated free cash fl ow (99% in 2013); and (iv) 108% for the contributive value of recurring contracts (79% in 2013).Altogether, the percentage obtained for the variable portion of compensation of the Chairman of the Board of Directors and the Chief Executive Offi cer represented 88% of the amount tied to the fulfi llment of annual targets (77% in 2013). Consequently, the total actual compensation due in respect of 2014 was 93% of the target-based compensation (86% in 2013). In its meeting of February 11, 2015, the Board maintained for 2015 the four criteria performance, together with their relative weighting as set for 2014.

70 – 2014 Financial Report Management discussion and analysis
Details of Individual Compensation of Each Executive DirectorThe table below presents the fi xed and variable compensation (gross amounts before employee contribution deductions) assuming fulfi llment of annual targets and the actual compensation effectively earned, in respect of each fi scal year:
(in euros)
2014 2013
Compensation assuming
fulfi llment of annual
targets
Actual compensation
earned in respect of the
fi scal year
% Actual compensation/Compensation
assuming fulfi llment of annual targets
Compensation assuming
fulfi llment of annual
targets
Actual compensation
earned in respect of the
fi scal year
% Actual compensation/Compensation
assuming fulfi llment of annual targets
André Harari, Chairman of the Board of Directors
Fixed compensation 224,000 224,000 100% 208,000 208,000 100%
Variable compensation 336,000 294,445 88% 312,000 240,041 77%
Total 560,000 518,445 93% 520,000 448,041 86%
Daniel Harari, Chief Executive Offi cer
Fixed compensation 224,000 224,000 100% 208,000 208,000 100%
Variable compensation 336,000 294,445 88% 312,000 240,041 77%
Total 560,000 518,445 93% 520,000 448,041 86%
The table below shows fi xed and variable compensation (gross amounts before deduction of social security contributions), benefi ts in kind, and directors’ fees due in respect of the fi scal year and amounts actually paid in the year.
(in euros)
2014 2013
Amounts earned in respect of
the fi scal year(1)Amounts paid
in the year(1)
Amounts earned in respect of
the fi scal year(1)Amounts paid
in the year(1)
André Harari, Chairman of the Board of Directors
Fixed compensation 224,000 224,000 208,000 208,000
Variable compensation 294,445 240,041 240,041 273,805
Directors’ fees(2) 40,000 40,000 40,000 25,000
Benefi ts in kind(3) 10,550 10,550 9,402 9,402
Total 568,995 514,591 497,443 516,207
Daniel Harari, Chief Executive Offi cer
Fixed compensation 224,000 224,000 208,000 208,000
Variable compensation 294,445 240,041 240,041 273,805
Directors’ fees(2) 40,000 40,000 40,000 25,000
Benefi ts in kind(3) 16,327 16,327 16,839 16,839
Total 574,772 520,368 504,880 523,644
(1) Differences between amounts earned in respect of 2014 and 2013 and the amounts paid in 2014 and 2013 stem from lags in the payment of this compensation. Allowance for variable compensation due in respect of a given fi scal year is made in the fi nancial statements of the said fi scal year, the fi nal amount being calculated after closure of the annual accounts and paid in the following fi scal year.(2) Directors’ fees in respect of fi scal 2014 shown here are subject to approval by the Shareholders’ Meeting of April 30, 2015.(3) The amounts shown for benefi ts in kind refl ect the value for tax purposes of the use of company cars (€10,550 for André Harari and €11,681 for Daniel Harari in 2014) and payments to life insurance policies for Daniel Harari (€4,646 until June 30, 2014, the date at which this contract ended); the life insurance policy for André Harari expired on April 1, 2009.
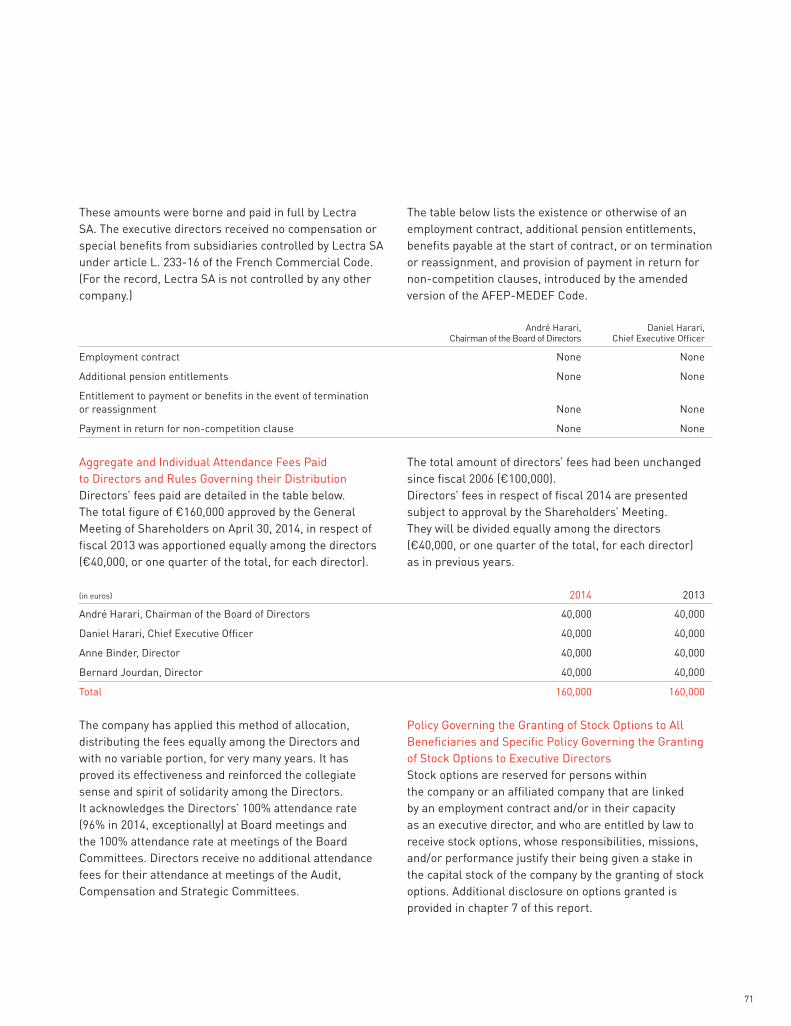
71
These amounts were borne and paid in full by Lectra SA. The executive directors received no compensation or special benefi ts from subsidiaries controlled by Lectra SA under article L. 233-16 of the French Commercial Code. (For the record, Lectra SA is not controlled by any other company.)
The table below lists the existence or otherwise of an employment contract, additional pension entitlements, benefi ts payable at the start of contract, or on termination or reassignment, and provision of payment in return for non-competition clauses, introduced by the amended version of the AFEP-MEDEF Code.
André Harari, Chairman of the Board of Directors
Daniel Harari, Chief Executive Offi cer
Employment contract None None
Additional pension entitlements None None
Entitlement to payment or benefi ts in the event of terminationor reassignment None None
Payment in return for non-competition clause None None
Aggregate and Individual Attendance Fees Paid to Directors and Rules Governing their DistributionDirectors’ fees paid are detailed in the table below. The total fi gure of €160,000 approved by the General Meeting of Shareholders on April 30, 2014, in respect of fi scal 2013 was apportioned equally among the directors (€40,000, or one quarter of the total, for each director).
The total amount of directors’ fees had been unchanged since fi scal 2006 (€100,000). Directors’ fees in respect of fi scal 2014 are presented subject to approval by the Shareholders’ Meeting. They will be divided equally among the directors (€40,000, or one quarter of the total, for each director) as in previous years.
(in euros) 2014 2013
André Harari, Chairman of the Board of Directors 40,000 40,000
Daniel Harari, Chief Executive Offi cer 40,000 40,000
Anne Binder, Director 40,000 40,000
Bernard Jourdan, Director 40,000 40,000
Total 160,000 160,000
The company has applied this method of allocation, distributing the fees equally among the Directors and with no variable portion, for very many years. It has proved its effectiveness and reinforced the collegiate sense and spirit of solidarity among the Directors. It acknowledges the Directors’ 100% attendance rate (96% in 2014, exceptionally) at Board meetings and the 100% attendance rate at meetings of the Board Committees. Directors receive no additional attendance fees for their attendance at meetings of the Audit, Compensation and Strategic Committees.
Policy Governing the Granting of Stock Options to All Benefi ciaries and Specifi c Policy Governing the Granting of Stock Options to Executive DirectorsStock options are reserved for persons within the company or an affi liated company that are linked by an employment contract and/or in their capacity as an executive director, and who are entitled by law to receive stock options, whose responsibilities, missions, and/or performance justify their being given a stake in the capital stock of the company by the granting of stock options. Additional disclosure on options granted is provided in chapter 7 of this report.
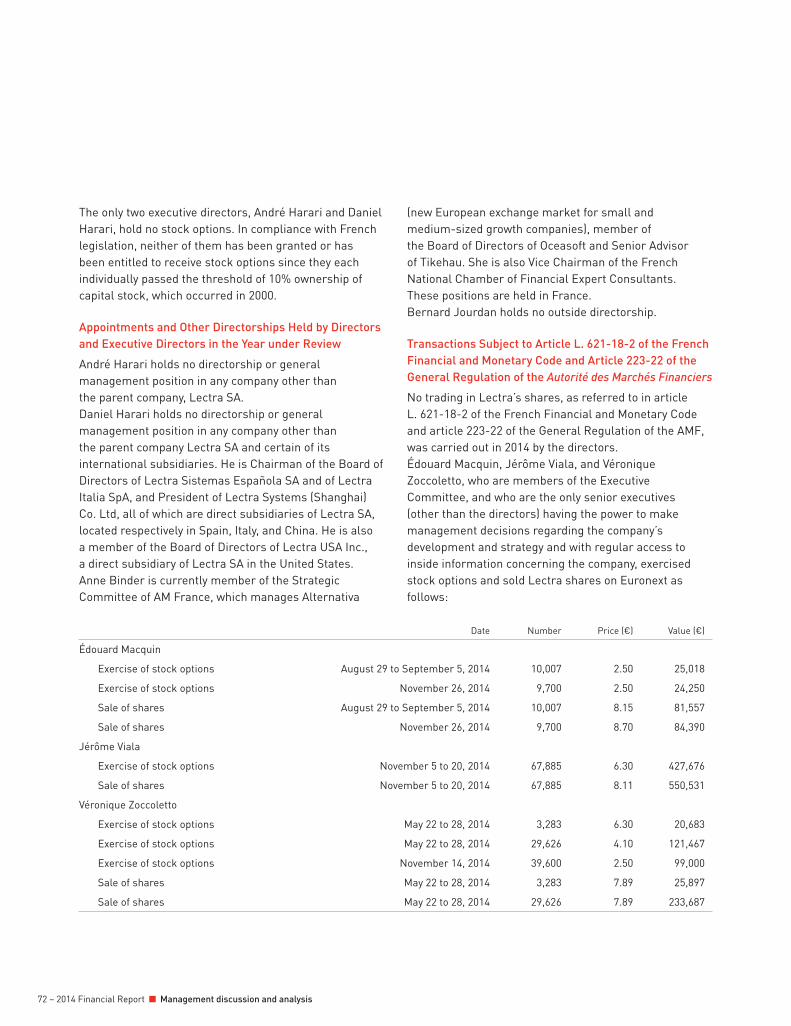
72 – 2014 Financial Report Management discussion and analysis
The only two executive directors, André Harari and Daniel Harari, hold no stock options. In compliance with French legislation, neither of them has been granted or has been entitled to receive stock options since they each individually passed the threshold of 10% ownership of capital stock, which occurred in 2000.
Appointments and Other Directorships Held by Directors and Executive Directors in the Year under Review
André Harari holds no directorship or general management position in any company other than the parent company, Lectra SA.Daniel Harari holds no directorship or general management position in any company other than the parent company Lectra SA and certain of its international subsidiaries. He is Chairman of the Board of Directors of Lectra Sistemas Española SA and of Lectra Italia SpA, and President of Lectra Systems (Shanghai) Co. Ltd, all of which are direct subsidiaries of Lectra SA, located respectively in Spain, Italy, and China. He is also a member of the Board of Directors of Lectra USA Inc., a direct subsidiary of Lectra SA in the United States.Anne Binder is currently member of the Strategic Committee of AM France, which manages Alternativa
(new European exchange market for small and medium-sized growth companies), member of the Board of Directors of Oceasoft and Senior Advisor of Tikehau. She is also Vice Chairman of the French National Chamber of Financial Expert Consultants. These positions are held in France.Bernard Jourdan holds no outside directorship.
Transactions Subject to Article L. 621-18-2 of the French Financial and Monetary Code and Article 223-22 of the General Regulation of the Autorité des Marchés Financiers
No trading in Lectra’s shares, as referred to in article L. 621-18-2 of the French Financial and Monetary Code and article 223-22 of the General Regulation of the AMF, was carried out in 2014 by the directors.Édouard Macquin, Jérôme Viala, and Véronique Zoccoletto, who are members of the Executive Committee, and who are the only senior executives (other than the directors) having the power to make management decisions regarding the company’s development and strategy and with regular access to inside information concerning the company, exercised stock options and sold Lectra shares on Euronext as follows:
Date Number Price (€) Value (€)
Édouard Macquin
Exercise of stock options August 29 to September 5, 2014 10,007 2.50 25,018
Exercise of stock options November 26, 2014 9,700 2.50 24,250
Sale of shares August 29 to September 5, 2014 10,007 8.15 81,557
Sale of shares November 26, 2014 9,700 8.70 84,390
Jérôme Viala
Exercise of stock options November 5 to 20, 2014 67,885 6.30 427,676
Sale of shares November 5 to 20, 2014 67,885 8.11 550,531
Véronique Zoccoletto
Exercise of stock options May 22 to 28, 2014 3,283 6.30 20,683
Exercise of stock options May 22 to 28, 2014 29,626 4.10 121,467
Exercise of stock options November 14, 2014 39,600 2.50 99,000
Sale of shares May 22 to 28, 2014 3,283 7.89 25,897
Sale of shares May 22 to 28, 2014 29,626 7.89 233,687

73
Compliance with the Transparency Directive of the Autorité des Marchés Financiers — Regulated Disclosure
The company complies with the fi nancial disclosure obligations of companies listed on Euronext, which took effect on January 20, 2007. These obligations are spelled out in Title 2, Book II, of the General Regulation of the AMF concerning periodic and continuous disclosure. The General Regulation defi nes regulated disclosure in the form of a list of reports and information to be disclosed by companies, together with rules governing its dissemination and storage. Lectra has recourse to the services of NASDAQ OMX, a professional information provider approved by the AMF that satisfi es the criteria laid down in the General Regulation, to publish and fi le information to the AMF. At the same time, the regulated information is published on the company’s website.
Fees Paid to Group Auditors and Companies in Their NetworkThe Lectra Group booked, in 2014, a total of €743,000 in fees paid for the audit of the fi nancial statements of all Group companies, including €466,000 to PricewaterhouseCoopers Audit, €254,000 to KPMG, and €34,000 to other auditors, excluding other services provided. The corresponding charge recognized in 2013 was €715,000. Total fees paid to the Group Statutory Auditors in respect of the audit of the fi nancial statements and other services provided to subsidiaries by members of their networks for 2014 amounted to €884,000, including €588,000 to PricewaterhouseCoopers Audit and €296,000 to KPMG.
(in thousands of euros)
PwC KPMG
Amount % Amount %
2014 2013 2014 2013 2014 2013 2014 2013
Audit
Statutory audits, certifi cation and examination of individuals and consolidated fi nancial statements
Issuer (Lectra SA) 143 146 24% 27% 125 119 42% 41%
Fully-consolidated subsidiaries 294 276 50% 50% 129 117 44% 40%
Others services directly related to the Auditors’ engagement
Issuer (Lectra SA) 18 12 3% 2% – 12 0% 4%
Fully-consolidated subsidiaries – – 0% 0% – – 0% 0%
Sub-total 455 434 77% 79% 254 248 86% 85%
Other services to consolidated entities
Legal, tax and social reviews (1) 133 115 23% 21% 42 45 15% 9%
Sub-total 133 115 23% 21% 42 45 14% 15%
Total 588 549 100% 100% 296 293 100% 100%
(1) These missions mostly relate to tax compliance services provided by members of the network to foreign subsidiaries of the company.

74 – 2014 Financial Report Management discussion and analysis
Information Concerning Items Covered by Article L. 225-100-3 of the French Commercial Code as Amended by the March 31, 2006, Public Tender Offers Act
Article L. 225-100-3 requires companies whose securities are eligible for trading on a regulated market to disclose and where applicable explain the following items if they are liable to be material in the event of a public tender offer:
a) the structure of the company’s capital stock;
b) any restrictions contained in the by-laws on the exercise of voting rights and on the transfer of shares, or clauses contained in agreements notifi ed to the company in application of article L. 233-11 of the French Commercial Code;
c) direct or indirect shareholdings in the capital of the company known to it in virtue of articles L. 233-7 and L. 233-12;
d) the list of holders of all securities carrying special control rights and the description thereof;
e) control mechanisms provided for in the event of an employee share ownership system, when the employees do not exercise controlling rights;
f) agreements between shareholders that are known to the company and that may entail restrictions on the transfer of shares and on the exercise of voting rights;
g) the rules governing the appointment and replacement of members of the Board of Directors and amendments to the company by-laws;
h) the powers of the Board of Directors and in particular concerning the issuance or buyback of shares;
i) agreements entered into by the company that will be modifi ed or terminated in the event of change of company control;
j) agreements providing for the payment of indemnities to members of the Board of Directors or employees in the event of resignation or dismissal without genuine and serious cause, or if their employment is terminated by reason of a public tender offer.
Under present conditions, none of these items is liable to be of consequence in the event of a public tender offer for the shares of Lectra SA.
Corporate Social and Environmental Responsibility Policy
Disclosures required under the July 12, 2010 “Grenelle II” Act (Law no. 2010-788) are presented in a separate report (available in French only) appended to the Board of Directors’ report submitted to the Annual Shareholders’ Meeting on April 30, 2015. The company had designated PricewaterhouseCoopers to verify disclosures in respect of fi scal 2014.
Diversity, Ethical Values and Core ValuesUncompromising ethical rigor in the conduct of its business activities, and respect for the individual, are fundamental values of Lectra.Lectra rejects all notion or practice of discrimination between people, notably on grounds of sex, age, handicap, ethnic origin, social origin, or nationality. This principle ensures fair treatment in terms of equal career opportunities and equal pay.As for diversity, it has been one the most fundamental features since its very beginning and extends well beyond barring discrimination of any sort. Lectra’s teams operate in 35 countries and represent 50 different nationalities. They work side by side every day, drawing enhanced creativity and vigor from their differences.Lectra’s strong corporate culture is built on fi ve core values shared by all Lectra team members worldwide: entrepreneurship, leadership, innovation, excellence, and customer care. Open-minded and dynamic, it emphasizes teamwork transcending geographic and cultural barriers, as well as a keen sense of individual responsibility. It has forged a company with a strong identity, attuned to the evolution of its customers, its markets, and their macroeconomic cycles.Whenever possible, Lectra facilitates internal mobility, with appropriate support, in order to enrich its employees’ know-how and preserve their employability.
Social PolicyThe Group’s ambition is to develop and consolidate its position as world leader. Building on its proximity to its customers, it forges long-term relationships with them
75
and supports them in their development, through its integrated solutions combining software with CAD/ CAM equipment and associated services to address their strategic challenges, by investing continuously in innovation and new technologies, and in the development of its human capital.Its business worldwide depends primarily on the value of its senior executives, the expertise of its personnel, and its international marketing and services network, both global and local. The Group has consistently set a high priority on preserving its human resources and talent. It has kept a tight grip on its recruitment plan. Emphasis is also placed on monitoring individual performance. On this score, the Group closely reviews under-performing staff, providing suitably tailored support to help them progress and improve their results. In 2005, the Group made the strategic decision of maintaining its research and manufacturing operations in France, in order to protect its intellectual property while guaranteeing its productivity and competitiveness.Initiated the same year, the company’s radical transformation was overhauled at the end of 2009 in order to prepare for the post-crisis period. Its aim is to adapt the Group to the profound changes taking place in its geographical markets and market sectors; to strengthen its competitiveness and world leadership; to concentrate its resources on the most promising geographical markets and market sectors so as to fulfi ll its development potential; to reinforce and develop its marketing and sales organization; and, lastly, to bolster the company’s innovative capabilities and reinforce its research and development teams.These actions are undertaken in parallel with a constant search for individual and collective performance. Continuous improvement and optimization of all functions, including administrative and fi nancial information, and processes, remains a permanent objective of the company. In support of this strategy, the Group is pursuing a robust policy of developing its human resources.The fi rst policy is to recruit and develop the best skills, at headquarters and in international subsidiaries. The Group continues to invest signifi cantly in skills training and in developing the capabilities of managers
and teams, nurturing and reinforcing their expertise and performance.The second policy is to implement the projects necessary to optimize the organization at headquarters and within its international subsidiaries with the help of new working methods, and high-performance internal information systems.
Economic HeadcountThe Group’s economic headcount at December 31, 2014 (number of active full-time equivalent persons), was 1,474 worldwide (1,433 at December 31, 2013). The Group’s legal headcount is 1,523 (registered workforce). Its customer relations teams (marketing, sales and services activities) account for 50% of the headcount; research and development 18%; production and logistics 11%; and administration and fi nance, human capital management, and information systems 21%.38% of the headcount at December 31, 2014 have joined the company in the past fi ve years, 31% of them in the last three years.Group policy is designed to advance the careers of its best-performing employees and support all of its employees in enriching their knowledge and know-how.The Group attaches particular importance to internal mobility for its employees. 98% of employees are on open-ended contracts. Fixed-term contracts apply mainly to persons hired to replace staff on maternity or long-term leave.As a transnational corporation, Lectra operates in a multicultural environment and shares its know-how with its customers in more than 100 countries via its own worldwide sales and services network, supplemented by agents or distributors in certain countries. Its workforce is spread across Lectra SA and its subsidiaries, with more than 50 nationalities represented. This diversity is a major source of wealth and indisputably a key competitive advantage for the Group.Men represented 65% of the Group’s total headcount (stable since 2012) and formed the majority of sales staff (81%), customer support (86%), manufacturing (79%) and R&D (81%) teams. Conversely, although women represented 35% of the total headcount, they were in the majority in other areas such as marketing (80%), administration and fi nance, human resources, and information systems (64%). Genders were more evenly

76 – 2014 Financial Report Management discussion and analysis
split in the professional training and consulting services (59% men, 41% women). Women accounted for 38% of recruitments in 2014 (39% over the past four years), 3 percentage points higher than the fi gure of 35% for the total headcount.Finally, by large region, Europe accounts for 70% of employees (including 49% in France and 21% in the rest of Europe), Asia-Pacifi c 14%, the Americas 11%, and the rest of the world 5%.
Training and IntegrationLectra invests heavily in training for its employees whose expertise is one of the Group’s key strengths.Hiring people with a wide diversity of profi les and skills development has been a priority, the aim being to match the skills and competencies of its teams as closely as possible to the strategy of the Group. The creation of Lectra Academy, the Group’s worldwide in-house training center, in Bordeaux-Cestas, in 2005, was one of a series of major initiatives forming part of a far-reaching plan. The fi ve key challenges of this program are: to adapt and upgrade business-related professional skills and know-how; to bolster the Group’s attractiveness to new job applicants around the world; to transmit the strong corporate culture in all its entities; to identify, develop, and retain talent; and to manage careers effectively.Employees worldwide enjoy access to a broad array of training programs. The Lectra Academy’s team is fully dedicated to this task and works directly with the managers of each department and subsidiary, implementing training plans geared to the specifi c needs of the company’s different businesses as well as to local circumstances. Group experts and outside instructors organize and run seminars in each of the company’s areas of competence.Moreover, Lectra Academy organizes an induction seminar, “Lectra Together”, for all new recruits on arrival in the Group. The seminar lasts between one and two weeks, depending on the profi les concerned, and managers provide follow-up coaching on their return from training. A special effort is made to enrich the capabilities of all Group sales, marketing and consulting teams, as part of the company’s accelerated transformation plan and support for the large number of new recruits. The Group
also continued to provide technical training for its other teams — R&D especially — in new technologies and methodologies, in Lectra’s solutions offer, and in its customers’ businesses.Some subsidiaries follow intensive training, given the evolution of their markets and the weight they carry in the Group’s strategy, as for example, China and the United States. Each session is then adapted to local needs and challenges and is led by the Group’s best experts. In 2014, the Group invested €3.7 million in training, representing 4% of total staff costs, 77% of the total headcount underwent at least one training course (82% in 2013).
Environmental DisclosuresIn view of their specifi c nature (design, production and distribution of software and CAD/CAM equipment, and related services), the Group’s activities have very little impact on the environment.As a result, the company has no internal environmental management department and does not dedicate specifi c resources to reducing environmental hazards, nor to the introduction of an organization for dealing with accidental pollution liable to have consequences outside of the company’s premises. Many employees have been made aware of environmental issues and incorporate these into their decisions. Environmental issues are, however, taken into account in the design phase of products and services. More generally, the Group’s efforts with regard to the environment focus on three main aspects:
– eco-design of its CAD/CAM equipment, the policy of which seeks to reduce raw materials usage in its manufacture, as well as its weight and dimensions. Other goals include limiting the use of polluting or hazardous materials, reducing noise levels in machinery, and raising the share of recyclable products used. This notably entails compliance with a wide range of standards that have yet to become mandatory. This policy also seeks to reduce energy consumption;
– products and services enabling the Group and its customers to reduce their CO2 emissions, and consumption of energy and natural resources. This is notably the case for remote diagnostic systems (part of the Smart Services offer), which serve to maintain

77
the performance and guarantee a very high level of availability in customers’ software and CAD/CAM equipment without the need for technicians to visit customers’ facilities. Moreover, thanks to Lectra solutions, customers are able to limit the number of physical prototypes needed in order to develop their products as well as reduce their consumption of raw materials (e.g. fabrics, leather, technical textiles and composite materials) in manufacturing. This reduction of raw materials translates on the other hand, indirectly, to reduced energy consumption and CO2 emissions.
– Investing in infrastructure designed to preserve the environment and encouraging employees to adopt environmentally friendly practices and behaviors. At its Bordeaux-Cestas facility, the Group has invested in energy-saving infrastructure to cut down on heating and lighting needs. It has also invested heavily in programs to dematerialize documents and virtualize its data servers, yielding substantial gains in paper and energy consumed. Finally, the Group has invested in high-performing, sophisticated videoconferencing systems equipping corporate headquarters and almost all subsidiaries worldwide. This allows for virtual meetings of a particular high quality and comfort in terms of images, sound, interactivity and in document sharing. Group employees use these facilities abundantly, signifi cantly reducing the need for travel (by plane in the fi rst place, given the worldwide locations of its teams) and resulting greenhouse gas emissions.The Group considers that its activities are without impact on biodiversity and therefore has no specifi c program devoted to preserving or developing this.Finally, no provision is made nor guarantee recognized for environmental risks in its fi nancial statements. It has never paid any compensation in execution of a court decision on environmental grounds, and has no knowledge of any violation by Lectra SA or any of its foreign subsidiaries of local environmental rules.
SubcontractorsThe Group subcontracts the production of sub-assemblies of the CAD/CAM equipment it markets to a network of French, regional or national, and foreign companies (most of them located in European Union
countries). These sub-assemblies are then assembled and tested at the Bordeaux-Cestas industrial facilities.Other subcontracted activities are mainly confi ned to cleaning and maintenance of premises and green areas, company cafeterias, and the packaging and transportation of equipment shipped throughout the world and a range of different services. The Group has for many years pursued a policy of responsible procurement, notably through the promotion of local subcontracting, reducing the number of outside suppliers, streamlining its logistics so as to minimize its recourse to transportation and packaging, the use of recyclable materials with a lower carbon footprint, promoting recycling, instituting a responsible procurement charter between the company, its suppliers and subcontractors, and implementing contracts recalling its social and environmental requirements.The Group encourages its subcontractors and suppliers to implement policies contributing to the conservation of natural resources, and to the reduction and elimination of their waste by means of solutions that respect the environment.Finally, the Group is not aware of any violation by its subcontractors and foreign subsidiaries of the fundamental provisions of the International Labor Organization (ILO).
Relations Between the Group and Educational InstitutionsThe Group has chosen to focus its commitment on the educational sector, with a special emphasis on training for the professionals of tomorrow.Lectra takes the view that, as a world leader, it has a responsibility to actively help students in their personal development and preparation for their careers, especially in the fashion and apparel industries. For the past several years the company and its foreign subsidiaries have forged partnerships with more than 850 educational institutions based in 60 countries.These partners mainly comprise:
– fashion schools and universities; – schools of engineering, especially those specializing
in textiles and computer sciences; – fashion trade associations.
The company has intensifi ed programs and its relations with the educational community since 2007. Its partnership policy has proved highly successful, providing

78 – 2014 Financial Report Management discussion and analysis
increased support for the professionals of tomorrow by assisting students throughout the duration of their studies. Three levels of partnership allow the Group to adapt the form and content of its actions to the specifi c characteristics of each institution (e.g. to the nature of their programs and the students’ course requirements). Lectra offers these students access to its latest technologies and to the full extent of its expertise, so that instructors can incorporate these into their programs. All these partnerships are part of a joint and customized approach, forming part of a long-term reciprocal commitment between the institution and Lectra.It has signed 40 “Privilege” (the highest level) partnerships with prestigious schools and universities in Brazil, Canada, China, France, Germany, India, Italy, the Netherlands, Poland, Sweden, Switzerland, the United Kingdom, and the United States. Lectra especially offers students opportunities to gain practical experience with technological innovations and with real world business activities through seminars in which they benefi t from the experience of the Group’s best experts. Lectra also provides them with an exceptional medium and showcase for their fi nal course projects, notably thanks to its international network and Internet website, which includes a special webpage reserved just for them. Lectra is increasingly working to build up this type of program, organizing competitions with schools to enable their students to present their work to the major players in the world of fashion. Group customers are invited to attend these events, giving them an opportunity to discover promising new talent. Finally, Lectra offers internships and actively recruits students graduating from these institutions. Following Shanghai in 2010, Bordeaux in 2011, London in 2012, and Milan in 2013, Lectra hosted a gathering for its “Privilege” partners in Paris in February 2015 and welcomed more than 60 professors, department heads, and directors from 32 fashion schools and colleges.These partnerships represent a major investment by the Group, equivalent to the value of more than 60,000 active software licenses, made available at no charge to professors and students.At the same time, the Group works with the world’s leading trade associations, such as the Fédération
française de la couture, du prêt-à-porter des couturiers et des créateurs de mode (French haute couture, ready-to-wear and fashion designers’ federation). It works closely with all players in the sector in order to anticipate industry developments and help them remain highly competitive in an environment subject to the vagaries of a complex global economy and to the new challenges of the post-crisis economy.Additionally, Lectra has become involved as a founding partner of the French Institute for Innovation and Competitiveness, created in 2011 and supported by ESCP Europe and the Europe+ Foundation. This veritable think tank aims to promote a broader vision of innovation and serve as a forum for exchanges of views on innovation with public authorities at both the French and European levels. In 2013, Lectra signed a new three-year partnership with the Institute for Innovation and Competitiveness to establish a Fashion and Technology Chair at the ESCP Europe. Inaugurated on February 6, 2014, this chair is intended to develop and transmit knowledge on the themes of innovation and of technologies in the fashion and luxury sectors. This chair has a special focus on new business models emerging notably in Europe and China. It is also rethinking the use of technology in design and supply chain management, and devising responses to the challenges posed by the development of the digital era.The Chair sets the standard for research in innovation, technology for the fashion and the luxury industries, as well as serving as a focal point for meetings and discussions between business leaders, academics, policymakers and students at ESCP Europe. It contributes to the dissemination and promotion of its research fi ndings via seminars and training for professionals in these industries.
9. RESEARCH AND DEVELOPMENT
Despite the economic crisis, the Group has continued to invest signifi cantly in research and development and had bolstered its R&D teams with the addition of 40 software engineers at Bordeaux-Cestas, as part of its €50 million investments for the future program.The R&D headcount increased by 4% in 2014. It comprised 260 persons at December 31, 2014 (250 at December 31, 2013),

79
including 247 in France and 13 in Spain. Consisting mainly of trained engineers, they span a wide array of specialties across a broad spectrum from software development and Internet services through electronics, mechanical engineering, as well as expert knowledge of the Group’s customers’ businesses. The Group also has recourse to specialized subcontractors, accounting for a small proportion of its total R&D spending.In addition, the Group is investing in advanced research and studies, drawing on areas of excellence across an array of laboratories, universities, schools, competitiveness clusters and technology centers. Partnership contracts with various actors are now in progress, accelerating and reinforcing the company’s innovative capabilities.All R&D expenditures are fully expensed in the year and booked in fi xed overhead costs. Before deduction of the (French) research tax credit and, since 2013, the portion of the competitiveness and employment tax credit applicable in France, these expenditures totaled €21.7 million in 2014, or 10.2% of revenues (€19.1 million and 9.4% in 2013). Net R&D expense, after deducting the subsidies and tax credits, amounted to €13.5 million (€12.5 million in 2013). These substantial investments (a total of more than €180 million in the aggregate over the past ten years, refl ecting a technology asset valued at zero in the statement of fi nancial position) have enabled the company to maintain and even strengthen its technology lead over its competitors.
10. AUTHORIZATION OF A NEW BUY BACK PROGRAM
BY THE COMPANY OF ITS OWN SHARES TO ENSURE
A LIQUID MARKET UNDER THE FRAMEWORK OF
THE LIQUIDITY AGREEMENT
The Shareholders’ Meeting of April 30, 2014 renewed the program in place since the Shareholders’ Meeting of April 30, 2013 and granted authority to the company to trade in its own shares for a period of eighteen months from the date of the said Meeting. The sole purpose of this program is to maintain a liquid market in the company’s shares by means of a Liquidity Agreement with an investment services provider, in compliance with the code of conduct of the Association française des entreprises d’investissement (AFEI, French Association of Investment Companies) or any other code of conduct recognized by the AMF.
Share Cancelations
The company is not authorized to cancel shares.
Transactions by the company on its own account
The company is not authorized to make any transactions to purchase and sell company shares on its own account.
Liquidity Agreement
Since May 21, 2012, Lectra has contracted with Exane BNP Paribas to act as liquidity provider under a Liquidity Agreement, signed in accordance with the Charter of Ethics of the Association française des marchés fi nanciers (AMAFI) recognized by the AMF.Under this Liquidity Agreement, from January 1 to December 31, 2014, the company purchased 302,206 shares and sold 297,682 shares at an average price of €7.95 and €8.07 respectively. Consequently, at December 31, 2014, the company held 14,932 Lectra shares (or 0.05% of share capital), at a par value of €1.00, with an average purchase price of €8.91, entirely under the Liquidity Agreement, together with €0.3 million in cash and cash equivalents.Additionally, Lectra may increase the resources allocated, if necessary, by contributing up to €1 million, with a maximum corresponding to the market value of 150,000 Lectra shares.
Renewal of the Share Buyback Program
The Board of Directors has proposed to the General Meeting of Shareholders of April 30, 2015, to renew the share buyback program pursuant to article L. 225-209 of the French Commercial Code, for a period of eighteen months from the date of the said Meeting. As in the case of previous programs, the new program’s objective is confi ned to maintaining a liquid market in Lectra shares. The program will be carried out by an investment services provider acting under a liquidity agreement compliant with the Charter of Ethics established by the AFEI or any other code of conduct approved by the AMF.The company will act in conformity with the requirements of French law with regard to the maintenance of suffi cient retained earnings and the elimination of voting rights attached to treasury shares.

80 – 2014 Financial Report Management discussion and analysis
Maximum Percentage of Capital Stock and Maximum Number of Shares that the Company Proposes to PurchaseAs previously, this program will concern a variable number of shares such that the company does not come to hold a number of treasury shares exceeding 3% of the capital stock (representing 915,306 shares at the date of this report), adjusted for transactions that may affect it subsequent to the date of the Ordinary Shareholders’ Meeting, where appropriate.
Characteristics of Shares Concerned by the Buyback ProgramLectra shares are listed on compartment B on Euronext (ISIN code: FR0000065484).The Board of Directors will provide shareholders with the information required in articles L. 225-211 of the French Commercial Code, in its reports to the Annual Shareholders’ Meeting.The Board of Directors has proposed the following terms:
– maximum purchase price: €20 per share; – gross maximum amount to be utilized in the stock
buyback program: €3 million.If the shareholders approve this resolution, the new program will replace the one authorized by the General Shareholders’ Meeting of April 30, 2014. It will have a duration of eighteen months from the date of the Annual Shareholders’ Meeting, i.e. until October 30, 2016.
11. POST-CLOSING EVENTS
No signifi cant event has occurred since December 31, 2014.
12. FINANCIAL CALENDAR
The Annual Shareholders’ Meeting will take place on April 30, 2015.First, second, and third quarter earnings for 2015 will be published on April 29, July 30, and October 29, 2015, respectively, after the close of trading on Euronext. Full-year earnings for 2015 will be published on February 11, 2016.
13. REPORT ON AUTHORITY TO INCREASE
THE CAPITAL
Article L. 225-100 of the French Commercial Code, as amended by the Executive Order (Ordonnance) of June 24, 2004, requires that the Management Discussion and Analysis comprises a table summarizing the authorities and powers granted to the Board of Directors by the Shareholders’ Meeting, with respect to capital increases in application of articles L. 225-129-1 and L. 225-129-2 of the French Commercial Code, and their utilization by the Board of Directors in the course of the year. The table is attached to this report.The Extraordinary Shareholders’ Meeting of April 30, 2014 authorized the issuance of shares within the framework of a stock option plan for a period of thirty-eight months expiring on June 30, 2017 (see chapter 7). This authority automatically terminated the authority to issue shares within the framework of a stock option plan, decided by the Extraordinary Shareholders’ Meeting of April 27, 2012.
14. BUSINESS TRENDS AND OUTLOOK
The company entered 2015 with even more solid operating fundamentals than in 2014 and an even stronger balance sheet.
2015 Outlook
As for the past two years, 2015 looks unpredictable. Persistent macroeconomic, geopolitical and monetary uncertainty is liable to delay the revival of confi dence and will continue to weigh heavily on companies’ investment decisions. Furthermore, Lectra sales teams in place should progressively gain momentum.
More Favorable Currency Parities The company has based its 2015 scenarios on exchange rates at December 15, 2014, notably $1.25/€1.The effect of converting 2014 results to the chosen 2015 exchange rates is to increase revenues and income from operations before non-recurring items by €4.5 million and €2.6 million, respectively, to €215.8 million and €22.4 million. The operating margin before non-recurring items increases by 1 percentage point to 10.4%.
81
Based on the estimated proportion of revenues and costs expressed in U.S. dollars or in currencies correlated with the dollar, a 5-cent fall in the euro against the dollar (at an exchange rate of $1.20/€1) would mechanically increase 2015 revenues by approximately €3.6 million and income from operations by €2 million. Conversely, a 5-cent appreciation of the euro against the dollar (i.e. $1.30/€1) would mechanically reduce revenues and income from operations by the same amounts. The company has not hedged its currency exposure for 2015. At the date of this report, the dollar has further strengthened against the euro, with a parity of $1.12/€1; if the exchange rate were to remain close to this level, it would have a benefi cial impact on the company’s revenues and income.
Key Financial MetricsKey fi nancial metrics of the 2015 plan are (like-for-like variations):
– keeping gross profi t margins on the different product lines at the same levels as in the second half of 2014, the product mix refl ecting the growing importance of new software licenses, training and consulting;
– an increase of around 4% to 6% in recurring revenues. Recurring contracts are expected to increase by around 4% to 5%, and sales of spare parts and consumables by 4% to 7%, given the increase in the installed base and the activity and output at customers;
– fi xed overhead costs of around €133 million, up €9.6 million (+8%) relative to 2014. Of this €133 million, €20 million, or 15%, is attributable to the company’s transformation plan;
– a security ratio (i.e. the percentage of annual fi xed overhead costs covered by gross profi t on recurring revenues) of 78%.
As in previous years, the main uncertainty concerns the level of revenues from new systems sales. Visibility remains limited, calling for continuing caution.The company’s objective is to reach total revenues of approximately €240 million (+14% relative to 2014; +11% like-for-like) for the fi scal year, income from operations before non-recurring items of around €29 million (+47%; +30% like-for-like), an operating margin before non-recurring items of 12% (a 1.6 percentage points increase like-for-like), and net income of around €20 million (+39%). For every €1 million increment (or decline) in revenues from new systems sales, income from operations should increase (or decrease) by approximately €0.45 million.Free cash fl ow should continue to exceed net income, assuming the use or the receipt of the French research tax credit and competitiveness and employment tax credit recognized in the year. In 2015, free cash fl ow will benefi t from the refund of the 2011 research tax credit (€4.7 million).
Company Confi dent in its Medium-Term Growth Prospects
The transformation plan is scheduled for completion at the end of 2015. The headcount will be strengthened and resources will be reallocated to the most strategically important activities and to those geographical markets and market sectors offering the greatest growth potential.Bolstered by the strength of its business model and the relevance of its strategic roadmap, the company maintains the fi nancial goals it has set for 2016 unchanged and remains confi dent in its growth prospects for the medium term.
The Board of Directors March 3, 2015

82 – 2014 Financial Report Management discussion and analysis
Type of issueAuthorization
date Maturity TermMaximum
amount Utilization
Stock options(1) April 30, 2014 June 30, 2017 38 monthsCapital:
€1,800,000Amount utilized:
€307,648
Total authorized, non expired and unutilized at December 31, 2014 €1,492,352
(1) The General Shareholders Meeting of April 30, 2014 authorized the creation of a new stock option plan for a maximum of 1,800,000 shares with a par value of €1.00. The maximum amount and amounts utilized at December 31, 2014 are in par value of shares; 307,648 options had been utilized, and 1,492,352 remained at the Board’s disposal (see note 15.5 to the consolidated fi nancial statements).
SCHEDULE OF AUTHORITY TO INCREASE THE CAPITAL AT THE CLOSE OF FISCAL YEAR 2014
Note to chapter 13 of the Management Discussion
83
“We certify that, to our knowledge, the fi nancial statements have been prepared in accordance with currently applicable accounting standards and provide a fair view of the assets, fi nancial condition, and results of the company and of its consolidated companies. We further certify that the Management Discussion and Analysis presents a true and fair view of the operations, results, and fi nancial condition of the parent company and consolidated companies, together with a description of the main risks and uncertainties faced by the company.”
Paris, March 3, 2015
Daniel Harari Jérôme Viala
Chief Executive Offi cer Chief Financial Offi cer
COMPANY CERTIFICATION OF THE ANNUAL FINANCIAL REPORT

84 – 2014 Financial Report Chairman’s Report
CHAIRMAN’S REPORT ON INTERNAL CONTROL PROCEDURES AND RISK MANAGEMENT, AND ON CORPORATE GOVERNANCE
Dear Shareholders,
The French Financial Security Act of August 1, 2003, modifying the obligations of French sociétés anonymes, notably amended article L. 225-37 of the French Commercial Code. This requires the Chairman of the Board of Directors of a société anonyme to append to the Management Discussion and Analysis of Financial Condition and Results of Operations a report giving details of the manner in which the Board’s proceedings are prepared and organized, and on the company’s internal control and risk management procedures.Under this Act, the report of the Chairman of the Board of Directors on conditions governing the preparation and organization of Board proceedings and on internal control procedures is also required to describe the principles and rules established by the Board regarding compensation and benefi ts of all kind of the company’s executive directors (mandataires sociaux).The French law no. 2008-649 of July 3, 2008, which amends various aspects of French company law in order to comply with European Union law, amended the terms of article L. 225-37 of the French Commercial Code. In particular, this requires that, when a company voluntarily refers to a code of corporate governance framed by representative organizations of corporations, the report of the Chairman must identify the provisions it has chosen not to apply and the reasons for doing so. Alternatively, if the company does not refer to any such code of corporate governance, the report must state which rules it has adopted in addition to those required by law and explain why the company has decided not to apply any of the provisions of this code of corporate governance.As required by the French Act (Law no. 2011-103) of January 27, 2011, this report also discusses the application of the principle of balanced representation of men and women on the Board.The Board of Directors of the company has formally adhered to the AFEP-MEDEF Corporate Governance Code of Listed Companies (the consolidated code of December 2008, updated in June 2013, hereafter referred to as the “AFEP-MEDEF Code”), since 2008 and has rigorously enforced it. In particular, the Board of Directors stated on November 28, 2008, that the company had decided to adopt the recommendations issued by the
AFEP-MEDEF Code as the code of corporate governance to which the company shall voluntarily refer in matters of compensation of its executive directors, and to comply with its provisions or, should any of these provisions be deemed inappropriate with respect to the specifi c circumstances of the company, to explain the reasons for not applying them, as prescribed in article L. 225-37 of the French Commercial Code.The AFEP-MEDEF Code is available for consultation at www.medef.com.In particular, the Board of Directors has examined the 2014 report of the (French) Financial Markets Authority (Autorité des Marchés Financiers — AMF) on corporate governance and executive compensation published on September 22, 2014, together with the fi rst report of the High Committee on Corporate Governance established by the AFEP and the MEDEF published in October 2014, including the annual report on the application by SBF 120 companies of their Code of Corporate Governance. The Internal Rules and Procedures of the Board of Directors were supplemented and revised this year, in order to describe notably in detail the roles and duties of the Board of Directors, the specifi c duties entrusted to the Chairman of the Board, arrangements for the provision of training for Directors, prevention and management of confl icts of interest, and for adopting the new recommendations of the AMF. Some of these changes having a particular impact on the elements presented hereinafter are mentioned in this report. The February 11, 2015 update of the Internal Rules and Procedures of the Board of Directors can be consulted in full on the company website. An English-language version was published for the fi rst time on February 11, 2015.As in prior years, the main objective of the present report is to describe (i) the composition as well as the conditions in which the Board prepared and organized its proceedings in the fi scal year ended December 31, 2014, (ii) the internal control and risk management procedures implemented by the company, (iii) the rules established by the Board for the purpose of determining the compensation and benefi ts in kind of executive directors, and (iv) to identify which of the recommendations of the AFEP-MEDEF Code have been considered ill-suited to the particular characteristics of the company, and

85
explain the reasons for not applying them, as prescribed in article L. 225-37 of the French Commercial Code. Modifi cations relative to the previous year are indicated as such.This report was submitted to and discussed by the Audit Committee and approved by the Board of Directors at their meetings of March 3, 2015.
1. CONDITIONS GOVERNING THE PREPARATION
AND ORGANIZATION OF BOARD PROCEEDINGS
1.1. Role, Powers and Operation of the Board of Directors
The Board of Directors is responsible under French law and determines the overall strategy and directions of the company’s business and oversees their execution. Subject to powers expressly invested in the Shareholders’ Meetings and within the limits of the corporate purpose, the Board considers itself with all issues pertaining to the proper functioning of the company and decides all matters concerning it.The Board scrutinizes and decides on major fi nancial operations, economic matters or questions relating to human capital, and on strategic initiatives.It appoints the executive directors entrusted with the management of the company and chooses the form of organization (separation of the positions of Chairman and of Chief Executive Offi cer, or combination of these offi ces in a single person), and oversees their management. It decides on the compensation of the Chairman and of the Chief Executive Offi cer, who are the sole executive directors. This mission cannot be delegated to the Compensation Committee.It formulates the company’s policy on fi nancial disclosure and ensures the quality of the information provided to shareholders and to the fi nancial markets.The following items require prior approval by the Board of Directors:
– all signifi cant transactions external to the Group’s stated strategy or liable to have a signifi cant impact on its fi nancial results, balance sheet structure, or risk profi le;
– all borrowings exceeding €5 million; – all creations of subsidiaries, all acquisitions of
companies or activities, together with all disposals
of a subsidiary, activity or item of Group intellectual property; and
– all fi nancial or stock market transactions having an immediate or future impact on the share capital.The Board of Directors performs such controls and verifi cations as it deems appropriate.It is kept informed of all important events affecting the life of the company.
Separation of the Offi ces of Chairman and Chief Executive Offi cer
In 2002, the Board of Directors separated the functions of Chairman of the Board of Directors from those of Chief Executive Offi cer. The Board of Directors considers that this organization of the company’s management and administration achieves a better balance and greater operational effi ciency in its governing bodies. It is better suited to its worldwide structure and mode of operation, and enables it to place its corporate governance practice on stronger foundations.In particular, and in the especially diffi cult macroeconomic conditions prevailing since the global economic and fi nancial crisis of 2008-2009, this organization allows the Chief Executive Offi cer to focus fully on accelerating the company’s transformation in response to the new challenges it faces, and on fulfi lling the Group’s objectives and short-term action plan while at the same time pursuing its medium-term strategic plan.The directorships of André Harari and Daniel Harari were renewed by the Shareholders’ Meeting of April 27, 2012 for a four-year period (in keeping with the reduction of directors’ appointments from six to four years, as decided by the same meeting) expiring at the end of the Shareholders’ Meeting called to approve the fi nancial statements for the fi scal year ended December 31, 2015. On the same day, the Board of Directors renewed the appointment of André Harari as Chairman of the Board and Daniel Harari as Chief Executive Offi cer. It has not appointed an Executive Vice President.The Chairman of the Board is responsible for organizing and directing the work of the Board of Director, reporting to the General Shareholders’ Meeting, and more generally overseeing the proper functionning of the company’s management bodies. He ensures that

86 – 2014 Financial Report Chairman’s Report
directors are in a position to fulfi ll their duties. Where appropriate, he attends the meetings of the Committees established by the Board of Directors.The Chairman represents the Board of Directors and, unless otherwise decided by the latter, has sole authority to speak in its name.He manages relations between the Board of Directors and the shareholders of the company, in consultation with the Chief Executive Offi cer.
Specifi c Missions of the Chairman of the Board In addition to the missions prescribed by law, the Chairman of the Board of Directors is invested with missions and particular duties that are outlined in chapter 1.5 (Specifi c Missions of the Chairman) of the Internal Rules and Procedures of the Board, and include, notably:
– the Chairman of the Board of Directors chairs and runs the Strategic Committee;
– working closely with the Chief Executive Offi cer, he takes part in the defi nition of the strategic options and development themes deemed essential in order to build the company’s future, prepare it for the global economic challenges and risks to which it is exposed, maximize its market potential, and to reinforce its business model and its operating and fi nancial ratios;This mission comprises, among others, preparation of the following key subjects: the strategic plan, the Group’s investments for the future and its transformation plan, the annual action plans, research and development, marketing and human resources plans, together with monitoring performance of their execution; external growth operations; and, fi nally, fi nancial and stock market transactions having a signifi cant immediate or future impact on the share capital and more generally the assets of the shareholders;
– he reviews and discusses with the Chief Executive Offi cer major decisions within the competence of the Board of Directors or its Committees, prior to their consideration by the said bodies;
– at the invitation of the Chief Executive Offi cer, he attends internal meetings with Group managers and teams dealing with these subjects, to give his views;
– he ensures respect for and promotes in all circumstances Lectra’s core values and uncompromising ethical standards in the conduct of its business;
– he is the guardian of corporate governance, of respect by the Board of Directors and its members for the rules of conduct, together with the demands of good faith and transparency in the company’s fi nancial and corporate publications. He monitors legislative and regulatory developments on these questions and regularly verifi es that the Internal Rules and Procedures of the Board of Directors are up to date and fi t for purpose; and
– in concert with the Chief Executive Offi cer, he attends meetings with the shareholders and potential investors, as well as securities analysts and investors conferences.The Chairman organizes his time so as to be available and place his experience at the service of the Group. His missions confer no executive authority.
Missions and Powers of the Chief Executive Offi cerThe Chief Executive Offi cer is invested with the fullest powers to act on behalf of the company in all circumstances and represents the company in its dealings with third parties. He may be assisted by one or more Executive Vice Presidents.As required in the company bylaws, the Chief Executive Offi cer must be a member of the Board of Directors. He exercises his powers within the limits of the corporate purpose and subject to those explicitly attributed by law to the Shareholders’ Meetings and to the Board of Directors.He is fully responsible for all operational and executive matters, and all Group teams report to him.The interactions between the Chief Executive Offi cer, on one hand, and the Board of Directors and its Chairman, on the other hand, are outlined in chapter 1.6 (Missions and powers of the Chief Executive Offi cer) in the Internal Rules and Procedures of the Board. He reports to each meeting of the Board of Directors on signifi cant developments relating to the life of the Group.The Chief Executive Offi cer chairs the Executive Committee and decides its composition.The Executive Committee has four members: Daniel Harari, Chairman of the Committee, Jérôme Viala, Chief Financial Offi cer, Véronique Zoccoletto, Chief Human Capital Offi cer, Chief Information Offi cer, and Edouard Macquin, Executive Vice President, Sales, who was appointed to the Committee on January 1, 2014.

87
1.2. Membership of the Board of Directors
The Board of Directors has four members: André Harari, Chairman of the Board of Directors, Daniel Harari, CEO, Anne Binder and Bernard Jourdan.All members of the Board are French nationals.The Board of Directors had co-opted Anne Binder and Bernard Jourdan respectively on October 27 and December 21, 2011 as new independent directors. This cooptation was ratifi ed by the Shareholders’ Meeting of April 27, 2012, which also re-elected them to the Board for a period of four years. They had not previously been directors of the company.In its amended version released in June 2013 the AFEP-MEDEF Code refers to the provisions of the French Commercial Code, which stipulates that if the shareholdings held by the employees of the company exceed 3% of the company’s capital, or if the company employs at least 5,000 full-time employees in France, or at least 10,000 worldwide, including its direct and indirect subsidiaries, the Board of Directors must include directors representing the employees. This provision does not affect the company, since it does not satisfy any of these conditions.
Directors’ Biographies and Other Appointments
Details of directors’ biographies and other appointments are provided in the company’s annual report. André Harari holds no outside directorships. Apart from his directorship of the company and certain of its subsidiaries, Daniel Harari holds no directorships outside the company.
Directors’ Shareholdings
Article 12 of the company’s bylaws stipulates that each director must hold at least one share of the company throughout his or her term as a director. At March 3, 2015, André Harari held 5,606,851 of the company’s shares, and Daniel Harari 5,507,560 shares (i.e., 18.4% and 18.1% of the share capital respectively). Also, at that date, Anne Binder held 200 of the company’s shares, and Bernard Jourdan 78 shares.The AFEP-MEDEF Code states that each director should be a shareholder in a personal capacity, which is the case for the company.
It further states that each director should own a signifi cant number of shares relative to the director’s fees received: if the director does not own these shares when joining the Board, he or she should use the director’s fee received in order to purchase shares. The company does not comply with this stipulation. The Board does not consider this detrimental to the functioning of its governing bodies and does not adversely affect the directors’ contributions. Indeed, the Board of Directors considers that the four directors together hold a very large number of shares, and that their concern for the interests of the shareholders is self-evident. The assessment of the work of the Board of Directors shows, moreover, that the directors in question fulfi ll the duties of a director diligently. Finally, the two non-executive directors, who own fewer shares, have been selected for their independence and their experience outside the company.
Criteria Defi ning Board Members’ Independence
The use of the term independent director is consistent with the terms of the AFEP-MEDEF Code. André Harari, Chairman of the Board of Directors, and Daniel Harari, Chief Executive Offi cer, are the two executive directors and as such are not deemed to be independent.To comply with the rules of corporate governance, as set forth in the AFEP-MEDEF Code, the Board of Directors must include at least two independent directors. In general, a director is deemed to be independent of company’s management when there is no relationship with the Group liable to compromise the said director’s freedom of judgment.Such is the case for two of the four members of the Board of Directors, namely Anne Binder and Bernard Jourdan, both of whom satisfy all the criteria of independence laid down in the AFEP-MEDEF Code.
Duration of Board Appointments
Following the motion by the Board of Directors, the Shareholders’ Meeting of April 27, 2012 reduced the terms of offi ce of the directors to four years, in order to comply with the recommendations of the AFEP-MEDEF Code. For very many years, the bylaws stipulated a duration of six years.
88 – 2014 Financial Report Chairman’s Report
Consequently, the directorships of André Harari, Daniel Harari, Anne Binder and Bernard Jourdan were renewed for a period of four years, on April 27, 2012. They will terminate in 2016 at the end of the Ordinary Shareholders’ Meeting called to approve the fi nancial statements for the fi scal year ended December 31, 2015. As a result, the company has not complied with the recommendation of the AFEP-MEDEF Code regarding the staggering of directors’ terms. It considers that, given the small number of directors, maintaining the stability of the Board of Directors, with coincident terms of offi ce, is an important factor in the proper functioning of the Board and its Committees and guarantees a better understanding of the activities, strategy, challenges and issues specifi c to the company.
Representation of Women on the Board
The January 13, 2011 law laid down new rules on the balance between men and women on Boards of Directors. The law comes into force on January 1, 2017 and sets the minimum proportion of directors of each gender at 40% as of that date, with a proportion of 20% at the close of the fi rst Ordinary Shareholders’ Meeting held after January 1, 2014. The AFEP-MEDEF Code has set a higher standard, requiring that the 40% threshold be met at the end of the Ordinary Shareholders’ Meeting held in 2016.With the cooptation of Anne Binder to the Board of Directors, and the confi rmation of her appointment by the Shareholders’ Meeting of April 27, 2012, the company has respected the fi gure of 20% referred to above, and will continue to do so throughout the terms of the current directors, i.e. until the fi rst half of 2016.On the occasion of the Extraordinary Shareholders’ Meeting of September 26, 2014 called to update and simplify the company bylaws, the Board of Directors again discussed the appropriate balance of its composition and that of the Committees it has established, and took the view that it had carried out all appropriate measures required to guarantee shareholders and the market that its missions are being performed with the necessary independence, diversity of analysis and objectivity. This point will be reviewed again, on the occasion of the renewal of the Board of Directors following the Annual Shareholders’ Meeting called to approve the
fi nancial statements for fi scal 2015. The Board of Directors will propose the election of a woman as the fi fth director, to meet the minimum quota of 40% for women Board members at that date.
Age Limit for Directors and for the Chairman of the Board of Directors
At the motion of the Board of Directors, the Extraordinary Shareholders’ Meeting on September 26, 2014 decided almost unanimously (99.2%) to amend Lectra’s company bylaws with a view to increasing the proportion of directors aged over 70 from one third to one half of the total number of directors in offi ce, and to raising the age limit for the position of Chairman of the Board of Directors from 75 to 76.Under the amended bylaws, moreover, if the threshold of one half of the directors is exceeded, the last director to reach the age of 70 shall automatically be deemed to have resigned, his or her appointment expiring at the end of the next annual Shareholders’ Meeting, in order to ensure the continuity of terms of offi ce and of the Board’s work in the course of a given fi scal year.
Training of Directors
The independent directors receive regular training on the specifi c characteristics of the company, its businesses and sectors of activity, its product and service offer, its organization and operating mode, notably by means of meetings of the Strategic Committee and the Compensation Committee, and with operational and corporate managers, or through visits to the Group’s technology campus, to acquire a thorough understanding of the company.Following the renewal of the Board of Directors at the end of 2011, numerous meetings have been held with the new directors within this framework.
Outside Directorships Held by Executive Directors
The AFEP-MEDEF Code recommends that an executive director seeks the opinion of the Board of Directors before accepting a new directorship in a listed company.This stipulation did not fi gure in the Internal Rules and Procedures of the Board insofar as it did not apply. It has been inserted this year to indicate that executive directors

89
are prohibited from holding directorships in any French or foreign company, listed or unlisted, outside the Group.
1.3. Committees of the Board of Directors
The Board of Directors has created three specialized Committees: an Audit Committee (2001), a Compensation Committee (2001), and a Strategic Committee (2004). Given the limited number of Directors, the functions of the Nominating Committee as laid down in the AFEP-MEDEF Code is performed either by the Compensation Committee or by the Board of Directors in plenary session, depending on the case.As recommended by the AFEP-MEDEF Code, the Audit and Compensation Committees do not contain any executive directors. Moreover, article L. 823-19 of the French Commercial Code, bars directors holding management positions from membership of the said Committee with effect from August 31, 2013. The company has complied with these stipulations. Finally, in its amended version of June 2013, the AFEP-MEDEF Code requires each committee to establish rules spelling out its duties and procedures. These may be incorporated into the standing Internal Rules and Procedures of the Board of Directors, and the company did so in its updated version published on its website on July 30, 2014.André Harari does not hold any operational position. However, he is closely involved in the management of the company, is regularly invited by the Chairs of the Audit and Compensation Committees to take part in their meetings to enable them to benefi t from his experience and deep knowledge of the company.Each Committee may invite all persons of its choosing to attend its meetings, conditional on a pledge of confi dentiality and subject to veto by its Chairman. In this event, it must then report on this to the Board of Directors.The chapters below have been completed this year to refl ect the most recent version of the Internal Rules and Procedures of the Board of Directors.
Audit Committee
MembershipThe Audit Committee consists of two independent Directors, Bernard Jourdan, Chairman of the Committee, and Anne Binder.The AFEP-MEDEF Code requires the members of the Committee to be competent in fi nancial and accounting matters, and that, upon their appointment, they should be provided with information regarding the specifi c accounting, fi nancial and operational characteristics of the company. This is the case with its two members, in view of their academic qualifi cations and professional career, as described in their biographies. In particular, Bernard Jourdan, the Chairman of the Committee, holds a Master of Science in Management from the Sloan School of Management (MIT, Cambridge, USA), is an alumnus of École Centrale de Paris (Engineering), and obtained an MS (DECS) in accounting from the University of Paris and a BA in economics from the University of Paris Assas. Anne Binder graduated from the Institut d’Études Politiques of Paris. She also has a BA from the Paris faculty of law and a Master in Business Administration from INSEAD in Fontainebleau, France; she is also Vice Chairman of the French National Chamber of Financial Expert Consultants.
MissionAs prescribed in law and as recommended by the AFEP-MEDEF Code, the mission of the Audit Committee is to:
– review the fi nancial statements, and in particular ensure the relevance and continuity of the company’s accounting methods used to prepare the consolidated and statutory fi nancial statements; oversee the process for the preparation of fi nancial disclosure and the effectiveness of internal control and risk management procedures; and, prior to meetings of the Board of Directors, to review press releases and quarterly and annual fi nancial announcements. The Audit Committee scrutinizes important transactions liable to give rise to confl icts of interest;
– oversee the rules governing the independence and objectivity of the Statutory Auditors, manage the procedure for the selection of Statutory Auditors when their current appointment expires, and to make

90 – 2014 Financial Report Chairman’s Report
its recommendation to the Board of Directors. Each year the Statutory Auditors inform the Committee on the services provided, directly related to their statutory audit engagement, together with fees paid by Group companies to members of their network in respect of services not directly related to this mission;
– review the information required under the “Grenelle II” Act of July 12, 2010 (French law no. 2010-788); and
– make recommendations and express all opinions to the Board.More generally, the Audit Committee may consider all questions brought to its attention and pertaining to the aforementioned areas.
Meetings and Activities The Audit Committee meets at least four times a year, prior to the meetings of the Board of Directors called to review the quarterly and annual fi nancial statements. The Statutory Auditors, the Chief Financial Offi cer and the Deputy Chief Financial Offi cer attend all of these meetings. The Audit Committee continuously oversees the preparation of the company accounts, internal audits and fi nancial reporting practices, together with the quality and fairness of the company’s fi nancial reports. The Chief Financial Offi cer and the Deputy Chief Financial Offi cer assist the Committee in the performance of its duties, and the Committee periodically reviews with them areas of potential risk to which it needs to be alerted or requiring closer attention. The Committee also works with them in reviewing and approving guidelines for the work program on management control and internal control for the year in progress. The Committee notably reviews signifi cant off-balance sheet risks and liabilities, assesses the magnitude of malfunctions or weaknesses brought to its attention, and any necessary corrective measures, and it informs the Board of Directors at its discretion. Further, it reviews the assumptions used in closing the consolidated and statutory, quarterly, half-year and annual fi nancial statements, the annual budget prepared by the Executive Committee, and the revenue and fi nancial results scenarios for the fi scal year and their quarterly review before review by the Board of Directors.The Committee Chairman reports on the Committee’s proceedings and recommendations to the Board of
Directors at its meetings called to review the quarterly and annual fi nancial statements. The Audit Committee held fi ve meetings in 2014. All members of the Committee were present, resulting in an effective attendance rate of 100%. The review of the fi nancial statements, which takes place quarterly, is accompanied by a presentation by the Chief Financial Offi cer and the Deputy Chief Financial Offi cer of the company’s fi nancial results, accounting methods chosen, exposure to risks and signifi cant off-balance sheet liabilities. It is also accompanied by a presentation by the Statutory Auditors drawing attention to the essential points raised in regard to fi nancial results, together with accounting choices made, together with an account of their auditing work and observations, if any. The Committee Chairman systematically asks the Statutory Auditors if their reports will be qualifi ed. In particular, the Committee considered the report of the (French) Financial Markets Authority (AMF) 2014 on corporate governance and executive compensation of September 22, 2014, together with the AMF recommendation of October 28, 2014 on the 2014 fi nancial statements.At the Committee meeting preceding the meeting of the Board of Directors held to consider the preparation of the Annual Shareholders’ Meeting, the Committee notably reviews the Board of Directors’ Management Discussion and the Chairman’s report on internal control procedures and risk management, and on corporate governance, for the past year, and makes recommendations.In 2014, then on February 11 and March 3, 2015, for the review of the fi scal 2014 fi nancial statements, the Committee notably reviewed the goodwill impairment tests and deferred tax assets at December 31, 2014, together with the impacts on the fi nancial statements of the December 29, 2013 Budget Act (loi de fi nances) for 2014, and of the August 8, 2014 and December 29, 2014 Supplementary Budget Acts for 2014 (loi de fi nances rectifi cative).The Committee also reviewed the mandatory corporate social and environmental disclosures required under the French “Grenelle II” Act (Law no. 2010-788) of July 12, 2010, its enabling decree published on April 24, 2012, and the ministerial decree of May 13, 2013 setting out the procedures for the performance of specifi c auditors’ duties, to be included in the Grenelle II report

91
appended to the Board of Directors’ report submitted to the Annual Shareholders’ Meeting on April 30, 2015. It notably took into account the November 5, 2013 report of the AMF on the implementation of these provisions.The Committee also reviewed the company’s 2015 budget as well as the 2015 revenue and income scenarios, together with the macroeconomic assumptions, serving as the basis for the information communicated to the market. The Committee has not identifi ed any operations liable to give rise to a confl ict of interests.Finally, the Committee reviews and discusses with the Statutory Auditors the scope of their engagement and their fees, and ensures that these are suffi cient to enable them to exercise a satisfactory level of control: each Group company is subject to an annual verifi cation, usually carried out by a local member of the Statutory Auditors’ fi rms, and a limited review is conducted on the half-year reporting package of the main subsidiaries. At each meeting the Committee invites them to report on their control program and on new areas of risk they may have identifi ed in the course of their work, and it discusses the quality of accounting information with them. Once a year, it receives from the Statutory Auditors a report prepared exclusively for its attention on the fi ndings of their audit of the company and consolidated accounts for the year ended, and confi rming the independence of their companies in accordance with the French Code of professional conduct and the August 1, 2003 (French) Financial Security Act.The Committee dedicated, on January 7, 2015, a working meeting with the Statutory Auditors and the fi nance team to the presentation of their overall auditory approach, a review of controls of information systems, the management of risks and recommendations on internal controls, and fi nally the results of auditory work on payroll conformity. The AFEP-MEDEF Code recommends that, when selecting or renewing the Statutory Auditors, the Committee should propose the selection procedure to the Board, and in particular if there is reason to issue a call for tenders. The Committee then supervises the call for tenders, approves the list of requirements and the shortlist of audit fi rms consulted, taking care to select the “best bidder” and not the “lowest bidder”.
Giving precedence to continuity and in light of the expertise gained by the company’s Statutory Auditors, the Committee opted not to issue a call for tenders when renewing the appointments of the full and alternate Statutory Auditors in 2008. The same approach has been adopted with regard to their reappointment for a further period of six years, as proposed to the Shareholders’ Meeting on April 30, 2014.The Committee annually reviews with the Statutory Auditors the risks to the latters’ independence. Given the size of the Lectra Group, there is no cause to consider safeguard measures required in order to attenuate these risks: the amount of fees paid by the company and its subsidiaries and the share of revenues paid to the audit fi rms and their networks, are immaterial and are not therefore such as to impair the independence of the Statutory Auditors. The Committee assures itself each year that the mission of the Statutory Auditors is exclusive of all other services unrelated to their legal verifi cation, notably all consulting (legal, tax, information system, etc.) performed directly or indirectly for the benefi t of the company and its subsidiaries. However, at the Committee’s recommendation, additional work or work directly complementing the audit of the fi nancial statements is performed; the corresponding fees are insignifi cant.The Committee has not seen fi t to call upon outside experts. Finally, the AFEP-MEDEF Code recommends a minimum period of two days between the meeting of the Audit Committee and that of the Board of Directors. The company does not follow this recommendation, since the Audit Committee systematically meets on the morning of the same day on which the Board of Directors meets, prior to the latter’s meeting, in order to shorten the time between the closing of consolidated and statutory fi nancial statements and market disclosure. However, the members of the Audit Committee, like those of the Board of Directors, are given suffi cient time for consideration insofar as the relevant documents are communicated to them at least three to fi ve days before their meetings. The Chairman of the Audit Committee systematically communicates the Committee’s recommendations to the Board in the course of the latter’s meeting.

92 – 2014 Financial Report Chairman’s Report
Compensation Committee
MembershipThe Compensation Committee consists of two independent directors, Bernard Jourdan, Chairman of the Committee, and Anne Binder.The June 2013 amended version of the AFEP-MEDEF Code states that “it is advised that an employee Director be a member of this Committee”. However, inasmuch as the company is not covered by the obligation to appoint employee directors, for the reasons stated above, this recommendation does not apply to the company.
MissionThe mission of the Compensation Committee is broader than that laid down in the recommendations of the AFEP-MEDEF Code and is to:
– review, prior to meetings of the Board of Directors called to vote on these questions, the principles and amount of fi xed and variable compensation, together with the corresponding annual targets serving to determine the variable portion thereof, and the additional benefi ts paid to executive directors, and make recommendations. At year-end closing, the Committee validates the actual amount corresponding to variable compensation earned during the fi scal year elapsed;
– review the principles and amount of fi xed and variable compensation, together with annual targets governing calculation of the variable portion, together with additional benefi ts paid to other members of the Executive Committee;
– review the fi xed and variable compensation of all Group managers whose total annual compensation exceeds €150,000 or $200,000;
– review, prior to the meeting of the Board of Directors to vote on these questions, the details, rules and granting of the annual stock options plan, and make its recommendations;
– review company policy on equal opportunities and equal pay, and to make recommendations to the Board prior to annual discussion by the latter, as prescribed in the (French) January 13, 2011 Act;
– take cognizance annually of the Group’s human resources performance report, of its policies and of the corresponding plan for the current fi scal year.
In that capacity, the Compensation Committee makes recommendations and expresses all opinions to the Board. More generally, the Compensation Committee may consider all questions brought to its attention and pertaining to the aforementioned areas.
Meetings and ActivitiesThe Compensation Committee organizes its work as it sees fi t. It meets as often as the interests of the company demand and at least before each meeting of the Board whenever the agenda provides for the setting of compensation and additional benefi ts for the executive directors, or for the granting of stock options, and reports on its recommendations to the said meeting.The Compensation Committee reviews the compensation and additional benefi ts of the other members of the Executive Committee, as well as the compensation of the senior Group managers. In addition, it annually reviews the company’s policy on equal opportunities and equal pay, prior to the meeting of the Board of Directors, as required under the January 13, 2011 Act, and makes its recommendations. The Committee reviews in detail all corresponding documents prepared by the Chief Executive Offi cer and the Chief Human Capital Offi cer, and communicates its recommendations to the Board. In view of its importance, the Compensation Committee regularly discussed progress of the Group’s recruitment plan for 2012-2015. The consequences of changes in French tax and social legislation are also reviewed regularly.In particular, the Committee has examined the 2014 report of the AMF on corporate governance and executive compensation of September 22, 2014, as well as the fi rst activity report by the High Committee for Corporate Governance created by AFEP and MEDEF and published in October 2014, which included the annual report on the application of the Code of corporate governance by SBF 120 companies. The Committee met three times in 2014, then on February 11 and March 3, 2015, prior to the Board of Directors, to assess the defi nitive amounts of the variable compensation of the executive directors, and to review the principles and amounts of their fi xed and variable compensation for 2015, together with the rules governing their variable compensation based on the targets for 2015.

93
All members of the Committee attended these meetings, resulting in an effective attendance rate of 100%.For the reasons given above, the Board of Directors has not seen fi t to appoint a Selection or Nominating Committee, this mission being performed as required by the Compensation Committee or the Board of Directors in full session. Moreover, the AFEP-MEDEF Code stipulates that, when reporting on the proceedings of the Compensation Committee to the Board of Directors, the executive directors absent themselves when the Board discusses and votes on their compensation. In view of the way in which the Board of Directors functions, the independent directors of the company, who are both members of the Compensation Committee, have not seen fi t to discuss the matter in the absence of the executive directors.
Strategic Committee
MembershipThe members of the Strategic Committee are André Harari, Committee Chairman, Anne Binder, and Bernard Jourdan.
MissionThe prime mission of the Strategic Committee is to review the consistency of the company’s strategic plan, its key challenges and risks to which it is exposed, its internal and external growth drivers, and the optimization of its development in the medium term.It formulates all recommendations and delivers all opinions to the Board.The Strategic Committee organizes its work as it sees fi t. It meets as often as the interests of the company demand and at least once a year.The Strategic Committee reports on its proceedings to the Board of Directors at least once a year and whenever it wishes to make recommendations to the Board.It notably reviews and discusses the major strategic directions and development themes proposed by the Chairman of the Board of Directors and the Chief Executive Offi cer in order to prepare the Group for the global economic challenges and key risks to which it is exposed, and to reinforce its business model and its operating and fi nancial ratios.
Within this framework, it also studies and formulates recommendations on the strategic plan, on the investments for the future and Group transformation plan; on the broad aims of annual action plans; on external growth operations; and, fi nally, on fi nancial or stock market transactions having a signifi cant immediate or future impact on the share capital and more generally on assets of the shareholders. It is kept informed of their execution.
Meetings and ActivitiesThe Committee met six times in 2014, in particular to review and discuss progress in execution of the 2013-2016 strategic roadmap, and to formulate recommendations. This applies also to progress in fulfi lling the 2012-2015 transformation plan of the company. The Committee has been regularly and fully informed of the impact of developments in the macroeconomic environment on the activities of the Group. In 2014, a meeting was devoted to a presentation of marketing plans by the Director of Marketing, Fashion and Apparel, and the Director of Marketing, Automotive and Furniture; a meeting was devoted to a presentation of a broad outline of the software offering by the Director of Software Marketing; fi nally, a meeting was devoted to a presentation by the Director and management team of the Chinese subsidiary of Lectra’s strategic plan in China.The Committee also reviewed and discussed the main priorities and the different scenarios for 2015, together with the broad outlines of the 2015 action plan, and the research and development, marketing and human resources plans. In view of the importance of these subjects, the Chief Executive Offi cer was invited to attend all these Committee’s meetings.All of the Committee’s members attended at these meetings, resulting in an effective attendance rate of 100%.
Limits to the Decision-Making Powers of the Committees
Subjects that the Chairman of the Board of Directors or the Chairman of either of these Committees wishes to discuss are placed on the agenda of the Committee concerned. When an item on the agenda

94 – 2014 Financial Report Chairman’s Report
of the Board of Directors requires prior discussion by the Audit Committee, the Compensation Committee, or the Strategic Committee, the Chairman of the Committee concerned communicates his Committee’s comments, if any, and recommendations to the full session of the Board. This communication enables the Board to be fully informed, thus facilitating its resolutions.No decision within the competence of the Board of Directors is made by the Audit Committee, the Compensation Committee, or the Strategic Committee. All decisions required to be made by the Board of Directors, and in particular those concerning the compensation of executive directors and the granting of stock options programs to managers and employees, together with all external growth operations, are considered and approved in full sessions of the Board of Directors. Moreover, all fi nancial press releases and notices published by the company are submitted to prior review by the Board and the Statutory Auditors, and are published on the same evening after the close of Euronext.
1.4. Internal Rules and Procedures of the Board of Directors and Board Committees
The AFEP-MEDEF Code recommends the establishment of internal rules to govern the procedures of the Board of Directors and the Board Committees.The Board of Directors laid down principles several years ago governing all cases requiring prior approval, notably as regards commitments and guarantees given by the company, signifi cant transactions outside the stated strategy of the company (the case has never arisen), and all external growth operations, and has laid down the rules whereby it is informed of the company’s fi nancial situation and cash position. It has also, historically, put in place a procedure for managing confl icts of interest, if any (the director concerned abstains from participating in the vote in cases where a confl ict of interest occurs). The company did not encounter this situation in the course of the period, apart from the remuneration of executive directors and related party transactions with subsidiaries.In view of the changes that have occurred in its membership, and following the motion by its Chairman,
in 2012 the Board of Directors adopted a set of internal rules and procedures, updated on February 11, 2015 and can be consulted on the company’s website, in French and in English. The company bylaws are regularly updated in response to legal and regulatory developments, in order to present the organizational and operational rules of the company clearly and in detail. At the motion of the Board of Directors, the Extraordinary Shareholders’ Meeting of September 26, 2014 simplifi ed certain provisions, details of which are now deemed inappropriate in light of new rules of governance promoted by the AFEP-MEDEF Code and the practice of the Board of Directors.
Prevention of Confl icts of Interest
Each director must ensure at all times that their personal situation avoids all confl ict of interest with the company or Group companies, has a duty spontaneously to inform the Board of any situation or risk of confl ict of interest, real or potential, and must abstain from taking part in corresponding discussions, votes or deliberations.Further, and without prejudice to the formalities pertaining to authorizations and control prescribed by law and the company bylaws, directors are required to notify the Chairman of the Board without delay of any related-party transaction into which the Group may enter and in which they have a direct or indirect interest, regardless of its nature.The Chairman of the Board notifi es the Board of any confl icts of interest or potential confl icts he may have identifi ed concerning the executive directors and the other directors.In the event of a confl ict of interest, including a potential confl ict of interest, the Board of Directors must decide on this question and, if necessary, call upon the director concerned to rectify their position.
1.5. Timetable, Meetings and Activity of the Board of Directors
The company’s fi nancial calendar setting out the dates for the publication of quarterly and annual fi nancial results, those of the Annual General Shareholders’ Meeting and the two annual analysts’ meetings is drawn up prior to the close of the current year for the following year.
95
The calendar is published on the company’s website and communicated to Euronext.The dates of six meetings of the Board of Directors are decided on the basis of this calendar. These comprise the quarterly and annual fi nancial results publication dates, approximately forty-fi ve to sixty days prior to the Annual General Shareholders’ Meeting in order to review the documents and decisions to be presented, and approximately twenty trading days after the dividend approved by the Annual Shareholders’ Meeting is made payable, or thirty to forty-fi ve calendar days after the Annual Shareholders’ Meeting if there is no dividend, i.e. around June 10, for the granting of the annual stock option plan. The Statutory Auditors are invited to, and systematically attend, these meetings (with the exception of the meeting to decide on the annual stock options plan). In addition, the Board also meets outside of these dates to discuss other subjects falling within its responsibilities (including all planned acquisitions or the review of the company’s strategic plan) or those that the Chairman wishes to submit to the directors. The Chief Financial Offi cer was appointed Board Secretary in 2006, and is systematically invited to attend and takes part in all Board meetings, except when prevented from doing so.The Board of Directors met six times in 2014. All members of the Board were present or represented at all of its meetings, resulting in an effective attendance rate of 96% (one absence, excused, at a meeting).
Voting Rights: Maintaining the Principle of One Share, One Vote
The Board of Directors called an Extraordinary Shareholders’ Meeting on September 26, 2014 to approve the amendments and simplifi cations to the company bylaws, regarding in particular maintenance of the principle of one share, one vote following the entry into force of the French March 29, 2014 Act (Law no. 2014-384, the “Florange Act”), reversing the principle that held until now, by providing that shares of listed companies registered for at least two years in the name of the same shareholder will henceforward enjoy double voting rights, except where otherwise provided in company bylaws adopted after the promulgation of the law.
As recommended by the Board of Directors, the Extraordinary Shareholders’ Meeting of September 26, 2014 approved almost unanimously (99%) the principle of one share, one vote, departing from the new law and amending the company bylaws in consequence.As a result, only 371,112 shares held in registered form before May 15, 2001 (representing 1.2% of the capital stock) carried double voting rights at December 31, 2014.
1.6. Investor Information on the Company’s Long-Term Outlook
In its amended version released in June 2013 the AFEP-MEDEF Code stipulates that, in communicating to the market, corporations must spell out their long-term outlook in their disclosures to investors. The company has complied with this requirement, presenting its February 11, 2014 Management Discussion and the Report of the Board of Directors to the Ordinary Shareholders’ Meeting of April 30, 2014, its strategic roadmap for 2013-2016 introduced in its February 12, 2014 Management Discussion and its fi nancial objectives set for 2016. The company has again spelled out its long-term outlook in its February 11, 2015 Management Discussion and the report of the Board of Directors to the Ordinary Shareholders’ Meeting of April 30, 2015.
1.7. Organization of Board Proceedings – Communication of Information to Directors
The agenda is set by the Chairman of the Board of Directors after consulting with the Chief Executive Offi cer, the Chief Financial Offi cer and, where appropriate, the Chairmen of the Audit Committee and the Compensation Committee in order to place on the agenda all subjects they wish to be discussed at the forthcoming Board meeting.In advance of each Board meeting, a set of documents is systematically addressed to each director, to the employees’ Works Council representatives and to the Chief Financial Offi cer, as well as to the Statutory Auditors for the four meetings called to review the fi nancial statements and for the meeting to prepare for the Annual General Meeting of Shareholders. Details of each item on the agenda are provided in a written document prepared by either the Chairman of the Board
96 – 2014 Financial Report Chairman’s Report
of Directors, the Chief Executive Offi cer, the Chief Financial Offi cer, or the Chief Human Capital and Information Offi cer, as required, or are presented during the meeting itself.As in previous years, in 2014 all documents to be communicated to the directors were made available to them in compliance with regulations. Further, the Chairman regularly asks directors if they require additional documents or reports in order to complete their information.Detailed minutes are produced for each meeting and submitted to the Board of Directors for approval at a subsequent meeting.Furthermore, to complete their understanding of the Group, after a series of detailed meetings with the Finance Division, Human Resources and Information Systems teams, Anne Binder and Bernard Jourdan attended meetings in 2014 with the Director of Marketing, Fashion and Apparel, and the Director of Marketing, Automotive and Furniture, devoted to the Group organization and marketing plans, two meetings with the Director Marketing Software on developments relating to the software offering, and fi nally a meeting with the Director of China and his management team on the Group’s strategy in China.
1.8. Evaluation of the Board of Directors
The AFEP-MEDEF Code recommends that once a year the Board should devote an item on its agenda to a discussion of its membership, organization and functioning. The Board is also required to verify that important questions are thoroughly prepared and discussed, and to assess the effective contribution of each director to the work of the Board in light of their expertise and involvement in the discussions.This point is considered during the February Board meeting, which reviews and closes the fi nancial statements for the year elapsed. In particular, the two independent directors, Anne Binder and Bernard Jourdan, were asked for their views on this subject at the February 11, 2015 meeting of the Board of Directors, three years after their nomination. The directors considered that the functioning of the Board and the governance of the company were highly
satisfactory and that relations with the two executive directors were transparent and based on complete trust. They again emphasized the high level of demands that the Chairman and the directors put upon themselves, the quality and comprehensive nature of the information communicated to them. The time frame in which it is communicated gives them suffi cient time to analyze it, together with the program drawn up by the Chairman to complete their familiarization with the businesses and specifi c characteristics of Lectra. Access to key managers is particularly appreciated. The directors also emphasized the frequency of the meetings of the Board, and of the Strategic, Compensation and Audit Committees, together with the regular attendance and the effective contribution of each of their members. Finally, the directors reiterated their wish that the Chairman be invited to attend the meetings of the Audit and Compensation Committees. The AFEP-MEDEF Code also recommends a formal evaluation exercise every three years at least, assisted by an outside consultant should the need arise, and that the shareholders be informed annually of the performance of these evaluations. No such evaluation has been performed by the company.The Board considers that, because of its small size, the comprehensive nature of the subjects discussed, the extent of its disclosure, and the fact that the directors are accustomed to working together and regularly discussing its functioning, this recommendation is satisfi ed informally, and that there is no need for a formal evaluation or to measure the individual contribution of directors to the work of the Board.The AFEP-MEDEF Code further recommends that the independent directors meet periodically in the absence of the executive or internal directors. In light of the way in which the Board of Directors functions, the company’s independent directors have not seen fi t to meet without the executive offi cers being present, bearing in mind that they have the opportunity to meet and discuss matters without the presence of the executive directors, in the course of the meetings of the Board committees.

97
1.9. AFEP-MEDEF Code Recommendations not Implemented: Application of the “Comply or Explain” Rule
As recommended by the AMF, the table below summarizes those provisions of the AFEP-MEDEF Code with which the company is non-compliant and explains the reasons why, applying the “comply or explain” rule provided for in article L. 225-37 of the French Commercial Code and referred to in article 25.1 of the AFEP-MEDEF Code:
AFEP-MEDEF Code recommendations not implemented Explanation
Obligation for each director to own personally a signifi cant number of shares relative to the director’s fees received: if the director does not own these shares when joining the Board, he or she should use the director’s fee received in order to purchase shares
The Board considers that the four directors collectively hold a very large number of shares, and that their concern for the interests of the shareholders is self-evident. It further considers that it is neither necessary nor suffi cient to be a large shareholder, individually, to fulfi ll the duties of a director diligently. The two non-executive directors, who individually own fewer shares, have been selected for their independence and their experience outside the company.
A variable portion dependent on attendance in calculating the payment of directors’ fees
In view of the strong commitment displayed by the members of the Board of Directors, in particular the historically high rate of attendance at meetings of the Board of Directors and its Committees, and the number of meetings, the Board has not considered it necessary to establish a variable portion dependent on attendance in calculating the payment of directors’ fees or a supplementary fee to encourage directors’ participation in specialized committees.
Presence of employee representatives on the Board of Directors
The company fulfi lls none of the conditions laid down in the French Commercial Code (employee shareholdings exceeding 3% of the corporate capital or at least 5,000 full-time employees in France or 10,000 worldwide), and is therefore not affected by this provision.
Staggering of directors’ terms of offi ce
The company considers that, given the small number of directors, maintaining the stability of the Board of Directors, with coincident terms of offi ce, is an important factor in the proper functioning of the Board and its Committees and guarantees a better understanding of the activities, strategy, challenges and issues specifi c to the company.
Minimum period of two days between the meeting of the Audit Committee and that of the Board of Directors
The Audit Committee meets on the morning of the same day on which the Board of Directors meets, prior to the latter’s meeting, in order to shorten the time between the closing of consolidated and statutory fi nancial statements and market disclosure. However, the members of the Audit Committee, like those of the Board of Directors, are given suffi cient time for consideration insofar as the relevant documents are communicated to them at least three to fi ve days before their meetings. The Chairman of the Audit Committee systematically communicates the Committee’s recommendations to the Board in the course of the latter’s meeting.
Presence of an employee director on the Compensation Committee
The company is not covered by the obligation to appoint employee directors and consequently this recommendation does not apply.

98 – 2014 Financial Report Chairman’s Report
AFEP-MEDEF Code recommendations not implemented Explanation
The Board of Directors to discuss the compensation of executive directors in the absence of the latter
In view of the highly transparent nature of the Board’s discussions on all subjects in full session, the Board has never deemed it necessary to follow this recommendation. André Harari and Daniel Harari abstain from voting on matters concerning them.
Formal evaluation of the functioning of the Board of Directors every three years at least, assisted by an outside consultant should the need arise
The Board considers that, because of its small size, the comprehensive nature of the subjects discussed, the extent of its disclosure, and the fact that the directors are accustomed to working together and regularly discussing its functioning, this recommendation is satisfi ed informally, and that the Board does not feel the need for a formal evaluation, or measurement of the directors’ individual contribution to the Board’s work.
Independent directors to meet periodically in the absence of the executive or internal directors.
In light of the way in which the Board of Directors functions, the company’s independent directors have not seen fi t to follow this recommendation, bearing in mind that they have the opportunity to meet and discuss matters without the presence of the executive directors, in the course of the meetings of the Board committees.
2. INTERNAL CONTROL AND RISK MANAGEMENT
PROCEDURES ESTABLISHED BY THE COMPANY
In its work, and in preparing this report, the company referred to the principles set forth in the reference framework published by the AMF in January 2007, and to its guide to implementing this recommendation for small and mid-sized companies updated in July 2010. The general approach adopted for this purpose makes due allowance for issues specifi cally applicable to the company and its subsidiaries having regard to their size and respective activities. This chapter refers to the parent company Lectra SA and to its consolidated subsidiaries. The risk management and internal control procedures are intimately bound up with the strategy of the Group and its business model, with which they evolve. They must enable the control and management of risks within the Group while optimizing its operating performance, respecting its culture, values and ethical standards.The Group regularly reviews its internal control and risks management procedures in order to identify areas for progress within the framework of its continuous improvement program. The overhaul and updating of certain procedures, the establishment
of a self-assessment procedure for internal control processes, and harmonization of the fi nancial reporting information system are all part of this program.The main risks to which the company is exposed, given the specifi c nature of its activities, structure and organization, and that of its strategy and business model, are discussed in chapter 4 of the Management Discussion, to which the reader is referred. This chapter also covers the management of these risks: their identifi cation, their analysis and how they are addressed.The internal audit approach implemented by the Group is a key component of risk management.
2.1. Group Internal Control and Risk Management System
The internal control system designed and implemented by the Group comprises a body of rules, procedures and charters. It also encompasses reporting obligations and the individual conduct of all of the players involved in the internal control system by virtue of their knowledge and understanding of its aims and rules.This system aims at providing reasonable assurance of achieving the following objectives:

99
2.1.1. Legal and Regulatory ComplianceThe company’s internal control procedures are designed to provide assurance that the operations carried out in all Group companies comply with the laws and regulations in force in each of the countries concerned for the different areas in question (e.g. corporate, customs, labor and tax laws, etc.).
2.1.2. Oversight of Proper Application of General Management Instructions A series of procedures has been put in place to defi ne the scope and the limits to the powers of action and decision of Group employees at all levels of responsibility. In particular these serve to ensure that the business of the Group is conducted in accordance with the policies and ethical rules laid down by General Management.
2.1.3. Protection of Assets and Optimizing Financial PerformanceThe purpose of the processes in place and procedures to control their application is to optimize the fi nancial performance consistently with the company’s short-and medium-term fi nancial goals. Internal control procedures contribute to the safeguarding of Group fi xed and intangible assets (such as intellectual property, company brands, customer relationships and corporate image, computer data), as well as the Group human capital, all of which play a key role in its property, business activity and growth dynamism.
2.1.4. Reliable Financial InformationAmong the control mechanisms in place, special emphasis is placed on procedures for preparing and processing accounting and fi nancial information. Their aim is to generate reliable, high-quality information that presents a fair view of the company’s operations and fi nancial condition. In addition, these procedures are designed to produce timely quarterly and annual fi nancial statements, ready for publication thirty days after the close of each quarter at the latest, and a maximum of forty-fi ve days after fi scal year end.
2.1.5. Risk ManagementThe risk management procedures, to which the internal control system contributes, follow objectives that are common or specifi c to internal control procedures.
It aims in particular at: – creating and preserving values, assets and
the company’s reputation; – securing the decision-making processes and reaching
goals; – ensuring coherence between the company’s core
values and its actions; – mobilizing employees involved in the management
of risks linked to their activity and responsibilities, by sharing the appraisal of the main risk factors.Lectra’s internal control system is designed to reach the specifi c risk management objectives. It covers all Group companies, taking into account their diversity in terms of size and the challenges of the different subsidiaries and the parent company. Similarly, the cost of implementing the system’s performance target for covered risks versus residual risks is compatible with the Group’s resources, its size and the complexity of its organization.While this system provides reasonable assurance of fulfi llment of the aforesaid objectives, it can provide no absolute guarantee of doing so. Many factors independent of the system’s quality, in particular human factors or those attributable to the outside environment in which the Group companies operate, could impair its effectiveness.
2.2. Components of Internal Control
2.2.1. Organization, Decision-Making Process, Information Systems and Procedures
(a) Organization and Decision-Making ProcessAs indicated in chapter 1, the Board of Directors is responsible for setting the company’s strategy and direction for the company’s operations, and for overseeing their implementation. The Chairman of the Board is responsible for overseeing the proper functioning of the company’s managing bodies.The Audit Committee discusses the internal control system at least once a year with the Group Statutory Auditors. It gathers their recommendations and, notably, ensures that their level and quality of coverage are adequate. It reports on its proceedings and opinions to the Board of Directors.

100 – 2014 Financial Report Chairman’s Report
The Executive Committee implements the strategy and policies defi ned by the Board of Directors. Its members have each been delegated broad powers and are critical to the effectiveness of the internal control system. The Chief Executive Offi cer is invested with the fullest powers to act on behalf of the company in all circumstances and represents the company in its dealings with third parties. He is fully responsible for all operational and executive matters and, together with the other members of the Executive Committee, for worldwide sales and service operations, of which the regional managers and subsidiaries form part.The heads of the Lectra Group’s various corporate divisions also report directly to the Chief Executive Offi cer or to another member of the Executive Committee, their organization and missions being adapted to the changing external and internal context of the company, i.e.:
– the Finance division (treasury, accounting and consolidation, management control and audit, sales administration, and legal affairs);
– the Manufacturing division (purchasing, manufacturing, logistics, quality control);
– the Human Resources and Information Systems division;
– the Sales division; – the Marketing and Communication divisions; – the Customer Support Services division; – the Professional Services division (training, consulting); – the Software and Hardware Research and Development
divisions.All important decisions (sales strategy, organization, investments and recruitment) relating to the operations of a region or Group subsidiary are made by a specifi c committee responsible for the region or subsidiary concerned. These committees, chaired by the Chief Executive Offi cer or by one of the Executive Committee members, meet regularly (usually quarterly for the regions and/or main countries), with the regional managers and heads of the subsidiaries concerned as well as their management teams attending. The latter submit to the committees their detailed action plans drawn up on the basis of Group strategic and budget directives, and they report on the implementation of decisions as well as on their operations and performance.
The powers and limits to the powers of directors of subsidiaries and regions and of the directors of the various corporate divisions are laid down by the Chief Executive Offi cer or by a member of the Executive Committee, depending on the area concerned. These powers and their limits are communicated in writing to the directors concerned. The directors are then required to account for their utilization of the powers thus conferred on them in the pursuit of their objectives, in monthly or quarterly reports on their activities to the members of the Executive Committee and to the Chairman of the Board of Directors.The internal control process involves a large number of other players. The corporate divisions are at the center of this organization. They are responsible for formulating rules and procedures, for monitoring their application and, more generally, for approving and authorizing a large number of decisions connected with the operations of each Group entity.Clear and precise delineation of organizations, responsibilities and decision-making processes, together with regular written and verbal exchanges, allow all players to understand their role, discharge their duties and form a precise assessment of their performance vis-à-vis the objectives assigned to them and also vis-à-vis those of the Group as a whole.The Chief Executive Offi cer draws up a detailed annual action plan to ensure the proper execution of the strategic roadmap. This is very closely monitored by the Executive Committee, the Chairman of the Board of Directors, and the Strategic Committee.
(b) Information SystemsThanks to integrated inter-company fi nancial information, assured homogeneity and communicability between the Group’s different IT systems, and their continuous adaptation to developments in business processes and modes of operation, together with tighter controls, the information systems play a structurally critical role in the Group’s system of internal control, and act as a key performance-tracking instrument. The information systems are regularly adapted to the expanded requirements of General Management in terms of the quality, relevance, timeliness and comprehensiveness of information, while at the same time providing stronger controls.

101
An ERP software application covers all of the functions pertaining to the parent company’s activities (purchasing, supply chain and accounting functions) and those of all Group subsidiaries (order and billing processing, and after-sales services). This system has enabled the deployment of strengthened management procedures and rules, and a better integration of business processes.The Group utilizes software application encompassing statutory consolidation of the accounts, whose scope was expanded in 2014 to include management reporting. This software enables stricter controls, ensuring the quality of fi nancial disclosure and guaranteeing the consistency of internal information and the Group’s external fi nancial communication.A human resources administration information system serves to track personnel (recruitment, promotions, departures, etc.), compensations and changes in compensation, and employee attendance in training programs. In addition to automated reporting, the system harmonizes procedures with strengthened controls across the entire Group.The deployment in 2014 of the new customer relations management (CRM) system project has improved sales and marketing effi ciency in the Group, and enabled it to support its transformation plan.Finally, specifi c procedures are in place to ensure the physical security and preservation of data, these procedures being periodically upgraded in response to the changing nature of risks.
(c) ProceduresA large number of procedures spell out the manner in which the different processes are to be performed, together with the roles of the different persons concerned, and the powers delegated to them within the framework of these processes. They further prescribe the method of controlling compliance with rules for the performance of processes. The main cycles or subjects entailing issues critical to Group objectives are:
• SalesA series of procedures exists to cover the sales cycle and more generally the entire marketing and sales process. In particular the “Sales rules and guidelines” clearly set forth rules, delegations of powers, and circuits, together with the controls performed at the different stages in
the sales process to verify the authenticity and content of orders, together with shipment and billing thereof.In addition, a member of the Executive Committee conducts one or more monthly reviews of current business with each region and subsidiary.Finally, procedures have been put in place for more effective monitoring of sales teams’ performance, including tracking their fulfi llment of targets and of individual performance (business expertise, knowledge of Lectra’s products and services, and their profi ciency in sales methods and tools).
• Credit ManagementCredit management procedures are designed to limit the risks of non-recovery and shorten account-collection delays. These procedures also track all Group accounts receivable above a certain threshold, providing for both upstream control of contractual payment terms and the customer’s solvency prior to booking of the order, together with the systematic and sequenced implementation of all means of recovery, from simple reminders to legal proceedings. These means of recovery are coordinated by the credit management department in conjunction with the Legal Affairs department.Historically, bad debts and customer defaults have been rare.There is no material risk of dependence on any particular customer, insofar as over the past three years no individual customer has represented more than 7% of consolidated revenues, and the 10 largest customers combined have represented less than 20% of revenues, and the 20 largest customers less than 25%.
• PurchasingThe parent company’s purchases and capital expenditure account for the bulk of Group outlays under these headings. Procedures are in place to ensure that all purchases from third parties are compliant with budgetary authorizations. They further spell out formally the delegations of powers regarding expenditure commitments and signatures, based on the principle of the separation of tasks within the process. The information system now in place reinforces the process of control over the proper application of rules.

102 – 2014 Financial Report Chairman’s Report
• PersonnelUnder the procedures in place, all forecasted or actual personnel changes are communicated to the Group Human Resources division. All recruitments and dismissals must receive the division’s prior authorization. In the case of dismissals, the division must systematically assess the actual and forecasted costs of the dismissal and communicate its fi ndings to the Finance division, which in turn ensures that the resulting liability is recognized in the Group fi nancial statements.Compensation is reviewed annually and submitted to the Chief Human Capital Offi cer for approval. Finally, for all personnel whose total annual compensation exceeds €150,000 or $200,000, the Executive Committee submits the annual compensation review, together with rules for the calculation of variable compensation, to the Compensation Committee for prior approval.These procedures are now monitored more strictly in light of the signifi cant recruitment plan in place for the period 2012-2015.
• Treasury and Currency RiskThe company’s internal control procedures regarding treasury operations mainly concern bank reconciliations, security of payment means, delegation of signing authority, and monitoring of currency risk.Bank reconciliation procedures are systematic and comprehensive. They entail verifi cation of all treasury department book entries and entries in the company’s bank accounts made by the banks, together with reconciliation between treasury balances and the cash and bank accounts within the fi nancial statements.The company has implemented secure means of payment to avoid or limit as far as possible all risks of fraud, and agreements covering check security have been signed with each of the Group’s banks. The company uses the EBICS TS protocol to secure payments made by bank transfer, and it began to comply with the obligation to issue bank transfers in accordance with the Single European Payment Area (SEPA) standard in 2013, in advance of the stipulated implementation date.Bank signature authorizations for each Group company are governed by written procedures laid down by the Executive Committee and are revocable at all times with immediate effect. Signing powers delegated under
these procedures are notifi ed to the banks, which must acknowledge receipt thereof.Recourse to short- and medium-term borrowing is strictly limited and is subject to prior approval by the Chief Financial Offi cer within the framework of delegations previously authorized by the Board of Directors.All decisions pertaining to currency hedging instruments are made jointly by the Chief Executive Offi cer and the Chief Financial Offi cer, and are implemented by the Group Treasurer.
2.2.2. Identifi cation and Management of RisksRisk factors and risk management processes are described in detail in chapter 4 of the Management Discussion to which this report is appended.
2.2.3. Control Activity: Players Involved in Risk Control and Management ProcessesThe Group does not have an internal audit department as such, but the Group Finance division — in particular the treasury and management control teams — and the department of Legal Affairs are central to the internal control and risk management system.Controls are in place at many points throughout the Group’s organization. These are adapted to the critical aspects of the processes and risks to which they apply, depending on their infl uence on the performance and fulfi llment of Group objectives. Controls are conducted by means of IT applications, procedures subject to systematic manual control, via ex-post audits, or via the chain of command, in particular by members of the Executive Committee. Spot checks are also performed in the various Group subsidiaries.In each subsidiary, the person in charge of fi nance and administration, which usually comprises legal affairs, also plays a major role in the organization and conduct of internal controls. The primary mission of this person, who reports functionally to the Group Finance division, is to ensure that the subsidiary complies with the rules and procedures established by the Executive Committee and the corporate divisions.The Information Systems division is responsible for guaranteeing the integrity of data processed by the various software packages in use within the Group. It works with the Group Finance division to ensure that

103
all automated processing routines contributing to the preparation of fi nancial information are compliant with accounting rules and procedures. In addition, it verifi es the quality and completeness of information transferred between the different software applications. Finally, it is responsible for information systems security.The Group Legal Affairs department and Human Resources division perform legal and social audits of all Group subsidiaries. Their role notably consists in verifying that their operations are compliant with the laws and other legal and social regulations in force in the countries concerned. They also supervise most of the contractual relations entered into between Group companies and employees or third parties.The Legal Affairs department works with a network of law fi rms located in the countries concerned and specializing in the subjects at issue, as needed. The Legal Affairs department is also responsible for identifying risks requiring insurance and formulating a policy for covering these risks by means of appropriate insurance contracts. It supervises and manages potential or pending litigation, in conjunction with the Group’s attorneys where appropriate.Currency risk is managed centrally by the Group Treasurer. Group exposure is hedged by a range of derivative instruments: forward currency contracts are used to hedge foreign exchange balance sheet positions; purchases of currency puts (calls euros / puts dollars) — when their cost relative to their benefi ts is not prohibitive — or forward contracts are utilized to hedge estimated exposure to fl uctuations in billing currencies for future periods, when these are considered justifi ed.A dedicated intellectual property team functions as part of the Legal Affairs department. It acts preventively to protect innovations and avert all risks of infringement of the company’s intellectual property rights. Finally, the Board of Directors works with a specialized law fi rm for all legal and regulatory issues governing listed companies.
2.2.4. Continuous Oversight of the Internal Control System and Improvement of ProceduresIncidents observed on the occasion of controls or the fi ndings of ex-post audits of compliance with internal control rules and procedures serve both to ensure the latter’s proper functioning, and continuous improvement.
Given the nature of its business, the Group is compelled to adapt its organization to market changes whenever necessary. In particular, it has accelerated deployment of its transformation plan over the period 2012-2015. Each change in its organization or modus operandi is preceded by a review process to ensure that the proposed change is consistent with the preservation of an internal control environment complying with the objectives described in chapter 2.1 above. Within this context, the scope and distribution of the powers of individuals and teams, reporting lines and rules for the delegation of signing authority, are subject to scrutiny and are adjusted, if necessary, during all organizational changes.Oversight of internal controls is underpinned by a continuous improvement process focused notably on:
– updating the Group’s risk mapping; – updating and/or formalizing accounting and fi nancial
procedures, procedures relating to human resources management and internal control rules;
– updating and improving reporting tools; – general improvements in IT systems and resources.
This matter is the subject of a specifi c communication to the Audit Committee and discussion at least once a year.
2.3. Specifi c Procedures to Ensure the Reliability of Accounting and Financial Information
In addition to the elements described in the foregoing paragraphs, the Group has implemented precise procedures for the preparation and control of accounting and fi nancial information. This is notably the case regarding reporting and budget procedures, and procedures for the preparation and verifi cation of the consolidated fi nancial statements, which are an integral part of the internal control system. Their purpose is to ensure the quality of accounting and fi nancial information communicated to management teams, the Audit Committee, the Board of Directors, and to the shareholders and the fi nancial markets, with particular reference to the consolidated and statutory fi nancial statements.The Finance Division regularly identifi es risks liable to impair the compilation and processing of accounting and fi nancial information, together with the quality of that information. It communicates continuously with the accounting and Finance Divisions of the Group’s

104 – 2014 Financial Report Chairman’s Report
subsidiaries to ensure that these risks are managed. Diffi culties arising in the management of a specifi c risk are dealt with and/or give rise to specifi c action by the fi nancial control teams. This analysis and centralized risk management process are additional to the procedures described below to reduce the risks of deliberate or involuntary error in the accounting and fi nancial information published by the company.
2.3.1. Reporting and Budget ProceduresThe company produces comprehensive and detailed fi nancial reporting covering all aspects of the activities of each parent company unit and each subsidiary. This is based on a sophisticated fi nancial information system built around a market-leading software package.Reporting procedures are based primarily on the budgetary control system put in place by the Group. The Group’s annual budget is prepared centrally by the Finance division management control teams. This detailed, comprehensive process consists in analyzing and quantifying the budgetary targets of each subsidiary and Group unit under a very wide range of income statement and treasury headings, working capital requirements, together with indicators specifi c to each activity and the structure of operations. This system permits rapid identifi cation of any deviation in actual or forecast results, and thereby minimizes the risk of error in the fi nancial information produced.
2.3.2. Accounts Preparation and Verifi cation Procedures
(a) Monthly Financial ResultsThe actual results of each Group company are verifi ed and analyzed on a monthly basis, and new forecasts for the current quarter are consolidated. Each deviation is identifi ed and described in detail in order to determine its causes, verify that procedures have been respected and the fi nancial information properly prepared. This approach is designed to ensure that transactions recorded in the accounts fully refl ect the economic reality of the Group’s business and operations.Assets and liabilities are subject to regular controls to ensure the accuracy of monthly reported results. These controls include physical counting of fi xed assets and reconciliation with accounts; a revolving physical count of inventories (the most important references being counted
four times a year); a comprehensive monthly review by the Finance Division of overdue accounts receivable; a monthly analysis of provisions for risks and charges, and provisions for asset impairment.
(b) Quarterly ConsolidationGroup fi nancial statements (statement of fi nancial position, income statement, statement of cash fl ows, and statements of changes in equity) are consolidated on a quarterly basis. The process of preparing the consolidated fi nancial statements comprises a large number of controls to ensure the quality of the accounting information communicated by each of the consolidated companies and of the consolidation process itself.All Group subsidiaries employ a single standard consolidation reporting package and the procedure is subject to a wide range of precise controls. Actual results are compared with forecasts received previously in the monthly reporting procedure. Discrepancies are analyzed and justifi ed and, more generally, the quality of information transmitted is verifi ed. Upon completion of the consolidation process, all items in the income statement, statement of fi nancial position and statement of cash fl ows are analyzed and justifi ed.The resulting fi nancial statements are reviewed by the Chief Executive Offi cer, by the Chairman of the Board of Directors in the course of organizing the work of the Board of Directors, and then submitted to the Audit Committee, before being reviewed and approved by the Board of Directors, and published by the company.
2.4. Specifi c Mechanism to Guarantee the Reliability of Corporate Social and Environmental Information
A working group put in place in 2012, under the supervision of the Legal Affairs department, coordinates the gathering and verifi cation of the corporate social and environmental responsibility information whose disclosure is now mandatory under the 2012 “Grenelle II” Act. An audit has been carried out in 2013 with one of the two joint auditors appointed to validate the content and relevance of the information, information-gathering procedures, and to identify areas for needed improvements. These have been taken into account in preparing the 2013 report Grenelle II appended to the
105
Board of Directors’ report to the Ordinary Shareholders’ Meeting on April 30, 2014. The audit found that the procedure in place and the quality of the information published in 2012 were satisfactory.The specifi c procedures for collecting and ensuring the reliability of corporate social and environmental information, and for preparing the annual “Grenelle II” report is now fully operational, under the supervision of Chief Financial Offi cer and the Chief Human Capital Offi cer and Information Systems Offi cer.
3. PRINCIPLES AND RULES ESTABLISHED
BY THE BOARD OF DIRECTORS FOR DETERMINING
THE COMPENSATION AND BENEFITS OF EXECUTIVE
DIRECTORS
The recommendations of the AFEP-MEDEF Code: – spell out principles for setting the compensation
of executive directors of listed companies; – prohibit the simultaneous holding of a position
as executive director and an employment contract; – place a cap on one-time termination payments (“golden
parachutes”) to two years’ compensation, and abolish the granting of indemnities in the event of voluntary resignation and in the event of failure;
– strengthen the rules governing pension plans and place a cap on additional pension benefi ts;
– make stock option plans for senior managers conditional on the extension of such option plans to all employees or to the existence of mechanisms entitling all employees to a share of profi ts;
– terminate the granting of bonus shares unrelated to performance to executive directors; the latter must also purchase shares at market price additional to any performance-related shares granted to them;
– make compensation policies more transparent by means of a standardized disclosure format.In its statement on November 28, 2008, the company declared that:
– it had already been in spontaneous compliance with these recommendations for many years with regard to André Harari and Daniel Harari in their respective capacities as Chairman of the Board of Directors and Chief Executive Offi cer;
– in particular, André Harari and Daniel Harari have never combined their positions as executive Directors
with an employment contract, are not entitled to any component of compensation, indemnity or benefi t owed or liable to be owed to them in virtue of a termination or change of their functions, to any additional defi ned benefi t pension plan, stock options or bonus shares.Detailed information additional to the disclosures below is provided in the Management Discussion and Analysis to which this report is amended.
3.1. Executive Directors
The sole executive directors are André Harari, Chairman of the Board of Directors, and Daniel Harari, Chief Executive Offi cer.The compensation policy as decided by the Board of Directors is strictly identical for the Chairman and for the Chief Executive Offi cer since the separation of their functions in 2002, as was previously the case. In particular, it takes into account the specifi c duties of the Chairman of the Board of Directors, who devotes the necessary time to these duties. Consistent with the prescriptions of the Internal Rules and Procedures, he holds no appointments in other companies.Acting in concert, the Chairman and the Chief Executive Offi cer are jointly accountable for the outcome of the strategy pursued by the Group under their leadership.Their signifi cant stake in the capital ensures their interests are strongly aligned with those of the shareholders and the fi nancial performance of the Group. Their compensation comprises a fi xed portion and an annual variable portion. It does not include any multi-year variable compensation.The company does not award them bonuses in any form.This policy is clear, consistent with the long-term strategy, objectives and challenges of the Group, and directly linked to its performance. It has proved its worth both in tough years and in years of record profi ts. The principles and rules for determining the compensation and benefi ts of executive directors are subject to prior review and recommendation by the Compensation Committee. This Committee notably reviews total compensation and the precise rules for determining its variable portion and the specifi c annual performance targets that serve to calculate it. All of these components are then discussed by the Board of Directors in full session and are subject to its sole discretion.

106 – 2014 Financial Report Chairman’s Report
Until 2013, all elements of the executive directors’ potential or actual compensation were made public with the publication online, before March 31, of the Board of Directors’ report submitted to the Ordinary Shareholders’ Meeting and the Chairman’s report on internal control procedures and risk management, and on corporate governance. As of 2014, these elements are henceforward published after the meeting of the Board of Directors held to approve them (they were published on February 12, 2014 and February 11, 2015).The provisions of the AFEP-MEDEF Code in its revised version of June 2013 state in particular that “variable compensation is a reward for the director’s performance and the progress of the company in the period under consideration. The share price must not be the only criteria for measuring this performance”. As stated below, the share price is not included among these criteria. The variable compensation “must be set at a level that is balanced in relation to the fi xed part. The variable part is a maximum percentage of the fi xed part, and is adapted to the business conducted by the company and predefi ned by the Board”; “without jeopardizing the confi dentiality that may be linked to certain elements of determining the variable part of the compensation, this presentation must indicate the criteria on the basis of which this variable part is determined”: this has been the Board of Directors’ practice at all times, consistently reporting how these criteria have been applied on the basis of results for the year in review.The compensation of executive directors is paid in its entirety by Lectra SA. They receive no compensation or particular benefi t from companies controlled by Lectra SA within the meaning of article L. 233-16 of the French Commercial Code (Lectra SA is not controlled by any company). No stock options have been granted to the two executive Directors since 2000. The only benefi t accorded to them concerns the valuation for tax purposes of the utilization of company cars and the payment of life insurance premiums for Daniel Harari alone, until July 31, 2014 (at which date the contract was terminated), the amount of which is indicated in the Management Discussion and Analysis of the Board of Directors.Finally, the executive directors are not the benefi ciaries of any particular arrangement or specifi c benefi t regarding deferred compensation, termination payment
or retirement benefi t committing the company to pay them any form of indemnity or benefi t if their duties are terminated, at the time of their retirement (they are not bound to the company by any form of employment contract) or, more generally, subsequent to the termination of their functions.In view of the foregoing, the company is compliant with the recommendations laid down in the June 2013 amended version of the AFEP-MEDEF Code, strengthening the rules governing elements of executive directors’ compensation — not applicable in the case of this company — notably introducing specifi c requirements relating to non-competition clauses and to start-of-contract indemnities, or with regard to caps on additional pension benefi ts. Each year the Board of Directors fi rst determines the amount of target-based total compensation for the year. Total target-based compensation has remained unchanged at €475,000 for the eight fi scal years 2005 through 2012. The fi xed portion has been unchanged since 2003. At its meeting on February 12, 2013, the Board decided to increase the total compensation of the Chairman of the Board of Directors and the Chief Executive Offi cer progressively over three years to €600,000 conditional upon fulfi llment of annual targets, i.e. to: €520,000 in 2013, €560,000 in 2014, and €600,000 in 2015.The Board now intends to apply this principle of revision every three years. Conditional upon the fulfi llment of annual targets, variable compensation is equal to 60% of total compensation. Variable compensation is set in accordance with the following four clear and complementary quantitative criteria (to the exclusion of any qualitative criteria) expressed in terms of annual targets, refl ecting the company’s strategy of profi table sales activity and earnings growth and determined according to clear criteria. In its meeting of February 11, 2014, the Board had maintained the four performance criteria defi ned since 2011, with, however, a change in the relative weighting of each one, to give particular importance to the realization of the company’s strategy of profi table sales activity growth: (i) a criterion measuring the contributive value of growth in sales activity (accounting for 50%);

107
(ii) consolidated income before tax, excluding net fi nancial expense and non-recurring items (accounting for 30%); (iii) consolidated free cash fl ow excluding net fi nancial expense, non-recurring items, income tax, and after restatement of certain items (accounting for 10%); and (iv) a criterion measuring the contributive value of recurring contracts (accounting for 10%). For each of these four criteria, the corresponding variable compensation is equal to zero below certain thresholds, if annual targets are met, it is 100%, and it is capped at 200% if annual targets are exceeded. Between these thresholds, it is calculated on a linear basis. The results are then weighted for each criterion. Only the annual targets and corresponding thresholds are revised each year according to the Group’s objectives for the fi scal year.Consequently, variable compensation is equal to zero if none of these thresholds is met, and is capped at 200% of target-based variable compensation if the annual targets are exceeded on all criteria and result in the ceiling of 200% for each of them.Total compensation is therefore comprised between 40% and 160% of the total target-based compensation.Annual targets are set by the Board of Directors based on the recommendations of the Compensation Committee. The Committee is responsible for ensuring that the rules for setting the variable portion of compensation each year are consistent and in line with the evaluation of executive directors’ performance, with progress made in implementing the company’s medium-term strategy, general macroeconomic conditions, and in particular those of the geographic markets and market sectors in which the company operates. After the close of each fi scal year, the Committee verifi es the annual application of these rules and the fi nal amount of variable compensation, on the basis of the audited fi nancial statements. In its meeting of February 11, 2015, the Board maintained for 2015 the four criteria performance, together with their relative weighting as set for 2014.These criteria and targets apply also to the three members of the Executive Committee who are not executive directors, and to around fi fteen managers of the parent company Lectra SA; only the relative weighting given to each criterion and the portion relating to target-based
variable compensations, which is set individually for each manager, vary.Executive Directors also receive directors’ fees in addition to the fi xed and variable compensation. In its June 2013 amended version, the AFEP-MEDEF Code links the granting of compensation to executive directors to the ownership and retention until the end of their term of offi ce of a signifi cant number of company shares, periodically determined by the Board. In view of the very large percentage of shares held by the Chairman of the Board and by the Chief Executive Offi cer, the Board has not deemed fi t to specify a number of shares.
Consultation of Shareholders on Individual Executive Directors’ Compensation
As stated in the Management Discussion and Analysis of Financial Condition and Results of Operations, the June 2013 amended version of the AFEP-MEDEF Code introduces new recommendations on corporate governance, including in particular a procedure for the annual consultation of shareholders on individual executive directors’ compensation, in application of the “say on pay” principle. This entails submitting for shareholders’ approval separate resolutions for each executive director. In the event of a negative vote, the Board of Directors, acting on the opinion of the Compensation Committee, is required to vote on the matter and to publish on the company’s website a statement indicating how it intends to respond to the expectations of the shareholders.The shareholders were invited to vote on this question for the fi rst time at the Ordinary Shareholders’ Meeting on April 30, 2014, approved the resolution concerning the Chairman of the Board of Directors with a 97.4% vote, and unanimously approved the resolution concerning the Chief Executive Offi cer.Shareholders are invited to express their opinion on the compensations of the Chairman of the Board and the Chief Executive Offi cer, for the fi scal year 2014 on the occasion of the Ordinary Shareholders’ Meeting on April 30, 2015.

108 – 2014 Financial Report Chairman’s Report
3.2. Non-Executive Directors
Non-executive directors — i.e. the two independent directors — receive no form of compensation other than directors’ fees.
3.3. Directors Fees
Directors’ fees approved annually by the General Shareholders’ Meeting are distributed equally among the directors. In view of the strong commitment displayed by the members of the Board of Directors, in particular the historically high rate of attendance at meetings of the Board of Directors and its Committees, and the number of meetings, the Board has not seen fi t to follow the recommendation of the AFEP-MEDEF Code and institute a variable portion dependent on attendance in calculating the payment of directors’ fees or a supplementary fee to encourage directors’ participation in specialized committees.The company has applied this method of allocation, distributing the fees equally among the directors and with no variable portion, for very many years. It has proved its effectiveness and reinforced the collegiate sense and spirit of solidarity among the directors. It acknowledges the directors’ 100% attendance rate (96% in 2014, exceptionally) at Board meetings and the 100% attendance rate at meetings of the Board Committees. Directors receive no additional attendance fees for their attendance at meetings of the Audit, Compensation and Strategic Committees.
4. PROHIBITION ON TRADING IN SHARES APPLICABLE
TO CERTAIN GROUP MANAGERS
The Board of Directors decided on May 23, 2006, in keeping with the rules of corporate governance and, since its publication, with the AFEP-MEDEF Code, to prohibit members of the corporate management and management teams of the Lectra Group from buying or selling the company’s shares during the period starting fi fteen calendar days before the end of each calendar quarter and expiring two stock market trading days after the meeting of the Board of Directors closing the quarterly and the annual fi nancial statements of the Lectra Group. However, contrary to the recommendations
of the AFEP-MEDEF Code, this prohibition does not apply to the exercise of stock options during the period in question by any person fi guring on the list drawn up by the Board of Directors, but the said persons are required to hold any resulting shares until the expiration of the period.The Board of Directors has further decided that, in addition to each of its members, only the three members of the Executive Committee who do not hold a directorship have “the power to make management decisions regarding the company’s development and strategy” and “regular access to inside information”, and are therefore required to notify the AMF within the stipulated deadlines of any purchases, sales, subscriptions or exchanges of fi nancial instruments issued by the company.Daniel Dufag, the company’s General Counsel, has been named compliance offi cer for all matters pertaining to the General Regulation of the AMF concerning the drawing up of lists of insiders. His duties include adapting the guidelines published by the ANSA and to draw up the guide to procedures specifi c to Lectra, to draw up lists of permanent and occasional insiders, to notify these people individually in writing, accompanied by a memorandum spelling out the procedures specifi c to Lectra.The list is regularly updated by the Board of Directors to indicate the people on this list that have left the company, together with those whom the General Management proposes to add to this list in virtue of their new duties or because they have reached a level of responsibility and information within the Group justifying their inclusion, or because they have been recently recruited. This list is reviewed and approved at least once a year by the Board of Directors.
5. SPECIFIC FORMALITIES FOR ATTENDANCE
AT SHAREHOLDERS’ MEETINGS
The right of attendance at shareholders’ meetings, to vote by correspondence or to be represented, is subject to the following conditions:
– for registered shareholders (actionnaires nominatifs): shares must be registered in their name or in the name of an authorized intermediary in the company register, which is maintained by Société Générale in its capacity as bookkeeper and company agent, at zero hour, Paris time,
109
on the second working day preceding the day set for the said Meeting;
– for holders of bearer shares (actionnaires au porteur): receipt by the General Meetings department of Société Générale of a certifi cate of attendance noting the registration of the shares in the register of bearer shares at zero hour, Paris time, on the second working day preceding the day set for the said Meeting, delivered by the fi nancial intermediary (bank, fi nancial institution or brokerage) that holds their account.Shareholders not attending this Meeting in person may vote by correspondence or may vote by proxy by giving their proxy voting form to the Chairman of the Meeting, to their spouse or partner, or to another shareholder or any other person of their choice, in accordance with the law and regulations, and in particular, those laid down in article L. 225-106 of the French Commercial Code. Shareholders are free to dispose of their shares in whole or in part until the time of the Meeting. However, if the disposal takes place before zero hour, Paris time, on the second working day preceding the day set for the said Meeting, the fi nancial intermediary that holds their account shall notify the disposal to Société Générale, and shall transmit the necessary information. The company shall invalidate or modify the vote by correspondence, proxy vote, admission card or the certifi cate of attendance in consequence of the foregoing. However, if the disposal takes place after zero hour, Paris time, on the second working day preceding the day set for the said Meeting, it will not be notifi ed by the fi nancial institution holding the account, nor taken into consideration by the company for the purposes of attendance at the Shareholders’ Meeting.Registered shareholders and holders of bearer shares unable to attend the Meeting in person may vote by correspondence or by proxy by applying to Société Générale for a voting form at least six days before the date of the Meeting.Correspondence and proxy voting forms together with all documents and information relating to the Meetings are available on the company website at www.lectra.com at least twenty-one days before the time of these Meetings. These documents are also obtainable on request,
free of charge, from the company. Written questions for submission to the Meeting may be addressed to the company at its headquarters: 16-18, rue Chalgrin, 75016 Paris, or by electronic mail at the following e-mail address: [email protected] on the fourth working day preceding the day set for the Meeting at the latest, and must be accompanied by proof of registration as a shareholder.All correspondence and proxy voting forms sent by post must reach Société Générale on the day prior to the date of the Meeting at the latest.As required in article R. 225-79 of the French Commercial Code, notifi cation of designation and revocation of a proxy may also be communicated electronically, by sending an electronically signed email, employing a reliable procedure for identifi cation of the shareholder guaranteeing that the notifi cation was effectively sent by the said shareholder, to [email protected] holding a fraction of the capital defi ned in articles L. 225-102 paragraph 2 and R. 225-71 paragraph 2 of the French Commercial Code must transmit any draft resolutions they wish to place on the agenda of the Meeting at least twenty-fi ve days prior to the date of the Meeting.Practical details pertaining to the above will be communicated in the notice of Meeting sent to the shareholders.
6. PUBLICATION OF INFORMATION CONCERNING
POTENTIALLY MATERIAL ITEMS IN THE EVENT
OF A PUBLIC TENDER OFFER
As required under article L. 225-37 paragraph 9 of the French Commercial Code, potentially material information is disclosed in chapter 8 of the Management Discussion and Analysis to which this report is appended, under “Information Concerning Items Covered by Article L. 225-100-3 of the French Commercial Code as Amended by the March 31, 2006 Public Tender Offers Act.”
André Harari Chairman of the Board of Directors March 3, 2015
110 – 2014 Financial Report Consolidated financial statements
Consolidated financial statements
"111 – Statement of fi nancial position
"112 – Income statement
"113 – Statement of cash fl ows
"114 – Statement of changes in equity
"115 – Notes to the consolidated fi nancial statements

111
STATEMENT OF FINANCIAL POSITIONconsolidated
ASSETS
As at December 31(in thousands of euros) 2014 2013
Goodwill note 6 31,724 29,986
Other intangible assets note 7 4,406 4,403
Property, plant and equipment note 8 16,447 13,328
Non-current fi nancial assets note 9 2,048 2,121
Deferred tax assets note 11 8,084 7,171
Total non-current assets 62,709 57,009
Inventories note 12 21,848 20,748
Trade accounts receivable note 13 50,531 50,269
Other current assets note 14 32,149 28,999
Cash and cash equivalents 43,484 29,534
Total current assets 148,012 129,550
Total assets 210,721 186,559
EQUITY AND LIABILITIES
(in thousands of euros) 2014 2013
Share capital note 15 30,329 29,664
Share premium note 15 7,282 5,043
Treasury shares note 15 (133) (83)
Currency translation adjustments note 16 (8,503) (8,721)
Retained earnings and net income 65,173 57,926
Total equity 94,148 83,829
Retirement benefi t obligations note 17 8,479 7,419
Borrowings, non-current portion note 18 – 394
Total non-current liabilities 8,479 7,813
Trade and other current payables note 19 53,449 45,109
Deferred revenues note 20 48,096 43,008
Current income tax liabilities note 11 2,857 2,391
Borrowings, current portion note 18 394 500
Provisions for other liabilities and charges note 21 3,298 3,909
Total current liabilities 108,094 94,917
Total equity and liabilities 210,721 186,559
The notes are an integral part of the consolidated fi nancial statements.

112 – 2014 Financial Report Consolidated financial statements
INCOME STATEMENTconsolidated
Twelve months ended December 31(in thousands of euros) 2014 2013
Revenues note 24 211,336 203,032
Cost of goods sold note 25 (55,606) (56,550)
Gross profi t note 25 155,730 146,482
Research and development note 26 (13,479) (12,503)
Selling, general and administrative expenses note 27 (122,470) (116,511)
Income (loss) from operations before non-recurring items 19,781 17,468
Non-recurring income note 23 – 11,124
Goodwill impairment note 6 – (702)
Income (loss) from operations 19,781 27,890
Financial income note 30 394 234
Financial expenses note 30 (418) (500)
Foreign exchange income (loss) note 31 (361) (541)
Income (loss) before tax 19,396 27,084
Income tax note 11 (5,043) (5,309)
Net income (loss) 14,353 21,775
(in euros)
Earnings per share note 32
– basic 0.48 0.75
– diluted 0.47 0.73
Shares used in calculating earnings per share
– basic 29,961,651 29,116,988
– diluted 30,750,854 29,664,802
STATEMENT OF COMPREHENSIVE INCOME
(in thousands of euros) 2014 2013
Net income (loss) 14,353 21,775
Currency translation adjustments note 16 382 119
Tax effect (164) –
Other comprehensive income (loss) to be reclassifi ed in net income (loss) 218 119
Remeasurement of the net liability arising from defi ned benefi ts pension plans note 17 (960) (574)
Tax effect 311 192
Other comprehensive income (loss) not to be reclassifi ed in net income (loss) (649) (382)
Total other comprehensive income (431) (263)
Comprehensive income (loss) 13,922 21,512
The notes are an integral part of the consolidated fi nancial statements.

113
STATEMENT OF CASH FLOWSconsolidated
Twelve months ended December 31(in thousands of euros) 2014 2013
I – OPERATING ACTIVITIES
Net income (loss) 14,353 21,775
Net depreciation, amortization and provisions 4,778 8,009
Non-cash operating expenses note 36 (1,051) 517
Loss (profi t) on sale of fi xed assets 63 (17)
Changes in deferred income taxes, net value note 11 (312) 1,393
Changes in inventories (1,435) 584
Changes in trade accounts receivable 3,872 (5,005)
Changes in other current assets and liabilities 5,483 (4,680)
Net cash provided by (used in) operating activities(1) note 37 25,751 22,575
II – INVESTING ACTIVITIES
Purchases of intangible assets note 7 (1,898) (1,879)
Purchases of property, plant and equipment note 8 (4,880) (2,915)
Proceeds from sales of intangible assets and property, plant and equipment 47 37
Acquisition cost of activities purchased note 2 (1,560) –
Purchases of fi nancial assets note 9 (2,547) (2,407)
Proceeds from sales of fi nancial assets note 9 2,574 2,177
Net cash provided by (used in) investing activities (8,264) (4,987)
III – FINANCING ACTIVITIES
Proceeds from issuance of ordinary shares note 15 2,904 3,159
Dividends paid (6,554) (6,377)
Purchases of treasury shares note 15 (2,403) (1,389)
Sales of treasury shares note 15 2,401 1,827
Flows on fi nancial derivatives qualifying net investment hedges 484 –
Repayments of long-term and short-term borrowings note 38 (500) (5,834)
Net cash provided by (used in) fi nancing activities (3,668) (8,614)
Increase (decrease) in cash and cash equivalents 13,819 8,974
Cash and cash equivalents at opening 29,534 20,966
Increase (decrease) in cash and cash equivalents 13,819 8,974
Effect of changes in foreign exchange rates 131 (406)
Cash and cash equivalents at closing 43,484 29,534
Free cash fl ow before non-recurring items 19,047 6,464
Non-recurring items of the free cash fl ow(1) – 11,124
Free cash fl ow note 39 19,047 17,588
Income tax paid (reimbursed), net 2,997 2,834
Interest paid – 15
(1) At December 31, 2013, the net cash provided by operating activities included €11,100,000 of non-recurring elements, corresponding to the receipt of the remaining amount due in the litigation against Induyco (see note 39).
The notes are an integral part of the consolidated fi nancial statements.

114 – 2014 Financial Report Consolidated financial statements
STATEMENT OF CHANGES IN EQUITYconsolidated
(in thousands of euros, except for par value per share expressed in euros)
Share capital
Sharepremium
Treasury shares
Currencytranslation
adjustments
Retained earnings
and net income Equity
Number of shares
Par valueper share
Sharecapital
Balance at January 1, 2013 28,948,315 1.00 28,948 2,600 (380) (8,840) 42,676 65,004
Net income (loss) 21,775 21,775
Other comprehensive income (loss) note 16 119 (382) (263)
Comprehensive income (loss) 119 21,393 21,512
Exercised stock options note 15 716,100 1.00 716 2,443 3,159
Fair value of stock options note 15 140 140
Sale (purchase) of treasury shares note 15 297 297
Profi t (loss) on treasury shares note 15 94 94
Dividends paid (6,377) (6,377)
Balance at December 31, 2013 29,664,415 1.00 29,664 5,043 (83) (8,721) 57,926 83,829
Net income (loss) 14,353 14,353
Other comprehensive income (loss) note 16 218 (649) (431)
Comprehensive income (loss) 218 13,704 13,922
Exercised stock options note 15 664,699 1.00 665 2,239 2,904
Fair value of stock options note 15 136 136
Sale (purchase) of treasury shares note 15 (50) (50)
Profi t (loss) on treasury shares note 15 32 32
Other variations (71) (71)
Dividends paid (6,554) (6,554)
Balance at December 31, 2014 30,329,114 1.00 30,329 7,282 (133) (8,503) 65,173 94,148
The notes are an integral part of the consolidated fi nancial statements.

115
NOTES TO THE CONSOLIDATED FINANCIAL STATEMENTSAll amounts in the tables are in thousands of euros, unless otherwise indicated.The Lectra Group, hereafter the Group, refers to Lectra SA, hereafter the company, and its subsidiaries. The Group’s consolidated fi nancial statements were drawn up by the Board of Directors on March 3, 2015 and will be proposed to the General Meeting of Shareholders for approval on April 30, 2015.
NOTE 1 BUSINESS ACTIVITY
Lectra was established in 1973 and has been listed since 1987 on Euronext (compartment B). Lectra is the world leader in software, CAD/CAM equipment and associated services dedicated to large-scale users of fabrics, leather, technical textiles and composite materials. Lectra addresses a broad array of major global markets, mainly fashion and apparel, automotive (car seats and interiors, airbags), furniture as well as a wide variety of other industries, such as aeronautical and marine industries, and wind power.The company’s technology offer is geared to the specifi c needs of each market, enabling its customers to design, develop and manufacture their products (garments, seats, airbags, etc.). For the fashion and apparel industry, Lectra’s software applications also facilitate the management of collections and cover the entire product lifecycle (Product Lifecycle Management, or PLM). Lectra forges long-term relationships with its customers and provides them with full-line, innovative solutions.The Group’s customers comprise large national and international corporations and medium-sized companies. Lectra helps them overcome their major strategic challenges: cutting costs and boosting productivity; reducing time-to-market; managing globalization; developing secure electronic communications; enhancing quality; satisfying the demand for mass-customization; and monitoring and developing their corporate brands. The Group markets end-to-end solutions comprising the sale of software, CAD/CAM equipment and associated services (technical maintenance, support, training, consulting, sales of consumables and spare parts). Lectra software and equipment is designed and developed in-house. Equipment is assembled from sub-elements produced by an international network of subcontractors and tested in the company’s industrial facilities in Bordeaux-Cestas (France) where most of Lectra’s R&D is performed.Lectra’s strength lies in the skills and experience of its 1,474 employees worldwide, encompassing expert R&D, technical and sales teams with deep knowledge of their customers’ businesses.
The Group has been present worldwide since the mid-1980s. Based in France, the company serves its customers in more than 100 countries through its extensive network of 32 sales and services subsidiaries, which are backed by agents and distributors in some regions. Thanks to this unrivaled network, Lectra generated 91% of its revenues directly in 2014. Its fi ve International Call Centers, in Bordeaux-Cestas (France), Madrid (Spain), Milan (Italy), Atlanta (USA) and Shanghai (China) cover Europe, North America and Asia. All of the company’s technologies are showcased at its International Advanced Technology & Conference Center in Bordeaux-Cestas (France) for Europe and international visitors, and its two International Advanced Technology Centers in Atlanta (USA) for North and South America, and Shanghai (China) for Asia and the Pacifi c. Lectra is geographically close to its customers wherever they are, with more than 800 employees in its sales and services subsidiaries. It employs 260 engineers dedicated to R&D, and nearly 160 employees in industrial purchasing, assembly and testing of CAD/CAM equipment, and logistics.
BUSINESS MODEL
Lectra’s business model is based on three pillars: – a balance of risks, which benefi t from natural hedging
by the distribution of business activity over market sectors and geographical markets with cycles that are different from each other, and by the very large number of customers throughout the world;
– a balanced revenue mix between revenues from new systems sales, the company’s growth driver, and revenues from recurring contracts and spare parts and consumables, a key factor in the company’s stability, that provide a cushion in periods of diffi cult economic conditions;
– the generation of annual free cash fl ow exceeding net income, assuming utilization or receipt of the annual research tax credit and the competitiveness and employment tax credit applicable in France.
116 – 2014 Financial Report Consolidated financial statements
NOTE 2 ACCOUNTING RULES AND METHODS
NOTE 2.1 CURRENT ACCOUNTING STANDARDS
AND INTERPRETATIONS
The consolidated fi nancial statements are compliant with the International Financial Reporting Standards (IFRS) published by the International Accounting Standards Board as adopted within the European Union, and available for consultation on the European Commission website: http://ec.europa.eu/fi nance/accounting/ias/index_en.htm.The consolidated fi nancial statements at December 31, 2014 have been prepared in accordance with the same rules and methods as those applied in the preparation of the 2013 fi nancial statements. They have been prepared under the responsibility of the Board of Directors that reviewed them at its meeting of March 3, 2015 and audited by the Statutory Auditors.The standards and interpretations adopted by the European Union as of January 1, 2014 had no impact on the Group’s fi nancial statements.The Group has not early adopted any standards, amendments or interpretations whose application is not required for fi scal years starting from January 1, 2014.
NOTE 2.2 CURRENT ASSETS AND LIABILITIES
The Group’s consolidated fi nancial statements are prepared on a historical cost basis with the exception of the assets and liabilities listed below:
– cash equivalents, recorded at fair value in the income statement;
– loans and receivables, together with borrowings and fi nancial debts, trade payables and other current fi nancial liabilities, recognized at their amortized cost;
– derivative fi nancial instruments, recorded at fair value. The Group uses such instruments to hedge its foreign exchange risks and recognizes them at fair value in the income statement, and to hedge interest-rate risk, and then recognizes them at fair value in other comprehensive income (see note 3 “Risk Hedging Policy”).Current assets comprise assets linked with the normal operating cycle of the Group, assets held with a view to
disposal within the next twelve months after the close of the fi nancial year, together with cash and cash equivalents. All other assets are non-current. Current liabilities comprise debts maturing in the course of the normal operating cycle of the Group or within the next twelve months after the close of the fi nancial year.
NOTE 2.3 GOODWILL
Goodwill is the difference between (i) the total of the fair value of the consideration transferred and the amount of any non-controlling interest in the acquiree, and (ii) the net of the acquisition-date amounts of the identifi able assets acquired and the liabilities assumed.Goodwill recognized in a foreign currency is translated at the year-end exchange rate.Each goodwill is allocated to a Cash Generating Unit (CGU) defi ned as being a sales subsidiary or group of more than one sales subsidiaries, being suffi ciently autonomous to generate cash infl ows independently.Taking into account expected future revenue streams, goodwill is tested for possible impairment loss at each closing date, or during the year when there is indication that it may be impaired.
NOTE 2.4 OTHER INTANGIBLE ASSETS
Intangible assets are carried at their purchase price less cumulative depreciation and impairment, if any. Depreciation is charged on a straight-line basis depending on the estimated useful life of the intangible asset.
Management Information SoftwareThis item contains only software utilized for internal purposes.The information system progressively implemented in the Group subsidiaries since January 1, 2007 is amortized on a straight-line basis over eight years, corresponding to their useful life as determined by the Group for this intangible asset. Activation of costs relating to this project has been made possible by the fact that the project’s technical feasibility has been consistently demonstrated and it has been established as probable that this fi xed asset will generate future benefi ts for the Group.

117
Other purchased management information software packages are amortized on a straight-line basis over three years.In addition to expenses incurred in the acquisition of software licenses, the Group also activates direct software development and confi guration costs, comprising personnel costs for personnel involved in development of the software and external expenses directly relating to these items.
Patents and TrademarksPatents, trademarks and associated costs are amortized on a straight-line basis over three to ten years from the date of registration. The amortization period refl ects the rate of consumption by the company of the economic benefi ts generated by the asset. The Group is not dependent on any patents or licenses that it does not own.In terms of intellectual property, no patents or other industrial property rights belonging to the Group are currently under license to third parties. The rights held by the Group, notably with regard to software specifi c to its business as a software developer and publisher, are used under license by its customers within the framework of sales activity.The Group does not activate any internally-generated expense relating to patents and trademarks.
OtherOther intangible assets are amortized on a straight-line basis over two to fi ve years.
NOTE 2.5 PROPERTY, PLANT AND EQUIPMENT
Property, plant and equipment is carried at cost less accumulated depreciation and impairment, if any. When a tangible asset comprises signifi cant components with different useful lives, the latter are analyzed separately. Consequently, costs incurred in replacing or renewing a component of a tangible asset are booked as a distinct asset. The carrying value of the component replaced is written-off. Moreover, the Group considers that there is no residual value on its assets. At each closing date, the useful life of assets is reviewed and adjusted as required.Subsequent expenditures relating to a tangible asset are capitalized if they increase the future economic benefi ts
of the specifi c asset to which they are attached. All other costs are expensed directly at the time they are incurred.Financial expense is not included in the cost of acquisition of tangible assets. Investment grants received are deducted from the value of tangible assets. Depreciation is computed on this net amount.Losses or gains on disposals of assets are recognized in the income statement under caption “Selling, general and administrative expenses”.Depreciation is computed on the straight-line method over their estimated useful lives as follows:
– buildings and building main structures: 20-35 years; – secondary structures and building installations: 15 years; – fi xtures and installations: 5-10 years; – land arrangements: 5-10 years; – technical installations, equipment and tools: 4-10 years; – offi ce equipment and computers: 3-5 years; – offi ce furniture: 5-10 years.
NOTE 2.6 FIXED ASSETS IMPAIRMENT – IMPAIRMENT TESTS
When events or changes in the market environment, or internal factors, indicate a potential impairment of value of goodwill, other intangible assets or property, plant and equipment, these are subject to thorough reviewing. Impairment tests are carried out systematically at least once a year.
GoodwillGoodwill is tested for impairment by comparing its carrying value with the recoverable amount of the Cash Generating Unit (CGU) it has been allocated to, which is defi ned as the higher of the asset’s fair value less costs to sell and value in use determined as the present value of future cash fl ows attached to them, excluding interest and tax. The results utilized are derived from the Group’s three-year plan. Beyond the time frame of the three-year plan, cash fl ows are projected to infi nity, the assumed growth rate being dependent on the growth potential of the markets and/or products concerned by the impairment test. The discount rate is computed under the Weighted Average Cost of Capital (WACC) method, the cost of capital being determined by applying the Capital Asset Pricing Model (CAPM). If the impairment test reveals an impairment of value relative to the carrying value, an irreversible impairment loss is

118 – 2014 Financial Report Consolidated financial statements
recognized to reduce the carrying value of the goodwill to its recoverable amount. This charge, if any, is recognized under “Goodwill impairment” in the income statement.
Other Fixed AssetsOther intangible assets and property, plant and equipment are tested by comparing the carrying value of each relevant group of assets (which may be an isolated asset or a cash-generating unit) with its recoverable amount. If the latter is lower than the carrying value, an impairment charge equal to the difference between these two amounts is recognized. The base and the schedule of amortization/depreciation of the assets concerned are reduced if a loss is recognized, the resulting charge being recorded as an amortization/depreciation charge under “Cost of goods sold”, or “Selling, general and administrative expenses” in the income statement depending on the nature and use of the assets concerned.
NOTE 2.7 NON-CURRENT FINANCIAL ASSETS
This item mainly comprises investments in subsidiaries and receivables relating to fi nancial investments in unconsolidated companies.Investments in subsidiaries are classifi ed as available for sale securities, as required by IAS 39. They are recognized at fair value.Non-current fi nancial assets are tested for impairment annually on the basis of the net asset value of the related companies.
NOTE 2.8 DEFERRED INCOME TAX
Deferred income tax is accounted for using the liability method on temporary differences arising between the book value and tax value of assets and liabilities shown in the statement of fi nancial position. The same is true for tax loss carry-forwards. Deferred taxes are calculated at the future tax rates enacted or substantially enacted at the fi scal year closing date. For a given entity, assets and liabilities are netted where taxes are levied by the same tax authority, and where permitted by the local tax authorities. Deferred tax assets are recognized where their future utilization is deemed probable in light of expected future taxable profi ts.
NOTE 2.9 INVENTORIES
Inventories of raw materials are valued at the lower of purchase cost (based on weighted-average cost, including related costs) and their net realizable value. Finished goods and works-in-progress are valued at the lower of standard industrial cost (adjusted at year end on an actual cost basis) and their net realizable value. Net realizable value is the estimated selling price in the normal course of business, less the estimated cost of completion or upgrading of the product and unavoidable selling costs.Inventory cost does not include interest expense.A write-down is recorded if the net realizable value is lower than the book value.Write-downs on inventories of spare parts and consumables are calculated by comparing book value and probable net realizable value considering a specifi c analysis of the rotation and obsolescence of inventory items, taking into account the utilization of items for maintenance and after-sales services activities, and changes in the range of products marketed.
NOTE 2.10 TRADE ACCOUNTS RECEIVABLE
Accounts receivable are originally accounted for in the statement of fi nancial position at their fair value, and thereafter at their amortized cost, which generally corresponds to their nominal value. Impairment is recorded on the basis of the risk of non-collectibility of the receivable, measured on a case-by-case basis in light of how long they are overdue, the results of reminders sent out, the local payment practices, and the risks specifi c to each country.Sales in those countries presenting a high degree of political or economic risk are generally secured by letters of credit or bank guarantees.Owing to the very short collection delays, trade accounts receivable are not discounted.
NOTE 2.11 CASH AND CASH EQUIVALENTS
Cash (as shown in the cash fl ow statement) is defi ned as the sum of cash and cash equivalents, less bank overdrafts if any. Cash equivalents comprise either investments in money-market funds recorded at market value at year end, convertible at any time into a known

119
amount of cash, or negotiable certifi cates of deposit issued by the company’s banks. Interest-bearing sight accounts opened in the company’s banks are treated as cash. All these holdings are short-term, highly liquid investments that are readily convertible to known amounts of cash and which are subject to an insignifi cant risk of changes in value, as specifi ed by IAS 7.Net cash (as shown in note 18.1) is defi ned as the amount of “Cash and cash equivalents” less fi nancial borrowings (as shown in note 18.2) when this difference is positive. When this difference is negative, the result corresponds to a net fi nancial debt.Cash equivalents are recognized at their fair value; changes in fair value are recognized in the income statement.
NOTE 2.12 CAPITAL MANAGEMENT POLICY
In managing its capital, the Group seeks to achieve the best possible return on capital employed.The liquidity of Lectra’s shares on the stock market has been ensured by means of a Liquidity Agreement with Exane BNP Paribas (see note 15.2).The payment of dividends is an important instrument in the Group’s capital management policy, the aim being to compensate shareholders adequately as soon as this is justifi ed by the Group’s fi nancial situation while preserving the necessary cash to fund the Group’s future development.
NOTE 2.13 STOCK OPTIONS
The company has granted stock options to Group employees and managers. All plans are issued at an exercise price equal or greater than the fi rst average stock market price for the 20 trading days prior to granting.Under the regulations governing the company’s stock option plans, which have been accepted by all of their benefi ciaries, the Group is not exposed to the risk of liability for payment of French social security charges on capital gains arising from sales of shares within four years of the granting of options, for the options granted before September 28, 2012. Those granted after this date are no longer concerned, as tax and social security regulations have changed.
The application of IFRS 2 has resulted in the recognition of an expense corresponding to the fair value of the advantage granted to benefi ciaries. This expense is recognized in personnel costs with a counterpart in equity. It is measured using the Black & Scholes model and is deferred prorata temporis over the stock options’ vesting period.
NOTE 2.14 BORROWINGS AND FINANCIAL DEBT
The non-current portion of borrowings and fi nancial debt comprises the portion due in more than one year of:
– the interest-bearing bank loans; – non-interest bearing reimbursable advances
corresponding to R&D grants.The current portion of borrowings and fi nancial debt comprises:
– the portion of bank loans, reimbursable advances and other borrowings and fi nancial debt due in less than one year;
– cash facilities, where applicable.Borrowings and fi nancial debts are recognized initially at fair value.At closing date, borrowings and fi nancial debt are stated at amortized cost using the effective interest rate method, defi ned as the rate whereby cash received equals the total cash fl ows relating to the servicing of the borrowing. Interest expenses on the bank loans and on the utilization of cash credit facilities are recognized as fi nancial expenses in the income statement.
NOTE 2.15 RETIREMENT BENEFITS OBLIGATIONS
The Group is subject to a variety of deferred employee benefi ts plans, depending on the subsidiary concerned. The only deferred employee liabilities are retirement benefi ts obligations.
Defi ned Contributions PlansThese refer to post-employment benefi ts plans under which, for certain categories of employee, the Group pays defi ned contributions to an outside insurance company or pension fund. Contributions are paid in exchange for services rendered by employees during the period. They are expensed as incurred, as are wages and salaries. Defi ned contributions plans do not create future liabilities
120 – 2014 Financial Report Consolidated financial statements
for the Group and hence do not require recognition of provisions.Most of the defi ned contributions plans to which the company and its subsidiaries contribute are additional to the employees’ legal retirement plans. In the case of the latter, the company and its subsidiaries contribute directly to a social security fund.
Defi ned Benefi ts PlansThese refer to post-employment benefi ts payable plans that guarantee contractual additional income for certain categories of employee (in some cases these plans are governed by specifi c industry-wide agreements). For the Group, these plans only cover lump-sum termination payments solely as required by legislation or as defi ned by the relevant industrywide agreement.The guaranteed additional income represents a future contribution for which a liability is estimated.This liability is calculated by estimating the benefi ts to which employees will be entitled having regard to projected end-of-career salaries.Benefi ts are reviewed in order to determine the net present value of the liability in respect of defi ned benefi ts in accordance with the principles set forth in IAS 19.Actuarial assumptions notably include a rate of salary increase, a discount rate (this corresponds to the average annual yield on investment-grade bonds with maturities approximately equal to those of the Group’s obligations), an average rate of social charges and a turnover rate, in accordance with local regulations where appropriate, based on observed historical data. Actuarial gains and losses are recognised in other comprehensive income, in accordance with the principles set forth in IAS 19 (revised).The relevant portion of any change in past-service cost is recognised immediately as a loss (in the case of an increase) or as a gain (in the case of a reduction) in the income statement when a plan is amended, in accordance with the principles set forth in IAS 19 (revised).
NOTE 2.16 PROVISIONS FOR OTHER LIABILITIES AND CHARGES
All known risks at the date of Board of Directors’ meeting are reviewed in detail and a provision is recognized if an obligation exists, if the costs entailed to settle this
obligation are probable or certain, and if they can be measured reliably. In view of the short-term nature of the risks covered by these provisions, the discounting impact is immaterial and therefore not recognized.At the time of the effective payment, the provision reversal is deducted from the corresponding expenses.
Provisions for WarrantiesA provision for warranties covers, on the basis of historical data, probable costs arising from warranties granted by the Group to its customers at the time of the sale of CAD/CAM equipment, for replacement of parts, technicians’ travel and labor costs. This provision is recorded at the time of the booking of the sale generating a contractual obligation of warranty.
NOTE 2.17 TRADE PAYABLES
Trade accounts payables refer to obligations to pay for goods or services acquired in the ordinary course of business. They are classifi ed in current liabilities when payment is due in less than twelve months, or in non-current liabilities when payment is due in more than one year.
NOTE 2.18 REVENUES
Revenues from sales of hardware are recognized when the signifi cant risks and benefi ts relating to ownership are transferred to the purchaser. For hardware, these conditions are fulfi lled upon physical transfer of the hardware in accordance with the contractual sale terms. For software, these conditions are generally fulfi lled at the time of installation of the software on the customer’s computer (either by CD-ROM or downloading).Revenues from software evolution and on-line services contracts and hardware maintenance and on-line services contracts are billed in advance, and their booking is spread over the duration of the contracts.Revenues from the billing of services not covered by recurring contracts are recognized at the time of performance of the service or, where appropriate, on a percentage of completion basis.

121
NOTE 2.19 COST OF GOODS SOLD
Cost of goods sold comprises all purchases of raw materials included in the costs of manufacturing, the change in inventory and inventory write-downs, all labor costs included in manufacturing costs which constitute the added value, freight-out costs on equipments sold, and a share of depreciation of the manufacturing facilities.Cost of goods sold does not include salaries and expenses associated with service revenues, which are included under “Selling, General and Administrative Expenses”.
NOTE 2.20 RESEARCH AND DEVELOPMENT
The technical feasibility of software and hardware developed by the Group is generally not established until a prototype has been produced or until feedback is received from its pilot sites, conditioning their commercialization. Consequently, the technical and economic criteria that render the recognition of development costs in assets at the moment they occur are not met, and these, together with research costs, are therefore expensed in the year in which they are incurred.The (French) research tax credit (crédit d’impôt recherche) and the portion of the competitiveness and employment tax credit (crédit d’impôt compétitivité et emploi) relating to R&D personnel is deducted from R&D expenses.
NOTE 2.21 GRANTS
Investment grants are deducted from the cost of the fi xed assets in respect of which they were received. Consequently they are recognized in the income statement over the period of consumption of the economic benefi ts expected to derive from the corresponding asset.Operating grants are deducted from their associated charges in the income statement. This applies to subsidies received to fi nance research and development projects.The Group receives interest-free reimbursable advances which are recognized at their amortized cost. Benefi ts arising from the non-remuneration of these advances are initially recognized as operating grants in deferred
income, then deducted from R&D expenses in the income statement.The research tax credit is treated as a subsidy in the Group fi nancial statements and is discounted in light of the probability of future offsetting against income tax and in light of reimbursement of the unused portion after four years (see note 14), if it could not be offset previoulsy.
NOTE 2.22 INCOME FROM OPERATIONS BEFORE
NON-RECURRING ITEMS
Where applicable, non-recurring items excluded from income from operations before non-recurring items refl ect the impact on the fi nancial statements of events that are either unusual, abnormal and infrequent. There are very few of these and their amounts are signifi cant.When the Group identifi es non-recurring items, it tracks its operating performance by means of an intermediate balance referred to as “Income from operations before non-recurring items”. This fi nancial metric refl ects income from operations less non-recurring income and plus non-recurring expenses, as set forth in CNC (French National Accouting Council) recommendation 2009-R.03.
NOTE 2.23 BASIC AND DILUTED EARNINGS PER SHARE
Basic net earnings per share are calculated by dividing net income by the weighted-average number of shares outstanding during the fi scal year, excluding the weighted average number of treasury shares.Diluted net earnings per share are calculated by dividing net income by the weighted-average number of shares adjusted for the dilutive effect of stock options outstanding during the fi scal year and excluding the weighted average number of treasury shares held solely under the Liquidity Agreement. The dilutive effect of stock options is computed in accordance with the share repurchase method provided by IAS 33. The assumed proceeds from exercise of stock options are regarded as having been used to repurchase shares at the average market price during the period. The number of shares thus obtained is deducted from the total number of shares resulting from the exercise of stock options.
122 – 2014 Financial Report Consolidated financial statements
Only options with an exercise price below the said average share price are included in the calculation of the number of shares representing the diluted capital.
NOTE 2.24 OPERATING SEGMENTS
Operating segment reporting is based directly on the Group’s performance tracking and review systems. The operating segments disclosed in note 35 are identical to those covered by the information regularly communicated to the Executive Committee, in its capacity as the Group’s “chief operating decision maker”.Operating segments refer to the major marketing regions that combine countries with similar economic characteristics in terms of type of product and service, customer type and distribution method. The regions concerned are: the Americas, Europe, Asia-Pacifi c, and the rest of the world, where the company operates chiefl y in North Africa, South Africa, Turkey, Israel, and the Middle East. These regions are involved in sales and the provision of services to their customers. They do not perform any industrial activities or R&D. They draw on centralized competencies and a wide array of functions that are pooled among all of the regions, including marketing, communication, logistics, procurement, manufacturing, R&D, fi nance, legal affairs, human resources, and information systems. All of these cross-divisional activities are reported as an additional operating segment referred to here as the “Corporate” segment. Performance is measured by the segment’s income from operations before non-recurring items and impairment of assets, if any. Marketing regions derive their revenues from external customers; all inter-segment billings are excluded from this item. The gross profi t margins used to determine operating performance are identical for all regions. They are computed for each product line and include added value supplied by the Corporate segment. Consequently, for products or services supplied in full or in part by the Corporate segment, a percentage of consolidated gross profi t is retained in the income computed for the Corporate segment in order to cover its costs. Since most of the Corporate segment’s general overheads are fi xed, its profi t margin and consequently its income from operations depend mainly on the volume of business generated by marketing regions.
NOTE 2.25 FREE CASH FLOW
Free cash fl ow is equal to net cash provided by operating activities plus cash used in investing activities — excluding cash used for acquisitions of companies, net of cash acquired.
NOTE 2.26 CRITICAL ACCOUNTING ESTIMATES
AND JUDGMENTS
Preparation of the fi nancial statements in accordance with IFRS demands that certain critical accounting estimates be made. Management is also required to exercise its judgment in applying the Group’s accounting policies. Although such estimates are made in a particularly uncertain environment, their relevance is supported by the Group’s business model features.The areas involving a higher degree of judgment or complexity, or requiring material assumptions and estimates in relation to the consolidated fi nancial statements, relates to goodwill impairment (see note 6) and deferred taxation (see note 11.3).
NOTE 2.27 TRANSLATION METHODS
Translation of Financial Statements of Foreign SubsidiariesMost subsidiaries’ functional currency is the local currency, which corresponds to the currency in which the majority of their transactions are denominated.Accounts of foreign companies are translated as follows:
– assets and liabilities are translated at the offi cial year-end closing rates;
– reserves and retained earnings are translated at historical rates;
– income statement items are translated at the average monthly exchange rates for the year for revenues and cost of products and services sold, and at the annual average rate for all other income statement items other than in the case of material transactions;
– items in the cash fl ow statement are translated at the annual average exchange rate. Thus, movements in short-term assets and liabilities are not directly comparable with the corresponding movements in the statement of fi nancial position, due to the currency translation impact, which is shown under a separate
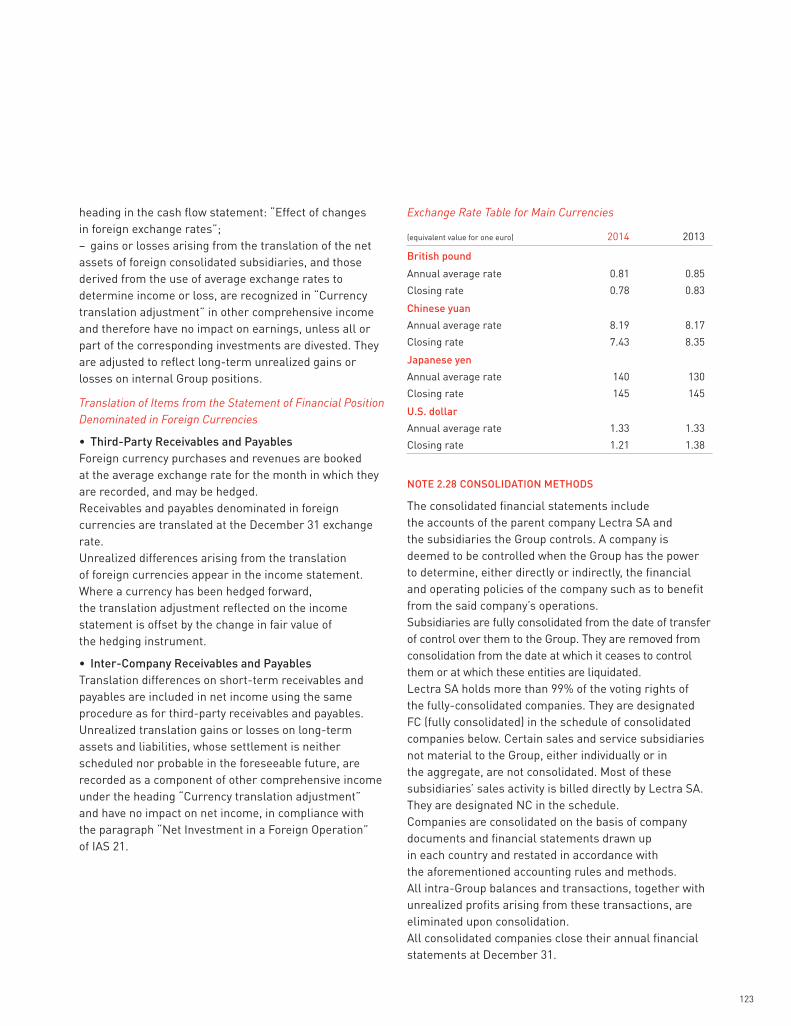
123
heading in the cash fl ow statement: “Effect of changes in foreign exchange rates”;
– gains or losses arising from the translation of the net assets of foreign consolidated subsidiaries, and those derived from the use of average exchange rates to determine income or loss, are recognized in “Currency translation adjustment” in other comprehensive income and therefore have no impact on earnings, unless all or part of the corresponding investments are divested. They are adjusted to refl ect long-term unrealized gains or losses on internal Group positions.
Translation of Items from the Statement of Financial Position Denominated in Foreign Currencies
• Third-Party Receivables and PayablesForeign currency purchases and revenues are booked at the average exchange rate for the month in which they are recorded, and may be hedged.Receivables and payables denominated in foreign currencies are translated at the December 31 exchange rate. Unrealized differences arising from the translation of foreign currencies appear in the income statement. Where a currency has been hedged forward, the translation adjustment refl ected on the income statement is offset by the change in fair value of the hedging instrument.
• Inter-Company Receivables and PayablesTranslation differences on short-term receivables and payables are included in net income using the same procedure as for third-party receivables and payables. Unrealized translation gains or losses on long-term assets and liabilities, whose settlement is neither scheduled nor probable in the foreseeable future, are recorded as a component of other comprehensive income under the heading “Currency translation adjustment” and have no impact on net income, in compliance with the paragraph “Net Investment in a Foreign Operation” of IAS 21.
Exchange Rate Table for Main Currencies
(equivalent value for one euro) 2014 2013
British pound
Annual average rate 0.81 0.85
Closing rate 0.78 0.83
Chinese yuan
Annual average rate 8.19 8.17
Closing rate 7.43 8.35
Japanese yen
Annual average rate 140 130
Closing rate 145 145
U.S. dollar
Annual average rate 1.33 1.33
Closing rate 1.21 1.38
NOTE 2.28 CONSOLIDATION METHODS
The consolidated fi nancial statements include the accounts of the parent company Lectra SA and the subsidiaries the Group controls. A company is deemed to be controlled when the Group has the power to determine, either directly or indirectly, the fi nancial and operating policies of the company such as to benefi t from the said company’s operations.Subsidiaries are fully consolidated from the date of transfer of control over them to the Group. They are removed from consolidation from the date at which it ceases to control them or at which these entities are liquidated.Lectra SA holds more than 99% of the voting rights of the fully-consolidated companies. They are designated FC (fully consolidated) in the schedule of consolidated companies below. Certain sales and service subsidiaries not material to the Group, either individually or in the aggregate, are not consolidated. Most of these subsidiaries’ sales activity is billed directly by Lectra SA. They are designated NC in the schedule.Companies are consolidated on the basis of company documents and fi nancial statements drawn up in each country and restated in accordance with the aforementioned accounting rules and methods. All intra-Group balances and transactions, together with unrealized profi ts arising from these transactions, are eliminated upon consolidation.All consolidated companies close their annual fi nancial statements at December 31.

124 – 2014 Financial Report Consolidated financial statements
Scope of ConsolidationAt December 31, 2014, the Group’s scope of consolidation comprised Lectra SA together with 28 fully-consolidated companies.
Company City Country
% of ownership and control Consolidation method(1)
2014 2013 2014 2013
Parent company
Lectra SA Cestas France FC FC
Subsidiaries
Lectra Australia Pty Ltd Melbourne Australia 100.0 100.0 FC FC
Lectra Benelux NV Gent Belgium 99.9 99.9 FC FC
Lectra Brasil Ltda São Paulo Brazil 100.0 100.0 FC FC
Lectra Canada Inc. Montreal Canada 100.0 100.0 FC FC
Lectra Systems (Shanghai) Co. Ltd Shanghai China 100.0 100.0 FC FC
Lectra Hong Kong Ltd Hong Kong China 99.9 99.9 FC FC
Lectra Danmark A/S Herning Denmark 100.0 100.0 FC FC
Lectra Baltic Oü Tallinn Estonia 100.0 100.0 FC FC
Lectra Suomi Oy Helsinki Finland 100.0 100.0 FC FC
Lectra Deutschland GmbH Munich Germany 99.9 99.9 FC FC
Humantec Industriesysteme GmbH Huisheim Germany 100.0 100.0 FC FC
Lectra Hellas EPE Athens Greece 99.9 99.9 FC FC
Lectra Technologies India Private Ltd Bangalore India 100.0 100.0 FC FC
Lectra Italia SpA Milan Italy 100.0 100.0 FC FC
Lectra Japan Ltd Osaka Japan 100.0 100.0 FC FC
Lectra Systèmes SA de CV Mexico Mexico 100.0 100.0 FC FC
Lectra Maroc Sarl Casablanca Morocco 99.4 99.4 FC FC
Lectra Portugal Lda Porto Portugal 99.9 99.9 FC FC
Lectra Russia OOO Moscow Russia 100.0 100.0 FC FC
Lectra Systems Pty Ltd Durban South Africa 100.0 100.0 FC FC
Lectra Korea Ltd Seoul South Korea 100.0 – FC –
Lectra Sistemas Española SA Madrid Spain 100.0 100.0 FC FC
Lectra Sverige AB Borås Sweden 100.0 100.0 FC FC
Lectra Taiwan Co. Ltd Taipei Taiwan 100.0 100.0 FC FC
Lectra Systèmes Tunisie SA Tunis Tunisia 99.8 99.8 FC FC
Lectra Systèmes CAD – CAM AS Istanbul Turkey 99.0 99.0 FC FC
Lectra UK Ltd Greengates United Kingdom 99.9 99.9 FC FC
Lectra USA Inc. Atlanta USA 100.0 100.0 FC FC
Lectra Chile SA Santiago Chile 99.9 99.9 NC NC
Lectra Israel Ltd Natanya Israel 100.0 100.0 NC NC
Lectra Philippines Inc. Manila Philippines 99.8 99.8 NC NC
Lectra Singapore Pte Ltd Singapore Singapore 100.0 100.0 NC NC
(1) FC: Fully consolidated – NC: Non-consolidated.
125
In April 2014, the company established a new subsidiary in South Korea, Lectra Korea, to accelerate its development in Asia.On May 1, 2014, this subsidiary took over the activities of the agent that previously represented Lectra in this country for many years. The cost of the purchase by Lectra of these activities is shown in the statement of cash fl ows under “Acquisition cost of activities purchased”. The impact of this subsidiary’s creation and of the purchase of these activities on the Group’s income statement and the statement of fi nancial position is immaterial, the bulk of sales in this country having previously been billed by Lectra SA. Lectra Korea has been fully consolidated since May 1, 2014.There was no other change in the scope of consolidation in 2014, and there were none in 2013.In view of the parent company’s percentage of interest in its consolidated subsidiaries, non-controlling interests are immaterial and are therefore not shown in the fi nancial statements.
NOTE 3 RISK MANAGEMENT POLICY
The Group’s risk management policy contained in these notes to the consolidated fi nancial statements is mainly discussed in the Management Discussion of the Board of Directors, in chapter 4, Risk Factors − Management of Risks, in chapter 14, Business Trends and Outlook, and in the Chairman’s Report on Internal Control Procedures and Risk Management, and on Corporate Governance, in chapter 2, Internal Control and Risk Management Procedures Established by the Company, to which readers are referred.
NOTE 3.1 SPECIFIC FOREIGN EXCHANGE RISKS – DERIVATIVE
FINANCIAL INSTRUMENTS
Exchange rate fl uctuations impact the Group at two levels:
Competitive ImpactThe Group sells its products and services in global markets. It competes primarily with its main competitor, a U.S. company that currently manufactures its equipment in China, as do the majority of the Group’s other competitors. As a result, their production costs
are primarily in Chinese yuan, while those of the Group are in euros. Meanwhile, sales prices in many markets are in U.S. dollars or euros. The exchange rates between these three currencies have, therefore, a competitive impact.
Currency Translation ImpactOn the income statement, as accounts are consolidated in euros, revenues, gross profi t, and income from operations of a subsidiary conducting its business in a foreign currency are mechanically affected by exchange rate fl uctuations when translated into euros.In the statement of fi nancial position, this refers primarily to foreign currency accounts receivable, in particular to those between the parent company Lectra SA and its subsidiaries, and it corresponds to the variation between exchange rates at collection date and those at billing date. This impact is recognized in “Foreign exchange income (loss)” in the income statement.Currency risk is borne by the parent company. The Group seeks to protect all of its foreign currency receivables and debts as well as future cash fl ows against currency risk on economically reasonable terms. Hedging decisions take into account currency risks and trends where these are likely to signifi cantly impact the Group’s fi nancial condition and competitive situation. The bulk of foreign currency risks concerns the U.S. dollar.The Group generally seeks to hedge the risk arising in respect of its net operational exposure to the U.S. dollar (revenues less all expenses denominated in U.S. dollars or strongly correlated currencies) by purchasing dollar puts (or euro calls) or by forward currency contracts, when justifi ed by the cost of the hedge.The Group’s statement of fi nancial position exposure is monitored in real time; it utilizes forward currency contracts to hedge all relevant receivables and debts. Consequently, all changes in the value of these instruments offset foreign exchange gains and losses on the remeasurement of these receivables and debts. However, these hedges are not treated as hedge accounting under IAS 39.Derivative fi nancial instruments to hedge future fl ows of funds are initially booked at fair value. Thereafter they are marked to market at the closing date. Resulting profi ts or losses are recognized in other comprehensive income or in the income statement, depending upon whether

126 – 2014 Financial Report Consolidated financial statements
the hedge (or the portion of the hedge concerned) was deemed to be effective or not, as defi ned by IAS 39.In the event that an appreciation was initially recognized in other comprehensive income, the accumulated profi ts or losses are then included in income for the period in which the initially planned transaction actually takes place.
NOTE 3.2 INTEREST RATE RISK
Since the Group no longer has fi nancial debt, it is not exposed to interest-rate risk.Its residual borrowings (€0.4 million at December 31, 2014) consist exclusively of interest-free government grants.Finally, the Group follows a conservative policy in short-term investing its cash surpluses, placing them only in money market mutual funds classifi ed as “euro money market funds” by the Autorité des Marchés Financiers, in negotiable certifi cates of deposit issued by the company’s banks, or in interest-bearing sight accounts.
NOTE 3.3 CUSTOMER DEPENDENCY RISK
There is no material risk of dependence on any particular customer or group of customers, as no individual customer represented more than 7% of consolidated revenues in 2014 as was the case in previous years, and the company’s 10 largest customers represented less than 20% revenues combined, and the top 20 less than 25%.
NOTE 3.4 CREDIT AND COUNTERPARTY RISKS
The Group is exposed to credit risks in the event of customer insolvency or default. This risk is heightened in the context of the economic crisis and can negatively impact Group profi t. The Group pays close attention to the security of payment for the systems and services delivered to its customers. It notably manages this risk via a range of procedures, which include preventively analyzing its customers’ solvency and provide for the strict and systematic application of several measures for dealing with customers in arrears.The Group’s exposure to counterparty risks arises from its cash holdings and contracts entered into within the framework of its policy on foreign exchange risk hedging.
The Group’s cash surpluses consist exclusively of interest-bearing sight accounts held with blue-chip international banks. The foreign exchange risk-hedging contracts are negotiated exclusively in France with the three company’s banks. The corresponding asset values are monitored regularly.
NOTE 3.5 LIQUIDITY RISK
The main indicator monitored by the Group in order to measure a possible liquidity risk is available cash (see note 18.1). This indicator is compared against cash forecasts over a six-month time horizon. The risk that the Group may have to contend with a short-term cash shortage is close to zero. The Group’s free cash represents a substantial and suffi cient liquidity reserve. Thanks to its structurally negative or near-zero working capital requirement, any cash fl ows generated by the Group help to bolster its liquidity.
NOTE 4 DIVIDEND
The Board of Directors has proposed to the Shareholders’ Meeting on April 30, 2015 to declare a dividend of €0.25 per share in 2015 in respect of fi scal year 2014.The company declared a dividend of €0.22 per share in 2014, in respect of fi scal year 2013.
TAX ON DIVIDENDS
The Second Supplementary Budget Act for 2012 (deuxième loi de fi nances rectifi cative pour 2012), dated August 16, 2012, has instituted a tax on dividends in the form of an additional contribution to income tax equal to 3% of the amounts distributed by companies subject to income tax in France. It applies to all dividends paid with effect from August 17, 2012 and must be recognized at the time of approval of the dividends by the Board of Directors.A tax expense of €197,000 has been recognized on dividends paid in 2014 in respect of fi scal year 2013. This amount was fully recognized in the income statement, as per IAS 12.
NOTE 5 POST-CLOSING EVENTS
No signifi cant event has occurred since December 31, 2014.

127
NOTE 6 GOODWILL
In April 2014, the company created a new subsidiary in South Korea. On May 1, 2014, this subsidiary took over the activities of the agent that had previously been representing Lectra in this country for many years. This purchase of assets and liabilities related to the agent’s activities generated goodwill for €718,000 at 2014 closing rate.No acquisition was made in fi scal year 2013.All past acquisitions have been paid for in full, and no further earn-out is due on these transactions.
2014 2013
Book value at January 1 29,986 31,132
Change in scope of consolidation(1) 664 –
Goodwill impairment – (702)
Exchange rate differences 1,074 (444)
Book value at December 31 31,724 29,986
(1) Integration of Lectra Korea, see note 2.28.
Cash Generating Units (CGU) have been defi ned as a sales subsidiary or group of more than one sales subsidiaries sharing common resources; these CGUs are suffi ciently autonomous to generate cash infl ows independently. Operating segments as defi ned in note 35 correspond to groups of these CGUs.Goodwill shown in the statement of fi nancial position was subjected to impairment testing in December 2014. The projections used are based on the 2015-2017 plan for each CGU based on actual 2014 cash fl ows and on forecast trends in each market concerned and, beyond 2017, on a projection to infi nity using a 2% growth rate assumption.Future fl ows after tax are discounted using the weighted average cost of capital. The discount rates adopted differ depending on the CGU to allow for exposure to local economic environments. They are broken down as follows:
– the cost of capital is determined on the basis of an estimated risk free rate for each CGU plus a market risk premium of 5% adjusted for the sector’s beta;
– a specifi c risk premium has been computed for each CGU. This varies between 1% and 1.5% depending on the estimated risk attaching to fulfi llment of the 2015-2017 plan;
– the normative cost of debt is determined on the basis of average market conditions for the fourth quarter of 2014 plus the margin applied by the banks.The resulting estimates of the value in use of goodwill components for the 2014 year end closing have not led to any impairment.In 2013, the impairment tests on the Spain CGU led to the goodwill recognized on this CGU in the statement of fi nancial position being reduced to zero. This had resulted in a €702,000 impairment expense recorded on the “Goodwill impairment” line in the income statement.
NOTES TO THE STATEMENT OF FINANCIAL POSITIONConsolidated
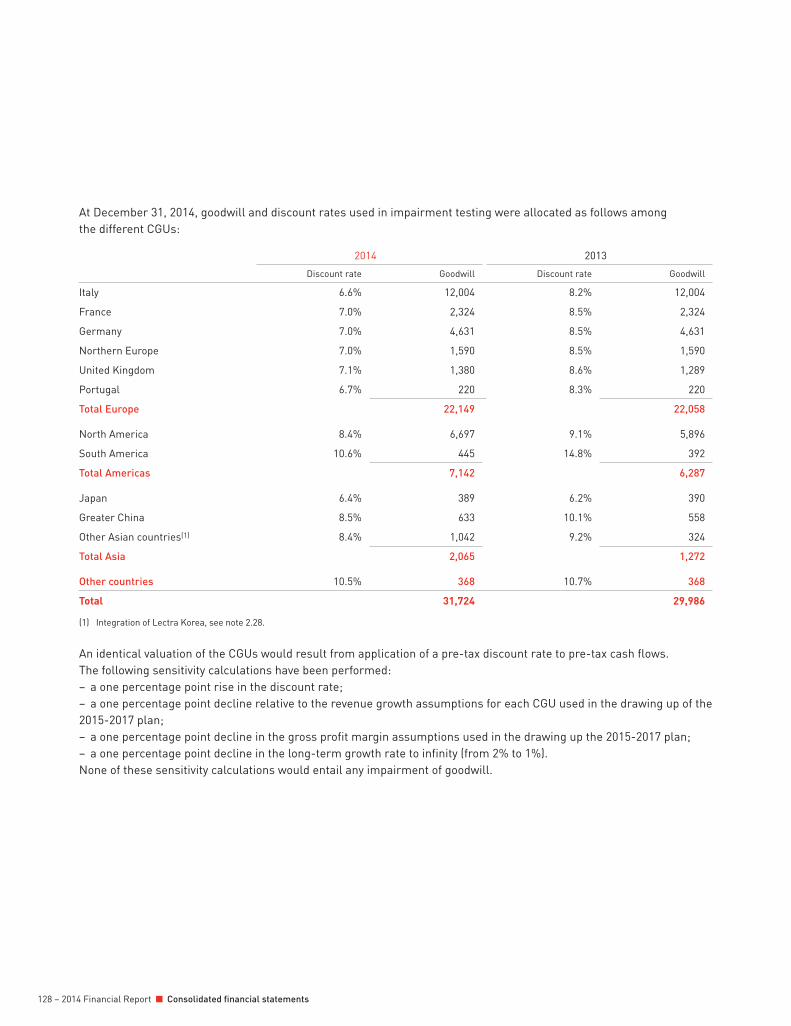
128 – 2014 Financial Report Consolidated financial statements
At December 31, 2014, goodwill and discount rates used in impairment testing were allocated as follows among the different CGUs:
2014 2013
Discount rate Goodwill Discount rate Goodwill
Italy 6.6% 12,004 8.2% 12,004
France 7.0% 2,324 8.5% 2,324
Germany 7.0% 4,631 8.5% 4,631
Northern Europe 7.0% 1,590 8.5% 1,590
United Kingdom 7.1% 1,380 8.6% 1,289
Portugal 6.7% 220 8.3% 220
Total Europe 22,149 22,058
North America 8.4% 6,697 9.1% 5,896
South America 10.6% 445 14.8% 392
Total Americas 7,142 6,287
Japan 6.4% 389 6.2% 390
Greater China 8.5% 633 10.1% 558
Other Asian countries(1) 8.4% 1,042 9.2% 324
Total Asia 2,065 1,272
Other countries 10.5% 368 10.7% 368
Total 31,724 29,986
(1) Integration of Lectra Korea, see note 2.28.
An identical valuation of the CGUs would result from application of a pre-tax discount rate to pre-tax cash fl ows. The following sensitivity calculations have been performed:
– a one percentage point rise in the discount rate; – a one percentage point decline relative to the revenue growth assumptions for each CGU used in the drawing up of the
2015-2017 plan; – a one percentage point decline in the gross profi t margin assumptions used in the drawing up the 2015-2017 plan; – a one percentage point decline in the long-term growth rate to infi nity (from 2% to 1%).
None of these sensitivity calculations would entail any impairment of goodwill.

129
NOTE 7 OTHER INTANGIBLE ASSETS
2013Management
information softwarePatents and trademarks Other Total
Gross value at January 1, 2013 19,755 2,095 1,117 22,968
External purchases 907 74 39 1,020
Internal developments 859 – – 859
Write-offs and disposals (321) – (1) (322)
Exchange rate differences (83) – (10) (94)
Gross value at December 31, 2013 21,117 2,169 1,145 24,431
Amortization at December 31, 2013 (17,129) (1,885) (1,014) (20,028)
Net value at December 31, 2013 3,988 284 131 4,403
2014Management
information softwarePatents and trademarks Other Total
Gross value at January 1, 2014 21,117 2,169 1,145 24,431
External purchases 857 49 – 906
Internal developments 992 – – 992
Write-offs and disposals (702) (309) (39) (1,050)
Exchange rate differences 91 – 10 102
Gross value at December 31, 2014 22,356 1,909 1,116 25,381
Amortization at December 31, 2014 (18,258) (1,676) (1,041) (20,975)
Net value at December 31, 2014 4,097 233 76 4,406
Changes in amortization:
2013Management
information softwarePatents and trademarks Other Total
Amortization at January 1, 2013 (15,916) (1,783) (996) (18,695)
Amortization charges (1,595) (102) (23) (1,720)
Amortization write-backs 323 – 2 324
Exchange rate differences 60 – 3 63
Amortization at December 31, 2013 (17,129) (1,885) (1,014) (20,028)
2014Management
information softwarePatents and trademarks Other Total
Amortization at January 1, 2014 (17,129) (1,885) (1,014) (20,028)
Amortization charges (1,765) (94) (21) (1,880)
Amortization write-backs 693 304 – 997
Exchange rate differences (57) – (6) (63)
Amortization at December 31, 2014 (18,258) (1,676) (1,041) (20,975)
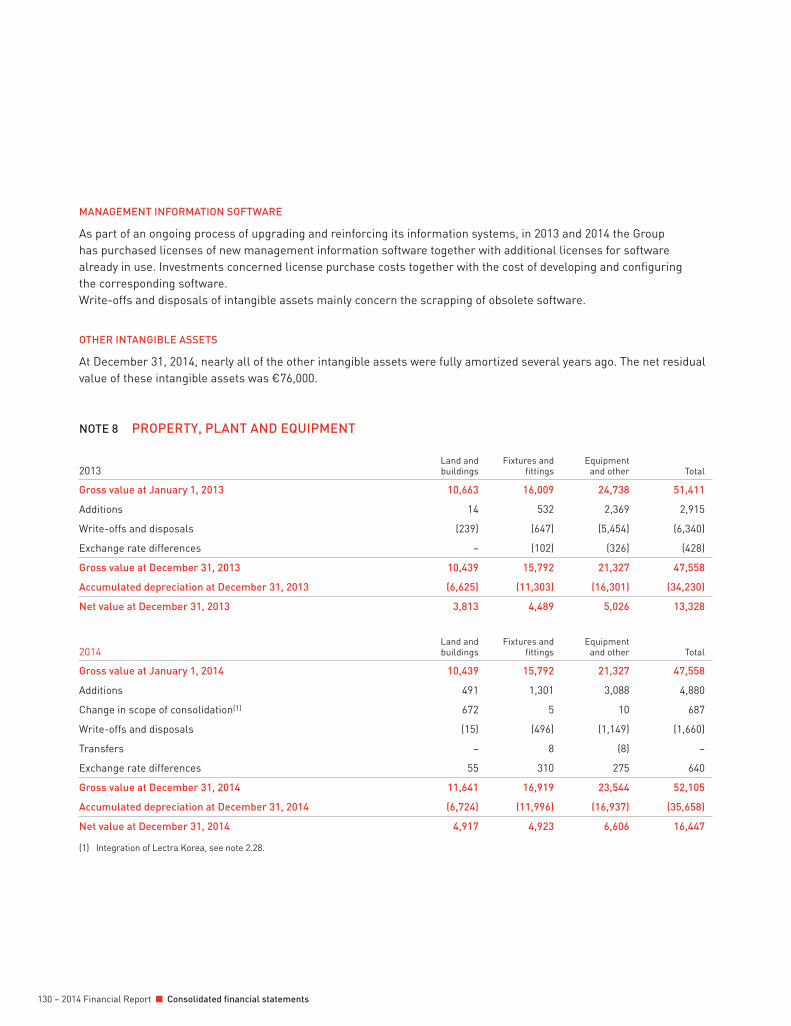
130 – 2014 Financial Report Consolidated financial statements
MANAGEMENT INFORMATION SOFTWARE
As part of an ongoing process of upgrading and reinforcing its information systems, in 2013 and 2014 the Group has purchased licenses of new management information software together with additional licenses for software already in use. Investments concerned license purchase costs together with the cost of developing and confi guring the corresponding software.Write-offs and disposals of intangible assets mainly concern the scrapping of obsolete software.
OTHER INTANGIBLE ASSETS
At December 31, 2014, nearly all of the other intangible assets were fully amortized several years ago. The net residual value of these intangible assets was €76,000.
NOTE 8 PROPERTY, PLANT AND EQUIPMENT
2013Land and buildings
Fixtures and fi ttings
Equipmentand other Total
Gross value at January 1, 2013 10,663 16,009 24,738 51,411
Additions 14 532 2,369 2,915
Write-offs and disposals (239) (647) (5,454) (6,340)
Exchange rate differences – (102) (326) (428)
Gross value at December 31, 2013 10,439 15,792 21,327 47,558
Accumulated depreciation at December 31, 2013 (6,625) (11,303) (16,301) (34,230)
Net value at December 31, 2013 3,813 4,489 5,026 13,328
2014Land and buildings
Fixtures and fi ttings
Equipmentand other Total
Gross value at January 1, 2014 10,439 15,792 21,327 47,558
Additions 491 1,301 3,088 4,880
Change in scope of consolidation(1) 672 5 10 687
Write-offs and disposals (15) (496) (1,149) (1,660)
Transfers – 8 (8) –
Exchange rate differences 55 310 275 640
Gross value at December 31, 2014 11,641 16,919 23,544 52,105
Accumulated depreciation at December 31, 2014 (6,724) (11,996) (16,937) (35,658)
Net value at December 31, 2014 4,917 4,923 6,606 16,447
(1) Integration of Lectra Korea, see note 2.28.
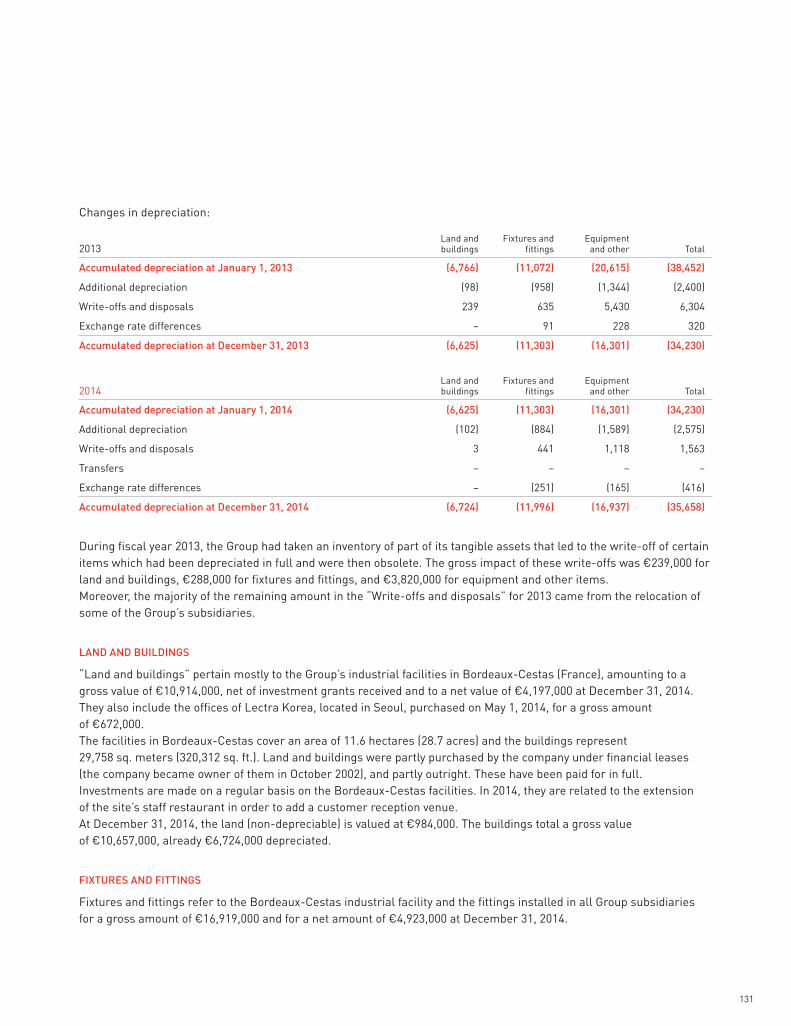
131
Changes in depreciation:
2013Land and buildings
Fixtures and fi ttings
Equipmentand other Total
Accumulated depreciation at January 1, 2013 (6,766) (11,072) (20,615) (38,452)
Additional depreciation (98) (958) (1,344) (2,400)
Write-offs and disposals 239 635 5,430 6,304
Exchange rate differences – 91 228 320
Accumulated depreciation at December 31, 2013 (6,625) (11,303) (16,301) (34,230)
2014Land and buildings
Fixtures and fi ttings
Equipmentand other Total
Accumulated depreciation at January 1, 2014 (6,625) (11,303) (16,301) (34,230)
Additional depreciation (102) (884) (1,589) (2,575)
Write-offs and disposals 3 441 1,118 1,563
Transfers – – – –
Exchange rate differences – (251) (165) (416)
Accumulated depreciation at December 31, 2014 (6,724) (11,996) (16,937) (35,658)
During fi scal year 2013, the Group had taken an inventory of part of its tangible assets that led to the write-off of certain items which had been depreciated in full and were then obsolete. The gross impact of these write-offs was €239,000 for land and buildings, €288,000 for fi xtures and fi ttings, and €3,820,000 for equipment and other items.Moreover, the majority of the remaining amount in the “Write-offs and disposals” for 2013 came from the relocation of some of the Group’s subsidiaries.
LAND AND BUILDINGS
“Land and buildings” pertain mostly to the Group’s industrial facilities in Bordeaux-Cestas (France), amounting to a gross value of €10,914,000, net of investment grants received and to a net value of €4,197,000 at December 31, 2014. They also include the offi ces of Lectra Korea, located in Seoul, purchased on May 1, 2014, for a gross amount of €672,000.The facilities in Bordeaux-Cestas cover an area of 11.6 hectares (28.7 acres) and the buildings represent 29,758 sq. meters (320,312 sq. ft.). Land and buildings were partly purchased by the company under fi nancial leases (the company became owner of them in October 2002), and partly outright. These have been paid for in full. Investments are made on a regular basis on the Bordeaux-Cestas facilities. In 2014, they are related to the extension of the site’s staff restaurant in order to add a customer reception venue.At December 31, 2014, the land (non-depreciable) is valued at €984,000. The buildings total a gross value of €10,657,000, already €6,724,000 depreciated.
FIXTURES AND FITTINGS
Fixtures and fi ttings refer to the Bordeaux-Cestas industrial facility and the fi ttings installed in all Group subsidiaries for a gross amount of €16,919,000 and for a net amount of €4,923,000 at December 31, 2014.

132 – 2014 Financial Report Consolidated financial statements
Investments have been made in fi xtures and fi ttings in 2013 (€532,000) and 2014 (€1,301,000) throughout the Group. In 2014, most of these are related to the Bordeaux-Cestas facilities, with the extension of the site’s staff restaurant in order to add a customer reception venue and the refurbishing of the International Advanced Technology & Conference Center. In 2013, most of the amount concerned the Group’s U.S. subsidiary, which relocated to new premises in Atlanta, as well as the Hong Kong subsidiary which also relocated.
EQUIPMENT AND OTHER
Other fi xed assets purchased in 2013 and 2014 mainly concerned computer equipment and manufacturing molds and tools for the Bordeaux-Cestas industrial facility, as well as, in 2013, new equipment for the new premises of the U.S. subsidiary.
NOTE 9 NON-CURRENT FINANCIAL ASSETS
2013Investments
in subsidiariesOther non-current
fi nancial assets Total
Gross value at January 1, 2013 2,559 972 3,530
Additions – 2,407 2,407
Disposals – (2,177) (2,177)
Exchange rate differences – (72) (72)
Gross value at December 31, 2013 2,559 1,130 3,689
Impairment provision at December 31, 2013 (1,567) – (1,567)
Net value at December 31, 2013 991 1,130 2,121
2014Investments
in subsidiariesOther non-current
fi nancial assets Total
Gross value at January 1, 2014 2,559 1,130 3,689
Additions – 2,547 2,547
Change in scope of consolidation(1) – 36 36
Disposals (308) (2,550) (2,859)
Exchange rate differences – 51 51
Gross value at December 31, 2014 2,251 1,213 3,463
Impairment provision at December 31, 2014 (1,415) – (1,415)
Net value at December 31, 2014 835 1,213 2,048
(1) Integration of Lectra Korea, see note 2.28.
INVESTMENTS IN SUBSIDIARIES
“Investments in subsidiaries” exclusively concern companies not included in the scope of consolidation. The disposal recorded in 2014 stems from the winding down the Cypriot subsidiary, which had had no business for years. All of the former subsidiary’s assets had been fully depreciated (mostly through a provision for liabilities, see note 21), this winding down had no impact on the Group’s income statement or cash.

133
At December 31, 2014, four sales and service subsidiaries were not consolidated, their revenues being immaterial both separately and in the aggregate. Most of these subsidiaries’ sales activity is billed directly by the parent company, Lectra SA (see note 10).
OTHER NON-CURRENT FINANCIAL ASSETS
“Other non-current fi nancial assets” at December 31, 2014 primarily consisted of deposits and guarantees for €909,000 (€824,000 at December 31, 2013), together with the amount (€304,000 at December 31, 2014) placed by the company at the disposal of Exane BNP Paribas, along with company shares under the Liquidity Agreement (see note 15.2).The cumulative amount of all transactions on treasury shares by Exane BNP Paribas under the Liquidity Agreement is shown in additions (in case of sales of shares) and disposals (in case of purchases of shares) of other non-current fi nancial assets (see note 15.2).The movements for the period also concern cash exchanged between the company and Exane BNP Paribas, under the Liquidity Agreement managed by the latter.
NOTE 10 RELATED-PARTY TRANSACTIONS
The amounts below refer to fi scal year 2014 or December 31, 2014, as applicable.
Type of transactionItems concerned in consolidated fi nancial statements
Non-consolidatedsubsidiaries concerned Amounts
Receivables(1) Trade accounts receivable Lectra Chile SA (Chile) 226
Lectra Philippines Inc. (Philippines) 364
Lectra Israel Ltd (Israel) 407
Payables(1) Trade payables and other current liabilities Lectra Singapore Pte Ltd (Singapore) (802)
Sales(2) Revenues Lectra Chile SA (Chile) 59
Lectra Israel Ltd (Israel) 30
Lectra Philippines Inc. (Philippines) 109
Commissions(2) Selling, general and administrative expenses Lectra Singapore Pte Ltd (Singapore) (187)
Lectra Philippines Inc. (Philippines) (39)
Personnel invoiced(2) Selling, general and administrative expenses Lectra Singapore Pte Ltd (Singapore) (675)
Fees(2) Selling, general and administrative expenses Lectra Singapore Pte Ltd (Singapore) (80)
(1) Amounts between brackets represent a liability in the statement of fi nancial position, absence of brackets an asset.(2) Amounts between brackets represent an expense for the year, absence of brackets an income for the year.
All of the parties concerned are non-consolidated subsidiaries acting either as agents or distributors of the company’s products in their respective countries. The transactions in question mainly concern purchases to the parent company for the purposes of their local operations or charges and commissions billed to the parent company in order to cover their overheads when they act as agents, as is generally the case with new systems sales.Transactions with the Board of Directors are limited to compensation details of which are provided in notes 28.6 and 28.7.

134 – 2014 Financial Report Consolidated financial statements
NOTE 11 TAXES
NOTE 11.1 TAX EXPENSE
2014 2013
Current tax income (expense) (5,355) (3,916)
Deferred tax income (expense) 312 (1,393)
Net tax income (expense) (5,043) (5,309)
The research tax credit (crédit d’impôt recherche) applicable in France is deducted from R&D expenses (see note 26). It amounts to €6,829,000 in 2014 (€6,346,000 in 2013), together with a €716,000 provision reversal, following the decision of the French Council of State (Conseil d’État, the supreme court for administrative justice), confi rming that profi t-sharing expenses could be incorporated in the annual calculation base (see note 14).The French competitiveness and employment tax credit (crédit d’impôt compétitivité et emploi) enacted in 2013, is shown as a deduction from the corresponding personnel expense (see note 28) and amounted to €825,000 in 2014 (€520,000 in 2013).These two tax credits are therefore not included in the net tax charge for the two fi scal years presented here.
NOTE 11.2 EFFECTIVE TAX RATE
2014 2013
Income before tax 19,396 27,084
Standard rate of corporate income tax in France 33.9% 33.4%
Expense at standard rate of corporate income tax in France (6,567) (9,056)
Effect of other countries’ different tax rates 570 678
Effect of reduction in unrecognized deferred tax assets (245) 2,312
Effect of tax credits(1) 2,924 2,328
Effect of CVAE(2) (707) (640)
Effect of other non taxable income and non deductible expenses(3) (423) (796)
Others (597) (135)
Net tax income / (expense) (5,043) (5,309)
Consolidated effective tax rate 26.0% 19.6%
(1) This mainly includes the non taxation of the research tax credit and the competitiveness and employment tax credit, included in the income before tax.(2) The “cotisation sur la valeur ajoutée des entreprises” (CVAE – tax on corporate added value) in France satisfi es the defi nition of an income tax as set forth in
IAS 12.2.(3) This mainly corresponds to income or expenses for the year that will never be subject to taxation or tax deduction, including in particular the neutralization
for tax purposes of some consolidation entries.
The net income tax expense in 2013 included the reduction of unrecognized deferred tax assets of the Spanish subsidiary for an amount of €2,238,000. The end of the litigation with Induyco and the receipt the remaining €11,100,000 outstanding allowed for a full recognition of the remaining deferred tax assets of the subsidiary.

135
NOTE 11.3 DEFERRED TAXES
Owing to uncertainty over the future profi t-earning capacity of some subsidiaries, all or part of their tax losses and other deferred tax assets on timing differences are not recognized as deferred tax assets. The Group considers fi ve years to be a reasonable period for the utilization of tax losses. Beyond that period, because forecasts of activity levels being deemed insuffi ciently reliable, the portion of their bases not expected to be utilized in the next fi ve years is not recognized. Forecasts made in order to determine the timetable for the utilization of deferred tax losses, based on assumptions consistent with those used in the impairment tests, were established on the basis of a Group three-year plan, extrapolated to fi ve years, subject to annual review, with variants according to the strategic objectives of each of the subsidiaries concerned and allowing for the cyclical diffi culties and macroeconomic environment in which it operates.At December 31, 2014, unrecognized deferred tax assets totaled €5,086,000, compared with €4,299,000 at December 31, 2013. The U.S. subsidiary accounted for the bulk of this fi gure, as its deferred tax assets have been partially recognized and its tax losses can be deferred for twenty years, pushing back the most distant deadlines for utilization to 2029. In 2013, the end of the litigation against Induyco and the receipt of the €11.1 million due allowed for full recognition in 2013 of the remaining deferred tax assets of the Spanish subsidiary.The share of deferred taxes directly recognized in equity for the year worked out to a positive €348,000 mostly corresponding to the tax effect of actuarial gains and losses on retirement benefi t obligations booking (€192,000 in 2013).
Deferred taxes are listed below according to the type of timing difference:
2012P&L
impactEquity
impactTranslation
adjustments 2013
Tax losses carry-forward 3,955 (2,050) – (73) 1,832
Depreciation/amortization of tangible and intangible assets 299 (114) – 12 197
Impairment of accounts receivable 654 71 – (7) 718
Write-down of inventories 1,159 84 – (169) 1,074
Other timing differences 2,722 616 192 (180) 3,350
Total 8,791 (1,393) 192 (417) 7,171
2013P&L
impactEquity
impactTranslation
adjustments 2014
Tax losses carry-forward 1,832 17 – 97 1,945
Depreciation/amortization of tangible and intangible assets 197 (110) – (38) 50
Impairment of accounts receivable 718 (63) – 11 667
Write-down of inventories 1,074 288 37 228 1,627
Financial instruments – 164 – (164) –
Other timing differences 3,350 16 311 118 3,795
Total 7,171 312 348 252 8,084

136 – 2014 Financial Report Consolidated financial statements
NOTE 11.4 SCHEDULE OF RECOGNIZED TAX LOSSES CARRY-FORWARDS
Expiration date
TotalUntil 2015Between 2016
and 2020 Beyond 2020
Deferred tax assets on tax losses(1) 40 289 1,616 1,945
(1) The above expiration date corresponds to the maximum period of utilization. Recognized deferred tax assets are expected to be utilized within a period of between one and fi ve years.
NOTE 12 INVENTORIES
2014 2013
Raw materials 22,441 22,660
Finished goods and work-in-progress(1) 7,024 6,052
Inventories, gross value 29,465 28,712
Raw materials (4,913) (5,776)
Finished goods and work-in-progress(1) (2,703) (2,187)
Write-downs (7,617) (7,963)
Raw materials 17,528 16,884
Finished goods and work-in-progress(1) 4,321 3,865
Inventories, net value 21,848 20,748
(1) Including demonstration and second-hand equipment.
€935,000 of inventory fully written-down was scrapped in the course of 2014 (€901,000 in 2013), thereby diminishing the gross value and write-downs by the same amount. Inventory write-downs charged for the year amounted to €2,290,000 (€2,008,000 in 2013). Reversals of previous write-downs relating to sales transactions amounted to €1,731,000 (€647,000 in 2013), booked against the charges for the period.
NOTE 13 TRADE ACCOUNTS RECEIVABLE
2014 2013
Trade accounts receivable, gross value 55,350 55,340
Provision for impairment (4,819) (5,071)
Trade accounts receivable, net value 50,531 50,269
Trade receivables at December 31, 2014 include €48,096,000, excluding taxes, on recurring contracts, other services and equipment billed in advance for 2015 (compared with €43,008,000, excluding taxes, at December 31, 2013 in respect of 2014). An identical amount is recorded in “Deferred revenues” (see note 20). Payments on recurring contracts generally become due on the fi rst day of the period covered by them. The Group endeavors to bill as many of them as possible in advance, in order to optimize collection.

137
Thus, at December 31, 2014, trade accounts receivables, net from deferred revenues, amount to €2,435,000 (€7,261,000 at December 31, 2013). The decrease illustrates an improvement in cash collection times.
The Group recognizes an impairment charge on trade accounts in light of an individual analysis of overdue accounts receivable. Changes in impairment charges are analyzed below:
2014 2013
Provisions at January 1 (5,071) (5,730)
Additional provision (2,002) (2,109)
Write-back of provisions no longer required 114 195
Write-back of provisions on receivables paid 899 941
Write-back of provisions on irrecoverable receivables written-off 1,291 1,602
Exchange rate differences (50) 30
Provisions at December 31 (4,819) (5,071)
Changes in provisions for impairment of accounts receivable and related accounts, net of irrecoverable receivables, are recognized under “Selling, general and administrative expenses” in the income statement, on the line “Net provisions” (see note 27).
Schedule of gross receivables by maturity:
2014 2013
Receivables not yet due 43,699 43,290
Receivables due, of which due in: 11,651 12,050
– less than 1 month 3,301 3,098
– 1-3 months 1,930 1,788
– more than 3 months 6,420 7,164
Total 55,350 55,340
Almost all of the provisions of accounts receivable and related accounts amounting to €4,819,000 at December 31, 2014 concerned accounts more than three months overdue.
NOTE 14 OTHER CURRENT ASSETS
2014 2013
Research tax credit and employment and competitiveness tax credit 23,046 22,294
Discount effect on research tax credit receivable (23) (182)
Other tax receivables 2,689 1,783
Income tax down-payments 2,349 1,470
Staff and social security receivables 251 236
Other current assets 3,838 3,398
Total other current assets 32,149 28,999

138 – 2014 Financial Report Consolidated financial statements
RESEARCH TAX CREDIT – COMPETITIVENESS AND EMPLOYMENT TAX CREDIT
It should be noted that, when the research tax credit and the competitiveness and employment tax credit recognized in the year cannot be charged against income tax, they are treated as a receivable on the French tax administration (Trésor public). If unused in the ensuing three years, it is repaid in the course of the fourth year.At December 31, 2014, the company held a receivable of €23,046,000 on the French tax administration. The company had until then deducted the most aged (2010) receivable relating to the research tax credit from its corporate income tax.However, as the company learnt in October 2014 when it was reimbursed for its 2010 research tax credit, the French tax administration operates in a different way, deducting the tax credit from the corporate income tax of the same fi scal year. Thus, and since no corporate income tax was recorded for 2010, the company received the reimbursement in full of the research tax credit recognized in 2010 (€5,729,000).According to this rule, the €23,046,000 receivable held on the French tax administration at December 31, 2014, now comprises:
– the remaining amount of the research tax credit, after deduction of the corporate income tax due by Lectra SA in the same year, for 2014 (€5,724,000), 2013 (€6,083,000), 2012 (€5,082,000) and 2011 (€4,812,000);
– the competitiveness and employment tax credit accounted for and not used in 2014 (€825,000) and 2013 (€520,000).Furthermore, the company incorporated profi t-sharing expenses in the annual calculation base for the research tax credit it accounted for. Due to the French tax administration’s position in questioning the eligibility of such expenses, the company had booked, for the relevant years (2010 to 2013), a provision equal to the part of the annual research tax credit calculated on these bases. In its decision of March 12, 2014, the French Council of State (Conseil d’État, the supreme court for administrative justice), confi rmed that the said expenses were eligible for the fi scal years in question, thus rejecting the French tax administration’s position adopted until then. As a result, the company reversed in the fi rst quarter of 2014 the previously booked €716,000 provision. This amount has no impact on the receivable booked, since it did not include this provision.In light of its estimates of tax credits and corporate income tax for the next three fi scal years, the company does not expect to make any payment in respect of corporate income tax, which will be deducted in full from the research tax credit and the competitiveness and employment tax credit, if any, of each fi scal year. It therefore expects to receive reimbursement of the balance outstanding of these tax credits not deducted as follows: in 2015 (in respect of the 2011 tax credit), 2016 (in respect of the 2012 tax credit), 2017 (in respect of the 2013 tax credits) and 2018 (in respect of the 2014 tax credits). This situation will last for as long as the amount of the annual tax credits exceeds the amount of income tax payable.If the income tax expense were to rise above the amounts of tax credits for the year, the company would continue not to pay the corporate income tax until deduction of the corresponding receivable in full. Thereafter it would deduct these tax credits each year from the income tax expense for the same year in full and would be required to pay the residual amount.
OTHER TAX RECEIVABLES
Other tax receivables at December 31, 2014 comprised the recoverable value-added tax for parent company and its subsidiaries.
OTHER CURRENT ASSETS
Other current assets comprise prepaid rental expenses, insurance premiums and equipment rental charges.

139
NOTE 15 SHAREHOLDERS’ EQUITY
NOTE 15.1 SHARE CAPITAL AND SHARE PREMIUM
The share capital at December 31, 2014 totaled €30,329,114, divided into 30,329,114 shares with a par value of €1.00. It was €29,664,415, divided into 29,664,415 shares with a par value of €1.00, at December 31, 2013.Share capital has increased by 664,699 shares since January 1, 2014, resulting from the exercise of stock options, that is, an increase of €2,904,000 of share capital together with total share premium (issuance of 716,100 shares in 2013). Apart from the authority to increase the capital granted by the Shareholders’ Meeting within the framework of the granting of stock options to senior managers and employees, there is no other authorization outstanding such as to alter the number of shares comprising the share capital. The tables below provide details of changes in the number of shares, the capital and additional paid-in capital and merger premiums in fi scal 2014 and 2013.
Note 15.1.1 Share Capital
2014 2013
Number of shares
Share capital(in euros)
Number of shares
Share capital(in euros)
Share capital at January 1 29,664,415 29,664,415 28,948,315 28,948,315
Stock options exercised 664,699 664,699 716,100 716,100
Share capital at December 31 30,329,114 30,329,114 29,664,415 29,664,415
The shares comprising the capital are fully paid up.
Note 15.1.2 Share Premium
2014 2013
Share premium at January 1 5,043 2,600
Stock options exercised 2,239 2,443
Share premium at December 31 7,282 5,043
NOTE 15.2 TREASURY SHARES
The General Meeting of Shareholders on April 30, 2014 renewed the existing share buyback program authorizing the Board of Directors to buy and sell company shares. The purpose of this program is solely to maintain liquidity in the market of the company’s shares, via an authorized investment services provider acting within the framework of a liquidity agreement in compliance with the Charter of Ethics of the French Association of Investment Companies (AFEI) or any other charter recognized by the French Financial Markets Authority (AMF).Since May 21, 2012, Lectra has contracted with Exane BNP Paribas to act as liquidity provider under a Liquidity Agreement, signed in accordance with the Charter of Ethics of the Association Française des Marchés Financiers (AMAFI) recognized by the AMF.The resources allocated to the previous contract have been allocated to the liquidity account under this new Liquidity Agreement (147,730 Lectra shares and €14,000 in cash, representing an equivalent value of around €635,000). Lectra may increase the resources allocated, if necessary, by contributing up to €1,000,000 (with a maximum corresponding to the market value of 150,000 Lectra shares).

140 – 2014 Financial Report Consolidated financial statements
At December 31, 2014, the company held 14,932 shares, i.e. 0.05% of its capital within the framework of the Liquidity Agreement (compared with 0.04% at December 31, 2013) for a total of €133,000 (compared with €83,000 at December 31, 2013) representing an average purchase price of €8.91 per share, which has been deducted from shareholders’ equity. The company holds no treasury shares outside the framework of the Liquidity Agreement.
2014 2013
Number of shares Amount
Average price per share
(in euros)Number of
shares Amount
Average price per share
(in euros)
Treasury shares at January 1 (historical cost) 10,408 (83) 8.01 84,284 (380) 4.51
Liquidity agreement
Purchases (at purchase price) 302,206 (2,403) 7.95 233,215 (1,389) 5.96
Sales (at sale price) (297,682) 2,401 8.07 (307,091) 1,827 5.95
Net cash fl ow(1) 4,524 (2) (73,876) 438
Gains (losses) on disposals 48 141
Treasury shares at December 31 (historical cost) 14,932 (133) 8.91 10,408 (83) 8.01
(1) A negative fi gure corresponds to a net outfl ow refl ecting purchases and sales of its own shares by the company.
NOTE 15.3 VOTING RIGHTS
Voting rights are proportional to the capital represented by stock held.However, double voting rights, subject to certain conditions, existed until May 3, 2001.The Extraordinary Meeting of Shareholders of May 3, 2001 had decided that shares registered after May 15, 2001, together with shares purchased after that date, are not eligible for double voting rights (with the exception of special cases covered by the corresponding resolution submitted to the said Extraordinary Meeting). At their own initiative, André Harari, Chairman of the Board of Directors, and Daniel Harari, Chief Executive Offi cer, had canceled at that time the double voting rights attached to the shares they held.The Board of Directors called an Extraordinary Shareholders’ Meeting on September 26, 2014 to approve the amendments and simplifi cations to the company bylaws, regarding in particular maintenance of the principle of one share, one vote following the entry into force of the French March 29, 2014 Act (Law no. 2014-384, the “Florange Act”), reversing the principle that held until now, by providing that shares of listed companies registered for at least two years in the name of the same shareholder will henceforward enjoy double voting rights, except where otherwise provided in company bylaws adopted after the promulgation of the law.As recommended by the Board of Directors, the Extraordinary Shareholders’ Meeting of September 26, 2014 approved almost unanimously (99%) the principle of one share, one vote, departing from the new law and amending the company bylaws in consequence.As a result, at December 31, 2014, 29,958,002 shares qualifi ed for normal voting rights, and only 371,112 (i.e. 1.2% of the share capital) for double voting rights. Moreover, no other shares could potentially qualify for double voting rights at some future date.At December 31, 2014, the theoretical total number of voting rights attached to the company’s shares was 30,700,226. This number has been reduced to 30,685,294 due to the fact that no voting rights are attached to treasury shares (under the Liquidity Agreement).

141
NOTE 15.4 STATUTORY THRESHOLDS
Other than the legal notifi cation requirements for crossing the thresholds established by French law, there is no special statutory obligation.
NOTE 15.5 STOCK OPTION PLANS
At December 31, 2014, 201 employees were the benefi ciaries of 2,060,074 options and 37 former employees still held 61,363 options; altogether, 238 persons were benefi ciaries of options (respectively 182, 28 and 210 at December 31, 2013). At the same date, the maximum number of shares comprising the share capital, including potential new shares liable to be issued via the exercise of existing rights qualifying for subscription to new shares was 32,450,551, made up as follows:
– share capital: 30,329,114 shares; – stock options: 2,121,437 options.
Each option entitles the holder to purchase one new share with a par value of €1.00 at the exercise price set by the Board of Directors on the grant date (adjusted for the effect of the public stock buyback tender offer carried out in May 2007, if applicable). If all of the options outstanding were exercised — regardless of whether the benefi ciary’s options are vested or not yet vested — and regardless of their exercise price relative to their market price at December 31, 2014, the share capital would increase by €2,121,437, together with a total issue premium of €10,190,814. None of the parent company’s subsidiary has set up a stock option or share purchase plan.Annual option plans are granted by the Board of Directors at least twenty trading days after the dividend approved by the annual Meeting of Shareholders is made payable, or thirty to forty-fi ve calendar dates after the Meeting if no dividend is declared, i.e. around June 10.The share exercise price is set on the date of granting of the options, at a price in no circumstances less than the average opening price of the share listed for the twenty trading sessions prior to the date of granting of options by the Board of Directors.IFRS 2 requires companies to expense the value of the benefi t granted to the benefi ciaries of stock options.Fair value of stock options granted in 2014 and 2013 was measured at grant date by means of the Black & Scholes method, using the following assumptions:
2014 2013
Exercise price (in euros) 8.50 6.25
Share price on the date of allocation (in euros) 7.80 5.14
Risk-free interest rate 1.84% 1.81%
Dividend payout rate 2.82% 4.28%
Volatility(1) 17.70% 17.60%
Duration of options 4 years 4 years
Fair value of one option (in euros) 0.64 0.20
(1) Expected volatility is calculated on the basis of the observed historical volatility of the company’s shares.
Volatility is calculated on the basis of the observed historical volatility of the company’s share price over a time frame corresponding to the vesting period. This calculation ignores peaks resulting from exceptional events.Fair value of the options granted on June 16, 2014 amounts to €440,000.An expense of €136,000 is recognized in the 2014 fi nancial statements, including €72,000 in respect of the grants made in 2014, and €64,000 in respect of options granted previously. Charges for the year are recognized under personnel expenses.

142 – 2014 Financial Report Consolidated financial statements
Plans in force at December 31, 2014 will impact the years 2015, 2016 and 2017 alone in the estimated amounts of €67,000, €27,000 and €9,000 respectively.The Group paid a €83,000 employer’s contribution based on the fair value of the options granted in 2014, fully expensed in personnel costs for 2014.
Note 15.5.1 Stock Options Outstanding: Options Granted, Exercised and Canceled During the Period
2014 2013
Number of stock options
Average exercise price
(in euros)Number of
stock options
Average exercise price
(in euros)
Stock options outstanding at January 1 2,557,443 5.10 3,039,225 4.83
Stock options granted during the year 687,656 8.50 836,000 6.25
Stock options exercised during the year (664,699) 4.37 (716,100) 4.41
Stock options expired/cancelled during the year (458,963) 8.03 (601,682) 6.13
Stock options outstanding at December 31 2,121,437 5.80 2,557,443 5.10
– of which fully vested 1,620,335 5.35 1,939,750 4.74
– for which exercise rights remain to be acquired 501,102 7.29 617,693 6.25
For plans in force at December 31, 2014, the terms relating to the vesting of options are determined on an annual basis over a period of four years since January 1 of the year they are granted, and depend on whether the benefi ciary was a Group employee at December 31 of the elapsed fi scal year.The 687,656 options granted on June 16, 2014 under the 2014 option plan (see note 15.5.6) to 145 benefi ciaries in respect of the fulfi llment of their 2014 performance targets and the 2013 Lectra Worldwide Championship corresponded to a maximum number, which was reduced to 307,648 and 143 benefi ciaries on December 31, 2014. 377,884 options have ceased to be valid after closing of the Group’s 2014 consolidated fi nancial statements due to non-fulfi llment of 2014 targets, and 2,124 due to two benefi ciaries’ departure from the Group.Moreover, 78,955 options granted prior to 2014 ceased to be valid.
Note 15.5.2 Breakdown of Stock Options Outstanding at December 31, 2014, by Category of Benefi ciaries
2014
Number of benefi ciaries
Number of stock options %
Of whichfully vested
Of which exercise
rights remainto be acquired
Executive Directors and other members of the Executive Committee(1) 3 742,409 35% 607,218 135,191
Group management 49 702,358 33% 524,690 177,668
Other employees 149 615,307 29% 427,064 188,243
Persons having left the company and still holding unexercised options 37 61,363 3% 61,363 –
Total 238 2,121,437 100% 1,620,335 501,102
(1) The only three benefi ciaries are Jérôme Viala, Chief Financial Offi cer, Véronique Zoccoletto, Chief Human Capital and Information Offi cer and Édouard Maquin, Executive Vice President, Sales, members of the Executive Committee. André Harari, Chairman of the Board of Directors, and Daniel Harari, Chief Executive Offi cer do not hold any options.
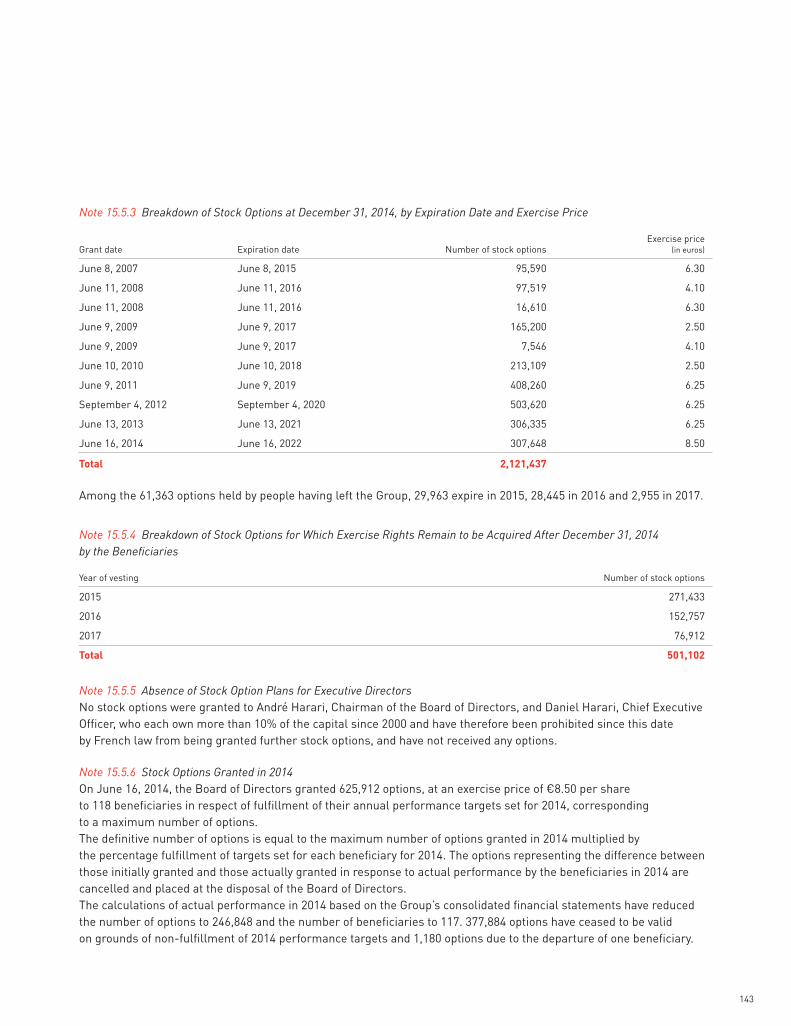
143
Note 15.5.3 Breakdown of Stock Options at December 31, 2014, by Expiration Date and Exercise Price
Grant date Expiration date Number of stock optionsExercise price
(in euros)
June 8, 2007 June 8, 2015 95,590 6.30
June 11, 2008 June 11, 2016 97,519 4.10
June 11, 2008 June 11, 2016 16,610 6.30
June 9, 2009 June 9, 2017 165,200 2.50
June 9, 2009 June 9, 2017 7,546 4.10
June 10, 2010 June 10, 2018 213,109 2.50
June 9, 2011 June 9, 2019 408,260 6.25
September 4, 2012 September 4, 2020 503,620 6.25
June 13, 2013 June 13, 2021 306,335 6.25
June 16, 2014 June 16, 2022 307,648 8.50
Total 2,121,437
Among the 61,363 options held by people having left the Group, 29,963 expire in 2015, 28,445 in 2016 and 2,955 in 2017.
Note 15.5.4 Breakdown of Stock Options for Which Exercise Rights Remain to be Acquired After December 31, 2014 by the Benefi ciaries
Year of vesting Number of stock options
2015 271,433
2016 152,757
2017 76,912
Total 501,102
Note 15.5.5 Absence of Stock Option Plans for Executive DirectorsNo stock options were granted to André Harari, Chairman of the Board of Directors, and Daniel Harari, Chief Executive Offi cer, who each own more than 10% of the capital since 2000 and have therefore been prohibited since this date by French law from being granted further stock options, and have not received any options.
Note 15.5.6 Stock Options Granted in 2014On June 16, 2014, the Board of Directors granted 625,912 options, at an exercise price of €8.50 per share to 118 benefi ciaries in respect of fulfi llment of their annual performance targets set for 2014, corresponding to a maximum number of options.The defi nitive number of options is equal to the maximum number of options granted in 2014 multiplied by the percentage fulfi llment of targets set for each benefi ciary for 2014. The options representing the difference between those initially granted and those actually granted in response to actual performance by the benefi ciaries in 2014 are cancelled and placed at the disposal of the Board of Directors.The calculations of actual performance in 2014 based on the Group’s consolidated fi nancial statements have reduced the number of options to 246,848 and the number of benefi ciaries to 117. 377,884 options have ceased to be valid on grounds of non-fulfi llment of 2014 performance targets and 1,180 options due to the departure of one benefi ciary.

144 – 2014 Financial Report Consolidated financial statements
The Board of Directors also granted 61,744 options at an exercise price of €8.50 per option to 43 winners of the 2013 Lectra Worldwide Championship, of which 944 options ceased to be valid due to the departure of two benefi ciaries.Altogether, the Board of Directors thus granted a maximum of 687,656 options to 145 benefi ciaries, reduced to 307,648 options and 143 benefi ciaries, in respect of the 2014 stock option plan. The 10 Group employees who are not executive corporate offi cers and to whom the largest number of options was granted in the course of fi scal 2014 were granted a total of 117,588 options.All of the options granted concerned Group employees.These options vest over a period of four years from January 1, 2014 and are conditional upon the benefi ciary’s presence in the Group at the end of each annual period (the benefi ciary being required to retain links with the company or with one of its affi liates in the form of an employment contract or as an executive director). The options are subject to a four-year lock-up period applicable to all the benefi ciaries of these plans.They are valid for a period of eight years from the date of granting.
Note 15.5.7 Stock Options Exercised in 2014664,699 options pertaining to the different options plans in force at December 31, 2013 were exercised in 2014.
2014
Grant date Number of stock options exercised Exercise price (in euros)
May 23, 2006 85,153 5.63
June 8, 2007 186,265 6.30
June 11, 2008 76,574 4.10
June 11, 2008 33,686 6.30
June 9, 2009 62,900 2.50
June 9, 2009 10,629 4.10
June 10, 2010 209,492 2.50
Total 664,699 4.37
NOTE 16 CURRENCY TRANSLATION ADJUSTMENT
Analysis of changes recorded in 2014 and 2013:
2014 2013
Cumulative translation adjustment at January 1 (8,721) (8,840)
Differences on translation of subsidiaries’ income statements 236 355
Adjustment required to maintain subsidiaries’ retained earning at historical exchange rate 479 389
Other movements (497) (625)
Cumulative translation adjustment at December 31 (8,503) (8,721)

145
NOTE 17 RETIREMENT BENEFIT OBLIGATIONS
Retirement benefi t obligations correspond to lump-sum amounts payable under defi ned benefi t plans. These lump-sum amounts are generally paid at the time of retirement, but they may also be paid upon resignation or dismissal, depending on local legislation. The two executive directors (dirigeants mandataires sociaux) are not benefi ciaries of any defi ned benefi t retirement plans.These obligations apply mainly in France, in Italy and Japan, as detailed below:
2013 France Italy Japan Taiwan Others Total
Retirement benefi ts at January 1, 2013 4,254 1,412 884 118 204 6,872
Expense/(income) of the year 373 44 113 9 37 576
Benefi ts paid (77) (146) (75) – (46) (344)
Contributions paid – – – (21) – (21)
Actuarial losses (gains) 444 15 86 4 25 574
Exchange rate differences – – (203) (8) (27) (238)
Retirement benefi ts at December 31, 2013 4,994 1,325 805 102 193 7,419
2014 France Italy Japan Taiwan Others Total
Retirement benefi ts at January 1, 2014 4,994 1,325 805 102 193 7,419
Expense/(income) of the year 457 36 101 12 41 647
Benefi ts paid – (351) (137) – (48) (536)
Contributions paid – – – (27) – (27)
Actuarial losses (gains) 874 133 (85) 8 30 960
Exchange rate differences – – 1 7 8 16
Retirement benefi ts at December 31, 2014 6,325 1,143 685 102 224 8,479
Actuarial losses generating an increase of the obligation in France come from the sharp fall in discount rates used, from 3.28% to 1.80%.
Breakdown of net annual charge:
2013 France Italy Japan Taiwan Others Total
Service cost provided in the year 227 – 99 7 21 354
Past service cost – – – – – –
Net interest cost 146 44 14 2 16 222
Expense/(income) of the year 373 44 113 9 37 576
2014 France Italy Japan Taiwan Others Total
Service cost provided in the year 284 – 92 10 20 406
Past service cost – – – – 7 7
Net interest cost 173 36 9 2 14 234
Expense/(income) of the year 457 36 101 12 41 647

146 – 2014 Financial Report Consolidated financial statements
Main actuarial assumptions used:
France Italy Japan Taiwan
Discount rate 1.80% 1.75% 0.60% 1.80%
Average rate of salary increase, including infl ation 2.24% 3.00% 2.24% 2.00%
Personnel turnover rate 1.49% / 6.13% 5.00% 3.49% 8.70%
The discount rate used is determined by reference to the yield the date of measurement on investment-grade corporate bonds with a maturity corresponding to the duration of the obligation. For the Eurozone, the discount rate used is determined by reference to the iBoxx rates.The personnel turnover rate was calculated via a table based on age group. For France, the personnel turnover rate for employees under 50 years of age was 1.49% for non-managerial grade personnel, and 6.13% for managerial grade personnel. It was 0% over 50 years of age.
NOTE 18 BORROWINGS AND FINANCIAL DEBTS
NOTE 18.1 NET CASH
2014 2013
Cash and cash equivalents 43,484 29,534
Borrowings and fi nancial debts (394) (894)
Net cash 43,090 28,640
The major part of cash is invested in interest-bearing sight accounts.
NOTE 18.2 BORROWINGS BY CATEGORY AND BY MATURITY
At December 31, 2014, the Group’s borrowings consisted solely of the remaining part of advances corresponding to public grants to fi nance R&D programs (see note 18.2.2), repayable on March 31, 2015, for €394,000.
Note 18.2.1 Medium-Term Bank LoanIn 2007, the company contracted a €48,000,000 medium-term bank loan from Société Générale and Natixis in order to fi nance the public stock buyback tender offer for 20% of the company’s share capital, carried out in May 2007, at a price of €6.75 per share. On March 31, 2013, the company repaid the balance outstanding, in advance of schedule and at its own initiative, the amount of €5,360,000, following receipt, on March 7, of the balance of €11,124,000 in damages remaining due to Lectra from El Corte Inglés (see note 23.2).
Note 18.2.2 Repayable AdvancesThe Group had received, between 2007 and 2010, a €2,000,000 repayable advance from OSEO Innovation, a French public body, to aid one of the company’s R&D programs. This advance bearing no interest was progressively repayable subject to the success and profi tability of the corresponding project.

147
NOTE 18.3 FINANCIAL INSTRUMENTS: INTEREST RATE HEDGES
Since the Group no longer has fi nancial debts, it is not exposed to interest-rate risk.
NOTE 18.4 ANALYSIS OF FINANCIAL BORROWINGS BY TYPE OF INTEREST RATE AND CURRENCY
At December 31, 2014, all fi nancial borrowings were in euro and bore no interest.Thus, fi nancial borrowings are not sensitive to currency variations or interest rates.
NOTE 18.5 FINANCIAL INSTRUMENTS: CURRENCY HEDGES
The Group mainly uses forward sales and purchases of currencies to hedge its foreign currency balance sheet positions at the end of each month. The main currencies commonly concerned are the U.S. dollar, the Hong Kong dollar, the Canadian dollar, the Taiwanese dollar, the Japanese yen, the Moroccan dirham, the Romanian leu and the British pound.Forward transactions entered into by the company to hedge signifi cant balance sheet currency positions at December 31, 2014 and 2013 are analyzed below:
2014 2013
In foreign currency
(in thousands)(1)
Fair value (in thousands
of euros)(2)Difference in value(3) Expiration date
In foreign currency
(in thousands)(1)
Fair value (in thousands
of euros)(2)Difference in value(3) Expiration date
USD 8,034 6,618 (61) January 6, 2015 4,936 3,579 41 January 6, 2014
CAD 1,773 1,261 (15) January 6, 2015 1,592 1,085 (1) January 6, 2014
GBP (1,596) (2,050) 21 January 6, 2015 (1,971) (2,364) 1 January 6, 2014
HKD 16,767 1,781 (20) January 6, 2015 9,645 902 7 January 6, 2014
JPY (75,608) (521) 3 January 6, 2015 (112,942) (780) (14) January 6, 2014
MAD 14,909 1,359 (7) January 6, 2015 11,372 1,013 – January 6, 2014
RON (192) (43) – January 6, 2015 (7,570) (1,693) 4 January 6, 2014
RUB – – – – 66,541 1,468 4 January 9, 2014
Other currencies na (806) 6 January 6 and 7, 2015 na (1,314) 1 January 6 and 7, 2014
Total 7,599 (73) 1,896 43
(1) For each currency, net balance of forward sales and (purchases) against euros.(2) Equivalent value of forward contracts is calculated by dividing the amounts in local currencies hedged by the closing rate. (3) Difference in value refl ects the difference between historical equivalent value and equivalent value at closing price of the forward contracts.
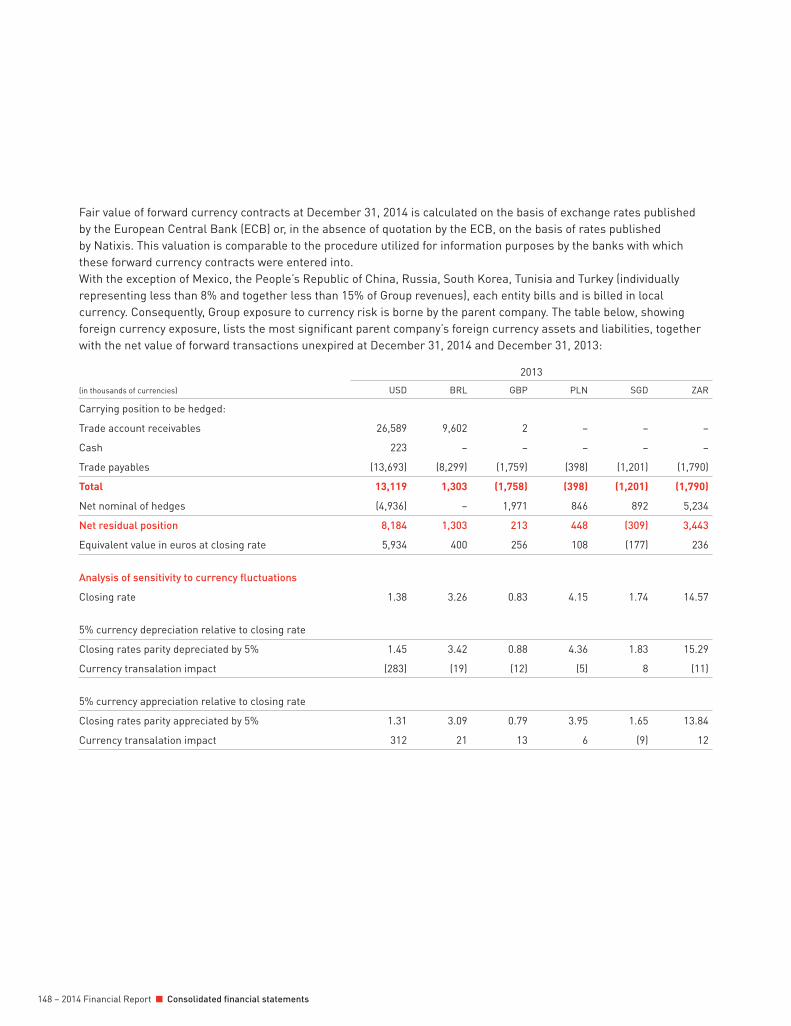
148 – 2014 Financial Report Consolidated financial statements
Fair value of forward currency contracts at December 31, 2014 is calculated on the basis of exchange rates published by the European Central Bank (ECB) or, in the absence of quotation by the ECB, on the basis of rates published by Natixis. This valuation is comparable to the procedure utilized for information purposes by the banks with which these forward currency contracts were entered into.With the exception of Mexico, the People’s Republic of China, Russia, South Korea, Tunisia and Turkey (individually representing less than 8% and together less than 15% of Group revenues), each entity bills and is billed in local currency. Consequently, Group exposure to currency risk is borne by the parent company. The table below, showing foreign currency exposure, lists the most signifi cant parent company’s foreign currency assets and liabilities, together with the net value of forward transactions unexpired at December 31, 2014 and December 31, 2013:
(in thousands of currencies)
2013
USD BRL GBP PLN SGD ZAR
Carrying position to be hedged:
Trade account receivables 26,589 9,602 2 – – –
Cash 223 – – – – –
Trade payables (13,693) (8,299) (1,759) (398) (1,201) (1,790)
Total 13,119 1,303 (1,758) (398) (1,201) (1,790)
Net nominal of hedges (4,936) – 1,971 846 892 5,234
Net residual position 8,184 1,303 213 448 (309) 3,443
Equivalent value in euros at closing rate 5,934 400 256 108 (177) 236
Analysis of sensitivity to currency fl uctuations
Closing rate 1.38 3.26 0.83 4.15 1.74 14.57
5% currency depreciation relative to closing rate
Closing rates parity depreciated by 5% 1.45 3.42 0.88 4.36 1.83 15.29
Currency transalation impact (283) (19) (12) (5) 8 (11)
5% currency appreciation relative to closing rate
Closing rates parity appreciated by 5% 1.31 3.09 0.79 3.95 1.65 13.84
Currency transalation impact 312 21 13 6 (9) 12

149
(in thousands of currencies)
2014
USD BRL GBP PLN SGD ZAR
Carrying position to be hedged:
Trade account receivables 22,456 13,146 (2) 873 – 479
Cash 64 – – – – –
Trade payables (12,894) (9,725) (2,049) (456) (1,272) (1,441)
Total 9,627 3,421 (2,051) 417 (1,272) (962)
Net nominal of hedges (8,034) – 1,596 (412) 1,146 1,108
Net residual position 1,592 3,421 (455) 5 (126) 145
Equivalent value in euros at closing rate 1,312 1,062 (584) 1 (78) 10
Analysis of sensitivity to currency fl uctuations
Closing rate 1.21 3.22 0.78 4.27 1.61 14.04
5% currency depreciation relative to closing rate
Closing rates parity depreciated by 5% 1.27 3.38 0.82 4.49 1.69 14.74
Currency transalation impact (62) (51) 28 – 4 –
5% currency appreciation relative to closing rate
Closing rates parity appreciated by 5% 1.15 3.06 0.74 4.06 1.53 13.33
Currency transalation impact 69 56 (31) – (4) 1
NOTE 19 TRADE AND OTHER PAYABLES
2014 2013
Trade payables 20,656 19,094
Social debts 19,315 16,759
Fiscal debts 6,308 5,148
Down-payments from customers 6,887 3,766
Other current payables 284 342
Total 53,449 45,109
The €2,556,000 increase in social debts mainly stems from the increase in the amount of variable compensation and profi t-sharing, payable in 2015 and relating to 2014, due to greater headcount and improved results.The increase in customers down payments in the statement of fi nancial position is due to new systems orders in Q4 2014 being higher than those in Q4 2013.

150 – 2014 Financial Report Consolidated financial statements
NOTE 20 DEFERRED REVENUES
2014 2013
Deferred software evolution and on-line services contracts and on-line services contracts 44,031 39,827
Other deferred revenues(1) 4,065 3,180
Total 48,096 43,008
(1) Other deferred revenues mainly correspond to invoiced services, which were not completed at year end.
The counterpart of “Deferred software evolution and on-line services contracts and hardware maintenance and on-line services contracts” and “Other deferred revenues” is recorded for the same amount (plus VAT and related taxes) in “Trade accounts receivable” in the statement of fi nancial position (see note 13).
NOTE 21 PROVISIONS FOR OTHER LIABILITIES AND CHARGES
Provisions for employee-related
claimsProvisions for tax litigations
Provisions for other litigations
Provisions for warranty and
technical risks Total
Provisions at January 1, 2013 1,079 1,315 748 540 3,682
Additional provisions 811 134 – 888 1,833
Used amounts reversed (320) – – (735) (1,055)
Unused amounts reversed (82) – – (219) (301)
Exchange rate differences (2) (240) (8) – (250)
Provisions at December 31, 2013 1,486 1,209 740 474 3,909
Provisions for employee-related
claimsProvisions for tax litigations
Provisions for other litigations
Provisions for warranty and
technical risks Total
Provisions at January 1, 2014 1,486 1,209 740 474 3,909
Additional provisions 306 144 234 496 1,180
Used amounts reversed (683) – (286) (425) (1,394)
Unused amounts reversed (386) – – (21) (407)
Exchange rate differences – 10 – – 10
Provisions at December 31, 2014 723 1,363 688 524 3,298
CONTINGENT LIABILITIES
The Group had no knowledge, at the date of Board of Directors’ meeting to draw up the accounts, of any contingent liability at December 31, 2014.To the Group’s knowledge, there were no proceedings pending at December 31, 2014, other than those for which provision has been made, that could have a material negative impact on the fi nancial condition of the Group.

151
ENVIRONMENTAL RISKS
Given the nature of its business the Group is not exposed to any environmental risks.
NOTE 22 ADDITIONAL DISCLOSURE CONCERNING FINANCIAL INSTRUMENTS
The Group has designated the following main categories of fi nancial assets and liabilities:
At December 31, 2013 IAS 39 category
Carried at amortized
cost
Carried at fair value through profi t or loss
Carried at fair value through
OCICarrying amount
Fair value
Loans, deposits and guarantees Loans and receivables X 1,130 1,130
Trades account receivables Loans and receivables X 50,269 50,269
Other current assets Loans and receivables X 26,184 26,184
Derivatives not designated as hedges
Financial assets at fair value through profi t and loss X – –
Derivatives designated as hedgesFinancial assets at fair value through equity X – –
Cash and cash equivalentsFinancial assets at fair value through profi t and loss X 29,534 29,534
Total fi nancial assets 107,117 107,117
Interest-bearing bank loansFinancial liabilities carried at amortized cost X – –
Repayable advance OSEOFinancial liabilities carried at amortized cost X 894 894
Cash facilitiesFinancial liabilities carried at amortized cost X – –
Derivatives not designated as hedges
Financial liabilities at fair value through profi t and loss X 43 43
Derivatives designated as hedgesFinancial liabilities at fair value through OCI X – –
Trade payables and other current liabilities
Financial liabilities carried at amortized cost X 45,109 45,109
Total fi nancial liabilities 46,046 46,046

152 – 2014 Financial Report Consolidated financial statements
At December 31, 2014 IAS 39 category
Carried at amortized
cost
Carried at fair value through profi t or loss
Carried at fair value through
OCICarrying amount
Fair value
Loans, deposits and guarantees Loans and receivables X 1,213 1,213
Trades account receivables Loans and receivables X 50,531 50,531
Other current assets Loans and receivables X 29,169 29,169
Derivatives not designated as hedges
Financial assets at fair value through profi t and loss X 73 73
Derivatives designated as hedgesFinancial assets at fair value through OCI X – –
Cash and cash equivalentsFinancial assets at fair value through profi t and loss X 43,484 43,484
Total fi nancial assets 124,470 124,470
Interest-bearing bank loansFinancial liabilities carried at amortized cost X – –
Repayable advance OSEOFinancial liabilities carried at amortized cost X 394 394
Cash facilitiesFinancial liabilities carried at amortized cost X – –
Derivatives not designated as hedges
Financial liabilities at fair value through profi t and loss X – –
Derivatives designated as hedgesFinancial liabilities at fair value through OCI X – –
Trade payables and other current liabilities
Financial liabilities carried at amortized cost X 53,449 53,449
Total fi nancial liabilities 53,843 53,843
Fair value of loans and trade accounts receivable, trade payables and other current liabilities is identical to their book value.

153
NOTE 23 ADDITIONAL DISCLOSURES
NOTE 23.1 COMMITMENTS GIVEN AND RECEIVED
Commitments Given
Contractual commitments
Payments due by period
TotalLess than 1 year Between 1 to 5 years More than 5 years
Rental contracts: offi ces 4,635 6,520 903 12,058
Rental contracts: others(1) 3,537 2,744 – 6,281
Total rental contracts 8,172 9,264 903 18,339
Other guarantees: sureties(2) 1,119 1,085 – 2,204
(1) These contracts mainly cover IT and offi ce equipment.(2) This mainly concerns sureties given by banks on the company’s behalf, or given by the company to fi nancial institutions against leases made by the latter
to its subsidiaries.
Rentals booked as expenses in 2014 amounted to €9,991,000.
Commitments ReceivedThe German subsidiary, Lectra Deutschland GmbH, has access to a confi rmed bank credit facility of €1 million intended for the giving of guarantees. This facility is generally renewed annually.
NOTE 23.2 END OF LITIGATION WITH INDUYCO
Lectra received on March 7, 2013, payment of the outstanding €11.1 million which was due by El Corte Inglés (after the absorption of Induyco) further to the decision rendered on January 28, 2013, by the Madrid Court of Appeal.With this decision, the Madrid Court of Appeal had rejected Induyco’s challenge to exequatur, and had thus confi rmed the judgment of the Madrid Court of First Instance of June 27, 2011, which had granted exequatur in Spain of the arbitral award rendered against Induyco in October 2009, in London, by an International Arbitral Tribunal.This payment had put an end to eight years of legal proceedings, after Lectra’s fi ling of its request for arbitration in 2005, and is the mark of success of Lectra’s determination since the dispute arose, to enforce its rights and recover the full amount of the damages the arbitral tribunal had awarded to it.The €11.1 million received resulted in a non-recurring income of the same amount recorded in the 2013 consolidated fi nancial statements, a net tax expense of €1.1 million – taking into account the tax losses carried forward of Lectra Spain, with no cash disbursement – and a net income of €10 million. Thus, free cash fl ow and cash position had been increased by €11.1 million.

154 – 2014 Financial Report Consolidated financial statements
By convention, a minus sign in the tables of notes to the income statement represents a charge for the year, and a plus sign an income or gain for the year. To make the discussion of revenues and earnings as relevant as possible, detailed comparisons between 2014 and 2013 are also provided at 2013 exchange rates (“like-for-like”), as indicated in the notes concerned.
NOTE 24 REVENUES
In 2014, no single customer represents more than 7% of consolidated revenues, the 10 largest customers combined account for less than 20% of revenues, and the 20 largest customers for less than 25%.
NOTE 24.1 REVENUES BY GEOGRAPHIC REGION
In 2014, almost 50% of total revenues were generated in 5 countries: the United States (12%), China (11%), Italy (11%), France (8%), and Mexico (7%).The other two European countries that have suffered severely from the downturn in their economies, Portugal and Spain, accounted for 4% and 3% respectively. While revenues were stable in France, Italy, Portugal and Spain registered revenue growth of 10%, 13% and 2%, respectively. Greece’s share of revenues is immaterial. The same applies to Russia.
2014 2013 Changes 2014/2013
Actual %At 2013
exchange rates Actual % Actual Like-for-like
Europe, of which: 98,203 46% 98,079 89,169 44% +10% +10%
– France 16,620 8% 16,624 16,560 8% 0% 0%
Americas 51,620 24% 51,949 55,017 27% –6% –6%
Asia-Pacifi c 47,770 23% 48,202 44,427 22% +8% +8%
Other countries 13,743 7% 14,009 14,419 7% –5% –3%
Total 211,336 100% 212,239 203,032 100% +4% +5%
NOTES TO THE INCOME STATEMENTConsolidated
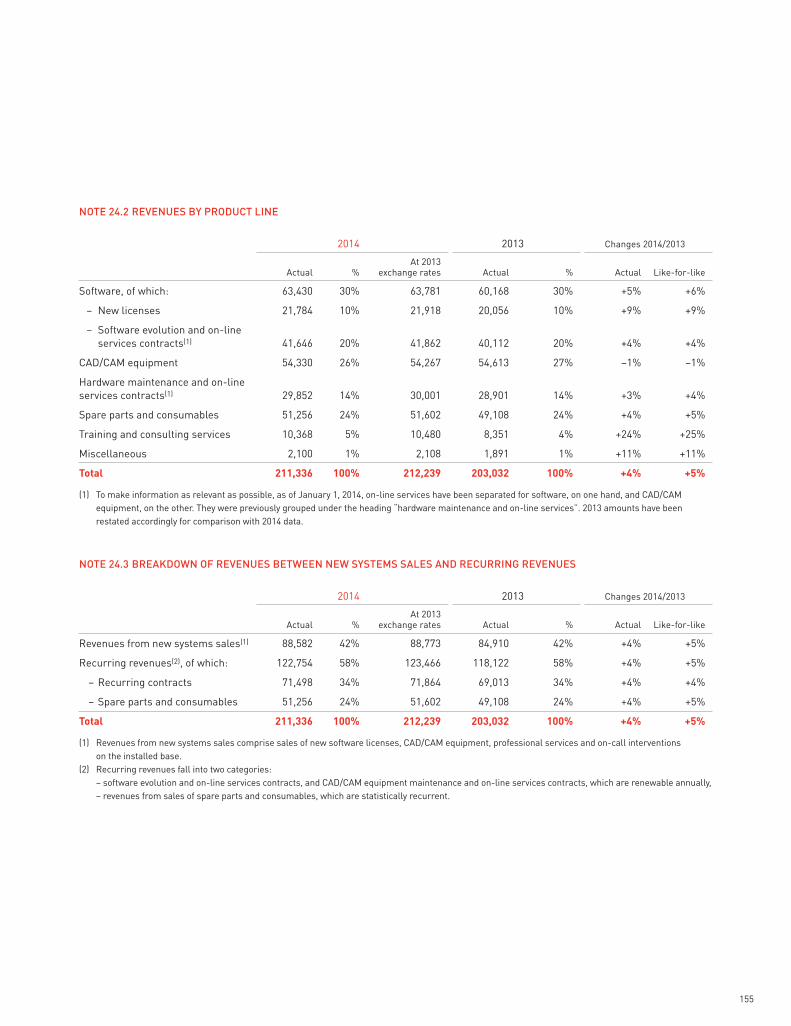
155
NOTE 24.2 REVENUES BY PRODUCT LINE
2014 2013 Changes 2014/2013
Actual %At 2013
exchange rates Actual % Actual Like-for-like
Software, of which: 63,430 30% 63,781 60,168 30% +5% +6%
– New licenses 21,784 10% 21,918 20,056 10% +9% +9%
– Software evolution and on-line services contracts(1) 41,646 20% 41,862 40,112 20% +4% +4%
CAD/CAM equipment 54,330 26% 54,267 54,613 27% –1% –1%
Hardware maintenance and on-line services contracts(1) 29,852 14% 30,001 28,901 14% +3% +4%
Spare parts and consumables 51,256 24% 51,602 49,108 24% +4% +5%
Training and consulting services 10,368 5% 10,480 8,351 4% +24% +25%
Miscellaneous 2,100 1% 2,108 1,891 1% +11% +11%
Total 211,336 100% 212,239 203,032 100% +4% +5%
(1) To make information as relevant as possible, as of January 1, 2014, on-line services have been separated for software, on one hand, and CAD/CAM equipment, on the other. They were previously grouped under the heading “hardware maintenance and on-line services”. 2013 amounts have been restated accordingly for comparison with 2014 data.
NOTE 24.3 BREAKDOWN OF REVENUES BETWEEN NEW SYSTEMS SALES AND RECURRING REVENUES
2014 2013 Changes 2014/2013
Actual %At 2013
exchange rates Actual % Actual Like-for-like
Revenues from new systems sales(1) 88,582 42% 88,773 84,910 42% +4% +5%
Recurring revenues(2), of which: 122,754 58% 123,466 118,122 58% +4% +5%
– Recurring contracts 71,498 34% 71,864 69,013 34% +4% +4%
– Spare parts and consumables 51,256 24% 51,602 49,108 24% +4% +5%
Total 211,336 100% 212,239 203,032 100% +4% +5%
(1) Revenues from new systems sales comprise sales of new software licenses, CAD/CAM equipment, professional services and on-call interventions on the installed base.
(2) Recurring revenues fall into two categories: – software evolution and on-line services contracts, and CAD/CAM equipment maintenance and on-line services contracts, which are renewable annually, – revenues from sales of spare parts and consumables, which are statistically recurrent.
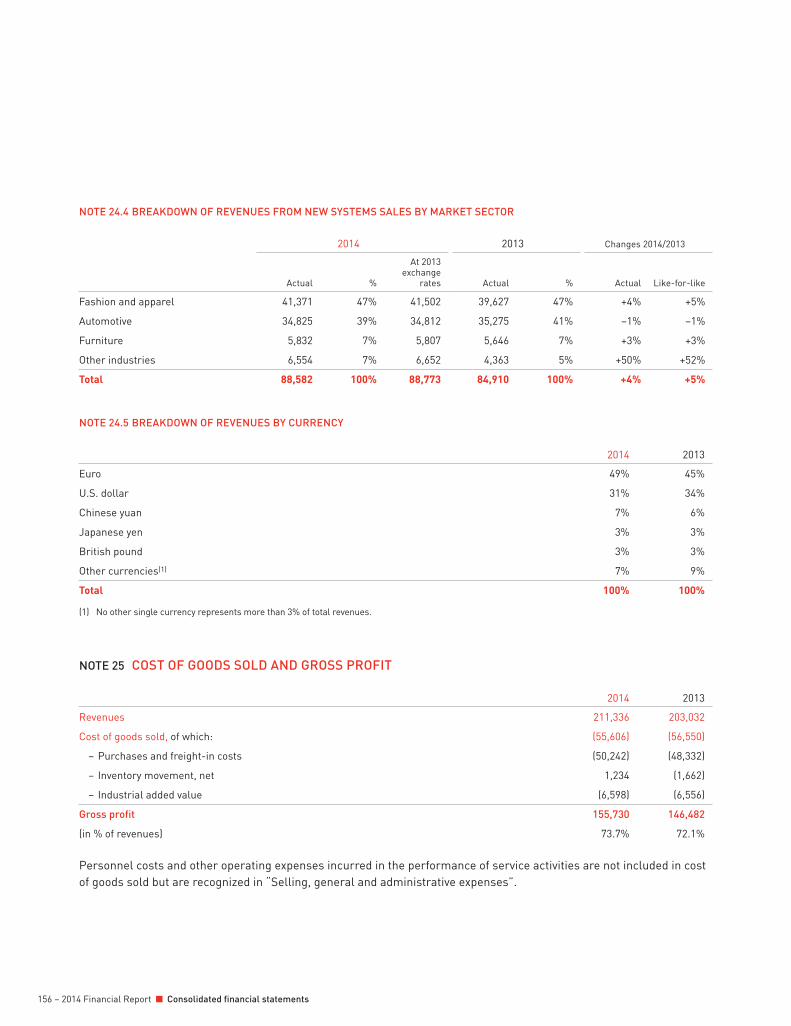
156 – 2014 Financial Report Consolidated financial statements
NOTE 24.4 BREAKDOWN OF REVENUES FROM NEW SYSTEMS SALES BY MARKET SECTOR
2014 2013 Changes 2014/2013
Actual %
At 2013 exchange
rates Actual % Actual Like-for-like
Fashion and apparel 41,371 47% 41,502 39,627 47% +4% +5%
Automotive 34,825 39% 34,812 35,275 41% –1% –1%
Furniture 5,832 7% 5,807 5,646 7% +3% +3%
Other industries 6,554 7% 6,652 4,363 5% +50% +52%
Total 88,582 100% 88,773 84,910 100% +4% +5%
NOTE 24.5 BREAKDOWN OF REVENUES BY CURRENCY
2014 2013
Euro 49% 45%
U.S. dollar 31% 34%
Chinese yuan 7% 6%
Japanese yen 3% 3%
British pound 3% 3%
Other currencies(1) 7% 9%
Total 100% 100%
(1) No other single currency represents more than 3% of total revenues.
NOTE 25 COST OF GOODS SOLD AND GROSS PROFIT
2014 2013
Revenues 211,336 203,032
Cost of goods sold, of which: (55,606) (56,550)
– Purchases and freight-in costs (50,242) (48,332)
– Inventory movement, net 1,234 (1,662)
– Industrial added value (6,598) (6,556)
Gross profi t 155,730 146,482
(in % of revenues) 73.7% 72.1%
Personnel costs and other operating expenses incurred in the performance of service activities are not included in cost of goods sold but are recognized in “Selling, general and administrative expenses”.

157
NOTE 26 RESEARCH AND DEVELOPMENT
2014 2013
Fixed personnel costs (18,597) (16,801)
Variable personnel costs (784) (95)
Other operating expenses (1,471) (1,467)
Depreciation expenses (502) (488)
Total before research tax credit and grants(1) (21,354) (18,851)
(in % of revenues) 10.1% 9.3%
Research tax credit and government grants 7,875 6,348
Total (13,479) (12,503)
(1) This amount includes, in fi xed personnel expenses, the relative share of the (French) competitiveness and employment tax credit. Before this deduction, it would amount to €21,655,000 (€19,065,000 in 2013), that is 10.2% of revenues (9.4% in 2013).
NOTE 27 SELLING, GENERAL AND ADMINISTRATIVE EXPENSES
2014 2013
Fixed personnel costs (71,066) (68,886)
Variable personnel costs (10,346) (8,601)
Other operating expenses (36,357) (34,651)
Depreciation expenses (3,441) (3,175)
Net provisions (1,260) (1,198)
Total(1) (122,470) (116,511)
(in % of revenues) 58.0% 57.4%
(1) “Selling, general and administrative expenses” do not include the expenses comprised in “Industrial added value” (see note 25), which amounted to €6,598,000 in 2014 and €6,556,000 in 2013.
FEES PAID TO GROUP AUDITORS AND COMPANIES IN THEIR NETWORKS
In 2014, other operating expenses comprised €743,000 in respect of the audit of all Group companies, of which €455,000 for PricewaterhouseCoopers, €254,000 for KPMG and €34,000 for other audit fi rms, excluding other services provided. The corresponding amount in 2013 was €715,000.

158 – 2014 Financial Report Consolidated financial statements
Fees paid by the Group in 2014 to the Statutory Auditors in respect of the audit and other services performed by their networks to consolidated entities were €884,000, of which €588,000 for PricewaterhouseCoopers and €296,000 for KPMG:
PwC KPMG
Amount % Amount %
2014 2013 2014 2013 2014 2013 2014 2013
Audit
Statutory audits, certifi cation and examination of individuals and consolidated fi nancial statements
– Issuer (Lectra SA) 143 146 24% 27% 125 119 42% 41%
– Fully-consolidated subsidiaries 294 276 50% 50% 129 117 44% 40%
Others services directly related to the Auditors' engagement
– Issuer (Lectra SA) 18 12 3% 2% – 12 0% 4%
– Fully-consolidated subsidiaries – – 0% 0% – – 0% 0%
Sub-total 455 434 77% 79% 254 248 86% 85%
Other services to consolidated entities
– Legal, tax and social reviews(1) 133 115 23% 21% 42 45 14% 15%
Sub-total 133 115 23% 21% 42 45 14% 15%
Total 588 549 100% 100% 296 293 100% 100%
(1) These missions mostly relate to tax compliance services provided by members of the network to foreign subsidiaries of the company.
NOTE 28 STAFF
NOTE 28.1 TOTAL PERSONNEL EXPENSES
The table below combines all fi xed and variable personnel costs for the Group.
2014 2013
Research and development (19,381) (16,896)
Selling, general and administrative (81,412) (77,487)
Manufacturing, logistics and purchasing(1) (4,483) (4,444)
Total (105,276) (98,827)
(1) “Manufacturing, logistics and purchasing” personnel expenses are included in the cost of goods sold, in “Industrial added value” (see note 25).
The increase in personnel expenses in “Selling, general and administrative” and “Research and development” stems mainly from the transformation plan (which comprises a major recruitment plan to bolster sales and marketing teams, as well as software R&D teams) implemented by the Group since the end of 2011.Personnel expenses for 2014 are presented after deduction of the competitiveness and employment tax credit, amounting to €825,000 (€520,000 in 2013).

159
NOTE 28.2 HEADCOUNT AT DECEMBER 31
2014 2013
Parent company(1) 728 708
Subsidiaries(2), of which: 746 725
– Europe 302 309
– Americas 167 167
– Asia-Pacifi c 205 178
– Other countries 72 71
Total 1,474 1,433
(1) In 2014 as in 2013, expatriates are attached to the economic entities for which they work.(2) Refers to all consolidated and non-consolidated Group companies.
Analysis of Headcount by Function
2014 2013
Marketing, Sales 287 277
Services (Business Consultants and Solutions Experts, Call Centers, Technical Maintenance) 456 444
Research and Development 260 250
Purchasing, Production, Logistics 157 156
Administration, Finance, Human Resources, Information Systems 314 306
Total 1,474 1,433
NOTE 28.3 CONTRIBUTIONS TO PENSION PLANS
Contributions to compulsory or contractual pension plans are expensed in the year in which they are paid.In 2014, Group companies subject to defi ned-contribution pension plans booked a sum of €4,082,000 under personnel costs in respect of their contributions to these pension or retirement funds. The main subsidiary concerned, in addition to the parent company, was Italy.
NOTE 28.4 INDIVIDUAL TRAINING RIGHTS
No provision is made for parent company employee training entitlements within the framework of individual training rights applicable in France (Droit Individuel à la Formation, or DIF) since future training represents a use value in return for the Group. The accumulated number of hours corresponding to rights acquired at December 31, 2014 by employees of the parent company is 70,705. Employees have not yet exercised their rights to 70,116 hours of training.The (French) DIF will no longer exist as it is now from January 1, 2015. It will be replaced by a personal training account (Compte Personnel de Formation, or CPF). The training rights associated with the DIF will be transferred into that new account.
160 – 2014 Financial Report Consolidated financial statements
NOTE 28.5 EMPLOYEE PROFIT-SHARING AND INCENTIVE PLANS
Profi t-Sharing PlanAn amendment to the October 1984 employee profi t-sharing plan (participation), applicable solely to parent company employees, was signed in October 2000. Under this plan, a portion of the special employee profi t-sharing reserve set aside annually may be invested in equity securities, in a corporate savings plan. Consequently, benefi ciaries may choose between fi ve types of funds, one consisting exclusively of Lectra shares, at their discretion. There will be no profi t-sharing payment in 2015 in respect of fi scal year 2014, due to non-fulfi llment of the threshold for payment.Likewise, there was no profi t-sharing payment in 2014 in respect of 2013.
Incentive Plan – Profi t Sharing BonusA collective employee incentive plan (intéressement), applicable solely to parent company employees, was signed for the fi rst time in September 1984 and renewed every year since that date. The most recent incentive plan signed in June 2014 covers the period 2014-2016.The cumulative incentive and profi t sharing bonus (prime de partage des profi ts) amount in respect of fi scal 2014 equals to €1,633,000 (€1,340,000 in respect of 2013). For fi scal 2014, an interim payment of €541,000 was made in November 2014, the balance outstanding to be paid in the fi rst half of 2015.
NOTE 28.6 COMPENSATION OF GROUP MANAGEMENT
The Group management team consists of two executive directors: the Chairman of the Board of Directors and the Chief Executive Offi cer; the Chief Financial Offi cer, the Chief Human Capital and Information Offi cer and, since January 1, 2014, the Executive Vice President, Sales.The executive directors (dirigeants mandataires sociaux) are not granted any special arrangement or specifi c benefi ts concerning deferred compensation, severance compensation, or pension liabilities committing the company to pay any form of indemnity or benefi t in the event of termination of their functions, or at the time of their retirement (they are not under any employment contract to the company), or more generally subsequent to the termination of their functions. The company does not award them bonuses in any form.Compensation of members of the management team, executive directors or other, comprises a fi xed portion and a variable portion.In 2014, as in 2013, variable compensation for the Chairman of the Board of Directors, the Chief Executive Offi cer, the Chief Financial Offi cer and the Chief Human Capital and Information Offi cer is set in accordance with four clear and complementary quantitative criteria (to the exclusion of any qualitative criteria) expressed in terms of annual targets, refl ecting the company’s strategy of profi table sales activity and earnings growth and determined according to clear criteria:
– a criterion measuring the contributive value of growth in sales activity; – consolidated income before tax, excluding net fi nancial expenses and non-recurring items; – a criterion measuring the contributive value of recurring contracts; – consolidated free cash fl ow excluding net fi nancial expenses, non-recurring items, income tax and after certain
restatements of certain items.Variable compensation for the Executive Vice President, Sales is set in accordance with the fi rst three criteria only, to the exclusion of that on the consolidated free cash fl ow.
161
Below certain thresholds this variable compensation is equal to zero; if annual targets are met it is 100%; and it is capped at 200% if annual targets are exceeded. Between these thresholds, it is calculated on a linear basis. The results are then weighted by the relative weight of each criterion. Only the annual targets and corresponding thresholds are reviewed every year, according to the Group’s objectives for the year.Consequently, variable compensation is equal to zero if none of these thresholds is met, and is capped at 200% of target-based variable compensation if annual targets are exceeded on all criteria and result in the ceiling of 200% for each of them.Conditional upon fulfi llment of annual targets, variable compensation for 2013 was equal to 60% of total compensation for the Chairman of the Board of Directors and Chief Executive Offi cer and 30% for the Chief Financial Offi cer and the Chief Human Capital and Information Offi cer. In 2014, this share remained the same for the two executive directors, but has been raised to 35% for the three other members of the management team.Thus, total compensation is comprised between 40% and 160% of the total target-based compensation for the Chairman of the Board of Directors and the Chief Executive Offi cer. It is comprised between 65% and 135% of the total target-based compensation for the three other members of the management team.Annual targets are set by the Board of Directors based on the recommendations of the Compensation Committee. The Committee is responsible for ensuring that the rules for setting the variable portion of compensation each year are stable and consistent with the evaluation of executive directors’ performance, the progress made in the implementation of the company’s medium-term strategy, general macroeconomic conditions, and in particular those of the geographic markets and market sectors in which the company operates. After the close of each fi scal year, the Committee verifi es the annual application of these rules and the fi nal amount of variable compensation, on the basis of the audited fi nancial statements.These criteria and targets apply to the members of the Group management and to approximately fi fteen managers of the parent company Lectra SA, the only differences concerning the portion relating to target-based variable compensations, which is set individually for each manager.In 2014, the variable portion of compensation for the Chairman of the Board of Directors, the Chief Executive Offi cer, the Chief Financial Offi cer and the Chief Human Capital and Information Offi cer represented 88% of the amount payable on fulfi llment of annual targets, the criteria measuring the contributive value of growth in sales activity and the consolidated income before tax not having been reached, but those measuring the contributive value of recurring contracts and consolidated free cash fl ow having been exceeded.Variable compensation for the Executive Vice President, Sales represented 78% of the amount payable on fulfi llment of annual targets.In 2013, the variable portion of compensation for the four members of the Group management represented 77% of the amount payable on fulfi llment of annual targets, none of the targets having been reached.In respect of 2014, aggregate compensation and benefi ts in kind paid to the Group management team in 2014 (excluding directors’ fees for the two executive directors), amounted to €2,160,000, of which €1,179,000 in fi xed compensation, €923,000 in variable compensation, and €57,000 in benefi ts in kind.In respect of 2013, this aggregate compensation and benefi ts in kind paid to four managers amounted to €1,595,000 (the Executive Vice-President, Sales only joined the management team on January 1, 2014), of which €906,000 in fi xed compensation, €642,000 in variable compensation, and €48,000 in benefi ts in kind.The Chief Financial Offi cer, the Chief Human Capital and Information Offi cer and the Executive Vice-President, Sales were granted stock options in 2014 (respectively 30,932, 27,840 and 16,592 given their actual performances). An expense of €16,000, €13,000 and €6,000 was recognized in respect of 2014 as a result of the new stock option plan together with prior-year plans concerning these three benefi ciaries (€22,000 and €16,000 in respect of 2013, for the fi rst two of them). The two executive directors held no stock options (see note 15.5.5).

162 – 2014 Financial Report Consolidated financial statements
NOTE 28.7 DIRECTORS’ FEES
Subject to the approval of the General Meeting of Shareholders on April 30, 2015, €160,000 in directors’ fees will be allocated in equal proportions to the four members of the Board with respect to fi scal 2014 (€160,000 with respect to fi scal 2013).Compensation paid to the two non-executive directors consists exclusively of directors’ fees.
NOTE 29 DEPRECIATION AND AMORTIZATION CHARGES
The table below combines all depreciation and amortization charges on tangible and intangible fi xed assets (excluding goodwill) and their allocation between income statement items:
2014 2013
Research and development(1) (502) (488)
Selling, general and administrative (3,441) (3,175)
Manufacturing, logistics and purchasing(2) (521) (472)
Total (4,464) (4,135)
(1) Amortization charges allocated to “Research and development” pertain to the share of the intangible assets and property, plant and equipment used by these teams. R&D costs themselves are expensed in full in the year.
(2) “Manufacturing, logistics and purchasing” depreciation and amortization charges are included in “Industrial added value” (see note 25).
NOTE 30 FINANCIAL INCOME AND EXPENSES
2014 2013
Financial income, of which: 394 234
Gains on sales of cash equivalents 102 68
Other interest income 224 77
Reversal of provisions for depreciation of investments and loans 68 89
Financial expenses, of which: (418) (500)
Bank charges (387) (427)
Interest expense on bank loans and fi nancial debts – (15)
Other fi nancial expenses (31) (58)
Total (24) (266)
Interest expense on borrowings in 2013 comprised €15,000 in interest on the medium-term bank loan contracted to fi nance the public stock buyback tender offer carried out in 2007 (see note 18.2), the balance of which had been fully repaid on March 31.

163
NOTE 31 FOREIGN EXCHANGE INCOME (LOSS)
A foreign exchange translation loss of €361,000 was recognized in 2014 (€541,000 in 2013). At December 31, 2014, as at December 31, 2013, the company held no currency options (see note 18.5).
NOTE 32 SHARES USED TO COMPUTE EARNINGS PER SHARE
At December 31, 2014 and 2013, the company had not issued any dilutive instrument other than the stock options detailed in note 15.5.
Basic earnings per share 2014 2013
Net income (in thousands of euros) 14,353 21,775
Weighted average number of shares outstanding during the period(1) 29,984,549 29,159,800
Weighted average number of treasury shares held during the period (22,897) (42,812)
Weighted average number of shares used to compute basic earnings per share 29,961,652 29,116,988
Basic earnings per share (in euros) 0.48 0.75
(1) In 2014, 664,699 stock options were exercised, giving rise to the creation of 664,699 new shares. In 2013, 716,100 stock options were exercised, giving rise to the creation of 716,100 new shares (see note 15).
Diluted earnings per share 2014 2013
Net income (in thousands of euros) 14,353 21,775
Weighted average number of shares outstanding during the period(1) 29,984,549 29,159,800
Weighted average number of treasury shares held during the period (22,897) (42,812)
Dilutive effect of stock options, under the share repurchase method(2) 789,202 547,814
Weighted average number of shares used to compute diluted earnings per share 30,750,854 29,664,802
Diluted earnings per share (in euros) 0.47 0.73
(1) In 2014, 664,699 stock options were exercised, giving rise to the creation of 664,699 new shares. In 2013, 716,100 stock options were exercised, giving rise to the creation of 716,100 new shares (see note 15).
(2) In 2014, due to an average share price of €8.09 during the period, the dilutive effect of stock options under the share repurchase method resulted in 789,202 theoretical additional shares (547,814 theoretical additional shares in 2013 due to an average share price of €5.86).

164 – 2014 Financial Report Consolidated financial statements
NOTE 33 INCOME STATEMENT AT CONSTANT EXCHANGE RATES
2014 2013 Changes 2014/2013
ActualAt 2013
exchange rates Actual Actual Like-for-like
Revenues 211,336 212,239 203,032 +4% +5%
Cost of goods sold (55,606) (55,762) (56,550) –2% –1%
Gross profi t 155,730 156,477 146,482 +6% +7%
Research and development (13,479) (13,479) (12,503) +8% +8%
Selling, general and administrative expenses (122,470) (123,170) (116,511) +5% +6%
Income from operations before non-recurring items 19,781 19,828 17,468 +13% +14%
(in % of revenues) 9.4% 9.3% 8.6% +0.8 points +0.7 points
Non-recurring income – – 11,124 ns ns
Non-recurring expenses – – (702) ns ns
Income from operations 19,781 19,828 27,890 –29% –29%
(in % of revenues) 9.4% 9.3% 13.7% –4.7 points –4.8 points
The company’s net operational exposure to foreign exchange fl uctuations corresponds to the difference between revenues and total costs denominated in each of these currencies. This exposure mainly concerns the U.S. dollar, which is the principal currency in which business is transacted after the euro. The other currencies having a signifi cant impact on Group exposure to foreign exchange risk are the South African rand, the British pound, the Canadian dollar, the Japanese yen and the Chinese yuan. The overall currency variations between 2013 and 2014 decreased 2014 Group revenues by only €903,000 and income from operations by €47,000. The U.S. dollar (average parity versus the euro $1.33/€1 in 2013 and 2014) accounted for an increase of €113,000 in revenues and of €125,000 in income from operations before non-recurring items in the 2014 fi gures at actual exchange rates, relative to the 2014 fi gures at 2013 exchange rates.In 2014, 49% of the Group’s consolidated revenues, 83% of its cost of sales, and 70% of its overhead expenses were denominated in euros. These percentages were respectively 31%, 9%, and 13% for the U.S. dollar. The Chinese yuan represented 7% of revenues (part of the revenues generated in China are denominated in U.S. dollars or other currencies), the other currencies each representing less than 4%; individually, their share of the cost of sales is negligible and less than 6% of overhead costs.
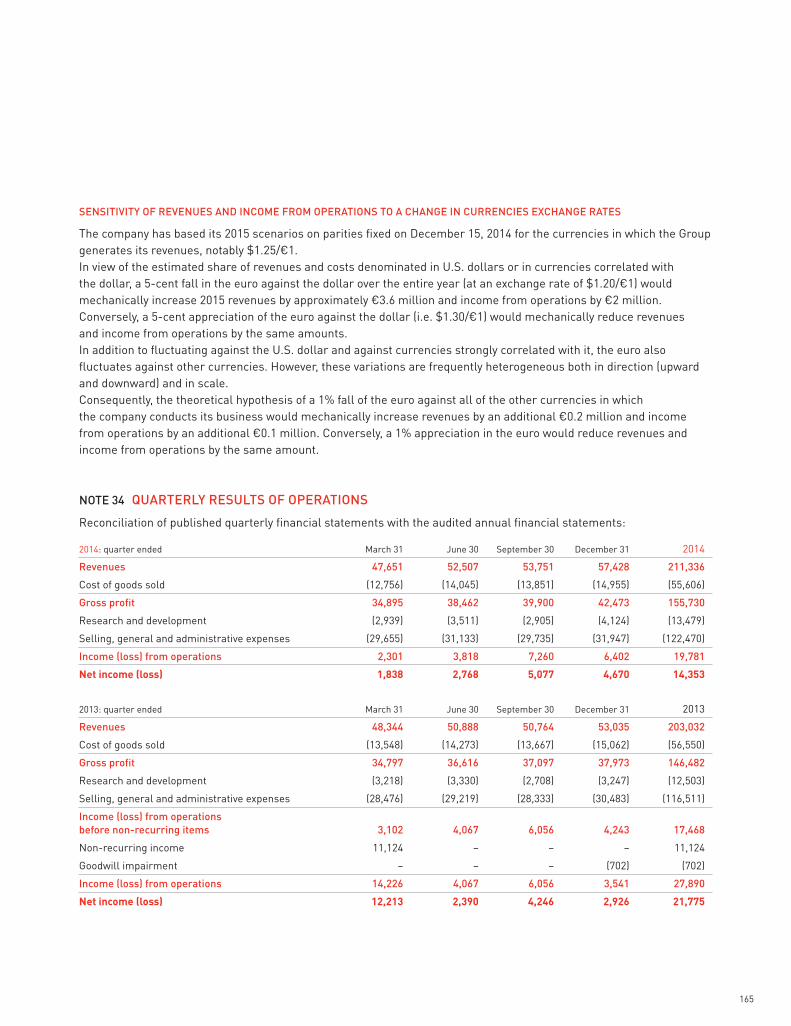
165
SENSITIVITY OF REVENUES AND INCOME FROM OPERATIONS TO A CHANGE IN CURRENCIES EXCHANGE RATES
The company has based its 2015 scenarios on parities fi xed on December 15, 2014 for the currencies in which the Group generates its revenues, notably $1.25/€1.In view of the estimated share of revenues and costs denominated in U.S. dollars or in currencies correlated with the dollar, a 5-cent fall in the euro against the dollar over the entire year (at an exchange rate of $1.20/€1) would mechanically increase 2015 revenues by approximately €3.6 million and income from operations by €2 million. Conversely, a 5-cent appreciation of the euro against the dollar (i.e. $1.30/€1) would mechanically reduce revenues and income from operations by the same amounts.In addition to fl uctuating against the U.S. dollar and against currencies strongly correlated with it, the euro also fl uctuates against other currencies. However, these variations are frequently heterogeneous both in direction (upward and downward) and in scale.Consequently, the theoretical hypothesis of a 1% fall of the euro against all of the other currencies in which the company conducts its business would mechanically increase revenues by an additional €0.2 million and income from operations by an additional €0.1 million. Conversely, a 1% appreciation in the euro would reduce revenues and income from operations by the same amount.
NOTE 34 QUARTERLY RESULTS OF OPERATIONS
Reconciliation of published quarterly fi nancial statements with the audited annual fi nancial statements:
2014: quarter ended March 31 June 30 September 30 December 31 2014
Revenues 47,651 52,507 53,751 57,428 211,336
Cost of goods sold (12,756) (14,045) (13,851) (14,955) (55,606)
Gross profi t 34,895 38,462 39,900 42,473 155,730
Research and development (2,939) (3,511) (2,905) (4,124) (13,479)
Selling, general and administrative expenses (29,655) (31,133) (29,735) (31,947) (122,470)
Income (loss) from operations 2,301 3,818 7,260 6,402 19,781
Net income (loss) 1,838 2,768 5,077 4,670 14,353
2013: quarter ended March 31 June 30 September 30 December 31 2013
Revenues 48,344 50,888 50,764 53,035 203,032
Cost of goods sold (13,548) (14,273) (13,667) (15,062) (56,550)
Gross profi t 34,797 36,616 37,097 37,973 146,482
Research and development (3,218) (3,330) (2,708) (3,247) (12,503)
Selling, general and administrative expenses (28,476) (29,219) (28,333) (30,483) (116,511)
Income (loss) from operations before non-recurring items 3,102 4,067 6,056 4,243 17,468
Non-recurring income 11,124 – – – 11,124
Goodwill impairment – – – (702) (702)
Income (loss) from operations 14,226 4,067 6,056 3,541 27,890
Net income (loss) 12,213 2,390 4,246 2,926 21,775

166 – 2014 Financial Report Consolidated financial statements
NOTE 35 OPERATING SEGMENTS INFORMATION
2014 Europe Americas Asia-Pacifi cOther
countriesCorporate
segment Total
Revenues 98,203 51,619 47,770 13,744 – 211,336
Income (loss) from operations before non-recurring items 9,415 1,699 348 1,985 6,334 19,781
2013 Europe Americas Asia-Pacifi cOther
countriesCorporate
segment Total
Revenues 89,169 55,017 44,427 14,419 – 203,032
Income (loss) from operations before non-recurring items 8,034 2,255 (136) 1,791 5,524 17,468
Income from operations before non-recurring items, which is obtained by adding together the income for each segment, is identical to consolidated income from operations before non-recurring items shown in the Group’s consolidated fi nancial statements and therefore does not require reconciliation.

167
NOTE 36 NON-CASH OPERATING EXPENSES
In 2014, as in 2013, “Non-cash operating expenses” includes unrealized translation gains or losses on short-term balance sheet positions affecting the gain or loss on foreign exchange translation (see note 2.26 – Translation Methods), additional fi nancial provisions, the impact of measurement of stock options, and reversal of the provision for impairment of investments in non-consolidated subsidiaries.
NOTE 37 CHANGES IN WORKING CAPITAL REQUIREMENT
In 2014, the net decrease of the working capital requirement amounted to €7,920,000 and comprised:• –€3,872,000 mainly corresponding to the decrease in trade accounts receivable, due to an improvement in cash collections (the variation in accounts receivable included “Deferred revenues” in the statement of fi nancial position, which for the most part comprised the share of recurring contracts billed but not yet recognized in revenues – see note 13);• +€1,435,000 corresponding to an increase in inventories;• +€753,000 arising from the increase of the receivable on the French tax administration (Trésor public) corresponding to the research tax credit and the competitiveness and employment tax credit receivable. This net amount corresponded to the difference between the 2014 tax credits after deduction from the corporate income tax due by Lectra SA, accounted for but not received (€6,482,000), and the 2010 research and development tax credit reimbursed in 2014 (€5,729,000);• −€2,917,000 corresponding to the increase of customers down payments in the statement of fi nancial position, due to new systems orders in Q4 2014 being higher than those in Q4 2013;• −€1,529,000 arising from the increase in the amount of variable compensation and profi t-sharing, payable in 2015 and relating to 2014, due to greater headcount and improved results;• −€982,000 corresponding to an increase in trade accounts payable;• −€808,000 arising from the change in other current assets and liabilities; taken individually, these changes are all immaterial.
In 2013, the net increase of the working capital requirement amounted to €9,101,000 and broke down as follows:• +€5,005,000 mainly corresponding to an increase in trade accounts receivable, for the most part due to increased revenues in November and December 2013 compared to the same months of 2012;• –€584,000 corresponding to a decrease in inventories;• +€6,572,000 arising from the receivable on the French tax administration (Trésor public) corresponding to the (French) research tax credit and competitiveness and employment tax credit receivable for 2013, accounted for but not received, after deduction of the corporate income tax due by Lectra SA for the same year;• –€1,914,000 arising from the increase in trade payables.
Finally, no change in other current assets and liabilities, taken individually, was material.At December 31, 2014, as at December 31, 2013, the ratio of accounts receivable net of down payments received and deferred revenues, measured in DSO (Days Sales Outstanding) represented less than ten days of revenues (inclusive of VAT).
NOTES TO THE STATEMENT OF CASH FLOWS Consolidated
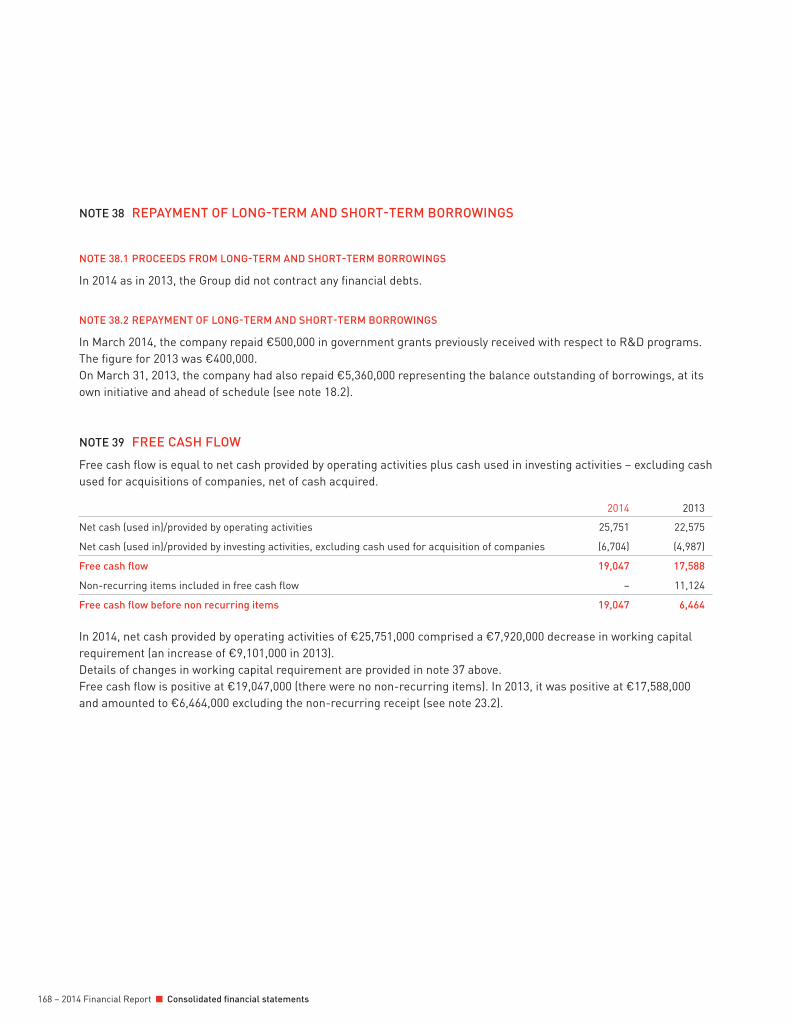
168 – 2014 Financial Report Consolidated financial statements
NOTE 38 REPAYMENT OF LONG-TERM AND SHORT-TERM BORROWINGS
NOTE 38.1 PROCEEDS FROM LONG-TERM AND SHORT-TERM BORROWINGS
In 2014 as in 2013, the Group did not contract any fi nancial debts.
NOTE 38.2 REPAYMENT OF LONG-TERM AND SHORT-TERM BORROWINGS
In March 2014, the company repaid €500,000 in government grants previously received with respect to R&D programs. The fi gure for 2013 was €400,000.On March 31, 2013, the company had also repaid €5,360,000 representing the balance outstanding of borrowings, at its own initiative and ahead of schedule (see note 18.2).
NOTE 39 FREE CASH FLOW
Free cash fl ow is equal to net cash provided by operating activities plus cash used in investing activities – excluding cash used for acquisitions of companies, net of cash acquired.
2014 2013
Net cash (used in)/provided by operating activities 25,751 22,575
Net cash (used in)/provided by investing activities, excluding cash used for acquisition of companies (6,704) (4,987)
Free cash fl ow 19,047 17,588
Non-recurring items included in free cash fl ow – 11,124
Free cash fl ow before non recurring items 19,047 6,464
In 2014, net cash provided by operating activities of €25,751,000 comprised a €7,920,000 decrease in working capital requirement (an increase of €9,101,000 in 2013).Details of changes in working capital requirement are provided in note 37 above.Free cash fl ow is positive at €19,047,000 (there were no non-recurring items). In 2013, it was positive at €17,588,000 and amounted to €6,464,000 excluding the non-recurring receipt (see note 23.2).

169
STATUTORY AUDITORS’ REPORT ON THE CONSOLIDATED FINANCIAL STATEMENTS For the year ended December 31, 2014
To the Shareholders,
In compliance with the assignment entrusted to us by your Annual General Meeting, we hereby report to you, for the year ended December 31, 2014, on:
– the audit of the accompanying consolidated financial statements of Lectra SA;
– the justification of our assessments; – the specific verification required by law.
These consolidated financial statements have been approved by the Board of Directors. Our role is to express an opinion on these consolidated financial statements based on our audit.
I. OPINION ON THE CONSOLIDATED FINANCIAL
STATEMENTS
We conducted our audit in accordance with professional standards applicable in France; those standards require that we plan and perform the audit to obtain reasonable assurance about whether the consolidated financial statements are free of material misstatement. An audit involves performing procedures, using sampling techniques or other methods of selection, to obtain audit evidence about the amounts and disclosures in the consolidated financial statements. An audit also includes evaluating the appropriateness of accounting policies used and the reasonableness of accounting estimates made, as well as the overall presentation of the consolidated financial statements. We believe that the audit evidence we have obtained is sufficient and appropriate to provide a basis for our audit opinion.In our opinion, the consolidated financial statements give a true and fair view of the assets and liabilities and
of the financial position of the Group as at December 31, 2014 and of the results of its operations for the year then ended in accordance with International Financial Reporting Standards as adopted by the European Union.
II. JUSTIFICATION OF OUR ASSESSMENTS
In accordance with the requirements of article L. 823-9 of the French Commercial Code (Code de commerce) relating to the justification of our assessments, we bring to your attention the following matters:
– Your company systematically performs impairment tests of goodwill at year end and also assesses any impairment indicators, as explained in the note 2.6 “Fixed assets impairment – Impairment tests” to the consolidated financial statements. We have examined the ways this impairment test was implemented as well as the cash flow forecasts and the assumptions upon which these forecasts were based. We verified the appropriateness of the information provided in the note 6 “Goodwill”.
– As explained in the note 2.8 “Deferred income tax”, your company is led to make estimates and assumptions with respect to the evaluation of deferred tax assets. In the context of our assessments, our procedures consisted in assessing the overall consistency of the data and the underlying assumptions used to support the evaluation of these deferred tax assets and in reviewing the company’s calculations and the appropriateness of the information provided in note 11.3.These assessments were made as part of our audit of the consolidated financial statements taken as a whole, and therefore contributed to the opinion we formed which is expressed in the first part of this report.
This is a free translation into English of the Statutory Auditors’ report issued in French and is provided solely for the convenience of English speaking users. The Statutory Auditors’ report includes information specifi cally required by French law in such reports, whether modified or not. This information is presented below the opinion on the consolidated financial statements and includes an explanatory paragraph discussing the Auditors’ assessments of certain significant accounting and auditing matters. These assessments were considered for the purpose of issuing an audit opinion on the consolidated financial statements taken as a whole and not to provide separate assurance on individual account captions or on information taken outside of the consolidated financial statements. This report should be read in conjunction with, and construed in accordance with, French law and professional auditing standards applicable in France.

170 – 2014 Financial Report Statutory Auditors’ report
III. SPECIFIC VERIFICATION
As required by law, we have also verified in accordance with professional standards applicable in France the information presented in the Group’s management report.We have no matters to report as to its fair presentation and its consistency with the consolidated financial statements.
Neuilly-sur-Seine and Mérignac, on March 3, 2015
The Statutory Auditors
KPMG SA PricewaterhouseCoopers Audit SA
Eric Junières Jean-Pierre Raud Bruno Tesnière

171
STATUTORY AUDITORS’ REPORT, PREPARED IN ACCORDANCE WITH ARTICLE L. 225-235 OF THE FRENCH COMMERCIAL CODE ON THE REPORT PREPARED BY THE CHAIRMAN OF THE BOARD OF DIRECTORS OF LECTRA SAFor the year ended December 31, 2014
To the Shareholders,
In our capacity as Statutory Auditors of Lectra SA and in accordance with article L. 225-235 of the French Commercial Code (Code de commerce), we hereby report to you on the report prepared by the Chairman of your company in accordance with article L. 225-37 of the French Commercial Code for the year ended December 31, 2014.It is the Chairman’s responsibility to prepare, and submit to the Board of Directors for approval, a report describing the internal control and risk management procedures implemented by the company and providing the other information required by article L. 225-37 of the French Commercial Code in particular relating to corporate governance. It is our responsibility:
– to report to you on the information set out in the Chairman’s report on internal control and risk management procedures relating to the preparation and processing of financial and accounting information, and
– to attest that the report sets out the other information required by article L. 225-37 of the French Commercial Code, it being specified that it is not our responsibility to assess the fairness of this information.We conducted our work in accordance with professional standards applicable in France.
INFORMATION CONCERNING THE INTERNAL
CONTROL AND RISK MANAGEMENT PROCEDURES
RELATING TO THE PREPARATION AND PROCESSING
OF FINANCIAL AND ACCOUNTING INFORMATION
The professional standards require that we perform procedures to assess the fairness of the information on internal control and risk management procedures relating to the preparation and processing of financial and accounting information set out in the Chairman’s report. These procedures mainly consisted of:
– obtaining an understanding of the internal control and risk management procedures relating to the preparation and processing of financial and accounting information on which the information presented in the Chairman’s report is based, and of the existing documentation;
– obtaining an understanding of the work performed to support the information given in the report and of the existing documentation;
– determining if any material weaknesses in the internal control procedures relating to the preparation and processing of financial and accounting information that we may have identifi ed in the course of our work are properly described in the Chairman’s report.On the basis of our work, we have no matters to report on the information given on internal control and risk management procedures relating to the preparation and processing of financial and accounting information, set out in the Chairman of the Board’s report, prepared in accordance with article L. 225-37 of the French Commercial Code.
This is a free translation into English of the Statutory Auditors’ report issued in the French language and is provided solely for the convenience of English speaking readers. This report should be read in conjunction with, and construed in accordance with, French law and professional auditing standards applicable in France.

172 – 2014 Financial Report Statutory Auditors’ report
OTHER INFORMATION
We attest that the Chairman’s report sets out the other information required by article L. 225-37 of the French Commercial Code.
Neuilly-sur-Seine and Mérignac, on March 3, 2015
The Statutory Auditors
PricewaterhouseCoopers Audit SA KPMG SA
Bruno Tesnière Eric Junières Jean-Pierre Raud
173
BIOGRAPHIES OF LECTRA DIRECTORS AND MEMBERS
OF THE GROUP EXECUTIVE COMMITTEE
André Harari
André Harari, 71, Chairman of the Board of Directors of Lectra since May 3, 2002. He became Vice Chairman of Lectra’s Board of Directors in 1991, and Vice Chairman and Executive Vice President in 1998. He was a member of the Supervisory Board of Lectra from 1978 to 1990, when Compagnie Financière du Scribe was a minority shareholder of Lectra since its early stage, before taking control of it at the end of 1990. André Harari holds no outside directorships. André Harari was Chairman and Chief Executive Offi cer of Compagnie Financière du Scribe (Paris, France), a venture capital fi rm specialized in technology companies, which he founded in 1975. Together with his brother Daniel Harari, he was the main shareholder in Compagnie Financière du Scribe until its merger with Lectra on April 30, 1998. He began his career with the consulting division of Arthur Andersen (Paris, 1970-1975). André Harari, of French nationality, is a graduate of the École Polytechnique and the École Nationale de la Statistique et de l’Administration Économique (Paris). He also holds a doctorate in management science from the University of Paris-Dauphine.
Daniel Harari
Daniel Harari, 60, Director and Chief Executive Offi cer of Lectra since May 3, 2002, Chairman of the Executive Committee since its creation in 2005. He became Chairman and Chief Executive Offi cer of Lectra in 1991, following its takeover by Compagnie Financière du Scribe at the end of 1990. He holds no directorships outside the company and its subsidiaries. Daniel Harari was a director (since 1981) and Chief Executive Offi cer (since 1986) of Compagnie Financière du Scribe, a venture capital fi rm specialized in technology companies. André Harari and Daniel Harari were the main shareholders until its merger with Lectra on April 30, 1998. He began his career as Vice President of Société d’Études et de Gestion Financière Meeschaert, an asset management company (Paris, France, 1980-1983). He was then Chairman and Chief Executive Offi cer of
La Solution Informatique (1984-1990), a PC distribution and services company, and of Interleaf France (1986-1989), a subsidiary of the U.S. software publisher, both of which he founded in Paris.Daniel Harari, of French nationality, is a graduate of the École Polytechnique (Paris, France) and the Institut Supérieur des Affaires (Paris, coupled with the second year of the Stanford Business School MBA program, Palo Alto, CA, United States).
Anne Binder
Anne Binder, 64, Director of Lectra since October 27, 2011.Anne Binder is currently a consultant in fi nancial strategy and an independent Director for publicly traded and non-publicly traded companies. From 1993 to 1996, she was the Executive Manager in charge of the development in France of international fi nancial services group GE Capital and Director of its French subsidiary. From 1990 to 1993, she was the Chief Executive Offi cer of the holding company Euris and Deputy Chief Executive Offi cer of investment fund Euris (investments in industrial companies). From 1983 to 1990, she participated in the creation and was General Manager of the French Pallas group (bank and investment). Prior to that, she was an associate manager for Générale Occidentale (bank and industrial holding) from 1978 to 1982. At the beginning of her career, she was a consultant at Boston Consulting Group and then associate manager at Lazard Frères Bank in Paris.Anne Binder is member of the Strategic Committee of AM France, which manages Alternativa (new European exchange market for small-and medium-sized growth companies), member of the Board of Directors of Oceasoft and Senior Advisor of Tikehau. She is also Vice Chairman of the French National Chamber of Financial Expert Consultants.Anne Binder, of French nationality, graduated from the Institut d’Études Politiques of Paris. She also has a BA from the Paris faculty of law and a Master in Business Administration from INSEAD in Fontainebleau, France.

174 – 2014 Financial Report Biographies
Bernard Jourdan
Bernard Jourdan, 70, Director of Lectra since December 21, 2011.Bernard Jourdan is currently an independent strategy and management consultant. From 1995 to 2005, he was member of the Board of Directors and Executive Vice President of the SPIE Group, a European leader in electrical and mechanical engineering and heating, ventilation and air conditioning services, energy and communication systems.From 1990 to 1995, he was Executive Vice President of Operations of the French subsidiary of the Schindler Group, a leading global provider of elevators, escalators and related services. From 1978 to 1990, he held various positions at Compagnie Générale des Eaux (currently Veolia Environment) group, a world leader in water treatment, environmental services, and energy services; he was, in particular, member of the Board of Directors and Chief Executive Offi cer of subsidiaries of the group in France from 1987 to 1990 and Executive Vice President and Chief Operating Offi cer of the U.S. division from 1981 to 1986. In his early career, he was successively a consultant at Arthur Andersen Paris, associate manager at First National Bank of Chicago, and project manager at the Institut de Développement Industriel (IDI) in Paris. Bernard Jourdan, of French nationality, holds a Master of Science in Management from the Sloan School of Management (MIT, Cambridge, USA), is an alumnus of École Centrale de Paris (Engineering), and obtained an MS (DECS) in accounting from the University of Paris and a BA in economics from the University of Paris Assas.
Édouard Macquin
Édouard Macquin, 49, has served as Executive Vice President, Sales, since January 1, 2011. He has been a member of the Executive Committee since January 1, 2014.He joined Lectra in 1987 in the R&D department and later became training manager in the United States, then services manager for Brazil. After that, he took on various marketing positions in Paris, Italy, the United States then in Brazil. In 2000, he was appointed Director of Lectra Brazil, then in 2005 Director for South America.Édouard Macquin holds an MBA from São Paulo (Brazil) Business School.
Jérôme Viala
Jérôme Viala, 53, Chief Financial Offi cer of Lectra since 1994, responsible for all fi nancial, legal and manufacturing functions, member of the Executive Committee since its creation in 2005.He joined the fi nance department of Lectra in 1985, then successively held the positions of Controller for Europe and North America (1988-1991), CFO for France (1992-1993) and CFO for the Product Division (1993-1994).Jérôme Viala began his career as a credit analyst at Esso (France). He is a graduate of the École Supérieure de Commerce de Bordeaux (Bordeaux, France).
Véronique Zoccoletto
Véronique Zoccoletto, 55, Chief Human Capital Offi cer, Chief Information Offi cer since 2005, member of the Executive Committee since its creation in 2005.She joined Lectra in 1993 as Chief Financial Offi cer for the Lectra France division, and subsequently was Group controller (1996-1998), Group Sales Administration manager (1998-2000), and Director of Organization and Information Systems (2000-2004). She began her career with Singer (France) in 1983 as Controller, and then was head of the budget and internal audit department. From 1989 to 1991, she was Chief Financial Offi cer of SYS-COM Ingénierie (France). In 1991, she became CFO of Riva Hugin Sweda France. Véronique Zoccoletto graduated from the University of Paris-Dauphine (France).

175
BOARD OF DIRECTORS AND GROUP MANAGEMENT
Board of Directors
André Harari, Chairman Anne BinderDaniel Harari, Chief Executive Offi cer Bernard Jourdan
Audit Committee Compensation Committee Strategic Committee
Bernard Jourdan, Chairman Bernard Jourdan, Chairman André Harari, ChairmanAnne Binder Anne Binder Anne Binder Bernard Jourdan
Group Management
Executive Committee
Daniel Harari, Chief Executive Offi cer, ChairmanÉdouard Macquin, Executive Vice President, SalesJérôme Viala, Chief Financial Offi cerVéronique Zoccoletto, Chief Human Capital Offi cer, Chief Information Offi cer
Management team
Myriam Akoun-Brunet, Director, CommunicationsLaurent Alt, Director, Software R&DAnastasia Charbin, Director, Marketing Fashion and ApparelOlivier du Chesnay, Deputy Chief Financial Offi cerCéline Choussy-Bedouet, Director, Marketing Automotive, Furniture, Technical TextilesDaniel Dufag, General CounselJavier Garcia, Strategic Accounts ManufacturingEric Hubert, Deputy Sales DirectorLaurence Jacquot, Director, Hardware R&D and ManufacturingBruno Mattia, Director, Strategic Accounts FashionPhilippe Ribera, Director, Marketing SoftwareDidier Teiller, Director, Customer Care
Americas
Roy Shurling, Director, North AmericaAdriana Vono Papavero, Director, South America
Asia-Pacifi c
Yves Delhaye, Director, ASEAN, Australia, South Korea, IndiaJean-Maurice Férauge, Director, JapanAndreas Kim, Director, China
Europe
Corinne Barbot-Morales, Director, SpainFabio Canali, Director, ItalyKaren Elalouf, Director, FranceEdwin Ingelaere, Director, Northern EuropeChris Nicolaes, Director, Germany and Eastern EuropeRodrigo Siza, Director, Portugal
Other countries
Jean-Patrice Gros, Director, Turkey, Middle East and North AfricaMichael Stoter, Director, South Africa
Statutory Auditors
PricewaterhouseCoopers Audit SA KPMG SARepresented by Bruno Tesnière Represented by Jean-Pierre Raud and Éric JunièresCrystal Park – 63, rue de Villiers Domaine de Pelus – 11, rue Archimède92208 Neuilly-sur-Seine Cedex 33692 Mérignac Cedex
A complete list of agents and distributors is available on lectra.com