azbil report 2015 : Financial Data
27
(Ended March 31) 2005 2006 2007 2008 Financial Results (For the Year): Net sales 180,763 188,321 234,572 248,551 Gross profit 67,754 72,769 84,780 89,946 Operating income 9,353 13,515 17,314 20,484 Net income 3,709 9,795 10,646 10,709 Capital expenditures 2,460 6,790 5,273 4,488 Depreciation 2,291 2,352 3,891 4,387 R&D expenses 8,170 8,360 8,776 9,844 Cash Flows (For the Year): Net cash provided by operating activities 8,503 6,386 7,524 21,086 Net cash provided by (used in) investing activities (3,707) (7,405) (2,475) (612) Free cash flow 4,796 (1,019) 5,049 20,474 Net cash used in financing activities (2,922) (3,328) (6,348) (6,433) Financial Position (At Year-end): Total assets 172,586 217,882 230,679 228,844 Net assets 99,848 110,859 118,967 121,721 Per Share Data: Net income (Yen) 49.88 132.52 144.71 145.63 Net assets (Yen) 1,356.65 1,506.25 1,602.33 1,641.73 Cash dividends (Yen) 23.00 50.00 50.00 60.00 Ratios: Gross profit/Net sales (%) 37.5 38.6 36.1 36.2 Operating income/Net sales (%) 5.2 7.2 7.4 8.2 R&D expenses/Net sales (%) 4.5 4.4 3.7 4.0 Shareholders’ equity/Total assets (%) 57.9 50.9 51.1 52.6 Return on equity (ROE) (%) 3.8 9.3 9.3 9.0 Dividend on equity (DOE) (%) 1.7 3.5 3.2 3.7 Dividend payout ratio (%) 45.6 37.6 34.6 41.2 62 azbil report 2015 11-Year Key Financial Figures Azbil Corporation and its consolidated subsidiaries
-
Upload
khangminh22 -
Category
Documents
-
view
3 -
download
0
Transcript of azbil report 2015 : Financial Data

(Ended March 31) 2005 2006 2007 2008
Financial Results (For the Year):
Net sales 180,763 188,321 234,572 248,551
Gross profit 67,754 72,769 84,780 89,946
Operating income 9,353 13,515 17,314 20,484
Net income 3,709 9,795 10,646 10,709
Capital expenditures 2,460 6,790 5,273 4,488
Depreciation 2,291 2,352 3,891 4,387
R&D expenses 8,170 8,360 8,776 9,844
Cash Flows (For the Year):
Net cash provided by operating activities 8,503 6,386 7,524 21,086
Net cash provided by (used in) investing activities (3,707) (7,405) (2,475) (612)
Free cash flow 4,796 (1,019) 5,049 20,474
Net cash used in financing activities (2,922) (3,328) (6,348) (6,433)
Financial Position (At Year-end):
Total assets 172,586 217,882 230,679 228,844
Net assets 99,848 110,859 118,967 121,721
Per Share Data:
Net income (Yen) 49.88 132.52 144.71 145.63
Net assets (Yen) 1,356.65 1,506.25 1,602.33 1,641.73
Cash dividends (Yen) 23.00 50.00 50.00 60.00
Ratios:
Gross profit/Net sales (%) 37.5 38.6 36.1 36.2
Operating income/Net sales (%) 5.2 7.2 7.4 8.2
R&D expenses/Net sales (%) 4.5 4.4 3.7 4.0
Shareholders’ equity/Total assets (%) 57.9 50.9 51.1 52.6
Return on equity (ROE) (%) 3.8 9.3 9.3 9.0
Dividend on equity (DOE) (%) 1.7 3.5 3.2 3.7
Dividend payout ratio (%) 45.6 37.6 34.6 41.2
62 azbil report 2015
11-Year Key Financial FiguresAzbil Corporation and its consolidated subsidiaries

2009 2010 2011 2012 2013 2014 2015
236,173 212,213 219,216 223,499 227,585 248,417 254,469
86,655 76,420 79,714 80,840 77,872 86,550 89,884
17,832 12,385 14,896 14,348 13,411 13,904 15,337
9,525 6,242 7,928 8,519 8,309 7,669 7,169
6,414 2,704 3,351 3,010 3,121 5,303 6,302
4,503 4,751 4,460 4,027 3,621 3,722 3,784
9,636 8,640 8,953 8,816 7,824 8,767 10,124
21,372 15,714 15,223 5,634 15,010 15,836 13,698
(16,606) 1,960 (2,276) (3,549) (12,716) (10,670) (13,472)
4,766 17,674 12,947 2,085 2,294 5,166 226
(8,575) (6,757) (8,001) (6,393) (2,487) (6,940) (6,066)
220,846 218,472 217,501 223,476 243,419 253,448 265,719
124,984 129,278 131,362 135,077 141,197 144,978 160,294
127.87 84.52 107.35 115.35 112.50 103.85 97.07
1,672.91 1,728.64 1,754.86 1,808.48 1,882.66 1,940.56 2,143.11
62.00 62.00 63.00 63.00 63.00 63.00 63.00
36.7 36.0 36.4 36.2 34.2 34.8 35.3
7.6 5.8 6.8 6.4 5.9 5.6 6.0
4.1 4.1 4.1 3.9 3.4 3.5 4.0
55.9 58.4 59.6 59.8 57.1 56.5 59.6
7.8 5.0 6.2 6.5 6.1 5.4 4.8
3.7 3.6 3.6 3.5 3.4 3.3 3.1
48.5 73.4 58.7 54.6 56.0 60.7 64.9
(Millions of yen)
2015
254,469
89,884
15,337
7,169
6,302
3,784
10,124
13,698
(13,472)
226
(6,066)
265,719
160,294
97.07
2,143.11
63.00
35.3
6.0
4.0
59.6
4.8
3.1
64.9
Finan
cial Data
azbil report 2015 63

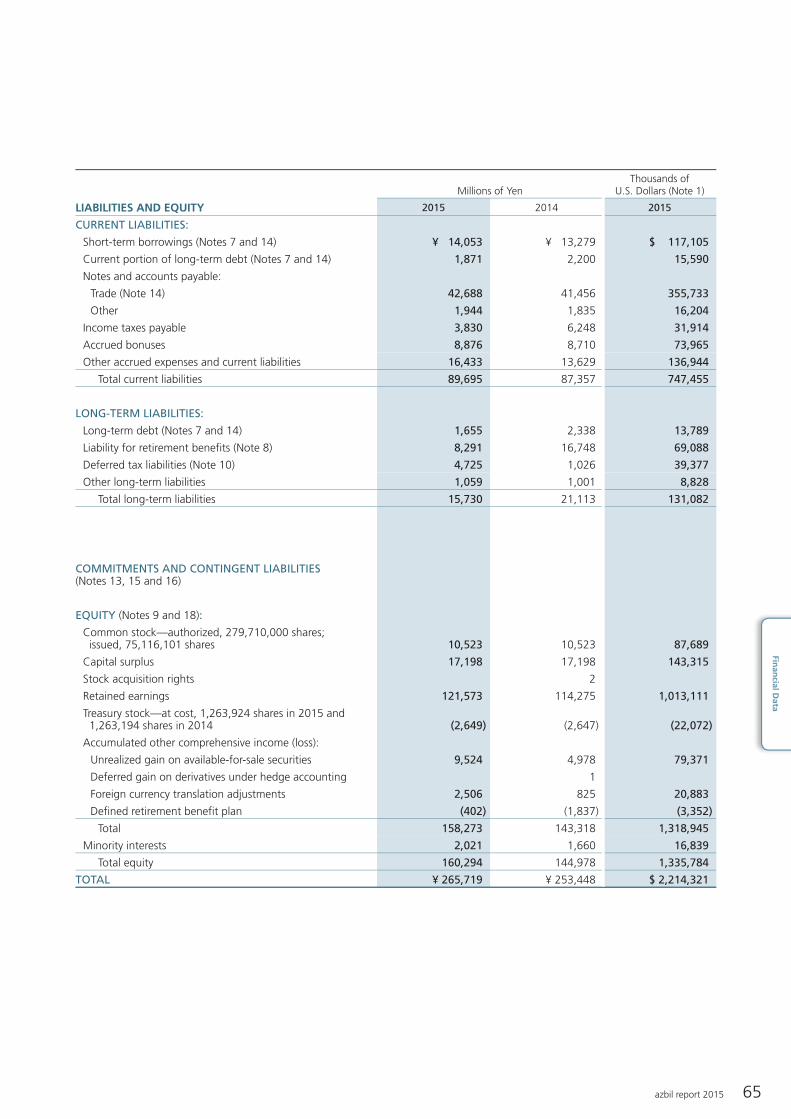
Millions of YenThousands of
U.S. Dollars (Note 1)
ASSETS 2015 2014 2015
CURRENT ASSETS:
Cash and cash equivalents (Note 14) ¥ 51,921 ¥ 55,845 $ 432,672
Marketable securities (Note 4) 13,606 10,106 113,382
Notes and accounts receivable:
Trade (Note 14) 88,961 88,228 741,340
Other 1,584 2,570 13,202
Allowance for doubtful receivables (566) (494) (4,715)
Inventories (Note 5) 21,683 18,194 180,691
Deferred tax assets (Note 10) 5,388 5,404 44,897
Prepaid expenses and other current assets 15,419 9,525 128,496
Total current assets 197,996 189,378 1,649,965
PROPERTY, PLANT AND EQUIPMENT:
Land (Note 7) 6,618 6,624 55,146
Buildings and structures (Notes 6 and 7) 42,254 40,831 352,121
Machinery and equipment (Notes 6 and 7) 20,264 19,713 168,863
Furniture and fixtures (Note 6) 20,231 20,226 168,593
Lease assets (Note 13) 279 294 2,324
Construction in progress 250 168 2,080
Total 89,896 87,856 749,127
Accumulated depreciation (64,197) (63,355) (534,971)
Net property, plant and equipment 25,699 24,501 214,156
INVESTMENTS AND OTHER ASSETS:
Investment securities (Notes 4 and 14) 22,395 16,185 186,622
Investments in and advances to unconsolidated subsidiaries and associated companies 350 999 2,914
Goodwill (Note 6) 5,601 8,084 46,678
Deposits 2,612 2,633 21,767
Deferred tax assets (Note 10) 875 2,102 7,288
Other assets 10,191 9,566 84,931
Total investments and other assets 42,024 39,569 350,200
TOTAL ¥ 265,719 ¥ 253,448 $ 2,214,321
See notes to consolidated financial statements.
64 azbil report 2015
Consolidated Balance SheetAzbil Corporation and Consolidated SubsidiariesMarch 31, 2015
Millions of YenThousands of
U.S. Dollars (Note 1)
LIABILITIES AND EQUITY 2015 2014 2015
CURRENT LIABILITIES:
Short-term borrowings (Notes 7 and 14) ¥ 14,053 ¥ 13,279 $ 117,105
Current portion of long-term debt (Notes 7 and 14) 1,871 2,200 15,590
Notes and accounts payable:
Trade (Note 14) 42,688 41,456 355,733
Other 1,944 1,835 16,204
Income taxes payable 3,830 6,248 31,914
Accrued bonuses 8,876 8,710 73,965
Other accrued expenses and current liabilities 16,433 13,629 136,944
Total current liabilities 89,695 87,357 747,455
LONG-TERM LIABILITIES:
Long-term debt (Notes 7 and 14) 1,655 2,338 13,789
Liability for retirement benefits (Note 8) 8,291 16,748 69,088
Deferred tax liabilities (Note 10) 4,725 1,026 39,377
Other long-term liabilities 1,059 1,001 8,828
Total long-term liabilities 15,730 21,113 131,082
COMMITMENTS AND CONTINGENT LIABILITIES(Notes 13, 15 and 16)
EQUITY (Notes 9 and 18):
Common stock—authorized, 279,710,000 shares; issued, 75,116,101 shares 10,523 10,523 87,689
Capital surplus 17,198 17,198 143,315
Stock acquisition rights 2
Retained earnings 121,573 114,275 1,013,111
Treasury stock—at cost, 1,263,924 shares in 2015 and 1,263,194 shares in 2014 (2,649) (2,647) (22,072)
Accumulated other comprehensive income (loss):
Unrealized gain on available-for-sale securities 9,524 4,978 79,371
Deferred gain on derivatives under hedge accounting 1
Foreign currency translation adjustments 2,506 825 20,883
Defined retirement benefit plan (402) (1,837) (3,352)
Total 158,273 143,318 1,318,945
Minority interests 2,021 1,660 16,839
Total equity 160,294 144,978 1,335,784
TOTAL ¥ 265,719 ¥ 253,448 $ 2,214,321
Finan
cial Data
azbil report 2015 65

See notes to consolidated financial statements.
Millions of YenThousands of
U.S. Dollars (Note 1)2015 2014 2015
NET INCOME BEFORE MINORITY INTERESTS ¥ 7,419 ¥ 7,648 $ 61,828OTHER COMPREHENSIVE INCOME (Note 17):
Unrealized gain on available-for-sale securities 4,546 1,202 37,883Deferred loss on derivatives under hedge accounting (1) (5)Foreign currency translation adjustments 1,794 2,042 14,953Defined retirement benefit plan 1,435 11,955
Total other comprehensive income 7,774 3,244 64,786COMPREHENSIVE INCOME ¥ 15,193 ¥ 10,892 $ 126,614TOTAL COMPREHENSIVE INCOME ATTRIBUTABLE TO:
Azbil Corporation ¥ 14,830 ¥ 10,649 $ 123,583Minority interests 363 243 3,031
Consolidated Statement of Comprehensive Income
Consolidated Statement of Income
Millions of YenThousands of
U.S. Dollars (Note 1)
2015 2014 2015
NET SALES ¥ 254,469 ¥ 248,417 $ 2,120,576COST OF SALES (Notes 8 and 13) 164,585 161,867 1,371,545
Gross profit 89,884 86,550 749,031SELLING, GENERAL AND ADMINISTRATIVE EXPENSES (Notes 8, 12 and 13) 74,547 72,646 621,219
Operating income 15,337 13,904 127,812OTHER INCOME (EXPENSES):
Interest income 131 170 1,092Dividend income 341 300 2,843Interest expense (461) (394) (3,845)Foreign currency exchange gain 1,771 518 14,754Gain (loss) on sales of property, plant, equipment and others—net 95 (54) 794Gain on sales of shares of subsidiaries and associates 1,607 13,388Gain on sales of investment securities—net (Note 4) 53 25 445Loss on impairment of long-lived assets (Note 6) (2,669) (36) (22,245)Loss on abolishment of retirement benefit plan (2,885) (24,042)Loss on reversal of foreign currency translation adjustment due to liquidation of a foreign subsidiary (899) (7,492)Others—net (Note 11) (808) 116 (6,732)
Other (expenses) income—net (3,724) 645 (31,040)INCOME BEFORE INCOME TAXES AND MINORITY INTERESTS 11,613 14,549 96,772INCOME TAXES (Note 10):
Current 4,426 6,664 36,882Deferred (232) 237 (1,938)
Total income taxes 4,194 6,901 34,944NET INCOME BEFORE MINORITY INTERESTS 7,419 7,648 61,828MINORITY INTERESTS IN NET (LOSS) INCOME (250) 21 (2,090)NET INCOME ¥ 7,169 ¥ 7,669 $ 59,738
Yen U.S. Dollars (Note 1)
2015 2014 2015
PER SHARE OF COMMON STOCK (Note 2.t):Net income ¥ 97.07 ¥ 103.85 $ 0.81Cash dividends applicable to the year 63.00 63.00 0.53
See notes to consolidated financial statements.
66 azbil report 2015
Consolidated Statement of Income and Consolidated Statement of Comprehensive IncomeAzbil Corporation and Consolidated SubsidiariesYear Ended March 31, 2015

Thousands Millions of YenAccumulated Other Comprehensive Income
(Loss)
Number of Shares of Common
Stock Outstanding
Common Stock
Capital Surplus
Stock Acquisition
RightsRetained Earnings
Treasury Stock
Unrealized Gain on
Available-for-Sale
Securities
Deferred Gain (Loss) on
Derivatives under Hedge Accounting
Foreign Currency
Translation Adjustments
Defined Retirement
Benefit Plan Total
Minority Interests
Total Equity
BALANCE, APRIL 1, 2013 73,854 ¥ 10,523 ¥ 17,198 ¥ 2 ¥ 111,141 ¥ (2,644) ¥ 3,776 ¥ (952) ¥ 139,044 ¥ 2,153 ¥ 141,197
Adjustment of retained earnings for newly consolidated subsidiaries 118 118 118
Net income 7,669 7,669 7,669
Cash dividends, ¥63 per share (4,653) (4,653) (4,653)
Purchase of treasury stock (1) (3) (3) (3)
Disposal of treasury stock
Net change in the year 1,202 ¥ 1 1,777 ¥ (1,837) 1,143 (493) 650
BALANCE, MARCH 31, 2014 (APRIL 1, 2014, as previously reported) 73,853 10,523 17,198 2 114,275 (2,647) 4,978 1 825 (1,837) 143,318 1,660 144,978
Cumulative effect of accounting change 5,149 5,149 5,149
BALANCE, APRIL 1, 2014 (as restated) 73,853 10,523 17,198 2 119,424 (2,647) 4,978 1 825 (1,837) 148,467 1,660 150,127
Adjustment of retained earnings for newly consolidated subsidiaries (367) (367) (367)
Net income 7,169 7,169 7,169
Cash dividends, ¥63 per share (4,653) (4,653) (4,653)
Purchase of treasury stock (1) (2) (2) (2)
Disposal of treasury stock
Net change in the year (2) 4,546 (1) 1,681 1,435 7,659 361 8,020
BALANCE,MARCH 31, 2015 73,852 ¥ 10,523 ¥ 17,198 ¥ 121,573 ¥ (2,649) ¥ 9,524 ¥ 2,506 ¥ (402) ¥ 158,273 ¥ 2,021 ¥ 160,294
See notes to consolidated financial statements.
Thousands of U.S. Dollars (Note 1)Accumulated Other Comprehensive Income
(Loss)
Common Stock
Capital Surplus
Stock Acquisition
RightsRetained Earnings
Treasury Stock
Unrealized Gain on
Available-for-Sale
Securities
Deferred Gain (Loss) on
Derivatives under Hedge Accounting
Foreign Currency
Translation Adjustments
Defined Retirement
Benefit Plan Total
Minority Interests
Total Equity
BALANCE, MARCH 31, 2014 (APRIL 1, 2014, as previously reported) $ 87,689 $ 143,315 $ 20 $ 952,294 $ (22,055) $ 41,487 $ 5 $ 6,872 $ (15,307) $ 1,194,320 $ 13,836 $ 1,208,156
Cumulative effect of accounting change 42,906 42,906 42,906
BALANCE, APRIL 1, 2014 (as restated) 87,689 143,315 20 995,200 (22,055) 41,487 5 6,872 (15,307) 1,237,226 13,836 1,251,062
Adjustment of retained earnings for newly consolidated subsidiaries (3,054) (3,054) (3,054)
Net income 59,738 59,738 59,738
Cash dividends, $0.53 per share (38,773) (38,773) (38,773)
Purchase of treasury stock (18) (18) (18)
Disposal of treasury stock 1 1 1
Net change in the year (20) 37,884 (5) 14,011 11,955 63,825 3,003 66,828
BALANCE, MARCH 31, 2015 $ 87,689 $ 143,315 $ 1,013,111 $ (22,072) $ 79,371 $ 20,883 $ (3,352) $ 1,318,945 $ 16,839 $ 1,335,784
Finan
cial Data
azbil report 2015 67
Consolidated Statement of Changes in EquityAzbil Corporation and Consolidated SubsidiariesYear Ended March 31, 2015

Millions of YenThousands of
U.S. Dollars (Note 1)
2015 2014 2015
OPERATING ACTIVITIES:Income before income taxes and minority interests ¥ 11,613 ¥ 14,549 $ 96,772Adjustments for:Income taxes—paid (6,851) (5,947) (57,092)Depreciation and amortization 5,636 5,595 46,966Reversal of doubtful receivables 51 189 427Increase in accrued bonuses 204 746 1,702Foreign currency exchange gain (1,334) (597) (11,118)(Gain) loss on sales of property, plant and equipment and others—net (95) 54 (794)Gain on sales of investment securities—net (53) (25) (445)Loss on impairment of long-lived assets 2,669 36 22,245Loss on abolishment of retirement benefit plan 2,885 24,042Loss on reversal of foreign currency translation adjustment due to liquidation of a foreign subsidiary 899 7,492Gain on sales of shares of subsidiaries and associates (1,607) (13,388)Changes in assets and liabilities:
(Increase) decrease in notes and accounts receivable (352) 2,630 (2,930)Increase in inventories (2,978) (847) (24,814)Increase (decrease) in notes and accounts payable 457 (341) 3,807(Decrease) increase in liability for retirement benefits (1,710) 1,319 (14,251)Decrease (increase) in other assets 438 (1,091) 3,651Increase (decrease) in other liabilities 3,214 (772) 26,784
Others—net 612 338 5,097Total adjustments 2,085 1,287 17,381Net cash provided by operating activities 13,698 15,836 114,153
INVESTING ACTIVITIES:Proceeds from sales of property, plant and equipment 562 254 4,680Purchases of property, plant and equipment (4,463) (2,651) (37,192)Purchase of intangible assets (1,591) (2,092) (13,258)Proceeds from sales of investment securities 138 250 1,149Purchases of investment securities (77) (27) (641)Proceeds from sales of beneficiary securities of trust 14,026 12,999 116,887Purchases of beneficiary securities of trust (13,971) (13,302) (116,426)Proceeds from sales of marketable securities 30,000 9,845 250,000Purchase of marketable securities (33,500) (16,700) (279,167)Proceeds from sales of shares of subsidiaries resulting in change in scope of consolidation 2,373 19,777Purchase of investments in capital of subsidiaries (1,637) (13,643)Others—net (5,332) 754 (44,437)
Net cash used in investing activities (13,472) (10,670) (112,271)FINANCING ACTIVITIES:Net increase in short-term borrowings 587 789 4,891Proceeds from long-term debt 380 87 3,167Repayment of long-term debt (2,115) (2,502) (17,622)Disposal of treasury stock 2Purchase of treasury stock (2) (3) (18)Dividends paid (4,865) (5,248) (40,545)Others—net (51) (63) (421)
Net cash used in financing activities (6,066) (6,940) (50,546)FOREIGN CURRENCY TRANSLATION ADJUSTMENTS ON CASH AND CASH EQUIVALENTS 1,432 1,533 11,931NET DECREASE IN CASH AND CASH EQUIVALENTS (4,408) (241) (36,733)CASH AND CASH EQUIVALENTS OF NEWLY CONSOLIDATED SUBSIDIARIES, BEGINNING OF YEAR 484 36 4,031CASH AND CASH EQUIVALENTS, BEGINNING OF YEAR 55,845 56,050 465,374CASH AND CASH EQUIVALENTS, END OF YEAR ¥ 51,921 ¥ 55,845 $ 432,672ADDITIONAL INFORMATION:Decrease in assets and liabilities in the exclusion of Azbil Care & Support Co., Ltd.: Asset excluded ¥ 1,201 $ 10,006 Liability excluded 402 3,354
See notes to consolidated financial statements.
68 azbil report 2015
Consolidated Statement of Cash FlowsAzbil Corporation and Consolidated SubsidiariesYear Ended March 31, 2015

1. BASIS OF PRESENTATION OF CONSOLIDATED FINANCIAL STATEMENTS
The accompanying consolidated financial statements have been pre-pared in accordance with the provisions set forth in the Japanese Financial Instruments and Exchange Act and its related accounting regulations and in accordance with accounting principles generally accepted in Japan, which are different in certain respects as to the application and disclosure requirements of International Financial Reporting Standards.
In preparing these consolidated financial statements, certain reclas-sifications and rearrangements have been made to the consolidated financial statements issued domestically in order to present them in a form which is more familiar to readers outside Japan. In addition, certain reclassifications have been made in the 2014 consolidated financial statements to conform to the classifications used in 2015.
The consolidated financial statements are stated in Japanese yen, the currency of the country in which Azbil Corporation (“Azbil”) is incorporated and operates. The translations of Japanese yen amounts into U.S. dollar amounts are included solely for the convenience of readers outside Japan and have been made at the rate of ¥120 to $1, the approximate rate of exchange as of March 31, 2015. Such transla-tions should not be construed as representations that the Japanese yen amounts could be converted into U.S. dollars at that or any other rate.
2. SUMMARY OF SIGNIFICANT ACCOUNTING POLICIES
a. Consolidation—The consolidated financial statements as of March 31, 2015, include the accounts of Azbil and its 60 significant (59 in 2014) subsidiaries (together, the “azbil Group”).
Under the control and influence concepts, those companies in which Azbil, directly or indirectly, is able to exercise control over op-erations are fully consolidated and those companies over which the azbil Group has the ability to exercise significant influence are ac-counted for by the equity method.
Investments in 3 (3 in 2014) associated companies are accounted for by the equity method.
Investments in the remaining unconsolidated subsidiaries and as-sociated companies are stated at cost. If the equity method of ac-counting had been applied to the investments in these companies, the effect on the accompanying consolidated financial statements would not be material.
Goodwill represents the excess of the cost of an acquisition over the fair value of net assets of the acquired subsidiary and associated company at the date of acquisition. Goodwill from the acquisition of Azbil Kimmon Co., Ltd. (“Azbil Kimmon”) is being amortized over seven years and Azbil Telstar, S.L.U. and its group are being amortized over nine years. Other goodwill is being amortized on a straight-line basis over five years, with the exception of minor amounts which are charged to income in the period of the acquisitions.
All significant intercompany balances and transactions have been eliminated in consolidation. All material unrealized profit included in assets resulting from transactions within the azbil Group is eliminated.
b. Business Combinations—In October 2003, the Business Accounting Council issued a Statement of Opinion, “Accounting for Business Combinations,” and in December 2005, the Accounting Standards Board of Japan (“ASBJ”) issued ASBJ Statement No. 7, “Accounting Standard for Business Divestitures” and ASBJ Guidance No. 10, “Guidance for Accounting Standard for Business Combinations and Business Divestitures.” The accounting standard for business combinations allowed companies to apply the pooling-of-interests method of accounting only when certain specific criteria
are met such that the business combination is essentially regarded as a uniting-of-interests. For business combinations that do not meet the uniting-of-interests criteria, the business combination is considered to be an acquisition and the purchase method of accounting is required. This standard also prescribes the accounting for combinations of enti-ties under common control and for joint ventures.
In December 2008, the ASBJ issued a revised accounting standard for business combinations, ASBJ Statement No. 21, “Accounting Standard for Business Combinations.” Major accounting changes under the revised accounting standard are as follows: (1) The revised standard requires accounting for business combinations only by the purchase method. As a result, the pooling-of-interests method of ac-counting is no longer allowed. (2) The previous accounting standard required research and development costs to be charged to income as incurred. Under the revised standard, in-process research and devel-opment costs (IPR&D) acquired in the business combination are capi-talized as an intangible asset. (3) The previous accounting standard provided for a bargain purchase gain (negative goodwill) to be sys-tematically amortized over a period not exceeding 20 years. Under the revised standard, the acquirer recognizes the bargain purchase gain in profit or loss immediately on the acquisition date after reassessing and confirming that all of the assets acquired and all of the liabilities assumed have been identified after a review of the procedures used in the purchase price allocation. The revised standard was applicable to business combinations undertaken on or after April 1, 2010.
c. Cash Equivalents—Cash equivalents are short-term investments that are readily convertible into cash and that are exposed to insignifi-cant risk of changes in value.
Cash equivalents include time deposits, certificates of deposit, ben-eficiary securities of trust under resale agreements and commercial paper, all of which mature or become due within three months of the date of acquisition.
d. Inventories—Inventories, other than raw materials, are principally stated at the lower of cost on a specific identification basis or net selling value. Raw materials are principally stated at the lower of cost deter-mined by the moving-average method or net selling value.
e. Allowance for Doubtful Receivables—The allowance for doubt-ful receivables is stated in amounts considered to be appropriate based on the azbil Group’s past credit loss experience and an evalua-tion of potential losses in the receivables outstanding.
f. Marketable and Investment Securities—Marketable and invest-ment securities are classified and accounted for, depending on man-agement’s intent, as follows: (1) trading securities, which are held for the purpose of earning capital gains in the near term, are reported at fair value, and the related unrealized gains and losses are included in earnings; (2) held-to-maturity debt securities, for which there is a positive intent and ability to hold to maturity, are reported at amor-tized cost; and (3) available-for-sale securities, which are not classified as either of the aforementioned securities, are reported at fair value, with unrealized gains and losses, net of applicable taxes, reported in a separate component of equity.
Nonmarketable available-for-sale securities are stated at cost deter-mined by the moving-average method. For other-than-temporary de-clines in fair value, investment securities are reduced to net realizable value by a charge to income.
g. Property, Plant and Equipment—Property, plant and equip-ment are stated at cost. Depreciation for Azbil and its consolidated
Finan
cial Data
azbil report 2015 69
Notes to Consolidated Financial StatementsAzbil Corporation and Consolidated SubsidiariesYear Ended March 31, 2015

domestic subsidiaries is computed by the declining-balance method, while the straight-line method is applied to buildings acquired after April 1, 1998. Depreciation of consolidated foreign subsidiaries is mainly computed by the straight-line method. Equipment held for lease is depreciated by the straight-line method over the respective lease periods.
The range of useful lives is from 15 to 50 years for buildings and structures, from 4 to 9 years for machinery and equipment, and from 2 to 6 years for furniture and fixtures.
h. Long-Lived Assets—The azbil Group reviews its long-lived assets for impairment whenever events or changes in circumstances indicate the carrying amount of an asset or asset group may not be recover-able. An impairment loss is recognized if the carrying amount of an asset or asset group exceeds the sum of the undiscounted future cash flows expected to result from the continued use and the eventual disposition of the asset or asset group. The impairment loss would be measured as the amount by which the carrying amount of the asset exceeds its recoverable amount, which is the higher of the discounted cash flows from the continued use and the eventual disposition of the asset or the net selling price at disposition.
i. Retirement and Pension Plans—Azbil has a noncontributory funded pension plan and a defined contribution pension plan cover-ing substantially all of its employees.
Most of the consolidated subsidiaries have noncontributory funded pension plans and unfunded retirement benefit plans.
The liability for employees’ retirement benefits is provided at the amount based on the projected benefit obligation and plan assets at the balance sheet date.
In May 2012, the ASBJ issued ASBJ Statement No. 26, “Accounting Standard for Retirement Benefits” and ASBJ Guidance No. 25, “Guidance on Accounting Standard for Retirement Benefits,” which replaced the accounting standard for retirement benefits that had been issued by the Business Accounting Council in 1998 with an effective date of April 1, 2000, and the other related practical guidance, and were followed by partial amendments from time to time through 2009.(a) Under the revised accounting standard, actuarial gains and losses
and past service costs that are yet to be recognized in profit or loss are recognized within equity (accumulated other compre-hensive income), after adjusting for tax effects, and any resulting deficit or surplus is recognized as a liability (liability for retirement benefits) or asset (asset for retirement benefits).
(b) The revised accounting standard does not change how to recog-nize actuarial gains and losses and past service costs in profit or loss. Those amounts are recognized in profit or loss over a certain period no longer than the expected average remaining service period of the employees. However, actuarial gains and losses and past service costs that arose in the current period and have not yet been recognized in profit or loss are included in other com-prehensive income and actuarial gains and losses and past service costs that were recognized in other comprehensive income in prior periods and then recognized in profit or loss in the current period are treated as reclassification adjustments (see Note 17).
(c) The revised accounting standard also made certain amendments relating to the method of attributing expected benefit to periods, the discount rate, and expected future salary increases.
This accounting standard and the guidance for (a) and (b) above are effective for the end of annual periods beginning on or after April 1, 2013, and for (c) above are effective for the beginning of annual periods beginning on or after April 1, 2014, or for the beginning of annual periods beginning on or after April 1, 2015, subject to certain
disclosure in March 2015, all with earlier application being permitted from the beginning of annual periods beginning on or after April 1, 2013. However, no retrospective application of this accounting stan-dard to consolidated financial statements in prior periods is required.
The azbil Group applied the revised accounting standard and guid-ance for retirement benefits for (a) and (b) above, effective March 31, 2014, and for (c) above, effective April 1, 2014.
With respect to (c) above, Azbil and certain subsidiaries changed the method of attributing the expected benefit to periods from a straight-line basis to a benefit formula basis and the method of determining the discount rate from using the period which approximates the ex-pected average remaining service period to using a single weighted average discount rate reflecting the estimated timing and amount of benefit payment, and recorded the effect of (c) above as of April 1, 2014, in retained earnings. As a result, liability for retirement benefits as of April 1, 2014, decreased by ¥7,986 million ($66,549 thousand), and retained earnings as of April 1, 2014, increased by ¥5,149 million ($42,906 thousand). On the other hand, there were no significant impact on operating income and income before income taxes and minority interests for the year ended March 31, 2015. In addition, net assets per share for the year ended March 31, 2015, increased by ¥69.72 ($0.58).
Retirement benefits to directors and Audit & Supervisory Board members are provided at the amount which would be required if all directors and Audit & Supervisory Board members retired at each bal-ance sheet date.
j. Asset Retirement Obligations—In March 2008, the ASBJ issued ASBJ Statement No. 18, “Accounting Standard for Asset Retirement Obligations,” and ASBJ Guidance No. 21, “Guidance on Accounting Standard for Asset Retirement Obligations.” Under this accounting standard, an asset retirement obligation is defined as a legal obli-gation imposed either by law or contract that results from the ac-quisition, construction, development and the normal operation of a tangible fixed asset and is associated with the retirement of such tan-gible fixed asset. The asset retirement obligation is recognized as the sum of the discounted cash flows required for the future asset retire-ment and is recorded in the period in which the obligation is incurred if a reasonable estimate can be made. If a reasonable estimate of the asset retirement obligation cannot be made in the period the asset retirement obligation is incurred, the liability should be recognized when a reasonable estimate of the asset retirement obligation can be made. Upon initial recognition of a liability for an asset retirement obligation, an asset retirement cost is capitalized by increasing the carrying amount of the related fixed asset by the amount of the li-ability. The asset retirement cost is subsequently allocated to expense through depreciation over the remaining useful life of the asset. Over time, the liability is accreted to its present value each period. Any sub-sequent revisions to the timing or the amount of the original estimate of undiscounted cash flows are reflected as an adjustment to the car-rying amount of the liability and the capitalized amount of the related asset retirement cost.
k. Stock Options—In December 2005, the ASBJ issued ASBJ Statement No. 8, “Accounting Standard for Stock Options,” and related guidance. The new standard and guidance are applicable to stock options newly granted on and after May 1, 2006. This standard requires companies to measure the cost of employee stock options based on the fair value at the date of grant and recognize compensa-tion expense over the vesting period as consideration for receiving goods or services. The standard also requires companies to account for stock options granted to non-employees based on the fair value
70 azbil report 2015

of either the stock option or the goods or services received. In the balance sheet, the stock option is presented as a stock acquisition right as a separate component of equity until exercised. The standard covers equity-settled, share-based payment transactions, but does not cover cash-settled, share-based payment transactions. In addition, the standard allows unlisted companies to measure options at their intrin-sic value if they cannot reliably estimate fair value.
l. Research and Development Costs—Research and development costs are charged to income as incurred.
m. Leases—In March 2007, the ASBJ issued ASBJ Statement No. 13, “Accounting Standard for Lease Transactions,” which revised the pre-vious accounting standard for lease transactions.
Under the previous accounting standard, finance leases that were deemed to transfer ownership of the leased property to the lessee were capitalized. However, other finance leases were permitted to be accounted for as operating lease transactions if certain “as if capital-ized” information was disclosed in the notes to the lessee’s financial statements. The revised accounting standard requires that all finance lease transactions be capitalized by recognizing lease assets and lease obligations in the balance sheet. In addition, the revised account-ing standard permits leases which existed at the transition date and which do not transfer ownership of the leased property to the lessee to be accounted for as operating lease transactions with certain “as if capitalized” information disclosed in the notes to the lessee’s financial statements.
Azbil and its consolidated domestic subsidiaries applied the revised accounting standard effective April 1, 2008. In addition, Azbil and its consolidated domestic subsidiaries continue to account for leases that existed at the transition date and which do not transfer ownership of the leased property to the lessee as operating lease transactions.
All other leases are accounted for as operating leases.
n. Bonuses to Directors—Bonuses to directors are accrued at the end of the year to which such bonuses are attributable. The balance of such accrued bonuses as of March 31, 2015 and 2014, was ¥117 million ($973 thousand) and ¥110 million, respectively.
o. Construction Contracts—In December 2007, the ASBJ issued ASBJ Statement No. 15, “Accounting Standard for Construction Contracts,” and ASBJ Guidance No. 18, “Guidance on Accounting Standard for Construction Contracts.” Under this accounting stan-dard, construction revenue and construction costs should be recog-nized by the percentage-of-completion method if the outcome of a construction contract can be estimated reliably. When total construc-tion revenue, total construction costs, and the stage of completion of the contract at the balance sheet date can be reliably measured, the outcome of a construction contract is deemed to be estimated reliably. If the outcome of a construction contract cannot be reliably estimated, the completed-contract method should be applied. When it is probable that total construction costs will exceed total construc-tion revenue, an estimated loss on the contract should be immediately recognized by providing for a loss on construction contracts.
p. Income Taxes—The provision for income taxes is computed based on the pretax income included in the consolidated statement of in-come. The asset and liability approach is used to recognize deferred tax assets and liabilities for the expected future tax consequences of temporary differences between the carrying amounts and the tax bases of assets and liabilities. Deferred taxes are measured by apply-ing currently enacted income tax rates to the temporary differences
and tax loss carryforwards.
q. Foreign Currency Transactions—All short-term and long-term monetary receivables and payables denominated in foreign currencies are translated into Japanese yen at the exchange rates at the balance sheet date. The foreign exchange gains and losses from translation are recognized in the consolidated statement of income to the extent that they are not hedged by forward exchange contracts.
r. Foreign Currency Financial Statements—The balance sheet accounts of consolidated foreign subsidiaries are translated into Japanese yen at the current exchange rate as of the balance sheet date except for equity, which is translated at the historical rate. Differences arising from such translation are shown as “Foreign cur-rency translation adjustments” under accumulated other comprehen-sive income in a separate component of equity. Revenue and expense accounts of consolidated foreign subsidiaries are translated into yen at the average exchange rate.
s. Derivatives Financial Instruments—The azbil Group uses deriva-tive financial instruments to manage its exposures to fluctuations in foreign exchange and interest rates. Foreign exchange forward con-tracts and interest rate swaps are utilized by the azbil Group to reduce foreign currency exchange and interest rate risks. The azbil Group does not enter into derivatives for trading or speculative purposes.
All derivatives are recognized as either assets or liabilities and mea-sured at fair value with gains or losses on derivative transactions rec-ognized in the consolidated statement of income. If derivatives qualify for hedge accounting because of high correlation and effectiveness between the hedging instruments and the hedged items, hedge ac-counting is applied.
Foreign exchange forward contracts are utilized to hedge foreign exchange exposures for export sales and import purchases. Trade re-ceivables and payables denominated in foreign currencies are trans-lated at the contracted rates if the forward contracts qualify for hedge accounting. Forward contracts related to forecasted (or committed) transactions are measured at fair value, but the unrealized gains/losses are deferred until the underlying transactions are completed.
t. Per Share Information—Net income per share is computed by dividing net income available to common shareholders by the weighted-average number of common shares outstanding for the period, retroactively adjusted for stock splits. The weighted-average number of shares of common stock used in the computation was 73,852,582 shares for 2015 and 73,853,357 shares for 2014.
Cash dividends per share presented in the accompanying consoli-dated statement of income are dividends applicable to the respective fiscal years including dividends to be paid after the end of the year.
Diluted net income per share is not disclosed because it is antidilutive.
u. Accounting Changes and Error Corrections—In December 2009, the ASBJ issued ASBJ Statement No. 24, “Accounting Standard for Accounting Changes and Error Corrections,” and ASBJ Guidance No. 24, “Guidance on Accounting Standard for Accounting Changes and Error Corrections.” Accounting treatments under this standard and guidance are as follows:(1) Changes in accounting policies
When a new accounting policy is applied following revision of an accounting standard, the new policy is applied retrospectively un-less the revised accounting standard includes specific transitional provisions, in which case the entity shall comply with the specific transitional provisions.
Finan
cial Data
azbil report 2015 71

(2) Changes in presentation When the presentation of financial statements is changed, prior-
period financial statements are reclassified in accordance with the new presentation.
(3) Changes in accounting estimates A change in an accounting estimate is accounted for in the period
of the change if the change affects that period only, and is ac-counted for prospectively if the change affects both the period of the change and future periods.
(4) Corrections of prior-period errors When an error in prior-period financial statements is discovered,
those statements are restated.
v. New Accounting PronouncementsAccounting Standards for Business Combinations and Consolidated Financial Statements—In September 2013, the ASBJ issued re-vised ASBJ Statement No. 21, “Accounting Standard for Business Combinations,” revised ASBJ Guidance No. 10, “Guidance on Accounting Standards for Business Combinations and Business Divestitures,” and revised ASBJ Statement No. 22, “Accounting Standard for Consolidated Financial Statements.”
Major accounting changes are as follows:(a) Transactions with noncontrolling interest
A parent’s ownership interest in a subsidiary might change if the parent purchases or sells ownership interests in its subsidiary. The carrying amount of minority interest is adjusted to reflect the change in the parent’s ownership interest in its subsidiary while the parent retains its controlling interest in its subsidiary. Under the current accounting standard, any difference between the fair value of the consideration received or paid and the amount by which the minority interest is adjusted is accounted for as an ad-justment of goodwill or as profit or loss in the consolidated state-ment of income. Under the revised accounting standard, such difference shall be accounted for as capital surplus as long as the parent retains control over its subsidiary.
(b) Presentation of the consolidated balance sheet In the consolidated balance sheet, “minority interest” under the
current accounting standard will be changed to “noncontrolling interest” under the revised accounting standard.
(c) Presentation of the consolidated statement of income In the consolidated statement of income, “income before mi-
nority interest” under the current accounting standard will be changed to “net income” under the revised accounting standard, and “net income” under the current accounting standard will be changed to “net income attributable to owners of the parent” under the revised accounting standard.
(d) Provisional accounting treatments for a business combination If the initial accounting for a business combination is incomplete
by the end of the reporting period in which the business combi-nation occurs, an acquirer shall report in its financial statements provisional amounts for the items for which the accounting is incomplete. Under the current accounting standard guidance, the impact of adjustments to provisional amounts recorded in a busi-ness combination on profit or loss is recognized as profit or loss in the year in which the measurement is completed. Under the revised accounting standard guidance, during the measurement period, which shall not exceed one year from the acquisition, the acquirer shall retrospectively adjust the provisional amounts recognized at the acquisition date to reflect new information obtained about facts and circumstances that existed as of the ac-quisition date and that would have affected the measurement of the amounts recognized as of that date. Such adjustments shall
be recognized as if the accounting for the business combination had been completed at the acquisition date.
(e) Acquisition-related costs Acquisition-related costs are costs, such as advisory fees or pro-
fessional fees, which an acquirer incurs to effect a business com-bination. Under the current accounting standard, the acquirer accounts for acquisition-related costs by including them in the acquisition costs of the investment. Under the revised account-ing standard, acquisition-related costs shall be accounted for as expenses in the periods in which the costs are incurred.
The above accounting standards and guidance for “transactions with noncontrolling interest,” “acquisition-related costs” and “pre-sentation changes in the consolidated financial statements” are effec-tive for the beginning of annual periods beginning on or after April 1, 2015. Earlier application is permitted from the beginning of annual periods beginning on or after April 1, 2014, except for the presenta-tion changes in the consolidated financial statements. In case of ear-lier application, all accounting standards and guidance above, except for the presentation changes, should be applied simultaneously.
Either retrospective or prospective application of the revised ac-counting standards and guidance for “transactions with noncon-trolling interest” and “acquisition-related costs” is permitted. In retrospective application of the revised standards and guidance for “transactions with noncontrolling interest” and “acquisition-related costs,” the accumulated effects of retrospective adjustments for all “transactions with noncontrolling interest” and “acquisition-related costs” which occurred in the past shall be reflected as adjustments to the beginning balance of capital surplus and retained earnings for the year of the first-time application. In prospective application, the new standards and guidance for “transactions with noncontrolling interest” and “acquisition-related costs” shall be applied prospec-tively from the beginning of the year of the first-time application. The changes in presentation shall be applied to all periods presented in fi-nancial statements containing the first-time application of the revised standards and guidance.
The revised standards and guidance for “provisional accounting treatments for a business combination” are effective for a business combination which will occur on or after the beginning of annual periods beginning on or after April 1, 2015. Earlier application is per-mitted for a business combination which will occur on or after the beginning of annual periods beginning on or after April 1, 2014.
The azbil Group expects to apply the revised accounting standards and guidance from the beginning of the annual period beginning on April 1, 2015, and is in the process of measuring the effects of ap-plying the revised accounting standards and guidance in future ap-plicable periods. The effect of these changes is expected to decrease capital surplus by ¥4,912 million ($40,936 thousand), and goodwill by ¥1,449 million ($12,074 thousand), and increase retained earnings by ¥3,463 million ($28,862 thousand), in the consolidated balance sheet as of April 1, 2015.
72 azbil report 2015

3. BUSINESS COMBINATIONSTransaction under Common Controla. Summary of Business Combination
(1) Name and business of the acquired company Name of the acquired company: Azbil Telstar, S.L.U. Business contents: Development, manufacturing, and sale of freeze-drying machines, sterilization devices, and pharmaceutical water/vapor production equip-
ment; consulting and engineering for clean rooms; and other businesses
(2) Date of business combination December 23, 2014
(3) Legal form of business combination Stock purchase for cash from minority stockholders
(4) Company name after business combination Not changed
(5) Major reason for business combination Azbil purchased 80.0% of the shares of Azbil Telstar, S.L.U. on January 10, 2013, and it became a consolidated subsidiary. Azbil decided
to make Azbil Telstar, S.L.U. a wholly owned subsidiary by purchasing the remaining outstanding shares. The purpose of the transaction is to accelerate management decision-making, improve the efficiency of management and maximize the synergies of the whole group for expanding profitability.
(6) Acquired voting rights
Owned voting rights before acquisition: 80.0%Acquired voting rights: 20.0%After additional acquisition: 100.0%
b. Outline of the Accounting Treatment Based on “Accounting Standard for Business Combinations” (ASBJ Statement No. 21, December 26, 2008) and “Guidance on Accounting
Standard for Business Combinations and Accounting Standard for Business Divestitures” (ASBJ Guidance No. 10, December 26, 2008), Azbil treated the business combination as a transaction with minority shareholders.
c. Details on the Acquisition Cost of the Acquired Company
Millions of Yen Thousands of U.S. Dollars
Stock purchase price ¥ 1,637 $ 13,643Purchase price ¥ 1,637 $ 13,643
d. Amount of Goodwill, Reason for Goodwill and Method and Term of Amortization (1) Amount of goodwill: ¥1,637 million ($13,643 thousand)
(2) Reason for goodwill: As the purchase price of Azbil Telstar, S.L.U. exceeded the fair value of its net equity, the excess amount was booked as goodwill.
(3) Method and term of amortization: Straight-line method over 7 years
Azbil devalued a part of the goodwill amount to the recoverable amount and booked the amount of the decrease as impairment loss.
Finan
cial Data
azbil report 2015 73

Business Divestituresa. Summary of Business Divestitures (1) Name and business of the divested company Name of the divested company: Azbil Care & Support Co., Ltd. Business contents: Emergency alert response service business including health consulting and emergency care service Nursing care business including home attendant care, day care, group homes and rental of welfare goods
(2) Major reason for business divestitures The azbil Group closely monitors changes in the business environment, in both the domestic and overseas markets, ensuring the optimum de-
ployment of management resources and strengthening its corporate structure. In this way, it aims to realize customer satisfaction—by provid-ing greater added value for its products and services—and thus achieve sustainable growth, which will lead to increased shareholders’ value. Azbil has come to the conclusion that the best way to realize the future business development of Azbil Care & Support Co., Ltd. in a speedy manner is to place this business within SOHGO SECURITY SERVICES CO., LTD., a company that already possesses an extensive customer base in the field of private sector services, and which is currently expanding a range of services to watch over the elderly and to provide nursing care. It was therefore decided to transfer the shares of Azbil Care & Support Co., Ltd. to SOHGO SECURITY SERVICES CO., LTD.
(3) Date of business divestitures February 4, 2015
(4) Legal form of business divestitures Stock transfer for cash as consideration
b. Outline of the Accounting Treatment (1) Amount of gain on sales of shares
Gain on sales of shares of subsidiaries and associates: ¥1,607 million ($13,338 thousand)
(2) Details of assets and liabilities divested on the date of business divestitures
Millions of Yen Thousands of U.S. Dollars
Current assets ¥ 839 $ 6,992Noncurrent assets 362 3,014Total assets ¥ 1,201 $ 10,006Current liabilities ¥ 397 $ 3,312Noncurrent liabilities 5 42Total liabilities ¥ 402 $ 3,354
(3) Accounting treatment Azbil recorded the difference between the market value of the asset received due to the share transfer and the equivalent of the net assets
for the divested business as a gain on sales of shares.
c. Reportable Segment for Divested Business Life Automation
d. Approximate Amount for Divested Business Recorded in Consolidated Statement of Income during the Year Ended March 31, 2015
Net sales: ¥3,402 million ($28,350 thousand)Operating income: ¥7 million ($60 thousand)
74 azbil report 2015

4. MARKETABLE AND INVESTMENT SECURITIESMarketable and investment securities as of March 31, 2015 and 2014, consisted of the following:
Millions of Yen Thousands of U.S. Dollars
2015 2014 2015
Current—Other ¥ 13,606 ¥ 10,106 $ 113,382Total ¥ 13,606 ¥ 10,106 $ 113,382Noncurrent: Equity securities ¥ 22,391 ¥ 16,182 $ 186,588 Other 4 3 34Total ¥ 22,395 ¥ 16,185 $ 186,622
The costs and aggregate fair values of marketable and investment securities whose fair values are readily determinable as of March 31, 2015 and 2014, were as follows:
Millions of Yen Thousands of U.S. Dollars
2015 2014 2015
CostUnrealized
GainsUnrealized
LossesFair
Value CostUnrealized
GainsUnrealized
LossesFair
Value CostUnrealized
GainsUnrealized
LossesFair
Value
Securities classified as available-for-sale:
Equity securities ¥ 5,793 ¥ 15,942 ¥ 40 ¥ 21,695 ¥ 5,793 ¥ 9,753 ¥ 38 ¥ 15,508 $ 48,276 $ 132,849 $ 336 $ 180,789
Other 13,606 13,606 14,937 14,937 113,382 113,382
The information for available-for-sale securities whose fair values are not readily determinable as of March 31, 2015 and 2014, is disclosed in Note 14.The information for available-for-sale securities which were sold during the years ended March 31, 2015 and 2014, is as follows:
Millions of Yen Thousands of U.S. Dollars
2015 2014 2015
ProceedsRealized Gains
Realized Losses Proceeds
Realized Gains
Realized Losses Proceeds
Realized Gains
Realized Losses
Available-for-sale—Equity securities ¥ 138 ¥ 53 ¥ 274 ¥ 44 ¥ 19 $ 1,149 $ 445
The impairment losses on available-for-sale equity securities for the year ended March 31, 2014, were ¥134 million.
5. INVENTORIESInventories at March 31, 2015 and 2014, consisted of the following:
Millions of Yen Thousands of U.S. Dollars
2015 2014 2015
Merchandise ¥ 1,580 ¥ 1,203 $ 13,164Finished products 3,774 3,034 31,450Work in process 7,009 5,959 58,408Raw materials 9,320 7,998 77,669Total ¥ 21,683 ¥ 18,194 $ 180,691
6. LONG-LIVED ASSETS AND GOODWILLThe azbil Group reviewed its long-lived assets for impairment, and recognized impairment losses of ¥2,669 million ($22,245 thousand) for the year ended March 31, 2015, for certain assets of Azbil and goodwill of Azbil Telstar, S.L.U., Azbil Vortek, LLC and Beijing YTYH Intelli-Technology (Beijing) Co., Ltd. The carrying amount of the relevant property, plant and equipment was written down to the net selling price and the carrying amount of goodwill was written down to the recoverable amount. The discount rate for measuring the recoverable amount was 6.9% for Azbil Telstar, S.L.U. and 12.7% was for Azbil Vortek, LLC. The recoverable amount was zero for Beijing YTYH Intelli-Technology (Beijing) Co., Ltd.
Impairment loss was ¥36 million for the year ended March 31, 2014, for part of Azbil Kimmon. The carrying amounts of the relevant property, plant and equipment were written down to the net selling price.
Millions of Yen Thousands of U.S. Dollars
2015 2014 2015
Buildings and structures ¥ 67 $ 559Machinery and equipment 2 ¥ 7 16Furniture and fixtures 13 29 107Goodwill of Azbil Telstar, S.L.U. 1,784 14,871Goodwill of Azbil Vortek, LLC 407 3,392Goodwill of Beijing YTYH Intelli-Technology (Beijing) Co., Ltd. 396 3,300Total ¥ 2,669 ¥ 36 $ 22,245
Finan
cial Data
azbil report 2015 75

7. SHORT-TERM BORROWINGS AND LONG-TERM DEBTShort-term borrowings as of March 31, 2015 and 2014, mainly consisted of notes to banks and bank overdrafts. The annual interest rates appli-cable to the short-term bank loans ranged from 0.4% to 9.4% as of March 31, 2015, and from 0.5% to 7.8% as of March 31, 2014.
Long-term debt as of March 31, 2015 and 2014, consisted of the following:
Millions of Yen Thousands of U.S. Dollars
2015 2014 2015
Loans from banks and other financial institutions, due serially through 2029 with interest rates ranging from 0.0% to 3.1% in 2015 and from 0.0% to 3.1% in 2014: Collateralized ¥ 310 ¥ 568 $ 2,583 Unsecured 2,271 3,749 18,922Bonds due serially through 2016 with interest rates of 0.7% in 2015 and from 0.7% to 0.9% in 2014— Collateralized 40 90 333Obligations under finance leases 905 131 7,541 Total 3,526 4,538 29,379Less current portion (1,871) (2,200) (15,590)Long-term debt, less current portion ¥ 1,655 ¥ 2,338 $ 13,789
As of March 31, 2015, Azbil had an unused line of credit amounting to ¥30,000 million ($250,000 thousand), of which ¥10,000 million ($83,333 thousand) was related to the unused portion of commitment lines with four banks and ¥20,000 million ($166,667 thousand) was related to a medium-term notes program.
Annual maturities of long-term debt as of March 31, 2015, for the next five years and thereafter were as follows:
Year Ending March 31 Millions of Yen Thousands of U.S. Dollars
2016 ¥ 1,871 $ 15,5902017 345 2,8762018 239 1,9922019 212 1,7652020 411 3,4262021 and thereafter 448 3,730Total ¥ 3,526 $ 29,379
The carrying amounts of assets pledged as collateral for the above collateralized debt at March 31, 2015, were as follows:
Millions of Yen Thousands of U.S. Dollars
Land ¥ 373 $ 3,111Buildings and structures 88 736Machinery and equipment 3 23Total ¥ 464 $ 3,870
As is customary in Japan, the azbil Group maintains deposit balances with banks with which it has bank loans. Such deposit balances are not legally or contractually restricted as to withdrawal.
General agreements with respective banks provide, as is customary in Japan, that additional collateral must be provided under certain circum-stances if requested by the lending banks and that certain banks have the right to offset cash deposited with them against any bank loan or obliga-tion that becomes due and, in case of default and certain other specified events, against all other debt payable to the banks. The azbil Group has never received any such requests.
8. RETIREMENT AND PENSION PLANSAzbil and certain subsidiaries have retirement and pension plans for employees, and certain domestic subsidiaries have retirement benefit plans for directors and Audit & Supervisory Board members.
Under most circumstances, employees terminating their employment are entitled to retirement benefits determined based on the rate of pay at the time of termination, years of service, and certain other factors. Such retirement benefits are made in the form of lump-sum severance pay-ments from the azbil Group and annuity payments from a trustee. Employees are entitled to larger payments if the termination is involuntary, by retirement at the mandatory retirement age or by death, than in the case of voluntary termination at certain specific ages prior to the mandatory retirement age.
In addition, Azbil and a certain subsidiary transferred the defined benefit pension plans for working employees to the defined contribution pension plans at June 1, 2015. The accounting for these transfers was recorded according to “Guidance on Accounting for Transfer between Retirement Benefit Plans” (ASBJ Guidance No. 1) and “Practical Solution on Accounting for Transfer between Retirement Benefit Plans” (ASBJ PITF No. 2). The estimated losses on these transfers were ¥2,885 million ($24,042 thousand) and recorded as losses on abolishment of retirement benefit plan in the consolidated statement of income for the year ended March 31, 2015.
The liability for retirement benefits at March 31, 2015 and 2014, for directors and Audit & Supervisory Board members is ¥126 million ($1,049 thousand) and ¥112 million, respectively. The retirement benefits for directors and Audit & Supervisory Board members are paid subject to the approval of the shareholders.
76 azbil report 2015

(1) The changes in defined benefit obligation for the years ended March 31, 2015 and 2014, were as follows:
Millions of Yen Thousands of U.S. Dollars
2015 2014 2015
Balance at beginning of year (as previously reported) ¥ 44,549 ¥ 44,934 $ 371,245 Cumulative effect of accounting change (7,985) (66,549)Balance at beginning of year (as restated) 36,564 44,934 304,696 Current service cost 1,675 1,631 13,962 Interest cost 402 359 3,352 Actuarial (gains) losses 65 (617) 548 Benefits paid (1,558) (1,758) (12,987) Decrease with transfer to the defined contribution pension plan (673) (5,610) Others 151 1,255Balance at end of year ¥ 36,626 ¥ 44,549 $ 305,216
(2) The changes in plan assets for the years ended March 31, 2015 and 2014, were as follows:
Millions of Yen Thousands of U.S. Dollars
2015 2014 2015
Balance at beginning of year ¥ 33,416 ¥ 29,871 $ 278,472 Expected return on plan assets 835 149 6,962 Actuarial gains 1,217 2,381 10,140 Contributions from the employer 3,070 2,773 25,584 Benefits paid (1,558) (1,758) (12,987) Others 158 1,314Balance at end of year ¥ 37,138 ¥ 33,416 $ 309,485
(3) Reconciliation between the liability recorded in the consolidated balance sheet and the balances of defined benefit obligation and plan assets
Millions of Yen Thousands of U.S. Dollars
2015 2014 2015
Funded defined benefit obligation ¥ 36,626 ¥ 44,549 $ 305,216Plan assets (37,138) (33,416) (309,485)
(512) 11,133 (4,269)Unfunded defined benefit obligation 8,670 5,503 72,258Net liability arising from defined benefit obligation ¥ 8,158 ¥ 16,636 $ 67,989
Millions of Yen Thousands of U.S. Dollars
2015 2014 2015
Liability for retirement benefits ¥ 8,165 ¥ 16,636 $ 68,039Asset for retirement benefits (7) (59)Net liability arising from defined benefit obligation ¥ 8,158 ¥ 16,636 $ 67,980
(4) The components of net periodic benefit costs for the years ended March 31, 2015 and 2014, were as follows:
Millions of Yen Thousands of U.S. Dollars
2015 2014 2015
Service cost ¥ 2,352 ¥ 2,236 $ 19,601Interest cost 430 388 3,584Expected return on plan assets (835) (149) (6,962)Recognized actuarial losses 1,007 2,377 8,394Amortization of prior service cost (516) (186) (4,300)Others 467 378 3,893Net periodic benefit costs ¥ 2,905 ¥ 5,044 $ 24,210Losses on abolishment of retirement benefit plan (recorded on other expenses) ¥ 2,885 $ 24,042
Finan
cial Data
azbil report 2015 77

(5) Amounts recognized in other comprehensive income (before income tax effect) in respect of defined retirement benefit plans for the years ended March 31, 2015 and 2014
Millions of Yen Thousands of U.S. Dollars
2015 2014 2015
Prior service cost ¥ (516) $ (4,300)Actuarial losses 2,264 18,867Reconciliation on abolishment of retirement benefit plan 404 3,367Total ¥ 2,152 $ 17,934
(6) Amounts recognized in accumulated other comprehensive income (before income tax effect) in respect of defined retirement benefit plans as of March 31, 2015 and 2014
Millions of Yen Thousands of U.S. Dollars
2015 2014 2015
Unrecognized prior service cost ¥ 1,013 ¥ 1,529 $ 8,444Unrecognized actuarial gains (1,867) (4,131) (15,559)Reconciliation on abolishment of retirement benefit plan 404 3,367Total ¥ (450) ¥ (2,602) $ (3,748)
(7) Plan assetsa. Components of plan assets Plan assets as of March 31, 2015 and 2014, consisted of the following:
2015 2014
Debt investments 45% 37%Life insurance company general accounts 36 33Equity investments 18 28Others 1 2Total 100% 100%
b. Method of determining the expected rate of return on plan assets The expected rate of return on plan assets is determined considering the long-term rates of return which are expected currently and in the future
from the various components of the plan assets.
(8) Assumptions used for the years ended March 31, 2015 and 2014, are set forth as follows:
2015 2014
Discount rate 0.8%–1.1% 0.8%Expected rate of return on plan assets 2.5% 0.5%Expected rate of increase in future salary 2.8% 2.8%
9. EQUITYJapanese companies are subject to the Companies Act of Japan (the “Companies Act”). The significant provisions in the Companies Act that affect financial and accounting matters are summarized below:a. Dividends Under the Companies Act, companies can pay dividends at any time during the fiscal year in addition to the year-end dividend upon resolution
at the shareholders’ meeting. For companies that meet certain criteria including (1) having a Board of Directors, (2) having independent audi-tors, (3) having an Audit & Supervisory Board, and (4) the term of service of the directors being prescribed as one year rather than the normal two-year term by its articles of incorporation, the Board of Directors may declare dividends (except for dividends-in-kind) at any time during the fiscal year if the company has prescribed so in its articles of incorporation. However, Azbil cannot do so because it does not meet all the above criteria. The Companies Act permits companies to distribute dividends-in-kind (noncash assets) to shareholders subject to a certain limitation and additional requirements. Semiannual interim dividends may also be paid once a year upon resolution by the Board of Directors if the articles of incorporation of the company so stipulate. The Companies Act provides certain limitations on the amounts available for dividends or the purchase of treasury stock. The limitation is defined as the amount available for distribution to the shareholders, but the amount of net assets after dividends must be maintained at no less than ¥3 million.
b. Increases/Decreases and Transfer of Common Stock, Reserve and Surplus The Companies Act requires that an amount equal to 10% of dividends must be appropriated as a legal reserve (a component of retained
earnings) or as additional paid-in capital (a component of capital surplus), depending on the equity account charged upon the payment of such dividends, until the aggregate amount of legal reserve and additional paid-in capital equals 25% of the amount of the common stock. Under the Companies Act, the total amount of additional paid-in capital and legal reserve may be reversed without limitation. The Companies Act also provides that common stock, legal reserve, additional paid-in capital, other capital surplus and retained earnings can be transferred among the accounts within equity under certain conditions upon resolution of the shareholders.
78 azbil report 2015

c. Treasury Stock and Treasury Stock Acquisition Rights The Companies Act also provides for companies to purchase treasury stock and dispose of such treasury stock by resolution of the Board of
Directors. The amount of treasury stock purchased cannot exceed the amount available for distribution to the shareholders which is determined by a specific formula. Under the Companies Act, stock acquisition rights are presented as a separate component of equity. The Companies Act also provides that companies can purchase both treasury stock acquisition rights and treasury stock. Such treasury stock acquisition rights are presented as a separate component of equity or deducted directly from stock acquisition rights.
10. INCOME TAXESAzbil and its domestic subsidiaries are subject to Japanese national and local income taxes which, in the aggregate, resulted in normal effective statutory tax rates of approximately 35.5% for the year ended March 31, 2015, and 37.9% for the year ended March 31, 2014.
The tax effects of significant temporary differences and tax loss carryforwards which resulted in deferred tax assets and liabilities at March 31, 2015 and 2014, are as follows:
Millions of Yen Thousands of U.S. Dollars
2015 2014 2015
Deferred tax assets: Pension and severance costs ¥ 2,651 ¥ 5,729 $ 22,090 Accrued expenses 3,762 4,092 31,352 Depreciation 771 896 6,426 Loss on impairment of property, plant and equipment 172 355 1,434 Allowance for doubtful receivables 774 1,229 6,454 Tax loss carryforwards 1,443 1,402 12,027 Others 2,324 2,505 19,360 Less valuation allowance (3,885) (4,709) (32,371) Total 8,012 11,499 66,772Deferred tax liabilities: Net unrealized gain on available-for-sale securities 5,053 3,383 42,107 Special advanced depreciation 1,154 1,315 9,617 Others 113 115 943 Total 6,320 4,813 52,667Net deferred tax assets ¥ 1,692 ¥ 6,686 $ 14,105
In addition to the above, the azbil Group recorded deferred tax liabilities on the revaluation surplus of ¥191 million ($1,589 thousand) at March 31, 2015, and ¥210 million at March 31, 2014.
There is no material difference between the normal effective statutory tax rate for the year ended March 31, 2015, and the actual effective tax rate reflected in the accompanying consolidated statement of income.
A reconciliation between the normal effective statutory tax rates and the actual effective tax rates reflected in the accompanying consolidated statement of income for the year ended March 31, 2014, is as follows:
2014
Normal effective statutory tax rate 37.9%Expenses not deductible for income tax purposes 2.0Tax benefits for qualified expenses (4.3)Valuation allowance increase 5.3Amortization of goodwill 3.6Effect of tax rate reduction 3.1Others—net (0.2)Actual effective tax rate 47.4%
On March 31, 2015, a tax reform law was enacted in Japan which changed the normal effective statutory tax rate from 35.5% to approximately 33.0% effective for the fiscal year beginning on or after April 1, 2015, and to approximately 32.1% effective for the fiscal year beginning on or after April 1, 2016. The effect of these changes was to decrease deferred tax assets, net of deferred tax liabilities by ¥74 million ($619 thousand) and increase accumulated other comprehensive income for unrealized gain on available-for-sale securities by ¥529 million ($4,411 thousand), and defined retirement benefit plan by ¥5 million ($41 thousand), in the consolidated balance sheet as of March 31, 2015, and to increase income taxes—deferred in the consolidated statement of income for the year then ended by ¥460 million ($3,832 thousand).
At March 31, 2015, certain subsidiaries have tax loss carryforwards aggregating approximately ¥8,500 million ($70,831 thousand) which are available to be offset against taxable income of such subsidiaries in future years. These tax loss carryforwards, if not utilized, will expire as follows:
Year Ending March 31 Millions of Yen Thousands of U.S. Dollars
2016 ¥ 13 $ 1102017 5 412018 481 4,0082019 6 522020 260 2,1642021 and thereafter 7,735 64,456Total ¥ 8,500 $ 70,831
Finan
cial Data
azbil report 2015 79

11. OTHER INCOME (EXPENSES)—OTHERS—NETOther income (expenses)—Others—net for the years ended March 31, 2015 and 2014, mainly consisted of the following:
Millions of Yen Thousands of U.S. Dollars
2015 2014 2015
Gain on compensation from Tokyo Electric Power Company caused by claim for damage from Fukushima nuclear disasters ¥ 132 ¥ 506 $ 1,097Restructuring loss (450) (358) (3,747)Provision for loss litigation (442) (3,683)Other (48) (32) (399)Total ¥ (808) ¥ 116 $ (6,732)
12. RESEARCH AND DEVELOPMENT COSTSResearch and development costs charged to income were ¥10,124 million ($84,365 thousand) and ¥8,767 million for the years ended March 31, 2015 and 2014, respectively.
13. LEASES(1) Financing Leases as a Lessee
The azbil Group leases certain machinery, computer equipment, office space and other assets as a lessee.Total rental expenses under the above leases for the years ended March 31, 2015 and 2014, were ¥5,542 million ($46,187 thousand) and
¥5,968 million, respectively.ASBJ Statement No. 13, “Accounting Standard for Lease Transactions,” requires that all finance lease transactions be capitalized to recog-
nize lease assets and lease obligations in the balance sheet. However, ASBJ Statement No. 13 permits leases without ownership transfer of the leased property to the lessee and whose lease inception was before March 31, 2008, to continue to be accounted for as operating lease transactions if certain “as if capitalized” information is disclosed in the notes to the financial statements. Azbil and its consolidated domestic subsidiaries applied ASBJ Statement No. 13 effective April 1, 2008, and accounted for such leases as operating lease transactions. Pro forma information of leased property whose lease inception was before March 31, 2008, was as follows:
Millions of Yen
2015 2014
Machinery and
Equipment
Furniture and
Fixtures Software Total
Machinery and
Equipment
Furniture and
Fixtures Software Total
Acquisition cost ¥ 30 ¥ 30 ¥ 30 ¥ 30
Accumulated depreciation 27 27 24 24
Accumulated impairment loss
Net leased property ¥ 3 ¥ 3 ¥ 6 ¥ 6
Thousands of U.S. Dollars
2015
Machinery and
Equipment
Furniture and
Fixtures Software Total
Acquisition cost $ 249 $ 249
Accumulated depreciation 224 224
Accumulated impairment loss
Net leased property $ 25 $ 25
Obligations under finance leases:
Millions of Yen Thousands of U.S. Dollars
2015 2014 2015
Due within one year ¥ 155 ¥ 171 $ 1,290Due after one year 282 437 2,353Total ¥ 437 ¥ 608 $ 3,643
The above obligations under finance leases include the imputed interest portion.Depreciation expense and other information for finance leases:
Millions of Yen Thousands of U.S. Dollars
2015 2014 2015
Depreciation expense ¥ 3 ¥ 5 $ 28Lease payments 3 8 28
The above depreciation expense, which is not reflected in the accompanying consolidated statement of income, is computed mainly by the declining-balance method at rates based on the period of those financing leases with a remaining value of 10% of total lease payments.
80 azbil report 2015

The minimum rental commitments under noncancelable operating leases as of March 31, 2015 and 2014, were as follows:
Millions of Yen Thousands of U.S. Dollars
2015 2014 2015
Due within one year ¥ 20 ¥ 18 $ 166Due after one year 55 58 456Total ¥ 75 ¥ 76 $ 622
(2) Financing Leases as a Lessor The azbil Group leases certain machinery and equipment as a lessor.
Azbil and its consolidated domestic subsidiaries applied ASBJ Statement No. 13 effective April 1, 2008, and accounted for leases which ex-isted at the transition date and which do not transfer ownership of the leased property to the lessee as operating lease transactions. Pro forma information of such leases existing at the transition date, such as receivables under the finance leases, on an “as if capitalized” basis for the years ended March 31, 2015 and 2014, was as follows:
Millions of Yen Thousands of U.S. Dollars
2015 2014 2015
Receivables under finance leases: Due within one year ¥ 152 ¥ 168 $ 1,265 Due after one year 282 434 2,353Total ¥ 434 ¥ 602 $ 3,618
14. FINANCIAL INSTRUMENTS AND RELATED DISCLOSURES(1) Policy for Financial Instruments
The azbil Group makes safety the first priority in terms of its asset management and limits its investments to financial assets that consist mainly of short-term deposits, while the azbil Group’s financing needs are met by selecting the most suitable method of funding while taking into ac-count such factors as the purpose of the loan, the terms and funding costs. The azbil Group limits the use of derivatives to forward exchange contracts and currency option contracts to hedge against the risks associated with fluctuating exchange rates, and interest rate swaps to hedge against the risks associated with fluctuating interest rates, and does not engage in transactions for speculative purposes.
(2) Nature and Extent of Risks Arising from Financial Instruments and Risk ManagementNotes and accounts receivable—trade are subject to the credit risks of the customers. The azbil Group manages its credit risks on the basis of internal guidelines, which include keeping track of due dates and outstanding balances of the receivables for each transaction and also moni-tors the credit standing of the major customers on a yearly basis. Notes and accounts receivable—trade denominated in foreign currencies are subject to risks associated with fluctuating exchange rates; however, their net positions after deducting operating liabilities are, in principle, hedged through the use of forward exchange contracts.
Investment securities mainly comprise stocks of companies with which the azbil Group has business relationships, and are subject to the risks associated with fluctuating stock prices. Such stock investments are managed by monitoring their fair values and the financial status of the companies on a regular basis, as well as conducting ongoing reviews of their holding status by taking into account the azbil Group’s relation-ship with the issuing companies.
Notes and accounts payable—trade are liabilities due within one year. Although certain notes and accounts payable—trade denominated in foreign currencies are subject to the risks associated with fluctuating exchange rates, the majority of such instruments are constantly kept within the amount of the outstanding balance of accounts receivable denominated in the same foreign currency.
Interest-bearing debt mainly comprises short-term borrowings. While a portion of these borrowings, having floating interest rates, is subject to the risks associated with fluctuating interest rates, the effects of these risks are negligible as their terms are short and amounts minimal.
Derivative transactions are executed and managed in accordance with internal rules that stipulate the authorization procedures of such trans-actions, are used for the purpose of mitigating credit risks, and are conducted solely with highly rated financial institutions as counterparties. Please see Note 15 for more details about derivatives.
Additionally, notes and accounts payable—trade and short-term borrowings are subject to liquidity risks such as in the event the azbil Group cannot execute payment on the payment date. Liquidity risks are managed by such methods as having each group company draw up monthly cash flow plans.
Finan
cial Data
azbil report 2015 81

(3) Fair Values of Financial InstrumentsFair values of financial instruments are based on quoted prices in active markets. If a quoted price is not available, other rational valuation techniques are used instead. Please see Note 15 for the details of fair value for derivatives.
(a) Fair value of financial instruments
Millions of Yen Thousands of U.S. Dollars
March 31March 31, 2015
2015 2014
Carrying Amount
Fair Value
Unrealized Loss
Carrying Amount
Fair Value
Unrealized Loss
Carrying Amount
Fair Value
Unrealized Loss
Cash and cash equivalents ¥ 51,921 ¥ 51,921 ¥ 51,014 ¥ 51,014 $ 432,672 $ 432,672
Notes and accounts receivable—trade 88,961 88,961 88,228 88,228 741,340 741,340
Investment securities 21,695 21,695 15,508 15,508 180,789 180,789
Total ¥ 162,577 ¥ 162,577 ¥ 154,750 ¥ 154,750 $ 1,354,801 $ 1,354,801
Short-term borrowings ¥ 14,053 ¥ 14,053 ¥ 13,279 ¥ 13,279 $ 117,105 $ 117,105
Current portion of long-term debt 1,871 1,871 2,200 2,200 15,590 15,590
Notes and accounts payable—trade 42,688 42,688 41,456 41,456 355,733 355,733
Long-term debt 1,655 1,656 ¥ (1) 2,338 2,340 ¥ (2) 13,789 13,799 $ (10)
Total ¥ 60,267 ¥ 60,268 ¥ (1) ¥ 59,273 ¥ 59,275 ¥ (2) $ 502,217 $ 502,227 $ (10)
Cash and Cash Equivalents, and Notes and Accounts Receivable—TradeThe carrying values of cash and cash equivalents and notes and accounts receivable—trade approximate fair value because of their short maturities.
Investment SecuritiesThe fair values of investment securities are measured at the quoted market price of the stock exchange for equity instruments, and at the quoted price obtained from the financial institution for certain debt instruments. Fair value information for investment securities by classification is included in Note 4.
Short-Term Borrowings, Current Portion of Long-Term Debt and Notes and Accounts Payable—TradeThe carrying values of short-term borrowings, current portion of long-term debt, and notes and accounts payable—trade approximate fair value because of their short maturities.
Long-Term DebtThe fair values of loans from banks and other financial institutions are determined by the present values calculated by discounting the total amount of principal and interest rates currently considered applicable to similar loans.
The fair values of bonds without market value price are determined by the present values calculated by discounting the total amount of principal and interest at a rate that takes into account the remaining term and credit risks.
DerivativesFair value information for derivatives is included in Note 15.
(b) Carrying amount of financial instruments whose fair value cannot be reliably determined
Millions of Yen Thousands of U.S. Dollars
2015 2014 2015
Investments in equity instruments that do not have a quoted market price in an active market ¥ 856 ¥ 1,333 $ 7,137
(4) Maturity Analysis for Financial Assets and Securities with Contractual Maturities
Millions of Yen Thousands of U.S. Dollars
March 31, 2015
Due in 1 Year or Less
Due after 1 Year
through 5 Years
Due after 5 Years through 10 Years
Due after 10 Years
Due in 1 Year or Less
Due after 1 Year
through 5 Years
Due after 5 Years through 10 Years
Due after 10 Years
Cash and cash equivalents ¥ 51,921 $ 432,672
Notes and accounts receivable—trade 85,817 ¥ 3,116 ¥ 28 715,142 $ 25,969 $ 229
Total ¥ 137,738 ¥ 3,116 ¥ 28 $ 1,147,814 $ 25,969 $ 229
Please see Note 7 for annual maturities of long-term debt and Note 13 for obligations under finance leases.
15. DERIVATIVESThe azbil Group enters into foreign currency forward contracts to hedge foreign exchange risk associated with trade receivables and payables denominated in foreign currencies. The azbil Group also enters into interest rate swap contracts to manage its interest rate exposures on certain liabilities.
It is the azbil Group’s policy to use derivatives only for the purpose of reducing market risks associated with assets and liabilities, not to hold or issue derivatives for speculative or trading purposes.
82 azbil report 2015

Since all of the azbil Group’s foreign currency forward contracts and interest rate swap contracts are related to qualified hedges of underlying business exposures, market gain or loss risk in the derivative instruments is effectively offset by opposite movements in the value of the hedged assets or liabilities.
Because the counterparties to these derivatives are limited to major international financial institutions, the azbil Group does not anticipate any losses arising from credit risk.
Derivative transactions entered into by the azbil Group have been made in accordance with internal policies which regulate the authorization and credit limit amounts.
Derivative Transactions to Which Hedge Accounting Is Not Applied
Millions of Yen Thousands of U.S. Dollars
March 31March 31, 20152015 2014
Contract Amount
Contract Amount
Due after One
YearFair
ValueUnrealized Gain/Loss
Contract Amount
Contract Amount
Due after One
YearFair
ValueUnrealized Gain/Loss
Contract Amount
Contract Amount
Due after One
YearFair
ValueUnrealized Gain/Loss
Foreign currency forward contracts:
Selling U.S. dollars ¥ 812 ¥ (4) ¥ (4) ¥ 643 ¥ (5) ¥ (5) $ 6,795 $ (35) $ (35)
Buying U.S. dollars 478 (2) (2) 319 4 4 3,987 (17) (17)
Buying BR real 130 58 58
Interest rate swaps (fixed rate payment, floating rate receipt) 676 (20) (20) 843 (26) (26) 5,636 (169) (169)
Derivative Transactions to Which Hedge Accounting Is Applied
Millions of Yen Thousands of U.S. Dollars
March 31March 31, 2015
2015 2014
Hedged ItemContract Amount
Contract Amount
Due after One
YearFair
ValueContract Amount
Contract Amount
Due after One
YearFair
ValueContract Amount
Contract Amount
Due after One
YearFair
Value
Foreign currency forward contracts:
Selling U.S. dollars Receivables ¥ 54 ¥ (2) $ 452 $ (18)
Buying IN rupee Payables 762 (4) 6,348 (30)
Interest rate swaps (fixed rate payment, floating rate receipt) Long-term debt 240 ¥ 39 ¥ 320 ¥ 79 2,000 $ 321
Information on the foreign currency forward contracts for the year ended March 31, 2014, is not disclosed as the amounts are not material.
Note: The above interest rate swaps which qualify for hedge accounting and meet specific matching criteria are not remeasured at market value, but the dif-ferential paid or received under the swap agreements is recognized and included in interest expense or income. In addition, the fair value of such interest rate swaps in Note 7 is included in that long-term debt.
The fair value of derivative transactions is measured at the quoted price obtained from the financial institution.The contract or notional amounts of derivatives which are shown in the above table do not represent the amounts exchanged by the parties and
do not measure the azbil Group’s exposure to credit or market risk.
16. COMMITMENT AND CONTINGENT LIABILITIESAt March 31, 2015, the azbil Group had the following contingent liabilities:
Millions of Yen Thousands of U.S. Dollars
Guarantees and similar items of loans ¥ 3 $ 23
Finan
cial Data
azbil report 2015 83

17. OTHER COMPREHENSIVE INCOMEThe components of other comprehensive income for the years ended March 31, 2015 and 2014, were as follows:
Millions of Yen Thousands of U.S. Dollars
2015 2014 2015
Unrealized gain on available-for-sale securities: Gains arising during the year ¥ 6,269 ¥ 1,762 $ 52,242 Reclassification adjustments to profit or loss (54) 93 (453) Amount before income tax effect 6,215 1,855 51,789 Income tax effect (1,669) (653) (13,906) Total ¥ 4,546 ¥ 1,202 $ 37,883Deferred gain on derivatives under hedge accounting: Reclassification adjustments to profit or loss ¥ (1) $ (7) Amount before income tax effect (1) (7) Income tax effect 2 Total ¥ (1) $ (5)Foreign currency translation adjustments: Adjustments arising during the year ¥ 2,693 ¥ 2,042 $ 22,445 Reclassification adjustments to profit or loss (899) (7,492) Amount before income tax effect 1,794 2,042 14,953 Total ¥ 1,794 ¥ 2,042 $ 14,953Defined retirement benefit plan: Adjustment arising during the year ¥ 1,257 $ 10,473 Reclassification adjustments to profit or loss 895 7,461 Amount before income tax effect 2,152 17,934 Income tax effect (717) (5,979) Total ¥ 1,435 $ 11,955Total other comprehensive income ¥ 7,774 ¥ 3,244 $ 64,786
18. SUBSEQUENT EVENTSa. Acquisition of Own Shares Azbil resolved at its Board of Directors’ meeting held on May 13, 2015, to acquire its own shares pursuant to Articles 156 and 165, paragraph
3 of the Companies Act.
(1) Reason for acquisition of own shares Taking into consideration the future business performance forecast, Azbil aims not only to improve capital efficiency but also to enhance
the return of profits to shareholders and develop capital policies in response to changes in the corporate environment. (2) Details of acquisition of own shares (a) Class of Shares to Be Acquired Common stock
(b) Total Number of Shares to Be Acquired Up to 600,000 shares (0.8% of number of common shares issued, excluding treasury shares)
(c) Total Payment Amount to Acquire Shares Up to ¥2,100 million ($17,500 thousand)
(d) Method of Acquisition Purchase on the stock exchange via a trust bank
(e) Period of Acquisition From May 14, 2015 to June 23, 2015
Based on this resolution, Azbil acquired 600,000 shares of its common stock for a total acquisition price of ¥1,998 million during the period from May 14, 2015 to June 8, 2015, and has completed the acquisition of its common stock as resolved by the Board of Directors.
b. Appropriation of Retained Earnings The following appropriation of retained earnings at March 31, 2015, was approved at Azbil’s shareholders’ meeting held on June 25, 2015:
Millions of Yen Thousands of U.S. Dollars
Year-end cash dividends, ¥31.5 ($0.26) per share ¥ 2,326 $ 19,386
84 azbil report 2015

19. SEGMENT INFORMATIONUnder ASBJ Statement No. 17, “Accounting Standard for Segment Information Disclosures” and ASBJ Guidance No. 20, “Guidance on Accounting Standard for Segment Information Disclosures,” an entity is required to report financial and descriptive information about its reportable segments. Reportable segments are operating segments or aggregations of operating segments that meet specified criteria. Operating segments are com-ponents of an entity about which separate financial information is available and such information is evaluated regularly by the chief operating decision maker in deciding how to allocate resources and in assessing performance. Generally, segment information is required to be reported on the same basis as is used internally for evaluating operating segment performance and deciding how to allocate resources to operating segments.
(1) Description of Reportable SegmentsThe reportable segments of the azbil Group—identifiable operating segments of the Group’s business structure for which financial informa-tion is made separately available—are subject to periodic review by the Board of Directors in order to make decisions on the distribution of management resources and to assess performance.
The azbil Group identifies its operating segments using such criteria as business organization, product lines, service content, and markets. This approach results in three separate reportable segments: the building automation business, the advanced automation business, and the life automation business.
The building automation business supplies commercial buildings and production facilities with automatic heating ventilation, and air con-ditioning control and security systems, including products, engineering, and related services. The advanced automation business supplies automation control systems, switches and sensors, and engineering and maintenance services to industrial plants and factories. The life auto-mation business supplies lifeline meters, as well as products and services related to nursing care/health support and emergency alert response services—all of which are intimately connected with the daily lives of the general public.
(2) Methods of Measurement for the Amounts of Sales, Profit (Loss), Assets, Liabilities and Other Items for Each Reportable SegmentThe accounting policies of each reportable segment are consistent with those disclosed in Note 2, “Summary of Significant Accounting Policies.”
(3) Information about Sales, Profit (Loss), Assets and Other Items
Millions of Yen
2015
Reportable Segment
Building Automation
Advanced Automation
Life Automation Total Other Total Reconciliations Consolidated
Sales:
Sales to external customers ¥ 114,098 ¥ 93,132 ¥ 47,178 ¥ 254,408 ¥ 61 ¥ 254,469 ¥ 254,469
Intersegment sales or transfers 423 1,231 153 1,807 6 1,813 ¥ (1,813)
Total ¥ 114,521 ¥ 94,363 ¥ 47,331 ¥ 256,215 ¥ 67 ¥ 256,282 ¥ (1,813) ¥ 254,469
Segment profit (loss) ¥ 12,245 ¥ 5,013 ¥ (1,937) ¥ 15,321 ¥ 18 ¥ 15,339 ¥ (2) ¥ 15,337
Segment assets 65,550 69,880 36,011 171,441 7 171,448 94,271 265,719
Other:
Depreciation 935 1,709 1,140 3,784 3,784 3,784
Increase in property, plant and equipment and intangible assets 1,582 4,016 704 6,302 6,302 6,302
Impairment losses of assets 396 407 1,866 2,669 2,669 2,669
Millions of Yen
2014
Reportable Segment
Building Automation
Advanced Automation
Life Automation Total Other Total Reconciliations Consolidated
Sales:
Sales to external customers ¥ 109,285 ¥ 89,638 ¥ 49,434 ¥ 248,357 ¥ 60 ¥ 248,417 ¥ 248,417
Intersegment sales or transfers 282 1,189 163 1,634 7 1,641 ¥ (1,641)
Total ¥ 109,567 ¥ 90,827 ¥ 49,597 ¥ 249,991 ¥ 67 ¥ 250,058 ¥ (1,641) ¥ 248,417
Segment profit (loss) ¥ 10,593 ¥ 3,966 ¥ (672) ¥ 13,887 ¥ 18 ¥ 13,905 ¥ (1) ¥ 13,904
Segment assets 62,299 66,716 40,558 169,573 16 169,589 83,859 253,448
Other:
Depreciation 989 1,642 1,091 3,722 3,722 3,722
Increase in property, plant and equipment and intangible assets 1,820 2,667 816 5,303 5,303 5,303
Impairment losses of assets 36 36 36 36
Finan
cial Data
azbil report 2015 85

Thousands of U.S. Dollars
2015
Reportable Segment
Building Automation
Advanced Automation
Life Automation Total Other Total Reconciliations Consolidated
Sales:
Sales to external customers $ 950,816 $ 776,098 $ 393,154 $ 2,120,068 $ 508 $ 2,120,576 $ 2,120,576
Intersegment sales or transfers 3,526 10,257 1,272 15,055 48 15,103 $ (15,103)
Total $ 954,342 $ 786,355 $ 394,426 $ 2,135,123 $ 556 $ 2,135,679 $ (15,103) $ 2,120,576
Segment profit (loss) $ 102,044 $ 41,779 $ (16,143) $ 127,680 $ 148 $ 127,828 $ (16) $ 127,812
Segment assets 546,251 582,332 300,095 1,428,678 56 1,428,734 785,587 2,214,321
Other:
Depreciation 7,793 14,242 9,504 31,539 3 31,542 31,542
Increase in property, plant and equipment and intangible assets 13,182 33,468 5,864 52,514 1 52,515 52,515
Impairment losses of assets 3,300 3,391 15,554 22,245 22,245 22,245
Note: Corporate assets of ¥94,271 million ($785,587 thousand) for the year ended March 31, 2015, included in “Reconciliations” mainly consist of cash and cash equivalents and investment securities.
Related Information(1) Information about Products and Services The information disclosed is identical to the segment information and is therefore omitted.
(2) Information by Region (a) Sales
Millions of Yen
2015
Japan Asia China North America Europe Other Total
¥ 207,713 ¥ 18,354 ¥ 9,630 ¥ 4,195 ¥ 10,244 ¥ 4,333 ¥ 254,469
Millions of Yen
2014
Japan Asia China North America Europe Other Total
¥ 202,282 ¥ 16,066 ¥ 11,293 ¥ 3,445 ¥ 11,572 ¥ 3,759 ¥ 248,417
Thousands of U.S. Dollars
2015
Japan Asia China North America Europe Other Total
$ 1,730,943 $ 152,950 $ 80,251 $ 34,954 $ 85,369 $ 36,109 $ 2,120,576
Note: Sales are classified by country or region based on the location of customers.
(b) Property, plant and equipment
Millions of Yen
2015
Japan Asia China North America Europe Other Total
¥ 21,374 ¥ 1,675 ¥ 1,173 ¥ 62 ¥ 674 ¥ 741 ¥ 25,699
Thousands of U.S. Dollars
2015
Japan Asia China North America Europe Other Total
$ 178,114 $ 13,962 $ 9,779 $ 515 $ 5,619 $ 6,167 $ 214,156
The value of domestic property, plant and equipment exceeds 90% of the value of the property, plant and equipment in the consolidated balance sheet for the year ended March 31, 2014, so this information is omitted.
86 azbil report 2015

(3) Information about Major Customers No clients accounted for more than 10% of sales in the consolidated statement of income, so this information is omitted.
Information on Amortization of Goodwill and Unamortized Balance by Reportable Segment
Millions of Yen
2015
Reportable Segment
Building Automation
Advanced Automation
Life Automation Total Other Total Reconciliations Consolidated
Amortization of goodwill ¥ 174 ¥ 355 ¥ 1,321 ¥ 1,850 ¥ 1,850 ¥ 1,850
Goodwill at March 31, 2015 837 4,764 5,601 5,601 5,601
Millions of Yen
2014
Reportable Segment
Building Automation
Advanced Automation
Life Automation Total Other Total Reconciliations Consolidated
Amortization of goodwill ¥ 158 ¥ 314 ¥ 1,399 ¥ 1,871 ¥ 1,871 ¥ 1,871
Goodwill at March 31, 2014 554 1,304 6,226 8,084 8,084 8,084
Thousands of U.S. Dollars
2015
Reportable Segment
Building Automation
Advanced Automation
Life Automation Total Other Total Reconciliations Consolidated
Amortization of goodwill $ 1,453 $ 2,960 $ 11,011 $ 15,424 $ 15,424 $ 15,424
Goodwill at March 31, 2015 6,979 39,699 46,678 46,678 46,678
Finan
cial Data
azbil report 2015 87
88 azbil report 2015