101) financial Management (101) Financial Management
15
(101) financial Management 1 (101) Financial Management (Wesfarmer’s Analysis Ratios for the annual report of 2010/2011) Lecturer name: Dr. Azra Fatima Submission Date: Sep, 18, 2014 Student Name: Nagwa Alagami Student Id: 874507
-
Upload
independent -
Category
Documents
-
view
0 -
download
0
Transcript of 101) financial Management (101) Financial Management
(101) financial Management
1
(101) Financial Management
(Wesfarmer’s Analysis Ratios for the annual report of 2010/2011)
Lecturer name: Dr. Azra Fatima
Submission Date: Sep, 18, 2014
Student Name: Nagwa Alagami
Student Id: 874507
(101) financial Management
2
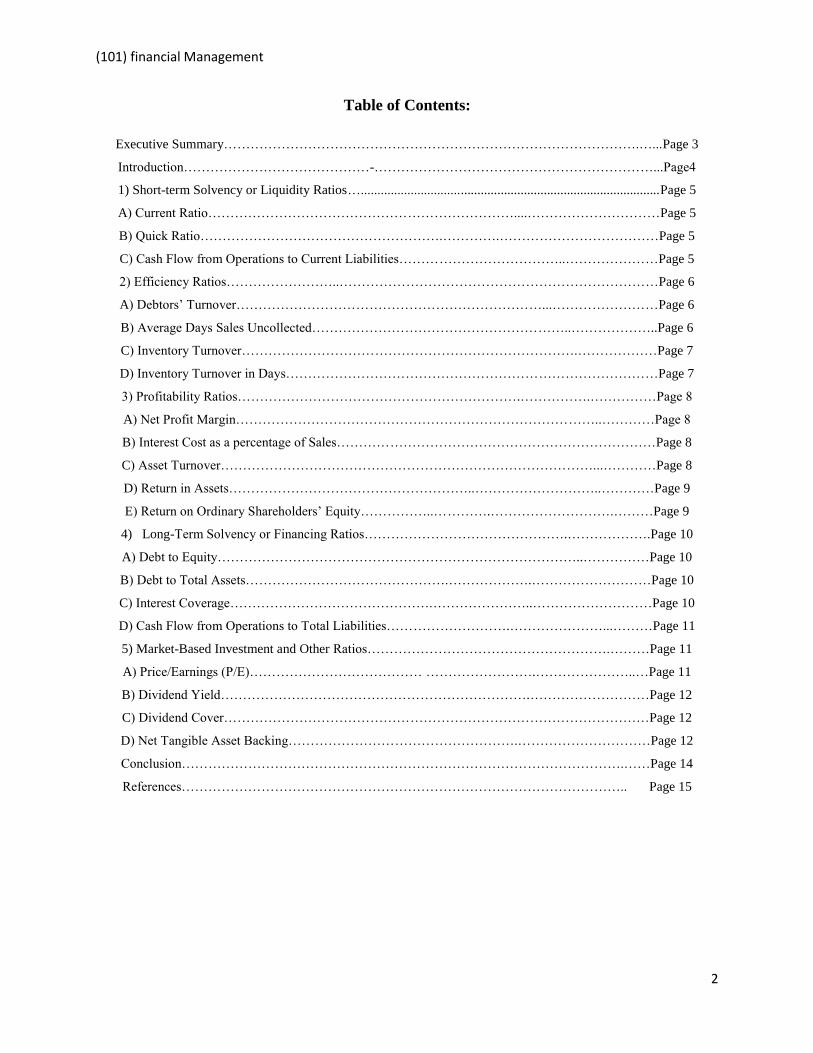
Table of Contents:
Executive Summary………………………………………………………………………………….…...Page 3
Introduction……………………………………-………………………………………………………...Page4
1) Short-term Solvency or Liquidity Ratios…..........................................................................................Page 5
A) Current Ratio……………………………………………………………....…………………………Page 5
B) Quick Ratio……………………………………………….………….………………………………Page 5
C) Cash Flow from Operations to Current Liabilities………………………………..…………………Page 5
2) Efficiency Ratios……………………..………………………………………………………………Page 6
A) Debtors’ Turnover……………………………………………………………...……………………Page 6
B) Average Days Sales Uncollected…………………………………………………..………………..Page 6
C) Inventory Turnover………………………………………………………………….………………Page 7
D) Inventory Turnover in Days…………………………………………………………………………Page 7
3) Profitability Ratios……………………………………………………….…………….……………Page 8
A) Net Profit Margin………………………………………………………………………..…………Page 8
B) Interest Cost as a percentage of Sales………………………………………………………………Page 8
C) Asset Turnover…………………………………………………………………………...…………Page 8
D) Return in Assets………………………………………………..………………………..…………Page 9
E) Return on Ordinary Shareholders’ Equity……………..………….……………………….………Page 9
4) Long-Term Solvency or Financing Ratios……………………………………….……………….Page 10
A) Debt to Equity………………………………………………………………………..……………Page 10
B) Debt to Total Assets……………………………………….……………….………………………Page 10
C) Interest Coverage……………………………………….…………………..………………………Page 10
D) Cash Flow from Operations to Total Liabilities……………………….…………………...………Page 11
5) Market-Based Investment and Other Ratios……………………………………………….………Page 11
A) Price/Earnings (P/E)………………………………… …………………….…………………..…Page 11
B) Dividend Yield…………………………………………………………….………………………Page 12
C) Dividend Cover……………………………………………………………………………………Page 12
D) Net Tangible Asset Backing…………………………………………….…………………………Page 12
Conclusion……………………………………………………………………………………….……Page 14
References……………………………………………………………………………………….. Page 15

(101) financial Management
3
Executive Summary
Wesfarmer is one of the most stable Australian cooperation companies, which is able to build
strong business with efficient performance, it has a significant assets portfolio, from the value end of
retail to direct and indirect exposure to the resource sector, they can afford establishing new
businesses and work efficiently with the most sensitive changes around them.
the last two year performance analysis showed that Wesfarmer able to create a long term investment
business strategy, they reduced the cost by managing time, and controlling inventory turnover and
products storage to make sure that all liabilities are covered, the equity managed to reflect as
improvement between 2010 to 2011, that reflect to good profit for ordinary shared Given a preference
by many shareholders to receive dividends in the form of shares.
Wesfarmers Operating lease incentives are recognized as a liability when received and released to
earnings on a straight line basis over the lease term. Fixed rate increases to lease payments,
excluding contingent or index based rental increases, such as turnover rental and other similar
increases, are recognized on a straight line basis over the lease term.
In general the financial analysis for the last two years shows that Wesfarmer is a company that has a
strong financial system, is able to come over the different circumstances, and has a goodwill that
help the company to gain trust of shareholders and the market.

(101) financial Management
4
Introduction:
Wesfarmer started originally as farmer company in western area of Australia, then expanded the
business including supermarket and department stores offices supplier, chemical supply, energy
,insurance and fertilizers , then they build large profit from investing on industrial products, the
company build trust with their own shareholders(Webpage 2011b).
As a limited share company have invest with heavy weight in Australia as per the country law
and the result also demonstrates how we truly reflect a cross-section of the Australian economy,
Wesfarmer resource oriented businesses performed very well, despite adverse weather events,
while retailers at the staples and value end of the market performed better than those relying on
need more discretionary spending(Webpage 2011a).
As per the annual report of 2010 / 2011 we did Ratio Analysis and compared with the last years
report to check:
Short term Solvency and Liquidity Ratios
Efficiency Ratios.
Profitability Ratios.
Long term Solvency or Financing Ratios.
Market based investment and other Ratios.

(101) financial Management
5
1) Liquidity Ratios:
A) Current Ration:
Current Ratio = Current Assets / Current Liabilities
Year Current
Assets
Current Liabilities Calculation Current Ratio
2010 $m 9,674 7,852 9,674/7,852 1.23
2011 $m 10,218 8,722 10,218/8,722 1.17
It’s clear that the liquids able to satisfy contingencies and uncertainties. The ratio shows that the
short-term solvency of business if a firm can pay the current liabilities when due, also noticed an
increase on the current liabilities and decrease in the last year Ratio so, Wesfarmer able to cover
their liabilities.
B) Quick Ratio:
Quick Ratio = (Current assets - Inventory) / Current Liabilities
Year Current
Assets
Inventory Current
Liabilities
Calculation Quick Ratio
2010
$m
9,674 4,658 7,852 (9,674-4,658) /7,852 0.64
2011
$m
10,218 4,987 8,722 (10,218-4,987)/8,722 0.60
The quick ratio is decreasing from 0.64 down to 0.6. The quick ratio does not include inventory
and prepaid expenses in the calculation. So, a business's quick ratio will be lower than its current
ratio. Wesfarmer needs to sell more to pay in short term liabilities quickly.
C) Cash Flow Ratio: (Cash Flow from Operations to Current Liabilities)
*Operating Cash Flow Ratio = Cash Flow / Current Liabilities
Year Cash Flow Current Liabilities Calculation *Ratio
2010 $m 3,327 7,852 3,327/7,852 0.42 or 42%
2011 $m 2,917 8,722 2,917/8,722 0.33 or 33%

(101) financial Management
6
The cash flow ratio is decreasing from 2010 to 2011and that decrease in cash from operating activities
of current liabilities in short period mentioned percentage. The working capital is increasing in the asset
amount, Wesfarmer could be affected, so new solutions should be found.
2)Efficiency Ratios:
A) Debtors’ Turnover:
Debtors’ Turnover = Net Sales / Average Debtors
Net Sales = Revenue – Interest
o 2010: 51,827 – 149 = 51,678
o 2011: 54,875 – 145 = 54,730
Average Debtor:
o 2010: (2009 + 2010/2 = (1893 + 1767)/2 = 1830
o 2011: (2010 + 2011)/2 = (1767 + 2149)/2 = 1958
Year Net Sales Average Debtors Calculation Debtors’ Turnover
2010 $m 51,678 1830 51,678/1830 28.2 times
2011 $m 54,730 1958 54,730/1958 28 times
Wesfarmer have maintained the ratio related to time, a clear drop from 28.2 time down to 28 which
indicates the debtor turnover either remain same or there is no progress.
B) Average Days Sales Uncollected:
Average Days Sales Uncollected = Days in Year / Debtors’ Turnover
Year Days in Year Debtors’ Turnover Calculation Av Days Sales
Uncollected
2010 $m 365 28.2 365/28.2 12.9 days
2011 $m 365 28 365/28 13 days

(101) financial Management
7
Wesfarmer did maintain the company credit of collection day’s average for their receivable and
that will be reflected on their inventories. So Wesfarmer could have the same inventories of the last
year period.
C) Inventory Turnover:
Inventory Turnover = Cost of Sales / Average Inventory
Inventory Turnover is the number of times inventory is turned over into sales during the year or
the number of days it takes to sell the inventory. (Demonstrating Value)
Average Inventory:
o 2010: (2009 + 2010/2 = (4,665 + 4,658)/2 = 4,661
o 2011: (2010 + 2011)/2 = (4,658 + 4,987)/2 = 4,82
Year
Cost of Sales Average Inventory Calculation Inventory Turnover
2010 $m 49,865 4,661 49,865/4,661 10.698
2011 $m 52,891 4,822 52,891/4,822 10.968
The inventory turnover grows up from 10.698 up to 10.968 which show increasing demand on
the company from last operation period, but increasing the cost of sale indicates lack of
inventory and losing sales because of inadequate stock on hand.
D) Inventory Turnover in Days:
Inventory Turnover in Days = Days in Year / Inventory Turnover
Year Days in Year Inventory Turnover Calculation Inventory Turnover
2010 $m 365 10.698 365/ 10.698 34.11 days
2011 $m 365 10.968 365/10.968 33.27 days
Wesfarmer is doing the inventory turnover very fast; day’s number increased from the last year
which shows better performance and that is a mark for Wesfarmer that they can manage their
own stock.
.

(101) financial Management
8
3)Profitability ratios:
A) Net Profit Margin:
Net Profit Margin = Net Profit / Sales
Year Net Profit Sales Calculation Net Profit Margin
2010 $m 1565 49,865 1565/ 49,865 0.031
2011 $m 1922 52,861 1922/52,861 0.036
The Net profit has developed from 2010 to 2011, Wesfarmer succeeded to add extra profit, the ratio
measures overall profitability
B) Interest Cost Ratio:
Interest Cost as a percentage of Sales = Interest Expense / Sales
Year Interest
Expense
Sales Calculation Interest Cost as a
Percentage of Sales
2010 $m 654 49,865 654/49,865x100 1.311%
2011 $m 526 52,891 526/52,891 x100 0.994%
It’s clear that, Wesfarmer reduced the cost of interest which means that they could get profit on sales
without need for loans; the interest cost has dropped from 1.3% to 0.994% in 2011 with decrease on
expenses like inventories.
C) Asset Turnover:
Asset Turnover = Sales / Average Total Asset
Average Total Assets
o 2010: (2009 + 2010)/2 = (39,062 + 39236)/2 = 39,149
o 2011: (2010 + 2011)/2 = (39236 + 40814)/2 = 40,025
Year Sales Average Total
Assets
Calculation Asset Turnover
2010 $m 51,485 39,149 51,485/39,149 1.32
2011 $m 54,513 40,025 54,513/40,025 1.36

(101) financial Management
9
Sales in Wesfarmer improved which indicates that they can manage using the available assets
wisely and producing based on its assets. While, increasing from 1.32 to 1.36 reflects the good
sale and success to point high demand products.
D) Return To Asset:
Return in Assets = Net Profit Average / Total Asset
Net Profit Average = Net Profit + Interest + Income Tax
o 2010 = 1,565 + 149 + 2,215 = 3,929
o 2011 = 1,922 + 145 + 2,706 = 4,773
Year Net Profit
Average
Average Total
Assets
Calculation Return on Assets
2010 $m 3,929 39,149 3,929/ 39,149 0.10 or 10%
2011 $m 4,773 40,025 4,773/40,025 0.12 or 12%
Wesfarmer managed to use the asset depending on its demands, Wesfarmer provides a
product that requires minimal additional assets.
E) Return to ordinary Shareholders:
Return on Ordinary Shareholders’ Equity = Net Profit / Average Shareholders’ Equity
Average Shareholders’ Equity
o 2010 = (2009 + 2010)/2 = (24,248 + 24,694)/2 = 24,471
o 2011 = (2010 + 2011)/2 = (24,694 + 25,329)/2 = 25,011
Year Net Profit Shareholders’
Equity
Calculation Return on Ordinary
Shareholders Equity
2010 $m 1,565 24,471 1,565/24,471 0.064 or 6.4%
2011 $m 1,922 25,011 1,922/25,011 0.077 or 7.7%
Wesfarmer managed to generate income for the Shareholders, a clear increasing on 2011 when
comparing with 2010 it sustain on the right direction. Increasing From 2010 of 6.4% up to 7.7%
indicates the right direction of creating profit with minimal base of assets.

(101) financial Management
10
4)Long-Term Solvency or Financing Ratios:
A) Debt to Equity Ratio:
Debt to Equity = Total Liabilities / Total Shareholders’ Equity
Year Total
Liabilities
Total
Shareholders’
Equity
Calculation Debt to Equity
2010 $m 14,542 24,694 14,542/24,694 0.59
2011 $m 15,485 25,329 15,485/25,329 0.61
Wesfarmer increased the liabilities, which keep the company in a high risk if they could not
manage the assets. an increasing trend of debt-to-equity ratio is not safe because it will make the
percentage of assets of a business increasing.
B) Debt to Total Asset Ratio:
Debt to Total Assets = Total Liabilities / Total Assets
Year Total Liabilities Total Assets Calculation Debt to Equity
2010 $m 14,542 39,236 14,542/39,236 0.37
2011 $m 15,485 40,814 15,485/40,814 0.38
the debt to equity is increasing , it provides Wesfarmer more values of asset and keep low risk with
loans to maintain their liabilities ,the total liabilities increased and shares also up and that reflecting on
more liabilities on to cover all debts.(“Financial Ratio Analysis Articles” 2014).
C) Interest Cover Ratio:
Interest Coverage = Net Profit + Income Tax + Interest (EBIT)/Interest Expense
Year Net Profit + Income Tax
+ Interest
Interest
Expense
Calculation Debt to Equity
2010 $m 1,565 + 2,215 + 149 654 3,929/654 6.007
2011 $m 1,922 + 2,706 + 145 526 4773/526 9.074
(101) financial Management
11
Liabilities are increased due to new debt to support the capital budget. That support Wesfarmer for
their own liabilities.
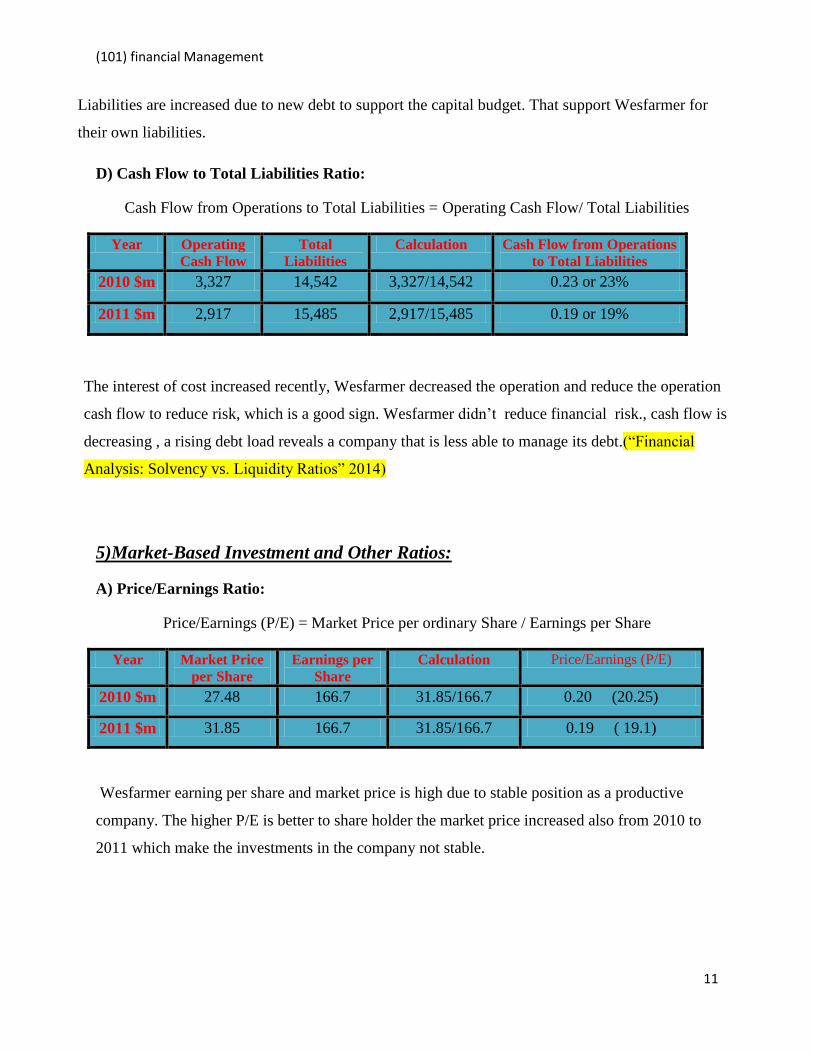
D) Cash Flow to Total Liabilities Ratio:
Cash Flow from Operations to Total Liabilities = Operating Cash Flow/ Total Liabilities
Year Operating
Cash Flow
Total
Liabilities
Calculation Cash Flow from Operations
to Total Liabilities
2010 $m 3,327 14,542 3,327/14,542 0.23 or 23%
2011 $m 2,917 15,485 2,917/15,485 0.19 or 19%
The interest of cost increased recently, Wesfarmer decreased the operation and reduce the operation
cash flow to reduce risk, which is a good sign. Wesfarmer didn’t reduce financial risk., cash flow is
decreasing , a rising debt load reveals a company that is less able to manage its debt.(“Financial
Analysis: Solvency vs. Liquidity Ratios” 2014)
5)Market-Based Investment and Other Ratios:
A) Price/Earnings Ratio:
Price/Earnings (P/E) = Market Price per ordinary Share / Earnings per Share
Year Market Price
per Share
Earnings per
Share
Calculation Price/Earnings (P/E)
2010 $m 27.48 166.7 31.85/166.7 0.20 (20.25)
2011 $m 31.85 166.7 31.85/166.7 0.19 ( 19.1)
Wesfarmer earning per share and market price is high due to stable position as a productive
company. The higher P/E is better to share holder the market price increased also from 2010 to
2011 which make the investments in the company not stable.

(101) financial Management
12
B) Dividend Yield Ratio:
Dividend Yield = Dividend per ordinary Share / Market Price per ordinary Share
Year Dividend per
Share
Market Price
per Share
Calculation Dividend Yield
2010 $m 125 27.48 125/27.48 4.55
2011 $m 150 31.85 150/31.85 4.71
Wesfarmer got good feedback with win/ win idea by getting a profit despite the risk of the
liabilities on the company.
C) Dividend Cover Ratio:
Dividend Cover = Earnings per Share / Dividend per Share
Year Earnings per
Share
Dividend per
Share
Calculation Dividend Cover
2010 $m 135.7 125 135.7/125 1.08
2011 $m 166.7 150 166.7/150 1.11
Dividend cover in Wesfarmer increased for the last year which supports the share dividend trust
to invest more in the company.
D) Net Tangible Asset Ratio:
Net Tangible Asset Backing = Net Tangible Assets / Balance of Number of Ordinary Shares
issued for Accounting purposes
Net Tangible Assets = Total Assets – Intangible Assets – (good will)
o 2010: 24,694 – 4,328 – 16,206 = 41.60
o 2011: 25,329 – 4,353 – 16,227 = 74.49

(101) financial Management
13
Year Net Tangible
Assets
Balance of
Ordinary Shares
Calculation Net Tangible
Asset Backing
2010 $m 41.60 11.52 41.60/11.52 3.609
2011 $m 74.49 11.52 74.49/11.52 4.118
Wesfarmer have a good evidence to move forward starting investments, the net tangible assets
indicates the good investment environment to create good profit.

(101) financial Management
14
Conclusion:
The combinations of stable and successful business Wesfarmer ensure to establish long term
satisfactory equity for the shareholder and added value in practical function on operating new
business.
Wesfarmers maintains a flexible financing structure and able to take advantages by using loans for
new investment opportunities that may arise. Also the risk was shows when the interest of cost
increased significant from 2010 to 2011 and that reflect in short term plan as risk reflect on
decreasing asset of capital and seem and objectives of planning to be maintain on long run.
As risk management Wesfarmer requires hedging and identifying foreign exchange exposures the
firm relating and belong to sales or purchases or when highly probable forecast transactions. Before
hedging the divisions are also taking into account their competitive position and how to protect and
sustain on same principles of earnings and protect from sudden currency movements, Wesfarmer
shows stable to increase in P/E investment Ratio which reflect relatively in the dividend yield and
that indicate high potential of growth with related expanding projects, also is stable financial as
long term despite risk available on short term plans.

(101) financial Management
15
References
AcountingExplained.com, 2013. Financial Acounting. [Online]
Available at: htp:/acountingexplained.com/financial/
[Acesed 26 June 2013].
Investopedia US, A Division of ValueClick, Inc, 2013. Investopedia. [Online]
Available at: htp:/www.investopedia.com/
[Acesed 21 June 2013].
Peavier, R., 2012. Financial Ratio Analysis Tutorial 101. [Online]
Available at: htp:/bizfinance.about.com/od/yourfinancialpositon/s/financial-ratio-analysis-
tutorial- 101.htm
[Acesed 1 July 2013].
Reports
Anderson, R., 2013. Financial Management Study Guide. 5th ed. Melbourne: Chifley Business
School.
Wesfarmer, 2011. Annual Report 2011,Wesfarmer.