testo 6383 · differential pressure transmitter P2A software ...
Upload
khangminh22Category
view
0download
0
CM2-GTX100-2001
Advanced TransmitterElectronic Differential Pressure/
Pressure TransmitterModel GTX_ _ _
User's Manual

NOTICE
While the information in this manual is presented in good faith and believed to be accurate, Azbil Corporation disclaims any implied warranty of merchantability or fitness for a particular purpose and makes no express warranty except as may be stated in its written agreement with and for its customer.
In no event shall Azbil Corporation be liable to anyone for any indirect, special or consequential damages. This information and specifications in this document are subject to change without notice.
This product has been designed, developed, and manufactured for general-purpose and explosion-proof applications in machinery and equipment. Never use this product in applications where human life may be put at risk, or in radiation-controlled areas for nuclear applications.
Especially when this product is used in applications where safety is critical, such as safety devices for plant worker protection, direct control of transportation equipment, or aeronautical or aerospace equipment, special care should be taken to implement a fail-safe and redundant design concept as well as a periodic maintenance program.
For details on system design, application design, instructions on use, suitable applications, etc., contact the azbil Group. In no event is Azbil Corporation liable to anyone for any indirect, special, or consequential damages as a result of using this product.
HART® is a registered trademark of the FieldComm Group.

WarrantyThe conditions for warranty of this product are shown below.
Within the warranty period, if the product has some defect for which Azbil Corporation is responsible, the company will repair the product or provide a replacement.
1. Warranty period
The warranty period is one (1) year from the date of delivery of the product to the location specified by the customer.
However, if the product is repaired for a fee, the warranty period is 3 months from the date of delivery of the repaired product.
2. Exemptions
The following cases are exempted from the warranty.
(1) A problem caused by incorrect handling, modification, or repair made by any person other than Azbil Corporation or a subcontractor commissioned by the company.
(2) A problem caused by handling, use, or storage that exceeds the operating conditions stated in the user's manual, specifications sheet, or delivery specification sheet.
(3) A problem caused by corrosion of wetted surfaces.
(4) Other problems for which Azbil Corporation is not responsible.
3. Other
(1) In the case of a warranty contract with Azbil Corporation other than this warranty, the contract has priority over this warranty.
(2) Whether product repair is free of charge depends on the results of inspection by Azbil Corporation.
© 2008-2019 Azbil Corporation. All Rights Reserved.


Safety
Instructions
Preface
Correct installation and periodic maintenance are essential to the safe use of your differential pressure transmitters.Read the safety instructions provided in this manual carefully and understand them fully before starting installation, operation, and maintenance work.
Inspection
On delivery, make sure that the specifications are correct and check for any damage that may have occurred during transportation. This equipment was tested under a strict quality control program before shipment. If you find any problem in the quality specifications, please contact an Azbil Corp. representative immediately, providing the model name and serial number.The name plate is mounted on the neck of the enclosure.
Precautions
The following symbols are used in this manual to ensure user safety.
WARNING
This symbol is used to warn of hazards where failure to observe a safety instruction may result in death or serious injury.
CAUTION
This symbol is used to warn of hazards where failure to observe a safety instruction may result in injury or physical damage.
To ensure safe operation, be sure to observe the safety instructions provided on the next page.Azbil Corporation will assume no responsibility, or offer any guarantee for any failure resulting from violation of these safety instructions.
i

ii
Handling Precautions for This Product
Installation Precautions
WARNING
• Some models of the transmitter have a mass of 10 kg or more because of differences in specifications. For your safety when transporting or installing the transmitter, use a dolly or two or more people. Carelessly lifting the transmitter and accidentally dropping it can cause injury or damage.
• When installing the transmitter, ensure that gaskets do not protrude from connecting points into the process (such as adapter flange connection points and connecting pipes and flanges). Failure to do so may cause a leak of process fluid, resulting in harm from burns, etc. In addition, if the process fluid contains toxic substances, take safety measures such as wearing goggles and a mask to prevent contact with the skin and eyes and to prevent inhalation.
• Use the transmitter within the operating ranges stated in the specifications (for explosion-proofing, pressure rating, temperature, humidity, voltage, vibration, shock, mounting direction, atmosphere, etc.). Using the transmitter outside the operating conditions may cause device failure or fire, resulting in a harmful physical risk of burning or the like.
• To ensure safety, installation and connection work should be carried out only by technicians skilled in instrumentation and electrical work. In areas where there is an explosion hazard., installation and wiring must conform to guidelines for explosion-proof electrical installations in general industrial use.
CAUTION
• After installation, do not use the transmitter as a foothold or put your weight on it. Doing so may cause damage.
• Be careful not to hit the glass indicator with tools etc. This could break the glass and cause injury.
• Carefully follow the instructions for grounding given in the user's manual. Improper grounding may affect output or violate explosion-proof guidelines.
• Impact to transmitter can damage sensor module.

iii
Wiring Precautions
WARNING
To avoid shocks, do not perform electrical wiring work with wet hands or with live wires.
CAUTION
• Do wiring work properly in conformance with the specifications. Wiring mistakes may result in malfunction or irreparable damage to the instrument.
• Use a power supply that conforms to the specifications. Use of an improper power supply may result in malfunction or irreparable damage to the instrument.
• Use a power supply with overcurrent protection for this instrument.
Maintenance Precautions
WARNING
• Before removing this product from the process equipment for purposes of maintenance, vent the residual pressure and discharge the residual fluid. When discharging the residual pressure and fluid, check the direction of the vent or drain to prevent injury by the process fluid. Failure to do so may result in burns or other injuries. If the process fluid contains toxic substances, take safety measures such as wearing goggles and a mask to prevent contact with the skin and eyes and to prevent inhalation.
• When the device is being used in an explosion-proof area, do not open the cover. Opening the cover may cause an explosion.
• If a sealing gasket is broken, replace it with a new one. If the device runs with a broken sealing gasket, since the degree of sealing is not sufficient, the process fluid may spurt out, resulting in burns or other injuries.

iv
CAUTION
• Do not disassemble or modify this device. Doing so may result in device failure or electric shock. Explosion-proof equipment cannot be inspected or disassembled in areas where there is an explosion hazard. In addition, the use of modified explosion-proof equipment is prohibited.
• If this device is used with a high-temperature fluid, be careful not to touch the device accidentally. Since this product can become extremely hot, contact with it may result in burns.
• If this device is no longer needed, dispose of it appropriately as industrial waste, in accordance with local regulations. Do not reuse all or a part of the device.
Precautions for Using Communication Devices
CAUTION
When using a communication device such as a transceiver, cell phone, PHS phone, or pager near this device, observe the precautions below. Otherwise, depending on the transmission frequency, this device may not function properly.• Determine beforehand the minimum distance at which the communication device
will not affect the operation of this device, and maintain a separation greater than that distance.
• Make sure the cover of its transmitter section of this device is closed before using the communication device.
Precautions for Communication
CAUTION
If transmitter output is reduced to 3.2 mA or less because of burnout, etc., communication with a HART communicator may not be possible. Try turning off the power, rebooting, and restarting communication.

v
Safety Manual
WARNING
Follow the instructions and procedures in this manual when the transmitter is used in SIS (Safety Instrumented Systems). Following description is applied when the Advanced Transmitter model code Q1 of Option, “Safety Transmitter” is selected.
1. ApplicationPressure measurements that shall meet the safety requirements according to IEC61508.
2. Safety related characteristics
2.1 Safety Integrity Level
The transmitter can be used up to SIL2 application as in single use or SIL3 application as in dual use.
2.2 Start up
The safety output signal will be effective within 2 seconds after the start-up.
2.3 Safety Accuracy
The safety accuracy is +/-2% or +/-4% depending on models used.
2.4 Diagnostics time
The failures of the transmitter can be detected within 5 minutes after they occur. The burnout signal can be output within 5 sec. after detecting the internal faults.
Item Specification
Mode of operation Low demand mode
SIL SIL2 (in single use)
Device type Type B
HFT 0 (in single use)

vi
2.5 Safety Parameters
Safe failure rate [FIT] 363Dangerous detected failure rate [FIT] 481Dangerous undetected failure rate [FIT] 222MTTR=72h
Proof Test Interval 1 year 5 years
PFD 1.02E-3 4.9E-3
%SIL2 10,2% 49%
3. Safety functions
3.1 Safety- relevant signal
The safety relevant signal of the transmitter is the analog output signal 4 to 20 mA. All safety functions refer to this analog output. The contact output or the digital output signal is not the safety relevant signal.
3.2 Normal Output
The analog current signal in the normal operating range of 3.6 to 21.6 mA including normal over range and under range is output.
3.3 Burnout output
The output will be driven to the Hi/Lo limit according to the setting.In the following cases, the output will be driven to LO limit regardless of the burnout direction setting.
• Watchdog timer reset• Internal voltage fault• Readback error
After the detection of internal faults the transmitter drives the signal to the fail alarm current of < 3.6 mA or > 21.6 mA.In case of NE-43 option, after the detection of the internal faults the transmitter drives the signal to the fail alarm current of = 3.6 mA or = 21.0 mA.
4. Non safety compliant activitiesThe transmitter output is not safety-compliant during the following activities
• Configuration modifications• Multidrop• Simulation• Test of the safety function
During transmitter configuration and maintenance work on the transmitter, alternative measures must be taken to guarantee process safety.

vii
5. SettingsThe following parameters should be set to the installed transmitter.
• Burnout direction• Write protect switch *
* When the transmitter is used in SIS as a safety transmitter, a communicator should not be used during the normal operation.
6. Maintenance and repair
6.1 Maintenance and repair
Maintenance and repair shall be performed by a skilled and knowledgeable engineer.
6.2 Proof test
The procedure of the proof test is shown below. The test will cover 59% of possible DU failures.i) Bypass PLC or take other appropriate action to avoid a false trip.ii) Use the Communicator to retrieve any diagnostics and take appropriate action.iii) Use the Communicator to change the mode to B/O simulation mode.iv) Verify the output signal of B/O Hi.v) Verify the output signal of B/O Lo.vi) Return to normal operationvii) Remove the bypass from the PLC. The following would be added to the above test. The tests including the following will
cover 99% of possible DU failures.viii) Apply pressure to verify the output at 0%, 20%, 40%, 60%, 80% and 100%.
7. Terms and AbbreviationSIS: Safety Instrumented SystemsSIL: Safety Integrity LevelHFT: Hardware Fault TolerancePFD: Probability of Failure on DemandPLC: Programmable Logic ControllerB/O: Burnout (It means fail alarm status)DU: Dangerous Undetected
viii
Precautions
General Precautions
1. Checking the ProductWhen you accept the transmitter, check its appearance to make sure that it is not damaged.An Advanced Transmitter with semi-standard or special specifications may have different accessories.
2. Check the specificationsThe specifications are marked on the name plate on the outside of the transmitter case.Make sure that the specifications match your order by referring to the specifications.In making an inquiry, identify the model No. and the product No.
3. TransportationWe recommend to transport the transmitter to the installation site in the packaged state in order to prevent damages from occurring during transportation.
4. Storage Environment(1) Storage locationDuring storage, protect the transmitter from rain water as well as from heavy vibration and shock. Store it at normal temperature and humidity (about 25°C, 65%RH) as much as possible.(2) Store the transmitter in original packaging if possible.(3) If a used transmitter must be stored for some period, wash it thoroughly after making
sure that no fluid remains in the pressure receiving section.
5. Installation EnvironmentIn order to maintain the original performance and reliability for a long time, install the transmitter in the following environment:(1) Ambient temperature (a) The temperature gradient and temperature changes in installation environment
should be as small as possible. (b) If a transmitter is exposed to heat radiated from the process side, lower its ambient
temperature as much as possible by insulating it or by selecting a well-ventilated location for installation.
(c) If a process fluid can freeze, prevent freezing by means of heat insulation.

ix
(2) Environment Pollution degree: 2 Avoid corrosive environment as much as possible. Install in explosion proof and intrinsically safe conditions.(3) Shock and vibrationInstall the transmitter where shocks and vibrations will be as small as possible.(4) Industrial Electromagnetic EnvironmentThe transmitter intends to be used in an environment existing at locations characterized by a separate power network, in most cases supplied from a high- or medium- voltage transformer, dedicated for the supply of installations feeding manufacturing or similar plants with one or more of the following conditions:-frequent switching of heavy inductive or capacitive loads;-high currents and associated magnetic fields;- presence of Industrial, Scientific and Medical (ISM) equipment (for example, welding machines)
6. Application of Pressure to transmitterIn applying pressure to this transmitter, observe the following rules.(1) The locking bolts of the adapter flange are loose when shipped. Tighten them to the
specified torque.(2) Do not apply a pressure that exceeds the specified level.(3) Do not tighten or loosen bolts while pressure is being applied to the transmitter.
7. Electronic Parts(1) This transmitter has several CMOS electronic components. Since static electricity can
easily cause the functional destruction of a CMOS component, never directly touch them or touch a circuit with your hands.
(2) Is components must be touched, equalize the potential of the components before doing so.
(3) When the printed wiring board (PWB) is removed, protect it in a non-conductive bag.
8. Contact usAzbil CorporationAdvanced Automation Company1-12-2 Kawana, Fujisawa-shiKanagawa-ken, 251-8522, Japan

x
PED Conformity (97/23EC)The maximum pressures applicable under the Sound Engineering Practice (SEP) section of the Pressure Equipment Directive depend on the type of fluid measured, as shown in the table below.
Measured fluid Group* Pressure Applicable models
Gas1 200 bar (20 MPa)
All models exceptGTX32D, 42D, 72D, 82G
2 1,000 bar (100 MPa) All models
Liquid1 500 bar (50 MPa) All models
2 1,000 bar (100 MPa) All models
*Note : Group 1 comprises fluids defines as: explosive, extremely flammable, highly flammable, flammable, very toxic, toxic and oxidizing.
Group 2 comprises all other fluids not refer to group 1
Any transmitter model having a maximum working pressure that is higher than the pressure corresponding to its group does not conform to SEP.Models GTX32D, 42D, 72D and 82G conform to PED according to Module A.
xi
Explosion protected Models
FM Intrinsically safe, Nonincendive and Suitable Approvals
1. Rating information
1.1 Intrinsically safeIntrinsically Safe for use in Class I, Division 1, Groups A, B, C and D; Class II, Division 1, Groups E, F and G; Class III, Division 1; Class I, Zone 0, AEx ia IIC; T4 -40 °C ≤ Tamb ≤ +60 °CHazardous (Classified) Locations; Indoor/Outdoor Enclosure TYPE 4X, IP67;For entity parameters see control drawings 80395278, 80395279 and 80395280.
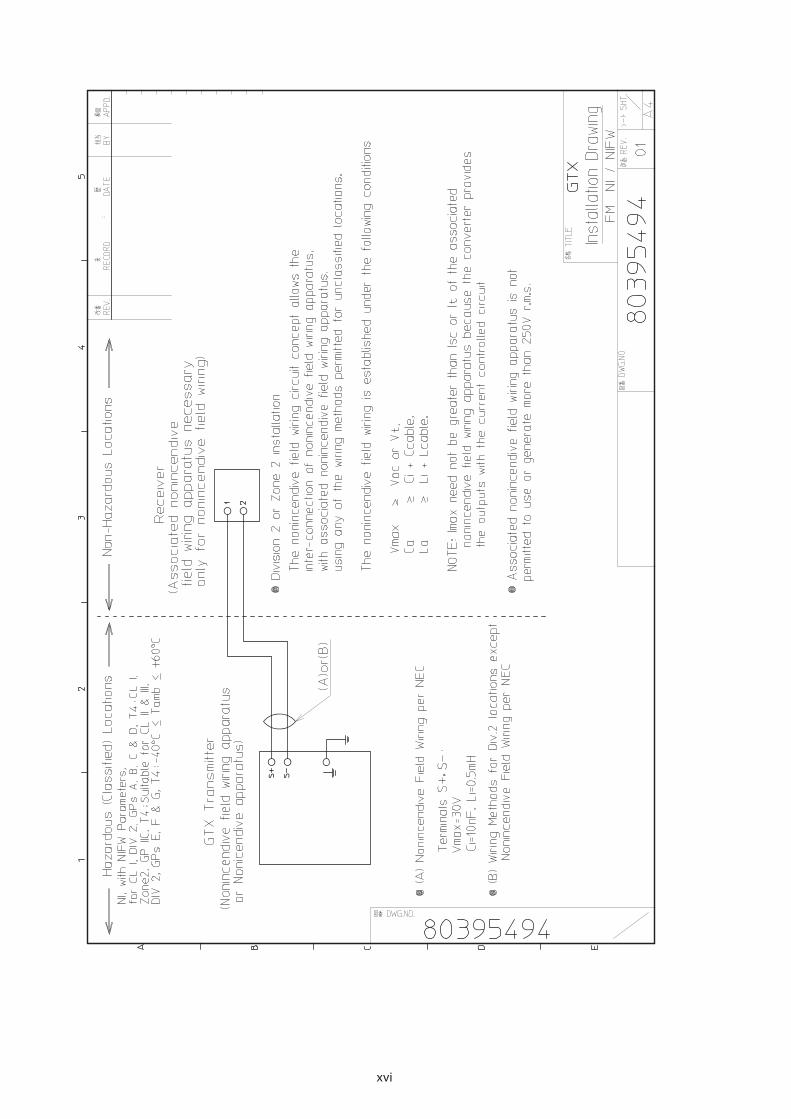
1.2 Nonincendive and SuitableNonincendive, with Nonincendive Field Wiring Parameters, for use in Class I, Division 2, Groups A, B, C and D, T4; Class I, Zone 2, Group IIC, T4; Suitable for Class II & III, Division 2, Groups E, F and G, T4; -40 °C ≤ Tamb ≤ +60 °C; Hazardous (Classified) Locations;Indoor/Outdoor Enclosure TYPE 4X, IP67;For Nonincendive Field Wiring parameters see control drawing 80395494.
2. Applicable standards- FM Class 3600:1998 Electrical Equipment for Use in Hazardous (Classified) Locations General Requirements
- FM Class 3610:2007 Intrinsically Safe Apparatus and Associated Apparatus for Use in Class I, II & III, Division 1, Hazardous (Classified) Locations
- FM Class 3611:2004 Nonincendive Electrical Equipment for Use in Class I & II, Division 2, and Class III, Divisions 1 & 2, Hazardous (Classified) Locations
-FM Class 3810:2005 Electrical Equipment for Measurement, Control and Laboratory Use- ANSI/ISA-12.00.01(IEC 60079-0 Mod):1999 Electrical Apparatus for Use in Class I, Zones 0, 1 & 2 Hazardous (Classified) Locations - Part 0: General Requirements
- ANSI/ISA-12.02.01(IEC 60079-11 Mod):2002 Electrical Apparatus for Use in Class I, Zones 0, 1 & 2 Hazardous (Classified) Locations - Part 11: Intrinsic Safety “i”
- ANSI/ISA-82.02.01(IEC 61010-1 Mod):2004 Safety Requirements for Electrical Equipment for Measurement, Control, and Laboratory Use - Part 1: General Requirements
-ANSI/IEC 60529:2004 Degrees of Protection Provided by Enclosures (IP Code)-ANSI/NEMA 250:1991 Enclosures for Electrical Equipment (1,000 Volts Maximum)

xii
3. Instruction for safe use
3.1 Installations shall comply with the relevant requirements of the National Electrical Code (ANSI/NFPA 70).
3.2 Installations shall comply with the latest edition of the manufacturer's instruction manual.
IS models shall be installed in accordance with control drawings 80395278, 80395279 and 80395280, and NI models shall be installed in accordance with control drawing 80395494.
3.3 The intrinsically safe associated apparatus must be FM Approvals approved.3.4 Control room equipment connected to the associated apparatus should not use or
generate more than 250 Vrms or VDC.3.5 See ANSI/ISA RP12.06.01, Installation of Intrinsically Safe Systems for Hazardous
(Classified) Locations, for guidance on the installation of intrinsically safe apparatus and systems.
3.6 Tampering and replacement with non-factory components may adversely affect the safe use of the system.
3.7 Insertion or withdrawal of removable electrical connectors is to be accomplished only when the area is known to be free of flammable vapors.
3.8 For ambient temperatures below -10 ºC (+14 ºF) and above +60 ºC (+140 ºF) use field wiring suitable for both minimum and maximum ambient temperatures.
3.9 Use copper, copper-clad aluminum or aluminum conductors only.3.10 The recommended tightening torque for field wiring terminals is 0.8 N·m (7 in.·lb)
or greater, as specified.3.11 A dust-tight conduit seal shall be used when installed in Class II & III
environments.3.12 WARNING - SUBSTITUTION OF COMPONENTS MAY IMPAIR INTRINSIC
SAFETY3.13 WARNING - SUBSTITUTION OF COMPONENTS MAY IMPAIR SUITABILITY
FOR DIVISIONS 1 & 2 AND ZONES 0, 1 & 23.14 WARNING - DO NOT DISCONNECT EQUIPMENT UNLESS AREA IS
KNOWN TO BE NONHAZARDOUS3.15 WARNING - FOR CONNECTION ONLY TO NON-FLAMMABLE PROCESSES3.16 For the use in the area where EPL “Ga” apparatus is required, electrostatic
discharge shall be avoided.

xiii

xiv

xv
xvi
xvii
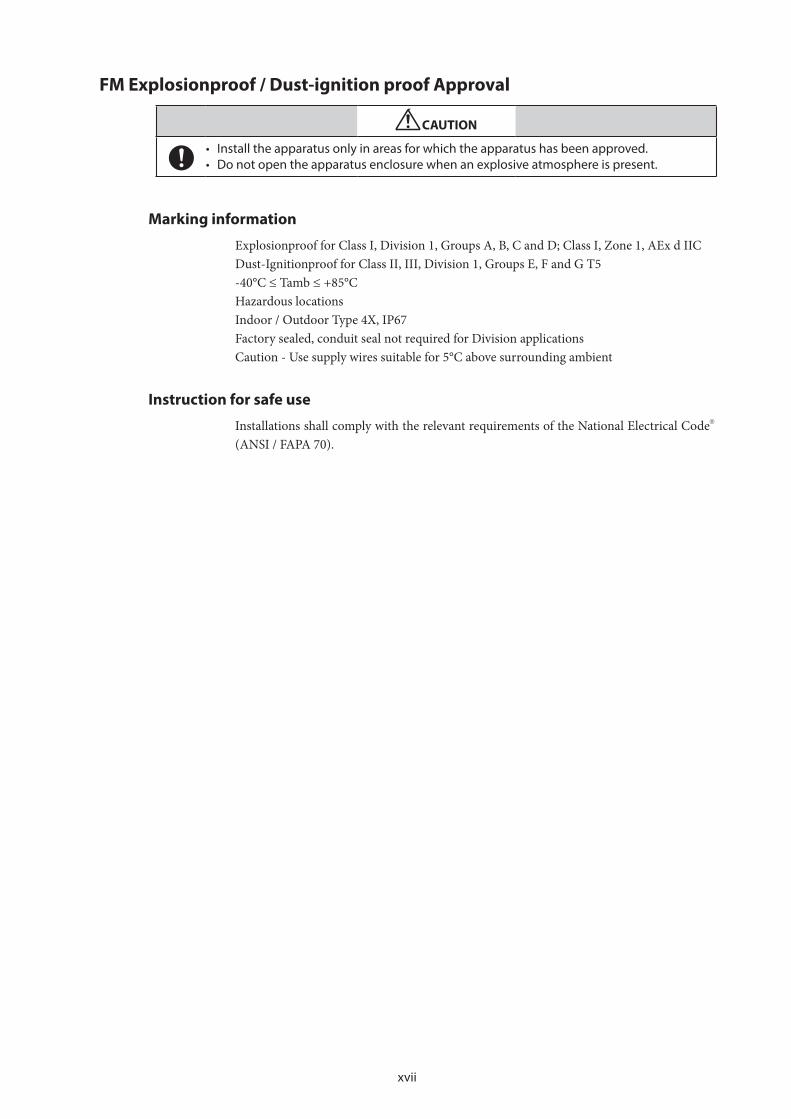
FM Explosionproof / Dust-ignition proof Approval
CAUTION
• Install the apparatus only in areas for which the apparatus has been approved.• Do not open the apparatus enclosure when an explosive atmosphere is present.
Marking information
Explosionproof for Class I, Division 1, Groups A, B, C and D; Class I, Zone 1, AEx d IICDust-Ignitionproof for Class II, III, Division 1, Groups E, F and G T5 -40°C ≤ Tamb ≤ +85°CHazardous locationsIndoor / Outdoor Type 4X, IP67Factory sealed, conduit seal not required for Division applicationsCaution - Use supply wires suitable for 5°C above surrounding ambient
Instruction for safe use
Installations shall comply with the relevant requirements of the National Electrical Code (ANSI / FAPA 70).

xviii
ATEX Flameproof and Dust Certifications (English)
1. Marking information
0344 KEMA 08ATEX0004X
II 1/2 G Ex db IIC T6 Ga/Gb -30°C ≤ Tamb ≤ +75°C -30°C ≤ TPROCESS ≤ 85°CII 1/2 G Ex db IIC T5 Ga/Gb -30°C ≤ Tamb ≤ +80°C -30°C ≤ TPROCESS ≤ 100°CII 1/2 G Ex db IIC T4 Ga/Gb -30°C ≤ Tamb ≤ +80°C -30°C ≤ TPROCESS ≤ 110°CII 2 D Ex tb IIIC T85°C Db -30°C ≤ Tamb ≤ +75°C -30°C ≤ TPROCESS ≤ 85°CII 2 D Ex tb IIIC T100°C Db -30°C ≤ Tamb ≤ +75°C -30°C ≤ TPROCESS ≤ 100°CII 2 D Ex tb IIIC T110°C Db -30°C ≤ Tamb ≤ +75°C -30°C ≤ TPROCESS ≤ 110°CIP66/IP67
2. Applicable standards- EN 60079-0: 2012+A11:2013- EN 60079-1: 2014- EN 60079-26: 2015- EN 60079-31: 2014
3. Installation Instruction3.1 To maintain the degree of protection of at least IP66 in accordance with IEC60529,
suitable cable entries must be used and correctly installed. Unused openings must be closed with a suitable stopping plug.
3.2 Use supply wire suitable for 5 °C above surrounding ambient.3.3 When Model No. is given with GTXxxx-x…x-yx…x-x…, if y=A, the thread type of the end of all entries is 1/2 NPT, or if y=B, the thread type of the end of all entries is M20.3.4 The earthing wire and the cable lug shall be assembled and the earthing wire secured
close to the cable lug to prevent it from being pulled sideways. The tightening torque of the earthing secure is 1.2±0.1 N·m.
4. Specific conditions of use4.1 The enclosure of the Model GTX is made of aluminum, so if it mounted in an area where
the use of 1G apparatus is required, it must be installed in such a way that, even in the event of rare incidents, ignition sources due to impact of friction sparks are excluded.
4.2 For the use in the area where EPL Db apparatus is required, electrostatic discharge shall be avoided.
4.3 See Table 4-1 in the clause 5.1.2 for the material of the barrier diaphragm. The barrier diaphragm shall not be subjected environmental conditions which might
adversely affect the partition wall, for example corrosion.4.4 Repairs of flameproof joints are allowed only by manufacturer.4.5 The equipment must be returned to the manufacturer in case of failure.4.6 The wetted parts with process fluid are suitable for EPL Ga and other parts are
suitable for EPL Gb.4.7 This product is specified for vibrating as follows. -For the enclosure material Amplitude: 0.42 mm / Frequency: 5 to 60 Hz Amplitude: 24.9 mm/s2 (3G) / Frequency: 60 to 200 Hz - For the enclosure of material of stainless steel only for inline type Amplitude: 0.42 mm / Frequency: 10 to 60 Hz Amplitude: 24.9 mm/s2 (3G) / Frequency: 60 to 2000 Hz

xix
-For the enclosure of material other than stainless steel only for inline type Amplitude: 0.30 mm / Frequency: 10 to 60 Hz Amplitude: 19.6 (2G) mm/s2 (3G) / Frequency: 60 to 500 Hz

xx

xxi

xxii

xxiii

xxiv

xxv
xxvi
IECEx Flameproof and Dust Certifications (English)
1. Marking informationIECEx KEM 08.0001XEx db IIC T6 Ga/Gb -30°C ≤ Tamb ≤ +75°C -30°C ≤ TPROCESS ≤ 85°CEx db IIC T5 Ga/Gb -30°C ≤ Tamb ≤ +80°C -30°C ≤ TPROCESS ≤ 100°CEx db IIC T4 Ga/Gb -30°C ≤ Tamb ≤ +80°C -30°C ≤ TPROCESS ≤ 110°CEx tb IIIC T85°C Db -30°C ≤ Tamb ≤ +75°C -30°C ≤ TPROCESS ≤ 85°CEx tb IIIC T100°C Db -30°C ≤ Tamb ≤ +75°C -30°C ≤ TPROCESS ≤ 100°CEx tb IIIC T110°C Db -30°C ≤ Tamb ≤ +75°C -30°C ≤ TPROCESS ≤ 110°CIP66/IP67
2. Applicable standards- IEC 60079-0: 2011- IEC 60079-1: 2014- IEC 60079-26: 2014- IEC 60079-31: 2014
3. Installation Instruction3.1 To maintain the degree of protection of at least IP66 in accordance with IEC60529,
suitable cable entries must be used and correctly installed. Unused openings must be closed with a suitable stopping plug.
3.2 Use supply wire suitable for 5 °C above surrounding ambient.3.3 When Model No. is given with GTXxxx-x…x-yx…x-x…, if y=A, the thread type of the end of all entries is 1/2 NPT, or if y=B, the thread type of the end of all entries is M203.4 The earthing wire and the cable lug shall be assembled and the earthing wire secured
close to the cable lug to prevent it from being pulled sideways. The tightening torque of the earthing secure is 1.2±0.1 N·m.
4. Specific conditions of use4.1 The enclosure of the Model GTX is made of aluminum, so if it mounted in Zone 0, where
the use of Ga apparatus is required, it must be installed in such a way that, even in the event of rare incidents, ignition sources due to impact of friction sparks are excluded.
4.2 For the use in the area where EPL Db apparatus is required, electrostatic discharge shall be avoided.
4.3 See Table 4-1 in the clause 5.1.2 for the material of the barrier diaphragm. The barrier diaphragm shall not be subjected environmental conditions which might
adversely affect the partition wall, for example corrosion.4.4 Repairs of flameproof joints are allowed only by manufacturer.4.5 The equipment must be returned to the manufacturer in case of failure.4.6 The wetted parts with process fluid are suitable for EPL Ga and other parts are
suitable for EPL Gb.4.7 This product is specified for vibrating as follows. -For the enclosure material Amplitude: 0.42 mm / Frequency: 5 to 60 Hz Amplitude: 24.9 mm/s2 (3G) / Frequency: 60 to 200 Hz - For the enclosure of material of stainless steel only for inline type Amplitude: 0.42 mm / Frequency: 10 to 60 Hz Amplitude: 24.9 mm/s2 (3G) / Frequency: 60 to 2000 Hz -For the enclosure of material other than stainless steel only for inline type Amplitude: 0.30 mm / Frequency: 10 to 60 Hz Amplitude: 19.6 (2G) mm/s2 (3G) / Frequency: 60 to 500 Hz

xxvii

xxviii
NEPSI Flameproof and Dust Certifications Advanced Transmitter type GTX Series, manufactured by Azbil Corporation, has been approved by National Supervision and Inspection Center for Explosion Protection and Safety of Instrumentation (NEPSI) in accordance with the following standards: GB3836.1 - 2010 Electical apparatus for explosive gas atmospheres
Part 1: General requirements GB3836.2 - 2010 Electical apparatus for explosive gas atmospheres
Part 2: Flameproof enclosure “d” GB12476.1 - 2013 Electrical apparatus for use in the presence of combustible dust
Part A-1: Electrical apparatus protected by enclosures and surface temperature limitation – Specification for apparatus
GB12476.5 - 2013 Electrical apparatus for use in the presence of combustible dust Part 5: Protection by enclosures “tD”
Transmitters are approved with Ex marking of Ex d IIC T4~T6 Gb; Ex tD A21 IP66/IP67 T85/T100/T115. The certificate number is GYJ17.1213X 1. REQUIREMENTS FOR SAFE USE 1.1 The external earthing terminal shall be connected to the ground reliably at site. 1.2 The relationship between Ex marking, ambient temperature range and maximum
process temperature are shown below:
Ex marking Ambient temperature range
Maximum process temperature
Ex d IIC T6 Gb; Ex tD A21 IP66/IP67 T85 -30~ +75 80 Ex d IIC T5 Gb; Ex tD A21 IP66/IP67 T100 -30~ +80 95 Ex d IIC T4 Gb; Ex tD A21 IP66/IP67 T115 -30~ +80 110 1.3 The cable entry holes have to be connected by means of suitable cable entries with
type of protection of Ex d IIC. The cable entries shall be approved by NEPSI in accordance with GB3836.A-2000, GB3836.2-2000 and GB12476.A-2013, which are covered by a separate examination certificate. The screws of the cable entries shall be 1/2-14NPT. Unwanted entry holes shall be blocked by blind plugs. After installation of the cable entry, the whole apparatus shall reach IP66/IP67.
1.4 The warning “Do not open while circuit is alive” must be obeyed when the product is used in the explosive gas area.
1.5 Rated supply voltage: 10.8~42Vd.c. or 9~32Vd.c. 1.6 End users are forbidden to change the configuration to ensure the explosion
protection performance of the product. 1.7 Regular cleanness shall be conducted to avoid the deposit of dust.

xxix
1.8 When installing, operating and performing maintenance of the product, users should comply with the relevant requirements of the product instruction manual and the following standards: GB3836.13 - 2013: “Electrical apparatus for explosive gas atmosphere
Part13: Repair and overhaul for apparatus used in explosive gas atmospheres”
GB3836.15 - 2000: “Electrical apparatus for explosive gas atmospheres Part15: Electrical installations in hazardous area (other than mines)”
GB3836.16 - 2006: “Electrical apparatus for explosive gas atmospheres Part16: Inspection and maintenance of electrical installation (other than mines)”
GB50257 - 2014: “Code for construction and acceptance of electric device for explosion atmospheres and fire hazard electrical equipment installation engineering.”
GB12476.2 - 2010: “Electrical apparatus for use in the presence of combustible dust Part2 ”
GB15577 - 2007: “Safety regulation for the protection of dust explosion”

xxx
NEPSI Intrinsic Safety Certification Advanced Transmitter type GTX Series, manufactured by Azbil Corporation, has been approved by National Supervision and Inspection Center for Explosion Protection and Safety of Instrumentation (NEPSI) in accordance with the following standards: GB3836.1 - 2010 Electical apparatus for explosive gas atmospheres
Part 1: General requirements GB3836.4 - 2010 Electical apparatus for explosive gas atmospheres
Part 4: Intrinsic safety “i” GB3836.20 - 2010 Explosive Atmosphere Part 20: Equipment with Equipment
Protection Level (EPL) of Ga Transmitters are approved with Ex marking of Ex ia IIC T4 Ga and Ex ic IIC T4 Gc. The certificate number is GYJ17.1214X 1. REQUIREMENTS FOR SAFE USE 1.1 The relationship between Ex marking, ambient temperature range and maximum
process temperature are shown below:
Ex Marking Ambient Temperature Range
Maximum Process Temperature
Ex ia IIC T4 Ga -40~ +60 105 Ex ic IIC T4 Gc -40~ +60 110
1.2 Only when connected to a certified associated apparatus or a certified associated
energy-limited apparatus, the product could be used in the explosive atmosphere. The connection shall be in accordance with the requirements of the manual of associated apparatus and the product.
1.2.1 Intrinsically safe parameters: Max. Input Voltage
Ui (V) Max. Input Current
Ii (mA) Max. Input Power
Pi (W) Max. Internal Parameter Ci (nF) Li (mH)
30 -100 1 13 0.5 1.2.2 A sheilded cable is suitable for connection. The cross-sectional area of the wire
shall be at least 0.5mm2, and the sheild shall be connected to the earth in a non-hazardous area.
1.3 End users are forbidden to change the configuration to ensure the explosion protection performance of the product.
xxxi
1.4 When installing, operating and performing maintenance of the product, users should comply with the relevant requirements of the product instruction manual and the following standards: GB3836.13 - 2013: “Electrical apparatus for explosive gas atmosphere
Part13: Repair and overhaul for apparatus used in explosive gas atmospheres”
GB3836.15 - 2000: “Electrical apparatus for explosive gas atmospheres Part15: Electrical installations in hazardous area (other than mines)”
GB3836.16 - 2006: “Electrical apparatus for explosive gas atmospheres Part16: Inspection and maintenance of electrical installation (other than mines)”
GB50257 - 2014: Code for construction and acceptance of electric device for explosion atmospheres and fire hazard electrical equipment installation engineering.”
GB3836.18 - 2010: “Explosive environment Part 18: Intrinsic safety system”

xxxii

xxxiii
Table of Contents
Chapter 1. Overview-First Time Users Only . . . . . . . . . . . . . . . . . . . . . . . . . . . . . . . . . . . . . .1-1
1-1. Introduction . . . . . . . . . . . . . . . . . . . . . . . . . . . . . . . . . . . . . . . . . . . . . . . . . . . . . . . . . . . . . . . . . . . . . . . . . 1-11-2. Advanced Transmitters . . . . . . . . . . . . . . . . . . . . . . . . . . . . . . . . . . . . . . . . . . . . . . . . . . . . . . . . . . . . . . . 1-11-3. Parts names of the transmitter . . . . . . . . . . . . . . . . . . . . . . . . . . . . . . . . . . . . . . . . . . . . . . . . . . . . . . . . 1-21-4. Transmitter Order . . . . . . . . . . . . . . . . . . . . . . . . . . . . . . . . . . . . . . . . . . . . . . . . . . . . . . . . . . . . . . . . . . . . 1-4
Chapter 2. Installation . . . . . . . . . . . . . . . . . . . . . . . . . . . . . . . . . . . . . . . . . . . . . . . . . . . . . . . . . .2-1
2-1. Introduction . . . . . . . . . . . . . . . . . . . . . . . . . . . . . . . . . . . . . . . . . . . . . . . . . . . . . . . . . . . . . . . . . . . . . . . . . 2-12-2. Mounting Advanced Transmitter . . . . . . . . . . . . . . . . . . . . . . . . . . . . . . . . . . . . . . . . . . . . . . . . . . . . . 2-12-3. Piping Advanced Transmitter . . . . . . . . . . . . . . . . . . . . . . . . . . . . . . . . . . . . . . . . . . . . . . . . . . . . . . . . 2-10
2-3-1. Piping for Liquid, Gas or Steam Flow Rate Measurement . . . . . . . . . . . . . . . . . . . . . . . 2-132-3-2. Pressure Measurement - Piping . . . . . . . . . . . . . . . . . . . . . . . . . . . . . . . . . . . . . . . . . . . . . . . . 2-162-3-3. Liquid Level Measurement - Piping (GTX_ _D/GTX_ _G) . . . . . . . . . . . . . . . . . . . . . . . . 2-19
2-4. Wiring Advanced Transmitter . . . . . . . . . . . . . . . . . . . . . . . . . . . . . . . . . . . . . . . . . . . . . . . . . . . . . . . . 2-242-4-1. Wiring for Transmitter -- Regular Model . . . . . . . . . . . . . . . . . . . . . . . . . . . . . . . . . . . . . . . . 2-24
Chapter 3. Operation of the Transmitter . . . . . . . . . . . . . . . . . . . . . . . . . . . . . . . . . . . . . . . . .3-1
3-1. Preparation. . . . . . . . . . . . . . . . . . . . . . . . . . . . . . . . . . . . . . . . . . . . . . . . . . . . . . . . . . . . . . . . . . . . . . . . . . . 3-13-1-1. Connecting communicator . . . . . . . . . . . . . . . . . . . . . . . . . . . . . . . . . . . . . . . . . . . . . . . . . . . . . 3-1
3-2. Settings Confirmation . . . . . . . . . . . . . . . . . . . . . . . . . . . . . . . . . . . . . . . . . . . . . . . . . . . . . . . . . . . . . . . . 3-23-3. Measurement with model GTX_ _D . . . . . . . . . . . . . . . . . . . . . . . . . . . . . . . . . . . . . . . . . . . . . . . . . . . 3-5
3-3-1. Flow Rate Measurement . . . . . . . . . . . . . . . . . . . . . . . . . . . . . . . . . . . . . . . . . . . . . . . . . . . . . . . 3-53-3-2. Gas Pressure Measurement . . . . . . . . . . . . . . . . . . . . . . . . . . . . . . . . . . . . . . . . . . . . . . . . . . . . . 3-93-3-3. Liquid Level Measurement of Open Tank and Closed Tank (Dry Leg) . . . . . . . . . . . . 3-133-3-4. Liquid Level Measurement of Closed Tank (Wet Leg) . . . . . . . . . . . . . . . . . . . . . . . . . . . 3-17
3-4. Measurement with Model GTX_ _G/GTX_ _A . . . . . . . . . . . . . . . . . . . . . . . . . . . . . . . . . . . . . . . . . 3-213-4-1. Pressure Measurement . . . . . . . . . . . . . . . . . . . . . . . . . . . . . . . . . . . . . . . . . . . . . . . . . . . . . . . . 3-21
3-5. Measurement with Model GTX_ _F . . . . . . . . . . . . . . . . . . . . . . . . . . . . . . . . . . . . . . . . . . . . . . . . . . . 3-253-5-1. Pressure Measurement . . . . . . . . . . . . . . . . . . . . . . . . . . . . . . . . . . . . . . . . . . . . . . . . . . . . . . . . 3-25
3-6. Measurement with Model GTX_ _U/GTX_ _R . . . . . . . . . . . . . . . . . . . . . . . . . . . . . . . . . . . . . . . . . 3-283-6-1. Pressure Measurement . . . . . . . . . . . . . . . . . . . . . . . . . . . . . . . . . . . . . . . . . . . . . . . . . . . . . . . . 3-283-6-2. Cautions Related to Flow Rate Measurement . . . . . . . . . . . . . . . . . . . . . . . . . . . . . . . . . . . 3-30
3-7. Measurement with Model GTX_ _U . . . . . . . . . . . . . . . . . . . . . . . . . . . . . . . . . . . . . . . . . . . . . . . . . . . 3-313-7-1. Pressure Measurement . . . . . . . . . . . . . . . . . . . . . . . . . . . . . . . . . . . . . . . . . . . . . . . . . . . . . . . . 3-31
3-8. Set Range Calculation for Liquid Level Measurement . . . . . . . . . . . . . . . . . . . . . . . . . . . . . . . . . 3-343-8-1. Open Tank or Closed Tank (Dry Leg) or Remote Seal Set Range Calculation . . . . . 3-343-8-2. Closed Tank (Wet Leg or Remote Seal) -- Set Range . . . . . . . . . . . . . . . . . . . . . . . . . . . . . 3-39
3-9. Indicator (Optional) . . . . . . . . . . . . . . . . . . . . . . . . . . . . . . . . . . . . . . . . . . . . . . . . . . . . . . . . . . . . . . . . . . 3-423-9-1. Display unit of indicator . . . . . . . . . . . . . . . . . . . . . . . . . . . . . . . . . . . . . . . . . . . . . . . . . . . . . . . 3-423-9-2. Bar Graph Display . . . . . . . . . . . . . . . . . . . . . . . . . . . . . . . . . . . . . . . . . . . . . . . . . . . . . . . . . . . . . 3-443-9-3. External Zero/Span Adjustment Display . . . . . . . . . . . . . . . . . . . . . . . . . . . . . . . . . . . . . . . 3-443-9-4. Square Root Extraction Display . . . . . . . . . . . . . . . . . . . . . . . . . . . . . . . . . . . . . . . . . . . . . . . . 3-453-9-5. Write Protect Display . . . . . . . . . . . . . . . . . . . . . . . . . . . . . . . . . . . . . . . . . . . . . . . . . . . . . . . . . . 3-453-9-6. Status Record Display . . . . . . . . . . . . . . . . . . . . . . . . . . . . . . . . . . . . . . . . . . . . . . . . . . . . . . . . . 3-453-9-7. Display Update Mark . . . . . . . . . . . . . . . . . . . . . . . . . . . . . . . . . . . . . . . . . . . . . . . . . . . . . . . . . . 3-45
3-10. External Zero/Span Adjustment function (Optional) . . . . . . . . . . . . . . . . . . . . . . . . . . . . . . . . . 3-463-11. Advanced Diagnostics (optional ) . . . . . . . . . . . . . . . . . . . . . . . . . . . . . . . . . . . . . . . . . . . . . . . . . . . 3-47
3-11-1. Pressure Frequency Index . . . . . . . . . . . . . . . . . . . . . . . . . . . . . . . . . . . . . . . . . . . . . . . . . . . . 3-473-11-2. Standard Deviation . . . . . . . . . . . . . . . . . . . . . . . . . . . . . . . . . . . . . . . . . . . . . . . . . . . . . . . . . . 3-513-11-3. Out-of-Range Pressure Event Count . . . . . . . . . . . . . . . . . . . . . . . . . . . . . . . . . . . . . . . . . . 3-53
xxxiv
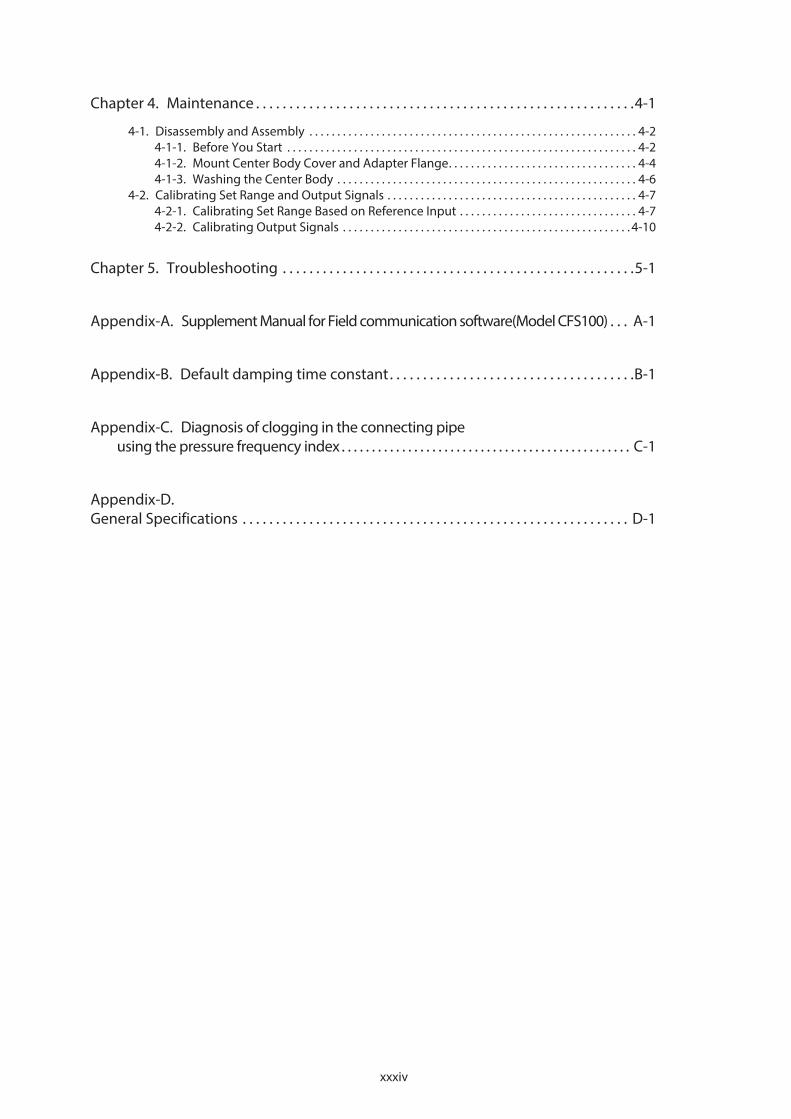
Chapter 4. Maintenance . . . . . . . . . . . . . . . . . . . . . . . . . . . . . . . . . . . . . . . . . . . . . . . . . . . . . . . . .4-1
4-1. Disassembly and Assembly . . . . . . . . . . . . . . . . . . . . . . . . . . . . . . . . . . . . . . . . . . . . . . . . . . . . . . . . . . . 4-24-1-1. Before You Start . . . . . . . . . . . . . . . . . . . . . . . . . . . . . . . . . . . . . . . . . . . . . . . . . . . . . . . . . . . . . . . 4-24-1-2. Mount Center Body Cover and Adapter Flange . . . . . . . . . . . . . . . . . . . . . . . . . . . . . . . . . . 4-44-1-3. Washing the Center Body . . . . . . . . . . . . . . . . . . . . . . . . . . . . . . . . . . . . . . . . . . . . . . . . . . . . . . 4-6
4-2. Calibrating Set Range and Output Signals . . . . . . . . . . . . . . . . . . . . . . . . . . . . . . . . . . . . . . . . . . . . . 4-74-2-1. Calibrating Set Range Based on Reference Input . . . . . . . . . . . . . . . . . . . . . . . . . . . . . . . . 4-74-2-2. Calibrating Output Signals . . . . . . . . . . . . . . . . . . . . . . . . . . . . . . . . . . . . . . . . . . . . . . . . . . . . 4-10
Chapter 5. Troubleshooting . . . . . . . . . . . . . . . . . . . . . . . . . . . . . . . . . . . . . . . . . . . . . . . . . . . . .5-1
Appendix-A. Supplement Manual for Field communication software(Model CFS100) . . . A-1
Appendix-B. Default damping time constant . . . . . . . . . . . . . . . . . . . . . . . . . . . . . . . . . . . . .B-1
Appendix-C. Diagnosis of clogging in the connecting pipe using the pressure frequency index . . . . . . . . . . . . . . . . . . . . . . . . . . . . . . . . . . . . . . . . . . . . . . . . C-1
Appendix-D. General Specifications . . . . . . . . . . . . . . . . . . . . . . . . . . . . . . . . . . . . . . . . . . . . . . . . . . . . . . . . . . D-1

1-1
Chapter 1. Overview-First Time Users Only
1-1. Introduction This section is intended for users who have never worked with our Advanced Transmitter. It provides some general information to acquaint you with the Advanced Transmitter.
1-2. Advanced Transmitters Azbil Corporation’s Advanced Transmitter includes model variations of these basic pressure measurement types. • Differential Pressure • Gauge Pressure • Absolute Pressure
Transmitter adjustments
Except for optional zero and span adjustments available with Advanced Transmitters only, the Advanced Transmitter has no physical adjustments.You need a CommPad or HART communicator to make adjustments to a transmitter.
GTX_ _ DDifferentialPressure
GTX_ _ FDifferentialPressure
with Flange
GTX_ _ GGauge
Pressure
GTX_ _ AAbsolutePressure
GTX_ _ RDIfferential Pressure
with Remote Diaphragm Seals
GTX_ _ UGauge Pressure
with Remote DIaphragm Seal
GTX_ _ GGauge
Pressure(Direct Mount)
Fig. 1-1. Advanced Transmitter Family
1-2
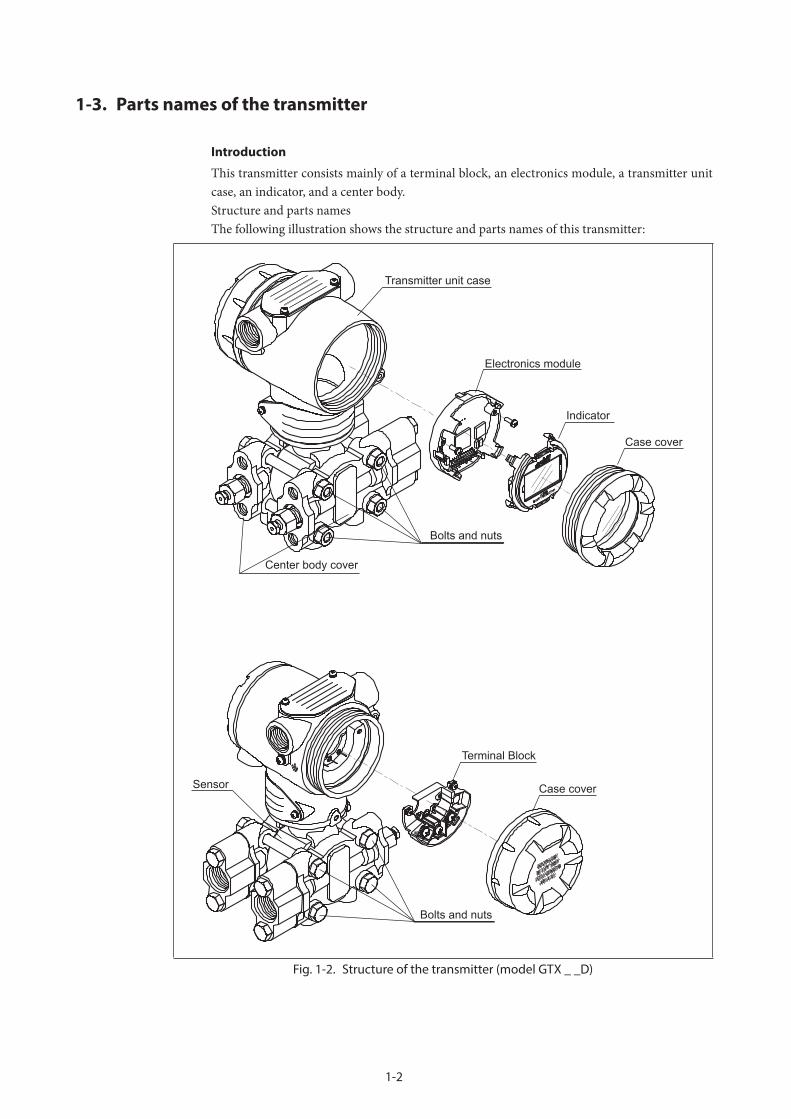
1-3. Parts names of the transmitter
Introduction
This transmitter consists mainly of a terminal block, an electronics module, a transmitter unit case, an indicator, and a center body.Structure and parts namesThe following illustration shows the structure and parts names of this transmitter:
Electronics module
Transmitter unit case
Center body cover
Bolts and nuts
Indicator
Case cover
Sensor
Bolts and nuts
Terminal Block
Case cover
Fig. 1-2. Structure of the transmitter (model GTX _ _D)
1-3
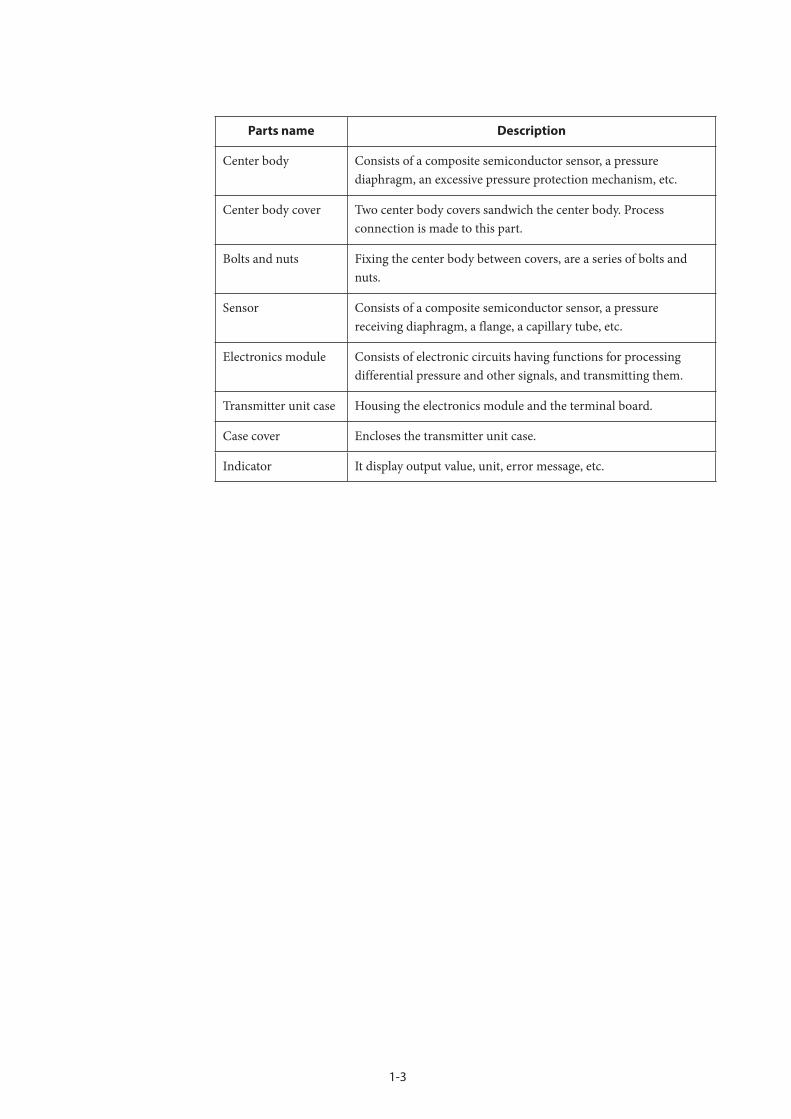
Parts name Description
Center body Consists of a composite semiconductor sensor, a pressure diaphragm, an excessive pressure protection mechanism, etc.
Center body cover Two center body covers sandwich the center body. Process connection is made to this part.
Bolts and nuts Fixing the center body between covers, are a series of bolts and nuts.
Sensor Consists of a composite semiconductor sensor, a pressure receiving diaphragm, a flange, a capillary tube, etc.
Electronics module Consists of electronic circuits having functions for processing differential pressure and other signals, and transmitting them.
Transmitter unit case Housing the electronics module and the terminal board.
Case cover Encloses the transmitter unit case.
Indicator It display output value, unit, error message, etc.
1-4
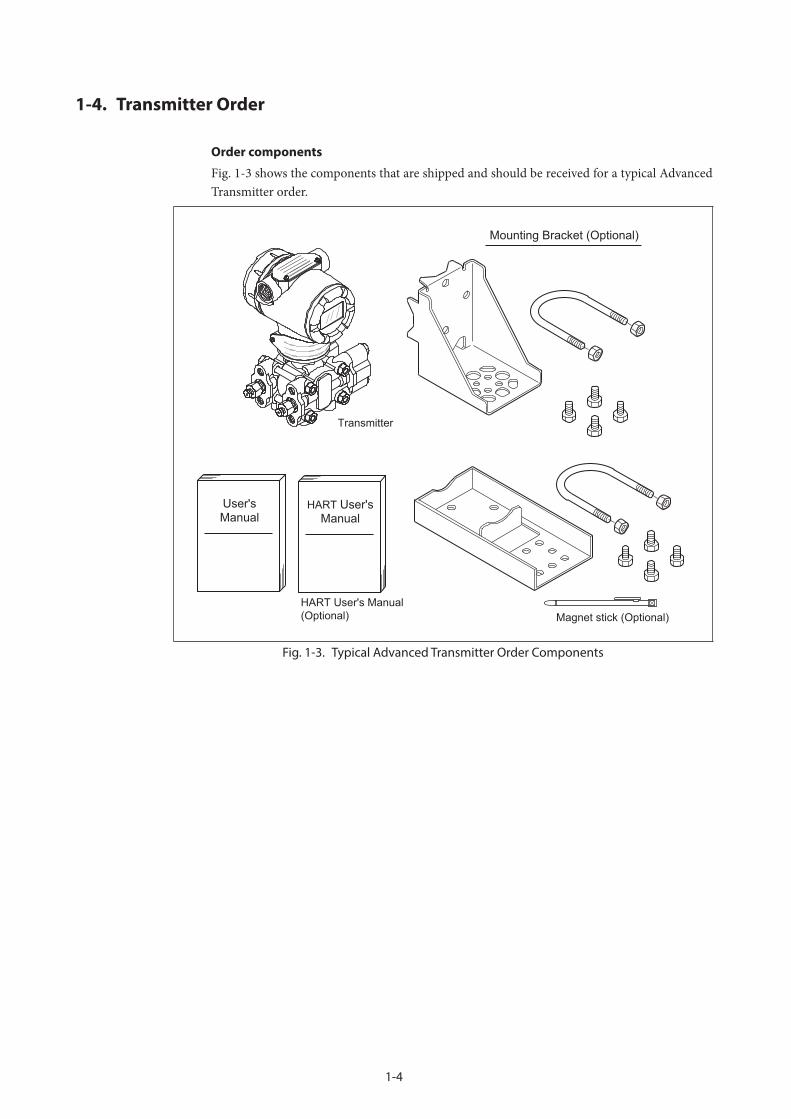
1-4. Transmitter Order
Order components
Fig. 1-3 shows the components that are shipped and should be received for a typical Advanced Transmitter order.
HART User'sManual
Mounting Bracket (Optional)
Transmitter
Magnet stick (Optional)HART User's Manual(Optional)
User'sManual
Fig. 1-3. Typical Advanced Transmitter Order Components

2-1
Chapter 2. Installation
2-1. Introduction This section provides information about installing the Advanced Transmitter. It includes procedures for mounting, piping and wiring the transmitter for operation.
2-2. Mounting Advanced Transmitter
Summary
You can mount all transmitter models except those with integral flanges to a 2-inch (50 mm) vertical or horizontal pipe using our optional angle or flat mounting bracket or a bracket of your own. Those models with integral flanges are supported by the flange connection.
Fig. 2-1 shows typical bracket mounted and flange mounted transmitter installations for comparison.
Fig. 2-1. Typical Bracket Mounted and Flange Mounted Installations.
2-2
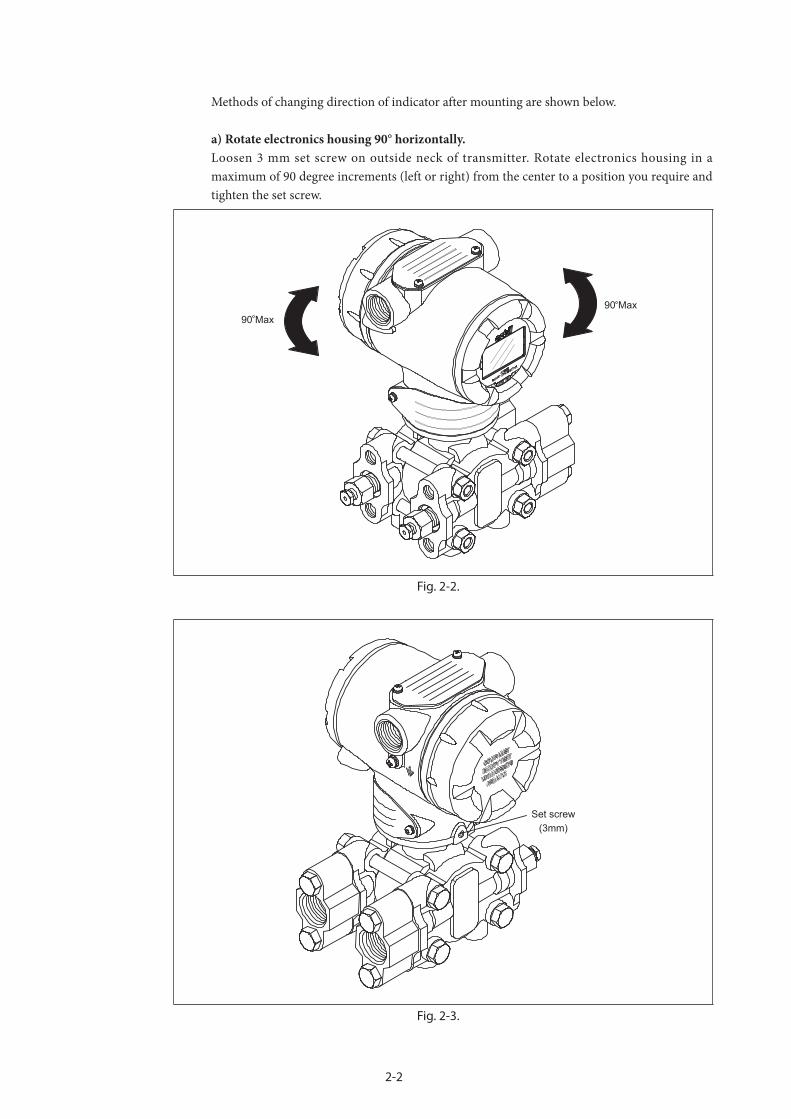
Methods of changing direction of indicator after mounting are shown below.
a) Rotate electronics housing 90° horizontally.Loosen 3 mm set screw on outside neck of transmitter. Rotate electronics housing in a maximum of 90 degree increments (left or right) from the center to a position you require and tighten the set screw.
90 Max90 Max
Fig. 2-2.
Set screw(3mm)
Fig. 2-3.

2-3
b) Rotate digital display module
Fig. 2-4.
Flange mounting
To mount a flange mounted transmitter model, bolt the transmitter’s flange to the flange pipe on the wall of the tank. Tighten the bolts to a torque ofSNB7 : 20 ± 1 N·m304SST : 10 ± 1 N·m
ATTENTION
On insulated tanks, remove enough insulation to accommodate the flange extension.
Fig. 2-5 shows a typical installation for a transmitter with the flange on the high pressure (HP) side so the HP diaphragm is in direct contact with the process fluid. The low pressure (LP) side of the transmitter is vented to atmosphere (no connection).
100 % Liquid
0 % Liquid
Fig. 2-5. Typical Flange Mounted Transmitter Installation.

2-4
Remote seal mounting
Use the procedure in “Table 2-1. Mounting Remote Diaphragm Seal Transmitter” to mount a remote diaphragm seal transmitter model. Fig. 2-6 shows a typical installation for a remote diaphragm seal transmitter for reference.
ATTENTION
Mount the transmitter flanges within the limits stated here for the given fill-fluid in the capillary tubes with a tank at one atmosphere.
Table 2-1. Mounting Remote Diaphragm Seal Transmitter
Step Action
1 Mount transmitter at a remote distance determined by length of capillary tubing.
2 H mark side of transmitter to upper flange mounting on tank wall.
ATTENTIONOn insulated tanks, remove enough insulation to accommodate the flange extension.
3 Tighten bolts to torque ofCarbon steel (SNB7): 20 ± 1 N·m ,304SST: 10 ± 1 N·m .

2-5
100 % Liquid Level
HP
LP
0 % Liquid Level
FixedRef Leg
Fig. 2-6. Typical Remote Diaphragm Seal Transmitter Installation
ATTENTION
Calculation of Allowable Transmitter Installation Location in Remote Seal Type Differential Pressure Transmitter.
When installing a remote seal type differential pressure transmitter on an enclosed tank, we recommend the installation of the main unit below the lower flange. However, it is sometimes necessary to install the transmitter main unit between the upper and lower flanges due to piping restrictions.
The condition that must be satisfied to ensure normal transmitter operations is specified here.
If a transmitter is installed in the position shown in Fig. 2-7, the inner pressure of the tank (P0) and the head pressure of the liquid sealed in the capillary can be applied to its main unit (low limit flange side).
The transmitter functions normally as long as the pressure applied to its diaphragm surface is equal to or higher than the low limit P (kPa abs.) of the allowable pressure of its main unit.
Fig. 2-7.

2-6
This condition can be expressed with the following formula; P0 + ( ( ρ'h ) ⁄ 102 ) ≥ P ( 1 kPa = 102 mmH2O ) Therefore, h ≤ ( P0 – P ) × 102 ⁄ ( ρ' )
Table 2-2.
Specific gravity of sealed liquid
ρ‘
Low limit of allowable pressure
P (kPa abs.)
Liquid contacting
temperature range
(°C)
General application (*1) 0.935 2 -40 to 40
High temperature application (*2)
1.07 2 -5 to 90
High temperature & vacuum application (*3)
1.07 0.1333 -5 to 50
High temperature & high vacuum application (*4)
1.09 0.1333 -10 to 250
Oxygen application, chlorine application (*5)
1.87 53 -10 to 40
Remarks1. An application where the pressure in the tank P0 becomes a vacuum requires special
caution.
2. If the above condition is not met, the pulling force applied to the diaphragm surface will exceed the specified range.
Foaming occurs because the pressure of sealed liquid exceeds the saturated vapor pressure and can cause zero point shifting. Negative pressure applied to the diaphragm can cause buckling and destroy the diaphragm.
3. When the liquid contacting temperature exceeds the levels shown in the table, the low limit of the allowable pressure also changes. Check the specifications.
4. *1. GTX_ _R-_A *2. GTX_ _R-_B *3. GTX_ _R-_C *4. GTX_ _R-_D *5. GTX_ _R-_H&J

2-7
Direct Mounting
The direct mount GTX can be installed directly on the pipe (direct mounting), on a 2 inch pipe using the optional mounting brackets, or on a wall, also using the brackets.
CAUTIONDo not use the direct mount GTX transmitter as a foothold, or for any other improper purpose.Doing so may result in damage to equipment and/or physical damage.For taper threaded connection, use sealing tape to prevent leakage.For straight threaded connection be sure to use the gasket included with the transmitter.When screwing the transmitter to the connecting pipe, do not tighten it holding the housing of the transmitter.Always use wrenches and hold the hex-head part of the transmitter. (See Fig. 2-8)Avoid installing the transmitter upside down. Doing so may cause debris to fill inside the transmitter and be the cause of inaccurate measurements.Make sure the process pressure does not exceed the maximum allowed temperature. If necessary, use siphons or other measures to lower the temperature at the wetted parts of the transmitter.When measuring liquids, take measures to keep the process fluid from freezing. Install the transmitter in a location where there is no excessive impact, vibration, or pressure.Screwing on the transmitter to a connecting pipe filled with liquid may damage the transmitter.(See Fig. 2-8)
Fig. 2-8. Installation precaution 1

2-8
Fig. 2-9. Installation precaution 2

2-9
<Example of calculation>Let’s take up an example in which a remote seal type transmitter of the of the general specifications is used for a vacuum application (3kPa abs.)• Liquid contacting pressure : Normal pressure (24°C)• Low limit of allowable pressure ( ρ ) : 2 kPa abs. (15mmHg abs.)• Specific gravity of sealed liquid ( ρ' ) : 0.935• Inner pressure of tank ( ρ0 ) : 3kPa abs.
The condition that must be met to satisfy the transmitter specifications is as follows:
h ≤ (P0 – P) × 102 ⁄ ( ρ' )h ≤ ( 3 – 2 ) × 102 ⁄ 0.935 = 109 mm
Therefore, the high limit of the transmitter position is 109 mm.
CAUTIONIf the above conditions are not met, the diaphragm surface will be pulled by negative pressure that exceeds its operating limit. When the pressure reaches the saturated vapor pressure, the sealed liquid will form bubbles. If the negative pressure continues to increase, the diaphragm may buckle and be damaged.Azbil Corporation recommends installing the transmitter at least 10 cm below the lower flange
2-10
2-3. Piping Advanced Transmitter
Summary
The actual piping arrangement will vary depending upon the process measurement requirements and the transmitter model. Except for flanged and remote diaphragm seal connections, process connections are made to 1/4 inch or 1/2 inch NPT female connections in the process head of the transmitter’s meter body. For example, a differential pressure transmitter comes with double ended process heads with 1/4 inch NPT connections but they can be modified to accept 1/2 inch NPT through optional flange adapters.
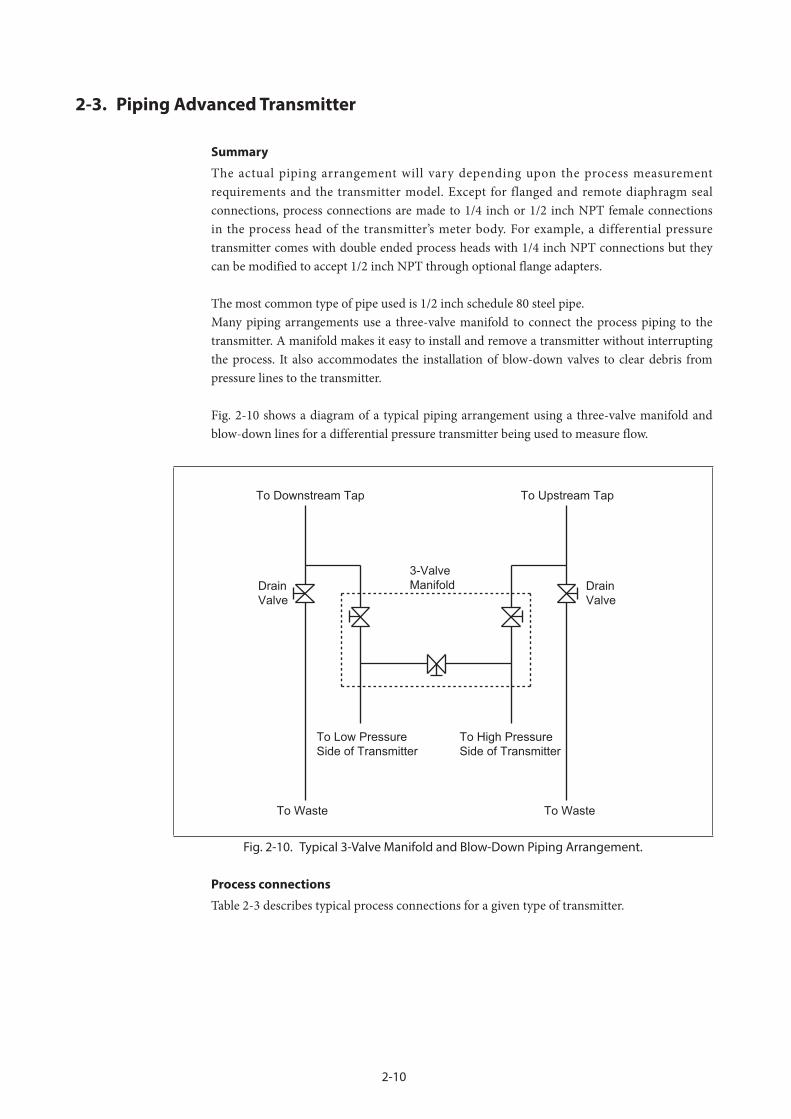
The most common type of pipe used is 1/2 inch schedule 80 steel pipe.Many piping arrangements use a three-valve manifold to connect the process piping to the transmitter. A manifold makes it easy to install and remove a transmitter without interrupting the process. It also accommodates the installation of blow-down valves to clear debris from pressure lines to the transmitter.
Fig. 2-10 shows a diagram of a typical piping arrangement using a three-valve manifold and blow-down lines for a differential pressure transmitter being used to measure flow.
To High Pressure Side of Transmitter
To Low Pressure Side of Transmitter
Drain Valve
Drain Valve
3-ValveManifold
To Waste To Waste
To Downstream Tap To Upstream Tap
Fig. 2-10. Typical 3-Valve Manifold and Blow-Down Piping Arrangement.
Process connections
Table 2-3 describes typical process connections for a given type of transmitter.

2-11
Table 2-3. Process Connections
Transmitter type Process Connection
Differential Pressure Process heads with 1/4 inch NPT internal thread connection.Flange adapters and manifolds with 1/2 inch internal thread connections are optional.
Gauge Pressure Process head with 1/2 inch NPT internal thread connection.Process heads with 1/4 inch NPT internal thread connection. (GTX_ _G)Flange adapters and manifolds with 1/2 inch internal thread connections are optional (GTX_ _G)
Absolute Pressure Process heads with 1/2 inch NPT internal thread connection (GTX_ _A)
Flange Mounted Liquid Level 1.5. 2 or 3 inches flange with flush or 2, 3 or 4 inches extended diaphragm on high pressure side.Reference side has standard differential pressure process head.
Remote Diaphragm Seals See Model Selection Guide for description of available Flanged, Button-diaphragm (G1·1/2), and Wafer type process connections.
Gauge Pressure (Direct Mount)
1/2 inch NPT internal thread1/2 inch NPT external threadRc1/2 internal threadR1/2 external threadM20 × 1.5 external threadG1/2 external thread

2-12
Installing flange Adapter
Table 2-4 gives the steps for installing an optional flange adapter on the process head. Slightly deforming the gasket supplied with the adapter before you insert it into the adapter may aid in retaining the gasket in the groove while you align the adapter to the process head. To deform the gasket, submerse it in hot water for a few minutes then firmly press it into its recessed mounting groove in the adapter.
Table 2-4. Installing Adapter Flange
Step Action
1 Carefully seat PTFE (white) gasket into adapter groove.
2 Thread adapter onto 1/2 inch process pipe and align mounting holes in adapter with holes in end of process head as required.
3 Secure adapter to process head by hand tightening 7/16-20UNF hexhead bolts.Example-Installing adapter onprocess head
ATTENTIONApply an anti-seize compoundon the stainless steel bolts priorto threading them into the process head.
4 Evenly tighten adapter bolts to the following torque;
Adapter material CS/SS CS/SS PVC
Bolt material Carbon steel(SNB7)/
SS630
304SST Carbon steel(SNB7)/304SST
Torque N•m 20 ±1 10 ±0.5 7 ±0.5
7/16 X 20 UNF Bolts
Adapter Flange
PTFE Gasket
ProcessHead

2-13
2-3-1. Piping for Liquid, Gas or Steam Flow Rate Measurement
Recommended Piping - Example 1
The illustration shows a typical example for liquid Flow Rate Measurement. This Differential pressure transmitter is located below the differential pressure output port of the process pipe.This minimizes the static head effect of the condensate.
The following apply:Grade the pipe at the differential pressure output part.Inclination symbol in illustration: Low level High levelAfter piping work, ensure that the connecting pipe, the 3-way manifold valve, and the transmitter have no pressure leak.
Orifice
Main valve
Differential pressure output port
Gasvent valve
High-pressure side
Low-pressure side
Inclination
Inclination
Inclination
3-way manifold valve
Drain valve
Drain valve
Tee
Orifice
Main valve
Differential pressure output port
High-pressure side
Low-pressure side
Gasvent valve
Inclination
Inclination
Inclination
Vent / Drain plug
Fig. 2-11. Piping for Liquid Flow Rate Measurement - Example
This transmitter is located underneath the differential pressure output port of the process pipe.

2-14
Recommended Piping - Example 2
The illustration shows a typical example for Gas Flow Rate Measurement. This Differential pressure transmitter is located above the differential pressure output port of the process pipe.The condensate drains away from the transmitter.
The following apply:Grade the pipe at the differential pressure output part. Inclination symbol in illustration: Low level High level
After piping work, ensure that the connecting pipe, check for pressure leaks around the 3-way manifold valve, and the transmitter.
Orifice Differential pressure output port
Main valve
Gas vent plug
Vent / Drain plug
High pressure side
Low pressure side
3-way manifold valve
Tee
Inclination
Inclination
OrificeDifferential pressure output port
Main valve
Gas vent plug
High pressure side
Low pressure side
Inclination
Inclination
Fig. 2-12. Piping for Gas Flow Rate Measurement - Example
This transmitter is located above the differential pressure output port of the process pipe.

2-15
Recommended Piping - Example 3
The illustration shows a typical example for Steam Flow Rate Measurement. Recommended for a Differential pressure transmitter located below the differential pressure output port of the process pipe.
The following apply:Grade the pipe at the differential pressure output part.Inclination symbol in illustration: Low level High level
After piping work, ensure that the connecting pipe, the 3-way manifold valve, and the transmitter have no pressure leaks.
If the process pipe is vertically mounted, mount seal pots at different levels to prevent zero drift. But in this case, you cannot apply the previously-used zero adjustment procedure (using a 3-way manifold valve). For zero shift occurring at different levels, use a HART
communicator.
Orifice
Main valve
Differential pressure output port
Seal pot
High-pressure side
Low-pressure side
Inclination
Inclination
Inclination
3-way manifold valve
Drain valve
Drain valve
Tee
Orifice
Main valve
Differential pressure output port
High-pressure side
Low-pressure side
Seal pot
Inclination
Inclination
Inclination
Vent / Drain plug
Fig. 2-13. Piping for Steam Flow Rate Measurement - Example
This transmitter is located under the differential pressure output port of the process pipe.
2-16
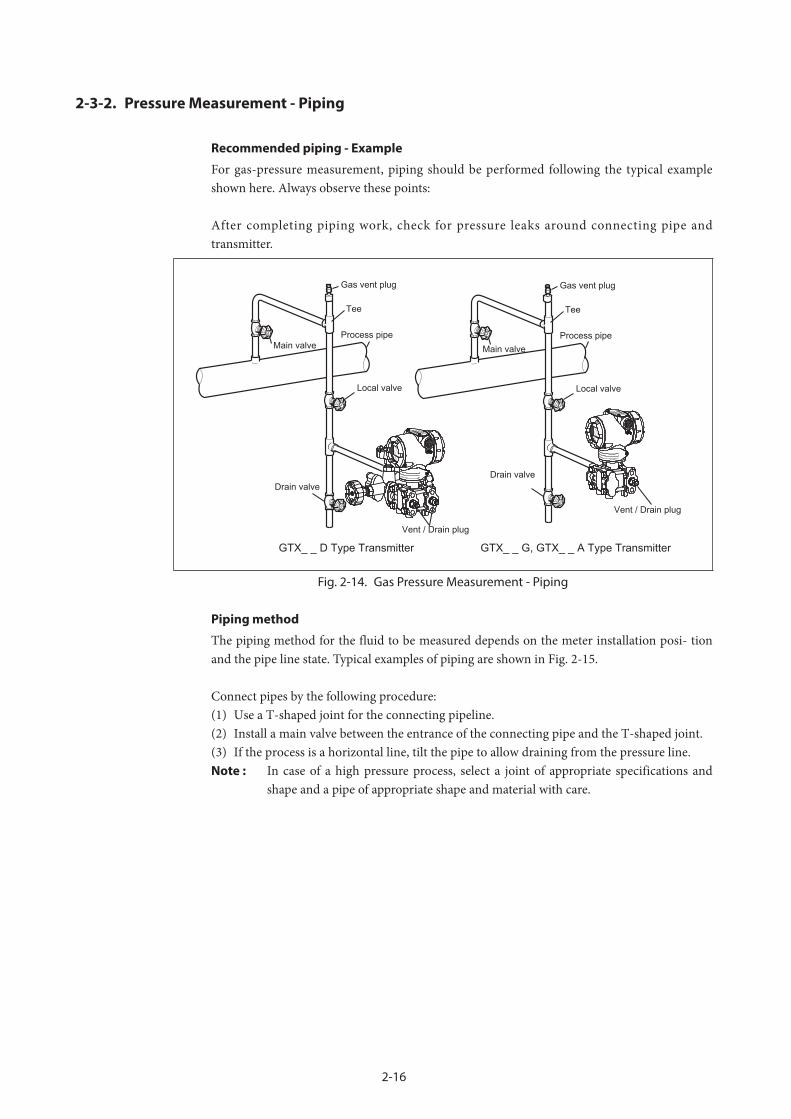
2-3-2. Pressure Measurement - Piping
Recommended piping - Example
For gas-pressure measurement, piping should be performed following the typical example shown here. Always observe these points:
After completing piping work, check for pressure leaks around connecting pipe and transmitter.
Gas vent plug
Local valve
Main valve
Drain valve
Vent / Drain plug
Process pipe
Tee
GTX_ _ D Type Transmitter
Gas vent plug
Main valve
Local valve
Drain valve
Vent / Drain plug
Process pipe
Tee
GTX_ _ G, GTX_ _ A Type Transmitter
Fig. 2-14. Gas Pressure Measurement - Piping
Piping method
The piping method for the fluid to be measured depends on the meter installation posi- tion and the pipe line state. Typical examples of piping are shown in Fig. 2-15.
Connect pipes by the following procedure:(1) Use a T-shaped joint for the connecting pipeline.(2) Install a main valve between the entrance of the connecting pipe and the T-shaped joint.(3) If the process is a horizontal line, tilt the pipe to allow draining from the pressure line.Note : In case of a high pressure process, select a joint of appropriate specifications and
shape and a pipe of appropriate shape and material with care.
2-17
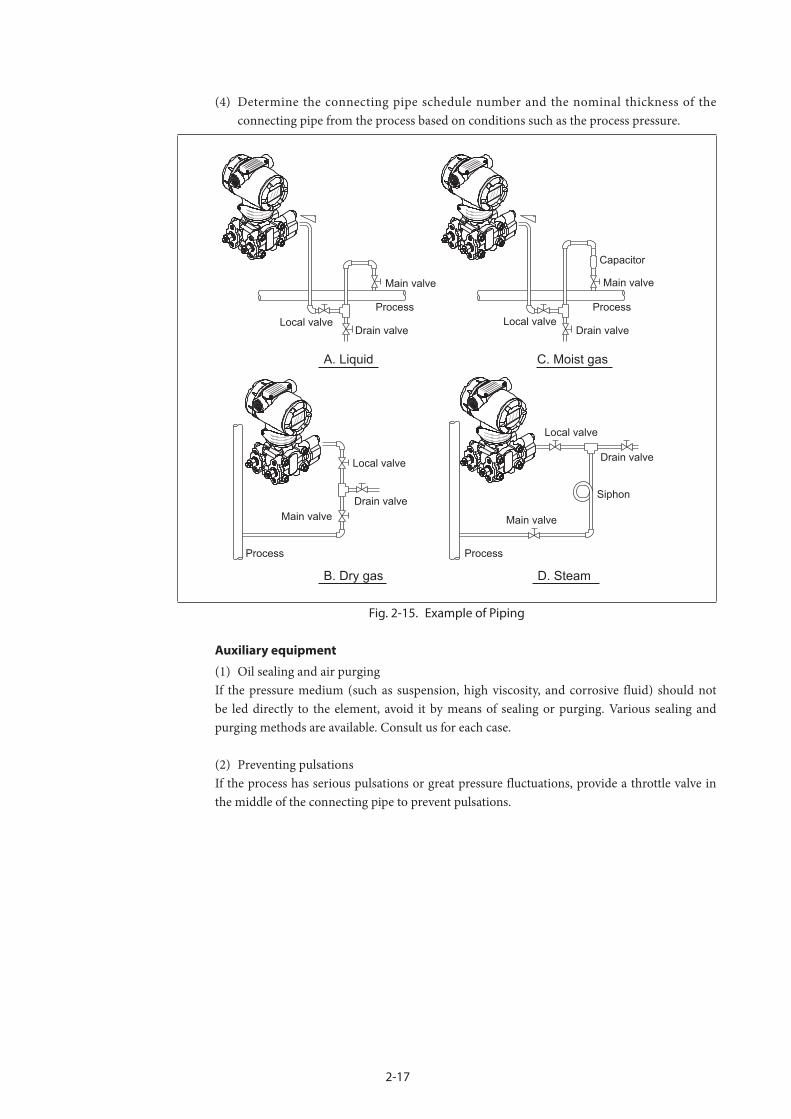
(4) Determine the connecting pipe schedule number and the nominal thickness of the connecting pipe from the process based on conditions such as the process pressure.
Capacitor
Main valveMain valve
Main valve Main valve
Local valveLocal valve
Local valve
Local valve
Drain valveDrain valve
Drain valve
Drain valve
ProcessProcess
Process Process
Siphon
C. Moist gasA. Liquid
B. Dry gas D. Steam
Fig. 2-15. Example of Piping
Auxiliary equipment
(1) Oil sealing and air purgingIf the pressure medium (such as suspension, high viscosity, and corrosive fluid) should not be led directly to the element, avoid it by means of sealing or purging. Various sealing and purging methods are available. Consult us for each case.
(2) Preventing pulsationsIf the process has serious pulsations or great pressure fluctuations, provide a throttle valve in the middle of the connecting pipe to prevent pulsations.

2-18
Fig. 2-16. Example of direct mounting
When mounting the transmitter directly onto the process line, takeinto consideration the weight, temperature at wetted part, and vibration. If necessary, use the optional bracket for reinforcement.

2-19
2-3-3. Liquid Level Measurement - Piping (GTX_ _D/GTX_ _G)
Piping
Introduction
For measurement by GTX_ _D type of liquid level in a tank, the piping method depends on whether the tank is open or closed. For closed tanks, piping is modified according to whether you use the gas sealing method (dry leg) or the liquid sealing method (wet leg).
H mark
H indicating high pressure is marked on the center body of this transmitter. Check the mark during piping work. The low-pressure side has no mark.
H
Low-pressure side High-pressure side
Fig. 2-17. H mark on center body
CAUTIONIf the nameplate indicates that the suppression is larger then 1/2 of the span, “H” is etched on the bottom left of the transmitter as viewed from the front. In this case, connect the high-pressure side of the process piping to the port on the right of the transmitter (without “H”) as viewed from the front.
Example:Range: -50 to 20 kPaSuppression = 50 kPa, Span = 70 kPa
Since the suppression is larger than 1/2 of the span (50 > 70/2 = 35), “H” is etched on the bottom left of the transmitter as viewed from the front. The connection port for the high-pressure side of the process piping is on the right side.

2-20
Before your start
The following parts are requirements for piping work. Refer to illustration.• 3-way manifold valve• Pipe• Main valve• Union or flange• Tee• Drain valve• Drain plug• Seal pot (for closed tank and wet-leg only)
Open Tank - Piping
Recommended piping - Example
For open tanks, connect the high-pressure side of this transmitter to the lower part of the tank. Open the low-pressure side to the air.
After completing piping work, check for pressure leaks around the connecting pipe, the transmitter, and the 3-way manifold valve. The illustration shows a typical installation.
Connect the high-pressure side of this transmitter to the lower part of the tank. Install this transmitter below the lowest liquid level to be measured.
Vent / Drain plug
Drain valve
Tee
Main valve
3-waymanifold valve
Liquid level
Open tank
Vent / Drain plug
Drain valve
Tee
Main valve
Liquid level
Open tank
Fig. 2-18. Open Tank - Piping Example
2-21
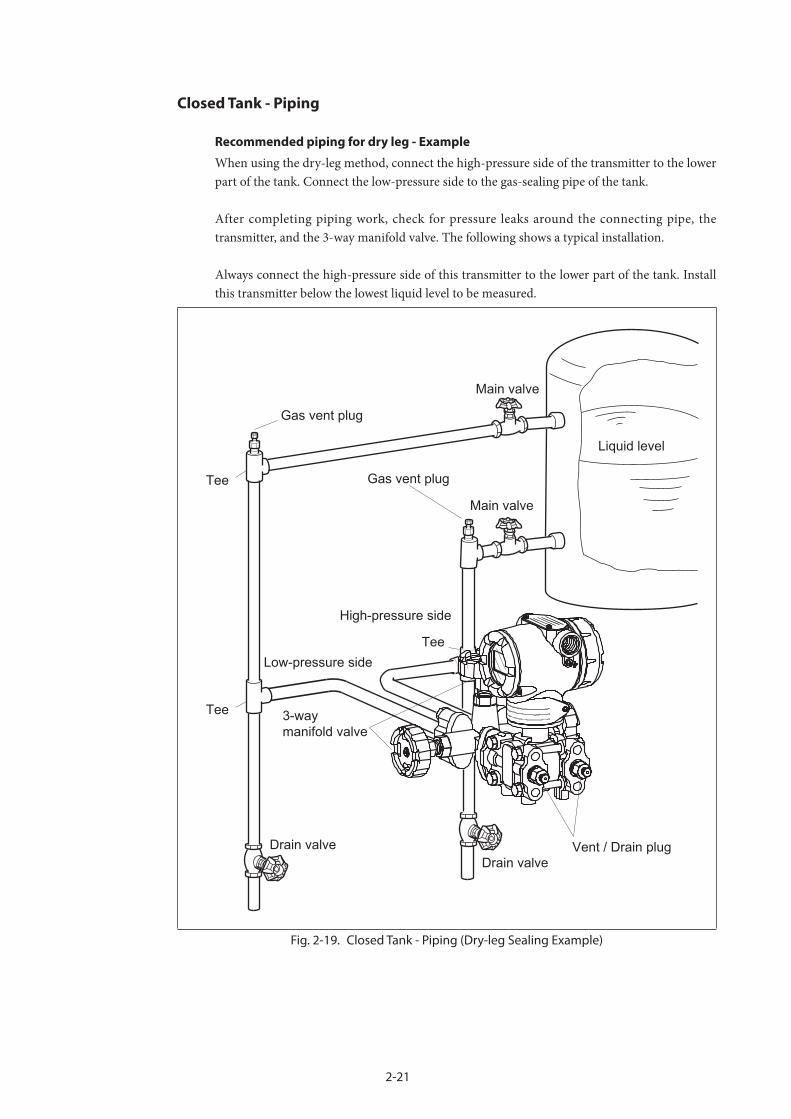
Closed Tank - Piping
Recommended piping for dry leg - Example
When using the dry-leg method, connect the high-pressure side of the transmitter to the lower part of the tank. Connect the low-pressure side to the gas-sealing pipe of the tank.
After completing piping work, check for pressure leaks around the connecting pipe, the transmitter, and the 3-way manifold valve. The following shows a typical installation.
Always connect the high-pressure side of this transmitter to the lower part of the tank. Install this transmitter below the lowest liquid level to be measured.
Liquid level
Gas vent plug
Low-pressure side
High-pressure side
3-way manifold valve
Main valve
Main valve
Tee
Tee
Tee
Gas vent plug
Drain valveDrain valve
Vent / Drain plug
Fig. 2-19. Closed Tank - Piping (Dry-leg Sealing Example)

2-22
Recommended piping for wet leg - Example
When using the wet-leg method, connect the high-pressure side of the transmitter to the sealing pipe of the tank. Connect the low-pressure side to the lower part of the tank.
After completing piping work, check for pressure leaks around the connecting pipe, the transmitter, and the 3-way manifold valve. The illustration shows a typical installation.
Be sure to connect the low-pressure side of this transmitter to the lower part of the tank.
Install this transmitter below the lowest liquid level to be measured.
Gas vent plug
Main valve
Main valve
High pressure side
Low pressure side
Drain valve Drain valve
Seal pot
Liquid level
Vent / Drain plug
Fig. 2-20. Closed Tank - Piping (Wet-leg Sealing Example)

2-23
ATTENTION
For liquid or steam, the piping should slope a minimum of 25.4 mm (1 inch) per 305 mm (1 foot). Slope the piping down towards the transmitter if the transmitter is below the process connection so the bubbles may rise back into the piping through the liquid. If the transmitter is located above the process connection, the piping should rise vertically above the transmitter, then slope down towards the flowline with a vent valve at the high point. For gas measurement, use a condensate leg and drain at the low point (freeze protection may be required here).

2-24
2-4. Wiring Advanced Transmitter
2-4-1. Wiring for Transmitter -- Regular Model
Introduction
Following wiring instructions when no explosion-proof standards apply. Wire and cable this transmitter as shown in the illustrations.
Earth Screw
Blanking plugDC Power Supply24V
Receivinginstrument
--
+
+
Fig. 2-21. Wiring for transmitter without Alarm output
Earth Screw
DC Power Supply24V
Receivinginstrument
--
+
+
DC Power Supply30V Max30mA Max
- +
This line should be connected to ground.
Diode(For inductive load)
Alarm load
Fig. 2-22. Wiring for transmitter with Alarm output

2-25
Note : 1. External load resistance of at least 250Ω required for communications with an HART communicator. If total load resistance of the receiving instrument is less than 250Ω, insert the necessary resistance to the loop.
2. In using Azbil Corporation’s field type indicator (Model NWS300, Model NWA300), please consult us.
3. A blanking plug may not be used on the adapter or elbow. 4. Current cannot checked for a transmitter with alarm contact output. 5. Use a power supply with overcurrent protection for the product.
Cable Specification
Use standard lead wires or cables that are the same as, or better than 600V grade PVC insulated wires.
Standard Models or Explosionproof Models Use wiring rated for at least 5 deg.C higher than ambient temperature.
Intrinsically Safe Models Use wiring rated for at least 10 deg.C higher than ambient temperature.
Conduit pipe for cables
Lead cables into the transmitter case, as follows: Mount a conduit pipe in the conduit hole (1/2NPT female thread) provided on the side of a transmitter, and lead cables through the pipe.Seal the part that contacts with the conduit pipe. Use a sealing agent or a seal plug to prevent entry of water.Install transmitter so that the cables lead into it, from the bottom.

2-26
Grounding
If a shielded cable is used, earth (ground) the shield at the receiver only (single point ground). Connecting the shield to signal ground is recommended to make the electric potential difference lower.If the transmitter is not grounded through a pipe stanchion, ground the transmitter using an earth terminal in the transmitter.To ground the transmitter, the ground resistance must be 100Ω or lower.
External Earthing or Bonding Connection
The connection of the earthing or equipotential bonding conductor with the external grounding terminal must comply with the following method.
Fig. 2-23. External Grounding or Bonding Connection
Supply power and external load resistance
Confirm the relationship between the external load resistance and the supply voltage. As shown in the illustration, the relationship should be inside the shaded area.
External resistance: the total resistance connected to the output terminals of a transmitter (includes resistances of all cables in the loop plus the internal resistance of the instruments).
2-27
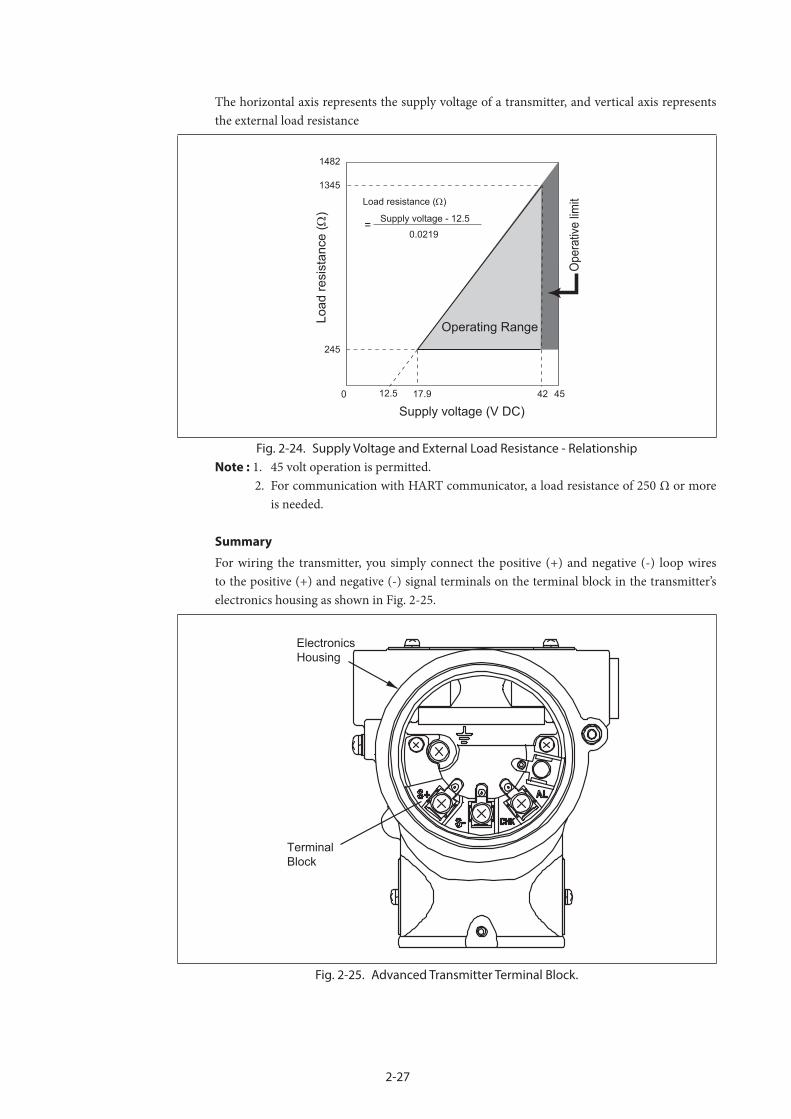
The horizontal axis represents the supply voltage of a transmitter, and vertical axis represents the external load resistance
1345
1482
Load resistance (Ω)
Supply voltage - 12.5
0.0219
245
0 17.9 42 45
Load
resi
stan
ce (Ω
)
Supply voltage (V DC)
Operating Range
=
Ope
rativ
e lim
it
12.5
Fig. 2-24. Supply Voltage and External Load Resistance - RelationshipNote : 1. 45 volt operation is permitted. 2. For communication with HART communicator, a load resistance of 250 Ω or more
is needed.
Summary
For wiring the transmitter, you simply connect the positive (+) and negative (-) loop wires to the positive (+) and negative (-) signal terminals on the terminal block in the transmitter’s electronics housing as shown in Fig. 2-25.
ElectronicsHousing
TerminalBlock
Fig. 2-25. Advanced Transmitter Terminal Block.

2-28

3-1
Chapter 3. Operation of the Transmitter
CAUTIONIf the transmitter uses SFN communication while the process is in the automatic control state, the output may fluctuate, and the device may enter a dangerous operating state.Before performing this operation, be sure to switch the control loop of the process to manual control.
In this chapter, the following items will be described.• Connecting a Communicator (Field communication software(Model CFS100), HART
Communicator, etc.) to this Device• Verifying Settings such as the Required Tag Number, the Output Format of this Device,
etc., during Receiving Inspection• Preparations before Measurement• Starting and Stopping Measurement• Items Necessary when Stopping this Device for Maintenance and Replacement
For information regarding communicator usage, see the operation manual for the relevant device.Field Communication Software (Model CFS100) User's Manual: CM2-CFS100-2001Field Communication Software (Model CFS100) Instruction Manual: CM2-CFS100-2003Advanced TransmitterField Communication Software (Model CFS100) Instruction Manual: CM2-CFS100-2013Advanced Transmitter (HART Version 7)Supplement Manual for HART Communication Option: CM2-GTX000-2002Advanced Transmitter (HART Version 7)HART Communicator Operation Manual CM2-GTX000-2003
Before connecting to this device, be sure to read the operation manual carefully.
3-1. Preparation
3-1-1. Connecting communicator
You connect the communicator directly to signal terminals on the transmitter’s terminal block or at any location in the 4 to 20 mA loop. (Polarity of the communicator connection does not matter)
Fig. 3-1.
3-2
3-2. Settings ConfirmationConfirm that the settings required for operation are set correctly.
(1) Tag Number Setting
Confirm that it is the tag number specified in advance. When changing the tag number, confirm that the specifications for this device are compatible with the installation location.
(2) Output Format Settings
WARNINGIn order to detach the terminal block with integrated indicator devices, refer to Chapter 4 and exercise sufficient care when opening the case cover. When using the product in a hazardous area, do not open its case cover. There is a risk of explosion, etc.
CAUTION Take sufficient care when specifying the output formats. In particular, if the fail-safe setting and the hardware write protection setting are specified incorrectly, the device can enter a dangerous operating state.
Take sufficient care when when changing the hardware write protection setting. Removing write protection makes it possible for the settings of this device to be changed erroneously, and as a result, for the device to enter a dangerous operating state.
• Output format Enables selection of “Linear / Square Root.”• Cutoff Output will be cut off when the flow rate is low. Sets the threshold value for that cutoff.• Dropout Selects whether to make the output zero or make it linear during output cutoff.• Flow rate mode Selects whether to take the square root in the positive direction only or in both directions.• Burnout direction Indicates the behavior of the output during major failures. Hi (H side): Output swings to the high limit (21.6 mA). Low (L side): Output swings to the low limit (3.6 mA). If optional specifications (special burnout) are selected, the low
limit will be 3.2 mA. None: Output continues.• Burnout On/Off Enables selection of burnout On/Off. On (E side): Device behaves according to burnout direction setting. Off (D side): Burnout direction setting is ignored, and the device continues to
output measurement results.• Output limit setting Except during burnout, the output current can be restricted to limit values which set the
output current range.
3-3
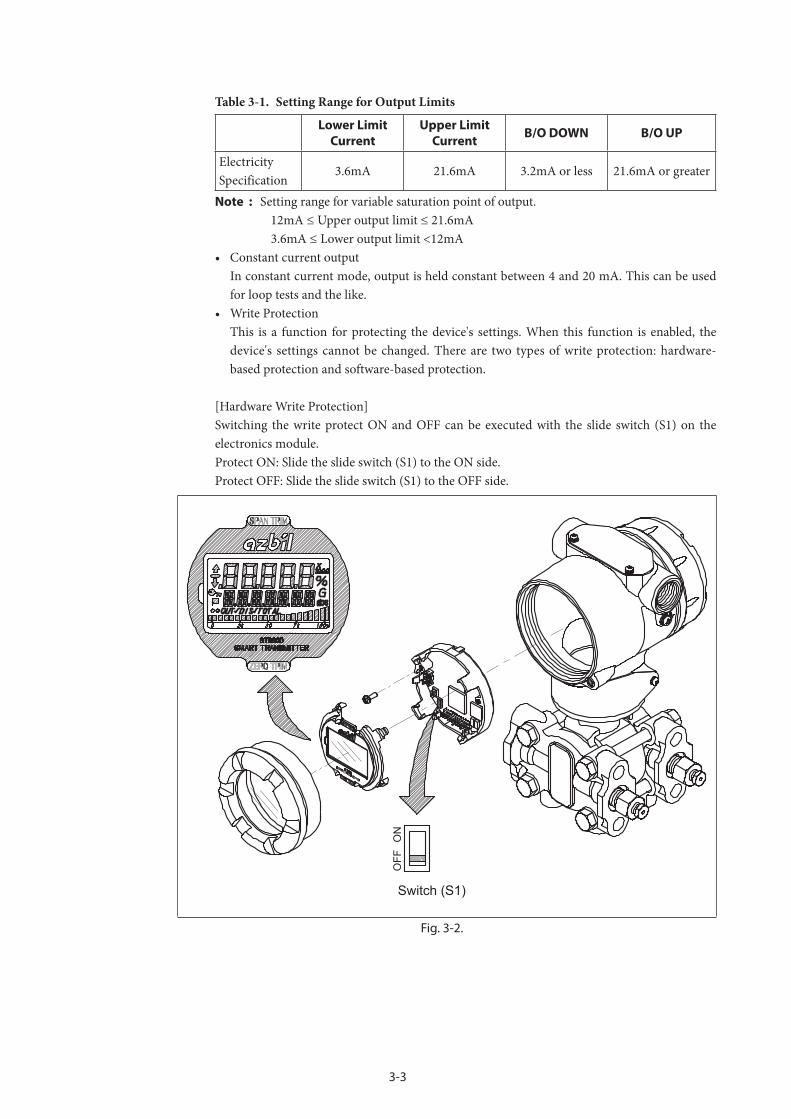
Table 3-1. Setting Range for Output Limits
Lower Limit Current
Upper Limit Current B/O DOWN B/O UP
ElectricitySpecification
3.6mA 21.6mA 3.2mA or less 21.6mA or greater
Note : Setting range for variable saturation point of output. 12mA ≤ Upper output limit ≤ 21.6mA 3.6mA ≤ Lower output limit <12mA• Constant current output In constant current mode, output is held constant between 4 and 20 mA. This can be used
for loop tests and the like.• Write Protection This is a function for protecting the device's settings. When this function is enabled, the
device's settings cannot be changed. There are two types of write protection: hardware-based protection and software-based protection.
[Hardware Write Protection]Switching the write protect ON and OFF can be executed with the slide switch (S1) on the electronics module.Protect ON: Slide the slide switch (S1) to the ON side.Protect OFF: Slide the slide switch (S1) to the OFF side.
Switch (S1)
OFF
ON
Fig. 3-2.
3-4
[Software Write Protection]For information regarding software write protection, see the operation manual for the communicator.Field communication software(Model CFS100) Instruction Manual (HART5) CM2-CFS100-2003Field communication software(Model CFS100) Instruction Manual (HART7) CM2-CFS100-2013HART Communicator Operation Manual (HART5) CM2-GTX000-2002HART Communicator Operation Manual (HART7) CM2-GTX000-2003
(3) Indicator Settings
The settings for display format (linear / square root) and display units (% / real pressure/engineering unit scale) of the indicators can be checked. “Real pressure” displays actual measured values in the selected pressure units.“Engineering unit scale” displays values for flow rate, level, etc., in the specified scale and units. If engineering unit scale is set, EULO (value at 0% output) and EUHI (value as 100% output) are set as well. With engineering unit scale, units can be selected or, alternatively, arbitrarily defined units can be displayed.
(4) Damping Time Constant Setting
The values which can be specified for the damping time are as follows.During SFN communication: 0, 0.16, 0.32, 0.48, 1, 2, 4, 8, 16, 32 (unit: seconds)During HART communication: Specify a value (to two decimal places) in the 0.00 - 120.00 second range.
Note : Transmitter responsiveness varies with each model. When replacing an instrument, adjust the damping time constant as necessary so that it is appropriate for the instrumentation loop.

3-5
3-3. Measurement with model GTX_ _D
3-3-1. Flow Rate Measurement
Preparation for Measurement
WARNING• Make sure that the process is in the manual control mode. If in automatic control mode, switch to manual control before starting the following
procedures.• Before discharging a process fluid that contains toxic substances, check the direction
of discharge and take safety measures such as wearing goggles and a mask to prevent contact with the skin and eyes and to prevent inhalation. Failure to do so is dangerous and may result in physical harm.
• Always close the differential pressure output valve (main valve), the drain valve, the gas vent plug (Refer to Fig. 2-11 and Fig. 2-12) and the high pressure side and low pressure side stop valves of the 3-way manifold valve. Also, open the equalizer valve of the 3-way manifold valve.
Procedure 1
Lead process pressure into the pressure receiving part of the transmitter, using this procedure:
Step Description
1 Gradually open the main valves of both the high-pressure side and the low-pressure side (Refer to Fig. 2-11 and Fig. 2-12). Lead process fluid into the connecting pipe.1
2 Fill with process fluid, the pressure-receiving part of the transmitter.1. Gradually open the high pressure side stop valve. Close, after the pressure receiving part has completely filled with process fluid.2. Gradually open the low pressure side stop valve. Close, after the pressure receiving part has completely filled with process fluid.
(Equalizer valve)
High-pressure side
Low-pressure side
Low-pressure sidestop valve
3-way manifold valve Vent / Drain plug
( )

3-6
Step Description
3 Decrease to zero, the differential pressure applied to the transmitter.• Gradually open the high-pressure side stop valve to lead process pressure into the
pressure receiving part of the transmitter.• In this state, equal pressure is applied to the high-pressure side and the low-pressure
side of the transmitter (equal pressure state).
4 Check for pressure leaks in the connecting pipe, the 3-way manifold valve, and the transmitter.
Procedure 2
Perform zero-point calibration, using this procedure:Zero point calibration by HART communicator operationCheck that the transmitters input is 0 kPa and its output is 0% at Online display. (Refer to HART Communicator Operation Manual (HART5) CM2-GTX000-2002HART Communicator Operation Manual (HART7) CM2-GTX000-2003If the screen display is not 0 kPa perform zero-point calibration using this procedure.
CAUTIONIf damping time constant is set to 0 sec. please adjust another value to keep the output stable before calibration. (Refer to HART Communicator Operation Manual (HART5) CM2-GTX000-2002HART Communicator Operation Manual (HART7) CM2-GTX000-2003)
(Device) - (Calibration) - (Correct Input)• Select “Zero Trim”.• You will be warned to remove the loop from automatic control. • After doing so, press OK.• When prompted, adjust pressure source to apply pressure equal to zero, then press OK.• When pressure is stable, press OK.

3-7
Starting Measurement
Procedure 3
Apply the differential pressure of the process by operating valves, using this procedure.How to apply process pressure
Step Description
1 Ensure that the 3-way manifold valve is in the following state:1. High-pressure side stop valve: Fully open2. Low-pressure side stop valve: Fully closed3. Equalizer valve: Fully open
2 1. Close the equalizer valve.2. Open the low-pressure side stop valve gradually.
(Equalizer valve)
High-pressure side
Low-pressure side
Low-pressure sidestop valve
3-way manifold valve Vent / Drain plug
( )
CAUTIONSecurely close the cover of the transmitter case. Imperfect closure allows entry of water, and may damage internal terminals as well as the electronics module. Such damage may require parts replacement, possibly of the entire module.
• If input and output values do not match, check the range and recalibrate.• If the displayed data value is unstable, adjust the damping time constant.

3-8
Stopping Measurement
Procedure
Stop the transmitter, using this procedure:
Step Description
1 Turn off the transmitter
2 Operate the 3-way manifold valve by the following procedure:1. Close the low-pressure side stop valve.2. Open the equalizer valve.3. Close the high-pressure side stop valve
(Equalizer valve)
High-pressure side
Low-pressure side
Low-pressure sidestop valve
3-way manifold valve Vent / Drain plug
( )
3 Close the main valves on the high and low pressure sides. Refer to Fig. 3-9 and Fig. 3-10.
CAUTION• If you plan to leave the transmitter OFF for a long period of time, always drain process
fluid from the connecting pipe and the pressure-receiving part.• Leave the equalizer valve open.
3-9
3-3-2. Gas Pressure Measurement
Preparation for Measurement
WARNING• Ensure that the process is in the manual control mode. If the process is in automatic control mode, switch to manual before starting the
procedure.• Before discharging a process fluid that contains toxic substances, check the direction
of discharge and take safety measures such as wearing goggles and a mask to prevent contact with the skin and eyes and to prevent inhalation. Failure to do so is dangerous and may result in physical harm.
• Close the differential pressure output valve (main valve), the local valve, the drain valve, and the gas vent plug. Refer to “Fig. 2-14. Gas Pressure Measurement - Piping”.
How to measure gas pressure
Perform zero-point adjustment and introduce process pressure into the transmitter, using this procedure:• Zero-point adjustment
Step Description
1 Open both the high-pressure side and low-pressure side vent plugs and open the pressure receiving part to the air.
2 Refer to procedure 2 on page 3-6. Perform zero-point calibration.
3 After completing zero-point calibration, close the high-pressure side vent plug.

3-10
Introducing process pressure and venting air
Step Description
1 1. Open the main valve (refer to “Fig. 2-14. Gas Pressure Measurement - Piping”.) to introduce process pressure into the connecting pipe.2. Open the local valve gradually, to introduce process pressure into the pressure-receiving part of the transmitter.
2 1. Open the high-pressure side vent plug gradually, to vent air from the center body.2. After venting air, close the vent plug and the local valve.
Vent / Drain plug
High-pressure side
Local valve
3 Check for pressure leaks in the connecting pipe and the transmitter.

3-11
Starting Measurement
Procedure
Operate the valves using this procedure, to apply process pressure to the transmitter.• How to apply process pressure
Step Description
1 Open the local valve gradually.
Vent / Drain plug
High-pressure side
Local valve
CAUTIONSecurely close the cover of the transmitter case. Failure to do so will result in entry of water, and cause damage to internal terminals and the electronics module.
• If input and output values fail to match, check the range and re-calibrate.• If the displayed data value is unstable, adjust the damping time constant.

3-12
Stopping Measurement
Procedure
How to stop the transmitter
Step Description
1 Turn off the transmitter.
2 Close the local valve.
Vent / Drain plug
High-pressure side
Local valve
3 Close the main valve. (Refer to "Fig. 2-14. Gas Pressure Measurement - Piping".)
CAUTIONIf you plan to leave the transmitter OFF for a long period of time, completely drain process fluid from the connecting pipe, and from the pressure receiving part.

3-13
3-3-3. Liquid Level Measurement of Open Tank and Closed Tank (Dry Leg)
Preparation for Measurement
WARNING• Place the process in the manual control mode. If the process is in the automatic control mode, switch to manual before performing
work.• Before discharging a process fluid that contains toxic substances, check the direction
of discharge and take safety measures such as wearing goggles and a mask to prevent contact with the skin and eyes and to prevent inhalation. Failure to do so is dangerous and may result in physical harm.
• Check that the differential pressure output valve (main valve), the drain valve, the gas vent plug (refer to “Fig. 2-18. Open Tank - Piping Example”.) are closed, as well as the high pressure side and low pressure side stop valves of the 3-way manifold valve. Also, make sure that the equalizer valve of the 3-way manifold valve is open.
Calculating setting range
Calculate the setting range. Refer to “3-8. Set Range Calculation for Liquid Level Measurement”.
Procedure
Perform zero-point adjustment and introduce process pressure into the transmitter by this procedure:Zero-point calibration
Step Description
1 Open the drain plugs and the stop valves of both the high-pressure side and the low-pressure side. Open the pressure receiving part to the air.If fluid remains in the pressure receiving part, blow it to drain.
2 Refer to procedure 2 in page 3-6 and perform zero-point calibration.
3 After completing zero-point calibration, close the high-pressure side drain plug and the high-pressure side stop valve.

3-14
Introducing process pressure
Step Description
1 1. Open the main valve (refer to “Fig. 2-18. Open Tank - Piping Example”) to introduce process pressure into the connecting pipe.2. Open the high-pressure side stop valve gradually to introduce process pressure. After introducing process pressure into the pressure receiving part of the transmitter, close the high-pressure side stop valve.
(Equalizer valve)
High-pressure side
Low-pressure side
Low-pressure sidestop valve
3-way manifold valve Vent / Drain plug
( )
2 Check for pressure leaks in the connecting pipe, the 3-way manifold valve, and the transmitter.

3-15
Starting Measurement
Procedure
Operate the valves with this procedure, to apply the differential pressure of the process to the transmitter.How to apply process pressure
Step Description
1 Check that the 3-way manifold valve is in the following state:1. High-pressure side stop valve: Fully closed2. Low-pressure side stop valve: Fully open3. Equalizer valve: Fully closed
(Equalizer valve)
High-pressure side
Low-pressure side
Low-pressure sidestop valve
3-way manifold valve Vent / Drain plug
( )
2 1. Open the high-pressure side stop valve gradually.
CAUTIONSecurely close the cover of the transmitter case. Failure to do so will result in entry of water, and cause damage to internal terminals and the electronics module.
• If the input and output values do not match, check the range and recalibrate.• If the displayed data value is unstable, adjust the damping time constant.

3-16
Stopping Measurement
Procedure
How to stop the transmitter
Step Description
1 Turn off the transmitter.
2 Operate the 3-way manifold valve using this procedure:1. Close the low-pressure side stop valve.2. Open the equalizer valve.3. Close the high-pressure side stop valve.
(Equalizer valve)
High-pressure side
Low-pressure side
Low-pressure sidestop valve
3-way manifold valve Vent / Drain plug
( )
3 Close the main valve. Refer to “Fig. 2-18. Open Tank - Piping Example”.
CAUTION• If you plan to leave the transmitter OFF for a long period, drain process fluid from the
connecting pipe and the pressure receiving part.• Leave the equalizer valve open.

3-17
3-3-4. Liquid Level Measurement of Closed Tank (Wet Leg)
Preparation for Measurement
WARNING• Place the process in manual control mode. If the process is in automatic control mode, change it to the manual control mode
before performing this work.• Before discharging a process fluid that contains toxic substances, check the direction of
discharge and take safety measures such as wearing gog- gles and a mask to prevent contact with the skin and eyes and to prevent inhalation. Failure to do so is dangerous and may result in physical harm.
• Make sure that the differential pressure output valve (main valve), the drain valve, the gas vent plug (refer to “Fig. 2-20. Closed Tank - Piping (Wet-leg Sealing Example)”.) and the high pressure side and low pressure side stop valves of the 3-way manifold valve are closed. Also, make sure that the equalizer valve of the 3-way manifold valve is open.
Calculating setting range
For the procedure for obtaining the setting range by calculation, refer to “3-8. Set Range Calculation for Liquid Level Measurement”.
Procedure
Perform zero-point adjustment and introduce process pressure into the transmitter using this procedure:Zero-point calibration
Step Description
1 Feed sealing liquid from the seal pot to fill the connecting pipe with sealing liquid.
2 Gradually open the stop valves of both the high-pressure side and the low- pressure side, and the drain plugs, to fill the pressure receiving part of the transmitter with sealing liquid.
3 When sealing liquid flows out from the drain plugs, close the stop valves of both the high pressure side and the low pressure side and the drain plugs.In this state, the same pressure is applied to the high pressure side and the low pressure side of the transmitter (equal pressure state).
4 Referring to procedure 2 in page 3-6, perform zero point calibration.
5 After completing zero-point calibration, close the equalizer valve. Open the stop valve and the drain plug of the low-pressure side to drain sealing liquid. Close the stop valve and the drain plug of the low-pressure side.

3-18
(Equalizer valve)
High-pressure side
Low-pressure side
Low-pressure sidestop valve
3-way manifold valve Vent / Drain plug
( )
Introducing process pressure
Step Description
1 Open the main valve (Refer to “Fig. 2-20. Closed Tank - Piping (Wet-leg Sealing Example)”.) to introduce process fluid into the connecting pipe.
2 Gradually open the low pressure side stop valve to introduce process fluid. After introducing process fluid into the pressure receiving part of the transmitter, close the low pressure side stop valve.
3 Make sure that the connecting pipe, the 3-way manifold valve, and the transmitter have no pressure leaks.

3-19
Starting Measurement
Procedure
Operate the valves by the following procedure to apply the differential pressure of the process to the transmitter and display the measured value by operating the HART communicator.
How to apply process pressure
Step Description
1 Make sure that the 3-way manifold valve is in this state:1. High-pressure side stop valve: Fully closed2. Low-pressure side stop valve: Fully closed3. Equalizer valve: Fully closed
2 Fill the liquid sealing pipe with sealing liquid.
3 1. Gradually open the high-pressure side stop valve.2. Gradually open the low-pressure side stop valve.
(Equalizer valve)
High-pressure side
Low-pressure side
Low-pressure sidestop valve
3-way manifold valve Vent / Drain plug
( )
CAUTIONClose the cover of the transmitter case securely. Imperfect closure allows entry of water, damaging internal terminals and the electronics module.
• If the input and output values are inconsistent, check the range and perform calibration again.
• If the displayed data value is unstable, adjust the damping time constant.

3-20
Stopping Measurement
Procedure
How to stop the transmitter
Step Description
1 Turn off the transmitter.
2 Operate the 3-way manifold valve by the following procedure:1. Close the low pressure side stop valve.2. Open the equalizer valve.3. Close the high pressure side stop valve.
(Equalizer valve)
High-pressure side
Low-pressure side
Low-pressure sidestop valve
3-way manifold valve Vent / Drain plug
( )
3 Close the main valve. (Refer to Fig. 2-20.)
CAUTION• If the transmitter is to be left off for a long period of time, drain process fluid from the
connecting pipe and the pressure receiving part.• Leave the equalizer valve open.

3-21
3-4. Measurement with Model GTX_ _G/GTX_ _A
3-4-1. Pressure Measurement
Preparation for Measurement
WARNING• Make sure that the process is in the manual control mode. If the process is in the automatic control mode, switch it to manual mode.• Before discharging a process fluid that contains toxic substances, check the direction
of discharge and take safety measures such as wearing goggles and a mask to prevent contact with the skin and eyes and to prevent inhalation. Failure to do so is dangerous and may result in physical harm.
• Before starting a measurement procedure, ensure closure of the pressure valve (main valve), the local valve, the drain valve, and the gas vent plug (Refer to Fig. 2-14).
Gas pressure measurement
Perform zero-point calibration and introduce process pressure, with this procedure:
CAUTIONIf damping time constant is set to 0 sec., please adjust another value to keep output sta- ble before calibration.
Zero-point calibration
Step Description
1 Open the vent plug to release the pressure receiving part to the open air.
2 Referring to procedure 2 in page 3-6, perform zero-point calibration.
3 When calibration is complete, close the vent plug.
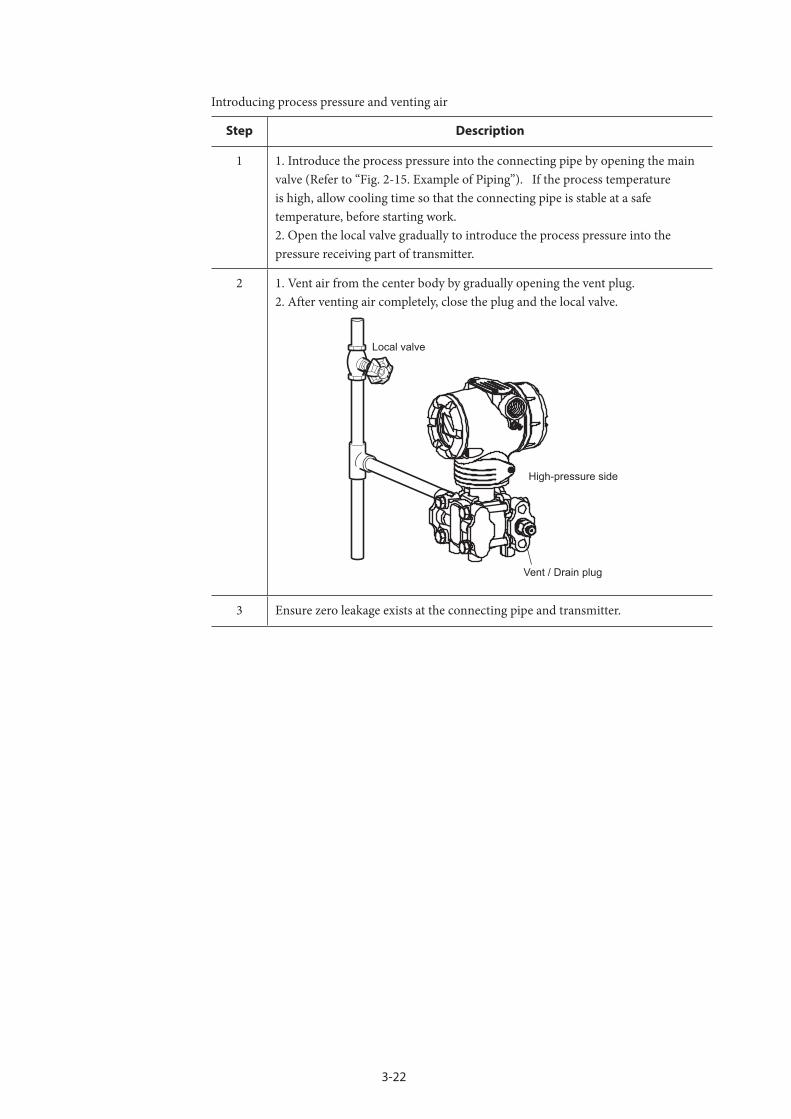
3-22
Introducing process pressure and venting air
Step Description
1 1. Introduce the process pressure into the connecting pipe by opening the main valve (Refer to “Fig. 2-15. Example of Piping”). If the process temperature is high, allow cooling time so that the connecting pipe is stable at a safe temperature, before starting work.2. Open the local valve gradually to introduce the process pressure into the pressure receiving part of transmitter.
2 1. Vent air from the center body by gradually opening the vent plug.2. After venting air completely, close the plug and the local valve.
Vent / Drain plug
High-pressure side
Local valve
3 Ensure zero leakage exists at the connecting pipe and transmitter.

3-23
Starting Measurement
Procedure
Operate the valve with the following procedure and apply the process pressure to transmitter.
Step Description
1 Open gradually the local valve.
Vent / Drain plug
High-pressure side
Local valve
CAUTIONSecurely close the case cover of the transmitter. Take precautions against moisture ingress into the transmitter body. Water entering the transmitter will damage the inter- nal terminals and the electronics module.
• If the output value does not correctly reflect the input value, check again the range and calibrate the transmitter.
• If the displayed data value is unstable, adjust the damping time constant

3-24
Stopping Measurement
Procedure
Stop the operation of the transmitter by this procedure:
Step Description
1 Turn OFF the transmitter.
2 Close the local valve.
Vent / Drain plug
High-pressure side
Local valve
3 Close the main valve.
CAUTIONWhen a long-term shutdown is planned, completely drain all process fluid from the connecting pipe and from the pressure receiving part of transmitter.

3-25
3-5. Measurement with Model GTX_ _F
3-5-1. Pressure Measurement
CAUTION• Make sure that the process is in the manual control mode. If in automatic control mode, switch to manual control before starting the following
procedures.• Before discharging a process fluid that contains toxic substances, check the direction
of discharge and take safety measures such as wearing goggles and a mask to prevent contact with the skin and eyes and to prevent inhalation. Failure to do so is dangerous and may result in physical harm.
• Always close the differential pressure output valve (main valve), the drain valve, the gas vent plug (Refer to Fig. 2-9 and Fig. 2-10) and the high pressure side and low pressure side stop valves of the 3-way manifold valve. Also, open the equalizer valve of the 3-way manifold valve.
Preparation for MeasurementWhen setting the zero point, set all the diaphragm surface area to be wet with the measured liquid for high accuracy. Even when the diaphragm surface area is not completely wet, make sure that the zero point is set at a level higher than the center of the diaphragm.

3-26
100 % Liquid Level
0 % Liquid Level
VariableHead
Fig. 3-3.

3-27
Starting MeasurementThe transmitter is ready for operation when zero-point adjustment is completed. This procedure is described in the previous section. Before starting, always check the following:(1) Check the correspondence between input and output values.• If the output does not correctly reflect the input, check the range, check the flange position
on the process, and calibrate the transmitter again.(2) Check the displayed data.• If unstable value is displayed, adjust the damping time constant. (3) Perform the following items carefully:• Disconnect the HART communicator from the transmitter terminal. Ensure that the
terminal is sufficiently tight, and not loose.• Close the case cover. Screw in the cover firmly until it can no longer be turned.• This transmitter has a locking structure. After closing the cover, tighten the lock using a
hexagon wrench.
Stopping Measurement
Procedure
Turn off the transmitter.
CAUTIONWhen a long-term shutdown is planned, completely drain all process fluid from the connecting pipe and from the pressure receiving part of transmitter.
3-28
3-6. Measurement with Model GTX_ _U/GTX_ _RWhen starting operation, adjust the transmitter in its actual process state. The specific gravity of the sealed-in liquid is stated in the specifications in Appendix A. Specific gravity changes with temperature at the rate of 0.0008/°C. Use the temperature of the capillary tube for items related to specific gravity, in this section.
3-6-1. Pressure Measurement
CAUTION• Make sure that the process is in the manual control mode. If in automatic control mode, switch to manual control before starting the following
procedures.• Before discharging a process fluid that contains toxic substances, check the direction
of discharge and take safety measures such as wearing goggles and a mask to prevent contact with the skin and eyes and to prevent inhalation. Failure to do so is dangerous and may result in physical harm.
• Always close the differential pressure output valve (main valve), the drain valve, the gas vent plug (Refer to Fig. 2-9 and Fig. 2-10) and the high pressure side and low pressure side stop valves of the 3-way manifold valve. Also, open the equalizer valve of the 3-way manifold valve.
Preparation for MeasurementWhen setting the zero point, set all the diaphragm surface area to be wet with the measured liquid for high accuracy. Even when the diaphragm surface area is not completely wet, make sure that the zero point is set at a level higher than the center of the diaphragm.

3-29
100 % Liquid Level
0 % Liquid Level
FixedRef LegVariable
Head
Fig. 3-4.
Sealed liquid temperature correction functionWhen the liquid level of a tank is measured using a remote sealing type differential pressure transmitter, the density of the sealed liquid in the capillary tube changes as the ambient temperature changes. This ordinarily causes about 4~5% zero shifting.The GTX_ _R has a composite semiconductor sensor with a function for correcting sealed liquid temperature by means of temperature measurement and arithmetic operation with a microprocessor. This assures accurate level measurements. (The zero shift is reduced to 1/5 from the previous level.)
Example of zero shiftL (Difference between flanges): 2500 mm (2.5 m)R (Measurement span): 2500 mm (2.5 m)A (Temperature coefficient of sealed liquid):0.001/°CT (Ambient temperature change): 55°C
Zero shi = A × T × LR
× 100 ... (1)
From (1)
Zero shift of a model without temperature correction:
= 5.5% 0.001 × 55 × 25002500
× 100
(Conventional transmitter)Zero shift of a model with temperature correction function: 1%

3-30
Starting MeasurementThe transmitter is ready for operation when zero-point adjustment is completed. This procedure is described in the previous section. Before starting, always check the following:(1) Check the correspondence between input and output values.• If the output does not correctly reflect the input, check the range, check the flange position
on the process, and calibrate the transmitter again.(2) Check the displayed data.• If unstable value is displayed, adjust the damping time constant. (3) Perform the following items carefully:• Disconnect the HART communicator from the transmitter terminal. Ensure that the
terminal is sufficiently tight, and not loose.• Close the case cover. Screw in the cover firmly until it can no longer be turned.• This transmitter has a locking structure. After closing the cover, tighten the lock using a
hexagon wrench.
Stopping Measurement
Procedure
Turn off the transmitter.
CAUTIONWhen long-term shutdown is planned, always dismount the transmitter flange from the tank, clean diaphragms with a soft brush, wash using a solvent, and store. Take care not to deform or damage the diaphragms.
3-6-2. Cautions Related to Flow Rate Measurement
Refer to the instructions on flange mounting for flow-rate measurement, to operate the transmitter for flow rate measurement.Always complete zero-point checking before introducing fluid to the pipe. This precaution is warranted since the GTX_ _R/GTX_ _U has a structural characteristic that prevents mounting of an equalizing valve or stop valve.For vertical pipes with differential-pressure take-out flange port, the high-pressure side flange and the low-pressure side flange exhibit a level difference. In this case, determine the zero point by setting LRV.

3-31
3-7. Measurement with Model GTX_ _UWhen starting operation, adjust the transmitter in its actual process state. The specific gravity of the sealed-in liquid is stated in the specifications of Chapter 3. Specific gravity changes with temperature at the rate of 0.0008/°C. Use the temperature of the capillary tube for items related to specific gravity, in this section.
3-7-1. Pressure Measurement
CAUTION• Make sure that the process is in the manual control mode. If in automatic control mode, switch to manual control before starting the following
procedures.• Before discharging a process fluid that contains toxic substances, check the direc- tion
of discharge and take safety measures such as wearing goggles and a mask to prevent contact with the skin and eyes and to prevent inhalation. Failure to do so is dangerous and may result in physical harm.
• Always close the differential pressure output valve (main valve), the drain valve, the gas vent plug (Refer to Fig. 2-9 and Fig. 2-10) and the high pressure side and low pressure side stop valves of the 3-way manifold valve. Also, open the equalizer valve of the 3-way manifold valve.
Preparation for MeasurementWhen setting the zero point, set all the diaphragm surface area to be wet with the measured liquid for high accuracy. Even when the diaphragm surface area is not completely wet, make sure that the zero point is set at a level higher than the center of the diaphragm.
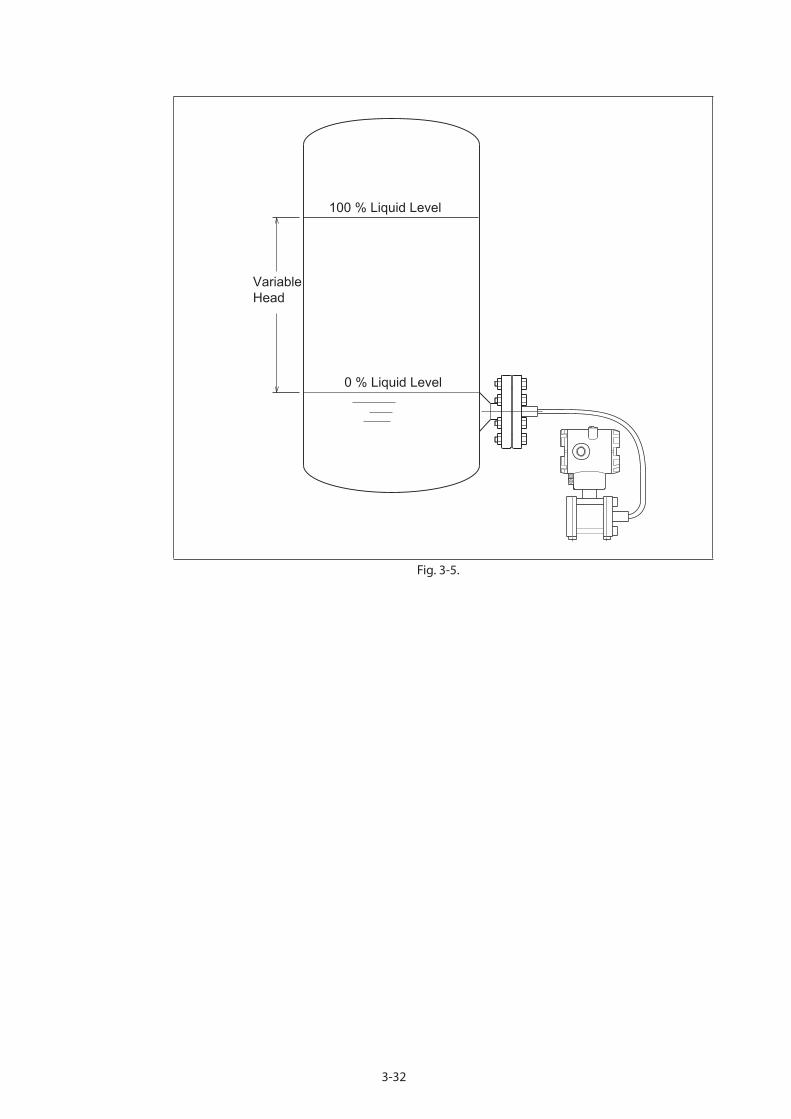
3-32
100 % Liquid Level
0 % Liquid Level
VariableHead
Fig. 3-5.

3-33
Starting MeasurementThe transmitter is ready for operation when zero-point adjustment is completed. This procedure is described in the previous section. Before starting, always check the following:(1) Check the correspondence between input and output values.• If the output does not correctly reflect the input, check the range, check the flange position
on the process, and calibrate the transmitter again.(2) Check the displayed data.• If unstable value is displayed, adjust the damping time constant. (3) Perform the following items carefully:• Disconnect the HART communicator from the transmitter terminal. Ensure that the
terminal is sufficiently tight, and not loose.• Close the case cover. Screw in the cover firmly until it can no longer be turned.• This transmitter has a locking structure. After closing the cover, tighten the lock using a
hexagon wrench.
Stopping Measurement
Procedure
Turn OFF the transmitter.
CAUTIONWhen long-term shutdown is planned, always dismount the transmitter flange from the tank, clean diaphragms with a soft brush, wash using a solvent, and store. Take care not to deform or damage the diaphragms.
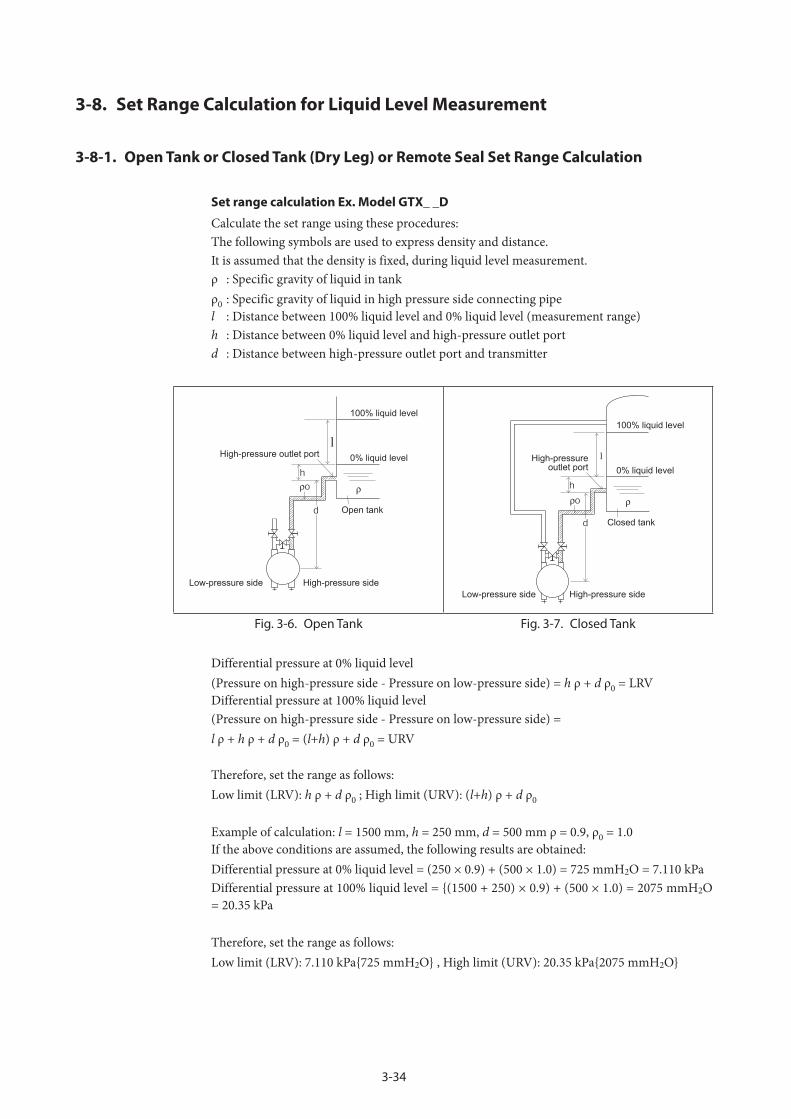
3-34
3-8. Set Range Calculation for Liquid Level Measurement
3-8-1. Open Tank or Closed Tank (Dry Leg) or Remote Seal Set Range Calculation
Set range calculation Ex. Model GTX_ _D
Calculate the set range using these procedures:The following symbols are used to express density and distance.It is assumed that the density is fixed, during liquid level measurement.ρ : Specific gravity of liquid in tankρ0 : Specific gravity of liquid in high pressure side connecting pipel : Distance between 100% liquid level and 0% liquid level (measurement range)h : Distance between 0% liquid level and high-pressure outlet portd : Distance between high-pressure outlet port and transmitter
High-pressure outlet port
100% liquid level
0% liquid level
Open tank
High-pressure sideLow-pressure side
100% liquid level
0% liquid level
Closed tank
High-pressureoutlet port
High-pressure sideLow-pressure side
Fig. 3-6. Open Tank Fig. 3-7. Closed Tank
Differential pressure at 0% liquid level (Pressure on high-pressure side - Pressure on low-pressure side) = h ρ + d ρ0 = LRVDifferential pressure at 100% liquid level (Pressure on high-pressure side - Pressure on low-pressure side) = l ρ + h ρ + d ρ0 = (l+h) ρ + d ρ0 = URV
Therefore, set the range as follows:Low limit (LRV): h ρ + d ρ0 ; High limit (URV): (l+h) ρ + d ρ0
Example of calculation: l = 1500 mm, h = 250 mm, d = 500 mm ρ = 0.9, ρ0 = 1.0If the above conditions are assumed, the following results are obtained:Differential pressure at 0% liquid level = (250 × 0.9) + (500 × 1.0) = 725 mmH2O = 7.110 kPaDifferential pressure at 100% liquid level = (1500 + 250) × 0.9) + (500 × 1.0) = 2075 mmH2O = 20.35 kPa
Therefore, set the range as follows:Low limit (LRV): 7.110 kPa725 mmH2O , High limit (URV): 20.35 kPa2075 mmH2O
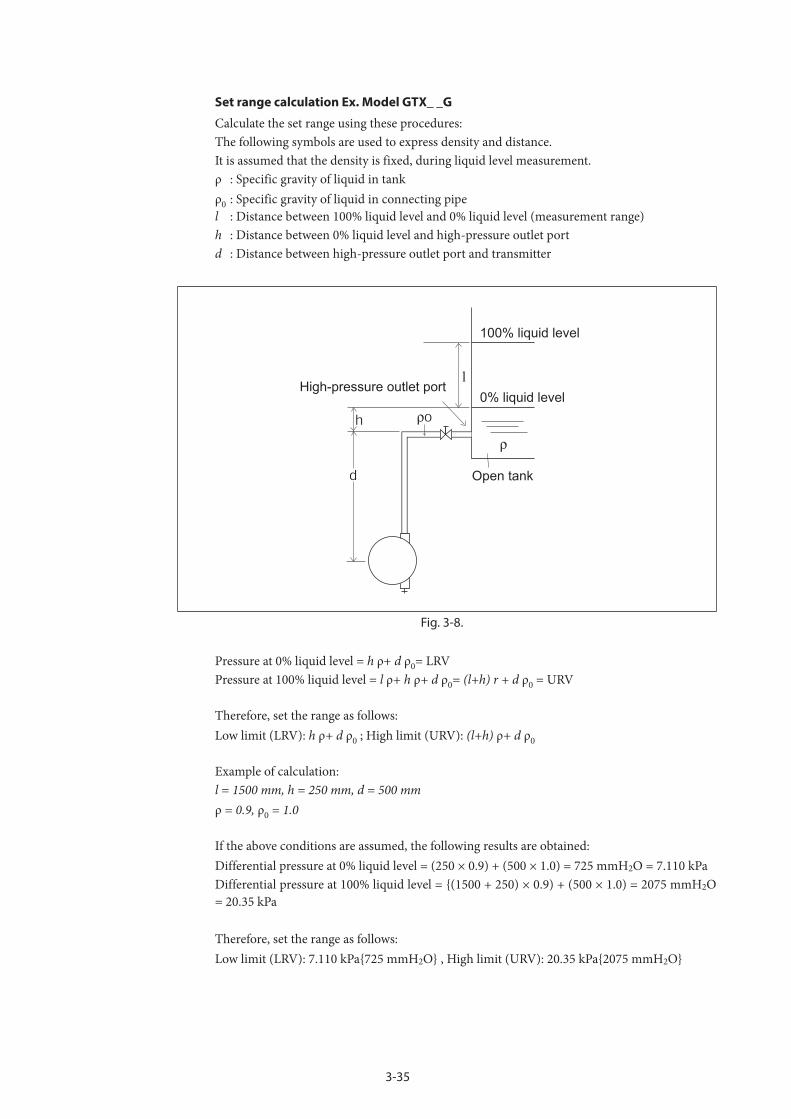
3-35
Set range calculation Ex. Model GTX_ _G
Calculate the set range using these procedures:The following symbols are used to express density and distance.It is assumed that the density is fixed, during liquid level measurement.ρ : Specific gravity of liquid in tankρ0 : Specific gravity of liquid in connecting pipel : Distance between 100% liquid level and 0% liquid level (measurement range)h : Distance between 0% liquid level and high-pressure outlet portd : Distance between high-pressure outlet port and transmitter
100% liquid level
0% liquid level
Open tank
High-pressure outlet port
Fig. 3-8.
Pressure at 0% liquid level = h ρ+ d ρ0= LRVPressure at 100% liquid level = l ρ+ h ρ+ d ρ0= (l+h) r + d ρ0 = URV
Therefore, set the range as follows:Low limit (LRV): h ρ+ d ρ0 ; High limit (URV): (l+h) ρ+ d ρ0
Example of calculation:l = 1500 mm, h = 250 mm, d = 500 mmρ = 0.9, ρ0 = 1.0
If the above conditions are assumed, the following results are obtained:Differential pressure at 0% liquid level = (250 × 0.9) + (500 × 1.0) = 725 mmH2O = 7.110 kPaDifferential pressure at 100% liquid level = (1500 + 250) × 0.9) + (500 × 1.0) = 2075 mmH2O = 20.35 kPa
Therefore, set the range as follows:Low limit (LRV): 7.110 kPa725 mmH2O , High limit (URV): 20.35 kPa2075 mmH2O
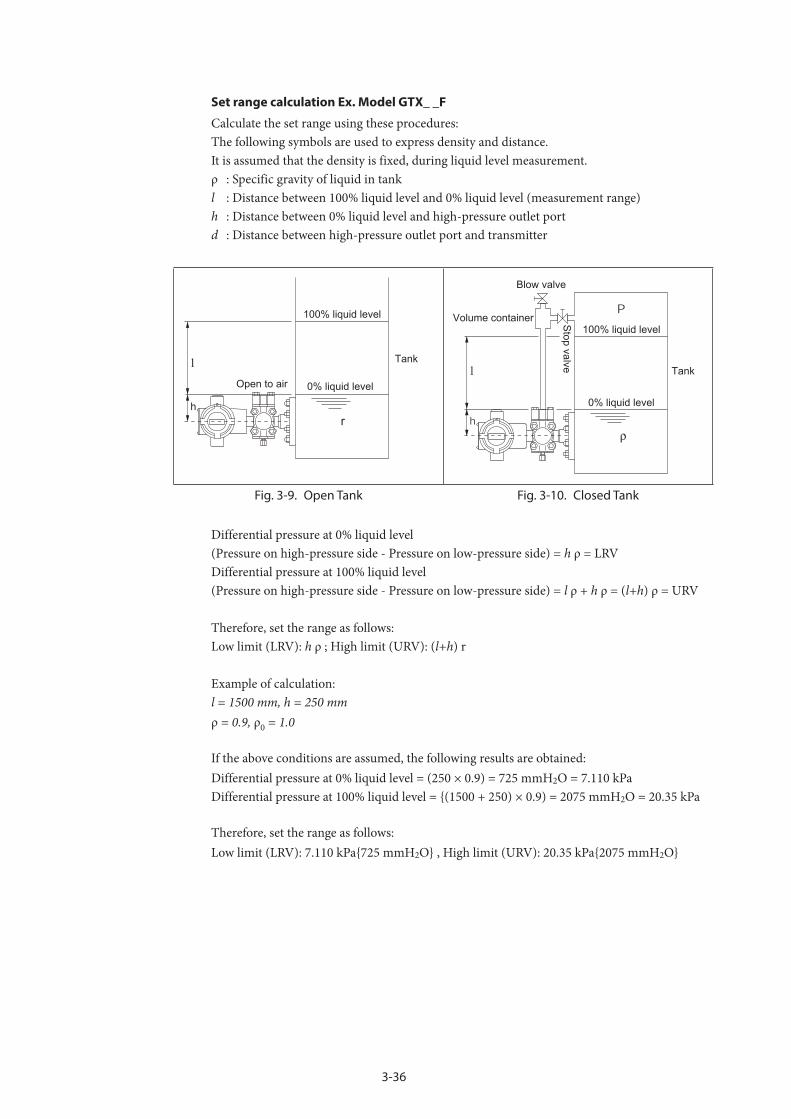
3-36
Set range calculation Ex. Model GTX_ _F
Calculate the set range using these procedures:The following symbols are used to express density and distance.It is assumed that the density is fixed, during liquid level measurement.ρ : Specific gravity of liquid in tankl : Distance between 100% liquid level and 0% liquid level (measurement range)h : Distance between 0% liquid level and high-pressure outlet portd : Distance between high-pressure outlet port and transmitter
hr
100% liquid level
0% liquid level
Tank
Open to air
100% liquid level
Tank
0% liquid level
Blow valve
Volume container Stop valve
Fig. 3-9. Open Tank Fig. 3-10. Closed Tank
Differential pressure at 0% liquid level (Pressure on high-pressure side - Pressure on low-pressure side) = h ρ = LRVDifferential pressure at 100% liquid level (Pressure on high-pressure side - Pressure on low-pressure side) = l ρ + h ρ = (l+h) ρ = URV
Therefore, set the range as follows:Low limit (LRV): h ρ ; High limit (URV): (l+h) r
Example of calculation:l = 1500 mm, h = 250 mmρ = 0.9, ρ0 = 1.0
If the above conditions are assumed, the following results are obtained: Differential pressure at 0% liquid level = (250 × 0.9) = 725 mmH2O = 7.110 kPa Differential pressure at 100% liquid level = (1500 + 250) × 0.9) = 2075 mmH2O = 20.35 kPa
Therefore, set the range as follows:Low limit (LRV): 7.110 kPa725 mmH2O , High limit (URV): 20.35 kPa2075 mmH2O

3-37
Set range calculation Ex. Model GTX_ _R
Calculate the set range using these procedures:The following symbols are used to express density and distance.It is assumed that the density is fixed, during liquid level measurement.ρ : Specific gravity of liquid in tankρ0 : Specific gravity of sealed liquidl : Distance between 100% liquid level and 0% liquid level (measurement range)h : Distance between 0% liquid level and high-pressure outlet portd : Distance between high-pressure outlet port and transmitter
100% liquid level
Open tank
0% liquid level
High-pressuresideLow-pressure
side
Fig. 3-11. Open Tank
Differential pressure at 0% liquid level (Pressure on high-pressure side - Pressure on low-pressure side) = hr = LRVDifferential pressure at 100% liquid level (Pressure on high-pressure side - Pressure on low-pressure side) = l ρ + h ρ = (l+h) ρ = URV
Therefore, set the range as follows:Low limit (LRV): h ρ ; High limit (URV): (l+h) r
Example of calculation:l = 1500 mm, h = 250 mm, d = 500 mm, ρ = 0.9, ρ0 = 0.935
If the above conditions are assumed, the following results are obtained: Differential pressure at 0% liquid level = 250 × 0.9= 225 mmH2O = 2.206 kPa Differential pressure at 100% liquid level = (1500 + 250) × 0.9 = 1575 mmH2O = 15.45 kPa
Therefore, set the range as follows:Low limit (LRV): 2.206 kPa, High limit (URV): 15.45 kPa

3-38
Set range calculation Ex. Model GTX_ _U
Calculate the set range using these procedures:The following symbols are used to express density and distance.It is assumed that the density is fixed, during liquid level measurement.ρ : Specific gravity of liquid in tankρ0 : Specific gravity of sealed liquidl : Distance between 100% liquid level and 0% liquid level (measurement range)h : Distance between 0% liquid level and high-pressure outlet portd : Distance between high-pressure outlet port and transmitter
100% liquid level
Open tank
0% liquid level
Processconnection
Fig. 3-12. Open Tank
Differential pressure at 0% liquid level = h ρ + d ρ0 = LRVDifferential pressure at 100% liquid level = l ρ + h ρ + d ρ0 = (l+h) ρ + d ρ0 = URV
Therefore, set the range as follows:Low limit (LRV): h ρ + d ρ0 ; High limit (URV): (l+h) ρ + d ρ0
Example of calculation:l = 1500 mm, h = 250 mm, d = 500 mm, ρ = 0.9, ρ0 = 1.0
If the above conditions are assumed, the following results are obtained:Differential pressure at 0% liquid level = (250 × 0.9) + (500 × 1.0) = 725 mmH2O = 7.110 kPaDifferential pressure at 100% liquid level = (1500 + 250) × 0.9) + (500 × 1.0) = 2075 mmH2O = 20.35 kPa
Therefore, set the range as follows:Low limit (LRV): 7.110 kPa, High limit (URV): 20.35 kPa
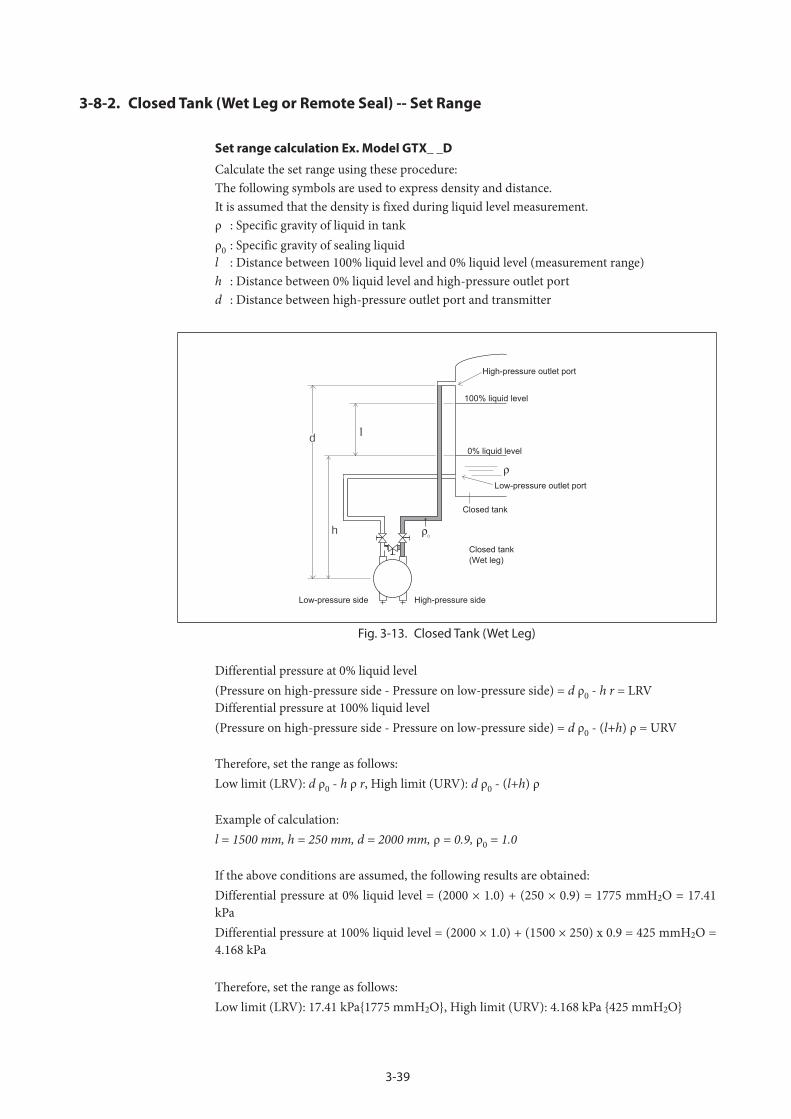
3-39
3-8-2. Closed Tank (Wet Leg or Remote Seal) -- Set Range
Set range calculation Ex. Model GTX_ _D
Calculate the set range using these procedure:The following symbols are used to express density and distance.It is assumed that the density is fixed during liquid level measurement.ρ : Specific gravity of liquid in tankρ0 : Specific gravity of sealing liquidl : Distance between 100% liquid level and 0% liquid level (measurement range)h : Distance between 0% liquid level and high-pressure outlet portd : Distance between high-pressure outlet port and transmitter
High-pressure outlet port
100% liquid level
0% liquid level
Low-pressure outlet port
Closed tank
Closed tank(Wet leg)
High-pressure sideLow-pressure side
Fig. 3-13. Closed Tank (Wet Leg)
Differential pressure at 0% liquid level (Pressure on high-pressure side - Pressure on low-pressure side) = d ρ0 - h r = LRVDifferential pressure at 100% liquid level (Pressure on high-pressure side - Pressure on low-pressure side) = d ρ0 - (l+h) ρ = URV
Therefore, set the range as follows:Low limit (LRV): d ρ0 - h ρ r, High limit (URV): d ρ0 - (l+h) ρ
Example of calculation:l = 1500 mm, h = 250 mm, d = 2000 mm, ρ = 0.9, ρ0 = 1.0
If the above conditions are assumed, the following results are obtained:Differential pressure at 0% liquid level = (2000 × 1.0) + (250 × 0.9) = 1775 mmH2O = 17.41 kPaDifferential pressure at 100% liquid level = (2000 × 1.0) + (1500 × 250) x 0.9 = 425 mmH2O = 4.168 kPa
Therefore, set the range as follows:Low limit (LRV): 17.41 kPa1775 mmH2O, High limit (URV): 4.168 kPa 425 mmH2O
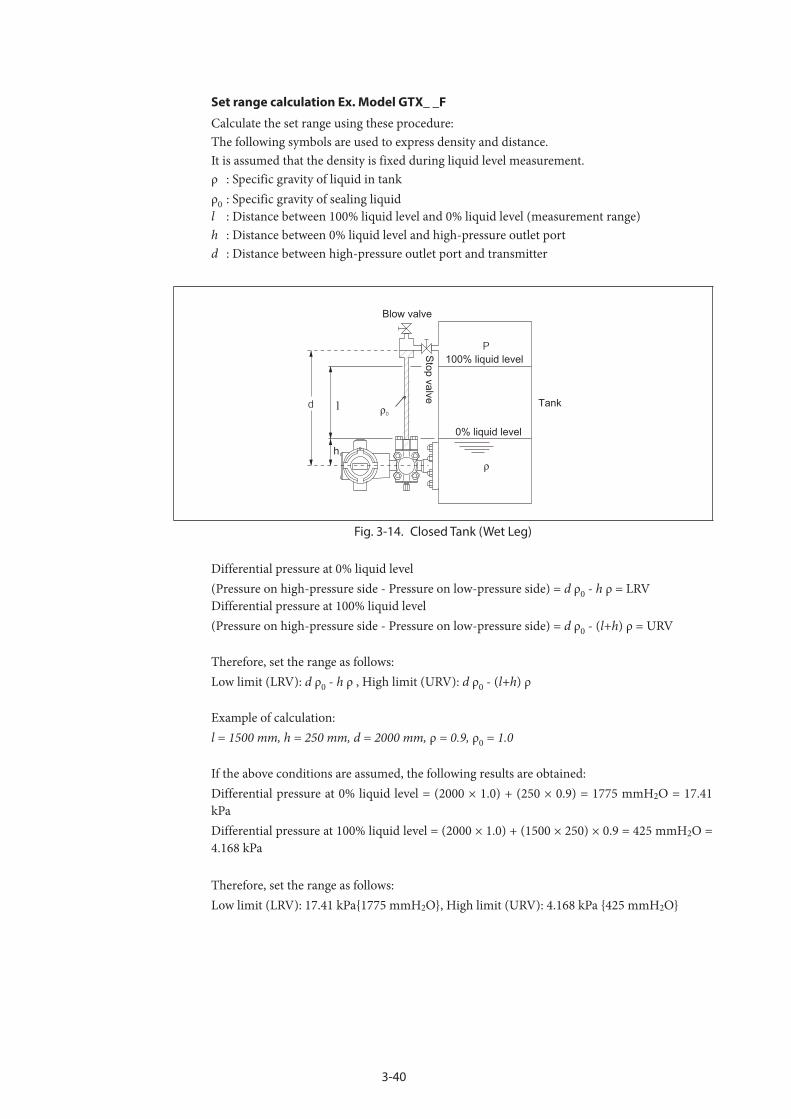
3-40
Set range calculation Ex. Model GTX_ _F
Calculate the set range using these procedure:The following symbols are used to express density and distance.It is assumed that the density is fixed during liquid level measurement.ρ : Specific gravity of liquid in tankρ0 : Specific gravity of sealing liquidl : Distance between 100% liquid level and 0% liquid level (measurement range)h : Distance between 0% liquid level and high-pressure outlet portd : Distance between high-pressure outlet port and transmitter
h
100% liquid level
0% liquid level
Tank
Blow valve
Stop valve
Fig. 3-14. Closed Tank (Wet Leg)
Differential pressure at 0% liquid level (Pressure on high-pressure side - Pressure on low-pressure side) = d ρ0 - h ρ = LRVDifferential pressure at 100% liquid level (Pressure on high-pressure side - Pressure on low-pressure side) = d ρ0 - (l+h) ρ = URV
Therefore, set the range as follows:Low limit (LRV): d ρ0 - h ρ , High limit (URV): d ρ0 - (l+h) ρ
Example of calculation:l = 1500 mm, h = 250 mm, d = 2000 mm, ρ = 0.9, ρ0 = 1.0
If the above conditions are assumed, the following results are obtained:Differential pressure at 0% liquid level = (2000 × 1.0) + (250 × 0.9) = 1775 mmH2O = 17.41 kPaDifferential pressure at 100% liquid level = (2000 × 1.0) + (1500 × 250) × 0.9 = 425 mmH2O = 4.168 kPa
Therefore, set the range as follows:Low limit (LRV): 17.41 kPa1775 mmH2O, High limit (URV): 4.168 kPa 425 mmH2O

3-41
Set range calculation Ex. Model GTX_ _R
Calculate the set range using these procedure:The following symbols are used to express density and distance.It is assumed that the density is fixed during liquid level measurement.ρ : Specific gravity of liquid in tankρ0 : Specific gravity of sealed liquidl : Distance between 100% liquid level and 0% liquid level (measurement range)h : Distance between 0% liquid level and lower flange of tankd : Distance between upper flange of tank and lower flange of tank
100% liquid level
Closed tank
0% liquid level
Fig. 3-15. Closed Tank (Wet Leg)
Differential pressure at 0% liquid level (Pressure on high-pressure side - Pressure on low-pressure side) = d ρ0 - h ρ = LRVDifferential pressure at 100% liquid level (Pressure on high-pressure side - Pressure on low-pressure side) = d ρ0 - (l+h) ρ = URV
Therefore, set the range as follows:Low limit (LRV): d ρ0 - h ρ , High limit (URV): d ρ0 - (l+h) ρ
Example of calculation:l = 1500 mm, h = 250 mm, d = 2000 mm, ρ = 0.9, ρ0 = 0.935
If the above conditions are assumed, the following results are obtained:Differential pressure at 0% liquid level = (2000 × 0.935) - (250 × 0.9) = 1645 mmH2O = 16.13 kPaDifferential pressure at 100% liquid level = (2000 × 0.935) + (1500 × 250) × 0.9 = 295 mmH2O = 2.893 kPaTherefore, set the range as follows:Low limit (LRV): 16.13 kPa1645 mmH2O, High limit (URV): 2.893 kPa 295 mmH2O

3-42
3-9. Indicator (Optional)
3-9-1. Display unit of indicator
The display unit of an indicator consists of the following:
2 5
4
6
8
7
1
109
13
3
11
12
Fig. 3-16. Display unit of indicator
No. Display Mark Contents of display
1 Digital Display (5digits) PV (%, actual, pressure) Status Number
2 Digital Display (5digits) Decimal point
3 16 segments (7digit) Unit, Status
4 % %
5 Exponent None, ×10, ×100, ×1000
6 Absolute pressure Abs
7 Gage pressure G
8 Bar Graph Bar Graph of output%
9 Output square root extraction OUT
10 Display square root extraction DISP
11 Key mark Write Protect
12 Flag mark Status Record
13 Status Record and

3-43
Disp. Unit
This is enabled when Display Mode is set to Scale. Disp. Unit is displayed on the indicator.Values shown in the table below may be selected.
user_define_unit mmH2O mmAq mH2O inH2O
ftH2O kPa MPa Pa hPa
kPaG MPaG kPa_abs MPa_abs Pa_abs
hPa_abs bar mbar barG mbarG
mmHg inHg mmHg_abs inHg_abs gf/cm2
kgf/cm2 g/cm2 kg/cm2 kgf/cm2G kgf/cm2_abs
atm Torr psi g/cm3 kg/m3
m3 l kl ml/h l/h
kl/h Skl/h Sm3/h t/h m3/h
km3/h Nm3/h kNm3/h l/min kl/min
m3/min Nml/min Nl/min Nm3/min kl/d
m3/d t/d Nm3/d kg/h gal/min
gal/h mm m % t
kg none
User define Unit
This is enabled when Display Mode is set to Scale. Available when Disp. Unit is set to User define unit. Any desired display unit can be set.
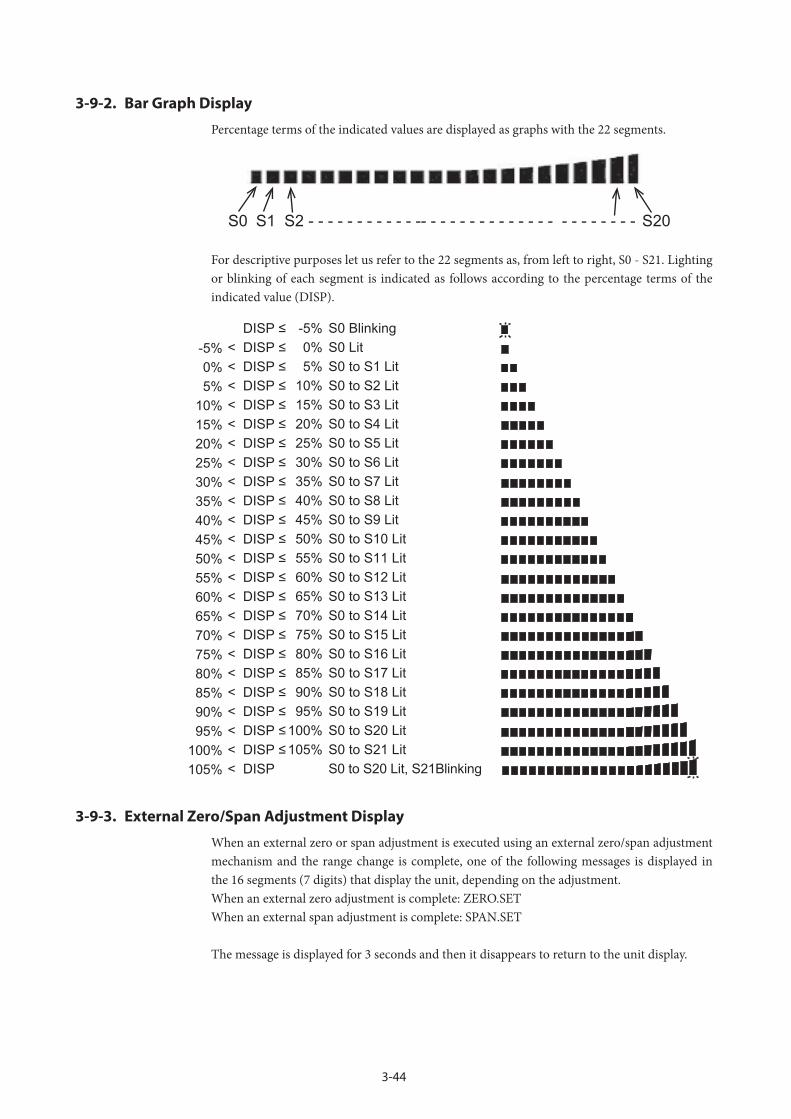
3-44
3-9-2. Bar Graph Display
Percentage terms of the indicated values are displayed as graphs with the 22 segments.
S0 S1 S2 - - - - - - - - - - - -- - - - - - - - - - - - - - - - - - - - - - S20
For descriptive purposes let us refer to the 22 segments as, from left to right, S0 - S21. Lighting or blinking of each segment is indicated as follows according to the percentage terms of the indicated value (DISP).
S0 BlinkingS0 LitS0 to S1 LitS0 to S2 LitS0 to S3 LitS0 to S4 LitS0 to S5 LitS0 to S6 LitS0 to S7 LitS0 to S8 LitS0 to S9 LitS0 to S10 LitS0 to S11 LitS0 to S12 LitS0 to S13 LitS0 to S14 LitS0 to S15 LitS0 to S16 LitS0 to S17 LitS0 to S18 LitS0 to S19 LitS0 to S20 Lit S0 to S21 LitS0 to S20 Lit, S21Blinking
-5%0%5%
10%15%20%25%30%35%40%45%50%55%60%65%70%75%80%85%90%95%
100%105%
-5%0%5%
10%15%20%25%30%35%40%45%50%55%60%65%70%75%80%85%90%95%
100%105%
DISP ≤ < DISP ≤< DISP ≤< DISP ≤< DISP ≤< DISP ≤< DISP ≤< DISP ≤< DISP ≤< DISP ≤< DISP ≤< DISP ≤< DISP ≤< DISP ≤< DISP ≤< DISP ≤< DISP ≤< DISP ≤< DISP ≤< DISP ≤< DISP ≤< DISP ≤< DISP ≤< DISP
3-9-3. External Zero/Span Adjustment Display
When an external zero or span adjustment is executed using an external zero/span adjustment mechanism and the range change is complete, one of the following messages is displayed in the 16 segments (7 digits) that display the unit, depending on the adjustment.When an external zero adjustment is complete: ZERO.SET When an external span adjustment is complete: SPAN.SET
The message is displayed for 3 seconds and then it disappears to return to the unit display.

3-45
3-9-4. Square Root Extraction Display
The segments for the square root extraction display are OUT and DISP . Each display lights up or goes out according to the output format and square root extraction display settings of the transmitter.
Transmitter setting Square Root Extraction Display
Output Indicator OUT DISP
Linear Linear Goes out Goes out
Linear Square root (Flow rate) Goes out Lights up
Square root (Flow rate) Lights up Goes out
3-9-5. Write Protect Display
The indicator for the write protect display is a key mark.The key mark lights up or goes out according to the write protect state of the transmitter.When write protect is ON: The key mark lights up. When write protect is OFF: The key mark goes out.
3-9-6. Status Record Display
The indicator for the status history display is a flag mark.The flag mark lights up or goes out according to the presence or absence of status history of the transmitter.When the status history exists: The flag mark lights up.When the status history does not exist: The flag mark goes out.
Lighting of the flag mark indicates that the diagnostic status has been ON in the past.
3-9-7. Display Update Mark
This mark indicates that the transmitter is working.The and marks alternately blink every 0.5 seconds.
Display Update CycleThe update cycle of the PV display (7 segments, 5 digits) is about 0.5 seconds.

3-46
3-10. External Zero/Span Adjustment function (Optional)A transmitter with External Zero/Span adjustment function enables zero/span point adjustment work without using communicator.Set output to any value corresponding to the pressure input.
SPAN TRIM
ZERO TRIM
Magnet stick (Optional)
Fig. 3-17.
Procedure
How to adjust zero point.:
STEP Procedure
1 Make sure that the zero pressure is applied to the transmitter.
2 Touch the magnet on the grass at the ZERO TRIM point for 3 seconds or more.And remove it when ammeter reading equals 4 mA.
How to adjust span point.:
STEP Procedure
1 Make sure that the desired upper range value pressure is applied to the transmitter.
2 Touch the magnet on the grass at the SPAN TRIM point for 3 seconds or more.And remove it when ammeter reading equals 20 mA.

3-47
3-11. Advanced Diagnostics (optional )The advanced diagnostics include the pressure frequency index, the standard deviation, and calculation of the out-of-range pressure event count.The diagnosis also determines whether the pressure frequency index, standard deviation, and the out-of-range pressure event count exceed the threshold values. Users can check alarms on the selfdiagnostics status screen in the communicator if the results exceed a threshold. Alarms can also be checked on the built-in indicator of the transmitter.
3-11-1. Pressure Frequency Index
The pressure frequency index quantifies how often the input pressure goes up and down (fluctuation) with a number between 0 and 1. The index is calculated from data on the number of fluctuations during a time period of several minutes. It is possible to detect a change in process conditions by monitoring changes in this value. For example, the pressure frequency index can be used for diagnosis of clogged connecting pipes.For information about diagnosis of clogged connecting pipes, see Appendix-C.In the practical example shown below, a change in the number of fluctuations of the input pressure when the process is operating normally and when conditions have changed can be easily seen.
normal conditions changed conditions
(1) Points to note
When using the pressure frequency index, note the following:The pressure frequency index changes depending on a combination of factors. Thus, it may be difficult to detect a single abnormality or phenomenon by this index alone.If the process is in an abnormal state from the beginning, it is not possible to detect a change caused by abnormal conditions. Carry out the steps described below in (3), “Preparation,” under normal conditions.Even if an unexpected abnormality occurs, the pressure frequency index does not necessarily change immediately. This is because it takes a few minutes to calculate the frequency of the pressure fluctuation with a high level of accuracy. If an abnormality occurs briefly and conditions quickly return to normal, the change in the index will be small, and an alarm may not be activated.If the transmitter is installed in an environment subject to excessive vibration, the pressure frequency index will be affected. As a result, an error may not be detected or there may be a false alarm. If the pressure frequency index is used to diagnose clogging of connecting pipes, problems may not be detected correctly, depending on the process conditions.

3-48
(2) Pressure Frequency Index-Related Parameters
Pressure frequency index-related parameters are shown below. For details on the attributes, see (4) below, “(4) Checking the Settings.”Pressure Frequency Index Pressure frequency indexPress Freq Index Max Maximum value of the pressure frequency indexPress Freq Index Min Minimum value of the pressure frequency indexReset Press Freq Index Resetting the pressure frequency indexPress Freq Index Alarm Use Operating mode of the pressure frequency index
diagnostic alarmPress Freq Index High Limit Upper limit of the pressure frequency index (Diagnostic
alarm threshold—high limit)Press Freq Index Low Limit Lower limit of the pressure frequency index (Diagnostic
alarm threshold—low limit)Press Freq Index Sensor Selection Sensor selectionPress Freq Calc PV High Limit Upper limit of pressure value filterPress Freq Calc PV Low Limit Lower limit of pressure value filterPress Freq Filter Constant Pressure frequency filter constant
(3) Preparation
First, it is necessary to monitor the process under normal conditions. The process should be monitored for time periods ranging from several hours to one day (the amount of time required for each condition to occur, if there is a significant change in the operating conditions).The way to monitor the process under normal conditions is to monitor trends in the pressure frequency index. If that is not possible, an easier way is to obtain the maximum and minimum values of the pressure frequency index.
(i) Monitoring of trends in the pressure frequency index
See the Field communication software(Model CFS100) Instruction Manual (HART 7).
(ii) Obtaining the maximum and minimum values of the pressure frequency index
Follow the procedure below to obtain the maximum and minimum values of the pressure frequency index. Reset the pressure frequency index and its maximum and minimum values when the process is stable under normal conditions. Recording of the maximum and minimum values then begins anew .To reset, execute Reset Press Freq Index.This resets the pressure frequency index and its maximum and minimum values. Note that resetting prevents these parameters from obtaining correct values until a new pressure frequency index is calculated.Once the set amount of time has elapsed, observe the value of the following two variables.Press Freq Index Max Maximum value of the pressure frequency indexPress Freq Index Min Minimum value of the pressure frequency index

3-49
(4) Checking the Settings
For information about setting the following descriptive parameters, see the operating manual for the relevant communicator.
(i) Setting the alarm
Based on the results from the Preparation section, set the variables for the upper and lower limits of the pressure frequency index.Press Freq Index High Limit: The setting range is between 0.0 and 1.0.Press Freq Index Low Limit: The setting range is between 0.0 and 1.0. Next, set the operating mode of the pressure frequency index diagnostic alarm. Press Freq IndexAlarm Use: The possible settings are shown below. Disabled: Alarm is not used. Enabled (High): Upper limit only Enabled (Low): Lower limit only Enabled (High and Low): Upper and lower limits
(ii) Alarm detection
If a pressure frequency index alarm is detected, it is reported as the appropriate self-diagnostic status. See “Chapter 5. Troubleshooting.”
(iii) Sensor Selection and P Sampling Interval
The sensor and pressure sensor sampling interval can be set. Press Freq Index Sensor Selection:The possible settings are shown below.For a differential pressure (DP) gauge DP, 120ms factory default DP, 240ms DP, 360ms SP, 360msFor a pressure gauge (GP) or absolute pressure gauge (AP) DP, 120ms factory default DP, 240ms DP, 360ms- Sensor selection For a differential pressure gauge, an SP sensor can be selected in addition to a DP sensor. If an SP sensor is selected, fluctuations in static pressure can be detected. Using the static pressure fluctuations allows the monitoring of the state of the process or application in a perspective different from that of differential pressure fluctuations. For example, when the pressure frequency index is used to detect clogged connecting pipes, a change in the pressure fluctuation frequency caused by clogging on one side may appear more quickly in the static pressure than in the differential pressure. Therefore, the SP sensor has the potential to detect clogging faster. The pressure frequency index is calculated based on the data from the SP sensor, provided that the pressure to be measured is sufficiently high and the SP sensor is capable of detecting pressure fluctuations.

3-50
- P Sampling Interval Select the sampling interval for the differential pressure and pressure value that is used to calculate the pressure frequency index value when [DP Sensor] is selected for [Sensor Selection].The options are 120, 240, and 360 ms. The shorter the fluctuation detection cycle is, the higher the upper limit on detectable frequencies becomes. However, a short fluctuation detection interval results in the lower limit being raised. A longer fluctuation detection cycle lowers the upper limit on detectable frequencies but allows the detection of lower frequencies. To detect phenomena resulting from high frequencies, as in the case of clogging of connecting pipes, it is generally better if the fluctuation detection cycle is as short as possible. However, if the original pressure fluctuation frequency is low, it may go out of the range of detectable frequencies, making it difficult to detect fluctuation. Therefore, when setting the sampling interval, it is necessary to take into consideration the pressure fluctuation frequency under normal conditions and the frequency domain in which abnormalities occur.
(iv) Filter adjustments
The pressure frequency index is intended to detect abnormalities in a process. However, if the pressure and flow rate naturally change slowly over a period of 40 seconds to five minutes (lowfrequency fluctuation), the index may fall to a low value even if the process is normal. Since such fluctuation in pressure and flow rate can occur in a normal process, a fall in the index may wrongly suggest an abnormality, or it may not be possible to correctly detect actual abnormalities. To prevent false recognition of abnormalities resulting from a reduction in the index value, high pass filtering is performed to remove the low-frequency component before the number of fluctuations is counted.The strength of the filter (filter coefficient) can be set.Press Freq Filter Constant: The possible setting range is between 0.0 and 1.0. The factory default is 0.0. Increase the filter coefficient to remove more low-frequency components, and decrease the coefficient for the opposite effect. Note that increasing the coefficient decreases the filter’s ability to detect abnormalities.

3-51
3-11-2. Standard Deviation
This function calculates the standard deviation of the input pressure. It can be used for diagnostic processes that detect a change in process conditions.
(1) Equation
The following equation is used to calculate the standard deviation (s).
s2 = n1
− (x)2 = x2 − (x)2
i =1
n
∑ x2i
s: Standard deviationx: Input pressuren: Number of samples
(2) Parameters Related to the Standard Deviation
Standard deviation-related parameters are shown below. For details on the attributes, see (4) below, “(4) Checking the Settings.”Standard Deviation Standard deviationStandard Deviation Maximum amount of standard deviationStandard Deviation Minimum amount of standard deviationAverage Pressure Average pressureStandard Deviation Unit The unit of measurement for standard deviationReset Standard Deviation Reset of the standard deviation and averageStandard Deviation Sample Count Number of samples used for calculationStandard Deviation Alarm Use Operating mode of the standard deviation alarmStandard Deviation High Limit Upper limit of standard deviation (alarm threshold—high limit)Standard Deviation Low Limit Lower limit of standard deviation (alarm threshold—low limit)
(3) Preparation
First, it is necessary to monitor the process under normal conditions. The process should be monitored for a time period of one to several hours (the amount of time required for each condition to occur, if there is a significant change in the operating conditions).The way to monitor the process under normal conditions is to monitor trends in the standard deviation. If that is not possible, an easier way is to obtain the maximum and minimum standard deviation.
(i) Monitoring trends in standard deviation
To monitor trends in the standard deviation, see the Field communication software(Model CFS100) Instruction Manual (HART 7).
(ii) Obtaining the maximum and minimum standard deviation
Follow the procedure below to obtain the maximum and minimum standard deviation. Reset the standard deviation and its maximum and minimum values when the process is stable under normal conditions. Recording of the maximum and minimum values then begins anew . To reset, execute Reset Standard Deviation. This resets the standard deviation, its maximum and minimum values, and the average pressure.Once the set amount of time has elapsed, observe the value of the following two variables.Standard Deviation Max Maximum amount of standard deviationStandard Deviation Min Minimum amount of standard deviation

3-52
(4) Checking the Settings
For information about setting the following descriptive parameters, see the operating manual for the relevant communicator.
(i) Setting the alarm
Based on the results from the Preparation section, set the variables for the upper and lower limits of standard deviation.Standard Deviation High Limit: The possible setting range is 0 and above.Standard Deviation Low Limit: The possible setting range is 0 and above.Next, set the operating mode of the standard deviation alarm.Standard Deviation Alarm Use: The possible settings are shown below. Disabled: Alarm is not used. Enabled (High): Upper limit only Enabled (Low): Lower limit only Enabled (High and Low): Upper and lower limits
(ii) Alarm detection
If a standard deviation alarm is detected, it is reported as the appropriate self-diagnostic status. See “Chapter 5. Troubleshooting.”
(iii) Number of samples
The number of samples of pressure used to calculate the standard deviation is set at 1,000 at the factory. The sampling interval is approximately 60 ms ; the standard deviation is calculated once every 60 seconds (approx.).To change the number of samples, use the following parameter: Standard Deviation Sample Count: Can be set in a range from 1,000 (approx. 1 minute) to 60,000 (approx. 1 hour).

3-53
3-11-3. Out-of-Range Pressure Event Count
The number of times the process pressure exceeds a preset threshold pressure (high or low limit) is counted. If the out-of-range pressure event count is greater than the alarm threshold, an alarm is issued.
(1) Parameters Related to the Out-of-Range Pressure Event Count
The parameters related to the out-of-range pressure event count are shown below. For details on the attributes, see the Field communication software(Model CFS100) Instruction Manual (HART 7).OOR Pressure Count Out-of-range pressure event count Reset OOR Pressure Count Resetting of the out-of-range pressure event count Normal Pressure High Limit Upper limit of normal pressure for the out-of-range
pressure event count Normal Pressure Low Limit Lower limit of normal pressure for the out-of-range
pressure event count OOR Count Alarm Use Operating mode of the out-of-range pressure event
count alarmOOR Count Alarm Threshold Threshold of the out-of-range pressure event
count alarm(2) Preparation
To reset an already generated out-of-range pressure event count, execute Reset OOR Pressure Count.
(3) Checking the Settings
For information about setting the following descriptive parameters, see the operating manual for the relevant communicator.
(i) Setting the alarm
Set the following parameters for the alarm threshold of the out-of-range pressure event count.OOR Count Alarm Threshold: The possible setting range is 100,000 or less.Next, set the operating mode of the out-of-range pressure event count alarm.OOR Count Alarm Use: The possible settings are shown below. Disabled: Alarm is not used. Enabled: Alarm is used.
(ii) Alarm detection
If an out-of-range pressure event count alarm is detected, it is reported as the appropriate selfdiagnostic status. See “Chapter 5. Troubleshooting.”
(iii) Threshold pressure
Set the following for the out-of-range pressure event count threshold pressure (high and low limits).Normal Pressure High Limit: -1.5*URL to 1.5*URLNormal Pressure Low Limit: -1.5*URL to 1.5*URL

3-54
4-1
Chapter 4. MaintenanceThis section explains the maintenance of the Advanced Transmitter and ways to ensure that your transmitter’s performance goals may be continuously met during its operating life, including instructions for:• disassembly and assembly procedures,• output checking,• calibration procedures, and troubleshooting procedures.At the start of operation or during operation, deal with performance problems by following these procedures. If you cannot fix the problem, it is possible that there is a problem with the product itself and you should contact an Azbil Corp. representative immediately.
4-2
4-1. Disassembly and Assembly
4-1-1. Before You Start
WARNING• Before removing this product from the process equipment for purposes of maintenance,
vent the residual pressure and discharge the residual fluid. When discharging the residual pressure and fluid, check the direction of the vent or drain to prevent injury by the process fluid. Failure to do so may result in burns or other injuries.
• If the process fluid contains toxic substances, take safety measures such as wearing goggles and a mask to prevent contact with the skin and eyes and to prevent inhalation.
• Before discharging a process fluid that contains toxic substances, check the direction of discharge and take safety measures such as wearing goggles and a mask to prevent contact with the skin and eyes and to prevent inhalation. Failure to do so is dangerous and may result in physical harm.
• To stop transmitter operation for maintenance, see Chapter 3 of this manual and follow the necessary procedures.
• If the O-ring attached to the case cover or the terminal cover is damaged or deteriorated, replace it with a new one. If the device is operated with a broken O-ring, since the degree of sealing will be insufficient, internal corrosion may occur, possibly resulting in electric shock from a short circuit or poor device performance.
• Never open the case cover while the transmitter is ON or in a hazardous location.• Handle the explosion-proof transmitter with care. It may lose its explosion-proof
performance due to corrosion, deformation, damage to the case cover, or damage to a screw or a joined part.
• The explosion-proof performance of the special explosion-proof pressure transmitter is not guaranteed unless it is LOCKED. Always tighten the case cover completely, and lock the case cover.
Opening and Closing the case cover
This transmitter has a locking structure. Before opening the case cover, unlock the mechanism using a hexagonal wrench.When closing, insert the case cover fully and lock it, using a hexagonal wrench.

4-3
CAUTIONAfter closing the case cover, make sure that no dust or rain enters the transmitter case.
Lock
Case cover
Fig. 4-1. Locking Case Cover

4-4
4-1-2. Mount Center Body Cover and Adapter Flange
Remove covers
Remove the four sets of bolts & nuts, shown in the illustration.
Remarks:After removing, handle the center body cover carefully. Avoid damage to the diaphragm.
Adapter flange
Bolt / NutBolt / Nut
Fig. 4-2. Center Body Cover Fixing Bolts
Mount covers and adapter flanges
When assembling the centers body cover and adapter flanges, tighten the bolts to the following torque.Replace the seal gasket, if it is damaged.

4-5
Table 4-1. Cover Bolts / Nuts and Tightening TorqueIf a seal gasket is broken, replace it with a new one. If the device is operated with a broken seal gasket, since the degree of sealing will not be sufficient, the process fluid may spurt out, resulting in burns or other injuries.Check that the seal gasket is not damaged. If it is, replace it with a new one.
Model No.
Wetted parts material
(other than diaphragm)
Bolt / NutMaterial
Bolt / Nut tightening torque N·m
Cover materialCarbon steel / Stainless steel
Cover materialPVC
When new gasket is used
When existing gasket is reused
When new / existing gasket is
usedGTX15D 316SST 304SST 15±1 10±1 -
GTX31D GTX41D
316SST ASTM B575
Carbon steel (SNB7)22±2 17±1
10±1630SST -304SST 15±1 10±1 10±1
GTX31D GTX41D GTX71D
Tantalum 316LSST
Carbon steel (SNB7) 22±2 17±1 10±1630SST -304SST 15±1 10±1 10±1
GTX32D GTX42D GTX72D
316SSTCarbon steel (SNB7)630SST
90±20 -
304SST 55±10 -
GTX60G GTX71G
316SST ASTM B575
Carbon steel (SNB7)22±2 17±1
10±1630SST -304SST 15±1 10±1 10±1
GTX60G GTX71G
Tantalum316LSST
Carbon steel (SNB7)22±2 17±1
10±1630SST -304SST 15±1 20±1 10±1
GTX82G316SST ASTM B575
Carbon steel (SNB7)630SST
90±20 -
304SST 55±10 -
GTX30A GTX60A
316SST ASTM B575Tantalum 316LSST
Carbon steel (SNB7)630SST
22±2 17±1 -
304SST 15±1 10±1 10±1
GTX35F GTX60F
316SSTCarbon steel (SNB7)630SST
22±2 17±1 -
304SST 15±1 10±1 -
Table 4-2. Adapter Flange Bolt / Nut Tightening Torque
Bolt / NutMaterial
Bolt / Nut tightening torque N·m
Adapter flange material Carbon steel / Stainless steel
Adapter flange material PVC
Carbon steel (SNB7)20±1
7±0.5630SST -304SST 10±0.5 7±0.5

4-6
4-1-3. Washing the Center Body
Introduction
The transmitter and the pipes must be kept clean to maintain its accuracy and achieve satisfactory performance. Deposits accumulated in the pressure chamber of the transmitter may result in measurement errors.
Rinsing the center body (GTX_ _D/GTX_ _A/GTX_ _G/GTX_ _F)
Rinse the center body using the following procedure:(1) Remove the hexagon head bolts of the center body and removed the cover.(2) Wash the diaphragm and the inner surface of the cover with a solvent and a soft brush. Take care not to deform or damage the diaphragm.(3) In reassembling the center body, replace the cover gasket with a new one as necessary.(4) Tighten the cover bolts at the specified tightening torque. (Refer to “Table 4-1. Cover
Bolts / Nuts and Tightening Torque”)
Remarks related to cold area
If you stop the operation after measuring liquid that may freeze (such as water) in a cold area, drain the liquid from the center body (by loosening the drain plug.)
Maintenance of sensor
The sensor does not need any special routine maintenance/inspection. When the flange is removed for maintenance, wash the diaphragm using a soft brush and solvent. Work carefully without deforming or damaging the diaphragm.

4-7
4-2. Calibrating Set Range and Output SignalsSome calibration work must be performed by Azbil Corporation or our authorized service provider. Generally, this work requires a high-precision reference input deviceand highly accurate measuring equipment. Such work is not ordinarily performed by end-users of Azbil Corporation equipment. These instructions are provided for the benefit of users who must perform calibration work themselves.Calibration includes input calibration (set range) and output calibration (output signals).
4-2-1. Calibrating Set Range Based on Reference Input
PreparationThe low limit (LRV) and the high limit (URV) of the set range are calibrated by inputting reference pressure.Calibrate the LRV and the URV, in that order.
Equipment
Prepare the following equipment before calibration:• Standard pressure generator: Pressure generated must be close to the measurement
range of the transmitter. Accuracy requirement: ±0.05% F.S. or ± 0.1% setting
• Power supply: 24V DC• Precision resistance: 250 Ω ± 0.005%• Voltmeter: Digital voltmeter with accuracy
(10V DC range) of ± 0.02% rdg+1 dgt• HART communicator
Calibration conditions
All of the following conditions must be met, before performing calibration:• A laboratory without any air currents. Wind will apply pressure to the pressure receiving
unit on the side open to the air, influencing the calibration accuracy.• Standard temperature of 23°C and humidity of 65%. Normal pressure range (15°C~35°C)
and the normal humidity range (45%~75%) are allowable, if no sudden changes occur.• Accuracy of the measuring equipment must be at least 4 times that of the transmitter.
CAUTIONIf damping time constant is set to 0 sec. please adjust another value to keep the output stable before calibration. (Refer to HART Communicator Operation Manual (HART5) CM2-GTX000-2002HART Communicator Operation Manual (HART7) CM2-GTX000-2003)
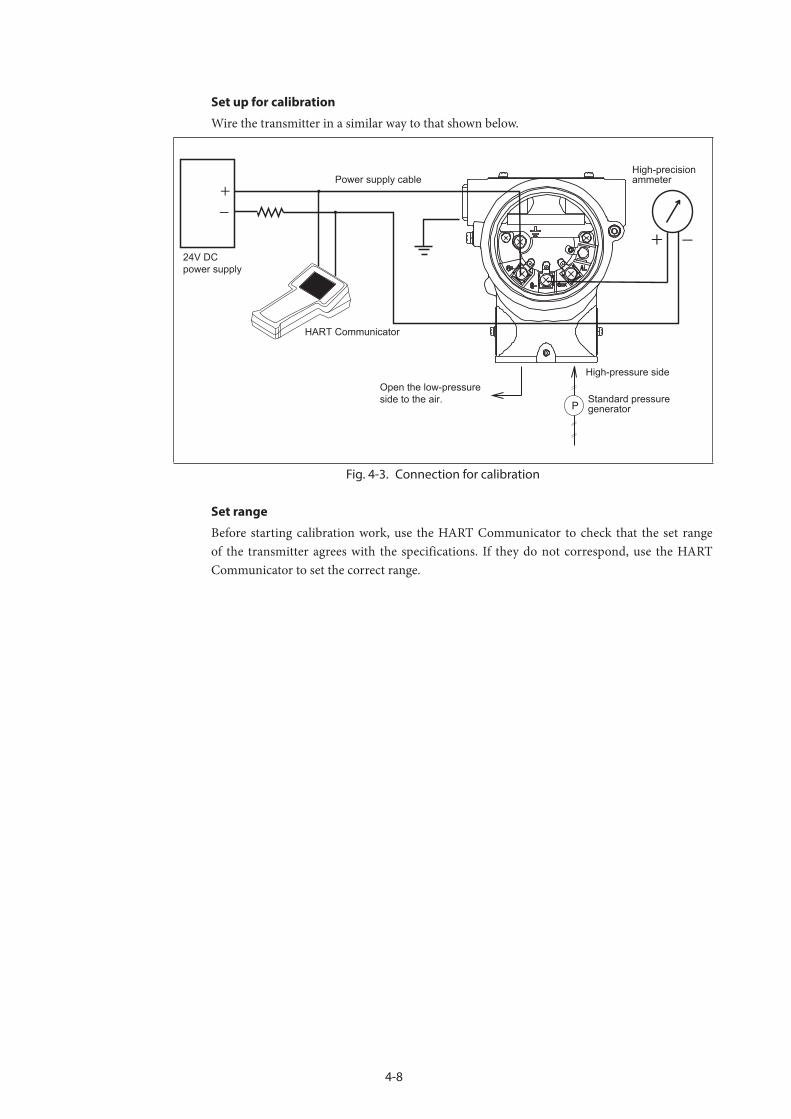
4-8
Set up for calibration
Wire the transmitter in a similar way to that shown below.
High-precisionammeter
High-pressure side
Standard pressuregenerator
Open the low-pressureside to the air.
Power supply cable
24V DCpower supply
HART Communicator
Fig. 4-3. Connection for calibration
Set range
Before starting calibration work, use the HART Communicator to check that the set range of the transmitter agrees with the specifications. If they do not correspond, use the HART
Communicator to set the correct range.
4-9
Calibrating Low LimitHow to calibrate the low limit value:It is assumed that the HART communicator and the transmitter have just started normal communications.
The Advanced Transmitter has two-point calibration. This means when you calibrate two points in the range, all the points in that range adjust to that calibration.(Device) - (Calibration) - (Correct Input)• Select “Correct Input LRV”.• You will be warned to remove the loop from automatic control. After doing so, press OK.• When prompted, adjust pressure source to apply pressure equal to LRV (0%) then press
OK.• When pressure is stable, press OK.• When prompted, remove pressure.
Calibrating High LimitHow to calibrate the high limit value: (Device) - (Calibration) - (Correct Input)• Select “Correct Input URV”.• You will be warned to remove the loop from automatic control. After doing so, press OK.• When prompted, adjust pressure source to apply pressure equal to URV (100%) then press
OK.• When pressure is stable, press OK.• When prompted, remove pressure.

4-10
4-2-2. Calibrating Output Signals
Before You StartOutput signal calibration (adjustment of the D/A conversion unit) is unnecessary under ordinary operating conditions. Normally, this work is performed by an authorized service provider of Azbil Corporation. For end-users who must perform this work, prepare the following equipment in advance:
Equipment
• High-precision ammeter with accuracy of 0.03% FS or higher• Resistor with a resistance of 250Ω ±0.005%• HART communicator
Set-up
Refer to Fig. 4-4. Connect the HART communicator and an ammeter.Refer to HART Communicator Operation Manual (HART5) CM2-GTX000-2002HART Communicator Operation Manual (HART7) CM2-GTX000-2003. Check to ensure proper wiring. Check that the HART communicator and the transmitter are in the normal communication status.
High-precisionammeter
High-pressure side
Standard pressuregenerator
Power supply cable
24V DCpower supply
HART Communicator
Fig. 4-4. Connection for Calibration.

4-11
Calibrating Analog Output SignalYou can calibrate the transmitter’s analog output circuit by using the transmitter in its constant-current source mode.(Device) - (Calibration) - (Correct Input) - (D/A trim)
STEP Action/Description
1 You will be warned to remove the loop from automatic control. After doing so, press OK.When prompt appears, connect a precision milliammeter or volt meter (0.03% accuracy or better) in loop to check readings. Press OK.
2 The following display prompts will appear:• Setting field device output to 4 mA. Press OK.• Enter meter value. Key in meter value, then press OK.• Is field device output 4.000 mA equal to reference meter? 1 Yes 2 NoIf not equal, select No, press ENTER, then key in new meter value. (returns to “Enter meter value” prompt until field device output equals reference meter.) If equal, select Yes, press ENTER.
3 The following display prompts will appear:• Setting field device output to 20 mA. Press OK.• Enter meter value. Key in meter value, then press ENTER.• Is field device output 20.000 mA equal to reference meter? 1 Yes 2 NoIf not equal, select No, press ENTER, then key in new meter value. (Returns to “Enter meter value” prompt until field device output equals reference meter.) If equal, select Yes, press ENTER.Prompt notifies you that the field device will be returned to its original output.

4-12

5-1
Chapter 5. TroubleshootingThe following describes the meaning of the status messages and the related troubleshooting procedures
If a fault is judged to be “Internal data inconsistency” or “Critical failure”, the output of the transmitter goes to the high or low limit, according to the code selected for Failure Alarm.
Suspect Input Input data error
CPU Fault CPU operation failure
NVM Fault Nonvolatile memory error
Err.06RAM
RAM Fault RAM failure
Err.07ROM
ROM Fault ROM failure
Output Circuit Fault Output circuit failure
Invalid Database
Invalid Database
Meter body is too hot. Change the installation so that thetemperature of the meter body falls within the specied range.Alternatively, check that the temperature ofthe process uid is not abnormal.
Restart the calibration value at the time ofshipping, or calibrate the high and low limits ofthe setting range.ere is a problem with the external zeroadjustment switch or the printed circuit board.Contact customer service.
Check that the input pressure is appropriatefor the calibration value, and calibrate again.
ere is a problem with the sensor.Contact customer service.
ere is a problem with the printed circuitboard.Contact customer service.
Description Countermeasures
Meter Body OverTemperature
Analog/Digital Conver-sion FaultSensor CharacteristicData Fault
Excess Zero Correct
Excess Span Correct
In Output Mode Exit from output mode
Exit from failure alarm simulation mode
Exit from failure alarm simulation mode
Check the output value
Check the sensor temperature.
Correct Reset Clears the calibration data
Output Alarm Detected
Sensor Temp. AlarmDetected
Meter Body Overload orFault
IndicatorDisplay
Diagnostics DisplayMessage
Err.01A-D CNV
An error occurred duringanalog-to-digital conversion.An error was detected in thesensor characteristic data.
Err.08OUTPUTErr.09CONFIG
Conguration data and/orcalibration data is invalid.
AL.20M/B. TEMP
AL.21ZERO. CAL
Excess Zero Correct e zero Calibration Valueexceeds the limit for accuratemeasurement.
AL.22SPAN. CAL
Excess Span Correct e span Calibration Valueexceeds the limit for accuratemeasurement.
OUTPUT%OUTMODE
In Output Mode e device is operating in Output Mode.
Exit from output mode
AL.24OVRLOAD
Meter Body Overload or Fault
e input pressure is more thantwo times the upper range limitfor the device. Or,-Device error
Exit from failure alarm simulation mode
AL.26NO.CALIB
Correct Reset Clears the calibration data.
AL.28SWITCH
External Zero/SpanAdjustment Fault
An error occurred during externaladjustment of the zero point orspan.
[blank]F/A SIM
Failure Alarm Simulation Mode
e device is operating in FailureAlarm Simulation Mode.
Exit from failure alarm simulation mode
AL.51OUT%.AL
Output Alarm Deected e output is going overupper/lower limit of outputalarm.
Check the output value
AL.52TEMP.AL
Sensor Temp. AlarmDetected
e sensor temperature isgoing over upper/lower limitof sensor temp. alarm.
Check the sensor temperature.
Device status
HART5
Err.02PROMErr.03INPUTErr.04CPUErr.05NVM
Major failure
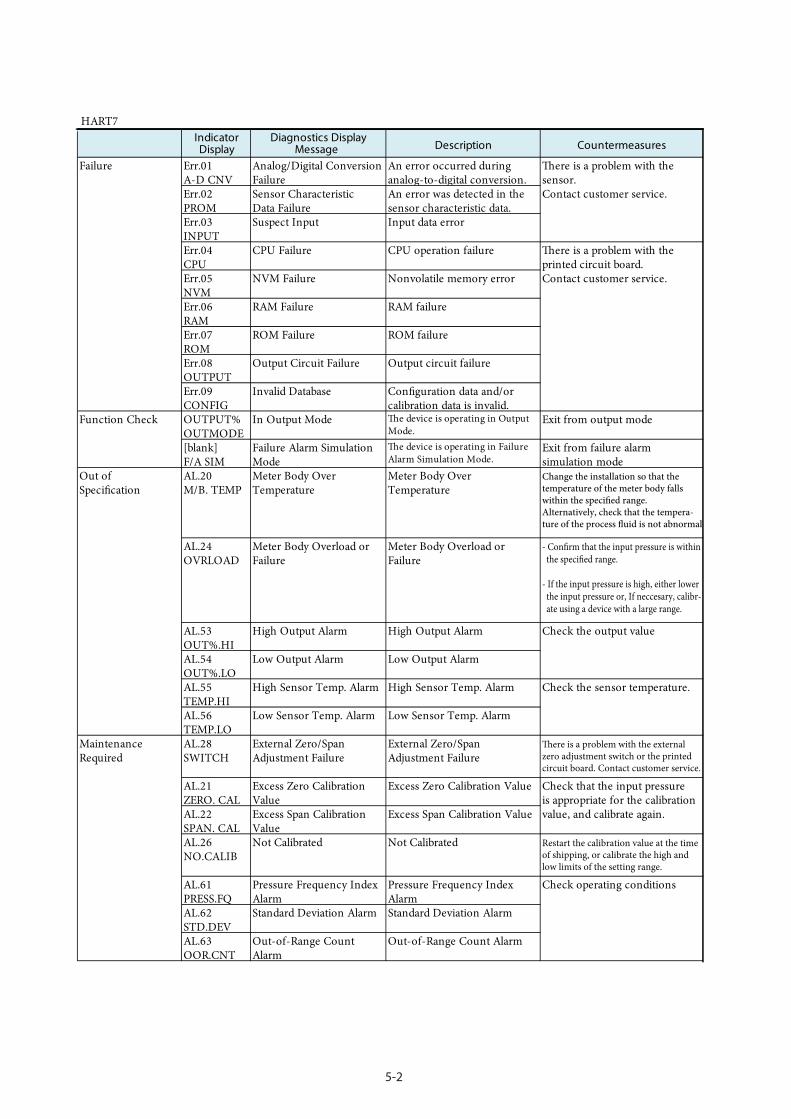
5-2
HART7IndicatorDisplay
Diagnostics DisplayMessage Description Countermeasures
Err.01A-D CNV
Analog/Digital ConversionFailure
An error occurred duringanalog-to-digital conversion.
Err.02PROM
Sensor CharacteristicData Failure
An error was detected in thesensor characteristic data.
Err.03INPUT
Suspect Input Input data error
Err.04CPU
CPU Failure CPU operation failure
Err.05NVM
NVM Failure Nonvolatile memory error
Err.06RAM
RAM Failure RAM failure
Err.07ROM
ROM Failure ROM failure
Err.08OUTPUT
Output Circuit Failure Output circuit failure
Err.09CONFIG
Invalid Database Conguration data and/orcalibration data is invalid.
OUTPUT%OUTMODE
In Output Mode e device is operating in OutputMode.
Exit from output mode
[blank]F/A SIM
Failure Alarm SimulationMode
e device is operating in FailureAlarm Simulation Mode.
Exit from failure alarmsimulation mode
AL.20M/B. TEMP
Meter Body OverTemperature
Meter Body OverTemperature
Change the installation so that the temperature of the meter body falls within the specied range.Alternatively, check that the tempera-ture of the process uid is not abnormal.
AL.24OVRLOAD
Meter Body Overload orFailure
Meter Body Overload orFailure
- Conrm that the input pressure is within the specied range.
- If the input pressure is high, either lower the input pressure or, If neccesary, calibr- ate using a device with a large range.
AL.53OUT%.HI
High Output Alarm High Output Alarm
AL.54OUT%.LO
Low Output Alarm Low Output Alarm
AL.55TEMP.HI
High Sensor Temp. Alarm High Sensor Temp. Alarm
AL.56TEMP.LO
Low Sensor Temp. Alarm Low Sensor Temp. Alarm
AL.28SWITCH
External Zero/SpanAdjustment Failure
External Zero/SpanAdjustment Failure
ere is a problem with the external zero adjustment switch or the printedcircuit board. Contact customer service.
AL.21ZERO. CAL
Excess Zero CalibrationValue
Excess Zero Calibration Value
AL.22SPAN. CAL
Excess Span CalibrationValue
Excess Span Calibration Value
AL.26NO.CALIB
Not Calibrated Not Calibrated Restart the calibration value at the time of shipping, or calibrate the high and low limits of the setting range.
AL.61PRESS.FQ
Pressure Frequency IndexAlarm
Pressure Frequency IndexAlarm
AL.62STD.DEV
Standard Deviation Alarm Standard Deviation Alarm
AL.63OOR.CNT
Out-of-Range CountAlarm
Out-of-Range Count Alarm
Failure ere is a problem with thesensor.Contact customer service.
ere is a problem with theprinted circuit board.Contact customer service.
Check operating conditions
Function Check
Out ofSpecication
Check the output value
Check the sensor temperature.
MaintenanceRequired
Check that the input pressureis appropriate for the calibrationvalue, and calibrate again.

5-3
If the transmitter does not work normally or at all, check the following items.
Phenomenon Measures
Nothing appears on the display.
• Make sure the power supply voltage is correctly applied.• Make sure the wire connection of the power supply is
provided.
Output remains zero and does not change.
• Make sure the settings are correct.• Make sure the flow rate is within the low flow cut range.• Make sure the pipes are not blocked.
Output is out of alignment.
• Make sure that no fluid is leaking from the pipes.• Make sure the fluid is not flowing backward.• Make sure the connection direction of the HP and LP sides is
correct.• Make sure the transmitter is not set at a tilt.
Also check the following points.·• Check the result of self-diagnosis with the Communicator.• Check that the connection direction of the HP and LP sides is correct.• Check for any leakage at the connections on the pipes.• Check for any loosened bolts on the clamping portions of the product.• Check for any loosened and/or broken wires.• Check for any wrong wiring connections.• Check that the power supply voltage and load resistance are in accordance with the
specifications.• Check that the pressure and temperature are in accordance with the specifications.• Check for the presence of any sources of strong magnetism or noise near by.
If even after checking the above items the transmitter still does not work properly, stop using it and unplug it. Then contact us at our branch office, sales office, or your local representative.

5-4

A-1
Appendix-A. Supplement Manual for Field communication software(Model CFS100)
A-1. Overview
A-1-1. IntroductionField communication software(Model CFS100) is a tool for communicating with Azbil Corporation’s smart field devices (e.g. the Differential Pressure Transmitter) that enables configuration of device settings. It is a software product that operates on Windows PCs. Field communication software(Model CFS100) with Azbil Corporation’s smart field devices using a USB interface connected to a Windows PC, which is then connected by communications cable to the USB port of a device.
Field communication software(Model CFS100) supports Azbil Corporation’s proprietary SFN/DE communication protocol as well as the HART communication protocol.
For information on the specifications common to all types of devices and information on how to install Field communication software(Model CFS100), please refer to the main Field communication software(Model CFS100) Operation Manual. Before reading this manual, make sure that you read the main Field communication software(Model CFS100) Operation Manual thoroughly.
A-1-2. Important Notes* When changing connected devices
Field communication software(Model CFS100) continues communicating with the device when displaying dynamic values, such as pressure, so that it can continuously update these values. If you remove the communications cable to change the device during this communication, an error will occur.
Exit Field communication software(Model CFS100) before detaching the communications cable from the device, and then start Field communication software(Model CFS100) again after connecting the communications cable to the new device.
* The use of SFN communication changes the transmission signal, so be sure to switch the process control loop to manual mode beforehand.
* For known troubleshooting issues, refer to section 7.4 of CM2-CFS100-2001, the common edition manual.

A-2
A-2. How to Connect the Field communication software(Model CFS100)
Please see “Fig. A-1. Wiring for connection with Model GTX” for instructions on connecting Field communication software(Model CFS100).
Note : Do not connect two or more communicators at the same time.
Red lead
Communications cableBlack lead
Field communication software(Model CFS100)
250
+-
+
-
24V DC power supply
Rec
eive
r
Note : Always connect the communications cable to the loop wiring as follows: Always connect Red lead: S+ terminal Black lead: S- terminal
Fig. A-1. Wiring for connection with Model GTX
1345
1482
Supply voltage - 12.5
0.0219
245
0 17.9 42 45
Supply voltage (V DC)
Operating Range
=
Ope
rativ
e lim
it
12.5
Fig. A-2. Supply voltage vs. load resistance

B-1
Appendix-B. Default damping time constantUnless specified in ordering information, the damping time constant is according to the following table.
Model Measuring spanCalibration span (x) /Default damping time constant
4sec 2sec 1sec
GTX15D 0.1 to 2kPa - 0.1 ≤ x ≤ 2kPa -
GTX30D/31D/32D 0.5 to 100kPa 0.5 ≤ x < 2.5kPa 2.5 ≤ x < 5kPa 5kPa ≤ x
GTX40D/41D/42D 35 to 700kPa 35 ≤ x < 45kPa 45 ≤ x < 90kPa 90kPa ≤ x
GTX71D/72D 0.25 to 14MPa 0.25 ≤ x < 0.7MPa 0.7 ≤ x < 1.4MPa 1.4MPa ≤ x
GTX60G 17.5 to 3500kPa 17.5 ≤ x < 80kPa 80 ≤ x < 210kPa 210kPa ≤ x
GTX71G 0.7 to 14MPa - 0.7 ≤ x < 1.4MPa 1.4kPa ≤ x
GTX82G 0.7 to 42MPa - 0.7 ≤ x ≤ 1MPa 1MPa ≤ x
GTX30A 4 to 104kPa - 4 ≤ x < 5kPa 5kPa ≤ x
GTX60A 35 to 3500kPa 35 ≤ x < 80kPa abs 80k ≤ x < 210kPa 210kPa ≤ x
GTX35F 2.5 to 100kPa - 2.5 ≤ x < 5kPa 5kPa ≤ x
GTX60F 35 to 3500kPa 35 ≤ x < 80kPa 80 ≤ x < 210kPa 210kPa ≤ x
GTX35R 2.5 to 100kPa - 2.5 ≤ x < 5kPa 5kPa ≤ x
GTX40R 35 to 700kPa 35 ≤ x < 45kPa 45 ≤ x < 90kPa 90kPa ≤ x
GTX35U 2.5 to 100kPa - 2.5 ≤ x < 5kPa 5kPa ≤ x
GTX60U 35 to 3500kPa 35 ≤ x < 80kPa 80 ≤ x < 210kPa 210kPa ≤ x
GTX71U 0.7 to 10MPa - 0.7 ≤ x < 1.4MPa 1.4kPa ≤ x
GTX82U 0.7 to 42MPa - 0.7 ≤ x < 1MPa 1MPa ≤ x
GTX30S 4 to 104kPa - 4 ≤ x < 5kPa 5kPa ≤ x
GTX60S 35 to 3500kPa 35 ≤ x < 80kPa 80 ≤ x < 210KPa 210kPa ≤ x

B-2

C-1
Appendix-C. Diagnosis of clogging in the connecting pipe using the pressure frequency index
This appendix describes judgment of an abnormal state, setup procedures, and operation check procedures when the pressure frequency index is used to diagnose clogging in the connecting pipe. For general matters concerning the pressure frequency index, see section 3-11-1, “Pressure Frequency Index.”
Section C-1 of Appendix-C describes the principle behind the diagnosis of clogging in the connecting pipe. Read this section first.Sections C-2-4 describe how to configure the diagnostic functions by transmitter and application type.
• When measuring the pressure using a pressure gauge, see section C-2.• When measuring the differential pressure and flow rate using the differential pressure
gauge, see section C-3.• When measuring the level, see section C-4.
Section C-5 provides a supplemental description of parameters related to the diagnosis of clogging.
C-1. Principle
The pressure of a flowing fluid fluctuates irregularly and frequently. The pressure frequency index shows the number of fluctuations that have been detected. A large index number means that the vertical oscillation is fast and that there are many high-frequency fluctuations. A small index shows that the vertical oscillation is slow and that there are relatively few high-frequency fluctuations.
There are many causes of fluctuation. First, the pressure that generates the flow fluctuates. The magnitude of this fluctuation may vary depending on the pressure and flow velocity, but fluctuation always occurs when the fluid flows. This fluctuation is the most important factor in the diagnosisof clogging in the connecting pipe. Also, pressure fluctuation occurs due to pumps, compressors, or agitators. This fluctuation may also be used to diagnose clogging, depending on its cycle and frequency.
Pressure fluctuation is transmitted to the differential pressure and pneumatic pressure transmitter through the connecting pipe. When the connecting pipe is operating normally, fluctuation in the process is directly transmitted to the transmitter, since there are no obstructions halfway. On the other hand, if the connecting pipe is clogged, the clogging and piping system function as a low- pass filter for pressure fluctuation. This is caused by the fact that the clogging obstructs the fluid flow, and the pressure levels at both ends of the clogged portion cannot be equalized within a short period of time. Therefore, even when the process pressure includes high frequency fluctuations, it is difficult for them to be transmitted past the clog.
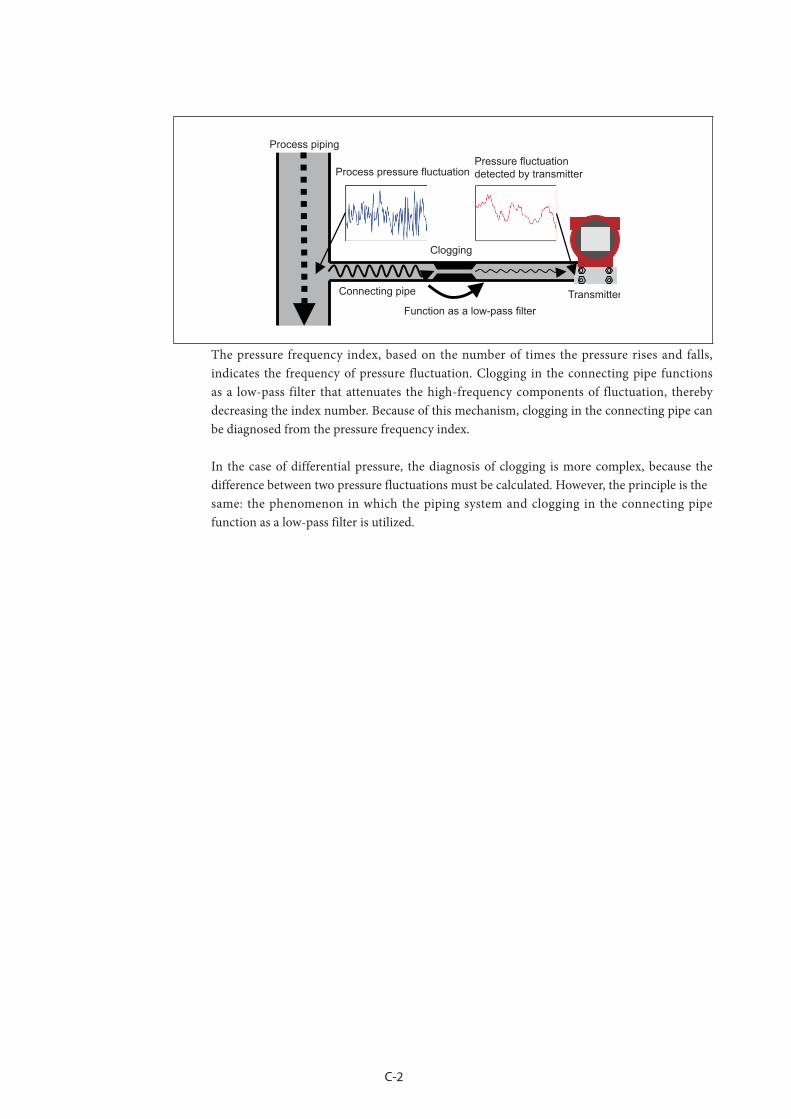
C-2
Process piping
Process pressure fluctuationPressure fluctuation detected by transmitter
Transmitter
Clogging
Connecting pipe
Function as a low-pass filter
The pressure frequency index, based on the number of times the pressure rises and falls, indicates the frequency of pressure fluctuation. Clogging in the connecting pipe functions as a low-pass filter that attenuates the high-frequency components of fluctuation, thereby decreasing the index number. Because of this mechanism, clogging in the connecting pipe can be diagnosed from the pressure frequency index.
In the case of differential pressure, the diagnosis of clogging is more complex, because the difference between two pressure fluctuations must be calculated. However, the principle is thesame: the phenomenon in which the piping system and clogging in the connecting pipe function as a low-pass filter is utilized.

C-3
C-2. Configuration using a pressure gauge
C-2-1. Clogging and the pressure frequency indexThe pressure frequency index varies depending on clogging in the connecting pipe. Generally, the pressure frequency index becomes smaller as clogging progresses. Normally, the pressure frequency index does not become larger.
C-2-2. Points to note regarding the diagnosis of cloggingWhen the pressure frequency index is used to diagnose clogging in the connecting pipe, observe the cautions shown below.
If the fluctuation is very small or its frequency is low, clogging cannot be diagnosed. This is because the pressure must include a sufficient number of fluctuations for the pressure frequency index to be calculated accurately. Specific examples are listed below.
• There is no fluid flow, or flow velocity is very slow.• Fluid viscosity is high.
Variation in the pressure frequency index does not always mean that clogging in the connecting pipe has occurred. The index may vary due to other factors, such as the following.
• A change in the operating conditions of the pump, compressor, etc. (ON/OFF, number of units, RPM, etc.)
• Air bubbles entering the process piping or connecting pipe• A change in the viscosity of the process fluid• Flow velocity variation caused by valve hunting
Note that whether or not the cause is clogging can be inferred by comparing the pressure frequency index and the standard deviation with their values when conditions are normal. If the standard deviation increases at the same time that the pressure frequency index decreases, it is probable that, rather than a decrease in high-frequency fluctuation due to clogging, there has been an increase in low-frequency fluctuation due to some other cause.
Depending on the material that causes clogging, it is possible that variation in the index will be too small for an alarm to be activated. For example, if the clog is made of something like gravel, where there are gaps, the pressure fluctuation can be transmitted through the gaps, and there will not be much change in the index.
If the frequency of pressure fluctuation is abnormal from the beginning, as is a case where the connecting pipe was clogged from the start, it may not be possible to diagnose the clogging. Do the setup procedures (C-2–4) when the connecting pipe is operating normally.
Even if clogging occurs suddenly, the pressure frequency index will not change immediately. This is because it takes a few minutes to calculate the frequency of the pressure fluctuation with a high level of accuracy.
If the transmitter is installed in an environment subject to heavy vibration, the pressure frequency index may be affected, preventing correct diagnosis.

C-4
C-2-3. Parameter configuration proceduresTo diagnose clogging in the connecting pipe using the pressure frequency index, parameters must be set. Use the configuration procedure below.
Preparation
Acquisition of index values under normal conditions
Clogging simulation test
Judge the possibility of diagnosis
Possible
not possible
Parameter adjustment
Setting of the alarm
Start the diagnosis
Note:
X
X
X
X
X
X
Preparation (see section C-2-4-1): Initialize the parameters in preparation for obtaining the index values.Acquisition of index values under normal conditions (see section C-2-4-2): Obtain index values under normal conditions, and also the maximum and minimum index values.Clogging simulation test (see section C-2-4-3): Operate the valve of the connecting pipe to simulate a clog and obtain index values.
If you cannot conduct the clogging simulation test, skip sections C-2-4-3 to C-2-4-6, and then read section C-2-4-7.
Judging the possibility of diagnosis (see section C-2-4-4): Determine whether or not you can differentiate between a normal state and a simulated clogged state by comparing their index values. Setting the alarm (see section C-2-4-5): If diagnosis is judged to be possible, adjust the parameters shown below to set an alarm based on the collected index values. When the configuration processis complete, the diagnosis can begin.
Press Freq Index Alarm Use Press Freq Index Low Limit
Parameter adjustment (see section C-2-4-6): If distinguishing the two states is not possible, analyze the cause, adjust the parameters shown below, and then return to “Acquisition of index values under normal conditions.”
Press Freq Index Sensor Selection Press Freq Filter Constant Press Freq Calc PV High Limit Press Freq Calc PV Low Limit

C-5
The procedures stated in “Acquisition of index values under normal conditions” and “Clogging simulation test” refer to the following parameters and process variables.
Pressure Frequency Index Press Freq Index Max Press Freq Index Min Standard Deviation Standard Deviation Max Standard Deviation Min
The standard deviation values are not directly used to diagnose clogging, but it may be necessary to refer to them during parameter adjustment. Therefore, it is recommended that they be collected at the same time as the pressure frequency indexes.
C-2-4. Configuration proceduresThis section describes the configuration procedures in order.
C-2-4-1. Preparation
Before starting configuration, initialize the parameters.
Procedure (1) Set Press Freq Index Sensor Selection to “DP, 120 ms.” (2) Set Press Freq Filter Constant to “0.15.”(3) Set Press Freq Calc PV High Limit to “Upper Range Value.” (4) Set Press Freq Calc PV Low Limit to “Lower Range Value.”(5) Set Press Freq Index Alarm Use to “Disabled” (operation off ).
C-2-4-2. Acquisition of index values under normal operating conditions
Obtain the index value under normal operating conditions without clogging in the connecting pipe. The collected pressure frequency index and standard deviation values are used to judge the possibility of diagnosis and to adjust the parameters in later steps.
Procedure (1) Check that the connecting pipe is operating normally. When a valve such as a manifold
valve is attached to the connecting pipe, check that the pressure can be measured.(2) Execute Reset Press Freq Index and Reset Standard Deviation. Note that after Reset Press
Freq Index is executed, the correct values for Pressure Frequency Index, Press Freq Index Min, and Press Freq Index Max cannot be obtained for a short period of time. After Reset Press Freq Index has been executed, wait until the first index calculation is completed.
(3) Wait for at least 30 minutes, and if possible one hour.(4) Obtain the pressure frequency index and its minimum and maximum values, and the PV,
and record them.(5) Obtain the values of Standard Deviation, Standard Deviation Min, and Standard
Deviation Max as reference values, and record them.If there are multiple operating conditions, perform the steps above under as many conditions as possible and collect the data. The reason for this is that the pressure frequency index value may vary depending on the operating conditions, even when the process state is normal. Covering as many conditions as possible will enable judging of the possibility of diagnosis and parameter adjustment to be carried out more reliably.

C-6
C-2-4-3. Clogging simulation test
If a valve such as a stop valve is connected to the connecting pipe, the valve can be utilized to conduct the clogging simulation test. The pressure frequency index and standard deviation values that are collected in the clogging simulation state are used to judge the possibility of diagnosis and to adjust the parameters in later steps.
CAUTIONWhen the valve of the connecting pipe is closed completely, the transmitter cannot measure the correct value. In addition, even when the valve is not closed completely, the delay before the process variable follows a change in pressure may be long. (This symptom is the same as when the damping time constant of the transmitter is made larger.) When conducting the clogging simulation test, exercise great care so that the test does not interfere with process safety or control.
Procedure (1) Close the valve of the connecting pipe either completely or so that it is slightly open (with
a small amount of fluid flow).(2) Execute Reset Press Freq Index and Reset Standard Deviation. (3) Wait 20 minutes or
more.(4) Record the values for Pressure Frequency Index, Press Freq Index Min, Press Freq Index
Max, and the PV.(5) Obtain the values for Standard Deviation, Standard Deviation Min, and Standard
Deviation Max as reference values, and record them.
If there are multiple operating conditions and the index value under normal operating conditions varies depending on the operating conditions, it is recommended that the steps described above be repeated under each operating condition.In the clogging simulation test, the valve of the connecting pipe needs to be sufficiently closed. The reason for this is that the low-pass filter effect due to clogging as described in “Principle” above does not occur if the flow path resistance caused by clogging (resistance to fluid flow) is not sufficiently high.

C-7
C-2-4-4. Judging the possibility of diagnosis
Whether or not clogging can be diagnosed can be judged according to the index and its maximum and minimum values collected under normal operating conditions (section C-2-4-2) and under a simulated clogged condition (section C-2-4-3).
Judgment criteria
• The maximum index value with simulated clogging is smaller than the minimum index value under normal operating conditions.
• The difference between the minimum under normal operating conditions and the maximum with simulated clogging is equivalent to or larger than the difference between the minimum and maximum under normal operating conditions.
Index value
Maximum value under normal operating conditionsMinimum value under normal operating conditions
Maximum value under simulated cloggingMinimum value under simulated clogging
Normal condition Simulated clogging
The larger the dierence between the minimum under normal operating conditions and the maximum with simulated clogging
Diagnosis is possible.
The above conditions are not satisfied. Diagnosis is not possible or difficult.
The minimum condition for diagnosis is that the maximum with simulated clogging is smaller than the minimum under normal conditions. If this condition is not satisfied, the index value may decrease to the value with simulated clogging even when the connecting pipe is operating normally. Therefore, the conditions are not suitable for diagnosis. In cases where the index value under normal conditions varies depending on the operating conditions, judgment should be based on the values when the minimum index value is at its smallest.The larger the difference between the minimum under normal operating conditions and the maximum with simulated clogging, the easier diagnosis is. Therefore, this value is important. A reference for judging whether diagnosis is possible is that this difference is equivalent to or larger than the difference between the minimum value and maximum value under normal operating conditions. If this difference is less than half of the difference between the minimum and maximum under normal conditions, diagnosis will probably be difficult. The reason for this is that the index will be close to its value with clogging even under normal conditions, so it will be difficult to distinguish between normal and abnormal states. In this case, conditions are probably inappropriate for diagnosis.
If diagnosis is judged to be possible, go on to section C-2-4-5 and set the diagnostic alarm.If diagnosis is judged to be not possible, go to section C-2-4-6 and consider parameter adjustment.
CAUTION The position of a clog may affect the amount of variation of the pressure frequency index. In particular, if the fluid is a compressible fluid or gas, the effect can be significant. In such a case, if clogging is closer to the process side, the amount of variation will be greater. Therefore, when the position where clogging actually occurs is closer to the transmitter than the position of the simulated clogging, changes in the index value will be small or almost zero in comparison to those in the simulation test. Likewise, when the position where clogging actually occurs is closer to the process as compared to the position of the simulated clog, changes in the index will be greater than in the simulation test.

C-8
C-2-4-5. Setting of the diagnosis alarm
If diagnosis is judged to be possible, set the alarm. If you do not want to activate the alarm, omit the steps in this section.
CAUTIONThe procedures described in this document do not guarantee the detection of clogging or the elimination of false indications. The pressure frequency index may change due to causes other than clogging, and may also depend on the degree of clogging or the material of the clog. Adjusting the settings should be done with the realization that there is no threshold value setting that can eliminate misinformation and securely detect clogging only.
First, determine the alarm threshold value. This threshold should be between the minimum index value under normal conditions and the maximum with simulated clogging. If the threshold is put close to the minimum under normal operating conditions, the alarm will be activated earlier, but the possibility of a false alarm is also higher. Put the threshold at a certain distance away from the minimum under normal operating conditions, leaving a margin.
Index value
Index value range under the normal operating conditions Minimum value
under normal operating conditionsMaximum value under simulated clogging
Threshold value
After determining the threshold value, follow the steps below to set the alarm and start the diagnosis.
Procedure (1) Execute Reset Press Freq Index.(2) Set Press Freq Index Low Limit to the determined threshold value. (3) Set Press Freq Index Alarm Use “Enabled (Low)” (lower limit only).
With these settings, when the index value is outside the normal range and approaches the value with simulated clogging, the alarm is activated.

C-9
C-2-4-6. Parameter adjustment
If diagnosis is judged to be not possible, the data collected under normal operating conditions (section C-2-4-2) and when there is simulated clogging (section C-2-4-3) can be analyzed and the parameters adjusted.The reason why diagnosis cannot be performed is that the index value—even under normal operating conditions—is similar to or smaller than that when there is clogging, so the normal and clogged states cannot be distinguished. There are two primary causes leading for this situation.
• A large amount of variation of the index under normal conditions• A small variation of the index when there is clogging
This situation may be improved by adjusting the parameters of the pressure frequency index diagnosis. The following describes the two cases.
(A) Variation of the index under normal operating conditions is large.In this case, although the value of the index is small with simulated clogging, variation in the index is large under normal conditions, so the index value can be close to or equivalent to its value with clogging even when there is no clogging, as shown in the figure below.
Index value Index value
Maximum value under normal operating conditions
Minimum value under normal operating conditions
Maximum value under simulatedclogging
Minimum value under simulated clogging
Maximum value under normal operating conditions
Minimum value under normal operating conditions
Maximum value under simulatedclogging
Minimum value under simulated clogging
Normal condition Simulated clogging condition
Normal condition Simulated clogging condition
Slight dierenceValue being overlapping
In this case, it is necessary to examine the cause of the large variation that occurs under normal conditions, and to reduce this effect. Use the following the guidelines for adjustment.
Guidelines for parameter adjustment
The index value sometimes decreases significantly under normal operating conditions. At this time, the process variable changes or the standard deviation becomes large.
Increase the Press Freq Filter Constant in steps of 0.02 - 0.05.
The index value under normal operating conditions changes significantly depending on the operating conditions.
Check whether the operating conditions are related to the process variable. If there is a PV range where the difference between the maximum index value and the minimum is relatively small, or a PV range where the minimum under normal conditions is not small, set Press Freq Calc PV High Limit and Press Freq Calc PV Low Limit to the values of this range. When these parameters are used, diagnosis should be carried out only when pressure is applied, and should be stopped when no pressure is applied.

C-10
(B) The variation of the index when there is a clog is small.In this case, although variation in the index is relatively small under normal operating conditions, the value of the index is almost the same as with simulated clogging, as shown in the figure below. In this case, the index value under normal operating conditions is similar to that with clogging, or the index value is almost the same even when clogging occurs. In either case, it is necessary to examine the cause and to minimize this effect. Use the following guidelines for adjustment.
Index value Index valueMaximum value under normal operating conditions
Minimum value under normal operating conditions
Maximum value under simulated clogging
Minimum value under simulated clogging The dierence with that of
the clog simulated condition is smallCannot make a distinctionas values are overlapped
Normal condition Simulated clogging condition
Maximum value under normal operating conditions
Minimum value under normal operating conditions
Maximum value under simulated clogging
Minimum value under simulated clogging
Normal condition Simulated clogging condition
Guidelines for parameter adjustment
Phenomenon Adjustment
Since the process variable fluctuates and there is always low-frequency pressure fluctuation, the value of the index is small even under normal operating conditions. The standard deviation is relatively large.
Increase the Press Freq Filter Constant in steps of 0.02 - 0.05.
The PV does not change and the standard deviation is also small. The frequency of the original pressure fluctuation is low and the index value is small. (The reference index value is 0.1 or less under normal operating conditions.) Fluid viscosity is high.
Change the Press Freq Index Sensor Selection. If the present value is “DP, 120 ms”, set it to “DP, 240 ms,” and if the present value is “DP, 240 ms,” set it to “DP, 360 ms.”
The magnitude and frequency of the original pressure fluctuation are acceptable. (The reference index value is 0.2 or more under normal operating conditions.) However, the value is almost the same when there is clogging.
Decrease the Press Freq Filter Constant in steps of 0.02 - 0.05.

C-11
C-2-4-7. Clogging simulation test cannot be conducted.
When the clogging simulation test cannot be conducted, only the index value data under normal operating conditions (index values collected in section C-2-4-2) can be used to determine the threshold value.When many index values can be collected, calculate the average value (μ) and standard deviation (σ), and determine the threshold value based on μ ± nσ. To eliminate misinformation, a value from 4 to 6 is recommended for n.The threshold value can also be determined using the maximum (xmax) and minimum (xmin) index values. For example, the threshold value should be set to a value that is no more than (xmax - xmin)/2 from the minimum value, as shown in the figure below.
xmax
xmin(xmax xmin)/2
Index value
Thresholdvalue (Low)
Index value range under the normal operating conditions
Note that the threshold value determined using only the index value data under normal operating conditions is not always appropriate. The index value may become smaller than the threshold value due to causes other than clogging, or the index value may not become smaller than the threshold value even when clogging occurs. Observe changes in the index value for a short period after the threshold value has been determined, and then check that the index value does not become smaller than the threshold value under normal operating conditions, and that the difference between the correct value range and threshold value is not large. Revise the threshold value when necessary.
C-12
C-3. Setting using a differential pressure gauge
C-3-1. Clogging and pressure frequency indexThe pressure frequency index may vary depending on clogging in the connecting pipe. The pressure frequency index may either become smaller or larger due to clogging in the connecting pipe. In differential pressure measurement, there is a connecting pipe on both the high pressure and low pressure sides. When both pipes are clogged over a certain level, the pressure frequency index will decrease. However, the index will increase or not change significantly as clogging progresses. The reason for this is explained below.
In differential pressure measurement, the fluctuation in the differential pressure is used to calculate the pressure frequency index (excluding the case where static pressure sensor is selected in the Press Freq Index Sensor Selection). Differential pressure fluctuation is a combination of the fluctuation on the high pressure side and the fluctuation on the low pressure side. Therefore, when there are common components in the fluctuation on both sides, under normal conditions they cancel each other out and the detected fluctuation becomes smaller than the original common component. In such a case, if the balance between the fluctuation on the two sides changes, the components that canceled each other out under normal operating conditions expand, and the fluctuation becomes larger than under normal operating conditions. Therefore, when there is a certain difference in the amount of clogging between the high and low pressure sides, that is, when one side only is clogged, the pressure frequency index will be larger than under normal operating conditions. In addition, depending on the relationship between the cause of increase in the index and the cause of decrease in the index, the index value may not change even when clogging occurs. Note that when both connecting pipes are clogged over a certain level, the cause of decrease in the index will become stronger, so that the index value eventually will become small as clogging progresses.
C-3-2. Points to note regarding the diagnosis of cloggingWhen the pressure frequency index is used to diagnose clogging in the connecting pipe, observe the cautions below.When the fluctuation is very small or when the fluctuation frequency is low, clogging cannot be diagnosed. The reason for this is that the pressure or differential pressure needs to include a sufficient number of fluctuations to calculate the pressure frequency index accurately. Specific examples are listed below.
• There is no fluid flow, or flow velocity is very slow.• Fluid viscosity is high.
Variation in the pressure frequency index does not always mean that clogging in the connecting pipe has occurred. The index may vary due to other factors, such as the following.
• A change in the operating conditions of the pump, compressor, etc. (ON/OFF, number of units, RPM, etc.)
• Air bubbles entering the process piping or connecting pipe.• A change in the viscosity of the process fluid• Flow velocity variation caused by valve hunting

C-13
Note that whether or not the cause is clogging can be inferred by comparing the pressure frequency index and the standard deviation with their values when conditions are normal. If the standard deviation increases at the same time that the pressure frequency index decreases, it is probable that, rather than a decrease in high-frequency fluctuation due to clogging, there has been an increase in low-frequency fluctuation due to some other cause.
Whether or not the status in which only one side of the connecting pipe is clogged is detected may vary depending on the various conditions such as fluid conditions or characteristics of the differential pressure generation mechanism (orifice, etc.). To understand whether or not detection is possible beforehand, it is strongly recommended that it is checked beforehand according to the clogging simulation test stated in section A-3-4-3.
Depending on materials that cause clogging, even when clogging occurs, variations in index are small and no alarm is activated. For example, it is understood that when there are clearances, even when a clogged state due to gravel exists, the pressure fluctuation is transmitted through the clearances, and changes in index become small.
If the frequency of pressure fluctuation is abnormal from the beginning, as is a case where the connecting pipe was clogged from the start, it may not be possible to diagnose the clogging. Do the setup procedures (section C-3-4) when the connecting pipe is operating normally.
Even if clogging occurs suddenly, the pressure frequency index will not change immediately. This is because it takes a few minutes to calculate the frequency of the pressure fluctuation with a high level of accuracy.
If the transmitter is installed in an environment subject to heavy vibration, the pressure frequency index may be affected, preventing correct diagnosis.
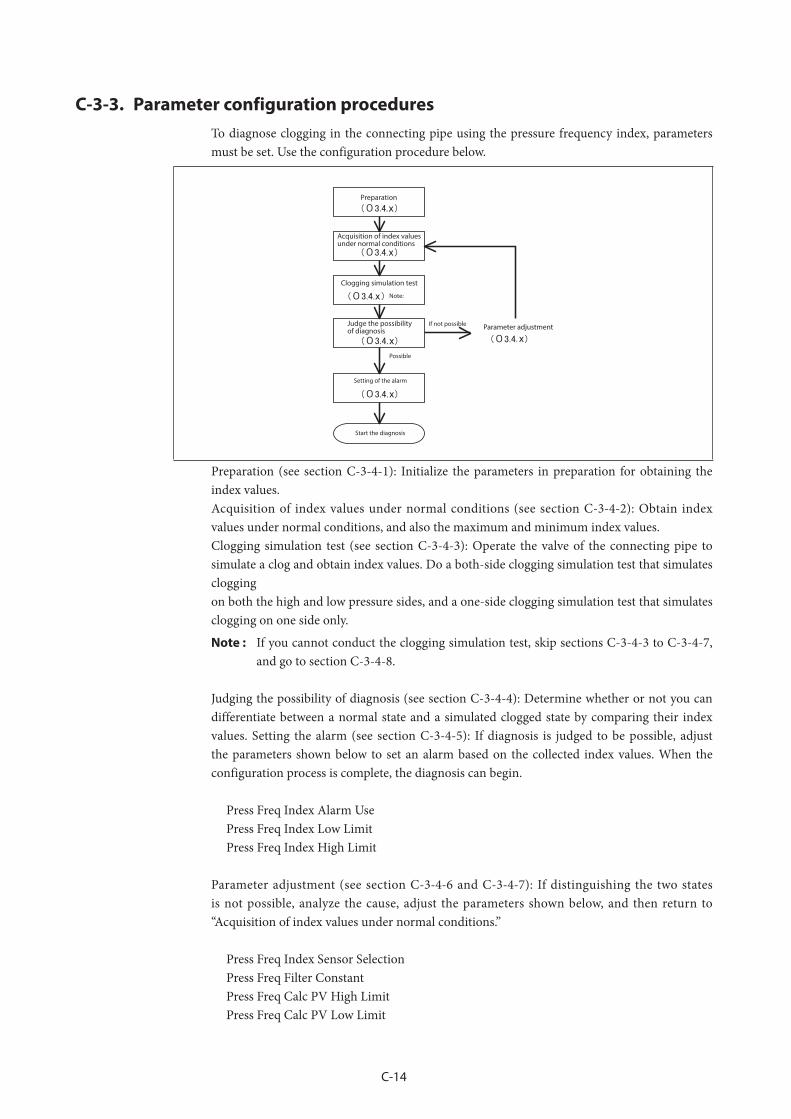
C-14
C-3-3. Parameter configuration proceduresTo diagnose clogging in the connecting pipe using the pressure frequency index, parameters must be set. Use the configuration procedure below.
Preparation
Acquisition of index values under normal conditions
Clogging simulation test
Judge the possibility of diagnosis Parameter adjustmentIf not possible
Possible
Note:
Setting of the alarm
Start the diagnosis
x
x
x
x
x
x
Preparation (see section C-3-4-1): Initialize the parameters in preparation for obtaining the index values.Acquisition of index values under normal conditions (see section C-3-4-2): Obtain index values under normal conditions, and also the maximum and minimum index values.Clogging simulation test (see section C-3-4-3): Operate the valve of the connecting pipe to simulate a clog and obtain index values. Do a both-side clogging simulation test that simulates cloggingon both the high and low pressure sides, and a one-side clogging simulation test that simulates clogging on one side only.
Note : If you cannot conduct the clogging simulation test, skip sections C-3-4-3 to C-3-4-7, and go to section C-3-4-8.
Judging the possibility of diagnosis (see section C-3-4-4): Determine whether or not you can differentiate between a normal state and a simulated clogged state by comparing their index values. Setting the alarm (see section C-3-4-5): If diagnosis is judged to be possible, adjust the parameters shown below to set an alarm based on the collected index values. When the configuration process is complete, the diagnosis can begin.
Press Freq Index Alarm Use Press Freq Index Low Limit Press Freq Index High Limit
Parameter adjustment (see section C-3-4-6 and C-3-4-7): If distinguishing the two states is not possible, analyze the cause, adjust the parameters shown below, and then return to “Acquisition of index values under normal conditions.”
Press Freq Index Sensor Selection Press Freq Filter Constant Press Freq Calc PV High Limit Press Freq Calc PV Low Limit

C-15
The procedures stated in “Acquisition of index values under normal conditions” and “Clogging simulation test” refer to the following parameters and process variables.
Pressure Frequency Index Press Freq Index Max Press Freq Index Min Standard Deviation Standard Deviation Max Standard Deviation Min
The standard deviation values are not directly used to diagnose clogging, but it may be necessary to refer to them during parameter adjustment. Therefore, it is recommended that they be collected at the same time as the pressure frequency indexes.

C-16
C-3-4. Configuration proceduresThis section describes the configuration procedures in order.
C-3-4-1. Preparation
Before starting configuration, initialize the parameters.
Procedure (1) Set Press Freq Index Sensor Selection to “DP, 120 ms.” (2) Set Press Freq Filter Constant to “0.15.”(3) Set Press Freq Calc PV High Limit to “Upper Range Value.” (4) Set Press Freq Calc PV Low Limit to “Lower Range Value.”(5) Set Press Freq Index Alarm Use to “Disabled” (operation off ).
C-3-4-2. Acquisition of the index values under normal operating conditions
Obtain the index value under normal operating conditions without clogging in the connecting pipe. The collected pressure frequency index and standard deviation values are used to judge the possibility of diagnosis and to adjust the parameters in later steps.
Procedure (1) Check that the connecting pipe is operating normally. When a valve such as a manifold
valve is attached to the connecting pipe, check that the pressure can be measured.(2) Execute Reset Press Freq Index and Reset Standard Deviation. Note that after Reset Press
Freq Index is executed, the correct values for Pressure Frequency Index, Press Freq Index Min, and Press Freq Index Max cannot be obtained for a short period. After Reset Press Freq Index has been executed, wait until the first index calculation is completed.
(3) Wait for at least 30 minutes, and if possible one hour.(4) Obtain the values of Pressure Frequency Index, Press Freq Index Min, Press Freq Index
Max, and the process variable, and record them.(5) Obtain the values of Standard Deviation, Standard Deviation Min, and Standard
Deviation Max as reference values, and record them.
If there are multiple operating conditions, perform the steps above under as many conditions as possible and collect the data. The reason for this is that the pressure frequency index value may vary depending on the operating conditions, even when the process state is normal. Coveringas many conditions as possible will enable judging of the possibility of diagnosis and parameter adjustment to be carried out more reliably.
C-17
C-3-4-3. Clogging simulation test
If a valve such as a manifold valve is connected to the connecting pipe, the valve can be utilized to conduct the clogging simulation test. The pressure frequency index and standard deviation values that are collected in the clogging simulation state are used to judge the possibility of diagnosis and to adjust the parameters in later steps.Three kinds of clogging simulation test are conducted. The both-side clogging simulation test, in which valves on both the high pressure and low pressure sides are closed, and the one-side clogging simulation test, in which the valve on one side only is closed, are conducted. Two kinds of one-side clogging simulation test are conducted, one where the high pressure side is closed, and the other where the low pressure side is closed.
CAUTIONWhen the valve of the connecting pipe is closed completely, the transmitter cannot measure the correct value. In addition, even when the valve is not closed completely, the delay before the process variable follows a change in pressure may be long. (This symptom is the same as when the damping time constant of the transmitter is made larger.) When conducting the clogging simulation test, exercise great care so that the test does not interfere with process safety or control.
Procedure (1) Close the valve of the connecting pipe either completely or so that it is slightly open (with
a small amount of fluid flow).
• For the both-side clogging simulation test, close the valves of the connecting pipes on both the high and low pressure sides.
• For the one-side clogging simulation test (high pressure side), open the valve of the connecting pipe on the high pressure side and close only the valve on the low pressure side.
• For the one-side clogging simulation test (low pressure side), close the valve of the connecting pipe on the high pressure side and open the valve on the low pressure side.
(2) Execute Reset Press Freq Index and Reset Standard Deviation. (3) Wait 20 minutes or more.
(4) Record the values for Pressure Frequency Index, Press Freq Index Min, Press Freq Index Max, and the PV.
(5) Obtain the values for Standard Deviation, Standard Deviation Min, and Standard Deviation Max as reference values, and record them.
If there are multiple operating conditions and the index value under normal operating conditions varies depending on the operating conditions, it is recommended that the steps described above be repeated under each operating condition.In the clogging simulation test, the valve of the connecting pipe needs to be sufficiently closed. The reason for this is that the low-pass filter effect due to clogging as described in “Principle” above does not occur if the flow path resistance caused by clogging (resistance to fluid flow) is not sufficiently high.
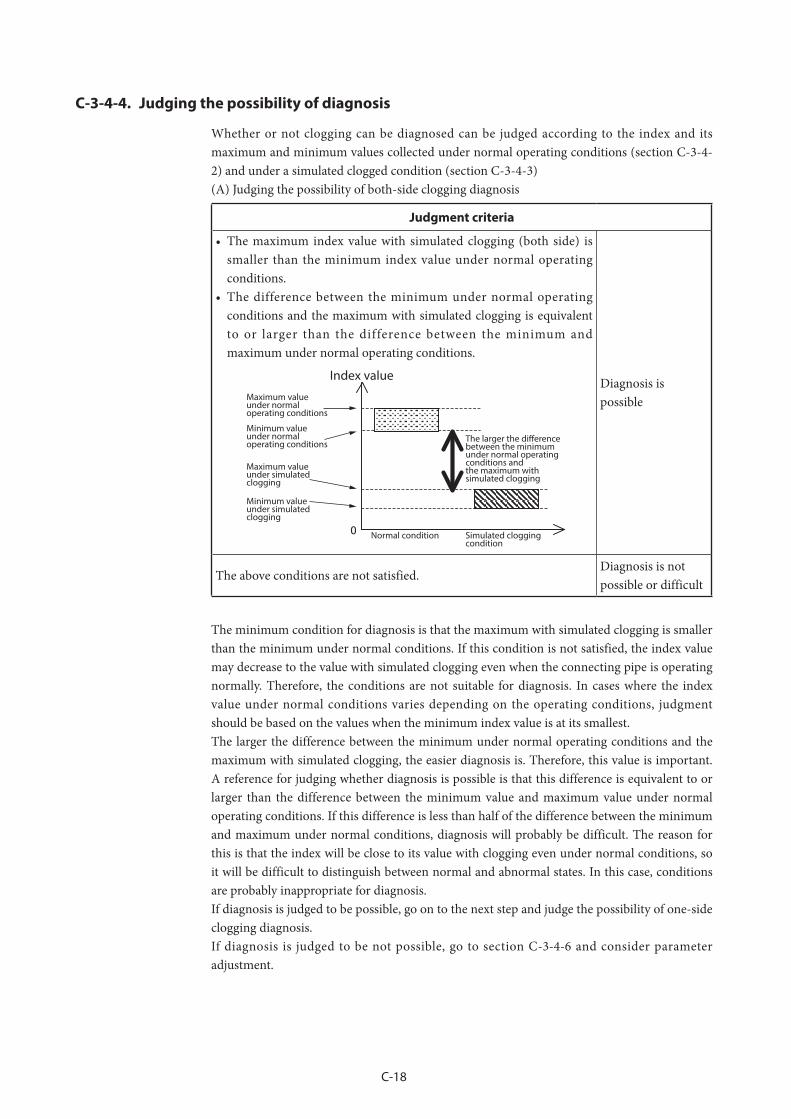
C-18
C-3-4-4. Judging the possibility of diagnosis
Whether or not clogging can be diagnosed can be judged according to the index and its maximum and minimum values collected under normal operating conditions (section C-3-4-2) and under a simulated clogged condition (section C-3-4-3)(A) Judging the possibility of both-side clogging diagnosis
Judgment criteria
• The maximum index value with simulated clogging (both side) is smaller than the minimum index value under normal operating conditions.
• The difference between the minimum under normal operating conditions and the maximum with simulated clogging is equivalent to or larger than the difference between the minimum and maximum under normal operating conditions.
Index value
Maximum value under normal operating conditions
Minimum value under normal operating conditions
Maximum value under simulated clogging
Minimum value under simulated clogging
Normal condition Simulated clogging condition
The larger the dierence between the minimum under normal operating conditions and the maximum with simulated clogging
Diagnosis is possible
The above conditions are not satisfied.Diagnosis is not possible or difficult
The minimum condition for diagnosis is that the maximum with simulated clogging is smaller than the minimum under normal conditions. If this condition is not satisfied, the index value may decrease to the value with simulated clogging even when the connecting pipe is operating normally. Therefore, the conditions are not suitable for diagnosis. In cases where the index value under normal conditions varies depending on the operating conditions, judgment should be based on the values when the minimum index value is at its smallest.The larger the difference between the minimum under normal operating conditions and the maximum with simulated clogging, the easier diagnosis is. Therefore, this value is important. A reference for judging whether diagnosis is possible is that this difference is equivalent to or larger than the difference between the minimum value and maximum value under normal operating conditions. If this difference is less than half of the difference between the minimum and maximum under normal conditions, diagnosis will probably be difficult. The reason for this is that the index will be close to its value with clogging even under normal conditions, so it will be difficult to distinguish between normal and abnormal states. In this case, conditions are probably inappropriate for diagnosis.If diagnosis is judged to be possible, go on to the next step and judge the possibility of one-side clogging diagnosis.If diagnosis is judged to be not possible, go to section C-3-4-6 and consider parameter adjustment.

C-19
(B) Judging the possibility of one-side clogging diagnosis
Judgment criteria
• The maximum value in either the one-side clogging simulation state on the high pressure or low pressure side is smaller than the minimum value under normal operating conditions.
• The difference between the minimum under normal operating conditions and the maximum with simulated clogging is equivalent to or larger than the difference between the minimum and maximum under normal operating conditions.
Index value
Maximum value under normal operating conditions
Minimum value under normal operating conditions
Maximum value under simulated clogging
Minimum value under simulated clogging
Normal condition Simulated clogging condition
The larger the dierence between the minimum under normal operating conditions and the maximum with simulated clogging
Diagnosis is possible (Case A)
• With simulated one-side clogging, the minimum index value on either the high or low pressure side, or on both sides, is larger than the maximum value under normal operating conditions.
• The difference between the index value under normal operating conditions and the index value with simulated clogging is equivalent to or larger than the difference between the minimum and maximum values under normal operating conditions.
The following diagram is an example of such case. There may be times when the index value will increase no matter which one of them gets clogged.
Maximum value with simulated clogging(High-pressure side)
There may be times whenthe index value will increase
It is acceptable for the indexvalue to decrease sometimes
Minimum value with simulated clogging(High-pressure side)
Maximum value with simulated clogging(Low-pressure side)
Minimum value with simulated clogging(Low-pressure side)
Maximum value under normal operating conditions
Minimum value under normal operating conditions
Index value
Normal condition Simulated cloggingcondition(High pressure side)
Simulated cloggingcondition(Low pressure side)
Diagnosis is possible (Case B)
• The above conditions are not satisfied.Diagnosis is not possible or difficult.
If the diagnosis is judged to be possible, go to section C-3-4-5 and set the diagnostic alarm.If only the one-side diagnosis is judged to be not possible, go to section C-3-4-7 and change the settings to enable easier detection of one-side clogging, or set only both-side clogging for the diagnosis target, and then set the diagnosis alarm as described in section C-3-4-5.

C-20
C-3-4-5. Setting the diagnosis alarm
When diagnosis is judged to be possible, set the alarm. If you do not want to activate the alarm, omit the steps in this section.
CAUTION The procedures described in this document do not guarantee the detection of clogging or the elimination of false indications. The pressure frequency index may change due to causes other than clogging, and may also depend on the degree of clogging or the material of the clog. Adjusting the settings should be done with the realization that there is no threshold value setting that can eliminate misinformation and securely detect clogging only.
(A) When using both-side clogging diagnosis only, or when judging case A in section C-3-4-4First, determine the alarm threshold value. Determine only the lower limit value. This threshold should be between the minimum index value under normal conditions and the maximum with simulated clogging. If the threshold is put close to the minimum under normal operating conditions, the alarm will be activated earlier, but the possibility of a false alarm is also higher. Put the threshold at a certain distance away from the minimum under normal operating conditions, leaving a margin.
Index value
Threshold value(Low limit)
Index value range under the normal operating conditions Minimum value
under normal operating conditions
Maximum value under simulated clogging
After determining the threshold value, follow the steps below to set the alarm and start the diagnosis.
Procedure (1) Execute Reset Press Freq Index.(2) Set Press Freq Index Low Limit to the determined threshold value (lower limit). (3) Set Press Freq Index Alarm Use “Enabled (Low)” (lower limit only).
With these settings, when the index value is outside the normal range and approaches the value with simulated clogging, the alarm is activated.
(B) When judging case B in section C-3-4-4First, determine both the upper limit and lower limit of the alarm threshold value. The threshold value (upper limit) should be put between the maximum value under normal operating conditions and the minimum value that increases the value of the index in the one-side clogging simulation. The threshold value (lower limit) should be put between the minimum value under normal operating conditions and the maximum value in the both-side clogging simulation. If the threshold is put close to the minimum value or maximum value under normal operating conditions, the alarm will be activated earlier, but the possibility of a false alarm is also higher. Put the threshold at a certain distance away from the minimum or maximum values under normal operating conditions, leaving a margin.

C-21
xmax
xmin
Index value Minimum value ofone-side clogging simulation test
Maximum value ofboth-side clogging simulation test
Maximum value under normal operating conditions
Minimum value under normal operating conditions
Index value range under the normal operating conditions
Threshold value(High limit)
Threshold value(Low limit)
After determining the threshold value, follow the steps below to set the alarm and start the diagnosis.
Procedure (1) Execute Reset Press Freq Index.(2) Set Press Freq Index Low Limit to the determined threshold value (lower limit). (3) Set Press Freq Index High Limit to the determined threshold value (upper limit).(4) Set Press Freq Index Alarm Use “Enabled (High and Low)” (upper and lower limits).
With these settings, when the index value is outside the normal range and approaches the value with simulated clogging, the alarm is activated.
C-3-4-6. Parameter adjustment (for both-side clogging diagnosis)
If both-side clogging diagnosis is judged to be not possible, the data that is collected under normal operating conditions (section C-3-4-2) and when there is simulated clogging (C-3-4-3) can be analyzed and the parameters adjusted. The reason why diagnosis cannot be performed is that the index value—even under normal operating conditions—is similar to or smaller than that when there is clogging, so the normal and clogged states cannot be distinguished. There are two primary causes leading for this situation.
• A large amount of variation of the index under normal conditions• A small variation of the index when there is clogging
This situation may be improved by adjusting the parameters of the pressure frequency index diagnosis. The following describes the two cases.
(A) Variation of the index under normal operating conditions is large.In this case, although the value of the index is small with simulated clogging, variation in the index is large under normal conditions, so the index value can be close to or equivalent to its value with clogging even when there is no clogging, as shown in the figure below.
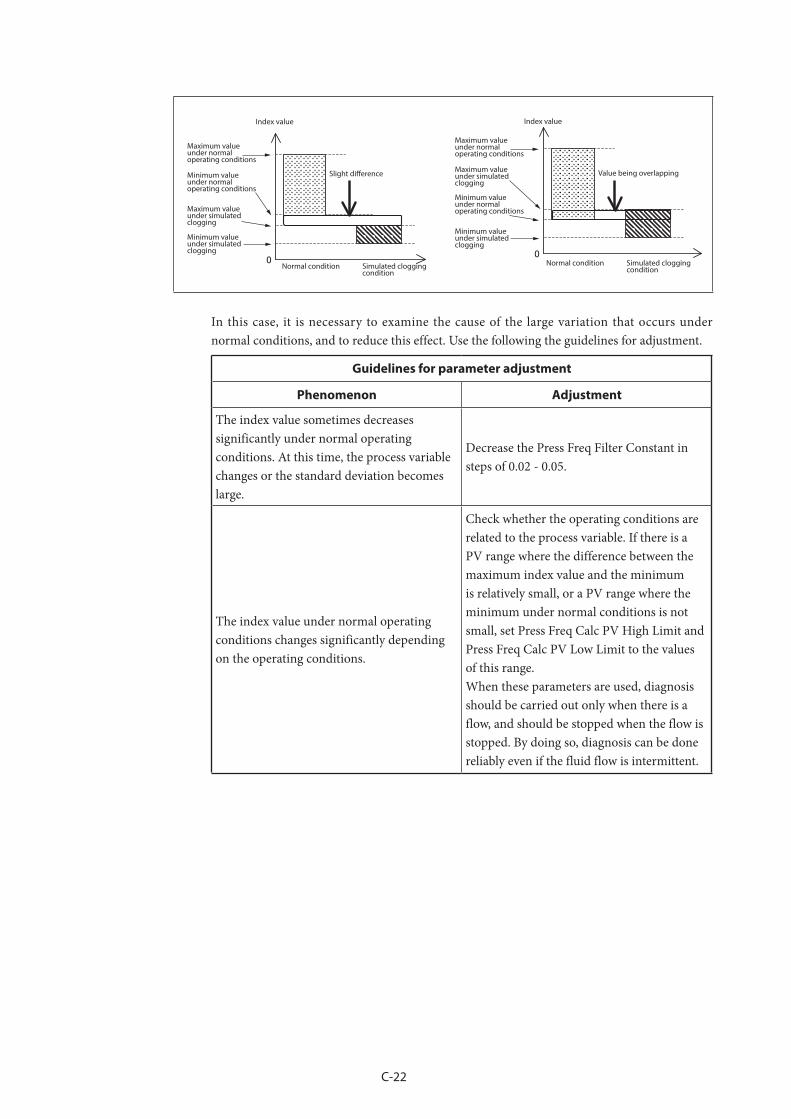
C-22
Index value
Maximum value under normal operating conditions
Minimum value under normal operating conditions
Maximum value under simulatedclogging
Minimum value under simulated clogging
Normal condition Simulated clogging condition
Slight dierence
Index value
Maximum value under normal operating conditions
Maximum valueunder simulatedclogging
Minimum valueunder normaloperating conditions
Minimum value under simulated clogging
Normal condition Simulated clogging condition
Value being overlapping
In this case, it is necessary to examine the cause of the large variation that occurs under normal conditions, and to reduce this effect. Use the following the guidelines for adjustment.
Guidelines for parameter adjustment
Phenomenon Adjustment
The index value sometimes decreases significantly under normal operating conditions. At this time, the process variable changes or the standard deviation becomes large.
Decrease the Press Freq Filter Constant in steps of 0.02 - 0.05.
The index value under normal operating conditions changes significantly depending on the operating conditions.
Check whether the operating conditions are related to the process variable. If there is a PV range where the difference between the maximum index value and the minimum is relatively small, or a PV range where the minimum under normal conditions is not small, set Press Freq Calc PV High Limit and Press Freq Calc PV Low Limit to the values of this range.When these parameters are used, diagnosis should be carried out only when there is a flow, and should be stopped when the flow is stopped. By doing so, diagnosis can be done reliably even if the fluid flow is intermittent.

C-23
(B) The variation of the index when there is a clog is small.In this case, although variation in the index is relatively small under normal operating conditions, the value of the index is almost the same as with simulated clogging, as shown in the figure below.
Index value Index valueMaximum value under normal operating conditions
Minimum value under normal operating conditions
Maximum value under simulated clogging
Minimum value under simulated clogging The dierence with that of
the clog simulated condition is smallCannot make a distinctionas values are overlapped
Normal condition Simulated clogging condition
Maximum value under normal operating conditions
Minimum value under normal operating conditions
Maximum value under simulated clogging
Minimum value under simulated clogging
Normal condition Simulated clogging condition
In this case, the index value under normal operating conditions is similar to that with clogging, or the index value is almost the same even when clogging occurs. In either case, it is necessary to examine the cause and to minimize this effect. Use the following guidelines for adjustment.
Guidelines for parameter adjustment
Phenomenon Adjustment
Since the process variable fluctuates and there is always low-frequency pressure fluctuation, the value of the index is small even under normal operating conditions. The standard deviation is relatively large.
Decrease the Press Freq Filter Constant in steps of 0.02 - 0.05.
The PV does not change and the standard deviation is also small. The frequency of the original pressure fluctuation is low and the index value is small. (The reference index value is 0.1 or less under normal operating conditions.) Fluid viscosity is high.
Change the Press Freq Index Sensor Selection. If the present value is “DP, 120 ms”, set it to “DP, 240 ms,” and if the present value is “DP, 240 ms,” set it to “DP, 360 ms.”Note : This adjustment can be performed
only when DP is selected for the Press Freq Index Sensor Selection.
The magnitude and frequency of the original pressure fluctuation are acceptable. (The reference index value is 0.2 or more under normal operating conditions.) However, the value is almost the same when there is clogging.
Decrease the Press Freq Filter Constant in steps of 0.02 - 0.05.

C-24
C-3-4-7. Parameter adjustment (for single side clog diagnosis)
If both-side clogging can be diagnosed but not one-side clogging, changing the Press Freq Index Sensor Selection to “SP, 360 ms” may make diagnosis possible. However, this change lowers the performance of both-side clogging diagnosis. Furthermore, changing the parameter does not necessarily ensure the reliable diagnosis of one-side clogging. Be sure you understand these points before changing the parameter.After the parameter has been changed, return to section C-3-4-1, and obtain the index value under normal operating conditions again. Since the data collected so far cannot be used, follow sections C-3-4-1 to C-3-4-4 again to collect the data. If both-side clogging cannot be diagnosed after the parameter has been changed, and the possibility of diagnosing one-side clogging has not changed, change the setting back to its previous value. Then set the diagnosis alarm for the case where only both-side clogging is diagnosed, referring to section C-3-4-5.
C-3-4-8. Clogging simulation test cannot be conducted.
When the clogging simulation test cannot be conducted, only the index value data under normal operating conditions (index values collected in section C-3-4-2) can be used to determine the threshold value. When many index values can be collected, calculate the average value (μ) and standard deviation (σ), and determine the threshold value based on μ ± nσ. To eliminate misinformation, a value from 4 to 6 is recommended for n.If only the maximum (xmax) and minimum (xmin) index values are known, the threshold value can also be determined using these values. For example, the threshold value should be set to a value that is no more than (xmax−xmin)/2 from the minimum value, as shown in the figure below.
x max
x min
( x max x min )/2
( x max x min )/2
Index value
Index value range under the normal operating conditions
Thresholdvalue(High)
Thresholdvalue(Low)
Note that the threshold value determined only using the index value data under normal operating conditions is not always appropriate. The index value may reach the threshold value due to causes other than clogging, or the index value may not change to the threshold value even when clogging occurs. Observe changes in the index value for a short period after the threshold value has been determined, and then check that the index value does not exceed the threshold value under normal operating conditions, and that the difference between the correct value range and threshold valueis not large. Revise the threshold value when necessary. Also, if the clogging simulation test is not conducted, it is difficult to predict the behavior of the index when one side is clogged. Therefore, even when the threshold value is set to the Press Freq Index High Limit, it is not relevant for clogging diagnosis.

C-25
C-4. Setting using a level meter
C-4-1. Clogging and the pressure frequency indexThe pressure frequency index varies depending on clogging in the connecting pipe. Generally, the pressure frequency index becomes smaller as clogging progresses. Normally, the pressure frequency index does not become larger.
C-4-2. Points to note regarding the diagnosis of cloggingWhen the pressure frequency index is used to diagnose clogging in the connecting pipe, observe the cautions shown below.If the fluctuation is very small or its frequency is low, clogging cannot be diagnosed. This is because the pressure and differential pressure need to include sufficient perturbation in order to calculate the pressure frequency index with high accuracy. The following is a list of specific examples.• There is no fluid flow, or flow velocity is very slow.• Fluid viscosity is high.• There is no fluctuation source due to the fact that no fluid is flowing in or out to/from the
tank or the fluid is not agitated.
Variation in the pressure frequency index does not always mean that clogging in the connecting pipe has occurred. The index may vary due to other factors, such as the following.• A change in the operating conditions of the pump, compressor, agitator, etc. (ON/OFF,
number of units, RPM, etc.)• A change in the viscosity of the process fluid
Depending on the material that causes clogging, it is possible that variation in the index will be too small for an alarm to be activated. For example, if the clog is made of something like gravel, where there are gaps, the pressure fluctuation can be transmitted through the gaps, and there will not be much change in the index.If the frequency of pressure fluctuation is abnormal from the beginning, as is a case where the connecting pipe was clogged from the start, it may not be possible to diagnose the clogging. Do the setup procedures (C-4–4) when the connecting pipe is operating normally.Even if clogging occurs suddenly, the pressure frequency index will not change immediately. This is because it takes a few minutes to calculate the frequency of the pressure fluctuation with a high level of accuracy.If the transmitter is installed in an environment subject to heavy vibration, the pressure frequency index may be affected, preventing correct diagnosis.

C-26
C-4-3. Parameter configuration proceduresTo diagnose clogging in the connecting pipe using the pressure frequency index, parameters must be set. Use the configuration procedure below.
Preparation
Acquisition of index values under normal conditions
Clogging simulation test
Judge the possibility of diagnosis
Setting of the alarm
Start the diagnosis
If not possible
Possible
Note:
Parameter adjustment
x
x
x
x
x
x
Preparation (see section C-4-4-1): Initialize the parameters in preparation for obtaining the index values.Acquisition of index values under normal conditions (see section C-4-4-2): Obtain index values under normal conditions, and also the maximum and minimum index values.Clogging simulation test (see section C-4-4-3): Operate the valve of the connecting pipe to simulate a clog and obtain index values.
Note : If you cannot conduct the clogging simulation test, skip sections C-4-4-3 to C-4-4-6, and then read section C-4-4-7.
Judging the possibility of diagnosis (see section C-4-4-4): Determine whether or not you can differentiate between a normal state and a simulated clogged state by comparing their index values. Setting the alarm (see section C-4-4-5): If diagnosis is judged to be possible, adjust the parameters shown below to set an alarm based on the collected index values. When the configuration process is complete, the diagnosis can begin.
Press Freq Index Alarm Use Press Freq Index Low Limit
Parameter adjustment (see section C-4-4-6): If distinguishing the two states is not possible, analyze the cause, adjust the parameters shown below, and then return to “Acquisition of index values under normal conditions.”
Press Freq Index Sensor Selection Press Freq Filter Constant Press Freq Calc PV High Limit Press Freq Calc PV Low Limit
C-27
The procedures stated in “Acquisition of index values under normal conditions” and “Clogging simulation test” refer to the following parameters and process variables.
Pressure Frequency Index Press Freq Index Max Press Freq Index Min Standard Deviation Standard Deviation Max Standard Deviation Min Press Freq Calc PV High Limit Press Freq Calc PV Low Limit
The standard deviation values are not directly used to diagnose clogging, but it may be necessary to refer to them during parameter adjustment. Therefore, it is recommended that they be collected at the same time as the pressure frequency indexes.
C-4-4. Configuration proceduresThis section describes the configuration procedures in order.
C-4-4-1. Preparation
Before starting configuration, initialize the parameters.
Procedure (1) Set Press Freq Index Sensor Selection to “DP, 120 ms.” (2) Set Press Freq Filter Constant to “0.15.”(3) Set Press Freq Calc PV High Limit to “Upper Range Value.” (4) Set Press Freq Calc PV Low Limit to “Lower Range Value.”(5) Set Press Freq Index Alarm Use to “Disabled” (operation off ).
C-4-4-2. Acquisition of the index values under normal operating conditions
Obtain the index value under normal operating conditions without clogging in the connecting pipe. The collected pressure frequency index and standard deviation values are used to judge the possibility of diagnosis and to adjust the parameters in later steps.
Procedure (1) Check that the connecting pipe is operating normally. When a valve such as a manifold
valve is attached to the connecting pipe, check that the pressure can be measured.(2) Execute Reset Press Freq Index and Reset Standard Deviation. Note that after Reset Press
Freq Index is executed, the correct values for Pressure Frequency Index, Press Freq Index Min, and Press Freq Index Max cannot be obtained for a short period of time. After Reset Press Freq Index has been executed, wait until the first index calculation is completed.
(3) Wait for at least 30 minutes, and if possible one hour.(4) Obtain the values for Pressure Frequency Index, Press Freq Index Min, Press Freq Index
Max, and the process variable, and record them.(5) Obtain the values of Standard Deviation, Standard Deviation Min, and Standard
Deviation Max as reference values, and record them.

C-28
If there are multiple operating conditions, perform the steps above under as many conditions as possible and collect the data. The reason for this is that the pressure frequency index value may vary depending on the operating conditions, even when the process state is normal. Covering as many conditions as possible will enable judging of the possibility of diagnosis and parameter adjustment to be carried out more reliably.
C-4-4-3. Clogging simulation test
If a valve such as a stop valve is connected to the connecting pipe, the valve can be utilized to conduct the clogging simulation test. The pressure frequency index and standard deviation values that are collected in the clogging simulation state are used to judge the possibility of diagnosis and to adjust the parameters in later steps.
CAUTIONWhen the valve of the connecting pipe is closed completely, the transmitter cannot measure the correct value. In addition, even when the valve is not closed completely, the delay before the process variable follows changes in pressure may be long. (This symptom is the same as when the damping time constant of the transmitter is made larger.) When conducting the clogging simulation test, exercise great care so that the test does not interfere with process safety or control.
Procedure (1) Close the valve of the connecting pipe either completely or so that it is slightly open (with
a small amount of fluid flow).(2) Execute Reset Press Freq Index and Reset Standard Deviation. (3) Wait 20 minutes or more.(4) Record the values for Pressure Frequency Index, Press Freq Index Min, Press Freq Index
Max, and the PV.(5) Obtain the values for Standard Deviation, Standard Deviation Min, and Standard
Deviation Max as reference values, and record them.
If there are multiple operating conditions and the index value under normal operating conditions varies depending on the operating conditions, it is recommended that the steps described above be repeated under each operating condition.In the clogging simulation test, the valve of the connecting pipe needs to be sufficiently closed. The reason for this is that the low-pass filter effect due to clogging as described in “Principle” above does not occur if the flow path resistance caused by clogging (resistance to fluid flow) is not sufficiently high.
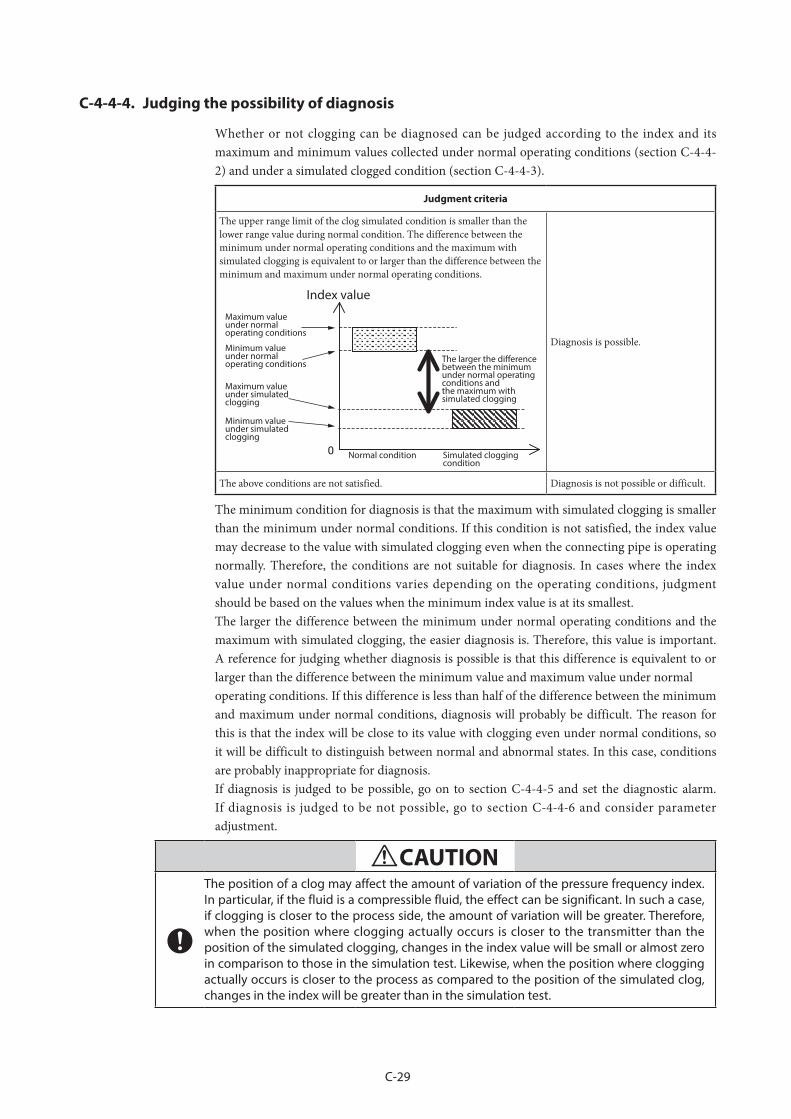
C-29
C-4-4-4. Judging the possibility of diagnosis
Whether or not clogging can be diagnosed can be judged according to the index and its maximum and minimum values collected under normal operating conditions (section C-4-4-2) and under a simulated clogged condition (section C-4-4-3).
Judgment criteria
The upper range limit of the clog simulated condition is smaller than the lower range value during normal condition. The difference between the minimum under normal operating conditions and the maximum with simulated clogging is equivalent to or larger than the difference between the minimum and maximum under normal operating conditions.
Index value
Maximum value under normal operating conditions
Minimum value under normal operating conditions
Maximum value under simulated clogging
Minimum value under simulated clogging
Normal condition Simulated clogging condition
The larger the dierence between the minimum under normal operating conditions and the maximum with simulated clogging
Diagnosis is possible.
The above conditions are not satisfied. Diagnosis is not possible or difficult.
The minimum condition for diagnosis is that the maximum with simulated clogging is smaller than the minimum under normal conditions. If this condition is not satisfied, the index value may decrease to the value with simulated clogging even when the connecting pipe is operating normally. Therefore, the conditions are not suitable for diagnosis. In cases where the index value under normal conditions varies depending on the operating conditions, judgment should be based on the values when the minimum index value is at its smallest.The larger the difference between the minimum under normal operating conditions and the maximum with simulated clogging, the easier diagnosis is. Therefore, this value is important. A reference for judging whether diagnosis is possible is that this difference is equivalent to or larger than the difference between the minimum value and maximum value under normaloperating conditions. If this difference is less than half of the difference between the minimum and maximum under normal conditions, diagnosis will probably be difficult. The reason for this is that the index will be close to its value with clogging even under normal conditions, so it will be difficult to distinguish between normal and abnormal states. In this case, conditions are probably inappropriate for diagnosis.If diagnosis is judged to be possible, go on to section C-4-4-5 and set the diagnostic alarm. If diagnosis is judged to be not possible, go to section C-4-4-6 and consider parameter adjustment.
CAUTIONThe position of a clog may affect the amount of variation of the pressure frequency index. In particular, if the fluid is a compressible fluid, the effect can be significant. In such a case, if clogging is closer to the process side, the amount of variation will be greater. Therefore, when the position where clogging actually occurs is closer to the transmitter than the position of the simulated clogging, changes in the index value will be small or almost zero in comparison to those in the simulation test. Likewise, when the position where clogging actually occurs is closer to the process as compared to the position of the simulated clog, changes in the index will be greater than in the simulation test.
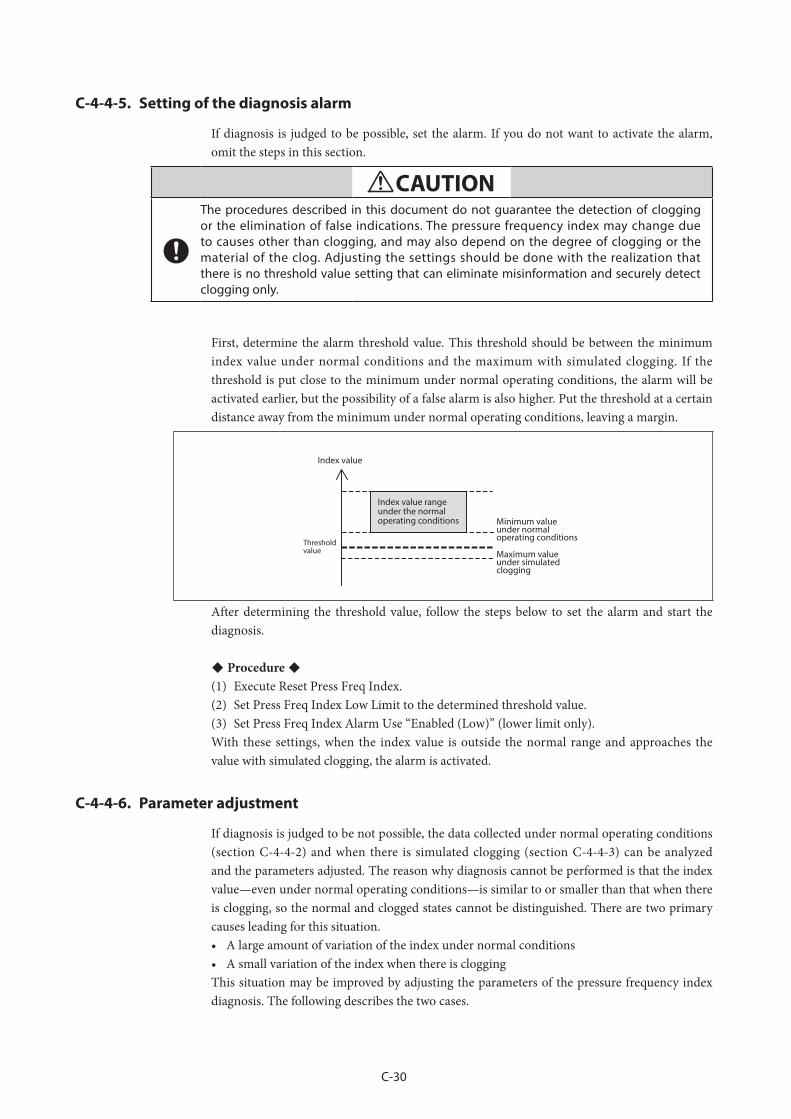
C-30
C-4-4-5. Setting of the diagnosis alarm
If diagnosis is judged to be possible, set the alarm. If you do not want to activate the alarm, omit the steps in this section.
CAUTION The procedures described in this document do not guarantee the detection of clogging or the elimination of false indications. The pressure frequency index may change due to causes other than clogging, and may also depend on the degree of clogging or the material of the clog. Adjusting the settings should be done with the realization that there is no threshold value setting that can eliminate misinformation and securely detect clogging only.
First, determine the alarm threshold value. This threshold should be between the minimum index value under normal conditions and the maximum with simulated clogging. If the threshold is put close to the minimum under normal operating conditions, the alarm will be activated earlier, but the possibility of a false alarm is also higher. Put the threshold at a certain distance away from the minimum under normal operating conditions, leaving a margin.
Index value
Threshold value
Minimum value under normal operating conditions
Maximum value under simulated clogging
Index value range under the normal operating conditions
After determining the threshold value, follow the steps below to set the alarm and start the diagnosis.
Procedure (1) Execute Reset Press Freq Index.(2) Set Press Freq Index Low Limit to the determined threshold value. (3) Set Press Freq Index Alarm Use “Enabled (Low)” (lower limit only).With these settings, when the index value is outside the normal range and approaches the value with simulated clogging, the alarm is activated.
C-4-4-6. Parameter adjustment
If diagnosis is judged to be not possible, the data collected under normal operating conditions (section C-4-4-2) and when there is simulated clogging (section C-4-4-3) can be analyzed and the parameters adjusted. The reason why diagnosis cannot be performed is that the index value—even under normal operating conditions—is similar to or smaller than that when there is clogging, so the normal and clogged states cannot be distinguished. There are two primary causes leading for this situation.• A large amount of variation of the index under normal conditions• A small variation of the index when there is cloggingThis situation may be improved by adjusting the parameters of the pressure frequency index diagnosis. The following describes the two cases.

C-31
(A) Variation of the index under normal operating conditions is large.In this case, although the value of the index is small with simulated clogging, variation in the index is large under normal conditions, so the index value can be close to or equivalent to its value with clogging even when there is no clogging, as shown in the figure below.
Maximum value under normal operating conditions
Minimum value under normal operating conditions
Maximum value under simulatedclogging
Minimum value under simulated clogging
Index value
Slight dierence
Normal condition Simulated clogging condition
Index value
Maximum value under normal operating conditions
Maximum valueunder simulatedclogging
Minimum valueunder normaloperating conditions
Minimum value under simulated clogging
Value being overlapping
Normal condition Simulated clogging condition
In this case, it is necessary to examine the cause of the large variation that occurs under normal conditions, and to reduce this effect. Use the following the guidelines for adjustment.
Guidelines for parameter adjustment
Phenomenon Adjustment
The index value sometimes decreases significantly under normal operating conditions. At this time, the process variable changes or the standard deviation becomes large.
Increase the Press Freq Filter Constant in steps of 0.02 - 0.05.
The index value under normal operating conditions changes significantly depending on the operating conditions.
Check whether the operating conditions are related to the process variable. If there is a PV range where the difference between the maximum index value and the minimum is relatively small, or a PV range where the minimum under normal conditions is not small, set Press Freq Calc PV High Limit and Press Freq Calc PV Low Limit to the values of this range.If you use this parameter, you can conduct the diagnosis only when there’s level, and stop the diagnosis when there is not.
(B) The variation of the index when there is a clog is small.In this case, although variation in the index is relatively small under normal operating conditions, the value of the index is almost the same as with simulated clogging, as shown in the figure below.
Index value Index valueMaximum value under normal operating conditions
Minimum value under normal operating conditions
Maximum value under simulated clogging
Minimum value under simulated clogging The dierence with that of
the clog simulated condition is smallCannot make a distinctionas values are overlapped
Normal condition Simulated clogging condition
Maximum value under normal operating conditions
Minimum value under normal operating conditions
Maximum value under simulated clogging
Minimum value under simulated clogging
Normal condition Simulated clogging condition

C-32
In this case, the index value under normal operating conditions is similar to that with clogging, or the index value is almost the same even when clogging occurs. In either case, it is necessary to examine the cause and to minimize this effect. Use the following guidelines for adjustment.
Guidelines for parameter adjustment
Phenomenon Adjustment
Since the process variable fluctuates and there is always low-frequency pressure fluctuation, the value of the index is small even under normal operating conditions. The standard deviation is relatively large.
Increase the Press Freq Filter Constant in steps of 0.02 - 0.05.
The PV does not change and the standard deviation is also small. The frequency of the original pressure fluctuation is low and the index value is small. (The reference index value is 0.1 or less under normal operating conditions.) Fluid viscosity is high.
Change the Press Freq Index Sensor Selection. If the present value is “DP, 120 ms”, set it to “DP, 240 ms,” and if the present value is “DP, 240 ms,” set it to “DP, 360 ms.”
The magnitude and frequency of the original pressure fluctuation are acceptable. (The reference index value is 0.2 or more under normal operating conditions.) However, the value is almost the same when there is clogging.
Decrease the Press Freq Filter Constant in steps of 0.02 - 0.05.
C-4-4-7. Clogging simulation test cannot be conducted.
When the clogging simulation test cannot be conducted, only the index value data under normal operating conditions (index values collected in section C-4-4-2) can be used to determine the threshold value. When many index values can be collected, calculate the average value (μ) and standard deviation (σ), and determine the threshold value based on μ ± nσ. To eliminate misinformation, a value from 4 to 6 is recommended for n. The threshold value can also be determined using the maximum (xmax) and minimum (xmin) index values. For example, the threshold value should be set to a value that is no more than (xmax−xmin)/2 from the minimum value, as shown in the figure below.
xmax
xmin(xmax xmin)/2
Index value
Thresholdvalue (Low)
Index value range under the normal operating conditions
Note that the threshold value determined using only the index value data under normal operating conditions is not always appropriate. The index value may become smaller than the threshold value due to causes other than clogging, or the index value may not become smaller than the threshold value even when clogging occurs. Observe changes in the index value for a short period after the threshold value has been determined, and then check that the index value does not become smaller than the threshold value under normal operating conditions, and that the difference between the correct value range and threshold value is not large. Revise the threshold value when necessary.
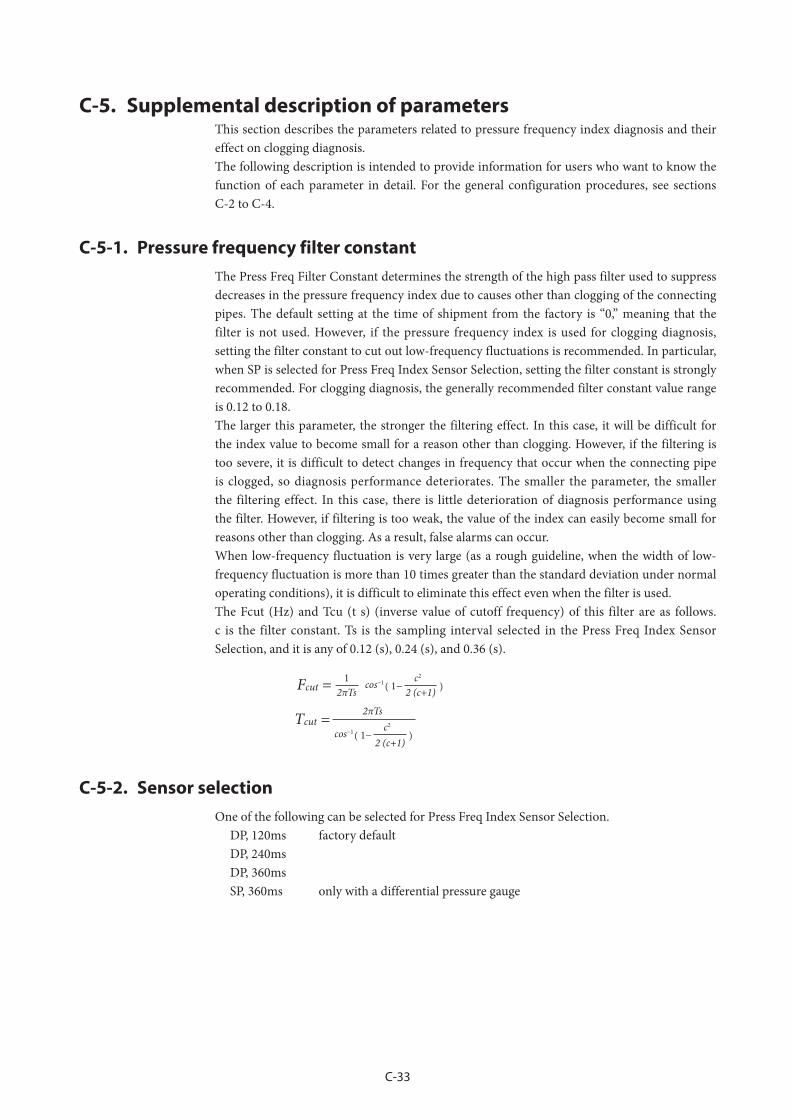
C-33
C-5. Supplemental description of parametersThis section describes the parameters related to pressure frequency index diagnosis and their effect on clogging diagnosis.The following description is intended to provide information for users who want to know the function of each parameter in detail. For the general configuration procedures, see sections C-2 to C-4.
C-5-1. Pressure frequency filter constantThe Press Freq Filter Constant determines the strength of the high pass filter used to suppress decreases in the pressure frequency index due to causes other than clogging of the connecting pipes. The default setting at the time of shipment from the factory is “0,” meaning that the filter is not used. However, if the pressure frequency index is used for clogging diagnosis, setting the filter constant to cut out low-frequency fluctuations is recommended. In particular, when SP is selected for Press Freq Index Sensor Selection, setting the filter constant is strongly recommended. For clogging diagnosis, the generally recommended filter constant value range is 0.12 to 0.18.The larger this parameter, the stronger the filtering effect. In this case, it will be difficult for the index value to become small for a reason other than clogging. However, if the filtering is too severe, it is difficult to detect changes in frequency that occur when the connecting pipe is clogged, so diagnosis performance deteriorates. The smaller the parameter, the smaller the filtering effect. In this case, there is little deterioration of diagnosis performance using the filter. However, if filtering is too weak, the value of the index can easily become small for reasons other than clogging. As a result, false alarms can occur.When low-frequency fluctuation is very large (as a rough guideline, when the width of low- frequency fluctuation is more than 10 times greater than the standard deviation under normal operating conditions), it is difficult to eliminate this effect even when the filter is used.The Fcut (Hz) and Tcu (t s) (inverse value of cutoff frequency) of this filter are as follows. c is the filter constant. Ts is the sampling interval selected in the Press Freq Index Sensor Selection, and it is any of 0.12 (s), 0.24 (s), and 0.36 (s).
Fcut = 12πTs
cos−1 1−c2
2 (c+1) )(
Tcut = 2πTs
cos−1 1−c2
2 (c+1) )(
C-5-2. Sensor selectionOne of the following can be selected for Press Freq Index Sensor Selection. DP, 120ms factory default DP, 240ms DP, 360ms SP, 360ms only with a differential pressure gauge

C-34
C-5-2-1. P sampling interval
When DP is selected for Press Freq Index Sensor Selection, 120, 240, or 360 ms can be selected for the P sampling interval. Normally, a shorter sampling interval is advantageous for clogging diagnosis. The reason for this is that changes in pressure fluctuation caused by clogging become apparent at higher frequencies. (For details, see the “C-1. Principle” section.) The sampling interval must be short for perception of changes in high frequency. Generally, the shorter the sampling interval, the better the performance of clogging diagnosis. However, with a shorter sampling interval, low frequencies are difficult to measure. Therefore, if the frequency of the pressure fluctuation is low initially, lengthening the sampling interval will make diagnosis easier.
C-5-2-2. Sensor type
DP and SP are the available sensor selections for a differential pressure gauge. The reason for this is that it allows different sensors to be used for the index calculation. When DP is selected, the differential pressure sensor is used. When SP is selected, the static pressure sensor is used. Therefore, the diagnosis characteristics may change.The following are the features of clogging diagnosis when DP is selected.• The flow rate or magnitude of the pressure fluctuation necessary for diagnosis is smaller
than for SP.• Since a sampling interval of 120 ms can be selected, the sensitivity for clogging detection is
high. The index update frequency is also high.• It may not be possible to detect one-side clogging.
The following are the features of clogging diagnosis when SP is selected.• The pressure fluctuation necessary for diagnosis is larger than for DP. Therefore, diagnosis
may be possible with DP but not possible with SP.• The sampling interval is fixed at 360 ms. The sensitivity for clogging detection decreases
and the index update frequency is low in comparison to DP with 120 or 240 ms selected.• It is possible that one-side clogging that cannot be detected or that is difficult to detect with
DP can be detected with SP.
The advantage of selecting SP is that its one-side clogging detection capability is different from that of DP. However, selecting SP does not ensure one-side clogging detection. When the clogging simulation test cannot be conducted or when one-side clogging cannot be detected with SP, select DP. In these cases there is no advantage in selecting SP.
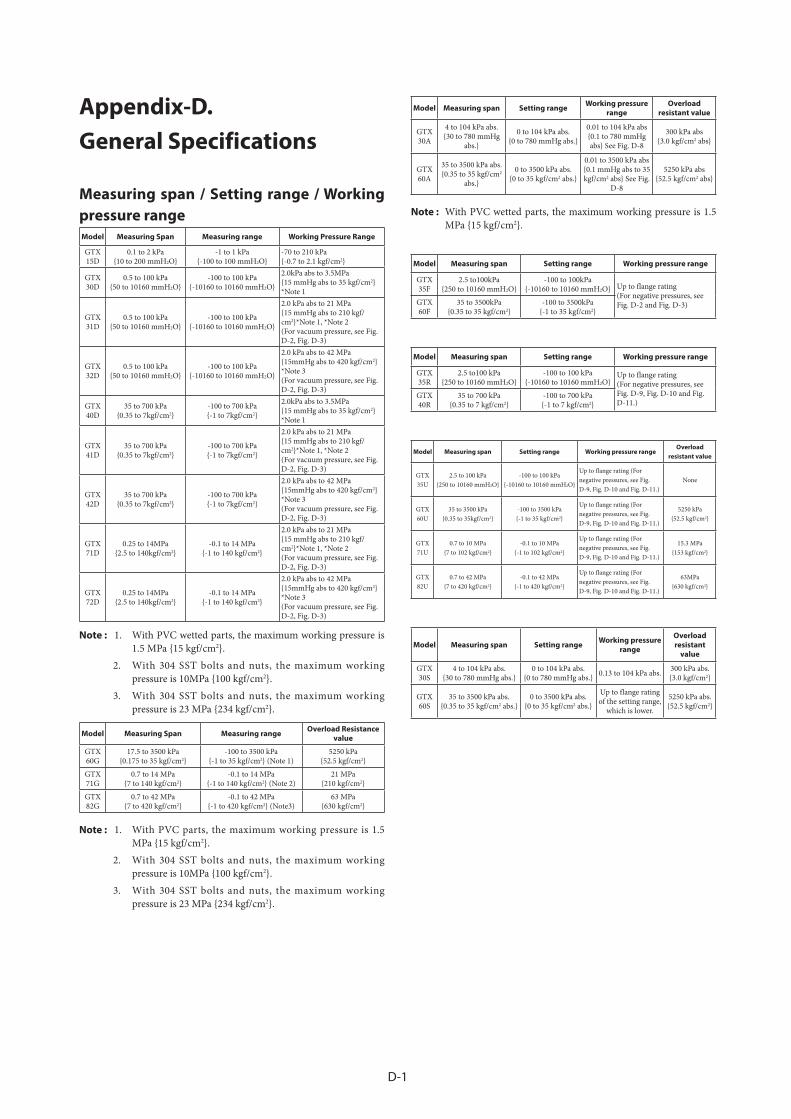
D-1
Appendix-D. General Specifications
Measuring span / Setting range / Working pressure rangeModel Measuring Span Measuring range Working Pressure Range
GTX15D
0.1 to 2 kPa10 to 200 mmH2O
-1 to 1 kPa-100 to 100 mmH2O
-70 to 210 kPa-0.7 to 2.1 kgf/cm2
GTX30D
0.5 to 100 kPa50 to 10160 mmH2O
-100 to 100 kPa-10160 to 10160 mmH2O
2.0kPa abs to 3.5MPa15 mmHg abs to 35 kgf/cm2*Note 1
GTX31D
0.5 to 100 kPa50 to 10160 mmH2O
-100 to 100 kPa-10160 to 10160 mmH2O
2.0 kPa abs to 21 MPa15 mmHg abs to 210 kgf/cm2*Note 1, *Note 2(For vacuum pressure, see Fig. D-2, Fig. D-3)
GTX32D
0.5 to 100 kPa50 to 10160 mmH2O
-100 to 100 kPa-10160 to 10160 mmH2O
2.0 kPa abs to 42 MPa15mmHg abs to 420 kgf/cm2 *Note 3(For vacuum pressure, see Fig. D-2, Fig. D-3)
GTX40D
35 to 700 kPa0.35 to 7kgf/cm2
-100 to 700 kPa-1 to 7kgf/cm2
2.0kPa abs to 3.5MPa15 mmHg abs to 35 kgf/cm2*Note 1
GTX41D
35 to 700 kPa0.35 to 7kgf/cm2
-100 to 700 kPa-1 to 7kgf/cm2
2.0 kPa abs to 21 MPa15 mmHg abs to 210 kgf/cm2*Note 1, *Note 2(For vacuum pressure, see Fig. D-2, Fig. D-3)
GTX42D
35 to 700 kPa0.35 to 7kgf/cm2
-100 to 700 kPa-1 to 7kgf/cm2
2.0 kPa abs to 42 MPa15mmHg abs to 420 kgf/cm2 *Note 3(For vacuum pressure, see Fig. D-2, Fig. D-3)
GTX71D
0.25 to 14MPa2.5 to 140kgf/cm2
-0.1 to 14 MPa-1 to 140 kgf/cm2
2.0 kPa abs to 21 MPa15 mmHg abs to 210 kgf/cm2*Note 1, *Note 2(For vacuum pressure, see Fig. D-2, Fig. D-3)
GTX72D
0.25 to 14MPa2.5 to 140kgf/cm2
-0.1 to 14 MPa-1 to 140 kgf/cm2
2.0 kPa abs to 42 MPa15mmHg abs to 420 kgf/cm2 *Note 3(For vacuum pressure, see Fig. D-2, Fig. D-3)
Note : 1. With PVC wetted parts, the maximum working pressure is 1.5 MPa 15 kgf/cm2.
2. With 304 SST bolts and nuts, the maximum working pressure is 10MPa 100 kgf/cm2.
3. With 304 SST bolts and nuts, the maximum working pressure is 23 MPa 234 kgf/cm2.
Model Measuring Span Measuring range Overload Resistance value
GTX60G
17.5 to 3500 kPa0.175 to 35 kgf/cm2
-100 to 3500 kPa-1 to 35 kgf/cm2 (Note 1)
5250 kPa52.5 kgf/cm2
GTX71G
0.7 to 14 MPa7 to 140 kgf/cm2
-0.1 to 14 MPa-1 to 140 kgf/cm2 (Note 2)
21 MPa210 kgf/cm2
GTX82G
0.7 to 42 MPa7 to 420 kgf/cm2
-0.1 to 42 MPa-1 to 420 kgf/cm2 (Note3)
63 MPa630 kgf/cm2
Note : 1. With PVC parts, the maximum working pressure is 1.5 MPa 15 kgf/cm2.
2. With 304 SST bolts and nuts, the maximum working pressure is 10MPa 100 kgf/cm2.
3. With 304 SST bolts and nuts, the maximum working pressure is 23 MPa 234 kgf/cm2.
Model Measuring span Setting range Working pressure range
Overload resistant value
GTX30A
4 to 104 kPa abs.30 to 780 mmHg
abs.
0 to 104 kPa abs.0 to 780 mmHg abs.
0.01 to 104 kPa abs0.1 to 780 mmHg abs See Fig. D-8
300 kPa abs3.0 kgf/cm2 abs
GTX60A
35 to 3500 kPa abs.0.35 to 35 kgf/cm2
abs.
0 to 3500 kPa abs.0 to 35 kgf/cm2 abs.
0.01 to 3500 kPa abs0.1 mmHg abs to 35 kgf/cm2 abs See Fig.
D-8
5250 kPa abs52.5 kgf/cm2 abs
Note : With PVC wetted parts, the maximum working pressure is 1.5 MPa 15 kgf/cm2.
Model Measuring span Setting range Working pressure range
GTX35F
2.5 to100kPa250 to 10160 mmH2O
-100 to 100kPa-10160 to 10160 mmH2O Up to flange rating
(For negative pressures, see Fig. D-2 and Fig. D-3)GTX
60F35 to 3500kPa
0.35 to 35 kgf/cm2-100 to 3500kPa
-1 to 35 kgf/cm2
Model Measuring span Setting range Working pressure range
GTX35R
2.5 to100 kPa250 to 10160 mmH2O
-100 to 100 kPa-10160 to 10160 mmH2O
Up to flange rating (For negative pressures, see Fig. D-9, Fig. D-10 and Fig. D-11.)
GTX40R
35 to 700 kPa0.35 to 7 kgf/cm2
-100 to 700 kPa-1 to 7 kgf/cm2
Model Measuring span Setting range Working pressure rangeOverload
resistant value
GTX35U
2.5 to 100 kPa250 to 10160 mmH2O
-100 to 100 kPa-10160 to 10160 mmH2O
Up to flange rating (For negative pressures, see Fig. D-9, Fig. D-10 and Fig. D-11.)
None
GTX60U
35 to 3500 kPa0.35 to 35kgf/cm2
-100 to 3500 kPa-1 to 35 kgf/cm2
Up to flange rating (For negative pressures, see Fig. D-9, Fig. D-10 and Fig. D-11.)
5250 kPa52.5 kgf/cm2
GTX71U
0.7 to 10 MPa7 to 102 kgf/cm2
-0.1 to 10 MPa-1 to 102 kgf/cm2
Up to flange rating (For negative pressures, see Fig. D-9, Fig. D-10 and Fig. D-11.)
15.3 MPa153 kgf/cm2
GTX82U
0.7 to 42 MPa7 to 420 kgf/cm2
-0.1 to 42 MPa-1 to 420 kgf/cm2
Up to flange rating (For negative pressures, see Fig. D-9, Fig. D-10 and Fig. D-11.)
63MPa630 kgf/cm2
Model Measuring span Setting range Working pressure range
Overload resistant
value
GTX30S
4 to 104 kPa abs.30 to 780 mmHg abs.
0 to 104 kPa abs.0 to 780 mmHg abs. 0.13 to 104 kPa abs. 300 kPa abs.
3.0 kgf/cm2
GTX60S
35 to 3500 kPa abs.0.35 to 35 kgf/cm2 abs.
0 to 3500 kPa abs.0 to 35 kgf/cm2 abs.
Up to flange rating of the setting range,
which is lower.
5250 kPa abs.52.5 kgf/cm2
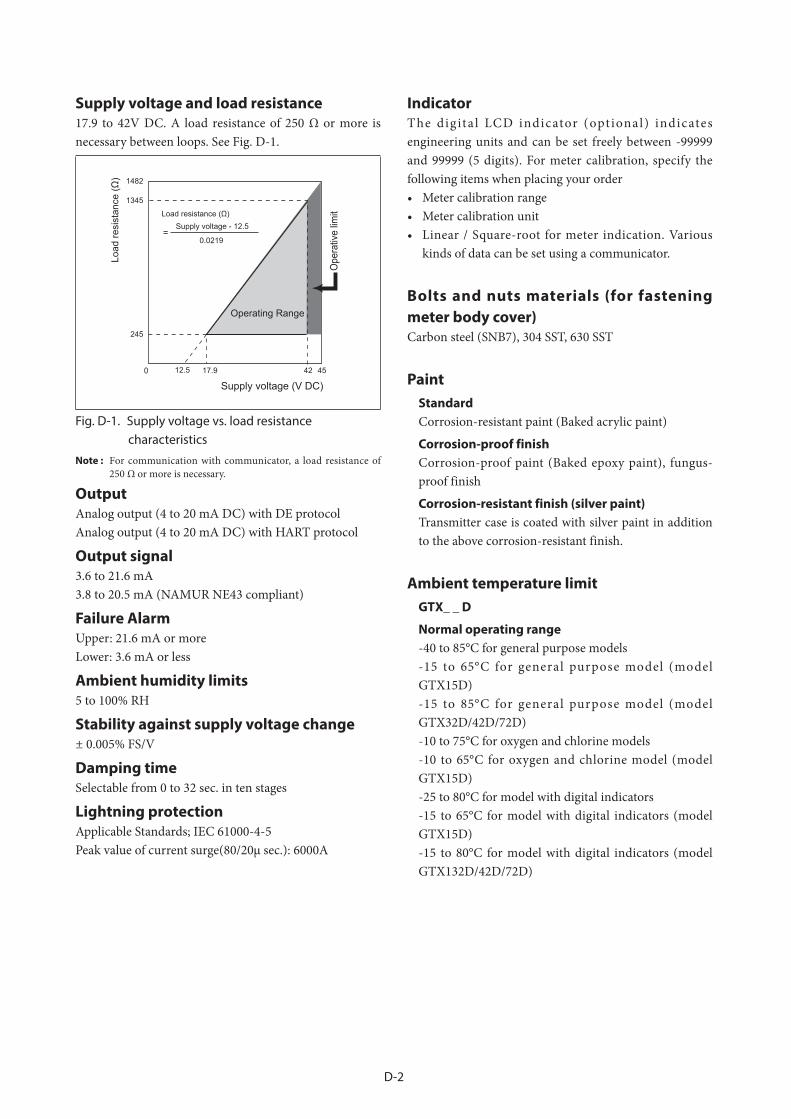
D-2
Supply voltage and load resistance17.9 to 42V DC. A load resistance of 250 Ω or more is necessary between loops. See Fig. D-1.
1345
1482
Supply voltage - 12.5
0.0219
245
0 17.9 42 45
Supply voltage (V DC)
Operating Range
=
Ope
rativ
e lim
it
12.5
Fig. D-1. Supply voltage vs. load resistance characteristics
Note : For communication with communicator, a load resistance of 250 Ω or more is necessary.
OutputAnalog output (4 to 20 mA DC) with DE protocolAnalog output (4 to 20 mA DC) with HART protocol
Output signal3.6 to 21.6 mA3.8 to 20.5 mA (NAMUR NE43 compliant)
Failure AlarmUpper: 21.6 mA or moreLower: 3.6 mA or less
Ambient humidity limits5 to 100% RH
Stability against supply voltage change ± 0.005% FS/V
Damping timeSelectable from 0 to 32 sec. in ten stages
Lightning protectionApplicable Standards; IEC 61000-4-5Peak value of current surge(80/20μ sec.): 6000A
IndicatorThe dig ita l LCD indicator (opt ional) indicates engineering units and can be set freely between -99999 and 99999 (5 digits). For meter calibration, specify the following items when placing your order• Meter calibration range• Meter calibration unit• Linear / Square-root for meter indication. Various
kinds of data can be set using a communicator.
Bolts and nuts materials (for fastening meter body cover)Carbon steel (SNB7), 304 SST, 630 SST
PaintStandardCorrosion-resistant paint (Baked acrylic paint)
Corrosion-proof finishCorrosion-proof paint (Baked epoxy paint), fungus-proof finish
Corrosion-resistant finish (silver paint)Transmitter case is coated with silver paint in addition to the above corrosion-resistant finish.
Ambient temperature limitGTX_ _ D
Normal operating range-40 to 85°C for general purpose models-15 to 65°C for general purpose model (model GTX15D)-15 to 85°C for general purpose model (model GTX32D/42D/72D)-10 to 75°C for oxygen and chlorine models-10 to 65°C for oxygen and chlorine model (model GTX15D)-25 to 80°C for model with digital indicators-15 to 65°C for model with digital indicators (model GTX15D)-15 to 80°C for model with digital indicators (model GTX132D/42D/72D)

D-3
Operative limits-50 to 93°C for general purpose models-40 to 70°C for general purpose model (model GTX15D)-25 to 93°C for general purpose model (model GTX32D/42D/72D)-40 to 80°C for oxygen and chlorine models-30 to 85°C for models with digital indicators-40 to 70°C for models with digital indicators (model GTX15D)-25 to 85°C for models with digital indicators (model GTX132D/42D/72D)
Transportation and storage conditions-50 to 85°C for general purpose models-15 to 65°C for general purpose model (model GTX15D)-15 to 85°C for general purpose model (model GTX32D/42D/72D)
GTX_ _ G, _ _A
Normal operating range-40 to 85°C for general purpose models-10 to 75°C for oxygen and chlorine models-25 to 80°C for models with digital indicators
Operative limits-50 to 93°C for general purpose models-40 to 80°C for oxygen and chlorine models-30 to 85°C for models with digital indicators
Transportation and storage conditions-50 to 85°C
GTX_ _ F
Normal operating range-30 to 75°C for general purpose models-10 to 75°C for oxygen and chlorine models-25 to 75°C for models with digital indicators
Operative limits-50 to 80°C for general purpose models-40 to 80°C for oxygen and chlorine models-30 to 80°C for models with digital indicators
Transportation and storage conditions-50 to 85°C
GTX_ _ G (Direct Mount)
Normal operating range-25 to 70°C for general purpose models-10 to 70°C for oxygen and chlorine models
Operative limits-40 to 85°C for general purpose models-40 to 80°C for oxygen and chlorine models
Transportation and storage conditions-40 to 70°C for general purpose models-40 to 70°C for oxygen and chlorine models
Temperature ranges of wetted partsGTX_ _ D
Normal operating range-40 to 110°C for general purpose models-15 to 65°C for general purpose model (model GTX15D)-15 to 110°C for general purpose model (model GTX32D/42D/72D)-20 to 75°C for oxygen and chlorine models-15 to 65°C for oxygen and chlorine model (model GTX15D)-15 to 75°C for oxygen and chlorine model (model GTX32D/42D/72D)
Operative limits-50 to 115°C for general purpose models-40 to 70°C for general purpose model (model GTX15D)-20 to 115°C for general purpose model (model GTX32D/42D/72D)-40 to 80°C for oxygen and chlorine models-40 to 70°C for oxygen and chlorine models (model GTX15D)-20 to 80°C for oxygen and chlorine models (model GTX32D/42D/72D)
GTX_ _ G, _ _ A, _ _ F
Normal operating range-40 to 110°C for general purpose models-20 to 75°C for oxygen and chlorine models
Operative limits-50 to 115°C for general purpose models-40 to 80°C for oxygen and chlorine models
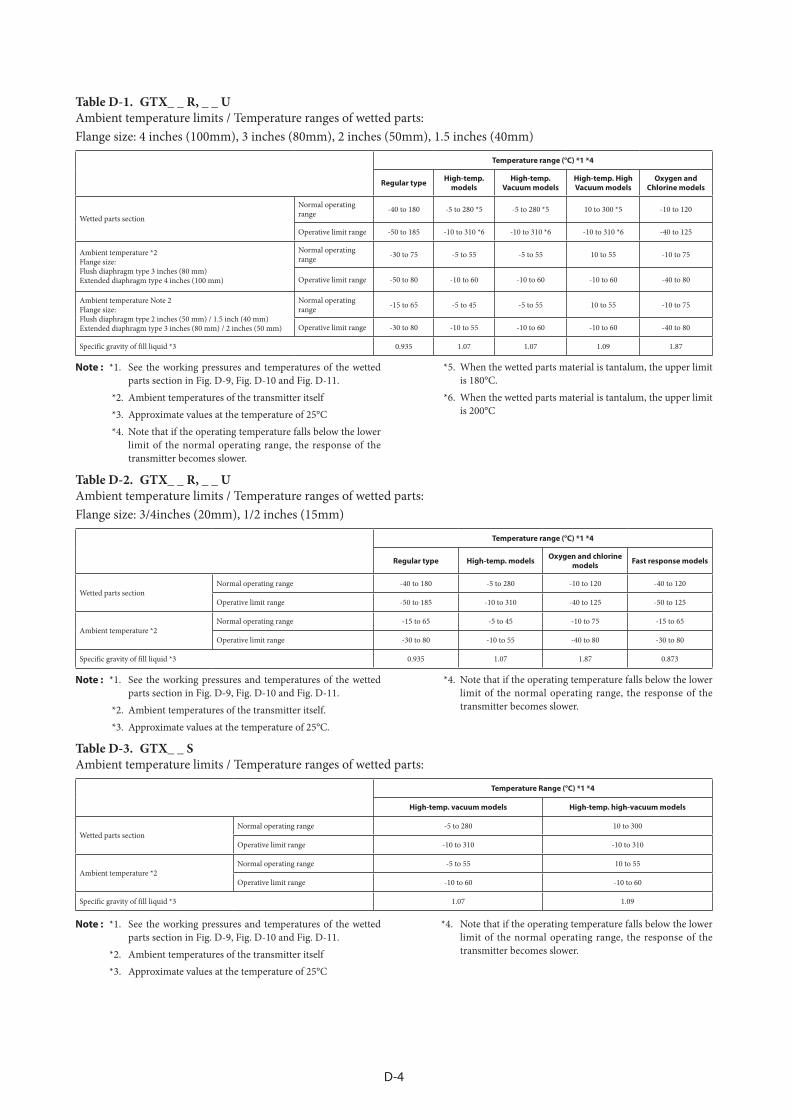
D-4
Table D-1. GTX_ _ R, _ _ UAmbient temperature limits / Temperature ranges of wetted parts: Flange size: 4 inches (100mm), 3 inches (80mm), 2 inches (50mm), 1.5 inches (40mm)
Temperature range (°C) *1 *4
Regular type High-temp. models
High-temp. Vacuum models
High-temp. HighVacuum models
Oxygen and Chlorine models
Wetted parts section
Normal operating range -40 to 180 -5 to 280 *5 -5 to 280 *5 10 to 300 *5 -10 to 120
Operative limit range -50 to 185 -10 to 310 *6 -10 to 310 *6 -10 to 310 *6 -40 to 125
Ambient temperature *2Flange size:Flush diaphragm type 3 inches (80 mm) Extended diaphragm type 4 inches (100 mm)
Normal operating range -30 to 75 -5 to 55 -5 to 55 10 to 55 -10 to 75
Operative limit range -50 to 80 -10 to 60 -10 to 60 -10 to 60 -40 to 80
Ambient temperature Note 2Flange size:Flush diaphragm type 2 inches (50 mm) / 1.5 inch (40 mm)Extended diaphragm type 3 inches (80 mm) / 2 inches (50 mm)
Normal operating range -15 to 65 -5 to 45 -5 to 55 10 to 55 -10 to 75
Operative limit range -30 to 80 -10 to 55 -10 to 60 -10 to 60 -40 to 80
Specific gravity of fill liquid *3 0.935 1.07 1.07 1.09 1.87
Note : *1. See the working pressures and temperatures of the wetted parts section in Fig. D-9, Fig. D-10 and Fig. D-11.
*2. Ambient temperatures of the transmitter itself *3. Approximate values at the temperature of 25°C *4. Note that if the operating temperature falls below the lower
limit of the normal operating range, the response of the transmitter becomes slower.
*5. When the wetted parts material is tantalum, the upper limit is 180°C.
*6. When the wetted parts material is tantalum, the upper limit is 200°C
Table D-2. GTX_ _ R, _ _ UAmbient temperature limits / Temperature ranges of wetted parts: Flange size: 3/4inches (20mm), 1/2 inches (15mm)
Temperature range (°C) *1 *4
Regular type High-temp. models Oxygen and chlorine models Fast response models
Wetted parts sectionNormal operating range -40 to 180 -5 to 280 -10 to 120 -40 to 120
Operative limit range -50 to 185 -10 to 310 -40 to 125 -50 to 125
Ambient temperature *2Normal operating range -15 to 65 -5 to 45 -10 to 75 -15 to 65
Operative limit range -30 to 80 -10 to 55 -40 to 80 -30 to 80
Specific gravity of fill liquid *3 0.935 1.07 1.87 0.873
Note : *1. See the working pressures and temperatures of the wetted parts section in Fig. D-9, Fig. D-10 and Fig. D-11.
*2. Ambient temperatures of the transmitter itself. *3. Approximate values at the temperature of 25°C.
*4. Note that if the operating temperature falls below the lower limit of the normal operating range, the response of the transmitter becomes slower.
Table D-3. GTX_ _ SAmbient temperature limits / Temperature ranges of wetted parts:
Temperature Range (°C) *1 *4
High-temp. vacuum models High-temp. high-vacuum models
Wetted parts sectionNormal operating range -5 to 280 10 to 300
Operative limit range -10 to 310 -10 to 310
Ambient temperature *2Normal operating range -5 to 55 10 to 55
Operative limit range -10 to 60 -10 to 60
Specific gravity of fill liquid *3 1.07 1.09
Note : *1. See the working pressures and temperatures of the wetted parts section in Fig. D-9, Fig. D-10 and Fig. D-11.
*2. Ambient temperatures of the transmitter itself *3. Approximate values at the temperature of 25°C
*4. Note that if the operating temperature falls below the lower limit of the normal operating range, the response of the transmitter becomes slower.

D-5
For Explosion proof models with digital indicators, which have to be used within the following ranges
Normal operating condition-20 to 70°C
Operative limit-30 to 80°C
Working pressure and temperature of wetted parts section
GTX_ _ D, _ _G, _ _F ,
133.31000
101
8053
27138.05.3
1.3
2.015
-50 -40 40 50 60 70 80 90100 110 115
Normal operating range
Ope
rativ
e lim
it
Unusable range
Ope
rativ
e lim
it
Temperature of wetted parts ( C)
Wor
king
Pre
ssur
e P
(kP
a ab
s/m
mH
g)
Fig. D-2. Working pressure and temperature of wetted parts section (for general purpose models)
133.3
101.3
53
-40 -10 0 40 75 80
Normal operating range
Wor
king
pre
ssur
e P
kP
a m
mH
g
Temperature of wetted parts ( C)
Unusable range
1000
760
400
Fig. D-3. Working pressure and temperature of wetted parts section (for oxygen and chlorine service)
2102.1
0
-70-0.7
-40 -15 0 657080Temperature of wetted parts ( C)
Wor
king
pres
sure
P (k
Pa k
gf/c
m2 )
Normal operating range
Ope
ratin
g lim
it
Ope
rativ
e lim
it
Fig. D-4. Working pressure and temperature of wetted parts section (for model GTX15D regular type)
Normaloperatingrange
2102.1
0
-20-0.2
-50-0.5
-40 -10 0 40 6570Temperature of wetted parts ( C)
Wor
king
pre
ssur
e P
(kP
a k
gf/c
m2
)
Fig. D-5. Working pressure and temperature of wetted parts section (for model GTX15D oxygen service)
Temperature of wetted parts (˚C)
Normal operating range
Operative limit
101.3760
100
6.67
21.5
−45 −25 0 40 6370
9.6
21.1
85 115
Wor
king
pre
ssur
e P
kPa
mm
Hg
Ope
rativ
e lim
it
Fig. D-6. Working pressure and temperature of wetted parts section (for general purpose models)
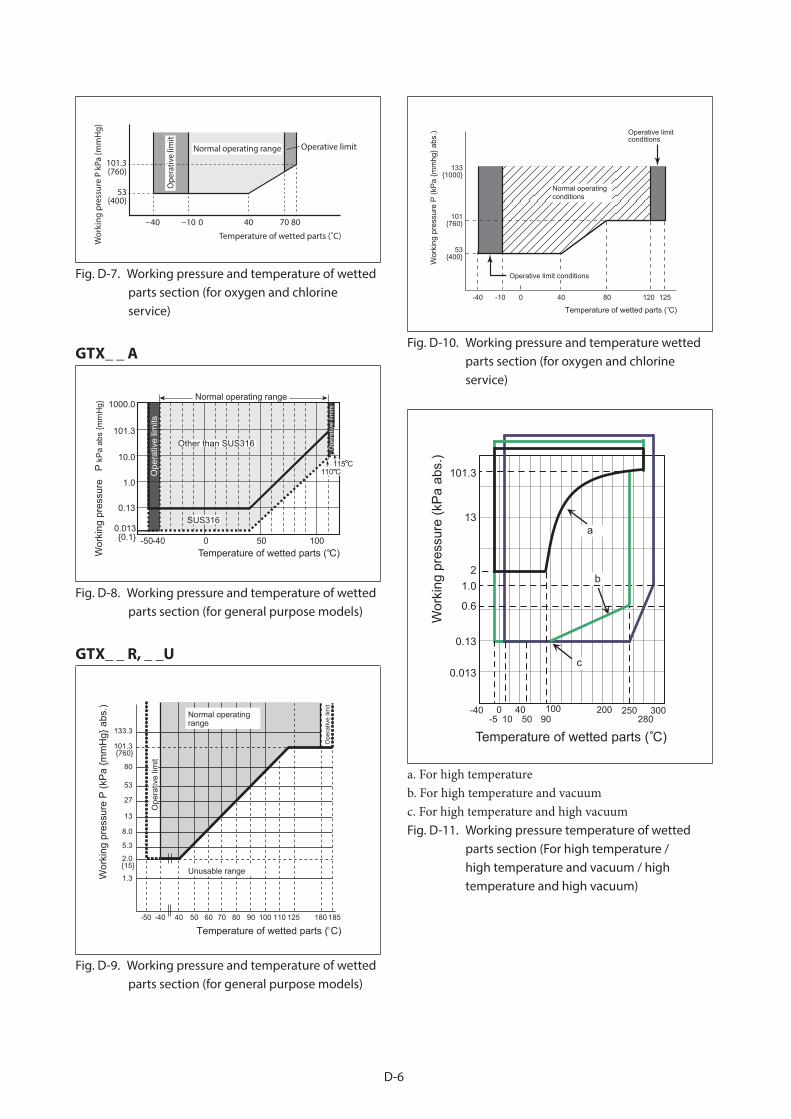
D-6
Temperature of wetted parts (˚C)
Normal operating range Operative limit
101.3760
53400
−40 −10 0 40 70 80
Wor
king
pre
ssur
e P
kPa
mm
Hg
Ope
rativ
e lim
it
Fig. D-7. Working pressure and temperature of wetted parts section (for oxygen and chlorine service)
GTX_ _ A
Temperature of wetted parts ( C)Wor
king
pre
ssur
e P
kP
a ab
s m
mH
g
-40-50 0 50 100
0.13
1.0
10.0
101.3
1000.0
0.0130.1
Normal operating range
Ope
rativ
e lim
its
SUS316
Other than SUS316 Ope
rativ
e lim
its
110 C115 C
Fig. D-8. Working pressure and temperature of wetted parts section (for general purpose models)
GTX_ _ R, _ _U
133.3
101.3
80
53
27
13
8.0
5.3
2.0
760
15
1.3Wor
king
pre
ssur
e P
(kP
a m
mH
g a
bs.)
Temperature of wetted parts ( C)-50 -40 40 50 60 70 80 90 100 110 125 180 185
Ope
rativ
e lim
it
Normal operating range
Ope
rativ
e lim
it
Unusable range
Fig. D-9. Working pressure and temperature of wetted parts section (for general purpose models)
1331000
101760
53400
-40 -10 0 40 80 120 125
Wor
king
pre
ssur
e P
(kP
a m
mhg
abs
.)
Temperature of wetted parts ( C)
Normal operatingconditions
Operative limit conditions
Operative limit conditions
Fig. D-10. Working pressure and temperature wetted parts section (for oxygen and chlorine service)
-40 0 40 100 200 300-5 50 90 280
a
b
c
10250
13
2
101.3
1.0
0.6
0.13
0.013
Temperature of wetted parts ( C)
Wor
king
pre
ssur
e (k
Pa
abs.
)
a. For high temperature b. For high temperature and vacuum c. For high temperature and high vacuumFig. D-11. Working pressure temperature of wetted
parts section (For high temperature / high temperature and vacuum / high temperature and high vacuum)

D-7
GTX_ _ S
-40 0 40 100 200 300-5 280
b
c
10250
13
101.3
0.6
0.13
0.013
Temperature of wetted parts ( C)
Wor
king
pre
ssur
e (k
Pa
abs.
)
1.0
b. For high temperature and vacuum,c. For high temperature and high vacuumFig. D-12. Working pressure temperature of wetted
parts section (For high temperature and vacuum / high temperature and high vacuum)

D-8
Ambient temperature and temperature of
wetted parts section
GTX_ _ R, _ _U
Normal operatingrange
Am
bien
t tem
pera
ture
( C
)
Temperature of wetted parts ( C)
Operative limit range100
8075726850
-50 -40 100 110 150 180185 200
Fig. D-13. Ambient temperature and temperature of wetted parts section (for general purpose models)
[Flange diameter: Flush diaphragm 2 inches (50 mm) / 1.5 inch (40 mm) Extended diaphragm 3 inches (80 mm) / 2 inches (50 mm)]Note : When the fill liquid is for general purposes, make sure before
using your transmitter that the conditions in both Fig. D-9, Fig. D-13 and Fig. D-14 are met.
Am
bien
t tem
pera
ture
( C
)
Temperature of wetted parts ( C)
100
80
-50 -40 100 110 150 180185 200
Normal operatingrange
Operative limit range
615850
65
Fig. D-14. Ambient temperature and temperature of wetted parts section (for general purpose models)
[Flange diameter: Flush diaphragm 3 inches (80 mm)Extended diaphragm 4 inches (100 mm)]
Am
bien
t tem
pera
ture
( C
)
Temperature of wetted parts ( C)
60
-10-5 165180 280 310
3327
55
-5-10
Normal operatingrange
Operative limit range
Fig. D-15. Ambient temperature and temperature of wetted parts section (for high temperature and vacuum 2, 3 m)
[Flange diameter: Flush diaphragm 2 inches (50 mm) / 1.5 inch (40 mm)]
Am
bien
t tem
pera
ture
( C
)
Temperature of wetted parts ( C)
60
-10-5 100 125 280 310
3027
55
-5-10
Normal operatingrange
Operative limit range
Fig. D-16. Ambient temperature and temperature of wetted parts section (for high temperature and vacuum 4, 5 m)
[Flange diameter: Flush diaphragm 2 inches (50 mm) / 1.5 inch (40 mm)]
Am
bien
t tem
pera
ture
( C
)
Temperature of wetted parts ( C)
60
-10 10 230240 280 310
4743
55
10
-10
Normal operatingrange
Operative limit range
Fig. D-17. Ambient temperature and temperature of wetted parts section (for high temperature and high vacuum 2, 3 m)
[Flange diameter: Flush diaphragm 2 inches (50 mm) / 1.5 inch (40 mm)]

D-9
Am
bien
t tem
pera
ture
( C
)
Temperature of wetted parts ( C)
60
-10 10 160190 280 310
4139
55
10
-10
Normal operatingrange
Operative limit range
Fig. D-18. Ambient temperature and temperature of wetted parts section (for high temperature and high vacuum 4, 5 m)
[Flange diameter: Flush diaphragm 2 inches (50 mm) / 1.5 inch (40 mm)]
PHYSICAL SPECIFICATIONS
MaterialsFill fluidSilicone oil for general purpose modelsFluorine oil for oxygen and chlorine models
Center body316 SST
Transmitter caseAluminum alloy
GTX_ _ D, _ _G, _ _A (not including direct mount)
Meter body cover flangeSCS14A (Equivalent to 316 SST) or 316 SST, PVC
For Wetted parts
Adapter flange (option)SCS14A (Equivalent to 316 SST), PVC
Center body316 SST (Diaphragm 316L SST)ASTM B575 (Equivalent to Hastelloy C-276), Tantalum, 316L SST
Vents and plugs316 SST, PVC
GTX_ _G(Direct mount)
Wetted Parts316 SST (Diaphragm 316L SST)
WeightGTX30D, 60G (not including direct mount), 30A, 60A:
Approx. 3.6 kgGTX60G, 71G (direct mount):
Approx. 1.3 kg

D-10
GTX_ _ FMeter body coverSCS14A (equivalent to 316 SST) or 316 SST
For Wetted parts
Adapter flange (option)SCS14A (equivalent to 316 SST)
Center body316 SST (316L SST for diaphragm only)ASTM B575 (Hastelloy C-276 equivalent), Tantalum,316L SST
Vents and plugs316 SST
GasketsFEP
Flange materials304 SST, 316 SST, 316L SST
GTX_ _ R, _ _ UMeter body coverSCS14A (316L SST for diaphragm only)ASTM B575 (Hastelloy C-276 equivalent), Tantalum, 316L SST
For wetted partsSCS14A (316L SST for diaphragm only)ASTM B575 (Hastelloy C-276 equivalent), Tantalum, 316L SST
Flange materials304 SST, 316 SST, 316L SST
Capillary tube material316 SST
Armored tube material304 SST
Coating (optional)Olefin coating to improve corrosion resistance (Not applicable for high-temperature / Vacuum service type and High-temperature / High-vacuum service type.)
GTX_ _ STransmitter caseAluminum alloy
Meter body cover304 SST
For Wetted parts316 SST (316L SST for diaphragm only)316L SST
Flange materials304 SST, 316 SST, 316L SST
Capillary tube material316 SST
Armored tube material304 SST
Weight
GTX30D, 60G, 30A, 60AApprox. 3.6 kg
GTX_ _FApprox. 5.9 kg (in case of ANSI 150# - 1-1/2 inches flange)
GTX_ _FApprox. 20.0 kg (Including ANSI 150# - 3 inches flange and capillary 5 m long)
GTX_ _UApprox. 13.5 kg (Including ANSI150 # - 3 inches flange and capillary 5 m long.)
GTX_ _SApprox. 13.5 kg (Including ANSI 150# - 3 inches flange and capillary 5 m long)


We would like to express our appreciation for your purchase and use of Azbil Corporation’s products.
You are required to acknowledge and agree upon the following terms and conditions for your purchase of Azbil Corporation’s products (system products, field instruments, control valves, and control products), unless otherwise stated in any separate document, including, without limitation, estimation sheets, written agreements, catalogs, specifications and instruction manuals.
1. Warranty period and warranty scope
1.1 Warranty period
Azbil Corporation’s products shall be warranted for one (1) year from the date of your purchase of the said products or the delivery of the said products to a place designated by you.
1.2 Warranty scope
In the event that Azbil Corporation’s product has any failure attributable to azbil during the aforementioned warranty period, Azbil Corporation shall, without charge, deliver a replacement for the said product to the place where you purchased, or repair the said product and deliver it to the aforementioned place. Notwithstanding the foregoing, any failure falling under one of the following shall not be covered under this warranty:
(1) Failure caused by your improper use of azbil product (noncompliance with conditions, environment of use, precautions, etc. set forth in catalogs, specifications, instruction manuals, etc.);
(2) Failure caused for other reasons than Azbil Corporation’s product;(3) Failure caused by any modification or repair made by any person other than Azbil Corporation or Azbil Corporation’s
subcontractors; (4) Failure caused by your use of Azbil Corporation’s product in a manner not conforming to the intended usage of that product; (5) Failure that the state-of-the-art at the time of Azbil Corporation’s shipment did not allow Azbil Corporation to predict; or (6) Failure that arose from any reason not attributable to Azbil Corporation, including, without limitation, acts of God, disasters, and
actions taken by a third party.
Please note that the term “warranty” as used herein refers to equipment-only-warranty, and Azbil Corporation shall not be liable for any damages, including direct, indirect, special, incidental or consequential damages in connection with or arising out of Azbil Corporation’s products.
2. Ascertainment of suitability
You are required to ascertain the suitability of Azbil Corporation’s product in case of your use of the same with your machinery, equipment, etc. (hereinafter referred to as “Equipment”) on your own responsibility, taking the following matters into consideration:
(1) Regulations and standards or laws that your Equipment is to comply with.(2) Examples of application described in any documents provided by Azbil Corporation are for your reference purpose only, and
you are required to check the functions and safety of your Equipment prior to your use. (3) Measures to be taken to secure the required level of the reliability and safety of your Equipment in your use
Although azbil is constantly making efforts to improve the quality and reliability of Azbil Corporation’s products, there exists a possibility that parts and machinery may break down. You are required to provide your Equipment with safety design such as fool-proof design,*1 and fail-safe design*2 (anti-flame propagation design, etc.), whereby preventing any occurrence of physical injuries, fires, significant damage, and so forth. Furthermore, fault avoidance,*3 fault tolerance,*4 or the like should be incorporated so that the said Equipment can satisfy the level of reliability and safety required for your use.
*1. A design that is safe even if the user makes an error. *2. A design that is safe even if the device fails. *3. Avoidance of device failure by using highly reliable components, etc. *4. The use of redundancy.
3. Precautions and restrictions on application
3.1 Restrictions on application
Please follow the table below for use in nuclear power or radiation-related equipment.
Nuclear power quality*5 required Nuclear power quality*5 not required
Within a radiation controlled area*6
Cannot be used (except for limit switches for nuclear power*7)
Cannot be used (except for limit switches for nuclear power*7)
Outside a radiation controlled area*6
Cannot be used (except for limit switches for nuclear power*7)
Can be used
*5. Nuclear power quality: compliance with JEAG 4121 required*6. Radiation controlled area: an area governed by the requirements of article 3 of “Rules on the Prevention of Harm from
Ionizing Radiation,” article 2 2 4 of “Regulations on Installation and Operation of Nuclear Reactors for Practical Power Generation,” article 4 of “Determining the Quantity, etc., of Radiation-Emitting Isotopes,”etc.
*7. Limit switch for nuclear power: a limit switch designed, manufactured and sold according to IEEE 382 and JEAG 4121.
Any Azbil Corporation’s products shall not be used for/with medical equipment.
The products are for industrial use. Do not allow general consumers to install or use any Azbil Corporation’s product. However, azbil products can be incorporated into products used by general consumers. If you intend to use a product for that purpose, please contact one of our sales representatives.
3.2 Precautions on application
you are required to conduct a consultation with our sales representative and understand detail specifications, cautions for operation, and so forth by reference to catalogs, specifications, instruction manual, etc. in case that you intend to use azbil product for any purposes specified in (1) through (6) below. Moreover, you are required to provide your Equipment with fool-proof design, fail-safe design, anti-flame propagation design, fault avoidance, fault tolerance, and other kinds of protection/safety circuit design on your own responsibility to ensure reliability and safety, whereby preventing problems caused by failure or nonconformity.
Terms and Conditions

(1) For use under such conditions or in such environments as not stated in technical documents, including catalogs, specification, and instruction manuals
(2) For use of specific purposes, such as: * Nuclear energy/radiation related facilities
[When used outside a radiation controlled area and where nuclear power quality is not required] [When the limit switch for nuclear power is used]
* Machinery or equipment for space/sea bottom * Transportation equipment [Railway, aircraft, vessels, vehicle equipment, etc.] * Antidisaster/crime-prevention equipment * Burning appliances * Electrothermal equipment * Amusement facilities * Facilities/applications associated directly with billing
(3) Supply systems such as electricity/gas/water supply systems, large-scale communication systems, and traffic/air traffic control systems requiring high reliability
(4) Facilities that are to comply with regulations of governmental/public agencies or specific industries (5) Machinery or equipment that may affect human lives, human bodies or properties (6) Other machinery or equipment equivalent to those set forth in items (1) to (5) above which require high reliability and safety
4. Precautions against long-term use
Use of Azbil Corporation’s products, including switches, which contain electronic components, over a prolonged period may degrade insulation or increase contact-resistance and may result in heat generation or any other similar problem causing such product or switch to develop safety hazards such as smoking, ignition, and electrification. Although acceleration of the above situation varies depending on the conditions or environment of use of the products, you are required not to use any Azbil Corporation’s products for a period exceeding ten (10) years unless otherwise stated in specifications or instruction manuals.
5. Recommendation for renewal
Mechanical components, such as relays and switches, used for Azbil Corporation’s products will reach the end of their life due to wear by repetitious open/close operations.
In addition, electronic components such as electrolytic capacitors will reach the end of their life due to aged deterioration based on the conditions or environment in which such electronic components are used. Although acceleration of the above situation varies depending on the conditions or environment of use, the number of open/close operations of relays, etc. as prescribed in specifications or instruction manuals, or depending on the design margin of your machine or equipment, you are required to renew any Azbil Corporation’s products every 5 to 10 years unless otherwise specified in specifications or instruction manuals. System products, field instruments (sensors such as pressure/flow/level sensors, regulating valves, etc.) will reach the end of their life due to aged deterioration of parts. For those parts that will reach the end of their life due to aged deterioration, recommended replacement cycles are prescribed. You are required to replace parts based on such recommended replacement cycles.
6. Other precautions
Prior to your use of Azbil Corporation’s products, you are required to understand and comply with specifications (e.g., conditions and environment of use), precautions, warnings/cautions/notices as set forth in the technical documents prepared for individual Azbil Corporation’s products, such as catalogs, specifications, and instruction manuals to ensure the quality, reliability, and safety of those products.
7. Changes to specifications
Please note that the descriptions contained in any documents provided by azbil are subject to change without notice for improvement or for any other reason. For inquires or information on specifications as you may need to check, please contact our branch offices or sales offices, or your local sales agents.
8. Discontinuance of the supply of products/parts
Please note that the production of any Azbil Corporation’s product may be discontinued without notice. After manufacturing is discontinued, we may not be able to provide replacement products even within the warranty period.
For repairable products, we will, in principle, undertake repairs for five (5) years after the discontinuance of those products. In some cases, however, we cannot undertake such repairs for reasons, such as the absence of repair parts. For system products, field instruments, we may not be able to undertake parts replacement for similar reasons.
9. Scope of services
Prices of Azbil Corporation’s products do not include any charges for services such as engineer dispatch service. Accordingly, a separate fee will be charged in any of the following cases:
(1) Installation, adjustment, guidance, and attendance at a test run (2) Maintenance, inspection, adjustment, and repair(3) Technical guidance and technical education (4) Special test or special inspection of a product under the conditions specified by you
Please note that we cannot provide any services as set forth above in a nuclear energy controlled area (radiation controlled area) or at a place where the level of exposure to radiation is equivalent to that in a nuclear energy controlled area.
AAS-511A-014-10


Document Number: CM2-GTX100-2001Document Name: Advanced Transmitter
Electronic Differential Pressure/Pressure Transmitter Model GTX_ _ _
User's Manual
Date: 1st edition: May 2008 12th edition: Feb. 2019Issued/Edited by:

Copyright © 2022 FDOKUMEN