Financial report - ANZ
134
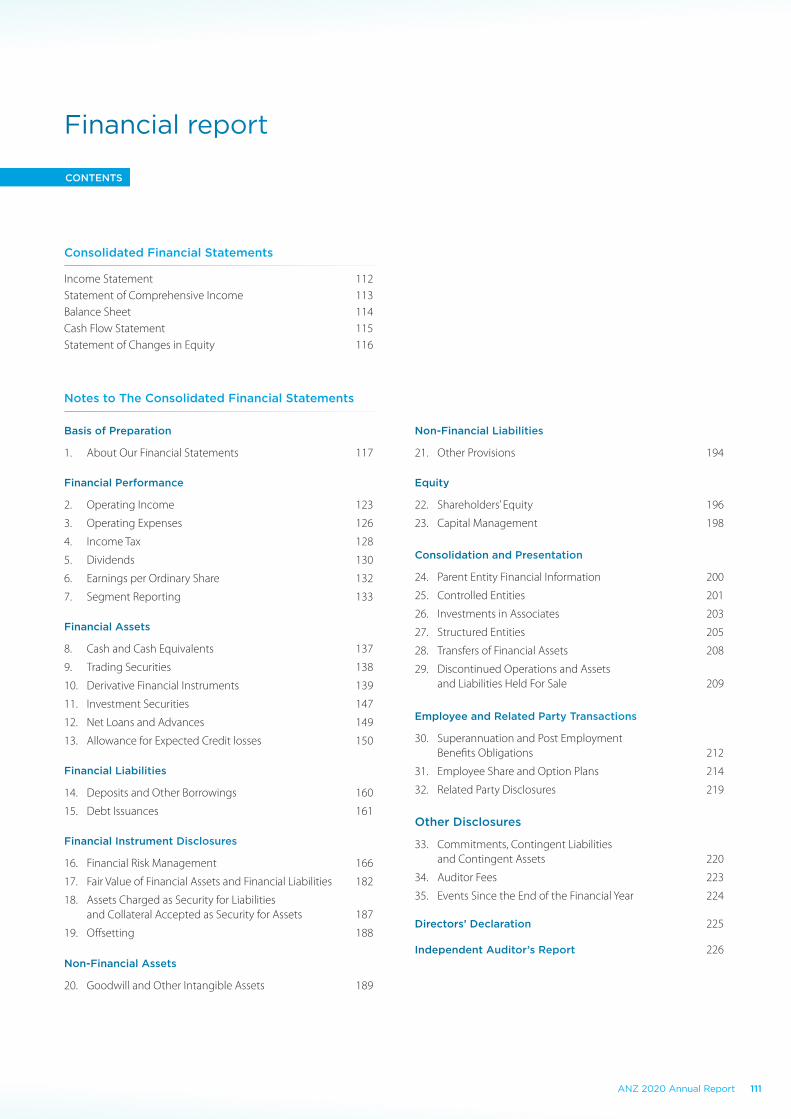
Financial report Consolidated Financial Statements Income Statement 112 Statement of Comprehensive Income 113 Balance Sheet 114 Cash Flow Statement 115 Statement of Changes in Equity 116 Notes to The Consolidated Financial Statements Basis of Preparation 1. About Our Financial Statements 117 Financial Performance 2. Operating Income 123 3. Operating Expenses 126 4. Income Tax 128 5. Dividends 130 6. Earnings per Ordinary Share 132 7. Segment Reporting 133 Financial Assets 8. Cash and Cash Equivalents 137 9. Trading Securities 138 10. Derivative Financial Instruments 139 11. Investment Securities 147 12. Net Loans and Advances 149 13. Allowance for Expected Credit losses 150 Financial Liabilities 14. Deposits and Other Borrowings 160 15. Debt Issuances 161 Financial Instrument Disclosures 16. Financial Risk Management 166 17. Fair Value of Financial Assets and Financial Liabilities 182 18. Assets Charged as Security for Liabilities and Collateral Accepted as Security for Assets 187 19. Offsetting 188 Non-Financial Assets 20. Goodwill and Other Intangible Assets 189 Non-Financial Liabilities 21. Other Provisions 194 Equity 22. Shareholders’ Equity 196 23. Capital Management 198 Consolidation and Presentation 24. Parent Entity Financial Information 200 25. Controlled Entities 201 26. Investments in Associates 203 27. Structured Entities 205 28. Transfers of Financial Assets 208 29. Discontinued Operations and Assets and Liabilities Held For Sale 209 Employee and Related Party Transactions 30. Superannuation and Post Employment Benefits Obligations 212 31. Employee Share and Option Plans 214 32. Related Party Disclosures 219 Other Disclosures 33. Commitments, Contingent Liabilities and Contingent Assets 220 34. Auditor Fees 223 35. Events Since the End of the Financial Year 224 Directors’ Declaration 225 Independent Auditor’s Report 226 CONTENTS 111 ANZ 2020 Annual Report
-
Upload
khangminh22 -
Category
Documents
-
view
2 -
download
0
Transcript of Financial report - ANZ
Financial report
Consolidated Financial Statements
Income Statement 112Statement of Comprehensive Income 113Balance Sheet 114Cash Flow Statement 115Statement of Changes in Equity 116
Notes to The Consolidated Financial Statements
Basis of Preparation
1. About Our Financial Statements 117
Financial Performance
2. Operating Income 123
3. Operating Expenses 126
4. Income Tax 128
5. Dividends 130
6. Earnings per Ordinary Share 132
7. Segment Reporting 133
Financial Assets
8. Cash and Cash Equivalents 137
9. Trading Securities 138
10. Derivative Financial Instruments 139
11. Investment Securities 147
12. Net Loans and Advances 149
13. Allowance for Expected Credit losses 150
Financial Liabilities
14. Deposits and Other Borrowings 160
15. Debt Issuances 161
Financial Instrument Disclosures
16. Financial Risk Management 166
17. Fair Value of Financial Assets and Financial Liabilities 182
18. Assets Charged as Security for Liabilities and Collateral Accepted as Security for Assets 187
19. Offsetting 188
Non-Financial Assets
20. Goodwill and Other Intangible Assets 189
Non-Financial Liabilities
21. Other Provisions 194
Equity
22. Shareholders’ Equity 196
23. Capital Management 198
Consolidation and Presentation
24. Parent Entity Financial Information 200
25. Controlled Entities 201
26. Investments in Associates 203
27. Structured Entities 205
28. Transfers of Financial Assets 208
29. Discontinued Operations and Assets and Liabilities Held For Sale 209
Employee and Related Party Transactions
30. Superannuation and Post Employment Benefits Obligations 212
31. Employee Share and Option Plans 214
32. Related Party Disclosures 219
Other Disclosures
33. Commitments, Contingent Liabilities and Contingent Assets 220
34. Auditor Fees 223
35. Events Since the End of the Financial Year 224
Directors’ Declaration 225
Independent Auditor’s Report 226
CONTENTS
111ANZ 2020 Annual Report

112
FINANCIAL REPORT
INCOME STATEMENT
2020 2019For the year ended 30 September Note $m $m
Interest income1 24,426 31,077
Interest expense (10,377) (16,738)
Net interest income 2 14,049 14,339
Other operating income 2 3,355 4,058
Net income from insurance business 2 78 126
Share of associates’ profit 2 155 262
Operating income 17,637 18,785
Operating expenses 3 (9,383) (9,071)
Profit before credit impairment and income tax 8,254 9,714
Credit impairment charge 13 (2,738) (794)
Profit before income tax 5,516 8,920
Income tax expense 4 (1,840) (2,609)
Profit after tax from continuing operations 3,676 6,311
Profit/(Loss) after tax from discontinued operations 29 (98) (343)
Profit for the year 3,578 5,968
Comprising:
Profit attributable to shareholders of the Company 3,577 5,953
Profit attributable to non-controlling interests 1 15
Earnings per ordinary share (cents) including discontinued operations Basic 6 126.4 210.0
Diluted 6 118.0 201.9
Earnings per ordinary share (cents) from continuing operations Basic 6 129.8 222.1
Diluted 6 121.1 213.0
Dividend per ordinary share (cents) 5 60 160 1. Includes interest income calculated using the effective interest method of $23,837 million on financial assets measured at amortised cost or fair value through other comprehensive income (2019: $30,224
million).
The notes appearing on pages 117 to 225 form an integral part of these financial statements.
ANZ 2020 ANNUAL REPORT
112
Overview How we create value
Performance overview
Remuneration report
Directors’ report
Financial report
Shareholder information
112
FINANCIAL REPORT
INCOME STATEMENT
2020 2019For the year ended 30 September Note $m $m
Interest income1 24,426 31,077
Interest expense (10,377) (16,738)
Net interest income 2 14,049 14,339
Other operating income 2 3,355 4,058
Net income from insurance business 2 78 126
Share of associates’ profit 2 155 262
Operating income 17,637 18,785
Operating expenses 3 (9,383) (9,071)
Profit before credit impairment and income tax 8,254 9,714
Credit impairment charge 13 (2,738) (794)
Profit before income tax 5,516 8,920
Income tax expense 4 (1,840) (2,609)
Profit after tax from continuing operations 3,676 6,311
Profit/(Loss) after tax from discontinued operations 29 (98) (343)
Profit for the year 3,578 5,968
Comprising:
Profit attributable to shareholders of the Company 3,577 5,953
Profit attributable to non-controlling interests 1 15
Earnings per ordinary share (cents) including discontinued operations Basic 6 126.4 210.0
Diluted 6 118.0 201.9
Earnings per ordinary share (cents) from continuing operations Basic 6 129.8 222.1
Diluted 6 121.1 213.0
Dividend per ordinary share (cents) 5 60 160 1. Includes interest income calculated using the effective interest method of $23,837 million on financial assets measured at amortised cost or fair value through other comprehensive income (2019: $30,224
million).
The notes appearing on pages 117 to 225 form an integral part of these financial statements.
ANZ 2020 ANNUAL REPORT
113
FINANCIAL REPORT
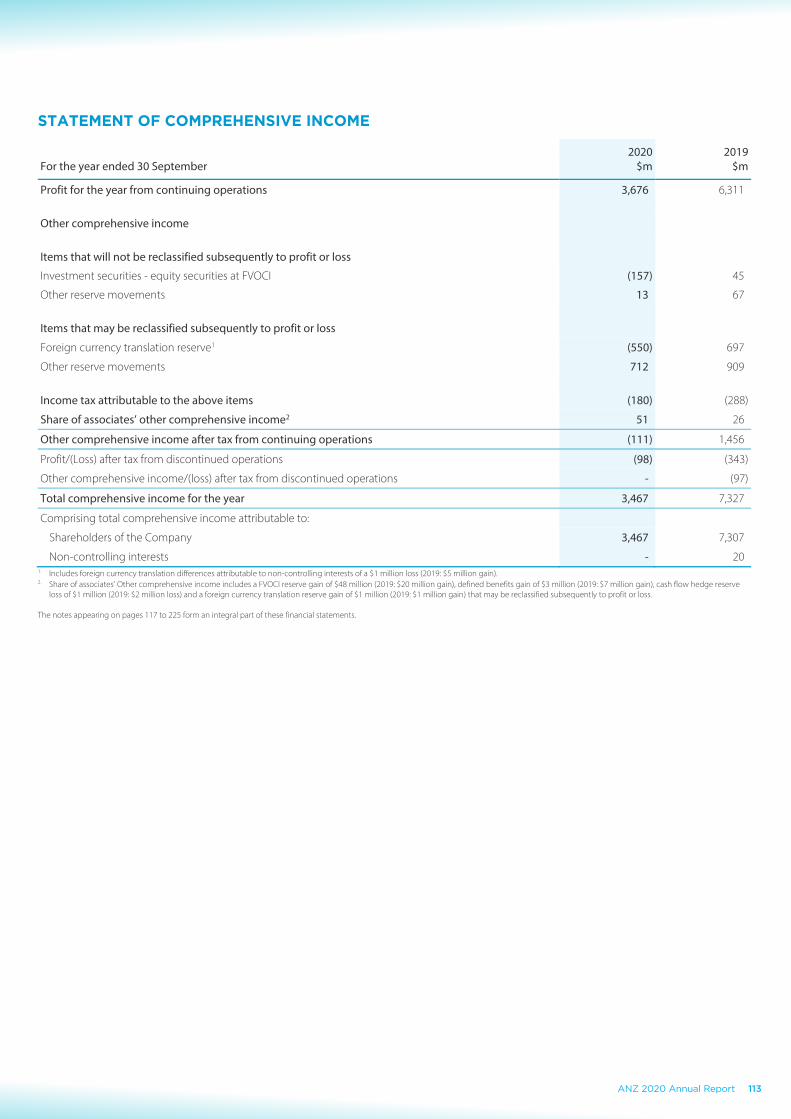
STATEMENT OF COMPREHENSIVE INCOME
2020 2019For the year ended 30 September $m $m
Profit for the year from continuing operations 3,676 6,311
Other comprehensive income
Items that will not be reclassified subsequently to profit or loss
Investment securities - equity securities at FVOCI (157) 45
Other reserve movements 13 67
Items that may be reclassified subsequently to profit or loss
Foreign currency translation reserve1 (550) 697
Other reserve movements 712 909
Income tax attributable to the above items (180) (288)
Share of associates’ other comprehensive income2 51 26
Other comprehensive income after tax from continuing operations (111) 1,456
Profit/(Loss) after tax from discontinued operations (98) (343)
Other comprehensive income/(loss) after tax from discontinued operations - (97)
Total comprehensive income for the year 3,467 7,327
Comprising total comprehensive income attributable to:
Shareholders of the Company 3,467 7,307
Non-controlling interests - 20 1. Includes foreign currency translation differences attributable to non-controlling interests of a $1 million loss (2019: $5 million gain). 2. Share of associates’ Other comprehensive income includes a FVOCI reserve gain of $48 million (2019: $20 million gain), defined benefits gain of $3 million (2019: $7 million gain), cash flow hedge reserve
loss of $1 million (2019: $2 million loss) and a foreign currency translation reserve gain of $1 million (2019: $1 million gain) that may be reclassified subsequently to profit or loss.
The notes appearing on pages 117 to 225 form an integral part of these financial statements.
112
FINANCIAL REPORT
INCOME STATEMENT
2020 2019For the year ended 30 September Note $m $m
Interest income1 24,426 31,077
Interest expense (10,377) (16,738)
Net interest income 2 14,049 14,339
Other operating income 2 3,355 4,058
Net income from insurance business 2 78 126
Share of associates’ profit 2 155 262
Operating income 17,637 18,785
Operating expenses 3 (9,383) (9,071)
Profit before credit impairment and income tax 8,254 9,714
Credit impairment charge 13 (2,738) (794)
Profit before income tax 5,516 8,920
Income tax expense 4 (1,840) (2,609)
Profit after tax from continuing operations 3,676 6,311
Profit/(Loss) after tax from discontinued operations 29 (98) (343)
Profit for the year 3,578 5,968
Comprising:
Profit attributable to shareholders of the Company 3,577 5,953
Profit attributable to non-controlling interests 1 15
Earnings per ordinary share (cents) including discontinued operations Basic 6 126.4 210.0
Diluted 6 118.0 201.9
Earnings per ordinary share (cents) from continuing operations Basic 6 129.8 222.1
Diluted 6 121.1 213.0
Dividend per ordinary share (cents) 5 60 160 1. Includes interest income calculated using the effective interest method of $23,837 million on financial assets measured at amortised cost or fair value through other comprehensive income (2019: $30,224
million).
The notes appearing on pages 117 to 225 form an integral part of these financial statements.
ANZ 2020 ANNUAL REPORT
113ANZ 2020 Annual Report
114
FINANCIAL REPORT (continued)
BALANCE SHEET
2020 2019As at 30 September Note $m $m
Assets
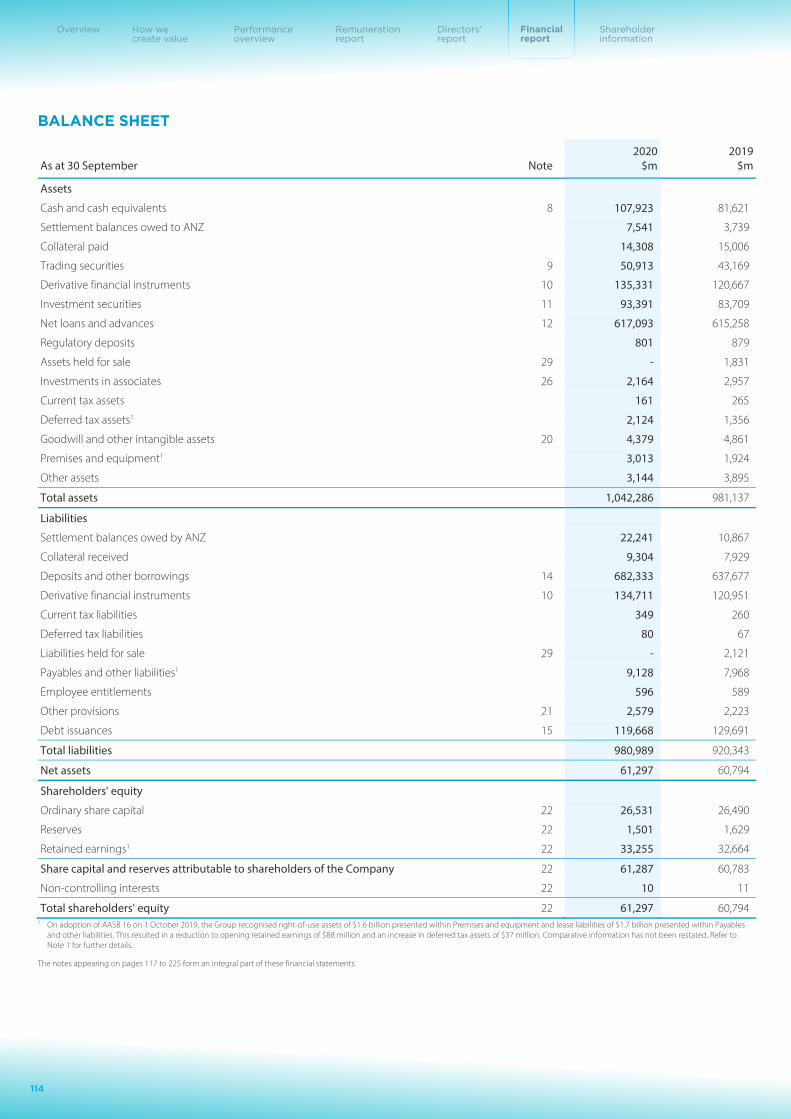
Cash and cash equivalents 8 107,923 81,621
Settlement balances owed to ANZ 7,541 3,739
Collateral paid 14,308 15,006
Trading securities 9 50,913 43,169
Derivative financial instruments 10 135,331 120,667
Investment securities 11 93,391 83,709
Net loans and advances 12 617,093 615,258
Regulatory deposits 801 879
Assets held for sale 29 - 1,831
Investments in associates 26 2,164 2,957
Current tax assets 161 265
Deferred tax assets1 2,124 1,356
Goodwill and other intangible assets 20 4,379 4,861
Premises and equipment1 3,013 1,924
Other assets 3,144 3,895
Total assets 1,042,286 981,137
Liabilities
Settlement balances owed by ANZ 22,241 10,867
Collateral received 9,304 7,929
Deposits and other borrowings 14 682,333 637,677
Derivative financial instruments 10 134,711 120,951
Current tax liabilities 349 260
Deferred tax liabilities 80 67
Liabilities held for sale 29 - 2,121
Payables and other liabilities1 9,128 7,968
Employee entitlements 596 589
Other provisions 21 2,579 2,223
Debt issuances 15 119,668 129,691
Total liabilities 980,989 920,343
Net assets 61,297 60,794
Shareholders' equity
Ordinary share capital 22 26,531 26,490
Reserves 22 1,501 1,629
Retained earnings1 22 33,255 32,664
Share capital and reserves attributable to shareholders of the Company 22 61,287 60,783
Non-controlling interests 22 10 11
Total shareholders' equity 22 61,297 60,794 1. On adoption of AASB 16 on 1 October 2019, the Group recognised right-of-use assets of $1.6 billion presented within Premises and equipment and lease liabilities of $1.7 billion presented within Payables
and other liabilities. This resulted in a reduction to opening retained earnings of $88 million and an increase in deferred tax assets of $37 million. Comparative information has not been restated. Refer to Note 1 for further details.
The notes appearing on pages 117 to 225 form an integral part of these financial statements.
ANZ 2020 ANNUAL REPORT
114
Overview How we create value
Performance overview
Remuneration report
Directors’ report
Financial report
Shareholder information

114
FINANCIAL REPORT (continued)
BALANCE SHEET
2020 2019As at 30 September Note $m $m
Assets
Cash and cash equivalents 8 107,923 81,621
Settlement balances owed to ANZ 7,541 3,739
Collateral paid 14,308 15,006
Trading securities 9 50,913 43,169
Derivative financial instruments 10 135,331 120,667
Investment securities 11 93,391 83,709
Net loans and advances 12 617,093 615,258
Regulatory deposits 801 879
Assets held for sale 29 - 1,831
Investments in associates 26 2,164 2,957
Current tax assets 161 265
Deferred tax assets1 2,124 1,356
Goodwill and other intangible assets 20 4,379 4,861
Premises and equipment1 3,013 1,924
Other assets 3,144 3,895
Total assets 1,042,286 981,137
Liabilities
Settlement balances owed by ANZ 22,241 10,867
Collateral received 9,304 7,929
Deposits and other borrowings 14 682,333 637,677
Derivative financial instruments 10 134,711 120,951
Current tax liabilities 349 260
Deferred tax liabilities 80 67
Liabilities held for sale 29 - 2,121
Payables and other liabilities1 9,128 7,968
Employee entitlements 596 589
Other provisions 21 2,579 2,223
Debt issuances 15 119,668 129,691
Total liabilities 980,989 920,343
Net assets 61,297 60,794
Shareholders' equity
Ordinary share capital 22 26,531 26,490
Reserves 22 1,501 1,629
Retained earnings1 22 33,255 32,664
Share capital and reserves attributable to shareholders of the Company 22 61,287 60,783
Non-controlling interests 22 10 11
Total shareholders' equity 22 61,297 60,794 1. On adoption of AASB 16 on 1 October 2019, the Group recognised right-of-use assets of $1.6 billion presented within Premises and equipment and lease liabilities of $1.7 billion presented within Payables
and other liabilities. This resulted in a reduction to opening retained earnings of $88 million and an increase in deferred tax assets of $37 million. Comparative information has not been restated. Refer to Note 1 for further details.
The notes appearing on pages 117 to 225 form an integral part of these financial statements.
ANZ 2020 ANNUAL REPORT
114
FINANCIAL REPORT (continued)
BALANCE SHEET
2020 2019As at 30 September Note $m $m
Assets
Cash and cash equivalents 8 107,923 81,621
Settlement balances owed to ANZ 7,541 3,739
Collateral paid 14,308 15,006
Trading securities 9 50,913 43,169
Derivative financial instruments 10 135,331 120,667
Investment securities 11 93,391 83,709
Net loans and advances 12 617,093 615,258
Regulatory deposits 801 879
Assets held for sale 29 - 1,831
Investments in associates 26 2,164 2,957
Current tax assets 161 265
Deferred tax assets1 2,124 1,356
Goodwill and other intangible assets 20 4,379 4,861
Premises and equipment1 3,013 1,924
Other assets 3,144 3,895
Total assets 1,042,286 981,137
Liabilities
Settlement balances owed by ANZ 22,241 10,867
Collateral received 9,304 7,929
Deposits and other borrowings 14 682,333 637,677
Derivative financial instruments 10 134,711 120,951
Current tax liabilities 349 260
Deferred tax liabilities 80 67
Liabilities held for sale 29 - 2,121
Payables and other liabilities1 9,128 7,968
Employee entitlements 596 589
Other provisions 21 2,579 2,223
Debt issuances 15 119,668 129,691
Total liabilities 980,989 920,343
Net assets 61,297 60,794
Shareholders' equity
Ordinary share capital 22 26,531 26,490
Reserves 22 1,501 1,629
Retained earnings1 22 33,255 32,664
Share capital and reserves attributable to shareholders of the Company 22 61,287 60,783
Non-controlling interests 22 10 11
Total shareholders' equity 22 61,297 60,794 1. On adoption of AASB 16 on 1 October 2019, the Group recognised right-of-use assets of $1.6 billion presented within Premises and equipment and lease liabilities of $1.7 billion presented within Payables
and other liabilities. This resulted in a reduction to opening retained earnings of $88 million and an increase in deferred tax assets of $37 million. Comparative information has not been restated. Refer to Note 1 for further details.
The notes appearing on pages 117 to 225 form an integral part of these financial statements.
ANZ 2020 ANNUAL REPORT
115
FINANCIAL REPORT
CASH FLOW STATEMENT The Consolidated Cash Flow Statement includes discontinued operations. Please refer to Note 29 for cash flows associated with discontinued operations and cash and cash equivalents reclassified as held for sale. 2020 2019 For the year ended 30 September $m $m
Profit after income tax 3,578 5,968 Adjustments to reconcile to net cash provided by/(used in) operating activities: Allowance for expected credit losses 2,738 794
Impairment of investment in associates 815 - Depreciation and amortisation1, 2 1,391 871
Goodwill impairment 77 - (Profit)/loss on sale of premises and equipment (8) (5) Net derivatives/foreign exchange adjustment (3,046) 4,940
(Gain)/loss on sale from divestments 25 (137) Other non-cash movements (80) (356) Net (increase)/decrease in operating assets:
Collateral paid 283 (3,493) Trading securities (1,803) (7,941) Net loans and advances (7,119) (10,268) Investments backing policy liabilities - (3,542) Other assets (76) (454)
Net increase/(decrease) in operating liabilities: Deposits and other borrowings 51,875 7,006
Settlement balances owed by ANZ 11,476 (1,077) Collateral received 1,739 1,004
Other liabilities (9,581) 2,140
Total adjustments 48,706 (10,518) Net cash (used in)/provided by operating activities3 52,284 (4,550) Cash flows from investing activities Investment securities assets:
Purchases (40,029) (23,847) Proceeds from sale or maturity 28,642 21,228
Proceeds from divestments, net of cash disposed 1,309 2,121
Proceeds from/(Repayment of) IOOF secured notes (800) 800
Other assets (587) (508) Net cash (used in)/provided by investing activities (11,465) (206) Cash flows from financing activities Debt issuances:4
Issue proceeds 12,260 25,900
Redemptions (21,430) (22,958) Dividends paid5 (2,861) (4,471) On market purchase of treasury shares (122) (112) Repayment of lease liabilities6 (281) - Share buyback - (1,120) Net cash (used in)/provided by financing activities (12,434) (2,761) Net (decrease)/increase in cash and cash equivalents 28,385 (7,517) Cash and cash equivalents at beginning of year 81,621 84,964 Effects of exchange rate changes on cash and cash equivalents (2,083) 4,174 Cash and cash equivalents at end of year7 107,923 81,621
1. Includes depreciation of right-of-use assets recognised on 1 October 2019 following the adoption of AASB 16. Comparatives have not been restated. 2. Includes accelerated amortisation of $197 million following the Group’s change in the application of its software amortisation policy to reflect the shorter useful life of software caused by rapidly changing
technology and business requirements. Refer to Note 20 Goodwill and Other Intangible Assets for further details. 3. Net cash inflows/(outflows) from operating activities includes income taxes paid of $2,348 million (2019: $3,129 million). 4. Non-cash changes in debt issuances includes fair value hedging loss of $1,127 million (2019: $2,437 million loss) and foreign exchange gains of $1,623 million (2019: $3,815 million loss). 5. Cash outflow for shares purchased to satisfy the dividend reinvestment plan are classified in Dividends paid. 6. Relates to repayments of lease liabilities which the Group commenced recognising on 1 October 2019 following the adoption of AASB 16. Comparative information has not been restated. 7. Includes cash and cash equivalents recognised on the face of balance sheet of $107,923 million (2019: $81,621 million) with no amounts recorded as part of assets held for sale. (2019: nil).
The notes appearing on pages 117 to 225 form an integral part of these financial statements.
115ANZ 2020 Annual Report

116
FINANCIAL REPORT (continued)
STATEMENT OF CHANGES IN EQUITY
Ordinary
share capital Reserves Retained earnings
Share capital and reserves
attributable to shareholders
of the Company
Non-controlling
interests
Total shareholders’
equity
$m $m $m $m $m $m
As at 1 October 2018 27,205 323 31,737 59,265 140 59,405
Impact on transition to AASB 9 - 14 (624) (610) - (610)
Profit or loss from continuing operations - - 6,296 6,296 15 6,311
Profit or loss from discontinued operations - - (343) (343) - (343)
Other comprehensive income for the year from continuing operations
- 1,393 58 1,451 5 1,456
Other comprehensive income for the year from discontinued operations
- (97) - (97) - (97)
Total comprehensive income for the year - 1,296 6,011 7,307 20 7,327 Transactions with equity holders in their capacity as equity holders: Dividends paid - - (4,481) (4,481) (2) (4,483)
Dividend income on treasury shares held within the Group’s life insurance statutory funds
- - 12 12 - 12
Group share buy-back2 (1,120) - - (1,120) - (1,120)
Other equity movements: Treasury shares Wealth Australia discontinued operations adjustment3
405 - - 405 - 405
Other items - (4) 9 5 (147) (142)
As at 30 September 2019 26,490 1,629 32,664 60,783 11 60,794
Impact on transition to AASB 16 - - (88) (88) - (88)
Profit or loss from continuing operations - - 3,675 3,675 1 3,676 Profit or loss from discontinued operations - - (98) (98) - (98)
Other comprehensive income for the year from continuing operations - (124) 14 (110) (1) (111)
Total comprehensive income for the year - (124) 3,591 3,467 - 3,467 Transactions with equity holders in their capacity as equity holders: Dividends paid - - (2,922) (2,922) - (2,922)
Dividend Reinvestment Plan1 61 - - 61 - 61
Other equity movements: Group employee share acquisition scheme (20) - - (20) - (20) Other items - (4) 10 6 (1) 5
As at 30 September 2020 26,531 1,501 33,255 61,287 10 61,297 1 3.4 million shares were issued under the Dividend Reinvestment Plan (DRP) for the 2020 interim dividend (nil shares for the 2019 final Dividend; nil shares for the 2019 interim dividend as the shares were
purchased on-market and provided directly to shareholders participating in the DRP). On-market share purchases for the DRP in 2020 were $185 million (2019: $432 million). 2 The Company completed a $3.0 billion on-market share buy-back of ANZ ordinary shares purchasing $1,120 million worth of shares in 2019 resulting in 42.0 million shares being cancelled. 3 The successor funds transfer performed in preparation for the sale of the Group’s wealth business to Zurich and IOOF completed on 13 April 2019. As a result, the Group no longer eliminates the ANZ shares
previously held in Wealth Australia discontinued operations (treasury shares).
The notes appearing on pages 117 to 225 form an integral part of these financial statements.
ANZ 2020 ANNUAL REPORT
116
Overview How we create value
Performance overview
Remuneration report
Directors’ report
Financial report
Shareholder information

116
FINANCIAL REPORT (continued)
STATEMENT OF CHANGES IN EQUITY
Ordinary
share capital Reserves Retained earnings
Share capital and reserves
attributable to shareholders
of the Company
Non-controlling
interests
Total shareholders’
equity
$m $m $m $m $m $m
As at 1 October 2018 27,205 323 31,737 59,265 140 59,405
Impact on transition to AASB 9 - 14 (624) (610) - (610)
Profit or loss from continuing operations - - 6,296 6,296 15 6,311
Profit or loss from discontinued operations - - (343) (343) - (343)
Other comprehensive income for the year from continuing operations
- 1,393 58 1,451 5 1,456
Other comprehensive income for the year from discontinued operations
- (97) - (97) - (97)
Total comprehensive income for the year - 1,296 6,011 7,307 20 7,327 Transactions with equity holders in their capacity as equity holders: Dividends paid - - (4,481) (4,481) (2) (4,483)
Dividend income on treasury shares held within the Group’s life insurance statutory funds
- - 12 12 - 12
Group share buy-back2 (1,120) - - (1,120) - (1,120)
Other equity movements: Treasury shares Wealth Australia discontinued operations adjustment3
405 - - 405 - 405
Other items - (4) 9 5 (147) (142)
As at 30 September 2019 26,490 1,629 32,664 60,783 11 60,794
Impact on transition to AASB 16 - - (88) (88) - (88)
Profit or loss from continuing operations - - 3,675 3,675 1 3,676 Profit or loss from discontinued operations - - (98) (98) - (98)
Other comprehensive income for the year from continuing operations - (124) 14 (110) (1) (111)
Total comprehensive income for the year - (124) 3,591 3,467 - 3,467 Transactions with equity holders in their capacity as equity holders: Dividends paid - - (2,922) (2,922) - (2,922)
Dividend Reinvestment Plan1 61 - - 61 - 61
Other equity movements: Group employee share acquisition scheme (20) - - (20) - (20) Other items - (4) 10 6 (1) 5
As at 30 September 2020 26,531 1,501 33,255 61,287 10 61,297 1 3.4 million shares were issued under the Dividend Reinvestment Plan (DRP) for the 2020 interim dividend (nil shares for the 2019 final Dividend; nil shares for the 2019 interim dividend as the shares were
purchased on-market and provided directly to shareholders participating in the DRP). On-market share purchases for the DRP in 2020 were $185 million (2019: $432 million). 2 The Company completed a $3.0 billion on-market share buy-back of ANZ ordinary shares purchasing $1,120 million worth of shares in 2019 resulting in 42.0 million shares being cancelled. 3 The successor funds transfer performed in preparation for the sale of the Group’s wealth business to Zurich and IOOF completed on 13 April 2019. As a result, the Group no longer eliminates the ANZ shares
previously held in Wealth Australia discontinued operations (treasury shares).
The notes appearing on pages 117 to 225 form an integral part of these financial statements.
ANZ 2020 ANNUAL REPORT
116
FINANCIAL REPORT (continued)
STATEMENT OF CHANGES IN EQUITY
Ordinary
share capital Reserves Retained earnings
Share capital and reserves
attributable to shareholders
of the Company
Non-controlling
interests
Total shareholders’
equity
$m $m $m $m $m $m
As at 1 October 2018 27,205 323 31,737 59,265 140 59,405
Impact on transition to AASB 9 - 14 (624) (610) - (610)
Profit or loss from continuing operations - - 6,296 6,296 15 6,311
Profit or loss from discontinued operations - - (343) (343) - (343)
Other comprehensive income for the year from continuing operations
- 1,393 58 1,451 5 1,456
Other comprehensive income for the year from discontinued operations
- (97) - (97) - (97)
Total comprehensive income for the year - 1,296 6,011 7,307 20 7,327 Transactions with equity holders in their capacity as equity holders: Dividends paid - - (4,481) (4,481) (2) (4,483)
Dividend income on treasury shares held within the Group’s life insurance statutory funds
- - 12 12 - 12
Group share buy-back2 (1,120) - - (1,120) - (1,120)
Other equity movements: Treasury shares Wealth Australia discontinued operations adjustment3
405 - - 405 - 405
Other items - (4) 9 5 (147) (142)
As at 30 September 2019 26,490 1,629 32,664 60,783 11 60,794
Impact on transition to AASB 16 - - (88) (88) - (88)
Profit or loss from continuing operations - - 3,675 3,675 1 3,676 Profit or loss from discontinued operations - - (98) (98) - (98)
Other comprehensive income for the year from continuing operations - (124) 14 (110) (1) (111)
Total comprehensive income for the year - (124) 3,591 3,467 - 3,467 Transactions with equity holders in their capacity as equity holders: Dividends paid - - (2,922) (2,922) - (2,922)
Dividend Reinvestment Plan1 61 - - 61 - 61
Other equity movements: Group employee share acquisition scheme (20) - - (20) - (20) Other items - (4) 10 6 (1) 5
As at 30 September 2020 26,531 1,501 33,255 61,287 10 61,297 1 3.4 million shares were issued under the Dividend Reinvestment Plan (DRP) for the 2020 interim dividend (nil shares for the 2019 final Dividend; nil shares for the 2019 interim dividend as the shares were
purchased on-market and provided directly to shareholders participating in the DRP). On-market share purchases for the DRP in 2020 were $185 million (2019: $432 million). 2 The Company completed a $3.0 billion on-market share buy-back of ANZ ordinary shares purchasing $1,120 million worth of shares in 2019 resulting in 42.0 million shares being cancelled. 3 The successor funds transfer performed in preparation for the sale of the Group’s wealth business to Zurich and IOOF completed on 13 April 2019. As a result, the Group no longer eliminates the ANZ shares
previously held in Wealth Australia discontinued operations (treasury shares).
The notes appearing on pages 117 to 225 form an integral part of these financial statements.
ANZ 2020 ANNUAL REPORT
117
NOTES TO THE CONSOLIDATED FINANCIAL STATEMENTS
NOTES TO THE CONSOLIDATED FINANCIAL STATEMENTS
1. ABOUT OUR FINANCIAL STATEMENTS These are the financial statements for Australia and New Zealand Banking Group Limited (the Company) and its controlled entities (together, ‘the Group’ or ‘ANZ’) for the year ended 30 September 2020. The Company is incorporated and domiciled in Australia. The address of the Company’s registered office and its principal place of business is ANZ Centre, 833 Collins Street, Docklands, Victoria, Australia 3008. The Group provides banking and financial services to individuals and business customers and operates in and across 33 markets.
On 4 November 2020, the Directors resolved to authorise the issue of these financial statements.
Information in the financial statements is included only to the extent we consider it material and relevant to the understanding of the financial statements. A disclosure is considered material and relevant if, for example:
the amount is significant in size (quantitative factor);
the information is significant by nature (qualitative factor);
the user cannot understand the Group’s results without the specific disclosure (qualitative factor);
the information is critical to a user’s understanding of the impact of significant changes in the Group’s business during the period - for example, business acquisitions or disposals (qualitative factor);
the information relates to an aspect of the Group’s operations that is important to its future performance (qualitative factor); and
the information is required under legislative requirements of the Corporations Act 2001, the Banking Act 1959 (Cth) or by the Group’s principal regulators, including the Australian Securities and Investments Commission (ASIC) and the Australian Prudential Regulation Authority (APRA).
This section of the financial statements:
outlines the basis upon which the Group’s financial statements have been prepared; and
discusses any new accounting standards or regulations that directly impact the financial statements.
BASIS OF PREPARATION This financial report is a general purpose (Tier 1) financial report prepared by a ‘for profit’ entity, in accordance with Australian Accounting Standards (AASs) and other authoritative pronouncements of the Australian Accounting Standards Board (AASB), the Corporations Act 2001, and International Financial Reporting Standards (IFRS) and interpretations published by the International Accounting Standards Board (IASB).
We present the financial statements of the Group in Australian dollars, which is the Company’s functional and presentation currency. We have rounded values to the nearest million dollars ($m), unless otherwise stated, as allowed under the ASIC Corporations (Rounding in Financial/Directors Report) Instrument 2016/191. We measure the financial statements of each entity in the Group using the currency of the primary economic environment in which that entity operates (the functional currency).
BASIS OF MEASUREMENT We have prepared the financial information in accordance with the historical cost basis - except the following assets and liabilities which we have stated at their fair value:
derivative financial instruments and in the case of fair value hedging, a fair value adjustment made to the underlying hedged exposure;
financial instruments held for trading;
financial assets and financial liabilities designated at fair value through profit or loss;
financial assets at fair value through other comprehensive income; and
assets and liabilities classified as held for sale (except those at their carrying value as per Note 29).
In accordance with AASB 1038 Life Insurance Contracts (AASB 1038) we have measured life insurance liabilities using the Margin on Services (MoS) model. In accordance with AASB 119 Employee Benefits (AASB 119) we have measured defined benefit obligations using the Projected Unit Credit Method.
DISCONTINUED OPERATIONS The aligned dealer groups business sold to IOOF Holdings Limited (IOOF) completed on 1 October 2018; the life insurance business sold to Zurich Financial Services Australia Limited completed on 31 May 2019; and the Wealth Australia pensions and investments business sold to IOOF was completed on 31 January 2020. As a result of these sale transactions, the associated Group reclassification and consolidation impacts are treated as discontinued operations from a financial reporting perspective.
Notes to the consolidated financial statements
117ANZ 2020 Annual Report

118
NOTES TO THE CONSOLIDATED FINANCIAL STATEMENTS (continued)
1. ABOUT OUR FINANCIAL STATEMENTS (continued)
BASIS OF CONSOLIDATION The consolidated financial statements of the Group comprise the financial statements of the Company and all its subsidiaries. An entity, including a structured entity, is considered a subsidiary of the Group when we determine that the Company has control over the entity. Control exists when the Group is exposed to, or has rights to, variable returns from its involvement with the entity and has the ability to affect those returns through its power over the entity. We assess power by examining existing rights that give the Group the current ability to direct the relevant activities of the entity. We have eliminated, on consolidation, the effect of all transactions between entities in the Group.
FOREIGN CURRENCY TRANSLATION TRANSACTIONS AND BALANCESForeign currency transactions are translated into the relevant functional currency at the exchange rate prevailing at the date of the transaction. At the reporting date, monetary assets and liabilities denominated in foreign currencies are translated into the functional currency at the relevant spot rate. Any foreign currency translation gains or losses that arise are included in profit or loss in the period they arise.
We measure translation differences on non-monetary items at fair value through profit or loss and report them as part of the fair value gain or loss on these items. For non-monetary items classified as investment securities measured at fair value through other comprehensive income translation differences are included in Other comprehensive income.
FINANCIAL STATEMENTS OF FOREIGN OPERATIONS THAT HAVE A FUNCTIONAL CURRENCY THAT IS NOT AUSTRALIAN DOLLARS The financial statements of our foreign operations are translated into Australian dollars for consolidation into the Group financial statements using the following method:
Foreign currency item Exchange rate used
Assets and liabilities The reporting date rate
Equity The initial investment date rate
Income and expenses The average rate for the period – but if for a significant transaction we believe the average rate is not reasonable, then we use the rate at the date of the transaction
Exchange differences arising from the translation of financial statements of foreign operations are recognised in the foreign currency translation reserve in equity. When we dispose of a foreign operation, the cumulative exchange differences are transferred to profit or loss as part of the gain or loss on sale.
FIDUCIARY ACTIVITIES
The Group provides fiduciary services to third parties including custody, nominee and trustee services. This involves the Group holding assets on behalf of third parties and making decisions regarding the purchase and sale of financial instruments. If ANZ is not the beneficial owner or does not control the assets, then we do not recognise these transactions in these financial statements, except when required by accounting standards or another legislative requirement.
ANZ 2020 ANNUAL REPORT
118
Overview How we create value
Performance overview
Remuneration report
Directors’ report
Financial report
Shareholder information

118
NOTES TO THE CONSOLIDATED FINANCIAL STATEMENTS (continued)
1. ABOUT OUR FINANCIAL STATEMENTS (continued)
BASIS OF CONSOLIDATION The consolidated financial statements of the Group comprise the financial statements of the Company and all its subsidiaries. An entity, including a structured entity, is considered a subsidiary of the Group when we determine that the Company has control over the entity. Control exists when the Group is exposed to, or has rights to, variable returns from its involvement with the entity and has the ability to affect those returns through its power over the entity. We assess power by examining existing rights that give the Group the current ability to direct the relevant activities of the entity. We have eliminated, on consolidation, the effect of all transactions between entities in the Group.
FOREIGN CURRENCY TRANSLATION TRANSACTIONS AND BALANCESForeign currency transactions are translated into the relevant functional currency at the exchange rate prevailing at the date of the transaction. At the reporting date, monetary assets and liabilities denominated in foreign currencies are translated into the functional currency at the relevant spot rate. Any foreign currency translation gains or losses that arise are included in profit or loss in the period they arise.
We measure translation differences on non-monetary items at fair value through profit or loss and report them as part of the fair value gain or loss on these items. For non-monetary items classified as investment securities measured at fair value through other comprehensive income translation differences are included in Other comprehensive income.
FINANCIAL STATEMENTS OF FOREIGN OPERATIONS THAT HAVE A FUNCTIONAL CURRENCY THAT IS NOT AUSTRALIAN DOLLARS The financial statements of our foreign operations are translated into Australian dollars for consolidation into the Group financial statements using the following method:
Foreign currency item Exchange rate used
Assets and liabilities The reporting date rate
Equity The initial investment date rate
Income and expenses The average rate for the period – but if for a significant transaction we believe the average rate is not reasonable, then we use the rate at the date of the transaction
Exchange differences arising from the translation of financial statements of foreign operations are recognised in the foreign currency translation reserve in equity. When we dispose of a foreign operation, the cumulative exchange differences are transferred to profit or loss as part of the gain or loss on sale.
FIDUCIARY ACTIVITIES
The Group provides fiduciary services to third parties including custody, nominee and trustee services. This involves the Group holding assets on behalf of third parties and making decisions regarding the purchase and sale of financial instruments. If ANZ is not the beneficial owner or does not control the assets, then we do not recognise these transactions in these financial statements, except when required by accounting standards or another legislative requirement.
ANZ 2020 ANNUAL REPORT
118
NOTES TO THE CONSOLIDATED FINANCIAL STATEMENTS (continued)
1. ABOUT OUR FINANCIAL STATEMENTS (continued)
BASIS OF CONSOLIDATION The consolidated financial statements of the Group comprise the financial statements of the Company and all its subsidiaries. An entity, including a structured entity, is considered a subsidiary of the Group when we determine that the Company has control over the entity. Control exists when the Group is exposed to, or has rights to, variable returns from its involvement with the entity and has the ability to affect those returns through its power over the entity. We assess power by examining existing rights that give the Group the current ability to direct the relevant activities of the entity. We have eliminated, on consolidation, the effect of all transactions between entities in the Group.
FOREIGN CURRENCY TRANSLATION TRANSACTIONS AND BALANCESForeign currency transactions are translated into the relevant functional currency at the exchange rate prevailing at the date of the transaction. At the reporting date, monetary assets and liabilities denominated in foreign currencies are translated into the functional currency at the relevant spot rate. Any foreign currency translation gains or losses that arise are included in profit or loss in the period they arise.
We measure translation differences on non-monetary items at fair value through profit or loss and report them as part of the fair value gain or loss on these items. For non-monetary items classified as investment securities measured at fair value through other comprehensive income translation differences are included in Other comprehensive income.
FINANCIAL STATEMENTS OF FOREIGN OPERATIONS THAT HAVE A FUNCTIONAL CURRENCY THAT IS NOT AUSTRALIAN DOLLARS The financial statements of our foreign operations are translated into Australian dollars for consolidation into the Group financial statements using the following method:
Foreign currency item Exchange rate used
Assets and liabilities The reporting date rate
Equity The initial investment date rate
Income and expenses The average rate for the period – but if for a significant transaction we believe the average rate is not reasonable, then we use the rate at the date of the transaction
Exchange differences arising from the translation of financial statements of foreign operations are recognised in the foreign currency translation reserve in equity. When we dispose of a foreign operation, the cumulative exchange differences are transferred to profit or loss as part of the gain or loss on sale.
FIDUCIARY ACTIVITIES
The Group provides fiduciary services to third parties including custody, nominee and trustee services. This involves the Group holding assets on behalf of third parties and making decisions regarding the purchase and sale of financial instruments. If ANZ is not the beneficial owner or does not control the assets, then we do not recognise these transactions in these financial statements, except when required by accounting standards or another legislative requirement.
ANZ 2020 ANNUAL REPORT NOTES TO THE CONSOLIDATED FINANCIAL STATEMENTS
119
1. ABOUT OUR FINANCIAL STATEMENTS (continued)
ACCOUNTING STANDARDS ADOPTED IN THE PERIOD
AASB 16 Leases (AASB 16)
AASB 16 became effective for the Group from 1 October 2019 and replaced the previous standard AASB 117 Leases (AASB 117). AASB 16 primarily impacts the Group’s property and technology leases which were previously classified as operating leases. Under AASB 117, operating leases were not recognised on balance sheet and rent payments were expensed over the lease term.
Under AASB 16, the Group recognises all leases (except for leases of low value assets and short term leases) on balance sheet under a single accounting model. Accordingly, the Group recognises its right to use an underlying leased asset over the lease term as a right-of-use (ROU) asset, and its obligation to make lease payments as a lease liability. In the income statement, the Group recognises depreciation expense on the ROU asset and interest expense on the lease liability. As a result, lease expenses will be higher in the early periods of a lease and lower in the later periods of the lease compared to the previous standard where expenses were constant over the lease term. Cumulative expenses over the life of a lease will not change.
As permitted by the standard, the Group does not recognise ROU assets and lease liabilities for leases of low value items and short term leases (less than 12 months). Instead, the lease payments associated with these leases are recognised as an operating expense in the income statement on a straight-line basis over the lease term.
The Group has applied the modified retrospective transition approach whereby initial lease liabilities are recognised based on the present value of remaining lease payments as of the transition date. The initial ROU asset recognised for certain large commercial and retail leases was measured as if AASB 16 had always been applied to the leases. For all other leases, the initial ROU asset was measured as equal to the initial lease liability.
The implementation of AASB 16 requires management to make certain key judgements including the determination of lease terms, discount rates and identifying arrangements that contain a lease. Extension options are included in the lease term if the Group is reasonably certain the option will be exercised. This assessment includes consideration of facts and circumstances that create an economic incentive for the Group to exercise the option.
Based on the modified retrospective transition approach, the Group recognised lease liabilities of $1.7 billion presented within Payables and other liabilities and ROU assets of $1.6 billion presented within Premises and equipment. This resulted in a reduction to opening retained earnings of $88 million and an increase in deferred tax assets of $37 million as of 1 October 2019. Comparatives have not been restated.
KEY JUDGEMENTS AND ESTIMATES
In the process of applying the Group’s accounting policies, management has made a number of judgements and applied estimates and assumptions about past and future events. Further information on the key judgements and estimates that we consider material to the financial statements are contained within each relevant note to the financial statements.
Coronavirus (COVID-19) pandemic The COVID-19 pandemic and its effect on the global economy have impacted our customers, operations and Group performance. The outbreak necessitated governments to respond at unprecedented levels to protect the health of the population, local economies and livelihoods. It has affected different regions at different times and at varying degrees and there remains a risk of subsequent waves of infection. Thus the pandemic has significantly increased the estimation uncertainty in the preparation of these financial statements including:
• the extent and duration of the disruption to business arising from the actions of governments, businesses and consumers to contain the spread of the virus;
• the extent and duration of the expected economic downturn, and subsequent recovery. This includes the impacts on capital markets and liquidity, credit quality, increasing unemployment, declines in consumer spending, reductions in production, and other restructuring activities; and
• the effectiveness of government and central bank measures to support businesses and consumers through this disruption and economic downturn.
The Group has made various accounting estimates in these financial statements based on forecasts of economic conditions which reflect expectations and assumptions as at 30 September 2020 about future events that the Directors believe are reasonable in the circumstances. There is a considerable degree of judgement involved in preparing these estimates. The underlying assumptions are also subject to uncertainties which are often outside the control of the Group. Accordingly, actual economic conditions are likely to be different from those forecast since anticipated events frequently do not occur as expected, and the effect of those differences may significantly impact accounting estimates included in these financial statements.
The significant accounting estimates impacted by these forecasts and associated uncertainties are predominantly related to expected credit losses, fair value measurement, and the assessment of the recoverable amount of non-financial assets.
The impact of the COVID-19 pandemic on each of these estimates is discussed further in the relevant note of these financial statements. Readers should carefully consider these disclosures in light of the inherent uncertainty described above.
Notes to the consolidated financial statements (continued)
119ANZ 2020 Annual Report

NOTES TO THE CONSOLIDATED FINANCIAL STATEMENTS (continued)
120
ANZ 2020 ANNUAL REPORT
1. ABOUT OUR FINANCIAL STATEMENTS (continued)
ACCOUNTING STANDARDS ADOPTED IN THE PERIOD (continued)
In addition, the Group elected to apply the following practical expedients as permitted under the modified retrospective transition approach: a) Impairment of ROU assets at the transition date was assessed by relying on onerous lease provisions previously recognised as of 30 September
2019 under AASB 117;b) Initial direct costs associated with entering leases prior to the transition date were excluded from the carrying value of ROU assets recognised at
transition;c) No ROU assets or lease liabilities were recognised for certain leases with less than 12 months remaining as of the transition date; these leases were
treated as short-term leases with all lease payments recognised in rent expense as incurred; and d) Hindsight was used to determine the lease term of contracts that contained options to extend the lease.
The following table reconciles the operating lease commitments disclosed under AASB 117 as at 30 September 2019 to the opening lease liabilities recognised under AASB 16 as at 1 October 2019.
$m Operating Lease Commitments as at 30 September 2019 1,656 Increase in lease term for extension options 210 Exclusion of low value leases and leases of less than 12 months (19) Exclusion of service components (10) Other (17) Total Undiscounted Lease Payments 1,820 Effect of discounting at a weighted average incremental borrowing rate of 2.44% (141)
Total lease liabilities under AASB 16 as at 1 October 2019 1,679
During the reporting period, the Group recognised the following amounts in the income statement $m
Depreciation expense on ROU assets 394 Interest expense on lease liabilities 37 Interest expense on makegood provisions 2 Rent expense in relation to low value leases and leases of less than 12 months 35 Other income in relation to subleases 21
The Group's accounting policies with respect to lease arrangements where it acts as lessor have not changed under AASB 16 except where the Group subleases certain leased properties. Where the Group acts as intermediate lessor, it classifies the sublease as either a finance lease or operating lease by reference to the ROU asset of the head lease. Income from operating subleases is recognised in Other operating income in the Income Statement.
120
Overview How we create value
Performance overview
Remuneration report
Directors’ report
Financial report
Shareholder information

NOTES TO THE CONSOLIDATED FINANCIAL STATEMENTS (continued)
120
ANZ 2020 ANNUAL REPORT
1. ABOUT OUR FINANCIAL STATEMENTS (continued)
ACCOUNTING STANDARDS ADOPTED IN THE PERIOD (continued)
In addition, the Group elected to apply the following practical expedients as permitted under the modified retrospective transition approach: a) Impairment of ROU assets at the transition date was assessed by relying on onerous lease provisions previously recognised as of 30 September
2019 under AASB 117;b) Initial direct costs associated with entering leases prior to the transition date were excluded from the carrying value of ROU assets recognised at
transition;c) No ROU assets or lease liabilities were recognised for certain leases with less than 12 months remaining as of the transition date; these leases were
treated as short-term leases with all lease payments recognised in rent expense as incurred; and d) Hindsight was used to determine the lease term of contracts that contained options to extend the lease.
The following table reconciles the operating lease commitments disclosed under AASB 117 as at 30 September 2019 to the opening lease liabilities recognised under AASB 16 as at 1 October 2019.
$m Operating Lease Commitments as at 30 September 2019 1,656 Increase in lease term for extension options 210 Exclusion of low value leases and leases of less than 12 months (19) Exclusion of service components (10) Other (17) Total Undiscounted Lease Payments 1,820 Effect of discounting at a weighted average incremental borrowing rate of 2.44% (141)
Total lease liabilities under AASB 16 as at 1 October 2019 1,679
During the reporting period, the Group recognised the following amounts in the income statement $m
Depreciation expense on ROU assets 394 Interest expense on lease liabilities 37 Interest expense on makegood provisions 2 Rent expense in relation to low value leases and leases of less than 12 months 35 Other income in relation to subleases 21
The Group's accounting policies with respect to lease arrangements where it acts as lessor have not changed under AASB 16 except where the Group subleases certain leased properties. Where the Group acts as intermediate lessor, it classifies the sublease as either a finance lease or operating lease by reference to the ROU asset of the head lease. Income from operating subleases is recognised in Other operating income in the Income Statement.
NOTES TO THE CONSOLIDATED FINANCIAL STATEMENTS
121
1. ABOUT OUR FINANCIAL STATEMENTS (continued)
ACCOUNTING STANDARDS ADOPTED IN THE PERIOD (continued)
Interest Rate Benchmark Reform
Background
Interbank offered rates (IBORs), such as the London Interbank Offered Rate (LIBOR), play a critical role in global financial markets, serving as reference rates for derivatives, loans and securities, and as parameters in the valuation of financial instruments.
Uncertainty surrounding the integrity of IBOR rates has in recent years, led regulators, central banks and market participants to work towards a transition to alternative risk-free benchmark reference rates (RFRs) and market-led working groups in respective jurisdictions have recommended alternative risk-free reference rates, which are gradually being adopted. Progress in the transition to these new benchmarks has resulted in significant uncertainty in the future of IBOR benchmarks beyond 1 January 2022.
Accounting amendments
In response to the uncertainty about the long-term viability of these benchmark rates, and LIBOR in particular, the International Accounting Standards Board (IASB) has established a project to consider the financial reporting implications of the reform. The transition from IBORs is expected to have an impact on various elements of financial instrument accounting, including hedge accounting, as well as fair value methodologies and disclosures.
In October 2019, the AASB issued AASB 2019-3 Amendments to Australian Accounting Standards – Interest Rate Benchmark Reform, which amends certain existing hedge accounting requirements to provide relief from potential effects of the uncertainty caused by the interest rate benchmark reform. The Group elected to early adopt the amendments from 1 October 2019 which have not had a significant impact on the Group. These amendments address the accounting effects of uncertainty in the period leading up to the reform arising from the Group’s ability to satisfy the existing prospective hedge effectiveness requirements of AASB 139. This uncertainty arises as it is not known when the hedged items (such as debt issuances) and associated hedging instruments (such as interest rate swaps) will be changed to reference the RFRs, or if both the hedging item and the associated hedging instrument will move to the new rates at the same time. The Group has applied this amendment to all hedge accounted relationships (cash flow or fair value hedges) where the reform gives rise to uncertainties about the timing or amount of IBOR based cash flows of the hedged item or hedging instrument.
In September 2020, the AASB issued AASB 2020-8 Amendments to Australian Accounting Standards – Interest Rate Benchmark Reform – Phase 2 which is mandatory for the Group for the 2022 financial year. This standard addresses issues that may affect the Group at the point of transition from an existing IBOR rate to a RFR, including the effects of changes to contractual cash flows or hedging relationships. The standard includes amendments in respect of:
Modification of a financial asset or a financial liability measured at amortised cost
IBOR reform is expected to result in a change to the basis for determining contractual cash flows of impacted assets and liabilities of the Group. The amendments provide a practical expedient to account for a change in the basis for determining the contractual cash flows as a result of IBOR reform by updating the effective interest rate. As a result, no immediate gain or loss is recognised. This applies only when the change is necessary as a direct consequence of the reform, and the new basis for determining the contractual cash flows is economically equivalent to the previous basis.
Additional relief for hedging relationships
The Standard also amends a number of existing hedge accounting requirements that will assist the Group to maintain its existing hedge accounted relationships post IBOR transition. The Group will continue to record any ongoing hedge ineffectiveness, including that generated by changes as a result of interest rate reform, within the Income Statement.
The Group is in the process of assessing the impact of the new standard on its financial statements.
Impact of IBOR reform
The Group has exposure to IBOR through its issuance of debt, the structural interest rate risk position, holdings of investment securities, products denominated in foreign currencies and associated hedging activities in our treasury and markets businesses within the TSO and Group Centre and Institutional divisions respectively.
The Group has established an enterprise-wide Benchmark Transition Program to manage the transition. The program includes the assessment and actions necessary to accommodate the transition to RFRs as they apply to internal processes and systems including pricing, risk management, documentation and hedge arrangements. The program includes management of the impact on customers.
Impact of IBOR reform on the Group’s hedging relationships
Certain IBOR rates are subject to replacement by RFRs. The Group has hedge accounted relationships referencing IBORs, with the most significant interest rate benchmarks to which the Group's hedging relationships are exposed to are USD LIBOR, Euro Interbank Offered Rate (EURIBOR), Bank Bill Swap Rate (BBSW) and Bank Bill Market (BKBM).
Of these benchmarks the Group expects BBSW, BKBM and EURIBOR to exist as benchmark rates for the foreseeable future and therefore does not believe its BBSW, BKBM or EURIBOR benchmark fair value or cash flow hedges will be directly impacted by IBOR reform.
Notes to the consolidated financial statements (continued)
121ANZ 2020 Annual Report

NOTES TO THE CONSOLIDATED FINANCIAL STATEMENTS (continued)
122
ANZ 2020 ANNUAL REPORT
1. About Our Financial Statements (continued)
ACCOUNTING STANDARDS ADOPTED IN THE PERIOD (continued)
Interest Rate Benchmark Reform (continued)
The table below details the carrying values of the Group's exposures designated in hedge accounting relationships that will be impacted by IBOR reform, principally USD LIBOR. The nominal value of the associated hedging instruments is also included:
As at 30 September 2020
Hedged items USD LIBOR exposures
$m Investment securities at FVOCI 15,002
Net loans and advances 111
Debt issuances 32,235
Hedging instruments
Notional designated up to 31 December 2021
$m
Notional designated beyond 31 December 2021
$m Total Notional Amount
$m Fair value hedges 12,778 32,250 45,028
Cash flow hedges - 1,055 1,055
As at 30 September 2020 the Group also has GBP LIBOR, CHF LIBOR and JPY LIBOR exposures designated in hedge accounting relationships of $927 million, $975 million and $2,131 million respectively.
In addition to hedge accounted relationships that will be impacted by IBOR reform, the Group has exposures to other financial instruments referencing an IBOR rate that are also subject to reform. The Group is continuing to monitor market developments in relation to the transition to RFRs from IBOR rates and their impact on the Group’s financial assets and liabilities to ensure that there are no unexpected consequences or disruption from the transition.
AASB INTERPRETATION 23 UNCERTAINTY OVER INCOME TAX TREATMENTS (AASB Interpretation 23)
AASB Interpretation 23 became effective for the Group from 1 October 2019. The interpretation clarifies application of recognition and measurement requirements in AASB 112 Income Taxes where there is uncertainty over income tax treatments. As the Group’s existing policy aligned with the requirements of AASB Interpretation 23, the interpretation had no material impact on the Group.
ACCOUNTING STANDARDS NOT EARLY ADOPTED A number of new standards, amendments to standards and interpretations have been published but are not mandatory for the financial statements for the year ended 30 September 2020, and have not been applied by the Group in preparing these financial statements. Further details of these are set out below.
GENERAL HEDGE ACCOUNTING
AASB 9 introduces new hedge accounting requirements which more closely align accounting with risk management activities undertaken when hedging both financial and non-financial risks. AASB 9 provides the Group with an accounting policy choice to continue to apply the AASB 139 hedge accounting requirements until the International Accounting Standards Board’s ongoing project on macro hedge accounting is completed. The Group continues to apply the hedge accounting requirements of AASB 139.
AASB 17 INSURANCE CONTRACTS (AASB 17)
The final version of AASB 17 was issued in July 2017 and is not effective for the Group until 1 October 2023. It will replace AASB 4 Insurance Contracts, AASB 1023 General Insurance Contracts and AASB 1038 Life Insurance Contracts. AASB 17 establishes principles for the recognition, measurement, presentation and disclosure of insurance contracts.
The measurement, presentation and disclosure requirements under AASB 17 are significantly different from current accounting standards. Although the overall profit recognised in respect of insurance contracts will not change, it is expected that the timing of profit recognition will change.
AASB 17 is not expected to have material impact on the Group.
REVISED CONCEPTUAL FRAMEWORK
In June 2019 the AASB issued a revised Conceptual Framework for Financial Reporting. The new Framework includes updated definitions and criteria for the recognition and derecognition of assets and liabilities. Additionally, it introduces new concepts on measurement, including factors to consider when selecting a measurement basis. The revised Conceptual Framework will apply to the Group from 1 October 2020 and is not expected to have a material impact on the Group.
122
Overview How we create value
Performance overview
Remuneration report
Directors’ report
Financial report
Shareholder information
NOTES TO THE CONSOLIDATED FINANCIAL STATEMENTS (continued)
122
ANZ 2020 ANNUAL REPORT
1. About Our Financial Statements (continued)
ACCOUNTING STANDARDS ADOPTED IN THE PERIOD (continued)
Interest Rate Benchmark Reform (continued)
The table below details the carrying values of the Group's exposures designated in hedge accounting relationships that will be impacted by IBOR reform, principally USD LIBOR. The nominal value of the associated hedging instruments is also included:
As at 30 September 2020
Hedged items USD LIBOR exposures
$m Investment securities at FVOCI 15,002
Net loans and advances 111
Debt issuances 32,235
Hedging instruments
Notional designated up to 31 December 2021
$m
Notional designated beyond 31 December 2021
$m Total Notional Amount
$m Fair value hedges 12,778 32,250 45,028
Cash flow hedges - 1,055 1,055
As at 30 September 2020 the Group also has GBP LIBOR, CHF LIBOR and JPY LIBOR exposures designated in hedge accounting relationships of $927 million, $975 million and $2,131 million respectively.
In addition to hedge accounted relationships that will be impacted by IBOR reform, the Group has exposures to other financial instruments referencing an IBOR rate that are also subject to reform. The Group is continuing to monitor market developments in relation to the transition to RFRs from IBOR rates and their impact on the Group’s financial assets and liabilities to ensure that there are no unexpected consequences or disruption from the transition.
AASB INTERPRETATION 23 UNCERTAINTY OVER INCOME TAX TREATMENTS (AASB Interpretation 23)
AASB Interpretation 23 became effective for the Group from 1 October 2019. The interpretation clarifies application of recognition and measurement requirements in AASB 112 Income Taxes where there is uncertainty over income tax treatments. As the Group’s existing policy aligned with the requirements of AASB Interpretation 23, the interpretation had no material impact on the Group.
ACCOUNTING STANDARDS NOT EARLY ADOPTED A number of new standards, amendments to standards and interpretations have been published but are not mandatory for the financial statements for the year ended 30 September 2020, and have not been applied by the Group in preparing these financial statements. Further details of these are set out below.
GENERAL HEDGE ACCOUNTING
AASB 9 introduces new hedge accounting requirements which more closely align accounting with risk management activities undertaken when hedging both financial and non-financial risks. AASB 9 provides the Group with an accounting policy choice to continue to apply the AASB 139 hedge accounting requirements until the International Accounting Standards Board’s ongoing project on macro hedge accounting is completed. The Group continues to apply the hedge accounting requirements of AASB 139.
AASB 17 INSURANCE CONTRACTS (AASB 17)
The final version of AASB 17 was issued in July 2017 and is not effective for the Group until 1 October 2023. It will replace AASB 4 Insurance Contracts, AASB 1023 General Insurance Contracts and AASB 1038 Life Insurance Contracts. AASB 17 establishes principles for the recognition, measurement, presentation and disclosure of insurance contracts.
The measurement, presentation and disclosure requirements under AASB 17 are significantly different from current accounting standards. Although the overall profit recognised in respect of insurance contracts will not change, it is expected that the timing of profit recognition will change.
AASB 17 is not expected to have material impact on the Group.
REVISED CONCEPTUAL FRAMEWORK
In June 2019 the AASB issued a revised Conceptual Framework for Financial Reporting. The new Framework includes updated definitions and criteria for the recognition and derecognition of assets and liabilities. Additionally, it introduces new concepts on measurement, including factors to consider when selecting a measurement basis. The revised Conceptual Framework will apply to the Group from 1 October 2020 and is not expected to have a material impact on the Group.
NOTES TO THE CONSOLIDATED FINANCIAL STATEMENTS
123
2. OPERATING INCOME
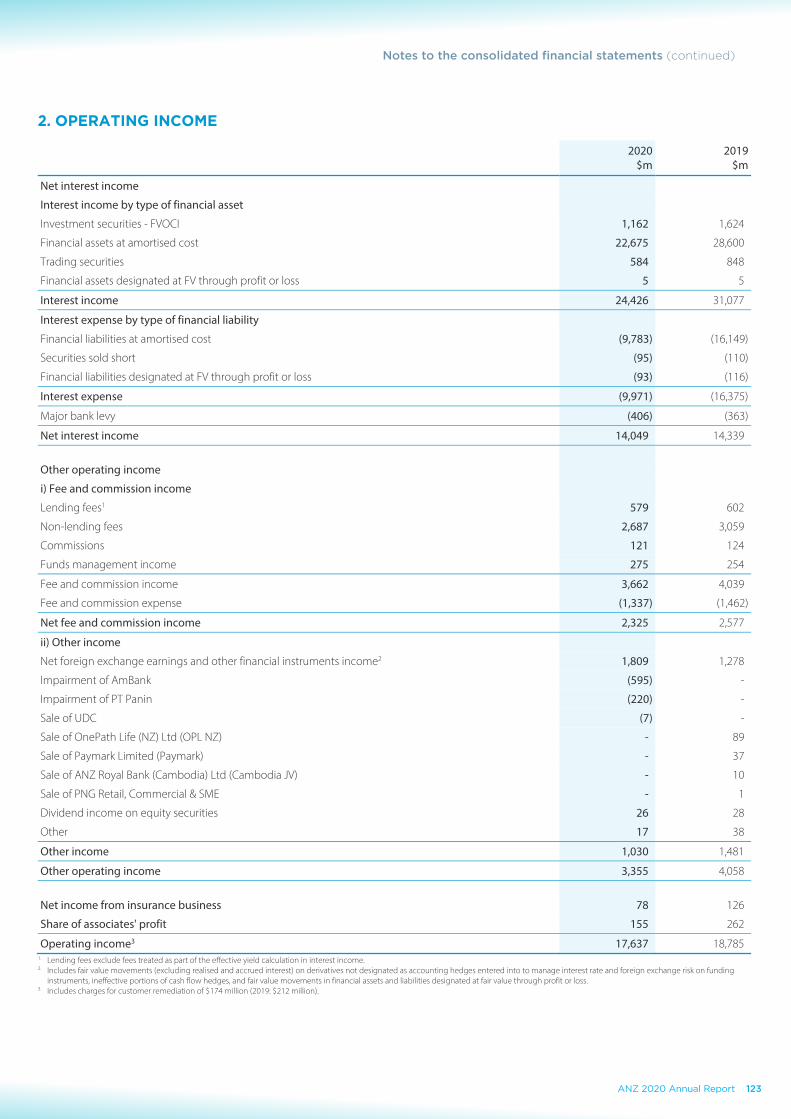
2020 2019$m $m
Net interest income
Interest income by type of financial asset
Investment securities - FVOCI 1,162 1,624
Financial assets at amortised cost 22,675 28,600
Trading securities 584 848
Financial assets designated at FV through profit or loss 5 5
Interest income 24,426 31,077
Interest expense by type of financial liability
Financial liabilities at amortised cost (9,783) (16,149)
Securities sold short (95) (110)
Financial liabilities designated at FV through profit or loss (93) (116)
Interest expense (9,971) (16,375)
Major bank levy (406) (363)
Net interest income 14,049 14,339
Other operating income
i) Fee and commission income
Lending fees1 579 602
Non-lending fees 2,687 3,059
Commissions 121 124
Funds management income 275 254
Fee and commission income 3,662 4,039
Fee and commission expense (1,337) (1,462)
Net fee and commission income 2,325 2,577
ii) Other income
Net foreign exchange earnings and other financial instruments income2 1,809 1,278
Impairment of AmBank (595) -
Impairment of PT Panin (220) -
Sale of UDC (7) -
Sale of OnePath Life (NZ) Ltd (OPL NZ) - 89
Sale of Paymark Limited (Paymark) - 37
Sale of ANZ Royal Bank (Cambodia) Ltd (Cambodia JV) - 10
Sale of PNG Retail, Commercial & SME - 1
Dividend income on equity securities 26 28
Other 17 38
Other income 1,030 1,481
Other operating income 3,355 4,058
Net income from insurance business 78 126
Share of associates' profit 155 262
Operating income3 17,637 18,785 1. Lending fees exclude fees treated as part of the effective yield calculation in interest income.2. Includes fair value movements (excluding realised and accrued interest) on derivatives not designated as accounting hedges entered into to manage interest rate and foreign exchange risk on funding
instruments, ineffective portions of cash flow hedges, and fair value movements in financial assets and liabilities designated at fair value through profit or loss. 3. Includes charges for customer remediation of $174 million (2019: $212 million).
Notes to the consolidated financial statements (continued)
123ANZ 2020 Annual Report
NOTES TO THE CONSOLIDATED FINANCIAL STATEMENTS (continued)
124
ANZ 2020 ANNUAL REPORT
2. OPERATING INCOME (continued)
RECOGNITION AND MEASUREMENT
NET INTEREST INCOME Interest Income and Expense We recognise interest income and expense for all financial instruments, including those classified as held for trading, assets measured at fair value through other comprehensive income or designated at fair value through profit or loss in net interest income. We use the effective interest rate method to calculate the amortised cost of assets held at amortised cost and to recognise interest income on financial assets measured at fair value through other comprehensive income. The effective interest rate is the rate that discounts the stream of estimated future cash receipts or payments over the expected life of the financial instrument or, when appropriate, a shorter period, to the net carrying amount of the financial asset or liability. For assets subject to prepayment, we determine their expected life on the basis of historical behaviour of the particular asset portfolio - taking into account contractual obligations and prepayment experience.
We recognise fees and costs, which form an integral part of the financial instrument (for example loan origination fees and costs), using the effective interest rate method. This is presented as part of interest income or expense depending on whether the underlying financial instrument is a financial asset or financial liability.
Major Bank Levy The Major Bank Levy Act 2017 (‘Levy’ or ‘Major bank levy’) applies a rate of 0.06% to certain liabilities of the Company. The Group has determined that the levy represents a finance cost for the Group and $406 million (2019: $363 million) is presented as interest expense in the Income Statement.
OTHER OPERATING INCOME Fee and Commission Revenue We recognise fee and commission revenue arising from contracts with customers (a) over time when the performance obligation is satisfied across more than one reporting period or (b) at a point in time when the performance obligation is satisfied immediately or is satisfied within one reporting period.
lending fees exclude fees treated as part of the effective yield calculation of interest income. Lending fees include certain guarantee and commitment fees where the loan or guarantee is not likely to be drawn upon, and other fees charged for providing customers a distinct good or service that are recognised separately from the underlying lending product (including annual package fees that provide benefits on other ANZ products).
non-lending fees includes fees associated with deposit and credit card accounts, interchange fees and fees charged for specific customer transactions such as international money transfers. Where the Group provides multiple goods or services to a customer under the same contract, the Group allocates the transaction price of the contract to distinct performance obligations based on the relative stand-alone selling price of each performance obligation. Revenue is recognised as each performance obligation is satisfied.
commissions represent fees from third parties where ANZ acts as an agent by arranging a third party (e.g. an insurance provider) to provide goods and services to a customer. In such cases, ANZ is not primarily responsible for providing the underlying good or service to the customer. If the Group collects funds on behalf of a third party when acting as an agent, the Group only recognises the net commission it retains as revenue. When the commission is variable based on factors outside the control of the Group (e.g. a trail commission), revenue is only recognised if it is highly probable that a significant reversal of the variable amount will not be required in future periods.
funds management income represents fees earned from customers for providing financial advice and fees for asset management services and advice provided to investment funds. Revenue is recognised either at the point the financial advice is provided or over the period in which the asset management services are delivered. Performance fees associated with funds management activities are only recognised when it becomes highly probable the performance hurdle will be achieved.
Net Foreign Exchange Earnings and Other Financial Instruments Income We recognise the following as net foreign exchange earnings and other financial instruments income:
exchange rate differences arising on the settlement of monetary items and translation differences on monetary items translated at rates different to those at which they were initially recognised or included in a previous financial report;
fair value movements (excluding realised and accrued interest) on derivatives that we use to manage interest rate and foreign exchange risk on funding instruments not designated as accounting hedges;
the ineffective portions of fair value hedges, cash flow hedges and net investment hedges;
124
Overview How we create value
Performance overview
Remuneration report
Directors’ report
Financial report
Shareholder information

NOTES TO THE CONSOLIDATED FINANCIAL STATEMENTS (continued)
124
ANZ 2020 ANNUAL REPORT
2. OPERATING INCOME (continued)
RECOGNITION AND MEASUREMENT
NET INTEREST INCOME Interest Income and Expense We recognise interest income and expense for all financial instruments, including those classified as held for trading, assets measured at fair value through other comprehensive income or designated at fair value through profit or loss in net interest income. We use the effective interest rate method to calculate the amortised cost of assets held at amortised cost and to recognise interest income on financial assets measured at fair value through other comprehensive income. The effective interest rate is the rate that discounts the stream of estimated future cash receipts or payments over the expected life of the financial instrument or, when appropriate, a shorter period, to the net carrying amount of the financial asset or liability. For assets subject to prepayment, we determine their expected life on the basis of historical behaviour of the particular asset portfolio - taking into account contractual obligations and prepayment experience.
We recognise fees and costs, which form an integral part of the financial instrument (for example loan origination fees and costs), using the effective interest rate method. This is presented as part of interest income or expense depending on whether the underlying financial instrument is a financial asset or financial liability.
Major Bank Levy The Major Bank Levy Act 2017 (‘Levy’ or ‘Major bank levy’) applies a rate of 0.06% to certain liabilities of the Company. The Group has determined that the levy represents a finance cost for the Group and $406 million (2019: $363 million) is presented as interest expense in the Income Statement.
OTHER OPERATING INCOME Fee and Commission Revenue We recognise fee and commission revenue arising from contracts with customers (a) over time when the performance obligation is satisfied across more than one reporting period or (b) at a point in time when the performance obligation is satisfied immediately or is satisfied within one reporting period.
lending fees exclude fees treated as part of the effective yield calculation of interest income. Lending fees include certain guarantee and commitment fees where the loan or guarantee is not likely to be drawn upon, and other fees charged for providing customers a distinct good or service that are recognised separately from the underlying lending product (including annual package fees that provide benefits on other ANZ products).
non-lending fees includes fees associated with deposit and credit card accounts, interchange fees and fees charged for specific customer transactions such as international money transfers. Where the Group provides multiple goods or services to a customer under the same contract, the Group allocates the transaction price of the contract to distinct performance obligations based on the relative stand-alone selling price of each performance obligation. Revenue is recognised as each performance obligation is satisfied.
commissions represent fees from third parties where ANZ acts as an agent by arranging a third party (e.g. an insurance provider) to provide goods and services to a customer. In such cases, ANZ is not primarily responsible for providing the underlying good or service to the customer. If the Group collects funds on behalf of a third party when acting as an agent, the Group only recognises the net commission it retains as revenue. When the commission is variable based on factors outside the control of the Group (e.g. a trail commission), revenue is only recognised if it is highly probable that a significant reversal of the variable amount will not be required in future periods.
funds management income represents fees earned from customers for providing financial advice and fees for asset management services and advice provided to investment funds. Revenue is recognised either at the point the financial advice is provided or over the period in which the asset management services are delivered. Performance fees associated with funds management activities are only recognised when it becomes highly probable the performance hurdle will be achieved.
Net Foreign Exchange Earnings and Other Financial Instruments Income We recognise the following as net foreign exchange earnings and other financial instruments income:
exchange rate differences arising on the settlement of monetary items and translation differences on monetary items translated at rates different to those at which they were initially recognised or included in a previous financial report;
fair value movements (excluding realised and accrued interest) on derivatives that we use to manage interest rate and foreign exchange risk on funding instruments not designated as accounting hedges;
the ineffective portions of fair value hedges, cash flow hedges and net investment hedges;
NOTES TO THE CONSOLIDATED FINANCIAL STATEMENTS
125
2. OPERATING INCOME (continued)
RECOGNITION AND MEASUREMENT (continued)
immediately upon sale or repayment of a hedged item, the unamortised fair value adjustments in items designated as fair value hedges and amounts accumulated in equity related to designated cash flow hedges;
fair value movements on financial assets and financial liabilities designated at fair value through profit or loss or held for trading;
amounts released from the fair value through other comprehensive income (FVOCI) reserve when a debt instrument classified as FVOCI is sold; and
the gain or loss on derecognition of financial assets or liabilities measured at amortised cost.
Gain or Loss on Disposal of Non-Financial Assets The gain or loss on the disposal of assets is the difference between the carrying value of the asset and the proceeds of disposal net of costs. This is recognised in other income in the year in which the significant risks and rewards from the asset transfer to the buyer.
NET INCOME FROM INSURANCE BUSINESS We recognise:
premiums received (net of reinsurance premiums paid) based on an assessment of the likely pattern in which risk will emerge over the term of the policies written. This assessment is undertaken periodically and updated in accordance with the latest pattern of risk emergence; and
claims incurred net of reinsurance, on an accruals basis once the liability to the policy owner has been established under the terms of the contract and through actuarial assumptions of future claims.
SHARE OF ASSOCIATES’ PROFIT The equity method is applied to accounting for associates. Under the equity method, the Group’s share of the after tax results of associates is included in the Income Statement and the Statement of Comprehensive Income.
Notes to the consolidated financial statements (continued)
125ANZ 2020 Annual Report

NOTES TO THE CONSOLIDATED FINANCIAL STATEMENTS (continued)
126
ANZ 2020 ANNUAL REPORT
RECOGNITION AND MEASUREMENT
OPERATING EXPENSES Operating expenses are recognised as services are provided to the Group, over the period in which an asset is consumed, or once a liability is created.
SALARIES AND RELATED COSTS - ANNUAL LEAVE, LONG SERVICE LEAVE AND OTHER EMPLOYEE BENEFITS Wages and salaries, annual leave and other employee entitlements expected to be paid or settled within twelve months of employees rendering service are measured at their nominal amounts using remuneration rates that the Group expects to pay when the liabilities are settled.
We accrue employee entitlements relating to long service leave using an actuarial calculation. It includes assumptions regarding staff departures, leave utilisation and future salary increases. The result is then discounted using market yields at the reporting date. The market yields are determined from a blended rate of high quality corporate bonds with terms to maturity that closely match the estimated future cash outflows.
If we expect to pay short term cash bonuses, then a liability is recognised when the Group has a present legal or constructive obligation to pay this amount (as a result of past service provided by the employee) and the obligation can be reliably measured.
3. OPERATING EXPENSES
2020 20191 $m $m
Personnel Salaries and related costs 4,310 4,249
Superannuation costs 329 293
Other 239 223
Personnel1 4,878 4,765
Premises
Rent 84 450
Depreciation 517 167
Other 188 178
Premises2 789 795
Technology
Depreciation and amortisation2,3 858 694
Subscription licences and outsourced services 780 672
Other 186 168
Technology (excluding personnel)1 1,824 1,534
Restructuring 161 77
Other
Advertising and public relations 177 226
Professional fees 667 537
Freight, stationery, postage and communication 205 216
Royal Commission legal costs - 15
Other4 682 906
Other1 1,731 1,900
Operating expenses1 9,383 9,071 1. Includes customer remediation expenses of $209 million in 2020 (2019: $373 million). 2. Following the adoption of AASB 16 on 1 October 2019, with the exception of low value leases and leases of less than 12 months, expenses associated with leases are shown as depreciation of the right-of-
use asset and interest expense associated with the lease liability (comparatives not restated). 3. During the 2020 financial year, the Group amended the application of its software amortisation policy to reflect the shorter useful life of software caused by rapidly changing technology and business
requirements. As a result of these changes, the Group recognised accelerated amortisation of $197 million during the year. Refer to Note 20 Goodwill and Other Intangible Assets for further details. 4. Includes goodwill write-off of $77 million in the September 2020 financial year.
126
Overview How we create value
Performance overview
Remuneration report
Directors’ report
Financial report
Shareholder information

NOTES TO THE CONSOLIDATED FINANCIAL STATEMENTS (continued)
126
ANZ 2020 ANNUAL REPORT
RECOGNITION AND MEASUREMENT
OPERATING EXPENSES Operating expenses are recognised as services are provided to the Group, over the period in which an asset is consumed, or once a liability is created.
SALARIES AND RELATED COSTS - ANNUAL LEAVE, LONG SERVICE LEAVE AND OTHER EMPLOYEE BENEFITS Wages and salaries, annual leave and other employee entitlements expected to be paid or settled within twelve months of employees rendering service are measured at their nominal amounts using remuneration rates that the Group expects to pay when the liabilities are settled.
We accrue employee entitlements relating to long service leave using an actuarial calculation. It includes assumptions regarding staff departures, leave utilisation and future salary increases. The result is then discounted using market yields at the reporting date. The market yields are determined from a blended rate of high quality corporate bonds with terms to maturity that closely match the estimated future cash outflows.
If we expect to pay short term cash bonuses, then a liability is recognised when the Group has a present legal or constructive obligation to pay this amount (as a result of past service provided by the employee) and the obligation can be reliably measured.
3. OPERATING EXPENSES
2020 20191 $m $m
Personnel Salaries and related costs 4,310 4,249
Superannuation costs 329 293
Other 239 223
Personnel1 4,878 4,765
Premises
Rent 84 450
Depreciation 517 167
Other 188 178
Premises2 789 795
Technology
Depreciation and amortisation2,3 858 694
Subscription licences and outsourced services 780 672
Other 186 168
Technology (excluding personnel)1 1,824 1,534
Restructuring 161 77
Other
Advertising and public relations 177 226
Professional fees 667 537
Freight, stationery, postage and communication 205 216
Royal Commission legal costs - 15
Other4 682 906
Other1 1,731 1,900
Operating expenses1 9,383 9,071 1. Includes customer remediation expenses of $209 million in 2020 (2019: $373 million). 2. Following the adoption of AASB 16 on 1 October 2019, with the exception of low value leases and leases of less than 12 months, expenses associated with leases are shown as depreciation of the right-of-
use asset and interest expense associated with the lease liability (comparatives not restated). 3. During the 2020 financial year, the Group amended the application of its software amortisation policy to reflect the shorter useful life of software caused by rapidly changing technology and business
requirements. As a result of these changes, the Group recognised accelerated amortisation of $197 million during the year. Refer to Note 20 Goodwill and Other Intangible Assets for further details. 4. Includes goodwill write-off of $77 million in the September 2020 financial year.
NOTES TO THE CONSOLIDATED FINANCIAL STATEMENTS
127
RECOGNITION AND MEASUREMENT
Personnel expenses also include share-based payments which may be cash or equity settled. We calculate the fair value of equity settled remuneration at grant date, which is then amortised over the vesting period, with a corresponding increase in share capital or the share option reserve as applicable. When we estimate the fair value, we take into account market vesting conditions, such as share price performance conditions. We take non-market vesting conditions, such as service conditions, into account by adjusting the number of equity instruments included in the expense.
After the grant of an equity-based award, the amount we recognise as an expense is reversed when non-market vesting conditions are not met, for example an employee fails to satisfy the minimum service period specified in the award on resignation, termination or notice of dismissal for serious misconduct. However, we do not reverse the expense if the award does not vest due to the failure to meet a market-based performance condition.
Further information on share-based payment schemes operated by the Group during the current and prior year is included in Note 31 Employee Share and Option Plans.
3. OPERATING EXPENSES (continued)
Notes to the consolidated financial statements (continued)
127ANZ 2020 Annual Report

NOTES TO THE CONSOLIDATED FINANCIAL STATEMENTS (continued)
128
ANZ 2020 ANNUAL REPORT
4. INCOME TAX
INCOME TAX EXPENSE Reconciliation of the prima facie income tax expense on pre-tax profit with the income tax expense recognised in profit or loss:
2020 2019
$m $m
Profit before income tax from continuing operations 5,516 8,920
Prima facie income tax expense at 30% 1,655 2,676
Tax effect of permanent differences:
Gains or losses on sale from divestments 2 (25)
Impairment of investment in AmBank and PT Panin 245 -
Share of associates' profit (47) (78)
Interest on convertible instruments 52 63
Overseas tax rate differential (86) (112)
Provision for foreign tax on dividend repatriation 20 39
Other 25 63
Subtotal 1,866 2,626
Income tax (over)/under provided in previous years (26) (17)
Income tax expense 1,840 2,609
Current tax expense 2,637 2,779
Adjustments recognised in the current year in relation to the current tax of prior years (26) (17)
Deferred tax expense/(income) relating to the origination and reversal of temporary differences (771) (153)
Income tax expense 1,840 2,609
Australia 1,115 1,682
Overseas 725 927
Effective tax rate 33.4% 29.2%
128
Overview How we create value
Performance overview
Remuneration report
Directors’ report
Financial report
Shareholder information
NOTES TO THE CONSOLIDATED FINANCIAL STATEMENTS (continued)
128
ANZ 2020 ANNUAL REPORT
4. INCOME TAX
INCOME TAX EXPENSE Reconciliation of the prima facie income tax expense on pre-tax profit with the income tax expense recognised in profit or loss:
2020 2019
$m $m
Profit before income tax from continuing operations 5,516 8,920
Prima facie income tax expense at 30% 1,655 2,676
Tax effect of permanent differences:
Gains or losses on sale from divestments 2 (25)
Impairment of investment in AmBank and PT Panin 245 -
Share of associates' profit (47) (78)
Interest on convertible instruments 52 63
Overseas tax rate differential (86) (112)
Provision for foreign tax on dividend repatriation 20 39
Other 25 63
Subtotal 1,866 2,626
Income tax (over)/under provided in previous years (26) (17)
Income tax expense 1,840 2,609
Current tax expense 2,637 2,779
Adjustments recognised in the current year in relation to the current tax of prior years (26) (17)
Deferred tax expense/(income) relating to the origination and reversal of temporary differences (771) (153)
Income tax expense 1,840 2,609
Australia 1,115 1,682
Overseas 725 927
Effective tax rate 33.4% 29.2%
NOTES TO THE CONSOLIDATED FINANCIAL STATEMENTS
129
KEY JUDGEMENTS AND ESTIMATES
Judgement is required in determining provisions held in respect of uncertain tax positions. The Group estimates its tax liabilities based on its understanding of the relevant law in each of the countries in which it operates and seeks independent advice where appropriate.
4. INCOME TAX (continued)
TAX CONSOLIDATION The Company and all its wholly owned Australian resident entities are part of a tax-consolidated group under Australian taxation law. The Company is the head entity in the tax-consolidated group. We recognise each of the following in the separate financial statements of members of the tax consolidated group on a ‘group allocation’ basis: tax expense/income, and deferred tax liabilities/assets that arise from temporary differences of the members of the tax-consolidated group. The Company (as head entity in the tax-consolidated group) recognises current tax liabilities and assets of the tax-consolidated group.
Under a tax funding arrangement between the entities in the tax-consolidated group, amounts are recognised as payable to or receivable by the Company and each member of the tax-consolidated group in relation to the tax contribution amounts paid or payable between the Company and the other members of the tax-consolidated group.
Members of the tax-consolidated group have also entered into a tax sharing agreement that provides for the allocation of income tax liabilities between the entities were the head entity to default on its income tax payment obligations.
UNRECOGNISED DEFERRED TAX ASSETS AND LIABILITIES
Unrecognised deferred tax assets related to unused realised tax losses (on revenue account) total $10 million (2019: $10 million).
Unrecognised deferred tax liabilities related to additional potential foreign tax costs (assuming all retained earnings in offshore branches and subsidiaries are repatriated) total $329 million (2019: $429 million).
RECOGNITION AND MEASUREMENT
INCOME TAX EXPENSE
CURRENT TAX EXPENSE
DEFERRED TAX ASSETS AND LIABILITIES
Notes to the consolidated financial statements (continued)
129ANZ 2020 Annual Report

NOTES TO THE CONSOLIDATED FINANCIAL STATEMENTS (continued)
130
ANZ 2020 ANNUAL REPORT
5. DIVIDENDS
ORDINARY SHARE DIVIDENDS Dividends are provided for in the financial statements once determined, accordingly, the final dividend announced for the current financial year is provided for and paid in the following financial year.
Amount Total dividendDividends % of total per share $m
Financial Year 2019
2018 final dividend paid1,2 80 cents 2,295
2019 interim dividend paid1,2 80 cents 2,267
Bonus option plan adjustment (81)
Dividends paid during the year ended 30 September 2019 4,481
Cash 90.4% 4,049
Dividend reinvestment plan 9.6% 432
Dividends paid during the year ended 30 September 2019 4,481
Financial Year 2020
2019 final dividend paid2,3 80 cents 2,268
2020 interim dividend paid1,2 25 cents 709
Bonus option plan adjustment (55)
Dividends paid during the year ended 30 September 2020 2,922
Cash 93.7% 2,737
Dividend reinvestment plan 6.3% 185
Dividends paid during the year ended 30 September 2020 2,922
Amount Total
dividend Dividends announced and to be paid after year-end Payment date per share $m
2020 final dividend (fully franked for Australian tax, New Zealand imputation credit NZD 4 cents per share) 16 December 2020 35 cents 994
1. Fully franked for Australian tax purposes (30% tax rate).2. Carries New Zealand imputation credits of NZD 3 cents for the 2020 interim dividend, NZD 9 cents for the 2019 final dividend, 2019 interim dividend and 2018 final dividend. 3. Partially franked at 70% for Australian tax purposes (30% tax rate).
DIVIDEND REINVESTMENT PLAN AND BONUS OPTION PLAN Eligible shareholders can elect to reinvest their dividend entitlement into ANZ ordinary shares under the Company’s Dividend Reinvestment Plan (DRP). Eligible shareholders can elect to forgo their dividend entitlement and instead receive ANZ ordinary shares under the Company’s Bonus Option Plan (BOP). For the 2020 final dividend, DRP and BOP participation will be satisfied by an issue of new ANZ ordinary shares. There will be no discount applied to the DRP and BOP price.
See Note 22 Shareholders’ Equity for details of shares the Company issued or purchased in respect of the DRP and BOP.
DIVIDEND FRANKING ACCOUNT
2020 2019Currency $m $m
Australian franking credits available at 30% tax rate AUD 477 35
New Zealand imputation credits available (which can be attached to our Australian dividends but may only be used by New Zealand resident shareholders)
NZD 4,583 4,068
The above amounts represent the balances of the franking accounts as at the end of the financial year, adjusted for:
franking credits that will arise from the payment of income tax payable as at the end of the financial year; and
franking credits/debits from the receipt/payment of dividends that have been recognised as tax receivables/payables as at the end of the financial year.
The proposed final 2020 dividend will utilise $426 million of the franking credits available at 30 September 2020.
130
Overview How we create value
Performance overview
Remuneration report
Directors’ report
Financial report
Shareholder information

NOTES TO THE CONSOLIDATED FINANCIAL STATEMENTS (continued)
130
ANZ 2020 ANNUAL REPORT
5. DIVIDENDS
ORDINARY SHARE DIVIDENDS Dividends are provided for in the financial statements once determined, accordingly, the final dividend announced for the current financial year is provided for and paid in the following financial year.
Amount Total dividendDividends % of total per share $m
Financial Year 2019
2018 final dividend paid1,2 80 cents 2,295
2019 interim dividend paid1,2 80 cents 2,267
Bonus option plan adjustment (81)
Dividends paid during the year ended 30 September 2019 4,481
Cash 90.4% 4,049
Dividend reinvestment plan 9.6% 432
Dividends paid during the year ended 30 September 2019 4,481
Financial Year 2020
2019 final dividend paid2,3 80 cents 2,268
2020 interim dividend paid1,2 25 cents 709
Bonus option plan adjustment (55)
Dividends paid during the year ended 30 September 2020 2,922
Cash 93.7% 2,737
Dividend reinvestment plan 6.3% 185
Dividends paid during the year ended 30 September 2020 2,922
Amount Total
dividend Dividends announced and to be paid after year-end Payment date per share $m
2020 final dividend (fully franked for Australian tax, New Zealand imputation credit NZD 4 cents per share) 16 December 2020 35 cents 994
1. Fully franked for Australian tax purposes (30% tax rate).2. Carries New Zealand imputation credits of NZD 3 cents for the 2020 interim dividend, NZD 9 cents for the 2019 final dividend, 2019 interim dividend and 2018 final dividend. 3. Partially franked at 70% for Australian tax purposes (30% tax rate).
DIVIDEND REINVESTMENT PLAN AND BONUS OPTION PLAN Eligible shareholders can elect to reinvest their dividend entitlement into ANZ ordinary shares under the Company’s Dividend Reinvestment Plan (DRP). Eligible shareholders can elect to forgo their dividend entitlement and instead receive ANZ ordinary shares under the Company’s Bonus Option Plan (BOP). For the 2020 final dividend, DRP and BOP participation will be satisfied by an issue of new ANZ ordinary shares. There will be no discount applied to the DRP and BOP price.
See Note 22 Shareholders’ Equity for details of shares the Company issued or purchased in respect of the DRP and BOP.
DIVIDEND FRANKING ACCOUNT
2020 2019Currency $m $m
Australian franking credits available at 30% tax rate AUD 477 35
New Zealand imputation credits available (which can be attached to our Australian dividends but may only be used by New Zealand resident shareholders)
NZD 4,583 4,068
The above amounts represent the balances of the franking accounts as at the end of the financial year, adjusted for:
franking credits that will arise from the payment of income tax payable as at the end of the financial year; and
franking credits/debits from the receipt/payment of dividends that have been recognised as tax receivables/payables as at the end of the financial year.
The proposed final 2020 dividend will utilise $426 million of the franking credits available at 30 September 2020.
NOTES TO THE CONSOLIDATED FINANCIAL STATEMENTS
131
5. DIVIDENDS (continued)
RESTRICTIONS ON THE PAYMENT OF DIVIDENDS APRA’s written approval is required before paying dividends on ANZ ordinary shares:
if the aggregate dividends exceed the Company’s after tax earnings (in calculating those after tax earnings, we take into account any payments we made on senior capital instruments) in the financial year to which they relate; or
if the Group’s Common Equity Tier 1 capital ratio falls within capital range buffers specified by APRA.
If the Company fails to pay a dividend or distribution on its ANZ Capital Notes or ANZ Capital Securities on the scheduled payment date, it may (subject to a number of exceptions) be restricted from resolving to pay or paying any dividend on the ANZ ordinary shares.
In July 2020, APRA provided an update to their guidance on capital management. In the updated guidance, APRA acknowledged that the uncertainty in the economic outlook has reduced somewhat since April 2020 and APRA had the opportunity to review ADIs’ financial projections and stress testing results. Taking these and other developments since April 2020 into account, APRA advised ADIs to maintain caution in planning capital distributions, including dividend payments and that for the remainder of the calendar year, the ADIs’ Board should:
seek to retain at least half of their earnings when making decisions on capital distributions (and utilise dividend reinvestment plans and other initiatives to offset the diminution in capital from capital distributions where possible);
conduct regular stress testing to inform decision-making and demonstrate ongoing lending capacity; and
make use of capital buffers to absorb the impacts of stress, and continue to lend to support households and businesses.
The Company’s 2020 interim dividend of 25 cents per share (paid to shareholders on 30 September 2020) and 2020 final dividend of 35 cents per share took into account the updated regulatory guidance above.
Notes to the consolidated financial statements (continued)
131ANZ 2020 Annual Report

NOTES TO THE CONSOLIDATED FINANCIAL STATEMENTS (continued)
132
ANZ 2020 ANNUAL REPORT
6. EARNINGS PER ORDINARY SHARE2020 2019
Earnings per ordinary share (EPS) - Basic cents cents
Earnings Per Share 126.4 210.0
Earnings Per Share from continuing operations1 129.8 222.1
Earnings Per Share from discontinued operations (3.4) (12.1)
2020 2019Earnings per ordinary share (EPS) - Diluted cents cents
Earnings Per Share 118.0 201.9
Earnings Per Share from continuing operations1 121.1 213.0
Earnings Per Share from discontinued operations (3.1) (11.1)
Basic EPS is calculated by dividing the profit or loss attributable to ordinary shareholders by the weighted average number of ordinary shares outstanding during the period (after eliminating ANZ shares held within the Group known as treasury shares). Diluted EPS is calculated by adjusting the profit or loss attributable to ordinary shareholders and the weighted average number of ordinary shares used in the basic EPS calculation for the effect of dilutive potential ordinary shares.
2020 2019Reconciliation of earnings used in earnings per share calculations $m $m
Basic:
Profit for the year 3,578 5,968
Less: Profit attributable to non-controlling interests 1 15
Earnings used in calculating basic earnings per share 3,577 5,953
Less: Profit/(Loss) after tax from discontinued operations (98) (343)
Earnings used in calculating basic earnings per share from continuing operations 3,675 6,296
Diluted:
Earnings used in calculating basic earnings per share 3,577 5,953
Add: Interest on convertible subordinated debt 201 268
Earnings used in calculating diluted earnings per share 3,778 6,221
Less: Profit/(Loss) after tax from discontinued operations (98) (343)
Earnings used in calculating diluted earnings per share from continuing operations 3,876 6,564
2020 2019Reconciliation of weighted average number of ordinary shares (WANOS) used in earnings per share calculations1,2
millions millions
WANOS used in calculating basic earnings per share 2,830.9 2,834.9
Add: Weighted average dilutive potential ordinary shares
Convertible subordinated debt 362.2 237.9
Share based payments (options, rights and deferred shares) 8.0 8.8
WANOS used in calculating diluted earnings per share 3,201.1 3,081.6 1. The successor fund transfer performed in preparation for the sale of the Group’s wealth businesses to Zurich and IOOF was completed on 13 April 2019. Post this date, treasury shares held in Wealth Australia
discontinued operations ceased to be eliminated in the Group’s consolidated financial statements and are included in the denominator used in calculating earnings per share. If the weighted average number of treasury shares held in Wealth Australia discontinued operations was included in the denominator used in calculating earnings per share from continuing operations in the comparative period, basic earnings per share from continuing operations for the comparative period would have been 221.4 cents and diluted earnings per share from continuing operations for the comparative period would have been 212.4 cents.
2. Weighted average number of ordinary shares excludes the weighted average number of treasury shares held in ANZEST of 5.0 million (2019: 4.7 million) and Wealth Australia discontinued operations of 8.2 million in 2019.
132
Overview How we create value
Performance overview
Remuneration report
Directors’ report
Financial report
Shareholder information

NOTES TO THE CONSOLIDATED FINANCIAL STATEMENTS (continued)
132
ANZ 2020 ANNUAL REPORT
6. EARNINGS PER ORDINARY SHARE2020 2019
Earnings per ordinary share (EPS) - Basic cents cents
Earnings Per Share 126.4 210.0
Earnings Per Share from continuing operations1 129.8 222.1
Earnings Per Share from discontinued operations (3.4) (12.1)
2020 2019Earnings per ordinary share (EPS) - Diluted cents cents
Earnings Per Share 118.0 201.9
Earnings Per Share from continuing operations1 121.1 213.0
Earnings Per Share from discontinued operations (3.1) (11.1)
Basic EPS is calculated by dividing the profit or loss attributable to ordinary shareholders by the weighted average number of ordinary shares outstanding during the period (after eliminating ANZ shares held within the Group known as treasury shares). Diluted EPS is calculated by adjusting the profit or loss attributable to ordinary shareholders and the weighted average number of ordinary shares used in the basic EPS calculation for the effect of dilutive potential ordinary shares.
2020 2019Reconciliation of earnings used in earnings per share calculations $m $m
Basic:
Profit for the year 3,578 5,968
Less: Profit attributable to non-controlling interests 1 15
Earnings used in calculating basic earnings per share 3,577 5,953
Less: Profit/(Loss) after tax from discontinued operations (98) (343)
Earnings used in calculating basic earnings per share from continuing operations 3,675 6,296
Diluted:
Earnings used in calculating basic earnings per share 3,577 5,953
Add: Interest on convertible subordinated debt 201 268
Earnings used in calculating diluted earnings per share 3,778 6,221
Less: Profit/(Loss) after tax from discontinued operations (98) (343)
Earnings used in calculating diluted earnings per share from continuing operations 3,876 6,564
2020 2019Reconciliation of weighted average number of ordinary shares (WANOS) used in earnings per share calculations1,2
millions millions
WANOS used in calculating basic earnings per share 2,830.9 2,834.9
Add: Weighted average dilutive potential ordinary shares
Convertible subordinated debt 362.2 237.9
Share based payments (options, rights and deferred shares) 8.0 8.8
WANOS used in calculating diluted earnings per share 3,201.1 3,081.6 1. The successor fund transfer performed in preparation for the sale of the Group’s wealth businesses to Zurich and IOOF was completed on 13 April 2019. Post this date, treasury shares held in Wealth Australia
discontinued operations ceased to be eliminated in the Group’s consolidated financial statements and are included in the denominator used in calculating earnings per share. If the weighted average number of treasury shares held in Wealth Australia discontinued operations was included in the denominator used in calculating earnings per share from continuing operations in the comparative period, basic earnings per share from continuing operations for the comparative period would have been 221.4 cents and diluted earnings per share from continuing operations for the comparative period would have been 212.4 cents.
2. Weighted average number of ordinary shares excludes the weighted average number of treasury shares held in ANZEST of 5.0 million (2019: 4.7 million) and Wealth Australia discontinued operations of 8.2 million in 2019.
NOTES TO THE CONSOLIDATED FINANCIAL STATEMENTS
133
7. SEGMENT REPORTING
DESCRIPTION OF SEGMENTS The Group’s five continuing operating segments are presented on a basis that is consistent with the information provided internally to the Chief Executive Officer, who is the chief operating decision maker. This reflects the way the Group’s businesses are managed, rather than the legal structure of the Group.
We measure the performance of these segments on a cash profit basis. To calculate cash profit, we remove certain non-core items from statutory profit. Details of these items are included in the “Other Items” section of this note. Transactions between business units across segments within ANZ are conducted on an arm’s-length basis and disclosed as part of the income and expenses of these segments.
The reportable segments are divisions engaged in providing either different products or services or similar products and services in different geographical areas. They are as follows:
Australia Retail and Commercial The Australia Retail and Commercial division comprises:
Retail provides products and services to consumer customers in Australia via the branch network, mortgage specialists, contact centres, a variety of self-service channels (internet banking, phone banking, ATMs, website, ANZ share investing and digital banking) and third party brokers inaddition to financial planning services provided by salaried financial planners.
Commercial provides a full range of banking products and financial services including asset financing across the following customer segments: medium to large commercial customers and agribusiness customers across regional Australia, small business owners and high net worthindividuals and family groups.
Institutional The Institutional division services governments, global institutional and corporate customers across three product sets: Transaction Banking, Corporate Finance and Markets.
Transaction Banking provides working capital and liquidity solutions including documentary trade, supply chain financing, commodity financing as well as cash management solutions, deposits, payments and clearing.
Corporate Finance (previously Loans and Specialised Finance) provides loan products, loan syndication, specialised loan structuring and execution, project and export finance, debt structuring and acquisition finance and corporate advisory.
Markets provide risk management services on foreign exchange, interest rates, credit, commodities, debt capital markets in addition to managingthe Group's interest rate exposure and liquidity position.
New Zealand The New Zealand division comprises:
Retail provides a full range of banking and wealth management services to consumer, private banking and small business banking customers. We deliver our services via our internet and app-based digital solutions and a network of branches, mortgage specialists, relationship managers and contact centres.
Commercial provides a full range of banking services including traditional relationship banking and sophisticated financial solutions through dedicated managers focusing on privately owned medium to large enterprises, the agricultural business segment, government and government-related entities.
Pacific The Pacific division provides products and services to retail customers, small to medium-sized enterprises, institutional customers and governments located in the Pacific Islands. Products and services include retail products provided to consumers, traditional relationship banking and sophisticated financial solutions provided to business customers through dedicated managers.
Technology, Services & Operations (TSO) and Group Centre TSO and Group Centre provide support to the operating divisions, including technology, group operations, shared services, property, risk management, financial management, strategy, marketing, human resources and corporate affairs. The Group Centre includes residual components of Group divestments, Group Treasury, Shareholder Functions and minority investments in Asia.
Refer to Note 29 for further details on Discontinued Operations.
OPERATING SEGMENTS There have been no methodology or structural changes during the year which have impacted the presentation of the Group’s operating segments in the 2020 financial year. As such, the presentation of the divisional results remains consistent with the prior period.
Notes to the consolidated financial statements (continued)
133ANZ 2020 Annual Report

NOTES TO THE CONSOLIDATED FINANCIAL STATEMENTS (continued)
134
ANZ 2020 ANNUAL REPORT
7. SEGMENT REPORTING (continued)
OPERATING SEGMENTS (continued)
Australia
Retail and Commercial Institutional
New Zealand Pacific
TSO and Group Centre
Other items1
Group Total
Year ended 30 September 2020 $m $m $m $m $m $m $m
Net interest income 7,916 3,182 2,731 109 111 - 14,049 Net fee and commission income
- Lending fees 267 288 14 10 - - 579 - Non-lending fees 1,310 776 586 29 (14) - 2,687 - Commissions 67 - 54 - - - 121 - Funds management income 30 2 243 - - - 275 - Fee and commission expense (588) (308) (436) (5) - - (1,337)
Net income from insurance business 77 - - - 1 - 78 Other income (1) 1,891 12 50 (807) (115) 1,030 Share of associates’ profit (1) - - - 156 - 155 Other operating income 1,161 2,649 473 84 (664) (115) 3,588 Operating income 9,077 5,831 3,204 193 (553) (115) 17,637 Operating expenses (4,091) (2,558) (1,435) (205) (1,094) - (9,383) Profit before credit impairment and income tax 4,986 3,273 1,769 (12) (1,647) (115) 8,254 Credit impairment (charge)/release (1,647) (694) (345) (52) - - (2,738) Profit before income tax 3,339 2,579 1,424 (64) (1,647) (115) 5,516 Income tax expense and non-controlling interests (1,002) (725) (407) 2 259 32 (1,841) Profit after tax from continuing operations 2,337 1,854 1,017 (62) (1,388) (83) 3,675 Profit/(Loss) after tax from discontinued operations (98) Profit after tax attributable to shareholders 3,577 Includes non-cash items: Share of associates’ profit (1) - - - 156 - 155
Impairment of associates2 - - - - (815) - (815) Depreciation and amortisation3 (197) (188) (103) (11) (892) - (1,391) Equity-settled share based payment expenses (7) (70) (7) (1) (25) - (110) Credit impairment (charge)/release (1,647) (694) (345) (52) - - (2,738)
Australia
Retail and Commercial Institutional
New Zealand Pacific
TSO and Group Centre
Discontinued operations
Group Total
Financial position $m $m $m $m $m $m $m Goodwill4 403 1,068 1,793 - - - 3,264 Investments in associates2 17 4 - - 2,143 - 2,164
1. Cash profit represents ANZ's preferred measure of the result of the segments. We remove certain items from the segments as discussed on page 136 if we consider them not integral to the ongoing performance of the segment.
2. During the 2020 financial year, ANZ recognised an $815 million impairment after tax in respect of two of the Group’s equity accounted investments to adjust their carrying values in line with their value-in-use calculations. AMMB Holdings Berhad (AmBank) was impaired by $595 million and PT Bank Pan Indonesia (PT Panin) was impaired by $220 million. Refer to Note 26 Investments in Associates for further details.
3. During the 2020 financial year, the Group amended the application of its software amortisation policy to reflect the shorter useful life of software caused by rapidly changing technology and business requirements. As a result of these changes, the Group recognised accelerated amortisation of $197 million during the year (Australia Retail and Commercial $31 million, Institutional $38 million, New Zealand $2 million, TSO and Group Centre $126 million). Refer to Note 20 Goodwill and Other Intangible Assets for further details.
4. During the 2020 financial year, the Group wrote off $50 million of goodwill in the Pacific division and wrote off $27 million of goodwill in the New Zealand division winding up the Bonus Bonds business, a managed investment product in New Zealand. Refer to Note 20 Goodwill and Other Intangible Assets for further details.
134
Overview How we create value
Performance overview
Remuneration report
Directors’ report
Financial report
Shareholder information

NOTES TO THE CONSOLIDATED FINANCIAL STATEMENTS (continued)
134
ANZ 2020 ANNUAL REPORT
7. SEGMENT REPORTING (continued)
OPERATING SEGMENTS (continued)
Australia
Retail and Commercial Institutional
New Zealand Pacific
TSO and Group Centre
Other items1
Group Total
Year ended 30 September 2020 $m $m $m $m $m $m $m
Net interest income 7,916 3,182 2,731 109 111 - 14,049 Net fee and commission income
- Lending fees 267 288 14 10 - - 579 - Non-lending fees 1,310 776 586 29 (14) - 2,687 - Commissions 67 - 54 - - - 121 - Funds management income 30 2 243 - - - 275 - Fee and commission expense (588) (308) (436) (5) - - (1,337)
Net income from insurance business 77 - - - 1 - 78 Other income (1) 1,891 12 50 (807) (115) 1,030 Share of associates’ profit (1) - - - 156 - 155 Other operating income 1,161 2,649 473 84 (664) (115) 3,588 Operating income 9,077 5,831 3,204 193 (553) (115) 17,637 Operating expenses (4,091) (2,558) (1,435) (205) (1,094) - (9,383) Profit before credit impairment and income tax 4,986 3,273 1,769 (12) (1,647) (115) 8,254 Credit impairment (charge)/release (1,647) (694) (345) (52) - - (2,738) Profit before income tax 3,339 2,579 1,424 (64) (1,647) (115) 5,516 Income tax expense and non-controlling interests (1,002) (725) (407) 2 259 32 (1,841) Profit after tax from continuing operations 2,337 1,854 1,017 (62) (1,388) (83) 3,675 Profit/(Loss) after tax from discontinued operations (98) Profit after tax attributable to shareholders 3,577 Includes non-cash items: Share of associates’ profit (1) - - - 156 - 155
Impairment of associates2 - - - - (815) - (815) Depreciation and amortisation3 (197) (188) (103) (11) (892) - (1,391) Equity-settled share based payment expenses (7) (70) (7) (1) (25) - (110) Credit impairment (charge)/release (1,647) (694) (345) (52) - - (2,738)
Australia
Retail and Commercial Institutional
New Zealand Pacific
TSO and Group Centre
Discontinued operations
Group Total
Financial position $m $m $m $m $m $m $m Goodwill4 403 1,068 1,793 - - - 3,264 Investments in associates2 17 4 - - 2,143 - 2,164
1. Cash profit represents ANZ's preferred measure of the result of the segments. We remove certain items from the segments as discussed on page 136 if we consider them not integral to the ongoing performance of the segment.
2. During the 2020 financial year, ANZ recognised an $815 million impairment after tax in respect of two of the Group’s equity accounted investments to adjust their carrying values in line with their value-in-use calculations. AMMB Holdings Berhad (AmBank) was impaired by $595 million and PT Bank Pan Indonesia (PT Panin) was impaired by $220 million. Refer to Note 26 Investments in Associates for further details.
3. During the 2020 financial year, the Group amended the application of its software amortisation policy to reflect the shorter useful life of software caused by rapidly changing technology and business requirements. As a result of these changes, the Group recognised accelerated amortisation of $197 million during the year (Australia Retail and Commercial $31 million, Institutional $38 million, New Zealand $2 million, TSO and Group Centre $126 million). Refer to Note 20 Goodwill and Other Intangible Assets for further details.
4. During the 2020 financial year, the Group wrote off $50 million of goodwill in the Pacific division and wrote off $27 million of goodwill in the New Zealand division winding up the Bonus Bonds business, a managed investment product in New Zealand. Refer to Note 20 Goodwill and Other Intangible Assets for further details.
NOTES TO THE CONSOLIDATED FINANCIAL STATEMENTS
135
7. SEGMENT REPORTING (continued)
OPERATING SEGMENT (continued)
Australia Retail and
Commercial Institutional New
Zealand Pacific
TSO and Group Centre
Other items1
Group Total
Year ended 30 September 2019 $m $m $m $m $m $m $m Net interest income 8,092 3,080 2,736 128 303 - 14,339 Net fee and commission income
- Lending fees 290 282 16 14 - - 602 - Non-lending fees 1,499 847 691 42 (20) - 3,059 - Commissions 75 - 61 - (12) - 124 - Funds management income 14 2 243 - (5) - 254 - Fee and commission expense (657) (338) (459) (9) 1 - (1,462)
Net income from insurance business 100 - 18 - 1 7 126 Other income 27 1,399 6 57 243 (251) 1,481 Share of associates’ profit (1) - 4 - 259 - 262 Other operating income 1,347 2,192 580 104 467 (244) 4,446 Operating income 9,439 5,272 3,316 232 770 (244) 18,785 Operating expenses (4,074) (2,667) (1,286) (150) (894) - (9,071) Profit before credit impairment and income tax 5,365 2,605 2,030 82 (124) (244) 9,714 Credit impairment (charge)/release (712) 2 (87) 1 1 1 (794) Profit before income tax 4,653 2,607 1,943 83 (123) (243) 8,920 Income tax expense and non-controlling interests (1,458) (779) (544) (24) 112 69 (2,624) Profit after tax from continuing operations 3,195 1,828 1,399 59 (11) (174) 6,296 Profit/(Loss) after tax from discontinued operations (343) Profit after tax attributable to shareholders 5,953 Non-cash items Share of associates’ profit (1) - 4 - 259 - 262 Depreciation and amortisation (176) (112) (41) (7) (535) - (871) Equity-settled share based payment expenses (13) (69) (4) (1) (33) - (120) Credit impairment (charge)/release (712) 2 (87) 1 1 1 (794)
Australia Retail and
Commercial Institutional New
Zealand Pacific
TSO and Group Centre
Discontinued operations
Group Total
Financial position $m $m $m $m $m $m $m Goodwill 410 1,070 1,937 50 - 42 3,509 Investments in associates 17 2 - - 2,938 - 2,957
1. Cash profit represents ANZ's preferred measure of the result of the segments. We remove certain items from the segments as discussed on page 136 if we consider them not integral to the ongoing performance of the segment.
Notes to the consolidated financial statements (continued)
135ANZ 2020 Annual Report
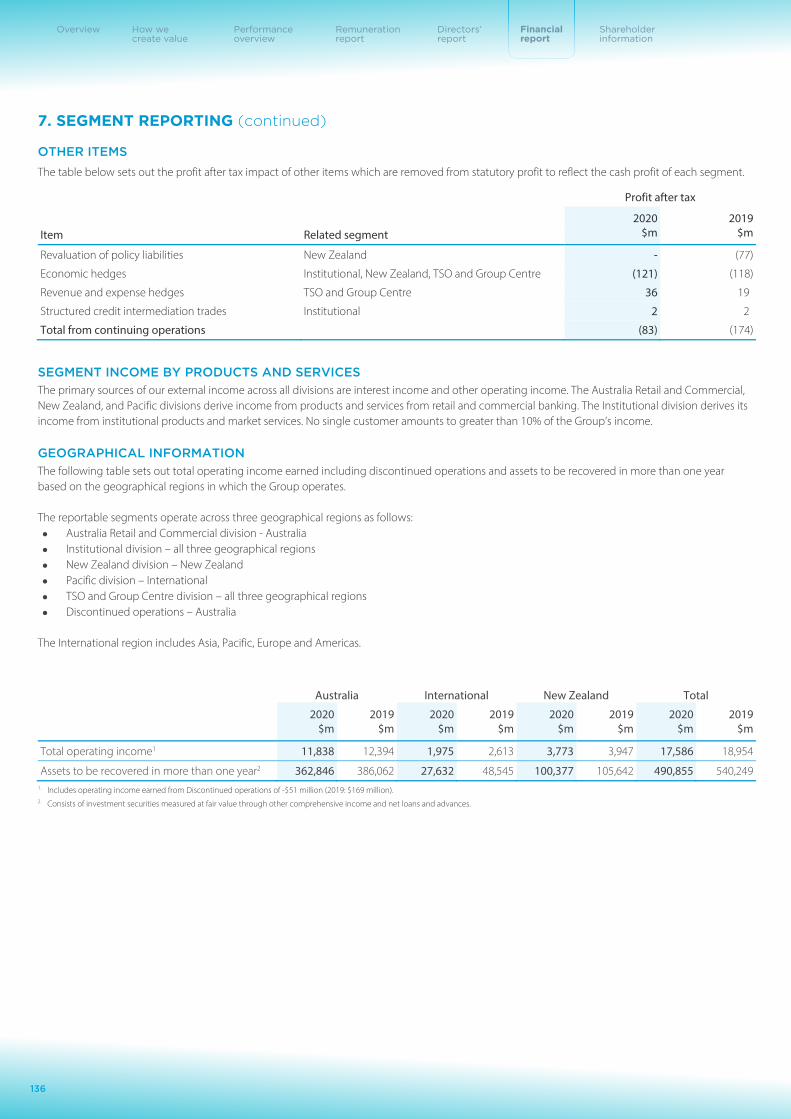
NOTES TO THE CONSOLIDATED FINANCIAL STATEMENTS (continued)
136
ANZ 2020 ANNUAL REPORT
7. SEGMENT REPORTING (continued)
OTHER ITEMS The table below sets out the profit after tax impact of other items which are removed from statutory profit to reflect the cash profit of each segment.
Profit after tax
2020 2019 Item Related segment $m $m
Revaluation of policy liabilities New Zealand - (77)
Economic hedges Institutional, New Zealand, TSO and Group Centre (121) (118)
Revenue and expense hedges TSO and Group Centre 36 19
Structured credit intermediation trades Institutional 2 2
Total from continuing operations (83) (174)
SEGMENT INCOME BY PRODUCTS AND SERVICES The primary sources of our external income across all divisions are interest income and other operating income. The Australia Retail and Commercial, New Zealand, and Pacific divisions derive income from products and services from retail and commercial banking. The Institutional division derives its income from institutional products and market services. No single customer amounts to greater than 10% of the Group’s income.
GEOGRAPHICAL INFORMATION The following table sets out total operating income earned including discontinued operations and assets to be recovered in more than one year based on the geographical regions in which the Group operates. The reportable segments operate across three geographical regions as follows: Australia Retail and Commercial division - Australia Institutional division – all three geographical regions New Zealand division – New Zealand Pacific division – International TSO and Group Centre division – all three geographical regions Discontinued operations – Australia
The International region includes Asia, Pacific, Europe and Americas.
Australia International New Zealand Total 2020 2019 2020 2019 2020 2019 2020 2019
$m $m $m $m $m $m $m $m
Total operating income1 11,838 12,394 1,975 2,613 3,773 3,947 17,586 18,954
Assets to be recovered in more than one year2 362,846 386,062 27,632 48,545 100,377 105,642 490,855 540,249 1. Includes operating income earned from Discontinued operations of -$51 million (2019: $169 million). 2. Consists of investment securities measured at fair value through other comprehensive income and net loans and advances.
136
Overview How we create value
Performance overview
Remuneration report
Directors’ report
Financial report
Shareholder information

NOTES TO THE CONSOLIDATED FINANCIAL STATEMENTS (continued)
136
ANZ 2020 ANNUAL REPORT
7. SEGMENT REPORTING (continued)
OTHER ITEMS The table below sets out the profit after tax impact of other items which are removed from statutory profit to reflect the cash profit of each segment.
Profit after tax
2020 2019 Item Related segment $m $m
Revaluation of policy liabilities New Zealand - (77)
Economic hedges Institutional, New Zealand, TSO and Group Centre (121) (118)
Revenue and expense hedges TSO and Group Centre 36 19
Structured credit intermediation trades Institutional 2 2
Total from continuing operations (83) (174)
SEGMENT INCOME BY PRODUCTS AND SERVICES The primary sources of our external income across all divisions are interest income and other operating income. The Australia Retail and Commercial, New Zealand, and Pacific divisions derive income from products and services from retail and commercial banking. The Institutional division derives its income from institutional products and market services. No single customer amounts to greater than 10% of the Group’s income.
GEOGRAPHICAL INFORMATION The following table sets out total operating income earned including discontinued operations and assets to be recovered in more than one year based on the geographical regions in which the Group operates. The reportable segments operate across three geographical regions as follows: Australia Retail and Commercial division - Australia Institutional division – all three geographical regions New Zealand division – New Zealand Pacific division – International TSO and Group Centre division – all three geographical regions Discontinued operations – Australia
The International region includes Asia, Pacific, Europe and Americas.
Australia International New Zealand Total 2020 2019 2020 2019 2020 2019 2020 2019
$m $m $m $m $m $m $m $m
Total operating income1 11,838 12,394 1,975 2,613 3,773 3,947 17,586 18,954
Assets to be recovered in more than one year2 362,846 386,062 27,632 48,545 100,377 105,642 490,855 540,249 1. Includes operating income earned from Discontinued operations of -$51 million (2019: $169 million). 2. Consists of investment securities measured at fair value through other comprehensive income and net loans and advances.
NOTES TO THE CONSOLIDATED FINANCIAL STATEMENTS
137
FFIINNAANNCCIIAALL AASSSSEETTSS
Outlined below is a description of how we classify and measure financial assets relevant to the subsequent note disclosures.
CLASSIFICATION AND MEASUREMENT
Financial assets - general
There are three measurement classifications for financial assets under AASB 9: amortised cost, fair value through profit or loss (FVTPL) and fair value through other comprehensive income (FVOCI). Financial assets are classified into these measurement classifications on the basis of two criteria:
the business model within which the financial asset is managed; and
the contractual cash flow characteristics of the financial asset (specifically whether the contractual cash flows represent solely payments of principal and interest).
The resultant financial asset classifications are as follows:
Amortised cost: Financial assets with contractual cash flows that comprise solely payments of principal and interest and which are held in a business model whose objective is to collect their cash flows;
FVOCI: Financial assets with contractual cash flows that comprise solely payments of principal and interest and which are held in a business model whose objective is to collect their cash flows or to sell the assets; and
FVTPL: Any other financial assets not falling into the categories above are measured at FVTPL.
Fair value option for financial assets
A financial asset may be irrevocably designated at FVTPL on initial recognition when the designation eliminates or significantly reduces an accounting mismatch that would otherwise arise.
88.. CCAASSHH AANNDD CCAASSHH EEQQUUIIVVAALLEENNTTSS2020 2019
$m $m
Coins, notes and cash at bank 1,514 1,186
Money at call, bills receivable and remittances in transit - 3
Securities purchased under agreements to resell in less than 3 months 35,603 25,277
Balances with central banks 46,091 25,681
Settlement balances owed to ANZ within 3 months 24,715 29,474
Cash and cash equivalents 107,923 81,621
Notes to the consolidated financial statements (continued)
137ANZ 2020 Annual Report

NOTES TO THE CONSOLIDATED FINANCIAL STATEMENTS (continued)
138
ANZ 2020 ANNUAL REPORT
9. TRADING SECURITIES
2020 2019 $m $m
Government debt securities and notes1 38,472 32,042
Corporate and financial institution securities1 6,574 4,987
Commodities 5,699 6,042
Equity and other securities1 168 1,017
Total 50,913 44,088
Less: Assets reclassified as held for sale (refer to Note 29) - (919)
Total 50,913 43,169
1. In 2020, ANZ reclassified trading securities issued by development banks and supra-nationals from Corporate and financial institution securities and Equity and other securities to Government debt securities and notes. Comparative information has been restated accordingly, with $4,865 million reclassified as Government debt securities and notes made up of $4,653 million from Corporate and financial institution securities and $212 million from Equity and other securities.
RECOGNITION AND MEASUREMENT
Trading securities are financial instruments we either:
acquire principally for the purpose of selling in the short-term; or
hold as part of a portfolio we manage for short-term profit making.
We recognise purchases and sales of trading securities on trade date:
initially, we measure them at fair value; and
subsequently, we measure them in the balance sheet at their fair value with any change in fair value recognised in the profit and loss.
KEY JUDGEMENTS AND ESTIMATES
Judgement is required when applying the valuation techniques used to determine the fair value of trading securities not valued using quoted market prices. Refer to Note 17 Fair Value of Financial Assets and Financial Liabilities for further details.
Government debt securities and notes
Corporate and financial institutional securities
168
6,574
5,699
38,472
Equity and other securities
Commodities
2020
1,017
6,042
4,987 32,042
2019
138
Overview How we create value
Performance overview
Remuneration report
Directors’ report
Financial report
Shareholder information
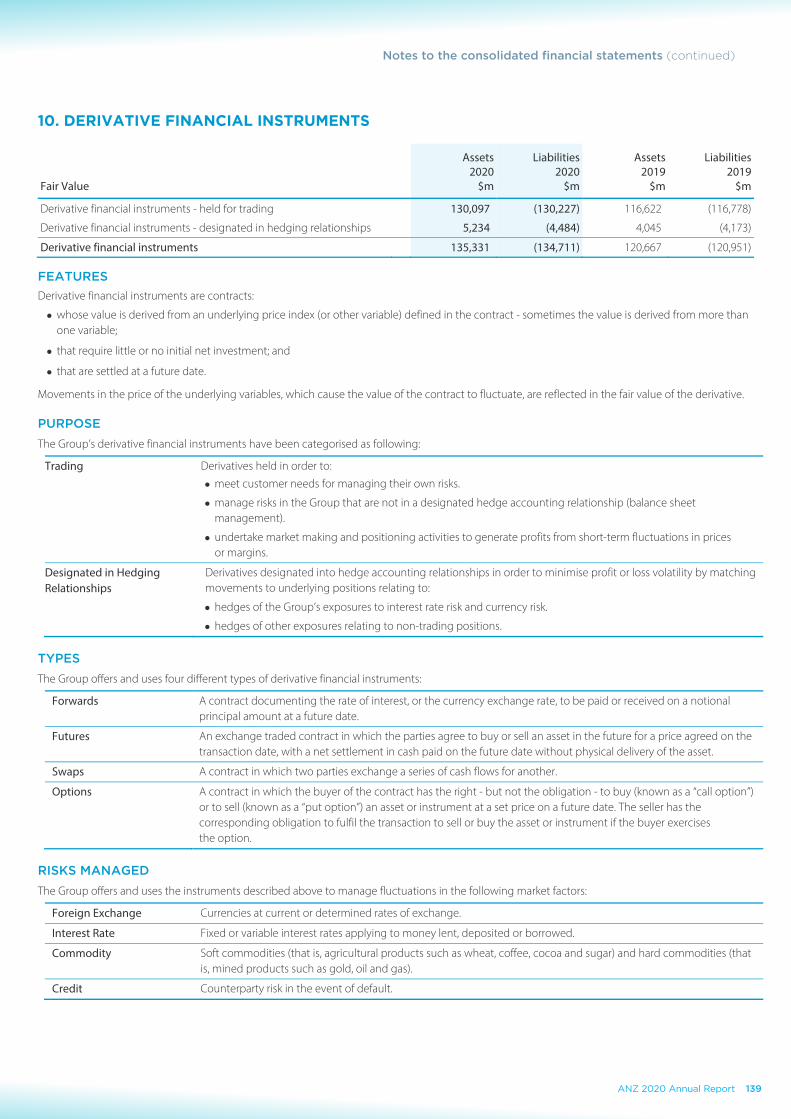
NOTES TO THE CONSOLIDATED FINANCIAL STATEMENTS (continued)
138
ANZ 2020 ANNUAL REPORT
9. TRADING SECURITIES
2020 2019 $m $m
Government debt securities and notes1 38,472 32,042
Corporate and financial institution securities1 6,574 4,987
Commodities 5,699 6,042
Equity and other securities1 168 1,017
Total 50,913 44,088
Less: Assets reclassified as held for sale (refer to Note 29) - (919)
Total 50,913 43,169
1. In 2020, ANZ reclassified trading securities issued by development banks and supra-nationals from Corporate and financial institution securities and Equity and other securities to Government debt securities and notes. Comparative information has been restated accordingly, with $4,865 million reclassified as Government debt securities and notes made up of $4,653 million from Corporate and financial institution securities and $212 million from Equity and other securities.
RECOGNITION AND MEASUREMENT
Trading securities are financial instruments we either:
acquire principally for the purpose of selling in the short-term; or
hold as part of a portfolio we manage for short-term profit making.
We recognise purchases and sales of trading securities on trade date:
initially, we measure them at fair value; and
subsequently, we measure them in the balance sheet at their fair value with any change in fair value recognised in the profit and loss.
KEY JUDGEMENTS AND ESTIMATES
Judgement is required when applying the valuation techniques used to determine the fair value of trading securities not valued using quoted market prices. Refer to Note 17 Fair Value of Financial Assets and Financial Liabilities for further details.
Government debt securities and notes
Corporate and financial institutional securities
168
6,574
5,699
38,472
Equity and other securities
Commodities
2020
1,017
6,042
4,987 32,042
2019
NOTES TO THE CONSOLIDATED FINANCIAL STATEMENTS (continued)
138
ANZ 2020 ANNUAL REPORT
9. TRADING SECURITIES
2020 2019 $m $m
Government debt securities and notes1 38,472 32,042
Corporate and financial institution securities1 6,574 4,987
Commodities 5,699 6,042
Equity and other securities1 168 1,017
Total 50,913 44,088
Less: Assets reclassified as held for sale (refer to Note 29) - (919)
Total 50,913 43,169
1. In 2020, ANZ reclassified trading securities issued by development banks and supra-nationals from Corporate and financial institution securities and Equity and other securities to Government debt securities and notes. Comparative information has been restated accordingly, with $4,865 million reclassified as Government debt securities and notes made up of $4,653 million from Corporate and financial institution securities and $212 million from Equity and other securities.
RECOGNITION AND MEASUREMENT
Trading securities are financial instruments we either:
acquire principally for the purpose of selling in the short-term; or
hold as part of a portfolio we manage for short-term profit making.
We recognise purchases and sales of trading securities on trade date:
initially, we measure them at fair value; and
subsequently, we measure them in the balance sheet at their fair value with any change in fair value recognised in the profit and loss.
KEY JUDGEMENTS AND ESTIMATES
Judgement is required when applying the valuation techniques used to determine the fair value of trading securities not valued using quoted market prices. Refer to Note 17 Fair Value of Financial Assets and Financial Liabilities for further details.
NOTES TO THE CONSOLIDATED FINANCIAL STATEMENTS
139
10. DERIVATIVE FINANCIAL INSTRUMENTS
Assets
2020 Liabilities
2020 Assets
2019 Liabilities
2019 Fair Value $m $m $m $m
Derivative financial instruments - held for trading 130,097 (130,227) 116,622 (116,778)
Derivative financial instruments - designated in hedging relationships 5,234 (4,484) 4,045 (4,173)
Derivative financial instruments 135,331 (134,711) 120,667 (120,951)
FEATURES Derivative financial instruments are contracts:
whose value is derived from an underlying price index (or other variable) defined in the contract - sometimes the value is derived from more than one variable;
that require little or no initial net investment; and
that are settled at a future date.
Movements in the price of the underlying variables, which cause the value of the contract to fluctuate, are reflected in the fair value of the derivative.
PURPOSE
The Group’s derivative financial instruments have been categorised as following:
Trading Derivatives held in order to:
meet customer needs for managing their own risks.
manage risks in the Group that are not in a designated hedge accounting relationship (balance sheet management).
undertake market making and positioning activities to generate profits from short-term fluctuations in prices or margins.
Designated in Hedging Relationships
Derivatives designated into hedge accounting relationships in order to minimise profit or loss volatility by matching movements to underlying positions relating to:
hedges of the Group’s exposures to interest rate risk and currency risk.
hedges of other exposures relating to non-trading positions.
TYPES The Group offers and uses four different types of derivative financial instruments:
Forwards A contract documenting the rate of interest, or the currency exchange rate, to be paid or received on a notional principal amount at a future date.
Futures An exchange traded contract in which the parties agree to buy or sell an asset in the future for a price agreed on the transaction date, with a net settlement in cash paid on the future date without physical delivery of the asset.
Swaps A contract in which two parties exchange a series of cash flows for another.
Options A contract in which the buyer of the contract has the right - but not the obligation - to buy (known as a “call option”) or to sell (known as a “put option”) an asset or instrument at a set price on a future date. The seller has the corresponding obligation to fulfil the transaction to sell or buy the asset or instrument if the buyer exercises the option.
RISKS MANAGED The Group offers and uses the instruments described above to manage fluctuations in the following market factors:
Foreign Exchange Currencies at current or determined rates of exchange.
Interest Rate Fixed or variable interest rates applying to money lent, deposited or borrowed.
Commodity Soft commodities (that is, agricultural products such as wheat, coffee, cocoa and sugar) and hard commodities (that is, mined products such as gold, oil and gas).
Credit Counterparty risk in the event of default.
Notes to the consolidated financial statements (continued)
139ANZ 2020 Annual Report

NOTES TO THE CONSOLIDATED FINANCIAL STATEMENTS (continued)
140
ANZ 2020 ANNUAL REPORT
10. DERIVATIVE FINANCIAL INSTRUMENTS (continued)
DERIVATIVE FINANCIAL INSTRUMENTS – HELD FOR TRADING The majority of the Group’s derivative financial instruments are held for trading. The fair values of derivative financial instruments held for trading are:
Assets Liabilities Assets Liabilities 2020 2020 2019 2019 Fair Value $m $m $m $m
Interest rate contracts
Forward rate agreements 86 (86) 74 (78)
Futures contracts 31 (128) 41 (109)
Swap agreements 104,814 (101,277) 82,996 (80,588)
Options purchased 1,676 - 1,454 -
Options sold - (2,609) - (2,317)
Total 106,607 (104,100) 84,565 (83,092)
Foreign exchange contracts
Spot and forward contracts 11,815 (11,435) 15,987 (15,359)
Swap agreements 8,703 (12,334) 13,836 (16,235)
Options purchased 372 - 405 -
Options sold - (502) - (514)
Total 20,890 (24,271) 30,228 (32,108)
Commodity contracts 2,577 (1,834) 1,807 (1,553)
Credit default swaps
Structured credit derivatives purchased 18 - 16 -
Other credit derivatives purchased 4 (3) 4 (3)
Credit derivatives purchased 22 (3) 20 (3)
Structured credit derivatives sold - (18) - (19)
Other credit derivatives sold 1 (1) 2 (3)
Credit derivatives sold 1 (19) 2 (22)
Total 23 (22) 22 (25)
Derivative financial instruments - held for trading 130,097 (130,227) 116,622 (116,778)
140
Overview How we create value
Performance overview
Remuneration report
Directors’ report
Financial report
Shareholder information

NOTES TO THE CONSOLIDATED FINANCIAL STATEMENTS (continued)
140
ANZ 2020 ANNUAL REPORT
10. DERIVATIVE FINANCIAL INSTRUMENTS (continued)
DERIVATIVE FINANCIAL INSTRUMENTS – HELD FOR TRADING The majority of the Group’s derivative financial instruments are held for trading. The fair values of derivative financial instruments held for trading are:
Assets Liabilities Assets Liabilities 2020 2020 2019 2019 Fair Value $m $m $m $m
Interest rate contracts
Forward rate agreements 86 (86) 74 (78)
Futures contracts 31 (128) 41 (109)
Swap agreements 104,814 (101,277) 82,996 (80,588)
Options purchased 1,676 - 1,454 -
Options sold - (2,609) - (2,317)
Total 106,607 (104,100) 84,565 (83,092)
Foreign exchange contracts
Spot and forward contracts 11,815 (11,435) 15,987 (15,359)
Swap agreements 8,703 (12,334) 13,836 (16,235)
Options purchased 372 - 405 -
Options sold - (502) - (514)
Total 20,890 (24,271) 30,228 (32,108)
Commodity contracts 2,577 (1,834) 1,807 (1,553)
Credit default swaps
Structured credit derivatives purchased 18 - 16 -
Other credit derivatives purchased 4 (3) 4 (3)
Credit derivatives purchased 22 (3) 20 (3)
Structured credit derivatives sold - (18) - (19)
Other credit derivatives sold 1 (1) 2 (3)
Credit derivatives sold 1 (19) 2 (22)
Total 23 (22) 22 (25)
Derivative financial instruments - held for trading 130,097 (130,227) 116,622 (116,778)
NOTES TO THE CONSOLIDATED FINANCIAL STATEMENTS
141
10. DERIVATIVE FINANCIAL INSTRUMENTS (continued)
DERIVATIVE FINANCIAL INSTRUMENTS – DESIGNATED IN HEDGING RELATIONSHIPS
There are three types of hedge accounting relationships the Group utilises:
Fair value hedge Cash flow hedge Net investment hedge
Objective of this hedging arrangement
To hedge our exposure to changes to the fair value of a recognised asset or liability or unrecognised firm commitment caused by interest rate or foreign currency movements.
To hedge our exposure to variability in cash flows of a recognised asset or liability, a firm commitment or a highly probable forecast transaction caused by interest rate, foreign currency and other price movements.
To hedge our exposure to exchange rate differences arising from the translation of our foreign operations from their functional currency to Australian dollars.
Recognition of effective hedge portion
The following are recognised in profit or loss at the same time:
all changes in the fair value of the underlying item relating to the hedged risk; and
the change in the fair value of the derivatives.
We recognise the effective portion of changes in the fair value of derivatives designated as a cash flow hedge in the cash flow hedge reserve.
We recognise the effective portion of changes in the fair value of the hedging instrument in the foreign currency translation reserve (FCTR).
Recognition of ineffective hedge portion
Recognised immediately in Other operating income.
If a hedging instrument expires, or is sold, terminated, or exercised; or no longer qualifies for hedge accounting
When we recognise the hedged item in profit or loss, we recognise the related unamortised fair value adjustment in profit or loss. This may occur over time if the hedged item is amortised to profit or loss as part of the effective yield over the period to maturity.
Only when we recognise the hedged item in profit or loss is the amount previously deferred in the cash flow hedge reserve transferred to profit or loss.
The amount we defer in the foreign currency translation reserve remains in equity and is transferred to profit or loss only when we dispose of, or partially dispose of, the foreign operation.
Hedged item sold or repaid
We recognise the unamortised fair value adjustment immediately in profit or loss.
Amounts accumulated in equity are transferred immediately to profit or loss.
The gain or loss, or applicable proportion, we have recognised in equity is transferred to profit or loss on disposal or partial disposal of a foreign operation.
Notes to the consolidated financial statements (continued)
141ANZ 2020 Annual Report
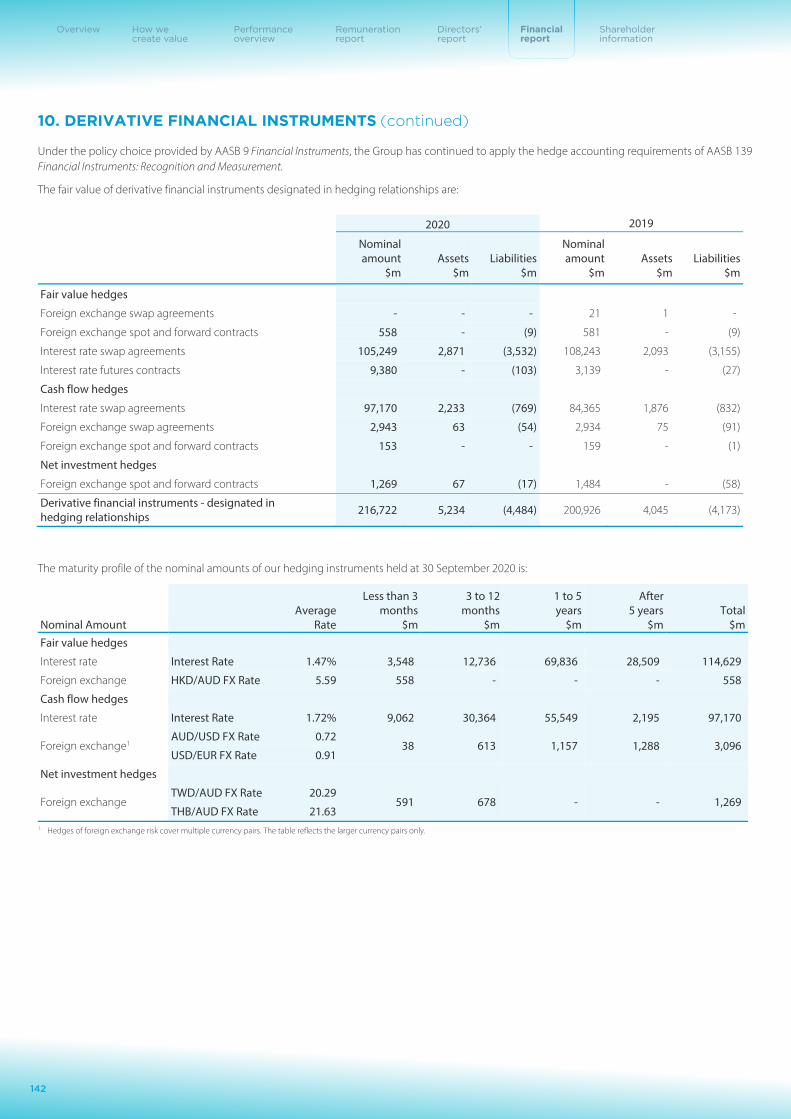
NOTES TO THE CONSOLIDATED FINANCIAL STATEMENTS (continued)
142
ANZ 2020 ANNUAL REPORT
10. DERIVATIVE FINANCIAL INSTRUMENTS (continued)
Under the policy choice provided by AASB 9 Financial Instruments, the Group has continued to apply the hedge accounting requirements of AASB 139 Financial Instruments: Recognition and Measurement.
The fair value of derivative financial instruments designated in hedging relationships are:
2020 2019
Nominal amount Assets Liabilities
Nominal amount Assets Liabilities
$m $m $m $m $m $m
Fair value hedges
Foreign exchange swap agreements - - - 21 1 -
Foreign exchange spot and forward contracts 558 - (9) 581 - (9)
Interest rate swap agreements 105,249 2,871 (3,532) 108,243 2,093 (3,155)
Interest rate futures contracts 9,380 - (103) 3,139 - (27)
Cash flow hedges
Interest rate swap agreements 97,170 2,233 (769) 84,365 1,876 (832)
Foreign exchange swap agreements 2,943 63 (54) 2,934 75 (91)
Foreign exchange spot and forward contracts 153 - - 159 - (1)
Net investment hedges
Foreign exchange spot and forward contracts 1,269 67 (17) 1,484 - (58)
Derivative financial instruments - designated in hedging relationships 216,722 5,234 (4,484) 200,926 4,045 (4,173)
The maturity profile of the nominal amounts of our hedging instruments held at 30 September 2020 is:
Nominal Amount Average
Rate
Less than 3 months
$m
3 to 12 months
$m
1 to 5 years
$m
After 5 years
$m Total
$m Fair value hedges
Interest rate Interest Rate 1.47% 3,548 12,736 69,836 28,509 114,629
Foreign exchange HKD/AUD FX Rate 5.59 558 - - - 558
Cash flow hedges
Interest rate Interest Rate 1.72% 9,062 30,364 55,549 2,195 97,170
Foreign exchange1 AUD/USD FX Rate 0.72
38 613 1,157 1,288 3,096 USD/EUR FX Rate 0.91
Net investment hedges
Foreign exchange TWD/AUD FX Rate 20.29
591 678 - - 1,269 THB/AUD FX Rate 21.63
1. Hedges of foreign exchange risk cover multiple currency pairs. The table reflects the larger currency pairs only.
142
Overview How we create value
Performance overview
Remuneration report
Directors’ report
Financial report
Shareholder information

NOTES TO THE CONSOLIDATED FINANCIAL STATEMENTS (continued)
142
ANZ 2020 ANNUAL REPORT
10. DERIVATIVE FINANCIAL INSTRUMENTS (continued)
Under the policy choice provided by AASB 9 Financial Instruments, the Group has continued to apply the hedge accounting requirements of AASB 139 Financial Instruments: Recognition and Measurement.
The fair value of derivative financial instruments designated in hedging relationships are:
2020 2019
Nominal amount Assets Liabilities
Nominal amount Assets Liabilities
$m $m $m $m $m $m
Fair value hedges
Foreign exchange swap agreements - - - 21 1 -
Foreign exchange spot and forward contracts 558 - (9) 581 - (9)
Interest rate swap agreements 105,249 2,871 (3,532) 108,243 2,093 (3,155)
Interest rate futures contracts 9,380 - (103) 3,139 - (27)
Cash flow hedges
Interest rate swap agreements 97,170 2,233 (769) 84,365 1,876 (832)
Foreign exchange swap agreements 2,943 63 (54) 2,934 75 (91)
Foreign exchange spot and forward contracts 153 - - 159 - (1)
Net investment hedges
Foreign exchange spot and forward contracts 1,269 67 (17) 1,484 - (58)
Derivative financial instruments - designated in hedging relationships 216,722 5,234 (4,484) 200,926 4,045 (4,173)
The maturity profile of the nominal amounts of our hedging instruments held at 30 September 2020 is:
Nominal Amount Average
Rate
Less than 3 months
$m
3 to 12 months
$m
1 to 5 years
$m
After 5 years
$m Total
$m Fair value hedges
Interest rate Interest Rate 1.47% 3,548 12,736 69,836 28,509 114,629
Foreign exchange HKD/AUD FX Rate 5.59 558 - - - 558
Cash flow hedges
Interest rate Interest Rate 1.72% 9,062 30,364 55,549 2,195 97,170
Foreign exchange1 AUD/USD FX Rate 0.72
38 613 1,157 1,288 3,096 USD/EUR FX Rate 0.91
Net investment hedges
Foreign exchange TWD/AUD FX Rate 20.29
591 678 - - 1,269 THB/AUD FX Rate 21.63
1. Hedges of foreign exchange risk cover multiple currency pairs. The table reflects the larger currency pairs only.
NOTES TO THE CONSOLIDATED FINANCIAL STATEMENTS
143
10. DERIVATIVE FINANCIAL INSTRUMENTS (continued)
The maturity profile of the nominal amounts of our hedging instruments held at 30 September 2019 is:
Nominal Amount Average
Rate
Less than 3 months
$m
3 to 12 months
$m
1 to 5 years
$m
After 5 years
$m Total
$m Fair value hedges
Interest rate Interest Rate 1.95% 3,195 18,407 63,873 25,907 111,382
Foreign exchange HKD/AUD FX Rate 5.38 602 - - - 602
Cash flow hedges
Interest rate Interest Rate 2.15% 1,088 14,040 66,880 2,357 84,365
Foreign exchange1 AUD/USD FX Rate 0.72
40 120 1,652 1,281 3,093 USD/EUR FX Rate 0.91
Net investment hedges
Foreign exchange TWD/AUD FX Rate 21.41
474 1,010 - - 1,484 THB/AUD FX Rate 21.77
1. Hedges of foreign exchange risk cover multiple currency pairs. The table reflects the larger currency pairs only.
The impact of ineffectiveness from our designated hedge relationships by type of hedge relationship and type of risk being hedged are:
Ineffectiveness Amount reclassified from the cash flow hedge
reserve or FCTR to profit and loss
Change in value of hedging instrument
Change in value of hedged item
Hedge ineffectiveness recognised in profit
and loss 2020 $m $m $m $m Fair value hedges1 Interest rate 372 (358) 14 - Foreign exchange 23 (23) - - Cash flow hedges1 Interest rate 451 (449) 2 10 Foreign exchange (15) 15 - (2) Net investment hedges1 Foreign exchange 94 (94) - (15)
Ineffectiveness Amount reclassified from the cash flow hedge
reserve or FCTR to profit and loss
Change in value of hedging instrument
Change in value of hedged item
Hedge ineffectiveness recognised in profit
and loss 2019 $m $m $m $m Fair value hedges1 Interest rate 586 (582) 4 - Foreign exchange (36) 36 - - Cash flow hedges1 Interest rate 836 (825) 11 14 Foreign exchange 20 (20) - 2 Net investment hedges1 Foreign exchange (144) 144 - -
1. All hedging instruments are held within Derivative Financial Instruments.
Hedge ineffectiveness recognised is classified within Other operating income. Reclassification adjustments to the Statement of Comprehensive Income are recognised within Net interest income and Other operating income.
Notes to the consolidated financial statements (continued)
143ANZ 2020 Annual Report

NOTES TO THE CONSOLIDATED FINANCIAL STATEMENTS (continued)
144
ANZ 2020 ANNUAL REPORT
10. DERIVATIVE FINANCIAL INSTRUMENTS (continued)
Hedged items in relation to the Group’s fair value hedges as at 30 September 2020 are as follows:
Carrying amount
Accumulated fair value hedge adjustments on
the hedged item
Balance sheet presentation Hedged risk
Assets $m
Liabilities $m
Assets $m
Liabilities $m
Fixed rate loans and advances Net loans and advances Interest rate 7,375 - 52 -
Fixed rate debt issuance Debt issuances Interest rate - (61,355) - (2,518)
Fixed rate investment securities (FVOCI)1 Investment securities Interest rate 55,233 - 2,256 -
Equity securities at FVOCI1 Investment securities Foreign exchange 558 - 29 -
Total 63,166 (61,355) 2,337 (2,518)
Hedged items in relation to the Group’s fair value hedges for 30 September 2019 are as follows:
Carrying amount
Accumulated fair value hedge adjustments on
the hedged item
Balance sheet presentation Hedged risk
Assets $m
Liabilities $m
Assets $m
Liabilities $m
Fixed rate loans and advances Net loans and advances Interest rate 2,281 - 17 -
Fixed rate debt issuance Debt issuances Interest rate - (67,555) - (1,749)
Fixed rate investment securities (FVOCI)1 Investment securities Interest rate 47,641 - 1,907 -
Equity securities at FVOCI1 Investment securities Foreign exchange 581 - 52 -
Total 50,503 (67,555) 1,976 (1,749) 1. The carrying amount of debt and equity instruments at fair value through other comprehensive income does not include the fair value hedge adjustment since accounting for the hedge relationship results
in the transfer of the hedge adjustment out of other comprehensive income into the Income Statement to match the profit or loss on the hedging instrument.
The cumulative amount of fair value hedge adjustments relating to ceased hedge relationships remaining on the Balance Sheet is $nil (2019: $8 million).
144
Overview How we create value
Performance overview
Remuneration report
Directors’ report
Financial report
Shareholder information
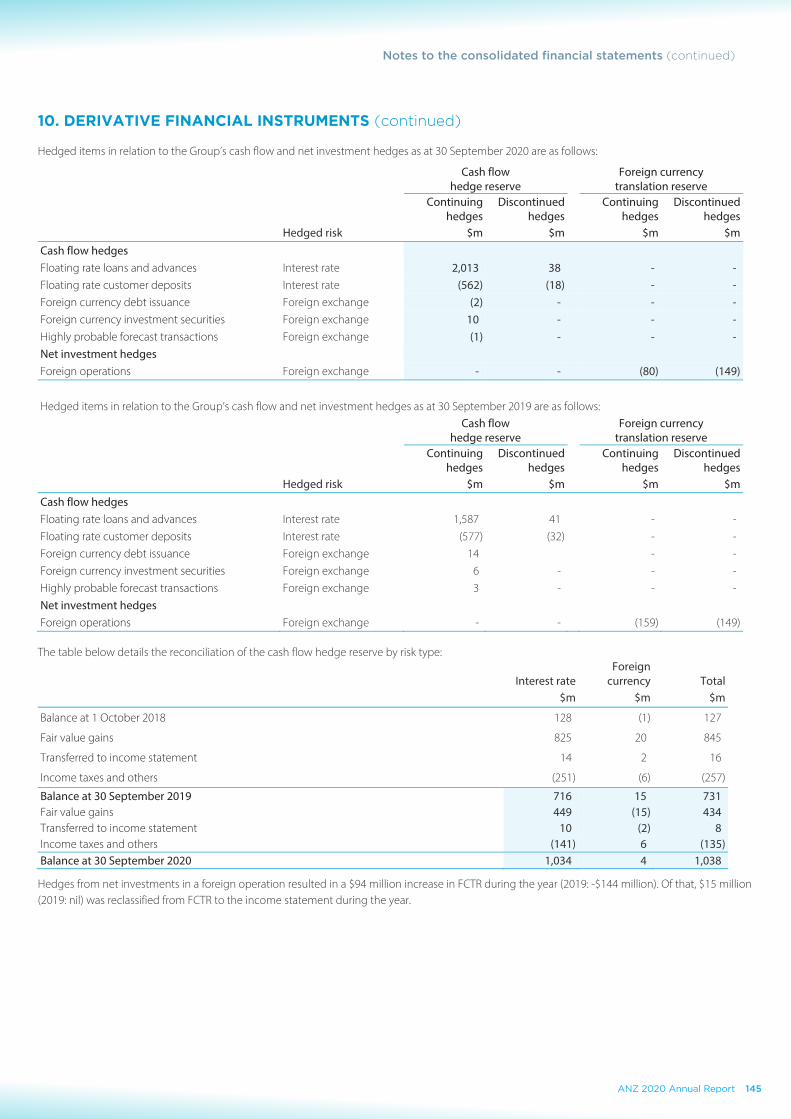
NOTES TO THE CONSOLIDATED FINANCIAL STATEMENTS (continued)
144
ANZ 2020 ANNUAL REPORT
10. DERIVATIVE FINANCIAL INSTRUMENTS (continued)
Hedged items in relation to the Group’s fair value hedges as at 30 September 2020 are as follows:
Carrying amount
Accumulated fair value hedge adjustments on
the hedged item
Balance sheet presentation Hedged risk
Assets $m
Liabilities $m
Assets $m
Liabilities $m
Fixed rate loans and advances Net loans and advances Interest rate 7,375 - 52 -
Fixed rate debt issuance Debt issuances Interest rate - (61,355) - (2,518)
Fixed rate investment securities (FVOCI)1 Investment securities Interest rate 55,233 - 2,256 -
Equity securities at FVOCI1 Investment securities Foreign exchange 558 - 29 -
Total 63,166 (61,355) 2,337 (2,518)
Hedged items in relation to the Group’s fair value hedges for 30 September 2019 are as follows:
Carrying amount
Accumulated fair value hedge adjustments on
the hedged item
Balance sheet presentation Hedged risk
Assets $m
Liabilities $m
Assets $m
Liabilities $m
Fixed rate loans and advances Net loans and advances Interest rate 2,281 - 17 -
Fixed rate debt issuance Debt issuances Interest rate - (67,555) - (1,749)
Fixed rate investment securities (FVOCI)1 Investment securities Interest rate 47,641 - 1,907 -
Equity securities at FVOCI1 Investment securities Foreign exchange 581 - 52 -
Total 50,503 (67,555) 1,976 (1,749) 1. The carrying amount of debt and equity instruments at fair value through other comprehensive income does not include the fair value hedge adjustment since accounting for the hedge relationship results
in the transfer of the hedge adjustment out of other comprehensive income into the Income Statement to match the profit or loss on the hedging instrument.
The cumulative amount of fair value hedge adjustments relating to ceased hedge relationships remaining on the Balance Sheet is $nil (2019: $8 million).
NOTES TO THE CONSOLIDATED FINANCIAL STATEMENTS
145
10. DERIVATIVE FINANCIAL INSTRUMENTS (continued)
Hedged items in relation to the Group’s cash flow and net investment hedges as at 30 September 2020 are as follows:
Cash flow hedge reserve
Foreign currency translation reserve
Continuing
hedges Discontinued
hedges Continuing hedges
Discontinued hedges
Hedged risk $m $m $m $m Cash flow hedges Floating rate loans and advances Interest rate 2,013 38 - - Floating rate customer deposits Interest rate (562) (18) - - Foreign currency debt issuance Foreign exchange (2) - - - Foreign currency investment securities Foreign exchange 10 - - - Highly probable forecast transactions Foreign exchange (1) - - - Net investment hedges Foreign operations Foreign exchange - - (80) (149)
Hedged items in relation to the Group’s cash flow and net investment hedges as at 30 September 2019 are as follows:
Cash flow hedge reserve
Foreign currency translation reserve
Continuing
hedges Discontinued
hedges Continuing hedges
Discontinued hedges
Hedged risk $m $m $m $m Cash flow hedges Floating rate loans and advances Interest rate 1,587 41 - - Floating rate customer deposits Interest rate (577) (32) - - Foreign currency debt issuance Foreign exchange 14 - - Foreign currency investment securities Foreign exchange 6 - - - Highly probable forecast transactions Foreign exchange 3 - - - Net investment hedges Foreign operations Foreign exchange - - (159) (149)
The table below details the reconciliation of the cash flow hedge reserve by risk type:
Interest rate Foreign
currency Total $m $m $m
Balance at 1 October 2018 128 (1) 127
Fair value gains 825 20 845
Transferred to income statement 14 2 16
Income taxes and others (251) (6) (257)
Balance at 30 September 2019 716 15 731 Fair value gains 449 (15) 434 Transferred to income statement 10 (2) 8 Income taxes and others (141) 6 (135) Balance at 30 September 2020 1,034 4 1,038
Hedges from net investments in a foreign operation resulted in a $94 million increase in FCTR during the year (2019: -$144 million). Of that, $15 million (2019: nil) was reclassified from FCTR to the income statement during the year.
Notes to the consolidated financial statements (continued)
145ANZ 2020 Annual Report
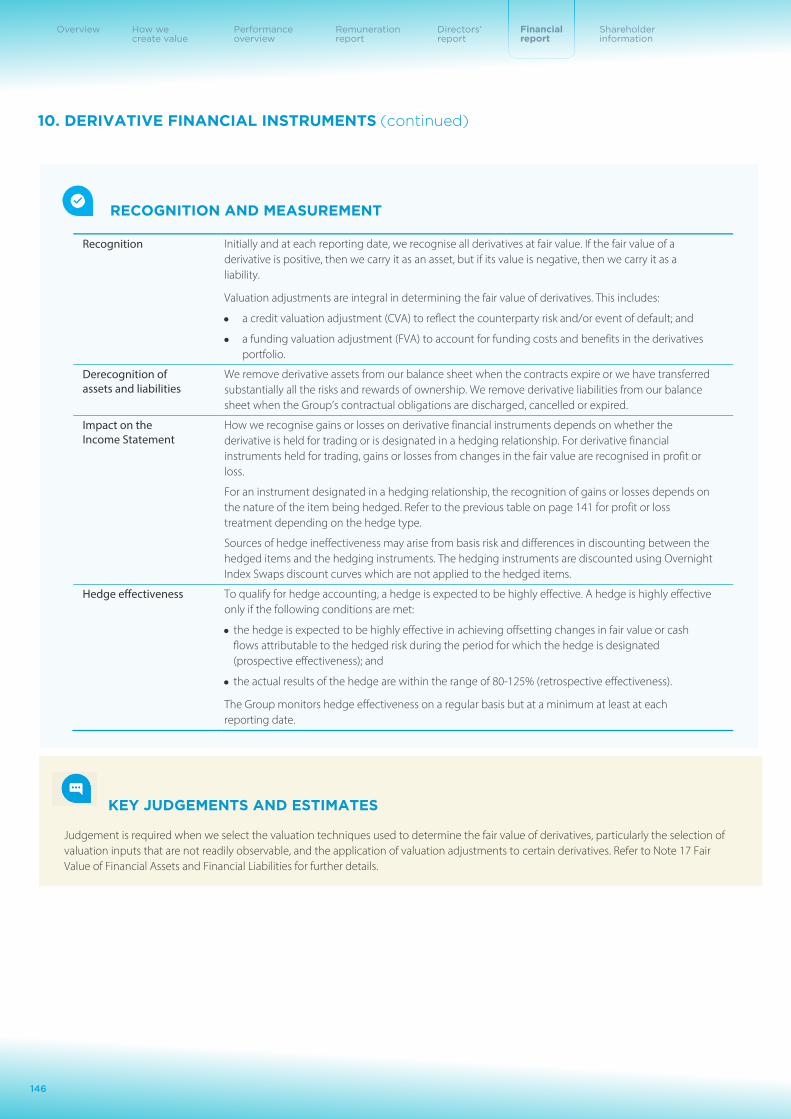
NOTES TO THE CONSOLIDATED FINANCIAL STATEMENTS (continued)
146
ANZ 2020 ANNUAL REPORT
10. DERIVATIVE FINANCIAL INSTRUMENTS (continued)
RECOGNITION AND MEASUREMENT
Recognition
Initially and at each reporting date, we recognise all derivatives at fair value. If the fair value of a derivative is positive, then we carry it as an asset, but if its value is negative, then we carry it as a liability.
Valuation adjustments are integral in determining the fair value of derivatives. This includes:
a credit valuation adjustment (CVA) to reflect the counterparty risk and/or event of default; and
a funding valuation adjustment (FVA) to account for funding costs and benefits in the derivatives portfolio.
Derecognition of assets and liabilities
We remove derivative assets from our balance sheet when the contracts expire or we have transferred substantially all the risks and rewards of ownership. We remove derivative liabilities from our balance sheet when the Group’s contractual obligations are discharged, cancelled or expired.
Impact on the Income Statement
How we recognise gains or losses on derivative financial instruments depends on whether the derivative is held for trading or is designated in a hedging relationship. For derivative financial instruments held for trading, gains or losses from changes in the fair value are recognised in profit or loss.
For an instrument designated in a hedging relationship, the recognition of gains or losses depends on the nature of the item being hedged. Refer to the previous table on page 141 for profit or loss treatment depending on the hedge type.
Sources of hedge ineffectiveness may arise from basis risk and differences in discounting between the hedged items and the hedging instruments. The hedging instruments are discounted using Overnight Index Swaps discount curves which are not applied to the hedged items.
Hedge effectiveness
To qualify for hedge accounting, a hedge is expected to be highly effective. A hedge is highly effective only if the following conditions are met:
the hedge is expected to be highly effective in achieving offsetting changes in fair value or cash flows attributable to the hedged risk during the period for which the hedge is designated (prospective effectiveness); and
the actual results of the hedge are within the range of 80-125% (retrospective effectiveness).
The Group monitors hedge effectiveness on a regular basis but at a minimum at least at each reporting date.
KEY JUDGEMENTS AND ESTIMATES
Judgement is required when we select the valuation techniques used to determine the fair value of derivatives, particularly the selection of valuation inputs that are not readily observable, and the application of valuation adjustments to certain derivatives. Refer to Note 17 Fair Value of Financial Assets and Financial Liabilities for further details.
146
Overview How we create value
Performance overview
Remuneration report
Directors’ report
Financial report
Shareholder information
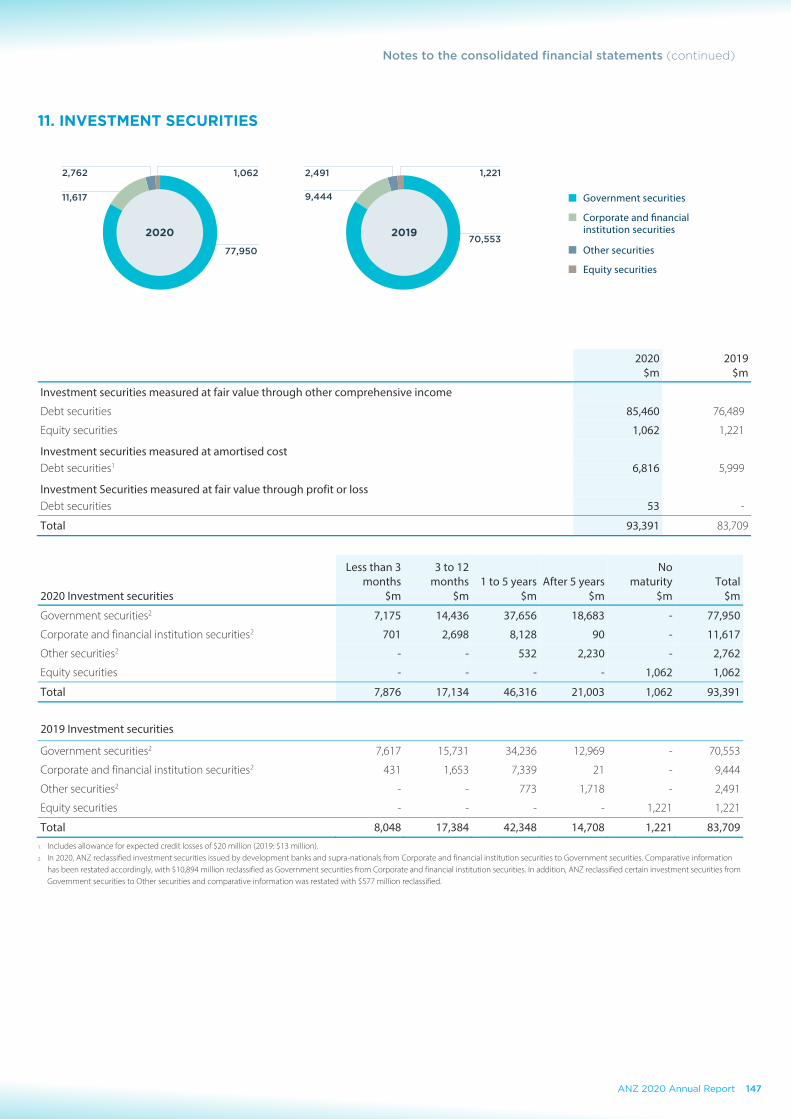
NOTES TO THE CONSOLIDATED FINANCIAL STATEMENTS (continued)
146
ANZ 2020 ANNUAL REPORT
10. DERIVATIVE FINANCIAL INSTRUMENTS (continued)
RECOGNITION AND MEASUREMENT
Recognition
Initially and at each reporting date, we recognise all derivatives at fair value. If the fair value of a derivative is positive, then we carry it as an asset, but if its value is negative, then we carry it as a liability.
Valuation adjustments are integral in determining the fair value of derivatives. This includes:
a credit valuation adjustment (CVA) to reflect the counterparty risk and/or event of default; and
a funding valuation adjustment (FVA) to account for funding costs and benefits in the derivatives portfolio.
Derecognition of assets and liabilities
We remove derivative assets from our balance sheet when the contracts expire or we have transferred substantially all the risks and rewards of ownership. We remove derivative liabilities from our balance sheet when the Group’s contractual obligations are discharged, cancelled or expired.
Impact on the Income Statement
How we recognise gains or losses on derivative financial instruments depends on whether the derivative is held for trading or is designated in a hedging relationship. For derivative financial instruments held for trading, gains or losses from changes in the fair value are recognised in profit or loss.
For an instrument designated in a hedging relationship, the recognition of gains or losses depends on the nature of the item being hedged. Refer to the previous table on page 141 for profit or loss treatment depending on the hedge type.
Sources of hedge ineffectiveness may arise from basis risk and differences in discounting between the hedged items and the hedging instruments. The hedging instruments are discounted using Overnight Index Swaps discount curves which are not applied to the hedged items.
Hedge effectiveness
To qualify for hedge accounting, a hedge is expected to be highly effective. A hedge is highly effective only if the following conditions are met:
the hedge is expected to be highly effective in achieving offsetting changes in fair value or cash flows attributable to the hedged risk during the period for which the hedge is designated (prospective effectiveness); and
the actual results of the hedge are within the range of 80-125% (retrospective effectiveness).
The Group monitors hedge effectiveness on a regular basis but at a minimum at least at each reporting date.
KEY JUDGEMENTS AND ESTIMATES
Judgement is required when we select the valuation techniques used to determine the fair value of derivatives, particularly the selection of valuation inputs that are not readily observable, and the application of valuation adjustments to certain derivatives. Refer to Note 17 Fair Value of Financial Assets and Financial Liabilities for further details.
NOTES TO THE CONSOLIDATED FINANCIAL STATEMENTS
147
11. INVESTMENT SECURITIES
2020 2019$m $m
Investment securities measured at fair value through other comprehensive income
Debt securities 85,460 76,489
Equity securities 1,062 1,221
Investment securities measured at amortised cost Debt securities1 6,816 5,999
Investment Securities measured at fair value through profit or loss Debt securities 53 -
Total 93,391 83,709
Less than 3 months
3 to 12 months 1 to 5 years After 5 years
No maturity Total
2020 Investment securities $m $m $m $m $m $m
Government securities2 7,175 14,436 37,656 18,683 - 77,950
Corporate and financial institution securities2 701 2,698 8,128 90 - 11,617
Other securities2 - - 532 2,230 - 2,762
Equity securities - - - - 1,062 1,062
Total 7,876 17,134 46,316 21,003 1,062 93,391
2019 Investment securities
Government securities2 7,617 15,731 34,236 12,969 - 70,553
Corporate and financial institution securities2 431 1,653 7,339 21 - 9,444
Other securities2 - - 773 1,718 - 2,491
Equity securities - - - - 1,221 1,221
Total 8,048 17,384 42,348 14,708 1,221 83,709 1. Includes allowance for expected credit losses of $20 million (2019: $13 million). 2. In 2020, ANZ reclassified investment securities issued by development banks and supra-nationals from Corporate and financial institution securities to Government securities. Comparative information
has been restated accordingly, with $10,894 million reclassified as Government securities from Corporate and financial institution securities. In addition, ANZ reclassified certain investment securities from Government securities to Other securities and comparative information was restated with $577 million reclassified.
NOTES TO THE CONSOLIDATED FINANCIAL STATEMENTS (continued)
146
ANZ 2020 ANNUAL REPORT
10. DERIVATIVE FINANCIAL INSTRUMENTS (continued)
RECOGNITION AND MEASUREMENT
Recognition
Initially and at each reporting date, we recognise all derivatives at fair value. If the fair value of a derivative is positive, then we carry it as an asset, but if its value is negative, then we carry it as a liability.
Valuation adjustments are integral in determining the fair value of derivatives. This includes:
a credit valuation adjustment (CVA) to reflect the counterparty risk and/or event of default; and
a funding valuation adjustment (FVA) to account for funding costs and benefits in the derivatives portfolio.
Derecognition of assets and liabilities
We remove derivative assets from our balance sheet when the contracts expire or we have transferred substantially all the risks and rewards of ownership. We remove derivative liabilities from our balance sheet when the Group’s contractual obligations are discharged, cancelled or expired.
Impact on the Income Statement
How we recognise gains or losses on derivative financial instruments depends on whether the derivative is held for trading or is designated in a hedging relationship. For derivative financial instruments held for trading, gains or losses from changes in the fair value are recognised in profit or loss.
For an instrument designated in a hedging relationship, the recognition of gains or losses depends on the nature of the item being hedged. Refer to the previous table on page 141 for profit or loss treatment depending on the hedge type.
Sources of hedge ineffectiveness may arise from basis risk and differences in discounting between the hedged items and the hedging instruments. The hedging instruments are discounted using Overnight Index Swaps discount curves which are not applied to the hedged items.
Hedge effectiveness
To qualify for hedge accounting, a hedge is expected to be highly effective. A hedge is highly effective only if the following conditions are met:
the hedge is expected to be highly effective in achieving offsetting changes in fair value or cash flows attributable to the hedged risk during the period for which the hedge is designated (prospective effectiveness); and
the actual results of the hedge are within the range of 80-125% (retrospective effectiveness).
The Group monitors hedge effectiveness on a regular basis but at a minimum at least at each reporting date.
KEY JUDGEMENTS AND ESTIMATES
Judgement is required when we select the valuation techniques used to determine the fair value of derivatives, particularly the selection of valuation inputs that are not readily observable, and the application of valuation adjustments to certain derivatives. Refer to Note 17 Fair Value of Financial Assets and Financial Liabilities for further details.
Notes to the consolidated financial statements (continued)
2,762
11,617
1,062 1,221
77,950
Government securities
Corporate and financial institution securities
Other securities
Equity securities
2020
2,491
9,444
70,5532019
147ANZ 2020 Annual Report
NOTES TO THE CONSOLIDATED FINANCIAL STATEMENTS (continued)
148
ANZ 2020 ANNUAL REPORT
11. INVESTMENT SECURITIES (continued)
During the year, the Group recognised a net gain (before tax) in Other operating income from the recycling of gains/losses previously deferred in equity of $23 million (2019: $240 million) in respect of investment securities.
The carrying value of equity securities at FVOCI is $1,062 million (2019: $1,221 million). This includes the Group’s $934 million (2019: $1,106 million) investment in the Bank of Tianjin (BoT).
RECOGNITION AND MEASUREMENT
Investment securities are those financial assets in security form (that is, transferable debt or equity instruments) that are not held for trading purposes. By way of exception, bills of exchange (a form of security/transferable instrument) which are used to facilitate the Group’s customer lending activities are classified as Loans and advances (rather than Investment securities) to better reflect the substance of the arrangement.
Non-traded equity investments may be designated at FVOCI on an instrument by instrument basis. If this election is made, gains or losses are not reclassified from other comprehensive income to profit or loss on disposal of the investment. However, gains or losses may be reclassified within equity.
Assets disclosed as Investment securities are subject to the general classification and measurement policy for Financial Assets outlined at the commencement of the Group’s financial asset disclosures on page 137. Additionally, expected credit losses associated with “Investment securities - debt securities at amortised cost” and “Investment securities - debt securities at fair value through other comprehensive income” are recognised and measured in accordance with the accounting policy outlined in Note 13. For “Investment securities – debt securities at fair value through other comprehensive income” the allowance for Expected Credit Loss (ECL) is recognised in the FVOCI reserve in equity with a corresponding charge to profit or loss.
KEY JUDGEMENTS AND ESTIMATES
Judgement is required when we select valuation techniques used to determine the fair value of assets not valued using quoted market prices, particularly the selection of valuation inputs that are not readily observable. Refer to Note 17 Fair Value of Financial Assets and Financial Liabilities for further details.
148
Overview How we create value
Performance overview
Remuneration report
Directors’ report
Financial report
Shareholder information

NOTES TO THE CONSOLIDATED FINANCIAL STATEMENTS (continued)
148
ANZ 2020 ANNUAL REPORT
11. INVESTMENT SECURITIES (continued)
During the year, the Group recognised a net gain (before tax) in Other operating income from the recycling of gains/losses previously deferred in equity of $23 million (2019: $240 million) in respect of investment securities.
The carrying value of equity securities at FVOCI is $1,062 million (2019: $1,221 million). This includes the Group’s $934 million (2019: $1,106 million) investment in the Bank of Tianjin (BoT).
RECOGNITION AND MEASUREMENT
Investment securities are those financial assets in security form (that is, transferable debt or equity instruments) that are not held for trading purposes. By way of exception, bills of exchange (a form of security/transferable instrument) which are used to facilitate the Group’s customer lending activities are classified as Loans and advances (rather than Investment securities) to better reflect the substance of the arrangement.
Non-traded equity investments may be designated at FVOCI on an instrument by instrument basis. If this election is made, gains or losses are not reclassified from other comprehensive income to profit or loss on disposal of the investment. However, gains or losses may be reclassified within equity.
Assets disclosed as Investment securities are subject to the general classification and measurement policy for Financial Assets outlined at the commencement of the Group’s financial asset disclosures on page 137. Additionally, expected credit losses associated with “Investment securities - debt securities at amortised cost” and “Investment securities - debt securities at fair value through other comprehensive income” are recognised and measured in accordance with the accounting policy outlined in Note 13. For “Investment securities – debt securities at fair value through other comprehensive income” the allowance for Expected Credit Loss (ECL) is recognised in the FVOCI reserve in equity with a corresponding charge to profit or loss.
KEY JUDGEMENTS AND ESTIMATES
Judgement is required when we select valuation techniques used to determine the fair value of assets not valued using quoted market prices, particularly the selection of valuation inputs that are not readily observable. Refer to Note 17 Fair Value of Financial Assets and Financial Liabilities for further details.
NOTES TO THE CONSOLIDATED FINANCIAL STATEMENTS
149
12. NET LOANS AND ADVANCES The following table provides details of net loans and advances for the Group:
2020 2019
$m $m
Overdrafts 5,214 7,267 Credit cards 7,194 9,241 Commercial bills 6,383 6,159 Term loans – housing 358,350 343,808 Term loans – non-housing 241,725 248,337 Other 2,406 3,483
Subtotal 621,272 618,295
Unearned income (66) (398) Capitalised brokerage/mortgage origination fees 868 870
Gross loans and advances 622,074 618,767 Allowance for expected credit losses (refer to Note 13) (4,981) (3,509)
Net loans and advances 617,093 615,258
Residual contractual maturity: Within one year 126,238 133,273 More than one year 490,855 481,985
Net loans and advances 617,093 615,258
Carried on Balance Sheet at: Amortised cost 613,155 614,336 Fair value through profit or loss1 3,938 922
Net loans and advances 617,093 615,258 1. From 1 October 2019, the Group changed its accounting treatment for certain gold loan and deposit products which are now designated as at fair value through the profit and loss.
RECOGNITION AND MEASUREMENT
Loans and advances are non-derivative financial assets with fixed or determinable payments that are not quoted in an active market and are facilities the Group provides directly to customers or through third party channels.
Loans and advances are initially recognised at fair value plus transaction costs directly attributable to the issue of the loan or advance, which are primarily brokerage/mortgage origination fees which we amortise over the estimated life of the loan. Subsequently, we then measure loans and advances at amortised cost using the effective interest rate method, net of any provision for credit impairment, or at fair value when they are specifically designated on initial recognition as fair value through profit or loss or when held for trading.
We classify contracts to lease assets and hire purchase agreements as finance leases if they transfer substantially all the risks and rewards of ownership of the asset to the customer or an unrelated third party. We include these facilities in ‘Other’ in the table above.
The Group enters into transactions in which it transfers financial assets that are recognised on its balance sheet. When the Group retains substantially all of the risks and rewards of the transferred assets, the transferred assets remain on the Group’s balance sheet, however if substantially all the risks and rewards are transferred, the Group derecognises the asset.
If the risks and rewards are partially retained and control over the asset is lost, the Group derecognises the asset. If control over the asset is not lost, the Group continues to recognise the asset to the extent of its continuing involvement.
We separately recognise the rights and obligations retained, or created, in the transfer of assets and liabilities as appropriate.
Assets disclosed as net loans and advances are subject to the general classification and measurement policy for financial assets outlined on page 137. Additionally, expected credit losses associated with loans and advances at amortised cost are recognised and measured in accordance with the accounting policy outlined in Note 13.
Notes to the consolidated financial statements (continued)
149ANZ 2020 Annual Report

NOTES TO THE CONSOLIDATED FINANCIAL STATEMENTS (continued)
150
ANZ 2020 ANNUAL REPORT
13. ALLOWANCE FOR EXPECTED CREDIT LOSSES
The following tables present the movement in the allowance for ECL (2019 includes allowance for ECL reclassified as held for sale) for the year. The total allowance for ECL at 30 September 2020 was $5,899 million (30 September 2019: $4,190 million).
Net loans and advances - at amortised cost Allowance for ECL is included in Net loans and advances. Stage 31
Stage 1 $m
Stage 2 $m
Collectively assessed
$m
Individually assessed
$m Total
$m As at 1 October 2018 920 1,391 359 894 3,564 Transfer between stages 166 (308) (91) 233 - New and increased provisions (net of releases) (168) 291 147 1,139 1,409 Write-backs - - - (382) (382) Bad debts written off (excluding recoveries) - - - (1,076) (1,076) Foreign currency translation and other movements2 9 4 (2) (17) (6) As at 30 September 2019 927 1,378 413 791 3,509
Transfer between stages 200 (308) (112) 220 - New and increased provisions (net of releases) 110 1,428 162 1,324 3,024 Write-backs - - - (321) (321) Bad debts written off (excluding recoveries) - - - (1,109) (1,109) Foreign currency translation and other movements2 (33) (33) (2) (54) (122) As at 30 September 2020 1,204 2,465 461 851 4,981
1. The Group’s credit exposures that are purchased or originated credit-impaired financial assets are insignificant. 2. Other movements include the impacts of divestments completed during the year and the impact of discount unwind on individually assessed allowance for ECL.
Investment securities - debt securities at amortised cost Allowance for ECL is included in Investment securities. Stage 3
Stage 1
$m Stage 2
$m
Collectively assessed
$m
Individually assessed
$m Total
$m As at 1 October 2018 9 2 - - 11 New and increased provisions (net of releases) 2 (1) - - 1 Foreign currency translation 1 - - - 1 As at 30 September 2019 12 1 - - 13
New and increased provisions (net of releases) 10 (1) - - 9 Foreign currency translation (2) - - - (2) As at 30 September 2020 20 - - - 20
150
Overview How we create value
Performance overview
Remuneration report
Directors’ report
Financial report
Shareholder information

NOTES TO THE CONSOLIDATED FINANCIAL STATEMENTS (continued)
150
ANZ 2020 ANNUAL REPORT
13. ALLOWANCE FOR EXPECTED CREDIT LOSSES
The following tables present the movement in the allowance for ECL (2019 includes allowance for ECL reclassified as held for sale) for the year. The total allowance for ECL at 30 September 2020 was $5,899 million (30 September 2019: $4,190 million).
Net loans and advances - at amortised cost Allowance for ECL is included in Net loans and advances. Stage 31
Stage 1 $m
Stage 2 $m
Collectively assessed
$m
Individually assessed
$m Total
$m As at 1 October 2018 920 1,391 359 894 3,564 Transfer between stages 166 (308) (91) 233 - New and increased provisions (net of releases) (168) 291 147 1,139 1,409 Write-backs - - - (382) (382) Bad debts written off (excluding recoveries) - - - (1,076) (1,076) Foreign currency translation and other movements2 9 4 (2) (17) (6) As at 30 September 2019 927 1,378 413 791 3,509
Transfer between stages 200 (308) (112) 220 - New and increased provisions (net of releases) 110 1,428 162 1,324 3,024 Write-backs - - - (321) (321) Bad debts written off (excluding recoveries) - - - (1,109) (1,109) Foreign currency translation and other movements2 (33) (33) (2) (54) (122) As at 30 September 2020 1,204 2,465 461 851 4,981
1. The Group’s credit exposures that are purchased or originated credit-impaired financial assets are insignificant. 2. Other movements include the impacts of divestments completed during the year and the impact of discount unwind on individually assessed allowance for ECL.
Investment securities - debt securities at amortised cost Allowance for ECL is included in Investment securities. Stage 3
Stage 1
$m Stage 2
$m
Collectively assessed
$m
Individually assessed
$m Total
$m As at 1 October 2018 9 2 - - 11 New and increased provisions (net of releases) 2 (1) - - 1 Foreign currency translation 1 - - - 1 As at 30 September 2019 12 1 - - 13
New and increased provisions (net of releases) 10 (1) - - 9 Foreign currency translation (2) - - - (2) As at 30 September 2020 20 - - - 20
NOTES TO THE CONSOLIDATED FINANCIAL STATEMENTS
151
13. ALLOWANCE FOR EXPECTED CREDIT LOSSES (continued)
Investment securities - debt securities at FVOCI As FVOCI assets are measured at fair value, there is no separate allowance for ECL. Instead, the allowance for ECL is recognised in Other Comprehensive Income (OCI) with a corresponding charge to profit or loss.
Stage 3
Stage 1 $m
Stage 2 $m
Collectively assessed
$m
Individually assessed
$m Total
$m As at 1 October 2018 14 - - - 14 New and increased provisions (net of releases) (2) - - - (2) Foreign currency translation and other movements1 (4) - - - (4) As at 30 September 2019 8 - - - 8
New and increased provisions (net of releases) 2 - - - 2 Foreign currency translation - - - - - As at 30 September 2020 10 - - - 10
1. Other movements includes the impacts of divestments completed in 2019.
Off-balance sheet commitments - undrawn and contingent facilities Allowance for ECL is included in Other provisions.
Stage 31
Stage 1 $m
Stage 2 $m
Collectively assessed
$m
Individually assessed
$m Total
$m As at 1 October 2018 474 166 15 26 681 Transfer between stages 27 (29) - 2 - New and increased provisions (net of releases) (36) 12 6 - (18) Write-backs - - - (3) (3) Foreign currency translation and other movements2 8 2 - (2) 8 As at 30 September 2019 473 151 21 23 668
Transfer between stages 18 (24) (1) 7 - New and increased provisions (net of releases) 115 115 3 24 257 Write-backs - - - (14) (14) Foreign currency translation and other movements2 (10) (3) - - (13) As at 30 September 2020 596 239 23 40 898
1. The Group’s credit exposures that are purchased or originated credit-impaired financial assets are insignificant. 2. Other movements includes the impacts of divestments completed during the year.
Notes to the consolidated financial statements (continued)
151ANZ 2020 Annual Report

NOTES TO THE CONSOLIDATED FINANCIAL STATEMENTS (continued)
152
ANZ 2020 ANNUAL REPORT
13. ALLOWANCE FOR EXPECTED CREDIT LOSSES (continued)
CREDIT IMPAIRMENT CHARGE - INCOME STATEMENT
Credit impairment charge/(release) analysis
2020 2019$m $m
New and increased provisions (net of releases)1
- Collectively assessed 1,717 16
- Individually assessed 1,575 1,374
Write-backs (335) (385)
Recoveries of amounts previously written-off (219) (212)
Total credit impairment charge 2,738 793
Less: credit impairment charge/(release) from discontinued operations - (1)
Total credit impairment charge 2,738 794 1. Includes the impact of transfers between collectively assessed and individually assessed.
The contractual amount outstanding on financial assets that were written off during the period ended 30 September 2020 and that are still subject to enforcement activity is $340 million (2019: $212 million).
COVID-19 REPAYMENT DEFERRAL PACKAGES OFFERED TO CUSTOMERS1
Since March 2020, the Group has offered various forms of assistance to customers to counteract the impact of COVID-19 on the ability of customers to meet their loan obligations. The assistance provided has included arrangements such as temporary deferral of principal and interest repayments, replacing principal and interest with interest only repayments, and extension of loan maturity dates. Refer to Key Judgements and Estimates in this Note for details of the impact of deferrals when determining if there has been a Significant Increase in Credit Risk (SICR).
The loan repayment deferral package is considered to be a loan modification under AASB 9. This either results in the loan being derecognised and replaced with a new loan (substantial modification) or the existing loan continuing to be recognised (non-substantial modification). The table below shows the outstanding balance as at 30 September 2020 of all loans that have been modified (both substantial and non-substantial modifications):
Total loan outstanding At 30 September 2020
Assistance package category $m Loan deferral package
Retail 29,822 Commercial and other 9,182
Interest only Retail 2,413 Commercial and other 527
Term extensions Retail 614 Commercial and other 90
Total2 42,648
Retail 32,849 Commercial and other 9,799
Total2 42,648 1. COVID-19 loan deferral packages are available to customers if either their loan repayments are less than 30 days past due, or if their repayments are less than 90 days past due but were up to date at 1 March 2020. 2. The gross carrying amount of loans at the date of modification that were considered non-substantial modifications and had loss allowances based on lifetime expected losses was $9,917 million. No gain or loss was
recognised as a result of the modification and none of the loans have subsequently changed to a 12 month expected loss allowance.
152
Overview How we create value
Performance overview
Remuneration report
Directors’ report
Financial report
Shareholder information

NOTES TO THE CONSOLIDATED FINANCIAL STATEMENTS (continued)
152
ANZ 2020 ANNUAL REPORT
13. ALLOWANCE FOR EXPECTED CREDIT LOSSES (continued)
CREDIT IMPAIRMENT CHARGE - INCOME STATEMENT
Credit impairment charge/(release) analysis
2020 2019$m $m
New and increased provisions (net of releases)1
- Collectively assessed 1,717 16
- Individually assessed 1,575 1,374
Write-backs (335) (385)
Recoveries of amounts previously written-off (219) (212)
Total credit impairment charge 2,738 793
Less: credit impairment charge/(release) from discontinued operations - (1)
Total credit impairment charge 2,738 794 1. Includes the impact of transfers between collectively assessed and individually assessed.
The contractual amount outstanding on financial assets that were written off during the period ended 30 September 2020 and that are still subject to enforcement activity is $340 million (2019: $212 million).
COVID-19 REPAYMENT DEFERRAL PACKAGES OFFERED TO CUSTOMERS1
Since March 2020, the Group has offered various forms of assistance to customers to counteract the impact of COVID-19 on the ability of customers to meet their loan obligations. The assistance provided has included arrangements such as temporary deferral of principal and interest repayments, replacing principal and interest with interest only repayments, and extension of loan maturity dates. Refer to Key Judgements and Estimates in this Note for details of the impact of deferrals when determining if there has been a Significant Increase in Credit Risk (SICR).
The loan repayment deferral package is considered to be a loan modification under AASB 9. This either results in the loan being derecognised and replaced with a new loan (substantial modification) or the existing loan continuing to be recognised (non-substantial modification). The table below shows the outstanding balance as at 30 September 2020 of all loans that have been modified (both substantial and non-substantial modifications):
Total loan outstanding At 30 September 2020
Assistance package category $m Loan deferral package
Retail 29,822 Commercial and other 9,182
Interest only Retail 2,413 Commercial and other 527
Term extensions Retail 614 Commercial and other 90
Total2 42,648
Retail 32,849 Commercial and other 9,799
Total2 42,648 1. COVID-19 loan deferral packages are available to customers if either their loan repayments are less than 30 days past due, or if their repayments are less than 90 days past due but were up to date at 1 March 2020. 2. The gross carrying amount of loans at the date of modification that were considered non-substantial modifications and had loss allowances based on lifetime expected losses was $9,917 million. No gain or loss was
recognised as a result of the modification and none of the loans have subsequently changed to a 12 month expected loss allowance.
NOTES TO THE CONSOLIDATED FINANCIAL STATEMENTS
153
13. ALLOWANCE FOR EXPECTED CREDIT LOSSES (continued)
RECOGNITION AND MEASUREMENT EXPECTED CREDIT LOSS IMPAIRMENT MODEL
The measurement of expected credit losses reflects an unbiased, probability weighted prediction which evaluates a range of scenarios and takes into account the time value of money, past events, current conditions and forecasts of future economic conditions.
Expected credit losses are either measured over 12 months or the expected lifetime of the financial asset, depending on credit deterioration since origination, according to the following three-stage approach:
Stage 1: At the origination of a financial asset, and where there has not been a Significant Increase in Credit Risk (SICR) since origination, an allowance equivalent to 12 months ECL is recognised reflecting the expected credit losses resulting from default events that are possible within the next 12 months from the reporting date. For instruments with a remaining maturity of less than 12 months, expected credit losses are estimated based on default events that are possible over the remaining time to maturity.
Stage 2: Where there has been a SICR since origination, an allowance equivalent to lifetime ECL is recognised reflecting expected credit losses resulting from all possible default events over the expected life of a financial instrument. If credit risk were to improve in a subsequent period such that the increase in credit risk since origination is no longer considered significant, the exposure returns to a Stage 1 classification and a 12 month ECL applies.
Stage 3: Where there is objective evidence of impairment, an allowance equivalent to lifetime ECL is recognised.
Expected credit losses are estimated on a collective basis for exposures in Stage 1 and Stage 2, and on either a collective or individual basis when transferred to Stage 3.
MEASUREMENT OF EXPECTED CREDIT LOSS
ECL is calculated as the product of the following credit risk factors at a facility level, discounted to incorporate the time value of money:
Probability of default (PD) - the estimate of the likelihood that a borrower will default over a given period;
Exposure at default (EAD) - the expected balance sheet exposure at default taking into account repayments of principal and interest, expected additional drawdowns and accrued interest; and
Loss given default (LGD) - the expected loss in the event of the borrower defaulting, expressed as a percentage of the facility's EAD, taking into account direct and indirect recovery costs.
These credit risk factors are adjusted for current and forward-looking information through the use of macro-economic variables.
EXPECTED LIFE
When estimating ECL for exposures in Stage 2 and 3, the Group considers the expected lifetime over which it is exposed to credit risk.
For non-retail portfolios, the Group uses the maximum contractual period as the expected lifetime for non-revolving credit facilities. For non-retail revolving credit facilities, such as corporate lines of credit, the expected life reflects the Group’s contractual right to withdraw a facility as part of a contractually agreed annual review, after taking into account the applicable notice period.
For retail portfolios, the expected lifetime is determined using a behavioural term, taking into account expected prepayment behaviour and substantial modifications.
DEFINITION OF DEFAULT, CREDIT IMPAIRED AND WRITE-OFFS
The definition of default used in measuring expected credit losses is aligned to the definition used for internal credit risk management purposes across all portfolios. This definition is also in line with the regulatory definition of default. Default occurs when there are indicators that a debtor is unlikely to fully satisfy contractual credit obligations to the Group, or the exposure is 90 days past due.
Financial assets, including those that are well secured, are considered credit impaired for financial reporting purposes when they default.
When there is no realistic probability of recovery, loans are written off against the related impairment allowance on completion of the Group’s internal processes and when all reasonably expected recoveries have been collected. In subsequent periods, any recoveries of amounts previously written-off are credited to credit impairment charge in the income statement.
Notes to the consolidated financial statements (continued)
153ANZ 2020 Annual Report
NOTES TO THE CONSOLIDATED FINANCIAL STATEMENTS (continued)
154
ANZ 2020 ANNUAL REPORT
13. ALLOWANCE FOR EXPECTED CREDIT LOSSES (continued)
RECOGNITION AND MEASUREMENT MODIFIED FINANCIAL ASSETS
If the terms of a financial asset are modified or an existing financial asset is replaced with a new one for either credit or commercial reasons, an assessment is made to determine if the changes to the terms of the existing financial asset are considered substantial. This assessment considers both changes in cash flows arising from the modified terms as well as changes in the overall instrument risk profile; for example, changes in the principal (credit limit), term, or type of underlying collateral. Where a modification is considered non-substantial, the existing financial asset is not derecognised and its date of origination continues to be used to determine SICR. Where a modification is considered substantial, the existing financial asset is derecognised and a new financial asset is recognised at its fair value on the modification date, which also becomes the date of origination used to determine SICR for this new asset. SIGNIFICANT INCREASE IN CREDIT RISK (SICR)
Stage 2 assets are those that have experienced a Significant Increase in Credit Risk (SICR) since origination. In determining what constitutes a SICR, the Group considers both qualitative and quantitative information: i. Internal credit rating grade
For the majority of portfolios, the primary indicator of a SICR is a significant deterioration in the internal credit rating grade of a facility since origination and is measured by application of thresholds.
For non-retail portfolios, a SICR is determined by comparing the Customer Credit Rating (CCR) applicable to a facility at reporting date to the CCR at origination of that facility. A CCR is assigned to each borrower which reflects the probability of default of the borrower and incorporates both borrower and non-borrower specific information, including forward-looking information. CCRs are subject to review at least annually or more frequently when an event occurs which could affect the credit risk of the customer.
For retail portfolios, a SICR is determined, depending on the type of facility, by either comparing the scenario weighted lifetime probability of default at the reporting date to that at origination, or by reference to customer behavioural score thresholds. The scenario weighted lifetime probability of default may increase significantly if:
there has been a deterioration in the economic outlook, or an increase in economic uncertainty; or
there has been a deterioration in the customer’s overall credit position, or ability to manage their credit obligations.
ii. Backstop criteria
The Group uses 30 days past due arrears as a backstop criteria for both non-retail and retail portfolios. For retail portfolios only, facilities are required to demonstrate three to six months of good payment behaviour prior to being allocated back to Stage 1.
iii. COVID-19 initiatives
For facilities subject to the COVID-19 repayment deferral arrangements noted above, an assessment of SICR has been determined based on various measures of the customer’s current financial position and earnings capacity from which the facilities are categorised into risk categories. SICR is then determined based on the resulting risk categorisation. Customers in higher risk categories, and those who have requested a deferral extension are classified as having a SICR.
FORWARD-LOOKING INFORMATION
Forward-looking information is incorporated into both our assessment of whether a financial asset has experienced a Significant Increase in Credit Risk (SICR) since its initial recognition and in our estimate of ECL. In applying forward-looking information for estimating ECL, the Group considers four probability-weighted forecast economic scenarios as follows:
i. Base case scenario
The base case scenario is ANZ’s view of the most likely future macro-economic conditions. It reflects management’s assumptions used for strategic planning and budgeting, and also informs the Group Internal Capital Adequacy Assessment Process (ICAAP) which is the process the Group applies in strategic and capital planning over a 3-year time horizon;
ii. Upside and iii. Downside scenarios
The upside and downside scenarios are fixed by reference to average economic cycle conditions (that is, they are not based on the economic conditions prevailing at balance date) and are based on a combination of more optimistic (in the case of the upside) and pessimistic (in the case of the downside) economic events and uncertainty over long term horizons; and
iv. Severe downside scenario
The severe downside scenario is fixed by reference to average economic cycle conditions and accounts for the potentially severe impact of less likely extremely adverse economic conditions. It reflects macro-economic conditions of a downturn economic event with a probability of occurrence once every 25 years.
154
Overview How we create value
Performance overview
Remuneration report
Directors’ report
Financial report
Shareholder information

NOTES TO THE CONSOLIDATED FINANCIAL STATEMENTS (continued)
154
ANZ 2020 ANNUAL REPORT
13. ALLOWANCE FOR EXPECTED CREDIT LOSSES (continued)
RECOGNITION AND MEASUREMENT MODIFIED FINANCIAL ASSETS
If the terms of a financial asset are modified or an existing financial asset is replaced with a new one for either credit or commercial reasons, an assessment is made to determine if the changes to the terms of the existing financial asset are considered substantial. This assessment considers both changes in cash flows arising from the modified terms as well as changes in the overall instrument risk profile; for example, changes in the principal (credit limit), term, or type of underlying collateral. Where a modification is considered non-substantial, the existing financial asset is not derecognised and its date of origination continues to be used to determine SICR. Where a modification is considered substantial, the existing financial asset is derecognised and a new financial asset is recognised at its fair value on the modification date, which also becomes the date of origination used to determine SICR for this new asset. SIGNIFICANT INCREASE IN CREDIT RISK (SICR)
Stage 2 assets are those that have experienced a Significant Increase in Credit Risk (SICR) since origination. In determining what constitutes a SICR, the Group considers both qualitative and quantitative information: i. Internal credit rating grade
For the majority of portfolios, the primary indicator of a SICR is a significant deterioration in the internal credit rating grade of a facility since origination and is measured by application of thresholds.
For non-retail portfolios, a SICR is determined by comparing the Customer Credit Rating (CCR) applicable to a facility at reporting date to the CCR at origination of that facility. A CCR is assigned to each borrower which reflects the probability of default of the borrower and incorporates both borrower and non-borrower specific information, including forward-looking information. CCRs are subject to review at least annually or more frequently when an event occurs which could affect the credit risk of the customer.
For retail portfolios, a SICR is determined, depending on the type of facility, by either comparing the scenario weighted lifetime probability of default at the reporting date to that at origination, or by reference to customer behavioural score thresholds. The scenario weighted lifetime probability of default may increase significantly if:
there has been a deterioration in the economic outlook, or an increase in economic uncertainty; or
there has been a deterioration in the customer’s overall credit position, or ability to manage their credit obligations.
ii. Backstop criteria
The Group uses 30 days past due arrears as a backstop criteria for both non-retail and retail portfolios. For retail portfolios only, facilities are required to demonstrate three to six months of good payment behaviour prior to being allocated back to Stage 1.
iii. COVID-19 initiatives
For facilities subject to the COVID-19 repayment deferral arrangements noted above, an assessment of SICR has been determined based on various measures of the customer’s current financial position and earnings capacity from which the facilities are categorised into risk categories. SICR is then determined based on the resulting risk categorisation. Customers in higher risk categories, and those who have requested a deferral extension are classified as having a SICR.
FORWARD-LOOKING INFORMATION
Forward-looking information is incorporated into both our assessment of whether a financial asset has experienced a Significant Increase in Credit Risk (SICR) since its initial recognition and in our estimate of ECL. In applying forward-looking information for estimating ECL, the Group considers four probability-weighted forecast economic scenarios as follows:
i. Base case scenario
The base case scenario is ANZ’s view of the most likely future macro-economic conditions. It reflects management’s assumptions used for strategic planning and budgeting, and also informs the Group Internal Capital Adequacy Assessment Process (ICAAP) which is the process the Group applies in strategic and capital planning over a 3-year time horizon;
ii. Upside and iii. Downside scenarios
The upside and downside scenarios are fixed by reference to average economic cycle conditions (that is, they are not based on the economic conditions prevailing at balance date) and are based on a combination of more optimistic (in the case of the upside) and pessimistic (in the case of the downside) economic events and uncertainty over long term horizons; and
iv. Severe downside scenario
The severe downside scenario is fixed by reference to average economic cycle conditions and accounts for the potentially severe impact of less likely extremely adverse economic conditions. It reflects macro-economic conditions of a downturn economic event with a probability of occurrence once every 25 years.
NOTES TO THE CONSOLIDATED FINANCIAL STATEMENTS
155
13. ALLOWANCE FOR EXPECTED CREDIT LOSSES (continued)
RECOGNITION AND MEASUREMENT (continued)
FORWARD-LOOKING INFORMATION (continued)
The four scenarios are described in terms of macro-economic variables used in the PD, LGD and EAD models (collectively the ECL models) depending on the portfolio and country of the borrower. Examples of the variables include unemployment rates, GDP growth rates, house price indices, commercial property price indices and consumer price indices.
Probability weighting of each scenario is determined by management considering the risks and uncertainties surrounding the base case economic scenario, as well as specific portfolio considerations where required. The Group Asset and Liability Committee (GALCO) is responsible for reviewing and approving the base case economic forecast scenario and the Credit and Market Risk Committee (CMRC) approves the probability weights applied to each scenario.
Where applicable, temporary adjustments may be made to account for situations where known or expected risks have not been adequately addressed in the modelling process. CMRC is responsible for approving such adjustments.
KEY JUDGEMENTS AND ESTIMATES
In estimating collectively assessed ECL, the Group makes judgements and assumptions in relation to: • the selection of an estimation technique or modelling methodology, noting that the modelling of the Group’s ECL estimates are
complex; and • the selection of inputs for those models, and the interdependencies between those inputs.
The following table summarises the key judgements and assumptions in relation to the ECL model inputs and the interdependencies between those inputs, and highlights significant changes during the current period.
The judgements and associated assumptions have been made within the context of the impact of COVID-19, and reflect historical experience and other factors that are considered to be relevant, including expectations of future events that are believed to be reasonable under the circumstances. In relation to COVID-19, judgements and assumptions include the extent and duration of the pandemic, the impacts of actions of governments and other authorities, and the responses of businesses and consumers in different industries, along with the associated impact on the global economy. Accordingly, the Group’s ECL estimates are inherently uncertain and, as a result, actual results may differ from these estimates.
Judgement/Assumption Description Considerations for the year ended 30 September 2020
Determining when a Significant Increase in Credit Risk (SICR) has occurred
In the measurement of ECL, judgement is involved in setting the rules and trigger points to determine whether there has been a SICR since initial recognition of a loan, which would result in the financial asset moving from ‘Stage 1’ to ‘Stage 2’. This is a key area of judgement since transition from Stage 1 to Stage 2 increases the ECL from an allowance based on the probability of default in the next 12 months, to an allowance for lifetime expected credit losses. Subsequent decreases in credit risk resulting in transition from Stage 2 to Stage 1 may similarly result in significant changes in the ECL allowance.
The setting of precise trigger points requires judgement which may have a material impact upon the size of the ECL allowance. The Group monitors the effectiveness of SICR criteria on an ongoing basis.
In response to the impacts of COVID-19, various packages, such as repayment deferrals, have been offered to eligible retail and commercial customers in Australia and New Zealand. The Group does not consider that when a customer is first provided assistance, all other things being equal, that there has been a Significant Increase in Credit Risk (SICR) and a consequent impact on ECL when assessing provisions.
Subsequent to take-up, customers have been contacted to discuss available options once the packages reach their end date. This additional information on the customer’s financial position and ability to recommence their loan repayments is used to assist in classification of customers into risk categories. Customers in higher risk categories, and those who have requested a deferral extension, have been classified as having a SICR.
Notes to the consolidated financial statements (continued)
155ANZ 2020 Annual Report

NOTES TO THE CONSOLIDATED FINANCIAL STATEMENTS (continued)
156
ANZ 2020 ANNUAL REPORT
13. ALLOWANCE FOR EXPECTED CREDIT LOSSES (continued)
KEY JUDGEMENTS AND ESTIMATES (continued)
Judgement/Assumption Description Considerations for the year ended 30 September 2020
Measuring both 12-month and lifetime credit losses
The probability of default (PD), loss given default (LGD) and exposure at default (EAD) credit risk parameters used in determining ECL are point-in-time measures reflecting the relevant forward-looking information determined by management. Judgement is involved in determining which forward-looking information variables are relevant for particular lending portfolios and for determining each portfolio’s point-in-time sensitivity.
The PD, EAD and LGD models are subject to the Group’s model risk policy that stipulates periodic model monitoring, periodic re-validation and defines approval procedures and authorities according to model materiality. There were no material changes to the policies during the year ended 30 September 2020.
In addition, judgement is required where behavioural characteristics are applied in estimating the lifetime of a facility to be used in measuring ECL.
There were no changes to behavioural lifetime estimates during the year ended 30 September 2020.
Base case economic forecast
The Group derives a forward-looking “base case” economic scenario which reflects ANZ’s view of the most likely future macro-economic conditions.
There have been no changes to the types of forward-looking variables (key economic drivers) used as model inputs in the current year.
As at 30 September 2020, the base case assumptions have been updated to reflect the rapidly evolving situation with respect to COVID-19. This includes an assessment of the impact of central bank policies, governments’ actions, the response of business, and institution specific responses (such as repayment deferrals). These are considered in determining the length and severity of the forecast economic downturn.
The expected outcomes of key economic drivers for the base case scenario as at 30 September 2020 are described below under the heading “Base case economic forecast assumptions”.
Probability weighting of each economic scenario (base case, upside, downside and severe downside scenarios)1,2
Probability weighting of each economic scenario is determined by management considering the risks and uncertainties surrounding the base case economic scenario at each measurement date.
The key consideration for probability weightings in the current period is the continuing impact of COVID-19.
The Group considers these weightings in each geography to provide the best estimate of the possible loss outcomes and has analysed inter-relationships and correlations (over both the short and long term) within the Group’s credit portfolios in determining them.
In addition to the base case forecast which reflects the negative economic consequences of COVID-19, greater weighting has been applied to the downside scenario given the Group’s assessment of downside risks.
The assigned probability weightings in Australia, New Zealand and Rest of world are subject to a high degree of inherent uncertainty and therefore the actual outcomes may be significantly different to those projected.
1. The upside and downside scenarios are fixed by reference to average economic cycle conditions (that is, they are not based on the economic conditions prevailing at balance date) and are based on a combination of more optimistic (in the case of the upside) and pessimistic (in the case of the downside) economic conditions.
2. The severe downside scenario is fixed by reference to average economic cycle conditions and accounts for the potentially severe downside impact of less likely extremely adverse economic conditions.
156
Overview How we create value
Performance overview
Remuneration report
Directors’ report
Financial report
Shareholder information

NOTES TO THE CONSOLIDATED FINANCIAL STATEMENTS (continued)
156
ANZ 2020 ANNUAL REPORT
13. ALLOWANCE FOR EXPECTED CREDIT LOSSES (continued)
KEY JUDGEMENTS AND ESTIMATES (continued)
Judgement/Assumption Description Considerations for the year ended 30 September 2020
Measuring both 12-month and lifetime credit losses
The probability of default (PD), loss given default (LGD) and exposure at default (EAD) credit risk parameters used in determining ECL are point-in-time measures reflecting the relevant forward-looking information determined by management. Judgement is involved in determining which forward-looking information variables are relevant for particular lending portfolios and for determining each portfolio’s point-in-time sensitivity.
The PD, EAD and LGD models are subject to the Group’s model risk policy that stipulates periodic model monitoring, periodic re-validation and defines approval procedures and authorities according to model materiality. There were no material changes to the policies during the year ended 30 September 2020.
In addition, judgement is required where behavioural characteristics are applied in estimating the lifetime of a facility to be used in measuring ECL.
There were no changes to behavioural lifetime estimates during the year ended 30 September 2020.
Base case economic forecast
The Group derives a forward-looking “base case” economic scenario which reflects ANZ’s view of the most likely future macro-economic conditions.
There have been no changes to the types of forward-looking variables (key economic drivers) used as model inputs in the current year.
As at 30 September 2020, the base case assumptions have been updated to reflect the rapidly evolving situation with respect to COVID-19. This includes an assessment of the impact of central bank policies, governments’ actions, the response of business, and institution specific responses (such as repayment deferrals). These are considered in determining the length and severity of the forecast economic downturn.
The expected outcomes of key economic drivers for the base case scenario as at 30 September 2020 are described below under the heading “Base case economic forecast assumptions”.
Probability weighting of each economic scenario (base case, upside, downside and severe downside scenarios)1,2
Probability weighting of each economic scenario is determined by management considering the risks and uncertainties surrounding the base case economic scenario at each measurement date.
The key consideration for probability weightings in the current period is the continuing impact of COVID-19.
The Group considers these weightings in each geography to provide the best estimate of the possible loss outcomes and has analysed inter-relationships and correlations (over both the short and long term) within the Group’s credit portfolios in determining them.
In addition to the base case forecast which reflects the negative economic consequences of COVID-19, greater weighting has been applied to the downside scenario given the Group’s assessment of downside risks.
The assigned probability weightings in Australia, New Zealand and Rest of world are subject to a high degree of inherent uncertainty and therefore the actual outcomes may be significantly different to those projected.
1. The upside and downside scenarios are fixed by reference to average economic cycle conditions (that is, they are not based on the economic conditions prevailing at balance date) and are based on a combination of more optimistic (in the case of the upside) and pessimistic (in the case of the downside) economic conditions.
2. The severe downside scenario is fixed by reference to average economic cycle conditions and accounts for the potentially severe downside impact of less likely extremely adverse economic conditions.
NOTES TO THE CONSOLIDATED FINANCIAL STATEMENTS
157
13. ALLOWANCE FOR EXPECTED CREDIT LOSSES (continued)
KEY JUDGEMENTS AND ESTIMATES (continued)
Judgement/Assumption Description Considerations for the year ended 30 September 2020
Management temporary adjustments
Management temporary adjustments to the ECL allowance are used in circumstances where it is judged that our existing inputs, assumptions and model techniques do not capture all the risk factors relevant to our lending portfolios. Emerging local or global macroeconomic, microeconomic or political events, and natural disasters that are not incorporated into our current parameters, risk ratings, or forward-looking information are examples of such circumstances. The use of management temporary adjustments may impact the amount of ECL recognised.
The uncertainty associated with the COVID-19 pandemic, and the extent to which the actions of governments, businesses and consumers mitigate against potentially adverse credit outcomes are not fully incorporated into existing ECL models. Accordingly, management overlays have been applied to ensure credit provisions are appropriate.
Management have applied a number of adjustments to the modelled ECL primarily due to the uncertainty associated with COVID-19.
Management overlays (including COVID-19 overlays) which add to the modelled ECL provision have been made for risks particular to small business and commercial banking in Australia, for retail, commercial and agri banking in New Zealand, and for tourism in the Pacific.
Base case economic forecast assumptions
The uncertain evolution of the COVID-19 pandemic increases the risk to the economic forecast resulting in an understatement or overstatement of the ECL balance due to uncertainties around: the extent and duration of measures to stop or reduce the speed of the spread of COVID-19; the extent and duration of the economic downturn, along with the time required for economies to recover; and the effectiveness of government stimulus measures, in particular their impact on the magnitude of economic downturn and the extent
and duration of the recovery.
The economic drivers of the base case economic forecasts at 30 September 2020 are set out below. These reflect ANZ’s view of the most likely future macro-economic conditions at 30 September 2020. For years beyond the near term forecasts below, the ECL models project future year economic conditions including an assumption to eventual reversion to mid-cycle economic conditions.
Forecast calendar year 2020 2021 2022 Australia GDP -4.3% 1.6% 4.0% Unemployment 7.3% 8.8% 7.7% Residential property prices -2.2% -4.8% 2.0% Consumer price index 0.8 1.2 1.3 New Zealand GDP -5.6% 2.0% 5.6% Unemployment 5.7% 9.1% 6.5% Residential property prices -0.3% 0.9% 4.1% Consumer price index 1.6 1.0 1.2 Rest of world GDP -4.5% 2.5% 2.5% Consumer price index 1.0 1.8 2.0
Notes to the consolidated financial statements (continued)
157ANZ 2020 Annual Report

NOTES TO THE CONSOLIDATED FINANCIAL STATEMENTS (continued)
158
ANZ 2020 ANNUAL REPORT
13. ALLOWANCE FOR EXPECTED CREDIT LOSSES (continued)
KEY JUDGEMENTS AND ESTIMATES (continued)
The base case economic forecasts as at 30 September 2020 reflect a significant deterioration in current and expected economic conditions from the forecasts as at 30 September 2019 reflecting the emergence and ongoing impact of the COVID-19 pandemic.
Probability weightings
Probability weighting of each scenario is determined by management considering the risks and uncertainties surrounding the base case economic scenario. The key consideration for probability weightings in the current period is the continuing impact of COVID-19.
In addition to the base case economic forecast which reflects the negative economic consequences of COVID-19, greater weighting has been applied to the downside economic scenario given the Group’s assessment of downside risks.
The assigned probability weightings in Australia, New Zealand and Rest of world are subject to a high degree of inherent uncertainty and therefore the actual outcomes may be significantly different to those projected. The Group considers these weightings in each geography to provide the best estimate of the possible loss outcomes and has analysed inter-relationships and correlations (over both the short and long term) within the Group’s credit portfolios in determining them. The average weightings applied across the Group are set out below:
2020 2019 Group
Base 50.0% 50.0% Upside 10.4% 15.7% Downside 33.3% 29.3% Severe Downside 6.3% 5.0%
ECL - Sensitivity analysis
The uncertainty of the impact of COVID-19 introduces significant estimation uncertainty in relation to the measurement of the Group’s allowance for expected credit losses. The rapidly evolving consequences of COVID-19 and government, business and consumer responses could result in significant adjustments to the allowance in future financial years.
Given current economic uncertainties and the judgment applied to factors used in determining the expected default of borrowers in future periods, expected credit losses reported by the Group should be considered as a best estimate within a range of possible estimates.
The table below illustrates the sensitivity of collectively assessed ECL to key factors used in determining it as at 30 September 2020:
ECL $m
Impact $m
If 1% of Stage 1 facilities were included in Stage 2 5,069 61 If 1% of Stage 2 facilities were included in Stage 1 4,998 (10) 100% upside scenario 1,898 (3,110) 100% base scenario 4,011 (997) 100% downside scenario 5,144 136 100% severe downside scenario 6,315 1,307
158
Overview How we create value
Performance overview
Remuneration report
Directors’ report
Financial report
Shareholder information

NOTES TO THE CONSOLIDATED FINANCIAL STATEMENTS (continued)
158
ANZ 2020 ANNUAL REPORT
13. ALLOWANCE FOR EXPECTED CREDIT LOSSES (continued)
KEY JUDGEMENTS AND ESTIMATES (continued)
The base case economic forecasts as at 30 September 2020 reflect a significant deterioration in current and expected economic conditions from the forecasts as at 30 September 2019 reflecting the emergence and ongoing impact of the COVID-19 pandemic.
Probability weightings
Probability weighting of each scenario is determined by management considering the risks and uncertainties surrounding the base case economic scenario. The key consideration for probability weightings in the current period is the continuing impact of COVID-19.
In addition to the base case economic forecast which reflects the negative economic consequences of COVID-19, greater weighting has been applied to the downside economic scenario given the Group’s assessment of downside risks.
The assigned probability weightings in Australia, New Zealand and Rest of world are subject to a high degree of inherent uncertainty and therefore the actual outcomes may be significantly different to those projected. The Group considers these weightings in each geography to provide the best estimate of the possible loss outcomes and has analysed inter-relationships and correlations (over both the short and long term) within the Group’s credit portfolios in determining them. The average weightings applied across the Group are set out below:
2020 2019 Group
Base 50.0% 50.0% Upside 10.4% 15.7% Downside 33.3% 29.3% Severe Downside 6.3% 5.0%
ECL - Sensitivity analysis
The uncertainty of the impact of COVID-19 introduces significant estimation uncertainty in relation to the measurement of the Group’s allowance for expected credit losses. The rapidly evolving consequences of COVID-19 and government, business and consumer responses could result in significant adjustments to the allowance in future financial years.
Given current economic uncertainties and the judgment applied to factors used in determining the expected default of borrowers in future periods, expected credit losses reported by the Group should be considered as a best estimate within a range of possible estimates.
The table below illustrates the sensitivity of collectively assessed ECL to key factors used in determining it as at 30 September 2020:
ECL $m
Impact $m
If 1% of Stage 1 facilities were included in Stage 2 5,069 61 If 1% of Stage 2 facilities were included in Stage 1 4,998 (10) 100% upside scenario 1,898 (3,110) 100% base scenario 4,011 (997) 100% downside scenario 5,144 136 100% severe downside scenario 6,315 1,307
NOTES TO THE CONSOLIDATED FINANCIAL STATEMENTS
159
FINANCIAL LIABILITIES
Outlined below is a description of how we classify and measure financial liabilities relevant to the subsequent note disclosures. CLASSIFICATION AND MEASUREMENT
Financial liabilities
Financial liabilities are measured at amortised cost, or fair value through profit or loss (FVTPL) when they are held for trading. Additionally, financial liabilities can be designated at FVTPL where:
the designation eliminates or significantly reduces an accounting mismatch which would otherwise arise; a group of financial liabilities are managed and their performance is evaluated on a fair value basis, in accordance with a documented risk
management strategy; or the financial liability contains one or more embedded derivatives unless:
a) the embedded derivative does not significantly modify the cash flows that otherwise would be required by the contract; or b) the embedded derivative is closely related to the host financial liability.
Where financial liabilities are designated as measured at fair value, gains or losses relating to changes in the entity’s own credit risk are included in other comprehensive income, except where doing so would create or enlarge an accounting mismatch in profit or loss.
Notes to the consolidated financial statements (continued)
159ANZ 2020 Annual Report
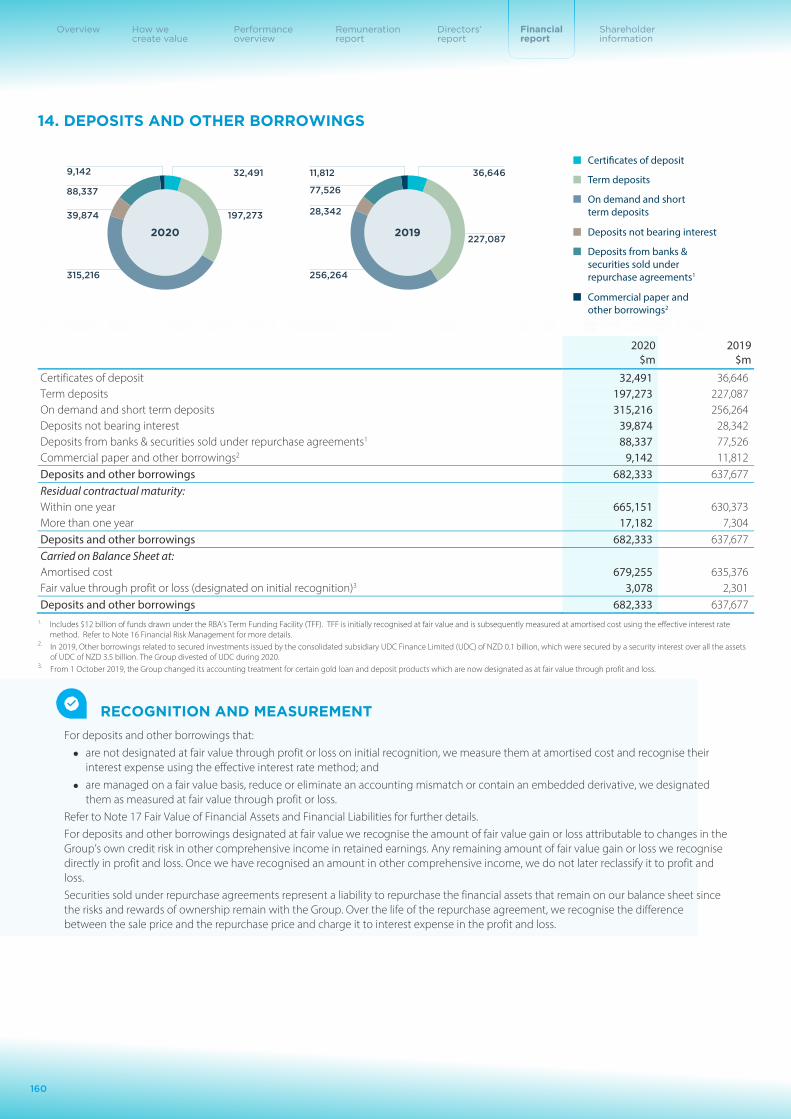
NOTES TO THE CONSOLIDATED FINANCIAL STATEMENTS (continued)
160
ANZ 2020 ANNUAL REPORT
14. DEPOSITS AND OTHER BORROWINGS
2020 2019 $m $m
Certificates of deposit 32,491 36,646 Term deposits 197,273 227,087 On demand and short term deposits 315,216 256,264 Deposits not bearing interest 39,874 28,342 Deposits from banks & securities sold under repurchase agreements1 88,337 77,526 Commercial paper and other borrowings2 9,142 11,812 Deposits and other borrowings 682,333 637,677 Residual contractual maturity: Within one year 665,151 630,373 More than one year 17,182 7,304 Deposits and other borrowings 682,333 637,677 Carried on Balance Sheet at: Amortised cost 679,255 635,376 Fair value through profit or loss (designated on initial recognition)3 3,078 2,301 Deposits and other borrowings 682,333 637,677
1. Includes $12 billion of funds drawn under the RBA’s Term Funding Facility (TFF). TFF is initially recognised at fair value and is subsequently measured at amortised cost using the effective interest rate method. Refer to Note 16 Financial Risk Management for more details.
2. In 2019, Other borrowings related to secured investments issued by the consolidated subsidiary UDC Finance Limited (UDC) of NZD 0.1 billion, which were secured by a security interest over all the assets of UDC of NZD 3.5 billion. The Group divested of UDC during 2020.
3. From 1 October 2019, the Group changed its accounting treatment for certain gold loan and deposit products which are now designated as at fair value through profit and loss.
RECOGNITION AND MEASUREMENT
For deposits and other borrowings that:
are not designated at fair value through profit or loss on initial recognition, we measure them at amortised cost and recognise their interest expense using the effective interest rate method; and
are managed on a fair value basis, reduce or eliminate an accounting mismatch or contain an embedded derivative, we designated them as measured at fair value through profit or loss.
Refer to Note 17 Fair Value of Financial Assets and Financial Liabilities for further details. For deposits and other borrowings designated at fair value we recognise the amount of fair value gain or loss attributable to changes in the Group’s own credit risk in other comprehensive income in retained earnings. Any remaining amount of fair value gain or loss we recognise directly in profit and loss. Once we have recognised an amount in other comprehensive income, we do not later reclassify it to profit and loss. Securities sold under repurchase agreements represent a liability to repurchase the financial assets that remain on our balance sheet since the risks and rewards of ownership remain with the Group. Over the life of the repurchase agreement, we recognise the difference between the sale price and the repurchase price and charge it to interest expense in the profit and loss.
Certi�cates of deposit
Term deposits
On demand and short term deposits39,874
88,337
197,273
32,491 36,646
Deposits not bearing interest
Deposits from banks & securities sold under repurchase agreements1
Commercial paper and other borrowings2
2020
77,526
28,342
11,8129,142
256,264315,216
227,0872019
160
Overview How we create value
Performance overview
Remuneration report
Directors’ report
Financial report
Shareholder information

NOTES TO THE CONSOLIDATED FINANCIAL STATEMENTS (continued)
160
ANZ 2020 ANNUAL REPORT
14. DEPOSITS AND OTHER BORROWINGS
2020 2019 $m $m
Certificates of deposit 32,491 36,646 Term deposits 197,273 227,087 On demand and short term deposits 315,216 256,264 Deposits not bearing interest 39,874 28,342 Deposits from banks & securities sold under repurchase agreements1 88,337 77,526 Commercial paper and other borrowings2 9,142 11,812 Deposits and other borrowings 682,333 637,677 Residual contractual maturity: Within one year 665,151 630,373 More than one year 17,182 7,304 Deposits and other borrowings 682,333 637,677 Carried on Balance Sheet at: Amortised cost 679,255 635,376 Fair value through profit or loss (designated on initial recognition)3 3,078 2,301 Deposits and other borrowings 682,333 637,677
1. Includes $12 billion of funds drawn under the RBA’s Term Funding Facility (TFF). TFF is initially recognised at fair value and is subsequently measured at amortised cost using the effective interest rate method. Refer to Note 16 Financial Risk Management for more details.
2. In 2019, Other borrowings related to secured investments issued by the consolidated subsidiary UDC Finance Limited (UDC) of NZD 0.1 billion, which were secured by a security interest over all the assets of UDC of NZD 3.5 billion. The Group divested of UDC during 2020.
3. From 1 October 2019, the Group changed its accounting treatment for certain gold loan and deposit products which are now designated as at fair value through profit and loss.
RECOGNITION AND MEASUREMENT
For deposits and other borrowings that:
are not designated at fair value through profit or loss on initial recognition, we measure them at amortised cost and recognise their interest expense using the effective interest rate method; and
are managed on a fair value basis, reduce or eliminate an accounting mismatch or contain an embedded derivative, we designated them as measured at fair value through profit or loss.
Refer to Note 17 Fair Value of Financial Assets and Financial Liabilities for further details. For deposits and other borrowings designated at fair value we recognise the amount of fair value gain or loss attributable to changes in the Group’s own credit risk in other comprehensive income in retained earnings. Any remaining amount of fair value gain or loss we recognise directly in profit and loss. Once we have recognised an amount in other comprehensive income, we do not later reclassify it to profit and loss. Securities sold under repurchase agreements represent a liability to repurchase the financial assets that remain on our balance sheet since the risks and rewards of ownership remain with the Group. Over the life of the repurchase agreement, we recognise the difference between the sale price and the repurchase price and charge it to interest expense in the profit and loss.
Certi�cates of deposit
Term deposits
On demand and short term deposits39,874
88,337
197,273
32,491 36,646
Deposits not bearing interest
Deposits from banks & securities sold under repurchase agreements1
Commercial paper and other borrowings2
2020
77,526
28,342
11,8129,142
256,264315,216
227,0872019
NOTES TO THE CONSOLIDATED FINANCIAL STATEMENTS (continued)
160
ANZ 2020 ANNUAL REPORT
14. DEPOSITS AND OTHER BORROWINGS
2020 2019 $m $m
Certificates of deposit 32,491 36,646 Term deposits 197,273 227,087 On demand and short term deposits 315,216 256,264 Deposits not bearing interest 39,874 28,342 Deposits from banks & securities sold under repurchase agreements1 88,337 77,526 Commercial paper and other borrowings2 9,142 11,812 Deposits and other borrowings 682,333 637,677 Residual contractual maturity: Within one year 665,151 630,373 More than one year 17,182 7,304 Deposits and other borrowings 682,333 637,677 Carried on Balance Sheet at: Amortised cost 679,255 635,376 Fair value through profit or loss (designated on initial recognition)3 3,078 2,301 Deposits and other borrowings 682,333 637,677
1. Includes $12 billion of funds drawn under the RBA’s Term Funding Facility (TFF). TFF is initially recognised at fair value and is subsequently measured at amortised cost using the effective interest rate method. Refer to Note 16 Financial Risk Management for more details.
2. In 2019, Other borrowings related to secured investments issued by the consolidated subsidiary UDC Finance Limited (UDC) of NZD 0.1 billion, which were secured by a security interest over all the assets of UDC of NZD 3.5 billion. The Group divested of UDC during 2020.
3. From 1 October 2019, the Group changed its accounting treatment for certain gold loan and deposit products which are now designated as at fair value through profit and loss.
RECOGNITION AND MEASUREMENT
For deposits and other borrowings that:
are not designated at fair value through profit or loss on initial recognition, we measure them at amortised cost and recognise their interest expense using the effective interest rate method; and
are managed on a fair value basis, reduce or eliminate an accounting mismatch or contain an embedded derivative, we designated them as measured at fair value through profit or loss.
Refer to Note 17 Fair Value of Financial Assets and Financial Liabilities for further details. For deposits and other borrowings designated at fair value we recognise the amount of fair value gain or loss attributable to changes in the Group’s own credit risk in other comprehensive income in retained earnings. Any remaining amount of fair value gain or loss we recognise directly in profit and loss. Once we have recognised an amount in other comprehensive income, we do not later reclassify it to profit and loss. Securities sold under repurchase agreements represent a liability to repurchase the financial assets that remain on our balance sheet since the risks and rewards of ownership remain with the Group. Over the life of the repurchase agreement, we recognise the difference between the sale price and the repurchase price and charge it to interest expense in the profit and loss.
NOTES TO THE CONSOLIDATED FINANCIAL STATEMENTS
161
15. DEBT ISSUANCES The Group uses a variety of funding programmes to issue senior debt (including covered bonds and securitisations) and subordinated debt. The difference between senior debt and subordinated debt is that holders of senior debt take priority over holders of subordinated debt owed by the relevant issuer. In the winding up of the relevant issuer, the subordinated debt will be repaid by the relevant issuer only after the repayment of claims of depositors, other creditors and the senior debt holders.
2020 2019
$m $m
Senior debt 80,835 89,737 Covered bonds 15,948 20,957 Securitisation 1,824 2,411
Total unsubordinated debt 98,607 113,105 Subordinated debt - Additional Tier 1 capital 8,196 8,171 - Tier 2 capital 12,865 8,415
Total subordinated debt 21,061 16,586 Total debt issued 119,668 129,691
TOTAL DEBT ISSUED BY CURRENCY
The table below shows the Group’s issued debt by currency of issue, which broadly represents the debt holders’ base location.
2020 2019 $m $m
USD United States dollars 41,100 45,841 EUR Euro 23,038 26,200 AUD Australian dollars 43,697 39,273 NZD New Zealand dollars 3,682 5,130 JPY Japanese yen 2,131 3,312 CHF Swiss francs 975 1,501 GBP Pounds sterling 2,387 4,720 HKD Hong Kong dollars 1,088 1,446 Other Chinese yuan, Norwegian kroner, Singapore dollars, Indonesian rupiah and Canadian dollars 1,570 2,268
Total debt issued 119,668 129,691
Residual contractual maturity1: Within one year 25,688 20,803 More than one year 92,059 106,963 No maturity date (instruments in perpetuity) 1,921 1,925
Total debt issued 119,668 129,691 1. Based on the final maturity date or, in the case of Additional Tier 1 capital securities, the mandatory conversion date (if any).
SUBORDINATED DEBT Subordinated debt qualifies as regulatory capital for the Group and is classified as either Additional Tier 1 (AT1) capital or Tier 2 capital for APRA’s capital adequacy purposes depending on their terms and conditions:
AT1 capital: perpetual capital instruments:
ANZ Capital Notes (ANZ CN);
ANZ Capital Securities (ANZ CS); and
ANZ NZ Capital Notes (ANZ NZ CN).
Tier 2 capital: perpetual or term subordinated notes.
Tier 2 capital instruments rank ahead of AT1 capital instruments, and AT1 capital instruments only rank ahead of ordinary shares, in any liquidation event impacting the issuer of the instruments.
Notes to the consolidated financial statements (continued)
161ANZ 2020 Annual Report
NOTES TO THE CONSOLIDATED FINANCIAL STATEMENTS (continued)
162
ANZ 2020 ANNUAL REPORT
15. DEBT ISSUANCES (continued)
AT1 CAPITAL All outstanding AT1 capital instruments are Basel III fully compliant instruments (refer to Note 23 Capital Management for further information about Basel III). Each of the ANZ CN and ANZ CS rank equally with each other.
Distributions on the AT1 capital instruments are non-cumulative and subject to the issuer’s absolute discretion and certain payment conditions (including regulatory requirements). Distributions on ANZ CNs are franked in line with the franking applied to ANZ ordinary shares.
Where specified, the AT1 capital instruments provide the issuer with an early redemption or conversion option on a specified date and in certain other circumstances (such as a tax or regulatory event). This redemption option is subject to APRA’s and, in respect of the ANZ NZ CN, the Reserve Bank of New Zealand’s (RBNZ) prior written approval.
Each of the AT1 capital instruments will immediately convert into a variable number of ANZ ordinary shares (based on the average market price of the shares immediately prior to conversion less a 1% discount, subject to a maximum conversion number of ANZ ordinary shares) if:
ANZ’s or, in the case of the ANZ NZ CN, ANZ Bank New Zealand Limited’s (ANZ NZ) Common Equity Tier 1 capital ratio is equal to or less than 5.125% - known as a Common Equity Capital Trigger Event; or
APRA notifies the Company that, without the conversion or write-off of certain securities or a public sector injection of capital (or equivalent support), it considers that the Company would become non-viable or, in the case of the ANZ NZ CN, the RBNZ directs ANZ NZ to convert or write-off the notes or a statutory manager is appointed to ANZ NZ and decides that ANZ NZ must convert or write-off the notes – known as a Non-Viability Trigger Event.
Where specified, AT1 capital instruments mandatorily convert into a variable number of ANZ ordinary shares (based on the average market price of the shares immediately prior to conversion less a 1% discount):
on a specified mandatory conversion date; or
on an earlier date under certain circumstances as set out in the terms.
However the mandatory conversion is deferred for a specified period if certain conversion tests are not met.
The tables below show the key details of the Group’s AT1 capital instruments on issue at 30 September in both the current and prior years:
2020 2019 $m $m
Additional Tier 1 capital (perpetual subordinated securities)1 ANZ Capital Notes (ANZ CN) AUD 1,120m ANZ CN1 1,119 1,118
AUD 1,610m ANZ CN2 1,608 1,607 AUD 970m ANZ CN3 967 966
AUD 1,622m ANZ CN4 1,614 1,612 AUD 931m ANZ CN5 926 925
ANZ Capital Securities (ANZ CS) USD 1,000m ANZ Capital Securities 1,499 1,481
ANZ NZ Capital Notes (ANZ NZ CN) NZD 500m ANZ NZ Capital Notes 463 462
Total Additional Tier 1 capital2 8,196 8,171 1. Carrying values net of issue costs. 2. This forms part of qualifying Additional Tier 1 capital (refer to Note 23 Capital Management).
162
Overview How we create value
Performance overview
Remuneration report
Directors’ report
Financial report
Shareholder information

NOTES TO THE CONSOLIDATED FINANCIAL STATEMENTS (continued)
162
ANZ 2020 ANNUAL REPORT
15. DEBT ISSUANCES (continued)
AT1 CAPITAL All outstanding AT1 capital instruments are Basel III fully compliant instruments (refer to Note 23 Capital Management for further information about Basel III). Each of the ANZ CN and ANZ CS rank equally with each other.
Distributions on the AT1 capital instruments are non-cumulative and subject to the issuer’s absolute discretion and certain payment conditions (including regulatory requirements). Distributions on ANZ CNs are franked in line with the franking applied to ANZ ordinary shares.
Where specified, the AT1 capital instruments provide the issuer with an early redemption or conversion option on a specified date and in certain other circumstances (such as a tax or regulatory event). This redemption option is subject to APRA’s and, in respect of the ANZ NZ CN, the Reserve Bank of New Zealand’s (RBNZ) prior written approval.
Each of the AT1 capital instruments will immediately convert into a variable number of ANZ ordinary shares (based on the average market price of the shares immediately prior to conversion less a 1% discount, subject to a maximum conversion number of ANZ ordinary shares) if:
ANZ’s or, in the case of the ANZ NZ CN, ANZ Bank New Zealand Limited’s (ANZ NZ) Common Equity Tier 1 capital ratio is equal to or less than 5.125% - known as a Common Equity Capital Trigger Event; or
APRA notifies the Company that, without the conversion or write-off of certain securities or a public sector injection of capital (or equivalent support), it considers that the Company would become non-viable or, in the case of the ANZ NZ CN, the RBNZ directs ANZ NZ to convert or write-off the notes or a statutory manager is appointed to ANZ NZ and decides that ANZ NZ must convert or write-off the notes – known as a Non-Viability Trigger Event.
Where specified, AT1 capital instruments mandatorily convert into a variable number of ANZ ordinary shares (based on the average market price of the shares immediately prior to conversion less a 1% discount):
on a specified mandatory conversion date; or
on an earlier date under certain circumstances as set out in the terms.
However the mandatory conversion is deferred for a specified period if certain conversion tests are not met.
The tables below show the key details of the Group’s AT1 capital instruments on issue at 30 September in both the current and prior years:
2020 2019 $m $m
Additional Tier 1 capital (perpetual subordinated securities)1 ANZ Capital Notes (ANZ CN) AUD 1,120m ANZ CN1 1,119 1,118
AUD 1,610m ANZ CN2 1,608 1,607 AUD 970m ANZ CN3 967 966
AUD 1,622m ANZ CN4 1,614 1,612 AUD 931m ANZ CN5 926 925
ANZ Capital Securities (ANZ CS) USD 1,000m ANZ Capital Securities 1,499 1,481
ANZ NZ Capital Notes (ANZ NZ CN) NZD 500m ANZ NZ Capital Notes 463 462
Total Additional Tier 1 capital2 8,196 8,171 1. Carrying values net of issue costs. 2. This forms part of qualifying Additional Tier 1 capital (refer to Note 23 Capital Management).
NOTES TO THE CONSOLIDATED FINANCIAL STATEMENTS
163
15. DEBT ISSUANCES (continued)
ANZ Capital Notes (ANZ CN)
CN1 CN2 CN3 Issuer
ANZ
ANZ
ANZ, acting through its New Zealand branch
Issue date 7 August 2013 31 March 2014 5 March 2015
Issue amount $1,120 million $1,610 million $970 million
Face value $100 $100 $100
Distribution frequency Semi-annually in arrears Semi-annually in arrears Semi-annually in arrears
Distribution rate
Floating rate: (180 day Bank Bill rate +3.4%)x(1-Australian corporate tax rate)
Floating rate: (180 day Bank Bill rate +3.25%)x(1-Australian corporate tax rate)
Floating rate: (180 day Bank Bill rate +3.6%)x(1-Australian corporate tax rate)
Issuer’s early redemption or conversion option 1 September 2021 24 March 2022 24 March 2023
Mandatory conversion date 1 September 2023 24 March 2024 24 March 2025
Common equity capital trigger event Yes Yes Yes
Non-viability trigger event Yes Yes Yes Carrying value 2020 (net of issue costs)
$1,119 million (2019: $1,118 million)
$1,608 million (2019: $1,607 million)
$967 million (2019: $966 million)
CN4 CN5
Issuer ANZ ANZ
Issue date 27 September 2016 28 September 2017
Issue amount $1,622 million $931 million
Face value $100 $100
Distribution frequency Quarterly in arrears Quarterly in arrears
Distribution rate
Floating rate: (90 day Bank Bill rate +4.7%)x(1-Australian corporate tax rate)
Floating rate: (90 day Bank Bill rate +3.8%)x(1-Australian corporate tax rate)
Issuer’s early redemption or conversion option 20 March 2024 20 March 2025
Mandatory conversion date 20 March 2026 20 March 2027
Common equity capital trigger event Yes Yes
Non-viability trigger event Yes Yes Carrying value 2020 (net of issue costs)
$1,614 million (2019: $1,612 million)
$926 million (2019: $925 million)
Notes to the consolidated financial statements (continued)
163ANZ 2020 Annual Report

NOTES TO THE CONSOLIDATED FINANCIAL STATEMENTS (continued)
164
ANZ 2020 ANNUAL REPORT
15. DEBT ISSUANCES (continued)
ANZ Capital Securities (ANZ CS)
Issuer ANZ, acting through its London branch
Issue date 15 June 2016
Issue amount USD 1,000 million
Face value Minimum denomination of USD 200,000 and an integral multiple of USD 1,000 above that
Interest frequency Semi-annually in arrears Interest rate
Fixed at 6.75% p.a. until 15 June 2026. Reset on 15 June 2026 and each 5 year anniversary to a floating rate: 5 year USD mid-market swap rate + 5.168%
Issuer’s early redemption option 15 June 2026 and each 5 year anniversary
Common equity capital trigger event Yes
Non-viability trigger event Yes
Carrying value 2020 (net of issue costs) $1,499 million (2019: $1,481 million)
ANZ NZ Capital Notes (ANZ NZ CN)
Issuer ANZ Bank New Zealand Limited (ANZ NZ)
Issue date 31 March 2015
Issue amount NZD 500 million
Face value NZD 1
Interest frequency Quarterly in arrears
Interest rate
Fixed at 7.2% p.a. until 25 May 2020. The rate reset in May 2020 to a floating rate: New Zealand 3 month bank bill rate + 3.5% Interest payments are subject to ANZ NZ’s absolute discretion and certain payment conditions (including APRA and RBNZ requirements)
Issuer’s early redemption option The option was not exercised on 25 May 2020 and has expired1
Mandatory conversion date 25 May 2022
Common equity capital trigger event Yes
Non-viability trigger event Yes
Carrying value 2020 (net of issue costs) $463 million (2019: $462 million) 1. The RBNZ has informed New Zealand-incorporated registered banks (including ANZ NZ) that they should not redeem capital instruments at this time. Accordingly, ANZ NZ was not permitted to redeem its
NZ$500 million Capital Notes in May 2020, although it can continue making coupon payments on those Capital Notes. As ANZ NZ did not exercise its option to convert in May 2020, the terms of the Capital Notes provide for their conversion into a variable number of ANZBGL shares in May 2022 subject to certain conditions.
164
Overview How we create value
Performance overview
Remuneration report
Directors’ report
Financial report
Shareholder information

NOTES TO THE CONSOLIDATED FINANCIAL STATEMENTS (continued)
164
ANZ 2020 ANNUAL REPORT
15. DEBT ISSUANCES (continued)
ANZ Capital Securities (ANZ CS)
Issuer ANZ, acting through its London branch
Issue date 15 June 2016
Issue amount USD 1,000 million
Face value Minimum denomination of USD 200,000 and an integral multiple of USD 1,000 above that
Interest frequency Semi-annually in arrears Interest rate
Fixed at 6.75% p.a. until 15 June 2026. Reset on 15 June 2026 and each 5 year anniversary to a floating rate: 5 year USD mid-market swap rate + 5.168%
Issuer’s early redemption option 15 June 2026 and each 5 year anniversary
Common equity capital trigger event Yes
Non-viability trigger event Yes
Carrying value 2020 (net of issue costs) $1,499 million (2019: $1,481 million)
ANZ NZ Capital Notes (ANZ NZ CN)
Issuer ANZ Bank New Zealand Limited (ANZ NZ)
Issue date 31 March 2015
Issue amount NZD 500 million
Face value NZD 1
Interest frequency Quarterly in arrears
Interest rate
Fixed at 7.2% p.a. until 25 May 2020. The rate reset in May 2020 to a floating rate: New Zealand 3 month bank bill rate + 3.5% Interest payments are subject to ANZ NZ’s absolute discretion and certain payment conditions (including APRA and RBNZ requirements)
Issuer’s early redemption option The option was not exercised on 25 May 2020 and has expired1
Mandatory conversion date 25 May 2022
Common equity capital trigger event Yes
Non-viability trigger event Yes
Carrying value 2020 (net of issue costs) $463 million (2019: $462 million) 1. The RBNZ has informed New Zealand-incorporated registered banks (including ANZ NZ) that they should not redeem capital instruments at this time. Accordingly, ANZ NZ was not permitted to redeem its
NZ$500 million Capital Notes in May 2020, although it can continue making coupon payments on those Capital Notes. As ANZ NZ did not exercise its option to convert in May 2020, the terms of the Capital Notes provide for their conversion into a variable number of ANZBGL shares in May 2022 subject to certain conditions.
NOTES TO THE CONSOLIDATED FINANCIAL STATEMENTS
165
15. DEBT ISSUANCES (continued)
TIER 2 CAPITAL
The convertible term subordinated notes are Basel III fully compliant instruments. If a Non-Viability Trigger Event occurs, the convertible term subordinated notes will immediately convert into ANZ ordinary shares (based on the average market price of the shares immediately prior to conversion less a 1% discount, subject to a maximum conversion number).
APRA has granted transitional Basel III capital treatment for the USD 300 million perpetual subordinated notes until the end of the transitional period (December 2021).
The table below shows the Tier 2 capital subordinated notes the Group holds at 30 September in both the current and prior year:
Next optional call date – subject Interest
Non-Viability Trigger 2020 2019
Currency Face value Maturity to APRA’s prior approval rate Event $m $m
Basel III transitional subordinated notes (perpetual)
USD 300m Perpetual Each semi-annual interest payment date Floating No 422 444
Total Basel III transitional subordinated notes 422 444
Basel III fully compliant convertible subordinated notes (term)
USD 800m 2024 N/A Fixed Yes 1,225 1,250
CNY 2,500m 2025 2020 Fixed Yes - 519
SGD 500m 2027 2022 Fixed Yes 529 544
AUD 200m 2027 2022 Fixed Yes 200 200
JPY 20,000m 2026 N/A Fixed Yes 270 281
AUD 700m 2026 2021 Floating Yes 700 700
USD 1,500m 2026 N/A Fixed Yes 2,253 2,229
JPY 10,000m 2026 2021 Fixed Yes 133 137
JPY 10,000m 2028 2023 Fixed Yes 133 137
AUD 225m 2032 2027 Fixed Yes 225 224
AUD 1,750m 2029 2024 Floating Yes 1,750 1,750
EUR 1,000m 2029 2024 Fixed Yes 1,657 -
AUD 265m 2039 N/A Fixed Yes 265 -
USD 1,250m 2030 2025 Fixed Yes 1,859 -
AUD 1,250m 2031 2026 Floating Yes 1,244 -
Total Basel III fully compliant subordinated notes 12,443 7,971
Total Tier 2 capital1,2 12,865 8,415 1. Carrying value net of issuance costs. 2. This forms part of qualifying Tier 2 capital (refer to Note 23 Capital Management)
RECOGNITION AND MEASUREMENT
Debt issuances are measured at amortised cost, except where designated at fair value through profit or loss. Where the Group enters into a fair value hedge accounting relationship, the fair value attributable to the hedge risk is reflected in adjustments to the carrying value of the debt. Interest expense is recognised using the effective interest rate method.
Subordinated debt with capital-based conversion features (i.e. Common Equity Capital Trigger Events or Non-Viability Trigger Events) are considered to contain embedded derivatives that we account for separately at fair value through profit and loss. The embedded derivatives arise because the amount of shares issued on conversion following any of those trigger events is subject to the maximum conversion number, however they have no significant value as of the reporting date given the remote nature of those trigger events.
Notes to the consolidated financial statements (continued)
165ANZ 2020 Annual Report
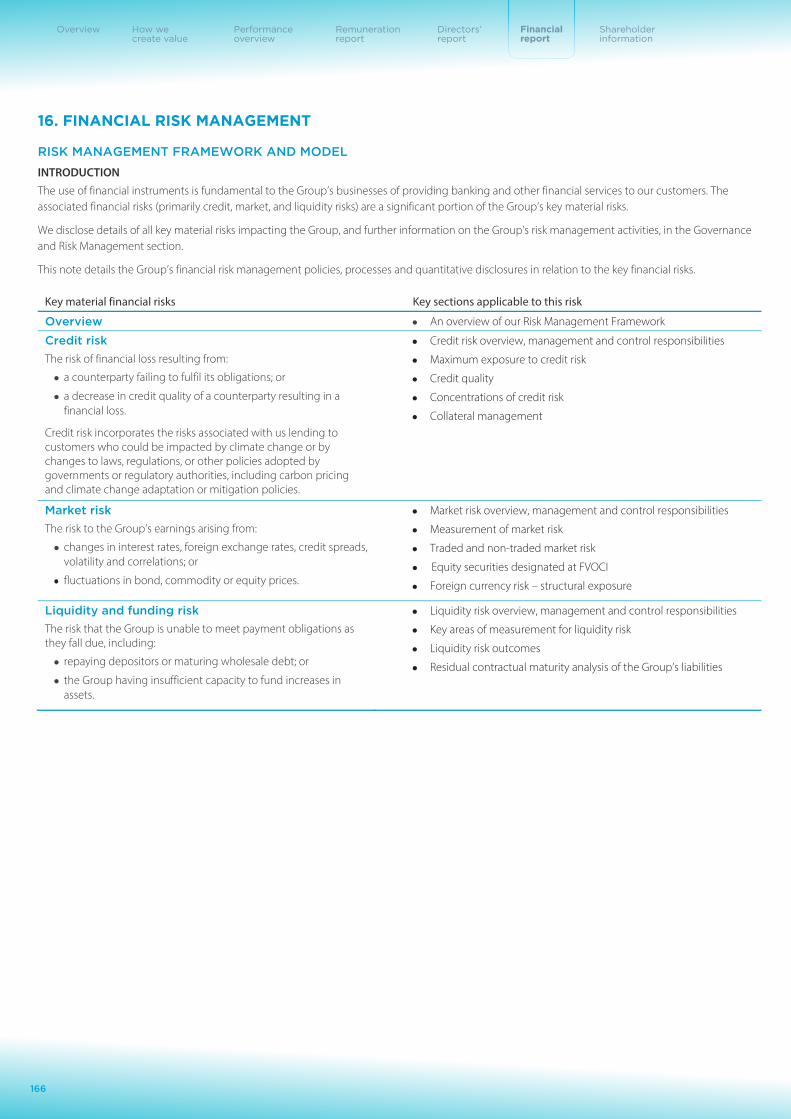
NOTES TO THE CONSOLIDATED FINANCIAL STATEMENTS (continued)
166
ANZ 2020 ANNUAL REPORT
16. FINANCIAL RISK MANAGEMENT
RISK MANAGEMENT FRAMEWORK AND MODEL
INTRODUCTION The use of financial instruments is fundamental to the Group’s businesses of providing banking and other financial services to our customers. The associated financial risks (primarily credit, market, and liquidity risks) are a significant portion of the Group’s key material risks.
We disclose details of all key material risks impacting the Group, and further information on the Group’s risk management activities, in the Governance and Risk Management section.
This note details the Group’s financial risk management policies, processes and quantitative disclosures in relation to the key financial risks.
Key material financial risks Key sections applicable to this risk
Overview An overview of our Risk Management Framework
Credit risk The risk of financial loss resulting from:
a counterparty failing to fulfil its obligations; or
a decrease in credit quality of a counterparty resulting in a financial loss.
Credit risk incorporates the risks associated with us lending to customers who could be impacted by climate change or by changes to laws, regulations, or other policies adopted by governments or regulatory authorities, including carbon pricing and climate change adaptation or mitigation policies.
Credit risk overview, management and control responsibilities
Maximum exposure to credit risk
Credit quality
Concentrations of credit risk
Collateral management
Market risk The risk to the Group’s earnings arising from:
changes in interest rates, foreign exchange rates, credit spreads, volatility and correlations; or
fluctuations in bond, commodity or equity prices.
Market risk overview, management and control responsibilities
Measurement of market risk
Traded and non-traded market risk
Equity securities designated at FVOCI
Foreign currency risk – structural exposure
Liquidity and funding risk The risk that the Group is unable to meet payment obligations as they fall due, including:
repaying depositors or maturing wholesale debt; or
the Group having insufficient capacity to fund increases in assets.
Liquidity risk overview, management and control responsibilities
Key areas of measurement for liquidity risk
Liquidity risk outcomes
Residual contractual maturity analysis of the Group’s liabilities
166
Overview How we create value
Performance overview
Remuneration report
Directors’ report
Financial report
Shareholder information

NOTES TO THE CONSOLIDATED FINANCIAL STATEMENTS (continued)
166
ANZ 2020 ANNUAL REPORT
16. FINANCIAL RISK MANAGEMENT
RISK MANAGEMENT FRAMEWORK AND MODEL
INTRODUCTION The use of financial instruments is fundamental to the Group’s businesses of providing banking and other financial services to our customers. The associated financial risks (primarily credit, market, and liquidity risks) are a significant portion of the Group’s key material risks.
We disclose details of all key material risks impacting the Group, and further information on the Group’s risk management activities, in the Governance and Risk Management section.
This note details the Group’s financial risk management policies, processes and quantitative disclosures in relation to the key financial risks.
Key material financial risks Key sections applicable to this risk
Overview An overview of our Risk Management Framework
Credit risk The risk of financial loss resulting from:
a counterparty failing to fulfil its obligations; or
a decrease in credit quality of a counterparty resulting in a financial loss.
Credit risk incorporates the risks associated with us lending to customers who could be impacted by climate change or by changes to laws, regulations, or other policies adopted by governments or regulatory authorities, including carbon pricing and climate change adaptation or mitigation policies.
Credit risk overview, management and control responsibilities
Maximum exposure to credit risk
Credit quality
Concentrations of credit risk
Collateral management
Market risk The risk to the Group’s earnings arising from:
changes in interest rates, foreign exchange rates, credit spreads, volatility and correlations; or
fluctuations in bond, commodity or equity prices.
Market risk overview, management and control responsibilities
Measurement of market risk
Traded and non-traded market risk
Equity securities designated at FVOCI
Foreign currency risk – structural exposure
Liquidity and funding risk The risk that the Group is unable to meet payment obligations as they fall due, including:
repaying depositors or maturing wholesale debt; or
the Group having insufficient capacity to fund increases in assets.
Liquidity risk overview, management and control responsibilities
Key areas of measurement for liquidity risk
Liquidity risk outcomes
Residual contractual maturity analysis of the Group’s liabilities
NOTES TO THE CONSOLIDATED FINANCIAL STATEMENTS
167
16. FINANCIAL RISK MANAGEMENT (continued)
OVERVIEW
AN OVERVIEW OF OUR RISK MANAGEMENT FRAMEWORK This overview is provided to aid the users of the financial statements to understand the context of the financial disclosures required under AASB 7 Financial Instruments: Disclosures (AASB 7). It should be read in conjunction with the Governance and Risk Management section.
The Board is responsible for establishing and overseeing the Group’s Risk Management Framework (RMF). The Board has delegated authority to the Board Risk Committee (BRC) to develop and monitor compliance with the Group’s risk management policies. The BRC reports regularly to the Board on its activities.
The Board approves the strategic objectives of the Group including:
the Risk Appetite Statement (RAS), which sets out the Board’s expectations regarding the degree of risk that ANZ is prepared to accept in pursuit of its strategic objectives and business plan; and
the Risk Management Strategy (RMS), which describes ANZ’s strategy for managing risks and the key elements of the RMF that gives effect to this strategy. This includes a description of each material risk, and an overview of how the RMF addresses each risk, with reference to the relevant policies, standards and procedures. It also includes information on how ANZ identifies, measures, evaluates, monitors, reports and controls or mitigates material risks.
The Group, through its training and management standards and procedures, aims to maintain a disciplined and robust control environment in which all employees understand their roles and obligations. At ANZ, risk is everyone’s responsibility.
The Group has an independent risk management function, headed by the Chief Risk Officer who:
is responsible for overseeing the risk profile and the risk management framework;
can effectively challenge activities and decisions that materially affect ANZ’s risk profile; and
has an independent reporting line to the BRC to enable the appropriate escalation of issues of concern.
The Internal Audit Function reports directly to the Board Audit Committee (BAC). Internal Audit provides:
an independent evaluation of the Group’s RMF annually that seeks to ensure compliance with, and the effectiveness of, the risk management framework;
facilitation of a comprehensive review every three years that seeks to ensure the appropriateness, effectiveness and adequacy of the risk management framework; and
recommendations to improve the framework and/or work practices to strengthen the effectiveness of day to day operations.
Notes to the consolidated financial statements (continued)
167ANZ 2020 Annual Report
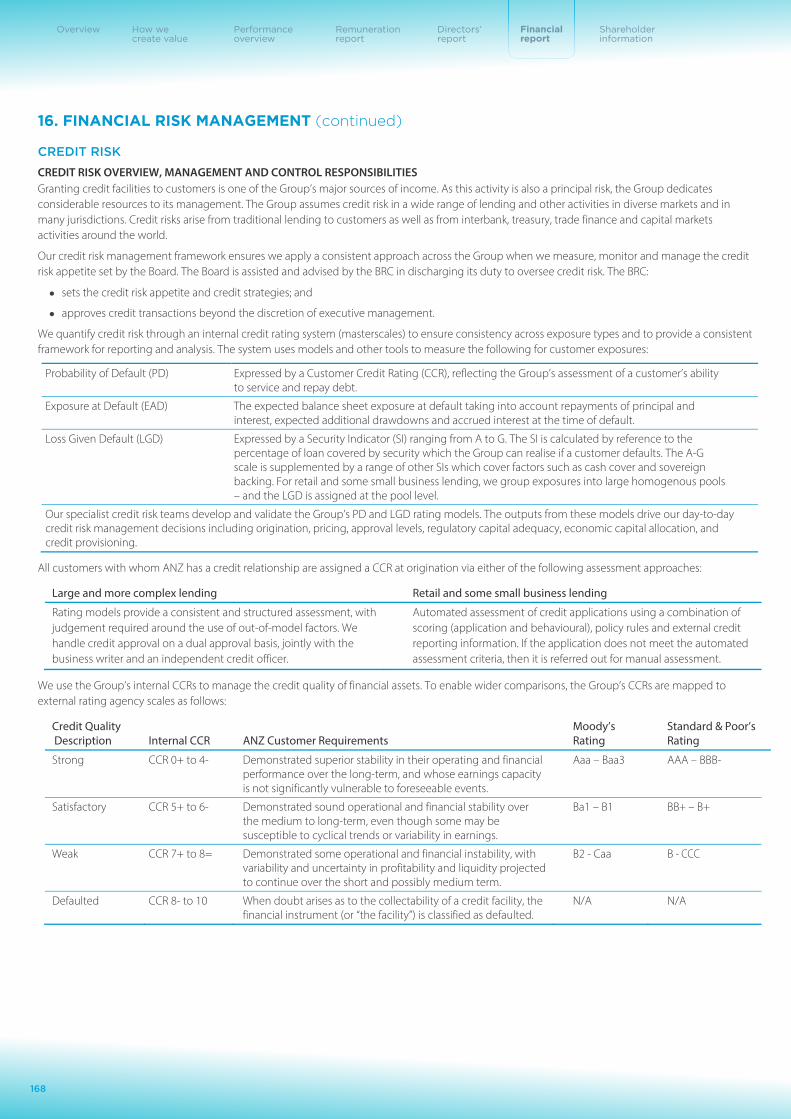
NOTES TO THE CONSOLIDATED FINANCIAL STATEMENTS (continued)
168
ANZ 2020 ANNUAL REPORT
16. FINANCIAL RISK MANAGEMENT (continued)
CREDIT RISK
CREDIT RISK OVERVIEW, MANAGEMENT AND CONTROL RESPONSIBILITIES Granting credit facilities to customers is one of the Group’s major sources of income. As this activity is also a principal risk, the Group dedicates considerable resources to its management. The Group assumes credit risk in a wide range of lending and other activities in diverse markets and in many jurisdictions. Credit risks arise from traditional lending to customers as well as from interbank, treasury, trade finance and capital markets activities around the world.
Our credit risk management framework ensures we apply a consistent approach across the Group when we measure, monitor and manage the credit risk appetite set by the Board. The Board is assisted and advised by the BRC in discharging its duty to oversee credit risk. The BRC:
sets the credit risk appetite and credit strategies; and
approves credit transactions beyond the discretion of executive management.
We quantify credit risk through an internal credit rating system (masterscales) to ensure consistency across exposure types and to provide a consistent framework for reporting and analysis. The system uses models and other tools to measure the following for customer exposures:
Probability of Default (PD) Expressed by a Customer Credit Rating (CCR), reflecting the Group’s assessment of a customer’s ability to service and repay debt.
Exposure at Default (EAD) The expected balance sheet exposure at default taking into account repayments of principal and interest, expected additional drawdowns and accrued interest at the time of default.
Loss Given Default (LGD) Expressed by a Security Indicator (SI) ranging from A to G. The SI is calculated by reference to the percentage of loan covered by security which the Group can realise if a customer defaults. The A-G scale is supplemented by a range of other SIs which cover factors such as cash cover and sovereign backing. For retail and some small business lending, we group exposures into large homogenous pools – and the LGD is assigned at the pool level.
Our specialist credit risk teams develop and validate the Group’s PD and LGD rating models. The outputs from these models drive our day-to-day credit risk management decisions including origination, pricing, approval levels, regulatory capital adequacy, economic capital allocation, and credit provisioning.
All customers with whom ANZ has a credit relationship are assigned a CCR at origination via either of the following assessment approaches:
Large and more complex lending Retail and some small business lending
Rating models provide a consistent and structured assessment, with judgement required around the use of out-of-model factors. We handle credit approval on a dual approval basis, jointly with the business writer and an independent credit officer.
Automated assessment of credit applications using a combination of scoring (application and behavioural), policy rules and external credit reporting information. If the application does not meet the automated assessment criteria, then it is referred out for manual assessment.
We use the Group’s internal CCRs to manage the credit quality of financial assets. To enable wider comparisons, the Group’s CCRs are mapped to external rating agency scales as follows:
Credit Quality Description Internal CCR ANZ Customer Requirements
Moody’s Rating
Standard & Poor’s Rating
Strong CCR 0+ to 4- Demonstrated superior stability in their operating and financial performance over the long-term, and whose earnings capacity is not significantly vulnerable to foreseeable events.
Aaa – Baa3 AAA – BBB-
Satisfactory CCR 5+ to 6- Demonstrated sound operational and financial stability over the medium to long-term, even though some may be susceptible to cyclical trends or variability in earnings.
Ba1 – B1 BB+ – B+
Weak CCR 7+ to 8= Demonstrated some operational and financial instability, with variability and uncertainty in profitability and liquidity projected to continue over the short and possibly medium term.
B2 - Caa B - CCC
Defaulted CCR 8- to 10 When doubt arises as to the collectability of a credit facility, the financial instrument (or “the facility”) is classified as defaulted.
N/A N/A
168
Overview How we create value
Performance overview
Remuneration report
Directors’ report
Financial report
Shareholder information

NOTES TO THE CONSOLIDATED FINANCIAL STATEMENTS (continued)
168
ANZ 2020 ANNUAL REPORT
16. FINANCIAL RISK MANAGEMENT (continued)
CREDIT RISK
CREDIT RISK OVERVIEW, MANAGEMENT AND CONTROL RESPONSIBILITIES Granting credit facilities to customers is one of the Group’s major sources of income. As this activity is also a principal risk, the Group dedicates considerable resources to its management. The Group assumes credit risk in a wide range of lending and other activities in diverse markets and in many jurisdictions. Credit risks arise from traditional lending to customers as well as from interbank, treasury, trade finance and capital markets activities around the world.
Our credit risk management framework ensures we apply a consistent approach across the Group when we measure, monitor and manage the credit risk appetite set by the Board. The Board is assisted and advised by the BRC in discharging its duty to oversee credit risk. The BRC:
sets the credit risk appetite and credit strategies; and
approves credit transactions beyond the discretion of executive management.
We quantify credit risk through an internal credit rating system (masterscales) to ensure consistency across exposure types and to provide a consistent framework for reporting and analysis. The system uses models and other tools to measure the following for customer exposures:
Probability of Default (PD) Expressed by a Customer Credit Rating (CCR), reflecting the Group’s assessment of a customer’s ability to service and repay debt.
Exposure at Default (EAD) The expected balance sheet exposure at default taking into account repayments of principal and interest, expected additional drawdowns and accrued interest at the time of default.
Loss Given Default (LGD) Expressed by a Security Indicator (SI) ranging from A to G. The SI is calculated by reference to the percentage of loan covered by security which the Group can realise if a customer defaults. The A-G scale is supplemented by a range of other SIs which cover factors such as cash cover and sovereign backing. For retail and some small business lending, we group exposures into large homogenous pools – and the LGD is assigned at the pool level.
Our specialist credit risk teams develop and validate the Group’s PD and LGD rating models. The outputs from these models drive our day-to-day credit risk management decisions including origination, pricing, approval levels, regulatory capital adequacy, economic capital allocation, and credit provisioning.
All customers with whom ANZ has a credit relationship are assigned a CCR at origination via either of the following assessment approaches:
Large and more complex lending Retail and some small business lending
Rating models provide a consistent and structured assessment, with judgement required around the use of out-of-model factors. We handle credit approval on a dual approval basis, jointly with the business writer and an independent credit officer.
Automated assessment of credit applications using a combination of scoring (application and behavioural), policy rules and external credit reporting information. If the application does not meet the automated assessment criteria, then it is referred out for manual assessment.
We use the Group’s internal CCRs to manage the credit quality of financial assets. To enable wider comparisons, the Group’s CCRs are mapped to external rating agency scales as follows:
Credit Quality Description Internal CCR ANZ Customer Requirements
Moody’s Rating
Standard & Poor’s Rating
Strong CCR 0+ to 4- Demonstrated superior stability in their operating and financial performance over the long-term, and whose earnings capacity is not significantly vulnerable to foreseeable events.
Aaa – Baa3 AAA – BBB-
Satisfactory CCR 5+ to 6- Demonstrated sound operational and financial stability over the medium to long-term, even though some may be susceptible to cyclical trends or variability in earnings.
Ba1 – B1 BB+ – B+
Weak CCR 7+ to 8= Demonstrated some operational and financial instability, with variability and uncertainty in profitability and liquidity projected to continue over the short and possibly medium term.
B2 - Caa B - CCC
Defaulted CCR 8- to 10 When doubt arises as to the collectability of a credit facility, the financial instrument (or “the facility”) is classified as defaulted.
N/A N/A
NOTES TO THE CONSOLIDATED FINANCIAL STATEMENTS
169
16. FINANCIAL RISK MANAGEMENT (continued)
CREDIT RISK (continued)
MAXIMUM EXPOSURE TO CREDIT RISK For financial assets recognised on the balance sheet, the maximum exposure to credit risk is the carrying amount. In certain circumstances there may be differences between the carrying amounts reported on the balance sheet and the amounts reported in the tables below. Principally, these differences arise in respect of financial assets that are subject to risks other than credit risk, such as equity instruments which are primarily subject to market risk, or bank notes and coins.
For undrawn facilities, this maximum exposure to credit risk is the full amount of the committed facilities. For contingent exposures, the maximum exposure to credit risk is the maximum amount the Group would have to pay if the instrument is called upon.
For the purpose of this note, assets presented as assets held for sale in the Balance Sheet have been reallocated to their respective Balance Sheet categories.
The table below shows our maximum exposure to credit risk of on-balance sheet and off-balance sheet positions before taking account of any collateral held or other credit enhancements.
Reported Excluded1
Maximum exposure to credit risk
2020 2019 2020 2019 2020 2019 $m $m $m $m $m $m
On-balance sheet positions
Net loans and advances 617,093 615,258 - - 617,093 615,258 Other financial assets:
Cash and cash equivalents 107,923 81,621 1,514 1,186 106,409 80,435
Settlement balances owed to ANZ 7,541 3,739 7,541 3,739 - -
Collateral paid 14,308 15,006 - - 14,308 15,006
Trading securities 50,913 44,088 5,698 6,199 45,215 37,889
Derivative financial instruments 135,331 120,667 - - 135,331 120,667
Investment securities
- debt securities at amortised costs 6,816 5,999 - - 6,816 5,999
- debt securities at FVOCI 85,460 76,489 - - 85,460 76,489
- equity securities at FVOCI 1,062 1,221 1,062 1,221 - -
- debt securities at FVTPL 53 - - - 53 -
Regulatory deposits 801 879 - - 801 879
Other financial assets2 2,407 3,619 - - 2,407 3,619
Total other financial assets 412,615 353,328 15,815 12,345 396,800 340,983
Subtotal 1,029,708 968,586 15,815 12,345 1,013,893 956,241
Off-balance sheet positions
Undrawn and contingent facilities3 266,716 253,123 - - 266,716 253,123
Total 1,296,424 1,221,709 15,815 12,345 1,280,609 1,209,364 1. Bank notes and coins and cash at bank within Cash and cash equivalents; Trade dated assets within Settlement balances owed to ANZ; Equity securities and precious metal exposures within Trading
securities; Equity securities within Investment securities were excluded as they do not have credit risk exposure. 2. Other financial assets mainly comprise accrued interest and acceptances. 3. Undrawn and contingent facilities include guarantees, letters of credit and performance related contingencies, net of collectively assessed and individually assessed allowance for expected credit losses.
Notes to the consolidated financial statements (continued)
169ANZ 2020 Annual Report

NOTES TO THE CONSOLIDATED FINANCIAL STATEMENTS (continued)
170
ANZ 2020 ANNUAL REPORT
16. FINANCIAL RISK MANAGEMENT (continued)
CREDIT RISK (continued)
CREDIT QUALITY An analysis of the Group’s credit risk exposure is presented in the following tables based on the Group’s internal rating by stage without taking account of the effects of any collateral or other credit enhancements:
Net loans and advances
2020 Stage 3
Stage 1 Stage 2 Collectively
assessed Individually
assessed Total $m $m $m $m $m
Strong 395,608 18,262 - - 413,870
Satisfactory 133,558 37,577 - - 171,135
Weak 8,461 16,850 - - 25,311
Defaulted - - 4,762 2,256 7,018
Gross loans and advances at amortised cost 537,627 72,689 4,762 2,256 617,334
Allowance for ECL (1,204) (2,465) (461) (851) (4,981)
Net loans and advances at amortised cost 536,423 70,224 4,301 1,405 612,353
Coverage ratio 0.22% 3.39% 9.68% 37.72% 0.81%
Loans and advances at fair value through profit or loss 3,938
Unearned income (66)
Capitalised brokerage/mortgage origination fees 868
Net carrying amount 617,093
2019 Stage 3
Stage 1 Stage 2 Collectively
assessed Individually
assessed Total $m $m $m $m $m
Strong 425,113 18,597 - - 443,710
Satisfactory 121,030 28,445 - - 149,475
Weak 7,138 10,373 - - 17,511
Defaulted - - 4,699 1,978 6,677
Gross loans and advances at amortised cost 553,281 57,415 4,699 1,978 617,373
Allowance for ECL (927) (1,378) (413) (791) (3,509)
Net loans and advances at amortised cost 552,354 56,037 4,286 1,187 613,864
Coverage ratio 0.17% 2.40% 8.79% 39.99% 0.57%
Loans and advances at fair value through profit or loss 922
Unearned income (398)
Capitalised brokerage/mortgage origination fees 870
Net carrying amount 615,258
170
Overview How we create value
Performance overview
Remuneration report
Directors’ report
Financial report
Shareholder information
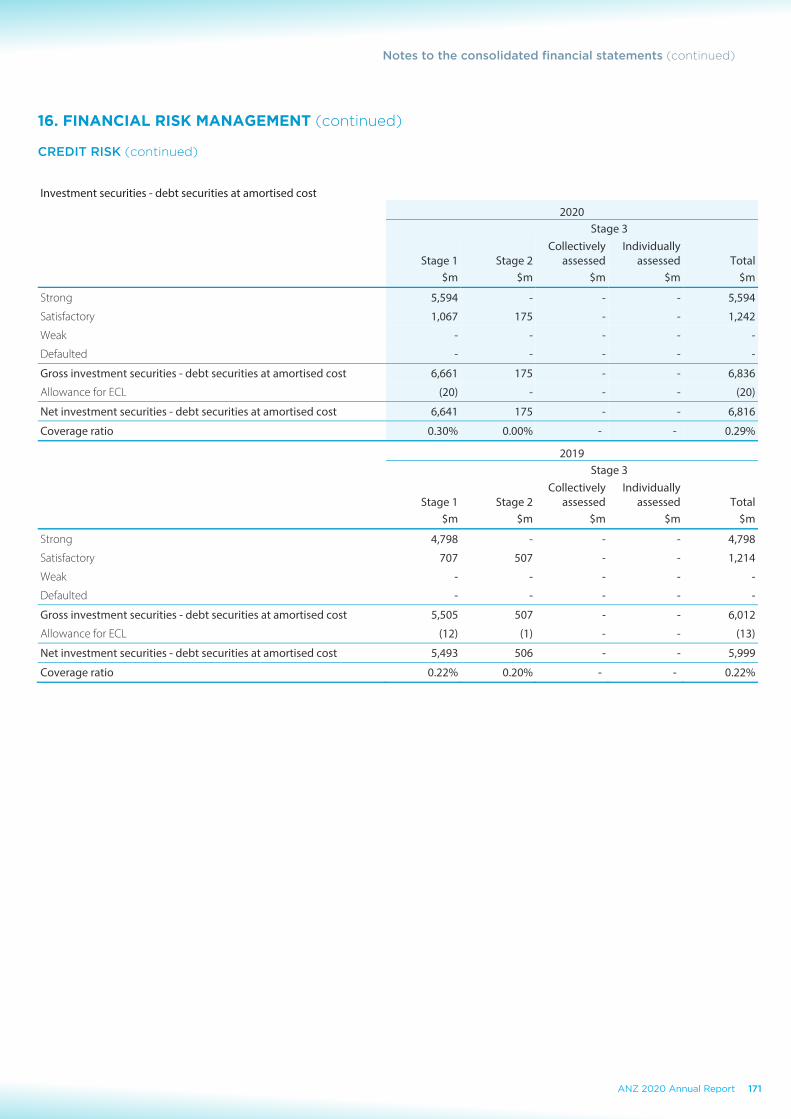
NOTES TO THE CONSOLIDATED FINANCIAL STATEMENTS (continued)
170
ANZ 2020 ANNUAL REPORT
16. FINANCIAL RISK MANAGEMENT (continued)
CREDIT RISK (continued)
CREDIT QUALITY An analysis of the Group’s credit risk exposure is presented in the following tables based on the Group’s internal rating by stage without taking account of the effects of any collateral or other credit enhancements:
Net loans and advances
2020 Stage 3
Stage 1 Stage 2 Collectively
assessed Individually
assessed Total $m $m $m $m $m
Strong 395,608 18,262 - - 413,870
Satisfactory 133,558 37,577 - - 171,135
Weak 8,461 16,850 - - 25,311
Defaulted - - 4,762 2,256 7,018
Gross loans and advances at amortised cost 537,627 72,689 4,762 2,256 617,334
Allowance for ECL (1,204) (2,465) (461) (851) (4,981)
Net loans and advances at amortised cost 536,423 70,224 4,301 1,405 612,353
Coverage ratio 0.22% 3.39% 9.68% 37.72% 0.81%
Loans and advances at fair value through profit or loss 3,938
Unearned income (66)
Capitalised brokerage/mortgage origination fees 868
Net carrying amount 617,093
2019 Stage 3
Stage 1 Stage 2 Collectively
assessed Individually
assessed Total $m $m $m $m $m
Strong 425,113 18,597 - - 443,710
Satisfactory 121,030 28,445 - - 149,475
Weak 7,138 10,373 - - 17,511
Defaulted - - 4,699 1,978 6,677
Gross loans and advances at amortised cost 553,281 57,415 4,699 1,978 617,373
Allowance for ECL (927) (1,378) (413) (791) (3,509)
Net loans and advances at amortised cost 552,354 56,037 4,286 1,187 613,864
Coverage ratio 0.17% 2.40% 8.79% 39.99% 0.57%
Loans and advances at fair value through profit or loss 922
Unearned income (398)
Capitalised brokerage/mortgage origination fees 870
Net carrying amount 615,258
NOTES TO THE CONSOLIDATED FINANCIAL STATEMENTS
171
16. FINANCIAL RISK MANAGEMENT (continued)
CREDIT RISK (continued)
Investment securities - debt securities at amortised cost
2020 Stage 3
Stage 1 Stage 2 Collectively
assessed Individually
assessed Total $m $m $m $m $m
Strong 5,594 - - - 5,594
Satisfactory 1,067 175 - - 1,242
Weak - - - - -
Defaulted - - - - -
Gross investment securities - debt securities at amortised cost 6,661 175 - - 6,836
Allowance for ECL (20) - - - (20)
Net investment securities - debt securities at amortised cost 6,641 175 - - 6,816
Coverage ratio 0.30% 0.00% - - 0.29%
2019 Stage 3
Stage 1 Stage 2 Collectively
assessed Individually
assessed Total $m $m $m $m $m
Strong 4,798 - - - 4,798
Satisfactory 707 507 - - 1,214
Weak - - - - -
Defaulted - - - - -
Gross investment securities - debt securities at amortised cost 5,505 507 - - 6,012
Allowance for ECL (12) (1) - - (13)
Net investment securities - debt securities at amortised cost 5,493 506 - - 5,999
Coverage ratio 0.22% 0.20% - - 0.22%
Notes to the consolidated financial statements (continued)
171ANZ 2020 Annual Report
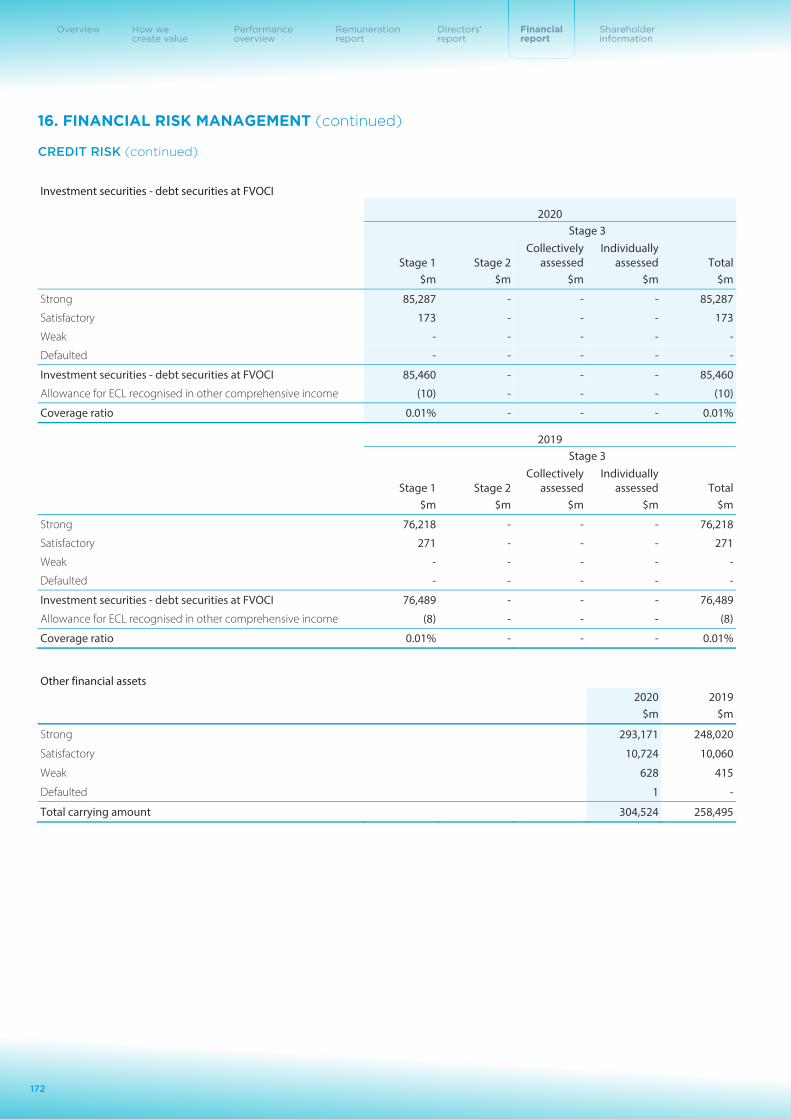
NOTES TO THE CONSOLIDATED FINANCIAL STATEMENTS (continued)
172
ANZ 2020 ANNUAL REPORT
16. FINANCIAL RISK MANAGEMENT (continued)
CREDIT RISK (continued)
Investment securities - debt securities at FVOCI
2020 Stage 3
Stage 1 Stage 2 Collectively
assessed Individually
assessed Total $m $m $m $m $m
Strong 85,287 - - - 85,287
Satisfactory 173 - - - 173
Weak - - - - -
Defaulted - - - - -
Investment securities - debt securities at FVOCI 85,460 - - - 85,460
Allowance for ECL recognised in other comprehensive income (10) - - - (10)
Coverage ratio 0.01% - - - 0.01%
2019 Stage 3
Stage 1 Stage 2 Collectively
assessed Individually
assessed Total $m $m $m $m $m
Strong 76,218 - - - 76,218
Satisfactory 271 - - - 271
Weak - - - - -
Defaulted - - - - -
Investment securities - debt securities at FVOCI 76,489 - - - 76,489
Allowance for ECL recognised in other comprehensive income (8) - - - (8)
Coverage ratio 0.01% - - - 0.01%
Other financial assets
2020 2019 $m $m
Strong 293,171 248,020
Satisfactory 10,724 10,060
Weak 628 415
Defaulted 1 -
Total carrying amount 304,524 258,495
172
Overview How we create value
Performance overview
Remuneration report
Directors’ report
Financial report
Shareholder information
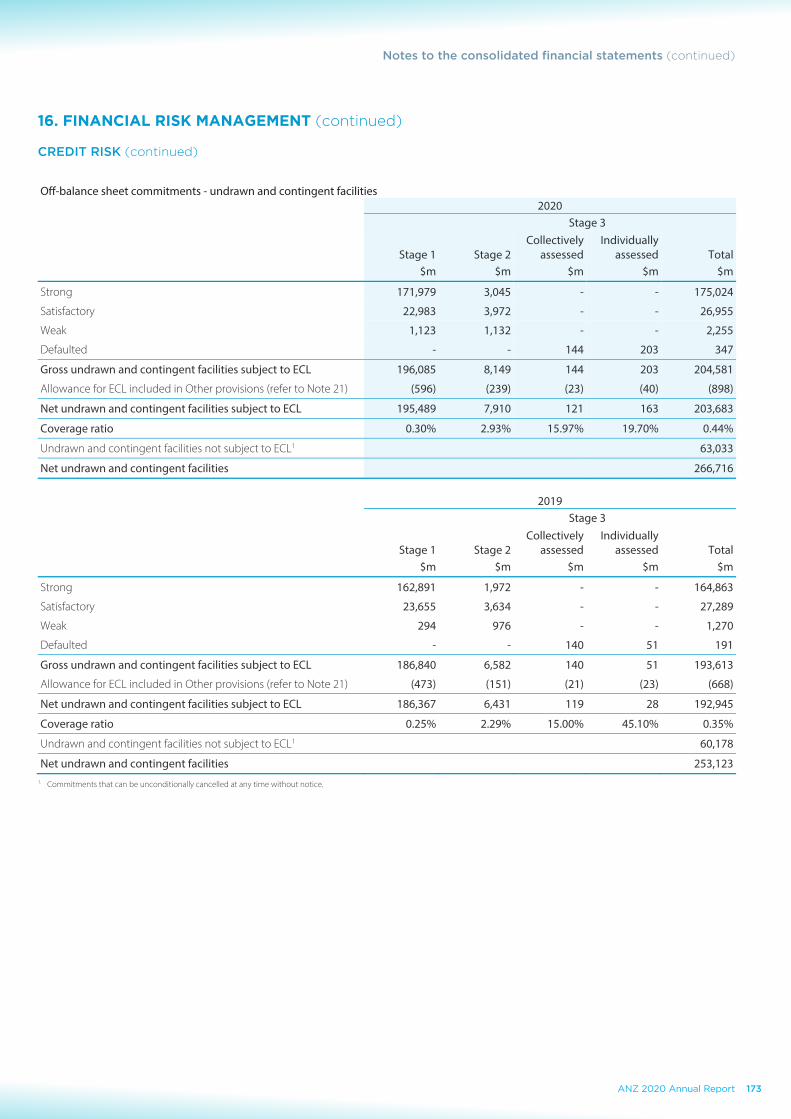
NOTES TO THE CONSOLIDATED FINANCIAL STATEMENTS (continued)
172
ANZ 2020 ANNUAL REPORT
16. FINANCIAL RISK MANAGEMENT (continued)
CREDIT RISK (continued)
Investment securities - debt securities at FVOCI
2020 Stage 3
Stage 1 Stage 2 Collectively
assessed Individually
assessed Total $m $m $m $m $m
Strong 85,287 - - - 85,287
Satisfactory 173 - - - 173
Weak - - - - -
Defaulted - - - - -
Investment securities - debt securities at FVOCI 85,460 - - - 85,460
Allowance for ECL recognised in other comprehensive income (10) - - - (10)
Coverage ratio 0.01% - - - 0.01%
2019 Stage 3
Stage 1 Stage 2 Collectively
assessed Individually
assessed Total $m $m $m $m $m
Strong 76,218 - - - 76,218
Satisfactory 271 - - - 271
Weak - - - - -
Defaulted - - - - -
Investment securities - debt securities at FVOCI 76,489 - - - 76,489
Allowance for ECL recognised in other comprehensive income (8) - - - (8)
Coverage ratio 0.01% - - - 0.01%
Other financial assets
2020 2019 $m $m
Strong 293,171 248,020
Satisfactory 10,724 10,060
Weak 628 415
Defaulted 1 -
Total carrying amount 304,524 258,495
NOTES TO THE CONSOLIDATED FINANCIAL STATEMENTS
173
16. FINANCIAL RISK MANAGEMENT (continued)
CREDIT RISK (continued)
Off-balance sheet commitments - undrawn and contingent facilities 2020
Stage 3
Stage 1 Stage 2 Collectively
assessed Individually
assessed Total $m $m $m $m $m
Strong 171,979 3,045 - - 175,024
Satisfactory 22,983 3,972 - - 26,955
Weak 1,123 1,132 - - 2,255
Defaulted - - 144 203 347
Gross undrawn and contingent facilities subject to ECL 196,085 8,149 144 203 204,581
Allowance for ECL included in Other provisions (refer to Note 21) (596) (239) (23) (40) (898)
Net undrawn and contingent facilities subject to ECL 195,489 7,910 121 163 203,683
Coverage ratio 0.30% 2.93% 15.97% 19.70% 0.44%
Undrawn and contingent facilities not subject to ECL1 63,033
Net undrawn and contingent facilities 266,716
2019 Stage 3
Stage 1 Stage 2 Collectively
assessed Individually
assessed Total$m $m $m $m $m
Strong 162,891 1,972 - - 164,863
Satisfactory 23,655 3,634 - - 27,289
Weak 294 976 - - 1,270
Defaulted - - 140 51 191
Gross undrawn and contingent facilities subject to ECL 186,840 6,582 140 51 193,613
Allowance for ECL included in Other provisions (refer to Note 21) (473) (151) (21) (23) (668)
Net undrawn and contingent facilities subject to ECL 186,367 6,431 119 28 192,945
Coverage ratio 0.25% 2.29% 15.00% 45.10% 0.35%
Undrawn and contingent facilities not subject to ECL1 60,178
Net undrawn and contingent facilities 253,123 1. Commitments that can be unconditionally cancelled at any time without notice.
Notes to the consolidated financial statements (continued)
173ANZ 2020 Annual Report

NOTES TO THE CONSOLIDATED FINANCIAL STATEMENTS (continued)
174
ANZ 2020 ANNUAL REPORT
16. FINANCIAL RISK MANAGEMENT (continued)
CREDIT RISK (continued)
CONCENTRATIONS OF CREDIT RISK Credit risk becomes concentrated when a number of customers are engaged in similar activities, have similar economic characteristics, or have similar activities within the same geographic region – therefore, they may be similarly affected by changes in economic or other conditions. The Group monitors its credit portfolio to manage risk concentration and rebalance the portfolio. The Group also applies single customer counterparty limits to protect against unacceptably large exposures to one single customer.
Composition of financial instruments that give rise to credit risk by industry group are presented below:
Loans Other financial Off-balance sheet
credit related and advances assets commitments Total
2020 2019 2020 2019 2020 2019 2020 2019 $m $m $m $m $m $m $m $m
Agriculture, forestry, fishing and mining 36,458 38,562 1,092 1,070 17,188 18,424 54,738 58,056
Business services 8,642 8,449 172 168 6,506 6,976 15,320 15,593
Construction 5,807 6,711 44 65 6,679 6,697 12,530 13,473
Electricity, gas and water supply 5,881 6,599 2,386 2,008 8,663 7,087 16,930 15,694
Entertainment, leisure and tourism 13,179 12,780 600 699 4,114 3,446 17,893 16,925
Financial, investment and insurance 51,857 55,344 279,468 247,351 48,537 41,874 379,862 344,569
Government and official institutions 4,645 3,388 98,017 75,066 1,968 2,524 104,630 80,978
Manufacturing 25,163 23,796 2,306 2,932 41,114 44,091 68,583 70,819
Personal lending 361,459 351,894 1,170 1,754 50,433 54,429 413,062 408,077
Property services 50,406 46,721 2,044 1,905 27,992 17,216 80,442 65,842
Retail trade 10,739 13,078 231 242 9,602 7,086 20,572 20,406
Transport and storage 12,657 13,583 1,280 1,194 8,587 8,269 22,524 23,046
Wholesale trade 11,816 15,177 2,649 3,141 19,494 20,283 33,959 38,601
Other 22,563 22,213 5,361 3,401 16,737 15,389 44,661 41,003
Gross total 621,272 618,295 396,820 340,996 267,614 253,791 1,285,706 1,213,082
Allowance for ECL (4,981) (3,509) (20) (13) (898) (668) (5,899) (4,190)
Subtotal 616,291 614,786 396,800 340,983 266,716 253,123 1,279,807 1,208,892
Unearned income (66) (398) - - - - (66) (398)
Capitalised brokerage/mortgage origination fees 868 870 - - - - 868 870
Maximum exposure to credit risk 617,093 615,258 396,800 340,983 266,716 253,123 1,280,609 1,209,364
174
Overview How we create value
Performance overview
Remuneration report
Directors’ report
Financial report
Shareholder information

NOTES TO THE CONSOLIDATED FINANCIAL STATEMENTS (continued)
174
ANZ 2020 ANNUAL REPORT
16. FINANCIAL RISK MANAGEMENT (continued)
CREDIT RISK (continued)
CONCENTRATIONS OF CREDIT RISK Credit risk becomes concentrated when a number of customers are engaged in similar activities, have similar economic characteristics, or have similar activities within the same geographic region – therefore, they may be similarly affected by changes in economic or other conditions. The Group monitors its credit portfolio to manage risk concentration and rebalance the portfolio. The Group also applies single customer counterparty limits to protect against unacceptably large exposures to one single customer.
Composition of financial instruments that give rise to credit risk by industry group are presented below:
Loans Other financial Off-balance sheet
credit related and advances assets commitments Total
2020 2019 2020 2019 2020 2019 2020 2019 $m $m $m $m $m $m $m $m
Agriculture, forestry, fishing and mining 36,458 38,562 1,092 1,070 17,188 18,424 54,738 58,056
Business services 8,642 8,449 172 168 6,506 6,976 15,320 15,593
Construction 5,807 6,711 44 65 6,679 6,697 12,530 13,473
Electricity, gas and water supply 5,881 6,599 2,386 2,008 8,663 7,087 16,930 15,694
Entertainment, leisure and tourism 13,179 12,780 600 699 4,114 3,446 17,893 16,925
Financial, investment and insurance 51,857 55,344 279,468 247,351 48,537 41,874 379,862 344,569
Government and official institutions 4,645 3,388 98,017 75,066 1,968 2,524 104,630 80,978
Manufacturing 25,163 23,796 2,306 2,932 41,114 44,091 68,583 70,819
Personal lending 361,459 351,894 1,170 1,754 50,433 54,429 413,062 408,077
Property services 50,406 46,721 2,044 1,905 27,992 17,216 80,442 65,842
Retail trade 10,739 13,078 231 242 9,602 7,086 20,572 20,406
Transport and storage 12,657 13,583 1,280 1,194 8,587 8,269 22,524 23,046
Wholesale trade 11,816 15,177 2,649 3,141 19,494 20,283 33,959 38,601
Other 22,563 22,213 5,361 3,401 16,737 15,389 44,661 41,003
Gross total 621,272 618,295 396,820 340,996 267,614 253,791 1,285,706 1,213,082
Allowance for ECL (4,981) (3,509) (20) (13) (898) (668) (5,899) (4,190)
Subtotal 616,291 614,786 396,800 340,983 266,716 253,123 1,279,807 1,208,892
Unearned income (66) (398) - - - - (66) (398)
Capitalised brokerage/mortgage origination fees 868 870 - - - - 868 870
Maximum exposure to credit risk 617,093 615,258 396,800 340,983 266,716 253,123 1,280,609 1,209,364
NOTES TO THE CONSOLIDATED FINANCIAL STATEMENTS
175
16. FINANCIAL RISK MANAGEMENT (continued)
CREDIT RISK (continued)
COLLATERAL MANAGEMENT
We use collateral for on and off-balance sheet exposures to mitigate credit risk if a counterparty cannot meet its repayment obligations. Where there is sufficient collateral, an expected credit loss is not recognised. This is largely the case for certain lending products that are secured by corresponding investment for which the margin loans are utilised and for reverse repurchase agreements. For some products, the collateral provided by customers is fundamental to the product’s structuring, so it is not strictly the secondary source of repayment - for example, lending secured by trade receivables is typically repaid by the collection of those receivables. During the period there was no change in our collateral policies.
The nature of collateral or security held for the relevant classes of financial assets is as follows:
Net loans and advances
Loans - housing and personal
Housing loans are secured by mortgage(s) over property and additional security may take the form of guarantees and deposits.
Personal lending (including credit cards and overdrafts) is predominantly unsecured. If we take security, then it is restricted to eligible vehicles, motor homes and other assets.
Loans - business Business loans may be secured, partially secured or unsecured. Typically, we take security by way of a mortgage over property and/or a charge over the business or other assets.
If appropriate, we may take other security to mitigate the credit risk, for example: guarantees, standby letters of credit or derivative protection.
Other financial assets
Trading securities, Investment securities, Derivatives and Other financial assets
For trading securities, we do not seek collateral directly from the issuer or counterparty. However, the collateral may be implicit in the terms of the instrument (for example, with an asset-backed security). The terms of debt securities may include collateralisation.
For derivatives, we typically terminate all contracts with the counterparty and settle on a net basis at market levels current at the time of a counterparty default under International Swaps and Derivatives Association (ISDA) Master Agreements.
Our preferred practice is to use a Credit Support Annex (CSA) to the ISDA so that open derivative positions with the counterparty are aggregated and cash collateral (or other forms of eligible collateral) is exchanged daily. The collateral is provided by the counterparty when their position is out of the money (or provided to the counterparty by ANZ when our position is out of the money).
Off-balance sheet positions
Undrawn and contingent facilities
Collateral for off-balance sheet positions is mainly held against undrawn facilities, and they are typically performance bonds or guarantees. Undrawn facilities that are secured include housing loans secured by mortgages over residential property and business lending secured by commercial real estate and/or charges over business assets.
The table below shows the estimated value of collateral we hold and the net unsecured portion of credit exposures:
Credit exposure Total value of collateral
Unsecured portion of credit exposure
2020 2019 2020 2019 2020 2019 $m $m $m $m $m $m
Net loans and advances 617,093 615,258 510,995 490,188 106,098 125,070
Other financial assets 396,800 340,983 45,246 31,898 351,554 309,085
Off-balance sheet positions 266,716 253,123 51,361 48,225 215,355 204,898
Total 1,280,609 1,209,364 607,602 570,311 673,007 639,053
Notes to the consolidated financial statements (continued)
175ANZ 2020 Annual Report
NOTES TO THE CONSOLIDATED FINANCIAL STATEMENTS (continued)
176
ANZ 2020 ANNUAL REPORT
16. FINANCIAL RISK MANAGEMENT (continued)
MARKET RISK
MARKET RISK OVERVIEW, MANAGEMENT AND CONTROL RESPONSIBILITIES Market risk stems from the Group’s trading and balance sheet management activities and the impact of changes and correlation between interest rates, foreign exchange rates, credit spreads and volatility in bond, commodity or equity prices.
The BRC delegates responsibility for day-to-day management of both market risks and compliance with market risk policies to the Credit & Market Risk Committee (CMRC) and the Group Asset & Liability Committee (GALCO).
Within overall strategies and policies established by the BRC, business units and risk management have joint responsibility for the control of market risk at the Group level. The Market Risk team (a specialist risk management unit independent of the business) allocates market risk limits at various levels and monitors and reports on them daily. This detailed framework allocates individual limits to manage and control exposures using risk factors and profit and loss limits.
Management, measurement and reporting of market risk is undertaken in two broad categories:
Traded Market Risk Non-Traded Market Risk
Risk of loss from changes in the value of financial instruments due to movements in price factors for both physical and derivative trading positions. Principal risk categories monitored are:
1. Currency risk – potential loss arising from changes in foreign exchange rates or their implied volatilities.
2. Interest rate risk – potential loss from changes in market interest rates or their implied volatilities.
3. Credit spread risk – potential loss arising from a movement in margin or spread relative to a benchmark.
4. Commodity risk – potential loss arising from changes in commodity prices or their implied volatilities.
5. Equity risk – potential loss arising from changes in equity prices.
Risk of loss associated with the management of non-traded interest rate risk, liquidity risk and foreign exchange exposures. This includes interest rate risk in the banking book. This risk of loss arises from adverse changes in the overall and relative level of interest rates for different tenors, differences in the actual versus expected net interest margin, and the potential valuation risk associated with embedded options in financial instruments and bank products.
MEASUREMENT OF MARKET RISK We primarily manage and control market risk using Value at Risk (VaR), sensitivity analysis and stress testing.
VaR gauges the Group’s possible daily loss based on historical market movements.
The Group’s VaR approach for both traded and non-traded risk is historical simulation. We use historical changes in market rates, prices and volatilities over:
the previous 500 business days, to calculate standard VaR, and
a 1-year stressed period, to calculate stressed VaR.
We calculate traded and non-traded VaR using one-day and ten-day holding periods. For stressed VaR, we use a ten-day period. Back testing is used to ensure our VaR models remain accurate.
ANZ measures VaR at a 99% confidence interval which means there is a 99% chance that a loss will not exceed the VaR for the relevant holding period.
176
Overview How we create value
Performance overview
Remuneration report
Directors’ report
Financial report
Shareholder information
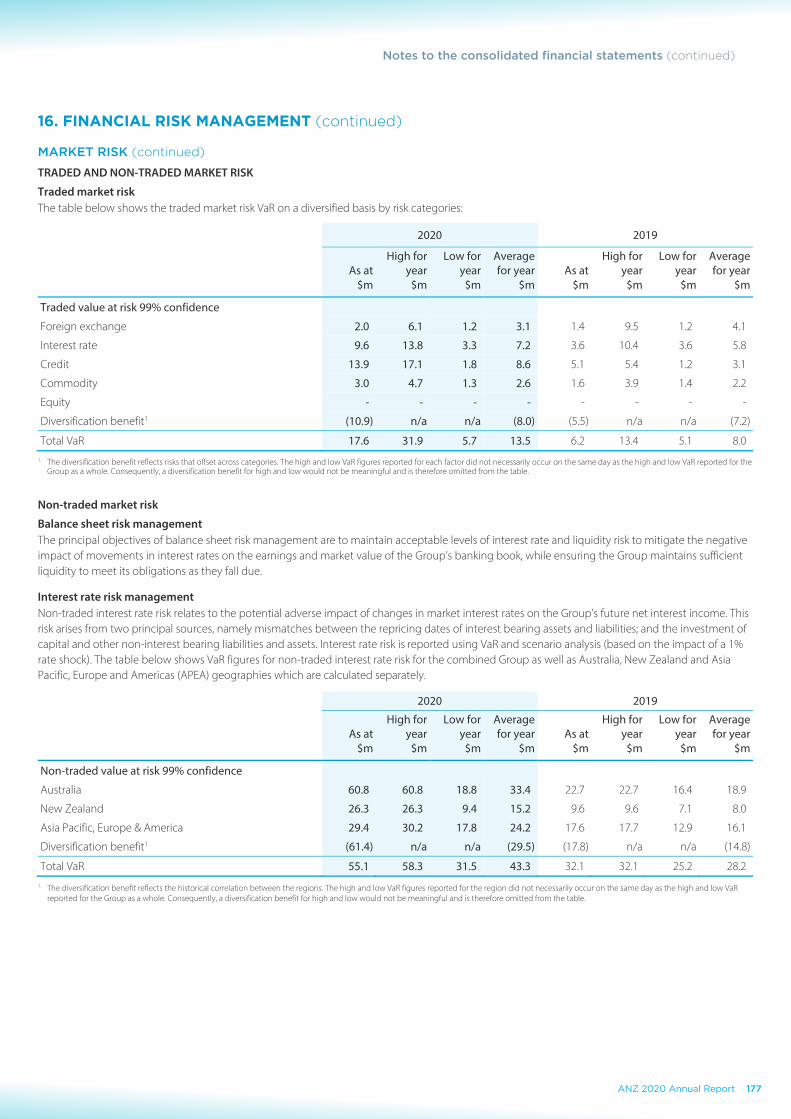
NOTES TO THE CONSOLIDATED FINANCIAL STATEMENTS (continued)
176
ANZ 2020 ANNUAL REPORT
16. FINANCIAL RISK MANAGEMENT (continued)
MARKET RISK
MARKET RISK OVERVIEW, MANAGEMENT AND CONTROL RESPONSIBILITIES Market risk stems from the Group’s trading and balance sheet management activities and the impact of changes and correlation between interest rates, foreign exchange rates, credit spreads and volatility in bond, commodity or equity prices.
The BRC delegates responsibility for day-to-day management of both market risks and compliance with market risk policies to the Credit & Market Risk Committee (CMRC) and the Group Asset & Liability Committee (GALCO).
Within overall strategies and policies established by the BRC, business units and risk management have joint responsibility for the control of market risk at the Group level. The Market Risk team (a specialist risk management unit independent of the business) allocates market risk limits at various levels and monitors and reports on them daily. This detailed framework allocates individual limits to manage and control exposures using risk factors and profit and loss limits.
Management, measurement and reporting of market risk is undertaken in two broad categories:
Traded Market Risk Non-Traded Market Risk
Risk of loss from changes in the value of financial instruments due to movements in price factors for both physical and derivative trading positions. Principal risk categories monitored are:
1. Currency risk – potential loss arising from changes in foreign exchange rates or their implied volatilities.
2. Interest rate risk – potential loss from changes in market interest rates or their implied volatilities.
3. Credit spread risk – potential loss arising from a movement in margin or spread relative to a benchmark.
4. Commodity risk – potential loss arising from changes in commodity prices or their implied volatilities.
5. Equity risk – potential loss arising from changes in equity prices.
Risk of loss associated with the management of non-traded interest rate risk, liquidity risk and foreign exchange exposures. This includes interest rate risk in the banking book. This risk of loss arises from adverse changes in the overall and relative level of interest rates for different tenors, differences in the actual versus expected net interest margin, and the potential valuation risk associated with embedded options in financial instruments and bank products.
MEASUREMENT OF MARKET RISK We primarily manage and control market risk using Value at Risk (VaR), sensitivity analysis and stress testing.
VaR gauges the Group’s possible daily loss based on historical market movements.
The Group’s VaR approach for both traded and non-traded risk is historical simulation. We use historical changes in market rates, prices and volatilities over:
the previous 500 business days, to calculate standard VaR, and
a 1-year stressed period, to calculate stressed VaR.
We calculate traded and non-traded VaR using one-day and ten-day holding periods. For stressed VaR, we use a ten-day period. Back testing is used to ensure our VaR models remain accurate.
ANZ measures VaR at a 99% confidence interval which means there is a 99% chance that a loss will not exceed the VaR for the relevant holding period.
NOTES TO THE CONSOLIDATED FINANCIAL STATEMENTS
177
16. FINANCIAL RISK MANAGEMENT (continued)
MARKET RISK (continued)
TRADED AND NON-TRADED MARKET RISK
Traded market risk The table below shows the traded market risk VaR on a diversified basis by risk categories:
2020 2019
As at High for
year Low for
year Average for year As at
High for year
Low for year
Average for year
$m $m $m $m $m $m $m $m
Traded value at risk 99% confidence
Foreign exchange 2.0 6.1 1.2 3.1 1.4 9.5 1.2 4.1
Interest rate 9.6 13.8 3.3 7.2 3.6 10.4 3.6 5.8
Credit 13.9 17.1 1.8 8.6 5.1 5.4 1.2 3.1
Commodity 3.0 4.7 1.3 2.6 1.6 3.9 1.4 2.2
Equity - - - - - - - -
Diversification benefit1 (10.9) n/a n/a (8.0) (5.5) n/a n/a (7.2)
Total VaR 17.6 31.9 5.7 13.5 6.2 13.4 5.1 8.01. The diversification benefit reflects risks that offset across categories. The high and low VaR figures reported for each factor did not necessarily occur on the same day as the high and low VaR reported for the
Group as a whole. Consequently, a diversification benefit for high and low would not be meaningful and is therefore omitted from the table.
Non-traded market risk
Balance sheet risk management The principal objectives of balance sheet risk management are to maintain acceptable levels of interest rate and liquidity risk to mitigate the negative impact of movements in interest rates on the earnings and market value of the Group’s banking book, while ensuring the Group maintains sufficient liquidity to meet its obligations as they fall due.
Interest rate risk management Non-traded interest rate risk relates to the potential adverse impact of changes in market interest rates on the Group’s future net interest income. This risk arises from two principal sources, namely mismatches between the repricing dates of interest bearing assets and liabilities; and the investment of capital and other non-interest bearing liabilities and assets. Interest rate risk is reported using VaR and scenario analysis (based on the impact of a 1% rate shock). The table below shows VaR figures for non-traded interest rate risk for the combined Group as well as Australia, New Zealand and Asia Pacific, Europe and Americas (APEA) geographies which are calculated separately.
2020 2019
As at High for
year Low for
year Average for year As at
High for year
Low for year
Average for year
$m $m $m $m $m $m $m $m
Non-traded value at risk 99% confidence
Australia 60.8 60.8 18.8 33.4 22.7 22.7 16.4 18.9
New Zealand 26.3 26.3 9.4 15.2 9.6 9.6 7.1 8.0
Asia Pacific, Europe & America 29.4 30.2 17.8 24.2 17.6 17.7 12.9 16.1
Diversification benefit1 (61.4) n/a n/a (29.5) (17.8) n/a n/a (14.8)
Total VaR 55.1 58.3 31.5 43.3 32.1 32.1 25.2 28.2 1. The diversification benefit reflects the historical correlation between the regions. The high and low VaR figures reported for the region did not necessarily occur on the same day as the high and low VaR
reported for the Group as a whole. Consequently, a diversification benefit for high and low would not be meaningful and is therefore omitted from the table.
Notes to the consolidated financial statements (continued)
177ANZ 2020 Annual Report

NOTES TO THE CONSOLIDATED FINANCIAL STATEMENTS (continued)
178
ANZ 2020 ANNUAL REPORT
16. FINANCIAL RISK MANAGEMENT (continued)
MARKET RISK (continued) We undertake scenario analysis to stress test the impact of extreme events on the Group’s market risk exposures. We model a 1% overnight parallel positive shift in the yield curve to determine the potential impact on our net interest income over the next 12 months. This is a standard risk measure which assumes the parallel shift is reflected in all wholesale and customer rates.
The table below shows the outcome of this risk measure for the current and previous financial years, expressed as a percentage of reported net interest income. A positive number signifies that a rate increase is positive for net interest income over the next 12 months.
2020 20191
Impact of 1% rate shock
As at period end 1.25% 1.19%
Maximum exposure 1.61% 1.19%
Minimum exposure 0.52% 0.33%
Average exposure (in absolute terms) 1.01% 0.69% 1. Prior period numbers have been restated to reflect IRR model enhancements
EQUITY SECURITIES DESIGNATED AT FVOCI Our investment securities contain equity investment holdings which predominantly comprise investments we hold for longer-term strategic reasons. The market risk impact on these equity investments is not captured by the Group’s VaR processes for traded and non-traded market risks. Therefore, the Group regularly reviews the valuations of the investments within the portfolio and assesses whether the investments are appropriately measured based on the recognition and measurement policies set out in Note 11 Investment securities. FOREIGN CURRENCY RISK – STRUCTURAL EXPOSURES Our investment of capital in foreign operations - for example, branches, subsidiaries or associates with functional currencies other than the Australian Dollar - exposes the Group to the risk of changes in foreign exchange rates. Variations in the value of these foreign operations arising as a result of exchange differences are reflected in the foreign currency translation reserve in equity. Where it is considered appropriate, the Group takes out economic hedges against larger foreign exchange denominated revenue streams (primarily New Zealand Dollar, US Dollar and US Dollar correlated). The primary objective of hedging is to ensure that, if practical, the effect of changes in foreign exchange rates on the consolidated capital ratios are minimised.
178
Overview How we create value
Performance overview
Remuneration report
Directors’ report
Financial report
Shareholder information
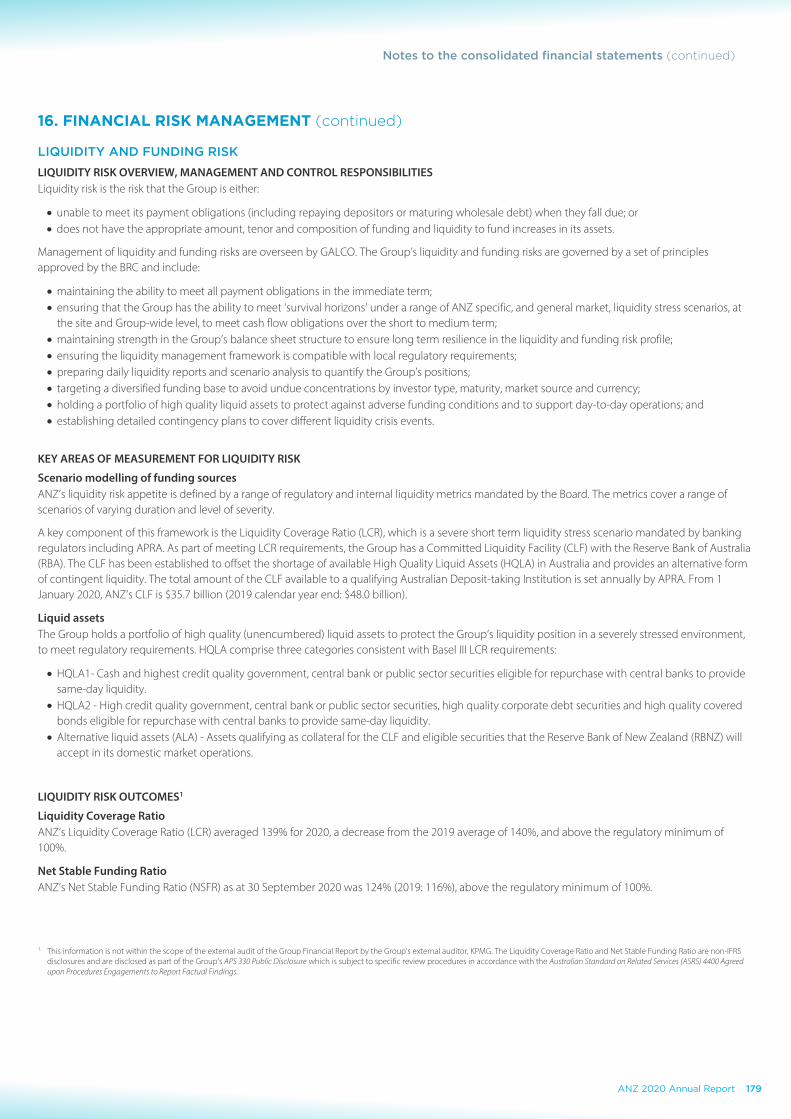
NOTES TO THE CONSOLIDATED FINANCIAL STATEMENTS (continued)
178
ANZ 2020 ANNUAL REPORT
16. FINANCIAL RISK MANAGEMENT (continued)
MARKET RISK (continued) We undertake scenario analysis to stress test the impact of extreme events on the Group’s market risk exposures. We model a 1% overnight parallel positive shift in the yield curve to determine the potential impact on our net interest income over the next 12 months. This is a standard risk measure which assumes the parallel shift is reflected in all wholesale and customer rates.
The table below shows the outcome of this risk measure for the current and previous financial years, expressed as a percentage of reported net interest income. A positive number signifies that a rate increase is positive for net interest income over the next 12 months.
2020 20191
Impact of 1% rate shock
As at period end 1.25% 1.19%
Maximum exposure 1.61% 1.19%
Minimum exposure 0.52% 0.33%
Average exposure (in absolute terms) 1.01% 0.69% 1. Prior period numbers have been restated to reflect IRR model enhancements
EQUITY SECURITIES DESIGNATED AT FVOCI Our investment securities contain equity investment holdings which predominantly comprise investments we hold for longer-term strategic reasons. The market risk impact on these equity investments is not captured by the Group’s VaR processes for traded and non-traded market risks. Therefore, the Group regularly reviews the valuations of the investments within the portfolio and assesses whether the investments are appropriately measured based on the recognition and measurement policies set out in Note 11 Investment securities. FOREIGN CURRENCY RISK – STRUCTURAL EXPOSURES Our investment of capital in foreign operations - for example, branches, subsidiaries or associates with functional currencies other than the Australian Dollar - exposes the Group to the risk of changes in foreign exchange rates. Variations in the value of these foreign operations arising as a result of exchange differences are reflected in the foreign currency translation reserve in equity. Where it is considered appropriate, the Group takes out economic hedges against larger foreign exchange denominated revenue streams (primarily New Zealand Dollar, US Dollar and US Dollar correlated). The primary objective of hedging is to ensure that, if practical, the effect of changes in foreign exchange rates on the consolidated capital ratios are minimised.
NOTES TO THE CONSOLIDATED FINANCIAL STATEMENTS
179
16. FINANCIAL RISK MANAGEMENT (continued)
LIQUIDITY AND FUNDING RISK
LIQUIDITY RISK OVERVIEW, MANAGEMENT AND CONTROL RESPONSIBILITIES Liquidity risk is the risk that the Group is either:
unable to meet its payment obligations (including repaying depositors or maturing wholesale debt) when they fall due; or does not have the appropriate amount, tenor and composition of funding and liquidity to fund increases in its assets.
Management of liquidity and funding risks are overseen by GALCO. The Group’s liquidity and funding risks are governed by a set of principles approved by the BRC and include:
maintaining the ability to meet all payment obligations in the immediate term; ensuring that the Group has the ability to meet ‘survival horizons’ under a range of ANZ specific, and general market, liquidity stress scenarios, at
the site and Group-wide level, to meet cash flow obligations over the short to medium term; maintaining strength in the Group’s balance sheet structure to ensure long term resilience in the liquidity and funding risk profile; ensuring the liquidity management framework is compatible with local regulatory requirements; preparing daily liquidity reports and scenario analysis to quantify the Group’s positions; targeting a diversified funding base to avoid undue concentrations by investor type, maturity, market source and currency; holding a portfolio of high quality liquid assets to protect against adverse funding conditions and to support day-to-day operations; and establishing detailed contingency plans to cover different liquidity crisis events.
KEY AREAS OF MEASUREMENT FOR LIQUIDITY RISK
Scenario modelling of funding sources ANZ’s liquidity risk appetite is defined by a range of regulatory and internal liquidity metrics mandated by the Board. The metrics cover a range of scenarios of varying duration and level of severity.
A key component of this framework is the Liquidity Coverage Ratio (LCR), which is a severe short term liquidity stress scenario mandated by banking regulators including APRA. As part of meeting LCR requirements, the Group has a Committed Liquidity Facility (CLF) with the Reserve Bank of Australia (RBA). The CLF has been established to offset the shortage of available High Quality Liquid Assets (HQLA) in Australia and provides an alternative form of contingent liquidity. The total amount of the CLF available to a qualifying Australian Deposit-taking Institution is set annually by APRA. From 1 January 2020, ANZ’s CLF is $35.7 billion (2019 calendar year end: $48.0 billion).
Liquid assets The Group holds a portfolio of high quality (unencumbered) liquid assets to protect the Group’s liquidity position in a severely stressed environment, to meet regulatory requirements. HQLA comprise three categories consistent with Basel III LCR requirements:
HQLA1- Cash and highest credit quality government, central bank or public sector securities eligible for repurchase with central banks to provide same-day liquidity.
HQLA2 - High credit quality government, central bank or public sector securities, high quality corporate debt securities and high quality covered bonds eligible for repurchase with central banks to provide same-day liquidity.
Alternative liquid assets (ALA) - Assets qualifying as collateral for the CLF and eligible securities that the Reserve Bank of New Zealand (RBNZ) will accept in its domestic market operations.
LIQUIDITY RISK OUTCOMES1
Liquidity Coverage Ratio ANZ’s Liquidity Coverage Ratio (LCR) averaged 139% for 2020, a decrease from the 2019 average of 140%, and above the regulatory minimum of 100%.
Net Stable Funding Ratio ANZ’s Net Stable Funding Ratio (NSFR) as at 30 September 2020 was 124% (2019: 116%), above the regulatory minimum of 100%.
1. This information is not within the scope of the external audit of the Group Financial Report by the Group’s external auditor, KPMG. The Liquidity Coverage Ratio and Net Stable Funding Ratio are non-IFRS disclosures and are disclosed as part of the Group's APS 330 Public Disclosure which is subject to specific review procedures in accordance with the Australian Standard on Related Services (ASRS) 4400 Agreedupon Procedures Engagements to Report Factual Findings.
Notes to the consolidated financial statements (continued)
179ANZ 2020 Annual Report

NOTES TO THE CONSOLIDATED FINANCIAL STATEMENTS (continued)
180
ANZ 2020 ANNUAL REPORT
16. FINANCIAL RISK MANAGEMENT (continued)
LIQUIDITY AND FUNDING RISK (continued)
Liquidity crisis contingency planning The Group maintains APRA-endorsed liquidity crisis contingency plans for analysing and responding to a liquidity threatening event at a country and Group-wide level. Key liquidity contingency crisis planning requirements and guidelines include:
Ongoing business management Early signs/ mild stress Severe Stress
establish crisis/severity levels
liquidity limits
early warning indicators
monitoring and review
management actions not requiring business rationalisation
activate contingency funding plans
management actions for altering asset and liability behaviour
Assigned responsibility for internal and external communications and the appropriate timing to communicate
Since the precise nature of any stress event cannot be known in advance, we design the plans to be flexible to the nature and severity of the stress event with multiple variables able to be accommodated in any plan.
Group funding The Group monitors the composition and stability of its funding so that it remains within the Group’s funding risk appetite. This approach ensures that an appropriate proportion of the Group’s assets are funded by stable funding sources, including customer deposits; longer-dated wholesale funding (with a remaining term exceeding one year); and equity.
Funding plans prepared Considerations in preparing funding plans
3 year strategic plan prepared annually
annual funding plan as part of budgeting process
forecasting in light of actual results as a calibration to the annual plan
customer balance sheet growth
changes in wholesale funding including: targeted funding volumes; markets; investors; tenors; and currencies for senior, secured, subordinated, hybrid transactions and market conditions
RBA Term Funding Facility
As an additional source of funding, in March 2020, the RBA announced a term funding facility (TFF) for the banking system to support lending to Australian businesses. The TFF is a three-year secured funding facility to ADIs at a fixed rate of 0.25%. APRA has determined that the TFF qualifies for inclusion in determining the Liquidity Coverage Ratio (LCR) and Net Stable Funding Ratio (NSFR). ADIs can obtain initial funding of up to 3% of their existing credit outstanding to Australian households and businesses, and have access to additional funding if they increase lending to business, especially to small and medium-sized businesses.
As at 30 September 2020, ANZ had drawn $12 billion from its initial TFF allowance of $12 billion, and drawn $nil from its additional TFF allowance of $6 billion.
180
Overview How we create value
Performance overview
Remuneration report
Directors’ report
Financial report
Shareholder information
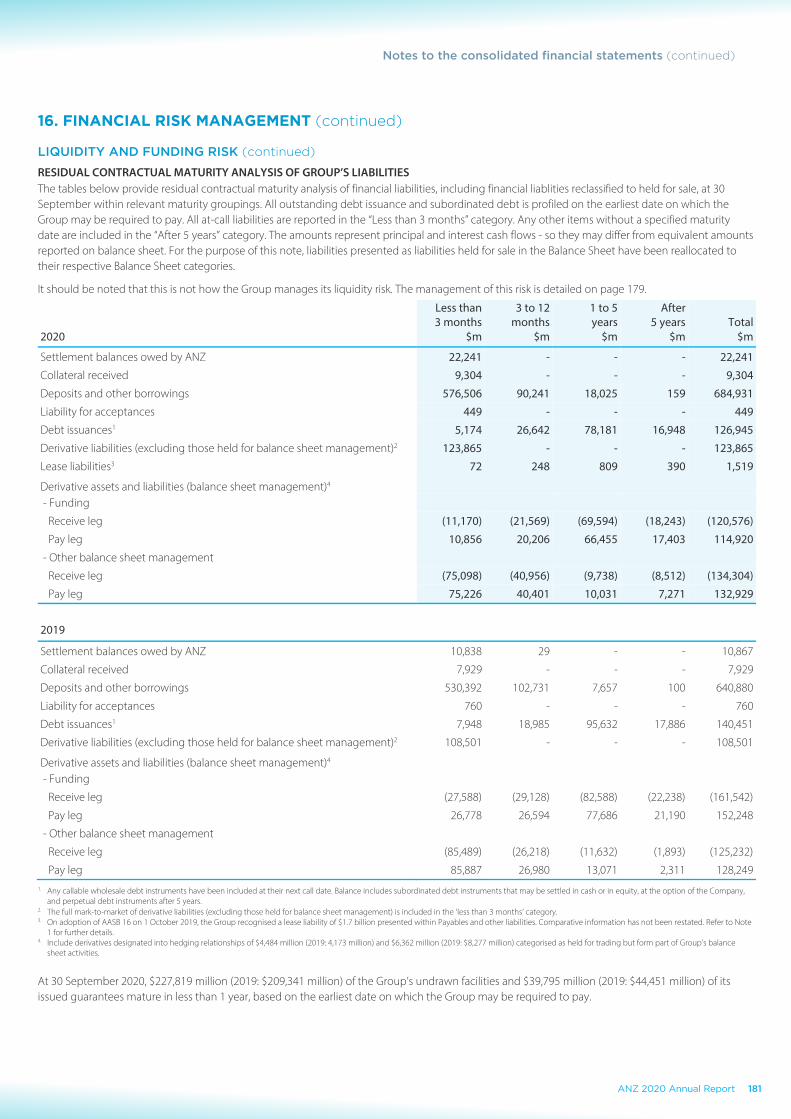
NOTES TO THE CONSOLIDATED FINANCIAL STATEMENTS (continued)
180
ANZ 2020 ANNUAL REPORT
16. FINANCIAL RISK MANAGEMENT (continued)
LIQUIDITY AND FUNDING RISK (continued)
Liquidity crisis contingency planning The Group maintains APRA-endorsed liquidity crisis contingency plans for analysing and responding to a liquidity threatening event at a country and Group-wide level. Key liquidity contingency crisis planning requirements and guidelines include:
Ongoing business management Early signs/ mild stress Severe Stress
establish crisis/severity levels
liquidity limits
early warning indicators
monitoring and review
management actions not requiring business rationalisation
activate contingency funding plans
management actions for altering asset and liability behaviour
Assigned responsibility for internal and external communications and the appropriate timing to communicate
Since the precise nature of any stress event cannot be known in advance, we design the plans to be flexible to the nature and severity of the stress event with multiple variables able to be accommodated in any plan.
Group funding The Group monitors the composition and stability of its funding so that it remains within the Group’s funding risk appetite. This approach ensures that an appropriate proportion of the Group’s assets are funded by stable funding sources, including customer deposits; longer-dated wholesale funding (with a remaining term exceeding one year); and equity.
Funding plans prepared Considerations in preparing funding plans
3 year strategic plan prepared annually
annual funding plan as part of budgeting process
forecasting in light of actual results as a calibration to the annual plan
customer balance sheet growth
changes in wholesale funding including: targeted funding volumes; markets; investors; tenors; and currencies for senior, secured, subordinated, hybrid transactions and market conditions
RBA Term Funding Facility
As an additional source of funding, in March 2020, the RBA announced a term funding facility (TFF) for the banking system to support lending to Australian businesses. The TFF is a three-year secured funding facility to ADIs at a fixed rate of 0.25%. APRA has determined that the TFF qualifies for inclusion in determining the Liquidity Coverage Ratio (LCR) and Net Stable Funding Ratio (NSFR). ADIs can obtain initial funding of up to 3% of their existing credit outstanding to Australian households and businesses, and have access to additional funding if they increase lending to business, especially to small and medium-sized businesses.
As at 30 September 2020, ANZ had drawn $12 billion from its initial TFF allowance of $12 billion, and drawn $nil from its additional TFF allowance of $6 billion.
NOTES TO THE CONSOLIDATED FINANCIAL STATEMENTS
181
16. FINANCIAL RISK MANAGEMENT (continued)
LIQUIDITY AND FUNDING RISK (continued)
RESIDUAL CONTRACTUAL MATURITY ANALYSIS OF GROUP’S LIABILITIES The tables below provide residual contractual maturity analysis of financial liabilities, including financial liablities reclassified to held for sale, at 30 September within relevant maturity groupings. All outstanding debt issuance and subordinated debt is profiled on the earliest date on which the Group may be required to pay. All at-call liabilities are reported in the “Less than 3 months” category. Any other items without a specified maturity date are included in the “After 5 years” category. The amounts represent principal and interest cash flows - so they may differ from equivalent amounts reported on balance sheet. For the purpose of this note, liabilities presented as liabilities held for sale in the Balance Sheet have been reallocated to their respective Balance Sheet categories.
It should be noted that this is not how the Group manages its liquidity risk. The management of this risk is detailed on page 179.
Less than 3 months
3 to 12 months
1 to 5 years
After 5 years Total
2020 $m $m $m $m $m
Settlement balances owed by ANZ 22,241 - - - 22,241
Collateral received 9,304 - - - 9,304
Deposits and other borrowings 576,506 90,241 18,025 159 684,931
Liability for acceptances 449 - - - 449
Debt issuances1 5,174 26,642 78,181 16,948 126,945
Derivative liabilities (excluding those held for balance sheet management)2 123,865 - - - 123,865
Lease liabilities3 72 248 809 390 1,519
Derivative assets and liabilities (balance sheet management)4 - Funding
Receive leg (11,170) (21,569) (69,594) (18,243) (120,576)
Pay leg 10,856 20,206 66,455 17,403 114,920
- Other balance sheet management
Receive leg (75,098) (40,956) (9,738) (8,512) (134,304)
Pay leg 75,226 40,401 10,031 7,271 132,929
2019
Settlement balances owed by ANZ 10,838 29 - - 10,867
Collateral received 7,929 - - - 7,929
Deposits and other borrowings 530,392 102,731 7,657 100 640,880
Liability for acceptances 760 - - - 760
Debt issuances1 7,948 18,985 95,632 17,886 140,451
Derivative liabilities (excluding those held for balance sheet management)2 108,501 - - - 108,501
Derivative assets and liabilities (balance sheet management)4 - Funding
Receive leg (27,588) (29,128) (82,588) (22,238) (161,542)
Pay leg 26,778 26,594 77,686 21,190 152,248
- Other balance sheet management
Receive leg (85,489) (26,218) (11,632) (1,893) (125,232)
Pay leg 85,887 26,980 13,071 2,311 128,249 1. Any callable wholesale debt instruments have been included at their next call date. Balance includes subordinated debt instruments that may be settled in cash or in equity, at the option of the Company,
and perpetual debt instruments after 5 years. 2. The full mark-to-market of derivative liabilities (excluding those held for balance sheet management) is included in the ‘less than 3 months’ category. 3. On adoption of AASB 16 on 1 October 2019, the Group recognised a lease liability of $1.7 billion presented within Payables and other liabilities. Comparative information has not been restated. Refer to Note
1 for further details. 4. Include derivatives designated into hedging relationships of $4,484 million (2019: 4,173 million) and $6,362 million (2019: $8,277 million) categorised as held for trading but form part of Group’s balance
sheet activities.
At 30 September 2020, $227,819 million (2019: $209,341 million) of the Group’s undrawn facilities and $39,795 million (2019: $44,451 million) of its issued guarantees mature in less than 1 year, based on the earliest date on which the Group may be required to pay.
Notes to the consolidated financial statements (continued)
181ANZ 2020 Annual Report

NOTES TO THE CONSOLIDATED FINANCIAL STATEMENTS (continued)
182
ANZ 2020 ANNUAL REPORT
17. FAIR VALUE OF FINANCIAL ASSETS AND FINANCIAL LIABILITIES
The Group carries a significant number of financial instruments on the balance sheet at fair value. In addition the Group also holds assets classified as held for sale which are measured at fair value less costs to sell. The fair value is the best estimate of the price that would be received to sell an asset, or paid to transfer a liability, in an orderly transaction between market participants at the measurement date.
VALUATION The Group has an established control framework, including appropriate segregation of duties, to ensure that fair values are accurately determined, reported and controlled. The framework includes the following features:
products are approved for transacting with external customers and counterparties only where fair values can be appropriately determined;
quoted market prices used to value financial instruments are independently verified with information from external pricing providers;
fair value methodologies and inputs are evaluated and approved by a function independent of the party that undertakes the transaction;
movements in fair values are independently monitored and explained by reference to underlying factors relevant to the fair value; and
valuation adjustments (such as funding valuation adjustments, credit valuation adjustments and bid-offer adjustments) are independently validated and monitored.
If the Group holds offsetting risk positions, then the Group uses the portfolio exception in AASB 13 Fair Value Measurement (AASB 13) to measure the fair value of such groups of financial assets and financial liabilities. We measure the portfolio based on the price that would be received to sell a net long position (an asset) for a particular risk exposure, or to transfer a net short position (a liability) for a particular risk exposure.
Fair value designation
We designate certain loans and advances and certain deposits and other borrowings and debt issuances as fair value through profit or loss:
where they contain a separable embedded derivative which significantly modifies the instruments’ cash flow; or
in order to eliminate an accounting mismatch which would arise if the asset or liabilities were otherwise carried at amortised cost. This mismatch arises as we measure the derivative financial instruments (which we acquired to mitigate interest rate risk of the assets or liabilities) at fair value through profit or loss.
Our approach ensures that we recognise the fair value movements on the assets or liabilities in profit or loss in the same period as the movement on the associated derivatives.
We may also designate certain loans and advances, certain deposits and other borrowings and debt issuances as fair value through profit or loss where they are managed on a fair value basis to align the measurement with how the instruments are managed.
FAIR VALUE APPROACH AND VALUATION TECHNIQUES We use valuation techniques to estimate the fair value of assets and liabilities for recognition, measurement and disclosure purposes where no quoted price in an active market exists for that asset or liability. This includes the following:
Asset or Liability Fair Value Approach
Financial instruments classified as:
- Trading securities
- Securities sold short
- Derivative financial assets and financial liabilities
- Investment securities
Valuation techniques are used that incorporate observable market inputs for financial instruments with similar credit risk, maturity and yield characteristics. Equity instruments that are not traded in active markets may be measured using comparable company valuation multiples.
Financial instruments classified as:
- Net loans and advances
- Deposits and other borrowings
- Debt issuances
Discounted cash flow techniques are used whereby contractual future cash flows of the instrument are discounted using wholesale market interest rates, or market borrowing rates for debt with similar maturities or yield curve appropriate for the remaining term to maturity.
Assets and liabilities held for sale Valuation based on the expected sale price before transaction costs.
182
Overview How we create value
Performance overview
Remuneration report
Directors’ report
Financial report
Shareholder information

NOTES TO THE CONSOLIDATED FINANCIAL STATEMENTS (continued)
182
ANZ 2020 ANNUAL REPORT
17. FAIR VALUE OF FINANCIAL ASSETS AND FINANCIAL LIABILITIES
The Group carries a significant number of financial instruments on the balance sheet at fair value. In addition the Group also holds assets classified as held for sale which are measured at fair value less costs to sell. The fair value is the best estimate of the price that would be received to sell an asset, or paid to transfer a liability, in an orderly transaction between market participants at the measurement date.
VALUATION The Group has an established control framework, including appropriate segregation of duties, to ensure that fair values are accurately determined, reported and controlled. The framework includes the following features:
products are approved for transacting with external customers and counterparties only where fair values can be appropriately determined;
quoted market prices used to value financial instruments are independently verified with information from external pricing providers;
fair value methodologies and inputs are evaluated and approved by a function independent of the party that undertakes the transaction;
movements in fair values are independently monitored and explained by reference to underlying factors relevant to the fair value; and
valuation adjustments (such as funding valuation adjustments, credit valuation adjustments and bid-offer adjustments) are independently validated and monitored.
If the Group holds offsetting risk positions, then the Group uses the portfolio exception in AASB 13 Fair Value Measurement (AASB 13) to measure the fair value of such groups of financial assets and financial liabilities. We measure the portfolio based on the price that would be received to sell a net long position (an asset) for a particular risk exposure, or to transfer a net short position (a liability) for a particular risk exposure.
Fair value designation
We designate certain loans and advances and certain deposits and other borrowings and debt issuances as fair value through profit or loss:
where they contain a separable embedded derivative which significantly modifies the instruments’ cash flow; or
in order to eliminate an accounting mismatch which would arise if the asset or liabilities were otherwise carried at amortised cost. This mismatch arises as we measure the derivative financial instruments (which we acquired to mitigate interest rate risk of the assets or liabilities) at fair value through profit or loss.
Our approach ensures that we recognise the fair value movements on the assets or liabilities in profit or loss in the same period as the movement on the associated derivatives.
We may also designate certain loans and advances, certain deposits and other borrowings and debt issuances as fair value through profit or loss where they are managed on a fair value basis to align the measurement with how the instruments are managed.
FAIR VALUE APPROACH AND VALUATION TECHNIQUES We use valuation techniques to estimate the fair value of assets and liabilities for recognition, measurement and disclosure purposes where no quoted price in an active market exists for that asset or liability. This includes the following:
Asset or Liability Fair Value Approach
Financial instruments classified as:
- Trading securities
- Securities sold short
- Derivative financial assets and financial liabilities
- Investment securities
Valuation techniques are used that incorporate observable market inputs for financial instruments with similar credit risk, maturity and yield characteristics. Equity instruments that are not traded in active markets may be measured using comparable company valuation multiples.
Financial instruments classified as:
- Net loans and advances
- Deposits and other borrowings
- Debt issuances
Discounted cash flow techniques are used whereby contractual future cash flows of the instrument are discounted using wholesale market interest rates, or market borrowing rates for debt with similar maturities or yield curve appropriate for the remaining term to maturity.
Assets and liabilities held for sale Valuation based on the expected sale price before transaction costs.
NOTES TO THE CONSOLIDATED FINANCIAL STATEMENTS
183
17. FAIR VALUE OF FINANCIAL ASSETS AND FINANCIAL LIABILITIES (continued)CLASSIFICATION OF FINANCIAL ASSETS AND FINANCIAL LIABILITIES The following tables set out the classification of financial asset and liability categories according to measurement bases together with their carrying amounts as reported on the balance sheet.
2020 2019
At amortised
cost
At fair
value Total
At amortised
cost
At fair
value Total Note $m $m $m $m $m $m
Financial assets
Cash and cash equivalents 8 107,923 - 107,923 81,621 - 81,621
Settlement balances owed to ANZ 7,541 - 7,541 3,739 - 3,739
Collateral paid 14,308 - 14,308 15,006 - 15,006
Trading securities 9 - 50,913 50,913 - 43,169 43,169
Derivative financial instruments 10 - 135,331 135,331 - 120,667 120,667
Investment securities 11 6,816 86,575 93,391 5,999 77,710 83,709
Net loans and advances 12 613,155 3,938 617,093 614,336 922 615,258
Regulatory deposits 801 - 801 879 - 879
Assets held for sale1 - - - - 1,420 1,420
Other financial assets 2,407 - 2,407 3,118 - 3,118
Total 752,951 276,757 1,029,708 724,698 243,888 968,586
Financial liabilities
Settlement balances owed by ANZ 22,241 - 22,241 10,867 - 10,867
Collateral received 9,304 - 9,304 7,929 - 7,929
Deposits and other borrowings 14 679,255 3,078 682,333 635,376 2,301 637,677
Derivative financial instruments 10 - 134,711 134,711 - 120,951 120,951
Liabilities held for sale1 - - - - 1,914 1,914
Payables and other liabilities 5,285 3,843 9,128 5,377 2,591 7,968
Debt issuances 15 117,509 2,159 119,668 127,102 2,589 129,691
Total 833,594 143,791 977,385 786,651 130,346 916,997 1. Assets held for sale and liabilities held for sale include only the components of assets or liabilities held for sale which are financial instruments.
FAIR VALUE HIERARCHY
The Group categorises assets and liabilities carried at fair value into a fair value hierarchy as required by AASB 13 based on the observability of inputs used to measure the fair value:
Level 1 - valuations based on quoted prices (unadjusted) in active markets for identical assets or liabilities;
Level 2 - valuations using inputs other than quoted prices included within Level 1 that are observable for a similar asset or liability, either directly or indirectly; and
Level 3 - valuations where significant unobservable inputs are used to measure the fair value of the asset or liability.
Notes to the consolidated financial statements (continued)
183ANZ 2020 Annual Report

NOTES TO THE CONSOLIDATED FINANCIAL STATEMENTS (continued)
184
ANZ 2020 ANNUAL REPORT
17. FAIR VALUE OF FINANCIAL ASSETS AND FINANCIAL LIABILITIES (continued)
The following table presents assets and liabilities carried at fair value in accordance with the fair value hierarchy:
Fair value measurements
Quoted price in active markets
(Level 1)
Using observable inputs (Level 2)
Using unobservable inputs (Level 3) Total
2020 2019 2020 2019 2020 2019 2020 2019 $m $m $m $m $m $m $m $m
Assets
Trading securities1 44,004 37,768 6,909 5,401 - - 50,913 43,169
Derivative financial instruments 681 365 134,588 120,241 62 61 135,331 120,667
Investment securities1 85,330 76,000 137 499 1,108 1,211 86,575 77,710
Net loans and advances2 - - 3,925 922 13 - 3,938 922
Assets held for sale3 - - - 1,952 - - - 1,952
Total 130,015 114,133 145,559 129,015 1,183 1,272 276,757 244,420
Liabilities
Deposits and other borrowings2 - - 3,078 2,301 - - 3,078 2,301
Derivative financial instruments 1,120 881 133,536 120,018 55 52 134,711 120,951
Payables and other liabilities4 3,830 2,553 13 38 - - 3,843 2,591
Debt issuances (designated at fair value) - - 2,159 2,589 - - 2,159 2,589
Liabilities held for sale3 - - - 2,121 - - - 2,121
Total 4,950 3,434 138,786 127,067 55 52 143,791 130,553 1. During the year, $127 million of assets were transferred from Level 2 to Level1 (2019: nil) following increased trading activity to support quoted prices. There were no other material transfers during the year.
Transfers into and out of levels are measured at the beginning of the reporting period in which the transfer occurred. 2. From 1 October 2019, Group changed its accounting treatment for certain gold loan and deposit products which are now designated as at fair value through profit and loss. 3. The amount classified as Assets and Liabilities held for sale relates to assets and liabilities measured at fair value less cost to sell in accordance with AASB 5 Non-current Assets Held for Sale and Discontinued
Operations. The amount presented reflects fair value excluding cost to sell but including intercompany eliminations. 4. Payables and other liabilities relates to securities sold short, which we classify as held for trading and measured at fair value through profit or loss.
FAIR VALUE MEASUREMENT INCORPORATING UNOBSERVABLE MARKET DATA
Level 3 fair value measurements
The net balance of Level 3 is an asset of $1,128 million (2019: $1,220 million). The assets and liabilities which incorporate significant unobservable inputs primarily include:
equities for which there is no active market or traded prices cannot be observed;
structured credit products for which credit spreads and default probabilities relating to the reference assets and derivative counterparties cannot be observed;
net loans and advances that are required to be measured at fair value for which there is no observable market data; and
other derivatives referencing market rates that cannot be observed primarily due to lack of market activity.
Movement in Level 3 balance is mainly due to the revaluation of the Group’s investment in Bank of Tianjin.
There were no material transfers in or out of Level 3 during the period.
184
Overview How we create value
Performance overview
Remuneration report
Directors’ report
Financial report
Shareholder information

NOTES TO THE CONSOLIDATED FINANCIAL STATEMENTS (continued)
184
ANZ 2020 ANNUAL REPORT
17. FAIR VALUE OF FINANCIAL ASSETS AND FINANCIAL LIABILITIES (continued)
The following table presents assets and liabilities carried at fair value in accordance with the fair value hierarchy:
Fair value measurements
Quoted price in active markets
(Level 1)
Using observable inputs (Level 2)
Using unobservable inputs (Level 3) Total
2020 2019 2020 2019 2020 2019 2020 2019 $m $m $m $m $m $m $m $m
Assets
Trading securities1 44,004 37,768 6,909 5,401 - - 50,913 43,169
Derivative financial instruments 681 365 134,588 120,241 62 61 135,331 120,667
Investment securities1 85,330 76,000 137 499 1,108 1,211 86,575 77,710
Net loans and advances2 - - 3,925 922 13 - 3,938 922
Assets held for sale3 - - - 1,952 - - - 1,952
Total 130,015 114,133 145,559 129,015 1,183 1,272 276,757 244,420
Liabilities
Deposits and other borrowings2 - - 3,078 2,301 - - 3,078 2,301
Derivative financial instruments 1,120 881 133,536 120,018 55 52 134,711 120,951
Payables and other liabilities4 3,830 2,553 13 38 - - 3,843 2,591
Debt issuances (designated at fair value) - - 2,159 2,589 - - 2,159 2,589
Liabilities held for sale3 - - - 2,121 - - - 2,121
Total 4,950 3,434 138,786 127,067 55 52 143,791 130,553 1. During the year, $127 million of assets were transferred from Level 2 to Level1 (2019: nil) following increased trading activity to support quoted prices. There were no other material transfers during the year.
Transfers into and out of levels are measured at the beginning of the reporting period in which the transfer occurred. 2. From 1 October 2019, Group changed its accounting treatment for certain gold loan and deposit products which are now designated as at fair value through profit and loss. 3. The amount classified as Assets and Liabilities held for sale relates to assets and liabilities measured at fair value less cost to sell in accordance with AASB 5 Non-current Assets Held for Sale and Discontinued
Operations. The amount presented reflects fair value excluding cost to sell but including intercompany eliminations. 4. Payables and other liabilities relates to securities sold short, which we classify as held for trading and measured at fair value through profit or loss.
FAIR VALUE MEASUREMENT INCORPORATING UNOBSERVABLE MARKET DATA
Level 3 fair value measurements
The net balance of Level 3 is an asset of $1,128 million (2019: $1,220 million). The assets and liabilities which incorporate significant unobservable inputs primarily include:
equities for which there is no active market or traded prices cannot be observed;
structured credit products for which credit spreads and default probabilities relating to the reference assets and derivative counterparties cannot be observed;
net loans and advances that are required to be measured at fair value for which there is no observable market data; and
other derivatives referencing market rates that cannot be observed primarily due to lack of market activity.
Movement in Level 3 balance is mainly due to the revaluation of the Group’s investment in Bank of Tianjin.
There were no material transfers in or out of Level 3 during the period.
NOTES TO THE CONSOLIDATED FINANCIAL STATEMENTS
185
17. FAIR VALUE OF FINANCIAL ASSETS AND FINANCIAL LIABILITIES (continued)
Bank of Tianjin (BoT) The investment is valued based on comparative price-to-book (P/B) multiples (a P/B multiple is the ratio of the market value of equity to the book value of equity). The extent of judgement applied in determining the appropriate multiple and comparator group from which the multiple is derived are non-observable inputs which have resulted in the Level 3 classification.
Sensitivity to Level 3 data inputs
When we make assumptions due to significant inputs not being directly observable in the market place (Level 3 inputs), then changing these assumptions changes the Group’s estimate of the instrument’s fair value. Favourable and unfavourable changes are determined by changing the primary unobservable parameter used to derive the valuation.
Bank of Tianjin (BoT) The valuation of the BoT investment is sensitive to the selected unobservable input, being the P/B multiple. If the P/B multiple was increased or decreased by 10% it would result in a $93 million (2019: $111 million) increase or decrease to the fair value of the investment, which would be recognised in shareholders’ equity.
Other The remaining Level 3 balance is immaterial and changes in the Level 3 inputs have a minimal impact on net profit and net assets of the Group.
Deferred fair value gains and losses
Where fair values are determined using unobservable inputs significant to the fair value of a financial instrument, the Group does not immediately recognise the difference between the transaction price and the amount we determine based on the valuation technique (day one gain or loss) in profit or loss. After initial recognition, we recognise the deferred amount in profit or loss on a straight line basis over the life of the transaction or until all inputs become observable.
The day one gains and losses deferred are not material.
FINANCIAL ASSETS AND FINANCIAL LIABILITIES NOT MEASURED AT FAIR VALUE
The following table sets out the Group’s basis of estimating fair values of financial instruments carried at amortised cost:
Financial Asset and Liability Fair Value Approach
Investment securities - debt securities at amortised cost Calculated based on quoted market prices or observable inputs as applicable. If quoted market prices are not available, we use a discounted cash flow model using a yield curve appropriate for the remaining term to maturity of the debt instrument. The fair value reflects adjustments to credit spreads applicable for that instrument.
Net loans and advances to banks Discounted cash flows using prevailing market rates for loans with similar credit quality.
Net loans and advances to customers Present value of future cash flows, discounted using a curve that incorporates changes in wholesale market rates, the Group’s cost of wholesale funding and the customer margin, as appropriate.
Deposit liability without a specified maturity or at call The amount payable on demand at the reporting date. We do not adjust the fair value for any value we expect the Group to derive from retaining the deposit for a future period.
Interest bearing fixed maturity deposits and other borrowings and acceptances with quoted market rates
Market borrowing rates of interest for debt with a similar maturity are used to discount contractual cash flows to derive the fair value.
Debt issuances Calculated based on quoted market prices or observable inputs as applicable. If quoted market prices are not available, we use a discounted cash flow model using a yield curve appropriate for the remaining term to maturity of the debt instrument. The fair value reflects adjustments to credit spreads applicable to ANZ for that instrument.
Notes to the consolidated financial statements (continued)
185ANZ 2020 Annual Report

NOTES TO THE CONSOLIDATED FINANCIAL STATEMENTS (continued)
186
ANZ 2020 ANNUAL REPORT
17. FAIR VALUE OF FINANCIAL ASSETS AND FINANCIAL LIABILITIES (continued)
The financial assets and financial liabilities listed in the table below are carried at amortised cost on the Group’s Balance Sheet. While this is the value at which we expect the assets will be realised and the liabilities settled, the Group provides an estimate of the fair value of the financial assets and financial liabilities at balance date in the table below.
Categorised into fair value hierarchy
Quoted price active markets Using observable
With significant non- observable inputs
At amortised cost (Level 1) inputs (Level 2) (Level 3) Fair value (total)
2020 2019 2020 2019 2020 2019 2020 2019 2020 2019 $m $m $m $m $m $m $m $m $m $m
Financial assets
Net loans and advances 613,155 614,336 - - 16,161 22,629 597,997 592,704 614,158 615,333
Investment securities 6,816 5,999 - - 6,816 5,997 - - 6,816 5,997
Total 619,971 620,335 - - 22,977 28,626 597,997 592,704 620,974 621,330
Financial liabilities
Deposits and other borrowings 679,255 635,376 - - 679,544 635,660 - - 679,544 635,660
Debt issuances 117,509 127,102 26,107 43,304 93,187 85,484 - - 119,294 128,788
Total 796,764 762,478 26,107 43,304 772,731 721,144 - - 798,838 764,448
KEY JUDGEMENTS AND ESTIMATES
The Group evaluates the material accuracy of the valuations incorporated in the financial statements as they can involve a high degree of judgement and estimation in determining the carrying values of financial assets and financial liabilities at the balance sheet date.
The majority of valuation models the Group uses employ only observable market data as inputs. This has not changed as a result of COVID-19, however the Group has considered the impact of related economic and market disruptions on fair value measurement assumptions and the appropriateness of valuation inputs, notably valuation adjustments, as well as the impact of COVID-19 on the classification of exposures in the fair value hierarchy.
For certain financial instruments, we may use data that is not readily observable in current markets. If we use unobservable market data, then we need to exercise more judgement to determine fair value depending on the significance of the unobservable input to the overall valuation. Generally, we derive unobservable inputs from other relevant market data and compare them to observed transaction prices where available.
When establishing the fair value of a financial instrument using a valuation technique, the Group considers valuation adjustments in determining the fair value. We may apply adjustments (such as bid/offer spreads, credit valuation adjustments and funding valuation adjustments – refer Note 10 Derivative Financial Instruments) to reflect the Group’s assessment of factors that market participants would consider in setting fair value.
186
Overview How we create value
Performance overview
Remuneration report
Directors’ report
Financial report
Shareholder information

NOTES TO THE CONSOLIDATED FINANCIAL STATEMENTS (continued)
186
ANZ 2020 ANNUAL REPORT
17. FAIR VALUE OF FINANCIAL ASSETS AND FINANCIAL LIABILITIES (continued)
The financial assets and financial liabilities listed in the table below are carried at amortised cost on the Group’s Balance Sheet. While this is the value at which we expect the assets will be realised and the liabilities settled, the Group provides an estimate of the fair value of the financial assets and financial liabilities at balance date in the table below.
Categorised into fair value hierarchy
Quoted price active markets Using observable
With significant non- observable inputs
At amortised cost (Level 1) inputs (Level 2) (Level 3) Fair value (total)
2020 2019 2020 2019 2020 2019 2020 2019 2020 2019 $m $m $m $m $m $m $m $m $m $m
Financial assets
Net loans and advances 613,155 614,336 - - 16,161 22,629 597,997 592,704 614,158 615,333
Investment securities 6,816 5,999 - - 6,816 5,997 - - 6,816 5,997
Total 619,971 620,335 - - 22,977 28,626 597,997 592,704 620,974 621,330
Financial liabilities
Deposits and other borrowings 679,255 635,376 - - 679,544 635,660 - - 679,544 635,660
Debt issuances 117,509 127,102 26,107 43,304 93,187 85,484 - - 119,294 128,788
Total 796,764 762,478 26,107 43,304 772,731 721,144 - - 798,838 764,448
KEY JUDGEMENTS AND ESTIMATES
The Group evaluates the material accuracy of the valuations incorporated in the financial statements as they can involve a high degree of judgement and estimation in determining the carrying values of financial assets and financial liabilities at the balance sheet date.
The majority of valuation models the Group uses employ only observable market data as inputs. This has not changed as a result of COVID-19, however the Group has considered the impact of related economic and market disruptions on fair value measurement assumptions and the appropriateness of valuation inputs, notably valuation adjustments, as well as the impact of COVID-19 on the classification of exposures in the fair value hierarchy.
For certain financial instruments, we may use data that is not readily observable in current markets. If we use unobservable market data, then we need to exercise more judgement to determine fair value depending on the significance of the unobservable input to the overall valuation. Generally, we derive unobservable inputs from other relevant market data and compare them to observed transaction prices where available.
When establishing the fair value of a financial instrument using a valuation technique, the Group considers valuation adjustments in determining the fair value. We may apply adjustments (such as bid/offer spreads, credit valuation adjustments and funding valuation adjustments – refer Note 10 Derivative Financial Instruments) to reflect the Group’s assessment of factors that market participants would consider in setting fair value.
NOTES TO THE CONSOLIDATED FINANCIAL STATEMENTS
187
18. ASSETS CHARGED AS SECURITY FOR LIABILITIES AND COLLATERAL ACCEPTED ASSECURITY FOR ASSETS
The following disclosure excludes the amounts presented as collateral paid and received in the Balance Sheet that relate to derivative liabilities and derivative assets respectively. The terms and conditions of those collateral agreements are included in the standard Credit Support Annex that forms part of the International Swaps and Derivatives Association Master Agreement.
ASSETS CHARGED AS SECURITY FOR LIABILITIES
Assets charged as security for liabilities include the following types of instruments:
securities provided as collateral for repurchase transactions. These transactions are governed by standard industry agreements;
specified residential mortgages provided as security for notes and bonds issued to investors as part of ANZ’s covered bond programs;
collateral provided to central banks; and
collateral provided to clearing houses.
The carrying amount of assets pledged as security are as follows:
2020 2019$m $m
Securities sold under arrangements to repurchase1 61,415 43,213
Assets pledged as collateral for UDC Secured Investments2 - 3,228
Residential mortgages provided as security for covered bonds 28,559 30,799
Other 4,990 4,9271. The amounts disclosed as securities sold under arrangements to repurchase include both:
assets pledged as security which continue to be recognised on the Group's balance sheet; and assets repledged, which are included in the disclosure below.
2. UDC Secured Investments were secured by a security interest over all of UDC’s assets. The Group divested of UDC during 2020 and, therefore, there are no longer any associated collateral balances requiringdisclosure by the Group.
COLLATERAL ACCEPTED AS SECURITY FOR ASSETS
ANZ has received collateral associated with various financial instruments. Under certain transactions ANZ has the right to sell, or to repledge, the collateral received. These transactions are governed by standard industry agreements.
The fair value of collateral we have received and that which we have sold or repledged is as follows:
2020 2019$m $m
Fair value of assets which can be sold or repledged 54,242 37,990
Fair value of assets sold or repledged 32,578 29,460
Notes to the consolidated financial statements (continued)
187ANZ 2020 Annual Report

NOTES TO THE CONSOLIDATED FINANCIAL STATEMENTS (continued)
188
ANZ 2020 ANNUAL REPORT
19. OFFSETTING
We offset financial assets and financial liabilities on the balance sheet (in accordance with AASB 132 Financial Instruments: Presentation) when there is:
a current legally enforceable right to set off the recognised amounts in all circumstances; and
an intention to settle the asset and liability on a net basis, or to realise the asset and settle the liability simultaneously.
If the above conditions are not met, the financial assets and financial liabilities are presented on a gross basis.
The Group does not have any arrangements that satisfy the conditions necessary to offset financial assets and financial liabilities within the balance sheet. The following table identifies financial assets and financial liabilities which have not been offset but are subject to enforceable master netting agreements (or similar arrangements) and the related amounts not offset in the balance sheet. We have not taken into account the effect of over-collateralisation.
Amount subject to master netting agreement or similar
Total amounts recognised in
the Balance Sheet
Amounts not subject to
master netting agreement or
similar Total Financial
instruments
Financial collateral
(received)/ pledged
Net amount
2020 $m $m $m $m $m $m
Derivative financial assets 135,331 (3,862) 131,469 (117,982) (6,397) 7,090
Reverse repurchase, securities borrowing and similar agreements1 53,434 (5,922) 47,512 (1,566) (45,946) -
Total financial assets 188,765 (9,784) 178,981 (119,548) (52,343) 7,090
Derivative financial liabilities (134,711) 2,824 (131,887) 117,982 10,059 (3,846)
Repurchase, securities lending and similar agreements2 (55,716) 14,354 (41,362) 1,566 39,796 -
Total financial liabilities (190,427) 17,178 (173,249) 119,548 49,855 (3,846)
Amount subject to master netting agreement or similar
Total amounts recognised in
the Balance Sheet
Amounts not subject to
master netting agreement or
similar Total Financial
instruments
Financial collateral
(received)/ pledged
Net amount
2019 $m $m $m $m $m $m
Derivative financial assets 120,667 (4,019) 116,648 (103,247) (6,378) 7,023
Reverse repurchase, securities borrowing and similar agreements1
37,102 (5,299) 31,803 (1,414) (30,389) -
Total financial assets 157,769 (9,318) 148,451 (104,661) (36,767) 7,023
Derivative financial liabilities (120,951) 3,145 (117,806) 103,247 10,970 (3,589)
Repurchase, securities lending and similar agreements2
(41,367) 17,781 (23,586) 1,414 22,172 -
Total financial liabilities (162,318) 20,926 (141,392) 104,661 33,142 (3,589)
1. Reverse repurchase agreements: with less than 90 days to maturity are presented in the Balance Sheet within cash and cash equivalents; or with 90 days or more to maturity are presented in the Balance Sheet within net loans and advances.
2. Repurchase agreements are presented on the Balance Sheet within deposits and other borrowings.
188
Overview How we create value
Performance overview
Remuneration report
Directors’ report
Financial report
Shareholder information

NOTES TO THE CONSOLIDATED FINANCIAL STATEMENTS (continued)
188
ANZ 2020 ANNUAL REPORT
19. OFFSETTING
We offset financial assets and financial liabilities on the balance sheet (in accordance with AASB 132 Financial Instruments: Presentation) when there is:
a current legally enforceable right to set off the recognised amounts in all circumstances; and
an intention to settle the asset and liability on a net basis, or to realise the asset and settle the liability simultaneously.
If the above conditions are not met, the financial assets and financial liabilities are presented on a gross basis.
The Group does not have any arrangements that satisfy the conditions necessary to offset financial assets and financial liabilities within the balance sheet. The following table identifies financial assets and financial liabilities which have not been offset but are subject to enforceable master netting agreements (or similar arrangements) and the related amounts not offset in the balance sheet. We have not taken into account the effect of over-collateralisation.
Amount subject to master netting agreement or similar
Total amounts recognised in
the Balance Sheet
Amounts not subject to
master netting agreement or
similar Total Financial
instruments
Financial collateral
(received)/ pledged
Net amount
2020 $m $m $m $m $m $m
Derivative financial assets 135,331 (3,862) 131,469 (117,982) (6,397) 7,090
Reverse repurchase, securities borrowing and similar agreements1 53,434 (5,922) 47,512 (1,566) (45,946) -
Total financial assets 188,765 (9,784) 178,981 (119,548) (52,343) 7,090
Derivative financial liabilities (134,711) 2,824 (131,887) 117,982 10,059 (3,846)
Repurchase, securities lending and similar agreements2 (55,716) 14,354 (41,362) 1,566 39,796 -
Total financial liabilities (190,427) 17,178 (173,249) 119,548 49,855 (3,846)
Amount subject to master netting agreement or similar
Total amounts recognised in
the Balance Sheet
Amounts not subject to
master netting agreement or
similar Total Financial
instruments
Financial collateral
(received)/ pledged
Net amount
2019 $m $m $m $m $m $m
Derivative financial assets 120,667 (4,019) 116,648 (103,247) (6,378) 7,023
Reverse repurchase, securities borrowing and similar agreements1
37,102 (5,299) 31,803 (1,414) (30,389) -
Total financial assets 157,769 (9,318) 148,451 (104,661) (36,767) 7,023
Derivative financial liabilities (120,951) 3,145 (117,806) 103,247 10,970 (3,589)
Repurchase, securities lending and similar agreements2
(41,367) 17,781 (23,586) 1,414 22,172 -
Total financial liabilities (162,318) 20,926 (141,392) 104,661 33,142 (3,589)
1. Reverse repurchase agreements: with less than 90 days to maturity are presented in the Balance Sheet within cash and cash equivalents; or with 90 days or more to maturity are presented in the Balance Sheet within net loans and advances.
2. Repurchase agreements are presented on the Balance Sheet within deposits and other borrowings.
NOTES TO THE CONSOLIDATED FINANCIAL STATEMENTS
189
20. GOODWILL AND OTHER INTANGIBLE ASSETS
Goodwill1 Software Other Intangibles Total
2020 2019 2020 2019 2020 2019 2020 2019
$m $m $m $m $m $m $m $m
Balance at start of year 3,467 3,440 1,323 1,421 71 69 4,861 4,930
Additions - - 375 421 6 - 381 421
Amortisation expense2 - - (657) (517) (1) - (658) (517)
Impairment expense (77) - (2) (4) - - (79) (4)
Written off on disposal (124) - - - - - (124) -
Foreign currency exchange difference (2) 27 - 2 - 2 (2) 31
Balance at end of year 3,264 3,467 1,039 1,323 76 71 4,379 4,861
Cost3 3,341 3,467 7,300 7,068 77 75 10,718 10,610
Accumulated amortisation/impairment (77) n/a (6,261) (5,745) (1) (4) (6,339) (5,749)
Carrying amount 3,264 3,467 1,039 1,323 76 71 4,379 4,861 1. Goodwill excludes notional goodwill in equity accounted investments.2. During the second half of the 2020 financial year, the Group amended the application of its software amortisation policy. The Group recognised accelerated amortisation of $197 million.3. Includes impact of foreign currency translation differences.
IMPAIRMENT TESTING FOR CASH GENERATING UNITS (CGUs) CONTAINING GOODWILL During the year ended September 2020, $124 million of goodwill was written off in relation to completed divestments. In addition, as a result of changes in economic outlook, the Group announced its intention to begin winding up the Bonus Bonds business, a managed investment product in New Zealand and the Group wrote off the associated goodwill of $27 million. The balance of goodwill was subject to impairment assessment as set out below which resulted in $50 million of goodwill impairment in the Pacific division.
An assessment as to whether the current carrying value of goodwill is impaired is undertaken annually or where there are indicators of potential impairment. For the purpose of impairment testing, goodwill acquired in a business combination is allocated at the date of acquisition to the cash generating units (CGUs) that are expected to benefit from the synergies of the related business combination. These CGUs are ANZ’s reportable segments. Goodwill is considered to be impaired if the carrying amount of the relevant CGU exceeds its recoverable amount.
In determining the carrying amount of the CGUs to which goodwill is allocated, we include all direct assets and liabilities and an allocation, on a reasonable and consistent basis, of corporate assets and liabilities that are recorded outside those CGUs to which goodwill is allocated.
We estimate the recoverable amount of each CGU to which goodwill is allocated using a fair value less costs of disposal (FVLCOD) approach, with a value in use (VIU) assessment performed where the FVLCOD is less than the carrying amount.
As the Group’s market capitalisation was below the Group’s net asset value at 30 September 2020, and considering uncertainties surrounding COVID-19, the Group assessed the carrying value of goodwill as at 30 September 2020. Based on this assessment: no impairment was identified in the Australia Retail and Commercial, New Zealand and Institutional CGUs under the FVLCOD approach;
the Pacific CGU’s recoverable amount measured on a VIU basis (being higher than its FVLCOD) indicated a shortfall in recoverable amount relative to carrying amount. Accordingly an impairment loss of $50 million has been recognised at 30 September 2020, reducing the carrying amount of goodwill to nil.
Fair Value Less Cost of Disposal
The recoverable amount of each CGU to which goodwill is allocated is estimated on a FVLCOD basis, calculated using a market multiple approach. Under this approach, we determine the estimated fair value of each of our CGUs by applying observable price earnings multiples of appropriate comparator companies to the estimated future maintainable earnings of each CGU. A deduction is then made for estimated costs of disposal. The valuation is considered to be level 3 in the fair value hierarchy due to unobservable inputs used in the valuation.
Notes to the consolidated financial statements (continued)
189ANZ 2020 Annual Report

NOTES TO THE CONSOLIDATED FINANCIAL STATEMENTS (continued)
190
ANZ 2020 ANNUAL REPORT
20. GOODWILL AND OTHER INTANGIBLE ASSETS (continued) Management’s approach and the key assumptions used to determine FVLCOD, for those CGUs where recoverable amount was determined on the basis of FVLCOD were as follows:
Key assumption Approach to determining the value (or values) for each key assumption Future maintainable earnings Future maintainable earnings for each CGU have been estimated as the sum of:
The financial year 2021 financial plan results for each CGU, which incorporates management estimates of the impacts of COVID-19; plus
An allocation of the central costs recorded outside of the CGU’s to which goodwill is allocated.
Adjustments have been made to the financial year 2021 plan results to: reflect longer term expected credit losses; and normalise certain other operating expenditure where specific factors result in financial year 2021
planned expenditure exceeding longer term maintainable levels with the higher operating expenditure treated as a one-off adjustment in the valuations.
Price/Earnings (P/E) multiple applied (including control premium)
Trading multiples: The P/E multiples used have been derived from valuations of comparable publicly traded companies as at 30 September 2020 and are the median P/E multiple (2021 earnings multiple) of the comparator group: For the Australia Retail and Commercial and New Zealand CGUs, the comparator group is the four
major banking groups headquartered in Australia; For the Institutional CGU, the comparator group includes the four major banking groups
headquartered in Australia plus certain major financial institutions who compete with the Group in international markets.
In the case of the New Zealand and Institutional CGUs, management has made downwards adjustments to comparator group multiples to address specific factors relevant to those CGUs. For each of ANZ’s CGUs where the recoverable amount was determined on the basis of FVLCOD, the P/E multiples applied (including a 30% control premium discussed below) were as follows:
Division 2020 2019 Australia Retail and Commercial 16.0 17.9 New Zealand 12.7 17.8 Institutional 13.4 14.7
Control premium: A control premium has been applied which recognises the increased consideration a potential acquirer would be willing to pay in order to gain sufficient ownership to achieve control over the relevant activities of the CGU. For each CGU, the control premium has been estimated as 30% of the comparator group P/E multiple based on historical transactions.
Costs of disposal Costs of disposal have been estimated as 2% of the fair value of the CGU based on input from historical and recent transactions.
FVLCOD assessment outcomes
For those CGUs where recoverable amount was determined on the basis of FVLCOD, the surplus of the recoverable amount over the carrying amount was as follows:
Surplus 30 September 2020
Cash generating unit: $m Australia Retail and Commercial 4,539 New Zealand 1,201 Institutional 516
Sensitivity analysis
The surpluses disclosed above are sensitive to judgements and estimates in respect of:
for recoverable amount – The future maintainable earnings and the P/E multiple applied (including the control premium applied in determining the P/E multiple); and
for carrying amount - The allocation of corporate assets and liabilities recorded outside those CGUs to which goodwill is allocated.
190
Overview How we create value
Performance overview
Remuneration report
Directors’ report
Financial report
Shareholder information
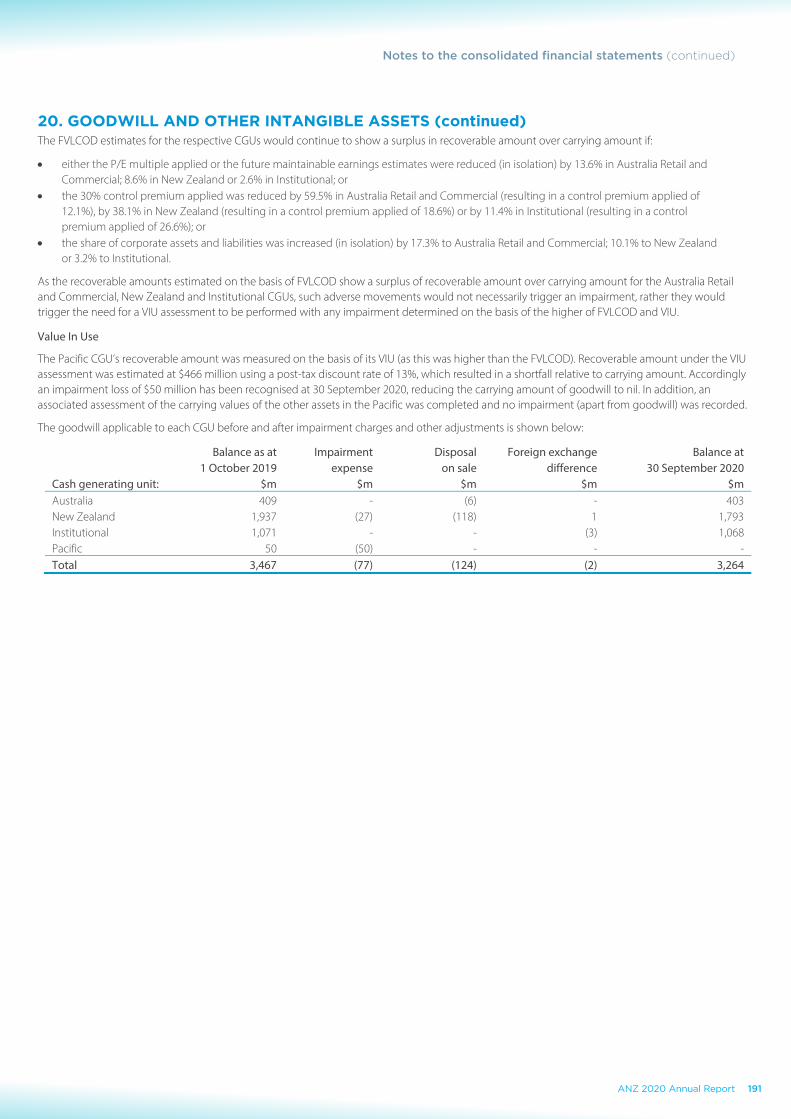
NOTES TO THE CONSOLIDATED FINANCIAL STATEMENTS (continued)
190
ANZ 2020 ANNUAL REPORT
20. GOODWILL AND OTHER INTANGIBLE ASSETS (continued) Management’s approach and the key assumptions used to determine FVLCOD, for those CGUs where recoverable amount was determined on the basis of FVLCOD were as follows:
Key assumption Approach to determining the value (or values) for each key assumption Future maintainable earnings Future maintainable earnings for each CGU have been estimated as the sum of:
The financial year 2021 financial plan results for each CGU, which incorporates management estimates of the impacts of COVID-19; plus
An allocation of the central costs recorded outside of the CGU’s to which goodwill is allocated.
Adjustments have been made to the financial year 2021 plan results to: reflect longer term expected credit losses; and normalise certain other operating expenditure where specific factors result in financial year 2021
planned expenditure exceeding longer term maintainable levels with the higher operating expenditure treated as a one-off adjustment in the valuations.
Price/Earnings (P/E) multiple applied (including control premium)
Trading multiples: The P/E multiples used have been derived from valuations of comparable publicly traded companies as at 30 September 2020 and are the median P/E multiple (2021 earnings multiple) of the comparator group: For the Australia Retail and Commercial and New Zealand CGUs, the comparator group is the four
major banking groups headquartered in Australia; For the Institutional CGU, the comparator group includes the four major banking groups
headquartered in Australia plus certain major financial institutions who compete with the Group in international markets.
In the case of the New Zealand and Institutional CGUs, management has made downwards adjustments to comparator group multiples to address specific factors relevant to those CGUs. For each of ANZ’s CGUs where the recoverable amount was determined on the basis of FVLCOD, the P/E multiples applied (including a 30% control premium discussed below) were as follows:
Division 2020 2019 Australia Retail and Commercial 16.0 17.9 New Zealand 12.7 17.8 Institutional 13.4 14.7
Control premium: A control premium has been applied which recognises the increased consideration a potential acquirer would be willing to pay in order to gain sufficient ownership to achieve control over the relevant activities of the CGU. For each CGU, the control premium has been estimated as 30% of the comparator group P/E multiple based on historical transactions.
Costs of disposal Costs of disposal have been estimated as 2% of the fair value of the CGU based on input from historical and recent transactions.
FVLCOD assessment outcomes
For those CGUs where recoverable amount was determined on the basis of FVLCOD, the surplus of the recoverable amount over the carrying amount was as follows:
Surplus 30 September 2020
Cash generating unit: $m Australia Retail and Commercial 4,539 New Zealand 1,201 Institutional 516
Sensitivity analysis
The surpluses disclosed above are sensitive to judgements and estimates in respect of:
for recoverable amount – The future maintainable earnings and the P/E multiple applied (including the control premium applied in determining the P/E multiple); and
for carrying amount - The allocation of corporate assets and liabilities recorded outside those CGUs to which goodwill is allocated.
NOTES TO THE CONSOLIDATED FINANCIAL STATEMENTS
191
20. GOODWILL AND OTHER INTANGIBLE ASSETS (continued) The FVLCOD estimates for the respective CGUs would continue to show a surplus in recoverable amount over carrying amount if:
either the P/E multiple applied or the future maintainable earnings estimates were reduced (in isolation) by 13.6% in Australia Retail and Commercial; 8.6% in New Zealand or 2.6% in Institutional; or
the 30% control premium applied was reduced by 59.5% in Australia Retail and Commercial (resulting in a control premium applied of 12.1%), by 38.1% in New Zealand (resulting in a control premium applied of 18.6%) or by 11.4% in Institutional (resulting in a control premium applied of 26.6%); or
the share of corporate assets and liabilities was increased (in isolation) by 17.3% to Australia Retail and Commercial; 10.1% to New Zealand or 3.2% to Institutional.
As the recoverable amounts estimated on the basis of FVLCOD show a surplus of recoverable amount over carrying amount for the Australia Retail and Commercial, New Zealand and Institutional CGUs, such adverse movements would not necessarily trigger an impairment, rather they would trigger the need for a VIU assessment to be performed with any impairment determined on the basis of the higher of FVLCOD and VIU.
Value In Use
The Pacific CGU’s recoverable amount was measured on the basis of its VIU (as this was higher than the FVLCOD). Recoverable amount under the VIU assessment was estimated at $466 million using a post-tax discount rate of 13%, which resulted in a shortfall relative to carrying amount. Accordingly an impairment loss of $50 million has been recognised at 30 September 2020, reducing the carrying amount of goodwill to nil. In addition, an associated assessment of the carrying values of the other assets in the Pacific was completed and no impairment (apart from goodwill) was recorded.
The goodwill applicable to each CGU before and after impairment charges and other adjustments is shown below:
Balance as at 1 October 2019
Impairment expense
Disposal on sale
Foreign exchange difference
Balance at 30 September 2020
Cash generating unit: $m $m $m $m $m Australia 409 - (6) - 403 New Zealand 1,937 (27) (118) 1 1,793 Institutional 1,071 - - (3) 1,068 Pacific 50 (50) - - - Total 3,467 (77) (124) (2) 3,264
Notes to the consolidated financial statements (continued)
191ANZ 2020 Annual Report

NOTES TO THE CONSOLIDATED FINANCIAL STATEMENTS (continued)
192
ANZ 2020 ANNUAL REPORT
20. GOODWILL AND OTHER INTANGIBLE ASSETS (continued)
RECOGNITION AND MEASUREMENT
The table below details how we recognise and measure different intangible assets:
Goodwill Software Other Intangible Assets
Definition
Excess amount the Group has paid in acquiring a business over the fair value of the identifiable assets and liabilities acquired.
Purchases of “off the shelf” software assets are capitalised as assets.
Internal and external costs incurred in building software and computer systems costing greater than $20 million are capitalised as assets. Those less than $20 million are expensed in the year in which the costs are incurred.
Management fee rights arising from acquisition of funds management business and an intangible asset arising from contractual rights.
Carrying value
Cost less any accumulated impairment losses.
Allocated to the cash generating unit to which the acquisition relates.
Initially, measured at cost.
Subsequently, carried at cost less accumulated amortisation and impairment losses.
Costs incurred in planning or evaluating software proposals or in maintaining systems after implementation are not capitalised.
Initially, measured at fair value at acquisition.
Subsequently, carried at cost less amortisation and impairment losses.
Useful life
Indefinite.
Goodwill is reviewed for impairment at least annually or when there is an indication of impairment.
Except for major core infrastructure, amortised over periods between 2-5 years; however major core infrastructure may be amortised up to 7 years subject to approval by the Audit Committee.
Purchased software is amortised over 2 years unless it is considered integral to other assets with a longer useful life.
Management fee rights with an indefinite life are reviewed for impairment at least annually or when there is an indication of impairment. The contractual rights intangible asset has a useful life of 3 years.
Depreciation method
Not applicable. Straight-line method. Not applicable to indefinite life intangible assets. Straight line for those with a limited life.
192
Overview How we create value
Performance overview
Remuneration report
Directors’ report
Financial report
Shareholder information

NOTES TO THE CONSOLIDATED FINANCIAL STATEMENTS (continued)
192
ANZ 2020 ANNUAL REPORT
20. GOODWILL AND OTHER INTANGIBLE ASSETS (continued)
RECOGNITION AND MEASUREMENT
The table below details how we recognise and measure different intangible assets:
Goodwill Software Other Intangible Assets
Definition
Excess amount the Group has paid in acquiring a business over the fair value of the identifiable assets and liabilities acquired.
Purchases of “off the shelf” software assets are capitalised as assets.
Internal and external costs incurred in building software and computer systems costing greater than $20 million are capitalised as assets. Those less than $20 million are expensed in the year in which the costs are incurred.
Management fee rights arising from acquisition of funds management business and an intangible asset arising from contractual rights.
Carrying value
Cost less any accumulated impairment losses.
Allocated to the cash generating unit to which the acquisition relates.
Initially, measured at cost.
Subsequently, carried at cost less accumulated amortisation and impairment losses.
Costs incurred in planning or evaluating software proposals or in maintaining systems after implementation are not capitalised.
Initially, measured at fair value at acquisition.
Subsequently, carried at cost less amortisation and impairment losses.
Useful life
Indefinite.
Goodwill is reviewed for impairment at least annually or when there is an indication of impairment.
Except for major core infrastructure, amortised over periods between 2-5 years; however major core infrastructure may be amortised up to 7 years subject to approval by the Audit Committee.
Purchased software is amortised over 2 years unless it is considered integral to other assets with a longer useful life.
Management fee rights with an indefinite life are reviewed for impairment at least annually or when there is an indication of impairment. The contractual rights intangible asset has a useful life of 3 years.
Depreciation method
Not applicable. Straight-line method. Not applicable to indefinite life intangible assets. Straight line for those with a limited life.
NOTES TO THE CONSOLIDATED FINANCIAL STATEMENTS
193
20. GOODWILL AND OTHER INTANGIBLE ASSETS (continued)
KEY JUDGEMENTS AND ESTIMATES
Management judgement is used to assess the recoverable value of goodwill, and other intangible assets, and the useful economic life of an asset, or if an asset has an indefinite life. We reassess the recoverability of the carrying value at each reporting date.
Goodwill
A number of key judgements are required in the determination of whether or not a goodwill balance is impaired:
the level at which goodwill is allocated – consistent with prior periods the CGUs to which goodwill is allocated are the Group’s four revenue generating segments that benefit from relevant historical business combinations generating goodwill.
determination of the carrying amount of each CGU which includes an allocation, on a reasonable and consistent basis of corporate assets and liabilities that are not directly attributable to the CGUs to which goodwill is allocated.
assessment of the recoverable amount of each CGU used to determine whether the carrying amount of goodwill is supported is based on judgements including:
o selection of the model used to determine the fair value – the Group has used the market multiple approach to estimate the fair value; and
o selection of the key assumptions in respect of future maintainable earnings, the P/E multiple applied, including selection of an appropriate comparator group and determination of an appropriate control premium, and costs of disposal as described above.
The assessment of the recoverable amount of each CGU has been made within the context of the ongoing impact of COVID-19 on both earnings and asset prices, and reflects expectations of future events that are believed to be reasonable under the circumstances. The rapidly evolving consequences of COVID-19 and government, business and consumer responses create heightened uncertainty in these estimates and any variations could have a positive or adverse impact on the determination of recoverable amounts.
Software and other intangible assets
At each reporting date, software and other intangible assets, are assessed for indicators of impairment and, where such indicators are identified, an impairment assessment is performed. In the event that an asset’s carrying amount is determined to be greater than its recoverable amount, the carrying amount of the asset is written down immediately. Those assets not yet ready for use are tested for impairment annually.
In addition, the expected useful lives of intangible assets are assessed at each reporting date. The assessment requires management judgement, and in relation to our software assets, a number of factors can influence the expected useful lives. These factors include changes to business strategy, significant divestments and the underlying pace of technological change.
During the Financial year the Group amended the application of the software policy to reflect the shorter useful lives of various types of software, including regulatory and compliance focused assets and purchased assets. These changes better reflect the Group’s rapidly changing technology and business needs and ongoing reinvestment in purchased and internally developed software to ensure assets remain fit for purpose.
Notes to the consolidated financial statements (continued)
193ANZ 2020 Annual Report

NOTES TO THE CONSOLIDATED FINANCIAL STATEMENTS (continued)
194
ANZ 2020 ANNUAL REPORT
21. OTHER PROVISIONS
2020 2019$m $m
ECL allowance on undrawn and contingent facilities1 898 668
Customer remediation 1,109 1,139
Restructuring costs 105 64
Non-lending losses, frauds and forgeries 79 94
Other 388 349
Total other provisions (including liabilities reclassified as held for sale) 2,579 2,314
Less: Other provisions reclassified as held for sale - (91)
Total other provisions 2,579 2,223 1. Refer to Note 13 Allowance for Expected Credit Losses for movement analysis.
Customer remediation
Restructuring costs
Non-lending losses, frauds and forgeries Other
$m $m $m $m
Balance at 1 October 2018 602 105 100 191
New and increased provisions made during the year 857 97 18 338
Provisions used during the year (186) (117) (5) (71)
Unused amounts reversed during the year (134) (21) (19) (109)
Balance at 30 September 2019 (including liabilities reclassified as held for sale) 1,139 64 94 349
New and increased provisions made during the year 773 124 4 400
Provisions used during the year (381) (74) (12) (215)
Unused amounts reversed during the year1 (422) (9) (7) (146)
Balance at end of year 1,109 105 79 388 1. Customer remediation includes a $99 million transfer to the purchaser on completion of divestment of part of Wealth Australia discontinued operations.
Customer remediation Customer remediation includes provisions for expected refunds to customers, remediation project costs and related customer and regulatory claims, penalties and litigation outcomes.
Restructuring costs Provisions for restructuring costs arise from activities related to material changes in the scope of business undertaken by the Group or the manner in which that business is undertaken and include employee termination benefits. Costs relating to on-going activities are not provided for and are expensed as incurred.
Non-lending losses, frauds and forgeries Non-lending losses include losses arising from certain legal actions not directly related to amounts of principal outstanding for loans and advances and losses arising from forgeries, frauds and the correction of operational issues. The amounts recognised are the best estimate of the consideration required to settle the present obligation at the reporting date, taking into account the risks and uncertainties that surround the events and circumstances that affect the provision.
Other Other provisions comprise various other provisions including workers compensation, make-good provisions associated with leased premises, warranties and indemnities provided in connection with various disposals of businesses and assets, and contingent liabilities recognised as part of a business combination.
194
Overview How we create value
Performance overview
Remuneration report
Directors’ report
Financial report
Shareholder information

NOTES TO THE CONSOLIDATED FINANCIAL STATEMENTS (continued)
194
ANZ 2020 ANNUAL REPORT
21. OTHER PROVISIONS
2020 2019$m $m
ECL allowance on undrawn and contingent facilities1 898 668
Customer remediation 1,109 1,139
Restructuring costs 105 64
Non-lending losses, frauds and forgeries 79 94
Other 388 349
Total other provisions (including liabilities reclassified as held for sale) 2,579 2,314
Less: Other provisions reclassified as held for sale - (91)
Total other provisions 2,579 2,223 1. Refer to Note 13 Allowance for Expected Credit Losses for movement analysis.
Customer remediation
Restructuring costs
Non-lending losses, frauds and forgeries Other
$m $m $m $m
Balance at 1 October 2018 602 105 100 191
New and increased provisions made during the year 857 97 18 338
Provisions used during the year (186) (117) (5) (71)
Unused amounts reversed during the year (134) (21) (19) (109)
Balance at 30 September 2019 (including liabilities reclassified as held for sale) 1,139 64 94 349
New and increased provisions made during the year 773 124 4 400
Provisions used during the year (381) (74) (12) (215)
Unused amounts reversed during the year1 (422) (9) (7) (146)
Balance at end of year 1,109 105 79 388 1. Customer remediation includes a $99 million transfer to the purchaser on completion of divestment of part of Wealth Australia discontinued operations.
Customer remediation Customer remediation includes provisions for expected refunds to customers, remediation project costs and related customer and regulatory claims, penalties and litigation outcomes.
Restructuring costs Provisions for restructuring costs arise from activities related to material changes in the scope of business undertaken by the Group or the manner in which that business is undertaken and include employee termination benefits. Costs relating to on-going activities are not provided for and are expensed as incurred.
Non-lending losses, frauds and forgeries Non-lending losses include losses arising from certain legal actions not directly related to amounts of principal outstanding for loans and advances and losses arising from forgeries, frauds and the correction of operational issues. The amounts recognised are the best estimate of the consideration required to settle the present obligation at the reporting date, taking into account the risks and uncertainties that surround the events and circumstances that affect the provision.
Other Other provisions comprise various other provisions including workers compensation, make-good provisions associated with leased premises, warranties and indemnities provided in connection with various disposals of businesses and assets, and contingent liabilities recognised as part of a business combination.
NOTES TO THE CONSOLIDATED FINANCIAL STATEMENTS
195
21. OTHER PROVISIONS (continued)
RECOGNITION AND MEASUREMENT
The Group recognises provisions when there is a present obligation arising from a past event, an outflow of economic resources is probable, and the amount of the provision can be measured reliably.
The amount recognised is the best estimate of the consideration required to settle the present obligation at the reporting date, taking into account the risks and uncertainties surrounding the timing and amount of the obligation. Where a provision is measured using the estimated cash flows required to settle the present obligation, its carrying amount is the present value of those cash flows.
KEY JUDGEMENTS AND ESTIMATES
The Group holds provisions for various obligations including customer remediation, restructuring costs, non-lending losses, fraud and forgeries and litigation related claims. These provisions involve judgements regarding the timing and outcome of future events, including estimates of expenditure required to satisfy such obligations. Where relevant, expert legal advice has been obtained and, in light of such advice, provisions and/or disclosures as deemed appropriate have been made.
In relation to customer remediation, determining the amount of the provisions, which represent management’s best estimate of the cost of settling the identified matters, requires the exercise of significant judgement. It will often be necessary to form a view on a number of different assumptions, including, the number of impacted customers, the average refund per customer, the associated remediation project costs, and the implications of regulatory exposures and customer claims having regard to their specific facts and circumstances. Consequently, the appropriateness of the underlying assumptions is reviewed on a regular basis against actual experience and other relevant evidence including expert legal advices and adjustments are made to the provisions where appropriate.
Notes to the consolidated financial statements (continued)
195ANZ 2020 Annual Report
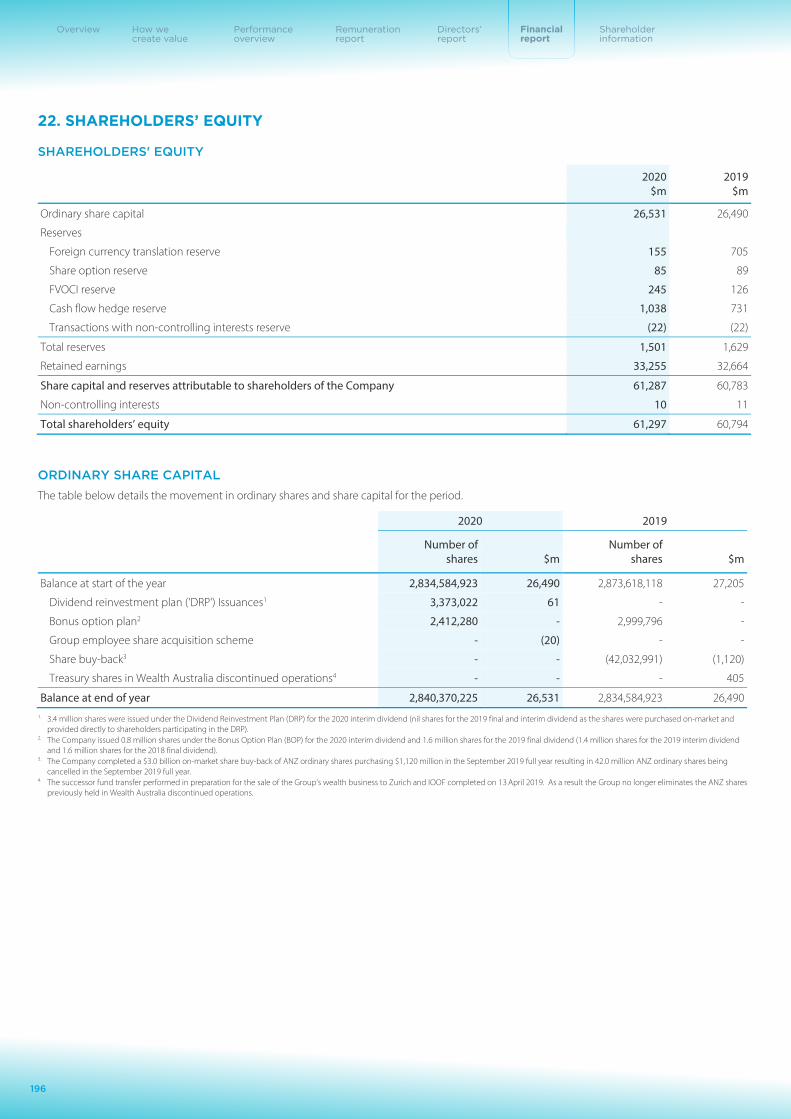
NOTES TO THE CONSOLIDATED FINANCIAL STATEMENTS (continued)
196
ANZ 2020 ANNUAL REPORT
22. SHAREHOLDERS’ EQUITY
SHAREHOLDERS' EQUITY
2020 2019 $m $m
Ordinary share capital 26,531 26,490
Reserves
Foreign currency translation reserve 155 705
Share option reserve 85 89
FVOCI reserve 245 126
Cash flow hedge reserve 1,038 731
Transactions with non-controlling interests reserve (22) (22)
Total reserves 1,501 1,629
Retained earnings 33,255 32,664
Share capital and reserves attributable to shareholders of the Company 61,287 60,783
Non-controlling interests 10 11
Total shareholders’ equity 61,297 60,794
ORDINARY SHARE CAPITAL The table below details the movement in ordinary shares and share capital for the period.
2020 2019
Number of shares
Number of shares $m $m
Balance at start of the year 2,834,584,923 26,490 2,873,618,118 27,205
Dividend reinvestment plan ('DRP') Issuances1 3,373,022 61 - -
Bonus option plan2 2,412,280 - 2,999,796 -
Group employee share acquisition scheme - (20) - -
Share buy-back3 - - (42,032,991) (1,120)
Treasury shares in Wealth Australia discontinued operations4 - - - 405
Balance at end of year 2,840,370,225 26,531 2,834,584,923 26,490 1. 3.4 million shares were issued under the Dividend Reinvestment Plan (DRP) for the 2020 interim dividend (nil shares for the 2019 final and interim dividend as the shares were purchased on-market and
provided directly to shareholders participating in the DRP). 2. The Company issued 0.8 million shares under the Bonus Option Plan (BOP) for the 2020 interim dividend and 1.6 million shares for the 2019 final dividend (1.4 million shares for the 2019 interim dividend
and 1.6 million shares for the 2018 final dividend). 3. The Company completed a $3.0 billion on-market share buy-back of ANZ ordinary shares purchasing $1,120 million in the September 2019 full year resulting in 42.0 million ANZ ordinary shares being
cancelled in the September 2019 full year. 4. The successor fund transfer performed in preparation for the sale of the Group’s wealth business to Zurich and IOOF completed on 13 April 2019. As a result the Group no longer eliminates the ANZ shares
previously held in Wealth Australia discontinued operations.
196
Overview How we create value
Performance overview
Remuneration report
Directors’ report
Financial report
Shareholder information

NOTES TO THE CONSOLIDATED FINANCIAL STATEMENTS (continued)
196
ANZ 2020 ANNUAL REPORT
22. SHAREHOLDERS’ EQUITY
SHAREHOLDERS' EQUITY
2020 2019 $m $m
Ordinary share capital 26,531 26,490
Reserves
Foreign currency translation reserve 155 705
Share option reserve 85 89
FVOCI reserve 245 126
Cash flow hedge reserve 1,038 731
Transactions with non-controlling interests reserve (22) (22)
Total reserves 1,501 1,629
Retained earnings 33,255 32,664
Share capital and reserves attributable to shareholders of the Company 61,287 60,783
Non-controlling interests 10 11
Total shareholders’ equity 61,297 60,794
ORDINARY SHARE CAPITAL The table below details the movement in ordinary shares and share capital for the period.
2020 2019
Number of shares
Number of shares $m $m
Balance at start of the year 2,834,584,923 26,490 2,873,618,118 27,205
Dividend reinvestment plan ('DRP') Issuances1 3,373,022 61 - -
Bonus option plan2 2,412,280 - 2,999,796 -
Group employee share acquisition scheme - (20) - -
Share buy-back3 - - (42,032,991) (1,120)
Treasury shares in Wealth Australia discontinued operations4 - - - 405
Balance at end of year 2,840,370,225 26,531 2,834,584,923 26,490 1. 3.4 million shares were issued under the Dividend Reinvestment Plan (DRP) for the 2020 interim dividend (nil shares for the 2019 final and interim dividend as the shares were purchased on-market and
provided directly to shareholders participating in the DRP). 2. The Company issued 0.8 million shares under the Bonus Option Plan (BOP) for the 2020 interim dividend and 1.6 million shares for the 2019 final dividend (1.4 million shares for the 2019 interim dividend
and 1.6 million shares for the 2018 final dividend). 3. The Company completed a $3.0 billion on-market share buy-back of ANZ ordinary shares purchasing $1,120 million in the September 2019 full year resulting in 42.0 million ANZ ordinary shares being
cancelled in the September 2019 full year. 4. The successor fund transfer performed in preparation for the sale of the Group’s wealth business to Zurich and IOOF completed on 13 April 2019. As a result the Group no longer eliminates the ANZ shares
previously held in Wealth Australia discontinued operations.
NOTES TO THE CONSOLIDATED FINANCIAL STATEMENTS
197
22. SHAREHOLDERS’ EQUITY (continued)
RECOGNITION AND MEASUREMENT
Ordinary shares
Ordinary shares have no par value. They entitle holders to receive dividends, or proceeds available on winding up of the Company, in proportion to the number of fully paid ordinary shares held. They are recognised at the amount paid per ordinary share net of directly attributable costs. Every holder of fully paid ordinary shares present at a meeting in person, or by proxy, is entitled to: on a show of hands, one vote; and on a poll, one vote, for each share held.
Treasury shares
Treasury shares are shares in the Company which: the ANZ Employee Share Acquisition Plan purchases on market and have not yet
distributed, or the Company issues to the ANZ Employee Share Acquisition Plan and have not yet
been distributed, or the life insurance business purchased and held to back policy liabilities in the
statutory funds prior to the successor fund transfer performed in preparation for the sale of the Group’s wealth business to Zurich and IOOF which completed on 13 April 2019.
Treasury shares are deducted from share capital and excluded from the weighted average number of ordinary shares used in the earnings per share calculations.
Reserves: Foreign currency translation reserve
Includes differences arising on translation of assets and liabilities into Australian dollars when the functional currency of a foreign operation (including subsidiaries and branches) is not Australian dollars. In this reserve, we reflect any offsetting gains or losses on hedging these exposures, together with any tax effect.
Cash flow hedge reserve
Includes fair value gains and losses associated with the effective portion of designated cash flow hedging instruments together with any tax effect.
FVOCI reserve Includes changes in the fair value of certain debt securities and equity securities included within Investment Securities together with any tax effect.
In respect of debt securities classified as measured at FVOCI, the FVOCI reserve records accumulated changes in fair value arising subsequent to initial recognition, except for those relating to allowance for expected credit losses, interest income and foreign currency exchange gains and losses which are recognised in profit or loss. As debt securities at FVOCI are recorded at fair value, the balance of the FVOCI reserve is net of the ECL allowance associated with such assets. When a debt security measured at FVOCI is derecognised, the cumulative gain or loss recognised in the FVOCI reserve in respect of that security is reclassified to profit or loss and presented in Other Operating Income.
In respect of the equity securities classified as measured at FVOCI, the FVOCI reserve records accumulated changes in fair value arising subsequent to initial recognition (including any related foreign exchange gains or losses). When an equity security measured at FVOCI is derecognised, the cumulative gain or loss recognised in the FVOCI reserve in respect of that security is not recycled to profit or loss.
Share option reserve Includes amounts which arise on the recognition of share-based compensation expense.
Transactions with non-controlling interests reserve
Includes the impact of transactions with non-controlling shareholders in their capacity as shareholders.
Non-controlling interests Share in the net assets of controlled entities attributable to equity interests which the Company does not own directly or indirectly.
Notes to the consolidated financial statements (continued)
197ANZ 2020 Annual Report

NOTES TO THE CONSOLIDATED FINANCIAL STATEMENTS (continued)
198
ANZ 2020 ANNUAL REPORT
23. CAPITAL MANAGEMENT CAPITAL MANAGEMENT STRATEGY ANZ’s capital management strategy aims to protect the interests of depositors, creditors and shareholders. We achieve this through an Internal Capital Adequacy Assessment Process (ICAAP) whereby ANZ conducts detailed strategic and capital planning over a 3 year time horizon. The process involves:
forecasting economic variables, financial performance of ANZ’s divisions and the financial impact of new strategic initiatives to be implemented during the planning period;
performing stress tests under different economic scenarios to determine the level of additional capital (‘stress capital buffer’) needed to absorb losses that may be experienced under an economic downturn;
reviewing capital ratios and targets across various classes of capital against ANZ’s risk profile; and
developing a capital plan, taking into account capital ratio targets, current and future capital issuances requirements and options around capital products, timing and markets to execute the capital plan under differing market and economic conditions.
The capital plan is approved by the Board and updated as required. The Board and senior management are provided with regular updates of ANZ’s capital position. Any material actions required to ensure ongoing prudent capital management are submitted to the Board for approval. Throughout the year, the Group maintained compliance with all the regulatory requirements related to Capital Adequacy in the jurisdictions in which it operates.
REGULATORY ENVIRONMENT Australia As ANZ is an Authorised Deposit-taking Institution (ADI) in Australia, it is primarily regulated by APRA under the Banking Act 1959 (Cth). ANZ must comply with the minimum regulatory capital requirements, prudential capital ratios and specific reporting levels that APRA sets and which are consistent with the global Basel III capital framework. This is the common framework for determining the appropriate level of bank regulatory capital as set by the Basel Committee on Banking Supervision (“BCBS”). APRA requirements are summarised below:
Regulatory Capital Definition
Common Equity Tier 1 (CET1) Capital Tier 1 Capital Tier 2 Capital Total Capital
Shareholders’ equity adjusted for specific items.
CET1 Capital plus certain securities with complying loss absorbing characteristics known as Additional Tier 1 Capital.
Subordinated debt instruments which have a minimum term of 5 years at issue date.
Tier 1 plus Tier 2 Capital.
Minimum Prudential Capital Ratios (PCRs)
CET1 Ratio Tier 1 Ratio Total Capital Ratio
CET1 Capital divided by total risk weighted assets must be at least 4.5%.
Tier 1 Capital divided by total risk weighted assets must be at least 6.0%.
Total Capital divided by total risk weighted assets must be at least 8.0%.
Reporting Levels
Level 1 Level 2 Level 3
The ADI on a stand-alone basis (that is the Company and specified subsidiaries which are consolidated to form the ADI’s Extended Licensed Entity).
The consolidated Group less certain subsidiaries and associates that are excluded under prudential standards.
A conglomerate Group at the widest level.
APRA also requires the ADI to hold additional CET1 buffers as follows:
a capital conservation buffer (CCB) of 3.5% which is inclusive of the additional 1% surcharge for domestically systemically important banks (D-SIBs). APRA has determined that ANZ is a D-SIB.
a countercyclical capital buffer which is set on a jurisdictional basis. The requirement is currently set to zero for Australia.
ANZ reports to APRA on a Level 1 and Level 2 basis, and measures capital adequacy monthly on a Level 1 and Level 2 basis, and is not yet required to maintain capital on a Level 3 basis (APRA have yet to conclude required timing for Level 3 reporting).
Life Insurance and Funds Management As required by APRA’s Prudential Standards, insurance and funds management activities are:
de-consolidated for the purposes of calculating capital adequacy; and
excluded from the risk based capital adequacy framework.
We deduct the investment in these controlled entities 100% from CET1 capital, and if we include any profits from these activities in the Group’s results, then we exclude them from the determination of CET1 capital to the extent they have not been remitted to the Company.
198
Overview How we create value
Performance overview
Remuneration report
Directors’ report
Financial report
Shareholder information

NOTES TO THE CONSOLIDATED FINANCIAL STATEMENTS (continued)
198
ANZ 2020 ANNUAL REPORT
23. CAPITAL MANAGEMENT CAPITAL MANAGEMENT STRATEGY ANZ’s capital management strategy aims to protect the interests of depositors, creditors and shareholders. We achieve this through an Internal Capital Adequacy Assessment Process (ICAAP) whereby ANZ conducts detailed strategic and capital planning over a 3 year time horizon. The process involves:
forecasting economic variables, financial performance of ANZ’s divisions and the financial impact of new strategic initiatives to be implemented during the planning period;
performing stress tests under different economic scenarios to determine the level of additional capital (‘stress capital buffer’) needed to absorb losses that may be experienced under an economic downturn;
reviewing capital ratios and targets across various classes of capital against ANZ’s risk profile; and
developing a capital plan, taking into account capital ratio targets, current and future capital issuances requirements and options around capital products, timing and markets to execute the capital plan under differing market and economic conditions.
The capital plan is approved by the Board and updated as required. The Board and senior management are provided with regular updates of ANZ’s capital position. Any material actions required to ensure ongoing prudent capital management are submitted to the Board for approval. Throughout the year, the Group maintained compliance with all the regulatory requirements related to Capital Adequacy in the jurisdictions in which it operates.
REGULATORY ENVIRONMENT Australia As ANZ is an Authorised Deposit-taking Institution (ADI) in Australia, it is primarily regulated by APRA under the Banking Act 1959 (Cth). ANZ must comply with the minimum regulatory capital requirements, prudential capital ratios and specific reporting levels that APRA sets and which are consistent with the global Basel III capital framework. This is the common framework for determining the appropriate level of bank regulatory capital as set by the Basel Committee on Banking Supervision (“BCBS”). APRA requirements are summarised below:
Regulatory Capital Definition
Common Equity Tier 1 (CET1) Capital Tier 1 Capital Tier 2 Capital Total Capital
Shareholders’ equity adjusted for specific items.
CET1 Capital plus certain securities with complying loss absorbing characteristics known as Additional Tier 1 Capital.
Subordinated debt instruments which have a minimum term of 5 years at issue date.
Tier 1 plus Tier 2 Capital.
Minimum Prudential Capital Ratios (PCRs)
CET1 Ratio Tier 1 Ratio Total Capital Ratio
CET1 Capital divided by total risk weighted assets must be at least 4.5%.
Tier 1 Capital divided by total risk weighted assets must be at least 6.0%.
Total Capital divided by total risk weighted assets must be at least 8.0%.
Reporting Levels
Level 1 Level 2 Level 3
The ADI on a stand-alone basis (that is the Company and specified subsidiaries which are consolidated to form the ADI’s Extended Licensed Entity).
The consolidated Group less certain subsidiaries and associates that are excluded under prudential standards.
A conglomerate Group at the widest level.
APRA also requires the ADI to hold additional CET1 buffers as follows:
a capital conservation buffer (CCB) of 3.5% which is inclusive of the additional 1% surcharge for domestically systemically important banks (D-SIBs). APRA has determined that ANZ is a D-SIB.
a countercyclical capital buffer which is set on a jurisdictional basis. The requirement is currently set to zero for Australia.
ANZ reports to APRA on a Level 1 and Level 2 basis, and measures capital adequacy monthly on a Level 1 and Level 2 basis, and is not yet required to maintain capital on a Level 3 basis (APRA have yet to conclude required timing for Level 3 reporting).
Life Insurance and Funds Management As required by APRA’s Prudential Standards, insurance and funds management activities are:
de-consolidated for the purposes of calculating capital adequacy; and
excluded from the risk based capital adequacy framework.
We deduct the investment in these controlled entities 100% from CET1 capital, and if we include any profits from these activities in the Group’s results, then we exclude them from the determination of CET1 capital to the extent they have not been remitted to the Company.
NOTES TO THE CONSOLIDATED FINANCIAL STATEMENTS
199
23. CAPITAL MANAGEMENT (continued)
Outside Australia In addition to APRA, the Company’s branch operations and major banking subsidiary operations are also overseen by local regulators such as the Reserve Bank of New Zealand, the US Federal Reserve, the UK Prudential Regulation Authority, the Monetary Authority of Singapore, the Hong Kong Monetary Authority and the China Banking and Insurance Regulatory Commission. They may impose minimum capital levels on operations in their individual jurisdictions.
CAPITAL ADEQUACY1 The following table provides details of the Group’s capital adequacy ratios at 30 September:
2020 2019 $m $m
Qualifying capital
Tier 1
Shareholders' equity and non-controlling interests 61,297 60,794
Prudential adjustments to shareholders' equity (205) 120
Gross Common Equity Tier 1 capital 61,092 60,914
Deductions (12,390) (13,559)
Common Equity Tier 1 capital 48,702 47,355
Additional Tier 1 capital2 7,779 7,866
Tier 1 capital 56,481 55,221
Tier 2 capital3 13,957 8,549
Total qualifying capital 70,438 63,770
Capital adequacy ratios (Level 2)
Common Equity Tier 1 11.3% 11.4%
Tier 1 13.2% 13.2%
Tier 2 3.3% 2.1%
Total capital ratio 16.4% 15.3%
Risk weighted assets 429,384 416,961 1. This information is not within the scope of the external audit of the Group Financial Report by the Group’s external auditor, KPMG. The information presented in this table is a regulatory requirement
disclosed in Part A of the APRA Reporting Form (ARF) 110 Capital Adequacy which will be subject to audit in accordance with Prudential Standard APS 310 Audit and Related Matters. 2. This includes Additional Tier 1 capital of $8,196 million (2019: $8,171 million) (refer to Note 15 Debt issuances), reduced for regulatory adjustments and deductions of $417 million (2019: $305 million). 3. This includes Tier 2 capital of $12,865 million (2019: $8,415 million) (refer to Note 15 Debt issuances), general reserve for impairment of financial assets of $1,813 million (2019: $296 million) and deductions
for regulatory adjustments of $721 million (2019: $162 million).
Notes to the consolidated financial statements (continued)
199ANZ 2020 Annual Report

NOTES TO THE CONSOLIDATED FINANCIAL STATEMENTS (continued)
200
ANZ 2020 ANNUAL REPORT
24. PARENT ENTITY FINANCIAL INFORMATION
Australia and New Zealand Banking Group Limited (the Company) has prepared a separate set of financial statements to satisfy the requirements of the Australian Financial Services Licence it holds with ASIC. These separate Company financial statements are available on the ANZ website at anz.com and have been lodged with ASIC. Selected financial information of the Company is provided below:
SUMMARY FINANCIAL INFORMATION
2020 2019 $m $m
Income statement information for the financial year Profit after tax for the year 2,806 4,447 Total comprehensive income for the year 3,007 5,413
Balance sheet information as at the end of the financial year Cash and cash equivalents 98,083 77,949 Net loans and advances 488,002 484,655 Total assets 979,078 914,832 Deposits and other borrowings 558,136 524,241 Total liabilities 925,806 861,618
Shareholders' equity Ordinary share capital 26,454 26,413 Reserves 1,018 840 Retained earnings 25,800 25,961
Total shareholders' equity 53,272 53,214 CREDIT RELATED COMMITMENTS AND CONTINGENCIES
2020 2019 $m $m
Contract amount of: Undrawn facilities 191,300 171,881 Guarantees and letters of credit 20,640 20,375 Performance related contingencies 15,505 20,097
Total 227,445 212,353
The contingent liabilities of the Group described under Other contingent liabilities in Note 33 are contingent liabilities of the parent entity (some are also contingent liabilities of other Group companies).
200
Overview How we create value
Performance overview
Remuneration report
Directors’ report
Financial report
Shareholder information
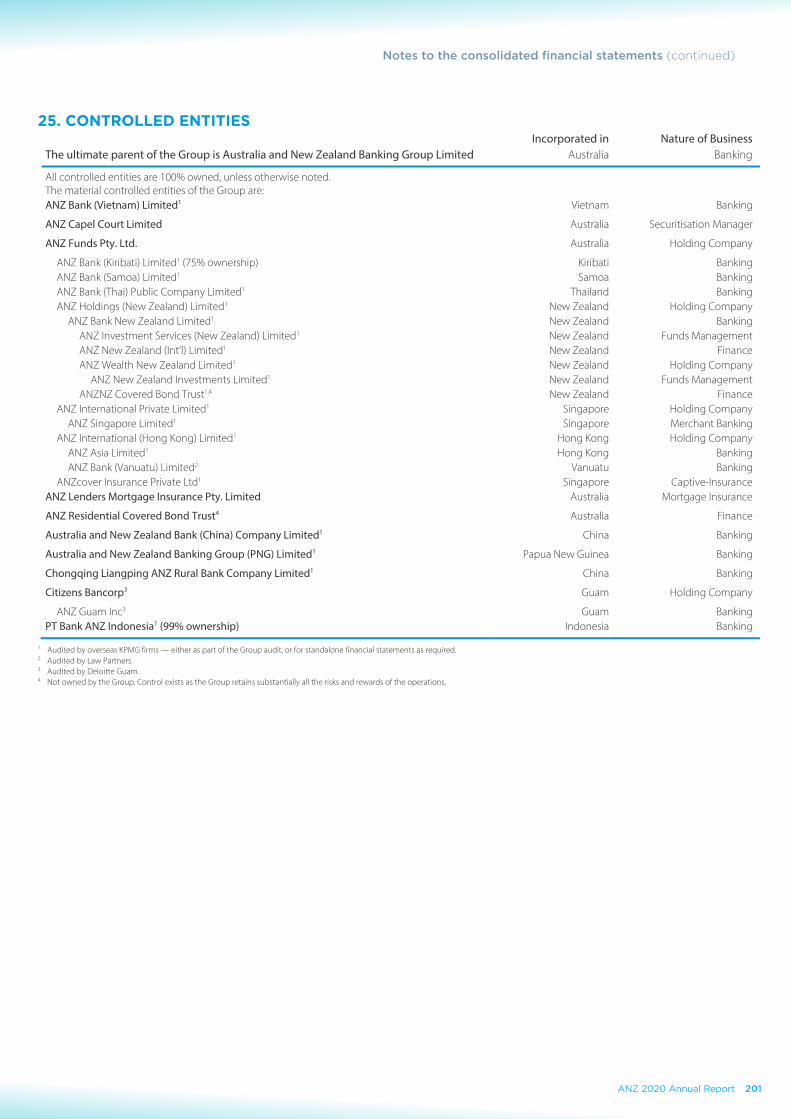
NOTES TO THE CONSOLIDATED FINANCIAL STATEMENTS (continued)
200
ANZ 2020 ANNUAL REPORT
24. PARENT ENTITY FINANCIAL INFORMATION
Australia and New Zealand Banking Group Limited (the Company) has prepared a separate set of financial statements to satisfy the requirements of the Australian Financial Services Licence it holds with ASIC. These separate Company financial statements are available on the ANZ website at anz.com and have been lodged with ASIC. Selected financial information of the Company is provided below:
SUMMARY FINANCIAL INFORMATION
2020 2019 $m $m
Income statement information for the financial year Profit after tax for the year 2,806 4,447 Total comprehensive income for the year 3,007 5,413
Balance sheet information as at the end of the financial year Cash and cash equivalents 98,083 77,949 Net loans and advances 488,002 484,655 Total assets 979,078 914,832 Deposits and other borrowings 558,136 524,241 Total liabilities 925,806 861,618
Shareholders' equity Ordinary share capital 26,454 26,413 Reserves 1,018 840 Retained earnings 25,800 25,961
Total shareholders' equity 53,272 53,214 CREDIT RELATED COMMITMENTS AND CONTINGENCIES
2020 2019 $m $m
Contract amount of: Undrawn facilities 191,300 171,881 Guarantees and letters of credit 20,640 20,375 Performance related contingencies 15,505 20,097
Total 227,445 212,353
The contingent liabilities of the Group described under Other contingent liabilities in Note 33 are contingent liabilities of the parent entity (some are also contingent liabilities of other Group companies).
NOTES TO THE CONSOLIDATED FINANCIAL STATEMENTS
201
25. CONTROLLED ENTITIES
The ultimate parent of the Group is Australia and New Zealand Banking Group Limited Incorporated in
Australia Nature of Business
Banking
All controlled entities are 100% owned, unless otherwise noted. The material controlled entities of the Group are: ANZ Bank (Vietnam) Limited1 Vietnam Banking
ANZ Capel Court Limited Australia Securitisation Manager
ANZ Funds Pty. Ltd. Australia Holding Company
ANZ Bank (Kiribati) Limited1 (75% ownership) Kiribati Banking ANZ Bank (Samoa) Limited1 Samoa Banking ANZ Bank (Thai) Public Company Limited1 Thailand Banking ANZ Holdings (New Zealand) Limited1 New Zealand Holding Company
ANZ Bank New Zealand Limited1 New Zealand Banking ANZ Investment Services (New Zealand) Limited1 New Zealand Funds Management ANZ New Zealand (Int’l) Limited1 New Zealand Finance ANZ Wealth New Zealand Limited1 New Zealand Holding Company
ANZ New Zealand Investments Limited1 New Zealand Funds Management ANZNZ Covered Bond Trust1,4 New Zealand Finance
ANZ International Private Limited1 Singapore Holding Company ANZ Singapore Limited1 Singapore Merchant Banking
ANZ International (Hong Kong) Limited1 Hong Kong Holding Company ANZ Asia Limited1 Hong Kong Banking ANZ Bank (Vanuatu) Limited2 Vanuatu Banking
ANZcover Insurance Private Ltd1 Singapore Captive-Insurance ANZ Lenders Mortgage Insurance Pty. Limited Australia Mortgage Insurance
ANZ Residential Covered Bond Trust4 Australia Finance
Australia and New Zealand Bank (China) Company Limited1 China Banking
Australia and New Zealand Banking Group (PNG) Limited1 Papua New Guinea Banking
Chongqing Liangping ANZ Rural Bank Company Limited1 China Banking
Citizens Bancorp3 Guam Holding Company
ANZ Guam Inc3 Guam Banking PT Bank ANZ Indonesia1 (99% ownership) Indonesia Banking
1. Audited by overseas KPMG firms — either as part of the Group audit, or for standalone financial statements as required. 2. Audited by Law Partners. 3. Audited by Deloitte Guam. 4. Not owned by the Group. Control exists as the Group retains substantially all the risks and rewards of the operations.
Notes to the consolidated financial statements (continued)
201ANZ 2020 Annual Report

NOTES TO THE CONSOLIDATED FINANCIAL STATEMENTS (continued)
202
ANZ 2020 ANNUAL REPORT
25. CONTROLLED ENTITIES (continued)
CHANGES TO MATERIAL CONTROLLED ENTITIES The following changes to our material entities have occurred during the year ended 30 September 2020.
In January 2020, OnePath Funds Management Limited and OnePath Custodians Pty Limited was sold to IOOF Holdings Limited. The holding company of these entities, ANZ Wealth Australia Limited, is no longer considered to be a material entity.
In September 2020, UDC Finance Limited was sold to Shinsei Bank Limited.
RECOGNITION AND MEASUREMENT
The Group’s subsidiaries are those entities it controls through:
being exposed to, or having rights to, variable returns from the entity; and
being able to affect those returns through its power over the entity.
The Group assesses whether it has power over those entities by examining the Group’s existing rights to direct the relevant activities of the entity.
If the Group sells or acquires subsidiaries during the year, it includes their operating results in the Group results to the date of disposal or from the date of acquisition. When the Group’s control ceases, it derecognises the assets and liabilities of the subsidiary, any related non-controlling interest and other components of equity.
When the Group ceases to control a subsidiary, it:
measures any retained interest in the entity at fair value; and
recognises any resulting gain or loss in profit or loss.
If the Group’s ownership interest in a subsidiary changes in a way that does not result in a loss of control, then the Group accounts for that as a transaction with equity holders in their capacity as equity holders.
All transactions between Group entities are eliminated on consolidation.
202
Overview How we create value
Performance overview
Remuneration report
Directors’ report
Financial report
Shareholder information
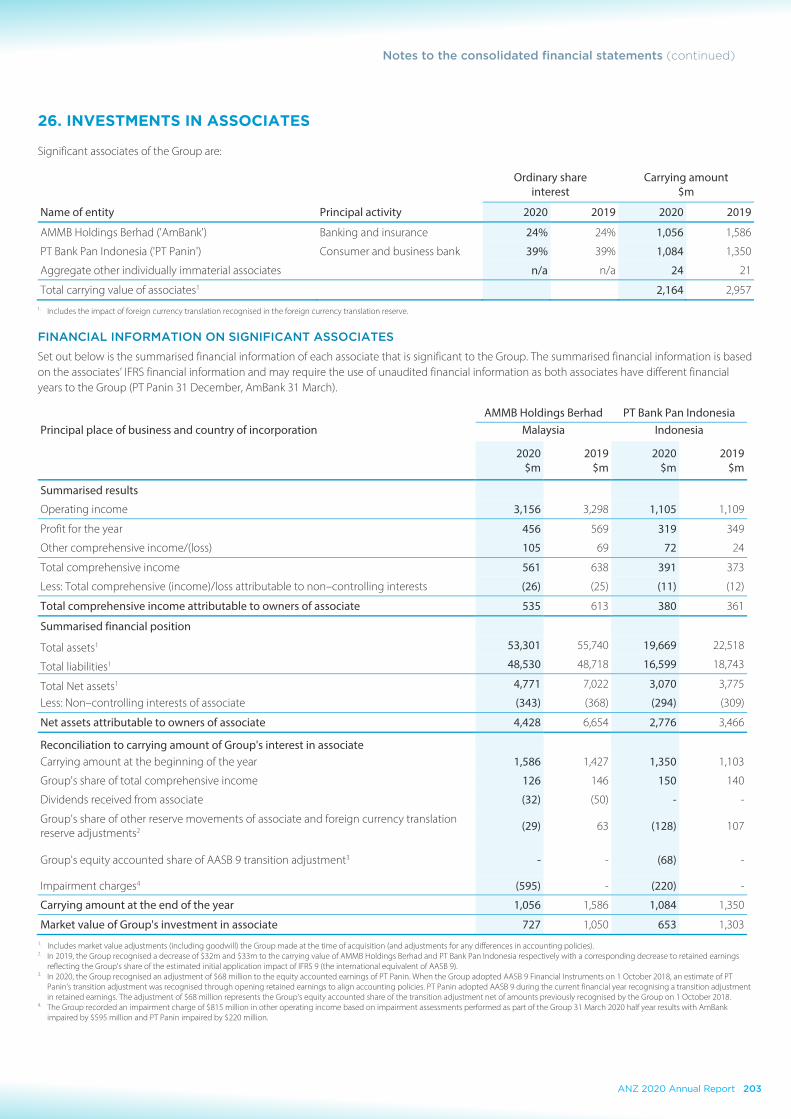
NOTES TO THE CONSOLIDATED FINANCIAL STATEMENTS (continued)
202
ANZ 2020 ANNUAL REPORT
25. CONTROLLED ENTITIES (continued)
CHANGES TO MATERIAL CONTROLLED ENTITIES The following changes to our material entities have occurred during the year ended 30 September 2020.
In January 2020, OnePath Funds Management Limited and OnePath Custodians Pty Limited was sold to IOOF Holdings Limited. The holding company of these entities, ANZ Wealth Australia Limited, is no longer considered to be a material entity.
In September 2020, UDC Finance Limited was sold to Shinsei Bank Limited.
RECOGNITION AND MEASUREMENT
The Group’s subsidiaries are those entities it controls through:
being exposed to, or having rights to, variable returns from the entity; and
being able to affect those returns through its power over the entity.
The Group assesses whether it has power over those entities by examining the Group’s existing rights to direct the relevant activities of the entity.
If the Group sells or acquires subsidiaries during the year, it includes their operating results in the Group results to the date of disposal or from the date of acquisition. When the Group’s control ceases, it derecognises the assets and liabilities of the subsidiary, any related non-controlling interest and other components of equity.
When the Group ceases to control a subsidiary, it:
measures any retained interest in the entity at fair value; and
recognises any resulting gain or loss in profit or loss.
If the Group’s ownership interest in a subsidiary changes in a way that does not result in a loss of control, then the Group accounts for that as a transaction with equity holders in their capacity as equity holders.
All transactions between Group entities are eliminated on consolidation.
NOTES TO THE CONSOLIDATED FINANCIAL STATEMENTS
203
26. INVESTMENTS IN ASSOCIATES
Significant associates of the Group are:
Ordinary share
interest Carrying amount
$m
Name of entity Principal activity 2020 2019 2020 2019
AMMB Holdings Berhad ('AmBank') Banking and insurance 24% 24% 1,056 1,586
PT Bank Pan Indonesia ('PT Panin') Consumer and business bank 39% 39% 1,084 1,350
Aggregate other individually immaterial associates n/a n/a 24 21
Total carrying value of associates1 2,164 2,957 1. Includes the impact of foreign currency translation recognised in the foreign currency translation reserve.
FINANCIAL INFORMATION ON SIGNIFICANT ASSOCIATES
Set out below is the summarised financial information of each associate that is significant to the Group. The summarised financial information is based on the associates’ IFRS financial information and may require the use of unaudited financial information as both associates have different financial years to the Group (PT Panin 31 December, AmBank 31 March).
AMMB Holdings Berhad PT Bank Pan Indonesia Principal place of business and country of incorporation Malaysia Indonesia
2020 2019 2020 2019 $m $m $m $m
Summarised results
Operating income 3,156 3,298 1,105 1,109
Profit for the year 456 569 319 349
Other comprehensive income/(loss) 105 69 72 24
Total comprehensive income 561 638 391 373
Less: Total comprehensive (income)/loss attributable to non–controlling interests (26) (25) (11) (12)
Total comprehensive income attributable to owners of associate 535 613 380 361
Summarised financial position
Total assets1 53,301 55,740 19,669 22,518
Total liabilities1 48,530 48,718 16,599 18,743
Total Net assets1 4,771 7,022 3,070 3,775
Less: Non–controlling interests of associate (343) (368) (294) (309)
Net assets attributable to owners of associate 4,428 6,654 2,776 3,466
Reconciliation to carrying amount of Group's interest in associate Carrying amount at the beginning of the year 1,586 1,427 1,350 1,103
Group's share of total comprehensive income 126 146 150 140
Dividends received from associate (32) (50) - -
Group's share of other reserve movements of associate and foreign currency translation reserve adjustments2 (29) 63 (128) 107
Group's equity accounted share of AASB 9 transition adjustment3 - - (68) -
Impairment charges4 (595) - (220) -
Carrying amount at the end of the year 1,056 1,586 1,084 1,350
Market value of Group's investment in associate 727 1,050 653 1,303 1. Includes market value adjustments (including goodwill) the Group made at the time of acquisition (and adjustments for any differences in accounting policies). 2. In 2019, the Group recognised a decrease of $32m and $33m to the carrying value of AMMB Holdings Berhad and PT Bank Pan Indonesia respectively with a corresponding decrease to retained earnings
reflecting the Group's share of the estimated initial application impact of IFRS 9 (the international equivalent of AASB 9). 3. In 2020, the Group recognised an adjustment of $68 million to the equity accounted earnings of PT Panin. When the Group adopted AASB 9 Financial Instruments on 1 October 2018, an estimate of PT
Panin’s transition adjustment was recognised through opening retained earnings to align accounting policies. PT Panin adopted AASB 9 during the current financial year recognising a transition adjustment in retained earnings. The adjustment of $68 million represents the Group’s equity accounted share of the transition adjustment net of amounts previously recognised by the Group on 1 October 2018.
4. The Group recorded an impairment charge of $815 million in other operating income based on impairment assessments performed as part of the Group 31 March 2020 half year results with AmBank impaired by $595 million and PT Panin impaired by $220 million.
Notes to the consolidated financial statements (continued)
203ANZ 2020 Annual Report

NOTES TO THE CONSOLIDATED FINANCIAL STATEMENTS (continued)
204
ANZ 2020 ANNUAL REPORT
26. INVESTMENTS IN ASSOCIATES (continued) IMPAIRMENT ASSESSMENT The Group assesses the carrying value of its associate investments for impairment indicators.
During the year the Group identified an indicator of impairment as neither the market values of the investments in AMMB Holdings Berhad (AmBank) and PT Bank Pan Indonesia (PT Panin) (based on share price) nor the value-in-use (VIU) calculation supported the carrying value of either investment. Accordingly, the Group recorded an impairment charge of $815 million ($595 million for AmBank and $220 million for PT Panin).
VIU assessments were also conducted as at 30 September 2020 given the market values were below their carrying values. The assumptions used in the VIU were updated to reflect the ongoing impact of COVID-19 and the uncertainty of the future performance of these investments. The VIU assessments supported the carrying value of both Ambank and PT Panin as at 30 September 2020, however did not indicate the recoverable amount of either investments had increased sufficiently to reverse any of the impairment recorded during the year.
RECOGNITION AND MEASUREMENT
An associate is an entity over which the Group has significant influence over its operating and financial policies but does not control. The Group accounts for associates using the equity method. Its investments in associates are carried at cost plus the post-acquisition share of changes in the associate’s net assets less accumulated impairments. Dividends the Group receives from associates are recognised as a reduction in the carrying amount of the investment. The Group includes goodwill relating to the associate in the carrying amount of the investment. It does not individually test the goodwill incorporated in the associates carrying amount for impairment.
At least at each reporting date, the Group reviews investments in associates for any indication of impairment. If an indication of impairment exists, then the Group determines the recoverable amount of the associate using the higher of:
the associate’s fair value less cost of disposal; and its value-in use.
We use a discounted cash flow methodology, and when applicable, other methodologies (such as capitalisation of earnings methodology), to determine the recoverable amount.
KEY JUDGEMENTS AND ESTIMATES
The ongoing impact of COVID-19 on the valuation of AmBank and PT Panin is uncertain. Significant management judgment is required to determine the key assumptions underpinning the VIU calculations. Factors that may change in subsequent periods and lead to potential future impairments include lower than forecast earnings levels in the near term and/or a decrease in the long term growth forecasts, increases to required levels of regulatory capital and an increase in the post-tax discount rate arising from an increase in the risk premium or risk-free rates.
The key assumptions used in the value-in-use calculation are outlined below:
As at 30 September 2020 AmBank PT Panin
Post-tax discount rate 11.3% 15.2%
Terminal growth rate 4.8% 5.3%
Expected earnings growth (compound annual growth rate – 5 years) 2.8% 4.2%
Common Equity Tier 1 ratio (5 year average) 12.9% 12.8%
The VIU calculations are sensitive to changes in the underlying assumptions with reasonably possible changes in key assumptions having a positive or negative impact on the VIU outcome, and as such the recoverable amount of the investment.
A change in the September 2020 post-tax discount rate by +/- 50bps would impact the VIU outcome for PT Panin by $(46 million) / $50 million, and $(87 million) / $99 million for AmBank.
A change in the September 2020 terminal growth rate by +/- 25bps would impact the VIU outcome for PT Panin by $8 million / ($8 million) and $47 million / ($44 million) for Ambank.
Neither investment would be impaired if the discount rate were increased or the terminal growth rate reduced by the reasonably possible changes above.
204
Overview How we create value
Performance overview
Remuneration report
Directors’ report
Financial report
Shareholder information

NOTES TO THE CONSOLIDATED FINANCIAL STATEMENTS (continued)
204
ANZ 2020 ANNUAL REPORT
26. INVESTMENTS IN ASSOCIATES (continued) IMPAIRMENT ASSESSMENT The Group assesses the carrying value of its associate investments for impairment indicators.
During the year the Group identified an indicator of impairment as neither the market values of the investments in AMMB Holdings Berhad (AmBank) and PT Bank Pan Indonesia (PT Panin) (based on share price) nor the value-in-use (VIU) calculation supported the carrying value of either investment. Accordingly, the Group recorded an impairment charge of $815 million ($595 million for AmBank and $220 million for PT Panin).
VIU assessments were also conducted as at 30 September 2020 given the market values were below their carrying values. The assumptions used in the VIU were updated to reflect the ongoing impact of COVID-19 and the uncertainty of the future performance of these investments. The VIU assessments supported the carrying value of both Ambank and PT Panin as at 30 September 2020, however did not indicate the recoverable amount of either investments had increased sufficiently to reverse any of the impairment recorded during the year.
RECOGNITION AND MEASUREMENT
An associate is an entity over which the Group has significant influence over its operating and financial policies but does not control. The Group accounts for associates using the equity method. Its investments in associates are carried at cost plus the post-acquisition share of changes in the associate’s net assets less accumulated impairments. Dividends the Group receives from associates are recognised as a reduction in the carrying amount of the investment. The Group includes goodwill relating to the associate in the carrying amount of the investment. It does not individually test the goodwill incorporated in the associates carrying amount for impairment.
At least at each reporting date, the Group reviews investments in associates for any indication of impairment. If an indication of impairment exists, then the Group determines the recoverable amount of the associate using the higher of:
the associate’s fair value less cost of disposal; and its value-in use.
We use a discounted cash flow methodology, and when applicable, other methodologies (such as capitalisation of earnings methodology), to determine the recoverable amount.
KEY JUDGEMENTS AND ESTIMATES
The ongoing impact of COVID-19 on the valuation of AmBank and PT Panin is uncertain. Significant management judgment is required to determine the key assumptions underpinning the VIU calculations. Factors that may change in subsequent periods and lead to potential future impairments include lower than forecast earnings levels in the near term and/or a decrease in the long term growth forecasts, increases to required levels of regulatory capital and an increase in the post-tax discount rate arising from an increase in the risk premium or risk-free rates.
The key assumptions used in the value-in-use calculation are outlined below:
As at 30 September 2020 AmBank PT Panin
Post-tax discount rate 11.3% 15.2%
Terminal growth rate 4.8% 5.3%
Expected earnings growth (compound annual growth rate – 5 years) 2.8% 4.2%
Common Equity Tier 1 ratio (5 year average) 12.9% 12.8%
The VIU calculations are sensitive to changes in the underlying assumptions with reasonably possible changes in key assumptions having a positive or negative impact on the VIU outcome, and as such the recoverable amount of the investment.
A change in the September 2020 post-tax discount rate by +/- 50bps would impact the VIU outcome for PT Panin by $(46 million) / $50 million, and $(87 million) / $99 million for AmBank.
A change in the September 2020 terminal growth rate by +/- 25bps would impact the VIU outcome for PT Panin by $8 million / ($8 million) and $47 million / ($44 million) for Ambank.
Neither investment would be impaired if the discount rate were increased or the terminal growth rate reduced by the reasonably possible changes above.
NOTES TO THE CONSOLIDATED FINANCIAL STATEMENTS
205
27. STRUCTURED ENTITIES
A Structured Entity (SE) is an entity that has been designed such that voting or similar rights are not the dominant factor in determining who controls the entity. SEs are generally established with restrictions on their ongoing activities in order to achieve narrow and well defined objectives.
SEs are classified as subsidiaries and consolidated when control exists. If the Group does not control a SE, then it is not consolidated. This note provides information on both consolidated and unconsolidated SEs.
The Group’s involvement with SEs is as follows:
Type Details
Securitisation The Group controls SEs established to securitise customer loans and advances that it has originated, in order to diversify sources of funding for liquidity management. Such transactions involve transfers to an internal securitisation (bankruptcy remote) vehicle used to create assets that are eligible for repurchase under agreements with the applicable central bank. These internal securitisation SEs are consolidated. Refer to Note 28 Transfers of Financial Assets for further details.
The Group also establishes SEs on behalf of customers to securitise their loans or receivables. The Group may manage these securitisation vehicles or provide liquidity or other support. Additionally, the Group may acquire interests in securitisation vehicles set up by third parties through holding securities issued by such entities. In limited circumstances where control exists, the Group consolidates the SE.
Covered bond issuances Certain loans and advances have been assigned to bankruptcy remote SEs to provide security for issuances of debt securities by the Group. The Group retains control over these SEs and therefore they are consolidated. Refer to Note 28 Transfers of Financial Assets for further details.
Structured finance arrangements
The Group is involved with SEs established:
in connection with structured lending transactions to facilitate debt syndication and/or to ring-fence collateral; and
to own assets that are leased to customers in structured leasing transactions.
The Group may manage the SE, hold minor amounts of the SE’s capital, or provide risk management products (derivatives) to the SE. In most instances, the Group does not control these SEs. In limited circumstances where control exists, the Group consolidates the SE.
Funds management activities The Group conducts investment management and other fiduciary activities as a responsible entity, trustee, custodian or manager for investment funds and trusts – including superannuation funds and wholesale and retail trusts (collectively ‘Investment Funds’). The Investment Funds are financed through the issuance of puttable units to investors. The Group’s exposure to Investment Funds is limited to receiving fees for services and derivatives entered into for risk management purposes. These interests do not create significant exposures to the funds that would allow the Group to control the funds. Therefore, the funds are not consolidated.
Notes to the consolidated financial statements (continued)
205ANZ 2020 Annual Report

NOTES TO THE CONSOLIDATED FINANCIAL STATEMENTS (continued)
206
ANZ 2020 ANNUAL REPORT
27. STRUCTURED ENTITIES (continued)
CONSOLIDATED STRUCTURED ENTITIES
FINANCIAL OR OTHER SUPPORT PROVIDED TO CONSOLIDATED STRUCTURED ENTITIES The Group provides financial support to consolidated SEs as outlined below. As these are intra-group transactions, they are eliminated on consolidation:
Securitisation and covered bond issuances
The Group provides lending facilities, derivatives and commitments to these SEs and/or holds debt instruments that they have issued.
Structured finance arrangements
The assets held by these SEs are normally pledged as collateral for financing provided. Certain consolidated SEs are financed entirely by the Group while others are financed by syndicated loan facilities in which the Group is a participant. The financing provided by the Group includes lending facilities where the Group’s exposure is limited to the amount of the loan and any undrawn amount. Additionally, the Group has provided Letters of Support to these consolidated SEs confirming that the Group will not demand repayment of the financing provided for the ensuing 12 month period.
The Group did not provide any non-contractual support to consolidated SEs during the year (2019: nil). Other than as disclosed above, the Group does not have any current intention to provide financial or other support to consolidated SEs.
UNCONSOLIDATED STRUCTURED ENTITIES
GROUP’S INTEREST IN UNCONSOLIDATED STRUCTURED ENTITIES An ‘interest’ in an unconsolidated SE is any form of contractual or non-contractual involvement with a SE that exposes the Group to variability of returns from the performance of that SE. These interests include, but are not limited to: holdings of debt or equity securities; derivatives that pass-on risks specific to the performance of the SE; lending; loan commitments; financial guarantees; and fees from funds management activities.
For the purpose of disclosing interests in unconsolidated SEs:
no disclosure is made if the Group’s involvement is not more than a passive interest - for example: when the Group’s involvement constitutes a typical customer-supplier relationship. On this basis, exposures to unconsolidated SEs that arise from lending, trading and investing activities are not considered disclosable interests - unless the design of the structured entity allows the Group to participate in decisions about the relevant activities (being those that significantly affect the entity’s returns).
‘interests’ do not include derivatives intended to expose the Group to market-risk (rather than performance risk specific to the SE) or derivatives through which the Group creates, rather than absorbs, variability of the unconsolidated SE (such as purchase of credit protection under a credit default swap).
The table below sets out the Group’s interests in unconsolidated SEs together with the maximum exposure to loss that could arise from those interests:
Securitisation Structured finance Total
2020 2019 2020 2019 2020 2019 $m $m $m $m $m $m
On-balance sheet interests
Investment securities 2,280 1,923 - - 2,280 1,923
Gross loans and advances 8,479 7,679 74 110 8,553 7,789
Total on-balance sheet 10,759 9,602 74 110 10,833 9,712
Off-balance sheet interests
Commitments (facilities undrawn) 2,072 1,531 22 9 2,094 1,540
Guarantees 40 67 - - 40 67
Total off-balance sheet 2,112 1,598 22 9 2,134 1,607
Maximum exposure to loss 12,871 11,200 96 119 12,967 11,319
In addition to the interests above, the Group earned funds management fees from unconsolidated investment funds of $285 million (2019: $509 million) during the year.
206
Overview How we create value
Performance overview
Remuneration report
Directors’ report
Financial report
Shareholder information

NOTES TO THE CONSOLIDATED FINANCIAL STATEMENTS (continued)
206
ANZ 2020 ANNUAL REPORT
27. STRUCTURED ENTITIES (continued)
CONSOLIDATED STRUCTURED ENTITIES
FINANCIAL OR OTHER SUPPORT PROVIDED TO CONSOLIDATED STRUCTURED ENTITIES The Group provides financial support to consolidated SEs as outlined below. As these are intra-group transactions, they are eliminated on consolidation:
Securitisation and covered bond issuances
The Group provides lending facilities, derivatives and commitments to these SEs and/or holds debt instruments that they have issued.
Structured finance arrangements
The assets held by these SEs are normally pledged as collateral for financing provided. Certain consolidated SEs are financed entirely by the Group while others are financed by syndicated loan facilities in which the Group is a participant. The financing provided by the Group includes lending facilities where the Group’s exposure is limited to the amount of the loan and any undrawn amount. Additionally, the Group has provided Letters of Support to these consolidated SEs confirming that the Group will not demand repayment of the financing provided for the ensuing 12 month period.
The Group did not provide any non-contractual support to consolidated SEs during the year (2019: nil). Other than as disclosed above, the Group does not have any current intention to provide financial or other support to consolidated SEs.
UNCONSOLIDATED STRUCTURED ENTITIES
GROUP’S INTEREST IN UNCONSOLIDATED STRUCTURED ENTITIES An ‘interest’ in an unconsolidated SE is any form of contractual or non-contractual involvement with a SE that exposes the Group to variability of returns from the performance of that SE. These interests include, but are not limited to: holdings of debt or equity securities; derivatives that pass-on risks specific to the performance of the SE; lending; loan commitments; financial guarantees; and fees from funds management activities.
For the purpose of disclosing interests in unconsolidated SEs:
no disclosure is made if the Group’s involvement is not more than a passive interest - for example: when the Group’s involvement constitutes a typical customer-supplier relationship. On this basis, exposures to unconsolidated SEs that arise from lending, trading and investing activities are not considered disclosable interests - unless the design of the structured entity allows the Group to participate in decisions about the relevant activities (being those that significantly affect the entity’s returns).
‘interests’ do not include derivatives intended to expose the Group to market-risk (rather than performance risk specific to the SE) or derivatives through which the Group creates, rather than absorbs, variability of the unconsolidated SE (such as purchase of credit protection under a credit default swap).
The table below sets out the Group’s interests in unconsolidated SEs together with the maximum exposure to loss that could arise from those interests:
Securitisation Structured finance Total
2020 2019 2020 2019 2020 2019 $m $m $m $m $m $m
On-balance sheet interests
Investment securities 2,280 1,923 - - 2,280 1,923
Gross loans and advances 8,479 7,679 74 110 8,553 7,789
Total on-balance sheet 10,759 9,602 74 110 10,833 9,712
Off-balance sheet interests
Commitments (facilities undrawn) 2,072 1,531 22 9 2,094 1,540
Guarantees 40 67 - - 40 67
Total off-balance sheet 2,112 1,598 22 9 2,134 1,607
Maximum exposure to loss 12,871 11,200 96 119 12,967 11,319
In addition to the interests above, the Group earned funds management fees from unconsolidated investment funds of $285 million (2019: $509 million) during the year.
NOTES TO THE CONSOLIDATED FINANCIAL STATEMENTS
207
27. STRUCTURED ENTITIES (continued)
The Group’s maximum exposure to loss represents the maximum amount of loss that the Group could incur as a result of its involvement with unconsolidated SEs if loss events were to take place — regardless of the probability of occurrence. This does not in any way represent the actual losses expected to be incurred. Furthermore, the maximum exposure to loss is stated gross of the effects of hedging and collateral arrangements entered into to mitigate ANZ’s exposure to loss.
The maximum exposure to loss has been determined as:
the carrying amount of Investment securities measured at amortised cost; and
the carrying amount plus the undrawn amount of any committed loans and advances.
The size of unconsolidated SEs is indicated by total assets which vary by SE with a maximum value of approximately $5.1 billion.
The Group did not provide any non-contractual support to unconsolidated SEs during the year (2019: nil) nor does it have any current intention to provide financial or other support to unconsolidated SEs.
SPONSORED UNCONSOLIDATED STRUCTURED ENTITIES The Group may also sponsor unconsolidated SEs in which it has no disclosable interest.
For the purposes of this disclosure, the Group considers itself the ‘sponsor’ of an unconsolidated SE if it is the primary party involved in the design and establishment of that SE and:
the Group is the major user of that SE; or
the Group’s name appears in the name of that SE, or on its products; or
the Group provides implicit or explicit guarantees of that SE’s performance.
The Group has sponsored the ANZ PIE Fund in New Zealand, which invests only in deposits with ANZ Bank New Zealand Limited. The Group does not provide any implicit or explicit guarantees of the capital value or performance of investments in the ANZ PIE Fund. There was no income received from, nor assets transferred to, this entity during the year.
KEY JUDGEMENTS AND ESTIMATES
Significant judgement is required in assessing whether the Group has control over Structured Entities. Judgement is required to determine the existence of:
power over the relevant activities (being those that significantly affect the entity’s returns);
exposure to variable returns of the entity; and
the ability to use its power over the entity to affect the Group’s returns.
Notes to the consolidated financial statements (continued)
207ANZ 2020 Annual Report

NOTES TO THE CONSOLIDATED FINANCIAL STATEMENTS (continued)
208
ANZ 2020 ANNUAL REPORT
28. TRANSFERS OF FINANCIAL ASSETS
In the normal course of business the Group enters into transactions where it transfers financial assets directly to third parties or to SEs. These transfers may give rise to the Group fully, or partially, derecognising those financial assets - depending on the Group’s exposure to the risks and rewards or control over the transferred assets. If the Group retains substantially all of the risk and rewards of a transferred asset, the transfer does not qualify for derecognition and the asset remains on the Group’s balance sheet in its entirety.
SECURITISATIONS Net loans and advances include residential mortgages securitised under the Group’s securitisation programs which are assigned to bankruptcy remote SEs to provide security for obligations payable on the notes issued by the SEs. The holders of the issued notes have full recourse to the pool of residential mortgages which have been securitised and the Group cannot otherwise pledge or dispose of the transferred assets.
In some instances the Group is also the holder of the securitised notes. In addition, the Group is entitled to any residual income of the SEs and sometimes enters into derivatives with the SEs. The Group retains the risks and rewards of the residential mortgages and continues to recognise the mortgages as financial assets. The obligation to pay this amount to the SE is recognised as a financial liability of the Group.
The Group is exposed to variable returns from its involvement with these securitisation SEs and has the ability to affect those returns through its power over the SEs activities. The SEs are therefore consolidated by the Group.
COVERED BONDS The Group operates various global covered bond programs to raise funding in its primary markets. Net loans and advances include residential mortgages assigned to bankruptcy remote SEs associated with these covered bond programs. The mortgages provide security for the obligations payable on the issued covered bonds.
The covered bond holders have dual recourse to the issuer and the cover pool of assets. The issuer cannot otherwise pledge or dispose of the transferred assets, however, subject to legal arrangements it may repurchase and substitute assets as long as the required cover is maintained.
The Group is required to maintain the cover pool at a level sufficient to cover the bond obligations. In addition, the Group is entitled to any residual income of the covered bond SEs and enters into derivatives with the SEs. The Group retains the majority of the risks and rewards of the residential mortgages and continues to recognise the mortgages as financial assets. The obligation to pay this amount to the SEs is recognised as a financial liability of the Group.
The Group is exposed to variable returns from its involvement with the covered bond SEs and has the ability to affect those returns through its power over the SEs activities. The SEs are therefore consolidated by the Group. The covered bonds issued externally are included within debt issuances.
REPURCHASE AGREEMENTS When the Group sells securities subject to repurchase agreements under which we retain substantially all the risks and rewards of ownership, then those assets do not qualify for derecognition. An associated liability is recognised for the consideration received from the counterparty.
STRUCTURED FINANCE ARRANGEMENTS The Group arranges funding for certain customer transactions through structured leasing and commodity prepayment arrangements. These transactions are recognised on Group’s balance sheet as lease receivables or loans. At times, other financial institutions participate in the funding of these arrangements. This participation involves a proportionate transfer of the rights to the assets recognised by the Group. The participating banks have limited recourse to the leased assets or financed commodity and related proceeds. Where the Group continues to be exposed to some of the risks of the transferred assets through a derivative or other continuing involvement, the Group does not derecognise the lease receivable or loan. Instead, the Group recognises an associated liability representing its obligations to the participating financial institutions.
The table below sets out the balance of assets transferred that do not qualify for derecognition, along with the associated liabilities:
Securitisations1,2 Covered bonds Repurchase agreements
Structured finance arrangements
2020 2019 2020 2019 2020 2019 2020 2019 $m $m $m $m $m $m $m $m
Current carrying amount of assets transferred 1,831 2,422 28,559 30,799 61,415 43,213 67 81
Carrying amount of associated liabilities 1,824 2,411 15,948 20,957 55,716 41,367 67 81 1. Does not include transfers to internal structured entities where there are no external investors. 2. The securitisation noteholders have recourse only to the pool of residential mortgages which have been securitised. The carrying value of securitised assets and the associated liabilities approximates their
fair value.
208
Overview How we create value
Performance overview
Remuneration report
Directors’ report
Financial report
Shareholder information
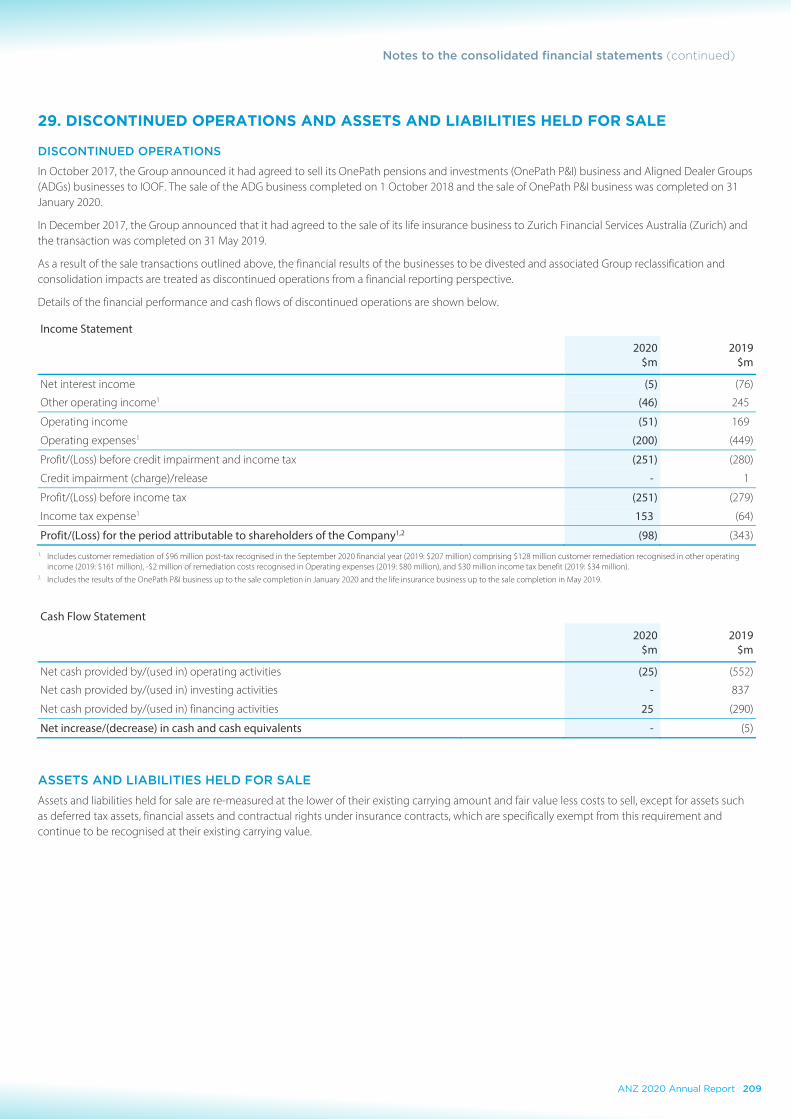
NOTES TO THE CONSOLIDATED FINANCIAL STATEMENTS (continued)
208
ANZ 2020 ANNUAL REPORT
28. TRANSFERS OF FINANCIAL ASSETS
In the normal course of business the Group enters into transactions where it transfers financial assets directly to third parties or to SEs. These transfers may give rise to the Group fully, or partially, derecognising those financial assets - depending on the Group’s exposure to the risks and rewards or control over the transferred assets. If the Group retains substantially all of the risk and rewards of a transferred asset, the transfer does not qualify for derecognition and the asset remains on the Group’s balance sheet in its entirety.
SECURITISATIONS Net loans and advances include residential mortgages securitised under the Group’s securitisation programs which are assigned to bankruptcy remote SEs to provide security for obligations payable on the notes issued by the SEs. The holders of the issued notes have full recourse to the pool of residential mortgages which have been securitised and the Group cannot otherwise pledge or dispose of the transferred assets.
In some instances the Group is also the holder of the securitised notes. In addition, the Group is entitled to any residual income of the SEs and sometimes enters into derivatives with the SEs. The Group retains the risks and rewards of the residential mortgages and continues to recognise the mortgages as financial assets. The obligation to pay this amount to the SE is recognised as a financial liability of the Group.
The Group is exposed to variable returns from its involvement with these securitisation SEs and has the ability to affect those returns through its power over the SEs activities. The SEs are therefore consolidated by the Group.
COVERED BONDS The Group operates various global covered bond programs to raise funding in its primary markets. Net loans and advances include residential mortgages assigned to bankruptcy remote SEs associated with these covered bond programs. The mortgages provide security for the obligations payable on the issued covered bonds.
The covered bond holders have dual recourse to the issuer and the cover pool of assets. The issuer cannot otherwise pledge or dispose of the transferred assets, however, subject to legal arrangements it may repurchase and substitute assets as long as the required cover is maintained.
The Group is required to maintain the cover pool at a level sufficient to cover the bond obligations. In addition, the Group is entitled to any residual income of the covered bond SEs and enters into derivatives with the SEs. The Group retains the majority of the risks and rewards of the residential mortgages and continues to recognise the mortgages as financial assets. The obligation to pay this amount to the SEs is recognised as a financial liability of the Group.
The Group is exposed to variable returns from its involvement with the covered bond SEs and has the ability to affect those returns through its power over the SEs activities. The SEs are therefore consolidated by the Group. The covered bonds issued externally are included within debt issuances.
REPURCHASE AGREEMENTS When the Group sells securities subject to repurchase agreements under which we retain substantially all the risks and rewards of ownership, then those assets do not qualify for derecognition. An associated liability is recognised for the consideration received from the counterparty.
STRUCTURED FINANCE ARRANGEMENTS The Group arranges funding for certain customer transactions through structured leasing and commodity prepayment arrangements. These transactions are recognised on Group’s balance sheet as lease receivables or loans. At times, other financial institutions participate in the funding of these arrangements. This participation involves a proportionate transfer of the rights to the assets recognised by the Group. The participating banks have limited recourse to the leased assets or financed commodity and related proceeds. Where the Group continues to be exposed to some of the risks of the transferred assets through a derivative or other continuing involvement, the Group does not derecognise the lease receivable or loan. Instead, the Group recognises an associated liability representing its obligations to the participating financial institutions.
The table below sets out the balance of assets transferred that do not qualify for derecognition, along with the associated liabilities:
Securitisations1,2 Covered bonds Repurchase agreements
Structured finance arrangements
2020 2019 2020 2019 2020 2019 2020 2019 $m $m $m $m $m $m $m $m
Current carrying amount of assets transferred 1,831 2,422 28,559 30,799 61,415 43,213 67 81
Carrying amount of associated liabilities 1,824 2,411 15,948 20,957 55,716 41,367 67 81 1. Does not include transfers to internal structured entities where there are no external investors. 2. The securitisation noteholders have recourse only to the pool of residential mortgages which have been securitised. The carrying value of securitised assets and the associated liabilities approximates their
fair value.
NOTES TO THE CONSOLIDATED FINANCIAL STATEMENTS
209
29. DISCONTINUED OPERATIONS AND ASSETS AND LIABILITIES HELD FOR SALE
DISCONTINUED OPERATIONS
In October 2017, the Group announced it had agreed to sell its OnePath pensions and investments (OnePath P&I) business and Aligned Dealer Groups (ADGs) businesses to IOOF. The sale of the ADG business completed on 1 October 2018 and the sale of OnePath P&I business was completed on 31 January 2020.
In December 2017, the Group announced that it had agreed to the sale of its life insurance business to Zurich Financial Services Australia (Zurich) and the transaction was completed on 31 May 2019.
As a result of the sale transactions outlined above, the financial results of the businesses to be divested and associated Group reclassification and consolidation impacts are treated as discontinued operations from a financial reporting perspective.
Details of the financial performance and cash flows of discontinued operations are shown below.
Income Statement
2020 2019 $m $m
Net interest income (5) (76)
Other operating income1 (46) 245
Operating income (51) 169
Operating expenses1 (200) (449)
Profit/(Loss) before credit impairment and income tax (251) (280)
Credit impairment (charge)/release - 1
Profit/(Loss) before income tax (251) (279)
Income tax expense1 153 (64)
Profit/(Loss) for the period attributable to shareholders of the Company1,2 (98) (343) 1. Includes customer remediation of $96 million post-tax recognised in the September 2020 financial year (2019: $207 million) comprising $128 million customer remediation recognised in other operating
income (2019: $161 million), -$2 million of remediation costs recognised in Operating expenses (2019: $80 million), and $30 million income tax benefit (2019: $34 million). 2. Includes the results of the OnePath P&I business up to the sale completion in January 2020 and the life insurance business up to the sale completion in May 2019.
Cash Flow Statement
2020 2019 $m $m
Net cash provided by/(used in) operating activities (25) (552)
Net cash provided by/(used in) investing activities - 837
Net cash provided by/(used in) financing activities 25 (290)
Net increase/(decrease) in cash and cash equivalents - (5)
ASSETS AND LIABILITIES HELD FOR SALE Assets and liabilities held for sale are re-measured at the lower of their existing carrying amount and fair value less costs to sell, except for assets such as deferred tax assets, financial assets and contractual rights under insurance contracts, which are specifically exempt from this requirement and continue to be recognised at their existing carrying value.
Notes to the consolidated financial statements (continued)
209ANZ 2020 Annual Report
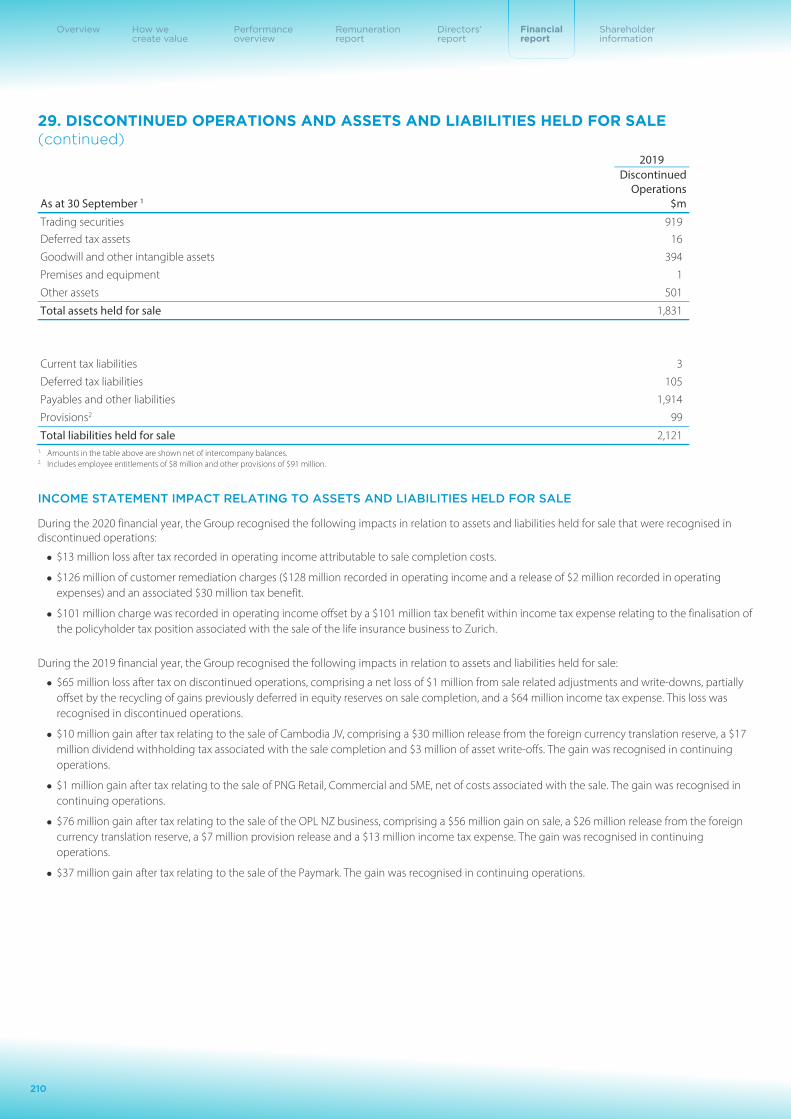
NOTES TO THE CONSOLIDATED FINANCIAL STATEMENTS (continued)
210
ANZ 2020 ANNUAL REPORT
29. DISCONTINUED OPERATIONS AND ASSETS AND LIABILITIES HELD FOR SALE (continued) 2019
Discontinued
Operations As at 30 September 1 $m
Trading securities 919 Deferred tax assets 16
Goodwill and other intangible assets 394
Premises and equipment 1
Other assets 501
Total assets held for sale 1,831
Current tax liabilities 3
Deferred tax liabilities 105
Payables and other liabilities 1,914
Provisions2 99
Total liabilities held for sale 2,121 1. Amounts in the table above are shown net of intercompany balances. 2. Includes employee entitlements of $8 million and other provisions of $91 million.
INCOME STATEMENT IMPACT RELATING TO ASSETS AND LIABILITIES HELD FOR SALE
During the 2020 financial year, the Group recognised the following impacts in relation to assets and liabilities held for sale that were recognised in discontinued operations:
$13 million loss after tax recorded in operating income attributable to sale completion costs.
$126 million of customer remediation charges ($128 million recorded in operating income and a release of $2 million recorded in operating expenses) and an associated $30 million tax benefit.
$101 million charge was recorded in operating income offset by a $101 million tax benefit within income tax expense relating to the finalisation of the policyholder tax position associated with the sale of the life insurance business to Zurich.
During the 2019 financial year, the Group recognised the following impacts in relation to assets and liabilities held for sale:
$65 million loss after tax on discontinued operations, comprising a net loss of $1 million from sale related adjustments and write-downs, partially offset by the recycling of gains previously deferred in equity reserves on sale completion, and a $64 million income tax expense. This loss was recognised in discontinued operations.
$10 million gain after tax relating to the sale of Cambodia JV, comprising a $30 million release from the foreign currency translation reserve, a $17 million dividend withholding tax associated with the sale completion and $3 million of asset write-offs. The gain was recognised in continuing operations.
$1 million gain after tax relating to the sale of PNG Retail, Commercial and SME, net of costs associated with the sale. The gain was recognised in continuing operations.
$76 million gain after tax relating to the sale of the OPL NZ business, comprising a $56 million gain on sale, a $26 million release from the foreign currency translation reserve, a $7 million provision release and a $13 million income tax expense. The gain was recognised in continuing operations.
$37 million gain after tax relating to the sale of the Paymark. The gain was recognised in continuing operations.
210
Overview How we create value
Performance overview
Remuneration report
Directors’ report
Financial report
Shareholder information

NOTES TO THE CONSOLIDATED FINANCIAL STATEMENTS (continued)
210
ANZ 2020 ANNUAL REPORT
29. DISCONTINUED OPERATIONS AND ASSETS AND LIABILITIES HELD FOR SALE (continued) 2019
Discontinued
Operations As at 30 September 1 $m
Trading securities 919 Deferred tax assets 16
Goodwill and other intangible assets 394
Premises and equipment 1
Other assets 501
Total assets held for sale 1,831
Current tax liabilities 3
Deferred tax liabilities 105
Payables and other liabilities 1,914
Provisions2 99
Total liabilities held for sale 2,121 1. Amounts in the table above are shown net of intercompany balances. 2. Includes employee entitlements of $8 million and other provisions of $91 million.
INCOME STATEMENT IMPACT RELATING TO ASSETS AND LIABILITIES HELD FOR SALE
During the 2020 financial year, the Group recognised the following impacts in relation to assets and liabilities held for sale that were recognised in discontinued operations:
$13 million loss after tax recorded in operating income attributable to sale completion costs.
$126 million of customer remediation charges ($128 million recorded in operating income and a release of $2 million recorded in operating expenses) and an associated $30 million tax benefit.
$101 million charge was recorded in operating income offset by a $101 million tax benefit within income tax expense relating to the finalisation of the policyholder tax position associated with the sale of the life insurance business to Zurich.
During the 2019 financial year, the Group recognised the following impacts in relation to assets and liabilities held for sale:
$65 million loss after tax on discontinued operations, comprising a net loss of $1 million from sale related adjustments and write-downs, partially offset by the recycling of gains previously deferred in equity reserves on sale completion, and a $64 million income tax expense. This loss was recognised in discontinued operations.
$10 million gain after tax relating to the sale of Cambodia JV, comprising a $30 million release from the foreign currency translation reserve, a $17 million dividend withholding tax associated with the sale completion and $3 million of asset write-offs. The gain was recognised in continuing operations.
$1 million gain after tax relating to the sale of PNG Retail, Commercial and SME, net of costs associated with the sale. The gain was recognised in continuing operations.
$76 million gain after tax relating to the sale of the OPL NZ business, comprising a $56 million gain on sale, a $26 million release from the foreign currency translation reserve, a $7 million provision release and a $13 million income tax expense. The gain was recognised in continuing operations.
$37 million gain after tax relating to the sale of the Paymark. The gain was recognised in continuing operations.
NOTES TO THE CONSOLIDATED FINANCIAL STATEMENTS
211
29. DISCONTINUED OPERATIONS AND ASSETS AND LIABILITIES HELD FOR SALE (continued)
RECOGNITION AND MEASUREMENT LIFE INSURANCE CONTRACT LIABILITIES AND LIABILITIES CEDED UNDER REINSURANCE CONTRACTS We calculate Life insurance contract Liabilities under the Margin on Service (MoS) model using a projection method based on actuarial principles and standards.
We discount the expected future cash flows of these contracts at the risk-free discount rate.
LIFE INVESTMENT CONTRACT LIABILITIES A life investment contract liability is measured at fair value and is directly linked to the fair value of the assets that back it. For guaranteed policies, we determine the liability as the net present value of expected cash flows, subject to a minimum of current surrender value.
KEY JUDGEMENTS AND ESTIMATES
A significant level of judgement is used by the Group to determine:
whether an asset or group of assets is classified and presented as held for sale or as a discontinued operation; and
the fair value of the assets and liabilities classified as being held for sale.
Management is required to exercise significant judgement when assessing the fair value less costs to sell for assets and liabilities held for sale. The judgemental factors include determining: costs to sell, allocation of goodwill, indemnities provided under the sale contract and consideration received - particularly where elements of consideration are contingent in nature. Any impairment we record is based on the best available evidence of fair value compared to the carrying value before the impairment. The final sale price may be different to the fair value we estimate when recording the impairment. Management regularly assess the appropriateness of the underlying assumptions against actual outcomes and other relevant evidence and adjustments are made to fair value where appropriate. We expect that the sales will complete within 12 months after balance date, subject to the relevant regulatory approvals and customary terms of sale for such assets.
Notes to the consolidated financial statements (continued)
211ANZ 2020 Annual Report

NOTES TO THE CONSOLIDATED FINANCIAL STATEMENTS (continued)
212
ANZ 2020 ANNUAL REPORT
30. SUPERANNUATION AND POST EMPLOYMENT BENEFIT OBLIGATIONS Set out below is a summary of amounts recognised in the Balance Sheet in respect of the defined benefit superannuation schemes:
2020 2019 $m $m
Defined benefit obligation and scheme assets
Present value of funded defined benefit obligation (1,478) (1,538)
Fair value of scheme assets 1,693 1,739
Net defined benefit asset 215 201
As represented in the Balance Sheet
Net liabilities arising from defined benefit obligations included in payables and other liabilities (59) (54)
Net assets arising from defined benefit obligations included in other assets 274 255
Net defined benefit asset 215 201
Weighted average duration of the benefit payments reflected in the defined benefit obligation (years) 14.9 14.9
As at the most recent reporting dates of the schemes, the aggregate surplus of net market value of assets over the value of accrued benefits on a funding basis was $104 million (2019 surplus of $48 million). In 2020, the Group made defined benefit contributions totaling $4 million (2019: $3 million). It expects to make contributions of around $3 million next financial year.
GOVERNANCE OF THE SCHEMES AND FUNDING OF THE DEFINED BENEFIT SECTIONS The main defined benefit superannuation schemes in which the Group participates operate under trust law and are managed and administered on behalf of the members in accordance with the terms of the relevant trust deed and rules and all relevant legislation. These schemes have corporate trustees, which are wholly owned subsidiaries of the Group. The trustees are the legal owners of the assets, which are held separately from the assets of the Group, and are responsible for setting investment policy and agreeing funding requirements with the employer through the triennial actuarial valuation process.
The Group has defined benefit arrangements in Australia, Japan, New Zealand, Philippines, Taiwan and United Kingdom. The defined benefit section of the ANZ Australian Staff Superannuation Scheme, the ANZ UK Staff Pension Scheme and the ANZ National Retirement Scheme in New Zealand are the three largest plans. They have been closed to new members since 1987, 2004 and 1991 respectively. None of the schemes had a material deficit, or surplus, at the last funding valuation. The Group has no present liability under any of the schemes’ trust deeds to fund a deficit (measured on a funding basis). A contingent liability of the Group may arise if any of the schemes were wound up.
RECOGNITION AND MEASUREMENT
Defined benefit superannuation schemes The Group operates a small number of defined benefit schemes. Independent actuaries calculate the liability and expenses related to providing benefits to employees under each defined benefit scheme. They use the Projected Unit Credit Method to value the liabilities. The balance sheet includes:
a defined benefit liability if the obligation is greater than the fair value of the schemes assets; and
an asset (capped to its recoverable amount) if the fair value of the assets is greater than the obligation.
In each reporting period, the movements in the net defined benefit liability are recognised as follows:
the net movement relating to the current period’s service cost, net interest on the defined benefit liability, past service costs and other costs (such as the effects of any curtailments and settlements) as operating expenses;
remeasurements of the net defined benefit liability (which comprise actuarial gains and losses and return on scheme assets, excluding interest income included in net interest) directly in retained earnings through other comprehensive income; and
contributions of the Group directly against the net defined benefit position.
Defined contribution superannuation schemes
The Group operates a number of defined contribution schemes. It also contributes (according to local law, in the various countries in which it operates) to Government and other plans that have the characteristics of defined contribution plans. The Group’s contributions to these schemes are recognised as personnel expenses when they are incurred.
212
Overview How we create value
Performance overview
Remuneration report
Directors’ report
Financial report
Shareholder information

NOTES TO THE CONSOLIDATED FINANCIAL STATEMENTS (continued)
212
ANZ 2020 ANNUAL REPORT
30. SUPERANNUATION AND POST EMPLOYMENT BENEFIT OBLIGATIONS Set out below is a summary of amounts recognised in the Balance Sheet in respect of the defined benefit superannuation schemes:
2020 2019 $m $m
Defined benefit obligation and scheme assets
Present value of funded defined benefit obligation (1,478) (1,538)
Fair value of scheme assets 1,693 1,739
Net defined benefit asset 215 201
As represented in the Balance Sheet
Net liabilities arising from defined benefit obligations included in payables and other liabilities (59) (54)
Net assets arising from defined benefit obligations included in other assets 274 255
Net defined benefit asset 215 201
Weighted average duration of the benefit payments reflected in the defined benefit obligation (years) 14.9 14.9
As at the most recent reporting dates of the schemes, the aggregate surplus of net market value of assets over the value of accrued benefits on a funding basis was $104 million (2019 surplus of $48 million). In 2020, the Group made defined benefit contributions totaling $4 million (2019: $3 million). It expects to make contributions of around $3 million next financial year.
GOVERNANCE OF THE SCHEMES AND FUNDING OF THE DEFINED BENEFIT SECTIONS The main defined benefit superannuation schemes in which the Group participates operate under trust law and are managed and administered on behalf of the members in accordance with the terms of the relevant trust deed and rules and all relevant legislation. These schemes have corporate trustees, which are wholly owned subsidiaries of the Group. The trustees are the legal owners of the assets, which are held separately from the assets of the Group, and are responsible for setting investment policy and agreeing funding requirements with the employer through the triennial actuarial valuation process.
The Group has defined benefit arrangements in Australia, Japan, New Zealand, Philippines, Taiwan and United Kingdom. The defined benefit section of the ANZ Australian Staff Superannuation Scheme, the ANZ UK Staff Pension Scheme and the ANZ National Retirement Scheme in New Zealand are the three largest plans. They have been closed to new members since 1987, 2004 and 1991 respectively. None of the schemes had a material deficit, or surplus, at the last funding valuation. The Group has no present liability under any of the schemes’ trust deeds to fund a deficit (measured on a funding basis). A contingent liability of the Group may arise if any of the schemes were wound up.
RECOGNITION AND MEASUREMENT
Defined benefit superannuation schemes The Group operates a small number of defined benefit schemes. Independent actuaries calculate the liability and expenses related to providing benefits to employees under each defined benefit scheme. They use the Projected Unit Credit Method to value the liabilities. The balance sheet includes:
a defined benefit liability if the obligation is greater than the fair value of the schemes assets; and
an asset (capped to its recoverable amount) if the fair value of the assets is greater than the obligation.
In each reporting period, the movements in the net defined benefit liability are recognised as follows:
the net movement relating to the current period’s service cost, net interest on the defined benefit liability, past service costs and other costs (such as the effects of any curtailments and settlements) as operating expenses;
remeasurements of the net defined benefit liability (which comprise actuarial gains and losses and return on scheme assets, excluding interest income included in net interest) directly in retained earnings through other comprehensive income; and
contributions of the Group directly against the net defined benefit position.
Defined contribution superannuation schemes
The Group operates a number of defined contribution schemes. It also contributes (according to local law, in the various countries in which it operates) to Government and other plans that have the characteristics of defined contribution plans. The Group’s contributions to these schemes are recognised as personnel expenses when they are incurred.
NOTES TO THE CONSOLIDATED FINANCIAL STATEMENTS
213
30. SUPERANNUATION AND POST EMPLOYMENT BENEFIT OBLIGATIONS (continued)
KEY JUDGEMENTS AND ESTIMATES
The main assumptions we use in valuing defined benefit obligations are listed in the table below. A change to any assumptions, or applying different assumptions, could have an affect on the Statement of Other Comprehensive Income and Balance Sheet.
Increase/(decrease) in
defined benefit obligation
Sensitivity analysis change in significant
assumptions
2020 2019
Assumptions
2020 2019 $m $m
Discount rate (% p.a.) 0.5 - 1.7 1.1 - 2.0 0.5% increase (103) (107)
Future salary increases (% p.a.) 1.6 - 3.0 1.7 - 3.2
Future pension indexation
In payment (% p.a.)/In deferment (% p.a) 1.1 - 2.8/2.2 1.7 - 3.0/2.3 0.5% increase 85 80
Life expectancy at age 60 for current pensioners 1 year increase 73 70
– Males (years) 26.0 - 28.7 25.6 - 28.6
– Females (years) 28.9 - 30.4 28.8 - 30.3
31. EMPLOYEE SHARE AND OPTION PLANS
ANZ operates a number of employee share and option schemes under the ANZ Employee Share Acquisition Plan and the ANZ Share Option Plan.
ANZ EMPLOYEE SHARE ACQUISITION PLAN ANZ Employee Share Acquisition Plan schemes that operated during the 2020 and 2019 years were the Employee Share Offer and the Deferred Share Plan.
Employee Share Offer Eligibility Most permanent employees employed in either Australia or New Zealand with three years continuous service for the
most recent financial year.
Grant Up to AUD 1,000 in Australia (and AUD 800 in New Zealand) of ANZ shares, subject to Board approval.
Allocation value One week Volume Weighted Average Price (VWAP) of ANZ shares traded on the ASX in the week leading up to and including the date of grant.
Australia ANZ ordinary shares are granted to eligible employees for nil consideration. The shares vest on grant and are held in trust for three years from grant date, after which time they may remain in trust, be transferred to the employee’s name or sold. Dividends are automatically reinvested in the Dividend Reinvestment Plan.
New Zealand Shares are granted to eligible employees on payment of NZD one cent per share. Shares vest subject to satisfaction of a three-year service period, after which they may remain in trust, be transferred to the employee’s name or sold. Unvested shares are forfeited if the employee resigns or is dismissed for serious misconduct. Dividends are either paid in cash or reinvested into the Dividend Reinvestment Plan.
Expensing value (fair value)
In Australia, the fair value of the shares is expensed in the year shares are granted, as they are not subject to forfeiture.
In New Zealand, the fair value is expensed on a straight-line basis over the three year vesting period.
The expense is recognised as a share-based compensation expense with a corresponding increase in equity.
2020 and 2019 grants
698,862 shares were granted on 2 December 2019 at an issue price of $24.96, noting this is the final Employee Share Offer in its current form following changes to variable remuneration (effective financial year 2020) as part of the Reimagining Reward initiative.
656,738 shares were granted on 3 December 2018 at an issue price of $26.91.
Notes to the consolidated financial statements (continued)
213ANZ 2020 Annual Report

NOTES TO THE CONSOLIDATED FINANCIAL STATEMENTS (continued)
214
ANZ 2020 ANNUAL REPORT
31. EMPLOYEE SHARE AND OPTION PLANS (continued)
Deferred Share Plan i) ANZ Incentive Plan (ANZIP) - Chief Executive Officer (CEO), Group Executive Committee (ExCo) and other Banking Executive Accountability Regime (BEAR) Accountable Executives
Eligibility Group CEO, ExCo and Group General Manager Internal Audit (GGM IA).
Grant 50% of the CEO’s Annual Variable Remuneration (AVR), 25% of ExCo’s Variable Remuneration (VR) (except for the Chief Risk Officer (CRO)), and 33% of the CRO and GGM IA’s VR, is received as deferred shares.
Conditions Deferred over at least one to four years from the date the Board approved the variable remuneration award. ii) ANZIP (all employees excluding the CEO, ExCo and other BEAR Accountable Executives1) and Business Unit Incentive Plans (BUIPs)
Eligibility All employees excluding the CEO, ExCo and GGM IA (i.e. other BEAR Accountable Executive).
Grant If VR is at or exceeds AUD 150,000, then 60% of VR amounts exceeding AUD 80,000 (subject to a minimum deferral amount of AUD 42,000) is deferred as shares.
Conditions Deferred over three years from grant date.
iii) Long Term Incentives (LTIs)
Eligibility Selected employees (excludes the CEO, ExCo and GGM IA (i.e. other BEAR Accountable Executive).
Grant 100% deferred shares.
Conditions Vest three years from grant date.
iv) Exceptional circumstances
Remuneration foregone In exceptional circumstances, we grant deferred shares to certain employees when they start with ANZ to compensate them for remuneration they have foregone from their previous employer. The vesting period generally aligns with the remaining vesting period of the remuneration they have foregone, and therefore varies between grants.
Retention We may grant deferred shares to high performing employees who are regarded as a significant retention risk to ANZ.
v) Further information
Cessation Unless the Board decides otherwise, employees forfeit their unvested deferred shares if they resign, are terminated on notice, or are dismissed for serious misconduct. The deferred shares may be held in trust beyond the deferral period.
Dividends Dividends are paid in cash or reinvested in the Dividend Reinvestment Plan.
Instrument Deferred share rights may be granted instead of deferred shares in some countries as locally appropriate (see deferred share rights section).
Allocation value All deferred shares are issued based on the VWAP of ANZ shares traded on the ASX in the week leading up to and including the date of grant.
Expensing value (fair value) We expense the fair value of deferred shares on a straight-line basis over the relevant vesting period and we recognise the expense as a share-based compensation expense with a corresponding increase in equity.
2020 and 2019 grants During the 2020 year, we granted 2,259,897 deferred shares (2019: 1,945,668) with a weighted average grant price of $24.94 (2019: $25.39).
Malus (downward adjustment)
Deferred shares remain at risk and the Board has the discretion to adjust the number of deferred shares downwards, including to zero at any time before the vesting date. ANZ’s malus (downward adjustment) provisions are detailed in section 5.3 of the 2020 Remuneration Report. Board discretion was not exercised to adjust downward any deferred shares in 2020 (2019: 9,810).
1. Specific deferral arrangements also exist under ANZIP for roles defined as United Kingdom Material Risk Takers and China Material Risk Takers, in line with local regulatory requirements.
Expensing of the ANZ Employee Share Acquisition Plan
Expensing value (fair value)
The fair value of shares we granted during 2020 under the Employee Share Offer and the Deferred Share Plan, measured as at the date of grant of the shares, is $73.4 million (2019: $67.7 million) based on 2,958,759 shares (2019: 2,602,406) at VWAP of $24.81 (2019: $26.01).
214
Overview How we create value
Performance overview
Remuneration report
Directors’ report
Financial report
Shareholder information

NOTES TO THE CONSOLIDATED FINANCIAL STATEMENTS (continued)
214
ANZ 2020 ANNUAL REPORT
31. EMPLOYEE SHARE AND OPTION PLANS (continued)
Deferred Share Plan i) ANZ Incentive Plan (ANZIP) - Chief Executive Officer (CEO), Group Executive Committee (ExCo) and other Banking Executive Accountability Regime (BEAR) Accountable Executives
Eligibility Group CEO, ExCo and Group General Manager Internal Audit (GGM IA).
Grant 50% of the CEO’s Annual Variable Remuneration (AVR), 25% of ExCo’s Variable Remuneration (VR) (except for the Chief Risk Officer (CRO)), and 33% of the CRO and GGM IA’s VR, is received as deferred shares.
Conditions Deferred over at least one to four years from the date the Board approved the variable remuneration award. ii) ANZIP (all employees excluding the CEO, ExCo and other BEAR Accountable Executives1) and Business Unit Incentive Plans (BUIPs)
Eligibility All employees excluding the CEO, ExCo and GGM IA (i.e. other BEAR Accountable Executive).
Grant If VR is at or exceeds AUD 150,000, then 60% of VR amounts exceeding AUD 80,000 (subject to a minimum deferral amount of AUD 42,000) is deferred as shares.
Conditions Deferred over three years from grant date.
iii) Long Term Incentives (LTIs)
Eligibility Selected employees (excludes the CEO, ExCo and GGM IA (i.e. other BEAR Accountable Executive).
Grant 100% deferred shares.
Conditions Vest three years from grant date.
iv) Exceptional circumstances
Remuneration foregone In exceptional circumstances, we grant deferred shares to certain employees when they start with ANZ to compensate them for remuneration they have foregone from their previous employer. The vesting period generally aligns with the remaining vesting period of the remuneration they have foregone, and therefore varies between grants.
Retention We may grant deferred shares to high performing employees who are regarded as a significant retention risk to ANZ.
v) Further information
Cessation Unless the Board decides otherwise, employees forfeit their unvested deferred shares if they resign, are terminated on notice, or are dismissed for serious misconduct. The deferred shares may be held in trust beyond the deferral period.
Dividends Dividends are paid in cash or reinvested in the Dividend Reinvestment Plan.
Instrument Deferred share rights may be granted instead of deferred shares in some countries as locally appropriate (see deferred share rights section).
Allocation value All deferred shares are issued based on the VWAP of ANZ shares traded on the ASX in the week leading up to and including the date of grant.
Expensing value (fair value) We expense the fair value of deferred shares on a straight-line basis over the relevant vesting period and we recognise the expense as a share-based compensation expense with a corresponding increase in equity.
2020 and 2019 grants During the 2020 year, we granted 2,259,897 deferred shares (2019: 1,945,668) with a weighted average grant price of $24.94 (2019: $25.39).
Malus (downward adjustment)
Deferred shares remain at risk and the Board has the discretion to adjust the number of deferred shares downwards, including to zero at any time before the vesting date. ANZ’s malus (downward adjustment) provisions are detailed in section 5.3 of the 2020 Remuneration Report. Board discretion was not exercised to adjust downward any deferred shares in 2020 (2019: 9,810).
1. Specific deferral arrangements also exist under ANZIP for roles defined as United Kingdom Material Risk Takers and China Material Risk Takers, in line with local regulatory requirements.
Expensing of the ANZ Employee Share Acquisition Plan
Expensing value (fair value)
The fair value of shares we granted during 2020 under the Employee Share Offer and the Deferred Share Plan, measured as at the date of grant of the shares, is $73.4 million (2019: $67.7 million) based on 2,958,759 shares (2019: 2,602,406) at VWAP of $24.81 (2019: $26.01).
NOTES TO THE CONSOLIDATED FINANCIAL STATEMENTS
215
31. EMPLOYEE SHARE AND OPTION PLANS (continued)
ANZ SHARE OPTION PLAN
Allocation We may grant selected employees options/rights which entitle them to acquire fully paid ordinary ANZ shares at a fixed price at the time the options/rights vest. Voting and dividend rights will be attached to the ordinary shares allocated on exercise of the options/rights.
Each option/right entitles the holder to one ordinary share subject to the terms and conditions imposed on grant. Exercise price of options, determined in accordance with the rules of the plan, is generally based on the VWAP of the shares traded on the ASX in the week leading up to and including the date of grant. For rights, the exercise price is nil.
Rules Prior to the exercise of the option/right if ANZ changes its share capital due to a bonus share issue, pro-rata new share issue or reorganisation the following adjustments are required:
Issue of bonus shares - When the holder exercises their option, they are also entitled to be issued the number of bonus shares they would have been entitled to had they held the underlying shares at the time of the bonus issue;
Pro-rata share offer - We will adjust the exercise price of the option in the manner set out in the ASX Listing Rules; and
Reorganisation - In respect of rights, if there is a bonus issue or reorganisation of ANZ’s share capital, then the Board may adjust the number of rights or the number of underlying shares so that there is no advantage or disadvantage to the holder.
Holders otherwise have no other entitlements to participate:
in any new issue of ANZ securities before they exercise their options/rights; or
in a share issue of a body corporate other than ANZ (such as a subsidiary).
Any portion of the award which vests may, at the Board’s discretion, be satisfied by a cash equivalent payment rather than shares.
Expensing We expense the fair value of options/rights on a straight-line basis over the relevant vesting period and we recognise the expense as a share-based compensation expense with a corresponding increase in equity.
Cessation The provisions that apply if the employee’s employment ends are in section 8.2.3 of the 2020 Remuneration Report.
Malus (downward adjustment)
ANZ’s malus (downward adjustment) provisions are detailed in section 5.3 of the 2020 Remuneration Report.
Option Plans that operated during 2020 and 2019
i) Performance Rights
Allocation We grant performance rights to the CEO and ExCo, and have granted performance rights to selected employees, as part of ANZ’s variable remuneration plans. Performance rights provide the holder with the right to acquire ANZ shares at nil cost, subject to a four-year vesting period1 and Total Shareholder Return (TSR) performance hurdles. Further details on the performance hurdles are in section 5.2.3a of the 2020 Remuneration Report.
Satisfying vesting Any portion of the award of performance rights (that have met the performance hurdles) may be satisfied by a cash equivalent payment rather than shares at the Board’s discretion. In 2020, all performance rights lapsed due to not meeting the performance hurdles. In 2019, the performance rights that vested were satisfied through a share allocation, other than 47,195 performance rights for which a cash payment was made.
2020 and 2019 grants During the 2020 year, we granted 520,172 performance rights (2019: 885,810).
Malus (downward adjustment)
Board discretion was not exercised to adjust downward any performance rights in 2020 (2019: 59,012).
1. Three years for grants during 2019.
Notes to the consolidated financial statements (continued)
215ANZ 2020 Annual Report

NOTES TO THE CONSOLIDATED FINANCIAL STATEMENTS (continued)
216
ANZ 2020 ANNUAL REPORT
31. EMPLOYEE SHARE AND OPTION PLANS (continued)
ii) Deferred Share Rights (no performance hurdles)
Allocation Deferred share rights provide the holder with the right to acquire ANZ shares at nil cost after a specified vesting period. We adjust the fair value of rights for the absence of dividends during the restriction period.
Satisfying vesting Any portion of the award of share rights may be satisfied by a cash equivalent payment rather than shares at the Board’s discretion. All share rights were satisfied through a share allocation, other than 99,891 deferred share rights (2019: 68,357) for which a cash payment was made.
2020 and 2019 grants During the 2020 year, 2,393,424 deferred share rights (no performance hurdles) were granted (2019: 2,078,427).
Malus (downward adjustment) Board discretion was not exercised to adjust downward any deferred share rights in 2020 (2019: 11,824).
Options, Deferred Share Rights and Performance Rights on Issue As at 4 November 2020, there were 543 holders of 4,489,045 deferred share rights on issue and 125 holders of 2,216,062 performance rights on issue. Options/Rights Movements This table shows the options/rights over unissued ANZ shares and their related weighted average (WA) exercise prices as at the beginning and end of 2020 and the movements during 2020:
Opening balance
1 Oct 2019
Options/ rights
granted
Options/ rights
forfeited1
Options/ rights
expired
Options/ rights
exercised
Closing balance
30 Sep 2020
Number of options/rights 6,688,538 2,913,596 (976,468) 0 (1,901,109) 6,724,557
WA exercise price $0.00 $0.00 $0.00 $0.00 $0.00 $0.00
WA closing share price $19.94
WA remaining contractual life 1.9 years
WA exercise price of all exercisable options/rights outstanding
$0.00
Outstanding exercisable options/rights 151,829
This table shows the options/rights over unissued ANZ shares and their related weighted average exercise prices as at the beginning and end of 2019 and the movements during 2019:
Opening balance
1 Oct 2018
Options/ rights
granted
Options/ rights
forfeited1
Options/ rights
expired
Options/ rights
exercised
Closing balance
30 Sep 2019
Number of options/rights 7,148,573 2,964,237 (1,589,109) 0 (1,835,163) 6,688,538
WA exercise price $0.00 $0.00 $0.00 $0.00 $0.00 $0.00
WA closing share price $26.66
WA remaining contractual life 1.9 years
WA exercise price of all exercisable options/rights outstanding
$0.00
Outstanding exercisable options/rights 181,581 1. Refers to any circumstance where equity can be forfeited (for example on cessation, downward adjustment or performance conditions not met).
All of the shares issued as a result of the exercise of options/rights during 2020 and 2019, were issued at a nil exercise price.
As at the date of the signing of the Directors’ Report on 4 November 2020:
no options/rights over ordinary shares have been granted since the end of 2020; and
15,592 shares issued as a result of the exercise of options/rights since the end of 2020, all with nil exercise prices.
216
Overview How we create value
Performance overview
Remuneration report
Directors’ report
Financial report
Shareholder information
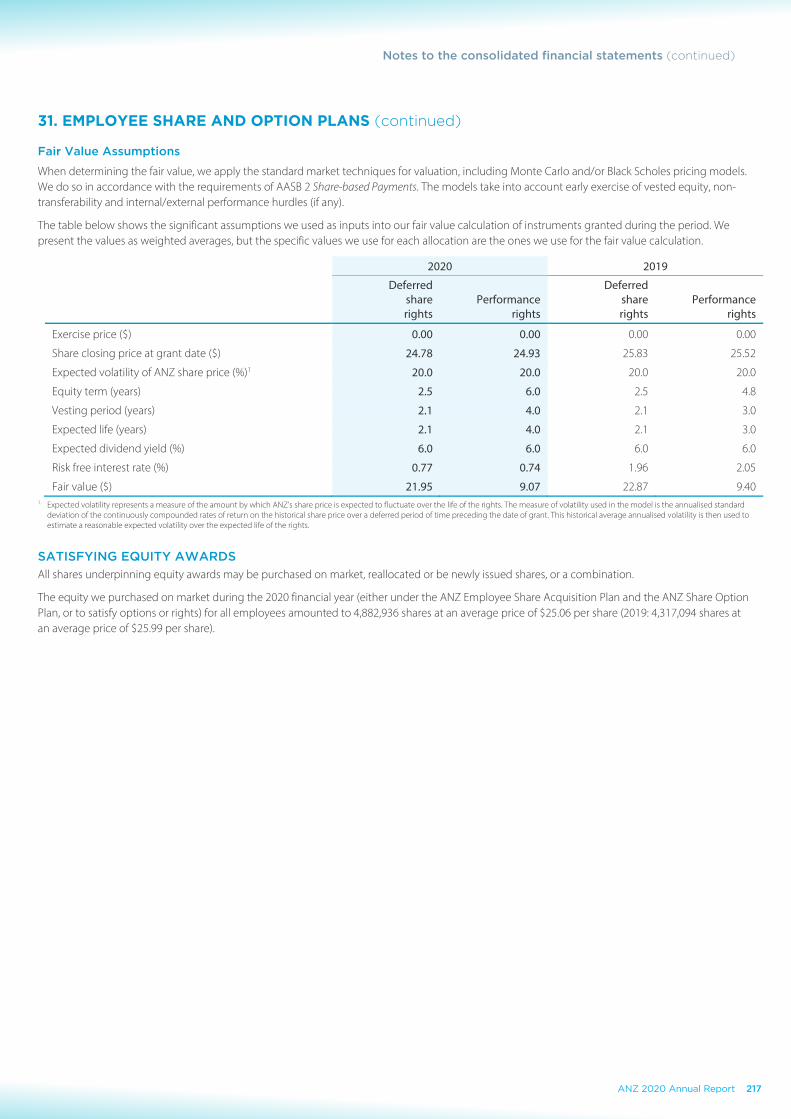
NOTES TO THE CONSOLIDATED FINANCIAL STATEMENTS (continued)
216
ANZ 2020 ANNUAL REPORT
31. EMPLOYEE SHARE AND OPTION PLANS (continued)
ii) Deferred Share Rights (no performance hurdles)
Allocation Deferred share rights provide the holder with the right to acquire ANZ shares at nil cost after a specified vesting period. We adjust the fair value of rights for the absence of dividends during the restriction period.
Satisfying vesting Any portion of the award of share rights may be satisfied by a cash equivalent payment rather than shares at the Board’s discretion. All share rights were satisfied through a share allocation, other than 99,891 deferred share rights (2019: 68,357) for which a cash payment was made.
2020 and 2019 grants During the 2020 year, 2,393,424 deferred share rights (no performance hurdles) were granted (2019: 2,078,427).
Malus (downward adjustment) Board discretion was not exercised to adjust downward any deferred share rights in 2020 (2019: 11,824).
Options, Deferred Share Rights and Performance Rights on Issue As at 4 November 2020, there were 543 holders of 4,489,045 deferred share rights on issue and 125 holders of 2,216,062 performance rights on issue. Options/Rights Movements This table shows the options/rights over unissued ANZ shares and their related weighted average (WA) exercise prices as at the beginning and end of 2020 and the movements during 2020:
Opening balance
1 Oct 2019
Options/ rights
granted
Options/ rights
forfeited1
Options/ rights
expired
Options/ rights
exercised
Closing balance
30 Sep 2020
Number of options/rights 6,688,538 2,913,596 (976,468) 0 (1,901,109) 6,724,557
WA exercise price $0.00 $0.00 $0.00 $0.00 $0.00 $0.00
WA closing share price $19.94
WA remaining contractual life 1.9 years
WA exercise price of all exercisable options/rights outstanding
$0.00
Outstanding exercisable options/rights 151,829
This table shows the options/rights over unissued ANZ shares and their related weighted average exercise prices as at the beginning and end of 2019 and the movements during 2019:
Opening balance
1 Oct 2018
Options/ rights
granted
Options/ rights
forfeited1
Options/ rights
expired
Options/ rights
exercised
Closing balance
30 Sep 2019
Number of options/rights 7,148,573 2,964,237 (1,589,109) 0 (1,835,163) 6,688,538
WA exercise price $0.00 $0.00 $0.00 $0.00 $0.00 $0.00
WA closing share price $26.66
WA remaining contractual life 1.9 years
WA exercise price of all exercisable options/rights outstanding
$0.00
Outstanding exercisable options/rights 181,581 1. Refers to any circumstance where equity can be forfeited (for example on cessation, downward adjustment or performance conditions not met).
All of the shares issued as a result of the exercise of options/rights during 2020 and 2019, were issued at a nil exercise price.
As at the date of the signing of the Directors’ Report on 4 November 2020:
no options/rights over ordinary shares have been granted since the end of 2020; and
15,592 shares issued as a result of the exercise of options/rights since the end of 2020, all with nil exercise prices.
NOTES TO THE CONSOLIDATED FINANCIAL STATEMENTS
217
31. EMPLOYEE SHARE AND OPTION PLANS (continued)
Fair Value Assumptions
When determining the fair value, we apply the standard market techniques for valuation, including Monte Carlo and/or Black Scholes pricing models. We do so in accordance with the requirements of AASB 2 Share-based Payments. The models take into account early exercise of vested equity, non-transferability and internal/external performance hurdles (if any).
The table below shows the significant assumptions we used as inputs into our fair value calculation of instruments granted during the period. We present the values as weighted averages, but the specific values we use for each allocation are the ones we use for the fair value calculation.
2020 2019
Deferred share rights
Performance rights
Deferred share rights
Performance rights
Exercise price ($) 0.00 0.00 0.00 0.00
Share closing price at grant date ($) 24.78 24.93 25.83 25.52
Expected volatility of ANZ share price (%)1 20.0 20.0 20.0 20.0
Equity term (years) 2.5 6.0 2.5 4.8
Vesting period (years) 2.1 4.0 2.1 3.0
Expected life (years) 2.1 4.0 2.1 3.0
Expected dividend yield (%) 6.0 6.0 6.0 6.0
Risk free interest rate (%) 0.77 0.74 1.96 2.05
Fair value ($) 21.95 9.07 22.87 9.40 1. Expected volatility represents a measure of the amount by which ANZ’s share price is expected to fluctuate over the life of the rights. The measure of volatility used in the model is the annualised standard
deviation of the continuously compounded rates of return on the historical share price over a deferred period of time preceding the date of grant. This historical average annualised volatility is then used to estimate a reasonable expected volatility over the expected life of the rights.
SATISFYING EQUITY AWARDS All shares underpinning equity awards may be purchased on market, reallocated or be newly issued shares, or a combination.
The equity we purchased on market during the 2020 financial year (either under the ANZ Employee Share Acquisition Plan and the ANZ Share Option Plan, or to satisfy options or rights) for all employees amounted to 4,882,936 shares at an average price of $25.06 per share (2019: 4,317,094 shares at an average price of $25.99 per share).
Notes to the consolidated financial statements (continued)
217ANZ 2020 Annual Report

NOTES TO THE CONSOLIDATED FINANCIAL STATEMENTS (continued)
218
ANZ 2020 ANNUAL REPORT
32. RELATED PARTY DISCLOSURES
KEY MANAGEMENT PERSONNEL COMPENSATION
Key Management Personnel (KMP) are defined as all directors of the Group and those personnel with a key responsibility for the strategic direction and management of the Group and report directly to the CEO. KMP compensation included within total personnel expenses in Note 3 Operating Expenses is as follows:
2020 2019$000 $0001
Short-term benefits 19,260 15,784
Post-employment benefits 414 415
Other long-term benefits 397 213
Termination benefits - 2,112
Share-based payments 8,198 6,184
Total 28,269 24,708 1. Includes former disclosed KMP until the end of their employment.
KEY MANAGEMENT PERSONNEL LOAN TRANSACTIONS
Loans made to KMP are made in the ordinary course of business and on normal commercial terms and conditions that are no more favourable than those given to other employees or customers, including: the term of the loan, security required and the interest rate. No amounts have been written off during the period, or individual provision raised in respect of these balances. Details of the terms and conditions of lending products can be found on ANZ.com. The aggregate of loans (including credit card balances) made, guaranteed or secured, and undrawn facilities to KMP including their related parties, were as follows:
2020 2019$000 $000
Loans advanced1,2 31,808 26,884
Undrawn facilities 1,028 513
Interest charged3 888 739 1. Prior period balance has been restated to reflect minor timing variances and omissions.2. Balances are as at the balance sheet date (for KMP in office at balance sheet date) or at the date of cessation of former KMP.3. Interest charged is for all KMP’s during the period.
KEY MANAGEMENT PERSONNEL HOLDINGS OF ANZ SECURITIES
KMP, including their related parties, held subordinated debt, shares, share rights and options over shares in the Company directly, indirectly or beneficially as shown below:
2020 2019Number Number1
Shares, options and rights 2,211,879 1,892,754
Subordinated debt 21,052 11,802 1. Balances are as at the balance sheet date (for KMP in office at balance sheet date) or at the date of cessation of former KMP.
218
Overview How we create value
Performance overview
Remuneration report
Directors’ report
Financial report
Shareholder information

NOTES TO THE CONSOLIDATED FINANCIAL STATEMENTS (continued)
218
ANZ 2020 ANNUAL REPORT
32. RELATED PARTY DISCLOSURES
KEY MANAGEMENT PERSONNEL COMPENSATION
Key Management Personnel (KMP) are defined as all directors of the Group and those personnel with a key responsibility for the strategic direction and management of the Group and report directly to the CEO. KMP compensation included within total personnel expenses in Note 3 Operating Expenses is as follows:
2020 2019$000 $0001
Short-term benefits 19,260 15,784
Post-employment benefits 414 415
Other long-term benefits 397 213
Termination benefits - 2,112
Share-based payments 8,198 6,184
Total 28,269 24,708 1. Includes former disclosed KMP until the end of their employment.
KEY MANAGEMENT PERSONNEL LOAN TRANSACTIONS
Loans made to KMP are made in the ordinary course of business and on normal commercial terms and conditions that are no more favourable than those given to other employees or customers, including: the term of the loan, security required and the interest rate. No amounts have been written off during the period, or individual provision raised in respect of these balances. Details of the terms and conditions of lending products can be found on ANZ.com. The aggregate of loans (including credit card balances) made, guaranteed or secured, and undrawn facilities to KMP including their related parties, were as follows:
2020 2019$000 $000
Loans advanced1,2 31,808 26,884
Undrawn facilities 1,028 513
Interest charged3 888 739 1. Prior period balance has been restated to reflect minor timing variances and omissions.2. Balances are as at the balance sheet date (for KMP in office at balance sheet date) or at the date of cessation of former KMP.3. Interest charged is for all KMP’s during the period.
KEY MANAGEMENT PERSONNEL HOLDINGS OF ANZ SECURITIES
KMP, including their related parties, held subordinated debt, shares, share rights and options over shares in the Company directly, indirectly or beneficially as shown below:
2020 2019Number Number1
Shares, options and rights 2,211,879 1,892,754
Subordinated debt 21,052 11,802 1. Balances are as at the balance sheet date (for KMP in office at balance sheet date) or at the date of cessation of former KMP.
NOTES TO THE CONSOLIDATED FINANCIAL STATEMENTS
219
32. RELATED PARTY DISCLOSURES (continued)
OTHER TRANSACTIONS OF KEY MANAGEMENT PERSONNEL AND THEIR RELATED PARTIES
The aggregate of deposits of KMP and their related parties with the Group were $48.4 million (2019: $60 million).
Other transactions with KMP and their related parties included amounts paid to the Group in respect of investment management service fees, brokerage and bank fees and charges. The Group has reimbursed KMP for the costs incurred for security and secretarial services associated with the performance of their duties. These transactions are conducted on normal commercial terms and conditions no more favourable than those given to other employees or customers.
ASSOCIATES
We disclose significant associates in Note 26 Investments in Associates. During the course of the financial year, transactions conducted with all associates were on terms equivalent to those made on an arm’s length basis: 2020 2019 $000 $000
Amounts receivable from associates 354 664
Amounts payable to associates 1,354 697
Interest income from associates - 93
Other revenue from associates 500 -
Other expenses paid to associates 7,706 11,561
Dividend income from associates 32,465 50,014 There have been no material guarantees given or received. No amounts receivable from the associates have been written-off during the period, or individual provisions raised in respect of these balances.
Notes to the consolidated financial statements (continued)
219ANZ 2020 Annual Report
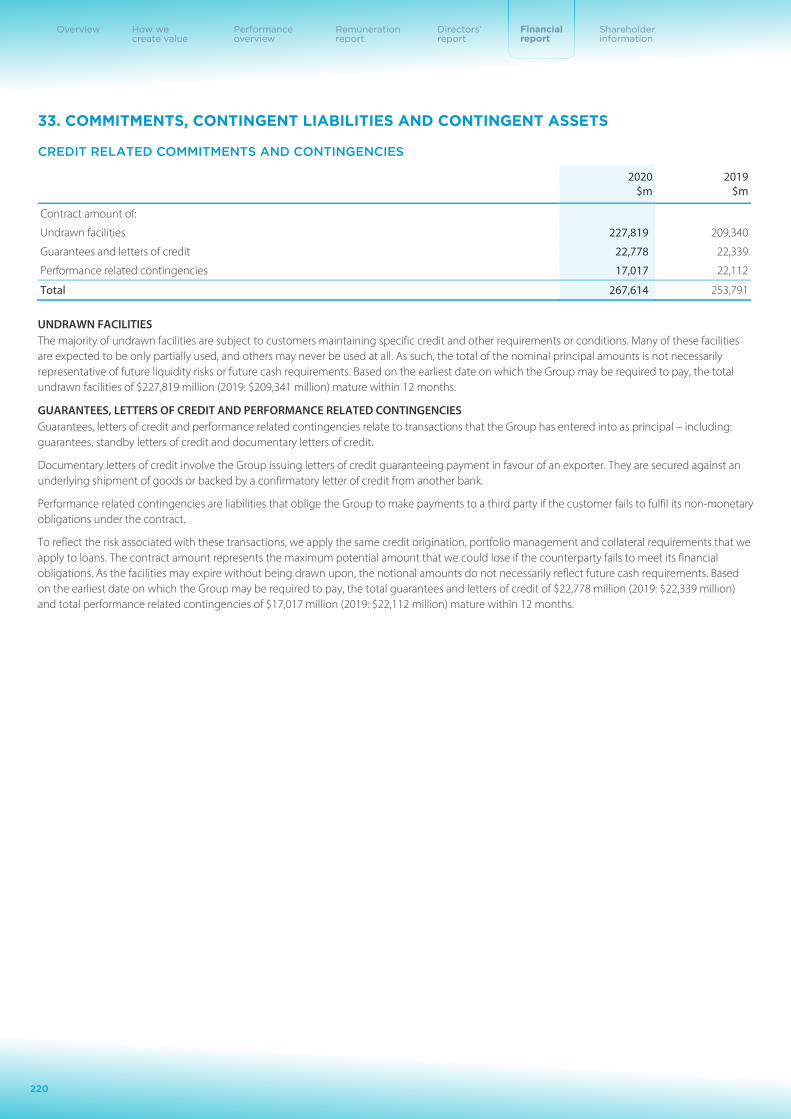
NOTES TO THE CONSOLIDATED FINANCIAL STATEMENTS (continued)
220
ANZ 2020 ANNUAL REPORT
33. COMMITMENTS, CONTINGENT LIABILITIES AND CONTINGENT ASSETS
CREDIT RELATED COMMITMENTS AND CONTINGENCIES
2020 2019 $m $m
Contract amount of:
Undrawn facilities 227,819 209,340
Guarantees and letters of credit 22,778 22,339
Performance related contingencies 17,017 22,112
Total 267,614 253,791
UNDRAWN FACILITIES The majority of undrawn facilities are subject to customers maintaining specific credit and other requirements or conditions. Many of these facilities are expected to be only partially used, and others may never be used at all. As such, the total of the nominal principal amounts is not necessarily representative of future liquidity risks or future cash requirements. Based on the earliest date on which the Group may be required to pay, the total undrawn facilities of $227,819 million (2019: $209,341 million) mature within 12 months.
GUARANTEES, LETTERS OF CREDIT AND PERFORMANCE RELATED CONTINGENCIES Guarantees, letters of credit and performance related contingencies relate to transactions that the Group has entered into as principal – including: guarantees, standby letters of credit and documentary letters of credit.
Documentary letters of credit involve the Group issuing letters of credit guaranteeing payment in favour of an exporter. They are secured against an underlying shipment of goods or backed by a confirmatory letter of credit from another bank.
Performance related contingencies are liabilities that oblige the Group to make payments to a third party if the customer fails to fulfil its non-monetary obligations under the contract.
To reflect the risk associated with these transactions, we apply the same credit origination, portfolio management and collateral requirements that we apply to loans. The contract amount represents the maximum potential amount that we could lose if the counterparty fails to meet its financial obligations. As the facilities may expire without being drawn upon, the notional amounts do not necessarily reflect future cash requirements. Based on the earliest date on which the Group may be required to pay, the total guarantees and letters of credit of $22,778 million (2019: $22,339 million) and total performance related contingencies of $17,017 million (2019: $22,112 million) mature within 12 months.
220
Overview How we create value
Performance overview
Remuneration report
Directors’ report
Financial report
Shareholder information
NOTES TO THE CONSOLIDATED FINANCIAL STATEMENTS (continued)
220
ANZ 2020 ANNUAL REPORT
33. COMMITMENTS, CONTINGENT LIABILITIES AND CONTINGENT ASSETS
CREDIT RELATED COMMITMENTS AND CONTINGENCIES
2020 2019 $m $m
Contract amount of:
Undrawn facilities 227,819 209,340
Guarantees and letters of credit 22,778 22,339
Performance related contingencies 17,017 22,112
Total 267,614 253,791
UNDRAWN FACILITIES The majority of undrawn facilities are subject to customers maintaining specific credit and other requirements or conditions. Many of these facilities are expected to be only partially used, and others may never be used at all. As such, the total of the nominal principal amounts is not necessarily representative of future liquidity risks or future cash requirements. Based on the earliest date on which the Group may be required to pay, the total undrawn facilities of $227,819 million (2019: $209,341 million) mature within 12 months.
GUARANTEES, LETTERS OF CREDIT AND PERFORMANCE RELATED CONTINGENCIES Guarantees, letters of credit and performance related contingencies relate to transactions that the Group has entered into as principal – including: guarantees, standby letters of credit and documentary letters of credit.
Documentary letters of credit involve the Group issuing letters of credit guaranteeing payment in favour of an exporter. They are secured against an underlying shipment of goods or backed by a confirmatory letter of credit from another bank.
Performance related contingencies are liabilities that oblige the Group to make payments to a third party if the customer fails to fulfil its non-monetary obligations under the contract.
To reflect the risk associated with these transactions, we apply the same credit origination, portfolio management and collateral requirements that we apply to loans. The contract amount represents the maximum potential amount that we could lose if the counterparty fails to meet its financial obligations. As the facilities may expire without being drawn upon, the notional amounts do not necessarily reflect future cash requirements. Based on the earliest date on which the Group may be required to pay, the total guarantees and letters of credit of $22,778 million (2019: $22,339 million) and total performance related contingencies of $17,017 million (2019: $22,112 million) mature within 12 months.
NOTES TO THE CONSOLIDATED FINANCIAL STATEMENTS
221
33. COMMITMENTS, CONTINGENT LIABILITIES AND CONTINGENT ASSETS (continued)
OTHER CONTINGENT LIABILITIES As at 30 September 2020, the Group had contingent liabilities in respect of the matters outlined below. Where relevant, expert legal advice has been obtained and, in the light of such advice, provisions (refer to note 21) and/or disclosures as deemed appropriate have been made. In some instances we have not disclosed the estimated financial impact of the individual items either because it is not practicable to do so or because such disclosure may prejudice the interests of the Group.
REGULATORY AND CUSTOMER EXPOSURES In recent years there has been an increase in the number of matters on which the Group engages with its regulators. There have also been significant increases in the nature and scale of regulatory investigations, surveillance and reviews, civil and criminal enforcement actions (whether by court action or otherwise), formal and informal inquiries, regulatory supervisory activities and the quantum of fines issued by regulators, particularly against financial institutions both in Australia and globally. The Group has received various notices and requests for information from its regulators as part of both industry-wide and Group-specific reviews and has also made disclosures to its regulators at its own instigation. The nature of these interactions can be wide ranging and, for example, currently include a range of matters including responsible lending practices, regulated lending requirements, product suitability and distribution, interest and fees and the entitlement to charge them, customer remediation, wealth advice, insurance distribution, pricing, competition, conduct in financial markets and financial transactions, capital market transactions, anti-money laundering and counter-terrorism financing obligations, reporting and disclosure obligations and product disclosure documentation. There may be exposures to customers which are additional to any regulatory exposures. These could include class actions, individual claims or customer remediation or compensation activities. The outcomes and total costs associated with such reviews and possible exposures remain uncertain.
BENCHMARK/RATE ACTIONS In July and August 2016, class action complaints were brought in the United States District Court against local and international banks, including the Company – one action relating to the bank bill swap rate (BBSW), and one action relating to the Singapore Interbank Offered Rate (SIBOR) and the Singapore Swap Offer Rate (SOR). The class actions are expressed to apply to persons and entities that engaged in US-based transactions in financial instruments that were priced, benchmarked, and/or settled based on BBSW or SIBOR. The claimants seek damages or compensation in amounts not specified, and allege that the defendant banks, including the Company, violated US anti-trust laws and (in the BBSW case only) anti-racketeering laws, the Commodity Exchange Act, and unjust enrichment principles. The Company is defending the proceedings.
In February 2017, the South African Competition Commission commenced proceedings against local and international banks including the Company alleging breaches of the cartel provisions of the South African Competition Act in respect of trading in the South African rand. The potential civil penalty or other financial impact is uncertain.
CAPITAL RAISING ACTIONS In June 2018, the Commonwealth Director of Public Prosecutions commenced criminal proceedings against the Company and a senior employee alleging that they were knowingly concerned in cartel conduct by the joint lead managers of the Company’s August 2015 underwritten institutional equity placement of approximately 80.8 million ordinary shares. The Company and its senior employee are defending the allegations.
In September 2018, the Australian Securities and Investments Commission (ASIC) commenced civil penalty proceedings against the Company alleging failure to comply with continuous disclosure obligations in connection with the Company’s August 2015 underwritten institutional equity placement. ASIC alleges the Company should have advised the market that the joint lead managers took up approximately 25.5 million ordinary shares of the placement. The Company is defending the allegations.
CONSUMER CREDIT INSURANCE LITIGATION In February 2020, a class action was brought against the Company alleging breaches of financial advice obligations, misleading or deceptive conduct and unconscionable conduct in relation to the distribution of consumer credit insurance products. The issuers of the insurance products, QBE and OnePath Life, are also defendants to the claim. The Company is defending the allegations.
ESANDA DEALER CAR LOAN LITIGATION In August 2020, a class action was brought against the Company alleging unfair conduct, misleading or deceptive conduct and equitable mistake in relation to the use of flex commissions in dealer arranged Esanda car loans. The Company is defending the allegations.
ROYAL COMMISSION The Royal Commission into Misconduct in the Banking, Superannuation and Financial Services Industry released its final report on 4 February 2019. The findings and recommendations of the Commission are resulting in additional costs and may lead to further exposures, including exposures associated with further regulator activity or potential customer exposures such as class actions, individual claims or customer remediation or compensation activities. The outcomes and total costs associated with these possible exposures remain uncertain.
Notes to the consolidated financial statements (continued)
221ANZ 2020 Annual Report

NOTES TO THE CONSOLIDATED FINANCIAL STATEMENTS (continued)
222
ANZ 2020 ANNUAL REPORT
33. COMMITMENTS, CONTINGENT LIABILITIES AND CONTINGENT ASSETS (continued)
SECURITY RECOVERY ACTIONS Various claims have been made or are anticipated, arising from security recovery actions taken to resolve impaired assets. These claims will be defended.
WARRANTIES AND INDEMNITIES The Group has provided warranties, indemnities and other commitments in favour of the purchaser and other persons in connection with various disposals of businesses and assets and other transactions, covering a range of matters and risks. It is exposed to claims under those warranties, indemnities and commitments.
CLEARING AND SETTLEMENT OBLIGATIONS Certain group companies have a commitment to comply with rules governing various clearing and settlement arrangements which could result in a credit risk exposure and loss if another member institution fails to settle its payment clearing activities. The Group’s potential exposure arising from these arrangements is unquantifiable in advance.
Certain group companies hold memberships of central clearing houses, including ASX Clear (Futures), London Clearing House (LCH) SwapClear and RepoClear, Korea Exchange (KRX), Hong Kong Exchange (HKEX), Clearing Corporation of India and the Shanghai Clearing House. These memberships allow the relevant group company to centrally clear derivative instruments in line with cross-border regulatory requirements. Common to all of these memberships is the requirement for the relevant group company to make default fund contributions. In the event of a default by another member, the relevant group company could potentially be required to commit additional default fund contributions which are unquantifiable in advance.
PARENT ENTITY GUARANTEES The Company has issued letters of comfort and guarantees in respect of certain subsidiaries in the normal course of business. Under these letters and guarantees, the Company undertakes to ensure that those subsidiaries continue to meet their financial obligations, subject to certain conditions including that the entity remains a controlled entity of the Company.
SALE OF GRINDLAYS BUSINESSES On 31 July 2000, the Company completed the sale to Standard Chartered Bank (SCB) of ANZ Grindlays Bank Limited (Grindlays) and certain other businesses. The Company provided warranties and indemnities relating to those businesses.
The indemnified matters include civil penalty proceedings and criminal prosecutions brought by Indian authorities against Grindlays and certain of its officers, in relation to certain transactions conducted in 1991 that are alleged to have breached the Foreign Exchange Regulation Act, 1973.
Civil penalties were imposed in 2007 which are the subject of appeals. The criminal prosecutions are being defended.
CONTINGENT ASSETS NATIONAL HOUSING BANK The Company is pursuing recovery of the proceeds of certain disputed cheques which were credited to the account of a former Grindlays customer in the early 1990s.
The disputed cheques were drawn on the National Housing Bank (NHB) in India. Proceedings between Grindlays and NHB concerning the proceeds of the cheques were resolved in early 2002.
Recovery is now being pursued from the estate of the Grindlays customer who received the cheque proceeds. Any amounts recovered are to be shared between the Company and NHB.
222
Overview How we create value
Performance overview
Remuneration report
Directors’ report
Financial report
Shareholder information

NOTES TO THE CONSOLIDATED FINANCIAL STATEMENTS (continued)
222
ANZ 2020 ANNUAL REPORT
33. COMMITMENTS, CONTINGENT LIABILITIES AND CONTINGENT ASSETS (continued)
SECURITY RECOVERY ACTIONS Various claims have been made or are anticipated, arising from security recovery actions taken to resolve impaired assets. These claims will be defended.
WARRANTIES AND INDEMNITIES The Group has provided warranties, indemnities and other commitments in favour of the purchaser and other persons in connection with various disposals of businesses and assets and other transactions, covering a range of matters and risks. It is exposed to claims under those warranties, indemnities and commitments.
CLEARING AND SETTLEMENT OBLIGATIONS Certain group companies have a commitment to comply with rules governing various clearing and settlement arrangements which could result in a credit risk exposure and loss if another member institution fails to settle its payment clearing activities. The Group’s potential exposure arising from these arrangements is unquantifiable in advance.
Certain group companies hold memberships of central clearing houses, including ASX Clear (Futures), London Clearing House (LCH) SwapClear and RepoClear, Korea Exchange (KRX), Hong Kong Exchange (HKEX), Clearing Corporation of India and the Shanghai Clearing House. These memberships allow the relevant group company to centrally clear derivative instruments in line with cross-border regulatory requirements. Common to all of these memberships is the requirement for the relevant group company to make default fund contributions. In the event of a default by another member, the relevant group company could potentially be required to commit additional default fund contributions which are unquantifiable in advance.
PARENT ENTITY GUARANTEES The Company has issued letters of comfort and guarantees in respect of certain subsidiaries in the normal course of business. Under these letters and guarantees, the Company undertakes to ensure that those subsidiaries continue to meet their financial obligations, subject to certain conditions including that the entity remains a controlled entity of the Company.
SALE OF GRINDLAYS BUSINESSES On 31 July 2000, the Company completed the sale to Standard Chartered Bank (SCB) of ANZ Grindlays Bank Limited (Grindlays) and certain other businesses. The Company provided warranties and indemnities relating to those businesses.
The indemnified matters include civil penalty proceedings and criminal prosecutions brought by Indian authorities against Grindlays and certain of its officers, in relation to certain transactions conducted in 1991 that are alleged to have breached the Foreign Exchange Regulation Act, 1973.
Civil penalties were imposed in 2007 which are the subject of appeals. The criminal prosecutions are being defended.
CONTINGENT ASSETS NATIONAL HOUSING BANK The Company is pursuing recovery of the proceeds of certain disputed cheques which were credited to the account of a former Grindlays customer in the early 1990s.
The disputed cheques were drawn on the National Housing Bank (NHB) in India. Proceedings between Grindlays and NHB concerning the proceeds of the cheques were resolved in early 2002.
Recovery is now being pursued from the estate of the Grindlays customer who received the cheque proceeds. Any amounts recovered are to be shared between the Company and NHB.
NOTES TO THE CONSOLIDATED FINANCIAL STATEMENTS
223
34. AUDITOR FEES
2020 2019 $’000 $’000
KPMG Australia
Audit or review of financial reports 8,059 9,036
Audit-related services1 3,693 3,392
Non-audit services2 25 114
Total3 11,777 12,542
Overseas related practices of KPMG Australia
Audit or review of financial reports 6,049 5,691
Audit-related services1 1,677 2,316
Non-audit services2 98 2
Total 7,824 8,009
Total auditor fees 19,601 20,551 1. Comprises prudential and regulatory services of $3.61 million (2019: $4.47 million), comfort letters $0.75 million (2019: $0.48 million) and other services $1.01 million (2019: $0.76 million). 2. The nature of the non-audit services includes training and methodology and procedural reviews. Further details are provided in the Directors’ Report. 3. Inclusive of goods and services tax.
The Group’s Policy allows KPMG Australia or any of its related practices to provide assurance and other audit-related services that, while outside the scope of the statutory audit, are consistent with the role of an external auditor. These include regulatory and prudential reviews requested by regulators such as APRA. Any other services that are not audit or audit-related services are non-audit services. The Policy allows certain non-audit services to be provided where the service would not contravene auditor independence requirements. KPMG Australia or any of its related practices may not provide services that are perceived to be in conflict with the role of the external auditor or breach auditor independence. These include consulting advice and subcontracting of operational activities normally undertaken by management, and engagements where the external auditor may ultimately be required to express an opinion on its own work.
Notes to the consolidated financial statements (continued)
223ANZ 2020 Annual Report

NOTES TO THE CONSOLIDATED FINANCIAL STATEMENTS (continued)
224
ANZ 2020 ANNUAL REPORT
35. EVENTS SINCE THE END OF THE FINANCIAL YEAR
There have been no significant events from 30 September 2020 to the date of signing this report.
224
Overview How we create value
Performance overview
Remuneration report
Directors’ report
Financial report
Shareholder information

NOTES TO THE CONSOLIDATED FINANCIAL STATEMENTS (continued)
224
ANZ 2020 ANNUAL REPORT
35. EVENTS SINCE THE END OF THE FINANCIAL YEAR
There have been no significant events from 30 September 2020 to the date of signing this report.
NOTES TO THE CONSOLIDATED FINANCIAL STATEMENTS
225
Directors’ Declaration
The Directors of Australia and New Zealand Banking Group Limited declare that:
a) in the Directors’ opinion, the financial statements and notes of the Consolidated Entity are in accordance with the Corporations Act 2001, including:
i) section 296, that they comply with the Australian Accounting Standards and any further requirements of the Corporations Regulations 2001; and
ii) section 297, that they give a true and fair view of the financial position of the Consolidated Entity as at 30 September 2020 and of its performance for the year ended on that date;
b) the notes to the financial statements of the Consolidated Entity include a statement that the financial statements and notes of the Consolidated Entity comply with International Financial Reporting Standards;
c) the Directors have been given the declarations required by section 295A of the Corporations Act 2001; and
d) in the Directors’ opinion, there are reasonable grounds to believe that the Company will be able to pay its debts as and when they become due and payable.
Signed in accordance with a resolution of the Directors.
Paul D O’Sullivan Chairman
4 November 2020
Shayne C Elliott Managing Director
NOTES TO THE CONSOLIDATED FINANCIAL STATEMENTS (continued)
224
ANZ 2020 ANNUAL REPORT
35. EVENTS SINCE THE END OF THE FINANCIAL YEAR
There have been no significant events from 30 September 2020 to the date of signing this report.
Notes to the consolidated financial statements (continued)
225ANZ 2020 Annual Report

CONSOLIDATED GROUP DIRECTORS’ DECLARATION
226
TO THE SHAREHOLDERS OF AUSTRALIA AND NEW ZEALAND BANKING GROUP LIMITED
REPORT ON THE AUDIT OF THE FINANCIAL REPORT OPINION We have audited the Financial Report of Australia and New Zealand Banking Group Limited (the Company) and the entities it controlled at the year end and from time to time during the financial year (together, the Group).
In our opinion, the accompanying Financial Report of the Group is in accordance with the Corporations Act 2001, including:
giving a true and fair view of the Group’s financial position as at 30 September 2020 and of its financial performance for the year ended on that date; and
complying with Australian Accounting Standards and the Corporations Regulations 2001.
The Financial Report comprises the:
consolidated balance sheet as at 30 September 2020;
consolidated income statement, consolidated statement of comprehensive income, consolidated statement of changes in equity, and consolidated statement of cash flows for the year then ended;
notes 1 to 35 including a summary of significant accounting policies; and
Directors’ Declaration.
BASIS FOR OPINION We conducted our audit in accordance with Australian Auditing Standards. We believe that the audit evidence we have obtained is sufficient and appropriate to provide a basis for our opinion.
Our responsibilities under those standards are further described in the Auditor’s responsibilities for the audit of the Financial Report section of our report.
We are independent of the Group in accordance with the Corporations Act 2001 and the ethical requirements of the Accounting Professional and Ethical Standards Board’s APES 110 Code of Ethics for Professional Accountants (the Code) that are relevant to our audit of the Financial Report in Australia. We have fulfilled our other ethical responsibilities in accordance with the Code.
KEY AUDIT MATTERS The Key Audit Matters we identified are:
Allowance for expected credit losses;
Subjective and complex valuation of Financial Instruments held at Fair Value;
Carrying value of goodwill;
Carrying value of investment in Asian associates;
Provisions for Customer Remediation; and
IT Systems and controls.
Key Audit Matters are those matters that, in our professional judgement, were of most significance in our audit of the Financial Report of the current period.
These matters were addressed in the context of our audit of the Financial Report as a whole, and in forming our opinion thereon, and we do not provide a separate opinion on these matters.
©2020 KPMG, an Australian partnership and a member firm of the KPMG global organisation of independent member firms affiliated with KPMG International Limited, a private English company limited by guarantee. All rights reserved. The KPMG name and logo are trademarks used under license.
226
Overview How we create value
Performance overview
Remuneration report
Directors’ report
Financial report
Shareholder information

CONSOLIDATED GROUP DIRECTORS’ DECLARATION
226
TO THE SHAREHOLDERS OF AUSTRALIA AND NEW ZEALAND BANKING GROUP LIMITED
REPORT ON THE AUDIT OF THE FINANCIAL REPORT OPINION We have audited the Financial Report of Australia and New Zealand Banking Group Limited (the Company) and the entities it controlled at the year end and from time to time during the financial year (together, the Group).
In our opinion, the accompanying Financial Report of the Group is in accordance with the Corporations Act 2001, including:
giving a true and fair view of the Group’s financial position as at 30 September 2020 and of its financial performance for the year ended on that date; and
complying with Australian Accounting Standards and the Corporations Regulations 2001.
The Financial Report comprises the:
consolidated balance sheet as at 30 September 2020;
consolidated income statement, consolidated statement of comprehensive income, consolidated statement of changes in equity, and consolidated statement of cash flows for the year then ended;
notes 1 to 35 including a summary of significant accounting policies; and
Directors’ Declaration.
BASIS FOR OPINION We conducted our audit in accordance with Australian Auditing Standards. We believe that the audit evidence we have obtained is sufficient and appropriate to provide a basis for our opinion.
Our responsibilities under those standards are further described in the Auditor’s responsibilities for the audit of the Financial Report section of our report.
We are independent of the Group in accordance with the Corporations Act 2001 and the ethical requirements of the Accounting Professional and Ethical Standards Board’s APES 110 Code of Ethics for Professional Accountants (the Code) that are relevant to our audit of the Financial Report in Australia. We have fulfilled our other ethical responsibilities in accordance with the Code.
KEY AUDIT MATTERS The Key Audit Matters we identified are:
Allowance for expected credit losses;
Subjective and complex valuation of Financial Instruments held at Fair Value;
Carrying value of goodwill;
Carrying value of investment in Asian associates;
Provisions for Customer Remediation; and
IT Systems and controls.
Key Audit Matters are those matters that, in our professional judgement, were of most significance in our audit of the Financial Report of the current period.
These matters were addressed in the context of our audit of the Financial Report as a whole, and in forming our opinion thereon, and we do not provide a separate opinion on these matters.
©2020 KPMG, an Australian partnership and a member firm of the KPMG global organisation of independent member firms affiliated with KPMG International Limited, a private English company limited by guarantee. All rights reserved. The KPMG name and logo are trademarks used under license.
NOTES TO THE CONSOLIDATED FINANCIAL STATEMENTS
227
KEY AUDIT MATTERS (continued)
ALLOWANCE FOR EXPECTED CREDIT LOSSES ($5,899m)
Refer to the critical accounting estimates and judgements disclosures in relation to the allowance for expected credit losses in Note 13 to the Financial Report.
The Key Audit Matter Allowance for expected credit losses is a key audit matter due to the significance of the loans and advances balance to the financial statements and the inherent complexity of the Group’s Expected Credit Loss (ECL) models (ECL models) used to measure ECL allowances. These models are reliant on data and a number of estimates including the impact of multiple economic scenarios and other assumptions such as defining a significant increase in credit risk (SICR).
AASB 9 Financial Instruments requires the Group to measure ECLs on a forward-looking basis reflecting a range of economic conditions, of which GDP and unemployment levels are considered key assumptions. Post-model adjustments are made by the Group to address known ECL model limitations or emerging trends in the loan portfolios. We exercise significant judgement in challenging the economic scenarios used and the judgemental post model adjustments the Group applies to the ECL results.
The Group’s criteria selected to identify a SICR, such as a decrease in customer credit rating (CCR), are key areas of judgement within the Group’s ECL methodology as these criteria determine if a forward-looking 12 month or lifetime allowance is recorded.
The COVID-19 pandemic has meant that assumptions regarding the economic outlook are more uncertain which, combined with varying government responses, increases the level of judgement required by the Group in calculating the ECL, and the associated audit risk.
Additionally, allowances for individually assessed wholesale loans exceeding specific thresholds are individually assessed by the Group. We exercise significant judgment in challenging the assessment of specific allowances based on the expected future cash repayments and estimated proceeds from the value of the collateral held by the Group in respect of the loans.
How the matter was addressed in our audit Our audit procedures for the allowance for ECL and disclosures included assessing the Group’s significant accounting policies against the requirements of the accounting standard. Additionally, our procedures covered:
Testing key controls of the Group in relation to:
The ECL model governance and validation processes which involved assessment of model performance;
The assessment and approval of the forward-looking macroeconomic assumptions and scenario weightings through challenge applied by the Group’s internal governance processes;
Reconciliation of the data used in the ECL calculation process to gross balances recorded within the general ledger as well as source systems;
Counterparty risk grading for wholesale loans (larger customer exposures are monitored individually). This covered elements such as: approval of new lending facilities against the Group’s lending policies, monitoring of counterparty credit quality against the Group’s exposure criteria for internal factors specific to the counterparty or external macroeconomic factors, and accuracy and timeliness of counterparty risk assessments and risk grading against the requirements of the Group’s lending policies and regulatory requirements; and
IT system controls which record retail loans lending arrears, group exposures into delinquency buckets, and re-calculate individual allowances. We tested automated calculation and change management controls and evaluated the Group’s oversight of the portfolios, with a focus on controls over delinquency monitoring.
We tested relevant General Information Technology Controls (GITCs) over the key IT applications used by the Group in measuring ECL allowances as detailed in the IT Systems and Controls key audit matter below.
In addition to controls testing, our procedures included:
Re-performing credit assessments of a sample of wholesale loans controlled by the Group’s specialist workout and recovery team assessed as higher risk or impaired, and a sample of other loans, focusing on larger exposures assessed by the Group as showing signs of deterioration, or in areas of emerging risk (assessed against external market conditions and in particular considering the impacts of COVID-19 and climate change). For each loan sampled, we challenged the Group’s CCR and Security Indicator (SI), taking into account our assessment of the customer’s financial position and, where relevant, the risk of stranded assets, and our overall assessment of loan recoverability, the valuation of security, and the impact on the credit allowance. To do this, we used the information on the Group’s loan file, discussed the facts and circumstances of the case with the loan officer, and performed our own assessment of recoverability. Exercising our judgment, our procedures included using our understanding of relevant industries and the macroeconomic environment and comparing data and assumptions used by the Group in recoverability assessments to externally sourced evidence, such as commodity prices, publicly available audited financial statements and comparable external valuations of collateral held. Where relevant we assessed the forecast timing of future cash flows in the context of underlying valuations and approved business plans and challenged key assumptions in the valuations;
Obtaining an understanding of the Group’s processes to determine ECL allowances, evaluating the Group’s ECL model methodologies against established market practices and criteria in the accounting standards;
Independent auditor's report (continued)
227ANZ 2020 Annual Report
INDEPENDENT AUDITOR’S REPORT (continued)
228
ANZ 2020 ANNUAL REPORT
KEY AUDIT MATTERS (continued)
Working with KPMG risk consulting specialists, we assessed the accuracy of the Group’s ECL model estimates by re-performing, for a sample of loans, the ECL allowance using our independently derived calculation tools and comparing this to the amount recorded by the Group;
Working with KPMG economic specialists, we challenged the Group’s forward-looking macroeconomic assumptions and scenarios incorporated in the Group’s ECL models. We compared the Group’s forecast GDP, unemployment rates, CPI and property price indices to relevant publicly available macro-economic information, and considered other known variables and information obtained through our other audit procedures to identify contradictory indicators;
Testing the implementation of the Group’s SICR methodology by re-performing the staging calculation for a sample of loans taking into consideration movements in the CCR from loan origination CCR and comparing our expectation to actual staging applied on an individual account level in the Group’s ECL model; and
Assessing the accuracy of the data used in the ECL models by confirming a sample of data fields such as account balance and CCR to relevant source systems.
We challenged key assumptions in the components of the Group’s post-model adjustments to the ECL allowance balance. This included:
Assessing the requirement for additional allowances considering the Group’s ECL model and data deficiencies identified by the Group’s ECL model validation processes, particularly in light of the extreme volatility in economic scenarios caused by the current COVID-19 pandemic and government responses;
Evaluating underlying data used in concentration risk and economic cycle allowances by comparing underlying loan portfolio characteristics to recent loss experience, current market conditions and specific risks in the Group’s loan portfolios;
Assessing the impacts on the modelled ECL and the requirement for out of model adjustments to account for the portion of customers on loan deferral packages that are not aged. We also assessed assumptions used to determine whether a SICR event has occurred; and
Assessing the completeness of additional allowance overlays by checking the consistency of risks we identified in the loan portfolios against the Group’s assessment.
We assessed the appropriateness of the Group’s disclosures in the financial report using our understanding obtained from our testing and against the requirements of the accounting standard.
SUBJECTIVE AND COMPLEX VALUATION OF FINANCIAL INSTRUMENTS HELD AT FAIR VALUE: - FAIR VALUE OF LEVEL 3 ASSET POSITIONS $1,183m - FAIR VALUE OF LEVEL 2 ASSET POSITIONS $145,559m - FAIR VALUE OF LEVEL 3 LIABILITY POSITIONS $55m - FAIR VALUE OF LEVEL 2 LIABILITY POSITIONS $138,786m
Refer to the critical accounting estimates, judgements and disclosures of fair values in Note 17 to the Financial Report.
The Key Audit Matter The fair value of the Group’s Level 2 and 3 financial instruments is determined by the Group through the application of valuation techniques which often involve the exercise of judgement and the use of assumptions and estimates.
The valuation of Level 3 and level 2 financial instruments held at fair value is considered a Key Audit Matter due to:
The high degree of estimation uncertainty and potentially significant range of reasonable outcomes associated with the valuation of financial instruments classified as Level 3 where significant pricing inputs used in the valuation methodology and models are not observable; and
The complexity associated with the valuation methodology and models of certain more complex Level 2 financial instruments leading to an increase in subjectivity and estimation uncertainty. Level 2 financial instruments represented 53% of the Group’s financial assets carried at fair value and 97% of the Group’s financial liabilities carried at fair value.
Level 3 financial instruments represented 0.4% of the Group’s financial assets carried at fair value and 0.04% of the Group’s financial liabilities carried at fair value. This population is made up of:
Investment securities at fair value through other comprehensive income;
Derivative assets and liabilities; and
Net loans and advances.
228
Overview How we create value
Performance overview
Remuneration report
Directors’ report
Financial report
Shareholder information

INDEPENDENT AUDITOR’S REPORT (continued)
228
ANZ 2020 ANNUAL REPORT
KEY AUDIT MATTERS (continued)
Working with KPMG risk consulting specialists, we assessed the accuracy of the Group’s ECL model estimates by re-performing, for a sample of loans, the ECL allowance using our independently derived calculation tools and comparing this to the amount recorded by the Group;
Working with KPMG economic specialists, we challenged the Group’s forward-looking macroeconomic assumptions and scenarios incorporated in the Group’s ECL models. We compared the Group’s forecast GDP, unemployment rates, CPI and property price indices to relevant publicly available macro-economic information, and considered other known variables and information obtained through our other audit procedures to identify contradictory indicators;
Testing the implementation of the Group’s SICR methodology by re-performing the staging calculation for a sample of loans taking into consideration movements in the CCR from loan origination CCR and comparing our expectation to actual staging applied on an individual account level in the Group’s ECL model; and
Assessing the accuracy of the data used in the ECL models by confirming a sample of data fields such as account balance and CCR to relevant source systems.
We challenged key assumptions in the components of the Group’s post-model adjustments to the ECL allowance balance. This included:
Assessing the requirement for additional allowances considering the Group’s ECL model and data deficiencies identified by the Group’s ECL model validation processes, particularly in light of the extreme volatility in economic scenarios caused by the current COVID-19 pandemic and government responses;
Evaluating underlying data used in concentration risk and economic cycle allowances by comparing underlying loan portfolio characteristics to recent loss experience, current market conditions and specific risks in the Group’s loan portfolios;
Assessing the impacts on the modelled ECL and the requirement for out of model adjustments to account for the portion of customers on loan deferral packages that are not aged. We also assessed assumptions used to determine whether a SICR event has occurred; and
Assessing the completeness of additional allowance overlays by checking the consistency of risks we identified in the loan portfolios against the Group’s assessment.
We assessed the appropriateness of the Group’s disclosures in the financial report using our understanding obtained from our testing and against the requirements of the accounting standard.
SUBJECTIVE AND COMPLEX VALUATION OF FINANCIAL INSTRUMENTS HELD AT FAIR VALUE: - FAIR VALUE OF LEVEL 3 ASSET POSITIONS $1,183m - FAIR VALUE OF LEVEL 2 ASSET POSITIONS $145,559m - FAIR VALUE OF LEVEL 3 LIABILITY POSITIONS $55m - FAIR VALUE OF LEVEL 2 LIABILITY POSITIONS $138,786m
Refer to the critical accounting estimates, judgements and disclosures of fair values in Note 17 to the Financial Report.
The Key Audit Matter The fair value of the Group’s Level 2 and 3 financial instruments is determined by the Group through the application of valuation techniques which often involve the exercise of judgement and the use of assumptions and estimates.
The valuation of Level 3 and level 2 financial instruments held at fair value is considered a Key Audit Matter due to:
The high degree of estimation uncertainty and potentially significant range of reasonable outcomes associated with the valuation of financial instruments classified as Level 3 where significant pricing inputs used in the valuation methodology and models are not observable; and
The complexity associated with the valuation methodology and models of certain more complex Level 2 financial instruments leading to an increase in subjectivity and estimation uncertainty. Level 2 financial instruments represented 53% of the Group’s financial assets carried at fair value and 97% of the Group’s financial liabilities carried at fair value.
Level 3 financial instruments represented 0.4% of the Group’s financial assets carried at fair value and 0.04% of the Group’s financial liabilities carried at fair value. This population is made up of:
Investment securities at fair value through other comprehensive income;
Derivative assets and liabilities; and
Net loans and advances.
NOTES TO THE CONSOLIDATED FINANCIAL STATEMENTS
229
KEY AUDIT MATTERS (continued)
How the matter was addressed in our audit Our audit procedures for the valuation of financial instruments held at fair value included:
We performed an assessment of the population of Financial instruments held at fair value to identify portfolios that have a higher risk of misstatement arising from significant judgements over valuation either due to unobservable inputs or complex models.
We tested the design and operating effectiveness of key controls relating specifically to these financial instruments, including:
Controls in relation to Independent Price Verification (IPV), including completeness of portfolios and valuation inputs subject to IPV;
Controls in relation to model validation at inception and periodically, including assessment of model limitation and assumptions;
Controls in relation to the review and challenge of daily profit and loss (P&L) by a control function;
Controls over the collateral management process, including review of margin reconciliations with clearing houses; and
Controls over fair value adjustments (FVAs), including exit price and portfolio level adjustments.
With the assistance of KPMG valuation experts, we independently re-valued a selection of financial instruments and FVAs. This involved sourcing independent inputs from markets data providers or external sources and using our own valuation models. We challenged the Group where our revaluations significantly differed from the Group’s.
In relation to the subjective valuation of Level 3 Investment Securities, with our valuation specialists, we:
Assessed the reasonableness of key inputs and assumptions using comparable data in the market and available alternatives; and
Compared the Group’s valuation methodology to industry practice and the criteria in the accounting standards.
We assessed the Group’s financial statements disclosures, including key judgements and assumptions using our understanding obtained from our testing and against the relevant accounting standard requirements.
CARRYING VALUE OF GOODWILL ($3,264m) Refer to the critical accounting estimates, judgements and disclosures in Notes 20 to the Financial Report.
The Key Audit Matter Carrying value of goodwill is a key audit matter as:
The Group’s net assets exceeded its market capitalisation at year-end. This increased the potential for impairment and our audit effort in this area.
We focussed on the significant forward-looking assumptions the Group applied in their value in use (VIU) and fair value less costs of disposal (FVLCOD) models, including:
Growth rates, and terminal growth rates in the VIU model, and future maintainable earnings and price earnings multiples applied in the FVLCOD model. The Group’s models are highly sensitive to small changes in these assumptions, reducing available headroom or indicating possible impairment. This drives additional audit effort specific to their feasibility and consistency of application to the Group’s strategy; and
Discount rates in the VIU model and the control premium in the FVLCOD. These are complicated in nature and vary according to the conditions and environment the specific Cash Generating Unit (CGU) is subject to from time to time.
Significant judgement was required by the Group as a result of the current COVID-19 environment. COVID-19 has caused significant estimation uncertainty and as a result there is increased judgement in forecasting cash flows and assumptions used in the discounted cash flow models and future maintainable earnings and market multiples used in its fair value calculations. These conditions and the uncertainty of their continuation increase the possibility of goodwill being impaired, plus the risk of inaccurate forecasts or a significantly wider range of possible outcomes, for us to consider.
The Group recorded an impairment charge of $50m against goodwill in the Pacific CGU further increasing our audit effort in this key audit area.
We involved valuation specialists to supplement our senior team members in assessing this key audit matter.
How the matter was addressed in our audit Working with our valuation specialists, our procedures included:
We considered the appropriateness of the valuation method (value in use or fair value less costs of disposal) applied by the Group to perform their annual test for impairment against the requirements of the accounting standards;
We assessed the integrity of the value in use and fair value less costs of disposal models used, including the accuracy of the underlying calculation formulas;
We assessed the accuracy of previous Group forecasts to inform our evaluation of forecasts incorporated in the models;
We assessed the Group’s key assumptions used in the fair value less costs of disposal model, such as, future maintainable earnings, the control premium and compared the implied multiples from comparable market transactions to the implied multiple used in the model;
Independent auditor's report (continued)
229ANZ 2020 Annual Report

INDEPENDENT AUDITOR’S REPORT (continued)
230
ANZ 2020 ANNUAL REPORT
KEY AUDIT MATTERS (continued)
We assessed the Group’s key assumptions used in the discounted cash flow model, such as, discount rates, growth rates, forecast earnings and terminal growth rate by comparing to external observable metrics, historical experience, our knowledge of the markets and current market practice;
We independently developed a discount rate range considered comparable using publicly available market data for comparable entities, adjusted for factors specific to the Group and industry it operates in;
We compared the forecast cash flows contained in the models to revised Strategic Plan reflecting the Group’s COVID-19 impacts;
We considered and challenged the Group’s assessment of the impact of COVID-19 on cash flows and assumptions as well as its assessment of the likely recovery period;
We considered the sensitivity of the models by varying key assumptions, such as market multiples, terminal growth rates and discount rates, within a reasonable possible range and included specific analysis of reasonable possible impacts of COVID-19;
We recalculated the impairment charge against the recorded amount disclosed; and
We assessed the disclosures in the financial report using our understanding obtained from our testing and against the requirements of the accounting standards.
CARRYING VALUE OF INVESTMENT IN ASIAN ASSOCIATES ($2,140M) Refer to the critical accounting estimates, judgements and disclosures in Notes 26 to the Financial Report.
The Key Audit Matter Carrying value of investment in Asian associates (PT Panin and AmBank) is a key audit matter as:
The Group’s impairment assessment of non-lending assets identified that two of the Group’s associate investments (PT Panin and AmBank) had indicators of impairment.
Significant judgement was required by the Group as a result of the business disruption and economic impacts of COVID-19 pandemic, raising estimation uncertainty. These conditions and the uncertainty of their continuation increase the possibility of the associates being impaired, plus the risk of inaccurate forecasts or a significantly wider range of possible outcomes in the cash flow models.
Our evaluation of potential impairment involves critically evaluating the Group’s judgement in relation to the Group’s Asian associates key forward-looking assumptions. Instances where the Group’s judgement is evaluated include:
Forecast earnings and terminal growth rates – The Group’s models are highly sensitive to small changes in these assumptions, reducing available headroom or indicating possible impairment. This drives additional audit effort specific to their feasibility and consistency of application to the Group’s strategy; and
Discount rates – These are complicated in nature and vary according to the conditions and environment the specific associate investments operate in.
The Group recorded impairment charges in relation to the investment in Ambank of $595m and PT Panin of $220m further increasing our audit effort in this key audit area.
We involved valuation specialists to supplement our senior team members in assessing this key audit matter.
How the matter was addressed in our audit Working with our valuation specialists, our procedures included:
We considered the appropriateness of the value in use valuation method applied by the Group to perform their annual test for impairment against the requirements of the accounting standards;
We assessed the integrity of the models used, including the accuracy of the underlying calculation formulas;
We assessed the Group’s key assumptions used in the discounted cash flow model, such as, discount rates, growth rates, forecast earnings and terminal growth rate by comparing to external observable metrics, historical experience, our knowledge of the markets and current market practice;
We independently developed a discount rate estimate or range considered comparable using publicly available market data for comparable entities, adjusted for factors specific to the Asian associates and the market and industry they operate in;
We compared the forecast cash flows contained in the models to recent broker consensus reports, reflecting the COVID-19 impacts;
We considered and challenged the Group’s assessment of the impact of COVID-19 on cash flows and assumptions as well as its assessment of the likely recovery period;
We considered the sensitivity of the models by varying key assumptions, such as, forecast growth rates, terminal growth rates and discount rates, within a reasonable possible range and included specific analysis of reasonable possible impacts of COVID-19;
We recalculated the impairment charge against the recorded amount disclosed; and
We assessed the disclosures in the financial report using our understanding obtained from our testing and against the requirements of the accounting standards.
230
Overview How we create value
Performance overview
Remuneration report
Directors’ report
Financial report
Shareholder information

INDEPENDENT AUDITOR’S REPORT (continued)
230
ANZ 2020 ANNUAL REPORT
KEY AUDIT MATTERS (continued)
We assessed the Group’s key assumptions used in the discounted cash flow model, such as, discount rates, growth rates, forecast earnings and terminal growth rate by comparing to external observable metrics, historical experience, our knowledge of the markets and current market practice;
We independently developed a discount rate range considered comparable using publicly available market data for comparable entities, adjusted for factors specific to the Group and industry it operates in;
We compared the forecast cash flows contained in the models to revised Strategic Plan reflecting the Group’s COVID-19 impacts;
We considered and challenged the Group’s assessment of the impact of COVID-19 on cash flows and assumptions as well as its assessment of the likely recovery period;
We considered the sensitivity of the models by varying key assumptions, such as market multiples, terminal growth rates and discount rates, within a reasonable possible range and included specific analysis of reasonable possible impacts of COVID-19;
We recalculated the impairment charge against the recorded amount disclosed; and
We assessed the disclosures in the financial report using our understanding obtained from our testing and against the requirements of the accounting standards.
CARRYING VALUE OF INVESTMENT IN ASIAN ASSOCIATES ($2,140M) Refer to the critical accounting estimates, judgements and disclosures in Notes 26 to the Financial Report.
The Key Audit Matter Carrying value of investment in Asian associates (PT Panin and AmBank) is a key audit matter as:
The Group’s impairment assessment of non-lending assets identified that two of the Group’s associate investments (PT Panin and AmBank) had indicators of impairment.
Significant judgement was required by the Group as a result of the business disruption and economic impacts of COVID-19 pandemic, raising estimation uncertainty. These conditions and the uncertainty of their continuation increase the possibility of the associates being impaired, plus the risk of inaccurate forecasts or a significantly wider range of possible outcomes in the cash flow models.
Our evaluation of potential impairment involves critically evaluating the Group’s judgement in relation to the Group’s Asian associates key forward-looking assumptions. Instances where the Group’s judgement is evaluated include:
Forecast earnings and terminal growth rates – The Group’s models are highly sensitive to small changes in these assumptions, reducing available headroom or indicating possible impairment. This drives additional audit effort specific to their feasibility and consistency of application to the Group’s strategy; and
Discount rates – These are complicated in nature and vary according to the conditions and environment the specific associate investments operate in.
The Group recorded impairment charges in relation to the investment in Ambank of $595m and PT Panin of $220m further increasing our audit effort in this key audit area.
We involved valuation specialists to supplement our senior team members in assessing this key audit matter.
How the matter was addressed in our audit Working with our valuation specialists, our procedures included:
We considered the appropriateness of the value in use valuation method applied by the Group to perform their annual test for impairment against the requirements of the accounting standards;
We assessed the integrity of the models used, including the accuracy of the underlying calculation formulas;
We assessed the Group’s key assumptions used in the discounted cash flow model, such as, discount rates, growth rates, forecast earnings and terminal growth rate by comparing to external observable metrics, historical experience, our knowledge of the markets and current market practice;
We independently developed a discount rate estimate or range considered comparable using publicly available market data for comparable entities, adjusted for factors specific to the Asian associates and the market and industry they operate in;
We compared the forecast cash flows contained in the models to recent broker consensus reports, reflecting the COVID-19 impacts;
We considered and challenged the Group’s assessment of the impact of COVID-19 on cash flows and assumptions as well as its assessment of the likely recovery period;
We considered the sensitivity of the models by varying key assumptions, such as, forecast growth rates, terminal growth rates and discount rates, within a reasonable possible range and included specific analysis of reasonable possible impacts of COVID-19;
We recalculated the impairment charge against the recorded amount disclosed; and
We assessed the disclosures in the financial report using our understanding obtained from our testing and against the requirements of the accounting standards.
NOTES TO THE CONSOLIDATED FINANCIAL STATEMENTS
231
KEY AUDIT MATTERS (continued)
PROVISIONS FOR CUSTOMER REMEDIATION ($1,109m) Refer to the critical accounting estimates, judgements and disclosures in Notes 21 and 33 to the Financial Report.
The Key Audit Matter The Group has assessed the need to recognise provisions in relation to certain customer remediation activities arising from both internal and external investigations and reviews.
The provision for customer remediation activities is a Key Audit Matter due to the number of investigations, the quantum of amounts involved, and the judgements required by us in assessing the Group’s determination of:
The existence of a present legal or constructive obligation arising from a past event using the conditions of the event against the criteria in the accounting standards;
The number of investigations and the quantum of amounts being paid arising from the present obligation;
Reliable estimates of the amounts which may be paid arising from investigations, including estimates of related costs; and
The potential for legal proceedings, further investigations, and reviews from its regulators leading to a wider range of estimation outcomes for us to consider.
How the matter was addressed in our audit Our audit procedures for customer remediation provisions included:
Obtaining an understanding of the Group’s processes and controls for identifying and assessing the potential impact of the investigations into customer remediation activities;
Enquiring with the Group regarding ongoing legal, regulatory and other investigation into remediation activities;
Conducting independent discussions on significant matters with external legal counsel;
Reading the minutes and other relevant documentation of the Group’s Board of Directors, Board Committees, various management committees, and attending the Group’s Audit and Risk Committee meetings;
Inspecting correspondence with relevant regulatory bodies;
For a sample of individual customer remediation matters, assessing the basis for recognition of a provision and associated costs against the requirements of the accounting standards. We did this by understanding and challenging the provisioning methodologies and underlying assumptions;
Testing completeness by evaluating where exposures may have arisen based upon our knowledge and experience of broader industry matters, the Group's documentation and the current regulatory environment. We also checked the features of these exposures against the criteria defining a provision or a contingency in the accounting standards;
Assessing the appropriateness of the Group’s conclusions against the requirements of Australian Accounting Standards where estimates were unable to be reliably made for a provision to be recognised; and
Evaluating the related disclosures using our understanding obtained from our testing and against the requirements of Australian Accounting Standards.
Independent auditor's report (continued)
231ANZ 2020 Annual Report

INDEPENDENT AUDITOR’S REPORT (continued)
232
ANZ 2020 ANNUAL REPORT
KEY AUDIT MATTERS (continued)
IT SYSTEMS AND CONTROLS The Key Audit Matter As a major Australian bank, the Group’s businesses utilise many complex, interdependent Information Technology (IT) systems to process and record a high volume of transactions. Controls over access and changes to IT systems are critical to the recording of financial information and the preparation of a financial report which provides a true and fair view of the Group’s financial position and performance.
The IT systems and controls, as they impact the financial recording and reporting of transactions, is a key audit matter as our audit approach could significantly differ depending on the effective operation of the Group’s IT controls. We work with our KPMG IT specialists as a core part of our audit team.
How the matter was addressed in our audit We tested the technology control environment for key IT applications (systems) used in processing significant transactions and recording balances in the general ledger. We also tested automated controls embedded within these systems which link the technology-enabled business processes. Our further audit procedures included:
Assessing the governance and higher-level controls across the IT Environment, including those regarding Group policy design, review and awareness, and IT Risk Management practices;
Design and operating effectiveness testing of controls across the User Access Management Lifecycle, including how users are on-boarded, reviewed, and removed on a timely basis from critical IT applications and supporting infrastructure. We also examined how privileged roles and functions are managed across each IT Application and the supporting infrastructure;
Design and operating effectiveness testing of controls to enable Change Management including how changes are initiated, documented, approved, tested and authorised prior to migration into the production environment of critical IT Applications. We assessed the appropriateness of users with access to release changes to IT application production environments across the Group;
Design and operating effectiveness testing of controls used by the Group’s technology teams to schedule system jobs and monitor system integrity;
Design and operating effectiveness testing of controls related to significant IT application programs delivered per the ANZ Delivery Framework;
Design and operating effectiveness testing of automated business process controls including those relating to enforcing segregation of duties to avoid conflicts from inappropriate role combinations within IT applications. We tested:
Configurations in place to perform calculations, mappings and flagging of financial transactions, and automated reconciliation controls (both between systems and intra-system); and
Data integrity of critical system reporting used by us in our audit to select samples and analyse data used by management to generate financial reporting.
OTHER INFORMATION
Other Information is both financial and non-financial information in Australia and New Zealand Banking Group Limited’s annual reporting which is provided in addition to the Financial Report and the Auditor's Report. The Directors are responsible for the Other Information.
Our opinion on the Financial Report does not cover the Other Information and, accordingly, we do not express an audit opinion or any form of assurance conclusion thereon, with the exception of the Remuneration Report and our related assurance opinion.
In connection with our audit of the Financial Report, our responsibility is to read the Other Information. In doing so, we consider whether the Other Information is materially inconsistent with the Financial Report or our knowledge obtained in the audit, or otherwise appears to be materially misstated.
We are required to report if we conclude that there is a material misstatement of this Other Information, and based on the work we have performed on the Other Information that we obtained prior to the date of this Auditor’s Report, we have nothing to report.
RESPONSIBILITIES OF DIRECTORS FOR THE FINANCIAL REPORT The Directors are responsible for:
preparing a Financial Report that gives a true and fair view in accordance with Australian Accounting Standards and the Corporations Act 2001
implementing necessary internal control to enable the preparation of a Financial Report that gives a true and fair view and is free from material misstatement, whether due to fraud or error
assessing the Group’s ability to continue as a going concern and whether the use of the going concern basis of accounting is appropriate. This includes disclosing, as applicable, matters related to going concern and using the going concern basis of accounting unless they either intend to liquidate the Group or to cease operations or have no realistic alternative but to do so.
232
Overview How we create value
Performance overview
Remuneration report
Directors’ report
Financial report
Shareholder information

INDEPENDENT AUDITOR’S REPORT (continued)
232
ANZ 2020 ANNUAL REPORT
KEY AUDIT MATTERS (continued)
IT SYSTEMS AND CONTROLS The Key Audit Matter As a major Australian bank, the Group’s businesses utilise many complex, interdependent Information Technology (IT) systems to process and record a high volume of transactions. Controls over access and changes to IT systems are critical to the recording of financial information and the preparation of a financial report which provides a true and fair view of the Group’s financial position and performance.
The IT systems and controls, as they impact the financial recording and reporting of transactions, is a key audit matter as our audit approach could significantly differ depending on the effective operation of the Group’s IT controls. We work with our KPMG IT specialists as a core part of our audit team.
How the matter was addressed in our audit We tested the technology control environment for key IT applications (systems) used in processing significant transactions and recording balances in the general ledger. We also tested automated controls embedded within these systems which link the technology-enabled business processes. Our further audit procedures included:
Assessing the governance and higher-level controls across the IT Environment, including those regarding Group policy design, review and awareness, and IT Risk Management practices;
Design and operating effectiveness testing of controls across the User Access Management Lifecycle, including how users are on-boarded, reviewed, and removed on a timely basis from critical IT applications and supporting infrastructure. We also examined how privileged roles and functions are managed across each IT Application and the supporting infrastructure;
Design and operating effectiveness testing of controls to enable Change Management including how changes are initiated, documented, approved, tested and authorised prior to migration into the production environment of critical IT Applications. We assessed the appropriateness of users with access to release changes to IT application production environments across the Group;
Design and operating effectiveness testing of controls used by the Group’s technology teams to schedule system jobs and monitor system integrity;
Design and operating effectiveness testing of controls related to significant IT application programs delivered per the ANZ Delivery Framework;
Design and operating effectiveness testing of automated business process controls including those relating to enforcing segregation of duties to avoid conflicts from inappropriate role combinations within IT applications. We tested:
Configurations in place to perform calculations, mappings and flagging of financial transactions, and automated reconciliation controls (both between systems and intra-system); and
Data integrity of critical system reporting used by us in our audit to select samples and analyse data used by management to generate financial reporting.
OTHER INFORMATION
Other Information is both financial and non-financial information in Australia and New Zealand Banking Group Limited’s annual reporting which is provided in addition to the Financial Report and the Auditor's Report. The Directors are responsible for the Other Information.
Our opinion on the Financial Report does not cover the Other Information and, accordingly, we do not express an audit opinion or any form of assurance conclusion thereon, with the exception of the Remuneration Report and our related assurance opinion.
In connection with our audit of the Financial Report, our responsibility is to read the Other Information. In doing so, we consider whether the Other Information is materially inconsistent with the Financial Report or our knowledge obtained in the audit, or otherwise appears to be materially misstated.
We are required to report if we conclude that there is a material misstatement of this Other Information, and based on the work we have performed on the Other Information that we obtained prior to the date of this Auditor’s Report, we have nothing to report.
RESPONSIBILITIES OF DIRECTORS FOR THE FINANCIAL REPORT The Directors are responsible for:
preparing a Financial Report that gives a true and fair view in accordance with Australian Accounting Standards and the Corporations Act 2001
implementing necessary internal control to enable the preparation of a Financial Report that gives a true and fair view and is free from material misstatement, whether due to fraud or error
assessing the Group’s ability to continue as a going concern and whether the use of the going concern basis of accounting is appropriate. This includes disclosing, as applicable, matters related to going concern and using the going concern basis of accounting unless they either intend to liquidate the Group or to cease operations or have no realistic alternative but to do so.
NOTES TO THE CONSOLIDATED FINANCIAL STATEMENTS
233
KEY AUDIT MATTERS (continued)
AUDITOR’S RESPONSIBILITIES FOR THE AUDIT OF THE FINANCIAL REPORT
Our objective is:
to obtain reasonable assurance about whether the Financial Report as a whole is free from material misstatement, whether due to fraud or error; and
to issue an Auditor’s Report that includes our opinion.
Reasonable assurance is a high level of assurance but is not a guarantee that an audit conducted in accordance with Australian Auditing Standards will always detect a material misstatement when it exists. Misstatements can arise from fraud or error. They are considered material if, individually or in the aggregate, they could reasonably be expected to influence the economic decisions of users taken on the basis of the Financial Report.
A further description of our responsibilities for the audit of the Financial Report is located at the Auditing and Assurance Standards Board website at: https://www.auasb.gov.au/admin/file/content102/c3/ar1_2020.pdf. This description forms part of our Auditor’s Report.
REPORT ON THE REMUNERATION REPORT In our opinion, the Remuneration Report of Australia and New Zealand Banking Group Limited for the year ended 30 September 2020, complies with Section 300A of the Corporations Act 2001.
DIRECTORS’ RESPONSIBILITIES The Directors of the Company are responsible for the preparation and presentation of the Remuneration Report in accordance with Section 300A of the Corporations Act 2001.
OUR RESPONSIBILITIES
We have audited the Remuneration Report included in the Directors’ report for the year ended 30 September 2020.
Our responsibility is to express an opinion on the Remuneration Report, based on our audit conducted in accordance with Australian Auditing Standards.
KPMG
Alison Kitchen Partner
Melbourne 4 November 2020
Independent auditor's report (continued)
233ANZ 2020 Annual Report
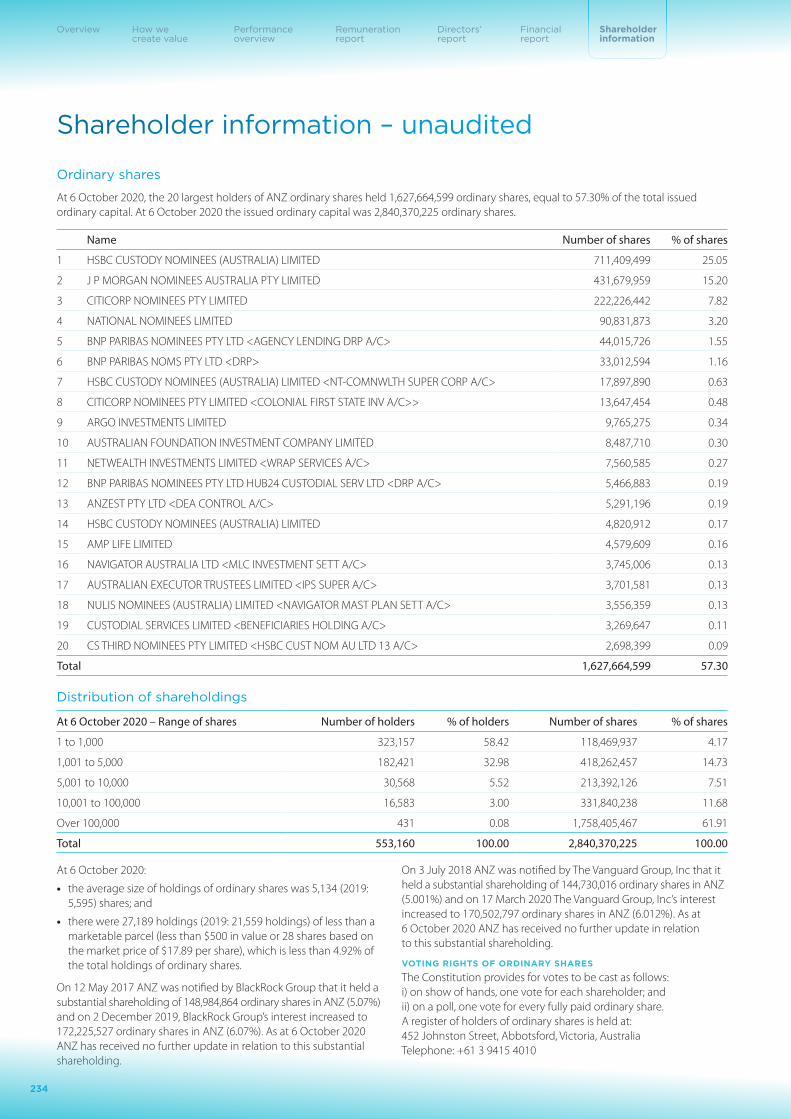
Shareholder information – unaudited
Ordinary shares
At 6 October 2020, the 20 largest holders of ANZ ordinary shares held 1,627,664,599 ordinary shares, equal to 57.30% of the total issued ordinary capital. At 6 October 2020 the issued ordinary capital was 2,840,370,225 ordinary shares.
Name Number of shares % of shares
1 HSBC CUSTODY NOMINEES (AUSTRALIA) LIMITED 711,409,499 25.05
2 J P MORGAN NOMINEES AUSTRALIA PTY LIMITED 431,679,959 15.20
3 CITICORP NOMINEES PTY LIMITED 222,226,442 7.82
4 NATIONAL NOMINEES LIMITED 90,831,873 3.20
5 BNP PARIBAS NOMINEES PTY LTD <AGENCY LENDING DRP A/C> 44,015,726 1.55
6 BNP PARIBAS NOMS PTY LTD <DRP> 33,012,594 1.16
7 HSBC CUSTODY NOMINEES (AUSTRALIA) LIMITED <NT-COMNWLTH SUPER CORP A/C> 17,897,890 0.63
8 CITICORP NOMINEES PTY LIMITED <COLONIAL FIRST STATE INV A/C>> 13,647,454 0.48
9 ARGO INVESTMENTS LIMITED 9,765,275 0.34
10 AUSTRALIAN FOUNDATION INVESTMENT COMPANY LIMITED 8,487,710 0.30
11 NETWEALTH INVESTMENTS LIMITED <WRAP SERVICES A/C> 7,560,585 0.27
12 BNP PARIBAS NOMINEES PTY LTD HUB24 CUSTODIAL SERV LTD <DRP A/C> 5,466,883 0.19
13 ANZEST PTY LTD <DEA CONTROL A/C> 5,291,196 0.19
14 HSBC CUSTODY NOMINEES (AUSTRALIA) LIMITED 4,820,912 0.17
15 AMP LIFE LIMITED 4,579,609 0.16
16 NAVIGATOR AUSTRALIA LTD <MLC INVESTMENT SETT A/C> 3,745,006 0.13
17 AUSTRALIAN EXECUTOR TRUSTEES LIMITED <IPS SUPER A/C> 3,701,581 0.13
18 NULIS NOMINEES (AUSTRALIA) LIMITED <NAVIGATOR MAST PLAN SETT A/C> 3,556,359 0.13
19 CUSTODIAL SERVICES LIMITED <BENEFICIARIES HOLDING A/C> 3,269,647 0.11
20 CS THIRD NOMINEES PTY LIMITED <HSBC CUST NOM AU LTD 13 A/C> 2,698,399 0.09
Total 1,627,664,599 57.30
Distribution of shareholdings
At 6 October 2020 – Range of shares Number of holders % of holders Number of shares % of shares
1 to 1,000 323,157 58.42 118,469,937 4.17
1,001 to 5,000 182,421 32.98 418,262,457 14.73
5,001 to 10,000 30,568 5.52 213,392,126 7.51
10,001 to 100,000 16,583 3.00 331,840,238 11.68
Over 100,000 431 0.08 1,758,405,467 61.91
Total 553,160 100.00 2,840,370,225 100.00
At 6 October 2020:
• the average size of holdings of ordinary shares was 5,134 (2019: 5,595) shares; and
• there were 27,189 holdings (2019: 21,559 holdings) of less than a marketable parcel (less than $500 in value or 28 shares based on the market price of $17.89 per share), which is less than 4.92% of the total holdings of ordinary shares.
On 12 May 2017 ANZ was notified by BlackRock Group that it held a substantial shareholding of 148,984,864 ordinary shares in ANZ (5.07%) and on 2 December 2019, BlackRock Group’s interest increased to 172,225,527 ordinary shares in ANZ (6.07%). As at 6 October 2020 ANZ has received no further update in relation to this substantial shareholding.
On 3 July 2018 ANZ was notified by The Vanguard Group, Inc that it held a substantial shareholding of 144,730,016 ordinary shares in ANZ (5.001%) and on 17 March 2020 The Vanguard Group, Inc’s interest increased to 170,502,797 ordinary shares in ANZ (6.012%). As at 6 October 2020 ANZ has received no further update in relation to this substantial shareholding.
VOTING RIGHTS OF ORDINARY SHARES
The Constitution provides for votes to be cast as follows: i) on show of hands, one vote for each shareholder; and ii) on a poll, one vote for every fully paid ordinary share. A register of holders of ordinary shares is held at: 452 Johnston Street, Abbotsford, Victoria, Australia Telephone: +61 3 9415 4010
234
Overview How we create value
Performance overview
Remuneration report
Directors’ report
Financial report
Shareholder information

ANZ Capital Notes
ANZ CN1
On 7 August 2013 the Company issued convertible subordinated perpetual notes (ANZ CN1) which were offered pursuant to a prospectus dated 10 July 2013.
At 6 October 2020 the 20 largest holders of ANZ CN1 held 2,994,981 securities, equal to 26.74% of the total issued securities. At 6 October 2020 the total number of ANZ CN1 on issue was 11,200,000.
Name Number of shares % of shares
1 HSBC CUSTODY NOMINEES (AUSTRALIA) LIMITED 990,169 8.84
2 BNP PARIBAS NOMS PTY LTD <DRP> 223,051 1.99
3 BNP PARIBAS NOMINEES PTY LTD HUB24 CUSTODIAL SERV LTD <DRP A/C> 191,519 1.71
4 J P MORGAN NOMINEES AUSTRALIA PTY LIMITED 176,833 1.58
5 NATIONAL NOMINEES LIMITED 172,760 1.54
6 NETWEALTH INVESTMENTS LIMITED <WRAP SERVICES A/C> 149,604 1.34
7 NAVIGATOR AUSTRALIA LTD <MLC INVESTMENT SETT A/C> 137,558 1.23
8 NULIS NOMINEES (AUSTRALIA) LIMITED <NAVIGATOR MAST PLAN SETT A/C> 115,425 1.03
9 CITICORP NOMINEES PTY LIMITED 111,520 0.99
10 AUSTRALIAN EXECUTOR TRUSTEES LIMITED <IPS SUPER A/C> 110,918 0.99
11 HSBC CUSTODY NOMINEES (AUSTRALIA) LIMITED - A/C 2 109,892 0.98
12 MUTUAL TRUST PTY LTD 101,222 0.90
13 BNP PARIBAS NOMINEES PTY LTD <AGENCY LENDING DRP A/C> 60,944 0.54
14 SERVCORP HOLDINGS PTY LTD 58,325 0.52
15 BERNE NO 132 NOMINEES PTY LTD <684168 A/C> 56,680 0.51
16 DIMBULU PTY LTD 50,000 0.45
17 MARROSAN INVESTMENTS PTY LTD 50,000 0.45
18 MCCUSKER FOUNDATION LTD <THE MCCUSKER CHARITABLE FNDN> 46,000 0.41
19 AUSTRALIAN EXECUTOR TRUSTEES LIMITED <IPS IDPS A/C> 42,561 0.38
20 THORSEN INVESTMENTS PTY LTD 40,000 0.36
Total 2,994,981 26.74
Distribution of ANZ CN1 holdings
At 6 October 2020 – Range of securities Number of holders % of holders Number of shares % of shares
1 to 1,000 14,717 91.51 4,526,930 40.42
1,001 to 5,000 1,231 7.65 2,500,696 22.33
5,001 to 10,000 85 0.53 652,810 5.83
10,001 to 100,000 37 0.23 929,093 8.29
Over 100,000 12 0.08 2,590,471 23.13
Total 16,082 100.00 11,200,000 100.00
At 6 October 2020 there were 7 holdings (2019: 6 holdings) of less than a marketable parcel (less than $500 in value or 5 securities based on the market price of $101.19 per security), which is less than 0.05% of the total holdings of ANZ CN1.
VOTING RIGHTS OF ANZ CN1
ANZ CN1 do not confer on holders a right to vote at any meeting of members of the Company.
A register of holders of ANZ CN1 is held at: 452 Johnston Street, Abbotsford, Victoria, Australia (Telephone: +61 3 9415 4010)
235ANZ 2020 Annual Report
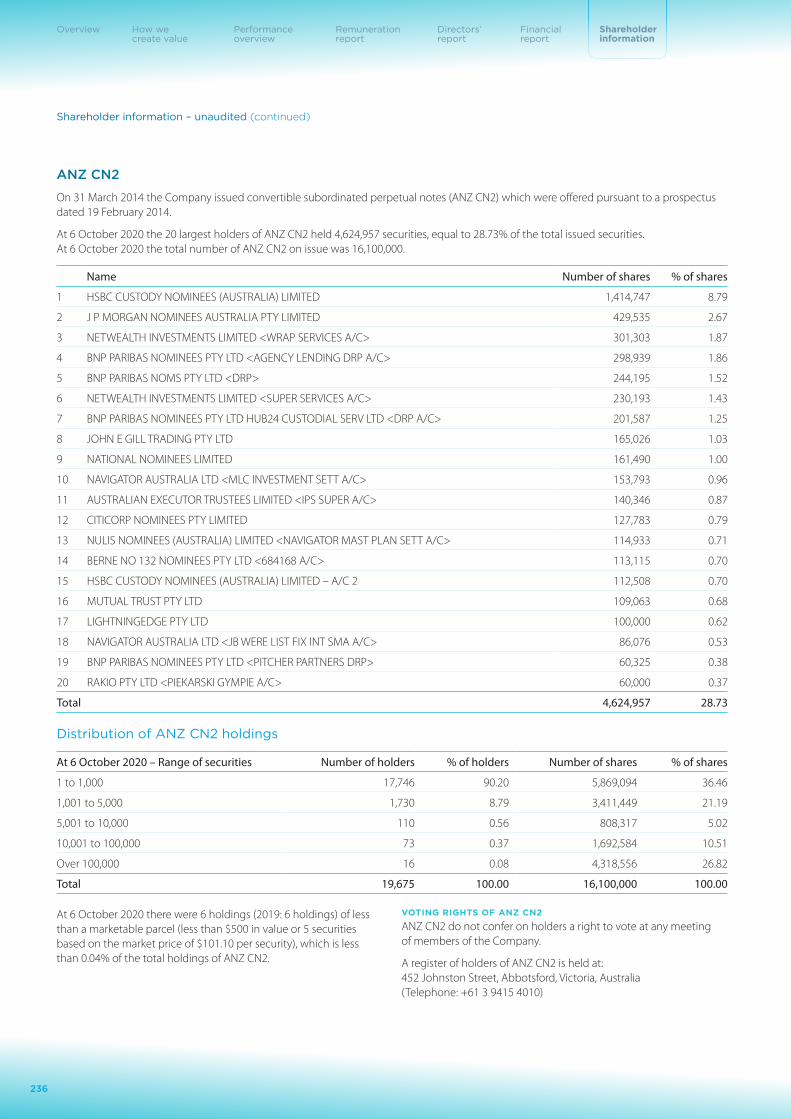
ANZ CN2
On 31 March 2014 the Company issued convertible subordinated perpetual notes (ANZ CN2) which were offered pursuant to a prospectus dated 19 February 2014.
At 6 October 2020 the 20 largest holders of ANZ CN2 held 4,624,957 securities, equal to 28.73% of the total issued securities. At 6 October 2020 the total number of ANZ CN2 on issue was 16,100,000.
Name Number of shares % of shares
1 HSBC CUSTODY NOMINEES (AUSTRALIA) LIMITED 1,414,747 8.79
2 J P MORGAN NOMINEES AUSTRALIA PTY LIMITED 429,535 2.67
3 NETWEALTH INVESTMENTS LIMITED <WRAP SERVICES A/C> 301,303 1.87
4 BNP PARIBAS NOMINEES PTY LTD <AGENCY LENDING DRP A/C> 298,939 1.86
5 BNP PARIBAS NOMS PTY LTD <DRP> 244,195 1.52
6 NETWEALTH INVESTMENTS LIMITED <SUPER SERVICES A/C> 230,193 1.43
7 BNP PARIBAS NOMINEES PTY LTD HUB24 CUSTODIAL SERV LTD <DRP A/C> 201,587 1.25
8 JOHN E GILL TRADING PTY LTD 165,026 1.03
9 NATIONAL NOMINEES LIMITED 161,490 1.00
10 NAVIGATOR AUSTRALIA LTD <MLC INVESTMENT SETT A/C> 153,793 0.96
11 AUSTRALIAN EXECUTOR TRUSTEES LIMITED <IPS SUPER A/C> 140,346 0.87
12 CITICORP NOMINEES PTY LIMITED 127,783 0.79
13 NULIS NOMINEES (AUSTRALIA) LIMITED <NAVIGATOR MAST PLAN SETT A/C> 114,933 0.71
14 BERNE NO 132 NOMINEES PTY LTD <684168 A/C> 113,115 0.70
15 HSBC CUSTODY NOMINEES (AUSTRALIA) LIMITED – A/C 2 112,508 0.70
16 MUTUAL TRUST PTY LTD 109,063 0.68
17 LIGHTNINGEDGE PTY LTD 100,000 0.62
18 NAVIGATOR AUSTRALIA LTD <JB WERE LIST FIX INT SMA A/C> 86,076 0.53
19 BNP PARIBAS NOMINEES PTY LTD <PITCHER PARTNERS DRP> 60,325 0.38
20 RAKIO PTY LTD <PIEKARSKI GYMPIE A/C> 60,000 0.37
Total 4,624,957 28.73
Distribution of ANZ CN2 holdings
At 6 October 2020 – Range of securities Number of holders % of holders Number of shares % of shares
1 to 1,000 17,746 90.20 5,869,094 36.46
1,001 to 5,000 1,730 8.79 3,411,449 21.19
5,001 to 10,000 110 0.56 808,317 5.02
10,001 to 100,000 73 0.37 1,692,584 10.51
Over 100,000 16 0.08 4,318,556 26.82
Total 19,675 100.00 16,100,000 100.00
At 6 October 2020 there were 6 holdings (2019: 6 holdings) of less than a marketable parcel (less than $500 in value or 5 securities based on the market price of $101.10 per security), which is less than 0.04% of the total holdings of ANZ CN2.
VOTING RIGHTS OF ANZ CN2
ANZ CN2 do not confer on holders a right to vote at any meeting of members of the Company.
A register of holders of ANZ CN2 is held at: 452 Johnston Street, Abbotsford, Victoria, Australia (Telephone: +61 3 9415 4010)
Shareholder information – unaudited (continued)
236
Overview How we create value
Performance overview
Remuneration report
Directors’ report
Financial report
Shareholder information

ANZ CN3
On 5 March 2015 the Company acting through its New Zealand branch, issued convertible subordinated perpetual notes (ANZ CN3) which were offered pursuant to a prospectus dated 5 February 2015.
At 6 October 2020 the 20 largest holders of ANZ CN3 held 2,490,252 securities, equal to 25.67% of the total issued securities. At 6 October 2020 the total number of ANZ CN3 on issue was 9,701,791.
Name Number of shares % of shares
1 HSBC CUSTODY NOMINEES (AUSTRALIA) LIMITED 632,543 6.52
2 J P MORGAN NOMINEES AUSTRALIA PTY LIMITED 298,703 3.08
3 NATIONAL NOMINEES LIMITED 178,109 1.84
4 LONGHURST MANAGEMENT SERVICES PTY LTD 173,868 1.79
5 NETWEALTH INVESTMENTS LIMITED <WRAP SERVICES A/C> 160,683 1.66
6 CITICORP NOMINEES PTY LIMITED 132,360 1.36
7 BNP PARIBAS NOMS PTY LTD <DRP> 124,821 1.29
8 RAKIO PTY LTD <PIEKARSKI GYMPIE A/C> 100,000 1.03
9 JDB SERVICES PTY LTD <RAC & JD BRICE INVEST A/C> 90,755 0.94
10 HSBC CUSTODY NOMINEES (AUSTRALIA) LIMITED - A/C 2 79,535 0.82
11 BNP PARIBAS NOMINEES PTY LTD HUB24 CUSTODIAL SERV LTD <DRP A/C> 67,301 0.69
12 BNP PARIBAS NOMINEES PTY LTD <AGENCY LENDING DRP A/C> 62,045 0.64
13 NULIS NOMINEES (AUSTRALIA) LIMITED <NAVIGATOR MAST PLAN SETT A/C> 59,995 0.62
14 NAVIGATOR AUSTRALIA LTD <MLC INVESTMENT SETT A/C> 57,994 0.60
15 MUTUAL TRUST PTY LTD 54,772 0.56
16 INVIA CUSTODIAN PTY LIMITED <INCOME POOL A/C> 50,850 0.52
17 HAWAII INVESTMENTS PTY LTD 44,250 0.46
18 NAVIGATOR AUSTRALIA LTD <JB WERE LIST FIX INT SMA A/C>MR RONI G SIKH 42,602 0.44
19 MR PAUL WILLIAM BROTCHIE + MR KENNETH FRANCIS WALLACE <STAFFORD FOX FOUNDATION A/C> 40,000 0.41
20 BNP PARIBAS NOMINEES PTY LTD <PITCHER PARTNERS DRP> 39,066 0.40
Total 2,490,252 25.67
Distribution of ANZ CN3 holdings
At 6 October 2020 – Range of securities Number of holders % of holders Number of shares % of shares
1 to 1,000 10,952 89.99 3,624,550 37.36
1,001 to 5,000 1,085 8.91 2,289,990 23.61
5,001 to 10,000 74 0.61 588,181 6.06
10,001 to 100,000 52 0.43 1,497,983 15.44
Over 100,000 7 0.06 1,701,087 17.53
Total 12,170 100.00 9,701,791 100.00
At 6 October 2020 there were 3 holdings (2019: 2 holdings) of less than a marketable parcel (less than $500 in value or 5 securities based on the market price of $101.91 per security), which is less than 0.03% of the total holdings of ANZ CN3.
VOTING RIGHTS OF ANZ CN3
ANZ CN3 do not confer on holders a right to vote at any meeting of members of the Company.
A register of holders of ANZ CN3 is held at: 452 Johnston Street, Abbotsford, Victoria, Australia (Telephone: +61 3 9415 4010)
237ANZ 2020 Annual Report
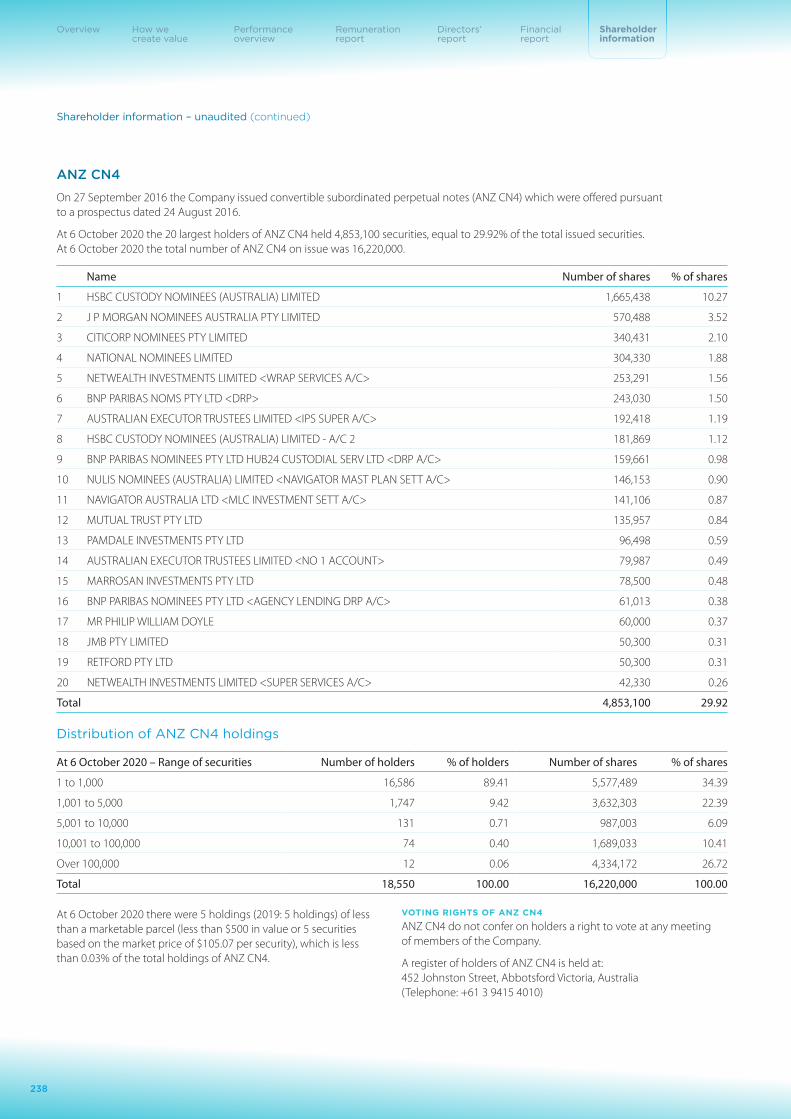
ANZ CN4
On 27 September 2016 the Company issued convertible subordinated perpetual notes (ANZ CN4) which were offered pursuant to a prospectus dated 24 August 2016.
At 6 October 2020 the 20 largest holders of ANZ CN4 held 4,853,100 securities, equal to 29.92% of the total issued securities. At 6 October 2020 the total number of ANZ CN4 on issue was 16,220,000.
Name Number of shares % of shares
1 HSBC CUSTODY NOMINEES (AUSTRALIA) LIMITED 1,665,438 10.27
2 J P MORGAN NOMINEES AUSTRALIA PTY LIMITED 570,488 3.52
3 CITICORP NOMINEES PTY LIMITED 340,431 2.10
4 NATIONAL NOMINEES LIMITED 304,330 1.88
5 NETWEALTH INVESTMENTS LIMITED <WRAP SERVICES A/C> 253,291 1.56
6 BNP PARIBAS NOMS PTY LTD <DRP> 243,030 1.50
7 AUSTRALIAN EXECUTOR TRUSTEES LIMITED <IPS SUPER A/C> 192,418 1.19
8 HSBC CUSTODY NOMINEES (AUSTRALIA) LIMITED - A/C 2 181,869 1.12
9 BNP PARIBAS NOMINEES PTY LTD HUB24 CUSTODIAL SERV LTD <DRP A/C> 159,661 0.98
10 NULIS NOMINEES (AUSTRALIA) LIMITED <NAVIGATOR MAST PLAN SETT A/C> 146,153 0.90
11 NAVIGATOR AUSTRALIA LTD <MLC INVESTMENT SETT A/C> 141,106 0.87
12 MUTUAL TRUST PTY LTD 135,957 0.84
13 PAMDALE INVESTMENTS PTY LTD 96,498 0.59
14 AUSTRALIAN EXECUTOR TRUSTEES LIMITED <NO 1 ACCOUNT> 79,987 0.49
15 MARROSAN INVESTMENTS PTY LTD 78,500 0.48
16 BNP PARIBAS NOMINEES PTY LTD <AGENCY LENDING DRP A/C> 61,013 0.38
17 MR PHILIP WILLIAM DOYLE 60,000 0.37
18 JMB PTY LIMITED 50,300 0.31
19 RETFORD PTY LTD 50,300 0.31
20 NETWEALTH INVESTMENTS LIMITED <SUPER SERVICES A/C> 42,330 0.26
Total 4,853,100 29.92
Distribution of ANZ CN4 holdings
At 6 October 2020 – Range of securities Number of holders % of holders Number of shares % of shares
1 to 1,000 16,586 89.41 5,577,489 34.39
1,001 to 5,000 1,747 9.42 3,632,303 22.39
5,001 to 10,000 131 0.71 987,003 6.09
10,001 to 100,000 74 0.40 1,689,033 10.41
Over 100,000 12 0.06 4,334,172 26.72
Total 18,550 100.00 16,220,000 100.00
At 6 October 2020 there were 5 holdings (2019: 5 holdings) of less than a marketable parcel (less than $500 in value or 5 securities based on the market price of $105.07 per security), which is less than 0.03% of the total holdings of ANZ CN4.
VOTING RIGHTS OF ANZ CN4
ANZ CN4 do not confer on holders a right to vote at any meeting of members of the Company.
A register of holders of ANZ CN4 is held at: 452 Johnston Street, Abbotsford Victoria, Australia (Telephone: +61 3 9415 4010)
Shareholder information – unaudited (continued)
238
Overview How we create value
Performance overview
Remuneration report
Directors’ report
Financial report
Shareholder information

ANZ CN5
On 28 September 2017 the Company issued convertible subordinated perpetual notes (ANZ CN5) which were offered pursuant to a prospectus dated 24 August 2017.
At 6 October 2020 the 20 largest holders of ANZ CN5 held 2,383,063 securities, equal to 25.59% of the total issued securities. At 6 October 2020 the total number of ANZ CN5 on issue was 9,310,782.
Name Number of shares % of shares
1 HSBC CUSTODY NOMINEES (AUSTRALIA) LIMITED 965,517 10.37
2 J P MORGAN NOMINEES AUSTRALIA PTY LIMITED 136,613 1.47
3 CITICORP NOMINEES PTY LIMITED 119,154 1.28
4 BNP PARIBAS NOMINEES PTY LTD HUB24 CUSTODIAL SERV LTD <DRP A/C> 108,380 1.16
5 HSBC CUSTODY NOMINEES (AUSTRALIA) LIMITED - A/C 2 103,224 1.11
6 NETWEALTH INVESTMENTS LIMITED <WRAP SERVICES A/C> 95,887 1.03
7 BNP PARIBAS NOMS PTY LTD <DRP> 91,926 0.99
8 NULIS NOMINEES (AUSTRALIA) LIMITED <NAVIGATOR MAST PLAN SETT A/C> 85,950 0.92
9 DIMBULU PTY LTD 85,000 0.91
10 LONGHURST MANAGEMENT SERVICES PTY LTD 78,246 0.84
11 NAVIGATOR AUSTRALIA LTD <MLC INVESTMENT SETT A/C> 73,795 0.79
12 AUSTRALIAN EXECUTOR TRUSTEES LIMITED <IPS SUPER A/C> 72,084 0.77
13 EASTCOTE PTY LTD <VAN LIESHOUT FAMILY A/C> 50,000 0.54
14 FEDERATION UNIVERSITY AUSTRALIA 50,000 0.54
15 MARROSAN INVESTMENTS PTY LTD 50,000 0.54
16 NETWEALTH INVESTMENTS LIMITED <SUPER SERVICES A/C> 46,057 0.49
17 BNP PARIBAS NOMINEES PTY LTD <PITCHER PARTNERS DRP> 45,892 0.49
18 G C F INVESTMENTS PTY LTD 44,811 0.48
19 MUTUAL TRUST PTY LTD 40,527 0.44
20 MR RONALD MAURICE BUNKER 40,000 0.43
Total 2,383,063 25.59
Distribution of ANZ CN5 holdings
At 6 October 2020 – Range of securities Number of holders % of holders Number of shares % of shares
1 to 1,000 10,432 90.50 3,682,742 39.55
1,001 to 5,000 975 8.46 2,097,705 22.53
5,001 to 10,000 65 0.57 501,417 5.39
10,001 to 100,000 50 0.43 1,596,030 17.14
Over 100,000 5 0.04 1,432,888 15.39
Total 11,527 100.00 9,310,782 100.00
At 6 October 2020 there were 4 holdings (2019: 4 holdings) of less than a marketable parcel (less than $500 in value or 5 securities based on the market price of $103.15 per security), which is less than 0.04% of the total holdings of ANZ CN5.
VOTING RIGHTS OF ANZ CN5
ANZ CN5 do not confer on holders a right to vote at any meeting of members of the Company.
A register of holders of ANZ CN5 is held at: 452 Johnston Street, Abbotsford Victoria, Australia (Telephone: +61 3 9415 4010)
239ANZ 2020 Annual Report

Employee Shareholder Information
In order to comply with the requirements of the ANZ Employee Share Acquisition Plan Rules and the ANZ Share Option Plan Rules, shares or options must not be issued under these plans if the aggregate number of shares and options that remain subject to the rules of either plan exceed 7% of the total number of ANZ shares of all classes on issue (including preference shares). At 30 September 2020 participants under the following plans/schemes held 0.71% (2019: 0.69%) of the total number of ANZ shares of all classes on issue:
• ANZ Employee Share Acquisition Plan;
• ANZ Employee Share Save Scheme;
• ANZ Share Option Plan; and
• ANZ Directors’ Share Plan.
Stock Exchange Listings
Australia and New Zealand Banking Group Limited’s ordinary shares are listed on the Australian Securities Exchange and New Zealand’s Exchange (NZX).
The Group’s other stock exchange listings include:
• Australian Securities Exchange – ANZ Capital Notes (CN1, CN2, CN3, CN4 and CN5), ANZ Capital Securities, senior debt (including covered bonds) and subordinated debt [Australia and New Zealand Banking Group Limited], and residential mortgage backed securities;
• London Stock Exchange – Senior (including covered bonds) debt [Australia and New Zealand Banking Group Limited] and senior (including covered bonds) debt [ANZ New Zealand (Int’l) Limited];
• Luxembourg Stock Exchange – Perpetual subordinated debt [Australia and New Zealand Banking Group Limited];
• NZX – ANZ NZ Capital Notes and senior debt [ANZ Bank New Zealand Limited];
• SIX Swiss Exchange – Senior debt [ANZ New Zealand (Int’l) Limited]; and
• Taipei Exchange – Senior debt [Australia and New Zealand Banking Group Limited].
For more information on the ANZ Capital Notes, ANZ Capital Securities and ANZ NZ Capital Notes please refer to Note 15 to the Financial Report.
American Depositary Receipts
The Company has American Depositary Receipts (ADRs) representing American Depositary Shares (ADSs) that are traded on the over-the-counter securities market ‘OTC Pink’ electronic platform operated by OTC Markets Group Inc. in the United States under the ticker symbol: ANZBY and the CUSIP number: 052528304.
With effect from 23 July 2008, the ADR ratio changed from one ADS representing five ANZ ordinary shares to one ADS representing one ANZ ordinary share.
The Bank of New York Mellon (BNY Mellon) is the Depositary for the Company’s ADR program in the United States. For further information about ADRs, please call BNY Mellon at 1-888-269-2377 if you are calling from within the United States. If you are calling from outside the United States, please call 1-201-680-6825. You may also visit BNY Mellon’s website at www.adrbnymellon.com.
Shareholder information – unaudited (continued)
240
Overview How we create value
Performance overview
Remuneration report
Directors’ report
Financial report
Shareholder information

Important dates for shareholders1
MAY 2021
5 May Half Year Results Announcement
10 May Interim Dividend Ex-Date
11 May Interim Dividend Record Date
12 May DRP/BOP/Foreign Currency Record Date
JULY 2021
1 July Interim Dividend Payment Date
OCTOBER 2021
14 October Closing date for receipt of Director Nominations
28 October Annual Results Announcement
NOVEMBER 2021
8 November Final Dividend Ex-Date
9 November Final Dividend Record Date
10 November DRP/BOP/Foreign Currency Record Date
DECEMBER 2021
16 December Final Dividend Payment Date
16 December Annual General Meeting (Adelaide)
OUR INTERNATIONAL PRESENCE AND EARNING COMPOSITION BY GEOGRAPHY2
1. If there are any changes to these dates, the Australian Securities Exchange will be notified accordingly. 2. On a Cash profit (continuing operations) basis. Excludes non-core items included in statutory profit and discontinued operations included in cash profit. It is provided to assist readers in understanding the result of the ongoing business activitives of the Group. For further information on adjustments between statutory and cash profit refer to page 56.
ASIA
China Hong Kong India IndonesiaJapan Laos
Malaysia
Myanmar The Philippines Singapore South Korea TaiwanThailandVietnam
PACIFIC
American SamoaCook Islands FijiGuamKiribatiNew CaledoniaPapua New Guinea
EUROPE
FranceGermany
United Kingdom
SamoaSolomon IslandsTimor-LesteTonga Vanuatu
INTERNATIONAL
MIDDLE EAST
United Arab Emirates (Dubai)
UNITED STATES
OF AMERICA
NEWZEALAND $1,293 MILLION
AUSTRALIA$2,522 MILLION
INTERNATIONAL $(57) MILLION
241ANZ 2020 Annual Report

Contacts
REGISTERED OFFICE
ANZ Centre Melbourne Level 9, 833 Collins Street Docklands VIC 3008 Australia
Telephone: +61 3 9273 5555 Facsimile: +61 3 8542 5252
Company Secretary: Simon Pordage
INVESTOR RELATIONS
Level 10, 833 Collins Street Docklands VIC 3008 Australia
Telephone: +61 3 8654 7682 Facsimile: +61 3 8654 8886 Email: [email protected] Web: shareholder.anz.com
Group General Manager Investor Relations: Jill Campbell
COMMUNICATIONS AND PUBLIC AFFAIRS
Level 10, 833 Collins Street Docklands VIC 3008 Australia
Telephone: +61 2 6198 5001 Email: [email protected]
Group General Manager Communications and Public Affairs: Tony Warren
SHARE AND SECURITIES REGISTRAR AUSTRALIA
AUSTRALIA
Computershare Investor Services Pty Ltd GPO Box 2975 Melbourne VIC 3001Australia
Telephone within Australia: 1800 11 33 99 International Callers: +61 3 9415 4010 Facsimile: +61 3 9473 2500 Email: [email protected]
Austraclear Services Limited 20 Bridge Street Sydney NSW 2000 Australia Telephone:1300 362 257
JAPAN
Japan Securities Depository Center, Incorporated1-1, Nihombashi Kayabacho 2-chome, Chuo-ku, Tokyo 103-0025 Japan
Telephone: +81-3-3661-0161 (Main) / +81-3-3661-7193 (Book-Entry Transfer Department)
LUXEMBOURG
Deutsche Bank Luxembourg S.A.2, Boulevard Konrad Adenauer L-1115 Luxembourg, Luxembourg
Telephone: +352 4 21 22 656
NEW ZEALAND
Computershare Investor Services Limited Private Bag 92119 Auckland 1142 New Zealand
Telephone: 0800 174 007 Facsimile: +64 9 488 8787
UNITED KINGDOM
Computershare Investor Services PLCThe Pavilions Bridgwater Road Bristol BS99 6ZZ UK
Telephone: +44 870 702 0000 Facsimile: +44 870 703 6101
UNITED STATES
The Bank of New York Mellon240 Greenwich St, Floor 7E New York, NY 10286 USA
Telephone: +1 1800 254 2826
BNY Mellon Shareowner ServicesPO Box 505000 Louisville, KY 40233-5000 USA
USA Toll Free Telephone: 1888 269 2377 Telephone for International Callers: 1201 680 6825 Web: www-us.computershare.com/investor Email: [email protected]
Deutsche Bank Trust Company Americas 60 Wall Street, 24th Floor Mailstop NYC 60-2407 New York, NY 10005 USA
Telephone: +1 212 250 2500
GERMANY
Deutsche Bank Aktiengesellschaft COO Global Markets Operations Schuldschein Operations Mainzer Landstr. 11-174 60272 60329 Frankfurt am Main Germany
Telephone: +49 69 910 31441 Facsimile: +49 69 910 85025 Email: [email protected]
MORE INFORMATION
General Information on ANZ can be obtained from our website: anz.com. Shareholders can visit our Shareholder Centre at anz.com/shareholder/centre. ANZ Corporate Governance: For information about ANZ’s approach to Corporate Governance and to obtain copies of ANZ’s Constitution, Board/Board Committee Charters, Code of Conduct and summaries of other ANZ policies of interest to shareholders and stakeholders, visit anz.com/corporategovernance. Australia and New Zealand Banking Group Limited ABN 11 005 357 522.
This Annual Report has been prepared for Australia and New Zealand Banking Group Limited (“the Company”) together with its subsidiaries which are variously described as: “ANZ”, “Group”, “ANZ Group”, “the Bank”, “us”, “we” or “our”.
DISCLOSURE INSIGHT ACTION
Founding Signatory of:
242
Overview How we create value
Performance overview
Remuneration report
Directors’ report
Financial report
Shareholder information
AASs Australian Accounting Standards.
AASB Australian Accounting Standards Board. The term “AASB” is commonly used when identifying AASs issued by the AASB. In doing so, the term is used together with the AAS number.
ADI Authorised Deposit-taking Institution.
APRA Australian Prudential Regulation Authority.
APS ADI Prudential Standard.
BCBS Basel Committee on Banking Supervision.
Cash and cash equivalents comprise coins, notes, money at call, balances held with central banks, liquid settlement balances (readily convertible to known amounts of cash which are subject to insignificant risk of changes in value) and securities purchased under agreements to resell (reverse repos) in less than three months.
Cash profit is an additional measure of profit which is prepared on a basis other than in accordance with accounting standards. Cash profit represents ANZ’s preferred measure of the result of the core business activities of the Group, enabling readers to assess Group and Divisional performance against prior periods and against peer institutions. To calculate cash profit, the Group excludes non-core items from statutory profit as noted below. These items are calculated consistently period on period so as not to discriminate between positive and negative adjustments.
Gains and losses are adjusted where they are significant, or have the potential to be significant in any one period, and fall into one of three categories:
1. gains or losses included in earnings arising from changes in tax, legal or accounting legislation or other non-core items not associated with the ongoing operations of the Group;
2. treasury shares, revaluation of policy liabilities, economic hedging impacts and similar accounting items that represent timing differences that will reverse through earnings in the future; and
3. accounting reclassifications between individual line items that do not impact reported results, such as policyholders tax gross-up.
Cash profit is not a measure of cash flow or profit determined on a cash accounting basis.
Collectively assessed provision under
AASB 139 is the provision for credit losses that are inherent in the portfolio but not able to be individually identified. A collectively assessed provision may only be recognised when a loss event has already occurred. Losses expected as a result of future events, no matter how likely, are not recognised.
Collectively assessed allowance for
expected credit loss under AASB 9 represent the Expected Credit Loss (ECL). This incorporates forward-looking information and does not require an actual loss event to have occurred for an impairment provision to be recognised.
Covered bonds are bonds issued by an ADI to external investors secured against a pool of the ADI’s assets (the cover pool) assigned to a bankruptcy remote special purpose entity. The primary assets forming the cover pool are mortgage loans. The mortgages remain on the issuer’s balance sheet. The covered bond holders have dual recourse to the issuer and the cover pool assets. The mortgages included in the cover pool cannot be otherwise pledged or disposed of but may be repurchased and substituted in order to maintain the credit quality of the pool. The Group issues covered bonds as part of its funding activities.
Credit risk is the risk of financial loss resulting from the failure of ANZ’s customers and counterparties to honour or perform fully the terms of a loan or contract.
Credit risk weighted assets (CRWA) represent assets which are weighted for credit risk according to a set formula as prescribed in APS 112/113.
Customer deposits represent term deposits, other deposits bearing interest, deposits not bearing interest and borrowing corporations’ debt excluding securitisation deposits.
Customer remediation includes provisions for expected refunds to customers, remediation project costs and related customer and regulatory claims, penalties and litigation outcomes.
Derivative credit valuation adjustment
(CVA) Over the life of a derivative instrument, ANZ uses a model to adjust fair value to take into account the impact of counterparty credit quality. The methodology calculates the present value of expected losses over the life of the financial instrument as a function of probability of default, loss given default, expected credit risk exposure and an asset correlation factor. Impaired derivatives are also subject to a CVA.
Dividend payout ratio is the total ordinary dividend payment divided by profit attributable to shareholders of the Company.
Fair value is an amount at which an asset or liability could be exchanged between knowledgeable and willing parties in an arm’s length transaction.
Group is Australia and New Zealand Banking Group Limited (the Company) and the entities it controlled at the year end and from time to time during the financial year (together, the Group).
Gross loans and advances (GLA) is made up of loans and advances, acceptances and capitalised brokerage/mortgage origination fees less unearned income.
IFRS International Financial Reporting Standards.
Impaired assets are those financial assets where doubt exists as to whether the full contractual amount will be received in a timely manner, or where concessional terms have been provided because of the financial difficulties of the customer. Financial assets are impaired if there is objective evidence of impairment as a result of a loss event that occurred prior to the reporting date, and that loss event has had an impact, which can be reliably estimated, on the expected future cash flows of the individual asset or portfolio of assets.
Impaired loans comprise drawn facilities where the customer’s status is defined as impaired.
Glossary
243ANZ 2020 Annual Report
Individually assessed allowance for
expected credit losses is assessed on a case-by-case basis for all individually managed impaired assets taking into consideration factors such as the realisable value of security (or other credit mitigants), the likely return available upon liquidation or bankruptcy, legal uncertainties, estimated costs involved in recovery, the market price of the exposure in secondary markets and the amount and timing of expected receipts and recoveries.
Interest rate risk in the banking book
(IRRBB) relates to the potential adverse impact of changes in market interest rates on ANZ’s future net interest income. The risk generally arises from:
1. repricing and yield curve risk – the risk to earnings or market value as a result of changes in the overall level of interest rates and/or the relativity of these rates across the yield curve;
2. basis risk – the risk to earnings or market value arising from volatility in the interest margin applicable to banking book items; and
3. optionality risk – the risk to earnings or market value arising from the existence of stand-alone or embedded options in banking book items.
Internationally comparable ratios are ANZ’s interpretation of the regulations documented in the Basel Committee publications; “Basel lll: A global regulatory framework for more resilient banks and banking systems” (June 2011) and “International Convergence of Capital Measurement and Capital Standards” (June 2006). They also include differences identified in APRA’s information paper entitled “International Capital Comparison Study” (13 July 2015).
Level 1 in the context of APRA supervision, Australia and New Zealand Banking Group Limited consolidated with certain approved subsidiaries.
Level 2 in the context of APRA supervision, the consolidated ANZ Group excluding associates, insurance and funds management entities, commercial non-financial entities and certain securitisation vehicles.
Net interest margin is net interest income as a percentage of average interest earning assets.
Net loans and advances represent gross loans and advances less allowance for expected credit losses.
Net Stable Funding Ratio (NSFR) is the ratio of the amount of available stable funding (ASF) to the amount of required stable funding (RSF) defined by APRA. The amount of ASF is the portion of an Authorised Deposit-taking Institution’s (ADI) capital and liabilities expected to be a reliable source of funds over a one year time horizon. The amount of RSF is a function of the liquidity characteristics and residual maturities of an ADI’s assets and off- balance sheet activities. ADIs must maintain an NSFR of at least 100%.
Net tangible assets equal share capital and reserves attributable to shareholders of the Company less unamortised intangible assets (including goodwill and software).
Regulatory deposits are mandatory reserve deposits lodged with local central banks in accordance with statutory requirements.
Restructured items comprise facilities in which the original contractual terms have been modified for reasons related to the financial difficulties of the customer. Restructuring may consist of reduction of interest, principal or other payments legally due, or an extension in maturity materially beyond those typically offered to new facilities with similar risk.
Return on average assets is the profit attributable to shareholders of the Company, divided by average total assets.
Return on average ordinary
shareholders’ equity is the profit attributable to shareholders of the Company, divided by average ordinary shareholders’ equity.
Risk weighted assets (RWA) are risk weighted according to each asset’s inherent potential for default and what the likely losses would be in the case of default. In the case of non asset backed risks (i.e. market and operational risk), RWA is determined by multiplying the capital requirements for those risks by 12.5.
Settlement balances owed to/by ANZ represent financial assets and/or liabilities which are in the course of being settled. These may include trade dated assets and liabilities, vostro accounts and securities settlement accounts.
Glossary continued
244
Overview How we create value
Performance overview
Remuneration report
Directors’ report
Financial report
Shareholder information