Comprehensive Annual Financial Report - TRS
124
R e t i r e m e n t Se c u r i t y f o r I l l i n o i s E d u c a t o rs Comprehensive Annual Financial Report Teachers’ Retirement System of the State of Illinois a component unit of the State of Illinois for the fiscal years ended June 30, 2013 and June 30, 2012
-
Upload
khangminh22 -
Category
Documents
-
view
1 -
download
0
Transcript of Comprehensive Annual Financial Report - TRS

Retirem
ent S
ecurity for Illinois Educators
Comprehensive Annual Financial Report
Teachers’ Retirement System of the State of Illinoisa component unit of the State of Illinois
for the fiscal years ended June 30, 2013 and June 30, 2012

STATEMENT OF PURPOSERetirement Security for Illinois Educators
MISSION STATEMENTSafeguard benefit security through committed staff, engaged members, and responsible funding.
FISCAL YEAR HIGHLIGHTS2013 2012
Active contributing members 160,692 162,217Inactive noncontributing members 120,325 99,052Benefit recipients* 108,783 105,447Total membership 389,800 366,716
Actuarial accrued liability (AAL) $93,886,988,000 $90,024,945,000Less actuarial value of assets (smoothed assets) 38,155,191,000 37,945,397,000Unfunded actuarial accrued liability (UAAL) $55,731,797,000 $52,079,548,000
Funded ratio (% of AAL covered by assets, based on smoothed assets) 40.6% 42.1%Total fund investment return, net of fees 12.8% 0.8%
ExpensesBenefits paid $4,893,084,234 $4,553,822,073Refunds paid 88,397,549 84,635,032Administrative expenses 20,257,553 19,011,899Total expenses $5,001,739,336 $4,657,469,004
IncomeMember contributions $921,422,657 $917,661,328Employer contributions 157,179,243 154,894,946State of Illinois contributions 2,703,312,213 2,406,364,156Total investment income 4,561,768,383 224,106,719Total income $8,343,682,496 $3,703,027,149
* Benefit recipients includes retiree, disability, and survivor beneficiaries.

Retirem
ent S
ecurity for Illinois Educators
Comprehensive Annual Financial Report
for the fiscal years ended June 30, 2013 and June 30, 2012
Teachers’ Retirement System of the State of Illinoisa component unit of the State of Illinois
2815 West Washington | P.O. Box 19253 | Springfield, Illinois 62794-9253http://trs.illinois.gov
Retirem
ent S
ecurity for Illinois Educators
http://trs.illinois.govTeachers' Retirement System of the State of Illinois
© Teachers’ Retirement System of the State of Illinois2815 West Washington Street | Springfield Illinois 62702
(800) 877-7896 | (866) 326-0087 for the hearing impairedWebmaster | Privacy Notice | State Links | Educator Resources
Member Account Access TRS Business News Room Publications Contact Us Go
Home
TRS PDF documents require Acrobat Reader ©.
MEM
BERS
EMPL
OYER
SAB
OUT
TRS Fall Member Meetings
Regional meetings for Tier
I members explain the TRS
retirement process and member
benefits. Click here for meeting
dates and locations.
Overhauling the Illinois Pension CodeA General Assembly committee
continues to work on legislation
to secure the long-term financial
security of TRS. This legislation
may include changes to benefits
and stronger guarantees of
future state funding for TRS.
This committee was formed
after lawmakers failed to reach
agreement on a bill during the
2013 spring session.
Welcome to the New TRS Website!TRS has redesigned and
improved its website to
make it easier to find the
online resources you need.
Just select from “Members,”
Employers,” “About TRS” or
a navigation button to find
information about benefits,
forms, publications, employer
responsibilities, investments,
legislation and news about TRS.
Click here for press release.
Redesigned siteThe design of the fiscal year 2013 Comprehensive Annual Financial Report mirrors the format and look of the System’s website, which was redesigned in 2012-2013 to make it more inviting and easier for mem-bers and the public to use.
Since the site was launched in 1996, it has steadily grown in importance. In the last year, roughly 1.1 million people visited the TRS website, a volume that easily surpasses any other communication method. The TRS website contains the analyses of legislative issues, procedures to be followed by members and school dis-tricts, and interactive tools that help members make important retirement decisions.
In less than 20 years, the website has grown to become a vital tool in the lasting relationships TRS has with its members and their families.
Preface This report was prepared by the TRS Accounting, Investments,
Research, and Communications Departments.

Page 2
contentsINTRODUCTION 6 CertificateofAchievement 7 Letter of Transmittal 12 Board of Trustees 12 Executive Cabinet Members 13 Organizational Structure 14 Consulting and Professional Services
FINANCIAL 16 IndependentAuditor'sReport 19 Management’sDiscussionandAnalysis 24 Financial Statements 24 Statements of Net Position as of June 30, 2013 and 2012 25 Statements of Changes in Net Position Years Ended June 30, 2013 and 2012 26 Notes to Financial Statements 55 Required Supplementary Information 55 Schedule of Funding Progress 55 Schedule of Contributions from Employers and Other Contributing Entities 56 Other Supplementary Information 56 ScheduleofAdministrativeExpensesForYearsEndedJune30 56 Schedule of Investment Expense For Years Ended June 30 56 Schedule of Payments to Consultants For Years Ended June 30
INVESTMENTS 58 Introduction 59 Fund Performance vs. Benchmarks and Fair Values 59 Performance Summary 59 AssetAllocationvs.Targets 61 Portfolio Securities Summary 62 Securities Holdings (Historical) 62 Securities Holdings For Years Ended June 30 62 Growth of $10,000 63 U.S. Equity 66 International Equity 68 Global Fixed Income 71 Real Return 72 Private Equity 77 AbsoluteReturn 78 Real Estate 80 Securities Lending 81 Securities Lending Summary 81 BrokerageActivity 81 Top 50 Brokers Used by TRS Managers 82 External Manager Fee Payments 82 Schedule of Investment Manager Fees

Page 3
ACTUARIAL 90 Actuary’sCertification 92 ActuarialAssumptionsandMethods 95 AnnualActuarialValuation 95 ActuarialValuation95 AnalysisofFinancialExperience:ReconciliationofUnfundedLiability96 Reconciliation of Unfunded Liability 97 State Funding98 Tests of Financial Condition98 Funded Ratio Test 98 Unfunded Liability as a Percentage of Payroll Test 99 Solvency Test 99 Other Information
99 RetireesandBeneficiariesAddedtoandRemovedfromRolls100 AverageAnnualSalaryforActiveMembersbyYearsofService102 ActiveMembersbyAgeandYearsofServiceasofJune30,2013 104 Plan Summary
STATISTICAL110 Retired Members by Years of Service and Years in Retirement as of June 30, 2013112 Changes in Net Position, Last 10 Fiscal Years 112 BenefitandRefundDeductionsfromNetPositionbyType,Last10FiscalYears115 Employee and Employer Contribution Rates, Last 10 Fiscal Years116 DemographicsofBenefitRecipientsandActiveMembersasofJune30,2013116 BenefitRecipientsbyTypeasofJune30,2013118 AverageBenefitPaymentsforNewRetirees,Last10FiscalYears120 Principal Participating Employers

TRS Website Development The TRS website went online in 1996. It was redesigned in 1998, 2002, 2006, and 2013. The 2013 design was planned by the Communications Department with input from department managers on content and navigation. The foundation of the design was simple. Visitors should be able to find information online in only a few clicks and duplication of information was avoided.
Member Feedback In June 2013, various members in the Springfield office agreed test our new website before it was launched and provide feedback. Here are some of their comments:
• “I like that there is easy access and drop downs to more specific information.”• “I like the easy navigation. It’s easy to navigate and understand.”• “I like the quick movement.”• “I like that the site is user-friendly, organized and non-cluttered.”
We also learned that members go to our site most commonly for the Member Guides, retirement planning, legislation topics, contact information and forms. The members were asked to locate specificsubjects, forms and publications, which most completed quite easily. This exercise helped us gauge whether the design was logical and organized for members to fin information on the first try

Retirem
ent S
ecurity for Illinois Educators
Introduction

Page 6 INTRODUCTION

Page 7INTRODUCTION
letter of transmittalDecember 18, 2013
To the Board of Trustees and TRS Members:
We are pleased to present the Comprehensive Annual Financial Report (CAFR) for the Teachers’ Retirement System of the State of Illinois (TRS) for the fiscal years ended June 30, 2013 and June 30, 2012. The presen-tation of this year’s report mirrors the stylistic and functional upgrades made during 2013 to the TRS website – http://trs.illinois.gov. A newly redesigned interactive platform provides the latest information on TRS's finances and pension issues facing Illinois, as well as tools to help members and employers do business with TRS.
The 2013 CAFR reveals that despite its standing as one of the 50 largest retirement systems in the United States and one of the top 100 funds worldwide, TRS continues to face significant financial challenges in the future unless the State of Illinois takes action to counteract decades of consistent underfunding by state government. Going forward, these financial challenges undermine the state’s legal and moral responsibility to make retire-ment promises that can be kept and to fully fund these promises.
According to a media analysis based on assets, TRS currently ranks 41st among both public and private United States pension systems, holding $39.9 billion in assets at the end of fiscal year 2013. However, if TRS had been properly funded over the last 74 years, TRS would be among the 10 largest U.S. systems. These facts underscore the extent of the problem.
By all accounts, the long-term funded status of TRS is worst in the nation. TRS's funded ratio at the end of the fiscal year stood at 40.6 percent, on an actuarial basis, with a total long-term unfunded liability of $55.7 billion. The obligations owed members over the next several decades have increased by 162 percent since 2000. However during the same period, TRS assets grew by only 63 percent.
TRS remains a major entity in institutional investing and the world economy, but over time its growing unfunded liability will increasingly threaten its sustainability for all members – those that are retired and those who are active educators. A large unfunded liability threatens investment returns that are vital to the retirement system’s security.
For the last two years TRS has played a leading role in pinpointing and explaining the steep challenges faced by the state’s five public pension systems. Led by the Board of Trustees, TRS has consistently warned that a growing pension debt and state government’s consistent inability to provide actuarially adequate funding will lead to calamity in less than 25 years. As this CAFR is being readied, members of the Illinois General Assembly continue to debate controversial legislation that could result in changes to funding for pensions and to retire-ment benefits. Without any changes to correct the imbalance between spending and revenue, TRS predicts that obligations could exceed resources as early as 2034.
In 2012 the TRS Board of Trustees approved a resolution that not only recognized the threat to our members, but set forth a five-point foundation for any change to the pension code designed to secure the future. The five cornerstones of future security for TRS pensions would:
1. Require the use of standard actuarial practices and formulas instead of alternate calculations and practices required by state law that artificially lower state funding levels.
Teachers' Retirement System of the State of Illinois2815 West Washington Street | P.O. Box 19253 | Springfield, Illinois 62794-9253
Richard W. Ingram, Executive [email protected] | http://trs.illinois.gov
(800) 877-7896 | for the hearing impaired: (866) 326-0087Retirem
ent S
ecurity for Illinois Educators

Page 8 INTRODUCTION
2. Require a legal guarantee that ensures state government fully funds TRS and the other public pension funds in the future.
3. Amend state law to fix a serious financial inequity in the benefits and funding for Tier II pensions that sig-nificantly penalizes those members over time and masks the true underfunded status of Tier I benefits.
4. Ensure that any changes in the pension code made by the General Assembly are uncomplicated and easy to administer fairly to all our members.
5. Require that any changes to the pension code adhere to Article 13, Section 5 of the Illinois Constitution – the pension protection clause.
Ensuring the long-term stability and strength of TRS will enable it to keep the promises made by the State of Illinois for a secure retirement. In good times and bad, TRS has maintained trusted relationships with generations of educators and has never defaulted on any promises.
TRS has more than fulfilled its duty to properly manage the money entrusted to it by our members. At the end of fiscal year 2013, TRS investments returned 12.8 percent, net of fees, outperforming the System’s custom benchmark of 12.5 percent. More importantly, TRS’s 30-year investment return exceeded 9 percent, which outperformed the long-term assumed rate of return of 8 percent.
The state’s promise of a secure retirement is vital to school teachers and communities in every corner of Illinois. TRS pensions provide our members with a stable income during their golden years that allow them to continue to be involved members of society. Moreover, TRS members continue to contribute to the Illinois economy. TRS benefits support economic activity that creates more than 32,000 jobs throughout the state and provide an annual economic stimulus in excess of $4.4 billion.
TRS is required by law to publish a CAFR annually with information about the System’s financial condition, investment methods and performance, actuarial conclusions that determine financial needs and statistical infor-mation about members, school districts, revenues and benefits. TRS management and staff are responsible for the accuracy of this report and for ensuring that all material disclosures have been made. TRS recognizes that the limitations of internal controls must be considered. These controls are designed to provide reasonable assur-ance regarding the safekeeping of assets, the reliability of financial records, the appropriate segregation of duties and responsibilities and the use of sound accounting and financial practices. The concept of reasonable assurance recognizes that the cost of a control should not exceed the benefits likely to be derived and that the valuation of costs and benefits requires estimates and judgments by management. The objective of internal con-trols at TRS is a reasonable, not absolute, assurance that the System’s financial statements are free of material misstatements. Three internal auditors are employed to continually review and determine that all laws, rules, policies and procedures are followed.
Profile of TRSTRS was established by the State of Illinois on July 1, 1939, to provide retirement, disability, and death ben-efits to teachers employed by Illinois public elementary and secondary schools outside the city of Chicago. A 13-member Board of Trustees governs TRS. The Board includes the state superintendent of education, six rep-resentatives of the public who are appointed by the governor, four members of TRS who are elected by active teachers, and two retired members who are elected by annuitants. The Board of Trustees appoints the executive director, who is responsible for the effective administration of TRS.
The annual budget for TRS administrative expenses is prepared by staff and approved by the Board of Trustees. The TRS annual operating budget request is prepared in conjunction with a review of the long-range strategic plan.

Page 9INTRODUCTION
Financial InformationOur staff issues a CAFR within six months of the close of each fiscal year. The report contains financial state-ments presented in conformity with generally accepted accounting principles (GAAP) applied within guidelines established by the Governmental Accounting Standards Board (GASB).
A system of internal controls helps us monitor and safeguard assets and promote efficient operations. Each year TRS’s financial statements, records, and internal controls are examined by a professional accounting firm who serves as special assistant auditors employed by the Illinois Auditor General. In addition, an annual compliance attestation examination is performed to review compliance with applicable statutes and codes. The Independent Auditor's Report on TRS’s financial statements is included in the Financial Section of this report.
Generally accepted accounting principles require that management provide a narrative introduction, overview, and analysis to accompany the financial statements in the form of a Management’s Discussion and Analysis (MD&A). This letter of transmittal is designed to complement the MD&A and should be read in conjunction with it. The MD&A can be found immediately following the report of the independent auditors.
Revenues and ExpensesThe three sources of TRS funding include member contributions, investment income, and employer contributions through state appropriations and payments by school districts. TRS expenses include payments of benefits, refunds, and administrative expenses. Negative amounts are shown in parentheses () throughout this report.
Revenues ($ millions) Increase
Source 2013 2012 Amount % ChangeMember contributions $922 $918 $4 0.4%State of Illinois 2,703 2,406 297 12.3Employer contributions 157 155 2 1.3Total investment income 4,562 224 4,338 1,936.6Total $8,344 $3,703 $4,641 125.3%
Expenses ($ millions)Increase
Source 2013 2012 Amount % ChangeBenefits payments $4,893 $4,554 $339 7.4%Refunds 89 84 5 6.0Administrative/Other 20 19 1 5.3Total $5,002 $4,657 $345 7.4%
TRS staff and the Board of Trustees remain vigilant in our efforts to improve the retirement system’s funded status for our current and future members. We continue to invest prudently and in a disciplined manner for the benefit of our membership and for the long-term success of the retirement system. The TRS Board and staff believe the overall investment strategy remains sound and appropriate for our circumstances.
InvestmentsThe TRS investment portfolio returned 13.5 percent, gross of fees, for the fiscal year ended June 30, 2013. Total TRS investment assets increased approximately $2.9 billion during the year.
The TRS trust fund is invested by authority of the Illinois Pension Code under the “prudent person rule,” requir-ing investments to be managed solely in the interest of fund participants and beneficiaries. The TRS Investment

Page 10 INTRODUCTION
Policy guides TRS’s investments. Investment principles include preserving the long-term principal of the trust fund, maximizing total return within prudent risk parameters, and acting in the exclusive interest of TRS members.
The Investment Section of this report contains a summary of the portfolio and investment activities.
FundingDuring the year ended June 30, 2013, the funded ratio of the Teachers’ Retirement System decreased from 42.1 percent to 40.6 percent. The actuarial value of assets at year end was $38.2 billion and the actuarial accrued liability was $93.9 billion. The decline in the funded ratio was due to an increase in the liability mainly due to the continued phase-in of prior investment losses. Under the smoothing methodology required by Public Act 96-0043, differences between actual and expected investment earnings are recognized prospectively over a five-year period. The actuarial value of assets now recognizes 100 percent of the 2009 losses, 80 percent of the 2010 gains, 60 percent of the 2011 gains, 40 percent of the 2012 losses, and 20 percent of the 2013 gains, compared to the actuarially assumed rate of return.
The Actuarial Section of this report contains the actuary’s letter and further information on TRS funding.
Major InitiativesIn fiscal year 2013, TRS initiated and continued several initiatives that benefited our members and enhanced the retirement system:
• An extensive document imaging project designed to digitize approximately 398,000 hard-copy member records containing an estimated 11 million images. The new record system will help prevent identity theft and the unintended loss of records. Once member records are converted, the project will begin digitizing files from the Employer Services and Investment Departments.
• Improvements to the System’s interaction with members, stakeholders and the public. The re-designed TRS website greatly improved the functionality and usefulness of the site for members. An extensive reconfigu-ration of the retirement system’s call center in Springfield will enhance direct service to members. A new larger office in Lisle will improve member outreach in northern Illinois. New software improves the Freedom of Information Act process for members and the public.
• A commitment to environmental stewardship. The document imaging project greatly reduces the amount of paper used in the day-to-day operations. All materials for TRS Board meetings for the first time are be-ing delivered electronically, eliminating thousands of pieces of paper for each meeting and the staff time needed for production and duplication.
• Extensive analysis and actuarial calculations on proposed pension legislation for state officials, legislators, policymakers and stakeholders regarding the impact of various ideas and concepts on benefits and sys-tem funding.
• The integration of new financial reporting guidelines established by the Governmental Accounting Standards Board for use in fiscal year 2014, along with an education program to help members, stakeholders and the media understand the rationale, use and limitations of the new procedures.
All of these initiatives are pursued with one goal in mind: to better serve our members, whether they are 25 or 100 years of age. We are committed to earn their trust. We know they look to us to keep the retirement promises made to them. That requires us to be honest about the threats to these promises. We are committed to being a source of clarity in a world filled with uncertainty and are grateful for the trust placed in our care.

Page 11INTRODUCTION
GFOA AwardThe Government Finance Officers Association of the United States and Canada (GFOA) awarded a Certificate of Achievement for Excellence in Financial Reporting to TRS for its Comprehensive Annual Financial Report for the fiscal year ended June 30, 2012. This was the 24th consecutive year that the government has achieved this prestigious award. In order to be awarded a Certificate of Achievement, a government must publish an easily readable and efficiently organized comprehensive annual financial report. This report must satisfy both gener-ally accepted accounting principles and applicable legal requirements.
A Certificate of Achievement is valid for a period of one year only. We believe that our current comprehensive annual financial report continues to meet the Certificate of Achievement Program's requirements and we are submitting it to the GFOA to determine its eligibility for another certificate.
AcknowledgementsInformation for this report was gathered by and reflects the combined efforts of TRS staff under the leadership of the Board of Trustees and the executive director. It is intended to provide complete and reliable information as a basis for making management decisions, to determine our compliance with legal provisions, and as a means of determining responsible stewardship of the assets contributed by members and their employers.
This report is made available to members of the General Assembly, participating employers, and to other interested persons by request. The participating employers of TRS form a link between TRS and its members. Their cooperation contributes significantly to our success. We hope all recipients of this report find it infor-mative and useful. This report is also available to the general public on our website, http://trs.illinois.gov.
We would like to take this opportunity to express our gratitude to staff, professional consultants, and others who have worked so diligently to ensure TRS’s successful operation.
Richard Ingram Jana Bergschneider, CPAExecutive Director Director of Administration

Page 12 INTRODUCTION
board of trusteesAs of December 1, 2013
executive cabinet membersAs of December 1, 2013
Front row, left to right: Vice President Sharon Leggett; Rainy Kaplan; Cinda Klickna; Marcia Campbell and Cynthia O’NeillBack row, left to right: Michael Busby; Mark Bailey; Executive Director Dick Ingram; Enrique M. Vasquez; Bob Lyons; President Christopher A. Koch, Ed. D. Shown at right: Sonia Walwyn
Front row, left to right: Director of Research Kathleen Farney, CEBS; Senior Assistant General Counsel Cynthia Fain; Director of Adminis-tration Jana Bergschneider, CPA; Director of Human Resources Gina Larkin; Executive Assistant Sue Billington and Assistant to the Executive Director Tammy Green Back row, left to right: Director of Member Services Sally Sherman; Communications Manager Kathy Boehme; General Counsel Tom Gray; Director of Outreach Rich Frankenfeld; Executive Director Dick Ingram; Chief Investment Officer Stan Rupnik, CFA; Director of Communications Dave Urbanek; Information Systems Officer Ed Mabie and Director of Internal Audit Stacy Smith, CPA, CIDA
Sonia Walwyn

Page 13INTRODUCTION
organizational structureExecutive Cabinet Members as of December 1, 2013
Stacy Smith, CPA, CIDA
Director of Internal Audit
Sue Billington
Executive Assistant
Tammy Green
Assistant to the Executive Director
Kathleen Farney, CEBS
Director of Research
Cynthia Fain
Senior Assistant General Counsel
Stan Rupnik, CFA
Chief Investment Officer
Tom Gray
General Counsel
Rich Frankenfeld
Director of Outreach
Dick Ingram
Executive Director
Kathy Boehme
Communications Manager
Gina Larkin
Director of Human Resources
Ed Mabie
Information Systems Officer
Sally Sherman
Director of Member Services
Board of Trustees
Jana Bergschneider, CPA
Director of Administration
Dave Urbanek
Director of Communications

Page 14 INTRODUCTION
consulting and professional servicesActuaryBuck Consultants, LLCChicago, Illinois
External Auditors(Special assistants to the Office of the Auditor General)
McGladrey LLPSchaumburg, Illinois
Information SystemsBrent Ozar Unlimited Beaverton, Oregon
Laserfiche Corporate HeadquartersLong Beach, California
McAfeeChicago, Illinois
Sentinel Technologies Chicago, Illinois
SunGard Availability ServicesChicago, Illinois
LegislativeLeinenweber Baroni & Daffada Consulting LLCSpringfield, Illinois
Legal ServicesBingham McCutchen LLPHartford, Connecticut
Cavanagh & O’HaraSpringfield, Illinois
Holland & Knight LLPChicago, Illinois
Howard & Howard Attorneys PLLCPeoria, Illinois
Jackson Walker LLPAustin, Texas
Kopec White & SpoonerSpringfield, Illinois
Loewenstein Hagen & Smith PCSpringfield, Illinois
Mayer Brown LLPChicago, Illinois
Morgan Lewis & Bockius LLPNew York, New York
Robbins Geller Rudman & Dowd LLPSan Diego, California
Sorling NorthrupSpringfield, Illinois
Master TrusteeState Street Bank and Trust CompanyBoston, Massachusetts
Securities Lending AgentCitibank, N.A.New York, New York
Investment ConsultantsCallan Associates Inc. (Real estate) San Francisco, California
R.V. Kuhns & Associates, Inc. (General investment) Portland, Oregon
Risk Resources(Real estate insurance consulting) Elmhurst, Illinois
TorreyCove Capital Partners LLC(Private equity) La Jolla, California
Co-Investment AdvisorsLP Capital Advisors, LLC(Private equity) Sacramento, California
ORG Portfolio Management LLC(Real estate) Cleveland, Ohio
Real Asset Portfolio Management LLC(Real estate) Portland, Oregon
Stout Risius Ross, Inc.(Private equity) Los Angeles, California

Retirem
ent S
ecurity for Illinois Educators
Financial

Page 16 FINANCIAL
Independent Auditor’s Report
Honorable William G. Holland, Auditor General – State of Illinois
Board of Trustees, Teachers’ Retirement System of the State of Illinois
Report on the Financial Statements
As Special Assistant Auditors for the Auditor General, we have audited the accompanying Statements of Net Position of the Teachers’ Retirement System of the State of Illinois (System), a component unit of the State of Illinois, as of and for the years ended June 30, 2013 and 2012, and the related Statement of Changes in Net Position for the years then ended, and the related notes to the financial statements as listed in the table of contents.
Management’s Responsibility for the Financial Statements
Management is responsible for the preparation and fair presentation of these financial statements in accordance with accounting principles generally accepted in the United States of America; this includes the design, implementation, and maintenance of internal control relevant to the preparation and fair presentation of financial statements that are free from material misstatement, whether due to fraud or error.
Auditor’s Responsibility
Our responsibility is to express an opinion on these financial statements based on our audits. We conducted our audits in accordance with auditing standards generally accepted in the United States of America. Those standards require that we plan and perform the audit to obtain reasonable assurance about whether the financial statements are free from material misstatement.
An audit involves performing procedures to obtain audit evidence about the amounts and disclosures in the financial statements. The procedures selected depend on the auditor’s judgment, including the assessment of the risks of material misstatement of the financial statements, whether due to fraud or error. In making those risk assessments, the auditor considers internal control relevant to the entity’s preparation and fair presentation of the financial statements in order to design audit procedures that are appropriate in the circumstances, but not for the purpose of expressing an opinion on the effectiveness of the entity’s internal control. Accordingly, we express no such opinion. An audit also includes evaluating the appropriateness of accounting policies used and the reasonableness of significant accounting estimates made by management, as well as evaluating the overall presentation of the financial statements.
We believe that the audit evidence we have obtained is sufficient and appropriate to provide a basis for our audit opinion.
Opinion
In our opinion, the financial statements referred to above present fairly, in all material respects, the net position of the Teachers’ Retirement System of Illinois as of June 30, 2013 and 2012, and the changes in net position for the years then ended in accordance with accounting principles generally accepted in the United States of America.

Page 17FINANCIAL
Other Matters
Required Supplementary Information:Accounting principles generally accepted in the United States of America require that the management’s discussion and analysis on pages 19 through 23 and the schedules of funding progress and contributions from employers and other contributing entities on page 55 be presented to supplement the financial statements. Such information, although not a part of the financial statements, is required by the Governmental Accounting Standards Board who considers it to be an essential part of financial reporting for placing the financial statements in an appropriate operational, economic, or historical context. We have applied certain limited procedures to the required supplementary information in accordance with auditing standards generally accepted in the United States of America, which consisted of inquiries of management about the methods of preparing the information and comparing the information for consistency with management’s responses to our inquiries, the financial statements, and other knowledge we obtained during our audit of the financial statements. We do not express an opinion or provide any assurance on the information because the limited procedures do not provide us with sufficient evidence to express an opinion or provide any assurance.
Other Information:Our audits were conducted for the purpose of forming an opinion on the System’s financial statements. The other supplementary information in the financial section, and the accompanying introductory, investment, actuarial, and statistical sections are presented for purposes of additional analysis and are not a required part of the financial statements.
The other supplementary information in the financial section is the responsibility of management and was derived from and relates directly to the underlying accounting and other records used to prepare the financial statements. Such information has been subjected to the auditing procedures applied in the audits of the financial statements and certain additional procedures, including comparing and reconciling such information directly to underlying accounting and other records used to prepare the financial statements or to the financial statements themselves and other additional procedures in accordance with auditing standards generally accepted in the United States of America. In our opinion, the other supplementary information in the financial section is fairly stated in all material respects, in relation to the financial statements as a whole. The introductory, investment, actuarial, and statistical sections have not been subjected to the auditing procedures applied in the audit of the financial statements, and accordingly, we do not express an opinion or provide any assurance on them.
Schaumburg, Illinois December 16, 2013

Page 18 FINANCIAL

P a g e 1 9FINANCIAL
management’s discussion and analysisThis discussion and analysis of the Teachers’ Retirement System of the State of Illinois provides an overview of financial activities for the fiscal years ended June 30, 2013 and June 30, 2012. Please read it in conjunction with the Letter of Transmittal in the Introduction Section on page 7 and the Financial Statements and related notes that follow this discussion.
Fi n a n c i a l H i g h l i g h t s• The net position of TRS at June 30, 2013 was $39.9 billion.
• During FY13, the net position of TRS increased $3.3 billion.
• Contributions from members, employers, and the state were $3.8 billion, an increase of $303 million or 8.7 percent for the fiscal year.
• Total investment gain was $4.6 billion, compared to investment gain of $224 million in FY12, an increase of $4.3 billion.
• Benefits and refunds paid to members and annuitants were $5.0 billion, an increase of $344 million or 7.4 percent compared to FY12.
• Total actuarial accrued liability was $93.9 billion at June 30, 2013.
• The unfunded actuarial accrued liability increased from $52.1 billion at June 30, 2012 to $55.7 billion at June 30, 2013. The funded ratio decreased from 42.1 percent at June 30, 2012 to 40.6 percent at June 30, 2013. The unfunded liability and funded ratio for both years are calculated using a smoothed value of assets, as required under Public Act 96-0043.
The Financial Statements contained in this section of the Comprehensive Annual Financial Report consist of:
Statements of Net Position. This statement reports the pension trust fund’s net position which represents the difference between the other statement elements comprised of assets and liabilities. It is the balance sheet for the pension system and reflects the financial position of the Teachers’ Retirement System as of June 30, 2013 and June 30, 2012.
Statements of Changes in Net Position. This statement details transactions that occurred during the fiscal year. It is the income statement of TRS and reflects the revenues and expenses recorded throughout the fiscal year. The Statements of Changes in Net Position supports the change in the value of net position reported on the Statements of Net Position.
Notes to the Financial Statements. The notes are an integral part of the financial statements and include addi-tional information not readily evident in the statements themselves. The required supplementary information and other schedules following the notes to the financial statements provide historical and additional detailed information considered useful in evaluating the pension system’s financial condition. The following are condensed comparative financial statements of the TRS pension trust fund.

P a g e 2 0 FINANCIAL
Co n d e n s e d Co m p a r a t i v e S t a t e m e n t s o f Ne t P o s i t i o n a s o f J u n e 3 0
2013Percentage
Change 2012Percentage
Change 2011
Cash $14,659,145 (14.2%) $17,092,564 (53.6%) $36,799,319Receivables and prepaid expenses 506,901,765 55.7 325,464,952 84.2 176,673,155Investments 39,681,752,953 7.9 36,782,104,053 (2.6) 37,748,341,891Invested securities lending collateral 1,932,554,323 (26.2) 2,617,763,246 (15.7) 3,104,528,064Capital assets 4,358,587 0.6 4,331,011 8.5 3,992,703Total assets 42,140,226,773 6.0 39,746,755,826 (3.2) 41,070,335,132Total liabilities 2,281,458,274 (29.4) 3,229,930,487 (10.3) 3,599,067,938Net position $39,858,768,499 9.2% $36,516,825,339 (2.5%) $37,471,267,194
Co n d e n s e d Co m p a r a t i v e S t a t e m e n t s o f Ch a n g e s i n Ne t P o s i t i o n Fo r t h e Y e a r s E n d e d J u n e 3 0
2013Percentage
Change 2012Percentage
Change 2011
Contributions $3,781,914,113 8.7% $3,478,920,430 7.5% $3,235,605,731Total investment income 4,561,768,383 1,935.5 224,106,719 (96.9) 7,234,539,490Total additions 8,343,682,496 125.3 3,703,027,149 (64.6) 10,470,145,221Benefits and refunds 4,981,481,783 7.4 4,638,457,105 7.7 4,304,870,170Administrative expenses 20,257,553 6.6 19,011,899 6.9 17,792,071Total deductions 5,001,739,336 7.4 4,657,469,004 7.7 4,322,662,241Net increase/(decrease) in net position 3,341,943,160 (954,441,855) 6,147,482,980Net position beginning of year 36,516,825,339 (2.5) 37,471,267,194 19.6 31,323,784,214
Net position end of year $39,858,768,499 9.2% $36,516,825,339 (2.5%) $37,471,267,194

P a g e 2 1FINANCIAL
Fi n a n c i a l An a l y s i sTRS was created to provide retirement, survivor, and disability benefits to qualified members. Increases or decreases in plan net position serve as useful indicators of TRS’s financial position. Net position available to pay benefits was $39.9 billion and $36.5 billion at June 30, 2013 and 2012, respectively. Net position increased $3.3 billion during FY13 and decreased $954 million during FY12.
Co n t r i b u t i o n sContributions increased $303 million and $243 million during FY13 and FY12, respectively. During FY13, member contributions increased $4 million and employer contributions from school districts increased $2 million. During FY12, member contributions increased $8 million and employer contributions from school districts decreased $215 thousand. The net increase in employer contributions from school districts in FY13 is attributable to an increase in federal funds contributions and a decrease in employer early retirement contributions. The net decrease in employer contributions from school districts in FY12 is attributable to a decrease in federal funds contributions and an increase in employer early retirement contributions.
The State of Illinois makes appropriations to TRS. Receipts from the State of Illinois increased $297 million in FY13 compared to an increase of $235 million in FY12. The increase in both FY13 and FY12 was mainly due to the continued recognition of FY09 losses in the FY11 and FY10 actuarial value of assets that were used to determine the FY13 and FY12 funding requirements, respectively. State funding law provides for a 50-year funding plan that included a 15-year phase-in period and a goal of 90 percent funding in the year 2045.
R e v e n u e s b y T y p e f o r t h e Y e a r E n d e d J u n e 3 0 , 2 0 1 3 ( $ m i l l i o n s )
Investment Income$4,562
Employers$157
State of Illinois$2,703
Members$922
In v e s t m e n t sThe TRS trust fund is invested according to law under the “prudent person rule” requiring investments to be man-aged solely in the interest of fund participants and beneficiaries. Principles guiding the investment of funds include preserving the long-term principal of the trust fund and maximizing total return within prudent risk parameters.
The TRS investment portfolio returned 12.8 percent, net of fees, for the fiscal year ended June 30, 2013. Total TRS investment assets increased approximately $2.9 billion during the year.

P a g e 2 2 FINANCIAL
An n u a l R a t e o f R e t u r n ( n e t o f i n v e s t m e n t e x p e n s e s )
19.2%16.5%
10.8% 11.8%
(22.7%)
20072004 2005 20062008
(5.0%)
2009
12.9%
2010
12.8%
201320122011
(25%)
(20%)
(15%)
(10%)
(5%)
0%
5%
10%
15%
20%
25%23.6%
0.8%
The annual rate of return is an indication of TRS investment performance and is provided by the TRS master trustee.
B e n e f i t s a n d R e f u n d sRetirement, survivor, and disability benefit payments increased $339 million and $326 million during FY13 and FY12, respectively. Benefit payments increased from $4.6 billion and 105,447 recipients in FY12 to $4.9 billion and 108,783 recipients in FY13. The overall increase in benefit payments for both FY13 and FY12 is due to an increase in retirement benefits and number of retirees. Retirement benefits were higher as a result of annual increases in retirement benefits and an increase in the number of retirees from 90,967 at June 30, 2011 to 94,865 as of June 30, 2012, increasing to 97,899 as of June 30, 2013.
Refunds of contributions increased $5 million and $7 million in FY13 and FY12, respectively. The increase dur-ing FY13 is the result of a greater number of member and retirement refunds. The increase during FY12 is the result of a greater number of member, survivor benefit, and retirement refunds.
E x p e n s e s b y T y p e f o r t h e Y e a r E n d e d J u n e 3 0 , 2 0 1 3
Retirement benefits93.4%
Refunds1.8%
Survivor benefits3.8%
Administrative expenses0.4%
Disability benefits0.6%

P a g e 2 3FINANCIAL
Ac t u a r i a lThe annual actuarial valuation measures the total liability for all benefits earned to date. The accrued liability is a present value estimate of all the benefits that have been earned to date but not yet paid. The actuarial accrued liability increased $3.9 billion and $8.7 billion during FY13 and FY12, respectively, to $93.9 billion at June 30, 2013 and $90.0 billion at June 30, 2012. The unfunded liability is the present value of future benefits payable that are not covered by the actuarial value of assets as of the valuation date. The unfunded liability increased $3.6 billion during FY13 to $55.7 billion at June 30, 2013 compared to an increase of $8.6 billion during FY12 to $52.1 billion at June 30, 2012. The funded ratio reflects the percentage of the accrued liability covered by the actuarial value of assets. The funded ratio decreased to 40.6 percent at June 30, 2013 from 42.1 percent at June 30, 2012. The June 30, 2012 accrued liability reflects revised actuarial assumptions fol-lowing a five-year experience review.
In 2013 and 2012, the unfunded liability and funded ratio are based on a smoothed value of assets. Public Act 96-0043 required the five state retirement systems to begin smoothing actuarial gains and losses on investments over a five-year period, beginning with the valuation for the year ended June 30, 2009.
When the funded ratio was based on the fair value of assets, the reported funded ratio was impacted immediately by changes in market conditions. State funding requirements based on fair value assets were also immediately impacted and therefore more volatile. Using the smoothed value of assets will result in more stable reported funded ratios and state funding requirements over time.
Fu n d e d R a t i o b a s e d o n Ac t u a r i a l V a l u e o f As s e t s
0%
10%
20%
30%
40%
50%
60%
70%
20072004
63.8%61.9%
2005
60.8%
2006
62.0%
2008
56.0%52.1%
2009 2011 20122010
48.4% 46.5%42.1%
2013
40.6%
0%
10%
20%
30%
40%
50%
60%
70%
The funded ratio in this chart is the ratio of actuarial assets to the actuarial liability. An increase in this ratio indicates an improvement in TRS’s ability to meet future benefit obligations. The actuarial value of assets was based on fair value through 2008 with five-year smoothing beginning in 2009.
Le g i s l a t i v eOn December 5, 2013, Governor Pat Quinn signed Public Act 98-0599 into law, with an effective date of no earlier than June 1, 2014. The law’s intent is to eliminate the TRS unfunded liability by 2045 and the long-term stabilization of the System’s finances. This is accomplished by, among other things, reducing the annual cost of living adjustment, capping pensionable earnings of Tier I members, delaying the retirement date of members under age 45, reducing Tier I member contributions, guaranteeing adequate annual state contributions, ear-marking extra funds to help pay off the unfunded liability and calculating the System’s liabilities under standard actuarial practices. A court challenge to the law’s constitutionality is expected. TRS continues to analyze this legislation and its effect on TRS members.

P a g e 2 4 FINANCIAL
financial statementsT e a c h e r s ’ R e t i r e m e n t S y s t e m o f t h e S t a t e o f Il l i n o i sS t a t e m e n t s o f Ne t P o s i t i o n a s o f J u n e 3 0 , 2 0 1 3 a n d 2 0 1 2
2013 2012AssetsCash $14,659,145 $17,092,564
Receivables and prepaid expensesMember contributions 61,631,048 49,230,548 Employer contributions 13,595,958 15,856,508 State of Illinois 331,413,880 160,551,000 Investment income 98,149,767 96,449,824 Prepaid expenses 2,111,112 3,377,072 Total receivables and prepaid expenses 506,901,765 325,464,952
Investments, at fair valueFixed income 6,872,432,511 6,826,294,726Equities 17,116,072,384 15,764,857,982Real estate 4,680,490,237 4,480,390,766Short-term investments 1,448,944,819 885,036,978Private equity investments 4,687,146,815 4,175,728,282Real return 2,661,472,243 2,582,307,633Absolute return 2,110,246,003 1,978,268,562Foreign currency 114,363,611 81,921,602Derivatives (9,415,670) 7,297,522Total investments 39,681,752,953 36,782,104,053
Invested securities lending collateralShort-term investments 1,836,179,323 1,897,321,779 Fixed income 0 661,852,467 Securities lending collateral w/State Treasurer 96,375,000 58,589,000 Total invested securities lending collateral 1,932,554,323 2,617,763,246
Property and equipment, at cost, net of accumulated depreciation of $7,685,796 and $6,810,702 in 2013 and 2012, respectively 4,358,587 4,331,011
Total assets 42,140,226,773 39,746,755,826
LiabilitiesBenefits and refunds payable 6,052,691 8,204,638 Administrative and investment expenses payable 44,511,510 37,368,405 Payable to brokers for unsettled trades, net 298,339,750 566,594,198 Securities lending collateral 1,932,554,323 2,617,763,246Total liabilities 2,281,458,274 3,229,930,487Net position – restricted for pension benefits $39,858,768,499 $36,516,825,339The accompanying notes are an integral part of these statements.

P a g e 2 5FINANCIAL
T e a c h e r s ’ R e t i r e m e n t S y s t e m o f t h e S t a t e o f Il l i n o i sS t a t e m e n t s o f Ch a n g e s i n Ne t P o s i t i o n Y e a r s E n d e d J u n e 3 0 , 2 0 1 3 a n d 2 0 1 2
2013 2012AdditionsContributionsMembers $921,422,657 $917,661,328 State of Illinois 2,703,312,213 2,406,364,156Employers
Early retirement 26,233,220 31,134,256 Federal funds 68,867,939 62,287,692 2.2 benefit formula 55,182,660 53,943,189 Excess salary/sick leave 6,895,424 7,529,809
Total contributions 3,781,914,113 3,478,920,430 Investment incomeFrom investment activities
Net appreciation (depreciation) in fair value 3,801,020,789 (569,789,574)Interest 237,105,503 252,487,148 Real estate operating income, net 224,838,678 217,106,145 Dividends 466,665,278 471,331,674 Private equity income 85,549,726 59,494,311 Other investment income 13,064,572 8,667,039 Investment activity income 4,828,244,546 439,296,743 Less investment expense (280,372,727) (234,807,327)Net investment activity income 4,547,871,819 204,489,416
From securities lending activitiesSecurities lending income 7,506,839 13,285,650 Securities lending management fees (1,254,991) (2,181,351)Securities lending borrower rebates 7,644,716 8,513,004Net securities lending activity income 13,896,564 19,617,303
Total investment income 4,561,768,383 224,106,719Total additions 8,343,682,496 3,703,027,149 DeductionsRetirement benefits 4,670,384,710 4,347,172,659 Survivor benefits 192,390,237 177,421,689 Disability benefits 30,309,287 29,227,725 Refunds 88,397,549 84,635,032 Administrative expenses 20,257,553 19,011,899 Total deductions 5,001,739,336 4,657,469,004 Net increase (decrease) 3,341,943,160 (954,441,855)Net position – restricted for pension benefitsBeginning of year 36,516,825,339 37,471,267,194End of year $39,858,768,499 $36,516,825,339
The accompanying notes are an integral part of these statements.

P a g e 2 6 FINANCIAL
No t e s t o Fi n a n c i a l S t a t e m e n t s
A. P l a n D e s c r i p t i o n1 . R e p o r t i n g E n t i t yThe Teachers’ Retirement System of the State of Illinois (TRS) is the administrator of a cost-sharing, multiple-employer defined benefit public employee retirement system (PERS). Membership is mandatory for all full-time, part-time, and substitute public school personnel employed outside of Chicago in positions requiring certifica-tion. Persons employed at certain state agencies are also members. Established by the State of Illinois, TRS is governed by the Illinois Pension Code (40 ILCS 5/16). TRS is a component unit of the State of Illinois and is included in the state’s financial statements as a pension trust fund.
TRS uses criteria established by the Governmental Accounting Standards Board (GASB) to determine whether other entities should be included within its financial reporting entity. Based on the criteria, TRS includes no other entities in these financial statements.
2 . E m p l o y e r sMembers of TRS are employed by school districts, special districts, and certain state agencies. Each employer remits member contributions to TRS. Employers are responsible for employer contributions for teachers paid from federal funds, employer contributions for the 2.2 formula increase, and for the employer’s portion of the Early Retirement Option contributions. As a result of Public Act 94-0004, which became law on June 1, 2005, employers are also required to pay the cost of pension benefits resulting from end-of-career salary increases over 6 percent. Public Act 94-1057, which became law on July 31, 2006, provides additional exemptions from employer contributions for excess salary increases. Some of these exemptions are permanent while others are available for a limited time period. Employers also pay a contribution for sick leave days granted in excess of the member’s normal annual allotment and used for service credit at retirement. The contributions do not apply to salary increases awarded or sick leave granted under contracts or collective bargaining agreements entered into, amended, or renewed prior to June 1, 2005. In addition, the State of Illinois provides employer contributions. For information about employer contributions made by the State of Illinois, see “Funding Status and Funding Progress” on page 28.
Nu m b e r o f E m p l o y e r s ( a s o f J u n e 3 0 )
2013 2012Local school districts 861 864Special districts 138 138State agencies 20 22Total 1,019 1,024
3 . M e m b e r sT R S M e m b e r s h i p ( a s o f J u n e 3 0 )
2013 2012Retirees and beneficiaries receiving benefits 108,783 105,447Inactive members entitled to but not yet receiving benefits 120,325 99,052Active members 160,692 162,217Total 389,800 366,716
4 . B e n e f i t P r o v i s i o n sGoverned by the Illinois Pension Code (40 ILCS 5/16), which is subject to amendment by the Illinois General Assembly and approval by the Governor, TRS provides retirement, death, and disability benefits.

P a g e 2 7FINANCIAL
Public Act 96-0889, which was signed into law in the spring of 2010, added a new section to the Pension Code that applies different benefits to anyone who first contributes to TRS on or after January 1, 2011 and does not have any previous service credit with a pension system that has reciprocal rights with TRS. These members are referred to as “Tier II” members.
T i e r II B e n e f i t sChanges from the “Tier I” pension law include raising the minimum eligibility to draw a retirement benefit to age 67 with 10 years of service, initiating a cap on the salaries used to calculate retirement benefits, and lim-iting cost-of-living annuity adjustments to the lesser of 3 percent or ½ of the annual increase in the Consumer Price Index, not compounded. The retirement formula is unchanged.
The new pension law does not apply to anyone who has made contributions to TRS prior to January 1, 2011. These members remain participants of Tier I.
T i e r I B e n e f i t sA member qualifies for an age retirement annuity after meeting one of the following requirements: age 62 with five years of service credit; age 60 with 10 years; or age 55 with 20 years. If a member retires between the ages of 55 and 60 with fewer than 35 years of service, the annuity will be reduced at the rate of 0.50 percent for each month the member is under age 60. A member who is age 55 and has at least 20 and fewer than 35 years of service credit may use the Early Retirement Option (ERO) to avoid a discount for early retirement if retirement occurs within six months of the last day of service requiring contributions and if the member and employer both make a one-time contribution to TRS.
A member with fewer than five years of creditable service and service on or after July 1, 1947, is entitled to a single-sum benefit payable once he or she reaches age 65.
A retirement benefit is determined by the average salary of the four highest consecutive salary rates within the last 10 years of creditable service and the percentage of average salary to which the member is entitled. This percentage is determined by the following formula for service earned before July 1, 1998: 1.67 percent for each of the first 10 years, plus 1.9 percent for each of the next 10 years, plus 2.1 percent for each of the next 10 years, plus 2.3 percent for each year over 30 years. The maximum retirement benefit, 75 percent of average salary, is achieved with 38 years of service under the graduated formula.
Public Act 90-0582 improved retirement benefits for TRS members by changing the rate at which members accrue benefits beginning July 1, 1998, from a graduated rate to a flat rate equal to 2.2 percent of final average salary. Members may attain the maximum 75 percent benefit with 34 years of service under the 2.2 benefit formula. Members retiring on or after the effective date have the option of upgrading their service earned prior to July 1, 1998, to the flat 2.2 percent formula by making a payment to TRS. Additionally, for members who continue to teach, every three full years worked after July 1, 1998, count toward a full one-year reduction of the years to be upgraded.
A money purchase (actuarial) benefit is payable if it results in a higher annuity than either the graduated or 2.2 formula. The 75 percent cap does not apply to the money purchase benefit. Public Act 94-0004 eliminates the money purchase benefit for persons who become TRS members after June 30, 2005.
Essentially all retirees receive an annual 3 percent increase in the current retirement benefit beginning January 1 following the attainment of age 61 or January 1 following the first anniversary in retirement, whichever is later.
If a member leaves covered employment, TRS will refund a member’s retirement contributions upon request. The refund consists of actual contributions, excluding the 1 percent death benefit contribution.

P a g e 2 8 FINANCIAL
5 . Fu n d i n g S t a t u s a n d Fu n d i n g P r o g r e s sThe funded status of the plan as of June 30, 2013, the most recent actuarial valuation date, follows and is compared to the 2012 funded status. The actuarial value of assets is rounded to the nearest thousand to be consistent with actuarial disclosures.
Actuarial Valuation
Date
Actuarial Value
of Assets*
Actuarial Accrued Liability
Funded Ratio
Unfunded Actuarial Accrued Liability
Annual Payroll
Unfunded Actuarial Accrued
Liability as a Percentage
of Covered Payroll6/30/12 $37,945,397,000 $90,024,945,000 42.1% $52,079,548,000 $9,321,098,000 558.7%6/30/13 38,155,191,000 93,886,988,000 40.6 55,731,797,000 9,394,741,000 593.2
* Five-year prospective smoothing began in FY09.
The schedules of funding progress, presented as required supplementary information (RSI) following the notes to the financial statements, present multi-year trend information about whether the actuarial values of plan assets are increasing or decreasing over time relative to the actuarial accrued liability for benefits.
Additional information regarding assumptions used in the actuarial valuations is as follows:
June 30, 2013 June 30, 2012Actuarial Cost Method: Projected unit credit Projected unit creditAmortization Method: Level percent of payrolla) For GASB Statement
#25 reporting purposesLevel percent of payroll Level percent of payroll
b) Per state statute 15-year phase-in to a level percent of payroll reached in FY10; then level percent of pay until a 90% funding
level is achieved in FY45
15-year phase-in to a level percent of payroll reached in FY10; then level percent of pay until a 90% funding
level is achieved in FY45Remaining Amortization Period:a) For GASB Statement
#25 reporting purposes30 years, open 30 years, open
b) Per state statute 32 years, closed 33 years, closed
Asset Valuation Method: Beginning with June 30, 2009 valuation, five-year
smoothing, prospective
Beginning with June 30, 2009 valuation, five-year
smoothing, prospective Actuarial Assumptions:Investment rate of return 8.0% 8.0% Projected salary increases 5.0% (at age 69) to 10.15%
(at age 20), composite 6.0%. Includes inflation and real wage
growth (productivity) assumptions.
5.0% (at age 69) to 10.15% (at age 20), composite 6.0%.
Includes inflation and real wage growth (productivity) assumptions.
Group size growth rate 0% 0%Assumed inflation rate 3.25% 3.25% Real wage growth (productivity) 0.75% 0.75%Post-retirement increase Tier I: 3% compounded;
Tier II: Lesser of 3% or ½ of the CPI increase, not compounded
Tier I: 3% compounded; Tier II: Lesser of 3% or ½ of the
CPI increase, not compoundedMortality table RP - 2000 Mortality Tables with
future mortality improvements on a generational basis.
RP - 2000 Mortality Tables with future mortality improvements
on a generational basis.

P a g e 2 9FINANCIAL
Member, employer, and state contributions are statutorily defined by the Illinois Pension Code (40 ILCS 5/16), which is subject to amendment by the Illinois General Assembly and approval by the Governor. Since July 1, 1995, state appropriations have been made through a continuing appropriation.
Effective July 1, 1998, member contributions increased from 8 percent to 9 percent of salary. These contributions are allocated as follows: 7.5 percent for retirement, 0.50 percent for post-retirement increases, and 1 percent for death benefits. The contribution rate changed from 9.0 percent to 9.4 percent effective July 1, 2005 as a result of Public Act 94-0004. The additional 0.4 percent is to help cover the cost of ERO and is refundable if the member does not retire using ERO or if the ERO program terminates.
Employer contributions are made by or on behalf of employers from several sources. The State of Illinois provides the largest source of contributions through state appropriations from the Common School Fund. Employers also make contributions for the 2.2 benefit formula and for teachers who are paid from federal funds. Additionally, employers contribute their portion of the cost of the Early Retirement Option and any excess salary increase or sick leave costs due.
State funding law provides for a 50-year funding plan that includes a 15-year phase-in period.
Public Act 93-0002 authorized the State of Illinois to issue $10 billion in general obligation bonds for the purpose of making contributions to designated retirement systems. TRS received an allocation of bond proceeds equal to $4,330,373,948 on July 1, 2003. The act also set limits on state contributions to the retirement systems that are tied to the debt service the state owes on the bonds.
Public Act 96-0043, effective July 15, 2009, requires TRS to use a five-year smoothing method for asset valu-ation beginning on June 30, 2009. It first affected state contribution requirements in FY11.
In FY10 and FY11, pension bonds were issued by the State of Illinois to cover the state’s share of TRS funding requirements not covered by state appropriations. These pension bonds did not reduce future state contributions as did the 2003 pension obligation bonds.
Administrative expenses are budgeted and approved by the TRS Board of Trustees. Funding for these expenses is included in the employer contribution, as determined by the annual actuarial valuation.

P a g e 3 0 FINANCIAL
B . S u m m a r y o f S i g n i f i c a n t Ac c o u n t i n g P o l i c i e s1 . B a s i s o f Ac c o u n t i n gTRS’s financial statements are prepared using the accrual basis of accounting. Member and employer contribu-tions are recognized as revenues when due, pursuant to formal commitments, as well as statutory or contractual requirements. Benefits and refunds are recognized as expenses when they are due and payable in accordance with the terms of the plan.
2 . U s e o f E s t i m a t e sThe preparation of financial statements in conformity with accounting principles generally accepted in the United States of America requires management to make estimates and assumptions that affect the reported amounts of assets and liabilities and disclosure of contingent assets and liabilities at the date of the financial statements and the reported amounts of additions to and deductions from net position during the reporting period. Actual results could differ from these estimates. TRS uses an actuary to determine the actuarial accrued liability for the defined benefit plan and to determine the actuarially required contribution.
3 . R i s k s a n d U n c e r t a i n t i e sTRS investments are diversified and include various investment securities. Investment securities are exposed to a variety of risk including credit, market and interest rate risk. Due to the level of risk associated with certain investment securities, it is at least reasonably possible that value changes will occur in the near-term and such changes could materially affect the amounts reported in the Statements of Net Position.
4 . Ne w Ac c o u n t i n g P r o n o u n c e m e n t sGASB Statement No. 63, “Financial Reporting of Deferred Outflows of Resources, Deferred Inflows of Resources, and Net Position,” was established to provide a framework that specifies where deferred outflows of resources and deferred inflows of resources, assets, liabilities and net position should be displayed on the financial state-ments. TRS implemented this Statement for the year ended June 30, 2013. The categories of Deferred Outflow and Deferred Inflow were not applicable for the financial statements for the year ended June 30, 2013 or June 30, 2012.
GASB Statement No. 65, “Items Previously Reported as Assets and Liabilities,” was established to improve financial reporting by clarifying the appropriate use of the financial statement elements deferred outflows of resources and deferred inflows of resources to ensure consistency in financial reporting. TRS is required to implement this statement for the year ended June 30, 2014.
GASB Statement No. 67, “Financial Reporting for Pension Plans,” established standards for defined benefit pen-sion plans financial reports and specifies the required approach to measuring the pension liability of employers and non-employer contributing entities for benefits provided through the pension plan (the net pension liability), about which information is required to be presented. TRS is required to implement this statement for the year ended June 30, 2014.
GASB Statement No. 68, “Accounting and Financial Reporting for Pensions,” was established to set standards for measuring and recognizing liabilities, deferred outflows of resources, deferred inflows of resources, and expenses/expenditures. This statement identifies the methods and assumptions that should be used to project benefit payments, discount projected benefit payments to their actuarial present value, and attribute that pres-ent value to periods of employee service. TRS will assist employers in their implementation of this statement for the year ended June 30, 2015.
Management has not fully determined what impact, if any, these Statements may have on its financial state-ments; however, GASB Statements 67 and 68 are expected to have a material impact.

P a g e 3 1FINANCIAL
5 . M e t h o d U s e d t o V a l u e In v e s t m e n t sTRS reports investments at fair value. Fair value for publicly traded real return funds, equities, foreign currency, and exchange traded derivatives is determined by using the closing price listed on national securities exchanges as of June 30. Fair value for fixed income securities and over-the-counter derivatives is determined primarily by using quoted market prices provided by independent pricing services. Short-term investments are gener-ally reported at average cost, which approximates fair value. Appraisals are used to determine fair value on directly-owned real estate investments. Fair value for private equity investments, absolute return funds, non-publicly traded real return funds and partnership interests in real estate funds is determined by TRS staff and the general partners or investment managers in accordance with the provisions in the individual agreements. These agreements also require an independent audit be performed on an annual basis.
6 . P r o p e r t y a n d E q u i p m e n tEquipment is stated on the basis of historical cost. Depreciation is computed using the straight-line method based upon the estimated useful lives of the assets. Office furniture and equipment are assigned a useful life of three to 10 years while vehicles are assigned a five-year life. TRS’s office building is depreciated over 40 years. Intangible assets are reported as part of property and equipment, with software having an estimated useful life from three to five years.
7 . Ac c r u e d Co m p e n s a t e d Ab s e n c e sWhen employment is terminated, TRS employees are entitled to receive compensation for all accrued unused vacation time and one-half of all unused sick leave earned through December 31, 1997. (Lump-sum payments for sick leave earned prior to January 1, 1984, are subject to a maximum of 60 days or 420 hours.) Accrued compensated absences as of June 30, 2013, and 2012 totaled $1,689,265 and $1,627,467, respectively, and are included as administrative and investment expenses payable.
8 . R e c e i v a b l e sReceivables consist primarily of 1) member and employer contributions owed and yet to be remitted by the employing districts, 2) interest, dividends, real estate and private equity income owed to TRS, and 3) appropriations not yet received from the State of Illinois as of June 30.
TRS assesses penalties for late payment of contributions and may collect any unpaid amounts from the employing districts by filing a claim with the regional superintendent of education or the Office of the Comptroller against future state aid payments to the employer. TRS considers these amounts to be fully collectible.
9 . P r i o r P e r i o d R e c l a s s i f i c a t i o nCertain prior year amounts have been reclassified on a basis consistent with the current year presentation.
1 0 . R i s k M a n a g e m e n tTRS, as a component unit of the State of Illinois, provides for risks of loss associated with workers’ compensation and general liability through the State’s self-insurance program. TRS obtains commercial insurance for fidelity, surety, and property. No material commercial insurance claims have been filed in the last three fiscal years.
C. Ca s hCustodial credit risk for deposits is the risk that in the event of a bank failure, TRS’s deposits may not be returned. TRS has a formal policy to address custodial credit risk. The policy’s purpose is to minimize custodial credit risk through proper due diligence of custody financial institutions and investment advisors; segregate safekeeping of TRS assets; establish investment guidelines; and endeavor to have all investments held in custodial accounts through an agent, in the name of custodian’s nominee, or in a corporate depository or federal book entry account system. For those investment assets held outside of the custodian, TRS will follow the applicable regulatory rules.

P a g e 3 2 FINANCIAL
The non-investment bank balance and carrying amount of TRS’s deposits were $14, 659,165 and $14,659,145 at June 30, 2013 and $17,092,514 and $17,092,564 at June 30, 2012. Of the bank balance, $14,659,020 and $17,092,439 were on deposit with the state treasurer at June 30, 2013 and 2012, respectively. State treasurer deposits are in an internal investment pool collateralized at a third party custodial bank and are not subject to custodial credit risk. Certain investments of TRS with maturities of 90 days or less would be consid-ered cash equivalents; these consist of bank-sponsored, short-term investment funds, commercial paper, and repurchase agreements. For financial statement presentation and investment purposes, TRS reports its cash equivalents as short-term investments in the Statements of Net Position. Included in the reported balances is the State Street Global Advisors Short-Term Investment Fund (STIF) with values of $1,412,687,584 at June 30, 2013 and $800,629,144 at June 30, 2012. The STIF fund had an average credit quality rating of A1P1, same as prior year, and a weighted average maturity of 40.0 and 31.0 days at June 30, 2013 and June 30, 2012, respectively.
For purposes of this disclosure, foreign currency held by investment managers is considered a deposit. However, for financial statement presentation and investment purposes, TRS considers foreign currency an investment asset. Uncollateralized foreign currency subject to custodial credit risk was $114,363,611 and $81,921,602 at June 30, 2013 and June 30, 2012, respectively.
D . In v e s t m e n t s1 . In v e s t m e n t P o l i c i e sThrough the Board of Trustees, as authorized in the Illinois Pension Code, TRS serves as fiduciary for the mem-bers’ trust funds and is responsible for investment of those funds by authority of the “prudent person rule.” This rule establishes a standard for all fiduciaries by specifying fiduciary responsibility with regard to the members’ trust funds.
2 . In v e s t m e n t R i s kCu s t o d i a l Cr e d i t R i s kCustodial credit risk for investments is the risk that, in the event of a financial institution failure, TRS would not be able to recover the value of the investments in the possession of an outside party. The TRS investment policy adopted by the Board of Trustees includes a formal process to address custodial credit risk.
Cr e d i t R i s kCredit risk is the risk that an issuer or other counterparty to an investment will not fulfill its obligations to TRS. Credit risk exposure is dictated by each investment manager’s agreement. Each portfolio is managed in accor-dance with investment guidelines that are specific as to permissible credit quality ranges, exposure levels within individual security quality rating tiers, and/or the average credit quality of the overall portfolio. Most guidelines allow managers to hold bonds rated Caa2 or better. However, in circumstances where position downgrades occur, investment managers have been given permission to hold securities below this rating due to circumstances such as a higher peer group rating from another nationally recognized statistical rating organization, the investment manager’s internal ratings, or other mitigating factors.

Page 33FINANCIAL

Pa
ge
34
FIN
AN
CIA
L
As of June 30, 2013, TRS held the following fixed income investments with respective Moody’s quality ratings or equivalent rating. Obligations of the U.S. government or obligations explicitly guaranteed by the U.S. government are not considered to have credit risk.
QualityRating
CorporateDebt Securities
Foreign DebtSecurities
U.S. AgencyObligations Municipals
CommingledFunds
SecuritiesLending
Collateral TotalAaa $266,404,834 $299,294,579 $1,753,121,422 $3,805,792 $ - $ - $2,322,626,627 Aa1 16,612,516 215,700,043 54,757,040 5,874,672 - - 292,944,271 Aa2 23,695,781 48,679,740 - 13,167,442 - - 85,542,963 Aa3 10,703,149 93,441,684 - 3,699,150 - - 107,843,983 A1 73,464,660 1,882,803 - 5,498,959 95,078,405 - 175,924,827 A2 61,717,624 52,105,311 - 9,252,632 - - 123,075,567 A3 116,382,317 60,791,130 - 17,477,572 - - 194,651,019 Baa1 157,435,079 114,596,793 - - 322,335,858 - 594,367,730 Baa2 234,112,147 122,136,837 - - - - 356,248,984 Baa3 310,102,196 138,731,740 - - - - 448,833,936 Ba1 139,170,748 196,840,332 - - 69,423,384 - 405,434,464 Ba2 88,690,967 17,377,341 - - - - 106,068,308 Ba3 110,526,721 23,273,617 - - 421,026,471 - 554,826,809 B1 140,432,099 23,565,963 - - 170,671,419 - 334,669,481 B2 60,265,344 12,230,880 - - - - 72,496,224 B3 83,867,005 36,539,148 - - - - 120,406,153 Caa1 28,079,723 601,560 - - - - 28,681,283 Caa2 19,553,613 2,396,850 - - - - 21,950,463 Caa3 27,304,983 - - - - - 27,304,983 Ca 9,812,462 3,726,600 - - - - 13,539,062 C 2,460,370 - - - - - 2,460,370 Not available 719,854 28,316,869 2,122,118 - 279,277,571 - 310,436,412 Not rated 20,328,987 131,642,351 277,210 - - - 152,248,548 Withdrawn 8,992,329 7,153,552 3,704,163 - - - 19,850,044 Total bonds, corporate notes & government obligations $2,010,835,508 $1,631,025,723 $1,813,981,953 $58,776,219 $1,357,813,108 $ - $6,872,432,511
Note: Invested securities lending collateral was in short-term investments as of June 30, 2013.

Pa
ge
35
FIN
AN
CIA
L
As of June 30, 2012, TRS held the following fixed income investments with respective Moody’s quality ratings or equivalent rating.
QualityRating
CorporateDebt Securities
Foreign DebtSecurities
U.S. AgencyObligations Municipals
CommingledFunds
SecuritiesLending
Collateral TotalAaa $302,869,773 $634,190,461 $1,704,602,030 $2,921,239 $ - $62,129,456 $2,706,712,959 Aa1 9,843,382 8,229,704 1,045,470 5,208,856 - - 24,327,412 Aa2 27,363,206 50,039,423 - 11,060,146 208,148,792 265,445,415 562,056,982 Aa3 21,583,626 82,572,944 - 18,250,364 - 219,507,096 341,914,030 A1 57,732,555 81,974,360 434,420 6,847,271 - 93,264,035 240,252,641 A2 64,905,184 54,997,779 - 8,250,498 - 8,507,284 136,660,745 A3 96,671,564 26,932,718 - 3,509,481 - 12,999,181 140,112,944 Baa1 183,477,850 109,243,528 - - - - 292,721,378 Baa2 253,465,208 160,771,071 - - - - 414,236,279 Baa3 352,530,595 133,549,972 - - 40,189,078 - 526,269,645 Ba1 149,865,005 184,496,074 - - - - 334,361,079 Ba2 109,686,946 27,211,968 - - - - 136,898,914 Ba3 60,055,225 31,489,361 - - - - 91,544,586 B1 115,209,525 18,647,089 - - 30,319,687 - 164,176,301 B2 83,824,253 53,214,823 - - - - 137,039,076 B3 91,204,677 7,805,485 - - - - 99,010,162 Caa1 50,882,711 2,106,550 - - - - 52,989,261 Caa2 21,857,004 4,058,950 - - - - 25,915,954 Caa3 21,451,193 1,890,050 - - - - 23,341,243 Ca 13,057,394 - - - - - 13,057,394 C 1,025,136 - - - - - 1,025,136 Not available 10,948,995 93,715,104 47,810,757 - 824,320,700 - 976,795,556 Not rated 4,896,775 26,559,060 - - - - 31,455,835 Withdrawn 10,938,522 276,891 4,056,268 - - - 15,271,681Total bonds, corporate notes & government obligations $2,115,346,304 $1,793,973,365 $1,757,948,945 $56,047,855 $1,102,978,257 $661,852,467 $7,488,147,193

Pa
ge
36
FIN
AN
CIA
L
In t e r e s t R a t e R i s kInterest rate risk is the risk that changes in interest rates will adversely affect the fair value of an investment. TRS’s fixed income investments are man-aged in accordance with operational guidelines that are specific as to the degree of interest rate risk that can be taken. TRS manages the interest rate risk within the portfolio using various methods, including effective duration, option adjusted duration, average maturity, and segmented time distribution, which reflects total fair value of investments maturing during a given time period. The segmented time distribution of the various investment types of TRS debt securities at June 30, 2013 is as follows:
Type
Maturity in Years
2013Fair Value
Less Than 1 year 1 to 5 years
5 to 10 years 10 to 20 years
More Than
20 years Other* U.S. treasuries $533,169,651 $30,801,967 $146,971,816 $285,259,534 $22,050,763 $48,085,571 $ -U.S. federal agencies 149,094,206 1,069,887 27,225,155 70,671,812 50,031,716 95,636 -U.S. government index- linked bonds 583,984,327 9,679,259 131,199,892 210,983,020 173,047,402 59,074,754 -U.S. government-backed mortgages 545,611,651 172,741,029 3,278,544 19,538,366 38,609,286 311,444,426 -
U.S. government special situations 2,122,118 2,122,118 - - - - -Municipals 58,776,219 129,376 898,197 1,484,391 23,424,484 32,839,771 -Asset-backed securities 163,658,569 - 31,777,706 32,164,035 22,382,213 77,334,615 -Commercial mortgage- backed securities 118,145,848 - - 10,806,121 14,898,374 92,441,353 -Collateralized mortgage obligations 231,647,528 - 2,521,665 12,525,781 26,599,393 190,000,689 -
Commingled funds (U.S. & International)** 1,357,813,108 - 16,332,420 1,184,792,769 - - 156,687,919
Corporate convertible bonds 45,022,136 288,057 19,670,784 5,813,172 10,394,141 8,855,982 -Domestic credit obligations 1,452,361,427 122,811,289 429,036,592 644,361,668 48,221,495 207,930,383 -Foreign debt/corporate obligations 1,631,025,723 251,564,349 529,525,944 457,600,410 210,891,705 181,443,315 -
Total bonds, corporate notes and government obligations 6,872,432,511 591,207,331 1,338,438,715 2,936,001,079 640,550,972 1,209,546,495 156,687,919Securities lending collateral*** - - - - - - -Derivatives (9,415,670) (4,174,103) (6,463,639) (4,535,605) (182,621) 5,940,298 -
Total bonds, corporate notes, government obligations, securities lending collateral and derivatives $6,863,016,841 $587,033,228 $1,331,975,076 $2,931,465,474 $640,368,351 $1,215,486,793 $156,687,919
* Maturity date is not available or applicable. ** Weighted average maturity figures were used if available to plot the commingled funds within the schedule. *** Invested securities lending collateral was in short-term investments as of June 30, 2013

Pa
ge
37
FIN
AN
CIA
L
The segmented time distribution of the various investment types of TRS debt securities at June 30, 2012 is as follows:
Type
Maturity in Years
2012Fair Value
Less Than 1 year 1 to 5 years
5 to 10 years
10 to 20 years
More Than
20 years Other*
U.S. treasuries $229,515,472 $10,921,042 $80,609,585 $71,789,401 $35,906,053 $30,289,391 $ -
U.S. federal agencies 139,056,624 414,845 44,554,380 28,462,646 64,871,122 753,631U.S. government index- linked bonds 540,160,277 1,875,204 96,181,408 209,494,865 200,924,675 31,684,125 -U.S. government-backed mortgages 801,736,346 366,921,530 2,153,081 26,434,822 112,966,926 293,259,987 -
U.S. government special situations** 47,480,226 - 47,480,226 - - - -
Municipals 56,047,855 400,384 966,141 1,495,092 21,386,908 31,799,330 -
Asset-backed securities 171,507,017 - 29,333,020 52,478,024 22,046,147 67,649,826 -Commercial mortgage- backed securities 155,105,622 - - 11,712,300 14,416,512 128,976,810 -Collateralized mortgage obligations 235,242,621 - 218,756 19,282,304 28,641,378 187,100,183 -
Commingled funds (U.S. & International)** 1,102,978,257 - 128,104,331 922,208,083 - - 52,665,843
Corporate convertible bonds 53,756,981 - 25,216,512 6,349,525 3,942,994 18,247,950 -
Domestic credit obligations 1,499,734,063 33,122,572 383,748,452 778,685,308 59,458,357 244,719,374 -Foreign debt/corporate obligations 1,793,973,365 193,332,021 571,238,510 525,050,743 299,361,112 204,990,979 -
Total bonds, corporate notes and government obligations 6,826,294,726 606,987,598 1,409,804,402 2,653,443,113 863,922,184 1,239,471,586 52,665,843Securities lending collateral 661,852,467 524,503,686 137,348,781 - - - -Derivatives 7,297,522 (648,407) 4,556,599 3,058,180 32,031 299,119 -
Total bonds, corporate notes, government obligations, securities lending collateral and derivatives $7,495,444,715 $1,130,842,877 $1,551,709,782 $2,656,501,293 $863,954,215 $1,239,770,705 $52,665,843
* Maturity date is not available or applicable. ** Weighted average maturity figures were used if available to plot the commingled funds within the schedule.

P a g e 3 8 FINANCIAL
Fo r e i g n Cu r r e n c y R i s kForeign currency risk is the risk that changes in exchange rates will adversely impact the fair value of an investment. TRS’s currency risk exposure, or exchange rate risk, is primarily derived from its holdings in foreign currency-denominated equity, fixed income investments, and foreign currency. According to TRS’s Investment Policy and investment manager agreements, international equity and global fixed income managers, at their discretion, may or may not hedge the portfolio’s foreign currency exposures with currency forward contracts or options depending upon their views on a specific country or foreign currency relative to the U.S. dollar. TRS’s exposure to foreign currency risk in U.S. dollars as of June 30, 2013 is as follows:
CurrencyForeign
Currency Equities Fixed Income Derivatives TotalAustralian Dollar $12,801,706 $308,054,720 $48,655,295 ($5,245,086) $364,266,635Brazilian Real 1,619,514 180,064,865 92,716,030 (5,494,664) 268,905,745British Pound 12,028,528 1,339,556,556 197,762,391 (241,531) 1,549,105,944Canadian Dollar 8,883,995 408,607,089 116,961,916 - 534,453,000Chilean Peso 4,302 13,699,734 4,462,894 - 18,166,930Chinese Yuan (1,017) - - - (1,017)Columbia Peso 32,480 4,829,627 439,197 - 5,301,304Czech Koruna 53,752 3,550,120 - - 3,603,872Danish Krone 231,126 77,583,012 25,254,741 - 103,068,879Egyptian Pound 55,482 5,434,183 - - 5,489,665Euro 25,030,282 1,388,211,057 231,777,627 448,691 1,645,467,657Ghana Cedi 369,661 - 23,748,240 - 24,117,901Hong Kong Dollar 7,131,439 512,676,277 - - 519,807,716Hungarian Forint 90,802 10,854,445 48,000,531 - 58,945,778Indian Rupee 420,726 97,643,321 - - 98,064,047Indonesian Rupiah 2,303,246 79,435,386 28,322,603 - 110,061,235Israeli Shekel 970,220 26,575,922 - - 27,546,142Japanese Yen 13,685,971 1,100,098,518 4,021,735 100,585 1,117,906,809Malaysian Ringgit 814,207 60,861,695 9,249,122 - 70,925,024Mexican Peso 8,917,025 59,862,800 89,100,131 (44,415) 157,835,541Moroccan Dirham 25,505 351,736 - - 377,241New Taiwan Dollar 1,382,102 202,450,949 - - 203,833,051New Zealand Dollar 370,513 11,414,969 43,392,803 - 55,178,285Norwegian Krone 1,469,295 58,942,205 8,197,436 - 68,608,936Philippine Peso 83,666 46,175,395 13,672,019 - 59,931,080Polish Zloty 2,082,516 24,826,392 39,987,338 - 66,896,246Qatari Rial - 7,597,377 - - 7,597,377Russian Ruble - 5,738,166 - - 5,738,166Serbian Dinar 575,289 - 11,240,073 - 11,815,362Singapore Dollar 817,004 162,802,638 22,683,969 - 186,303,611South African Rand 2,449,136 100,576,397 - - 103,025,533South Korean Won 1,940,768 240,436,960 70,550,356 - 312,928,084Sri Lanka Rupee 318,443 - 9,956,229 - 10,274,672Swedish Krona 2,177,987 135,481,534 33,085,353 - 170,744,874Swiss Franc 1,513,646 504,814,468 - - 506,328,114Thailand Baht 13,216 99,540,039 10,310,163 - 109,863,418Turkish Lira 871,604 67,677,177 - - 68,548,781Ukraine Hryvnia 967 - 1,379,839 - 1,380,806Uruguayo Peso 2,828,507 - 58,955,141 - 61,783,648Total subject to foreign
currency risk 114,363,611 7,346,425,729 1,243,883,172 (10,476,420) 8,694,196,092Investments in
international securities payable in U.S. dollars - 1,014,957,544 433,873,697 (1,671,401) 1,447,159,840
Total international investment securities (including domestic securities payable in foreign currency) 114,363,611 8,361,383,273 1,677,756,869 (12,147,821) 10,141,355,932
Domestic investments (excluding securities payable in foreign currency) - 8,754,689,111 5,194,675,642 2,732,151 13,952,096,904
Total fair value $114,363,611 $17,116,072,384 $6,872,432,511 ($9,415,670) $24,093,452,836

P a g e 3 9FINANCIAL
TRS’s exposure to foreign currency risk in U.S. dollars as of June 30, 2012 is as follows:
Currency Foreign Currency Equities Fixed Income
Derivatives Total
Australian Dollar $949,941 $238,982,486 $68,687,119 $32,031 $308,651,577Brazilian Real 358,664 173,462,580 53,693,956 1,043,569 228,558,769British Pound 9,178,966 1,246,780,786 243,932,095 305,769 1,500,197,616Canadian Dollar 3,289,601 331,407,010 135,290,724 - 469,987,335Chilean Peso 7,306 1,604,340 2,283,177 - 3,894,823Chinese Yuan - - - - -Czech Koruna - 9,604,707 - - 9,604,707Danish Krone 471,356 50,264,260 - - 50,735,616Egyptian Pound 223,011 10,190,732 - - 10,413,743Euro 38,025,295 1,337,645,083 281,550,209 1,569,234 1,658,789,821Ghana Cedi - - 14,243,319 - 14,243,319Hong Kong Dollar 1,964,655 359,671,925 - - 361,636,580Hungarian Forint 884 11,974,855 42,992,043 - 54,967,782Indian Rupee 756,567 116,472,559 - - 117,229,126Indonesian Rupiah 599,978 71,509,766 56,741,279 - 128,851,023Israeli Shekel 1,694,923 16,427,337 16,671,538 - 34,793,798Japanese Yen 10,657,681 1,005,440,927 61,442,044 (281,406) 1,077,259,246Malaysian Ringgit 147,805 43,848,592 4,574,640 - 48,571,037Mexican Peso 2,234,099 37,106,319 94,234,838 40,870 133,616,126Moroccan Dirham 51,830 689,699 - - 741,529New Taiwan Dollar 2,997,272 120,779,827 - - 123,777,099New Zealand Dollar 165,576 3,855,640 41,801,307 - 45,822,523Norwegian Krone 334,490 48,513,665 7,443,386 - 56,291,541Philippine Peso 188,711 41,193,090 24,328,826 - 65,710,627Polish Zloty 103,584 20,945,755 40,182,299 - 61,231,638Singapore Dollar 281,342 108,274,491 15,734,471 - 124,290,304South African Rand 516,955 68,916,048 270,512 - 69,703,515South Korean Won 1,201,994 145,990,116 70,388,920 - 217,581,030Swedish Krona 940,403 109,365,820 50,817,263 - 161,123,486Swiss Franc 3,732,679 424,003,948 - - 427,736,627Thai Baht 682,145 126,529,544 - - 127,211,689Turkish Lira 162,913 72,109,638 - - 72,272,551Ukraine Hryvnia 976 - 5,331,133 - 5,332,109Uruguayo Peso - - 30,657,203 - 30,657,203Total subject to foreign
currency risk 81,921,602 6,353,561,545 1,363,292,301 2,710,067 7,801,485,515Investments in
international securities payable in U.S. dollars - 1,006,764,843 497,615,018 (300,166) 1,504,079,695
Total international investment securities (including domestic securities payable in foreign currency) 81,921,602 7,360,326,388 1,860,907,319 2,409,901 9,305,565,210
Domestic investments (excluding securities pay-able in foreign currency) - 8,404,531,594 4,965,387,407 4,887,621 13,374,806,622
Total fair value $81,921,602 $15,764,857,982 $6,826,294,726 $7,297,522 $22,680,371,832
In addition to the above, TRS’s foreign currency investments in real estate and private equity were $355,127,377 and $275,665,018 at June 30, 2013 and 2012, respectively. Currencies included Euro, British pound and Canadian dollar.

P a g e 4 0 FINANCIAL
3 . S e c u r i t i e s Le n d i n g P r o g r a mThe Board of Trustees’ policies permit TRS to use investments to enter into securities lending transactions, which are loans of securities to broker-dealers or other approved entities. The borrower of a security must post collateral in excess of the fair value of the security. Eligible forms of collateral include cash consisting of U.S. dollar, Euro, Sterling and Yen, U.S. treasuries, government agency securities, certificates of deposit, letters of credit issued by approved banks and specific types of corporate debt obligations. Initial collateral received from the borrower must be at least 102 percent of the fair value of all loaned securities except non-U.S. securities which require 105 percent. Securities on loan are marked to market daily and collateral for the loan is required not to fall below minimum levels established by TRS and its lending agent. Agreements are in place for TRS to return the collateral in exchange for the original securities upon demand or when the security is no longer borrowed. TRS does not have the authority to pledge or sell collateral securities, without borrower default.
As of June 30, 2013, Citibank, N.A. was the lending agent for the TRS securities lending program including fixed income, domestic equities and international equities. TRS transitioned the lending program to Citibank, N.A. from the master trustee, State Street Bank and Trust Company, during the fiscal year. At fiscal-year end, TRS has no credit risk exposure to borrowers because the amount TRS owes the borrowers exceeds the amount the borrowers owe TRS. The contract with TRS’s lending agent requires the agent to indemnify TRS if the bor-rowers fail to return the securities (and if the collateral is inadequate to replace the securities lent) or fail to pay TRS for income distributions by the securities issuers while the securities are on loan. All securities loans can be terminated on demand either by TRS or the borrower, although the average term of the loans is 27 and 15 days at June 30, 2013 and June 30, 2012, respectively.
The cash collateral received is invested in a separate account managed by the lending agent, with a weighted average maturity of 77 and 30 days at June 30, 2013 and June 30, 2012, respectively. There were no signifi-cant violations of legal or contractual provisions, and there were no borrower or lending agent default losses known to the securities lending agent.
As of June 30, 2013 and June 30, 2012, TRS had outstanding loaned investment securities with a fair value of $1,781,796,752 and $2,682,477,139, respectively, against which it had received cash and non-cash collateral with a fair value of $1,836,179,323 and $2,760,697,851, respectively. Securities lending collateral reflected on the Statements of Net Position reflects the fair value of securities purchased with cash collateral. As of June 30, 2013 and June 30, 2012, these amounts were $1,836,179,323 and $2,559,174,246 respectively. TRS also reports securities lending collateral with the Office of the Illinois State Treasurer on the Statements of Net Position. Income earned and costs related to securities lending activities are reported on the Statements of Changes in Net Position. Additional detail regarding securities lending activity is included within the investments section.
4 . D e r i v a t i v e sTRS, through its investment managers, invests in derivative securities as a fundamental part of the overall invest-ment process. All TRS derivatives are considered investments and the fair value is reported in the Statements of Net Position. TRS does not directly invest in derivatives but allows certain external managers to utilize these instruments within the investment portfolio for a variety of purposes. TRS managers may hold derivatives to hedge investment transactions accounted for at fair value. The term “hedge” in this context denotes the broad economic activity of entering into contracts intended to offset risks associated with certain transactions, such as the changes in interest rates on investments in debt securities, commodities or instruments denominated in a foreign currency. Assets and liabilities that are measured at fair value, such as investments, do not qualify as hedgeable items and do not meet the requirements for hedge accounting.
A derivative security is an investment whose return depends upon the value of another financial instrument or security such as stocks, bonds, commodities, or a market index. The derivative investments in TRS’s portfolio are used primarily to enhance performance and reduce volatility. TRS’s investments in derivatives are not leveraged

P a g e 4 1FINANCIAL
through borrowing. In the case of an obligation to purchase (long a financial future or call option), the full value of the obligation is primarily held in cash or cash equivalents. For obligations to sell (short a financial future or put option), the reference security is held in the portfolio.
To varying degrees, derivative transactions involve credit risk, sometimes known as default or counterparty risk, and market risk. Credit risk is the possibility that a loss may occur because a party to a transaction fails to per-form according to the established contract terms. To eliminate credit risk, derivative securities can be acquired through a clearinghouse that guarantees delivery and accepts the risk of default by either party.
Market risk is the possibility that a change in interest, currency, or other pertinent market rates will cause the value of a financial instrument to decrease or become more costly to settle. Imposing limits on the types, amounts, and degree of risk that investment managers may undertake restricts the market risk associated with the constantly fluctuating prices of derivatives. These limits are approved by the Board of Trustees and senior management, and the derivative positions of the investment managers are reviewed on a regular basis to monitor compliance.
As of June 30, 2013, derivative investments in the TRS investment portfolio included currency forward contracts, rights, warrants, futures, options, swaps, and swaptions. Within the financial statements, currency forward contracts are reflected as investment payables/receivables, rights and warrants are reflected as equities, and all futures, options, swaps and swaptions are classified as derivatives. The change in fair value of derivative investments is included in investment income on the Statements of Changes in Net Position.
The following tables summarize the derivatives held within the TRS investment portfolio and the change in fair value of derivative investments, realized and unrealized, during the fiscal year. The notional amounts shown represent TRS’s financial exposure to these instruments in U.S. dollars. Investments in limited partnerships and commingled funds may include derivatives that are not reported in the following disclosure.
As of June 30, 2013, the TRS investment portfolio held the following derivatives.
Investment DerivativesFair Value at
June 30, 2013 Change in Fair Value Shares/Par Notional
Rights $93,912 $300,275 1,109,466 $1,109,466 Warrants 140,324 138,463 2,240,351 2,240,351 Currency forwards 20,981,922 32,131,351 - - Equity futures long - 6,389,076 593,387 92,081,079 Equity futures short - (6,503,676) (38,900) (37,915,830)Fixed income futures long - (6,309,613) 1,264,775,779 1,276,550,677 Fixed income futures short - 10,611,510 (947,626,611) (1,111,084,897)Commodity futures long - 1,357,216 2,310,000 4,021,890 Commodity futures short - 1,500,180 (1,533,870) (5,315,943)Currency futures long - (637,383) 2,761,250 4,625,888 Currency futures short - 6,762 - - U.S. equity put options purchased 497,995 (3,301,704) 580,100 1,276,604 U.S. equity put options written - 1,040,834 - - Currency forward put options purchased 507,002 (1,211,937) 71,771,036 7,420,637 Currency forward put options written (2,251) 1,891,917 (4,800,000) 194,242 Currency forward call options purchased 799,044 1,202,525 58,321,857 21,073,647 Currency forward call options written - 147,755 - - Options on futures bought 1,060,781 1,091,685 438,000 32,547,780 Options on futures written (1,277,062) 860,125 (2,084,879) 48,030,649 Swaptions bought 2,878,267 1,091,455 134,390,000 1,968,575 Swaptions written (5,801,841) 629,011 (734,162,616) 122,848,546
(continued)

P a g e 4 2 FINANCIAL
Investment DerivativesFair Value at
June 30, 2013 Change in Fair Value Shares/Par Notional
Inflation options written ($38,871) $22,313 (23,000,000) $23,000,000 Credit default swaps buying protection (728,043) (4,650,781) 64,181,962 64,458,687 Credit default swaps selling protection 36,240 7,634,873 57,674,119 57,728,863 Pay fixed interest rate swaps 8,491,517 4,826,498 138,533,942 138,569,230 Receive fixed interest rate swaps (14,672,588) (18,138,498) 683,993,495 669,836,033 Pay fixed inflation swaps (1,329,413) (1,865,373) 60,900,000 59,570,961 Receive fixed inflation swaps 163,553 135,026 13,908,384 14,071,938 Grand Totals $11,800,488 $30,389,885 $1,488,909,073
As of June 30, 2012, the TRS investment portfolio held the following derivatives.
Investment DerivativesFair Value at
June 30, 2012 Change in Fair Value
Shares/Par
Notional
Rights $384,212 $530,500 1,123,377 $1,123,377 Warrants 4,394,509 (917,714) 699,928 699,928 Currency forwards 15,350,583 35,695,414 - -Equity futures long - (767,138) 813,100 52,395,479 Equity futures short - (990,685) - -Fixed income futures long - 24,463,684 462,051,772 483,318,656 Fixed income futures short - (12,113,657) (120,126,905) (159,964,653)Commodity futures long - (6,214,249) 233,000 21,477,720 Commodity futures short - 2,695,672 - -U.S. equity put options purchased 881,503 (10,942,693) 321,500 5,445,378 U.S. equity put options written (53,536) 2,811,873 (230,900) 1,623,722 Currency forward put options purchased 935,560 (2,264,839) 49,759,452 7,810,368 Currency forward put options written - 109,144 - -Currency forward call options purchased 128,658 208,865 16,900,000 2,453,930 Currency forward call options written (1,111) 41,993 (71,900) 51,588 Options on futures bought 120,938 (3,132,538) 835,000 13,235,600 Options on futures written (90,743) 1,926,928 (1,073,000) 19,612,190 Swaptions bought 3,699,098 (3,684,410) 185,408,000 21,572,559 Swaptions written (2,731,131) 5,207,610 (1,479,618,000) 40,080,802 Inflation options written (36,894) 27,694 (22,600,000) 22,600,000 Credit default swaps buying protection 2,502,411 (1,778,120) 267,988,320 266,705,167 Credit default swaps selling protection 642,925 (12,442,630) 339,077,566 339,862,121 Pay fixed interest rate swaps (164,255) (18,874,390) 6,734,816 6,750,832 Receive fixed interest rate swaps 1,462,285 7,083,419 50,341,522 51,863,859 Receive fixed inflation swaps 1,814 2,386 1,100,000 1,101,814 Grand Totals $27,426,826 $6,682,119 $1,199,820,437
Cu r r e n c y Fo r w a r d Co n t r a c t s Objective: Currency forward contracts are agreements to exchange one currency for another at an agreed upon price and settlement date. TRS’s investment managers use these contracts primarily to hedge the currency exposure of its investments.
Terms: Currency forward contracts are two-sided contracts in the form of either forward purchases or forward sales. Forward purchases obligate TRS to purchase specific currency at an agreed upon price. Forward sales obligate TRS to sell specific currency at an agreed upon price. As of June 30, 2013, TRS had currency forward purchase or sale contracts for 33 different currencies with various settlement dates.
(continued)

P a g e 4 3FINANCIAL
Fair Value: As of June 30, 2013 and June 30, 2012, TRS’s open currency forward contracts had a net fair value of $20,981,922 and $15,350,583, respectively. The following table represents the unrealized gain on the contracts at June 30.
As of June 30, 2013
As of June 30, 2012
Forward currency purchases $3,124,064,999 $1,979,648,142Forward currency sales (3,103,083,077) (1,964,297,559)Unrealized gain $20,981,922 $15,350,583
Fi n a n c i a l Fu t u r e sObjective: Financial futures are agreements to purchase or sell a specific amount of an asset at a specified delivery or maturity date for an agreed upon price. These derivative securities are used to improve yield, adjust the duration of the fixed income portfolio, protect against changes in interest rates, or replicate an index.
Terms: Futures contracts are standardized and traded on organized exchanges, thereby minimizing TRS’s credit risk. As the daily market value of the futures contract varies from the original contract price, a gain or loss is recognized and paid to, or received from, the clearinghouse. As of June 30, 2013 and June 30, 2012, TRS had outstanding futures contracts with a notional value, or exposure, of $222,962,864 and $397,227,202, respectively. Notional values do not represent the actual values in the Statements of Net Position. The contracts have various expiration dates through March 2017.
Fair Value: Gains and losses on futures contracts are settled daily based on the change of the index or com-modity price for the underlying notional value. Because of daily settlement, the futures contracts have no fair value. The realized gain on futures contracts was $3,500,084 and $8,631,152 during the fiscal years 2013 and 2012, respectively.
Type
FY13 FY12Number of
ContractsNotional Principal
Number of Contracts
Notional Principal
Commodity FuturesCommodity futures - long 91 $4,021,890 233 $21,477,720Commodity futures - short (125) (5,315,943) - -Currency FuturesCurrency futures - long 41 4,625,888 - -Equity FuturesU.S. stock index futures - long 2,672 39,298,264 158 10,715,560U.S. stock index futures - short (389) (37,915,830) - -Volatility index futures - long - - 42 821,100International equity index futures - long 1,159 52,782,815 723 40,858,819Fixed Income/Cash Equivalent FuturesFixed income index futures – long 1,026 129,295,078 657 102,875,438Fixed income index futures – short (5,673) (958,179,266) (1,200) (159,785,844)International fixed income index futures – long 61 10,352,847 66 12,329,993International fixed income index futures – short (888) (152,905,631) (1) (178,809)Cash equivalent (Eurodollar) futures – long 4,574 1,127,544,375 1,486 368,113,225Cash equivalent foreign yield curve – long 29 9,358,377 - -Total Futures (Net) 2,578 $222,962,864 2,164 $397,227,202
Fi n a n c i a l O p t i o n sObjective: Financial options are agreements that give one party the right, but not the obligation, to buy or sell a specific amount of an asset for a specified price, called the strike price, on or before a specified expiration

P a g e 4 4 FINANCIAL
date. The owner (buyer) of an option has all the rights, while the seller (writer) of an option has the obligations of the agreement. As a writer of financial options, TRS receives a premium at the outset of the agreement and bears the risk of an unfavorable change in the price of the financial instrument underlying the option. Premiums received are recorded as a liability when the financial option is written. The Options Clearing Corporation (OCC) performs much the same sort of function for options markets as the clearinghouse does for futures markets.
Terms: As of June 30, 2013, the TRS investment portfolio held U.S. equity options with notional value of $1,276,604, currency forward options with notional value of $28,688,526, inflation options with notional value of $23,000,000, and options on futures with underlying notional value of $80,578,429. As of June 30, 2012, the TRS investment portfolio held U.S. equity options with notional value of $7,069,100, currency forward options with notional value of $10,315,886, inflation options with notional value of $22,600,000, and options on futures with underlying notional value of $32,847,790. Contractual principal/notional values do not represent the actual values in the Statements of Net Position. The contracts have various expiration dates through August 2021.
Fair Value: Fluctuations in the fair value of financial options are recognized in TRS’s financial statements as incurred rather than at the time the options are exercised or at expiration. As of June 30, 2013 and June 30, 2012, the fair value of all option contracts, gross of premiums received, was $1,546,638 and $1,884,375, respectively. The fair value represents the amount needed to close all positions as of that date. The following table presents the aggregate contractual principal (notional value) of outstanding contracts as of June 30, 2013 and June 30, 2012. Notional principal amounts are often used to express the volume of these transactions but do not reflect the extent to which positions may offset one another. Options on futures represent the corresponding futures exposure.
Fi n a n c i a l O p t i o n s
FY13 FY12
TypeNumber of
ContractsNotional
PrincipalNumber of
ContractsNotional Principal
Equity OptionsEquity index put options - purchased 1,131 $299,220 776 $476,059Equity index put options - written - - (7) 11,606ETF/Stock put options - purchased 4,670 977,384 2,439 4,969,319ETF/Stock put options - written - - (2,302) 1,612,116Currency Forward OptionsCurrency forward call options - purchased 6 21,073,647 2 2,453,930Currency forward call options - written - - 1 51,588Currency forward put options - written 6 194,242 - -Currency forward put options - purchased 3 7,420,637 4 7,810,368Inflation OptionsInflation put options - written 12 23,000,000 12 22,600,000Options on FuturesFixed income call options on futures USD - purchased - - 735 12,024,600Fixed income call options on futures USD - written (440) 10,051,427 (954) 18,865,500Fixed income put options on futures USD - purchased 438 32,547,780 100 1,211,000Fixed income put options on futures USD - written (605) 37,673,524 (119) 746,690Fixed income call options on futures (non-dollar) - written (4) 15,801 - -Fixed income put options on futures (non-dollar) - written (4) 289,897 - -

P a g e 4 5FINANCIAL
S w a p t i o n sObjective: Swaptions are options on swaps that give the purchaser the right, but not the obligation, to enter into a swap at a specific date in the future. An interest-rate swaption gives the buyer the right to pay or receive a specified fixed interest rate in a swap in exchange for a floating rate for a stated time period. TRS has both written and purchased interest rate swaptions in its portfolio. In a written call swaption, the seller (writer) is obligated to pay a fixed rate in exchange for a floating rate for a stated period of time and in a written put swaption, the seller is obligated to receive a fixed rate in exchange for a floating rate if the swaption is exercised. A purchased (long) call swaption gives the buyer the right to receive a fixed rate in exchange for a floating rate for a stated period of time while a purchased (long) put swaption gives the buyer the right to pay a fixed rate in exchange for a floating rate if the swaption is exercised.
The TRS investment portfolio also holds credit default swaptions. A credit default swaption gives the holder the right, but not the obligation to buy (call) or sell (put) protection on a specified entity or index for a specified future time period.
As the writer of a swaption, TRS receives a premium at the outset of the agreement. Premiums are recorded as a liability when the swaption is written. As the purchaser of a swaption, TRS pays an upfront premium.
Terms: As of June 30, 2013, TRS had outstanding written call swaption exposure of $2,246,825, written put swaption exposure of $120,601,721, purchased put swaption exposure of $1,603,948, and purchased call swaption exposure of $364,627. The contracts have various maturity dates through August 2021. As of June 30, 2012, TRS had outstanding written call swaption exposure of $23,214,270, written put swaption exposure of $16,866,532, purchased put swaption exposure of $972,559, and purchased call swaption expo-sure of $20,600,000. Exposure amounts for swaptions do not represent the actual values in the Statements of Net Position.
Fair Value: Fluctuations in the fair value of swaptions are recognized in TRS’s financial statements as incurred rather than at the time the swaptions are exercised or when they expire. As of June 30, 2013, and June 30, 2012, the fair value of swaption contracts was ($2,923,574) and $967,967, respectively.
Cr e d i t D e f a u l t S w a p s / In d e x S w a p sObjective: Credit default swaps are financial instruments used to replicate the effect of investing in debt obli-gations of corporate bond issuers as a means to manage bond exposure, effectively buying or selling insurance protection in case of default. Credit default swaps may be specific to an individual security or to a specific market sector (index swaps). The risk of the credit default/index swap is comparable to the credit risk of the underlying debt obligations of issuers that comprise the credit default/index swap, with the primary risk being counterparty risk. The owner/buyer of protection (long the swap) pays an agreed upon premium to the seller of protection (short the swap) for the right to sell the debt at a previously agreed upon value in the event of a default by the bond issuer. The premium is paid periodically over the term of the swap or until a credit event of the bond issuer occurs. In the event of a default, the swap is called, and the seller of protection makes a payment to the buyer, which is usually based on a fixed percentage of total par.
Purchased credit default swaps decrease credit exposure (buying protection), providing the right to sell debt to the counterparty in the event of a default. A buyer of credit protection against a basket of securities pays an upfront or periodic payment until either maturity or default. In the event of a default, the buyer receives a lump-sum payment. If no default occurs, the buyer loses only the premium paid.
Written credit default swaps increase credit exposure (selling protection), obligating the portfolio to buy debt from counterparties in the event of a default. A seller of credit protection against a basket of securities receives an upfront or periodic payment to compensate against potential default events. If a default event occurs, the seller must pay the buyer the full notional value of the obligation in exchange for the obligation. If no default occurs, the seller will have earned the premium paid.

P a g e 4 6 FINANCIAL
Terms: As of June 30, 2013, TRS had credit default/index swaps in its portfolio with various maturity dates through February 2051. The total notional value of written credit default swaps (selling protection) was $57,728,863 and $339,862,121 as of June 30, 2013 and 2012, respectively. The total notional value of purchased credit default swaps (buying protection) was $64,458,687 and $266,705,167 as of June 30, 2013 and 2012, respectively.
Fair Value: The fair value of credit default swaps, including index swaps, held by TRS was ($691,803) as of June 30, 2013 and $3,145,336 as of June 30, 2012. This represents the amount due to or (from) TRS under the terms of the counterparty agreements.
In t e r e s t R a t e S w a p sObjective: Interest rate swaps are agreements between parties to exchange a set of cash flow streams over a period of time. In the most common type of interest rate swap arrangement, one party agrees to pay fixed interest payments on designated dates to a counterparty who, in turn, agrees to make return interest payments that float with some reference rate. Long-swap positions (receive fixed) increase exposure to long-term interest rates; short positions (pay fixed) decrease interest rate/risk exposure.
Terms: As of June 30, 2013 and June 30, 2012, TRS held interest rate swaps in various currencies with various expiration/maturity dates ranging from 2013 to 2043. Swap agreements typically are settled on a net basis, with a party receiving or paying only the net amount of the fixed/floating payments. Payments may be made at the conclusion of a swap agreement or periodically during its term.
Fair Value: The table below presents the fair value of TRS’s interest rate swap exposure as of June 30, 2013 and June 30, 2012.
June 30, 2013 Payable/Receivable
June 30, 2012 Payable/Receivable
Receive floating/pay fixed $8,491,517 ($164,255)Receive fixed/pay floating (14,672,588) 1,462,285
In f l a t i o n - l i n k e d S w a p sObjective: Inflation-linked swaps are agreements where a fixed payment is exchanged for a variable payment linked to an inflation index. These swaps can protect against unfavorable changes in inflation expectations and are used to transfer inflation risk from one counterparty to another.
Terms: As of June 30, 2013, TRS was a party to inflation-linked swaps denominated in various currencies with expiration dates through May 2023 and total par of 71.6 million. TRS was a party to inflation-linked swaps with a maturity date of November 2, 2012 and total par of 1.1 million as of June 30, 2012. TRS receives a fixed rate for all current positions, reducing inflation risks in certain countries. Inflation-linked swaps initially have no net value; the value of the swap’s outstanding payments will change as interest and inflation rates change. The value may be either positive or negative.
Fair value: The fair value of the inflation-linked swaps held by TRS was ($1,165,860) as of June 30, 2013 and $1,814 as of June 30, 2012.
D e r i v a t i v e In t e r e s t R a t e R i s kInterest rate risk for derivative securities is disclosed in the Financial Note D. 2. Both interest rate and inflation rate swaps have fair values that are sensitive to interest rate changes. TRS had the following interest rate and inflation swaps at June 30, 2013.

P a g e 4 7FINANCIAL
Interest Rate and Inflation Swaps
Asset Description ParGross
NotionalTRS
ReceivesTRS
PaysMaturity
DateFair Value
6/30/13
Pay Fixed Interest Rate Swaps:
Interest Rate Swap USD 1,800,000 $1,800,1633 month
LIBOR 0.75% 6/19/2016 $2,708
Interest rate swap USD 28,800,000 28,802,6093 month
LIBOR 2.75 6/19/2033 2,585,332
Interest rate swap USD 39,300,000 39,303,5793 month
LIBOR 2.75 6/19/2043 5,415,904
Interest rate swap JPY 4,190,000,000 42,180,5026 month
LIBOR 1.00 9/18/2023 130,245
Interest rate swap USD 21,600,000 21,617,1123 month
LIBOR 1.40 3/20/2018 55,635
Interest rate swap GBP 3,200,000 4,865,2656 month
LIBOR 3.00 3/21/2042 301,693Total Pay Fixed Interest Rate Swaps: $138,569,230 $8,491,517
Receive Fixed Interest Rate Swaps:
Interest rate swap MXN 7,000,000 $538,757 5.50%28 day
Mexican TIIE 9/13/2017 $957
Interest rate swap MXN 7,000,000 538,757 5.5028 day
Mexican TIIE 9/13/2017 957
Interest rate swap MXN 39,000,000 3,001,646 5.5028 day
Mexican TIIE 9/13/2017 5,329
Interest rate swap AUD 5,100,000 4,710,890 4.256 month Australian
Bank Bill 3/15/2023 (15,307)
Interest rate swap MXN 1,000,000 76,965 5.5028 day
Mexican TIIE 9/13/2017 137
Interest rate swap AUD 4,760,000 4,304,436 4.006 month Australian
Bank Bill 3/15/2023 (103,502)
Interest rate swap AUD 400,000 361,776 4.006 month Australian
Bank Bill 3/15/2023 (8,698)
Interest rate swap MXN 5,000,000 363,931 5.7528 day
Mexican TIIE 9/2/2022 (20,533)
Interest rate swap MXN 3,000,000 218,358 5.7528 day
Mexican TIIE 9/2/2022 (12,320)
Interest rate swap MXN 1,100,000 78,540 5.5028 day
Mexican TIIE 9/2/2022 (6,026)
Interest rate swap AUD 17,900,000 15,839,580 3.756 month Australian
Bank Bill 3/15/2023 (724,715)Interest rate swap USD 16,700,000 16,727,824 0.40 3 month LIBOR 8/15/2013 2,589
Interest rate swap MXN 400,000 28,564 5.5028 day
Mexican TIIE 9/2/2022 (2,191)
Interest rate swap AUD 17,500,000 15,145,757 3.506 month Australian
Bank Bill 3/15/2023 (1,036,517)
Interest rate swap AUD 2,700,000 2,436,350 3.986 month Australian
Bank Bill 3/15/2023 (63,771)Interest rate swap GBP 19,900,000 29,366,622 3.00 6 month LIBOR 3/21/2023 (815,708)Interest rate swap USD 78,900,000 75,720,882 3.00 3 month LIBOR 3/21/2023 (3,179,118)
Interest rate swap AUD 93,500,000 84,249,325 4.256 month Australian
Bank Bill 12/11/2023 (1,335,900)
Interest rate swap AUD 59,900,000 54,800,789 3.756 month Australian
Bank Bill 12/11/2018 (28,676)
(continued)

P a g e 4 8 FINANCIAL
(continued)
Asset Description ParGross
NotionalTRS
ReceivesTRS
PaysMaturity
DateFair Value
6/30/13
Interest rate swap USD 24,900,000 $24,507,800 1.00%Fed Fund
Effective Rate 10/15/2017 ($392,200)
Interest rate swap AUD 4,800,000 4,325,099 4.256 month Australian
Bank Bill 12/11/2023 (68,581)
Interest rate swap BRL 400,000 174,258 9.103 month
Brazilian CDI 1/2/2017 (6,815)
Interest rate swap AUD 45,100,000 39,788,568 4.006 month Australian
Bank Bill 12/11/2023 (1,493,717)
Interest rate swap AUD 33,500,000 30,298,523 3.506 month Australian
Bank Bill 12/11/2018 (365,702)
Interest rate swap MXN 100,000 7,202 5.7528 day
Mexican TIIE 6/5/2023 (492)
Interest rate swap MXN 600,000 43,212 5.7528 day
Mexican TIIE 6/5/2023 (2,953)
Interest rate swap MXN 400,000 28,808 5.7528 day
Mexican TIIE 6/5/2023 (1,969)
Interest rate swap MXN 400,000 28,808 5.7528 day
Mexican TIIE 6/5/2023 (1,969)
Interest rate swap MXN 100,000 7,202 5.7528 day
Mexican TIIE 6/5/2023 (492)
Interest rate swap MXN 400,000 29,390 6.0028 day
Mexican TIIE 6/5/2023 (1,390)
Interest rate swap MXN 800,000 58,780 6.0028 day
Mexican TIIE 6/5/2023 (2,779)
Interest rate swap BRL 4,500,000 1,926,173 8.303 month
Brazilian CDI 1/2/2017 (110,900)
Interest rate swap BRL 11,800,000 5,165,395 9.013 month
Brazilian CDI 1/2/2017 (176,264)
Interest rate swap BRL 55,600,000 24,025,260 8.723 month
Brazilian CDI 1/2/2017 (1,143,915)
Interest rate swap BRL 48,500,000 20,890,916 8.603 month
Brazilian CDI 1/2/2017 (1,064,210)
Interest rate swap BRL 9,500,000 4,144,338 8.903 month
Brazilian CDI 1/2/2017 (156,151)
Interest rate swap BRL 4,600,000 1,998,244 8.953 month
Brazilian CD 1/2/2017 (84,097)
Interest rate swap BRL 38,700,000 16,626,124 8.503 month
Brazilian CD 1/2/2017 (892,708)
Interest rate swap BRL 5,000,000 2,156,847 8.653 month
Brazilian CD 1/2/2017 (106,568)
Interest rate swap BRL 7,700,000 3,321,077 8.653 month
Brazilian CDI 1/2/2017 (164,582)
Interest rate swap BRL 5,800,000 2,518,352 8.903 month
Brazilian CD 1/2/2017 (107,210)
Interest rate swap BRL 9,000,000 3,837,410 8.203 month
Brazilian CD 1/2/2017 (236,737)
Interest rate swap BRL 1,800,000 767,942 8.223 month
Brazilian CD 1/2/2017 (46,887)
Interest rate swap MXN 1,100,000 85,894 5.603 month
Brazilian CD 9/6/2016 1,276
Interest rate swap MXN 500,000 38,556 6.353 month
Brazilian CD 6/2/2021 43
Interest rate swap BRL 2,000,000 861,481 8.603 month
Brazilian CDI 1/2/2017 (43,885)
(continued)

P a g e 4 9FINANCIAL
(continued)
Asset Description ParGross
NotionalTRS
ReceivesTRS
PaysMaturity
DateFair Value
6/30/13 Interest rate swap USD 144,400,000 $144,896,014 1.50% 3 month LIBOR 3/18/2016 $496,014
Interest rate swap BRL 19,500,000 8,451,486 8.643 month
Brazilian CDI 1/2/2017 (375,832)
Interest rate swap BRL 13,800,000 6,020,771 8.863 month
Brazilian CD 1/2/2017 (226,255)
Interest rate swap BRL 30,500,000 13,255,041 8.943 month
Brazilian CD 1/2/2017 (551,790)
Interest rate swap BRL 2,300,000 1,041,313 8.833 month
Brazilian CDI 1/20/2015 142Total Receive Fixed Interest Rate Swaps: $669,836,033 ($14,672,588)Pay Fixed Inflation-Linked Swaps:
Inflation swap USD 19,900,000 $19,461,762U.S. CPI URNSA 2.25% 7/15/2017 ($438,238)
Inflation swap USD 5,500,000 5,379,253U.S. CPI URNSA 2.25 7/15/2017 (121,121)
Inflation swap USD 500,000 488,446U.S. CPI URNSA 2.42 2/12/2017 (11,554)
Inflation swap USD 2,100,000 2,060,759U.S. CPI URNSA 2.56 5/8/2023 (39,241)
Inflation swap USD 8,200,000 8,020,732U.S. CPI URNSA 2.50 7/15/2022 (179,268)
Inflation swap USD 17,800,000 17,410,857U.S. CPI URNSA 2.50 7/15/2022 (389,143)
Inflation swap USD 2,000,000 1,956,276U.S. CPI URNSA 2.50 7/15/2022 (43,724)
Inflation swap USD 4,900,000 4,792,876U.S. CPI URNSA 2.50 7/15/2022 (107,124)
Total Pay Fixed Inflation-Linked Swaps: $59,570,961 ($1,329,413) Receive Fixed Inflation-Linked Swaps:
Inflation swap EUR 1,100,000 $1,466,894 2.15%France CPI
Ex-Tobacco 4/1/2021 $37,060
Inflation swap EUR 700,000 933,478 2.15France CPI
Ex-Tobacco 4/1/2021 23,583
Interest rate swap EUR 2,000,000 2,667,080 2.15France CPI
Ex-Tobacco 4/1/2021 67,382
Interest rate swap EUR 400,000 533,416 2.15France CPI
Ex-Tobacco 4/1/2021 13,476
Interest rate swap EUR 1,400,000 1,824,538 1.95France CPI
Ex-Tobacco 7/25/2021 4,750
Interest rate swap EUR 400,000 521,297 1.95France CPI
Ex-Tobacco 7/25/2021 1,357
Interest rate swap EUR 2,100,000 2,736,807 1.95France CPI
Ex-Tobacco 7/25/2021 7,124
Interest rate swap EUR 2,600,000 3,388,428 1.95France CPI
Ex-Tobacco 7/25/2021 8,821 Total Receive Fixed Inflation-Linked Swaps: $14,071,938 $163,553 CDI - Cetip Interbank Deposit (interbank lending rate) CPI - Consumer Price Index LIBOR - London Interbank Offered Rate TIIE - Mexico Interbank Equilibrium Interest Rate URNSA - Urban Consumers NSA Index Rate

P a g e 5 0 FINANCIAL
TRS had the following interest rate and inflation swaps at June 30, 2012.
Asset Description ParGross
NotionalTRS
ReceivesTRS
PaysMaturity
DateFair Value
6/30/12
Pay Fixed Interest Rate Swaps:
Interest rate swap GBP 2,700,000 $4,250,8326 month
LIBOR 3.00% 3/21/2042 ($32,020)
Interest rate swap USD 2,500,000 2,500,0003 month
LIBOR 2.75 6/20/2042 (132,235)
Total Pay Fixed Interest Rate Swaps: $6,750,832 ($164,255)
Receive Fixed Interest Rate Swaps:Interest rate swap MXN 7,000,000 $526,280 5.50% 4 week Mexican TIIE 9/13/2017 $4,899Interest rate swap MXN 7,000,000 526,280 5.50 4 week Mexican TIIE 9/13/2017 4,899Interest rate swap MXN 39,000,000 2,932,129 5.50 4 week Mexican TIIE 9/13/2017 27,292
Interest rate swap AUD 5,100,000 5,296,297 4.256 month Australian
Bank Bill 3/15/2023 68,541Interest rate swap MXN 1,000,000 75,183 5.50 4 week Mexican TIIE 9/13/2017 700
Interest rate swap AUD 4,700,000 4,784,089 4.006 month Australian
Bank Bill 3/15/2023 (33,646)
Interest rate swap AUD 400,000 407,157 4.006 month Australian
Bank Bill 3/15/2023 (2,864)Interest rate swap BRL 7,700,000 3,936,309 10.22 3 month Brazilian CDI 1/2/2014 121,500Interest rate swap BRL 1,800,000 923,095 10.58 3 month Brazilian CDI 1/2/2014 31,321Interest rate swap MXN 1,100,000 83,601 5.60 4 week Mexican TIIE 9/6/2016 1,517Interest rate swap BRL 15,700,000 7,990,254 9.98 3 month Brazilian CDI 1/2/2014 212,009Interest rate swap MXN 500,000 38,923 6.35 4 week Mexican TIIE 6/2/2021 1,563Interest rate swap GBP 5,500,000 9,024,042 2.50 6 month LIBOR 3/21/2022 337,790Interest rate swap BRL 400,000 203,458 9.97 3 month Brazilian CDI 1/2/2014 5,286Interest rate swap USD 2,000,000 2,008,025 1.50 3 month LIBOR 3/18/2016 8,025Interest rate swap BRL 16,600,000 8,755,813 11.94 3 month Brazilian CDI 1/2/2014 531,681Interest rate swap BRL 2,300,000 1,174,534 10.18 3 month Brazilian CDI 1/2/2014 35,046Interest rate swap BRL 6,200,000 3,178,390 10.14 3 month Brazilian CDI 1/2/2015 106,726
Total Receive Fixed Interest Rate Swaps: $51,863,859 $1,462,285
Receive Fixed Inflation-Linked Swaps: Inflation swap USD 1,100,000 $1,101,814 1.50% U.S. CPI URNSA 11/2/2012 $1,814
Total Receive Fixed Inflation-Linked Swaps: $1,101,814 $1,814 CDI - Cetip Interbank Deposit (interbank lending rate) CPI - Consumer Price Index LIBOR - London Interbank Offered Rate TIIE - Mexico Interbank Equilibrium Interest Rate URNSA - Urban Consumers NSA Index Rate
D e r i v a t i v e Cr e d i t R i s kCredit risk is the possibility that a loss may occur because a party to a transaction fails to perform according to the established terms. In order to eliminate credit risk, derivative securities are traded through a clearing house which guarantees delivery and accepts the risk of default by either party. Derivatives which are exchange traded are not subject to credit risk and are evaluated within the investment risk disclosure.

P a g e 5 1FINANCIAL
Non-exchange traded derivative instruments may expose TRS to credit/counterparty risk. TRS investment manag-ers reduce credit risk by evaluating the credit quality and operational capabilities of the counterparties. Because the counterparty risk of a security will fluctuate with market movements, all TRS managers using non-exchange traded derivatives operate a collateral call process ensuring full collateralization of these derivatives. TRS does not have a policy regarding master netting arrangements.
As of June 30, 2013 and June 30, 2012, the aggregate fair value of non-exchange traded derivative instru-ments in asset positions was $53,073,286 and $40,471,834, respectively. All applicable futures, options and swaps are in compliance with Dodd-Frank requirements and cleared through the appropriate futures and swaps exchanges. The counterparty risk exposure below is primarily currency forward unsettled contracts. This repre-sents the maximum loss that would be recognized at the reporting date if all counterparties failed to perform as contracted.
Co u n t e r p a r t y R a t i n g s f o r No n - E x c h a n g e T r a d e d D e r i v a t i v e s
Moody’s Quality RatingFair Value at 6/30/13
Fair Value at 6/30/12
Aaa $ - $24,081Aa1 27,313 278,084Aa2 7,814,221 305,895Aa3 10,029,991 3,313,425A1 11,363,846 7,100,421A2 15,953,193 21,652,246A3 6,459,732 5,255,795Baa1 1,424,990 2,473,346Baa2 - 68,541Total subject to credit risk $53,073,286 $40,471,834
Although the derivative instruments held within the TRS investment portfolio are executed with various counter-parties, approximately 88 percent of the net market value exposure to credit risk is for non-exchange traded derivative contracts held with nine counterparties.
5 . In v e s t m e n t Co m m i t m e n t sAs of June 30, 2013, TRS had commitments for the future purchase of investments in real estate of $551.3 mil-lion and private equity partnerships of $3,034.1 million.
E . R e s e r v e sTRS maintains statutory reserve accounts in accordance with the provisions of 40 ILCS 5/16-101 et seq. In 1997, the Illinois General Assembly passed legislation that allowed the crediting of income at fair value, as opposed to book value, to the Benefit Trust Reserve.
1 . B e n e f i t T r u s t2013 2012
Balances at June 30 $39,851,929,930 $36,510,374,060 This reserve serves as a clearing account for TRS income and expenses. The reserve is credited with contributions from the State of Illinois that are not specifically allocated to the Minimum Retirement Annuity Reserve, member and employer contributions, income from TRS invested assets, and contributions from annuitants who qualify for automatic annual increases in annuity.
The reserve accumulates, with 6 percent interest, the contributions by members prior to retirement. Contributions have been 7.5 percent of salary since July 1, 1998. Contributions are fully refundable upon withdrawal from

P a g e 5 2 FINANCIAL
TRS, excluding interest credited thereon. The interest accrued is refundable only in the event of death. Interest is credited as of the date of retirement or death of those retiring or dying during the year and as of the end of the fiscal year for all other members. Interest is computed annually based upon the individual member’s bal-ance in the reserve at the beginning of the fiscal year.
This reserve is charged for transfers to the Minimum Retirement Annuity Reserve and all
• refunds to withdrawing members,
• retirement annuity payments (except as provided by the Minimum Retirement Annuity Reserve),
• benefits that are paid to disabled members,
• death benefits paid, and
• refunds to annuitants for survivor benefit contributions.
The expected benefit payments do not equal the present value of the reserve. The additional amount needed (the unfunded actuarial accrued liability) as calculated by the actuary was $55,731,797,000 in 2013 and $52,079,548,000 in 2012.
2 . M i n i m u m R e t i r e m e n t An n u i t y2013 2012
Balances at June 30 $6,838,569 $6,451,279
The minimum annuity is set by law at $25 per month for each year of creditable service to a maximum of $750 per month after 30 or more years of creditable service. To qualify, annuitants are required to make a one-time contribution that is credited to the reserve. Interest at 6 percent is credited to the reserve annually based upon the average reserve balance. The State of Illinois also appropriated funds necessary to pay the minimum benefits provided in the legislation. All benefits paid under this program are charged to the reserve. This reserve is fully funded.
F. P e n s i o n a n d O t h e r P o s t - e m p l o y m e n t B e n e f i t s f o r T R S E m p l o y e e sTRS employees are covered by either the State Employees’ Retirement System of Illinois or the Teachers’ Retirement System of the State of Illinois. Also, most employees are eligible for other types of post-employment benefits.
S t a t e E m p l o y e e s ’ R e t i r e m e n t S y s t e m ( S E R S )1 . P l a n D e s c r i p t i o n f o r S E R S TRS employees who do not participate in TRS are covered by the State Employees’ Retirement System (SERS), a pension trust fund in the State of Illinois reporting entity. SERS is a single-employer defined benefit public employee retirement system. SERS provides retirement, disability, and death benefits to plan members and beneficiaries. Automatic annual post-retirement increases are provided. SERS is governed by Article 14 of the Illinois pension code, 5 ILCS 40/14-101 and following as well as the Illinois Administrative Code, Title 80, Subtitle D, Chapter I. SERS issues a publicly available financial report that includes financial statements and required supplemental information. It may be obtained at www.state.il.us/srs or by writing to SERS at 2101 South Veterans Parkway, Springfield, Illinois, 62794-9255. SERS’s financial position and results of operations are also included in the State of Illinois Comprehensive Annual Financial Report. This report may be obtained at www.ioc.state.il.us, or by writing to the Office of the Comptroller, Financial Reporting Department, 325 West Adams Street, Springfield, Illinois, 62704-1858.
2 . Fu n d i n g P o l i c y f o r S E R SThe contribution requirements of SERS members and the state are established by state statute and may be amended by action of the General Assembly and the Governor. TRS employees covered by SERS contribute

P a g e 5 3FINANCIAL
4.0 percent of their annual covered salaries. The state contribution rate for the years ended June 30, 2013, 2012, and 2011 were actuarially determined according to a statutory schedule.
TRS contribution rates to SERS for its SERS-covered employees for the years ended June 30, 2013, 2012, and 2011 were 37.987 percent, 34.190 percent, and 27.988 percent, respectively. TRS paid the required contributions for the years ended June 30, 2013, 2012, and 2011 totaling $2,065,699, $1,991,650, and $1,615,531, respectively.
T e a c h e r s ’ R e t i r e m e n t S y s t e m ( T R S )1 . P l a n D e s c r i p t i o n f o r T R S A summary description of the TRS plan can be found within these notes to the financial statements at “A. Plan Description.”
2 . Fu n d i n g P o l i c y f o r T R S TRS employees who participate in TRS are required to contribute 9.4 percent of their annual covered salaries. For employees who were members of TRS on August 17, 2001 and for employees hired on or after that date, TRS contributes 0.58 percent of the employees’ annual covered salaries. Additional employer contributions for these employees are paid by the State of Illinois and are included in the annual state contribution to TRS. TRS’s contributions for participating employees for the years ended June 30 in 2013, 2012, and 2011 were $23,331, $22,130, and $20,439, respectively. These amounts represent 100 percent of the required contributions.
O t h e r P o s t - e m p l o y m e n t B e n e f i t s f o r T R S E m p l o y e e sThe state provides health, dental, vision, and life insurance benefits for retirees and their dependents in a pro-gram administered by the Department of Central Management Services (CMS). Substantially all state employees become eligible for post-employment benefits if they eventually become annuitants of one of the state-sponsored pension plans. Health, dental, and vision benefits include basic benefits for annuitants and dependents under the state’s self-insurance plan and insurance contracts currently in force. Annuitants may be required to contribute towards health, dental, and vision benefits with the amount based on factors such as date of retirement, years of credited service with the state, whether the annuitant is covered by Medicare, and whether the annuitant has chosen a managed health care plan. Employees of the system who retired before January 1, 1998 and are vested in either SERS or TRS do not contribute towards health and vision benefits. A premium is required for dental. For annuitants who retired on or after January 1, 1998, the annuitant’s contribution amount is reduced 5 percent for each year of credited service with the state allowing those annuitants with 20 or more years of credited service to not have to contribute towards health and vision benefits. A premium is required for dental. Annuitants also receive life insurance coverage equal to the annual salary of the last day of employment until age 60, at which time the benefit becomes $5,000.
Public Act 97-0695 was signed into law on June 21, 2012. Effective July 1, 2013, all retirees will begin incur-ring a cost for health and vision benefits at a rate determined by CMS. The rate is a percentage of the retiree's annuity and differs depending on whether the retiree is a Medicare recipient.
The state pays the TRS portion of employer costs for the benefits provided. The total cost of the state’s portion of health, dental, vision, and life insurance benefits of all members, including post-employment health, dental, vision, and life insurance benefits, is recognized as an expenditure by the state in the Illinois Comprehensive Annual Financial Report. The state finances the costs on a pay-as-you-go basis. The total costs incurred for health, dental, vision, and life insurance benefits are not separated by department or component unit for annuitants and their dependents nor active employees and their dependents.
A summary of post-employment benefit provisions, changes in benefit provisions, employee eligibility require-ments including eligibility for vesting, and the authority under which benefit provisions are established are included as an integral part of the financial statements for CMS. A copy of the financial statements may be

P a g e 5 4 FINANCIAL
obtained by writing to their office, Department of Central Management Services, 704 Stratton Office Building, Springfield, Illinois, 62706.
G . S u b s e q u e n t E v e n t sOn December 5, 2013, Governor Pat Quinn signed Public Act 98-0599 into law. This new law takes effect no earlier than June 1, 2014 and would significantly alter the overall funding structure of TRS and reduce retire-ment benefits for Tier I members.

P a g e 5 5FINANCIAL
required supplementary informationS c h e d u l e o f Fu n d i n g P r o g r e s s 1
Actuarial Valuation
Date
Actuarial Value of Assets* (a)
Accrued Liability (AAL-Projected
Unit Credit) (b)
Funded Ratio
(a)/(b)
Unfunded Actuarial Accrued
Liability (UAAL) (b) - (a)
Covered Payroll (c)
Unfunded Actuarial Accrued Liability as
a Percentage of Covered Payroll
(b-a)/(c)6/30/04 $31,544,729,000 $50,947,451,000 61.9% $19,402,722,000 $7,280,795,000 266.5%6/30/05 34,085,218,000 56,075,029,000 60.8 21,989,811,000 7,550,510,000 291.26/30/06 36,584,889,000 58,996,913,000 62.0 22,412,024,000 7,765,752,000 288.66/30/07 41,909,318,000 65,648,395,000 63.8 23,739,077,000 8,149,849,000 291.36/30/08 38,430,723,000 68,632,367,000 56.0 30,201,644,000 8,521,717,000 354.46/30/09 38,026,044,000 73,027,198,000 52.1 35,001,154,000 8,945,021,000 391.36/30/10 37,439,092,000 77,293,198,000 48.4 39,854,106,000 9,251,139,000 430.86/30/11 37,769,753,000 81,299,745,000 46.5 43,529,992,000 9,205,603,000 472.96/30/12 37,945,397,000 90,024,945,000 42.1 52,079,548,000 9,321,098,000 558.76/30/13 38,155,191,000 93,886,988,000 40.6 55,731,797,000 9,394,741,000 593.2
* Fair value through FY08. Five-year prospective smoothing began in FY09.
S c h e d u l e o f Co n t r i b u t i o n s f r o m E m p l o y e r sa n d O t h e r Co n t r i b u t i n g E n t i t i e s 1
Year Ended
June 30 State Contributions2
Federal and Employer Contributions2 Total
Annual Required Contribution per GASB Statement
#25Percentage
Contributed
Annual Required Contribution per
State StatutePercentage
Contributed2004 $1,028,259,000 $75,078,000 $1,103,337,000 $1,716,977,000 64.3% $1,100,264,000 100.3%2005 903,928,000 83,434,000 987,362,000 1,683,212,000 58.7 986,269,000 100.12006 531,828,000 69,645,000 601,473,000 1,679,524,000 35.8 601,555,000 100.02007 735,515,000 81,155,000 816,670,000 2,052,396,000 39.8 822,890,000 99.22008 1,039,195,000 130,578,000 1,169,773,000 1,949,463,000 60.0 1,135,127,000 103.12009 1,449,889,000 151,716,000 1,601,605,000 2,109,480,000 75.9 1,556,737,000 102.92010 2,079,129,000 170,653,000 2,249,782,000 2,481,914,000 90.6 2,217,053,000 101.52011 2,169,518,000 154,150,000 2,323,668,000 2,743,221,000 84.7 2,293,321,000 101.32012 2,405,172,000 153,409,000 2,558,581,000 3,429,945,000 74.6 2,547,803,000 100.42013 2,702,278,000 155,787,000 2,858,065,000 3,582,033,000 79.8 2,843,463,000 100.5
1 For consistency with figures reported by TRS’s actuaries, the amounts have been rounded to the nearest thousand. Actual contributions varied slightly from contributions that are required by statute mainly because of differences between estimated and actual federal contributions. Beginning in FY08, lump-sum payments for ERO are included as employer contributions, further increasing the difference.
2 Excludes minimum retirement contributions. Excludes employer ERO contributions through FY07. Beginning in FY08, employer ERO contribu-tions are included because the costs of the ERO program are now included in the actuarial accrued liability. Beginning in FY06, employer contributions for excess salary increases are included. However, employer contributions for excess sick leave, which also began in FY06, are not included because there is no assumption for excess sick leave and it is not included in the funding requirements.

P a g e 5 6 FINANCIAL
other supplementary informationS c h e d u l e o f Ad m i n i s t r a t i v e E x p e n s e s Fo r Y e a r s E n d e d J u n e 3 0
2013 2012Personal services $15,482,674 $14,856,497Professional services 1,460,844 1,216,461Postage 253,734 292,006Machine repair and rental 571,212 583,638Other contractual services 914,800 878,682Commodities 429,789 291,941Occupancy expense 242,689 248,570Depreciation 901,811 644,104Total administrative expenses $20,257,553 $19,011,899
S c h e d u l e o f In v e s t m e n t E x p e n s e Fo r Y e a r s E n d e d J u n e 3 0
2013 2012Investment manager fees $237,066,159 $199,628,532Private equity investment expense 12,738,535 8,140,998Miscellaneous 30,568,033 27,037,797Total investment expense $280,372,727 $234,807,327
S c h e d u l e o f P a y m e n t s t o Co n s u l t a n t s Fo r Y e a r s E n d e d J u n e 3 0
2013 2012Actuarial services $315,309 $375,329External auditors 166,629 162,407Legal services 532,242 458,196Management consultants
Information systems 17,250 2,000Legislative consultant 84,000 84,000Salary review 35,721 23,000Internal audit 68,028 79,800Operations 231,450 27,975Other 10,215 3,754
Total payments to consultants $1,460,844 $1,216,461

Retirem
ent S
ecurity for Illinois Educators
Investments

Page 58 INVESTMENTS
introductionGlobal financial markets contributed to strong investment returns through the fiscal year ended June 30, 2013. Following the uncertainty and concerns of the prior fiscal year, diminished market volatility and improved funda-mentals drove investment performance, led by double-digit gains in global equity markets. All TRS asset classes produced positive returns within this environment. Net of fees, the retirement system’s U.S. and international equity portfolios returned 23.3 percent and 13.2 percent, respectively. TRS also enjoyed double-digit investment returns within its private equity, real estate and absolute return portfolios. The TRS investment portfolio posted a positive result, returning 12.8 percent, net of fees, for the fiscal year ended June 30, 2013.
The TRS portfolio remains fully diversified across different asset classes. A number of investment managers are utilized within each asset class to ensure the appropriate mixture across the various investment styles, allowing the portfolio to achieve broad exposure to the market while minimizing overall risk. This broad diversification serves as the best defense against the uncertainty of volatile global markets.
The TRS trust fund is invested by authority of the Illinois Pension Code under the “prudent person rule,” requir-ing investments to be managed solely in the interest of fund participants and beneficiaries. The TRS Investment Policy guides TRS’s investments. Investment principles include preserving the long-term principal of the trust fund, maximizing total return within prudent risk parameters, and acting in the exclusive interest of TRS members.
As master trustee, State Street Bank and Trust has provided to TRS, unless otherwise noted, detailed financial reports of all investments, receipts, disbursements, purchases and sales of securities, and other transactions pertinent to the fund for the period July 1, 2012 through June 30, 2013. A statement of detailed assets, along with their fair market value, was also provided as of June 30, 2013.
Investment performance is calculated using a time-weighted rate of return. Returns are calculated by State Street Bank and Trust using industry best practices. Additionally, State Street Bank and Trust calculated performance rates of return by portfolio, composite, and for all respective indices used throughout this section. TRS staff, in collaboration with the staff of its custodian, prepared the Investments section.
A complete listing of investment holdings is available on request.
Summary Data June 30, 2013Total fund fair value $39.7 billion1-year return (net of fees) 12.8%3-year return (net of fees) 12.0%5-year return (net of fees) 4.2%10-year return (net of fees) 7.2%Percent externally managed 100.0%Number of external managers 148Custodian State Street Bank and TrustGeneral consultant R. V. Kuhns and Associates, Inc.
TRS is ranked 41 out of the top 1,000 U.S. pension funds/plan sponsors according to Pensions & Investments. Rankings are based on market value of total assets at September 30, 2012.

Page 59INVESTMENTS
fund performance vs. benchmarks and fair valuesAs of June 30, 2013, the fair value of TRS's investments as reported on the Statements of Net Position was $39.7 billion, an increase of $2.9 billion from the prior year.
A summary of holdings and assets is discussed throughout the Investment Section. The totals represent the actual assets (gross of any liabilities, amounts due to brokers, and expenses). The liabilities of the fund are included in the Statements of Net Position located within the Financial Statements.
TRS had a total fund annualized return of 13.5 percent, gross of fees, and 12.8 percent, net of fees, for the one-year period ended June 30, 2013. The Performance Summary table shows the performance of the total investment portfolio versus comparative benchmarks.
As illustrated in the Performance Summary table, TRS total fund performance outperformed the policy index by 30 basis points for the year ended June 30, 2013. The policy index represents a weighted average of each asset class benchmark, based on the total fund’s interim target asset allocation. The total return also exceeded the 8.0 percent actuarial return assumption and the real rate of return expectation, which is to exceed the rate of inflation, as measured by the Consumer Price Index, by 4.75 percentage points.
Performance Summary (net of fees)
Years ended June 30 Annualized at 6/30/13Asset Class / Index 2013 2012 2011 2010 2009 3 Years 5 Years 10 YearsTRS Total Fund 12.8% 0.8% 23.6% 12.9% (22.7%) 12.0% 4.2% 7.2%TRS Weighted Policy Index 12.5 2.4 21.5 10.9 (18.6) 11.9 4.8 7.4CPI (Inflation) 1.8 1.7 3.6 1.1 (1.4) 2.3 1.3 2.4
TRS Equity - U.S. 23.3 1.0 32.9 17.0 (27.3) 18.3 7.1 7.5Russell 3000 Index 21.5 3.8 32.4 15.7 (26.6) 18.6 7.3 7.8TRS Equity - International 13.2 (11.7) 30.3 11.3 (31.9) 9.2 (0.3) 8.9Non-U.S. Equity Index 13.9 (14.8) 30.3 11.5 (30.5) 8.1 (0.4) 9.1TRS Fixed Income 6.5 5.7 8.9 16.8 4.9 7.0 8.5 6.1Barclays Capital U.S. Aggregate Index (0.7) 7.5 3.9 9.5 6.1 3.5 5.2 4.5TRS Real Return 0.1 2.5 23.4 13.5 (26.2) 8.2 1.2 -CPI (Inflation) + 5.0%* 6.8 6.7 8.7 6.1 3.5 7.4 6.4 -TRS Real Estate 12.6 9.9 17.8 (5.6) (30.0) 13.4 (0.7) 7.4NCREIF Property Index 10.7 12.0 16.7 (1.5) (19.6) 13.1 2.8 8.6TRS Private Equity 15.2 3.8 22.3 16.5 (17.9) 13.5 6.9 11.8Russell 3000 Index + 3.0%* 25.1 6.9 36.2 19.2 (24.3) 22.1 10.5 11.1TRS Absolute Return 10.5 2.6 12.4 9.6 (13.9) 8.4 3.8 -90-day Treasury Bill +4.0%* 4.1 4.1 4.2 4.2 5.0 4.1 4.3 -
* Index compounded monthly.Note: Performance calculations provided by State Street Bank and Trust use net-of-fee time-weighted rates of return.
asset allocation vs. targetsA pension fund’s most important investment policy decision is the selection of its asset allocation. Similar to other large institutional funds, TRS maintains a well-diversified portfolio to manage risk effectively.

Page 60 INVESTMENTS
FY13 Asset Allocation Long-term Target Allocation
RealReturnReal
Estate
8.9%
InternationalEquity
FixedIncome
U.S. Equity
Short-termInvestments
PrivateEquity
AbsoluteReturn
15.9%
21.1%
22.8%
11.9%
5.3%
2.1%
12.0%
10.0%
8.0%
20.0%
14.0%
16.0%
20.0%
0.0%
12.0%
Through the fiscal year, TRS continued implementation of the asset allocation structure adopted in April 2011. That study focused primarily on controlling the overall volatility of the investment portfolio given an uncertain global economic landscape. To accomplish that goal, the new targets called for continued evolution of the fund’s diversification into the absolute return and private equity asset classes, with a gradual reduction in exposure to publicly traded equity securities. In fiscal year 2013, TRS continued reallocating assets according to this plan by recognizing gains within a very strong public equity market environment.
The asset mix is periodically compared to the policy targets to determine when rebalancing of the fund or changes to the interim policy targets are necessary. The following Strategic Investment Listing table shows the asset allocation targets, as adopted by the Board of Trustees, compared to the total assets assigned to each particular asset class at June 30, 2013.
Strategic Investment ListingAllocation Targets vs. Total Assets
6/30/2013 Total Fund
$ Million
As of June 30, 2013 As of June 30, 2012Actual
PercentInterim Target
Policy Target
Actual Percent
Policy Target
U.S. equities $9,008 22.8% 23.0% 20.0% 23.7% 20.0%International equities 8,323 21.1 20.0 20.0 20.2 20.0Fixed income 6,279 15.9 16.0 16.0 16.4 16.0Real return 3,510 8.9 10.0 10.0 9.4 10.0Real estate 4,738 12.0 13.0 14.0 12.5 14.0Private equity 4,690 11.9 11.0 12.0 11.5 12.0Absolute return 2,110 5.3 6.0 8.0 5.5 8.0Short-term investments 821 2.1 1.0 0.0 0.8 0.0Pending settlements/expenses* 203 NA NA NA NA NATotal fund $39,682 100.0% 100.0% 100.0% 100.0% 100.0%
* This amount is included within the liability section in the Statements of Net Position.

Page 61INVESTMENTS
portfolio securities summaryThe Portfolio Securities Summary table contains a detailed list of security types. The amounts in this table differ from the allocation percentages shown in the previous Strategic Investment Listing table. The strategic investment listing represents assets assigned to managers within each asset class, whereas the portfolio securities summary represents specific types of financial instruments. The principal differences can be explained by the types of investments a manager is allowed to hold within its portfolio. For example, cash and currency held within a manager’s portfolio is categorized in the same way as the manager’s primary assignment on the Strategic Investment Listing. However, in the portfolio securities summary, these investments are categorized as short-term investments and foreign currency.
Portfolio Securities Summary
2013 2012
Fair Value% of Total Fair Value
% of Total
U.S. treasuries & agencies $1,266,248,184 3.2% $908,732,373 2.5%U.S. government-backed mortgages 545,611,651 1.4 801,736,346 2.2 U.S. government special situations 2,122,118 - 47,480,226 0.1 Municipals 58,776,219 0.1 56,047,855 0.2 Asset-backed securities 163,658,569 0.4 171,507,017 0.5 Commercial & collateralized mortgages 349,793,376 0.9 390,348,243 1.0 Commingled funds (U.S. & international) 1,357,813,108 3.4 1,102,978,257 3.0 Domestic corporate obligations 1,497,383,563 3.8 1,553,491,044 4.2 Foreign debt/corporate obligations 1,631,025,723 4.1 1,793,973,365 4.9 Total Bonds, Corporate Notes, and Government Obligations 6,872,432,511 17.3 6,826,294,726 18.6 U.S. equities 8,754,689,111 22.0 8,404,570,096 22.8 International equities 8,361,383,273 21.1 7,360,287,886 20.0 Total Equities 17,116,072,384 43.1 15,764,857,982 42.8 Absolute return 2,110,246,003 5.3 1,978,268,562 5.4 Private equity 4,687,146,815 11.8 4,175,728,282 11.4 Real estate 4,680,490,237 11.8 4,480,390,766 12.2 Real return strategies 2,661,472,243 6.7 2,582,307,633 7.0 Derivatives - Options, Futures and Swaps (9,415,670) - 7,297,522 -Cash and cash equivalents 1,448,944,819 3.7 885,036,978 2.4 Foreign currency 114,363,611 0.3 81,921,602 0.2 TRS Total Portfolio $39,681,752,953 100.0% $36,782,104,053 100.0%

Page 62 INVESTMENTS
securities holdings (historical)Historically, TRS has adopted various asset allocation strategies. The Asset Allocation table shows the actual asset allocation based on asset types for the last five-year period.
Securities Holdings For Years Ended June 30
Asset Type 2013 2012 2011 2010 2009 Bonds, corporate notes, and government obligations 17.3% 18.6% 18.8% 20.8% 22.0%Equities - U.S. 22.0 22.8 26.4 25.8 27.8Equities - international 21.1 20.0 19.7 20.0 18.9Real return 6.7 7.0 7.3 7.3 5.3Short-term investments/currency 4.0 2.6 3.7 2.4 3.8Absolute return 5.3 5.4 3.9 3.9 2.5Private equity 11.8 11.4 9.6 9.5 8.1Real estate 11.8 12.2 10.6 10.3 11.6Totals 100.0% 100.0% 100.0% 100.0% 100.0%
Source: TRS
TRS’s asset allocation has provided consistent overall returns over the years, as represented by the following chart showing the growth of $10,000 since 1982.
Growth of $10,000
July
200
4
July
200
2
July
200
0
July
199
8
July
199
6
July
199
4
July
199
2
July
199
0
July
198
8
July
198
6
July
198
4
July
198
2
July
200
6
July
200
8
July
200
9
July
201
0
July
201
1
July
201
2Ju
ne 2
013
$60,000
$80,000
$100,000
$120,000
$0
$20,000
$40,000
$140,000
$160,000
$180,000
$200,000
Source: TRS

Page 63INVESTMENTS
The following sections provide a brief and informative overview of the various asset classes utilized by TRS for the period ended June 30, 2013.
u.s. equityU.S. equity, or common stock, represents shares or units of ownership in public corporations domiciled within the United States. TRS invests in equities because the asset class offers the opportunity to participate in the success of the U.S. economy and specific corporations within it. Stockholders share in the growth of a company through an increase in stock price, as well as through the distribution of corporate profits in the form of dividends.
For the year ended June 30, 2013, the U.S. equity asset class earned 23.3 percent return on a net of fee basis, compared to the Russell 3000 Index gain of 21.5 percent. One-, three-, five-, and 10-year comparisons to this benchmark follow.
FY13 3-Year 5-Year 10-Year TRS, net of fees 23.3% 18.3% 7.1% 7.5%Russell 3000 Index 21.5 18.6 7.3 7.8
The top 10 U.S. equity holdings as of June 30, 2013 follow and represent 12.7 percent of the total U.S. equity holdings. These investments represent sector diversification and include companies that are dominant within their industry.
Top 10 U.S. Equity Holdings at June 30, 2013Firm Industry Fair Value (USD)Exxon Mobil Corp. Energy $151,189,883Apple, Inc. Information Technology 143,678,812Google, Inc. Information Technology 127,630,760Pfizer, Inc. Health Care 123,041,572Wells Fargo & Co. Financials 107,975,815Citigroup, Inc. Financials 102,445,691JP Morgan Chase & Co. Financials 99,634,262Microsoft Corp. Information Technology 94,554,466Chevron Corp. Energy 82,598,953Johnson & Johnson Health Care 82,183,046Total $1,114,933,260

Page 64 INVESTMENTS
At June 30, 2013, 22.8 percent of the TRS investment portfolio was assigned to U.S. equity managers. TRS employed the following U.S. equity managers during fiscal year 2013.
U.S. Equity Managers and Assets Under Management (inception date of account)Large Cap CoreHerndon Capital Management, L.L.C. (3/11) $190,554,199J.P. Morgan Investment Management, Inc. (12/07) 583,863,271Levin Capital Strategies, L.P. (10/10) 463,918,371MFS Institutional Advisors, Inc. (10/10) 516,208,779Oakbrook Investments, L.L.C. (11/09) 343,509,523Rhumbline Advisors, L.P. (8/06) 1,931,462,932T. Rowe Price Associates, Inc. (6/05) 729,366,788Large Cap ValueLoomis, Sayles & Company, L.P. (3/10) 346,711,269Robeco Boston Partners Asset Management, L.P. (3/10) 671,368,424Large Cap GrowthJ.P. Morgan Investment Management, Inc. (10/12) 439,019,405T. Rowe Price Associates, Inc. (11/06) 632,819,091Small/Mid Cap CoreRhumbline Advisors, L.P. (5/07) 25,854,994Small/Mid Cap ValueCramer Rosenthal McGlynn, L.L.C. (3/09) 330,666,299Fiduciary Management Associates, L.L.C. (7/08) 161,114,340Lombardia Capital Partners, L.L.C. (11/08) 264,089,619LSV Asset Management (12/02) 311,165,277Small/Mid Cap GrowthBoston Company Asset Management, L.L.C. (3/09) 190,074,922Cortina Asset Management, L.L.C. (6/12) 129,286,471Emerald Advisors, Inc. (11/04) 280,431,989State Street Global Markets (5/13) 97,293,322Emerging ManagerChanning Capital Management, L.L.C. (12/11) 36,720,478RhumbLine Advisors, L.P. (5/06) 331,859,768
Note: The list does not include managers terminated prior to June 30, 2013 with residual assets in the account.
Discussion of U.S. EquityInvestment managers are chosen to diversify the portfolio on both a capitalization and style basis. This diversi-fication is important for controlling the risk of the portfolio, as well as balancing the portfolio against the broad benchmark and economy.

Page 65INVESTMENTS
Capitalization Market Style
Value24.0%
Growth20.0%
Core56.0%
Large Cap78.0%
Small-Mid Cap22.0%
Source: TRS Investment Policy
The broad U.S. equity market (Russell 3000 index) rose 21.5 percent in fiscal year 2013. This followed a mod-est 3.8 percent gain in fiscal year 2012. Accommodative monetary policy and solid corporate fundamentals were among factors that drove investor assets back into equities. Market volatility dropped sharply as the prior year’s negative macroeconomic events (e.g. European debt crisis) diminished. The plan’s domestic equity portfolio outperformed the Russell 3000 benchmark by 1.8 percent in fiscal year 2013 as the retirement system’s active investment managers benefited from lower market volatility. A modest overweight to outperforming small cap stocks was also a contributor.
Statistical DataThe following tables convey various statistics, including attribution and sector analysis, of the U.S. equity portfolio as compared to TRS’s domestic equity benchmark, the Russell 3000 Index. The Russell 3000 Index is a broad market benchmark representing 98 percent of the investible U.S. equity market.
TRS Domestic Equity as of June 30, 2013Characteristic TRS Domestic Equity Russell 3000 IndexWeighted average market cap ($ billions) $74.3 $85.8Price/earnings ratio 19.1x 19.2xDividend yield 1.8% 2.1%Beta 1.1 1.05-year EPS growth 13.2% 11.7%Price/book ratio 3.8x 3.7x
Source: State Street Bank and Trust

Page 66 INVESTMENTS
U.S. Equity – Diversification by Industry Sector for Year Ended June 30, 2013
Sector TRS Domestic
Equity Weighting Russell 3000
Index WeightingConsumer discretionary 14.6% 13.5%Consumer staples 7.0 8.6Energy 8.9 9.4Financial services 16.6 17.5Health care 14.7 12.6Industrials 11.6 11.4Materials 4.3 3.8Technology 18.6 17.8Telecommunication services 1.6 2.2Utilities 2.1 3.2Total 100.0% 100.0%Source: State Street Bank and Trust and TRS
international equityInternational equity, or common stock, represents shares or units of ownership in public corporations domiciled outside the United States. International investing provides important diversification benefits to the TRS portfo-lio. While the international economy has increasingly become more global in nature, not all economies move in tandem. TRS’s international equity managers are able to participate in the strength of individual markets, thus enhancing the TRS total portfolio. Additionally, corporations worldwide have expanded their global reach. The international equity portfolio is able to seek out superior companies operating multi-nationally, or companies that are particularly strong in their own markets or industries.
For the year ended June 30, 2013, the international equity asset class earned 13.2 percent on a net of fee basis compared to the Morgan Stanley Capital International (MSCI) All Country Excluding U.S. Investable Market Index (identified as Non-U.S. Equity Index in the following references) gain of 13.9 percent. One-, three-, five-, and 10-year comparisons to this benchmark are in the following table.
FY13 3-Year 5-Year 10-YearTRS, net of fees 13.2% 9.2% (0.3%) 8.9%Non-U.S. Equity Index 13.9 8.1 (0.4) 9.1
The top 10 international equity holdings as of June 30, 2013 follow and represent 8.9 percent of the total international equity holdings. These investments are diversified geographically and include companies that are dominant within their industry and familiar to the U.S. economy.
Top 10 International Holdings at June 30, 2013Firm Country Fair Value (USD)Novartis AG Switzerland $88,950,140Roche Holding AG Switzerland 88,149,030Vodafone Group PLC United Kingdom 86,746,729Sanofi France 84,823,471Nestle SA Switzerland 80,134,288Taiwan Semiconductor LTD Taiwan 73,584,534HSBC Holdings PLC United Kingdom 67,181,881British American Tobacco PLC United Kingdom 59,413,167BP PLC United Kingdom 59,280,921Samsung Electronics LTD Korea 55,880,751Total $744,144,912

Page 67INVESTMENTS
At June 30, 2013, 21.1 percent of the TRS investment portfolio was assigned to international equity managers. TRS employed the following international equity managers during fiscal year 2013
International Equity Managers and Assets Under Management (inception date of account)Large Cap CoreAberdeen Asset Management, Inc. (7/10) $580,297,792Northern Trust Investments, Inc. (8/10) 1,969,536,641Large Cap GrowthJarislowsky, Fraser Limited (8/05) 427,821,313McKinley Capital Management, Inc. (8/05) 786,989,683State Street Global Markets (5/13) 388,136,972Large Cap ValueLSV Asset Management (10/12) 762,649,490Mondrian Investment Partners Limited (4/93) 864,800,418Small/Mid CapAmerican Century Global Investment Management, Inc. (6/08) 262,460,903DFA Investment Dimensions Group Inc. (6/11) 203,001,272Dimensional Fund Advisors, L.P. (6/08) 262,765,965Mondrian Investment Partners Limited (11/12) 248,556,448Emerging MarketsAberdeen Asset Management, Inc. (3/08) 559,907,348Northern Trust Investments, Inc. (4/13) 409,619,522Emerging ManagerAtivo Capital Management (3/13) 24,969,183Sky Investment Council (12/12) 24,888,767Strategic Global Advisors (3/11) 53,631,103Note: The list does not include managers terminated prior to June 30, 2013 with residual assets in the account.
Discussion of International EquityThe International Equity Manager Structure table provides a further breakdown of the styles within the inter-national equity portfolio.
International Equity Manager StructureInternational Equity Classification Target ActualLarge cap core 32.5% 31.0%Large cap growth 20.0 19.5Large cap value 20.0 19.9Small/mid cap 11.0 11.9Emerging markets 16.5 17.7Total 100.0% 100.0%
International equity markets produced solid returns for the year ended June 30, 2013. Markets appreciated strongly during the first half of the fiscal year, advancing over 13.0 percent as investor fears over weakening global economic conditions and concerns regarding the Euro-based sovereign debt crisis abated. Further sup-porting the rally was the continued accommodative monetary policies employed by central bankers throughout the developed world (U.S., Europe and Japan). Economically sensitive sectors such as materials, energy, indus-trials and financials led equity markets higher during the second half of 2012. During the last quarter of the fiscal year, markets weakened as investors speculated the U.S. Federal Reserve would begin “tapering” its bond purchases, thus causing a spike in U.S. interest rates and dampening equity market expectations.

Page 68 INVESTMENTS
The biggest story to emerge during the past year was the significant underperformance of emerging market equities relative to U.S. and Non-US developed equity markets. Emerging equity markets returned 3.6 percent during the fiscal year, lagging the U.S. equity market by 17.8 percent and non-US equity markets by 13.5 per-cent. Emerging equity markets were hampered by fears of a hard landing in China as it transitions its economy from a direct investment economy to a more service-oriented, domestic-based economy. A slow-down in China has a rippling effect throughout the developed and emerging world economy, but especially impacts natural resource sensitive emerging economies in Brazil and Russia.
The TRS international equity portfolio modestly underperformed the benchmark return during the fiscal year. Negative excess returns were driven by the portfolio’s defensive sector positioning relative to the index and the portfolio’s modest overweight to emerging market equities. TRS managers have continued to position the portfolio by over-weighting specific sectors including telecom, consumer staples and healthcare at the expense of more economically sensitive sectors such as materials, energy and industrials.
Portfolio CharacteristicsThe next two charts convey the fundamental characteristics and the regional exposure of the international equity portfolio as of June 30, 2013.
International Equity Fundamental CharacteristicsCharacteristic TRS International Equity Non-U.S. Equity Index
Weighted average market cap ($ billions) $41.1 $48.2Price/earnings ratio 15.1x 15.7xDividend yield 3.2% 3.2%Price/book ratio 2.7x 2.6xSource: State Street Bank and Trust
Regional Allocation Comparison at June 30, 2013TRS International Equity Exposure
Europe43.3%
Emerging Markets28.8%
North America (Ex. U.S.)4.9%
Cash/Other1.7%
Japan13.0%
Pacific Rim (Ex. Japan)8.3%
Source: TRS
global fixed incomeGlobal fixed income is a financial obligation of an entity including, but not limited to, U.S. and foreign corpora-tions, governments, agencies, indices, or municipalities. These entities promise to pay a specified sum of money at a future date, while paying specified interest during the term of the issue. A fixed or floating income security

Page 69INVESTMENTS
represents a contractual obligation of a debt or a loan, with the issuer of debt as the borrower of capital, and the purchaser, or holder of bonds, as the creditor or lender.
Global fixed income is an important asset class in a well-diversified portfolio. Fixed income investments can reduce volatility, offer low or negative correlation to other asset classes and provide income streams, or coupons, essential to the growth of the overall portfolio.
For the year ended June 30, 2013, the TRS fixed income portfolio returned 6.5 percent, net of fees, compared to the loss of 0.7 percent of the benchmark, the Barclays Capital U.S. Aggregate Index. One-, three-, five-, and 10-year comparisons to the relative benchmark follow.
FY13 3-Year 5-Year 10-Year TRS, net of fees 6.5% 7.0% 8.5% 6.1%Barclays Capital U.S. Aggregate Index (0.7) 3.5 5.2 4.5
The following table lists the top 10 global fixed income investments or funds held by TRS as of June 30, 2013. A complete listing of investment holdings is available as a separate report.
Top 10 Global Fixed Income Holdings at June 30, 2013Security/Position Fair ValueFranklin Templeton Emerging Market Debt Fund $421,026,471Loomis Sayles Strategic Alpha Fund 322,335,858U.S. Treasury Note 147,635,228Oaktree Enhanced Income Fund, L.P. 129,425,191PIMCO Distressed Senior Credit Opportunities Fund II 122,589,652PIMCO Bank Recapitalization and Value Opportunities Fund 103,814,900PIMCO Global Advantage Strategy Bond Fund 95,078,405Federal Home Loan Mortgage Note 57,318,910MacKay Shields Defensive Bond Arbitrage Fund 53,090,964U.S. Treasury Inflation Linked Note 48,077,712Total $1,500,393,291
Source: State Street Bank and Trust and TRS
At June 30, 2013, 15.9 percent of the TRS investment portfolio was assigned to global fixed income. TRS employed the following fixed income managers during fiscal year 2013. This excludes fixed income-type assets overseen by managers in other asset classes containing fixed income securities as a small part of their overall strategies.
Global Fixed Income Managers and Assets Under Management (inception date of account)AQR Risk Balanced Reinsurance Fund Ltd. (12/12) $40,442,612Dolan McEniry Capital Management, L.L.C. (5/06) 327,857,688Franklin Advisers, Inc. (2/08) 760,079,349Franklin Templeton Investment Management Limited (12/10) 421,026,471Garcia Hamilton & Associates, L.P. (6/10) 26,541,207Hartford Investment Management Company (3/11) 291,010,833LM Capital Group, L.L.C. (12/09) 33,765,382Loomis Sayles & Company, L.P. (6/08) 443,503,279Loomis Sayles Trust Company L.L.C. (3/11) 322,335,860MacKay Shields L.L.C. (8/11) 797,262,690
(continued)

Page 70 INVESTMENTS
(continued)
Global Fixed Income Managers and Assets Under Management(inception date of account)Manulife Asset Management, L.L.C. (8/11) $416,541,441Maranon Senior Credit Fund II-B, L.P. (6/13) 16,332,420Oaktree Enhanced Income Fund, L.P. (9/12) 129,425,191Pacific Investment Management Company, L.L.C. (7/82) 985,998,619 Pacific Investment Management Company - Bank Recapitalization and Value Opportunities Bravo Fund, L.P. (1/11) 103,814,900
Pacific Investment Management Company - Bank Recapitalization and Value Opportunities Bravo Fund II, L.P. (3/13) 12,430,407
Pacific Investment Management Company - Distressed Senior Credit Opportunities Fund II, L.P. (11/11) 122,589,654
Pacific Investment Management Company - Global Advantage Strategy Bond Fund (3/11) 95,078,405
Prudential Investment Management, Inc. (12/08) 509,588,301Taplin, Canida & Habacht (3/04) 251,315,194Westwood Management Corp. (6/12) 73,985,955Note: This list does not include certain mangers terminated prior to June 30, 2013 with residual assets in the account.
Discussion of Global Fixed IncomeTRS’s global fixed income portfolio significantly outperformed the Barclays Capital U.S. Aggregate Index by 7.2 percent, net of fees, during the fiscal year. The global fixed income portfolio maintained low exposure to global developed market nominal positions with low yields and high debt levels. TRS continues the bias away from U.S. and global fixed income indices as benchmark investments tend to reward governments and corporations with the highest debt levels. TRS has increased floating rate exposures and maintained below market weight duration in anticipation of higher interest rates. Further, the System has worked to create structural flexibility within the portfolio to opportunistically address potential market dislocations.
Statistical Data
The following data provides statistical information on TRS’s global fixed income portfolio.
Global Fixed Income Profile
Characteristic
TRS Fixed Income Portfolio
6/30/13
Barclays Capital Aggregate Index
6/30/13
TRS Fixed Income Portfolio
6/30/12
Barclays Capital Aggregate Index
6/30/12Average maturity 5.8 years 7.5 years 6.0 years 6.7 yearsEffective duration 3.8 years 5.5 years 4.2 years 5.1 years Average coupon 3.6% 3.4% 4.5% 3.9%Average quality rating Baa1 Aa2 A3 Aa2Source: State Street Bank and Trust and TRS

Page 71INVESTMENTS
Diversification by Quality Rating for Individual BondsMoody’s Quality Rating 2013 2012Aaa* 42.1% 46.2%Aa1 through Aa3 8.8 4.1A1 through A3 7.2 7.0Baa1 through Baa3 19.5 20.9Ba1 through Ba3 10.5 9.8B1 through B3 6.5 6.5Under B3 1.7 2.0Other** 3.7 3.5Total 100.0% 100.0%* U.S. treasury securities are included ** Other includes unrated securitiesSource: State Street Bank and Trust and TRS
real returnThe real return asset class was established during 2007 in recognition of the significant impact inflation has on an investment portfolio and its return objectives. Traditional asset classes, such as equities and fixed income, tend to perform well in periods of stable or falling inflation yet face meaningful challenges in periods of rising inflation.
The objective of the real return asset class is to exceed the Consumer Price Index (CPI) by 5.0 percentage points over a five- to 10-year period of time. Real return strategies are generally less correlated with traditional stock and bond portfolios and provide inflation protection and excess returns during periods of rising inflation while reducing overall risk to the total fund. It should be noted that the CPI is not an investible benchmark, but is utilized as a benchmark given the inflation focus of the asset class. For the year ended June 30, 2013, TRS’s real return asset class earned 0.1 percent, net of fees, compared to the 6.8 percent return of the benchmark.
FY13 3-Year 5-YearTRS, net of fees 0.1% 8.2% 1.2%Consumer Price Index + 5% 6.8 7.4 6.4
At June 30, 2013, 8.9 percent of TRS’s investment portfolio was assigned to real return managers. As of June 30, 2013, TRS employed the following managers and/or funds including their respective assets under management.
Real Return Managers and Assets Under Management (inception date of account)Global Inflation-linked BondsNew Century Advisors, L.L.C. (2/08) $218,639,764Pacific Investment Management Company, L.L.C. (5/07) 487,602,592Global Macro/ Risk Parity StrategiesAQR Global Risk Premium Tactical Fund II, Ltd. (7/07) 678,512,264Bridgewater All Weather Portfolio Limited (7/07) 665,632,619 PIMCO Global Multi-Asset Strategy Fund (12/09) 496,816,983PIMCO Multi-Asset Volatility Fund LLC (5/13) 58,914,960Standard Life Investments Global Absolute Return Strategies Fund Ltd. (6/12) 542,394,327 Targeted Real ReturnAQR Real Return Fund, L.P. (6/12) 357,984,885Black River Agriculture Fund 2 LP (6/13) 3,961,408

Page 72 INVESTMENTS
Discussion of Real ReturnThe real return asset class serves as a portfolio diversifier and protects against unanticipated and actual inflation within the total fund. The real return portfolio is expected to maintain a risk/return profile between global equi-ties and fixed income. The real return portfolio generated a 0.1 percent return, net of fees, for the fiscal year ended June 30, 2013. The global macro/risk parity strategies returned 2.3 percent, however inflation linked bonds and targeted real return posted returns of (3.0) percent and (8.4) percent, respectively. The majority of the underperformance occurred in the fourth quarter of the fiscal year when commodities, inflation-linked and nominal bonds were negatively impacted by the inaction of the Federal Reserve. As a result, most inflationary assets experienced increased correlation. However, TRS modestly underweighted most real return sectors dur-ing the second half of the fiscal year while primarily overweighting equities. The policy target for real return remains 10.0 percent of total fund.
Real Return Targets and Actual Allocation as of June 30, 2013Real Return Subclasses Target ActualGlobal inflation-linked bonds 21.0% 20.1%Global macro/risk parity strategies 66.0 69.6Targeted real return 13.0 10.3 Total 100.0% 100.0%Source: TRS
private equityPrivate equity includes investments that are placed and traded outside of the stock exchanges and other public markets. Over the long term, they are an attractive investment for pension funds, endowments, insurance compa-nies, and other sophisticated investors. The investment class benefits the economy by providing needed capital to start-up companies and for continued growth in privately held companies and firms that are restructuring to better compete. Investing in private equity carries additional risk, but with skillful selection of managers, returns can be significantly higher than public equity investments.
The asset class is commonly referred to as private equity, even though it includes privately placed debt instru-ments as well. Often, the debt includes a control position that is similar to equity because it allows the debt holder to influence the operations and management of the company. TRS is widely diversified across all subsectors within private equity, including buyout, growth equity, venture capital, subordinated debt, and distressed debt.
TRS measures private equity performance against the Russell 3000 stock index plus 300 basis points (3 per-centage points). This benchmark does not specifically compare performance to the private equity industry, but rather to the TRS long-term expectation that private equity produce returns superior to the public markets. For the one-year period ended June 30, 2013, private equity earned 15.2 percent on a net of fee basis, compared to the benchmark gain of 25.1 percent.
In general, an investor must look at a longer-term investment horizon to measure the success of a private equity program. TRS’s investments in private equity maintain a very strong long-term return. One-, three-, five-, and 10-year comparisons to the benchmark are noted in the following table.
FY13 3-Year 5-Year 10-YearTRS, net of fees 15.2% 13.5% 6.9% 11.8%Russell 3000 Index + 3.0% 25.1 22.1 10.5 11.1

Page 73INVESTMENTS
At June 30, 2013, 11.9 percent of the TRS investment portfolio was assigned to the private equity asset class. The FY13 policy target for private equity is 12 percent of the total fund. The following chart lists the private equity partnerships/funds (and the respective assets under management) that TRS has investments with as of June 30, 2013.
Private Equity Partnerships and Assets Under Management (inception date of account)BuyoutAdvent International GPE VI, L.P. (7/08) $71,340,394Advent International GPE VII, L.P. (12/12) 20,400,438Apollo Investment Fund V, L.P. (5/01) 23,284,007Apollo Investment Fund VI, L.P. (5/06) 129,554,292Apollo Investment Fund VII, L.P. (1/08) 235,202,376Apollo Investment Fund VII Annex A (5/12) 34,431,646Banc Fund VI, L.P. (6/02) 30,214,468Banc Fund VII, L.P. (5/05) 33,042,110Baring Asia Private Equity Fund V, L.P. (3/11) 30,809,763Black River Capital Partners Fund (Food), L.P. (8/11) 34,515,223Blackstone Capital Partners VI, L.P. (8/11) 42,093,133Blackstone Capital Partners VI Annex A (10/11) 19,577,724Carlyle Partners IV, L.P. (4/05) 62,853,027Carlyle Partners V, L.P. (7/07) 171,236,878Carlyle Partners VI, L.P. (6/13) 1,466,726Carlyle/Riverstone Global Energy and Power Fund II, L.P. (1/03) 43,151,059Carlyle/Riverstone Global Energy and Power Fund III, L.P. (4/06) 57,317,303
Castle Harlan Partners IV, L.P. (5/03) 10,787,596
Code Hennessy & Simmons V, L.P. (2/05) 16,550,638DLJ Merchant Banking Partners II, L.P. (3/97) 2,061,231DLJ Merchant Banking Partners III, L.P. (9/00) 29,659,919Edgewater Growth Capital Partners, L.P. (11/03) 2,824,942Edgewater Growth Capital Partners II, L.P. (2/06) 13,018,845Edgewater Growth Capital Partners III, L.P. (9/11) 25,839,923EIF United States Power Fund IV, L.P. (11/11) 12,389,192Elevation Partners, L.P. (4/05) 6,880,008Energy Capital Partners I, L.P. (4/06) 29,570,541Energy Capital Partners II-A, L.P. (9/09) 47,763,704Energy Capital Partners II Annex A (10/11) 46,198,431EnerVest Energy Institutional Fund XII-A, L.P. (12/10) 46,301,141EQT VI, L.P. (9/11) 29,016,847Evercore Capital Partners II, L.P. (4/03) 16,568,557GI Partners Fund III, L.P. (1/09) 51,844,360Glencoe Capital Partners III, L.P. (1/04) 12,408,236Glencoe Capital Institutional Partners III, L.P. (6/04) 4,280,487Green Equity Investors V, L.P. (8/07) 82,809,943
(continued)

Page 74 INVESTMENTS
(continued)
Private Equity Partnerships and Assets Under Management(inception date of account)
Green Equity Investors VI, L.P. (11/12) $17,667,626
GTCR Fund VII/VIIA, L.P. (3/00) 212,664GTCR Fund VIII, L.P. (7/03) 12,045,179ICV Partners II, L.P. (1/06) 11,701,954J.C. Flowers II, L.P. (2/07) 14,221,823Littlejohn Fund IV, L.P. (7/10) 62,861,521Madison Dearborn V, L.P. (7/06) 87,571,179Madison Dearborn Partners V Annex A (4/13) 25,780,269MBK Partners Fund II, L.P. (5/09) 28,387,682MBK Partners Fund III, L.P. (4/13) 11,816,552Mesirow Capital Partners VII, L.P. (6/97) 37,069Morgan Creek Partners Asia, L.P. (1/11) 59,534,934NGP Natural Resources X, L.P. (5/12) 40,889,128NGP Natural Resources Annex A (11/12) 21,738,788New Mountain Partners III, L.P. (8/07) 89,189,318Onex Partners III, L.P. (04/09) 42,082,358PAI Europe V, L.P. (4/08) 33,668,564Parthenon Investors IV, L.P. (4/12) 5,350,859Pine Brook Capital Partners, L.P. (1/08) 37,704,458Providence Equity Partners VI, L.P. (3/07) 106,276,517Providence Equity Partners VI Annex A (8/12) 46,983,135Providence Equity Partners VII, L.P. (6/12) 10,814,434Rhone Partners IV, L.P. (1/12) 17,824,112Riverstone/Carlyle Global Energy and Power Fund IV, L.P. (3/08) 77,145,166Riverstone Global Energy and Power Fund V, L.P. (6/12) 90,073,197Silver Lake Partners III, L.P. (8/07) 61,275,498Silver Lake Partners III Annex A (12/11) 59,663,631Siris Partners II, L.P. (1/12) 7,629,461Stone Point Capital Annex A (10/11) 33,693,735Stone Point Capital Trident V, L.P. (12/10) 39,431,307TCW/Latin America Private Equity Partners, L.P. (5/97) 15,667Thayer Equity Investors V, L.P. (5/03) 79,180,361TPG Partners IV, L.P. (12/03) 23,032,884TPG Partners VI, L.P. (4/08) 103,790,485Trilantic Capital Partners III, L.P. (4/05) 3,017,391Trilantic Capital Partners IV, L.P. (10/07) 28,698,151Trustbridge Partners IV, L.P. (12/11) 14,669,702Veritas Capital Fund IV, L.P. (11/10) 56,030,098Veritas Capital Fund IV Annex A (2/11) 10,862,910Vicente Capital Partners Growth Equity Fund, L.P. (4/08) 12,592,876Vista Equity Partners Fund III, L.P. (11/07) 48,307,448Vista Equity Partners Fund IV, L.P. (10/11) 47,312,564
(continued)

Page 75INVESTMENTS
(continued)
Private Equity Partnerships and Assets Under Management(inception date of account)VS&A Communications Partners II, L.P. (8/95) $106,972VSS Communications Partners IV, L.P. (3/05) 28,149,962Warburg Pincus International Partners, L.P. (9/00) 38,278,922Warburg Pincus Private Equity IX, L.P. (9/05) 63,560,237Warburg Pincus Private Equity X, L.P. (10/07) 238,378,300Welsh, Carson, Anderson & Stowe Capital Partners X, L.P. (8/05) 56,731,502Windpoint Partners VI, L.P. (2/06) 18,504,990WPG Corporate Development Associates V, L.P. (11/97) 771,373Venture Capital21st Century Communications T-E Partners, L.P. (2/95) 318,991Apex Investment Fund V, L.P. (8/03) 3,742,311Carlyle U.S. Growth Fund III, L.P. (6/07) 27,558,689Carlyle Venture Partners II, L.P. (10/02) 31,114,152Evergreen Partners IV, L.P. (12/02) 16,476,222Evergreen Partners V, L.P. (6/07) 13,090,281Granite Ventures II, L.P. (5/05) 16,112,544HealthpointCapital Partners, L.P. (6/04) 19,796,713Hopewell Ventures, L.P. (6/04) 2,534,107Illinois Emerging Technologies Fund, L.P. (6/04) 1,211,476JMI Equity Fund VII, L.P. (2/11) 13,040,220Lightspeed Venture Partners IX, L.P. (3/12) 12,936,345LiveOak Venture Partners I, L.P. (2/13) 388,924Longitude Venture Partners, L.P. (3/08) 27,009,713Longitude Venture Partners II, L.P. (4/13) 1,072,625Morgan Creek Partners Venture Access Fund, L.P. (1/12) 32,404,411SCP Private Equity Partners, L.P. (5/97) 66,219SCP Private Equity Partners II, L.P. (6/00) 39,742,847Shasta Ventures, L.P. (1/05) 24,192,109Sofinnova Venture Partners VIII, L.P. (8/11) 8,166,565Starvest Partners, L.P. (1/09) 8,612,730Technology Crossover Ventures VII, L.P. (10/08) 33,986,996VantagePoint Venture Partners IV, L.P. (6/00) 32,966,129VantagePoint Venture Partners 2006 (Q), L.P. (12/06) 38,575,578WPG Enterprise Fund II, L.P. (8/94) 1,794,370WPG Enterprise Fund III, L.P. (3/97) 2,913,311Special SituationsAvenue Europe Special Situations Fund, L.P. (5/08) 884,095Avenue Special Situations Fund V, L.P. (10/07) 2,814,218Blackstone/GSO Capital Solutions Fund, L.P. (9/09) 139,731,080Carlyle Strategic Partners, L.P. (10/04) 1,360,167Clearlake Capital Partners II, L.P. (7/09) 22,595,420Clearlake Capital Partners III, L.P. (10/12) 10,863,081
(continued)

Page 76 INVESTMENTS
(continued)
Private Equity Partnerships and Assets Under Management(inception date of account)Maranon Mezzanine Fund, L.P. (8/09) $24,745,122MatlinPatterson Global Opportunities Partners II, L.P. (1/04) 2,404,051MatlinPatterson Global Opportunities Partners III, L.P. (6/07) 67,577,498MP II Preferred Partners (3/09) 6,209,096Merit Mezzanine Fund IV, L.P. (1/05) 29,033,232Oaktree Annex A (11/10) 39,385,426Oaktree Opportunities Fund VIII, L.P. (3/10) 100,161,595Oaktree Opportunities Fund VIIIb, L.P. (8/11) 49,489,958OCM Opportunities Fund V, L.P. (6/04) 2,906,319OCM Opportunities Fund VIIb, L.P. (6/08) 28,988,670Oaktree Opportunities Fund IX, L.P. (3/13) 9,863,009Oaktree Opportunities Fund IX Annex A (3/13) 6,995,981OCM European Principal Opportunities Fund II, L.P. (8/08) 56,357,929Oaktree European Principal Fund III, L.P. (11/11) 27,875,564Oaktree Real Estate Opportunities Fund VI, L.P. (6/13) 51,763,223Prism Mezzanine Fund, L.P. (12/04) 6,584,188SW Pelham Fund II, L.P. (9/03) 73,300Welsh, Carson, Anderson & Stowe Capital Partners IV, L.P. (2/05) 33,149,517William Blair Mezzanine Capital Fund II, L.P. (5/97) 92,244William Blair Mezzanine Capital Fund III, L.P. (1/00) 2,888,231
Discussion of Private EquityTRS’s private equity portfolio earned 15.2 percent, net of fees, during the fiscal year. While under its one-year benchmark, private equity has outperformed on a long-term basis. The long-term performance strength of the private equity program and the asset class’s diversification both benefit the overall portfolio. TRS continues to prudently increase its exposure to private equity. In April 2011, the Board of Trustees adopted a new asset allocation study that increased the private equity allocation target to 12 percent. Successful implementation of this target is subject to many factors, including public market performance and sufficient availability of high quality private equity opportunities in the market.
The following chart provides exposure percentage by investment type including breakdown of TRS’s targeted style allocation as compared to the actual allocation at June 30, 2013.
Private Equity Target and Actual Allocation as of June 30, 2013Investment Type Target ActualBuyout 60-80% 76.0% Venture capital 5-20 9.0Special situations/distressed debt/subordinated debt 10-25 15.0Total 100.0%
North America NA 67.0%International NA 33.0Total 100.0%Source: TorreyCove Capital Partners LLC

Page 77INVESTMENTS
TRS made new commitments to eight separate private equity funds totaling nearly $850 million and four co-investments totaling $110 million during the fiscal year. Included in this total were funds designed to broaden the program’s geographic diversification in Europe and Asia and specifically target growth opportunities within the technology sector. TRS remains opportunistic with its private equity investment approach and received Board approval to establish a private equity secondary market program which will allow acquisition and divestment of private equity funds in the secondary market.
absolute returnThe absolute return asset class includes mandates designed to provide attractive return and risk attributes while exhibiting low correlation to traditional public equity and fixed income investments. The absolute return class was established as a result of an asset allocation study adopted in FY07.
The fiscal year policy target for absolute return is 8.0 percent of the overall TRS investment portfolio. The asset class is measured against a relative risk-free index of 90-Day Treasury Bills + 4.0 percent. While this is not an investible index, the benchmark represents the intended risk reduction characteristic of the asset class.
For the year ended June 30, 2013, TRS’s absolute return investment asset class earned 10.5 percent, net of fees, compared to the 4.1 percent return of the benchmark.
FY13 3-Year 5-YearTRS, net of fees 10.5% 8.4% 3.8%Treasury Bill + 4% 4.1 4.1 4.3
Investments in absolute return are administered via both direct investment manager relationships and diversified fund of funds. At June 30, 2013, 5.3 percent of TRS’s investment portfolio was assigned to absolute return managers and TRS employed the following managers including their respective assets under management.
Absolute Return Managers and Assets Under Management (inception date of account)Diversified FundsBridgewater Pure Alpha Fund I (1/09) $302,312,412 Diversified Fund of FundsGrosvenor Monarch Fund, L.L.C. (6/07) 446,097,128 K2 Bluegill Fund, L.L.C. (6/07) 525,144,129Direct Investment FundsGrosvenor Monarch Fund, L.L.C. (Monarch Series B) (3/11) 425,649,720 K2 Bluegill Fund, L.L.C. (Bluegill Series B) (3/11) 409,850,454Emerging ManagerLasair Capital L.L.C. (8/09) 1,192,160
The following chart provides a further breakdown of TRS’s targeted style allocation as compared to the actual allocation at June 30, 2013. The absolute return portfolio has continued to reduce exposure to fund of funds and implement direct fund investments through fiscal year end.

Page 78 INVESTMENTS
Absolute Return Target and Actual Allocation as of June 30, 2013Subclasses Target Range ActualFund of Funds 50.0% +/- 15% 46.1%Equity Focus 10.0 +/- 10% 2.4Credit Focus 20.0 +/- 10% 21.5Event/Macro/Other 20.0 +/- 10% 30.0Total 100.0% 100.0%Source: TRS
Discussion of Absolute ReturnThe absolute return investment portfolio performed well for the fiscal year, outperforming the non-investable benchmark by more than 6 percent. The three-year outperformance versus the benchmark continues to be strong, and the program narrowed the gap on the five-year performance metric. A core component of returns over the fiscal year was investment in credit strategies that rewarded expertise in complexity and structuring. These investments overcame the drag on performance from hedging downside risks. Consistent with the long term plan, staff continues to reduce the allocation to fund of funds in order to lower total fees paid, while maintaining relatively low risk – compared with equities – and a stable return profile.
real estateReal estate investments are direct investments or ownership in land and buildings including apartments, offices, warehouses, shopping centers, and hotels. TRS also holds partnership interests in entities that purchase and man-age property and pass rent and sale income back to TRS. Investment in real estate is intended to increase the TRS total portfolio long-term rate of return and reduce year-to-year volatility.
The real estate asset class offers competitive returns, provides diversification benefits to portfolios of stocks and bonds, and also serves as a hedge against inflation. Additionally, real estate offers a strong income component to pay TRS benefits.
As of June 30, 2013, TRS held $4.7 billion in real estate assets, or 12.0 percent of the total fund portfolio. For the fiscal year, TRS’s real estate investments earned 12.6 percent, net of fees. Real estate performance and benchmark comparisons are noted in the following table.
FY13 3-Year 5-Year 10-YearTRS, net of fees 12.6% 13.4% (0.7%) 7.4%NCREIF Property Index 10.7 13.1 2.8 8.6
To enhance returns and reduce risk, TRS acquires high quality properties diversified geographically and by property type. TRS’s real estate holdings by type and geography are exhibited in the following charts.

Page 79INVESTMENTS
Real Estate Holdings by Type Geographic Diversification of as of June 30, 2013 Real Estate Holdings as of
June 30, 2013
Other2.7%
Office30.4%
Industrial7.9%
Hotel4.6%
Apartment25.9%
Retail28.5%
West33.1%
South26.9%
Other4.2%
East22.8%
Midwest13.0%
Source: Callan Associates Inc.
Professional real estate advisors manage real estate owned by TRS. Separate account managers administer TRS’s direct investments in real estate assets. Closed-end and open-end accounts represent partnership interests in real estate funds including TRS’s international real estate accounts. As of June 30, 2013, TRS employed the following managers including their respective assets under management.
Real Estate Managers and Assets Under Management (inception date of account)Separate AccountsCapri/Capital Advisors, L.L.C. (12/91) $724,698,010Cornerstone Real Estate Advisors, L.L.C. (7/08) 306,638,734Cornerstone II S/A (7/09) 12,217,500Cornerstone III S/A (8/09) 55,551,405Heitman Capital Management, L.L.C. (7/09) 1,082,262,054Invesco Institutional (N.A.), Inc. (7/08) 483,753,134LPC Realty Advisors I, Ltd. (7/92) 670,030,836LPC Realty Advisors Core, Ltd. (4/07) 103,769,648Closed-End AccountsBeacon Capital Strategic Partners V, L.P. (8/07) 35,433,488Blackstone Real Estate Partners VI, L.P. (9/07) 62,221,733Blackstone Real Estate Partners VII, L.P. (1/12) 119,166,089Capri Capital Advisors Apartment Fund III, L.P. (11/02) 126,831,888Capri Select Income Fund II, L.L.C. (12/05) 3,730,290Carlyle Realty Partners IV, L.P. (6/05) 54,702,551Cornerstone Hotel Income & Equity Fund II, L.P. (7/08) 41,890,244JBC Opportunity Fund II, L.P. (5/03) 1,552,310JER Real Estate Qualified Partners III, L.P. (1/05) 22,958,008Southwest Multifamily Partners, L.P. (8/12) 3,316,180Starwood Distressed Opportunity Fund IX, L.P. (3/13) 36,930,427Thayer Hotel Investors IV, L.P. (5/04) 7,452,112Walton Street Real Estate Fund IV, L.P. (7/03) 45,837,687
(continued)

Page 80 INVESTMENTS
(continued)
Real Estate Managers and Assets Under Management (inception date of account)Walton Street Real Estate Fund VI, L.P. (4/09) $86,235,537Walton Street Real Estate Fund VII, L.P. (6/13) 9,843,152Open-End Accounts
Hines U.S. Core Office Fund, L.P. (12/05) 182,760,503Lion Industrial Trust (4/05) 199,604,134International Real Estate AccountsCarlyle Europe Real Estate Partners III, L.P. (9/07) 52,510,049CB Richard Ellis Strategic Partners Europe Fund III, L.P. (4/07) 25,039,650CB Richard Ellis Strategic Partners UK Fund III, L.P. (5/07) 9,483,928LaSalle Asia Opportunity Fund III, L.P. (11/07) 32,762,322MGPA Asia Fund III, L.P. (12/07) 71,919,178Niam Nordic V, L.P. (4/12) 9,387,456Real Estate Investment TrustCornerstone Real Estate Advisors, L.L.C. (9/11) 57,203,655
Discussion of Real EstateTRS’s real estate portfolio earned 12.6 percent during the fiscal year, outpacing the National Council of Real Estate Investment Fiduciaries (“NCREIF”) Index by 190 basis points. TRS’s portfolio outperformed the NCREIF Index by 30 basis points for three years, while lagging 350 basis points and 120 basis points for the respective five- and 10- year periods. The commercial real estate market has continued to experience a recovery in asset prices, transactions, and capital availability. Asset prices are nearing 2007 peak levels in the major metropolitan markets and transac-tion activity has increased in secondary markets. TRS’s managers maintain their focus on upgrading the portfolio through selective acquisitions of desirable assets while selling assets that are not considered long-term strategic holds. The TRS investment portfolio maintains a long-term target allocation of 14.0 percent to real estate.
securities lendingAs of June 30, 2013, Citibank, N.A. was the lending agent for the TRS securities lending program including fixed income, domestic equities and international equities. TRS transitioned the lending program to Citibank, N.A. from the master trustee, State Street Bank and Trust Company, during the fiscal year. The Board of Trustees’ policies permit TRS to use investments to enter into securities lending transactions, which are loans of securities to broker-dealers or other entities. Additional information regarding securities lending activity is included in the Notes to Financial Statements under “D. Investments.”
For the year ended June 30, 2013, TRS earned net income of $13.9 million through its securities lending program. The decrease from prior year was driven primarily by a weaker securities lending market. The global equity rally, combined with the uncertainty of regulatory changes, resulted in the market producing fewer short posi-tions required to be covered by broker/dealers. The securities lending market experienced significant spread compression, or decrease in lending fees, creating a reduction in hard to borrow “specials” resulting in lower return to lendable. The TRS lending agent transition during the fiscal year also contributed to lower income levels as State Street Bank and Trust Company recalled all securities on loan in January 2013 while Citibank, N.A. started gradually putting out loans during the months of February 2013 and March 2013.
The Securities Lending Summary table outlines the net income from securities lending activity, the securities on loan, the amount of collateral for these securities, and the average utilization rate information.

Page 81INVESTMENTS
Securities Lending SummaryFY13 FY12
Net securities lending income $13,896,564 $19,617,303Values as of fiscal year-end (June 30):Total fair value of collateral 1,836,179,323 2,760,697,851Total fair value of securities on loan 1,781,796,752 2,682,477,139Total collateralized percentage 103% 103%
Fiscal year 12 month averages:Average lendable $18,353,448,742 $17,370,240,196Average on loan 1,937,213,348 2,852,601,356Average utilization 10.6% 16.4%
Source: State Street Bank and Trust and Citibank, N.A. Note: Securities lending collateral reflected on the Statements of Net Position reflects the securities purchased with cash collateral.
brokerage activityThe following table shows the top 50 listed brokers used by TRS external equity managers for the years ended June 30, 2013 and June 30, 2012. TRS also manages a commission recapture program as part of its trading strategies. For the year ended June 30, 2013, TRS recaptured $0.4 million in cash that was reinvested in the fund. In addition, TRS uses a portion of these commission recapture refunds to pay for Investment Department expenses. During fiscal year 2013, TRS used $0.2 million of recaptured funds to offset expenses.
Top 50 Brokers Used by TRS Managers
BrokerFY13
CommissionFY12
CommissionMerrill Lynch & Co., Inc. and all Subsidiaries (Worldwide) $1,667,540 $1,461,814Citigroup, Inc. and all Subsidiaries (Worldwide) 1,503,975 622,384 J.P. Morgan Securities, Inc. (Worldwide) 1,132,338 1,245,559 State Street Brokerage Services (Worldwide) 1,003,250 754,647 Credit Suisse (Worldwide) 901,362 710,279 Goldman Sachs & Co. (Worldwide) 651,135 827,365 Morgan Stanley & Co., Inc. and Subsidiaries (Worldwide) 609,961 526,303 UBS Warburg Securities and all Subsidiaries (Worldwide) 558,236 858,265 Deutsche Bank & Securities (Worldwide) 524,919 510,806 Macquarie Bank & Securities, Ltd. (Worldwide) 437,567 317,683 Barclays (Worldwide) 327,618 472,478 Cabrera Capital Markets, Inc. 323,754 264,639 G-Trade Services, L.L.C. 303,345 212,269 Loop Capital Markets, L.L.C. 242,361 342,758 Sanford Bernstein (Worldwide) 205,938 139,774 Instinet, L.L.C. (Worldwide) 184,332 174,106 Liquidnet, Inc. 169,479 216,491 Bank of New York Mellon (Worldwide) 162,915 451,521 Investment Technology Group, Inc. (Worldwide) 160,406 197,845 HSBC (Worldwide) 152,985 54,624 Jefferies & Company 152,709 158,038 Island Trader Securities, Inc. 151,620 58,429 Stifel Nicolaus & Company (Worldwide) 151,313 193,218 Williams Capital Group, L.P. 151,302 289,671 Credit Lyonnais Securities (Worldwide) 148,168 121,162
(continued)

Page 82 INVESTMENTS
(continued)
BrokerFY13
CommissionFY12
CommissionCantor Fitzgerald $140,757 $191,300 CL King & Associates, Inc. 125,766 69,953 Raymond James (Worldwide) 123,006 135,532 Mischler Financial Group 122,008 78,283 RBC Dain Rauscher (Worldwide) 121,418 175,018 Guzman & Company 113,953 62,632 Baird, Robert W., & Company, Incorporated 107,594 153,853 Bloomberg Tradebook, L.L.C. 106,299 150,523 M. Ramsey King Securities 96,293 203,661 CLSA Securities 94,095 112,332 Kim Eng Securities 91,769 34,252 Nomura International (Worldwide) 89,141 210,213 Abel Noser Corporation (Worldwide) 83,050 50,624 SG Cowen & Company (Worldwide) 80,980 108,772 Piper Jaffray, Inc. 78,331 73,844 ISI Group Inc. 74,165 81,405 Credit Agricole 72,699 150,187 Citation Group 72,696 62,472 Weeden & Co. 66,418 83,885 S.J. Levinson & Sons, L.L.C. 65,984 7,637 Exane, Inc. 62,045 63,116 Jones Trading Institutional Services, L.L.C. 61,554 5,269 Suntrust Capital Markets, Inc. 61,427 41,121 Cheevers & Co., Inc. 60,532 151,246 Keybanc Capital Markets 57,380 79,566 All Others - (251 Brokers in FY13, 249 Brokers in FY12) 2,300,005 2,766,002 Total $16,507,893 $16,484,826 Source: State Street Bank and Trust and TRS
external manager fee paymentsFor the year ended June 30, 2013, fee payments to external investment managers totaled $236.8 million, com-pared to $199.5 million from the year ended June 30, 2012. The rise is attributable to the asset class mix within the portfolio that continues to shift toward long-term asset allocation targets.
Schedule of Investment Manager FeesInvestment Manager/Account FY13 FY12Aberdeen Asset Management, Inc. $7,664,054 $8,230,664 Advent International GPE VI, L.P. 664,588 946,167Advent International GPE VII-C, L.P. 1,352,232 -American Century Global Investment Management, Inc. 1,803,774 1,538,686Apex Investment Fund V, L.P. - 4,683Apollo Investment Fund VII, L.P. 2,249,774 2,757,225AQR Capital Management, L.L.C. 3,572,014 3,623,173AQR Real Return Offshore Fund, L.P. 2,254,465 94,126
(continued)

Page 83INVESTMENTS
(continued)Investment Manager/Account FY13 FY12AQR Risk Balanced Reinsurance Fund LTD. $181,383 $ -Ativo Capital Management 40,390 -Avenue Europe Special Situations Fund, L.P. - 161,194Avenue Special Situations Fund V, L.P. - -Banc Fund VI, L.P. 375,000 750,937Banc Fund VII, L.P. 901,200 901,200Baring Asia Private Equity Fund V 1,600,000 1,600,000Beacon Capital Strategic Partners V, L.P. 357,863 239,798Black River Agriculture Fund 2, L.P. 159,349 -Black River Asset Management L.L.C. 1,123,450 2,140,591Blackstone Capital Partners VI, L.P. 1,444,149 1,411,180Blackstone Real Estate Partners VI, L.P. 611,324 657,245Blackstone Real Estate Partners VII, L.P. 2,977,772 2,521,699Blackstone/GSO Capital Solutions Fund, L.P. 1,858,849 525,869Boston Company Asset Management, L.L.C. 2,238,982 2,981,459Brandes Investment Partners, L.P. 683,913 2,613,890Bridgewater All Weather Portfolio Offshore Limited 2,275,516 2,325,150Bridgewater Pure Alpha Fund I 8,842,252 10,487,996Capri Capital Advisors Apartment Fund III, L.P. 1,486,453 1,496,984Capri Select Income II, L.L.C. 14,360 11,483Capri/Capital Advisors, L.L.C. 2,616,952 2,822,115Carlyle Europe Real Estate Partners III, L.P. 818,394 716,692Carlyle Europe Real Estate Partners, L.P. - 85,387Carlyle Partners IV, L.P. 300,376 284,421Carlyle Partners V, L.P. 2,129,213 1,531,938Carlyle Partners VI, L.P. 254,795 -Carlyle Realty Partners IV, L.P. 890,346 890,346Carlyle Strategic Partners, L.P. - -Carlyle U.S. Growth Fund III, L.P. 533,698 694,399Carlyle Ventures Capital II, L.P. 158,958 738,593Carlyle/Riverstone Global Energy Fund II, L.P. 543,011 438,345Carlyle/Riverstone Global Energy Fund III, L.P. 491,480 581,214CB Richard Ellis Strategic Partners Europe Fund III, L.P. 384,709 402,461CB Richard Ellis Strategic Partners UK Fund III, L.P. 233,939 330,680Channing Capital Management, L.L.C. 252,044 124,200Clearlake Capital Partners II, L.P. 276,065 425,457Clearlake Capital Partners III, L.P. 448,294 -Code Hennessy & Simmons V, L.P. - 15,827Cornerstone Hotel Income & Equity Fund II, L.P. 435,035 299,725Cornerstone Real Estate Advisors, L.L.C. 1,828,404 1,443,717Cortina Asset Management, L.L.C. 522,504 26,104Cramer Rosenthal McGlynn, L.L.C. 1,287,375 1,038,359Credo Capital Management, L.L.C. 30,263 210,428Denali Advisors, L.L.C. 54,354 583,912Dimensional Fund Advisors, L.P. 2,751,256 1,930,026
(continued)

Page 84 INVESTMENTS
(continued)Investment Manager/Account FY13 FY12DLJ Merchant Banking Partners III, L.P. $87,975 $170,843Dolan McEniry Capital Management, L.L.C. 737,944 735,140EARNEST Partners, L.L.C. - 190,915Edgewater Growth Capital Partners II, L.P. 148,612 262,442Edgewater Growth Capital Partners III, L.P. 232,990 988,656Edgewater Growth Capital Partners, L.P. - 133,682EIF United States Power Fund IV, L.P. 3,670,995 -Elevation Partners, L.P. 87,400 112,596Emerald Advisers, Inc. 1,514,434 1,262,112Energy Capital Partners Fund II-A, L.P. 491,969 360,439Energy Capital Partners I, L.P. 430,822 321,407Energy Capital Partners II, L.P. 32,298 23,485Enervest Energy Institutional Fund XII-A, L.P. 848,935 1,000,000EQT VI 1,284,021 1,349,692Evercore Capital Partners II, L.P. 26,563 136,659Evergreen Partners IV, L.P. 124,254 199,790Evergreen Partners V, L.P. 560,754 591,742Fiduciary Management Associates, L.L.C. 1,055,856 1,047,809Flintlock Commodity Opportunities Master Fund, L.P. 79,084 170,025Franklin Advisers, Inc. 2,284,426 2,086,454Franklin Templeton Investment Management Limited 1,797,702 1,695,398Fred Alger Management, Inc. - 548,311Frontier Capital Management, L.L.C. 1,363,351 1,068,216Garcia Hamilton & Associates, L.P. 67,879 69,353GI Partners 556,204 718,370Glencoe Capital Partners III, L.P. 68,436 14,077Goldman Sachs Asset Management, L.P. - 108,998Granite Ventures II, L.P. 258,926 276,839Grantham, Mayo, Van Otterloo & Co., L.L.C. 5,063,946 5,777,304Green Equity Investors V, L.P. 603,271 -Green Equity Investors VI, L.P. 759,854 -Gresham Investment Management Company, L.L.C. - 426,490Grosvenor Monarch Fund, L.L.C. 3,121,806 2,913,621Grosvenor Monarch Fund, L.L.C. (Monarch Series B) 14,245,203 2,353,059GTCR Fund VII/VIIA, L.P. - 29,467GTCR Fund VIII, L.P. 174,642 337,426Hartford Investment Management Company 281,524 324,245HealthPoint Partners, L.P. 350,000 908,982Heitman Capital Management, L.L.C. 4,643,818 4,440,952Herndon Capital Management, L.L.C. 335,181 158,319Hines U.S. Core Office Fund, L.P. 850,000 850,000Hispania Private Equity, L.P. - 114,302Hopewell Ventures, L.P. 306,723 313,200ICV Partners II, L.P. - 119,016Illinois Emerging Technologies Fund, L.P. 12,910 12,623
(continued)

Page 85INVESTMENTS
(continued)Investment Manager/Account FY13 FY12Invesco Institutional (N.A.), Inc. $1,810,286 $1,550,884J.C. Flowers II, L.P. 283,487 311,745Jarislowsky, Fraser Limited 866,835 809,278JBC Opportunity Fund II, L.P. - 70,289JER Real Estate Qualified Partners III, L.P. 134,341 187,843JMI Equity Fund VII, L.P. 393,765 387,718JP Morgan Investment Management, Inc. 138,855 35,213JP Morgan Management Associates, L.L.C. 3,338,325 3,862,176K2 Bluegill Fund, L.L.C. 4,317,724 4,487,033K2 Bluegill Fund, L.L.C. (Bluegill Series B) 9,979,215 3,351,698KKR 1996 Fund, L.P. - 2,015Koll Bren Schreiber Realty Advisors 366,842 1,147,736Lasair Capital L.L.C. 90,708 274,520LaSalle Asia Opportunity Fund III, L.P. 512,088 536,202Levin Capital Strategies, L.P. 922,468 926,360Lightspeed Venture Partners IX, L.P. 654,044 311,174Lion Industrial Trust 1,876,089 1,729,904Littlejohn Fund IV, L.P. 922,053 718,668LiveOak Venture Partners I, L.P. 168,750 -LM Capital Group, L.L.C. 120,656 74,398Lombardia Capital Partners, L.L.C. 1,468,703 1,370,040Longitude Ventures Partners, L.P. 714,088 562,500Loomis, Sayles & Company, L.P. 3,657,116 3,793,642LPC Realty Advisors I, Ltd. 3,288,982 2,189,086LSV Asset Management 2,120,802 1,335,057MacKay Shields, L.L.C. 2,283,554 1,197,756Madison Dearborn V, L.P. 462,773 520,136Manulife Asset Management, L.L.C. 935,050 742,134Maranon Credit Fund II-B, L.P. 671 -Maranon Mezzanine Fund, L.P. 260,233 326,112MatlinPatterson Global Opportunities Fund III, L.P. 764,472 1,244,890MBK Partners Fund II, L.P. 253,473 439,646MBK Partners Fund III, L.P. 590,355 -McKinley Capital Management, Inc. 2,002,555 3,058,545Merit Mezzanine Fund IV, L.P. 368,984 365,555MFS Institutional Advisors, Inc. 948,742 808,955MGPA Asia Fund III. L.P. 704,499 640,360Mondrian Investment Partners Limited 3,763,992 978,428Morgan Creek Partners Asia, L.P. 863,555 686,917Morgan Creek Partners Venture Access Fund, L.P. 1,000,000 534,247New Century Advisors, L.L.C. 451,026 470,835New Mountain Investments III, L.P. 1,051,686 1,139,078NGP Natural Resources X, L.P. 1,427,118 684,426Niam Nordic V, L.P. 389,385 548,997Northern Trust Investments, N.A. 548,089 453,702
(continued)

Page 86 INVESTMENTS
(continued)Investment Manager/Account FY13 FY12OakBrook Investments, L.L.C. $401,513 $177,090Oaktree Enhanced Income Fund, L.P. 752,572 -Oaktree Opportunities Fund VIIIb, L.P. 728,584 625,537Oaktree PPIP Private Fund, L.P. 203,878 186,309Oaktree Real Estate Opportunities Fund VI, L.P. 877,378 -OCM European Principal Fund III, L.P. 679,431 732,857OCM European Principal Opportunities Fund II, L.P. 801,528 1,063,202OCM Opportunities Fund V, L.P. 73,711 103,624OCM Opportunities Fund VIIb, L.P. 725,769 1,125,035OCM Opportunities Fund VIII, L.P. 1,314,106 1,314,105OCM Opportunities Fund IX 31,835 -Onex Partners III, L.P. 827,995 856,986Pacific Investment Management Company, L.L.C. 8,045,956 5,572,649PAI Europe V, L.P. 470,533 408,913Parthenon Investors IV, L.P. 674,026 350,000PIMCO BRAVO Fund, L.P. 960,140 431,981PIMCO BRAVO Fund II, L.P. 36,490 -PIMCO Distressed Senior Credit Opportunities Fund II, L.P. 9,290,231 561,686Pine Brook Capital Partners, L.P. 924,631 851,546Prism Mezzanine Fund, L.P. 350,256 449,953Providence Equity Partners VI, L.P. 698,071 770,297Providence Equity Partners VII, L.P. 1,030,231 -Prudential Investment Management, Inc. 796,962 885,600Putnam Advisory Company, L.L.C. 381,959 1,240,873Rhone Partners IV, L.P. 998,743 666,498RhumbLine Advisers, L.P. 175,886 180,200Riverstone/Carlyle Global Energy and Power Fund IV, L.P. (55,948) 1,372,759Riverstone/Carlyle Global Energy and Power Fund V, L.P. 2,589,667 1,375,000Robeco Boston Partners Asset Management, L.P. 1,191,546 1,003,509Schroder Commodity Offshore Portfolio, L.L.P. - 1,798,007SCP Private Equity Partners II, L.P. 418,920 527,282Shasta Ventures, L.P. 468,750 531,250Silver Lake Partners III, L.P. 964,639 927,799Siris Partners II, L.P. (139,770) 411,397Sky Investment Council 63,707 -Sofinnova Ventures Partners VIII, L.P. 902,041 926,706Southwest Multifamily Partners, L.P. 312,500 19,746Standard Life Investment Global Absolute Return Strategies Master Fund Ltd. 3,747,270 163,015StarVest Partners, L.P. 275,000 300,000Starwood Distressed Opportunity Fund IX Global, L.P. 1,972,541 -State Street Bank and Trust Company (Custody) 908,333 200,000Stone Point Capital Trident V, L.P. 1,125,000 1,042,116Strategic Global Advisors 254,254 149,556SW Pelham Fund II, L.P. 3,939 27,434T. Rowe Price Associates, Inc. 3,910,190 3,639,067
(continued)

Page 87INVESTMENTS
(continued)Investment Manager/Account FY13 FY12Taplin, Canida & Habacht $192,380 $260,809Technology Crossover Ventures VII, L.P. 779,671 702,195Thayer Equity Investors V, L.P. 122,478 268,156Thayer Hotel Investors IV, L.P. 167,108 121,073TPG Partners VI, L.P. 1,197,912 1,128,853Trilantic Capital Partners III, L.P. 89,924 107,650Trilantic Capital Partners IV, L.P. 242,002 571,080Trilogy Global Advisors, L.L.C. 1,141,056 1,236,606Trustbridge Partners IV, L.P. 600,000 695,342Turner Investment, L.P. 340,223 1,535,764VantagePoint Venture Partners 2006, L.P. 1,036,561 1,166,194Veritas Capital Fund IV, L.P. 429,574 1,146,154Vicente Capital Partners Growth Equity Fund, L.P. 229,393 276,573Vista Equity Partners Fund IV, L.P. 1,173,081 1,357,451Vista Equity Partners III, L.P. 339,658 462,644VSS Communications Partners IV, L.P. 327,059 363,997Walton Street Real Estate Fund IV, L.P. 626,937 626,007Walton Street Real Estate Fund VI, L.P. 1,222,345 1,092,935Walton Street Real Estate Fund VII, L.P. 13,027 -Warburg Pincus International Partners, L.P. 250,592 289,682Warburg Pincus Private Equity IX, L.P. 540,502 690,163Warburg Pincus Private Equity X, L.P. 3,706,612 3,722,750Wellington Management Company - Diversified Inflation Hedges Portfolio, L.L.C. - 3,897,718
Wellington Management Company, L.P. - 647,357Welsh, Carson, Anderson & Stowe Capital Partners IV, L.P. 379,975 398,634Welsh, Carson, Anderson & Stowe Capital Partners X, L.P. 170,286 221,212Westwood Management Corp 500,141 40,546William Blair Mezzanine Capital Fund III, L.P. - 71,470WPG Corporate Development Associates V, L.P. 6,119 7,628WPG Enterprise Fund II, L.P. 9,542 21,372WPG Enterprise Fund III, L.P. 37,505 133,647Total Fees Paid by TRS $236,788,370 $199,455,345
Note: This schedule captures investment manager fees applicable to the fiscal year(s) reported and differs from investment fees reported within the Financial Section.

0
5,000
June 2003 June 2013 increase
8,763
26,525
17,762
10,000
15,000
20,000
25,000
30,000
Visitors IncreaseIn the month of June 2003, our website had 8,763 visits. All visitors used desktops. In June 2013, TRS's website had 26,525 visitors. Of those visi-tors, 21,498 were on desktops, 2,779 were on tablets, and 2,248 were on mobile devices. This was before our website was mobile accessible.
Member Account Access Use IncreasesAs of June 30, 2009, 73,088 members were signed up for Member Account Access. As of June 30, 2013, 109,611 members were signed up. This is an increase of 36,523 accounts.
Benefits Report Cost DecreasesIn 2009, it cost $129,899 to print and mail your Benefits Report. TRS began emailing Benefits Reports in 2012, but half of the reports were still printed. In calendar year 2013, the Benefits Report became fully elec-tronic and the cost of printing and mailing was $0, for a total saving of $190,000 from 2012 through 2013.
TRS Website Use
(200,000)
(150,000)
$190,000
(100,000)
(50,000)
0 2009 2013 2013increase
Email Notifications Print/Mail Costs
2009
$0Total Saved2009-2013
50,000
73,088
36,512
100,000
150,000109,611
$129,899
Member Account Access Benefits Report Print/Mail Costs

Retirem
ent S
ecurity for Illinois Educators
Actuarial

Page 90 ACTUARIAL

Page 91ACTUARIAL

P a g e 9 2 ACTUARIAL
Actuaries estimate the cost of benefits members and survivors will receive over their lifetimes and calculate the amount that should be set aside each year to fund them.
TRS complies with the requirements issued by the Governmental Accounting Standards Board (GASB) under Statement No. 25, Financial Reporting for Defined Benefit Pension Plans and Note Disclosures for Defined Contribution Plans, as amended by GASB Statement No. 50.
actuarial assumptions and methodsEach year the actuary reconciles the differences between major actuarial assumptions and experience to explain the change in TRS’s unfunded liability. The unfunded liability is the difference between the accrued liability (the present value of benefits including the cost of annual increases) and the assets that are available to cover the liability. Many of the following assumptions were revised in the 2012 actuarial experience analysis. All assump-tions were adopted in the FY12 valuation unless otherwise noted.
Investment return: 8.0 percent per annum, compounded annually. Components: inflation 3.25 percent and real return 4.75 percent.
Salary Increases: Total averages 6.0 percent per year and includes:
• inflation: 3.25 percent,
• real wage growth (productivity): 0.75 percent, and
• merit or seniority (including employment status changes of 0.25 percent): average of 2.00 percent; ranges from 6.15 percent at age 20 to 1.00 percent at age 50 and above.
Assumed increase on payroll and account balances to account for one-year data lag for reporting to actu-ary: 4.0 percent.
Sample annual percentage salary increases (including all components of increase):
Age
Male and Female20 10.15%30 7.4540 6.25
50 and above
5.00
Inflation: 3.25 percent per annum. Implicit in investment and earnings progression assumptions.
Retirement age: Graduated rates based on age and service of active members.
Sample annual retirement rates per 100 par ticipants:
a) For those entering service before January 1, 2011 (includes ERO retirees):
Years of ServiceAge 5-18 19-30 31 32-33 34+54 - 6 12 38 4055 - 10 20 38 4060 14 27 45 45 3165 23 33 45 45 3170 100 100 100 100 100
(continued)

P a g e 9 3ACTUARIAL
(Retirement age continued)
b) Tier II, for those entering service on or after January 1, 2011:
Years of ServiceAge 9-18 19-30 31 32-33 34+
62 13 15 20 25 2565 8 10 15 20 2067 20 40 70 70 7070 100 100 100 100 100
Utilization of ERO among Tier I members retiring from active service:
Years of Service on June 30 prior
to Retirement
Age
54 55 56 57 58 5919 – 30 68% 75% 66% 63% 64% 23%
31 90 79 75 71 69 2732 49 53 45 48 46 2833 22 25 17 15 14 13
Mortality: For active members, the RP-2000 White Collar Table projected nine years using scale AA, with a two-year age setback for men and three-year age setback for women. Rates for women are further adjusted, multiplying all rates by 70 percent. The sample rates reflect values as of July 1, 2012:
Age Male Female25 0.029 0.01130 0.035 0.01340 0.061 0.03150 0.122 0.06955 0.183 0.11660 0.303 0.21965 0.531 0.395
For retirees and inactive members, the RP-2000 White Collar Table projected nine years using scale AA, with a two-year age setback for men and no age setback for women. Rates for women are further adjusted for ages 63-77 by 65 percent and ages 78-87 by 85 percent.
For beneficiaries, the RP-2000 blended table, projected nine years using scale AA, with a one-year age set-back for both men and women.
For the period after disability retirement, the RP-2000 Disabled Table, projected nine years using scale AA, with a one-year age setback for both men and women.
Disability: Sample annual disability rates:
Age Male Female25 0.029 0.04530 0.026 0.117 40 0.051 0.16250 0.094 0.17255 0.111 0.197 60 0.170 0.14465 0.510 0.287

P a g e 9 4 ACTUARIAL
Termination from active service: Sample annual termination rates per 100 participants:
Nonvested Members
Vested Members
Age Male Female Male Female25 7.0 7.8 6.0 9.030 8.6 10.6 3.7 6.040 11.1 10.0 1.5 2.250 12.0 10.0 1.4 1.455 16.0 15.0 4.0 3.160 21.0 14.0 4.0 4.065 21.0 40.0 4.0 4.0
Severance pay: The percent of retirees from active service assumed to receive severance pay and the amount of such severance payments are assumed to be as follows. Not applicable to Tier II.
Percent Retiring with Severance PaySeverance Pay as a Percent of Other
Pensionable Earnings in Last Year of Service 20% 6%
Optional service at retirement: The accrued liability for retirement benefits for active members who have not previously purchased optional service is increased to cover the employer cost of optional service purchased in the last two years of service. Sample purchases at retirement follow.
Years of Regular Service at Retirement Maximum Service Purchased10 0.473 years20 0.835 years25 1.360 years30 1.040 years
34 or more None
Unused and uncompensated sick leave: Varies by the amount of regular service at retirement.
Sample amounts of sick leave at retirement:
Years of Service at Retirement Sick Leave Service Credit20 1.035 years25 1.847 years30 1.454 years34 1.000 years
35 or more none
Actuarial cost method: Projected unit credit. Gains and losses are reflected in the unfunded liability. Adopted in the FY89 valuation.
Asset valuation method: Five-year prospective asset smoothing was adopted in the FY09 valuation as required by Public Act 96-0043.

P a g e 9 5ACTUARIAL
annual actuarial valuationThe annual actuarial valuation measures the total liability for all benefits earned to date. The accrued liability is a present value estimate of all the benefits that have been earned to date but not yet paid. The unfunded liability is the present value of future benefits payable that are not covered by the actuarial value of assets on the valuation date.
The funded ratio shows the percentage of the accrued liability covered by actuarial value of assets. A table later in this section also shows funded status using the fair value of assets.
Ac t u a r i a l V a l u a t i o n ( $ t h o u s a n d s )
Years Ended June 302013 2012
Total actuarial accrued liability $93,886,988 $90,024,945Less actuarial value of assets* 38,155,191 37,945,397Unfunded liability $55,731,797 $52,079,548Funded ratio* 40.6% 42.1%* Five-year prospective smoothing began in FY09.
analysis of financial experience: reconciliation of unfunded liabilityThe net increase in the June 30, 2013, unfunded liability of $3.6 billion was caused by a combination of factors.
The employer cost in excess of contributions is the shortfall between actual employer contributions and the amount needed to cover the cost of benefits earned during the year and to keep the unfunded liability from growing. In 2013, this shortfall was $2.1 billion and in 2012 it was $2.7 billion. The 2012 valuation reflected changes in actuarial assumptions resulting from the five-year experience review and caused a net increase of $4.6 billion in the unfunded liability.
TRS experienced actuarial gains under the salary increase assumption in both FY13 and FY12. Salary increases for continuing active members were $413 million lower than expected in 2013 and $1.2 billion lower than expected in 2012. Under the investment return assumption, losses occurred both years. In FY13, smoothed assets were assumed to earn $3.0 billion, but earnings were actually $1.4 billion. The actuarial loss due to investments was $1.6 billion in FY13, compared to a loss of $1.8 billion in FY12.
In both years, actuarial losses occurred under the mortality assumptions because fewer people died than expected. Actuarial losses were also incurred under the turnover assumption because fewer people left service than assumed. Additionally, many members repaid refunds, and the repurchased service increased the unfunded liability. Delayed reporting of retirements also increased the unfunded liability because more people were receiving benefits than expected.
Other, which is a balancing item, reflects actuarial losses in both 2013 and 2012. Other includes retirements in 2013 that were reported late to the actuary and several other factors. Other is smaller than in previous years because of an improvement in the reconciliation procedure. This improvement allowed the differences between actual and expected experience for retirement rates and disabilities to be broken out in 2013.

P a g e 9 6 ACTUARIAL
Re c o n c i l i a t i o n o f Un f u n d e d Li a b i l i t y ( $ t h o u s a n d s )
Years Ended June 30Item 2013 2012Unfunded liability at beginning of year $52,079,548 $43,529,992
Additions
Employer cost in excess of contributions 2,125,732 2,710,713
Change in actuarial assumptions and methods - 4,624,966Net additions 2,125,732 7,335,679Actuarial losses (gains) compared to assumptionsSalary increases for continuing active members (412,776) (1,211,157)Asset gains on actuarial value of assets1 1,557,219 1,806,148New entrant loss 12,678 14,505Mortality other than expected 7,355 52,681Retirements other than expected 65,579 -Disabilities other than expected (6,121) -Terminations other than expected 22,926 29,810Repayments of refunded member contributions2 25,733 30,013Delayed reporting of retirements (effect on assets)3 2,303 12,666Other4 251,621 479,211
Net actuarial losses 1,526,517 1,213,877
Unfunded liability at end of year $55,731,797 $52,079,548
1 Assets are expected to earn 8.0 percent. This item is the difference between the expected and the actual return on an actuarial ba-sis. For example, in fiscal year 2013, the expected actuarial returns of $2.987 billion was greater than the $1.430 billion actual return on assets, resulting in an actuarial loss which increased the unfunded pension benefit obligation by $1.557 billion.
2 This includes the employer-paid portion of the benefit that was restored when members repaid previously refunded contributions.3 547 retirements which occurred prior to 7/1/11 were not reported to the actuary until 6/30/2012.
191 retirements which occurred prior to 7/1/12 were not reported to the actuary until 6/30/2013.4 Other includes items such as:
(a) Retroactive benefit payments for individuals who delayed applying for retirement; (b) Differences between actual cost of benefits earned during the year and projected cost; (c) Retirements with reciprocal service credits; (d) Delayed reporting of retirements (effect on PBO); and (e) For 6/30/2013, transition to eliminate data lag between active and retired members.

P a g e 9 7ACTUARIAL
state fundingPublic Act 88-0593 was enacted in 1994 and first affected state contributions in FY96. The law established a 50-year funding plan that includes a 15-year phase-in period. By the end of the funding period in FY45, TRS will have a 90 percent funded ratio. A key feature of this act is the “continuing appropriation” language that requires state contributions to be made automatically to TRS, provided state funds are available.
Public Act 93-0002, the pension obligation bond (POB) legislation, was enacted in 2003 and first affected state contributions in FY05. The law requires a multi-step process that ensures that state contributions do not exceed certain maximums.
S t a t e F u n d i n g Am o u n t sThe FY13 actuarial valuation was used to determine the required FY15 state contributions and the FY15 employer’s normal cost. The FY12 actuarial valuation was used to determine the required FY14 state contributions and the FY14 employer’s normal cost.
The FY15 amount is the proposed certification submitted to the state actuary, governor, and General Assembly pursuant to Public Act 97-0694. The act requires the state actuary to review the assumptions used to calculate the state contribution under the statutory funding plan. The final certification is due January 15, 2014.
S t a t e F u n d i n g Re q u i r e m e n t s Un d e r Cu r r e n t S t a t u t o r y F u n d i n g P l a nFY15 FY14
Benefit Trust Reserve (excludes federal and school district contributions) $3,411,878,000 $3,437,478,000
Minimum benefit reserve 1,000,000 1,100,000Total state funding amount $3,412,878,000 $3,438,578,000Employer’s normal cost as a percentage of active member payroll 8.02% 7.89%
In 2012, the TRS Board of Trustees resolved to certify state funding requirements under generally accepted actuarial principles and standards. The FY15 amounts below are additional proposed certifications submitted to the state actuary, governor, and General Assembly. They were calculated under the same actuarial assumptions as the amount under the current statutory funding plan. Final certifications under all three calculation procedures will be submitted on or before the January 15, 2014 deadline.
Ad d i t i o n a l F Y 1 5 S t a t e F u n d i n g Ce r t i f i c a t i o n s Un d e r Ac t u a r i a l S t a n d a r d s
Employer's Normal Cost Plus
30 Yr. Level Percent Amortization
Employer's Normal Cost Plus
Interest on the Unfunded Liability
Benefit Trust Reserve (excludes federal and school district contributions) $4,061,168,000 $5,090,537,000
Minimum benefit reserve 1,000,000 1,000,000Total state funding amount $4,062,168,000 $5,091,537,000

P a g e 9 8 ACTUARIAL
tests of financial conditionThe funded ratio shows the percentage of the accrued liability covered by actuarial value of assets.
F u n d e d Ra t i o Te s t ( $ t h o u s a n d s )
AssetsUnfunded Liability using
Assets based onFunded Ratio using
Assets based on
As of June 30
Actuarial Accrued Liability
Actuarial Value
(Smoothed) 1Fair
Value2
Actuarial Value
(Smoothed)1Fair
Value 2
Actuarial Value
(Smoothed)1Fair
Value 2
2004 $50,947,451 $31,544,729 $31,544,729 $19,402,722
$19,402,722 61.9% 61.9%2005 56,075,029 34,085,218 34,085,218 21,989,811 21,989,811 60.8 60.82006 58,996,913 36,584,889 36,584,889 22,412,024 22,412,024 62.0 62.02007 65,648,395 41,909,318 41,909,318 23,739,077 23,739,077 63.8 63.82008 68,632,367 38,430,723 38,430,723 30,201,644 30,201,644 56.0 56.02009 73,027,198 38,026,044 28,497,729 3 35,001,154 44,529,469 52.1 39.03 2010 77,293,198 37,439,092 31,323,784 39,854,106 45,969,414 48.4 40.52011 81,299,745 37,769,753 37,471,267 43,529,992 43,828,478 46.5 46.12012 90,024,945 37,945,397 36,516,825 52,079,548 53,508,120 42.1 40.62013 93,886,988 38,155,191 39,858,768 55,731,797 54,028,220 40.6 42.5
1 The actuarial value of assets was the same as the fair value of assets through FY08. Five-year prospective smoothing began in FY09.
2 The fair value of assets was used as the actuarial value of assets through FY08. Beginning in FY09, the fair value of assets is no longer used for determining state funding requirements but is shown here for comparative purposes.
3 The 2009 fair value of assets is the final, actual figure. The actuary's report shows a slightly higher funded ratio of 39.1 percent for 2009 because the fair value of assets was lowered after the actuarial results were certified.
The unfunded liability as a percentage of payroll is a standard measure of the relative size of the unfunded liability. Decreases in this percentage indicate improvements in a system’s financial position.
Un f u n d e d Li a b i l i t y a s a P e r c e n t a g e o f P a y r o l l Te s t ( $ t h o u s a n d s )
Year Ended June 30
Approximate Member Payroll Unfunded Liability* Percentage of Payroll
2004 $7,281,000 $19,402,722 266.5%2005 7,550,510 21,989,811 291.22006 7,765,752 22,412,024 288.62007 8,149,849 23,739,077 291.32008 8,521,717 30,201,644 354.42009 8,945,021 35,001,154 391.32010 9,251,139 39,854,106 430.82011 9,205,603 43,529,992 472.92012 9,321,098 52,079,548 558.72013 9,394,741 55,731,797 593.2
* Fair value through FY08. Five-year prospective smoothing began in FY09.
The solvency test measures TRS’s ability to cover different types of obligations if the plan was terminated and is hypothetical. The columns are in the order that assets would be used to cover certain types of obligations. Employee contributions would be refunded first, amounts due for participants currently receiving benefits would

P a g e 9 9ACTUARIAL
be covered next, and the employer’s obligation for active members would be covered last. Columns 1 and 2 should be fully covered by assets. The portion of column 3 that is covered by assets should increase over time.
S o l v e n c y Te s t ( $ t h o u s a n d s )
Aggregate Accrued Liabilities for
Year Ended
June 30
Members’ Accumulated Contributions (1)
Participants Currently
Receiving Benefits (2)
Active Members
Employer Portion (3)
Actuarial Value
of Assets*
Percentage of Benefits Covered by Net Assets
(1) (2) (3)2004 $5,853,274 $28,286,916 $16,807,261 $31,544,729 100% 91% -2005 5,925,696 32,861,473 17,287,860 34,085,218 100 86 -2006 6,303,750 35,315,529 17,377,634 36,584,889 100 86 -2007 6,500,318 39,785,368 19,362,709 41,909,318 100 89 -2008 6,931,518 41,849,964 19,850,885 38,430,723 100 75 -2009 7,320,600 44,495,917 21,210,681 38,026,044 100 69 -2010 7,715,984 47,475,906 22,101,308 37,439,092 100 63 -2011 8,048,689 50,567,881 22,683,175 37,769,753 100 59 -2012 8,270,073 58,734,636 23,020,236 37,945,397 100 51 -2013 8,569,939 61,254,334 24,062,715 38,155,191 100 48 -
* Fair value through FY08. Five-year prospective smoothing began in FY09.
other informationRe t i r e e s a n d B e n e f i c i a r i e s Ad d e d t o a n d Re m o v e d f r o m Ro l l s
Year Ended
June 30
Number at Beginning of
Year
Number Added to
Rolls
Number Removed
from Rolls
Number at End
of Year
End-of-Year Annual Allowances
Average Annual Allowance
Amount % Increase Amount % Increase2004 73,431 6,016 2,542 76,905 $2,432,132,334 11.5% $31,625 6.5%2005 76,905 7,897 2,227 82,575 2,806,341,054 15.4 33,985 7.52006 82,575 5,147 2,619 85,103 3,018,848,450 7.6 35,473 4.42007 85,103 6,473 2,340 89,236 3,344,714,652 10.8 37,482 5.72008 89,236 4,912 2,686 91,462 3,551,117,836 6.2 38,826 3.62009 91,462 5,520 2,558 94,424 3,815,292,869 7.4 40,406 4.12010 94,424 5,711 2,381 97,754 4,109,018,971 7.7 42,034 4.02011 97,754 6,377 2,843 101,288 4,418,500,521 7.5 43,623 3.82012 101,288 6,943 2,784 105,447 4,781,692,373 8.2 45,347 4.02013 105,447 6,404 3,068 108,783 5,100,219,925 6.7 46,884 3.4
Amount Added to Rolls* Amount Removed
from RollsAnnual Benefit
IncreasesNew Benefit
Recipients2007 $81,629,966 $295,571,869 $51,335,6332008 93,731,561 174,119,867 61,448,2442009 108,144,294 219,175,023 63,144,2842010 114,879,927 247,234,501 68,388,3262011 125,124,423 263,213,399 78,856,2722012 135,604,876 311,161,467 83,574,4912013 145,282,975 268,124,075 94,879,498
* Amounts added to and removed from rolls are available beginning with the year ended June 30, 2007.

P a g e 1 0 0 ACTUARIAL
Av e r a g e An n u a l S a l a r y f o r Ac t i v e M e m b e r s b y Y e a r s o f S e r v i c eYears ofService* 2013 2012 2011 2010 2009 2008 2007 2006 2005 2004under 5 Number 24,812 25,733 27,960 33,487 37,293 42,725 41,244 40,930 39,728 36,951
Average salary $46,058 $46,222 $47,292 $46,324 $45,464 $44,916 $43,446 $42,404 $41,444 $37,633
5-9 Number 34,682 35,071 34,626 34,529 33,494 31,959 30,520 28,847 26,557 26,027Average salary $58,027 $57,741 $57,416 $57,105 $55,945 $55,436 $53,062 $51,314 $49,536 $45,568
10-14 Number 28,503 28,105 26,865 25,051 23,133 21,395 20,469 20,222 20,295 18,307Average salary $69,686 $68,751 $67,691 $66,788 $65,168 $64,705 $62,447 $60,476 $58,195 $52,771
15-19 Number 19,406 18,610 17,935 17,790 17,417 14,753 14,422 14,086 13,429 13,358Average salary $79,295 $78,328 $77,268 $76,001 $73,770 $71,802 $69,368 $67,343 $65,276 $59,820
20-24 Number 12,280 11,834 11,682 11,391 11,084 10,447 9,814 9,619 9,431 10,868Average salary $86,235 $84,904 $83,563 $82,184 $79,805 $78,080 $74,894 $72,531 $70,278 $64,881
25-29 Number 7,913 7,940 7,834 7,786 7,790 8,654 9,484 10,349 10,667 12,488Average salary $91,735 $89,986 $88,416 $86,566 $84,282 $82,013 $78,831 $76,616 $74,127 $69,276
30-34 Number 4,247 4,826 5,839 6,554 6,858 5,763 5,301 6,134 5,900 9,186Average salary $96,966 $94,665 $93,299 $91,077 $87,973 $85,738 $82,508 $83,165 $79,236 $75,643
35 + Number 889 994 1,179 1,251 1,265 790 694 785 744 1,162Average salary $101,293 $98,140 $98,678 $95,486 $90,698 $88,478 $84,065 $84,524 $81,497 $77,805
Total number 132,732 133,113 133,920 137,839 138,334 136,486 131,948 130,972 126,751 128,347Average salary $67,558 $66,696 $66,044 $64,385 $62,319 $60,254 $58,116 $56,916 $55,237 $52,181
% Change average salary 1.3% 1.0% 2.6% 3.3% 3.4% 3.7% 2.1% 3.0% 5.9% (0.4%)Total payroll full & part-time $8,967,108,456 $8,878,104,648 $8,844,612,480 $8,874,727,268 $8,620,836,546 $8,223,827,444 $7,668,289,968 $7,454,402,352 $7,001,344,987 $6,697,274,807
Annual salaries are computed using full- and part-time salary rates only; substitute and hourly employee salaries are omitted.
Total payroll shown will be lower than payroll figures used elsewhere in this report.
* From FY04-FY08, years of service increments were as follows: 0-5, 6-10, 11-15, 16-20, 21-25, 26-30, 31-35, and 35+. However, figures for those years are not restated because the differences would be minor.

P a g e 1 0 1ACTUARIAL
Av e r a g e An n u a l S a l a r y f o r Ac t i v e M e m b e r s b y Y e a r s o f S e r v i c eYears ofService* 2013 2012 2011 2010 2009 2008 2007 2006 2005 2004under 5 Number 24,812 25,733 27,960 33,487 37,293 42,725 41,244 40,930 39,728 36,951
Average salary $46,058 $46,222 $47,292 $46,324 $45,464 $44,916 $43,446 $42,404 $41,444 $37,633
5-9 Number 34,682 35,071 34,626 34,529 33,494 31,959 30,520 28,847 26,557 26,027Average salary $58,027 $57,741 $57,416 $57,105 $55,945 $55,436 $53,062 $51,314 $49,536 $45,568
10-14 Number 28,503 28,105 26,865 25,051 23,133 21,395 20,469 20,222 20,295 18,307Average salary $69,686 $68,751 $67,691 $66,788 $65,168 $64,705 $62,447 $60,476 $58,195 $52,771
15-19 Number 19,406 18,610 17,935 17,790 17,417 14,753 14,422 14,086 13,429 13,358Average salary $79,295 $78,328 $77,268 $76,001 $73,770 $71,802 $69,368 $67,343 $65,276 $59,820
20-24 Number 12,280 11,834 11,682 11,391 11,084 10,447 9,814 9,619 9,431 10,868Average salary $86,235 $84,904 $83,563 $82,184 $79,805 $78,080 $74,894 $72,531 $70,278 $64,881
25-29 Number 7,913 7,940 7,834 7,786 7,790 8,654 9,484 10,349 10,667 12,488Average salary $91,735 $89,986 $88,416 $86,566 $84,282 $82,013 $78,831 $76,616 $74,127 $69,276
30-34 Number 4,247 4,826 5,839 6,554 6,858 5,763 5,301 6,134 5,900 9,186Average salary $96,966 $94,665 $93,299 $91,077 $87,973 $85,738 $82,508 $83,165 $79,236 $75,643
35 + Number 889 994 1,179 1,251 1,265 790 694 785 744 1,162Average salary $101,293 $98,140 $98,678 $95,486 $90,698 $88,478 $84,065 $84,524 $81,497 $77,805
Total number 132,732 133,113 133,920 137,839 138,334 136,486 131,948 130,972 126,751 128,347Average salary $67,558 $66,696 $66,044 $64,385 $62,319 $60,254 $58,116 $56,916 $55,237 $52,181
% Change average salary 1.3% 1.0% 2.6% 3.3% 3.4% 3.7% 2.1% 3.0% 5.9% (0.4%)Total payroll full & part-time $8,967,108,456 $8,878,104,648 $8,844,612,480 $8,874,727,268 $8,620,836,546 $8,223,827,444 $7,668,289,968 $7,454,402,352 $7,001,344,987 $6,697,274,807
Annual salaries are computed using full- and part-time salary rates only; substitute and hourly employee salaries are omitted.
Total payroll shown will be lower than payroll figures used elsewhere in this report.
* From FY04-FY08, years of service increments were as follows: 0-5, 6-10, 11-15, 16-20, 21-25, 26-30, 31-35, and 35+. However, figures for those years are not restated because the differences would be minor.

P a g e 1 0 2 ACTUARIAL
Years of Service Years of Service
Age Under 5 5-9 10-14 15-19 20-24 25-29 30-34 35-39 40-44 45-49 50+Full and Part-time
Member TotalsSubs
20-24 Number 2,955 3,148 - - - - - - - - - - 3,148
Average Salary $5,006 $39,452 - - - - - - - - - - $39,452
25-29 Number 4,260 11,297 6,062 - - - - - - - - - 17,359
Average Salary $5,069 $44,777 $53,378 - - - - - - - - - $47,781
30-34 Number 2,611 4,121 13,939 4,722 - - - - - - - - 22,782
Average Salary $4,566 $48,313 $57,814 $66,396 - - - - - - - - $57,874
35-39 Number 2,436 2,008 5,005 10,550 2,795 - - - - - - - 20,358
Average Salary $4,505 $49,681 $60,155 $70,250 $77,985 - - - - - - - $66,802
40-44 Number 3,645 1,754 3,513 4,691 7,446 2,066 - - - - - - 19,470
Average Salary $4,697 $49,091 $60,108 $71,114 $80,459 $85,065 - - - - - - $72,198
45-49 Number 3,239 1,140 2,457 2,825 3,174 4,459 1,476 - - - - - 15,531
Average Salary $4,772 $50,233 $58,693 $70,381 $80,613 $87,330 $91,720 - - - - - $76,038
50-54 Number 2,992 734 1,969 2,498 2,356 2,329 3,652 1,302 - - - - 14,840
Average Salary $4,773 $50,663 $59,452 $68,884 $77,007 $85,988 $91,703 $95,078 - - - - $78,619
55-59 Number 2,621 409 1,133 2,100 2,231 2,065 1,837 2,355 373 - - - 12,503
Average Salary $4,863 $54,086 $61,944 $69,726 $77,878 $84,385 $91,497 $97,624 $100,027 - - - $81,742
60-64 Number 1,931 156 490 915 1,201 1,155 809 512 340 74 - - 5,652
Average Salary $4,660 $55,956 $64,475 $71,446 $78,457 $87,942 $92,175 $98,772 $101,895 $100,838 - - $82,934
65-69 Number 861 33 106 182 184 191 125 71 33 37 4 - 966
Average Salary $4,342 $60,724 $69,678 $74,391 $82,190 $86,176 $93,855 $97,693 $98,051 $108,366 $145,767 - $83,859
70-74 Number 260 6 7 18 16 14 12 6 7 6 4 2 98
Average Salary $4,318 $37,179 $48,806 $89,099 $70,771 $84,631 $90,407 $87,389 $103,378 $90,084 $89,302 $94,664 $80,669
Over 74 Number 149 6 1 2 3 1 2 1 2 2 3 2 25
Average Salary $4,070 $39,695 $29,405 $77,488 $72,030 $75,508 $78,739 $86,450 $92,341 $139,624 $118,142 $88,159 $78,110
Total Number 27,960 24,812 34,682 28,503 19,406 12,280 7,913 4,247 755 119 11 4 132,732
Average Salary $4,769 $46,058 $58,027 $69,686 $79,295 $86,235 $91,735 $96,966 $100,792 $103,288 $117,700 $91,412 $67,558
active members by age and years of serviceas of june 30, 2013

P a g e 1 0 3ACTUARIAL
Years of Service Years of Service
Age Under 5 5-9 10-14 15-19 20-24 25-29 30-34 35-39 40-44 45-49 50+Full and Part-time
Member TotalsSubs
20-24 Number 2,955 3,148 - - - - - - - - - - 3,148
Average Salary $5,006 $39,452 - - - - - - - - - - $39,452
25-29 Number 4,260 11,297 6,062 - - - - - - - - - 17,359
Average Salary $5,069 $44,777 $53,378 - - - - - - - - - $47,781
30-34 Number 2,611 4,121 13,939 4,722 - - - - - - - - 22,782
Average Salary $4,566 $48,313 $57,814 $66,396 - - - - - - - - $57,874
35-39 Number 2,436 2,008 5,005 10,550 2,795 - - - - - - - 20,358
Average Salary $4,505 $49,681 $60,155 $70,250 $77,985 - - - - - - - $66,802
40-44 Number 3,645 1,754 3,513 4,691 7,446 2,066 - - - - - - 19,470
Average Salary $4,697 $49,091 $60,108 $71,114 $80,459 $85,065 - - - - - - $72,198
45-49 Number 3,239 1,140 2,457 2,825 3,174 4,459 1,476 - - - - - 15,531
Average Salary $4,772 $50,233 $58,693 $70,381 $80,613 $87,330 $91,720 - - - - - $76,038
50-54 Number 2,992 734 1,969 2,498 2,356 2,329 3,652 1,302 - - - - 14,840
Average Salary $4,773 $50,663 $59,452 $68,884 $77,007 $85,988 $91,703 $95,078 - - - - $78,619
55-59 Number 2,621 409 1,133 2,100 2,231 2,065 1,837 2,355 373 - - - 12,503
Average Salary $4,863 $54,086 $61,944 $69,726 $77,878 $84,385 $91,497 $97,624 $100,027 - - - $81,742
60-64 Number 1,931 156 490 915 1,201 1,155 809 512 340 74 - - 5,652
Average Salary $4,660 $55,956 $64,475 $71,446 $78,457 $87,942 $92,175 $98,772 $101,895 $100,838 - - $82,934
65-69 Number 861 33 106 182 184 191 125 71 33 37 4 - 966
Average Salary $4,342 $60,724 $69,678 $74,391 $82,190 $86,176 $93,855 $97,693 $98,051 $108,366 $145,767 - $83,859
70-74 Number 260 6 7 18 16 14 12 6 7 6 4 2 98
Average Salary $4,318 $37,179 $48,806 $89,099 $70,771 $84,631 $90,407 $87,389 $103,378 $90,084 $89,302 $94,664 $80,669
Over 74 Number 149 6 1 2 3 1 2 1 2 2 3 2 25
Average Salary $4,070 $39,695 $29,405 $77,488 $72,030 $75,508 $78,739 $86,450 $92,341 $139,624 $118,142 $88,159 $78,110
Total Number 27,960 24,812 34,682 28,503 19,406 12,280 7,913 4,247 755 119 11 4 132,732
Average Salary $4,769 $46,058 $58,027 $69,686 $79,295 $86,235 $91,735 $96,966 $100,792 $103,288 $117,700 $91,412 $67,558
Average Age
Average Years of Service Number
Full and part-time members 42 12 132,732Substitutes 42 3 27,960All 42 10 160,692

P a g e 1 0 4 ACTUARIAL
plan summaryAd m i n i s t r a t i o n TRS was created and is governed by Article 16 of the Illinois Pension Code, contained in the Illinois Compiled Statutes (ILCS). A 13-member Board of Trustees is authorized to carry out duties granted to it under the article.
M e m b e r s h i p Membership is mandatory for all full-time, part-time, and substitute public school personnel employed outside the city of Chicago in positions requiring certification. Persons employed at certain state agencies are also members.
Co n t r i b u t i o n sDuring FY13, members contributed 9.4 percent of gross creditable earnings designated as 7.5 percent for retirement annuity, 0.5 percent for post-retirement increases, 0.4 percent for the Early Retirement Option, and 1.0 percent for death benefits. Active members do not contribute to Social Security for TRS-covered employment; however, members hired after March 31, 1986, are required to contribute to Medicare. In addition, virtually all members pay a contribution to the Teachers’ Health Insurance Security Fund, a separate fund in the State Treasury that is not a part of this retirement plan. For FY13, the member contribution was 0.92 percent of pay.
S e r v i c e Cr e d i t A member is granted a maximum of one year of service credit for 170 paid days per school year, defined by statute as July 1 through June 30. Optional service credit is available for periods of public school teaching in other states or under the authority of the United States government, substitute or part-time teaching prior to July 1, 1990, leaves of absence, involuntary layoffs, military service, and gaps in teaching due to pregnancy or adoption prior to July 1, 1983. Up to two years of unused, uncompensated sick leave that has been certified by former employers may also be added as service credit at retirement.
Re f u n d sAfter a four-month waiting period from the date last taught, a member ceasing TRS-covered employment may withdraw all contributions, except the 1 percent death benefit. When accepting a refund, the member forfeits all service credit and benefit rights. Credit can be re-established if the member returns to a TRS-covered position for one year or to a reciprocal system for two years and repays the refund with interest. A member receiving disability benefits is not eligible for a refund.
Re t i r e m e n t B e n e f i t sThe following vesting schedule applies to all members hired before January 1, 2011.
Years of Service Age
5 6210 6020 55 (discounted)35 55 (nondiscounted)
To be eligible to receive a monthly retirement annuity, a member must terminate active service and meet specific age and service requirements. If a member retires at an age less than 60 with fewer than 35 years of service and does not elect the Early Retirement Option (discussed under “Early Retirement”), the benefit will be reduced by 6 percent for each year the member is under age 60.

P a g e 1 0 5ACTUARIAL
A member with fewer than five years of creditable service who taught after July 1, 1947, is eligible to receive a single-sum retirement benefit at age 65.
Most members retire under a retirement benefit formula. This retirement annuity is determined by two factors: average salary and years of creditable service. Average salary is the average of the creditable earnings in the highest four consecutive years within the last 10 years of creditable service. Years of service determine the percentage of the final average salary to which members are entitled. Members with contributing service before July 1, 2005, can retire under a money purchase style “actuarial” benefit instead of a retirement benefit formula. By law, the higher of the formula benefit or the actuarial benefit is paid. The maximum formula benefit is 75 percent of the final average salary; there is no maximum for the actuarial benefit.
Public Act 90-0582 improved retirement benefits for TRS members by changing the rate at which TRS benefits accrue beginning July 1, 1998, from a graduated rate to a flat rate equal to 2.2 percent of final average sal-ary. Members who retire on or after the effective date have the option of upgrading their service earned prior to July 1, 1998, to the flat-rate 2.2 percent formula by making a payment to TRS. Additionally, for members who continue to teach, every three full years worked after July 1, 1998, count toward a full one-year reduction of the years to be upgraded.
Public Act 91-0017 reduced the 2.2 formula upgrade cost on a sliding scale for members who have more than 34 years of service credit. The legislation also made a technical correction in the benefit accrual rate for mem-bers who do not upgrade their pre-July 1998 service.
Years of service earned before July 1, 1998, were earned under a four-step graduated formula:
• 1.67 percent for each of years one through 10,
• 1.9 percent for each of years 11 through 20,
• 2.1 percent for each of years 21 through 30, and
• 2.3 percent for each year over 30.
The maximum annuity, 75 percent of final average salary, is achieved with 34 years under the 2.2 formula and with 38 years of service under the graduated formula. The minimum retirement benefit is $25 per month for each year of creditable service up to 30 years of service.
E a r l y Re t i r e m e n tMembers who are age 55 but under age 60 who have at least 20 but fewer than 35 years of service can elect the Early Retirement Option (ERO) to avoid a discounted annuity. Both the member and employer make one-time contributions at retirement. Under the terms of the ERO program described in Public Act 98-0042, the member pays 14.4 percent for each year that his or her age is under 60 or years of service is under 35, whichever is less. The employer pays 29.3 percent for each year the member is under age 60.
Continuation of the ERO program beyond June 30, 2016 will depend on legislative action.
P o s t - Re t i r e m e n t In c r e a s e Annuitants who meet certain service credit criteria receive an annual 3 percent increase in their gross annuities on the January 1 after they turn age 61 or the January 1 following the first anniversary in retirement, whichever is later.

P a g e 1 0 6 ACTUARIAL
D i s a b i l i t y B e n e f i t sTRS offers occupational and nonoccupational disability benefits to active members. Nonoccupational disability benefits are payable as disability benefits or as a disability retirement annuity to members who have a minimum of three years of creditable service. There is no minimum service requirement for occupational disability benefits for duty-related accidents or illnesses. Members continue to accrue service credit while they are receiving dis-ability benefits but not while they are receiving disability retirement annuities. On January 1 following the fourth anniversary of the granting of the disability benefit, the monthly benefit is increased 7 percent. Thereafter, the benefit increases by 3 percent each January 1.
Public Act 94-0539 allows individuals who have received TRS disability benefits for one year or more to return to teaching if their medical conditions improve, allowing part-time work. It allows members on a limited basis to tutor, substitute, or teach part-time for a TRS-covered employer without loss of disability benefits as long as the combined earnings from teaching and disability benefits do not exceed 100 percent of the salary rate upon which the disability benefit was based.
D e a t h B e n e f i t sThere are two types of death benefits: a return of the member’s accumulated contributions and survivor benefits.
The return of member contributions includes the retirement contributions (6.5 percent of salary through June 30, 1998 and 7.5 percent after that date), with interest, as well as 0.5 percent paid toward annual increases in annuity, and 0.4 percent paid for the Early Retirement Option. Beneficiaries of an annuitant receive the accumulated contributions minus the amount that the member had already received as a retirement annuity.
Survivor benefits can be paid in either a lump-sum or a monthly payment. A lump-sum benefit is the only method payable to nondependent beneficiaries. A dependent beneficiary may choose either a lump-sum benefit or a monthly payment. Survivor benefit recipients who are beneficiaries of a retired member are eligible for an annual 3 percent increase effective January 1 following the granting of the survivor benefit. Survivor benefit recipients who are beneficiaries of an active or eligible inactive member are eligible for an annual 3 percent increase on January 1 following the first anniversary of their receiving the survivor benefit.
E m p l o y m e n t - Re l a t e d F e l o n y Co n v i c t i o nAny member convicted of a felony related to or in connection with teaching is not eligible for TRS benefits; however, the member may receive a refund of contributions.
Co n t i n u i t y o f Cr e d i t w i t h i n Il l i n o i sTRS is one of 13 public retirement systems that are included in the provisions of the Illinois Retirement Systems’ Reciprocal Act. This act ensures continuous pension credit for public employment in Illinois.
Co n f l i c t sConditions involving a claim for benefits may require further clarification. If conflicts arise between material in this summary and that of the law, the law takes precedence.

Retirem
ent S
ecurity for Illinois Educators
Statistical

P a g e 1 0 8 STATISTICAL
2003 2013
2003 2013
total saved2009-2013
total saved2009-2013
203,000
(250,000)0
2,300
300 (9,500)
203,000
(250,000)
(200,000)
(150,000)
(100,000)
(50,000)
0
50,000
100,000
150,000
200,000
250,000
(10,000)
(8,000)
(6,000)
(4,000)
(2,000)
0
2,000
4,000
Member Guides P r i n t e d a n d M a i l e d
Employer Guides P r i n t e d a n d M a i l e d
Comprehensive Annual Financial Reports P r i n t e d a n d M a i l e d
Total2003-2008
2009-2013
otal aved 2009-2013
22,400
(14,000)0
(15,000)
(10,000)
(5,000)
0
5,000
10,000
15,000
20,000
25,000
E l e c t r o n i c D i s t r i b u t i o nIn 2003, TRS printed and distributed 203,000 copies of our revised Member Guide to members. Because our Member Guide is available online and constantly updated, revised Member Guides are no longer printed annually.
The Comprehensive Annual Financial Report has decreased in quantity due to online distribution. In 2003, TRS printed 2,300 copies of the 100+ page report. In 2013, 300 copies were printed, a total decrease of 11,100 printed copies from 2003 to 2013.
The Employer Guide was formerly printed and two copies were mailed with a binder to each of 1,000+ school districts. In 2006 - 2008, three copies were mailed to each employer. Electronic distribution of the Employer Guide began in 2009, after which no copies of the Employer Guide have been printed or mailed to employers.

P a g e 1 0 9STATISTICAL
statistical sectionThe tables in this section present detailed information on benefit payments and recipients, member and employer contributions, employer contribution rates, and the largest TRS employers.
Se c t i o n Co n t e n t sR e t i r e d M e m b e r s b y Y e a r s o f Se r v i c e a n d Y e a r s i n R e t i r e m e n t – P a g e s 1 1 0 - 1 1 1This schedule shows the number of retirees by their years of service and years in retirement in five-year incre-ments. It also shows their average current monthly benefits and average benefits when they first retired. A column on the right shows the average age of retirees in each “years retired” increment.
1 0 - Y e a r F i n a n c i a l Tr e n d s – P a g e s 1 1 2 - 1 1 3These schedules contain information that allows the reader to view the change in net position and benefit and refund deductions from net position over a 10-year period. Both schedules help the reader understand the financial changes that have occurred over time.
E m p l o y e e a n d E m p l o y e r Co n t r i b u t i o n R a t e s – P a g e 1 1 5This schedule offers information on the contribution rates for employees, the state, and employers to the system over a 10-year period.
D e m o g r a p h i c s o f B e n e f i t R e c i p i e n t s – P a g e s 1 1 6 - 1 1 7These schedules help the reader understand characteristics of the specific groups of benefit recipients and active members of the Teachers' Retirement System.
Av e r a g e B e n e f i t P a y m e n t s – P a g e s 1 1 8 - 1 1 9This schedule contains information regarding the average benefits paid to new retirees over a 10-year period. The schedule also allows the reader to view those payments by increments of years of service.
P a r t i c i p a t i n g E m p l o y e r s – P a g e 1 2 0This schedule allows the reader to view the 10 largest participating employers of the Teachers' Retirement System. The reader can also view the percentages of total membership covered by the largest employers in the current year and nine years ago.

P a g e 1 1 0 STATISTICAL
Years Retired
Years of Service Years of ServiceAvg AgeUnder 5 5-9 10-14 15-19 20-24 25-29 30-34 35-39 40-44 45-49 50+
Weighted Average
Under 1 Number 148 298 352 391 672 663 750 1,115 115 23 4 4,531 61 Average current benefit $279 $771 $1,426 $2,239 $3,182 $4,239 $5,406 $6,066 $7,029 $7,920 $13,978 $4,075 Average original benefit $279 $771 $1,424 $2,237 $3,179 $4,233 $5,396 $6,066 $7,029 $7,920 $13,978 $4,071
1-4 Number 862 1,650 1,513 1,525 2,347 2,359 3,641 5,618 422 64 9 20,010 62 Average current benefit $291 $730 $1,370 $2,278 $3,141 $4,256 $5,418 $5,898 $6,776 $7,593 $11,523 $4,034 Average original benefit $276 $686 $1,291 $2,155 $3,000 $4,075 $5,212 $5,755 $6,464 $7,227 $10,916 $3,891
5-9 Number 911 1,345 1,382 1,314 2,515 2,775 9,703 4,968 365 56 4 25,338 66 Average current benefit $285 $697 $1,344 $2,234 $3,108 $4,307 $5,866 $6,372 $6,651 $7,021 $10,729 $4,625 Average original benefit $235 $574 $1,105 $1,845 $2,576 $3,556 $4,839 $5,312 $5,449 $5,773 $8,877 $3,827
10-14 Number 850 877 816 760 1,805 2,169 8,267 3,632 244 36 6 19,462 70 Average current benefit $292 $699 $1,246 $2,098 $2,973 $4,249 $5,855 $6,320 $6,021 $6,609 $7,248 $4,684 Average original benefit $206 $494 $887 $1,498 $2,128 $3,042 $4,244 $4,521 $4,291 $4,712 $5,262 $3,374
15-19 Number 412 491 380 329 676 1,034 1,535 2,935 3,741 11 1 11,545 75 Average current benefit $291 $677 $1,047 $1,543 $2,251 $2,952 $3,854 $4,951 $5,471 $6,060 $4,828 $4,064 Average original benefit $179 $411 $635 $941 $1,397 $1,808 $2,343 $2,955 $3,180 $3,762 $2,792 $2,412
20-24 Number 265 379 482 428 1,125 1,271 1,708 2,201 1,617 11 2 9,489 80 Average current benefit $234 $608 $1,019 $1,474 $2,212 $2,942 $3,954 $4,929 $4,956 $4,769 $3,923 $3,511 Average original benefit $125 $313 $531 $773 $1,157 $1,558 $2,104 $2,659 $2,772 $2,535 $2,074 $1,895
25-29 Number 104 198 331 385 971 882 1,068 830 35 5 - 4,809 86 Average current benefit $222 $508 $888 $1,463 $1,923 $2,672 $3,787 $4,702 $4,467 $4,197 - $2,772 Average original benefit $100 $216 $391 $664 $882 $1,229 $1,753 $2,159 $2,062 $1,966 - $1,274
30-34 Number 30 47 152 214 504 402 418 222 27 2 - 2,018 91 Average current benefit $215 $425 $747 $1,099 $1,548 $2,061 $2,987 $3,456 $3,262 $2,725 - $2,028 Average original benefit 86 $138 $277 $428 $618 $832 $1,215 $1,412 $1,321 $1,056 - $817
35-39 Number 6 7 38 51 158 132 83 115 12 2 - 604 95 Average current benefit $190 $241 $635 $945 $1,166 $1,535 $1,964 $2,634 $3,226 $2,788 - $1,610 Average original benefit $64 $39 $199 $308 $387 $530 $691 $937 $1,131 $923 - $556
40-44 Number - 1 3 5 31 15 13 11 5 - - 84 99 Average current benefit - $39 $635 $819 $983 $1,161 $1,442 $2,146 $1,949 - - $1,262 Average original benefit - - $135 $198 $237 $292 $418 $686 $592 - - $346
45-49 Number - - - - 3 1 3 - - - - 7 102 Average current benefit - - - - $978 $1,113 $1,333 - - - - $1,149 Average original benefit - - - - $192 $115 $320 - - - - $236
Over 50 Number - - - - - 2 - - - - - 2 106 Average current benefit - - - - - $1,172 - - - - - $1,172 Average original benefit - - - - - $163 - - - - - $163
Total Number 3,588 5,293 5,449 5,402 10,807 11,705 27,189 21,647 6,583 210 26 97,899 70Average current benefit $282 $693 $1,243 $2,012 $2,736 $3,778 $5,416 $5,769 $5,520 $6,906 $9,950 $4,150Average original benefit $220 $555 $988 $1,616 $2,127 $2,924 $4,219 $4,557 $3,505 $5,813 $8,776 $3,196
retired members by years of service and years in retirement as of june 30, 2013

P a g e 1 1 1STATISTICAL
Years Retired
Years of Service Years of ServiceAvg AgeUnder 5 5-9 10-14 15-19 20-24 25-29 30-34 35-39 40-44 45-49 50+
Weighted Average
Under 1 Number 148 298 352 391 672 663 750 1,115 115 23 4 4,531 61Average current benefit $279 $771 $1,426 $2,239 $3,182 $4,239 $5,406 $6,066 $7,029 $7,920 $13,978 $4,075Average original benefit $279 $771 $1,424 $2,237 $3,179 $4,233 $5,396 $6,066 $7,029 $7,920 $13,978 $4,071
1-4 Number 862 1,650 1,513 1,525 2,347 2,359 3,641 5,618 422 64 9 20,010 62Average current benefit $291 $730 $1,370 $2,278 $3,141 $4,256 $5,418 $5,898 $6,776 $7,593 $11,523 $4,034Average original benefit $276 $686 $1,291 $2,155 $3,000 $4,075 $5,212 $5,755 $6,464 $7,227 $10,916 $3,891
5-9 Number 911 1,345 1,382 1,314 2,515 2,775 9,703 4,968 365 56 4 25,338 66Average current benefit $285 $697 $1,344 $2,234 $3,108 $4,307 $5,866 $6,372 $6,651 $7,021 $10,729 $4,625Average original benefit $235 $574 $1,105 $1,845 $2,576 $3,556 $4,839 $5,312 $5,449 $5,773 $8,877 $3,827
10-14 Number 850 877 816 760 1,805 2,169 8,267 3,632 244 36 6 19,462 70Average current benefit $292 $699 $1,246 $2,098 $2,973 $4,249 $5,855 $6,320 $6,021 $6,609 $7,248 $4,684Average original benefit $206 $494 $887 $1,498 $2,128 $3,042 $4,244 $4,521 $4,291 $4,712 $5,262 $3,374
15-19 Number 412 491 380 329 676 1,034 1,535 2,935 3,741 11 1 11,545 75Average current benefit $291 $677 $1,047 $1,543 $2,251 $2,952 $3,854 $4,951 $5,471 $6,060 $4,828 $4,064Average original benefit $179 $411 $635 $941 $1,397 $1,808 $2,343 $2,955 $3,180 $3,762 $2,792 $2,412
20-24 Number 265 379 482 428 1,125 1,271 1,708 2,201 1,617 11 2 9,489 80Average current benefit $234 $608 $1,019 $1,474 $2,212 $2,942 $3,954 $4,929 $4,956 $4,769 $3,923 $3,511Average original benefit $125 $313 $531 $773 $1,157 $1,558 $2,104 $2,659 $2,772 $2,535 $2,074 $1,895
25-29 Number 104 198 331 385 971 882 1,068 830 35 5 - 4,809 86Average current benefit $222 $508 $888 $1,463 $1,923 $2,672 $3,787 $4,702 $4,467 $4,197 - $2,772Average original benefit $100 $216 $391 $664 $882 $1,229 $1,753 $2,159 $2,062 $1,966 - $1,274
30-34 Number 30 47 152 214 504 402 418 222 27 2 - 2,018 91Average current benefit $215 $425 $747 $1,099 $1,548 $2,061 $2,987 $3,456 $3,262 $2,725 - $2,028Average original benefit 86 $138 $277 $428 $618 $832 $1,215 $1,412 $1,321 $1,056 - $817
35-39 Number 6 7 38 51 158 132 83 115 12 2 - 604 95Average current benefit $190 $241 $635 $945 $1,166 $1,535 $1,964 $2,634 $3,226 $2,788 - $1,610Average original benefit $64 $39 $199 $308 $387 $530 $691 $937 $1,131 $923 - $556
40-44 Number - 1 3 5 31 15 13 11 5 - - 84 99Average current benefit - $39 $635 $819 $983 $1,161 $1,442 $2,146 $1,949 - - $1,262Average original benefit - - $135 $198 $237 $292 $418 $686 $592 - - $346
45-49 Number - - - - 3 1 3 - - - - 7 102Average current benefit - - - - $978 $1,113 $1,333 - - - - $1,149Average original benefit - - - - $192 $115 $320 - - - - $236
Over 50 Number - - - - - 2 - - - - - 2 106Average current benefit - - - - - $1,172 - - - - - $1,172Average original benefit - - - - - $163 - - - - - $163
Total Number 3,588 5,293 5,449 5,402 10,807 11,705 27,189 21,647 6,583 210 26 97,899 70Average current benefit $282 $693 $1,243 $2,012 $2,736 $3,778 $5,416 $5,769 $5,520 $6,906 $9,950 $4,150Average original benefit $220 $555 $988 $1,616 $2,127 $2,924 $4,219 $4,557 $3,505 $5,813 $8,776 $3,196

P a g e 1 1 2 STATISTICAL
changes in net position, last 10 fiscal years ( $ t h o u s a n d s )
2013 2012 2011 2010 2009 2008 2007 2006 2005 2004AdditionsMember contributions* $921,423 $917,661 $909,577 $899,401 $876,182 $865,400 $826,249 $799,034 $761,790 $768,661State of Illinois 2,703,312 2,406,364 2,170,918 2,080,729 1,451,592 1,041,115 737,671 534,305 906,749 1,031,478Pension Obligation Bond proceeds - - - - - - - - - 4,330,374Employer contributions** 157,179 154,895 155,111 171,421 152,329 130,673 115,915 123,543 148,813 127,573Investment income (loss) net of expenses 4,561,768 224,107 7,234,539 3,679,643 (8,688,286) (2,014,902) 6,831,324 3,993,290 3,330,040 4,485,730Total additions to/reductions from plan net position
8,343,682 3,703,027 10,470,145 6,831,194 (6,208,183) 22,286 8,511,159 5,450,172 5,147,392 10,743,816
DeductionsBenefit payments 4,893,084 4,553,822 4,228,283 3,927,838 3,653,714 3,423,982 3,111,753 2,877,231 2,533,103 2,262,329Refunds 88,398 84,635 76,587 60,350 53,709 60,286 59,732 57,967 59,396 48,020Administrative expenses 20,257 19,012 17,792 16,951 17,388 16,613 15,245 15,303 14,404 13,561Total deductions from plan net position 5,001,739 4,657,469 4,322,662 4,005,139 3,724,811 3,500,881 3,186,730 2,950,501 2,606,903 2,323,910
Changes in net positionBeginning of year 36,516,825 37,471,267 31,323,784 28,497,729 38,430,723 41,909,318 36,584,889 34,085,218 31,544,729 23,124,823Net increase (decrease) 3,341,943 (954,442) 6,147,483 2,826,055 (9,932,994) (3,478,595) 5,324,429 2,499,671 2,540,489 8,419,906End of year $39,858,768 $36,516,825 $37,471,267 $31,323,784 $28,497,729 $38,430,723 $41,909,318 $36,584,889 $34,085,218 $31,544,729
* Member contributions increased from 9.0 percent to 9.4 percent beginning in FY06. Also included are member contributions for purchases of optional service, early retirement, and upgrades to the 2.2 formula.** Employer contributions include contributions from federal funds, for early retirement, and for the 2.2 formula. Beginning in FY06, it in-cludes employer contributions for salary increases in excess of 6 percent used in final average salary calculations and for excess sick leave used for service credit.
benefit and refund deductions from net position by type, last 10 fiscal years( $ t h o u s a n d s )
2013 2012 2011 2010 2009 2008 2007 2006 2005 2004Type of benefitRetirement $4,670,385 $4,347,173 $4,036,147 $3,749,666 $3,486,697 $3,268,108 $2,965,356 $2,741,164 $2,407,652 $2,145,187Survivor 192,390 177,422 163,910 151,074 140,695 130,369 121,822 112,902 103,991 97,155Disability 30,309 29,227 28,226 27,098 26,322 25,505 24,575 23,165 21,460 19,987Total benefits 4,893,084 4,553,822 4,228,283 3,927,838 3,653,714 3,423,982 3,111,753 2,877,231 2,533,103 2,262,329
Type of refundWithdrawals 30,194 25,563 22,528 17,149 17,357 17,280 17,147 17,155 15,526 14,858Death benefits and excess contribution refunds paid to survivors 16,764 18,415 16,404 15,161 15,076 17,182 17,081 16,747 16,541 16,1452.2 and optional service 20,053 20,988 19,861 15,050 11,013 14,082 14,145 12,666 15,181 7,977Survivor contributions refunded to retirees 10,780 10,358 10,252 7,967 6,916 8,522 8,808 10,198 10,354 7,835ERO and other 10,607 9,311 7,542 5,023 3,347 3,220 2,551 1,201 1,794 1,205Total refunds $88,398 $84,635 $76,587 $60,350 $53,709 $60,286 $59,732 $57,967 $59,396 $48,020

P a g e 1 1 3STATISTICAL
changes in net position, last 10 fiscal years ( $ t h o u s a n d s )
2013 2012 2011 2010 2009 2008 2007 2006 2005 2004AdditionsMember contributions* $921,423 $917,661 $909,577 $899,401 $876,182 $865,400 $826,249 $799,034 $761,790 $768,661State of Illinois 2,703,312 2,406,364 2,170,918 2,080,729 1,451,592 1,041,115 737,671 534,305 906,749 1,031,478Pension Obligation Bond proceeds - - - - - - - - - 4,330,374Employer contributions** 157,179 154,895 155,111 171,421 152,329 130,673 115,915 123,543 148,813 127,573Investment income (loss) net of expenses 4,561,768 224,107 7,234,539 3,679,643 (8,688,286) (2,014,902) 6,831,324 3,993,290 3,330,040 4,485,730Total additions to/reductions from plan net position
8,343,682 3,703,027 10,470,145 6,831,194 (6,208,183) 22,286 8,511,159 5,450,172 5,147,392 10,743,816
DeductionsBenefit payments 4,893,084 4,553,822 4,228,283 3,927,838 3,653,714 3,423,982 3,111,753 2,877,231 2,533,103 2,262,329Refunds 88,398 84,635 76,587 60,350 53,709 60,286 59,732 57,967 59,396 48,020Administrative expenses 20,257 19,012 17,792 16,951 17,388 16,613 15,245 15,303 14,404 13,561Total deductions from plan net position 5,001,739 4,657,469 4,322,662 4,005,139 3,724,811 3,500,881 3,186,730 2,950,501 2,606,903 2,323,910
Changes in net positionBeginning of year 36,516,825 37,471,267 31,323,784 28,497,729 38,430,723 41,909,318 36,584,889 34,085,218 31,544,729 23,124,823Net increase (decrease) 3,341,943 (954,442) 6,147,483 2,826,055 (9,932,994) (3,478,595) 5,324,429 2,499,671 2,540,489 8,419,906End of year $39,858,768 $36,516,825 $37,471,267 $31,323,784 $28,497,729 $38,430,723 $41,909,318 $36,584,889 $34,085,218 $31,544,729
* Member contributions increased from 9.0 percent to 9.4 percent beginning in FY06. Also included are member contributions for purchases of optional service, early retirement, and upgrades to the 2.2 formula.** Employer contributions include contributions from federal funds, for early retirement, and for the 2.2 formula. Beginning in FY06, it in-cludes employer contributions for salary increases in excess of 6 percent used in final average salary calculations and for excess sick leave used for service credit.
benefit and refund deductions from net position by type, last 10 fiscal years( $ t h o u s a n d s )
2013 2012 2011 2010 2009 2008 2007 2006 2005 2004Type of benefitRetirement $4,670,385 $4,347,173 $4,036,147 $3,749,666 $3,486,697 $3,268,108 $2,965,356 $2,741,164 $2,407,652 $2,145,187Survivor 192,390 177,422 163,910 151,074 140,695 130,369 121,822 112,902 103,991 97,155Disability 30,309 29,227 28,226 27,098 26,322 25,505 24,575 23,165 21,460 19,987Total benefits 4,893,084 4,553,822 4,228,283 3,927,838 3,653,714 3,423,982 3,111,753 2,877,231 2,533,103 2,262,329
Type of refundWithdrawals 30,194 25,563 22,528 17,149 17,357 17,280 17,147 17,155 15,526 14,858Death benefits and excess contribution refunds paid to survivors 16,764 18,415 16,404 15,161 15,076 17,182 17,081 16,747 16,541 16,1452.2 and optional service 20,053 20,988 19,861 15,050 11,013 14,082 14,145 12,666 15,181 7,977Survivor contributions refunded to retirees 10,780 10,358 10,252 7,967 6,916 8,522 8,808 10,198 10,354 7,835ERO and other 10,607 9,311 7,542 5,023 3,347 3,220 2,551 1,201 1,794 1,205Total refunds $88,398 $84,635 $76,587 $60,350 $53,709 $60,286 $59,732 $57,967 $59,396 $48,020
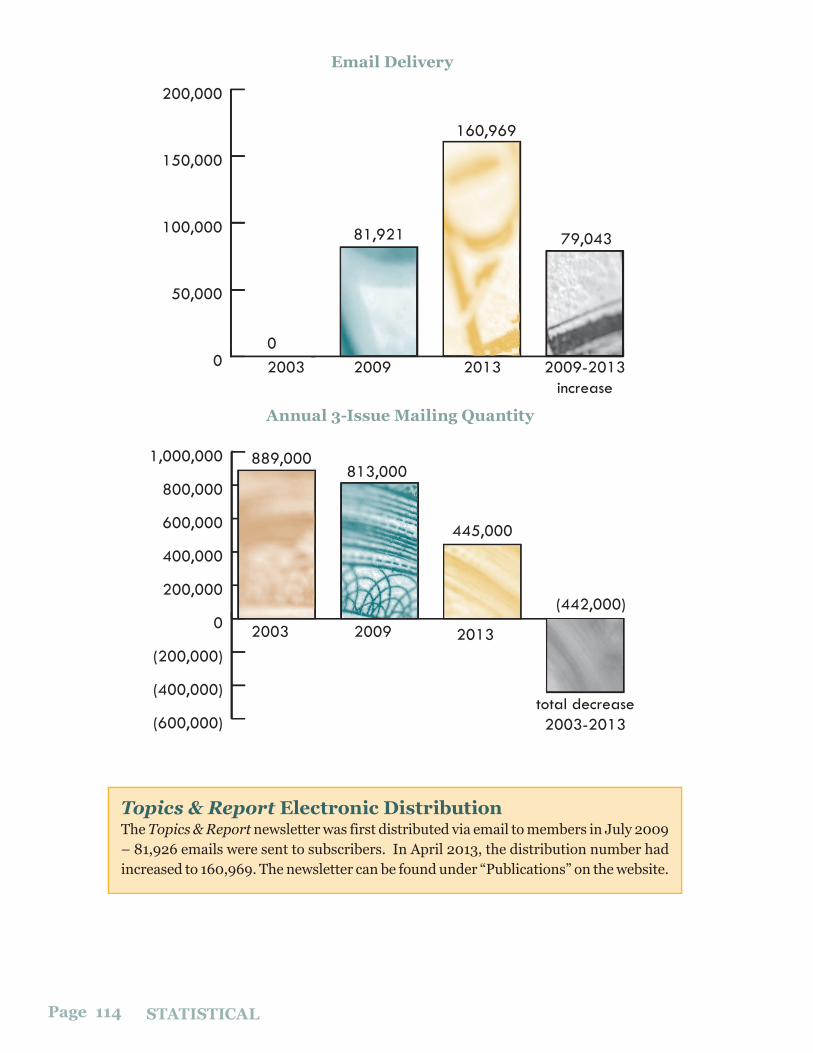
P a g e 1 1 4 STATISTICAL
Topics & Report E l e c t r o n i c D i s t r i b u t i o n The Topics & Report newsletter was first distributed via email to members in July 2009 – 81,926 emails were sent to subscribers. In April 2013, the distribution number had increased to 160,969. The newsletter can be found under “Publications” on the website.
0
50,000
100,000
150,000
200,000
2009-2013increase
2013
160,969
2003 20090
81,921 79,043
(600,000)
(400,000)
(200,000)
0
200,000
400,000
600,000
800,000
1,000,000
total decrease2003-2013
2013
445,000
2003 2009
889,000813,000
(442,000)
E m a i l D e l i v e r y
An n u a l 3 - Is s u e M a i l i n g Q u a n t i t y

P a g e 1 1 5STATISTICAL
employee and employer contribution rates, last 10 fiscal years
Employer Rate (%)2
Fiscal Year
EmployeeRate (%)1 State3
School Districts for 2.2 Formula
School Districts from Federal Sources4 Total5
2004 9.00% 13.98% 0.58% 0.40% 14.96%
2005 9.00 11.76 0.58 0.49 12.842006 9.40 6.75 0.58 0.31 7.642007 9.40 9.26 0.58 0.52 10.362008 9.40 12.53 0.58 0.58 13.692009 9.40 16.44 0.58 0.63 17.66
2010 9.40 22.56 0.58 0.82 23.962011 9.40 22.38 0.58 0.72 23.682012 9.40 24.06 0.58 0.85 25.492013 9.40 27.21 0.58 0.84 28.63
1 Rate increase in FY06 was for the Early Retirement Option.2 Employer contributions exclude contributions for Early Retirement Option. 3 State contributions increased through FY04 pursuant to statutory ramp schedule under 40 ILCS 5/16-158 (b-3). Pension obligation
bond (POB) proceeds that were received in FY04 are not state contributions and are not included in this schedule. FY05 decline was due to calculation required under POB legislation. FY06 and FY07 rates were due to specific dollar appropriation specified in Public Act 94-0004 that were not based on the statutory ramp schedule. FY08 through FY10 rates are based on statutory ramp schedule. FY11 rate is based on recertification requirements of Pubic Act 96-1511. FY12 and FY13 were based on the statutory formula.
4 Federal contributions above are expressed as percentages of total active member payroll. Through FY05, employers contributed 10.5 percent of pay as the employer contribution for members paid from federal sources. Beginning in FY06, the employer contribution rate paid on behalf of members paid from federal sources is the same as the employer contribution rate paid by the State of Illinois on behalf of members not paid from federal sources [7.06 percent in FY06, 9.78 percent in FY07, 13.11 percent in FY08, 17.08 percent in FY09, 23.38 percent in FY10, 23.10 percent in FY11, 24.91 percent in FY12, and 28.05 in FY13. A change to the federal contribution rate will be effective in FY15.
5 Totals shown are rates certified by the TRS Board of Trustees based on estimated payrolls and may not total due to rounding. Actual amounts collected do not equal amounts estimated by actuaries due to differences between estimated and actual payroll.

P a g e 1 1 6 STATISTICAL
demographics of benefit recipients and active members as of june 3 0 , 2 0 1 3( e x c l u d e s i n a c t i v e m e m b e r s )
RetireesDisability Benefit
Recipients Survivors Active MembersTotal Retirees, Disabilitants,
Survivors, and Active Members
Percent Distribution of Retirees, Disabilitants,
Survivors, and Active Members
Age Male Female Total Male Female Total Male Female Total Male Female Total Male Female Total Male Female Total
Under 20 - - - - - - 26 26 52 - - - 26 26 52 50% 50% 100%20-24 - - - - - - 5 9 14 1,324 4,779 6,103 1,329 4,788 6,117 22 78 10025-29 - - - - 6 6 3 2 5 5,080 16,539 21,619 5,083 16,547 21,630 23 77 10030-34 - - - 1 16 17 4 5 9 6,107 19,286 25,393 6,112 19,307 25,419 24 76 10035-39 - - - 1 32 33 6 13 19 5,898 16,896 22,794 5,905 16,941 22,846 26 74 10040-44 - - - 7 61 68 12 16 28 5,780 17,335 23,115 5,799 17,412 23,211 25 75 10045-49 - - - 18 79 97 11 27 38 4,327 14,443 18,770 4,356 14,549 18,905 23 77 10050-54 20 22 42 30 115 145 36 82 118 3,707 14,125 17,832 3,793 14,344 18,137 21 79 10055-59 1,609 4,314 5,923 40 200 240 102 157 259 2,853 12,271 15,124 4,604 16,942 21,546 21 79 10060-64 6,133 17,813 23,946 40 187 227 239 455 694 1,578 6,005 7,583 7,990 24,460 32,450 25 75 10065-69 8,550 17,383 25,933 26 102 128 368 747 1,115 576 1,251 1,827 9,520 19,483 29,003 33 67 10070-74 5,880 10,829 16,709 13 49 62 406 988 1,394 158 236 394 6,457 12,102 18,559 35 65 10075-79 4,022 6,383 10,405 10 44 54 404 1,125 1,529 54 51 105 4,490 7,603 12,093 37 63 10080-84 2,830 4,611 7,441 4 24 28 468 1,366 1,834 11 10 21 3,313 6,011 9,324 36 64 10085-89 1,524 3,054 4,578 4 11 15 406 1,100 1,506 - - - 1,934 4,165 6,099 32 68 100
90+ 515 2,407 2,922 - 8 8 282 860 1,142 3 9 12 800 3,284 4,084 20 80 100Total 31,083 66,816 97,899 194 934 1,128 2,778 6,978 9,756 37,456 123,236 160,692 71,511 197,964 269,475 27% 73% 100%
benefit recipients by type as of june 30, 2013 Type of Monthly Benefit Subtypes of Age Retirement Benefit
Monthly Benefit Range
Number of Recipients (all) Retirement
Disability Retirement
Non- occupational
DisabilityOccupational
Disability
Survivor Monthly Benefits
Regular 2.2 Flat Formula
Graduated Formula
Actuarial Benefit
ERO (2.2 & Grad. Form.)
ERI (State or TRS) Other
Retirement Total
Under $500 6,537 5,408 5 2 - 1,122 1,083 1,619 2,697 4 1 4 5,408$500 - $999 7,545 5,419 64 2 - 2,060 882 1,586 2,844 37 57 13 5,419
$1,000 - $1,499 6,965 5,014 199 15 - 1,737 949 1,555 2,052 227 199 32 5,014$1,500 - $1,999 7,263 5,340 204 106 - 1,613 1,249 1,299 1,587 789 384 32 5,340$2,000 - $2,499 7,270 5,788 101 114 1 1,266 1,476 1,185 1,100 1,358 641 28 5,788$2,500 - $2,999 6,989 6,020 71 55 2 841 1,643 967 776 1,681 913 40 6,020$3,000 - $3,499 7,338 6,767 33 24 - 514 2,165 872 503 2,064 1,133 30 6,767$3,500 - $3,999 8,202 7,842 34 14 - 312 2,773 893 431 2,454 1,222 69 7,842$4,000 - $4,499 8,307 8,140 19 8 - 140 3,026 891 342 2,668 1,127 86 8,140$4,500 - $4,999 8,258 8,180 15 1 - 62 3,029 894 337 2,675 1,125 120 8,180$5,000 - $5,499 7,492 7,445 12 - - 35 2,844 819 224 2,660 784 114 7,445$5,500 - $5,999 5,823 5,789 12 - - 22 2,235 732 183 1,972 581 86 5,789$6,000 - $6,499 4,785 4,759 10 - - 16 1,847 653 115 1,555 495 94 4,759$6,500 - $6,999 4,060 4,050 2 - - 8 1,629 510 100 1,294 436 81 4,050$7,000 - $7,499 3,254 3,249 1 - 1 3 1,247 435 59 1,145 301 62 3,249$7,500 - $7,999 2,543 2,542 - - - 1 936 375 38 946 205 42 2,542$8,000 or more 6,152 6,147 1 - - 4 2,368 986 124 2,111 386 172 6,147
Total benefit recipients: 108,783 97,899 783 341 4 9,756 31,381 16,271 13,512 25,640 9,990 1,105 97,899
Su m m a r y St a t i s t i c s , Al l B e n e f i t R e c i p i e n t s , a s o f J u n e 3 0 , 2 0 1 3Age Retirement Disability Benefits (3 types) Survivor Benefits
Average monthly benefit $4,150 $2,214 $1,665Average age 70 59 77Average years of service 28 16 10*
* average years receiving benefit

P a g e 1 1 7STATISTICAL
demographics of benefit recipients and active members as of june 3 0 , 2 0 1 3( e x c l u d e s i n a c t i v e m e m b e r s )
RetireesDisability Benefit
Recipients Survivors Active MembersTotal Retirees, Disabilitants,
Survivors, and Active Members
Percent Distribution of Retirees, Disabilitants,
Survivors, and Active Members
Age Male Female Total Male Female Total Male Female Total Male Female Total Male Female Total Male Female Total
Under 20 - - - - - - 26 26 52 - - - 26 26 52 50% 50% 100%20-24 - - - - - - 5 9 14 1,324 4,779 6,103 1,329 4,788 6,117 22 78 10025-29 - - - - 6 6 3 2 5 5,080 16,539 21,619 5,083 16,547 21,630 23 77 10030-34 - - - 1 16 17 4 5 9 6,107 19,286 25,393 6,112 19,307 25,419 24 76 10035-39 - - - 1 32 33 6 13 19 5,898 16,896 22,794 5,905 16,941 22,846 26 74 10040-44 - - - 7 61 68 12 16 28 5,780 17,335 23,115 5,799 17,412 23,211 25 75 10045-49 - - - 18 79 97 11 27 38 4,327 14,443 18,770 4,356 14,549 18,905 23 77 10050-54 20 22 42 30 115 145 36 82 118 3,707 14,125 17,832 3,793 14,344 18,137 21 79 10055-59 1,609 4,314 5,923 40 200 240 102 157 259 2,853 12,271 15,124 4,604 16,942 21,546 21 79 10060-64 6,133 17,813 23,946 40 187 227 239 455 694 1,578 6,005 7,583 7,990 24,460 32,450 25 75 10065-69 8,550 17,383 25,933 26 102 128 368 747 1,115 576 1,251 1,827 9,520 19,483 29,003 33 67 10070-74 5,880 10,829 16,709 13 49 62 406 988 1,394 158 236 394 6,457 12,102 18,559 35 65 10075-79 4,022 6,383 10,405 10 44 54 404 1,125 1,529 54 51 105 4,490 7,603 12,093 37 63 10080-84 2,830 4,611 7,441 4 24 28 468 1,366 1,834 11 10 21 3,313 6,011 9,324 36 64 10085-89 1,524 3,054 4,578 4 11 15 406 1,100 1,506 - - - 1,934 4,165 6,099 32 68 100
90+ 515 2,407 2,922 - 8 8 282 860 1,142 3 9 12 800 3,284 4,084 20 80 100Total 31,083 66,816 97,899 194 934 1,128 2,778 6,978 9,756 37,456 123,236 160,692 71,511 197,964 269,475 27% 73% 100%
Percentage of Age Retirement Benefits by Subtype32% 17% 14% 26% 10% 1% 100%
benefit recipients by type as of june 30, 2013 Type of Monthly Benefit Subtypes of Age Retirement Benefit
Monthly Benefit Range
Number of Recipients (all) Retirement
Disability Retirement
Non- occupational
DisabilityOccupational
Disability
Survivor Monthly Benefits
Regular 2.2 Flat Formula
Graduated Formula
Actuarial Benefit
ERO (2.2 & Grad. Form.)
ERI (State or TRS) Other
Retirement Total
Under $500 6,537 5,408 5 2 - 1,122 1,083 1,619 2,697 4 1 4 5,408$500 - $999 7,545 5,419 64 2 - 2,060 882 1,586 2,844 37 57 13 5,419
$1,000 - $1,499 6,965 5,014 199 15 - 1,737 949 1,555 2,052 227 199 32 5,014$1,500 - $1,999 7,263 5,340 204 106 - 1,613 1,249 1,299 1,587 789 384 32 5,340$2,000 - $2,499 7,270 5,788 101 114 1 1,266 1,476 1,185 1,100 1,358 641 28 5,788$2,500 - $2,999 6,989 6,020 71 55 2 841 1,643 967 776 1,681 913 40 6,020$3,000 - $3,499 7,338 6,767 33 24 - 514 2,165 872 503 2,064 1,133 30 6,767$3,500 - $3,999 8,202 7,842 34 14 - 312 2,773 893 431 2,454 1,222 69 7,842$4,000 - $4,499 8,307 8,140 19 8 - 140 3,026 891 342 2,668 1,127 86 8,140$4,500 - $4,999 8,258 8,180 15 1 - 62 3,029 894 337 2,675 1,125 120 8,180$5,000 - $5,499 7,492 7,445 12 - - 35 2,844 819 224 2,660 784 114 7,445$5,500 - $5,999 5,823 5,789 12 - - 22 2,235 732 183 1,972 581 86 5,789$6,000 - $6,499 4,785 4,759 10 - - 16 1,847 653 115 1,555 495 94 4,759$6,500 - $6,999 4,060 4,050 2 - - 8 1,629 510 100 1,294 436 81 4,050$7,000 - $7,499 3,254 3,249 1 - 1 3 1,247 435 59 1,145 301 62 3,249$7,500 - $7,999 2,543 2,542 - - - 1 936 375 38 946 205 42 2,542$8,000 or more 6,152 6,147 1 - - 4 2,368 986 124 2,111 386 172 6,147
Total benefit recipients: 108,783 97,899 783 341 4 9,756 31,381 16,271 13,512 25,640 9,990 1,105 97,899

P a g e 1 1 8 STATISTICAL
* The average for the final average salary by years of service is not available for periods before July 1, 2004.
average benefit payments for new retireesLa s t 1 0 F i s c a l Y e a r s
Retirement Effective Dates Years of Service Years of Service Under 5 5-9 10-14 15-19 20-24 25-29 30-34 35-39 40+
All Fiscal Year Retirees
Average Age For
All Fiscal Year Retirees
Average Service For
All Fiscal Year Retirees
Period July 1, 2012 through June 30, 2013Average monthly benefit $279 $771 $1,424 $2,237 $3,179 $4,232 $5,396 $6,066 $7,369 $4,070 age 61 26 yearsAverage final average salary $59,313 $42,291 $49,881 $66,108 $76,095 $83,918 $90,517 $96,245 $101,109 $79,689Number of retired members 149 298 353 391 673 664 750 1,115 142 4,535
Period July 1, 2011 through June 30, 2012Average monthly benefit $271 $787 $1,426 $2,354 $3,159 $4,310 $5,568 $6,214 $7,273 $4,292 age 60 27 yearsAverage final average salary $63,513 $49,970 $53,199 $68,176 $76,104 $85,929 $92,839 $98,975 $103,131 $83,346Number of retired members 215 358 375 380 620 702 923 1,516 177 5,266
Period July 1, 2010 through June 30, 2011Average monthly benefit $281 $712 $1,317 $2,171 $2,989 $4,097 $5,190 $5,708 $6,527 $3,984 age 60 27 yearsAverage final average salary $59,267 $40,317 $48,191 $62,212 $71,841 $81,416 $86,636 $91,033 $92,605 $76,805Number of retired members 160 328 349 357 599 562 905 1,359 134 4,753
Period July 1, 2009 through June 30, 2010Average monthly benefit $280 $670 $1,228 $2,121 $2,947 $3,891 $5,063 $5,621 $5,819 $3,960 age 60 27 yearsAverage final average salary $61,557 $38,116 $44,679 $62,156 $71,152 $77,352 $84,466 $89,648 $82,289 $75,507Number of retired members 144 312 304 335 495 536 887 1,410 118 4,541
Period July 1, 2008 through June 30, 2009Average monthly benefit $247 $642 $1,181 $2,012 $2,920 $3,941 $4,940 $5,411 $6,457 $3,840 age 59 27 yearsAverage final average salary $55,946 $39,118 $42,853 $57,824 $70,216 $78,684 $82,544 $86,467 $92,170 $73,725Number of retired members 155 295 240 297 472 425 779 1,301 65 4,029
Period July 1, 2007 through June 30, 2008Average monthly benefit $228 $623 $1,077 $1,836 $2,713 $3,505 $4,737 $5,098 $5,413 $3,536 age 59 26 yearsAverage final average salary $54,905 $41,044 $40,557 $52,692 $66,593 $71,223 $80,631 $81,570 $79,227 $69,412Number of retired members 112 197 256 251 400 398 695 884 67 3,260
Period July 1, 2006 through June 30, 2007Average monthly benefit $208 $595 $1,118 $1,932 $2,716 $3,744 $5,080 $5,598 $5,887 $4,260 age 58 29 yearsAverage final average salary $55,395 $40,331 $46,226 $56,872 $66,645 $75,511 $83,693 $89,451 $89,442 $77,499Number of retired members 132 212 233 286 492 575 1,858 1,506 139 5,433
Period July 1, 2005 through June 30, 2006Average monthly benefit $210 $515 $1,139 $1,744 $2,509 $3,372 $4,728 $5,161 $5,600 $3,789 age 59 28 yearsAverage final average salary $55,558 $36,036 $44,715 $53,349 $62,206 $68,902 $77,920 $82,558 $85,399 $70,764Number of retired members 114 202 202 199 376 404 1,205 1,005 84 3,791
Period July 1, 2004 through June 30, 2005Average monthly benefit $228 $544 $1,074 $1,715 $2,475 $3,467 $4,700 $5,264 $5,270 $4,070 age 58 30 yearsAverage final average salary $59,538 $39,038 $44,000 $52,488 $61,882 $70,637 $76,980 $84,774 $81,371 $73,078Number of retired members 170 198 233 251 567 737 2,992 1,637 123 6,908
Period July 1, 2003 through June 30, 2004Average monthly benefit $208 $575 $1,052 $1,635 $2,359 $3,227 $4,546 $5,056 $5,206 $3,892 age 58 30 yearsAverage final average salary* - - - - - - - - - $70,359Number of retired members 106 152 182 181 419 510 1,988 1,184 95 4,817

P a g e 1 1 9STATISTICAL
average benefit payments for new retireesLa s t 1 0 F i s c a l Y e a r s
Retirement Effective Dates Years of Service Years of Service Under 5 5-9 10-14 15-19 20-24 25-29 30-34 35-39 40+
All Fiscal Year Retirees
Average Age For
All Fiscal Year Retirees
Average Service For
All Fiscal Year Retirees
Period July 1, 2012 through June 30, 2013Average monthly benefit $279 $771 $1,424 $2,237 $3,179 $4,232 $5,396 $6,066 $7,369 $4,070 age 61 26 yearsAverage final average salary $59,313 $42,291 $49,881 $66,108 $76,095 $83,918 $90,517 $96,245 $101,109 $79,689Number of retired members 149 298 353 391 673 664 750 1,115 142 4,535
Period July 1, 2011 through June 30, 2012Average monthly benefit $271 $787 $1,426 $2,354 $3,159 $4,310 $5,568 $6,214 $7,273 $4,292 age 60 27 yearsAverage final average salary $63,513 $49,970 $53,199 $68,176 $76,104 $85,929 $92,839 $98,975 $103,131 $83,346Number of retired members 215 358 375 380 620 702 923 1,516 177 5,266
Period July 1, 2010 through June 30, 2011Average monthly benefit $281 $712 $1,317 $2,171 $2,989 $4,097 $5,190 $5,708 $6,527 $3,984 age 60 27 yearsAverage final average salary $59,267 $40,317 $48,191 $62,212 $71,841 $81,416 $86,636 $91,033 $92,605 $76,805Number of retired members 160 328 349 357 599 562 905 1,359 134 4,753
Period July 1, 2009 through June 30, 2010Average monthly benefit $280 $670 $1,228 $2,121 $2,947 $3,891 $5,063 $5,621 $5,819 $3,960 age 60 27 yearsAverage final average salary $61,557 $38,116 $44,679 $62,156 $71,152 $77,352 $84,466 $89,648 $82,289 $75,507Number of retired members 144 312 304 335 495 536 887 1,410 118 4,541
Period July 1, 2008 through June 30, 2009Average monthly benefit $247 $642 $1,181 $2,012 $2,920 $3,941 $4,940 $5,411 $6,457 $3,840 age 59 27 yearsAverage final average salary $55,946 $39,118 $42,853 $57,824 $70,216 $78,684 $82,544 $86,467 $92,170 $73,725Number of retired members 155 295 240 297 472 425 779 1,301 65 4,029
Period July 1, 2007 through June 30, 2008Average monthly benefit $228 $623 $1,077 $1,836 $2,713 $3,505 $4,737 $5,098 $5,413 $3,536 age 59 26 yearsAverage final average salary $54,905 $41,044 $40,557 $52,692 $66,593 $71,223 $80,631 $81,570 $79,227 $69,412Number of retired members 112 197 256 251 400 398 695 884 67 3,260
Period July 1, 2006 through June 30, 2007Average monthly benefit $208 $595 $1,118 $1,932 $2,716 $3,744 $5,080 $5,598 $5,887 $4,260 age 58 29 yearsAverage final average salary $55,395 $40,331 $46,226 $56,872 $66,645 $75,511 $83,693 $89,451 $89,442 $77,499Number of retired members 132 212 233 286 492 575 1,858 1,506 139 5,433
Period July 1, 2005 through June 30, 2006Average monthly benefit $210 $515 $1,139 $1,744 $2,509 $3,372 $4,728 $5,161 $5,600 $3,789 age 59 28 yearsAverage final average salary $55,558 $36,036 $44,715 $53,349 $62,206 $68,902 $77,920 $82,558 $85,399 $70,764Number of retired members 114 202 202 199 376 404 1,205 1,005 84 3,791
Period July 1, 2004 through June 30, 2005Average monthly benefit $228 $544 $1,074 $1,715 $2,475 $3,467 $4,700 $5,264 $5,270 $4,070 age 58 30 yearsAverage final average salary $59,538 $39,038 $44,000 $52,488 $61,882 $70,637 $76,980 $84,774 $81,371 $73,078Number of retired members 170 198 233 251 567 737 2,992 1,637 123 6,908
Period July 1, 2003 through June 30, 2004Average monthly benefit $208 $575 $1,052 $1,635 $2,359 $3,227 $4,546 $5,056 $5,206 $3,892 age 58 30 yearsAverage final average salary* - - - - - - - - - $70,359Number of retired members 106 152 182 181 419 510 1,988 1,184 95 4,817

P a g e 1 2 0 STATISTICAL
principal participating employers
Year ended June 30, 2013 Year ended June 30, 2004
Participating Employer City RankCovered
Employees
Percentage of Total TRS Membership Rank
Covered Employees
Percentage of Total TRS Membership
School District U46 Elgin 1 2,766 1.7% 1 2,654 1.8%Indian Prairie CUSD 204 Naperville 2 2,514 1.6 2 2,428 1.5Plainfield SD 202 Plainfield 3 2,330 1.4 5 1,653 1.0Rockford School District 205 Rockford 4 2,261 1.4 3 2,371 1.5Naperville CUSD 203 Naperville 5 1,753 1.1 4 1,718 1.1Valley View CUSD 365 Romeoville 6 1,619 1.0 - - -Community USD 300 Carpentersville 7 1,606 1.0 10 1,324 0.8Springfield SD 186 Springfield 8 1,558 1.0 7 1,494 0.9Waukegan CUSD 60 Waukegan 9 1,477 0.9 - - -Schaumburg CCSD 54 Schaumburg 10 1,468 0.9 9 1,377 0.9Peoria SD 150 Peoria - - - 6 1,602 1.0Community Unit SD 200 Wheaton - - - 8 1,378 0.9Total, largest 10 employers 19,352 12.0% 17,999 11.4%All other (1,009 employers in 2013* 1,039 employers in 2004) 141,340 88.0% 139,991 88.6%
Grand Total
160,692 100.0% 157,990 100.0%
*Other Employers by Type as of June 30, 2013
Number of Other
EmployersOther Covered
EmployeesLocal school districts 851 133,899 Special districts 138 6,803 State agencies 20 638 Total, employers other than largest 10 1,009 141,340
Total Employers by Type as of June 30, 2013
Total Number of Employers
Total Covered Employees
Local school districts 861 153,251 Special districts 138 6,803 State agencies 20 638 Total, all employers 1,019 160,692

Tablet AccessibilityIn FY13, the number of visits from tablets and smart phones was 27,395 and 21,930, respectively. The new web design is friendly to tablets and smart phones, so that visitors can simply find their information without scrolling across the larger design of a desktop website. The design automatically identifies and adapts to the technology the visitors use.

Printed by the Authority of the State of Illinois. 250 - Pub1 - 12/13 $10.34 per copy*
* As a green agency, TRS has significantly reduced the printed number of report copies. We encourage readers to use the online report to conserve our natural resources. The price per copy reflects that only 250 copies were printed; smaller runs often have a higher cost per copy.
Teachers’ Retirement System of the State of Illinois2815 W. Washington | P.O. Box 19253 | Springfield, IL 62794-9253
[email protected] | http://trs.illinois.gov(800) 877-7896 | for the hearing impaired: (866) 326-0087
Retirem
ent S
ecurity for Illinois Educators