Comprehensive Annual Financial Report - Orange County ...
276
-
Upload
khangminh22 -
Category
Documents
-
view
0 -
download
0
Transcript of Comprehensive Annual Financial Report - Orange County ...


County of Orange
State of California
Comprehensive
Annual Financial Report
For the Year Ended June 30, 2020
Frank Davies, CPA
Auditor-Controller

i
TABLE OF CONTENTS INTRODUCTORY SECTION
Letter of Transmittal ................................................................................................................................................ 1
GFOA Certificate of Achievement for Excellence in Financial Reporting ........................................................... 15
Organizational Chart............................................................................................................................................. 16
FINANCIAL SECTION
Independent Auditor’s Report .............................................................................................................................. 17
Management’s Discussion and Analysis (Unaudited Required Supplementary Information) ........................... 20
Basic Financial Statements:
Government-wide Financial Statements:
Statement of Net Position ........................................................................................................................ 40
Statement of Activities ............................................................................................................. ………….42
Fund Financial Statements:
Governmental Fund Financial Statements:
Balance Sheet ................................................................................................................................... 44
Reconciliation of the Governmental Funds Balance Sheet
to the Statement of Net Position. ............................................................................................... 46
Statement of Revenues, Expenditures, and Changes in
Fund Balances .......................................................................................................................... 48
Reconciliation of the Governmental Funds Statement of Revenues,
Expenditures, and Changes in Fund Balances to the Statement of Activities ......................... 50
Budgetary Comparison Statements:
General Fund.............................................................................................................................. 52
Flood Control District .................................................................................................................. 53
Other Public Protection .............................................................................................................. 54
Mental Health Services Act ........................................................................................................ 55
Proprietary Fund Financial Statements:
Statement of Net Position ................................................................................................................. 56
Statement of Revenues, Expenses, and Changes in Fund Net Position ....................................... 58
Statement of Cash Flows .................................................................................................................. 59
Fiduciary Fund Financial Statements:
Statement of Fiduciary Net Position ................................................................................................. 61
Statement of Changes in Fiduciary Net Position ............................................................................. 62
Notes to the Basic Financial Statements:
1. Summary of Significant Accounting Policies .................................................................................... 63
2. Deficit Fund Equity ............................................................................................................................ 85
3. Deposits and Investments ................................................................................................................ 85
4. Changes in Capital Assets ................................................................................................................ 99
5. Service Concession Arrangements ................................................................................................ 101
6. Receivables ..................................................................................................................................... 102
7. Interfund Receivables and Payables ............................................................................................. 102
8. County Property on Lease to Others .............................................................................................. 103
ii
FINANCIAL SECTION (Continued)
Basic Financial Statements (Continued):
Notes to the Basic Financial Statements (Continued):
9. Interfund Transfers .......................................................................................................................... 104
10. Short-Term Obligations ................................................................................................................... 106
11. Long-Term Obligations ................................................................................................................... 107
12. Conduit Debt Obligations and Successor Agency Debt ................................................................ 115
13. Leases. ............................................................................................................................................ 116
14. Landfill Site Closure and Postclosure Care Costs ......................................................................... 116
15. Construction and Other Significant Commitments ......................................................................... 118
16. Self-Insurance ................................................................................................................................. 120
17. Pollution Remediation ..................................................................................................................... 121
18. Retirement Plans ............................................................................................................................. 125
19. Postemployment Health Care Benefits .......................................................................................... 137
20. Contingencies .................................................................................................................................. 145
21. Subsequent Events ......................................................................................................................... 145
Required Supplementary Information (Unaudited):
Orange County Employees Retirement System (OCERS):
Schedule of County’s Proportionate Share of the Net Pension Liability .............................................. 147
Schedule of County Contributions ......................................................................................................... 147
Orange County Extra-Help Defined Benefit Plan:
Schedule of County’s Proportionate Share of the Net Pension Liability .............................................. 148
Schedule of Collective Plan Contributions ............................................................................................ 148
Schedule of County Contributions ......................................................................................................... 148
Schedule of Changes in the Collective Plan Net Pension Liability and Related Ratios ...................... 149
Schedule of Investment Returns ........................................................................................................... 151
Notes to Schedule .................................................................................................................................. 151
Orange County Retiree Medical Plan:
Schedule of Changes in the Collective Plan Net OPEB Liability and Related Ratios ......................... 152
Schedule of Investment Returns ........................................................................................................... 152
Schedule of County’s Proportionate Share of the Net OPEB Liability ................................................. 153
Schedule of Collective Plan Contributions ............................................................................................ 153
Schedule of County Contributions ......................................................................................................... 153
Notes to Schedule .................................................................................................................................. 154
Supplemental Information:
Nonmajor Governmental Funds:
Nonmajor Governmental Funds Description......................................................................................... 155
Combining Balance Sheet ..................................................................................................................... 159
Combining Statement of Revenues, Expenditures, and Changes in Fund Balances ......................... 165
Budgetary Comparison Schedules:
Special Revenue ............................................................................................................................. 171
Debt Service .................................................................................................................................... 176
Capital Projects ............................................................................................................................... 177
Permanent Fund ............................................................................................................................. 178
iii
FINANCIAL SECTION (Continued)
Supplemental Information (Continued):
Internal Service Funds:
Internal Service Funds Descriptions ..................................................................................................... 179
Combining Statement of Net Position ................................................................................................... 180
Combining Statement of Revenues, Expenses, and Changes in Fund Net Position ......................... 182
Combining Statement of Cash Flows .................................................................................................... 184
Fiduciary Funds:
Fiduciary Funds Descriptions ................................................................................................................ 186
Combining Statement of Fiduciary Net Position-Private-Purpose Trust Funds .................................. 188
Combining Statement of Changes in Fiduciary Net Position-Private-Purpose
Trust Funds ..................................................................................................................................... 189
Combining Statement of Fiduciary Position-Pension and Other Employee
Benefits Trust Funds ....................................................................................................................... 190
Combining Statement of Changes in Fiduciary Position-Pension and Other
Employee Benefits Trust Funds ..................................................................................................... 192
Combining Statement of Fiduciary Position-All Agency Funds ............................................................ 194
Combining Statement of Changes in Assets and Liabilities-All Agency Funds ................................... 195
STATISTICAL SECTION
Financial Trends:
Introduction .................................................................................................................................................. 197
Net Position by Component......................................................................................................................... 198
Changes in Net Position .............................................................................................................................. 202
Fund Balances, Governmental Funds ........................................................................................................ 206
Changes in Fund Balances of Governmental Funds ................................................................................. 208
Revenue Capacity:
Assessed Value of Taxable Property .......................................................................................................... 210
Direct and Overlapping Property Tax Rates ............................................................................................... 212
Principal Property Taxpayers ...................................................................................................................... 213
Property Tax Levies and Collections .......................................................................................................... 214
Debt Capacity:
Ratios of Outstanding Debt by Type ........................................................................................................... 215
Ratios of Net General Bonded Debt Outstanding ...................................................................................... 217
Legal Debt Margin as a Percentage of Debt Limit ...................................................................................... 218
Pledged Revenue Coverage ....................................................................................................................... 219
Economic and Demographic Information:
Demographic and Economic Statistics ....................................................................................................... 220
Principal Employers…... .............................................................................................................................. 221
Operating Information:
Full-time Equivalent County Employees by Function ................................................................................. 222
Operating Indicators by Function/Program ................................................................................................. 223
Capital Assets Statistics by Function .......................................................................................................... 227

Old Orange County Courthouse


December 22, 2020
The Citizens of Orange County:
The Comprehensive Annual Financial Report (CAFR) of the County of Orange, State of California (County), for the year ended June 30, 2020, is hereby submitted in accordance with the provisions of Sections 25250 and 25253 of the Government Code of the State of California. The report contains financial statements that have been prepared in conformity with United States generally accepted accounting principles (GAAP) prescribed for governmental entities. Responsibility for both the accuracy of the data and the completeness and fairness of the presentation, including all disclosures, rests with the County. A comprehensive framework of internal controls has been designed and established to provide reasonable assurance that the enclosed data is accurate in all material respects and is reported in a manner designed to present fairly the financial position and changes in financial position of County Funds. Because the cost of internal controls should not outweigh their benefits, the County’s comprehensive framework of internal controls has been designed to provide reasonable, rather than absolute, assurance that the financial statements will be free from material misstatements. The CAFR has been audited by the independent certified public accounting firm of Eide Bailly LLP. The goal of the independent audit was to provide reasonable assurance about whether the basic financial statements of the County for the year ended June 30, 2020, are free of material misstatement. The independent certified public accounting firm has issued an unmodified (clean) opinion on the County’s basic financial statements as of and for the year ended June 30, 2020. The independent auditor’s report is located at the front of the financial section of this report. This letter of transmittal is designed to complement and should be read in conjunction with Management’s Discussion and Analysis (MD&A) that immediately follows the independent auditor’s report. MD&A provides a narrative introduction, overview, and analysis of the basic financial statements. PROFILE OF THE GOVERNMENT The County, incorporated in 1889 and located in the southern part of the State of California, is one of the major metropolitan areas in the state and nation. The County occupies a land area of 799 square miles with a coastline of 42 miles serving a population of over 3 million. It represents the third most populous county in the state and ranks sixth in the nation. The County converted to a charter county as a result of the March 5, 2002, voter approval of Measure V, which provides for an electoral process to fill mid-term vacancies on the Board of Supervisors. Before Measure V, as a general law county, mid-term vacancies would otherwise be filled by gubernatorial appointment. In November 2008, voters approved Measure J, which added Article III, Section 301 to the Charter of Orange County requiring voter approval for increases in future retirement system benefits of any employee, legislative officer, or elected official of the County in the Orange County Employees Retirement System (OCERS) or any successor retirement system, with the exception of statutorily-established cost of living adjustments, salary increases, and annual leave or compensatory time cash-outs. In June 2012, voters approved Measure B, which requires that any Orange County Supervisors elected on or after June 5, 2012 can enroll only in the minimum pension option, i.e., the least lucrative pension plan, offered to Orange County employees. At present, the minimum pension plan is a 1.62% at 65 pension
AUDITOR-CONTROLLER COUNTY OF ORANGE
1770 N. BROADWAY
POST OFFICE BOX 567
SANTA ANA, CALIFORNIA 92706
(714) 834-2450 FAX: (714) 834-2569
www.ac.ocgov.com
COUNTY EXECUTIVE OFFICE COUNTY OF ORANGE
ROBERT E. THOMAS HALL OF
ADMINISTRATION
333 W. SANTA ANA BLVD. SANTA ANA, CALIFORNIA 92701
(714) 834-2345 FAX: (714) 834-3018
www.ocgov.com
___________________________________________________________________________________________1
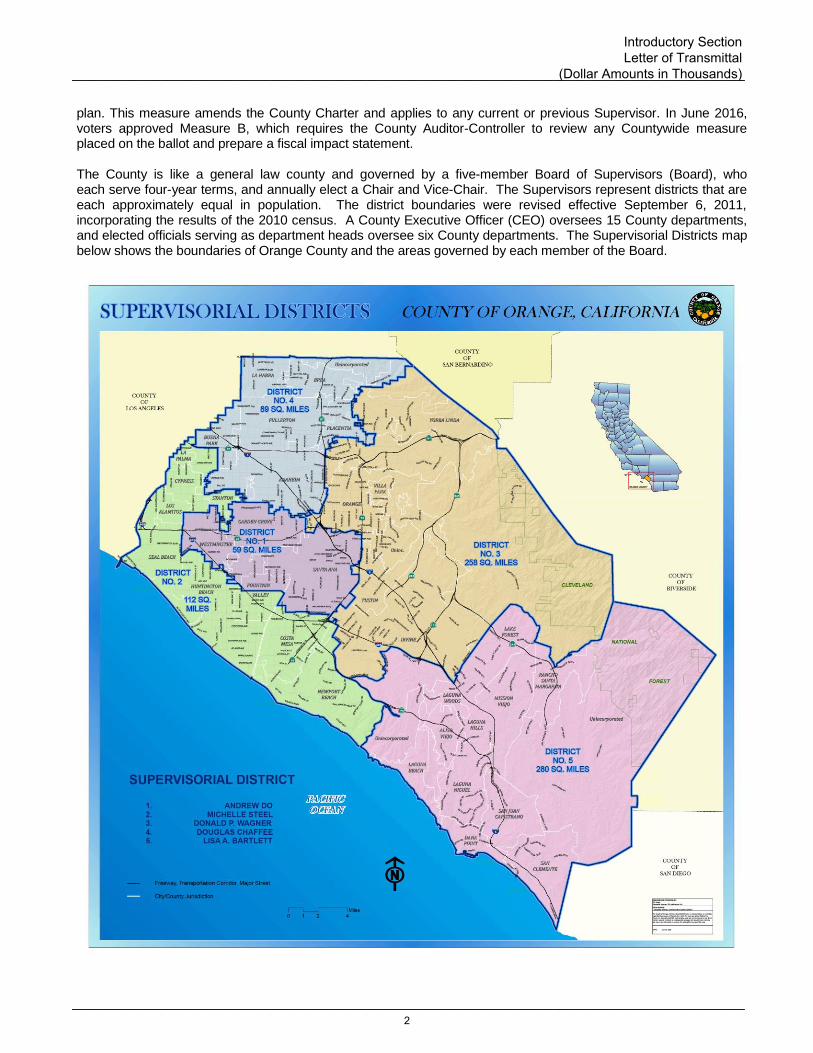
plan. This measure amends the County Charter and applies to any current or previous Supervisor. In June 2016, voters approved Measure B, which requires the County Auditor-Controller to review any Countywide measure placed on the ballot and prepare a fiscal impact statement. The County is like a general law county and governed by a five-member Board of Supervisors (Board), who each serve four-year terms, and annually elect a Chair and Vice-Chair. The Supervisors represent districts that are each approximately equal in population. The district boundaries were revised effective September 6, 2011, incorporating the results of the 2010 census. A County Executive Officer (CEO) oversees 15 County departments, and elected officials serving as department heads oversee six County departments. The Supervisorial Districts map below shows the boundaries of Orange County and the areas governed by each member of the Board.
___________________________________________________________________________________________
___________________________________________________________________________________________
Introductory Section Letter of Transmittal
(Dollar Amounts in Thousands)
2

Sources: County departments
The County provides a full range of services Countywide, for the unincorporated areas, and contracted services for cities. These services are outlined in the following table:
Countywide Services Unincorporated Area Services
Affordable Housing (Housing Authority)
Veterans Services Animal Care & Control Libraries
Agricultural Commissioner Indigent Medical Services Flood Control Parks
Airport Jails & Juvenile Facilities Land Use Waste Disposal Collection
Child Protection & Social Services
Juvenile Justice Commission Law Enforcement
Child Support Services Landfills & Solid Waste Disposal
Clerk-Recorder Law Enforcement
Coroner & Forensic Services
Probationary Supervision Contracted Services for Cities
District Attorney/Public Administrator
Public Assistance Animal Care & Control Libraries
Elections & Voter Registration
Public Defender/ Alternate Defense
Law Enforcement Public Works & Engineering
Environmental/Regulatory Health
Public & Behavioral Health Utility Billing and Check Remittance Processing
Flood Control & Transportation
Senior Services
OC Parks Collection & Appeals
Disaster Preparedness Weights & Measures
Grand Jury Property Tax Assessment, Apportionment & Collection
Public Guardian
In addition to these services, the County is also financially accountable for the reporting of component units, which can be either blended or discretely reported. Blended units, although legally separate entities, are, in substance, part of the County's operations and, therefore, data from these units are combined with data of the County. The County has two discretely presented component units, the Children and Families Commission of Orange County (CFCOC) and CalOptima, which require discrete presentation in the government-wide financial statements. The County has one fiduciary component unit, the Orange County Housing Finance Trust. The following entities are presented as blended component units in the basic financial statements for the year ended June 30, 2020: the Orange County Flood Control District, Orange County Housing Authority, Orange County Public Financing Authority, Capital Facilities Development Corporation, South Orange County Public Financing Authority, Orange County Public Facilities Corporation, County Service Areas, Special Assessment Districts, Community Facility Districts, and In-Home Supportive Services Public Authority. Additional information on these entities can be found in Note 1, Summary of Significant Accounting Policies, in the Notes to the Basic Financial Statements section. The County maintains budgetary controls to ensure compliance with legal provisions embodied in the annual appropriated budget approved by the Board. Activities of the General Fund and most of the Special Revenue, Debt Service, Capital Projects and Permanent Funds are included in the annual appropriated budget. The level of budgetary control (that level which cannot be exceeded without action by the Board) is at the legal fund-budget control-unit level, which represents a department or an agency. Budget-to-actual comparisons are provided in this report for each Governmental Fund for which an appropriated annual budget has been adopted. The Budgetary Comparison Statements for the General Fund and major Special Revenue Funds are part of the Basic Financial Statements. The Budgetary Comparison Schedules for the nonmajor Governmental Funds with appropriated annual budgets are presented in the Supplemental Information section for Governmental Funds. The County also
___________________________________________________________________________________________
___________________________________________________________________________________________
County of Orange Comprehensive Annual Financial Report For the Year Ended June 30, 2020 (Dollar Amounts in Thousands)
3
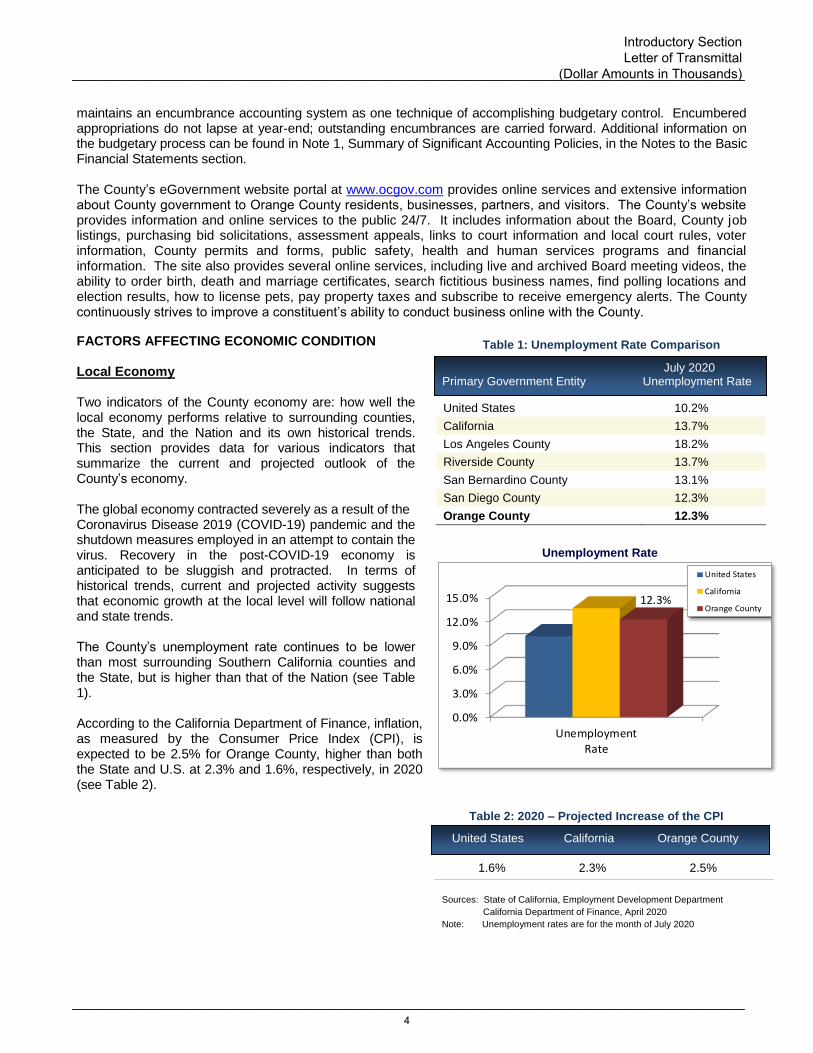
Table 1: Unemployment Rate Comparison
United States 10.2%
California 13.7%
Los Angeles County 18.2%
Riverside County 13.7%
San Bernardino County 13.1%
San Diego County 12.3%
Orange County 12.3%
Table 2: 2020 – Projected Increase of the CPI
1.6% 2.3% 2.5%
United States California Orange County
Unemployment Rate
maintains an encumbrance accounting system as one technique of accomplishing budgetary control. Encumbered appropriations do not lapse at year-end; outstanding encumbrances are carried forward. Additional information on the budgetary process can be found in Note 1, Summary of Significant Accounting Policies, in the Notes to the Basic Financial Statements section. The County’s eGovernment website portal at www.ocgov.com provides online services and extensive information about County government to Orange County residents, businesses, partners, and visitors. The County’s website provides information and online services to the public 24/7. It includes information about the Board, County job listings, purchasing bid solicitations, assessment appeals, links to court information and local court rules, voter information, County permits and forms, public safety, health and human services programs and financial information. The site also provides several online services, including live and archived Board meeting videos, the ability to order birth, death and marriage certificates, search fictitious business names, find polling locations and election results, how to license pets, pay property taxes and subscribe to receive emergency alerts. The County continuously strives to improve a constituent’s ability to conduct business online with the County.
FACTORS AFFECTING ECONOMIC CONDITION
Local Economy
Two indicators of the County economy are: how well the local economy performs relative to surrounding counties, the State, and the Nation and its own historical trends. This section provides data for various indicators that summarize the current and projected outlook of the County’s economy. The global economy contracted severely as a result of the Coronavirus Disease 2019 (COVID-19) pandemic and the shutdown measures employed in an attempt to contain the virus. Recovery in the post-COVID-19 economy is anticipated to be sluggish and protracted. In terms of historical trends, current and projected activity suggests that economic growth at the local level will follow national and state trends. The County’s unemployment rate continues to be lower than most surrounding Southern California counties and the State, but is higher than that of the Nation (see Table 1). According to the California Department of Finance, inflation, as measured by the Consumer Price Index (CPI), is expected to be 2.5% for Orange County, higher than both the State and U.S. at 2.3% and 1.6%, respectively, in 2020 (see Table 2).
July 2020 Primary Government Entity Unemployment Rate
Sources: State of California, Employment Development Department
California Department of Finance, April 2020
Note: Unemployment rates are for the month of July 2020
0.0%
3.0%
6.0%
9.0%
12.0%
15.0%
UnemploymentRate
12.3%
United States
California
Orange County
___________________________________________________________________________________________
___________________________________________________________________________________________
Introductory Section Letter of Transmittal
(Dollar Amounts in Thousands)
4
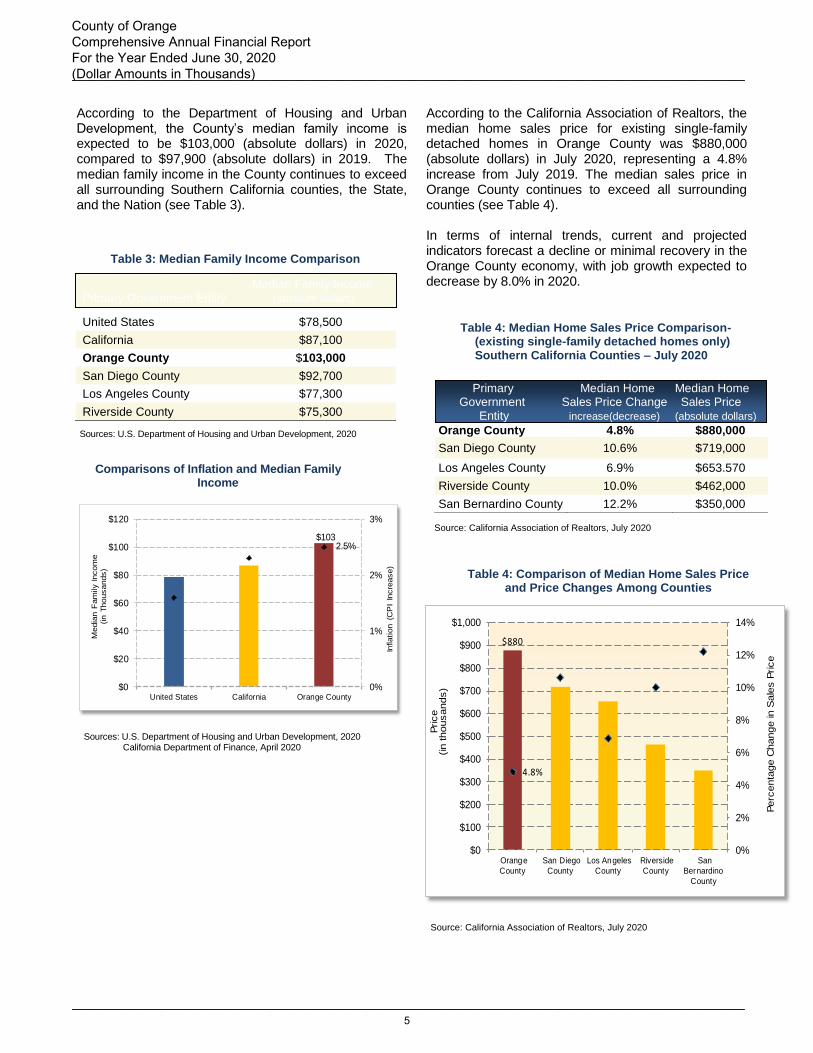
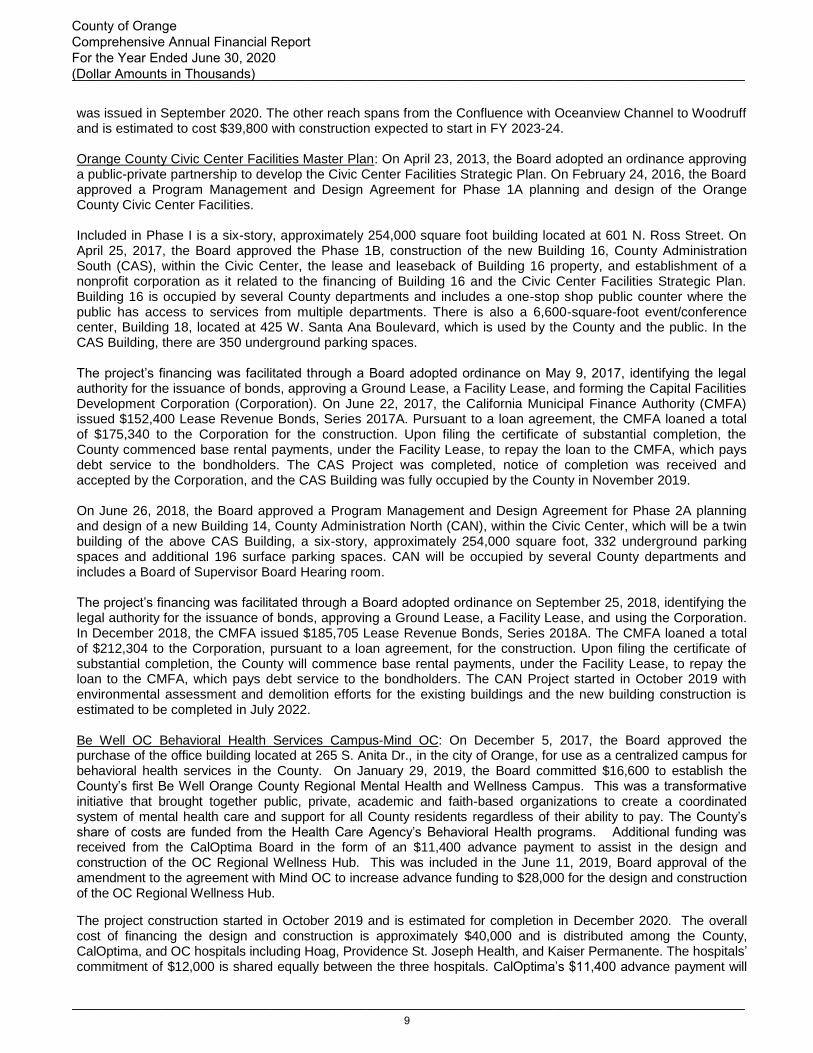
Comparisons of Inflation and Median Family Income
Sources: U.S. Department of Housing and Urban Development, 2020
Sources: U.S. Department of Housing and Urban Development, 2020 California Department of Finance, April 2020
According to the Department of Housing and Urban Development, the County’s median family income is expected to be $103,000 (absolute dollars) in 2020, compared to $97,900 (absolute dollars) in 2019. The median family income in the County continues to exceed all surrounding Southern California counties, the State, and the Nation (see Table 3).
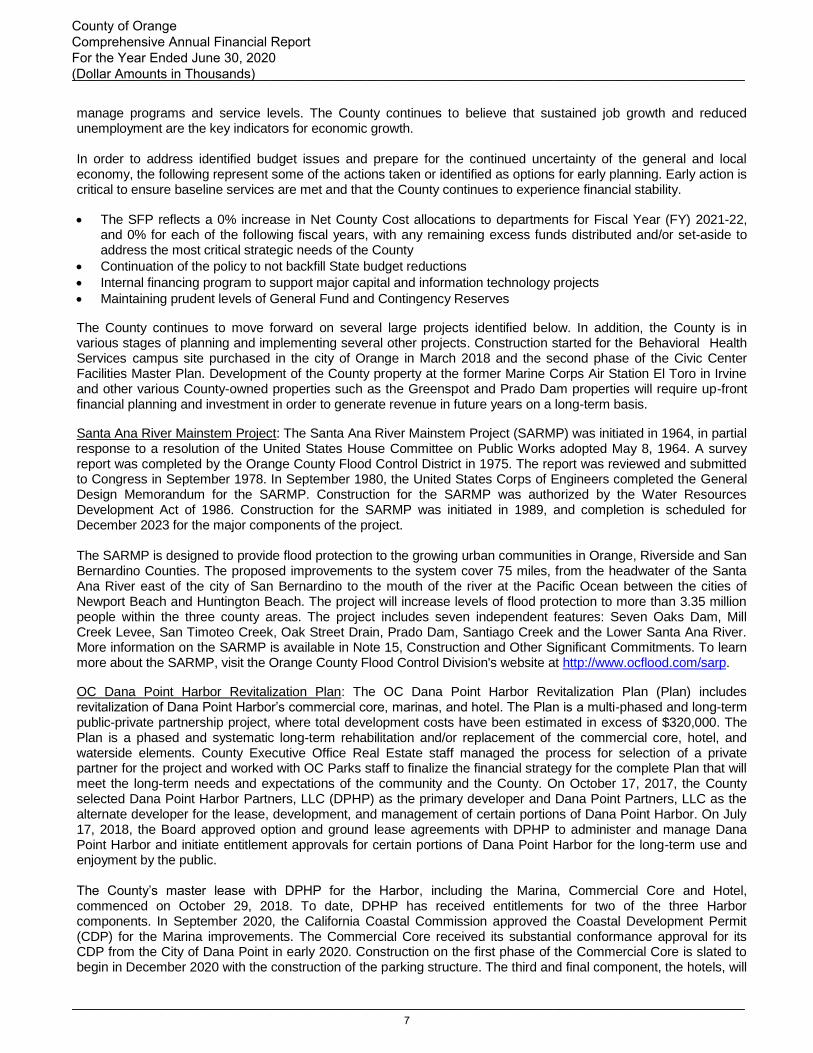
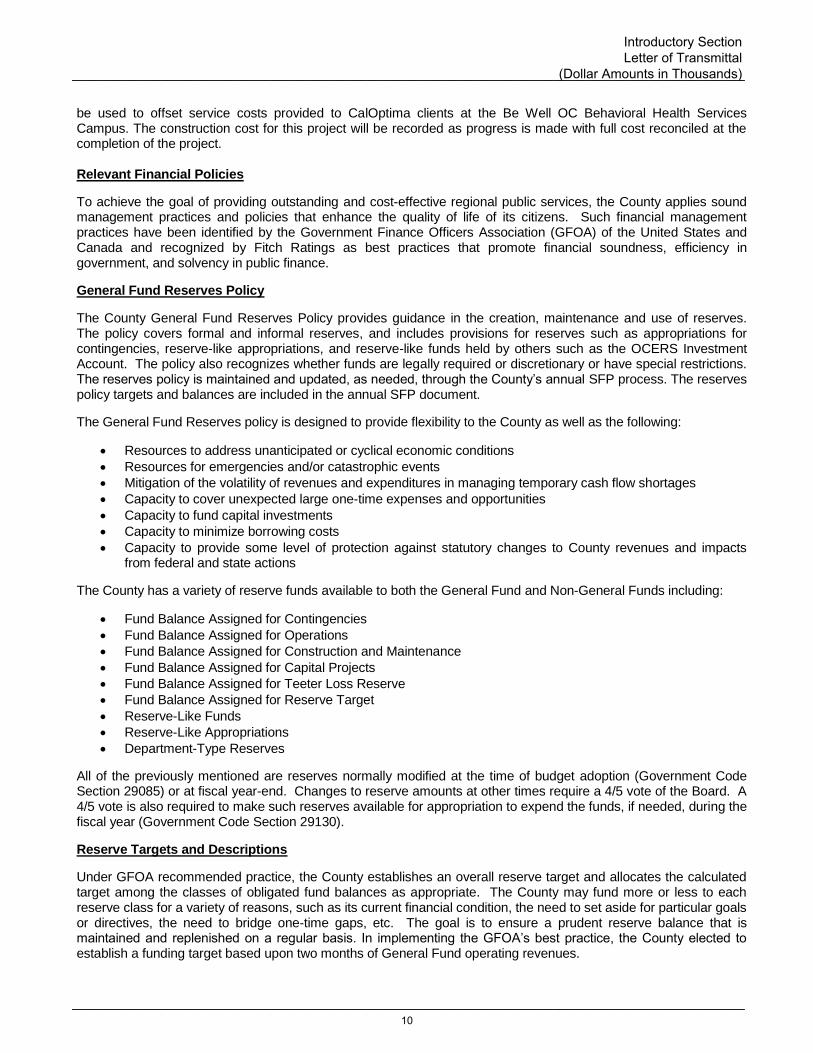
According to the California Association of Realtors, the median home sales price for existing single-family detached homes in Orange County was $880,000 (absolute dollars) in July 2020, representing a 4.8% increase from July 2019. The median sales price in Orange County continues to exceed all surrounding counties (see Table 4).
In terms of internal trends, current and projected indicators forecast a decline or minimal recovery in the Orange County economy, with job growth expected to decrease by 8.0% in 2020.
$1032.5%
0%
1%
2%
3%
$0
$20
$40
$60
$80
$100
$120
United States California Orange County
Inflation (C
PI
Incre
ase)
Media
n F
am
ily Incom
e
(in T
housands)
Table 3: Median Family Income Comparison
United States $78,500
California $87,100
Orange County $103,000
San Diego County $92,700
Los Angeles County $77,300
Riverside County $75,300
Median Family Income Primary Government Entity (absolute dollars)
Orange County 4.8% $880,000
San Diego County 10.6% $719,000
Los Angeles County 6.9% $653.570
Riverside County 10.0% $462,000
San Bernardino County 12.2% $350,000
Source: California Association of Realtors, July 2020
Table 4: Comparison of Median Home Sales Price
and Price Changes Among Counties
Primary Median Home Median Home Government Sales Price Change Sales Price Entity increase(decrease) (absolute dollars)
Source: California Association of Realtors, July 2020
Table 4: Median Home Sales Price Comparison- (existing single-family detached homes only)
Southern California Counties – July 2020
$880
4.8%
0%
2%
4%
6%
8%
10%
12%
14%
$0
$100
$200
$300
$400
$500
$600
$700
$800
$900
$1,000
Orange
County
San Diego
County
Los Angeles
County
Riverside
County
San
Bernardino
County
Price
(in thousands)
Perc
enta
ge C
hange in S
ale
s P
rice
___________________________________________________________________________________________
___________________________________________________________________________________________
County of Orange Comprehensive Annual Financial Report For the Year Ended June 30, 2020 (Dollar Amounts in Thousands)
5

Table 5: Orange County Historical Data
Unemployment Rates 4.5% 3.9% 3.3% 3.1% 12.3% Annual Job Growth Rates 2.6% 2.1% 2.0% 1.3% (8.0%)
Annual CPI Inflation 1.7% 2.1% 3.5% 3.4% 2.5%
Median Home Sales Price Increase 4.3% 6.2% 4.8% 0.9% 1.4%
Annual Change in Sales Tax Receipts 2.8% 3.3% 3.6% 3.0% (12.1%)
Table 5 shows various internal indicators reflecting a decline or minimal growth of the County’s economy. The unemployment rate increased from 3.1% in July 2019 relative to 12.3% in July 2020. Job growth is expected to decrease by 8.0% in 2020. Median home sales price for existing single-family detached homes are forecasted to increase by 1.4% in 2020, relative to an increase of 0.9% in 2019, according to the June 2020 Champan University Economic & Business Review. Sales tax receipts are forecasted to decrease by 12.1% in 2020.
-13.0%
-11.0%
-9.0%
-7.0%
-5.0%
-3.0%
-1.0%
1.0%
3.0%
5.0%
7.0%
9.0%
11.0%
13.0%Unemployment Rates
Annual Job Growth Rates
Annual CPI Inflation
Median Home Sales PriceIncrease
Annual Change in SalesTax Receipts
In summary, the economy in Orange County is forecasted to slow. Long–Term Financial Planning Strategic Plan: In March 1997, the Board initiated a financial planning process that is a key component of the County’s commitment to fiscal responsibility, accountability, and efficiency. The plan includes projections of County general purpose revenues, departmental projections of operating costs, revenues, capital and information technology needs for current programs and services and anticipated caseload changes. New programs, services and capital projects are identified and prioritized on a Countywide basis with financial impacts identified over the plan period. The plan covers a five-year period and includes a ten-year analysis of operating costs in cases where new programs and facilities are assessed to ensure the ability to pay for long-term operational costs. The 2020 Strategic Financial Plan (SFP) will be presented to the Board on January 26, 2021. The 2020 SFP is the foundation in planning for continued financial stability and is augmented by the monitoring and establishment of budgetary control via the budget reporting process and adoption of the Annual Budget. The five-year SFP projections indicate that General Purpose Revenue will grow, on average, about 3.0% annually. The moderate growth rate for revenue, coupled with the increasing cost of doing business, will require the County to carefully
Orange County Historical Data Comparison (Shown as a year-to-year percentage increase/decrease)
Historical Indicators 2016 2017 2018 2019 2020 2014 2015 2016 2017 fFffprFForecast for
Sources: State of California, Employment Development Department
Economic & Business Review, Chapman University, June 2020
California Association of Realtors
Data in Table 5 for prior years may be different from previous years CAFR due to the timing of obtaining data. Data for 2020 is based on forecasted data
___________________________________________________________________________________________
___________________________________________________________________________________________
Introductory Section Letter of Transmittal
(Dollar Amounts in Thousands)
6
manage programs and service levels. The County continues to believe that sustained job growth and reduced unemployment are the key indicators for economic growth. In order to address identified budget issues and prepare for the continued uncertainty of the general and local economy, the following represent some of the actions taken or identified as options for early planning. Early action is critical to ensure baseline services are met and that the County continues to experience financial stability.
• The SFP reflects a 0% increase in Net County Cost allocations to departments for Fiscal Year (FY) 2021-22, and 0% for each of the following fiscal years, with any remaining excess funds distributed and/or set-aside to address the most critical strategic needs of the County
• Continuation of the policy to not backfill State budget reductions
• Internal financing program to support major capital and information technology projects
• Maintaining prudent levels of General Fund and Contingency Reserves
The County continues to move forward on several large projects identified below. In addition, the County is in various stages of planning and implementing several other projects. Construction started for the Behavioral Health Services campus site purchased in the city of Orange in March 2018 and the second phase of the Civic Center Facilities Master Plan. Development of the County property at the former Marine Corps Air Station El Toro in Irvine and other various County-owned properties such as the Greenspot and Prado Dam properties will require up-front financial planning and investment in order to generate revenue in future years on a long-term basis.
Santa Ana River Mainstem Project: The Santa Ana River Mainstem Project (SARMP) was initiated in 1964, in partial response to a resolution of the United States House Committee on Public Works adopted May 8, 1964. A survey report was completed by the Orange County Flood Control District in 1975. The report was reviewed and submitted to Congress in September 1978. In September 1980, the United States Corps of Engineers completed the General Design Memorandum for the SARMP. Construction for the SARMP was authorized by the Water Resources Development Act of 1986. Construction for the SARMP was initiated in 1989, and completion is scheduled for December 2023 for the major components of the project. The SARMP is designed to provide flood protection to the growing urban communities in Orange, Riverside and San Bernardino Counties. The proposed improvements to the system cover 75 miles, from the headwater of the Santa Ana River east of the city of San Bernardino to the mouth of the river at the Pacific Ocean between the cities of Newport Beach and Huntington Beach. The project will increase levels of flood protection to more than 3.35 million people within the three county areas. The project includes seven independent features: Seven Oaks Dam, Mill Creek Levee, San Timoteo Creek, Oak Street Drain, Prado Dam, Santiago Creek and the Lower Santa Ana River. More information on the SARMP is available in Note 15, Construction and Other Significant Commitments. To learn more about the SARMP, visit the Orange County Flood Control Division's website at http://www.ocflood.com/sarp.
OC Dana Point Harbor Revitalization Plan: The OC Dana Point Harbor Revitalization Plan (Plan) includes revitalization of Dana Point Harbor’s commercial core, marinas, and hotel. The Plan is a multi-phased and long-term public-private partnership project, where total development costs have been estimated in excess of $320,000. The Plan is a phased and systematic long-term rehabilitation and/or replacement of the commercial core, hotel, and waterside elements. County Executive Office Real Estate staff managed the process for selection of a private partner for the project and worked with OC Parks staff to finalize the financial strategy for the complete Plan that will meet the long-term needs and expectations of the community and the County. On October 17, 2017, the County selected Dana Point Harbor Partners, LLC (DPHP) as the primary developer and Dana Point Partners, LLC as the alternate developer for the lease, development, and management of certain portions of Dana Point Harbor. On July 17, 2018, the Board approved option and ground lease agreements with DPHP to administer and manage Dana Point Harbor and initiate entitlement approvals for certain portions of Dana Point Harbor for the long-term use and enjoyment by the public. The County’s master lease with DPHP for the Harbor, including the Marina, Commercial Core and Hotel, commenced on October 29, 2018. To date, DPHP has received entitlements for two of the three Harbor components. In September 2020, the California Coastal Commission approved the Coastal Development Permit (CDP) for the Marina improvements. The Commercial Core received its substantial conformance approval for its CDP from the City of Dana Point in early 2020. Construction on the first phase of the Commercial Core is slated to begin in December 2020 with the construction of the parking structure. The third and final component, the hotels, will
___________________________________________________________________________________________
___________________________________________________________________________________________
County of Orange Comprehensive Annual Financial Report For the Year Ended June 30, 2020 (Dollar Amounts in Thousands)
7

require an amendment to the existing Local Coastal Plan as well as a CDP to allow for the two hotels proposed by DPHP as part of their overall revitalization program. It is anticipated that the review and permitting process will not be completed until at least 2022, with construction of the hotels commencing thereafter. Additional information on these agreements can be found in Note 5, Service Concession Arrangements, in the Notes to the Basic Financial Statements section.
James A. Musick Facility Expansion: On March 8, 2012, the County received a conditional award from the State for $100,000 in funds for expansion of the James A. Musick Facility, Assembly Bill 900 (AB900 Phase II). On March 8, 2013, the State approved the funding to complete design and construction for the project, of which establishment allows the County to commit funding to design and construction that is reimbursed from the AB900 Phase II $100,000 award. The County must front costs initially until the notice to proceed for construction is approved by the State. At that time, all past eligible costs incurred can be invoiced for reimbursement by the State in full, and all future costs will be invoiced for reimbursement by the State on an ongoing basis until construction completion and occupancy. It is anticipated that costs will be reimbursed beginning in FY 2020-21. On March 13, 2014, the State approved $80,000 in funds for the County for additional rehabilitation, treatment, and housing for the James A. Musick Facility (Senate Bill 1022). This project will be completed in parallel with the AB900 Phase II project. Because of schedule compaction during design, the State approved executing both project phases into a single construction project. The financial requirements for this second phase are consistent with those described above. On May 5, 2020, the County awarded a construction contract to Bernards Bros., Inc. for the project in the amount of $261,118 and also approved a five percent construction contingency amount of $13,056. The total project cost is estimated to be $308,000 including all design, construction, project management and contingency costs. The cost is funded by $180,000 from AB900 and SB 1022 State funding and $128,000 from the County’s General Fund. This project started in June 2020, with an estimated completion in August 2022.
Central Utility Facility (CUF) Infrastructure Upgrade Project: The County CUF Project (Project) in the city of Santa Ana, replaced the cooling tower, chillers and pumps, and added a boiler and related equipment at the CUF, replaced the absorption chiller and steam line, and modified the steam system to accommodate the new absorption chiller. The Project replaced the original 1968 CUF components which were beyond useful life and required upgrades and replacement to be reliable and energy efficient. The Project also included expansion of the present thermal utility distribution system to new thermal utility clients and improving the cogeneration system efficiency and performance by using the full capacity of the cogeneration components. The total Project was budgeted at $68,000 and was funded from CUF Lease Revenue Bonds, Series 2016 issued in June 2016. As of June 30, 2019, $67,800 of $68,000 bond proceeds were spent. The Project is complete and notice of completion was submitted in August 2019.
Westminster Watershed Feasibility Study/East Garden Grove Wintersburg Channel: OC Public Works (OCPW) completed work with the Army Corps of Engineers (USACE) to finalize the Westminster Watershed Feasibility Study to reach the final milestone of Chief’s Report issued on July 9, 2020. The Chief’s Report is developed when a water resources project requires Congressional authorization and is the final step in the feasibility process. After having reached the Tentatively Selected Plan (TSP) milestone, which is the flood mitigation plan prepared by USACE, OCPW began a Design-Build contract to construct reaches covered by the study while receiving Work-In-Kind (WIK) credit towards Orange County Flood Control District’s (OCFCD) portion of the expected 65% Federal and 35% Non-Federal cost share. Improvements to OCFCD facilities will benefit several cities including Huntington Beach, Fountain Valley, Westminster, Garden Grove, Santa Ana and Seal Beach. As part of the Study, USACE conducted public hearings and continues to incorporate refinements to cost analyses. The cost estimates from the Study indicate that total construction cost is approximately $1,224,000 for the Project; however, final analyses will provide a better estimate. Authorization is required by Congress through the Water Resources Development Act of 2020. Appropriations would then be needed to establish funding for the Project. Two projects for the East Garden Grove Wintersburg Channel are planned for construction by OCPW ahead of the formal partnership agreement with USACE for the federal project. The reach from Warner Ave. to Goldenwest St. is estimated to cost $78,700. A construction contract was awarded in June 2020 and the Notice to Proceed
___________________________________________________________________________________________
___________________________________________________________________________________________
Introductory Section Letter of Transmittal
(Dollar Amounts in Thousands)
8
was issued in September 2020. The other reach spans from the Confluence with Oceanview Channel to Woodruff and is estimated to cost $39,800 with construction expected to start in FY 2023-24. Orange County Civic Center Facilities Master Plan: On April 23, 2013, the Board adopted an ordinance approving a public-private partnership to develop the Civic Center Facilities Strategic Plan. On February 24, 2016, the Board approved a Program Management and Design Agreement for Phase 1A planning and design of the Orange County Civic Center Facilities. Included in Phase I is a six-story, approximately 254,000 square foot building located at 601 N. Ross Street. On April 25, 2017, the Board approved the Phase 1B, construction of the new Building 16, County Administration South (CAS), within the Civic Center, the lease and leaseback of Building 16 property, and establishment of a nonprofit corporation as it related to the financing of Building 16 and the Civic Center Facilities Strategic Plan. Building 16 is occupied by several County departments and includes a one-stop shop public counter where the public has access to services from multiple departments. There is also a 6,600-square-foot event/conference center, Building 18, located at 425 W. Santa Ana Boulevard, which is used by the County and the public. In the CAS Building, there are 350 underground parking spaces. The project’s financing was facilitated through a Board adopted ordinance on May 9, 2017, identifying the legal authority for the issuance of bonds, approving a Ground Lease, a Facility Lease, and forming the Capital Facilities Development Corporation (Corporation). On June 22, 2017, the California Municipal Finance Authority (CMFA) issued $152,400 Lease Revenue Bonds, Series 2017A. Pursuant to a loan agreement, the CMFA loaned a total of $175,340 to the Corporation for the construction. Upon filing the certificate of substantial completion, the County commenced base rental payments, under the Facility Lease, to repay the loan to the CMFA, which pays debt service to the bondholders. The CAS Project was completed, notice of completion was received and accepted by the Corporation, and the CAS Building was fully occupied by the County in November 2019. On June 26, 2018, the Board approved a Program Management and Design Agreement for Phase 2A planning and design of a new Building 14, County Administration North (CAN), within the Civic Center, which will be a twin building of the above CAS Building, a six-story, approximately 254,000 square foot, 332 underground parking spaces and additional 196 surface parking spaces. CAN will be occupied by several County departments and includes a Board of Supervisor Board Hearing room. The project’s financing was facilitated through a Board adopted ordinance on September 25, 2018, identifying the legal authority for the issuance of bonds, approving a Ground Lease, a Facility Lease, and using the Corporation. In December 2018, the CMFA issued $185,705 Lease Revenue Bonds, Series 2018A. The CMFA loaned a total of $212,304 to the Corporation, pursuant to a loan agreement, for the construction. Upon filing the certificate of substantial completion, the County will commence base rental payments, under the Facility Lease, to repay the loan to the CMFA, which pays debt service to the bondholders. The CAN Project started in October 2019 with environmental assessment and demolition efforts for the existing buildings and the new building construction is estimated to be completed in July 2022. Be Well OC Behavioral Health Services Campus-Mind OC: On December 5, 2017, the Board approved the purchase of the office building located at 265 S. Anita Dr., in the city of Orange, for use as a centralized campus for behavioral health services in the County. On January 29, 2019, the Board committed $16,600 to establish the County’s first Be Well Orange County Regional Mental Health and Wellness Campus. This was a transformative initiative that brought together public, private, academic and faith-based organizations to create a coordinated system of mental health care and support for all County residents regardless of their ability to pay. The County’s share of costs are funded from the Health Care Agency’s Behavioral Health programs. Additional funding was received from the CalOptima Board in the form of an $11,400 advance payment to assist in the design and construction of the OC Regional Wellness Hub. This was included in the June 11, 2019, Board approval of the amendment to the agreement with Mind OC to increase advance funding to $28,000 for the design and construction of the OC Regional Wellness Hub.
The project construction started in October 2019 and is estimated for completion in December 2020. The overall cost of financing the design and construction is approximately $40,000 and is distributed among the County, CalOptima, and OC hospitals including Hoag, Providence St. Joseph Health, and Kaiser Permanente. The hospitals’ commitment of $12,000 is shared equally between the three hospitals. CalOptima’s $11,400 advance payment will
___________________________________________________________________________________________
___________________________________________________________________________________________
County of Orange Comprehensive Annual Financial Report For the Year Ended June 30, 2020 (Dollar Amounts in Thousands)
9
be used to offset service costs provided to CalOptima clients at the Be Well OC Behavioral Health Services Campus. The construction cost for this project will be recorded as progress is made with full cost reconciled at the completion of the project. Relevant Financial Policies
To achieve the goal of providing outstanding and cost-effective regional public services, the County applies sound management practices and policies that enhance the quality of life of its citizens. Such financial management practices have been identified by the Government Finance Officers Association (GFOA) of the United States and Canada and recognized by Fitch Ratings as best practices that promote financial soundness, efficiency in government, and solvency in public finance.
General Fund Reserves Policy
The County General Fund Reserves Policy provides guidance in the creation, maintenance and use of reserves. The policy covers formal and informal reserves, and includes provisions for reserves such as appropriations for contingencies, reserve-like appropriations, and reserve-like funds held by others such as the OCERS Investment Account. The policy also recognizes whether funds are legally required or discretionary or have special restrictions. The reserves policy is maintained and updated, as needed, through the County’s annual SFP process. The reserves policy targets and balances are included in the annual SFP document.
The General Fund Reserves policy is designed to provide flexibility to the County as well as the following:
• Resources to address unanticipated or cyclical economic conditions
• Resources for emergencies and/or catastrophic events
• Mitigation of the volatility of revenues and expenditures in managing temporary cash flow shortages
• Capacity to cover unexpected large one-time expenses and opportunities
• Capacity to fund capital investments
• Capacity to minimize borrowing costs
• Capacity to provide some level of protection against statutory changes to County revenues and impacts from federal and state actions
The County has a variety of reserve funds available to both the General Fund and Non-General Funds including:
• Fund Balance Assigned for Contingencies
• Fund Balance Assigned for Operations
• Fund Balance Assigned for Construction and Maintenance
• Fund Balance Assigned for Capital Projects
• Fund Balance Assigned for Teeter Loss Reserve
• Fund Balance Assigned for Reserve Target
• Reserve-Like Funds
• Reserve-Like Appropriations
• Department-Type Reserves
All of the previously mentioned are reserves normally modified at the time of budget adoption (Government Code Section 29085) or at fiscal year-end. Changes to reserve amounts at other times require a 4/5 vote of the Board. A 4/5 vote is also required to make such reserves available for appropriation to expend the funds, if needed, during the fiscal year (Government Code Section 29130).
Reserve Targets and Descriptions
Under GFOA recommended practice, the County establishes an overall reserve target and allocates the calculated target among the classes of obligated fund balances as appropriate. The County may fund more or less to each reserve class for a variety of reasons, such as its current financial condition, the need to set aside for particular goals or directives, the need to bridge one-time gaps, etc. The goal is to ensure a prudent reserve balance that is maintained and replenished on a regular basis. In implementing the GFOA’s best practice, the County elected to establish a funding target based upon two months of General Fund operating revenues.
___________________________________________________________________________________________
___________________________________________________________________________________________
Introductory Section Letter of Transmittal
(Dollar Amounts in Thousands)
10
Contingencies
The purpose and use of this reserve is to cover unanticipated and severe economic downturns, major emergencies, or catastrophes that cannot be covered with existing appropriations. In particular, continued drought conditions with the attendant risk of wildfires, highlights the potential for catastrophic events within the County. A significant event could create the need for a higher funding level of this reserve. The target amount for this reserve is 15% of ongoing annual General Purpose Revenues (excluding fund balance unassigned and one-time amounts and transfers).
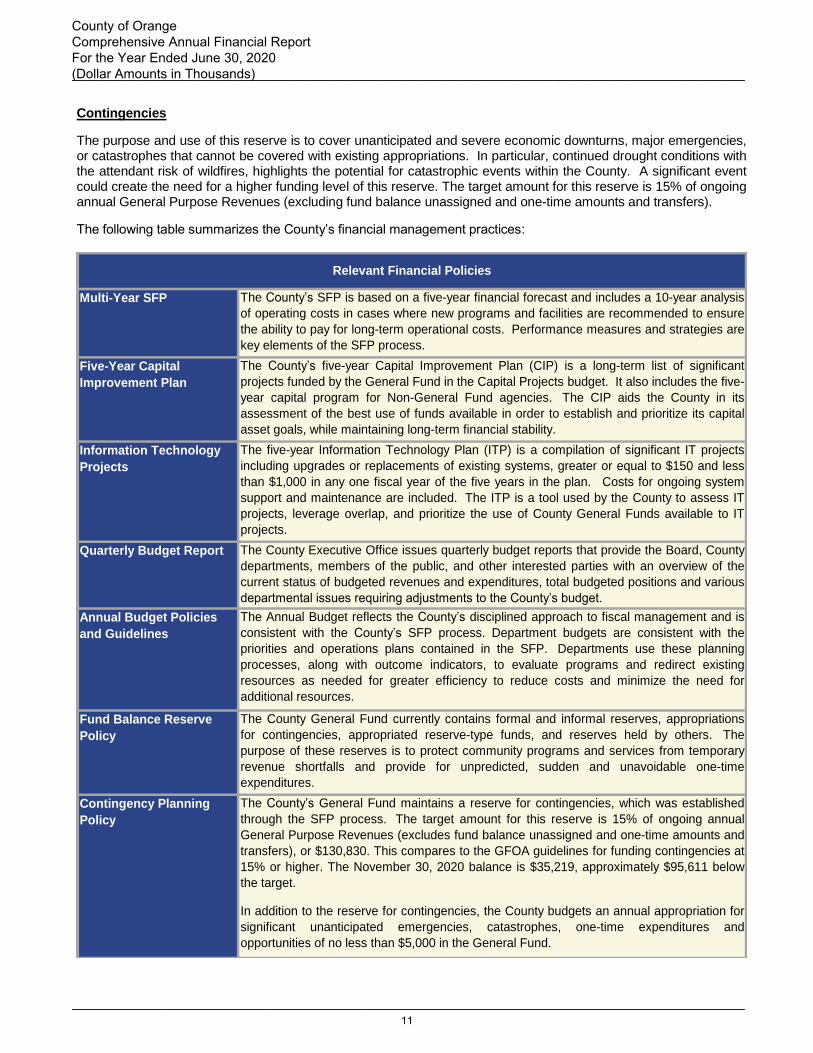
The following table summarizes the County’s financial management practices:
Multi-Year SFP The County’s SFP is based on a five-year financial forecast and includes a 10-year analysis
of operating costs in cases where new programs and facilities are recommended to ensure
the ability to pay for long-term operational costs. Performance measures and strategies are
key elements of the SFP process.
Five-Year Capital
Improvement Plan
The County’s five-year Capital Improvement Plan (CIP) is a long-term list of significant
projects funded by the General Fund in the Capital Projects budget. It also includes the five-
year capital program for Non-General Fund agencies. The CIP aids the County in its
assessment of the best use of funds available in order to establish and prioritize its capital
asset goals, while maintaining long-term financial stability.
Information Technology
Projects
The five-year Information Technology Plan (ITP) is a compilation of significant IT projects
including upgrades or replacements of existing systems, greater or equal to $150 and less
than $1,000 in any one fiscal year of the five years in the plan. Costs for ongoing system
support and maintenance are included. The ITP is a tool used by the County to assess IT
projects, leverage overlap, and prioritize the use of County General Funds available to IT
projects.
Quarterly Budget Report The County Executive Office issues quarterly budget reports that provide the Board, County
departments, members of the public, and other interested parties with an overview of the
current status of budgeted revenues and expenditures, total budgeted positions and various
departmental issues requiring adjustments to the County’s budget.
Annual Budget Policies
and Guidelines
The Annual Budget reflects the County’s disciplined approach to fiscal management and is
consistent with the County’s SFP process. Department budgets are consistent with the
priorities and operations plans contained in the SFP. Departments use these planning
processes, along with outcome indicators, to evaluate programs and redirect existing
resources as needed for greater efficiency to reduce costs and minimize the need for
additional resources.
Fund Balance Reserve
Policy
The County General Fund currently contains formal and informal reserves, appropriations
for contingencies, appropriated reserve-type funds, and reserves held by others. The
purpose of these reserves is to protect community programs and services from temporary
revenue shortfalls and provide for unpredicted, sudden and unavoidable one-time
expenditures.
Contingency Planning
Policy
The County’s General Fund maintains a reserve for contingencies, which was established
through the SFP process. The target amount for this reserve is 15% of ongoing annual
General Purpose Revenues (excludes fund balance unassigned and one-time amounts and
transfers), or $130,830. This compares to the GFOA guidelines for funding contingencies at
15% or higher. The November 30, 2020 balance is $35,219, approximately $95,611 below
the target.
In addition to the reserve for contingencies, the County budgets an annual appropriation for
significant unanticipated emergencies, catastrophes, one-time expenditures and
opportunities of no less than $5,000 in the General Fund.
Relevant Financial Policies
___________________________________________________________________________________________
___________________________________________________________________________________________
County of Orange Comprehensive Annual Financial Report For the Year Ended June 30, 2020 (Dollar Amounts in Thousands)
11
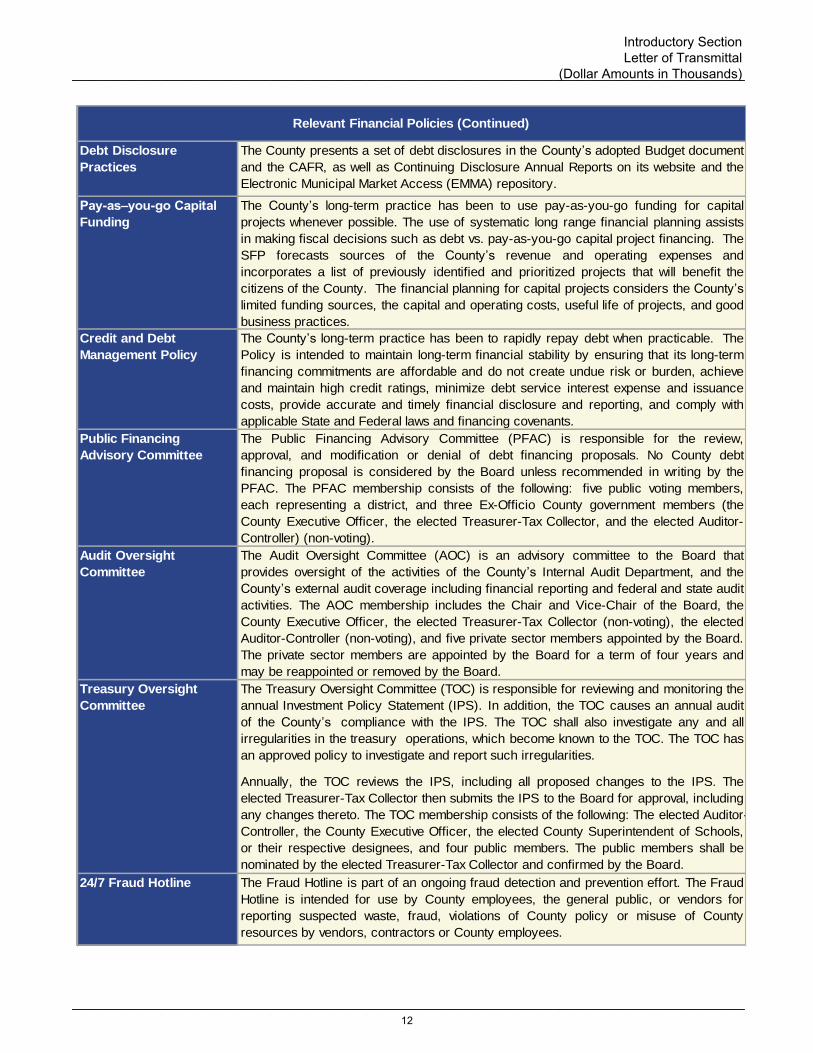
Debt Disclosure
Practices
The County presents a set of debt disclosures in the County’s adopted Budget document
and the CAFR, as well as Continuing Disclosure Annual Reports on its website and the
Electronic Municipal Market Access (EMMA) repository.
Pay-as–you-go Capital
Funding
The County’s long-term practice has been to use pay-as-you-go funding for capital
projects whenever possible. The use of systematic long range financial planning assists
in making fiscal decisions such as debt vs. pay-as-you-go capital project financing. The
SFP forecasts sources of the County’s revenue and operating expenses and
incorporates a list of previously identified and prioritized projects that will benefit the
citizens of the County. The financial planning for capital projects considers the County’s
limited funding sources, the capital and operating costs, useful life of projects, and good
business practices.
Credit and Debt
Management Policy
The County’s long-term practice has been to rapidly repay debt when practicable. The
Policy is intended to maintain long-term financial stability by ensuring that its long-term
financing commitments are affordable and do not create undue risk or burden, achieve
and maintain high credit ratings, minimize debt service interest expense and issuance
costs, provide accurate and timely financial disclosure and reporting, and comply with
applicable State and Federal laws and financing covenants.
Public Financing
Advisory Committee
The Public Financing Advisory Committee (PFAC) is responsible for the review,
approval, and modification or denial of debt financing proposals. No County debt
financing proposal is considered by the Board unless recommended in writing by the
PFAC. The PFAC membership consists of the following: five public voting members,
each representing a district, and three Ex-Officio County government members (the
County Executive Officer, the elected Treasurer-Tax Collector, and the elected Auditor-
Controller) (non-voting).
Audit Oversight
Committee
The Audit Oversight Committee (AOC) is an advisory committee to the Board that
provides oversight of the activities of the County’s Internal Audit Department, and the
County’s external audit coverage including financial reporting and federal and state audit
activities. The AOC membership includes the Chair and Vice-Chair of the Board, the
County Executive Officer, the elected Treasurer-Tax Collector (non-voting), the elected
Auditor-Controller (non-voting), and five private sector members appointed by the Board.
The private sector members are appointed by the Board for a term of four years and
may be reappointed or removed by the Board.
Treasury Oversight
Committee
The Treasury Oversight Committee (TOC) is responsible for reviewing and monitoring the
annual Investment Policy Statement (IPS). In addition, the TOC causes an annual audit
of the County’s compliance with the IPS. The TOC shall also investigate any and all
irregularities in the treasury operations, which become known to the TOC. The TOC has
an approved policy to investigate and report such irregularities.
Annually, the TOC reviews the IPS, including all proposed changes to the IPS. The
elected Treasurer-Tax Collector then submits the IPS to the Board for approval, including
any changes thereto. The TOC membership consists of the following: The elected Auditor-
Controller, the County Executive Officer, the elected County Superintendent of Schools,
or their respective designees, and four public members. The public members shall be
nominated by the elected Treasurer-Tax Collector and confirmed by the Board.
24/7 Fraud Hotline The Fraud Hotline is part of an ongoing fraud detection and prevention effort. The Fraud
Hotline is intended for use by County employees, the general public, or vendors for
reporting suspected waste, fraud, violations of County policy or misuse of County
resources by vendors, contractors or County employees.
Relevant Financial Policies (Continued)
___________________________________________________________________________________________
___________________________________________________________________________________________
Introductory Section Letter of Transmittal
(Dollar Amounts in Thousands)
12
Major Initiatives
Funding Equity: The County hovers at the bottom of funding for counties statewide, receiving the lowest percentage of property taxes in California to support services-about 5 cents on the dollar; the state average is 14 cents. The formula for returning local property taxes to the counties where they were collected was set in 1978 and has not been updated since. This systematically disadvantages the County’s ability to provide services to its diverse population. The County’s predicament does not have easy fixes. Shifting funding formulas could affect other counties receiving more of their share of taxes, as well as other taxing entities such as cities, special districts, and schools, which have constitutional protections for state funding. Therefore, the answer to assuring funding equity for the County lies in increasing funding, programs, and partnerships that specifically benefit County programs and services. When the state shifts or adds responsibilities at the county level, the County will seek enough funding for those programs to ensure their success. The County’s robust legislative agenda seeks creative and substantive ways to assure our residents are provided with their fair share of the taxes they pay to support the programs and services they deserve. Labor Agreements: Most County employees are represented by one of 21 bargaining units, which are separated into eight labor organizations. The principal organization is the Orange County Employees Association (OCEA), which represents six bargaining units totaling about 9,603 permanent filled employee positions. The next largest unions are the Association of County Deputy Sheriffs, which represents four bargaining units totaling about 2,702 members and the American Federation of State and Municipal Employees at about 1,438 members. All contracts have been successfully negotiated and County employees continue to work under their contract terms and conditions of employment. AWARDS AND ACKNOWLEDGEMENTS GFOA Awards: The GFOA awarded a Certificate of Achievement for Excellence in Financial Reporting to the County for its CAFR for the year ended June 30, 2019; this represents the County’s 25th consecutive award. The Certificate of Achievement is the highest form of recognition for excellence in state and local government financial reporting. In order to be awarded a Certificate of Achievement, a government unit must publish an easily readable and efficiently organized CAFR, whose contents conform to program standards. Such a CAFR must satisfy both GAAP and applicable legal requirements. A Certificate of Achievement is valid for a period of one year only. We believe our current report continues to meet the Certificate of Achievement Program’s requirements and we are submitting it to the GFOA to determine its eligibility for another certificate. In addition, the County issued its 17th consecutive Popular Annual Financial Report (PAFR) titled the “OC Citizens’ Report” for the year ended June 30, 2019. The County received the GFOA Award for Outstanding Achievement in Popular Annual Financial Reporting for this PAFR. The award is a prestigious national award recognizing conformance with the highest standards for preparation of state and local government popular reports. In order to be awarded, a government must publish a PAFR that reflects the program standards of creativity, presentation, understandability, and reader appeal. The “OC Citizens’ Report” is available for viewing at www.ac.ocgov.com. Distinguished Budget Presentation Award: The GFOA awarded a Distinguished Budget Presentation Award to the County for its FY 2019-20 Annual Budget; this is the County’s fourth award. The award is the highest form of recognition in governmental budgeting. In order to receive the award, the entity had to satisfy nationally recognized guidelines for effective budget presentation. These guidelines are designed to acknowledge how well an entity’s budget serves as a policy document, a financial plan, an operations guide, and a communications device. Counties Financial Transactions Reporting Award: The County received the Financial Transactions Reporting Award from the State Controller’s Office for its Year-End Financial Transaction Report for the fiscal year ended June 30, 2019. The award is in recognition of the professionalism demonstrated by Counties in preparing accurate and timely financial reports and for those counties that meet the review criteria of the award program.
___________________________________________________________________________________________
___________________________________________________________________________________________
County of Orange Comprehensive Annual Financial Report For the Year Ended June 30, 2020 (Dollar Amounts in Thousands)
13

Acknowledgments: We would like to express our sincere appreciation to County staff and the staff of the certified public accounting firm of Eide Bailly LLP. We hope this report will be of interest and use to those in county government, other governmental agencies, and the public interested in the financial activities of the County of Orange. Respectfully submitted,
Frank Davies, CPA Michelle Aguirre Auditor-Controller Chief Financial Officer
___________________________________________________________________________________________
___________________________________________________________________________________________
Introductory Section Letter of Transmittal
(Dollar Amounts in Thousands)
14

15
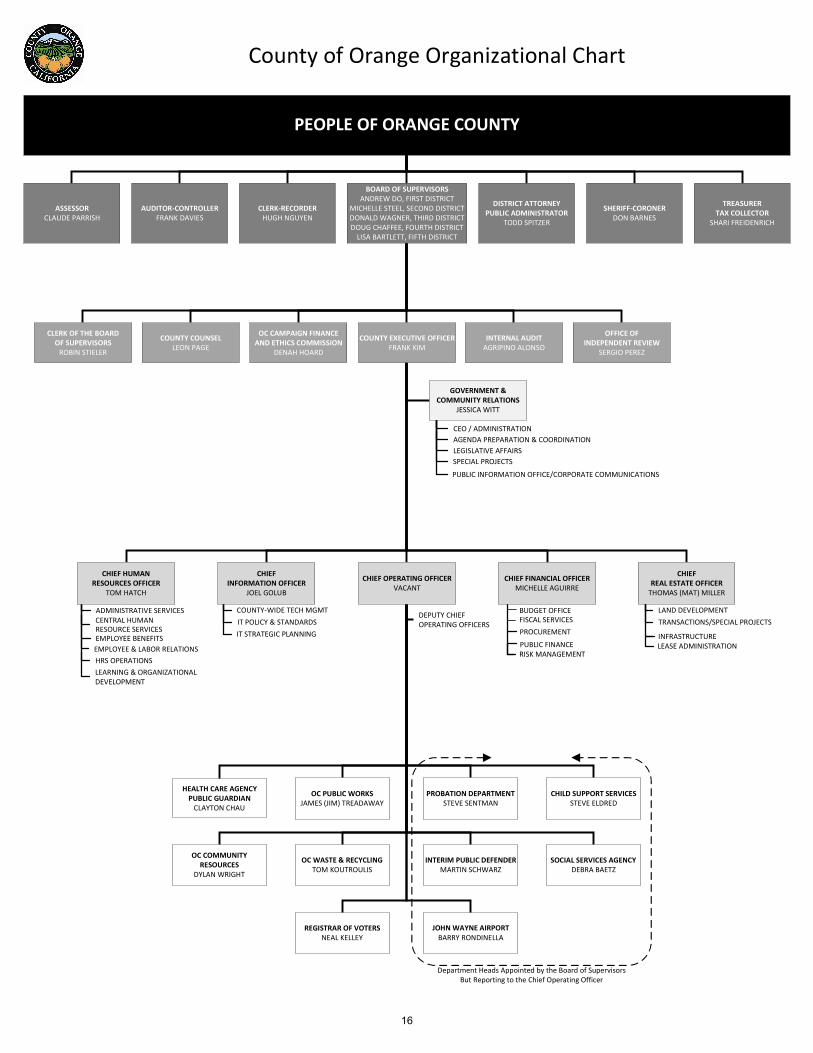
PEOPLE OF ORANGE COUNTY
ASSESSORCLAUDE PARRISH
AUDITOR-CONTROLLERFRANK DAVIES
CLERK-RECORDERHUGH NGUYEN
DISTRICT ATTORNEY PUBLIC ADMINISTRATOR
TODD SPITZER
SHERIFF-CORONERDON BARNES
BOARD OF SUPERVISORSANDREW DO, FIRST DISTRICT
MICHELLE STEEL, SECOND DISTRICTDONALD WAGNER, THIRD DISTRICTDOUG CHAFFEE, FOURTH DISTRICT
LISA BARTLETT, FIFTH DISTRICT
TREASURERTAX COLLECTOR
SHARI FREIDENRICH
INTERNAL AUDITAGRIPINO ALONSO
COUNTY EXECUTIVE OFFICERFRANK KIM
OFFICE OFINDEPENDENT REVIEW
SERGIO PEREZ
OC CAMPAIGN FINANCE AND ETHICS COMMISSION
DENAH HOARD
COUNTY COUNSELLEON PAGE
CHIEF OPERATING OFFICERVACANT
JOHN WAYNE AIRPORTBARRY RONDINELLA
OC PUBLIC WORKSJAMES (JIM) TREADAWAY
OC WASTE & RECYCLINGTOM KOUTROULIS
SOCIAL SERVICES AGENCYDEBRA BAETZ
CHILD SUPPORT SERVICESSTEVE ELDRED
HEALTH CARE AGENCYPUBLIC GUARDIAN
CLAYTON CHAU
OC COMMUNITY RESOURCES
DYLAN WRIGHT
PROBATION DEPARTMENTSTEVE SENTMAN
INTERIM PUBLIC DEFENDERMARTIN SCHWARZ
REGISTRAR OF VOTERSNEAL KELLEY
County of Orange Organizational Chart
Department Heads Appointed by the Board of SupervisorsBut Reporting to the Chief Operating Officer
ADMINISTRATIVE SERVICES
EMPLOYEE BENEFITSEMPLOYEE & LABOR RELATIONSHRS OPERATIONS
CENTRAL HUMAN RESOURCE SERVICES
LEARNING & ORGANIZATIONAL DEVELOPMENT
CHIEF HUMANRESOURCES OFFICER
TOM HATCH
COUNTY-WIDE TECH MGMT
IT STRATEGIC PLANNINGIT POLICY & STANDARDS
CHIEFINFORMATION OFFICER
JOEL GOLUB
DEPUTY CHIEF OPERATING OFFICERS
CEO / ADMINISTRATIONAGENDA PREPARATION & COORDINATIONLEGISLATIVE AFFAIRS
PUBLIC INFORMATION OFFICE/CORPORATE COMMUNICATIONS
SPECIAL PROJECTS
GOVERNMENT &COMMUNITY RELATIONS
JESSICA WITT
BUDGET OFFICE
PUBLIC FINANCE
PROCUREMENT
RISK MANAGEMENT
FISCAL SERVICES TRANSACTIONS/SPECIAL PROJECTSLAND DEVELOPMENT
CHIEF FINANCIAL OFFICERMICHELLE AGUIRRE
CHIEFREAL ESTATE OFFICER
THOMAS (MAT) MILLER
INFRASTRUCTURELEASE ADMINISTRATION
CLERK OF THE BOARDOF SUPERVISORS
ROBIN STIELER
16

Clerk‐Recorder South County Branch Office


What inspires you, inspires us. | eidebailly.com25231 Paseo De Alicia, Ste. 100 | Laguna Hills, CA 92653-4615 | T 949.768.0833 | F 949.768.8408 | EOE
Independent Auditor’s Report
To the Board of Supervisors
County of Orange, California
Report on the Financial Statements
We have audited the accompanying financial statements of the governmental activities, the business-type
activities, the aggregate discretely presented component units, each major fund, and the aggregate remaining
fund information of the County of Orange, California (County) as of and for the year ended June 30, 2020, and the
related notes to the financial statements, which collectively comprise the County’s basic financial statements as
listed in the table of contents.
Management’s Responsibility for the Financial Statements
Management is responsible for the preparation and fair presentation of these financial statements in accordance
with accounting principles generally accepted in the United States of America; this includes the design,
implementation, and maintenance of internal control relevant to the preparation and fair presentation of financial
statements that are free from material misstatement, whether due to fraud or error.
Auditor’s Responsibility
Our responsibility is to express opinions on these financial statements based on our audit. We did not audit the
financial statements of the Orange County Health Authority, a Public Agency/dba Orange Prevention and
Treatment Integrated Medical Assistance (CalOptima) which represent 97 percent, 96 percent, and 99 percent,
respectively, of the assets, net position, and revenues of the aggregate discretely presented component units.
Those statements were audited by other auditors whose report has been furnished to us, and our opinion, insofar
as it relates to the amounts included for CalOptima, is based solely on the report of the other auditors. We
conducted our audit in accordance with auditing standards generally accepted in the United States of America
and the standards applicable to financial audits contained in Government Auditing Standards, issued by the
Comptroller General of the United States. Those standards require that we plan and perform the audit to obtain
reasonable assurance about whether the financial statements are free from material misstatement.
An audit involves performing procedures to obtain audit evidence about the amounts and disclosures in the
financial statements. The procedures selected depend on the auditor’s judgment, including the assessment of the
risks of material misstatement of the financial statements, whether due to fraud or error. In making those risk
assessments, the auditor considers internal control relevant to the entity’s preparation and fair presentation of
the financial statements in order to design audit procedures that are appropriate in the circumstances, but not
for the purpose of expressing an opinion on the effectiveness of the entity’s internal control. Accordingly, we
express no such opinion. An audit also includes evaluating the appropriateness of accounting policies used and
the reasonableness of significant accounting estimates made by management, as well as evaluating the overall
presentation of the financial statements.
We believe that the audit evidence we have obtained is sufficient and appropriate to provide a basis for our audit
opinions.
17

Opinions
In our opinion, the financial statements referred to above present fairly, in all material respects, the respective
financial position of the governmental activities, the business-type activities, the aggregate discretely presented
component units, each major fund, and the aggregate remaining fund information of the County, as of June 30,
2020, and the respective changes in financial position and, where applicable, cash flows thereof and the respective
budgetary comparison for the General fund, Flood Control District fund, Other Public Protection fund, and Mental
Health Services Act fund for the year then ended in accordance with accounting principles generally accepted in
the United States of America.
Other Matters
Required Supplementary Information
Accounting principles generally accepted in the United States of America require that the management’s
discussion and analysis, and the schedules for the Orange County Employees Retirement System (OCERS) plan,
Orange County Extra-Help Defined Benefit plan, and the Orange County Retiree Medical plan, as listed in the table
of contents, be presented to supplement the basic financial statements. Such information, although not a part of
the basic financial statements, is required by the Governmental Accounting Standards Board, who considers it to
be an essential part of financial reporting for placing the basic financial statements in an appropriate operational,
economic, or historical context. We have applied certain limited procedures to the required supplementary
information in accordance with auditing standards generally accepted in the United States of America, which
consisted of inquiries of management about the methods of preparing the information and comparing the
information for consistency with management’s responses to our inquiries, the basic financial statements, and
other knowledge we obtained during our audit of the basic financial statements. We do not express an opinion or
provide any assurance on the information because the limited procedures do not provide us with sufficient
evidence to express an opinion or provide any assurance.
Other Information
Our audit was conducted for the purpose of forming opinions on the financial statements that collectively
comprise the County’s financial statements. The introductory section, combining and individual nonmajor fund
financial statements and budgetary comparison schedules, and statistical section are presented for purposes of
additional analysis and are not a required part of the financial statements.
The combining and individual nonmajor fund financial statements and budgetary comparison schedules are the
responsibility of management and were derived from and relate directly to the underlying accounting and other
records used to prepare the basic financial statements. Such information has been subjected to the auditing
procedures applied in the audit of the basic financial statements and certain additional procedures, including
comparing and reconciling such information directly to the underlying accounting and other records used to
prepare the basic financial statements or to the basic financial statements themselves, and other additional
procedures in accordance with auditing standards generally accepted in the United States of America. In our
opinion, the combining and individual nonmajor fund financial statements and budgetary comparison schedules
are fairly stated, in all material respects, in relation to the basic financial statements as a whole.
The introductory and statistical sections have not been subjected to the auditing procedures applied in the audit
of the basic financial statements and, accordingly, we do not express an opinion or provide any assurance on
them.
18

Other Reporting Required by Government Auditing Standards
In accordance with Government Auditing Standards, we have also issued our report dated December 22, 2020, on
our consideration of the County’s internal control over financial reporting and on our tests of its compliance with
certain provisions of laws, regulations, contracts, and grant agreements and other matters. The purpose of that
report is solely to describe the scope of our testing of internal control over financial reporting and compliance and
the results of that testing, and not to provide an opinion on the effectiveness of the County’s internal control over
financial reporting or on compliance. That report is an integral part of an audit performed in accordance with
Government Auditing Standards in considering the County’s internal control over financial reporting and
compliance.
Laguna Hills, California
December 22, 2020
19

Clerk‐Recorder North County Branch Ceremony Room


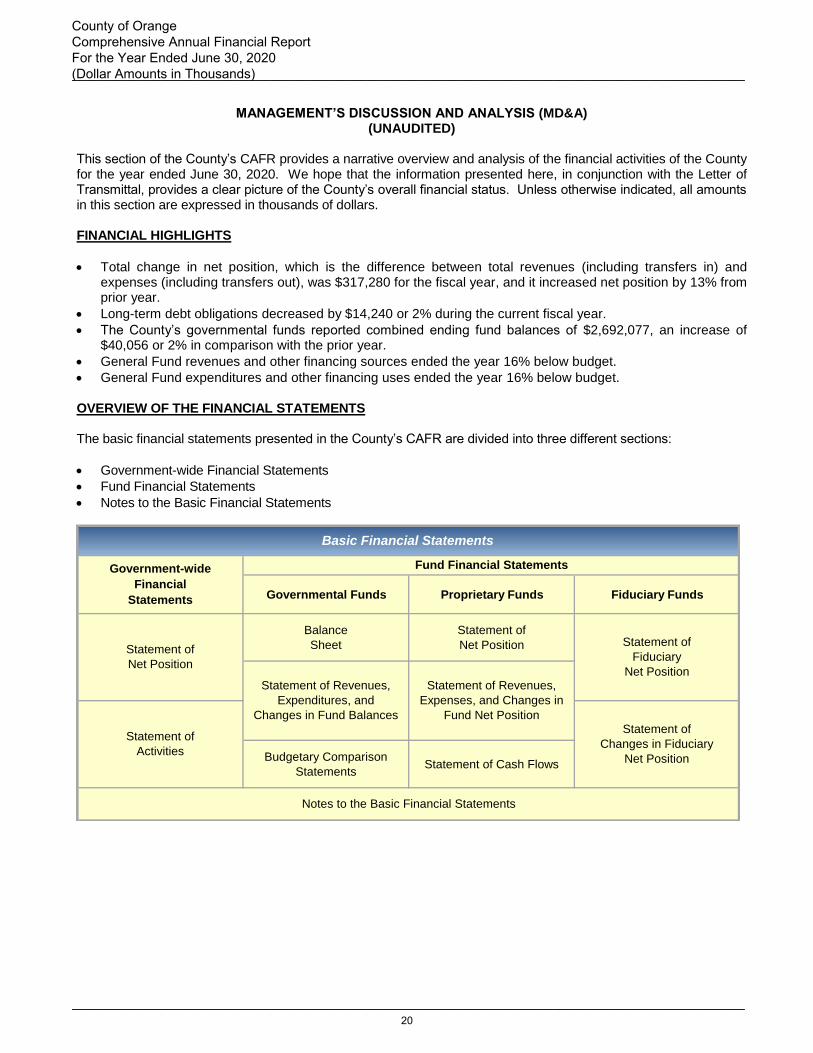
MANAGEMENT’S DISCUSSION AND ANALYSIS (MD&A) (UNAUDITED)
This section of the County’s CAFR provides a narrative overview and analysis of the financial activities of the County for the year ended June 30, 2020. We hope that the information presented here, in conjunction with the Letter of Transmittal, provides a clear picture of the County’s overall financial status. Unless otherwise indicated, all amounts in this section are expressed in thousands of dollars. FINANCIAL HIGHLIGHTS
• Total change in net position, which is the difference between total revenues (including transfers in) and expenses (including transfers out), was $317,280 for the fiscal year, and it increased net position by 13% from prior year.
• Long-term debt obligations decreased by $14,240 or 2% during the current fiscal year.
• The County’s governmental funds reported combined ending fund balances of $2,692,077, an increase of $40,056 or 2% in comparison with the prior year.
• General Fund revenues and other financing sources ended the year 16% below budget.
• General Fund expenditures and other financing uses ended the year 16% below budget. OVERVIEW OF THE FINANCIAL STATEMENTS The basic financial statements presented in the County’s CAFR are divided into three different sections:
• Government-wide Financial Statements
• Fund Financial Statements
• Notes to the Basic Financial Statements
Governmental Funds Proprietary Funds Fiduciary Funds
Balance
Sheet
Statement of
Net Position
Budgetary Comparison
StatementsStatement of Cash Flows
Basic Financial Statements
Fund Financial StatementsGovernment-wide
Financial
Statements
Notes to the Basic Financial Statements
Statement of Revenues,
Expenditures, and
Changes in Fund Balances
Statement of Revenues,
Expenses, and Changes in
Fund Net Position
Statement of
Net Position
Statement of
Activities
Statement of
Fiduciary
Net Position
Statement of
Changes in Fiduciary
Net Position
___________________________________________________________________________________________
___________________________________________________________________________________________
County of Orange Comprehensive Annual Financial Report For the Year Ended June 30, 2020 (Dollar Amounts in Thousands)
20

The following table summarizes the major features of the basic financial statements:
Governmental Funds Proprietary Funds Fiduciary Funds
Type of Financial
Statement
Statement of
Net Position
Statement of
Activities
Balance Sheet
Statement of Revenues,
Expenditures, and
Changes in Fund
Balances
Budgetary Comparison
Statements
Statement of
Net Position
Statement of Revenues,
Expenses, and Changes
in Fund Net Position
Statement of Cash Flows
Statement of Fiduciary
Net Position
Statement of Changes in
Fiduciary Net Position
Scope Entire entity (except
fiduciary funds)
Day-to-day operating
activities for basic
services
Day-to-day operating
activities for business-
type services
Resources on behalf of
others
Accounting Basis
and Measurement
Focus
Accrual accounting and
economic resources
measurement focus
Modified accrual
accounting and
current financial
resources
measurement focus
Accrual accounting and
economic resources
measurement focus
Accrual accounting and
economic resources
measurement focus
(except for agency funds)
Type of Asset,
Deferred Outflows
of Resources,
Liability, and
Deferred Inflows of
Resources
Information
All assets, deferred
outflows of resources,
liabilities, and deferred
inflows of resources, both
financial and capital, short-
term and long-term
Current assets, liabilities,
and deferred inflows of
resources that come due
during the year or soon
thereafter
All assets, deferred
outflows of resources,
liabilities, and deferred
inflows of resources both
financial and capital, short-
term and long-term
All assets, deferred
outflows of resources,
liabilities, and deferred
inflows of resources held
in a trustee or agency
capacity for others
Type of Inflows
and Outflows
Information
All revenues and
expenses during the year,
regardless of when cash
is received or paid
Revenues for which cash
is received during the
year or soon thereafter;
expenditures for when
goods or services have
been received, and the
related liability is due and
payable
All revenues and
expenses during the year,
regardless of when cash
is received or paid
All additions and
deductions during the
year, regardless of when
cash is received or paid
Government-wide
Financial
Statements
Fund Financial Statements
___________________________________________________________________________________________
___________________________________________________________________________________________
Management’s
Discussion and Analysis (Dollar Amounts in Thousands)
21

• Fund - a separate accounting entity with a self-balancing set of accounts.
• Focus is on major funds.
• Provides information regarding the three major categories of all County funds: governmental, proprietary, and fiduciary.
Government-wide Financial Statements The government-wide financial statements consist of the following two financial statements: the Statement of Net Position and the Statement of Activities. Both of these statements were prepared using an accounting method and a measurement focus similar to those used by private-sector companies, the accrual basis of accounting and the economic resources measurement focus. The Statement of Net Position provides information regarding all of the County’s assets, deferred outflows of resources, liabilities, and deferred inflows of resources with the difference reported as net position. Over time, increases or decreases in net position may serve as a useful indicator of whether the financial position of the County is improving or deteriorating. The Statement of Activities, on the other hand, provides information on how the government’s net position changed during the most recent fiscal year regardless of the period when the related cash or cash equivalent is received or paid. Therefore, revenues and expenses are reported in this statement for some items that will only result in cash flows in future fiscal periods (for example, uncollected taxes, and earned but unused vacation leave).
The Statement of Net Position and the Statement of Activities distinguish functions of the County that are principally supported by taxes (governmental activities) from other functions that are intended to recover all or a significant portion of their costs through user fees and charges (business-type activities). The governmental activities of the County include (1) general government, (2) public protection, (3) public ways and facilities, (4) health and sanitation, (5) public assistance, (6) education, and (7) recreation and cultural services. The business-type activities of the County include John Wayne Airport (Airport), OC Waste & Recycling, and Compressed Natural Gas (CNG).
The government-wide financial statements also provide information regarding the County’s component units, entities for which the County (the primary government) is considered to be financially accountable. Blended component units, although legally separate entities, are in substance part of the County’s operations; therefore, data from these component units are combined with data of the primary government. Financial information for the CFCOC and CalOptima, discretely presented component units, are reported separately from the financial information presented for the primary government itself. Separate stand-alone annual financial reports can be obtained by accessing the County’s website at the following address: www.ac.ocgov.com. A separate stand-alone CalOptima annual financial report can be obtained by accessing the website at http://wpso.dmhc.ca.gov/fe/search/.
Fund Financial Statements
The fund financial statements report on groupings of related funds that are used to maintain control over resources that have been segregated for specific activities or objectives. A fund is a separate accounting entity with a self-balancing set of accounts. Like other state and local governments, the County uses fund accounting to ensure and demonstrate compliance with finance-related legal requirements. The focus of governmental and proprietary fund financial statements is on major funds as determined by the criteria set forth in Governmental Accounting Standards Board (GASB) Statement No. 34, “Basic Financial Statements – and Management’s Discussion and Analysis – for State and Local Governments,” and GASB Statement No. 65, “Items Previously Reported as Assets and Liabilities.” All of the County funds can be divided into three major categories of funds: governmental, proprietary, and fiduciary.
Governmental Funds - Governmental funds include most of the County’s basic services and are used to account for essentially the same functions reported as governmental activities in the government-wide financial statements. However, unlike the government-wide financial statements, governmental funds financial statements are prepared using the modified accrual basis of accounting and current financial resources measurement focus.
Because the focus of governmental funds is narrower than that of the government-wide financial statements, it is useful to compare the information presented for governmental funds with similar information presented for governmental activities in the government-wide financial statements. By doing so, readers may better understand the long-term impact of the government’s near-term financing decisions. Reconciliations are prepared for the governmental funds balance sheet and the governmental funds statement of revenues, expenditures, and changes in fund balances to facilitate comparisons between governmental funds and governmental activities. The primary differences between the government-wide and fund financial statements relate to noncurrent assets, such
___________________________________________________________________________________________
___________________________________________________________________________________________
County of Orange Comprehensive Annual Financial Report For the Year Ended June 30, 2020 (Dollar Amounts in Thousands)
22

as land and structures and improvements, and noncurrent liabilities, such as bonded debt and amounts owed for compensated absences, capital lease obligations, net pension liability and other postemployment benefits (OPEB), which are reported in the government-wide statements but not in the fund financial statements.
The County maintains several individual governmental funds organized according to their type (General Fund, Special Revenue, Debt Service, Capital Projects and Permanent funds). Information is presented separately in the governmental funds balance sheet and in the statement of revenues, expenditures, and changes in fund balances for the General Fund, which is always a major fund, and all other major funds which may change each year depending on if they meet the major funds criteria. Information for nonmajor funds is presented in the aggregate as “Other Governmental Funds” in these statements. Individual fund data for each of the nonmajor governmental funds is presented in the Supplemental Information Section of this CAFR. The County adopts an annual appropriated budget for its governmental funds. Budgetary comparison statements and schedules have been provided for these funds to demonstrate compliance with the budget and are presented in the Basic Financial Statements and Supplemental Information Section of this CAFR, respectively.
Proprietary Funds - The County maintains two different types of proprietary funds: Enterprise funds and Internal Service funds. Enterprise funds are used to report the same functions presented as business-type activities in the government-wide financial statements. The County uses enterprise funds to account for its Airport, OC Waste & Recycling, and CNG activities. Internal Service funds are used to accumulate and allocate costs internally among the County’s various functions such as insurance, transportation, publishing services, and information technology. Because these services predominantly benefit governmental rather than business-type functions, Internal Service funds have been included within governmental activities in the government-wide financial statements.
Proprietary fund financial statements provide the same type of information as the government-wide financial statements, only in more detail. The proprietary fund financial statements provide separate information for the Airport and OC Waste & Recycling operations, which are both considered to be major funds of the County. Conversely, the Internal Service funds are combined into a single, aggregated presentation in the proprietary fund financial statements with the individual fund data provided in the combining statements, which can be found in the Supplemental Information Section of this CAFR.
Fiduciary Funds - Fiduciary funds include the Trust and Agency funds and are used to account for assets held on behalf of outside parties, including other governments. Financial information for fiduciary funds is not reported in the government-wide financial statements because the resources of these funds are not available to support the County’s programs. The combining statements for fiduciary funds are included in the Supplemental Information Section of this CAFR.
Notes to the Basic Financial Statements
The Notes to the Basic Financial Statements provide additional information that is essential to a full understanding of the data provided in the government-wide and fund financial statements. To find a specific note, refer to the Table of Contents. GOVERNMENT-WIDE FINANCIAL ANALYSIS As noted earlier, net position may serve over time as a useful indicator of the County’s financial position. At June 30, 2020, the County’s combined net position (governmental and business-type activities) totaled $2,844,388, an increase of 13% from FY 2018-19.
The largest component of the County’s net position, which totals $4,175,423 was net investment in capital assets, which represents the County’s investment in capital assets, less any related outstanding debt used to acquire those assets and debt-related deferred outflows and inflows of resources. The County’s capital assets are used to provide needed services to its citizens. Since the capital assets themselves cannot be used to liquidate the associated debt, the resources needed to repay the debt must be provided from other sources.
COMPONENTS OF NET POSITION
• Net Investment in Capital Assets
• Restricted • Unrestricted
___________________________________________________________________________________________
___________________________________________________________________________________________
Management’s
Discussion and Analysis (Dollar Amounts in Thousands)
23

The County’s restricted net position of $1,602,769 represents resources that are subject to external restrictions on their use and are available to meet the County’s ongoing obligations for programs with external restrictions. External restrictions include those imposed by grantors, contributors, laws/regulations of other governments, or restrictions imposed by law through constitutional provisions or legislation, including those passed by the County itself.
The unrestricted net position is the final component of net position. Unrestricted net position is resources that the County may use to meet its ongoing obligations to citizens and creditors. As of June 30, 2020, the County’s unrestricted net position totals a deficit of $2,933,804. Among governmental activities the deficit was $3,480,608 in unrestricted net position, compared to its deficit of $3,582,580 at June 30, 2019. The main contributor of the deficit continues to be the reporting of the County’s proportionate share of net pension and OPEB liability on the financial statements.
The following table presents condensed financial information derived from the government-wide Statement of Net Position:
ASSETS
Current and Other Assets $ 4,373,638 $ 3,875,987 $ 976,845 $ 897,628 $ 5,350,483 $ 4,773,615
3,426,770 3,243,628 946,913 949,383 4,373,683 4,193,011
7,800,408 7,119,615 1,923,758 1,847,011 9,724,166 8,966,626
874,422 1,363,252 19,453 30,374 893,875 1,393,626
8,674,830 8,482,867 1,943,211 1,877,385 10,618,041 10,360,252
Long-term Liabilities 5,296,601 6,143,569 392,806 410,108 5,689,407 6,553,677
1,278,107 783,794 76,679 64,616 1,354,786 848,410
6,574,708 6,927,363 469,485 474,724 7,044,193 7,402,087
DEFERRED INFLOWS OF RESOURCES 717,070 423,123 12,390 7,934 729,460 431,057
7,291,778 7,350,486 481,875 482,658 7,773,653 7,833,144
Net Investment in Capital Assets 3,319,173 3,127,371 856,250 858,924 4,175,423 3,986,295
Restricted 1,544,487 1,587,590 58,282 44,444 1,602,769 1,632,034
(3,480,608) (3,582,580) 546,804 491,359 (2,933,804) (3,091,221)
$ 1,383,052 $ 1,132,381 $ 1,461,336 $ 1,394,727 $ 2,844,388 $ 2,527,108
Activities
Governmental Business-Type
TotalActivities
2019
Capital Assets
2020 2019 2020 20202019
Other Liabilities
LIABILITIES
Total Assets
NET POSITION – Primary Government
June 30, 2020 and 2019
Total Net Position
Unrestricted
NET POSITION
Total Liabilities
DEFERRED OUTFLOWS OF RESOURCES
Total Assets/Deferred Outflows of Resources
Total Liabilities/Deferred Inflows of Resources
As of June 30, 2020, the County’s total assets and deferred outflows of resources increased by 2% or $257,789 during the current fiscal year. Capital assets increased by $180,672, primarily due to construction projects related to Civic Center Facilities Master Plan, and road donations accepted to the County Road System. In addition, there was an increase of $576,868 in current and other assets, which is primarily attributable to an overall increase in cash and cash equivalents as a result of federal assistance received from the Coronavirus Relief Fund (CRF) established to assist governments to cover expenditures related to the COVID-19 public health emergency, higher tax apportionments and interest revenue received. Deferred outflows of resources decreased by $499,751, primarily due to a decrease in deferred outflows related to pension as a result of an investment gain, which reflects the changes in net pension liability measurements as required by GASB Statement No. 68, “Accounting and Financial Reporting for Pensions–An Amendment of GASB Statement No. 27,” (GASB Statement No. 68) and employer pension contributions made after the measurement date as required by GASB Statement No. 71, “Pension Transition for Contributions Made Subsequent to the Measurement Date–An Amendment of GASB Statement No. 68” (GASB Statement No. 71). Total liabilities and deferred inflows of resources for FY 2019-20 decreased by 1% or $59,491. Long-term liabilities decreased by 13% or $864,270, mainly due to a decrease in the County’s proportionate share of the net pension liability as a result of an investment gain, offset by an increase in the Taxable Pension Obligation Bonds 2020, Series A issuance. Other liabilities increased by 60% or $506,376, primarily due to an increase in unearned revenue as a result of federal assistance received from the CRF. Deferred inflows of resources increased by 69% or $298,403, mainly due to the changes in the net pension liability calculated as required by GASB Statement No. 68.
___________________________________________________________________________________________
___________________________________________________________________________________________
County of Orange Comprehensive Annual Financial Report For the Year Ended June 30, 2020 (Dollar Amounts in Thousands)
24
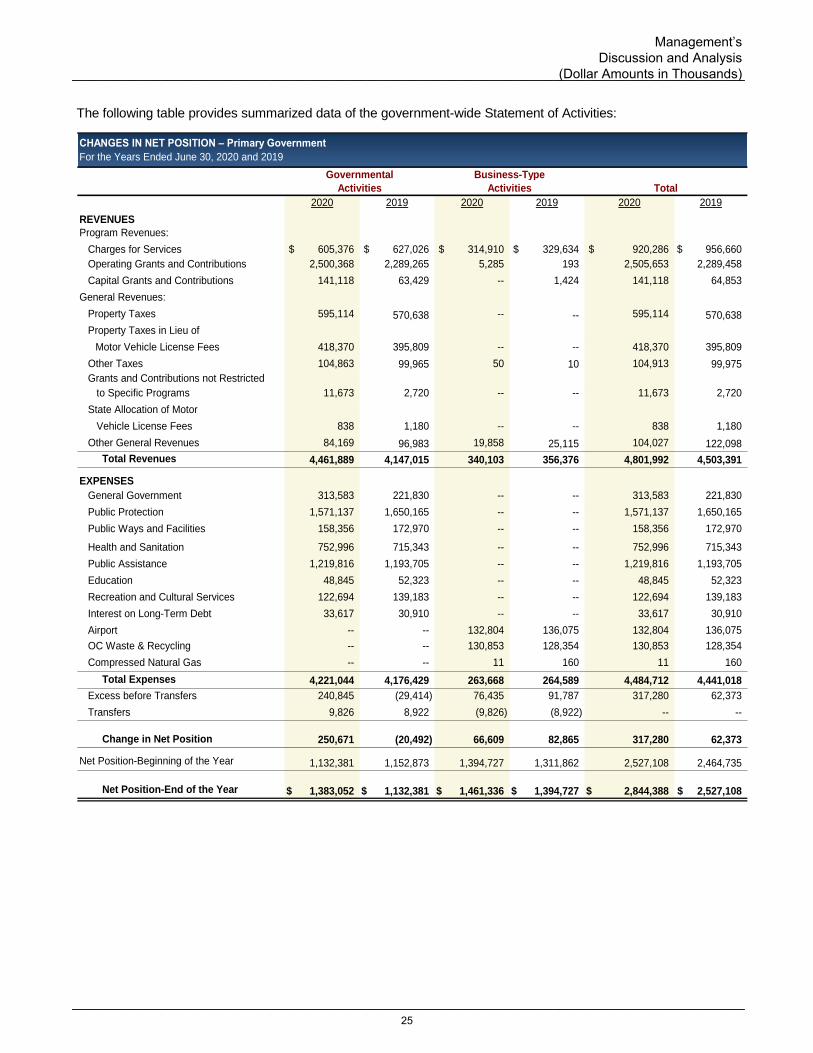
The following table provides summarized data of the government-wide Statement of Activities:
REVENUES
Program Revenues:
Charges for Services $ 605,376 $ 627,026 $ 314,910 $ 329,634 $ 920,286 $ 956,660
Operating Grants and Contributions 2,500,368 2,289,265 5,285 193 2,505,653 2,289,458
Capital Grants and Contributions 141,118 63,429 -- 1,424 141,118 64,853
General Revenues:
Property Taxes 595,114 570,638 -- -- 595,114 570,638
Property Taxes in Lieu of
Motor Vehicle License Fees 418,370 395,809 -- -- 418,370 395,809
Other Taxes 104,863 99,965 50 10 104,913 99,975
Grants and Contributions not Restricted
to Specific Programs 11,673 2,720 -- -- 11,673 2,720
State Allocation of Motor
Vehicle License Fees 838 1,180 -- -- 838 1,180
84,169 96,983 19,858 25,115 104,027 122,098
Total Revenues 4,461,889 4,147,015 340,103 356,376 4,801,992 4,503,391
General Government 313,583 221,830 -- -- 313,583 221,830
Public Protection 1,571,137 1,650,165 -- -- 1,571,137 1,650,165
Public Ways and Facilities 158,356 172,970 -- -- 158,356 172,970
Health and Sanitation 752,996 715,343 -- -- 752,996 715,343
Public Assistance 1,219,816 1,193,705 -- -- 1,219,816 1,193,705
Education 48,845 52,323 -- -- 48,845 52,323
Recreation and Cultural Services 122,694 139,183 -- -- 122,694 139,183
Interest on Long-Term Debt 33,617 30,910 -- -- 33,617 30,910
Airport -- -- 132,804 136,075 132,804 136,075
OC Waste & Recycling -- -- 130,853 128,354 130,853 128,354
Compressed Natural Gas -- -- 11 160 11 160
Total Expenses 4,221,044 4,176,429 263,668 264,589 4,484,712 4,441,018
Excess before Transfers 240,845 (29,414) 76,435 91,787 317,280 62,373
Transfers 9,826 8,922 (9,826) (8,922) -- --
Change in Net Position 250,671 (20,492) 66,609 82,865 317,280 62,373
Net Position-Beginning of the Year 1,132,381 1,152,873 1,394,727 1,311,862 2,527,108 2,464,735
Net Position-End of the Year $ 1,383,052 $ 1,132,381 $ 1,461,336 $ 1,394,727 $ 2,844,388 $ 2,527,108
Governmental Business-Type
CHANGES IN NET POSITION – Primary Government
For the Years Ended June 30, 2020 and 2019
EXPENSES
Activities Activities Total
Other General Revenues
2020 2019 2020 2019 2020 2019
___________________________________________________________________________________________
___________________________________________________________________________________________
Management’s
Discussion and Analysis (Dollar Amounts in Thousands)
25

The County’s net position increased by $317,280 during the current fiscal year. Revenues for the year totaled $4,801,992, an increase of $298,601 from prior year’s total revenues. Expenses totaled $4,484,712, an increase of $43,694 from the previous year’s total expenses. Governmental Activities The County’s governmental activities rely on several sources of revenue to finance ongoing operations. Operating grants and contributions comprised the largest revenue source for the County, followed by charges for services. Operating grants and contributions are monies received from parties outside the County and are generally restricted to one or more specific programs such as State and Federal revenues for public assistance and for health care. Charges for services are revenues that arise from charges to customers or applicants who purchase, use, or directly benefit from the goods, services, or privileges provided. Examples of the types of services that fall under this category include engineering services provided to cities under contract, park and recreation fees, and law enforcement services provided to other governmental agencies under contract. At the end of FY 2019-20, total revenues for governmental activities, including transfers from the business-type activities were $4,471,715, an increase of $315,778 from the previous year. Expenses totaled $4,221,044, an increase of $44,615 from the prior year. During the current fiscal year, net position for governmental activities increased by $250,671 from the prior fiscal year for an ending balance of $1,383,052. Key elements of the increase are as follows: Revenues
• Operating grants and contributions increased by $211,103, primarily due to federal assistance received from the CRF that covered expenditures related to the COVID-19 public health emergency. This increase was also due to higher claim payments received for the CalWorks and CalFresh programs, and timing of claiming and payments for the Child Welfare Services, Adult Protective Services, and In-Home Supportive Services programs.
• Capital grants and contributions increased by $77,689, due to an increase in revenues related to roads donated from the construction companies to the County Road System. Offsetting this increase was a decrease in revenues related to Ortega Highway Widening Improvement Project.
Expenses
• Expenses in general government increased by $91,753, primarily due to CRF funds distributed to cities for establishing business recovery grant programs and for covering COVID-19 related costs, as well as, contributions to other entities in relation to the design and construction of the OC Regional Wellness Hub.
• Expenses in public protection decreased by $79,028, mainly due to a decrease in salaries and employee benefits (S&EB), pension costs and a decrease in services and supplies (S&S) primarily in the Sheriff-Coroner Department.
• Expenses in health and sanitation increased by $37,653, primarily due to increases in professional services and medical supplies related to COVID-19. Partially offsetting this increase was a decrease in pension costs.
___________________________________________________________________________________________
___________________________________________________________________________________________
County of Orange Comprehensive Annual Financial Report For the Year Ended June 30, 2020 (Dollar Amounts in Thousands)
26
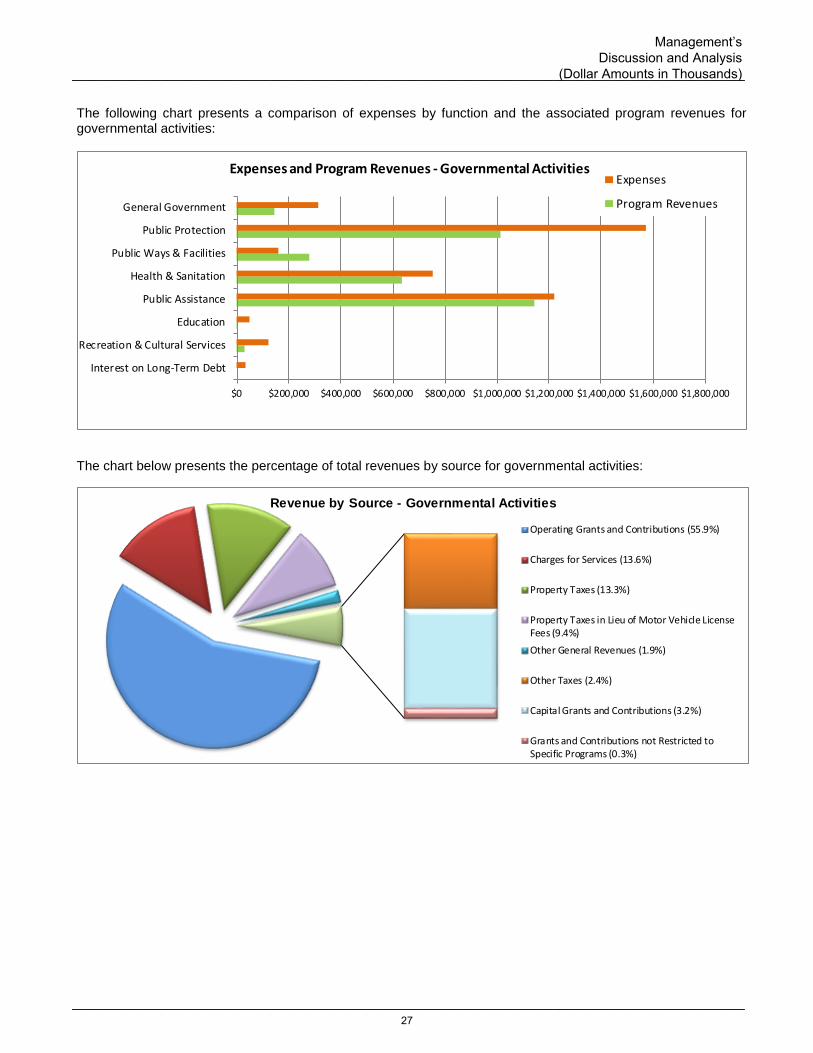
The following chart presents a comparison of expenses by function and the associated program revenues for governmental activities:
$0 $200,000 $400,000 $600,000 $800,000 $1,000,000 $1,200,000 $1,400,000 $1,600,000 $1,800,000
General Government
Public Protection
Public Ways & Facilities
Health & Sanitation
Public Assistance
Education
Recreation & Cultural Services
Interest on Long-Term Debt
Expenses
Program Revenues
Expenses and Program Revenues - Governmental Activities
The chart below presents the percentage of total revenues by source for governmental activities:
Operating Grants and Contributions (55.9%)
Charges for Services (13.6%)
Property Taxes (13.3%)
Property Taxes in Lieu of Motor Vehicle LicenseFees (9.4%)
Other General Revenues (1.9%)
Other Taxes (2.4%)
Capital Grants and Contributions (3.2%)
Grants and Contributions not Restricted toSpecific Programs (0.3%)
Revenue by Source - Governmental Activities
___________________________________________________________________________________________
___________________________________________________________________________________________
Management’s
Discussion and Analysis (Dollar Amounts in Thousands)
27

Business-Type Activities The County has three business-type activities: Airport, OC Waste & Recycling, and Compressed Natural Gas. In keeping with the intent of recovering all or a significant portion of their cost through user fees and charges, business-type activities reported charges for services as their largest source of revenues.
$0 $50,000 $100,000 $150,000 $200,000
Airport
OC Waste &Recycling
Expenses
Program Revenues
Expenses and Program Revenues - Business-Type Activities
At the end of FY 2019-20, the business-type activities’ total revenues exceeded expenses and transfers resulting in an increase of $66,609 in net position compared to the prior year’s increase in net position of $82,865. Revenues totaled $340,103 a decrease of $16,273 from the previous fiscal year, which is primarily attributable to decreases in revenue from the Airport’s auto parking fees, concessions, landing fees, interest income, Passenger Facility Charge (PFC) revenue, and capital grant contributions, partially offset by OC Waste & Recycling’s increase in importation disposal revenue and in-county disposal revenue. Expenses, including transfers to governmental activities, totaled $273,494, representing a decrease of $17 from the previous year. This decrease is primarily due to the Airport’s decrease in interest expense, due to the prior year payoff of the Airport Revenue Bonds, Series 2009, as well as decreases for OC Waste and Recycling’s closure and postclosure care costs, and taxes and other fees. Partially offsetting this decrease was an increase in OC Waste and Recycling's S&S and professional and specialized services. Other factors concerning the finances of the County’s two major enterprise funds are discussed in the Proprietary Funds section of the “Financial Analysis of the County’s Funds.” The following chart displays expenses and the associated program revenues by function for the business-type activities (major enterprise funds):
Charges for Services (92.6%)
Other General Revenues (5.8%)
Operating Grants andContributions (1.6%)
Revenue by Source - Business-Type Activities
___________________________________________________________________________________________
___________________________________________________________________________________________
County of Orange Comprehensive Annual Financial Report For the Year Ended June 30, 2020 (Dollar Amounts in Thousands)
28

FINANCIAL ANALYSIS OF THE COUNTY’S FUNDS
The County uses fund accounting to demonstrate legal compliance and aid financial management by segregating transactions related to certain government functions or activities.
Governmental Funds
Governmental funds are accounted for using the current financial resources measurement focus. With this measurement focus, only current assets, current liabilities, and deferred inflows of resources related to unavailable revenue generally are included on the balance sheet, with the difference reported as fund balance. Fund balance, excluding nonspendable and restricted fund balances, may serve as a valuable measure of the government’s available financial resources for spending at the end of a fiscal year. This amount is available for spending at the discretion of the Board in order to achieve the established function of the respective funds.
At June 30, 2020, the County’s governmental funds reported total fund balances of $2,692,077, which is an increase of $40,056 in comparison with prior year ending fund balances.
Comparative Analysis of Changes in Fund Balances
The following schedule presents a summary of revenues and other financing sources, expenditures and other financing uses, and the net change in fund balances for the governmental funds for the current and previous fiscal year:
2020 2019 2020 2019 2020 2019
General Fund $ 3,767,361 $ 3,382,454 $ 3,694,792 $ 3,400,499 $ 72,569 $ (18,045)
Flood Control District 174,694 194,368 144,155 146,280 30,539 48,088
Other Public Protection 65,384 62,121 48,816 52,662 16,568 9,459
147,928 168,334 231,783 200,386 (83,855) (32,052)
906,417 1,204,481 902,182 1,059,415 4,235 145,066
$ 5,061,784 $ 5,011,758 $ 5,021,728 $ 4,859,242 $ 40,056 $ 152,516
Mental Health Services Act
Total
Other Governmental Funds
GOVERNMENTAL FUNDS
COMPARATIVE SCHEDULE OF REVENUES, EXPENDITURES, OTHER FINANCING SOURCES (USES) AND CHANGES IN FUND
BALANCES
For the Years Ended June 30, 2020 and 2019
Net Change in
Financing Sources
Revenues and Other Expenditures and Other
Financing Uses Fund Balances
In addition to the effects of expenditure-driven grants, the following information provides explanations for the significant changes in fund balance:
General Fund The General Fund is the chief operating fund of the County. At the end of FY 2019-20, revenues and other financing sources were more than the expenditures and other financing uses resulting in an increase in fund balance of $72,569 compared to last year’s decrease of $18,045. Revenues and other financing sources increased by $384,907 and expenditures and other financing uses increased by $294,293. The following is a brief summary of the primary factors that contributed to the increase in the net change in fund balance for the General Fund in FY 2019-20:
Revenues
• Intergovernmental revenues increased by $282,986, mainly due to federal assistance received from the CRF that covered expenditures related to the COVID-19 public health emergency. The increase was also due to funding received for the Whole Person Care Program, higher claim payments received for the CalWorks and CalFresh programs, and timing of claiming and payments for the Child Welfare Services, Adult Protective Services, and In-Home Supportive Services programs.
• Transfers to the General Fund increased by $62,722 due to an increase in Prop 63 drawdowns from the Mental Health Services Act (MHSA), an increase in drawdowns from the Health Care Agency (HCA) purpose restricted revenue fund for eligible expenditures under the Homeless Emergency Aid Program, and an increase in
___________________________________________________________________________________________
___________________________________________________________________________________________
Management’s
Discussion and Analysis (Dollar Amounts in Thousands)
29

transfers to fund multi-year capital projects such as the Be Well OC Hub, Civic Center Facility Master Plan, and the Yale Transitional Center.
Expenditures
• Transfers from the General Fund increased by $73,732 for the development of permanent supportive housing and to the Countywide Capital Projects Non-General Fund for renovation and construction related to the Be Well OC Hub, Yale Transitional Center, and OC Animal Shelter.
• Expenditures for the general government increased by $70,057, which was primarily attributable to CRF funds distributed to cities for establishing business recovery grant programs and for covering COVID-19 related costs. Additionally, there was an increase in taxes and other fees for expenses related to the Be Well OC Hub. Partially offsetting the increase was a decrease in judgements and damages as the final Vehicle License Fee Adjustment settlement agreement payment to the State was made in June 2019.
• Expenditures for health and sanitation increased by $67,822, primarily as a result of ongoing operational cost increases in HCA for professional services, S&EB, and S&S to address the COVID-19 public health emergency. Another factor contributing to the increase was the reallocation of homeless programs in order to allow better program coordination and efficient delivery of services to the community.
• Expenditures for public assistance increased by $44,910, mainly due to increases in caseloads for CalWorks and Child Welfare Services programs. In addition, there was an increase in S&EB in Social Services Agency (SSA) for additional positions added to address increased State-mandated reporting requirements for the California Statewide Automated Welfare System migration planning and development. Partially offsetting this increase was a decrease in taxes and other fees for homeless services and a decrease in S&S in SSA due to decreases in expenditures for leases, household expenses and purchase of office furniture, installations and related services.
Flood Control District This group of funds is used to account for the planning, construction, and operation of flood control and water conservation works, such as dams, basins, and trunk channels, and for the retardation, conservation, and controlled discharge of storm waters. At the end of FY 2019-20, there was an increase in fund balance of $30,539 compared to last year’s increase of $48,088. Revenues and other financing sources decreased by $19,674, mainly due to lower intergovernmental revenues received for the Santa Ana River (SAR) Subvention claims, and a decrease in other revenues due to the sale of the Honda Center parking lot in the prior year. Expenditures and other financing uses decreased by $2,125, primarily due to decreases in payments for the SAR Mainstem Project. The decreases were offset by an increase in payments for the Santa Ana River Mainstem/Prado Dam project.
Other Public Protection This group of funds accounts for revenues restricted for safety and law enforcement activities such as the child support program, automated finger print identification systems, and investigation team. At the end of FY 2019-20, there was an increase in fund balance of $16,568 compared to last year’s increase of $9,459. Revenues and other financing sources increased by $3,263, which was primarily attributable to more revenue received from the Department of Justice for the Regional Narcotics Suppression Program (RNSP), and an increase in State Criminal Alien Assistance Program revenue received for costs incurred from incarcerating undocumented criminal aliens with felony or misdemeanor convictions. Additionally, there was an increase in transfers from Clerk-Recorder’s restricted fee revenue. Expenditures and other financing uses decreased by $3,846, mainly due to one-time purchase of items such as radio communication, telephone, and telecommunication equipment in the prior year, and no RNSP equitable sharing was paid to the cities in FY 2019-20. Mental Health Services Act (MHSA) This fund accounts for purpose restricted MHSA revenues. At the end of FY 2019-20, fund balance decreased by $83,855 compared to last year’s decrease of $32,052. Revenues and other financing sources decreased by $20,406, primarily due to lower allocation from the State for approved mental health services. Expenditures increased by $31,397, primarily due to an increase in transfers out to the General Fund for eligible reimbursement of MHSA related services. Other Governmental Funds Other governmental funds encompass nonmajor funds, which include special revenue funds, debt service funds, capital projects funds, and a permanent fund. At the end of FY 2019-20, fund balances increased by $4,235 in comparison to prior year’s increase of $145,066. Revenues and other financing sources decreased by $298,064,
___________________________________________________________________________________________
___________________________________________________________________________________________
County of Orange Comprehensive Annual Financial Report For the Year Ended June 30, 2020 (Dollar Amounts in Thousands)
30

primarily due to loan proceeds received in FY 2018-19 from the CMFA for the construction of Building 14, County Administration North (CAN). The decrease was offset by an increase in transfers in for Non-General Fund multi-year countywide capital projects, and the development of permanent supportive rental housing units for individuals diagnosed with serious mental illness and eligible for MHSA services. Expenditures and other financing uses decreased by $157,233, primarily due to a one-time transfer out from the loan proceeds in the prior year. The decrease was offset by transfers out to fund General Fund capital projects, including the Be Well OC Hub, Yale Transitional Center, and the Sheriff’s Intake/Release Center project. The following table shows fund balances and percentage change in fund balances for governmental funds for the current and previous fiscal year:
2020 2019 Increase/(Decrease) %
General Fund $ 863,302 $ 790,733 9 %
Flood Control District 487,839 457,300 7 %
Other Public Protection 182,191 165,623 10 %
132,075 215,930 (39)%
Other Governmental Funds 1,026,670 1,022,435 --
$ 2,692,077 $ 2,652,021 2 %
COMPARATIVE FUND BALANCE
Governmental Funds
June 30, 2020 and 2019
Total
Mental Health Services Act
Proprietary Funds
The proprietary fund financial statements provide the same type of information as the government-wide financial statements, only in more detail. The proprietary funds financial statements provide separate information for the Airport and OC Waste & Recycling funds, which are considered to be major funds of the County, and the Compressed Natural Gas fund. Internal Service Funds are combined into a single, aggregated presentation in the proprietary funds financial statements.
Comparative Analysis of Changes in Fund Net Position
The following table presents the enterprise funds’ revenues, expenses, contributions, transfers, and changes in fund net position for the current and previous fiscal year:
2020 2019 2020 2019 2020 2019
Airport $ 146,606 $ 167,574 $ 132,866 $ 135,589 $ 13,740 $ 31,985
OC Waste & Recycling 194,163 189,300 141,632 137,710 52,531 51,590
Compressed Natural Gas 149 120 11 160 138 (40)
$ 340,918 $ 356,994 $ 274,509 $ 273,459 $ 66,409 $ 83,535
ENTERPRISE FUNDS
COMPARATIVE SCHEDULE OF REVENUES, EXPENSES, CONTRIBUTIONS, TRANSFERS, AND CHANGES IN FUND NET POSITION
For the Years Ended June 30, 2020 and 2019
Change in
Total
Fund Net Position
Revenues, Contributions
and Transfers
Expenses
and Transfers
Airport This fund accounts for major construction and self-supporting aviation related activities rendered at the Airport. At the end of FY 2019-20, there was an increase of $13,740 in fund net position compared to the prior year increase of $31,985. Revenues, contributions and transfers decreased by $20,968, primarily due to the lease deferral rent plan which contributed to a decrease in auto parking fees, concessions, landing fees, airport fees, passenger and terminal fees, partially offset by an increase in intergovernmental revenues as a result of monies received from the FAA Coronavirus Aid, Relief, and Economic Security (CARES) Grant 49. Expenses decreased by $2,723, mainly due to a decrease in interest expense, partially offset by an increase in S&S.
___________________________________________________________________________________________
___________________________________________________________________________________________
Management’s
Discussion and Analysis (Dollar Amounts in Thousands)
31

OC Waste & Recycling This fund is used to account for the operation, expansion and closing of existing landfills. Monies are collected through gate tipping fees, which users pay based primarily on tonnage. At the end of FY 2019-20, there was an increase of $52,531 in fund net position compared to the prior year increase of $51,590. Revenues, contributions and transfers increased by $4,863, which was primarily due to an increase in sanitation and landfill disposal tonnage and fees collected for waste, recycling and importation. Expenses and transfers increased by $3,922, primarily due to an increase in S&S, depreciation expense, professional and specialized services. These increases were offset by a decrease in landfill site closure and post-closure care costs, taxes and other fees, and S&EB. Compressed Natural Gas (CNG) This fund is used to account for the operation and maintenance of the CNG facility. Revenues consist primarily of compressed natural gas sales to fuel the County’s growing fleet of CNG-powered heavy equipment. At the end of FY 2019-20, there was an increase of $138 in fund net position compared to the prior year decrease of $40. Revenues increased by $29 due to a higher royalty payment from Clean Energy, and higher Federal Excise Tax credit received for the Alternative Fuel. Expenditures decreased by $149 due to a decrease in utilities-purchased, monthly maintenance and repairs, and services as Clean Energy took over the operations of the CNG station. For further comparative analysis of Changes in Fund Net Position, please see the Business-Type Activities. GENERAL FUND BUDGETARY HIGHLIGHTS
This section provides a summary of the primary factors involved in the variances between: 1) the Original Budget and the Final Budget; and 2) the Final Budget and the budgetary based Actual amounts for the General Fund. In addition to the effects of expenditure-driven grants, the following information provides explanations for significant variances. Refer to the General Fund Budgetary Comparison Statement for a full budgetary comparison.
Original Revenue Budget vs. Final Revenue Budget
The following provides a summary of the primary factors attributable to the increase or decrease in the General Fund final budget revenues and other financing sources compared to the original budget revenues and other financing sources: Intergovernmental
• An increase of $558,500 in the Miscellaneous budget due to the anticipated federal assistance related to the CARES Act funding for COVID-19 economic support, as well as an increase for anticipated grant monies from the California Office of Emergency Services to initiate a pilot program to assist in the protection of life, property, and infrastructure during a wildfire and to better protect Californians from wildfires through enhanced resource allocation, early detection and immediate response.
• An increase of $6,280 in HCA mainly due to federal grant revenue for Whole Person Care and CalOptima, which will enable HCA to strengthen the focus on housing, provide resources for non Medi-Cal reimbursable services and fund programs to assist those living with serious mental illness.
• An increase of $6,200 in Registrar of Voters due to State funding for the Voters Choice Act implementation and the Voting System Replacement grants.
• Partially offsetting the increases in intergovernmental revenue was a decrease of $9,733 in OC Community Resources (OCCR) for State revenue due to the reallocation of homeless services to HCA, which will allow increased program coordination in the efficient delivery of services to the community.
Transfers In
• An increase of $24,120 in HCA to support ongoing program costs, and to cover anticipated increased eligible program costs funded by the OC Tobacco Settlement.
• An increase of $11,439 in Capital Projects mainly due to the additional funding for the Facilities Master Plan and other multi-year capital projects.
• An increase of $4,061 in the Sheriff-Coroner Department primarily due to transfers from the Sheriff’s State Criminal Assistance Program to reimburse costs related to the tracking and collection of criminal activity information and to support the costs incurred from the incarceration of undocumented criminal aliens with felony or misdemeanor convictions.
___________________________________________________________________________________________
___________________________________________________________________________________________
County of Orange Comprehensive Annual Financial Report For the Year Ended June 30, 2020 (Dollar Amounts in Thousands)
32

• An increase of $3,153 in Data Systems Development Projects primarily due to the additional funding for Countywide IT projects, and unspent multi-year IT projects, which were delayed to FY 2020-21.
Final Revenue Budget vs. Actual Revenue Amounts The following information provides a summary of the primary factors that caused significant variances in the General Fund actual revenues and other financing sources compared to the final revenue and other financing sources budget: Intergovernmental
• A $535,366 less than budgeted amount was primarily comprised of the following: - $498,025 less in the Miscellaneous Fund due to eligible COVID-19 expenditures not being incurred for
reimbursement from CARES Act funding. - $10,041 less received in HCA primarily due to a decrease in revenues for substance use disorder
services, adult mental health outpatient services, and the Medical Safety Net, as well as a lower amount received for eligible expenditures associated with MHSA/Prop 63 services.
- $9,602 less received in Probation due to lower than expected revenues for Joplin Youth Center, Youth Leadership Academy, and Postrelease Community Supervision Division.
- $8,810 less received in Sheriff Court Operations due to lower than expected revenues for court services as a result of COVID-19.
- $7,272 less received in the Sheriff-Coroner due to lower than expected revenues for Theo Lacy Facility and James A Musick Facility as a result of lower AB109 realignment allocations.
- Partially offsetting the overall less than budgeted amounts was an increase of $16,810 in SSA as a result of reimbursement for COVID-19 related claims from the CARES Act Federal Funds and higher than expected revenue for Foster Care Assistance payments.
Transfers In
• A $125,755 less than budgeted amount was primarily comprised of the following: - $72,332 less received in HCA due to lower than expected drawdowns in the MHSA Fund and OC
Tobacco Settlement Revenue. - $15,916 less received in SSA mainly attributable to lower than budgeted reimbursements from
Wraparound expenditures and less utility cost reimbursements for the Tustin Family Campus Program. - $8,000 less received in Capital Projects from the Countywide Capital Projects Non-General Fund due to a
delay in the OC Waste & Recycling - Landfill Postclosure Maintenance Project. - $6,280 less received in the District Attorney Department due to lower than expected drawdowns from
Prop 64 Consumer Protection and the Excess Public Safety Sales Tax. - $6,000 less revenue in the General Fund due to lower than anticipated transfers of Teeter penalties and
interest. - $4,786 less received in Sheriff-Coroner due to lower transfers from the Countywide Capital Projects Non-
General Fund due to less expenditures for the Automated Jail System. Additionally, less transfers were received from the Prop 69 DNA Identification Fund and the Sheriff Narcotics Program due to reduced spending in service contracts.
Original Expenditure Budget vs. Final Expenditure Budget The following provides a brief summary of the primary factors attributable to the increase or decrease in the General Fund final budget expenditures and other financing uses compared to the original budget expenditures and other financing uses: Miscellaneous
• An increase of $555,020, mainly due to an increase in appropriations to mitigate the COVID-19 health emergency. The COVID-19 pandemic emergency may result in some County department expenditures exceeding current appropriations.
___________________________________________________________________________________________
___________________________________________________________________________________________
Management’s
Discussion and Analysis (Dollar Amounts in Thousands)
33
Health Care Agency
• An increase of $41,341 primarily due to reorganization of homeless programs to HCA to increase program coordination and efficient delivery of services to the community.
OC Community Resources
• A decrease of $18,979 primarily due to reorganization of the Homeless Services division to HCA to increase efficiency in the delivery of services to the community.
Final Expenditure Budget vs. Actual Expenditure Amounts The following provides a summary of the primary factors that caused significant variances in the General Fund actual expenditures as compared to the final budget: Miscellaneous
• $508,753 less than budgeted amount due to eligible COVID-19 expenditures have not been incurred or claimed against CARES Act funds.
Health Care Agency
• $59,126 less than budgeted amount mainly due to lower than anticipated expenditures for S&EB, professional and specialized services associated with MHSA programs, as well as lower expenditures for IT professional services.
Sheriff-Coroner
• $23,625 less than budgeted amount primarily due to lower than expected costs for professional and specialized contracted services, lower salary and performance incentive pay expenditures and the department reducing or deferring facility maintenance and equipment purchases.
Probation
• $12,222 less than budgeted amount mainly due to lower than anticipated expenditures for S&EB, professional and specialized services associated with the Joplin Youth Center.
District Attorney
• $11,243 less than budgeted amount mainly as a result of lower expenditures for S&EB, professional and specialized contracted services, transportation and travel, and the deferral of IT hardware purchases.
Capital Projects
• $11,138 less than budgeted amount was primarily due to the delayed construction of the various structure and improvement projects such as El Toro Development, Civic Center Master Plan Phase II, and Yale Transitional Center.
Capital Assets At June 30, 2020, the County’s capital assets for both the governmental and business-type activities amounted to $4,373,683 net of accumulated depreciation. The investment in capital assets includes land, structures and improvements, land improvements, equipment, software, infrastructure, intangible in progress, land use rights, and construction in progress. The total increase in the County’s investment in capital assets for the current year was 4%.
___________________________________________________________________________________________
___________________________________________________________________________________________
County of Orange Comprehensive Annual Financial Report For the Year Ended June 30, 2020 (Dollar Amounts in Thousands)
34

Capital assets for the governmental and business-type activities are presented below to illustrate changes:
Increase
(Decrease)
% Change
Land $ 871,319 $ 855,763 $ 38,379 $ 38,379 $ 909,698 $ 894,142 2 %
Structures and
Improvements 819,263 649,912 534,484 550,660 1,353,747 1,200,572 13 %
Land Improvements 3,077 3,319 603 -- 3,680 3,319 11 %
Equipment 187,638 174,904 43,797 38,332 231,435 213,236 9 %
Software 34,573 39,832 2,727 3,142 37,300 42,974 (13)%
Infrastructure 1,302,875 1,235,355 286,240 302,063 1,589,115 1,537,418 3 %
Intangible in Progress 18,798 13,610 749 291 19,547 13,901 41 %
Land Use Rights 6,439 6,439 -- -- 6,439 6,439 --
Construction in
Progress 182,788 264,494 39,934 16,516 222,722 281,010 (21)%
$ 3,426,770 $ 3,243,628 $ 946,913 $ 949,383 $ 4,373,683 $ 4,193,011 4 % Total
2020 20192020 2019 2020 2019
Activities
CAPITAL ASSETS
(Net of Accumulated Depreciation)
June 30, 2020 and 2019
Governmental Business-Type
TotalActivities
The following lists the significant expenditures for capital assets in FY 2019-20: General Fund
• $14,677 for the purchase of the Hart Voting System for the November 3, 2020 General election
• $12,638 for the purchase of the Yale Transitional Center to provide community services in Central Orange County
• $2,841 for the Property Tax System Re-platforming Project
• $1,717 for the purchase of mail extractors and mailing sorting equipment for election services
• $1,622 for the purchase of IT hardware, software and services for District Attorney
• $1,600 for the construction costs associated with District Attorney Osborne Building remodeling
• $1,427 for the replacement of air handlers at the County Operations Center-Building B
• $1,241 for the installation of Tridium Alarm Front End at various locations
• $1,102 for the purchase of telecommunication equipment and computer equipment for the Sheriff-Coroner
• $1,030 for of the replacement of HVAC units at the Orangewood Children and Family Center Flood Control District
• $18,429 for the Fullerton Creek Channel Project
• $9,179 for the purchase of property for the Santa Ana River Mainstem and Prado Dam Project
• $4,977 for the Lane Channel Improvements
• $2,386 for the East Garden Grove Wintersburg Channel Project
• $2,134 for the purchase of construction equipment such as a crane and backhoe loader
• $1,272 for the Huntington Beach Channel Sheet Piling Project
• $1,066 for the maintenance of the Prima Deshecha Channel
• $1,023 for the San Diego Sediment Removal Project Other Public Protection
• $1,258 for the purchase of 800 MHZ Countywide Coordinated Communications System
Other Governmental Funds
• $24,677 for the Civic Center Facilities Master Plan, Building 16 Construction Project
• $24,459 for the Civic Center Facilities Master Plan, Building 14 Construction Project
• $4,659 for the Juvenile Hall-Gym and Visitation Center
• $2,815 for OC Zoo entry plaza and restroom
___________________________________________________________________________________________
___________________________________________________________________________________________
Management’s
Discussion and Analysis (Dollar Amounts in Thousands)
35
• $2,113 for the replacement of air handlers at the Central Men’s Jail, the Central Women’s Jail, and Headquarters
• $2,113 for the James A. Musick Facility Master Plan, Phase I Project
• $2,045 for the La Pata Avenue Gap Closure/Widening, Phase I & II Project
• $1,725 for the James A. Musick Facility Master Plan, Phase II Project
• $1,701 for Laguna Canyon Road Segment 4, Phase II Project
• $1,582 for the Irvine Park Drainage Improvements Project
• $1,224 for the remodel and renovation at the Central Jails Complex, and the purchase and installation of furniture at the Central Men’s Jail and the Central Women’s Jail
• $1,146 for the Old Courthouse exterior repairs Airport
• $11,274 for the Airport Operations Center
• $9,812 for the infrastructure work of the Concession Development
• $3,798 for the replacement of Terminal A & B air handlers
• $1,781 for the generator engines blackstart in the Central Plant
• $1,745 for the rental car reconfiguration
• $1,087 for the Terminals A & B HVAC ducting refurbishments OC Waste & Recycling
• $5,738 for the purchase of heavy equipment for the Prima Zone and South Regional Landfill
• $4,039 for the purchase of heavy equipment at the Olinda Alpha Landfill and the North Regional Landfill
• $1,348 for the purchase of heavy equipment at the Frank R. Bowerman Landfill and the Central Regional Landfill
• $1,280 for the Prima steel materials storage structure
• $1,111 for the Bee Canyon Greenery Composting Facility Internal Service Funds
• $5,789 for the purchase of vehicles for OC Fleet Services Additional information on the County’s capital assets can be found in Note 4, Changes in Capital Assets. Commitments for Capital Expenditures At the end of FY 2019-20, significant commitments for capital expenditures included the following:
• $158,579 for the Civic Center Facilities Master Plan, Building 14
• $53,445 for the East Garden Grove-Winterburg Channel U/S Warner
• $11,062 for the purchase of various vehicles
• $6,868 for the Orange County Zoo-Oak Woodland Exhibit
• $4,767 for the Bee Canyon Greenery Project
• $4,157 for the Airport Operations Center
• $4,073 for the Capistrano Greenery Project
• $3,565 for the James A. Musick Facility Expansion, Phase I Project
• $2,832 for the James A. Musick Facility Expansion, Phase II Project
• $2,787 for the Intake Release Center facility modifications-Mental Health Upgrade Additional information on the County’s commitments for capital expenditures can be found in Note 15, Construction and Other Significant Commitments. Long-Term Debt At June 30, 2020, the County had total debt obligations outstanding of $593,661 excluding long-term liabilities such as compensated absences payable, pension, OPEB, and capital lease obligations payable. During the year, the County’s outstanding bond obligations decreased by 2% which is primarily attributable to the redemption of $87,837 in bond obligations and a decrease of $12,022 in Interest Accretion on Capital Appreciation Bonds
___________________________________________________________________________________________
___________________________________________________________________________________________
County of Orange Comprehensive Annual Financial Report For the Year Ended June 30, 2020 (Dollar Amounts in Thousands)
36

(CABs). This was partially offset by the issuance of $83,708 in Teeter Plan Notes and $1,911 in Interest Accretion on CABs. The County is limited by law in issuing general obligation bonded debt to 1.25% of the last equalized assessment property tax roll values. However, this does not affect the financing of any of the County’s planned facilities or services. As of the end of the fiscal year, the County had no net general obligation bonded debt. The County’s debt obligations are in the form of revenue bonds and other forms of debt not covered by the general obligation bonded debt limitation. The following table summarizes the County’s outstanding bonds at June 30, 2020 and 2019:
Increase
(Decrease)
% Change
Revenue Bonds $ 386,745 $ 388,720 $ 83,080 $ 85,030 $ 469,825 $ 473,750 (1)%
Pension Obligation Bonds 2,967 5,445 -- -- 2,967 5,445 (46)%
Teeter Plan Notes (Direct Placement) 34,661 29,507 -- -- 34,661 29,507 17 %
Add: Premium
on Bonds Payable 60,736 60,949 10,382 13,049 71,118 73,998 (4)%
Add: Interest Accretion
15,090 25,201 -- -- 15,090 25,201 (40)%
$ 500,199 $ 509,822 $ 93,462 $ 98,079 $ 593,661 $ 607,901 (2)%
LONG-TERM DEBT OBLIGATIONS
June 30, 2020 and 2019
2020 2019 2020
Governmental Business-Type
Activities Activities Total
Total
2019 2020 2019
on CABs
The following summarizes the County’s long-term debt issuance during FY 2019-20: Teeter Plan Notes On December 28, 2018 and June 20, 2019, the County used all of the accumulated base taxes to redeem $22,084 and $9,516, respectively, of the Teeter Plan Obligation Notes. As of June 30, 2019, the outstanding principal amount of the Teeter Plan Obligation Notes was $29,507.
On July 15, 2019, additional Teeter Plan Notes were issued in the amount of $40,269 to finance the delinquent property tax receivables associated with the Teeter Plan for a new outstanding balance of $69,776.
On December 23, 2019, the County used all of the accumulated base taxes to redeem $26,337 of the Teeter Plan Obligation Notes for a new outstanding balance of $43,439.
Due to the anticipated economic impact of the COVID-19 pandemic, on April 21, 2020, the Board approved an increase in the authorized amount from $100,000 to $150,000. On June 24, 2020, the County used accumulated base taxes to redeem $8,778 of the Teeter Plan Obligation Notes. As of June 30, 2020, the outstanding principal amount of the Teeter Plan Obligation Notes was $34,661 and the authorized, unused available commitment under the First Amendment to Amended and Restated Note Purchase and Reimbursement Agreement was $115,339.
At the time of the increase in authorized amount, the prior notes in the amount of $43,439 were paid off, and new notes in the amount of $43,439 were issued. Additional information on the County’s long-term debt activity can be found in Note 11, Long-Term Obligations, and Note 21, Subsequent Events. Bond Ratings
The County maintained its Issuer Credit Rating of Aa1 from Moody’s Investors Service (Moody’s), AA+ from Standard & Poor’s Global Ratings (S&P), and AAA Issuer Default Rating from Fitch Ratings. In October 2020, S&P lowered its long-term rating of the Airport Revenue Refunding Bonds to A+ from AA-. For additional information on the bond rating, refer to Note 21, Subsequent Events.
___________________________________________________________________________________________
___________________________________________________________________________________________
Management’s
Discussion and Analysis (Dollar Amounts in Thousands)
37

The County has the following long-term underlying debt ratings:
S&P Moody’s Fitch
2016 Lease Revenue Bonds AA NR NR
Teeter Plan Notes NR NR NR
1997A Pension Obligation Bonds NR Aa1 AA+
Airport 2019A Revenue Refunding Bonds AA- NR NR
Airport 2019B Revenue Refunding Bonds AA- NR NR
LONG-TERM DEBT RATINGS
June 30, 2020
OTHER POTENTIALLY SIGNIFICANT MATTERS The County’s management has determined that the following are significant matters that have a potential impact on the County’s financial position or changes in financial position: State Legislation and Budget System of Care The County is working together with cities to respond to regional community needs in addressing homelessness. The continuous partnership between the County and each of the 34 cities in Orange County is essential to meet the needs of people experiencing homelessness and leverages the funding available with the Building Homes and Jobs Act (SB 2) or other programs such as the State’s No Place Like Home, Whole Person Care, and the Special Needs Housing Programs. In June 2018, the County issued its Housing Funding Strategy to create 2,700 permanent supportive housing units. This is in addition to funding three city-operated emergency shelters in Buena Park, Placentia, Huntington Beach, and construction and opening of the Yale Transitional Center to transition the operations of the Courtyard Transitional Center to a more suitable building. The COVID-19 pandemic required the mobilization of community partners and stakeholders to develop an emergency response to provide no-congregate shelter to individuals experiencing homelessness who are at high-risk for severe COVID-19 illness through Project Roomkey. The participants of Project Roomkey were provided an opportunity to access other resources of the System of Care including bridge housing, housing navigation to assist individuals and families experiencing homelessness in overcoming barriers as they transition to permanent housing, receive assistance to apply for disability benefits, and access other support services that promote housing stability. The County applied to the California Department of Housing and Community Development for Homekey Projects for funding to secure motel buildings and convert them into interim or/and permanent, long-term housing. The County was successful in receiving Homekey funding from the State to purchase two motels to increase the community’s response to homelessness and the COVID-19 pandemic. These hotels will create 132 units of interim housing and will transition into permanent supportive housing in approximately three years. The County also supports city-led homeless service programs through field-based outreach teams that integrate with County behavioral health resources. CARES Act and FEMA Revenue for COVID-19 In April 2020, the County received $554,134 from the United States Treasury CRF. Use of the funds is subject to the restrictions outlined in the CARES Act. The CARES Act provided funds to state, territorial, local, and tribal governments. In addition to the $554,134, the State allocated a portion of its CARES Act funds to counties and cities, of which the County is allocated $73,509. As of June 30, 2020, the County used $166,446 from the United States Treasury CRF allocation for eligible COVID-19 related expenditures. All CARES Act funds must be spent by December 30, 2020 according to the Federal guidelines issued by the United States Treasury. In addition to the allocations mentioned above, the Airport received dedicated funding of $44,910 from the Federal Aviation Administration-CARES Act Airport Grants, which are restricted to Airport use only. The County will also receive reimbursement for eligible COVID-19-related expenditures from the Federal Emergency Management Agency (FEMA). On March 13, 2020, the President declared the ongoing COVID-19 pandemic of sufficient severity and magnitude to warrant an emergency declaration for all states, tribes, territories, and the District of Columbia pursuant to section 501 (b) of the Robert T. Stafford Disaster Relief and Emergency Assistance Act, 42 U.S.C. 5121-5207 (the “Stafford Act”). State, territorial, tribal, local government entities and certain private non-profit organizations are eligible to apply for public assistance. In June 2020, the
___________________________________________________________________________________________
___________________________________________________________________________________________
County of Orange Comprehensive Annual Financial Report For the Year Ended June 30, 2020 (Dollar Amounts in Thousands)
38
County submitted FEMA claims for five eligible COVID-19 projects: Emergency Operations Center, Testing Kits, Personal Protective Equipment, Project RoomKey, and the Great Plates Program. In addition to CARES Act and FEMA funding, some county departments are receiving additional funding from the state/federal governments for other eligible program costs related to COVID-19. Long-Term Financial Planning Funding Progress of the County’s Retirement System (System) The funded ratio of the System is a measure of the ability of the System to make obligated payments to current retirees and future retirees. The funded ratio (valuation value of plan assets divided by actuarial accrued liability) dropped from 82.76% in 2002 to 70.85% in 2004. Since 2004, the funded ratio increased to 74.08% in 2007 before dropping to 62.52% in 2012. As of December 31, 2019, the funding ratio for the System is 73.17%, which is an increase from 72.43% in 2018. The System’s Unfunded Actuarial Accrued Liability (UAAL) increased from $5.71 billion ($4.59 billion attributable to the County) to $5.88 billion ($4.75 billion attributable to the County). The increase in the UAAL is primarily attributable to unfavorable investment returns (after smoothing) and COLA increase for retirees larger than expected, which were slightly offset by salary increase less than expected. On November 4, 2008, the voters in Orange County approved Measure J, which requires voter approval for any future pension benefit enhancements. The County carefully monitors the activities at OCERS and regularly provides input to OCERS management, as well as providing input at OCERS Board meetings as deemed appropriate. Reduction in OCERS Assumed Investment Rate of Return The assumed investment rate of return is the rate of investment yield that the Plan will earn over the long-term future. On December 5, 2012, the OCERS Board voted to reduce the assumed investment rate of return from 7.75% to 7.25%. The reduction was phased in over a two-year period beginning July 2014 at 7.5% and reducing to 7.25% effective July 2015. On October 16, 2017, the OCERS Board adopted a reduction in the assumed investment rate of return to 7.00% effective July 1, 2019. The assumed rate of return reduction had the impact of increasing contribution rates of members and plan sponsors. OCERS Actuarial Funding Policy (Amortization) On November 18, 2013, the OCERS Board adopted the actuarial funding policy to reduce the amortization period for future UAAL from 30 years to 20 years, which included combining and re-amortizing the entire outstanding UAAL balance as of December 31, 2012, over a single 20-year period. This will allow for future UAAL to be paid off in a shorter period of time and will ultimately reduce retirement rates and costs over time. OCERS Actuarial Assumptions The 2014 through 2016 valuations were impacted by economic assumption changes, which flowed from the 2014 Triennial Study of Actuarial Assumptions. These changes, adopted by the OCERS Board on September 23, 2014, included a decrease in the inflation assumption from 3.25% to 3.00% per annum. As a result of the 2017 Triennial Study of Actuarial Assumptions, the OCERS Board, on October 16, 2017, adopted a further decrease in the inflation assumption to 2.75%, which was effective with the 2017 valuation. On August 17, 2020, the OCERS Board adopted another decrease in the inflation rate assumption to 2.50%, while maintaining the post-retirement cost-of-living adjustment (COLA) at 2.75%. The new assumption changes will be effective with the 2020 valuation. Requests for Information
We hope that the preceding information provides a general overview of the County’s overall financial status. For questions or comments concerning information contained in this report, please contact the Auditor-Controller’s Office, County of Orange, 1770 N Broadway, Santa Ana, CA 92706 or you can access our website at www.ac.ocgov.com.
___________________________________________________________________________________________
___________________________________________________________________________________________
Management’s
Discussion and Analysis (Dollar Amounts in Thousands)
39


County Service Center Computer Terminals


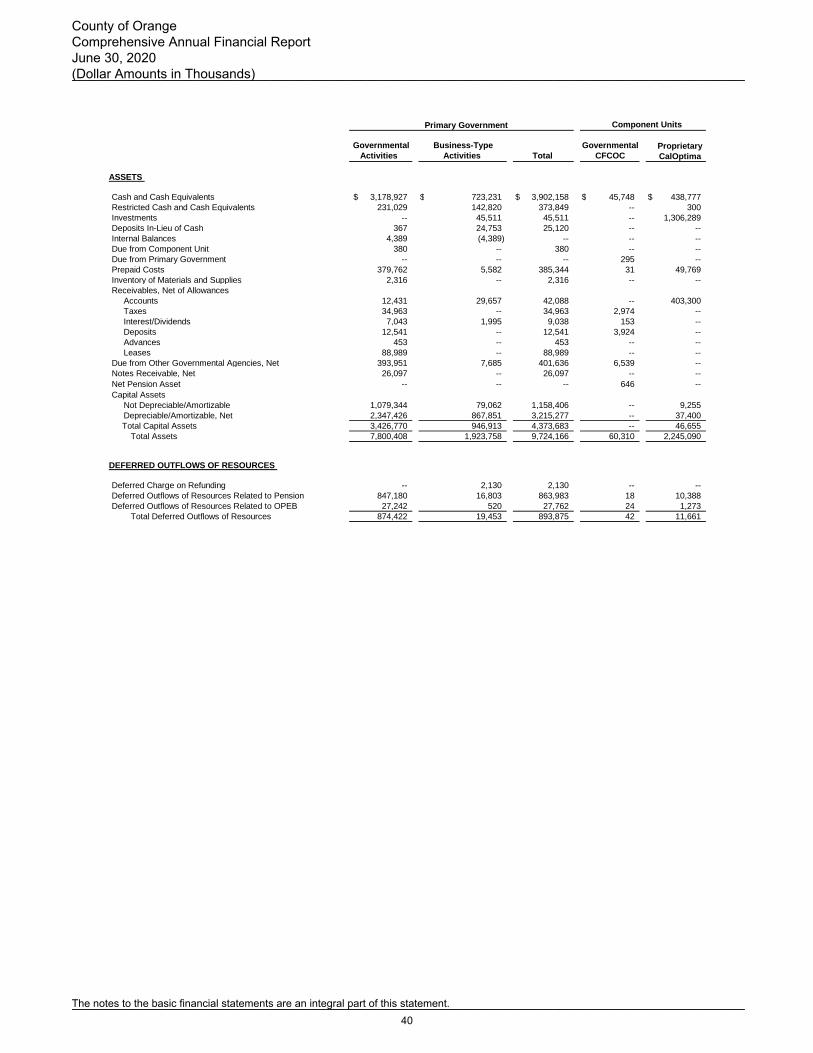
Primary Government
Proprietary
CalOptima
ASSETS
Cash and Cash Equivalents $ 3,178,927 $ 723,231 $ 3,902,158 $ 45,748 $ 438,777
Restricted Cash and Cash Equivalents 231,029 142,820 373,849 -- 300
Investments -- 45,511 45,511 -- 1,306,289
Deposits In-Lieu of Cash 367 24,753 25,120 -- --
Internal Balances 4,389 (4,389) -- -- --
Due from Component Unit 380 -- 380 -- --
Due from Primary Government -- -- -- 295 --
Prepaid Costs 379,762 5,582 385,344 31 49,769
Inventory of Materials and Supplies 2,316 -- 2,316 -- --
Receivables, Net of Allowances
Accounts 12,431 29,657 42,088 -- 403,300
Taxes 34,963 -- 34,963 2,974 --
Interest/Dividends 7,043 1,995 9,038 153 --
Deposits 12,541 -- 12,541 3,924 --
Advances 453 -- 453 -- --
Leases 88,989 -- 88,989 -- --
Due from Other Governmental Agencies, Net 393,951 7,685 401,636 6,539 --
Notes Receivable, Net 26,097 -- 26,097 -- --
Net Pension Asset -- -- -- 646 --
Capital Assets
Not Depreciable/Amortizable 1,079,344 79,062 1,158,406 -- 9,255
Depreciable/Amortizable, Net 2,347,426 867,851 3,215,277 -- 37,400
Total Capital Assets 3,426,770 946,913 4,373,683 -- 46,655
Total Assets 7,800,408 1,923,758 9,724,166 60,310 2,245,090
DEFERRED OUTFLOWS OF RESOURCES
Deferred Charge on Refunding -- 2,130 2,130 -- --
Deferred Outflows of Resources Related to Pension 847,180 16,803 863,983 18 10,388
Deferred Outflows of Resources Related to OPEB 27,242 520 27,762 24 1,273
Total Deferred Outflows of Resources 874,422 19,453 893,875 42 11,661
Component Units
Activities Total CFCOCActivities
Governmental GovernmentalBusiness-Type
___________________________________________________________________________________________
___________________________________________________________________________________________
County of Orange Comprehensive Annual Financial Report June 30, 2020 (Dollar Amounts in Thousands)
The notes to the basic financial statements are an integral part of this statement.40

Primary Government
Proprietary
CalOptima
LIABILITIES
Accounts Payable $ 138,938 $ 27,802 $ 166,740 $ 4,531 $ 8,300
Salaries and Employee Benefits Payable 66,177 1,505 67,682 46 13,622
Retainage Payable 5,834 1,188 7,022 1,363 --
Interest Payable 4,511 2,077 6,588 -- --
Deposits from Others 94,139 29,142 123,281 -- --
Due to Primary Government -- -- -- 380 --
Due to Other Governmental Agencies 41,906 12,797 54,703 4,926 677,498
Unearned Revenue 462,707 2,168 464,875 -- 22,693
Short-Term Bonds Payable 463,895 -- 463,895 -- --
Long-Term Liabilities
Due Within One Year
Civic Center Facilities Master Plan Loan 3,211 -- 3,211 -- --
Interest Accretion on Capital Appreciation Bonds Payable 13,049 -- 13,049 -- --
Insurance Claims Payable 57,917 -- 57,917 -- --
Medical Claims Payable -- -- -- -- 306,902
Capitation and Withholds -- -- -- -- 142,981
Compensated Employee Absences Payable 107,023 2,504 109,527 65 --
Capital Lease Obligations Payable 6,610 -- 6,610 -- --
Bonds Payable 4,868 13,552 18,420 -- --
Pollution Remediation Obligation -- 698 698 -- --
Intangible Assets Obligations Payable 721 72 793 -- --
Landfill Site Closure/Postclosure Liability -- 3,680 3,680 -- --
Due in More than One Year
Civic Center Facilities Master Plan Loan 384,433 -- 384,433 -- --
Interest Accretion on Capital Appreciation Bonds Payable 2,041 -- 2,041 -- --
Insurance Claims Payable 165,758 -- 165,758 -- --
Compensated Employee Absences Payable 72,781 1,742 74,523 21 --
Capital Lease Obligations Payable 25,092 -- 25,092 -- --
Notes Payable 34,661 -- 34,661 -- --
Bonds Payable 57,936 79,910 137,846 -- --
Pollution Remediation Obligation -- 15,487 15,487 -- --
Intangible Assets Obligations Payable 1,174 2 1,176 -- --
Landfill Site Closure/Postclosure Liability -- 180,701 180,701 -- --
Net Pension Liability 4,037,059 88,313 4,125,372 -- 27,123
Net OPEB Liability 322,267 6,145 328,412 245 25,824
Total Liabilities 6,574,708 469,485 7,044,193 11,577 1,224,943
DEFERRED INFLOWS OF RESOURCES
Deferred Inflows of Resources Related to Pension 616,912 11,823 628,735 1,620 4,235
Deferred Inflows of Resources Related to OPEB 29,740 567 30,307 26 2,442
Deferred Inflows for Service Concession Arrangements 70,418 -- 70,418 -- --
Total Deferred Inflows of Resources 717,070 12,390 729,460 1,646 6,677
NET POSITION
Net Investment in Capital Assets 3,319,173 856,250 4,175,423 -- 46,494 Restricted for:
Expendable
Pension Benefits 135,342 -- 135,342 -- --
Capital Projects 162,614 -- 162,614 -- --
Debt Service 33,179 11,591 44,770 -- --
Legally Segregated for Grants and Other Purposes 1,212,985 -- 1,212,985 -- --
Regional Park Endowment 167 -- 167 -- --
CalOptima -- -- -- -- 100,574
Passenger Facility Charges Approved Capital Projects -- 8,158 8,158 -- --
Capital Projects-Replacements and Renewals -- 1,000 1,000 -- --
Landfill Closure/Postclosure -- 27,730 27,730 -- --
Landfill Corrective Action -- 8,820 8,820 -- --
Wetland -- 879 879 -- --
Prima Deshecha/La Pata Closure -- 104 104 -- --
Nonexpendable
Regional Park Endowment 200 -- 200 -- -- 9770Unrestricted (Deficit) (3,480,608) 546,804 (2,933,804) 47,129 878,063
Total Net Position $ 1,383,052 $ 1,461,336 $ 2,844,388 $ 47,129 $ 1,025,131
Component Units
Governmental Business-Type Governmental
CFCOCActivities Activities Total
___________________________________________________________________________________________
___________________________________________________________________________________________
Basic Financial Statements Statement of Net Position
(Dollar Amounts in Thousands)
41

Functions/Programs
Primary Government
Governmental Activities
General Government $ 361,582 $ (47,999) $ 45,713 $ 87,876 $ 10,759
Public Protection 1,539,583 31,554 299,121 709,037 7,155
Public Ways and Facilities 162,586 (4,230) 54,762 106,745 116,218
Health and Sanitation 746,443 6,553 140,631 485,875 6,939
Public Assistance 1,210,469 9,347 38,431 1,104,754 47
Education 47,919 926 575 1,826 --
Recreation and Cultural Services 120,296 2,398 26,143 4,255 --
Interest on Long-Term Debt 33,617 -- -- -- --
Total Governmental Activities 4,222,495 (1,451) 605,376 2,500,368 141,118
Business-Type Activities
Airport 132,196 608 135,273 5,281 --
OC Waste & Recycling 130,012 841 179,542 3 --
Compressed Natural Gas 9 2 95 1 --
Total Business-Type Activities 262,217 1,451 314,910 5,285 --
Total Primary Government $ 4,484,712 $ -- $ 920,286 $ 2,505,653 $ 141,118
Component Units
Children and Families
Commission of Orange County $ 30,681 $ -- $ -- $ 29,505 $ --
CalOptima 3,786,560 -- 3,833,145 -- -- Total Component Units $ 3,817,241 $ -- $ 3,833,145 $ 29,505 $ --
General Revenues
Taxes
Property Taxes, Levied for General Fund
Property Taxes, Levied for Flood Control District
Property Taxes, Levied for OC Parks
Property Taxes, Levied for OC Public Libraries
Property Taxes in-Lieu of Motor Vehicle License Fees
Other Taxes
Grants and Contributions Not Restricted to Specific Programs
State Allocation of Motor Vehicle License Fees
Unrestricted Investment EarningsMiscellaneous
Transfers
Total General Revenues and Transfers
Change in Net Position
Net Position-Beginning of Year
Net Position-End of Year
Direct
Expenses Allocation Services Contributions Contributions
Expenses Charges for Grants and Grants and
Program Revenues
Indirect Operating Capital
Expenses
___________________________________________________________________________________________
___________________________________________________________________________________________
County of Orange Comprehensive Annual Financial Report For the Year Ended June 30, 2020 (Dollar Amounts in Thousands)
The notes to the basic financial statements are an integral part of this statement.42
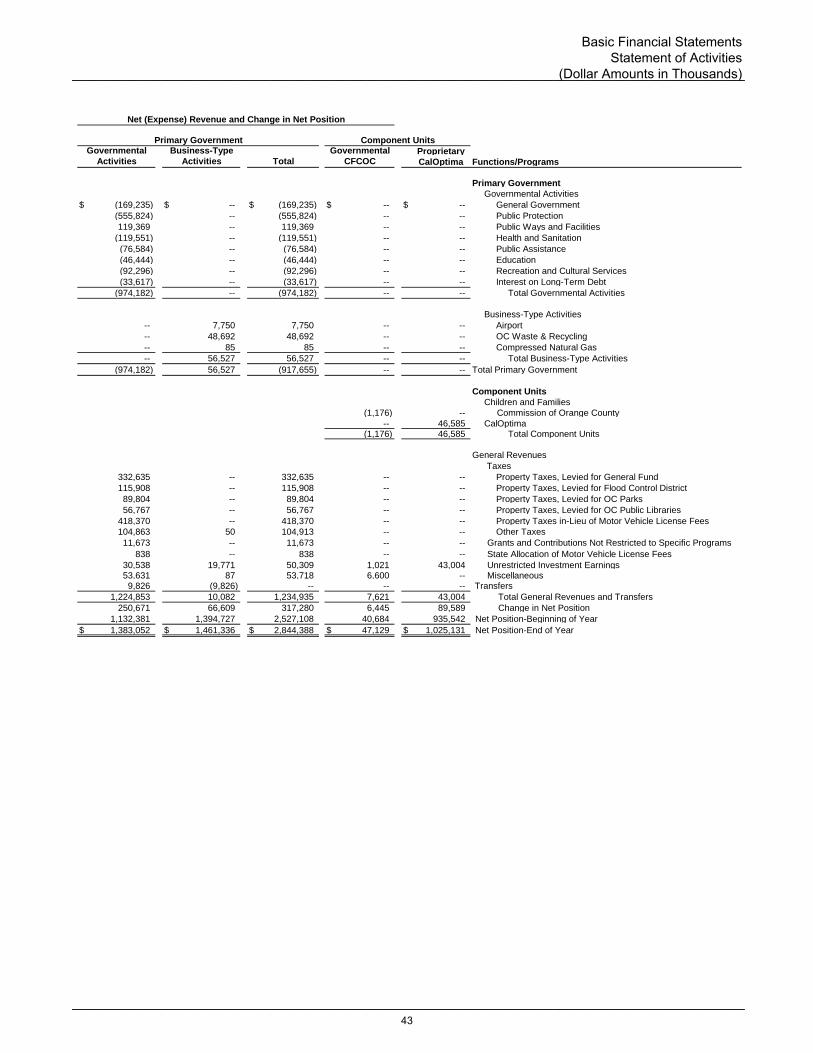
Proprietary
CalOptima Functions/Programs
Primary Government
Governmental Activities
$ (169,235) $ -- $ (169,235) $ -- $ -- General Government
(555,824) -- (555,824) -- -- Public Protection
119,369 -- 119,369 -- -- Public Ways and Facilities
(119,551) -- (119,551) -- -- Health and Sanitation
(76,584) -- (76,584) -- -- Public Assistance
(46,444) -- (46,444) -- -- Education
(92,296) -- (92,296) -- -- Recreation and Cultural Services
(33,617) -- (33,617) -- -- Interest on Long-Term Debt
(974,182) -- (974,182) -- -- Total Governmental Activities
Business-Type Activities
-- 7,750 7,750 -- -- Airport
-- 48,692 48,692 -- -- OC Waste & Recycling
-- 85 85 -- -- Compressed Natural Gas
-- 56,527 56,527 -- -- Total Business-Type Activities
(974,182) 56,527 (917,655) -- -- Total Primary Government
Component Units
Children and Families
(1,176) -- Commission of Orange County
-- 46,585 CalOptima(1,176) 46,585 Total Component Units
General Revenues
Taxes
332,635 -- 332,635 -- -- Property Taxes, Levied for General Fund
115,908 -- 115,908 -- -- Property Taxes, Levied for Flood Control District
89,804 -- 89,804 -- -- Property Taxes, Levied for OC Parks
56,767 -- 56,767 -- -- Property Taxes, Levied for OC Public Libraries
418,370 -- 418,370 -- -- Property Taxes in-Lieu of Motor Vehicle License Fees
104,863 50 104,913 -- -- Other Taxes
11,673 -- 11,673 -- -- Grants and Contributions Not Restricted to Specific Programs
838 -- 838 -- -- State Allocation of Motor Vehicle License Fees
30,538 19,771 50,309 1,021 43,004 Unrestricted Investment Earnings53,631 87 53,718 6,600 -- Miscellaneous9,826 (9,826) -- -- -- Transfers
1,224,853 10,082 1,234,935 7,621 43,004 Total General Revenues and Transfers
250,671 66,609 317,280 6,445 89,589 Change in Net Position
1,132,381 1,394,727 2,527,108 40,684 935,542 Net Position-Beginning of Year
$ 1,383,052 $ 1,461,336 $ 2,844,388 $ 47,129 $ 1,025,131 Net Position-End of Year
Governmental
Activities Activities Total CFCOC
Governmental Business-Type
Net (Expense) Revenue and Change in Net Position
Primary Government Component Units
___________________________________________________________________________________________
___________________________________________________________________________________________
Basic Financial Statements Statement of Activities
(Dollar Amounts in Thousands)
43
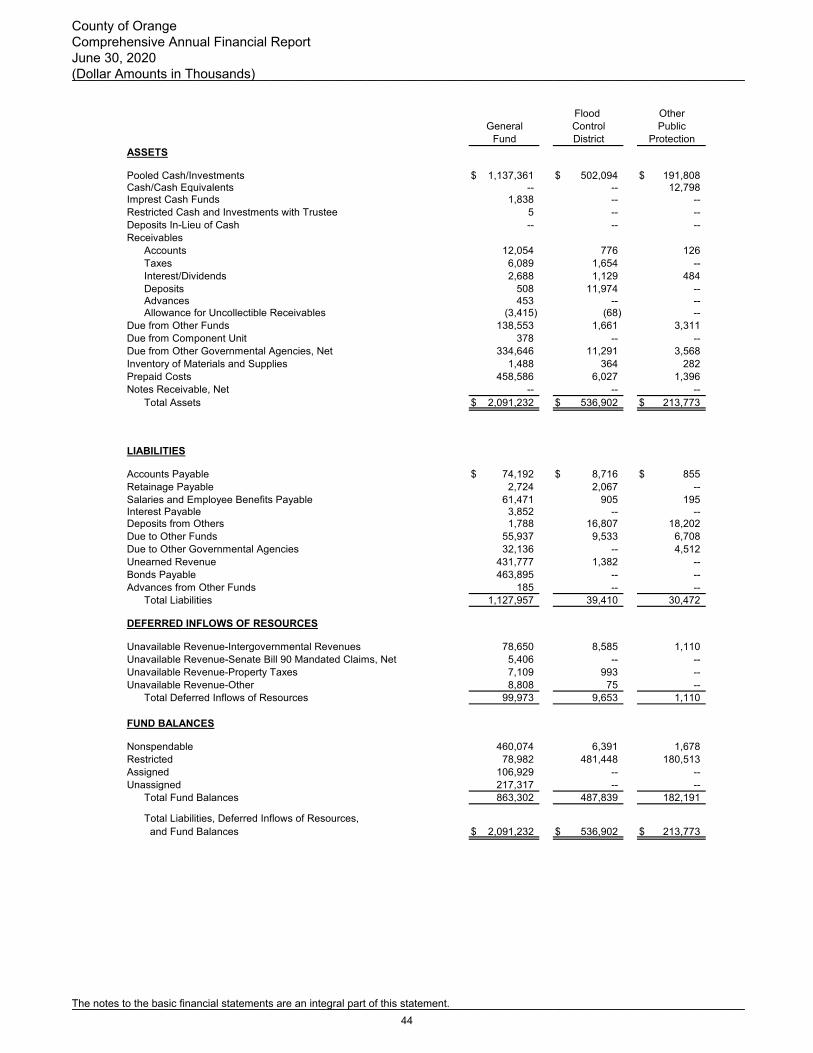
ASSETS
Pooled Cash/Investments $ 1,137,361 $ 502,094 $ 191,808Cash/Cash Equivalents -- -- 12,798Imprest Cash Funds 1,838 -- -- Restricted Cash and Investments with Trustee 5 -- -- Deposits In-Lieu of Cash -- -- -- Receivables
Accounts 12,054 776 126Taxes 6,089 1,654 -- Interest/Dividends 2,688 1,129 484Deposits 508 11,974 -- Advances 453 -- -- Allowance for Uncollectible Receivables (3,415) (68) --
Due from Other Funds 138,553 1,661 3,311Due from Component Unit 378 -- -- Due from Other Governmental Agencies, Net 334,646 11,291 3,568Inventory of Materials and Supplies 1,488 364 282Prepaid Costs 458,586 6,027 1,396Notes Receivable, Net -- -- --
Total Assets $ 2,091,232 $ 536,902 $ 213,773
LIABILITIES
Accounts Payable $ 74,192 $ 8,716 $ 855Retainage Payable 2,724 2,067 -- Salaries and Employee Benefits Payable 61,471 905 195Interest Payable 3,852 -- -- Deposits from Others 1,788 16,807 18,202Due to Other Funds 55,937 9,533 6,708Due to Other Governmental Agencies 32,136 -- 4,512Unearned Revenue 431,777 1,382 -- Bonds Payable 463,895 -- -- Advances from Other Funds 185 -- --
Total Liabilities 1,127,957 39,410 30,472
DEFERRED INFLOWS OF RESOURCES
Unavailable Revenue-Intergovernmental Revenues 78,650 8,585 1,110Unavailable Revenue-Senate Bill 90 Mandated Claims, Net 5,406 -- -- Unavailable Revenue-Property Taxes 7,109 993 -- Unavailable Revenue-Other 8,808 75 --
Total Deferred Inflows of Resources 99,973 9,653 1,110
FUND BALANCES
Nonspendable 460,074 6,391 1,678Restricted 78,982 481,448 180,513Assigned 106,929 -- -- Unassigned 217,317 -- --
Total Fund Balances 863,302 487,839 182,191
Total Liabilities, Deferred Inflows of Resources, and Fund Balances $ 2,091,232 $ 536,902 $ 213,773
FundGeneral
Flood Control
OtherPublic
ProtectionDistrict
___________________________________________________________________________________________
___________________________________________________________________________________________
County of Orange Comprehensive Annual Financial Report June 30, 2020 (Dollar Amounts in Thousands)
The notes to the basic financial statements are an integral part of this statement.44

ASSETS
$ 177,150 $ 845,035 $ 2,853,448 Pooled Cash/Investments -- -- 12,798 Cash/Cash Equivalents-- 45 1,883 Imprest Cash Funds-- 231,024 231,029 Restricted Cash and Investments with Trustee -- 367 367 Deposits In-Lieu of Cash
Receivables -- 2,183 15,139 Accounts-- 27,220 34,963 Taxes
461 1,654 6,416 Interest/Dividends-- 59 12,541 Deposits-- -- 453 Advances-- (289) (3,772) Allowance for Uncollectible Receivables6 60,068 203,599 Due from Other Funds -- -- 378 Due from Component Unit
14,942 29,082 393,529 Due from Other Governmental Agencies, Net -- -- 2,134 Inventory of Materials and Supplies -- 17,597 483,606 Prepaid Costs -- 26,097 26,097 Notes Receivable, Net
$ 192,559 $ 1,240,142 $ 4,274,608 Total Assets
LIABILITIES
$ -- $ 25,089 $ 108,852 Accounts Payable-- 1,020 5,811 Retainage Payable-- 2,820 65,391 Salaries and Employee Benefits Payable -- 51 3,903 Interest Payable-- 57,342 94,139 Deposits from Others
60,484 49,836 182,498 Due to Other Funds -- 5,258 41,906 Due to Other Governmental Agencies-- 29,548 462,707 Unearned Revenue -- -- 463,895 Bonds Payable -- 29,867 30,052 Advances from Other Funds
60,484 200,831 1,459,154 Total Liabilities
DEFERRED INFLOWS OF RESOURCES
-- 11,516 99,861 Unavailable Revenue-Intergovernmental Revenues-- -- 5,406 Unavailable Revenue-Senate Bill 90 Mandated Claims, Net-- 1,098 9,200 Unavailable Revenue-Property Taxes-- 27 8,910 Unavailable Revenue-Other-- 12,641 123,377 Total Deferred Inflows of Resources
FUND BALANCES
-- 17,797 485,940 Nonspendable132,075 794,729 1,667,747 Restricted
-- 214,144 321,073 Assigned-- -- 217,317 Unassigned
132,075 1,026,670 2,692,077 Total Fund Balances
Total Liabilities, Deferred Inflows of Resources,$ 192,559 $ 1,240,142 $ 4,274,608 and Fund Balances
HealthTotal
GovernmentalFunds
Mental Other Governmental
FundsServices Act
___________________________________________________________________________________________
___________________________________________________________________________________________
Basic Financial Statements Balance Sheet
Governmental Funds (Dollar Amounts in Thousands)
45

Total Fund Balances-Governmental Funds $ 2,692,077
Land 871,319
Structures and Improvements 1,577,775
Equipment 371,276
Software 142,759
Infrastructure 2,015,577
Land Use Rights (Permanent) 6,439
Land Improvements 4,256
Construction in Progress 181,289
Intangible in Progress 18,798
Accumulated Depreciation/Amortization (1,820,772) 3,368,716
Prepaid Pension Investment with OCERS 135,342
Installment Receivables from Service Concession Arrangement 88,989
105,746
596,154
26,889
Deferred Outflows of Resources:
The governmental funds balance sheet includes a reconciliation between fund balances-total governmental funds
and net position-governmental activities as reported in the government-wide Statement of Net Position. The
difference in fund balances of ($1,309,025) is due to the long-term economic focus of the Statement of Net Position
versus the short-term economic focus of the governmental funds. The components of the difference are described
below.
Capital assets used in the operations of the County are not reported in the
governmental funds financial statements:
Other assets used in governmental activities do not consume current
financial resources, and therefore, are not reported in the governmental
funds:
The assets, deferred outflows of resources, liabilities, and deferred inflows
of resources of the internal service funds are included in governmental
activities in the Statement of Net Position.
Deferred outflows of resources are similar to assets, but they do not meet
the definition of an asset at June 30, 2020. When all the recognition
criteria are met, the deferred outflows of resources will become an
expense. The counterpart to deferred outflows of resources are deferred
inflows of resources, which do not meet the definition of a liability at June
30, 2020. When all recognition criteria are met, the deferred inflows of
resources will become revenue, except for pension and OPEB related
deferred inflows of resources which will be recognized as a credit to
expense. The County reports the different types of deferred outflows and
inflows of resources in the Statement of Net Position as follows:
Employer retirement contribution subsequent to measurement
date for the net OPEB liability
Employer retirement contribution subsequent to measurement
date
___________________________________________________________________________________________
___________________________________________________________________________________________
County of Orange Comprehensive Annual Financial Report June 30, 2020 (Dollar Amounts in Thousands)
The notes to the basic financial statements are an integral part of this statement.46

Prepaid Pension Contribution (241,789)
Deferred Outflows of Resources 241,789
Liabilities for Service Concession Arrangements (18,574)
123,377
(610,541)
(29,347)
(70,418)
Bonds and COPs Payable, Net (62,804)
Civic Center Facilities Master Plan Financing (387,644)
Teeter Plan Notes Payable (34,661)
Compensated Employee Absences Payable (177,374)
Capital Lease Obligations Payable (29,593)
Intangible Assets Obligations Payable (1,895)
Interest Payable on Bonds (608)
Interest Accretion on Capital Appreciation Bonds (15,090)
County's Net Pension Liability (3,997,475)
County's Net OPEB Liability (318,214) (5,025,358)
Net Position of Governmental Activities $ 1,383,052
Reclassification of prepaid pension contribution from prepaid costs to
deferred outflows of resources for the portion to be recognized in the next
measurement period. Refer to Note 18, Retirement Plans for further
information.
Deferred Inflows of Resources:
Deferred Inflows of Resources that have been earned but not
available to finance expenditures in the current period
Deferred Inflows from Service Concession Arrangements
Long-term liabilities, including bonds and notes payable, are not due and
payable in the current period and, therefore, are not reported in the
governmental funds:
Deferred Inflows of Resources Related to Pension
Deferred Inflows of Resources Related to OPEB
___________________________________________________________________________________________
___________________________________________________________________________________________
Reconciliation of the Governmental Funds Balance Sheet to the Statement of Net Position (Dollar Amounts in Thousands)
47

Revenues
Taxes $ 799,690 $ 128,172 $ --
Licenses, Permits, and Franchises 24,052 948 350
Fines, Forfeitures, and Penalties 35,510 20 4,409
Use of Money and Property 22,910 12,788 7,635
Intergovernmental 1,969,292 16,235 29,361
Charges for Services 481,210 14,978 11,923
Other 19,653 392 6,077
Total Revenues 3,352,317 173,533 59,755
Expenditures
Current
General Government 299,639 -- --
Public Protection 1,375,934 96,429 19,960
Public Ways and Facilities 34,901 -- --
Health and Sanitation 746,409 -- --
Public Assistance 987,669 -- --
Education -- -- --
Recreation and Cultural Services -- -- --
Capital Outlay 54,477 42,055 3,667
Debt Service
Principal Retirement 7,071 -- --
Interest 11,629 -- --
Total Expenditures 3,517,729 138,484 23,627
Excess (Deficit) of Revenues
Over Expenditures (165,412) 35,049 36,128
Other Financing Sources (Uses)
Transfers In 415,044 1,161 5,629
Transfers Out (177,063) (5,671) (25,189)
Debt Issued -- -- --
Total Other Financing Sources (Uses) 237,981 (4,510) (19,560)
Net Change in Fund Balances 72,569 30,539 16,568
Fund Balances-Beginning of Year 790,733 457,300 165,623
Fund Balances-End of Year $ 863,302 $ 487,839 $ 182,191
ProtectionFund
Public
Other
Control
District
General
Flood
___________________________________________________________________________________________
___________________________________________________________________________________________
County of Orange Comprehensive Annual Financial Report For the Year Ended June 30, 2020 (Dollar Amounts in Thousands)
The notes to the basic financial statements are an integral part of this statement.
48
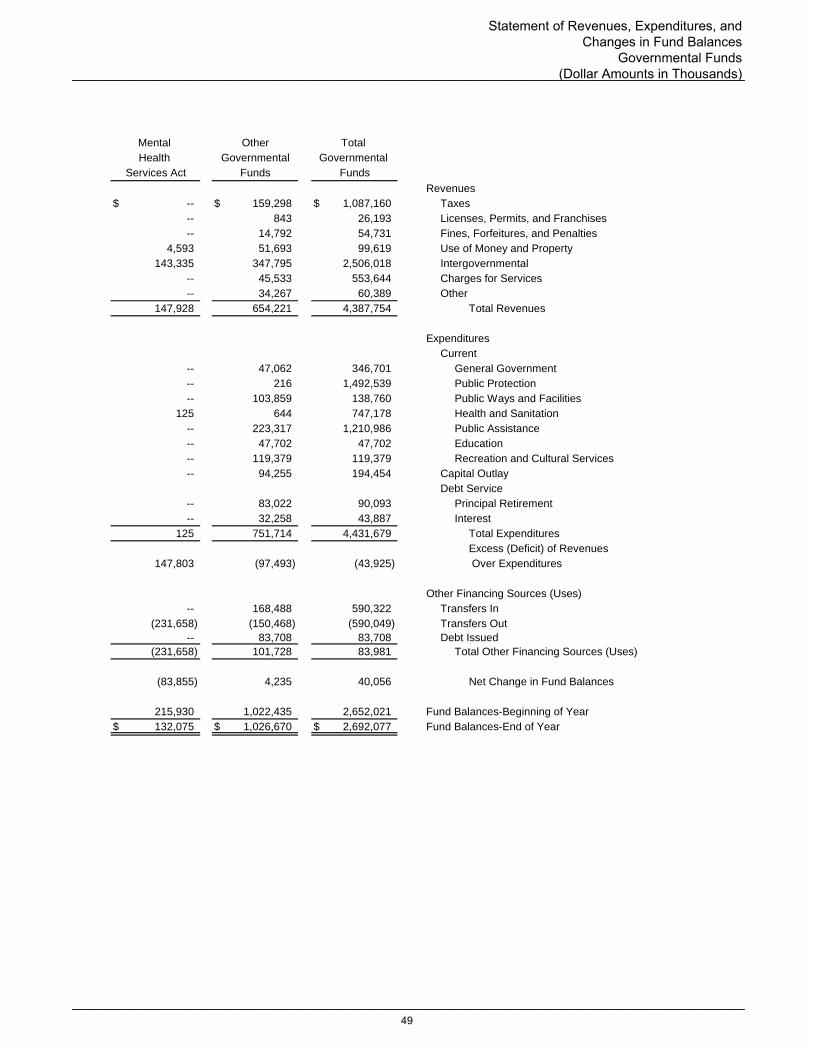
Revenues
$ -- $ 159,298 $ 1,087,160 Taxes
-- 843 26,193 Licenses, Permits, and Franchises
-- 14,792 54,731 Fines, Forfeitures, and Penalties
4,593 51,693 99,619 Use of Money and Property
143,335 347,795 2,506,018 Intergovernmental
-- 45,533 553,644 Charges for Services
-- 34,267 60,389 Other
147,928 654,221 4,387,754 Total Revenues
Expenditures
Current
-- 47,062 346,701 General Government
-- 216 1,492,539 Public Protection
-- 103,859 138,760 Public Ways and Facilities
125 644 747,178 Health and Sanitation
-- 223,317 1,210,986 Public Assistance
-- 47,702 47,702 Education
-- 119,379 119,379 Recreation and Cultural Services
-- 94,255 194,454 Capital Outlay
Debt Service
-- 83,022 90,093 Principal Retirement
-- 32,258 43,887 Interest
125 751,714 4,431,679 Total Expenditures
Excess (Deficit) of Revenues
147,803 (97,493) (43,925) Over Expenditures
Other Financing Sources (Uses)
-- 168,488 590,322 Transfers In
(231,658) (150,468) (590,049) Transfers Out
-- 83,708 83,708 Debt Issued
(231,658) 101,728 83,981 Total Other Financing Sources (Uses)
(83,855) 4,235 40,056 Net Change in Fund Balances
215,930 1,022,435 2,652,021 Fund Balances-Beginning of Year
$ 132,075 $ 1,026,670 $ 2,692,077 Fund Balances-End of Year
Total
Governmental
Funds
Other
Governmental
FundsServices Act
Health
Mental
___________________________________________________________________________________________
___________________________________________________________________________________________
Statement of Revenues, Expenditures, and Changes in Fund Balances
Governmental Funds (Dollar Amounts in Thousands)
49

Net Change in Fund Balances-Total Governmental Funds $ 40,056
Expenditures for Capital Outlay:
Land 10,077
Construction in Progress 137,233
Equipment 34,578
Software 9,007
Net of Gains/(Losses) on Capital Assets Dispositions (1,007)
Depreciation/Amortization Expense (109,095)
Capital Contributions 109,636 190,429
Teeter Plan Notes Proceeds (83,708)
Principal and Other Long-Term Liability Payments:
Bonds Payable 4,453
Teeter Plan Notes Payable 78,554
Capital Lease Obligations Payable 7,085 6,384
The Net Change in Fund Balances for governmental funds of $40,056 in the Statement of Revenues, Expenditures, and
Changes in Fund Balances differs from the Change in Net Position for governmental activities of $250,671 reported in the
government-wide Statement of Activities. The differences arise primarily from the long-term economic focus of the
Statement of Activities versus the current financial resources focus of the governmental funds. The main components of
the difference are described below.
When capital assets used in governmental activities are purchased or
constructed in the current fiscal year, the resources expended for those
assets are reported as expenditures in the governmental funds.
However, in the Statement of Activities, the cost of these assets is
allocated over their estimated useful lives and reported as depreciation
or amortization expense. In addition, donations, transfers, gains or
losses from sales and other disposals/acquisitions of capital assets are
not reported in governmental funds. These assets, and their
associated depreciation/amortization expense, must be reported or
removed in the government-wide financial statements. The details of
the expenditures for capital outlay, capital contributions,
depreciation/amortization and other disposals/acquisitions of capital
assets are as follows:
The issuance of long-term debt (e.g. bonds) is recorded as an other
financing source in the governmental funds because it provides current
financial resources. Similarly, the repayment of principal on long–term
debt or the payment of other long-term liabilities is reported as an
expenditure in the governmental funds because current financial
resources have been consumed. Bond proceeds, net of payments to
escrow agents and principal payments, are reported as financing
sources in governmental funds and thus contribute to the change in
fund balance. These transactions do not have any effect on net
position in the government-wide financial statements. The details of the
principal and other long-term liability payments and other financing
sources are as follows:
___________________________________________________________________________________________
___________________________________________________________________________________________
County of Orange Comprehensive Annual Financial Report For the Year Ended June 30, 2020 (Dollar Amounts in Thousands)
The notes to the basic financial statements are an integral part of this statement.50

(38,546)
Property Tax Revenues (352) (38,898)
Accrued Interest Expense on Bonds Payable 20
Amortization of Deferred Charges 12,235
Change in Compensated Employee Absences 716
Pension Costs and Investment of the County's
(8,305)
Interest Accretion on Capital Appreciation Bonds (1,911) 2,755
Allocation of ISF's Operating Gain to Governmental Activities, net of Business-Type Activities 12,564
Consolidation of Nonoperating Revenues, Expenses
and Transfers to Governmental Activities 23,819 36,383
OPEB Expense (40,163)
OPEB Employer Contribution 48,868 8,705
Pension Expense (440,711)Pension Employer Contribution 445,568 4,857
Change in Net Position of Governmental Activities $ 250,671
Some expenses reported in the Statement of Activities do not require
the use of current financial resources; and therefore, are not reported
as expenditures in the governmental funds until paid. The following
amounts represent the net effect of these differences in the treatment
of long-term liabilities:
Revenues related to prior years that are available in the current fiscal
year are reported as revenue in the governmental funds. In contrast,
revenues that are earned, but unavailable in the current year are
deferred in the governmental funds. For government-wide reporting,
revenue is recognized when earned, regardless of availability. The
following amounts reflect the net effect of the timing differences for
revenue recognition:
Government Mandated and Voluntary Nonexchange
GASB Statement No. 68 requires an employer to record pension
expense and employer contribution that affects the County's
proportionate share of the net pension liability.
Investment Account with OCERS
Internal service funds (ISF) are used by management to charge the
costs of certain activities, such as insurance, transportation, and
telephone services to individual governmental funds. The operating
gain of internal service funds is eliminated in the Statement of Activities
as an adjustment to the various functions to arrive at a break-even
basis. Also, general or non-program revenues and expenses of the
internal service funds are recorded in governmental activities.
GASB Statement No. 75 requires an employer to record OPEB
expense and employer contribution that affects the County's
proportionate share of the net OPEB liability.
___________________________________________________________________________________________
___________________________________________________________________________________________
Reconciliation of the Governmental Funds Statement of Revenues, Expenditures, and Changes in Fund Balances to the Statement of Activities
(Dollar Amounts in Thousands)
51
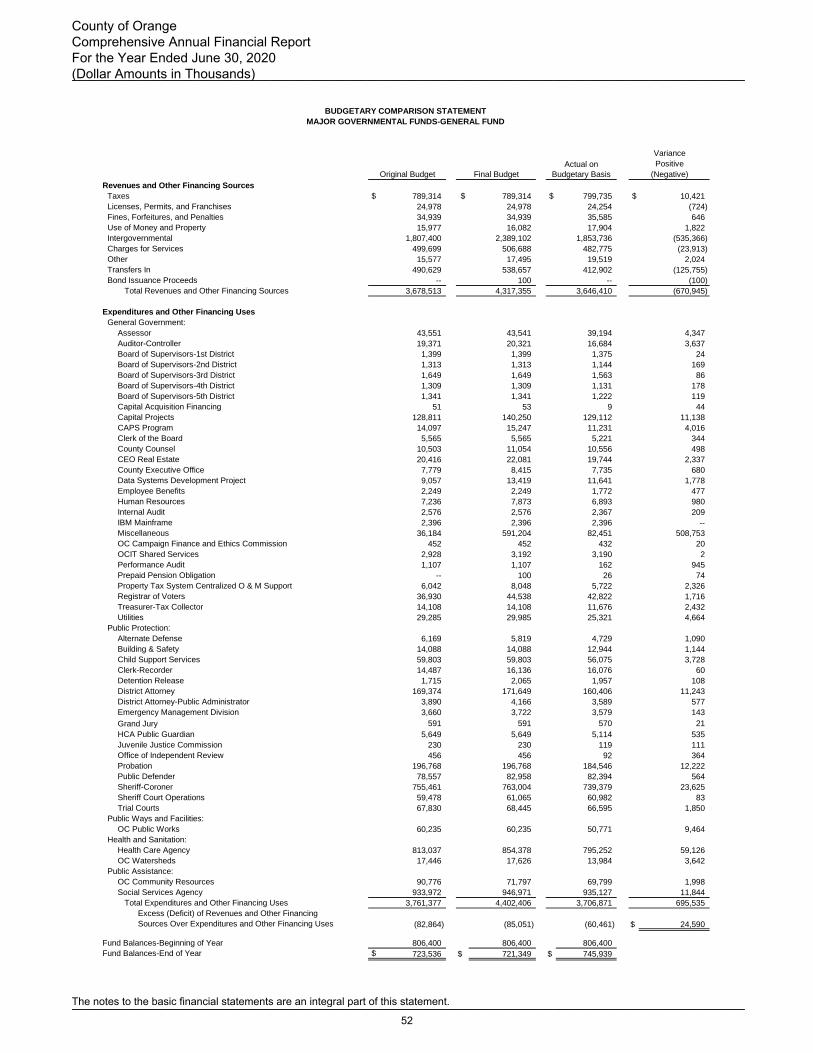
Revenues and Other Financing Sources
Taxes $ 789,314 $ 789,314 $ 799,735 $ 10,421
Licenses, Permits, and Franchises 24,978 24,978 24,254 (724)
Fines, Forfeitures, and Penalties 34,939 34,939 35,585 646
Use of Money and Property 15,977 16,082 17,904 1,822
Intergovernmental 1,807,400 2,389,102 1,853,736 (535,366)
Charges for Services 499,699 506,688 482,775 (23,913)
Other 15,577 17,495 19,519 2,024
Transfers In 490,629 538,657 412,902 (125,755)
Bond Issuance Proceeds -- 100 -- (100)
Total Revenues and Other Financing Sources 3,678,513 4,317,355 3,646,410 (670,945)
Expenditures and Other Financing Uses
General Government:
Assessor 43,551 43,541 39,194 4,347
Auditor-Controller 19,371 20,321 16,684 3,637
Board of Supervisors-1st District 1,399 1,399 1,375 24
Board of Supervisors-2nd District 1,313 1,313 1,144 169
Board of Supervisors-3rd District 1,649 1,649 1,563 86
Board of Supervisors-4th District 1,309 1,309 1,131 178
Board of Supervisors-5th District 1,341 1,341 1,222 119
Capital Acquisition Financing 51 53 9 44
Capital Projects 128,811 140,250 129,112 11,138
CAPS Program 14,097 15,247 11,231 4,016
Clerk of the Board 5,565 5,565 5,221 344
County Counsel 10,503 11,054 10,556 498
CEO Real Estate 20,416 22,081 19,744 2,337
County Executive Office 7,779 8,415 7,735 680
Data Systems Development Project 9,057 13,419 11,641 1,778
Employee Benefits 2,249 2,249 1,772 477
Human Resources 7,236 7,873 6,893 980
Internal Audit 2,576 2,576 2,367 209
IBM Mainframe 2,396 2,396 2,396 --
Miscellaneous 36,184 591,204 82,451 508,753
OC Campaign Finance and Ethics Commission 452 452 432 20
OCIT Shared Services 2,928 3,192 3,190 2
Performance Audit 1,107 1,107 162 945
Prepaid Pension Obligation -- 100 26 74
Property Tax System Centralized O & M Support 6,042 8,048 5,722 2,326
Registrar of Voters 36,930 44,538 42,822 1,716
Treasurer-Tax Collector 14,108 14,108 11,676 2,432
Utilities 29,285 29,985 25,321 4,664
Public Protection:
Alternate Defense 6,169 5,819 4,729 1,090
Building & Safety 14,088 14,088 12,944 1,144
Child Support Services 59,803 59,803 56,075 3,728
Clerk-Recorder 14,487 16,136 16,076 60
Detention Release 1,715 2,065 1,957 108
District Attorney 169,374 171,649 160,406 11,243
District Attorney-Public Administrator 3,890 4,166 3,589 577
Emergency Management Division 3,660 3,722 3,579 143
Grand Jury 591 591 570 21
HCA Public Guardian 5,649 5,649 5,114 535
Juvenile Justice Commission 230 230 119 111
Office of Independent Review 456 456 92 364
Probation 196,768 196,768 184,546 12,222
Public Defender 78,557 82,958 82,394 564
Sheriff-Coroner 755,461 763,004 739,379 23,625
Sheriff Court Operations 59,478 61,065 60,982 83
Trial Courts 67,830 68,445 66,595 1,850
Public Ways and Facilities:
OC Public Works 60,235 60,235 50,771 9,464
Health and Sanitation:
Health Care Agency 813,037 854,378 795,252 59,126
OC Watersheds 17,446 17,626 13,984 3,642
Public Assistance:
OC Community Resources 90,776 71,797 69,799 1,998
Social Services Agency 933,972 946,971 935,127 11,844
Total Expenditures and Other Financing Uses 3,761,377 4,402,406 3,706,871 695,535
Excess (Deficit) of Revenues and Other Financing
Sources Over Expenditures and Other Financing Uses (82,864) (85,051) (60,461) $ 24,590
Fund Balances-Beginning of Year 806,400 806,400 806,400
Fund Balances-End of Year $ 723,536 $ 721,349 $ 745,939
MAJOR GOVERNMENTAL FUNDS-GENERAL FUND
Variance
BUDGETARY COMPARISON STATEMENT
Actual on
Budgetary Basis
Positive
Original Budget Final Budget (Negative)
___________________________________________________________________________________________
___________________________________________________________________________________________
County of Orange Comprehensive Annual Financial Report For the Year Ended June 30, 2020 (Dollar Amounts in Thousands)
The notes to the basic financial statements are an integral part of this statement.
52
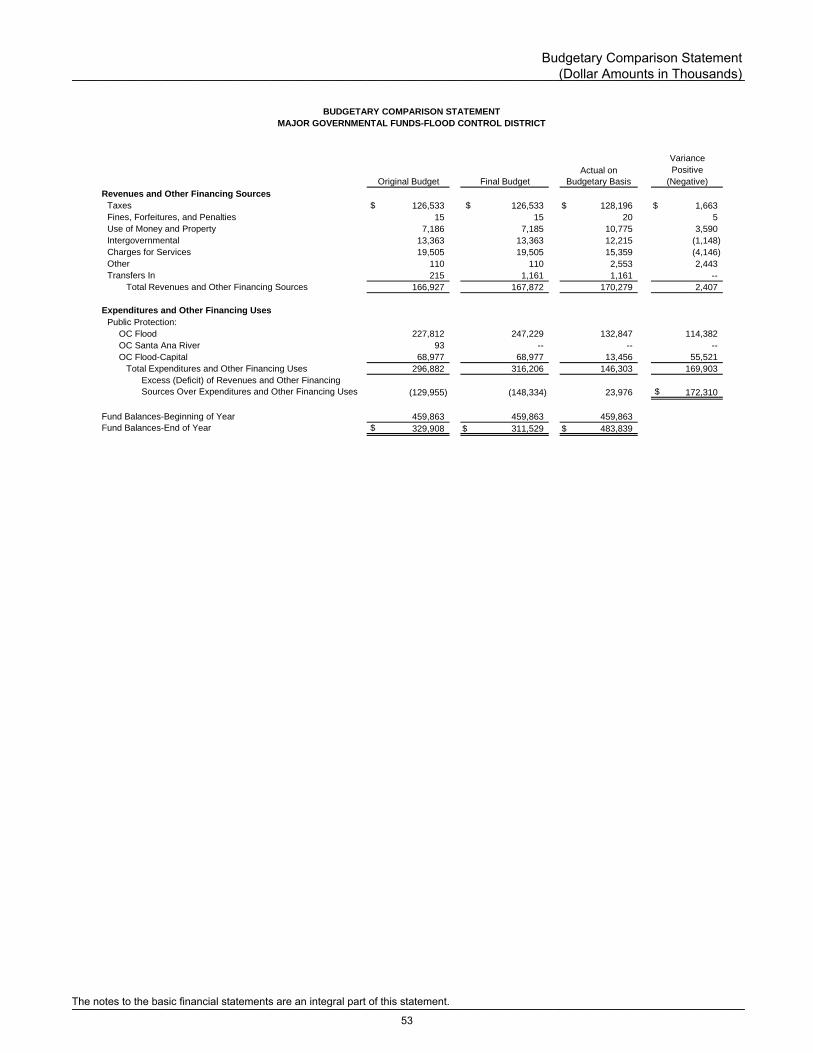
Revenues and Other Financing Sources
Taxes $ 126,533 $ 126,533 $ 128,196 $ 1,663
Fines, Forfeitures, and Penalties 15 15 20 5
Use of Money and Property 7,186 7,185 10,775 3,590
Intergovernmental 13,363 13,363 12,215 (1,148)
Charges for Services 19,505 19,505 15,359 (4,146)
Other 110 110 2,553 2,443
Transfers In 215 1,161 1,161 --
Total Revenues and Other Financing Sources 166,927 167,872 170,279 2,407
Expenditures and Other Financing Uses
Public Protection:
OC Flood 227,812 247,229 132,847 114,382
OC Santa Ana River 93 -- -- --
OC Flood-Capital 68,977 68,977 13,456 55,521
Total Expenditures and Other Financing Uses 296,882 316,206 146,303 169,903
Excess (Deficit) of Revenues and Other Financing
Sources Over Expenditures and Other Financing Uses (129,955) (148,334) 23,976 $ 172,310
Fund Balances-Beginning of Year 459,863 459,863 459,863
Fund Balances-End of Year $ 329,908 $ 311,529 $ 483,839
MAJOR GOVERNMENTAL FUNDS-FLOOD CONTROL DISTRICT
Original Budget Final Budget (Negative)
Actual on
Budgetary Basis
Variance
Positive
BUDGETARY COMPARISON STATEMENT
___________________________________________________________________________________________
___________________________________________________________________________________________
Budgetary Comparison Statement (Dollar Amounts in Thousands)
The notes to the basic financial statements are an integral part of this statement.
53

Revenues and Other Financing Sources
Licenses, Permits, and Franchises $ 350 $ 350 $ 350 $ --
Fines, Forfeitures, and Penalties 4,956 4,956 2,115 (2,841)
Use of Money and Property 5,167 5,167 6,551 1,384
Intergovernmental 19,207 23,316 29,511 6,195
Charges for Services 8,633 9,124 11,923 2,799
Other 7,582 7,582 6,077 (1,505)
Transfers In 4,977 9,288 7,208 (2,080)
Total Revenues and Other Financing Sources 50,872 59,783 63,735 3,952
Expenditures and Other Financing Uses
Public Protection:
County Automated Fingerprint Identification 1,950 1,795 1,490 305
Building and Safety-Operating Reserve 576 887 803 84
Narcotic Forfeiture and Seizure 491 491 225 266
Sheriff-Regional Narcotics Suppression Program 904 650 32 618
Motor Vehicle Theft Task Force 3,810 3,810 3,218 592
Regional Narcotic Suppression Program-Dept of Treasury 8 7 -- 7
Regional Narcotic Suppression Program-Other 2,865 3,162 1,166 1,996
Clerk Recorder Special Revenue 7,434 7,434 5,456 1,978
Clerk Recorder Operating Reserve 1,005 3,284 12 3,272
Real Estate Prosecution 855 1,416 1,415 1
Proposition 64-Consumer Protection 5,593 6,383 1,371 5,012
Proposition 69-DNA Identification 1,494 2,382 771 1,611
Traffic Violator 1,032 1,058 131 927
Sheriff Narcotics Program-Dept of Justice 7,110 10,281 1,710 8,571
Sheriff Narcotics Program-Other 1,254 2,455 78 2,377
Orange County Jail 351 412 175 237
Sheriff Narcotics Program-CALMMET-Treasury 1,077 2,070 847 1,223
Sheriff's State Criminal Alien Assistance Program 2,644 5,142 4,977 165
California Automated Fingerprint Identification Operational Costs 1,957 2,184 1,582 602
California Automated Fingerprint Identification Systems Costs 38,490 38,766 918 37,848
Sheriff's Supplemental Law Enforcement Services 1,836 1,801 1,801 --
District Attorney's Supplemental Law Enforcement Services 1,437 1,437 1,032 405
Excess Public Safety Sales Tax 15 1,128 2 1,126
Sheriff-Coroner Replacement and Maintenance 20,281 20,471 758 19,713
Ward Welfare 150 150 110 40
Sheriff's Substations Fee Program 1,072 1,079 99 980
Sheriff Court OPS-Special Collections 4,401 4,381 1,567 2,814
Jail Commissary 11,582 12,405 6,847 5,558
Inmate Welfare 16,400 16,292 3,592 12,700
Child Support Program Development 4,298 4,298 3,805 493
800 MHz Countywide Coordinated Communications System 7,319 8,206 4,207 3,999
Delta Special Revenue 30 30 6 24
Total Expenditures and Other Financing Uses 149,721 165,747 50,203 115,544
Excess (Deficit) of Revenues and Other Financing
Sources Over Expenditures and Other Financing Uses (98,849) (105,964) 13,532 $ 119,496
Fund Balances-Beginning of Year 147,148 147,148 147,148
Fund Balances-End of Year $ 48,299 $ 41,184 $ 160,680
MAJOR GOVERNMENTAL FUNDS-OTHER PUBLIC PROTECTION
Original Budget Final Budget (Negative)
Actual on
Budgetary Basis
BUDGETARY COMPARISON STATEMENT
Variance
Positive
___________________________________________________________________________________________
___________________________________________________________________________________________
County of Orange Comprehensive Annual Financial Report For the Year Ended June 30, 2020 (Dollar Amounts in Thousands)
The notes to the basic financial statements are an integral part of this statement.
54

Revenues and Other Financing Sources
Use of Money and Property $ 3,600 $ 3,600 $ 4,171 $ 571
Intergovernmental 163,200 163,200 143,332 (19,868)
Total Revenues and Other Financing Sources 166,800 166,800 147,503 (19,297)
Expenditures and Other Financing Uses
Health & Sanitation:
Mental Health Services Act 269,195 269,195 231,783 37,412
Total Expenditures and Other Financing Uses 269,195 269,195 231,783 37,412
Excess (Deficit) of Revenues and Other Financing
Sources Over Expenditures and Other Financing Uses (102,395) (102,395) (84,280) $ 18,115
Fund Balances-Beginning of Year 214,847 214,847 214,847
Fund Balances-End of Year $ 112,452 $ 112,452 $ 130,567
Actual on
Budgetary Basis
BUDGETARY COMPARISON STATEMENT
MAJOR GOVERNMENTAL FUNDS-MENTAL HEALTH SERVICES ACT
Original Budget Final Budget (Negative)
Positive
Variance
___________________________________________________________________________________________
___________________________________________________________________________________________
Budgetary Comparison Statement (Dollar Amounts in Thousands)
The notes to the basic financial statements are an integral part of this statement.
55
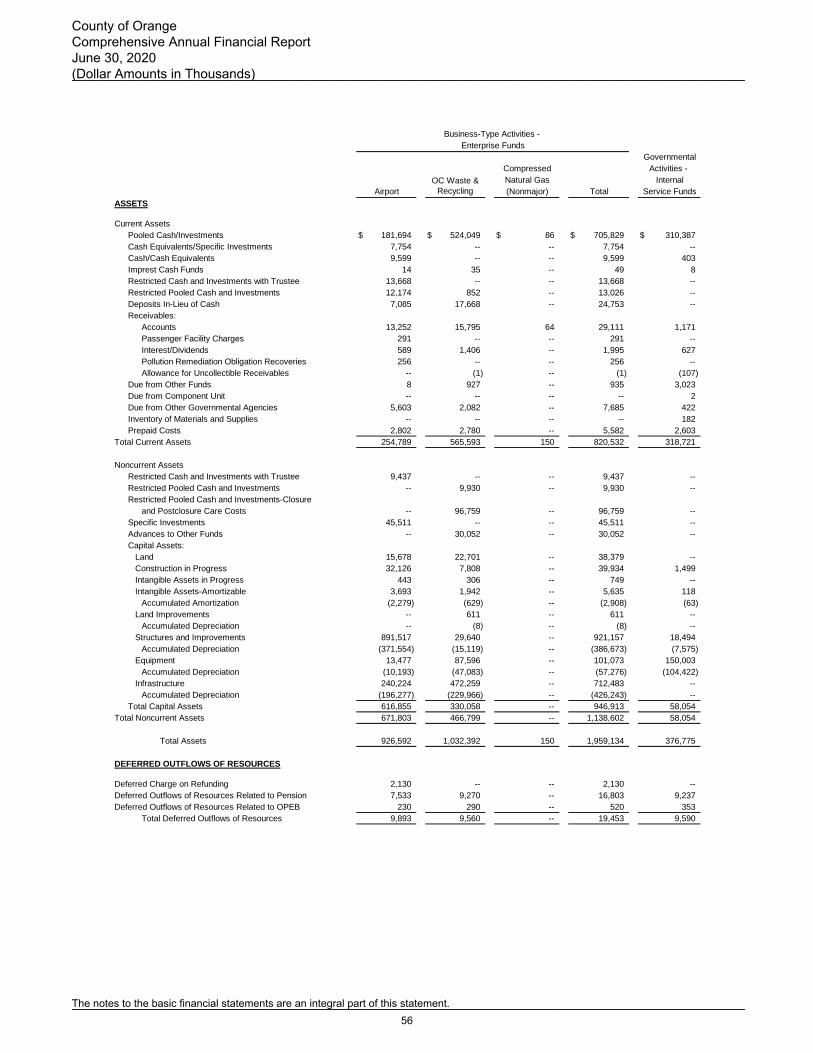
ASSETS
Current Assets
Pooled Cash/Investments $ 181,694 $ 524,049 $ 86 $ 705,829 $ 310,387
Cash Equivalents/Specific Investments 7,754 -- -- 7,754 --
Cash/Cash Equivalents 9,599 -- -- 9,599 403
Imprest Cash Funds 14 35 -- 49 8
Restricted Cash and Investments with Trustee 13,668 -- -- 13,668 --
Restricted Pooled Cash and Investments 12,174 852 -- 13,026 --
Deposits In-Lieu of Cash 7,085 17,668 -- 24,753 --
Receivables:
Accounts 13,252 15,795 64 29,111 1,171
Passenger Facility Charges 291 -- -- 291 --
Interest/Dividends 589 1,406 -- 1,995 627
Pollution Remediation Obligation Recoveries 256 -- -- 256 --
Allowance for Uncollectible Receivables -- (1) -- (1) (107)
Due from Other Funds 8 927 -- 935 3,023
Due from Component Unit -- -- -- -- 2
Due from Other Governmental Agencies 5,603 2,082 -- 7,685 422
Inventory of Materials and Supplies -- -- -- -- 182
Prepaid Costs 2,802 2,780 -- 5,582 2,603
Total Current Assets 254,789 565,593 150 820,532 318,721
Noncurrent Assets
Restricted Cash and Investments with Trustee 9,437 -- -- 9,437 --
Restricted Pooled Cash and Investments -- 9,930 -- 9,930 --
Restricted Pooled Cash and Investments-Closure
and Postclosure Care Costs -- 96,759 -- 96,759 --
Specific Investments 45,511 -- -- 45,511 --
Advances to Other Funds -- 30,052 -- 30,052 --
Capital Assets:
Land 15,678 22,701 -- 38,379 --
Construction in Progress 32,126 7,808 -- 39,934 1,499
Intangible Assets in Progress 443 306 -- 749 --
Intangible Assets-Amortizable 3,693 1,942 -- 5,635 118
Accumulated Amortization (2,279) (629) -- (2,908) (63)
Land Improvements -- 611 -- 611 --
Accumulated Depreciation -- (8) -- (8) --
Structures and Improvements 891,517 29,640 -- 921,157 18,494
Accumulated Depreciation (371,554) (15,119) -- (386,673) (7,575)
Equipment 13,477 87,596 -- 101,073 150,003
Accumulated Depreciation (10,193) (47,083) -- (57,276) (104,422)
Infrastructure 240,224 472,259 -- 712,483 --
Accumulated Depreciation (196,277) (229,966) -- (426,243) --
Total Capital Assets 616,855 330,058 -- 946,913 58,054
Total Noncurrent Assets 671,803 466,799 -- 1,138,602 58,054
Total Assets 926,592 1,032,392 150 1,959,134 376,775
DEFERRED OUTFLOWS OF RESOURCES
Deferred Charge on Refunding 2,130 -- -- 2,130 --
Deferred Outflows of Resources Related to Pension 7,533 9,270 -- 16,803 9,237
Deferred Outflows of Resources Related to OPEB 230 290 -- 520 353
Total Deferred Outflows of Resources 9,893 9,560 -- 19,453 9,590
Internal
(Nonmajor)
Natural GasOC Waste &
RecyclingAirport Total Service Funds
Compressed Activities -
Business-Type Activities -
Enterprise Funds
Governmental
___________________________________________________________________________________________
___________________________________________________________________________________________
County of Orange Comprehensive Annual Financial Report June 30, 2020 (Dollar Amounts in Thousands)
The notes to the basic financial statements are an integral part of this statement.56

LIABILITIES
Current Liabilities
Accounts Payable $ 13,530 $ 14,272 $ -- $ 27,802 $ 11,512
Retainage Payable 958 230 -- 1,188 23
Salaries and Employee Benefits Payable 678 827 -- 1,505 786
Unearned Revenue 2,104 64 -- 2,168 --
Due to Other Funds 2,309 19,247 -- 21,556 3,503
Due to Other Governmental Agencies 157 12,640 -- 12,797 --
Insurance Claims Payable -- -- -- -- 57,917
Compensated Employee Absences Payable 1,112 1,392 -- 2,504 1,339
Pollution Remediation Obligation -- 698 -- 698 --
Intangible Assets Obligations Payable 72 -- -- 72 --
Landfill Site Closure/Postclosure Liability -- 3,680 -- 3,680 --
Bonds Payable 13,552 -- -- 13,552 --
Capital Lease Obligations Payable -- -- -- -- 627
Interest Payable 2,077 -- -- 2,077 --
Deposits from Others 10,392 18,750 -- 29,142 --
Total Current Liabilities 46,941 71,800 -- 118,741 75,707
Noncurrent Liabilities
Insurance Claims Payable -- -- -- -- 165,758
Compensated Employee Absences Payable 729 1,013 -- 1,742 1,091
Pollution Remediation Obligation 994 14,493 -- 15,487 --
Intangible Assets Obligations Payable -- 2 -- 2 --
Landfill Site Closure/Postclosure Liability -- 180,701 -- 180,701 --
Bonds Payable 79,910 -- -- 79,910 --
Capital Lease Obligations Payable -- -- -- -- 1,482
Net Pension Liability 39,263 49,050 -- 88,313 39,584
Net OPEB Liability 2,697 3,448 -- 6,145 4,053
Total Noncurrent Liabilities 123,593 248,707 -- 372,300 211,968
Total Liabilities 170,534 320,507 -- 491,041 287,675
DEFERRED INFLOWS OF RESOURCES
Deferred Inflows of Resources Related to Pension 5,140 6,683 -- 11,823 6,371
Deferred Inflows of Resources Related to OPEB 255 312 -- 567 393
Total Deferred Inflows of Resources 5,395 6,995 -- 12,390 6,764
NET POSITION
Net Investment in Capital Assets 526,303 329,947 -- 856,250 55,933
Restricted for:
Debt Service 11,591 -- -- 11,591 --
Passenger Facility Charges Approved Capital Projects 8,158 -- -- 8,158 --
Capital Projects-Replacements and Renewals 1,000 -- -- 1,000 --
Landfill Closure/Postclosure -- 27,730 -- 27,730 --
Landfill Corrective Action -- 8,820 -- 8,820 --
Wetland -- 879 -- 879 --
Prima Deshecha/La Pata Closure -- 104 -- 104 --
Unrestricted 213,504 346,970 150 560,624 35,993
Total Net Position $ 760,556 $ 714,450 $ 150 1,475,156 $ 91,926
Adjustment to Reflect the Consolidation of Internal Service
Funds' Activities Related to Enterprise Funds 200
Cumulative Effect of Prior Years' Internal Service Funds Allocation (14,020)
Net Position of Business-Type Activities $ 1,461,336
Business-Type Activities -
Enterprise Funds
Governmental
Compressed Activities -
Airport Total Service Funds
Natural Gas
(Nonmajor)
InternalOC Waste &
Recycling
___________________________________________________________________________________________
___________________________________________________________________________________________
Basic Financial Statements Statement of Net Position
Proprietary Funds (Dollar Amounts in Thousands)
57
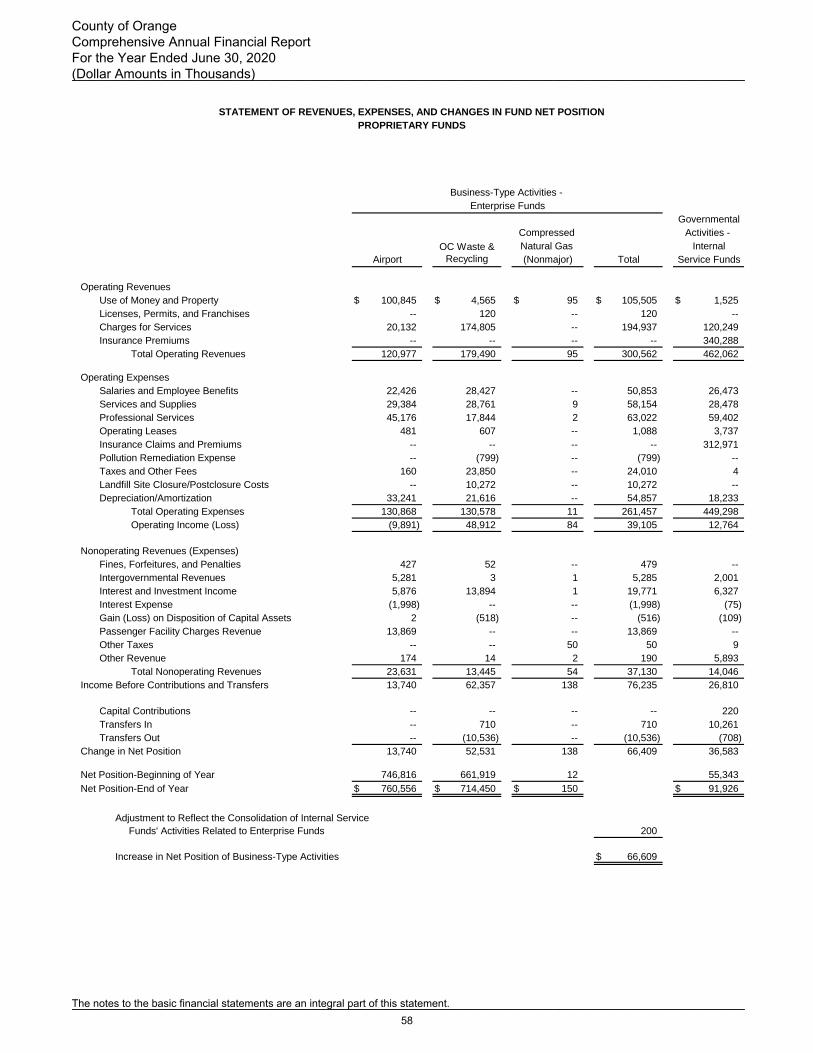
Operating Revenues
Use of Money and Property $ 100,845 $ 4,565 $ 95 $ 105,505 $ 1,525
Licenses, Permits, and Franchises -- 120 -- 120 --
Charges for Services 20,132 174,805 -- 194,937 120,249
Insurance Premiums -- -- -- -- 340,288
Total Operating Revenues 120,977 179,490 95 300,562 462,062
Operating Expenses
Salaries and Employee Benefits 22,426 28,427 -- 50,853 26,473
Services and Supplies 29,384 28,761 9 58,154 28,478
Professional Services 45,176 17,844 2 63,022 59,402
Operating Leases 481 607 -- 1,088 3,737
Insurance Claims and Premiums -- -- -- -- 312,971
Pollution Remediation Expense -- (799) -- (799) --
Taxes and Other Fees 160 23,850 -- 24,010 4
Landfill Site Closure/Postclosure Costs -- 10,272 -- 10,272 --
Depreciation/Amortization 33,241 21,616 -- 54,857 18,233
Total Operating Expenses 130,868 130,578 11 261,457 449,298
Operating Income (Loss) (9,891) 48,912 84 39,105 12,764
Nonoperating Revenues (Expenses)
Fines, Forfeitures, and Penalties 427 52 -- 479 --
Intergovernmental Revenues 5,281 3 1 5,285 2,001
Interest and Investment Income 5,876 13,894 1 19,771 6,327
Interest Expense (1,998) -- -- (1,998) (75)
Gain (Loss) on Disposition of Capital Assets 2 (518) -- (516) (109)
Passenger Facility Charges Revenue 13,869 -- -- 13,869 --
Other Taxes -- -- 50 50 9
Other Revenue 174 14 2 190 5,893
Total Nonoperating Revenues 23,631 13,445 54 37,130 14,046
Income Before Contributions and Transfers 13,740 62,357 138 76,235 26,810
Capital Contributions -- -- -- -- 220
Transfers In -- 710 -- 710 10,261
Transfers Out -- (10,536) -- (10,536) (708)
Change in Net Position 13,740 52,531 138 66,409 36,583
Net Position-Beginning of Year 746,816 661,919 12 55,343
Net Position-End of Year $ 760,556 $ 714,450 $ 150 $ 91,926
Adjustment to Reflect the Consolidation of Internal Service
Funds' Activities Related to Enterprise Funds 200
Increase in Net Position of Business-Type Activities $ 66,609
Governmental
Business-Type Activities -
Service Funds
Activities -
Airport Total
Compressed
Natural Gas Internal
(Nonmajor)
OC Waste &
Recycling
STATEMENT OF REVENUES, EXPENSES, AND CHANGES IN FUND NET POSITION
PROPRIETARY FUNDS
Enterprise Funds
___________________________________________________________________________________________
___________________________________________________________________________________________
County of Orange Comprehensive Annual Financial Report For the Year Ended June 30, 2020 (Dollar Amounts in Thousands)
The notes to the basic financial statements are an integral part of this statement.58


CompressedNatural Gas(Nonmajor)
CASH FLOWS FROM OPERATING ACTIVITIESReceipts from Customers $ 112,898 $ 178,974 $ 37 $ 291,909 $ 36,156 Cash Received for Premiums within the County's Entity -- -- -- -- 340,288 Payments to Suppliers for Goods and Services (73,673) (45,427) (11) (119,111) (399,960) Payments to Employees for Services (22,973) (28,110) -- (51,083) (27,616) Payments for Interfund Services (8) (446) (7) (461) (229) Receipts for Interfund Services Used 82 10,819 -- 10,901 87,234 Landfill Site Closure/Postclosure Care Costs -- (5,649) -- (5,649) -- Payment for Taxes and Other Fees (160) (23,850) -- (24,010) (4) Other Operating Receipts 601 865 2 1,468 5,897 Other Operating Payments (269) (2,857) -- (3,126) (3,751)
Net Cash Provided by Operating Activities 16,498 84,319 21 100,838 38,015
CASH FLOWS FROM NONCAPITAL FINANCING ACTIVITIESTransfers In -- 710 -- 710 10,261 Transfers Out -- (10,536) -- (10,536) (708) Intergovernmental Revenues 152 3 1 156 2,001 Other Taxes -- -- 50 50 9 Advances Received from Other Funds -- 5,030 -- 5,030 --
Net Cash Provided (Used) by Noncapital Financing Activities 152 (4,793) 51 (4,590) 11,563
CASH FLOWS FROM CAPITAL AND RELATED FINANCING ACTIVITIES
Acquisition of Capital Assets (26,816) (19,818) -- (46,634) (11,071) Principal Paid on Bonds (1,950) -- -- (1,950) -- Interest Paid on Long-Term Debt (2,632) -- -- (2,632) -- Capital Grant Contributions 1,839 -- -- 1,839 -- Passenger Facility Charges Received 16,555 -- -- 16,555 -- Principal Paid on Capital Lease Obligations -- -- -- -- (609) Interest Paid on Capital Lease Obligations -- -- -- -- (75) Proceeds (Loss) from Sale of Capital Assets 2 (518) -- (516) (109)
Net Cash Used by Capital and Related Financing Activities (13,002) (20,336) -- (33,338) (11,864)
CASH FLOWS FROM INVESTING ACTIVITIESInterest on Investments 6,351 14,551 1 20,903 6,600 Purchase of Investments (1,818) -- -- (1,818) --
Net Cash Provided by Investing Activities 4,533 14,551 1 19,085 6,600
Net Increase in Cash and Cash Equivalents 8,181 73,741 73 81,995 44,314 Cash and Cash Equivalents-Beginning of Year 216,722 557,884 13 774,619 266,484 Cash and Cash Equivalents-End of Year $ 224,903 $ 631,625 $ 86 $ 856,614 $ 310,798
Activities -OC Waste &
Recycling
Enterprise FundsBusiness-Type Activities -
Governmental
AirportInternal
Service FundsTotal
___________________________________________________________________________________________
___________________________________________________________________________________________
County of Orange Comprehensive Annual Financial Report For the Year Ended June 30, 2020 (Dollar Amounts in Thousands)
The notes to the basic financial statements are an integral part of this statement.59
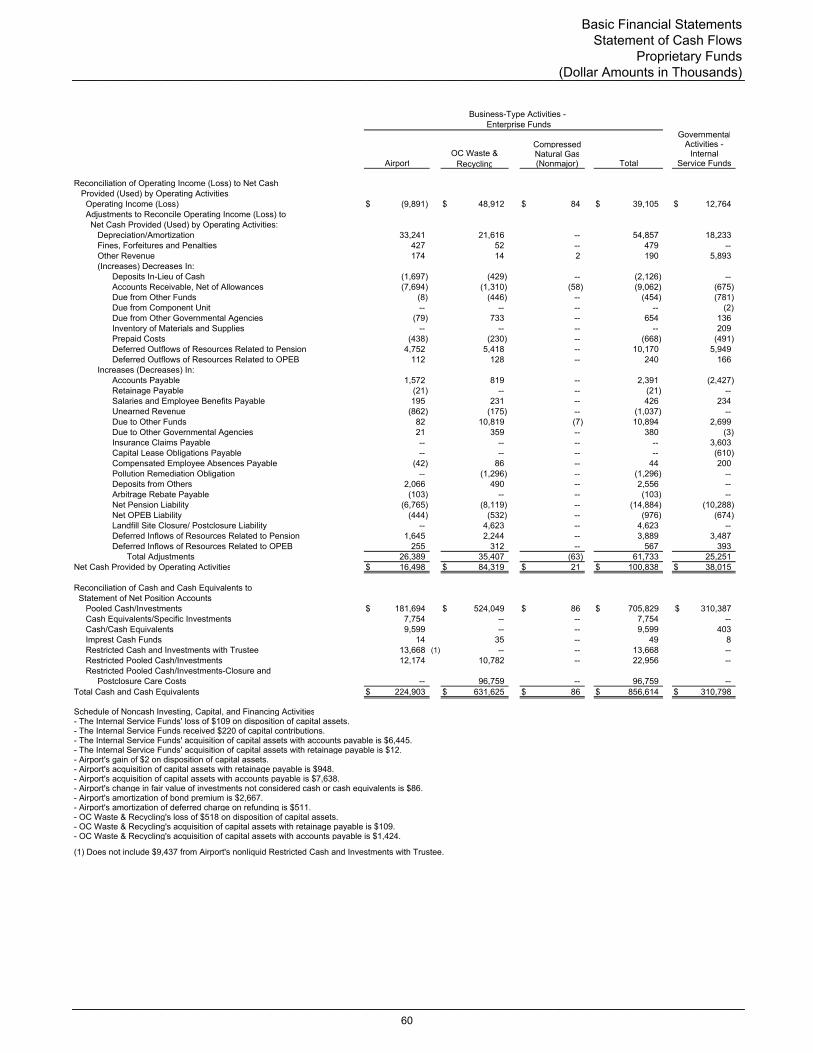
CompressedNatural Gas(Nonmajor)
Reconciliation of Operating Income (Loss) to Net Cash Provided (Used) by Operating Activities
Operating Income (Loss) $ (9,891) $ 48,912 $ 84 $ 39,105 $ 12,764 Adjustments to Reconcile Operating Income (Loss) to Net Cash Provided (Used) by Operating Activities:
Depreciation/Amortization 33,241 21,616 -- 54,857 18,233 Fines, Forfeitures and Penalties 427 52 -- 479 -- Other Revenue 174 14 2 190 5,893 (Increases) Decreases In:
Deposits In-Lieu of Cash (1,697) (429) -- (2,126) -- Accounts Receivable, Net of Allowances (7,694) (1,310) (58) (9,062) (675) Due from Other Funds (8) (446) -- (454) (781) Due from Component Unit -- -- -- -- (2) Due from Other Governmental Agencies (79) 733 -- 654 136 Inventory of Materials and Supplies -- -- -- -- 209 Prepaid Costs (438) (230) -- (668) (491) Deferred Outflows of Resources Related to Pension 4,752 5,418 -- 10,170 5,949 Deferred Outflows of Resources Related to OPEB 112 128 -- 240 166
Increases (Decreases) In:Accounts Payable 1,572 819 -- 2,391 (2,427) Retainage Payable (21) -- -- (21) -- Salaries and Employee Benefits Payable 195 231 -- 426 234 Unearned Revenue (862) (175) -- (1,037) -- Due to Other Funds 82 10,819 (7) 10,894 2,699 Due to Other Governmental Agencies 21 359 -- 380 (3) Insurance Claims Payable -- -- -- -- 3,603 Capital Lease Obligations Payable -- -- -- -- (610) Compensated Employee Absences Payable (42) 86 -- 44 200 Pollution Remediation Obligation -- (1,296) -- (1,296) -- Deposits from Others 2,066 490 -- 2,556 -- Arbitrage Rebate Payable (103) -- -- (103) -- Net Pension Liability (6,765) (8,119) -- (14,884) (10,288) Net OPEB Liability (444) (532) -- (976) (674) Landfill Site Closure/ Postclosure Liability -- 4,623 -- 4,623 -- Deferred Inflows of Resources Related to Pension 1,645 2,244 -- 3,889 3,487 Deferred Inflows of Resources Related to OPEB 255 312 -- 567 393
Total Adjustments 26,389 35,407 (63) 61,733 25,251 Net Cash Provided by Operating Activities $ 16,498 $ 84,319 $ 21 $ 100,838 $ 38,015
Reconciliation of Cash and Cash Equivalents to Statement of Net Position Accounts
Pooled Cash/Investments $ 181,694 $ 524,049 $ 86 $ 705,829 $ 310,387 Cash Equivalents/Specific Investments 7,754 -- -- 7,754 -- Cash/Cash Equivalents 9,599 -- -- 9,599 403 Imprest Cash Funds 14 35 -- 49 8 Restricted Cash and Investments with Trustee 13,668 (1) -- -- 13,668 -- Restricted Pooled Cash/Investments 12,174 10,782 -- 22,956 -- Restricted Pooled Cash/Investments-Closure and
Postclosure Care Costs -- 96,759 -- 96,759 -- Total Cash and Cash Equivalents $ 224,903 $ 631,625 $ 86 $ 856,614 $ 310,798
Schedule of Noncash Investing, Capital, and Financing Activities- The Internal Service Funds' loss of $109 on disposition of capital assets. - The Internal Service Funds received $220 of capital contributions. - The Internal Service Funds' acquisition of capital assets with accounts payable is $6,445. - The Internal Service Funds' acquisition of capital assets with retainage payable is $12. - Airport's gain of $2 on disposition of capital assets. - Airport's acquisition of capital assets with retainage payable is $948. - Airport's acquisition of capital assets with accounts payable is $7,638. - Airport's change in fair value of investments not considered cash or cash equivalents is $86. - Airport's amortization of bond premium is $2,667. - Airport's amortization of deferred charge on refunding is $511. - OC Waste & Recycling's loss of $518 on disposition of capital assets. - OC Waste & Recycling's acquisition of capital assets with retainage payable is $109. - OC Waste & Recycling's acquisition of capital assets with accounts payable is $1,424.
(1) Does not include $9,437 from Airport's nonliquid Restricted Cash and Investments with Trustee.
Business-Type Activities - Enterprise Funds
Service FundsTotalInternal
Airport
Governmental
OC Waste & Recycling
Activities -
___________________________________________________________________________________________
___________________________________________________________________________________________
Basic Financial Statements Statement of Cash Flows
Proprietary Funds (Dollar Amounts in Thousands)
60
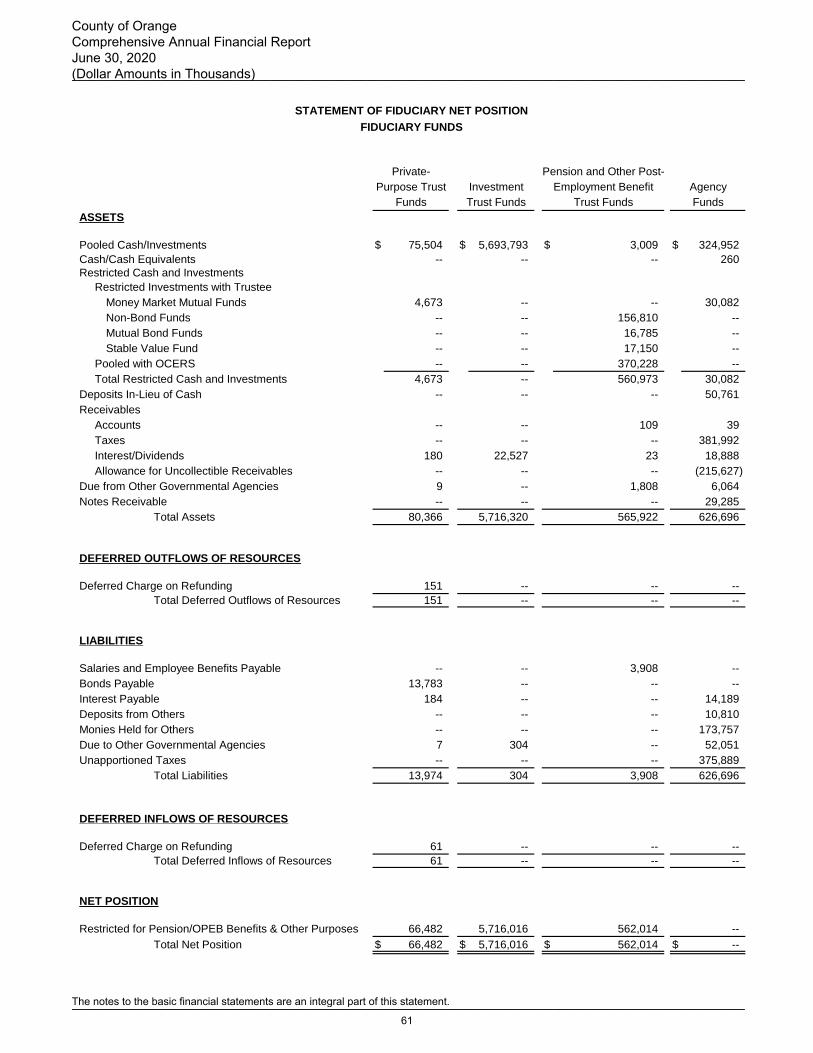
ASSETS
Pooled Cash/Investments $ 75,504 $ 5,693,793 $ 3,009 $ 324,952
Cash/Cash Equivalents -- -- -- 260
Restricted Cash and Investments
Restricted Investments with Trustee
Money Market Mutual Funds 4,673 -- -- 30,082
Non-Bond Funds -- -- 156,810 --
Mutual Bond Funds -- -- 16,785 --
Stable Value Fund -- -- 17,150 --
Pooled with OCERS -- -- 370,228 --
Total Restricted Cash and Investments 4,673 -- 560,973 30,082
Deposits In-Lieu of Cash -- -- -- 50,761
Receivables
Accounts -- -- 109 39
Taxes -- -- -- 381,992
Interest/Dividends 180 22,527 23 18,888
Allowance for Uncollectible Receivables -- -- -- (215,627)
Due from Other Governmental Agencies 9 -- 1,808 6,064
Notes Receivable -- -- -- 29,285
Total Assets 80,366 5,716,320 565,922 626,696
DEFERRED OUTFLOWS OF RESOURCES
Deferred Charge on Refunding 151 -- -- --
Total Deferred Outflows of Resources 151 -- -- --
LIABILITIES
Salaries and Employee Benefits Payable -- -- 3,908 --
Bonds Payable 13,783 -- -- --
Interest Payable 184 -- -- 14,189
Deposits from Others -- -- -- 10,810
Monies Held for Others -- -- -- 173,757
Due to Other Governmental Agencies 7 304 -- 52,051
Unapportioned Taxes -- -- -- 375,889
Total Liabilities 13,974 304 3,908 626,696
DEFERRED INFLOWS OF RESOURCES
Deferred Charge on Refunding 61 -- -- --
Total Deferred Inflows of Resources 61 -- -- --
NET POSITION
Restricted for Pension/OPEB Benefits & Other Purposes 66,482 5,716,016 562,014 --
Total Net Position $ 66,482 $ 5,716,016 $ 562,014 $ --
STATEMENT OF FIDUCIARY NET POSITION
FIDUCIARY FUNDS
Agency
Pension and Other Post-
FundsFunds Trust Funds Trust Funds
Investment
Private-
Purpose Trust Employment Benefit
___________________________________________________________________________________________
___________________________________________________________________________________________
County of Orange Comprehensive Annual Financial Report June 30, 2020 (Dollar Amounts in Thousands)
The notes to the basic financial statements are an integral part of this statement.
61

Additions:
Contributions to Pension and Other Postemployment
Benefit Trust Funds:
Employer $ -- $ -- $ 75,257
Employee -- -- 2,313
Contributions to Pooled Investments -- 9,031,954 --
Contributions to Private-Purpose Trust 90,769 -- --
Intergovernmental Revenues 4,173 -- --
Other Revenues -- -- 1
Interest and Investment Income 2,171 138,113 51,581
Less: Investment Expense (39) (3,358) (321)
Total Additions 97,074 9,166,709 128,831
Deductions:
Benefits Paid to Participants -- -- 46,292
Distributions from Pooled Investments -- 9,521,610 --
Distributions from Private-Purpose Trust 77,696 -- --
Professional Services 142 -- 15
Tax Pass-Throughs 250 -- --
Interest Expense 412 -- --
Total Deductions 78,500 9,521,610 46,307
Change in Net Position:
Private-Purpose Trust 18,574 -- --
External Investment Pool -- (354,901) --
Employees' Pension and Other Post-
Employment Benefits -- -- 82,524
Net Position-Beginning of Year 47,908 6,070,917 479,490
Net Position-End of Year $ 66,482 $ 5,716,016 $ 562,014
Trust Funds
Private-
Purpose Trust
Funds
STATEMENT OF CHANGES IN FIDUCIARY NET POSITION
FIDUCIARY FUNDS
FOR THE YEAR ENDED JUNE 30, 2020
Investment
Trust Funds
Pension and Other Post-
Employment Benefit
___________________________________________________________________________________________
___________________________________________________________________________________________
Basic Financial Statements (Dollar Amounts in Thousands)
The notes to the basic financial statements are an integral part of this statement.
62


Courthouse Ceremony Room


1. SUMMARY OF SIGNIFICANT ACCOUNTING POLICIES
The following is a summary of the more significant accounting policies of the County of Orange:
A. Reporting Entity
The County is a legal subdivision of the State of California charged with general governmental powers. The County's powers are exercised through an elected five-member Board of Supervisors (Board), which, as the governing body, is responsible for the legislative and executive control of the County. The County provides a full range of general government services, including police protection, detention and correction, public assistance, health and sanitation, recreation, library, flood control, public ways and facilities, waste management, airport management, and general financial and administrative support.
As required by GAAP, these financial statements present financial information for both the County (the primary government) and its component units, entities for which the County is considered to be financially accountable. Blended component units, although legally separate entities, are in substance part of the County's operations and the Board is typically their governing body. Therefore, data from these component units are combined with data of the primary government. Discretely presented component units are reported in a separate column in the government-wide financial statements to emphasize that they are legally separate from the County. Management applied the criteria of Governmental Accounting Standards Board (GASB) Statement No. 14, “The Financial Reporting Entity,” Statement No. 39, “Determining Whether Certain Organizations are Component Units-An Amendment of GASB Statement No. 14,” Statement No. 61, “The Financial Reporting Entity: Omnibus-An Amendment of GASB Statements No. 14 and No. 34,” and Statement No. 80, “Blending Requirements for Certain Component Units-An Amendment of GASB Statement No. 14,” to determine whether the component units should be reported as blended or discretely presented component units. The criteria included whether the County appoints the voting majority, there is a financial benefit/burden relationship, the County is able to impose its will, the component unit is fiscally dependent on the County, the component unit’s governing body is substantially the same as the County, and management of the County have operational responsibility for the activities of the component unit. These criteria were used to determine the following:
Blended Component Units
Orange County Flood Control District The governing body of the District is the County’s governing body. Among its duties, it approves the District’s budget, determines the District’s tax rates, approves contracts, and appoints the management. The District is reported in governmental fund types.
Orange County Housing Authority The governing body of the Authority is the County’s governing body. Among its duties, it approves the Authority’s budget and policies that govern the administration of the housing assistance programs and appoints the management. The Authority is reported in governmental fund types.
Orange County Public Financing Authority The Authority is a joint powers authority of the County and the Orange County Development Agency (OCDA), formed to provide financial assistance to the County by financing the acquisition, construction and improvement of public facilities in the County. The governing body of the Authority is the County’s governing body. The Authority is reported in governmental fund types. With the passage of ABX1 26 dissolving redevelopment agencies statewide effective February 1, 2012, the Authority will not issue any new debt. South Orange County Public Financing Authority The Authority is a joint powers authority of the County and Community Facilities District 88-2 of the County of Orange (Lomas Laguna), formed to provide for the financing of public capital improvements. The governing body of the Authority is the County’s governing body. The Authority is reported in governmental fund types.
___________________________________________________________________________________________
___________________________________________________________________________________________
County of Orange Comprehensive Annual Financial Report For the Year Ended June 30, 2020 (Dollar Amounts in Thousands)
63

1. SUMMARY OF SIGNIFICANT ACCOUNTING POLICIES (Continued)
A. Reporting Entity (Continued) Blended Component Units (Continued)
Capital Facilities Development Corporation The Corporation has its own three-member governing body appointed by the County’s governing body. The purpose of the Corporation is to facilitate financings, acquisitions of property, and other financial and property related transactions, by or for the benefit of the County, including but not limited to purchasing property from or for the benefit of, borrowing or loaning money and selling or leasing property to, and otherwise participating in financial and leasing transactions with the County. The Corporation is reported in governmental fund types. Orange County Public Facilities Corporation The Corporation has its own five-member governing body appointed by the County’s governing body and provides services entirely to the primary government, the County, through the purchases, construction or leasing of land and/or facilities, which are then leased back to the County. The Corporation is reported in governmental fund types.
County Service Areas, Special Assessment Districts, and Community Facilities Districts The governing body of County Service Areas, Special Assessment Districts, and Community Facilities Districts (special districts) is the County’s governing body. Among its duties, it approves the special districts’ budgets, and approves parcel fees, special assessments and special taxes. The special districts are reported in governmental fund types.
In-Home Supportive Services (IHSS) Public Authority The governing body of the Authority is the County's governing body. The Authority was established by the Board to act as the employer of record for the individual providers for the IHSS program. The duties of the Authority include collective bargaining for the individual providers, establishing a registry of providers, investigating the background of providers and providing training to both IHSS providers and consumers. The Authority is reported in governmental fund types.
Fiduciary Component Unit
Orange County Housing Finance Trust The Orange County Housing Finance Trust (OCHFT) was formed in 2019 as a joint powers authority between the County and the cities throughout the county. OCHFT was created for the purpose of funding housing, specifically assisting the homeless population and persons and families of extremely low, very low, and low income within the County. The County became a member of the Trust on March 12, 2019. The Trust is reported as a Private-Purpose Trust Fund.
Discretely Presented Component Units
Children and Families Commission of Orange County (CFCOC) The CFCOC is administered by a governing board of nine members, who are appointed by the Board. Its purpose is to develop, adopt, promote and implement early childhood development programs in the County. It is funded by additional State taxes on tobacco products and approved by California voters via Proposition 10 in November 1998. The CFCOC is presented as a discretely presented component unit of the County because, although the County Board has no control over the revenues, budgets, staff, or funding decisions made by the CFCOC, the appointed CFCOC members serve at the will of the Board members who appoint them. A separate stand-alone annual financial report can be obtained by writing to the Children and Families Commission of Orange County, 1505 E. 17th Street, Suite 230, Santa Ana, CA 92705, or by accessing Orange County’s website: www.ac.ocgov.com. Orange County Health Authority, a Public Agency/dba Orange Prevention and Treatment Integrated Medical Assistance (CalOptima) The Board established CalOptima in 1993. The governing board of CalOptima is comprised of nine voting members and includes two County Board members and one
___________________________________________________________________________________________
___________________________________________________________________________________________
Notes to the Basic Financial Statements
(Dollar Amounts in Thousands)
64

1. SUMMARY OF SIGNIFICANT ACCOUNTING POLICIES (Continued)
A. Reporting Entity (Continued) Discretely Presented Component Units (Continued) Orange County Health Authority, a Public Agency/dba Orange Prevention and Treatment Integrated Medical Assistance (CalOptima) (Continued)
County Board member alternate; all other members are appointed by the Board. This is a County organized health system whose purpose is to administer health insurance programs for low-income families, children, seniors, and persons with disabilities throughout the County. These programs include Medi-Cal, OneCare (HMO SNP), OneCare Connect Cal MediConnect Plan, and Program of All-Inclusive Care for the Elderly (PACE). CalOptima is presented as a discretely presented component unit of the County because, although the County Board has no control over the revenues, budgets, staff, or funding decisions made by CalOptima, the appointed CalOptima members serve at the will of the Board members who appoint them. CalOptima will continue until such time as the Board takes action to terminate CalOptima. A separate stand-alone annual financial report can be obtained by writing to CalOptima, 505 City Parkway West, Orange, CA 92868 or can be accessed via the website http://wpso.dmhc.ca.gov/fe/search/.
B. Government-Wide and Fund Financial Statements
The basic financial statements include both the government-wide and fund financial statements. The government-wide financial statements are prepared using the accrual basis of accounting and the economic resources measurement focus. The government-wide financial statements report long-term liabilities and capital assets. Depreciation/amortization expense and accumulated depreciation/amortization are displayed on the government-wide financial statements. The capital assets and related depreciation include the costs and depreciation of infrastructure assets.
The fund financial statements for the governmental funds are prepared under the modified accrual basis of accounting and the current financial resources measurement focus. Fund financial statements are shown separately for specific major governmental funds and in total for all other governmental funds. Fund financial statements for proprietary funds are reported under the accrual basis of accounting and the economic resources measurement focus. Major enterprise funds are shown separately, with internal service funds shown in total. Financial data for the internal service funds is included with the governmental funds for presentation in the government-wide financial statements. Fiduciary funds are displayed by category in the fund financial statements, but are not reported in the government-wide financial statements, because the assets of these funds are not available to the County.
Government-Wide Financial Statements
GASB Statement No. 34, “Basic Financial Statements-and Management’s Discussion and Analysis-for State and Local Governments” (GASB Statement No. 34), as amended by GASB Statement No. 63, “Financial Reporting of Deferred Outflows of Resources, Deferred Inflows of Resources, and Net Position” (GASB Statement No. 63), mandates the presentation of two basic government-wide financial statements:
• Statement of Net Position • Statement of Activities
The scope of the government-wide financial statements is to report information on all of the non-fiduciary activities of the primary government and its component units.
Governmental activities, which are normally supported by taxes, intergovernmental revenues, other nonexchange revenues, and business-type activities, which are financed by fees charged to external parties for goods or services, are reported in separate columns with a combined total column presented for the
___________________________________________________________________________________________
___________________________________________________________________________________________
County of Orange Comprehensive Annual Financial Report For the Year Ended June 30, 2020 (Dollar Amounts in Thousands)
65

1. SUMMARY OF SIGNIFICANT ACCOUNTING POLICIES (Continued)
B. Government-Wide and Fund Financial Statements (Continued) Government-Wide Financial Statements (Continued) primary government. Likewise, the primary government is reported separately from the legally separate component units, CFCOC and CalOptima, for which the primary government is financially accountable. The government-wide Statement of Net Position displays the financial position of the primary government, in this case, the County and its discretely presented component units. The Statement of Net Position reports the County’s financial and capital resources, including infrastructure, as well as the County’s long-term obligations. The difference between the County’s assets plus deferred outflows of resources, and liabilities plus deferred inflows of resources is its net position. Net position represents the resources that the County has available for use in providing services after its debt or other obligations are settled. These resources may not be readily available or spendable and consequently are classified into the following categories of net position in the government-wide financial statements:
• Net Investment in Capital Assets This amount is derived by subtracting the outstanding liabilities incurred by the County, including debt-related deferred outflows and inflows of resources, to buy or construct capital assets shown in the Statement of Net Position, net of depreciation.
• Restricted Net Position This category represents restrictions imposed on the use of the County’s resources by parties outside of the government or by law through constitutional provisions or enabling legislation. All of the County’s net position restrictions are externally imposed by outside parties, constitutional provisions or enabling legislation. Examples of restricted net position include federal and state grants that are restricted by grant agreements for specific purposes and restricted cash set aside for debt service payments. At June 30, 2020, the County’s governmental activities reported restricted net position of $1,544,487 and is restricted for pension benefits related to the OCERS Investment Account, capital projects, debt service, legally segregated funds restricted for grants and other purposes, and regional park endowment. Restricted Net Position for business-type activities amounted to $58,282 and is restricted for the use of Airport and OC Waste & Recycling activities, including debt service, passenger facility charges (PFC), capital projects replacements and renewals, landfill closure/postclosure, and landfill corrective action. At June 30, 2020, the County reported $8,158 of net position restricted by enabling legislation related to the Airport’s PFC.
• Unrestricted Net Position These assets are resources of the County that can be used for any purpose, though they may not necessarily be liquid. In addition, assets in a fund that exceed the amounts required to be restricted by external parties or enabling legislation are reported as unrestricted net position. When both restricted and unrestricted resources are available for use, it is the County’s policy to use restricted resources first, and then unrestricted resources as they are needed.
The government-wide Statement of Activities demonstrates the degree to which the direct expenses of a given function or segment are offset by program revenues and the extent to which the function or segment is supported by general government revenues, such as property taxes, local unrestricted sales taxes, and investment earnings. Direct expenses are those that are clearly identifiable with a specific function or segment. Indirect expenses are allocated to match the reimbursement of indirect costs recorded as program revenues to the same function where the related expense is recorded. Program revenues include:
• Charges and fees to customers or applicants for goods, services, or privileges provided, including fines, forfeitures, and penalties related to the program
• Operating grants and contributions
• Capital grants and contributions, including special assessments
Taxes and other items such as unrestricted investment earnings not properly included among program revenues are reported instead as general revenues.
___________________________________________________________________________________________
___________________________________________________________________________________________
Notes to the Basic Financial Statements
(Dollar Amounts in Thousands)
66
1. SUMMARY OF SIGNIFICANT ACCOUNTING POLICIES (Continued)
B. Government-Wide and Fund Financial Statements (Continued)
Fund Financial Statements
Separate fund financial statements are provided for governmental funds, proprietary funds and fiduciary funds, even though the latter are excluded from the government-wide financial statements. The focus of governmental and proprietary fund financial statements is on major funds. The financial information of each major fund is shown in a separate column in the fund financial statements, with the data for all nonmajor governmental funds aggregated into a single column and all nonmajor proprietary funds aggregated into a single column. GASB Statement No. 34, as amended by GASB Statement No. 65, “Items Previously Reported as Assets and Liabilities” (GASB Statement No. 65), sets forth minimum criteria (specified minimum percentages of the assets plus deferred outflows of resources, liabilities plus deferred inflows of resources, revenues or expenditures/expenses of a fund category and of the governmental and enterprise funds combined) for the determination of major funds. In addition to funds that meet the minimum criteria, any other governmental or enterprise fund that the government believes is of particular importance to financial statement users may be reported as a major fund.
The County reports the following major governmental funds:
General Fund This fund accounts for resources traditionally associated with government and all other resources, which are not required legally, or by sound financial management, to be accounted for in another fund. Revenues are primarily derived from taxes; licenses, permits and franchises; fines, forfeitures and penalties; use of money and property; intergovernmental revenues; charges for services; and other revenues. Expenditures are primarily expended for functions of general government, public protection, public ways and facilities, health and sanitation, public assistance, capital outlay, and debt service.
Flood Control District This fund accounts for the planning, construction, operation, and maintenance of regional flood protection and water conservation works, such as dams, control channels, retarding basins, and other flood control infrastructure, charges for services revenue, along with property taxes restricted for flood control activities, provide most of this fund’s revenues.
Other Public Protection This fund accounts for revenues restricted for safety and law enforcement activities such as the child support program, automated fingerprint identification systems, and investigation team. Revenues consist primarily of federal grants, state grants, fines, use of money and property, and charges for services.
Mental Health Services Act This fund accounts for the County’s mental health programs for children, transition age youth, adults, older adults and families pursuant to the State of California Mental Health Services Act. Revenues consist primarily from a 1% income tax on personal income in excess of one million dollars.
The County reports the following proprietary enterprise funds:
Airport This major fund accounts for major construction and for self-supporting aviation-related activities rendered at John Wayne Airport, Orange County. The airport’s staff coordinates and administers general business activities related to the Airport, including concessions, commercial and general aviation operations, leased property, auto parking, and aircraft tie-down facilities.
OC Waste & Recycling This major fund accounts for the operation, expansion, and closing of existing landfills. Monies are collected through landfill disposal fees, which users pay based primarily on tonnage.
Compressed Natural Gas (CNG) This nonmajor fund accounts for the operation and maintenance of the CNG facility. Revenues consist primarily of CNG sales to both the County and the public.
___________________________________________________________________________________________
___________________________________________________________________________________________
County of Orange Comprehensive Annual Financial Report For the Year Ended June 30, 2020 (Dollar Amounts in Thousands)
67

1. SUMMARY OF SIGNIFICANT ACCOUNTING POLICIES (Continued)
B. Government-Wide and Fund Financial Statements (Continued) Fund Financial Statements (Continued)
Additionally, the County reports the following fund types:
Internal Service Funds The County reports nine Internal Service Fund types. These proprietary funds are used to report activities that provide goods or services to other funds of the County. These funds account for fleet services, publishing services, and other services (including claims for workers’ compensation, property damage, information & technology, insurance and various health programs) provided to other County departments or agencies. The Internal Service Funds receive revenues on a cost-reimbursement basis.
Fiduciary Fund Types The County has a total of 384 individual trust and agency funds for FY 2019-20. These trust and agency funds are used to account for assets held on behalf of outside parties or employees, including other governments. When these assets are held under the terms of a formal trust agreement, a private-purpose trust, pension trust or other postemployment benefits (OPEB) trust fund is used. An investment trust fund is used for the portion of the County investment pool representing external pool participants. Agency funds are used to account for assets that the County holds on behalf of others as their agent. The County reports the following trust and agency funds:
Private-Purpose Trust These funds are used to account for trust arrangements where the principal and income benefit individuals, private organizations, or other governments. Examples of private-purpose trusts include unidentified funds, unclaimed prisoner funds, and decedents’ property held for escheatment. Also included are the County accounts for the former redevelopment agency.
Investment Trust
Orange County Investment Pool These funds are used to account for assets, consisting primarily of cash and investments, of separate legal entities, other than school and community college districts, which participate in the County Treasurer’s Investment Pool, and includes debt reserves for school and community college districts.
Orange County Educational Investment Pool These funds are used to account for assets, consisting primarily of cash and investments, of school and community college districts that participate in the County Treasurer’s External Educational Investment Pool.
Pension and Other Employee Benefits Trust The County reports six Pension and OPEB Trust funds. These trust funds are used to account for resources that are required to be held in trust for the members and beneficiaries of defined benefit and defined contribution pension and post-employment benefit plans.
Agency Funds These funds are custodial in nature and do not report operating results. These funds are used to account for assets held by the County as an agent for various local governments and individuals, such as unapportioned taxes for other local government agencies, monies collected for the Redevelopment Property Tax Trust funds, civil filing fees, and special assessment districts debt service funds. Accordingly, assets reported in the statements are offset by a liability for resources held on behalf of others.
___________________________________________________________________________________________
___________________________________________________________________________________________
Notes to the Basic Financial Statements
(Dollar Amounts in Thousands)
68
1. SUMMARY OF SIGNIFICANT ACCOUNTING POLICIES (Continued)
C. Measurement Focus and Basis of Accounting
Government-Wide Financial Statements
The government-wide financial statements are reported using the economic resources measurement focus and the accrual basis of accounting. With this measurement focus, all assets, deferred outflows of resources and all liabilities, and deferred inflows of resources associated with the operation of these funds are included on the Statement of Net Position. Receivables are reported net of allowances for uncollectible receivables in the Statement of Net Position. Revenues are recorded when earned, and expenses are recorded when a liability is incurred, regardless of the timing of the related cash flows. Property taxes are recognized as revenues in the year for which they are levied. Grants and similar items are recognized as revenue as soon as all eligibility requirements imposed by the provider have been met. For purposes of not overstating the true costs and program revenues reported for the various functions, interfund activities (e.g. interfund transfers and interfund reimbursements) have been eliminated from the government-wide Statement of Activities. Exceptions to the general rule are interfund services provided and used between functions, such as charges for auditing and accounting fees between the general government function and various other functions of the primary government. Elimination of these interfund activities would distort the direct costs and program revenues reported for the various functions concerned. When both restricted and unrestricted resources are available for use, it is the County’s policy to use restricted resources first, and then unrestricted resources as they are needed. Additionally, only the interfund transfers between governmental and business-type activities are reported in the Statement of Activities.
Governmental Fund Financial Statements Governmental funds are used to report all governmental activities that are not primarily self-funded by fees or charges to external users or other funds and are not fiduciary activities. These activities include the County’s basic services to its citizenry and to other agencies, including general government, public protection, public ways and facilities, health and sanitation, public assistance, education, and recreation and cultural services. There are five types of governmental funds:
• General Fund
• Special Revenue Funds • Capital Projects Funds
• Debt Service Funds
• Permanent Fund
Governmental fund financial statements are reported using the current financial resources measurement focus and the modified accrual basis of accounting. Under this method of accounting, revenues and other governmental fund type financial resources (e.g., bond issuance proceeds) are recognized in the accounting period in which they become susceptible to accrual–that is, when they become both measurable and available. Revenues are considered to be available when they are collectible within the current period or soon enough thereafter to pay liabilities of the current period. For this purpose, the County considers revenues to be available if they are collected within 60 days after the end of the current fiscal period.
Revenues that are accrued include real and personal property taxes, sales taxes, property taxes in-lieu of motor vehicle license fees, fines, forfeitures and penalties, interest, federal and state grants and subventions, charges for current services, and the portion of long-term sales contracts and leases receivable that are measurable and available and where collectability is assured. Revenues that are not considered susceptible to accrual include penalties on delinquent property taxes and minor licenses and permits. Grants and similar items are recognized as revenue as soon as all eligibility requirements imposed by the provider have been met, provided that the revenues are also available. If intergovernmental revenues are expected to be received later than 60 days following the end of the fiscal year, then a receivable is recorded along with deferred inflows of resources. Once the intergovernmental revenue is received, revenue
___________________________________________________________________________________________
___________________________________________________________________________________________
County of Orange Comprehensive Annual Financial Report For the Year Ended June 30, 2020 (Dollar Amounts in Thousands)
69
1. SUMMARY OF SIGNIFICANT ACCOUNTING POLICIES (Continued)
C. Measurement Focus and Basis of Accounting (Continued)
Governmental Fund Financial Statements (Continued) and cash are recorded, and the receivable and deferred inflows of resources are eliminated. Receipts that have not met all of the earning requirements are reported as unearned revenue received. As of June 30, 2020, the County reported $123,377 of deferred inflows of resources and $462,707 of unearned revenue received in the governmental funds’ balance sheet.
Most expenditures are recorded when the related fund liabilities are incurred. However, inventory type items are considered expenditures at the time of use and principal and interest expenditures on bonded debt and capital leases are recorded in the year they become due for payment. Costs of claims, judgments, compensated employee absences and employer pension contributions are recorded as expenditures at fiscal year-end if they are due and payable. The related long-term obligation is recorded in the government- wide financial statements. Commitments such as purchase orders and contracts for materials and services are recorded as encumbrances.
Because the fund financial statements are presented on a different measurement focus and basis of accounting than the government-wide financial statements, a reconciliation is presented to explain the adjustments necessary to reconcile fund financial statements to the government-wide financial statements.
Proprietary Fund Financial Statements
Proprietary fund financial statements are reported using the economic resources measurement focus and the accrual basis of accounting. Proprietary funds are used to account for business-type activities, which are financed mainly by fees and charges to users of the services provided by the funds’ operations. Proprietary funds distinguish operating revenues and expenses from nonoperating items. Operating revenues and expenses generally result from providing services and producing and delivering goods in connection with a proprietary fund’s principal ongoing operations. All revenues and expenses not meeting this definition are reported as nonoperating revenues and expenses.
There are two types of proprietary funds:
• Enterprise Funds • Internal Service Funds
The County has three enterprise funds: Airport, OC Waste & Recycling, and CNG. The principal operating revenues of the Airport, OC Waste & Recycling, and CNG enterprise funds are charges to customers for (1) landing fees, terminal space rental, auto parking, concessions, revenue from use of property, revenue from services, and aircraft tie-down fees, (2) disposal fees charged to users of the waste disposal sites, and (3) natural gas sales, respectively.
Internal Service Funds are used to report activities that provide goods or services to other funds of the County. The internal service funds receive revenues through cost-reimbursements of the goods and services provided to other County departments and agencies. Operating expenses for enterprise funds and internal service funds include the cost of sales and services, administrative expenses, and depreciation on capital assets.
Fiduciary Fund Financial Statements
Fiduciary funds are used to account for assets held in a trustee or agency capacity and cannot be used to support the County’s own programs. Trust funds are accounted for using the economic resources measurement focus and accrual basis of accounting. Agency funds report only assets and liabilities and therefore do not have a measurement focus; however, agency funds use the accrual basis of accounting to recognize receivables and payables.
___________________________________________________________________________________________
___________________________________________________________________________________________
Notes to the Basic Financial Statements
(Dollar Amounts in Thousands)
70
1. SUMMARY OF SIGNIFICANT ACCOUNTING POLICIES (Continued)
D. Budget Adoption and Revision No later than October 2nd of each year, after conducting public hearings concerning the recommended budget, the Board adopts a budget in accordance with Government Code Sections 29000-29144 and 30200. The County publishes the results of this initial budgeting process in a separate report, the "Adopted Budget," which specifies all accounts established within each fund/department/budget control (a collection of account numbers necessary to fund a certain division or set of goal related activities) and will not include the carried forward prior year encumbrances. However, the original and final budget amounts presented in the financial statements may differ due to the inclusion of the carried forward prior year encumbrances.
Throughout the year, the original budget is adjusted to reflect increases or decreases in revenues and changes in fund balance, offset by an equal amount of adjustments to appropriations. Department heads are authorized to approve appropriation transfers within a fund/department/budget control. However, appropriation transfers between funds/departments/budget controls require approval of the Board. Accordingly, the lowest level of budgetary control exercised by the County's governing body is the fund/department/budget control level. Annual budgets are adopted on a basis consistent with GAAP except for the general fund and major special revenue funds as detailed in the Budgetary Comparison Statement reconciliation between the budgetary basis and GAAP basis. Budgeted governmental funds consist of the general fund, major funds, and other nonmajor governmental funds. Budgetary comparison statements are prepared only for the general fund and major special revenue funds (listed below) for which the County legally adopts annual budgets, and are presented as part of the basic financial statements. The County did not legally adopt annual budgets for the Capital Facilities Development Corporation, South OC Public Financing Authority Fund, and Capital Facilities Construction Fund. The budgetary comparison statements provide three separate types of information: (1) the original budget, which is the first complete appropriated budget; (2) the final amended budget, which includes all legally authorized changes regardless of when they occurred; and (3) the actual revenues and expenditures during the year for budget-to-actual comparisons.
The major special revenue fund Budgetary Comparison Statements reported by the County in the Basic Financial Statements are:
• Flood Control District • Other Public Protection • Mental Health Services Act
The intent of preparing the Budgetary Comparison Statement reconciliation is to provide the reader with a more complete understanding and appreciation for the difference between budgetary revenues and other financing sources and expenditures and other financing uses presented in the Budgetary Comparison Statements and the revenues, expenditures, and other financing sources (uses) reported on the Statement of Revenues, Expenditures, and Changes in Fund Balances, which is prepared in accordance with GAAP. The major areas of difference are as follows:
• Under the budgetary basis, investment income is recognized on an amortized cost basis. In accordance with GASB Statement No. 31, “Accounting and Financial Reporting for Certain Investments and for External Investment Pools" (GASB Statement No. 31), all investment income, including changes in fair value (gains/losses) of investments, are recognized as investment income.
• Under the budgetary basis, revenues are normally recorded when earned. For GAAP basis, in accordance with GASB Statement No. 33, “Accounting and Financial Reporting for Nonexchange Transactions” (GASB Statement No. 33), and GASB Statement No. 65, all nonexchange transactions, such as government-mandated nonexchange transactions and voluntary nonexchange transactions, can be accrued only if they are measurable and “available.” “Available” has been defined by GASB Statement No. 33 as “collected within the current period or expected to be collected soon enough thereafter to be used to pay liabilities of the current period.” The County has established the
___________________________________________________________________________________________
___________________________________________________________________________________________
County of Orange Comprehensive Annual Financial Report For the Year Ended June 30, 2020 (Dollar Amounts in Thousands)
71

1. SUMMARY OF SIGNIFICANT ACCOUNTING POLICIES (Continued)
D. Budget Adoption and Revision (Continued)
availability period as 60 days after the end of the fiscal year. In order to ensure all transactions for the current fiscal year meet this criterion, the County analyzes revenue receipts through August 31 and records adjustments to deferred inflows of resources for transactions that are not collected.
• GASB Statement No. 34 states, “Fiduciary funds should be used to report assets held in a trustee or agency capacity for others and therefore, cannot be used to support the government’s own programs.” For the GAAP financial statements, an adjustment to record public-purpose trust monies as revenue in the benefitting funds is recorded for funds which continue to be accounted for as fiduciary funds on a budgetary basis, but do not meet the definition of a fiduciary fund.
• Under the budgetary basis, intrafund transfers are recognized as other financing sources (uses). For the GAAP financial statements, intrafund transfers are eliminated to minimize the “grossing-up” of intrafund transfers.
• For budgetary purposes, the loan from OC Waste & Recycling to the General Fund was recognized as other financing sources (uses). In accordance with GASB Statement No. 34, an adjustment to record the interfund loan as an interfund receivable in the lender fund and interfund payable in the borrower fund was recorded for the GAAP financial statements.
• Under the budgetary basis, interfund reimbursements or repayments from funds responsible for particular expenditures or expenses to the funds that initially paid for them are recorded as revenues in the payer fund. In accordance with GASB Statement No. 34, an adjustment to eliminate interfund reimbursements is recorded for the GAAP financial statements.
• In accordance with GAAP, the County has established guidelines for recording expenditure accruals. In order to reasonably ensure that accruals for current fiscal year transactions are materially accurate, the County performs an analysis to identify expenditure accruals for the GAAP financial statements.
• The OC Animal Care Center used cash basis to record money it received from invoicing due to the low collection rate. Per GAAP, the receivables and the amount of the allowance for the doubtful accounts should be recorded.
• Under the budgetary basis, the lease rental payments were recorded in the Information Technology ISF. Per GAAP, the lease payments were reclassed to the fund where the lease liability is recorded.
___________________________________________________________________________________________
___________________________________________________________________________________________
Notes to the Basic Financial Statements
(Dollar Amounts in Thousands)
72
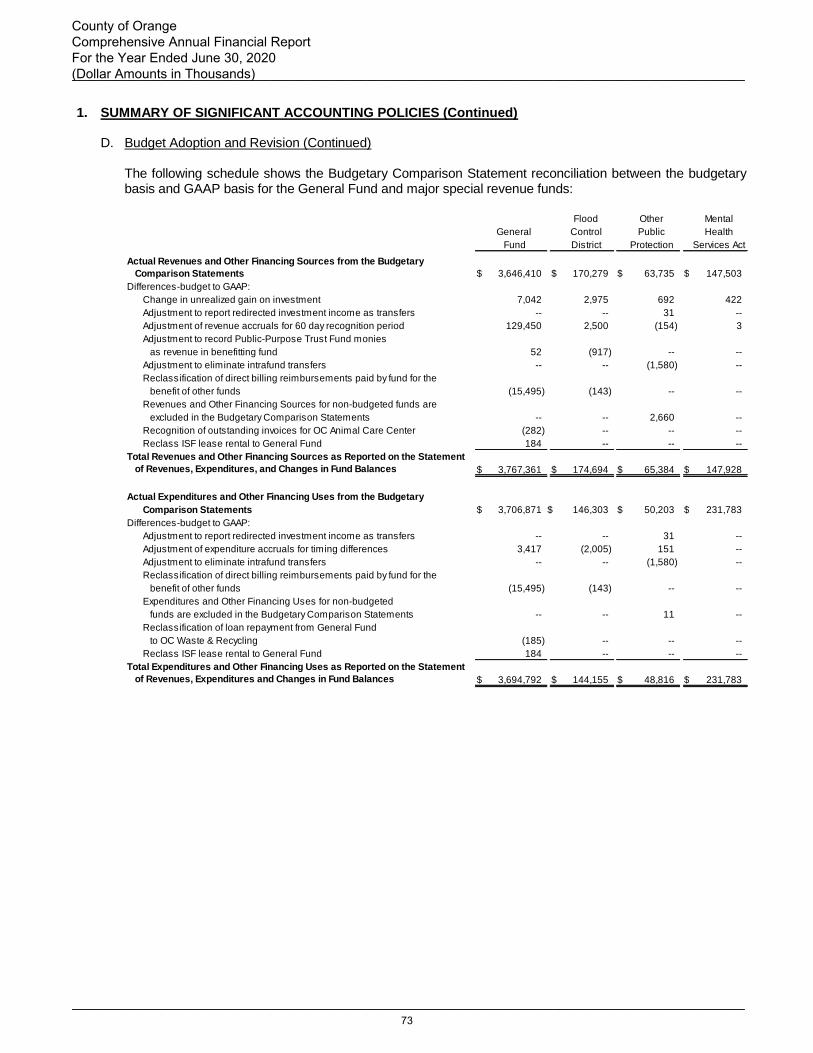
1. SUMMARY OF SIGNIFICANT ACCOUNTING POLICIES (Continued)
D. Budget Adoption and Revision (Continued)
The following schedule shows the Budgetary Comparison Statement reconciliation between the budgetary basis and GAAP basis for the General Fund and major special revenue funds:
Flood Other Mental
General Control Public Health
Fund District Protection Services Act
Actual Revenues and Other Financing Sources from the Budgetary
Comparison Statements $ 3,646,410 $ 170,279 $ 63,735 $ 147,503
Differences-budget to GAAP:
Change in unrealized gain on investment 7,042 2,975 692 422
Adjustment to report redirected investment income as transfers -- -- 31 --
Adjustment of revenue accruals for 60 day recognition period 129,450 2,500 (154) 3
Adjustment to record Public-Purpose Trust Fund monies
as revenue in benefitting fund 52 (917) -- --
Adjustment to eliminate intrafund transfers -- -- (1,580) --
Reclassification of direct billing reimbursements paid by fund for the
benefit of other funds (15,495) (143) -- --
Revenues and Other Financing Sources for non-budgeted funds are
excluded in the Budgetary Comparison Statements -- -- 2,660 --
Recognition of outstanding invoices for OC Animal Care Center (282) -- -- --
Reclass ISF lease rental to General Fund 184 -- -- --
Total Revenues and Other Financing Sources as Reported on the Statement
of Revenues, Expenditures, and Changes in Fund Balances $ 3,767,361 $ 174,694 $ 65,384 $ 147,928
Actual Expenditures and Other Financing Uses from the Budgetary
Comparison Statements $ 3,706,871 $ 146,303 $ 50,203 $ 231,783
Differences-budget to GAAP:
Adjustment to report redirected investment income as transfers -- -- 31 --
Adjustment of expenditure accruals for timing differences 3,417 (2,005) 151 --
Adjustment to eliminate intrafund transfers -- -- (1,580) --
Reclassification of direct billing reimbursements paid by fund for the
benefit of other funds (15,495) (143) -- --
Expenditures and Other Financing Uses for non-budgeted
funds are excluded in the Budgetary Comparison Statements -- -- 11 --
Reclassification of loan repayment from General Fund
to OC Waste & Recycling (185) -- -- --
Reclass ISF lease rental to General Fund 184 -- -- --
Total Expenditures and Other Financing Uses as Reported on the Statement
of Revenues, Expenditures and Changes in Fund Balances $ 3,694,792 $ 144,155 $ 48,816 $ 231,783
___________________________________________________________________________________________
___________________________________________________________________________________________
County of Orange Comprehensive Annual Financial Report For the Year Ended June 30, 2020 (Dollar Amounts in Thousands)
73
1. SUMMARY OF SIGNIFICANT ACCOUNTING POLICIES (Continued)
E. Fund Balance The County applies GASB Statement No. 54 for financial statement purposes. The intent of this statement is to enhance the usefulness of fund balance information by providing clearer fund balance classifications that can be more consistently applied and by clarifying the existing governmental fund type definitions. The balance sheet reports the following five different classifications of fund balance: Nonspendable Fund Balance Amounts that are not in a spendable form, such as long-term receivables, inventory or prepaid costs, or that are required to be maintained intact, such as the corpus of an endowment fund. The County’s Regional Park Endowment Permanent Fund reports the original donation as nonspendable in accordance with donor requirements.
Restricted Fund Balance Amounts constrained to specific purposes by their providers (such as grantors, bondholders, and higher levels of government), through constitutional provisions, or by enabling legislation.
Committed Fund Balance Amounts constrained to specific purposes by a formal action of the highest level of decision-making authority. The constraint remains binding unless the government takes the same highest-level action to remove or change the constraint. The Board is the County’s highest level of decision-making authority. The highest level of formal action to commit resources is an ordinance. Assigned Fund Balance Amounts a government intends to use for a specific purpose that are neither restricted nor committed; intent can be expressed by the governing body (Board) or by an official or body to which the governing body delegates authority (CEO, County Department Heads, and County Purchasing Agent). The County’s budget development guidelines provide the policy that is used by all County departments to determine the designation of assigned fund balance. Assigned fund balance includes the aggregation of resources for capital projects, which are expected to develop in future periods and fund balance reserved for outstanding contractual obligations for which goods and services have not yet been received or approved by the Board for appropriation in FY 2019-20, through the County’s budget process.
Unassigned Fund Balance Residual amounts within the General Fund in excess of what can be properly classified in one of the four other fund balance classifications. Within all other governmental funds, unassigned fund balance is comprised of the negative residual in excess of what can be properly classified as nonspendable, restricted, or committed. With regards to the hierarchy for spending, when expenditures are incurred for purposes for which both restricted and unrestricted fund balances are available, the County’s policy is to spend restricted fund balance before unrestricted fund balance. When committed, assigned, and unassigned fund balance is available for the same specific purpose, the County’s policy is to expend fund balance according to the following priority: committed, assigned, and then unassigned.
Following are detailed descriptions within each fund balance classification reported in the balance sheet:
___________________________________________________________________________________________
___________________________________________________________________________________________
Notes to the Basic Financial Statements
(Dollar Amounts in Thousands)
74
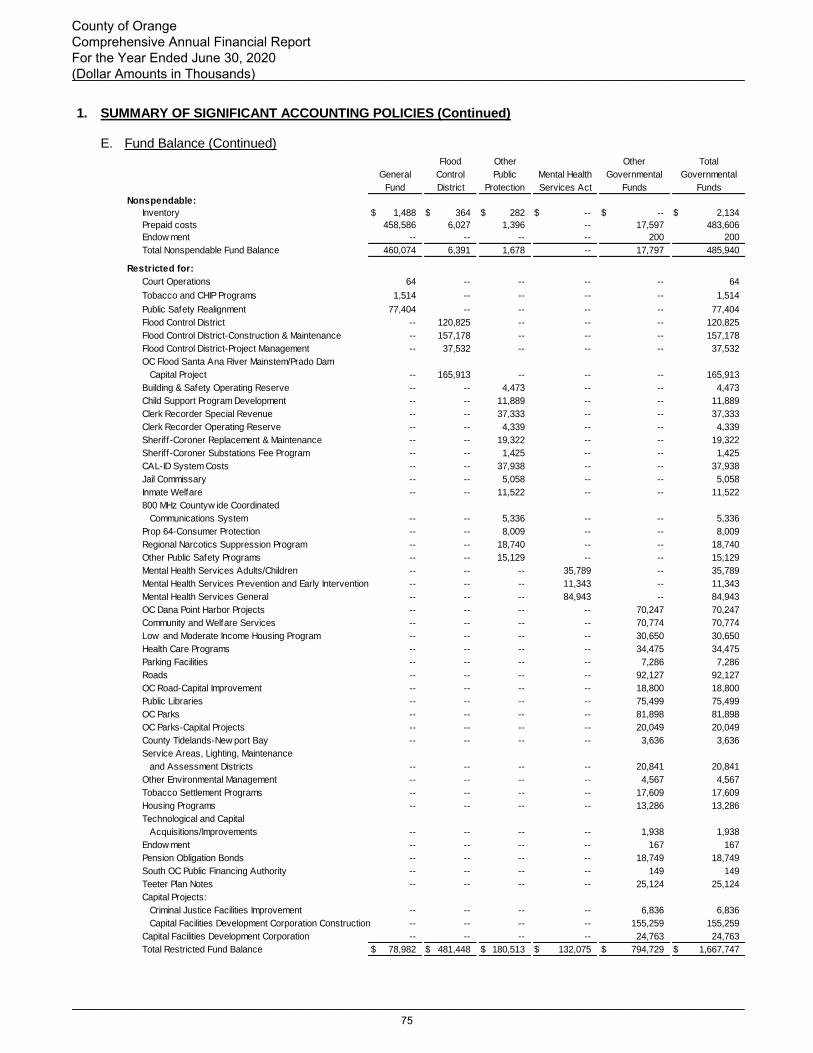
1. SUMMARY OF SIGNIFICANT ACCOUNTING POLICIES (Continued) E. Fund Balance (Continued)
Nonspendable:
Inventory $ 1,488 $ 364 $ 282 $ -- $ -- $ 2,134
Prepaid costs 458,586 6,027 1,396 -- 17,597 483,606
Endow ment -- -- -- -- 200 200
Total Nonspendable Fund Balance 460,074 6,391 1,678 -- 17,797 485,940
Restricted for:
Court Operations 64 -- -- -- -- 64
Tobacco and CHIP Programs 1,514 -- -- -- -- 1,514
Public Safety Realignment 77,404 -- -- -- -- 77,404
Flood Control District -- 120,825 -- -- -- 120,825
Flood Control District-Construction & Maintenance -- 157,178 -- -- -- 157,178
Flood Control District-Project Management -- 37,532 -- -- -- 37,532
OC Flood Santa Ana River Mainstem/Prado Dam
Capital Project -- 165,913 -- -- -- 165,913
Building & Safety Operating Reserve -- -- 4,473 -- -- 4,473
Child Support Program Development -- -- 11,889 -- -- 11,889
Clerk Recorder Special Revenue -- -- 37,333 -- -- 37,333
Clerk Recorder Operating Reserve -- -- 4,339 -- -- 4,339
Sheriff-Coroner Replacement & Maintenance -- -- 19,322 -- -- 19,322
Sheriff-Coroner Substations Fee Program -- -- 1,425 -- -- 1,425
CAL-ID System Costs -- -- 37,938 -- -- 37,938
Jail Commissary -- -- 5,058 -- -- 5,058
Inmate Welfare -- -- 11,522 -- -- 11,522
800 MHz Countyw ide Coordinated
Communications System -- -- 5,336 -- -- 5,336
Prop 64-Consumer Protection -- -- 8,009 -- -- 8,009
Regional Narcotics Suppression Program -- -- 18,740 -- -- 18,740
Other Public Safety Programs -- -- 15,129 -- -- 15,129
Mental Health Services Adults/Children -- -- -- 35,789 -- 35,789
Mental Health Services Prevention and Early Intervention -- -- -- 11,343 -- 11,343
Mental Health Services General -- -- -- 84,943 -- 84,943
OC Dana Point Harbor Projects -- -- -- -- 70,247 70,247
Community and Welfare Services -- -- -- -- 70,774 70,774
Low and Moderate Income Housing Program -- -- -- -- 30,650 30,650
Health Care Programs -- -- -- -- 34,475 34,475
Parking Facilities -- -- -- -- 7,286 7,286
Roads -- -- -- -- 92,127 92,127
OC Road-Capital Improvement -- -- -- -- 18,800 18,800
Public Libraries -- -- -- -- 75,499 75,499
OC Parks -- -- -- -- 81,898 81,898
OC Parks-Capital Projects -- -- -- -- 20,049 20,049
County Tidelands-New port Bay -- -- -- -- 3,636 3,636
Service Areas, Lighting, Maintenance
and Assessment Districts -- -- -- -- 20,841 20,841
Other Environmental Management -- -- -- -- 4,567 4,567
Tobacco Settlement Programs -- -- -- -- 17,609 17,609
Housing Programs -- -- -- -- 13,286 13,286
Technological and Capital
Acquisitions/Improvements -- -- -- -- 1,938 1,938
Endow ment -- -- -- -- 167 167
Pension Obligation Bonds -- -- -- -- 18,749 18,749
South OC Public Financing Authority -- -- -- -- 149 149
Teeter Plan Notes -- -- -- -- 25,124 25,124
Capital Projects:
Criminal Justice Facilities Improvement -- -- -- -- 6,836 6,836
Capital Facilities Development Corporation Construction -- -- -- -- 155,259 155,259
Capital Facilities Development Corporation -- -- -- -- 24,763 24,763
Total Restricted Fund Balance $ 78,982 $ 481,448 $ 180,513 $ 132,075 $ 794,729 $ 1,667,747
General
Fund
Mental Health
Services Act
Other
Governmental
Funds
Total
Governmental
Funds
Flood
Control
District
Other
Public
Protection
___________________________________________________________________________________________
___________________________________________________________________________________________
County of Orange Comprehensive Annual Financial Report For the Year Ended June 30, 2020 (Dollar Amounts in Thousands)
75
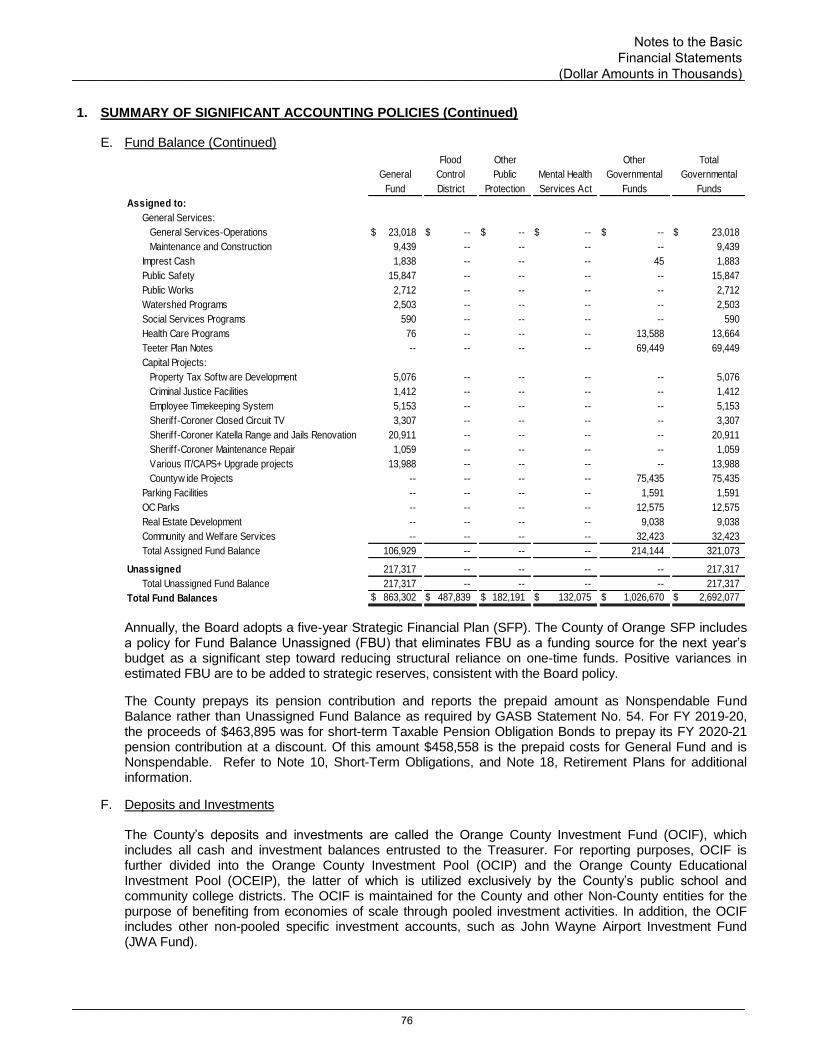
1. SUMMARY OF SIGNIFICANT ACCOUNTING POLICIES (Continued)
E. Fund Balance (Continued)
Assigned to:
General Services:
General Services-Operations $ 23,018 $ -- $ -- $ -- $ -- $ 23,018
Maintenance and Construction 9,439 -- -- -- -- 9,439
Imprest Cash 1,838 -- -- -- 45 1,883
Public Safety 15,847 -- -- -- -- 15,847
Public Works 2,712 -- -- -- -- 2,712
Watershed Programs 2,503 -- -- -- -- 2,503
Social Services Programs 590 -- -- -- -- 590
Health Care Programs 76 -- -- -- 13,588 13,664
Teeter Plan Notes -- -- -- -- 69,449 69,449
Capital Projects:
Property Tax Softw are Development 5,076 -- -- -- -- 5,076
Criminal Justice Facilities 1,412 -- -- -- -- 1,412
Employee Timekeeping System 5,153 -- -- -- -- 5,153
Sheriff-Coroner Closed Circuit TV 3,307 -- -- -- -- 3,307
Sheriff-Coroner Katella Range and Jails Renovation 20,911 -- -- -- -- 20,911
Sheriff-Coroner Maintenance Repair 1,059 -- -- -- -- 1,059
Various IT/CAPS+ Upgrade projects 13,988 -- -- -- -- 13,988
Countyw ide Projects -- -- -- -- 75,435 75,435
Parking Facilities -- -- -- -- 1,591 1,591
OC Parks -- -- -- -- 12,575 12,575
Real Estate Development -- -- -- -- 9,038 9,038
Community and Welfare Services -- -- -- -- 32,423 32,423
Total Assigned Fund Balance 106,929 -- -- -- 214,144 321,073
Unassigned 217,317 -- -- -- -- 217,317
Total Unassigned Fund Balance 217,317 -- -- -- -- 217,317
Total Fund Balances $ 863,302 $ 487,839 $ 182,191 $ 132,075 $ 1,026,670 $ 2,692,077
General
Fund
Mental Health
Services Act
Other
Governmental
Funds
Total
Governmental
Funds
Flood
Control
District
Other
Public
Protection
Annually, the Board adopts a five-year Strategic Financial Plan (SFP). The County of Orange SFP includes a policy for Fund Balance Unassigned (FBU) that eliminates FBU as a funding source for the next year’s budget as a significant step toward reducing structural reliance on one-time funds. Positive variances in estimated FBU are to be added to strategic reserves, consistent with the Board policy.
The County prepays its pension contribution and reports the prepaid amount as Nonspendable Fund Balance rather than Unassigned Fund Balance as required by GASB Statement No. 54. For FY 2019-20, the proceeds of $463,895 was for short-term Taxable Pension Obligation Bonds to prepay its FY 2020-21 pension contribution at a discount. Of this amount $458,558 is the prepaid costs for General Fund and is Nonspendable. Refer to Note 10, Short-Term Obligations, and Note 18, Retirement Plans for additional information.
F. Deposits and Investments
The County’s deposits and investments are called the Orange County Investment Fund (OCIF), which includes all cash and investment balances entrusted to the Treasurer. For reporting purposes, OCIF is further divided into the Orange County Investment Pool (OCIP) and the Orange County Educational Investment Pool (OCEIP), the latter of which is utilized exclusively by the County’s public school and community college districts. The OCIF is maintained for the County and other Non-County entities for the purpose of benefiting from economies of scale through pooled investment activities. In addition, the OCIF includes other non-pooled specific investment accounts, such as John Wayne Airport Investment Fund (JWA Fund).
___________________________________________________________________________________________
___________________________________________________________________________________________
Notes to the Basic Financial Statements
(Dollar Amounts in Thousands)
76
1. SUMMARY OF SIGNIFICANT ACCOUNTING POLICIES (Continued)
F. Deposits and Investments (Continued)
The County has reported investment values at fair value in the accompanying financial statements, using the fair value measurement within the fair value hierarchy established by GASB Statement No. 72 “Fair Value Measurement and Application” (GASB Statement No. 72).
Other than proceeds held by the County in the OCIP, proceeds from County-issued bonds are held by trustees and are invested in instruments authorized by the respective trust agreements including money market mutual funds, investment agreements, repurchase agreements, and U.S. Government securities. All investments are measured at fair value. The trustee uses an independent service to value those securities. The pools value participants’ shares using an amortized cost basis. Specifically, the pools distribute income to participants based on their relative participation during the period. Income is calculated based on (1) realized investment gains and losses calculated on an amortized cost basis, (2) interest income based on stated rates (both paid and accrued), (3) amortization of discounts and premiums on a straight-line basis, and reduced by (4) actual investment administrative cost of such investing, depositing or handling of funds. This method differs from the fair value method used to value investments in this statement because the amortized cost method is not designed to distribute to participants all unrealized gains and losses in the fair values of the pools’ investments. Refer to Note 3, Deposits and Investments for additional information.
The investments in the Retiree Medical Defined Benefit Trust are managed by OCERS and are reported at fair value. Refer to Note 19, Postemployment Health Care Benefits, to obtain OCERS stand-alone annual financial statements.
G. Inventory of Materials and Supplies
Inventories consist of expendable materials and supplies held for consumption. Inventories are valued at cost, which is determined on a moving weighted-average basis. Applicable fund balances are non-spendable for amounts equal to the inventories on hand at the end of the fiscal year, as these amounts are not available for appropriation and expenditure. The costs of inventory items are recorded as expenditures/expenses when issued to user departments/agencies.
H. Prepaid Costs
The County pays for certain types of services in advance, such as pension costs and rents, and recognizes these expenditures/expenses when consumed. Prepaid costs in the governmental funds balance sheet include $483,606, which primarily consist of $483,578 for the County’s FY 2020-21 pension contribution at a discount.
Prepaid costs in the government-wide financial statements include the prepaid costs reported in the fund financial statements, reduced for 50% of the prepaid asset related to the pension contribution after the measurement date in accordance with GASB Statement No. 68 and GASB Statement No. 71. Refer to Note 18, Retirement Plans for additional information.
I. Capital Assets
Capital assets are defined as assets of a long-term character that are intended to be held or used in operations, such as land, land improvements, structures and improvements, equipment, intangible, and infrastructure. Infrastructure assets are grouped by networks consisting of flood channels, roads, bridges, trails, traffic signals, and harbors.
___________________________________________________________________________________________
___________________________________________________________________________________________
County of Orange Comprehensive Annual Financial Report For the Year Ended June 30, 2020 (Dollar Amounts in Thousands)
77
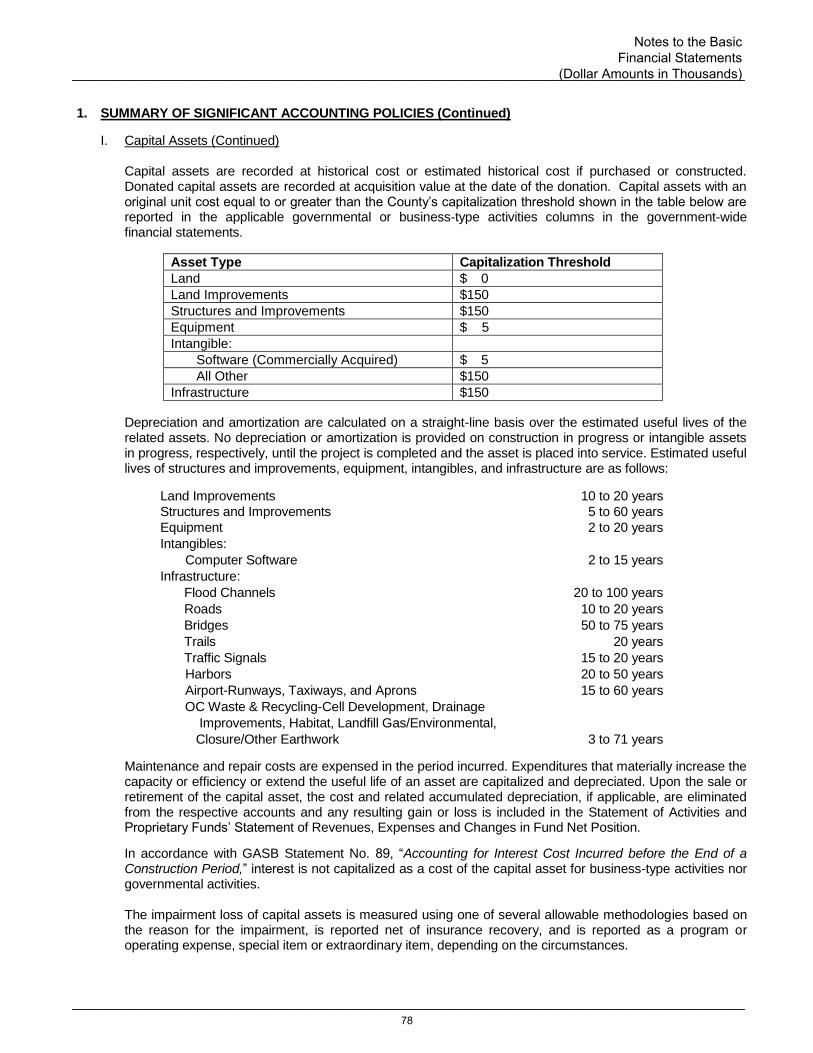
1. SUMMARY OF SIGNIFICANT ACCOUNTING POLICIES (Continued)
I. Capital Assets (Continued) Capital assets are recorded at historical cost or estimated historical cost if purchased or constructed. Donated capital assets are recorded at acquisition value at the date of the donation. Capital assets with an original unit cost equal to or greater than the County’s capitalization threshold shown in the table below are reported in the applicable governmental or business-type activities columns in the government-wide financial statements.
Asset Type Capitalization Threshold Land $ 0 Land Improvements $150 Structures and Improvements $150 Equipment $ 5 Intangible:
Software (Commercially Acquired) $ 5 All Other $150
Infrastructure $150
Depreciation and amortization are calculated on a straight-line basis over the estimated useful lives of the related assets. No depreciation or amortization is provided on construction in progress or intangible assets in progress, respectively, until the project is completed and the asset is placed into service. Estimated useful lives of structures and improvements, equipment, intangibles, and infrastructure are as follows:
Land Improvements 10 to 20 years Structures and Improvements 5 to 60 years
Equipment 2 to 20 years Intangibles: Computer Software 2 to 15 years Infrastructure:
Flood Channels 20 to 100 years Roads 10 to 20 years Bridges 50 to 75 years Trails 20 years Traffic Signals 15 to 20 years Harbors 20 to 50 years
Airport-Runways, Taxiways, and Aprons
15 to 60 years OC Waste & Recycling-Cell Development, Drainage
Channels, Facility
Improvements, Habitat, Landfill Gas/Environmental,
Closure/Other Earthwork 3 to 71 years
Maintenance and repair costs are expensed in the period incurred. Expenditures that materially increase the capacity or efficiency or extend the useful life of an asset are capitalized and depreciated. Upon the sale or retirement of the capital asset, the cost and related accumulated depreciation, if applicable, are eliminated from the respective accounts and any resulting gain or loss is included in the Statement of Activities and Proprietary Funds’ Statement of Revenues, Expenses and Changes in Fund Net Position.
In accordance with GASB Statement No. 89, “Accounting for Interest Cost Incurred before the End of a Construction Period,” interest is not capitalized as a cost of the capital asset for business-type activities nor governmental activities. The impairment loss of capital assets is measured using one of several allowable methodologies based on the reason for the impairment, is reported net of insurance recovery, and is reported as a program or operating expense, special item or extraordinary item, depending on the circumstances.
___________________________________________________________________________________________
___________________________________________________________________________________________
Notes to the Basic Financial Statements
(Dollar Amounts in Thousands)
78
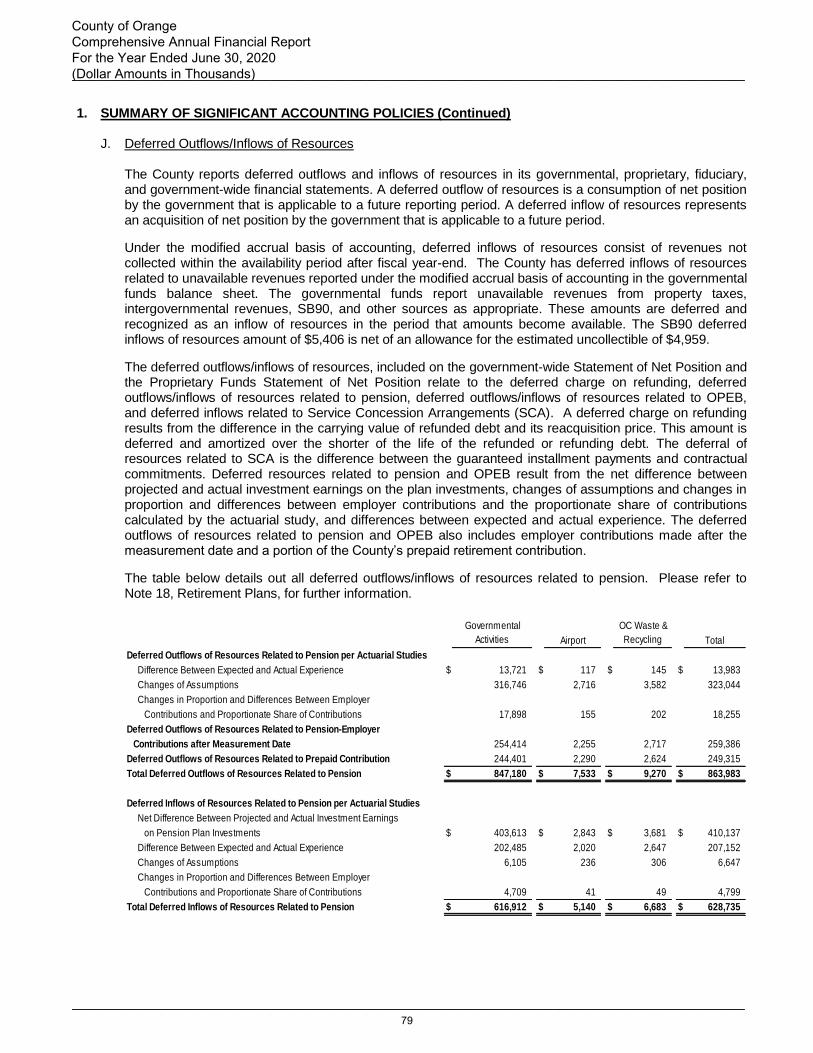
1. SUMMARY OF SIGNIFICANT ACCOUNTING POLICIES (Continued)
J. Deferred Outflows/Inflows of Resources The County reports deferred outflows and inflows of resources in its governmental, proprietary, fiduciary, and government-wide financial statements. A deferred outflow of resources is a consumption of net position by the government that is applicable to a future reporting period. A deferred inflow of resources represents an acquisition of net position by the government that is applicable to a future period.
Under the modified accrual basis of accounting, deferred inflows of resources consist of revenues not collected within the availability period after fiscal year-end. The County has deferred inflows of resources related to unavailable revenues reported under the modified accrual basis of accounting in the governmental funds balance sheet. The governmental funds report unavailable revenues from property taxes, intergovernmental revenues, SB90, and other sources as appropriate. These amounts are deferred and recognized as an inflow of resources in the period that amounts become available. The SB90 deferred inflows of resources amount of $5,406 is net of an allowance for the estimated uncollectible of $4,959.
The deferred outflows/inflows of resources, included on the government-wide Statement of Net Position and the Proprietary Funds Statement of Net Position relate to the deferred charge on refunding, deferred outflows/inflows of resources related to pension, deferred outflows/inflows of resources related to OPEB, and deferred inflows related to Service Concession Arrangements (SCA). A deferred charge on refunding results from the difference in the carrying value of refunded debt and its reacquisition price. This amount is deferred and amortized over the shorter of the life of the refunded or refunding debt. The deferral of resources related to SCA is the difference between the guaranteed installment payments and contractual commitments. Deferred resources related to pension and OPEB result from the net difference between projected and actual investment earnings on the plan investments, changes of assumptions and changes in proportion and differences between employer contributions and the proportionate share of contributions calculated by the actuarial study, and differences between expected and actual experience. The deferred outflows of resources related to pension and OPEB also includes employer contributions made after the measurement date and a portion of the County’s prepaid retirement contribution.
The table below details out all deferred outflows/inflows of resources related to pension. Please refer to Note 18, Retirement Plans, for further information.
Governmental
Activities Airport
OC Waste &
Recycling Total
Deferred Outflows of Resources Related to Pension per Actuarial Studies
Difference Between Expected and Actual Experience $ 13,721 $ 117 $ 145 $ 13,983
Changes of Assumptions 316,746 2,716 3,582 323,044
Changes in Proportion and Differences Between Employer
Contributions and Proportionate Share of Contributions 17,898 155 202 18,255
Deferred Outflows of Resources Related to Pension-Employer
Contributions after Measurement Date 254,414 2,255 2,717 259,386
Deferred Outflows of Resources Related to Prepaid Contribution 244,401 2,290 2,624 249,315
Total Deferred Outflows of Resources Related to Pension $ 847,180 $ 7,533 $ 9,270 $ 863,983
Deferred Inflows of Resources Related to Pension per Actuarial Studies
Net Difference Between Projected and Actual Investment Earnings
on Pension Plan Investments $ 403,613 $ 2,843 $ 3,681 $ 410,137
Difference Between Expected and Actual Experience 202,485 2,020 2,647 207,152
Changes of Assumptions 6,105 236 306 6,647
Changes in Proportion and Differences Between Employer
Contributions and Proportionate Share of Contributions 4,709 41 49 4,799
Total Deferred Inflows of Resources Related to Pension $ 616,912 $ 5,140 $ 6,683 $ 628,735
___________________________________________________________________________________________
___________________________________________________________________________________________
County of Orange Comprehensive Annual Financial Report For the Year Ended June 30, 2020 (Dollar Amounts in Thousands)
79
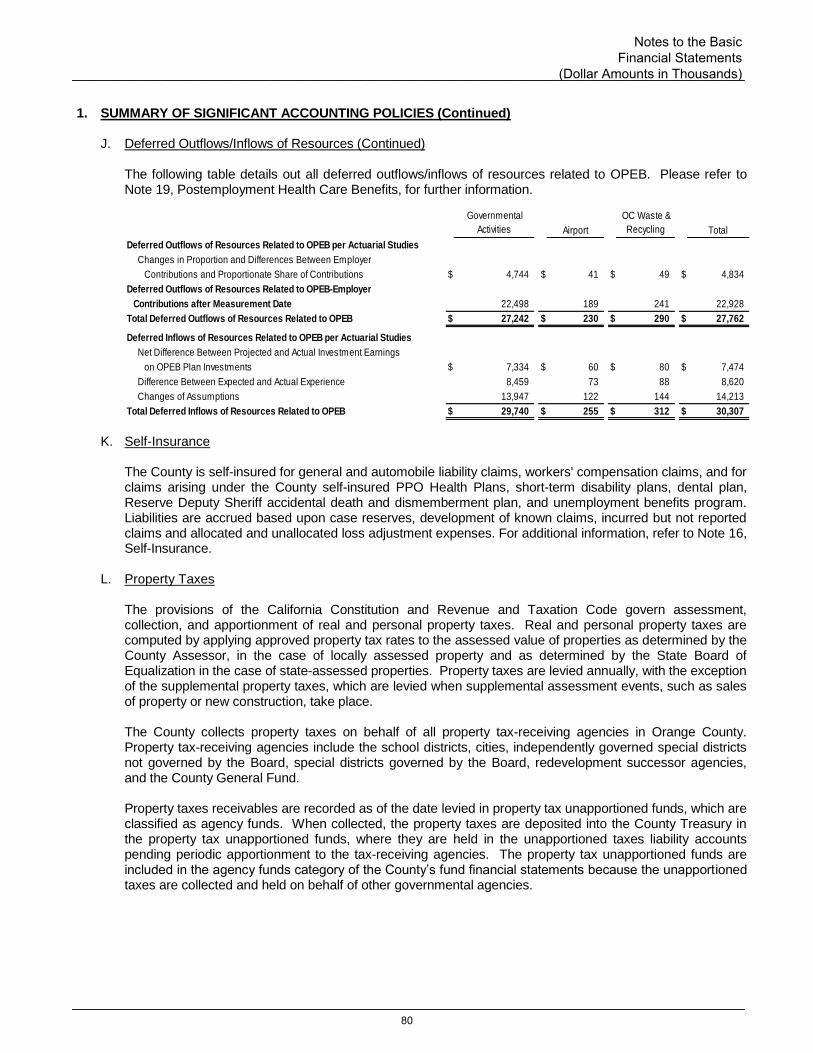
1. SUMMARY OF SIGNIFICANT ACCOUNTING POLICIES (Continued)
J. Deferred Outflows/Inflows of Resources (Continued) The following table details out all deferred outflows/inflows of resources related to OPEB. Please refer to Note 19, Postemployment Health Care Benefits, for further information.
Governmental
Activities Airport
OC Waste &
Recycling Total
Deferred Outflows of Resources Related to OPEB per Actuarial Studies
Changes in Proportion and Differences Between Employer
Contributions and Proportionate Share of Contributions $ 4,744 $ 41 $ 49 $ 4,834
Deferred Outflows of Resources Related to OPEB-Employer
Contributions after Measurement Date 22,498 189 241 22,928
Total Deferred Outflows of Resources Related to OPEB $ 27,242 $ 230 $ 290 $ 27,762
Deferred Inflows of Resources Related to OPEB per Actuarial Studies
Net Difference Between Projected and Actual Investment Earnings
on OPEB Plan Investments $ 7,334 $ 60 $ 80 $ 7,474
Difference Between Expected and Actual Experience 8,459 73 88 8,620
Changes of Assumptions 13,947 122 144 14,213
Total Deferred Inflows of Resources Related to OPEB $ 29,740 $ 255 $ 312 $ 30,307
K. Self-Insurance The County is self-insured for general and automobile liability claims, workers' compensation claims, and for claims arising under the County self-insured PPO Health Plans, short-term disability plans, dental plan, Reserve Deputy Sheriff accidental death and dismemberment plan, and unemployment benefits program. Liabilities are accrued based upon case reserves, development of known claims, incurred but not reported claims and allocated and unallocated loss adjustment expenses. For additional information, refer to Note 16, Self-Insurance.
L. Property Taxes The provisions of the California Constitution and Revenue and Taxation Code govern assessment, collection, and apportionment of real and personal property taxes. Real and personal property taxes are computed by applying approved property tax rates to the assessed value of properties as determined by the County Assessor, in the case of locally assessed property and as determined by the State Board of Equalization in the case of state-assessed properties. Property taxes are levied annually, with the exception of the supplemental property taxes, which are levied when supplemental assessment events, such as sales of property or new construction, take place. The County collects property taxes on behalf of all property tax-receiving agencies in Orange County. Property tax-receiving agencies include the school districts, cities, independently governed special districts not governed by the Board, special districts governed by the Board, redevelopment successor agencies, and the County General Fund. Property taxes receivables are recorded as of the date levied in property tax unapportioned funds, which are classified as agency funds. When collected, the property taxes are deposited into the County Treasury in the property tax unapportioned funds, where they are held in the unapportioned taxes liability accounts pending periodic apportionment to the tax-receiving agencies. The property tax unapportioned funds are included in the agency funds category of the County’s fund financial statements because the unapportioned taxes are collected and held on behalf of other governmental agencies.
___________________________________________________________________________________________
___________________________________________________________________________________________
Notes to the Basic Financial Statements
(Dollar Amounts in Thousands)
80
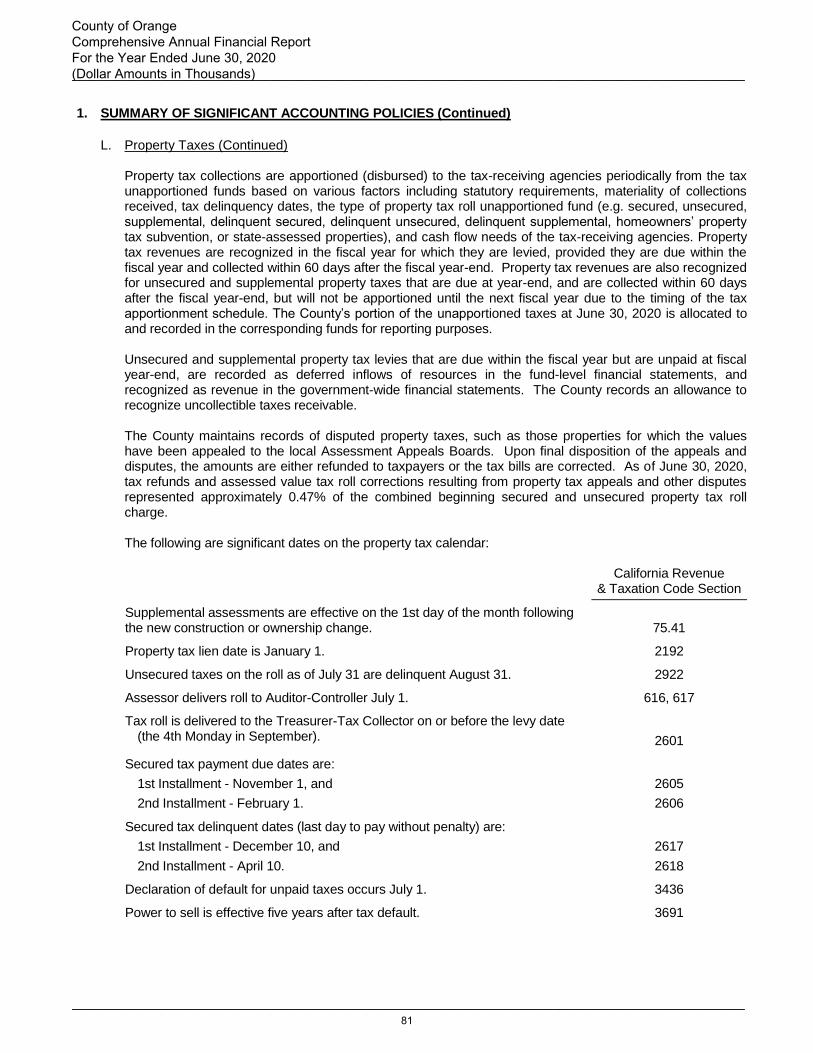
1. SUMMARY OF SIGNIFICANT ACCOUNTING POLICIES (Continued)
L. Property Taxes (Continued)
Property tax collections are apportioned (disbursed) to the tax-receiving agencies periodically from the tax unapportioned funds based on various factors including statutory requirements, materiality of collections received, tax delinquency dates, the type of property tax roll unapportioned fund (e.g. secured, unsecured, supplemental, delinquent secured, delinquent unsecured, delinquent supplemental, homeowners’ property tax subvention, or state-assessed properties), and cash flow needs of the tax-receiving agencies. Property tax revenues are recognized in the fiscal year for which they are levied, provided they are due within the fiscal year and collected within 60 days after the fiscal year-end. Property tax revenues are also recognized for unsecured and supplemental property taxes that are due at year-end, and are collected within 60 days after the fiscal year-end, but will not be apportioned until the next fiscal year due to the timing of the tax apportionment schedule. The County’s portion of the unapportioned taxes at June 30, 2020 is allocated to and recorded in the corresponding funds for reporting purposes. Unsecured and supplemental property tax levies that are due within the fiscal year but are unpaid at fiscal year-end, are recorded as deferred inflows of resources in the fund-level financial statements, and recognized as revenue in the government-wide financial statements. The County records an allowance to recognize uncollectible taxes receivable. The County maintains records of disputed property taxes, such as those properties for which the values have been appealed to the local Assessment Appeals Boards. Upon final disposition of the appeals and disputes, the amounts are either refunded to taxpayers or the tax bills are corrected. As of June 30, 2020, tax refunds and assessed value tax roll corrections resulting from property tax appeals and other disputes represented approximately 0.47% of the combined beginning secured and unsecured property tax roll charge.
The following are significant dates on the property tax calendar:
California Revenue & Taxation Code Section
Supplemental assessments are effective on the 1st day of the month following the new construction or ownership change.
75.41
Property tax lien date is January 1. 2192
Unsecured taxes on the roll as of July 31 are delinquent August 31. 2922
Assessor delivers roll to Auditor-Controller July 1. 616, 617
Tax roll is delivered to the Treasurer-Tax Collector on or before the levy date (the 4th Monday in September).
2601
Secured tax payment due dates are:
1st Installment - November 1, and
2nd Installment - February 1.
2605
2606
Secured tax delinquent dates (last day to pay without penalty) are:
1st Installment - December 10, and
2nd Installment - April 10.
2617
2618
Declaration of default for unpaid taxes occurs July 1. 3436
Power to sell is effective five years after tax default. 3691
___________________________________________________________________________________________
___________________________________________________________________________________________
County of Orange Comprehensive Annual Financial Report For the Year Ended June 30, 2020 (Dollar Amounts in Thousands)
81

1. SUMMARY OF SIGNIFICANT ACCOUNTING POLICIES (Continued)
M. Compensated Employee Absences
Compensated employee absences (vacation, compensatory time off, performance incentive plan time off, annual leave, and sick leave) are accrued as an expense and liability in the proprietary funds when incurred. In the governmental funds, only those amounts that are due and payable at year-end are accrued. Compensated employee absences that exceed this amount represent a reconciling item between the fund and government-wide presentations.
N. Pensions
The County recognizes a net pension liability to reflect the County’s proportionate share of the excess of the total pension liability over the fiduciary net position of the County’s retirement plans. For purposes of measuring the net pension liability, deferred outflows of resources and deferred inflows of resources related to pension, and pension expense, information about the fiduciary net position of the OCERS and the Extra-Help Defined Benefit Plan and additions to/deductions from OCERS and the Extra-Help Defined Benefit Plan fiduciary net position have been determined on the same basis as they are reported by OCERS and the Extra-Help Defined Benefit Plan. For this purpose, benefit payments (including refunds of employee contributions) are recognized when due and payable in accordance with the benefit terms. Investments are reported at fair value. At June 30, 2020, the County’s net pension liability from OCERS was measured as of December 31, 2019, and the total pension liability (TPL) used to calculate the net pension liability was determined by using actuary valuation results. The County’s net pension liability from the Extra-Help Defined Benefit Plan was measured as of June 30, 2020; and the plan’s TPL used to calculate the net pension liability was determined by rolling forward the July 1, 2019 valuation to June 30, 2020.
O. Other Postemployment Benefits (OPEB) The County recognizes a net OPEB liability to reflect the County’s proportionate share of the excess of the total OPEB liability over the fiduciary net position of the County’s Retiree Medical Plan. The Plan is reported in the County’s financial statements and has a plan year-end of December 31, 2019. For purposes of measuring the net OPEB liability, deferred outflows of resources and deferred inflows of resources related to OPEB, and OPEB expense, information about the fiduciary net position of the County’s Retiree Medical Plan and additions to/deductions from the Plan’s fiduciary net position have been determined on the same basis as they are reported by the Retiree Medical Plan. For this purpose, benefit payments are recognized when due and payable in accordance with the benefit terms. Investments are reported at fair value. At June 30, 2020, the County’s net OPEB liability was measured as of December 31, 2019, and the total OPEB liability (TOL) used to calculate the net OPEB liability was determined by an actuarial valuation as of June 30, 2019.
P. Statement of Cash Flows
A Statement of Cash Flows is presented for proprietary fund types. The County's cash and cash equivalents for cash flow reporting purposes are considered to be cash on hand, demand deposits, unrestricted and restricted investments held in the County Treasury’s investment pooled funds and outside trustees.
Q. Indirect Costs
County indirect costs are allocated to benefitting departments in the “Indirect Expenses Allocation” column of the government-wide Statement of Activities. Allocated costs are from the County’s FY 2019-20 County-Wide Cost Allocation Plan (CWCAP), which was prepared in accordance with the Code of Federal Regulation, Title 2, Part 200. For financial statement purposes, the County has elected to allocate indirect costs to budget controls within the General Fund in order to match the reimbursement of indirect costs recorded as program revenues to the same function where the related expense is recorded.
___________________________________________________________________________________________
___________________________________________________________________________________________
Notes to the Basic Financial Statements
(Dollar Amounts in Thousands)
82
1. SUMMARY OF SIGNIFICANT ACCOUNTING POLICIES (Continued)
R. Effects of New Pronouncements The following lists recent GASB Pronouncements that have been implemented in FY 2019-20:
In May 2020, GASB issued Statement No. 95, “Postponement of the Effective Dates of Certain Authoritative Guidance.” This Statement postpones effective dates of certain Statements and Implementation Guides that first became effective for periods beginning after June 15, 2018. The primary objective of this Statement is to provide temporary relief to governments and stakeholders in light of the COVID-19 pandemic. The following summarizes recent GASB Pronouncements that will be implemented in future financial statements, as amended by GASB Statement 95. The County has not determined the effect of these Statements.
In January 2017, GASB issued Statement No. 84, “Fiduciary Activities.” This statement establishes criteria for identifying fiduciary activities for accounting and financial reporting purposes and how those activities should be reported. The statement also describes four fiduciary funds that should be reported, if applicable: (1) pension (and other employee benefit) trust funds, (2) investment trust funds, (3) private-purpose trust funds, and (4) custodial funds. The requirements of this statement are effective for reporting periods beginning after December 15, 2019, which requires the County to implement this Statement in FY 2020-21. In June 2017, GASB issued Statement No. 87, “Leases.” This statement requires recognition of certain lease assets and liabilities for leases that previously were classified as operating leases and recognized as inflows of resources or outflows of resources based on the payment provisions of the contract. The statement requires a lessee to recognize a lease liability and an intangible right-to-use lease asset, and a lessor to recognize a lease receivable and a deferred inflows of resources. The requirements of this statement are effective for reporting periods beginning after June 15, 2021, which requires the County to implement this Statement in FY 2021-22. In August 2018, GASB issued Statement No. 90, “Majority Equity Interests.” This statement improves the consistency and comparability of a government’s majority equity interest in a legally separate organization and the relevance of financial statement information for certain component units. The statement requires that a component unit in which a government has a 100% equity interest account for its assets, deferred outflows of resources, liabilities, and deferred inflows of resources at acquisition value at the date the government acquired 100% equity interest in the component unit. The requirements of this statement are effective for reporting periods beginning after December 15, 2019, which requires the County to implement this Statement in FY 2020-21. In May 2019, GASB issued Statement No. 91, “Conduit Debt Obligations.” This statement provides a single method of reporting conduit debt obligations by issuers and eliminate diversity in practice associated with commitments extended by issuers, arrangements associated with conduit debt obligations, and related note disclosures. The statement requires issuers to disclose general information about their conduit debt obligations, organized by type of commitment, including the aggregate outstanding principal amount of the issuers’ conduit debt obligations and a description of each type of commitment. The requirements of this statement are effective for reporting periods beginning after December 15, 2021, which requires the County to implement this Statement in FY 2022-23. In January 2020, GASB issued Statement No. 92, “Omnibus 2020.” This statement enhances comparability in accounting and financial reporting and to improve the consistency of authoritative literature by addressing practice issues that have been identified during implementation and application of certain GASB Statements. The requirements of this statement are effective for reporting periods after June 15 2021, which requires the County to implement the Statement in FY 2021-22.
___________________________________________________________________________________________
___________________________________________________________________________________________
County of Orange Comprehensive Annual Financial Report For the Year Ended June 30, 2020 (Dollar Amounts in Thousands)
83
1. SUMMARY OF SIGNIFICANT ACCOUNTING POLICIES (Continued)
R. Effects of New Pronouncements (Continued) In March 2020, GASB issued Statement No. 93, “Replacement of Interbank Offered Rates.” This statement is to address accounting and financial reporting implications that result from the replacement of an interbank offered rate due to global reference rate reform. The requirements of this Statement, are effective for reporting periods beginning after June 15, 2021, which requires the County to implement this Statement in FY 2021-22. In March 2020, GASB issued Statement No. 94, “Public-Private and Public-Public Partnerships and Availability Payment Arrangements.” This statement improves financial reporting by addressing issues related to public-private and public-public partnership arrangements. It also provides guidance for accounting and financial reporting for availability payment arrangements. The requirements of this Statement are effective for fiscal years beginning after June 15, 2022, and all reporting periods thereafter. The County will implement this Statement in FY 2022-23.
In May 2020, GASB issued Statement No. 96, “Subscription-Based Information Technology Arrangements.” This statement provides guidance on the accounting and financial reporting for subscription-based information technology arrangements. The requirements of this Statement are effective for fiscal years beginning after June 15, 2022. The County will implement this Statement in FY 2022-23. In June 2020, GASB Statement No. 97, “Certain Component Unit Criteria, and Accounting and Financial Reporting for Internal Revenue Code Section 457 Deferred Compensation Plans—an amendment of GASB Statements No. 14 and No. 84, and a supersession of GASB Statement No. 32.” The primary objectives of this Statement are to (1) increase consistency and comparability related to the reporting of fiduciary component units in circumstances in which a potential component unit does not have a governing board, and (2) mitigate costs associated with the reporting of certain defined contribution pension plans, defined contribution OPEB plans by clarifying the financial burden criteria in Statement No.84. It also extends the accounting and financial reporting requirements related to the Pension Plans, to Section 457 plans that meet the definition of a pension plan. The requirements of this Statement are effective for fiscal years beginning after June 15, 2021 and all reporting periods thereafter, which requires the County to implement this Statement in FY 2021-22.
S. Use of Estimates
The preparation of the basic financial statements in conformity with GAAP requires management to make estimates and assumptions that affect the amounts reported in the basic financial statements and accompanying notes. Actual results could differ from those estimates. Where significant estimates have been made in preparing these financial statements, they are described in the applicable footnotes.
T. Consolidation of Governmental Funds Balance Sheet and Proprietary Funds Statement of Net Position Line Items in Statement of Net Position
Several asset line items in the Governmental Funds Balance Sheet and the Proprietary Funds Statement of Net Position are combined into one line item in the Government-Wide Statement of Net Position for presentation purposes. In order to avoid any confusion, the following table lists the line items shown in the Governmental and Proprietary Fund financial statements that are condensed together in the Government-Wide Statement of Net Position.
___________________________________________________________________________________________
___________________________________________________________________________________________
Notes to the Basic Financial Statements
(Dollar Amounts in Thousands)
84
1. SUMMARY OF SIGNIFICANT ACCOUNTING POLICIES (Continued)
T. Consolidation of Governmental Funds Balance Sheet and Proprietary Funds Statement of Net Position Line Items in Statement of Net Position (Continued)
Government-Wide Statement of Net Position Line Item
Corresponding Governmental Funds Balance Sheet or Proprietary Funds Statement of Net Position Line Item
Cash and Cash Equivalents
Pooled Cash/Investments; Cash Equivalents/Specific Investments; Imprest Cash Funds; and Cash/Cash Equivalents
Restricted Cash and Cash Equivalents
Restricted Cash and Investments with Trustee; Restricted Pooled Cash/Investments; and Restricted Pooled Cash/Investments–Closure and Postclosure Care Costs
Capital Assets – Not Depreciable/Amortizable
Land; Construction in Progress; and Intangible Assets in Progress
Capital Assets – Depreciable/Amortizable (Net)
Structures and Improvements and Accumulated Depreciation; Equipment and Accumulated Depreciation; Infrastructure and Accumulated Depreciation; and Intangible Assets and Accumulated Amortization
2. DEFICIT FUND EQUITY
The Workers’ Compensation ISF reported a deficit net position balance of $41,293. The deficit results from the amount calculated in the annual actuarial study which includes case reserves, development of known claims, incurred but not reported claims, allocated and unallocated loss adjustment expenses, and a discount for anticipated investment income. The deficit decreased by $13,164 from the previous fiscal year primarily due to a strategic decision to increase charges to program participants combined with a decrease in claim costs. Charges to County departments have not provided sufficient cash flows to entirely fund the deficit in the Workers’ Compensation ISF. The County will continue to review charges to departments and manage the funding status of the Workers’ Compensation Program. Effective with OCDA’s dissolution on February 1, 2012, their assets and liabilities (including bond debt) were transferred to and reported in a private-purpose trust fund of the County. This transfer and reporting structure reflect the custodial role accepted by the Successor Agency. The Successor Agency private-purpose trust fund reported a deficit net position of $7,313. The deficit for the Successor Agency decreased by $3,528 from the previous fiscal year primarily due to a decrease in tax pass-throughs.
3. DEPOSITS AND INVESTMENTS
The elected Treasurer is responsible for authorizing all County bank accounts and pursuant to California Government Code (CGC) Sections 27000.1–27000.5, 27130–27137 and 53600–53686 is responsible for conducting County investment activities of the County’s investment pooled funds in addition to various specific investment accounts outside of the pooled funds. The public funds entrusted to the Treasurer are called the OCIF. OCIF contains pooled funds in an “external investment pool” wherein monies of the County and other legally separate external entities, which are not part of the County reporting entity, are commingled (pooled) and invested on the participants’ behalf. The OCIF is not registered with the Securities and Exchange Commission (SEC) as an investment company, and therefore is exempt from SEC rules. For reporting purposes only, the Treasurer separates OCIF into the OCIP, the OCEIP and non-pooled funds. In addition to the pooled funds in OCIF, the Treasurer separately invests other non-pooled funds (Specific Investments), including the JWA Fund and other separately managed investments. The Treasurer further invests pooled funds from the OCIF into three Funds: the Orange County Money Market Fund (OCMMF), the Orange County Educational Money Market Fund (OCEMMF), and the Extended Fund. On December 6, 2019, Standard & Poor’s (S&P) reaffirmed its highest rating of AAAm Principal Stability Fund
___________________________________________________________________________________________
___________________________________________________________________________________________
County of Orange Comprehensive Annual Financial Report For the Year Ended June 30, 2020 (Dollar Amounts in Thousands)
85
3. DEPOSITS AND INVESTMENTS (Continued) Rating (AAAm) on the OCMMF and the OCEMMF. The Treasurer will act on a “best efforts” basis to stabilize the Net Asset Value (NAV) of OCMMF and OCEMMF at or above $0.9975 (in absolute dollar amounts). The pooled funds do not have any legally binding guarantees of share values. The maximum maturity of investments for the two short-term pools is 13 months with a maximum weighted average maturity (WAM) of 60 days. The maximum maturity of the long-term pool is five years per CGC. The Investment Policy Statement (IPS) provides that all pools, except short-term pools, shall have a maximum duration of 1.50 years. Pursuant to CGC Sections 27130-27137, the Board has established a Treasury Oversight Committee (TOC) that monitors and reviews the IPS annually and also ensures that the Treasurer has an audit annually, which includes limited tests of compliance with laws and regulations. The TOC consists of the County Executive Officer, the elected County Auditor-Controller, the County Superintendent of Schools, or their respective designees, and four public members, with at least three having expertise in, or an academic background in, public finance. The investment practices and policies of the Treasurer are based on compliance with state law and prudent money management. The primary goal is to invest public funds in a manner which will provide maximum security of principal invested with secondary emphasis on providing adequate liquidity to pool participants. The last goal is to achieve a market rate of return within the parameters of prudent risk management while conforming to all applicable statutes and resolutions governing the investment of public funds. Interest is allocated to individual Funds monthly based on the average daily balances on deposit with the Treasurer. Deposits and investments in OCIF with the Treasurer totaled $10,340,690 as of June 30, 2020, consisting of $26,919 in Deposits for OCIF, $10,200,374 in Investments for pooled funds and $113,397 for the Specific Investments.
Total County deposits and investments at fair value as of June 30, 2020, are reported as follows: Deposits:
Imprest Cash $ 1,950
Pooled Deposits for OCIF with Treasurer 26,919
Deposits with Trustees 36,155
All other Deposits and Timing Differences (125,830)
Total Deposits and Timing Differences (60,806)
Investments:
Pooled Investments for OCIF with Treasurer 10,200,374
Specific Investments with Treasurer 113,397
Restricted Investments with Trustees 437,319
External-OCERS 370,228
Total Investments 11,121,318
Total Deposits and Investments $ 11,060,512
Total County deposits and investments are reported in the following funds:
Governmental Funds $ 3,099,158
Proprietary Funds 1,222,360
Fiduciary Funds 6,693,246
Component Unit-CFCOC 45,748
Total Deposits and Investments $ 11,060,512
___________________________________________________________________________________________
___________________________________________________________________________________________
Notes to the Basic Financial Statements
(Dollar Amounts in Thousands)
86

3. DEPOSITS AND INVESTMENTS (Continued)
A. Deposits
CGC 53652 et. seq. and the IPS prescribe the amount of collateral that is required to secure the deposit of public funds. The pledge to secure deposits is administered by the California Commissioner of Business Oversight. Collateral is required for demand deposits at 110% of all deposits not covered by Federal Depository Insurance Corporation (FDIC) if obligations of the United States and its agencies, or obligations of the State or its municipalities, school districts, and district corporations are pledged. Collateral of 150% is required if a deposit is secured by first mortgages or first trust deeds upon improved residential real property located in California. All such collateral is considered to be held by the pledging financial institutions’ trust departments or agents in the name of the County. Obligations pledged to secure deposits must be delivered to an institution other than the institution in which the deposit is made; however, the trust department of the same institution may hold them. Written agreements are required to provide, among other things, that the collateral securities are held separately from the assets of the custodial institution. FDIC is available for demand deposits and interest saving deposit funds deposited at any one financial institution up to a maximum of $250. Custodial Credit Risk-Deposits The custodial credit risk for deposits is the risk that the County will not be able to recover deposits that are in the possession of an outside party. Deposits are exposed to custodial credit risk if they are not insured or collateralized. The County’s deposits are not exposed to custodial credit risk, since all of its deposits are covered by FDIC or collateralized with securities held by the County or its agent in the County’s name in accordance with CGC Section 53652 and 53658.
B. Investments
The CGC Sections 53601 and 53635, Board ordinances and resolutions, the County’s IPS, the bond indenture documents, trust agreements, and other contractual agreements govern the investments that may be purchased and may include certain restrictions on investment maturity, maximum portfolio percentages, term, value, and credit quality to minimize the risk of loss. The IPS adds further restrictions to permitted investments from the CGC. As of June 30, 2020, the Treasurer was in full compliance with the more restrictive IPS for the OCIF and the Specific Investments accounts.
___________________________________________________________________________________________
___________________________________________________________________________________________
County of Orange Comprehensive Annual Financial Report For the Year Ended June 30, 2020 (Dollar Amounts in Thousands)
87
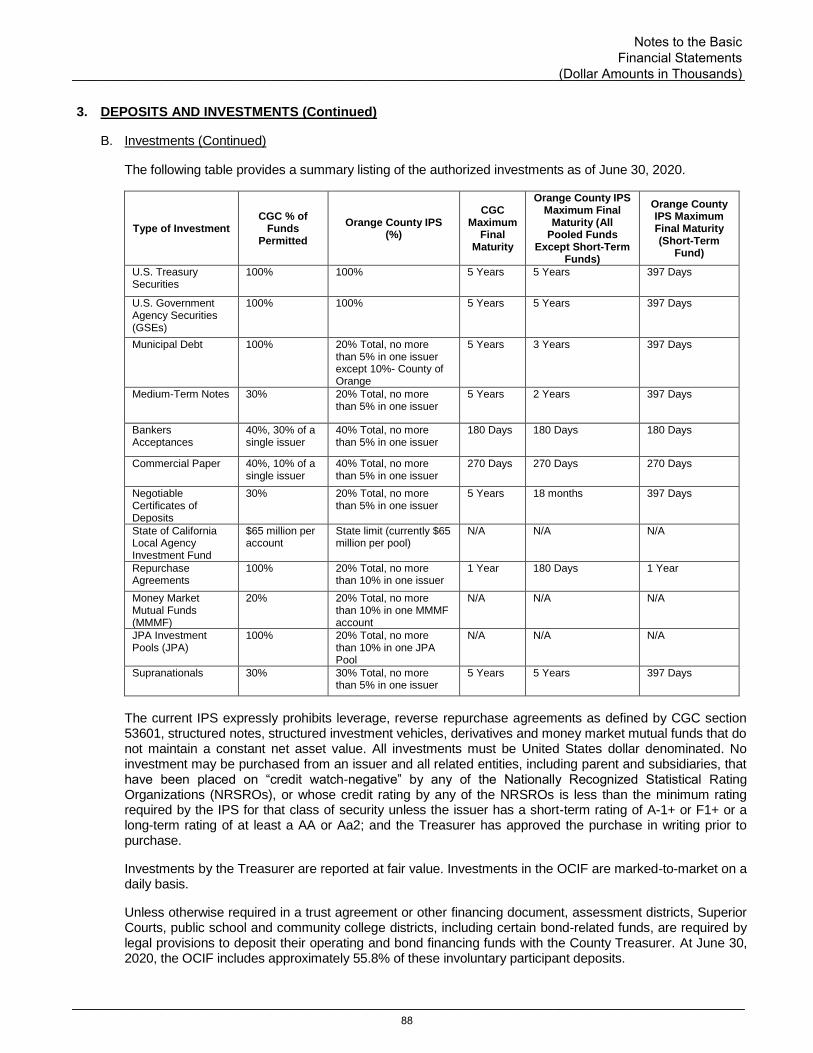
3. DEPOSITS AND INVESTMENTS (Continued)
B. Investments (Continued)
The following table provides a summary listing of the authorized investments as of June 30, 2020.
Type of Investment CGC % of
Funds Permitted
Orange County IPS (%)
CGC Maximum
Final Maturity
Orange County IPS Maximum Final
Maturity (All Pooled Funds
Except Short-Term Funds)
Orange County IPS Maximum Final Maturity (Short-Term
Fund)
U.S. Treasury Securities
100% 100% 5 Years 5 Years 397 Days
U.S. Government Agency Securities (GSEs)
100% 100% 5 Years 5 Years 397 Days
Municipal Debt 100% 20% Total, no more than 5% in one issuer except 10%- County of Orange
5 Years 3 Years 397 Days
Medium-Term Notes 30% 20% Total, no more than 5% in one issuer
5 Years 2 Years 397 Days
Bankers Acceptances
40%, 30% of a single issuer
40% Total, no more than 5% in one issuer
180 Days 180 Days 180 Days
Commercial Paper 40%, 10% of a single issuer
40% Total, no more than 5% in one issuer
270 Days 270 Days 270 Days
Negotiable Certificates of Deposits
30% 20% Total, no more than 5% in one issuer
5 Years 18 months 397 Days
State of California Local Agency Investment Fund
$65 million per account
State limit (currently $65 million per pool)
N/A N/A N/A
Repurchase Agreements
100% 20% Total, no more than 10% in one issuer
1 Year 180 Days 1 Year
Money Market Mutual Funds (MMMF)
20% 20% Total, no more than 10% in one MMMF account
N/A N/A N/A
JPA Investment Pools (JPA)
100% 20% Total, no more than 10% in one JPA Pool
N/A N/A N/A
Supranationals 30% 30% Total, no more than 5% in one issuer
5 Years 5 Years 397 Days
The current IPS expressly prohibits leverage, reverse repurchase agreements as defined by CGC section 53601, structured notes, structured investment vehicles, derivatives and money market mutual funds that do not maintain a constant net asset value. All investments must be United States dollar denominated. No investment may be purchased from an issuer and all related entities, including parent and subsidiaries, that have been placed on “credit watch-negative” by any of the Nationally Recognized Statistical Rating Organizations (NRSROs), or whose credit rating by any of the NRSROs is less than the minimum rating required by the IPS for that class of security unless the issuer has a short-term rating of A-1+ or F1+ or a long-term rating of at least a AA or Aa2; and the Treasurer has approved the purchase in writing prior to purchase.
Investments by the Treasurer are reported at fair value. Investments in the OCIF are marked-to-market on a daily basis.
Unless otherwise required in a trust agreement or other financing document, assessment districts, Superior Courts, public school and community college districts, including certain bond-related funds, are required by legal provisions to deposit their operating and bond financing funds with the County Treasurer. At June 30, 2020, the OCIF includes approximately 55.8% of these involuntary participant deposits.
___________________________________________________________________________________________
___________________________________________________________________________________________
Notes to the Basic Financial Statements
(Dollar Amounts in Thousands)
88

3. DEPOSITS AND INVESTMENTS (Continued)
B. Investments (Continued)
Investment Disclosures
The following table presents a summary of the County’s investments, the credit quality distribution, and concentration of credit risk by investment type as a percentage of each category’s fair value at June 30, 2020.
With Treasurer: Fair Value Principal
Interest Rate
Range (%) Maturity Range
Weighted
Average
Maturity
(Years) Rating (1)
% of
Portfolio
OCIF
U.S. Treasuries 2,802,207$ 2,789,700$ 0.07-2.98% 7/02/20-5/31/22 0.094 27.47%
U.S. Government Agencies 4,764,541 4,697,318 0.07-3.09% 7/02/20-10/15/24 0.616 AA 46.71%
Municipal Debt 463,895 463,895 1.49-1.82% 7/31/20-4/30/21 0.021 NR 4.55%
Medium-Term Notes 275,557 272,917 1.70-3.12% 9/01/20-8/08/21 0.016 AA 2.70%
Local Agency Investment Fund (LAIF) 73,828 73,467 1.22% 7/01/20 0.000 NR 0.72%
Money Market Mutual Funds 1,820,346 1,820,346 0.04-0.16% 7/01/20 0.000 AAA 17.85%
10,200,374$ 10,117,643$ 0.747 100.00%
With Treasurer: Fair Value Principal
Interest Rate
Range (%) Maturity Range
Weighted
Average
Maturity
(Years) Rating (1)
% of
Portfolio
Specif ic Investments
U.S. Treasuries 32,318$ 31,000$ 0.14-2.90% 8/31/20-2/15/36 0.644 28.50%
U.S. Government Agencies 72,687 68,021 0.11-3.48% 7/10/20-11/02/35 2.462 AA 64.10%
Money Market Mutual Funds 8,392 8,392 0.04-0.16% 7/01/20 0.000 AAA 7.40%
113,397$ 107,413$ 3.106 100.00%
With Trustees: Fair Value Principal
Interest Rate
Range (%) Maturity Range
Weighted
Average
Maturity
(Years) Rating (1)
% of
Portfolio
Restricted Investments w ith Trustees
U.S. Government Agencies 27,718$ 17,250$ 0.00-2.88% 11/27/20-9/01/21 0.064 AA 6.34%
U.S. Treasuries 15,761 14,829 1.63-2.00% 11/30/20-5/31/23 0.068 3.60%
Guaranteed Investment Contracts 155,513 155,513 2.76% 9/20/22 0.791 NR 35.56%
Money Market Mutual Funds 47,582 47,582 Variable 7/01/20 0.000 AAA 10.88%
Bond Mutual Funds 16,785 16,785 (0.53)-3.89% 7/01/20 0.000 Baa2 3.84%
Non-Bond Funds 156,810 156,810 Variable 7/01/20 0.001 NR 35.86%
Stable Value Funds 17,150 17,150 Variable 7/01/20 0.000 AA 3.92%
437,319$ 425,919$ 0.924 100.00%
With External OCERS
Restricted Investments (3) 370,228$
(2)
(2)
(2)
(4)
(4)
(4)
(1) The County obtains credit ratings from S&P, Moody's, and Fitch. The ratings indicative of the greatest degree of risk have been disclosed. NR
means not rated. The County is not required to disclose the credit ratings of obligations of the U.S. government or obligations explicitly guaranteed by the U.S. government, and the ratings for U.S. Treasuries are not disclosed.
(2) Portfolio weighted average maturity (3) The Retiree Medical Trust Reports $370,228 of restricted investments with OCERS as of plan year 12/31/19, refer to Note 19. For more information regarding investments with OCERS, refer to their most recently issued financial statements available at https://www.ocers.org/financial-reports. (4) Interest Rate Range for OCIF and Specific Investments are purchase yield rates and for Restricted Investments with Trustees are coupon rates.
___________________________________________________________________________________________
___________________________________________________________________________________________
County of Orange Comprehensive Annual Financial Report For the Year Ended June 30, 2020 (Dollar Amounts in Thousands)
89
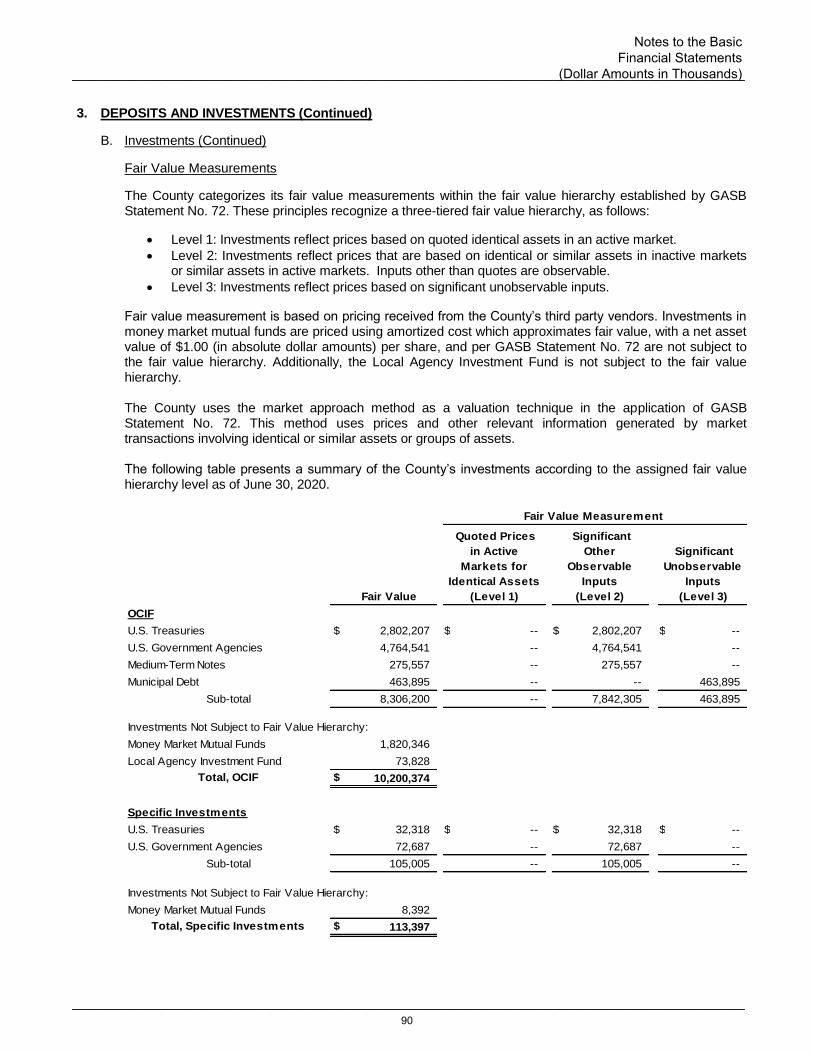
3. DEPOSITS AND INVESTMENTS (Continued)
B. Investments (Continued)
Fair Value Measurements
The County categorizes its fair value measurements within the fair value hierarchy established by GASB Statement No. 72. These principles recognize a three-tiered fair value hierarchy, as follows:
• Level 1: Investments reflect prices based on quoted identical assets in an active market.
• Level 2: Investments reflect prices that are based on identical or similar assets in inactive markets or similar assets in active markets. Inputs other than quotes are observable.
• Level 3: Investments reflect prices based on significant unobservable inputs.
Fair value measurement is based on pricing received from the County’s third party vendors. Investments in money market mutual funds are priced using amortized cost which approximates fair value, with a net asset value of $1.00 (in absolute dollar amounts) per share, and per GASB Statement No. 72 are not subject to the fair value hierarchy. Additionally, the Local Agency Investment Fund is not subject to the fair value hierarchy. The County uses the market approach method as a valuation technique in the application of GASB Statement No. 72. This method uses prices and other relevant information generated by market transactions involving identical or similar assets or groups of assets. The following table presents a summary of the County’s investments according to the assigned fair value hierarchy level as of June 30, 2020.
Fair Value
OCIF
U.S. Treasuries $ 2,802,207 $ -- $ 2,802,207 $ --
U.S. Government Agencies 4,764,541 -- 4,764,541 --
Medium-Term Notes 275,557 -- 275,557 --
Municipal Debt 463,895 -- -- 463,895
Sub-total 8,306,200 -- 7,842,305 463,895
Investments Not Subject to Fair Value Hierarchy:
Money Market Mutual Funds 1,820,346
Local Agency Investment Fund 73,828
Total, OCIF $ 10,200,374
Specific Investments
U.S. Treasuries $ 32,318 $ -- $ 32,318 $ --
U.S. Government Agencies 72,687 -- 72,687 --
Sub-total 105,005 -- 105,005 --
Investments Not Subject to Fair Value Hierarchy:
Money Market Mutual Funds 8,392
Total, Specific Investments $ 113,397
Fair Value Measurement
Quoted Prices
in Active
Markets for
Identical Assets
(Level 1)
Significant
Other
Observable
Inputs
(Level 2)
Significant
Unobservable
Inputs
(Level 3)
___________________________________________________________________________________________
___________________________________________________________________________________________
Notes to the Basic Financial Statements
(Dollar Amounts in Thousands)
90
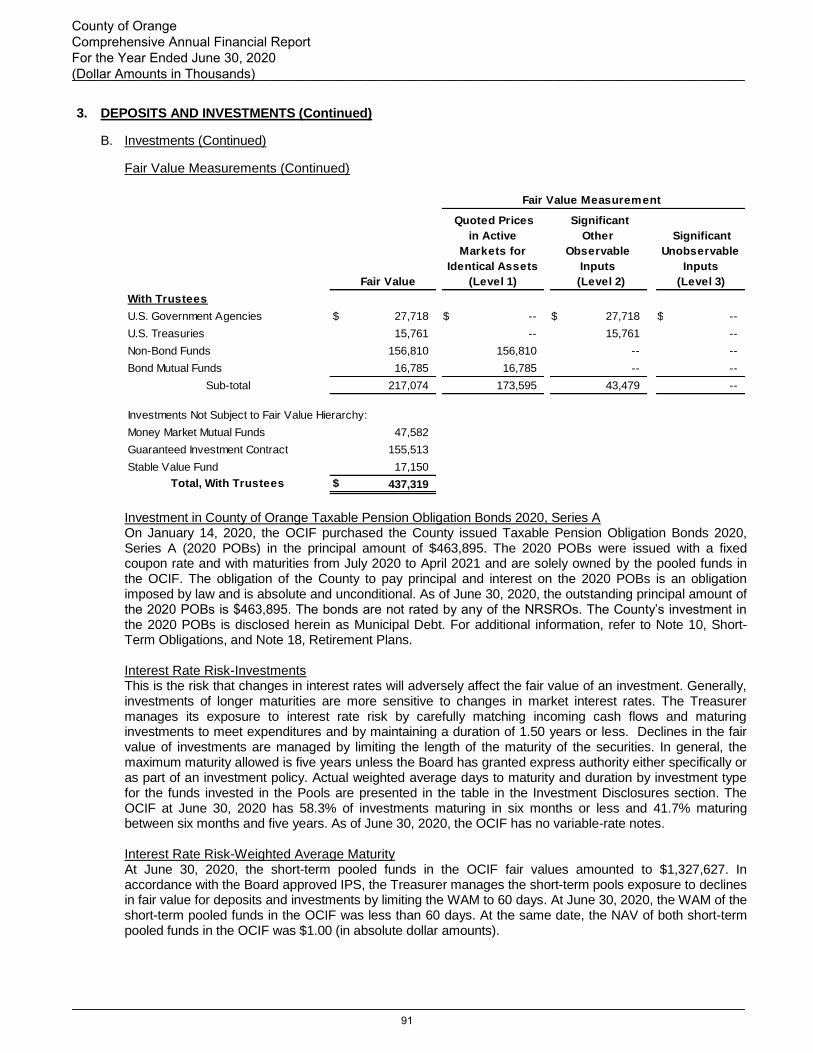
3. DEPOSITS AND INVESTMENTS (Continued)
B. Investments (Continued)
Fair Value Measurements (Continued)
Fair Value
With Trustees
U.S. Government Agencies $ 27,718 $ -- $ 27,718 $ --
U.S. Treasuries 15,761 -- 15,761 --
Non-Bond Funds 156,810 156,810 -- --
Bond Mutual Funds 16,785 16,785 -- --
Sub-total 217,074 173,595 43,479 --
Investments Not Subject to Fair Value Hierarchy:
Money Market Mutual Funds 47,582
Guaranteed Investment Contract 155,513
Stable Value Fund 17,150
Total, With Trustees $ 437,319
Quoted Prices
in Active
Markets for
Identical Assets
(Level 1)
Significant
Other
Observable
Inputs
(Level 2)
Significant
Unobservable
Inputs
(Level 3)
Fair Value Measurement
Investment in County of Orange Taxable Pension Obligation Bonds 2020, Series A On January 14, 2020, the OCIF purchased the County issued Taxable Pension Obligation Bonds 2020, Series A (2020 POBs) in the principal amount of $463,895. The 2020 POBs were issued with a fixed coupon rate and with maturities from July 2020 to April 2021 and are solely owned by the pooled funds in the OCIF. The obligation of the County to pay principal and interest on the 2020 POBs is an obligation imposed by law and is absolute and unconditional. As of June 30, 2020, the outstanding principal amount of the 2020 POBs is $463,895. The bonds are not rated by any of the NRSROs. The County’s investment in the 2020 POBs is disclosed herein as Municipal Debt. For additional information, refer to Note 10, Short-Term Obligations, and Note 18, Retirement Plans. Interest Rate Risk-Investments This is the risk that changes in interest rates will adversely affect the fair value of an investment. Generally, investments of longer maturities are more sensitive to changes in market interest rates. The Treasurer manages its exposure to interest rate risk by carefully matching incoming cash flows and maturing investments to meet expenditures and by maintaining a duration of 1.50 years or less. Declines in the fair value of investments are managed by limiting the length of the maturity of the securities. In general, the maximum maturity allowed is five years unless the Board has granted express authority either specifically or as part of an investment policy. Actual weighted average days to maturity and duration by investment type for the funds invested in the Pools are presented in the table in the Investment Disclosures section. The OCIF at June 30, 2020 has 58.3% of investments maturing in six months or less and 41.7% maturing between six months and five years. As of June 30, 2020, the OCIF has no variable-rate notes. Interest Rate Risk-Weighted Average Maturity At June 30, 2020, the short-term pooled funds in the OCIF fair values amounted to $1,327,627. In accordance with the Board approved IPS, the Treasurer manages the short-term pools exposure to declines in fair value for deposits and investments by limiting the WAM to 60 days. At June 30, 2020, the WAM of the short-term pooled funds in the OCIF was less than 60 days. At the same date, the NAV of both short-term pooled funds in the OCIF was $1.00 (in absolute dollar amounts).
___________________________________________________________________________________________
___________________________________________________________________________________________
County of Orange Comprehensive Annual Financial Report For the Year Ended June 30, 2020 (Dollar Amounts in Thousands)
91

3. DEPOSITS AND INVESTMENTS (Continued)
B. Investments (Continued)
Interest Rate Risk-Duration At June 30, 2020, the long-term pooled funds in the OCIF investment fair value amounted to $8,872,747. In accordance with the Board-approved IPS, the Treasurer manages investment related risk for deposits and investments by limiting duration pooled funds to a maximum of 1.50 years.
As of June 30, 2020, the long-term pooled funds in the OCIF had the following duration by investment type:
Investment Type Fair Value Portfolio %
Duration
(In Years)
U.S. Treasuries 1,975,978$ 22.27% 0.46
U.S. Government Agencies 4,498,436 50.70% 1.40
Medium-Term Notes 275,557 3.11% 0.59
Municipal Debt 463,895 5.23% 0.45
Local Agency Investment Fund 73,828 0.83% 0.00
Money Market Mutual Funds 1,585,053 17.86% 0.00
Total Fair Value 8,872,747$
Portfolio Duration 0.85
Custodial Credit Risk For an investment, custodial credit risk is the risk that in the event of the failure of the counterparty, the County will not be able to recover the value of its investments or collateral securities that are in possession of an outside party. The IPS does not permit investments in uninsured and unregistered securities not held by the County. The Treasurer utilizes third party Delivery Versus Payment (DVP) which mitigates any custodial credit risk. Securities purchased by the Treasurer are held by third party custodians in their trust department to mitigate custodial credit risk. At year-end, in accordance with the IPS, the County’s pooled funds and specific investments did not have any securities exposed to custodial credit risk, and the Treasurer did not have any securities lending during the year (or at year-end).
Credit Risk-Investments This is the risk that an issuer or other counterparty to an investment may not fulfill its obligations. The IPS sets forth the minimum acceptable credit ratings for investments from at least two of the following NRSROs: S&P, Moody’s, or Fitch. For purchases of short-term debt, the issuer rating must be no less than A-1 or SP-1 (S&P), P-1 or MIG 1/VMIG 1 (Moody’s), or F1 (Fitch) for purchases with remaining maturities less than 397 days, while purchases of long-term debt shall have issuer ratings no less than “AA” for purchases with remaining maturities longer than 397 days. Municipal debt issued by the County is exempt from the above credit rating requirements. As of June 30, 2020, the OCIF investments were in compliance with the IPS limits when purchased.
Concentration of Credit Risk This is the risk of loss attributed to the magnitude of a government’s investment in a single issuer. As of June 30, 2020, all OCIF investments were in compliance with state law and the IPS single issuer limits. See the County’s investments table for concentrations of holdings. The following holdings in OCIF pooled funds exceeded five percent of the portfolio at June 30, 2020.
Investment Type Issuer Fair Value Portfolio %
U.S. Government Agencies Federal Home Loan Bank (FHLB) 2,034,977$ 20.0%
Federal Farm Credit Bank (FFCB) 1,709,804 16.8%
Federal National Mortgage Association (FNMA) 595,470 5.8%
___________________________________________________________________________________________
___________________________________________________________________________________________
Notes to the Basic Financial Statements
(Dollar Amounts in Thousands)
92

3. DEPOSITS AND INVESTMENTS (Continued)
B. Investments (Continued) Foreign Currency Risk The IPS requires all securities to be U.S. dollar denominated. The County investments are not exposed to foreign currency risk.
Condensed Financial Statements In lieu of separately issued financial statements for the entire pools and the external portion of the pools, condensed financial statements for the OCIF are presented below as of and for the year ended June 30, 2020:
OCIF
Statement of Net Position
OCIP OCEIP Total
Net Position Held for Pool Participants $ 5,024,746 $ 5,220,045 $ 10,244,791
Equity of Internal Pool Participants $ 4,483,689 $ -- $ 4,483,689
Equity of External Pool Participants 495,971 5,176,983 5,672,954
Undistributed and Unrealized Gain 45,086 43,062 88,148
Total Net Position $ 5,024,746 $ 5,220,045 $ 10,244,791
Statement of Changes in Net Position
Net Position at July 1, 2019 $ 4,260,219 $ 5,623,638 $ 9,883,857
Net Changes in Investments by Pool
Participants 764,527 (403,593) 360,934
Net Position at June 30, 2020 $ 5,024,746 $ 5,220,045 $ 10,244,791
External Pool Portion
Combining Statement of Fiduciary Net Position
Assets
Pooled Cash/Investments $ 494,928 $ 5,198,865 $ 5,693,793
Receivables
Interest/Dividends 1,152 21,375 22,527
Total Assets 496,080 5,220,240 5,716,320
Liabilities
Due to Other Governmental Agencies 109 195 304
Total Liabilities 109 195 304
Net Position
Restricted for Pool Participants 495,971 5,220,045 5,716,016
Total Net Position $ 495,971 $ 5,220,045 $ 5,716,016
OCIP OCEIP Total
___________________________________________________________________________________________
___________________________________________________________________________________________
County of Orange Comprehensive Annual Financial Report For the Year Ended June 30, 2020 (Dollar Amounts in Thousands)
93

3. DEPOSITS AND INVESTMENTS (Continued)
B. Investments (Continued) Condensed Financial Statements (Continued) Combining Statement of Changes in Fiduciary Net Position
Additions:
Contributions to Pooled Investments $ 666,901 $ 8,365,053 $ 9,031,954
Interest and Investment Income 8,628 129,485 138,113
Less: Investment Expense (192) (3,166) (3,358)
Total Additions 675,337 8,491,372 9,166,709
Deductions:
Distributions from Pooled Investments 626,645 8,894,965 9,521,610
Total Deductions 626,645 8,894,965 9,521,610
Change in Net Position Held in
Trust For External Investment Pool 48,692 (403,593) (354,901)
Net Position-Beginning of Year 447,279 5,623,638 6,070,917
Net Position-End of Year $ 495,971 $ 5,220,045 $ 5,716,016
OCIP OCEIP Total
C. Restricted Deposits and Investments with Trustees
All monies for restricted investments held by trustees are invested in “permitted investments” as defined in the various trust agreements. Restricted deposits with trustees are insured by FDIC up to $250 and the excess amounts are collateralized.
D. Restricted Investments with OCERS OCERS may invest, in accordance with state statutes, in any form or type of investment deemed prudent by the Board of Retirement. Pension and 401(h) health care plan assets are restricted for the exclusive purposes of providing benefits to plan participants and defraying reasonable expenses of administering the plans. The Board of Retirement may invest, or delegate the authority to invest, the assets of the funds through the purchase, holding, or sale of any form or type of investment, financial instrument, or financial transaction. For additional information, refer to Note 19, Postemployment Health Care Benefits. For more information regarding investments with OCERS, refer to their most recently issued financial statements available online at www.ocers.org, in writing to the Orange County Employees Retirement System, 2223 East Wellington Avenue, Suite 100, Santa Ana, CA 92701, or by calling (714) 558-6200.
___________________________________________________________________________________________
___________________________________________________________________________________________
Notes to the Basic Financial Statements
(Dollar Amounts in Thousands)
94
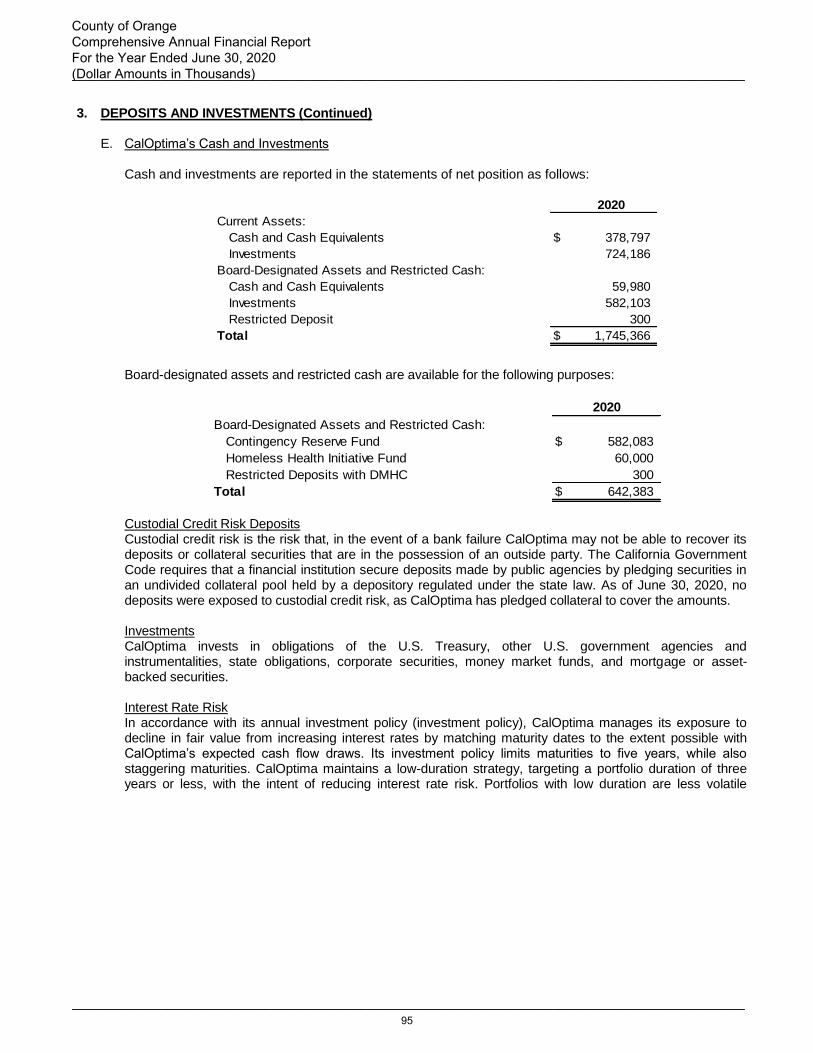
3. DEPOSITS AND INVESTMENTS (Continued)
E. CalOptima’s Cash and Investments Cash and investments are reported in the statements of net position as follows:
2020
Current Assets:
Cash and Cash Equivalents $ 378,797
Investments 724,186
Board-Designated Assets and Restricted Cash:
Cash and Cash Equivalents 59,980
Investments 582,103
Restricted Deposit 300
Total $ 1,745,366
Board-designated assets and restricted cash are available for the following purposes:
Board-Designated Assets and Restricted Cash:
Contingency Reserve Fund $ 582,083
Homeless Health Initiative Fund 60,000
Restricted Deposits with DMHC 300
Total $ 642,383
2020
Custodial Credit Risk Deposits Custodial credit risk is the risk that, in the event of a bank failure CalOptima may not be able to recover its deposits or collateral securities that are in the possession of an outside party. The California Government Code requires that a financial institution secure deposits made by public agencies by pledging securities in an undivided collateral pool held by a depository regulated under the state law. As of June 30, 2020, no deposits were exposed to custodial credit risk, as CalOptima has pledged collateral to cover the amounts. Investments CalOptima invests in obligations of the U.S. Treasury, other U.S. government agencies and instrumentalities, state obligations, corporate securities, money market funds, and mortgage or asset-backed securities. Interest Rate Risk In accordance with its annual investment policy (investment policy), CalOptima manages its exposure to decline in fair value from increasing interest rates by matching maturity dates to the extent possible with CalOptima’s expected cash flow draws. Its investment policy limits maturities to five years, while also staggering maturities. CalOptima maintains a low-duration strategy, targeting a portfolio duration of three years or less, with the intent of reducing interest rate risk. Portfolios with low duration are less volatile
___________________________________________________________________________________________
___________________________________________________________________________________________
County of Orange Comprehensive Annual Financial Report For the Year Ended June 30, 2020 (Dollar Amounts in Thousands)
95
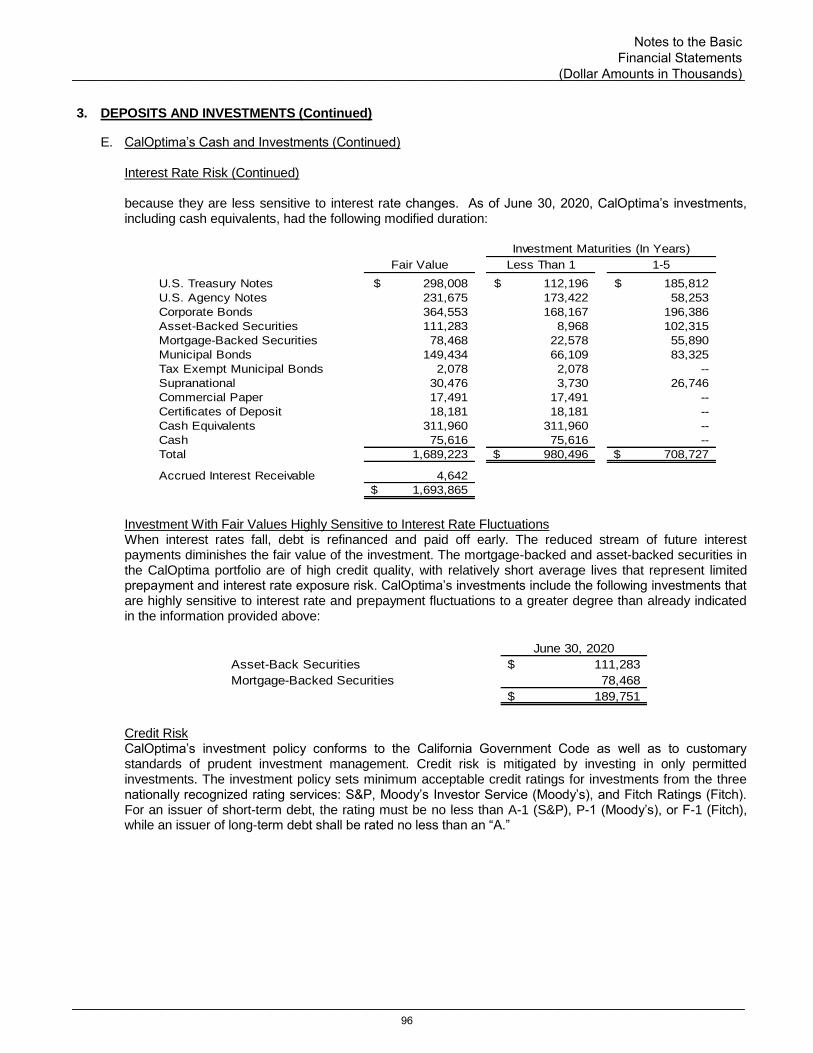
3. DEPOSITS AND INVESTMENTS (Continued)
E. CalOptima’s Cash and Investments (Continued) Interest Rate Risk (Continued) because they are less sensitive to interest rate changes. As of June 30, 2020, CalOptima’s investments, including cash equivalents, had the following modified duration:
Fair Value Less Than 1 1-5
U.S. Treasury Notes 298,008$ 112,196$ 185,812$
U.S. Agency Notes 231,675 173,422 58,253
Corporate Bonds 364,553 168,167 196,386
Asset-Backed Securities 111,283 8,968 102,315
Mortgage-Backed Securities 78,468 22,578 55,890
Municipal Bonds 149,434 66,109 83,325
Tax Exempt Municipal Bonds 2,078 2,078 --
Supranational 30,476 3,730 26,746
Commercial Paper 17,491 17,491 --
Certificates of Deposit 18,181 18,181 --
Cash Equivalents 311,960 311,960 --
Cash 75,616 75,616 --
Total 1,689,223 980,496$ 708,727$
Accrued Interest Receivable 4,642
1,693,865$
Investment Maturities (In Years)
Investment With Fair Values Highly Sensitive to Interest Rate Fluctuations When interest rates fall, debt is refinanced and paid off early. The reduced stream of future interest payments diminishes the fair value of the investment. The mortgage-backed and asset-backed securities in the CalOptima portfolio are of high credit quality, with relatively short average lives that represent limited prepayment and interest rate exposure risk. CalOptima’s investments include the following investments that are highly sensitive to interest rate and prepayment fluctuations to a greater degree than already indicated in the information provided above:
June 30, 2020
Asset-Back Securities 111,283$
Mortgage-Backed Securities 78,468
189,751$
Credit Risk CalOptima’s investment policy conforms to the California Government Code as well as to customary standards of prudent investment management. Credit risk is mitigated by investing in only permitted investments. The investment policy sets minimum acceptable credit ratings for investments from the three nationally recognized rating services: S&P, Moody’s Investor Service (Moody’s), and Fitch Ratings (Fitch). For an issuer of short-term debt, the rating must be no less than A-1 (S&P), P-1 (Moody’s), or F-1 (Fitch), while an issuer of long-term debt shall be rated no less than an “A.”
___________________________________________________________________________________________
___________________________________________________________________________________________
Notes to the Basic Financial Statements
(Dollar Amounts in Thousands)
96

3. DEPOSITS AND INVESTMENTS (Continued)
E. CalOptima’s Cash and Investments (Continued) Credit Risk (Continued)
As of June 30, 2020, following are the credit ratings of investments and cash equivalents:
Minimum Exempt
Fair Legal From
Investment Type Value Rating Disclosure AAA Aa & Aa+ Aa- A+ A A-
U.S. Treasury Notes $ 490,315 N/A $ 490,315 $ -- $ -- $ -- $ -- $ -- $ --
U.S. Agency Notes 263,977 N/A 263,977 -- -- -- -- -- --
Corporate Bonds 322,970 A- -- 1,021 24,280 32,942 70,325 135,118 59,284
Floating-Rate Note Securities 78,471 A- -- 45,454 3,602 4,991 10,641 12,195 1,588
Asset-Backed Securities 93,580 AAA -- 92,987 593 -- -- -- --
Mortgage-Backed Securities 85,145 AAA -- 85,145 -- -- -- -- --
Municipal Bonds 164,025 A -- 23,392 81,908 38,646 12,600 5,977 1,502
Supranational 10,110 AAA -- 10,110 -- -- -- -- --
Certificates of Deposit 29,600 A1/P1 -- 29,600 -- -- -- -- --
Commercial Paper 70,079 A1/P1 -- 70,079 -- -- -- -- --
Money Market Mutual Funds 85,593 AAA -- 85,593 -- -- -- -- --
Total $ 1,693,865 $ 754,292 $ 443,381 $ 110,383 $ 76,579 $ 93,566 $ 153,290 $ 62,374
Rating as of Year-End
Concentration of Credit Risk
Concentration of credit risk is the risk of loss attributed to the magnitude of CalOptima’s investment in a single issuer. CalOptima’s investment policy limits to no more than 5% of the total fair value of investments in the securities of any one issuer, except for obligations of the U.S. government, U.S. government agencies, or government-sponsored enterprises, and no more than 10% may be invested in one money market mutual fund unless approved by the governing board. The investment policy also places a limit of 35% of the amount of investment holdings with any one government-sponsored issuer and 5% of all other issuers. As of June 30, 2020, all holdings complied with the foregoing limitations. The following holdings exceeded 5% of the portfolio as of June 30, 2020:
Percentage of Portfolio
Investment Type Issuer June 30, 2020
U.S. Treasury Notes United States Treasury 29.93
U.S. Agency Notes Federal Home Loan Bank 11.24
Fair Value Measurements
CalOptima categorizes its fair value investments within the fair value hierarchy established by U.S. GAAP. The hierarchy for fair value measurements is based upon the transparency of inputs to the valuation of an asset or liability as of the measurement date.
• Level 1: Quoted prices in active markets for identical assets or liabilities.
• Level 2: Inputs other than quoted prices included within Level 1 that are observable for an asset or liability, either directly or indirectly.
• Level 3: Significant unobservable inputs. The following is a description of the valuation methodologies used for instruments at fair value on a recurring basis and recognized in CalOptima’s consolidated statements of net position, as well as the general classification of such instruments pursuant to the valuation hierarchy.
___________________________________________________________________________________________
___________________________________________________________________________________________
County of Orange Comprehensive Annual Financial Report For the Year Ended June 30, 2020 (Dollar Amounts in Thousands)
97

3. DEPOSITS AND INVESTMENTS (Continued)
E. CalOptima’s Cash and Investments (Continued)
Marketable Securities: Where quoted market prices are available in an active market, securities are classified within Level 1 of the valuation hierarchy. If quoted market prices are not available, then fair values are estimated by using pricing models, quoted prices of securities with similar characteristics, or discounted cash flows. These securities are classified within Level 2 of the valuation hierarchy. In certain cases where Level 1 or Level 2 inputs are not available, securities are classified within Level 3 of the hierarchy. The following table presents the fair value measurements of assets recognized in CalOptima’s consolidated statements of net position measured at fair value on a recurring basis and the level within the fair value hierarchy in which the fair value measurements fall:
Level 1 Level 2 Level 3 Total
U.S. Treasury Notes 298,008$ --$ --$ 298,008$
U.S. Agency Notes -- 231,675 -- 231,675
Corporate Bonds -- 364,553 -- 364,553
Asset-Backed Securities -- 111,283 -- 111,283
Mortgage-Backed Securities -- 78,468 -- 78,468
Municipal Bonds -- 149,434 -- 149,434
Tax Exempt Municipal Bonds -- 2,078 2,078
Supranational -- 30,476 -- 30,476
Commercial Paper -- 17,491 -- 17,491
Certificates of Deposits -- 18,181 -- 18,181
298,008$ 1,003,639$ --$ 1,301,647$
Investment Assets at Fair Value as of June 30, 2020
___________________________________________________________________________________________
___________________________________________________________________________________________
Notes to the Basic Financial Statements
(Dollar Amounts in Thousands)
98
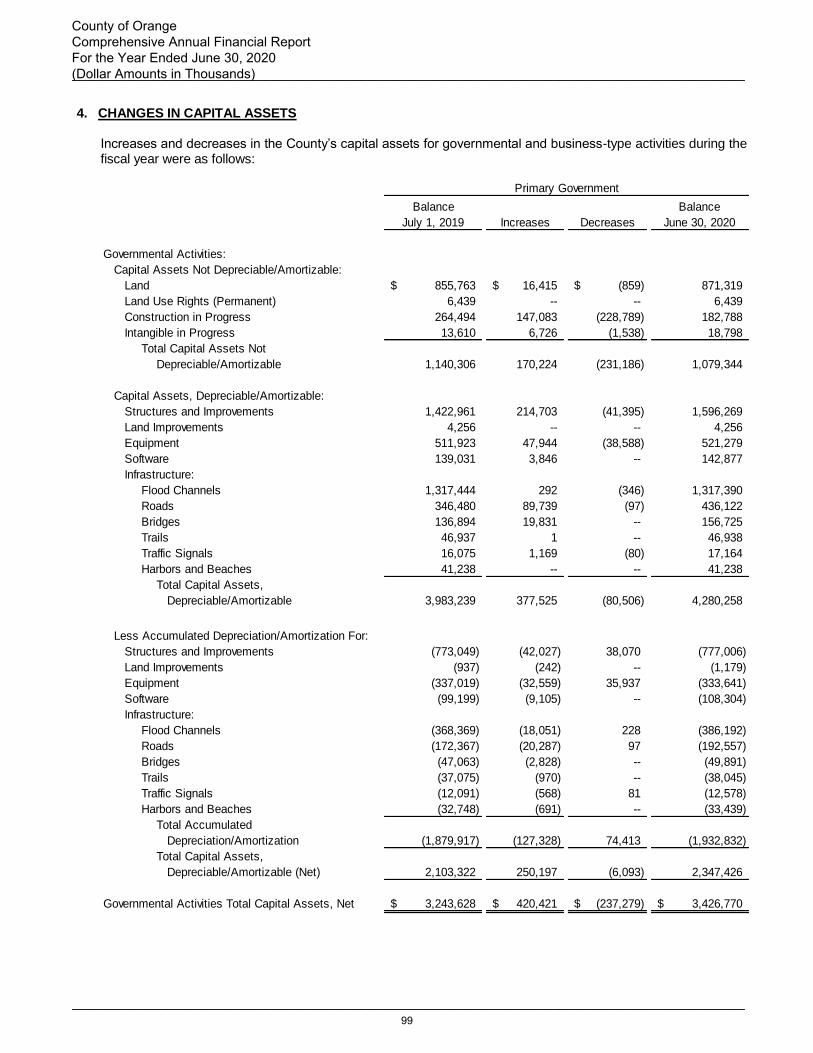
4. CHANGES IN CAPITAL ASSETS Increases and decreases in the County’s capital assets for governmental and business-type activities during the fiscal year were as follows:
Balance
July 1, 2019 Increases Decreases
Balance
June 30, 2020
Governmental Activities:
Capital Assets Not Depreciable/Amortizable:
Land 855,763$ 16,415$ (859)$ 871,319
Land Use Rights (Permanent) 6,439 -- -- 6,439
Construction in Progress 264,494 147,083 (228,789) 182,788
Intangible in Progress 13,610 6,726 (1,538) 18,798
Total Capital Assets Not
Depreciable/Amortizable 1,140,306 170,224 (231,186) 1,079,344
Capital Assets, Depreciable/Amortizable:
Structures and Improvements 1,422,961 214,703 (41,395) 1,596,269
Land Improvements 4,256 -- -- 4,256
Equipment 511,923 47,944 (38,588) 521,279
Software 139,031 3,846 -- 142,877
Infrastructure:
Flood Channels 1,317,444 292 (346) 1,317,390
Roads 346,480 89,739 (97) 436,122
Bridges 136,894 19,831 -- 156,725
Trails 46,937 1 -- 46,938
Traffic Signals 16,075 1,169 (80) 17,164
Harbors and Beaches 41,238 -- -- 41,238
Total Capital Assets,
Depreciable/Amortizable 3,983,239 377,525 (80,506) 4,280,258
Less Accumulated Depreciation/Amortization For:
Structures and Improvements (773,049) (42,027) 38,070 (777,006)
Land Improvements (937) (242) -- (1,179)
Equipment (337,019) (32,559) 35,937 (333,641)
Software (99,199) (9,105) -- (108,304)
Infrastructure:
Flood Channels (368,369) (18,051) 228 (386,192)
Roads (172,367) (20,287) 97 (192,557)
Bridges (47,063) (2,828) -- (49,891)
Trails (37,075) (970) -- (38,045)
Traffic Signals (12,091) (568) 81 (12,578)
Harbors and Beaches (32,748) (691) -- (33,439)
Total Accumulated
Depreciation/Amortization (1,879,917) (127,328) 74,413 (1,932,832)
Total Capital Assets,
Depreciable/Amortizable (Net) 2,103,322 250,197 (6,093) 2,347,426
Governmental Activities Total Capital Assets, Net 3,243,628$ 420,421$ (237,279)$ 3,426,770$
Primary Government
___________________________________________________________________________________________
___________________________________________________________________________________________
County of Orange Comprehensive Annual Financial Report For the Year Ended June 30, 2020 (Dollar Amounts in Thousands)
99
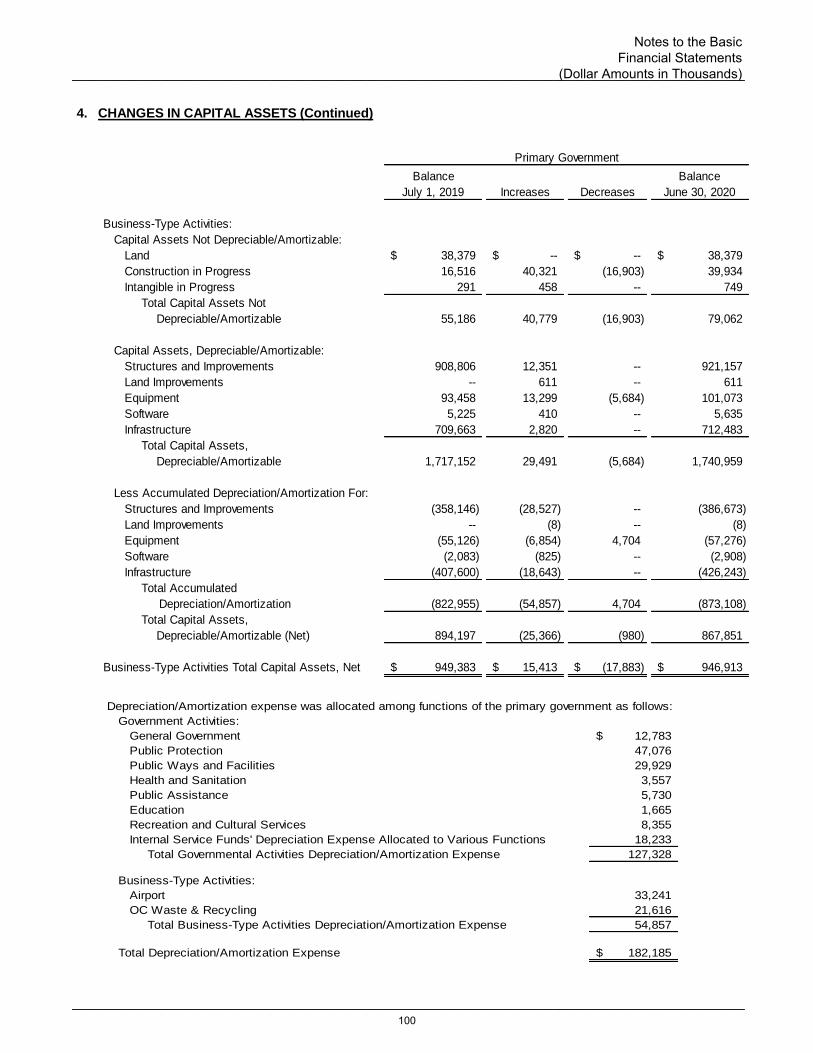
4. CHANGES IN CAPITAL ASSETS (Continued)
Balance
July 1, 2019 Increases Decreases
Balance
June 30, 2020
Business-Type Activities:
Capital Assets Not Depreciable/Amortizable:
Land 38,379$ --$ --$ 38,379$
Construction in Progress 16,516 40,321 (16,903) 39,934
Intangible in Progress 291 458 -- 749
Total Capital Assets Not
Depreciable/Amortizable 55,186 40,779 (16,903) 79,062
Capital Assets, Depreciable/Amortizable:
Structures and Improvements 908,806 12,351 -- 921,157
Land Improvements -- 611 -- 611
Equipment 93,458 13,299 (5,684) 101,073
Software 5,225 410 -- 5,635
Infrastructure 709,663 2,820 -- 712,483
Total Capital Assets,
Depreciable/Amortizable 1,717,152 29,491 (5,684) 1,740,959
Less Accumulated Depreciation/Amortization For:
Structures and Improvements (358,146) (28,527) -- (386,673)
Land Improvements -- (8) -- (8)
Equipment (55,126) (6,854) 4,704 (57,276)
Software (2,083) (825) -- (2,908)
Infrastructure (407,600) (18,643) -- (426,243)
Total Accumulated
Depreciation/Amortization (822,955) (54,857) 4,704 (873,108)
Total Capital Assets,
Depreciable/Amortizable (Net) 894,197 (25,366) (980) 867,851
Business-Type Activities Total Capital Assets, Net 949,383$ 15,413$ (17,883)$ 946,913$
Primary Government
Depreciation/Amortization expense was allocated among functions of the primary government as follows:
Government Activities:
General Government 12,783$
Public Protection 47,076
Public Ways and Facilities 29,929
Health and Sanitation 3,557
Public Assistance 5,730
Education 1,665
Recreation and Cultural Services 8,355
Internal Service Funds' Depreciation Expense Allocated to Various Functions 18,233
Total Governmental Activities Depreciation/Amortization Expense 127,328
Business-Type Activities:
Airport 33,241
OC Waste & Recycling 21,616
Total Business-Type Activities Depreciation/Amortization Expense 54,857
Total Depreciation/Amortization Expense 182,185$
___________________________________________________________________________________________
___________________________________________________________________________________________
Notes to the Basic Financial Statements
(Dollar Amounts in Thousands)
100

5. SERVICE CONCESSION ARRANGEMENTS
GASB Statement No. 60, “Accounting and Financial Reporting for Service Concession Arrangements” (SCA) (GASB Statement No. 60) defines the required criteria for which a public-private or public-public partnership arrangement qualifies as a SCA:
• The transferor must convey to the operator both the right and obligation to use one of its capital assets to provide services to the public
• The operator must provide significant consideration to the transferor
• The operator must be compensated from fees that it collects from third parties
• The transferor must either determine what services are provided to whom, and at what rate or price
• The transferor must retain a significant residual interest in the service utility of the facility
The County determined that the Dana Point Harbor arrangements met the criteria set forth in GASB Statement No. 60 (where the County is the transferor), and therefore included this SCA in the County’s financial statements. The Dana Point Harbor is held in trust by the County in accordance with the State Tidelands Grant. Pursuant to the State Tidelands Grant, the County must administer the use of the tidelands and submerged lands in a manner consistent with the tidelands trust and all applicable laws. This includes promoting the use of the harbor for navigation, fishing, public access, water-oriented recreations and the provision of coastal-dependent uses adjacent to the water in leasing or releasing of publicly owned land. Commercial uses, incidental to the above uses, are also allowed. In addition, the Dana Point Harbor is located entirely within the Coastal Zone and is subject to regulation under the Coastal Act. The Coastal Act was enacted to protect and enhance the coastal environment and to guide and regulate local planning within the Coastal Zone to assure conformity with the statewide goals and policies. For example, the Coastal Act provides that lower cost visitor and recreational facilities shall be protected, encouraged, and where feasible, provided. On October 29, 2018, the County entered into 66-year term lease agreements with Dana Point Harbor Partners, LLC (DPHP), and Dana Point Harbor Partners Drystack, LLC (DPHPD) to conduct due diligence regarding master lease and development of the Dana Point Harbor. The County must ensure that DPHP and DPHPD, as the Lessees, adhere to the tidelands trust and all applicable laws. The agreements include the reconstruction of the commercial core, the east and west marinas, two new hotels, and the rebuilding of docks. DPHP and DPHPD will fund and build the improvements, and then operate those portions of the harbor on a 66-year lease. DPHP and DPHPD are required to assume full responsibility for operation and maintenance of their lease premises, and make minimum rent payments to the County, in accordance with their respective agreements. Additionally, the agreements provide for the County to receive a percentage of the gross receipts generated from sales, subleases, or any activity permitted under the DPHP and DPHPD arrangements. After the leases end, the assets and improvements will be returned to the County. The current net book value of the Dana Point Harbor assets associated with these agreements is $809, and it is reported in the County’s government-wide financial statements. Under the terms of the agreement with DPHPD, the County is required to reimburse the Lessee for applicable redevelopment costs. The present value of this obligation, $18,574, is reported as part of the accounts payable liability in the government-wide financial statements.
As of June 30, 2020, the present value of the minimum rent payments under the contracts is estimated to be $88,989, using a 2.5% discount rate. This amount is reported as a receivable in the government-wide financial statements. The total monthly minimum rent payments received in FY 2019-20 was $1,132. In addition, $70,418 is reported as deferred inflows of resources. As of June 30, 2020, the lease terms for Dana Point Harbor cover the remaining period of 64 years.
___________________________________________________________________________________________
___________________________________________________________________________________________
County of Orange Comprehensive Annual Financial Report For the Year Ended June 30, 2020 (Dollar Amounts in Thousands)
101

6. RECEIVABLES
GASB Statement No. 38, “Certain Financial Statement Note Disclosures,” requires identification of receivable balances not expected to be collected within one year. The details of the receivables reported in the government-wide Statement of Net Position that are not expected to be collected within the next fiscal year are identified below:
Accounts Receivable
Accounts Receivable had a balance of $42,088 as of June 30, 2020. Of this amount, $1,968 is not expected to be collected within the next fiscal year. This primarily consists of $1,658 for animal care delinquent invoices and $256 of expected recoveries from the Airport’s multi-year fixed-base operator lessee for pollution remediation costs.
Deposits Receivable
Deposits Receivable had a balance of $12,541 as of June 30, 2020. Of this amount, $12,287 is not expected to be collected within the next fiscal year. This primarily consists of $11,397 which is not expected to be collected within the next fiscal year for deposits held in condemnation proceedings related to real property acquired through eminent domain, $417 in deposits with the U.S. Army Corps of Engineers for regulatory permitting process on various maintenance projects and a $400 deposit required by the vendor per agreement with HCA. Leases Receivable
Leases Receivable had a balance of $88,989 as of June 30, 2020. Of this amount, $87,571 is not expected to be received within the next fiscal year. This represents the receivable for a 66-year term lease agreement for the renovation and operation of the Dana Point Harbor.
Due from Other Governmental Agencies
Due from Other Governmental Agencies had a balance of $401,636 as of June 30, 2020. Of this amount, $14,856 is not expected to be received within the next fiscal year, which primarily consists of $5,406 owed by the State of California to the County for various mandated cost reimbursements for programs and services the State requires the County to provide. $7,973 is for reimbursement claims for various healthcare programs and $1,161 is for expected reimbursement of the Santa Ana River Subvention claims that will be submitted to the State Department of Water Resources.
Notes Receivable
Notes Receivable had a balance of $26,097 as of June 30, 2020. Of this amount, $25,729 is not expected to be received within the next fiscal year. This primarily consists of $23,090 for loans made to developers to build affordable, low to moderate income, and senior housing. In addition, $2,030 is for housing loans for MHSA programs and $560 is for loans provided to first time home buyers.
7. INTERFUND RECEIVABLES AND PAYABLES
Interfund receivables and payables may result from services rendered by one fund to another fund, or from interfund loans. “Due from” and “due to” balances are generally used to reflect short-term interfund receivables and payables whereas “advance from” and “advance to” balances are long-term.
___________________________________________________________________________________________
___________________________________________________________________________________________
Notes to the Basic Financial Statements
(Dollar Amounts in Thousands)
102
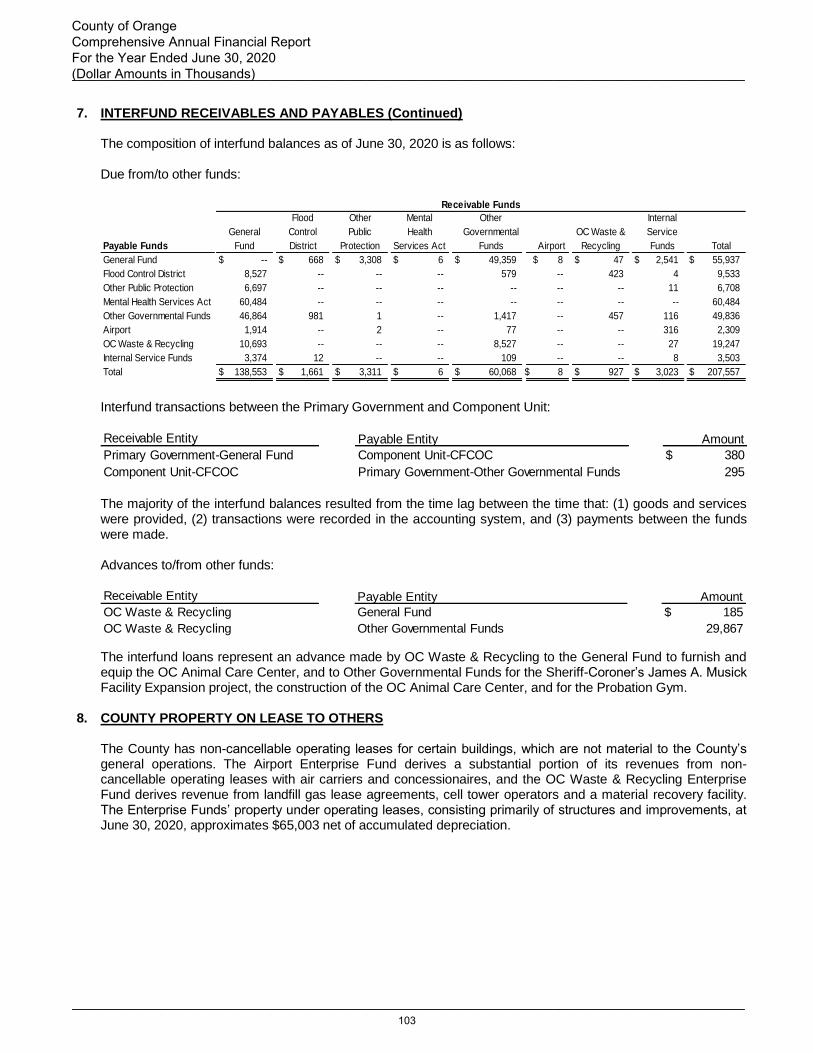
7. INTERFUND RECEIVABLES AND PAYABLES (Continued)
The composition of interfund balances as of June 30, 2020 is as follows: Due from/to other funds:
Payable Funds
Other
Governmental
Funds Airport
Internal
Service
Funds Total
General Fund $ -- $ 668 $ 3,308 $ 6 $ 49,359 $ 8 $ 47 $ 2,541 $ 55,937
Flood Control District 8,527 -- -- -- 579 -- 423 4 9,533
Other Public Protection 6,697 -- -- -- -- -- -- 11 6,708
Mental Health Services Act 60,484 -- -- -- -- -- -- -- 60,484
Other Governmental Funds 46,864 981 1 -- 1,417 -- 457 116 49,836
Airport 1,914 -- 2 -- 77 -- -- 316 2,309
OC Waste & Recycling 10,693 -- -- -- 8,527 -- -- 27 19,247
Internal Service Funds 3,374 12 -- -- 109 -- -- 8 3,503
Total $ 138,553 $ 1,661 $ 3,311 $ 6 $ 60,068 $ 8 $ 927 $ 3,023 $ 207,557
Receivable Funds
General
Fund
Flood
Control
District
Other
Public
Protection
Mental
Health
Services Act
OC Waste &
Recycling
Interfund transactions between the Primary Government and Component Unit:
Receivable Entity Payable Entity Amount
Primary Government-General Fund Component Unit-CFCOC $ 380
Component Unit-CFCOC Primary Government-Other Governmental Funds 295
The majority of the interfund balances resulted from the time lag between the time that: (1) goods and services were provided, (2) transactions were recorded in the accounting system, and (3) payments between the funds were made. Advances to/from other funds: Receivable Entity Payable Entity Amount
OC Waste & Recycling General Fund $ 185
OC Waste & Recycling Other Governmental Funds 29,867
The interfund loans represent an advance made by OC Waste & Recycling to the General Fund to furnish and equip the OC Animal Care Center, and to Other Governmental Funds for the Sheriff-Coroner’s James A. Musick Facility Expansion project, the construction of the OC Animal Care Center, and for the Probation Gym.
8. COUNTY PROPERTY ON LEASE TO OTHERS
The County has non-cancellable operating leases for certain buildings, which are not material to the County’s general operations. The Airport Enterprise Fund derives a substantial portion of its revenues from non-cancellable operating leases with air carriers and concessionaires, and the OC Waste & Recycling Enterprise Fund derives revenue from landfill gas lease agreements, cell tower operators and a material recovery facility. The Enterprise Funds’ property under operating leases, consisting primarily of structures and improvements, at June 30, 2020, approximates $65,003 net of accumulated depreciation.
___________________________________________________________________________________________
___________________________________________________________________________________________
County of Orange Comprehensive Annual Financial Report For the Year Ended June 30, 2020 (Dollar Amounts in Thousands)
103

8. COUNTY PROPERTY ON LEASE TO OTHERS (Continued) The County leases real property to others under operating lease agreements for recreational boating, retail, restaurants, and other commercial operations. Future minimum rentals to be received under these non-cancellable operating leases as of June 30, 2020 are as follows:
Fiscal Year Ending June 30
2021 $ 10,740 $ 44,310
2022 11,638 23,110
2023 9,099 19,998
2024 8,914 19,893
2025 8,614 20,165
49,005 127,476
2026-2030 37,144 86,107
2031-2035 33,812 15,957
2036-2040 25,779 --
2041-2045 6,325 --
2046-2050 3,833 --
2051-2055 3,832 --
2056-2060 3,878 --
2061-2065 3,929 --
2066-2070 4,003 --
2071-2075 4,051 --
2076-2080 2,725 --
129,311 102,064
Total future minimum rentals $ 178,316 $ 229,540
Governmental Activities Business-Type Activities
Total contingent rentals, which arise primarily from a percentage of lessee's gross revenues, amounted to approximately $27,561 (Enterprise Funds), $3,284 (Other Governmental Funds), $487 (Internal Service Funds) and $91 (Flood Control District) for the year ended June 30, 2020.
9. INTERFUND TRANSFERS
Interfund transfers for the year ended June 30, 2020 were as follows:
Transfer In Funds
Flood Other Other Internal
General Control Public Governmental OC Waste & Service
Transfer Out Funds Fund District Protection Funds Recycling Funds Total
General Fund $ -- $ -- $ 5,619 $ 164,717 $ -- $ 6,727 $ 177,063
Flood Control District 3,126 -- -- 1,467 -- 1,078 5,671
Other Public Protection 24,734 -- -- 336 -- 119 25,189
Mental Health Services Act 231,658 -- -- -- -- -- 231,658
Other Governmental Funds 145,496 946 -- 1,044 710 2,272 150,468
OC Waste & Recycling 9,612 -- -- 924 -- -- 10,536
Internal Service Funds 418 215 10 -- -- 65 708
Total $ 415,044 $ 1,161 $ 5,629 $ 168,488 $ 710 $ 10,261 $ 601,293
Interfund transfers reflect a flow of assets between funds and blended component units of the primary government without an equivalent flow of assets in return. Recurring transfers were made in the current fiscal year to: (1) relay cash/resources from contributing County funds to various debt service funds for the retirement of long-term obligations, (2) transfer Measure H Tobacco Settlement revenues and Public Safety
___________________________________________________________________________________________
___________________________________________________________________________________________
Notes to the Basic Financial Statements
(Dollar Amounts in Thousands)
104

9. INTERFUND TRANSFERS (Continued) Sales Tax (PSST) excess revenue in compliance with the specific statutory requirements, (3) provide resources for services provided within the County’s Wraparound Program, (4) contribute resources to comply with Proposition 63 MHSA, (5) transfer waste importation revenue in accordance to the Waste Disposal Agreement, and (6) transfer excess unrestricted revenues to finance various County programs based on budgetary authorizations by the Board. Not all-inclusive, the summary below details some of the more significant transfers: Recurring Transfers From General Fund
• $74,385 was transferred to Other Governmental Funds for various capital projects including, the Civic Center Facilities Master Plan and construction at the Be Well OC Hub and the Yale Transitional Center.
• $11,705 was transferred to Other Governmental Funds to reimburse expenditures for Sheriff-Coroner construction and facility development projects.
• $9,182 was transferred to Other Governmental Funds to finance the County’s 60% share of the Social Services Agency Wraparound Program.
• $7,024 was transferred to Other Governmental Funds for data systems development projects.
• $5,645 was transferred to Internal Service Funds primarily for the purchase of Sheriff-Coroner vehicles.
• $4,484 was transferred to Other Public Protection in connection with debt service payments for the Central Utility Facility debt issue.
• $3,000 was transferred to Other Governmental Funds for the maintenance and repair of various Probation Criminal Justice Facilities.
• $1,442 was transferred to Other Public Protection for the purchase, replacement, and maintenance of Sheriff-Coroner equipment.
From Flood Control District
• $3,126 was transferred to the General Fund for the Watershed Management Program.
• $1,078 was transferred to the Internal Service Funds for the purchase of OC Flood Vehicles.
From Other Public Protection
• $11,280 was transferred to the General Fund to support the Sheriff-Coroner Department’s operations.
• $4,696 was transferred to the General Fund for the reimbursement of various District Attorney programs, such as Proposition 64 Consumer Protection Fund, Real Estate Fraud, Orange County Auto Theft Task Force, and Supplemental Law Enforcement Services Fund.
• $3,834 was transferred to the General Fund for the reimbursement of qualifying Public Protection expenditures incurred by the Clerk-Recorder’s Office for specific charges mandated by state law that includes modernization of the County’s record keeping system, health statistics, micrographics, and security measures.
• $3,792 was transferred to the General Fund to cover the shortfall of state and federal appropriations over department expenditures in Child Support Services.
From Mental Health Services Act
• $231,658 was transferred to the General Fund for the reimbursement of qualifying Proposition 63 MHSA expenditures.
From Other Governmental Funds
• $56,748 was transferred to the General Fund for funding multi-year capital projects, including the Civic Center Master Plan and Be Well OC Hub construction.
• $37,634 was transferred to the General Fund for the reimbursement of various County programs as follows: - $18,760 for the Social Services Agency Wraparound Program - $6,947 for Emergency Medical Services
___________________________________________________________________________________________
___________________________________________________________________________________________
County of Orange Comprehensive Annual Financial Report For the Year Ended June 30, 2020 (Dollar Amounts in Thousands)
105

9. INTERFUND TRANSFERS (Continued)
Recurring Transfers (Continued)
- $6,375 for Homeless Emergency Aid Program and Crisis Stabilization Program. - $5,552 for health disaster preparedness and the Center for Disease Control pandemic flu costs.
• $29,324 of tobacco settlement monies was transferred to the General Fund to finance HCA’s various health care programs and Sheriff-Coroner Department’s operational costs.
• $5,340 was transferred to the General Fund for various information systems projects.
• $1,226 was transferred to the Internal Service Funds for the purchase of OC Parks vehicles.
From Enterprise Funds
• $9,612 was transferred to the General Fund for the County’s portion of OC Waste & Recycling’s net importation revenue.
In addition, the County had non-recurring transfers in the current fiscal year, which consisted of the following:
Non-Recurring Transfers
From General Fund
• $40,323 was transferred to Other Governmental Funds for development of permanent supportive housing.
• $12,700 was transferred to Other Governmental Funds for loan payments related to construction of OC Animal Shelter.
• $2,279 was transferred to Other Public Protection for Clerk-Recorder restricted fee revenue.
From Flood Control District
• $1,112 was transferred to Other Governmental Funds for reimbursement of County Administration South, Building 16 costs.
From Other Governmental Funds
• $9,230 was transferred to the General Fund for Sheriff-Coroner capital projects.
• $2,500 was transferred to the General Fund for the Yale Transitional Center expenses. 10. SHORT-TERM OBLIGATIONS
Taxable Pension Obligation Bonds, 2019 Series A On January 14, 2019, the County issued Taxable Pension Obligation Bonds, 2019 Series A (the 2019 POBs) in the principal amount of $402,182. The 2019 POBs were issued in order to take advantage of the discount offered by the OCERS Board of Retirement to prepay the County's FY 2019-20 pension contribution. The 2019 POBs were issued as standard bonds, with four fixed-rate tranches, and a final maturity date of April 30, 2020. The obligation of the County to pay principal and interest on the 2019 POBs is imposed by law and is absolute and unconditional. Pledged security for the bonds are any lawfully available funds of the County. If an event of default has occurred and is continuing, the trustee may proceed to protect or enforce its rights by a suit in equity or action at law. The County repaid in full the outstanding balance of the bonds on April 30, 2020. Taxable Pension Obligation Bonds, 2020 Series A On January 14, 2020, the County issued Taxable Pension Obligation Bonds, 2020 Series A (the 2020 POBs) in the principal amount of $463,895. The 2020 POBs were issued in order to take advantage of the discount offered by the OCERS Board of Retirement to prepay the County's FY 2020-21 pension contribution. The 2020 POBs were issued as standard bonds, with four fixed-rate tranches, and a final maturity date of April 30, 2021. The obligation of the County to pay principal and interest on the 2020 POBs is imposed by law and is absolute and unconditional. Pledged security for the bonds are any lawfully available funds of the County. If an
___________________________________________________________________________________________
___________________________________________________________________________________________
Notes to the Basic Financial Statements
(Dollar Amounts in Thousands)
106

10. SHORT-TERM OBLIGATIONS (Continued)
Taxable Pension Obligation Bonds, 2020 Series A (Continued) event of default has occurred and is continuing, the trustee may proceed to protect or enforce its rights by a suit in equity or action at law. As of June 30, 2020, the outstanding principal amount of the 2020 POBs reported in the General Fund was $463,895. Refer to Note 3, Deposits and Investments and Note 18, Retirement Plans for additional information.
Amounts
Due within
Description Retirements One Year
County of Orange
Taxable Pension Obligation
Bonds, 2019 Series A
Date Issued: January 14, 2019
Interest Rate: 2.816% to 2.899%
Original Amount: $402,182
Maturing in installments through April 30, 2020 $ 402,182 $ -- $ (402,182) $ -- $ --
County of Orange
Taxable Pension Obligation
Bonds, 2020 Series A
Date Issued: January 14, 2020
Interest Rate: 1.770% to 1.820%
Original Amount: $463,895
Maturing in installments through April 30, 2021 -- 463,895 -- 463,895 463,895
Total $ 402,182 $ 463,895 $ (402,182) $ 463,895 $ 463,895
Balance
Issuances &
Amortization
Balance
Discount/
Premium
June 30, 2020July 1, 2019
11. LONG-TERM OBLIGATIONS
General Bonded Debt General Obligation Bonded Debt The amount of general obligation bonded indebtedness the County can incur is limited by law to 1.25% of the last equalized assessment property tax roll. At June 30, 2020, the County had no net general obligation bonded debt. The County’s legal debt limit for the year was $7,909,478. In order for the County to issue general obligation bonds secured by ad valorem taxes on real property, California Constitution Article XIIIA, Section 1 requires the approval of 2/3 of the voters voting on the proposition. Revenue Bonds Payable Central Utility Facility Lease Revenue Bonds, Series 2016 On June 2, 2016, the South Orange County Public Financing Authority (SOCPFA) issued its $56,565 Lease Revenue Bonds, Series 2016 at a premium of $11,724 with an interest rate range of 3.00% to 5.00%. The Lease Revenue Bonds, payable through April 2036, were issued to finance the acquisition, construction and installation of certain capital improvements to be owned by the County and to pay costs relating to the issuance of the bonds. As of June 30, 2020, the outstanding principal amount, including the premium of the Series 2016 Bonds, and interest were $59,837 and $23,167, respectively.
___________________________________________________________________________________________
___________________________________________________________________________________________
County of Orange Comprehensive Annual Financial Report For the Year Ended June 30, 2020 (Dollar Amounts in Thousands)
107

11. LONG-TERM OBLIGATIONS (Continued) Revenue Bonds Payable (Continued)
Central Utility Facility Lease Revenue Bonds, Series 2016 (Continued) The bonds are special obligations of the SOCPFA payable from and secured by the base rental payments to be made by the County pursuant to and as required under the lease agreement and the amounts held in all funds and accounts (other than the rebate fund) under the indenture. The Central Utility Facility is pledged as collateral for the debt. In the event of default, the SOCPFA or the trustee may exercise any and all remedies available pursuant to law or granted pursuant to the Lease.
Lease Revenue Bonds, Series 2017A
On June 22, 2017, the CMFA issued its $152,400 Lease Revenue Bonds, Series 2017A (Orange County Civic Center Infrastructure Improvement Program-Phase I) at a premium of $22,940, with an interest rate range from 4.00%-5.00%. As the debt was issued by CMFA, this does not constitute debt for the County. Pursuant to a loan agreement, CMFA loaned the bond proceeds totaling $175,340 to the Capital Facilities Development Corporation (Corporation), a component unit of the County, to construct the County Administration South (CAS) located at 601 N. Ross Street. The County’s payment obligation commenced on November 12, 2019 when the building’s Certificate of Substantial Completion was delivered to the trustee. County departments occupying CAS will be responsible for making base rental payments. Debt service interest payments were paid through FY 2019-20. The County’s base rental payments, under the Facility Lease, are scheduled to begin in FY 2020-21 and will be used to repay the loan to the CMFA. Loan repayments are scheduled to conclude when the bonds mature, in June 2047. In the event of default, the trustee may exercise any remedies available under the Indenture, the Loan Agreement and the Facility Lease. Lease Revenue Bonds, Series 2018A
On December 13, 2018, CMFA issued its $185,705 Lease Revenue Bonds, Series 2018A (Orange County Civic Center Infrastructure Improvement Program-Phase II) at a premium of $26,599, with an interest rate coupon of 5%. As the debt was issued by CMFA, this does not constitute debt for the County. Pursuant to a loan agreement, CMFA loaned the bond proceeds totaling $212,304 to the Corporation, a component unit of the County, to construct County Administration North (CAN) located at 645 N. Ross Street. A contractor has been selected to construct CAN pursuant to a Development Agreement with the Corporation and construction has begun. The County’s payment obligation will commence once the building’s Certificate of Substantial Completion is delivered to the trustee. County departments occupying CAN will be responsible for making base rental payments. The County’s base rental payments, under the Facility Lease, are scheduled to begin in FY 2022-23 and will be used to repay the loan to the CMFA. Loan repayments are scheduled to end when the bonds mature, in June 2048. In the event of default, the trustee may exercise any remedies available under the Indenture, the Loan Agreement and the Facility Lease. Taxable Refunding Pension Obligation Bonds, Series 1997A In September 1994, the County issued its Taxable Pension Obligation Bonds, Series 1994A in the aggregate principal amount of $209,840 and Series 1994B in the aggregate principal amount of $110,200 (Series 1994 Pension Bonds). The Series 1994 Pension Bonds were partially refunded with proceeds of the County’s Taxable Refunding Pension Obligation Bonds, Series 1996A and Series 1997A.
___________________________________________________________________________________________
___________________________________________________________________________________________
Notes to the Basic Financial Statements
(Dollar Amounts in Thousands)
108

11. LONG-TERM OBLIGATIONS (Continued) Revenue Bonds Payable (Continued)
Taxable Refunding Pension Obligation Bonds, Series 1997A (Continued) On May 11, 2000, a cash tender offer of certain outstanding Pension Obligation Bonds was completed. The County purchased and canceled $288,290 (maturity value) of Pension Obligation Bonds for a cost of $179,016. On June 22, 2000, the debt service on the outstanding Pension Obligation Bonds was provided for through the deposit with the trustee of $175,492 principal amount of “AAA” rated debt securities issued by Fannie Mae, along with $9,151 in debt service funds already being held by the trustee. In accordance with irrevocable instructions, these securities, together with other cash amounts and investments held by the trustee, will be used solely to retire the remaining Pension Obligation Bonds as they mature. Because this was an economic defeasance and not a legal defeasance, this debt continues to be reported in the County’s financial statements until it is fully redeemed. As of June 30, 2020, the outstanding principal amount, interest accretion, and unaccreted interest of the Series 1997A Pension Obligation Bonds were $2,967, $15,090, and $985 respectively. Airport Revenue Refunding Bonds, Series 2019A and 2019B
On July 9, 2009, the Airport issued the Airport Revenue Bonds, Series 2009A and 2009B (2009A and 2009B Bonds) in the aggregate principal amount of $233,115, with an original issue net premium of $288. The 2009A and 2009B Bonds were issued to finance a portion of the Airport Improvement Program (AIP), fund the debt service requirement for the bonds, fund capitalized interest on a portion of the bonds and pay costs relating to the issuance of the bonds. The AIP consist of numerous direct improvements to the Airport facilities such as construction of Terminal C, Parking Structure C and two commuter/regional holdrooms at the north and south ends of the extended Terminal. On May 14, 2019, the Airport issued the Airport Revenue Refunding Bonds, Series 2019A and 2019B (2019A and 2019B Bonds) in the principal amount of $85,030, with a premium of $13,404. The 2019A and 2019B Bonds were issued to refund and defease the 2009A and 2009B Bonds, fund a debt service reserve subaccount for the bonds, and pay certain expenses in connection with the issuance of the bonds. As of June 30, 2020, the outstanding principal amount, including premium, of the 2019A and 2019B Bonds were $38,821 and $54,641, respectively. The 2019 Bonds are secured by a pledge of (1) operating revenues, net of specified operating expenses, (2) interest earnings, (3) other miscellaneous revenue and (4) available PFC revenue. In the event of default, the trustee may exercise any remedies available under the bond indentures and under state and federal law. Fiscal Year 2019-20 Debt Obligation Activity
Direct Placement Obligations Teeter Plan Notes On July 16, 2018, the County issued its three-year taxable Teeter Plan Notes, Series B with Wells Fargo Bank, National Association as a direct placement under the Amended and Restated Note Purchase and Reimbursement Agreement. The Teeter Plan Notes were authorized for a total amount of $100,000 and certain delinquent taxes (excluding penalties and interest) were pledged revenues for the Teeter Plan Notes. The Teeter Plan Notes were issued for $61,107 in taxable Teeter Plan Obligation Notes, Series B to refund the June 30, 2018 outstanding Teeter balance of $27,247 and finance the purchase of $33,860 for the delinquent property tax receivables associated with the Teeter Plan. Proceeds of this issuance, associated with the purchase of delinquent property tax receivables, paid the participating agencies in the Teeter Plan the full amount of their taxes from the secured property tax roll. In the event of default, the Purchaser may exercise any and all remedies available under the Trust Agreement or pursuant to law. There is an acceleration clause that
___________________________________________________________________________________________
___________________________________________________________________________________________
County of Orange Comprehensive Annual Financial Report For the Year Ended June 30, 2020 (Dollar Amounts in Thousands)
109
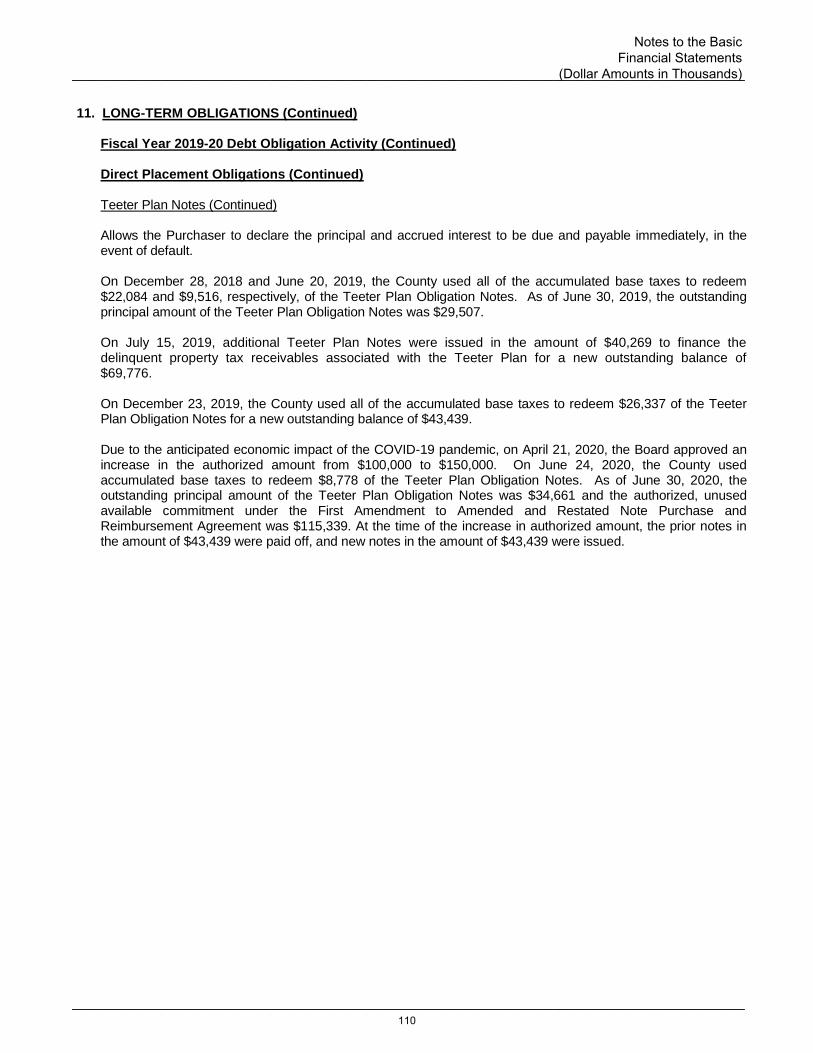
11. LONG-TERM OBLIGATIONS (Continued)
Fiscal Year 2019-20 Debt Obligation Activity (Continued) Direct Placement Obligations (Continued) Teeter Plan Notes (Continued)
Allows the Purchaser to declare the principal and accrued interest to be due and payable immediately, in the event of default.
On December 28, 2018 and June 20, 2019, the County used all of the accumulated base taxes to redeem $22,084 and $9,516, respectively, of the Teeter Plan Obligation Notes. As of June 30, 2019, the outstanding principal amount of the Teeter Plan Obligation Notes was $29,507. On July 15, 2019, additional Teeter Plan Notes were issued in the amount of $40,269 to finance the delinquent property tax receivables associated with the Teeter Plan for a new outstanding balance of $69,776. On December 23, 2019, the County used all of the accumulated base taxes to redeem $26,337 of the Teeter Plan Obligation Notes for a new outstanding balance of $43,439. Due to the anticipated economic impact of the COVID-19 pandemic, on April 21, 2020, the Board approved an increase in the authorized amount from $100,000 to $150,000. On June 24, 2020, the County used accumulated base taxes to redeem $8,778 of the Teeter Plan Obligation Notes. As of June 30, 2020, the outstanding principal amount of the Teeter Plan Obligation Notes was $34,661 and the authorized, unused available commitment under the First Amendment to Amended and Restated Note Purchase and Reimbursement Agreement was $115,339. At the time of the increase in authorized amount, the prior notes in the amount of $43,439 were paid off, and new notes in the amount of $43,439 were issued.
___________________________________________________________________________________________
___________________________________________________________________________________________
Notes to the Basic Financial Statements
(Dollar Amounts in Thousands)
110

11. LONG-TERM OBLIGATIONS (Continued)
Schedule of Long-Term Debt Obligations, Fiscal Year 2019-20 The table below summarizes the revenue bonds and direct placement obligations outstanding and related activity for the year ended June 30, 2020.
Loans/Debt
Issuances and
Discount/ Amounts
Premium Accreted Balance Due within
Description Amortization Interest One Year
Governmental Activities:
Revenue Bonds and POBs:
South Orange County Public Financing Authority
Central Utility Facility Lease Revenue Bonds,
Series 2016
Date Issued: June 2, 2016
Interest Rate: 3.00% to 5.00%
Original Amount: $56,565
FY 2019-20 Principal and Interest: $4,486
FY 2019-20 Total Pledged Revenues: $4,427
Maturing in installments through April 1, 2036 $ 62,025 $ (213) $ -- $ (1,975) $ 59,837 $ 2,417
California Municipal Finance Authority
Lease Revenue Bonds, Series 2017A
(Orange County Civic Center Infrastructure
Improvement Program-Phase I)
Date Issued: June 22, 2017
Interest Rate: 4.00% to 5.00%
Original Amount: $152,400
FY 2019-20 Interest: $7,176
Maturing in installments through June 1, 2047 175,340 -- -- -- 175,340 3,211
California Municipal Finance Authority
Lease Revenue Bonds, Series 2018A
(Orange County Civic Center Infrastructure
Improvement Program-Phase II)
Date Issued: December 13, 2018
Interest Rate: 5.00%
Original Amount: $185,705
FY 2019-20 Interest: $9,285
Maturing in installments through June 1, 2048 212,304 -- -- -- 212,304 --
County of Orange
Taxable Refunding Pension
Obligation Bonds, Series 1997 A
Date Issued: January 1, 1997 - Current Interest
Rate Bonds (CIB)
Date Issued: January 14, 1997 - Capital Appreciation
Bonds (CAB)
To Refund the Taxable POBs Series 1994 A
Interest Rate: CIB - 5.71% to 7.36%
Interest Rate: CAB - 7.33% to 7.96%
Original Amount: CIB - $71,605
Original Amount: CAB - $65,318
FY 2019-20 Principal and Interest: $14,500
Maturing in installments through September 1,
2010 (CIB) and September 1, 2021 (CAB) 5,445 -- -- (2,478) 2,967 2,451
Interest Accretion on CAB 25,201 -- 1,911 (12,022) 15,090 13,049
Subtotal-Revenue Bonds and POBs 480,315 (213) 1,911 (16,475) 465,538 21,128
BalanceJune 30, 2020RetirementsJuly 1, 2019
___________________________________________________________________________________________
___________________________________________________________________________________________
County of Orange Comprehensive Annual Financial Report For the Year Ended June 30, 2020 (Dollar Amounts in Thousands)
111
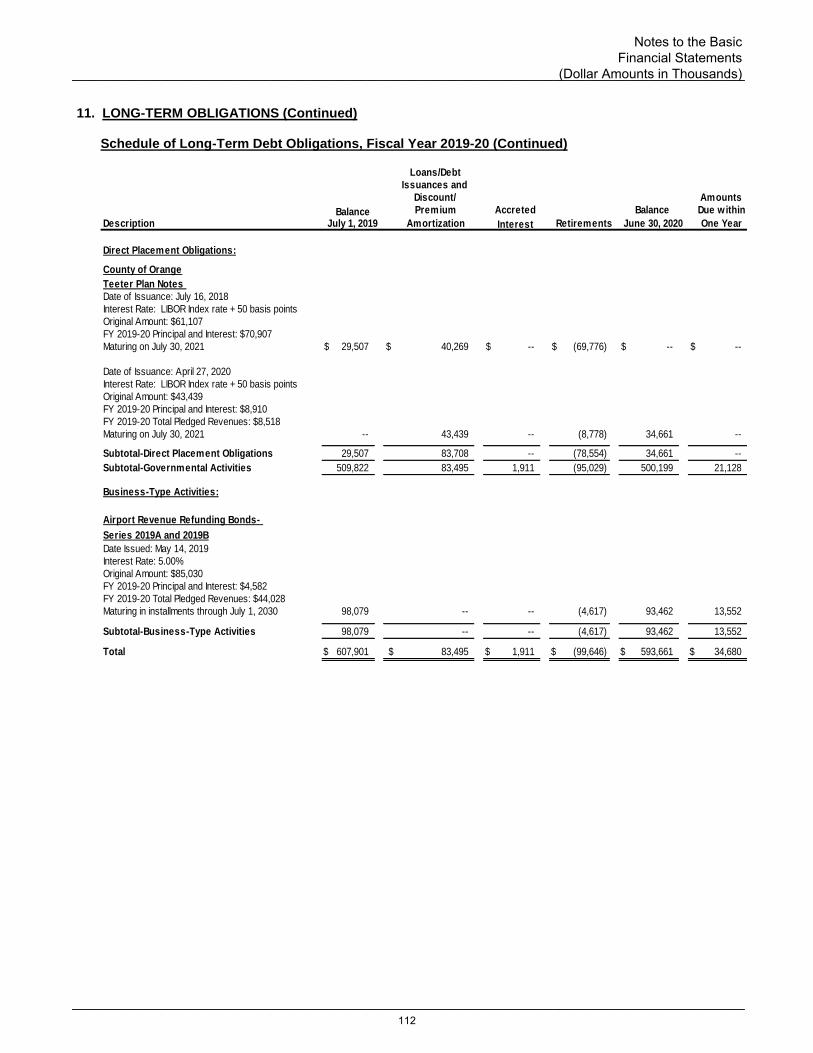
11. LONG-TERM OBLIGATIONS (Continued)
Schedule of Long-Term Debt Obligations, Fiscal Year 2019-20 (Continued)
Loans/Debt
Issuances and
Discount/ Amounts
Premium Accreted Balance Due within
Description Amortization Interest One Year
Direct Placement Obligations:
County of Orange
Teeter Plan Notes
Date of Issuance: July 16, 2018
Interest Rate: LIBOR Index rate + 50 basis points
Original Amount: $61,107
FY 2019-20 Principal and Interest: $70,907
Maturing on July 30, 2021 $ 29,507 $ 40,269 $ -- $ (69,776) $ -- $ --
Date of Issuance: April 27, 2020
Interest Rate: LIBOR Index rate + 50 basis points
Original Amount: $43,439
FY 2019-20 Principal and Interest: $8,910
FY 2019-20 Total Pledged Revenues: $8,518
Maturing on July 30, 2021 -- 43,439 -- (8,778) 34,661 --
Subtotal-Direct Placement Obligations 29,507 83,708 -- (78,554) 34,661 --
Subtotal-Governmental Activities 509,822 83,495 1,911 (95,029) 500,199 21,128
Business-Type Activities:
Airport Revenue Refunding Bonds-
Series 2019A and 2019B
Date Issued: May 14, 2019
Interest Rate: 5.00%
Original Amount: $85,030
FY 2019-20 Principal and Interest: $4,582
FY 2019-20 Total Pledged Revenues: $44,028
Maturing in installments through July 1, 2030 98,079 -- -- (4,617) 93,462 13,552
Subtotal-Business-Type Activities 98,079 -- -- (4,617) 93,462 13,552
Total $ 607,901 $ 83,495 $ 1,911 $ (99,646) $ 593,661 $ 34,680
BalanceJune 30, 2020RetirementsJuly 1, 2019
___________________________________________________________________________________________
___________________________________________________________________________________________
Notes to the Basic Financial Statements
(Dollar Amounts in Thousands)
112
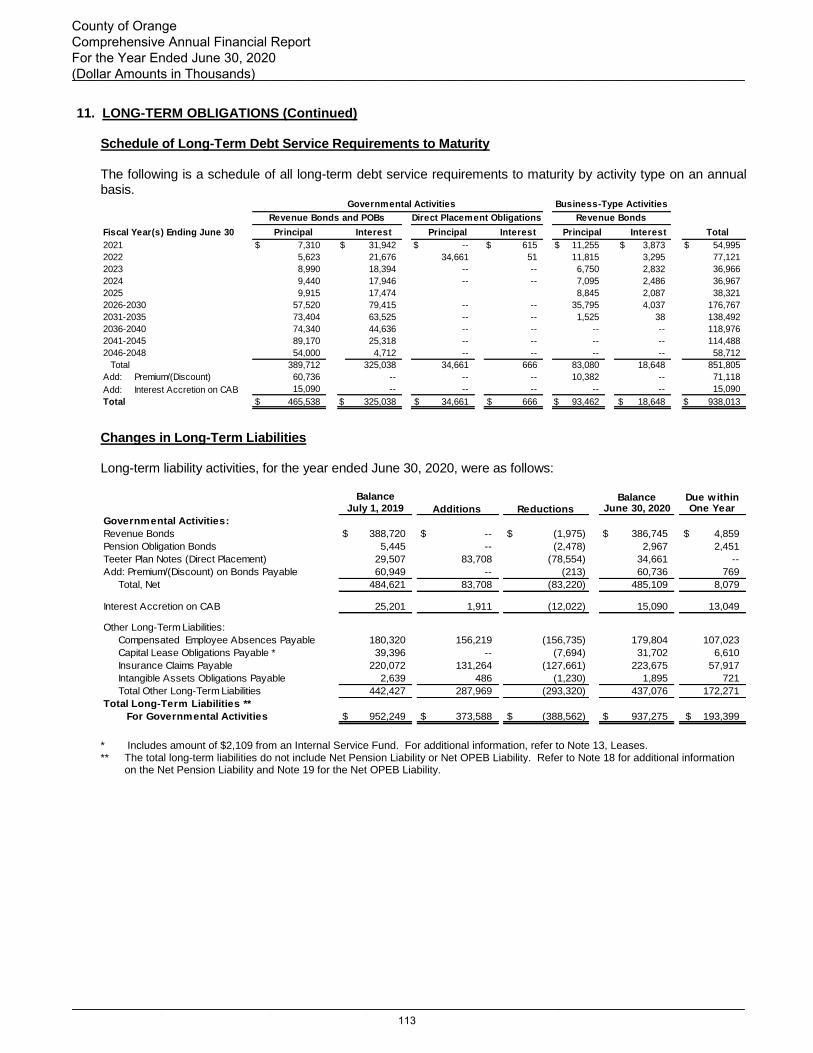
11. LONG-TERM OBLIGATIONS (Continued)
Schedule of Long-Term Debt Service Requirements to Maturity
The following is a schedule of all long-term debt service requirements to maturity by activity type on an annual basis.
Fiscal Year(s) Ending June 30 Principal Interest Principal Interest Principal Interest Total
2021 $ 7,310 $ 31,942 $ -- $ 615 $ 11,255 $ 3,873 $ 54,995
2022 5,623 21,676 34,661 51 11,815 3,295 77,121
2023 8,990 18,394 -- -- 6,750 2,832 36,966
2024 9,440 17,946 -- -- 7,095 2,486 36,967
2025 9,915 17,474 8,845 2,087 38,321
2026-2030 57,520 79,415 -- -- 35,795 4,037 176,767
2031-2035 73,404 63,525 -- -- 1,525 38 138,492
2036-2040 74,340 44,636 -- -- -- -- 118,976
2041-2045 89,170 25,318 -- -- -- -- 114,488
2046-2048 54,000 4,712 -- -- -- -- 58,712
Total 389,712 325,038 34,661 666 83,080 18,648 851,805
Add: Premium/(Discount) 60,736 -- -- -- 10,382 -- 71,118
Add: Interest Accretion on CAB 15,090 -- -- -- -- -- 15,090
Total $ 465,538 $ 325,038 $ 34,661 $ 666 $ 93,462 $ 18,648 $ 938,013
Governmental Activities Business-Type Activities
Revenue Bonds and POBs Direct Placement Obligations Revenue Bonds
Changes in Long-Term Liabilities Long-term liability activities, for the year ended June 30, 2020, were as follows:
Revenue Bonds $ 388,720 $ -- $ (1,975) $ 386,745 $ 4,859
Pension Obligation Bonds 5,445 -- (2,478) 2,967 2,451
Teeter Plan Notes (Direct Placement) 29,507 83,708 (78,554) 34,661 --
60,949 -- (213) 60,736 769
Total, Net 484,621 83,708 (83,220) 485,109 8,079
Interest Accretion on CAB 25,201 1,911 (12,022) 15,090 13,049
Compensated Employee Absences Payable 180,320 156,219 (156,735) 179,804 107,023
Capital Lease Obligations Payable * 39,396 -- (7,694) 31,702 6,610
Insurance Claims Payable 220,072 131,264 (127,661) 223,675 57,917
Intangible Assets Obligations Payable 2,639 486 (1,230) 1,895 721
Total Other Long-Term Liabilities 442,427 287,969 (293,320) 437,076 172,271
For Governmental Activities $ 952,249 $ 373,588 $ (388,562) $ 937,275 $ 193,399
Balance
Governmental Activities:
Add: Premium/(Discount) on Bonds Payable
June 30, 2020 One YearDue within
July 1, 2019 Additions Reductions
Balance
Other Long-Term Liabilities:
Total Long-Term Liabilities **
* Includes amount of $2,109 from an Internal Service Fund. For additional information, refer to Note 13, Leases. ** The total long-term liabilities do not include Net Pension Liability or Net OPEB Liability. Refer to Note 18 for additional information
on the Net Pension Liability and Note 19 for the Net OPEB Liability.
___________________________________________________________________________________________
___________________________________________________________________________________________
County of Orange Comprehensive Annual Financial Report For the Year Ended June 30, 2020 (Dollar Amounts in Thousands)
113

11. LONG-TERM OBLIGATIONS (Continued)
Changes in Long-Term Liabilities (Continued)
Revenue Bonds $ 85,030 $ -- $ (1,950) $ 83,080 $ 11,255
13,049 -- (2,667) 10,382 2,297
Total Bonds Payable, Net 98,079 -- (4,617) 93,462 13,552
Compensated Employee Absences Payable 4,202 4,341 (4,297) 4,246 2,504
Arbitrage Rebate Payable 103 -- (103) -- --
Landfill Site Closure/Postclosure
Liabilities * 179,758 10,272 (5,649) 184,381 3,680
Pollution Remediation Obligation ** 17,481 -- (1,296) 16,185 698
Intangible Assets Obligations Payable 167 -- (93) 74 72
Total Other Long-Term Liabilities 201,711 14,613 (11,438) 204,886 6,954
For Business-Type Activities $ 299,790 $ 14,613 $ (16,055) $ 298,348 $ 20,506
Other Long-Term Liabilities:
Total Long-Term Liabilities ***
Business-Type Activities:
Bonds Payable:
Add: Premium (Discount) on Bonds Payable
Balance
One YearJuly 1, 2019 June 30, 2020Additions Reductions
Balance Due within
* Refer to Note 14 for additional information regarding the increase in Landfill Site Closure/Post Closure Liabilities. ** Refer to Note 17 for additional information regarding the decrease in Pollution Remediation Obligation. *** The total long-term liabilities do not include Net Pension Liability or Net OPEB Liability. Refer to Note 18 for additional information
on the Net Pension Liability and Note 19 for Net OPEB Liability.
Compensated Employee Absences
The estimated compensated employee absences payable recorded at June 30, 2020 is $184,050. Employees are entitled to be paid annual leave, compensated time, and in some cases vacation and sick time depending on job classification, length of service, and other factors. For the governmental funds, most of the compensated absences liability will ultimately be paid from the General Fund.
Special Assessment District Bonds
Special Assessment District Bonds consist of Assessment District Bonds and Community Facilities District Bonds. Assessment District Bonds are issued pursuant to provisions of the Improvement Bond Act of 1915 (Division 10 of the California Streets and Highways Code). Proportionate shares of principal and interest installments sufficient in aggregate to meet annual bond debt service requirements are included on the regular County tax bills sent to owners of property against which there are unpaid assessments. Neither the faith and credit nor the taxing power of the County, the State, or any political subdivision thereof is pledged to the payment of the bonds. Assessment District Bonds represent limited obligations of the County payable solely from special assessments paid by property owners within each district. Accordingly, such obligations are not included in the accompanying basic financial statements. Community Facilities District Bonds are issued pursuant to the Mello-Roos Community Facilities Act of 1982, as amended, and are payable from a portion of certain special taxes to be levied on property within the boundaries of the Community Facilities District. Except for the special taxes, no other taxes are pledged to the payment of the bonds. The bonds are not general or special obligations of the County nor general obligations of the District, but are limited obligations of the District payable solely from certain amounts deposited by the District in the special tax fund. Accordingly, such obligations are not included in the accompanying basic financial statements.
___________________________________________________________________________________________
___________________________________________________________________________________________
Notes to the Basic Financial Statements
(Dollar Amounts in Thousands)
114

11. LONG-TERM OBLIGATIONS (Continued) Special Assessment District Bonds (Continued) The County is acting as an agent of the assessment and community facilities districts in collecting the assessments and special taxes, forwarding the collections to other paying agents or directly to bondholders, and initiating any necessary foreclosure proceedings. Because of the County’s limited obligation in connection with special assessment district and community facilities district debt, related transactions are reflected in Agency Departmental Funds. Major capital outlay expenditures relating to these bonds are accounted for in the “Service Areas, Lighting Maintenance and Assessment Districts” Special Revenue Fund. Special assessment district and community facilities district bonds outstanding as of June 30, 2020, amounted to $478,904.
12. CONDUIT DEBT OBLIGATIONS AND SUCCESSOR AGENCY DEBT Single and Multi-Family Housing Bonds
From 1980 through 2013, the County issued bonds under the authority of Chapter 7 of Part 5 of Division 3 of the Health and Safety Code of the State of California. The purpose of the bonds is to finance the purchase of single-family homes and the construction of multi-family units to benefit low and moderate income families. The bonds are secured by the property financed and are payable solely from revenue of the projects and payments received on the underlying mortgage loans. The bonds do not constitute a liability of the County. Neither the County, the State of California, nor any political subdivisions thereof are obligated in any manner for the repayment of the bonds. In no event shall the bonds be payable out of any funds or properties of the County. Accordingly, the bonds are not reported as liabilities in the accompanying financial statements. As of June 30, 2020, there were 13 series of bonds outstanding with an aggregate principal amount payable of $76,201.
Orange County Development Agency (OCDA) Successor Agency Bond Debt
On December 29, 2011, the California Supreme Court issued an opinion in California Redevelopment Association (CRA) v. Matosantos, upholding the constitutionality of ABX1 26, eliminating Redevelopment Agencies (RDA) statewide effective February 1, 2012. Under ABX1 26, a successor agency was created for each dissolved RDA, including OCDA, and charged with winding down the dissolved RDA’s operations and performing enforceable obligations (as defined in the law). The OCDA Successor Agency assumed the dissolved RDA’s enforceable obligations, which include bond debt obligations. The Neighborhood Development and Preservation Project and Santa Ana Heights Project Refunding Bonds debt service obligations for FY 2019-20 appeared on the OCDA Successor Agency Recognized Obligation Payment Schedule and were approved by the Successor Agency Oversight Board, the State Department of Finance, and were paid to bondholders according to the debt service schedule. Effective with OCDA’s dissolution on February 1, 2012, the assets and liabilities (including bond debt) were transferred to and reported in a Private-Purpose Trust Fund of the County. This transfer and reporting structure reflects the custodial role accepted by the successor agency. As of June 30, 2020, the outstanding principal amount, including the premium of the OCDA Successor Agency bonds and remaining interests were $13,783 and $1,059, respectively. The bonds do not constitute a liability of the County. Neither the County, the State of California nor any political subdivisions thereof are obligated in any manner for the repayment of the bonds. In no event shall the bonds be payable out of any funds or properties of the County. Accordingly, the bonds are reported as liabilities in the Private-Purpose Trust Fund.
___________________________________________________________________________________________
___________________________________________________________________________________________
County of Orange Comprehensive Annual Financial Report For the Year Ended June 30, 2020 (Dollar Amounts in Thousands)
115
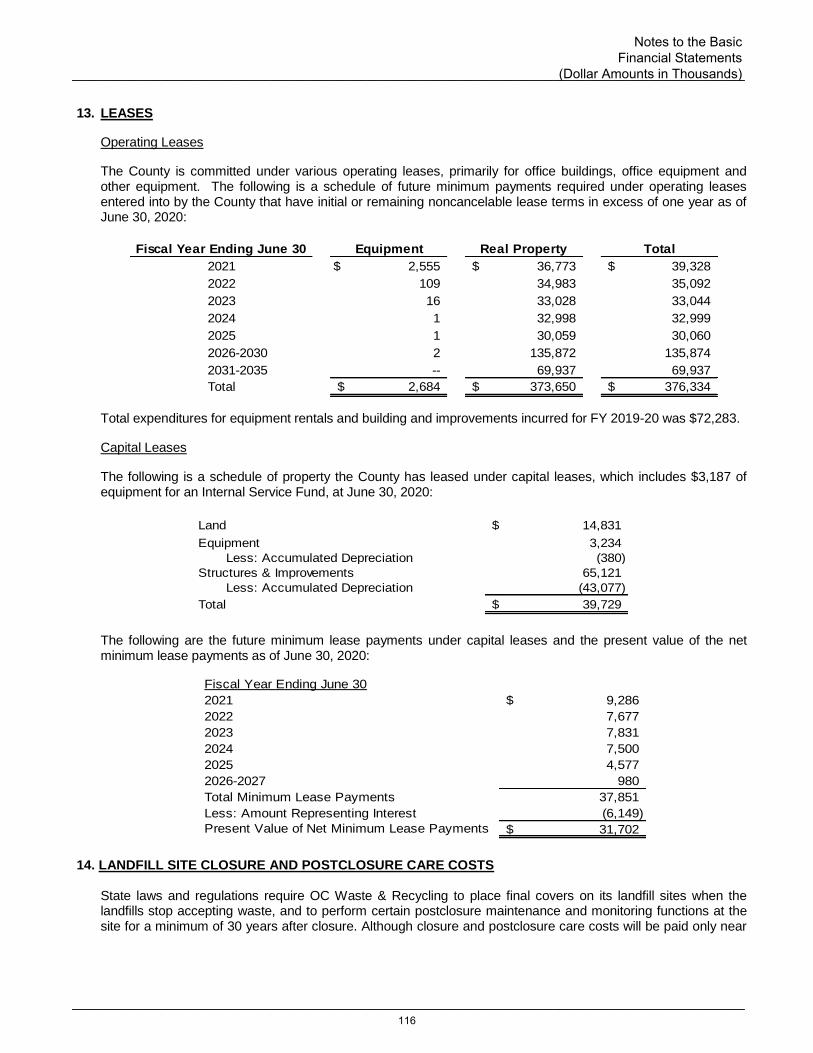
13. LEASES
Operating Leases
The County is committed under various operating leases, primarily for office buildings, office equipment and other equipment. The following is a schedule of future minimum payments required under operating leases entered into by the County that have initial or remaining noncancelable lease terms in excess of one year as of June 30, 2020:
Fiscal Year Ending June 30
2021 $ 2,555 $ 36,773 $ 39,328
2022 109 34,983 35,092
2023 16 33,028 33,044
2024 1 32,998 32,999
2025 1 30,059 30,060
2026-2030 2 135,872 135,874
2031-2035 -- 69,937 69,937
Total $ 2,684 $ 373,650 $ 376,334
Equipment Real Property Total
Total expenditures for equipment rentals and building and improvements incurred for FY 2019-20 was $72,283. Capital Leases The following is a schedule of property the County has leased under capital leases, which includes $3,187 of equipment for an Internal Service Fund, at June 30, 2020:
Land 14,831$
Equipment 3,234
Less: Accumulated Depreciation (380)
Structures & Improvements 65,121
Less: Accumulated Depreciation (43,077)
Total 39,729$
The following are the future minimum lease payments under capital leases and the present value of the net minimum lease payments as of June 30, 2020:
Fiscal Year Ending June 30
2021 9,286$
2022 7,677
2023 7,831
2024 7,500
2025 4,577
2026-2027 980
Total Minimum Lease Payments 37,851
Less: Amount Representing Interest (6,149)
Present Value of Net Minimum Lease Payments 31,702$
14. LANDFILL SITE CLOSURE AND POSTCLOSURE CARE COSTS
State laws and regulations require OC Waste & Recycling to place final covers on its landfill sites when the landfills stop accepting waste, and to perform certain postclosure maintenance and monitoring functions at the site for a minimum of 30 years after closure. Although closure and postclosure care costs will be paid only near
___________________________________________________________________________________________
___________________________________________________________________________________________
Notes to the Basic Financial Statements
(Dollar Amounts in Thousands)
116

14. LANDFILL SITE CLOSURE AND POSTCLOSURE CARE COSTS (Continued) or after the date each respective landfill stops accepting waste, OC Waste & Recycling will report a portion of these closure and postclosure care costs as an operating expense in each period based on the landfill capacity used as of the Statement of Net Position date.
OC Waste & Recycling owns or operates the following waste disposal sites:
• Frank R. Bowerman (FRB) (Irvine-Active) • Olinda Alpha (Brea-Active) • Prima Deshecha (San Juan Capistrano-Active) • Santiago Canyon (Orange-Ceased accepting waste in 1996, final closure certification in 2005) • Coyote Canyon (Newport Beach-Ceased accepting waste in 1990, final closure certification in 1995)
The total landfill closure and postclosure care liability at June 30, 2020 was $184,381. The total liability represents the cumulative amount accrued based on the percentage of the active landfill capacities that have been used to date (37.18% for FRB, 85.42% for Olinda Alpha and 22.26% for Prima Deshecha), less actual costs paid related to both closure and postclosure of the Santiago and Coyote Canyon landfills. OC Waste & Recycling will recognize the remaining estimated cost of closure and postclosure care of $184,913 as the remaining estimated capacity is filled. These amounts are based on what it would cost to perform all closure and postclosure care in 2019 dollars (using the 2019 inflation factor of 1.018). OC Waste & Recycling has enough landfill capacity to operate the system for a minimum of 25 years. However, OC Waste & Recycling estimates that it intends to operate the landfills well beyond this period as a result of approved and planned expansions. In compliance with Title 27-Environmental Protection of California Code of Regulations, OC Waste & Recycling makes cash contributions as required to its escrow funds to provide financial assurance for estimated future landfill closure costs based on the GASB Statement No. 18, “Accounting for Municipal Solid Waste Landfill Closure and Postclosure Care Costs”, formula which is adjusted annually by the Cal Recycle-provided CPI factor. Also in compliance with regulations, OC Waste & Recycling has executed pledge-of-revenue agreements to provide financial assurance for estimated future landfill postclosure maintenance costs. The agreements state that OC Waste & Recycling pledges revenue from future gate fees deposited to pay for estimated postclosure maintenance or shall obtain alternative coverage within sixty (60) days if OC Waste & Recycling ceases at any time to retain control of its ability to allocate pledged revenue to pay postclosure maintenance costs. OC Waste & Recycling has proactively pre-funded this cost based on the State mandated formula that computes landfill capacity as a percentage of the total landfill capacity times the total estimated cost for postclosure maintenance. The estimated costs for future closure and postclosure maintenance are annually adjusted based on State provided inflation factors. The State mandated formula under which contributions to both closure and postclosure funds are calculated would provide for the accumulation of sufficient cash to cover all estimated costs when each landfill site reaches maximum capacity. If additional costs for closure or postclosure maintenance are determined due to changes in technology or higher regulatory requirements, these costs may need to be covered by increasing the amount charged to landfill customers.
As of June 30, 2020, a total of $96,759 has been set aside for estimated closure and postclosure costs and is included in the accompanying Statement of Net Position as Restricted Pooled Cash and Investments-Closure and Postclosure Care Costs. Regulations governing solid waste management are promulgated by government agencies on the federal, state and local levels. These regulations address the design, construction, operation, maintenance, closure and postclosure maintenance of various types of facilities, acceptable and prohibited waste types, and inspection, permitting, environmental monitoring and solid waste recycling requirements. Regulations at both the state and federal levels could impose retroactive liability, particularly with respect to cleanup activities relating to any landfill site ever operated by the County, whether or not owned by the County. Refer to Note 17, Pollution Remediation, for additional discussion regarding pollution remediation liabilities.
___________________________________________________________________________________________
___________________________________________________________________________________________
County of Orange Comprehensive Annual Financial Report For the Year Ended June 30, 2020 (Dollar Amounts in Thousands)
117
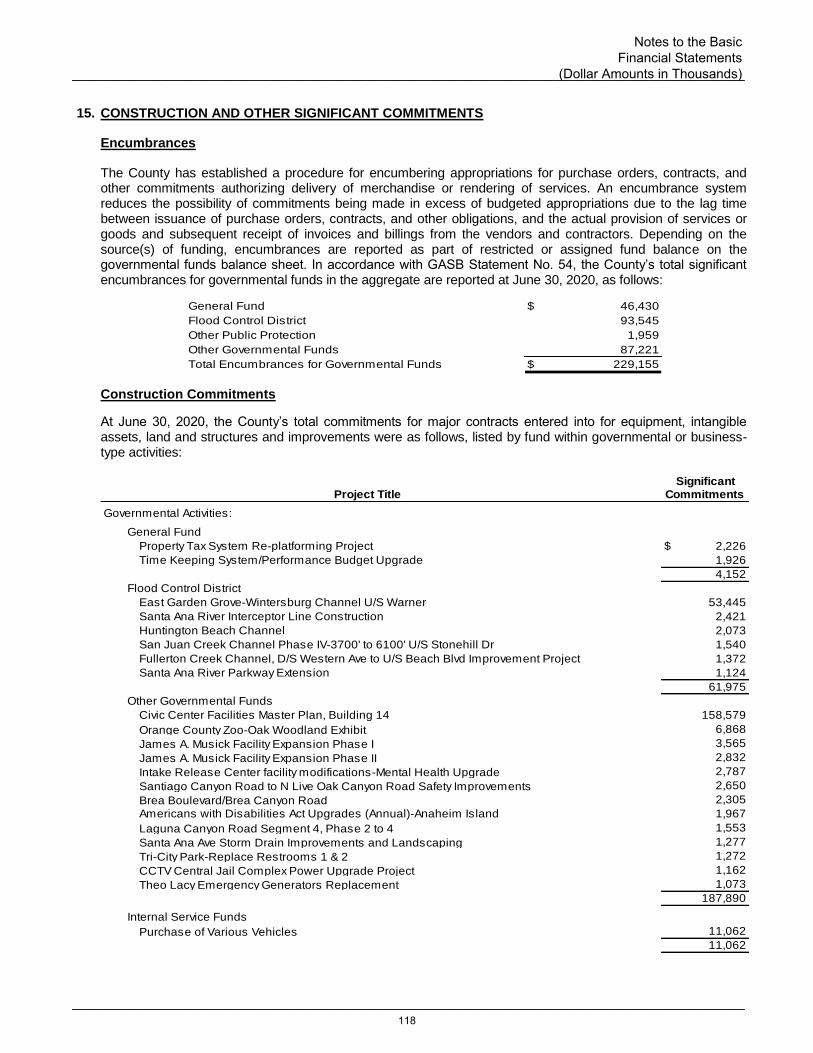
15. CONSTRUCTION AND OTHER SIGNIFICANT COMMITMENTS
Encumbrances
The County has established a procedure for encumbering appropriations for purchase orders, contracts, and other commitments authorizing delivery of merchandise or rendering of services. An encumbrance system reduces the possibility of commitments being made in excess of budgeted appropriations due to the lag time between issuance of purchase orders, contracts, and other obligations, and the actual provision of services or goods and subsequent receipt of invoices and billings from the vendors and contractors. Depending on the source(s) of funding, encumbrances are reported as part of restricted or assigned fund balance on the governmental funds balance sheet. In accordance with GASB Statement No. 54, the County’s total significant encumbrances for governmental funds in the aggregate are reported at June 30, 2020, as follows:
General Fund $ 46,430
Flood Control District 93,545
Other Public Protection 1,959
Other Governmental Funds 87,221
Total Encumbrances for Governmental Funds $ 229,155
Construction Commitments
At June 30, 2020, the County’s total commitments for major contracts entered into for equipment, intangible assets, land and structures and improvements were as follows, listed by fund within governmental or business-type activities:
Project Title
Governmental Activities:
General Fund
Property Tax System Re-platforming Project $ 2,226
Time Keeping System/Performance Budget Upgrade 1,926
4,152
Flood Control District
East Garden Grove-Wintersburg Channel U/S Warner 53,445
Santa Ana River Interceptor Line Construction 2,421
Huntington Beach Channel 2,073
San Juan Creek Channel Phase IV-3700' to 6100' U/S Stonehill Dr 1,540
Fullerton Creek Channel, D/S Western Ave to U/S Beach Blvd Improvement Project 1,372
Santa Ana River Parkway Extension 1,124
61,975
Other Governmental Funds
Civic Center Facilities Master Plan, Building 14 158,579
6,868
3,565
2,832
2,787
2,650
2,305
Americans with Disabilities Act Upgrades (Annual)-Anaheim Island 1,967
1,553
1,277
1,272
1,162
1,073
187,890
Internal Service Funds
11,062
11,062
SignificantCommitments
Purchase of Various Vehicles
Intake Release Center facility modifications-Mental Health Upgrade
James A. Musick Facility Expansion Phase I
Brea Boulevard/Brea Canyon Road
Theo Lacy Emergency Generators Replacement
Santa Ana Ave Storm Drain Improvements and Landscaping
Tri-City Park-Replace Restrooms 1 & 2
Santiago Canyon Road to N Live Oak Canyon Road Safety Improvements
Orange County Zoo-Oak Woodland Exhibit
James A. Musick Facility Expansion Phase II
CCTV Central Jail Complex Power Upgrade Project
Laguna Canyon Road Segment 4, Phase 2 to 4
___________________________________________________________________________________________
___________________________________________________________________________________________
Notes to the Basic Financial Statements
(Dollar Amounts in Thousands)
118
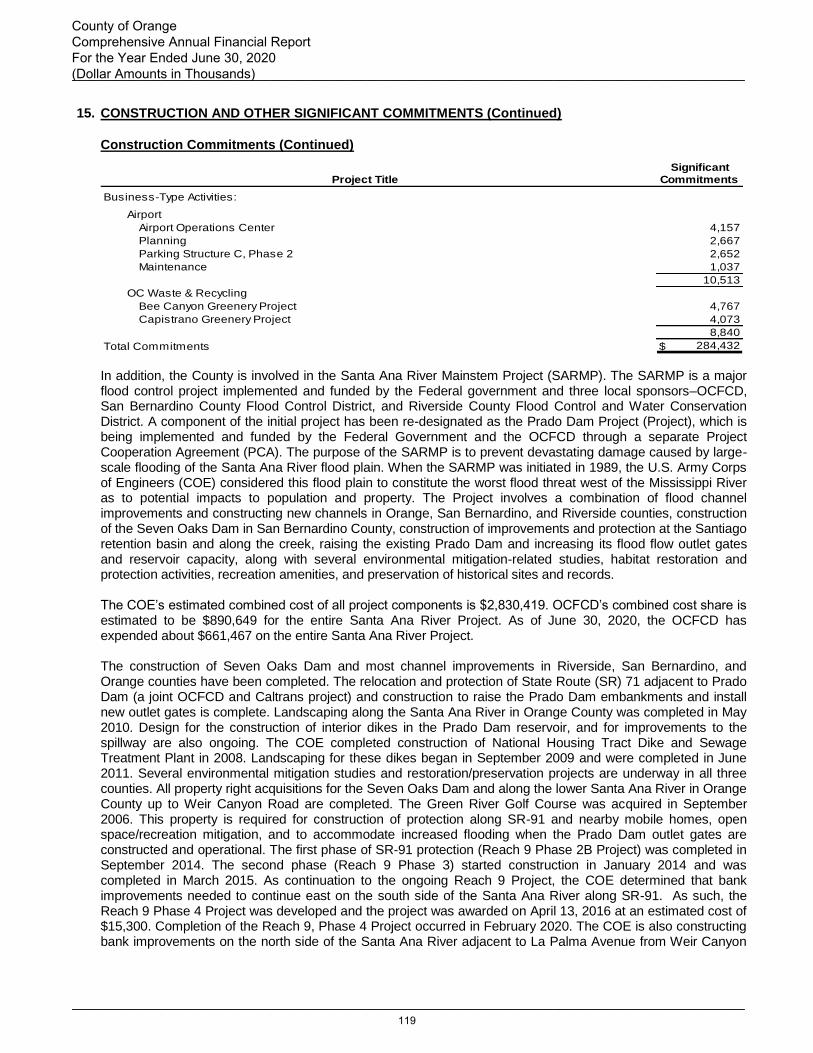
15. CONSTRUCTION AND OTHER SIGNIFICANT COMMITMENTS (Continued)
Construction Commitments (Continued)
Project Title
Business-Type Activities:
Airport
Airport Operations Center 4,157
Planning 2,667
Parking Structure C, Phase 2 2,652
Maintenance 1,037
10,513
OC Waste & Recycling
Bee Canyon Greenery Project 4,767
Capistrano Greenery Project 4,073
8,840
Total Commitments $ 284,432
SignificantCommitments
In addition, the County is involved in the Santa Ana River Mainstem Project (SARMP). The SARMP is a major flood control project implemented and funded by the Federal government and three local sponsors–OCFCD, San Bernardino County Flood Control District, and Riverside County Flood Control and Water Conservation District. A component of the initial project has been re-designated as the Prado Dam Project (Project), which is being implemented and funded by the Federal Government and the OCFCD through a separate Project Cooperation Agreement (PCA). The purpose of the SARMP is to prevent devastating damage caused by large-scale flooding of the Santa Ana River flood plain. When the SARMP was initiated in 1989, the U.S. Army Corps of Engineers (COE) considered this flood plain to constitute the worst flood threat west of the Mississippi River as to potential impacts to population and property. The Project involves a combination of flood channel improvements and constructing new channels in Orange, San Bernardino, and Riverside counties, construction of the Seven Oaks Dam in San Bernardino County, construction of improvements and protection at the Santiago retention basin and along the creek, raising the existing Prado Dam and increasing its flood flow outlet gates and reservoir capacity, along with several environmental mitigation-related studies, habitat restoration and protection activities, recreation amenities, and preservation of historical sites and records. The COE’s estimated combined cost of all project components is $2,830,419. OCFCD’s combined cost share is estimated to be $890,649 for the entire Santa Ana River Project. As of June 30, 2020, the OCFCD has expended about $661,467 on the entire Santa Ana River Project. The construction of Seven Oaks Dam and most channel improvements in Riverside, San Bernardino, and Orange counties have been completed. The relocation and protection of State Route (SR) 71 adjacent to Prado Dam (a joint OCFCD and Caltrans project) and construction to raise the Prado Dam embankments and install new outlet gates is complete. Landscaping along the Santa Ana River in Orange County was completed in May 2010. Design for the construction of interior dikes in the Prado Dam reservoir, and for improvements to the spillway are also ongoing. The COE completed construction of National Housing Tract Dike and Sewage Treatment Plant in 2008. Landscaping for these dikes began in September 2009 and were completed in June 2011. Several environmental mitigation studies and restoration/preservation projects are underway in all three counties. All property right acquisitions for the Seven Oaks Dam and along the lower Santa Ana River in Orange County up to Weir Canyon Road are completed. The Green River Golf Course was acquired in September 2006. This property is required for construction of protection along SR-91 and nearby mobile homes, open space/recreation mitigation, and to accommodate increased flooding when the Prado Dam outlet gates are constructed and operational. The first phase of SR-91 protection (Reach 9 Phase 2B Project) was completed in September 2014. The second phase (Reach 9 Phase 3) started construction in January 2014 and was completed in March 2015. As continuation to the ongoing Reach 9 Project, the COE determined that bank improvements needed to continue east on the south side of the Santa Ana River along SR-91. As such, the Reach 9 Phase 4 Project was developed and the project was awarded on April 13, 2016 at an estimated cost of $15,300. Completion of the Reach 9, Phase 4 Project occurred in February 2020. The COE is also constructing bank improvements on the north side of the Santa Ana River adjacent to La Palma Avenue from Weir Canyon
___________________________________________________________________________________________
___________________________________________________________________________________________
County of Orange Comprehensive Annual Financial Report For the Year Ended June 30, 2020 (Dollar Amounts in Thousands)
119

15. CONSTRUCTION AND OTHER SIGNIFICANT COMMITMENTS (Continued)
Construction Commitments (Continued)
Road to the railroad (Reach 9 Phase 5A and Phase 5B). Phase 5A was awarded on September 28, 2015 at a cost of $22,500 and was completed in January 2019. The construction contract for Phase 5B was awarded in September 2016 with an estimated cost of $25,500, but it was ultimately terminated in FY 2019-20. A new contract will be awarded in September 2020 with completion expected within 18 months. The OCFCD awarded the construction contract on August 9, 2011 for the four miles of Santa Ana River Interceptor Line (SARI) relocation project, which was completed by August 2014. Phase I of the Auxiliary Embankment (an extension of Prado Dam) was completed in September 2012 and Phase II was completed in July 2019. A contract for the construction of the Yorba-Slaughter Adobe Dike was awarded in December of 2012 at a cost of $6,000 and was substantially completed in August 2017. The Women’s Prison Dike (to protect the California Institute of Women) was awarded September 2014 for $12,700 and a $3,400 modification which was awarded in August 2015. This feature was substantially completed April of 2016. The OCFCD continues to acquire property rights for the Prado Dam Project, subject to the availability of funding.
The project has been authorized by the State Legislature for reimbursement of up to 70% of the Local Sponsors’ expenses through the State Flood Control Subvention Fund, which is administered by the Department of Water Resources (DWR). As of June 30, 2020, OCFCD has submitted $440,359 in claims, and received $426,914 in reimbursements. An additional $1,064 in claims is in the process of being prepared for submittal to the DWR. Of the total amount outstanding, $6,601 was reported as deferred inflows of resources at the fund level and recognized as revenue in the government-wide financial statements. Once a claim is reviewed and approved by DWR, 90% of the eligible expenditures can be paid, subject to available funding, with the remaining 10% paid after an audit by the State Controller’s Office.
16. SELF-INSURANCE
The County is exposed to various risks of losses related to torts; theft of, damage to and destruction of assets; errors and omissions; injuries to employees; natural disasters; unemployment; salary continuance; and providing health benefits to employees, retirees and their dependents. The County has chosen to establish ISFs where assets are set aside for claim settlements and judgments associated with such losses. The Workers' Compensation ISF addresses the risks related to employee injury through its Safety Program, which is responsible for injury and illness prevention. The Workers' Compensation program ensures that all benefits are properly provided and administers the contract for the third-party workers' compensation claims administration. Workers' compensation claims are self-funded up to $20,000. The Property and Casualty Risk ISF is responsible for managing losses related to torts; theft of, damage to and destruction of assets, errors and omissions, civil rights claims, and natural disasters. Tort liability is also self-funded, up to $5,000. Commercial insurance is purchased for property and other risk exposures. Excess liability insurance provides up to an additional $85,000 in liability coverage. There were no losses that impacted the County’s excess insurance coverage for the last three fiscal years. Independent actuarial studies are prepared annually for the Workers’ Compensation and Property and Casualty Risk ISFs. The reported unpaid claims liabilities are based on the results of those annual actuarial studies and include case reserves, development of known claims, incurred but not reported claims, allocated loss adjustment expenses and unallocated loss adjustment expenses. Unpaid claims liabilities are calculated considering inflation, claims cost trends, including frequency and payout of settlements and judgments, interest earnings, and changes in legal and economic factors. Unpaid claims liabilities have been discounted at a rate of 2.50% in the Workers’ Compensation ISF and 1.50% in the Property and Casualty Risk ISF to reflect anticipated future investment earnings. The decrease from 2.00% to 1.50% in FY 2019-20 in the Property and Casualty Risk ISF rate is due to lower than anticipated interest rates for the past few years.
___________________________________________________________________________________________
___________________________________________________________________________________________
Notes to the Basic Financial Statements
(Dollar Amounts in Thousands)
120
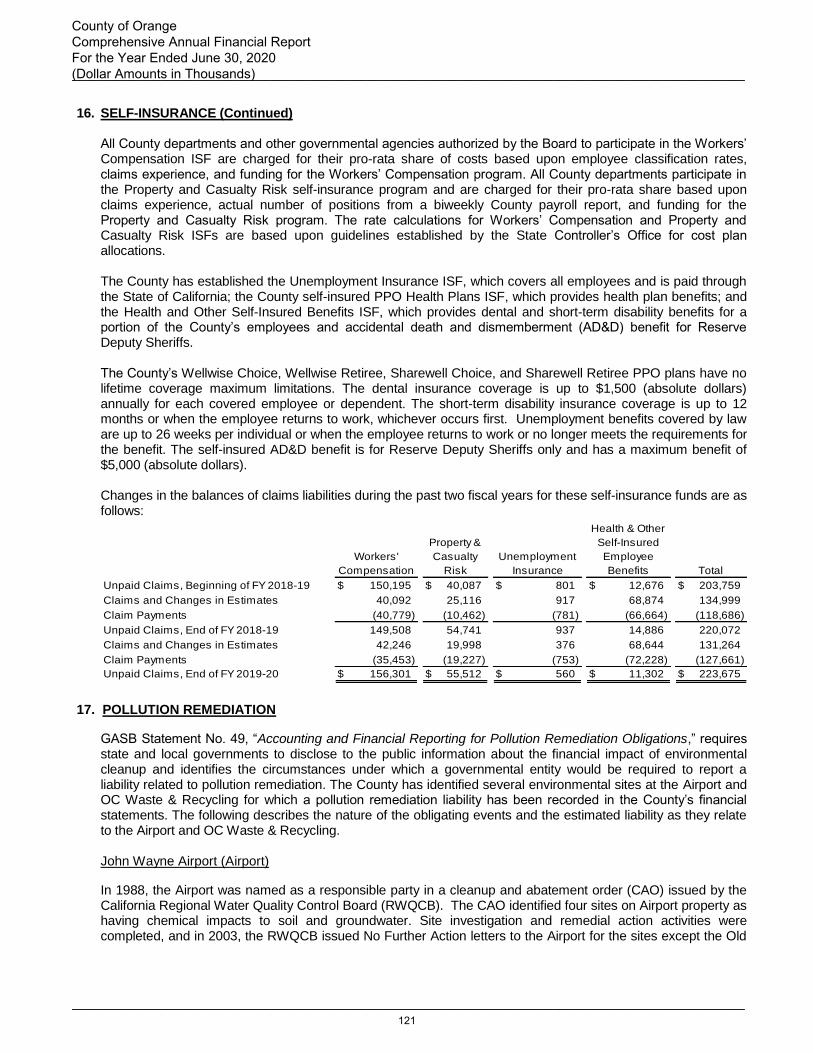
16. SELF-INSURANCE (Continued) All County departments and other governmental agencies authorized by the Board to participate in the Workers’ Compensation ISF are charged for their pro-rata share of costs based upon employee classification rates, claims experience, and funding for the Workers’ Compensation program. All County departments participate in the Property and Casualty Risk self-insurance program and are charged for their pro-rata share based upon claims experience, actual number of positions from a biweekly County payroll report, and funding for the Property and Casualty Risk program. The rate calculations for Workers’ Compensation and Property and Casualty Risk ISFs are based upon guidelines established by the State Controller’s Office for cost plan allocations. The County has established the Unemployment Insurance ISF, which covers all employees and is paid through the State of California; the County self-insured PPO Health Plans ISF, which provides health plan benefits; and the Health and Other Self-Insured Benefits ISF, which provides dental and short-term disability benefits for a portion of the County’s employees and accidental death and dismemberment (AD&D) benefit for Reserve Deputy Sheriffs.
The County’s Wellwise Choice, Wellwise Retiree, Sharewell Choice, and Sharewell Retiree PPO plans have no lifetime coverage maximum limitations. The dental insurance coverage is up to $1,500 (absolute dollars) annually for each covered employee or dependent. The short-term disability insurance coverage is up to 12 months or when the employee returns to work, whichever occurs first. Unemployment benefits covered by law are up to 26 weeks per individual or when the employee returns to work or no longer meets the requirements for the benefit. The self-insured AD&D benefit is for Reserve Deputy Sheriffs only and has a maximum benefit of $5,000 (absolute dollars). Changes in the balances of claims liabilities during the past two fiscal years for these self-insurance funds are as follows:
Unpaid Claims, Beginning of FY 2018-19 $ 150,195 $ 40,087 $ 801 $ 12,676 $ 203,759
Claims and Changes in Estimates 40,092 25,116 917 68,874 134,999
Claim Payments (40,779) (10,462) (781) (66,664) (118,686)
Unpaid Claims, End of FY 2018-19 149,508 54,741 937 14,886 220,072
Claims and Changes in Estimates 42,246 19,998 376 68,644 131,264
Claim Payments (35,453) (19,227) (753) (72,228) (127,661)
Unpaid Claims, End of FY 2019-20 $ 156,301 $ 55,512 $ 560 $ 11,302 $ 223,675
Total
Unemployment
Insurance
Property &
Casualty
Risk
Workers'
Compensation
Health & Other
Self-Insured
Employee
Benefits
17. POLLUTION REMEDIATION
GASB Statement No. 49, “Accounting and Financial Reporting for Pollution Remediation Obligations,” requires state and local governments to disclose to the public information about the financial impact of environmental cleanup and identifies the circumstances under which a governmental entity would be required to report a liability related to pollution remediation. The County has identified several environmental sites at the Airport and OC Waste & Recycling for which a pollution remediation liability has been recorded in the County’s financial statements. The following describes the nature of the obligating events and the estimated liability as they relate to the Airport and OC Waste & Recycling.
John Wayne Airport (Airport)
In 1988, the Airport was named as a responsible party in a cleanup and abatement order (CAO) issued by the California Regional Water Quality Control Board (RWQCB). The CAO identified four sites on Airport property as having chemical impacts to soil and groundwater. Site investigation and remedial action activities were completed, and in 2003, the RWQCB issued No Further Action letters to the Airport for the sites except the Old
___________________________________________________________________________________________
___________________________________________________________________________________________
County of Orange Comprehensive Annual Financial Report For the Year Ended June 30, 2020 (Dollar Amounts in Thousands)
121

17. POLLUTION REMEDIATION (Continued)
John Wayne Airport (Airport) (Continued) Fuel Farm site. At the Old Fuel Farm, site investigation activities were completed, and on-going remedial activities include removal of residual free hydrocarbon product and monitored natural attenuation of groundwater. Annual groundwater sampling and reporting is currently conducted at the Old Fuel Farm, and the reports are prepared and submitted to the RWQCB. In 1993, hydrocarbon-impacted soils were documented following removal of two 1,000-gallon underground storage tanks (USTs) at Former Fire Station #33. Following over-excavation and off-site disposal of hydrocarbon-impacted soils, the Orange County Health Care Agency issued a Completion of Corrective Action Letter to the Airport in 1994 related to the UST removal activities. During geotechnical assessment activities conducted at Former Fire Station #33 in 1999, soils appearing to be impacted with hydrocarbons were encountered and the soil boring logs were submitted to the RWQCB. In 2002, the RWQCB requested that the Airport assess the presence and distribution of chemical impacts to soil and groundwater. Site investigation activities were conducted between 2002 and 2006, and on-going remedial activities include monitored natural attenuation of groundwater. Currently, semi-annual groundwater sampling and reporting is conducted at Former Fire Station #33, and the reports prepared are submitted to the RWQCB. In 2009, a new estimated pollution remediation liability was calculated based on a more active method of remediation for each of the Old Fuel Farm and Former Fire Station #33 sites. Active remediation has been delayed pending further guidance from the RWQCB, which could possibly affect the estimated pollution remediation liability as well as cause changes to the remedial technologies used to remediate the sites. As of June 30, 2020, the Airport has a liability of $994 based on management’s assessment and the results of the consultant’s evaluation of potential remediation costs. The liability is not expected to decrease until active remediation begins or a closure plan is accepted by the RWQCB. In 1995, the Airport entered into a Memorandum of Understanding (MOU) with one of its fixed-base operator (FBO) lessees to address the remediation of the Old Fuel Farm. The FBO was identified as the operator of the site and the other responsible party. The lessee agreed to be obligated to pay 50% of the remediation costs associated with the Old Fuel Farm site. Reported in the Proprietary Funds Statement of Net Position as part of accounts receivable, the total expected recovery for the Old Fuel Farm site is $256 as of June 30, 2020. The estimated pollution remediation obligation as of June 30, 2020, is:
Old Fuel Farm Site $ 785
Former Fire Station #33 Site 692
Less: Remediation Activity (483)
Airport Pollution Remediation Obligation $ 994
OC Waste & Recycling Six closed sites were identified and the remediation costs and time periods were calculated for each of these sites based upon the type of remediation needed and historical trend data for closed landfill sites. The combined pollution remediation obligation ending balance for the year ended June 30, 2020, after deducting actual pollution remediation expenses incurred during fiscal year 2020 is $15,191. Cannery Former Refuse Disposal Station A park owned by the City of Huntington Beach (Huntington Beach), California and an elementary school playground are located on a site that was formerly used as a refuse disposal station operated by the County from 1957 to 1969. Levels of methane gas that exceed regulatory limits were detected on the property.
___________________________________________________________________________________________
___________________________________________________________________________________________
Notes to the Basic Financial Statements
(Dollar Amounts in Thousands)
122
17. POLLUTION REMEDIATION (Continued)
OC Waste & Recycling (Continued) Cannery Former Refuse Disposal Station (Continued) The Local Enforcement Agency (LEA) issued a Notice and Order to Huntington Beach, requiring Huntington Beach to remedy the landfill gas exceedances and to control potential offsite migration of landfill gases. In response to the LEA’s Notice and Order, Huntington Beach and the Huntington Beach City School District (Huntington Beach School District) issued the Notices of Intent to Sue under the Resource and Conservation and Recovery Act and the Comprehensive Environmental Response, Compensation, and Liability Act to the County in 2004. Under an agreement with the County, Huntington Beach, and Huntington Beach School District claims were tolled until June 2006. The County, Huntington Beach, and Huntington Beach School District entered into a Settlement Agreement in 2007 whereby Huntington Beach would be responsible for maintaining the cover of the former disposal site and the County would assume responsibility for the collection and control of landfill gas.
Based on engineering estimates and existing contracts for the operation and maintenance of other disposal sites of a similar size, the age of the site, the length of time waste has been buried and other factors, the County anticipates that the landfill gas collection system will operate fully for 15 years from beginning of the obligation date. The anticipated costs to operate, maintain and monitor the landfill gas collection system over the remaining anticipated operational period is $31. Lane Road Former Refuse Disposal Station The site, located in the City of Irvine, California and owned by NGP Realty Sub, L.P. and others, was leased and operated by the County as a refuse disposal facility from 1961 until its closure in 1964. An investigation revealed that landfill gas was present above regulatory limits in close proximity to residential housing units. The LEA issued a Notice and Order to the property owner requiring them to remedy the landfill gas exceedances, and to control potential offsite migration of landfill gases. In response to the LEA’s Notice and Order, a claim was filed with CEO Risk Management. The County entered into a Settlement Agreement with the property owner in 2005. Per terms of that Settlement Agreement, the County funded the construction of a landfill gas collection and control system, including a carbon treatment element, for the eastern portion of the site. After verification that the system was operating as planned, the County assumed ownership of the system and responsibility for its operation, maintenance and monitoring in 2008. Also in 2008, it was discovered that landfill gas was elevated in the northern portion of the site. Pursuant to the Settlement Agreement, the County designed and constructed an upgrade and enhancement to the existing landfill gas system to control landfill gas migration on the northern portion of the site. Based on engineering estimates and existing contracts for the operation and maintenance of other similar disposal sites, the County anticipates that the landfill gas collection system will operate fully for 25 years from beginning of the obligation date, then will most likely either no longer be required or will be converted to a passive system. The cost for the operation, maintenance and monitoring of the system was highest in the first full year of operation when the carbon canisters needed more regular replacement. For each subsequent year of operation, the cost will be reduced due to less frequent carbon swapping and due to anticipated alternative monitoring requirements. The cost to operate and maintain the landfill gas collection system at the site for the next fiscal year of operation is $310. The anticipated costs to operate, maintain and monitor the landfill gas collection system over the remaining anticipated operational period is $1,469. San Joaquin Former Refuse Disposal Station The site, owned by the University of California at Irvine (UC Irvine), was leased and operated by the County as a refuse disposal facility from 1954 to 1961. In 1996, a portion of the site was sold to the U.S. Food and Drug Administration. Levels of methane gas that exceed regulatory limits were detected on the property. As both parties expressed an interest in avoiding costly litigation, the County entered into negotiations to cooperatively address site concerns, resulting in a Cooperative Agreement with UC Irvine that was approved by the Board in May 2008. Pursuant to the Cooperative Agreement, the County constructed a landfill gas collection and control system, including a carbon treatment element.
___________________________________________________________________________________________
___________________________________________________________________________________________
County of Orange Comprehensive Annual Financial Report For the Year Ended June 30, 2020 (Dollar Amounts in Thousands)
123

17. POLLUTION REMEDIATION (Continued)
OC Waste & Recycling (Continued) San Joaquin Former Refuse Disposal Station (Continued)
The County retains responsibility for the operation, maintenance, and monitoring of that system. Based on engineering estimates and existing contracts for the operation and maintenance of similar disposal sites, the County anticipates that the landfill gas collection system will operate fully for 15 years from beginning of the obligation date. The cost to operate and maintain the landfill gas collection system at the site for the next fiscal year of operation is $141. The remaining obligation for landfill gas remediation at the San Joaquin site over the anticipated operational period is $195.
Forster Former Refuse Disposal Station The site, located in the City of San Juan Capistrano (San Juan Capistrano), California, was formerly leased and operated as a refuse disposal station by the County from 1958 to 1976. The current owner, Advanced Group 99-SJ, is proposing a change in land use for the property and has notified the County of its position that the County is responsible for re-closure of the site to meet current commercial and redevelopment requirements. The County disputes responsibility for site development related costs. In early 2010, San Juan Capistrano approved the proposed project and certified the Environmental Impact Report (EIR). The EIR was a subject of a citizen's referendum that ultimately resulted in affirmation of the proposed project. Subsequent to San Juan Capistrano approval of the proposed development plan, Advanced Group 99-SJ and the County entered into negotiations to resolve issues related to environmental responsibility at the site. These negotiations resulted in a settlement agreement and release of claims, brought about by a threat of litigation over the CEQA approvals. The settlement and release will permit the development of the site, with monies paid by the County for environmental controls to be installed at the site, an operation and maintenance fund and for environmental insurance, subject to conditions such as obtaining grading permits for the site for its actual development. In exchange, indemnification and environmental releases were provided by the developer to the County. The obligation by the County for environmental infrastructure and controls at the site as agreed upon in the Settlement Agreement is $7,500. The entire sum is anticipated to be released within five years from the approval of the project grading permits, but is dependent upon actions by the owner and regulatory approvals for the project. The County will continue to incur additional costs for work related to the County’s current obligation to monitor the groundwater underlying the site. This responsibility will be transferred to the site owner upon completion of one of the settlement agreement milestones, but due to the uncertainty of specific timing, the County is unable to fully estimate the remaining ground water obligations as of June 30, 2020. The remaining balance for landfill gas remediation at the Forster site is $7,500 as of June 30, 2020. Distribution of these funds will occur over time, based on specific milestones in the development of the site. Yorba Refuse Disposal Station The site, located in Orange, California (Orange), was owned and operated as a solid waste disposal site by the County. After disposal operations ceased, the site was sold to Orange for use as a city park. Park deed restrictions were later lifted from the property at the request of the city, which then began investigation into some form of commercial application or development at the site. In 2010, the Orange Redevelopment Agency filed suit against the City of Orange. The Complaint alleged various causes of action, including those for private nuisance, public nuisance, dangerous condition of property and statutory contributions for hazardous substances, and a Porter-Cologne contribution and for Polanco Redevelopment Act cost recovery. The relief sought is for unknown costs and damages. In turn, Orange filed a cross-complaint against the County. The causes of action alleged include indemnity and/or contribution, declaratory relief, hazardous substance account act indemnity and remedies under the Porter-Cologne Act.
The County and Orange entered into negotiations to resolve the issues brought forth by Orange. The negotiations resulted in a settlement agreement and release of claims executed on November 5, 2015. This settlement agreement and release of claims provides a remedy for the differential settlement or subsidence, to replace the irrigation system, and for costs associated with site maintenance with monies paid for by the
___________________________________________________________________________________________
___________________________________________________________________________________________
Notes to the Basic Financial Statements
(Dollar Amounts in Thousands)
124
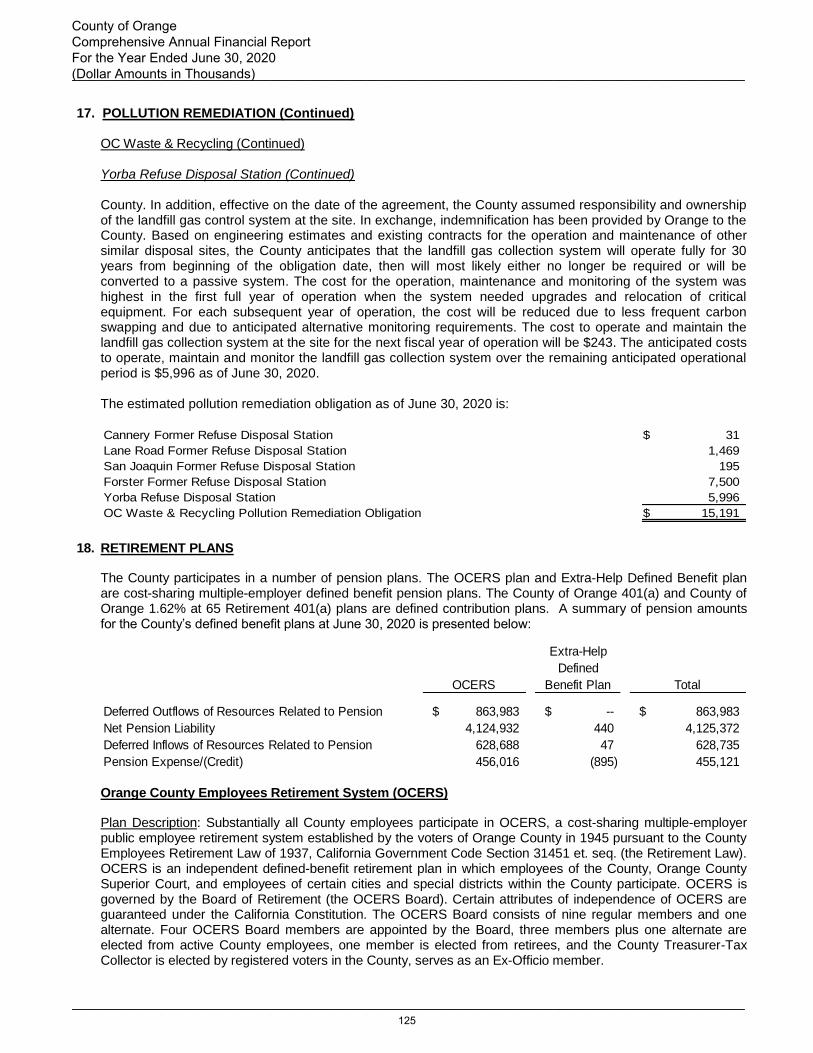
17. POLLUTION REMEDIATION (Continued)
OC Waste & Recycling (Continued) Yorba Refuse Disposal Station (Continued) County. In addition, effective on the date of the agreement, the County assumed responsibility and ownership of the landfill gas control system at the site. In exchange, indemnification has been provided by Orange to the County. Based on engineering estimates and existing contracts for the operation and maintenance of other similar disposal sites, the County anticipates that the landfill gas collection system will operate fully for 30 years from beginning of the obligation date, then will most likely either no longer be required or will be converted to a passive system. The cost for the operation, maintenance and monitoring of the system was highest in the first full year of operation when the system needed upgrades and relocation of critical equipment. For each subsequent year of operation, the cost will be reduced due to less frequent carbon swapping and due to anticipated alternative monitoring requirements. The cost to operate and maintain the landfill gas collection system at the site for the next fiscal year of operation will be $243. The anticipated costs to operate, maintain and monitor the landfill gas collection system over the remaining anticipated operational period is $5,996 as of June 30, 2020. The estimated pollution remediation obligation as of June 30, 2020 is:
Cannery Former Refuse Disposal Station $ 31
Lane Road Former Refuse Disposal Station 1,469
San Joaquin Former Refuse Disposal Station 195
Forster Former Refuse Disposal Station 7,500
Yorba Refuse Disposal Station 5,996
OC Waste & Recycling Pollution Remediation Obligation $ 15,191
18. RETIREMENT PLANS
The County participates in a number of pension plans. The OCERS plan and Extra-Help Defined Benefit plan are cost-sharing multiple-employer defined benefit pension plans. The County of Orange 401(a) and County of Orange 1.62% at 65 Retirement 401(a) plans are defined contribution plans. A summary of pension amounts for the County’s defined benefit plans at June 30, 2020 is presented below:
Deferred Outflows of Resources Related to Pension $ 863,983 $ -- $ 863,983
Net Pension Liability 4,124,932 440 4,125,372
Deferred Inflows of Resources Related to Pension 628,688 47 628,735
Pension Expense/(Credit) 456,016 (895) 455,121
Total
Extra-Help
Defined
Benefit PlanOCERS
Orange County Employees Retirement System (OCERS) Plan Description: Substantially all County employees participate in OCERS, a cost-sharing multiple-employer public employee retirement system established by the voters of Orange County in 1945 pursuant to the County Employees Retirement Law of 1937, California Government Code Section 31451 et. seq. (the Retirement Law). OCERS is an independent defined-benefit retirement plan in which employees of the County, Orange County Superior Court, and employees of certain cities and special districts within the County participate. OCERS is governed by the Board of Retirement (the OCERS Board). Certain attributes of independence of OCERS are guaranteed under the California Constitution. The OCERS Board consists of nine regular members and one alternate. Four OCERS Board members are appointed by the Board, three members plus one alternate are elected from active County employees, one member is elected from retirees, and the County Treasurer-Tax Collector is elected by registered voters in the County, serves as an Ex-Officio member.
___________________________________________________________________________________________
___________________________________________________________________________________________
County of Orange Comprehensive Annual Financial Report For the Year Ended June 30, 2020 (Dollar Amounts in Thousands)
125

18. RETIREMENT PLANS (Continued)
Orange County Employees Retirement System (OCERS) (Continued)
Plan Description (Continued)
The OCERS Board supervises the investment of OCERS assets and the distribution of benefits to retired employees. The OCERS Board also determines the annual contributions required of the County and other participating local governmental entities to fund OCERS. The Retirement Law requires an actuarial valuation to be performed at least once every three years. OCERS’ practice has been to conduct an actuarial valuation annually as of December 31, which is the end of the OCERS fiscal year. OCERS operates as a cost-sharing multi-employer defined benefit pension plan for the County, Orange County Superior Court of California, City of San Juan Capistrano, and ten special districts: Orange County Cemetery District, Orange County Children and Families Commission, Orange County Department of Education, Orange County Employees Retirement System, Orange County Fire Authority, Orange County In-Home Supportive Services Public Authority, Orange County Local Agency Formation Commission (LAFCO), Orange County Public Law Library, Orange County Sanitation District, Orange County Transportation Authority, Transportation Corridor Agencies and the University of California, Irvine Medical Center and Campus. The Orange County Department of Education and the University of California, Irvine Medical Center and Campus are closed to new member participation. Capistrano Beach, Cypress Recreation & Parks District, Orange County Mosquito and Vector Control and City of Rancho Santa Margarita are no longer active plan sponsors, but retired members and their beneficiaries, as well as deferred members, remain in the System. OCERS is legally and fiscally independent of the County. Benefits Provided: OCERS provides for retirement, death, disability, and cost-of-living benefits. Under OCERS, each County employee receives a defined-benefit pension at retirement, that is, a specific amount per month determined in accordance with the Retirement Law, which amount is not dependent upon the amount of money credited to the employee’s account at the time of retirement. An OCERS member may be eligible for a Disability Retirement allowance. The member will be asked to designate a beneficiary or beneficiaries, who may be entitled to receive lifetime and/or lump sum benefits that may be payable upon a member’s death. OCERS also provides two types of disability benefits, a nonservice-connected disability retirement or service-connected disability retirement. Under each type, the eligibility requirements are different. More information can be found on www.ocers.org. The OCERS Board does not set the benefit amounts. OCERS administers benefits that are set by the County Board through the collective bargaining process with County employees in accordance with the Retirement Law.
Effective June 28, 2002, Safety members, including Probation Services employees, became eligible for an annual annuity equal to a retirement benefit formula of 3% of the member’s “final compensation” for each year of service rendered at age 50. Law enforcement management, which includes executives in the Sheriff-Coroner and District Attorney departments, and employees represented by the Association of Orange County Deputy Sheriffs hired after April 9, 2010, receive an annual annuity equal to a retirement benefit formula of 3% of the member’s “final compensation” for each year of service rendered at age 55.
Effective July 1, 2005, as part of collective bargaining agreements with County employees, most General members who work for the County (approximately 14,000) became eligible for an enhanced annual annuity equal to a retirement benefit formula of 2.7% of the member’s “final compensation” for each year of service rendered at age 55. In collective bargaining agreements with General members, the employee associations agreed to pay the increased retirement costs related to the difference between the prior retirement benefit formulas and the new 2.7% at age 55 enhanced formula, as well as the annual amortization of the unfunded liability created by the retroactive application of the increased benefit. Members of the American Federation of State, County and Municipal Employees (AFSCME) did not elect the 2.7% at age 55 retirement formula and remain at the previous benefit formulas. The benefit formulas for AFSCME are an annual annuity equal to 2% of the “final compensation” for each year of service rendered at age 57 for Tier I General members and 1.667% of
___________________________________________________________________________________________
___________________________________________________________________________________________
Notes to the Basic Financial Statements
(Dollar Amounts in Thousands)
126
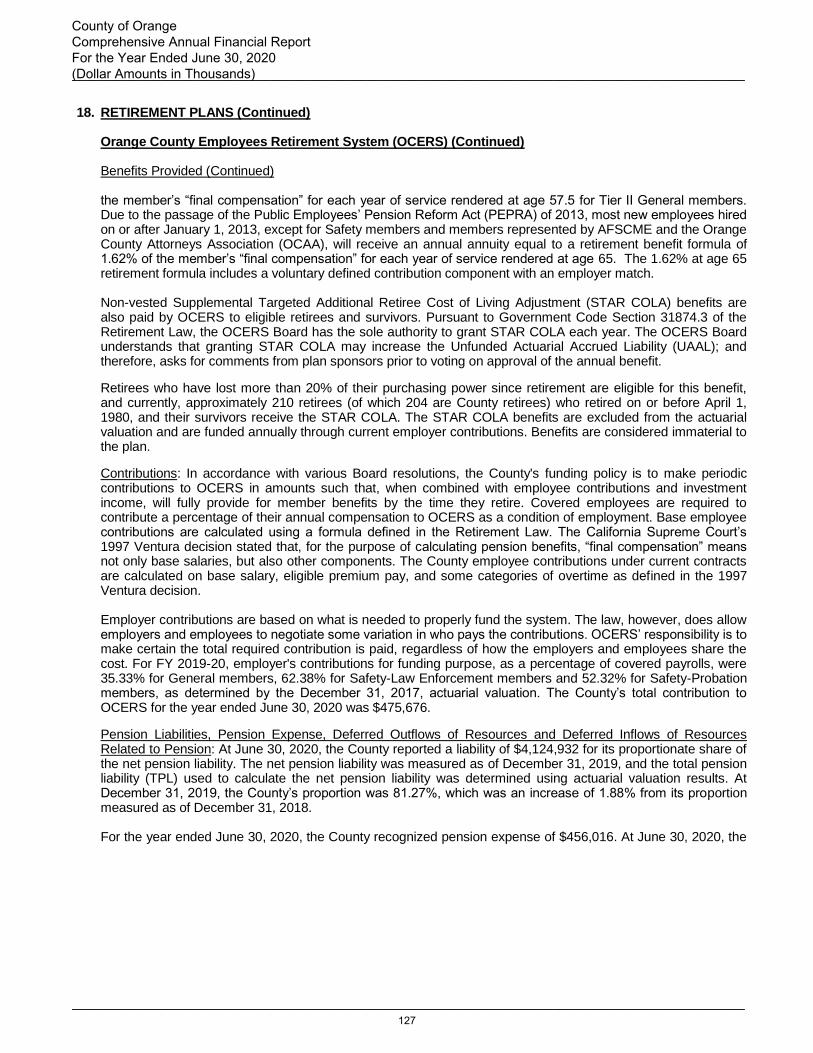
18. RETIREMENT PLANS (Continued)
Orange County Employees Retirement System (OCERS) (Continued) Benefits Provided (Continued) the member’s “final compensation” for each year of service rendered at age 57.5 for Tier II General members. Due to the passage of the Public Employees’ Pension Reform Act (PEPRA) of 2013, most new employees hired on or after January 1, 2013, except for Safety members and members represented by AFSCME and the Orange County Attorneys Association (OCAA), will receive an annual annuity equal to a retirement benefit formula of 1.62% of the member’s “final compensation” for each year of service rendered at age 65. The 1.62% at age 65 retirement formula includes a voluntary defined contribution component with an employer match. Non-vested Supplemental Targeted Additional Retiree Cost of Living Adjustment (STAR COLA) benefits are also paid by OCERS to eligible retirees and survivors. Pursuant to Government Code Section 31874.3 of the Retirement Law, the OCERS Board has the sole authority to grant STAR COLA each year. The OCERS Board understands that granting STAR COLA may increase the Unfunded Actuarial Accrued Liability (UAAL); and therefore, asks for comments from plan sponsors prior to voting on approval of the annual benefit.
Retirees who have lost more than 20% of their purchasing power since retirement are eligible for this benefit, and currently, approximately 210 retirees (of which 204 are County retirees) who retired on or before April 1, 1980, and their survivors receive the STAR COLA. The STAR COLA benefits are excluded from the actuarial valuation and are funded annually through current employer contributions. Benefits are considered immaterial to the plan.
Contributions: In accordance with various Board resolutions, the County's funding policy is to make periodic contributions to OCERS in amounts such that, when combined with employee contributions and investment income, will fully provide for member benefits by the time they retire. Covered employees are required to contribute a percentage of their annual compensation to OCERS as a condition of employment. Base employee contributions are calculated using a formula defined in the Retirement Law. The California Supreme Court’s 1997 Ventura decision stated that, for the purpose of calculating pension benefits, “final compensation” means not only base salaries, but also other components. The County employee contributions under current contracts are calculated on base salary, eligible premium pay, and some categories of overtime as defined in the 1997 Ventura decision. Employer contributions are based on what is needed to properly fund the system. The law, however, does allow employers and employees to negotiate some variation in who pays the contributions. OCERS’ responsibility is to make certain the total required contribution is paid, regardless of how the employers and employees share the cost. For FY 2019-20, employer's contributions for funding purpose, as a percentage of covered payrolls, were 35.33% for General members, 62.38% for Safety-Law Enforcement members and 52.32% for Safety-Probation members, as determined by the December 31, 2017, actuarial valuation. The County’s total contribution to OCERS for the year ended June 30, 2020 was $475,676.
Pension Liabilities, Pension Expense, Deferred Outflows of Resources and Deferred Inflows of Resources Related to Pension: At June 30, 2020, the County reported a liability of $4,124,932 for its proportionate share of the net pension liability. The net pension liability was measured as of December 31, 2019, and the total pension liability (TPL) used to calculate the net pension liability was determined using actuarial valuation results. At December 31, 2019, the County’s proportion was 81.27%, which was an increase of 1.88% from its proportion measured as of December 31, 2018. For the year ended June 30, 2020, the County recognized pension expense of $456,016. At June 30, 2020, the
___________________________________________________________________________________________
___________________________________________________________________________________________
County of Orange Comprehensive Annual Financial Report For the Year Ended June 30, 2020 (Dollar Amounts in Thousands)
127
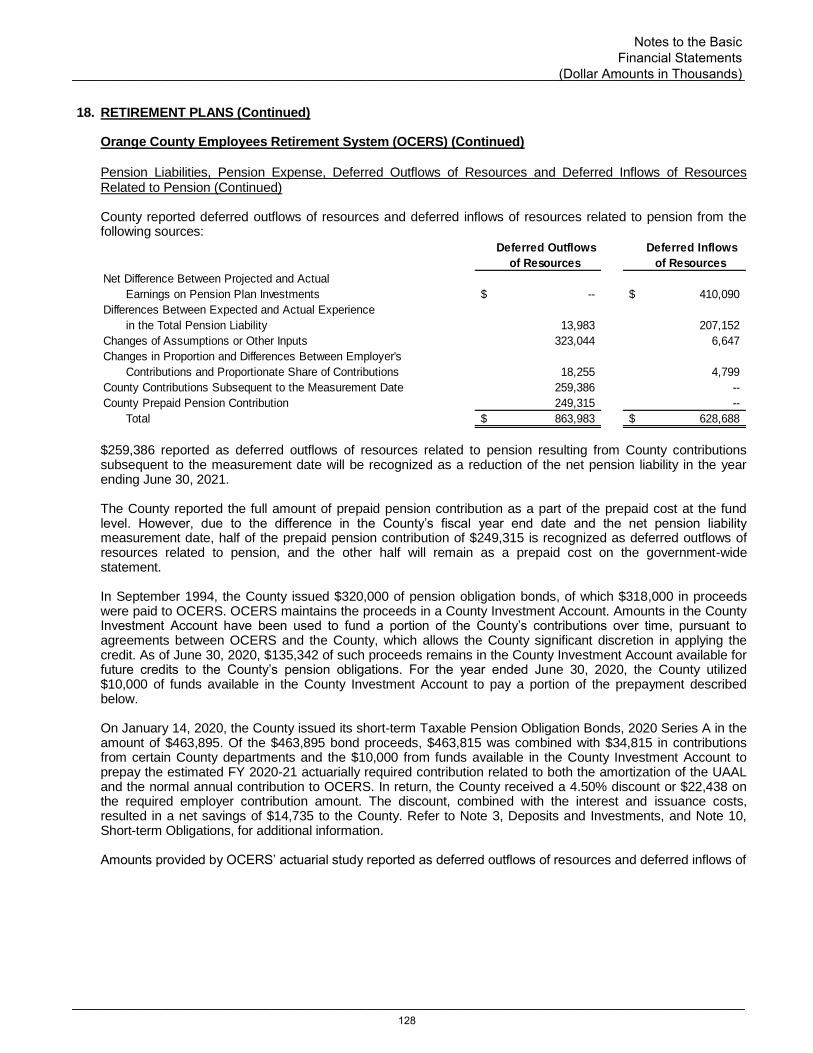
18. RETIREMENT PLANS (Continued)
Orange County Employees Retirement System (OCERS) (Continued) Pension Liabilities, Pension Expense, Deferred Outflows of Resources and Deferred Inflows of Resources Related to Pension (Continued) County reported deferred outflows of resources and deferred inflows of resources related to pension from the following sources:
Deferred Outflows
of Resources
Deferred Inflows
of Resources
Net Difference Between Projected and Actual
Earnings on Pension Plan Investments $ -- $ 410,090
Differences Between Expected and Actual Experience
in the Total Pension Liability 13,983 207,152
Changes of Assumptions or Other Inputs 323,044 6,647
Changes in Proportion and Differences Between Employer's
Contributions and Proportionate Share of Contributions 18,255 4,799
County Contributions Subsequent to the Measurement Date 259,386 --
County Prepaid Pension Contribution 249,315 --
Total $ 863,983 $ 628,688
$259,386 reported as deferred outflows of resources related to pension resulting from County contributions subsequent to the measurement date will be recognized as a reduction of the net pension liability in the year ending June 30, 2021.
The County reported the full amount of prepaid pension contribution as a part of the prepaid cost at the fund level. However, due to the difference in the County’s fiscal year end date and the net pension liability measurement date, half of the prepaid pension contribution of $249,315 is recognized as deferred outflows of resources related to pension, and the other half will remain as a prepaid cost on the government-wide statement. In September 1994, the County issued $320,000 of pension obligation bonds, of which $318,000 in proceeds were paid to OCERS. OCERS maintains the proceeds in a County Investment Account. Amounts in the County Investment Account have been used to fund a portion of the County’s contributions over time, pursuant to agreements between OCERS and the County, which allows the County significant discretion in applying the credit. As of June 30, 2020, $135,342 of such proceeds remains in the County Investment Account available for future credits to the County’s pension obligations. For the year ended June 30, 2020, the County utilized $10,000 of funds available in the County Investment Account to pay a portion of the prepayment described below. On January 14, 2020, the County issued its short-term Taxable Pension Obligation Bonds, 2020 Series A in the amount of $463,895. Of the $463,895 bond proceeds, $463,815 was combined with $34,815 in contributions from certain County departments and the $10,000 from funds available in the County Investment Account to prepay the estimated FY 2020-21 actuarially required contribution related to both the amortization of the UAAL and the normal annual contribution to OCERS. In return, the County received a 4.50% discount or $22,438 on the required employer contribution amount. The discount, combined with the interest and issuance costs, resulted in a net savings of $14,735 to the County. Refer to Note 3, Deposits and Investments, and Note 10, Short-term Obligations, for additional information. Amounts provided by OCERS’ actuarial study reported as deferred outflows of resources and deferred inflows of
___________________________________________________________________________________________
___________________________________________________________________________________________
Notes to the Basic Financial Statements
(Dollar Amounts in Thousands)
128

18. RETIREMENT PLANS (Continued)
Orange County Employees Retirement System (OCERS) (Continued) Pension Liabilities, Pension Expense, Deferred Outflows of Resources and Deferred Inflows of Resources Related to Pension (Continued) resources related to pension will be recognized as follows:
Year ending June 30:
2021 $ (135,898)
2022 (67,742)
2023 116,049
2024 (182,563)
2025 (3,252)
Total $ (273,406)
Actuarial Assumptions: The actuarial assumptions included a 2.75% inflation rate, 4.25% to 12.25% projected salary increases to general members and 4.75% to 17.25% to safety members, and a 7.00% investment rate of return, net of investment expense. The mortality assumptions used were based on the results of the actuarial experience study for the period of January 1, 2014 through December 31, 2016, using the Headcount-Weighted RP-2014 Healthy Annuitant Mortality Tables projected generationally with the two-dimensional MP-2016 projection scale.
Discount Rate: The discount rate used to measure the total pension liability was 7.00%, the long-term expected rate of return on pension plan investments. The projection of cash flows used to determine the discount rate assumed plan member contributions will be made at the current contribution rate and that the employer contributions will be made at rates equal to the actuarially determined contribution rates.
According to Paragraph 30 of GASB Statement No. 68, the long-term expected rate of return should be determined net of pension plan investment expense but without reduction for pension plan administrative expenses. The 7.00% investment return assumption used in this accounting valuation is net of administrative expenses. Administrative expenses are assumed to be 13 basis points. Using this lower discount rate has resulted in a slightly higher total pension liability and net pension liability. The difference is not material to the County’s financial statements. The long-term expected rate of return on pension plan investments was determined using a building-block method in which expected future real rates of return (expected returns, net of inflation) are developed for each major asset class. These returns are combined to produce the long-term expected rate of return by weighting the expected future real rate of return by the target asset allocation percentage adding expected inflation and deducting expected investment expenses and a risk margin. The target allocation and projected arithmetic real rates of return for each major asset class, after deducting inflation but before deducting investment expenses, used in the derivation of the long-term expected investment rate of return assumption are summarized in the following table:
___________________________________________________________________________________________
___________________________________________________________________________________________
County of Orange Comprehensive Annual Financial Report For the Year Ended June 30, 2020 (Dollar Amounts in Thousands)
129

18. RETIREMENT PLANS (Continued)
Orange County Employees Retirement System (OCERS) (Continued) Discount Rate (Continued)
Asset class Target Allocation
Long-Term Expected
Real Rate of Return
Global Equity 35.00% 6.38%
Core Bonds 13.00% 1.03%
High Yield Bonds 4.00% 3.52%
Bank Loan 2.00% 2.86%
TIPS 4.00% 0.96%
Emerging Market Debt 4.00% 3.78%
Real Estate 10.00% 4.33%
Core Infrastructure 2.00% 5.48%
Natural Resources 10.00% 7.86%
Risk Mitigation 5.00% 4.66%
Mezzanine/Distressed Debts 3.00% 6.53%
Private Equity 8.00% 9.48%
Total 100.00%
Sensitivity of the County’s Proportionate Share of the Net Pension Liability to Changes in the Discount Rate: The following presents the County’s proportionate share of the net pension liability calculated using the discount rate of 7.00%, as well as what the County’s proportionate share of the net pension liability would be if it were calculated using a discount rate that is 1-percentage-point lower (6.00%) or 1-percentage-point higher (8.00%) than the current rate:
County’s proportionate share of the
net pension liability $ 6,457,732 $ 4,124,932 $ 2,227,420
Current
Discount Rate
(7.00%)
1%
Increase
(8.00%)
1%
Decrease
(6.00%)
Pension Plan Fiduciary Net Position: OCERS issues an audited stand-alone annual financial report for each year ending December 31. Detailed information about the pension plan’s fiduciary net position is available and can be obtained online at www.ocers.org, in writing to the Orange County Employees Retirement System, 2223 East Wellington Avenue, Suite 100, Santa Ana, CA 92701, or by calling (714) 558-6200.
County Administered Plan
Extra-Help Defined Benefit Plan
Plan Description: The plan is a cost-sharing multiple-employer defined benefit retirement plan for employees working less than half-time or as extra-help for the County and six (6) other cost-sharing agencies. Eligible employees of this plan are not covered by OCERS or Social Security. Initially, the normal retirement benefits for a participant who retired on or after the normal retirement date was a monthly amount equal to one-twelfth of 2% of the participant’s career earnings during the final 30 years of service credited under the Plan. There are no automatic cost-of-living adjustment (COLA) increases and no ad hoc COLAs have ever been granted. The current benefit for a participant who terminates or retires after November 20, 2008 is a lump sum payment, which is the greater of the actuarial equivalent of the participant’s frozen accrued monthly benefit or the participant’s contribution plus interest earnings. The normal retirement date is the first day of the month coinciding with or immediately preceding a participant’s 65th birthday. The plan was adopted to comply with the Omnibus Budget Reconciliation Act of 1990. The Board has full authority to amend or establish plan or benefit provisions at any time in accordance with the plan. The County is the named fiduciary and has the duty and full power to administer the plan. The Chief Financial Officer of the County is the trustee of the plan and has authority over the management and investment of plan assets.
___________________________________________________________________________________________
___________________________________________________________________________________________
Notes to the Basic Financial Statements
(Dollar Amounts in Thousands)
130

18. RETIREMENT PLANS (Continued)
County Administered Plans (Continued)
Extra-Help Defined Benefit Plan (Continued)
Plan Description (Continued) The plan was adopted in January 1992 and was closed to new participants as of February 28, 2002. This plan subsequently froze benefit accruals and stopped collecting employee contributions effective November 21, 2008. As of that date, the normal retirement benefit was changed to a single lump sum distribution equal to the greater of the participant’s account balance or the present value of their normal retirement benefit. As of June 30, 2020, the plan consists of 16 active plan participants, 171 terminated plan participants entitled to but not yet receiving benefits, and 36 retirees receiving benefits.
The plan financial statements are prepared using the accrual basis of accounting. County contributions are recognized in the period in which contributions are due, pursuant to the plan documentation and as may be required by statutory requirements. The benefits paid to participants and refunds of prior contributions are recognized when due and payable, in accordance with the terms of the plan. The County charges a benefits administration fee to County agencies, which funds the cost of administering all of the County benefit programs, including the Extra-Help Defined Benefit Retirement Plan. The Empower Retirement Investment management fee is an annual asset-based fee of 8.5 basis points (each basis point is one hundredth of a percent). Contributions: The County has the authority to determine plan contributions. GASB Statement No. 67 requires the County to have an actuarial valuation performed at least biennially to determine the plan’s total pension liability. This valuation is currently performed biennially. The plan’s total pension liability was calculated using the data as of July 1, 2019, rolled forward to June 30, 2020 using actual benefit payments for FY 2019-20. In both the 2019 valuation and the 2020 roll forward calculations the actuarial assets are valued at market value. Because plan benefits are frozen, the actuary has determined the County’s actuarially determined contribution using the projected unit credit method and a 5-year rolling amortization of the Unfunded Actuarial Accrued Liability. Based on the plan actuary’s advice, the County determines the amount necessary for contribution to the plan. Since the plan’s inception, the County and six (6) cost-sharing agencies have contributed $7,696. For the year ended June 30, 2020, the County and six (6) cost-sharing agencies contributed $114. The County’s proportionate share of the contribution was $112. Plan participants do not contribute to the fund effective November 21, 2008 (the date of the freeze). Note that effective November 21, 2008, there is no normal cost due to the plan freeze.
Investment policy: The County has sole authority for establishing and amending the plan’s investment policy and allocation of the invested assets. The plan's policy in regard to the allocation of invested assets may be established and amended by the plan’s Trustee. The plan may invest in bonds, mortgages, notes, common or preferred stock, mutual funds, or other securities, policies of life insurance, annuity contracts, or property (real, bank deposits, or retain in cash or other property). The allocation policy with the target asset class and allocation is set forth in the investment policy.
Concentrations: The plan is invested 100% with Empower Retirement. The plan has stated its assets at fair value based on information provided by Empower Retirement. Discount Rate: For the year ended June 30, 2020, the annual money-weighted rate of return on the Plan’s investments, net of pension plan investment expense, was 4.56%. The money-weighted rate of return expresses investment performance, net of investment expense, adjusted for the changing amounts actually invested. The discount rate used to measure the total pension liability was 5.25%, the same as the long-term expected rate of return on plan assets.
___________________________________________________________________________________________
___________________________________________________________________________________________
County of Orange Comprehensive Annual Financial Report For the Year Ended June 30, 2020 (Dollar Amounts in Thousands)
131
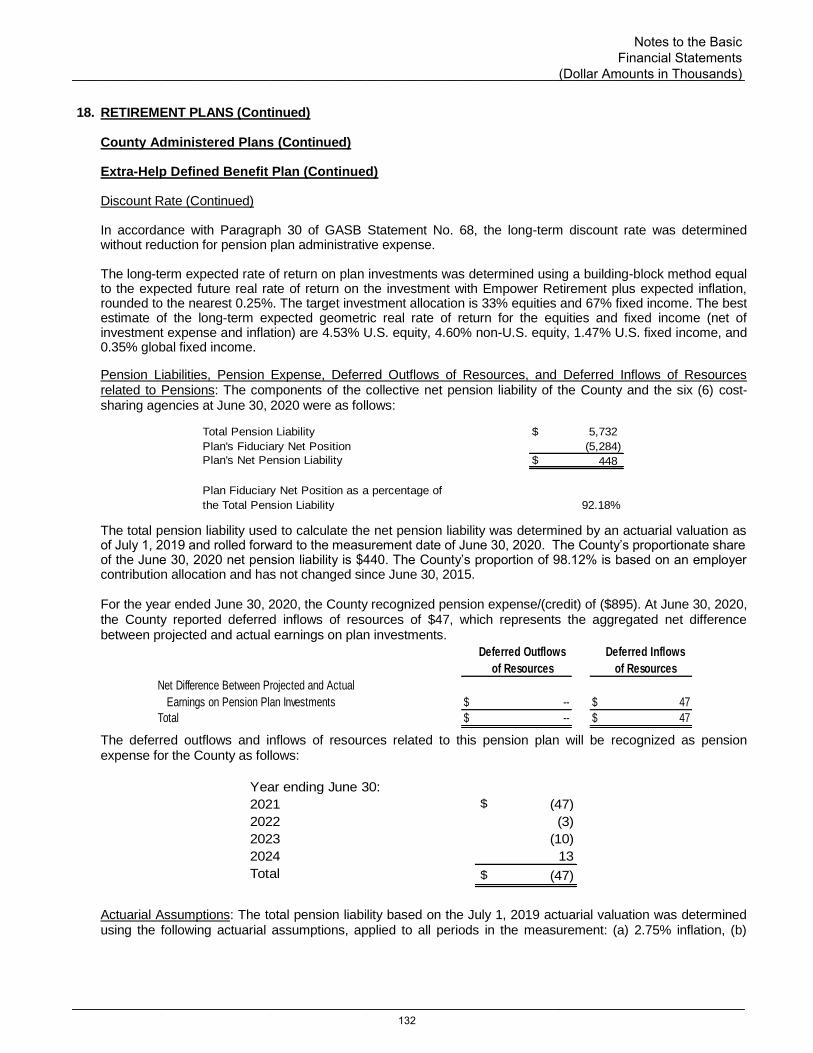
18. RETIREMENT PLANS (Continued)
County Administered Plans (Continued)
Extra-Help Defined Benefit Plan (Continued) Discount Rate (Continued)
In accordance with Paragraph 30 of GASB Statement No. 68, the long-term discount rate was determined without reduction for pension plan administrative expense.
The long-term expected rate of return on plan investments was determined using a building-block method equal to the expected future real rate of return on the investment with Empower Retirement plus expected inflation, rounded to the nearest 0.25%. The target investment allocation is 33% equities and 67% fixed income. The best estimate of the long-term expected geometric real rate of return for the equities and fixed income (net of investment expense and inflation) are 4.53% U.S. equity, 4.60% non-U.S. equity, 1.47% U.S. fixed income, and 0.35% global fixed income.
Pension Liabilities, Pension Expense, Deferred Outflows of Resources, and Deferred Inflows of Resources related to Pensions: The components of the collective net pension liability of the County and the six (6) cost-sharing agencies at June 30, 2020 were as follows:
Total Pension Liability $ 5,732
Plan's Fiduciary Net Position (5,284)
Plan's Net Pension Liability $ 448
Plan Fiduciary Net Position as a percentage of
the Total Pension Liability 92.18%
The total pension liability used to calculate the net pension liability was determined by an actuarial valuation as of July 1, 2019 and rolled forward to the measurement date of June 30, 2020. The County’s proportionate share of the June 30, 2020 net pension liability is $440. The County’s proportion of 98.12% is based on an employer contribution allocation and has not changed since June 30, 2015.
For the year ended June 30, 2020, the County recognized pension expense/(credit) of ($895). At June 30, 2020, the County reported deferred inflows of resources of $47, which represents the aggregated net difference between projected and actual earnings on plan investments.
Deferred Outflows
of Resources
Deferred Inflows
of Resources
Net Difference Between Projected and Actual
Earnings on Pension Plan Investments $ -- $ 47
Total $ -- $ 47
The deferred outflows and inflows of resources related to this pension plan will be recognized as pension expense for the County as follows:
Year ending June 30:
2021 $ (47)
2022 (3)
2023 (10)
2024 13
Total $ (47)
Actuarial Assumptions: The total pension liability based on the July 1, 2019 actuarial valuation was determined using the following actuarial assumptions, applied to all periods in the measurement: (a) 2.75% inflation, (b)
___________________________________________________________________________________________
___________________________________________________________________________________________
Notes to the Basic Financial Statements
(Dollar Amounts in Thousands)
132
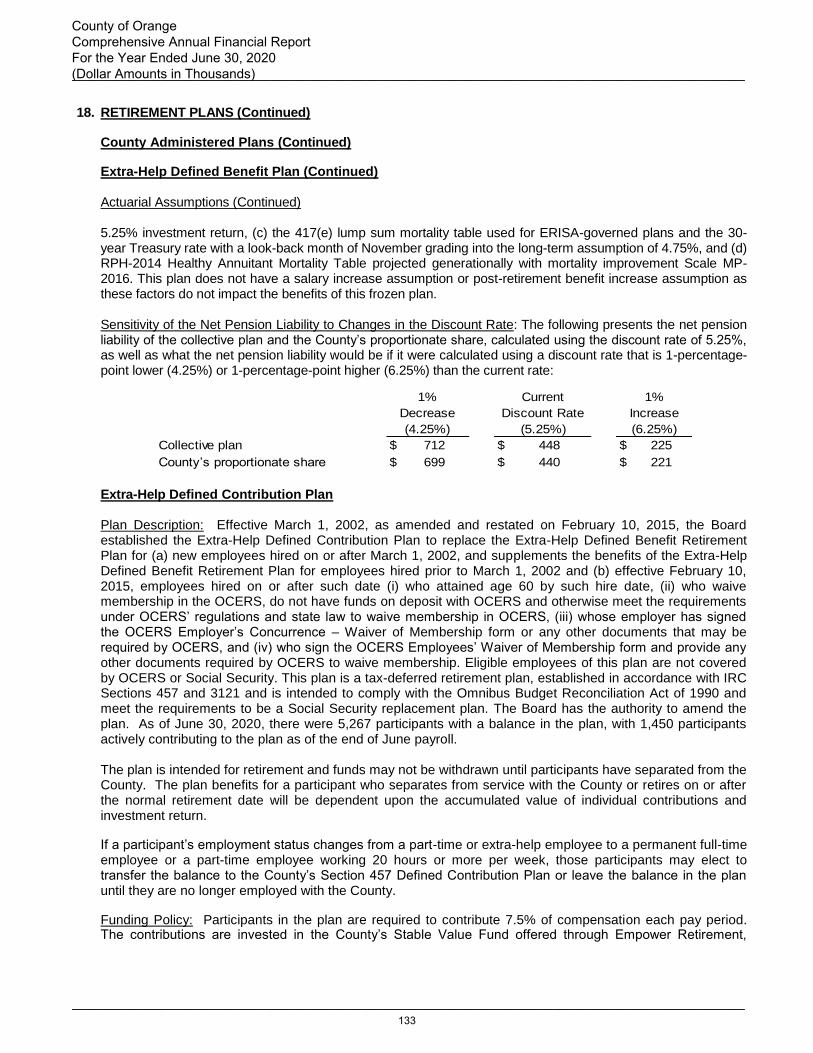
18. RETIREMENT PLANS (Continued)
County Administered Plans (Continued) Extra-Help Defined Benefit Plan (Continued) Actuarial Assumptions (Continued) 5.25% investment return, (c) the 417(e) lump sum mortality table used for ERISA-governed plans and the 30-year Treasury rate with a look-back month of November grading into the long-term assumption of 4.75%, and (d) RPH-2014 Healthy Annuitant Mortality Table projected generationally with mortality improvement Scale MP-2016. This plan does not have a salary increase assumption or post-retirement benefit increase assumption as these factors do not impact the benefits of this frozen plan. Sensitivity of the Net Pension Liability to Changes in the Discount Rate: The following presents the net pension liability of the collective plan and the County’s proportionate share, calculated using the discount rate of 5.25%, as well as what the net pension liability would be if it were calculated using a discount rate that is 1-percentage-point lower (4.25%) or 1-percentage-point higher (6.25%) than the current rate:
Collective plan $ 712 $ 448 $ 225
County’s proportionate share $ 699 $ 440 $ 221
1%
Increase
(6.25%)
Current
Discount Rate
(5.25%)
1%
Decrease
(4.25%)
Extra-Help Defined Contribution Plan Plan Description: Effective March 1, 2002, as amended and restated on February 10, 2015, the Board established the Extra-Help Defined Contribution Plan to replace the Extra-Help Defined Benefit Retirement Plan for (a) new employees hired on or after March 1, 2002, and supplements the benefits of the Extra-Help Defined Benefit Retirement Plan for employees hired prior to March 1, 2002 and (b) effective February 10, 2015, employees hired on or after such date (i) who attained age 60 by such hire date, (ii) who waive membership in the OCERS, do not have funds on deposit with OCERS and otherwise meet the requirements under OCERS’ regulations and state law to waive membership in OCERS, (iii) whose employer has signed the OCERS Employer’s Concurrence – Waiver of Membership form or any other documents that may be required by OCERS, and (iv) who sign the OCERS Employees’ Waiver of Membership form and provide any other documents required by OCERS to waive membership. Eligible employees of this plan are not covered by OCERS or Social Security. This plan is a tax-deferred retirement plan, established in accordance with IRC Sections 457 and 3121 and is intended to comply with the Omnibus Budget Reconciliation Act of 1990 and meet the requirements to be a Social Security replacement plan. The Board has the authority to amend the plan. As of June 30, 2020, there were 5,267 participants with a balance in the plan, with 1,450 participants actively contributing to the plan as of the end of June payroll. The plan is intended for retirement and funds may not be withdrawn until participants have separated from the County. The plan benefits for a participant who separates from service with the County or retires on or after the normal retirement date will be dependent upon the accumulated value of individual contributions and investment return.
If a participant’s employment status changes from a part-time or extra-help employee to a permanent full-time employee or a part-time employee working 20 hours or more per week, those participants may elect to transfer the balance to the County’s Section 457 Defined Contribution Plan or leave the balance in the plan until they are no longer employed with the County. Funding Policy: Participants in the plan are required to contribute 7.5% of compensation each pay period. The contributions are invested in the County’s Stable Value Fund offered through Empower Retirement,
___________________________________________________________________________________________
___________________________________________________________________________________________
County of Orange Comprehensive Annual Financial Report For the Year Ended June 30, 2020 (Dollar Amounts in Thousands)
133
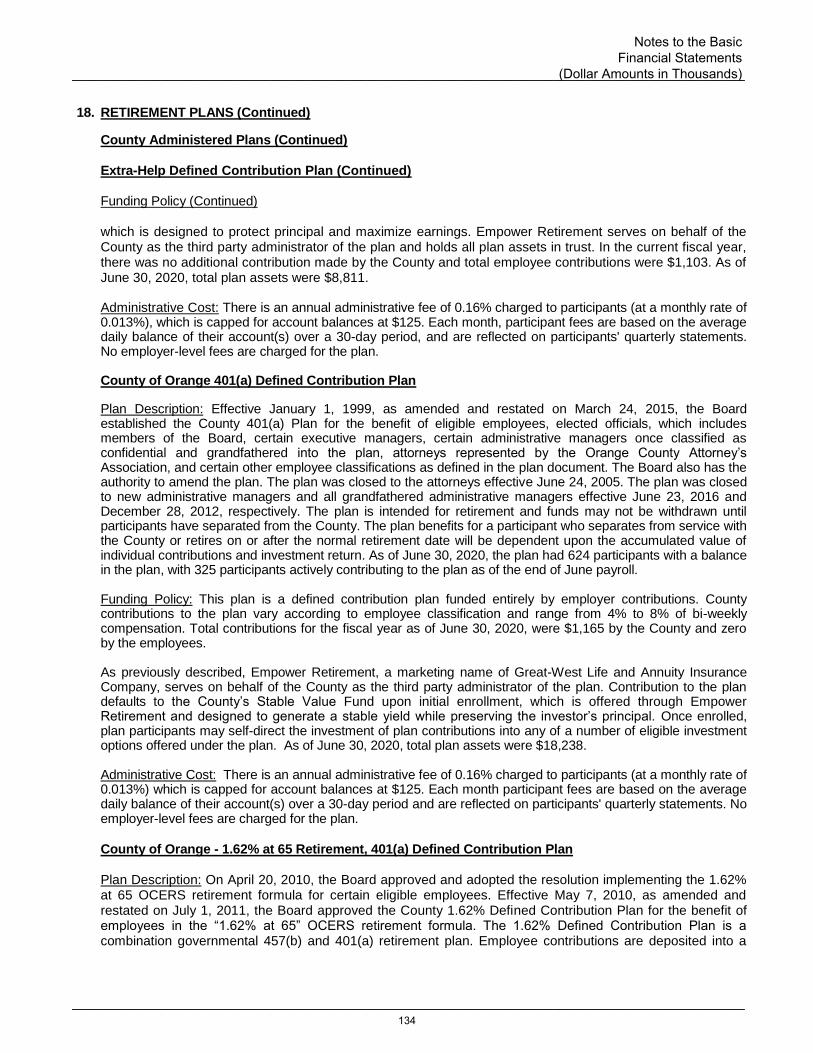
18. RETIREMENT PLANS (Continued)
County Administered Plans (Continued) Extra-Help Defined Contribution Plan (Continued) Funding Policy (Continued) which is designed to protect principal and maximize earnings. Empower Retirement serves on behalf of the County as the third party administrator of the plan and holds all plan assets in trust. In the current fiscal year, there was no additional contribution made by the County and total employee contributions were $1,103. As of June 30, 2020, total plan assets were $8,811. Administrative Cost: There is an annual administrative fee of 0.16% charged to participants (at a monthly rate of 0.013%), which is capped for account balances at $125. Each month, participant fees are based on the average daily balance of their account(s) over a 30-day period, and are reflected on participants' quarterly statements. No employer-level fees are charged for the plan.
County of Orange 401(a) Defined Contribution Plan
Plan Description: Effective January 1, 1999, as amended and restated on March 24, 2015, the Board established the County 401(a) Plan for the benefit of eligible employees, elected officials, which includes members of the Board, certain executive managers, certain administrative managers once classified as confidential and grandfathered into the plan, attorneys represented by the Orange County Attorney’s Association, and certain other employee classifications as defined in the plan document. The Board also has the authority to amend the plan. The plan was closed to the attorneys effective June 24, 2005. The plan was closed to new administrative managers and all grandfathered administrative managers effective June 23, 2016 and December 28, 2012, respectively. The plan is intended for retirement and funds may not be withdrawn until participants have separated from the County. The plan benefits for a participant who separates from service with the County or retires on or after the normal retirement date will be dependent upon the accumulated value of individual contributions and investment return. As of June 30, 2020, the plan had 624 participants with a balance in the plan, with 325 participants actively contributing to the plan as of the end of June payroll. Funding Policy: This plan is a defined contribution plan funded entirely by employer contributions. County contributions to the plan vary according to employee classification and range from 4% to 8% of bi-weekly compensation. Total contributions for the fiscal year as of June 30, 2020, were $1,165 by the County and zero by the employees. As previously described, Empower Retirement, a marketing name of Great-West Life and Annuity Insurance Company, serves on behalf of the County as the third party administrator of the plan. Contribution to the plan defaults to the County’s Stable Value Fund upon initial enrollment, which is offered through Empower Retirement and designed to generate a stable yield while preserving the investor’s principal. Once enrolled, plan participants may self-direct the investment of plan contributions into any of a number of eligible investment options offered under the plan. As of June 30, 2020, total plan assets were $18,238. Administrative Cost: There is an annual administrative fee of 0.16% charged to participants (at a monthly rate of 0.013%) which is capped for account balances at $125. Each month participant fees are based on the average daily balance of their account(s) over a 30-day period and are reflected on participants' quarterly statements. No employer-level fees are charged for the plan. County of Orange - 1.62% at 65 Retirement, 401(a) Defined Contribution Plan
Plan Description: On April 20, 2010, the Board approved and adopted the resolution implementing the 1.62% at 65 OCERS retirement formula for certain eligible employees. Effective May 7, 2010, as amended and restated on July 1, 2011, the Board approved the County 1.62% Defined Contribution Plan for the benefit of employees in the “1.62% at 65” OCERS retirement formula. The 1.62% Defined Contribution Plan is a combination governmental 457(b) and 401(a) retirement plan. Employee contributions are deposited into a
___________________________________________________________________________________________
___________________________________________________________________________________________
Notes to the Basic Financial Statements
(Dollar Amounts in Thousands)
134
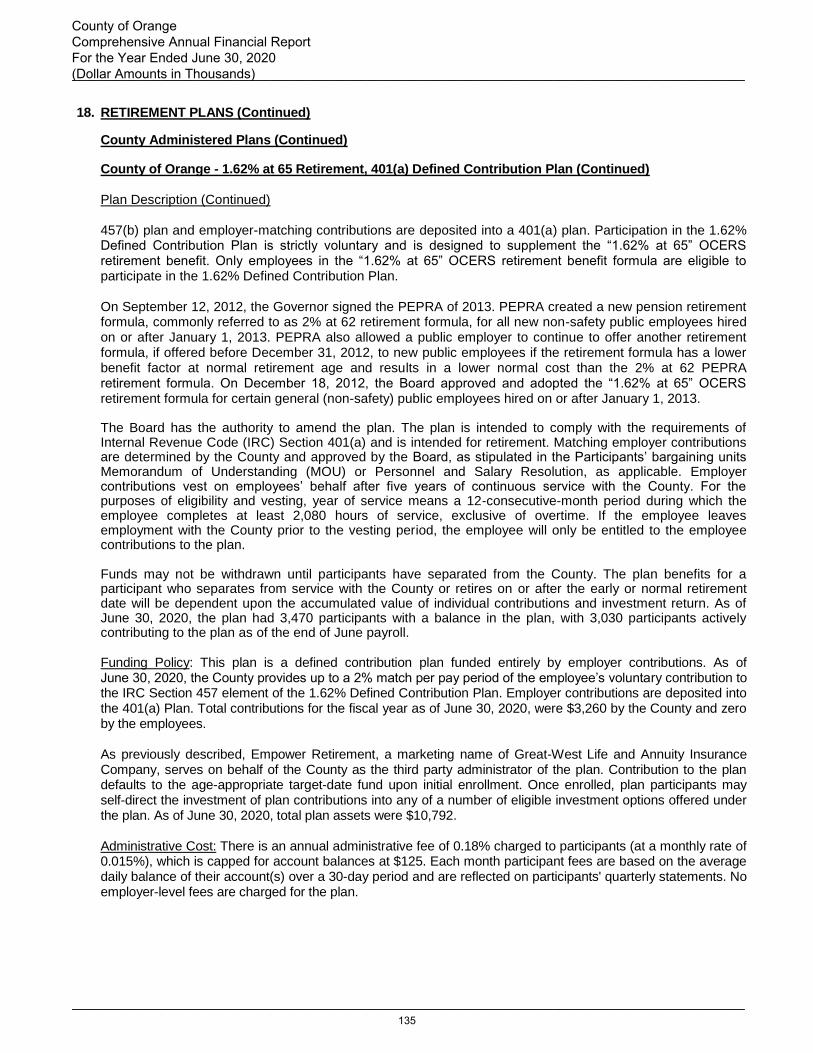
18. RETIREMENT PLANS (Continued)
County Administered Plans (Continued)
County of Orange - 1.62% at 65 Retirement, 401(a) Defined Contribution Plan (Continued) Plan Description (Continued) 457(b) plan and employer-matching contributions are deposited into a 401(a) plan. Participation in the 1.62% Defined Contribution Plan is strictly voluntary and is designed to supplement the “1.62% at 65” OCERS retirement benefit. Only employees in the “1.62% at 65” OCERS retirement benefit formula are eligible to participate in the 1.62% Defined Contribution Plan. On September 12, 2012, the Governor signed the PEPRA of 2013. PEPRA created a new pension retirement formula, commonly referred to as 2% at 62 retirement formula, for all new non-safety public employees hired on or after January 1, 2013. PEPRA also allowed a public employer to continue to offer another retirement formula, if offered before December 31, 2012, to new public employees if the retirement formula has a lower benefit factor at normal retirement age and results in a lower normal cost than the 2% at 62 PEPRA retirement formula. On December 18, 2012, the Board approved and adopted the “1.62% at 65” OCERS retirement formula for certain general (non-safety) public employees hired on or after January 1, 2013. The Board has the authority to amend the plan. The plan is intended to comply with the requirements of Internal Revenue Code (IRC) Section 401(a) and is intended for retirement. Matching employer contributions are determined by the County and approved by the Board, as stipulated in the Participants’ bargaining units Memorandum of Understanding (MOU) or Personnel and Salary Resolution, as applicable. Employer contributions vest on employees’ behalf after five years of continuous service with the County. For the purposes of eligibility and vesting, year of service means a 12-consecutive-month period during which the employee completes at least 2,080 hours of service, exclusive of overtime. If the employee leaves employment with the County prior to the vesting period, the employee will only be entitled to the employee contributions to the plan. Funds may not be withdrawn until participants have separated from the County. The plan benefits for a participant who separates from service with the County or retires on or after the early or normal retirement date will be dependent upon the accumulated value of individual contributions and investment return. As of June 30, 2020, the plan had 3,470 participants with a balance in the plan, with 3,030 participants actively contributing to the plan as of the end of June payroll.
Funding Policy: This plan is a defined contribution plan funded entirely by employer contributions. As of June 30, 2020, the County provides up to a 2% match per pay period of the employee’s voluntary contribution to the IRC Section 457 element of the 1.62% Defined Contribution Plan. Employer contributions are deposited into the 401(a) Plan. Total contributions for the fiscal year as of June 30, 2020, were $3,260 by the County and zero by the employees. As previously described, Empower Retirement, a marketing name of Great-West Life and Annuity Insurance Company, serves on behalf of the County as the third party administrator of the plan. Contribution to the plan defaults to the age-appropriate target-date fund upon initial enrollment. Once enrolled, plan participants may self-direct the investment of plan contributions into any of a number of eligible investment options offered under the plan. As of June 30, 2020, total plan assets were $10,792. Administrative Cost: There is an annual administrative fee of 0.18% charged to participants (at a monthly rate of 0.015%), which is capped for account balances at $125. Each month participant fees are based on the average daily balance of their account(s) over a 30-day period and are reflected on participants' quarterly statements. No employer-level fees are charged for the plan.
___________________________________________________________________________________________
___________________________________________________________________________________________
County of Orange Comprehensive Annual Financial Report For the Year Ended June 30, 2020 (Dollar Amounts in Thousands)
135

18. RETIREMENT PLANS (Continued)
County Administered Plans (Continued)
Condensed Financial Statements
In lieu of separately issued financial statements for the County administered retirement funds, condensed financial statements are presented below as of and for the fiscal year ended June 30, 2020:
Statement of Fiduciary Net Position
Assets
Pooled Cash/Investments $ 117 $ 117 $ -- $ -- $ --
Restricted Cash and Investments
Restricted Investments with Trustee 42,837 5,167 8,787 18,202 10,681
Due from Other Governmental Agencies 171 -- 24 36 111
Total Assets 43,125 5,284 8,811 18,238 10,792
Net Position
Restricted for Retirement Plans Benefits 43,125 5,284 8,811 18,238 10,792
Total Net Position $ 43,125 $ 5,284 $ 8,811 $ 18,238 $ 10,792
Statement of Changes in Fiduciary Net Position
Additions:
Contributions to Pension Trust:
Employer $ 4,539 $ 114 $ -- $ 1,165 $ 3,260
Employee 1,103 -- 1,103 -- --
Other Revenues 1 1 -- -- --
Interest and Investment Income 1,561 246 195 884 236
Less: Investment Expense (51) (7) (7) (17) (20)
Total Additions 7,153 354 1,291 2,032 3,476
Deductions:
Benefits Paid to Participants 3,193 1,101 784 1,267 41
Total Deductions 3,193 1,101 784 1,267 41
Change in Net Position for
Employees' Retirement 3,960 (747) 507 765 3,435
Net Position at Beginning of Year 39,165 6,031 8,304 17,473 7,357
Net Position at End of Year $ 43,125 $ 5,284 $ 8,811 $ 18,238 $ 10,792
1.62% at 65
Retirement,
401(a) Defined
Contribution Plan
401(a)
Defined
Contribution
PlanTotal
Total
Extra-Help
Defined
Contribution
Plan
Extra-Help
Defined
Benefit
Plan
Extra-Help
Defined
Contribution
Plan
Extra-Help
Defined
Benefit
Plan
401(a)
Defined
Contribution
Plan
1.62% at 65
Retirement,
401(a) Defined
Contribution Plan
___________________________________________________________________________________________
___________________________________________________________________________________________
Notes to the Basic Financial Statements
(Dollar Amounts in Thousands)
136

19. POSTEMPLOYMENT HEALTH CARE BENEFITS
County of Orange Retiree Medical Plan
Plan Description: The County of Orange Third Amended Retiree Medical Plan (the Retiree Medical Plan) is a cost-sharing multiple-employer defined benefit OPEB plan, intended to assist career employees in maintaining health insurance coverage following retirement from County and participating employers’ service. The Retiree Medical Plan was established by the Board. The Board is also the authority for amending the Retiree Medical Plan. The Retiree Medical Plan is not required by the County Employees Retirement Law of 1937 (“CERL”)–the statute governing County employee retirement benefits. Eligible retired County employees receive a monthly grant (the Grant), which helps offset the cost of monthly County-offered health plans and/or Medicare A and/or B premiums. The Retiree Medical Plan specifically states that it does not create any vested right to the benefits. The Plan is reported in the County’s financial statements since it administers the Plan. The Plan is reported as of December 31, 2019. Plan Membership: As of June 30, 2020, seven employers, the County, Orange County Public Law Library, Superior Courts of Orange County, Orange County Local Agency Formation Commission, Orange County Employees Retirement System, Children and Families Commission of Orange County, and Orange County Cemetery District have elected to participate in the plan. As of the most recent actuarial valuation date of June 30, 2019, the membership consisted of the following:
Inactive plan members currently receiving benefit payments 9,148
Inactive plan members entitled to but not yet receiving benefit payments 40
Active plan members 15,053
24,241
Benefits Provided: In order to be eligible to receive the Grant upon retirement, the employee must have completed at least 10 years of continuous County and/or participating employers’ service (although exceptions for disability retirements exist), be enrolled in a County sponsored health plan and/or Medicare, qualify as a retiree as defined by the Retiree Medical Plan and be able to receive a monthly benefit payment from OCERS. To qualify as a retiree as defined by the Retiree Medical Plan, the employee upon retirement must be at least 50 years of age or have at least 20 years of service for a safety member of OCERS or at least 30 years of service for a general member of OCERS. The monthly Grant amount is determined by a formula that multiplies a base number by the number of years of qualifying County employment up to a maximum of 25 years. The base number for calendar year 2019 was $23.44 (absolute dollars) per year of County service, and the maximum base monthly Grant was $586.00 (absolute dollars). The base number for calendar year 2020 is $24.14 (absolute dollars) per year of County service, and the maximum monthly Grant is $603.50 (absolute dollars). The amount of the Grant is netted against the monthly health plan premium and/or reimburses Medicare premiums paid by the retiree for retiree and dependent coverage with the retiree obligated to pay the remaining balance. In no case shall the Grant exceed the actual cost to a retiree for the Qualified Health Plan and Medicare premiums. The plan was amended in 2007. Certain plan provisions were changed as of effective dates that varied by labor group. The Grant is reduced by 50% once the retiree becomes Medicare Parts A and B eligible. Retirees who were age 65 and/or Medicare Parts A and B eligible on the effective date are not subject to the Medicare reduction. For employees retiring after the effective date, the Grant is reduced or increased by 7.5% based on the employee’s age at retirement, such that the Grant is reduced 7.5% for each year under age 60 and increased by 7.5% for each year of age worked after age 60 up to age 70. Safety employees and disability retirements are exempt from the age adjustment. The base number for the Grant is adjusted annually based on a formula defined in the Retiree Medical Plan document with a maximum increase/decrease of 3%. Surviving dependents of a deceased employee or retiree eligible for the Grant are entitled to receive 50% of the Grant that the employee/retiree was eligible to receive. In addition to the Grant, the Retiree Medical Plan provides a frozen lump sum payment to terminated employees
___________________________________________________________________________________________
___________________________________________________________________________________________
County of Orange Comprehensive Annual Financial Report For the Year Ended June 30, 2020 (Dollar Amounts in Thousands)
137
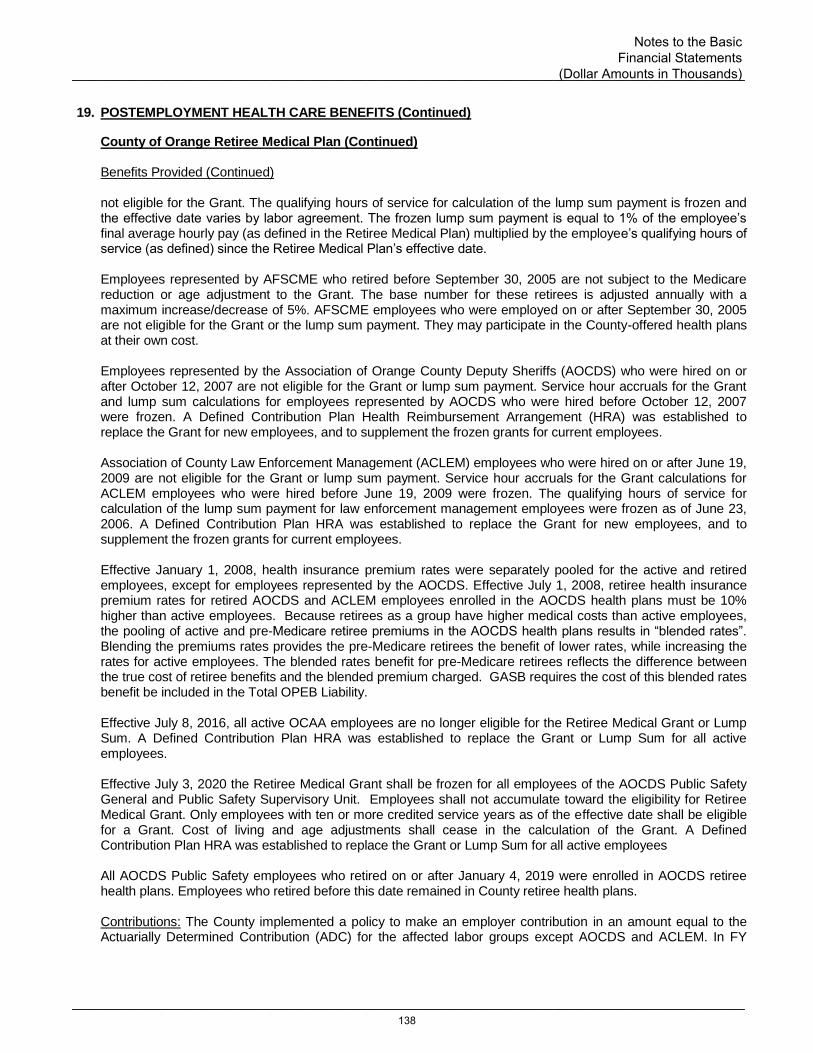
19. POSTEMPLOYMENT HEALTH CARE BENEFITS (Continued)
County of Orange Retiree Medical Plan (Continued) Benefits Provided (Continued) not eligible for the Grant. The qualifying hours of service for calculation of the lump sum payment is frozen and the effective date varies by labor agreement. The frozen lump sum payment is equal to 1% of the employee’s final average hourly pay (as defined in the Retiree Medical Plan) multiplied by the employee’s qualifying hours of service (as defined) since the Retiree Medical Plan’s effective date. Employees represented by AFSCME who retired before September 30, 2005 are not subject to the Medicare reduction or age adjustment to the Grant. The base number for these retirees is adjusted annually with a maximum increase/decrease of 5%. AFSCME employees who were employed on or after September 30, 2005 are not eligible for the Grant or the lump sum payment. They may participate in the County-offered health plans at their own cost. Employees represented by the Association of Orange County Deputy Sheriffs (AOCDS) who were hired on or after October 12, 2007 are not eligible for the Grant or lump sum payment. Service hour accruals for the Grant and lump sum calculations for employees represented by AOCDS who were hired before October 12, 2007 were frozen. A Defined Contribution Plan Health Reimbursement Arrangement (HRA) was established to replace the Grant for new employees, and to supplement the frozen grants for current employees. Association of County Law Enforcement Management (ACLEM) employees who were hired on or after June 19, 2009 are not eligible for the Grant or lump sum payment. Service hour accruals for the Grant calculations for ACLEM employees who were hired before June 19, 2009 were frozen. The qualifying hours of service for calculation of the lump sum payment for law enforcement management employees were frozen as of June 23, 2006. A Defined Contribution Plan HRA was established to replace the Grant for new employees, and to supplement the frozen grants for current employees.
Effective January 1, 2008, health insurance premium rates were separately pooled for the active and retired employees, except for employees represented by the AOCDS. Effective July 1, 2008, retiree health insurance premium rates for retired AOCDS and ACLEM employees enrolled in the AOCDS health plans must be 10% higher than active employees. Because retirees as a group have higher medical costs than active employees, the pooling of active and pre-Medicare retiree premiums in the AOCDS health plans results in “blended rates”. Blending the premiums rates provides the pre-Medicare retirees the benefit of lower rates, while increasing the rates for active employees. The blended rates benefit for pre-Medicare retirees reflects the difference between the true cost of retiree benefits and the blended premium charged. GASB requires the cost of this blended rates benefit be included in the Total OPEB Liability. Effective July 8, 2016, all active OCAA employees are no longer eligible for the Retiree Medical Grant or Lump Sum. A Defined Contribution Plan HRA was established to replace the Grant or Lump Sum for all active employees. Effective July 3, 2020 the Retiree Medical Grant shall be frozen for all employees of the AOCDS Public Safety General and Public Safety Supervisory Unit. Employees shall not accumulate toward the eligibility for Retiree Medical Grant. Only employees with ten or more credited service years as of the effective date shall be eligible for a Grant. Cost of living and age adjustments shall cease in the calculation of the Grant. A Defined Contribution Plan HRA was established to replace the Grant or Lump Sum for all active employees All AOCDS Public Safety employees who retired on or after January 4, 2019 were enrolled in AOCDS retiree health plans. Employees who retired before this date remained in County retiree health plans. Contributions: The County implemented a policy to make an employer contribution in an amount equal to the Actuarially Determined Contribution (ADC) for the affected labor groups except AOCDS and ACLEM. In FY
___________________________________________________________________________________________
___________________________________________________________________________________________
Notes to the Basic Financial Statements
(Dollar Amounts in Thousands)
138
19. POSTEMPLOYMENT HEALTH CARE BENEFITS (Continued)
County of Orange Retiree Medical Plan (Continued) Contributions (Continued) 2019-20, to ensure adequate funding of the Grant, the ADC included amortization of liabilities for the Grant, Lump Sum and blended rates. In addition to contributing the ADC for the blended rates, for retired employees enrolled in the AOCDS health plans, the County funded the blended rates benefit on a pay-as-you-go basis. Beginning in 2021, the ADC will only include the Grant and Lump Sum and the blended rates will only be funded on a pay-as-you-go basis. In order to more adequately fund benefits under the Retiree Medical Plan, on June 19, 2007, the Board adopted the County of Orange Retiree Medical Trust (Trust) effective July 2, 2007. The Trust is an Internal Revenue Code section 115 trust for which the County Chief Financial Officer is the Trustee. In addition, OCERS has established an Internal Revenue Code section 401(h) account to invest monies and acts as Trustee for the 401(h) account which is used to pay the Grant. The combined Trust and 401(h) represent the fiduciary net position of the Plan and are reported in the County’s CAFR. During the fiscal year ending June 30, 2020, the County was setting aside contributions of 0.3% of payroll for AFSCME, 0.4% for OCAA, 5.6% for AOCDS, 8.3% for law enforcement management, 4.4% for the Probation Department safety personnel and 3.9% of payroll for all other labor groups, which is the estimated ADC for those groups calculated by an actuary. Additionally, ACLEM employees covered under the “3%@50” safety retirement formula contributed 1.2% of base pay.
For the Plan year ended December 31, 2019, the total Plan contributions were $58,807. The County’s contribution was $54,284 (92.31%), Superior Court was $4,032 (6.86%), OCERS was $329 (0.56%), CFCOC was $40 (0.07%), Law Library was $44 (0.07%), Cemetery District was $60 (0.10%), and LAFCO was $18 (0.03%). The County’s contribution for the fiscal year June 30, 2020 was $50,466. Funds were initially deposited into the Trust in December 2007, with subsequent deposits made throughout each fiscal year. The administrative expenses for the Trust are paid from the Trust. OPEB Liabilities, OPEB Expense, Deferred Outflows of Resources and Deferred Inflows of Resources Related to OPEB: The components of the collective net OPEB liability of the participating employers as of June 30, 2020 were as follows:
Collective OPEB Liability $ 726,322
Collective Plan's Fiduciary Net Position (370,545)
Collective Net OPEB Liability $ 355,777
Plan Fiduciary Net Position as a percentage of
the Total OPEB Liability 51.02%
The Collective OPEB Liability of $726,322 includes $643,803 for the Grant and Lump Sum benefits and $82,519 for the blended rates benefit. At June 30, 2020, the County reported a liability of $328,412 for its proportionate share of the collective net OPEB liability. The collective net OPEB liability was measured as of December 31, 2019, and the total OPEB liability used to calculate the collective net OPEB liability was determined by an actuarial valuation as of June 30, 2019. The County’s proportion of the collective net OPEB liability was based on the 2019 share of actuarially determined contributions to the OPEB plan relative to the projected contributions of all participating employers. At December 31, 2019, the County’s proportion was 92.31%, which was an increase of 0.53% from its proportion measured as of December 31, 2018.
___________________________________________________________________________________________
___________________________________________________________________________________________
County of Orange Comprehensive Annual Financial Report For the Year Ended June 30, 2020 (Dollar Amounts in Thousands)
139
19. POSTEMPLOYMENT HEALTH CARE BENEFITS (Continued)
County of Orange Retiree Medical Plan (Continued) OPEB Liabilities, OPEB Expense, Deferred Outflows of Resources and Deferred Inflows of Resources Related to OPEB (Continued) For the year ended June 30, 2020, the County recognized OPEB expense of $41,476. At June 30, 2020, the County reported deferred outflows of resources and deferred inflows of resources related to OPEB from the following sources:
Net Difference Between Projected and Actual Investment
Earnings on OPEB Plan Investments $ -- $ 7,474
Differences Between Expected and Actual Experience -- 8,620
Changes in Assumptions -- 14,213
Changes in Proportion and Differences Between Employer
Contributions and Proportionate Share of Contributions 4,834 --
Employer Contributions after Measurement Date 22,928 --
Total $ 27,762 $ 30,307
Deferred Outflows
of Resources
Deferred Inflows
of Resources
Deferred outflow of resources of $22,928 related to OPEB resulting from County’s contributions subsequent to the measurement date will be included as a reduction of the collective net OPEB liability in the following fiscal year. Other deferred outflows of resources and deferred inflows of resources related to OPEB will be recognized in the County’s OPEB expense as follows:
Year ending June 30:
2021 $ (4,634)
2022 (4,633)
2023 (1,493)
2024 (6,474)
2025 (2,441)
Thereafter (5,798)
Total $ (25,473)
Projections of benefits for financial reporting purposes are based on the substantive plan and include the types of benefits provided at the time of each valuation. The actuarial valuations involve estimates of the values of reported amounts and assumptions about the probability of events far into the future and will be subject to continual revision as they reflect a long-term perspective. Actuarial Methods and Assumptions: The total OPEB liability was determined by an actuarial valuation as of June 30, 2019. The County contracts with an outside actuarial consultant to prepare a biennial actuarial valuation in conformance with GASB requirements and is based on established pattern of practice. The actuarial methods and significant actuarial assumptions used in the June 30, 2019 actuarial valuation are:
• The entry age normal actuarial cost method
• 7.00% long-term expected rate of return, net of investment expenses, on funds held in the Trusts
• 3.25% per annum payroll increase assumption
• 2.75% per annum general inflation rate assumption
• Assumed annual increases in the monthly grant of 3% for non-AFSCME employees and 5% for AFSCME employees. The healthcare trend was assumed to be greater than or equal to the annual increase to the Grant in almost all future years. Therefore, it is the Grant annual increase rather than the healthcare trend that has the largest impact on the projected benefits and the net OPEB liability.
• Grant participation rate was 50% to 95%, determined by employee group and Grant service at retirement, based on the April 2019 participation study
___________________________________________________________________________________________
___________________________________________________________________________________________
Notes to the Basic Financial Statements
(Dollar Amounts in Thousands)
140

19. POSTEMPLOYMENT HEALTH CARE BENEFITS (Continued)
County of Orange Retiree Medical Plan (Continued) Actuarial Methods and Assumptions (Continued) Medical trend used for pre-Medicare members was 7.25% for 2021, decreasing to 4.00% for 2076 and later; for Medicare eligible members, 6.3% was used for 2021, decreasing to 4.00% for 2076 and later. Mortality rates were based on the Headcount-Weighted RP-2014 Mortality Tables with separate tables for males and females. Mortality improvement was projected fully generational with Society of Actuaries mortality improvement Scale MP-2016. Discount Rate: The discount rate used to measure the total OPEB liability was 7.00%, the long-term expected rate of return on plan assets, net of investment expenses. The projection of cash flows used to determine the discount rate assumed plan member contributions will be made at the current negotiated contribution rate and that the employer contributions will be made at rates equal to the actuarially determined contribution rates for the Grant and lump sum benefits (with blended rates benefit paid on a pay-as-you-go basis). Based on actuarial assumptions, the OPEB plan’s fiduciary net position was projected to be available to make all projected OPEB payments for current active and inactive employees. Therefore, the long-term expected rate of return on OPEB plan investments was applied to all periods of projected benefit payments to determine the total OPEB liability.
The target allocation and long-term expected real rate of return for each asset class are summarized in the following table:
Asset class
Target
Allocation
Long-Term
Expected
Arithmetic Real
Rate of Return
Global Equity 35.00% 6.38%
Core Bonds 13.00% 1.03%
High Yield Bonds 4.00% 3.52%
Bank Loan 2.00% 2.86%
TIPS 4.00% 0.96%
Emerging Market Debt 4.00% 3.78%
Real Estate 10.00% 4.33%
Core Infrastructure 2.00% 5.48%
Natural Resources 10.00% 7.86%
Risk Mitigation 5.00% 4.66%
Mezzanine/Distressed Debt 3.00% 6.53%
Private Equity 8.00% 9.48%
Total 100.00%
Assumed Long-Term Rate of Inflation 2.75%
Long-Term Expected Real Rate of Return,
Net of Investment Expenses 7.00%
Rate of Return: For the year ended December 31, 2019, the annual money-weighted rate of return on investments, net of investment expense, was 14.81%. The money-weighted rate of return expresses investment performance, net of investment expense, adjusted for the changing amounts actually invested. For further information on the investment policy of OCERS refer to Note 3, Deposits and Investments. Sensitivity of Net OPEB Liability to Changes in the Discount Rate: The following presents the Net OPEB liability of the collective plan and the County’s proportionate share, calculated using the discount rate of 7.00%, as well as what the County’s proportionate share of the collective net OPEB liability would be if it were calculated using a discount rate that is 1-percentage-point lower (6.00%) or 1-percentage-point higher (8.00%) than the current rate:
___________________________________________________________________________________________
___________________________________________________________________________________________
County of Orange Comprehensive Annual Financial Report For the Year Ended June 30, 2020 (Dollar Amounts in Thousands)
141
19. POSTEMPLOYMENT HEALTH CARE BENEFITS (Continued)
County of Orange Retiree Medical Plan (Continued) Sensitivity of Net OPEB Liability to Changes in the Discount Rate (Continued)
Collective plan $ 440,729 $ 355,777 $ 284,472
County’s proportionate share $ 406,832 $ 328,412 $ 262,593
1%
Increase
(8.00%)
1%
Decrease
(6.00%)
Current
Discount Rate
(7.00%)
Sensitivity of the Net OPEB Liability to Changes in the Healthcare Cost Trend Rates: The following presents the Net OPEB liability of the collective plan and the County’s proportionate share, as well as what they would be calculated using healthcare cost trend rates that are 1-percentage-point lower (6.25%/5.3% decreasing to 3.0%) or 1-percentage-point higher (8.25%/7.3% decreasing to 5.0%) than the current healthcare cost trend rates:
Collective plan $ 345,610 $ 355,777 $ 366,280
County’s proportionate share $ 319,028 $ 328,412 $ 338,109
Current Healthcare Cost
Trend Rates
(7.25%/6.30%
decreasing to 4.00%)
1% Increase
(8.25%/7.30%
decreasing to 5.00%)
1% Decrease
(6.25%/5.30%
decreasing to 3.00%)
OPEB Plan Fiduciary Net Position: As previously described, the 401(h) assets are held with OCERS. The underlying investments should be obtained from OCERS, however the combined Plan is in the County’s financial statements. OCERS issues a Comprehensive Annual Financial Report (CAFR) for each fiscal year ending on December 31, which includes the 401(h) assets. The CAFR can be obtained online at www.ocers.org by request, or in writing, to the Orange County Employees Retirement System, 2223 East Wellington Avenue, Suite 100, Santa Ana, CA 92701, or by calling (714) 558-6200.
County of Orange Health Reimbursement Arrangement (HRA)
Plan Description: On October 23, 2007, the Board approved and adopted a MOU agreement with the AOCDS. The MOU restructured the Retiree Medical Plan and established a Defined Contribution Plan Health Reimbursement Arrangement to replace the Retiree Medical Plan for new employees, and to supplement the current employees’ frozen service hour accruals for the Grant. On June 24, 2008, the Board approved the County of Orange Health Reimbursement Arrangement (HRA) Plan Document. The HRA Plan is not required by the Retirement Law. The plan is intended to fund the reimbursement accounts of eligible employees on a pre-tax basis and reimburse the eligible unreimbursed and substantiated qualified medical expenses of retired participants. On March 10, 2009, the Board approved the restructuring of the Retiree Medical Plan and establishment of a Defined Contribution Plan HRA for employees represented by ACLEM effective June 19, 2009. The HRA replaces the Retiree Medical Plan for new employees, and supplements the current ACLEM employees’ frozen service hour accruals for the Grant. On May 12, 2015, the Board approved the restructuring of the Retiree Medical Plan and establishment of a Defined Contribution Plan HRA for employees represented by OCAA effective July 8, 2016. The HRA replaces the Retiree Medical Plan for all active attorney employees. Administration of the HRA by the third party administrator began in August 2009. The HRA is intended to
___________________________________________________________________________________________
___________________________________________________________________________________________
Notes to the Basic Financial Statements
(Dollar Amounts in Thousands)
142
19. POSTEMPLOYMENT HEALTH CARE BENEFITS (Continued)
County of Orange Health Reimbursement Arrangement (HRA) (Continued) Plan Description (Continued) comply with the requirements of IRC Sections 105 and 106 and meets the requirements of a health reimbursement arrangement as defined under IRS Notice 2002-45. The contributions made to reimbursement accounts, any investment gains and qualified medical expenses reimbursed under this plan are intended to be eligible for exclusion from the gross income of eligible employees, participants and retired participants (including the spouses and dependents of each) under IRC Section 105(b). The HRA may be amended by the Board or the plan administrator to comply with federal, state, or local laws, statues, regulations, or guidance from regulatory agencies. The Plan Document was amended and restated on January 1, 2011 to reflect changes to the definition of dependent due to healthcare reform. The Plan Document was amended and restated on June 1, 2016 to provide for the transition of the OCAA to the HRA Plan in July 2016. Prior employee contributions for employees represented by OCAA to the retiree Medical program and the interest earnings thereon through July 5, 2016 were transferred as a lump sum deposit for eligible employees to their HRA accounts. As of June 30, 2020, the plan had 2,755 active and 1,009 inactive participants.
Funding Policy: Employer and mandatory employee contributions were effective October 12, 2007 for employees represented by AOCDS, effective June 19, 2009 for employees represented by ACLEM, and effective July 8, 2016 for OCAA represented employees. All contributions made to the HRA are deemed to be employer contributions. Employee contributions for employees represented by each of the bargaining units are mandatory pursuant to their bargaining unit MOU and mandatory pursuant to Board action. For employees represented by AOCDS, the County contributes 5.0% of base salary each pay period. For employees represented by ACLEM, the County contributes 4.0% of base salary each pay period. For employees represented by OCAA, the County contributes 1.0% of base salary each pay period and employees are also required to contribute 1.0% of base salary each pay period. ICMA Retirement Corporation serves on behalf of the County as the third party administrator of the HRA. Contributions to the HRA Plan default to the age-appropriate target-date fund upon initial enrollment. Once enrolled, HRA participants may self-direct the investment of plan contributions into any of a number of eligible investment options offered under the HRA. As of June 30, 2020, the value of the HRA assets was $148,344. Administrative Cost: Prior to April 1, 2019, annual administrative fees included a plan asset fee of 0.40% and an annual account fee of $80. Beginning on April 1, 2019, the administrative fee was reduced to 0.195% with no annual account fee. Each quarter, 25% of the fees are assessed to participant accounts and are reflected on participants' quarterly statements. No employer-level fees are charged for the Plan.
___________________________________________________________________________________________
___________________________________________________________________________________________
County of Orange Comprehensive Annual Financial Report For the Year Ended June 30, 2020 (Dollar Amounts in Thousands)
143
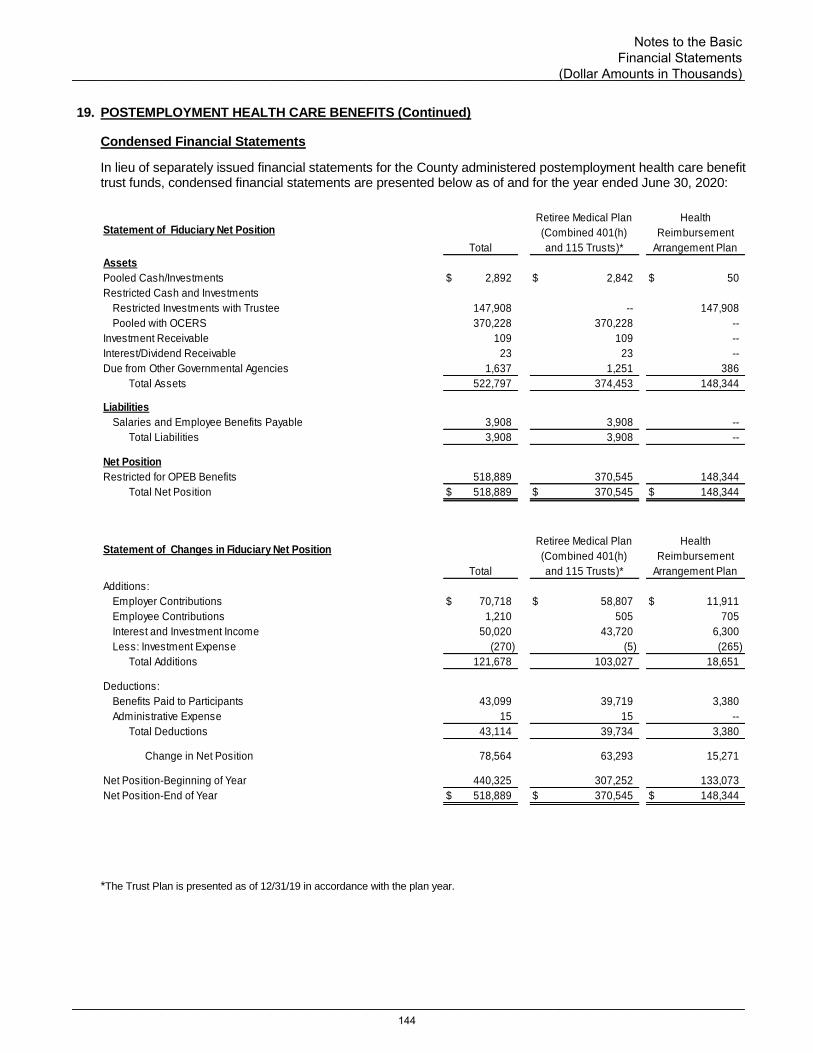
19. POSTEMPLOYMENT HEALTH CARE BENEFITS (Continued)
Condensed Financial Statements
In lieu of separately issued financial statements for the County administered postemployment health care benefit trust funds, condensed financial statements are presented below as of and for the year ended June 30, 2020:
Assets
Pooled Cash/Investments $ 2,892 $ 2,842 $ 50
Restricted Cash and Investments
Restricted Investments with Trustee 147,908 -- 147,908
Pooled with OCERS 370,228 370,228 --
Investment Receivable 109 109 --
Interest/Dividend Receivable 23 23 --
Due from Other Governmental Agencies 1,637 1,251 386
Total Assets 522,797 374,453 148,344
Liabilities
Salaries and Employee Benefits Payable 3,908 3,908 --
Total Liabilities 3,908 3,908 --
Net Position
Restricted for OPEB Benefits 518,889 370,545 148,344
Total Net Position $ 518,889 $ 370,545 $ 148,344
Additions:
Employer Contributions $ 70,718 $ 58,807 $ 11,911
Employee Contributions 1,210 505 705
Interest and Investment Income 50,020 43,720 6,300
Less: Investment Expense (270) (5) (265)
Total Additions 121,678 103,027 18,651
Deductions:
Benefits Paid to Participants 43,099 39,719 3,380
Administrative Expense 15 15 --
Total Deductions 43,114 39,734 3,380
Change in Net Position 78,564 63,293 15,271
Net Position-Beginning of Year 440,325 307,252 133,073
Net Position-End of Year $ 518,889 $ 370,545 $ 148,344
Total
Health
Reimbursement
Arrangement Plan
Retiree Medical Plan
(Combined 401(h)
and 115 Trusts)*
Statement of Changes in Fiduciary Net PositionRetiree Medical Plan
(Combined 401(h)
and 115 Trusts)*
Health
Reimbursement
Arrangement PlanTotal
Statement of Fiduciary Net Position
*The Trust Plan is presented as of 12/31/19 in accordance with the plan year.
___________________________________________________________________________________________
___________________________________________________________________________________________
Notes to the Basic Financial Statements
(Dollar Amounts in Thousands)
144

20. CONTINGENCIES
Estimated Liability for Litigation and Claims
The County is a defendant in various lawsuits. Although the outcome of these lawsuits is not presently determinable, in the opinion of the County’s legal counsel, the resolution of these matters will not have a material adverse effect on the financial condition of the County. To the extent the outcome of such litigation has been determined to result in probable financial loss to the County, a liability has been accrued in the accompanying financial statements. Litigation where loss to the County is reasonably possible has not been accrued and at this time an estimate cannot be made. For information regarding claim payments and unpaid claims balance for self-insurance claims, refer to Note 16, Self-Insurance.
Deferral of Rent
In April 2020, the Airport took measures to respond to the COVID-19 crisis and offered a deferment of rents or Minimum Annual Guarantees (MAG) to tenants, including airlines, rental cars, and concessions from March 1, 2020 through June 30, 2020. Effective July 1, 2020, tenants could commence six-month payment plans to repay all deferred rent by December 31, 2020. As of June 30, 2020, the Airport reported a receivable balance of $10,370 for rent deferrals and expected to collect this amount within the next fiscal year. Federal Assistance
During the year ended June 30, 2020, the County received $554,134 of CARES Act relief funds, which are required to be used by December 30, 2020. As of June 30, 2020, the County has spent $166,446 with the remaining $387,688 reported as part of the unearned revenues. Furthermore, the Airport received an allocation of $44,910 of CARES Act grant funds to be claimed for allowable costs incurred through May 20, 2024. During the year, the Airport recognized grant revenue of $4,782.
21. SUBSEQUENT EVENTS
The following events occurred subsequent to June 30, 2020: Rent Deferral: In July 2020, the Airport took additional measures to respond to the COVID-19 crisis and provided an extension on the deferment of rents, which was approved in April 2020, through September 30, 2020. Beginning October 1, 2020, tenants will have nine months to repay all deferred rent from March 1, 2020 through September 30, 2020 in full by June 30, 2021. Tenants are also expected to recommence making regular rent or MAG payments on October 1, 2020. Teeter Plan Notes: On July 14, 2020, the County issued an additional $50,725 in taxable Teeter Plan Obligation Notes, Series B to finance the purchase of delinquent property tax receivables associated with the Teeter Plan. Proceeds of this issuance paid the participating agencies in the Teeter Plan the full amount of their taxes from the secured property tax roll. The outstanding balance as of July 14, 2020 was $85,386 and the authorized, unused available commitment under the Amended and Restated Note Purchase and Reimbursement Agreement was $64,614. On August 4, 2020, the County requested a reduction in authorized commitment in the amount of $64,000. The reduction was made on August 5, 2020, leaving an authorized unused available commitment of $614. For additional information regarding the Teeter Plan Series B Notes, refer to Note 11, Long-Term Obligations. Voluntary Incentive Program: On July 14, 2020, the Board approved and adopted the Voluntary Incentive Program (VIP) to assist in addressing County revenue losses resulting from the COVID-19 pandemic economic impacts. Implementation of the VIP provides the County the ability to realize cost savings by reducing salary and employee benefits expenditures while providing employees incentive options to separate from County employment. The VIP provides the County with a necessary tool, with the Board’s approval regarding incentive amounts, timeframes and other implementation parameters, to address potential future severe budget shortfalls. As a result of the VIP, 458 employees retired and 160 employees resigned from County employment.
___________________________________________________________________________________________
___________________________________________________________________________________________
County of Orange Comprehensive Annual Financial Report For the Year Ended June 30, 2020 (Dollar Amounts in Thousands)
145
21. SUBSEQUENT EVENTS (Continued) FY 2020-21 Budget Process: On September 15, 2020, the Board approved and adopted the FY 2020-21 Final Budget. As a result of the uncertain economic conditions resulting from the ongoing COVID-19 pandemic, the FY 2020-21 Recommended Budget process was altered. As such, on June 2, 2020, the Board approved a base FY 2020-21 Recommended Budget which set base Net County Cost limits for departments and included transfers, essential technical adjustments such as position realignment and funding for in-progress, ongoing capital and information technology projects. The approval of the Recommended Budget permitted the County to make payments in accordance with the approved appropriations after the start of the fiscal year on July 1, 2020 until adoption of the FY 2020-21 Final Budget. In accordance with Government Code section 29080, the FY 2020-21 Recommended Budget was made available to the public on August 18, 2020. In addition, a public notice stating the public availability of the Recommended Budget documents to members of the public and the time and place of the public hearing on the budget was published on August 14, 2020. Airport Revenue Refunding Bonds, Series 2019A and 2019B: In October 2020, S&P lowered its long-term rating of the Airport Revenue Refunding Bonds to A+ from AA-. S&P placed the Airport and the airport sector portfolio on CreditWatch to reflect the material negative impact of the COVID-19 pandemic on passenger traffic, the consequential effect on financial metrics, and overall credit quality. S&P opined that the prolonged exposure to weak or unpredictable enplanement levels could complicate financial planning and increase operational challenges to airports. The downgrade and negative outlook reflect S&P’s expectation that activity levels at the Airport, and the airport sector in general, will be materially depressed, unpredictable, resulting in anemic growth due to the COVID-19 pandemic and associated effects beyond management control. The S&P noted that the Airport’s key strengths are its exceptional liquidity position, low outstanding debts, economically healthy service area, very strong management, evidenced by an experienced and proactive team that historically maintained excellent financial metrics. Frank R. Bowerman Landfill: In late October 2020, OC Waste & Recycling experienced extensive fire damage at the Frank R. Bowerman landfill (FRB) in Irvine. During the week of October 28, 2020, the wildfire known as the Silverado Fire burned over 12,466 acres, destroyed and damaged a total of 14 structures in Irvine and the surrounding areas, and injured two fire fighters from the Orange County Fire Authority. While its overall financial impact to OC Waste & Recycling and the FRB landfill operation cannot be fully assessed at the moment, the effects of the Silverado Fire are expected to be significant. OC Waste & Recycling has reported major damage to the landfill environmental control, and landfill infrastructures including the drainage, electrical grid, liner and stormwater structures. The FRB landfill operation has been suspended for an unknown period of time due to substantial landfill gas system and infrastructure damage, which will result in loss of revenue and high cost for repairs. OC Waste & Recycling has filed a claim to the insurance company, and reported estimated loss of over $20,000 to the County Emergency Operations Center. However, it is unknown at this point if the potential total loss would be mitigated by recoveries through insurance, or relief from the Federal, State and local government.
___________________________________________________________________________________________
___________________________________________________________________________________________
Notes to the Basic Financial Statements
(Dollar Amounts in Thousands)
146


Clerk‐Recorder South County Branch Office


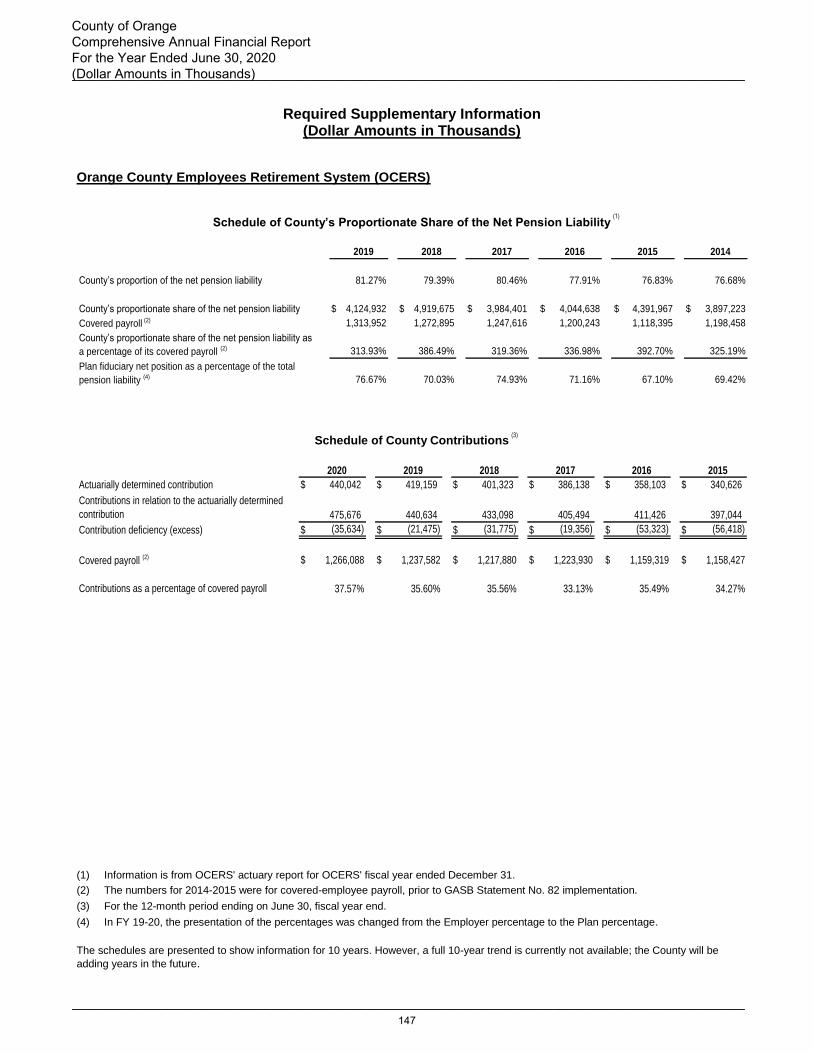
Required Supplementary Information (Dollar Amounts in Thousands)
Orange County Employees Retirement System (OCERS)
Schedule of County’s Proportionate Share of the Net Pension Liability
2019 2018 2017 2016 2015 2014
County’s proportion of the net pension liability 81.27% 79.39% 80.46% 77.91% 76.83% 76.68%
County’s proportionate share of the net pension liability $ 4,124,932 $ 4,919,675 $ 3,984,401 $ 4,044,638 $ 4,391,967 $ 3,897,223
Covered payroll (2) 1,313,952 1,272,895 1,247,616 1,200,243 1,118,395 1,198,458
313.93% 386.49% 319.36% 336.98% 392.70% 325.19%
76.67% 70.03% 74.93% 71.16% 67.10% 69.42%
Plan fiduciary net position as a percentage of the total
pension liability (4)
County’s proportionate share of the net pension liability as
a percentage of its covered payroll (2)
Schedule of County Contributions
2020 2019 2018 2017 2016 2015
Actuarially determined contribution $ 440,042 $ 419,159 $ 401,323 $ 386,138 $ 358,103 $ 340,626
Contributions in relation to the actuarially determined
contribution 475,676 440,634 433,098 405,494 411,426 397,044
Contribution deficiency (excess) $ (35,634) $ (21,475) $ (31,775) $ (19,356) $ (53,323) $ (56,418)
Covered payroll (2) $ 1,266,088 $ 1,237,582 $ 1,217,880 $ 1,223,930 $ 1,159,319 $ 1,158,427
37.57% 35.60% 35.56% 33.13% 35.49% 34.27%Contributions as a percentage of covered payroll
The schedules are presented to show information for 10 years. However, a full 10-year trend is currently not available; the County will be
adding years in the future.
(1) Information is from OCERS' actuary report for OCERS' fiscal year ended December 31.
(2) The numbers for 2014-2015 were for covered-employee payroll, prior to GASB Statement No. 82 implementation.
(3) For the 12-month period ending on June 30, fiscal year end.
(4) In FY 19-20, the presentation of the percentages was changed from the Employer percentage to the Plan percentage.
(1)
(3)
___________________________________________________________________________________________
___________________________________________________________________________________________
County of Orange Comprehensive Annual Financial Report For the Year Ended June 30, 2020 (Dollar Amounts in Thousands)
147

Orange County Extra-Help Defined Benefit Plan
Schedule of County’s Proportionate Share of the Net Pension Liability
2020 2019 2018 2017 2016 2015
County’s proportion of the
net pension liability 98.12% 98.12% 98.12% 98.12% 98.12% 98.12%
County’s proportionate share
of the net pension liability $ 440 $ 1,382 $ 1,962 $ 1,995 $ 2,845 $ 3,163
Covered payroll (1) $ 3,613 $ 3,906 $ 4,298 $ 4,725 $ 1,747 $ 1,829
County’s proportionate share
of the net pension liability as a
percentage of its covered payroll (1) 12.18% 35.38% 45.65% 42.22% 162.85% 172.94%
Plan fiduciary net position as a
percentage of the total pension liability 92.18% 81.06% 76.76% 76.24% 65.89% 61.35%
Schedule of Collective Plan Contributions
2020 2019 2018 2017 2016 2015 2014
Actuarially determined contribution $ 114 $ 555 $ 555 $ 784 $ 784 $ 421 $ 421
Contributions in relation to the
actuarially determined contribution 114 565 545 784 784 421 421
Contribution deficiency (excess) $ - $ (10) $ 10 $ -- $ -- $ -- $ --
Covered payroll (1) $ 3,613 $ 3,906 $ 4,298 $ 4,725 $ 1,747 $ 1,829 $ 1,876
Contributions as a percentage
of covered payroll 3.16% 14.46% 12.68% 16.59% 44.88% 23.02% 22.44%
Schedule of County Contributions
2020 2019 2018 2017 2016 2015 2014
Actuarially determined contribution $ 112 $ 544 $ 545 $ 769 $ 769 $ 413 $ 421
Contributions in relation to the
actuarially determined contribution 112 554 535 769 769 413 421
Contribution deficiency (excess) $ - $ (10) $ 10 $ -- $ -- $ -- $ --
Covered payroll (1) $ 3,613 $ 3,906 $ 4,298 $ 4,725 $ 1,747 $ 1,829 $ 1,876
3.10% 14.19% 12.45% 16.28% 44.02% 22.58% 22.44%
Contributions as a percentage
of covered payroll
(1) The numbers for 2014 and 2015 were for covered-employee payroll, prior to GASB Statement No. 82 implementation.
The schedules are presented to show information for 10 years. However, a full 10-year trend is currently not available; the County will be
adding years in the future.
___________________________________________________________________________________________
___________________________________________________________________________________________
Required Supplemental Information (Dollar Amounts in Thousands)
148

Orange County Extra-Help Defined Benefit Plan (Continued)
Schedule of Changes in the Collective Plan Net Pension Liability and Related Ratios
2020 2019 2018
Total Pension Liability
Service cost $ -- $ -- $ --
Interest 362 411 448
Changes of benefit terms -- -- --
Difference between expected and actual experience (879) -- (127)
Changes of assumptions (90) -- 480
Benefit payments, including refunds of member contributions (1,101) (1,572) (762)
Net change in Total Pension Liability (1,708) (1,161) 39
Total Pension Liability-beginning 7,440 8,601 8,562
Total Pension Liability-ending (a) $ 5,732 $ 7,440 $ 8,601
Plan Fiduciary Net Position
Contributions-employer $ 114 $ 565 $ 545
Contributions-member -- -- --
Net investment income 239 436 295
Investment Expense -- (7) (7)
Benefit payments, including refunds of member contributions (1,101) (1,572) (762)
Administrative expense (1) -- -- --
Other 1 7 3
Net change in Plan Fiduciary Net Position (747) (571) 74
Plan Fiduciary Net Position-beginning 6,031 6,602 6,528
Plan Fiduciary Net Position-ending (b) $ 5,284 $ 6,031 $ 6,602
Plan Net Pension Liability-ending (a) – (b) $ 448 $ 1,409 $ 1,999
Plan Fiduciary Net Position as a percentage of the Total
Pension Liability 92.18% 81.06% 76.76%
Covered payroll (2) $ 3,613 $ 3,906 $ 4,298
Plan Net Pension Liability as a percentage of covered (2)
payroll
12.40% 36.07% 46.51%
(1) Administrative expense does not round up to $1 in thousands.
(2) The numbers for 2014 and 2015 were for covered-employee payroll, prior to GASB Statement No. 82 implementation.
The schedule is presented to show information for 10 years. However, a full 10-year trend is currently not available; the County will be adding
years in the future.
___________________________________________________________________________________________
___________________________________________________________________________________________
County of Orange Comprehensive Annual Financial Report For the Year Ended June 30, 2020 (Dollar Amounts in Thousands)
149

2017 2016 2015 2014
Total Pension Liability
$ -- $ -- $ -- $ -- Service cost
436 435 271 282 Interest
-- -- -- -- Changes of benefit terms
-- 73 -- -- Difference between expected and actual experience
-- 73 -- -- Changes of assumptions
(372) (424) (522) (695) Benefit payments, including refunds of member contributions
64 157 (251) (413) Net change in Total Pension Liability
8,498 8,341 8,592 9,005 Total Pension Liability-beginning
$ 8,562 $ 8,498 $ 8,341 $ 8,592 Total Pension Liability-ending (a)
Plan Fiduciary Net Position
$ 784 $ 784 $ 421 $ 421 Contributions-employer
-- -- -- -- Contributions-member
527 123 17 15 Net investment income
(5) (4) -- -- Investment Expense
(372) (428) (522) (695) Benefit payments, including refunds of member contributions
-- -- -- -- Administrative expense (1)
(5) 7 -- -- Other
929 482 (84) (259) Net change in Plan Fiduciary Net Position
5,599 5,117 5,201 5,460 Plan Fiduciary Net Position-beginning
$ 6,528 $ 5,599 $ 5,117 $ 5,201 Plan Fiduciary Net Position-ending (b)
$ 2,034 $ 2,899 $ 3,224 $ 3,391 Plan Net Pension Liability-ending (a) – (b)
76.24% 65.89% 61.35% 60.53%
Plan Fiduciary Net Position as a percentage of the Total
Pension Liability
$ 4,725 $ 1,747 $ 1,829 $ 1,876 Covered payroll (2)
43.05% 165.94% 176.27% 180.76% Plan Net Pension Liability as a percentage of covered (2)
payroll
___________________________________________________________________________________________
___________________________________________________________________________________________
Required Supplemental Information (Dollar Amounts in Thousands)
150

Orange County Extra-Help Defined Benefit Plan (Continued)
Schedule of Investment Returns
2020 2019 2018 2017 2016 2015 2014
4.56% 6.90% 4.53% 8.51% 2.22% 0.35% 0.26%
Actual money-weighted rate of return,
net of investment expense
Valuation date July 1, 2019
Actuarial cost method Projected Unit Credit (all plan benefits frozen)
Amortization method Level dollar
Amortization period 5 years rolling (open)
Asset valuation method Market Value of assets
Discount rate 5.25%
General Inflation 2.75%
Mortality
Notes to Schedule
Methods and assumptions used to determine acturially
determined contribution:
RPH-2014, projected generationally with mortality
improvement Scale MP-2016
The schedule is presented to show information for 10 years. However, a full 10-year trend is currently not available; the County will be adding
years in the future.
___________________________________________________________________________________________
___________________________________________________________________________________________
County of Orange Comprehensive Annual Financial Report For the Year Ended June 30, 2020 (Dollar Amounts in Thousands)
151
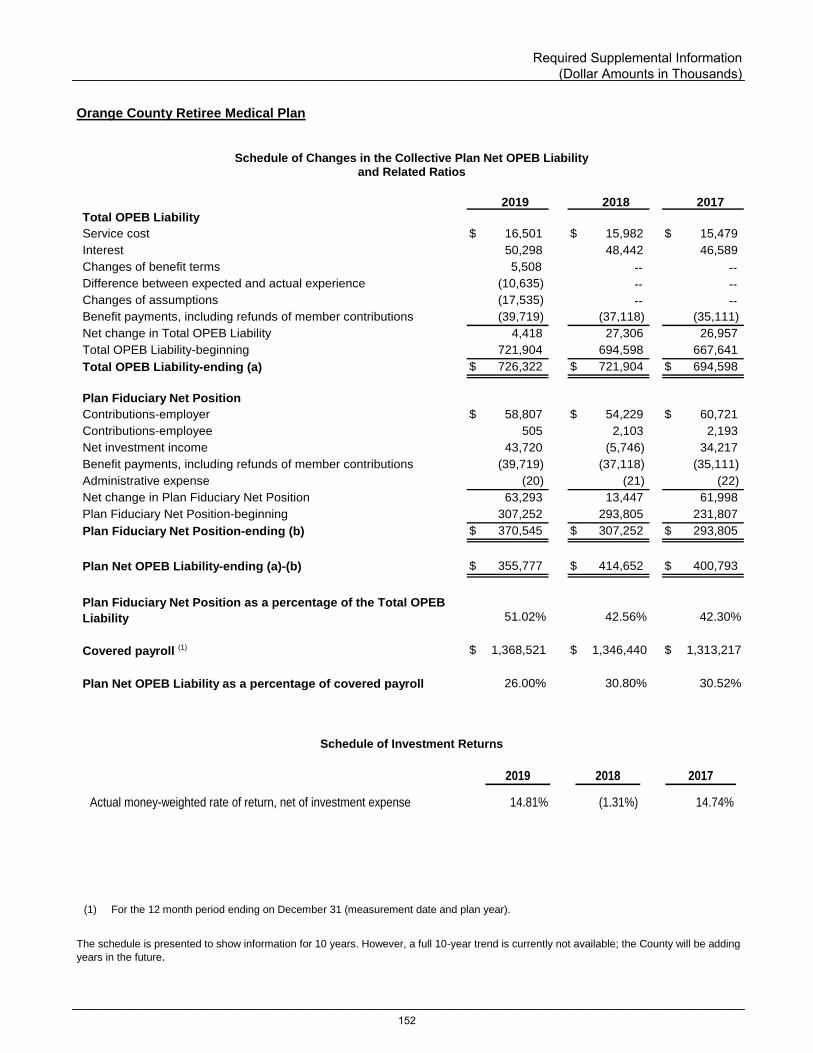
Orange County Retiree Medical Plan
Schedule of Changes in the Collective Plan Net OPEB Liability and Related Ratios
2019 2018 2017
Total OPEB Liability
Service cost $ 16,501 $ 15,982 $ 15,479
Interest 50,298 48,442 46,589
Changes of benefit terms 5,508 -- --
Difference between expected and actual experience (10,635) -- --
Changes of assumptions (17,535) -- --
Benefit payments, including refunds of member contributions (39,719) (37,118) (35,111)
Net change in Total OPEB Liability 4,418 27,306 26,957
Total OPEB Liability-beginning 721,904 694,598 667,641
Total OPEB Liability-ending (a) $ 726,322 $ 721,904 $ 694,598
Plan Fiduciary Net Position
Contributions-employer $ 58,807 $ 54,229 $ 60,721
Contributions-employee 505 2,103 2,193
Net investment income 43,720 (5,746) 34,217
Benefit payments, including refunds of member contributions (39,719) (37,118) (35,111)
Administrative expense (20) (21) (22)
Net change in Plan Fiduciary Net Position 63,293 13,447 61,998
Plan Fiduciary Net Position-beginning 307,252 293,805 231,807
Plan Fiduciary Net Position-ending (b) $ 370,545 $ 307,252 $ 293,805
Plan Net OPEB Liability-ending (a)-(b) $ 355,777 $ 414,652 $ 400,793
51.02% 42.56% 42.30%
Covered payroll (1) $ 1,368,521 $ 1,346,440 $ 1,313,217
26.00% 30.80% 30.52%Plan Net OPEB Liability as a percentage of covered payroll
Plan Fiduciary Net Position as a percentage of the Total OPEB
Liability
Schedule of Investment Returns
2019 2018 2017
Actual money-weighted rate of return, net of investment expense 14.81% (1.31%) 14.74%
(1) For the 12 month period ending on December 31 (measurement date and plan year).
The schedule is presented to show information for 10 years. However, a full 10-year trend is currently not available; the County will be adding
years in the future.
___________________________________________________________________________________________
___________________________________________________________________________________________
Required Supplemental Information (Dollar Amounts in Thousands)
152

Orange County Retiree Medical Plan (Continued)
Schedule of County’s Proportionate Share of the Net OPEB Liability
2019 2018 2017
County’s proportion of the net OPEB liability 92.31% 91.78% 90.84%
County’s proportionate share of the net OPEB liability $ 328,412 $ 380,581 $ 364,071Covered payroll (1) $ 1,254,780 $ 1,234,558 $ 1,203,106County’s proportionate share of the net OPEB liability as a percentage of its covered payroll 26.17% 30.83% 30.26%
Plan fiduciary net position as a percentage of thetotal OPEB liability 51.02% 42.56% 42.30%
Schedule of Collective Plan Contributions
2019 2018 2017
Actuarially determined contribution $ 50,037 $ 52,554 $ 47,006Contributions in relation to the actuarially determined contribution 58,807 54,229 60,721
Contribution deficiency (excess) $ (8,770) $ (1,675) $ (13,715)
Covered payroll (1)$ 1,368,521 $ 1,346,440 $ 1,313,217
Contributions as a percentage of covered payroll 4.30% 4.03% 4.62%
Schedule of County Contributions
2020 2019 2018
Actuarially determined contribution $ 45,698 $ 48,101 $ 42,716 Contributions in relation to the actuarially determined contribution 50,466 52,349 46,005 Contribution deficiency (excess) $ (4,768) $ (4,248) $ (3,289)
Covered payroll (2)$ 1,293,186 $ 1,254,706 $ 1,220,638
3.90% 4.17% 3.77%Contributions as a percentage of covered payroll
(1) For the 12 month period ending on December 31 (measurement date and plan year).
(2) For the 12 month period ending on June 30, fiscal year end.
The schedule is presented to show information for 10 years. However, a full 10-year trend is currently not available; the County will be adding
years in the future.
___________________________________________________________________________________________
___________________________________________________________________________________________
County of Orange Comprehensive Annual Financial Report For the Year Ended June 30, 2020 (Dollar Amounts in Thousands)
153

Orange County Retiree Medical Plan (Continued)
Valuation date June 30, 2017
Actuarial cost method Entry age
Amortization method Level percent of payroll, closed
Remaining amortization period 16 years
Asset valuation method 5-year smoothed market
Inflation 2.75%
Investment rate of return 7.00%, net of investment expenses, including inflation
Mortality
Grant increase rates 5% for AFSCME, 3% for others
Medical Trend
Notes to Schedule
Methods and assumptions used to determine
contribution rates:
OCERS 2014-2016 Experience Study projected
generationally with modified mortality improvement Scale
MP-2016
7.5% initial (6.5% Medicare) decreasing to 4.0% in 2076
and later
___________________________________________________________________________________________
___________________________________________________________________________________________
Required Supplemental Information (Dollar Amounts in Thousands)
154


County Administration South


NONMAJOR GOVERNMENTAL FUNDS
SPECIAL REVENUE FUNDS These Funds are used to account for the proceeds of specific revenue sources (other than the Permanent Fund or for major capital projects) that have either legal or operational requirements to restrict expenditures for specified purposes. Parking Facilities
This Fund is used to account for revenues and expenditures related to parking facilities. This includes costs to lease parking spaces for County staff, costs and revenue from the Manchester lot, interest revenue, and the County’s operating and maintenance costs.
Service Areas, Lighting, Maintenance and Assessment Districts This group of Funds is used to account for the construction of public facilities from the proceeds of various
Mello-Roos districts (also known as Community Facilities Districts) bond issues, special assessment district bond issues, and interfund transfers from County Service Area operating funds. Upon completion of construction, the public facilities are transferred to the Special Assessment and Community Facilities Districts. It is also used to account for local park and recreation facilities, highway lighting, and street sweeping services within unincorporated areas of the County. Revenues consist primarily of property taxes and State grants.
Other Environmental Management This group of Funds is used to account for Local Redevelopment Authority activities, fees from violations of fish and game laws, usage of various State tidelands held in trust by the County, registration of off-highway vehicles, and motor vehicle fees levied by the South Coast Air Quality Management District.
Tobacco Settlement This Fund accounts for Tobacco Settlement monies allocated to the County from the State of California, pursuant to the Master Settlement Agreement concluded on November 23, 1998 between the major tobacco companies and 46 States (including California), the District of Columbia and four U.S. Territories. On November 7, 2000, Orange County voters passed Measure H. This measure requires the County to utilize its share of the national tobacco litigation settlement revenues in the following percentages:
• 80% for specified health care services
• 20% for public safety
Community and Welfare Services This group of Funds is used to account for the Orange County Workforce Innovation and Opportunity Act,
Welfare-to-Work, Shelter Care Facilities, In Home Supportive Services, Housing and Community Development, Substance Abuse Treatment, and Other Community and Welfare Social Programs. Revenues consist primarily of Federal grants passed through the State, as well as State grants.
OC Parks This Fund accounts for the development and maintenance of County tidelands and related aquatic recreational facilities, as well as the acquisition, operation and maintenance of County beaches, inland, regional park facilities and community park sites in the unincorporated areas. Revenues consist primarily of property taxes, State aid, lease and concession revenues, and park and recreation fees.
OC Dana Point Harbor This Fund accounts for monies received primarily through rent and concession revenues which are dedicated to providing public coastal access, environmental stewardship, and a diverse regional recreational facility so users and visitors may experience the Dana Point Harbor resource in a safe and enjoyable way. The Board approved a lease agreement with Dana Point Harbor Partners to renovate and operate the Dana Point Harbor. For additional information regarding Dana Point Harbor, refer to Note 5, Service Concession Arrangements.
___________________________________________________________________________________________
___________________________________________________________________________________________
County of Orange Comprehensive Annual Financial Report For the Year Ended June 30, 2020 (Dollar Amounts in Thousands)
155

Housing Asset The Orange County Development Agency (OCDA) was dissolved effective February 1, 2012 in accordance
with Health and Safety Code 34172. The Orange County Housing Authority assumed the housing functions previously performed by OCDA. The Housing Asset Fund was established and the housing assets from the OCDA Low and Moderate Income Housing Fund were transferred into the Fund.
OC Public Libraries This Fund accounts for library services for the unincorporated areas as well as some of the incorporated areas within the County. Property taxes provide most of the fund’s revenue. Licenses, permits, Federal and State aid, and charges for services make up the remaining revenue.
Health Care Programs This group of Funds is used to account for Board-approved Realignment Reserves for Health Care, Medi-Cal Mental Health Managed Care programs, Medi-Cal Administrative Activities and Targeted Case Management, Bioterrorism Preparedness grant funds, Emergency Medical Services allocations, and other purpose-restricted revenues related to health care programs. Revenues consist primarily of State grants and allocations, and Federal grants passed through the State. Roads This Fund accounts for proceeds restricted for the maintenance and construction of roadways, and for specialized engineering services to other governmental units and the public. Revenues consist primarily of the County’s share of State highway users’ taxes, and SB1 related transportation taxes and fees, Federal funds, and charges for engineering services provided.
Orange County Housing Authority This Fund is used to account for revenues received from the Federal Government for Section 8 Rental
Assistance Program expenditures. This program assists low-income families to obtain decent, safe, and sanitary housing through a system of rental subsidies.
Other Governmental Resources This group of Funds is used to account for fees charged for property characteristics information that are purpose-restricted for technological and capital acquisitions and/or improvements.
___________________________________________________________________________________________
___________________________________________________________________________________________
Supplemental Information (Dollar Amounts in Thousands)
156

NONMAJOR GOVERNMENTAL FUNDS (Continued)
DEBT SERVICE FUNDS These Funds are used to account for the accumulation and disbursement of taxes and other revenues for the periodic payment of principal and interest on general long-term debt that includes general obligation, revenue, and demand bond issues.
Teeter Plan Notes This Fund accounts for the financing of the County’s purchase of delinquent taxes receivable pursuant to the Teeter Plan. The Teeter Plan is an alternate secured property tax distribution plan, whereby, the County distributes 100% of the local secured levy to the taxing agencies participating in the Teeter Plan and in exchange receives the right to keep the delinquent taxes, penalties and interest.
Pension Obligation Bonds This Fund is used to account for the debt service expenditures for the Orange County Taxable Pension
Obligation Bonds. The Taxable Refunding Pension Obligation Bonds, Series 1997A are economically defeased and the outstanding debt service is paid through debt securities issued by Fannie Mae, along with Debt Service Funds already being held by the Trustee.
Capital Facilities Development Corporation This non-budgeted Fund was established to account for the Civic Center Facilities Master Plan project and will facilitate financings, acquisitions of property, and other property related transactions for the benefit of Orange County, California.
South Orange County Public Financing Authority This non-budgeted Fund was established to account for the debt service expenditures for the South Orange County Public Financing Authority (SOCPFA). On June 2, 2016, SOCPFA issued the Central Utility Facility Lease Revenue Bonds, Series 2016 to finance the acquisition, construction and installation of certain capital improvements.
CAPITAL PROJECTS FUNDS
These Funds are used to account for the acquisition and construction of major capital facilities (other than those financed by the proprietary funds).
Criminal Justice Facilities This group of Funds is used to account for monies received from surcharges and penalty assessments on
offenses used for capital improvements to court and other criminal justice facilities. Countywide Capital Projects Non-General Fund This Fund was established to budget and account for the multi-year approved capital projects funded
primarily with Net County Cost or general purpose revenue. Capital Facilities Development Corporation Construction This non-budgeted Fund was established for the Civic Center Facilities Master Plan project and to account
for the related construction.
___________________________________________________________________________________________
___________________________________________________________________________________________
County of Orange Comprehensive Annual Financial Report For the Year Ended June 30, 2020 (Dollar Amounts in Thousands)
157
PERMANENT FUND A Permanent Fund is used to report resources that are legally restricted to the extent that only earnings, and not principal, may be used for purposes that support the reporting government’s programs, that is, for the benefit of the government or its citizenry.
Regional Park Endowment This Fund is used to account for costs associated with the repair and maintenance of a mitigation area in Limestone Regional Park.
___________________________________________________________________________________________
___________________________________________________________________________________________
Supplemental Information (Dollar Amounts in Thousands)
158
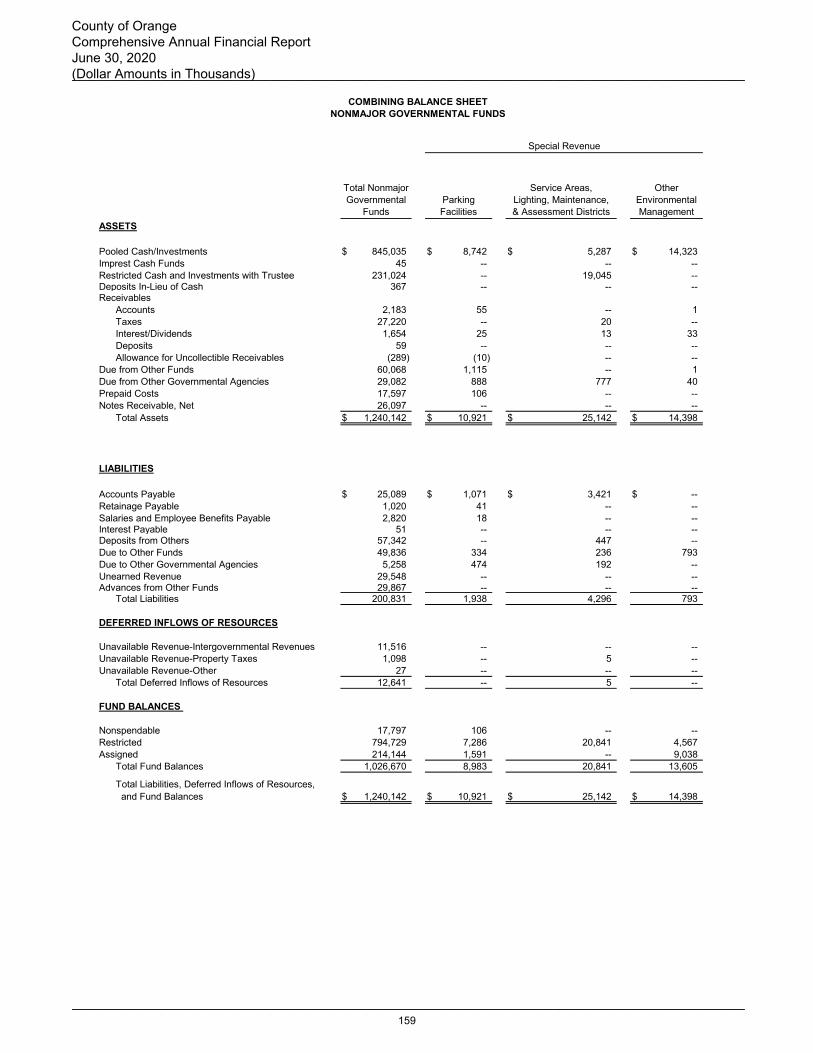
ASSETS
Pooled Cash/Investments $ 845,035 $ 8,742 $ 5,287 $ 14,323Imprest Cash Funds 45 -- -- -- Restricted Cash and Investments with Trustee 231,024 -- 19,045 -- Deposits In-Lieu of Cash 367 -- -- -- Receivables
Accounts 2,183 55 -- 1Taxes 27,220 -- 20 -- Interest/Dividends 1,654 25 13 33Deposits 59 -- -- -- Allowance for Uncollectible Receivables (289) (10) -- --
Due from Other Funds 60,068 1,115 -- 1Due from Other Governmental Agencies 29,082 888 777 40Prepaid Costs 17,597 106 -- -- Notes Receivable, Net 26,097 -- -- --
Total Assets $ 1,240,142 $ 10,921 $ 25,142 $ 14,398
LIABILITIES
Accounts Payable $ 25,089 $ 1,071 $ 3,421 $ -- Retainage Payable 1,020 41 -- -- Salaries and Employee Benefits Payable 2,820 18 -- -- Interest Payable 51 -- -- -- Deposits from Others 57,342 -- 447 -- Due to Other Funds 49,836 334 236 793Due to Other Governmental Agencies 5,258 474 192 -- Unearned Revenue 29,548 -- -- -- Advances from Other Funds 29,867 -- -- --
Total Liabilities 200,831 1,938 4,296 793
DEFERRED INFLOWS OF RESOURCES
Unavailable Revenue-Intergovernmental Revenues 11,516 -- -- -- Unavailable Revenue-Property Taxes 1,098 -- 5 -- Unavailable Revenue-Other 27 -- -- --
Total Deferred Inflows of Resources 12,641 -- 5 --
FUND BALANCES
Nonspendable 17,797 106 -- -- Restricted 794,729 7,286 20,841 4,567Assigned 214,144 1,591 -- 9,038
Total Fund Balances 1,026,670 8,983 20,841 13,605
Total Liabilities, Deferred Inflows of Resources, and Fund Balances $ 1,240,142 $ 10,921 $ 25,142 $ 14,398
Special Revenue
Service Areas, Lighting, Maintenance,& Assessment Districts
Total Nonmajor Governmental
FundsParking Facilities
Other Environmental Management
COMBINING BALANCE SHEETNONMAJOR GOVERNMENTAL FUNDS
___________________________________________________________________________________________
___________________________________________________________________________________________
County of Orange Comprehensive Annual Financial Report June 30, 2020 (Dollar Amounts in Thousands)
159

ASSETS
$ 21,557 $ 99,726 $ 126,499 $ 71,295 Pooled Cash/Investments -- 45 -- -- Imprest Cash Funds-- -- -- -- Restricted Cash and Investments with Trustee-- -- 352 15 Deposits In-Lieu of Cash
Receivables-- 1 1,347 119 Accounts-- -- 1,279 -- Taxes-- 177 293 167 Interest/Dividends-- -- 7 -- Deposits-- -- -- -- Allowance for Uncollectible Receivables-- 18,429 62 -- Due from Other Funds-- 4,289 406 -- Due from Other Governmental Agencies-- 349 5,841 -- Prepaid Costs-- 5,202 -- -- Notes Receivable, Net
$ 21,557 $ 128,218 $ 136,086 $ 71,596 Total Assets
LIABILITIES
$ -- $ 2,532 $ 3,860 $ -- Accounts Payable-- -- 423 1 Retainage Payable-- 46 1,043 -- Salaries and Employee Benefits Payable -- -- -- -- Interest Payable-- 1 3,211 392 Deposits from Others
3,948 16,409 2,051 951 Due to Other Funds-- 670 20 -- Due to Other Governmental Agencies-- 105 623 5 Unearned Revenue -- 3,867 -- -- Advances from Other Funds
3,948 23,630 11,231 1,349 Total Liabilities
DEFERRED INFLOWS OF RESOURCES
-- 997 178 -- Unavailable Revenue-Intergovernmental Revenues-- -- 678 -- Unavailable Revenue-Property Taxes-- -- -- -- Unavailable Revenue-Other-- 997 856 -- Total Deferred Inflows of Resources
FUND BALANCES
-- 349 5,841 -- Nonspendable17,609 70,774 105,583 70,247 Restricted
-- 32,468 12,575 -- Assigned17,609 103,591 123,999 70,247 Total Fund Balances
Total Liabilities, Deferred Inflows of Resources,$ 21,557 $ 128,218 $ 136,086 $ 71,596 and Fund Balances
Tobacco Settlement
Community & Welfare Services
OCParks
OC Dana Point
Harbor
Special Revenue
___________________________________________________________________________________________
___________________________________________________________________________________________
Supplemental Information (Dollar Amounts in Thousands)
160
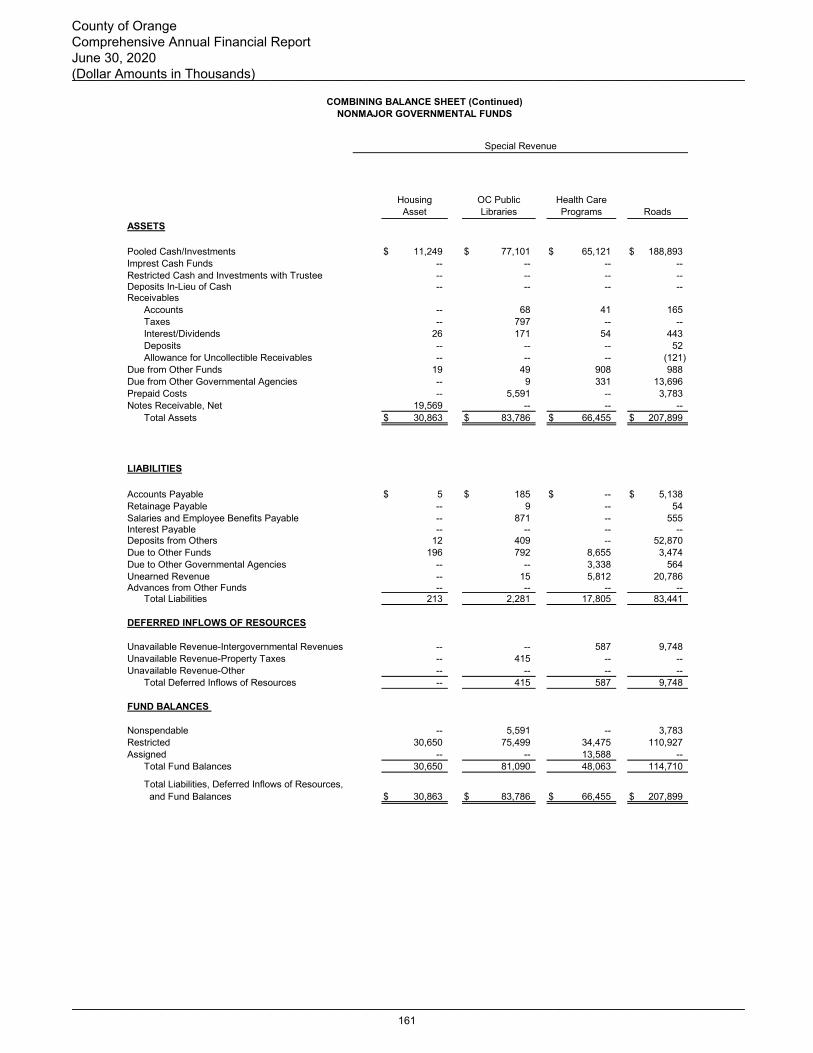
ASSETS
Pooled Cash/Investments $ 11,249 $ 77,101 $ 65,121 $ 188,893Imprest Cash Funds -- -- -- -- Restricted Cash and Investments with Trustee -- -- -- -- Deposits In-Lieu of Cash -- -- -- -- Receivables
Accounts -- 68 41 165Taxes -- 797 -- -- Interest/Dividends 26 171 54 443Deposits -- -- -- 52Allowance for Uncollectible Receivables -- -- -- (121)
Due from Other Funds 19 49 908 988Due from Other Governmental Agencies -- 9 331 13,696Prepaid Costs -- 5,591 -- 3,783Notes Receivable, Net 19,569 -- -- --
Total Assets $ 30,863 $ 83,786 $ 66,455 $ 207,899
LIABILITIES
Accounts Payable $ 5 $ 185 $ -- $ 5,138Retainage Payable -- 9 -- 54Salaries and Employee Benefits Payable -- 871 -- 555Interest Payable -- -- -- -- Deposits from Others 12 409 -- 52,870Due to Other Funds 196 792 8,655 3,474Due to Other Governmental Agencies -- -- 3,338 564Unearned Revenue -- 15 5,812 20,786Advances from Other Funds -- -- -- --
Total Liabilities 213 2,281 17,805 83,441
DEFERRED INFLOWS OF RESOURCES
Unavailable Revenue-Intergovernmental Revenues -- -- 587 9,748Unavailable Revenue-Property Taxes -- 415 -- -- Unavailable Revenue-Other -- -- -- --
Total Deferred Inflows of Resources -- 415 587 9,748
FUND BALANCES
Nonspendable -- 5,591 -- 3,783Restricted 30,650 75,499 34,475 110,927Assigned -- -- 13,588 --
Total Fund Balances 30,650 81,090 48,063 114,710
Total Liabilities, Deferred Inflows of Resources, and Fund Balances $ 30,863 $ 83,786 $ 66,455 $ 207,899
Health Care Programs
Housing Asset
Special Revenue
OC Public Libraries Roads
COMBINING BALANCE SHEET (Continued)NONMAJOR GOVERNMENTAL FUNDS
___________________________________________________________________________________________
___________________________________________________________________________________________
County of Orange Comprehensive Annual Financial Report June 30, 2020 (Dollar Amounts in Thousands)
161
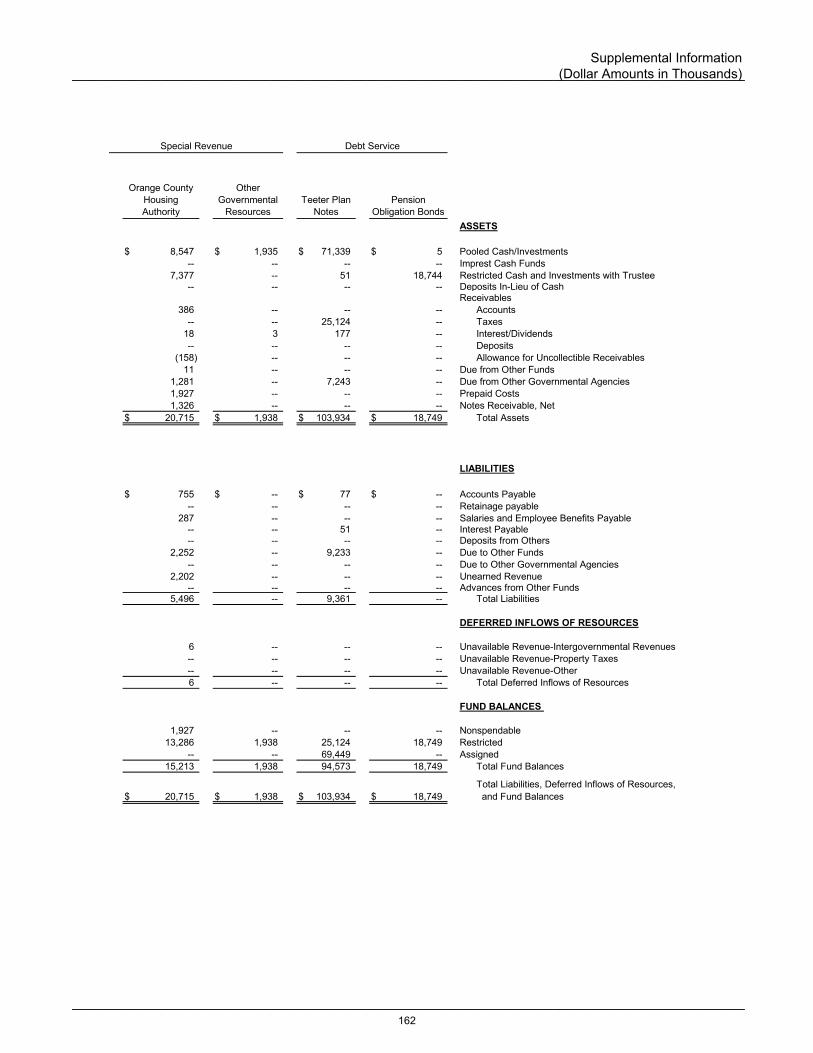
ASSETS
$ 8,547 $ 1,935 $ 71,339 $ 5 Pooled Cash/Investments -- -- -- -- Imprest Cash Funds
7,377 -- 51 18,744 Restricted Cash and Investments with Trustee-- -- -- -- Deposits In-Lieu of Cash
Receivables386 -- -- -- Accounts
-- -- 25,124 -- Taxes18 3 177 -- Interest/Dividends-- -- -- -- Deposits
(158) -- -- -- Allowance for Uncollectible Receivables11 -- -- -- Due from Other Funds
1,281 -- 7,243 -- Due from Other Governmental Agencies1,927 -- -- -- Prepaid Costs1,326 -- -- -- Notes Receivable, Net
$ 20,715 $ 1,938 $ 103,934 $ 18,749 Total Assets
LIABILITIES
$ 755 $ -- $ 77 $ -- Accounts Payable-- -- -- -- Retainage payable
287 -- -- -- Salaries and Employee Benefits Payable -- -- 51 -- Interest Payable-- -- -- -- Deposits from Others
2,252 -- 9,233 -- Due to Other Funds-- -- -- -- Due to Other Governmental Agencies
2,202 -- -- -- Unearned Revenue -- -- -- -- Advances from Other Funds
5,496 -- 9,361 -- Total Liabilities
DEFERRED INFLOWS OF RESOURCES
6 -- -- -- Unavailable Revenue-Intergovernmental Revenues-- -- -- -- Unavailable Revenue-Property Taxes-- -- -- -- Unavailable Revenue-Other6 -- -- -- Total Deferred Inflows of Resources
FUND BALANCES
1,927 -- -- -- Nonspendable13,286 1,938 25,124 18,749 Restricted
-- -- 69,449 -- Assigned15,213 1,938 94,573 18,749 Total Fund Balances
Total Liabilities, Deferred Inflows of Resources,$ 20,715 $ 1,938 $ 103,934 $ 18,749 and Fund Balances
Teeter Plan Notes
Pension Obligation Bonds
Debt ServiceSpecial Revenue
Orange County Housing Authority
Other Governmental
Resources
___________________________________________________________________________________________
___________________________________________________________________________________________
Supplemental Information (Dollar Amounts in Thousands)
162

ASSETS
Pooled Cash/Investments $ -- $ -- $ 18,316Imprest Cash Funds -- -- -- Restricted Cash and Investments with Trustee 24,763 149 -- Deposits In-Lieu of Cash -- -- -- Receivables
Accounts -- -- -- Taxes -- -- -- Interest/Dividends -- -- 53Deposits -- -- -- Allowance for Uncollectible Receivables -- -- --
Due from Other Funds -- -- 17,305Due from Other Governmental Agencies -- -- 122Prepaid Costs -- -- -- Notes Receivable, Net -- -- --
Total Assets $ 24,763 $ 149 $ 35,796
LIABILITIES
Accounts Payable $ -- $ -- $ 2,409Retainage payable -- -- 492Salaries and Employee Benefits Payable -- -- -- Interest Payable -- -- -- Deposits from Others -- -- -- Due to Other Funds -- -- 32Due to Other Governmental Agencies -- -- -- Unearned Revenue -- -- -- Advances from Other Funds -- -- 26,000
Total Liabilities -- -- 28,933
DEFERRED INFLOWS OF RESOURCES
Unavailable Revenue-Intergovernmental Revenues -- -- -- Unavailable Revenue-Property Taxes -- -- -- Unavailable Revenue-Other -- -- 27
Total Deferred Inflows of Resources -- -- 27
FUND BALANCES
Nonspendable -- -- -- Restricted 24,763 149 6,836Assigned -- -- --
Total Fund Balances 24,763 149 6,836
Total Liabilities, Deferred Inflows of Resources, and Fund Balances $ 24,763 $ 149 $ 35,796
Capital Facilities Development Corporation
South OC Public Financing
Authority
COMBINING BALANCE SHEET (Continued)NONMAJOR GOVERNMENTAL FUNDS
Debt Service Capital Projects
Criminal Justice Facilities
___________________________________________________________________________________________
___________________________________________________________________________________________
County of Orange Comprehensive Annual Financial Report June 30, 2020 (Dollar Amounts in Thousands)
163
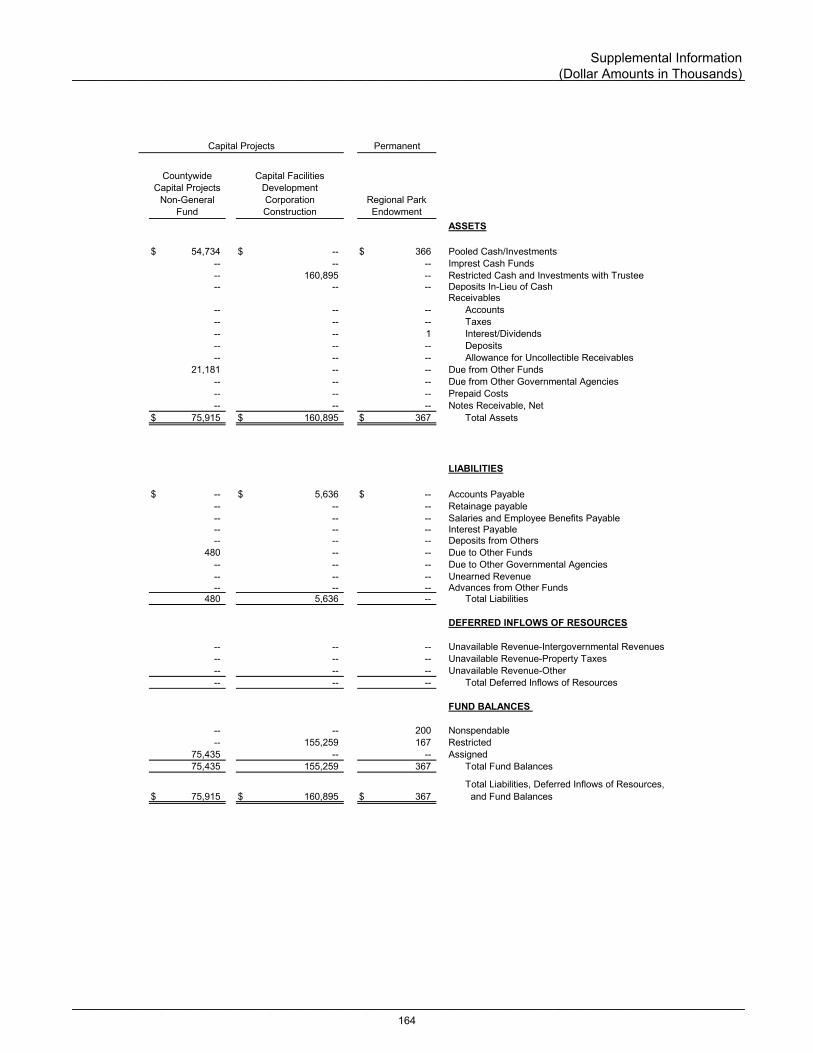
ASSETS
$ 54,734 $ -- $ 366 Pooled Cash/Investments -- -- -- Imprest Cash Funds-- 160,895 -- Restricted Cash and Investments with Trustee-- -- -- Deposits In-Lieu of Cash
Receivables-- -- -- Accounts-- -- -- Taxes-- -- 1 Interest/Dividends-- -- -- Deposits-- -- -- Allowance for Uncollectible Receivables
21,181 -- -- Due from Other Funds-- -- -- Due from Other Governmental Agencies-- -- -- Prepaid Costs-- -- -- Notes Receivable, Net
$ 75,915 $ 160,895 $ 367 Total Assets
LIABILITIES
$ -- $ 5,636 $ -- Accounts Payable-- -- -- Retainage payable-- -- -- Salaries and Employee Benefits Payable -- -- -- Interest Payable-- -- -- Deposits from Others
480 -- -- Due to Other Funds-- -- -- Due to Other Governmental Agencies-- -- -- Unearned Revenue -- -- -- Advances from Other Funds
480 5,636 -- Total Liabilities
DEFERRED INFLOWS OF RESOURCES
-- -- -- Unavailable Revenue-Intergovernmental Revenues-- -- -- Unavailable Revenue-Property Taxes-- -- -- Unavailable Revenue-Other-- -- -- Total Deferred Inflows of Resources
FUND BALANCES
-- -- 200 Nonspendable-- 155,259 167 Restricted
75,435 -- -- Assigned75,435 155,259 367 Total Fund Balances
Total Liabilities, Deferred Inflows of Resources,$ 75,915 $ 160,895 $ 367 and Fund Balances
Countywide Capital Projects
Non-General Fund
PermanentCapital Projects
Capital Facilities Development Corporation Construction
Regional Park Endowment
___________________________________________________________________________________________
___________________________________________________________________________________________
Supplemental Information (Dollar Amounts in Thousands)
164

Revenues
Taxes $ 159,298 $ -- $ 708 $ --
Licenses, Permits, and Franchises 843 -- -- --
Fines, Forfeitures, and Penalties 14,792 -- -- --
Use of Money and Property 51,693 11,275 1,021 1,103
Intergovernmental 347,795 1,624 780 2,775
Charges for Services 45,533 1,033 7 301
Other 34,267 -- -- 216
Total Revenues 654,221 13,932 2,516 4,395
Expenditures
Current
General Government 47,062 -- 45,907 803
Public Protection 216 -- -- 182
Public Ways and Facilities 103,859 13,691 846 1,564
Health and Sanitation 644 -- -- --
Public Assistance 223,317 -- -- --
Education 47,702 -- -- --
Recreation and Cultural Services 119,379 -- -- --
Capital Outlay 94,255 1,735 2 --
Debt Service
Principal Retirement 83,022 -- -- --
Interest 32,258 -- -- --
Total Expenditures 751,714 15,426 46,755 2,549
Excess (Deficit) of Revenues
Over Expenditures (97,493) (1,494) (44,239) 1,846
Other Financing Sources (Uses)
Transfers In 168,488 -- 100 355
Transfers Out (150,468) (76) -- --
Debt Issued 83,708 -- -- --
Total Other Financing Sources (Uses) 101,728 (76) 100 355
Net Change in Fund Balances 4,235 (1,570) (44,139) 2,201
Fund Balances-Beginning of Year 1,022,435 10,553 64,980 11,404
Fund Balances-End of Year $ 1,026,670 $ 8,983 $ 20,841 $ 13,605
COMBINING STATEMENT OF REVENUES, EXPENDITURES,
AND CHANGES IN FUND BALANCES
NONMAJOR GOVERNMENTAL FUNDS
Total
Nonmajor
Governmental
Funds
Special Revenue
Parking
Facilities
Service Area,
Lighting, Maintenance,
& Assessment Districts
Other
Environmental
Management
___________________________________________________________________________________________
___________________________________________________________________________________________
County of Orange Comprehensive Annual Financial Report For the Year Ended June 30, 2020 (Dollar Amounts in Thousands)
165

Revenues
$ -- $ -- $ 97,937 $ -- Taxes
-- 681 162 -- Licenses, Permits, and Franchises
-- -- 58 2 Fines, Forfeitures, and Penalties
296 2,515 14,402 3,827 Use of Money and Property
-- 26,048 793 26 Intergovernmental
-- 3,123 12,162 67 Charges for Services
29,607 639 1,930 102 Other
29,903 33,006 127,444 4,024 Total Revenues
Expenditures
Current
10 -- -- -- General Government
-- 34 -- -- Public Protection
-- -- -- -- Public Ways and Facilities
-- -- -- -- Health and Sanitation
-- 24,222 -- -- Public Assistance
-- -- -- -- Education
-- -- 112,880 6,499 Recreation and Cultural Services
-- -- 11,638 -- Capital Outlay
Debt Service
-- -- -- -- Principal Retirement
-- -- -- -- Interest
10 24,256 124,518 6,499 Total Expenditures
Excess (Deficit) of Revenues
29,893 8,750 2,926 (2,475) Over Expenditures
Other Financing Sources (Uses)
10 62,925 -- -- Transfers In
(29,658) (21,936) (1,326) (1) Transfers Out
-- -- -- -- Debt Issued
(29,648) 40,989 (1,326) (1) Total Other Financing Sources (Uses)
245 49,739 1,600 (2,476) Net Change in Fund Balances
17,364 53,852 122,399 72,723 Fund Balances-Beginning of Year
$ 17,609 $ 103,591 $ 123,999 $ 70,247 Fund Balances-End of Year
Special Revenue
Community &
Welfare
Services
COMBINING STATEMENT OF REVENUES, EXPENDITURES,
AND CHANGES IN FUND BALANCES
NONMAJOR GOVERNMENTAL FUNDS
OC
Parks
OC
Dana Point
Harbor
Tobacco
Settlement
___________________________________________________________________________________________
___________________________________________________________________________________________
Supplemental Information (Dollar Amounts in Thousands)
166
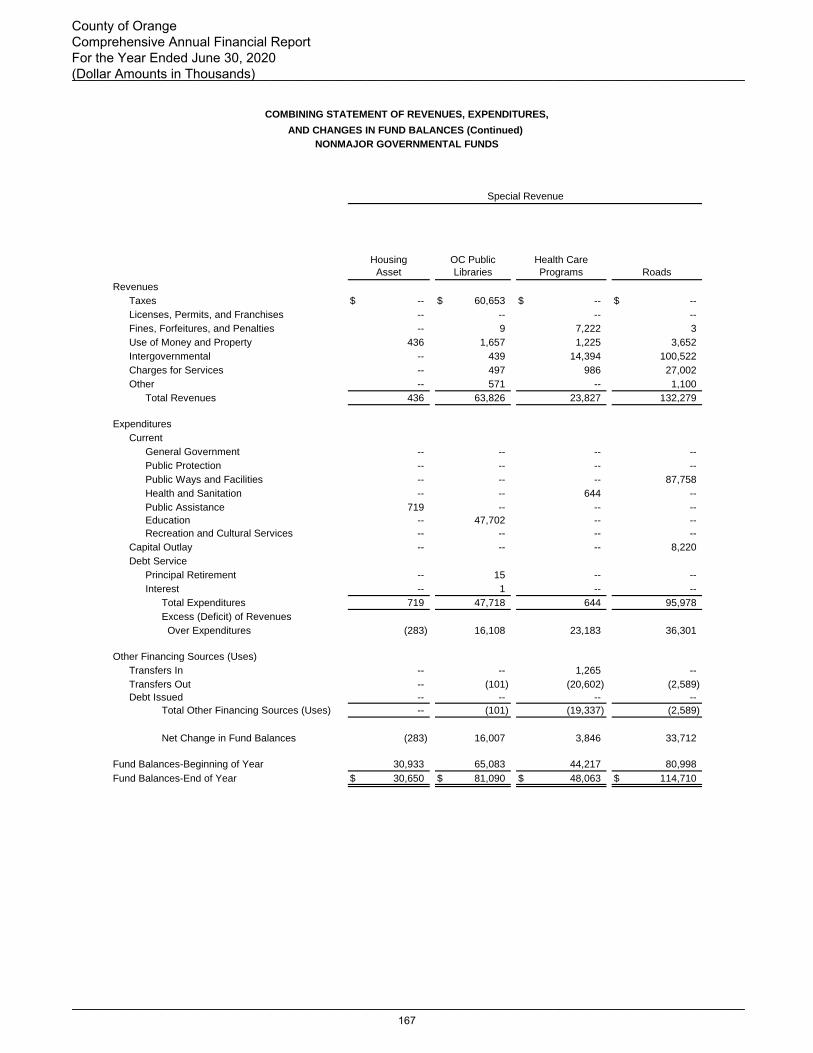
Revenues
Taxes $ -- $ 60,653 $ -- $ --
Licenses, Permits, and Franchises -- -- -- --
Fines, Forfeitures, and Penalties -- 9 7,222 3
Use of Money and Property 436 1,657 1,225 3,652
Intergovernmental -- 439 14,394 100,522
Charges for Services -- 497 986 27,002
Other -- 571 -- 1,100
Total Revenues 436 63,826 23,827 132,279
Expenditures
Current
General Government -- -- -- --
Public Protection -- -- -- --
Public Ways and Facilities -- -- -- 87,758
Health and Sanitation -- -- 644 --
Public Assistance 719 -- -- --
Education -- 47,702 -- --
Recreation and Cultural Services -- -- -- --
Capital Outlay -- -- -- 8,220
Debt Service
Principal Retirement -- 15 -- --
Interest -- 1 -- --
Total Expenditures 719 47,718 644 95,978
Excess (Deficit) of Revenues
Over Expenditures (283) 16,108 23,183 36,301
Other Financing Sources (Uses)
Transfers In -- -- 1,265 --
Transfers Out -- (101) (20,602) (2,589)
Debt Issued -- -- -- --
Total Other Financing Sources (Uses) -- (101) (19,337) (2,589)
Net Change in Fund Balances (283) 16,007 3,846 33,712
Fund Balances-Beginning of Year 30,933 65,083 44,217 80,998
Fund Balances-End of Year $ 30,650 $ 81,090 $ 48,063 $ 114,710
Health Care
Programs
Housing
Asset
COMBINING STATEMENT OF REVENUES, EXPENDITURES,
AND CHANGES IN FUND BALANCES (Continued)
NONMAJOR GOVERNMENTAL FUNDS
OC Public
Libraries Roads
Special Revenue
___________________________________________________________________________________________
___________________________________________________________________________________________
County of Orange Comprehensive Annual Financial Report For the Year Ended June 30, 2020 (Dollar Amounts in Thousands)
167
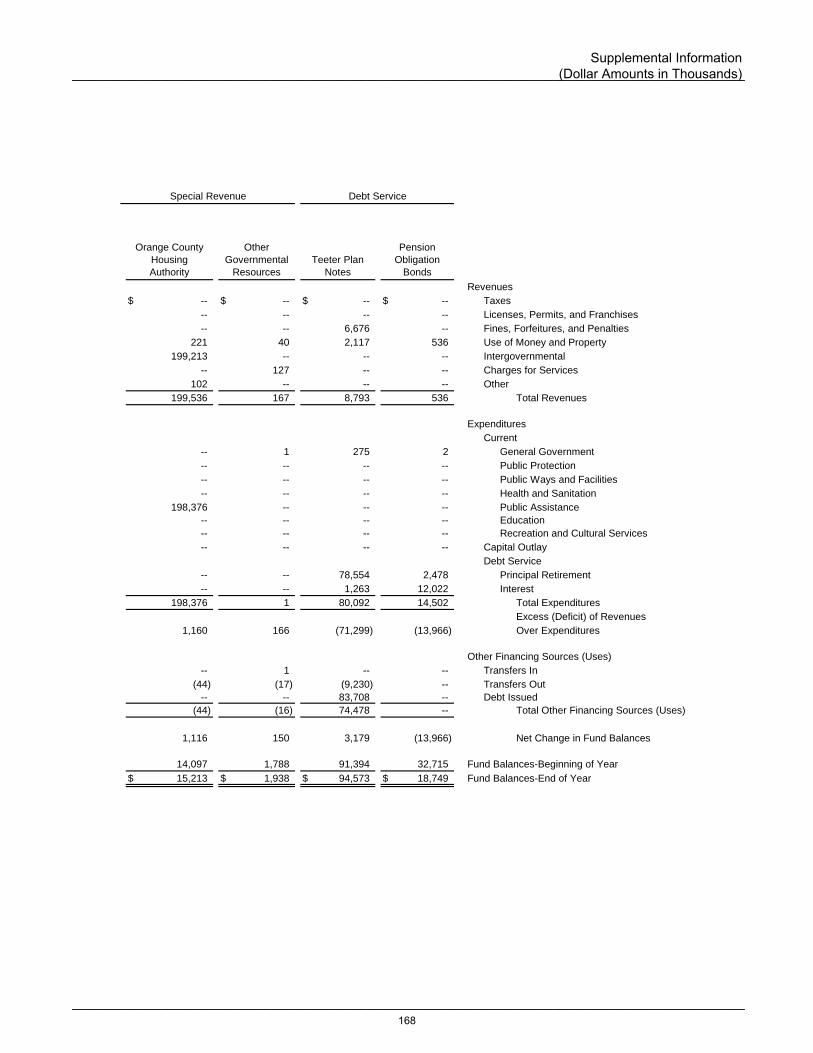
Revenues
$ -- $ -- $ -- $ -- Taxes
-- -- -- -- Licenses, Permits, and Franchises
-- -- 6,676 -- Fines, Forfeitures, and Penalties
221 40 2,117 536 Use of Money and Property
199,213 -- -- -- Intergovernmental
-- 127 -- -- Charges for Services
102 -- -- -- Other
199,536 167 8,793 536 Total Revenues
Expenditures
Current
-- 1 275 2 General Government
-- -- -- -- Public Protection
-- -- -- -- Public Ways and Facilities
-- -- -- -- Health and Sanitation
198,376 -- -- -- Public Assistance
-- -- -- -- Education
-- -- -- -- Recreation and Cultural Services
-- -- -- -- Capital Outlay
Debt Service
-- -- 78,554 2,478 Principal Retirement
-- -- 1,263 12,022 Interest
198,376 1 80,092 14,502 Total Expenditures
Excess (Deficit) of Revenues
1,160 166 (71,299) (13,966) Over Expenditures
Other Financing Sources (Uses)
-- 1 -- -- Transfers In
(44) (17) (9,230) -- Transfers Out
-- -- 83,708 -- Debt Issued
(44) (16) 74,478 -- Total Other Financing Sources (Uses)
1,116 150 3,179 (13,966) Net Change in Fund Balances
14,097 1,788 91,394 32,715 Fund Balances-Beginning of Year
$ 15,213 $ 1,938 $ 94,573 $ 18,749 Fund Balances-End of Year
Special Revenue
Teeter Plan
Notes
Orange County
Housing
Authority
Other
Governmental
Resources
Pension
Obligation
Bonds
Debt Service
___________________________________________________________________________________________
___________________________________________________________________________________________
Supplemental Information (Dollar Amounts in Thousands)
168
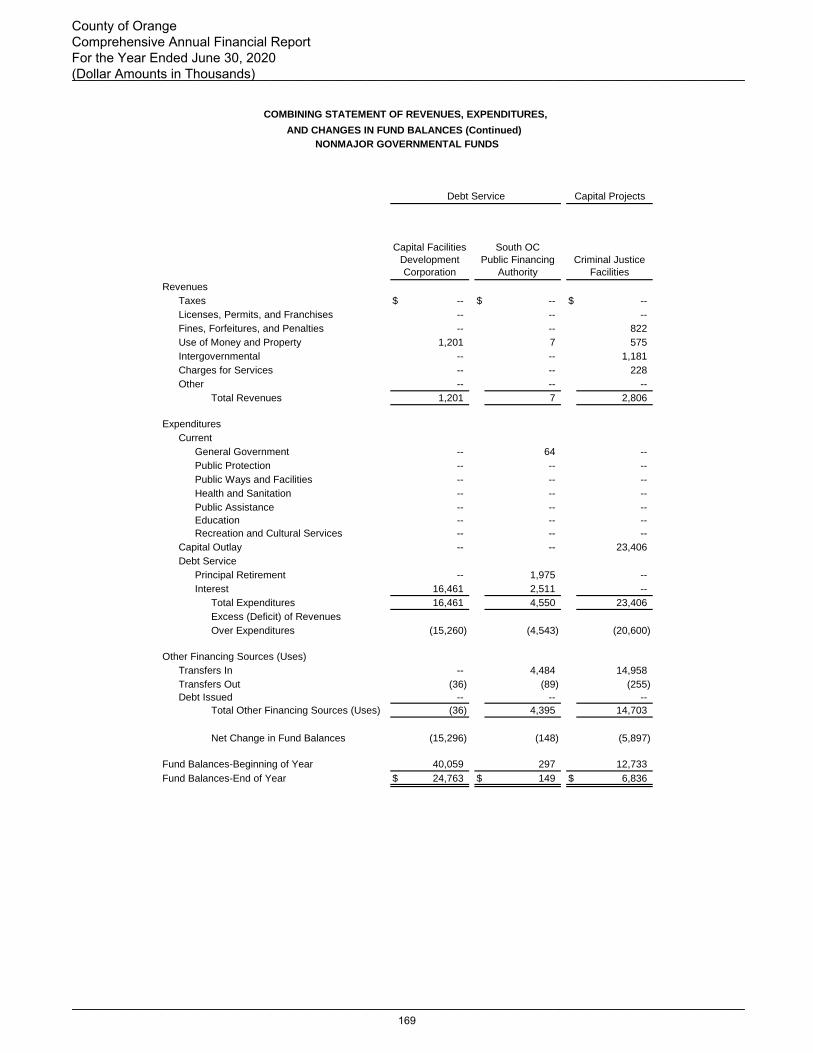
Revenues
Taxes $ -- $ -- $ --
Licenses, Permits, and Franchises -- -- --
Fines, Forfeitures, and Penalties -- -- 822
Use of Money and Property 1,201 7 575
Intergovernmental -- -- 1,181
Charges for Services -- -- 228
Other -- -- --
Total Revenues 1,201 7 2,806
Expenditures
Current
General Government -- 64 --
Public Protection -- -- --
Public Ways and Facilities -- -- --
Health and Sanitation -- -- --
Public Assistance -- -- --
Education -- -- --
Recreation and Cultural Services -- -- --
Capital Outlay -- -- 23,406
Debt Service
Principal Retirement -- 1,975 --
Interest 16,461 2,511 --
Total Expenditures 16,461 4,550 23,406
Excess (Deficit) of Revenues
Over Expenditures (15,260) (4,543) (20,600)
Other Financing Sources (Uses)
Transfers In -- 4,484 14,958
Transfers Out (36) (89) (255)
Debt Issued -- -- --
Total Other Financing Sources (Uses) (36) 4,395 14,703
Net Change in Fund Balances (15,296) (148) (5,897)
Fund Balances-Beginning of Year 40,059 297 12,733
Fund Balances-End of Year $ 24,763 $ 149 $ 6,836
Criminal Justice
Facilities
COMBINING STATEMENT OF REVENUES, EXPENDITURES,
AND CHANGES IN FUND BALANCES (Continued)
NONMAJOR GOVERNMENTAL FUNDS
Capital Facilities
Development
Corporation
South OC
Public Financing
Authority
Debt Service Capital Projects
___________________________________________________________________________________________
___________________________________________________________________________________________
County of Orange Comprehensive Annual Financial Report For the Year Ended June 30, 2020 (Dollar Amounts in Thousands)
169
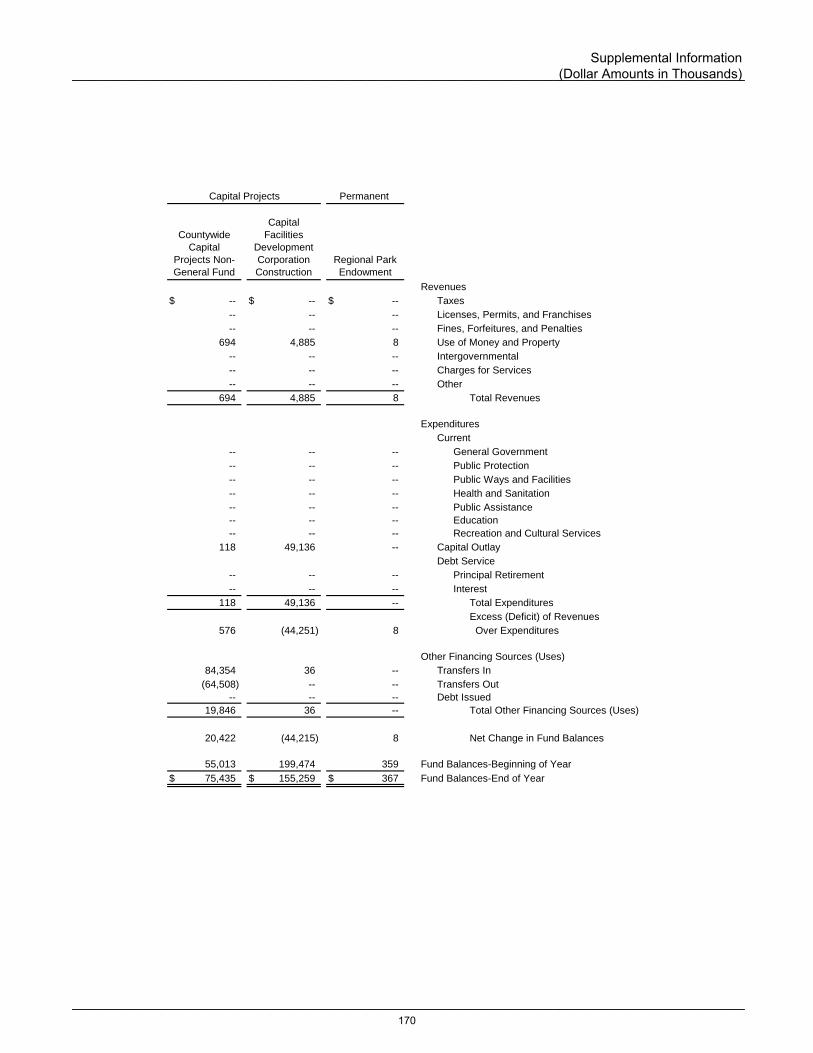
Revenues
$ -- $ -- $ -- Taxes
-- -- -- Licenses, Permits, and Franchises
-- -- -- Fines, Forfeitures, and Penalties
694 4,885 8 Use of Money and Property
-- -- -- Intergovernmental
-- -- -- Charges for Services
-- -- -- Other
694 4,885 8 Total Revenues
Expenditures
Current
-- -- -- General Government
-- -- -- Public Protection
-- -- -- Public Ways and Facilities
-- -- -- Health and Sanitation
-- -- -- Public Assistance
-- -- -- Education
-- -- -- Recreation and Cultural Services
118 49,136 -- Capital Outlay
Debt Service
-- -- -- Principal Retirement
-- -- -- Interest
118 49,136 -- Total Expenditures
Excess (Deficit) of Revenues
576 (44,251) 8 Over Expenditures
Other Financing Sources (Uses)
84,354 36 -- Transfers In
(64,508) -- -- Transfers Out
-- -- -- Debt Issued
19,846 36 -- Total Other Financing Sources (Uses)
20,422 (44,215) 8 Net Change in Fund Balances
55,013 199,474 359 Fund Balances-Beginning of Year
$ 75,435 $ 155,259 $ 367 Fund Balances-End of Year
Capital Projects Permanent
Capital
Facilities
Development
Corporation
Construction
Regional Park
Endowment
Countywide
Capital
Projects Non-
General Fund
___________________________________________________________________________________________
___________________________________________________________________________________________
Supplemental Information (Dollar Amounts in Thousands)
170

Parking Facilities
Revenues and Other Financing Sources
Use of Money and Property $ 6,850 $ 6,850 $ 5,746 $ (1,104)
Intergovernmental -- 369 444 75
Charges for Services 125 125 1,033 908
Total Revenues and Other Financing Sources 6,975 7,344 7,223 (121)
Expenditures and Other Financing Uses
Public Ways and Facilities:
Parking Facilities 8,282 9,645 8,416 1,229
Total Expenditures and Other Financing Uses 8,282 9,645 8,416 1,229
Excess (Deficit) of Revenues and Other Financing
Sources Over Expenditures and Other Financing Uses (1,307) (2,301) (1,193) $ 1,108
Fund Balances-Beginning of Year 2,790 2,790 2,790
Fund Balances-End of Year $ 1,483 $ 489 $ 1,597
Service Area, Lighting, Maintenance, and Assessment Districts
Revenues and Other Financing Sources
Taxes $ 668 $ 668 $ 708 $ 40
Use of Money and Property 1,127 1,477 999 (478)
Intergovernmental 3 3 3 --
Charges for Services 29 29 7 (22)
Other 2 2 -- (2)
Transfers In -- 878 877 (1)
Total Revenues and Other Financing Sources 1,829 3,057 2,594 (463)
Expenditures and Other Financing Uses
General Government:
Special Assessment-Top of the World Improvement 61 61 19 42
CFD 2016-1 RMV (Village of Esencia) Construction 92 1,628 1,317 311
CFD 2017-1 RMV (Village of Esencia) Construction 40,278 43,360 43,360 --
Public Ways and Facilities:
North Tustin Landscaping and Lighting Assessment District 2,115 2,115 703 1,412
County Service Area No. 13-La Mirada 8 21 8 13
County Service Area No. 22-East Yorba Linda 123 211 136 75
Total Expenditures and Other Financing Uses 42,677 47,396 45,543 1,853
Excess (Deficit) of Revenues and Other Financing
Sources Over Expenditures and Other Financing Uses (40,848) (44,339) (42,949) $ 1,390
Fund Balances-Beginning of Year 63,746 63,746 63,746
Fund Balances-End of Year $ 22,898 $ 19,407 $ 20,797
Other Environmental Management
Revenues and Other Financing Sources
Use of Money and Property $ 520 $ 520 $ 1,035 $ 515
Intergovernmental 2,191 2,777 2,774 (3)
Charges for Services 325 325 301 (24)
Other -- -- 216 216
Transfers In -- 360 355 (5)
Total Revenues and Other Financing Sources 3,036 3,982 4,681 699
Expenditures and Other Financing Uses
General Government:
Real Estate Development Program 1,629 1,989 765 1,224
Air Quality Improvement 199 199 38 161
Public Protection:
Survey Monument Preservation 259 259 182 77
Public Ways and Facilities:
El Toro Improvement Fund 4,080 5,243 1,565 3,678
Total Expenditures and Other Financing Uses 6,167 7,690 2,550 5,140
Excess (Deficit) of Revenues and Other Financing
Sources Over Expenditures and Other Financing Uses (3,131) (3,708) 2,131 $ 5,839
Fund Balances-Beginning of Year 11,350 11,350 11,350
Fund Balances-End of Year $ 8,219 $ 7,642 $ 13,481
BUDGETARY COMPARISON SCHEDULES
NONMAJOR GOVERNMENTAL FUNDS-SPECIAL REVENUE
Actual on
Budgetary Basis* Original Budget * Final Budget
Variance
Positive
(Negative)
___________________________________________________________________________________________
___________________________________________________________________________________________* Budgeted amounts, which include carried forward prior year encumbrance, may differ from the adopted budget.
County of Orange Comprehensive Annual Financial Report For the Year Ended June 30, 2020 (Dollar Amounts in Thousands)
171
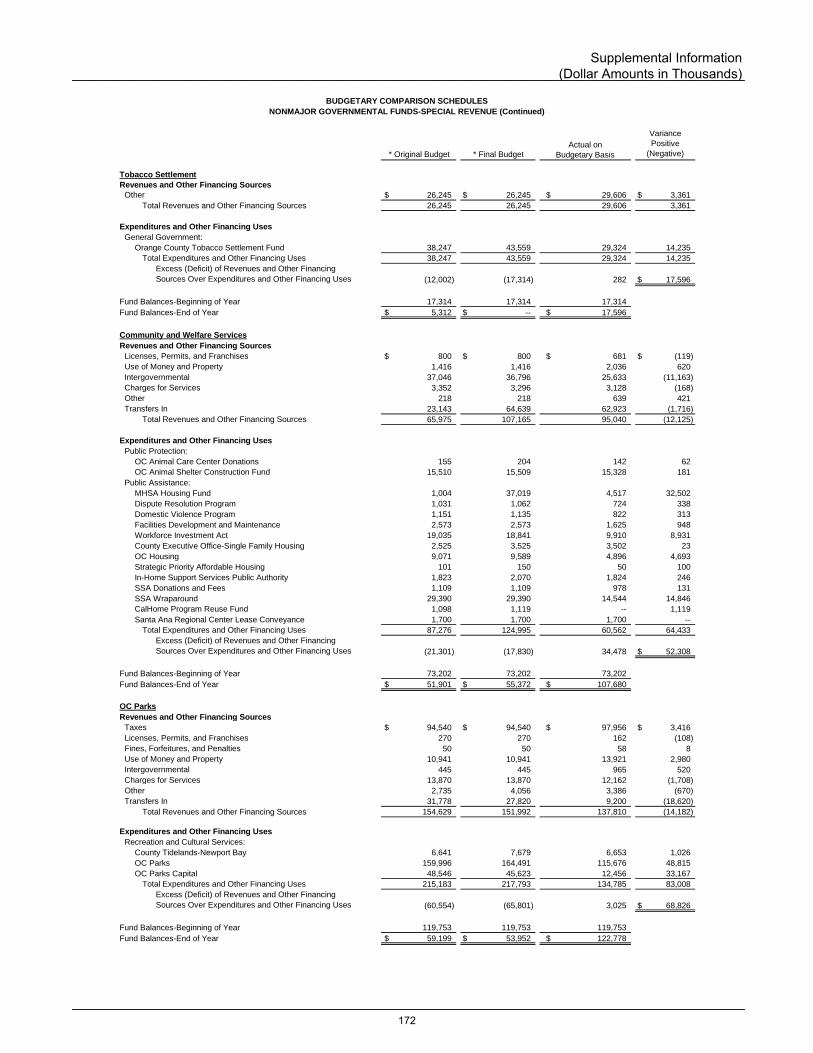
Tobacco Settlement
Revenues and Other Financing Sources
Other $ 26,245 $ 26,245 $ 29,606 $ 3,361
Total Revenues and Other Financing Sources 26,245 26,245 29,606 3,361
Expenditures and Other Financing Uses
General Government:
Orange County Tobacco Settlement Fund 38,247 43,559 29,324 14,235
Total Expenditures and Other Financing Uses 38,247 43,559 29,324 14,235
Excess (Deficit) of Revenues and Other Financing
Sources Over Expenditures and Other Financing Uses (12,002) (17,314) 282 $ 17,596
Fund Balances-Beginning of Year 17,314 17,314 17,314
Fund Balances-End of Year $ 5,312 $ -- $ 17,596
Community and Welfare Services
Revenues and Other Financing Sources
Licenses, Permits, and Franchises $ 800 $ 800 $ 681 $ (119)
Use of Money and Property 1,416 1,416 2,036 620
Intergovernmental 37,046 36,796 25,633 (11,163)
Charges for Services 3,352 3,296 3,128 (168)
Other 218 218 639 421
Transfers In 23,143 64,639 62,923 (1,716)
Total Revenues and Other Financing Sources 65,975 107,165 95,040 (12,125)
Expenditures and Other Financing Uses
Public Protection:
OC Animal Care Center Donations 155 204 142 62
OC Animal Shelter Construction Fund 15,510 15,509 15,328 181
Public Assistance:
MHSA Housing Fund 1,004 37,019 4,517 32,502
Dispute Resolution Program 1,031 1,062 724 338
Domestic Violence Program 1,151 1,135 822 313
Facilities Development and Maintenance 2,573 2,573 1,625 948
Workforce Investment Act 19,035 18,841 9,910 8,931
County Executive Office-Single Family Housing 2,525 3,525 3,502 23
OC Housing 9,071 9,589 4,896 4,693
Strategic Priority Affordable Housing 101 150 50 100
In-Home Support Services Public Authority 1,823 2,070 1,824 246
SSA Donations and Fees 1,109 1,109 978 131
SSA Wraparound 29,390 29,390 14,544 14,846
CalHome Program Reuse Fund 1,098 1,119 -- 1,119
Santa Ana Regional Center Lease Conveyance 1,700 1,700 1,700 --
Total Expenditures and Other Financing Uses 87,276 124,995 60,562 64,433
Excess (Deficit) of Revenues and Other Financing
Sources Over Expenditures and Other Financing Uses (21,301) (17,830) 34,478 $ 52,308
Fund Balances-Beginning of Year 73,202 73,202 73,202
Fund Balances-End of Year $ 51,901 $ 55,372 $ 107,680
OC Parks
Revenues and Other Financing Sources
Taxes $ 94,540 $ 94,540 $ 97,956 $ 3,416
Licenses, Permits, and Franchises 270 270 162 (108)
Fines, Forfeitures, and Penalties 50 50 58 8
Use of Money and Property 10,941 10,941 13,921 2,980
Intergovernmental 445 445 965 520
Charges for Services 13,870 13,870 12,162 (1,708)
Other 2,735 4,056 3,386 (670)
Transfers In 31,778 27,820 9,200 (18,620)
Total Revenues and Other Financing Sources 154,629 151,992 137,810 (14,182)
Expenditures and Other Financing Uses
Recreation and Cultural Services:
County Tidelands-Newport Bay 6,641 7,679 6,653 1,026
OC Parks 159,996 164,491 115,676 48,815
OC Parks Capital 48,546 45,623 12,456 33,167
Total Expenditures and Other Financing Uses 215,183 217,793 134,785 83,008
Excess (Deficit) of Revenues and Other Financing
Sources Over Expenditures and Other Financing Uses (60,554) (65,801) 3,025 $ 68,826
Fund Balances-Beginning of Year 119,753 119,753 119,753
Fund Balances-End of Year $ 59,199 $ 53,952 $ 122,778
NONMAJOR GOVERNMENTAL FUNDS-SPECIAL REVENUE (Continued)
BUDGETARY COMPARISON SCHEDULES
Variance
Positive
(Negative)* Final Budget
Actual on
Budgetary Basis* Original Budget
___________________________________________________________________________________________
___________________________________________________________________________________________
Supplemental Information (Dollar Amounts in Thousands)
172
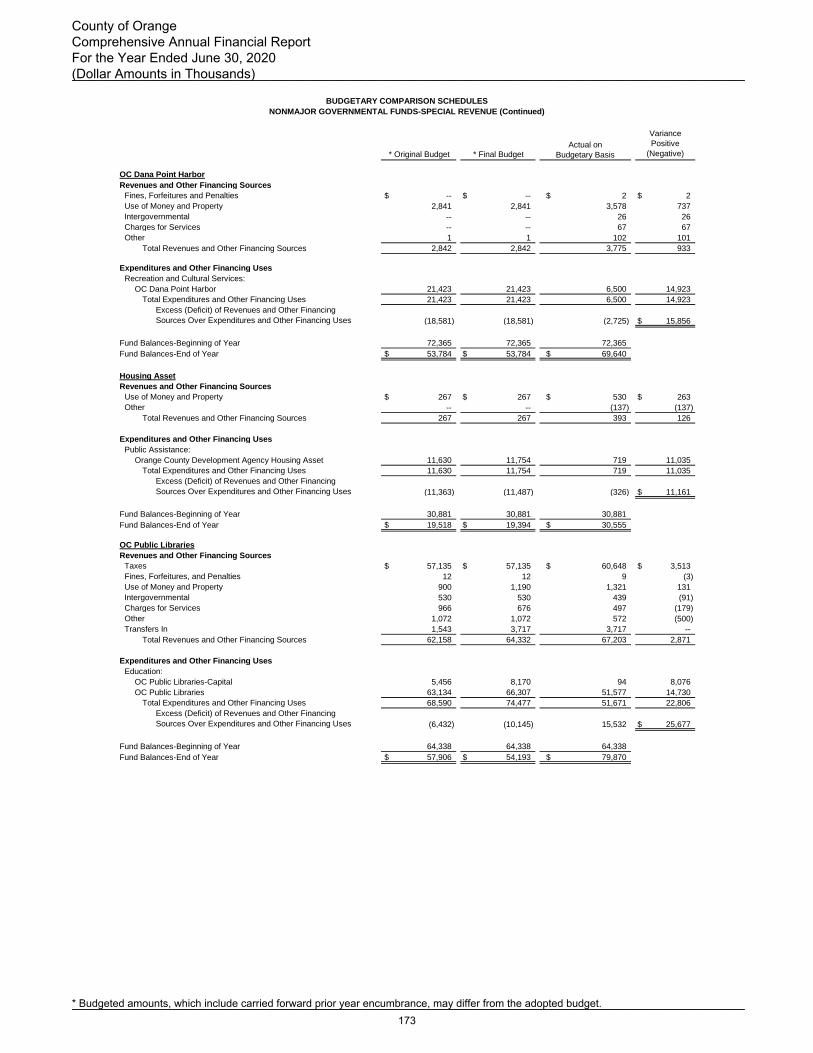
OC Dana Point Harbor
Revenues and Other Financing Sources
Fines, Forfeitures and Penalties $ -- $ -- $ 2 $ 2
Use of Money and Property 2,841 2,841 3,578 737
Intergovernmental -- -- 26 26
Charges for Services -- -- 67 67
Other 1 1 102 101
Total Revenues and Other Financing Sources 2,842 2,842 3,775 933
Expenditures and Other Financing Uses
Recreation and Cultural Services:
OC Dana Point Harbor 21,423 21,423 6,500 14,923
Total Expenditures and Other Financing UsesTotal Expenditures and Other Financing Uses 21,423 21,423 6,500 14,923
Excess (Deficit) of Revenues and Other Financing
Sources Over Expenditures and Other Financing Uses (18,581) (18,581) (2,725) $ 15,856
Fund Balances-Beginning of Year 72,365 72,365 72,365
Fund Balances-End of Year $ 53,784 $ 53,784 $ 69,640
Housing Asset
Revenues and Other Financing Sources
Use of Money and Property $ 267 $ 267 $ 530 $ 263
Other -- -- (137) (137)
Total Revenues and Other Financing Sources 267 267 393 126
Expenditures and Other Financing Uses
Public Assistance:
Orange County Development Agency Housing Asset 11,630 11,754 719 11,035
Total Expenditures and Other Financing Uses 11,630 11,754 719 11,035
Excess (Deficit) of Revenues and Other Financing
Sources Over Expenditures and Other Financing Uses (11,363) (11,487) (326) $ 11,161
Fund Balances-Beginning of Year 30,881 30,881 30,881
Fund Balances-End of Year $ 19,518 $ 19,394 $ 30,555
OC Public Libraries
Revenues and Other Financing Sources
Taxes $ 57,135 $ 57,135 $ 60,648 $ 3,513
Fines, Forfeitures, and Penalties 12 12 9 (3)
Use of Money and Property 900 1,190 1,321 131
Intergovernmental 530 530 439 (91)
Charges for Services 966 676 497 (179)
Other 1,072 1,072 572 (500)
Transfers In 1,543 3,717 3,717 --
Total Revenues and Other Financing Sources 62,158 64,332 67,203 2,871
Expenditures and Other Financing Uses
Education:
OC Public Libraries-Capital 5,456 8,170 94 8,076
OC Public Libraries 63,134 66,307 51,577 14,730
Total Expenditures and Other Financing Uses 68,590 74,477 51,671 22,806
Excess (Deficit) of Revenues and Other Financing
Sources Over Expenditures and Other Financing Uses (6,432) (10,145) 15,532 $ 25,677
Fund Balances-Beginning of Year 64,338 64,338 64,338
Fund Balances-End of Year $ 57,906 $ 54,193 $ 79,870
Actual on
Budgetary Basis
Variance
Positive
(Negative)
BUDGETARY COMPARISON SCHEDULES
* Original Budget * Final Budget
NONMAJOR GOVERNMENTAL FUNDS-SPECIAL REVENUE (Continued)
___________________________________________________________________________________________
___________________________________________________________________________________________* Budgeted amounts, which include carried forward prior year encumbrance, may differ from the adopted budget.
County of Orange Comprehensive Annual Financial Report For the Year Ended June 30, 2020 (Dollar Amounts in Thousands)
173

Health Care Programs
Revenues and Other Financing Sources
Fines, Forfeitures, and Penalties $ 8,093 $ 8,093 $ 7,221 $ (872)
Use of Money and Property 359 359 384 25
Intergovernmental 4,813 24,023 14,768 (9,255)
Charges for Services 1,100 1,100 986 (114)
Other 403 403 -- (403)
Transfers In 1,100 3,477 1,243 (2,234)
Total Revenues and Other Financing Sources 15,868 37,455 24,602 (12,853)
Expenditures and Other Financing Uses
Health and Sanitation:
Medi-Cal Administrative Activities Targeted Case Management 1,166 1,166 750 416
Emergency Medical Services 8,196 8,196 6,950 1,246
HCA Purpose Restricted Revenues 2,965 4,965 885 4,080
HCA Interest Bearing Purpose Restricted Revenues 109 17,933 6,382 11,551
HCA Realignment 6,943 6,943 -- 6,943
Bioterrorism Center for Disease Control 3,794 5,557 5,552 5
Total Expenditures and Other Financing Uses 23,173 44,760 20,519 24,241
Excess (Deficit) of Revenues and Other Financing
Sources Over Expenditures and Other Financing Uses (7,305) (7,305) 4,083 $ 11,388
Fund Balances-Beginning of Year 44,337 44,337 44,337
Fund Balances-End of Year $ 37,032 $ 37,032 $ 48,420
Roads
Revenues and Other Financing Sources
Licenses, Permits, and Franchises $ -- $ -- $ 5 $ 5
Fines, Forfeitures, and Penalties 4 4 3 (1)
Use of Money and Property 1,010 1,010 2,822 1,812
Intergovernmental 125,525 125,525 103,828 (21,697)
Charges for Services 23,562 23,562 27,123 3,561
Other 40,775 45,811 1,172 (44,639)
Transfers In 20,176 20,176 20,176 --
Total Revenues and Other Financing Sources 211,052 216,088 155,129 (60,959)
Expenditures and Other Financing Uses
Public Ways and Facilities:
OC Road 111,967 115,903 91,190 24,713
Foothill Circulation Phasing Plan 291 291 54 237
South County Roadway Improve Prog (SCRIP) 17,500 17,500 5,038 12,462
OC Road-Capital Improvement 84,452 84,452 22,626 61,826
Total Expenditures and Other Financing Uses 214,210 218,146 118,908 99,238
Excess (Deficit) of Revenues and Other Financing
Sources Over Expenditures and Other Financing Uses (3,158) (2,058) 36,221 $ 38,279
Fund Balances-Beginning of Year 82,911 82,911 82,911
Fund Balances-End of Year $ 79,753 $ 80,853 $ 119,132
NONMAJOR GOVERNMENTAL FUNDS-SPECIAL REVENUE (Continued)
* Original Budget * Final Budget
Actual on
Budgetary Basis
Variance
Positive
(Negative)
BUDGETARY COMPARISON SCHEDULES
___________________________________________________________________________________________
___________________________________________________________________________________________
Supplemental Information (Dollar Amounts in Thousands)
174
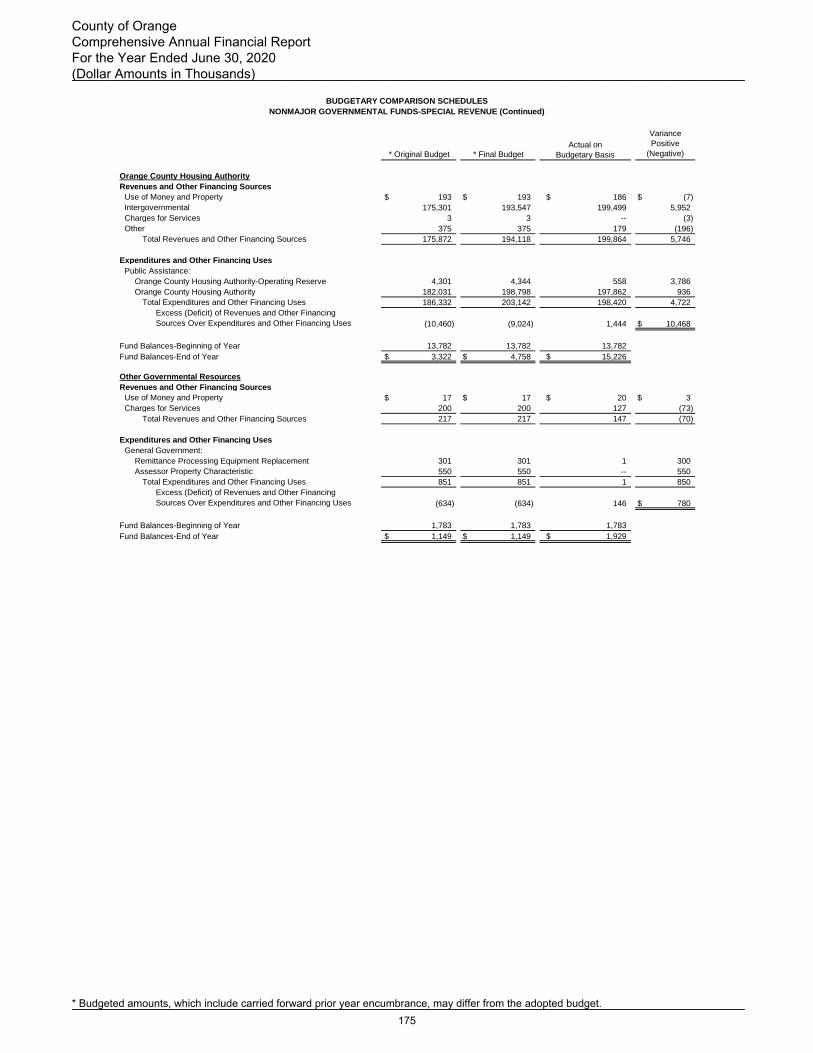
Orange County Housing Authority
Revenues and Other Financing Sources
Use of Money and Property $ 193 $ 193 $ 186 $ (7)
Intergovernmental 175,301 193,547 199,499 5,952
Charges for Services 3 3 -- (3)
Other 375 375 179 (196)
Total Revenues and Other Financing Sources 175,872 194,118 199,864 5,746
Expenditures and Other Financing Uses
Public Assistance:
Orange County Housing Authority-Operating Reserve 4,301 4,344 558 3,786
Orange County Housing Authority 182,031 198,798 197,862 936
Total Expenditures and Other Financing Uses 186,332 203,142 198,420 4,722
Excess (Deficit) of Revenues and Other Financing
Sources Over Expenditures and Other Financing Uses (10,460) (9,024) 1,444 $ 10,468
Fund Balances-Beginning of Year 13,782 13,782 13,782
Fund Balances-End of Year $ 3,322 $ 4,758 $ 15,226
Other Governmental Resources
Revenues and Other Financing Sources
Use of Money and Property $ 17 $ 17 $ 20 $ 3
Charges for Services 200 200 127 (73)
Total Revenues and Other Financing Sources 217 217 147 (70)
Expenditures and Other Financing Uses
General Government:
Remittance Processing Equipment Replacement 301 301 1 300
Assessor Property Characteristic 550 550 -- 550
Total Expenditures and Other Financing Uses 851 851 1 850
Excess (Deficit) of Revenues and Other Financing
Sources Over Expenditures and Other Financing Uses (634) (634) 146 $ 780
Fund Balances-Beginning of Year 1,783 1,783 1,783
Fund Balances-End of Year $ 1,149 $ 1,149 $ 1,929
BUDGETARY COMPARISON SCHEDULES
* Final Budget* Original Budget
Variance
Positive
(Negative)Actual on
Budgetary Basis
NONMAJOR GOVERNMENTAL FUNDS-SPECIAL REVENUE (Continued)
___________________________________________________________________________________________
___________________________________________________________________________________________* Budgeted amounts, which include carried forward prior year encumbrance, may differ from the adopted budget.
County of Orange Comprehensive Annual Financial Report For the Year Ended June 30, 2020 (Dollar Amounts in Thousands)
175

Teeter Plan Notes
Revenues and Other Financing Sources
Fines, Forfeitures, and Penalties $ 9,500 $ 9,500 $ 6,926 $ (2,574)
Use of Money and Property 1,000 1,000 1,813 813
Bond Issuance Proceeds 32,395 78,834 83,708 4,874
Total Revenues and Other Financing Sources 42,895 89,334 92,447 3,113
Expenditures and Other Financing Uses
General Government:
Teeter Series A Debt Service 52,125 98,564 89,322 9,242
Total Expenditures and Other Financing Uses 52,125 98,564 89,322 9,242
Excess (Deficit) of Revenues and Other Financing
Sources Over Expenditures and Other Financing Uses (9,230) (9,230) 3,125 $ 12,355
Fund Balances-Beginning of Year 87,041 87,041 87,041
Fund Balances-End of Year $ 77,811 $ 77,811 $ 90,166
Pension Obligation Bonds
Revenues and Other Financing Sources
Use of Money and Property $ 8,081 $ 8,081 $ 8,082 $ 1
and Other Financing SourcesTotal Revenues and Other Financing Sources 8,081 8,081 8,082 1
Expenditures and Other Financing Uses
General Government:
Pension Obligation Bonds Debt Service 14,540 14,540 14,502 38
and Other Financing UsesTotal Expenditures and Other Financing Uses 14,540 14,540 14,502 38
Excess (Deficit) of Revenues and Other Financing
Sources Over Expenditures and Other Financing Uses (6,459) (6,459) (6,420) $ 39
Fund Balances-Beginning of Year 14,859 14,859 14,859
Fund Balances-End of Year $ 8,400 $ 8,400 $ 8,439
BUDGETARY COMPARISON SCHEDULES
NONMAJOR GOVERNMENTAL FUNDS-DEBT SERVICE
Variance
* Original Budget * Final Budget (Negative)
PositiveActual on
Budgetary Basis
___________________________________________________________________________________________
___________________________________________________________________________________________
Supplemental Information (Dollar Amounts in Thousands)
* Budgeted amounts, which include carried forward prior year encumbrance, may differ from the adopted budget.
176

Criminal Justice Facilities
Revenues and Other Financing Sources
Fines, Forfeitures, and Penalties $ 4,800 $ 1,000 $ 822 $ (178)
Use of Money and Property 200 200 491 291
Intergovernmental 52,454 53,635 1,181 (52,454)
Charges for Services -- -- 228 228
Transfers In 48,227 37,641 28,458 (9,183)
Total Revenues and Other Financing Sources 105,681 92,476 31,180 (61,296)
Expenditures and Other Financing Uses
Public Protection:
Criminal Justice Facilities Accumulated Capital Outlay 19,753 24,277 9,138 15,139
Courthouse Temporary Construction 273 -- -- --
Sheriff-Coroner Construction and Facility Development 105,150 97,650 17,599 80,051
and Other Financing UsesTotal Expenditures and Other Financing Uses 125,176 121,927 26,737 95,190
Excess (Deficit) of Revenues and Other Financing
Sources Over Expenditures and Other Financing Uses (19,495) (29,451) 4,443 $ 33,894
Fund Balances-Beginning of Year 29,451 29,451 29,451
Fund Balances-End of Year $ 9,956 $ -- $ 33,894
Countywide Capital Projects Non-General Fund
Revenues and Other Financing Sources
Charges for Services -- -- 2,855 2,855
Transfers In 29,870 82,602 81,391 (1,211)
Bond Issuance Proceeds -- -- 89 89
and Other Financing SourcesTotal Revenues and Other Financing Sources 29,870 82,602 84,335 1,733
Expenditures and Other Financing Uses
General Government:
Countywide Capital Projects Non-General 56,868 82,183 57,318 24,865
Countywide IT Projects Non-General 3,207 7,850 6,570 1,280
and Other Financing UsesTotal Expenditures and Other Financing Uses 60,075 90,033 63,888 26,145
Excess (Deficit) of Revenues and Other Financing
Sources Over Expenditures and Other Financing Uses (30,205) (7,431) 20,447 $ 27,878
Fund Balances-Beginning of Year 54,982 54,982 54,982
Fund Balances-End of Year $ 24,777 $ 47,551 $ 75,429
Actual on
Budgetary Basis
Variance
Positive
(Negative)
BUDGETARY COMPARISON SCHEDULES
NONMAJOR GOVERNMENTAL FUNDS-CAPITAL PROJECTS
* Original Budget * Final Budget
___________________________________________________________________________________________
___________________________________________________________________________________________
County of Orange Comprehensive Annual Financial Report For the Year Ended June 30, 2020 (Dollar Amounts in Thousands)
* Budgeted amounts, which include carried forward prior year encumbrance, may differ from the adopted budget.
177

Regional Park Endowment
Revenues and Other Financing Sources
Use of Money and Property $ 8 $ 8 $ 7 $ (1)
and Other Financing Sources Total Revenues and Other Financing Sources 8 8 7 (1)
Expenditures and Other Financing Uses
Recreation and Cultural Services:
Limestone Regional Park Mitigation Maintenance Endowment 8 8 -- 8
Total Expenditures and Other Financing Uses 8 8 -- 8
Excess (Deficit) of Revenues and Other Financing Sources
Over Expenditures and Other Financing Uses -- -- 7 $ 7
Fund Balances-Beginning of Year 200 200 200
Fund Balances-End of Year $ 200 $ 200 $ 207
BUDGETARY COMPARISON SCHEDULE
NONMAJOR GOVERNMENTAL FUNDS-PERMANENT FUND
Variance
Actual on
Budgetary Basis
Positive
* Original Budget * Final Budget (Negative)
___________________________________________________________________________________________
___________________________________________________________________________________________
Supplemental Information (Dollar Amounts in Thousands)
* Budgeted amounts, which include carried forward prior year encumbrance, may differ from the adopted budget.
178


INTERNAL SERVICE FUNDS These Funds are used to account for the financing of goods or services provided by one County department or agency to other County departments or agencies, on a cost-reimbursement basis. Health and Other Self-Insured Employee Benefits These Funds are used to account for the County’s self-funded health insurance programs, group salary
continuance plan, group dental insurance programs, wellness program, and flexible spending accounts. Insured Health Plans This Fund is used to account for the fully insured health plans for the County employees and retirees.
Life Insurance This Fund is used to account for the County’s life insurance and accidental death and dismemberment insurance for employees.
Workers' Compensation
This Fund is used to account for the County's self-funded workers' compensation insurance program. Unemployment Insurance
This Fund is used to account for the County's self-funded unemployment insurance program. Property and Casualty Risk This Fund is used to account for the County's self-funded property and casualty risk insurance program. Transportation This Fund is used to account for motor pool repair and maintenance, and for other transportation services,
which are provided to departments and agencies on a cost-reimbursement basis. Reprographics This Fund is used to account for printing and graphic services, which are provided to departments and
agencies on a cost-reimbursement basis. Information and Technology
This Fund is used to account for applications development and support, voice and data services, and desktop support to departments and agencies on a cost-reimbursement basis.
___________________________________________________________________________________________
___________________________________________________________________________________________
Supplemental Information (Dollar Amounts in Thousands)
179
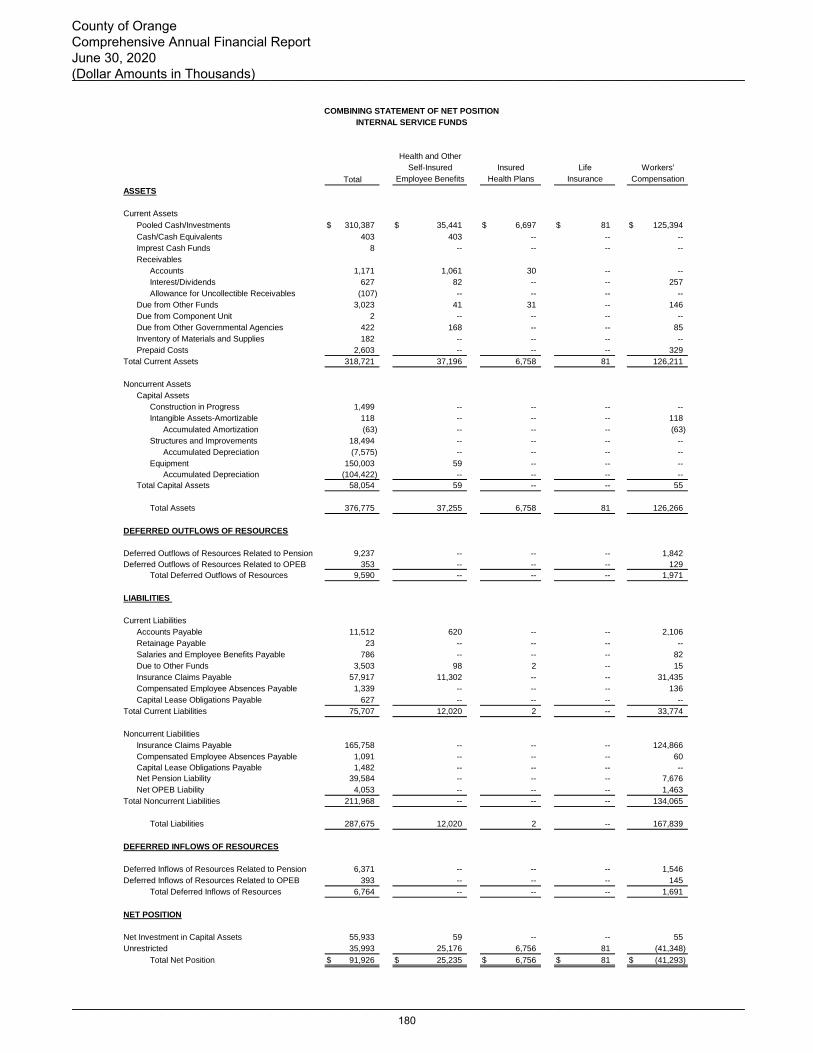
Total
ASSETS
Current Assets
Pooled Cash/Investments $ 310,387 $ 35,441 $ 6,697 $ 81 $ 125,394
Cash/Cash Equivalents 403 403 -- -- --
Imprest Cash Funds 8 -- -- -- --
Receivables
Accounts 1,171 1,061 30 -- --
Interest/Dividends 627 82 -- -- 257
Allowance for Uncollectible Receivables (107) -- -- -- --
Due from Other Funds 3,023 41 31 -- 146
Due from Component Unit 2 -- -- -- --
Due from Other Governmental Agencies 422 168 -- -- 85
Inventory of Materials and Supplies 182 -- -- -- --
Prepaid Costs 2,603 -- -- -- 329
Total Current Assets 318,721 37,196 6,758 81 126,211
Noncurrent Assets
Capital Assets
Construction in Progress 1,499 -- -- -- --
Intangible Assets-Amortizable 118 -- -- -- 118
Accumulated Amortization (63) -- -- -- (63)
Structures and Improvements 18,494 -- -- -- --
Accumulated Depreciation (7,575) -- -- -- --
Equipment 150,003 59 -- -- --
Accumulated Depreciation (104,422) -- -- -- --
Total Capital Assets 58,054 59 -- -- 55
Total Assets 376,775 37,255 6,758 81 126,266
DEFERRED OUTFLOWS OF RESOURCES
Deferred Outflows of Resources Related to Pension 9,237 -- -- -- 1,842
Deferred Outflows of Resources Related to OPEB 353 -- -- -- 129
Total Deferred Outflows of Resources 9,590 -- -- -- 1,971
LIABILITIES
Current Liabilities
Accounts Payable 11,512 620 -- -- 2,106
Retainage Payable 23 -- -- -- --
Salaries and Employee Benefits Payable 786 -- -- -- 82
Due to Other Funds 3,503 98 2 -- 15
Insurance Claims Payable 57,917 11,302 -- -- 31,435
Compensated Employee Absences Payable 1,339 -- -- -- 136
Capital Lease Obligations Payable 627 -- -- -- --
Total Current Liabilities 75,707 12,020 2 -- 33,774
Noncurrent Liabilities
Insurance Claims Payable 165,758 -- -- -- 124,866
Compensated Employee Absences Payable 1,091 -- -- -- 60
Capital Lease Obligations Payable 1,482 -- -- -- --
Net Pension Liability 39,584 -- -- -- 7,676
Net OPEB Liability 4,053 -- -- -- 1,463
Total Noncurrent Liabilities 211,968 -- -- -- 134,065
Total Liabilities 287,675 12,020 2 -- 167,839
DEFERRED INFLOWS OF RESOURCES
Deferred Inflows of Resources Related to Pension 6,371 -- -- -- 1,546
Deferred Inflows of Resources Related to OPEB 393 -- -- -- 145
Total Deferred Inflows of Resources 6,764 -- -- -- 1,691
NET POSITION
Net Investment in Capital Assets 55,933 59 -- -- 55
Unrestricted 35,993 25,176 6,756 81 (41,348)
Total Net Position $ 91,926 $ 25,235 $ 6,756 $ 81 $ (41,293)
Compensation
COMBINING STATEMENT OF NET POSITION
INTERNAL SERVICE FUNDS
Health and Other
Self-Insured
Employee Benefits
Workers'
Insurance
Life
Health Plans
Insured
___________________________________________________________________________________________
___________________________________________________________________________________________
County of Orange Comprehensive Annual Financial Report June 30, 2020 (Dollar Amounts in Thousands)
180

Property &
ASSETS
Current Assets
$ 6,899 $ 78,444 $ 33,913 $ 4,778 $ 18,740 Pooled Cash/Investments
-- -- -- -- -- Cash/Cash Equivalents
-- 5 -- -- 3 Imprest Cash Funds
Receivables
-- 4 55 -- 21 Accounts
16 167 58 8 39 Interest/Dividends
-- -- (55) -- (52) Allowance for Uncollectible Receivables
-- 303 1,613 19 870 Due from Other Funds
-- -- -- -- 2 Due from Component Unit
-- 15 4 -- 150 Due from Other Governmental Agencies
-- -- 182 -- -- Inventory of Materials and Supplies
-- 160 829 134 1,151 Prepaid Costs
6,915 79,098 36,599 4,939 20,924 Total Current Assets
Noncurrent Assets
Capital Assets
-- -- -- -- 1,499 Construction in Progress
-- -- -- -- -- Intangible Assets-Amortizable
-- -- -- -- -- Accumulated Amortization
-- -- 9,798 559 8,137 Structures and Improvements
-- -- (5,886) (54) (1,635) Accumulated Depreciation
-- -- 62,117 4,778 83,049 Equipment
-- -- (29,883) (1,647) (72,892) Accumulated Depreciation
-- -- 36,146 3,636 18,158 Total Capital Assets
6,915 79,098 72,745 8,575 39,082 Total Assets
DEFERRED OUTFLOWS OF RESOURCES
-- 610 2,854 548 3,383 Deferred Outflows of Resources Related to Pension
-- 18 87 14 105 Deferred Outflows of Resources Related to OPEB
-- 628 2,941 562 3,488 Total Deferred Outflows of Resources
LIABILITIES
Current Liabilities
-- 1,896 203 34 6,653 Accounts Payable
-- -- 1 1 21 Retainage Payable
-- 50 262 53 339 Salaries and Employee Benefits Payable
28 18 263 301 2,778 Due to Other Funds
560 14,620 -- -- -- Insurance Claims Payable
-- 113 398 61 631 Compensated Employee Absences Payable
-- -- -- 627 -- Capital Lease Obligations Payable
588 16,697 1,127 1,077 10,422 Total Current Liabilities
Noncurrent Liabilities
-- 40,892 -- -- -- Insurance Claims Payable
-- 76 360 25 570 Compensated Employee Absences Payable
-- -- -- 1,482 -- Capital Lease Obligations Payable
-- 2,929 12,834 2,510 13,635 Net Pension Liability
-- 217 1,025 164 1,184 Net OPEB Liability
-- 44,114 14,219 4,181 15,389 Total Noncurrent Liabilities
588 60,811 15,346 5,258 25,811 Total Liabilities
DEFERRED INFLOWS OF RESOURCES
-- 441 1,942 350 2,092 Deferred Inflows of Resources Related to Pension
-- 19 95 16 118 Deferred Inflows of Resources Related to OPEB
-- 460 2,037 366 2,210 Total Deferred Inflows of Resources
NET POSITION
-- -- 36,146 1,527 18,146 Net Investment in Capital Assets
6,327 18,455 22,157 1,986 (3,597) Unrestricted
$ 6,327 $ 18,455 $ 58,303 $ 3,513 $ 14,549 Total Net Position
Insurance
Unemployment
Reprographics Technology
Information &
TransportationCasualty Risk
___________________________________________________________________________________________
___________________________________________________________________________________________
Supplemental Information (Dollar Amounts in Thousands)
181

Operating Revenues
Use of Money and Property $ 1,525 $ -- $ -- $ -- $ --
Charges for Services 120,249 1,802 -- -- --
Insurance Premiums 340,288 68,001 179,775 837 61,474
Total Operating Revenues 462,062 69,803 179,775 837 61,474
Operating Expenses
Salaries and Employee Benefits 26,473 -- -- -- 2,825
Services and Supplies 28,478 2,094 -- -- 338
Professional Services 59,402 4,597 5 -- 5,885
Operating Leases 3,737 1 -- -- 42
Insurance Claims and Premiums 312,971 69,086 180,404 861 42,246
Taxes and Other Fees 4 -- -- -- --
Depreciation/Amortization 18,233 -- -- -- 24
Total Operating Expenses 449,298 75,778 180,409 861 51,360
Operating Income (Loss) 12,764 (5,975) (634) (24) 10,114
Nonoperating Revenues (Expenses)
Intergovernmental Revenues 2,001 834 -- -- 88
Interest and Investment Income 6,327 805 140 2 2,515
Interest Expense (75) -- -- -- --
Gain (Loss) on Disposition of Capital Assets (109) -- -- -- --
Other Taxes 9 -- -- -- --
Other Revenue (Expense) 5,893 4,468 -- -- 367
Total Nonoperating Revenues 14,046 6,107 140 2 2,970
Income (Loss) Before Contributions and Transfers 26,810 132 (494) (22) 13,084
Capital Contributions 220 -- -- -- --
Transfers In 10,261 997 5 -- 80
Transfers Out (708) -- (150) (2) --
Change in Net Position 36,583 1,129 (639) (24) 13,164
Net Position-Beginning of Year 55,343 24,106 7,395 105 (54,457)
Net Position-End of Year $ 91,926 $ 25,235 $ 6,756 $ 81 $ (41,293)
COMBINING STATEMENT OF REVENUES, EXPENSES, AND CHANGES IN FUND NET POSITION
INTERNAL SERVICE FUNDS
CompensationTotal Health PlansEmployee Benefits Insurance
Health and Other
Self-Insured Insured Workers'Life
___________________________________________________________________________________________
___________________________________________________________________________________________
County of Orange Comprehensive Annual Financial Report For the Year Ended June 30, 2020 (Dollar Amounts in Thousands)
182
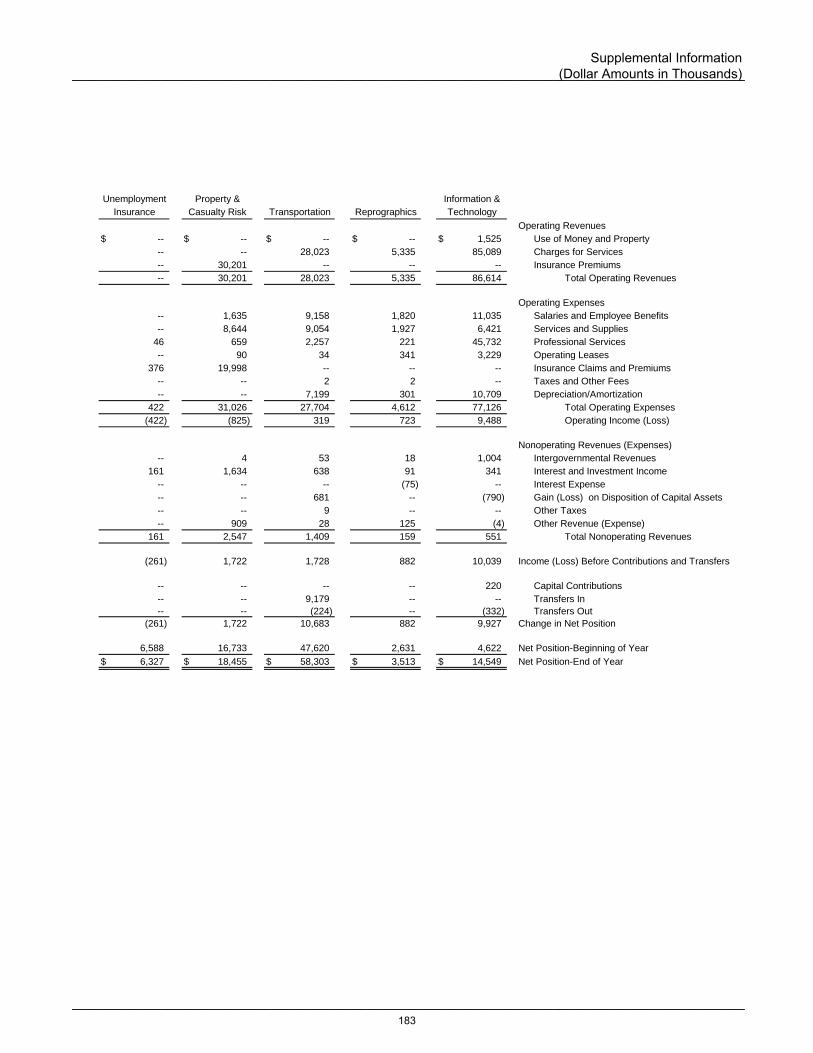
Operating Revenues
$ -- $ -- $ -- $ -- $ 1,525 Use of Money and Property
-- -- 28,023 5,335 85,089 Charges for Services
-- 30,201 -- -- -- Insurance Premiums
-- 30,201 28,023 5,335 86,614 Total Operating Revenues
Operating Expenses
-- 1,635 9,158 1,820 11,035 Salaries and Employee Benefits
-- 8,644 9,054 1,927 6,421 Services and Supplies
46 659 2,257 221 45,732 Professional Services
-- 90 34 341 3,229 Operating Leases
376 19,998 -- -- -- Insurance Claims and Premiums
-- -- 2 2 -- Taxes and Other Fees
-- -- 7,199 301 10,709 Depreciation/Amortization
422 31,026 27,704 4,612 77,126 Total Operating Expenses
(422) (825) 319 723 9,488 Operating Income (Loss)
Nonoperating Revenues (Expenses)
-- 4 53 18 1,004 Intergovernmental Revenues
161 1,634 638 91 341 Interest and Investment Income
-- -- -- (75) -- Interest Expense
-- -- 681 -- (790) Gain (Loss) on Disposition of Capital Assets
-- -- 9 -- -- Other Taxes
-- 909 28 125 (4) Other Revenue (Expense)
161 2,547 1,409 159 551 Total Nonoperating Revenues
(261) 1,722 1,728 882 10,039 Income (Loss) Before Contributions and Transfers
-- -- -- -- 220 Capital Contributions
-- -- 9,179 -- -- Transfers In
-- -- (224) -- (332) Transfers Out
(261) 1,722 10,683 882 9,927 Change in Net Position
6,588 16,733 47,620 2,631 4,622 Net Position-Beginning of Year
$ 6,327 $ 18,455 $ 58,303 $ 3,513 $ 14,549 Net Position-End of Year
COMBINING STATEMENT OF REVENUES, EXPENSES, AND CHANGES IN FUND NET POSITION
INTERNAL SERVICE FUNDS
Insurance
Unemployment Property & Information &
Casualty Risk Transportation Reprographics Technology
___________________________________________________________________________________________
___________________________________________________________________________________________
Supplemental Information (Dollar Amounts in Thousands)
183

Total
CASH FLOWS FROM OPERATING ACTIVITIES
Receipts from Customers $ 36,156 $ 880 $ -- $ -- $ 259
Cash Received for Premiums Within the County's Entity 340,288 68,001 179,775 837 61,474
Payments to Suppliers for Goods and Services (399,960) (79,175) (180,409) (861) (41,213)
Payments to Employees for Services (27,616) -- -- -- (2,972)
Payments for Interfund Services (229) -- -- -- (89)
Receipts for Interfund Services 87,234 233 16 -- --
Payment for Taxes and Other Fees (4) -- -- -- --
Other Operating Receipts 5,897 4,468 -- -- 367
Other Operating Payments (3,751) (1) (10) -- (42)
Net Cash Provided (Used) by Operating Activities 38,015 (5,594) (628) (24) 17,784
CASH FLOWS FROM NONCAPITAL FINANCING ACTIVITIES
Transfers In 10,261 997 5 -- 80
Transfers Out (708) -- (150) (2) --
Intergovernmental Revenues 2,001 834 -- -- 88
Other Taxes 9 -- -- -- --
Net Cash Provided (Used) by Noncapital Financing Activities 11,563 1,831 (145) (2) 168
CASH FLOWS FROM CAPITAL AND RELATED FINANCING
ACTIVITIES
Acquisition of Capital Assets (11,071) (59) -- -- --
Principal Paid on Capital Lease Obligations (609) -- -- -- --
Interest Paid on Capital Lease Obligations (75) -- -- -- --
Proceeds (Loss) from Sale of Capital Assets (109) -- -- -- --
Net Cash Used by Capital and Related Financing Activities (11,864) (59) -- -- --
CASH FLOW FROM INVESTING ACTIVITIES
Interest on Investments 6,600 867 140 2 2,608
Net Cash Provided by Investing Activities 6,600 867 140 2 2,608
Net Increase (Decrease) in Cash and Cash Equivalents 44,314 (2,955) (633) (24) 20,560
Cash and Cash Equivalents-Beginning of Year 266,484 38,799 7,330 105 104,834
Cash and Cash Equivalents-End of Year $ 310,798 $ 35,844 $ 6,697 $ 81 $ 125,394
Reconciliation of Operating Income (Loss) to Net Cash
Provided (Used) by Operating Activities
Operating Income (Loss) $ 12,764 $ (5,975) $ (634) $ (24) $ 10,114
Adjustments to Reconcile Operating Income (Loss) to
Net Cash Provided (Used) by Operating Activities:
Depreciation/Amortization 18,233 -- -- -- 24
Other Revenue 5,893 4,468 -- -- 367
(Increases) Decreases In:
Accounts Receivable, Net of Allowances (675) (1,010) (10) -- 322
Due from Other Funds (781) 137 14 -- (92)
Due from Component Unit (2) -- -- -- --
Due from Other Governmental Agencies 136 88 -- -- (63)
Inventory of Materials and Supplies 209 -- -- -- --
Prepaid Costs (491) -- -- -- (36)
Deferred Outflows of Resources Related to Pension 5,949 -- -- -- 2,422
Deferred Outflows of Resources Related to OPEB 166 -- -- -- 61
Increases (Decreases) In:
Accounts Payable (2,427) 186 -- -- 499
Salaries and Employee Benefits Payable 234 -- -- -- 12
Due to Other Funds 2,699 96 2 -- 3
Due to Other Governmental Agencies (3) -- -- -- --
Insurance Claims Payable 3,603 (3,584) -- -- 6,793
Capital Lease Obligations Payable (610) -- -- -- --
Compensated Employee Absences Payable 200 -- -- -- (33)
Net Pension Liability (10,288) -- -- -- (3,790)
Net OPEB Liability (674) -- -- -- (249)
Deferred Inflows of Resources Related to Pension 3,487 -- -- -- 1,285
Deferred Inflows of Resources Related to OPEB 393 -- -- -- 145
Total Adjustments 25,251 381 6 -- 7,670
Net Cash Provided (Used) by Operating Activities $ 38,015 $ (5,594) $ (628) $ (24) $ 17,784
Reconciliation of Cash and Cash Equivalents to
Statement of Net Position
Pooled Cash/Investments $ 310,387 $ 35,441 $ 6,697 $ 81 $ 125,394
Cash/Cash Equivalents 403 403 -- -- --
Imprest Cash Funds 8 -- -- -- --
Total Cash and Cash Equivalents $ 310,798 $ 35,844 $ 6,697 $ 81 $ 125,394
Employee Benefits Health Plans Insurance Compensation
Self-Insured Insured Life Workers'
COMBINING STATEMENT OF CASH FLOWS
INTERNAL SERVICE FUNDS
Health and Other
___________________________________________________________________________________________
___________________________________________________________________________________________
County of Orange Comprehensive Annual Financial Report For the Year Ended June 30, 2020 (Dollar Amounts in Thousands)
184
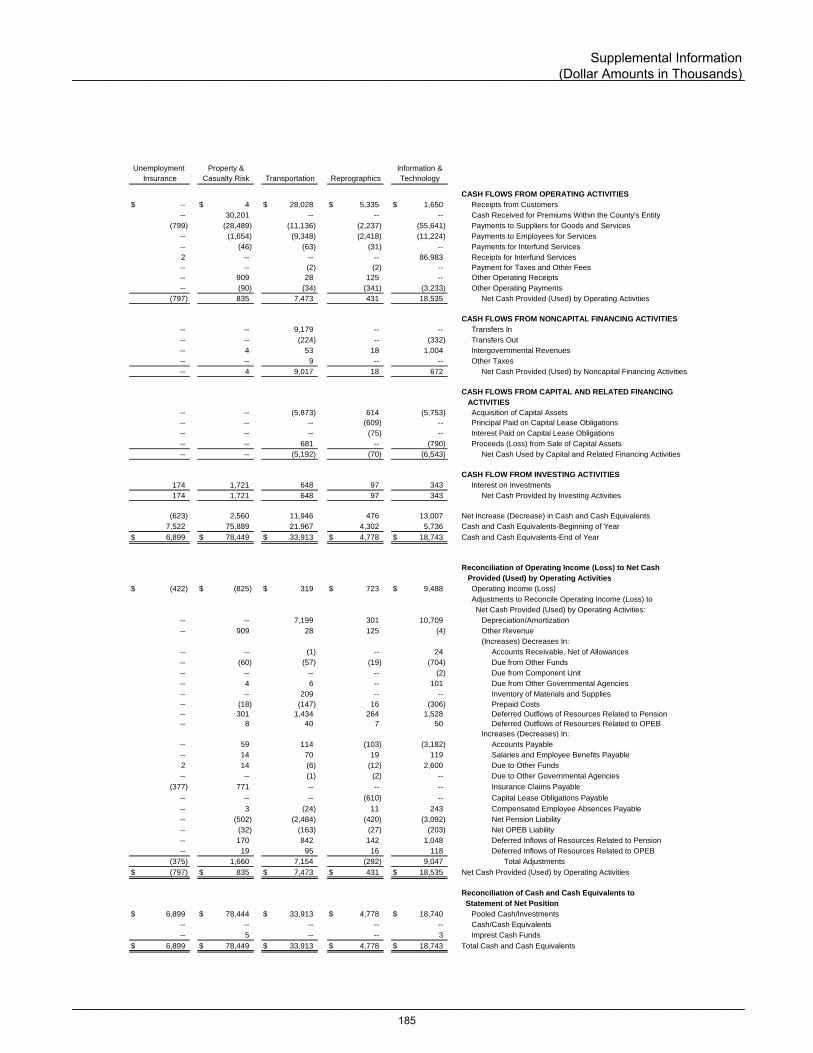
CASH FLOWS FROM OPERATING ACTIVITIES
$ -- $ 4 $ 28,028 $ 5,335 $ 1,650 Receipts from Customers
-- 30,201 -- -- -- Cash Received for Premiums Within the County's Entity
(799) (28,489) (11,136) (2,237) (55,641) Payments to Suppliers for Goods and Services
-- (1,654) (9,348) (2,418) (11,224) Payments to Employees for Services
-- (46) (63) (31) -- Payments for Interfund Services
2 -- -- -- 86,983 Receipts for Interfund Services
-- -- (2) (2) -- Payment for Taxes and Other Fees
-- 909 28 125 -- Other Operating Receipts
-- (90) (34) (341) (3,233) Other Operating Payments
(797) 835 7,473 431 18,535 Net Cash Provided (Used) by Operating Activities
CASH FLOWS FROM NONCAPITAL FINANCING ACTIVITIES
-- -- 9,179 -- -- Transfers In
-- -- (224) -- (332) Transfers Out
-- 4 53 18 1,004 Intergovernmental Revenues
-- -- 9 -- -- Other Taxes
-- 4 9,017 18 672 Net Cash Provided (Used) by Noncapital Financing Activities
CASH FLOWS FROM CAPITAL AND RELATED FINANCING
ACTIVITIES
-- -- (5,873) 614 (5,753) Acquisition of Capital Assets
-- -- -- (609) -- Principal Paid on Capital Lease Obligations
-- -- -- (75) -- Interest Paid on Capital Lease Obligations
-- -- 681 -- (790) Proceeds (Loss) from Sale of Capital Assets
-- -- (5,192) (70) (6,543) Net Cash Used by Capital and Related Financing Activities
CASH FLOW FROM INVESTING ACTIVITIES
174 1,721 648 97 343 Interest on Investments
174 1,721 648 97 343 Net Cash Provided by Investing Activities
(623) 2,560 11,946 476 13,007 Net Increase (Decrease) in Cash and Cash Equivalents
7,522 75,889 21,967 4,302 5,736 Cash and Cash Equivalents-Beginning of Year
$ 6,899 $ 78,449 $ 33,913 $ 4,778 $ 18,743 Cash and Cash Equivalents-End of Year
Reconciliation of Operating Income (Loss) to Net Cash
Provided (Used) by Operating Activities
$ (422) $ (825) $ 319 $ 723 $ 9,488 Operating Income (Loss)
Adjustments to Reconcile Operating Income (Loss) to
Net Cash Provided (Used) by Operating Activities:
-- -- 7,199 301 10,709 Depreciation/Amortization
-- 909 28 125 (4) Other Revenue
(Increases) Decreases In:
-- -- (1) -- 24 Accounts Receivable, Net of Allowances
-- (60) (57) (19) (704) Due from Other Funds
-- -- -- -- (2) Due from Component Unit
-- 4 6 -- 101 Due from Other Governmental Agencies
-- -- 209 -- -- Inventory of Materials and Supplies
-- (18) (147) 16 (306) Prepaid Costs
-- 301 1,434 264 1,528 Deferred Outflows of Resources Related to Pension
-- 8 40 7 50 Deferred Outflows of Resources Related to OPEB
Increases (Decreases) In:
-- 59 114 (103) (3,182) Accounts Payable
-- 14 70 19 119 Salaries and Employee Benefits Payable
2 14 (6) (12) 2,600 Due to Other Funds
-- -- (1) (2) -- Due to Other Governmental Agencies
(377) 771 -- -- -- Insurance Claims Payable
-- -- -- (610) -- Capital Lease Obligations Payable
-- 3 (24) 11 243 Compensated Employee Absences Payable
-- (502) (2,484) (420) (3,092) Net Pension Liability
-- (32) (163) (27) (203) Net OPEB Liability
-- 170 842 142 1,048 Deferred Inflows of Resources Related to Pension
-- 19 95 16 118 Deferred Inflows of Resources Related to OPEB
(375) 1,660 7,154 (292) 9,047 Total Adjustments
$ (797) $ 835 $ 7,473 $ 431 $ 18,535 Net Cash Provided (Used) by Operating Activities
Reconciliation of Cash and Cash Equivalents to
Statement of Net Position
$ 6,899 $ 78,444 $ 33,913 $ 4,778 $ 18,740 Pooled Cash/Investments
-- -- -- -- -- Cash/Cash Equivalents
-- 5 -- -- 3 Imprest Cash Funds
$ 6,899 $ 78,449 $ 33,913 $ 4,778 $ 18,743 Total Cash and Cash Equivalents
Technology
Information &
Insurance Casualty Risk Transportation Reprographics
Unemployment Property &
___________________________________________________________________________________________
___________________________________________________________________________________________
Supplemental Information (Dollar Amounts in Thousands)
185

FIDUCIARY FUNDS
Fiduciary Funds are used to account for assets held by the County in a trustee or agency capacity on behalf of outside parties, including employees, individuals, private organizations, or other governments. These Funds cannot be used to support the County’s programs. When these assets are held under a formal trust agreement, a trust Fund is used. Agency Funds are generally used to account for assets that the County holds on behalf of others as their agent in a purely custodial capacity.
PRIVATE-PURPOSE TRUST FUNDS
Public Administration Trust Funds These Funds are used to account for trust arrangements where the principal and income benefit individuals,
private organizations, or other governments. Examples of private-purpose trusts include unidentified funds, unclaimed prisoner funds, decedents’ property held for escheatment, and various funding services to finance permanent supportive & affordable housing.
Orange County Redevelopment Successor Agency (Successor Agency)
The Orange County Development Agency (OCDA) was dissolved effective February 1, 2012 in accordance with ABx1 26. A successor agency was designated as the successor entity to the former redevelopment agency in accordance with Health and Safety Code 34173. The Orange County Redevelopment Successor Agency holds the assets of the dissolved OCDA pending liquidation and distribution.
PENSION AND OTHER EMPLOYEE BENEFITS TRUST FUNDS
Extra-Help Defined Benefit Plan
This Fund is used to account for the retirement plan for employees working less than half-time or as extra-help. This retirement plan was closed to new participants as of February 28, 2002. The eligible employees of these plans are not covered by OCERS.
Extra-Help Defined Contribution Plan
This Fund is used to account for the defined contribution retirement plan for extra-help and part-time employees. This plan replaced the Extra-Help Defined Benefit Retirement Plan and was effective for new employees on March 1, 2002. Effective February 10, 2015, the plan also includes new employees who have attained age 60 at date of hire, who waive membership in OCERS, and do not have funds on deposit with OCERS and otherwise meet the requirements under OCERS’ regulations and state law to waive membership in OCERS. The eligible employees of these plans are not covered by OCERS.
401(a) Defined Contribution Plan
This Fund accounts for the 401(a) defined contribution plan, which was established in January 1999 for eligible employees, including the members of the Board, certain executive managers, certain administrative managers once classified as confidential and grandfathered in the plan, attorneys represented by the Orange County Attorney’s Association and certain other employee classifications as defined in the plan document. The plan was closed to the attorneys effective June 24, 2005. The plan was closed to new administrative managers and to all grandfathered administrative managers, effective June 23, 2016 and December 28, 2012, respectively.
1.62% at 65 Retirement, 401(a) Defined Contribution Plan
This Fund is used to account for the matching 401(a) employer contributions for eligible employees in the “1.62% at 65” Retirement (OCERS) formula who voluntarily contribute to the “1.62% at 65” Retirement, 457(b) defined contribution plan. The Plan was established on May 7, 2010.
___________________________________________________________________________________________
___________________________________________________________________________________________
County of Orange Comprehensive Annual Financial Report For the Year Ended June 30, 2020 (Dollar Amounts in Thousands)
186
Retiree Medical Plan (Combined 401h and 115 Trust)
This Fund is used to account for the annual required contributions, benefit payments, and investment losses and gains in the Retiree Medical Trust (Trust) which was established effective July 2, 2007. The Trust was established exclusively for the Retiree Medical Plan (Plan) which is a cost-sharing multiple-employer defined benefit other postemployment benefit plan that was established on August 1, 1993 for eligible employees as defined in the plan document. The Trust and the 401(h) account with OCERS represents the Plan reported here. The Plan is reported as of December 31.
Health Reimbursement Arrangement (HRA) Plan
This Fund is used to account for the employer contributions to the HRA, a defined contribution plan, which
became effective on June 24, 2008 for eligible employees, including employees represented by the Association of Orange County Deputy Sheriffs and Law Enforcement Management employees as defined in the plan document. The HRA was amended and restated on June 1, 2016 to provide for the transition of the Orange County Attorney’s Association to the HRA Plan in July 2016.
AGENCY FUNDS
Unapportioned Tax and Interest Funds
This group of Funds is used to account for the collection of property taxes, and later distribution of such taxes,
as well as the interest earned on them. Included are taxes collected by the County for other governmental units using the County treasury, as well as governmental units not using the County treasury, such as cities.
Departmental Funds
This group of Funds is used by certain County officers to hold various types of cash receipts and deposits in a fiduciary capacity. Disbursements are made from these Funds.
___________________________________________________________________________________________
___________________________________________________________________________________________
Supplemental Information (Dollar Amounts in Thousands)
187

ASSETS
Pooled Cash/Investments $ 75,504 $ 73,613 $ 1,891
Restricted Cash and Investments
Restricted Investments with Trustee 4,673 -- 4,673
Receivables
Interest/Dividends 180 175 5
Due from Other Governmental Agencies 9 9 --
Total Assets 80,366 73,797 6,569
DEFERRED OUTFLOWS OF RESOURCES
Deferred Charge on Refunding 151 -- 151
Total Deferred Outflows of Resources 151 -- 151
LIABILITIES
Bonds Payable 13,783 -- 13,783
Interest Payable 184 -- 184
Due to Other Governmental Agencies 7 2 5
Total Liabilities 13,974 2 13,972
DEFERRED INFLOWS OF RESOURCES
Deferred Charge on Refunding 61 -- 61
Total Deferred Inflows of Resources 61 -- 61
NET POSITION
Restricted for Private-Purpose Trust Funds 66,482 73,795 (7,313)
Net Position (Deficit) $ 66,482 $ 73,795 $ (7,313)
Orange County
Redevelopment
Successor Agency
Public
Administration
Trust FundsTotal
COMBINING STATEMENT OF FIDUCIARY NET POSITION
PRIVATE-PURPOSE TRUST FUNDS
___________________________________________________________________________________________
___________________________________________________________________________________________
County of Orange Comprehensive Annual Financial Report June 30, 2020 (Dollar Amounts in Thousands)
188

Additions:
Contributions to Private-Purpose Trust $ 90,769 $ 90,769 $ --
Intergovernmental Revenues 4,173 -- 4,173
Interest and Investment Income 2,171 2,061 110
Less: Investment Expense (39) (38) (1)
Total Additions 97,074 92,792 4,282
Deductions:
Distributions from Private-Purpose Trust 77,696 77,696 --
Professional Services 142 50 92
Tax Pass-Throughs 250 -- 250
Interest Expense 412 -- 412
Total Deductions 78,500 77,746 754
Change in Net Position 18,574 15,046 3,528
Net Position (Deficit)-Beginning of Year 47,908 58,749 (10,841)
Net Position (Deficit)-End of Year $ 66,482 $ 73,795 $ (7,313)
Total
Public
Administration
Trust Funds
Orange County
Redevelopment
Successor Agency
COMBINING STATEMENT OF CHANGES IN FIDUCIARY NET POSITION
PRIVATE-PURPOSE TRUST FUNDS
FOR THE YEAR ENDED JUNE 30, 2020
___________________________________________________________________________________________
___________________________________________________________________________________________
Supplemental Information (Dollar Amounts in Thousands)
189

ASSETS
Pooled Cash/Investments $ 3,009 $ 117 $ -- $ --
Restricted Cash and Investments
Restricted Investments with Trustee 190,745 5,167 8,787 18,202
Pooled with OCERS 370,228 -- -- --
Receivables
Investments 109 -- -- --
Interest/Dividends 23 -- -- --
Due from Other Governmental Agencies 1,808 -- 24 36
Total Assets 565,922 5,284 8,811 18,238
LIABILITIES
Salaries and Employee Benefits Payable 3,908 -- -- --
Total Liabilities 3,908 -- -- --
NET POSITION
Restricted for Pension and OPEB Benefits 562,014 5,284 8,811 18,238
Net Position $ 562,014 $ 5,284 $ 8,811 $ 18,238
COMBINING STATEMENT OF FIDUCIARY NET POSITION
PENSION AND OTHER EMPLOYEE BENEFITS TRUST FUNDS
Extra-Help
Defined Benefit
Plan
401(a)
Defined
Contribution
Plan
Extra-Help
Defined
Contribution
PlanTotal
___________________________________________________________________________________________
___________________________________________________________________________________________
County of Orange Comprehensive Annual Financial Report June 30, 2020 (Dollar Amounts in Thousands)
190
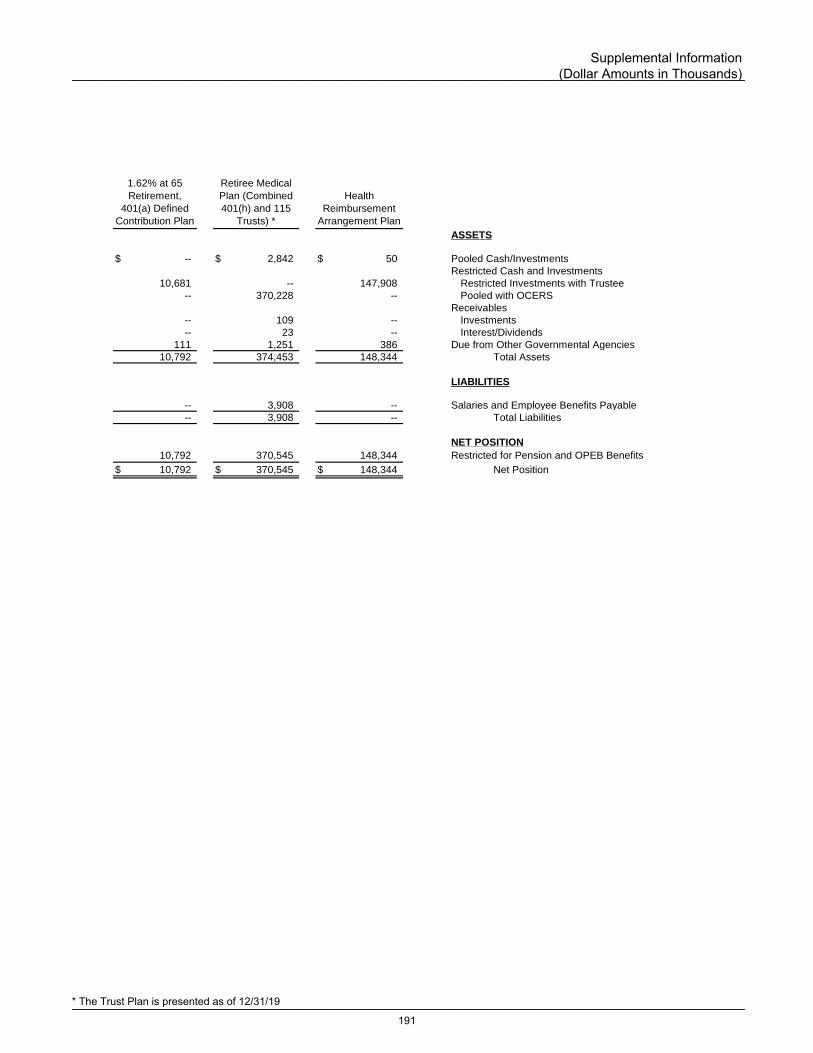
ASSETS
$ -- $ 2,842 $ 50 Pooled Cash/Investments
Restricted Cash and Investments
10,681 -- 147,908 Restricted Investments with Trustee
-- 370,228 -- Pooled with OCERS
Receivables
-- 109 -- Investments
-- 23 -- Interest/Dividends
111 1,251 386 Due from Other Governmental Agencies
10,792 374,453 148,344 Total Assets
LIABILITIES
-- 3,908 -- Salaries and Employee Benefits Payable
-- 3,908 -- Total Liabilities
NET POSITION
10,792 370,545 148,344 Restricted for Pension and OPEB Benefits
$ 10,792 $ 370,545 $ 148,344 Net Position
1.62% at 65
Retirement,
401(a) Defined
Contribution Plan
Health
Reimbursement
Arrangement Plan
Retiree Medical
Plan (Combined
401(h) and 115
Trusts) *
___________________________________________________________________________________________
___________________________________________________________________________________________
Supplemental Information (Dollar Amounts in Thousands)
* The Trust Plan is presented as of 12/31/19
191
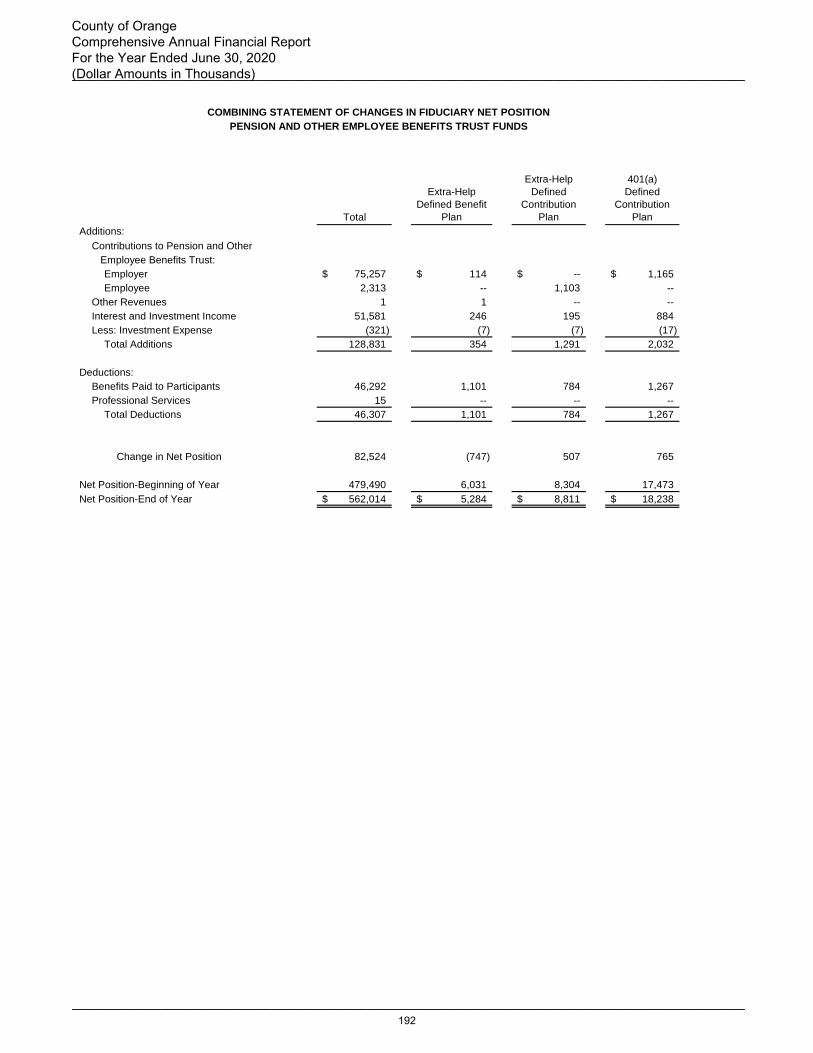
RCLS/OCLS CD
Additions:
Contributions to Pension and Other
Employee Benefits Trust:
Employer $ 75,257 $ 114 $ -- $ 1,165
Employee 2,313 -- 1,103 --
Other Revenues 1 1 -- --
Interest and Investment Income 51,581 246 195 884
Less: Investment Expense (321) (7) (7) (17)
Total Additions 128,831 354 1,291 2,032
Deductions:
Benefits Paid to Participants 46,292 1,101 784 1,267
Professional Services 15 -- -- --
Total Deductions 46,307 1,101 784 1,267
Change in Net Position 82,524 (747) 507 765
Net Position-Beginning of Year 479,490 6,031 8,304 17,473
Net Position-End of Year $ 562,014 $ 5,284 $ 8,811 $ 18,238
Extra-Help
Defined
Contribution
Plan
PENSION AND OTHER EMPLOYEE BENEFITS TRUST FUNDS
COMBINING STATEMENT OF CHANGES IN FIDUCIARY NET POSITION
Total
Extra-Help
Defined Benefit
Plan
401(a)
Defined
Contribution
Plan
___________________________________________________________________________________________
___________________________________________________________________________________________
County of Orange Comprehensive Annual Financial Report For the Year Ended June 30, 2020 (Dollar Amounts in Thousands)
192
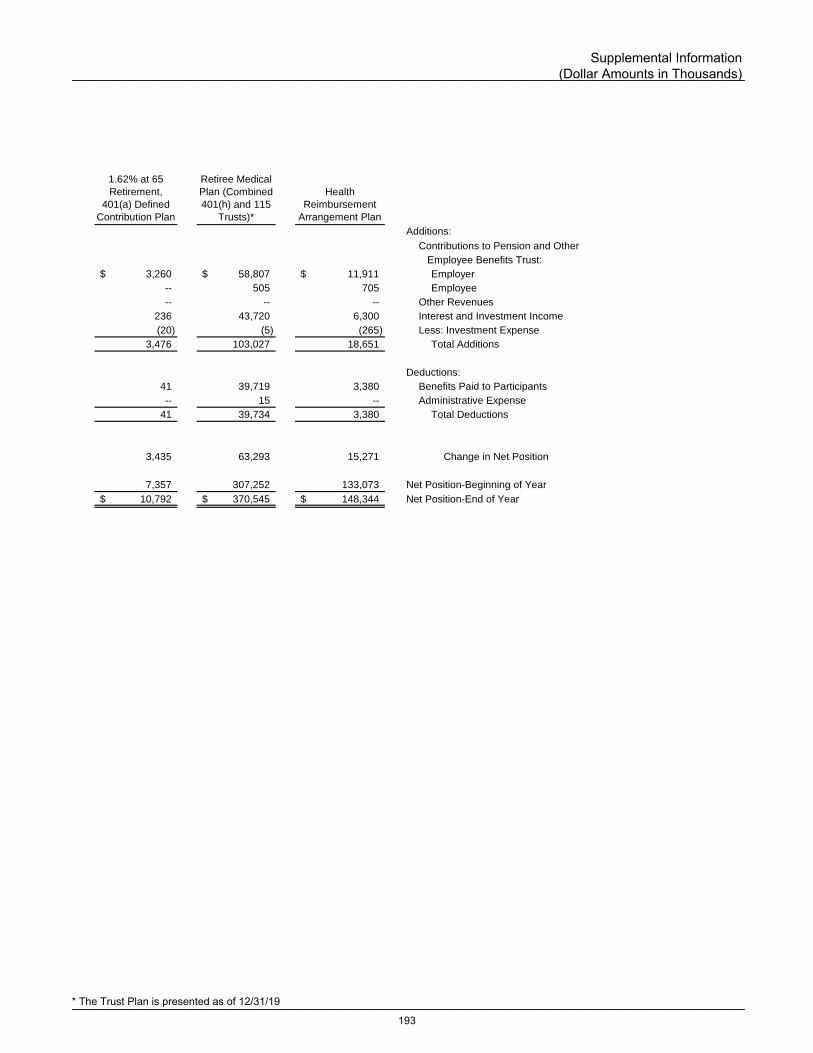
Additions:
Contributions to Pension and Other
Employee Benefits Trust:
$ 3,260 $ 58,807 $ 11,911 Employer
-- 505 705 Employee
-- -- -- Other Revenues
236 43,720 6,300 Interest and Investment Income
(20) (5) (265) Less: Investment Expense
3,476 103,027 18,651 Total Additions
Deductions:
41 39,719 3,380 Benefits Paid to Participants
-- 15 -- Administrative Expense
41 39,734 3,380 Total Deductions
3,435 63,293 15,271 Change in Net Position
7,357 307,252 133,073 Net Position-Beginning of Year
$ 10,792 $ 370,545 $ 148,344 Net Position-End of Year
Health
Reimbursement
Arrangement Plan
1.62% at 65
Retirement,
401(a) Defined
Contribution Plan
Retiree Medical
Plan (Combined
401(h) and 115
Trusts)*
___________________________________________________________________________________________
___________________________________________________________________________________________
Supplemental Information (Dollar Amounts in Thousands)
* The Trust Plan is presented as of 12/31/19
193
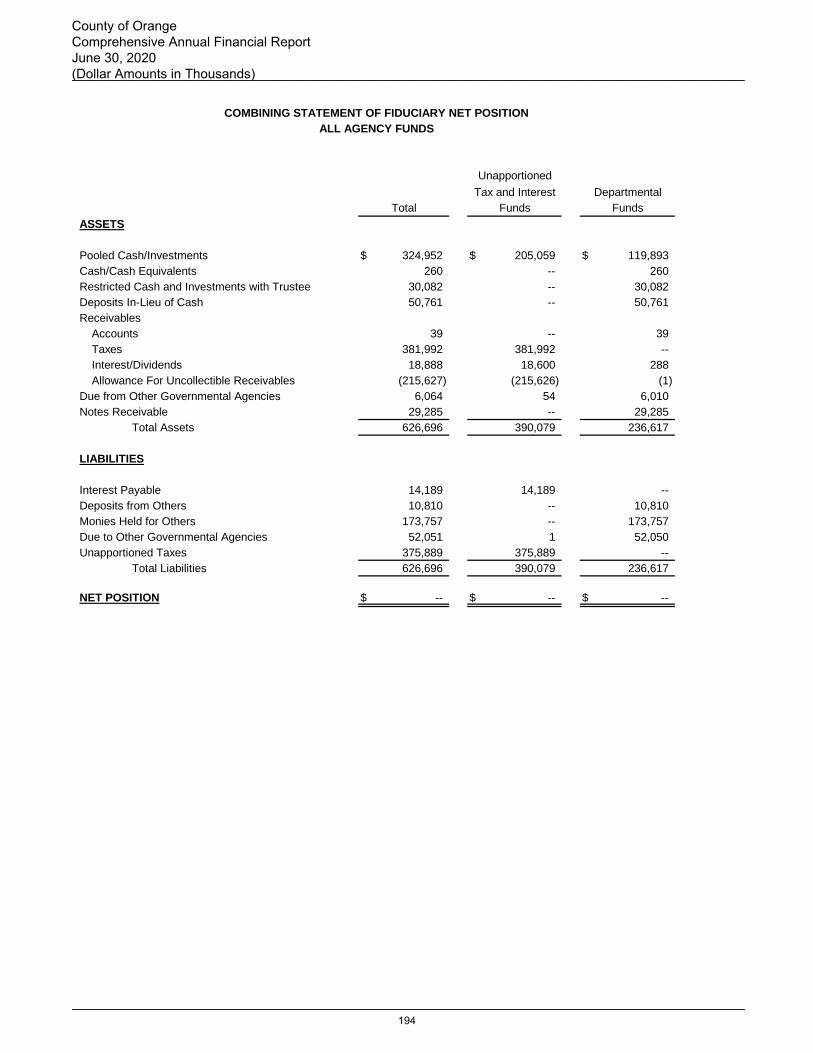
ASSETS
Pooled Cash/Investments $ 324,952 $ 205,059 $ 119,893
Cash/Cash Equivalents 260 -- 260
Restricted Cash and Investments with Trustee 30,082 -- 30,082
Deposits In-Lieu of Cash 50,761 -- 50,761
Receivables
Accounts 39 -- 39
Taxes 381,992 381,992 --
Interest/Dividends 18,888 18,600 288
Allowance For Uncollectible Receivables (215,627) (215,626) (1)
Due from Other Governmental Agencies 6,064 54 6,010
Notes Receivable 29,285 -- 29,285
Total Assets 626,696 390,079 236,617
LIABILITIES
Interest Payable 14,189 14,189 --
Deposits from Others 10,810 -- 10,810
Monies Held for Others 173,757 -- 173,757
Due to Other Governmental Agencies 52,051 1 52,050
Unapportioned Taxes 375,889 375,889 --
Total Liabilities 626,696 390,079 236,617
NET POSITION $ -- $ -- $ --
COMBINING STATEMENT OF FIDUCIARY NET POSITION
Unapportioned
Tax and Interest
ALL AGENCY FUNDS
Funds
Departmental
FundsTotal
___________________________________________________________________________________________
___________________________________________________________________________________________
County of Orange Comprehensive Annual Financial Report June 30, 2020 (Dollar Amounts in Thousands)
194

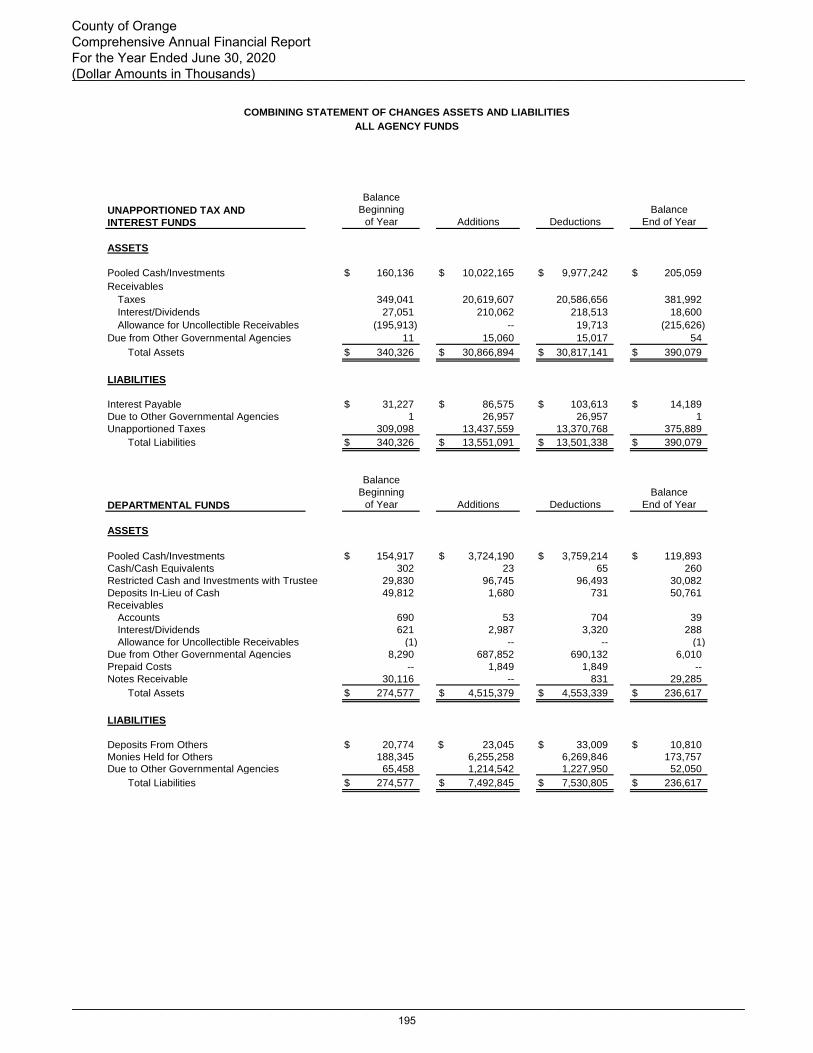
UNAPPORTIONED TAX AND
INTEREST FUNDS
ASSETS
Pooled Cash/Investments $ 160,136 $ 10,022,165 $ 9,977,242 $ 205,059
Receivables
Taxes 349,041 20,619,607 20,586,656 381,992
Interest/Dividends 27,051 210,062 218,513 18,600
Allowance for Uncollectible Receivables (195,913) -- 19,713 (215,626)
Due from Other Governmental Agencies 11 15,060 15,017 54
Total Assets $ 340,326 $ 30,866,894 $ 30,817,141 $ 390,079
LIABILITIES
Interest Payable $ 31,227 $ 86,575 $ 103,613 $ 14,189
Due to Other Governmental Agencies 1 26,957 26,957 1
Unapportioned Taxes 309,098 13,437,559 13,370,768 375,889
Total Liabilities $ 340,326 $ 13,551,091 $ 13,501,338 $ 390,079
DEPARTMENTAL FUNDS
ASSETS
Pooled Cash/Investments $ 154,917 $ 3,724,190 $ 3,759,214 $ 119,893
Cash/Cash Equivalents 302 23 65 260
Restricted Cash and Investments with Trustee 29,830 96,745 96,493 30,082
Deposits In-Lieu of Cash 49,812 1,680 731 50,761
Receivables
Accounts 690 53 704 39
Interest/Dividends 621 2,987 3,320 288
Allowance for Uncollectible Receivables (1) -- -- (1)
Due from Other Governmental Agencies 8,290 687,852 690,132 6,010
Prepaid Costs -- 1,849 1,849 --
Notes Receivable 30,116 -- 831 29,285
Total Assets $ 274,577 $ 4,515,379 $ 4,553,339 $ 236,617
LIABILITIES
Deposits From Others $ 20,774 $ 23,045 $ 33,009 $ 10,810
Monies Held for Others 188,345 6,255,258 6,269,846 173,757 Due to Other Governmental Agencies 65,458 1,214,542 1,227,950 52,050
Total Liabilities $ 274,577 $ 7,492,845 $ 7,530,805 $ 236,617
COMBINING STATEMENT OF CHANGES ASSETS AND LIABILITIES
ALL AGENCY FUNDS
End of Year
Balance
Balance
Additions
Beginning
Deductionsof Year
Additions End of Year
Balance
Deductions
Balance
Beginning
of Year
___________________________________________________________________________________________
___________________________________________________________________________________________
County of Orange Comprehensive Annual Financial Report For the Year Ended June 30, 2020 (Dollar Amounts in Thousands)
195

TOTAL - ALL AGENCY FUNDS
ASSETS
Pooled Cash/Investments $ 315,053 $ 13,746,355 $ 13,736,456 $ 324,952
Cash/Cash Equivalents 302 23 65 260
Restricted Cash and Investments with Trustee 29,830 96,745 96,493 30,082
Deposits In-Lieu of Cash 49,812 1,680 731 50,761
Receivables
Accounts 690 53 704 39
Taxes 349,041 20,619,607 20,586,656 381,992
Interest/Dividends 27,672 213,049 221,833 18,888
Allowance for Uncollectible Receivables (195,914) -- 19,713 (215,627)
Due from Other Governmental Agencies 8,301 702,912 705,149 6,064
Prepaid Costs -- 1,849 1,849 --
Notes Receivable 30,116 -- 831 29,285
Total Assets $ 614,903 $ 35,382,273 $ 35,370,480 $ 626,696
LIABILITIES
Interest Payable $ 31,227 $ 86,575 $ 103,613 $ 14,189
Deposits from Others 20,774 23,045 33,009 10,810
Monies Held for Others 188,345 6,255,258 6,269,846 173,757
Due to Other Governmental Agencies 65,459 1,241,499 1,254,907 52,051
Unapportioned Taxes 309,098 13,437,559 13,370,768 375,889
Total Liabilities $ 614,903 $ 21,043,936 $ 21,032,143 $ 626,696
Balance
Additionsof Year
Beginning
Balance
Deductions End of Year
___________________________________________________________________________________________
___________________________________________________________________________________________
Supplemental Information (Dollar Amounts in Thousands)
196


Clerk‐Recorder Honda Center Marriage Services


Contents Page
Financial Trends
198
Revenue Capacity
210
Debt Capacity
215
Economic and Demographic Information
220
Operating Information
222
Source: Unless otherwise noted, the information in these schedules is derived from the Comprehensive Annual Financial Reports for the relevant year.
These schedules contain service and infrastructure data to help the
reader understand how the information in the County’s financial report
relates to the services the County provides and the activities it
performs.
The information in this section is not covered by the Independent Auditor’s Report but is presented as
supplemental data for the benefit of the readers of the Comprehensive Annual Financial Report. The objectives
of statistical section information are to provide financial statement users with additional historical perspective,
context, and detail to assist in using the information in the basic financial statements, notes to the basic financial
statements, and required supplementary information to understand and assess a government’s economic
condition.
These schedules contain trend information to help the reader
understand how the County’s financial performance and well-being
have changed over time.
These schedules contain trend information to help the reader assess
the County’s most significant local revenue source, the property tax.
These schedules offer economic and demographic indicators to help
the reader understand the environment within which the County’s
financial activities take place.
These schedules offer economic and demographic indicators to help
the reader understand how the information in the County’s financial
report relates to the services the County provides and the activities it
performs.
STATISTICAL SECTION
(UNAUDITED)
___________________________________________________________________________________________
___________________________________________________________________________________________197

2019-20 2018-19 2017-18 2016-17 2015-16
Governmental Activities
Net Investment in Capital Assets 3,319,173$ 3,127,371$ 3,031,574$ 2,813,296$ 2,707,493$
Restricted for:
Expendable
OPEB -- -- -- -- --
Pension Benefits 135,342 143,647 135,485 125,876 111,639
Capital Projects 162,614 212,897 123,245 164,400 10,836
Debt Service 33,179 28,370 25,792 33,409 36,380
Legally Segregated for Grants
and Other Purposes 1,212,985 1,202,317 1,148,735 1,192,827 1,103,257
Regional Park Endowment 167 159 148 145 144 NonexpendableRegional Park Endowment 200 200 200 196 193
Unrestricted (3,480,608) (3,582,580) (3,312,306) (3,074,958) (2,979,945)
Total Governmental Activities Net Position 1,383,052$ 1,132,381$ 1,152,873$ 1,255,191$ 989,997$
Business-Type Activities
Net Investment in Capital Assets 856,250$ 858,924$ 799,668$ 708,286$ 663,280$
Restricted for:
Expendable
Debt Service 11,591 2,029 8,672 36,181 8,499
Passenger Facility Charges
Approved Capital Projects 8,158 3,282 12,044 2,775 14,705
Replacements and Renewals 1,000 1,000 1,000 1,000 1,000
Landfill Closure/Postclosure 27,730 28,531 26,655 28,962 33,997
Landfill Corrective Action 8,820 8,619 8,358 8,278 8,245
Wetland 879 879 879 879 879
Prima Deshecha/La Pata Closure 104 104 104 104 104
Airport -- -- -- -- --
OC Waste & Recycling -- -- -- -- --
Unrestricted 546,804 491,359 454,482 463,495 465,003
Total Business-Type Activities Net Position 1,461,336$ 1,394,727$ 1,311,862$ 1,249,960$ 1,195,712$
Notes: (1)
(2)
(3)
Net Position by Component
Last Ten Fiscal Years
(Accrual Basis of Accounting)
Starting in FY 2012-13, Restricted Net Position for Business-Type Activities will be shown by activity detail.
The balances shown have not been restated to include the prior period adjustments.
In FY 2011-12, it was determined that the Restricted Net Position for Other Postemployment Benefits does not meet the
definition of restriction and should be reported as unrestricted.
Fiscal Year
(2)
(3)
(2)
___________________________________________________________________________________________
___________________________________________________________________________________________
County of Orange Comprehensive Annual Financial Report June 30, 2020 (Dollar Amounts in Thousands)
198

2014-15 2013-14 2012-13 2011-12 2010-11
Governmental Activities
2,670,577$ 2,646,812$ 2,563,976$ 2,699,809$ 2,626,281$ Net Investment in Capital Assets
Restricted for:
Expendable
-- -- -- -- 41,609 OPEB
112,544 109,986 105,900 96,604 107,807 Pension Benefits
6,154 8,661 11,904 16,269 56,219 Capital Projects
37,734 37,639 31,965 -- 87,253 Debt Service
Legally Segregated for Grants
1,045,897 1,190,106 1,174,791 1,077,117 1,133,256 and Other Purposes
141 140 139 -- -- Regional Park EndowmentNonexpendable
188 185 183 319 315 Regional Park Endowment
(2,991,814) 331,408 196,850 37,790 (73,741) Unrestricted
881,421$ 4,324,937$ 4,085,708$ 3,927,908$ 3,978,999$ Total Governmental Activities Net Position
Business-Type Activities
642,427$ 624,621$ 587,934$ 574,982$ 591,664$ Net Investment in Capital Assets
Restricted for:
Expendable
7,324 7,090 58,772 -- -- Debt Service
-- -- Passenger Facility Charges
70,538 62,522 55,331 -- -- Approved Capital Projects
1,000 1,000 1,000 -- -- Replacements and Renewals
33,337 37,412 40,355 -- -- Landfill Closure/Postclosure
8,174 7,141 6,109 -- -- Landfill Corrective Action
879 879 879 -- -- Wetland
104 104 104 -- -- Prima Deshecha/La Pata Closure
-- -- -- 58,149 50,899 Airport
-- -- -- 82,205 84,070 OC Waste & Recycling
362,546 384,871 335,122 350,474 313,568 Unrestricted
1,126,329$ 1,125,640$ 1,085,606$ 1,065,810$ 1,040,201$ Total Business-Type Activities Net Position
Net Position by Component
Last Ten Fiscal Years
(Accrual Basis of Accounting)
Starting in FY 2012-13, Restricted Net Position for Business-Type Activities will be shown by activity detail.
The balances shown have not been restated to include the prior period adjustments.
In FY 2011-12, it was determined that the Restricted Net Position for Other Postemployment Benefits does not meet the
definition of restriction and should be reported as unrestricted.
Fiscal Year(3)
(1)
(3)
(2)
(2)
___________________________________________________________________________________________
___________________________________________________________________________________________
Statistical Section (Dollar Amounts in Thousands)
199

2019-20 2018-19 2017-18 2016-17 2015-16
Primary Government
Net Investment in Capital Assets 4,175,423$ 3,986,295$ 3,831,242$ 3,521,582$ 3,370,773$
Restricted for:
Expendable
OPEB -- -- -- -- --
Pension Benefits 135,342 143,647 135,485 125,876 111,639
Capital Projects 162,614 212,897 123,245 164,400 10,836
Debt Service 44,770 30,399 34,464 69,590 44,879
Legally Segregated for Grants
and Other Purposes 1,212,985 1,202,317 1,148,735 1,192,827 1,103,257
Regional Park Endowment 167 159 148 145 144
Passenger Facility Charges
Approved Capital Projects 8,158 3,282 12,044 2,775 14,705
Replacements and Renewals 1,000 1,000 1,000 1,000 1,000
Landfill Closure/Postclosure 27,730 28,531 26,655 28,962 33,997
Landfill Corrective Action 8,820 8,619 8,358 8,278 8,245
Wetland 879 879 879 879 879
Prima Deshecha/La Pata Closure 104 104 104 104 104
Airport -- -- -- -- --
OC Waste & Recycling -- -- -- -- --
Nonexpendable
Regional Park Endowment 200 200 200 196 193
Unrestricted (2,933,804) (3,091,221) (2,857,824) (2,611,463) (2,514,942)
Total Primary Government Net Position 2,844,388$ 2,527,108$ 2,464,735$ 2,505,151$ 2,185,709$
Notes: (1)
(2)
(3)
Net Position by Component
Last Ten Fiscal Years
(Accrual Basis of Accounting) (Continued)
The balances shown have not been restated to include the prior period adjustments.
Starting in FY 2012-13, Restricted Net Position for Business-Type Activities will be shown by activity detail.
In FY 2011-12, it was determined that the Restricted Net Position for Other Postemployment Benefits does not meet the
definition of restriction and should be reported as unrestricted.
Fiscal Year
(2)
(3)
(1)
(2)
___________________________________________________________________________________________
___________________________________________________________________________________________
County of Orange Comprehensive Annual Financial Report June 30, 2020 (Dollar Amounts in Thousands)
200
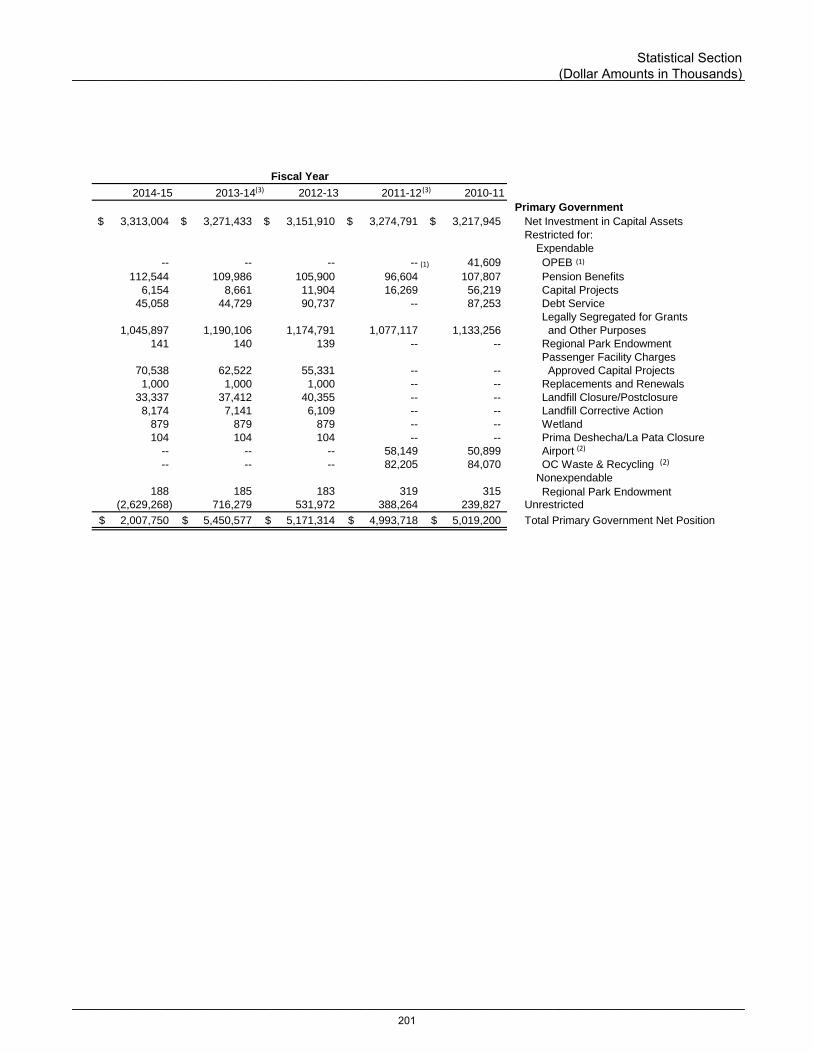
2014-15 2013-14 2012-13 2011-12 2010-11
Primary Government
3,313,004$ 3,271,433$ 3,151,910$ 3,274,791$ 3,217,945$ Net Investment in Capital Assets
Restricted for:
Expendable
-- -- -- -- 41,609 OPEB
112,544 109,986 105,900 96,604 107,807 Pension Benefits
6,154 8,661 11,904 16,269 56,219 Capital Projects
45,058 44,729 90,737 -- 87,253 Debt Service
Legally Segregated for Grants
1,045,897 1,190,106 1,174,791 1,077,117 1,133,256 and Other Purposes
141 140 139 -- -- Regional Park Endowment
Passenger Facility Charges
70,538 62,522 55,331 -- -- Approved Capital Projects
1,000 1,000 1,000 -- -- Replacements and Renewals
33,337 37,412 40,355 -- -- Landfill Closure/Postclosure
8,174 7,141 6,109 -- -- Landfill Corrective Action
879 879 879 -- -- Wetland
104 104 104 -- -- Prima Deshecha/La Pata Closure
-- -- -- 58,149 50,899 Airport
-- -- -- 82,205 84,070 OC Waste & Recycling
Nonexpendable
188 185 183 319 315 Regional Park Endowment(2,629,268) 716,279 531,972 388,264 239,827 Unrestricted
2,007,750$ 5,450,577$ 5,171,314$ 4,993,718$ 5,019,200$ Total Primary Government Net Position
Net Position by Component
Last Ten Fiscal Years
(Accrual Basis of Accounting) (Continued)
The balances shown have not been restated to include the prior period adjustments.
Starting in FY 2012-13, Restricted Net Position for Business-Type Activities will be shown by activity detail.
In FY 2011-12, it was determined that the Restricted Net Position for Other Postemployment Benefits does not meet the
definition of restriction and should be reported as unrestricted.
Fiscal Year(3)
(1)
(3)
(2)
(1)
(2)
___________________________________________________________________________________________
___________________________________________________________________________________________
Statistical Section (Dollar Amounts in Thousands)
201
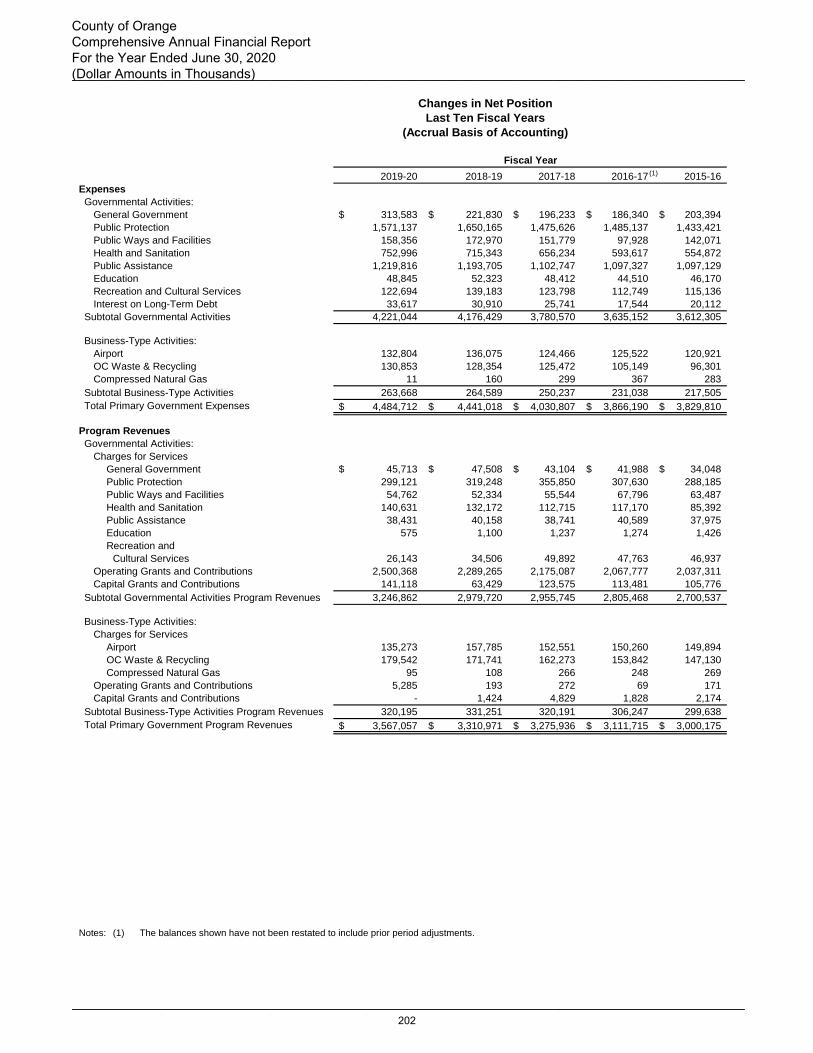
2019-20 2018-19 2017-18 2016-17 2015-16
Expenses
Governmental Activities:
General Government 313,583$ 221,830$ 196,233$ 186,340$ 203,394$
Public Protection 1,571,137 1,650,165 1,475,626 1,485,137 1,433,421
Public Ways and Facilities 158,356 172,970 151,779 97,928 142,071
Health and Sanitation 752,996 715,343 656,234 593,617 554,872
Public Assistance 1,219,816 1,193,705 1,102,747 1,097,327 1,097,129
Education 48,845 52,323 48,412 44,510 46,170
Recreation and Cultural Services 122,694 139,183 123,798 112,749 115,136
Interest on Long-Term Debt 33,617 30,910 25,741 17,544 20,112
Subtotal Governmental Activities 4,221,044 4,176,429 3,780,570 3,635,152 3,612,305
Business-Type Activities:
Airport 132,804 136,075 124,466 125,522 120,921
OC Waste & Recycling 130,853 128,354 125,472 105,149 96,301
Compressed Natural Gas 11 160 299 367 283
Subtotal Business-Type Activities 263,668 264,589 250,237 231,038 217,505
Total Primary Government Expenses 4,484,712$ 4,441,018$ 4,030,807$ 3,866,190$ 3,829,810$
Program Revenues
Governmental Activities:
Charges for Services
General Government 45,713$ 47,508$ 43,104$ 41,988$ 34,048$
Public Protection 299,121 319,248 355,850 307,630 288,185
Public Ways and Facilities 54,762 52,334 55,544 67,796 63,487
Health and Sanitation 140,631 132,172 112,715 117,170 85,392
Public Assistance 38,431 40,158 38,741 40,589 37,975
Education 575 1,100 1,237 1,274 1,426
Recreation and
Cultural Services 26,143 34,506 49,892 47,763 46,937
Operating Grants and Contributions 2,500,368 2,289,265 2,175,087 2,067,777 2,037,311
Capital Grants and Contributions 141,118 63,429 123,575 113,481 105,776
Subtotal Governmental Activities Program Revenues 3,246,862 2,979,720 2,955,745 2,805,468 2,700,537
Business-Type Activities:
Charges for Services
Airport 135,273 157,785 152,551 150,260 149,894
OC Waste & Recycling 179,542 171,741 162,273 153,842 147,130
Compressed Natural Gas 95 108 266 248 269
Operating Grants and Contributions 5,285 193 272 69 171
Capital Grants and Contributions - 1,424 4,829 1,828 2,174
Subtotal Business-Type Activities Program Revenues 320,195 331,251 320,191 306,247 299,638
Total Primary Government Program Revenues 3,567,057$ 3,310,971$ 3,275,936$ 3,111,715$ 3,000,175$
Notes: (1) The balances shown have not been restated to include prior period adjustments.
Fiscal Year
Changes in Net Position
Last Ten Fiscal Years
(Accrual Basis of Accounting)
(1)
___________________________________________________________________________________________
___________________________________________________________________________________________
County of Orange Comprehensive Annual Financial Report For the Year Ended June 30, 2020 (Dollar Amounts in Thousands)
202

2014-15 2013-14 2012-13 2011-12 2010-11
Expenses
Governmental Activities:
191,793$ 131,026$ 221,110$ 161,615$ 223,710$ General Government
1,326,028 1,261,984 1,264,354 1,231,925 1,174,859 Public Protection
114,398 127,561 137,651 144,382 136,017 Public Ways and Facilities
537,580 626,063 621,381 593,657 586,525 Health and Sanitation
1,049,665 988,735 944,230 930,348 931,263 Public Assistance
43,314 41,240 38,548 41,226 39,788 Education
102,069 96,820 101,232 102,762 101,993 Recreation and Cultural Services
23,560 28,028 31,269 56,765 53,806 Interest on Long-Term Debt
3,388,407 3,301,457 3,359,775 3,262,680 3,247,961 Subtotal Governmental Activities
Business-Type Activities:
124,778 120,731 122,568 107,120 88,059 Airport
69,307 94,161 94,737 94,553 93,985 OC Waste & Recycling
331 379 305 306 349 Compressed Natural Gas
194,416 215,271 217,610 201,979 182,393 Subtotal Business-Type Activities
3,582,823$ 3,516,728$ 3,577,385$ 3,464,659$ 3,430,354$ Total Primary Government Expenses
Program Revenues
Governmental Activities:
Charges for Services
36,924$ 32,016$ 32,127$ 26,942$ 33,561$ General Government
286,644 273,215 283,031 271,423 310,773 Public Protection
53,834 53,071 39,981 62,653 53,960 Public Ways and Facilities
102,599 93,470 81,039 86,027 93,815 Health and Sanitation
37,650 42,300 34,780 35,036 36,304 Public Assistance
1,480 2,059 1,327 1,437 1,576 Education
Recreation and
43,882 39,251 39,637 38,888 37,560 Cultural Services
1,996,861 2,033,550 1,904,858 1,800,296 1,706,231 Operating Grants and Contributions
33,241 54,478 62,893 39,010 170,516 Capital Grants and Contributions
2,593,115 2,623,410 2,479,673 2,361,712 2,444,296 Subtotal Governmental Activities Program Revenues
Business-Type Activities:
Charges for Services
141,563 136,359 132,941 129,213 124,298 Airport
139,493 125,106 106,876 99,249 102,595 OC Waste & Recycling
312 392 385 293 242 Compressed Natural Gas
255 900 200 212 657 Operating Grants and Contributions
9,215 5,277 3,839 5,216 6,544 Capital Grants and Contributions
290,838 268,034 244,241 234,183 234,336 Subtotal Business-Type Activities Program Revenues
2,883,953$ 2,891,444$ 2,723,914$ 2,595,895$ 2,678,632$ Total Primary Government Program Revenues
Fiscal Year
Changes in Net Position
Last Ten Fiscal Years
(Accrual Basis of Accounting)
(1)(1)
___________________________________________________________________________________________
___________________________________________________________________________________________
Statistical Section (Dollar Amounts in Thousands)
203
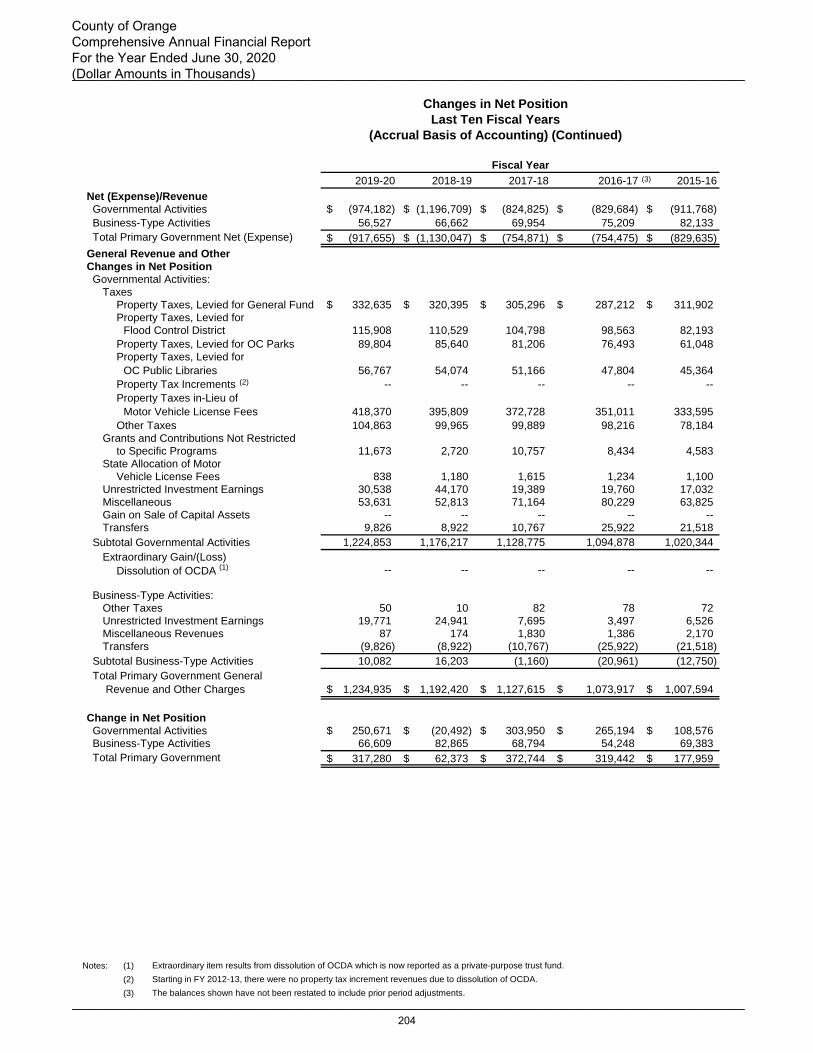
2019-20 2018-19 2017-18 2016-17 2015-16
Governmental Activities (974,182)$ (1,196,709)$ (824,825)$ (829,684)$ (911,768)$
Business-Type Activities 56,527 66,662 69,954 75,209 82,133
Total Primary Government Net (Expense) (917,655)$ (1,130,047)$ (754,871)$ (754,475)$ (829,635)$
General Revenue and Other
Changes in Net Position
Governmental Activities:
Taxes
Property Taxes, Levied for General Fund 332,635$ 320,395$ 305,296$ 287,212$ 311,902$
Property Taxes, Levied for
Flood Control District 115,908 110,529 104,798 98,563 82,193
Property Taxes, Levied for OC Parks 89,804 85,640 81,206 76,493 61,048
Property Taxes, Levied for
OC Public Libraries 56,767 54,074 51,166 47,804 45,364
Property Tax Increments -- -- -- -- --
Motor Vehicle License Fees 418,370 395,809 372,728 351,011 333,595
Other Taxes 104,863 99,965 99,889 98,216 78,184
Grants and Contributions Not Restricted
to Specific Programs 11,673 2,720 10,757 8,434 4,583
State Allocation of Motor
Vehicle License Fees 838 1,180 1,615 1,234 1,100
Unrestricted Investment Earnings 30,538 44,170 19,389 19,760 17,032
Miscellaneous 53,631 52,813 71,164 80,229 63,825
Gain on Sale of Capital Assets -- -- -- -- --
Transfers 9,826 8,922 10,767 25,922 21,518
Subtotal Governmental Activities 1,224,853 1,176,217 1,128,775 1,094,878 1,020,344
Extraordinary Gain/(Loss)
Dissolution of OCDA -- -- -- -- --
Business-Type Activities:
Other Taxes 50 10 82 78 72
Unrestricted Investment Earnings 19,771 24,941 7,695 3,497 6,526
Miscellaneous Revenues 87 174 1,830 1,386 2,170
Transfers (9,826) (8,922) (10,767) (25,922) (21,518)
Subtotal Business-Type Activities 10,082 16,203 (1,160) (20,961) (12,750)
Total Primary Government General
Revenue and Other Charges 1,234,935$ 1,192,420$ 1,127,615$ 1,073,917$ 1,007,594$
Change in Net Position
Governmental Activities 250,671$ (20,492)$ 303,950$ 265,194$ 108,576$
Business-Type Activities 66,609 82,865 68,794 54,248 69,383
Total Primary Government 317,280$ 62,373$ 372,744$ 319,442$ 177,959$
Notes: (1)
(2)
(3)
Net (Expense)/Revenue
Fiscal Year
Changes in Net Position
Last Ten Fiscal Years
(Accrual Basis of Accounting) (Continued)
Starting in FY 2012-13, there were no property tax increment revenues due to dissolution of OCDA.
The balances shown have not been restated to include prior period adjustments.
Property Taxes in-Lieu of
Extraordinary item results from dissolution of OCDA which is now reported as a private-purpose trust fund.
(1)
(2)
(3)
___________________________________________________________________________________________
___________________________________________________________________________________________
County of Orange Comprehensive Annual Financial Report For the Year Ended June 30, 2020 (Dollar Amounts in Thousands)
204

2014-15 2013-14 2012-13 2011-12 2010-11
(795,292)$ (678,047)$ (880,102)$ (900,968)$ (803,665)$ Governmental Activities
96,422 52,763 26,631 32,204 51,943 Business-Type Activities
(698,870)$ (625,284)$ (853,471)$ (868,764)$ (751,722)$ Total Primary Government Net (Expense)
General Revenue and Other
Changes in Net Position
Governmental Activities:
Taxes
328,500$ 277,591$ 313,299$ 311,779$ 298,953$ Property Taxes, Levied for General Fund
Property Taxes, Levied for
77,090 72,737 69,321 68,184 73,260 Flood Control District
57,266 54,042 51,550 51,168 51,554 Property Taxes, Levied for OC Parks
Property Taxes, Levied for
42,333 39,734 37,961 37,389 37,590 OC Public Libraries
-- -- -- 18,308 30,755 Property Tax Increments
314,957 295,798 309,745 303,955 228,421 Motor Vehicle License Fees
71,613 73,178 108,430 43,568 83,938 Other Taxes
Grants and Contributions Not Restricted
49,476 14,192 6,711 9,377 27,457 to Specific Programs
State Allocation of Motor
764 895 1,659 2,667 49,889 Vehicle License Fees
6,796 18,459 11,559 4,195 23,703 Unrestricted Investment Earnings
69,789 54,412 48,478 57,125 64,563 Miscellaneous
-- -- -- 34 -- Gain on Sale of Capital Assets
19,959 17,557 10,276 11,767 12,681 Transfers
1,038,543 918,595 968,989 919,516 982,764 Subtotal Governmental Activities
Extraordinary Gain/(Loss)
-- -- 1,800 (69,639) -- Dissolution of OCDA
Business-Type Activities:
109 101 93 134 -- Other Taxes
3,042 3,064 2,113 3,530 5,509 Unrestricted Investment Earnings
1,597 3,177 1,235 1,508 1,109 Miscellaneous Revenues
(19,959) (17,557) (10,276) (11,767) (12,681) Transfers
(15,211) (11,215) (6,835) (6,595) (6,063) Subtotal Business-Type Activities
Total Primary Government General
1,023,332$ 907,380$ 963,954$ 843,282$ 976,701$ Revenue and Other Charges
Change in Net Position
243,251$ 240,548$ 90,687$ (51,091)$ 179,099$ Governmental Activities
81,211 41,548 19,796 25,609 45,880 Business-Type Activities
324,462$ 282,096$ 110,483$ (25,482)$ 224,979$ Total Primary Government
Net (Expense)/Revenue
Fiscal Year
Changes in Net Position
Last Ten Fiscal Years
(Accrual Basis of Accounting) (Continued)
Starting in FY 2012-13, there were no property tax increment revenues due to dissolution of OCDA.
The balances shown have not been restated to include prior period adjustments.
Extraordinary item results from dissolution of OCDA which is now reported as a private-purpose trust fund.
Property Taxes in-Lieu of
(3) (3)
(2)
(1)
___________________________________________________________________________________________
___________________________________________________________________________________________
Statistical Section (Dollar Amounts in Thousands)
205
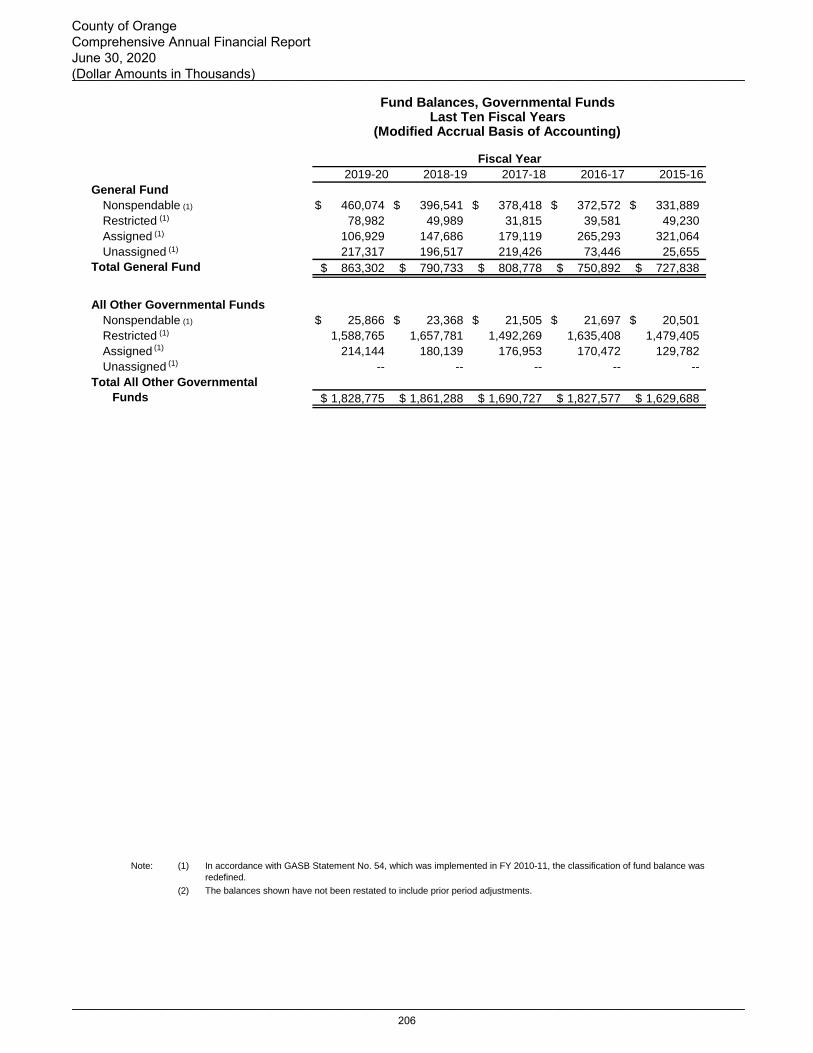
2019-20 2018-19 2017-18 2016-17 2015-16
General Fund
Nonspendable 460,074$ 396,541$ 378,418$ 372,572$ 331,889$
Restricted 78,982 49,989 31,815 39,581 49,230
Assigned 106,929 147,686 179,119 265,293 321,064
Unassigned 217,317 196,517 219,426 73,446 25,655
Total General Fund 863,302$ 790,733$ 808,778$ 750,892$ 727,838$
All Other Governmental Funds
Nonspendable 25,866$ 23,368$ 21,505$ 21,697$ 20,501$
Restricted 1,588,765 1,657,781 1,492,269 1,635,408 1,479,405
Assigned 214,144 180,139 176,953 170,472 129,782
Unassigned -- -- -- -- --
Total All Other Governmental
Funds 1,828,775$ 1,861,288$ 1,690,727$ 1,827,577$ 1,629,688$
Note: (1) In accordance with GASB Statement No. 54, which was implemented in FY 2010-11, the classification of fund balance was
redefined.
(2) The balances shown have not been restated to include prior period adjustments.
Fiscal Year
Fund Balances, Governmental FundsLast Ten Fiscal Years
(Modified Accrual Basis of Accounting)
(1)
(1)
(1)
(1)
(1)
(1)
(1)
(1)
___________________________________________________________________________________________
___________________________________________________________________________________________
County of Orange Comprehensive Annual Financial Report June 30, 2020 (Dollar Amounts in Thousands)
206

2014-15 2013-14 2012-13 2011-12 2010-11
General Fund
336,606$ 321,022$ 263,446$ 225,460$ 266,328$ Nonspendable
31,486 42,028 34,679 26,336 10,872 Restricted
269,529 153,336 68,157 100,448 1,394 Assigned
26,887 -- 78,264 990 -- Unassigned
664,508$ 516,386$ 444,546$ 353,234$ 278,594$ Total General Fund
All Other Governmental Funds
21,296$ 21,207$ 18,929$ 23,057$ 20,802$ Nonspendable
1,417,122 1,362,102 1,357,556 1,318,071 1,482,755 Restricted
83,765 67,929 65,556 43,900 34,173 Assigned
-- -- -- (3,016) (8,074) Unassigned
Total All Other Governmental
1,522,183$ 1,451,238$ 1,442,041$ 1,382,012$ 1,529,656$ Funds
Fiscal Year
Fund Balances, Governmental FundsLast Ten Fiscal Years
(Modified Accrual Basis of Accounting)
$0
$200,000
$400,000
$600,000
$800,000
$1,000,000
$1,200,000
$1,400,000
$1,600,000
$1,800,000
$2,000,000
2010-11 2011-12 2012-13 2013-14 2014-15 2015-16 2016-17 2017-18 2018-19 2019-20
General Fund
All Other Governmental Funds
Fund Balances - Governmental Funds
(2)
(1)
(1)
(1)
(1)
(1)
(1)
(1)
(1)
___________________________________________________________________________________________
___________________________________________________________________________________________
Statistical Section (Dollar Amounts in Thousands)
207
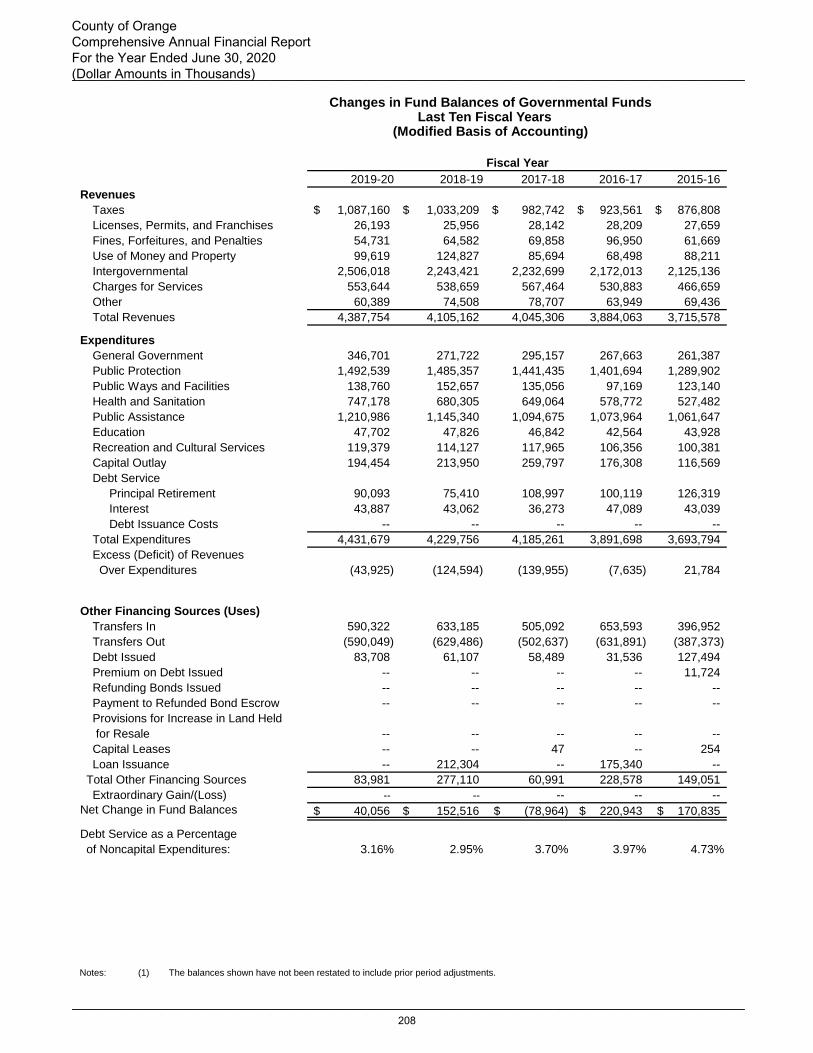
2019-20 2018-19 2017-18 2016-17 2015-16
Revenues
Taxes 1,087,160$ 1,033,209$ 982,742$ 923,561$ 876,808$
Licenses, Permits, and Franchises 26,193 25,956 28,142 28,209 27,659
Fines, Forfeitures, and Penalties 54,731 64,582 69,858 96,950 61,669
Use of Money and Property 99,619 124,827 85,694 68,498 88,211
Intergovernmental 2,506,018 2,243,421 2,232,699 2,172,013 2,125,136
Charges for Services 553,644 538,659 567,464 530,883 466,659
Other 60,389 74,508 78,707 63,949 69,436
Total Revenues 4,387,754 4,105,162 4,045,306 3,884,063 3,715,578
Expenditures
General Government 346,701 271,722 295,157 267,663 261,387
Public Protection 1,492,539 1,485,357 1,441,435 1,401,694 1,289,902
Public Ways and Facilities 138,760 152,657 135,056 97,169 123,140
Health and Sanitation 747,178 680,305 649,064 578,772 527,482
Public Assistance 1,210,986 1,145,340 1,094,675 1,073,964 1,061,647
Education 47,702 47,826 46,842 42,564 43,928
Recreation and Cultural Services 119,379 114,127 117,965 106,356 100,381
Capital Outlay 194,454 213,950 259,797 176,308 116,569
Debt Service
Principal Retirement 90,093 75,410 108,997 100,119 126,319
Interest 43,887 43,062 36,273 47,089 43,039
Debt Issuance Costs -- -- -- -- --
Total Expenditures 4,431,679 4,229,756 4,185,261 3,891,698 3,693,794
Excess (Deficit) of Revenues
Over Expenditures (43,925) (124,594) (139,955) (7,635) 21,784
Other Financing Sources (Uses)
Transfers In 590,322 633,185 505,092 653,593 396,952
Transfers Out (590,049) (629,486) (502,637) (631,891) (387,373)
Debt Issued 83,708 61,107 58,489 31,536 127,494
Premium on Debt Issued -- -- -- -- 11,724
Refunding Bonds Issued -- -- -- -- --
Payment to Refunded Bond Escrow -- -- -- -- --
Provisions for Increase in Land Held
for Resale -- -- -- -- --
Capital Leases -- -- 47 -- 254
Loan Issuance -- 212,304 -- 175,340 --
Total Other Financing Sources 83,981 277,110 60,991 228,578 149,051
Extraordinary Gain/(Loss) -- -- -- -- --
Net Change in Fund Balances 40,056$ 152,516$ (78,964)$ 220,943$ 170,835$
Debt Service as a Percentage
of Noncapital Expenditures: 3.16% 2.95% 3.70% 3.97% 4.73%
Notes: (1) The balances shown have not been restated to include prior period adjustments.
Fiscal Year
Changes in Fund Balances of Governmental FundsLast Ten Fiscal Years
(Modified Basis of Accounting)
___________________________________________________________________________________________
___________________________________________________________________________________________
County of Orange Comprehensive Annual Financial Report For the Year Ended June 30, 2020 (Dollar Amounts in Thousands)
208
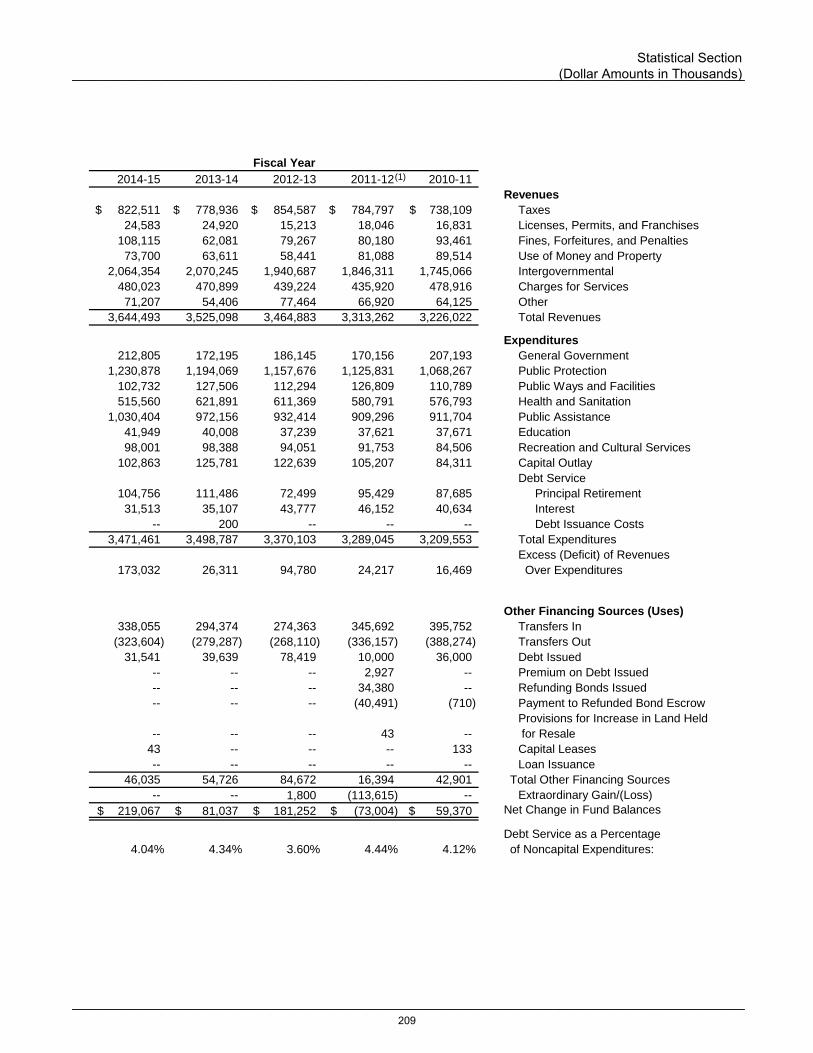
2014-15 2013-14 2012-13 2011-12 2010-11
Revenues
822,511$ 778,936$ 854,587$ 784,797$ 738,109$ Taxes
24,583 24,920 15,213 18,046 16,831 Licenses, Permits, and Franchises
108,115 62,081 79,267 80,180 93,461 Fines, Forfeitures, and Penalties
73,700 63,611 58,441 81,088 89,514 Use of Money and Property
2,064,354 2,070,245 1,940,687 1,846,311 1,745,066 Intergovernmental
480,023 470,899 439,224 435,920 478,916 Charges for Services
71,207 54,406 77,464 66,920 64,125 Other
3,644,493 3,525,098 3,464,883 3,313,262 3,226,022 Total Revenues
Expenditures
212,805 172,195 186,145 170,156 207,193 General Government
1,230,878 1,194,069 1,157,676 1,125,831 1,068,267 Public Protection
102,732 127,506 112,294 126,809 110,789 Public Ways and Facilities
515,560 621,891 611,369 580,791 576,793 Health and Sanitation
1,030,404 972,156 932,414 909,296 911,704 Public Assistance
41,949 40,008 37,239 37,621 37,671 Education
98,001 98,388 94,051 91,753 84,506 Recreation and Cultural Services
102,863 125,781 122,639 105,207 84,311 Capital Outlay
Debt Service
104,756 111,486 72,499 95,429 87,685 Principal Retirement
31,513 35,107 43,777 46,152 40,634 Interest
-- 200 -- -- -- Debt Issuance Costs
3,471,461 3,498,787 3,370,103 3,289,045 3,209,553 Total Expenditures
Excess (Deficit) of Revenues
173,032 26,311 94,780 24,217 16,469 Over Expenditures
Other Financing Sources (Uses)
338,055 294,374 274,363 345,692 395,752 Transfers In
(323,604) (279,287) (268,110) (336,157) (388,274) Transfers Out
31,541 39,639 78,419 10,000 36,000 Debt Issued
-- -- -- 2,927 -- Premium on Debt Issued
-- -- -- 34,380 -- Refunding Bonds Issued
-- -- -- (40,491) (710) Payment to Refunded Bond Escrow
Provisions for Increase in Land Held
-- -- -- 43 -- for Resale
43 -- -- -- 133 Capital Leases
-- -- -- -- -- Loan Issuance
46,035 54,726 84,672 16,394 42,901 Total Other Financing Sources
-- -- 1,800 (113,615) -- Extraordinary Gain/(Loss)
219,067$ 81,037$ 181,252$ (73,004)$ 59,370$ Net Change in Fund Balances
Debt Service as a Percentage
4.04% 4.34% 3.60% 4.44% 4.12% of Noncapital Expenditures:
Fiscal Year
Changes in Fund Balances of Governmental FundsLast Ten Fiscal Years
(Modified Basis of Accounting)
(1)
___________________________________________________________________________________________
___________________________________________________________________________________________
Statistical Section (Dollar Amounts in Thousands)
209

Industrial/
Fiscal Residential Commercial Other Unsecured Roll
Year Property Property Property (2)
Gross Total (3)
2019-20 480,900,743$ 134,341,781$ 2,582,299$ 22,599,621$
2018-19 454,536,503 127,625,128 2,489,493 21,677,257
2017-18 427,214,695 119,884,555 2,827,145 20,772,113
2016-17 400,931,553 114,636,194 2,787,769 20,582,609
2015-16 377,592,570 110,440,476 3,294,159 20,394,462
2014-15 352,800,864 105,523,254 3,694,094 20,902,660
2013-14 328,138,473 102,580,010 3,792,261 19,281,087
2012-13 315,635,908 100,074,695 3,489,057 19,905,480
2011-12 310,211,002 96,431,670 2,848,162 20,634,672
2010-11 304,895,403 97,097,750 3,038,747 21,198,638
Notes: (1)
(2)
(3)
Source: Orange County Assessor Department
Article XIIIA, added to the California Constitution by Proposition 13 in 1978, fixed the base valuation of property subject to taxes at the
full cash value appeared on the Assessor's 1975-76 assessment roll. The full cash value can be increased to reflect the annual
inflation up to 2 percent, the current market value at time of ownership change and the market value for new construction. Estimated
actual value of taxable property cannot easily be determined as the property in the County is not reassessed annually. Reassessment
normally occurs when ownership changes.
Other property includes: timeshares, rural/agricultural land, unique miscellaneous, mineral rights, water rights and personal property
and fixtures.
Unsecured roll includes properties for which taxes assessed are not a lien on real property and are not sufficient, in the opinion of the
Assessor, to secure payment of taxes. It consists of improvements, business personal property, boats and aircrafts, and it can also
include land and improvements that are identified as real estate of others, as defined by the Assessor (reference Revenue and
Taxation Code Section 134).
Assessed Value of Taxable Property (1)
Last Ten Fiscal Years
___________________________________________________________________________________________
___________________________________________________________________________________________
County of Orange Comprehensive Annual Financial Report June 30, 2020 (Dollar Amounts in Thousands)
210
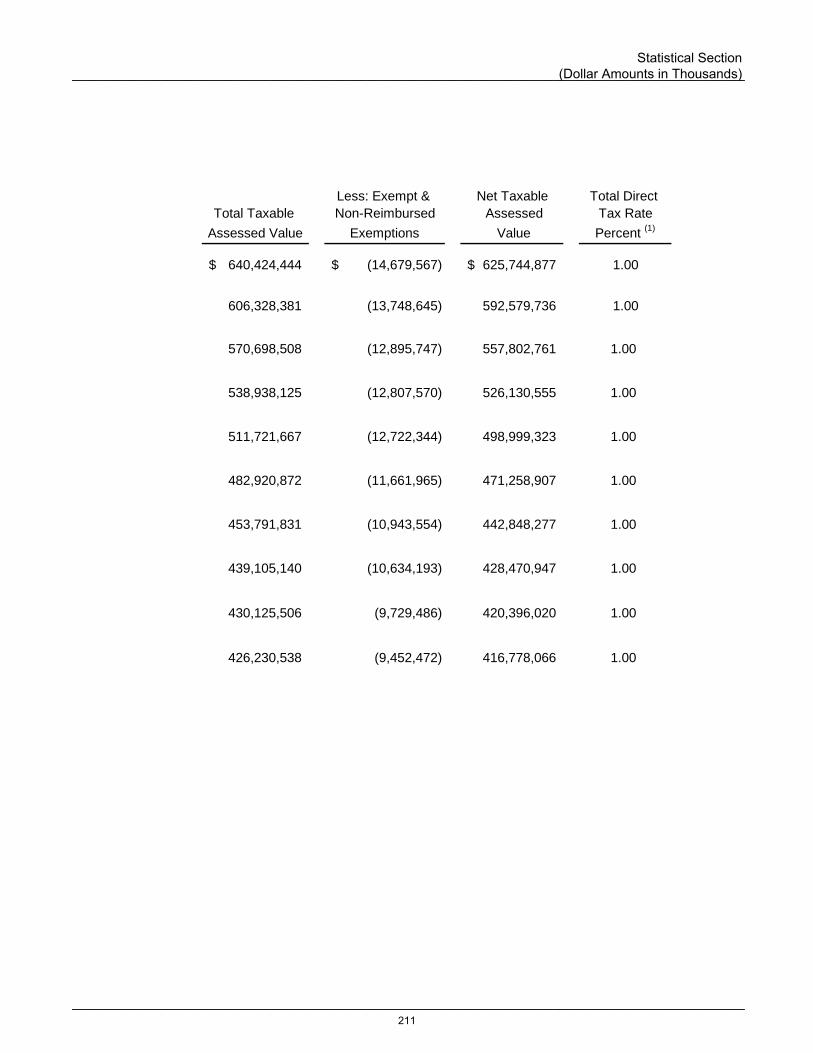
Less: Exempt & Net Taxable Total Direct
Total Taxable Non-Reimbursed Assessed Tax Rate
Assessed Value Exemptions Value Percent (1)
640,424,444$ (14,679,567)$ 625,744,877$ 1.00
606,328,381 (13,748,645) 592,579,736 1.00
570,698,508 (12,895,747) 557,802,761 1.00
538,938,125 (12,807,570) 526,130,555 1.00
511,721,667 (12,722,344) 498,999,323 1.00
482,920,872 (11,661,965) 471,258,907 1.00
453,791,831 (10,943,554) 442,848,277 1.00
439,105,140 (10,634,193) 428,470,947 1.00
430,125,506 (9,729,486) 420,396,020 1.00
426,230,538 (9,452,472) 416,778,066 1.00
___________________________________________________________________________________________
___________________________________________________________________________________________
Statistical Section (Dollar Amounts in Thousands)
211

Last Ten Fiscal Years
Direct Rate ⁽¹⁾
Total
Local Direct &
Fiscal County School Special Public Overlapping
Year General Districts Districts Cities Utility Rates
2019-20 1.00000 0.05358 0.01202 0.00678 0.00326 1.07564
2018-19 1.00000 0.05515 0.01216 0.00687 0.00317 1.07735
2017-18 1.00000 0.05366 0.01289 0.00713 0.00259 1.07627
2016-17 1.00000 0.04840 0.01316 0.00659 0.00270 1.07085
2015-16 1.00000 0.05101 0.01455 0.00670 0.00227 1.07453
2014-15 1.00000 0.04579 0.04438 0.00681 -- ₍₃₎ 1.09698
Notes: (1)
(2)
(3)
(4)
Source: Auditor-Controller, County of Orange
The schedule is presented to show information for 10 years. However, a full 10-year trend is not currently available; the County will be adding years in
the future.
Overlapping Rates ⁽²⁾
Direct and Overlapping Property Tax Rates
(Rate Per $1,000 of Assessed Value) (4)
Article XIIIA, added to the California Constitution by Proposition 13 in 1978, fixed the base valuation of property subject to taxes at the full cash value
appeared on the Assessor's 1975-76 assessment roll. The full cash value can be increased to reflect the annual inflation up to 2 percent, the current
market value at time of ownership change and the market value for new construction. Estimated actual value of taxable property cannot easily be
determined as the property in the County is not reassessed annually. Reassessment normally occurs when ownership changes.These overlapping rates are in addition to the County General rate, but only apply to taxpayers within the borders of the school districts, local special
districts, cities, and public utilities that lie within the County.
No rate was available for Public Utility in FY 2014-15.
___________________________________________________________________________________________
___________________________________________________________________________________________
County of Orange Comprehensive Annual Financial Report June 30, 2020 (Dollar Amounts in Thousands)
212

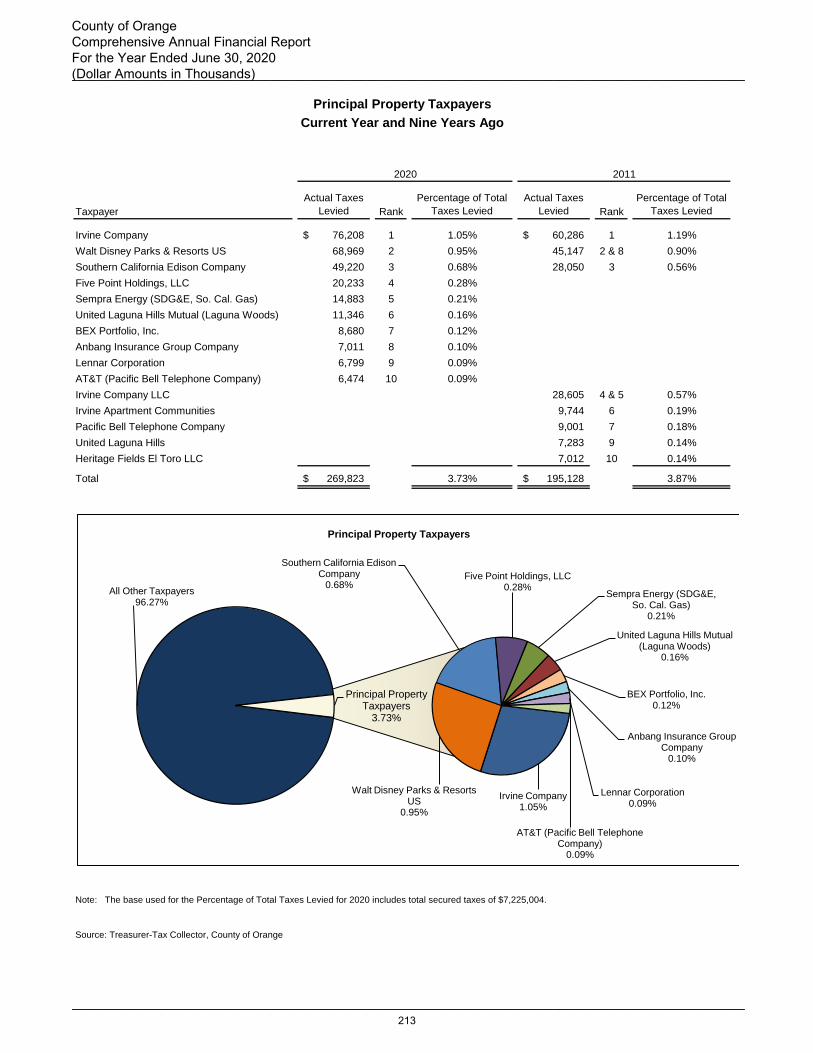
Taxpayer
Actual Taxes
Levied Rank
Percentage of Total
Taxes Levied
Actual Taxes
Levied Rank
Percentage of Total
Taxes Levied
Irvine Company 76,208$ 1 1.05% 60,286$ 1 1.19%
Walt Disney Parks & Resorts US 68,969 2 0.95% 45,147 2 & 8 0.90%
Southern California Edison Company 49,220 3 0.68% 28,050 3 0.56%
Five Point Holdings, LLC 20,233 4 0.28%
Sempra Energy (SDG&E, So. Cal. Gas) 14,883 5 0.21%
United Laguna Hills Mutual (Laguna Woods) 11,346 6 0.16%
BEX Portfolio, Inc. 8,680 7 0.12%
Anbang Insurance Group Company 7,011 8 0.10%
Lennar Corporation 6,799 9 0.09%
AT&T (Pacific Bell Telephone Company) 6,474 10 0.09%
Irvine Company LLC 28,605 4 & 5 0.57%
Irvine Apartment Communities 9,744 6 0.19%
Pacific Bell Telephone Company 9,001 7 0.18%
United Laguna Hills 7,283 9 0.14%
Heritage Fields El Toro LLC 7,012 10 0.14%
Total 269,823$ 3.73% 195,128$ 3.87%
Note: The base used for the Percentage of Total Taxes Levied for 2020 includes total secured taxes of $7,225,004.
Source: Treasurer-Tax Collector, County of Orange
Principal Property Taxpayers
Current Year and Nine Years Ago
2020 2011
All Other Taxpayers96.27%
Irvine Company1.05%
Walt Disney Parks & Resorts US
0.95%
Southern California Edison Company
0.68%Five Point Holdings, LLC
0.28%Sempra Energy (SDG&E,
So. Cal. Gas)0.21%
United Laguna Hills Mutual (Laguna Woods)
0.16%
BEX Portfolio, Inc.0.12%
Anbang Insurance Group Company
0.10%
Lennar Corporation0.09%
AT&T (Pacific Bell Telephone Company)
0.09%
Principal Property Taxpayers
3.73%
Principal Property Taxpayers
___________________________________________________________________________________________
___________________________________________________________________________________________
County of Orange Comprehensive Annual Financial Report For the Year Ended June 30, 2020 (Dollar Amounts in Thousands)
213

Taxes Levied
for the
Collections of
Delinquent
Taxes from
Fiscal Year (1)
Amount Percentage of Levy Prior Years Amount Percentage of Levy
2019-20 7,664,009$ 7,567,252$ 98.74% --$ 7,567,252$ 98.74%
2018-19 7,333,137 7,252,952 98.91% 42,520 7,295,472 99.49%
2017-18 6,925,546 6,855,493 98.99% 45,929 6,901,422 99.65%
2016-17 6,511,944 6,446,780 99.00% 48,232 6,495,012 99.74%
2015-16 6,183,862 6,119,771 98.96% 52,179 6,171,950 99.81%
2014-15 5,828,106 5,759,699 98.83% 59,019 5,818,718 99.84%
2013-14 5,509,379 5,444,912 98.83% 54,185 5,499,097 99.81%
2012-13 5,265,844 5,194,193 98.64% 59,586 5,253,779 99.77%
2011-12 5,079,589 5,002,490 98.48% 84,249 5,086,739 100.14%
2010-11 5,045,802 4,960,748 98.31% 35,665 4,996,413 99.02%
Notes: Total tax levy includes secured, supplemental, unsecured and former redevelopment agency increment, including penalties.
Total tax collections include penalties.
Total collections include collections of current year taxes and collections related to prior year levies.
The percentage of levy represents the ratio of total collections to the taxes levied for that fiscal year.
No amounts are shown because the property taxes levied will be collected in the following year.
Source: Auditor-Controller, County of Orange
Property Tax Levies and Collections
Last Ten Fiscal Years
Collections Within the Fiscal
Year of the Levy (2)
Total Collections for the Fiscal Year (3)
(3)
(4)
(1)
(2)
Fiscal Year
$0
$500,000
$1,000,000
$1,500,000
$2,000,000
$2,500,000
$3,000,000
$3,500,000
$4,000,000
$4,500,000
$5,000,000
$5,500,000
$6,000,000
$6,500,000
$7,000,000
$7,500,000
$8,000,000
2010-11 2011-12 2012-13 2013-14 2014-15 2015-16 2016-17 2017-18 2018-19 2019-20
Property Taxes Levied
(4)
___________________________________________________________________________________________
___________________________________________________________________________________________
Statistical Section (Dollar Amounts in Thousands)
214
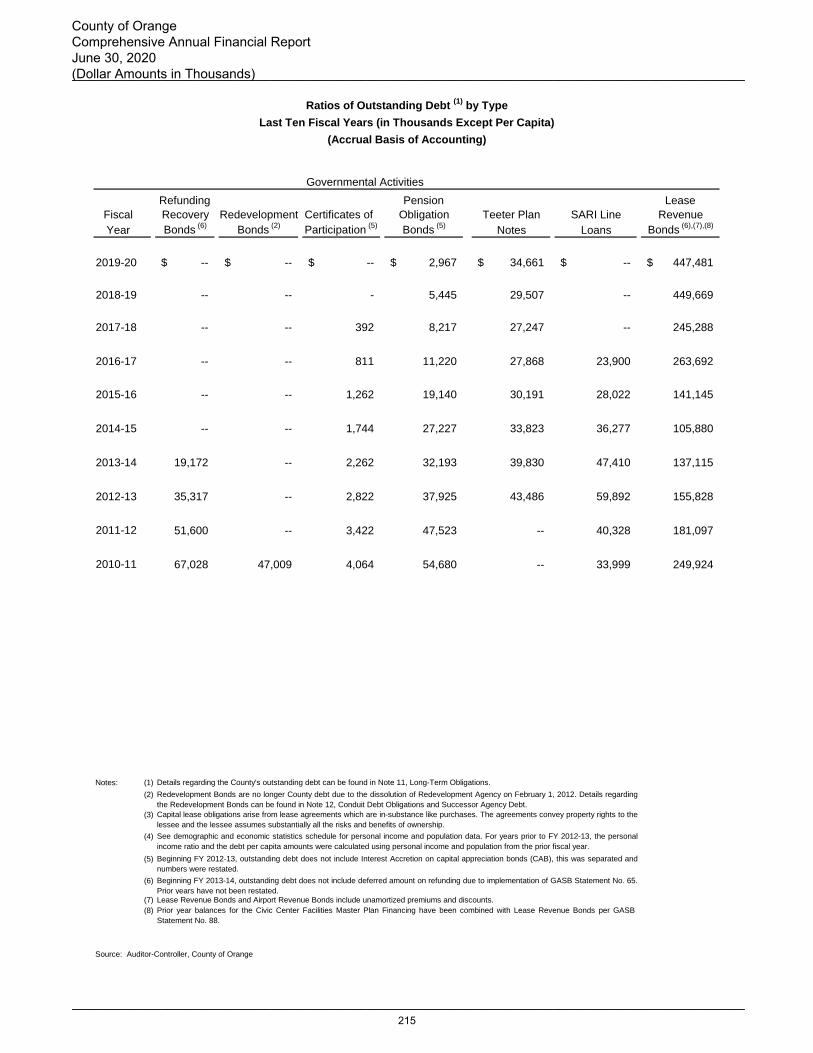
Refunding Pension Lease
Fiscal Recovery Redevelopment Certificates of Obligation Teeter Plan SARI Line Revenue
Year Bonds (6)
Bonds (2)
Participation (5)
Bonds (5)
Notes Loans Bonds (6),(7),(8)
2019-20 --$ --$ --$ 2,967$ 34,661$ --$ 447,481$
2018-19 -- -- - 5,445 29,507 -- 449,669
2017-18 -- -- 392 8,217 27,247 -- 245,288
2016-17 -- -- 811 11,220 27,868 23,900 263,692
2015-16 -- -- 1,262 19,140 30,191 28,022 141,145
2014-15 -- -- 1,744 27,227 33,823 36,277 105,880
2013-14 19,172 -- 2,262 32,193 39,830 47,410 137,115
2012-13 35,317 -- 2,822 37,925 43,486 59,892 155,828
2011-12 51,600 -- 3,422 47,523 -- 40,328 181,097
2010-11 67,028 47,009 4,064 54,680 -- 33,999 249,924
Notes:
Lease Revenue Bonds and Airport Revenue Bonds include unamortized premiums and discounts.
Source: Auditor-Controller, County of Orange
Ratios of Outstanding Debt (1)
by Type
Last Ten Fiscal Years (in Thousands Except Per Capita)
(Accrual Basis of Accounting)
Beginning FY 2013-14, outstanding debt does not include deferred amount on refunding due to implementation of GASB Statement No. 65.
Prior years have not been restated.
Beginning FY 2012-13, outstanding debt does not include Interest Accretion on capital appreciation bonds (CAB), this was separated and
numbers were restated.
Governmental Activities
(7)
(8)
(1)
(3)
(4)
(5)
(6)
(2)
Details regarding the County's outstanding debt can be found in Note 11, Long-Term Obligations.
Redevelopment Bonds are no longer County debt due to the dissolution of Redevelopment Agency on February 1, 2012. Details regarding
the Redevelopment Bonds can be found in Note 12, Conduit Debt Obligations and Successor Agency Debt.
Capital lease obligations arise from lease agreements which are in-substance like purchases. The agreements convey property rights to the
lessee and the lessee assumes substantially all the risks and benefits of ownership.
See demographic and economic statistics schedule for personal income and population data. For years prior to FY 2012-13, the personal
income ratio and the debt per capita amounts were calculated using personal income and population from the prior fiscal year.
Prior year balances for the Civic Center Facilities Master Plan Financing have been combined with Lease Revenue Bonds per GASB
Statement No. 88.
___________________________________________________________________________________________
___________________________________________________________________________________________
County of Orange Comprehensive Annual Financial Report June 30, 2020 (Dollar Amounts in Thousands)
215
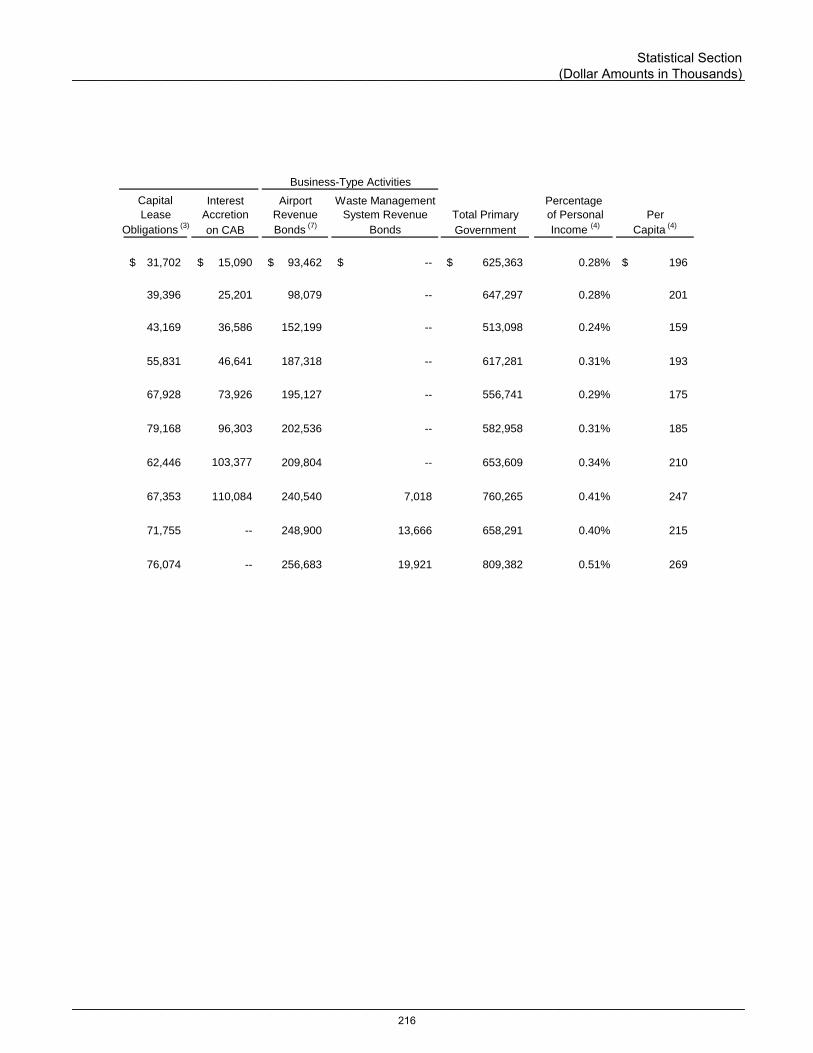
Capital Interest Airport Waste Management Percentage
Lease Accretion Revenue System Revenue Total Primary of Personal Per
Obligations (3)
on CAB Bonds (7)
Bonds Government Income (4)
Capita (4)
31,702$ 15,090$ 93,462$ --$ 625,363$ 0.28% 196$
39,396 25,201 98,079 -- 647,297 0.28% 201
43,169 36,586 152,199 -- 513,098 0.24% 159
55,831 46,641 187,318 -- 617,281 0.31% 193
67,928 73,926 195,127 -- 556,741 0.29% 175
79,168 96,303 202,536 -- 582,958 0.31% 185
62,446 103,377 209,804 -- 653,609 0.34% 210
67,353 110,084 240,540 7,018 760,265 0.41% 247
71,755 -- 248,900 13,666 658,291 0.40% 215
76,074 -- 256,683 19,921 809,382 0.51% 269
Business-Type Activities
___________________________________________________________________________________________
___________________________________________________________________________________________
Statistical Section (Dollar Amounts in Thousands)
216
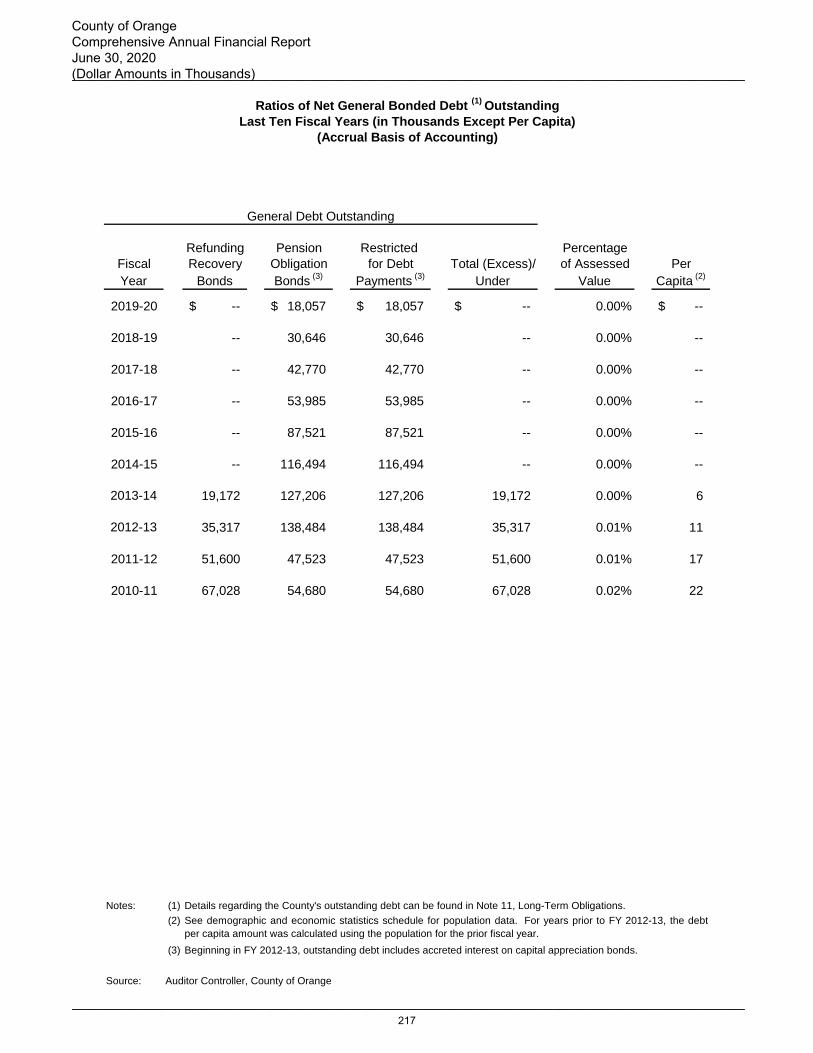
Refunding Pension Restricted Percentage
Fiscal Recovery Obligation for Debt Total (Excess)/ of Assessed Per
Year Bonds Bonds (3)
Payments (3)
Under Value Capita (2)
2019-20 --$ 18,057$ 18,057$ --$ 0.00% --$
2018-19 -- 30,646 30,646 -- 0.00% --
2017-18 -- 42,770 42,770 -- 0.00% --
2016-17 -- 53,985 53,985 -- 0.00% --
2015-16 -- 87,521 87,521 -- 0.00% --
2014-15 -- 116,494 116,494 -- 0.00% --
2013-14 19,172 127,206 127,206 19,172 0.00% 6
2012-13 35,317 138,484 138,484 35,317 0.01% 11
2011-12 51,600 47,523 47,523 51,600 0.01% 17
2010-11 67,028 54,680 54,680 67,028 0.02% 22
Notes: (1) Details regarding the County's outstanding debt can be found in Note 11, Long-Term Obligations.
(2)
(3) Beginning in FY 2012-13, outstanding debt includes accreted interest on capital appreciation bonds.
Source: Auditor Controller, County of Orange
General Debt Outstanding
Ratios of Net General Bonded Debt (1)
Outstanding
Last Ten Fiscal Years (in Thousands Except Per Capita)
See demographic and economic statistics schedule for population data. For years prior to FY 2012-13, the debt
per capita amount was calculated using the population for the prior fiscal year.
(Accrual Basis of Accounting)
___________________________________________________________________________________________
___________________________________________________________________________________________
County of Orange Comprehensive Annual Financial Report June 30, 2020 (Dollar Amounts in Thousands)
217

Fiscal
Year Assessed Value Legal Debt Limit
Total Net Debt
Applicable to
Limit
Legal Debt
Margin
Total Net Debt
Applicable to
the Limit as a
Percentage of
Debt Limit
2019-20 632,758,256$ 7,909,478$ --$ 7,909,478$ 0%
2018-19 598,901,016 7,486,263 -- 7,486,263 0%
2017-18 563,662,044 7,045,776 -- 7,045,776 0%
2016-17 531,052,158 6,638,152 -- 6,638,152 0%
2015-16 504,650,360 6,308,130 -- 6,308,130 0%
2014-15 476,303,290 5,953,791 -- 5,953,791 0%
2013-14 447,749,156 5,596,864 -- 5,596,864 0%
2012-13 432,902,274 5,411,278 -- 5,411,278 0%
2011-12 424,769,642 5,309,621 -- 5,309,621 0%
2010-11 420,751,575 5,259,395 -- 5,259,395 0%
--
Note:
(1) Assessed Value includes the State assessed properties.
Source: Auditor-Controller, County of Orange
Legal Debt Margin as a Percentage of Debt Limit
Last Ten Fiscal Years
(2) The amount of the general obligation bonded indebtedness the County can incur is limited by law to 1.25 percent of the equalized assessment
property tax roll. In order for the County to issue general obligation bonds secured by ad valorem taxes on real property, California Constitution Article
XIIIA, section 1 requires the approval of 2/3 of the voting on the proposition.
$0
$1,000,000
$2,000,000
$3,000,000
$4,000,000
$5,000,000
$6,000,000
$7,000,000
$8,000,000
2010-11 2011-12 2012-13 2013-14 2014-15 2015-16 2016-17 2017-18 2018-19 2019-20
Legal Debt Margin
(2)(1)
___________________________________________________________________________________________
___________________________________________________________________________________________
Statistical Section (Dollar Amounts in Thousands)
218

Funding Source: Interest Earnings, Rents and Concessions, and Transfers Funding Source: Interest Earnings and Transfers
Fiscal
Year
Gross
Revenue
Operating
Expenses
Net Available
Revenue Principal Interest Coverage
Fiscal
Year
Gross
Revenue
Operating
Expenses
Net
Available
Revenue Principal Interest Coverage
2019-20 4,491$ 64$ 4,427$ 1,975$ 2,511$ 0.99 2019-20 --$ --$ --$ --$ --$ --
2018-19 6,076 -- 6,076 6,930 2,839 0.62 2018-19 53 -- 53 392 2,209 0.02
2017-18 10,489 -- 10,489 7,165 3,152 1.02 2017-18 2,423 -- 2,423 419 2,179 0.93
2016-17 10,465 -- 10,465 7,335 2,974 1.02 2016-17 2,405 8 2,397 451 2,157 0.92
2015-16 5,828 271 5,557 4,920 906 0.95 2015-16 2,470 -- 2,470 482 2,121 0.95
2014-15 5,830 -- 5,830 4,780 1,049 1.00 2014-15 2,475 -- 2,475 518 2,090 0.95
2013-14 5,825 -- 5,825 4,680 1,143 1.00 2013-14 2,459 -- 2,459 560 2,045 0.94
2012-13 5,841 -- 5,841 4,520 1,307 1.00 2012-13 2,403 44 2,359 600 2,005 0.91
2011-12 -- 262 (262) -- -- -- 2011-12 2,770 -- 2,770 642 1,958 1.07
2010-11 -- -- -- -- -- -- 2010-11 2,525 -- 2,525 694 1,906 0.97
Funding Source: Interest Earnings, Rents and Concessions, and Transfers Funding Source: Delinquent Property Taxes Collected
Fiscal
Year
Gross
Revenue
Operating
Expenses
Net Available
Revenue Principal Interest Coverage
Fiscal
Year
Gross
Revenue
Operating
Expenses
Net
Available
Revenue Principal Interest Coverage
2019-20 --$ --$ --$ --$ --$ -- 2019-20 8,793$ 275$ 8,518$ 78,554$ 1,263$ 0.11
2018-19 -- -- -- -- -- -- 2018-19 9,701 239 9,462 58,847 1,379 0.16
2017-18 2,466 -- 2,466 9,590 335 0.25 2017-18 11,210 220 10,990 59,110 1,105 0.18
2016-17 10,189 -- 10,189 41,235 1,587 0.24 2016-17 26,232 154 26,078 33,859 600 0.77
2015-16 44,418 -- 44,418 25,420 3,235 1.55 2015-16 316 210 106 74,561 347 0.00
2014-15 29,928 -- 29,928 24,235 4,455 1.04 2014-15 174 2,954 (2,780) 37,548 352 (0.07)
2013-14 29,949 -- 29,949 23,115 5,605 1.04 2013-14 11,147 251 10,896 43,295 413 0.25
2012-13 29,952 -- 29,952 22,160 6,638 1.04 2012-13 15,706 1,032 14,674 14,449 327 0.99
2011-12 35,697 -- 35,697 61,630 10,837 0.49 2011-12 -- -- -- -- -- --
2010-11 74,725 -- 74,725 58,990 13,643 1.03 2010-11 -- -- -- -- -- --
Funding Source: Rents and Concessions, Other Charges for Services, Misc Revenue,
Interest Earnings, and Available Passenger Facility Charge Revenue
Fiscal
Year
Gross
Revenue
Operating
Expenses
Net Available
Revenue Principal Interest Coverage
2019-20 136,374$ 92,346$ 44,028$ 1,950$ 2,632$ 9.61
2018-19 154,833 95,862 58,971 22,170 7,924 1.96
2017-18 145,649 90,889 54,760 35,090 8,845 1.25
2016-17 143,707 89,055 54,652 7,530 9,999 3.12
2015-16 143,661 82,833 60,828 7,205 10,338 3.47
2014-15 135,491 82,558 52,933 6,995 10,603 3.01
2013-14 131,285 84,708 46,577 30,473 11,395 1.11
2012-13 126,966 79,739 47,227 9,250 12,250 2.20
2011-12 124,403 77,628 46,775 7,851 12,592 2.29
2010-11 120,088 70,521 49,567 7,460 12,906 2.43
Notes:
Source:
Debt Service
(3) For FY 2014-15, there is a deficit balance for Net Available Revenue due to the change in Teeter Plan Reserve methodology.
Auditor-Controller, County of Orange
(2) Teeter Plan Notes were converted from short-term commercial paper to long-term note in FY 2012-13, therefore, only long-term note information is presented.
(1) Details regarding the County's outstanding debt can be found in the notes to the financial statements. Operating expenses do not include interest, depreciation or
amortization expenses.
Pledged Revenue Coverage
Last Ten Fiscal Years
South Orange County Public Financing Authority Orange County Public Facilities Corporation Bonds
Debt ServiceDebt Service
Airport Revenue Bonds
Debt Service Debt Service
Orange County Public Financing Authority Teeter Plan Notes
(1)
(2)
(3)
___________________________________________________________________________________________
___________________________________________________________________________________________
County of Orange Comprehensive Annual Financial Report For the Year Ended June 30, 2020 (Dollar Amounts in Thousands)
219

Year Population (1)
Personal Income (2)
Per Capita Personal
Income
(Absolute Dollars) (2)
Median
Age (3)
Public School
Enrollment
(In Thousands) (4)
Unemployment
Rate (5)
2020 3,194,332 226,531,000$ 70,917$ 38.6 473,612 12.3%
2019 3,222,498 230,180,000 71,429 37.8 478,823 3.0%
2018 3,221,103 215,479,000 66,896 37.5 485,835 3.1%
2017 3,194,024 199,492,000 62,458 37.3 490,430 4.2%
2016 3,183,011 190,978,000 59,999 37.1 493,030 4.4%
2015 3,147,655 185,500,000 58,933 36.7 497,116 4.0%
2014 3,113,991 177,412,900 56,973 36.4 500,487 5.4%
2013 3,081,804 168,966,400 54,827 36.2 501,801 6.7%
2012 3,055,792 166,345,500 54,436 36.7 502,195 8.1%
2011 3,010,232 159,007,100 52,822 37.3 502,895 8.6%
Sources:
(1) California Department of Finance, Demographic Research Unit, http://www.dof.ca.gov
(2) Chapman University Economic & Business Review.
(3) U.S. Census Bureau, American Community Survey, http://www.census.gov
(4) California Department of Education, http://www.cde.ca.gov
(5) State of California, Employment Development Department, http://www.edd.ca.gov/
Demographic and Economic Statistics
Last Ten Calendar Years
0
500,000
1,000,000
1,500,000
2,000,000
2,500,000
3,000,000
3,500,000
2011 2012 2013 2014 2015 2016 2017 2018 2019 2020
Population
___________________________________________________________________________________________
___________________________________________________________________________________________
Statistical Section (Dollar Amounts in Thousands)
220

Employer
Number of
Employees Rank
Percentage of
Total County
Employment
Walt Disney Co. 32,000 1 2.04%
University of California, Irvine 24,174 2 1.54%
County of Orange 18,435 3 1.17%
St. Joseph Health System 14,000 4 0.89%
Kaiser Permanente 8,200 5 0.52%
Albertsons 7,535 6 0.48%
Boeing Co. 6,500 7 0.41%
Hoag Memorial Hospital 6,500 8 0.41%
Walmart Inc. 6,200 9 0.39%
Target Corporation 6,000 10 0.38%
Employer
Number of
Employees Rank
Percentage of
Total County
Employment
Walt Disney Co. 22,000 1 1.37%
University of California, Irvine 21,291 2 1.33%
County of Orange 17,257 3 1.08%
St. Joseph Health System 12,048 4 0.75%
Boeing Co. 7,700 5 0.48%
Bank of America Corporation 6,300 6 0.39%
Yum Brands Inc. 6,300 7 0.39%
Kaiser Permanente 5,968 8 0.37%
Target Corporation 5,527 9 0.34%
Cedar Fair LP 5,200 10 0.32%
Source: Orange County Business Journal Book of Lists - County of Orange
http://www.labormarketinfo.edd.ca.gov
2011
Principal Employers
Current Year and Nine Years Ago
2020
___________________________________________________________________________________________
___________________________________________________________________________________________
County of Orange Comprehensive Annual Financial Report For the Year Ended June 30, 2020
221
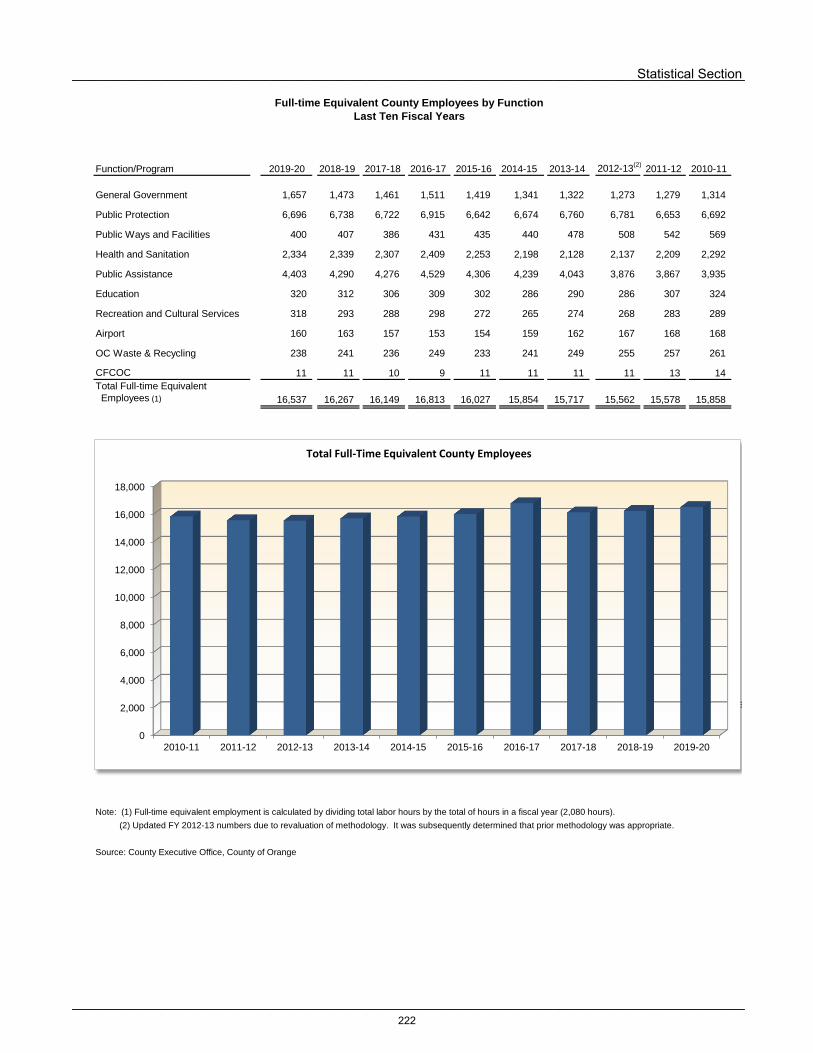
Function/Program 2019-20 2018-19 2017-18 2016-17 2015-16 2014-15 2013-14 2012-13(2)
2011-12 2010-11
General Government 1,657 1,473 1,461 1,511 1,419 1,341 1,322 1,273 1,279 1,314
Public Protection 6,696 6,738 6,722 6,915 6,642 6,674 6,760 6,781 6,653 6,692
Public Ways and Facilities 400 407 386 431 435 440 478 508 542 569
Health and Sanitation 2,334 2,339 2,307 2,409 2,253 2,198 2,128 2,137 2,209 2,292
Public Assistance 4,403 4,290 4,276 4,529 4,306 4,239 4,043 3,876 3,867 3,935
Education 320 312 306 309 302 286 290 286 307 324
Recreation and Cultural Services 318 293 288 298 272 265 274 268 283 289
Airport 160 163 157 153 154 159 162 167 168 168
OC Waste & Recycling 238 241 236 249 233 241 249 255 257 261
CFCOC 11 11 10 9 11 11 11 11 13 14
Total Full-time Equivalent
Employees 16,537 16,267 16,149 16,813 16,027 15,854 15,717 15,562 15,578 15,858
Secured Tax Bill Subscribers Secured Tax Bill Subscribers
Note: (1) Full-time equivalent employment is calculated by dividing total labor hours by the total of hours in a fiscal year (2,080 hours).
(2) Updated FY 2012-13 numbers due to revaluation of methodology. It was subsequently determined that prior methodology was appropriate.
Source: County Executive Office, County of Orange
Full-time Equivalent County Employees by Function
Last Ten Fiscal Years
0
2,000
4,000
6,000
8,000
10,000
12,000
14,000
16,000
18,000
2010-11 2011-12 2012-13 2013-14 2014-15 2015-16 2016-17 2017-18 2018-19 2019-20
Total Full-Time Equivalent County Employees
(1)
___________________________________________________________________________________________
___________________________________________________________________________________________
Statistical Section
222
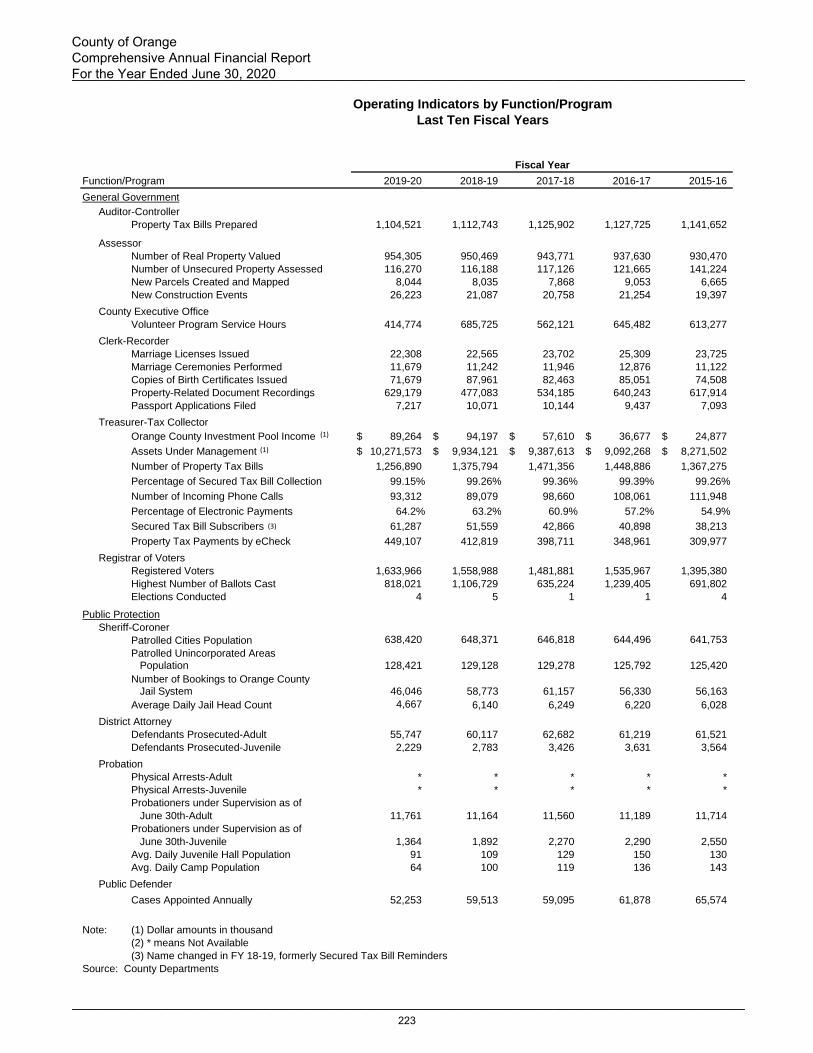
Function/Program 2019-20 2018-19 2017-18 2016-17 2015-16
General Government
Auditor-Controller
Property Tax Bills Prepared 1,104,521 1,112,743 1,125,902 1,127,725 1,141,652
Assessor
Number of Real Property Valued 954,305 950,469 943,771 937,630 930,470
Number of Unsecured Property Assessed 116,270 116,188 117,126 121,665 141,224
New Parcels Created and Mapped 8,044 8,035 7,868 9,053 6,665
New Construction Events 26,223 21,087 20,758 21,254 19,397
County Executive Office
Volunteer Program Service Hours 414,774 685,725 562,121 645,482 613,277
Clerk-Recorder
Marriage Licenses Issued 22,308 22,565 23,702 25,309 23,725
Marriage Ceremonies Performed 11,679 11,242 11,946 12,876 11,122
Copies of Birth Certificates Issued 71,679 87,961 82,463 85,051 74,508
Property-Related Document Recordings 629,179 477,083 534,185 640,243 617,914
Passport Applications Filed 7,217 10,071 10,144 9,437 7,093
Treasurer-Tax Collector
Orange County Investment Pool Income 89,264$ 94,197$ 57,610$ 36,677$ 24,877$
Assets Under Management 10,271,573$ 9,934,121$ 9,387,613$ 9,092,268$ 8,271,502$
Number of Property Tax Bills 1,256,890 1,375,794 1,471,356 1,448,886 1,367,275
Percentage of Secured Tax Bill Collection 99.15% 99.26% 99.36% 99.39% 99.26%
Number of Incoming Phone Calls 93,312 89,079 98,660 108,061 111,948
Percentage of Electronic Payments 64.2% 63.2% 60.9% 57.2% 54.9%
Secured Tax Bill Subscribers 61,287 51,559 42,866 40,898 38,213
Property Tax Payments by eCheck 449,107 412,819 398,711 348,961 309,977
Registrar of Voters
Registered Voters 1,633,966 1,558,988 1,481,881 1,535,967 1,395,380
Highest Number of Ballots Cast 818,021 1,106,729 635,224 1,239,405 691,802
Elections Conducted 4 5 1 1 4
Public Protection
Sheriff-Coroner
638,420 648,371 646,818 644,496 641,753
Population 128,421 129,128 129,278 125,792 125,420
Jail System 46,046 58,773 61,157 56,330 56,163
Average Daily Jail Head Count 4,667 6,140 6,249 6,220 6,028
District Attorney
Defendants Prosecuted-Adult 55,747 60,117 62,682 61,219 61,521
Defendants Prosecuted-Juvenile 2,229 2,783 3,426 3,631 3,564
Probation
Physical Arrests-Adult * * * * *
Physical Arrests-Juvenile * * * * *
Probationers under Supervision as of
June 30th-Adult 11,761 11,164 11,560 11,189 11,714
Probationers under Supervision as of
June 30th-Juvenile 1,364 1,892 2,270 2,290 2,550
Avg. Daily Juvenile Hall Population 91 109 129 150 130
Avg. Daily Camp Population 64 100 119 136 143
Public Defender
Cases Appointed Annually 52,253 59,513 59,095 61,878 65,574
Note: (1) Dollar amounts in thousand
(2) * means Not Available
(3) Name changed in FY 18-19, formerly Secured Tax Bill Reminders
Source: County Departments
Patrolled Cities Population
Patrolled Unincorporated Areas
Fiscal Year
Operating Indicators by Function/Program
Last Ten Fiscal Years
Number of Bookings to Orange County
(1)
(1)
(3)
___________________________________________________________________________________________
___________________________________________________________________________________________
County of Orange Comprehensive Annual Financial Report For the Year Ended June 30, 2020
223
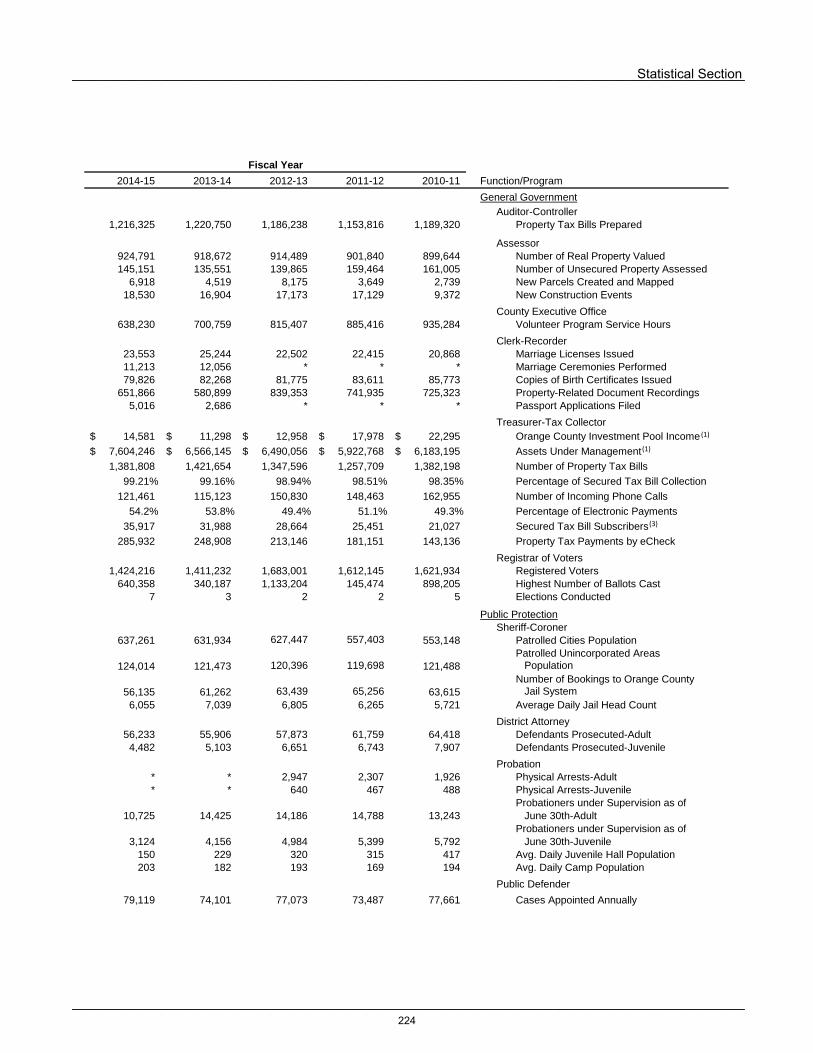
2014-15 2013-14 2012-13 2011-12 2010-11 Function/Program
General Government
Auditor-Controller
1,216,325 1,220,750 1,186,238 1,153,816 1,189,320 Property Tax Bills Prepared
Assessor
924,791 918,672 914,489 901,840 899,644 Number of Real Property Valued
145,151 135,551 139,865 159,464 161,005 Number of Unsecured Property Assessed
6,918 4,519 8,175 3,649 2,739 New Parcels Created and Mapped
18,530 16,904 17,173 17,129 9,372 New Construction Events
County Executive Office
638,230 700,759 815,407 885,416 935,284 Volunteer Program Service Hours
Clerk-Recorder
23,553 25,244 22,502 22,415 20,868 Marriage Licenses Issued
11,213 12,056 * * * Marriage Ceremonies Performed
79,826 82,268 81,775 83,611 85,773 Copies of Birth Certificates Issued
651,866 580,899 839,353 741,935 725,323 Property-Related Document Recordings
5,016 2,686 * * * Passport Applications Filed
Treasurer-Tax Collector
14,581$ 11,298$ 12,958$ 17,978$ 22,295$ Orange County Investment Pool Income
7,604,246$ 6,566,145$ 6,490,056$ 5,922,768$ 6,183,195$ Assets Under Management
1,381,808 1,421,654 1,347,596 1,257,709 1,382,198 Number of Property Tax Bills
99.21% 99.16% 98.94% 98.51% 98.35% Percentage of Secured Tax Bill Collection
121,461 115,123 150,830 148,463 162,955 Number of Incoming Phone Calls
54.2% 53.8% 49.4% 51.1% 49.3% Percentage of Electronic Payments
35,917 31,988 28,664 25,451 21,027 Secured Tax Bill Subscribers
285,932 248,908 213,146 181,151 143,136 Property Tax Payments by eCheck
Registrar of Voters
1,424,216 1,411,232 1,683,001 1,612,145 1,621,934 Registered Voters
640,358 340,187 1,133,204 145,474 898,205 Highest Number of Ballots Cast
7 3 2 2 5 Elections Conducted
Public Protection
Sheriff-Coroner
637,261 631,934 627,447 557,403 553,148
124,014 121,473 120,396 119,698 121,488 Population
56,135 61,262 63,439 65,256 63,615 Jail System
6,055 7,039 6,805 6,265 5,721 Average Daily Jail Head Count
District Attorney
56,233 55,906 57,873 61,759 64,418 Defendants Prosecuted-Adult
4,482 5,103 6,651 6,743 7,907 Defendants Prosecuted-Juvenile
Probation
* * 2,947 2,307 1,926 Physical Arrests-Adult
* * 640 467 488 Physical Arrests-Juvenile
Probationers under Supervision as of
10,725 14,425 14,186 14,788 13,243 June 30th-Adult
Probationers under Supervision as of
3,124 4,156 4,984 5,399 5,792 June 30th-Juvenile
150 229 320 315 417 Avg. Daily Juvenile Hall Population
203 182 193 169 194 Avg. Daily Camp Population
Public Defender
79,119 74,101 77,073 73,487 77,661 Cases Appointed Annually
Number of Bookings to Orange County
Patrolled Cities Population
Patrolled Unincorporated Areas
Fiscal Year
Operating Indicators by Function/Program
Last Ten Fiscal Years
(1)
(1)
(3)
___________________________________________________________________________________________
___________________________________________________________________________________________
Statistical Section
224

Function/Program 2019-20 2018-19 2017-18 2016-17 2015-16
Public Ways and Facilities
OC Public Works
Building and Home Inspections 42,365 60,753 42,590 39,056 40,662
Health and Sanitation
OC Community Resources
Animal Licenses 136,985 147,874 149,342 171,237 192,470
Health Care Agency
911 Emergency Medical Services Responses 242,201 234,589 234,459 204,683 193,538
Retail Food Facility Inspections Conducted 28,146 35,406 30,893 32,305 26,195
Hazardous Waste Inspections Conducted 7,433 7,735 6,003 7,271 8,328
Number of Home Visits by Public Health Nurses 10,777 20,794 20,156 32,108 29,219
Number of Low Income Children Dental Health
Services 199 200 360 311 496
Number of Ocean Water Days of Closure
(In Beach-Miles) 64 10 10 17 22
Public Assistance
OC Community Resources
Adult Day Care Hours of Service 45,252 52,819 65,900 47,567 49,971
Elderly Nutrition Program Meals Delivered 1,174,703 1,353,713 1,323,802 1,417,361 1,374,275
One-Way Transportation Trips Provided to Seniors 139,891 183,429 185,258 190,534 198,851
Veterans Served-Veterans/Dependents 27,419 23,555 24,063 9,091 *
Veterans Served-OC4Vets 723 910 673 555 *
Social Services Agency
Average Monthly Medi-Cal Recipients 774,729 782,990 806,716 817,408 810,388
Average Monthly Child Abuse Hotline Calls 3,005 4,572 4,189 4,076 4,259
Average Monthly CalFresh (formerly Food
Stamp) Recipients 214,668 206,789 233,038 250,772 263,556
Average Monthly In-Home Supportive Services 28,988 27,892 26,369 24,427 22,635
Average Persons Receiving Cash Assistance 35,098 35,803 41,622 46,369 52,081
Average Children in Foster Care/Relative Care 2,333 1,977 1,917 1,886 1,791
Average Elder and Adult Abuse Unduplicated
Reports Received 1,153 1,175 1,091 995 942
Education
OC Community Resources
Total Volumes Borrowed at Library Branches 7,016,302 7,746,484 7,041,985 6,864,635 6,634,747
Recreation and Cultural Services
OC Community Resources
Exotic Invasive Plant Removal (acres) 1,791 3,225 2,285 2,940 2,782
Native Vegetation Restoration (acres) 358 411 414 262 293
Slip and Dry Storage Tenants 603 3,150 438 438 2,903
Boat Launches 21,890 15,521 16,487 16,303 17,695
Sailing and Event Center Participants 78,340 100,952 101,945 80,752 50,000
Ocean Institute Students/Visitors 39,561 44,404 90,948 127,361 192,384
Hotel Guests 49,165 58,998 59,319 39,140 43,515
Catalina Express Passengers 109,030 124,471 129,239 128,000 25,711
Special Events at the Harbor 4 5 6 6 8
Airport
Passengers 7,562,040 10,718,001 10,670,156 10,373,714 10,361,436
Air Cargo Tonnage 17,193 19,098 19,577 17,813 18,568
Takeoffs & Landings 260,644 314,000 302,483 285,704 276,817
OC Waste & Recycling
Solid Waste Tonnage 5,174,096 5,148,761 4,980,101 4,810,116 4,772,722
Gallons of Leachate and Impacted
Ground Water Collected 7,573,496 8,062,718 5,576,351 5,599,757 3,542,736 `
Note: * means Not Available
Source: County Departments
Fiscal Year
Operating Indicators by Function/Program
Last Ten Fiscal Years (Continued)
___________________________________________________________________________________________
___________________________________________________________________________________________
County of Orange Comprehensive Annual Financial Report For the Year Ended June 30, 2020
225
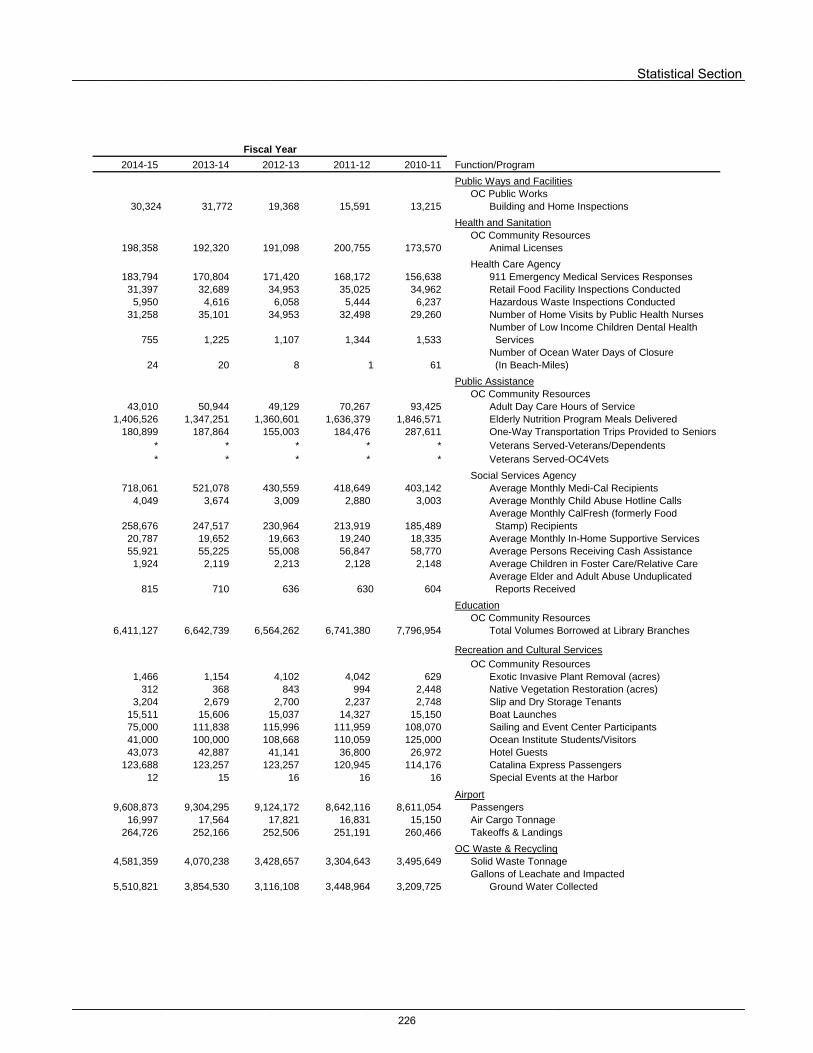
2014-15 2013-14 2012-13 2011-12 2010-11 Function/Program
Public Ways and Facilities
OC Public Works
30,324 31,772 19,368 15,591 13,215 Building and Home Inspections
Health and Sanitation
OC Community Resources
198,358 192,320 191,098 200,755 173,570 Animal Licenses
Health Care Agency
183,794 170,804 171,420 168,172 156,638 911 Emergency Medical Services Responses
31,397 32,689 34,953 35,025 34,962 Retail Food Facility Inspections Conducted
5,950 4,616 6,058 5,444 6,237 Hazardous Waste Inspections Conducted
31,258 35,101 34,953 32,498 29,260 Number of Home Visits by Public Health Nurses
Number of Low Income Children Dental Health
755 1,225 1,107 1,344 1,533 Services
Number of Ocean Water Days of Closure
24 20 8 1 61 (In Beach-Miles)
Public Assistance
OC Community Resources
43,010 50,944 49,129 70,267 93,425 Adult Day Care Hours of Service
1,406,526 1,347,251 1,360,601 1,636,379 1,846,571 Elderly Nutrition Program Meals Delivered
180,899 187,864 155,003 184,476 287,611 One-Way Transportation Trips Provided to Seniors
* * * * * Veterans Served-Veterans/Dependents
* * * * * Veterans Served-OC4Vets
Social Services Agency
718,061 521,078 430,559 418,649 403,142 Average Monthly Medi-Cal Recipients
4,049 3,674 3,009 2,880 3,003 Average Monthly Child Abuse Hotline Calls
Average Monthly CalFresh (formerly Food
258,676 247,517 230,964 213,919 185,489 Stamp) Recipients
20,787 19,652 19,663 19,240 18,335 Average Monthly In-Home Supportive Services
55,921 55,225 55,008 56,847 58,770 Average Persons Receiving Cash Assistance
1,924 2,119 2,213 2,128 2,148 Average Children in Foster Care/Relative Care
Average Elder and Adult Abuse Unduplicated
815 710 636 630 604 Reports Received
Education
OC Community Resources
6,411,127 6,642,739 6,564,262 6,741,380 7,796,954 Total Volumes Borrowed at Library Branches
Recreation and Cultural Services
OC Community Resources
1,466 1,154 4,102 4,042 629 Exotic Invasive Plant Removal (acres)
312 368 843 994 2,448 Native Vegetation Restoration (acres)
3,204 2,679 2,700 2,237 2,748 Slip and Dry Storage Tenants
15,511 15,606 15,037 14,327 15,150 Boat Launches
75,000 111,838 115,996 111,959 108,070 Sailing and Event Center Participants
41,000 100,000 108,668 110,059 125,000 Ocean Institute Students/Visitors
43,073 42,887 41,141 36,800 26,972 Hotel Guests
123,688 123,257 123,257 120,945 114,176 Catalina Express Passengers
12 15 16 16 16 Special Events at the Harbor
Airport
9,608,873 9,304,295 9,124,172 8,642,116 8,611,054 Passengers
16,997 17,564 17,821 16,831 15,150 Air Cargo Tonnage
264,726 252,166 252,506 251,191 260,466 Takeoffs & Landings
OC Waste & Recycling
4,581,359 4,070,238 3,428,657 3,304,643 3,495,649 Solid Waste Tonnage
Gallons of Leachate and Impacted
5,510,821 3,854,530 3,116,108 3,448,964 3,209,725 Ground Water Collected`
Fiscal Year
Operating Indicators by Function/Program
Last Ten Fiscal Years (Continued)
___________________________________________________________________________________________
___________________________________________________________________________________________
Statistical Section
226

Function/Program 2019-20 2018-19 2017-18 2016-17 2015-16
General Government
Auditor-Controller
AC Administration Building 1 1 1 1 1
Hall of Finance and Records - 1 1 1 1
County Executive Office
Hall of Administration 1 1 1 1 1
Clerk-Recorder
OC Archives Building 1 1 1 1 1
Registrar of Voters
Trailers 2 2 2 1 1
Vehicles/Trucks 3 3 3 4 4
Public Protection
Sheriff-Coroner
Crime/Forensic Lab 1 1 1 1 1
Jail Facilities 3 3 3 3 3
Vehicles 944 939 938 948 917
Buses 13 13 13 12 11
Helicopters 5 5 5 5 4
Boats 10 10 10 10 10
Robot Andros 3 3 3 3 3
Haz-mat Vehicles 4 4 4 4 4
K-9 units 31 35 34 26 28
District Attorney
Justice Center Offices 5 5 5 5 5
Probation Department
Juvenile Institutions 3 4 4 4 4
Vehicles/Trucks 139 171 158 159 155
Equipment 15 16 15 13 12
Public Ways and Facilities
OC Public Works
County Administration South Bldg 16 1 * * * *
Data Center 1 1 1 1 1
Alternate Fuel Vehicles 49 41 42 46 50
Vehicles/Trucks 135 318 314 316 268
Watersheds 23 22 22 21 19
Dams 5 4 4 4 3
Dump Trucks 2 20 17 16 19
Tractors 27 36 50 50 50 Trailers 44 37 42 40 46 Street Miles 346 320 345 330 330
Note: (1) Presentation changed in FY 19-20 to summarize by function
(2) * means Not Available
(3) Building was moved from OC Community Resources to the Auditor-Controller in FY 19-20
Source: County Departments
Fiscal Year
Capital Asset Statistics by Function
Last Ten Fiscal Years
(1)
(3)
___________________________________________________________________________________________
___________________________________________________________________________________________
County of Orange Comprehensive Annual Financial Report For the Year Ended June 30, 2020
227

2014-15 2013-14 2012-13 2011-12 2010-11 Function/Program
General Government
Auditor-Controller
1 1 1 1 1 AC Administration Building
1 1 1 1 1 Hall of Finance and Records
County Executive Office
1 1 1 1 1 Hall of Administration
Clerk-Recorder
1 1 1 1 1 OC Archives Building
Registrar of Voters
1 1 1 1 1 Trailers
4 3 3 3 3 Vehicles/Trucks
Public Protection
Sheriff-Coroner
1 1 1 1 1 Crime/Forensic Lab
3 3 3 3 3 Jail Facilities
916 911 918 838 844 Vehicles
11 11 11 11 13 Buses
3 3 2 2 2 Helicopters
10 10 9 9 5 Boats
3 3 3 3 3 Robot Andros
4 4 4 4 4 Haz-mat Vehicles
22 18 13 10 14 K-9 units
District Attorney
5 5 5 5 5 Justice Center Offices
Probation Department
4 4 4 5 5 Juvenile Institutions
159 156 * * * Vehicles/Trucks
16 12 * * * Equipment
Public Ways and Facilities
OC Public Works
* * * * * County Administration South Bldg 16
1 1 1 1 1 Data Center
51 60 60 59 59 Alternate Fuel Vehicles
355 375 358 361 362 Vehicles/Trucks
13 13 13 13 19 Watersheds
3 3 3 3 3 Dams
18 21 9 16 22 Dump Trucks
32 28 11 8 14 Tractors
54 35 18 17 24 Trailers
320 320 319 320 320 Street Miles
Fiscal Year
Capital Asset Statistics by Function
Last Ten Fiscal Years
(1)
(3)
___________________________________________________________________________________________
___________________________________________________________________________________________
Statistical Section
228

Function/Program 2019-20 2018-19 2017-18 2016-17 2015-16
Health and Sanitation
Health Care Agency
Clinics 9 4 4 4 4
Laboratories 2 2 2 2 2
Trailers 25 9 10 9 12
Vehicles/Trucks 39 35 33 30 24
OC Community Resources
Animal Care Center 1 1 1 1 1
Trailers 6 3 2 3 3
Public Assistance
Social Service Agency
Vehicles 1 1 2 4 5
Office Locations 19 19 20 20 20
Education
OC Community Resources
Library Branches 32 32 33 33 33 Library Headquarters * * * * *
Recreation and Cultural Services
OC Community Resources
Park Land (acres) 62,617 62,617 62,900 62,900 62,900
Recreational Trails (in miles) 295 295 295 295 295
Zoo 1 1 1 1 1
Urban Regional Parks 15 15 15 15 15
Wilderness Parks 5 5 5 5 5
Nature Preserves 4 4 4 4 4
Harbors 3 3 3 3 3
Beaches 11 11 11 11 11
Historical Sites 7 7 7 7 7
Boats 9 7 9 10 8
Tractors 25 22 26 26 25
Trailers 45 42 35 33 31
Vehicles/Trucks 261 239 207 199 204
Harbor 1 1 1 1 1 Marinas 1 1 2 2 2 Public Parking Areas 9 9 9 9 9 Beaches 1 1 1 1 1 Access Points to Ocean 6 6 6 6 6 Hotel 1 1 1 1 1 Ocean Education Center 1 1 1 1 1 Sailing and Events Center 1 1 1 1 1 Shops 17 20 24 24 24 Restaurants 16 14 16 16 16 Fuel Dock 1 1 1 1 1 Shipyard 1 1 1 1 1 Boater Service Buildings 15 15 15 15 15 Parcel 11 (Yacht Building Company) 1 1 1 1 1 Parcel 23 (Yacht Club) 1 1 1 1 1
Note: (1) Presentation changed in FY 2014-15 to summarize by asset
(2) * means Not Available
Source: County Departments
Fiscal Year
Capital Asset Statistics by Function
Last Ten Fiscal Years (Continued)
(1)
(1)
(1)
(1)
___________________________________________________________________________________________
___________________________________________________________________________________________
County of Orange Comprehensive Annual Financial Report For the Year Ended June 30, 2020
229
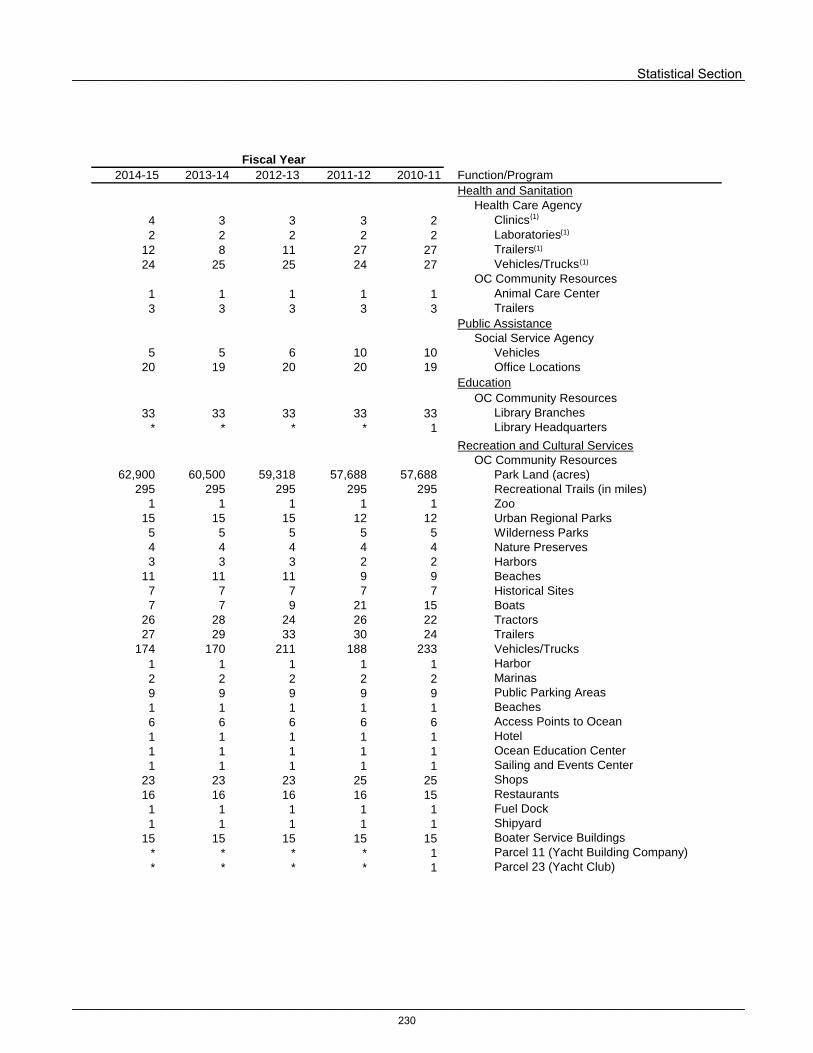
2014-15 2013-14 2012-13 2011-12 2010-11 Function/Program
Health and Sanitation
Health Care Agency
4 3 3 3 2 Clinics
2 2 2 2 2 Laboratories
12 8 11 27 27 Trailers
24 25 25 24 27 Vehicles/Trucks
OC Community Resources
1 1 1 1 1 Animal Care Center
3 3 3 3 3 Trailers
Public Assistance
Social Service Agency
5 5 6 10 10 Vehicles
20 19 20 20 19 Office Locations
Education
OC Community Resources
33 33 33 33 33 Library Branches
* * * * 1 Library Headquarters
Recreation and Cultural Services
OC Community Resources
62,900 60,500 59,318 57,688 57,688 Park Land (acres)
295 295 295 295 295 Recreational Trails (in miles)
1 1 1 1 1 Zoo
15 15 15 12 12 Urban Regional Parks
5 5 5 5 5 Wilderness Parks
4 4 4 4 4 Nature Preserves
3 3 3 2 2 Harbors
11 11 11 9 9 Beaches
7 7 7 7 7 Historical Sites
7 7 9 21 15 Boats
26 28 24 26 22 Tractors
27 29 33 30 24 Trailers
174 170 211 188 233 Vehicles/Trucks
1 1 1 1 1 Harbor
2 2 2 2 2 Marinas
9 9 9 9 9 Public Parking Areas
1 1 1 1 1 Beaches
6 6 6 6 6 Access Points to Ocean
1 1 1 1 1 Hotel
1 1 1 1 1 Ocean Education Center
1 1 1 1 1 Sailing and Events Center
23 23 23 25 25 Shops
16 16 16 16 15 Restaurants
1 1 1 1 1 Fuel Dock
1 1 1 1 1 Shipyard
15 15 15 15 15 Boater Service Buildings
* * * * 1 Parcel 11 (Yacht Building Company)
* * * * 1 Parcel 23 (Yacht Club)
Fiscal Year
Capital Asset Statistics by Function
Last Ten Fiscal Years (Continued)
(1)
(1)
(1)
(1)
___________________________________________________________________________________________
___________________________________________________________________________________________
Statistical Section
230
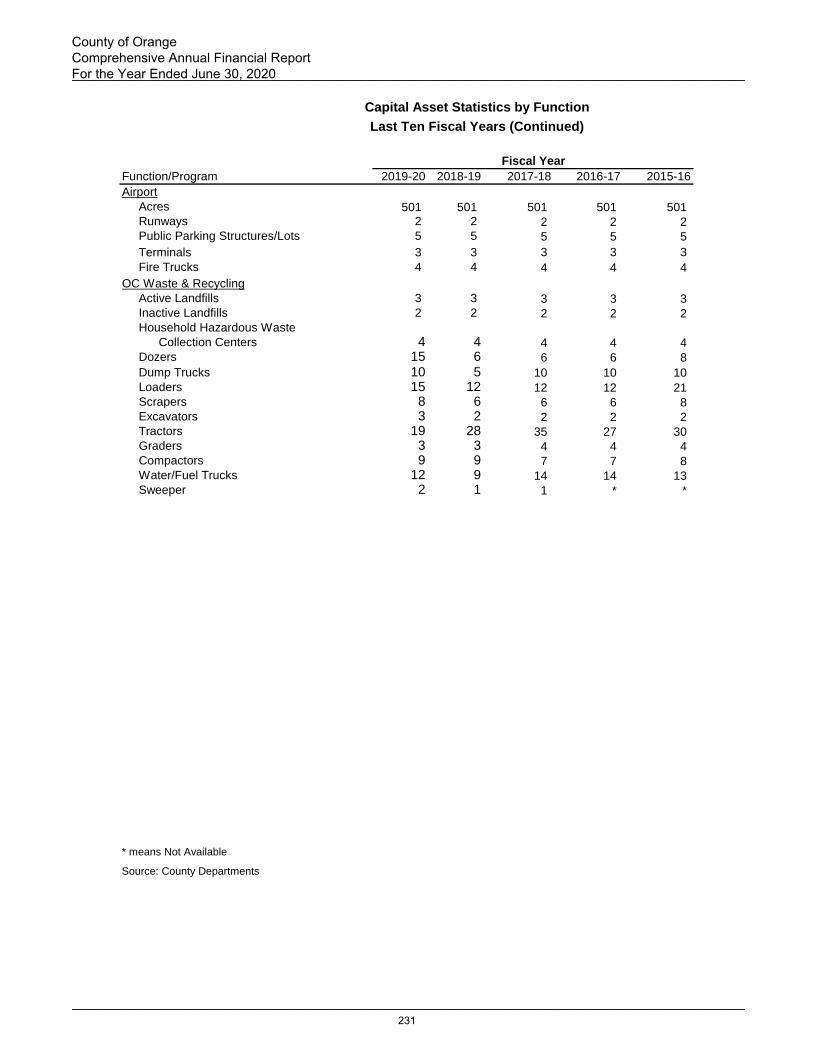
Function/Program 2019-20 2018-19 2017-18 2016-17 2015-16
Airport
Acres 501 501 501 501 501
Runways 2 2 2 2 2
Public Parking Structures/Lots 5 5 5 5 5
Terminals 3 3 3 3 3
Fire Trucks 4 4 4 4 4
OC Waste & Recycling
Active Landfills 3 3 3 3 3
Inactive Landfills 2 2 2 2 2
Household Hazardous Waste
Collection Centers 4 4 4 4 4
Dozers 15 6 6 6 8
Dump Trucks 10 5 10 10 10
Loaders 15 12 12 12 21
Scrapers 8 6 6 6 8
Excavators 3 2 2 2 2
Tractors 19 28 35 27 30
Graders 3 3 4 4 4
Compactors 9 9 7 7 8
Water/Fuel Trucks 12 9 14 14 13
Sweeper 2 1 1 * *
* means Not Available
Source: County Departments
Fiscal Year
Capital Asset Statistics by Function
Last Ten Fiscal Years (Continued)
___________________________________________________________________________________________
___________________________________________________________________________________________
County of Orange Comprehensive Annual Financial Report For the Year Ended June 30, 2020
231
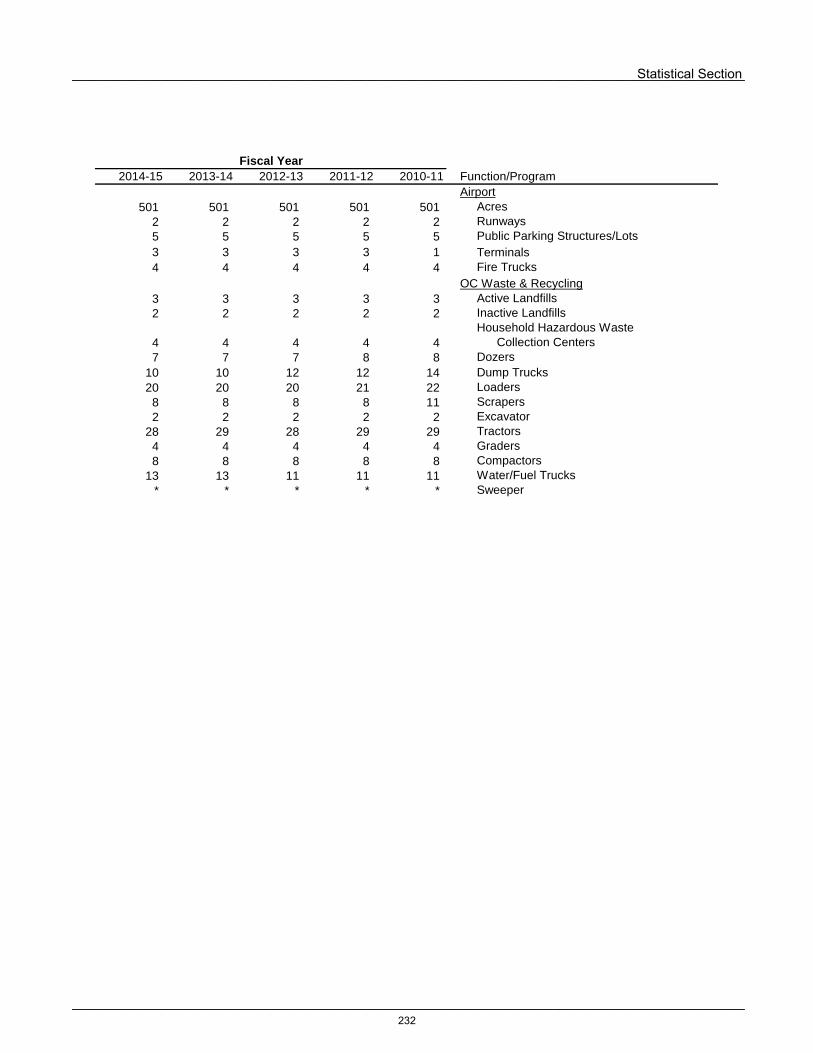
2014-15 2013-14 2012-13 2011-12 2010-11 Function/Program
Airport
501 501 501 501 501 Acres
2 2 2 2 2 Runways
5 5 5 5 5 Public Parking Structures/Lots
3 3 3 3 1 Terminals
4 4 4 4 4 Fire Trucks
OC Waste & Recycling
3 3 3 3 3 Active Landfills
2 2 2 2 2 Inactive Landfills
Household Hazardous Waste
4 4 4 4 4 Collection Centers
7 7 7 8 8 Dozers
10 10 12 12 14 Dump Trucks
20 20 20 21 22 Loaders
8 8 8 8 11 Scrapers
2 2 2 2 2 Excavator
28 29 28 29 29 Tractors
4 4 4 4 4 Graders
8 8 8 8 8 Compactors
13 13 11 11 11 Water/Fuel Trucks
* * * * * Sweeper
Fiscal Year
Capital Asset Statistics by Function
Last Ten Fiscal Years (Continued)
___________________________________________________________________________________________
___________________________________________________________________________________________
Statistical Section
232