annual comprehensive financial report county of york, virginia
227
-
Upload
khangminh22 -
Category
Documents
-
view
4 -
download
0
Transcript of annual comprehensive financial report county of york, virginia

ANNUAL COMPREHENSIVE FINANCIAL REPORT
COUNTY OF YORK, VIRGINIA
For the Fiscal Year Ended June 30, 2021
Prepared by the Department of Finance, Division of Accounting and Financial Reporting
Theresa S. Owens, CPA
Director of Finance
Carolyn T. Cuthrell Deputy Director of Finance
Amy L. Santiago
Matthew J. Stewart, CPA Catherine A. Murdock

THIS PAGE LEFT BLANK INTENTIONALLY

Page
INTRODUCTORY SECTION
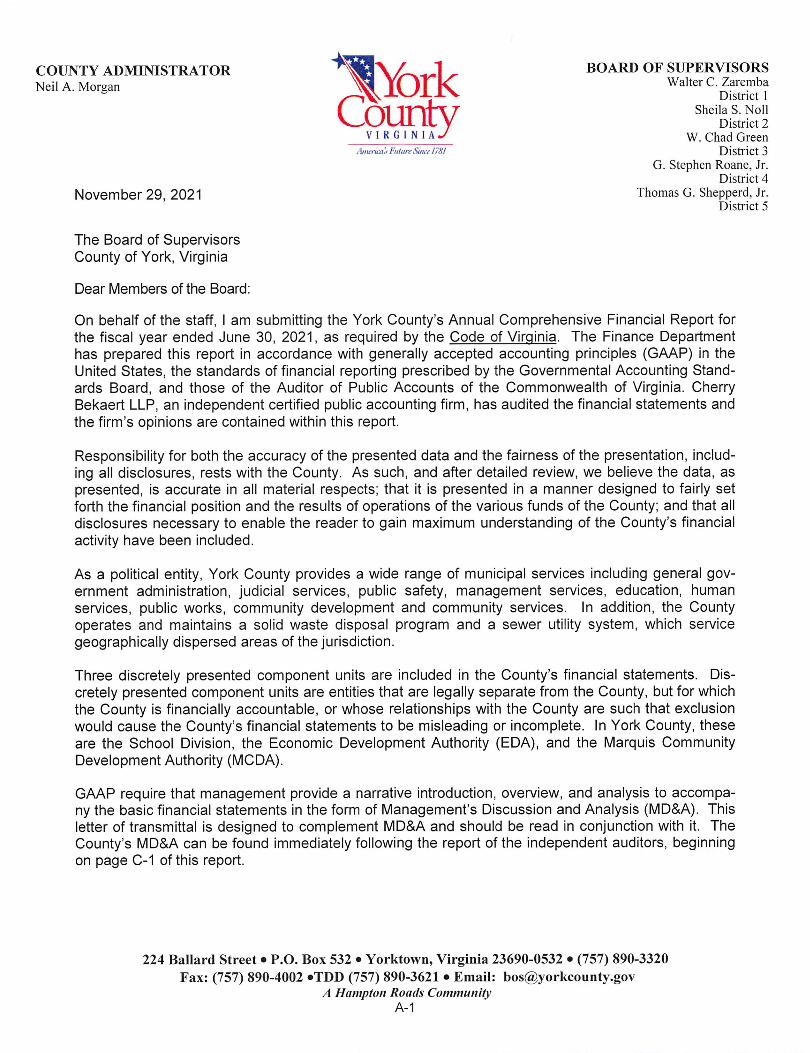
Letter of Transmittal A-1 - A-8
Certificate of Achievement for Excellence in Financial Reporting A-10
Organizational Diagram of York County Government A-11
Principal Officials A-12
FINANCIAL SECTION
Report of Independent Auditor B-1 - B-3
Management’s Discussion and Analysis C-1 - C-15
Basic Financial Statements:
Government-wide Financial Statements:
Statement of Net Position D-1
Statement of Activities D-2
Fund Financial Statements:
Governmental Funds Financial Statements:
Balance Sheet E-1
Reconciliation of the Balance Sheet of Governmental Funds to the Statement of Net Position E-2
Statement of Revenues, Expenditures and Changes in Fund Balances E-3
Reconciliation of the Statement of Revenues, Expenditures and Changes in Fund
Balances of Governmental Funds to the Statement of Activities E-4
Proprietary Funds Financial Statements:
Statement of Net Position E-5
Statement of Revenues, Expenses and Changes in Fund Net Position E-6
Statement of Cash Flows E-7
Fiduciary Financial Statements:
Statement of Fiduciary Net Position E-8
Statement of Changes in Fiduciary Net Position E-9
Notes to Basic Financial Statements F-1 - F-97
Required Supplementary Information Other Than Management’s Discussion and Analysis:
Budgetary Comparison Schedule, General Fund - Revenues and Other Financing Sources G-2 - G-3
Budgetary Comparison Schedule, General Fund - Expenditures and Other Financing Uses G-4 - G-5
Budgetary Comparison Schedule, Tourism Fund G-7
Schedule of Changes in Employer's Net Pension Liability and Related Ratios G-8 - G-9
Schedule of Employer's Share of Net Pension Liability G-10
Schedule of Employer Contributions - Pension G-11
Schedule of Changes in Employer's Net OPEB Liability and Related Ratios - Health/Dental G-12
Schedule of Employer Contributions - OPEB - Health/Dental G-13
Schedule of Changes in Employer's Net HIC OPEB Liability and Related Ratios G-14
Schedule of Employer HIC OPEB Contributions G-15
Schedule of Employer's Share of Net OPEB Liability - Health Insurance Credit Program Professional Employees G-16
Schedule of Employer's Share of Net OPEB Liability - Group Life Insurance G-17
Schedule of Employer's Share of Net OPEB Liability - Group Life Insurance Nonprofessional Employees G-18
Schedule of Employer's Share of Net OPEB Liability - Group Life Insurance Professional Employees G-19
Schedule of Employer GLI OPEB Contributions G-20
Schedule of Employer's Share of Net OPEB Liability - Virginia Local Disability Program (VLDP) Nonprofessional Employees G-21
Schedule of Employer's Share of Net OPEB Liability - Virginia Local Disability Program (VLDP) Professional Employees G-22
Schedule of Employer Virginia Local Disability Program (VLDP) G-23
Schedule of Investment Returns - Other Postemployment Benefits G-24
Notes to Required Supplementary Information G-25 - G-29
Other Supplementary Information:
Nonmajor Governmental Funds:
Combining Balance Sheet H-2
Combining Statement of Revenues, Expenditures and Changes in Fund Balances H-3
Budgetary Comparison Schedule - Nonmajor Special Revenue Funds H-4 - H-5
Budgetary Comparison Schedule - Debt Service Funds H-6
Budgetary Comparison Schedule - Capital Project Funds H-7
Nonmajor Enterprise Funds:
Combining Statement of Net Position I-2
Combining Statement of Revenues, Expenses and Changes in Fund Net Position I-3
Combining Statement of Cash Flows I-4
Internal Service Funds:
Combining Statement of Net Position J-2
Combining Statement of Revenues, Expenses and Changes in Fund Net Position J-3
Combining Statement of Cash Flows J-4
COUNTY OF YORK, VIRGINIA
Annual Comprehensive Financial Report
June 30, 2021
Table of Contents

Page
Custodial Funds:
Combining Statement of Fiduciary Net Position K-2
Combining Statement of Changes in Fiduciary Net Position K-3
STATISTICAL SECTION (Unaudited)
Financial Trends:
Net Position By Component - Accrual Basis of Accounting - Last Ten Fiscal Years L-3
Changes in Net Position - Accrual Basis of Accounting - Last Ten Fiscal Years L-4
Governmental Activities Tax Revenues By Source - Accrual Basis of Accounting - Last Ten Fiscal Years L-5
Fund Balances of Governmental Funds - Modified Accrual Basis of Accounting - Last Ten Fiscal Years L-6
Changes in Fund Balances of Governmental Funds - Modified Accrual Basis of Accounting - Last Ten Fiscal Years L-7
General Government Tax Revenues By Source - Modified Accrual Basis of Accounting - Last Ten Fiscal Years L-8
Revenue Capacity:
Assessed Value and Estimated Actual Value of Taxable Property - Last Ten Calendar Years L-9
Property Tax Rates - Last Ten Fiscal Years L-10
Principal Property Taxpayers - Calendar Year 2017 and Nine Years Prior L-11
Property Tax Levies and Collections - Last Ten Fiscal Years L-12
Debt Capacity:
Ratio of Outstanding Debt By Type - Last Ten Fiscal Years L-13
Ratio of General Bonded Debt Outstanding - Last Ten Fiscal Years L-14
Demographic and Economic Information:
Demographic and Economic Statistics - Last Ten Fiscal Years L-15
Principal Employers - Current and Nine Years Prior L-16
Operating Information:
Full-time Equivalent County Employees By Function - Last Ten Fiscal Years L-17
Operating Indicators By Function - Last Ten Years L-18
Capital Asset Statistics By Function - Last Ten Years L-19
Table of Contents, Continued
COUNTY OF YORK, VIRGINIA
Annual Comprehensive Financial Report
June 30, 2021


A-9
THIS PAGE LEFT BLANK INTENTIONALLY

Government Finance Officers Association
Certificate of Achievementfor Excellence
in Financial Reporting
Presented to
County of YorkVirginia
For its Comprehensive AnnualFinancial Report
For the Fiscal Year Ended
June 30, 2020
Executive Director/CEO
leeper
Typewriter
A-10

County Attorney
York County Voters
Board of Supervisors
Commonwealth’s AttorneyTreasurerCommissioner
of the RevenueClerk of the
Circuit Court Sheriff School Board
Colonial Soil & Water Conservation
District
York County Public Schools
Planning Commission
Committees, Boards &
CommissionsLibrary Board
Economic Development
AuthorityWetlands Board
York County Public Library
County Administrator
Circuit Court
Magistrate
Board of Equalization
Board of Zoning
Appeals
Voter Registrar
Electoral Board
Virginia General Assembly
Juvenile & Domestic Relations
Court
General District Court
Administrative Services
Fire & Life Safety
Technical Services & Special
Operations
Prevention & Community
Safety
Fire & Rescue Operations
Support Services
Emergency Management
Economic Development
Emergency CommunicationsFinance
Central Purchasing
Accounting & FinancialReporting
Budget
Fiscal Accounting
Services
Social Services
InformationTechnology
Public Affairs
Video Services
Public Works
Waste Management
Utilities Operations
Project/Development
Inspection
Engineering
Facility Maintenance
Fleet Services
Stormwater & Grounds
InfrastructureManagement
Community Services
Juvenile Services
Children & Family Services
Housing & Neighborhood Revitalization
Parks & Recreation
Deputy County Administrator
Planning & Development
Services
Planning
Building Safety
Development Services
Stormwater Engineering
Animal Services
Tourism Development
This diagram represents the organizational structure of the local government of York County, Virginia. Elected officials are shown in bold at the top of the organizational chart. The diagram further depicts the organizational structure of local government staff and supporting agencies. This diagram was prepared by the York County Public Information Office, 224 Ballard Street, Yorktown, Virginia, 23690. Mailing Address: P.O. Box 532, Yorktown, Virginia, 23690-0532. Updated June 30 2021
Public Library
Real Estate
Human Resources
leeper
Typewriter
A-11

Clerk of the Circuit Court Kristen N. Nelson
Commissioner of the Revenue Ann H. Thomas
County Treasurer Candice D. Kelley
Commonwealth's Attorney Benjamin M. Hahn
Sheriff J. D. Diggs
County Administrator Neil A. Morgan
County Attorney James E. Barnett, Jr.
Deputy County Administrator Mark L. Bellamy, Jr.
Director of Community Services Brian P. Fuller
Director of Economic Development James W. Noel, Jr.
Director of Emergency Communications Donald T. Hall
Director of Finance Theresa S. Owens
Fire Chief Stephen P. Kopczynski
Director of Human Resources Amy R. Etheridge
Director of Information Technology Adam A. Frisch
Director of Library Services Kevin W. Smith
Director of Planning and Development Services Susan D. Kassel
Director of Public Works Brian K. Woodward
Director of York-Poquoson Social Services Margaret Mack-Yaroch
Superintendent of Schools Dr. Victor D. Shandor
Chief Academic Officer Candi L. Skinner
Chief Financial Officer William Bowen
Chief Human Resources Officer Dr. Anthony Vladu
Chief Operations Officer Dr. James Carroll
Director of Elementary Instruction Dr. David Reitz
Director of Information Technology Douglas E. Meade
Director of School Administration Dr. Aaron Butler
Director of Secondary Instruction Angela Seiders
Director of Student Services Dr. Elaine B. Gould
School Officials
School Board
James E. Richardson
Sean P. Myatt
Laurel M. Garrelts, Vice-Chairman
Brett Higginbotham, Chairman
County Officials
Board of Supervisors
Sheila S. Noll, Vice-Chairman
Thomas G. Shepperd, Jr.
Mark J. Shafer
W. Chad Green, Chairman
Walter C. Zaremba
COUNTY OF YORK, VIRGINIA
Principal Officials
For the Fiscal Year Ended June 30, 2021
Constitutional Officers
G. Stephen Roane, Jr.
A-12

cbh.com
B-1
Report of Independent Auditor To the Honorable Members of the Board of Supervisors County of York, Virginia Report on the Financial Statements We have audited the accompanying financial statements of the governmental activities, the business-type activities, the aggregate discretely presented component units, each major fund, and the aggregate remaining fund information of the County of York, Virginia (the “County”), as of and for the year ended June 30, 2021, and the related notes to the financial statements, which collectively comprise the County’s basic financial statements as listed in the table of contents. Management’s Responsibility for the Financial Statements Management is responsible for the preparation and fair presentation of these financial statements in accordance with accounting principles generally accepted in the United States of America; this includes the design, implementation, and maintenance of internal control relevant to the preparation and fair presentation of financial statements that are free from material misstatement, whether due to fraud or error. Auditor’s Responsibility Our responsibility is to express opinions on these financial statements based on our audit. We conducted our audit in accordance with auditing standards generally accepted in the United States of America, the standards applicable to financial audits contained in Government Auditing Standards, issued by the Comptroller General of the United States, and the Specifications for Audits of Counties, Cities, and Towns, issued by the Auditor of Public Accounts of the Commonwealth of Virginia. Those standards and specifications require that we plan and perform the audit to obtain reasonable assurance about whether the financial statements are free from material misstatement. An audit involves performing procedures to obtain audit evidence about the amounts and disclosures in the financial statements. The procedures selected depend on the auditor’s judgment, including the assessment of the risks of material misstatement of the financial statements, whether due to fraud or error. In making those risk assessments, the auditor considers internal control relevant to the entity’s preparation and fair presentation of the financial statements in order to design audit procedures that are appropriate in the circumstances, but not for the purpose of expressing an opinion on the effectiveness of the entity’s internal control. Accordingly, we express no such opinion. An audit also includes evaluating the appropriateness of accounting policies used and the reasonableness of significant accounting estimates made by management, as well as evaluating the overall presentation of the financial statements. We believe that the audit evidence we have obtained is sufficient and appropriate to provide a basis for our audit opinions. Opinions In our opinion, the financial statements referred to above present fairly, in all material respects, the respective financial position of the governmental activities, the business-type activities, the aggregate discretely presented component units, each major fund, and the aggregate remaining fund information of the County of York, Virginia, as of June 30, 2021, and the respective changes in financial position and, where applicable, cash flows thereof for the year then ended in accordance with accounting principles generally accepted in the United States of America.

B-2
Emphasis of Matter As discussed in Note 15 to the basic financial statements, the County adopted the provisions of Governmental Accounting Standards Board Statement No. 84, Fiduciary Activities, effective July 1, 2020. As a result, related net position and fund balance has been restated. Our opinions are not modified with respect to this matter. OTHER MATTERS Required Supplementary Information Accounting principles generally accepted in the United States of America require that the management’s discussion and analysis and the required supplementary information other than management discussion and analysis, as listed in the table of contents, be presented to supplement the basic financial statements. Such information, although not a part of the basic financial statements, is required by the Governmental Accounting Standards Board, who considers it to be an essential part of financial reporting for placing the basic financial statements in an appropriate operational, economic, or historical context. We have applied certain limited procedures to the required supplementary information in accordance with auditing standards generally accepted in the United States of America, which consisted of inquiries of management about the methods of preparing the information and comparing the information for consistency with management’s responses to our inquiries, the basic financial statements, and other knowledge we obtained during our audit of the basic financial statements. We do not express an opinion or provide any assurance on the information because the limited procedures do not provide us with sufficient evidence to express an opinion or provide any assurance. Other Information Our audit was conducted for the purpose of forming opinions on the financial statements that collectively comprise the County’s basic financial statements. The Introductory Section, Other Supplementary Information, and Statistical Section, as listed in the table of contents, are presented for purposes of additional analysis and are not a required part of the basic financial statements. The Other Supplementary Information is the responsibility of management and was derived from and relates directly to the underlying accounting and other records used to prepare the basic financial statements. Such information has been subjected to the auditing procedures applied in the audit of the basic financial statements and certain additional procedures, including comparing and reconciling such information directly to the underlying accounting and other records used to prepare the basic financial statements or to the basic financial statements themselves, and other additional procedures in accordance with auditing standards generally accepted in the United States of America. In our opinion, the Other Supplementary Information is fairly stated, in all material respects, in relation to the basic financial statements as a whole. The Introductory and Statistical Sections have not been subjected to the auditing procedures applied in the audit of the basic financial statements and, accordingly, we do not express an opinion or provide any assurance on them.

B-3
Other Reporting Required by Government Auditing Standards In accordance with Government Auditing Standards, we have also issued our report dated November 29, 2021 on our consideration of the County’s internal control over financial reporting and on our tests of its compliance with certain provisions of laws, regulations, contracts, and grant agreements and other matters. The purpose of that report is solely to describe the scope of our testing of internal control over financial reporting and compliance and the results of that testing, and not to provide an opinion on the effectiveness of the County’s internal control over financial reporting or on compliance. That report is an integral part of an audit performed in accordance with Government Auditing Standards in considering the County’s internal control over financial reporting and compliance. Virginia Beach, Virginia November 29, 2021

B-4
THIS PAGE LEFT BLANK INTENTIONALLY

C - 1
MANAGEMENT’S DISCUSSION AND ANALYSIS This section of the County of York's (the "County's") Annual Comprehensive Financial Report (ACFR) presents management’s discussion and analysis of the County's financial performance during the fiscal year ended June 30, 2021. Please read it in conjunction with the transmittal letter on pages A-1 through A-8 at the front of this report and the County's basic financial statements, which begin on page D-1.
FINANCIAL HIGHLIGHTS FOR FISCAL YEAR 2021 (FY2021)
The assets and deferred outflows of resources of the County on a government-wide basis, excluding component units, exceeded its liabilities and deferred inflows of resources as of June 30, 2021 by $172,912,065 (net position). Under Virginia law, School Divisions hold title to all school property and local governments incur financial obligations for school property. The assets are reported on the School Division’s Statement of Net Position and the related debt is reported on the County’s Statement of Net Position. Consequently, the County reports $82,529,933 in school debt without the related assets.
The County’s total net position increased by $15,738,494. Governmental activities increased by
$13,259,232, primarily due to General Fund expenditures being offset with Coronavirus Aid, Relief and Economic Security Act (CARES) and American Rescue Plan Act (ARPA) funding and an increase in General Fund property tax revenues, sales tax and taxes on recordation and wills. Business-type activities increased by $2,479,262, mainly attributable to capital contributions of sewer lines in FY2021.
As of June 30, 2021, the County’s governmental funds reported combined ending fund balances
of $83,914,488, an increase of $15,146,951 from the prior year. Unassigned fund balance totaled $14,730,706 and is available for spending at the County’s discretion. This amount reflects a General Fund unassigned fund balance of $18,240,000, or 13.6% of total General Fund expenditures and an unassigned fund deficit of $3,509,294 in the Yorktown Capital Improvements Fund, attributable to a long-term advance payable to another fund.
The County’s noncurrent liabilities, which includes the net OPEB liability and net pension liability
at June 30, 2021, were $182,539,214, which is an increase of $9,766,100 from the prior year. The key factors in this increase was the issuance of new debt for the School Division capital projects and the increase for pension liabilities based on actuarial calculations.
OVERVIEW OF THE FINANCIAL STATEMENTS The Annual Comprehensive Financial Report consists of three (3) sections: introductory, financial and statistical. The financial section includes the basic financial statements consisting of three components: 1) Government-wide financial statements; 2) Fund financial statements; and 3) Notes to the basic financial statements. Required Supplementary Information as well as Other Supplementary Information is included in addition to the basic financial statements. Government-wide Statements - The government-wide financial statements are designed to provide the reader with a broad overview of the County's finances, in a manner similar to a private-sector business. One of the most frequently asked questions about the County's finances is, "Is the County as a whole better off or worse off as a result of this year's activities?" The Statement of Net Position and the Statement of Activities report information about the County as a whole and about its activities in a way that helps answer this question. These statements include all of the assets and liabilities using the accrual basis of accounting, which is similar to the accounting used by most private-sector companies.

C - 2
All of the current year's revenues and expenses are taken into account regardless of when cash is received or paid. These two statements report the County's net position and the changes in them. One can think of the County's net position - the difference between assets + deferred outflows of resources less liabilities + deferred inflows of resources - as one way to measure the County's financial health or financial position. Over time, increases or decreases in the County's net position is one indicator of whether its financial health is improving or deteriorating. However, other non-financial factors will need to be considered, such as changes in the County property tax base, to assess the overall health of the County. In the Statement of Net Position and the Statement of Activities, the County is divided into three kinds of activities:
Governmental activities - Most of the County's basic services are reported here, including general government, judicial services, public safety, management services including finance, education, human services, public works, community development including planning and community services. Property taxes, other local taxes, and state and federal grants finance most of these activities.
Business-type activities - The County charges a fee to customers to help cover the majority of
the costs of services it provides. The County's water and sewer utilities, solid waste, Yorktown operations, the two Sanitary Districts, and Regional Radio System operations are reported here.
Component units - The County includes three separate legal entities in its report - the York County School Division, the Economic Development Authority of York County and the Marquis Community Development Authority. Although legally separate, the County is financially accountable for the School Division and the Economic Development Authority component units and provides operating and capital funding. The County provides the financial reporting for the Marquis Community Development Authority.
The government-wide financial statements can be found on pages D-1 through D-2 of this report. Fund Financial Statements - Traditional users of government financial statements will find the fund statement presentation more familiar, although the focus is only on the County's most significant funds. The County uses fund accounting to ensure and demonstrate compliance with finance related legal requirements. The County has three kinds of funds:
Governmental funds - Most of the County's basic services are reported in governmental funds, which focus on (1) how cash and other financial assets that can readily be converted to cash flow in and out; and (2) the balances left at year-end that are available for spending. Consequently, the governmental funds statements provide a detailed, short-term view of the County's general government operations and the basic services it provides.

C - 3
Governmental fund information helps the reader determine whether there are more or fewer financial resources that can be spent in the future to finance the County's programs. Because this information does not address the long-term focus of the government-wide statements, additional information is provided after the governmental funds statements that explains the relationship (or differences) between the fund financial statements and the government-wide financial statements. The basic governmental fund financial statements can be found on pages E-1 through E-4 of this report. The County maintains thirteen individual governmental funds. Information is presented separately in the governmental fund balance sheet and the governmental fund statement of revenues, expenditures, and changes in fund balances for the General Fund, Tourism Fund, Yorktown Capital Improvements Fund, County Capital Fund and Education Debt Service Fund, all of which are considered to be major funds. Data from the other eight governmental funds are combined into a single, aggregated presentation. Individual fund data for each of these non-major governmental funds is provided in the form of combining statements on pages H-2 through H-7 of this report.
Proprietary funds - Services for which the County charges customers a fee are generally reported in proprietary funds. Proprietary funds, like the government-wide statements, provide both long and short-term financial information.
In fact, the County's enterprise funds (one type of proprietary fund) are its business-type activities, but the fund financial statements provide more detail and additional information, such as cash flow. The basic proprietary fund financial statements can be found on pages E-5 through E-7 of this report. The County maintains eight individual enterprise funds. Information is presented separately in the proprietary fund statement of net position, the proprietary fund statement of revenues, expenses and changes in fund net position and the proprietary fund statement of cash flows for the Sewer Utility Fund, which is a major fund. Data for the other seven enterprise funds are combined into a single, aggregated presentation. Individual fund data for each of these non-major enterprise funds is provided in the form of combining statements on pages I-2 through I-4 of this report. During fiscal year 2021, the County used four internal service funds (the other type of proprietary fund) to report activities that provide supplies and services for the County's other programs and activities. The Vehicle Maintenance Fund provides for the accumulation of resources to replace capital equipment and maintenance services for the County's vehicle fleet. The Health and Dental Insurance fund provides for the revenues and expenses of the health and dental programs. The Workers’ Compensation fund accounts for the claims and related expenses for workers’ compensation. The Information Technology fund accounts for the costs of providing computer technical support, software support, and internet and telecommunications services. The internal service funds are presented as a separate column in the proprietary fund financial statements, on pages E-5 through E-7 of this report. Individual fund data for each of these internal service funds is provided in the form of combining statements on pages J-2 through J-4 of this report.
Fiduciary funds – The County's fiduciary activities are reported in an Other Postemployment
Benefit Trust Fund and custodial fund statements of fiduciary net position and changes in fiduciary net position. The County excludes these activities from the County's government-wide statements because the County cannot use these assets to finance its operations. The OPEB Trust Fund is irrevocable and custodial funds are used to provide accountability of client monies for which the County is the custodian. The OPEB Trust Fund accounts for future benefits payable for eligible retirees of the County towards health insurance coverage in a plan sponsored by the County.

C - 4
The Statement of Fiduciary Net Position and Statement of Changes in Fiduciary Net Position can be found on pages E-8 to E-9 of this report. Individual fund data for the custodial funds is provided in the form of combining statements on pages K-2 through K-3 of this report. Notes to the Basic Financial Statements - The notes provide additional information that is essential to a full understanding of the data provided in the government-wide and fund financial statements. The notes to the financial statements can be found on pages F-1 through F-96 of this report. Other information - In addition to the basic financial statements and accompanying notes, this report also presents certain required supplementary information concerning the County’s General Fund and Tourism Fund budgets and progress in funding its obligations to provide pension benefits and other postemployment benefits to its employees and contributions for other postemployment benefits and for the single-employer defined benefit pension plan of the School Division. Required supplementary information can be found beginning on page G-2 of this report. The combining statements for nonmajor governmental funds are presented immediately following the required supplementary information. Combining statements can be found on pages H-2 through K-3 of this report. GOVERNMENT-WIDE FINANCIAL ANALYSIS Summary of Statement of Net Position - As of June 30, 2021 and 2020
FY2021 FY2020 FY2021 FY2020 FY2021 FY2020
127,926,084$ 109,711,992$ 20,113,295$ 17,756,691$ 148,039,379$ 127,468,683$
Capital assets 91,018,245 90,080,979 128,221,425 128,272,615 219,239,670 218,353,594
Total assets 218,944,329$ 199,792,971$ 148,334,720$ 146,029,306$ 367,279,049$ 345,822,277$
Deferred outflows of resources 26,655,976$ 25,080,471$ 2,901,934$ 2,767,915$ 29,557,910$ 27,848,386$
Current and other liabilities 26,821,770$ 26,755,875$ 2,425,259$ 2,239,142$ 29,247,029$ 28,995,017$
Long-term liabilities 158,752,331 148,997,468 23,786,883 23,775,646 182,539,214 172,773,114
Total liabilities 185,574,101$ 175,753,343$ 26,212,142$ 26,014,788$ 211,786,243$ 201,768,131$
Deferred inflows of resources 11,137,972$ 13,491,099$ 1,000,679$ 1,237,862$ 12,138,651$ 14,728,961$
Net position:
Net investment in capital assets 67,685,243$ 63,819,651$ 110,749,120$ 110,685,466$ 178,434,363$ 174,505,117$
Restricted 8,951,725 3,484,204 - - 8,951,725 3,484,204
Unrestricted (deficit) (27,748,736) (31,674,855) 13,274,713 10,859,105 (14,474,023) (20,815,750)
Total net position 48,888,232$ 35,629,000$ 124,023,833$ 121,544,571$ 172,912,065$ 157,173,571$
Governmental Activities Business-type Activities Total
Current and other assets

C - 5
The County's net position totaled $172,912,065, an increase of $15,738,494. This result is comprised of an increase of net position in governmental activities of $13,259,232, and an increase of $2,479,262 in business-type activities. The increase in governmental activities was primarily due to General Fund expenditures being offset with CARES and ARPA and an increase in General Fund property tax revenues, sales tax and taxes on recordation and wills. The increase for business-type activities was mainly attributable to capital contributions of sewer lines in FY2021. Approximately 5.2% of net position represented resources that are subject to external restrictions. Restrictions do not significantly affect the availability of fund resources for future use. The majority of the County's net position reflected its investment in capital assets, less any related debt used to acquire those assets that were still outstanding. These assets are used to provide services to citizens and consequently are not available for future spending. At June 30, 2021, the County reported an unrestricted deficit of $14,474,023. The decrease in the unrestricted deficit of $6,341,727 is primarily due to an increase in capital contributions in the Sewer Fund and General Fund increases in property tax, sales tax and taxes on recordation and wills with expenditures being offset with CARES and ARPA funding. Under Virginia law, School Divisions hold title to all school property, except when the governing bodies of the local government and school division agree that title may vest in the locality. Since Virginia school divisions do not have taxing authority, local governments incur financial obligations for school property. In June 2003, the York County Board of Supervisors passed a resolution electing not to acquire tenancy in common of school property as allowed for under GAAP. The County borrows funds to finance the acquisition, construction, and improvement of school property and the School Division holds title to this property. With the County opting out of Senate Bill 276, the asset values are reported on the School Division’s Statement of Net Position and the related debt or liability are reported on the County’s Statement of Net Position. Consequently, the County reports $82,529,933 in school debt without the related assets.

C - 6
Summary of Changes in Net Position - Years Ended June 30, 2021 and 2020
FY2021 FY2020 FY2021 FY2020 FY2021 FY2020
Revenues:
Program revenues:
Charges for services 7,858,320$ 8,152,973$ 21,185,080$ 20,426,879$ 29,043,400$ 28,579,852$
Operating grants and contributions 29,664,580 15,103,972 90,492 292,221 29,755,072 15,396,193
Capital grants and contributions 911,612 2,443,417 2,179,427 1,144,164 3,091,039 3,587,581
General revenues:
Property taxes 96,141,095 93,017,827 - - 96,141,095 93,017,827
Other taxes 39,554,043 37,578,694 937,343 1,493,198 40,491,386 39,071,892
8,741,680 8,741,680 - - 8,741,680 8,741,680
Unrestricted investment earnings (19,787) 859,654 25,086 133,285 5,299 992,939
Miscellaneous 372,731 162,593 8,534 11,841 381,265 174,434
Gain on sale of capital assets 4,391 14,378 23,769 - 28,160 14,378
Total revenues 183,228,665 166,075,188 24,449,731 23,501,588 207,678,396 189,576,776
Expenses:
Governmental activities:
General administration 3,753,814 4,468,101 - - 3,753,814 4,468,101
Judicial services 3,704,339 3,721,294 - - 3,704,339 3,721,294
Public safety 42,065,399 43,575,955 - - 42,065,399 43,575,955
Management services 12,923,458 11,861,804 - - 12,923,458 11,861,804
Education 70,239,829 68,609,783 - - 70,239,829 68,609,783
Human services 10,111,077 9,834,859 - - 10,111,077 9,834,859
Public works 10,943,599 14,572,672 - - 10,943,599 14,572,672
Community development 3,498,074 3,012,762 - - 3,498,074 3,012,762
Community services 8,106,746 5,682,266 - - 8,106,746 5,682,266
Interest and fiscal charges on noncurrent debt 3,577,368 3,518,196 - - 3,577,368 3,518,196
Business-type activities:
Sewer Utility - - 11,992,147 12,245,651 11,992,147 12,245,651
Water Utility - - 324,391 326,842 324,391 326,842
Solid Waste - - 6,055,946 5,742,136 6,055,946 5,742,136
Yorktown Operations - - 157,317 158,295 157,317 158,295
Sanitary Districts - - 418,134 418,134 418,134 418,134
Regional Radio System - - 4,068,264 4,208,960 4,068,264 4,208,960
Total expenses 168,923,703 168,857,692 23,016,199 23,100,018 191,939,902 191,957,710
14,304,962 (2,782,504) 1,433,532 401,570 15,738,494 (2,380,934)
Transfers (1,045,730) (1,087,134) 1,045,730 1,087,134 - -
Change in net position 13,259,232 (3,869,638) 2,479,262 1,488,704 15,738,494 (2,380,934)
Net position, beginning 35,629,000 39,498,638 121,544,571 120,055,867 157,173,571 159,554,505
Net position, ending 48,888,232$ 35,629,000$ 124,023,833$ 121,544,571$ 172,912,065$ 157,173,571$
Governmental Activities Business-type Activities Total
Change in net position, before transfers
Commonwealth of Virginia, net
Local Aid to Commonwealth

C - 7
Governmental Activities - For the fiscal year ended June 30, 2021, revenues from governmental activities totaled $183,228,665. The $3,123,268 increase from fiscal year 2020 in property taxes is comprised primarily of two revenue sources: real estate and personal property tax revenues. Real estate tax revenue, the County's largest revenue source, was $78,351,752. The County's assessed real property tax base for calendar year 2021 was $9,662,298,100. The County's second largest revenue source is personal property taxes, with total current year collections of $26,070,926. The Commonwealth of Virginia provides a constant $8,741,680 as an entitlement grant under the provisions of the Personal Property Tax Relief Act (PPTRA), which is included in the total current year collections. Other taxes increased by $1,975,349 from the prior year as a result of increases in sales taxes, restaurant food taxes and taxes on recordation and wills. For the fiscal year ended June 30, 2021, expenses for governmental activities totaled $168,923,703, including the following payments to the component unit - School Division: $55,093,852 for operations and capital projects; the component unit - Economic Development Authority: $66,385 for operations and capital, and the component unit - Community Development Authority: $1,177,003 in incremental taxes and special assessments. For further discussion on changes from the prior year for the governmental funds, see page C-12.

C - 8
Charges for services
4.3%
Operating grants and contributions
16.2%
Capital grants and contributions
0.5%
Property taxes52.5%
Local sales and use taxes
9.5%
Other taxes12.1%
Personal property tax relief - VA
4.8%
Other.1%
Revenues by Source - Governmental Activities
Business-type Activities - Business-type activities increased the County’s net position by $2,479,262 for the fiscal year ended June 30, 2021. This increase is primarily attributable to capital contributions of sewer lines in FY2021. Significant transfers include $1,045,730 for the maintenance on the emergency radio system in the Regional Radio System Fund.

C - 9
GENERAL FUND As of June 30, 2021, the County’s governmental funds reported combined ending fund balances of $83,914,488, an increase of $15,146,951 from the prior year. Unassigned fund balance totaled $14,730,706 and is available for spending at the County’s discretion. Of the remainder of fund balance, $6,396,239 is nonspendable, $8,928,711 is restricted, $17,370,859 is committed and $36,487,973 is assigned. The General Fund is the chief operating fund of the County. At the end of the current fiscal year, unassigned fund balance of the General Fund was $18,240,000 and total fund balance was $44,630,114. As a measure of the General Fund’s liquidity, it may be useful to compare both unassigned fund balance and total fund balance to total fund expenditures. Unassigned fund balance represents 13.6% of total General Fund expenditures while total fund balance represents 33.2% of the same amount. During the year, the Board of Supervisors approved various budget revisions. The following chart shows the original approved budget, the revised budget at the end of the fiscal year and the actual amounts for both revenues and expenditures in the General Fund.

C - 10
General Fund Revenue - Comparison of Budget to Actual
The total change in General Fund final budgeted revenues and other financing sources were $17,629,304 or 12.3% over the original budget. The majority of the increase was driven by the appropriation of approximately $6 million for the second allocation of the CARES Act Coronavirus Relief Funding (CRF); $3 million from the first allocation of CRF not expended in FY2020; approximately $6.6 million for the first allocation of ARPA Funding; and $1.2 million of a Community Development Block Grant from the CARES Act as part of the FY2021 amended budget. The total General Fund actual revenues and other financing sources were $7,768,867 or 4.8% over the final budget. Significant variances include the following:
General property taxes were higher than the final budget by $3,654,866 or 4.0%, which was
primarily driven by higher than anticipated real estate and personal property tax collections.
Other local taxes were higher than the final budget by $5,244,151 or 18.3%, primarily due to higher than anticipated local sales and use tax as well as the historic triangle sales tax and business license taxes.
Charges for services were lower than the final budget by $582,658 or 13.3%, which was driven
by lower emergency medical services fees and school closures resulting in school resources officers not working at the middle and high schools.
Intergovernmental revenue was $90,452 or 0.3% above the final budget.

C - 11
General Fund Expenditures - Comparison of Budget to Actual
The total change in General Fund final budgeted expenditures and other financing uses were $26,308,860 or 18.3% over the original budget. The majority of the increase was driven by the appropriation of approximately $6 million for the second allocation of the CRF Funding; $3 million from the first allocation of CRF Funding not expended in FY2020; approximately $6.6 million for the first allocation of ARPA Funding; $1.2 million of a Community Development Block Grant from the CARES; and approximately $8.7 million of carryovers for continuing capital and special projects. The total General Fund actual expenditures and other financing uses were $12,833,805 or 7.6% under the final budget. A portion of the variance, $779,238 is attributable to outstanding encumbrances at June 30, 2021, which are not reflected in the budgetary comparison schedule. Other significant variances include the following:
Education: the payment to the School Division is under budget due to the return of unspent funds to the County per State code.
All Functions: The majority of all the cost centers were under budget as a result of additional
funding received to support government operating personnel and fringe benefit costs through the revenue loss provision of the ARPA Act.
Additional Functions with significant variances:
o Judicial Administration: The Clerk of Circuit Court was also under budget due to unspent
information technology funding.
o Public Safety: Fire and Life Safety were also under budget as a result of additional funding received through the CARES Act to support personnel costs for public health and safety employees.

C - 12
o Management Services: In addition, Budget and Human Resources were under budget
as a result of vacancies and due to funding set aside for management training yet to occur.
o Public Works: this department realized savings from operations and personnel due to
turnover and vacancies.
o Community Services: the department had savings from operations due to the cancellation of parks and recreation programs as a result of the coronavirus pandemic.
GOVERNMENTAL FUNDS The County maintains thirteen individual governmental funds. Information is presented separately in the governmental fund balance sheet and the governmental fund statement of revenues, expenditures, and changes in fund balances for the General, Tourism, Yorktown Capital Improvements, County Capital and the Education Debt Service Funds, all of which are considered to be major funds. The General Fund increased by $11,923,116 primarily due to an increase in property taxes and other local taxes and expenditures were offset by the CARES Act and ARPA Act funding received and expended in FY2021. The Tourism Fund accounts for transactions related to the lodging tax restricted by the State for tourism activities. The Yorktown Capital Improvements and County Capital Funds account for major capital improvements. The Education Debt Service Fund accounts for debt service payments for School Division capital projects for which debt was issued. For fiscal year ended June 30, 2021, the Tourism Fund and the County Capital Fund had increases in fund balance of $455,876 and $590,586 due to transfers from the General Fund. The Yorktown Capital Improvements Fund had a decrease in fund deficit of $7,024, mainly due to interest received for Riverwalk Landing. PROPRIETARY FUNDS The County reported operations for eight enterprise funds and four internal service funds. The enterprise funds provide the means to account for the operations of the County-operated utilities, the two sanitary districts, the County solid waste disposal activity, the operations at Yorktown and the operations of the Regional Radio System. During fiscal year 2021, the internal service funds were used to account for the operation of the centralized motor vehicle pool, for health and dental insurance programs, claims and related expenses for workers’ compensation and costs of providing computer technical support, software support, internet and telecommunications. The Sewer Utility Fund earned $11,380,626 through charges for services and $874,583 from restaurant food taxes. The Vehicle Maintenance Fund (internal service fund) collects its revenues through charges for services imposed on the various County departments to which fleet vehicles are assigned. The expenses relate directly to the maintenance and depreciation of the County’s fleet of vehicles. The Health and Dental Insurance Fund, accounts for the health and dental insurance claims, payments to the insurance providers and the IRS as required by the Affordable Care Act, and the contributions from the County and employees. The Workers’ Compensation Fund accounts for the claims associated with workers compensation. The Information Technology Fund collects its revenues through charges for

C - 13
services imposed on the various County departments to which computer and network software and hardware are assigned and a transfer from the General Fund for overall operations. The enterprise funds in the aggregate had an increase in net position during the fiscal period of $2,479,262, and the internal service funds reported an increase in net position of $2,972,165. The net position for the enterprise funds and internal service funds were $124,023,833 and $14,894,245, respectively, at the end of the fiscal year. CAPITAL ASSETS AND DEBT ADMINISTRATION Capital Assets At the end of fiscal year 2021, the County’s investment in capital assets for its governmental and business-type activities amounts to $219,239,670 (net of accumulated depreciation and amortization). This investment in capital assets includes land, easements, construction in progress, land improvements, buildings and improvements, infrastructure, equipment, vehicles and computer software. The increase in governmental activities is mainly attributable to equipment associated with a capital lease. The County does not own its roads and they are therefore not included in the capital assets. In addition, the School Division owns school buildings and the related debt is County debt. For this reason, the assets are reflected in the Statement of Net Position of the component unit School Division, while the related debt is reflected in the Statement of Net Position of the County. The slight decrease in capital assets for business-type activities is driven by fewer additions compared to the prior year; and an increase for a full year of depreciation for assets entered into service during the previous year.
Governmental Activities and Business-Type Activities - Capital Assets, Net of Depreciation and Amortization
FY2021 FY2020 FY2021 FY2020 FY2021 FY2020
Land 12,854,926$ 12,854,926$ 3,946,755$ 3,946,755$ 16,801,681$ 16,801,681$
Easements 821,664 789,666 704,453 688,253 1,526,117 1,477,919
Construction in progress 3,157,559 1,339,091 3,961,322 3,991,047 7,118,881 5,330,138
Land improvements 4,965,567 5,475,389 39,576 43,020 5,005,143 5,518,409
Buildings 28,293,133 29,161,191 5,660,268 6,374,786 33,953,401 35,535,977
Building improvements 12,051,882 10,573,604 294,017 125,530 12,345,899 10,699,134
Infrastructure 6,803,391 7,277,552 107,727,109 106,937,960 114,530,500 114,215,512
Equipment 8,645,500 8,959,741 4,212,498 4,509,182 12,857,998 13,468,923
Vehicles 12,086,907 12,218,918 1,675,427 1,656,082 13,762,334 13,875,000
Computer software 1,337,716 1,430,901 - - 1,337,716 1,430,901
Total 91,018,245$ 90,080,979$ 128,221,425$ 128,272,615$ 219,239,670$ 218,353,594$
Governmental Activities Business-type Activities Total
Capital Project Funds The capital project funds are used by the County to acquire and construct major capital projects. Yorktown Capital Improvements Fund This fund had a $3,509,294 deficit at June 30, 2021, resulting from a prior year advance from the Tourism Fund.

C - 14
County Capital Fund For fiscal year 2021, a transfer of $3,748,694 was from the General Fund for future projects. Capital expenditures of $4,127,680 included the following: software replacement for records management in the Sheriff’s office; radios; fire and life safety apparatus; public safety building design work; county administration building renovations; trolley replacement; Yorktown pier improvements; heating and air conditioning repairs/replacement; roof, building, parking lot and grounds repairs/maintenance; sidewalk projects; and VDOT intersection and road related projects.
Additional information on the County’s capital assets can be found in note 5 beginning on page F-17 of this report. Governmental Activities and Business-type Activities - Long-term Debt At the end of the fiscal year, the County had total bonded debt of $124,585,413. Capital leases, compensated absences, claims liabilities, net pension liability and net OPEB obligation are not included in these figures.
FY2021 FY2020 FY2021 FY2020 FY2021 FY2020
Bonds payable 105,817,406$ 103,489,477$ 18,768,007$ 19,604,905$ 124,585,413$ 123,094,382$
Total 105,817,406$ 103,489,477$ 18,768,007$ 19,604,905$ 124,585,413$ 123,094,382$
Governmental Activities Business-type Activities Total
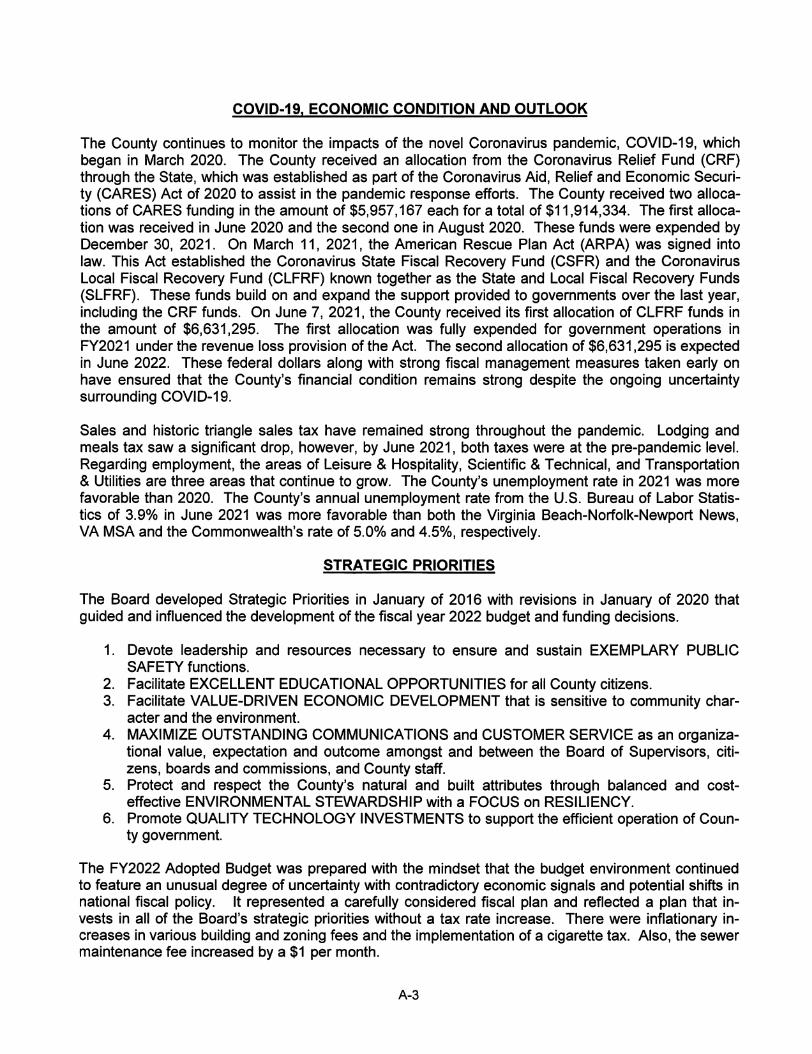
Under Virginia state law, school divisions do not have the authority to issue debt. Therefore, all school debt is issued by and is a liability of the County. In fiscal year 2021, the County paid debt service of $4,705,000 and $2,958,195 for education related principal and interest and fiscal charges, respectively, through the Education Debt Service Fund. The County continues to maintain an excellent bond rating for local governmental jurisdictions of its type and size. The rating assigned by Standard & Poor's Corporation is AAA and the Moody's rating is Aa1 for the lease revenue bonds issued in December 2008. Additional information on the County’s long-term debt can be found in note 7 beginning on page F-21 of this report. ECONOMIC FACTORS AND NEXT YEAR'S BUDGETS AND TAX RATES The County's staff and Board of Supervisors considered many factors when developing the fiscal year 2022 budget including the economic impact from the coronavirus pandemic. The fiscal year 2022 approved budget for the General Fund is $152,000,000, a 5.8% increase from the fiscal year 2021 budget. The fiscal year 2022 Budget was adopted on May 4, 2021 and represents a cautious fiscal plan taking into consideration the uncertainty of the economic impacts of the coronavirus pandemic. It reflects a plan that invests in all of the Board’s strategic priorities as outlined in the Letter of Transmittal without a tax rate increase. There were, however, inflationary increases in various building and zoning fees and the implementation of a cigarette tax. In addition, there was a $1 per month increase in the sewer maintenance fee with all other fees remaining the same.

C - 15
The School Division’s request for funding in FY2022 was fully funded. The budget also provided for pay increases for over 900 employees. Preparations for the next budget cycle are underway for FY2023. REQUESTS FOR INFORMATION This financial report is designed to provide our citizens, taxpayers, customers, and investors and creditors with a general overview of the County's finances and to demonstrate the County's accountability for the money it receives. Questions concerning this report or requests for additional financial information should be directed to Theresa S. Owens, CPA, Finance Director, P.O. Box 532, Yorktown, VA 23690, telephone (757) 890-3700.

C - 16
THIS PAGE LEFT BLANK INTENTIONALLY

Marquis
Economic Community
Governmental Business-type School Development Development
Activities Activities Total Division Authority Authority
Cash and investments 104,499,830$ 17,683,030$ 122,182,860$ 14,561,481$ 1,412,487$ -$
Restricted cash 1,019,011 936,224 1,955,235 - 24,121 334,826
Receivables, net 19,611,481 3,768,074 23,379,555 5,531,404 47,673 6
Due from Primary Government - - - 17,469,975 - 456,222
Due from component unit - EDA - 51,484 51,484 - - -
Prepaid expenses 445,762 24,483 470,245 586,000 13 -
Other assets - - - - 1,726,399 -
Net OPEB asset - - - 5,177,881 - -
Internal balances 2,350,000 (2,350,000) - - - -
Capital assets:
Nondepreciable/nonamortizable 16,834,149 8,612,530 25,446,679 17,917,419 - 20,366,995
Depreciable/amortizable 159,777,458 204,280,687 364,058,145 259,718,842 860,517 9,000 Less accumulated depreciation/amortization (85,593,362) (84,671,792) (170,265,154) (108,475,302) (274,940) (9,000)
Total assets 218,944,329 148,334,720 367,279,049 212,487,700 3,796,270 21,158,049
Debt refundings resulting in loss transactions, net
of accumulated amortization 1,056,153 359,477 1,415,630 - - -
OPEB costs 10,567,283 1,077,425 11,644,708 3,736,853 - -
Pension costs 15,032,540 1,465,032 16,497,572 33,254,092 - -
Total deferred outflows of resources 26,655,976 2,901,934 29,557,910 36,990,945 - -
Total assets and deferred outflows of resources 245,600,305$ 151,236,654$ 396,836,959$ 249,478,645$ 3,796,270$ 21,158,049$
Accounts payable 2,265,754$ 851,155$ 3,116,909$ 3,857,224$ 15,968$ 13,686$
Retainage payable 20,635 - 20,635 41,764 - -
Deposits payable 594,872 58,036 652,908 634 24,121 -
Salaries, taxes and benefits payable 1,984,516 191,738 2,176,254 16,785,538 - -
Unearned revenues 2,511,008 1,142,551 3,653,559 228,027 525 17,117
Due to Primary Government - - - - 51,484 -
Due to component unit - School Division 17,469,975 - 17,469,975 - - -
Due to component unit - CDA 414,616 - 414,616 - - -
Accrued interest payable 1,560,394 181,779 1,742,173 - - 409,600
Noncurrent liabilities:
Due within one year 10,282,470 984,398 11,266,868 3,666,000 20,000 - Due in more than one year 148,469,861 22,802,485 171,272,346 149,758,664 16,667 38,978,885
Total liabilities 185,574,101 26,212,142 211,786,243 174,337,851 128,765 39,419,288
Prepaid taxes, fees and receivables 1,350,054 - 1,350,054 - - -
OPEB costs 9,787,918 1,000,679 10,788,597 3,126,609 - -
Pension costs - - - 8,733,916 - -
Total deferred inflows of resources 11,137,972 1,000,679 12,138,651 11,860,525 - -
Net investment in capital assets 67,685,243 110,749,120 178,434,363 169,160,959 585,577 (17,383,090)
Restricted for:
Community services 186,637 - 186,637 - - -
Public safety 1,599,447 - 1,599,447 - - -
Tourism 739,568 - 739,568 - - -
Judical services 88,464 - 88,464 - - -
Transportation improvements 705,800 - 705,800 - - -
Library renovations 5,592,247 - 5,592,247 - - -
Other purposes 39,562 - 39,562 6,649,611 - -
Food service - - - 3,256,436 - - Unrestricted (deficit) (27,748,736) 13,274,713 (14,474,023) (115,786,737) 3,081,928 (878,149)
Total net position (deficit) 48,888,232 124,023,833 172,912,065 63,280,269 3,667,505 (18,261,239)
Total liabilities, deferred inflows of resources,
and net position 245,600,305$ 151,236,654$ 396,836,959$ 249,478,645$ 3,796,270$ 21,158,049$
COUNTY OF YORK, VIRGINIA
Statement of Net Position
June 30, 2021
Component Units
Discretely Presented
Primary Government
DEFERRED OUTFLOWS OF RESOURCES
LIABILITIES
NET POSITION
DEFERRED INFLOWS OF RESOURCES
ASSETS
The accompanying notes are an integral part of the basic financial statements.
D-1

Marquis
Operating Capital Economic Community
Charges for Grants and Grants and Governmental Business-type School Development Development
Functions/Programs Expenses Services Contributions Contributions Activities Activities Total Division Authority Authority
Primary Government:
Governmental activities:
General administration 3,753,814$ 250,352$ 499,643$ 243,621$ (2,760,198)$ -$ (2,760,198)$ -$ -$ -$
Judicial services 3,704,339 651,790 1,640,150 - (1,412,399) - (1,412,399) - - -
Public safety 42,065,399 3,496,404 13,324,828 45,000 (25,199,167) - (25,199,167) - - -
Management services 12,923,458 496,213 2,846,463 - (9,580,782) - (9,580,782) - - -
Education 70,239,829 16,364 2,479,523 331,998 (67,411,944) - (67,411,944) - - -
Human services 10,111,077 312,338 5,566,170 - (4,232,569) - (4,232,569) - - -
Public works 10,943,599 1,445,206 807,818 43,342 (8,647,233) - (8,647,233) - - -
Community development 3,498,074 787,606 244,869 - (2,465,599) - (2,465,599) - - -
Community services 8,106,746 402,047 2,255,116 247,651 (5,201,932) - (5,201,932) - - -
Interest and fiscal charges on noncurrent debt 3,577,368 - - - (3,577,368) - (3,577,368) - - -
Total governmental activities 168,923,703 7,858,320 29,664,580 911,612 (130,489,191) - (130,489,191) - - -
Business-type activities:
Sewer Utility 11,992,147 11,380,626 78,797 2,174,548 - 1,641,824 1,641,824 - - -
Water Utility 324,391 310,542 - - - (13,849) (13,849) - - -
Solid Waste 6,055,946 5,911,272 11,695 4,879 - (128,100) (128,100) - - -
Yorktown Operations 157,317 183,713 - - - 26,396 26,396 - - -
Sanitary Districts 418,134 - - - - (418,134) (418,134) - - -
Regional Radio System 4,068,264 3,398,927 - - - (669,337) (669,337) - - -
Total business-type activities 23,016,199 21,185,080 90,492 2,179,427 - 438,800 438,800 - - -
Total Primary Government 191,939,902$ 29,043,400$ 29,755,072$ 3,091,039$ (130,489,191) 438,800 (130,050,391) - - -
Component units:
School Division 168,125,447$ 826,336$ 87,431,532$ 20,881$ - - - (79,846,698)$ -$ -$
Economic Development Authority 618,725 360,742 - - - - - - (257,983) -
Marquis Community Development Authority 6,376,193 - - 127 - - - - - (6,376,066)
Total component units 175,120,365$ 1,187,078$ 87,431,532$ 21,008$ - - - (79,846,698) (257,983) (6,376,066)
General revenues:
Taxes:
Property taxes 96,141,095 - 96,141,095 - - -
Local sales and use taxes 17,389,034 - 17,389,034 - - -
Hotel and motel room taxes 3,549,512 - 3,549,512 - - -
Restaurant food taxes 5,338,091 937,343 6,275,434 - - -
Business license taxes 7,513,546 - 7,513,546 - - -
Motor vehicle licenses 1,647,098 - 1,647,098 - - -
Taxes on recordation and wills 2,207,395 - 2,207,395 - - -
Other local taxes 1,909,367 - 1,909,367 - - -
Personal property tax relief from Commonwealth of Virginia, net Local Aid to Commonwealth 8,741,680 - 8,741,680 - - -
Payment from Primary Government - - - 64,822,756 66,385 1,218,609
Unrestricted shared intergovernmental revenues - - - 15,266,600 - -
Unrestricted investment earnings (19,787) 25,086 5,299 15,805 7,636 -
Miscellaneous 372,731 8,534 381,265 3,937,730 500 -
Gain on disposal of capital assets 4,391 23,769 28,160 - - -
Transfers (1,045,730) 1,045,730 - - - -
Total general revenues and transfers 143,748,423 2,040,462 145,788,885 84,042,891 74,521 1,218,609
Change in net position 13,259,232 2,479,262 15,738,494 4,196,193 (183,462) (5,157,457)
Net position (deficit), beginning, as restated 35,629,000 121,544,571 157,173,571 59,084,076 3,850,967 (13,103,782)
Net position (deficit), ending 48,888,232$ 124,023,833$ 172,912,065$ 63,280,269$ 3,667,505$ (18,261,239)$
Component Units
COUNTY OF YORK, VIRGINIA
Statement of Activities
For the Year Ended June 30, 2021
Primary Government
Net (Expenses) Revenues and Changes in Net PositionProgram Revenues
Discretely Presented
The accompanying notes are an integral part of the basic financial statements.
D-2

Tourism Yorktown Nonmajor Total
Special Capital County Debt Service Governmental Governmental
General Revenue Improvements Capital Education Funds Funds
Cash and investments 48,124,409$ 383,071$ 487,836$ 26,335,923$ 372,699$ 16,659,375$ 92,363,313$
Restricted cash 17,025 - - 1,001,986 - - 1,019,011
Receivables, net 16,383,906 418,764 36,667 722,641 - 1,390,916 18,952,894
Prepaid expenditures 12,442 - - - - 17,117 29,559
Advances to other funds 6,383,797 4,033,797 - - - - 10,417,594
Total assets 70,921,579$ 4,835,632$ 524,503$ 28,060,550$ 372,699$ 18,067,408$ 122,782,371$
Liabilities:
Accounts payable 1,166,050$ 6,884$ -$ 338,041$ 16,025$ 321,775$ 1,848,775$
Retainage payable - - - - - 10,549 10,549
Deposits payable 594,872 - - - - - 594,872
Salaries, taxes and benefits payable 1,816,999 28,534 - - - 96,191 1,941,724
Unearned revenues 16,788 41,726 - 2,287,521 - 164,973 2,511,008
Due to component unit - School Division 17,469,975 - - - - - 17,469,975
Due to component unit - CDA - - - - - 414,616 414,616
Advances from other funds - 4,033,797 4,033,797 - - - 8,067,594
Total liabilities 21,064,684 4,110,941 4,033,797 2,625,562 16,025 1,008,104 32,859,113
Deferred inflows of resources:
Unavailable revenues - property taxes, fees and grants 4,605,519 8,137 - - - 45,060 4,658,716
Prepaid taxes, fees and receivables 621,262 - - 711,675 - 17,117 1,350,054
Total deferred inflows of resources 5,226,781 8,137 - 711,675 - 62,177 6,008,770
Fund balances (deficit):
Nonspendable 6,396,239 - - - - - 6,396,239
Restricted 13,104 716,554 - 6,927,926 - 1,271,127 8,928,711
Committed 1,252,245 - - 2,189,112 - 13,929,502 17,370,859
Assigned 18,728,526 - - 15,606,275 356,674 1,796,498 36,487,973
Unassigned 18,240,000 - (3,509,294) - - - 14,730,706
Total fund balances (deficit) 44,630,114 716,554 (3,509,294) 24,723,313 356,674 16,997,127 83,914,488
Total liabilities, deferred inflows of resources
and fund balances (deficit) 70,921,579$ 4,835,632$ 524,503$ 28,060,550$ 372,699$ 18,067,408$ 122,782,371$
AND FUND BALANCES
Governmental Funds
Balance Sheet
June 30, 2021
COUNTY OF YORK, VIRGINIA
ASSETS
LIABILITIES, DEFERRED INFLOWS OF RESOURCES
Capital Project
The accompanying notes are an integral part of the basic financial statements.
E-1

Fund balances - Total governmental funds 83,914,488$
Amounts reported for governmental activities in the Statement of Net Position are different because:
87,272,663
Unavailable revenue property taxes, fees and grants $ 4,658,716
Less allowance for doubtful accounts, fees (226,077) 4,432,639
Deferred outflows of resources related to OPEB costs $ 10,351,720
Deferred inflows of resources related to OPEB costs (9,589,320)
Deferred outflows of resources related to pension costs 14,701,147 15,463,547
Deferred charge on refunded debt $ 2,049,699
Less accumulated amortization (993,546) 1,056,153
Assets
Current assets $ 13,437,384
Capital assets 9,880,225
Less accumulated depreciation/amortization (6,134,643)
Deferred outflows of resources 546,956
17,729,922
Liabilities (2,637,079) Deferred inflows of resources (198,598) 14,894,245
Accrued interest payable $ (1,560,394)
Net OPEB liability (8,103,202)
Net pension liability (35,468,004)
General obligation bonds, net (82,529,933)
Capital leases (919,423)
Lease revenue bonds, net (23,287,473)
Compensated absences (6,277,074) (158,145,503)
Total net position - Statement of Net Position 48,888,232$
Other noncurrent assets are not available to pay for current period expenditures and,
therefore, are deferred in the funds.
Costs incurred from the issuance of long-term debt are recognized as expenditures in
the fund statements, but are deferred in the government-wide statements.
Internal Service Funds are used by management to provide certain goods and services
to governmental funds. The assets and liabilities of the Internal Service Funds are
included in the governmental activities in the Statement of Net Position.
Noncurrent assets/liabilities are not due and payable in the current period and,
therefore, are not reported in the funds.
COUNTY OF YORK, VIRGINIA
Reconciliation of the Balance Sheet of Governmental Funds to the Statement of Net Position
June 30, 2021
Capital assets used in governmental fund activities are not financial resources and,
therefore, are not reported in the funds.
Deferred outflows and inflows of resources related to the net pension and OPEB
obligations are not recognized in the funds.
The accompanying notes are an integral part of the basic financial statements.
E-2
Tourism Yorktown Nonmajor Total
Special Capital County Debt Service Governmental Governmental
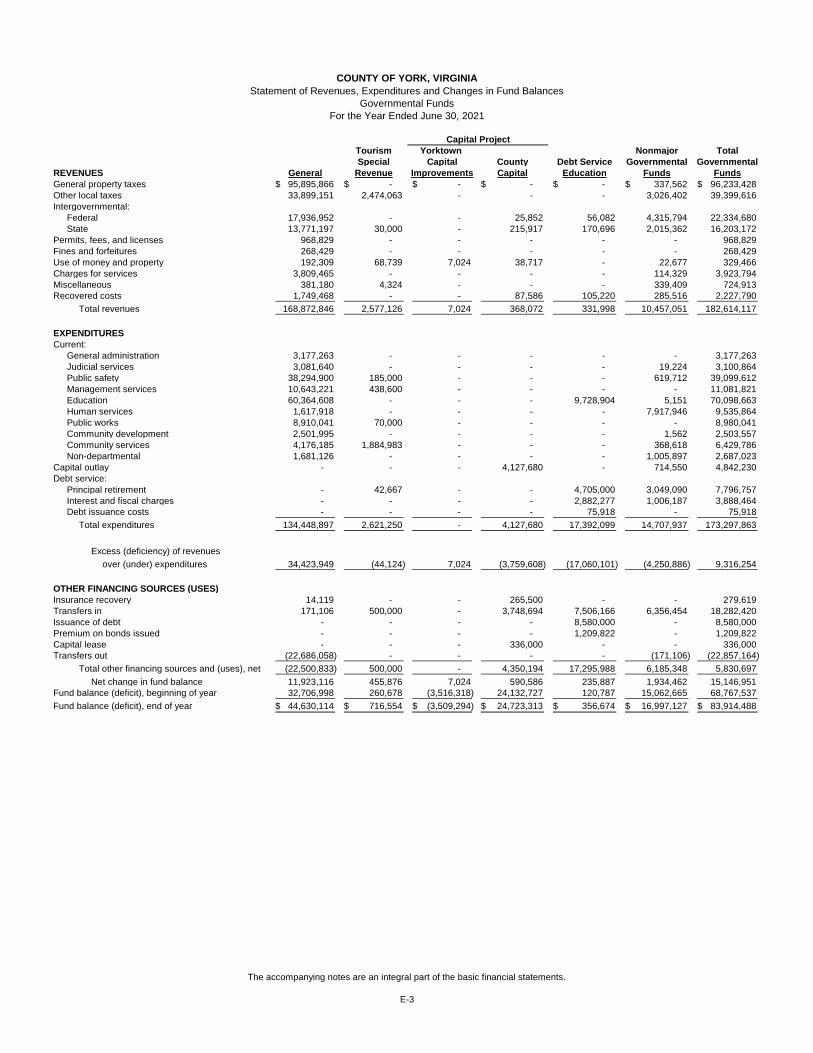
REVENUES General Revenue Improvements Capital Education Funds Funds
General property taxes 95,895,866$ -$ -$ -$ -$ 337,562$ 96,233,428$
Other local taxes 33,899,151 2,474,063 - - - 3,026,402 39,399,616
Intergovernmental:
Federal 17,936,952 - - 25,852 56,082 4,315,794 22,334,680
State 13,771,197 30,000 - 215,917 170,696 2,015,362 16,203,172
Permits, fees, and licenses 968,829 - - - - - 968,829
Fines and forfeitures 268,429 - - - - - 268,429
Use of money and property 192,309 68,739 7,024 38,717 - 22,677 329,466
Charges for services 3,809,465 - - - - 114,329 3,923,794
Miscellaneous 381,180 4,324 - - - 339,409 724,913
Recovered costs 1,749,468 - - 87,586 105,220 285,516 2,227,790
Total revenues 168,872,846 2,577,126 7,024 368,072 331,998 10,457,051 182,614,117
EXPENDITURES
Current:
General administration 3,177,263 - - - - - 3,177,263
Judicial services 3,081,640 - - - - 19,224 3,100,864
Public safety 38,294,900 185,000 - - - 619,712 39,099,612
Management services 10,643,221 438,600 - - - - 11,081,821
Education 60,364,608 - - - 9,728,904 5,151 70,098,663
Human services 1,617,918 - - - - 7,917,946 9,535,864
Public works 8,910,041 70,000 - - - - 8,980,041
Community development 2,501,995 - - - - 1,562 2,503,557
Community services 4,176,185 1,884,983 - - - 368,618 6,429,786
Non-departmental 1,681,126 - - - - 1,005,897 2,687,023
Capital outlay - - - 4,127,680 - 714,550 4,842,230
Debt service:
Principal retirement - 42,667 - - 4,705,000 3,049,090 7,796,757
Interest and fiscal charges - - - - 2,882,277 1,006,187 3,888,464
Debt issuance costs - - - - 75,918 - 75,918
Total expenditures 134,448,897 2,621,250 - 4,127,680 17,392,099 14,707,937 173,297,863
Excess (deficiency) of revenues
over (under) expenditures 34,423,949 (44,124) 7,024 (3,759,608) (17,060,101) (4,250,886) 9,316,254
OTHER FINANCING SOURCES (USES)
Insurance recovery 14,119 - - 265,500 - - 279,619
Transfers in 171,106 500,000 - 3,748,694 7,506,166 6,356,454 18,282,420
Issuance of debt - - - - 8,580,000 - 8,580,000
Premium on bonds issued - - - - 1,209,822 - 1,209,822
Capital lease - - - 336,000 - - 336,000
Transfers out (22,686,058) - - - - (171,106) (22,857,164)
Total other financing sources and (uses), net (22,500,833) 500,000 - 4,350,194 17,295,988 6,185,348 5,830,697
Net change in fund balance 11,923,116 455,876 7,024 590,586 235,887 1,934,462 15,146,951
Fund balance (deficit), beginning of year 32,706,998 260,678 (3,516,318) 24,132,727 120,787 15,062,665 68,767,537
Fund balance (deficit), end of year 44,630,114$ 716,554$ (3,509,294)$ 24,723,313$ 356,674$ 16,997,127$ 83,914,488$
Capital Project
COUNTY OF YORK, VIRGINIA
Statement of Revenues, Expenditures and Changes in Fund Balances
For the Year Ended June 30, 2021
Governmental Funds
The accompanying notes are an integral part of the basic financial statements.
E-3

Net change in fund balances - total governmental funds 15,146,951$
Amounts reported for governmental activities in the Statement of Activities are different because:
Capital outlay expenditures 6,747,282$
Transfer of capital asset to proprietary fund (4,879)
Depreciation and amortization expenses (5,425,248)
Loss on disposal of capital assets (743,348) 573,807
317,518
Principal repayments 7,796,757$
Issuance of debt (8,580,000)
Capital lease (336,000)
Premium on issuance of noncurrent debt, net (1,209,822)
Amortization of premium on issuance of noncurrent debt 596,892
Amortization of deferred charge on refunded debt (186,591) (1,918,764)
Accrued interest payable (23,288)$
Net OPEB liability 492,910
Net pension liability (4,673,892)
Compensated absences 371,825 (3,832,445)
2,972,165
Change in net position of governmental activities 13,259,232$
The internal service funds are used by management to charge the costs of certain activities to
individual funds. The net income of the internal service funds are reported with governmental
activities.
COUNTY OF YORK, VIRGINIA
Reconciliation of the Statement of Revenues, Expenditures and Changes
For the Year Ended June 30, 2021
in Fund Balances of Governmental Funds to the Statement of Activities
Governmental funds report capital outlays as expenditures. In the Statement of Activities, the cost
of those assets is allocated over their estimated useful lives and reported as depreciation expense.
Capital outlay expenditures, depreciation and amortization expenses and the loss on disposal of
capital assets in the current period are provided below.
Revenues in the Statement of Activities that do not provide current financial resources are not
reported as revenues in the funds. Unavailable revenues changed by this amount in the current
year.
The issuance of long-term debt provides current financial resources to governmental funds, while
the repayment of the principal of long-term debt consumes the current financial resources of
governmental funds. Neither transaction has an effect on net position. Governmental funds report
the effect of premiums, discounts and similar items when debt is issued, whereas these amounts
are deferred and amortized in the Statement of Activities. This amount is the net effect of those
differences in the treatment of long-term debt and related items.
Some expenses reported in the Statement of Activities do not require the use of current financial
resources and, therefore, are not reported as expenditures in governmental funds. Retirement
liabilities, accrued interest and compensated absences changed by the amounts provided below in
the current year.
The accompanying notes are an integral part of the basic financial statements.
E-4

Governmental
Activities
Nonmajor Internal
Sewer Enterprise Service
Utility Funds Total Funds
Current assets:
Cash and investments 15,013,115$ 2,669,915$ 17,683,030$ 12,136,517$
Restricted cash 936,224 - 936,224 -
Receivable, net 2,125,889 1,642,185 3,768,074 884,664
Due from component unit - EDA - 51,484 51,484 -
Prepaid expenses 6,263 18,220 24,483 416,203
Total current assets 18,081,491 4,381,804 22,463,295 13,437,384
Noncurrent assets:
Nondepreciable capital assets:
Land 501,353 3,445,402 3,946,755 -
Construction in progress 3,961,322 - 3,961,322 394,700
Easements 693,508 10,945 704,453 -
Depreciable capital assets:
Land improvements 68,920 - 68,920 262,573
Buildings 18,155,052 5,033,608 23,188,660 -
Buildings improvements 309,011 295,438 604,449 -
Infrastructure 143,438,788 23,422,860 166,861,648 -
Equipment 5,483,144 4,627,292 10,110,436 1,696,215
Vehicles 1,976,687 1,399,615 3,376,302 7,396,145
Intangibles 70,272 - 70,272 130,592
Less accumulated depreciation (57,517,046) (27,084,475) (84,601,521) (6,030,223)
Less accumulated amortization (70,271) - (70,271) (104,420)
Total noncurrent assets 117,070,740 11,150,685 128,221,425 3,745,582
Debt refundings resulting in loss transactions, net
of accumulated amortization 359,477 - 359,477 -
Deferred outflows related to OPEB costs 902,761 174,664 1,077,425 215,563
Deferred outflows related to pension costs 1,186,902 278,130 1,465,032 331,393
Total deferred outlfows 2,449,140 452,794 2,901,934 546,956
Total assets and deferred outflows of resources 137,601,371$ 15,985,283$ 153,586,654$ 17,729,922$
Current liabilities:
Accounts payable 469,933$ 381,222$ 851,155$ 416,979$
Retainage payable - - - 10,086
Deposits payable 46,036 12,000 58,036 -
Salaries, taxes and benefits payable 152,076 39,662 191,738 42,792
Unearned revenues 1,075,461 67,090 1,142,551 -
Accrued interest payable 181,779 - 181,779 -
Revenue bonds 966,898 - 966,898 -
Claims payable - - - 1,065,000
Compensated absences 15,000 2,500 17,500 6,000
Total current liabilities 2,907,183 502,474 3,409,657 1,540,857
Noncurrent liabilities:
Revenue bonds 17,801,109 - 17,801,109 -
Compensated absences 545,828 76,143 621,971 122,374
Net OPEB liability 688,458 143,350 831,808 173,549
Net pension liability 2,878,689 668,908 3,547,597 800,299
Advance from other fund - 2,350,000 2,350,000 -
Total noncurrent liabilities 21,914,084 3,238,401 25,152,485 1,096,222
Total liabilities 24,821,267 3,740,875 28,562,142 2,637,079
Deferred inflows related to OPEB costs 840,374 160,305 1,000,679 198,598
Total deferred inflows of resources 840,374 160,305 1,000,679 198,598
Net investment in capital assets 99,598,434 11,150,686 110,749,120 3,745,582
Unrestricted 12,341,296 933,417 13,274,713 11,148,663
Total net position 111,939,730 12,084,103 124,023,833 14,894,245
Total liabilities, deferred inflows of resources
and net position 137,601,371$ 15,985,283$ 153,586,654$ 17,729,922$
NET POSITION
LIABILITIES
COUNTY OF YORK, VIRGINIA
Statement of Net Position
June 30, 2021
Proprietary Funds
ASSETS
Business-type Activities
DEFERRED OUTFLOWS OF RESOURCES
DEFERRED INFLOWS OF RESOURCES
The accompanying notes are an integral part of the basic financial statements.
E-5

Governmental
Activities
Nonmajor Internal
Sewer Enterprise Service
Utility Funds Total Funds
Operating Revenues
Use of property -$ 3,664,837$ 3,664,837$ -$
Charges for services 11,380,626 6,139,617 17,520,243 19,038,350
Miscellaneous 201 8,333 8,534 126,967
Total operating revenues 11,380,827 9,812,787 21,193,614 19,165,317
Operating Expenses
Personal services 5,047,527 1,200,500 6,248,027 2,479,316
Contractual services 566,978 8,497,570 9,064,548 15,025,982
Materials and supplies 1,912,319 452,823 2,365,142 1,622,550
Depreciation 3,888,688 873,159 4,761,847 633,582
Total operating expenses 11,415,512 11,024,052 22,439,564 19,761,430
Operating loss (34,685) (1,211,265) (1,245,950) (596,113)
Nonoperating Revenues (Expenses)
Other local taxes 874,853 62,490 937,343 -
Federal subsidy for interest on debt 78,797 - 78,797 -
Grant income - 11,695 11,695 -
Interest income 22,105 2,981 25,086 13,020
Amortization of debt premium 236,898 - 236,898 -
Interest and fiscal charges (813,533) - (813,533) -
Gain on disposal of capital assets - 23,769 23,769 4,391
Total nonoperating revenues, net 399,120 100,935 500,055 17,411
Income (loss) before contributions and transfers, net 364,435 (1,110,330) (745,895) (578,702)
Capital Contributions 2,174,548 4,879 2,179,427 21,853
Transfers In - 1,045,740 1,045,740 3,529,014
Transfers Out (10) - (10) -
Change in net position 2,538,973 (59,711) 2,479,262 2,972,165
Total net position, beginning of year 109,400,757 12,143,814 121,544,571 11,922,080
Total net position, end of year 111,939,730$ 12,084,103$ 124,023,833$ 14,894,245$
Business-type Activities
COUNTY OF YORK, VIRGINIA
Statement of Revenues, Expenses and Changes in Fund Net Position
For the Year Ended June 30, 2021
Proprietary Funds
The accompanying notes are an integral part of the basic financial statements.
E-6

Governmental
Activities
Internal
Sewer Nonmajor Service
Utility Enterprise Funds Total Funds
CASH FLOWS FROM OPERATING ACTIVITIES
Receipts from customers and users 11,058,630$ 9,143,294$ 20,201,924$ 18,190,008$
Other receipts 201 8,333 8,534 126,967
Payments to suppliers for goods and services (2,165,663) (9,043,059) (11,208,722) (16,646,097)
Payments to employees for services (4,657,404) (1,137,703) (5,795,107) (2,329,543) Payment for interfund activity - (50,000) (50,000) -
Net cash provided by (used in) operating activities 4,235,764 (1,079,135) 3,156,629 (658,665)
CASH FLOWS FROM NONCAPITAL FINANCING ACTIVITIES
Grant income - 11,695 11,695 -
Transfers in - 1,045,740 1,045,740 3,529,014 Transfers out (10) - (10) -
Net cash provided by (used in) noncapital financing activities (10) 1,057,435 1,057,425 3,529,014
CASH FLOWS FROM CAPITAL AND RELATED FINANCING ACTIVITIES
Acquisition and construction of capital assets (2,545,961) - (2,545,961) (1,013,442)
Net proceeds from the disposal of capital assets - 38,500 38,500 42,645
Other receipts 874,853 62,490 937,343 -
Federal subsidy for interest on debt 78,797 - 78,797 -
Deferred charge from capital debt 4,471 - 4,471 -
Principal paid on capital debt (600,000) - (600,000) - Interest paid on capital debt (709,249) - (709,249) -
Net cash provided by (used in) capital and related
financing activities (2,897,089) 100,990 (2,796,099) (970,797)
CASH FLOWS FROM INVESTING ACTIVITIES
Interest income 22,105 2,981 25,086 13,020
Net cash provided by investing activities 22,105 2,981 25,086 13,020
Net increase in cash and cash equivalents 1,360,770 82,271 1,443,041 1,912,572 Cash and cash equivalents, beginning of year 14,588,569 2,587,644 17,176,213 10,223,945
Cash and cash equivalents, end of year 15,949,339$ 2,669,915$ 18,619,254$ 12,136,517$
Reconciliation of cash and cash equivalents to the Statement of Net Position:
Cash and investments 15,013,115$ 2,669,915$ 17,683,030$ 12,136,517$ Restricted cash 936,224 - 936,224 -
Cash and cash equivalents, end of year 15,949,339$ 2,669,915$ 18,619,254$ 12,136,517$
Reconciliation of operating loss to net
cash provided by (used in) operating activities:
Operating loss (34,685)$ (1,211,265)$ (1,245,950)$ (596,113)$
Adjustments to reconcile operating income (loss) to net cash provided by (used in) operating activities:
Depreciation 3,888,688 873,159 4,761,847 633,582 Decrease (increase) in:
Receivables (196,259) (643,702) (839,961) (848,342)
Due from/to component unit - EDA - (38,189) (38,189) -
Prepaid expenses (324) 14,911 14,587 (39,203)
Increase (decrease) in:
Accounts payable 350,982 (92,666) 258,316 56,452
Retainage payable (34,172) - (34,172) 10,086
Deposits payable (2,852) - (2,852) -
Salaries, taxes and benefits payable 11,401 3,699 15,100 7,122
Unearned revenues (125,737) 5,820 (119,917) -
Net OPEB liablility and related outflows/inflows (37,745) (8,862) (46,607) (875)
Net pension liablility and related outflows/inflows 431,195 69,182 500,377 143,713
Claims payable - - - (24,900)
Compensated absences (14,728) (1,222) (15,950) (187) Advance from other fund - (50,000) (50,000) -
Net cash provided by (used in) operating activities 4,235,764$ (1,079,135)$ 3,156,629$ (658,665)$
Noncash investing, capital, and financing activities:
Contributions of capital assets 2,174,548$ 4,879$ 2,179,427$ 21,853$
Business-type Activities
COUNTY OF YORK, VIRGINIAStatement of Cash Flows
For the Year Ended June 30, 2021Proprietary Funds
The accompanying notes are an integral part of the basic financial statements.
E-7
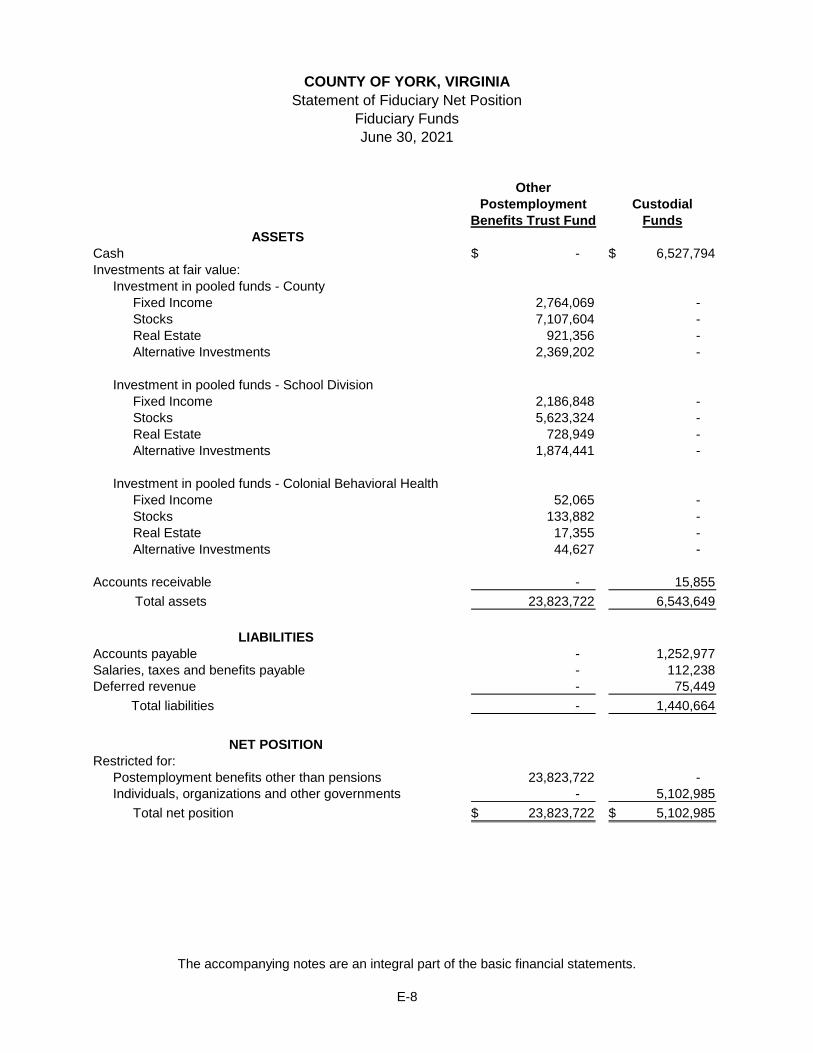
Other
Postemployment Custodial
Benefits Trust Fund Funds
Cash -$ 6,527,794$
Investments at fair value:
Investment in pooled funds - County
Fixed Income 2,764,069 -
Stocks 7,107,604 -
Real Estate 921,356 -
Alternative Investments 2,369,202 -
Investment in pooled funds - School Division
Fixed Income 2,186,848 -
Stocks 5,623,324 -
Real Estate 728,949 -
Alternative Investments 1,874,441 -
Investment in pooled funds - Colonial Behavioral Health
Fixed Income 52,065 -
Stocks 133,882 -
Real Estate 17,355 -
Alternative Investments 44,627 -
Accounts receivable - 15,855
Total assets 23,823,722 6,543,649
Accounts payable - 1,252,977
Salaries, taxes and benefits payable - 112,238
Deferred revenue - 75,449
Total liabilities - 1,440,664
Restricted for:
Postemployment benefits other than pensions 23,823,722 -
Individuals, organizations and other governments - 5,102,985
Total net position 23,823,722$ 5,102,985$
COUNTY OF YORK, VIRGINIA
Statement of Fiduciary Net Position
Fiduciary Funds
June 30, 2021
NET POSITION
ASSETS
LIABILITIES
The accompanying notes are an integral part of the basic financial statements.
E-8

Other
Postemployment Custodial
Benefits Trust Fund Funds
Contributions:
County 1,175,136$ -$
School Division 635,431 -
Colonial Behavioral Health 167,514 -
Federal receipts for other agencies & individuals - 1,292,988
State receipts for other agencies & individuals - 7,315,415
Payments from other governments, agencies & local sources - 11,484,209
Interest earned on cash balances - 1,240
Total contributions 1,978,081 20,093,852
Investment earnings:
Net increase in fair value of investments 5,429,044 -
Less administrative expenses (21,929) -
Total investment earnings, net 5,407,115 -
Total additions 7,385,196 20,093,852
Retirement benefits 1,536,671 -
Payments to other governments, agencies & individuals - 19,301,524
Total deductions 1,536,671 19,301,524
Change in net position 5,848,525 792,328
Total net position, beginning of year, as restated 17,975,197 4,310,657
Total net position, end of year 23,823,722$ 5,102,985$
For the Year Ended June 30, 2021
ADDITIONS
DEDUCTIONS
COUNTY OF YORK, VIRGINIA
Statement of Changes in Fiduciary Net Position
Fiduciary Funds
The accompanying notes are an integral part of the basic financial statements.
E-9

E-10
THIS PAGE LEFT BLANK INTENTIONALLY

COUNTY OF YORK, VIRGINIA Notes to Basic Financial Statements
June 30, 2021
F-1
1. SUMMARY OF SIGNIFICANT ACCOUNTING POLICIES
York County, which was originally named Charles River County, was one of Virginia's eight original "shires" formed in 1634. It was renamed nine years later in 1643 when the river that determines the County's character was also given the name of the then Duke of York. York County has played a major role in the development of this nation. Most importantly, it was the location of the culminating battle of the Revolutionary War and the subsequent surrender of Lord Cornwallis and his British army on October 19, 1781. The County of York, Virginia (the County) is organized under the traditional form of government (as defined under Virginia Law). The governing body of the County is the Board of Supervisors that establishes policies for the administration of the County. The Board of Supervisors comprises five members: one member from each of five districts, elected for a four-year term by the voters of the district in which the member resides. The Board of Supervisors appoints a County Administrator to act as the administrative head of the County. The financial statements of the County have been prepared in conformity with accounting principles generally accepted in the United States of America (GAAP) as applied to government units. The Governmental Accounting Standards Board (GASB) is the accepted primary standard-setting body for establishing governmental accounting and financial reporting principles. The County’s significant accounting and reporting policies are described below. In fiscal year 2021, GASB Statement No. 84 (“GASB 84”), Fiduciary Activities, was implemented to improve guidance regarding the identification of fiduciary activities for accounting and financial reporting purposes and how those activities should be reported. Additional information about GASB 84 can be found in Note 15. In addition, the County has early implemented GASB Statement No. 98 (“GASB 98”), The Annual Comprehensive Financial Report, which changes the wording of this reporting package to Annual Comprehensive Financial Report (ACFR). This Statement was developed in response to concerns raised by stakeholders that the common pronunciation of the acronym from the prior reporting package sounded like a profoundly objectionable racial slur. The Reporting Entity
The County’s financial reporting entity is defined and its financial statements are presented in accordance with GAAP where in it defines the distinction between the County as a Primary Government and its related entities. The financial reporting entity consists of the Primary Government and its discretely presented component units, which are legally, separate organizations for which the elected officials of the Primary Government are financially accountable. Financial accountability is defined as appointment of a voting majority of the component unit’s board, and either a) the ability to impose will by the Primary Government, or b) the possibility that the component unit will provide a financial benefit or impose a financial burden on the Primary Government. The Primary Government may also be financially accountable if the component unit is fiscally dependent on the Primary Government regardless of whether the component unit has a separately elected governing board.

COUNTY OF YORK, VIRGINIA Notes to Basic Financial Statements
June 30, 2021
F-2
1. SUMMARY OF SIGNIFICANT ACCOUNTING POLICIES (Continued) As such, the York County School Division (the School Division), the Economic Development Authority of York County (EDA) and the Marquis Community Development Authority (CDA) are reported as separate and discretely presented component units in the County’s reporting entity. The Primary Government is hereafter referred to as the “County” and the reporting entity, which includes the County and its component units, is hereafter referred to as the “Reporting Entity.” As required by GAAP, the accompanying basic financial statements include all activities of the County. The component unit columns in the basic financial statements include the financial data of the County’s three discretely presented component units. The discretely presented component units are reported in separate columns in the government-wide financial statements to emphasize that they are legally separate from the primary government and a description of each follows: The York County School Division (the School Division) is a separate legal entity that is responsible for elementary and secondary education within the County. Since January 1, 1996, the citizens of the County have elected the members of the School Board; however, the School Division is fiscally dependent upon the County because the Board of Supervisors approves the School Division’s annual budget and levies the necessary taxes to finance the School Division’s operations. The Board of Supervisors makes an annual appropriation to the School Division, but is prohibited from exercising any control over specific expenditures of the School Division’s operating funds. The School Division may not issue debt, so the Board of Supervisors borrows funds to finance the acquisition, construction, and improvement of School Division property. The School Division holds title to this property, while the County remains responsible for repayment of the debt. The majority of the School Division’s funding is from the County and the Commonwealth of Virginia. Separate audited financial statements are available from the School Division at 302 Dare Road, Yorktown, Virginia, 23692. The Economic Development Authority of York County (EDA) was originally established under the Industrial Development and Revenue Bond Act - Code of Virginia (Code). The 2004 General Assembly amended the Code 15.2-4903 to allow localities to change the name of their Industrial Development Authorities if so authorized by the local governing body and the EDA took such action. A separate board appointed by the Board of Supervisors governs the EDA. The EDA is fiscally dependent upon the County because substantially all of its income is derived from an appropriation from the County. The EDA has the responsibility to promote industry and develop trade by inducing manufacturing, industrial and commercial enterprises to locate or to remain in the County. Separate audited financial statements are available from the EDA at P.O. Box 612, Yorktown, Virginia, 23690. The Marquis Community Development Authority (CDA) was created pursuant to the Virginia Water and Waste Authorities Act (the “Act”), beginning with 15.2-5100 et. seq. of the Code of Virginia, 1950, by an ordinance adopted by the County’s Board of Supervisors on December 19, 2006. The Marquis Development Authority District (the “District”) consists of a land area of approximately 222.85 acres in York County, Virginia just outside of the City of Williamsburg, Virginia. The Act provides that the Authority may issue bonds to finance infrastructure improvements located within or benefiting the District and the Board of Supervisors, at the request of the Authority, may levy and collect special assessments within the District and appropriate such sums to the Authority for use in paying the administrative expenses and debt service requirement in connection with any such bonds.

COUNTY OF YORK, VIRGINIA Notes to Basic Financial Statements
June 30, 2021
F-3
1. SUMMARY OF SIGNIFICANT ACCOUNTING POLICIES (Continued) The CDA is fiscally dependent upon the County for the remittance of the incremental tax revenues to fund the CDA’s debt service requirements. On November 28, 2007, the Authority issued $32,860,000 Revenue Bonds, Series 2007 which were restructured on March 1, 2012. On October 27, 2015, the CDA issued convertible capital appreciation revenue bonds. The principal of and the interest on the 2007 bonds do not constitute a pledge of the faith and credit of the County and therefore the faith and credit of the County have not been pledged to the payment of the principal of or interest on the 2007 bonds. The issuance of the bonds does not directly, indirectly or contingently obligate the County to levy any taxes or to make any appropriation for their payment except from the revenues and receipts pledged therefore. Pursuant to the Act, the County is expressly precluded from paying the principal of or interest on the bonds except from the special assessments and the incremental tax revenues. A separate board appointed by the Board of Supervisors governs the CDA. Separate audited financial statements are available from Theresa S. Owens, Marquis Community Development Authority at 120 Alexander Hamilton Boulevard, Yorktown, Virginia 23690. Joint Venture Government Organizations The County does not include in the basic financial statements certain authorities created as separate governments under the laws of the Commonwealth of Virginia. These authorities are separate legal entities having governmental character and sufficient autonomy in the management of their own affairs to distinguish them as separate from the administrative organization of the County although the County Board of Supervisors appoints certain members of their governing bodies. While the County may have some reversionary interest in the assets of these entities in the event they are dissolved, the nature and extent of that interest would be subject to negotiation at the time of dissolution. The County does not include these entities as component units because they do not meet the criteria as set forth in GAAP. The Virginia Peninsulas Public Service Authority (VPPSA) was established under the Code, Virginia Water and Sewer Authorities Act. A separate ten-member board of which the County appoints one representative governs VPPSA. VPPSA was formed for the purpose of developing regional refuse collection, waste reduction and disposal alternatives with the ultimate goal of acquiring, financing, constructing and/or operating and maintaining a residential, commercial and industrial garbage and refuse collection and disposal system or systems. VPPSA is fiscally independent of the County because substantially all of its income is generated through the collection of user fees. Separate audited financial statements are available from VPPSA at 300 McLaws Circle, Suite 200, Williamsburg, Virginia 23185. The Virginia Peninsula Regional Jail Authority (Jail Authority) was created pursuant to Article 3.1, Chapter 3, Title 53.1 of the Code to finance, acquire, construct, equip, maintain and operate a regional jail. A separate seven-member board, of which the County Sheriff serves as a member and the County appoints one representative, governs the Jail Authority. The Jail Authority is fiscally independent of the County because substantially all of its income is generated from payments by the member jurisdictions and reimbursements from the Commonwealth of Virginia for a portion of the capital costs, a portion of salaries and benefits of certain regional jail employees and a charge for prisoners housed at the jail. Separate audited financial statements are available from the Jail Authority, c/o the County of James City at P.O. Box 8784, Williamsburg, Virginia 23187-8784.

COUNTY OF YORK, VIRGINIA Notes to Basic Financial Statements
June 30, 2021
F-4
1. SUMMARY OF SIGNIFICANT ACCOUNTING POLICIES (Continued)
The Middle Peninsula Juvenile Detention Commission (the Commission) was created to enhance the region for the protection of the citizens by the construction, equipping, maintenance and operation of a new juvenile detention facility serving the eighteen member jurisdictions of which the Director of Community Services serves as the County’s representative on the board. The Commission is fiscally independent of the County because substantially all of its income will be generated from per diem payments from the member jurisdictions and reimbursements from the Commonwealth of Virginia for a portion of the capital costs. Separate audited financial statements are available from the Commission, c/o the County of James City at P. O. Box 8784, Williamsburg, Virginia 23187-8784. The Eastern Virginia Regional Industrial Facility Authority (EVRIFA) was created pursuant to the Virginia Regional Industrial Facilities Act, Chapter 64, Title 15.2, Section 15.2-6400, et seq., of the Code to provide a regional authority mechanism for member localities to cooperate in developing, owning, and operating one or more facilities through combined action. The EVRIFA was established in November 2018. A separate thirteen-primary member board, of which the County Board of Supervisor serves as a member and the County appoints one representative, governs the EVRIFA. The EVRIFA is fiscally independent of the County because substantially all of its income is generated from a GO Virginia grant. Separate audited financial statements will be available from the City of Hampton at 22 Lincoln Street, Hampton, Virginia 23669. Government-wide and Fund Financial Statements The basic financial statements are composed of both government-wide and fund financial statements. The government-wide statements, the Statement of Net Position and the Statement of Activities, report information on all of the nonfiduciary activities of the County and its component units. Generally, the effect of interfund activity has been removed from these statements. Governmental activities, which are normally supported by taxes and intergovernmental revenues, are reported separately from business-type activities, which rely primarily on fees and charges for services. The Primary Government is reported separately from certain legally separate component units for which the Primary Government is financially accountable. The Statement of Net Position provides information on assets and deferred outflows of resources, liabilities and deferred inflows of resources and the net position. The Statement of Activities presents a comparison between direct expenses of a function and program revenues. Direct expenses are those that are specifically associated with a specific function or segment. Program revenues include fees, fines and charges paid by the recipients of goods or services offered by the function or segment; and grants and contributions that are restricted to meet the operations or capital requirements of a particular function or segment. Revenues that are not classified as program revenues, including all taxes, are presented as general revenues. Separate financial statements are provided for governmental funds, proprietary funds and fiduciary funds, even though the latter are excluded from the government-wide financial statements. Major individual governmental funds and major individual enterprise funds are reported as separate columns in the fund financial statements. Measurement Focus, Basis of Accounting, Financial Statement Presentation The government-wide, proprietary and fiduciary fund financial statements are reported using the economic resources measurement focus and the accrual basis of accounting.

COUNTY OF YORK, VIRGINIA Notes to Basic Financial Statements
June 30, 2021
F-5
1. SUMMARY OF SIGNIFICANT ACCOUNTING POLICIES (Continued) Revenues are recorded when earned and expenses are recorded at the time liabilities are incurred, regardless of when the related cash flows take place. Nonexchange transactions, in which the County gives (or receives) value without directly receiving (or giving) equal value in exchange, include property taxes, grants, entitlements and donations. On an accrual basis, revenue from property taxes is recognized in the fiscal year for which the taxes are levied. Revenue from grants, entitlements and donations is recognized in the fiscal year in which all eligibility requirements have been satisfied. Governmental fund financial statements are reported using the current financial resources measurement focus and the modified accrual basis of accounting. Under this method, revenues are recognized when measurable and available. Revenues are generally considered available to be used to pay liabilities of the current period if they are collectible within the current period or within 45 days thereafter, or within 90 days thereafter for intergovernmental reimbursement grants. The primary revenues susceptible to accrual include property taxes, sales taxes, other local taxes and intergovernmental revenues. In applying the susceptible to accrual concept to intergovernmental revenues, the legal and contractual requirements of the individual programs are used as guidance. Expenditures are generally recorded when the related fund liability is incurred. Debt service expenditures, as well as compensated absences and claims and judgments, are recorded when payment is due. The County reports the following major governmental funds:
General Fund: The County’s primary operating fund; accounts for revenue sources and expenditures not required to be accounted for in other funds. Tourism Fund: Accounts for the receipt and disbursement of 3% of the lodging tax and the $2.00 additional tax restricted by the Commonwealth of Virginia for tourism activities. Yorktown Capital Improvements Fund: Accounts for revenue and expenditures related to capital improvements in the historical Yorktown area. County Capital Fund: Accounts for revenue and expenditures related to construction or acquisition of facilities and equipment in general governmental areas (other than those financed by proprietary funds). Education Debt Service Fund: Accounts for the receipt and payment of bonds and loans issued for the construction and maintenance of educational facilities and equipment.
The County reports the following nonmajor governmental funds:
Special Revenue Funds: The Revenue Stabilization, Children and Family Services, Virginia Public Assistance, Grant and Donations, Law Library and Community Development Authority Revenue Account Funds are used to account for the proceeds of federal, state, and local sources that are legally restricted to expenditures for specified purposes. County Debt Service Fund: Accounts for the receipt and payment of bonds and loans issued for the construction and maintenance of County facilities and equipment.

COUNTY OF YORK, VIRGINIA Notes to Basic Financial Statements
June 30, 2021
F-6
1. SUMMARY OF SIGNIFICANT ACCOUNTING POLICIES (Continued)
Stormwater Capital Projects Fund: Accounts for revenue and expenditures related to the drainage maintenance projects.
The County reports the following major enterprise fund:
Sewer Utility Fund: Accounts for the operations of the County’s sewer utility systems.
The County reports the following nonmajor enterprise funds:
Yorktown Operations Fund: Accounts for the operations at the Yorktown waterfront. York Sanitary District Fund: Accounts for the capital assets as of January 1, 1992 of the Sanitary District No. 1 utility systems. Upper County Utility Fund: Accounts for the capital assets as of January 1, 1992 of the upper County utility systems. Solid Waste Fund: Accounts for the operations of the County’s solid waste disposal system. Water Utility Fund: Accounts for operations of the County’s water utility systems. Sanitary District No. 2 Fund: Accounts for the capital assets as of January 1, 1992 of the Sanitary District No. 2 utility systems. Regional Radio System Fund: Accounts for the County’s joint emergency communication system with James City County and Gloucester County.
The County reports the following additional fund types:
Internal Service Funds: The Vehicle Maintenance Fund accounts for the operation of the vehicle maintenance and replacement services provided to County departments on a cost reimbursement basis. The Health and Dental Insurance Fund accounts for the payment of claims and other expenses related to medical and dental benefits provided to employees and retirees. The Workers’ Compensation Fund accounts for the claims and related expenses for workers’ compensation. The Information Technology Fund accounts for the costs of providing computer technical support, software support, internet and telecommunications services. Fiduciary Funds:
Custodial Funds: The County’s custodial funds account for fiscal funds held for the Colonial Behavioral Health; the Colonial Group Home Commission; the Special Welfare Board; regional projects, the Peninsula Public Sports Facility Authority, and the Darby-Firby Neighborhood Corporation. Other Postemployment Benefits (OPEB) Trust Fund: Accounts for the resources held in trust for members and beneficiaries other postemployment benefits.

COUNTY OF YORK, VIRGINIA Notes to Basic Financial Statements
June 30, 2021
F-7
1. SUMMARY OF SIGNIFICANT ACCOUNTING POLICIES (Continued) Proprietary funds distinguish operating revenues and expenses from nonoperating revenues and expenses. Operating revenues and expenses generally result from providing services and producing and delivering goods in connection with a proprietary fund’s principal ongoing operations. As a general rule, the effect of interfund activity has been eliminated from the government-wide financial statements. Exceptions to this general rule are charges between the government’s Sewer Utility and various other functions of the government; elimination of these charges would distort the direct costs and program revenues reported for the various functions concerned. When both restricted and unrestricted resources are available for use, it is the government’s policy to use restricted resources first, then unrestricted on an as needed basis. Property Taxes The two major sources of property taxes are described below:
Real Estate: The County levies real estate taxes on all real estate within its boundaries, except that exempted by statute, each year as of January 1 on the estimated market value of the property. All real estate property is assessed biennially. Real estate taxes are billed in semi-annual installments due June 25 and December 5. Liens are placed on the property on the date real estate taxes are delinquent, June 26 and December 6, and must be satisfied prior to the sale or transfer of the property. Real estate taxes reported as revenue are for the assessment due December 5, 2020 and June 25, 2021, less an allowance for uncollectible amounts and taxes not collected within 45 days after year-end. The tax rate for calendar year 2020 and 2021 was $0.795, per $100 of assessed value. Personal Property: The County levies personal property taxes on motor vehicles and tangible personal business property. These levies are made each year as of January 1. Personal property taxes are billed in equal semi-annual installments due June 25 and December 5. Personal property taxes do not create a lien on property. The personal property taxes reported as revenue are for the levies due December 5, 2020, and June 25, 2021, less an allowance for uncollectible amounts and taxes not collected within 45 days after year-end. The tax rate for calendar years 2020 and 2021 was $4.00 per $100 of assessed value.
The County's property tax collection records show that 95.45% of the property taxes due for the current tax year were collected. Allowance for Uncollectible Amounts Provision for uncollectible property taxes is based upon a historical percentage of accounts written off applied to the total levies of all years carried in taxes receivable and, in certain cases, specific account analysis. Provision for uncollectible solid waste, water and sewer service bills is based upon a historical analysis of uncollected accounts and, in certain cases, specific account analysis. Cash and Temporary Investments The County utilizes the pooled cash investment method. Income from the investment of pooled cash is allocated to the various funds based on the percentage of cash and temporary investments of each fund to the total pooled cash and temporary investments. See Note 2 for description of cash and temporary investment policies. Investments are stated at fair value.

COUNTY OF YORK, VIRGINIA Notes to Basic Financial Statements
June 30, 2021
F-8
1. SUMMARY OF SIGNIFICANT ACCOUNTING POLICIES (Continued) Inventories Inventories consist of materials and supplies held for future consumption and are stated at cost using the first-in, first-out method. Inventory is accounted for under the consumption method. Prepaids Certain payments to vendors reflect costs applicable to future accounting periods and are recorded as prepaid items in the basic financial statements. Prepaid items are recorded as expenditures when consumed. Advances Advances to other funds as reported in the General Fund, net advances from other funds, is offset by a fund balance nonspendable account, to indicate that they are not available for appropriation and are not expendable available financial resources. Capital Assets Capital assets include land, land improvements, buildings and improvements, infrastructure, equipment, and vehicles. Intangible assets include easements and computer software. Infrastructure acquired prior to 2002 that meets the County’s capitalization threshold has been reported. All acquisitions of land and easements; land improvements, infrastructure, equipment, and computer software that individually costs $5,000 or more; vehicles that individually cost $10,000 or more; and buildings and improvements that individually cost $30,000 or more and with useful lives greater than one year are reported in the applicable governmental or business-type activities column in the government-wide financial statements. Such assets are recorded at historical cost or estimated historical cost if constructed or purchased. Donated capital assets are recorded at acquisition value at the date of donation. Capital and intangible assets are depreciated and amortized over their estimated useful lives using the straight-line, half-year convention method. Land and permanent easements have an indefinite life. Temporary easements are amortized over the period of time the easement covers. The estimated useful lives of other capital and intangible assets are as follows: land improvements (15 - 20), buildings and improvements (10 - 50), infrastructure (10 - 50), equipment (3 - 20), vehicles (3 - 20), and computer software (3 - 7). Compensated Absences County employees are granted vacation and sick pay in varying amounts as services are provided. They may accumulate, subject to certain limitations, unused vacation and sick pay earned and, upon retirement, termination or death, may be compensated for certain amounts at their then current rates of pay. A liability for these amounts is reported in governmental funds only if they have matured, for the reasons stated above. The current and noncurrent liability for accrued vacation and sick leave benefits at June 30, 2021 has been reported in the government-wide statements, representing the County’s commitment to fund such costs from future operations. In the proprietary funds, the amount of compensated absences recognized is the amount earned. Such benefits are included in the government-wide statements. The amount due within one year has been estimated based on historic trends.

COUNTY OF YORK, VIRGINIA Notes to Basic Financial Statements
June 30, 2021
F-9
1. SUMMARY OF SIGNIFICANT ACCOUNTING POLICIES (Continued) Deferred Outflows and Inflows of Resources Deferred outflows of resources represent a consumption of net position that applies to a future period and so will not be recognized as an expense or expenditure until then. The County’s deferred outflows of resources consist of the amount by which the principal and premium of a refunding bond exceed the net carrying amount of the refunded debt and amounts related to pension and OPEB costs. The deferred outflow associated with the refunded debt is being amortized over the remaining life of the refunded debt. Changes of assumptions, differences between projected and actual earnings on investments, differences between expected and actual experience, and changes in proportion and differences between employer contributions and proportionate share of contributions on pension plan investments are actuarially determined and recorded as deferred outflows. Additionally, employer contributions subsequent to the measurement date will be recognized as a reduction of the liability in the following fiscal year. Other amounts reported as deferred outflows of resources will be amortized according to the actuarial amortization calculation. See note 10 and 11 for further details. Deferred inflows of resources represent an acquisition of net position that applies to a future period and so will not be recognized as revenue until then. Under the modified accrual basis of accounting, the County has revenues, which are applicable to a future period, and will not be recognized until the period they become available. These amounts are recorded on the governmental funds’ Balance Sheet as a deferred inflow of resources. Deferred revenue for prepaid taxes, fees and receivables are recorded as deferred inflows in the government-wide financial statements. Additionally, amounts related to pension and OPEB costs are actuarially determined and recorded as deferred inflows in the government-wide financial statements and proprietary funds’ Balance Sheet. These inflows include differences between expected and actual experience, differences between projected and actual earnings, changes of assumptions and changes in proportionate share. Other amounts reported as deferred inflows of resources will be amortized according to the actuarial amortization calculation. See note 10 and 11 for further details. Fund Balances In the governmental fund financial statements, fund balances have been classified to reflect the limitations and restrictions placed on the respective funds as follows:
Nonspendable: Amounts that cannot be spent because they are not in spendable form, or are legally or contractually required to be maintained intact.
Restricted: Amounts that can be spent only for the specific purposes stipulated by constitution, external resource providers or through enabling legislation.
Committed: Amounts that can be used only for the specific purposes determined by a formal action of the County’s highest level of decision making authority, the Board of Supervisors, whom can commit funds, by adoption of an ordinance (establishing rates and fees earmarked for a specific purpose). Once adopted, the limitation cannot be used for any other purpose unless the Board of Supervisors removes or changes the specified use by taking the same type of action (ordinance) it employed to previously commit those amounts. In contrast to fund balance that is restricted by enabling legislation, committed fund balance may be redeployed for other purposes with appropriate due process.
Assigned: Amounts that are intended to be used for specific purposes, but do not meet the criteria as restricted or committed. In governmental funds other than the General Fund, assigned fund balance represents the remaining amount that is not restricted or committed. In
COUNTY OF YORK, VIRGINIA Notes to Basic Financial Statements
June 30, 2021
F-10
1. SUMMARY OF SIGNIFICANT ACCOUNTING POLICIES (Continued)
Fund Balances (Continued)
the General Fund, assigned amounts represent intended uses established by the Board of Supervisors, or as delegated to the County Administrator. The Board of Supervisors has by resolution authorized the County Administrator to assign fund balance. Unlike commitments, assignments generally only exist temporarily and an additional action is not normally required to be taken for the removal of an assignment. Conversely, as discussed above, an additional action is essential to either remove or revise a commitment.
Unassigned: The residual classification for the County’s General Fund and includes all spendable amounts not contained in other classifications.
The County’s policy is to apply expenditures against restricted resources first when either restricted or unrestricted amounts are available. Within unrestricted fund balance, it is the County’s policy to apply expenditures against committed amounts first, followed by assigned, and then unassigned amounts. In a governmental fund other than the General Fund, a negative unassigned fund balance could result if expenditures incurred for a specific purpose exceeds the amounts in the fund that are restricted, committed, and assigned for that purpose. Net Position Net position in government-wide and proprietary fund financial statements are classified as net investment in capital assets, restricted and unrestricted. Restricted net position represent constraints on resources that are either externally imposed by creditors, grantors, contributors, laws and regulations of other governments or imposed by law through state statute. Statement of Cash Flows For purposes of the Statement of Cash Flows, cash and temporary investments with original maturities of three months or less are considered to be cash and cash equivalents. Use of Estimates Management of the County has made a number of estimates and assumptions relating to the reporting of assets, liabilities and deferred flows of resources and related disclosures to prepare these financial statements in conformity with GAAP. Any differences between these estimates and actual results should immaterially affect the County’s reporting of its financial position. Credit Risk The assessed value of real estate and personal property for the County’s ten largest taxpayers comprises 10.47% of the County’s tax base. Concentration of credit risk with respect to receivables is limited due to the large number of customers comprising the County’s customer base. The Code of Virginia (Code), as amended, requires the election of a County Treasurer. The County’s Treasurer is the custodian of cash and investments for the County, EDA and School Division. Oversight for investment activity is the responsibility of the Treasurer.

COUNTY OF YORK, VIRGINIA Notes to Basic Financial Statements
June 30, 2021
F-11
2. DEPOSITS AND INVESTMENTS Deposits with banks are covered by the Federal Deposit Insurance Corporation (FDIC) and collateralized in accordance with the Virginia Security for Public Deposits Act (“the Act”) Section 2.2-4400 et. seq. of the Code. Under the Act, banks and savings institutions holding public deposits in excess of the amount insured by the FDIC must pledge collateral to the Commonwealth of Virginia Treasury Board. Financial Institutions may choose between two collateralization methodologies and depending upon that choice, will pledge collateral that ranges in the amounts from 50% to 130% of excess deposits. Accordingly, all deposits are considered fully collateralized. Statutes authorize the County to invest in obligations of the United States or agencies thereof, obligations of the Commonwealth of Virginia or political subdivisions thereof, obligations of the International Bank for Reconstruction and Development (World Bank), the Asian Development Bank, the African Development Bank, “prime quality” commercial paper and certain corporate notes, bankers’ acceptances, repurchase agreements and the State Treasurer’s Local Government Investment Pool (LGIP). The Treasury Board of the Commonwealth of Virginia has regulatory oversight of the LGIP. It is managed in a manner consistent with the “2a7 like pool” risk limiting requirements of GAAP with the portfolio securities valued by the amortized cost method, which approximates fair value. Investments with a maturity date of one year or less are stated at amortized cost. The fair value of the County’s position in the LGIP is the same as the value of the pool shares. All other investments are stated at fair value. The County and the School Division are participates in the Virginia Pooled OPEB Trust administered by the VML/VACo Finance Program. Funds of participating jurisdictions are pooled and invested in the name of the Virginia Pooled OPEB Trust. The County, Colonial Behavioral Health and the School Division’s investment amounts are reported on the Fiduciary Fund statements on pages E-8 and E-9. The Board of Trustees of the Virginia Pooled OPEB Trust have adopted an investment policy to maximize total long-term rate of return with reasonable risk by seeking capital appreciation and, secondarily, principal protection. Investments are structured to achieve a compound annualized total expected rate of return over a market cycle, including current income and capital appreciation, of 7.5%. Investment decisions for the fund’s assets are made by the Board of Trustees. The Board of Trustees establishes investment objectives, risk tolerance, and asset allocation policies in light of market and economic conditions and generally prevailing prudent investment practices. The Board of Trustees also monitors the investments through the appointment and oversight of investment managers and ensures adherence to the adopted policies and guidelines. Specific investment information and written investment policies for the Virginia Pooled OPEB Trust can be obtained by writing to VML/VACo Finance Program, 8 E. Canal Street, Suite 100, Richmond, VA 23219. The carrying amount of the Primary Government’s cash and investments at June 30, 2021 is as follows:
Amount
Restricted cash 1,955,235$
Investments 58,623,575
Deposits with financial institutions 63,554,940
Petty cash 4,345
Total cash and investments 124,138,095$

COUNTY OF YORK, VIRGINIA Notes to Basic Financial Statements
June 30, 2021
F-12
2. DEPOSITS AND INVESTMENTS (Continued) A reconciliation to the basic financial statements is as follows:
Economic Community
School Development Development
Division Authority Authority
Primary Component Component Component
Government Unit Unit Unit Total
Cash and investments 122,182,860$ 14,561,481$ 1,412,487$ -$ 138,156,828$
Restricted cash 1,955,235 - 24,121 334,826 2,314,182
Total cash and investments 124,138,095$ 14,561,481$ 1,436,608$ 334,826$ 140,471,010$
Restricted Cash The County’s restricted cash of $1,955,235 at June 30, 2021 consisted of the following: $4,000 of surety deposits for junkyards held in the County and junkyards’ names; $13,025 of surety deposits for developments; $1,001,986 for debt reserves on the 2020 bonds; and $936,224 for debt reserves on the 2020 sewer revenue bonds.
Credit Risk As required by state statute, the policy requires that commercial paper be rated “prime quality” by at least two nationally recognized statistical rating organizations (A-1 by both Standard & Poor’s and Moody’s Investor Service) and corporate notes and bonds must be rated in the AAA or AA categories by both Standard & Poor’s and Moody’s Investor Service. The County’s policy further limits credit risk by limiting investments in securities that have higher credit risks. As of June 30, 2021, the County’s investments as rated by Standard & Poor’s were as follows:
Investment Type AAA AA+ Unrated
LGIP 20,299,433$ -$ -$
Money market - - 66,223
Treasury bills - 1,377,179 -
Municipal bonds 2,543,797 - -
Federal agency bonds and notes - 37,660,678 -
Total investments 22,843,230$ 39,037,857$ 66,223$
Concentration of Credit Risk State statute limits the percentage of the portfolio that can be invested in any one issuer, excluding the U.S. Government, U.S. Government Agencies, the Commonwealth of Virginia and its authorities, mutual funds and pooled investment funds. Furthermore, no more than 35% of total available funds may be invested in commercial paper.

COUNTY OF YORK, VIRGINIA Notes to Basic Financial Statements
June 30, 2021
F-13
2. DEPOSITS AND INVESTMENTS (Continued) Interest Rate Risk As a means of limiting exposure to fair value losses arising from rising interest rates, the County’s policy limits the investment portfolio holdings to no more than 24 months, unless approved by the Treasurer. As of June 30, 2021, the carrying values and weighted average maturity of the County’s investments were as follows:
Weighted
Average
Maturity
Investment Type Fair Value in Years
Money market 66,223$ 0.02
Treasury bills 1,377,179 1.09
Federal agency bonds and notes 37,660,678 1.39
Municipal Bonds 2,543,797 1.05
Total investments 41,647,877$
Weighted average of portfolio 0.96
Custodial Credit Risk The policy requires that all investment securities purchased by the County be held by an independent third-party custodian and evidenced by safekeeping receipts in the County’s name. As of June 30, 2021, all of the County’s investments were held in a bank’s trust department in the County’s name. Fair Value Hierarchy GAAP establishes a hierarchy (3 Levels) of valuation techniques used to measure fair value. The hierarchy is based on the valuation inputs used to measure the fair value of an asset. Level 1 inputs are quoted prices in active markets for identical assets. Level 2 inputs are inputs other than quoted prices that are observable either directly or indirectly. Level 3 inputs are unobservable inputs. The County has the following fair value measurements as of June 30, 2021:
Investments - At fair value June 30, 2021
Quoted Prices in
Active Markets for
Identical Assets
(Level 1)
Significant Other
Observable Inputs
(Level 2)
Money market 66,223$ 66,223$ -$
Treasury bills 1,377,179 1,377,179 -
Federal agency bonds and notes 37,660,678 10,922,421 26,738,257
Municipal Bonds 2,543,797 - 2,543,797
Total investments 41,647,877$ 12,365,823$ 29,282,054$
Fair Value Measurements Using

COUNTY OF YORK, VIRGINIA Notes to Basic Financial Statements
June 30, 2021
F-14
2. DEPOSITS AND INVESTMENTS (Continued) In addition, investments held by the Virginia Pooled OPEB Trust Fund in the pool in which the County and the School Division participate (Portfolio I) as reported by the Fund’s investment advisor, Asset Consulting Group, at June 30, 2021 are $1.366 billion, of which the County, School Division and the Colonial Behavioral Health have $23,823,722 invested. Investments measured at fair value using net asset value per share (VML/VACo Pooled OPEB Trust) are not classified in the fair value hierarchy. The VML/VACo Pooled OPEB Trust categorizes their investments within the fair value hierarchy established by GAAP. A government is permitted, in certain circumstances, to establish the fair value of an investment that does not have a readily determinable fair value by using the Net Asset Value (NAV) per share (or its equivalent) of the investment. Investments in the VML/VACo Pooled OPEB Trust are valued using the NAV per share, which is determined by dividing the total value of the Trust by the number of outstanding shares. The NAV per share changes with the value of the underlying investments in the Trust. Generally, VML/VACo Pooled OPEB Trust participants may redeem their investment at the end of a calendar quarter upon 90 days; written notice. Discretely Presented Component Units At June 30, 2021, and excluding Pension Trust funds of $1,737,977 and other cash not held by the Treasurer of $1,471,730, the School Division’s investments held by the County Treasurer consisted of $176,734 invested in LGIP, with a Standard and Poor’s rating of AAA. At June 30, 2021, the EDA had bank deposits of $512,682 ($24,121 of which was restricted for tenant security deposits) and investments in LGIP of $923,926, rated AAAm by Standard & Poor’s. The CDA’s restricted cash and investments of $334,826 at June 30, 2021, consisted of unspent bond proceeds. The total amount was invested in the U.S. Treasury money market funds. The U.S. Treasury money market funds are rated AAAm by Standard & Poor’s and were stated at cost, which approximates fair value.
3. RECEIVABLES
At June 30, 2021, receivables were as follows:
Yorktown Nonmajor Nonmajor Internal
Capital County Governmental Sewer Enterprise Service
General Tourism Imps Capital Funds Utility Funds Funds
Property taxes 7,107,490$ -$ -$ -$ 1,330$ -$ -$ -$
Vehicle registration
fees 655,521 - - - - - - -
Other taxes 4,145,462 448,155 - - 338,506 213,269 - -
Accounts 491,430 - - - 85,986 2,008,100 1,690,971 884,664
Interest - - - - - - - -
Notes - - 36,667 711,675 - - - -
Intergovernmental:
Federal 849,386 - - 5,928 627,443 - - -
State 4,454,286 20,000 - 5,038 337,651 - - -
Receivables, gross 17,703,575 468,155 36,667 722,641 1,390,916 2,221,369 1,690,971 884,664
Less allowance for
doubtful accounts (1,319,669) (49,391) - - - (95,480) (48,786) -
Receivables, net 16,383,906$ 418,764$ 36,667$ 722,641$ 1,390,916$ 2,125,889$ 1,642,185$ 884,664$

COUNTY OF YORK, VIRGINIA Notes to Basic Financial Statements
June 30, 2021
F-15
4. INTERFUND AND COMPONENT UNIT TRANSACTIONS
The composition of interfund balances as of June 30, 2021 is as follows:
Advance from Fund Advance to Fund Purpose Amount
General Tourism Infrastructure 4,033,797$
Nonmajor Enterprise Funds Land purchase 2,350,000
Total Advances to other funds 6,383,797$
Tourism
Yorktown Capital
Improvements Infrastructure 4,033,797$
The advances from the General Fund and Tourism Fund were capital project loans and are not expected to be fully repaid in the subsequent year. Repayments for the infrastructure loan have begun from the lodging tax revenue generated by tourism. There was no repayment made in FY2021 due to the decline in Tourism revenues related to the coronavirus pandemic. Repayments for the land purchase have also begun, from net rental income generated by the tenant operations managed by the EDA. Repayments in both instances are expected to continue until the advances are fully liquidated.
Due to/from Primary Government:
Due from Entity Due to Entity Purpose Amount
County of York School Division Operations 17,469,975$
EDA County of York Riverwalk Landing lease 51,484$
County of York CDA Incremental tax revenues 456,222$
Transfers In and Out:
Transfers Out Transfers In
Fund Fund Fund
General 22,686,058$ 171,106$
Tourism - 500,000
County Capital - 3,748,694
Debt Service Education - 7,506,166
Nonmajor governmental 171,106 6,356,454
Sewer Utility 10 -
Nonmajor enterprise - 1,045,740
Internal service - 3,529,014
Total 22,857,174$ 22,857,174$

COUNTY OF YORK, VIRGINIA Notes to Basic Financial Statements
June 30, 2021
F-16
4. INTERFUND AND COMPONENT UNIT TRANSACTIONS (Continued) Significant transactions between the Primary Government and component units during fiscal year 2021 were as follows:
Payments from County to School Division for School operations 56,346,097$
Payments to County from School Division - year-end reversion entry (1,252,245)
Total General Fund 55,093,852$
Bond proceeds from County to School Division for construction -
Education Debt Service 9,728,904$
Statement of Activities - Payment from County of York 64,822,756$
Payment from County General Fund to Economic Development Authority
for operations; Statement of Activities - Payment from County of York 66,385$
Payment from County Nonmajor Governmental Fund to Community Development Authority
for incremental tax revenue; Statement of Activities - Payment from County of York 1,218,609$

COUNTY OF YORK, VIRGINIA Notes to Basic Financial Statements
June 30, 2021
F-17
5. CAPITAL ASSETS Capital asset activity for the year ended June 30, 2021 was as follows:
Primary Government:
Governmental Activities: Balance Balance
Capital assets not being depreciated/amortized: July 1, 2020 Additions Reductions June 30, 2021
Land 12,854,926$ -$ -$ 12,854,926$
Easements 789,666 31,998 - 821,664
Construction in progress 1,339,091 3,532,116 (1,713,648) 3,157,559
Total capital assets not being depreciated/amortized 14,983,683 3,564,114 (1,713,648) 16,834,149
Capital assets being depreciated/amortized:
Land improvements 24,026,835 507,481 - 24,534,316
Buildings 45,440,197 24,623 - 45,464,820
Building improvements 14,442,367 1,924,540 - 16,366,907
Infrastructure 15,142,791 - - 15,142,791
Equipment 30,337,260 1,357,157 (688,169) 31,006,248
Vehicles 24,804,560 1,941,943 (2,467,153) 24,279,350
Computer software 2,811,537 171,489 - 2,983,026
Total capital assets being depreciated/amortized 157,005,547 5,927,233 (3,155,322) 159,777,458
Less accumulated depreciation/amortization for:
Land improvements (18,551,446) (1,017,303) - (19,568,749)
Buildings (16,279,006) (892,681) - (17,171,687)
Building improvements (3,868,763) (446,262) - (4,315,025)
Infrastructure (7,865,239) (474,161) - (8,339,400)
Equipment (21,377,519) (1,528,439) 545,210 (22,360,748)
Vehicles (12,585,642) (1,435,310) 1,828,509 (12,192,443)
Computer software (1,380,636) (264,674) - (1,645,310)
Total accumulated depreciation/amortization (81,908,251) (6,058,830) 2,373,719 (85,593,362)
Total capital assets being depreciated/amortized, net 75,097,296 (131,597) (781,603) 74,184,096
Governmental activities capital assets, net 90,080,979$ 3,432,517$ (2,495,251)$ 91,018,245$

COUNTY OF YORK, VIRGINIA Notes to Basic Financial Statements
June 30, 2021
F-18
5. CAPITAL ASSETS (Continued) Depreciation and amortization expense was charged to functions of the Primary Government for
governmental activities as follows:
General administration 840,585$
Judicial services 328,664
Public safety 2,283,938
Management services 392,737
Education 96,509
Human services 4,780
Public works 346,793
Community services 1,131,242
Internal Service Fund - charged to functions based on usage 633,582
Total depreciation and amortization expenses -
governmental activities 6,058,830$
Business-type Activities: Balance Balance
Capital assets not being depreciated/amortized: July 1, 2020 Additions Reductions June 30, 2021
Land 3,946,755$ -$ -$ 3,946,755$
Easements 688,253 16,200 - 704,453
Construction in progress 3,991,047 1,582,413 (1,612,138) 3,961,322
Total capital assets not being depreciated/amortized 8,626,055 1,598,613 (1,612,138) 8,612,530
Capital assets being depreciated/amortized:
Land improvements 68,920 - - 68,920
Buildings 23,188,660 - - 23,188,660
Building improvements 426,257 178,191 - 604,448
Infrastructure 162,814,757 4,046,891 - 166,861,648
Equipment 9,931,145 319,833 (140,541) 10,110,437
Vehicles 3,249,292 225,215 (98,205) 3,376,302
Computer software 70,272 - - 70,272
Total capital assets being depreciated/amortized 199,749,303 4,770,130 (238,746) 204,280,687
Less accumulated depreciation/amortization for:
Land improvements (25,900) (3,444) - (29,344)
Buildings (16,813,874) (714,518) - (17,528,392)
Building improvements (300,727) (9,704) - (310,431)
Infrastructure (55,876,797) (3,257,742) - (59,134,539)
Equipment (5,421,963) (585,300) 109,324 (5,897,939)
Vehicles (1,593,210) (191,139) 83,474 (1,700,875)
Computer software (70,272) - - (70,272)
Total accumulated depreciation/amortization (80,102,743) (4,761,847) 192,798 (84,671,792)
Total capital assets being depreciated/amortized, net 119,646,560 8,283 (45,948) 119,608,895
Business-type activities capital assets, net 128,272,615$ 1,606,896$ (1,658,086)$ 128,221,425$
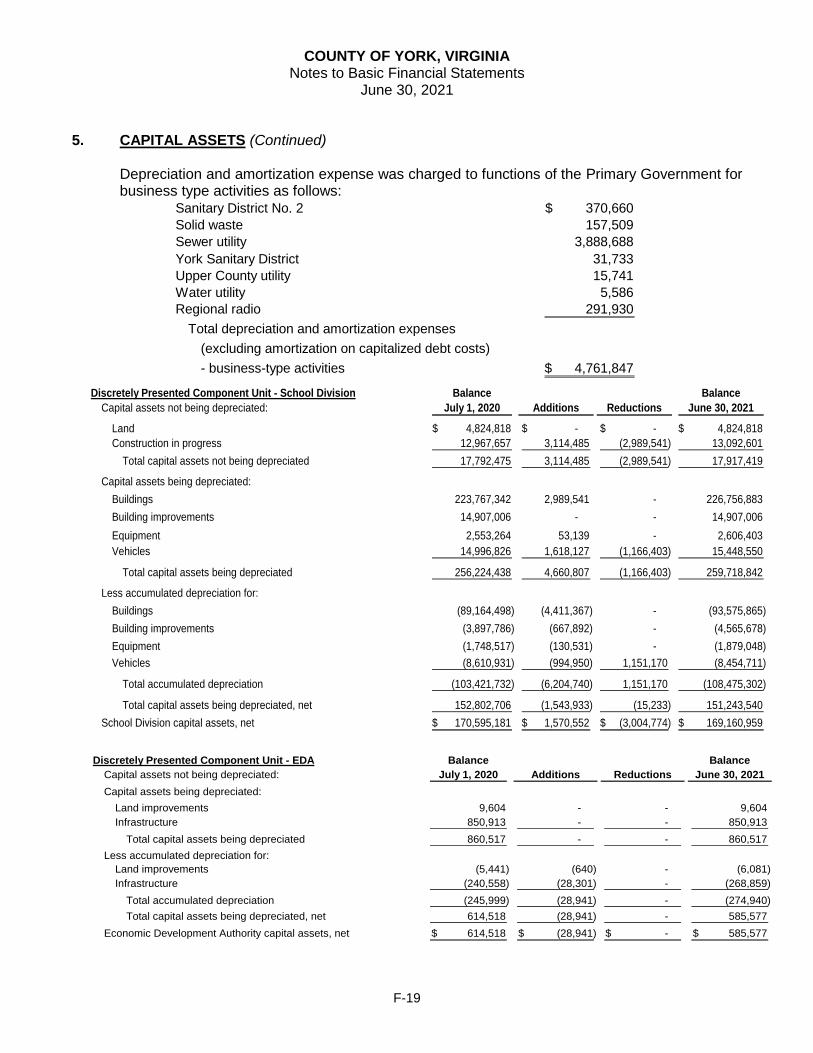
COUNTY OF YORK, VIRGINIA Notes to Basic Financial Statements
June 30, 2021
F-19
5. CAPITAL ASSETS (Continued)
Depreciation and amortization expense was charged to functions of the Primary Government for business type activities as follows:
Sanitary District No. 2 370,660$
Solid waste 157,509
Sewer utility 3,888,688
York Sanitary District 31,733
Upper County utility 15,741
Water utility 5,586
Regional radio 291,930
Total depreciation and amortization expenses
(excluding amortization on capitalized debt costs)
- business-type activities 4,761,847$
Discretely Presented Component Unit - School Division Balance Balance
Capital assets not being depreciated: July 1, 2020 Additions Reductions June 30, 2021
Land 4,824,818$ -$ -$ 4,824,818$
Construction in progress 12,967,657 3,114,485 (2,989,541) 13,092,601
Total capital assets not being depreciated 17,792,475 3,114,485 (2,989,541) 17,917,419
Capital assets being depreciated:
Buildings 223,767,342 2,989,541 - 226,756,883
Building improvements 14,907,006 - - 14,907,006
Equipment 2,553,264 53,139 - 2,606,403
Vehicles 14,996,826 1,618,127 (1,166,403) 15,448,550
Total capital assets being depreciated 256,224,438 4,660,807 (1,166,403) 259,718,842
Less accumulated depreciation for:
Buildings (89,164,498) (4,411,367) - (93,575,865)
Building improvements (3,897,786) (667,892) - (4,565,678)
Equipment (1,748,517) (130,531) - (1,879,048)
Vehicles (8,610,931) (994,950) 1,151,170 (8,454,711)
Total accumulated depreciation (103,421,732) (6,204,740) 1,151,170 (108,475,302)
Total capital assets being depreciated, net 152,802,706 (1,543,933) (15,233) 151,243,540
School Division capital assets, net 170,595,181$ 1,570,552$ (3,004,774)$ 169,160,959$
Discretely Presented Component Unit - EDA Balance Balance
Capital assets not being depreciated: July 1, 2020 Additions Reductions June 30, 2021
Capital assets being depreciated:
Land improvements 9,604 - - 9,604
Infrastructure 850,913 - - 850,913
Total capital assets being depreciated 860,517 - - 860,517
Less accumulated depreciation for:
Land improvements (5,441) (640) - (6,081)
Infrastructure (240,558) (28,301) - (268,859)
Total accumulated depreciation (245,999) (28,941) - (274,940)
Total capital assets being depreciated, net 614,518 (28,941) - 585,577
Economic Development Authority capital assets, net 614,518$ (28,941)$ -$ 585,577$

COUNTY OF YORK, VIRGINIA Notes to Basic Financial Statements
June 30, 2021
F-20
5. CAPITAL ASSETS (Continued)
6. UNEARNED REVENUE AND DEFERRED INFLOWS
Unearned revenue represents amounts for which asset recognition criteria have been met, but for which revenue recognition criteria have not been met. Unearned revenue at the fund level arises when potential revenue does not meet both the “measurable” and “available” criteria for recognition in the current period. In subsequent periods, when both revenue recognition criteria are met, or when the government has a legal claim to the resources, the liability for unearned revenue is removed from the balance sheet and revenue is recognized. Deferred inflows represent an acquisition of net position that will not be recognized as revenue until a future period. At June 30, 2021, unearned revenues and deferred inflows are provided in the table below.
Nonmajor Nonmajor
County Governmental Sewer Enterprise
General Tourism Capital Funds Utility Funds
Unearned Revenues
Advance payments for fees, services
and rents 16,788$ 41,726$ 2,287,521$ 164,973$ 1,075,461$ 67,090$
Deferred Inflows
Unavailable property taxes and fees 4,248,433$ 8,137$ -$ 41,606$ -$ -$
Unavailable grants 357,086 - - 3,454 - -
Prepaid taxes and services 621,262 - - 17,117 - -
Long-term notes receivable - - 711,675 - - -
Total 5,226,781$ 8,137$ 711,675$ 62,177$ -$ -$
Capital assets not being depreciated: July 1, 2020 Additions Transfers Reductions June 30, 2021
Construction in progress 18,561,448$ -$ (15,014,735)$ (3,546,713)$ -$
Capitalized interest expense 2,821,491 - (2,290,692) (530,799) -
Less interest revenue on investments (496,139) - 402,801 93,338 -
Public improvements 2015 to be transferred 3,530,000 - - (65,630) 3,464,370
Roads - - 7,524,128 - 7,524,128
BMP Basins - - 4,442,390 - 4,442,390
Storm Drain - - 4,936,107 - 4,936,107
Total capital assets not being depreciated 24,416,800 - - (4,049,805) 20,366,995
Capital assets being amortized:
Computer software 9,000 - - - 9,000
Less accumulated amortization (9,000) - - - (9,000)
Total capital assets being amortized, net - - - - -
Community Development Authority
capital assets, net 24,416,800$ -$ -$ (4,049,805)$ 20,366,995$

COUNTY OF YORK, VIRGINIA Notes to Basic Financial Statements
June 30, 2021
F-21
7. LONG-TERM DEBT
The following is a summary of changes in long-term debt during the year ended June 30, 2021: Primary Government: Balance Balance Due Within
Governmental Activities: July 1, 2020 Additions Reductions June 30, 2021 One Year
General obligation bonds 73,700,000$ 8,580,000$ (4,705,000)$ 77,575,000$ 5,250,000$
Premium on bonds 4,033,259 1,209,822 (288,148) 4,954,933 338,557
Capital leases 1,515,179 336,000 (931,756) 919,423 554,169
Lease revenue bonds 22,740,000 - (2,160,000) 20,580,000 2,320,000
Premium on bonds 3,016,218 - (308,745) 2,707,473 308,744
Compensated absences 6,777,460 5,511,372 (5,883,384) 6,405,448 446,000
Claims liabilities, IBNR 1,089,900 1,065,000 (1,089,900) 1,065,000 1,065,000
Net pension liability 25,371,455 20,096,200 (9,199,352) 36,268,303 -
Net OPEB liability 10,753,997 21,975,312 (24,452,558) 8,276,751 -
Total Governmental Activities 148,997,468$ 58,773,706$ (49,018,843)$ 158,752,331$ 10,282,470$
Primary Government: Balance Balance Due Within
Business-type Activities: July 1, 2020 Additions Reductions June 30, 2021 One Year
Revenue bonds 16,130,000$ -$ (600,000)$ 15,530,000$ 730,000$
Premium on bonds 3,474,905 - (236,898) 3,238,007 236,898
Compensated absences 655,421 434,666 (450,616) 639,471 17,500
Net pension liability 2,432,880 1,985,952 (871,235) 3,547,597 -
Net OPEB liability 1,082,440 2,255,731 (2,506,363) 831,808 -
Total Business-type Activities 23,775,646$ 4,676,349$ (4,665,112)$ 23,786,883$ 984,398$

COUNTY OF YORK, VIRGINIA Notes to Basic Financial Statements
June 30, 2021
F-22
7. LONG-TERM DEBT (Continued)
Discretely Presented Balance Balance Due Within
Component Units: July 1, 2020 Additions Reductions June 30, 2021 One Year
School Division
Compensated absences 3,253,908$ 1,320,410$ (1,066,557)$ 3,507,761$ 1,110,000$
Claims liabilities 4,658,830 441,807 (266,496) 4,834,141 2,556,000
Net pension liability * 112,675,325 48,800,392 (34,511,000) 126,964,717 -
Net OPEB liability 17,873,640 4,027,183 (3,782,778) 18,118,045 -
138,461,703$ 54,589,792$ (39,626,831)$ 153,424,664$ 3,666,000$
Economic Development Authority
Notes payable 56,667$ -$ (20,000)$ 36,667$ 20,000$
Community Development Authority
Refunding bonds payable 28,875,000$ -$ -$ 28,875,000$ -$
Capital Appreciation bonds payable 4,404,482 - - 4,404,482 -
Total bonds payable 33,279,482$ -$ -$ 33,279,482$ -$
Accretion of interest payable:
Refunding bonds 3,046,875$ 365,625$ -$ 3,412,500$ -$
Capital Appreciation bonds 1,811,890 475,013 - 2,286,903 -
Total accretion of interest payable 4,858,765$ 840,638$ -$ 5,699,403$ -$
Total bonds and accretion of interest payables 38,138,247$ 840,638$ -$ 38,978,885$ -$
* Beginning balance restated to add York County Public Schools - Option plan, which was a net pension asset in the prior year.

COUNTY OF YORK, VIRGINIA Notes to Basic Financial Statements
June 30, 2021
F-23
7. LONG-TERM DEBT (Continued) Arbitrage Arbitrage is the difference between the yield on an issuer’s tax-exempt bonds and the investment income earned on the proceeds. Arbitrage restrictions imposed by the federal government prohibit an issuer from retaining arbitrage profits when investing bond proceeds at a yield that exceeds the yield on the bonds. Any excess arbitrage must be rebated to the U.S. Treasury. As of June 30, 2021, there was no rebate liability. General Obligation Bonds General obligations bonds (GOB) are backed by the full faith and credit of the County. There are no sinking fund requirements. Outstanding general obligation bonds at June 30, 2021 of the Primary Government governmental activities are as follows:
GOB Bond Maturity Interest Balance
Series Purpose Date Date Rate June 30, 2021
VPSA 05 York High and School Board renovations 11/10/05 07/15/25 4.60-5.10% 5,225,000$
VPSA 10 Grafton Bethel Elementary 07/08/10 06/01/27 1.09-1.93% 405,000
VPSA 12Coventry Elementary and New Horizons HVAC; Coventry
Elem. gymnasium (gym), Grafton Bethel and Grafton
Complex gym roof; Tabb Elementary classrooms 05/10/12 07/15/32 2.55-5.05% 4,900,000
VPSA 14Various schools HVAC, roofs, kitchens, gyms and repairs 11/20/14 01/15/35 2.05-5.05% 6,810,000
VPSA 14B Yorktown Middle and New Horizons renovations 05/15/14 07/15/26 3.60-5.35% 4,430,000
VPSA 15 Dare, Magruder, Yorktown Elementary classrooms 02/17/15 07/15/28 4.10-5.35% 2,840,000
VPSA 16 Waller Mill roof and Magruder HVAC and roof 05/17/16 07/15/36 2.30-5.05% 9,975,000
VPSA 16B Dare and Mt. Vernon Elementary and Tabb High 11/17/16 07/15/29 3.05-4.05% 2,240,000
VPSA 17 York HVAC, roof and Bethel Manor roof, renovation 04/30/17 07/15/37 3.05-5.05% 7,300,000
VPSA 18A
Tabb Elementary HVAC; Grafton Complex, Yorktown
Elementary Roofs, York High School Interior doors, modular
classrooms 04/15/18 07/15/38 3.05-5.05% 7,345,000
VPSA 19A
Tabb, Dare, Mt. Vernon, Coventry Elementary, Tabb Middle,
and Grafton Complex various renovations 05/21/19 07/15/39 3.05-5.05% 7,525,000
VPSA 19B Bruton High 05/21/19 07/15/22 2.35-5.10% 1,145,000
VPSA 19B Queens Lake 05/21/19 07/15/23 3.10-5.35% 855,000
VPSA 20
Various schools HVAC, roofs, interior doors, security
vestibules, parking lot and other repairs 04/16/20 07/15/40 2.90% 8,000,000
VPSA 21 Coventry Elementary Grafton Complex 04/25/21 07/15/41 2.05-5.05% 8,580,000
77,575,000$

COUNTY OF YORK, VIRGINIA Notes to Basic Financial Statements
June 30, 2021
F-24
7. LONG-TERM DEBT (Continued) The following is a summary of the repayment schedules for fiscal years:
Year Principal Interest
2022 5,250,000$ 2,913,402$
2023 5,780,000 2,734,930
2024 5,435,000 2,471,460
2025 5,385,000 2,218,830
2026 5,640,000 1,961,122
2027-2031 20,445,000 6,682,626
2032-2036 18,410,000 3,025,547
2037-2041 10,670,000 646,254
2042-2046 560,000 5,740
77,575,000$ 22,659,911$
Governmental Activities
Compensated Absences For governmental activities, compensated absences are typically liquidated by the General Fund. Net OPEB and Pension Liabilities For governmental activities, net OPEB and pension obligations are typically liquidated by the General Fund. For business-type activities, net OPEB and pension obligations are liquidated by the respective fund. Lease Revenue Bonds Principal payments will be made in annual installments and interest payments will be made in semi-annual installments. Outstanding lease revenue bonds at June 30, 2021 of the Primary Government governmental activities are as follows:
Bond Maturity Interest Balance
Series Purpose Date Date Rate June 30, 2021
2014Communications system and building,
equipment, parking garage 02/27/14 07/15/23 2.000-4.500% 2,440,000$
2016Sports Field Complex-Partial refunding of
Series 2008 05/25/16 10/01/29 4.163-5.125% 8,870,000
2018AFire Apparatus, Grafton Fire Station and
Carver Gardens 05/23/18 10/01/38 1.918%-5.125% 7,085,000
2020Fire Apparatus, Yorktown Library, Sheriff
Building 06/03/20 10/01/40 4.125%-5.125% 2,185,000
20,580,000$
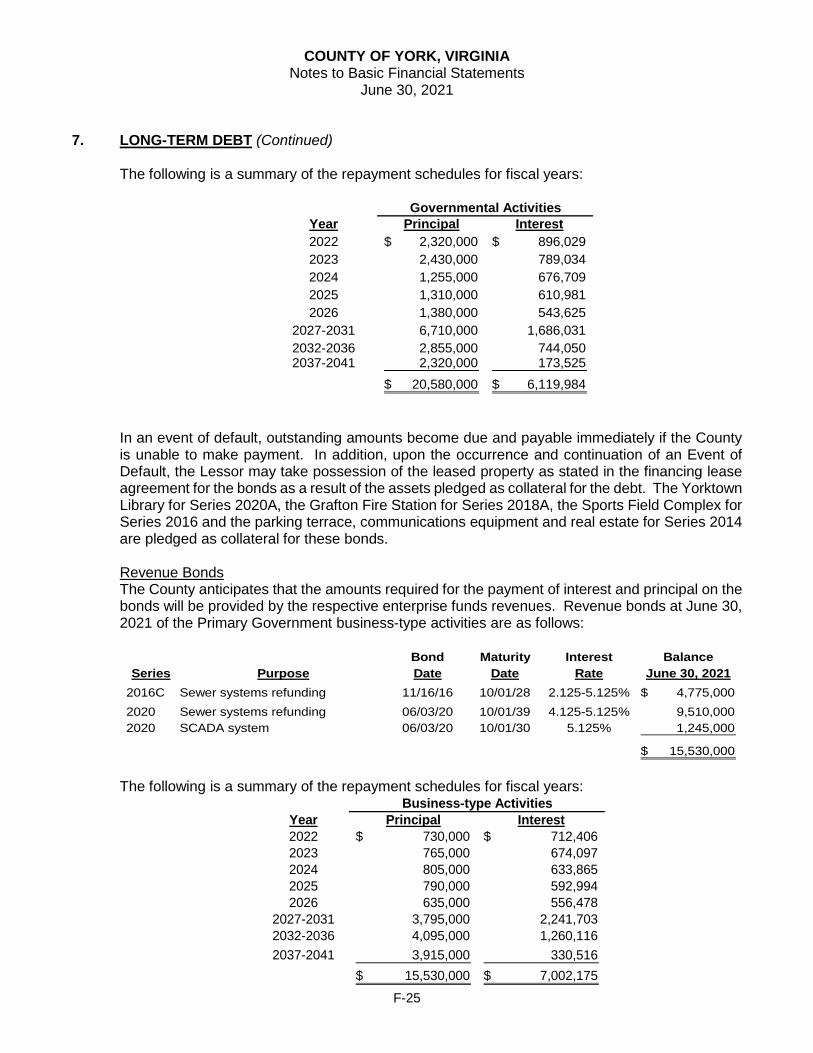
COUNTY OF YORK, VIRGINIA Notes to Basic Financial Statements
June 30, 2021
F-25
7. LONG-TERM DEBT (Continued) The following is a summary of the repayment schedules for fiscal years:
Year Principal Interest
2022 2,320,000$ 896,029$
2023 2,430,000 789,034
2024 1,255,000 676,709
2025 1,310,000 610,981
2026 1,380,000 543,625
2027-2031 6,710,000 1,686,031
2032-2036 2,855,000 744,050 2037-2041 2,320,000 173,525
20,580,000$ 6,119,984$
Governmental Activities
In an event of default, outstanding amounts become due and payable immediately if the County is unable to make payment. In addition, upon the occurrence and continuation of an Event of Default, the Lessor may take possession of the leased property as stated in the financing lease agreement for the bonds as a result of the assets pledged as collateral for the debt. The Yorktown Library for Series 2020A, the Grafton Fire Station for Series 2018A, the Sports Field Complex for Series 2016 and the parking terrace, communications equipment and real estate for Series 2014 are pledged as collateral for these bonds. Revenue Bonds The County anticipates that the amounts required for the payment of interest and principal on the bonds will be provided by the respective enterprise funds revenues. Revenue bonds at June 30, 2021 of the Primary Government business-type activities are as follows:
Bond Maturity Interest Balance
Series Purpose Date Date Rate June 30, 2021
2016C Sewer systems refunding 11/16/16 10/01/28 2.125-5.125% 4,775,000$
2020 Sewer systems refunding 06/03/20 10/01/39 4.125-5.125% 9,510,000
2020 SCADA system 06/03/20 10/01/30 5.125% 1,245,000
15,530,000$
The following is a summary of the repayment schedules for fiscal years:
Year Principal Interest
2022 730,000$ 712,406$
2023 765,000 674,097
2024 805,000 633,865
2025 790,000 592,994
2026 635,000 556,478
2027-2031 3,795,000 2,241,703
2032-2036 4,095,000 1,260,116
2037-2041 3,915,000 330,516
15,530,000$ 7,002,175$
Business-type Activities

COUNTY OF YORK, VIRGINIA Notes to Basic Financial Statements
June 30, 2021
F-26
7. LONG-TERM DEBT (Continued)
In an event of default, outstanding amounts become due and payable immediately if the County is unable to make payment. The County would pay to the Owners of the Bonds the entire unpaid principal and accrued interest on the Bonds, but only from the Net Revenues and other funds of the County pledged to such payment. Economic Development Authority In November 2012, the Authority executed a property lease for the Riverwalk Restaurant and an adjacent vacant space for another restaurant to a new private company. As part of the negotiations, the Authority also entered into an equipment lease. The lease is for $200,000, with repayments starting on May 1, 2013 for 120 months and with interest on the outstanding balance of 3.14% per annum. The balance at June 30, 2021 is $36,667. Marquis Community Development Authority On November 27, 2007, the CDA issued special obligation bonds for $32,860,000 to finance the construction of public infrastructure improvements located within the District. On March 1, 2012, the Bonds were restructured and reissued pursuant to a Restructuring Memorandum of Understanding. Under the restructuring and reissuance terms, the original 2007 Bonds have been restructured and $2,805,000 of the original Bonds has been redeemed. Interest on the bonds is payable each March 1 and September 1. Interest is computed on the basis of a year of 360 days and twelve 30-day months. Interest rates range from 5.1% - 5.625%. The following is a summary of the repayment schedules for fiscal years:
Year Ending
June 30, Principal Interest Principal Interest Principal Interest
2022 -$ 289,425$ -$ 939,375$ -$ -$
2023 - 289,425 - 939,375 - -
2024 - 289,425 - 939,375 - -
2025 - 289,425 - 939,375 - -
2026 - 289,425 - 939,375 - -
2027-2031 2,200,000 1,177,845 - 4,696,875 - -
2032-2036 2,820,000 540,600 6,365,000 3,840,609 - -
2037-2041 655,000 16,703 8,370,000 1,781,156 - -
2042 - - 1,965,000 55,266 6,500,000 26,890,476
Total 5,675,000$ 3,182,273$ 16,700,000$ 15,070,781$ 6,500,000$ 26,890,476$
Series A Bonds 5.100% Series C Bonds 5.625%Series B Bonds 5.625%
On October 27, 2015, the CDA issued convertible capital appreciation revenue bonds in the amount of $4,404,482 to finance additional public infrastructure improvements located within the District. The 2015 Bonds will initially be issued as capital appreciation bonds and will convert to current interest bonds on September 1, 2021, the “conversion date”. Prior to the conversion date, the 2015 Bonds will not pay interest on a current basis, but will increase in value by the accumulation of earned interest from their initial principal amounts on the issue date to the conversion date. Interest will be compounded each March 1 and September 1, commencing March 1, 2016 at a rate of 7.5% according to the table of accreted values. The accreted value at

COUNTY OF YORK, VIRGINIA Notes to Basic Financial Statements
June 30, 2021
F-27
7. LONG-TERM DEBT (Continued) Marquis Community Development Authority (Continued) the conversion date will be $6,773,000. Following the conversion date, interest on the 2015 Bonds will be payable semiannually on each March 1 and September 1, commencing March 1, 2022 at a rate of 7.5%. The Authority’s long-term debt activity for the 2015 Bonds for the year ended June 30, 2021 was as follows:
Balance Balance
July 1, 2020 Additions Reductions June 30, 2021
Series 2015 CAB Bonds 4,404,482$ -$ -$ 4,404,482$
Accretion of interest payable 1,811,890 475,013 - 2,286,903
Total 6,216,372$ 475,013$ -$ 6,691,385$
Mandatory debt service requirements after conversion consist of the following:
Year Ending
June 30, Principal Interest
2022 -$ 253,998$
2023 - 507,975
2024 - 507,975
2025 - 507,975
2026 - 507,975
2027-2031 - 2,539,875
2032-2036 - 2,539,875
2037-2041 - 2,539,875
2042-2046 6,773,000 1,777,838
Total 6,773,000$ 11,683,361$
Series 2015 CAB Bonds
8. FUND BALANCE (DEFICIT)
Fund balance (deficit) is classified as nonspendable, restricted, committed, assigned and/or unassigned based primarily on the extent to which the County is bound to observe constraints imposed upon the use of the resources in the governmental funds. The constraints placed on fund balance (deficit) for the major governmental funds and all other governmental funds are presented below:

COUNTY OF YORK, VIRGINIA Notes to Basic Financial Statements
June 30, 2021
F-28
8. FUND BALANCE (DEFICIT) (Continued)
Yorktown Nonmajor Total
Capital County Debt Service Governmental Governmental
Purpose General Tourism Imps Capital Education Funds Funds
Nonspendable:
Prepaid expenditures 12,442$ -$ -$ -$ -$ -$ 12,442$
Advances 6,383,797 - - - - - 6,383,797
Total nonspendable 6,396,239$ -$ -$ -$ -$ -$ 6,396,239$
Restricted:
Judicial services and Commonwealth's Attorney grants -$ -$ -$ -$ -$ 88,464$ 88,464$
Interest earned on CARES Act funding received in advance 13,104 - - - - - 13,104
Public safety grants and donations - - - 606,782 - 969,568 1,576,350
Library renovation & expansion - - - 5,592,247 - - 5,592,247
Fire equipment - - - 23,097 - - 23,097
Community services grants and donations - - - - - 186,637 186,637
Tourism projects - 716,554 - - - - 716,554
Proffer projects - - - 705,800 - - 705,800
Other purposes - - - - - 26,458 26,458
Total restricted 13,104$ 716,554$ -$ 6,927,926$ -$ 1,271,127$ 8,928,711$
Committed:
School reversion 1,252,245$ -$ -$ -$ -$ -$ 1,252,245$
Intergovernmental revenue shortfalls for School Division - - - - - 8,585,686 8,585,686
Meals tax for drainage projects - - - - - 5,343,816 5,343,816
Environmental and transportation improvements - - - 2,189,112 - - 2,189,112
Total committed 1,252,245$ -$ -$ 2,189,112$ -$ 13,929,502$ 17,370,859$
Assigned:
Active Transportation Projects -$ -$ -$ 411,490$ -$ -$ 411,490$
Backup power emergency shelter support - - - 250,000 - - 250,000
Capital outlay/one time expenditures 10,644,093 - - 2,112,251 - - 12,756,344
Capital and operating one time expenditures 6,631,295 - - - - - 6,631,295
Communications system - - - 1,060,286 - - 1,060,286
Community Services and Tourism Improvements - - - 356,571 - - 356,571
Contractual services 473,568 - - - - - 473,568
Economic development - - - 1,637,090 - - 1,637,090
Emergency communications operations 81,348 - - 343,309 - - 424,657
Environmental and transportation improvements - - - 1,918,231 - - 1,918,231
Facility maintenance and repair - - - 1,401,432 - - 1,401,432
Facility renovation & relocation - - - 543,334 - - 543,334
Facility security - - - 87,299 - - 87,299
Fire & Life Safety equipment and operations 194,599 - - 386,986 - - 581,585
Fire Alarm System - - - 171,150 - - 171,150
Fire Station #7 - - - 1,693,694 - - 1,693,694
Grounds maintenance repairs, operations and equipment - - - 143,237 - - 143,237
Head Start and Social Services programs - - - - - 901,848 901,848
Information technology: hardware/software - - - 1,027,900 - - 1,027,900
Other purposes/miscellaneous 242,729 - - - 356,674 894,650 1,494,053
Public works operations 28,188 - - - - - 28,188
Sheriff operations, equipment and training facility 242,706 - - 2,050,000 - - 2,292,706
Video services equipment - - - 12,015 - - 12,015
Waste management equipment 190,000 - - - - - 190,000
Total assigned 18,728,526$ -$ -$ 15,606,275$ 356,674$ 1,796,498$ 36,487,973$
Unassigned: 18,240,000$ -$ (3,509,294)$ -$ -$ -$ 14,730,706$
Total fund balances (deficit) 44,630,114$ 716,554$ (3,509,294)$ 24,723,313$ 356,674$ 16,997,127$ 83,914,488$

COUNTY OF YORK, VIRGINIA Notes to Basic Financial Statements
June 30, 2021
F-29
9. LEASES County as Lessee The County leases certain land, equipment and office space under noncancellable operating lease agreements. A summary of future minimum rental payments under these noncancellable operating leases as of June 30, 2021 is as follows:
Discretely
Presented
Primary Component Unit -
Year Government School Division
2022 605,265$ 198,054$
2023 606,966 185,547
2024 607,311 33,156
2025 547,354 2,677
2026 520,207 2,454
2027-2031 2,560,754 -
2032-2036 2,599,536 -
2037-2041 2,105,332 -
2042-2046 1,202,552 -
2047-2051 937,801 -
2052-2056 76,150 -
2057-2061 55,805 -
Total minimum lease payments 12,425,033$ 421,888$
Rental expenditures for the year ended June 30, 2021 for all operating leases were $592,606 and $231,055 for the County and Discretely Presented Component Unit-School Division, respectively. County as Lessor The County leases the usage of its communication towers under operating lease agreements. The towers are included in capital assets as communications equipment with a cost of $9,392,690 and accumulated depreciation of $9,378,223 for a carrying amount of $14,467 at June 30, 2021. A summary of the future minimum rental receipts under noncancellable operating leases as of June 30, 2021 is as follows:
Rental revenue receipts for all operating leases were $582,306 for the County and $852,341 for the School Division for the year ended June 30, 2021.
DiscretelyPresented
Primary Component Unit - Year Government School Division2022 579,278$ 374,304$ 2023 577,684 376,767 2024 430,826 379,613 2025 406,460 381,641 2026 309,270 385,258
2027-2031 1,550,512 - 2032-2036 1,419,445 - 2037-2041 717,279 - 2042-2046 398,959 -
2047-2051 207,006 -
2052-2056 10 -
Total minimum lease payments 6,596,729$ 1,897,583$

COUNTY OF YORK, VIRGINIA Notes to Basic Financial Statements
June 30, 2021
F-30
9. LEASES (Continued) Capital Leases The County leases certain equipment and a building under capital lease agreements. In July 2016, the County executed a lease-purchase agreement with Motorola for 800 MHz system upgrades on behalf of York, James City and Gloucester Counties with the final payment scheduled to end in FY2022. Also, a Memorandum of Understanding was executed with the County’s partner counties that will empower York to act as their fiscal agent for purposes of this contract and committing the local government partners to make their proportional contributions over the next five fiscal years. The total cost of the upgrade is $10,492,814, and York and James City County’s shares are each $4,736,044 and Gloucester’s share is $1,020,276. A summary of future minimum lease payments under capital leases together with the present value of the net minimum lease payments as of June 30, 2021 is as follows:
The gross value of capital assets under capital lease agreements is as follows: Governmental Activities - $8,105,303 (equipment) with Accumulated Depreciation of $5,019,595.
10. DEFINED BENEFIT PENSION PLANS Virginia Retirement System
The Virginia Retirement System (VRS) Political Subdivision Retirement Plan is a multi-employer, agent plan for the County. The School Division participates in the VRS Teacher Employee Plan (Professional Plan), which is a multiple employer, cost-sharing plan. The School Division also participates in the VRS Political Subdivision Retirement Plan (Nonprofessional Plan), which is a multi-employer, agent plan. For purposes of measuring the net pension liability, deferred outflows of resources and deferred inflows of resources related to pensions, and pension expense, information about the fiduciary net position of the County’s Retirement Plan and the York County Schools (“Schools”) Professional and Nonprofessional Retirement Plans and the additions to/deductions from the County Retirement Plan’s and Schools Professional and Nonprofessional Retirement Plans’ net fiduciary position have been determined on the same basis as they were
Primary
Government -
Governmental
Year Activities
2022 574,995$
2023 52,000
2024 52,000
2025 55,921
2026 28,000
2027-2031 140,000
2032-2036 37,333
Total minimum lease payments 940,249
Less amount representing interest (20,826)
Present value of principal 919,423$

COUNTY OF YORK, VIRGINIA Notes to Basic Financial Statements
June 30, 2021
F-31
10. DEFINED BENEFIT PENSION PLANS (Continued)
reported by Virginia Retirement System (VRS). For this purpose, benefit payments (including refunds of employee contributions) are recognized when due and payable in accordance with the benefit terms. Investments are reported at fair value. All full-time, salaried permanent employees of the County and School Division are automatically covered by a VRS retirement plan upon employment. This plan is administered by the Virginia Retirement System (the System) along with plans for other employer groups in the Commonwealth of Virginia. Members earn one month of service credit for each month they are employed and for which they and their employer are paying contributions to VRS. Members are eligible to purchase prior public service, based on specific criteria as defined in the Code of Virginia, as amended. Eligible prior service that may be purchased includes prior public service, active duty military service, certain periods of leave, and previously refunded VRS service. The System administers three different benefit structures for covered employees – Plan 1, Plan 2, and Hybrid. Each of these benefit structures has different eligibility criteria. The specific information for each plan and the eligibility for covered groups within each plan are set out in the table below:
PLAN 1 Retirement Plan Provisions
PLAN 2 Retirement Plan Provisions
HYBRID Retirement Plan Provisions
About Plan 1 Plan 1 is a defined benefit plan. The retirement benefit is based on a member’s age, service credit and average final compensation at retirement using a formula.
About Plan 2 Plan 2 is a defined benefit plan. The retirement benefit is based on a member’s age, service credit and average final compensation at retirement using a formula.
About the Hybrid Plan The Hybrid Retirement Plan combines the features of a defined benefit plan and a defined contribution plan. • The defined benefit is based on a member’s age, service credit and average final compensation at retirement using a formula. • The benefit from the defined contribution component of the plan depends on the member and employer contributions made to the plan and the investment performance of those contributions. • In addition to the monthly benefit payment payable from the defined benefit plan at retirement, a member may start receiving distributions from the balance in the defined contribution account, reflecting the contributions, investment gains or losses, and any required fees.

COUNTY OF YORK, VIRGINIA Notes to Basic Financial Statements
June 30, 2021
F-32
10. DEFINED BENEFIT PENSION PLANS (Continued)
PLAN 1 Retirement Plan Provisions
PLAN 2 Retirement Plan Provisions
HYBRID Retirement Plan Provisions
Eligible Members Employees are in Plan 1 if their membership date is before July 1, 2010, and they were vested as of January 1, 2013, and they have not taken a refund.
Hybrid Opt-In Election VRS non-hazardous duty covered Plan 1 members were allowed to make an irrevocable decision to opt into the Hybrid Retirement Plan during a special election window held January 1 through April 30, 2014. The Hybrid Retirement Plan’s effective date for eligible Plan 1 members who opted in was July 1, 2014. If eligible deferred members returned to work during the election window, they were also eligible to opt into the Hybrid Retirement Plan. Members who were eligible for an optional retirement plan (ORP) and had prior service under Plan 1 were not eligible to elect the Hybrid Retirement Plan and remain as Plan 1 or ORP.
Eligible Members Employees are in Plan 2 if their membership date is on or after July 1, 2010, or their membership date is before July 1, 2010, and they were not vested as of January 1, 2013.
Hybrid Opt-In Election Plan 2 members were allowed to make an irrevocable decision to opt into the Hybrid Retirement Plan during a special election window held January 1 through April 30, 2014. The Hybrid Retirement Plan’s effective date for eligible Plan 2 members who opted in was July 1, 2014. If eligible deferred members returned to work during the election window, they were also eligible to opt into the Hybrid Retirement Plan. Members who were eligible for an optional retirement plan (ORP) and have prior service under Plan 2 were not eligible to elect the Hybrid Retirement Plan and remain as Plan 2 or ORP.
Eligible Members Employees are in the Hybrid Retirement Plan if their membership date is on or after January 1, 2014. This includes: • County employees • Members in Plan 1 or Plan 2 who elected to opt into the plan during the election window held January 1-April 30, 2014; the plan’s effective date for opt-in members was July 1, 2014.
Non-Eligible Members Some employees are not eligible to participate in the Hybrid Retirement Plan. They include political subdivision employees who are covered by enhanced benefits for hazardous duty employees. Those employees eligible for an optional retirement plan (ORP) must elect the ORP plan or the Hybrid Retirement Plan. If these members have prior service under Plan 1 or Plan 2, they are not eligible to elect the Hybrid Retirement Plan and must select Plan 1 or Plan 2 (as applicable) or ORP.

COUNTY OF YORK, VIRGINIA Notes to Basic Financial Statements
June 30, 2021
F-33
10. DEFINED BENEFIT PENSION PLANS (Continued)
PLAN 1 Retirement Plan Provisions
PLAN 2 Retirement Plan Provisions
HYBRID Retirement Plan Provisions
Retirement Contributions Members contribute 5% of their compensation each month to their member contribution account through a pre-tax salary reduction. Some school divisions and political subdivisions elected to phase in the required 5% member contribution; all employees pay the full 5% as of July 1, 2016. Member contributions are tax-deferred until they are withdrawn as part of a retirement benefit or as a refund. The employer makes a separate actuarially determined contribution to VRS for all covered employees. VRS invests both member and employer contributions to provide funding for the future benefit payment.
Retirement Contributions Same as Plan 1.
Retirement Contributions A member’s retirement benefit is funded through mandatory and voluntary contributions made by the member and the employer to both the defined benefit and the defined contribution components of the plan. Mandatory contributions are based on a percentage of the employee’s creditable compensation and are required from both the member and the employer. Additionally, members may choose to make voluntary contributions to the defined contribution component of the plan, and the employer is required to match those voluntary contributions according to specified percentages.
Service Credit Service credit includes active service. Members earn service credit for each month they are employed in a covered position. It also may include credit for prior service the member has purchased or additional service credit the member was granted. A member’s total service credit is one of the factors used to determine their eligibility for retirement and to calculate their retirement benefit. It also may count toward eligibility for the health insurance credit in retirement, if the employer offers the health insurance credit.
Service Credit Same as Plan 1.
Service Credit Defined Benefit Component: Under the defined benefit component of the plan, service credit includes active service. Members earn service credit for each month they are employed in a covered position. It also may include credit for prior service the member has purchased or additional service credit the member was granted. A member’s total service credit is one of the factors used to determine their eligibility for retirement and to calculate their retirement benefit. It also may count toward eligibility for the health insurance credit in retirement, if the employer offers the health insurance credit. Defined Contributions Component: Under the defined contribution component, service credit is used to determine vesting for the employer contribution portion of the plan.

COUNTY OF YORK, VIRGINIA Notes to Basic Financial Statements
June 30, 2021
F-34
10. DEFINED BENEFIT PENSION PLANS (Continued)
PLAN 1 Retirement Plan Provisions
PLAN 2 Retirement Plan Provisions
HYBRID Retirement Plan Provisions
Vesting Vesting is the minimum length of service a member needs to qualify for a future retirement benefit. Members become vested when they have at least five years (60 months) of service credit. Vesting means members are eligible to qualify for retirement if they meet the age and service requirements for their plan. Members also must be vested to receive a full refund of their member contribution account balance if they leave employment and request a refund. Members are always 100% vested in the contributions that they make.
Vesting Same as Plan 1.
Vesting Defined Benefit Component: Defined benefit vesting is the minimum length of service a member needs to qualify for a future retirement benefit. Members are vested under the defined benefit component of the Hybrid Retirement Plan when they reach five years (60 months) of service credit. Plan 1 or Plan 2 members with at least five years (60 months) of service credit who opted into the Hybrid Retirement Plan remain vested in the defined benefit component. Defined Contributions Component: Defined contribution vesting refers to minimum length of service a member needs to be eligible to withdraw employer contributions from the defined contribution component of the plan. Members are always 100% vested in contributions they make. Upon retirement or leaving covered employment, a member is eligible to withdraw a percentage of employer contributions to the defined contribution component of the plan, based on service. • After two years, a member is 50% vested and may withdraw 50% of employer contributions. • After three years, a member is 75% vested and may withdraw 75% of employer contributions. • After four or more years, a member is 100% vested and may withdraw
100% of employer contributions. Distributions not required, except as governed by law.

COUNTY OF YORK, VIRGINIA Notes to Basic Financial Statements
June 30, 2021
F-35
10. DEFINED BENEFIT PENSION PLANS (Continued)
PLAN 1 Retirement Plan Provisions
PLAN 2 Retirement Plan Provisions
HYBRID Retirement Plan Provisions
Calculating the Benefit The basic benefit is determined using the average final compensation, service credit and plan multiplier. An early retirement reduction is applied to this amount if the member is retiring with a reduced benefit. In cases where the member has elected an optional form of retirement payment, an option factor specific to the option chose in then applied.
Calculating the Benefit See definition under Plan 1.
Calculating the Benefit Defined Benefit Component: See definition under Plan 1 Defined Contribution Component: The benefit is based on contributions made by the member and any matching contributions made by the employer, plus net investment earnings on those contributions.
Average Final Compensation A member’s average final compensation is the average of the 36 consecutive months of highest compensation as a covered employee.
Average Final Compensation A member’s average final compensation is the average of their 60 consecutive months of highest compensation as a covered employee.
Average Final Compensation Same as Plan 2. It is used in the retirement formula for the defined benefit component of the plan.
Service Retirement Multiplier The retirement multiplier is a factor used in the formula to determine a final retirement benefit. The retirement multiplier for non-hazardous duty members is 1.70%. Sheriffs The retirement multiplier for sheriffs is 1.85%. Hazardous Duty Employees The retirement multiplier of eligible political subdivision hazardous duty employees other than sheriffs is 1.85% as elected by the employer.
Service Retirement Multiplier Same as Plan 1 for service earned, purchased or granted prior to January 1, 2013. For non-hazardous duty members the retirement multiplier is 1.65% for service credit earned, purchased or granted on or after January 1, 2013. Sheriffs and Hazardous Duty Employees Same as Plan 1.
Service Retirement Multiplier Defined Benefit Component: The retirement multiplier for the defined benefit component is 1.00%. For members who opted into the Hybrid Retirement Plan from Plan 1 or Plan 2, the applicable multipliers for those plans will be used to calculate the retirement benefit for service credited in those plans. Sheriffs and Hazardous Duty Employees Not applicable. Defined Contribution Component: Not applicable.

COUNTY OF YORK, VIRGINIA Notes to Basic Financial Statements
June 30, 2021
F-36
10. DEFINED BENEFIT PENSION PLANS (Continued)
PLAN 1 Retirement Plan Provisions
PLAN 2 Retirement Plan Provisions
HYBRID Retirement Plan Provisions
Normal Retirement Age Age 65. Hazardous Duty Employees Age 60.
Normal Retirement Age Normal Social Security retirement age. Hazardous Duty Employees Same as Plan 1.
Normal Retirement Age Defined Benefit Component: Same as Plan 2. Hazardous Duty Employees Not applicable. Defined Contribution Component: Members are eligible to receive distributions upon leaving employ- ment, subject to restrictions.
Earliest Unreduced Retirement Eligibility Members who are not in hazardous duty positions are eligible for an unreduced retirement benefit at age 65 with at least five years (60 months) of service credit or at age 50 with at least 30 years of service credit. Hazardous Duty Employees Age 60 with at least five years of service credit or age 50 with at least 25 years of service credit.
Earliest Unreduced Retirement Eligibility Members who are not in hazardous duty positions are eligible for an unreduced retirement benefit when they reach normal Social Security retirement age and have at least five years (60 months) of service credit or when their age plus service credit equals 90. Hazardous Duty Employees Same as Plan 1.
Earliest Unreduced Retirement Eligibility Defined Benefit Component: Members are eligible for an unreduced retirement benefit when they reach normal Social Security retirement age and have at least five years (60 months) of service credit or when their age plus service credit equals 90. Hazardous Duty Employees Not applicable. Defined Contribution Component: Members are eligible to receive distributions upon leaving employ-ment, subject to restrictions.
Earliest Reduced Retirement Eligibility Members may retire with a reduced benefit as early as age 55 with at least five years (60 months) of service credit or age 50 with at least 10 years of service credit. Hazardous Duty Employees Age 50 with at least five years of service credit.
Earliest Reduced Retirement Eligibility Members may retire with a reduced benefit as early as age 60 with at least five years (60 months) of service credit. Hazardous Duty Employees Same as Plan 1.
Earliest Reduced Retirement Eligibility Defined Benefit Component: Members may retire with a reduced benefit as early as age 60 with at least five years (60 months) of service credit. Hazardous Duty Employees Not applicable. Defined Contribution Component: Members are eligible to receive distributions upon leaving employ-ment, subject to restrictions.

COUNTY OF YORK, VIRGINIA Notes to Basic Financial Statements
June 30, 2021
F-37
10. DEFINED BENEFIT PENSION PLANS (Continued)
PLAN 1 Retirement Plan Provisions
PLAN 2 Retirement Plan Provisions
HYBRID Retirement Plan Provisions
Cost-of-Living Adjustment (COLA) in Retirement The Cost-of-Living Adjustment (COLA) matches the first 3% increase in the Consumer Price Index for all Urban Consumers (CPI-U) and half of any additional increase (up to 4%) up to a maximum COLA of 5%. Eligibility: For members who retire with an unreduced benefit or with a reduced benefit with at least 20 years of service credit, the COLA will go into effect on July 1 after one full calendar year from the retirement date. For members who retire with a reduced benefit and who have less than 20 years of service credit, the COLA will go into effect on July 1 after one calendar year following the unreduced retirement eligibility date. Exceptions to COLA Effective Dates: The COLA is effective July 1 following one full calendar year (January 1 to December 31) under any of the following circumstances: • The member is within 5 years of qualifying for an unreduced retire-ment benefit as of Jan. 1, 2013. • The member retires on disability. • The member retires directly from short-term or long-term disability. • The member is involuntarily separated from employment for causes other than job performance or misconduct and is eligible to retire under the Workforce Transition Act or the Transitional Benefits Program.
Cost-of-Living Adjustment (COLA) in Retirement The Cost-of-Living Adjustment (COLA) matches the first 2% increase in the CPI-U and half of any additional increase (up to 2%), for a maximum COLA of 3%. Eligibility: Same as Plan 1. Exceptions to COLA Effective Dates: Same as Plan 1.
Cost-of-Living Adjustment (COLA) in Retirement Defined Benefit Component: Same as Plan 2. Defined Contribution Component: Not applicable. Eligibility: Same as Plan 1 and Plan 2. Exceptions to COLA Effective Dates: Same as Plan 1 and Plan 2.
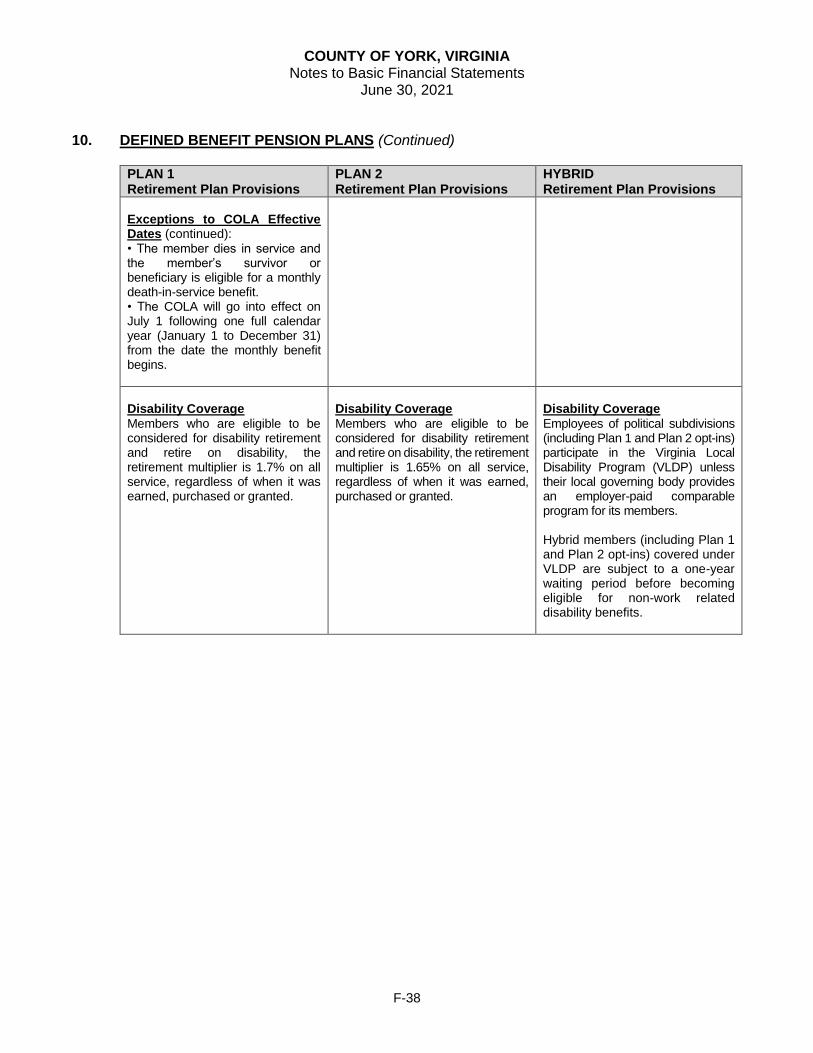
COUNTY OF YORK, VIRGINIA Notes to Basic Financial Statements
June 30, 2021
F-38
10. DEFINED BENEFIT PENSION PLANS (Continued)
PLAN 1 Retirement Plan Provisions
PLAN 2 Retirement Plan Provisions
HYBRID Retirement Plan Provisions
Exceptions to COLA Effective Dates (continued): • The member dies in service and the member’s survivor or beneficiary is eligible for a monthly death-in-service benefit. • The COLA will go into effect on July 1 following one full calendar year (January 1 to December 31) from the date the monthly benefit begins.
Disability Coverage
Members who are eligible to be considered for disability retirement and retire on disability, the retirement multiplier is 1.7% on all service, regardless of when it was earned, purchased or granted.
Disability Coverage
Members who are eligible to be considered for disability retirement and retire on disability, the retirement multiplier is 1.65% on all service, regardless of when it was earned, purchased or granted.
Disability Coverage
Employees of political subdivisions (including Plan 1 and Plan 2 opt-ins) participate in the Virginia Local Disability Program (VLDP) unless their local governing body provides an employer-paid comparable program for its members. Hybrid members (including Plan 1 and Plan 2 opt-ins) covered under VLDP are subject to a one-year waiting period before becoming eligible for non-work related disability benefits.

COUNTY OF YORK, VIRGINIA Notes to Basic Financial Statements
June 30, 2021
F-39
10. DEFINED BENEFIT PENSION PLANS (Continued)
PLAN 1 Retirement Plan Provisions
PLAN 2 Retirement Plan Provisions
HYBRID Retirement Plan Provisions
Purchase of Prior Service Members may be eligible to purchase service from previous public employment, active duty military service, an eligible period of leave or VRS refunded service as service credit in their plan. Prior service credit counts toward vesting, eligibility for retirement and the health insurance credit. Only active members are eligible to purchase prior service. Members also may be eligible to purchase periods of leave without pay.
Purchase of Prior Service Same as Plan 1.
Purchase of Prior Service Defined Benefit Component: Same as Plan 1, with the following exceptions:
Hybrid Retirement Plan members are ineligible for ported service.
Defined Contribution Component: Not applicable.
1. Employees Covered by Benefit Terms
As of the June 30, 2019 actuarial valuation, the following employees were covered by the benefit terms of the pension plan:
(Nonprofessional)
County Schools
Inactive Members or Their Beneficiaries
Currently Receiving Benefits 539 226
Inactive Members:
Vested Inactive Members 127 36
Non-Vested Inactive Members 220 163
Inactive Members Active Elsewhere in VRS 264 57
Total Inactive Members 611 256
Active Members 791 271
Total Covered Employees 1,941 753

COUNTY OF YORK, VIRGINIA Notes to Basic Financial Statements
June 30, 2021
F-40
10. DEFINED BENEFIT PENSION PLANS (Continued)
2. Contributions The contribution requirement for active employees is governed by §51.1-145 of the Code, as amended, but may be impacted as a result of funding options provided to school divisions by the Virginia General Assembly. Employees are required to contribute 5.00% of their compensation toward their retirement. Prior to July 1, 2012, all or part of the 5.00% member contribution may have been assumed by the employer. Beginning July 1, 2012 new employees were required to pay the 5% member contribution. In addition, for existing employees, employers were required to begin making the employee pay the 5% member contribution. This could have been phased in over a period of up to 5 years and the employer was required to provide a salary increase equal to the amount of the increase in the employee-paid member contribution. The County’s contractually required contribution rate for the year ended June 30, 2021 was 16.87% of covered employee compensation. This rate was based on an actuarially determined rate from an actuarial valuation as of June 30, 2019. The School Division’s contractually required contribution rate for the year ended June 30, 2021 was 16.62% of covered employee compensation (professional employees). This rate was based on an actuarially determined rate from an actuarial valuation as of June 30, 2019. The actuarially determined rate, when combined with employee contributions, was expected to finance the costs of benefits earned by employee during the year, with an additional amount to finance any unfunded accrued liability. Contributions to the pension plan from the School Division were $12,234,048 and $11,359,571 for the years ended June 30, 2021 and June 30, 2020, respectively. In addition, for the Nonprofessional (non-teacher) employees, the School Division is contractually required to contribute the remaining amounts necessary to fund its participation in the VRS using the actuarial basis specified by the Code and approved by the VRS Board of Trustees. The School Division contribution rate for the fiscal year ended 2021 was 6.27% of covered employee compensation. This rate was based on an actuarially determined rate from an actuarial valuation as of June 30, 2019. These rates, when combined with employee contributions, were expected to finance the costs of benefits earned by employees during the year, with an additional amount to finance any unfunded accrued liability. Contributions to the pension plan from the County were $5,003,134 and $4,448,949 for the year ended June 30, 2021 and 2020, respectively. Contributions to the pension plan from the School Division were $392,338 and $324,157 for the years ended June 30, 2021 and June 30, 2020, respectively.

COUNTY OF YORK, VIRGINIA Notes to Basic Financial Statements
June 30, 2021
F-41
10. DEFINED BENEFIT PENSION PLANS (Continued)
3. Net Pension Liability The County and School Division’s net pension liability (NPL) is calculated separately for each employer and represents that particular employer’s total pension liability determined in accordance with GAAP, less that employer’s fiduciary net position. The County’s net pension liability was measured as of June 30, 2020 and totaled $39,815,900. The total pension liability used to calculate the net pension liability was determined by an actuarial valuation performed as of June 30, 2019, rolled forward to the measurement date of June 30, 2020. At June 30, 2021, the School Division reported a net pension liability of $124,749,477 for its proportionate share of the net pension liability of the Teacher Retirement Plan (Professional). The net pension liability was measured as of June 30, 2020 and the total pension liability used to calculate the net pension liability was determined by an actuarial valuation as of June 30, 2019, and rolled forward to the measurement date of June 30, 2020. The School Division’s proportion of the net pension liability was based on the School Division’s actuarially determined employer contributions to the pension plan for the year ended June 30, 2020 relative to the total of the actuarially determined employer contributions for all participating employers. At June 30, 2020, the School Division’s proportion was 0.85723% as compared to 0.85177% at June 30, 2019. In addition, the School Division’s net pension liability for the Nonprofessional (non-teacher) Retirement Plan was measured as of June 30, 2020. The total pension liability used to calculate the net pension liability was determined by an actuarial valuation performed as of June 30, 2019, rolled forward to the measurement date of June 30, 2020. At June 30, 2021, the School Division reported a liability of $2,000,679 for the Nonprofessional (non-teacher) Retirement Plan.
4. Pension Expense
For the year ended June 30, 2021, the County recognized pension expense of $10,237,138. For the year ended June 30, 2021, the School Division recognized pension expense of $14,434,898 of the Teacher Retirement Plan (Professional). Since there was a change in proportionate share between measurement dates, a portion of the pension expense was related to deferred amounts from changes in proportion and from differences between employer contributions and the proportionate share of employer contributions. In addition, for the year ended June 30, 2021, the School Division recognized pension expense of $938,297 for the Nonprofessional (non-teacher) Retirement Plan.

COUNTY OF YORK, VIRGINIA Notes to Basic Financial Statements
June 30, 2021
F-42
10. DEFINED BENEFIT PENSION PLANS (Continued)
5. Deferred Outflows/Inflows of Resources At June 30, 2021, the County reported deferred outflows of resources and deferred inflows of resources related to pensions from the following sources:
Differences between expected and actual experience 2,790,763$ -
Difference between projected and actual earnings
on pension plan investments 6,102,617 -
Change in assumptions 2,601,058 -
Employer contributions subsequent to the measurement date 5,003,134 -
Total 16,497,572$ -$
Deferred
Outflows of
Resources
Deferred
Inflows of
Resources
$5,003,134 reported as deferred outflows of resources related to pensions results from the County’s contributions subsequent to the measurement date and will be recognized as a reduction of the net pension liability in the year ended June 30, 2022. Other amounts reported as deferred outflows of resources and deferred inflows of resources related to pensions will be recognized in pension expense as follows:
Deferred
Amounts
2022 3,890,435$
2023 3,409,452
2024 2,243,374
2025 1,951,177
Total 11,494,438$

COUNTY OF YORK, VIRGINIA Notes to Basic Financial Statements
June 30, 2021
F-43
10. DEFINED BENEFIT PENSION PLANS (Continued)
5. Deferred Outflows/Inflows of Resources At June 30, 2021, for the Teacher Retirement Plan (Professional), the School Division reported deferred outflows of resources and deferred inflows of resources related to pensions from the following sources:
Differences between expected and actual experience -$ $7,312,242
Change of assumptions 8,515,716 -
Net difference between projected and actual earnings
on pension plan investments 9,488,579 -
Changes in proportion and differences between employer
contributions and proportionate share of contributions 1,649,197 1,404,850
Employer contributions subsequent to the measurement date 12,234,048 -
Total 31,887,540$ 8,717,092$
Deferred
Outflows of
Resources
Deferred
Inflows of
Resources
The $12,234,048 reported as deferred outflows of resources related to pensions resulting from the School Division’s contributions subsequent to the measurement date, will be recognized as a reduction of the net pension liability in the year ended June 30, 2022. Other amounts reported as deferred outflows of resources and deferred inflows of resources related to pensions will be recognized in pension expense as follows:
Deferred
Amounts
2022 (49,016)$
2023 3,154,560
2024 4,458,159
2025 3,489,124
2026 (116,427)
Total 10,936,400$

COUNTY OF YORK, VIRGINIA Notes to Basic Financial Statements
June 30, 2021
F-44
10. DEFINED BENEFIT PENSION PLANS (Continued)
5. Deferred Outflows/Inflows of Resources (Continued) In addition, at June 30, 2021, for the Nonprofessional (non-teacher) Retirement Plan, the School Division reported deferred outflows of resources and deferred inflows of resources related to pensions from the following sources:
Deferred Deferred
Outflows of Inflows of
Resources Resources
Difference between expected and
actual experience 107,409$ -$
Changes of assumptions 107,738 -
Net difference between projected and actual
earnings on pension plan investments 759,067 -
Employer contributions subsequent to the
measurement date 392,338 -
Total 1,366,552$ -$
The $392,338 reported as deferred outflows of resources related to pensions resulting from the School Division’s contributions subsequent to the measurement date will be recognized as a reduction of the net pension liability in the year ended June 30, 2022. Other amounts reported as deferred outflows of resources and deferred inflows of resources related to pensions will be recognized in pension expense as follows:
Deferred
Amounts
2022 219,122$
2023 254,949
2024 257,310
2025 242,833
Total 974,214$

COUNTY OF YORK, VIRGINIA Notes to Basic Financial Statements
June 30, 2021
F-45
10. DEFINED BENEFIT PENSION PLANS (Continued)
6. Actuarial Assumptions
County Retirement Plan The total pension liability for the County Retirement Plan was based on an actuarial valuation as of June 30, 2019, using the Entry Age Normal actuarial cost method and the following assumptions, applied to all periods included in the measurement and rolled forward to the measurement date of June 30, 2020: Inflation 2.5% Salary increases, including Inflation 3.5% – 5.35% Investment rate of return 6.75%, net of pension plan investment
expenses, including inflation*
* Administrative expenses as a percent of the market value of assets for the last experience study were found to be approximately 0.06% of the market assets for all of the VRS plans. This would provide an assumed investment return rate for GAAP purposes of slightly more than the assumed 6.75%. However, since the difference was minimal, and a more conservative 6.75% investment return assumption provided a projected plan net position that exceeded the projected benefit payments, the long-term expected rate of return on investments was assumed to be 6.75% to simplify preparation of pension liabilities.
Mortality rates: Largest 10 – Non-Hazardous Duty: 20% of deaths are assumed to be service related
Pre-Retirement:
RP-2014 Employee Rates to age 80, Heathy Annuitant Rates at ages 81 and older projected with scale BB to 2020; males 95% of rates; females 105% of rates.
Post-Retirement:
RP-2014 Employee Rates to age 49, Healthy Annuitant Rates at ages 50 and older projected with scale BB to 2020; males set forward 3 years; females 1.0% increase compounded from ages 70 to 90.
Post-Disablement:
RP-2014 Disability Mortality Rates projected with scale BB to 2020; males set forward 2 years, 110% of rates; females 125% of rates.
All Others (Non 10 Largest) – Non-Hazardous Duty: 15% of deaths are assumed to be service related
Pre-Retirement:
RP-2014 Employee Rates to age 80, Heathy Annuitant Rates at ages 81 and older projected with scale BB to 2020; males 95% of rates; females 105% of rates.

COUNTY OF YORK, VIRGINIA Notes to Basic Financial Statements
June 30, 2021
F-46
10. DEFINED BENEFIT PENSION PLANS (Continued)
6. Actuarial Assumptions (Continued)
Post-Retirement: RP-2014 Employee Rates to age 49, Healthy Annuitant Rates at ages 50 and older projected with scale BB to 2020; males set forward 3 years; females 1.0% increase compounded from ages 70 to 90.
Post-Disablement:
RP-2014 Disability Mortality Rates projected with scale BB to 2020; males set forward 2 years, 110% of rates; females 125% of rates.
The actuarial assumptions used in the June 30, 2019 valuation were based on the results of an actuarial experience study for the period from July 1, 2012 through June 30, 2016, except the change in the discount rate, which was based on VRS Board action effective as of July 1, 2019. Changes to the actuarial assumptions as a result of the experience study and VRS Board action are as follows: Largest 10 – Non-Hazardous Duty:
Mortality Rates (Pre-retirement, post-retirement healthy, and disabled)
Updated to a more current mortality table – RP-2014 projected to 2020
Retirement Rates Lowered rates at older ages and changed final retirement from 70 to 75
Withdrawal Rates Adjusted rates to better fit experience at each year age and service through 9 years of service
Disability Rates Lowered rates
Salary Scale No change
Line of Duty Disability Increase rate from 14% to 20%
Discount Rate Decrease rate from 7.00% to 6.75%
All Others (Non 10 Largest) – Non-Hazardous Duty:
Mortality Rates (Pre-retirement, post-retirement healthy, and disabled)
Updated to a more current mortality table – RP-2014 projected to 2020
Retirement Rates Lowered rates at older ages and changed final retirement from 70 to 75
Withdrawal Rates Adjusted rates to better fit experience at each year age and service through 9 years of service
Disability Rates Lowered rates
Salary Scale No change
Line of Duty Disability Increase rate from 14% to 15%
Discount Rate Decrease rate from 7.00% to 6.75%

COUNTY OF YORK, VIRGINIA Notes to Basic Financial Statements
June 30, 2021
F-47
10. DEFINED BENEFIT PENSION PLANS (Continued)
6. Actuarial Assumptions (Continued)
Public Safety Employees with Hazardous Duty Benefits
The total pension liability for Public Safety employees with Hazardous Duty Benefits in the Political Subdivision Retirement Plan was based on an actuarial valuation as of June 30, 2019, using the Entry Age Normal actuarial cost method and the following assumptions, applied to all periods included in the measurement and rolled forward to the measurement date of June 30, 2020. Inflation 2.5% Salary increases, including Inflation 3.5% – 4.75% Investment rate of return 6.75%, net of pension plan investment
expense, including inflation*
* Administrative expenses as a percent of the market value of assets for the last experience study were found to be approximately 0.06% of the market assets for all of the VRS plans. This would provide an assumed investment return rate for GAAP purposes of slightly more than the assumed 6.75%. However, since the difference was minimal, and a more conservative 6.75% investment return assumption provided a projected plan net position that exceeded the projected benefit payments, the long term expected rate of return on investments was assumed to be 6.75% to simplify preparation of pension liabilities.
Mortality rates:
Largest 10 - Hazardous Duty: 70% of deaths are assumed to be service related Pre-Retirement:
RP-2014 Employee Rates to age 80, Heathy Annuitant Rates at ages 81 and older projected with scale BB to 2020; males 90% of rates; females set forward 1 year.
Post-Retirement:
RP-2014 Employee Rates to age 49, Healthy Annuitant Rates at ages 50 and older projected with scale BB to 2020; males set forward 1 year, 1.0% increase compounded from ages 70 to 90; females set forward 3 years.
Post-Disablement:
RP-2014 Disability Mortality Rates projected with scale BB to 2020; males set forward 2 years, unisex using 100% male.
All Others (Non 10 Largest) – Hazardous Duty: 45% of deaths are assumed to be service related

COUNTY OF YORK, VIRGINIA Notes to Basic Financial Statements
June 30, 2021
F-48
10. DEFINED BENEFIT PENSION PLANS (Continued)
6. Actuarial Assumptions (Continued) Pre-Retirement:
RP-2014 Employee Rates to age 80, Heathy Annuitant Rates at ages 81 and older projected with scale BB to 2020; males 90% of rates; females set forward 1 year.
Post-Retirement:
RP-2014 Employee Rates to age 49, Healthy Annuitant Rates at ages 50 and older projected with scale BB to 2020; males set forward 1 year, 1.0% increase compounded from ages 70 to 90; females set forward 3 years.
Post-Disablement:
RP-2014 Disability Mortality Rates projected with scale BB to 2020; males set forward 2 years, unisex using 100% male.
The actuarial assumptions used in the June 30, 2019 valuation were based on the results of an actuarial experience study for the period from July 1, 2012 through June 30, 2016, except the change in the discount rate, which was based on VRS Board action effective as of July 1, 2019. Changes to the actuarial assumptions as a result of the experience study and VRS Board action are as follows:
Largest 10 – Hazardous Duty:
Mortality Rates (Pre-retirement, post-retirement healthy, and disabled)
Updated to a more current mortality table – RP-2014 projected to 2020
Retirement Rates Lowered rates at older ages
Withdrawal Rates Adjusted rates to better fit experience
Disability Rates Increased rates
Salary Scale No change
Line of Duty Disability Increased rate from 60% to 70%
Discount Rate Decrease rate from 7.00% to 6.75%
All Others (Non 10 Largest) – Hazardous Duty:
Mortality Rates (Pre-retirement, post-retirement healthy, and disabled)
Updated to a more current mortality table – RP-2014 projected to 2020
Retirement Rates Increased age 50 rates, and lowered rates at older ages
Withdrawal Rates Adjusted rates to better fit experience at each year age and service through 9 years of service
Disability Rates Adjusted rates to better fit experience
Salary Scale No change
Line of Duty Disability Decreased rate from 60% to 45%
Discount Rate Decrease rate from 7.00% to 6.75%

COUNTY OF YORK, VIRGINIA Notes to Basic Financial Statements
June 30, 2021
F-49
10. DEFINED BENEFIT PENSION PLANS (Continued)
6. Actuarial Assumptions (Continued)
Public Safety Employees with Hazardous Duty Benefits The total pension liability for the VRS Teacher Retirement Plan and Nonprofessional Retirement Plan (non-teacher) was based on an actuarial valuation as of June 30, 2019, using the Entry Age Normal actuarial cost method and the following assumptions, applied to all periods included in the measurement and rolled forward to the measurement date of June 30, 2020.
Inflation 2.5% Salary increases, including Inflation 3.5% to 5.95% Investment rate of return 6.75%, net of pension plan investment
expense, including inflation*
* Administrative expenses as a percent of the fair value of assets for the last experience study were found to be approximately 0.06% of the market assets for all of the VRS plans. This would provide an assumed investment return rate for U.S. GAAP purposes of slightly more than the assumed 6.75%. However, since the difference was minimal, and a more conservative 6.75% investment return assumption provided a projected plan net position that exceeded the projected benefit payments, the long-term expected rate of return on investments was assumed to be 6.75% to simplify preparation of pension liabilities.
Mortality rates Teachers:
Pre-Retirement: RP-2014 White Collar Employee Rates to age 80, White Collar Healthy Annuitant Rates at age 81 and older, projected with scale BB to 2020.
Post-Retirement: RP-2014 White Collar Employee Rates to age 49, White Collar Healthy Annuitant Rates at age 50 and older projected, with scale BB to 2020; males 1% increase compounded from age 70 to 90; females set back 3 years with 1.5% increase compounded from age 65 to 70 and 2.0% increase compounded from age 75 to 90.
Post-Disablement: RP-2014 Disability Mortality Rates projected with Scale BB to 2020; 115% of rates for males and females.
All Others (Non-10 Largest) – Non-Hazardous Duty: 15% of deaths are assumed to be service
related:
Pre-Retirement: RP-2014 Employee Rates to age 80, Healthy Annuitant Rates at ages 81 and older projected with scale BB to 2020; males 95% of rates; females 105% of rates.
Post-Retirement: RP-2014 Employee Rates to age 49, Healthy Annuitant Rates at ages 50 and older projected with scale BB to 2020; males set forward 3 years; females 1.0% increase compounded from ages 70 to 90.
Post-Disablement: RP-2014 Disability Mortality Rates projected with scale BB to 2020; males set forward 2 years, 110% of rates; females 125% of rates.

COUNTY OF YORK, VIRGINIA Notes to Basic Financial Statements
June 30, 2021
F-50
10. DEFINED BENEFIT PENSION PLANS (Continued)
6. Actuarial Assumptions (Continued)
The actuarial assumptions used in the June 30, 2019 valuation were based on the results of an actuarial experience study for the four-year period from July 1, 2012 through June 30, 2016 except the change in the discount rate, which was based on VRS Board action effective as of July 1, 2019. Changes to the actuarial assumptions as a result of the experience study and VRS Board action are as follows:
Teachers:
Mortality Rates (pre-retirement, post-retirement healthy and disabled
Update to a more current mortality table – RP-2014 projected to 2020
Retirement Rates Lowered rates at older ages and changed final retirement from age 70 to 75
Withdrawal Rates Adjusted rates to better fit experience at each year age and service through 9 years of service
Disability Rates Adjusted rates to better match experience
Salary Scale No change
Discount Rate Decrease rate from 7.00% to 6.75%
All Others (Non-10 Largest) – Non-Hazardous Duty:
Mortality Rates (pre-retirement, post-retirement healthy and disabled
Update to a more current mortality table – RP-2014 projected to 2020
Retirement Rates Lowered rates at older ages and changed final retirement from age 70 to 75
Withdrawal Rates Adjusted rates to better fit experience at each year age and service through 9 years of service
Disability Rates Lowered rates
Salary Scale No change
Line of Duty Disability Increase from 14% to 15%
Discount Rate Decrease from 7.00% to 6.75%

COUNTY OF YORK, VIRGINIA Notes to Basic Financial Statements
June 30, 2021
F-51
10. DEFINED BENEFIT PENSION PLANS (Continued)
7. Long-Term Expected Rate of Return
The long-term expected rate of return on pension System investments was determined using a log-normal distribution analysis in which best-estimate ranges of expected future real rates of return (expected returns, net of pension System investment expense and inflation) are developed for each major asset class. These ranges are combined to produce the long-term expected rate of return by weighting the expected future real rates of return by the target asset allocation percentage and by adding expected inflation. The target asset allocation and best estimate of arithmetic real rates of return for each major asset class are summarized in the following table:
Asset Class (Strategy)
Long-Term
Target Allocation
Arithmetic Long-Term Expected Rate of Return
Weighted Average
Long-Term Expected Rate of Return
Public Equity 34.00% 4.65% 1.58% Fixed Income 15.00% 0.46% 0.07% Credit Strategies 14.00% 5.38% 0.75% Real Assets 14.00% 5.01% 0.70% Private Equity 14.00% 8.34% 1.17% MAPS-Multi-Asset Public Strategies 6.00% 3.04% 0.18% PIP-Private Investment Partnership 3.00% 6.49% 0.19%
Total 100.00% 4.64%
Inflation 2.50%
Expected arithmetic nominal return* 7.14%
* The above allocation provides a one-year return of 7.14%. However, one-year returns do not take into account the volatility present in each of the asset classes. In setting the long-term expected return of the system, stochastic projections are employed to model future returns under various economic conditions. The results provide a range of returns over various time periods that ultimately provide a median return of 7.11%, including expected inflation of 2.50%. On October 10, 2019, the VRS Board elected a long-term rate of 6.75% which is roughly at the 40th percentile of expected long-term results of the VRS fund asset allocation. More recent capital market assumptions compiled for the FY2020 actuarial valuations, provide a median return of 6.81%.

COUNTY OF YORK, VIRGINIA Notes to Basic Financial Statements
June 30, 2021
F-52
9. DEFINED BENEFIT PENSION PLANS (Continued)
8. Discount Rate
The discount rate used to measure the total pension liability was 6.75%. The projection of cash flows used to determine the discount rate assumed that member contributions will be made per the VRS Statutes and the employer contributions will be made in accordance with the VRS funding policy at rates equal to the difference between actuarially determined contribution rates adopted by the VRS Board of Trustees and the member rate. Consistent with the phased-in funding provided by the General Assembly for state and teacher employer contributions; political subdivisions were also provided with an opportunity to use an alternate employer contribution rate. For the year ended June 30, 2020, the alternate rate was the employer contribution rate used in FY2012 or 100% of the actuarially determined employer contribution rate from the June 30, 2017, actuarial valuations, whichever was greater. From July 1, 2020 on, participating employers are assumed to contribute 100% of the actuarially determined contribution rates. Based on those assumptions, the pension plan’s fiduciary net position was projected to be available to make all projected future benefit payments of current active and inactive employees. Therefore, the long-term expected rate of return was applied to all periods of projected benefit payments to determine the total pension liability.
9. Sensitivity of the Net Pension Liability to Changes in the Discount Rate The following presents the County’s net pension liability using the discount rate of 6.75%, as well as what the net pension liability would be if it were calculated using a discount rate that is one percentage point lower (5.75%) or one percentage point higher (7.75%) than the current rate:
1.00% Current 1.00%Decrease Discount Rate Increase(5.75%) (6.75%) (7.75%)
County's Net Pension Liability 70,240,897$ 39,815,900$ 14,457,982$
The following presents the School Division’s proportionate share of the net pension liability for the Professional/Teacher Retirement Plan using the discount rate of 6.75%, as well as what the School Division’s proportionate share of the net pension liability would be if it were calculated using a discount rate that is one percentage point lower (5.75%) or one percentage point higher (7.75%) than the current rate:
1.00% Current 1.00%Decrease Discount Rate Increase(5.75%) (6.75%) (7.75%)
School Division’s Proportionate Share
of the Net Pension Liability for the
VRS Teacher Retirement Plan 183,035,500$ 124,749,477$ 76,539,567$

COUNTY OF YORK, VIRGINIA Notes to Basic Financial Statements
June 30, 2021
F-53
10. DEFINED BENEFIT PENSION PLANS (Continued)
9. Sensitivity of the Net Pension Liability to Changes in the Discount Rate (Continued) In addition, the following presents the net pension liability of the Nonprofessional (non-teacher) Retirement Plan using the discount rate of 6.75%, as well as what the net pension liability would be if it were calculated using a discount rate that is one percentage point lower (5.75%) or one percentage point higher (7.75%) than the current rate:
1.00% Current 1.00%Decrease Discount Rate Increase(5.75%) (6.75%) (7.75%)
School Division’s Proportionate Share
of the Net Pension Liability (Asset)
for the Nonprofessional Plan 5,149,129$ 2,000,679$ (651,077)$
10. Changes in Net Pension Liability – County Retirement Plan
Total Fiduciary Net
Pension Net Pension
Liability Position Liability
(a) (b) (a) – (b)
Balance – June 30, 2019 $ 231,973,062 $ 204,168,727 $ 27,804,335
Changes for the fiscal year:
Service cost 4,974,047 - 4,974,047
Interest 15,295,937 - 15,295,937
Difference between expected
and actual experience2,016,305 - 2,016,305
Contribution – employer - 4,364,971 (4,364,971)
Contribution – employee - 2,169,677 (2,169,677)
Net investment income - 3,879,115 (3,879,115)
Benefit payments (10,733,177) (10,733,177) -
Administrative expenses - (133,317) 133,317
Other changes - (5,722) 5,722
Net Changes 11,553,112 (458,453) 12,011,565
Balance – June 30, 2020 $ 243,526,174 $ 203,710,274 $ 39,815,900

COUNTY OF YORK, VIRGINIA Notes to Basic Financial Statements
June 30, 2021
F-54
10. DEFINED BENEFIT PENSION PLANS (Continued)
11. Changes in Net Pension Liability – Nonprofessional (non-teacher) Retirement Plan
Total Fiduciary Net
Pension Net Pension
Liability Position Liability
(a) (b) (a) – (b)
Balance – July 1, 2019 $ 26,054,776 $ 25,467,177 $ 587,599
Changes for the fiscal year:
Service cost 612,876 - 612,876
Interest 1,716,651 - 1,716,651
Difference between expected
and actual experience 180,378 - 180,378
Contribution – employer - 322,379 (322,379)
Contribution – employee - 308,119 (308,119)
Net investment income - 483,529 (483,529)
Benefit payments (1,245,823) (1,245,823) -
Administrative expenses - (16,631) 16,631
Other changes - (571) 571
Net Changes 1,264,082 (148,998) 1,413,080
Balance – June 30, 2020 $ 27,318,858 $ 25,318,179 $ 2,000,679
12. Pension Plan Fiduciary Net Position – Teacher Retirement Plan Detailed information about the VRS Teacher Retirement Plan’s Fiduciary Net Position is available in the separately issued VRS 2020 Annual Comprehensive Financial Report (Annual Report). A copy of the 2020 VRS Annual Report may be downloaded from the VRS website at http://www.varetire.org/pdf/Publications/2020-annual-report.pdf, or by writing to the System’s Chief Financial Officer at P.O. Box 2500, Richmond, VA, 23218-2500.
13. Pension Plan Data
Information about the VRS Political Subdivision Retirement Plan is also available in the separately issued VRS 2020 Comprehensive Annual Financial Report (Annual Report). A copy of the 2020 VRS Annual Report may be downloaded from the VRS website at http://www.varetire.org/pdf/publications/2020-annual-report.pdf, or by writing to the System’s Chief Financial Officer at P.O. Box 2500, Richmond, VA, 23218-2500.

COUNTY OF YORK, VIRGINIA Notes to Basic Financial Statements
June 30, 2021
F-55
10. DEFINED BENEFIT PENSION PLANS (Continued)
York County Public Schools - Optional Plan Plan Description
Plan Administration – The York County School Division administers the Optional Plan, a single employer defined benefit pension plan, provides pension benefits to non-professional employees of the School Division who were not previously covered by VRS. A fiduciary agent of the School Division administers the optional plan, which provides retirement benefits as well as death and disability benefits. As of June 30, 1992, the optional plan was frozen and the non-professional employees who participated in the plan became fully vested. The non-professional employees now participate in the VRS as noted above. Stand-alone financial reports are not issued for this plan. Plan Membership – At June 30, 2021, optional plan membership consisted of the following:
Active plan members 7
Retirees and beneficiaries 65
Number of vested terminations 4
76
Benefits Provided – The School Division provides retirement benefits. Retirement benefits for plan members are calculated as 1.5% of final 3-year average earnings times the member’s years of participation. Optional Plan members may retire at the age of 65 for normal retirement. Optional Plan members may retire at the age of 55 and with 5 years of participation for early retirement. Benefits are reduced actuarially for early commencement. Contributions – 2.50% of pay contribution was required as a condition of participation; however, no employee contributions were required after June 30, 1992. Employee contributions are accumulated with interest at 5.00%. For the year ended, June 30, 2021, the average active member contribution rate was 0% of annual payroll, and the School Division’s average contribution rate was 0% percent of annual payroll. Summary of Significant Accounting Policies
Method Used to Value Investments - Investments are reported at fair value. Short-term investments are recorded at cost, which approximates fair value. Securities traded on a national securities exchange are valued at the last reported sales price on the last business day of the School Division’s fiscal year. Investments that do not have an established market are reported at estimated fair value. Investments
Investment Policy – The Optional Plan’s policy in regard to the allocation of invested assets is established and may be amended by the School Division Board. It is the policy of the School Division Board to pursue an investment strategy that reduces the risk through the prudent diversification of the portfolio across a broad selection of distinct asset classes. The Optional Plan’s investment policy discourages the use of no-load mutual funds that invest in combinations of stocks and/or bonds.

COUNTY OF YORK, VIRGINIA Notes to Basic Financial Statements
June 30, 2021
F-56
10. DEFINED BENEFIT PENSION PLANS (Continued)
Rate of Return – For the year ended June 30, 2021, the annual money-weighted rate of return on pension plan investments, net of pension plan investment expense was 24.69%. The money-weighted return expresses investment performance net of investment expense, adjusted for the changing amounts actually invested. Net Pension Liability (Asset) of the School Division – Optional Plan Based on a measurement date of June 30, 2020, the components of the net pension liability of the School Division’s Optional Plan at June 30, 2021 were as follows:
Total Fiduciary Net
Pension Net Pension
Liability Position Liability (Asset)
(a) (b) (a) – (b)
Balance – June 30, 2020 $ 1,735,362 $ 1,745,408 $ (10,046)
Changes for the fiscal year:
Service cost 646 - 646
Interest 115,237 - 115,237
Difference between expected and
actual experience 34,647 - 34,647
Change of assumptions 79,355 - 79,355
Net investment income - 23,675 (23,675)
Benefit payments (179,529) (179,529) -
Administrative expenses - (18,397) 18,397
Net Changes 50,356 (174,251) 224,607
Balance – June 30, 2021 $ 1,785,718 $ 1,571,157 $ 214,561

COUNTY OF YORK, VIRGINIA Notes to Basic Financial Statements
June 30, 2021
F-57
10. DEFINED BENEFIT PENSION PLANS (Continued)
Actuarial Assumptions – The total pension liability was determined by an actuarial valuation as of July 1, 2020, using the following actuarial assumptions applied to all periods included in the measurement:
Interest 7.00% General Inflation 2.50% Cost of Living Adjustment (COLA) 2.00% Salary Scale N/A
Mortality rates were based on the Pub 2010, “Teachers” Classification table under Scale MP-2019. Discount Rate – From July 1, 2018 on, it is assumed the School Division will contribute 100% of the actuarially determined contribution rates. Based on those assumptions the pension plan’s fiduciary net position was projected to be available to make all projected future benefit payments of current active and inactive employees. Therefore, the long-term expected rate of return was applied to all periods of projected benefit payments to determine the total pension liability. The discount rate used to measure the total pension liability was 7.00%. Pension Expense and Deferred Outflows/Inflows of Resources At June 30, 2021, for the Optional Retirement Plan, the School Division reported deferred outflows of resources and deferred inflows of resources related to pensions from the following sources:
Deferred Deferred
Outflows of Inflows of
Resources Resources
Net difference between projected and
actual earnings on pension plan investments -$ 16,824$
The School Division did not have any contributions subsequent to the measurement date to be reported as a deferred outflow of resources that will be recognized as a reduction of the net pension liability in the year ended June 30, 2022. Other amounts reported as deferred outflows of resources related to the Optional Plan will be recognized in pension expense as follows:
Deferred
Amounts
2022 (22,796)$
2023 (18,270)
2024 5,926
2025 18,316
Total (16,824)$

COUNTY OF YORK, VIRGINIA Notes to Basic Financial Statements
June 30, 2021
F-58
10. DEFINED BENEFIT PENSION PLANS (Continued)
For the year ended June 30, 2021, the School Division recognized pension expense for the Optional Plan of $110,619. Sensitivity of the Net Pension Liability to Changes in the Discount Rate – The following presents the net pension liability of the School Division’s Optional Plan, calculated using the discount rate of 7.00%, as well as what the School Division’s Optional Plan net pension liability would be if it were calculated using a discount rate that is 1-percentage point lower (6.00%) or 1-percentage-point higher (8.00%) than the current rate:
1.00% Current 1.00%Decrease Discount Rate Increase
(6.00%) (7.00%) (8.00%)
School Division’s Net Pension
Liability (Asset) for the Optional Plan 336,111$ 214,561$ 106,832$ Combining Pension Liabilities, Pension Expense, Deferred Outflows of Resources and Deferred Inflows of Resources Related to Pensions The VRS County Retirement plan, the VRS School Professional plan, VRS Nonprofessional plan, and the School Optional plan are reported separately herein since each plan has distinctive characteristics, reporting requirements and valuations. The impact of total pension requirements on the net position of the County and the York County School Division is combined and summarized in the schedule below:
County VRS VRS School
Retirement Professional Nonprofessional Optional Combined
Plan Plan Plan Plan Totals
Net pension liability 39,815,900$ 124,749,477$ 2,000,679$ 214,561$ 126,964,717$
Pension expense 10,237,138$ 14,434,898$ 938,297$ 110,619$ 15,483,814$
Deferred outflows of resources:
Differences between expected and actual experience 2,790,763$ -$ 107,409$ -$ 107,409$
Changes in assumptions 2,601,058 8,515,716 107,738 - 8,623,454
Net difference between projected and actual earnings
on pension plan investments 6,102,617 9,488,579 759,067 - 10,247,646
Changes in proportion and differences between
employer contributions and proportionate share
of contributions - 1,649,197 - - 1,649,197
Employer contributions subsequent to the
measurement date 5,003,134 12,234,048 392,338 - 12,626,386
Total deferred outflows of resources 16,497,572$ 31,887,540$ 1,366,552$ -$ 33,254,092$
Deferred inflows of resources:
Differences between expected and actual experience -$ 7,312,242$ -$ -$ 7,312,242$
Net difference between projected and actual earnings
on pension plan investments - - - 16,824 16,824
Changes in proportion and differences between
employer contributions and proportionate share
of contributions - 1,404,850 - - 1,404,850
Total deferred inflows of resources -$ 8,717,092$ -$ 16,824$ 8,733,916$
School Division

COUNTY OF YORK, VIRGINIA Notes to Basic Financial Statements
June 30, 2021
F-59
11. OTHER POSTEMPLOYMENT BENEFITS (OPEB)
County and School Division OPEB Liability – VRS Plans The County participates in a cost-sharing multiple employer Group Life Insurance (GLI) Program and an Employee Health Insurance Credit (HIC) Program offered by VRS. The School Division participates in a cost-sharing multiple employer GLI Program, a Teacher Employee HIC Program, a Political Subdivision Employee Virginia Disability Program, and a Teacher Employee Virginia Local Disability Program (VLDP) offered by the VRS.
VRS issues a publicly available Annual Report that includes financial statements and required
supplementary information for the plans administered by VRS. A copy of the most recent report may be obtained from the VRS website at http://www.varetire.org, or by writing to VRS’ Chief Financial Officer at P.O. Box 2500, Richmond, Virginia 23218-2500.
The actuarial assumptions and long term expected rate of return are the same for the VRS OPEB
programs. As such, the presentation of the actuarial assumptions and long term expected rate of return are combined below. Specific information for the OPEB plans will be presented after this section.
Actuarial Assumptions
The VRS OPEB liability was based on an actuarial valuation as of June 30, 2019, using the Entry Age Normal actuarial cost method and the following assumptions, applied to all periods included in the measurement and rolled forward to the measurement date of June 30, 2020.
Inflation 2.5% Salary increases, including inflation –
General state employees 3.5% – 5.35% Teachers 3.5% – 5.95% SPORS & VaLORS employees 3.5% – 4.75% JRS employees 4.5% Locality – General employees 3.5% – 5.35%
Locality – Hazardous Duty employees 3.5% – 4.75% Investment rate of return 6.75%, net of plan investment expenses, including inflation* * Administrative expenses as a percent of the market value of assets for the last experience study were found to be approximately 0.06% of the assets for all of the VRS plans. This would provide an assumed investment return rate for GAAP purposes of slightly more than the assumed 6.75%. However, since the difference was minimal, and a more conservative 6.75% investment return assumption provided a projected plan net position that exceeded the projected benefit payments, the long-term expected rate of return on investments was assumed to be 6.75% to simplify preparation of the OPEB liabilities.
Mortality rates – Teachers Pre-Retirement: RP-2014 White Collar Employee Rates to age 80, White Collar Healthy Annuitant Rates at age 81 and older projected with scale BB to 2020.

COUNTY OF YORK, VIRGINIA Notes to Basic Financial Statements
June 30, 2021
F-60
11. OTHER POSTEMPLOYMENT BENEFITS (Continued) Post-Retirement: RP-2014 White Collar Employee Rates to age 49, White Collar Health Annuitant Rates at ages 50 and older projected with scale BB to 2020; males 1% increase compounded from ages 70 to 90; females set back 3 years with 1.5% increase compounded from ages 65 to 70 and 2.0% increase compounded from ages 75 to 90. Post-Disablement: RP-2014 Disability Mortality Rates projected with Scale BB to 2020; 115% of rates for males and females. The actuarial assumptions used in the June 30, 2019 valuation were based on the results of an actuarial experience study for the four-year period from July 1, 2012 through June 30, 2016, except the change in the discount rate, which was based on VRS Board action effective as of July 1, 2019. Changes to the actuarial assumptions as a result of the experience study and VRS Board action are as follows:
Mortality Rates (Pre-retirement, post-retirement healthy, and disabled)
Updated to a more current mortality table – RP-2014 projected to 2020
Retirement Rates Lowered rates at older ages and changed final retirement from 70 to 75
Withdrawal Rates Adjusted rates to better fit experience at each year age and service through 9 years of service
Disability Rates Adjusted rates to better match experience
Salary Scale No change
Discount Rate Decreased rate from 7.00% to 6.75%
Mortality rates – Largest and Non-Largest Ten Locality Employers - General Employees Pre-Retirement: RP-2014 Employee Rates to age 80, Healthy Annuitant Rates to 81 and older projected with Scale BB to 2020; males 95% of rates; females 105% of rates. Post-Retirement: RP-2014 Employee Rates to age 49, Healthy Annuitant Rates at ages 50 and older projected with Scale BB to 2020; males set forward 3 years; females 1.0% increase compounded from age 70 to 90. Post-Disablement: RP-2014 Disability Life Mortality Table projected with scale BB to 2020; males set forward 2 years, 110% of rates; females 125% of rates.
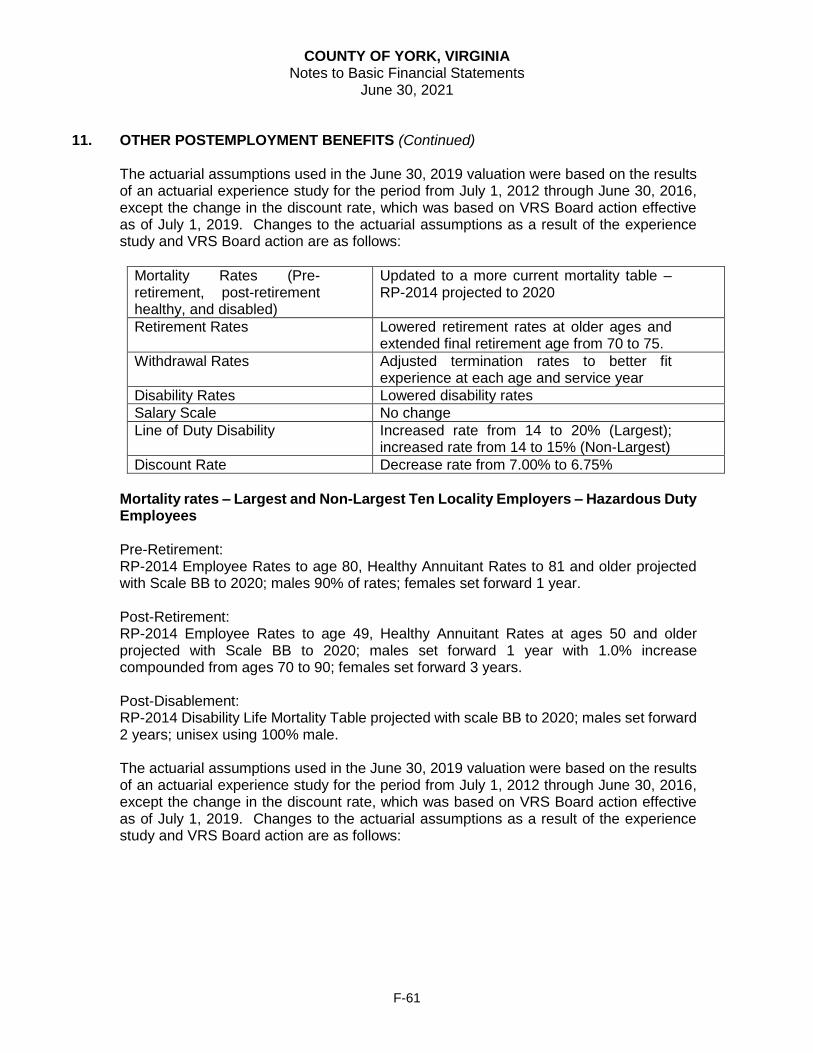
COUNTY OF YORK, VIRGINIA Notes to Basic Financial Statements
June 30, 2021
F-61
11. OTHER POSTEMPLOYMENT BENEFITS (Continued) The actuarial assumptions used in the June 30, 2019 valuation were based on the results of an actuarial experience study for the period from July 1, 2012 through June 30, 2016, except the change in the discount rate, which was based on VRS Board action effective as of July 1, 2019. Changes to the actuarial assumptions as a result of the experience study and VRS Board action are as follows:
Mortality Rates (Pre-retirement, post-retirement healthy, and disabled)
Updated to a more current mortality table – RP-2014 projected to 2020
Retirement Rates Lowered retirement rates at older ages and extended final retirement age from 70 to 75.
Withdrawal Rates Adjusted termination rates to better fit experience at each age and service year
Disability Rates Lowered disability rates
Salary Scale No change
Line of Duty Disability Increased rate from 14 to 20% (Largest); increased rate from 14 to 15% (Non-Largest)
Discount Rate Decrease rate from 7.00% to 6.75%
Mortality rates – Largest and Non-Largest Ten Locality Employers – Hazardous Duty Employees Pre-Retirement: RP-2014 Employee Rates to age 80, Healthy Annuitant Rates to 81 and older projected with Scale BB to 2020; males 90% of rates; females set forward 1 year. Post-Retirement: RP-2014 Employee Rates to age 49, Healthy Annuitant Rates at ages 50 and older projected with Scale BB to 2020; males set forward 1 year with 1.0% increase compounded from ages 70 to 90; females set forward 3 years. Post-Disablement: RP-2014 Disability Life Mortality Table projected with scale BB to 2020; males set forward 2 years; unisex using 100% male. The actuarial assumptions used in the June 30, 2019 valuation were based on the results of an actuarial experience study for the period from July 1, 2012 through June 30, 2016, except the change in the discount rate, which was based on VRS Board action effective as of July 1, 2019. Changes to the actuarial assumptions as a result of the experience study and VRS Board action are as follows:

COUNTY OF YORK, VIRGINIA Notes to Basic Financial Statements
June 30, 2021
F-62
11. OTHER POSTEMPLOYMENT BENEFITS (Continued)
Mortality Rates (Pre-retirement, post-retirement healthy, and disabled)
Updated to a more current mortality table – RP-2014 projected to 2020
Retirement Rates Lowered retirement rates at older ages (Largest); increased age 50 rates and lowered rates at older ages (Non-Largest)
Withdrawal Rates Adjusted termination rates to better fit experience at each age and service year
Disability Rates Increased disability rates (Largest); adjusted rates to better match experience (Non-Largest)
Salary Scale No change
Line of Duty Disability Increased rate from 60 to 70% (Largest); Decreased rate from 60% to 45% (Non-Largest)
Discount Rate Decrease rate from 7.00% to 6.75%
Long-Term Expected Rate of Return The long-term expected rate of return on the System’s investments was determined using a log-normal distribution analysis in which best-estimate ranges of expected future real rates of return (expected returns, net of System’s investment expense and inflation) are developed for each major asset class. These ranges are combined to produce the long-term expected rate of return by weighting the expected future real rates of return by the target asset allocation percentage and by adding expected inflation. The target asset allocation and best estimate of arithmetic real rates of return for each major asset class are summarized in the following table:
Asset Class (Strategy)
Target Allocation
Arithmetic Long-Term Expected Rate of Return
Weighted Average
Long-Term Expected Rate of Return
Public Equity 34.00% 4.65% 1.58% Fixed Income 15.00% 0.46% 0.07% Credit Strategies 14.00% 5.38% 0.75% Real Assets 14.00% 5.01% 0.70% Private Equity 14.00% 8.34% 1.17% MAPS-Multi-Asset Public Strategies 6.00% 3.04% 0.18% PIP-Private Investment Parnership 3.00% 6.49% 0.19%
Total 100.00% 4.64%
Inflation 2.50%
Expected arithmetic nominal return* 7.14%
* The above allocation provides a one-year return of 7.14%. However, one-year returns do not take into account the volatility present in each of the asset classes. In setting the long-term expected return of the system, stochastic projections are employed to model future returns under various economic conditions. The results provide a range of returns over various time periods that ultimately provide a median return of 7.11%, including expected inflation of 2.50%. On October 10, 2019, the VRS Board elected a long-term rate of 6.75% which is roughly at the 40th percentile of expected long-term results of the VRS fund asset allocation. More recent capital market assumptions compiled for the FY2020 actuarial valuations, provide a median return of 6.81%.

COUNTY OF YORK, VIRGINIA Notes to Basic Financial Statements
June 30, 2021
F-63
11. OTHER POSTEMPLOYMENT BENEFITS (Continued) Virginia Retirement System – Group Life Insurance Program Plan Description
All full-time, salaried permanent employees of the state agencies, teachers and employees of participating political subdivisions are automatically covered by the VRS GLI Program upon employment. This plan is administered by the Virginia Retirement System (the System), along with pensions and other OBEB plans, for public employer groups in the Commonwealth of Virginia.
In addition to the Basic Group Life Insurance benefit, members are also eligible to elect additional coverage for themselves as well as a spouse or dependent children through the Optional Group Life Insurance Program. For members who elect the optional group life insurance coverage, the insurer bills employers directly for the premiums. Employers deduct these premiums from members’ paychecks and pay the premiums to the insurer. Since this is a separate and fully insured program, it is not included as part of the Group Life Insurance Program OPEB. The specific information for Group Life Insurance Program OPEB, including eligibility, coverage and benefits is set out in the table below:
GROUP LIFE INSURANCE PROGRAM PLAN PROVISIONS
Eligible Employees The Group Life Insurance Program was established July 1, 1960, for state employees, teachers and employees of political subdivisions that elect the program, including the following employers that do not participate in VRS for retirement:
City of Richmond
City of Portsmouth
City of Roanoke
City of Norfolk
Roanoke City School Board Basic group life insurance coverage is automatic upon employment. Coverage ends for employees who leave their position before retirement eligibility or who take a refund of their member contributions and accrued interest.
Benefit Amounts The benefits payable under the Group Life Insurance Program have several components.
Natural Death Benefit – The natural death benefit is equal to the employee’s covered compensation rounded to the next highest thousand and then doubled.
Accidental Death Benefit – The accidental death benefit is double the natural death benefit.
Other Benefit Provisions – In addition to the basic natural and accidental death benefits, the program provides additional benefits provided under specific circumstances. These include:
o Accidental dismemberment benefit o Safety belt benefit o Repatriation benefit o Felonious assault benefit o Accelerated death benefit option

COUNTY OF YORK, VIRGINIA Notes to Basic Financial Statements
June 30, 2021
F-64
11. OTHER POSTEMPLOYMENT BENEFITS (Continued)
Reduction in Benefit Amounts The benefit amounts provided to members covered under the Group Life Insurance Program are subject to a reduction factor. The benefit amount reduces by 25% on January 1 following one calendar year of separation. The benefit amount reduces by an additional 25% on each subsequent January 1 until it reaches 25% of its original value.
Minimum Benefit Amount and Cost-of-Living Adjustment (COLA) For covered members with at least 30 years of service credit, there is a minimum benefit payable under the Group Life Insurance Program. The minimum benefit was set at $8,000 by statute in 2015. This amount is increased annually based on the VRS Plan 2 cost-of-living adjustment calculation. The minimum benefit adjusted for the COLA was $8,616 as of June 30, 2021.
Contributions The contribution requirements for the GLI Program are governed by §51.1-506 and §51.1-508 of the Code of Virginia, as amended, but may be impacted as a result of funding provided to state agencies and school divisions by the Virginia General Assembly. The total rate for the GLI Program was 1.34% of covered employee compensation. This was allocated into an employee and an employer component using a 60/40 split. The employee component was 0.80% (1.34% X 60%) and the employer component was 0.54% (1.34% X 40%). Employers may elect to pay all or part of the employee contribution; however the employer must pay all of the employer contribution. Each employer’s contractually required employer contribution rate for the year ended June 30, 2021 was 0.54% of covered employee compensation. This rate was based on an actuarially determined rate from an actuarial valuation as of June 30, 2019. The actuarially determined rate, when combined with employee contributions, was expected to finance the costs of benefits payable during the year, with an additional amount to finance any unfunded accrued liability. Contributions to the GLI Program from the County were $234,716 and $233,351 for the years ended June 30, 2021 and June 30, 2020, respectively. Contribution to the GLI Program from the School Division for nonprofessional employees were $34,603 and $34,895 or the years ended June 30, 2021 and June 30, 2020, respectively. Contributions to the GLI Program from the School Division for professional employees were $398,328 and $387,637 for the years ended June 30, 2021 and June 30, 2020, respectively.
GLI OPEB Liabilities, GLI OPEB Expense, and Deferred Outflows of Resources and Deferred Inflows of Resources Related to the Group Life Insurance Program OPEB At June 30, 2021 , the County reported a liability of $3,638,898 for its proportionate share of the Net GLI OPEB Liability. At June 30, 2021, the School Division reported a liability of $544,207 for its proportionate share of the Net GLI OPEB Liability for nonprofessional employees. At June 30, 2021, the School Division reported a liability of $6,044,858 for its proportionate share of the Net GLI OPEB Liability for professional employees. The Net GLI OPEB Liability was measured as of June 30, 2020 and the total GLI OPEB liability used to calculate the Net GLI OPEB Liability was determined by an actuarial valuation performed as of June 30, 2019, and rolled forward to the measurement date of June 30, 2020. The covered employer’s proportion of the Net GLI OPEB Liability was based on the covered employer’s actuarially determined employer contributions to the GLI Program for the year ended June 30, 2020 relative to the total of the actuarially determined employer contributions for all participating employers. At June 30, 2020, the participating employer’s proportion was 0.21805% as compared to 0.22168% at June 30, 2019. At June 30, 2020, the participating employer’s proportion was 0.03261% as compared to 0.03328% at June
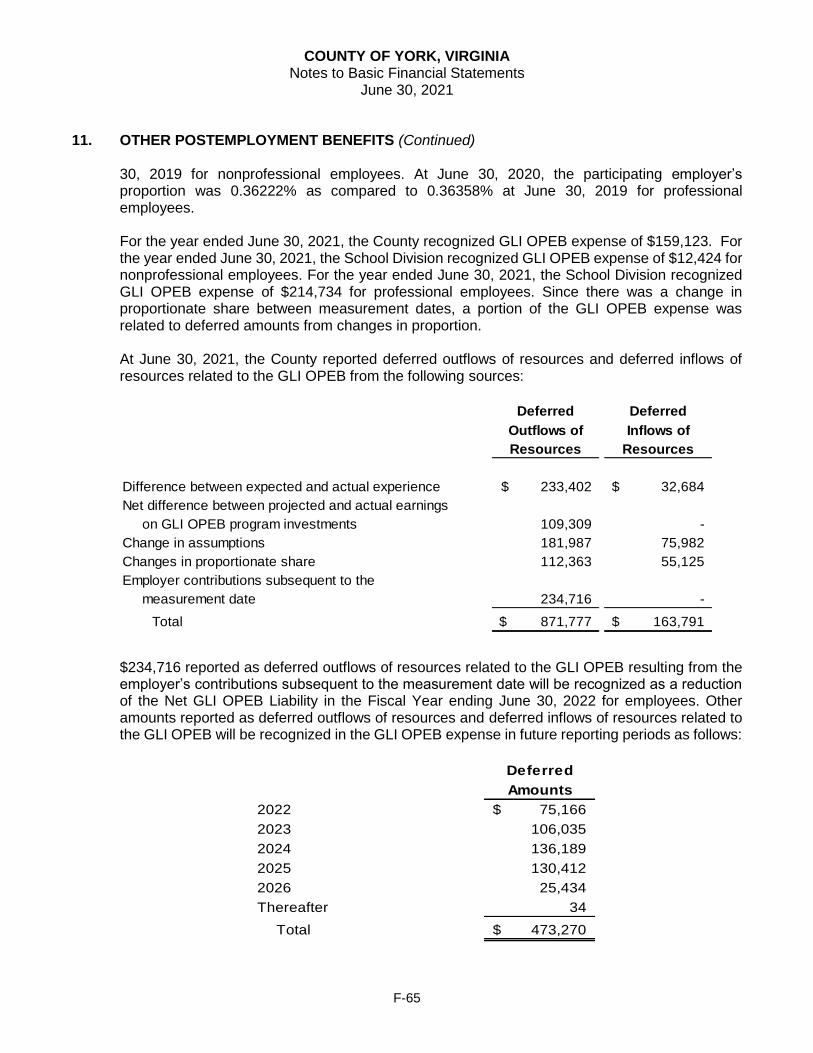
COUNTY OF YORK, VIRGINIA Notes to Basic Financial Statements
June 30, 2021
F-65
11. OTHER POSTEMPLOYMENT BENEFITS (Continued)
30, 2019 for nonprofessional employees. At June 30, 2020, the participating employer’s proportion was 0.36222% as compared to 0.36358% at June 30, 2019 for professional employees. For the year ended June 30, 2021, the County recognized GLI OPEB expense of $159,123. For the year ended June 30, 2021, the School Division recognized GLI OPEB expense of $12,424 for nonprofessional employees. For the year ended June 30, 2021, the School Division recognized GLI OPEB expense of $214,734 for professional employees. Since there was a change in proportionate share between measurement dates, a portion of the GLI OPEB expense was related to deferred amounts from changes in proportion.
At June 30, 2021, the County reported deferred outflows of resources and deferred inflows of resources related to the GLI OPEB from the following sources:
Deferred Deferred
Outflows of Inflows of
Resources Resources
Difference between expected and actual experience 233,402$ 32,684$
Net difference between projected and actual earnings
on GLI OPEB program investments 109,309 -
Change in assumptions 181,987 75,982
Changes in proportionate share 112,363 55,125
Employer contributions subsequent to the
measurement date 234,716 -
Total 871,777$ 163,791$
$234,716 reported as deferred outflows of resources related to the GLI OPEB resulting from the employer’s contributions subsequent to the measurement date will be recognized as a reduction of the Net GLI OPEB Liability in the Fiscal Year ending June 30, 2022 for employees. Other amounts reported as deferred outflows of resources and deferred inflows of resources related to the GLI OPEB will be recognized in the GLI OPEB expense in future reporting periods as follows:
Deferred
Amounts
2022 75,166$
2023 106,035
2024 136,189
2025 130,412
2026 25,434
Thereafter 34
Total 473,270$

COUNTY OF YORK, VIRGINIA Notes to Basic Financial Statements
June 30, 2021
F-66
11. OTHER POSTEMPLOYMENT BENEFITS (Continued) At June 30, 2021, the School Division reported deferred outflows of resources and deferred inflows of resources related to the GLI OPEB for nonprofessional employees from the following sources:
Deferred Deferred
Outflows of Inflows of
Resources Resources
Difference between expected and actual experience 34,906$ 4,889$
Net difference between projected and actual earnings
on OPEB plan investments 16,348 -
Changes of assumptions 27,217 11,363
Changes in proportionate share - 32,274
Employer contributions subsequent to the measurement date 34,603 -
Total 113,074$ 48,526$
$34,603 reported as deferred outflows of resources related to the GLI OPEB resulting from the employer’s contributions subsequent to the measurement date will be recognized as a reduction of the Net GLI OPEB Liability in the Fiscal Year ending June 30, 2022 for nonprofessional employees. Other amounts reported as deferred outflows of resources and deferred inflows of resources related to the GLI OPEB will be recognized in the GLI OPEB expense in future reporting periods as follows:
Deferred
Amounts
2022 (132)$
2023 4,485
2024 10,183
2025 13,311
2026 2,162
Thereafter (64)
Total 29,945$
At June 30, 2021, the School Division reported deferred outflows of resources and deferred inflows of resources related to the GLI OPEB for professional employees from the following sources:

COUNTY OF YORK, VIRGINIA Notes to Basic Financial Statements
June 30, 2021
F-67
11. OTHER POSTEMPLOYMENT BENEFITS (Continued)
Deferred Deferred
Outflows of Inflows of
Resources Resources
Difference between expected and actual experience 387,722$ 54,294$
Net difference between projected and actual earnings
on OPEB plan investments 181,582 -
Changes of assumptions 302,313 126,220
Changes in proportionate share 63,944 115,267
Employer contributions subsequent to the measurement date 398,328 -
Total 1,333,889$ 295,781$
$398,328 reported as deferred outflows of resources related to the GLI OPEB resulting from the employer’s contributions subsequent to the measurement date will be recognized as a reduction of the Net GLI OPEB Liability in the Fiscal Year ending June 30, 2022 for professional employees. Other amounts reported as deferred outflows of resources and deferred inflows of resources related to the GLI OPEB will be recognized in the GLI OPEB expense in future reporting periods as follows:
Deferred
Amounts
2022 75,267$
2023 126,547
2024 182,494
2025 202,543
2026 50,255
Thereafter 2,674
Total 639,780$
Net GLI OPEB Liability The net OPEB liability (NOL) for the Group Life Insurance Program represents the program’s total OPEB liability determined in accordance with U.S. GAAP, less the associated fiduciary net position. As of the measurement date of June 30, 2020, NOL amounts for the Group Life Insurance Program is as follows (amounts expressed in thousands):
Group Life
Insurance
OPEB Program
Total GLI OPEB Liability 3,523,937$
Plan Fiduciary Net Position 1,855,102
Employers' Net GLI OPEB Liability 1,668,835$
Plan Fiduciary Net Position as a Percentage
of the Total GLI OPEB Liability 52.64%

COUNTY OF YORK, VIRGINIA Notes to Basic Financial Statements
June 30, 2021
F-68
11. OTHER POSTEMPLOYMENT BENEFITS (Continued) The total GLI OPEB liability is calculated by the System’s actuary, and each plan’s fiduciary net position is reported in the System’s financial statements. The net GLI OPEB liability is disclosed in accordance with the requirements of U.S. GAAP in the System’s notes to the financial statements and required supplementary information.
Discount Rate The discount rate used to measure the total GLI OPEB liability was 6.75%. The projection of cash flows used to determine the discount rate assumed that member contributions will be made per the VRS guidance and the employer contributions will be made in accordance with the VRS funding policy at rates equal to the difference between actuarially determined contribution rates adopted by the VRS Board of Trustees and the member rate. Through the fiscal year ending June 30, 2020, the rate contributed by the entity for the GLI OPEB will be subject to the portion of the VRS Board-certified rates that are funded by the Virginia General Assembly which was 100% of the actuarially determined contribution rate. From July 1, 2020 on, employers are assumed to contribute 100% of the actuarially determined contribution rates. Based on those assumptions, the GLI OPEB’s fiduciary net position was projected to be available to make all projected future benefit payments of eligible employees. Therefore, the long-term expected rate of return was applied to all periods of projected benefit payments to determine the total GLI OPEB liability. Sensitivity of the County’s Proportionate Share of the Net GLI OPEB Liability to Changes in the Discount Rate The following presents the employer’s proportionate share of the net GLI OPEB liability for County employees using the discount rate of 6.75%, as well as what the employer’s proportionate share of the net GLI OPEB liability would be if it were calculated using a discount rate that is one percentage point lower (5.75%) or one percentage point higher (7.75%) than the current rate:
1.00% Current 1.00%Decrease Discount Rate Increase(5.75%) (6.75%) (7.75%)
County's Proportionate Share of the
GLI Program Net OPEB Liability 4,783,610$ 3,638,898$ 2,709,284$
Sensitivity of the School Division’s Proportionate Share of the Net GLI OPEB Liability to Changes in the Discount Rate The following presents the employer’s proportionate share of the net GLI OPEB liability for nonprofessional employees using the discount rate of 6.75%, as well as what the employer’s proportionate share of the net GLI OPEB liability would be if it were calculated using a discount rate that is one percentage point lower (5.75%) or one percentage point higher (7.75%) than the current rate:

COUNTY OF YORK, VIRGINIA Notes to Basic Financial Statements
June 30, 2021
F-69
11. OTHER POSTEMPLOYMENT BENEFITS (Continued)
Sensitivity of the School Division’s Proportionate Share of the Net GLI OPEB Liability to Changes in the Discount Rate (Continued)
1.00% Current 1.00%Decrease Discount Rate Increase(5.75%) (6.75%) (7.75%)
School Division's Proportionate Share of
the GLI Program Net OPEB Liability -
nonprofessional 715,402$ 544,207$ 405,181$ The following presents the employer’s proportionate share of the net GLI OPEB liability for professional employees using the discount rate of 6.75%, as well as what the employer’s proportionate share of the net GLI OPEB liability would be if it were calculated using a discount rate that is one percentage point lower (5.75%) or one percentage point higher (7.75%) than the current rate:
1.00% Current 1.00%Decrease Discount Rate Increase(5.75%) (6.75%) (7.75%)
School Division's Proportionate Share of
the GLI Program Net OPEB Liability -
professional 7,946,431$ 6,044,858$ 4,500,604$ Virginia Retirement System – Health Insurance Credit Program Plan Description The HIC Program is a multiple-employer, agent defined benefit plan that provides a credit toward the cost of health insurance coverage for retired political subdivision employees of participating employers. All full-time, salaried permanent employees of participating political subdivisions are automatically covered by the VRS Political Subdivision HIC Program upon employment. This plan is administered by the Virginia Retirement System (the System), along with pension and other OPEB plans, for public employer groups in the Commonwealth of Virginia. Members earn one month of service credit toward the benefit for each month they are employed and for which their employer pays contributions to VRS. The health insurance credit is a tax-free reimbursement in an amount set by the General Assembly for each year of service credit against qualified health insurance premiums retirees pay for single coverage, excluding any portion covering the spouse or dependents. The credit cannot exceed the amount of the premiums and ends upon the retiree’s death. The specific information about the Political Subdivision HIC Program OPEB, including eligibility, coverage, and benefits is set out in the table below:

COUNTY OF YORK, VIRGINIA Notes to Basic Financial Statements
June 30, 2021
F-70
11. OTHER POSTEMPLOYMENT BENEFITS (Continued)
POLITICAL SUBDIVISION HEALTH INSURANCE CREDIT PROGRAM (HIC) PLAN PROVISIONS
Eligible Employees The Political Subdivision Retiree Health Insurance Credit Program was established July 1, 1993 for retired political subdivision employees of employers who elect the benefit and who retire with at least 15 years of service credit. Eligible employees are enrolled automatically upon employment. They include:
Full-time permanent salaried employees of the County who are covered under the VRS pension plan.
Benefit Amounts The County’s Retiree Health Insurance Credit Program provides the following benefits for eligible employees:
At Retirement – For employees who retire, the monthly benefit is $1.50 per year of service per month with a maximum benefit of $45.00 per month.
Disability Retirement – For employees who retire on disability or go on long-term disability under the Virginia Local Disability Program (VLDP), the monthly benefit is $45.00 per month.
Health Insurance Credit Program Notes:
The monthly Health Insurance Credit benefit cannot exceed the individual premium amount.
No health insurance credit for premiums paid and qualified under LODA, however, the employee may receive the credit for premiums paid for other qualified health plans.
Employees who retire after being on long-term disability under VLDP must have at least 15 years of service credit to qualify for the health insurance credit as a retiree.
The specific information for the Teacher HIC Program OPEB, including eligibility, coverage, and benefits is set out in the table below:
TEACHER EMPLOYEE HEALTH INSURANCE CREDIT PROGRAM (HIC) PLAN PROVISIONS
Eligible Employees – Teacher Employee (Professional) The Teacher Employee Retiree Health Insurance Credit Program was established July 1, 1993 for retired Teacher Employees covered under VRS who retire with at least 15 years of service credit. Eligible employees are enrolled automatically upon employment. They include:
Full-time permanent (professional) salaried employees of public school divisions covered under VRS.
Eligible Employees – Political Subdivision (Nonprofessional) The political subdivision’s Retiree HIC was established July 1, 1993 for retired political subdivision employees of employers who elect the benefit and who retire with at least 15 years of service credit.
Eligible employees are enrolled automatically upon employment. They include:
Full-time permanent salaried employees of public school divisions covered under the VRS pension plan.

COUNTY OF YORK, VIRGINIA Notes to Basic Financial Statements
June 30, 2021
F-71
11. OTHER POSTEMPLOYMENT BENEFITS (Continued)
TEACHER EMPLOYEE HEALTH INSURANCE CREDIT PROGRAM (HIC) PLAN PROVISIONS (Continued)
Benefit Amounts – Teacher Employee (Professional) The Teacher Employee Retiree Health Insurance Credit Program provides the following benefits for eligible employees:
At Retirement – For Teacher and other professional school employees who retire with at least 15 years of service credit, the monthly benefit is $4.00 per year of service per month with no cap on the benefit amount.
Disability Retirement – For Teacher and other professional school employees who retire on disability or go on long-term disability under the Virginia Local Disability Program (VLDP), the monthly benefit is either:
o $4.00 per month, multiplied by twice the amount of service credit, or o $4.00 per month, multiplied by the amount of service earned had the employee
been active until age 60, whichever is lower. Benefit Amounts – Political Subdivision (Nonprofessional) The political subdivision’s Retiree HIC provides the following benefits for eligible employees:
At Retirement – For employees who retire, the monthly benefit is $1.50 per year of service per month with a maximum benefit of $45.00 per month.
Disability Retirement – For employees who retire on disability or go on long-term
disability under the Virginia Local Disability Program (VLDP), the monthly benefit is
$45.00 per month.
Health Insurance Credit Program Notes:
The monthly Health Insurance Credit benefit cannot exceed the individual premium amount.
Employees who retire after being on long-term disability under VLDP must have at least 15 year of service credit to qualify for the health insurance credit as a retiree.
No health insurance credit for premiums paid and qualified under LODA, however, the employee may receive the credit for premiums paid for other qualified health plans. (Nonprofessional employees only)
Employees Covered by Benefit Terms
As of the June 30, 2019 actuarial valuation, the following employees were covered by the benefit terms of the HIC OPEB plan:
(Nonprofessional)
County Schools
Inactive Members or Their Beneficiaries
Currently Receiving Benefits 172 38
Active Members 553 271
Total Covered Employees 725 309

COUNTY OF YORK, VIRGINIA Notes to Basic Financial Statements
June 30, 2021
F-72
11. OTHER POSTEMPLOYMENT BENEFITS (Continued) Contributions The contribution requirement for active employees is governed by §51.1-1402(E) of the Code of Virginia, as amended, but may be impacted as a result of funding provided to school divisions by the Virginia General Assembly. The County’s contractually required employer contribution rate for the year ended June 30, 2020 was 0.17% of covered employee compensation for employees in the VRS Health Insurance Credit Program. Each school division’s contractually required employer contribution rate for the year ended June 30, 2021 was 1.21% of covered employee compensation for employees in the VRS Teacher Employee Health Insurance Credit Program (Professional) and 0.66% of covered compensation for the School Division’s nonprofessional employees. This rate was based on an actuarially determined rate from an actuarial valuation as of June 30, 2019. The actuarially determined rate was expected to finance the costs of benefits earned by employees during the year, with an additional amount to finance any unfunded accrued liability. Contributions from the County to the VRS Health Insurance Credit Program were $51,730 and $53,656 for the years ended June 30, 2021 and June 30, 2020, respectively. Contributions from the school division to the VRS Teacher Employee Health Insurance Credit Program were $890,686 and $892,376 for the years ended June 30, 2021 and June 30, 2020, respectively. For nonprofessional employees, contributions from the School Division to the HIC were $41,299 and $34,311 for the years ended June 30, 2021 and June 30, 2020, respectively.
HIC Program OPEB Liabilities, HIC Program OPEB Expense, and Deferred Outflows of Resources and Deferred Inflows of Resources Related to HIC Program OPEB At June 30, 2021, the County reported a HIC Program Net OPEB liability of $374,831 measured as of June 30, 2020. The total HIC OPEB liability was determined by an actuarial valuation performed as of June 30, 2019, using updated actuarial assumptions, applied to all periods included in the measurement date and rolled forward to the measurement date of June 30, 2020. At June 30, 2021, the School Division reported a liability of $11,065,692 for its proportionate share of the VRS Teacher Employee HIC Program Net OPEB Liability and $435,877 for the Nonprofessional HIC Program Net OPEB Liability. The School Division’s Net HIC Program OPEB Liability was measured as of June 30, 2020 and the total HIC OPEB liability used to calculate the net HIC OPEB Liability was determined by an actuarial valuation performed as of June 30, 2019 and rolled forward to the measurement date of June 30, 2020. The School Division’s proportion of the Net VRS Teacher Employee HIC Program OPEB Liability was based on the school division’s actuarially determined employer contributions to the VRS Teacher Employee HIC Program OPEB plan for the year ended June 30, 2020, relative to the total of the actuarially determined employer contributions for all participating employers. At June 30, 2020, the school division’s proportion of the VRS Teacher Employee HIC Program was 0.84826% as compared to 0.84659% at June 30, 2019.
For the year ended June 30, 2021, the County recognized VRS HIC Program OPEB expense of $51,791. Since there was a change in proportionate share between June 30, 2019 and June 30, 2020 a portion of the VRS HIC Program Net OPEB expense was related to deferred amounts from changes in proportion. At June 30, 2021, the County reported deferred outflows of resources and deferred inflows of resources related to the VRS HIC Program OPEB from the following sources:

COUNTY OF YORK, VIRGINIA Notes to Basic Financial Statements
June 30, 2021
F-73
11. OTHER POSTEMPLOYMENT BENEFITS (Continued)
Deferred Deferred
Outflows of Inflows of
Resources Resources
Differences between expected and actual experience 15,291$ 9,273$
Net difference between projected and actual earnings
on HIC OPEB program investments 32,557 -
Change in assumptions 21,720 16,531
Employer contributions subsequent to the
measurement date 51,730 -
Total 121,298$ 25,804$
$51,730 reported as deferred outflows of resources related to the HIC OPEB resulting from the County’s contributions subsequent to the measurement date will be recognized as a reduction of the Net HIC OPEB Liability in the Fiscal Year ending June 30, 2022. Other amounts reported as deferred outflows of resources and deferred inflows of resources related to the HIC OPEB will be recognized in the HIC OPEB expense in future reporting periods as follows:
Deferred
Amounts
2022 2,973$
2023 10,121
2024 15,036
2025 16,626
2026 (841)
Thereafter (151)
Total 43,764$
For the year ended June 30, 2021, the school division recognized VRS nonprofessional HIC Program OPEB expense of $117,628. At June 30, 2021 the School Division reported deferred outflows of resources and deferred inflows of resources related to the School Division’s HIC from the following sources:
Deferred Deferred
Outflows of Inflows of
Resources Resources
Difference between expected and actual experience 315,866$ -$
Net difference between projected and actual earnings
on OPEB plan investments 849 -
Changes of assumptions 6,265 -
Employer contributions subsequent to the measurement date 41,299 -
Total 364,279$ -$

COUNTY OF YORK, VIRGINIA Notes to Basic Financial Statements
June 30, 2021
F-74
11. OTHER POSTEMPLOYMENT BENEFITS (Continued) $41,299 reported as deferred outflows of resources related to the HIC OPEB resulting from the school division’s contributions subsequent to the measurement date will be recognized as a reduction of the nonprofessional HIC OPEB Liability in the Fiscal Year ending June 30, 2022. Other amounts reported as deferred outflows of resources and deferred inflows of resources related to the nonprofessional HIC OPEB will be recognized in the nonprofessional HIC OPEB expense in future reporting periods as follows:
Deferred
Amounts
2022 78,640$
2023 78,640
2024 78,638
2025 78,727
2026 8,335
Thereafter -
Total 322,980$
For the year ended June 30, 2021, the school division recognized VRS Teacher Employee HIC Program OPEB expense of $876,970. Since there was a change in proportionate share between measurement dates a portion of the VRS Teacher Employee HIC Program Net OPEB expense was related to deferred amounts from changes in proportion.
At June 30, 2021, the School Division reported deferred outflows of resources and deferred inflows of resources related to the VRS Teacher Employee HIC Program OPEB from the following sources:
Deferred Deferred
Outflows of Inflows of
Resources Resources
Difference between expected and actual experience -$ 147,778$
Net difference between projected and actual earnings
on OPEB plan investments 49,039 -
Changes of assumptions 218,753 60,460
Changes in proportionate share 110,548 220,480
Employer contributions subsequent to the measurement date 890,686 -
Total 1,269,026$ 428,718$
$890,686 reported as deferred outflows of resources related to the Teacher Employee HIC OPEB resulting from the school division’s contributions subsequent to the measurement date will be recognized as a reduction of the Net Teacher Employee HIC OPEB Liability in the Fiscal Year ending June 30, 2022. Other amounts reported as deferred outflows of resources and deferred inflows of resources related to the Teacher Employee HIC OPEB will be recognized in the Teacher Employee HIC OPEB expense in future reporting periods as follows:

COUNTY OF YORK, VIRGINIA Notes to Basic Financial Statements
June 30, 2021
F-75
11. OTHER POSTEMPLOYMENT BENEFITS (Continued)
Deferred
Amounts
2022 (29,239)$
2023 (24,379)
2024 (26,007)
2025 (7,387)
2026 25,932
Thereafter 10,702
Total (50,378)$
Net HIC OPEB Liability The net OPEB liability (NOL) for the County’s HIC Program represents the program’s total OPEB liability determined in accordance with GAAP, less the associated fiduciary net position. As of June 30, 2020, NOL amounts for the VRS HIC Program is as follows (amounts expressed in thousands):
HIC OPEB
Program
Total HIC OPEB Liability 77,490,000$
Plan Fiduciary Net Position 24,468,000
Employers' Net HIC OPEB Liability 53,022,000
Plan Fiduciary Net Position as a Percentage
of the Total HIC OPEB Liability 31.58% The total HIC OPEB liability is calculated by the System’s actuary, and the plan’s fiduciary net position is reported in the System’s financial statements. The net HIC OPEB liability is disclosed in accordance with the requirements of GAAP in the System’s notes to the financial statements and required supplementary information.
Net Teacher Employee HIC OPEB Liability The net OPEB liability (NOL) for the Teacher Employee HIC Credit Program represents the program’s total OPEB liability determined in accordance with U.S. GAAP, less the associated fiduciary net position. As of June 30, 2020, the amounts for the VRS HIC Program is as follows (amounts expressed in thousands):
Teacher Employee
HIC OPEB
Program
Total Teacher Employee HIC OPEB Liability 1,448,676$
Plan Fiduciary Net Position 144,160
Teacher Employee Net HIC OPEB Liability 1,304,516
Plan Fiduciary Net Position as a Percentage
of the Total Teacher Employee HIC OPEB Liability 9.95%

COUNTY OF YORK, VIRGINIA Notes to Basic Financial Statements
June 30, 2021
F-76
11. OTHER POSTEMPLOYMENT BENEFITS (Continued) The total Teacher Employee HIC OPEB liability is calculated by the System’s actuary, and the plan’s fiduciary net position is reported in the System’s financial statements. The net Teacher Employee HIC OPEB liability is disclosed in accordance with the requirements of U.S. GAAP in the System’s notes to the financial statements and required supplementary information. Discount Rate The discount rate used to measure the total HIC OPEB liability was 6.75%. The projection of cash flows used to determine the discount rate assumed that employer contributions will be made in accordance with the VRS funding policy at rates equal to the difference between actuarially determined contribution rates adopted by the VRS Board of Trustees and the member rate. Through the fiscal year ending June 30, 2020, the rate contributed by the entity for the HIC OPEB will be subject to the portion of the VRS Board-certified rates that are funded by the Virginia General Assembly, which was 100% of the actuarially determined contribution rate. From July 1, 2020 on, employers are assumed to contribute 100% of the actuarially determined contribution rates. Based on those assumptions, the HIC OPEB fiduciary net position was projected to be available to make all projected future benefit payments of eligible employees. Therefore, the long-term expected rate of return was applied to all periods of projected benefit payments to determine the total HIC OPEB liability. Changes in Net HIC OPEB Liability:
Total Plan Net
HIC OPEB Fiduciary HIC OPEB
Liability Net Position Liability
(a) (b) (a) – (b)
Balance – June 30, 2019 $ 1,351,888 $ 986,102 $ 365,786
Changes for the fiscal year:
Service cost 24,734 - 24,734
Interest 88,266 - 88,266
Difference between expected
and actual experience (10,087) - (10,087)
Contribution – employer - 76,063 (76,063)
Net investment income - 19,702 (19,702)
Benefit payments (88,479) (88,479) -
Administrative expenses - (1,888) 1,888
Other changes - (9) 9
Net Changes 14,434 5,389 9,045
Balance – June 30, 2020 $ 1,366,322 $ 991,491 $ 374,831

COUNTY OF YORK, VIRGINIA Notes to Basic Financial Statements
June 30, 2021
F-77
11. OTHER POSTEMPLOYMENT BENEFITS (Continued) Nonprofessional Changes in Net HIC OPEB Liability:
Total Plan Net
HIC OPEB Fiduciary HIC OPEB
Liability Net Position Liability
(a) (b) (a) – (b)
Balance – June 30, 2019 $ 326,336 $ 19,963 $ 306,373
Changes for the fiscal year:
Service cost 11,482 - 11,482
Interest 21,325 - 21,325
Changes of benefits 7,946 - 7,946
Difference between expected
and actual experience 124,238 - 124,238
Contribution – employer - 35,120 (35,120)
Net investment income - 431 (431)
Benefit payments (20,815) (20,815) -
Administrative expenses - (64) 64
Net Changes 144,176 14,672 129,504
Balance – June 30, 2020 $ 470,512 $ 34,635 $ 435,877
Sensitivity of the Employer’s Proportionate Share of the Net HIC OPEB Liability to Changes in the Discount Rate The following presents the employer’s proportionate share of the net HIC OPEB liability for County employees using the discount rate of 6.75%, as well as what the employer’s proportionate share of the net HIC OPEB liability would be if it were calculated using a discount rate that is one percentage point lower (5.75%) or one percentage point higher (7.75%) than the current rate:
1.00% Current 1.00%Decrease Discount Rate Increase(5.75%) (6.75%) (7.75%)
County's Proportionate Share of the
HIC Program Net OPEB Liability 518,653$ 374,831$ 252,154$
The following presents the School Division’s proportionate share of the VRS Teacher Employee Health Insurance Credit Program net HIC (professional) OPEB liability and the Political Subdivision HIC (nonprofessional) OPEB liability using the discount rate of 6.75%, as well as what the School Division’s proportionate share of the net HIC OPEB liability would be if it were calculated using a discount rate that is one percentage point lower (5.75%) or one percentage point higher (7.75%) than the current rate:

COUNTY OF YORK, VIRGINIA Notes to Basic Financial Statements
June 30, 2021
F-78
11. OTHER POSTEMPLOYMENT BENEFITS (Continued)
1.00% Current 1.00%Decrease Discount Rate Increase(5.75%) (6.75%) (7.75%)
School Division's Proportionate Share of the
HIC Program Net OPEB Liability -
professional employees 12,386,888$ 11,065,692$ 9,942,771$
1.00% Current 1.00%Decrease Discount Rate Increase(5.75%) (6.75%) (7.75%)
School Division's Proportionate Share of the
HIC Program Net OPEB Liability -
nonprofessional employees 486,857$ 435,877$ 392,100$ Virginia Retirement System – Virginia Local Disability Program
Plan Description All full-time, salaried permanent teachers and general employees; including local law enforcement officers, firefighters, or emergency medical technicians of political subdivisions who do not provide enhanced hazardous duty benefits; who are in the VRS Hybrid Retirement Plan benefit structure and whose employer has not elected to opt out of the VRS-sponsored program are automatically covered by the VRS Political Subdivision Employee VLDP. This plan is administered by the Virginia Retirement System (the System), along with pension and other OPEB plans, for eligible public employer groups in the Commonwealth of Virginia. Political subdivisions are required by Title 51.1 of the Code of Virginia, as amended to provide short-term and long-term disability benefits for their Hybrid employees either through a local plan or through the VLDP. The specific information for each plan and the eligibility for covered groups within each plan are set out in the table below:
VIRGINIA LOCAL DISABILITY PROGRAM (VLDP) PLAN PROVISIONS
Eligible Employees The Virginia Local Disability Program was implemented January 1, 2014 to provide short-term and long-term disability benefits for non-work-related and work-related disabilities for employees with Hybrid retirement benefits Eligible employees are enrolled automatically upon employment, unless their employer has elected to provide comparable coverage. They include:
Political subdivision (non-professional) - Full-time general employees; including local law enforcement officers, firefighters, or emergency medical technicians who do not have enhanced hazardous duty benefits; of public political subdivisions covered under VRS.
Teachers (professional) – Teachers and other full-time permanent salaried employees of public school division covered under VRS.
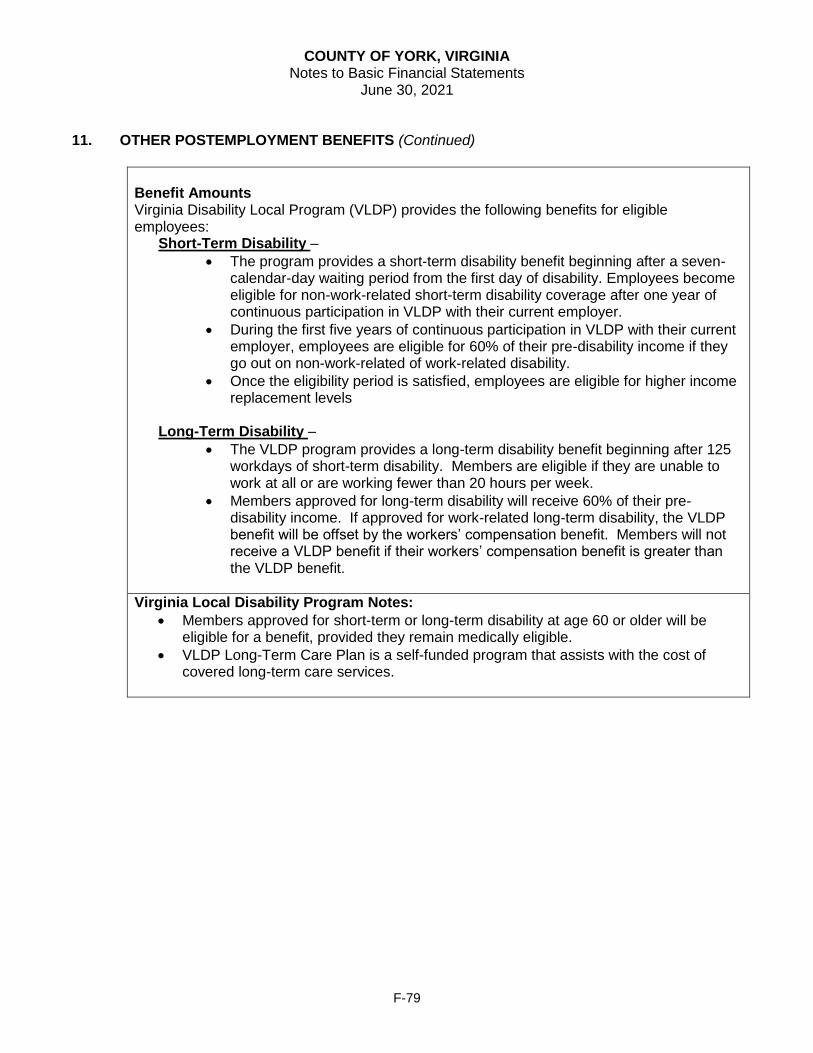
COUNTY OF YORK, VIRGINIA Notes to Basic Financial Statements
June 30, 2021
F-79
11. OTHER POSTEMPLOYMENT BENEFITS (Continued)
Benefit Amounts Virginia Disability Local Program (VLDP) provides the following benefits for eligible employees:
Short-Term Disability –
The program provides a short-term disability benefit beginning after a seven-calendar-day waiting period from the first day of disability. Employees become eligible for non-work-related short-term disability coverage after one year of continuous participation in VLDP with their current employer.
During the first five years of continuous participation in VLDP with their current employer, employees are eligible for 60% of their pre-disability income if they go out on non-work-related of work-related disability.
Once the eligibility period is satisfied, employees are eligible for higher income replacement levels
Long-Term Disability –
The VLDP program provides a long-term disability benefit beginning after 125 workdays of short-term disability. Members are eligible if they are unable to work at all or are working fewer than 20 hours per week.
Members approved for long-term disability will receive 60% of their pre-disability income. If approved for work-related long-term disability, the VLDP benefit will be offset by the workers’ compensation benefit. Members will not receive a VLDP benefit if their workers’ compensation benefit is greater than the VLDP benefit.
Virginia Local Disability Program Notes:
Members approved for short-term or long-term disability at age 60 or older will be eligible for a benefit, provided they remain medically eligible.
VLDP Long-Term Care Plan is a self-funded program that assists with the cost of covered long-term care services.

COUNTY OF YORK, VIRGINIA Notes to Basic Financial Statements
June 30, 2021
F-80
11. OTHER POSTEMPLOYMENT BENEFITS (Continued) Contributions Nonprofessional - The contribution requirement for active Hybrid employees is governed by §51.1-1178(C) of the Code of Virginia, as amended, but may be impacted as a result of funding provided to political subdivisions by the Virginia General Assembly. Each political subdivision’s contractually required employer contribution rate for the year ended June 30, 2021 was 0.83% of covered employee compensation for employees in the VRS Political Subdivision Employee Virginia Local Disability Program. This rate was based on an actuarially determined rate from an actuarial valuation as of June 30, 2019. The actuarially determined rate was expected to finance the costs of benefits earned by employees during the year, with an additional amount to finance any unfunded accrued liability. Contributions were $17,919 and $15,907 for the years ended June 30, 2021 and June 30, 2020, respectively. Professional - The contribution requirement for active Hybrid employees is governed by §51.1-1178(C) of the Code of Virginia, as amended, but may be impacted as a result of funding provided to political subdivisions by the Virginia General Assembly. Each political subdivision’s contractually required employer contribution rate for the year ended June 30, 2021 was 0.47% of covered employee compensation for employees in the VRS Political Subdivision Employee VLDP. This rate was based on an actuarially determined rate from an actuarial valuation as of June 30, 2019. The actuarially determined rate was expected to finance the costs of benefits earned by employees during the year, with an additional amount to finance any unfunded accrued liability. Contributions were $84,455 and $64,967 for the years ended June 30, 2021 and June 30, 2020, respectively. OPEB Liabilities, OPEB Expense, and Deferred Outflows of Resources and Deferred Inflows of Resources Related to VLDP OPEB Nonprofessional - At June 30, 2021, the political subdivision reported a liability of $5,919 for its proportionate share of the VRS Political Subdivision Employee Virginia Local Disability Program Net OPEB Liability. The Net VRS Political Subdivision Employee VLDP OPEB Liability was measured as of June 30, 2020 and the total VRS Political Subdivision Employee VLDP OPEB liability used to calculate the Net VRS Political Subdivision Employee VLDP OPEB Liability was determined by an actuarial valuation as of June 30, 2019, and rolled forward to the measurement date of June 30, 2020. The School Division’s proportion of the Net VLDP OPEB Liability was based on the School Division’s actuarially determined employer contributions to the VLDP OPEB plan for the year ended June 30, 2020 relative to the total of the actuarially determined employer contributions for all participating employers. At June 30, 2020, the School Division’s proportion of VLDP was 0.59289% as compared to 0.56622% at June 30, 2019. For the year ended June 30, 2021, the School Division recognized VLDP OPEB expense of $17,095. Since there was a change in proportionate share between measurement dates a portion of the VRS Political Subdivision Employee VLDP Net OPEB expense was related to deferred amounts from changes in proportion.
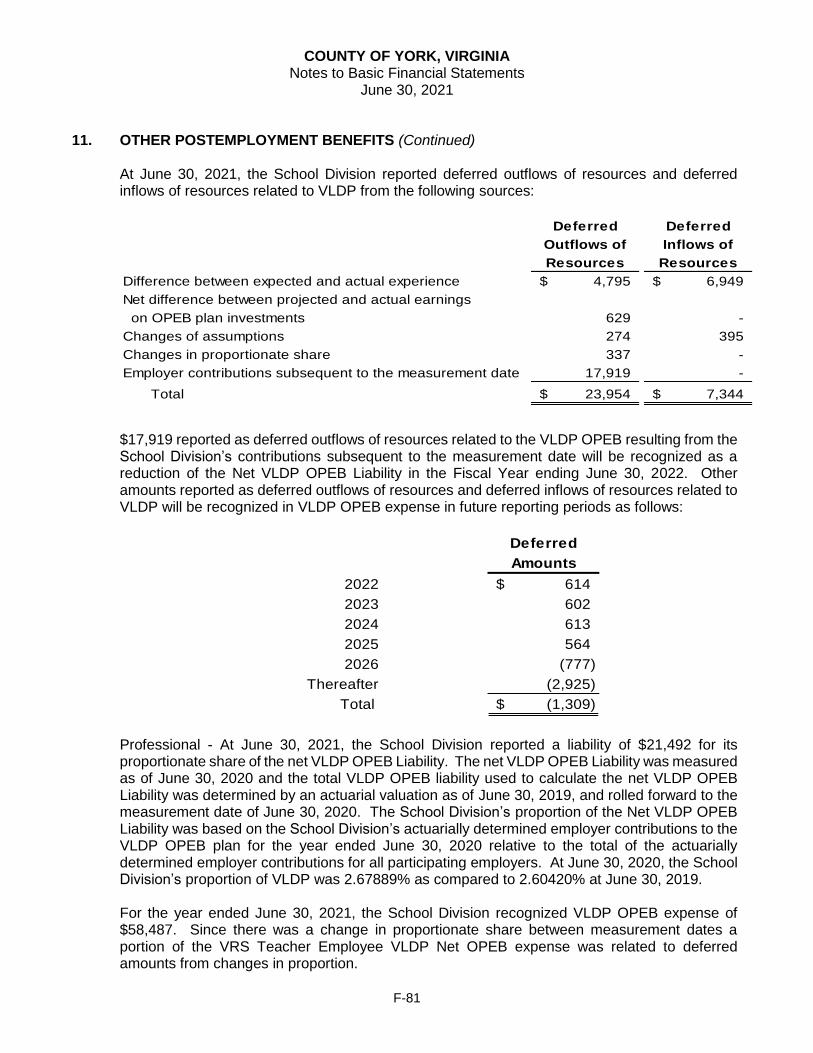
COUNTY OF YORK, VIRGINIA Notes to Basic Financial Statements
June 30, 2021
F-81
11. OTHER POSTEMPLOYMENT BENEFITS (Continued) At June 30, 2021, the School Division reported deferred outflows of resources and deferred inflows of resources related to VLDP from the following sources:
Deferred Deferred
Outflows of Inflows of
Resources Resources
Difference between expected and actual experience 4,795$ 6,949$
Net difference between projected and actual earnings
on OPEB plan investments 629 -
Changes of assumptions 274 395
Changes in proportionate share 337 -
Employer contributions subsequent to the measurement date 17,919 -
Total 23,954$ 7,344$
$17,919 reported as deferred outflows of resources related to the VLDP OPEB resulting from the School Division’s contributions subsequent to the measurement date will be recognized as a reduction of the Net VLDP OPEB Liability in the Fiscal Year ending June 30, 2022. Other amounts reported as deferred outflows of resources and deferred inflows of resources related to VLDP will be recognized in VLDP OPEB expense in future reporting periods as follows:
Deferred
Amounts
2022 614$
2023 602
2024 613
2025 564
2026 (777)
Thereafter (2,925)
Total (1,309)$
Professional - At June 30, 2021, the School Division reported a liability of $21,492 for its proportionate share of the net VLDP OPEB Liability. The net VLDP OPEB Liability was measured as of June 30, 2020 and the total VLDP OPEB liability used to calculate the net VLDP OPEB Liability was determined by an actuarial valuation as of June 30, 2019, and rolled forward to the measurement date of June 30, 2020. The School Division’s proportion of the Net VLDP OPEB Liability was based on the School Division’s actuarially determined employer contributions to the VLDP OPEB plan for the year ended June 30, 2020 relative to the total of the actuarially determined employer contributions for all participating employers. At June 30, 2020, the School Division’s proportion of VLDP was 2.67889% as compared to 2.60420% at June 30, 2019. For the year ended June 30, 2021, the School Division recognized VLDP OPEB expense of $58,487. Since there was a change in proportionate share between measurement dates a portion of the VRS Teacher Employee VLDP Net OPEB expense was related to deferred amounts from changes in proportion.

COUNTY OF YORK, VIRGINIA Notes to Basic Financial Statements
June 30, 2021
F-82
11. OTHER POSTEMPLOYMENT BENEFITS (Continued) At June 30, 2021, the School Division reported deferred outflows of resources and deferred inflows of resources related to VLDP OPEB from the following sources:
Deferred Deferred
Outflows of Inflows of
Resources Resources
Difference between expected and actual experience 10,162$ 1,661$
Net difference between projected and actual earnings
on OPEB plan investments 2,320 -
Changes of assumptions 2,411 -
Changes in proportionate share 383 602
Employer contributions subsequent to the measurement date 84,455 -
Total 99,731$ 2,263$
$84,455 reported as deferred outflows of resources related to VLDP OPEB resulting from the School Division’s subsequent to the measurement date will be recognized as a reduction of the net VLDP OPEB Liability in the Fiscal Year ending June 30, 2022. Other amounts reported as deferred outflows of resources and deferred inflows of resources related to the VLDP OPEB will be recognized in the VLDP OPEB expense in future reporting periods as follows:
Deferred
Amounts
2022 1,336$
2023 1,282
2024 1,264
2025 1,289
2026 713
Thereafter 7,129 Thereafter
Total 13,013$ Total
Net School Division’s VLDP OPEB Liability The net VLDP OPEB liabilities represents the program’s total OPEB liability determined in accordance with U.S. GAAP, less the associated fiduciary net position. As of June 30, 2020, net VLDP OPEB liabilities are as follows (amounts expressed in thousands):
Political
Subdivision Teacher
Employee VLDP Employee VLDP
OPEB Plan OPEB Plan
Total VLDP OPEB Liability 4,317$ 3,687$
Plan Fiduciary Net Position 3,317 2,886
Net VLDP OPEB Liability 1,000$ 801$
Plan Fiduciary Net Position as a Percentage of the
Total VLDP OPEB Liability 76.84% 78.28%

COUNTY OF YORK, VIRGINIA Notes to Basic Financial Statements
June 30, 2021
F-83
11. OTHER POSTEMPLOYMENT BENEFITS (Continued)
The VLDP OPEB liability is calculated by the System’s actuary, and the plan’s fiduciary net position is reported in the System’s financial statements. The net VLDP OPEB liability is disclosed in accordance with the requirements of U.S. GAAP in the System’s notes to the financial statements and required supplementary information. Discount Rate The discount rate used to measure the School Division’s VLDP OPEB liability was 6.75%. The projection of cash flows used to determine the discount rate assumed that employer contributions will be made in accordance with the VRS funding policy at rates equal to the actuarially determined contribution rates adopted by the VRS Board of Trustees. Through the fiscal year ending June 30, 2019, the rate contributed by entity for the VRS Virginia Local Disability Program will be subject to the portion of the VRS Board-certified rates that are funded by the Virginia General Assembly which was 100% of the actuarially determined contribution rate. From July 1, 2019 on, employers are assumed to continue to contribute 100% of the actuarially determined contribution rates. Based on those assumptions, the VLDP OPEB plan’s fiduciary net position was projected to be available to make all projected future benefit payments of eligible employees. Therefore, the long-term expected rate of return was applied to all periods of projected benefit payments to determine the total VRS VLDP OPEB liability.
Sensitivity of the School Division’s Proportionate Share of the VLDP OPEB Liability to Changes in the Discount Rate The following presents the proportionate share of the net VLDP OPEB liability using the discount rate of 6.75%, as well as what the net VLDP OPEB liability would be if it were calculated using a discount rate that is one percentage point lower (5.75%) or one percentage point higher (7.75%) than the current rate:
1.00% Current 1.00%Decrease Discount Rate Increase(5.75%) (6.75%) (7.75%)
School Division's Proportionate Share of the
net VLDP OPEB liability -
nonprofessional employees 7,938$ 5,919$ 4,159$
1.00% Current 1.00%
Decrease Discount Rate Increase(5.75%) (6.75%) (7.75%)
School Division's Proportionate Share of the
net VLDP OPEB liability -
professional employees 33,463$ 21,492$ 11,161$

COUNTY OF YORK, VIRGINIA Notes to Basic Financial Statements
June 30, 2021
F-84
11. OTHER POSTEMPLOYMENT BENEFITS (OPEB) (Continued)
County and School Division OPEB Liability – Health and Dental Insurance Plan Description The County’s and School Division’s OPEB plan are each single-employer defined benefit plans administered by the County and School Division. At July 1, 2020, the County had 789 active members and the School Division had 1,724 active members of the plan. In accordance with Article 8, Chapter 15, Title 15.2 of the Code of Virginia, the County and School Division have elected to establish a pooled trust for the purpose of accumulating and investing assets to fund Other Postemployment Benefits. The School Division in accordance with this election has joined the Virginia Pooled OPEB Trust Fund (Trust Fund), an irrevocable trust, with the purpose to fund other postemployment benefits. The Colonial Behavioral Health (CBH), an agency fund to the County of York, began to participate in the County’s OPEB Trust in June 2019. Both the County and the School Division agreed to the participation of CBH as a sub-account. The Trust Fund issues separate financial statements, which can be obtained by requesting a copy from the plan administrator, VML/VACo Finance, 919 E. Main Street, Suite 1100, Richmond, Virginia 23219.
Benefits Provided
Employees retiring after January 1, 2002 and having twenty or more years of service with the County and receiving a VRS annuity will qualify for a health insurance premium contribution from the County. The retiree’s VRS annuity may be either a full or reduced benefit. The amount of the County’s contribution shall be equal to 50% of the retiree’s total monthly health insurance premium subject to the following provision: the County’s 50% contribution will be reduced by the amount of any health insurance credit that the retiree may qualify for under the VRS program (retiring employees who have fifteen years of service with the VRS will qualify for the VRS Retiree HIC Program).
At June 30, 2021, 122 retirees were participating in this program. The School Division’s contribution for retirees having 20 or more years of service with the School Division is 50% of the medical premium and 100% of the dental premium cost, regardless of the plan or coverage tier elected. The School Division’s contribution is reduced by the amount of any VRS HIC received by the retiree.
The School Division provides post-retirement health care benefits, in accordance with School Division policy. Medical and dental coverage is provided to eligible retirees and their dependents. Medical benefits are provided until the retiree’s age 65. Medical benefits for dependent spouse are provided until the earlier of the spouses’s death, the retiree’s death, or the retiree’s age 65. Upon the earlier of the retiree’s death or the retiree’s age 65, the dependent spouse may elect to continue coverage through COBRA only. For participant’s who retire on or before age 65, dental benefits for both the retiree and their dependent spouse are provided until the retiree’s age 66, 6 months. For participants who retire after age 65, dental benefits for both the retiree and their dependent spouse are provided for 18 months from the date of retirement.
Contributions
Contribution requirements are established and may be amended by the Board of Supervisors and School Board. The required contributions were actuarially determined and are based upon projected pay-as-you-go financing requirements. Contributions to the County and School Division plans were $1,175,136 and $635,431, respectively, for the year ended June 30, 2021. The actuarially determined contribution at June 30, 2021 was $755,941 and $260,789 for the County

COUNTY OF YORK, VIRGINIA Notes to Basic Financial Statements
June 30, 2021
F-85
11. OTHER POSTEMPLOYMENT BENEFITS (OPEB) (Continued) and School Division, respectively. OPEB Expense and Deferred Outflows of Resources and Deferred Inflows of Resources Related to OPEB At June 30, 2021, the County reported an OPEB liability of $5,094,830 for its share of the Net OPEB Liability. The Net OPEB Liability was measured as of June 30, 2021 and the total OPEB liability used to calculate the Net OPEB Liability was determined by an actuarial valuation as of July 1, 2019. The covered employer’s proportion of the Net OPEB Liability was based on the covered employer’s actuarially determined employer contributions to the Program for the year ended June 30, 2021 relative to the total of the actuarially determined employer contributions.
For the year ended June 30, 2021, the County recognized OPEB expense of $733,192. OPEB expense was calculated as follows:
OPEB
Expense
Service cost 268,714$
Interest 1,147,607
Administrative expenses 11,889
Expected Investment Return Net of Investment Expenses (653,122)
Recognition of Deferred Inflows/Outflows of Resources
Economic/demographic gains or losses 1,061,666
Assumption changes or inputs (702,227)
Investment gains or losses (401,335)
OPEB Expense 733,192$
At June 30, 2021, the County reported deferred outflows of resources and deferred inflows of resources related to OPEB from the following sources:
Deferred Deferred
Outflows of Inflows of
Resources Resources
Difference between expected and actual experience 4,692,429$ -$
Net difference between projected and actual earnings - 1,642,546
Change in assumptions 5,959,204 8,956,456
Total 10,651,633$ 10,599,002$
Other amounts reported as deferred outflows of resources and deferred inflows of resources related to the OPEB will be recognized in OPEB expense in future reporting periods as follows:

COUNTY OF YORK, VIRGINIA Notes to Basic Financial Statements
June 30, 2021
F-86
11. OTHER POSTEMPLOYMENT BENEFITS (OPEB) (Continued)
Deferred
Amounts
2022 (41,897)$
2023 (1,994)
2024 (46,648)
2025 (114,251)
2026 219,970
Thereafter 37,451
Total 52,631$
For the year ended June 30, 2021, the School Division recognized OPEB expense of $(111,310). At June 30, 2021, the School Division reported deferred outflows of resources and deferred inflows of resources related to OPEB from the following sources:
Deferred Deferred
Outflows of Inflows of
Resources Resources
Difference between expected and actual experience 92,690$ 55,883$
Changes of assumptions 440,210 1,007,758
Net difference between projected and actual earnings
on OPEB plan investements - 1,280,336
Total 532,900$ 2,343,977$
Other amounts reported as deferred outflows of resources and deferred inflows of resources related to the OPEB will be recognized in OPEB expense in future reporting periods as follows:
Deferred
Amounts
2022 (352,799)$
2023 (321,403)
2024 (356,792)
2025 (409,086)
2026 (39,936)
Thereafter (331,061)
Total (1,811,077)$
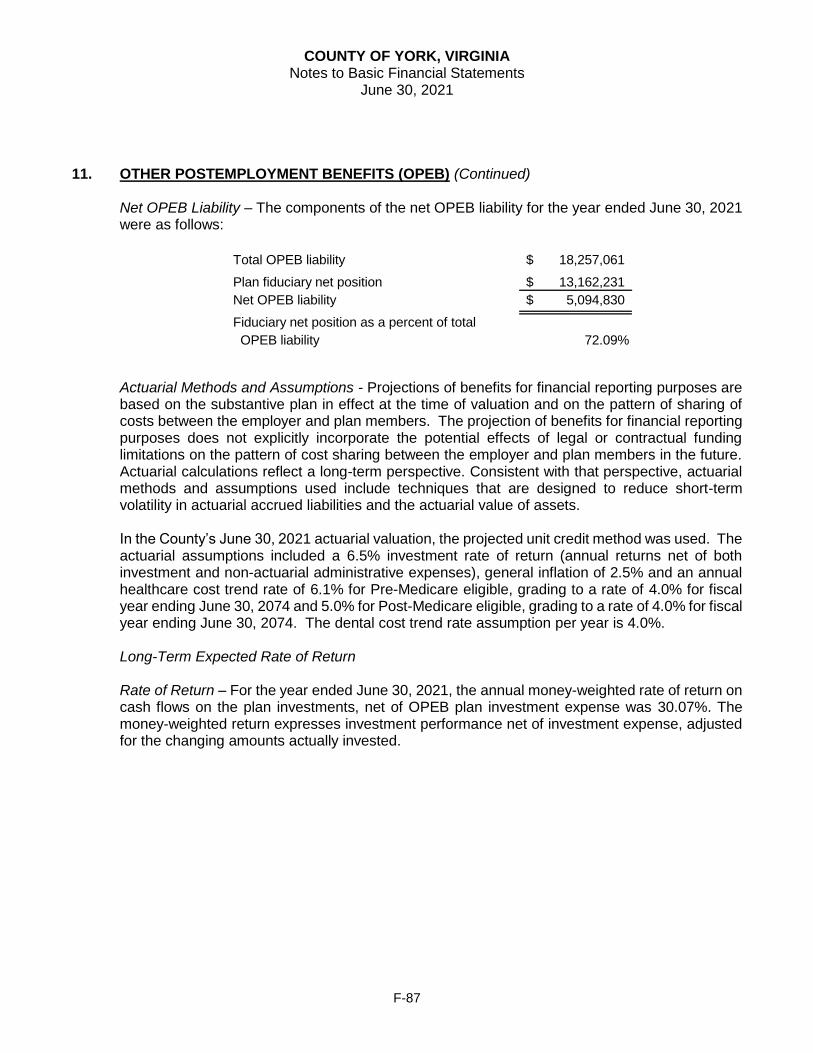
COUNTY OF YORK, VIRGINIA Notes to Basic Financial Statements
June 30, 2021
F-87
11. OTHER POSTEMPLOYMENT BENEFITS (OPEB) (Continued) Net OPEB Liability – The components of the net OPEB liability for the year ended June 30, 2021 were as follows:
Total OPEB liability 18,257,061$
Plan fiduciary net position 13,162,231$
Net OPEB liability 5,094,830$
Fiduciary net position as a percent of total
OPEB liability 72.09%
Actuarial Methods and Assumptions - Projections of benefits for financial reporting purposes are based on the substantive plan in effect at the time of valuation and on the pattern of sharing of costs between the employer and plan members. The projection of benefits for financial reporting purposes does not explicitly incorporate the potential effects of legal or contractual funding limitations on the pattern of cost sharing between the employer and plan members in the future. Actuarial calculations reflect a long-term perspective. Consistent with that perspective, actuarial methods and assumptions used include techniques that are designed to reduce short-term volatility in actuarial accrued liabilities and the actuarial value of assets. In the County’s June 30, 2021 actuarial valuation, the projected unit credit method was used. The actuarial assumptions included a 6.5% investment rate of return (annual returns net of both investment and non-actuarial administrative expenses), general inflation of 2.5% and an annual healthcare cost trend rate of 6.1% for Pre-Medicare eligible, grading to a rate of 4.0% for fiscal year ending June 30, 2074 and 5.0% for Post-Medicare eligible, grading to a rate of 4.0% for fiscal year ending June 30, 2074. The dental cost trend rate assumption per year is 4.0%. Long-Term Expected Rate of Return
Rate of Return – For the year ended June 30, 2021, the annual money-weighted rate of return on cash flows on the plan investments, net of OPEB plan investment expense was 30.07%. The money-weighted return expresses investment performance net of investment expense, adjusted for the changing amounts actually invested.

COUNTY OF YORK, VIRGINIA Notes to Basic Financial Statements
June 30, 2021
F-88
11. OTHER POSTEMPLOYMENT BENEFITS (OPEB) (Continued) The long-term expected rate of return on OPEB investments was determined by adding inflation to expected long-term real returns and reflecting volatility and correlation. The data used in the assessment of reasonability were Milliman’s December 31, 2020 capital market assumptions (real returns) and the 2020 Social Security Trustees Report (inflation). The target asset allocation and best estimate of arithmetic real rates of return for each major asset class are summarized in the following table:
Asset Class (Strategy)
Target Allocation
Long-Term Expected Arithmetic Real Rate of Return
Long-Term Expected Geometric Real Rate of Return
US Core Fixed Income 21.00% .83% 0.76% US Large Caps 26.00% 3.93% 2.74% US Small Caps 10.00% 5.09% 3.08% Foreign Developed Equity 13.00% 5.73% 4.16% Emerging Markets Equity 5.00% 7.51% 4.70% Private Real Estate Property 7.00% 3.89% 3.18% Private Equity 5.00% 8.99% 5.19% Commodities 3.00% 2.29% 0.68% Hedge FOF Strategic 10.00% 2.71% 2.20%
Total 100.00%
Inflation 2.40% 2.40%
Portfolio Real Mean Return 3.93% 3.27%
Portfolio Nominal Mean Return 6.33% 5.74%
Portfolio Standard Deviation 11.60%
Long-Term Expected Rate of Return 6.50%

COUNTY OF YORK, VIRGINIA Notes to Basic Financial Statements
June 30, 2021
F-89
11. OTHER POSTEMPLOYMENT BENEFITS (OPEB) (Continued) Discount Rate – The discount rate used to measure the total OPEB liability was 6.50%. The projection of cash flows used to determine the discount rate assumed that employer contributions will be made at current contribution rates. The Plan’s Fiduciary Net Position was projected to be available to make all projected future benefit payments of current active and inactive employees. The long-term expected rate of return on plan investments is 6.5%. Therefore, the discount rate for calculating the Total OPEB Liability is equal to the long-term expected rate of return. Changes in Net OPEB Liability – County
Total Fiduciary Net
OPEB Net OPEB
Liability Position Liability
(a) (b) (a) – (b)
Balance – June 30, 2020 $ 17,915,876 $ 10,052,548 $ 7,863,328
Changes for the fiscal year:
Service cost 268,714 - 268,714
Interest 1,147,607 - 1,147,607
Contribution – employer - 1,175,136 (1,175,136)
Net investment income - 3,021,572 (3,021,572)
Benefit payments (1,075,136) (1,075,136) -
Administrative expenses - (11,889) 11,889
Net Changes 341,185 3,109,683 (2,768,498)
Balance – June 30, 2021 $ 18,257,061 $ 13,162,231 $ 5,094,830
Sensitivity of the Net OPEB Liability to Changes in the Discount Rate – The following presents the net OPEB liability of the County, calculated using the discount rate of 6.50%, as well as what the net OPEB liability would be if it were calculated using a discount rate that is 1-percentage point lower (5.50%) or 1-percentage-point higher (7.50%) than the current rate:
1.00% Current 1.00%Decrease Discount Rate Increase
(5.50%) (6.50%) (7.50%)
Net OPEB Liability 7,389,294$ 5,094,830$ 3,183,473$

COUNTY OF YORK, VIRGINIA Notes to Basic Financial Statements
June 30, 2021
F-90
11. OTHER POSTEMPLOYMENT BENEFITS (OPEB) (Continued) Sensitivity of the Net OPEB Liability to Changes in the Healthcare Cost Trend Rates – The following presents the net OPEB liability of the County, as well as what the net OPEB liability would be if it were calculated using the healthcare cost trend rates that are 1-percentage-point lower or 1-percentage-point higher than the current healthcare cost trend rates:
1.00% Healthcare 1.00%
Decrease Cost Trend Increase
Net OPEB Liability 2,728,140$ 5,094,830$ 7,975,643$
Changes in Net OPEB Liability (Asset) – School Division
Total Fiduciary Net
OPEB Net OPEB
Liability Position Asset
(a) (b) (a) – (b)
Balance – June 30, 2020 $ 6,043,980 $ 7,826,149 $ (1,782,169)
Changes for the fiscal year:
Service cost 339,426 - 339,426
Interest 402,318 - 402,318
Effect of economic demographic
gains or losses (61,892) - (61,892)
Effect of assumption changes or
inputs (1,094,130) - (1,094,130)
Contribution – employer - 635,431 (635,431)
Net investment income - 2,355,368 (2,355,368)
Benefit payments (394,021) (394,021) -
Administrative expenses - (9,365) 9,365
Net Changes (808,299) 2,587,413 (3,395,712)
Balance – June 30, 2020 $ 5,235,681 $ 10,413,562 $ (5,177,881)
Sensitivity of the Net OPEB Liability to Changes in the Discount Rate – The following presents the net OPEB liability of the School Division, calculated using the discount rate of 6.50%, as well as what the net OPEB liability would be if it were calculated using a discount rate that is 1-percentage point lower (5.50%) or 1-percentage-point higher (7.50%) than the current rate:
1.00% Current 1.00%Decrease Discount Rate Increase
(5.50%) (6.50%) (7.50%)
Net OPEB Asset (4,815,083)$ (5,177,881)$ (5,514,763)$

COUNTY OF YORK, VIRGINIA Notes to Basic Financial Statements
June 30, 2021
F-91
11. OTHER POSTEMPLOYMENT BENEFITS (OPEB) (Continued) Sensitivity of the Net OPEB Liability to Changes in the Healthcare Cost Trend Rates – The following presents the net OPEB liability of the School Division, as well as what the School Division’s net OPEB liability would be if were calculated using healthcare cost trend rates that are 1-percentage-point lower (4.3% decreasing to 2.7%) or 1-percentage-point higher (6.3% decreasing to 4.7%) than the current healthcare cost trend rates:
1.00% Healthcare 1.00%Decrease Cost Trend Increase
(4.3% Rates (5.3% (6.3%decreasing decreasing decreasing
to 2.7%) to 3.7%) to 4.7%)
Net OPEB Asset (5,708,082)$ (5,177,881)$ (4,568,152)$
Combining Net OPEB Liabilities, OPEB Expense, Deferred Outflows of Resources and Deferred Inflows of Resources Related to OPEB The VRS GLI County plan, the VRS HIC County plan and the County Health and Dental OPEB plan are reported separately herein since each plan has distinctive characteristics, reporting requirements and valuations. The impact of total OPEB requirements on the net position of the County is combined and summarized in the schedule below:
VRS VRS County
GLI HIC Health/Dental Combined
Plan Plan Plan Totals
Net OPEB liability 3,638,898$ 374,831$ 5,094,830$ 9,108,559$
OPEB expense 159,123$ 51,791$ 733,192$ 944,106$
Deferred outflows of resources:
Differences between expected and actual experience 233,402$ 15,291$ 4,692,429$ 4,941,122$
Changes in assumptions 181,987 21,720 5,959,204 6,162,911
Net difference between projected and actual earnings 109,309 32,557 - 141,866
Changes in proportion and differences between
Employer contributions and proportionate share
of contributions 112,363 - - 112,363
Employer contributions subsequent to the
measurement date 234,716 51,730 - 286,446
Total deferred outflows of resources 871,777$ 121,298$ 10,651,633$ 11,644,708$
Deferred inflows of resources:
Differences between expected and actual experience 32,684$ 9,273$ 1,642,546$ 1,684,503$
Changes in assumptions 75,982 16,531 8,956,456 9,048,969
Changes in proportion and differences between
Employer contributions and proportionate share
of contributions 55,125 - - 55,125
Total deferred inflows of resources 163,791$ 25,804$ 10,599,002$ 10,788,597$
County

COUNTY OF YORK, VIRGINIA Notes to Basic Financial Statements
June 30, 2021
F-92
11. OTHER POSTEMPLOYMENT BENEFITS (OPEB) (Continued) The VRS GLI School Professional plan, VRS GLI School Nonprofessional County plan, VRS HIC School Professional plan, VRS VLDP School Professional plan, VRS VLDP School Nonprofessional plan and the School Division Health and Dental OPEB plan are reported separately herein since each plan has distinctive characteristics, reporting requirements and valuations. The impact of total OPEB requirements on the net position of the School Division is combined and summarized in the schedule below:
12. DEFERRED COMPENSATION PLAN
The County offers its employees a deferred compensation plan created in accordance with Internal Revenue Code Section 457. The plan, available to all County employees, permits them to defer a portion of their salary until future years. Participation in the plan is optional. The deferred compensation is not available to employees until termination, retirement, death or unforeseeable emergency. All amounts of compensation deferred under the plan, all property and rights purchased with those amounts, and all income attributable to those amounts, property or rights are held in trust for the participants. Investments are managed by the plan's trustee under one or a combination of 21 investment options. The participants make the choice of the investment options. The School Division offers its employees a deferred compensation plan created in accordance with Internal Revenue Code Section 403(b). The plan, available to all School employees, permits them to defer a portion of their salary until future years. Participation in the plan is optional. The deferred compensation is not available to employees until separation from service, retirement, death, disability, financial hardship and/or reaching age 59½. The School Division offers a selection of investment options to participants. All earnings on the invested funds compound tax-free until withdrawn from the account.
The County offered to its employees a retirement health savings plan, which was available to all full-time, regular County employees who have worked in that capacity for at least one full year.

COUNTY OF YORK, VIRGINIA Notes to Basic Financial Statements
June 30, 2021
F-93
12. DEFERRED COMPENSATION PLAN (Continued)
Participation in the plan was optional and employees could be reimbursed for qualified medical expenses, in accordance with Internal Revenue Service Publication 502, for themselves, spouse, and dependents upon separation or retirement from the County. In March 2007, the County was notified of an IRS ruling that due to its elective features, disallowed the County’s plan design to continue and consequently, new elections to the existing plan are no longer accepted. The existing plan preserves the favorable tax treatments for elections and contributions prior to December 31, 2007. Investments are managed by the plan’s trustee under one or a combination of 10 investment options.
13. COMMITMENTS AND CONTINGENT LIABILITIES
Significant Commitments Significant commitments as of June 30, 2021 were as follows:
Remaining
Spent-to-date Commitment
Project:
Library Addition/Renovation -$ 5,502,000$
Records Management Software Upgrades - 1,799,708
Fuel Station Rehabilitation 201,728 809,141
Radio Communications Upgrade (SCADA System) 726,590 577,900
Sheriff's Office Renovation 890,380 543,030
Bulk Fuel for Fuel Sites 781,918 519,082
Knuckleboom Truck - 189,298
Charles Brown Park Stream Restoration 210,986 172,762
Truck-Mounted Fuel Tanks for Public Works - 127,800
Learning Management System Software Fees 14,875 116,763
Radio Communications Support (SCADA System) 24,690 116,429
Vehicle Fleet Equipment Management Software - 109,723
Public Works Linework Find and Fix Initiative 18,362 109,638
Underground Fuel Storage Tanks - 99,750
Carver Gardens Housing Rehabilitation - 97,500
Bypass Pump - 94,466
Fort Eustis Pump Station Improvements - 91,407
Tyler Munis Software Conversion 112,179 83,395
2,981,708$ 11,159,792$
Risk Management The County and the School Division are exposed to various risks of loss related to torts, theft of, damage to, and destruction of assets; errors and omissions; injuries to and health and dental benefits for employees; and natural disasters. The County and the School Division maintain comprehensive property and casualty policies, commercial general liability policies, comprehensive liability, vehicle fleet policies and coverages for errors and omissions, and employer’s liability and certain other risks with commercial insurance companies. The County reports all of its risk management activities except those related to health and dental benefits and workers’ compensation in its General Fund. The General Fund retains the full risk for unemployment compensation.

COUNTY OF YORK, VIRGINIA Notes to Basic Financial Statements
June 30, 2021
F-94
13. COMMITMENTS AND CONTINGENT LIABILITIES (Continued) The Workers’ Compensation Fund retains the risk up to $400,000 with no aggregate, for each workers’ compensation occurrence and all claims for workers’ compensation are paid from this fund. Risks related to health and dental benefits for employees and retirees are reported in an Internal Service Fund. The County’s risk for each health care claim is $300,000 per year.
The School Division reports all of its risk management activities in its Operating Fund, except those related to health and dental benefits. The School Operating Fund retains the full risk for unemployment compensation, and up to $500,000, with no aggregate, for each workers’ compensation occurrence. All claims for retained risks are paid from Operating Fund resources. Risks related to health and dental benefits for employees and retirees are reported in an Internal Service Fund. The School Division’s risk for each health care claim is $300,000. All unemployment and school workers’ compensation claims are paid through a third-party administrator through resources from the General and School Operating Funds. The County’s workers’ compensation claims and both the County and School Division’s health care claims are paid through a third-party administrator through each entity’s Internal Service Funds. For all retained risks, claims expenditures and liabilities are reported when it is probable that a loss has occurred and the amount of loss can be reasonably estimated. These losses include an estimate of claims that have been incurred but not reported. The County’s health care liability at June 30 has been included in claims payable in the County’s internal service funds. The County had available $7,671,545 for health care and dental claims and $1,000,000 for workers’ compensation claims at June 30, 2021, which is considered sufficient. Changes in the reported amounts for both workers’ compensations and health and dental claims resulted from the following:
2021 2020
Claims payable/unrestricted net position,
beginning of fiscal year 6,906,545$ 7,647,353$
Claims and changes in estimates 16,408,705 13,468,533
Claims payments (14,643,705) (14,209,341)
Claims payable/unrestricted net position, end of fiscal year 8,671,545$ 6,906,545$

COUNTY OF YORK, VIRGINIA Notes to Basic Financial Statements
June 30, 2021
F-95
13. COMMITMENTS AND CONTINGENT LIABILITIES (Continued) The School Division’s health care claim liability of $2,018,000 at June 30, 2021 is reasonably estimated and has been included in claims payable in the School Division’s internal service fund. The School Division’s workers’ compensation claims liability of $2,816,141 at June 30, 2021 is included in long-term debt, and is considered sufficient to cover pending claims and incurred but not reported claims that may arise. Changes in the reported amounts since June 30, 2020 resulted from the following:
2021 2020
Claims payable/committed fund balance,
beginning of fiscal year 4,658,830$ 4,420,182$
Claims and changes in estimates 441,807 608,976
Claims payment (266,496) (370,328)
Claims payable/committed fund balance, end of fiscal year 4,834,141$ 4,658,830$
Consent Order A Special Order has been issued under the authority of the Code Section 62.1-44.15(8a) between the State Water Control Board and the Hampton Roads Sanitation District, the Cities of Chesapeake, Hampton, Newport News, Norfolk, Poquoson, Portsmouth, Suffolk, Virginia Beach and Williamsburg; the counties of Gloucester, Isle of Wight, and York; the James City Service Authority; and the town of Smithfield for the purpose of resolving certain alleged violations of environmental laws and regulations. The goal of the Order by Consent is to eliminate all sanitary sewer overflows. As part of the Special Order by Consent, all parties have agreed to a Regional Technical Standard that requires detailed flow modeling, collection of real time rainfall data, peak flow threshold calculations, projected 10 year, 24 hour peak flows, comprehensive sewer system field inspections and testing and the development of a regional and a locality sanitary sewer hydraulic model. Litigation The County is a defendant in various lawsuits and although the outcome of these lawsuits is not presently determinable, in the opinion of the County’s counsel, only one possible claim or assessment exists that would be deemed material. The matter is related to the tax assessed value of a heavily industrialized property, for tax years beginning in 2018. The County has already refunded taxes and interest in the amount of approximately $250,000. This matter is scheduled for trial in February 2022. Should the property owner prevail on the totality of its claim, then an additional tax refund by the County would be approximately $1.5 million, plus interest. Uncertainty In March 2020, the World Health Organization declared COVID-19 a global pandemic. Due to the pandemic, the County undertook steps to limit non-essential spending, while continuing to provide safe and essential services to the county residents. As there is still a significant level of uncertainty associated with the pandemic, the County continues to actively monitor developments and will take steps to respond accordingly to the situation.

COUNTY OF YORK, VIRGINIA Notes to Basic Financial Statements
June 30, 2021
F-96
14. DISCRETELY PRESENTED COMPONENT UNIT – CDA: CASH LIQUIDITY FOR FUTURE DEBT SERVICE PAYMENTS AND GOING CONCERN
The Series 2007 Bonds were restructured in 2015 limiting the availability of future special assessments to cover any shortfall in incremental tax revenues. The terms of the restructuring have materially inhibited the Marquis CDA’s ability to pay its operating expenses, including debt service, in an economic environment of declining sales. The delay in expanding the retail portion of the development, along with the impacts of COVID-19 on sales revenues, have resulted in lower-than-forecasted incremental tax revenues available for the Marquis CDA’s expenses.
There have been regular draws on the Series 2007 Debt Service Reserve Fund and Series 2015 Debt Service Reserve Fund to make the regularly scheduled debt service payments on the Bonds each September and March since September 1, 2015. As of September 30, 2021, the Series 2007 Debt Service Reserve Fund balance was $3.60 and the Series 2015 Debt Service Reserve Fund balance has been depleted. The next scheduled debt service payment due on March 1, 2022, consists of an interest payment in the amount of $614,400. Incremental tax revenues are not projected to be sufficient to make up the difference between the debt service requirements and the current balances in the trust accounts. Currently, the Marquis CDA does not have any plans to mitigate the shortfall in revenues and the expected default on the Bonds. Therefore, there is substantial doubt regarding the entity’s ability to continue as a going concern.
15. RESTATEMENT OF PRIOR PERIOD NET POSITION
For fiscal year 2021, the County and School Division have adopted GASB Statement No. 84, Fiduciary Activities. “The objective of this Statement is to improve guidance regarding the identification of fiduciary activities for accounting and financial reporting purposes and how those activities should be reported. This statement establishes criteria for identifying fiduciary activities of all state and local governments. The focus of the criteria generally is on (1) whether a government is controlling the assets of the fiduciary activity and (2) the beneficiaries with whom a fiduciary relationship exists. Separate criteria are included to identify fiduciary component units and postemployment benefit arrangements that are fiduciary activities. An activity meeting the criteria should be reported in a fiduciary fund in the basic financial statements. Governments with activities meeting the criteria should present a statement of fiduciary net position and a statement of changes in fiduciary net position. An exception to that requirement is provided for a business-type activity that normally expects to hold custodial assets for three months or less. This Statement describes four fiduciary funds that should be reported, if applicable: (1) pension (and other employee benefit) trust funds, (2) investment trust funds, (3) private-purpose trust funds, and (4) custodial funds. Custodial funds generally should report fiduciary activities that are not held in a trust or equivalent arrangement that meets specific criteria.” As a result of the implementation of GASB 84, the County analyzed various activities to determine if they meet the criterion of fiduciary activities as defined in Statement No. 84. As a result of the implementation of this standard, the County revised its custodial activity presentation to denote Custodial Funds in place of Agency Funds. As a result of the change in accounting requirements, the fiscal year 2020 liabilities differ from the items presented in the previously issued fiscal year 2020 financial statements. The amounts held for others reported as a liability in fiscal year 2020 have been moved to net position. The 2020 ending balances for liabilities and net position are adjusted as follows:

COUNTY OF YORK, VIRGINIA Notes to Basic Financial Statements
June 30, 2021
F-97
15. RESTATEMENT OF PRIOR PERIOD LIABILITIES AND NET POSITION (Continued)
ColonialColonial Group
Behavioral Home Special Regional Other
Health Commission Welfare Projects Funds Total
Liabilities, as previously reported,
June 30, 2020 4,590,786$ 595,693$ 55,566$ 36,285$ 12,166$ 5,290,496$ Adjustments:
Net change in accounting principle (3,667,190) (542,483) (55,566) (33,252) (12,166) (4,310,657)
Liabilities, as restated, June 30, 2020 923,596$ 53,210$ -$ 3,033$ -$ 979,839$
Colonial
Colonial GroupBehavioral Home Special Regional Other
Health Commission Welfare Projects Funds Total
Net position, as previously reported,
June 30, 2020 -$ -$ -$ -$ -$ -$ Adjustments:
Net change in accounting principle 3,667,190 542,483 55,566 33,252 12,166 4,310,657
Net position, as restated, June 30, 2020 3,667,190$ 542,483$ 55,566$ 33,252$ 12,166$ 4,310,657$
Based on the criteria set forth, it was determined that the School Activity Fund of the School Division should be reported as a Special Revenue Fund. The fund was previously reported as an Agency Fund. The total effect of the restatement for the School Division is as follows:
School Division
Governmental
Activities
Net position, as previously reported, June 30, 2020 57,494,655$
Adjustments: School Activity Funds 1,589,421
Net position, as restated, June 30, 2020 59,084,076$
School Division
NonmajorGovernmental
Fund
Fund Balance, as previously reported, June 30, 2020 -$
Adjustments: School Activity Funds 1,589,421
Fund Balance as restated, June 30, 2020 1,589,421$

F-98
THIS PAGE LEFT BLANK INTENTIONALLY

G-1
REQUIRED SUPPLEMENTARY INFORMATION –
BUDGET COMPARISON SCHEDULE
GENERAL FUND
To account for revenues and expenditures of the County not accounted for in other funds. Revenues are primarily derived from general property taxes, other local taxes, licenses, permits and fees, revenues from the Commonwealth of Virginia and federal grants. A significant part of the General Fund’s revenues is provided to the School Division to fund operations and transferred to other funds to meet debt service requirements, assist with the operations of Virginia Public Assistance and fund capital projects.

Variance with
Final Budget
Original Final Positive
Budget Budget Actual (Negative)
General property taxes:
Real property taxes 73,782,000$ 73,782,000$ 74,424,101$ 642,101$
Real and personal property taxes-public service corporation 2,120,000 2,120,000 3,726,198 1,606,198
Personal property taxes 15,564,000 15,564,000 17,256,247 1,692,247
Machinery and tools taxes 150,000 150,000 145,152 (4,848)
Penalties and interest 625,000 625,000 344,168 (280,832)
Total general property taxes 92,241,000 92,241,000 95,895,866 3,654,866
Other local taxes:
Local sales and use taxes 9,900,000 9,900,000 11,757,686 1,857,686
Historic Triangle local sales and use taxes 3,800,000 3,800,000 4,908,304 1,108,304
Hotel and motel room taxes 1,328,000 1,328,000 1,088,279 (239,721)
Restaurant food taxes 2,657,000 2,657,000 3,137,215 480,215
Business license taxes 5,950,000 5,950,000 7,406,723 1,456,723
Consumer utility taxes 232,000 232,000 230,278 (1,722)
Communications sales taxes 1,100,000 1,100,000 968,207 (131,793)
Vehicle registration fees 1,536,000 1,536,000 1,599,783 63,783
Bank stock taxes 350,000 350,000 367,400 17,400
Franchise taxes 2,000 2,000 4,464 2,464
Taxes on recordation and wills 1,640,000 1,640,000 2,207,395 567,395
Rental taxes 160,000 160,000 223,417 63,417
Total other local taxes 28,655,000 28,655,000 33,899,151 5,244,151
From the Federal Government:
Payments in lieu of taxes 11,000 11,000 11,363 363
Categorical aid:
Supplemental Local Emergency Management Program grant 50,335 50,335 50,335 -
Universal Service Library E-rate program 10,000 10,000 10,542 542
Violence Against Women Formula grant 27,400 27,400 27,366 (34)
Crime Victim Assistance grant 110,650 110,650 103,003 (7,647)
Community Development Block grant - CARES Act - 1,230,000 1,219,052 (10,948)
DMV Traffic Enforcement grant - 49,273 21,658 (27,615)
Section 8 Housing Choice Vouchers program 102,000 102,000 166,590 64,590
Assistance to Firefighters grant (SAFER) 217,584 217,584 363,406 145,822
Indirect Cost Allocation reimbursement 180,000 180,000 192,910 12,910
Edward Byrne Memorial State and Local Law Enforcement grant - - 14,326 14,326
FEMA Public Assistance - Coronavirus - 403,338 36,688 (366,650)
Virginia Department of Elections grant - CARES Act - 68,555 68,555 -
CARES Act Coronavirus Relief Funding (CRF) - 9,019,863 9,019,863 -
ARPA American Rescue Plan Act Funding (SLFRF) - 6,631,295 6,631,295 -
Total categorical aid 697,969 18,100,293 17,925,589 (174,704)
Total revenues from the Federal Government 708,969 18,111,293 17,936,952 (174,341)
From the Commonwealth of Virginia:
Non-categorical aid:
Mobile home taxes 10,000 10,000 15,315 5,315
Rolling stock taxes 20,000 20,000 18,363 (1,637)
Personal property tax relief 8,742,000 8,742,000 8,741,680 (320)
Skill games tax - - 70,560 70,560
Total non-categorical aid 8,772,000 8,772,000 8,845,918 73,918
Categorical aid:
Shared expenses:
Commonwealth's Attorney 572,000 572,000 565,874 (6,126)
Sheriff 2,576,000 2,576,000 2,769,688 193,688
Commissioner of the Revenue 215,000 215,000 208,557 (6,443)
Treasurer 162,000 162,000 154,875 (7,125)
Registrar 39,000 39,000 40,949 1,949
Electoral Board 9,000 9,000 8,967 (33)
Clerk of the Circuit Court 484,000 541,065 541,718 653
Total shared expenses 4,057,000 4,114,065 4,290,628 176,563
Other categorical aid:
VA Department of Emergency Management FEMA
Public Assistance - Coronavirus - - (22,465) (22,465)
Fire and life safety grants - - 2,013 2,013
Wireless E911 services 313,000 313,000 329,876 16,876
Crime Victim Assistance grant 37,000 37,000 34,335 (2,665)
VA Juvenile Community Crime Control Act grant 55,000 55,000 54,684 (316)
VA Supreme Court extradition 15,000 15,000 9,207 (5,793)
Emergency Home Repair grant - - 30,374 30,374
Arts Commission grant - 4,500 4,500 -
Presidential election postage reimbursement - 4,847 4,847 -
Library Aid 161,462 178,992 178,992 -
Court services postage reimbursement 12,000 12,000 8,288 (3,712)
Total other categorical aid 593,462 620,339 634,651 14,312
Total categorical aid 4,650,462 4,734,404 4,925,279 190,875
Total revenues from the Commonwealth of Virginia 13,422,462 13,506,404 13,771,197 264,793
(Continued)
Year Ended June 30, 2021
COUNTY OF YORK, VIRGINIA
Required Supplementary Information - Budgetary Comparison Schedule
General Fund - Revenues and Other Financing Sources
The accompanying notes are an integral part of the required supplementary information.
G-2
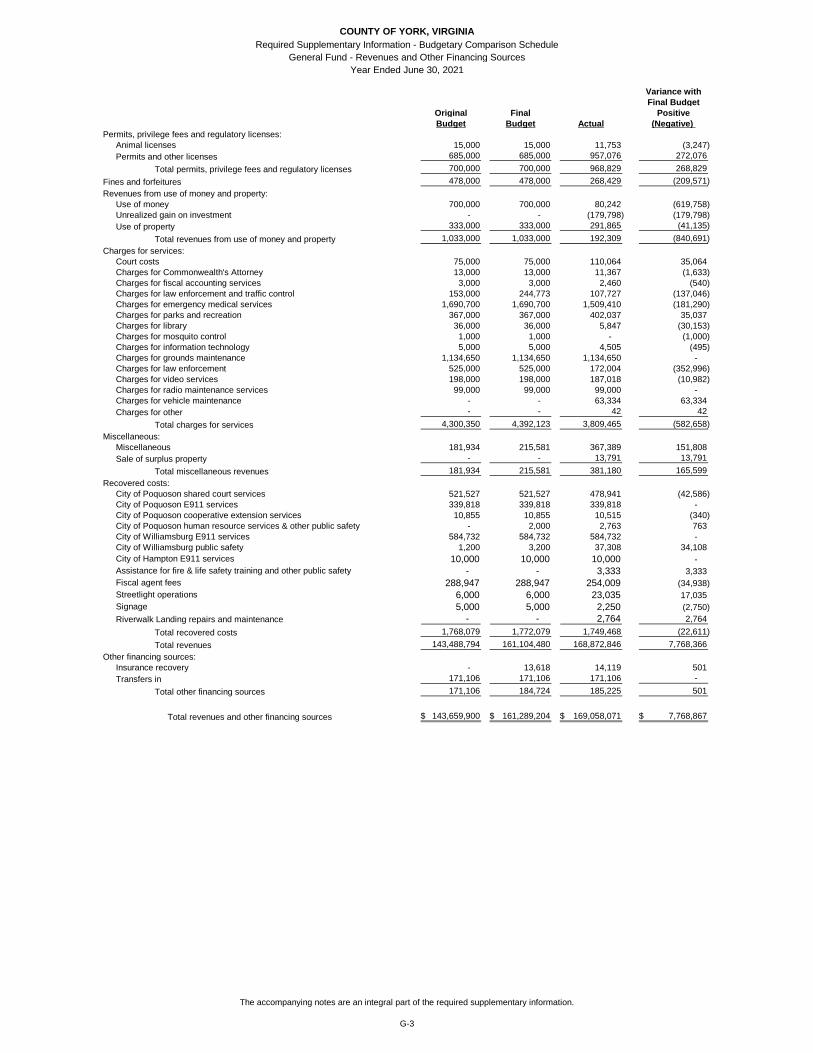
Year Ended June 30, 2021
COUNTY OF YORK, VIRGINIA
Required Supplementary Information - Budgetary Comparison Schedule
General Fund - Revenues and Other Financing Sources
Variance with
Final Budget
Original Final Positive
Budget Budget Actual (Negative)
Permits, privilege fees and regulatory licenses:
Animal licenses 15,000 15,000 11,753 (3,247)
Permits and other licenses 685,000 685,000 957,076 272,076
Total permits, privilege fees and regulatory licenses 700,000 700,000 968,829 268,829
Fines and forfeitures 478,000 478,000 268,429 (209,571)
Revenues from use of money and property:
Use of money 700,000 700,000 80,242 (619,758)
Unrealized gain on investment - - (179,798) (179,798)
Use of property 333,000 333,000 291,865 (41,135)
Total revenues from use of money and property 1,033,000 1,033,000 192,309 (840,691)
Charges for services:
Court costs 75,000 75,000 110,064 35,064
Charges for Commonwealth's Attorney 13,000 13,000 11,367 (1,633)
Charges for fiscal accounting services 3,000 3,000 2,460 (540)
Charges for law enforcement and traffic control 153,000 244,773 107,727 (137,046)
Charges for emergency medical services 1,690,700 1,690,700 1,509,410 (181,290)
Charges for parks and recreation 367,000 367,000 402,037 35,037
Charges for library 36,000 36,000 5,847 (30,153)
Charges for mosquito control 1,000 1,000 - (1,000)
Charges for information technology 5,000 5,000 4,505 (495)
Charges for grounds maintenance 1,134,650 1,134,650 1,134,650 -
Charges for law enforcement 525,000 525,000 172,004 (352,996)
Charges for video services 198,000 198,000 187,018 (10,982)
Charges for radio maintenance services 99,000 99,000 99,000 -
Charges for vehicle maintenance - - 63,334 63,334
Charges for other - - 42 42
Total charges for services 4,300,350 4,392,123 3,809,465 (582,658)
Miscellaneous:
Miscellaneous 181,934 215,581 367,389 151,808
Sale of surplus property - - 13,791 13,791
Total miscellaneous revenues 181,934 215,581 381,180 165,599
Recovered costs:
City of Poquoson shared court services 521,527 521,527 478,941 (42,586)
City of Poquoson E911 services 339,818 339,818 339,818 -
City of Poquoson cooperative extension services 10,855 10,855 10,515 (340)
City of Poquoson human resource services & other public safety - 2,000 2,763 763
City of Williamsburg E911 services 584,732 584,732 584,732 -
City of Williamsburg public safety 1,200 3,200 37,308 34,108
City of Hampton E911 services 10,000 10,000 10,000 -
Assistance for fire & life safety training and other public safety - - 3,333 3,333
Fiscal agent fees 288,947 288,947 254,009 (34,938)
Streetlight operations 6,000 6,000 23,035 17,035
Signage 5,000 5,000 2,250 (2,750)
Riverwalk Landing repairs and maintenance - - 2,764 2,764
Total recovered costs 1,768,079 1,772,079 1,749,468 (22,611)
Total revenues 143,488,794 161,104,480 168,872,846 7,768,366
Other financing sources:
Insurance recovery - 13,618 14,119 501
Transfers in 171,106 171,106 171,106 -
Total other financing sources 171,106 184,724 185,225 501
Total revenues and other financing sources 143,659,900$ 161,289,204$ 169,058,071$ 7,768,867$
The accompanying notes are an integral part of the required supplementary information.
G-3
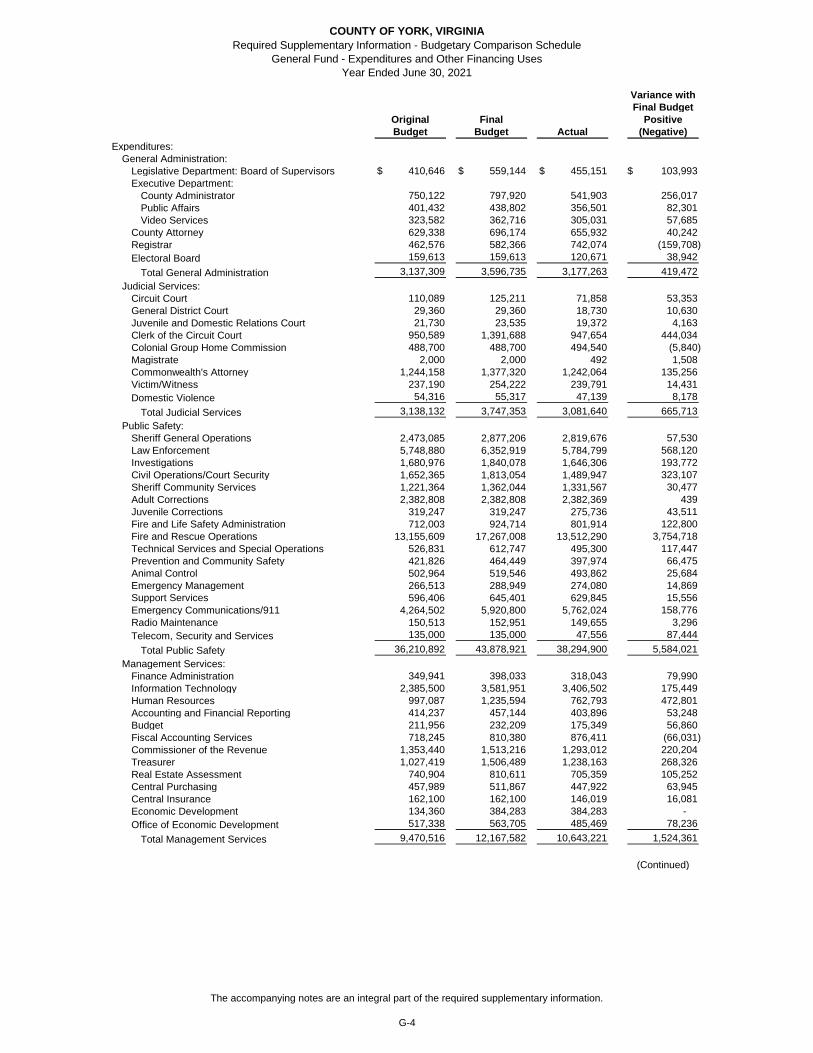
Variance with
Final Budget
Original Final Positive
Budget Budget Actual (Negative)
Expenditures:
General Administration:
Legislative Department: Board of Supervisors 410,646$ 559,144$ 455,151$ 103,993$
Executive Department:
County Administrator 750,122 797,920 541,903 256,017
Public Affairs 401,432 438,802 356,501 82,301
Video Services 323,582 362,716 305,031 57,685
County Attorney 629,338 696,174 655,932 40,242
Registrar 462,576 582,366 742,074 (159,708)
Electoral Board 159,613 159,613 120,671 38,942
Total General Administration 3,137,309 3,596,735 3,177,263 419,472
Judicial Services:
Circuit Court 110,089 125,211 71,858 53,353
General District Court 29,360 29,360 18,730 10,630
Juvenile and Domestic Relations Court 21,730 23,535 19,372 4,163
Clerk of the Circuit Court 950,589 1,391,688 947,654 444,034
Colonial Group Home Commission 488,700 488,700 494,540 (5,840)
Magistrate 2,000 2,000 492 1,508
Commonwealth's Attorney 1,244,158 1,377,320 1,242,064 135,256
Victim/Witness 237,190 254,222 239,791 14,431
Domestic Violence 54,316 55,317 47,139 8,178
Total Judicial Services 3,138,132 3,747,353 3,081,640 665,713
Public Safety:
Sheriff General Operations 2,473,085 2,877,206 2,819,676 57,530
Law Enforcement 5,748,880 6,352,919 5,784,799 568,120
Investigations 1,680,976 1,840,078 1,646,306 193,772
Civil Operations/Court Security 1,652,365 1,813,054 1,489,947 323,107
Sheriff Community Services 1,221,364 1,362,044 1,331,567 30,477
Adult Corrections 2,382,808 2,382,808 2,382,369 439
Juvenile Corrections 319,247 319,247 275,736 43,511
Fire and Life Safety Administration 712,003 924,714 801,914 122,800
Fire and Rescue Operations 13,155,609 17,267,008 13,512,290 3,754,718
Technical Services and Special Operations 526,831 612,747 495,300 117,447
Prevention and Community Safety 421,826 464,449 397,974 66,475
Animal Control 502,964 519,546 493,862 25,684
Emergency Management 266,513 288,949 274,080 14,869
Support Services 596,406 645,401 629,845 15,556
Emergency Communications/911 4,264,502 5,920,800 5,762,024 158,776
Radio Maintenance 150,513 152,951 149,655 3,296
Telecom, Security and Services 135,000 135,000 47,556 87,444
Total Public Safety 36,210,892 43,878,921 38,294,900 5,584,021
Management Services:
Finance Administration 349,941 398,033 318,043 79,990
Information Technology 2,385,500 3,581,951 3,406,502 175,449
Human Resources 997,087 1,235,594 762,793 472,801
Accounting and Financial Reporting 414,237 457,144 403,896 53,248
Budget 211,956 232,209 175,349 56,860
Fiscal Accounting Services 718,245 810,380 876,411 (66,031)
Commissioner of the Revenue 1,353,440 1,513,216 1,293,012 220,204
Treasurer 1,027,419 1,506,489 1,238,163 268,326
Real Estate Assessment 740,904 810,611 705,359 105,252
Central Purchasing 457,989 511,867 447,922 63,945
Central Insurance 162,100 162,100 146,019 16,081
Economic Development 134,360 384,283 384,283 -
Office of Economic Development 517,338 563,705 485,469 78,236
Total Management Services 9,470,516 12,167,582 10,643,221 1,524,361
(Continued)
COUNTY OF YORK, VIRGINIA
Required Supplementary Information - Budgetary Comparison Schedule
General Fund - Expenditures and Other Financing Uses
Year Ended June 30, 2021
The accompanying notes are an integral part of the required supplementary information.
G-4

COUNTY OF YORK, VIRGINIA
Required Supplementary Information - Budgetary Comparison Schedule
General Fund - Expenditures and Other Financing Uses
Year Ended June 30, 2021
Variance with
Final Budget
Original Final Positive
Budget Budget Actual (Negative)
Education:
County of York Public School Division - Local 55,237,094 58,409,523 57,157,279 1,252,244
Library Services 3,280,121 3,527,809 3,156,237 371,572
Cooperative Extension 66,927 67,818 51,092 16,726
Total Education 58,584,142 62,005,150 60,364,608 1,640,542
Human Services:
Social Services - payments to Board members 7,050 65,459 63,814 1,645
Contributions 1,565,108 1,565,108 1,554,104 11,004
Total Human Services 1,572,158 1,630,567 1,617,918 12,649
Public Works:
Administration 209,846 226,018 214,430 11,588
Engineering and Facility Maintenance 3,523,944 3,751,950 3,286,381 465,569
Grounds Maintenance and Construction 3,501,827 3,914,175 3,471,475 442,700
Stormwater 1,158,533 1,274,803 1,028,591 246,212
Mosquito Control 993,918 1,137,397 909,164 228,233
Total Public Works 9,388,068 10,304,343 8,910,041 1,394,302
Community Development:
Building Safety 1,167,819 1,285,362 1,071,231 214,131
Board of Zoning/Subdivision Appeals 7,025 7,025 1,693 5,332
Development and Compliance 806,844 885,514 764,663 120,851
Planning 325,018 364,613 328,445 36,168
Planning Commission 30,056 30,056 17,713 12,343
Planning and Development Admin 316,733 353,721 318,250 35,471
Total Community Development 2,653,495 2,926,291 2,501,995 424,296
Community Services:
Administration 339,820 549,298 500,939 48,359
Housing & Neighborhood Revitalization 621,126 1,933,417 1,843,254 90,163
Parks and Recreation 2,237,998 2,396,135 1,772,805 623,330
Freight Shed and Tourism events - 58,630 59,187 (557)
Total Community Services 3,198,944 4,937,480 4,176,185 761,295
Non-departmental:
Employee benefits 115,881 1,021,696 1,003,011 18,685
Contributions 341,921 371,821 303,079 68,742
Appropriated reserves 314,476 325,476 86,317 239,159
Emergencies - Coronavirus - 419,731 288,719 131,012
Total Non-departmental 772,278 2,138,724 1,681,126 457,598
Total expenditures 128,125,934 147,333,146 134,448,897 12,884,249
Other Financing Uses:
Transfers out 15,533,966 22,635,614 22,686,058 (50,444)
Total other financing uses 15,533,966 22,635,614 22,686,058 (50,444)
Total expenditures and other financing uses 143,659,900$ 169,968,760$ 157,134,955$ 12,833,805$
The accompanying notes are an integral part of the required supplementary information.
G-5

G-6
REQUIRED SUPPLEMENTARY INFORMATION –
BUDGET COMPARISON SCHEDULE
TOURISM FUND
To account for the receipt and disbursement of 3% of the lodging tax and the $2.00 additional tax restricted by the Commonwealth of Virginia for tourism activities. Per Section 58.1-3823 of the Code of Virginia, one-half of the revenues collected from the additional tax shall be deposited into the Historic Triangle Marketing Fund. The other half is retained by the County. This fund is a major special revenue fund, with a legally adopted annual budget.

Variance with
Final Budget
Original Final Positive
Budget Budget Actual (Negative)
REVENUES
Other local taxes 2,922,000$ 2,922,000$ 2,474,063$ (447,937)$
Intergovernmental: State - 30,000 30,000 -
Use of money and property 110,500 110,500 68,739 (41,761)
Miscellaneous - - 4,324 4,324
Total revenues 3,032,500 3,062,500 2,577,126 (485,374)
EXPENDITURES
Current:
Public safety 250,000 250,000 185,000 65,000
Management services 438,600 438,600 438,600 -
Public works 70,000 70,000 70,000 -
Community services 2,491,911 3,021,911 1,884,983 1,136,928
Debt service - principal retirement 42,667 42,667 42,667 -
Total expenditures 3,293,178 3,823,178 2,621,250 1,201,928
Excess (deficiency) of revenues over
(under) expenditures (260,678) (760,678) (44,124) 716,554
OTHER FINANCING SOURCES
Transfers in - 500,000 500,000 -
Total other financing uses - 500,000 500,000 -
Net change in fund balances (260,678) (260,678) 455,876 716,554
Fund balances, beginning of year 260,678 260,678 260,678 -
Fund balances, end of year -$ -$ 716,554$ 716,554$
COUNTY OF YORK, VIRGINIA
Tourism Fund
For the Year Ended June 30, 2021
Required Supplementary Information - Budgetary Comparison Schedule
The accompanying notes are an integral part of the required supplementary information.
G-7

2021 2020 2019 2018 2017 2016 2015 2021 2020 2019 2018 2017 2016 2015
Total Pension Liability
Service cost 4,974,047$ 4,577,670$ 4,414,111$ 4,400,884$ 4,390,926$ 4,347,200$ 4,324,554$ 612,876$ 601,823$ 601,022$ 639,053$ 645,253$ 657,682$ 651,659$
Interest 15,295,937 14,551,387 13,608,499 13,134,091 12,607,441 12,029,849 11,340,354 1,716,651 1,652,635 1,586,058 1,511,907 1,434,468 1,340,262 1,257,618
Difference between expected and actual 2,016,305 3,138,804 1,407,645 (867,346) (1,790,361) (1,334,258) - 180,378 56,704 (180,060) 21,121 (113,364) 144,530 -
Benefit payments (10,733,177) (9,548,874) (9,473,846) (8,050,116) (7,318,772) (6,264,165) (5,365,786) (1,245,823) (1,143,487) (968,357) (883,431) (836,736) (756,608) (700,700)
Other - 6,602,686 3,550,930 (1,128,389) - - - - 706,288 - (186,884) - - -
Net change in total pension liability 11,553,112 19,321,673 13,507,339 7,489,124 7,889,234 8,778,626 10,299,122 1,264,082 1,873,963 1,038,663 1,101,766 1,129,621 1,385,866 1,208,577
Total pension liability - beginning 231,973,062 212,651,389 199,144,050 191,654,926 183,765,692 174,987,066 164,687,944 26,054,776 24,180,813 23,142,150 22,040,384 20,910,763 19,524,897 18,316,320
Total pension liability - ending 243,526,174$ 231,973,062$ 212,651,389$ 199,144,050$ 191,654,926$ 183,765,692$ 174,987,066$ 27,318,858$ 26,054,776$ 24,180,813$ 23,142,150$ 22,040,384$ 20,910,763$ 19,524,897$
Plan Fiduciary Net Position
Contributions - employer 4,364,971$ 4,260,368$ 4,166,554$ 3,593,323$ 4,373,897$ 4,288,412$ 4,332,603$ 322,379$ 326,377$ 354,063$ 361,828$ 487,737$ 474,730$ 540,694$
Contributions - employee 2,169,677 2,116,844 1,990,383 1,906,698 1,955,396 1,871,311 1,851,612 308,119 305,891 303,951 309,049 310,891 303,379 300,981
Net investment income 3,879,115 12,930,127 13,562,714 20,266,521 2,893,068 7,259,533 21,563,882 483,529 1,615,700 1,696,743 2,525,399 361,926 896,825 2,649,679
Benefit payments (10,733,177) (9,548,874) (9,473,846) (8,050,116) (7,318,772) (6,264,165) (5,365,786) (1,245,823) (1,143,487) (968,357) (883,431) (836,736) (756,608) (700,700)
Administrative expenses (133,317) (128,063) (117,688) (117,234) (102,044) (98,165) (114,394) (16,631) (16,095) (14,629) (14,499) (12,543) (12,064) (14,022)
Other changes (5,722) (8,149) (12,075) (18,023) (1,221) (1,538) 1,136 (571) (1,017) (1,513) (2,249) (151) (188) 139
Net change in plan fiduciary net position (458,453) 9,622,253 10,116,042 17,581,169 1,800,324 7,055,388 22,269,053 (148,998) 1,087,369 1,370,258 2,296,097 311,124 906,074 2,776,771
Plan fiduciary net position - beginning 204,168,727 194,546,474 184,430,432 166,849,263 165,048,939 157,993,551 135,724,498 25,467,177 24,379,808 23,009,550 20,713,453 20,402,329 19,496,255 16,719,484
Plan fiduciary net position - ending 203,710,274$ 204,168,727$ 194,546,474$ 184,430,432$ 166,849,263$ 165,048,939$ 157,993,551$ 25,318,179$ 25,467,177$ 24,379,808$ 23,009,550$ 20,713,453$ 20,402,329$ 19,496,255$
Net pension liability (asset) * 39,815,900$ 27,804,335$ 18,104,915$ 14,713,618$ 24,805,663$ 18,716,753$ 16,993,515$ 2,000,679$ 587,599$ (198,995)$ 132,600$ 1,326,931$ 508,434$ 28,642$
Plan fiduciary net position as a percentage of total pension liability 83.65% 88.01% 91.49% 92.61% 87.06% 89.81% 90.29% 92.68% 97.74% 100.82% 99.43% 93.98% 97.57% 99.85%
Covered payroll 45,217,918$ 43,554,938$ 41,074,204$ 39,079,963$ 38,259,805$ 37,197,611$ 37,009,571$ 6,598,388$ 6,466,346$ 6,347,608$ 6,373,699$ 6,361,525$ 6,167,447$ 6,035,633$
Net pension liability as a percentage of covered payroll 88.05% 63.84% 44.08% 37.65% 64.83% 50.32% 45.92% 30.32% 9.09% -3.13% 2.08% 20.86% 8.24% 0.47%
* 'Per GAAP, net pension liabilities are reported using the measurement date, which is one year prior to the reporting date.
Schedule is intended to show information for 10 years. Since 2021 is the seventh year for this presentation, only six additional years of data are available. However, additional years will be included as they become available.
COUNTY OF YORK, VIRGINIA
Schedule of Changes in Employer's Net Pension Liability and Related Ratios
Years Ended June 30
School Division NonprofessionalCounty
G-8

2021 2020 2019 2018 2017 2016 2015
Total Pension Liability
Service cost 646$ 1,138$ 1,206$ 1,385$ 1,834$ 1,731$ 2,224$
Interest 115,237 117,944 120,762 127,986 132,210 120,051 124,341
Difference between expected and actual 34,647 40,567 47,716 (2,386) 2,076 74,161 -
Benefit payments (179,529) (206,332) (189,804) (197,602) (194,429) (164,908) (193,616)
Change in assumptions 79,355 (4,898) (11,814) (36,292) - 157,315 -
Net change in total pension liability 50,356 (51,581) (31,934) (106,909) (58,309) 188,350 (67,051)
Total pension liability - beginning 1,735,362 1,786,943 1,818,877 1,925,786 1,984,095 1,795,745 1,862,796
Total pension liability - ending 1,785,718$ 1,735,362$ 1,786,943$ 1,818,877$ 1,925,786$ 1,984,095$ 1,795,745$
Plan Fiduciary Net Position
Contributions - employer -$ -$ -$ 20,000$ 10,000$ -$ 290,495$
Net investment income 23,675 179,448 237,109 142,975 89,571 20,333 -
Benefit payments (179,529) (206,332) (189,804) (197,602) (194,429) (164,908) (177,455)
Refunds of contributions - - - - - - (22,106)
Administrative expenses (18,397) (19,034) (19,484) (19,782) (21,276) (21,515) -
Net change in plan fiduciary net position (174,251) (45,918) 27,821 (54,409) (116,134) (166,090) 90,934
Plan fiduciary net position - beginning 1,745,408 1,791,326 1,763,505 1,817,914 1,934,048 2,100,138 2,009,204
Plan fiduciary net position - ending 1,571,157$ 1,745,408$ 1,791,326$ 1,763,505$ 1,817,914$ 1,934,048$ 2,100,138$
Net pension liability (asset) * 214,561$ (10,046)$ (4,383)$ 55,372$ 107,872$ 50,047$ (304,393)$
Plan fiduciary net position as a percentage of total pension liability (asset) 87.98% 100.58% 100.25% 96.96% 94.40% 97.48% 116.95%
Covered payroll 334,285$ 315,384$ 393,083$ 416,038$ 490,949$ 540,694$ 605,577$
Net pension liability (asset) as a percentage of covered payroll 64.19% -3.19% -1.12% 13.31% 21.97% 9.26% -50.26%
* 'Per GAAP, net pension liabilities are reported using the measurement date, which is one year prior to the reporting date.
Schedule is intended to show information for 10 years. Since 2021 is the seventh year for this presentation, only six additional years of data are available. However,
additional years will be included as they become available.
School Division Optional
COUNTY OF YORK, VIRGINIA
Schedule of Changes in Employer's Net Pension Liability and Related Ratios, Continued
Years Ended June 30
G-9
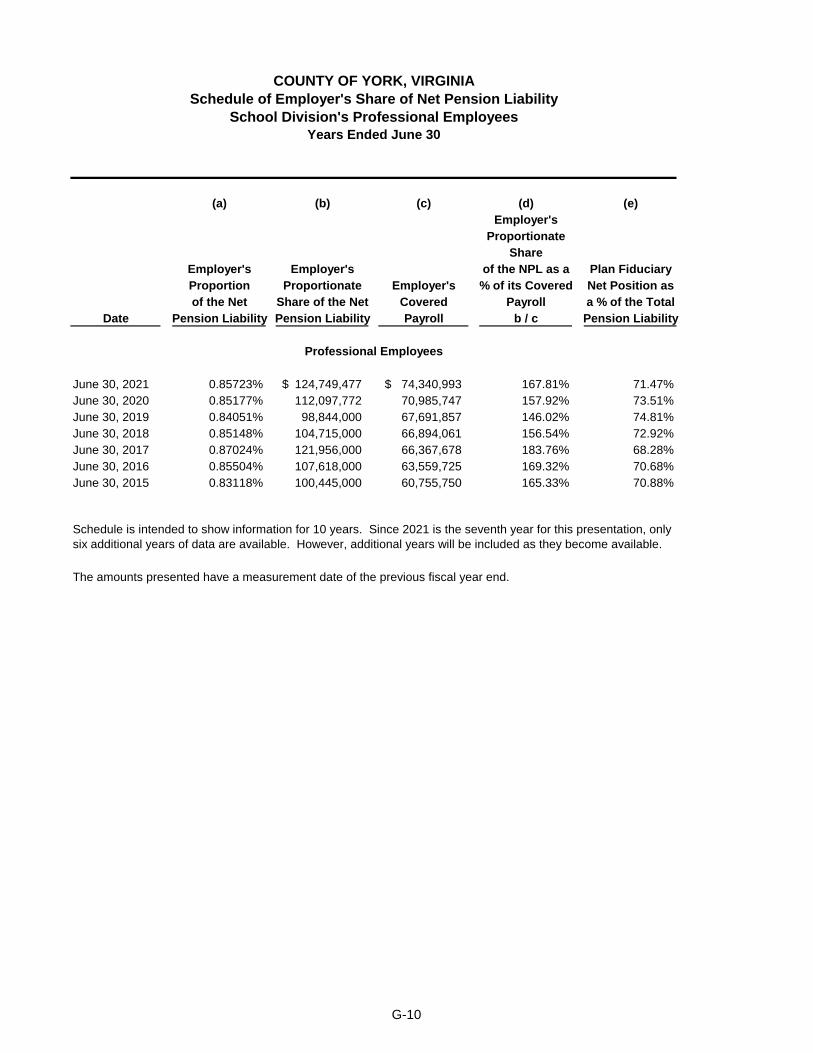
(a) (b) (c) (d) (e)
Employer's
Proportionate
Share
Employer's Employer's of the NPL as a Plan Fiduciary
Proportion Proportionate Employer's % of its Covered Net Position as
of the Net Share of the Net Covered Payroll a % of the Total
Date Pension Liability Pension Liability Payroll b / c Pension Liability
June 30, 2021 0.85723% 124,749,477$ 74,340,993$ 167.81% 71.47%
June 30, 2020 0.85177% 112,097,772 70,985,747 157.92% 73.51%
June 30, 2019 0.84051% 98,844,000 67,691,857 146.02% 74.81%
June 30, 2018 0.85148% 104,715,000 66,894,061 156.54% 72.92%
June 30, 2017 0.87024% 121,956,000 66,367,678 183.76% 68.28%
June 30, 2016 0.85504% 107,618,000 63,559,725 169.32% 70.68%
June 30, 2015 0.83118% 100,445,000 60,755,750 165.33% 70.88%
The amounts presented have a measurement date of the previous fiscal year end.
Schedule is intended to show information for 10 years. Since 2021 is the seventh year for this presentation, only
six additional years of data are available. However, additional years will be included as they become available.
COUNTY OF YORK, VIRGINIA
Schedule of Employer's Share of Net Pension Liability
School Division's Professional Employees
Years Ended June 30
Professional Employees
G-10
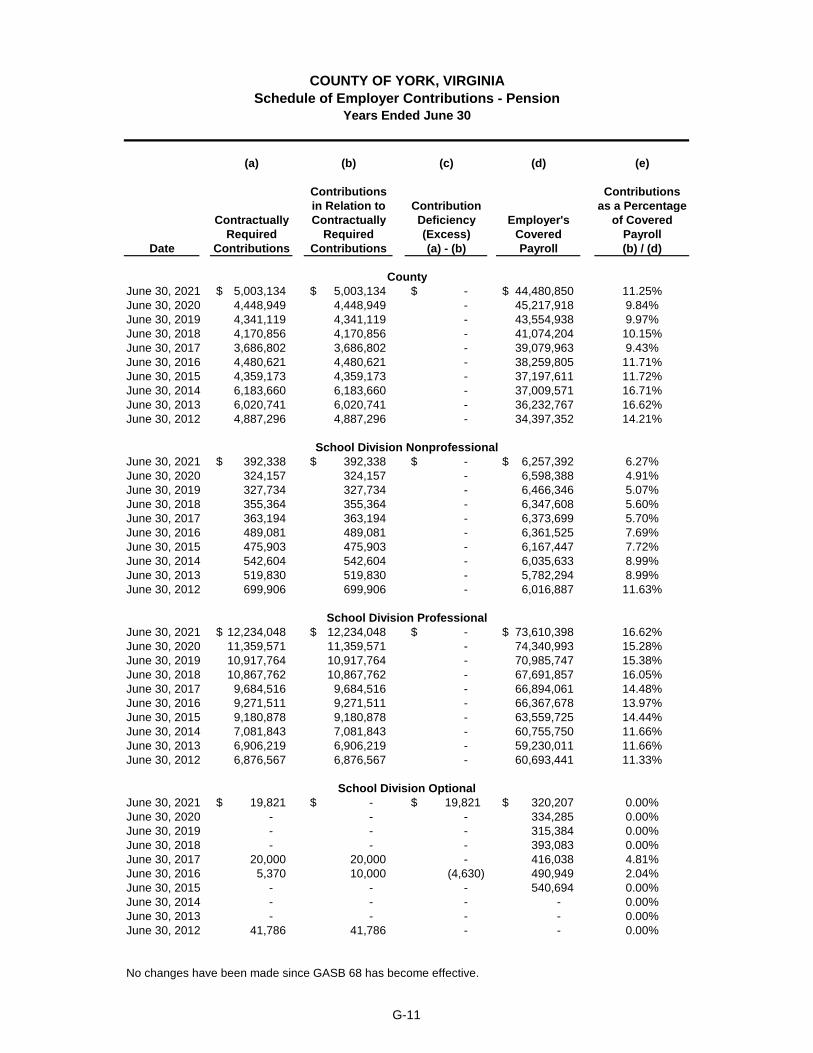
(a) (b) (c) (d) (e)
Contributions Contributions
in Relation to Contribution as a Percentage
Contractually Contractually Deficiency Employer's of Covered
Required Required (Excess) Covered Payroll
Date Contributions Contributions (a) - (b) Payroll (b) / (d)
June 30, 2021 5,003,134$ 5,003,134$ -$ 44,480,850$ 11.25%
June 30, 2020 4,448,949 4,448,949 - 45,217,918 9.84%
June 30, 2019 4,341,119 4,341,119 - 43,554,938 9.97%
June 30, 2018 4,170,856 4,170,856 - 41,074,204 10.15%
June 30, 2017 3,686,802 3,686,802 - 39,079,963 9.43%
June 30, 2016 4,480,621 4,480,621 - 38,259,805 11.71%
June 30, 2015 4,359,173 4,359,173 - 37,197,611 11.72%
June 30, 2014 6,183,660 6,183,660 - 37,009,571 16.71%
June 30, 2013 6,020,741 6,020,741 - 36,232,767 16.62%
June 30, 2012 4,887,296 4,887,296 - 34,397,352 14.21%
June 30, 2021 392,338$ 392,338$ -$ 6,257,392$ 6.27%
June 30, 2020 324,157 324,157 - 6,598,388 4.91%
June 30, 2019 327,734 327,734 - 6,466,346 5.07%
June 30, 2018 355,364 355,364 - 6,347,608 5.60%
June 30, 2017 363,194 363,194 - 6,373,699 5.70%
June 30, 2016 489,081 489,081 - 6,361,525 7.69%
June 30, 2015 475,903 475,903 - 6,167,447 7.72%
June 30, 2014 542,604 542,604 - 6,035,633 8.99%
June 30, 2013 519,830 519,830 - 5,782,294 8.99%
June 30, 2012 699,906 699,906 - 6,016,887 11.63%
June 30, 2021 12,234,048$ 12,234,048$ -$ 73,610,398$ 16.62%
June 30, 2020 11,359,571 11,359,571 - 74,340,993 15.28%
June 30, 2019 10,917,764 10,917,764 - 70,985,747 15.38%
June 30, 2018 10,867,762 10,867,762 - 67,691,857 16.05%
June 30, 2017 9,684,516 9,684,516 - 66,894,061 14.48%
June 30, 2016 9,271,511 9,271,511 - 66,367,678 13.97%
June 30, 2015 9,180,878 9,180,878 - 63,559,725 14.44%
June 30, 2014 7,081,843 7,081,843 - 60,755,750 11.66%
June 30, 2013 6,906,219 6,906,219 - 59,230,011 11.66%
June 30, 2012 6,876,567 6,876,567 - 60,693,441 11.33%
June 30, 2021 19,821$ -$ 19,821$ 320,207$ 0.00%
June 30, 2020 - - - 334,285 0.00%
June 30, 2019 - - - 315,384 0.00%
June 30, 2018 - - - 393,083 0.00%
June 30, 2017 20,000 20,000 - 416,038 4.81%
June 30, 2016 5,370 10,000 (4,630) 490,949 2.04%
June 30, 2015 - - - 540,694 0.00%
June 30, 2014 - - - - 0.00%
June 30, 2013 - - - - 0.00%
June 30, 2012 41,786 41,786 - - 0.00%
School Division Nonprofessional
School Division Professional
School Division Optional
No changes have been made since GASB 68 has become effective.
COUNTY OF YORK, VIRGINIA
Schedule of Employer Contributions - Pension
Years Ended June 30
County
G-11

2021 2020 2019 2018 2017 2021 2020 2019 2018 2017
Total OPEB Liability
Service cost 268,714$ 233,175$ 94,396$ 299,500$ 289,250$ 339,426$ 324,527$ 256,396$ 280,180$ 261,850$
Interest 1,147,607 1,196,966 479,609 1,539,270 1,002,541 402,318 382,499 348,052 323,944 308,920
Liability gains or losses - 1,558,131 - 6,981,442 - (61,892) - 131,855 - -
Assumption changes or inputs - (1,192,982) 10,215,778 (15,941,922) - (1,094,130) (25,368) 626,213 - -
Benefit payments (1,075,136) (990,328) (857,558) (802,870) (435,212) (394,021) (389,344) (383,086) (352,983) (395,238)
Net change in total OPEB liability 341,185 804,962 9,932,225 (7,924,580) 856,579 (808,299) 292,314 979,430 251,141 175,532
Total OPEB liability - beginning 17,915,876 17,110,914 7,178,689 15,103,269 14,246,690 6,043,980 5,751,666 4,772,236 4,521,095 4,345,563
Total OPEB liability - ending 18,257,061$ 17,915,876$ 17,110,914$ 7,178,689$ 15,103,269$ 5,235,681$ 6,043,980$ 5,751,666$ 4,772,236$ 4,521,095$
Plan Fiduciary Net Position
Contributions - employer 1,175,136$ 1,070,691$ 930,691$ 1,183,144$ 812,312$ 635,431$ 389,344$ 593,608$ 563,505$ 589,228$
Net investment income 3,021,572 294,017 423,140 776,228 911,857 2,355,368 232,409 325,272 602,829 700,174
Benefit payments (1,075,136) (990,328) (857,558) (802,870) (435,212) (394,021) (389,344) (383,086) (352,983) (395,238)
Administrative expenses (11,889) (11,270) (10,499) (9,596) (6,740) (9,365) (8,907) (8,187) (7,558) (5,292)
Net change in plan fiduciary net position 3,109,683 363,110 485,774 1,146,906 1,282,217 2,587,413 223,502 527,607 805,793 888,872
Plan fiduciary net position - beginning 10,052,548 9,689,438 9,203,664 8,056,758 6,774,541 7,826,149 7,602,647 7,075,040 6,269,247 5,380,376
Plan fiduciary net position - ending 13,162,231$ 10,052,548$ 9,689,438$ 9,203,664$ 8,056,758$ 10,413,562$ 7,826,149$ 7,602,647$ 7,075,040$ 6,269,248$
Net OPEB liability (asset) 5,094,830$ 7,863,328$ 7,421,476$ (2,024,975)$ 7,046,511$ (5,177,881)$ (1,782,169)$ (1,850,981)$ (2,302,804)$ (1,748,153)$
Plan fiduciary net position as a percentage of total OPEB liability 72.09% 56.11% 56.63% 128.21% 53.34% 198.90% 129.49% 132.18% 148.25% 138.67%
Covered payroll 44,992,730$ 44,992,730$ 39,807,161$ 39,807,161$ 37,197,611$ 78,051,732$ 72,562,703$ 72,562,703$ 73,417,704$ 73,417,704$
Net OPEB liability as a percentage of covered employee payroll 11.32% 17.48% 18.64% -5.09% 18.94% -6.63% -2.46% -2.55% -3.14% -2.38%
Schedule is intended to show information for 10 years. Since 2021 is the fifth year for this presentation, only four additional years are available. However, additional years will be included as they become available.
COUNTY OF YORK, VIRGINIA
Schedule of Changes in Employer's Net OPEB Liability and Related Ratios - Health/Dental
Year Ended June 30
School DivisionCounty
G-12

2021 2020 2019 2018 2017 2016
Actuarially determined contribution 755,941$ 720,577$ 80,363$ 73,133$ 816,365$ 762,958$ Contributions in relation to the actuarially determined contribution 1,175,136 1,070,691 930,691 1,183,144 812,312 7,146,558
Contribution deficiency (excess) (419,195)$ (350,114)$ (850,328)$ (1,110,011)$ 4,053$ (6,383,600)$
Covered payroll 44,992,730$ 44,992,730$ 39,807,161$ 39,807,161$ 37,197,611$ 37,197,611$
Contribution as a % of covered employee payroll 2.61% 2.38% 2.34% 2.97% 2.18% 19.21%
2021 2020 2019 2018 2017 2016
Actuarially determined contribution 260,789$ 241,410$ 223,313$ 210,522$ 193,990$ 178,621$ Contributions in relation to the actuarially determined contribution 635,431 389,344 593,608 563,505 589,228 5,777,164
Contribution deficiency (excess) (374,642)$ (147,934)$ (370,295)$ (352,983)$ (395,238)$ (5,598,543)$
Covered payroll 78,051,732$ 72,562,703$ 72,562,703$ 73,417,704$ 73,417,704$ 73,417,704$
Contribution as a % of covered employee payroll 0.81% 0.54% 0.82% 0.77% 0.80% 7.87%
County
School Division
COUNTY OF YORK, VIRGINIA
Schedule of Employer ContributionsOther Postemployment Benefits - Health/Dental
Years Ended June 30
G-13

2021 2020 2019 2018 2021 2020
Total OPEB Liability
Service cost 24,734$ 23,113$ 22,681$ 25,337$ 11,482$ 11,130$
Interest 88,266 85,890 84,301 84,360 21,325 (540)
Benefit changes - - - - 7,946 -
Assumption changes or inputs - 32,340 - (44,791) - 9,367
Difference between expected and actual (10,087) 22,769 (1,640) - 124,238 321,805
Benefit payments (88,479) (78,442) (86,835) (44,700) (20,815) (15,426)
Net change in total OPEB liability 14,434 85,670 18,507 20,206 144,176 326,336
Total OPEB liability - beginning 1,351,888 1,266,218 1,247,711 1,227,505 326,336 -
Total OPEB liability - ending 1,366,322$ 1,351,888$ 1,266,218$ 1,247,711$ 470,512$ 326,336$
Plan Fiduciary Net Position
Contributions - employer 76,063$ 73,808$ 77,571$ 73,420$ 35,120$ 34,311$
Net investment income 19,702 59,868 62,659 90,253 431 1,107
Benefit payments (88,479) (78,442) (86,835) (44,700) (20,815) (15,426)
Administrative expenses (1,888) (1,313) (1,474) (1,503) (64) (28)
Other changes (9) (71) (4,438) 4,438 - (1)
Net change in plan fiduciary net position 5,389 53,850 47,483 121,908 14,672 19,963
Plan fiduciary net position - beginning 986,102 932,252 884,769 762,861 19,963 -
Plan fiduciary net position - ending 991,491$ 986,102$ 932,252$ 884,769$ 34,635$ 19,963$
Net OPEB liability 374,831$ 365,786$ 333,966$ 362,942$ 435,877$ 306,373$
Plan fiduciary net position as a percentage
of total OPEB liability 72.57% 72.94% 73.62% 70.91% 7.36% 6.12%
Covered payroll 31,562,625$ 30,253,324$ 28,521,474$ 26,950,520$ 6,473,737$ 6,441,833$
Net OPEB liability as a percentage
of covered payroll 1.19% 1.21% 1.17% 1.35% 6.73% 4.76%
Year Ended June 30
* Per GAAP, net OPEB liabilities are reported using the measurement date, which is one year prior to the reporting
date.
Schedule is intended to show information for 10 years. Since 2021 is the fourth year for this presentation, only three additional years are available. Since the
York County School Division nonprofessional employees began participating in the program in 2020, only two years of data are available. However, additional
years will be included as they become available.
COUNTY OF YORK, VIRGINIA
Schedule of Changes in Employer's Net HIC OPEB Liability and Related Ratios
School Division
NonprofessionalCounty
G-14

(a) (b) (c) (d) (e)
Contributions Contributions
in Relation to Contribution as a Percentage
Contractually Contractually Deficiency Employer's of Covered
Required Required (Excess) Covered Payroll
Date Contributions Contributions (a) - (b) Payroll (b) / (d)
June 30, 2021 51,730$ 51,730$ - 30,429,429$ 0.17%
June 30, 2020 53,656 53,656 - 31,562,625 0.17%
June 30, 2019 51,431 51,431 - 30,253,324 0.17%
June 30, 2018 54,191 54,191 - 28,521,474 0.19%
June 30, 2017 51,206 51,206 - 26,950,520 0.19%
June 30, 2016 50,313 50,313 - 26,480,681 0.19%
June 30, 2015 49,503 49,503 - 26,054,442 0.19%
June 30, 2014 41,680 41,680 - 26,049,790 0.16%
June 30, 2013 57,577 57,577 - 35,985,373 0.16%
June 30, 2012 52,474 52,474 - 34,982,680 0.15%
June 30, 2021 890,686$ 890,686$ -$ 73,610,398$ 1.21%
June 30, 2020 892,376 892,376 - 74,364,656 1.20%
June 30, 2019 852,109 852,109 - 71,009,117 1.20%
June 30, 2018 832,471 832,471 - 67,680,531 1.23%
June 30, 2017 743,350 743,350 - 66,968,466 1.11%
June 30, 2016 703,335 703,335 - 66,352,331 1.06%
June 30, 2015 673,859 673,859 - 63,571,618 1.06%
June 30, 2014 674,705 674,705 - 60,784,260 1.11%
June 30, 2013 657,477 657,477 - 59,232,163 1.11%
June 30, 2012 364,850 364,850 - 60,808,301 0.60%
June 30, 2021 41,299$ 41,299$ -$ 6,257,392$ 0.66%
June 30, 2020 34,311 34,311 - 6,473,737 0.53%
School Division Nonprofessional
Schedule is intended to show information for 10 years. Since the York County School Division
nonprofessional employees began participating in the program in 2020, only two years of data are available.
However, additional years will be included as they become available.
School Division Professional
COUNTY OF YORK, VIRGINIA
Schedule of Employer HIC OPEB Contributions
For the Years Ended June 30, 2012 through 2021
County
G-15

2021 2020 2019 2018
Employer's Proportion of the Net HIC OPEB Liability 0.84826% 0.84659% 0.83687% 0.84856%
Employer's Proportionate Share of the Net HIC
OPEB Liability 11,065,692$ 11,082,687$ 10,626,000$ 10,765,000$
Employer's Covered Payroll 74,364,656$ 71,009,117$ 67,680,531$ 66,968,466$
Employer's Proportionate Share of the Net HIC
OPEB Liability as a Percentage of its Covered Payroll 14.88% 15.61% 15.70% 16.07%
Plan Fiduciary Net Position as a Percentage of the
Total HIC OPEB Liability 9.95% 8.97% 8.08% 7.04%
Schedule is intended to show information for 10 years. Since 2021 is the fourth year for this presentation, only three additional years of
data are available. However, additional years will be included as they become available.
* Per GAAP, net OPEB liabilities are reported using the measurement date, which is one year prior to the reporting date.
COUNTY OF YORK, VIRGINIA
Schedule of Employer's Share of Net OPEB Liability
Health Insurance Credit Program - Professional Employees
Year Ended June 30
School Division
G-16

2021 2020 2019 2018
Employer's Proportion of the Net GLI OPEB Liability 0.21805% 0.22168% 0.21566% 0.21034%
Employer's Proportionate Share of the Net GLI
OPEB Liability 3,638,898$ 3,607,323$ 3,276,000$ 3,165,000$
Employer's Covered Payroll 44,875,227$ 43,457,502$ 41,007,670$ 38,797,164$
Employer's Proportionate Share of the Net GLI
OPEB Liability as a Percentage of its Covered Payroll 8.11% 8.30% 7.99% 8.16%
Plan Fiduciary Net Position as a Percentage of the
Total GLI OPEB Liability 52.64% 52.00% 51.22% 48.86%
Schedule is intended to show information for 10 years. Since 2021 is the fourth year for this presentation, only three
additional years of data are available. However, additional years will be included as they become available.
* Per GAAP, net OPEB liabilities are reported using the measurement date, which is one year prior to the reporting date.
COUNTY OF YORK, VIRGINIA
Schedule of Employer's Share of Net OPEB Liability
Group Life Insurance Program
Year Ended June 30
County
G-17

2021 2020 2019 2018
Employer's Proportion of the Net GLI OPEB Liability 0.03261% 0.03328% 0.33990% 0.03505%
Employer's Proportionate Share of the Net GLI
OPEB Liability 544,207$ 541,554$ 516,000$ 527,000$
Employer's Covered Payroll 6,710,645$ 6,524,499$ 6,464,042$ 6,465,629$
Employer's Proportionate Share of the Net GLI
OPEB Liability as a Percentage of its Covered Payroll 8.11% 8.30% 7.98% 8.15%
Plan Fiduciary Net Position as a Percentage of the
Total GLI OPEB Liability 52.64% 52.00% 51.22% 48.86%
Schedule is intended to show information for 10 years. Since 2021 is the fourth year for this presentation, only three
additional years of data are available. However, additional years will be included as they become available.
* Per GAAP, net OPEB liabilities are reported using the measurement date, which is one year prior to the reporting date.
COUNTY OF YORK, VIRGINIA
Schedule of Employer's Share of Net OPEB Liability
Group Life Insurance Program - Nonprofessional Employees
Years Ended June 30
School Division
G-18

2021 2020 2019 2018
Employer's Proportion of the Net GLI OPEB Liability 0.36222% 0.36358% 0.35768% 0.36412%
Employer's Proportionate Share of the Net GLI
OPEB Liability 6,044,858$ 5,916,415$ 5,432,000$ 5,479,000$
Employer's Covered Payroll 74,545,554$ 71,274,389$ 68,011,166$ 67,163,557$
Employer's Proportionate Share of the Net GLI
OPEB Liability as a Percentage of its Covered Payroll 8.11% 8.30% 7.99% 8.16%
Plan Fiduciary Net Position as a Percentage of the
Total GLI OPEB Liability 52.64% 52.00% 51.22% 48.86%
Schedule is intended to show information for 10 years. Since 2021 is the fourth year for this presentation, only three
additional years of data are available. However, additional years will be included as they become available.
* Per GAAP, net OPEB liabilities are reported using the measurement date, which is one year prior to the reporting date.
COUNTY OF YORK, VIRGINIA
Schedule of Employer's Share of Net OPEB Liability
Group Life Insurance Program - Professional Employees
Years Ended June 30
School Division
G-19

(a) (b) (c) (d) (e)
Contributions Contributions
in Relation to Contribution as a Percentage
Contractually Contractually Deficiency Employer's of Covered
Required Required (Excess) Covered Payroll
Date Contributions Contributions (a) - (b) Payroll (b) / (d)
June 30, 2021 234,716$ 234,716$ - 43,465,887$ 0.54%
June 30, 2020 233,351 233,351 - 44,875,227 0.52%
June 30, 2019 225,979 225,979 - 43,457,502 0.52%
June 30, 2018 213,240 213,240 - 41,007,670 0.52%
June 30, 2017 201,745 201,745 - 38,797,164 0.52%
June 30, 2016 182,606 182,606 - 38,042,921 0.48%
June 30, 2015 179,206 179,206 - 37,334,631 0.48%
June 30, 2014 178,047 178,047 - 37,093,209 0.48%
June 30, 2013 173,173 173,173 - 36,077,655 0.48%
June 30, 2012 98,058 98,058 - 35,020,634 0.28%
June 30, 2021 34,603$ 34,603$ -$ 6,407,980$ 0.54%
June 30, 2020 34,895 34,895 - 6,710,645 0.52%
June 30, 2019 33,927 33,927 - 6,524,499 0.52%
June 30, 2018 33,613 33,613 - 6,464,042 0.52%
June 30, 2017 33,621 33,621 - 6,465,629 0.52%
June 30, 2016 31,104 31,104 - 6,479,929 0.48%
June 30, 2015 29,858 29,858 - 6,220,361 0.48%
June 30, 2014 29,091 29,091 - 6,060,588 0.48%
June 30, 2013 28,253 28,253 - 5,885,972 0.48%
June 30, 2012 16,918 16,918 - 6,042,070 0.28%
June 30, 2021 398,328$ 398,328$ -$ 73,764,438$ 0.54%
June 30, 2020 387,637 387,637 - 74,545,554 0.52%
June 30, 2019 370,627 370,627 - 71,274,389 0.52%
June 30, 2018 353,658 353,658 - 68,011,166 0.52%
June 30, 2017 349,251 349,251 - 67,163,557 0.52%
June 30, 2016 319,402 319,402 - 66,542,088 0.48%
June 30, 2015 306,106 306,106 - 63,772,157 0.48%
June 30, 2014 292,259 292,259 - 60,887,315 0.48%
June 30, 2013 284,574 284,574 - 59,286,277 0.48%
June 30, 2012 170,304 170,304 - 60,822,776 0.28%
School Division Professional
COUNTY OF YORK, VIRGINIA
Schedule of Employer GLI OPEB Contributions
For the Years Ended June 30, 2012 through 2021
County
School Division Nonprofessional
G-20

2021 2020 2019 2018
Employer's Proportion of the Net VLDP OPEB Liability 0.59289% 0.56622% 0.55393% 0.58111%
Employer's Proportionate Share of the Net VLDP
OPEB Liability 5,919$ 11,471$ 4,000$ 3,000$
Employer's Covered Payroll 2,209,330$ 1,749,657$ 1,344,986$ 1,067,079$
Employer's Proportionate Share of the Net VLDP
OPEB Liability as a Percentage of its Covered Payroll 0.27% 0.66% 0.30% 0.28%
Plan Fiduciary Net Position as a Percentage of the
Total VLDP OPEB Liability 76.88% 49.21% 51.39% 38.40%
Schedule is intended to show information for 10 years. Since 2021 is the fourth year for this presentation, only three additional
years of data are available. However, additional years will be included as they become available.
* Per GAAP, net OPEB liabilities are reported using the measurement date, which is one year prior to the reporting date.
COUNTY OF YORK, VIRGINIA
Schedule of Employer's Share of Net OPEB Liability
Virginia Local Disability Program - Nonprofessional Employees
Years Ended June 30
School Division
G-21

2021 2020 2019 2018
Employer's Proportion of the Net VLDP OPEB Liability 2.67889% 2.60420% 2.70217% 2.91011%
Employer's Proportionate Share of the Net VLDP
OPEB Liability 21,492$ 15,140$ 21,000$ 17,000$
Employer's Covered Payroll 15,845,658$ 12,487,933$ 10,075,546$ 8,212,334$
Employer's Proportionate Share of the Net VLDP
OPEB Liability as a Percentage of its Covered Payroll 0.14% 0.12% 0.21% 0.21%
Plan Fiduciary Net Position as a Percentage of the
Total VLDP OPEB Liability 78.25% 74.07% 46.18% 31.96%
Schedule is intended to show information for 10 years. Since 2021 is the fourth year for this presentation, only three additional
years of data are available. However, additional years will be included as they become available.
* Per GAAP, net OPEB liabilities are reported using the measurement date, which is one year prior to the reporting date.
COUNTY OF YORK, VIRGINIA
Schedule of Employer's Share of Net OPEB Liability
Virginia Local Disability Program - Professional Employees
Years Ended June 30
School Division
G-22

(a) (b) (c) (d) (e)
Contributions Contributions
in Relation to Contribution as a Percentage
Contractually Contractually Deficiency Employer's of Covered
Required Required (Excess) Covered Payroll
Date Contributions Contributions (a) - (b) Payroll (b) / (d)
June 30, 2021 17,919$ 17,919$ -$ 2,158,928$ 0.83%
June 30, 2020 15,907 15,907 - 2,209,330 0.72%
June 30, 2019 10,848 10,848 - 1,749,657 0.62%
June 30, 2018 8,070 8,070 - 1,344,986 0.60%
June 30, 2017 6,402 6,402 - 1,067,079 0.60%
June 30, 2016 4,505 4,505 - 750,816 0.60%
June 30, 2015 2,825 2,825 - 470,890 0.60%
June 30, 2014 461 461 - 76,841 0.60%
June 30, 2021 84,455$ 84,455$ -$ 17,969,082$ 0.47%
June 30, 2020 64,967 64,967 - 15,845,658 0.41%
June 30, 2019 51,201 51,201 - 12,487,933 0.41%
June 30, 2018 31,234 31,234 - 10,075,546 0.31%
June 30, 2017 25,458 25,458 - 8,212,334 0.31%
June 30, 2016 18,227 18,227 - 6,285,203 0.29%
June 30, 2015 9,074 9,074 - 3,129,075 0.29%
June 30, 2014 336 336 - 115,993 0.29%
School Division Professional
Schedule is intended to show information for 10 years. Since VLDP was implemented in January 2014, only
eight years of data are available. However, additional years will be included as they become available.
COUNTY OF YORK, VIRGINIA
Schedule of Employer Virginia Local Disability Program (VLDP)
For the Years Ended June 30, 2014 through 2021
School Division Nonprofessional
G-23

2021 2020 2019 2018 2017
Annual money-weighted rate of return,
net of investment expense 30.07% 3.02% 4.60% 9.46% 12.93%
Other Postemployment Benefits - Health/Dental
Schedule is intended to show information for 10 years. Since 2021 is the fifth year for this presentation, only five years of data are
available. However, additional years will be included as they become available.
County
COUNTY OF YORK, VIRGINIA
Schedule of Investment Returns
Years Ended June 30
G-24
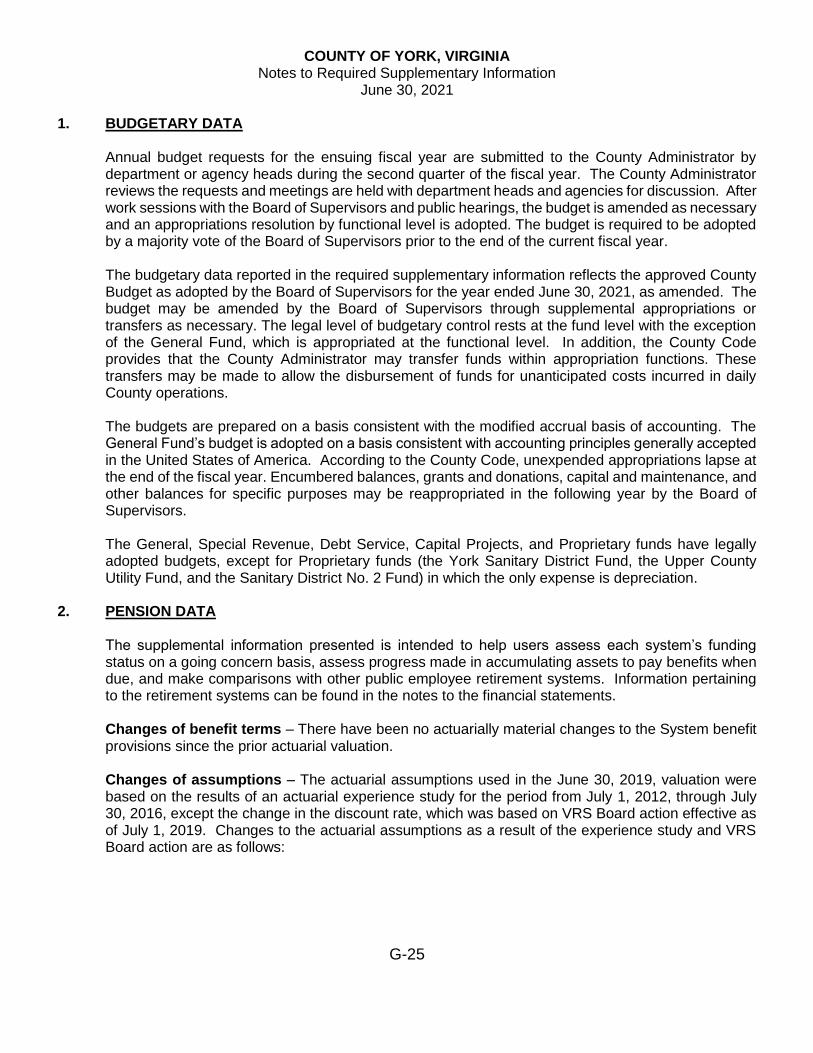
G-25
COUNTY OF YORK, VIRGINIA Notes to Required Supplementary Information
June 30, 2021 1. BUDGETARY DATA
Annual budget requests for the ensuing fiscal year are submitted to the County Administrator by department or agency heads during the second quarter of the fiscal year. The County Administrator reviews the requests and meetings are held with department heads and agencies for discussion. After work sessions with the Board of Supervisors and public hearings, the budget is amended as necessary and an appropriations resolution by functional level is adopted. The budget is required to be adopted by a majority vote of the Board of Supervisors prior to the end of the current fiscal year. The budgetary data reported in the required supplementary information reflects the approved County Budget as adopted by the Board of Supervisors for the year ended June 30, 2021, as amended. The budget may be amended by the Board of Supervisors through supplemental appropriations or transfers as necessary. The legal level of budgetary control rests at the fund level with the exception of the General Fund, which is appropriated at the functional level. In addition, the County Code provides that the County Administrator may transfer funds within appropriation functions. These transfers may be made to allow the disbursement of funds for unanticipated costs incurred in daily County operations. The budgets are prepared on a basis consistent with the modified accrual basis of accounting. The General Fund’s budget is adopted on a basis consistent with accounting principles generally accepted in the United States of America. According to the County Code, unexpended appropriations lapse at the end of the fiscal year. Encumbered balances, grants and donations, capital and maintenance, and other balances for specific purposes may be reappropriated in the following year by the Board of Supervisors. The General, Special Revenue, Debt Service, Capital Projects, and Proprietary funds have legally adopted budgets, except for Proprietary funds (the York Sanitary District Fund, the Upper County Utility Fund, and the Sanitary District No. 2 Fund) in which the only expense is depreciation.
2. PENSION DATA
The supplemental information presented is intended to help users assess each system’s funding status on a going concern basis, assess progress made in accumulating assets to pay benefits when due, and make comparisons with other public employee retirement systems. Information pertaining to the retirement systems can be found in the notes to the financial statements. Changes of benefit terms – There have been no actuarially material changes to the System benefit provisions since the prior actuarial valuation. Changes of assumptions – The actuarial assumptions used in the June 30, 2019, valuation were based on the results of an actuarial experience study for the period from July 1, 2012, through July 30, 2016, except the change in the discount rate, which was based on VRS Board action effective as of July 1, 2019. Changes to the actuarial assumptions as a result of the experience study and VRS Board action are as follows:

G-26
COUNTY OF YORK, VIRGINIA Notes to Required Supplementary Information
June 30, 2021
2. PENSION DATA (Continued)
Largest 10 – Non-Hazardous Duty:
Mortality Rates (Pre-retirement, post-retirement healthy, and disabled)
Updated to a more current mortality table – RP-2014 projected to 2020
Retirement Rates Lowered rates at older ages and changed final retirement from 70 to 75
Withdrawal Rates Adjusted rates to better fit experience at each year age and service through 9 years of service
Disability Rates Lowered rates
Salary Scale No change
Line of Duty Disability Increase rate from 14% to 20%
Discount Rate Decrease rate from 7.00% to 6.75%
All Others (Non 10 Largest) – Non-Hazardous Duty:
Mortality Rates (Pre-retirement, post-retirement healthy, and disabled)
Updated to a more current mortality table – RP-2014 projected to 2020
Retirement Rates Lowered rates at older ages and changed final retirement from 70 to 75
Withdrawal Rates Adjusted rates to better fit experience at each year age and service through 9 years of service
Disability Rates Lowered rates
Salary Scale No change
Line of Duty Disability Increase rate from 14% to 15%
Discount Rate Decrease rate from 7.00% to 6.75%
Largest 10 – Hazardous Duty:
Mortality Rates (Pre-retirement, post-retirement healthy, and disabled)
Updated to a more current mortality table – RP-2014 projected to 2020
Retirement Rates Lowered rates at older ages
Withdrawal Rates Adjusted rates to better fit experience
Disability Rates Increased rates
Salary Scale No change
Line of Duty Disability Increase rate from 60% to 70%
Discount Rate Decrease rate from 7.00% to 6.75%
All Others (Non 10 Largest) – Hazardous Duty:
Mortality Rates (Pre-retirement, post-retirement healthy, and disabled)
Updated to a more current mortality table – RP-2014 projected to 2020
Retirement Rates Increased age 50 rates, and lowered rates at older ages
Withdrawal Rates Adjusted rates to better fit experience at each year age and service through 9 years of service
Disability Rates Adjusted rates to better fit experience
Salary Scale No change
Line of Duty Disability Decrease rate from 60% to 45%
Discount Rate Decrease rate from 7.00% to 6.75%

G-27
COUNTY OF YORK, VIRGINIA Notes to Required Supplementary Information
June 30, 2021 3. OTHER POSTEMPLOYMENT BENEFITS GLI and HIC (OPEB) DATA
Changes of benefit terms – There have been no actuarially material changes to the System benefit provisions since the prior actuarial valuation. Changes of assumptions – The actuarial assumptions used in the June 30, 2019, valuation were based on the results of an actuarial experience study for the period from July 1, 2012, through July 30, 2016, except the change in the discount rate, which was based on VRS Board action effective as of July 1, 2019. Changes to the actuarial assumptions as a result of the experience study and VRS Board action are as follows:
Largest 10 – General Employees:
Mortality Rates (Pre-retirement, post-retirement healthy, and disabled)
Updated to a more current mortality table – RP-2014 projected to 2020
Retirement Rates Lowered retirement rates at older ages and extended final retirement age from 70 to 75
Withdrawal Rates Adjusted termination rates to better fit experience at each age and service year
Disability Rates Lowered disability rates
Salary Scale No change
Line of Duty Disability Increase rate from 14% to 20%
Discount Rate Decrease rate from 7.00% to 6.75%
Non-Largest – General Employees:
Mortality Rates (Pre-retirement, post-retirement healthy, and disabled)
Updated to a more current mortality table – RP-2014 projected to 2020
Retirement Rates Lowered retirement rates at older ages and extended final retirement age from 70 to 75
Withdrawal Rates Adjusted termination rates to better fit experience at each age and service year
Disability Rates Lowered disability rates
Salary Scale No change
Line of Duty Disability Increase rate from 14% to 15%
Discount Rate Decrease rate from 7.00% to 6.75%
Largest 10 – Hazardous Duty:
Mortality Rates (Pre-retirement, post-retirement healthy, and disabled)
Updated to a more current mortality table – RP-2014 projected to 2020
Retirement Rates Lowered retirement rates at older ages
Withdrawal Rates Adjusted termination rates to better fit experience at each age and service year
Disability Rates Increased disability rates
Salary Scale No change
Line of Duty Disability Increased rate from 60% to 70%
Discount Rate Decrease rate from 7.00% to 6.75%

G-28
COUNTY OF YORK, VIRGINIA Notes to Required Supplementary Information
June 30, 2021 3. OTHER POSTEMPLOYMENT BENEFITS HIC (OPEB) DATA (Continued)
Non-Largest – Hazardous Duty:
Mortality Rates (Pre-retirement, post-retirement healthy, and disabled)
Updated to a more current mortality table – RP-2014 projected to 2020
Retirement Rates Increased age 50 rates and lowered rates at older ages
Withdrawal Rates Adjusted termination rates to better fit experience at each age and service year
Disability Rates Adjusted rates to better match experience
Salary Scale No change
Line of Duty Disability Decreased rate from 60% to 45%
Discount Rate Decrease rate from 7.00% to 6.75%
4. OTHER POSTEMPLOYMENT BENEFITS (OPEB) DATA Actuarial valuations involve estimates of the value of reported amounts and assumptions about the probability of events far into the future. Actuarially determined amounts are subject to continual revision as actual results are compared to past expectations and new estimates are made about the future. The required schedule of funding progress presents multi-year trend information about whether the actuarial value of the plan assets is increasing or decreasing over time relative to the actuarial accrued liability for benefits. Information pertaining to the OPEB plans can be found in the notes to the financial statements. The County and School Division pre-fund benefits through contributions to the trust. The current funding policy is to contribute the Actuarially Determined Contribution as calculated by the actuary with exceptions if there is a contribution excess. The Actuarially Determined Contribution is the sum of the current year’s normal cost plus an amount necessary to amortize the unfunded liability over a closed period. The following methods and assumptions were used to calculate the Actuarially Determined Contribution for the fiscal year ending June 30, 2021.
Actuarial cost method: Projected Unit Credit Amortization method: Layered approach, with each new base amortized over a closed
30-year period as a level percentage of payroll Asset valuation method: Market value
Inflation: 2.5 percent
Payroll growth: 3.0 percent
Discount rate: 6.5 percent

G-29
COUNTY OF YORK, VIRGINIA Notes to Required Supplementary Information
June 30, 2021 4. OTHER POSTEMPLOYMENT BENEFITS (OPEB) DATA (Continued)
Medical cost trend: Pre-65 is 6.10% for fiscal 2021, 5.30% for fiscal 2022, and then
grading to an ultimate rate of 4.00% for fiscal 2074 Post-65 is 5.00% for fiscal 2021 and fiscal 2022, and then grading to an ultimate rate of 4.00% for fiscal 2074
Dental cost trend: 4.00% annual increase for fiscal 2021 and each fiscal year
thereafter

G-30
THIS PAGE LEFT BLANK INTENTIONALLY

H-1
NONMAJOR GOVERNMENTAL FUNDS
Special Revenue Funds:
Revenue Stabilization Fund – accounts for local funds equal to the excess of Federal Impact Aid receipts returned by the School Division at the close of any fiscal year. When applicable, expenditures reflect funds transferred to the School Division for school capital projects, which are typically repaid with future receipts. Children and Family Services Fund - accounts for the receipt and disbursement of federal and local funds for the Head Start and USDA Food Service Programs. Virginia Public Assistance Fund - accounts for the rendering of economic aid to qualifying citizens. Law Library Fund - accounts for the receipt and disbursement of funds for the Law Library. Community Development Authority Revenue Account Fund - accounts for the incremental tax revenues generated by the Marquis Lifestyle Center and paid to the Authority’s trustee and for the payment to the County for services provided to the facilities in the project area. Grants and Donations Fund - accounts for various grant-funded programs which include non-recurring grants as well as grants that cross multiple years and non-permanent personnel grants.
Debt Service Funds:
County Fund - accounts for the receipt and payment of bonds and loans issued for the construction and maintenance of County facilities and equipment. Education Fund - accounts for the receipt and payment of bonds and loans issued for the construction and maintenance of educational facilities and equipment. This fund is a major governmental fund; however, it is shown here for budgetary comparison purposes.
Capital Project Funds:
Stormwater Fund - accounts for revenue and expenditures related to the drainage maintenance projects. Yorktown Capital Improvements Fund - accounts for revenue and expenditures related to capital improvements in the historical Yorktown area. This fund is a major governmental fund; however, it is shown here for budgetary comparison purposes. County Capital Fund - accounts for revenue and expenditures related to construction or acquisition of facilities and equipment in the general governmental areas such as facilities maintenance, public safety, and parks and recreation. This fund is a major governmental fund; however, it is shown here for budgetary comparison purposes.
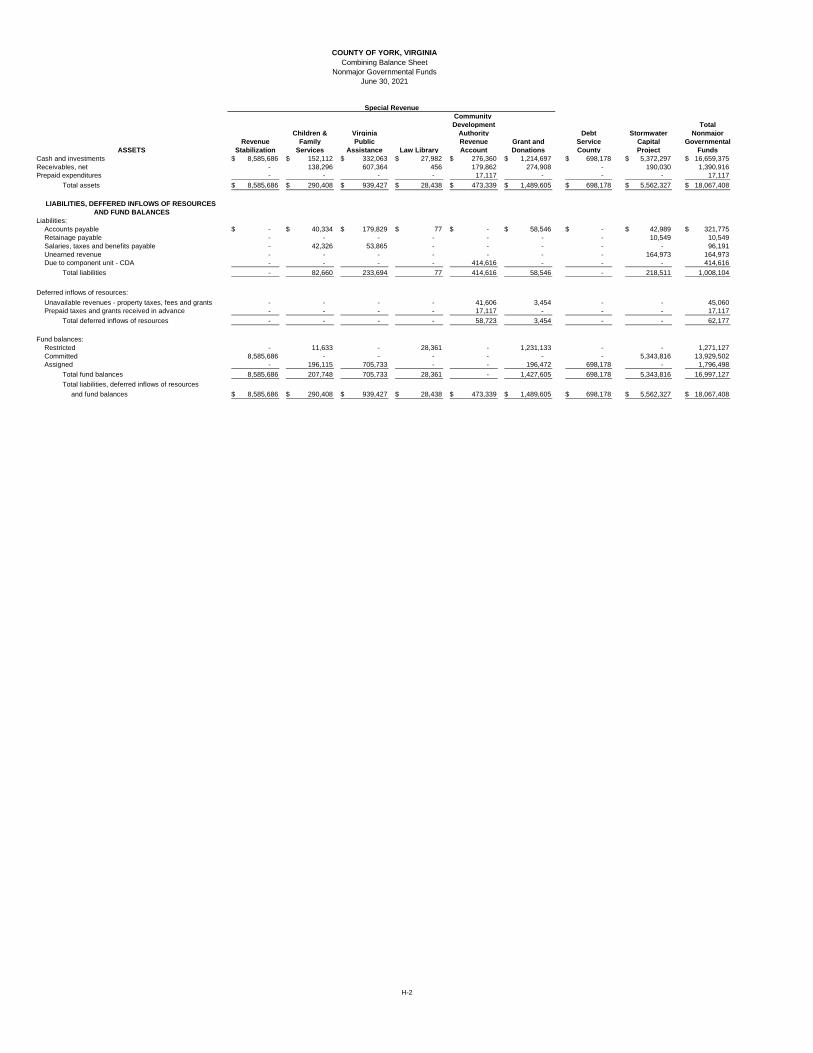
Community
Development Total
Children & Virginia Authority Debt Stormwater Nonmajor
Revenue Family Public Revenue Grant and Service Capital Governmental
Stabilization Services Assistance Law Library Account Donations County Project Funds
Cash and investments 8,585,686$ 152,112$ 332,063$ 27,982$ 276,360$ 1,214,697$ 698,178$ 5,372,297$ 16,659,375$
Receivables, net - 138,296 607,364 456 179,862 274,908 - 190,030 1,390,916
Prepaid expenditures - - - - 17,117 - - - 17,117
Total assets 8,585,686$ 290,408$ 939,427$ 28,438$ 473,339$ 1,489,605$ 698,178$ 5,562,327$ 18,067,408$
Liabilities:
Accounts payable -$ 40,334$ 179,829$ 77$ -$ 58,546$ -$ 42,989$ 321,775$
Retainage payable - - - - - - - 10,549 10,549
Salaries, taxes and benefits payable - 42,326 53,865 - - - - - 96,191
Unearned revenue - - - - - - - 164,973 164,973
Due to component unit - CDA - - - - 414,616 - - - 414,616
Total liabilities - 82,660 233,694 77 414,616 58,546 - 218,511 1,008,104
Deferred inflows of resources:
Unavailable revenues - property taxes, fees and grants - - - - 41,606 3,454 - - 45,060
Prepaid taxes and grants received in advance - - - - 17,117 - - - 17,117
Total deferred inflows of resources - - - - 58,723 3,454 - - 62,177
Fund balances:
Restricted - 11,633 - 28,361 - 1,231,133 - - 1,271,127
Committed 8,585,686 - - - - - - 5,343,816 13,929,502
Assigned - 196,115 705,733 - - 196,472 698,178 - 1,796,498
Total fund balances 8,585,686 207,748 705,733 28,361 - 1,427,605 698,178 5,343,816 16,997,127
Total liabilities, deferred inflows of resources
and fund balances 8,585,686$ 290,408$ 939,427$ 28,438$ 473,339$ 1,489,605$ 698,178$ 5,562,327$ 18,067,408$
AND FUND BALANCES
ASSETS
LIABILITIES, DEFFERED INFLOWS OF RESOURCES
COUNTY OF YORK, VIRGINIA
Combining Balance Sheet
June 30, 2021
Nonmajor Governmental Funds
Special Revenue
H-2

Community
Development Total
Children & Virginia Authority Debt Stormwater Nonmajor
Revenue Family Public Revenue Grants and Service Capital Governmental
Stabilization Services Assistance Law Library Account Donations County Project Funds
General property taxes -$ -$ -$ -$ 337,562$ -$ -$ -$ 337,562$
Other local taxes - - - - 839,269 - - 2,187,133 3,026,402
Intergovernmental:
Federal - 1,267,987 2,549,096 - - 498,711 - - 4,315,794
State - - 1,502,268 - - 512,338 - 756 2,015,362
Use of money and property 13,569 213 - 42 172 1,842 10 6,829 22,677
Charges for services - 4,000 450 5,981 - - - 103,898 114,329
Miscellaneous - 13,220 - - - 326,189 - - 339,409
Recovered costs - - 285,516 - - - - - 285,516
Total revenues 13,569 1,285,420 4,337,330 6,023 1,177,003 1,339,080 10 2,298,616 10,457,051
Current:
Judicial services - - - 3,098 - 16,126 - - 19,224
Public Safety - - - - - 619,712 - - 619,712
Education - - - - - 5,151 - - 5,151
Human services - 1,618,080 6,299,866 - - - - - 7,917,946
Community development - - - - - 1,562 - - 1,562
Community services - - - - - 368,618 - - 368,618
Nondepartmental - - - - 1,005,897 - - - 1,005,897
Capital outlay - - - - - - - 714,550 714,550
Debt service:
Principal retirement - - - - - - 3,049,090 - 3,049,090
Interest and fiscal charges - - - - - - 1,006,187 - 1,006,187
Total expenditures - 1,618,080 6,299,866 3,098 1,005,897 1,011,169 4,055,277 714,550 14,707,937
Excess (deficiency) of revenues over
(under) expenditures 13,569 (332,660) (1,962,536) 2,925 171,106 327,911 (4,055,267) 1,584,066 (4,250,886)
OTHER FINANCING SOURCES (USES)
Transfers in - 340,000 2,253,009 - - 10,000 3,753,445 - 6,356,454
Transfers out - - - - (171,106) - - - (171,106)
Total other financing sources (uses),net - 340,000 2,253,009 - (171,106) 10,000 3,753,445 - 6,185,348
Net change in fund balances 13,569 7,340 290,473 2,925 - 337,911 (301,822) 1,584,066 1,934,462
Fund balances, beginning of year 8,572,117 200,408 415,260 25,436 - 1,089,694 1,000,000 3,759,750 15,062,665
Fund balances, end of year 8,585,686$ 207,748$ 705,733$ 28,361$ -$ 1,427,605$ 698,178$ 5,343,816$ 16,997,127$
REVENUES
EXPENDITURES
COUNTY OF YORK, VIRGINIA
Combining Statement of Revenues, Expenditures and Changes in Fund Balances
For the Year Ended June 30, 2021
Nonmajor Governmental Funds
Special Revenue
H-3

Variance with Variance with
Final Budget Final Budget
Original Final Positive Original Final Positive
REVENUES Budget Budget Actual (Negative) Budget Budget Actual (Negative)
Intergovernmental:
Federal -$ -$ -$ -$ 1,214,362$ 1,492,386$ 1,267,987$ (224,399)$
Use of money and property - - 13,569 13,569 1,800 1,800 213 (1,587)
Charges for services - - - - 21,450 21,450 4,000 (17,450)
Miscellaneous - - - - 2,400 13,220 13,220 -
Total revenues - - 13,569 13,569 1,240,012 1,528,856 1,285,420 (243,436)
EXPENDITURES
Current:
Human services - - - - 1,635,436 1,924,280 1,618,080 306,200
Total expenditures - - - - 1,635,436 1,924,280 1,618,080 306,200
Excess (deficiency) of revenues
over (under) expenditures - - 13,569 13,569 (395,424) (395,424) (332,660) 62,764
OTHER FINANCING SOURCES
Transfers in - - - - 340,000 340,000 340,000 -
Total other financing sources - - - - 340,000 340,000 340,000 -
Net change in fund balances - - 13,569 13,569 (55,424) (55,424) 7,340 62,764
Fund balances, beginning of year - - 8,572,117 8,572,117 55,424 55,424 200,408 144,984
Fund balances, end of year -$ -$ 8,585,686$ 8,585,686$ -$ -$ 207,748$ 207,748$
Variance with Variance with
Final Budget Final Budget
Original Final Positive Original Final Positive
REVENUES Budget Budget Actual (Negative) Budget Budget Actual (Negative)
Intergovernmental:
Federal 2,502,128$ 2,502,128$ 2,549,096$ 46,968$ -$ -$ -$ -$
State 1,748,699 1,748,699 1,502,268 (246,431) - - - -
Use of money and property - - - - 150 150 42 (108)
Charges for services - - 450 450 9,000 9,000 5,981 (3,019)
Miscellaneous - - - - - - - -
Recovered costs 304,000 304,000 285,516 (18,484) - - - -
Total revenues 4,554,827 4,554,827 4,337,330 (217,497) 9,150 9,150 6,023 (3,127)
EXPENDITURES
Current:
Judicial services - - - - 6,000 6,000 3,098 2,902
Human services 6,926,872 6,926,872 6,299,866 627,006 - - - -
Total expenditures 6,926,872 6,926,872 6,299,866 627,006 6,000 6,000 3,098 2,902
Excess (deficiency) of revenues
over (under) expenditures (2,372,045) (2,372,045) (1,962,536) 409,509 3,150 3,150 2,925 (225)
OTHER FINANCING SOURCES
Transfers in 2,372,045 2,372,045 2,253,009 (119,036) - - - -
Total other financing sources 2,372,045 2,372,045 2,253,009 (119,036) - - - -
Net change in fund balances - - 290,473 290,473 3,150 3,150 2,925 (225)
Fund balances, beginning of year - - 415,260 415,260 (3,150) (3,150) 25,436 28,586
Fund balances, end of year -$ -$ 705,733$ 705,733$ -$ -$ 28,361$ 28,361$
Children and Family Services
Virginia Public Assistance Law Library
COUNTY OF YORK, VIRGINIA
Budgetary Comparison Schedule
Nonmajor Special Revenue Funds
For the Year Ended June 30, 2021
Revenue Stabilization
H-4

Variance with Variance with
Final Budget Final Budget
Original Final Positive Original Final Positive
REVENUES Budget Budget Actual (Negative) Budget Budget Actual (Negative)
General property taxes 302,923$ 302,923$ 337,562$ 34,639$ -$ -$ -$ -$
Other local taxes 736,450 736,450 839,269 102,819 - - - -
Intergovernmental
Federal - - - - 310,370 1,973,902 498,711 (1,475,191)
State - - - - 402,460 513,020 512,338 (682)
Use of money and property - - 172 172 - - 1,842 1,842
Miscellaneous - - - - - 326,189 326,189 -
Total revenues 1,039,373 1,039,373 1,177,003 137,630 712,830 2,813,111 1,339,080 (1,474,031)
EXPENDITURES
Current:
Judicial services - - - - 57,248 76,230 16,126 60,104
Public Safety - - - - 1,347,761 2,298,307 619,712 1,678,595
Education - - - - 5,958 11,741 5,151 6,590
Public Works - - - - - 2,428 - 2,428
Community development - - - - - 2,000 1,562 438
Community services - - - - 253,939 1,329,086 368,618 960,468
Nondepartmental 868,267 868,267 1,005,897 (137,630) 80,916 200,369 - 200,369
Total expenditures 868,267 868,267 1,005,897 (137,630) 1,745,822 3,920,161 1,011,169 2,908,992
Excess (deficiency) of revenues
over (under) expenditures 171,106 171,106 171,106 - (1,032,992) (1,107,050) 327,911 1,434,961
OTHER FINANCING SOURCES (USES)
Transfers in - - - - - 10,000 10,000 -
Transfers out (171,106) (171,106) (171,106) - - - - -
Total other financing sources (uses), net (171,106) (171,106) (171,106) - - 10,000 10,000 -
Net change in fund balances - - - - (1,032,992) (1,097,050) 337,911 1,434,961
Fund balances, beginning of year - - - - 1,032,992 1,097,050 1,089,694 (7,356)
Fund balances, end of year -$ -$ -$ -$ -$ -$ 1,427,605$ 1,427,605$
Variance with
Final Budget
Original Final Positive
REVENUES Budget Budget Actual (Negative)
General property taxes 302,923$ 302,923$ 337,562$ 34,639$
Other local taxes 736,450 736,450 839,269 102,819
Intergovernmental
Federal 4,026,860 5,968,416 4,315,794 (1,652,622)
State 2,151,159 2,261,719 2,014,606 (247,113)
Use of money and property 1,950 1,950 15,838 13,888
Charges for services 30,450 30,450 10,431 (20,019)
Miscellaneous 2,400 339,409 339,409 -
Recovered costs 304,000 304,000 285,516 (18,484)
Total revenues 7,556,192 9,945,317 8,158,425 (1,786,892)
EXPENDITURES
Current:
Judicial services 63,248 82,230 19,224 63,006
Public Safety 1,347,761 2,298,307 619,712 1,678,595
Education 5,958 11,741 5,151 6,590
Human services 8,562,308 8,853,580 7,917,946 935,634
Community development - 2,000 1,562 438
Community services 253,939 1,329,086 368,618 960,468
Nondepartmental 949,183 1,068,636 1,005,897 62,739
Total expenditures 11,182,397 13,645,580 9,938,110 3,707,470
Excess (deficiency) of revenues
over (under) expenditures (3,626,205) (3,700,263) (1,779,685) 1,920,578
OTHER FINANCING SOURCES (USES)
Transfers in 2,712,045 2,722,045 2,603,009 (119,036)
Transfers out (171,106) (171,106) (171,106) -
Total other financing sources, net 2,540,939 2,550,939 2,431,903 (119,036)
Net change in fund balances (1,085,266) (1,149,324) 652,218 1,801,542
Fund balances, beginning of year 1,085,266 1,149,324 10,302,915 9,153,591
Fund balances, end of year -$ -$ 10,955,133$ 10,955,133$
Total
Community Development Authority Revenue Account Grants and Donations
COUNTY OF YORK, VIRGINIA
Budgetary Comparison Schedule
Nonmajor Special Revenue Funds
For the Year Ended June 30, 2021
H-5

Variance with Variance with
Final Budget Final Budget
Original Final Positive Original Final Positive
Budget Budget Actual (Negative) Budget Budget Actual (Negative)
REVENUE
Intergovernmental - Federal -$ -$ -$ -$ 59,472$ 59,472$ 56,082$ (3,390)$
Intergovernmental - State - - - - 170,698 170,698 170,696 (2)
Use of money and property - - 10 10 - - - -
Recovered costs - - - - 105,119 105,119 105,220 101
Total revenues - - 10 10 335,289 335,289 331,998 (3,291)
EXPENDITURES
Education - - - - 12,740,500 12,740,500 9,728,904 3,011,596
Debt service:
Principal retirement 3,631,226 3,631,227 3,049,090 582,137 4,705,000 4,705,000 4,705,000 -
Interest and fiscal charges 1,049,478 1,049,477 1,006,187 43,290 2,976,455 2,976,455 2,882,277 94,178
Costs of issuance - - - - 160,000 160,000 75,918 84,082
Total expenditures 4,680,704 4,680,704 4,055,277 625,427 20,581,955 20,581,955 17,392,099 3,189,856
Excess (deficiency) of revenues
over (under) expenditures (4,680,704) (4,680,704) (4,055,267) 625,437 (20,246,666) (20,246,666) (17,060,101) 3,186,565
OTHER FINANCING SOURCES (USES)
Transfers in 3,253,445 3,753,445 3,753,445 - 7,506,166 7,506,166 7,506,166 -
Issuance of debt, net - - - - 12,740,500 12,740,500 8,580,000 (4,160,500)
Premium on bonds issued - - - - - - 1,209,822 1,209,822
Total other financing sources and uses, net 3,253,445 3,753,445 3,753,445 - 20,246,666 20,246,666 17,295,988 (2,950,678)
Net change in fund balances (1,427,259) (927,259) (301,822) 625,437 - - 235,887 235,887
Fund balances, beginning of year 1,427,259 927,259 1,000,000 72,741 - - 120,787 120,787
Fund balances, end of year -$ -$ 698,178$ 698,178$ -$ -$ 356,674$ 356,674$
Variance with
Final Budget
Original Final Positive
Budget Budget Actual (Negative)
REVENUE
Intergovernmental - Federal 59,472$ 59,472$ 56,082$ (3,390)$
Intergovernmental - State 170,698 170,698 170,696 (2)
Use of money and property - - 10 10
Recovered costs 105,119 105,119 105,220 101
Total revenues 335,289 335,289 332,008 (3,281)
EXPENDITURES
Education 12,740,500 12,740,500 9,728,904 3,011,596
Debt service:
Principal retirement 8,336,226 8,336,227 7,754,090 582,137
Interest and fiscal charges 4,025,933 4,025,932 3,888,464 137,468
Costs of issuance 160,000 160,000 75,918 84,082
Total expenditures 25,262,659 25,262,659 21,447,376 3,815,283
Excess (deficiency) of revenues
over (under) expenditures (24,927,370) (24,927,370) (21,115,368) 3,812,002
OTHER FINANCING SOURCES (USES)
Transfers in 10,759,611 11,259,611 11,259,611 -
Issuance of debt, net 12,740,500 12,740,500 8,580,000 (4,160,500)
Premium on bonds issued - - 1,209,822 1,209,822
Total other financing sources, net 23,500,111 24,000,111 21,049,433 (2,950,678)
Net change in fund balances (1,427,259) (927,259) (65,935) 861,324
Fund balances, beginning of year 1,427,259 927,259 1,120,787 193,528
Fund balances, end of year -$ -$ 1,054,852$ 1,054,852$
Total
County Education
COUNTY OF YORK, VIRGINIA
Budgetary Comparison Schedule
Debt Service Funds
For the Year Ended June 30, 2021
H-6

Variance with Variance with
Final Budget Final Budget
Original Final Positive Original Final Positive
REVENUES Budget Budget Actual (Negative) Budget Budget Actual (Negative)
Intergovernmental:
State 300,000$ 300,000$ 756$ (299,244)$ -$ -$ -$ -$
Other local taxes 1,857,000 1,857,000 2,187,133 330,133 - - - -
Use of money and property - - 6,829 6,829 - - 7,024 7,024
Charges for services 28,000 115,698 103,898 (11,800) - - - -
Total revenues 2,185,000 2,272,698 2,298,616 25,918 - - 7,024 7,024
EXPENDITURES
Capital outlay 4,500,194 4,587,891 714,550 3,873,341 - - - -
Total expenditures 4,500,194 4,587,891 714,550 3,873,341 - - - -
Excess (deficiency) of revenues
over (under) expenditures (2,315,194) (2,315,193) 1,584,066 3,899,259 - - 7,024 7,024
Net change in fund balances (2,315,194) (2,315,193) 1,584,066 3,899,259 - - 7,024 7,024
Fund balances (deficit), beginning of year 2,315,194 2,315,193 3,759,750 1,444,557 - - (3,516,318) (3,516,318)
Fund balances (deficit), end of year -$ -$ 5,343,816$ 5,343,816$ -$ -$ (3,509,294)$ (3,509,294)$
Variance with Variance with
Final Budget Final Budget
Original Final Positive Original Final Positive
REVENUES Budget Budget Actual (Negative) Budget Budget Actual (Negative)
Intergovernmental:
Federal 536,534$ 536,534$ 25,852$ (510,682)$ 536,534$ 536,534$ 25,852$ (510,682)$
State 1,086,151 1,086,151 215,917 (870,234) 1,386,151 1,386,151 216,673 (1,169,478)
Other local taxes - - - - 1,857,000 1,857,000 2,187,133 330,133
Use of money and property - - 38,717 38,717 - - 52,570 52,570
Charges for services - - - - 28,000 115,698 103,898 (11,800)
Recovered costs 45,000 45,000 87,586 42,586 45,000 45,000 87,586 42,586
Total revenues 1,667,685 1,667,685 368,072 (1,299,613) 3,852,685 3,940,383 2,673,712 (1,266,671)
EXPENDITURES
Capital outlay 32,055,412 35,069,606 4,127,680 30,941,926 36,555,606 39,657,497 4,842,230 34,815,267
Total expenditures 32,055,412 35,069,606 4,127,680 30,941,926 36,555,606 39,657,497 4,842,230 34,815,267
Excess (deficiency) of revenues
over (under) expenditures (30,387,727) (33,401,921) (3,759,608) 29,642,313 (32,702,921) (35,717,114) (2,168,518) 33,548,596
OTHER FINANCING SOURCES
Insurance recovery - 265,500 265,500 - - 265,500 265,500 -
Transfers in 1,000,000 3,748,694 3,748,694 - 1,000,000 3,748,694 3,748,694 -
Issuance of debt 5,300,000 5,300,000 - (5,300,000) 5,300,000 5,300,000 - (5,300,000)
Capital lease - - 336,000 336,000 - - 336,000 336,000
Total other financing sources, net 6,300,000 9,314,194 4,350,194 (4,964,000) 6,300,000 9,314,194 4,350,194 (4,964,000)
Net change in fund balances (24,087,727) (24,087,727) 590,586 24,678,313 (26,402,921) (26,402,920) 2,181,676 28,584,596
Fund balances (deficit), beginning of year 24,087,727 24,087,727 24,132,727 45,000 26,402,921 26,402,920 24,376,159 (2,026,761)
Fund balances (deficit), end of year -$ -$ 24,723,313$ 24,723,313$ -$ -$ 26,557,835$ 26,557,835$
Stormwater Fund
County Capital Total
Yorktown Capital Improvements
COUNTY OF YORK, VIRGINIA
Budgetary Comparison Schedule
Capital Project Funds
For the Year Ended June 30, 2021
H-7

H-8
THIS PAGE LEFT BLANK INTENTIONALLY

I-1
NONMAJOR ENTERPRISE FUNDS
Yorktown Operations Fund - accounts for the operations at the Yorktown waterfront.
York Sanitary District Fund - accounts for the capital assets as of January 1, 1992 of the Sanitary District No. 1 utility systems.
Upper County Utility Fund - accounts for the capital assets as of January 1, 1992 of the upper County utility systems.
Solid Waste Fund - accounts for the operations of the County’s solid waste disposal system.
Water Utility Fund - accounts for the operations of the County’s water utility systems.
Sanitary District No. 2 Fund - accounts for the capital assets as of January 1, 1992 of the Sanitary District No. 2 utility systems.
Regional Radio System Fund - accounts for the County’s joint emergency communication system with James City County and Gloucester County.

York
Yorktown Sanitary Upper County Solid Water Sanitary Regional
Operations District Utility Waste Utility District No. 2 Radio System Total
Current assets:
Cash and investments 158,605$ 322$ -$ 1,197,254$ 287,025$ -$ 1,026,709$ 2,669,915$
Receivables, net 16,321 - - 925,531 30,300 - 670,033 1,642,185
Due from component unit - EDA 51,484 - - - - - - 51,484
Prepaid expenses - - - 2,545 15,675 - - 18,220
Total current assets 226,410 322 - 2,125,330 333,000 - 1,696,742 4,381,804
Noncurrent assets:
Nondepreciable capital assets:
Land 2,707,736 37,916 33,994 413,902 - 251,854 - 3,445,402
Easements - - - - 10,945 - - 10,945
Depreciable capital assets:
Buildings - 783,982 - 1,550,467 - 2,699,159 - 5,033,608
Building improvements - - - 295,438 - - - 295,438
Infrastructure - 2,254,362 767,391 163,209 281,553 19,956,345 - 23,422,860
Equipment - 446,216 - 807,944 - 453,831 2,919,301 4,627,292
Vehicles - - - 1,399,615 - - - 1,399,615
Less accumulated depreciation - (2,995,578) (593,596) (3,260,667) (88,372) (19,416,437) (729,825) (27,084,475)
Total noncurrent assets 2,707,736 526,898 207,789 1,369,908 204,126 3,944,752 2,189,476 11,150,685
Deferred outflows related to OPEB costs 12,853 - - 161,811 - - - 174,664
Deferred outflows related to pension costs 9,874 - - 268,256 - - - 278,130
Total deferred outflows of resources 22,727 - - 430,067 - - - 452,794
Total assets and deferred outflows
of resources 2,956,873$ 527,220$ 207,789$ 3,925,305$ 537,126$ 3,944,752$ 3,886,218$ 15,985,283$
Current liabilities:
Accounts payable 3,714$ -$ -$ 376,158$ 31$ -$ 1,319$ 381,222$
Deposits payable - - - 12,000 - - - 12,000
Salaries, taxes and benefits payable 4,493 - - 35,169 - - - 39,662
Unearned revenue 13 - - 21,737 45,340 - - 67,090
Compensated absences - current - - - 2,500 - - - 2,500
Total current liabilities 8,220 - - 447,564 45,371 - 1,319 502,474
Noncurrent liabilities:
Compensated absences - net current - - - 76,143 - - - 76,143
Net OPEB liability 8,261 - - 135,089 - - - 143,350
Net pension liability 23,890 - - 645,018 - - - 668,908
Advance from other fund 2,350,000 - - - - - - 2,350,000
Total noncurrent liabilities 2,382,151 - - 856,250 - - - 3,238,401
Total liabilities 2,390,371 - - 1,303,814 45,371 - 1,319 3,740,875
DEFERRED INFLOWS OF RESOURCES
Deferred inflows related to OPEB costs 12,313 - - 147,992 - - - 160,305
Total deferred inflows of resources 12,313 - - 147,992 - - - 160,305
Net investment in capital assets 2,707,736 526,898 207,789 1,369,909 204,126 3,944,752 2,189,476 11,150,686
Unrestricted (2,153,547) 322 - 1,103,590 287,629 - 1,695,423 933,417
Total net position 554,189 527,220 207,789 2,473,499 491,755 3,944,752 3,884,899 12,084,103
Total liabilities and net position 2,956,873$ 527,220$ 207,789$ 3,925,305$ 537,126$ 3,944,752$ 3,886,218$ 15,985,283$
NET POSITION
ASSETS
LIABILITIES
COUNTY OF YORK, VIRGINIA
Combining Statement of Net Position
June 30, 2021
Nonmajor Enterprise Funds
DEFERRED OUTFLOWS OF RESOURCES
I-2

York
Yorktown Sanitary Upper County Solid Water Sanitary Regional
Operations District Utility Waste Utility District No. 2 Radio System Total
Operating Revenues
Use of property 121,910$ -$ -$ 144,000$ -$ -$ 3,398,927$ 3,664,837$
Charges for services 61,803 - - 5,767,272 310,542 - - 6,139,617
Miscellaneous - - - 8,333 - - - 8,333
Total operating revenues 183,713 - - 5,919,605 310,542 - 3,398,927 9,812,787
Operating Expenses
Personal services 77,185 - - 1,158,938 - - (35,623) 1,200,500
Contractual services 75,757 - - 4,623,662 17,205 - 3,780,946 8,497,570
Materials and supplies 4,375 - - 115,837 301,600 - 31,011 452,823
Depreciation - 31,733 15,741 157,509 5,586 370,660 291,930 873,159
Total operating expenses 157,317 31,733 15,741 6,055,946 324,391 370,660 4,068,264 11,024,052
Operating income (loss) 26,396 (31,733) (15,741) (136,341) (13,849) (370,660) (669,337) (1,211,265)
Nonoperating Revenues
Other local taxes - - - - 62,490 - - 62,490
Grant income - - - 11,695 - - - 11,695
Interest income 277 - - 1,808 404 - 492 2,981
Gain on disposal of capital assets - - - 23,769 - - - 23,769
Total nonoperating revenues 277 - - 37,272 62,894 - 492 100,935
Income before transfers 26,673 (31,733) (15,741) (99,069) 49,045 (370,660) (668,845) (1,110,330)
Capital Contributions - - - 4,879 - - - 4,879
Transfers In - 10 - - - - 1,045,730 1,045,740
Change in net position 26,673 (31,723) (15,741) (94,190) 49,045 (370,660) 376,885 (59,711)
Total net position, beginning of year 527,516 558,943 223,530 2,567,689 442,710 4,315,412 3,508,014 12,143,814
Total net position, end of year 554,189$ 527,220$ 207,789$ 2,473,499$ 491,755$ 3,944,752$ 3,884,899$ 12,084,103$
COUNTY OF YORK, VIRGINIA
Combining Statement of Revenues, Expenses and Changes in Fund Net Position
For the Year Ended June 30, 2021
Nonmajor Enterprise Funds
I-3

York
Yorktown Sanitary Upper County Solid Water Sanitary Regional
Operations District Utility Waste Utility District No. 2 Radio System Total
CASH FLOWS FROM OPERATING ACTIVITIES
Receipts from customers and users 129,258$ -$ -$ 5,860,071$ 326,372$ -$ 2,827,593$ 9,143,294$
Other receipts - - - 8,333 - - - 8,333
Payments to suppliers for goods and services (80,797) - - (4,797,061) (318,774) - (3,846,427) (9,043,059)
Payments to employees for services (71,760) - - (1,064,913) - - (1,030) (1,137,703)
Payments for interfund activity (50,000) - - - - - - (50,000)
Net cash provided by (used in) operating activities (73,299) - - 6,430 7,598 - (1,019,864) (1,079,135)
CASH FLOWS FROM NONCAPITAL FINANCING ACTIVITIES
Grant income - - - 11,695 - - - 11,695
Transfers in - 10 - - - - 1,045,730 1,045,740
Net cash provided by noncapital financing activities - 10 - 11,695 - - 1,045,730 1,057,435
CASH FLOWS FROM CAPITAL AND RELATED FINANCING ACTIVITIES
Net proceeds from the disposal of capital assets - - - 38,500 - - - 38,500
Other receipts - - - - 62,490 - - 62,490
Net cash provided by capital and related financing activities - - - 38,500 62,490 - - 100,990
CASH FLOWS FROM INVESTING ACTIVITIES
Interest income 277 - - 1,808 404 - 492 2,981
Net cash provided by investing activities 277 - - 1,808 404 - 492 2,981
Net increase (decrease) in cash and cash equivalents (73,022) 10 - 58,433 70,492 - 26,358 82,271
Cash and cash equivalents, beginning of year 231,627 312 - 1,138,821 216,533 - 1,000,351 2,587,644
Cash and cash equivalents, end of year 158,605$ 322$ -$ 1,197,254$ 287,025$ -$ 1,026,709$ 2,669,915$
Reconciliation of cash and cash equivalents
to the Statement of Net Position:
Cash and investments 158,605$ 322$ -$ 1,197,254$ 287,025$ -$ 1,026,709$ 2,669,915$
Cash and cash equivalents, end of year 158,605$ 322$ -$ 1,197,254$ 287,025$ -$ 1,026,709$ 2,669,915$
Reconciliation of operating income (loss) to net
cash provided by (used in) operating activities:
Operating income (loss) 26,396$ (31,733)$ (15,741)$ (136,341)$ (13,849)$ (370,660)$ (669,337)$ (1,211,265)$
Adjustments to reconcile operating income (loss) to net
cash provided by (used in) operating activities:
Depreciation - 31,733 15,741 157,509 5,586 370,660 291,930 873,159
(Increase) decrease in:
Receivables (16,265) - - (51,322) (4,781) - (571,334) (643,702)
Prepaid expenses - - - - 14,911 - - 14,911
Due from/to component unit - EDA (38,189) - - - - - - (38,189)
Increase (decrease) in:
Accounts payable (665) - - (57,562) 31 - (34,470) (92,666)
Salaries, taxes and benefits payable 2,051 - - 2,678 - - (1,030) 3,699
Unearned revenues (1) - - 121 5,700 - - 5,820
Net OPEB liability and related outflows/inflows 284 - - (3,658) - - (5,488) (8,862)
Net pension liability and related outflows/inflows 3,090 - - 96,227 - - (30,135) 69,182
Compensated absences - - - (1,222) - - - (1,222)
Advance from other fund (50,000) - - - - - - (50,000)
Net cash provided by (used in) operating activities (73,299)$ -$ -$ 6,430$ 7,598$ -$ (1,019,864)$ (1,079,135)$
Noncash investing, capital, and financing activities:
Contributions of capital assets -$ -$ -$ 4,879$ -$ -$ -$ 4,879$
COUNTY OF YORK, VIRGINIA
Combining Statement of Cash Flows
For the Year Ended June 30, 2021
Nonmajor Enterprise Funds
I-4

J-1
INTERNAL SERVICE FUNDS
To account for the financing of goods or services provided by one department or agency to other departments or agencies of the government and to other government units, on a cost-reimbursement basis. An internal service fund may also be used to account for all or a portion of a government’s risk financing activities.
Vehicle Maintenance Fund - accounts for the operations of the vehicle maintenance and replacement services provided to County departments.
Health and Dental Insurance Fund – accounts for the claims and related expenses for health and dental benefits of County employees and retirees.
Workers’ Compensation Fund – accounts for the claims and related expenses for workers’ compensation.
Information Technology Fund – accounts for the costs of computer hardware and software, computer technical support, software support, internet and telecommunications services to county departments.

Health and
Vehicle Dental Workers' Information
Maintenance Insurance Compensation Technology
Fund Fund Fund Fund Total
Current assets:
Cash and investments 3,960,271$ 6,448,038$ 1,078,868$ 649,340$ 12,136,517$
Receivable, net 17,486 867,178 - - 884,664
Prepaid expenses - 377,000 - 39,203 416,203
Total current assets 3,977,757 7,692,216 1,078,868 688,543 13,437,384
Noncurrent assets:
Nondepreciable capital assets:
Construction in progress 236,621 - - 158,079 394,700
Depreciable capital assets:
Intangibles 130,592 - - - 130,592
Land improvements 262,573 - - - 262,573
Equipment 1,468,472 - - 227,743 1,696,215
Vehicles 7,396,145 - - - 7,396,145
Less accumulated depreciation (5,962,342) - - (67,881) (6,030,223)
Less accumulated amortization (104,420) - - - (104,420)
Total noncurrent assets 3,427,641 - - 317,941 3,745,582
Deferred outflows of resources
Deferred outflows related to OPEB costs 205,902 - 1,390 8,271 215,563
Deferred ouflows related to pension costs 290,203 - 23,302 17,888 331,393
Total deferred outflows of resources 496,105 - 24,692 26,159 546,956
Total assets 7,901,503$ 7,692,216$ 1,103,560$ 1,032,643$ 17,729,922$
Current liabilities:
Accounts payable 338,346$ 20,206$ 38,996$ 19,431$ 416,979$
Retainage payable 10,086 - - - 10,086
Salaries, taxes and benefits payable 36,179 465 2,943 3,205 42,792
Claims payable - 1,065,000 - - 1,065,000
Compensated absences - current 6,000 - - - 6,000
Total current liabilities 390,611 1,085,671 41,939 22,636 1,540,857
Noncurrent liabilities:
Compensated absences - net current 122,374 - - - 122,374
Net OPEB liability 160,437 - 5,614 7,498 173,549
Net pension liability 700,760 - 55,742 43,797 800,299
Total noncurrent liabilities 983,571 - 61,356 51,295 1,096,222
Total liabilities 1,374,182 1,085,671 103,295 73,931 2,637,079
Deferred inflows of resources
Deferred inflows related to OPEB costs 190,901 - 265 7,432 198,598
190,901 - 265 7,432 198,598
Net investment in capital assets 3,427,641 - - 317,941 3,745,582
Unrestricted 2,908,779 6,606,545 1,000,000 633,339 11,148,663
Total net position 6,336,420 6,606,545 1,000,000 951,280 14,894,245
Total liabilities and net position 7,901,503$ 7,692,216$ 1,103,560$ 1,032,643$ 17,729,922$
NET POSITION
LIABILITIES
ASSETS
COUNTY OF YORK, VIRGINIA
Combining Statement of Net Position
Internal Service Funds
June 30, 2021
J-2

Health and
Vehicle Dental Workers' Information
Maintenance Insurance Compensation Technology
Fund Fund Fund Fund Total
Operating Revenues
Charges for services 4,484,259$ 12,879,952$ -$ 1,674,139$ 19,038,350$
Miscellaneous 108,606 - 18,361 - 126,967
Total operating revenues 4,592,865 12,879,952 18,361 1,674,139 19,165,317
Operating Expenses
Personal services 1,202,582 1,098,166 82,362 96,206 2,479,316
Contractual services 564,193 13,180,764 282,413 998,612 15,025,982
Materials and supplies 1,399,669 - - 222,881 1,622,550
Depreciation 593,586 - - 39,996 633,582
Total operating expenses 3,760,030 14,278,930 364,775 1,357,695 19,761,430
Operating income (loss) 832,835 (1,398,978) (346,414) 316,444 (596,113)
Nonoperating Revenues (Expenses)
Interest income 4,765 5,083 1,195 1,977 13,020
Gain on disposal of capital assets 4,391 - - - 4,391
Total nonoperating revenues, net 9,156 5,083 1,195 1,977 17,411
Income before transfers 841,991 (1,393,895) (345,219) 318,421 (578,702)
Capital Contributions 21,853 - - - 21,853
Transfers In - 3,000,000 529,014 - 3,529,014
Change in net position 863,844 1,606,105 183,795 318,421 2,972,165
Total net position, beginning of year 5,472,576 5,000,440 816,205 632,859 11,922,080
Total net position, end of year 6,336,420$ 6,606,545$ 1,000,000$ 951,280$ 14,894,245$
COUNTY OF YORK, VIRGINIA
Combining Statement of Revenues, Expenses and Changes in Fund Net Position
For the Year Ended June 30, 2021
Internal Service Funds
J-3

Health and
Vehicle Dental Workers' Information
Maintenance Insurance Compensation Technology
Fund Fund Fund Fund Total
CASH FLOWS FROM OPERATING ACTIVITIES
Receipts from customers and users 4,489,865$ 12,026,004$ -$ 1,674,139$ 18,190,008$
Other receipts 108,606 - 18,361 - 126,967
Payments to suppliers for goods and services (1,789,567) (13,192,853) (298,466) (1,365,211) (16,646,097) Payments to employees for services (1,098,976) (1,097,701) (72,433) (60,433) (2,329,543)
Net cash provided by (used in) operating activities 1,709,928 (2,264,550) (352,538) 248,495 (658,665)
CASH FLOWS FROM NONCAPITAL FINANCING ACTIVITIES
Transfers in - 3,000,000 529,014 - 3,529,014
Net cash provided by noncapital financing activities - 3,000,000 529,014 - 3,529,014
CASH FLOWS FROM CAPITAL AND RELATED FINANCING ACTIVITIES
Acquisition and construction of capital assets (831,730) - - (181,712) (1,013,442) Net proceeds from the disposal of capital assets 42,645 - - - 42,645
Net cash used in capital and related financing activities (789,085) - - (181,712) (970,797)
CASH FLOWS FROM INVESTING ACTIVITIES
Interest income 4,765 5,083 1,195 1,977 13,020
Net cash provided by investing activities 4,765 5,083 1,195 1,977 13,020
Net increase in cash and cash equivalents 925,608 740,533 177,671 68,760 1,912,572 Cash and cash equivalents, beginning of year 3,034,663 5,707,505 901,197 580,580 10,223,945
Cash and cash equivalents, end of year 3,960,271$ 6,448,038$ 1,078,868$ 649,340$ 12,136,517$
Reconciliation of cash and cash equivalents to the Statement of Net Position:
Cash and investments 3,960,271$ 6,448,038$ 1,078,868$ 649,340$ 12,136,517$
Cash and cash equivalents, end of year 3,960,271$ 6,448,038$ 1,078,868$ 649,340$ 12,136,517$
Reconciliation of operating income (loss) to net cash
provided by (used in) operating activities:
Operating income (loss) 832,835$ (1,398,978)$ (346,414)$ 316,444$ (596,113)$
Adjustments to reconcile operating income (loss) to net cashprovided by (used in) operating activities:
Depreciation 593,586 - - 39,996 633,582
Decrease (increase) in:
Receivables 5,606 (853,948) - - (848,342)
Prepaid expenses - - - (39,203) (39,203)
Increase (decrease) in:
Accounts payable 164,209 12,811 (16,053) (104,515) 56,452
Retainage payable 10,086 - - - 10,086
Salaries, taxes and benefits payable 3,112 465 340 3,205 7,122
Claims payable - (24,900) - - (24,900)
Compensated absences (187) - - - (187)
Net OPEB liability and related outflows/inflows (7,657) - 123 6,659 (875) Net pension liability and related outflows/inflows 108,338 - 9,466 25,909 143,713
Net cash provided by (used in) operating activities 1,709,928$ (2,264,550)$ (352,538)$ 248,495$ (658,665)$
Noncash investing, capital, and financing activities:
Contributions of capital assets 21,853$ -$ -$ -$ 21,853$
COUNTY OF YORK, VIRGINIACombining Statement of Cash Flows
For the Year Ended June 30, 2021Internal Service Funds
J-4

K-1
CUSTODIAL FUNDS
Custodial funds are a type of Fiduciary Fund. Custodial funds are maintained to account for funds held by the County on behalf of individuals, private organizations or other governments, as follows:
Colonial Behavioral Health - accounts for fiscal custodial funds held for the Colonial Behavioral Health.
Colonial Group Home Commission - accounts for monies received for and expenditures made for the Commission.
Special Welfare Fund - accounts for monies received for and expenditures made on behalf of social service clients.
Regional Projects - accounts for monies received for and expenditures made on behalf of other agencies for regional projects.
Other Funds - the following funds are included in “Other Funds:”
Peninsula Public Sports Facility Authority - accounts for fiscal custodial funds held for the Peninsula Public Sports Facility Authority.
Darby-Firby Neighborhood Corporation Fund - accounts for fiscal custodial funds held for the Darby-Firby Neighborhood Corporation.

Colonial
Colonial Group
Behavioral Home Special Regional Other
Health Commission Welfare Projects Funds Total
Cash and investments 5,657,117$ 794,292$ 64,225$ -$ 12,160$ 6,527,794$
Accounts receivable (8,328) 1,412 - 22,771 - 15,855
Total assets 5,648,789 795,704 64,225 22,771 12,160 6,543,649
Accounts payable 1,235,159 5,491 - 12,327 - 1,252,977
Salaries, taxes and benefits payable 86,195 26,043 - - - 112,238
Deferred revenue 75,449 - - - - 75,449
Total liabilities 1,396,803 31,534 - 12,327 - 1,440,664
Restricted for:
Individuals, organizations and other governments 4,251,986 764,170 64,225 10,444 12,160 5,102,985
Total net position 4,251,986$ 764,170$ 64,225$ 10,444$ 12,160$ 5,102,985$
NET POSITION
ASSETS
LIABILITIES
COUNTY OF YORK, VIRGINIA
Custodial Funds
Combining Statement of Fiduciary Net Position
June 30, 2021
K-2

Colonial
Colonial Group
Behavioral Home Special Regional Other
Health Commission Welfare Projects Funds Total
Federal receipts for other agencies & individuals 1,275,134$ 339$ 17,515$ -$ -$ 1,292,988$
State receipts for other agencies & individuals 7,315,415 - - - - 7,315,415
Payments from other governments, agencies & local sources 8,726,208 1,563,787 48,377 1,145,837 - 11,484,209
Interest earned on cash balances - 1,221 - - 19 1,240
Total additions 17,316,757 1,565,347 65,892 1,145,837 19 20,093,852
Payments to other governments, agencies & individuals 16,731,961 1,343,660 57,233 1,168,645 25 19,301,524
Total deductions 16,731,961 1,343,660 57,233 1,168,645 25 19,301,524
Change in net position 584,796 221,687 8,659 (22,808) (6) 792,328
Net position, beginning, as restated 3,667,190 542,483 55,566 33,252 12,166 4,310,657
Net position, end of year 4,251,986$ 764,170$ 64,225$ 10,444$ 12,160$ 5,102,985$
COUNTY OF YORK, VIRGINIA
Combining Statement of Changes in Fiduciary Net Position
Custodial Funds
June 30, 2021
ADDITIONS
DEDUCTIONS
K-3

K-4
THIS PAGE LEFT BLANK INTENTIONALLY
L-1
STATISTICAL SECTION
This part of the County’s comprehensive annual financial report presents detailed information as a context for understanding what the information in the financial statements, note disclosures and required supplementary information says about the County’s overall financial health.
Contents:
Financial Trends (pages L-3, L-4, L-5, L-6, L-7 and L-8) These schedules contain trend information to help the reader understand how the County’s financial performance and well-being have changed over time. Revenue Capacity (pages L-9, L-10, L-11 and L-12) These schedules contain information to help the reader assess the County’s most significant local revenue source, the property tax. Debt Capacity (pages L-13 and L-14) These schedules present information to help the reader assess the affordability of the County’s current levels of outstanding debt and the County’s ability to issue additional debt in the future. Demographic and Economic Information (pages L-15 and L-16) These schedules offer demographic and economic indicators to help the reader understand how the environment within which the County’s financial activities take place. Operating Information (pages L-17, L-18 and L-19) These schedules contain service and infrastructure data to help the reader understand how the information in the County’s financial report relates to the services the County provides and the activities it performs.

L-2
THIS PAGE LEFT BLANK INTENTIONALLY
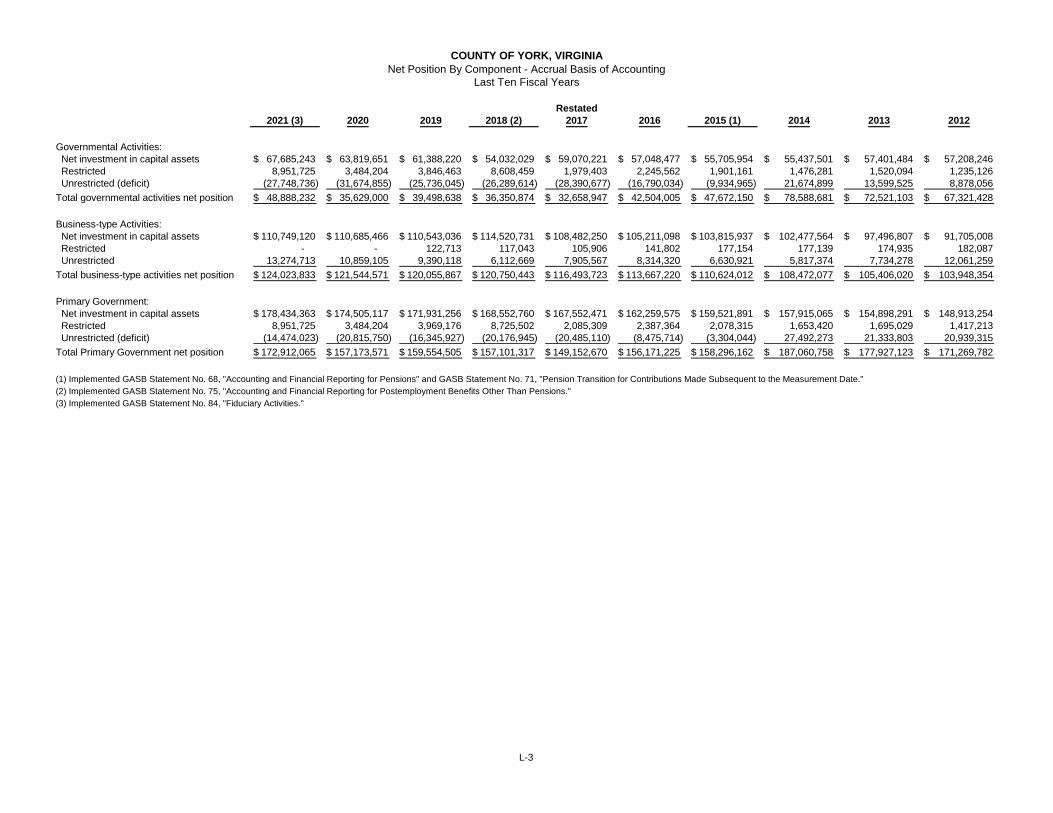
Restated
2021 (3) 2020 2019 2018 (2) 2017 2016 2015 (1) 2014 2013 2012
Governmental Activities:
Net investment in capital assets 67,685,243$ 63,819,651$ 61,388,220$ 54,032,029$ 59,070,221$ 57,048,477$ 55,705,954$ 55,437,501$ 57,401,484$ 57,208,246$
Restricted 8,951,725 3,484,204 3,846,463 8,608,459 1,979,403 2,245,562 1,901,161 1,476,281 1,520,094 1,235,126
Unrestricted (deficit) (27,748,736) (31,674,855) (25,736,045) (26,289,614) (28,390,677) (16,790,034) (9,934,965) 21,674,899 13,599,525 8,878,056
Total governmental activities net position 48,888,232$ 35,629,000$ 39,498,638$ 36,350,874$ 32,658,947$ 42,504,005$ 47,672,150$ 78,588,681$ 72,521,103$ 67,321,428$
Business-type Activities:
Net investment in capital assets 110,749,120$ 110,685,466$ 110,543,036$ 114,520,731$ 108,482,250$ 105,211,098$ 103,815,937$ 102,477,564$ 97,496,807$ 91,705,008$
Restricted - - 122,713 117,043 105,906 141,802 177,154 177,139 174,935 182,087
Unrestricted 13,274,713 10,859,105 9,390,118 6,112,669 7,905,567 8,314,320 6,630,921 5,817,374 7,734,278 12,061,259
Total business-type activities net position 124,023,833$ 121,544,571$ 120,055,867$ 120,750,443$ 116,493,723$ 113,667,220$ 110,624,012$ 108,472,077$ 105,406,020$ 103,948,354$
Primary Government:
Net investment in capital assets 178,434,363$ 174,505,117$ 171,931,256$ 168,552,760$ 167,552,471$ 162,259,575$ 159,521,891$ 157,915,065$ 154,898,291$ 148,913,254$
Restricted 8,951,725 3,484,204 3,969,176 8,725,502 2,085,309 2,387,364 2,078,315 1,653,420 1,695,029 1,417,213
Unrestricted (deficit) (14,474,023) (20,815,750) (16,345,927) (20,176,945) (20,485,110) (8,475,714) (3,304,044) 27,492,273 21,333,803 20,939,315
Total Primary Government net position 172,912,065$ 157,173,571$ 159,554,505$ 157,101,317$ 149,152,670$ 156,171,225$ 158,296,162$ 187,060,758$ 177,927,123$ 171,269,782$
(1) Implemented GASB Statement No. 68, "Accounting and Financial Reporting for Pensions" and GASB Statement No. 71, "Pension Transition for Contributions Made Subsequent to the Measurement Date."
(2) Implemented GASB Statement No. 75, "Accounting and Financial Reporting for Postemployment Benefits Other Than Pensions."
(3) Implemented GASB Statement No. 84, "Fiduciary Activities."
COUNTY OF YORK, VIRGINIA
Net Position By Component - Accrual Basis of Accounting
Last Ten Fiscal Years
L-3

2021 2020 2019 2018 2017 2016 2015 2014 2013 2012
Expenses (1)
Governmental activities:
General administration 3,753,814$ 4,468,101$ 4,195,707$ 5,589,064$ 5,713,262$ 5,281,219$ 3,408,038$ 8,717,434$ 3,469,315$ 3,852,265$
Judicial services 3,704,339 3,721,294 3,102,522 2,739,760 3,104,169 2,925,400 3,256,745 3,190,077 2,974,509 2,983,284
Public safety 42,065,399 43,575,955 37,867,220 34,764,761 33,955,855 31,455,990 31,565,116 31,994,037 31,809,187 30,651,085
Environmental and development services - - - - - - 5,921,822 4,459,304 4,392,549 5,110,799
Management services 12,923,458 11,861,804 11,029,496 11,470,801 11,381,592 9,863,547 - - - -
Finance and planning - - - - - - 9,776,644 11,071,656 9,605,982 9,246,805
Education 70,239,829 68,609,783 65,751,397 66,176,627 63,842,618 68,349,890 68,436,746 49,589,562 51,052,753 55,589,523
Human services 10,111,077 9,834,859 9,900,319 8,825,140 9,386,250 8,538,830 7,854,783 8,217,138 7,895,079 8,250,918
General services - - - - - - 6,884,634 6,707,865 6,400,928 7,185,728
Public works 10,943,599 14,572,672 11,607,674 8,543,538 9,486,304 9,918,224 - - - -
Community development 3,498,074 3,012,762 4,551,850 - - - - - - -
Community services 8,106,746 5,682,266 7,201,508 7,011,085 7,044,559 6,479,836 6,449,967 6,263,573 6,333,119 6,667,688
Interest and fiscal charges on noncurrent debt 3,577,368 3,518,196 3,422,992 3,308,747 2,454,107 3,643,143 2,735,422 3,898,226 3,974,566 4,048,324
Total governmental activities 168,923,703 168,857,692 158,630,685 148,429,523 146,368,716 146,456,079 146,289,917 134,108,872 127,907,987 133,586,419
Business-type activities:
Sewer Utility 11,992,147 12,245,651 11,582,981 10,210,063 11,036,541 10,792,409 10,705,774 10,505,293 10,086,788 10,467,392
Water Utility 324,391 326,842 4,036,161 1,751,336 443,414 332,253 339,656 349,496 1,002,427 346,275
Solid Waste 6,055,946 5,742,136 4,830,364 4,252,661 4,058,355 4,238,137 4,249,485 4,818,406 4,651,045 5,599,987
Yorktown Operations 157,317 158,295 72,335 77,918 92,828 85,983 77,434 74,718 98,893 112,258
Sanitary Districts 418,134 418,134 418,134 418,133 418,133 418,133 418,133 418,133 424,857 431,544
Regional Radio System 4,068,264 4,208,960 4,075,751 3,859,521 2,649,549 2,597,863 2,634,351 2,494,441 2,402,484 2,024,644
Total business-type activities 23,016,199 23,100,018 25,015,726 20,569,632 18,698,820 18,464,778 18,424,833 18,660,487 18,666,494 18,982,100
Total Primary Government 191,939,902$ 191,957,710$ 183,646,411$ 168,999,155$ 165,067,536$ 164,920,857$ 164,714,750$ 152,769,359$ 146,574,481$ 152,568,519$
Program Revenues
Governmental activities:
Charges for services:
General administration 250,352$ 260,592$ 179,970$ 1,030,633$ 667,530$ 734,113$ 141,697$ 121,888$ 86,198$ 77,019$
Judicial services 651,790 842,850 602,875 550,272 551,142 540,591 496,240 528,711 606,118 854,103
Public safety 3,496,404 3,726,192 3,949,345 3,490,235 3,490,578 3,361,432 3,146,553 3,212,578 2,252,219 3,408,661
Environmental and development services - - - - - - 816,746 741,235 654,373 403,657
Management services 496,213 536,482 614,300 515,776 495,514 470,186 - - - -
Finance and planning - - - - - - 447,610 449,041 447,077 411,139
Education 16,364 37,231 51,304 52,037 57,119 431,785 311,851 213,633 161,115 59,587
Human services 312,338 322,784 335,960 327,270 323,279 320,155 277,393 270,403 295,254 289,378
General services - - - - - - 1,289,908 1,257,665 1,404,091 1,181,949
Public works 1,445,206 1,339,954 1,337,489 1,305,091 1,285,384 1,308,871 - - - -
Community development 787,606 832,921 862,596 - - - - - - -
Community services 402,047 253,967 680,005 659,451 631,672 576,602 500,144 514,474 503,702 443,227
Operating grants and contributions 29,664,580 15,103,972 11,737,764 11,226,226 10,845,577 10,631,197 10,188,235 10,521,429 10,205,585 10,146,333
Capital grants and contributions 911,612 2,443,417 2,742,009 2,514,487 872,828 797,833 1,369,785 317,128 1,668,035 2,727,017
Total governmental activities 38,434,512 25,700,362 23,093,617 21,671,478 19,220,623 19,172,765 18,986,162 18,148,185 18,283,767 20,002,070
Business-type activities:
Charges for services:
Sewer Utility 11,380,626 11,215,726 11,678,458 11,194,581 10,660,740 10,788,652 11,144,763 9,924,081 8,928,385 7,938,010
Water Utility 310,542 317,101 320,586 273,009 336,448 323,387 349,594 383,138 357,728 333,534
Solid Waste 5,911,272 5,847,097 4,676,104 4,439,291 4,460,309 4,626,276 4,626,082 4,856,961 3,739,588 3,505,246
Yorktown Operations 183,713 137,906 158,467 182,898 146,991 186,905 164,106 166,197 88,725 87,353
Regional Radio System 3,398,927 2,909,049 2,965,402 2,928,359 1,726,723 1,643,514 1,901,788 1,602,377 1,501,755 1,259,130
Operating grants and contributions 90,492 292,221 293,054 291,507 290,552 291,307 289,674 295,108 300,180 1,342,550
Capital grants and contributions 2,179,427 1,144,164 1,501,760 1,719,060 1,121,944 299,948 925,950 1,371,580 1,139,604 1,063,452
Total business-type activities 23,454,999 21,863,264 21,593,831 21,028,705 18,743,707 18,159,989 19,401,957 18,599,442 16,055,965 15,529,275
Total Primary Government 61,889,511$ 47,563,626$ 44,687,448$ 42,700,183$ 37,964,330$ 37,332,754$ 38,388,119$ 36,747,627$ 34,339,732$ 35,531,345$
Net (expense)/revenue
Governmental activities (130,489,191)$ (143,157,330)$ (135,537,068)$ (126,758,045)$ (127,148,093)$ (127,283,314)$ (127,303,755)$ (115,960,687)$ (109,624,220)$ (113,584,349)$
Business-type activities 438,800 (1,236,754) (3,421,895) 459,073 44,887 (304,789) 977,124 (61,045) (2,610,529) (3,452,825)
Total Primary Government net expense (130,050,391)$ (144,394,084)$ (138,958,963)$ (126,298,972)$ (127,103,206)$ (127,588,103)$ (126,326,631)$ (116,021,732)$ (112,234,749)$ (117,037,174)$
General Revenues and Other Changes in Net Position
Governmental activities:
Taxes:
Property taxes 96,141,095$ 93,017,827$ 91,611,559$ 90,382,404$ 88,210,050$ 85,362,882$ 81,767,345$ 80,907,792$ 79,711,885$ 76,373,509$
Local sales and use taxes 17,389,034 16,525,293 14,921,971 10,266,194 10,236,341 10,146,625 9,759,880 9,475,836 9,380,393 9,425,492
Hotel and motel room taxes 3,549,512 3,793,734 5,241,150 5,142,868 5,071,633 4,994,074 4,643,484 4,323,868 4,268,312 4,221,304
Restaurant food taxes 5,338,091 4,501,921 5,258,588 4,436,519 6,387,418 6,047,842 5,818,598 5,607,884 5,550,391 5,321,843
Business license taxes 7,513,546 7,633,724 7,330,820 6,952,681 6,603,695 6,187,990 6,240,330 6,410,146 5,720,592 5,855,061
Motor vehicle licenses 1,647,098 1,602,643 1,623,247 1,624,520 1,600,973 1,591,953 1,558,331 1,582,332 1,596,403 1,523,082
Taxes on recordation and wills 2,207,395 1,777,073 1,601,992 1,796,928 1,470,205 1,477,446 1,391,389 1,545,219 1,587,812 1,604,286
Other local taxes 1,909,367 1,744,306 1,893,226 1,921,574 1,935,553 1,938,974 1,925,269 1,956,544 1,966,816 1,969,937
Personal property tax relief - Commonwealth of Virginia 8,741,680 8,741,680 8,741,680 8,760,374 8,741,680 8,741,680 8,665,120 8,741,680 8,525,325 8,485,927
Unrestricted investment earnings (19,787) 859,654 1,386,131 650,388 248,076 305,043 149,037 216,877 85,087 174,000
Miscellaneous 372,731 162,593 210,254 115,481 43,452 358,177 79,766 1,256,436 232,168 414,057
Gain (loss) on sale of capital assets 4,391 14,378 - 35,569 - 188,537 (118,576) 22,306 25,631 28,907
Transfers (1,045,730) (1,087,134) (1,135,786) (1,635,528) (3,694,516) (3,425,018) (3,346,849) (3,262,639) (3,826,920) (3,739,725)
Total governmental activities 143,748,423 139,287,692 138,684,832 130,449,972 126,854,560 123,916,205 118,533,124 118,784,281 114,823,895 111,657,680
Business-type activities:
Restaurant food taxes 937,343 1,493,198 1,446,798 2,036,878 - - - - - -
Unrestricted investment earnings 25,086 133,285 134,586 93,526 63,619 46,907 12,167 37,303 54,762 66,982
Miscellaneous 8,534 11,841 8,469 19,493 35,417 32,179 17,684 43,003 82,881 30,039
Gain on sale of capital assets 23,769 - 1,680 12,222 - 7,000 573 - 103,632 -
Transfers 1,045,730 1,087,134 1,135,786 1,635,528 3,694,516 3,425,018 3,346,849 3,262,639 3,826,920 3,739,725
Total business-type activities 2,040,462 2,725,458 2,727,319 3,797,647 3,793,552 3,511,104 3,377,273 3,342,945 4,068,195 3,836,746
Total Primary Government 145,788,885$ 142,013,150$ 141,412,151$ 134,247,619$ 130,648,112$ 127,427,309$ 121,910,397$ 122,127,226$ 118,892,090$ 115,494,426$
Change in Net Position
Governmental activities 13,259,232$ (3,869,638)$ 3,147,764$ 3,691,927$ (293,533)$ (3,367,109)$ (8,770,631)$ 2,823,594$ 5,199,675$ (1,926,669)$
Business-type activities 2,479,262 1,488,704 (694,576) 4,256,720 3,838,439 3,206,315 4,354,397 3,281,900 1,457,666 383,921
Total Primary Government 15,738,494$ (2,380,934)$ 2,453,188$ 7,948,647$ 3,544,906$ (160,794)$ (4,416,234)$ 6,105,494$ 6,657,341$ (1,542,748)$
COUNTY OF YORK, VIRGINIAChanges in Net Position - Accrual Basis of Accounting
Last Ten Fiscal Years
(1) Expenditure categories were reclassified in FY2016. "Finance and planning" became "Management services" and Environmental and development services" and "General services" were combined into "Public works" except for building regulations
and development and compliance expenditures were moved from "Environmental and development services" to "General government." In FY2019, planning and planning commission were moved from "Management services" to "Community
development." Also in FY2019, building regulations and development services were moved from "General administration" to "Community development."
L-4

2021 2020 2019 (1) 2018 2017 2016 2015 2014 2013 2012
Property tax 96,141,095$ 93,017,827$ 91,611,559$ 90,382,404$ 88,210,050$ 85,362,882$ 81,767,345$ 80,907,792$ 79,711,885$ 76,373,509$
Local sales and use tax 17,389,034 16,525,293 14,921,971 10,266,194 10,236,341 10,146,625 9,759,880 9,475,836 9,380,393 9,425,492
Hotel and motel room taxes 3,549,512 3,793,734 5,241,150 5,142,868 5,071,633 4,994,074 4,643,484 4,323,868 4,268,312 4,221,304
Restaurant food taxes 5,338,091 4,501,921 5,258,588 4,436,519 6,387,418 6,047,842 5,818,598 5,607,884 5,550,391 5,321,843
Business license taxes 7,513,546 7,633,724 7,330,820 6,952,681 6,603,695 6,187,990 6,240,330 6,410,146 5,720,592 5,855,061
Motor vehicle licenses 1,647,098 1,602,643 1,623,247 1,624,520 1,600,973 1,591,953 1,558,331 1,582,332 1,596,403 1,523,082
Taxes on recordation and wills 2,207,395 1,777,073 1,601,992 1,796,928 1,470,205 1,477,446 1,391,389 1,545,219 1,587,812 1,604,286
Other local taxes 1,909,367 1,744,306 1,893,226 1,921,574 1,935,553 1,938,974 1,925,269 1,956,544 1,966,816 1,969,937
Total 135,695,138$ 130,596,521$ 129,482,553$ 122,523,688$ 121,515,868$ 117,747,786$ 113,104,626$ 111,809,621$ 109,782,604$ 106,294,514$
(1) Beginning in fiscal year 2019, local sales and use tax includes the historic triangle sales tax as established by Senate Bill 942.
Governmental Activities Tax Revenues By Source - Accrual Basis of Accounting
COUNTY OF YORK, VIRGINIA
Last Ten Fiscal Years
L-5

2021 2020 2019 2018 2017 2016 2015 2014 2013 2012
General Fund
Nonspendable 6,396,239$ 6,452,931$ 6,518,691$ 7,191,310$ 7,787,380$ 8,750,971$ 9,743,740$ 9,808,279$ 10,518,258$ 10,578,620$
Restricted 13,104 13,872 11,645 948,861 1,069,702 1,106,571 991,058 940,152 843,439 781,934
Committed 1,252,245 1,109,003 3,327,357 11,567,875 12,479,603 12,027,362 13,315,169 12,664,460 12,520,518 12,380,970
Assigned 18,728,526 7,560,552 5,786,348 9,880,308 11,296,640 11,275,325 13,262,008 18,505,878 14,064,015 18,997,964
Unassigned 18,240,000 17,570,640 17,570,640 17,040,240 17,026,740 16,270,680 16,126,447 19,747,802 15,612,469 15,547,246
Total General Fund 44,630,114$ 32,706,998$ 33,214,681$ 46,628,594$ 49,660,065$ 49,430,909$ 53,438,422$ 61,666,571$ 53,558,699$ 58,286,734$
All Other Governmental Funds
Nonspendable -$ -$ -$ 107,390$ -$ -$ -$ -$ 138,671$ 210,976$
Restricted 8,915,607 3,434,488 3,834,818 7,659,598 909,701 1,138,991 910,103 536,129 676,655 432,829
Committed 16,118,614 16,582,668 16,071,516 7,521,642 5,396,429 6,213,357 4,052,604 5,653,220 9,937,427 851,246
Assigned 17,759,447 19,559,701 20,059,989 13,384,755 14,777,136 12,844,980 11,745,879 11,931,032 12,203,643 15,058,975
Unassigned (3,509,294) (3,516,318) (3,278,362) (3,947,179) (4,736,725) (5,638,008) (6,637,510) (6,716,787) (7,285,908) (7,308,883)
Total all other governmental funds 39,284,374$ 36,060,539$ 36,687,961$ 24,726,206$ 16,346,541$ 14,559,320$ 10,071,076$ 11,403,594$ 15,670,488$ 9,245,143$
COUNTY OF YORK, VIRGINIA
Fund Balances of Governmental Funds - Modified Accrual Basis of Accounting
Last Ten Fiscal Years*
L-6

2021 2020 2019 2018 2017 2016 2015 2014 2013 2012
Revenues
General property taxes 96,233,428$ 91,924,860$ 91,174,219$ 90,544,105$ 88,434,572$ 85,368,220$ 81,977,556$ 81,125,127$ 80,071,914$ 78,172,692$
Other local taxes 39,399,616 37,544,954 37,842,737 32,189,944 33,181,367 32,343,857 31,318,061 30,891,414 30,012,365 29,997,922
Intergovernmental 38,537,852 26,052,098 22,896,708 20,513,452 20,157,138 19,884,521 19,612,174 19,413,247 20,114,231 20,720,210
Permits, fees and licenses 968,829 999,687 1,104,298 1,037,354 680,369 779,390 882,569 818,221 659,658 468,190
Fines and forfeitures 268,429 380,930 433,857 345,783 332,090 308,039 277,108 298,754 335,974 387,560
Use of money and property 329,466 1,165,293 1,748,352 1,006,387 604,377 912,391 523,982 547,159 393,980 438,442
Charges for services 3,923,794 3,827,605 4,507,835 4,100,646 3,985,157 3,841,821 3,659,811 3,802,981 3,821,047 3,772,679
Miscellaneous 724,913 731,463 561,346 2,300,983 428,328 566,588 360,608 1,013,034 251,048 779,129
Recovered costs 2,227,790 2,205,724 2,152,453 2,133,591 2,074,403 2,547,682 2,343,291 2,732,928 2,527,853 2,378,769
Total revenues 182,614,117 164,832,614 162,421,805 154,172,245 149,877,801 146,552,509 140,955,160 140,642,865 138,188,070 137,115,593
Expenditures (2)
General administration 3,177,263 2,861,717 2,860,531 4,571,362 4,266,942 4,125,373 2,117,469 2,203,303 2,056,291 2,011,421
Judicial services 3,100,864 3,199,581 3,008,038 2,909,235 2,753,613 2,607,584 2,788,807 2,741,134 2,576,351 2,630,531
Public safety 39,099,612 36,222,021 34,948,693 33,363,370 35,979,369 30,245,518 29,524,373 29,096,722 28,296,119 27,595,816
Environmental and
development services - - - - - - 3,420,823 3,668,780 3,512,884 3,441,640
Finance and planning - - - - - - 8,687,984 9,613,082 8,305,316 7,822,399
Management services 11,081,821 9,779,528 9,619,413 10,798,169 10,180,894 8,863,808 - - - -
Education 70,098,663 68,528,167 65,763,188 66,371,103 63,460,252 68,240,885 65,747,918 49,386,779 50,780,591 55,271,680
Human services 9,535,864 9,492,564 9,892,383 9,698,743 9,166,051 8,611,086 7,958,815 7,839,768 7,663,060 7,875,456
Public works 8,980,041 8,780,738 8,677,408 8,431,491 8,541,683 8,623,135 - - - -
General services - - - - - - 6,640,288 6,323,547 6,086,730 6,747,125
Community development 2,503,557 2,534,211 4,030,153 - - - - - - -
Community services 6,429,786 5,428,488 5,818,632 5,769,126 5,572,438 5,151,517 5,089,962 4,796,824 4,758,072 5,271,976
Non-departmental 2,687,023 2,483,031 2,537,255 2,713,097 2,495,321 1,693,556 1,925,791 1,615,921 2,267,011 2,278,091
Capital outlay 4,842,230 15,313,579 11,083,627 6,128,438 4,635,455 5,988,334 6,955,577 7,784,015 4,646,213 4,091,765
Debt service:
Principal 7,796,757 6,821,895 7,091,646 8,649,276 7,143,707 5,425,023 6,882,404 7,182,911 6,550,894 6,901,861
Interest and fiscal charges 3,888,464 3,837,070 3,841,150 3,611,114 3,363,409 3,507,961 3,336,339 3,652,774 3,959,671 4,078,062
Other costs of debt issuance 75,918 98,183 45,918 153,611 63,044 180,516 25,822 188,219 - 41,814
Total expenditures 173,297,863 175,380,773 169,218,035 163,168,135 157,622,178 153,264,296 151,102,372 136,093,779 131,459,203 136,059,637
Excess (deficiency) of revenues
over (under) expenditures 9,316,254 (10,548,159) (6,796,230) (8,995,890) (7,744,377) (6,711,787) (10,147,212) 4,549,086 6,728,867 1,055,956
Other Financing Sources (Uses)
Insurance recovery 279,619 27,734 54,673 19,705 13,163 78,234 19,749 21,459 23,596 37,594
Bonds issued 8,580,000 10,185,000 7,765,000 15,405,000 11,135,000 21,950,000 21,125,000 9,865,000 - 6,925,000
Premium on bonds issued 1,209,822 491,419 879,737 1,178,493 606,063 3,312,073 974,672 827,791 - 1,047,456
Capital leases 336,000 - - - 4,736,044 - - 300,376 - -
Sale of capital and other assets - - - - - - - - - 11,000
Transfers In 18,282,420 23,710,598 25,975,972 26,722,915 19,253,176 20,304,143 17,065,038 13,989,217 19,188,067 14,018,812
Deposits for refunding - - - - (3,035,000) (12,598,700) (12,595,000) (10,500,116) - -
Transfers Out (22,857,164) (25,001,697) (27,839,661) (28,982,029) (22,947,692) (24,082,571) (22,139,715) (18,879,173) (24,243,220) (19,085,520)
Total other financing sources (uses), net 5,830,697 9,413,054 6,835,721 14,344,084 9,760,754 8,963,179 4,449,744 (4,375,446) (5,031,557) 2,954,342
Net change in fund balances 15,146,951$ (1,135,105)$ 39,491$ 5,348,194$ 2,016,377$ 2,251,392$ (5,697,468)$ 173,640$ 1,697,310$ 4,010,298$
Debt service as a percentage of
noncapital expenditures (1) 7.02% 6.35% 6.81% 7.75% 7.05% 6.01% 6.95% 8.11% 8.27% 8.22%
COUNTY OF YORK, VIRGINIA
Changes in Fund Balances of Governmental Funds - Modified Accrual Basis of Accounting
Last Ten Fiscal Years
(1) Noncapital expenditures = total expenditures less amounts for capitalized assets on the Government-Wide Statement of Net Assets.
(2) Expenditure categories were reclassified in FY2016. "Finance and planning" became "Management services" and Environmental and development services" and "General services" were combined into
"Public works" except for building regulations and development and compliance expenditures were moved from "Environmental and development services" to "General government." In FY2019, planning
and planning commission were moved from "Management services" to "Community development." Also in FY2019, building regulations and development services were moved from "General
administration" to "Community development."
L-7

2021 2020 2019 2018 2017 2016 2015 2014 2013 2012
Property tax 96,233,428$ 91,924,860$ 91,174,219$ 90,544,105$ 88,434,572$ 85,368,220$ 81,977,556$ 81,125,127$ 80,071,914$ 78,172,692$
Local sales and use tax 17,389,034 16,525,293 14,921,971 10,266,194 10,236,341 10,146,625 9,759,880 9,475,836 9,380,393 9,425,492
Hotel and motel room taxes 3,562,342 3,757,890 5,241,150 5,171,984 5,058,976 4,977,615 4,643,484 4,323,868 4,302,250 4,278,426
Restaurant food taxes 5,333,750 4,497,970 5,272,635 4,488,226 6,332,930 6,060,974 5,814,040 5,631,472 5,563,010 5,381,266
Business license taxes 7,513,546 7,633,724 7,330,820 6,952,681 6,603,695 6,187,990 6,240,330 6,410,146 5,720,592 5,855,061
Communications sales tax 968,207 1,090,046 1,115,481 1,202,410 1,241,212 1,272,490 1,311,310 1,322,868 1,345,767 1,342,206
Motor vehicle licenses 1,599,783 1,648,997 1,621,817 1,627,449 1,582,337 1,590,308 1,574,559 1,586,865 1,525,026 1,514,549
Franchise taxes 4,464 4,713 4,403 4,295 3,808 2,876 1,267 1,247 1,028 735
Taxes on recordation and wills 2,207,395 1,777,073 1,601,992 1,796,928 1,470,205 1,477,446 1,391,389 1,545,219 1,587,812 1,604,286
Other local taxes 821,095 609,248 732,468 679,777 651,863 627,533 581,802 593,893 586,487 595,901
Total 135,633,044$ 129,469,814$ 129,016,956$ 122,734,049$ 121,615,939$ 117,712,077$ 113,295,617$ 112,016,541$ 110,084,279$ 108,170,614$
COUNTY OF YORK, VIRGINIA
General Government Tax Revenues By Source - Modified Accrual Basis of Accounting
Last Ten Fiscal Years
L-8

Total Total
Personal Mobile Real Personal Taxable Direct
Year Residential Commercial Property Home Estate Property Assessed Value Tax Rate
2021 8,111,896,200$ 1,550,401,900$ 688,651,850$ 3,196,500$ 420,403,508$ 39,455$ 10,774,589,413$ 0.9999$
2020 7,977,730,200 1,536,027,800 621,368,315 3,218,000 323,164,444 39,455 10,461,548,214 0.9854
2019 7,747,444,900 1,465,593,000 612,318,755 3,302,000 453,482,644 50,142 10,282,191,441 0.9859
2018 7,686,020,670 1,417,754,500 595,105,775 3,294,500 459,070,808 55,504 10,161,301,757 0.9827
2017 7,588,190,700 1,516,028,900 582,157,745 3,568,200 459,191,601 82,826 10,149,219,972 0.9789
2016 7,425,810,400 1,574,952,300 593,894,890 3,512,600 442,369,715 104,756 10,040,644,661 0.9437
2015 7,307,361,300 1,491,507,600 561,880,260 3,939,500 430,748,916 127,592 9,795,565,168 0.9379
2014 7,243,259,500 1,491,310,000 552,552,935 3,780,000 425,978,786 148,514 9,717,029,735 0.9363
2013 7,321,920,900 1,368,970,400 531,217,905 3,912,100 420,994,403 186,019 9,647,201,727 0.9304
2012 7,276,743,200 1,361,986,800 514,828,080 3,812,600 393,773,490 69,127 9,551,213,297 0.9172
Source: County Commissioner of Revenue.
Note: Values are net of tax exempt property. Property in the County is reassessed every two years. Property is assessed on a calendar year basis and at
actual value; therefore, the assessed values are equal to actual value. Tax rates are per $100 of assessed value. Calendar year 2012 reflects an
amendment to the Virginia State Code, which exempted CPC (Certified Pollution Control) equipment. Calendar year 2017 included a change to the boat
tax in that all boats are taxed at $.000000001/$100; previously boats less than 5 tons were taxed in the same class as personal property.
COUNTY OF YORK, VIRGINIA
Assessed Value and Estimated Actual Value of Taxable Property
Last Ten Calendar Years
Real Property
Public Utility
L-9

Total
Fiscal Real Estate Personal Mobile Home Boats > 5 Tons Direct
Year (1) (2) (3) Property (1) (4) (1) (3) (1) (5) Tax Rate
2021 0.795$ 4.00$ 0.7950$ 0.000000001$ 0.9999$
2020 0.795 4.00 0.7950 0.000000001 0.9854
2019 0.795 4.00 0.7950 0.000000001 0.9859
2018 0.795 4.00 0.7950 0.000000001 0.9827
2017 0.7515/0.795 4.00 0.7515/0.795 1.00/0.000000001 0.9789
2016 0.7515 4.00 0.7515 1.00 0.9437
2015 0.7515 4.00 0.7515 1.00 0.9379
2014 0.7515 4.00 0.7515 1.00 0.9363
2013 0.7415/0.7515 4.00 0.7415/0.7515 1.00 0.9304
2012 0.6575/0.7415 4.00 0.6575/0.7415 1.00 0.9172
(1) Tax rate per $100 of assessed valuation.
(3) The tax rate, 1st half/2nd half, if different.
Note: The County has no overlapping taxes with other governments.
(2) The amount designated for school operating is $0.605 per $100 of valuation for fiscal year 2021.
COUNTY OF YORK, VIRGINIA
Property Tax Rates
Last Ten Fiscal Years
(4) The tax rate per $100 of assessed valuation for Disabled American Veterans has been $1.00 since
2008.
(5) Effective for calendar year 2017, all boats are taxed at $.000000001/$100. The boat tax rate has
been effectively eliminated on all classes of boats.
L-10

Percentage Percentage
2020 of Total 2011 of Total
Taxable Taxable Taxable Taxable
Assessed Assessed Assessed Assessed
Taxpayer Description Value Rank Value Valuation Rank Value
Virginia Power Company Generating plant 318,272,575$ 1 3.02% 319,517,999$ 1 3.20%
Lawyers Title/Fairfield Resorts/Wyndham Timeshare condominiums 184,765,580 2 1.76% 186,798,600 2 1.87%
City of Newport News ** Water system 134,899,500 3 1.28% 132,589,700 3 1.33%
GWR OP Lessee VA LLC (Great Wolf Lodge) Hotel and water park 120,491,445 4 1.15% 82,423,100 5 0.83%
BP/Western Refining/Plains Marketing Former Refinery 87,711,770 5 0.83% 85,983,600 4 0.86%
Kings Creek Plantation Timeshare condominiums 87,665,120 6 0.83% 73,000,400 6 0.73%
Premier Properties-Marquis Retail sales - 0.00% 35,324,200 10 0.35%
Moyork LLC (Commonwealth Apartments) Apartment complex 49,743,200 7 0.47%
Busch Entertainment/Water Country USA Water Park 42,909,880 8 0.41% 47,692,800 7 0.48%
Walmart Retail sales 40,092,965 9 0.38% 36,309,600 9 0.36%
Holiday Inn Club Vacations Timeshare condominiums 36,175,395 10 0.34%
1991 Ashe Partnership Apartment complex - 0.00% 37,090,700 8 0.37%
Total 1,102,727,430$ 10.47% 1,036,730,699$ 10.38%
*The County's assessment cycle is on a calendar year basis.
Source: Commissioner of the Revenue of the County of York, Virginia.
COUNTY OF YORK, VIRGINIA
Principal Property Taxpayers
Calendar Year 2020 and Nine Years Prior*
** City of Newport News is the third largest taxpayer based on assessed value. However, the city pays a tax to the County according to a formula set out in the Code of
Virginia section 58.1-3663, based on the proportion of its total revenues derived from outside York County. The applicable taxable percentage is approximately 56%.
L-11
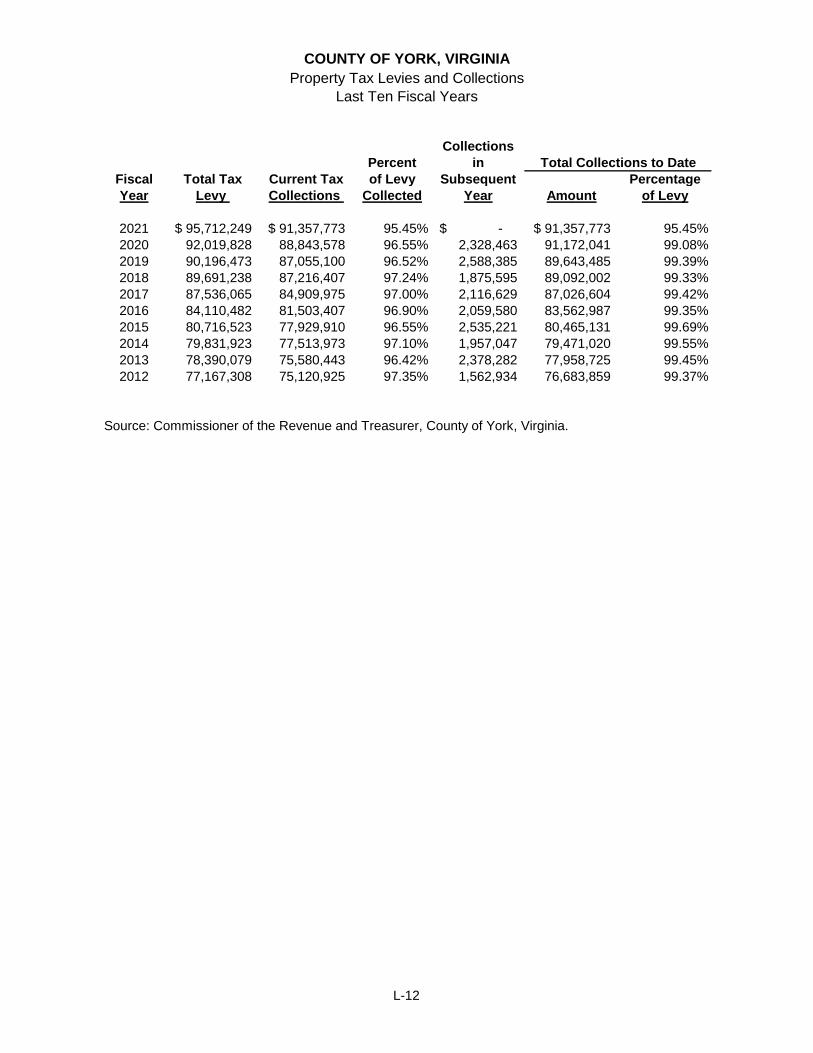
Collections
Percent in
Fiscal Total Tax Current Tax of Levy Subsequent Percentage
Year Levy Collections Collected Year Amount of Levy
2021 95,712,249$ 91,357,773$ 95.45% -$ 91,357,773$ 95.45%
2020 92,019,828 88,843,578 96.55% 2,328,463 91,172,041 99.08%
2019 90,196,473 87,055,100 96.52% 2,588,385 89,643,485 99.39%
2018 89,691,238 87,216,407 97.24% 1,875,595 89,092,002 99.33%
2017 87,536,065 84,909,975 97.00% 2,116,629 87,026,604 99.42%
2016 84,110,482 81,503,407 96.90% 2,059,580 83,562,987 99.35%
2015 80,716,523 77,929,910 96.55% 2,535,221 80,465,131 99.69%
2014 79,831,923 77,513,973 97.10% 1,957,047 79,471,020 99.55%
2013 78,390,079 75,580,443 96.42% 2,378,282 77,958,725 99.45%
2012 77,167,308 75,120,925 97.35% 1,562,934 76,683,859 99.37%
Source: Commissioner of the Revenue and Treasurer, County of York, Virginia.
COUNTY OF YORK, VIRGINIA
Property Tax Levies and Collections
Last Ten Fiscal Years
Total Collections to Date
L-12

General Lease General Total Percentage
Fiscal Obligation Literary Capital Revenue Note Obligation Revenue Capital Primary of Personal Per
Year Bonds Loans Leases Bonds Payable Bonds Bonds Leases Government Income (2) Capita (2)
2021 82,529,933$ -$ 919,423$ 23,287,473$ -$ -$ 18,768,007$ -$ 125,504,836$ N/A 1,787$
2020 77,733,259 - 1,515,179 25,756,218 - - 19,604,905 - 124,609,561 N/A 1,785
2019 74,271,325 - 1,997,074 25,446,020 - - 19,963,073 - 121,677,492 2.46% 1,753
2018 69,812,399 - 3,423,720 28,136,579 - - 20,616,187 - 121,988,885 2.57% 1,775
2017 66,330,054 - 5,722,996 21,308,937 - - 21,254,301 - 114,616,288 2.52% 1,664
2016 61,906,639 - 2,420,659 23,247,569 - - 21,169,120 - 108,743,987 2.46% 1,586
2015 53,270,668 - 2,860,682 23,544,723 - - 21,696,428 325,301 101,697,802 2.35% 1,464
2014 49,619,991 - 3,113,086 24,847,309 - - 22,207,989 638,542 100,426,917 2.38% 1,490
2013 54,961,398 - 2,862,880 26,059,652 372,740 - 22,141,530 940,170 107,338,370 2.67% 1,603
2012 59,822,805 - 2,917,121 27,499,214 719,393 - 22,570,884 1,230,616 114,760,033 2.88% 1,728
N/A - This information is not available.
(2) See Population and Personal Income on Demographic and Economic Statistics table, page L-16.
Governmental Activities
COUNTY OF YORK, VIRGINIA
Ratio of Outstanding Debt By Type (1)
Last Ten Fiscal Years
Business-type Activities
(1) Bonds are shown at net of related premiums and/or discounts and deferred amounts on refundings for 2012 - 2013. Beginning in FY2014, bonds are shown at net of related premiums and/or
discounts.
L-13

Less Percentage
Amounts of Actual
General Available in Taxable
Fiscal Obligation Debt Service Value of Per
Year Bonds Fund Total Property (1) Capita (2)
2021 82,529,933$ -$ 82,529,933$ 0.77% 1,175
2020 77,733,259 - 77,733,259 0.74% 1,114
2019 74,271,325 - 74,271,325 0.72% 1,070
2018 69,812,399 - 69,812,399 0.69% 1,016
2017 66,330,054 - 66,330,054 0.65% 963
2016 61,906,639 - 61,906,639 0.62% 903
2015 53,270,668 - 53,270,668 0.54% 767
2014 49,619,991 - 49,619,991 0.51% 736
2013 54,961,398 - 54,961,398 0.57% 821
2012 59,822,805 - 59,822,805 0.63% 901
(1) See Assessed Value table, page L-9.
(2) See Population on Demographic and Economic Statistics table, page L-16.
COUNTY OF YORK, VIRGINIA
Ratio of General Bonded Debt Outstanding
Last Ten Fiscal Years
L-14

Education
Level In Student
Personal Years of Average
Fiscal Income Per Capita Median Formal Daily Unemployment
Year Population (1) (Thousands) (2) Income (2) Age (3) Schooling (4) Membership (5) Rate (6)
2021 70,230 N/A N/A 39.20 13.20 12,244 3.40%
2020 69,792 N/A N/A 39.20 13.20 12,914 5.60%
2019 69,407 4,938,435$ 61,308$ 39.00 13.20 12,756 2.60%
2018 68,725 4,756,232 59,345 38.80 13.20 12,610 2.80%
2017 68,890 4,541,816 56,729 38.80 13.20 12,584 3.50%
2016 68,585 4,415,578 55,344 39.30 13.20 12,522 3.80%
2015 69,466 4,326,498 54,201 39.40 13.20 12,519 4.20%
2014 67,396 4,216,899 53,697 39.40 13.20 12,333 4.90%
2013 66,955 4,014,425 51,418 39.40 13.20 12,226 5.30%
2012 66,428 3,983,237 51,107 39.40 13.20 12,410 5.70%
N/A - This information is not available.
Source:
(1) Weldon Cooper Center for Public Service; 2021 estimate derived from previous years' data.
(2) Bureau of Economic Analysis combined amount for York County/Poquoson.
(3) Median Age from U.S. Census Bureau
(4) Educational Attainment derived from data published by the U.S. Census Bureau.
(5) County School Division.
(6) Virginia Employment Commission; 2021 estimate per County Planning Division.
COUNTY OF YORK, VIRGINIA
Demographic and Economic Statistics
Last Ten Fiscal Years
L-15

Percentage Percentage
of Total of Total
County CountyEmployer Employees Rank Employment Employees Rank Employment
Naval Weapons Station/
Cheatham Annex 3,787 1 17.68% 3,026 1 14.00%
York County School Division 1,874 2 8.75% 1,745 2 8.07%
U.S. Coast Guard Station 1,063 3 4.96% 1,437 3 6.65%
Sentara Williamsburg Regional
Medical Center 787 4 3.67% 722 6 3.34%
York County Government 779 5 3.64% 733 5 3.39%
Walmart 752 6 3.51% 934 4 4.32%
Water Country 546 7 2.55% 676 7 3.13%
Great Wolf Lodge of Williamsburg, LLC 386 8 1.80% 624 8 2.89%
Kroger 275 9 1.28% - 0.00%
YMCA 250 10 1.17% 298 9 1.38%
Wyndham Vacation Ownership 267 10 1.23%
Total 10,499 49.01% 10,462 48.40%
Source: County Office of Economic Development.
Source: York County School Division Annual Comprehensive Financial Report.
COUNTY OF YORK, VIRGINIA
Principal Employers
Current and Nine Years Prior
2021 2012
L-16

2021 2020 2019 2018 2017 2016 2015 2014 2013 2012
Function (1)
General government 22.00 23.00 24.00 46.00 44.00 46.00 20.00 19.00 18.00 20.00
Judicial services 33.00 32.00 32.00 32.00 31.00 31.50 32.50 32.50 32.50 32.75
Public safety 333.50 323.00 323.00 313.50 307.00 302.00 300.00 300.00 300.00 300.00
Environmental and
development services - - - - - - 54.50 54.50 54.25 55.00
Management services 97.50 99.50 97.50 97.50 95.75 95.25 - - - -
Finance and planning - - - - - - 92.25 91.25 91.25 89.25
Education (Library) 32.50 32.50 32.50 32.50 32.00 33.00 33.00 33.00 33.00 33.50
Public works 180.00 174.00 176.00 177.00 173.00 171.00 - - - -
General services - - - - - - 72.00 72.00 71.00 80.00
Community development 26.00 26.00 26.00 - - - - - - -
Community services 53.70 53.20 51.40 51.40 50.20 50.20 50.20 50.20 50.20 54.20
Sewer (Public Works) - - - - - - 56.00 57.00 56.00 56.50
Solid Waste (Public Works) - - - - - - 12.00 12.00 12.00 12.00
778.20 763.20 762.40 749.90 732.95 728.95 722.45 721.45 718.20 733.20
Source: County Human Resources. Includes full-time and part-time positions; excludes work-as-required staff.
COUNTY OF YORK, VIRGINIA
Full-time Equivalent County Employees By Function
Last Ten Fiscal Years
(1) Functional categories were reclassified in FY2016. "Finance and planning" became "Management services" and Environmental and development services" and "General services" were
combined into "Public works" except for building regulations and development and compliance were reclassified from "Environmental and development services" to "General government." In
FY2019, "Community Development" was created and includes building, development, and planning services.
L-17

2021 2020 2019 2018 2017 2016 2015 2014 2013 2012
Function
General Government
Elections - Registered voters 49,009 46,553 45,274 45,757 45,134 44,361 43,007 44,840 45,165 45,540
Building Permits Issued 5,287 4,077 4,774 4,380 3,570 3,648 4,175 4,822 4,043 3,663
Building Permit Value 137,491,800$ 91,355,798$ 171,001,866$ 153,764,229$ 64,886,424$ 68,300,485$ 91,568,396$ 78,778,858$ 74,340,412$ 55,959,121$
Judicial Services (Clerk of Court)
Criminal and civil cases filed 4,414 3,127 4,674 4,137 3,307 3,361 2,886 2,501 1,651 1,773
Land records filed 26,360 22,157 21,242 24,273 25,576 22,857 22,821 23,023 26,117 21,061
Sheriff
Physical arrests 951 1,414 1,851 1,768 1,596 1,685 1,547 1,673 1,655 1,768
Parking violations 111 100 112 62 72 106 83 103 71 92
Traffic violations 2,209 3,900 5,095 3,965 3,565 3,768 2,675 2,126 2,476 3,489
Fire and Life Safety
Number of calls 11,266 10,942 11,558 11,464 10,919 9,969 9,707 9,550 9,289 9,070
Fire dispatches 4,284 4,411 4,971 4,992 4,743 4,117 4,076 4,007 3,567 3,504
Rescue dispatches 6,982 6,531 6,587 6,472 6,176 5,852 5,631 5,543 5,722 5,566
Education
Library book circulation 365,523 451,753 557,764 509,704 514,824 527,047 534,923 524,847 529,718 562,212
Library registered patrons 44,770 43,149 52,592 48,530 44,022 64,436 63,248 69,860 65,057 70,684
School Division cost per pupil 12,449$ 10,960$ 10,847$ 10,662$ 10,204$ 10,081$ 10,177$ 9,584$ 9,743$ 9,424$
Community services
Recreation program participation (1) 22,307 110,683 151,048 160,280 131,205 105,032 121,587 100,542 108,590 101,650
Sewer
New connections 318 250 316 273 109 170 401 277 339 366
Solid Waste
Refuse collections (tons) 91,437 100,164 95,735 83,094 68,714 83,000 83,996 78,352 82,774 91,699
Recyclables collected (tons) 24,853 28,190 35,686 27,997 27,814 32,005 37,651 28,702 23,970 18,139
Source: Various County departments
(1) Recreation program participant numbers decreased in FY2021 due to the impacts of COVID-19.
COUNTY OF YORK, VIRGINIA
Operating Indicators By Function
Last Ten Years
L-18
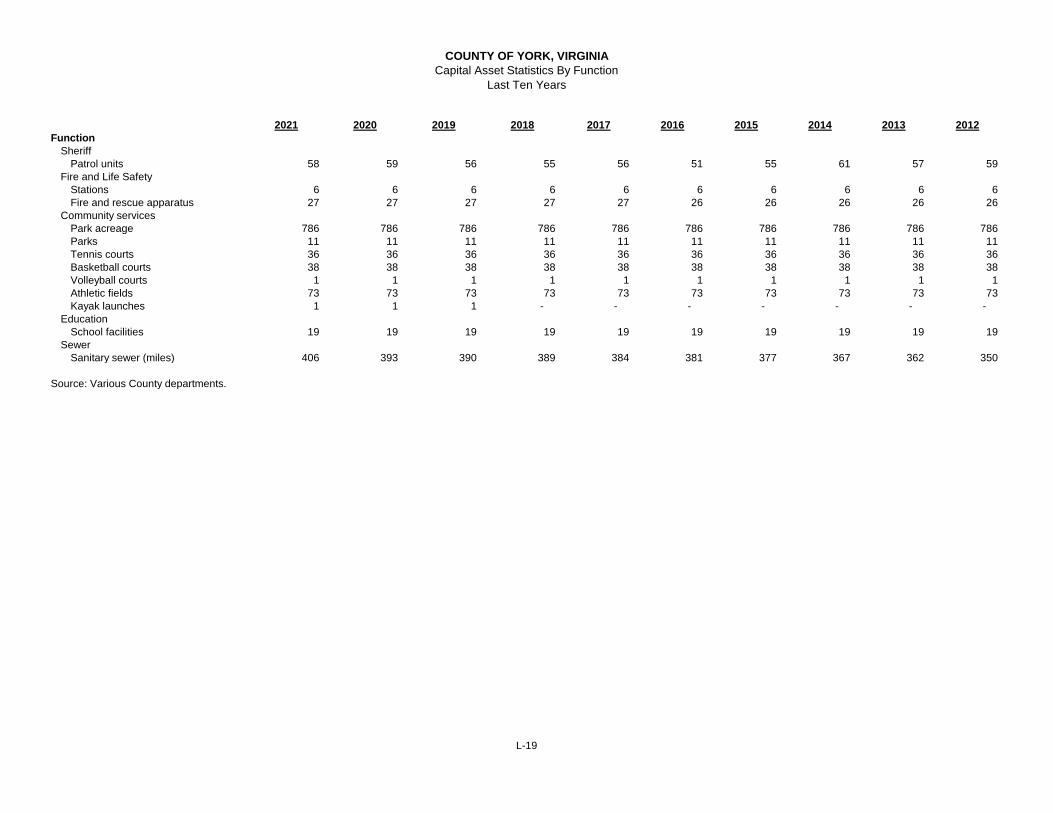
2021 2020 2019 2018 2017 2016 2015 2014 2013 2012
Function
Sheriff
Patrol units 58 59 56 55 56 51 55 61 57 59
Fire and Life Safety
Stations 6 6 6 6 6 6 6 6 6 6
Fire and rescue apparatus 27 27 27 27 27 26 26 26 26 26
Community services
Park acreage 786 786 786 786 786 786 786 786 786 786
Parks 11 11 11 11 11 11 11 11 11 11
Tennis courts 36 36 36 36 36 36 36 36 36 36
Basketball courts 38 38 38 38 38 38 38 38 38 38
Volleyball courts 1 1 1 1 1 1 1 1 1 1
Athletic fields 73 73 73 73 73 73 73 73 73 73
Kayak launches 1 1 1 - - - - - - -
Education
School facilities 19 19 19 19 19 19 19 19 19 19
Sewer
Sanitary sewer (miles) 406 393 390 389 384 381 377 367 362 350
Source: Various County departments.
COUNTY OF YORK, VIRGINIA
Capital Asset Statistics By Function
Last Ten Years
L-19

L-20
THIS PAGE LEFT BLANK INTENTIONALLY

COUNTY OF YORK, VIRGINIA
COMPLIANCE AUDIT PURSUANT TO 2 CFR PART 200 (SINGLE AUDIT REPORT)
For the Fiscal Year Ended June 30, 2021
(With Reports of Independent Auditor Thereon)

Page
Report of Independent Auditor on Internal Control over Financial Reporting and 1 - 2
on Compliance and Other Matters Based on an Audit of Financial Statements
Performed in Accordance with Government Auditing Standards
Report of Independent Auditor on Compliance for Each Major Federal Program and on 3 - 4
Internal Control over Compliance Required by the Uniform Guidance
Schedule of Expenditures of Federal Awards 5 - 6
Notes to Schedule of Expenditures of Federal Awards 7
Schedule of Findings and Questioned Costs 8
COUNTY OF YORK, VIRGINIA
TABLE OF CONTENTSSINGLE AUDIT REPORT

cbh.com
Report of Independent Auditor on Internal Control over Financial Reporting and on Compliance and Other Matters Based on an Audit
of Financial Statements Performed in Accordance with Government Auditing Standards
To the Honorable Members of the Board of Supervisors County of York, Virginia We have audited, in accordance with the auditing standards generally accepted in the United States of America, the standards applicable to financial audits contained in Government Auditing Standards issued by the Comptroller General of the United States, and the Specifications for Audits of Counties, Cities, and Towns issued by the Auditor of Public Accounts of the Commonwealth of Virginia, the financial statements of the governmental activities, the business-type activities, the aggregate discretely presented component units, each major fund, and the aggregate remaining fund information of the County of York, Virginia (the “County”), as of and for the year ended June 30, 2021, and the related notes to the financial statements, which collectively comprise the County’s basic financial statements, and have issued our report thereon dated November 29, 2021. That report recognizes that the County restated certain net position amounts due to the implementation of a new accounting standard effective July 1, 2020. Internal Control over Financial Reporting In planning and performing our audit of the financial statements, we considered the County’s internal control over financial reporting (“internal control”) as a basis for designing audit procedures that are appropriate in the circumstances for the purpose of expressing our opinions on the financial statements, but not for the purpose of expressing an opinion on the effectiveness of the County’s internal control. Accordingly, we do not express an opinion on the effectiveness of the County’s internal control. A deficiency in internal control exists when the design or operation of a control does not allow management or employees, in the normal course of performing their assigned functions, to prevent, or detect and correct, misstatements on a timely basis. A material weakness is a deficiency, or a combination of deficiencies, in internal control, such that there is a reasonable possibility that a material misstatement of the entity’s financial statements will not be prevented, or detected and corrected, on a timely basis. A significant deficiency is a deficiency, or a combination of deficiencies, in internal control that is less severe than a material weakness, yet important enough to merit attention by those charged with governance. Our consideration of internal control was for the limited purpose described in the first paragraph of this section and was not designed to identify all deficiencies in internal control that might be material weaknesses or significant deficiencies. Given these limitations, during our audit we did not identify any deficiencies in internal control that we consider to be material weaknesses. However, material weaknesses may exist that have not been identified. Compliance and Other Matters As part of obtaining reasonable assurance about whether the County’s financial statements are free from material misstatement, we performed tests of its compliance with certain provisions of laws, regulations, contracts, and grant agreements, noncompliance with which could have a direct and material effect on the financial statements. However, providing an opinion on compliance with those provisions was not an objective of our audit, and accordingly, we do not express such an opinion. The results of our tests disclosed no instances of noncompliance or other matters that are required to be reported under Government Auditing Standards or the Specifications for Audits of Counties, Cities, and Towns.
1

Purpose of this Report The purpose of this report is solely to describe the scope of our testing of internal control and compliance and the results of that testing, and not to provide an opinion on the effectiveness of the entity’s internal control or on compliance. This report is an integral part of an audit performed in accordance with Government Auditing Standards in considering the entity’s internal control and compliance. Accordingly, this communication is not suitable for any other purpose. Virginia Beach, Virginia November 29, 2021
2

cbh.com
Report of Independent Auditor on Compliance for Each Major Federal Program and on Internal Control over Compliance
Required by the Uniform Guidance To the Honorable Members of the Board of Supervisors County of York, Virginia Report on Compliance for Each Major Federal Program We have audited the County of York, Virginia’s (the “County”) compliance with the types of compliance requirements described in the OMB Compliance Supplement that could have a direct and material effect on each of the County’s major federal programs for the year ended June 30, 2021. The County’s major federal programs are identified in the summary of auditor’s results section of the accompanying schedule of findings and questioned costs. Management’s Responsibility Management is responsible for compliance with federal statutes, regulations, and the terms and conditions of its federal awards applicable to its federal programs. Auditor’s Responsibility Our responsibility is to express an opinion on compliance for each of the County’s major federal programs based on our audit of the types of compliance requirements referred to above. We conducted our audit of compliance in accordance with auditing standards generally accepted in the United States of America; the standards applicable to financial audits contained in Government Auditing Standards, issued by the Comptroller General of the United States of America; and the audit requirements of Title 2 U.S. Code of Federal Regulations Part 200, Uniform Administrative Requirements, Cost Principles, and Audit Requirements for Federal Awards (“Uniform Guidance”). Those standards and the Uniform Guidance require that we plan and perform the audit to obtain reasonable assurance about whether noncompliance with the types of compliance requirements referred to above that could have a direct and material effect on a major federal program occurred. An audit includes examining, on a test basis, evidence about the County’s compliance with those requirements and performing such other procedures as we considered necessary in the circumstances. We believe that our audit provides a reasonable basis for our opinion on compliance for each major federal program. However, our audit does not provide a legal determination of the County’s compliance. Opinion on Each Major Federal Program In our opinion, the County complied, in all material respects, with the types of compliance requirements referred to above that could have a direct and material effect on each of its major federal programs for the year ended June 30, 2021. Report on Internal Control over Compliance Management of the County is responsible for establishing and maintaining effective internal control over compliance with the types of compliance requirements referred to above. In planning and performing our audit of compliance, we considered the County’s internal control over compliance with the types of requirements that could have a direct and material effect on each major federal program to determine the auditing procedures that are appropriate in the circumstances for the purpose of expressing an opinion on compliance for each major federal program and to test and report on internal control over compliance in accordance with the Uniform Guidance, but not for the purpose of expressing an opinion on the effectiveness of internal control over compliance. Accordingly, we do not express an opinion on the effectiveness of the County’s internal control over compliance.
3

A deficiency in internal control over compliance exists when the design or operation of a control over compliance does not allow management or employees, in the normal course of performing their assigned functions, to prevent, or detect and correct, noncompliance with a type of compliance requirement of a federal program on a timely basis. A material weakness in internal control over compliance is a deficiency, or combination of deficiencies, in internal control over compliance, such that there is a reasonable possibility that material noncompliance with a type of compliance requirement of a federal program will not be prevented, or detected and corrected, on a timely basis. A significant deficiency in internal control over compliance is a deficiency, or a combination of deficiencies, in internal control over compliance with a type of compliance requirement of a federal program that is less severe than a material weakness in internal control over compliance, yet important enough to merit attention by those charged with governance. Our consideration of internal control over compliance was for the limited purpose described in the first paragraph of this section and was not designed to identify all deficiencies in internal control over compliance that might be material weaknesses or significant deficiencies. We did not identify any deficiencies in internal control over compliance that we consider to be material weaknesses. However, material weaknesses may exist that have not been identified. Report on Schedule of Expenditures of Federal Awards Required by the Uniform Guidance We have audited the financial statements of the governmental activities, business-type activities, the aggregate discretely presented component units, each major fund, and the aggregate remaining fund information of the County, as of and for the year ended June 30, 2021, and the related notes to the financial statements, which collectively comprise the County’s basic financial statements. We issued our report thereon dated November 29, 2021, which contained unmodified opinions on those financial statements. Our audit was conducted for the purpose of forming opinions on the financial statements that collectively comprise the basic financial statements. The accompanying schedule of expenditures of federal awards is presented for purposes of additional analysis as required by the Uniform Guidance and is not a required part of the basic financial statements. Such information is the responsibility of management and was derived from and relates directly to the underlying accounting and other records used to prepare the basic financial statements. The information has been subjected to the auditing procedures applied in the audit of the financial statements and certain additional procedures, including comparing and reconciling such information directly to the underlying accounting and other records used to prepare the basic financial statements or to the basic financial statements themselves, and other additional procedures in accordance with auditing standards generally accepted in the United States of America. In our opinion, the schedule of expenditures of federal awards is fairly stated, in all material respects, in relation to the basic financial statements as a whole. The purpose of this report on internal control over compliance is solely to describe the scope of our testing of internal control over compliance and the results of that testing based on the requirements of the Uniform Guidance. Accordingly, this report is not suitable for any other purpose.
Virginia Beach, Virginia February 22, 2022
4

Assistance Listing Federal
Federal Granting Agency/Recipient State Agency/Grant Program/Grant Number Number Expenditures
Department of Agriculture:
Direct payments: Child and Adult Care Food Program 10.558 55,292$
Pass-through payments:
Department of Social Services:
State Administrative Matching Grants for the Supplemental Nutrition
Assistance Program (765-460-03; 765-460-010) 10.561 913,263
Department of Education:
School Breakfast Program (197-179-01) 10.553 2,039,950
Department of Agriculture:
National School Lunch Program (Donated Foods) 10.555 320,962
Department of Education:
National School Lunch Program (197-179-01) 10.555 3,825,825
Subtotal Donated Foods and National School Lunch Program 10.555 4,146,787
Total Child Nutrition Cluster 6,186,737
Department of Defense:
Direct payments:
Naval Junior ROTC Program 12.UNK 126,578
National Defense Authorization Act 12.UNK 1,257,379
Forest Reserve 12.UNK 5,928
Competitive Grants: Promoting K-12 Student Achievement at Military-Connected Schools 12.556 186,763
Department of Housing and Urban Development:
Pass-through payments:
Department of Housing and Community Development
Community Development Block Grants/State's Program (165-533-05) 14.228 1,470,073
Virginia Housing Development Authority:
Section 8 Housing Choice Vouchers 14.871 166,590
Total Housing Voucher Cluster 166,590
Department of Justice:
Direct payments:
Bulletproof Vest Partnership Program 16.607 14,115
Equitable Sharing Program 16.922 29,475
Pass-through payments:
Department of Criminal Justice Services:
Crime Victim Assistance (140-390-01) 16.575 103,003
Violence Against Women Formula Grants (140-390-01) 16.588 27,366
Department of Transportation:
Pass-through payments: Department of Transportation:
Highway Planning and Construction 20.205 25,852
Total Highway Planning and Construction Cluster 25,852
Pass-through payments: Department of Motor Vehicles:
State and Community Highway Safety (530-605-07) 20.600 12,656
Total Highway Safety Cluster 12,656
Alcohol Open Container Requirements 20.607 9,002
Department of the Treasury:
Pass-through payments: Department of Accounts:
Coronavirus Relief Fund 21.019 11,394,140
Coronavirus State and Local Fiscal Recovery Fund (ARPA) 21.027 6,631,295
Federal Communications Commission:
Direct payments: Universal Service Fund - Schools and Libraries (E-rate) 32.004 10,542
Department of Education:
Direct payments:
Impact Aid 84.041 9,123,392
Pass-through payments:
Department of Education (197-179-01):
Title I Grants to Local Educational Agencies 84.010 755,511
(continued)
COUNTY OF YORK, VIRGINIA
Schedule of Expenditures of Federal Awards
Year Ended June 30, 2021
See accompanying notes to Schedule of Expenditures of Federal Awards.
5

Assistance Listing Federal
Federal Granting Agency/Recipient State Agency/Grant Program/Grant Number Number Expenditures
COUNTY OF YORK, VIRGINIA
Schedule of Expenditures of Federal Awards
Year Ended June 30, 2021
Department of Education:
Special Education and Rehabilitative Services:
Special Education Grants to States 84.027 2,269,963
Special Education Preschool Grants 84.173 47,709
Total Special Education Cluster (IDEA) 2,317,672
Department of Education:
Pass-through payments:
Department of Education (197-179-01):
School Safety National Activities 84.184 46,102
Vocational and Adult Education:
Career and Technical Education - Basic Grants to States 84.048 115,819
English Language Acquisition State Grants 84.365 23,326
Supporting Effective Instruction State Grants 84.367 179,100
Education Stabilization Fund 84.425D 1,133,377
United States Election Assistance Commission:
Pass-through payments:
State Board of Elections
HAVA Election Security Grants 90.404 68,555
Department of Health and Human Services:
Direct payments:
Administration for Children, Youth and Families: Head Start 93.600 1,212,695
Pass-through payments:
Department of Social Services:
MaryLee Allen Promoting Safe and Stable Families Program (765-460-10; 765-469-02) 93.556 15,410
Temporary Assistance for Needy Families (765-452-12; 765-452-01; 765-460-10) 93.558 319,443
Refugee and Entrant Assistance State/Replacement Designee Administered Programs
(765-460-10; 765-491-02) 93.566 507
Low-Income Home Energy Assistance (765-460-10) 93.568 44,253
Child Care and Development Block Grant (765-452-15) 93.575 (1,874)
Child Care Mandatory and Matching Funds of the Child Care and
Development Fund (765-452-14; 765-452-15; 765-460-10) 93.596 69,682
Total Child Care and Development Fund Cluster (93.575, 93.596) 67,808
Chafee Education and Training Vouchers Program (ETV) (765-469-02) 93.599 888
Stephanie Tubbs Jones Child Welfare Services Program (765-460-10) 93.645 312
Foster Care - Title IV-E (765-460-03; 765-460-10; 765-469-01; 765-469-02) 93.658 274,519
Adoption Assistance (765-460-03; 765-460-10; 765-469-03) 93.659 108,274
Social Services Block Grant (765-460-10; 765-468-02; 765-469-02; 765-469-03) 93.667 300,319
John H.Chafee Foster Care Program for Successful Transition to Adulthood
(765-460-10; 765-469-02) 93.674 8,283
Children's Health Insurance Program (765-460-10) 93.767 8,033
Medical Assistance Program (765-460-03; 765-460-10) 93.778 680,694
Department of Medical Assistance Services: Medical Assistance Program 93.778 182,308
Subtotal Medical Assistance Program 863,002
Total Medicaid Cluster 863,002
Department of Homeland Security:
Direct payments:
Assistance to Firefighters Grant 97.044 36,688
Staffing for Adequate Fire and Emergency Response (SAFER) 97.083 363,406
Pass-through payments:
Department of Homeland Security:
Disaster Grants - Public Assistance (Presidentially Declared Disasters) 97.036 490,958
Emergency Management Performance Grants (127-775-01) 97.042 50,335
Homeland Security Grant Program (127-775-01) 97.067 234,858
Total 46,788,894$
See accompanying notes to Schedule of Expenditures of Federal Awards.
6

COUNTY OF YORK, VIRGINIA Notes to Schedule of Expenditures of Federal Awards
June 30, 2021
1. GENERAL
The accompanying Schedule of Expenditures of Federal Awards (the Schedule) presents the activity of all federal awards of the County. The County’s reporting entity is defined in Note 1 to the basic financial statements. All amounts expended directly from federal agencies as well as monies passed through other government agencies are included on the Schedule.
2. BASIS OF ACCOUNTING
The accompanying Schedule is presented using the modified accrual basis of accounting, which is described in Note 1 to the County’s basic financial statements.
3. SUBRECIPIENTS
Of the federal expenditures presented in the Schedule, the County provided no federal awards to a subrecipient during the year ended June 30, 2021.
4. UNIFORM GRANT GUIDANCE
The Uniform Administrative Requirements, Cost Principles, and Audit Requirement for Federal Awards, which is effective for new grants, issued after December 26, 2014, included changes to how indirect costs are awarded. In an effort to relieve administrative burden, the Office of Management and Budget (OMB) specified that non-federal entities that have never received a negotiated indirect cost rate may elect to charge a de minimis cost rate of 10 percent of modified total direct costs, which may be used indefinitely. The County elected not to apply the de minimis rate for fiscal year 2021.
7
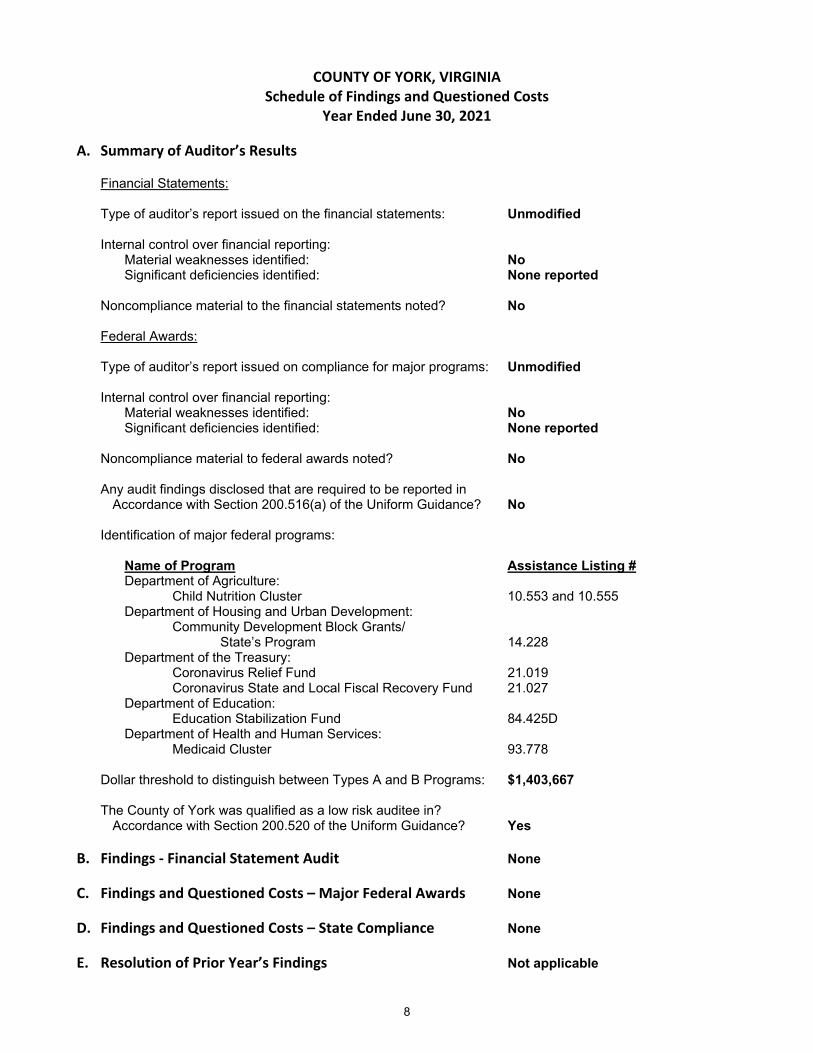
COUNTY OF YORK, VIRGINIA Schedule of Findings and Questioned Costs
Year Ended June 30, 2021 A. Summary of Auditor’s Results
Financial Statements:
Type of auditor’s report issued on the financial statements: Unmodified
Internal control over financial reporting: Material weaknesses identified: No Significant deficiencies identified: None reported
Noncompliance material to the financial statements noted? No
Federal Awards:
Type of auditor’s report issued on compliance for major programs: Unmodified
Internal control over financial reporting:
Material weaknesses identified: No Significant deficiencies identified: None reported
Noncompliance material to federal awards noted? No
Any audit findings disclosed that are required to be reported in
Accordance with Section 200.516(a) of the Uniform Guidance? No
Identification of major federal programs:
Name of Program Assistance Listing # Department of Agriculture:
Child Nutrition Cluster 10.553 and 10.555 Department of Housing and Urban Development:
Community Development Block Grants/ State’s Program 14.228
Department of the Treasury: Coronavirus Relief Fund 21.019
Coronavirus State and Local Fiscal Recovery Fund 21.027 Department of Education:
Education Stabilization Fund 84.425D Department of Health and Human Services:
Medicaid Cluster 93.778
Dollar threshold to distinguish between Types A and B Programs: $1,403,667
The County of York was qualified as a low risk auditee in? Accordance with Section 200.520 of the Uniform Guidance? Yes
B. Findings ‐ Financial Statement Audit None C. Findings and Questioned Costs – Major Federal Awards None D. Findings and Questioned Costs – State Compliance None E. Resolution of Prior Year’s Findings Not applicable
8