county of franklin, virginia comprehensive annual financial ...
157
-
Upload
khangminh22 -
Category
Documents
-
view
4 -
download
0
Transcript of county of franklin, virginia comprehensive annual financial ...


COUNTY OF FRANKLIN, VIRGINIA COMPREHENSIVE ANNUAL FINANCIAL REPORT FOR THE ENDED JUNE 30, 2015
Prepared by the Franklin County Department of Finance

COUNTY OF FRANKLIN, VIRGINIA COMPREHENSIVE ANNUAL FINANCIAL REPORT FISCAL YEAR ENDED JUNE 30, 2015 TABLE OF CONTENTS INTRODUCTORY SECTION Page Letter of Transmittal .................................................................................. 1-4 Historical Sketch of Franklin County ................................................................ 5 List of Elected and Appointed Officials ............................................................. 6-8 Organizational Chart ................................................................................... 9 Certificate of Achievement for Excellence in Financial Reporting ............................. 10
FINANCIAL SECTION Independent Auditors' Report ....................................................................... 11-13 Management’s Discussion and Analysis ............................................................. 14-22
Exhibit Page Basic Financial Statements: Government-Wide Financial Statements: Statement of Net Position ......................................................................... 1 23 Statement of Activities ............................................................................. 2 24 Fund Financial Statements: Governmental Fund Financial Statements:
Balance Sheet – Governmental Funds ......................................................... 3 25 Reconciliation of the Balance Sheet of Governmental Funds to the Statement
of Net Position ............................................................................... 4 26 Statement of Revenues, Expenditures and Change in Fund Balances –
Governmental Funds ........................................................................... 5 27 Reconciliation of the Statement of Revenues, Expenditures, and Changes
in Fund Balances of Governmental Funds to the Statement of Activities ............ 6 28 Proprietary Fund Financial Statements: Statement of Net Position – Proprietary Fund ............................................. 7 29
Statement of Revenues, Expenses, and Changes in Net Position – Proprietary Fund ............................................................................... 8 30
Statement of Cash Flows – Proprietary Fund ............................................... 9 31 Fiduciary Fund Financial Statements:
Statement of Fiduciary Net Position – Fiduciary Funds ..................................... 10 32
Notes to Financial Statements ...................................................................... 33-91

COUNTY OF FRANKLIN, VIRGINIA COMPREHENSIVE ANNUAL FINANCIAL REPORT FISCAL YEAR ENDED JUNE 30, 2015 TABLE OF CONTENTS (CONTINUED) FINANCIAL SECTION (Continued)
Exhibit Page Required Supplementary Information: Schedule of OPEB Funding Progress ................................................................. 11 92 Schedule of Components of and Changes in Net Pension Liability and Related Rations Primary Government ............................................................................. 12 93 Component Unit School Board (nonprofessional) ............................................ 13 94 Schedule of Employer’s Share of Net Pension Liability VRS Teacher Retirement Plan ...... 14 95 Schedule of Employer Contributions ................................................................ 15 96 Notes to Required Supplementary Information .................................................... 16 97 Individual Fund Statements:
Schedule of Revenues, Expenditures and Change in Fund Balances – Budget and Actual - General Fund ........................................................... 17 98 Other Supplementary Information: Combining and Individual Fund Statements and Schedules:
Schedule of Revenues, Expenditures and Change in Fund Balances – Budget and Actual: County Capital Projects Fund – Major Fund ................................................ 18 99 Schedule of Revenues, Expenditures, and Changes in Fund Balances --
Budget and Actual -- Nonmajor Special Revenue Fund ..................................... 19 100 Combining Statement of Fiduciary Net Position – Fiduciary Funds.......................... 20 101 Combining Statement of Changes in Assets and Liabilities – Agency Funds ............... 21 102
Discretely Presented Component Unit – School Board: Balance Sheet ....................................................................................... 22 103 Statement of Revenues, Expenditures, and Changes in Fund Balances
Governmental Funds ............................................................................ 23 104 Schedule of Revenues, Expenditures, and Changes in Fund Balances –
Budget and Actual ................................................................................ 24 105
Schedule Page Supporting Schedules: Schedule of Revenues – Budget and Actual Governmental Funds ............................ 1 106-111
Schedule of Expenditures – Budget and Actual Governmental Funds ........................ 2 112-116

COUNTY OF FRANKLIN, VIRGINIA COMPREHENSIVE ANNUAL FINANCIAL REPORT FISCAL YEAR ENDED JUNE 30, 2015 TABLE OF CONTENTS (CONTINUED)
STATISTICAL SECTION
Table Page Financial Trends: Net Position by Component ....................................................................... 1 117 Changes in Net Position ............................................................................ 2 118-119 Fund Balances of Governmental Funds .......................................................... 3 120 Changes in Fund Balances of Governmental Funds ............................................ 4 121 Revenue Capacity:
General Governmental Tax Revenues by Source ............................................... 5 122 Assessed Value and Estimated Actual Value of Taxable Property ........................... 6 123 Property Tax Rates-Direct and Overlapping Governments ................................... 7 124 Principal Property Taxpayers ..................................................................... 8 125 Property Tax Levies and Collections ............................................................. 9 126
Debt Capacity: Ratios of Outstanding Debt by Type ............................................................. 10 127 Ratio of Net General Bonded Debt to Assessed Value and Net Bonded Debt Per Capita 11 128 Direct and Overlapping Governmental Activities Debt ....................................... 12 129 Legal Debt Margin Information ................................................................... 13 130
Demographic and Economic Information: Demographic and Economic Statistics ........................................................... 14 131 Principal Employers ................................................................................ 15 132 Operating Information: Full-time Equivalent County Government Employees by Function.......................... 16 133 Operating Indicators by Function ................................................................ 17 134 Capital Asset Statistics by Function .............................................................. 18 135
COMPLIANCE SECTION
Page Independent Auditors’ Report on Internal Control over Financial Reporting and
on Compliance and on Other Matters Based on an Audit of Financial Statements Performed in Accordance with Government Auditing Standards ........................... 136-137
Independent Auditors’ Report on Compliance for Each Major Program and on Internal Control over Compliance Required by OMB Circular A-133 .................................. 138-139
Schedule of Expenditures of Federal Awards ...................................................... 140-141 Schedule of Findings and Questioned Costs ........................................................ 142-143

INTRODUCTORY SECTION

December 2, 2015 To the Honorable Chairman, Members of the Board of Supervisors, and Citizens of Franklin County, Virginia: We are pleased to submit Franklin County’s Comprehensive Annual Financial Report (CAFR) for the fiscal year ended June 30, 2015. State law requires that all local governments have their accounts and records audited annually as of June 30 by an independent certified public accountant. This report has been prepared in accordance with the standards of financial reporting as prescribed by the Governmental Accounting Standards Board (GASB) and the Auditor of Public Accounts for the Commonwealth of Virginia.
The CAFR was prepared with an emphasis on full disclosure of the financial activities of the County. Responsibility for both the accuracy of the data, and the completeness and fairness of the presentation, including all disclosures, rests with the government and is based upon a comprehensive framework of internal controls that has been established for this purpose. Because the cost of internal controls should not exceed the anticipated benefits, the objective is to provide reasonable, rather than absolute, assurance that the financial statements are free of any material misstatements.
The auditing firm of Robinson, Farmer, Cox Associates has issued an unqualified opinion on the County’s financial statements as of and for the year ended June 30, 2015. The audit was conducted in accordance with professional standards which require that the independent auditors plan and perform the audit to obtain reasonable assurance about whether the financial statements are free of material misstatement. The independent auditors’ report is located in the front of the financial section of this report.
Under generally accepted accounting principles, as promulgated by the
Governmental Accounting Standards board (GASB), management is required to provide a narrative that precedes the basic financial statements. This Management’s Discussion and Analysis (MD&A) provides an introduction, overview and analysis of financial results for fiscal year 2014-2015, along with summaries of the government wide financial statements that follow. Management’s Discussion and Analysis is contained in the financial section of this report.
-1-

Profile of the Government Within the boundaries of Franklin County lie the independent towns of Rocky Mount and Boones Mill. The County’s population at June 30, 2015 is estimated at 56,793 with a population density of 82.1 people per square mile. Franklin County is included in the Roanoke Metropolitan Statistical Area (MSA) that has a total population of approximately 300,000. The Board of Supervisors is the governing body of the County with one board member representing each of the seven magisterial districts. Board members are elected to four-year terms – a Chairman and Vice-Chairman are selected annually to serve one year terms. The Board appoints a County Administrator to act as the administrative head of the County. All department heads report to the County Administrator. Five constitutional officers (Commissioner of Revenue, Commonwealth’s Attorney, Clerk of the Circuit Court, Sheriff, and Treasurer) are elected by the voters of the County and, although are not accountable to the Board, do work closely with the Board, County Administrator, and other departments. The County provides a full range of services, including public safety and law enforcement, sanitation services, planning and zoning management, recreation and cultural activities, economic development and administrative services. The Franklin County School Board is also part of this reporting entity as a component unit. The annual budget serves as the basis for financial planning and control and is prepared by fund, function, and department. Economic Conditions and Outlook Franklin County, the seventh largest county in size in Virginia with an area of 692 square miles, is located in southwest Virginia. By offering close proximity to all markets along the East coast, the County is an excellent location for local industries and commerce. The local economy remained fairly strong this past fiscal year compared to the national economy with an average unemployment rate of 5.2%. Much of fiscal year 2014-2015 was spent on a number of capital projects including new landfill development and site improvements at the County’s Commerce Center Industrial Park. The County continues to develop its’ park system with various rehab projects being completed at a number of parks. The future economic outlook for Franklin County looks very good. In 2012, Franklin County ranked 12th for job creation and 26th in investment among Virginia’s Counties and Cities. With a stable employment base, easy market access, low construction costs, a quality work force, and excellent quality of life, Franklin County and the region are ready to continue future economic growth. In the years to come, the County will focus on diversifying the employment opportunities within the County by recruiting various technology related companies and traditional manufacturing businesses to utilize the training provided by the local schools and colleges.
-2-

Major Initiatives
During the year, the Franklin Center for Advanced Learning and Enterprise continued to expand its reach to provide employer and employee services in a “One Stop Environment”. The consortium, composed of 15 partners, provides opportunities in employment, training, and education. Representatives from the local school system, colleges, government and community agencies work together to provide workforce development services to the citizens and employers of Franklin County. Franklin County continues to place major emphasis upon the capital needs of the County School System. A five-year School Capital Projects Plan was approved in FY12-13 and includes School roof replacements, paving projects, plumbing fixture upgrades, water system upgrades and security enhancements at various schools. The County is working on various projects to improve our community. In conjunction with the Western Virginia Water Authority, a new water line was constructed that will extend water from the Westlake community to the Burnt Chimney community. Appalachian Power has built new lines to reinforce the electrical grid around Smith Mountain Lake and a land option agreement was just signed on a possible 350 acre business/commercial park in the northern part of the County. For the Future
In conjunction with the Western Virginia Water Authority, the County continues to plan for future expansion of utilities in the County. A wastewater treatment facility in the Westlake area of the County has been operational for several years bringing public sewer to that part of the County.
Public Safety increased its presence in the Westlake area of the County by continuing to staff the Westlake Public Safety complex, a twenty-four hours a day, seven days a week facility that houses on-duty Sheriff’s office and Public Safety personnel. This facility is currently housed in leased space – plans are being developed for a future building to house these operations. Long-Term Financial Planning
Capital Improvement Plan. The Capital Improvement Plan (CIP) is a listing of capital needs projected over a 5-year period for County services. It is a planning document and provides a listing of projects requested by County departments and the School system. The CIP is updated annually. Projects are removed from the plan as they are completed or as priorities change. The plan is intended to assist the County Board of Supervisors in the preparation of the County budget. General Fund Balance (Unassigned). The Board of Supervisors has adopted a policy to keep the unassigned general fund balance at a minimum of two months of general fund operating revenues. Bond rating agencies have also recommended the unassigned general fund balance be maintained at this level. The unassigned general fund balance is 18.1 million for the year ended June 30, 2015. This is a decrease of
-3-

approximately $300,000 from the prior fiscal year and is the result of the County using unassigned fund balance for one-time capital expenditures.
Budgetary Controls. The budget function is used as a management control device during the year for the General Fund, Special Revenue, and Component Unit Funds. The objective of these budgetary controls is to ensure compliance with legal provisions embodied in the annual appropriated budget approved by the County Board of Supervisors. Only the Board of Supervisors can revise the appropriation for each department or category. The County Administrator is authorized to transfer amounts within general governmental departments; however, the School Board and Social Services Board are authorized to transfer amounts within their total appropriated funds. Other Information
Independent Audit. State statutes require an annual audit by independent certified public accountants. The accounting firm of Robinson, Farmer, Cox Associates was selected by the County to perform this audit. In addition to meeting the requirements set forth in state statutes, the audit also was designed to meet the requirements of the Single Audit Act Amendments of 1996 and related OMB Circular A-133. The independent auditors’ report on the general purpose financial statements and combining and individual fund statements and schedules is included in the Financial Section of this report. The auditors reports related specifically to the single audit are included in the Compliance Section.
Awards. The Government Finance Officers Association of the United States and Canada (GFOA) awarded a Certificate of Achievement for Excellence in Financial Reporting to the County of Franklin, Virginia for its comprehensive annual financial report for the fiscal year ended June 30, 2014. This was the 15th consecutive year that Franklin County has achieved this prestigious award. In order to be awarded a Certificate of Achievement, a government must publish an easily readable and efficiently organized comprehensive annual financial report. This report must satisfy both generally accepted accounting principles and applicable legal requirements.
A Certificate of Achievement is valid for a period of one year only. We believe that our current comprehensive annual financial report continues to meet the Certificate of Achievement Program’s requirements and we are submitting it to the GFOA to determine its eligibility for another certificate.
Acknowledgements. In closing, without the leadership and support of the Board of Supervisors of Franklin County, preparation of this report would not have been possible. Sincerely,
W. Brent Robertson Vincent K. Copenhaver, CPA County Administrator Director of Finance
-4-

HISTORICAL SKETCH OF FRANKLIN COUNTY
In the 1740’s, pioneers traveling by river and road from Eastern Virginia and Maryland, and Scotch-Irish and German families coming down the Carolina Road (originally known as the Great Indian Warrior Path) settled in what would become Franklin County, then the western-most county in Virginia. The County was formed in 1786 from parts of Bedford and Henry Counties by an act of the General Assembly. It was named for Benjamin Franklin, then governor of Pennsylvania, where many settlers originated. The County lies in the western piedmont, a diverse terrain ranging from flatlands on the east to rugged peaks of the Blue Ridge on the west. The area was home to Native Americans as early as 10,000 B.C. In the 1600’s an eastern Siouan tribe inhabited the region. Indian relics, arrowheads and artifacts found throughout the County remind us of the original settlers. Since the County’s early beginnings, its citizens have served as gallant soldiers in every war the U.S. has known. Notable Confederate General Jubal A. Early was born in the Red Valley community. He went to West Point for his education, represented Franklin County in the General Assembly, and served as commonwealth’s attorney for many years. Another nationally known native son was Booker T. Washington, a black educator. Born a slave on a plantation near Hales Ford, Booker T. Washington founded the Tuskegee Institute in 1881. His birthplace is a national monument. Agriculture has figured prominently in Franklin County’s 200-year history, and was the occupation of most county residents until recent times. Tobacco was a leading crop in early Franklin County. Locally mined iron and copper were transported over the Carolina Road as far south as Georgia. The furnace of the Washington Ironworks, the County’s oldest landmark, stands as a monument where munitions for the Revolutionary Army were manufactured. A growing animal husbandry industry established Franklin County as one of Virginia’s leading dairy producers. The late nineteenth century saw increasing industrialization. With the entry of the Norfolk and Western railroad in 1892, the Punkin Vine route through the County provided new access for industry. Tobacco factories as well as diversified wood and textile-based industries became significant components of the County’s economy. The development of 2,880 acre Philpott Lake in 1953 and 20,600 acre Smith Mountain Lake in 1966 gave rise to Franklin County’s current designation as the “Land Between the Lakes and the Blue Ridge Mountain.” It is an apt description for a remarkable place – a land of compelling natural beauty, economic stability, recreational abundance, and rich heritage!
-5-

Franklin County Officials June 30, 2015
Board of Supervisors
Cline Brubaker, Chairman, Blackwater District
Charles Wagner, Vice-Chairman, Rocky Mount District Leland Mitchell, Snow Creek District
Bob Camicia, Gills Creek District Ronnie Thompson, Boone District
Bobby Thompson, Blue Ridge District C. B. Reynolds, Union Hall District
County Administration
Richard E. Huff, II, County Administrator
County Attorney ................................................................................................... B. James Jefferson Deputy County Administrator .......................................................................... Christopher Whitlow Director of Finance ............................................................................................ Vincent Copenhaver Director of Economic Development ....................................................................... Michael Burnette Director of Information Technology ............................................................................ Steve Thomas Director of Planning .................................................................................................. Neil Holthouser Director of Public Safety ............................................................................................. Daryl Hatcher Director of General Properties ................................................................................ Michael Thurman Director of Public Works ................................................................................................... Don Smith Director of Park & Recreation ..................................................................................... Paul Chapman Director of Library Services .......................................................................................... Alison Barry Director of Franklin Center .......................................................................................... Kathy Hodges Director of Family Resource Center ...................................................................... Cynthia Treadway Director of Social Services ................................................................................... Deborah K. Powell Chief Building Official .................................................................................................. Andy Morris Unit Coordinator of Va. Cooperative Extension ................................................................. Sean Duff General Registrar ......................................................................................................... Kay Chitwood
Constitutional Officers
Clerk of the Circuit Court ............................................................................................. Teresa Brown Commissioner of the Revenue .............................................................................. Margaret Torrence Commonwealth Attorney .................................................................................................... Tim Allen Sheriff ....................................................................................................................... Bill Overton, Jr. Treasurer .......................................................................................................................... Susan Wray
Franklin County Social Services Board Members
Michael A DeGorgi, Union Hall District Danny Agee, Blackwater District
Charles Wagner, Rocky Mount District/BOS Representative John R. Lipscomb, Boone District
Howard Ferguson, Snow Creek District Richard L. Kleckner, Gills Creek District Martha H. Bowling, Blue Ridge District
-6-

-7-

Franklin County Public Schools June 30, 2015
School Board Members
Sarah Alexander
Chairperson Rocky Mount District
G.B. Washburn, Jr. Vice Chairperson
Snow Creek District
Bill Brush Gills Creek District
Crystal Naff Blackwater District
P.D. Hambrick
Union Hall District Thad Montgomery
Boones District Julie Nix
Blue Ridge District Penny Blue
Member at Large
School Administration Dr. W. Mark Church, Superintendent of Schools
Assistant Superintendent ............................................................ Suzanne M. Rogers Director of Human Resources ............................................................ Phillip L. Poff Director of Business & Finance ......................................................... C. David Tery K-12 Director of Curriculum & Instruction ......................................... Brenda Muse Coordinator of Federal Programs ................................................... Brenda McGrath Coordinator of Testing ..................................................................... Elaine Hawkins Director of Special Programs & Services ............................. Gwendolyn A. Adkins Director of Technology Services K-12 ................................. George F. Washington Coordinator of Student Services/Clerk .......................................... Janet J. Stockton Coordinator School Food Services/Nutrition ..................................... Heather Snead Director of Operations ................................................................ Anthony Patterson Supervisor of Transportation .......................................................... Donna C. Carter Supervisor of Maintenance .......................................................... Darryl K. Spencer Coordinator of Purchasing .................................................................... J. T. Hodges
-8-

Fra
nk
lin
Cou
nty
O
rgan
izat
ion
al
Ch
art-
2015
Soi
l & W
ater
D
istr
ict
Sh
erif
f/E
911/
C
orre
ctio
ns
Com
mis
sion
er
of R
even
ue
Tre
asu
rer
Com
mon
wea
lth
A
ttor
ney
C
lerk
of
Cou
rt
Ele
ctor
al
Boa
rd
Gen
eral
R
egis
trar
Boa
rd o
f Z
onin
g A
pp
eals
Cou
nty
Cit
izen
s
Sch
ool B
oard
C
onst
itu
tion
al
Off
icer
s
Pla
nn
ing
Com
mis
sion
L
ibra
ry
Boa
rd
Rec
. Ad
viso
ry
Com
mis
sion
T
ran
s. S
afet
y C
omm
issi
on
Tri
-Cou
nty
Lak
e A
dm
in. C
omm
. S
ocia
l Ser
vice
s/B
oard
In
du
stri
al
Dev
. R
oad
V
iew
ers
Cou
nty
A
dm
inis
trat
or
Dep
uty
Cou
nty
A
dm
in.
Com
pre
hen
sive
S
ervi
ces
Bu
ild
ing
In
spec
tion
s
Lib
rary
F
amil
y R
esou
rces
Cle
rk t
o B
oard
of
Su
per
viso
rs
HR
/Pol
icy/
T
rain
ing
Par
ks &
R
ecre
atio
n
Wor
kfo
rce
Dev
elop
men
t
Pu
bli
c S
afet
y/
An
imal
Con
trol
G
ener
al
Pro
per
ties
E
con
omic
D
evel
opm
ent
Cir
cuit
C
ourt
Cou
nty
A
ttor
ney
Boa
rd o
f
Su
per
viso
rs
Dev
elop
men
t S
ervi
ces
Pu
bli
c
Wor
ks
Pla
nni
ng/
Com
mu
nit
y D
ev.
Sol
id
Was
te
Agi
ng
Ser
vice
s
Info
rmat
ion
T
ech
./ G
IS
Fin
ance
/Pay
roll
/B
enef
its/
Bu
dge
t
Ag
Dev
elop
men
t T
ouri
sm
-9-

Government Finance Officers Association
Certificate of Achievement
for Excellence in Financial Reporting
Presented to
County of Franklin
Virginia
For its Comprehensive Annual Financial Report
for the Fiscal Year Ended
June 30, 2014
Executive Director/CEO
-10-

FINANCIAL SECTION

ROBINSON, FARMER, COX ASSOCIATES
A PROFESSIONAL LIMITED LIABILITY COMPANY CERTIFIED PUBLIC ACCOUNTANTS
Independent Auditors’ Report
To the Honorable Members of The Board of Supervisors County of Franklin, Virginia Report on the Financial Statements We have audited the accompanying financial statements of the governmental activities, the business-type activities, the discretely presented component unit, each major fund, and the aggregate remaining fund information of the County of Franklin, Virginia, as of and for the year ended June 30, 2015, and the related notes to the financial statements, which collectively comprise the County’s basic financial statements as listed in the table of contents. Management’s Responsibility for the Financial Statements Management is responsible for the preparation and fair presentation of these financial statements in accordance with accounting principles generally accepted in the United States of America; this includes the design, implementation, and maintenance of internal control relevant to the preparation and fair presentation of financial statements that are free from material misstatement, whether due to fraud or error. Auditors’ Responsibility Our responsibility is to express opinions on these financial statements based on our audit. We conducted our audit in accordance with auditing standards generally accepted in the United States of America; the standards applicable to financial audits contained in Government Auditing Standards, issued by the Comptroller General of the United States; and the Specifications for Audits of Counties, Cities, and Towns, issued by the Auditor of Public Accounts of the Commonwealth of Virginia. Those standards require that we plan and perform the audit to obtain reasonable assurance about whether the financial statements are free from material misstatement. An audit involves performing procedures to obtain audit evidence about the amounts and disclosures in the financial statements. The procedures selected depend on the auditors’ judgment, including the assessment of the risks of material misstatement of the financial statements, whether due to fraud or error. In making those risk assessments, the auditor considers internal control relevant to the entity’s preparation and fair presentation of the financial statements in order to design audit procedures that are appropriate in the circumstances, but not for the purpose of expressing an opinion on the effectiveness of the entity’s internal control. Accordingly, we express no such opinion. An audit also includes evaluating the appropriateness of accounting policies used and the reasonableness of significant accounting estimates made by management, as well as evaluating the overall presentation of the financial statements. We believe that the audit evidence we have obtained is sufficient and appropriate to provide a basis for our audit opinions.
-11-

Opinions In our opinion, the financial statements referred to above present fairly, in all material respects, the respective financial position of the governmental activities, the business-type activities, the discretely presented component unit, each major fund, and the aggregate remaining fund information of the County of Franklin, Virginia, as of June 30, 2015, and the respective changes in financial position, and, where applicable, cash flows thereof for the year then ended in accordance with accounting principles generally accepted in the United States of America. Change in Accounting Principle As described in Note 20 to the financial statements, in 2015, the County adopted new accounting guidance, GASB Statement Nos. 68, Accounting and Financial Reporting for Pensions – an amendment of GASB Statement No. 27 and 71, Pension Transition for Contributions Made Subsequent to the Measurement Date – an amendment of GASB Statement No. 68. Our opinion is not modified with respect to this matter. Other Matters Required Supplementary Information Accounting principles generally accepted in the United States of America require that the management’s discussion and analysis, schedules related to pension and OPEB funding, and budgetary comparison information on pages 14-22, 92-97, and 98 be presented to supplement the basic financial statements. Such information, although not a part of the basic financial statements, is required by the Governmental Accounting Standards Board, who considers it to be an essential part of financial reporting for placing the basic financial statements in an appropriate operational, economic, or historical context. We have applied certain limited procedures to the required supplementary information in accordance with auditing standards generally accepted in the United States of America, which consisted of inquiries of management about the methods of preparing the information and comparing the information for consistency with management’s responses to our inquiries, the basic financial statements, and other knowledge we obtained during our audit of the basic financial statements. We do not express an opinion or provide any assurance on the information because the limited procedures do not provide us with sufficient evidence to express an opinion or provide any assurance. The budgetary comparison information has been subjected to the auditing procedures applied in the audit of the basic financial statements and, in our opinion, is fairly stated in all material respects in relation to the basic financial statements taken as a whole. Other Information Our audit was conducted for the purpose of forming opinions on the financial statements that collectively comprise the County of Franklin, Virginia’s basic financial statements. The introductory section, other supplementary information, and statistical section, are presented for purposes of additional analysis and are not a required part of the basic financial statements. The schedule of expenditures of federal awards is presented for purposes of additional analysis as required by U.S. Office of Management and Budget Circular A-133, Audits of States, Local Governments, and Non-Profit Organizations, and is also not a required part of the basic financial statements. The other supplementary information and the schedule of expenditures of federal awards are the responsibility of management and were derived from and relate directly to the underlying accounting and other records used to prepare the basic financial statements. Such information has been subjected to the auditing procedures applied in the audit of the basic financial statements and certain additional procedures, including comparing and reconciling such information directly to the underlying accounting and other records used to prepare the basic financial statements or to the basic financial statements themselves, and other additional procedures in accordance with auditing standards generally accepted in the United States of America. In our opinion, the other supplementary information and the schedule of expenditures of
-12-

federal awards are fairly stated in all material respects in relation to the basic financial statements as a whole. The introductory and statistical sections have not been subjected to the auditing procedures applied in the audit of the basic financial statements and, accordingly, we do not express an opinion or provide any assurance on them. Other Reporting Required by Government Auditing Standards In accordance with Government Auditing Standards, we have also issued our report dated December 2, 2015, on our consideration of the County of Franklin, Virginia’s internal control over financial reporting and on our tests of its compliance with certain provisions of laws, regulations, contracts, and grant agreements and other matters. The purpose of that report is to describe the scope of our testing of internal control over financial reporting and compliance and the results of that testing, and not to provide an opinion on internal control over financial reporting or on compliance. That report is an integral part of an audit performed in accordance with Government Auditing Standards in considering the County of Franklin, Virginia’s internal control over financial reporting and compliance.
Blacksburg, Virginia December 2, 2015
-13-

Management’s Discussion and Analysis
As management of the County of Franklin, Virginia we offer the following discussion and analysis of the County’s financial performance and overview of the County’s financial activities for the fiscal year ended June 30, 2015. We encourage readers to consider the information presented here in conjunction with the additional information that we have furnished in our letter of transmittal. Financial Highlights for Fiscal Year 2014-2015:
The total net position for governmental activities was $67.2 million at the end of FY 2015. This figure is based on assets totaling $128.7 million, deferred outflows of resources of $1.5 million liabilities of $59.8 million, and deferred inflows of resources of $3.2 million. Liabilities include a non-current component for long-term debt associated with the acquisition of assets for the County and School system. The total for assets includes school properties financed with debt (Exhibit 1).
During the year, the County’s taxes and other revenues for governmental programs were $6 million
more than the $77.3 million of expenses (Exhibit 2).
The business-type activities net position at June 30, 2015 totaled $1.3 million. This figure is based on total assets of $1.4 million and liabilities of $67 thousand.
Total general fund revenues were more than the final budgeted amount by $818 thousand or
approximately 1 percent. Actual expenditures were $12.1 million less than the final expenditure budget.
The County’s total outstanding debt increased $8.5 million at fiscal year-end. New debt was issued
for various County projects in the amount of $12.5 million. Debt retirements totaled $4 million. See Note 6 and 7 for additional information on long-term obligations.
Component Unit net position was a deficit of $50.4 million at the end of FY 2015. Of this amount,
$20.3 million is the net investment in capital assets, $112,185 is restricted, and the unrestricted deficit was $70.8 million. The large deficit is from the School Board's share of the net pension liability for the state retirement teacher pool being shown for the first time this past fiscal year in Franklin County's financial statements.
At the end of the current fiscal year, the general fund unassigned fund balance was approximately
$18.1 million. The Board of Supervisors has adopted a policy to keep the unassigned general fund balance at a minimum of two months of general fund operating revenues.
Overview of the Financial Statements This discussion and analysis is intended to serve as an introduction to the County of Franklin’s basic financial statements which comprise three sections: 1) government-wide financial statements, 2) fund financial statements, and 3) notes to the financial statements. This report also contains other supplementary information in addition to the basic financial statements themselves. Government-wide financial statements: The government-wide financial statements are designed to provide readers with a broad overview of the County’s finances, in a manner similar to a private-sector business.
-14-

The statement of net position presents information on all of the County’s assets, deferred outflows, liabilities, and deferred inflows of resources with the difference between the four reported as net position. Over time, increases or decreases in net position may serve as a useful indicator of whether the financial position of the County is improving or deteriorating. The statement of activities presents information showing how the government’s net position changed during the recent fiscal year. All changes in net position are reported as soon as the underlying event giving rise to the change occurs, regardless of the timing of related cash flows. Thus, revenues and expenses are reported in this statement for some items that will result in cash flows in future fiscal periods (e.g., uncollected taxes and earned but unused vacation leave.) Both of the government-wide financial statements distinguish functions of the County that are principally supported by taxes and intergovernmental revenues (governmental activities) from other functions that are intended to recover all or a significant portion of their costs through user fees and charges (business-type activities). The governmental activities of the County include general government, judicial administration, public safety, health and welfare, parks and recreation, libraries, solid waste and community development. The only business-type activity is a small water and sewer system at an existing industrial park. The government-wide financial statements include the County (known as the primary government) as well as activity of the Franklin County School Board known as the component unit). Financial information for this component unit is reported separately from the financial information presented for the primary government. Fund Financial Statements Traditional users of governmental financial statements will find the fund financial statement presentation more familiar. The focus is now on the County’s most significant funds, and the fund financial statements provide more information about these funds – not the County as a whole. The County has three kinds of funds: Governmental funds – Most of the County’s basic services are included in governmental funds, which focus on how cash and other financial assets that can readily be converted to cash flow in and out and the balances left at year end that are available for spending. Consequently, the governmental funds statements report financial resources that can be spent in the near future to finance the County’s programs. Because this information does not encompass the additional long-term focus of the government-wide statements, additional information is provided following the governmental fund statements that explains the relationship (or difference) between them. Proprietary funds – When the County charges customers for the services it provides, these services are generally reported in proprietary funds. Proprietary funds are reported using the full accrual accounting method as are all activities reported in the Statement of Net Position and Statement of Activities. The County’s enterprise fund, one type of proprietary fund, is the same as the government-wide business-type activities; however, the fund financial statements provide more detail and additional information, such as cash flows. The County’s enterprise fund is the Utility Fund. Fiduciary funds – The County is the trustee, or fiduciary, for the County’s agency funds. The County is responsible for ensuring that the assets reported in these funds are used for their intended purposes. All of the County’s fiduciary activities are reported in a separate statement of fiduciary net position and a statement of changes in fiduciary net position. The County excludes these activities from the County’s government-wide financial statements because the County cannot use these assets to finance its operations.
-15-

Notes to the basic financial statements. The notes to the basic financial statements provide additional information that is essential to a full understanding of the data provided in the government-wide and fund financial statements. Required supplementary information. In addition to the basic financial statements and accompanying notes, this report also presents certain required supplementary information concerning the County’s budgetary comparisons and progress in funding its obligation to provide pension and other post employment benefits to its employees. Financial Analysis of the County as a Whole A comparative analysis of government-wide information is as follows: Summary of Net Position: The following table reflects the condensed Statement of Net Position at June 30, 2015 as presented in the government-wide financial statements (in millions):
FY2015 FY2014 FY2015 FY2014 FY2015 FY2014 FY2015 FY2014
Current and other assets 56.8$ 43.2$ 0.3$ 0.2$ 57.1$ 43.4$ 2.6$ 2.1$ Capital assets, net 71.9 71.7 1.1 1.1 73.0 72.8 20.3 20.2
Total assets 128.7$ 114.9$ 1.4$ 1.3$ 130.1$ 116.2$ 22.9$ 22.3$
Deferred outflows of resources 1.5$ -$ -$ -$ 1.5$ -$ 6.0$
Other liabilities 1.2$ 1.4$ 0.1$ -$ 1.3$ 1.4$ 2.0$ 1.7$ Long-term liabilities 58.6 45.3 - - 58.6 45.3 67.1 3.2
Total liabilities 59.8$ 46.7$ 0.1$ -$ 59.9$ 46.7$ 69.1$ 4.9$
Deferred inflows of resources 3.2$ 0.1$ -$ -$ 3.2$ -$ 10.2$ -$
Net position:Net invesment in capital assets 50.2$ 47.8$ 1.1$ 1.1$ 51.3$ 48.9$ 20.3$ 20.1$ Restricted 0.4 0.4 - - 0.4 0.4 0.1 0.2 Unrestricted 16.6 20.0 0.2 0.2 16.8 20.2 (70.8) (3.0)
Total net position 67.2$ 68.2$ 1.3$ 1.3$ 68.5$ 69.5$ (50.4)$ 17.3$
ActivitiesGovernmental
Component UnitGovernmentTotal Primary
ActivitiesBusiness-type
* Prior year balances have not been restated above for the implementation of GASB Nos. 68 and 71.
The County’s combined net position decreased from $69.5 million to $68.5 million as a result of the decrease in net activities of $1.0 million. The decrease is the result of using unrestricted funds for one-time capital projects during the fiscal year. Unrestricted governmental net position, the portion of net position that can be used to finance the day-to-day activities of the County totaled $16.6 million. Net position: net investment in capital assets represents the amount of capital assets owned by the County less any related debt. Net position is reported as restricted when constraints on asset use are externally imposed by creditors, grantors, contributors, regulators, or imposed by law through constitutional provisions or enabling legislation. For example: E911 funds are restricted so that they can be used for E911 purposes. Business-type net position did not change during the fiscal year.
-16-

Component unit net position decreased due to the first time recognition of net pension liability from the state teacher retirement system. Summary of Activities: The following table shows the revenues and expenses of the governmental activities for the year ended June 30, 2015 (in millions):
FY2015 FY2014 FY2015 FY2014 FY2015 FY2014 FY2015 FY2014Revenues:Program revenues:
Charges for Services 3.1$ 3.3$ -$ -$ 3.1$ 3.3$ 2.3$ 2.3$ Operating Grants & Contributions 12.7 12.5 - - 12.7 12.5 46.9 44.6 Capital Grants & Contributions 0.8 0.3 - - 0.8 0.3 - -
Total Program Revenues 16.6$ 16.1$ -$ -$ 16.6$ 16.1$ 49.2$ 46.9$
General Revenues:Property Taxes 48.4$ 46.5$ -$ -$ 48.4$ 46.5$ -$ -$ Other Taxes 9.2 7.8 - - 9.2 7.8 - - Other 9.1 7.0 - - 9.1 7.0 0.7 0.5 Payments from the County - - - - - - 33.4 32.5
Total General Revenues 66.7$ 61.3$ -$ -$ 66.7$ 61.3$ 34.1$ 33.0$
Total Revenues 83.3$ 77.4$ -$ -$ 83.3$ 77.4$ 83.3$ 79.9$
ExpensesGeneral Government Administration 4.2$ 4.6$ -$ -$ 4.2$ 4.6$ -$ -$ Judicial Administration 2.5 2.3 - - 2.5 2.3 - - Public Safety 14.6 14.8 - - 14.6 14.8 - - Public Works 4.9 5.0 - - 4.9 5.0 - - Health and Welfare 11.0 11.0 - - 11.0 11.0 - - Education 33.4 32.5 - - 33.4 32.5 82.4 81.2 Parks, Recreation, and Cultural 2.3 2.0 - - 2.3 2.0 - - Community Development 3.3 3.6 - - 3.3 3.6 - - Interest on Long-Term Debt 1.1 1.0 - - 1.1 1.0 - -
Total Expenses 77.3$ 76.8$ -$ -$ 77.3$ 76.8$ 82.4$ 81.2$
Change in Net Position 6.0$ 0.6$ -$ -$ 6.0$ 0.6$ 0.9$ (1.3)$
Net Position, Beginning, as restated 61.2 67.6 1.3 1.3 69.5 68.9 (51.3) 18.6 Net Position, Ending 67.2$ 68.2$ 1.3$ 1.3$ 75.5$ 69.5$ (50.4)$ 17.3$
ActivitiesGovernmental
Component UnitGovernmentTotal Primary
ActivitiesBusiness-type
* Prior year activity has not been restated above for the implementation of GASB Nos. 68 and 71.
-17-

Revenues For the fiscal year ended June 30, 2015, revenues for governmental activities totaled $83.3 million, an increase of $5.9 million from the prior fiscal year. Property tax revenues, the County’s largest local revenue source, were $48.4 million, an increase of $1.9 million over the prior fiscal year primarily from new construction within the County. The County assesses all real property every four years. The most recent reassessed values were effective January 1, 2012. Other local taxes (including sales taxes, recordation taxes, and meals taxes) were $9.2 million, which was an increase of $1.4 million from FY 2014. The County raised the vehicle license fee during the year to compensate for the reduced fee in the first year of this program. Operating grants and contributions totaled $12.7 million, reflecting a small increase from the prior fiscal year. Additional funds were received for the Comprehensive Services Program from the Commonwealth of Virginia which helped offset additional expenditures of this program. Business-type revenues consist of charges to customers for water consumption. During FY 09-10, almost all of the County’s water systems were transferred to the Western Virginia Water Authority - a regional provider of water and sewer services. The County receives a small amount of water revenue from a system located in one of the County’s Industrial parks. Component unit revenues total $83.3 million, including a $33.4 million payment from the general government. The increase in revenues was due to additional local funds from the general government. Expenses For the fiscal year ended June 30, 2015, expenses for governmental activities totaled $77.3 million. Expenses contain the local county support of the school system. Business-type activities account for the expenses of the County’s small water system at the Commerce Center Industrial Park which serves approximately four commercial customers. Education is a high priority in the Franklin County community; consequently the County contributed $33.4 million to the operation of the Franklin County schools. This amount represented about 43% of the County’s governmental activities expenses. Financial Analysis of the County’s Funds For the fiscal year ended June 30, 2015, the County’s general fund reflects total fund balance of $21.2 million, roughly a decrease of $0.2 million from the fiscal year ended June 30, 2014. The decrease is from the County using fund balance for one-time capital projects. The County Capital Projects fund balance increased from fiscal year 13-14. The County borrowed $12.5 million during fiscal year 14-15 for improvements to the County's public safety radio system. All of this debt issuance remained unspent at June 30, 2015. It is anticipated that these funds will be expended during FY15-16 and early FY16-17. Other Governmental Funds comprise the E911 fund. This fund balance increased slightly from FY 13-14 to FY 14-15.
-18-

General Fund Budgetary Highlights The County’s budget is prepared in accordance with the Code of Virginia. During the year, the County amended the original budget primarily for the following purposes:
To reappropriate grants and other revenues authorized in the prior fiscal year but not expended as of June 30, 2014.
To re-appropriate monies to pay for commitments in the form of encumbrances established prior to June 30, 2014 but not paid by that date.
To appropriate grants and other revenues received in the current fiscal year. The following table presents revenues and expenditures for the General Fund only for FY 14-15 (in millions):
Original Amended
Budget Budget Actual
Revenues:
Taxes 47.3$ 47.7$ 48.8$
Intergovernmental 17.9 18.3 17.9
Other 14.1 14.3 14.4
Total revenues 79.3$ 80.3$ 81.1$
Expenditures:
Expenditures 75.3$ 87.7$ 75.6$
Total expenditures 75.3$ 87.7$ 75.6$
Other financing sources (uses): (4.0)$ 5.2$ (5.7)$
Net change in fund balance (0.0)$ (2.2)$ (0.2)$
Fund balance - beginning 0.7 2.6 21.4
Fund balance - ending 0.7$ 0.4$ 21.2$
A discussion of the budgetary variances between the original budget and the final budget and of the variance between the final budget and the actual results follows. The increase in comparing original budget to final budget in the revenues is found in the budget for intergovernmental revenue and other revenue. Intergovernmental revenues were increased during the year from additional grants being received by the County. There is significant increase in the final budget for expenditures over the original budget primarily due to budgeted capital expenditures not being spent during the fiscal year. These expenditures will be incurred and recognized in future years. Actual revenues were more than anticipated due to the County collecting additional tax revenues generated by small growth in the value of all county property. Actual expenditures were less than the final amended budget because of capital projects being budgeted but not spent during the 2014-2015 fiscal year. It’s the County’s policy for unspent appropriated capital project budgets to carry forward into the next fiscal year so that the project may continue and be completed. In some cases, expenditures on a particular capital project may span multiple fiscal years.
-19-

Capital Assets The following table displays the County and Schools (Component Unit) capital assets at June 30, 2015, in millions of dollars:
FY2015 FY2014 FY2015 FY2014 FY2015 FY2014 FY2015 FY2014
Non-Depreciable Assets:Land 7.4$ 6.5$ -$ -$ 7.4$ 6.5$ 0.7$ 0.7$ Construction in Progress 1.4 1.1 - - 1.4 1.1 0.6 0.2
Other Capital Assets:Buildings and Systems 69.7 71.4 - - 69.7 71.4 37.1 35.1 Infrastructure 6.1 6.1 1.3 1.3 7.4 7.4 - Machinery and Equipment 29.2 25.4 - 29.2 25.4 18.2 17.4 Accumulated Depreciation (41.9) (38.8) (0.2) (0.2) (42.1) (39.0) (36.3) (33.2)
Total 71.9$ 71.7$ 1.1$ 1.1$ 73.0$ 72.8$ 20.3$ 20.2$
ActivitiesGovernmental
Component UnitGovernmentTotal Primary
ActivitiesBusiness-type
The table below shows the change in capital assets for the fiscal year ended June 30, 2015 in millions of dollars:
Balance Additions/ BalanceJune 30, 2014 Deletions June 30, 2015
Non-Depreciable Assets:Land 7.2$ 0.9$ 8.1$ Construction in Progress 1.3 0.7 2.0
Other Capital Assets:Buildings and Systems 106.5 0.3 106.8 Infrastructure 7.4 - 7.4 Machinery and Equipment 42.8 4.6 47.4 Accumulated Depreciation (72.2) (6.2) (78.4)
Total 93.0$ 0.3$ 93.3$
During the FY 14-15 budget process, the Board of Supervisors approved a five-year Capital Improvement Program (CIP) that totaled $3.1 million for FY 14-15. Various projects have been funded in the plan and include software and hardware upgrades for the information technology department, trail, park and field development for the parks and recreation department and $1.1 million for various school projects. Smaller projects make up the balance of the funding and include such items as fire/rescue apparatus replacement and Landfill engineering and development. Additional detailed capital asset information can be found in Note 13 in the “Notes to Financial Statements” section of the report.
-20-

Long Term Obligations The following table displays the County and Schools (Component Unit) Outstanding Debt at June 30, 2015 and at June 30, 2014, in millions of dollars:
FY2015 FY2014 FY2015 FY2014 FY2015 FY2014
General Obligation Bonds 41.8$ 33.2$ 41.8$ 33.2$ -$ -$ Capital Leases 0.3 0.4 0.3 0.4 - - Landfill Closure/Post Closure Liability 9.7 9.6 9.7 9.6 - - Compensated Absences 1.4 1.4 1.4 1.4 0.8 0.9 Other Post Employment Benefits 0.8 0.7 0.8 0.7 2.4 2.3 Net Pension Liability 4.5 - 4.5 - 63.9 -
Total 58.5$ 45.3$ 58.5$ 45.3$ 67.1$ 3.2$
Component UnitGovernmentActivitiesTotal Primary Governmental
* Prior year balances have not been restated above for the implementation of GASB Nos. 68 and 71. Additional detailed information on long-term debt activity can be found in Note 6 and Note 7 in the “Notes to Financial Statements” section of the report. The Franklin County Board of Supervisors adopted the following debt policy on October 10, 1994:
1. Financing should be considered for County assets that are designed to serve the citizens for a period of time in excess of five years with debt issued for a similar period and designed to spread the cost of the asset to all users, both current and future, unless a more feasible alternative exists (grants, gifts, etc.); and
2. Debt issued for the purpose of financing water and sewer projects or other enterprise fund projects will primarily be supported by revenues generated by those projects; and
3. County debt as a percentage of assessments will not exceed 3.5%; and 4. The County’s debt service as a percentage of general government expenditures will not exceed
10%; and 5. The County’s debt per capita will not exceed $1,500 per capita; and 6. Capital leases of longer than three (3) years duration will be included as debt for the purpose of
computing the ratios expressed herein. Franklin County maintains bond ratings of Double A Two (Aa2) from Moody’s Investor’s Services and Double A Plus (AA+) from Standard & Poor’s. Economic Factors and Future Budgets Recent trends and revenue forecasts from the Commonwealth of Virginia indicate that the State is experiencing the same economic slowdown that is impacting our national economy as well. Although Franklin County’s population growth continues to be one of the fastest in the State of Virginia, the County is still very dependent on the State for support of the school system and constitutional officers including the Sheriff’s office. Approximately 49% of total County revenues are from the State of Virginia.
-21-

Factors that are expected to impact future budgets include:
Projected increases in health insurance premiums and retirement contribution rates assessed by the Virginia Retirement System.
Funding for the Capital Improvement Plan. Uncertainty regarding the local and national economy especially including new housing starts. Future State funding for local Constitutional Officers and the School division.
Contacting the County’s Financial Management This financial report is designed to provide our citizens, taxpayers, customers, investors and creditors with a general overview of the County’s finances and to demonstrate the County’s accountability for the resources it receives and their uses. Questions concerning this report or requests for additional financial information should be directed to the Director of Finance, 1255 Franklin Street, Suite 111, Rocky Mount, Virginia 24151, telephone (540) 483-6624. The County’s website address is www.franklincountyva.gov.
-22-

Basic Financial Statements

Exhibit 1
ComponentGovernmental Business-type Unit
Activities Activities Total School Board
ASSETSCash and cash equivalents 31,593,754$ 307,948$ 31,901,702$ 232,235$ Cash in custody of others 17,880,435 - 17,880,435 - Receivables (net of allowance for uncollectibles):
Taxes receivable 1,727,629 - 1,727,629 - Accounts receivable - 655 655 1,245 Other local taxes receivable 266,615 - 266,615 -
Due from other governmental units 5,347,459 - 5,347,459 2,288,934 Restricted assets:
Cash and cash equivalents (in custody of others) - - - 112,185 Capital assets (net of accumulated depreciation):
Land 7,417,979 - 7,417,979 725,315 Buildings and improvements 48,153,727 - 48,153,727 13,844,057 Machinery and equipment 9,660,496 - 9,660,496 5,176,537 Infrastructure 5,330,651 1,069,241 6,399,892 - Construction in progress 1,362,814 - 1,362,814 542,422
Total assets 128,741,559$ 1,377,844$ 130,119,403$ 22,922,930$
DEFFERRED OUTFLOWS OF RESOURCESChange in proportionate share of net pension liability -$ -$ -$ 147,000$ Pension contributions subsequent to measurement date 1,462,651 - 1,462,651 5,898,125
Total deferred outflows of resources 1,462,651$ -$ 1,462,651$ 6,045,125$
LIABILITIESAccounts payable 767,528$ 67,454$ 834,982$ 1,441,355$ Accrued liabilities - - - 612,855 Accrued interest payable 491,476 - 491,476 - Long-term liabilities:
Due within one year 5,634,556 - 5,634,556 603,493 Due in more than one year 52,919,672 - 52,919,672 66,521,225
Total liabilities 59,813,232$ 67,454$ 59,880,686$ 69,178,928$
DEFERRED INFLOWS OF RESOURCESDeferred revenue - prepaid property taxes 26,248$ -$ 26,248$ -$ Items related to measurement of net pension liability 3,125,819 - 3,125,819 10,232,336
Total deferred inflows of resources 3,152,067$ -$ 3,152,067$ 10,232,336$
NET POSITIONNet investment in capital assets 50,269,458$ 1,069,241$ 51,338,699$ 20,288,331$ Restricted:
E-911 158,391 - 158,391 - Law Library 109,364 - 109,364 - Forfeited Assets 31,206 - 31,206 - Courthouse maintenance 66,506 - 66,506 - School cafeteria programs - - - 112,185
Unrestricted (deficit) 16,603,986 241,149 16,845,135 (70,843,725) Total net position 67,238,911$ 1,310,390$ 68,549,301$ (50,443,209)$
The notes to the financial statements are an integral part of this statement.
Primary Government
County of Franklin, VirginiaStatement of Net Position
June 30, 2015
-23-

Exhib
it 2
Oper
atin
gC
apit
alC
ompon
ent
Unit
Char
ges
for
Gra
nts
and
Gra
nts
and
Gov
ernm
enta
lBusi
nes
s-ty
pe
Funct
ions/
Pro
gram
sEx
pen
ses
Serv
ices
Con
trib
uti
ons
Con
trib
uti
ons
Act
ivit
ies
Act
ivit
ies
Tot
alSc
hoo
l Boa
rd
PR
IMA
RY
GO
VER
NM
ENT
:G
over
nmen
tal ac
tivi
ties
:G
ener
al g
over
nmen
t ad
min
istr
atio
n
4,19
7,11
9$
7,10
4$
463,
734
$
-$
(3,7
26,2
81)
$
-$
(3
,726
,281
)$
-$
Ju
dici
al a
dmin
istr
atio
n
2,47
1,93
8
128,
609
95
9,22
3
-
(1,3
84,1
06)
-
(1,3
84,1
06)
-
Publ
ic s
afet
y14
,616
,834
1,78
1,81
1
3,37
0,18
6
497,
704
(8,9
67,1
33)
-
(8,9
67,1
33)
-
Publ
ic w
orks
4,91
1,21
0
888,
773
20
,550
-
(4,0
01,8
87)
-
(4,0
01,8
87)
-
Hea
lth
and
wel
fare
11,0
09,0
49
23,6
30
7,
601,
972
-
(3,3
83,4
47)
-
(3,3
83,4
47)
-
Educ
atio
n33
,439
,404
-
-
-
(33,
439,
404)
-
(33,
439,
404)
-
Park
s, r
ecre
atio
n, a
nd c
ultu
ral
2,28
7,73
0
251,
127
16
1,14
6
31
,130
(1,8
44,3
27)
-
(1,8
44,3
27)
-
Com
mun
ity
deve
lopm
ent
3,29
8,67
1
-
90,3
15
30
3,55
6
(2,9
04,8
00)
-
(2,9
04,8
00)
-
Inte
rest
on
long
-ter
m d
ebt
1,07
1,09
7
-
-
-
(1,0
71,0
97)
-
(1,0
71,0
97)
-
Tot
al g
over
nmen
tal ac
tivi
ties
77,3
03,0
52$
3,08
1,05
4$
12
,667
,126
$
83
2,39
0$
(60,
722,
482)
$
-$
(6
0,72
2,48
2)$
-$
Busi
ness
-typ
e ac
tivi
ties
:
Uti
lity
Fun
d45
,390
$
26,3
15$
-$
-
$
-$
(1
9,07
5)$
(1
9,07
5)$
-
$
Tot
al p
rim
ary
gove
rnm
ent
77,3
48,4
42$
3,
107,
369
$
12
,667
,126
$
83
2,39
0$
(60,
722,
482)
$
(19,
075)
$
(6
0,74
1,55
7)$
-$
CO
MPO
NEN
T U
NIT
S:Sc
hool
Boa
rd82
,425
,510
$
2,
276,
272
$
46
,898
,394
$
-
$
-$
-
$
-
$
(3
3,25
0,84
4)$
Tot
al c
ompo
nent
uni
ts
82,4
25,5
10$
2,
276,
272
$
46
,898
,394
$
-
$
-$
-
$
-
$
(3
3,25
0,84
4)$
Gen
eral
rev
enue
s: G
ener
al p
rope
rty
taxe
s48
,388
,606
$
-$
48
,388
,606
$
-
$
O
ther
loc
al t
axes
: L
ocal
sal
es a
nd u
se t
axes
4,22
2,61
5
-
4,22
2,61
5
-
C
onsu
mer
s' ut
ilit
y ta
xes
979,
527
-
979,
527
-
B
usin
ess
lice
nse
taxe
s
4,07
9
-
4,07
9
-
U
tility
lic
ense
tax
es
239,
118
-
239,
118
-
M
otor
veh
icle
lic
ense
s
1,93
0,60
5
-
1,93
0,60
5
-
B
ank
stoc
k ta
xes
188,
100
-
188,
100
-
E
-911
tax
es1,
150
-
1,15
0
-
T
axes
on
reco
rdat
ion
and
wills
469,
299
-
469,
299
-
H
otel
and
mot
el r
oom
tax
es
88,0
41
-
88,0
41
-
R
esta
uran
t fo
od t
axes
1,04
3,85
1
-
1,04
3,85
1
-
U
nres
tric
ted
reve
nues
fro
m u
se o
f m
oney
and
pro
pert
y
907,
931
-
907,
931
46
4
M
isce
llan
eous
2,92
8,29
2
-
2,92
8,29
2
709,
289
Pa
ymen
ts f
rom
the
Cou
nty
of F
rank
lin,
Vir
gini
a-
-
-
33,4
39,4
04
G
rant
s an
d co
ntri
buti
ons
not
rest
rict
ed t
o sp
ecif
ic p
rogr
ams
5,31
3,28
9
-
5,31
3,28
9
-
Tra
nsfe
rs(1
7,00
0)
17
,000
-
-
Tot
al g
ener
al r
even
ues
and
tran
sfer
s66
,687
,503
$
17,0
00$
66,7
04,5
03$
34
,149
,157
$
Cha
nge
in n
et p
osit
ion
5,96
5,02
1$
(2
,075
)$
5,96
2,94
6$
89
8,31
3$
Net
pos
itio
n -
begi
nnin
g, a
s re
stat
ed61
,273
,890
1,31
2,46
5
62,5
86,3
55
(51,
341,
521)
Net
pos
itio
n -
endi
ng
67,2
38,9
11$
1,
310,
390
$
68
,549
,301
$
(5
0,44
3,20
8)$
The
not
es t
o th
e fi
nanc
ial st
atem
ents
are
an
inte
gral
par
t of
thi
s st
atem
ent.
Net
(Ex
pen
se)
Rev
enue
and
Chan
ges
in N
et P
osit
ion
Pri
mar
y G
over
nm
ent
Cou
nty
of
Fra
nkl
in,
Vir
ginia
Stat
emen
t of
Act
ivit
ies
For
the
Yea
r En
ded
June
30,
2015
Pro
gram
Rev
enues
-24-

Exhibit 3
OtherCounty Capital Governmental
General Projects Funds Total
ASSETSCash and cash equivalents 18,570,506$ 12,869,120$ 154,128$ 31,593,754$ Cash in custody of others - 17,880,435 - 17,880,435 Receivables (net of allowance for uncollectibles):
Taxes receivable 1,727,629 - - 1,727,629 Other local taxes receivable 266,615 - - 266,615
Due from other governmental units 5,337,291 - 10,168 5,347,459 Total assets 25,902,041$ 30,749,555$ 164,296$ 56,815,892$
LIABILITIES, DEFERRED INFLOWS OF RESOURCES, AND FUND BALANCESLIABILITIES
Accounts payable 743,363$ 18,260$ 5,905$ 767,528$ Total liabilities 743,363$ 18,260$ 5,905$ 767,528$
DEFERRED INFLOWS OF RESOURCESUnavailable revenue - prepaid property taxes 26,248$ -$ -$ 26,248$ Unavailable revenue - due from other governments 2,600,916 - - 2,600,916 Unavailable revenue - property taxes 1,325,059 - - 1,325,059
Total deferred inflows of resources 3,952,223$ -$ -$ 3,952,223$
FUND BALANCESRestricted:
E-911 -$ -$ 158,391$ 158,391$ Law Library 109,364 - - 109,364 Forfeited Assets 31,206 - - 31,206 Capital projects - 17,880,435 - 17,880,435 Courthouse maintenance 66,506 - - 66,506
Assigned;Debt service 2,942,604 - - 2,942,604 Capital projects - 12,850,860 - 12,850,860
Unassigned 18,056,775 - - 18,056,775 Total fund balances 21,206,455$ 30,731,295$ 158,391$ 52,096,141$ Total liabilities, deferred inflows of resources and fund balance 25,902,041$ 30,749,555$ 164,296$ 56,815,892$
The notes to the financial statements are an integral part of this statement.
County of Franklin, VirginiaBalance Sheet
Governmental FundsJune 30, 2015
-25-

Exhibit 4
Amounts reported for governmental activities in the statement of net position aredifferent because:
Total fund balances per Exhibit 3 - Balance Sheet - Governmental Funds 52,096,141$
Capital assets used in governmental activities are not financial resources and, therefore,are not reported in the funds.
Land 7,417,979$ Buildings and improvements 48,153,727 Machinery and equipment 9,660,496 Infrastructure 5,330,651 Construction in progress 1,362,814 71,925,667
Other long-term assets are not available to pay for current-period expenditures and,therefore, are deferred in the funds.
Unavailable revenue-Western Virginia Water Authority 2,600,916$ Unavailable revenue-property taxes 1,325,059 Items related to measurement of the net pension liability (3,125,819) 800,156
Pension contributions subsequent to the measurement date will be a reduction tothe net pension liability in the next fiscal year and, therefore, are not reported in the funds. 1,462,651
Long-term liabilities, including bonds payable, are not due and payable in the currentperiod and, therefore, are not reported in the funds.
General obligation bonds (41,671,485)$ Capital leases (264,911) Accrued interest payable (491,476) Unamortized bond premium (170,248) Landfill closure/postclosure liability (9,738,263) Compensated absences (1,424,472) Net OPEB obligation (760,160) Net pension liability (4,524,689) (59,045,704)
Net position of governmental activities 67,238,911$
The notes to the financial statements are an integral part of this statement.
County of Franklin, VirginiaReconciliation of the Balance Sheet of Governmental Funds
To the Statement of Net PositionJune 30, 2015
-26-

Exhibit 5
County OtherCapital Governmental
General Projects Funds TotalREVENUESGeneral property taxes 48,823,104$ -$ -$ 48,823,104$ Other local taxes 9,165,235 - 1,150 9,166,385 Permits, privilege fees, and regulatory licenses 498,402 - - 498,402 Fines and forfeitures 110,271 - - 110,271 Revenue from the use of money and property 891,282 16,649 - 907,931 Charges for services 2,472,381 - - 2,472,381 Miscellaneous 237,089 89,787 500 327,376 Recovered costs 999,921 - - 999,921 Intergovernmental:
Commonwealth 15,013,205 712,390 60,736 15,786,331 Federal 2,906,474 50,000 - 2,956,474
Total revenues 81,117,364$ 868,826$ 62,386$ 82,048,576$
EXPENDITURESCurrent:
General government administration 4,324,399$ -$ -$ 4,324,399$ Judicial administration 2,574,462 - - 2,574,462 Public safety 12,828,160 - 920,920 13,749,080 Public works 3,639,061 - - 3,639,061 Health and welfare 11,525,467 - - 11,525,467 Education 30,532,779 1,193,700 - 31,726,479 Parks, recreation, and cultural 1,936,652 - - 1,936,652 Community development 3,338,880 - - 3,338,880 Nondepartmental 26,674 - - 26,674
Capital projects - 5,171,761 - 5,171,761 Debt service:
Principal retirement 3,810,068 - - 3,810,068 Interest and other fiscal charges 1,103,561 - - 1,103,561 Bond issuance costs - 131,432 - 131,432
Total expenditures 75,640,163$ 6,496,893$ 920,920$ 83,057,976$
Excess (deficiency) of revenues over(under) expenditures 5,477,201$ (5,628,067)$ (858,534)$ (1,009,400)$
OTHER FINANCING SOURCES (USES)Transfers in 1,322,394$ 6,043,848$ 889,425$ 8,255,667$ Transfers out (6,950,273) (1,322,394) - (8,272,667) Issuance of general obligation bonds - 12,500,000 - 12,500,000 Sale of capital assets - 3,000 - 3,000
Total other financing sources (uses) (5,627,879)$ 17,224,454$ 889,425$ 12,486,000$
Net change in fund balances (150,678)$ 11,596,387$ 30,891$ 11,476,600$ Fund balances - beginning 21,357,133 19,134,908 127,500 40,619,541 Fund balances - ending 21,206,455$ 30,731,295$ 158,391$ 52,096,141$
The notes to the financial statements are an integral part of this statement.
County of Franklin, VirginiaStatement of Revenues, Expenditures, and Changes in Fund Balances
Governmental FundsFor the Year Ended June 30, 2015
-27-

Exhibit 6
Amounts reported for governmental activities in the statement of activities are different because:
Net change in fund balances - total governmental funds 11,476,600$
Governmental funds report capital outlays as expenditures. However, in the statement ofactivities the cost of those assets is allocated over their estimated useful lives and reported as depreciation expense. This is the amount by which the capital outlays exceeded depreciation in the current period.
Capital outlays 6,065,452$ Depreciation expenses (4,802,917) 1,262,535
The net effect of various miscellaneous transactions involving capital assets (I.e., sales, trade-ins, anddonations) is to decrease net position. (1,007,511)
Revenues in the statement of activities that do not provide current financial resources arenot reported as revenues in the funds.
Property taxes (434,498)$ Receivable from Western Virginia Water Authority - long term 2,600,916 Change in deferred inflows related to the measurement of the net pension liability (3,125,819) (959,401)
The issuance of long-term debt (e.g. bonds, leases) provides current financial resources to governmental funds, while the repayment of the principal of long-term debt consumes the current financial resources of governmental funds. Neither transaction, however, has any effect on net position. Also, governmental funds report the effect of premiums, discounts, and similar items when debt is first issued, whereas these amounts are deferred and amortized in the statement of activities. This amount is the net effectof these differences in the treatment of long-term debt and related items.
Debt issued or incurred:Issuance of general obligation debt (12,500,000)$
Principal repayments:General obligation bonds and literary loans 3,680,256 Capital leases 129,812
Decrease (increase) in estimated liability:Landfill closure/postclosure liability (143,915) (8,833,847)
Some expenses reported in the statement of activities do not require the use of currentfinancial resources and, therefore are not reported as expenditures in governmental funds.
Change in compensated absenses 14,502$ Change in accrued interest payable 21,391 Amortization of bond premium 142,505 Change in net OPEB obligation (60,000) Change in net pension liability 4,016,628 Change in deferred outflows related to pension payments subsequent to the measurement date (108,381) 4,026,645
Change in net position of governmental activities 5,965,021$
The notes to the financial statements are an integral part of this statement.
For the Year Ended June 30, 2015
County of Franklin, VirginiaReconciliation of Statement of Revenues,
Expenditures, and Changes in Fund Balances of Governmental FundsTo the Statement of Activities
-28-

Exhibit 7
EnterpriseFundUtilityFund
ASSETSCurrent assets:
Cash and cash equivalents 307,948$ Accounts receivable, net of allowance for uncollectibles 655
Total current assets 308,603$
Noncurrent assets:Capital assets:
Infrastructure 1,319,774$ Accumulated depreciation (250,533) Total capital assets 1,069,241$ Total noncurrent assets 1,069,241$ Total assets 1,377,844$
LIABILITIESCurrent liabilities:
Accounts payable 67,454$ Total current liabilities 67,454$ Total liabilities 67,454$
NET POSITIONInvestment in capital assets 1,069,241$ Unrestricted 241,149
Total net position 1,310,390$
The notes to the financial statements are an integral part of this statement.
County of Franklin, VirginiaStatement of Net Position
Proprietary FundJune 30, 2015
-29-

Exhibit 8
EnterpriseFundUtilityFund
OPERATING REVENUESCharges for services:
Water and sewer revenue 21,690$ Connection fees (operating) 4,625
Total operating revenues 26,315$
OPERATING EXPENSESUtilities 3,641$ Professional services 8,904 Depreciation 32,845
Total operating expenses 45,390$
Operating income (loss) (19,075)$
Income before transfers (19,075)$
Transfers in 17,000$
Change in net position (2,075)$
Total net position - beginning 1,312,465 Total net position - ending 1,310,390$
The notes to the financial statements are an integral part of this statement.
County of Franklin, VirginiaStatement of Revenues, Expenses, and Changes in Net Position
Proprietary FundFor the Year Ended June 30, 2015
-30-

Exhibit 9
EnterpriseFundUtilityFund
CASH FLOWS FROM OPERATING ACTIVITIESReceipts from customers and users 26,308$ Payments for materials and supplies 54,768
Net cash provided by (used for) operating activities 81,076$
CASH FLOWS FROM NONCAPITAL FINANCING ACTIVITIESTransfers from other funds 17,000$
Net cash provided by (used for) noncapital financingactivities 17,000$
Net increase (decrease) in cash and cash equivalents 98,076$
Cash and cash equivalents - beginning 209,872 Cash and cash equivalents - ending 307,948$
Reconciliation of operating income (loss) to net cash provided by (used for) operating activities:Operating income (loss) (19,075)$ Adjustments to reconcile operating income (loss) to net cash
provided by (used for) operating activities:Depreciation 32,845$ (Increase) decrease in accounts receivable (7) Increase (decrease) in accounts payable 67,313 Total adjustments 100,151$
Net cash provided by (used for) operating activities 81,076$
The notes to the financial statements are an integral part of this statement.
County of Franklin, VirginiaStatement of Cash Flows
Proprietary FundFor the Year Ended June 30, 2015
-31-

Exhibit 10
AgencyFunds
ASSETSCash and cash equivalents 173,194$ Cash in custody of others 43,272
Total assets 216,466$
LIABILITIESAmounts held for social services clients 13,975$ Amounts held for citizens 17,740 Amounts held for performance bonds 137,479 Amounts held for Library 4,000 Amounts held for inmates 43,272
Total liabilities 216,466$
The notes to the financial statements are an integral part of this statement.
County of Franklin, VirginiaStatement of Fiduciary Net Position
Fiduciary FundsJune 30, 2015
-32-

COUNTY OF FRANKLIN, VIRGINIA NOTES TO FINANCIAL STATEMENTS JUNE 30, 2015 Note 1-Summary of Significant Accounting Policies: The financial statements of the County of Franklin, Virginia (“the County”) conform to generally accepted accounting principles (GAAP) applicable to governmental units promulgated by the Governmental Accounting Standards Board (GASB). The following is a summary of the more significant policies: A. Financial Reporting Entity
The County of Franklin, Virginia (government) is a municipal corporation governed by an elected seven-member Board of Supervisors. The accompanying financial statements present the government and its component unit, entities for which the government is considered to be financially accountable. Blended component units, although legally separate entities, are, in substance, part of the government’s operations. Each discretely presented component unit is reported in a separate column in the government-wide financial statements (see note below for description) to emphasize that it is legally separate from the government.
Blended component units - None
Discretely Presented Component Units - The component unit column in the financial statements include the financial data of the County's discretely presented component units. They are reported in a separate column to emphasize that they are legally separate from the County.
The Franklin County School Board (“the School Board”) operates the elementary and secondary public schools in the County. School Board members are popularly elected. The School Board is fiscally dependent upon the County because the County approves all debt issuances of the School Board and provides significant funding to operate the public schools since the School Board does not have separate taxing powers. The School Board is presented as a governmental fund type. The School Board does not issue separate financial statements. Related Organizations - None Jointly governed organizations to which the County and School Board makes appointments and contributions are listed below:
County:Roanoke Valley Economic Development Partnership $ 117,195Piedmont Community Services 138,838Roanoke Valley Detention Commission 245,525Western Virginia Regional Jail 2,087,213Western Virginia Water Authority N/A
School Board:Roanoke Valley Regional Board 1,353,984
-33-

COUNTY OF FRANKLIN, VIRGINIA NOTES TO FINANCIAL STATEMENTS (CONTINUED) JUNE 30, 2015
Note 1-Summary of Significant Accounting Policies: (continued) B. Government-wide and fund financial statements
The government-wide financial statements (i.e., the statement of net position and the statement of activities) report information on all of the nonfiduciary activities of the primary government and its component unit. For the most part, the effect of interfund activity has been removed from these statements. Governmental activities, which normally are supported by taxes and intergovernmental revenues, are reported separately from business-type activities, which rely to a significant extent on fees and charges for support. Likewise, the primary government is reported separately from certain legally separate component units for which the primary government is financially accountable. The statement of net position is designed to display financial position of the primary government (governmental and business-type activities) and its discretely presented component unit. Governments will report all capital position in the government-wide Statement of Net Position and will report depreciation expense – the cost of “using up” capital assets – in the Statement of Activities. The net position of a government will be broken down into three categories – 1) net investment in capital assets; 2) restricted; and 3) unrestricted. The government-wide statement of activities reports expenses and revenues in a format that focuses on the cost of each of the government’s functions. The expense of individual functions is compared to the revenues generated directly by the function (for instance, through user charges or intergovernmental grants).
The Statement of Activities demonstrates the degree to which the direct expenses of a given function or segment are offset by program revenues. Direct expenses are those that are clearly identifiable with a specific function or segment. Program revenues include 1) charges to customers or applicants who purchase, use, or directly benefit from goods, services, or privileges provided by a given function or segment and 2) grants and contributions that are restricted to meeting the operational or capital requirements of a particular function or segment. Taxes and other items not properly included among program revenues are reported instead as general revenues.
Separate financial statements are provided for governmental funds, proprietary funds, and fiduciary funds, even though the latter is excluded from the government-wide financial statements. Major individual governmental funds and major individual enterprise funds, if any, are reported as separate columns in the fund financial statements.
C. Measurement focus, basis of accounting, and financial statement presentation
The government-wide financial statements are reported using the economic resources measurement focus and the accrual basis of accounting, as are the proprietary fund and fiduciary fund financial statements. Agency funds, which are a type of fiduciary fund do not have a measurement focus and therefore do not use the economic resource measurement focus. Revenues are recorded when earned and expenses are recorded when a liability is incurred, regardless of the timing of related cash flows. Property taxes are recognized as revenues in the year for which they are levied. Grants and similar items are recognized as revenue as soon as all eligibility requirements imposed by the provider have been met.
-34-

COUNTY OF FRANKLIN, VIRGINIA NOTES TO FINANCIAL STATEMENTS (CONTINUED) JUNE 30, 2015 Note 1-Summary of Significant Accounting Policies: (continued) C. Measurement focus, basis of accounting, and financial statement presentation: (continued)
Governmental fund financial statements are reported using the current financial resources measurement focus and the modified accrual basis of accounting. Revenues are recognized as soon as they are both measurable and available. Revenues are considered to be available when they are collectible within the current period or soon enough thereafter to pay liabilities of the current period. For this purpose, the government considers revenues to be available if they are collected within 60 days of the end of the current fiscal period. Expenditures generally are recorded when a liability is incurred, as under accrual accounting. However, debt service expenditures, as well as expenditures related to compensated absences and claims and judgments, are recorded only when payment is due.
Property taxes, franchise taxes, licenses, and interest associated with the current fiscal period are all considered to be susceptible to accrual and so have been recognized as revenues of the current fiscal period. Accordingly, real and personal property taxes are recorded as revenues and receivables when billed, net of allowances for uncollectible amounts. Property taxes not collected within 60 days after year-end are reflected as unavailable revenues. Sales and utility taxes, which are collected by the state or utilities and subsequently remitted to the County, are recognized as revenues and receivables upon collection by the state or utility, which is generally in the month preceding receipt by the County.
Licenses, permits, fines and rents are recorded as revenues when received. Intergovernmental revenues, consisting primarily of federal, state and other grants for the purpose of funding specific expenditures, are recognized when earned or at the time of the specific expenditure. Revenues from general-purpose grants are recognized in the period to which the grant applies. All other revenue items are considered to be measurable and available only when the government receives cash.
The County reports the following major governmental funds: The general fund is the government’s primary operating fund. It accounts for and reports all financial resources of the general government, except those required to be accounted for and reported in other funds. The general fund includes the activities of the Virginia Public Assistance, Law Library, Victim Witness, Landfill Closure, Capital Outlay, Landfill Replacement, Industrial Access, Forfeited Assets, Corporate Drive, Recreation Facilities Improvements, Capital Improvements, Public Safety Capital Improvements, Library Endowment, West Franklin Industrial Access Road, Smith Mountain Lake Park State Grant, and Economic Development Set-aside Funds. The County reports the following major capital projects funds: The County capital projects fund accounts for and reports the financial resources to be used for the acquisition or construction of major capital facilities, other than those financed by the Proprietary Fund and the School Construction Fund. It accounts for and reports financial resources that are restricted, committed, or assigned to expenditure for capital facilities.
-35-

COUNTY OF FRANKLIN, VIRGINIA NOTES TO FINANCIAL STATEMENTS (CONTINUED) JUNE 30, 2015
Note 1-Summary of Significant Accounting Policies: (continued) C. Measurement focus, basis of accounting, and financial statement presentation: (continued)
The County reports the following major proprietary fund: Proprietary funds account for operations that are financed in a manner similar to those found in private business enterprises. The measurement focus is upon determination of net income, financial position, and changes in financial position. Proprietary Funds consist of Enterprise Funds. Enterprise funds account for the financing of services to the general public where all or most of the operating expenses involved are recorded in the form of charges to users of such services. Enterprise Funds consist of the Utility Fund. Activity associated with the County’s water system is accounted for in the Utility Fund.
The government reports the following nonmajor governmental funds:
Special Revenue Funds account for and report the proceeds of specific revenue sources (other than those dedicated for debt service or major capital projects) requiring separate accounting because of legal or regulatory provisions or administrative action. The E-911 Fund is reported as a nonmajor special revenue fund. Additionally, the government reports the following fund types:
Fiduciary funds (Trust and Agency Funds) account for assets held by the government in a trustee capacity or as agent or custodian for individuals, private organizations, other governmental units, or other funds. Agency funds include the Special Welfare, Road Escrow, Escrow Fund for Soil and Erosion Control Agreement, Library, and Inmate Trust and Canteen Account Funds.
As a general rule the effect of interfund activity has been eliminated from the government-wide financial statements. Exceptions to this general rule are charges between departments of the government. Elimination of these charges would distort the direct costs and program revenues reported for the various functions concerned. Amounts reported as program revenues include 1) charges to customers or applicants for goods, services, or privileges provided, 2) operating grants and contributions, and 3) capital grants and contributions, including special assessments. Internally dedicated resources are reported as general revenues rather than as program revenues. Likewise, general revenues include all taxes.
-36-

COUNTY OF FRANKLIN, VIRGINIA NOTES TO FINANCIAL STATEMENTS (CONTINUED) JUNE 30, 2015 Note 1-Summary of Significant Accounting Policies: (continued) C. Measurement focus, basis of accounting, and financial statement presentation: (continued)
Proprietary funds distinguish operating revenues and expenses from nonoperating items. Operating revenues and expenses generally result from providing services and producing and delivering goods in connection with a proprietary fund’s principal ongoing operations. The principal operating revenues of the County’s enterprise fund are charges to customers for sales and services. The County also recognizes as operating revenue the portion of tap fees intended to recover the cost of connecting new customers to the system. Operating expenses for enterprise funds include the cost of sales and services, administrative expense, and depreciation on capital assets. All revenues and expenses not meeting this definition are reported as nonoperating revenues and expenses.
D. Deferred Outflows/Inflows of Resources: In addition to assets, the statement of financial position will sometimes report a separate section for deferred outflows of resources. This separate financial statement element, deferred outflows of resources, represents a consumption of net position that applies to a future period(s) and so will not be recognized as an outflow of resources (expenditure/expense) until then. The County only has one item that qualifies for reporting in this category. It is comprised of certain items related to the measurement of the net pension liability. These include differences between expected and actual experience, change in assumptions, the net difference between projected and actual earnings on pension plan investments and is comprised of contributions to the pension plan made during the current year and subsequent to the net pension liability measurement date, which will be recognized as a reduction of the net pension liability next fiscal year. For more detailed information on these items, reference the pension note. In addition to liabilities, the statement of financial position will sometimes report a separate section for deferred inflows of resources. This separate financial statement element, deferred inflows of resources, represents an acquisition of net position that applies to a future period(s) and so will not be recognized as an inflow of resources (revenue) until that time. The County has two types of items that qualify for reporting in this category. Under a modified accrual basis of accounting, unavailable revenue representing property taxes receivable is reported in the governmental funds balance sheet. This amount is comprised of uncollected property taxes due prior to June 30 and prepaid taxes, which are deferred and recognized as an inflow of resources in the period that the amounts become available. Under the accrual basis, amounts prepaid are reported as deferred inflows of resources. In addition, certain items related to the measurement of the net pension liability are reported as deferred inflows of resources. These include differences between expected and actual experience, change in assumptions, and the net difference between projected and actual earnings on pension plan investments and changes in proportion and differences between employer contributions and proportionate share of contributions. For more detailed information on these items, reference the pension note.
-37-

COUNTY OF FRANKLIN, VIRGINIA NOTES TO FINANCIAL STATEMENTS (CONTINUED) JUNE 30, 2015 Note 1-Summary of Significant Accounting Policies: (continued) E. Assets, liabilities, deferred outflows/inflows of resources and net position/fund balance:
1. Cash and Cash Equivalents The government’s cash and cash equivalents are considered to be cash on hand, demand deposits, and short-term investments with original maturities of three months or less from the date of acquisition.
Investments for the government, as well as for its component unit, are reported at fair value. The State Non-Arbitrage Investment Pool operates in accordance with appropriate state laws and regulations. The reported value of the pool is the same as the fair value of the pool shares.
2. Receivables and payables
Activity between funds that are representative of lending/borrowing arrangements outstanding at the end of the fiscal year are referred to as either “due to/from other funds” (i.e., the current portion of interfund loans) or “advances to/from other funds” (i.e., the non-current portion of interfund loans). All other outstanding balances between funds are reported as “due to/from other funds.” Advances between funds, as reported in the fund financial statements, if any, are offset by nonspendable fund balance in applicable governmental funds to indicate that they are not available for appropriation and are not expendable available financial resources.
3. Property Taxes
Property is assessed at its value on January 1. Property taxes attach as an enforceable lien on property as of January 1. Real estate taxes are payable on December 5th. Personal property taxes are due and collectible annually on December 5th. The County bills and collects its own property taxes.
4. Allowance for Uncollectible Accounts
The County calculates its allowance for uncollectible accounts using historical collection data and, in certain cases, specific account analysis. The allowance amounted to approximately $657,909 at June 30, 2015 and is comprised solely of property taxes.
5. Use of Estimates
The preparation of financial statements in conformity with generally accepted accounting principles requires management to make estimates and assumptions that affect certain reported amounts and disclosures. Accordingly, actual results could differ from those estimates.
-38-

COUNTY OF FRANKLIN, VIRGINIA NOTES TO FINANCIAL STATEMENTS (CONTINUED) JUNE 30, 2015 Note 1-Summary of Significant Accounting Policies: (continued) E. Assets, liabilities, deferred outflows/inflows of resources and net position/fund balance: (continued)
6. Capital assets
Capital assets, which include property, plant, equipment, and infrastructure assets (e.g., roads, bridges, sidewalks, and similar items), are reported in the applicable governmental or business-type columns in the government-wide financial statements. Capital assets are defined by the government as assets with an initial, individual cost of more than $5,000 (amount not rounded) and an estimated useful life in excess of one year. Such assets are recorded at historical cost or estimated historical cost if purchased or constructed. Donated capital assets are recorded at estimated fair market value at the date of donation. The County had no infrastructure that was acquired prior to the implementation of GASB 34.
The cost of normal maintenance and repairs that do not add to the value of the asset or materially extend asset’s life are not capitalized.
Major outlays for capital assets and improvements are capitalized as projects are constructed. Property, plant, and equipment and infrastructure of the primary government, as well as the component unit, is depreciated using the straight line method over the following estimated useful lives:
Assets Years
Buildings 40
Building improvements 10-40
Structures, lines, and accessories 20-40
Machinery and equipment 4-30
7. Compensated Absences
Vested or accumulated vacation leave that is expected to be liquidated with expendable available financial resources is reported as an expenditure and a fund liability of the governmental fund that will pay it. In accordance with the provisions of Government Accounting Standards No. 16, Accounting for Compensated Absences, no liability is recorded for non-vesting accumulating rights to receive sick pay benefits. The County accrues salary-related payments associated with the payment of compensated absences. All vacation pay is accrued when incurred in the government-wide and proprietary fund financial statements. A liability for these amounts is reported in the governmental funds only if they have matured, for example, as a result of employee resignations and retirements.
-39-

COUNTY OF FRANKLIN, VIRGINIA NOTES TO FINANCIAL STATEMENTS (CONTINUED) JUNE 30, 2015
Note 1-Summary of Significant Accounting Policies: (continued) E. Assets, liabilities, deferred outflows/inflows of resources and net position/fund balance: (continued)
8. Pensions
For purposes of measuring the net pension liability, deferred outflows of resources and deferred inflows of resources related to pensions, and pension expense, information about the fiduciary net position of the County’s Retirement Plan and the additions to/deductions from the County’s Retirement Plan’s net fiduciary position have been determined on the same basis as they were reported by the Virginia Retirement System (VRS). For this purpose, benefit payments (including refunds of employee contributions) are recognized when due and payable in accordance with the benefit terms. Investments are reported at fair value.
9. Long-term obligations
In the government-wide financial statements, long-term obligations are reported as liabilities in the applicable governmental activities statement of net position. Bond premiums and discounts are deferred and amortized over the life of the bonds using the effective interest method. Bonds payable are reported net of the applicable bond premium or discount.
In the fund financial statements, governmental fund types recognize bond premiums and discounts during the current period. The face amount of debt issued is reported as other financing sources. Premiums received on debt issuances are reported as other financing sources while discounts on debt issuances are reported as other financing uses.
10. Fund equity
The County reports fund balances in accordance with GASB Statement No. 54, Fund Balance Reporting and Governmental Fund Type Definitions. The County evaluated its funds at June 30, 2015 and classified fund balance into the following five categories:
Nonspendable -items that cannot be spent because they are not in spendable form, such as prepaid items and inventory, or are required to maintained intact (corpus of a permanent fund).
Restricted -items that are restricted by external parties such as creditors or imposed by grants, law or legislation
Committed -The committed fund balance classification includes amounts that can be used only for the specific purposes determined by a formal action of the government’s highest level of decision-making authority. The County Board of Supervisors is the highest level of decision-making authority for the government that can, by adoption of an ordinance prior to the end of the fiscal year, commit fund balance. Once adopted, the limitation imposed by the ordinance remains in place until a similar action is taken (the adoption of another ordinance) to remove or revise the limitation.
-40-

COUNTY OF FRANKLIN, VIRGINIA NOTES TO FINANCIAL STATEMENTS (CONTINUED) JUNE 30, 2015 Note 1-Summary of Significant Accounting Policies: (continued) E. Assets, liabilities, deferred outflows/inflows of resources and net position/fund balance: (continued)
10. Fund equity (continued)
Assigned -Amounts in the assigned fund balance classification are intended to be used by the government for specific purposes but do not meet the criteria to be classified as committed. The County Board of Supervisors (Board) has by resolution authorized the Finance Director to assign fund balance. The Board may also assign fund balance as it does when appropriating fund balance to cover a gap between estimated revenue and appropriations in the subsequent year’s appropriated budget. Unlike commitments, assignments generally only exist temporarily. In other words, an additional action does not normally have to be taken for the removal of an assignment. Conversely, as discussed above, an additional action is essential to either remove or revise a commitment. At year end the assigned fund balance represents an amount necessary to balance the subsequent year’s budget (i.e. budgeted use of reserves). Unassigned -this category is for any balances that have no restrictions placed upon them; positive amounts are only reported in the General Fund.
When fund balance resources are available for a specific purpose in more than one classification, it is the County’s policy to use the most restrictive funds first in the following order: restricted, committed, assigned, and unassigned as they are needed. Minimum fund balance policy - The governing body has adopted a financial policy to maintain a minimum level of unassigned fund balance in the general fund. The target level is set at two months of general fund annual revenues (approximately 16.7%). This amount is intended to provide fiscal stability when economic downturns and other unexpected events occur. If unassigned fund balance falls below the minimum target level because it has been used, essentially as a “revenue” source, as dictated by current circumstances, the policy provides for actions to replenish the amount to the minimum target level.
11. Net Position
Net position is the difference between assets and deferred outflows of resources and liabilities and deferred inflows of resources. Net position is divided into three components:
Net investment in capital assets—consist of the historical cost of capital assets less
accumulated depreciation and less any debt that remains outstanding that was used to finance those assets plus deferred outflows of resources less deferred inflows of resources related to those assets.
Restricted —consist of assets that are restricted by the County’s creditors (for example, through debt covenants), by the state enabling legislation (through restrictions on shared revenues), by grantors (both federal and state), and by other contributors.
Unrestricted—all other net position is reported in this category.
-41-

COUNTY OF FRANKLIN, VIRGINIA NOTES TO FINANCIAL STATEMENTS (CONTINUED) JUNE 30, 2015
Note 1-Summary of Significant Accounting Policies: (continued) E. Assets, liabilities, deferred outflows/inflows of resources and net position/fund balance: (continued)
12. Net Position Flow Assumption Sometimes the County will fund outlays for a particular purpose from both restricted (e.g. restricted bond and grant proceeds) and unrestricted resources. In order to calculate the amounts to report as restricted – net position and unrestricted – net position in the financial statements, a flow assumption must be made about the order in which the resources are considered to be applied. It is the County’s policy to consider restricted – net position to have been depleted before unrestricted – net position is applied.
13. Prepaid Items
Certain payments to vendors reflect costs applicable to future accounting periods and are recorded as prepaid items in both government-wide and fund financial statements. The consumption method is used in governmental funds to report prepaid items.
14. Inventories
All inventories are valued at cost using the first in/first out (FIFO) method. Inventories of governmental funds are recorded as expenditures when purchased.
15. Cash in the Custody of Others
Certain bond proceeds, held by trustee(s) pursuant to the County’s bond agreements, are reported in the financial statements as cash in the custody of others. These funds, totaling $17,880,435 at year end, are expected to be used for capital projects during the next two years.
Note 2-Stewardship, Compliance, and Accountability:
A. Budgetary information
The following procedures are used by the County in establishing the budgetary data reflected in the financial statements:
1. Prior to March 30, the County Administrator submits to the Board of Supervisors a proposed
operating and capital budget for the fiscal year commencing the following July 1. The operating and capital budget includes proposed expenditures and the means of financing them. The following funds have legally adopted budgets: General Fund and the School Operating Fund.
2. Public hearings are conducted to obtain citizen comments.
3. Prior to June 30, the budget is legally enacted through passage of an Appropriations Resolution.
-42-

COUNTY OF FRANKLIN, VIRGINIA NOTES TO FINANCIAL STATEMENTS (CONTINUED) JUNE 30, 2015 Note 2-Stewardship, Compliance, and Accountability: (continued)
A. Budgetary information (continued)
4. The Appropriations Resolution places legal restrictions on expenditures at the function level. Only the Board of Supervisors can revise the appropriation for each department or category. The County Administrator is authorized to transfer budgeted amounts within general government departments; however, the School Board is authorized to transfer budgeted amounts within the school system's categories.
5. Formal budgetary integration is employed as a management control device during the year for
the General Fund, Special Revenue Funds (except the School Fund), and the General Capital Projects Funds. The School Fund and School Capital Projects Fund are integrated only at the level of legal adoption.
6. All budgets are adopted on a basis consistent with generally accepted accounting principles
(GAAP).
7. Appropriations lapse on June 30, for all County units. The County's practice is to appropriate Capital Projects by Project. Several supplemental appropriations were necessary during this fiscal year.
8. Budgetary data presented in the accompanying financial statements is the revised budget as of
June 30, and the original budget adopted by the Board of Supervisors. 9. Encumbrance accounting, under which purchase orders, contracts, and other commitments for
the expenditure of monies are recorded in order to commit that portion of the applicable appropriations, is not part of the County's accounting system.
A. Excess of expenditures over appropriations
There were no expenditures exceeding appropriations for the year ended June 30, 2015. B. Deficit fund equity
At June 30, 2015, there were no funds with deficit fund equity.
-43-

COUNTY OF FRANKLIN, VIRGINIA NOTES TO FINANCIAL STATEMENTS (CONTINUED) JUNE 30, 2015 Note 3-Deposits and Investments: Deposits:
Deposits with banks are covered by the Federal Deposit Insurance Corporation (FDIC) and collateralized in accordance with the Virginia Security for Public Deposits Act (the “Act”), Section 2.2-4400 et. Seq. of the Code of Virginia. Under the Act, banks and savings institutions holding public deposits in excess of the amount insured by the FDIC must pledge collateral to the Commonwealth of Virginia Treasury Board. Financial Institutions may choose between two collateralization methodologies and depending upon that choice, will pledge collateral that ranges in the amounts from 50% to 130% of excess deposits. Accordingly, all deposits are considered fully collateralized.
Investments: Statutes authorize local governments and other public bodies to invest in obligations of the United
States or agencies thereof, obligations of the Commonwealth of Virginia or political subdivisions thereof, obligations of the International Bank for Reconstruction and Development (World Bank), the Asian Development Bank, the African Development Bank, “prime quality” commercial paper and certain corporate notes, bankers acceptances, repurchase agreements, and the State Treasurer's Local Government Investment Pool (LGIP).
Custodial Credit Risk (Investments)
Custodial credit risk is the risk that, in the event of the failure of the counterparty, the County will not be able to recover the value of its investments or collateral securities that are in the possession of an outside party. Neither the County nor its discretely presented component unit has an investment policy for custodial credit risk. As of June 30, 2015, the County and the Component Unit – School Board did not hold any investments that were subject to custodial credit risk.
Concentration of Credit Risk At June 30, 2015, the County did not have any investments meeting the GASB 40 definition requiring
concentration of credit risk disclosures that exceeded 5% of total investments.
Credit Risk of Debt Securities
State law limits investments in commercial paper to holdings rated by at least two of the following: Moody's Investors Service, Inc., within its NCO/Moody's rating of prime 1, by Standard & Poor's, Inc., within its rating of A-1, by Fitch Investor's Services, Inc., within its rating of F-1, by Duff and Phelps, Inc., within its rating of D-1. State law further limits investments in corporate notes and bonds to those with a rating of at least Aa by Moody's Investors Service, Inc., and a rating of at least AA by Standard & Poors, Inc. In addition, State law permits investments in Stocks, bonds, notes, and other evidences of indebtedness of the Commonwealth and those unconditionally guaranteed as to the payment of principal and interest by the Commonwealth. It is the government’s policy to limit its investments to those allowed under State law.
-44-

COUNTY OF FRANKLIN, VIRGINIA NOTES TO FINANCIAL STATEMENTS (CONTINUED) JUNE 30, 2015 Note 3-Deposits and Investments: (continued)
Credit Risk of Debt Securities (continued)
The County’s rated debt investments as of June 30, 2015 were rated by Standard and Poor’s and/or an equivalent national rating organization and the ratings are presented below using the Standard and Poor’s rating scale.
Rated Debt InvestmentsAAAm
SNAP 17,880,435$
County's Rated Debt Investments' Values
Fair Quality Ratings
The State Non-Arbitrage Pool (SNAP) is an open-end management investment company registered with the Securities and Exchange Commission (SEC).
Interest Rate Risk At June 30, 2015, the County did not have any investments meeting the GASB 40 definition requiring
interest rate risk disclosures. Note 4-Due from Other Governmental Units:
The following amounts represent receivables from other governments at year-end:
Primary Component Unit-Government School Board
Local Government:Western Virginia Water Authority $ 2,600,916 $ -
Commonwealth of Virginia:Local sales tax 785,212 - State sales tax - 674,295 Noncategorical aid 464,206 - Categorical aid-shared expenses 414,138 - Categorical aid-VPA funds 181,391 - Categorical aid-CSA funds 614,664 - Other categorical aid 36,238 466,000
Federal Government:Categorical aid-VPA funds 241,846 - Other categorical aid 8,848 1,148,639
Totals $ 5,347,459 $ 2,288,934
-45-

COUNTY OF FRANKLIN, VIRGINIA NOTES TO FINANCIAL STATEMENTS (CONTINUED) JUNE 30, 2015 Note 5-Interfund Transfers: Interfund transfers for the year ended June 30, 2015, consisted of the following:
Transfers In Transfers Out
Primary Government:General Fund $ 1,322,394 $ 6,950,273 Utility Fund 17,000 - County Capital Projects Fund 6,043,848 1,322,394 E-911 Fund 889,425 -
Total $ 8,272,667 $ 8,272,667
Fund
Transfers are used to (1) move revenues from the fund that statute or budget requires to collect them, to the fund that statute or budget requires to expend them and (2) use unrestricted revenues collected in the General Fund to finance various programs accounted for in other funds in accordance with budgeting authorization. The County transfers funds to the Capital Projects Fund and the E-911 Fund as funds are needed to cover capital programs of those funds. Transfers to the Utility Fund are required to cover operating expenses of the fund. Note 6-Long-Term Obligations:
Primary Government - Governmental Activities Obligations: The following is a summary of long-term obligation transactions of the County for the year ended June 30, 2015.
Balance
July 1, 2014, Increases/ Decreases/ Balanceas restated Issuances Retirements June 30, 2015
General ObligationBonds and Notes $ 32,851,741 $ 12,500,000 (3,680,256) $ 41,671,485
Premiums on General Obligation bonds 312,753 - (142,505) 170,248 Capital leases 394,723 - (129,812) 264,911 Landfill closure/postclosure liability 9,594,348 143,915 - 9,738,263 Compensated absences 1,438,974 1,064,728 (1,079,231) 1,424,472 Net OPEB obligation 700,160 103,000 (43,000) 760,160 Net pension liability 8,541,317 5,214,060 (9,230,688) 4,524,689
Total $ 53,834,016 $ 19,025,703 $ (14,305,492) $ 58,554,228
-46-

COUNTY OF FRANKLIN, VIRGINIA NOTES TO FINANCIAL STATEMENTS (CONTINUED) JUNE 30, 2015 Note 6-Long-Term Obligations: (continued) Primary Government - Governmental Activities Obligations: (continued) Annual requirements to amortize long-term debt and related interest are as follows:
Year EndingJune 30, Principal Interest
2016 $ 4,434,636 $ 1,147,172 2017 4,507,234 1,031,835 2018 4,586,472 909,090 2019 4,052,837 785,409 2020 3,771,455 671,121
2021-2025 15,345,451 1,907,941 2026-2031 4,083,401 484,012 2031-2035 889,999 110,598
Totals $ 41,671,485 $ 7,047,178
General Obligation Bonds and Notes
The County has entered into capital leases for a trash compactor and track excavator. These lease agreements qualify as capital leases for accounting purposes and therefore have been recorded at the present value of future minimum lease payments as of the inception date. Total capital assets acquired through capital leases are as follows:
Trash compactor-Landfill 584,653$ Waste Track Type Loader-Landfill 279,894 Total capital assets 864,547$ Accumulated Depreciation (322,123) Net Book Value of Capital Assets 542,424$
Present value of future minimum lease payments:
Year Ending CapitalJune 30, Leases
2016 $ 135,145 2017 135,146
Total minimum lease payments $ 270,291 Less: amount representing interest (5,380)
Present value of future minimum lease payments $ 264,911
-47-

COUNTY OF FRANKLIN, VIRGINIA NOTES TO FINANCIAL STATEMENTS (CONTINUED) JUNE 30, 2015
Note 6-Long-Term Obligations: (continued)
Primary Government - Governmental Activities Obligations: (continued) Details of long-term obligations:
Final Amount of Balance AmountInterest Issue Maturity Original Governmental Due WithinRates Date Date Issue Activities One Year
General Obligation Bonds and Notes:GO bond2 5.0-5.9% 11/16/2000 2021 6,285,526$ 2,121,814$ 337,263$ GO bond2 5.1-6.35% 5/18/2000 2021 3,400,000 1,020,000 170,000 GO bond2 4.1-5.6% 11/10/2004 2025 2,500,000 1,250,000 125,000 GO bond1 3.710% 7/13/2005 2021 6,500,000 1,182,876 184,557 GO bond2 4.225-5.1% 11/9/2006 2027 6,760,943 4,158,954 323,446 GO bond1 3.910% 12/20/2007 2023 4,253,000 2,573,857 290,382 GO bond2 3.910% 12/20/2007 2023 4,897,000 2,962,734 334,238 GO bond3 4.68% 6/12/2009 2035 2,905,000 2,570,000 75,000 GO bond1 2.75% 11/20/2013 2029 8,518,000 8,095,000 479,000 GO bond1 2.15% 11/20/2013 2019 1,226,000 995,000 241,000 Note Payable - WVCC1 0.00% 12/15/2009 2019 1,000,000 400,000 100,000 GO refunding bond2 1.45% 8/27/2012 2018 3,068,750 1,841,250 613,750 GO bond1 1.73% 2/26/2015 2025 12,500,000 12,500,000 1,161,000
Total General Obligation Bonds and Notes 41,671,485$ 4,434,636$
Other Obligations:Landfill Closure/Postclosure Liability 9,738,263$ -$ Capital Leases 264,911 131,566 Premiums on GO Bonds 170,248 - Compensated Absences 1,424,472 1,068,354 Net OPEB Obligation 760,160 - Net Pension Liability 4,524,689 -
Total Other Obligations 16,882,743$ 1,199,920$
Total Long-term obligations 58,554,228$ 5,634,556$ 1 Denotes debt issued for General Government Projects2 Denotes debt issued for School Construction3 Denotes debt issued for Utility Assets transferred to the Western Virginia Water Authority (Operating Debt)
For the governmental activities, landfill closure and postclosure liability, compensated absences, and net OPEB obligation are generally liquidated by the General Fund. At year end, unspent bond proceeds totaled $17,880,435
The remainder of this page left blank intentionally.
-48-

COUNTY OF FRANKLIN, VIRGINIA NOTES TO FINANCIAL STATEMENTS (CONTINUED) JUNE 30, 2015 Note 7-Long-Term Obligations-Component Unit School Board:
Discretely Presented Component Unit-School Board Obligations: The following is a summary of long-term obligation transactions of the Component-Unit School Board for the year ended June 30, 2015.
July 1, 2014, Balanceas restated Increases Decreases June 30, 2015
Compensated absences $ 856,739 $ 590,472 $ (642,554) $ 804,657 Net OPEB obligation 2,186,180 433,000 (222,000) 2,397,180 Net pension liability 73,621,757 6,715,617 (16,414,493) 63,922,881
Total $ 76,664,676 $ 7,739,089 $ (17,279,047) $ 67,124,718
Details of long-term obligations:
Total Amount DueAmount Within One Year
Other Obligations:Compensated absences $ 804,657 $ 603,493 Net OPEB obligation 2,397,180 - Net pension liability 63,922,881 -
Total Long-Term Obligations $ 67,124,718 $ 603,493
For the governmental activities of the discretely presented component unit-School Board, compensated absences, and net OPEB obligation are generally liquidated by the School fund. Note 8-Short-Term Debt: The School Board, through the County, issued a revolving line of credit during the fiscal year in anticipation of contributions from the County government. This anticipation note carried an interest rate of 1.5% and was paid off on July 1, 2014. Short-term debt activity was as follows:
Balance BalanceJuly 1, 2014 Issuances Retirements June 30, 2015
Revenue anticipation note $ 552,425 $ - $ (552,425) $ -
-49-

COUNTY OF FRANKLIN, VIRGINIA NOTES TO FINANCIAL STATEMENTS (CONTINUED) JUNE 30, 2015 Note 9-Pension Plan: Plan Description All full-time, salaried permanent employees of the County and (nonprofessional) employees of public school divisions are automatically covered by VRS Retirement Plan upon employment. This is an agent multiple-employer plan administered by the Virginia Retirement System (the System) along with plans for other employer groups in the Commonwealth of Virginia. Members earn one month of service credit for each month they are employed and for which they and their employer pay contributions to VRS. Members are eligible to purchase prior service, based on specific criteria as defined in the Code of Virginia, as amended. Eligible prior service that may be purchased includes prior public service, active military service, certain periods of leave, and previously refunded service. The System administers three different benefit structures for covered employees – Plan 1, Plan 2, and, Hybrid. Each of these benefit structures has a different eligibility criteria. The specific information for each plan and the eligibility for covered groups within each plan are set out in the table below:
RETIREMENT PLAN PROVISIONS
PLAN 1 PLAN 2 HYBRID RETIREMENT PLAN About Plan 1 Plan 1 is a defined benefit plan. The retirement benefit is based on a member’s age, creditable service and average final compensation at retirement using a formula. Employees are eligible for Plan 1 if their membership date is before July 1, 2010, and they were vested as of January 1, 2013.
About Plan 2 Plan 2 is a defined benefit plan. The retirement benefit is based on a member’s age, creditable service and average final compensation at retirement using a formula. Employees are eligible for Plan 2 if their membership date is on or after July 1, 2010, or their membership date is before July 1, 2010, and they were not vested as of January 1, 2013.
About the Hybrid Retirement Plan The Hybrid Retirement Plan combines the features of a defined benefit plan and a defined contribution plan. Most members hired on or after January 1, 2014 are in this plan, as well as Plan 1 and Plan 2 members who were eligible and opted into the plan during a special election window. (see “Eligible Members”)
• The defined benefit is based on a member’s age, creditable service and average final compensation at retirement using a formula.
• The benefit from the defined contribution component of the plan depends on the member and employer contributions made to the plan and the investment performance of those contributions.
-50-

COUNTY OF FRANKLIN, VIRGINIA NOTES TO FINANCIAL STATEMENTS (CONTINUED) JUNE 30, 2015 Note 9-Pension Plan: (continued) Plan Description (continued)
RETIREMENT PLAN PROVISIONS (CONTINUED)
PLAN 1 PLAN 2 HYBRID RETIREMENT PLAN About Plan 1 (Cont.)
About Plan 2 (Cont.)
About the Hybrid Retirement Plan (Cont.)
• In addition to the monthly benefit payment payable from the defined benefit plan at retirement, a member may start receiving distributions from the balance in the defined contribution account, reflecting the contributions, investment gains or losses, and any required fees.
Eligible Members Employees are in Plan 1 if their membership date is before July 1, 2010, and they were vested as of January 1, 2013. Hybrid Opt-In Election VRS non-hazardous duty covered Plan 1 members were allowed to make an irrevocable decision to opt into the Hybrid Retirement Plan during a special election window held January 1 through April 30, 2014. The Hybrid Retirement Plan’s effective date for eligible Plan 1 members who opted in was July 1, 2014. If eligible deferred members returned to work during the election window, they were also eligible to opt into the Hybrid Retirement Plan.
Eligible Members Employees are in Plan 2 if their membership date is on or after July 1, 2010, or their membership date is before July 1, 2010, and they were not vested as of January 1, 2013. Hybrid Opt-In Election Eligible Plan 2 members were allowed to make an irrevocable decision to opt into the Hybrid Retirement Plan during a special election window held January 1 through April 30, 2014. The Hybrid Retirement Plan’s effective date for eligible Plan 2 members who opted in was July 1, 2014. If eligible deferred members returned to work during the election window, they were also eligible to opt into the Hybrid Retirement Plan
Eligible Members Employees are in the Hybrid Retirement Plan if their membership date is on or after January 1, 2014. This includes:
• Political subdivision employees*
• School division employees • Members in Plan 1 or Plan 2
who elected to opt into the plan during the election window held January 1-April 30, 2014; the plan’s effective date for opt-in members was July 1, 2014.
*Non-Eligible Members Some employees are not eligible to participate in the Hybrid Retirement Plan. They include:
• Political subdivision employees who are covered by enhanced benefits for hazardous duty employees.
-51-

COUNTY OF FRANKLIN, VIRGINIA NOTES TO FINANCIAL STATEMENTS (CONTINUED) JUNE 30, 2015 Note 9-Pension Plan: (continued) Plan Description (continued)
RETIREMENT PLAN PROVISIONS (CONTINUED)
PLAN 1 PLAN 2 HYBRID RETIREMENT PLAN Hybrid Opt-In Election (Cont.) Members who were eligible for an optional retirement plan (ORP) and had prior service under Plan 1 were not eligible to elect the Hybrid Retirement Plan and remain as Plan 1 or ORP.
Hybrid Opt-In Election (Cont.) Members who were eligible for an optional retirement plan (ORP) and have prior service under Plan 2 were not eligible to elect the Hybrid Retirement Plan and remain as Plan 2 or ORP.
*Non-Eligible Members (Cont.) Those employees eligible for an optional retirement plan (ORP) must elect the ORP plan or the Hybrid Retirement Plan. If these members have prior service under Plan 1 or Plan 2, they are not eligible to elect the Hybrid Retirement Plan and must select Plan 1 or Plan 2 (as applicable) or ORP.
Retirement Contributions Employees contribute 5% of their compensation each month to their member contribution account through a pre-tax salary reduction. Some political subdivisions and school divisions elected to phase in the required 5% member contribution but all employees will be paying the full 5% by July 1, 2016. Member contributions are tax-deferred until they are withdrawn as part of a retirement benefit or as a refund. The employer makes a separate actuarially determined contribution to VRS for all covered employees. VRS invests both member and employer contributions to provide funding for the future benefit payment.
Retirement Contributions Employees contribute 5% of their compensation each month to their member contribution account through a pre-tax salary reduction. Some political subdivisions and school divisions elected to phase in the required 5% member contribution but all employees will be paying the full 5% by July 1, 2016.
Retirement Contributions A member’s retirement benefit is funded through mandatory and voluntary contributions made by the member and the employer to both the defined benefit and the defined contribution components of the plan. Mandatory contributions are based on a percentage of the employee’s creditable compensation and are required from both the member and the employer. Additionally, members may choose to make voluntary contributions to the defined contribution component of the plan, and the employer is required to match those voluntary contributions according to specified percentages.
-52-

COUNTY OF FRANKLIN, VIRGINIA NOTES TO FINANCIAL STATEMENTS (CONTINUED) JUNE 30, 2015 Note 9-Pension Plan: (continued) Plan Description (continued)
RETIREMENT PLAN PROVISIONS (CONTINUED)
PLAN 1 PLAN 2 HYBRID RETIREMENT PLAN Creditable Service Creditable service includes active service. Members earn creditable service for each month they are employed in a covered position. It also may include credit for prior service the member has purchased or additional creditable service the member was granted. A member’s total creditable service is one of the factors used to determine their eligibility for retirement and to calculate their retirement benefit. It also may count toward eligibility for the health insurance credit in retirement, if the employer offers the health insurance credit.
Creditable Service Same as Plan 1.
Creditable Service Defined Benefit Component: Under the defined benefit component of the plan, creditable service includes active service. Members earn creditable service for each month they are employed in a covered position. It also may include credit for prior service the member has purchased or additional creditable service the member was granted. A member’s total creditable service is one of the factors used to determine their eligibility for retirement and to calculate their retirement benefit. It also may count toward eligibility for the health insurance credit in retirement, if the employer offers the health insurance credit. Defined Contributions Component: Under the defined contribution component, creditable service is used to determine vesting for the employer contribution portion of the plan.
-53-

COUNTY OF FRANKLIN, VIRGINIA NOTES TO FINANCIAL STATEMENTS (CONTINUED) JUNE 30, 2015 Note 9-Pension Plan: (continued) Plan Description (continued)
RETIREMENT PLAN PROVISIONS (CONTINUED)
PLAN 1 PLAN 2 HYBRID RETIREMENT PLAN Vesting Vesting is the minimum length of service a member needs to qualify for a future retirement benefit. Members become vested when they have at least five years (60 months) of creditable service. Vesting means members are eligible to qualify for retirement if they meet the age and service requirements for their plan. Members also must be vested to receive a full refund of their member contribution account balance if they leave employment and request a refund. Members are always 100% vested in the contributions that they make.
Vesting Same as Plan 1.
Vesting Defined Benefit Component: Defined benefit vesting is the minimum length of service a member needs to qualify for a future retirement benefit. Members are vested under the defined benefit component of the Hybrid Retirement Plan when they reach five years (60 months) of creditable service. Plan 1 or Plan 2 members with at least five years (60 months) of creditable service who opted into the Hybrid Retirement Plan remain vested in the defined benefit component. Defined Contributions Component: Defined contribution vesting refers to the minimum length of service a member needs to be eligible to withdraw the employer contributions from the defined contribution component of the plan. Members are always 100% vested in the contributions that they make.
-54-

COUNTY OF FRANKLIN, VIRGINIA NOTES TO FINANCIAL STATEMENTS (CONTINUED) JUNE 30, 2015 Note 9-Pension Plan: (continued) Plan Description (continued)
RETIREMENT PLAN PROVISIONS (CONTINUED)
PLAN 1 PLAN 2 HYBRID RETIREMENT PLAN Vesting (Cont.)
Vesting (Cont.)
Vesting (Cont.) Defined Contributions Component: (Cont.) Upon retirement or leaving covered employment, a member is eligible to withdraw a percentage of employer contributions to the defined contribution component of the plan, based on service.
• After two years, a member is 50% vested and may withdraw 50% of employer contributions.
• After three years, a member is 75% vested and may withdraw 75% of employer contributions.
• After four or more years, a member is 100% vested and may withdraw 100% of employer contributions.
Distribution is not required by law until age 70½.
Calculating the Benefit The Basic Benefit is calculated based on a formula using the member’s average final compensation, a retirement multiplier and total service credit at retirement. It is one of the benefit payout options available to a member at retirement.
Calculating the Benefit See definition under Plan 1.
Calculating the Benefit Defined Benefit Component: See definition under Plan 1
-55-

COUNTY OF FRANKLIN, VIRGINIA NOTES TO FINANCIAL STATEMENTS (CONTINUED) JUNE 30, 2015 Note 9-Pension Plan: (continued) Plan Description (continued)
RETIREMENT PLAN PROVISIONS (CONTINUED)
PLAN 1 PLAN 2 HYBRID RETIREMENT PLAN Calculating the Benefit (Cont.) An early retirement reduction factor is applied to the Basic Benefit if the member retires with a reduced retirement benefit or selects a benefit payout option other than the Basic Benefit.
Calculating the Benefit (Cont.)
Calculating the Benefit (Cont.) Defined Contribution Component: The benefit is based on contributions made by the member and any matching contributions made by the employer, plus net investment earnings on those contributions.
Average Final Compensation A member’s average final compensation is the average of the 36 consecutive months of highest compensation as a covered employee.
Average Final Compensation A member’s average final compensation is the average of their 60 consecutive months of highest compensation as a covered employee.
Average Final Compensation Same as Plan 2. It is used in the retirement formula for the defined benefit component of the plan.
Service Retirement Multiplier VRS: The retirement multiplier is a factor used in the formula to determine a final retirement benefit. The retirement multiplier for non-hazardous duty members is 1.70%. Sheriffs and regional jail superintendents: The retirement multiplier for sheriffs and regional jail superintendents is 1.85%. Political subdivision hazardous duty employees: The retirement multiplier of eligible political subdivision hazardous duty employees other than sheriffs and regional jail superintendents is 1.70% or 1.85% as elected by the employer.
Service Retirement Multiplier VRS: Same as Plan 1 for service earned, purchased or granted prior to January 1, 2013. For non-hazardous duty members the retirement multiplier is 1.65% for creditable service earned, purchased or granted on or after January 1, 2013. Sheriffs and regional jail superintendents: Same as Plan 1. Political subdivision hazardous duty employees: Same as Plan 1.
Service Retirement Multiplier Defined Benefit Component: VRS: The retirement multiplier for the defined benefit component is 1.00%. For members who opted into the Hybrid Retirement Plan from Plan 1 or Plan 2, the applicable multipliers for those plans will be used to calculate the retirement benefit for service credited in those plans. Sheriffs and regional jail superintendents: Not applicable. Political subdivision hazardous duty employees: Not applicable. Defined Contribution Component: Not applicable.
-56-

COUNTY OF FRANKLIN, VIRGINIA NOTES TO FINANCIAL STATEMENTS (CONTINUED) JUNE 30, 2015 Note 9-Pension Plan: (continued) Plan Description (continued)
RETIREMENT PLAN PROVISIONS (CONTINUED)
PLAN 1 PLAN 2 HYBRID RETIREMENT PLAN
Normal Retirement Age VRS: Age 65. Political subdivisions hazardous duty employees: Age 60.
Normal Retirement Age VRS: Normal Social Security retirement age. Political subdivisions hazardous duty employees: Same as Plan 1.
Normal Retirement Age Defined Benefit Component: VRS: Same as Plan 2. Political subdivisions hazardous duty employees: Not applicable. Defined Contribution Component: Members are eligible to receive distributions upon leaving employment, subject to restrictions.
Earliest Unreduced Retirement Eligibility VRS: Age 65 with at least five years (60 months) of creditable service or at age 50 with at least 30 years of creditable service. Political subdivisions hazardous duty employees: Age 60 with at least five years of creditable service or age 50 with at least 25 years of creditable service.
Earliest Unreduced Retirement Eligibility VRS: Normal Social Security retirement age with at least five years (60 months) of creditable service or when their age and service equal 90. Political subdivisions hazardous duty employees: Same as Plan 1.
Earliest Unreduced Retirement Eligibility Defined Benefit Component: VRS: Normal Social Security retirement age and have at least five years (60 months) of creditable service or when their age and service equal 90. Political subdivisions hazardous duty employees: Not applicable. Defined Contribution Component: Members are eligible to receive distributions upon leaving employment, subject to restrictions.
Earliest Reduced Retirement Eligibility VRS: Age 55 with at least five years (60 months) of creditable service or age 50 with at least 10 years of creditable service.
Earliest Reduced Retirement Eligibility VRS: Age 60 with at least five years (60 months) of creditable service.
Earliest Reduced Retirement Eligibility Defined Benefit Component: VRS: Members may retire with a reduced benefit as early as age 60 with at least five years (60 months) of creditable service.
-57-

COUNTY OF FRANKLIN, VIRGINIA NOTES TO FINANCIAL STATEMENTS (CONTINUED) JUNE 30, 2015 Note 9-Pension Plan: (continued) Plan Description (continued)
RETIREMENT PLAN PROVISIONS (CONTINUED)
PLAN 1 PLAN 2 HYBRID RETIREMENT PLAN Earliest Reduced Retirement Eligibility (Cont.) Political subdivisions hazardous duty employees: 50 with at least five years of creditable service.
Earliest Reduced Retirement Eligibility (Cont.) Political subdivisions hazardous duty employees: Same as Plan 1.
Earliest Reduced Retirement Eligibility (Cont.) Political subdivisions hazardous duty employees: Not applicable. Defined Contribution Component: Members are eligible to receive distributions upon leaving employment, subject to restrictions.
Cost-of-Living Adjustment (COLA) in Retirement The Cost-of-Living Adjustment (COLA) matches the first 3% increase in the Consumer Price Index for all Urban Consumers (CPI-U) and half of any additional increase (up to 4%) up to a maximum COLA of 5%. Eligibility: For members who retire with an unreduced benefit or with a reduced benefit with at least 20 years of creditable service, the COLA will go into effect on July 1 after one full calendar year from the retirement date.
For members who retire with a reduced benefit and who have less than 20 years of creditable service, the COLA will go into effect on July 1 after one calendar year following the unreduced retirement eligibility date.
Cost-of-Living Adjustment (COLA) in Retirement The Cost-of-Living Adjustment (COLA) matches the first 2% increase in the CPI-U and half of any additional increase (up to 2%), for a maximum COLA of 3%. Eligibility: Same as Plan 1.
Cost-of-Living Adjustment (COLA) in Retirement Defined Benefit Component: Same as Plan 2. Defined Contribution Component: Not applicable. Eligibility: Same as Plan 1 and Plan 2.
-58-

COUNTY OF FRANKLIN, VIRGINIA NOTES TO FINANCIAL STATEMENTS (CONTINUED) JUNE 30, 2015 Note 9-Pension Plan: (continued) Plan Description (continued)
RETIREMENT PLAN PROVISIONS (CONTINUED)
PLAN 1 PLAN 2 HYBRID RETIREMENT PLAN Cost-of-Living Adjustment (COLA) in Retirement (Cont.) Exceptions to COLA Effective Dates: The COLA is effective July 1 following one full calendar year (January 1 to December 31) under any of the following circumstances:
• The member is within five years of qualifying for an unreduced retirement benefit as of January 1, 2013.
• The member retires on disability.
• The member retires directly from short-term or long-term disability under the Virginia Sickness and Disability Program (VSDP).
• The member is involuntarily separated from employment for causes other than job performance or misconduct and is eligible to retire under the Workforce Transition Act or the Transitional Benefits Program.
• The member dies in service and the member’s survivor or beneficiary is eligible for a monthly death-in-service benefit. The COLA will go into effect on July 1 following one full calendar year (January 1 to December 31) from the date the monthly benefit begins.
Cost-of-Living Adjustment (COLA) in Retirement (Cont.) Exceptions to COLA Effective Dates: Same as Plan 1.
Cost-of-Living Adjustment (COLA) in Retirement (Cont.) Exceptions to COLA Effective Dates: Same as Plan 1 and Plan 2.
-59-

COUNTY OF FRANKLIN, VIRGINIA NOTES TO FINANCIAL STATEMENTS (CONTINUED) JUNE 30, 2015 Note 9-Pension Plan: (continued) Plan Description (continued)
RETIREMENT PLAN PROVISIONS (CONTINUED)
PLAN 1 PLAN 2 HYBRID RETIREMENT PLAN
Disability Coverage Members who are eligible to be considered for disability retirement and retire on disability, the retirement multiplier is 1.7% on all service, regardless of when it was earned, purchased or granted.
VSDP members are subject to a one-year waiting period before becoming eligible for non-work-related disability benefits.
Disability Coverage Members who are eligible to be considered for disability retirement and retire on disability, the retirement multiplier is 1.65% on all service, regardless of when it was earned, purchased or granted.
VSDP members are subject to a one-year waiting period before becoming eligible for non-work related disability benefits.
Disability Coverage Employees of political subdivisions and School divisions (including Plan 1 and Plan 2 opt-ins) participate in the Virginia Local Disability Program (VLDP) unless their local governing body provides an employer-paid comparable program for its members.
Hybrid members (including Plan 1 and Plan 2 opt-ins) covered under VLDP are subject to a one-year waiting period before becoming eligible for non-work-related disability benefits.
Purchase of Prior Service Members may be eligible to purchase service from previous public employment, active duty military service, an eligible period of leave or VRS refunded service as creditable service in their plan. Prior creditable service counts toward vesting, eligibility for retirement and the health insurance credit. Only active members are eligible to purchase prior service. When buying service, members must purchase their most recent period of service first. Members also may be eligible to purchase periods of leave without pay.
Purchase of Prior Service Same as Plan 1.
Purchase of Prior Service Defined Benefit Component: Same as Plan 1, with the following exceptions:
Hybrid Retirement Plan members are ineligible for ported service.
The cost for purchasing refunded service is the higher of 4% of creditable compensation or average final compensation.
Plan members have one year from their date of hire or return from leave to purchase all but refunded prior service at approximate normal cost. After that one-year period, the rate for most categories of service will change to actuarial cost.
Defined Contribution Component: Not applicable.
-60-
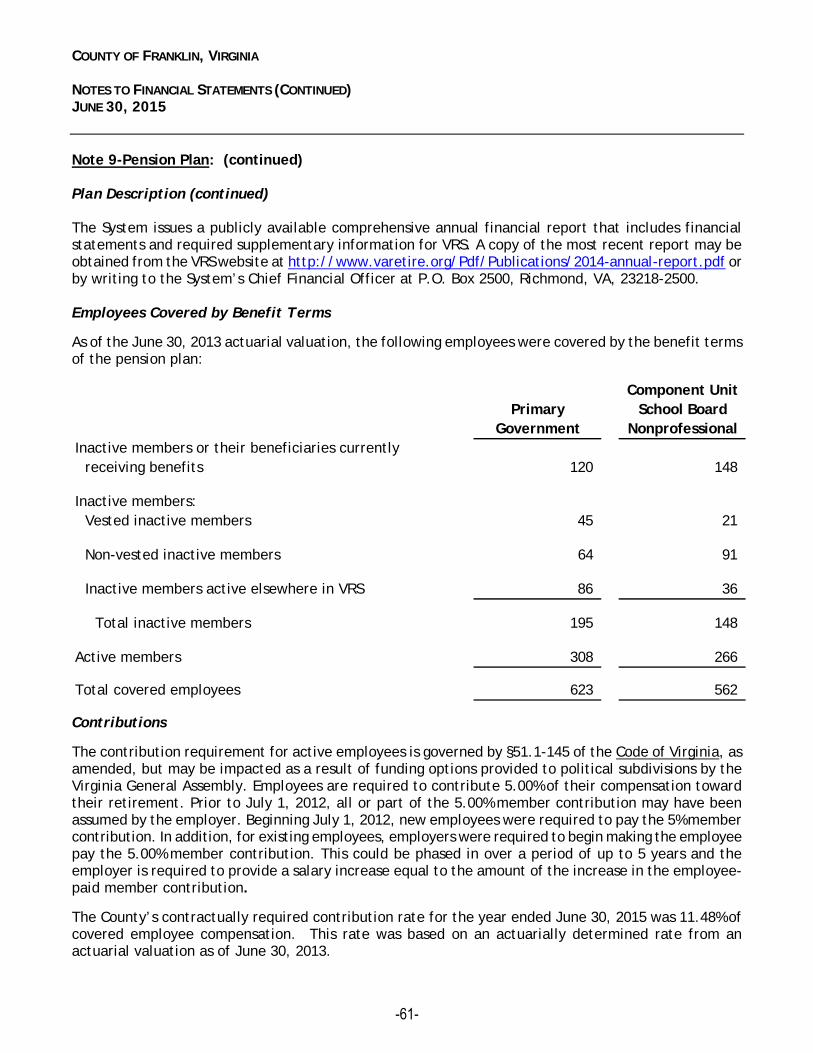
COUNTY OF FRANKLIN, VIRGINIA NOTES TO FINANCIAL STATEMENTS (CONTINUED) JUNE 30, 2015 Note 9-Pension Plan: (continued) Plan Description (continued) The System issues a publicly available comprehensive annual financial report that includes financial statements and required supplementary information for VRS. A copy of the most recent report may be obtained from the VRS website at http://www.varetire.org/Pdf/Publications/2014-annual-report.pdf or by writing to the System’s Chief Financial Officer at P.O. Box 2500, Richmond, VA, 23218-2500. Employees Covered by Benefit Terms
As of the June 30, 2013 actuarial valuation, the following employees were covered by the benefit terms of the pension plan:
Component UnitPrimary School Board
Government NonprofessionalInactive members or their beneficiaries currently
receiving benefits 120 148
Inactive members:Vested inactive members 45 21
Non-vested inactive members 64 91
Inactive members active elsewhere in VRS 86 36
Total inactive members 195 148
Active members 308 266
Total covered employees 623 562
Contributions
The contribution requirement for active employees is governed by §51.1-145 of the Code of Virginia, as amended, but may be impacted as a result of funding options provided to political subdivisions by the Virginia General Assembly. Employees are required to contribute 5.00% of their compensation toward their retirement. Prior to July 1, 2012, all or part of the 5.00% member contribution may have been assumed by the employer. Beginning July 1, 2012, new employees were required to pay the 5% member contribution. In addition, for existing employees, employers were required to begin making the employee pay the 5.00% member contribution. This could be phased in over a period of up to 5 years and the employer is required to provide a salary increase equal to the amount of the increase in the employee-paid member contribution.
The County’s contractually required contribution rate for the year ended June 30, 2015 was 11.48% of covered employee compensation. This rate was based on an actuarially determined rate from an actuarial valuation as of June 30, 2013.
-61-

COUNTY OF FRANKLIN, VIRGINIA NOTES TO FINANCIAL STATEMENTS (CONTINUED) JUNE 30, 2015
Note 9-Pension Plan: (continued) Contributions (continued) This rate, when combined with employee contributions, was expected to finance the costs of benefits earned by employees during the year, with an additional amount to finance any unfunded accrued liability. Contributions to the pension plan from the County were $1,462,651 and $1,571,032 for the years ended June 30, 2015 and June 30, 2014, respectively. The Component Unit School Board’s contractually required contribution rate for nonprofessional employees for the year ended June 30, 2015 was 9.41% of covered employee compensation. This rate was based on an actuarially determined rate from an actuarial valuation as of June 30, 2013. This rate, when combined with employee contributions, was expected to finance the costs of benefits earned by employees during the year, with an additional amount to finance any unfunded accrued liability. Contributions to the pension plan from the Component Unit School Board’s nonprofessional employees were $393,357 and $395,872 for the years ended June 30, 2015 and June 30, 2014, respectively. Net Pension Liability The County’s and Component Unit School Board’s (nonprofessional) net pension liabilities were measured as of June 30, 2014. The total pension liabilities used to calculate the net pension liabilities were determined by an actuarial valuation performed as of June 30, 2013, using updated actuarial assumptions, applied to all periods included in the measurement and rolled forward to the measurement date of June 30, 2014. Actuarial Assumptions – General Employees The total pension liability for General Employees in the County’s and Component Unit School Board’s (nonprofessional) Retirement Plan was based on an actuarial valuation as of June 30, 2013, using the Entry Age Normal actuarial cost method and the following assumptions, applied to all periods included in the measurement and rolled forward to the measurement date of June 30, 2014.
Inflation 2.5%
Salary increases, including inflation 3.5% – 5.35%
Investment rate of return 7.0%, net of pension plan investmentexpense, including inflation*
* Administrative expenses as a percent of the market value of assets for the last experience study were found to be approximately 0.06% of the market assets for all of the VRS plans. This would provide an assumed investment return rate for GASB purposes of slightly more than the assumed 7.0%. However, since the difference was minimal, and a more conservative 7.0% investment return assumption provided a projected plan net position that exceeded the projected benefit payments, the long-term expected rate of return on investments was assumed to be 7.0% to simplify preparation of pension liabilities.
-62-

COUNTY OF FRANKLIN, VIRGINIA NOTES TO FINANCIAL STATEMENTS (CONTINUED) JUNE 30, 2015 Note 9-Pension Plan: (continued) Actuarial Assumptions – General Employees (continued) Mortality rates: 14% of deaths are assumed to be service related
Largest 10 – Non-LEOS: Pre-Retirement:
RP-2000 Employee Mortality Table Projected with Scale AA to 2020 with males set forward 4 years and females set back 2 years
Post-Retirement:
RP-2000 Combined Mortality Table Projected with Scale AA to 2020 with males set forward 1 year
Post-Disablement: RP-2000 Disability Life Mortality Table Projected to 2020 with males set back 3 years and no provision for future mortality improvement
All Others (Non 10 Largest) – Non-LEOS: Pre-Retirement: RP-2000 Employee Mortality Table Projected with Scale AA to 2020 with males set forward 4 years and females set back 2 years
Post-Retirement: RP-2000 Combined Mortality Table Projected with Scale AA to 2020 with males set forward 1 year
Post-Disablement: RP-2000 Disability Life Mortality Table Projected to 2020 with males set back 3 years and no provision for future mortality improvement
The actuarial assumptions used in the June 30, 2013 valuation were based on the results of an actuarial experience study for the period from July 1, 2008 through June 30, 2012. Changes to the actuarial assumptions as a result of the experience study are as follows:
Largest 10 – Non-LEOS: - Update mortality table - Decrease in rates of service retirement
- Decrease in rates of disability retirement - Reduce rates of salary increase by 0.25% per year
All Others (Non 10 Largest) – Non-LEOS: - Update mortality table - Decrease in rates of service retirement - Decrease in rates of disability retirement - Reduce rates of salary increase by 0.25% per year
-63-

COUNTY OF FRANKLIN, VIRGINIA NOTES TO FINANCIAL STATEMENTS (CONTINUED) JUNE 30, 2015 Note 9-Pension Plan: (continued) Actuarial Assumptions – Public Safety Employees The total pension liability for Public Safety employees in the County’s Retirement Plan was based on an actuarial valuation as of June 30, 2013, using the Entry Age Normal actuarial cost method and the following assumptions, applied to all periods included in the measurement and rolled forward to the measurement date of June 30, 2014.
Inflation 2.5%
Salary increases, including inflation 3.5% – 4.75%
Investment rate of return 7.0%, net of pension plan investmentexpense, including inflation*
* Administrative expenses as a percent of the market value of assets for the last experience study were found to be approximately 0.06% of the market assets for all of the VRS plans. This would provide an assumed investment return rate for GASB purposes of slightly more than the assumed 7.0%. However, since the difference was minimal, and a more conservative 7.0% investment return assumption provided a projected plan net position that exceeded the projected benefit payments, the long-term expected rate of return on investments was assumed to be 7.0% to simplify preparation of pension liabilities. Mortality rates: 60% of deaths are assumed to be service related
Largest 10 – Non-LEOS: Pre-Retirement:
RP-2000 Employee Mortality Table Projected with Scale AA to 2020 with males set back 2 years and females set back 2 years
Post-Retirement: RP-2000 Combined Mortality Table Projected with Scale AA to 2020 with males set forward 1 year
Post-Disablement:
RP-2000 Disability Life Mortality Table Projected to 2020 with males set back 3 years and no provision for future mortality improvement
All Others (Non 10 Largest) – Non-LEOS:
Pre-Retirement: RP-2000 Employee Mortality Table Projected with Scale AA to 2020 with males set back 2 years and females set back 2 years
Post-Retirement:
RP-2000 Combined Mortality Table Projected with Scale AA to 2020 with males set forward 1 year
Post-Disablement: RP-2000 Disability Life Mortality Table Projected to 2020 with males set back 3 years and no provision for future mortality improvement
-64-

COUNTY OF FRANKLIN, VIRGINIA NOTES TO FINANCIAL STATEMENTS (CONTINUED) JUNE 30, 2015 Note 9-Pension Plan: (continued) Actuarial Assumptions – Public Safety Employees (continued) The actuarial assumptions used in the June 30, 2013 valuation were based on the results of an actuarial experience study for the period from July 1, 2008 through June 30, 2012. Changes to the actuarial assumptions as a result of the experience study are as follows:
Largest 10 – LEOS: - Update mortality table - Decrease in male rates of disability
All Others (Non 10 Largest) – LEOS:
- Update mortality table - Adjustments to rates of service retirement for females - Increase in rates of withdrawal - Decrease in male and female rates of disability
The remainder of this page left blank intentionally.
-65-

COUNTY OF FRANKLIN, VIRGINIA NOTES TO FINANCIAL STATEMENTS (CONTINUED) JUNE 30, 2015 Note 9-Pension Plan: (continued) Long-Term Expected Rate of Return The long-term expected rate of return on pension System investments was determined using a log-normal distribution analysis in which best-estimate ranges of expected future real rates of return (expected returns, net of pension System investment expense and inflation) are developed for each major asset class. These ranges are combined to produce the long-term expected rate of return by weighting the expected future real rates of return by the target asset allocation percentage and by adding expected inflation. The target asset allocation and best estimate of arithmetic real rates of return for each major asset class are summarized in the following table:
WeightedArithmetic AverageLong-Term Long-Term
Target Expected ExpectedAsset Class (Strategy) Allocation Rate of Return Rate of Return
U.S. Equity 19.50% 6.46% 1.26%Developed Non U.S. Equity 16.50% 6.28% 1.04%Emerging Market Equity 6.00% 10.00% 0.60%Fixed Income 15.00% 0.09% 0.01%Emerging Debt 3.00% 3.51% 0.11%Rate Sensitive Credit 4.50% 3.51% 0.16%Non Rate Sensitive Credit 4.50% 5.00% 0.23%Convertibles 3.00% 4.81% 0.14%Public Real Estate 2.25% 6.12% 0.14%Private Real Estate 12.75% 7.10% 0.91%Private Equity 12.00% 10.41% 1.25%Cash 1.00% -1.50% -0.02%
Total 100.00% 5.83%
Inflation 2.50%
*Expected arithmetic nominal return 8.33% * Using stochastic projection results provides an expected range of real rates of return over various time horizons. Looking at one year results produces an expected real return of 8.33% but also has a high standard deviation, which means there is high volatility. Over larger time horizons the volatility declines significantly and provides a median return of 7.44%, including expected inflation of 2.50%.
-66-

COUNTY OF FRANKLIN, VIRGINIA NOTES TO FINANCIAL STATEMENTS (CONTINUED) JUNE 30, 2015 Note 9-Pension Plan: (continued) Discount Rate The discount rate used to measure the total pension liability was 7.00%. The projection of cash flows used to determine the discount rate assumed that System member contributions will be made per the VRS Statutes and the employer contributions will be made in accordance with the VRS funding policy at rates equal to the difference between actuarially determined contribution rates adopted by the VRS Board of Trustees and the member rate. Through the fiscal year ending June 30, 2018, the rate contributed by the employer for the County and Component Unit School Board (nonprofessional) Retirement Plans will be subject to the portion of the VRS Board-certified rates that are funded by the Virginia General Assembly. From July 1, 2018 on, participating employers are assumed to contribute 100% of the actuarially determined contribution rates. Based on those assumptions, the pension plan’s fiduciary net position was projected to be available to make all projected future benefit payments of current active and inactive employees. Therefore the long-term expected rate of return was applied to all periods of projected benefit payments to determine the total pension liability. Changes in Net Pension Liability
Total Plan NetPension Fiduciary PensionLiability Net Position Liability
(a) (b) (a) - (b)
Balances at June 30, 2013 $ 53,108,530 $ 44,567,213 $ 8,541,317
Changes for the year:Service cost $ 1,541,854 $ - $ 1,541,854 Interest 3,634,557 - 3,634,557 Differences between expected
and actual experience - - - Contributions - employer - 1,571,032 (1,571,032) Contributions - employee - 639,291 (639,291) Net investment income - 7,019,995 (7,019,995) Benefit payments, including refunds
of employee contributions (2,372,581) (2,372,581) - Administrative expenses - (37,649) 37,649 Other changes - 370 (370)
Net changes $ 2,803,830 $ 6,820,458 $ (4,016,628)
Balances at June 30, 2014 $ 55,912,360 $ 51,387,671 $ 4,524,689
Increase (Decrease)Primary Government
-67-

COUNTY OF FRANKLIN, VIRGINIA NOTES TO FINANCIAL STATEMENTS (CONTINUED) JUNE 30, 2015 Note 9-Pension Plan: (continued) Changes in Net Pension Liability (continued)
Total Plan NetPension Fiduciary PensionLiability Net Position Liability
(a) (b) (a) - (b)
Balances at June 30, 2013 $ 18,627,439 $ 15,228,682 $ 3,398,757
Changes for the year:Service cost $ 511,225 $ - $ 511,225 Interest 1,273,433 - 1,273,433 Differences between expected
and actual experience - - - Contributions - employer - 395,872 (395,872) Contributions - employee - 247,003 (247,003) Net investment income - 2,390,492 (2,390,492) Benefit payments, including refunds
of employee contributions (871,073) (871,073) - Administrative expenses - (12,959) 12,959 Other changes - 126 (126)
Net changes $ 913,585 $ 2,149,461 $ (1,235,876)
Balances at June 30, 2014 $ 19,541,024 $ 17,378,143 $ 2,162,881
Increase (Decrease)Component School Board (nonprofessional)
The remainder of this page left blank intentionally.
-68-

COUNTY OF FRANKLIN, VIRGINIA NOTES TO FINANCIAL STATEMENTS (CONTINUED) JUNE 30, 2015 Note 9-Pension Plan: (continued) Sensitivity of the Net Pension Liability to Changes in the Discount Rate The following presents the net pension liability of the County and Component Unit School Board (nonprofessional) using the discount rate of 7.00%, as well as what the County’s and Component Unit School Board’s (nonprofessional) net pension liability would be if it were calculated using a discount rate that is one percentage point lower (6.00%) or one percentage point higher (8.00%) than the current rate:
(6.00%) (7.00%) (8.00%)
CountyNet Pension Liability (Asset) 11,907,395 4,524,689 (1,616,965)
Component Unit School Board (nonprofessional)Net Pension Liability (Asset) 4,539,062 2,162,881 168,255
Rate
Pension Expense and Deferred Outflows of Resources and Deferred Inflows of Resources Related to Pensions For the year ended June 30, 2015, the County and Component Unit School Board (nonprofessional) recognized pension expense of $680,223 and $226,332, respectively. At June 30, 2015, the County and Component Unit School Board (nonprofessional) reported deferred outflows of resources and deferred inflows of resources related to pensions from the following sources:
Deferred Deferred Deferred DeferredOutflows of Inflows of Outflows of Inflows ofResources Resources Resources Resources
Differences between expected and actual experience $ - $ - $ - $ -
Change in assumptions - - - -
Net difference between projected and actualearnings on pension plan investments - 3,125,819 - 1,066,336
Employer contributions subsequent to themeasurement date 1,462,651 - 393,357 -
Total $ 1,462,651 $ 3,125,819 $ 393,357 $ 1,066,336
Primary Government Board (nonprofessional)
Component Unit School
-69-

COUNTY OF FRANKLIN, VIRGINIA NOTES TO FINANCIAL STATEMENTS (CONTINUED) JUNE 30, 2015 Note 9-Pension Plan: (continued) Pension Expense and Deferred Outflows of Resources and Deferred Inflows of Resources Related to Pensions (continued) $1,462,651 and $393,357 reported as deferred outflows of resources related to pensions resulting from the County’s and Component Unit School Board’s (nonprofessional) contributions, respectively, subsequent to the measurement date will be recognized as a reduction of the Net Pension Liability in the year ended June 30, 2016. Other amounts reported as deferred outflows of resources and deferred inflows of resources related to pensions will be recognized in pension expense as follows:
Component UnitPrimary School Board
Year ended June 30 Government (nonprofessional)
2016 $ (781,455) $ (266,584) 2017 (781,455) (266,584) 2018 (781,455) (266,584) 2019 (781,454) (266,584)
Thereafter - -
Component Unit School Board (professional) Plan Description All full-time, salaried permanent (professional) employees of public school divisions are automatically covered by the VRS Teacher Retirement Plan upon employment. This is a cost-sharing multiple employer plan administered by the Virginia Retirement System (the system). Additional information regarding the plan description can be found in the first section of this note. Contributions The contribution requirement for active employees is governed by §51.1-145 of the Code of Virginia, as amended, but may be impacted as a result of funding options provided to political subdivisions by the Virginia General Assembly. Employees are required to contribute 5.00% of their compensation toward their retirement. Prior to July 1, 2012, all or part of the 5.00% member contribution may have been assumed by the employer. Beginning July 1, 2012, new employees were required to pay the 5% member contribution. In addition, for existing employees, employers were required to begin making the employee pay the 5.00% member contribution. This could be phased in over a period of up to 5 years and the employer is required to provide a salary increase equal to the amount of the increase in the employee-paid member contribution.
-70-

COUNTY OF FRANKLIN, VIRGINIA NOTES TO FINANCIAL STATEMENTS (CONTINUED) JUNE 30, 2015 Note 9-Pension Plan: (continued) Component Unit School Board (professional) (continued) Contributions (continued) Each School Division’s contractually required contribution rate for the year ended June 30, 2015 was 14.50% of covered employee compensation. This rate was based on an actuarially determined rate from an actuarial valuation as of June 30, 2013. The actuarial rate for the Teacher Retirement Plan was 18.20%. This rate, when combined with employee contributions, was expected to finance the costs of benefits earned by employees during the year, with an additional amount to finance any unfunded accrued liability. Based on the provisions of §51.1-145 of the Code of Virginia, as amended the contributions were funded at 79.69% of the actuarial rate for the year ended June 30, 2015. Contributions to the pension plan from the School Board were $5,504,768 and $4,362,000 for the years ended June 30, 2015 and June 30, 2014, respectively. Pension Liabilities, Pension Expense, and Deferred Outflows of Resources and Deferred Inflows of Resources Related to Pensions At June 30, 2015, the school division reported a liability of $61,760,000 for its proportionate share of the Net Pension Liability. The Net Pension Liability was measured as of June 30, 2014 and the total pension liability used to calculate the Net Pension Liability was determined by an actuarial valuation as of that date. The school division’s proportion of the Net Pension Liability was based on the school division’s actuarially determined employer contributions to the pension plan for the year ended June 30, 2014 relative to the total of the actuarially determined employer contributions for all participating employers. At June 30, 2014, the school division’s proportion was 0.51106% as compared to 0.50975% at June 30, 2013. For the year ended June 30, 2015, the school division recognized pension expense of $4,918,000. Since there was a change in proportionate share between June 30, 2013 and June 30, 2014, a portion of the pension expense was related to deferred amounts from changes in proportion and from differences between employer contributions and the proportionate share of employer contributions.
The remainder of this page left blank intentionally.
-71-

COUNTY OF FRANKLIN, VIRGINIA NOTES TO FINANCIAL STATEMENTS (CONTINUED) JUNE 30, 2015 Note 9-Pension Plan: (continued) Component Unit School Board (professional) (continued) Pension Liabilities, Pension Expense, and Deferred Outflows of Resources and Deferred Inflows of Resources Related to Pensions (continued) At June 30, 2015, the school division reported deferred outflows of resources and deferred inflows of resources related to pensions from the following sources:
Deferred Outflows Deferred Inflowsof Resources of Resources
Differences between expected and actual experience $ - $ -
Change in assumptions - -
Net difference between projected and actualearnings on pension plan investments - 9,166,000
Changes in proportion and differences betweenemployer contributions and proportionateshare of contributions 147,000 -
Employer contributions subsequent to themeasurement date 5,504,768 -
Total $ 5,651,768 $ 9,166,000
$5,504,768 reported as deferred outflows of resources related to pensions resulting from the school division’s contributions subsequent to the measurement date will be recognized as a reduction of the Net Pension Liability in the year ended June 30, 2016. Other amounts reported as deferred outflows of resources and deferred inflows of resources related to pensions will be recognized in pension expense as follows:
Year ended June 30
2016 $ (2,258,000) 2017 (2,258,000) 2018 (2,258,000) 2019 (2,258,000)
Thereafter 13,000
-72-

COUNTY OF FRANKLIN, VIRGINIA NOTES TO FINANCIAL STATEMENTS (CONTINUED) JUNE 30, 2015 Note 9-Pension Plan: (continued) Component Unit School Board (professional) (continued) Actuarial Assumptions The total pension liability for the VRS Teacher Retirement Plan was based on an actuarial valuation as of June 30, 2013, using the Entry Age Normal actuarial cost method and the following assumptions, applied to all periods included in the measurement and rolled forward to the measurement date of June 30, 2014.
Inflation 2.5%
Salary increases, including inflation 3.5% – 5.95%
Investment rate of return 7.0%, net of pension plan investmentexpense, including inflation*
* Administrative expenses as a percent of the market value of assets for the last experience study were found to be approximately 0.06% of the market assets for all of the VRS plans. This would provide an assumed investment return rate for GASB purposes of slightly more than the assumed 7.0%. However, since the difference was minimal, and a more conservative 7.0% investment return assumption provided a projected plan net position that exceeded the projected benefit payments, the long-term expected rate of return on investments was assumed to be 7.0% to simplify preparation of pension liabilities. Mortality rates:
Pre-Retirement: RP-2000 Employee Mortality Table Projected with Scale AA to 2020 with males set back 3 years and females set back 5 years
Post-Retirement: RP-2000 Combined Mortality Table Projected with Scale AA to 2020 with males set back 2 years and females set back 3 years
Post-Disablement: RP-2000 Disability Life Mortality Table Projected to 2020 with males set back 1 year and no provision for future mortality improvement
The actuarial assumptions used in the June 30, 2013 valuation were based on the results of an actuarial experience study for the period from July 1, 2008 through June 30, 2012. Changes to the actuarial assumptions as a result of the experience study are as follows: - Update mortality table - Adjustments to the rates of service retirement - Decrease in rates of withdrawals for 3 through 9 years of service - Decrease in rates of disability - Reduce rates of salary increase by 0.25% per year
-73-

COUNTY OF FRANKLIN, VIRGINIA NOTES TO FINANCIAL STATEMENTS (CONTINUED) JUNE 30, 2015 Note 9-Pension Plan: (continued) Component Unit School Board (professional) (continued) Long-Term Expected Rate of Return The long-term expected rate of return on pension System investments was determined using a log-normal distribution analysis in which best-estimate ranges of expected future real rates of return (expected returns, net of pension System investment expense and inflation) are developed for each major asset class. These ranges are combined to produce the long-term expected rate of return by weighting the expected future real rates of return by the target asset allocation percentage and by adding expected inflation. The target asset allocation and best estimate of arithmetic real rates of return for each major asset class are summarized in the following table:
WeightedArithmetic AverageLong-Term Long-Term
Target Expected ExpectedAsset Class (Strategy) Allocation Rate of Return Rate of Return
U.S. Equity 19.50% 6.46% 1.26%Developed Non U.S. Equity 16.50% 6.28% 1.04%Emerging Market Equity 6.00% 10.00% 0.60%Fixed Income 15.00% 0.09% 0.01%Emerging Debt 3.00% 3.51% 0.11%Rate Sensitive Credit 4.50% 3.51% 0.16%Non Rate Sensitive Credit 4.50% 5.00% 0.23%Convertibles 3.00% 4.81% 0.14%Public Real Estate 2.25% 6.12% 0.14%Private Real Estate 12.75% 7.10% 0.91%Private Equity 12.00% 10.41% 1.25%Cash 1.00% -1.50% -0.02%
Total 100.00% 5.83%
Inflation 2.50%
*Expected arithmetic nominal return 8.33% * Using stochastic projection results provides an expected range of real rates of return over various time horizons. Looking at one year results produces an expected real return of 8.33% but also has a high standard deviation, which means there is high volatility. Over larger time horizons the volatility declines significantly and provides a median return of 7.44%, including expected inflation of 2.50%.
-74-

COUNTY OF FRANKLIN, VIRGINIA NOTES TO FINANCIAL STATEMENTS (CONTINUED) JUNE 30, 2015 Note 9-Pension Plan: (continued) Component Unit School Board (professional) (continued) Discount Rate The discount rate used to measure the total pension liability was 7.00%. The projection of cash flows used to determine the discount rate assumed that member contributions will be made per the VRS Statutes and the employer contributions will be made in accordance with the VRS funding policy at rates equal to the difference between actuarially determined contribution rates adopted by the VRS Board of Trustees and the member rate. Through the fiscal year ending June 30, 2018, the rate contributed by the school division for the VRS Teacher Retirement Plan will be subject to the portion of the VRS Board-certified rates that are funded by the Virginia General Assembly. From July 1, 2018 on, school divisions are assumed to contribute 100% of the actuarially determined contribution rates. Based on those assumptions, the pension plan’s fiduciary net position was projected to be available to make all projected future benefit payments of current active and inactive employees. Therefore the long-term expected rate of return was applied to all periods of projected benefit payments to determine the total pension liability. Sensitivity of the School Division’s Proportionate Share of the Net Pension Liability to Changes in the Discount Rate The following presents the school division’s proportionate share of the net pension liability using the discount rate of 7.00%, as well as what the school division’s proportionate share of the net pension liability would be if it were calculated using a discount rate that is one percentage point lower (6.00%) or one percentage point higher (8.00%) than the current rate:
(6.00%) (7.00%) (8.00%)
School division's proportionateshare of the VRS TeacherEmployee Retirement PlanNet Pension Liability 90,689,000 61,760,000 37,942,000
Rate
Pension Plan Fiduciary Net Position Detailed information about the VRS Teacher Retirement Plan’s Fiduciary Net Position is available in the separately issued VRS 2014 Comprehensive Annual Financial Report (CAFR). A copy of the 2014 VRS CAFR may be downloaded from the VRS website at http://www.varetire.org/Pdf/Publications/2014-annual-report.pdf, or by writing to the System’s Chief Financial Officer at P.O. Box 2500, Richmond, VA, 23218-2500.
-75-

COUNTY OF FRANKLIN, VIRGINIA NOTES TO FINANCIAL STATEMENTS (CONTINUED) JUNE 30, 2015 Note 10-Other Postemployment Benefits-Health Insurance: The County and Component-unit School Board recognize the cost of postemployment health care in the year(s) when employee services are rendered, reports the accumulating liability, and provides information useful in assessing potential demands on the County and School Board’s future cash flows. Primary Government A. Plan Description
The County administers a single-employer healthcare plan (“the Plan”). The Plan provides for participation by eligible retirees of the County and their dependents in the health and dental insurance programs available to County employees. The Plan will provide retiring employees the option to continue health and dental insurance offered by the County. An eligible County retiree may receive this benefit until the retiree is eligible to receive Medicare. To be eligible for this benefit a retiree must have 15 years of service with the County and the employee must have attained the age of fifty (50). The benefits, employee contributions and the employer contributions are governed by the County Board and can be amended through Board action. The Plan does not issue a publicly available financial report.
B. Funding Policy The County currently pays for post-retirement health care benefits on a pay-as-you-go basis. The
County currently has 309 employees that are eligible for the program. In addition, for retirees of the County, 100 percent of premiums are the responsibility of the retiree. The rates were as follows:
Participants POS 25/500 POS 30/1000Employee 551.38$ 519.08$ Employee / Spouse 1,185.47 1,116.02 Employee / Child 827.07 778.63 Employee / Children 1,157.90 1,090.07 Family 1,764.43 1,661.06
PremiumsMedical
The County is required to contribute the annual required contribution of the employer (ARC), an amount actuarially determined in accordance with the parameters of GASB Statement 45. The ARC represents a level of funding that, if paid on an ongoing basis, is projected to cover normal costs each year and amortize any unfunded actuarial liabilities (or funding excess) over a period not to exceed thirty years.
-76-

COUNTY OF FRANKLIN, VIRGINIA NOTES TO FINANCIAL STATEMENTS (CONTINUED) JUNE 30, 2015
Note 10-Other Postemployment Benefits-Health Insurance: (continued)
Primary Government (continued)
C. Annual OPEB Cost and Net OPEB Obligation
For 2015, the County’s annual contribution of $43,000 did not equal the annual OPEB cost of $103,000. The obligation calculation is as follows:
Annual required contribution 104,000$ Interest on net OPEB obligation 28,000 Adjustment to annual required contribution (29,000)
Annual OPEB cost (expense) 103,000$ Contributions made 43,000
Increase in net OPEB obligation 60,000$ Net OPEB obligation - beginning of year 700,160 Net OPEB obligation - ending of year 760,160$
The County’s annual OPEB cost, the percentage of annual OPEB cost contributed to the plan, and the net OPEB obligation for 2015 and the preceding two years were as follows:
Percentage ofFiscal Annual Annual OPEB Cost Net OPEB
Year Ended OPEB Cost Contributed Obligation
6/30/2013 104,000$ 39.42% 628,160$ 6/30/2014 108,000 33.33% 700,160 6/30/2015 103,000 41.75% 760,160
D. Funded Status and Funding Progress
The funded status of the Plan as of July 1, 2014 (the most recent actuarial valuation), was as follows:
Actuarial accrued liability (AAL) 992,000$ Actuarial value of plan assets -$ Unfunded actuarial accrued liability (UAAL) 992,000$ Funded ratio (actuarial value of plan assets/AAL) 0.00%Covered payroll (active plan members) 9,381,563$ UAAL as a percentage of covered payroll 10.57%
-77-

COUNTY OF FRANKLIN, VIRGINIA NOTES TO FINANCIAL STATEMENTS (CONTINUED) JUNE 30, 2015 Note 10-Other Postemployment Benefits-Health Insurance: (continued)
Primary Government (continued)
D. Funded Status and Funding Progress (continued)
Actuarial valuations of an ongoing plan involve estimates of the value of reported amounts and assumptions about the probability of occurrence of events far in the future. Examples include assumptions about future employment, mortality, and the healthcare cost trend. Amounts determined regarding the funded status of the plan and the annual required contributions of the employer are subject to continual revision as actual results are compared with past expectations and new estimates are made about the future. The schedule of funding progress, presented as required supplementary information following the notes to the financial statements, presents multiyear trend information about whether the actuarial value of plan assets is increasing or decreasing over time relative to the actuarial accrued liabilities for benefits.
E. Actuarial methods and Assumptions
Projections of benefits for financial reporting purposes are based on the substantive plan and include the types of benefits provided at the time of each valuation and the historical pattern of sharing of benefit costs between the employer and plan members to that point. The actuarial methods and assumptions used include techniques that are designed to reduce the effects of short-term volatility in actuarial accrued liabilities and the actuarial value of assets, consistent with the long-term perspective of the calculations. In the July 1, 2014, the most recent actuarial valuation, the projected unit of credit actuarial cost method was used. Under this method, future benefits are projected and the present value of such benefits is allocated from date of hire to date of eligibility. The actuarial assumptions included: inflation at 2.5%, an investment rate of return at 4.0%, and a health care trend rate of 8.333% graded to 5%, decreasing 0.333% annually. The UAAL is being amortized as a level percentage on an open basis, which at July 1, 2014, was 30 years.
Component Unit: School Board A. Plan Description
The Component Unit - School Board administers a single-employer healthcare plan (“the Plan”). The Plan provides for participation by eligible retirees of the School Board and their dependents in the health and dental insurance programs available to School Board employees. The Plan will provide retiring employees the option to continue health and dental insurance offered by the School Board. An eligible retiree may receive this benefit until the retiree is eligible to receive Medicare. To be eligible for this benefit a retiree must have 15 years of service with the School Board and the employee must have attained the age of fifty (50). The benefits, employee contributions and the employer contributions are governed by the School Board and can be amended through Board action. The Plan does not issue a publicly available financial report.
-78-

COUNTY OF FRANKLIN, VIRGINIA NOTES TO FINANCIAL STATEMENTS (CONTINUED) JUNE 30, 2015 Note 10-Other Postemployment Benefits-Health Insurance: (continued) Component Unit: School Board: (continued) B. Funding Policy The School Board currently pays for post-retirement health care benefits on a pay-as-you-go basis.
The School Board currently has 1,196 employees that are eligible for the program. In addition, for retirees of the School Board, 100 percent of premiums are the responsibility of the retiree. The rates were as follows:
Participants Keycare 30/1000 Keycare 30/2000 Keycare 30/2000Employee 532.00$ 511.00$ 474.00$ Employee / Spouse 1,127.00 1,080.00 1,004.00 Employee / Child 788.00 755.00 702.00 Family 1,252.00 1,202.00 1,116.00
Medical Premiums
The Board is required to contribute the annual required contribution of the employer (ARC), an amount actuarially determined in accordance with the parameters of GASB Statement 45. The ARC represents a level of funding that, if paid on an ongoing basis, is projected to cover normal costs each year and amortize any unfunded actuarial liabilities (or funding excess) over a period not to exceed thirty years.
C. Annual OPEB Cost and Net OPEB Obligation
For 2015, the Board’s annual contribution of $222,000 did not equal the annual OPEB cost of $433,000. The obligation calculation is as follows:
Annual required contribution 438,000$ Interest on net OPEB obligation 87,000 Adjustment to annual required contribution (92,000)
Annual OPEB cost (expense) 433,000$ Contributions made 222,000
Increase in net OPEB obligation 211,000$ Net OPEB obligation - beginning of year 2,186,180 Net OPEB obligation - ending of year 2,397,180$
The remainder of this page left blank intentionally.
-79-

COUNTY OF FRANKLIN, VIRGINIA NOTES TO FINANCIAL STATEMENTS (CONTINUED) JUNE 30, 2015 Note 10-Other Postemployment Benefits-Health Insurance: (continued) Component Unit: School Board: (continued) C. Annual OPEB Cost and Net OPEB Obligation (continued)
The Board’s annual OPEB cost, the percentage of annual OPEB cost contributed to the plan, and the net OPEB obligation for 2015 and the preceding two years were as follows:
Percentage ofFiscal Annual Annual OPEB Cost Net OPEB
Year Ended OPEB Cost Contributed Obligation
6/30/2013 428,000$ 41.36% 1,940,180$ 6/30/2014 450,000 45.33% 2,186,180 6/30/2015 433,000 51.27% 2,397,180
D. Funded Status and Funding Progress
The funded status of the Plan as of July 1, 2014 (the most recent actuarial valuation), was as follows:
Actuarial accrued liability (AAL) 4,360,000$ Actuarial value of plan assets -$ Unfunded actuarial accrued liability (UAAL) 4,360,000$ Funded ratio (actuarial value of plan assets/AAL) 0.00%Covered payroll (active plan members) 41,233,484$ UAAL as a percentage of covered payroll 10.57%
Actuarial valuations of an ongoing plan involve estimates of the value of reported amounts and assumptions about the probability of occurrence of events far in the future. Examples include assumptions about future employment, mortality, and the healthcare cost trend. Amounts determined regarding the funded status of the plan and the annual required contributions of the employer are subject to continual revision as actual results are compared with past expectations and new estimates are made about the future. The schedule of funding progress, presented as required supplementary information following the notes to the financial statements, presents multiyear trend information about whether the actuarial value of plan assets is increasing or decreasing over time relative to the actuarial accrued liabilities for benefits.
The remainder of this page left blank intentionally.
-80-

COUNTY OF FRANKLIN, VIRGINIA NOTES TO FINANCIAL STATEMENTS (CONTINUED) JUNE 30, 2015 Note 10-Other Postemployment Benefits-Health Insurance: (continued) Component Unit: School Board: (continued)
E. Actuarial methods and Assumptions
Projections of benefits for financial reporting purposes are based on the substantive plan and include the types of benefits provided at the time of each valuation and the historical pattern of sharing of benefit costs between the employer and plan members to that point. The actuarial methods and assumptions used include techniques that are designed to reduce the effects of short-term volatility in actuarial accrued liabilities and the actuarial value of assets, consistent with the long-term perspective of the calculations. In the July 1, 2014, the most recent actuarial valuation, the projected unit of credit actuarial cost method was used. Under this method, future benefits are projected and the present value of such benefits is allocated from date of hire to date of eligibility. The actuarial assumptions included: inflation at 2.5%, an investment rate of return at 4.0%, and a health care trend rate of 8.333% graded to 5%, decreasing 0.333% annually. The UAAL is being amortized as a level percentage on an open basis, which at July 1, 2014, was 30 years.
Note 11- Other Postemployment Benefits - VRS Health Insurance Credit: Non-Professional Employees – Discretely Presented Component Unit School Board A. Plan Description
The School Board participates in the Health Insurance Credit Program, a plan designed to assist retirees with the cost of health insurance coverage. This program is a cost sharing, multiple-employer defined benefit plan administered by the Virginia Retirement System (VRS). The Virginia General Assembly establishes the dollar amount of the health insurance credit for each year of creditable service. The credit amount and eligibility differs for state, school division, political subdivision, local officer, local social services department and general registrar retirees.
An employee of the School Board, who retires under VRS with at least 15 years of total creditable service under the System and is enrolled in a health insurance plan, is eligible to receive a monthly health insurance credit of $1.50 per year of creditable service up to a maximum monthly credit of $45. However, such credit shall not exceed the health insurance premium for the retiree. Disabled retirees automatically receive the maximum monthly health insurance credit of $45. Benefit provisions and eligibility requirements are established by Title 51.1, Chapter 14 of the Code of Virginia. The VRS actuarially determines the amount necessary to fund all credits provided, reflects the cost of such credits in the applicable employer contribution rate pursuant to §51.1-145, and prescribes such terms and conditions as are necessary to carry out the provisions of the health insurance credit program. VRS issues separate financial statements as previously discussed in Note 9.
-81-

COUNTY OF FRANKLIN, VIRGINIA NOTES TO FINANCIAL STATEMENTS (CONTINUED) JUNE 30, 2015 Note 11- Other Postemployment Benefits - VRS Health Insurance Credit: (continued) B. Funding Policy
As a participating local political subdivision, the School Board is required to contribute the entire amount necessary to fund participation in the program using the actuarial basis specified by the Code of Virginia and the VRS Board of Trustees. Contribution rates were 0.77%, 0.57%, and 0.57%, of annual covered payroll for the years ending June 30, 2015, 2014, and 2013, respectively. The School Board’s actual contributions to VRS for the years ending June 30, 2015, 2014, and 2013 were $23,263, $28,190, and $28,011, respectively and equaled the required contributions for each year.
C. Annual OPEB Cost and Net OPEB Obligation
The annual cost of OPEB under Governmental Accounting Standards Board (GASB) 45, Accounting and Financial Reporting by Employers for Postemployment Benefits Other than Pensions, is based on the annual required contribution (ARC). The School Board is required to contribute the ARC, an amount actuarially determined in accordance with the parameters of GASB Statement 45. The ARC represents a level of funding that, if paid on an ongoing basis, is projected to cover normal cost each year and amortize any unfunded actuarial liabilities (or funding excess) over a period not to exceed thirty years. For 2015, the School Board’s annual contribution of $23,263 equaled the annual required contribution and OPEB cost. The School Board’s annual OPEB cost, the percentage of annual OPEB cost contributed to the plan, and the net OPEB obligation were for the current and preceding two years as follows:
Percentage ofFiscal Annual Annual OPEB Cost Net OPEB
Year Ended OPEB Cost Contributed Obligation
6/30/2013 28,011$ 100% -$ 6/30/2014 28,190 100% - 6/30/2015 23,263 100% -
The remainder of this page left blank intentionally.
-82-

COUNTY OF FRANKLIN, VIRGINIA NOTES TO FINANCIAL STATEMENTS (CONTINUED) JUNE 30, 2015 Note 11- Other Postemployment Benefits - VRS Health Insurance Credit: (continued)
D. Funded Status and Funding Progress
The funded status of the Plan as of June 30, 2014 (date of the most recent actuarial valuation), was as follows:
Actuarial accrued liability (AAL) 494,741$ Actuarial value of plan assets 280,070$ Unfunded actuarial accrued liability (UAAL) 214,671$ Funded ratio (actuarial value of plan assets/AAL) 56.61%Covered payroll (active plan members) 4,947,948$ UAAL as a percentage of covered payroll 4.34%
Actuarial valuations of an ongoing plan involve estimates of the value of reported amounts and assumptions about the probability of occurrence of events far into the future and reflect a long-term perspective. Examples include assumptions about future employment, mortality, and the healthcare cost trend. Amounts determined regarding the funded status of the plan and the annual required contributions of the employer are subject to continual revision as actual results are compared with past expectations and new estimates are made about the future. The schedule of funding progress, presented as required supplementary information following the notes to the financial statements presents multi-year trend information about whether the actuarial value of plan assets is increasing or decreasing over time relative to the actuarial accrued liability for benefits. The projection of benefits for financial reporting purposes does not explicitly incorporate the potential effects of legal or contractual funding limitations.
E. Actuarial Methods and Assumptions
Projections of benefits for financial reporting purposes are based on the substantive plan and include the types of benefits provided at the time of each valuation and the historical pattern of sharing of benefit costs between the employer and plan members to that point. The actuarial value of the School Board’s assets is equal to the modified market value of assets. This method uses techniques that smooth the effects of short-term volatility in the market value of assets over a five-year period. The actuarial methods and assumptions used include techniques that are designed to reduce the effects of short-term volatility in actuarial accrued liabilities and the actuarial value of assets, consistent with the long-term perspective of the calculations. In the June 30, 2014, most recent actuarial valuation, the entry age normal cost method was used. Under this method, future benefits are projected and the present value of such benefits is allocated from date of hire to date of eligibility. The actuarial assumptions included: inflation at 2.5%, payroll growth rate of 3% and investment rate of return at 7.00%. The UAAL is being amortized as a level dollar amount over the remaining amortization period, which at June 30, 2014, was 20-29 years. Amortizations are open ended in that they begin anew at each valuation date.
-83-

COUNTY OF FRANKLIN, VIRGINIA NOTES TO FINANCIAL STATEMENTS (CONTINUED) JUNE 30, 2015 Note 11- Other Postemployment Benefits - VRS Health Insurance Credit: (Continued) Professional Employees – Discretely Presented Component Unit School Board A. Plan Description
The School Board participates in the Health Insurance Credit Program, a plan designed to assist retirees with the cost of health insurance coverage. This program is a cost sharing, multiple-employer defined benefit plan administered by the Virginia Retirement System (VRS). The Virginia General Assembly establishes the dollar amount of the health insurance credit for each year of creditable service. A teacher, who retires under VRS with at least 15 years of total creditable service under the System and is enrolled in a health insurance plan, is eligible to receive a monthly health insurance credit of $4 per year of creditable service. However, such credit shall not exceed the health insurance premium for the retiree. Disabled retirees automatically receive a monthly health insurance credit of $4 multiplied by the smaller of (i) twice the amount of their creditable service or (ii) the amount of creditable service they would have completed at age 60 if they had remained in service to that age.
B. Funding Policy The School Board is required to contribute, at an actuarially determined rate, the entire amount necessary to fund participation in the program. Contribution rates were 1.06%, 1.11%, and 1.10%, of annual covered payroll for the years ending June 30, 2015, 2014, and 2013, respectively. The School Board’s contributions to VRS for the years ending June 30, 2015, 2014, and 2013 were $403,847, $414,436, and $406,120, respectively and equaled the required contributions for each year.
Note 12-Unearned and Deferred/Unavailable Revenue: Unearned and unavailable revenue represents amounts for which asset recognition criteria have been met, but for which revenue recognition criteria have not been met. Under the modified accrual basis of accounting, such amounts are measurable, but not available. Primary Government: Unavailable Property Tax Revenue – Unavailable revenue representing uncollected tax billings not available for funding of current expenditures totaled $1,325,059 at June 30, 2015. Prepaid Property Taxes – Property taxes due subsequent to June 30, 2015 but paid in advance by the taxpayers totaled $26,248. Unavailable Revenue – Unavailable revenue representing locality compensation payments that are not available for funding current expenditures totaled $2,600,916 at June 30, 2015.
-84-

COUNTY OF FRANKLIN, VIRGINIA NOTES TO FINANCIAL STATEMENTS (CONTINUED) JUNE 30, 2015 Note 13-Capital Assets:
Capital asset activity for the year ended June 30, 2015 was as follows: Primary Government:
Beginning EndingBalance Increases Decreases Balance
Governmental Activities:Capital assets, not being depreciated:
Land $ 6,511,756 $ 906,223 $ - $ 7,417,979 Construction in progress 1,081,206 2,654,591 (2,372,983) 1,362,814
Total capital assets not being depreciated $ 7,592,962 $ 3,560,814 $ (2,372,983) $ 8,780,793
Capital assets, being depreciated:Buildings and improvements $ 71,365,675 $ 281,314 $ (1,939,980) $ 69,707,009 Machinery and equipment 25,430,708 4,596,307 (804,130) 29,222,885 Infrastructure 6,082,667 - - 6,082,667
Total capital assets being depreciated $ 102,879,050 $ 4,877,621 $ (2,744,110) $ 105,012,561
Accumulated depreciation:Buildings and improvements $ (20,769,737) $ (1,800,121) $ 1,016,576 $ (21,553,282) Machinery and equipment (18,029,737) (2,252,675) 720,023 (19,562,389) Infrastructure (1,895) (750,121) - (752,016)
Total accumulated depreciation $ (38,801,369) $ (4,802,917) $ 1,736,599 $ (41,867,687)
Total capital assets being depreciated, net $ 64,077,681 $ 74,704 $ (1,007,511) $ 63,144,874
Governmental activities capital assets, net $ 71,670,643 $ 3,635,518 $ (3,380,494) $ 71,925,667
During the fiscal year, a new truck, with a market value of $70,000, was donated to the County. Current year asset additions include the truck valued at $70,000. During the fiscal year, the County transferred assets to the School Board with an original cost of $1,879,483 and accumulated depreciation of $1,010,543 (net book value of $868,940).
The remainder of this page left blank intentionally.
-85-

COUNTY OF FRANKLIN, VIRGINIA NOTES TO FINANCIAL STATEMENTS (CONTINUED) JUNE 30, 2015 Note 13-Capital Assets: (continued)
Beginning EndingBalance Increases Decreases Balance
Business-type Activities:Capital assets, being depreciated:
Infrastructure $ 1,319,774 $ - $ - $ 1,319,774 Total capital assets being depreciated $ 1,319,774 $ - $ - $ 1,319,774
Accumulated depreciation:Infrastructure $ (217,688) $ (32,845) $ - $ (250,533)
Total accumulated depreciation $ (217,688) $ (32,845) $ - $ (250,533)
Total capital assets being depreciated, net $ 1,102,086 $ (32,845) $ - $ 1,069,241
Business-type activities capital assets, net $ 1,102,086 $ (32,845) $ - $ 1,069,241
Depreciation expense was charged to functions/programs of the primary government as follows:
Governmental activities:General government administration $ 212,815 Judicial administration 85,708 Public safety 1,644,141 Public works 1,457,000 Health and welfare 42,664 Education 843,985 Parks, recreation, and cultural 337,586 Community development 179,018
Total depreciation expense-governmental activities $ 4,802,917
Business-type activitiesUtility fund $ 32,845
The remainder of this page left blank intentionally.
-86-

COUNTY OF FRANKLIN, VIRGINIA NOTES TO FINANCIAL STATEMENTS (CONTINUED) JUNE 30, 2015 Note 13-Capital Assets: (continued) Capital asset activity for the School Board for the year ended June 30, 2015 was as follows: Discretely Presented Component Unit:
Beginning EndingBalance Increases Decreases Balance
Governmental Activities:Capital assets, not being depreciated:
Land $ 725,315 $ - $ - $ 725,315 Construction in progress 25,000 542,422 (25,000) 542,422
Total capital assets not being depreciated $ 750,315 $ 542,422 $ (25,000) $ 1,267,737
Capital assets, being depreciated:Buildings and improvements $ 35,112,531 $ 1,991,409 $ - $ 37,103,940 Machinery and equipment 17,496,729 830,522 (100,800) 18,226,451
Total capital assets being depreciated $ 52,609,260 $ 2,821,931 $ (100,800) $ 55,330,391
Accumulated depreciation:Buildings and improvements $ (21,307,621) $ (1,952,262) $ - $ (23,259,883) Machinery and equipment (11,901,641) (1,249,073) 100,800 (13,049,914)
Total accumulated depreciation $ (33,209,262) $ (3,201,335) $ 100,800 $ (36,309,797)
Total capital assets being depreciated, net $ 19,399,998 $ (379,404) $ - $ 19,020,594
Governmental activities capital assets, net $ 20,150,313 $ 163,018 $ (25,000) $ 20,288,331
During the fiscal year, the County transferred assets to the School Board with an original cost of $1,879,483 and accumulated depreciation of $1,010,543 (net book value of $868,940). All depreciation of the component-unit School Board is posted to the education function in the financial statements.
The remainder of this page left blank intentionally.
-87-

COUNTY OF FRANKLIN, VIRGINIA NOTES TO FINANCIAL STATEMENTS (CONTINUED) JUNE 30, 2015 Note 14-Risk Management: The County and its component unit – School Board are exposed to various risks of loss related to torts; theft of, damage to, and destruction of assets; errors and omissions; and natural disasters. The County and its component unit – School Board participate with other localities in a public entity risk pool for their coverage of general liability and auto insurance with the Virginia Municipal Liability Pool. Each member of this risk pool jointly and severally agrees to assume, pay and discharge any liability. The County and its component unit – School Board pay the Virginia Municipal Group contributions and assessments based upon classifications and rates into a designated cash reserve fund out of which expenses of the pool, claims and awards are to be paid. In the event of a loss deficit or depletion of all available excess insurance, the pool may assess all members in the proportion in which the premium of each bears to the total premiums of all members in the year in which such deficit occurs. The County and its component unit – School Board continue to carry commercial insurance for all other risks of loss. Settled claims resulting from these risks have not exceeded commercial insurance coverage in any of the past three fiscal years. Note 15-Contingent Liabilities: Federal programs in which the County and its component unit participate were audited in accordance with the provisions of U.S. Office of Management and Budget Circular A-133, Audits of States, Local Governments, and Non-Profit Organizations. Pursuant to the provisions of this circular all major programs and certain other programs were tested for compliance with applicable grant requirements. While no matters of noncompliance were disclosed by audit, the Federal Government may subject grant programs to additional compliance tests, which may result in disallowed expenditures. In the opinion of management, any future disallowances of current grant program expenditures, if any, would be immaterial. Note 16-Surety Bonds: Primary Government:
Fidelity & Deposit Company of Maryland-Surety:Teresa J. Brown, Clerk of the Circuit Court 500,000$ Susan J. Wray, Treasurer 500,000 Margaret S. Torrence, Commissioner of the Revenue 3,000 Bill Overton, Jr., Sheriff 30,000 All constitutional officers' employees: blanket bond 50,000 All Social Services employees-blanket bond 100,000
-88-
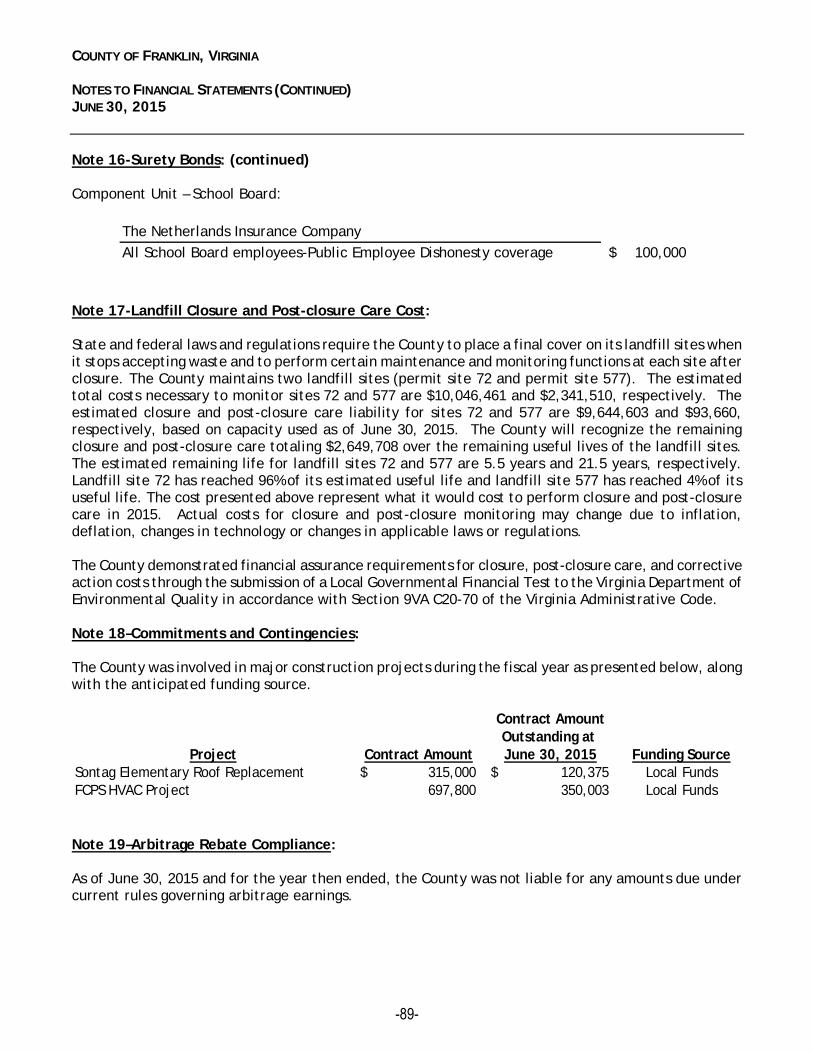
COUNTY OF FRANKLIN, VIRGINIA NOTES TO FINANCIAL STATEMENTS (CONTINUED) JUNE 30, 2015 Note 16-Surety Bonds: (continued) Component Unit – School Board:
The Netherlands Insurance CompanyAll School Board employees-Public Employee Dishonesty coverage 100,000$
Note 17-Landfill Closure and Post-closure Care Cost: State and federal laws and regulations require the County to place a final cover on its landfill sites when it stops accepting waste and to perform certain maintenance and monitoring functions at each site after closure. The County maintains two landfill sites (permit site 72 and permit site 577). The estimated total costs necessary to monitor sites 72 and 577 are $10,046,461 and $2,341,510, respectively. The estimated closure and post-closure care liability for sites 72 and 577 are $9,644,603 and $93,660, respectively, based on capacity used as of June 30, 2015. The County will recognize the remaining closure and post-closure care totaling $2,649,708 over the remaining useful lives of the landfill sites. The estimated remaining life for landfill sites 72 and 577 are 5.5 years and 21.5 years, respectively. Landfill site 72 has reached 96% of its estimated useful life and landfill site 577 has reached 4% of its useful life. The cost presented above represent what it would cost to perform closure and post-closure care in 2015. Actual costs for closure and post-closure monitoring may change due to inflation, deflation, changes in technology or changes in applicable laws or regulations. The County demonstrated financial assurance requirements for closure, post-closure care, and corrective action costs through the submission of a Local Governmental Financial Test to the Virginia Department of Environmental Quality in accordance with Section 9VA C20-70 of the Virginia Administrative Code. Note 18–Commitments and Contingencies: The County was involved in major construction projects during the fiscal year as presented below, along with the anticipated funding source.
Contract AmountOutstanding at
Project Contract Amount June 30, 2015 Funding SourceSontag Elementary Roof Replacement 315,000$ 120,375$ Local FundsFCPS HVAC Project 697,800 350,003 Local Funds
Note 19–Arbitrage Rebate Compliance: As of June 30, 2015 and for the year then ended, the County was not liable for any amounts due under current rules governing arbitrage earnings.
-89-

COUNTY OF FRANKLIN, VIRGINIA NOTES TO FINANCIAL STATEMENTS (CONTINUED) JUNE 30, 2015 Note 20-Adoption of Accounting Principles:
Governmental Accounting Standards Board Statement No. 68, Accounting and Financial Reporting for Pensions – an amendment of GASB Statement No. 27 and Statement No. 71, Pension Transition for Contributions Made Subsequent to the Measurement Date – an amendment of GASB Statement No. 68:
The County implemented the financial reporting provisions of the above Statements for the fiscal year ended June 30, 2015. These Statements establish standards for measuring and recognizing liabilities, deferred outflows of resources, and deferred inflows of resources, and expense/expenditures related to pensions. Note disclosure and required supplementary information requirements about pensions are also addressed. The requirements of these Statements will improve financial reporting by improving accounting and financial reporting by state and local governments for pensions. The implementation of these Statements resulted in the following restatement of net position:
Governmental
ActivitiesComponent Unit-
School BoardNet Position, July 1, 2014, as previously stated 68,244,175$ 17,324,227$ Net pension liability (8,541,317) (73,621,757) Deferred outflow 1,571,032 4,757,872 Remove net VRS pension obligation - 198,137 Net Position, July 1, 2014, as restated 61,273,890$ (51,341,521)$
Note 21-Upcoming Pronouncements: Statement No. 72, Fair Value Measurement and Application, amends the definitions of fair value used throughout GASB literature to be consistent with the definition and principles provided in FASB Accounting Standards Codification Topic 820, Fair Value Measurement. This Statement provides guidance for determining a fair value measurement for financial reporting purposes and for applying fair value to certain investments and disclosures related to all fair value measurements. The requirements of this Statement are effective for financial statements for periods beginning after June 15, 2015. No formal study or estimate of the impact of this standard has been performed. Statement No. 73, Accounting and Financial Reporting for Pensions and Related Assets That are Not Within the Scope of GASB Statement 68, and Amendments to Certain Provisions of GASB Statements 67 and 68, establishes requirements for defined benefit pensions that are not within the scope of Statement No. 68, Accounting and Financial Reporting for Pensions, as well as for the assets accumulated for purposes of providing those pensions. In addition, it establishes requirements for defined contribution pensions that are not within the scope of Statement 68 and amends certain provisions of Statement No. 67, Financial Reporting for Pension Plans, and Statement 68 for pension plans and pensions that are within their respective scopes. The requirements of this Statement that address accounting and financial reporting by employers and governmental nonemployer contributing entities for pensions that are not within the scope of Statement 68 are effective for financial statements for fiscal years beginning after June 15, 2016, and the requirements of this Statement that address financial reporting for assets accumulated for purposes of providing those pensions are effective for fiscal years beginning after June 15, 2015. The requirements of this Statement for pension plans that are within the scope of Statement 67 or for pensions that are within the scope of Statement 68 are effective for fiscal years beginning after June 15, 2015. No formal study or estimate of the impact of this standard has been performed.
-90-

COUNTY OF FRANKLIN, VIRGINIA NOTES TO FINANCIAL STATEMENTS (CONTINUED) JUNE 30, 2015 Note 21-Upcoming Pronouncements: (continued) Statement No. 74, Financial Reporting for Postemployment Benefit Plans Other Than Pension Plans, improves the usefulness of information about postemployment benefits other than pensions (other postemployment benefits or OPEB) included in the general purpose external financial reports of state and local governmental OPEB plans for making decisions and assessing accountability. This Statement replaces Statements No. 43, Financial Reporting for Postemployment Benefit Plans Other Than Pension Plans, as amended, and No. 57, OPEB Measurements by Agent Employers and Agent Multiple Employer Plans. It also includes requirements for defined contribution OPEB plans that replace the requirements for those OPEB plans in Statement No. 25, Financial Reporting for Defined Benefit Pension Plans and Note Disclosures for Defined Contribution Plans, as amended, Statement 43, and Statement No. 50, Pension Disclosures. This Statement is effective for financial statements for fiscal years beginning after June 15, 2016. No formal study or estimate of the impact of this standard has been performed. Statement No. 75, Accounting and Financial Reporting for Postemployment Benefits Other Than Pension, improves accounting and financial reporting by state and local governments for postemployment benefits other than pensions (other postemployment benefits or OPEB). This Statement replaces the requirements of Statements No. 45, Accounting and Financial Reporting by Employers for Postemployment Benefits Other Than Pensions, as amended, and No. 57, OPEB Measurements by Agent Employers and Agent Multiple Employer Plans, for OPEB. Statement No. 74, Financial Reporting for Postemployment Benefit Plans Other Than Pension Plans, establishes new accounting and financial reporting requirements for OPEB plans. This Statement is effective for fiscal years beginning after June 15, 2017. No formal study or estimate of the impact of this standard has been performed. Statement No. 76, The Hierarchy of Generally Accepted Accounting Principles for State and Local Governments, objective is to identify—in the context of the current governmental financial reporting environment—the hierarchy of generally accepted accounting principles (GAAP). This Statement supersedes Statement No. 55, The Hierarchy of Generally Accepted Accounting Principles for State and Local Governments. The requirements of this Statement are effective for financial statements for periods beginning after June 15, 2015, and should be applied retroactively. No formal study or estimate of the impact of this standard has been performed. Statement No. 77, Tax Abatement Disclosures, will increase the disclosure of tax abatement agreements to disclose information about the agreements. The requirements of this Statement improve financial reporting by giving users of financial statements essential information that is not consistently or comprehensively reported to the public at present. The requirements of this Statement are effective for financial statements for periods beginning after December 15, 2015. No formal study or estimate of the impact of this standard has been performed.
-91-

Required Supplementary Information

Exhibit 11
County Healthcare Plan
Actuarial Actuarial Actuarial Unfunded UAAL as aValuation Value of Accrued AAL (UAAL) Funded Ratio Covered % of Covered
as of* Assets Liability (AAL) (3) - (2) (2)/(3) Payroll Payroll (4)/(6)(1) (2) (3) (4) (5) (6) (7)
July 1, 2014 -$ 992,000$ 992,000$ 0.00% 9,381,563$ 10.57%July 1, 2012 - 1,048,000 1,048,000 0.00% 9,724,965 10.78%July 1, 2011 - 1,706,000 1,706,000 0.00% 11,460,168 14.89%
Discretely Presented Component Unit:School Board Healthcare Plan
Actuarial Actuarial Actuarial Unfunded UAAL as aValuation Value of Accrued AAL (UAAL) Funded Ratio Covered % of Covered
as of* Assets Liability (AAL) (3) - (2) (2)/(3) Payroll Payroll (4)/(6)(1) (2) (3) (4) (5) (6) (7)
July 1, 2014 -$ 4,360,000$ 4,360,000$ 0.00% 41,233,484$ 10.57%July 1, 2012 - 4,169,000 4,169,000 0.00% 40,893,828 10.19%July 1, 2011 - 6,126,000 6,126,000 0.00% 41,652,207 14.71%
Discretely Presented Component Unit:
School Board Non-Professional Health Insurance Credit Plan
Actuarial Actuarial Actuarial Unfunded UAAL as aValuation Value of Accrued AAL (UAAL) Funded Ratio Covered % of Covered
as of Assets Liability (AAL) (3) - (2) (2)/(3) Payroll Payroll (4)/(6)(1) (2) (3) (4) (5) (6) (7)
June 30, 2014 280,070$ 494,741$ 214,671$ 56.61% 4,947,948$ 4.34%June 30, 2013 240,350 468,639 228,289 51.29% 4,893,316 4.67%June 30, 2012 212,494 449,324 236,830 47.29% 4,915,681 4.82%
County of Franklin, VirginiaSchedule of OPEB Funding ProgressFor the Year Ended June 30, 2015
-92-

Exhibit 12
2014Total pension liabilityService cost $ 1,541,854 Interest 3,634,557 Changes of benefit terms - Differences between expected and actual experience - Changes in assumptions - Benefit payments, including refunds of employee contributions (2,372,581) Net change in total pension liability $ 2,803,830 Total pension liability - beginning 53,108,530 Total pension liability - ending (a) $ 55,912,360
Plan fiduciary net positionContributions - employer $ 1,571,032 Contributions - employee 639,291 Net investment income 7,019,995 Benefit payments, including refunds of employee contributions (2,372,581) Administrative expense (37,649) Other 370 Net change in plan fiduciary net position $ 6,820,458 Plan fiduciary net position - beginning 44,567,213 Plan fiduciary net position - ending (b) $ 51,387,671
County's net pension liability - ending (a) - (b) $ 4,524,689
Plan fiduciary net position as a percentage of the totalpension liability 8.09%
Covered-employee payroll $ 12,688,971
County's net pension liability as a percentage of covered-employee payroll 35.66%
Schedule is intended to show information for 10 years. Since 2015 is the first year for thispresentation, no other data is available. However, additional years will be included as theybecome available.
County of Franklin, Virginia
For the Year Ended June 30, 2015Primary Government
Schedule of Components of and Changes in Net Pension Liability and Related Ratios
-93-

Exhibit 13
2014Total pension liabilityService cost $ 511,225 Interest 1,273,433 Changes of benefit terms - Differences between expected and actual experience - Changes in assumptions - Benefit payments, including refunds of employee contributions (871,073) Net change in total pension liability $ 913,585 Total pension liability - beginning 18,627,439 Total pension liability - ending (a) $ 19,541,024
Plan fiduciary net positionContributions - employer $ 395,872 Contributions - employee 247,003 Net investment income 2,390,492 Benefit payments, including refunds of employee contributions (871,073) Administrative expense (12,959) Other 126 Net change in plan fiduciary net position $ 2,149,461 Plan fiduciary net position - beginning 15,228,682 Plan fiduciary net position - ending (b) $ 17,378,143
School Division's net pension liability - ending (a) - (b) $ 2,162,881
Plan fiduciary net position as a percentage of the totalpension liability 11.07%
Covered-employee payroll $ 4,945,841
School Division's net pension liability as a percentage of covered-employee payroll 43.73%
Schedule is intended to show information for 10 years. Since 2015 is the first year for thispresentation, no other data is available. However, additional years will be included asthey become available.
County of Franklin, Virginia
For the Year Ended June 30, 2015Component Unit School Board (nonprofessional)
Schedule of Components of and Changes in Net Pension Liability and Related Ratios
-94-

Exhibit 14
2015
Employer's Proportion of the Net Pension Liability (Asset) 0.51106%
Employer's Proportionate Share of the Net Pension Liability (Asset) $ 61,760,000
Employer's Covered-Employee Payroll 38,098,804
Employer's Proportionate Share of the Net Pension Liability (Asset) as a Percentage of its Covered-Employee Payroll 61.69%
Plan Fiduciary Net Position as a Percentage of the Total Pension Liability 70.88%
Schedule is intended to show information for 10 years. Since 2015 is the first year for thispresentation, no other data is available. However, additional years will be included as theybecome available.
* The amounts presented have a measurement date of the previous fiscal year end.
County of Franklin, Virginia
For the Year Ended June 30, 2015*Schedule of Employer's Share of Net Pension Liability VRS Teacher Retirement Plan
-95-

Exhibit 15
Contributions in ContributionsRelation to Employer's as a % of
Contractually Contractually Contribution Covered CoveredRequired Required Deficiency Employee Employee
Contribution Contribution (Excess)* Payroll PayrollDate (1) (2) (3) (4) (5)
Primary Government2015 $ 1,462,651 $ 1,462,651 $ - $ 12,814,396 11.41%
Component Unit School Board (nonprofessional)2015 $ 393,357 $ 393,357 $ - $ 4,950,850 7.95%
Component Unit School Board (professional)2015 $ 5,504,768 $ 5,504,768 $ - $ 38,098,804 14.45%
County of Franklin, Virginia
For the Year Ended June 30, 2015Schedule of Employer Contributions
*The difference relates to the School Board using an agreed upon reduced rate from the VRS.This amount will impact the calculation of the net pension liability in the next fiscal year.
Schedule is intended to show information for 10 years. Since 2015 is the first year for thispresentation, no other data is available. However, additional years will be included as theybecome available.
-96-

Exhibit 16
Largest 10 – Non-LEOS:- Update mortality table- Decrease in rates of service retirement- Decrease in rates of disability retirement- Reduce rates of salary increase by 0.25% per year
Largest 10 – LEOS:- Update mortality table- Decrease in male rates of disability
All Others (Non 10 Largest) – Non-LEOS:- Update mortality table- Decrease in rates of service retirement- Decrease in rates of disability retirement- Reduce rates of salary increase by 0.25% per year
All Others (Non 10 Largest) – LEOS:- Update mortality table- Adjustments to rates of service retirement for females- Increase in rates of withdrawal- Decrease in male and female rates of disability
Component Unit School Board - Professional Employees- Update mortality table- Adjustments to the rates of service retirement- Decrease in rates withdrawals for 3 through 9 years of service- Decrease in rates of disability retirement- Reduce rates of salary increase by 0.25% per year
Other Information - Annual money-weighted rates of return for all plans administered bythe VRS may be obainted from VRS at the address listed in Note 9 to the financial statements.
Changes of benefit terms – There have been no significant changes to the System benefitprovisions since the prior actuarial valuation. A hybrid plan with changes to the defined benefitplan structure and a new defined contribution component were adopted in 2012. The hybrid planapplies to most new employees hired on or after January 1, 2014 and not covered by enhancedhazardous duty benefits. The liabilities presented do not reflect the hybrid plan since it coversnew members joining the System after the valuation date of June 30, 2013 and the impact on theliabilities as of the measurement date of June 30, 2014 are minimal.
Changes of assumptions – The following changes in actuarial assumptions were made effectiveJune 30, 2013 based on the most recent experience study of the System for the four-year periodending June 30, 2012:
For the Year Ended June 30, 2015Notes to Required Supplementary Information
County of Franklin, Virginia
-97-

Exhibit 17
Variance withFinal Budget -
Actual PositiveOriginal Final Amounts (Negative)
REVENUESGeneral property taxes 47,349,410$ 47,699,410$ 48,823,104$ 1,123,694$ Other local taxes 8,781,944 8,781,944 9,165,235 383,291 Permits, privilege fees, and regulatory licenses 372,000 438,240 498,402 60,162 Fines and forfeitures 98,000 98,000 110,271 12,271 Revenue from the use of money and property 1,350,931 1,350,931 891,282 (459,649) Charges for services 2,713,621 2,779,650 2,472,381 (307,269) Miscellaneous 35,000 61,086 237,089 176,003 Recovered costs 694,926 807,026 999,921 192,895 Intergovernmental:
Commonwealth 17,873,816 15,416,512 15,013,205 (403,307) Federal 51,615 2,866,648 2,906,474 39,826
Total revenues 79,321,263$ 80,299,447$ 81,117,364$ 817,917$
EXPENDITURESCurrent:
General government administration 4,195,798$ 4,703,606$ 4,324,399$ 379,207$ Judicial administration 2,256,094 2,596,318 2,574,462 21,856 Public safety 13,262,214 13,740,842 12,828,160 912,682 Public works 3,703,150 5,432,205 3,639,061 1,793,144 Health and welfare 11,694,429 11,710,411 11,525,467 184,944 Education 29,743,017 31,175,964 30,532,779 643,185 Parks, recreation, and cultural 1,928,496 2,036,521 1,936,652 99,869 Community development 2,721,056 11,370,736 3,338,880 8,031,856 Nondepartmental 254,407 26,674 26,674 -
Debt service:Principal retirement 3,946,822 3,815,736 3,810,068 5,668 Interest and other fiscal charges 1,103,563 1,103,563 1,103,561 2 Bond issuance costs 525,170 500 - 500
Total expenditures 75,334,216$ 87,713,076$ 75,640,163$ 12,072,913$
Excess (deficiency) of revenues over (under) expenditures 3,987,047$ (7,413,629)$ 5,477,201$ 12,890,830$
OTHER FINANCING SOURCES (USES)Transfers in 800,360$ 12,119,160$ 1,322,394$ (10,796,766)$ Transfers out (4,762,985) (6,950,273) (6,950,273) -
Total other financing sources (uses) (3,962,625)$ 5,168,887$ (5,627,879)$ (10,796,766)$
Net change in fund balances 24,422$ (2,244,742)$ (150,678)$ 2,094,064$ Fund balances - beginning 693,670 2,615,834 21,357,133 18,741,299 Fund balances - ending 718,092$ 371,092$ 21,206,455$ 20,835,363$
Note: All budgets are adopted on a basis consistent with generally accepted accounting principles (GAAP).
Budgeted Amounts
County of Franklin, VirginiaGeneral Fund
Schedule of Revenues, Expenditures, and Change in Fund Balances - Budget and ActualFor the Year Ended June 30, 2015
-98-

Other Supplementary Information

Exhibit 18
Variance withFinal Budget
PositiveOriginal Final Actual (Negative)
REVENUESRevenue from the use of money and property -$ 6,480$ 16,649$ 10,169$ Miscellaneous - 89,368 89,787 419 Intergovernmental:
Commonwealth - 292,678 712,390 419,712 Federal - 50,000 50,000 -
Total revenues -$ 438,526$ 868,826$ 430,300$
EXPENDITURESCapital projects 1,215,141$ 24,862,599$ 5,171,761$ 19,690,838$ Education:
Contribution to County School Board 1,220,000 1,480,640 1,193,700 286,940 Debt service:
Bond issuance costs - 131,432 131,432 - Total expenditures 2,435,141$ 26,474,671$ 6,496,893$ 19,977,778$
Excess (deficiency) of revenues over (under)expenditures (2,435,141)$ (26,036,145)$ (5,628,067)$ 20,408,078$
OTHER FINANCING SOURCES (USES)Transfers in 3,235,501$ 6,043,848$ 6,043,848$ -$ Transfers out (800,360) (12,119,160) (1,322,394) 10,796,766 Issuance of general obligation bonds - 12,500,000 12,500,000 - Sale of capital assets - 3,000 3,000 -
Total other financing sources (uses) 2,435,141$ 6,427,688$ 17,224,454$ 10,796,766$
Net change in fund balances -$ (19,608,457)$ 11,596,387$ 31,204,844$ Fund balances - beginning - 19,608,457 19,134,908 (473,549) Fund balances - ending -$ -$ 30,731,295$ 30,731,295$
Note: All budgets are adopted on a basis consistent with generally accepted accounting principles (GAAP).
County of Franklin, VirginiaSchedule of Revenues, Expenditures, and Change in Fund Balances - Budget and Actual
Capital Projects Fund - Major FundFor the Year Ended June 30, 2015
County Capital Projects
Budgeted Amounts
-99-

Exhibit 19
Variance withFinal Budget
PositiveOriginal Final Actual (Negative)
REVENUESOther local taxes -$ -$ 1,150$ 1,150$ Miscellaneous - - 500 500 Intergovernmental:
Commonwealth 52,508 52,508 60,736 8,228 Total revenues 52,508$ 52,508$ 62,386$ 9,878$
EXPENDITURESCurrent:
Public safety 1,041,666$ 941,933$ 920,920$ 21,013$ Total expenditures 1,041,666$ 941,933$ 920,920$ 21,013$
Excess (deficiency) of revenues over (under)expenditures (989,158)$ (889,425)$ (858,534)$ 30,891$
OTHER FINANCING SOURCES (USES)Transfers in 989,158$ 889,425$ 889,425$ -$
Total other financing sources (uses) 989,158$ 889,425$ 889,425$ -$
Net change in fund balances -$ -$ 30,891$ 30,891$ Fund balances - beginning - - 127,500 127,500 Fund balances - ending -$ -$ 158,391$ 158,391$
Note: All budgets are adopted on a basis consistent with generally accepted accounting principles (GAAP).
County of Franklin, VirginiaSchedule of Revenues, Expenditures, and Change in Fund Balances - Budget and Actual
Nonmajor Special Revenue FundFor the Year Ended June 30, 2015
E-911 Fund
Budgeted Amounts
-100-

FIDUCIARY FUNDS
Special Welfare – The Special Welfare fund accounts for those funds belonging to individuals entrusted to the local social services agency, such as foster care children. Road Escrow – The Road Escrow fund accounts for those funds belonging to County citizens for which road improvements are being made. Escrow Fund for Soil and Erosion Control Agreement– The Soil and Erosion Control Agreement fund accounts for those funds held by the County on behalf of developers, corporations, or individuals to ensure performance under requirements set forth by the County. Library Fund – The Library Fund is used to account for contributions made by donors to the Library. Inmate Trust and Canteen – The Jail Inmate Trust and Canteen fund accounts for the inmate commissary, inmate trust, and inmate monitoring funds.

Exhibit 20
Escrow Fundfor Soil and Inmate Trust
Special Road Erosion and CanteenWelfare Escrow Control Library Account
Fund Fund Agreement Fund Fund Total
ASSETSCash and cash equivalents 13,975$ 17,740$ 137,479$ 4,000$ -$ 173,194$ Cash in custody of others - - - - 43,272 43,272
Total assets 13,975$ 17,740$ 137,479$ 4,000$ 43,272$ 216,466$
LIABILITIESAmounts held for social services clients 13,975$ -$ -$ -$ -$ 13,975$ Amounts held for citizens - 17,740 - - - 17,740 Amounts held for performance bonds - - 137,479 - - 137,479 Amounts held for Library - - - 4,000 - 4,000 Amounts held for inmates - - - - 43,272 43,272
Total liabilities 13,975$ 17,740$ 137,479$ 4,000$ 43,272$ 216,466$
Agency Funds
County of Franklin, VirginiaCombining Statement of Fiduciary Net Position
Fiduciary FundsJune 30, 2015
-101-

Exhibit 21
Balance BalanceJuly 1, June 30,2014 Additions Deductions 2015
ASSETSCash and cash equivalents:
Special Welfare Fund 82,829$ 151,535$ 220,389$ 13,975$ Road Escrow Fund 20,231 - 2,491 17,740 Escrow Fund for Soil and Erosion Control Agreement 179,177 - 41,698 137,479 Library Fund 4,000 - - 4,000
Cash in custody of others:Inmate Trust and Canteen Account Fund 46,071 145,381 148,180 43,272 Total assets 332,308$ 296,916$ 412,758$ 216,466$
LIABILITIESAmounts held for others:
Social services clients 82,829$ 151,535$ 220,389$ 13,975$ Citizens 20,231 - 2,491 17,740 Performance bonds 179,177 - 41,698 137,479 Library 4,000 - - 4,000 Inmates 46,071 145,381 148,180 43,272 Total liabilities 332,308$ 296,916$ 412,758$ 216,466$
Agency Funds
County of Franklin, VirginiaCombining Statement of Changes in Assets and Liabilities
Agency FundsFor the Year Ended June 30, 2015
-102-

DISCRETELY PRESENTED COMPONENT UNIT – SCHOOL BOARD
MAJOR GOVERNMENTAL FUNDS School Operating Fund - The School Operating Fund accounts for and reports the operations of the County's school system. Financing is provided by the State and Federal governments as well as contributions from the General Fund.

Exhibit 22
SchoolOperating
Fund
ASSETSCash and cash equivalents 232,235$
Accounts receivable 1,245 Due from other governmental units 2,288,934 Restricted assets:
Temporarily restricted:Cash and cash equivalents 112,185 Total assets 2,634,599$
LIABILITIES AND FUND BALANCESLiabilities:
Accounts payable 1,441,355$ Accrued liabilities 612,855
Total liabilities 2,054,210$
Fund balances:Restricted
Cafeteria program 112,185$ Assigned 468,204
Total fund balances 580,389$ Total liabilities and fund balances 2,634,599$
Amounts reported for governmental activities in the statement of net position (Exhibit 1) aredifferent because:
Total fund balances per above 580,389$
Capital assets used in governmental activities are not financial resources and, therefore,are not reported in the funds.
Land 725,315$ Buildings and improvements 13,844,057 Machinery and equipment 5,176,537 Construction in progress 542,422 20,288,331
Other long-term assets are not available to pay for current-period expenditures and,therefore, are deferred in the funds.
Items related to measurement of net pension liability (10,232,336)
Pension contributions subsequent to the measurement date will be a reduction tothe net pension liability in the next fiscal year and, therefore, are not reported in the funds. 5,898,125
Long-term liabilities, including compensated absenses, net OPEB obligation, and net pension liability, are not due and payable in the current period and, therefore, are not reported in the funds.
Compensated absences (804,657)$ Net OPEB obligation (2,397,180) Net pension liability (63,922,881) Adjustment for changes in the proportionate share of net pension liability 147,000 (66,977,718)
Net position of governmental activities (50,443,209)$
County of Franklin, VirginiaBalance Sheet
Discretely Presented Component Unit - School BoardJune 30, 2015
-103-

Exhibit 23
SchoolOperating
FundREVENUESRevenue from the use of money and property 464$ Charges for services 2,276,272 Miscellaneous 673,325 Recovered costs 1,015,994 Intergovernmental:
Local government 31,726,479 Commonwealth 39,323,540 Federal 7,574,854
Total revenues 82,590,928$
EXPENDITURESCurrent:
Education 81,232,549$ Capital projects 1,228,923
Total expenditures 82,461,472$
Excess (deficiency) of revenues over (under)expenditures 129,456$
OTHER FINANCING SOURCES (USES)Sale of capital assets 35,964$
Total other financing sources (uses) 35,964$
Net change in fund balances 165,420$ Fund balances - beginning 414,969 Fund balances - ending 580,389$
Amounts reported for governmental activities in the statement of activities (Exhibit 2) are different because:
Net change in fund balances - total governmental funds - per above 165,420$
Governmental funds report capital outlays as expenditures. However, in the statement ofactivities the cost of those assets is allocated over their estimated useful lives and reported as depreciation expense. This is the amount by which the depreciation exceeded capital outlays in the current period.
Capital outlays 2,328,810$ Depreciation expenses (2,190,792) 138,018
Revenues in the statement of activities that do not provide current financial resources arenot reported as revenues in the funds.
Change in deferred inflows related to the measurement of the net pension liability (10,232,336)
Some expenses reported in the statement of activities do not require the use of currentfinancial resources and, therefore are not reported as expenditures in governmental funds.
Change in compensated absenses 52,082$ Change in net OPEB obligation (211,000) Change in net pension liability 9,698,876 Change in deferred outflows related to pensions 1,287,253 10,827,211
Change in net position of governmental activities 898,313$
County of Franklin, VirginiaStatement of Revenues, Expenditures, and Changes in Fund Balances
Governmental Funds - Discretely Presented Component Unit - School BoardFor the Year Ended June 30, 2015
-104-

Exhibit 24
Variance withFinal Budget
PositiveOriginal Final Actual (Negative)
REVENUESRevenue from the use of money and property -$ -$ 464$ 464$ Charges for services 2,579,368 2,596,748 2,276,272 (320,476) Miscellaneous 389,832 323,314 673,325 350,011 Recovered costs 843,639 892,777 1,015,994 123,217 Intergovernmental:
Local government 30,963,017 32,656,604 31,726,479 (930,125) Commonwealth 38,327,513 38,707,535 39,323,540 616,005 Federal 7,564,795 7,281,946 7,574,854 292,908
Total revenues 80,668,164$ 82,458,924$ 82,590,928$ 132,004$
EXPENDITURESCurrent:
Education 79,460,153$ 81,294,362$ 81,232,549$ 61,813$ Capital projects 1,220,000 1,176,551 1,228,923 (52,372)
Total expenditures 80,680,153$ 82,470,913$ 82,461,472$ 9,441$
Excess (deficiency) of revenues over (under)expenditures (11,989)$ (11,989)$ 129,456$ 141,445$
OTHER FINANCING SOURCES (USES)Sale of capital assets 11,989 11,989 35,964 23,975
Total other financing sources (uses) 11,989$ 11,989$ 35,964$ 23,975$
Net change in fund balances -$ -$ 165,420$ 165,420$ Fund balances - beginning - - 414,969 414,969 Fund balances - ending -$ -$ 580,389$ 580,389$
Note: All budgets are adopted on a basis consistent with generally accepted accounting principles (GAAP).
County of Franklin, VirginiaSchedule of Revenues, Expenditures, and Changes in Fund Balances - Budget and Actual
Discretely Presented Component Unit - School BoardFor the Year Ended June 30, 2015
Budgeted Amounts
School Operating Fund
-105-

Schedule 1Page 1 of 6
Variance withFinal Budget -
Original Final PositiveBudget Budget Actual (Negative)
Primary Government:General Fund:Revenue from local sources:
General property taxes:Real property taxes 35,484,134$ 35,834,134$ 36,012,863$ 178,729$ Real and personal public service corporation taxes 872,246 872,246 969,010 96,764 Personal property taxes 8,842,930 8,842,930 9,454,745 611,815 Mobile home taxes 199,267 199,267 227,289 28,022 Machinery and tools taxes 639,709 639,709 709,421 69,712 Merchant's capital 671,124 671,124 691,324 20,200 Penalties 386,624 386,624 495,247 108,623 Interest 253,376 253,376 263,205 9,829
Total general property taxes 47,349,410$ 47,699,410$ 48,823,104$ 1,123,694$
Other local taxes:Local sales and use taxes 4,003,534$ 4,003,534$ 4,222,615$ 219,081$ Consumers' utility taxes 973,782 973,782 979,527 5,745 Business license taxes 4,700 4,700 4,079 (621) Utility license taxes 220,000 220,000 239,118 19,118 Motor vehicle licenses 1,876,174 1,876,174 1,930,605 54,431 Bank stock taxes 128,791 128,791 188,100 59,309 Taxes on recordation and wills 500,000 500,000 452,037 (47,963) Hotel and motel room taxes 81,963 81,963 88,041 6,078 Local probate tax 13,000 13,000 17,262 4,262 Restaurant food taxes 980,000 980,000 1,043,851 63,851
Total other local taxes 8,781,944$ 8,781,944$ 9,165,235$ 383,291$
Permits, privilege fees, and regulatory licenses:Animal licenses 30,000$ 30,000$ 27,908$ (2,092)$ Zoning and planning fees 67,500 67,500 46,722 (20,778) Erosion and sediment control - - 12,490 12,490 Building permits 250,500 250,500 265,967 15,467 Land use application fees - - 18,915 18,915 Transfer fees - - 2,046 2,046 Other permits and licenses 24,000 90,240 124,354 34,114
Total permits, privilege fees, and regulatory licenses 372,000$ 438,240$ 498,402$ 60,162$
Fines and forfeitures:Court fines and forfeitures 98,000$ 98,000$ 110,271$ 12,271$
Total fines and forfeitures 98,000$ 98,000$ 110,271$ 12,271$
Revenue from use of money and property:Revenue from use of money 1,231,971$ 1,231,971$ 769,421$ (462,550)$ Revenue from use of property 118,960 118,960 121,861 2,901
Total revenue from use of money and property 1,350,931$ 1,350,931$ 891,282$ (459,649)$
Fund, Major and Minor Revenue Source
County of Franklin, VirginiaSchedule of Revenues - Budget and Actual
Governmental FundsFor the Year Ended June 30, 2015
-106-

Schedule 1Page 2 of 6
Variance withFinal Budget -
Original Final PositiveBudget Budget Actual (Negative)Fund, Major and Minor Revenue Source
County of Franklin, VirginiaSchedule of Revenues - Budget and Actual
Governmental FundsFor the Year Ended June 30, 2015
Primary Government: (Continued)General Fund: (Continued)Revenue from local sources: (Continued)
Charges for services:Charges for courthouse security 66,000$ 66,000$ 74,600$ 8,600$ Charges for courthouse maintenance 12,000 12,000 44,719 32,719 Charges for law enforcement and traffic control 45,000 51,655 62,777 11,122 Excess Clerk of Court fees 32,000 32,000 718 (31,282) Charges for Commonwealth's Attorney 5,000 5,000 7,080 2,080 Prisoner's board 5,000 5,000 - (5,000) Miscellaneous jail and inmate fees - - 803 803 Miscellaneous animal fees 8,000 8,000 4,200 (3,800) Charges for private landfills - - 20,703 20,703 Charges for sale of maps and codes and copies 11,800 11,800 7,104 (4,696) Charges for emergency medical services billing 1,294,564 1,294,564 1,114,097 (180,467) Charges for sanitation and waste removal 1,000,000 1,000,000 811,320 (188,680) Charges for parks and recreation 113,257 158,837 203,764 44,927 Charges for aging services 12,000 12,000 23,630 11,630 Charges for library 35,000 48,794 47,363 (1,431) Charges for law library 12,000 12,000 10,540 (1,460) Charges for concealed weapons permits 33,000 33,000 26,932 (6,068) Sale of recycled goods 29,000 29,000 12,031 (16,969)
Total charges for services 2,713,621$ 2,779,650$ 2,472,381$ (307,269)$
Miscellaneous revenue:Miscellaneous 35,000$ 61,086$ 237,089$ 176,003$
Total miscellaneous revenue 35,000$ 61,086$ 237,089$ 176,003$
Recovered costs:Health department 123,178$ 123,178$ 74,617$ (48,561)$ Court reporting fees 60,000 60,000 48,870 (11,130) School resource officer 86,658 86,658 86,658 - Office on youth - - 242,831 242,831 Blue ridge soil and water 217,090 217,090 220,116 3,026 Jail payphone commissions 13,000 13,000 16,071 3,071 Other recovered costs 195,000 307,100 310,758 3,658
Total recovered costs 694,926$ 807,026$ 999,921$ 192,895$
Total revenue from local sources 61,395,832$ 62,016,287$ 63,197,685$ 1,181,398$
Intergovernmental:Revenue from the Commonwealth:
Motor vehicle carrier tax (rolling stock) 40,962$ 40,962$ 41,743$ 781$ Mobile home titling tax 110,499 110,499 82,382 (28,117) Grantor's tax 124,000 124,000 130,760 6,760 Motor vehicle rental tax 46,660 46,660 39,641 (7,019) Communications tax 2,271,784 2,271,784 2,213,617 (58,167) State recordation tax 159,000 159,000 161,936 2,936 Personal property tax relief funds 2,626,618 2,626,618 2,626,618 -
Total noncategorical aid 5,379,523$ 5,379,523$ 5,296,697$ (82,826)$
-107-

Schedule 1Page 3 of 6
Variance withFinal Budget -
Original Final PositiveBudget Budget Actual (Negative)Fund, Major and Minor Revenue Source
County of Franklin, VirginiaSchedule of Revenues - Budget and Actual
Governmental FundsFor the Year Ended June 30, 2015
Primary Government: (Continued)General Fund: (Continued)Intergovernmental: (Continued)Revenue from the Commonwealth: (Continued)
Categorical aid:Shared expenses:
Commonwealth's attorney 520,000$ 525,851$ 569,323$ 43,472$ Sheriff 3,120,000 3,120,000 3,095,282 (24,718) Commissioner of revenue 151,795 163,806 160,544 (3,262) Treasurer 149,892 149,892 147,268 (2,624) Registrar/electoral board 42,000 42,000 44,625 2,625 Clerk of the Circuit Court 356,829 372,649 369,217 (3,432) Total shared expenses 4,340,516$ 4,374,198$ 4,386,259$ 12,061$
Other categorical aid:Public assistance and welfare administration 4,552,606$ 1,836,740$ 1,806,610$ (30,130)$ Comprehensive services act 3,200,042 3,200,042 2,905,651 (294,391) Office on youth-juvenile 20,040 20,040 20,683 643 Family resource center-family violence prevention 119,438 180,816 147,595 (33,221) Four for life - 54,166 54,166 - Asset forfeiture funds 10,000 10,005 12,599 2,594 Library grants 153,449 153,184 148,646 (4,538) Workforce development grants 67,000 67,000 60,315 (6,685) Litter control grant - 15,789 15,789 - VDA grant - - 4,761 4,761 Drug enhancement grant 12,000 12,000 29,637 17,637 Park and recreation grants - 17,500 12,500 (5,000) Other categorical aid 19,202 95,509 111,297 15,788 Total other categorical aid 8,153,777$ 5,662,791$ 5,330,249$ (332,542)$
Total categorical aid 12,494,293$ 10,036,989$ 9,716,508$ (320,481)$
Total revenue from the Commonwealth 17,873,816$ 15,416,512$ 15,013,205$ (403,307)$
Revenue from the federal government:Noncategorical aid:
Payments in lieu of taxes 17,031$ 17,031$ 16,592$ (439)$ Total noncategorical aid 17,031$ 17,031$ 16,592$ (439)$
Categorical aid:Department of Health and Human Services payments -$ 2,742,116$ 2,742,116$ -$ Violence against women grant - 35,390 35,390 - State homeland security program - - 35,248 35,248 CDBG State's program - 30,000 30,000 - Equitable sharing program - 7,527 10,630 3,103 Emergency management performance grant 34,584 34,584 36,498 1,914
Total categorical aid 34,584$ 2,849,617$ 2,889,882$ 40,265$
Total revenue from the federal government 51,615$ 2,866,648$ 2,906,474$ 39,826$
Total General Fund 79,321,263$ 80,299,447$ 81,117,364$ 817,917$
-108-

Schedule 1Page 4 of 6
Variance withFinal Budget -
Original Final PositiveBudget Budget Actual (Negative)Fund, Major and Minor Revenue Source
County of Franklin, VirginiaSchedule of Revenues - Budget and Actual
Governmental FundsFor the Year Ended June 30, 2015
County Capital Projects Fund: Revenue from local sources:
Revenue from use of money and property:Revenue from use of money -$ 6,480$ 16,649$ 10,169$
Total revenue from use of money and property -$ 6,480$ 16,649$ 10,169$
Miscellaneous revenue:Miscellaneous -$ 89,368$ 89,787$ 419$
Total miscellaneous revenue -$ 89,368$ 89,787$ 419$
Total revenue from local sources -$ 95,848$ 106,436$ 10,588$
Intergovernmental:Revenue from the Commonwealth:
Categorical aid:Tobacco commission funds -$ 65,000$ 303,556$ 238,556$ Virginia fire programs - 186,233 161,958 (24,275) Conservation and recreation grants - - 31,130 31,130 Public safety grants - - 174,301 174,301 Wireless board funds - 41,445 41,445 -
Total other categorical aid -$ 292,678$ 712,390$ 419,712$
Total categorical aid -$ 292,678$ 712,390$ 419,712$
Total revenue from the Commonwealth -$ 292,678$ 712,390$ 419,712$
Revenue from the federal government:Categorical aid:
Community facilities grant -$ 50,000$ 50,000$ -$ Total categorical aid -$ 50,000$ 50,000$ -$
Total revenue from the federal government -$ 50,000$ 50,000$ -$
Total County Capital Projects Fund -$ 438,526$ 868,826$ 430,300$
Special Revenue Fund:E-911 Fund:Revenue from local sources:
Other local taxes:E-911 taxes -$ -$ 1,150$ 1,150$
Total other local taxes -$ -$ 1,150$ 1,150$
Miscellaneous revenue:Other miscellaneous -$ -$ 500$ 500$
Total miscellaneous revenue -$ -$ 500$ 500$
Total revenue from local sources -$ -$ 1,650$ 1,650$
-109-

Schedule 1Page 5 of 6
Variance withFinal Budget -
Original Final PositiveBudget Budget Actual (Negative)Fund, Major and Minor Revenue Source
County of Franklin, VirginiaSchedule of Revenues - Budget and Actual
Governmental FundsFor the Year Ended June 30, 2015
Special Revenue Fund: (Continued)E-911 Fund: (Continued)Intergovernmental:Revenue from the Commonwealth:
Categorical aid:Wireless board reimbursement 52,508$ 52,508$ 60,736$ 8,228$
Total categorical aid 52,508$ 52,508$ 60,736$ 8,228$
Total revenue from the Commonwealth 52,508$ 52,508$ 60,736$ 8,228$
Total E-911 Fund 52,508$ 52,508$ 62,386$ 9,878$
Total Primary Government 79,373,771$ 80,790,481$ 82,048,576$ 1,258,095$
Discretely Presented Component Unit - School Board:School Operating Fund:Revenue from local sources:
Revenue from use of money and property:Revenue from the use of property -$ -$ 464$ 464$
Total revenue from use of money and property -$ -$ 464$ 464$
Charges for services:Other charges for education -$ 17,380$ 17,438$ 58$ Cafeteria sales 1,645,631 1,645,631 1,163,178 (482,453) Payments from other localities 917,315 917,315 1,076,545 159,230 Cannery fees 16,422 16,422 19,111 2,689
Total charges for services 2,579,368$ 2,596,748$ 2,276,272$ (320,476)$
Miscellaneous revenue:Miscellaneous 389,832$ 323,314$ 673,325$ 350,011$
Total miscellaneous revenue 389,832$ 323,314$ 673,325$ 350,011$
Recovered costs:Insurance recoveries and rebates 18,242$ 18,242$ 47,429$ 29,187$ Sale of supplies - - 10,048 10,048 Famis/Medicare reimbursement 317,528 317,528 297,154 (20,374) E-rate program 450,418 450,418 407,745 (42,673) JROTC 57,451 57,451 53,150 (4,301) Other recovered costs - 49,138 200,468 151,330
Total recovered costs 843,639$ 892,777$ 1,015,994$ 123,217$
Total revenue from local sources 3,812,839$ 3,812,839$ 3,966,055$ 153,216$
Intergovernmental:Revenues from local governments:
Contribution from County of Franklin, Virginia 30,963,017$ 32,656,604$ 31,726,479$ (930,125)$ Total revenues from local governments 30,963,017$ 32,656,604$ 31,726,479$ (930,125)$
Revenue from the Commonwealth:Categorical aid:
Algebra readiness 93,348$ 93,348$ 91,644$ (1,704)$ At risk four-year olds 703,680 703,680 703,440 (240) At risk payments 691,161 691,161 690,674 (487) Basic school aid 18,224,115 18,224,115 18,179,341 (44,774)
-110-

Schedule 1Page 6 of 6
Variance withFinal Budget -
Original Final PositiveBudget Budget Actual (Negative)Fund, Major and Minor Revenue Source
County of Franklin, VirginiaSchedule of Revenues - Budget and Actual
Governmental FundsFor the Year Ended June 30, 2015
Discretely Presented Component Unit - School Board: (Continued)School Operating Fund: (Continued)Intergovernmental: (Continued)Revenue from the Commonwealth: (Continued)
Categorical aid: (Continued)English as a second language 59,614$ 59,614$ 55,137$ (4,477)$ Early reading intervention 81,809 81,809 74,347 (7,462) Gifted and talented 195,615 195,615 195,579 (36) GED funds 23,576 23,576 23,576 - Group life 83,240 83,240 74,902 (8,338) Homebound education 37,338 37,338 28,050 (9,288) Mentor teacher program - - 5,873 5,873 Primary class size 851,487 851,487 866,137 14,650 Race to GED - 119,537 - (119,537) Regular foster care 101,027 101,027 133,308 32,281 Remedial education 653,437 653,437 653,316 (121) Remedial summer education 176,978 176,978 114,905 (62,073) Retirement fringe benefits 2,401,486 2,401,486 2,384,394 (17,092) School food 39,173 39,173 54,463 15,290 Share of state sales tax 8,025,338 8,025,338 8,061,432 36,094 Social security fringe benefits 1,173,690 1,173,690 1,173,471 (219) Special education 2,647,045 2,647,045 2,646,553 (492) Special education - foster children 166,570 166,570 191,101 24,531 Special education-regional program 530,986 530,986 1,052,012 521,026 State lottery payments - - 400,395 400,395 Textbook payment 400,470 400,470 - (400,470) Vocational standards of quality education 475,828 475,828 479,693 3,865 Vocational education - equipment 15,420 15,420 15,660 240 VPSA technology grant 466,000 466,000 466,000 - Other state funds 9,082 269,567 508,137 238,570
Total categorical aid 38,327,513$ 38,707,535$ 39,323,540$ 616,005$
Total revenue from the Commonwealth 38,327,513$ 38,707,535$ 39,323,540$ 616,005$
Revenue from the federal government:Categorical aid:
Adult literacy 986,452$ 606,430$ 531,004$ (75,426)$ Advanced placement - - 1,739 1,739 School food program 2,255,811 2,255,811 2,553,160 297,349 Title I funds 1,780,452 1,823,100 1,875,814 52,714 Title II Teacher improvement 262,147 262,147 246,920 (15,227) Title III funds 11,382 11,382 2,409 (8,973) Title VI-B, special education flow-through 2,099,607 2,154,132 2,200,558 46,426 Title VI-B, special education pre-school 32,803 32,803 32,803 - Vocational education 136,141 136,141 130,447 (5,694)
Total categorical aid 7,564,795$ 7,281,946$ 7,574,854$ 292,908$
Total revenue from the federal government 7,564,795$ 7,281,946$ 7,574,854$ 292,908$
Total School Operating Fund 80,668,164$ 82,458,924$ 82,590,928$ 132,004$
-111-

Schedule 2Page 1 of 5
Variance withFinal Budget -
Original Final PositiveBudget Budget Actual (Negative)
Primary Government:General Fund:General government administration:
Legislative:Board of supervisors 301,508$ 339,220$ 338,693$ 527$
Total legislative 301,508$ 339,220$ 338,693$ 527$
General and financial administration:County administrator 428,119$ 447,619$ 447,372$ 247$ Risk management 367,963 331,790 330,801 989 Human resources 123,007 179,199 173,885 5,314 Commissioner of revenue 536,422 565,533 565,447 86 Reassessment 150,000 654,002 339,651 314,351 Land use 39,602 42,827 42,104 723 Treasurer 457,498 488,028 482,038 5,990 Director of finance 319,051 288,517 283,160 5,357 Information technology 1,136,836 1,066,608 1,048,770 17,838 Telecommunications and Postage 65,500 86,531 80,632 5,899
Total general and financial administration 3,623,998$ 4,150,654$ 3,793,860$ 356,794$
Board of elections:Registrar 190,503$ 168,943$ 157,134$ 11,809$ Electoral board 79,789 44,789 34,712 10,077
Total board of elections 270,292$ 213,732$ 191,846$ 21,886$
Total general government administration 4,195,798$ 4,703,606$ 4,324,399$ 379,207$
Judicial administration:Courts:
Circuit court 98,658$ 102,591$ 102,559$ 32$ General district court 7,580 12,020 11,282 738 Law library 12,000 12,000 5,000 7,000 Special magistrates 2,000 1,500 601 899 Juvenile and domestic relations court 17,180 18,880 17,486 1,394 Juvenile court services 328,288 446,762 442,258 4,504 Sheriff-courts 354,398 519,280 519,280 - Clerk of the circuit court 643,350 676,767 673,221 3,546
Total courts 1,463,454$ 1,789,800$ 1,771,687$ 18,113$
Commonwealth's attorney:Commonwealth's attorney 792,640$ 806,518$ 802,775$ 3,743$
Total commonwealth's attorney 792,640$ 806,518$ 802,775$ 3,743$
Total judicial administration 2,256,094$ 2,596,318$ 2,574,462$ 21,856$
Public safety:Law enforcement and traffic control:
Sheriff 3,794,559$ 4,162,415$ 4,136,953$ 25,462$ Total law enforcement and traffic control 3,794,559$ 4,162,415$ 4,136,953$ 25,462$
Correction and detention:County operated institutions and regional jail 4,986,428$ 4,870,462$ 4,131,391$ 739,071$
Total correction and detention 4,986,428$ 4,870,462$ 4,131,391$ 739,071$
Inspections:Building 505,136$ 486,640$ 478,013$ 8,627$
Total inspections 505,136$ 486,640$ 478,013$ 8,627$
County of Franklin, VirginiaSchedule of Expenditures - Budget and Actual
Governmental FundsFor the Year Ended June 30, 2015
Fund, Function, Activity, and Element
-112-

Schedule 2Page 2 of 5
Variance withFinal Budget -
Original Final PositiveBudget Budget Actual (Negative)
County of Franklin, VirginiaSchedule of Expenditures - Budget and Actual
Governmental FundsFor the Year Ended June 30, 2015
Fund, Function, Activity, and Element
Primary Government: (Continued)General Fund: (Continued)Public safety: (Continued)
Other protection:Director of public safety 2,371,422$ 2,523,827$ 2,435,726$ 88,101$ Animal control 290,393 338,758 288,867 49,891 Department of forestry 24,000 23,300 23,299 1 EMS career billing 1,022,776 1,047,776 1,046,254 1,522 EMS volunteer billing 267,500 287,664 287,657 7
Total other protection 3,976,091$ 4,221,325$ 4,081,803$ 139,522$
Total public safety 13,262,214$ 13,740,842$ 12,828,160$ 912,682$
Public works:Maintenance of highways, streets, bridges and sidewalks:
Highways, streets, bridges and sidewalks 450$ 450$ -$ 450$ Total maintenance of highways, streets, bridges and sidewalks 450$ 450$ -$ 450$
Sanitation and waste removal:Refuse collection and disposal 1,868,572$ 3,429,146$ 1,940,336$ 1,488,810$ Recycling program 74,756 81,756 77,530 4,226 Scale house 65,298 65,298 59,415 5,883 Public works 236,352 220,352 217,733 2,619
Total sanitation and waste removal 2,244,978$ 3,796,552$ 2,295,014$ 1,501,538$
Maintenance of general buildings and grounds:General properties 1,219,471$ 1,395,952$ 1,124,696$ 271,256$ Mechanic 226,251 227,251 219,351 7,900 Courthouse maintenance 12,000 12,000 - 12,000
Total maintenance of general buildings and grounds 1,457,722$ 1,635,203$ 1,344,047$ 291,156$
Total public works 3,703,150$ 5,432,205$ 3,639,061$ 1,793,144$
Health and welfare:Health:
Supplement of local health department 338,705$ 338,705$ 338,705$ -$ Total health 338,705$ 338,705$ 338,705$ -$
Mental health and mental retardation:Development center of Franklin 40,000$ 40,000$ 40,000$ -$
Total mental health and mental retardation 40,000$ 40,000$ 40,000$ -$
Welfare:Public assistance and welfare administration 5,820,263$ 5,856,563$ 5,787,979$ 68,584$ Youth services agency (CSA) 4,794,924 4,794,924 4,735,996 58,928 Family resource center 215,900 287,582 269,591 17,991 Area agency on aging 324,777 232,777 193,386 39,391 Contribution to health and welfare organizations 142,596 142,596 142,596 - Assistance - institutions 17,264 17,264 17,214 50
Total welfare 11,315,724$ 11,331,706$ 11,146,762$ 184,944$
Total health and welfare 11,694,429$ 11,710,411$ 11,525,467$ 184,944$
-113-

Schedule 2Page 3 of 5
Variance withFinal Budget -
Original Final PositiveBudget Budget Actual (Negative)
County of Franklin, VirginiaSchedule of Expenditures - Budget and Actual
Governmental FundsFor the Year Ended June 30, 2015
Fund, Function, Activity, and Element
Primary Government: (Continued)General Fund: (Continued)Education:
Other instructional costs:Contribution to County School Board 29,743,017$ 31,175,964$ 30,532,779$ 643,185$
Total education 29,743,017$ 31,175,964$ 30,532,779$ 643,185$
Parks, recreation, and cultural:Parks and recreation:
Parks and recreation 994,905$ 1,072,631$ 988,659$ 83,972$ Total parks and recreation 994,905$ 1,072,631$ 988,659$ 83,972$
Library:Library administration 677,040$ 717,814$ 704,496$ 13,318$ Westlake branch library 256,551 246,076 243,497 2,579
Total library 933,591$ 963,890$ 947,993$ 15,897$
Total parks, recreation, and cultural 1,928,496$ 2,036,521$ 1,936,652$ 99,869$
Community development:Planning and community development:
Community development 1,003,161$ 9,059,257$ 1,151,645$ 7,907,612$ Ferrum planning grant - 20,000 - 20,000 Economic development 478,837 808,008 801,087 6,921 Tourism 200,821 308,555 308,554 1 GIS and mapping 162,046 146,046 142,808 3,238 4-H youth 3,750 3,750 3,750 - Planning 219,770 231,549 224,271 7,278 Franklin career center 197,811 206,811 205,694 1,117 Stormwater - 66,240 4,188 62,052 Contributions to Western Va Water Authority (assets constructed on - 46,590 23,238 23,352 Contributions to other entities 129,362 157,019 156,737 282
Total planning and community development 2,395,558$ 11,053,825$ 3,021,972$ 8,031,853$
Environmental management:Contribution to soil and water district 221,106$ 223,561$ 223,558$ 3$
Total environmental management 221,106$ 223,561$ 223,558$ 3$
Cooperative extension program:Extension office 104,392$ 93,350$ 93,350$ -$
Total cooperative extension program 104,392$ 93,350$ 93,350$ -$
Total community development 2,721,056$ 11,370,736$ 3,338,880$ 8,031,856$
Nondepartmental:Contingencies 254,407$ 26,674$ 26,674$ -$
Total nondepartmental 254,407$ 26,674$ 26,674$ -$
Debt service:Principal retirement 3,946,822$ 3,815,736$ 3,810,068$ 5,668$ Interest and other fiscal charges 1,103,563 1,103,563 1,103,561 2
Total debt service 5,575,555$ 4,919,799$ 4,913,629$ 6,170$
Total General Fund 75,334,216$ 87,713,076$ 75,640,163$ 12,072,913$
-114-

Schedule 2Page 4 of 5
Variance withFinal Budget -
Original Final PositiveBudget Budget Actual (Negative)
County of Franklin, VirginiaSchedule of Expenditures - Budget and Actual
Governmental FundsFor the Year Ended June 30, 2015
Fund, Function, Activity, and Element
Primary Government: (Continued)County Capital Projects Fund:Capital projects:
General government -$ 267,305$ -$ 267,305$ Information technology 167,274 652,453 485,528 166,925 Public safety 966,429 17,350,246 2,069,738 15,280,508 Public works 17,979 2,236,473 1,378,941 857,532 General property improvements - 3,062,405 947,744 2,114,661 Parks and recreation 37,000 673,157 223,133 450,024 Community development 26,459 620,560 66,677 553,883
Total capital projects 1,215,141$ 24,862,599$ 5,171,761$ 19,690,838$
Education:Other instructional costs:
Contribution to County School Board 1,220,000$ 1,480,640$ 1,193,700$ 286,940$ Total education 1,220,000$ 1,480,640$ 1,193,700$ 286,940$
Debt service:Bond issuance costs -$ 131,432$ 131,432$ -$
Total debt service -$ 131,432$ 131,432$ -$
Total County Capital Projects Fund 2,435,141$ 26,474,671$ 6,496,893$ 19,977,778$
Special Revenue Fund:E-911 Fund:Public safety:
Other protection:E-911 Administration 1,041,666$ 941,933$ 920,920$ 21,013$
Total other protection 1,041,666$ 941,933$ 920,920$ 21,013$
Total public safety 1,041,666$ 941,933$ 920,920$ 21,013$
Total E-911 Fund 1,041,666$ 941,933$ 920,920$ 21,013$
Total Primary Government 78,811,023$ 115,129,680$ 83,057,976$ 32,071,704$
Discretely Presented Component Unit - School Board:School Operating Fund:Education:
Administration of schools:Administration cost 2,696,188$ 2,726,442$ 2,423,031$ 303,411$
Total administration of schools 2,696,188$ 2,726,442$ 2,423,031$ 303,411$ Instruction costs:
Instruction cost 58,690,770$ 60,051,997$ 61,170,840$ (1,118,843)$ Total instruction costs 58,690,770$ 60,051,997$ 61,170,840$ (1,118,843)$
Operating costs:Pupil transportation 6,893,267$ 6,450,656$ 6,102,141$ 348,515$ Operation and maintenance of school plant 7,158,413 7,487,984 7,560,788 (72,804) School food and non-instructional 4,021,515 4,024,065 3,975,749 48,316 Interest and other fiscal charges - 553,218 - 553,218
Total operating costs 18,073,195$ 18,515,923$ 17,638,678$ 877,245$
Total education 79,460,153$ 81,294,362$ 81,232,549$ 61,813$
-115-

Schedule 2Page 5 of 5
Variance withFinal Budget -
Original Final PositiveBudget Budget Actual (Negative)
County of Franklin, VirginiaSchedule of Expenditures - Budget and Actual
Governmental FundsFor the Year Ended June 30, 2015
Fund, Function, Activity, and Element
Discretely Presented Component Unit - School Board: (Continued)School Operating Fund: (Continued)Education: (Continued)Capital projects:
Capital projects 1,220,000$ 1,176,551$ 1,228,923$ (52,372)$ Total capital projects 1,220,000$ 1,176,551$ 1,228,923$ (52,372)$
Total School Operating Fund 80,680,153$ 82,470,913$ 82,461,472$ 9,441$ Total Discretely Presented Component Unit - School Board 80,680,153$ 82,470,913$ 82,461,472$ 9,441$
Note 1: School Board appropriations occur at the fund level
-116-

STATISTICAL SECTION

CO
UN
TY
OF F
RA
NK
LIN
, V
IRG
INIA
Tab
le 1
Net
Pos
itio
n by
Com
pone
n tLa
st T
en F
isca
l Ye
ars
(acc
rual
bas
is o
f ac
coun
ting
)
2006
2007
2008
2009
2010
2011
2012
2013
2014
2015
Gov
ernm
enta
l ac
tivi
ties
N
et inv
estm
ent
in c
apit
al a
sset
s16
,592
,783
17
,067
,811
24
,045
,244
33
,598
,908
37
,125
,995
38
,512
,330
40
,509
,583
47
,333
,389
47
,869
,639
50
,269
,458
Res
tric
ted
174,
252
6,85
3,22
7
211,
128
159,
656
295,
455
202,
014
295,
849
388,
906
373,
539
365,
467
U
nres
tric
ted
32,2
61,9
85
28,8
12,7
60
31,3
07,2
46
24,9
72,6
06
25,2
45,7
59
25,3
53,5
80
23,3
88,1
87
19,8
52,8
17
20,0
00,9
97
16,6
03,9
86
Tot
al g
over
nmen
tal ac
tivi
ties
net
pos
itio
n49
,029
,020
52
,733
,798
55
,563
,618
58
,731
,170
62
,667
,209
64
,067
,924
64
,193
,619
67
,575
,112
68
,244
,175
67
,238
,911
Busi
ness
-typ
e ac
tivi
ties
N
et inv
estm
ent
in c
apit
al a
sset
s1,
547,
373
1,72
4,68
4
3,02
7,37
2
1,64
0,98
1
1,05
6,53
9
1,02
6,87
7
1,16
7,77
6
1,13
4,93
1
1,10
2,08
6
1,06
9,24
1
U
nres
tric
ted
1,75
8,68
3
1,91
6,29
8
1,30
3,50
4
721,
629
296,
579
294,
773
944,
367
182,
806
210,
379
241,
149
Tot
al b
usin
ess-
type
act
ivit
ies
net
posi
tion
3,30
6,05
6
3,64
0,98
2
4,33
0,87
6
2,36
2,61
0
1,35
3,11
8
1,32
1,65
0
2,11
2,14
3
1,31
7,73
7
1,31
2,46
5
1,31
0,39
0
Prim
ary
gove
rnm
ent
N
et inv
estm
ent
in c
apit
al a
sset
s18
,140
,156
18
,792
,495
27
,072
,616
35
,239
,889
38
,182
,534
39
,539
,207
41
,677
,359
48
,468
,320
48
,971
,725
51
,338
,699
Res
tric
ted
174,
252
6,85
3,22
7
211,
128
159,
656
295,
455
202,
014
295,
849
388,
906
373,
539
365,
467
U
nres
tric
ted
34,0
20,6
68
30,7
29,0
58
32,6
10,7
50
25,6
94,2
35
25,5
42,3
38
25,6
48,3
53
24,3
32,5
54
20,0
35,6
23
20,2
11,3
76
16,8
45,1
35
Tot
al p
rim
ary
gove
rnm
ent
net
posi
tion
52,3
35,0
76
56,3
74,7
80
59,8
94,4
94
61,0
93,7
80
64,0
20,3
27
65,3
89,5
74
66,3
05,7
62
68,8
92,8
49
69,5
56,6
40
68,5
49,3
01
Sour
ce:
Cou
nty
fina
ncia
l re
port
s
-117-

CO
UN
TY
OF F
RA
NK
LIN
, V
IRG
INIA
Tab
le 2
Pag
e 1 o
f 2
Cha
nges
in
Net
Pos
itio
nLa
st T
en F
isca
l Ye
ars
(acc
rual
bas
is o
f ac
coun
ting
)
2006
2007
2008
2009
2010
2011
2012
2013
2014
2015
Expen
ses
Gov
ernm
enta
l ac
tivi
ties
:
Gen
eral
gov
ernm
ent
adm
inis
trat
ion
3,46
3,16
8
4,
157,
343
4,
042,
082
4,
027,
157
3,
934,
191
4,
171,
457
4,
851,
681
4,
297,
357
4,
618,
400
4,19
7,11
8
Jud
icia
l ad
min
istr
atio
n3,
326,
151
2,16
0,55
5
2,47
5,74
9
2,67
0,40
2
2,35
4,04
4
2,32
7,75
0
2,34
4,13
3
2,53
5,88
1
2,31
7,63
2
2,
471,
939
P
ublic
saf
ety
8,46
4,17
1
10
,347
,921
12,5
08,2
48
12
,737
,913
14,4
44,0
78
14
,252
,682
14,4
45,5
31
14
,590
,942
14,8
13,6
90
14,6
16,8
34
P
ublic
wor
ks98
6,89
1
1,
982,
292
3,
370,
469
3,
135,
781
5,
397,
533
4,
966,
247
6,
855,
118
4,
728,
017
5,
018,
567
4,91
1,21
0
Hea
lth
and
wel
fare
8,07
0,65
7
9,
732,
455
9,
324,
129
9,
952,
103
10
,201
,556
10,3
67,2
70
10
,430
,549
10,2
69,0
99
10
,968
,715
11
,009
,049
Edu
cati
on24
,078
,623
28
,332
,013
25,7
84,2
94
29
,621
,387
27,0
11,0
85
31
,797
,712
29,8
73,8
35
31
,912
,383
32,4
92,2
21
33,4
39,4
04
P
arks
, re
crea
tion
and
cul
tura
l1,
284,
696
1,65
6,66
4
1,91
6,52
9
2,31
0,26
7
2,13
2,55
1
2,01
3,39
5
2,16
5,86
7
2,07
1,98
5
1,95
2,89
1
2,
287,
730
C
omm
unit
y de
velo
pmen
t1,
887,
256
3,87
3,63
1
4,75
7,65
9
5,19
0,19
9
5,12
6,18
2
4,87
5,62
9
3,02
9,60
3
3,00
3,65
1
3,57
2,12
4
3,
298,
671
In
tere
st o
n lo
ng-t
erm
deb
t1,
274,
457
1,43
5,33
4
1,16
1,20
5
1,54
1,43
1
1,49
6,12
0
1,48
0,03
9
1,17
1,32
5
946,
745
1,04
6,70
9
1,
071,
097
Tot
al g
over
nmen
tal ac
tivi
ties
exp
ense
s52
,836
,070
63
,678
,208
65,3
40,3
64
71
,186
,640
72,0
97,3
40
76
,252
,181
75,1
67,6
42
74
,356
,060
76,8
00,9
49
77,3
03,0
52
Bus
ines
s-ty
pe a
ctiv
itie
s:
Uti
lity
fun
d41
3,45
0
58
1,35
5
42
8,70
8
2,
630,
752
61
5,95
7
56
,909
41
,741
42
,490
47
,643
45,3
90
Tot
al b
usin
ess-
type
act
ivit
ies
expe
nses
413,
450
581,
355
428,
708
2,63
0,75
2
615,
957
56,9
09
41,7
41
42,4
90
47,6
43
45
,390
Tot
al p
rim
ary
gove
rnm
ent
expe
nses
53,2
49,5
20
64,2
59,5
63
65
,769
,072
73,8
17,3
92
72
,713
,297
76,3
09,0
90
75
,209
,383
74,3
98,5
50
76
,848
,592
77
,348
,442
Pro
gram
Rev
enues
Gov
ernm
enta
l ac
tivi
ties
:
Cha
rges
for
ser
vice
s:
G
ener
al g
over
nmen
t ad
min
istr
atio
n-
45
,684
22
,205
16
,548
22
,775
13
,445
12
,989
7,
980
12,2
24
7,
104
J
udic
ial ad
min
istr
atio
n78
8,90
1
20
0,37
4
15
4,55
6
12
2,51
8
14
4,05
4
11
1,61
2
49
,506
10
3,74
8
16
2,40
2
12
8,60
9
Pub
lic
safe
ty46
3,42
1
1,
317,
116
1,
297,
973
1,
276,
255
1,
561,
354
1,
466,
223
1,
601,
892
1,
781,
500
1,
943,
658
1,78
1,81
1
P
ublic
wor
ks92
0,14
6
94
7,68
5
89
1,59
5
66
5,91
7
63
7,02
9
77
6,57
2
74
0,68
6
95
2,99
0
94
2,26
5
88
8,77
3
Hea
lth
and
wel
fare
19,0
05
25
,398
22
,513
16
,737
22
,198
16
,986
19
,056
13
,425
18
,731
23,6
30
P
arks
, re
crea
tion
and
cul
tura
l86
,633
85,3
15
140,
640
114,
806
107,
936
103,
406
100,
043
194,
202
188,
675
251,
127
C
omm
unit
y de
velo
pmen
t29
3,44
9
28
6,17
4
19
5,43
3
97
,971
-
-
-
-
-
-
Ope
rati
ng g
rant
s an
d co
ntri
buti
ons
10,3
48,9
84
11,9
65,5
31
12
,126
,502
12,0
47,5
19
11
,858
,743
12,2
30,6
79
11
,722
,367
11,4
12,5
89
12
,501
,912
12
,667
,126
Cap
ital
gra
nts
and
cont
ribu
tion
s41
2,41
7
85
4,26
8
3,
733,
498
2,
003,
393
2,
259,
154
2,
461,
498
99
4,35
7
86
4,88
5
29
9,81
0
83
2,39
0
Tot
al g
over
nmen
tal ac
tivi
ties
pro
gram
rev
enue
s13
,332
,956
15
,727
,545
18,5
84,9
15
16
,361
,664
16,6
13,2
43
17
,180
,421
15,2
40,8
96
15
,331
,319
16,0
69,6
77
16,5
80,5
70
Bus
ines
s-ty
pe a
ctiv
itie
s:
Cha
rges
for
ser
vice
s:
W
ater
333,
003
145,
464
466,
359
190,
471
26,0
31
8,09
6
11
2,52
2
31
,084
25
,371
26,3
15
Cap
ital
gra
nts
and
cont
ribu
tion
s42
2,02
2
14
1,76
1
18
,200
63
,055
-
-
16
4,45
6
-
-
-
Tot
al b
usin
ess-
type
act
ivit
ies
prog
ram
rev
enue
s75
5,02
5
28
7,22
5
48
4,55
9
25
3,52
6
26
,031
8,
096
276,
978
31,0
84
25,3
71
26
,315
Tot
al p
rim
ary
gove
rnm
ent
prog
ram
rev
enue
s14
,087
,981
16
,014
,770
19,0
69,4
74
16
,615
,190
16,6
39,2
74
17
,188
,517
15,5
17,8
74
15
,362
,403
16,0
95,0
48
16,6
06,8
85
-118-

CO
UN
TY
OF F
RA
NK
LIN
, V
IRG
INIA
Tab
le 2
Pag
e 2 o
f 2
Cha
nges
in
Net
Pos
itio
nLa
st T
en F
isca
l Ye
ars
(acc
rual
bas
is o
f ac
coun
ting
)
2006
2007
2008
2009
2010
2011
2012
2013
2014
2015
Net
(ex
pens
e) /
rev
enue
G
over
nmen
tal ac
tivi
ties
(39,
503,
114)
(4
7,95
0,66
3)
(46,
755,
449)
(5
4,82
4,97
6)
(55,
484,
097)
(5
9,07
1,76
0)
(59,
926,
746)
(5
9,02
4,74
1)
(60,
731,
272)
(6
0,72
2,48
2)
Busi
ness
-typ
e ac
tivi
ties
341,
575
(294
,130
)
55
,851
(2
,377
,226
)
(5
89,9
26)
(48,
813)
235,
237
(11,
406)
(22,
272)
(19,
075)
T
otal
pri
mar
y go
vern
men
t ne
t ex
pens
e(3
9,16
1,53
9)
(48,
244,
793)
(4
6,69
9,59
8)
(57,
202,
202)
(5
6,07
4,02
3)
(59,
120,
573)
(5
9,69
1,50
9)
(59,
036,
147)
(6
0,75
3,54
4)
(60,
741,
557)
Gen
eral
Rev
enues
and O
ther
Chan
ges
in
Net
Pos
itio
n G
over
nmen
tal ac
tivi
ties
:
Tax
es
P
rope
rty
taxe
s30
,887
,533
32
,824
,967
34,2
55,4
31
43
,374
,361
42,9
35,3
36
45
,616
,322
45,7
83,0
87
46
,330
,843
46,5
05,3
12
48,3
88,6
06
Loc
al s
ales
and
use
tax
es4,
163,
629
4,24
2,80
5
4,15
3,45
1
3,74
2,26
8
3,63
4,35
1
3,79
5,73
3
3,86
7,95
7
4,02
9,52
8
4,08
7,35
5
4,
222,
615
Tax
es o
n re
cord
atio
n an
d w
ills
993,
726
842,
747
658,
226
581,
797
507,
081
513,
861
465,
882
513,
088
468,
085
469,
299
M
otor
veh
icle
lic
ense
s ta
xes
1,26
5,60
5
1,
279,
225
1,
270,
653
1,
227,
296
1,
207,
504
1,
182,
088
1,
159,
789
1,
148,
502
83
3,47
2
1,
930,
605
Con
sum
ers'
utili
ty t
axes
2,46
8,53
9
1,
715,
239
96
4,50
0
96
9,16
1
97
0,93
4
97
2,41
9
97
1,69
3
97
3,78
2
97
6,80
4
97
9,52
7
Bus
ines
s lic
ense
s ta
xes
4,26
1
4,99
8
4,
697
4,44
4
4,
440
3,82
9
4,
585
4,79
8
13
,745
4,07
9
Oth
er loc
al t
axes
(1)
2,07
8,42
9
2,
975,
802
3,
789,
514
3,
522,
927
1,
342,
836
1,
297,
445
1,
294,
561
1,
429,
674
1,
465,
873
1,56
0,26
0
Unr
estr
icte
d gr
ants
and
con
trib
utio
ns3,
579,
663
5,35
1,26
7
3,24
1,48
3
3,13
4,60
6
5,48
3,80
7
5,46
3,98
3
5,37
9,77
7
5,47
8,61
2
5,37
1,65
7
5,
313,
289
U
nres
tric
ted
reve
nues
fro
m u
se o
f m
oney
and
pro
pert
y1,
293,
731
2,53
2,07
9
1,52
0,62
9
1,57
8,53
4
1,06
4,80
6
1,07
1,59
5
1,13
9,12
4
1,12
9,80
7
1,14
2,79
2
90
7,93
1
M
isce
llan
eous
1,12
2,03
2
35
6,37
3
34
5,57
0
25
7,61
3
1,
849,
101
57
2,54
5
54
1,24
2
58
4,60
0
55
2,24
0
2,
928,
292
T
rans
fers
(643
,621
)
(347
,878
)
(5
99,3
73)
(400
,479
)
41
9,94
0
(1
7,34
5)
(5
55,2
56)
783,
000
(17,
000)
(17,
000)
Tot
al g
over
nmen
tal ac
tivi
ties
47,2
13,5
27
51,7
77,6
24
49
,604
,781
57,9
92,5
28
59
,420
,136
60,4
72,4
75
60
,052
,441
62,4
06,2
34
61
,400
,335
66
,687
,503
Bus
ines
s-ty
pe a
ctiv
itie
s:
Unr
estr
icte
d gr
ants
and
con
trib
utio
ns-
13
7,66
3
-
-
-
-
-
-
-
-
Tra
nsfe
rs64
3,62
1
34
7,87
8
59
9,37
3
40
0,47
9
(4
19,9
40)
17,3
45
555,
256
(783
,000
)
17
,000
17,0
00
Unr
estr
icte
d re
venu
es f
rom
use
of
mon
ey a
nd p
rope
rty
25,2
07
21
,332
15
,158
8,
481
374
-
-
-
-
-
Tot
al b
usin
ess-
type
act
ivit
ies
668,
828
506,
873
614,
531
408,
960
(419
,566
)
17
,345
55
5,25
6
(7
83,0
00)
17,0
00
17
,000
T
otal
pri
mar
y go
vern
men
t47
,882
,355
52
,284
,497
50,2
19,3
12
58
,401
,488
59,0
00,5
70
60
,489
,820
60,6
07,6
97
61
,623
,234
61,4
17,3
35
66,7
04,5
03
Chan
ge in N
et P
osit
ion
Gov
ernm
enta
l ac
tivi
ties
7,71
0,41
3
3,
826,
961
2,
849,
332
3,
167,
552
3,
936,
039
1,
400,
715
12
5,69
5
3,
381,
493
66
9,06
3
5,
965,
021
Bus
ines
s-ty
pe a
ctiv
itie
s1,
010,
403
212,
743
670,
382
(1,9
68,2
66)
(1,0
09,4
92)
(31,
468)
790,
493
(794
,406
)
(5
,272
)
(2,0
75)
T
otal
pri
mar
y go
vern
men
t8,
720,
816
4,03
9,70
4
3,51
9,71
4
1,19
9,28
6
2,92
6,54
7
1,36
9,24
7
916,
188
2,58
7,08
7
663,
791
5,96
2,94
6
(1)
Begi
nnin
g in
201
0, c
omm
unic
atio
ns t
ax is
clas
sifi
ed a
s re
venu
e fr
om t
he C
omm
onw
ealt
hSo
urce
: C
ount
y fi
nanc
ial re
port
s
-119-

CO
UN
TY
OF F
RA
NK
LIN
, V
IRG
INIA
Tab
le 3
Fund
Bal
ance
s of
Gov
ernm
enta
l Fu
nds
Last
Ten
Fis
cal Ye
ars
(mod
ifie
d ac
crua
l ba
sis
of a
ccou
ntin
g)
2006
2007
2008
2009
2010
2011
2012
2013
2014
2015
Gen
eral
fun
d
Res
erve
d85
,811
221,
133
21
1,12
8
159,
656
-
-
-
-
-
-
Unr
eser
ved
35,0
92,8
81
31,9
08,4
99
17,7
90,3
97
16,7
69,4
17
19,8
72,2
20
-
-
-
-
-
Non
spen
dabl
e-
-
-
-
-
-
148,
078
-
-
-
Res
tric
ted
-
-
-
-
-
173,
399
24
3,92
0
253,
224
24
6,03
9
207,
076
Ass
igne
d-
-
-
-
-
92
,994
210,
233
27
7,28
9
2,68
1,01
1
2,94
2,60
4
U
nass
igne
d-
-
-
-
-
19
,653
,231
19
,963
,500
20
,397
,311
18
,430
,083
18,0
56,7
75
Tot
al g
ener
al f
und
35,1
78,6
92
32,1
29,6
32
18,0
01,5
25
16,9
29,0
73
19,8
72,2
20
19,9
19,6
24
20,5
65,7
31
20,9
27,8
24
21,3
57,1
33
21,2
06,4
55
All o
ther
gov
ernm
enta
l fu
nds
Res
erve
d88
,441
6,63
2,09
4
-
5,04
9,69
0
29
5,45
5
-
-
-
-
-
Unr
eser
ved,
rep
orte
d in
:
Sp
ecia
l re
venu
e fu
nds
-
-
14
,127
51,9
55
46
,367
-
-
-
-
-
Cap
ital
pro
ject
s fu
nds
-
-
21
,980
,834
11
,665
,266
13
,037
,850
-
-
-
-
-
Res
tric
ted,
rep
orte
d in
:
Sp
ecia
l re
venu
e fu
nds
-
-
-
-
-
28,6
15
51
,929
135,
682
7,
430,
713
18
,038
,826
Ass
igne
d, r
epor
ted
in:
Cap
ital
pro
ject
s fu
nds
-
-
-
-
-
14,0
21,9
93
14,7
79,7
18
11,7
76,5
28
11,8
31,6
95
12,8
50,8
60
Tot
al a
ll o
ther
gov
ernm
enta
l fu
nds
88,4
41
6,
632,
094
21,9
94,9
61
16,7
66,9
11
13,3
79,6
72
14,0
50,6
08
14,8
31,6
47
11,9
12,2
10
19,2
62,4
08
30,8
89,6
86
Prov
isio
ns o
f G
over
nmen
tal Acc
ount
ing
Stan
dard
s Bo
ard
Stat
emen
t 54
(G
ASB
54)
wer
e im
plem
ente
d in
the
201
1 fi
scal
yea
r.So
urce
: C
ount
y fi
nanc
ial re
port
s
-120-

CO
UN
TY
OF
FRA
NK
LIN
, V
IRG
INIA
Tab
le 4
Cha
nges
in F
und
Bala
nces
of
Gov
ernm
enta
l Fu
nds
Last
Ten
Fis
cal Ye
ars
(mod
ifie
d ac
crua
l ba
sis
of a
ccou
ntin
g)
Not
e:
FY 2
006 incl
udes
the C
ompon
ent
Unit
Sch
ool Boa
rd
2006
2007
2008
2009
2010
2011
2012
2013
2014
2015
Reve
nues
Gen
eral
pro
pert
y ta
xes
30,8
18,3
86
32,7
07,5
64
33,7
29,1
92
43,2
89,2
14
42,5
15,1
65
45,2
77,4
34
46,1
18,1
84
46,5
29,1
72
46,7
73,3
66
48,8
23,1
04
Oth
er loc
al t
axes
10,9
74,1
89
11,0
60,8
16
10,8
41,0
41
10,0
47,8
93
7,66
7,14
6
7,76
5,37
5
7,76
4,46
7
8,09
9,37
2
7,84
5,33
4
9,16
6,38
5
Per
mit
s, p
rivi
lege
fee
s an
d re
gula
tory
lic
ense
s76
4,82
6
691,
500
573,
664
413,
467
359,
451
359,
111
319,
277
356,
552
381,
133
498,
402
Fin
es a
nd f
orfe
itur
es16
,968
16,3
78
10,7
72
10,0
82
15,0
02
13,0
32
17,0
76
67,4
74
110,
411
110,
271
Rev
enue
fro
m u
se o
f m
oney
and
pro
pert
y 1,
319,
687
2,53
2,07
9
1,52
0,62
9
1,57
8,53
4
1,06
4,80
6
1,07
1,59
5
1,13
9,12
4
1,12
9,80
7
1,14
2,79
2
907,
931
Cha
rges
for
ser
vice
s3,
628,
164
2,19
9,86
8
2,14
0,47
9
1,88
7,20
3
2,12
0,89
3
2,11
6,10
1
2,18
7,81
9
2,62
9,81
9
2,77
6,41
1
2,47
2,38
1
Mis
cellan
eous
1,75
0,21
0
371,
305
345,
570
257,
613
1,84
9,10
1
572,
545
541,
242
584,
600
552,
240
327,
376
Rec
over
ed c
osts
1,78
2,27
1
731,
213
905,
027
744,
082
646,
857
683,
734
609,
920
515,
589
466,
701
999,
921
Inte
rgov
ernm
enta
l: C
omm
onw
ealt
h45
,471
,082
14,7
23,1
53
15,7
40,8
96
13,0
02,8
63
13,1
20,6
57
16,9
18,8
58
15,2
12,6
23
15,1
07,5
65
15,3
80,7
78
15,7
86,3
31
F
eder
al9,
135,
829
3,43
2,98
1
3,36
0,58
7
4,18
2,65
5
4,15
6,76
7
3,23
7,30
2
2,88
3,87
8
2,64
8,52
1
2,79
2,60
1
2,95
6,47
4
Tot
al r
even
ues
105,
661,
612
68
,466
,857
69,1
67,8
57
75,4
13,6
06
73,5
15,8
45
78,0
15,0
87
76,7
93,6
10
77,6
68,4
71
78,2
21,7
67
82,0
48,5
76
Expendit
ure
s G
ener
al g
over
nmen
t ad
min
istr
atio
n3,
591,
991
3,93
9,01
5
3,53
2,25
2
3,67
8,19
0
3,70
3,75
9
4,25
4,79
4
4,19
4,73
1
4,20
1,86
6
3,84
7,43
7
4,32
4,39
9
Jud
icia
l ad
min
istr
atio
n2,
082,
436
2,21
4,11
8
2,51
7,12
7
2,64
7,22
4
2,40
6,09
6
2,27
3,71
7
2,31
0,28
8
2,40
1,01
3
2,28
9,67
9
2,57
4,46
2
Pub
lic s
afet
y10
,499
,222
11,1
25,3
14
11,5
04,5
55
13,6
19,5
80
13,7
05,0
18
13,0
35,8
02
14,0
65,5
89
13,8
82,1
20
14,0
95,2
20
13,7
49,0
80
Pub
lic
wor
ks2,
567,
643
3,76
3,33
3
2,32
4,27
8
2,75
9,76
3
3,29
3,94
9
3,72
2,27
2
3,31
5,56
3
3,67
9,29
1
3,59
7,66
0
3,63
9,06
1
Hea
lth
and
wel
fare
8,38
3,15
2
9,68
5,05
9
9,77
2,70
6
10,1
88,3
70
10,3
57,7
62
10,8
54,8
62
10,6
70,1
06
10,3
57,7
75
11,0
53,1
19
11,5
25,4
67
Edu
cati
on66
,045
,924
25,6
40,8
22
25,0
84,8
49
26,7
34,6
19
26,0
58,9
65
30,8
13,2
04
28,2
49,7
20
30,8
78,3
12
31,5
46,9
56
31,7
26,4
79
Par
ks,
recr
eati
on a
nd c
ultu
ral
1,61
6,13
1
2,30
0,70
6
1,64
3,25
7
2,05
6,20
6
1,86
8,80
1
1,73
3,92
9
1,81
4,82
3
1,91
5,96
8
1,95
0,17
1
1,93
6,65
2
Com
mun
ity
deve
lopm
ent
1,76
5,26
5
8,51
0,07
2
2,41
5,46
7
5,44
7,83
6
2,04
4,76
7
3,02
1,43
0
2,47
1,00
2
3,15
7,33
1
3,59
8,64
2
3,33
8,88
0
Non
depa
rtm
enta
l40
,097
58,8
79
77,7
18
-
13
5
-
46,8
97
3,97
8
26
,674
Cap
ital
pro
ject
s3,
265,
505
521,
917
10,9
81,0
71
12,7
84,4
91
9,75
2,25
0
3,08
4,91
1
3,40
8,09
0
7,10
3,07
4
4,09
0,82
5
5,17
1,76
1
Deb
t se
rvic
e P
rinc
ipal
1,
848,
143
2,07
6,76
7
6,00
4,14
0
2,75
3,60
2
2,96
0,92
2
3,12
2,02
0
3,02
8,68
1
6,30
4,48
4
3,12
2,13
2
3,81
0,06
8
In
tere
st a
nd o
ther
fis
cal ch
arge
s1,
035,
008
1,23
2,65
8
1,36
4,83
9
1,58
2,73
6
1,60
2,61
8
1,36
2,32
6
1,29
3,21
5
1,04
0,60
2
852,
941
1,10
3,56
1
B
ond
Issu
ance
cos
ts-
-
69
,099
73,4
24
58,2
50
-
-
14,9
58
120,
500
131,
432
Tota
l ex
pend
itur
es10
2,70
0,42
0
71,0
49,8
78
77,2
72,5
19
84,4
03,7
59
77,8
13,1
57
77,2
79,4
02
74,8
21,8
08
84,9
83,6
91
80,1
69,2
60
83,0
57,9
76
Exce
ss o
f re
venu
es o
ver
(und
er)
expe
ndit
ures
2,96
1,19
2
(2,5
83,0
21)
(8,1
04,6
62)
(8,9
90,1
53)
(4,2
97,3
12)
735,
685
1,97
1,80
2
(7,3
15,2
20)
(1,9
47,4
93)
(1,0
09,4
00)
Oth
er f
inan
cing
sou
rces
(us
es)
Tra
nsfe
rs in
807,
277
1,09
4,44
7
6,99
3,30
1
7,63
5,87
8
2,58
5,65
3
2,71
9,84
6
3,07
8,17
9
9,37
3,68
4
7,24
5,01
1
8,25
5,66
7
Tra
nsfe
rs o
ut(1
,450
,896
)
(1,4
42,3
25)
(7,5
92,6
74)
(8,0
36,3
57)
(2,1
65,7
13)
(2,7
37,1
91)
(3,6
33,4
35)
(8,5
90,6
84)
(7,2
62,0
11)
(8,2
72,6
67)
Bon
ds a
nd n
otes
issu
ed6,
500,
000
6,57
3,60
0
9,93
8,79
5
2,90
5,00
0
1,10
9,00
0
-
-
3,06
8,75
0
9,74
4,00
0
12,5
00,0
00
Pre
miu
m o
n de
bt is
suan
ce-
187,
343
-
130,
152
-
-
-
-
-
-
Cap
ital
lea
ses
234,
332
-
-
54,9
78
-
-
-
655,
000
-
-
Sal
e of
cap
ital
ass
ets
-
-
-
-
-
-
10
,600
251,
124
-
3,00
0
Tota
l ot
her
fina
ncin
g so
urce
s (u
ses)
6,09
0,71
3
6,41
3,06
5
9,33
9,42
2
2,68
9,65
1
1,52
8,94
0
(17,
345)
(544
,656
)
4,75
7,87
4
9,72
7,00
0
12,4
86,0
00
N
et c
hang
e in
fun
d ba
lanc
es9,
051,
905
3,83
0,04
4
1,23
4,76
0
(6,3
00,5
02)
(2,7
68,3
72)
718,
340
1,42
7,14
6
(2,5
57,3
46)
7,77
9,50
7
11,4
76,6
00
Deb
t se
rvic
e as
a p
erce
ntag
e of
no
ncap
ital
exp
endi
ture
s3%
5%11
%6%
7%6%
6%10
%5%
7%
Tota
l D
ebt
Serv
ice
Expe
ndit
ures
2,88
3,15
1
3,30
9,42
5
7,36
8,97
9
4,33
6,33
8
4,62
1,79
0
4,48
4,34
6
4,32
1,89
6
7,36
0,04
4
4,09
5,57
3
5,04
5,06
1
Tota
l G
over
nmen
tal N
on-c
apit
al E
xpen
ditu
res
99,4
34,9
15
70,5
27,9
61
66,2
91,4
48
71,6
19,2
68
69,1
01,3
31
74,1
94,4
91
71,3
37,4
31
76,6
21,7
59
76,3
70,9
77
77,0
62,5
24
Sour
ce:
Cou
nty
fina
ncia
l re
port
s
-121-

CO
UN
TY
OF F
RA
NK
LIN
, V
IRG
INIA
Tab
le 5
Gen
eral
Gov
ernm
enta
l Tax
Rev
enue
s by
Sou
rce
Last
Ten
Fis
cal Ye
ars
(acc
rual
bas
is o
f ac
coun
ting
)
Mot
orLo
cal sa
les
Con
sum
erV
ehic
leR
ecor
d-
Fis
cal
Pro
per
tyan
d u
seU
tility
Mea
lsH
otel
&U
tility
Lic
ense
Ban
k St
ock
Lice
nse
atio
n a
nd
Oth
erY
ear
Tax
Tax
Tax
Tax
Mot
el T
axT
axT
axT
axW
ills
Tax
Tax
Tot
al
2015
48,8
23,1
04
4,22
2,61
5
97
9,52
7
1,04
3,85
1
88,0
41
23
9,11
8
188,
100
1,
930,
605
469,
299
5,22
9
57,9
89,4
89
2014
46,5
05,3
12
4,08
7,35
5
97
6,80
4
990,
322
86,0
10
23
1,09
5
156,
590
83
3,47
2
468,
085
15,6
01
54,3
50,6
46
2013
46,3
30,8
43
4,02
9,52
8
97
3,78
2
962,
596
85,1
24
25
0,09
8
128,
791
1,
148,
502
513,
088
7,86
3
54,4
30,2
15
2012
45,7
83,0
87
3,86
7,95
7
97
1,69
3
912,
380
91,6
28
16
8,98
0
119,
639
1,
159,
789
465,
882
4,58
5
53,5
45,6
20
2011
45,2
77,4
34
3,79
5,73
3
97
2,41
9
843,
382
97,0
56
23
1,83
3
123,
267
1,
182,
088
500,
736
3,82
9
53,0
27,7
77
2010
42,5
15,1
65
3,63
4,35
1
1,
254,
157
83
4,61
7
98
,194
283,
223
12
5,68
1
1,20
7,50
4
49
7,23
1
4,
440
50
,454
,563
20
0943
,289
,214
3,
742,
268
969,
161
82
9,98
2
10
3,69
6
166,
457
10
7,36
1
1,22
7,29
6
58
1,79
7
4,
444
51
,021
,676
20
0833
,729
,192
4,
153,
451
964,
500
81
5,58
4
11
2,94
4
212,
074
99
,550
1,27
0,65
3
65
8,22
6
N
A42
,016
,174
20
0732
,707
,564
4,
242,
805
1,71
5,23
9
814,
071
109,
353
12
9,85
4
105,
091
1,
279,
225
842,
747
NA
41,9
45,9
49
2006
30,8
18,3
86
4,16
3,62
9
1,
880,
168
76
0,12
1
11
1,40
4
431,
217
14
4,16
3
1,26
5,60
5
99
3,72
6
N
A40
,568
,419
-122-

CO
UN
TY
OF F
RA
NK
LIN
, V
IRG
INIA
Tab
le 6
Ass
esse
d Val
ue a
nd E
stim
ated
Act
ual Val
ue o
f Tax
able
Pro
pert
yLa
st T
en F
isca
l Ye
ars
Tot
al T
axab
leFis
cal
Rea
l Es
tate
/Per
sonal
Mer
chan
ts'
Mac
hin
ery
&Public
Ass
esse
dY
ear
Mob
ile
Hom
esPro
per
tyC
apit
alT
ools
Serv
ice
Val
ue
2015
6,58
6,12
5,69
0
51
6,35
8,66
3
63,1
54,4
82
10
0,79
3,26
5
174,
799,
137
7,44
1,23
1,23
7
20
146,
563,
692,
254
499,
419,
869
62,1
41,1
14
91
,386
,941
160,
408,
641
7,37
7,04
8,81
9
20
136,
512,
213,
873
478,
922,
754
62,3
92,9
29
97
,259
,640
161,
030,
712
7,31
1,81
9,90
8
20
127,
714,
753,
492
466,
053,
799
61,1
16,3
02
87
,420
,378
163,
682,
723
8,49
3,02
6,69
4
20
117,
658,
949,
539
452,
339,
636
58,4
54,4
12
85
,551
,282
151,
199,
948
8,40
6,49
4,81
7
20
107,
606,
214,
950
448,
673,
632
63,3
85,8
20
83
,369
,833
162,
132,
199
8,36
3,77
6,43
4
20
097,
495,
611,
081
502,
466,
388
68,4
22,4
17
77
,815
,711
148,
209,
734
8,29
2,52
5,33
1
20
085,
312,
089,
342
472,
049,
385
70,5
69,7
52
74
,111
,761
97,2
34,8
92
6,02
6,05
5,13
2
20
074,
807,
045,
787
510,
854,
136
76,8
47,9
10
62
,916
,661
102,
235,
038
5,55
9,89
9,53
2
20
064,
585,
493,
371
471,
380,
050
65,3
44,9
89
60
,749
,046
116,
612,
320
5,29
9,57
9,77
6
Ass
esse
dR
eal Pro
per
t yPer
sonal
Mer
chan
ts'
Mac
hin
ery
Tot
alEs
tim
ated
Val
ue
as a
Fis
cal
Tot
al D
irec
tPro
per
tyC
apit
alan
d T
ools
Dir
ect
Rat
eA
ctual
Per
centa
ge o
fY
ear
Tax
Rat
eT
ax R
ate
Tax
Rat
eT
ax R
ate
(Wei
ghte
d A
vera
ge)
Val
ue
Act
ual
Val
ue
2015
0.55
2.36
1.08
0.70
0.68
7,
309,
902,
429
101.
80%
201 4
0.54
2.34
1.08
0.70
0.67
7,
198,
027,
786
102.
49%
2013
0.54
2.34
1.08
0.70
0.66
7,
100,
025,
919
102.
98%
2012
0.48
2.04
1.08
0.60
0.57
8,
492,
757,
485
100.
00%
2011
0.48
2.04
1.08
0.60
0.57
8,
147,
764,
905
103.
18%
2010
0.46
1.89
1.08
0.60
0.54
8,
074,
239,
188
103.
59%
2009
0.46
1.89
1.08
0.60
0.55
8,
027,
547,
143
103.
30%
2008
0.53
1.67
1.08
0.54
0.63
5,
633,
589,
940
106.
97%
200 7
0.53
1.67
1.08
0.54
0.64
5,
473,
576,
675
101.
58%
2006
0.53
1.67
1.08
0.60
0.64
5,
247,
621,
108
100.
99%
Sour
ce:
Com
mis
sion
er o
f Rev
enue
-123-

COUNTY OF FRANKLIN, VIRGINIA Table 7
Property Tax Rates (1)Direct and Overlapping GovernmentsLast Ten Fiscal Years
Overlapping RatesDirect Rates Town of Rocky Mount
TotalFiscal Real Personal Machinery Merchant's Direct Rate Real PersonalYears Estate Property and Tools Capital Weighted Average Estate Property
2015 0.55 2.36 0.70 1.08 0.68 0.13 0.512014 0.54 2.34 0.70 1.08 0.67 0.13 0.512013 0.54 2.34 0.70 1.08 0.66 0.13 0.512012 0.48 2.04 0.60 1.08 0.57 0.12 0.512011 0.48 2.04 0.60 1.08 0.57 0.12 0.512010 0.46 1.89 0.60 1.08 0.54 0.12 0.512009 0.46 1.89 0.60 1.08 0.55 0.12 0.512008 0.53 1.67 0.54 1.08 0.63 0.12 0.512007 0.53 1.67 0.54 1.08 0.64 0.14 0.512006 0.53 1.67 0.60 1.08 0.64 0.14 0.51
(1) Per $100 of assessed valueSource: Franklin County Commissioner of Revenue, Town of Rocky Mount Finance Department
-124-

CO
UN
TY
OF F
RA
NK
LIN
, V
IRG
INIA
Tab
le 8
Prin
cipa
l Pr
oper
ty T
axpa
yers
Cur
rent
Yea
r an
d th
e Pe
riod
Nin
e Ye
ars
Prio
r
2015
2006
Ass
esse
d%
of
Tot
alA
sses
sed
% o
f T
otal
Typ
e V
aluat
ion
Ass
esse
dV
aluat
ion
Ass
esse
dT
axpay
erBusi
nes
s(M
illion
s)V
aluat
ion
(Million
s)V
aluat
ion
App
alac
hian
Pow
er C
ompa
n yEl
ectr
ic U
tilit
y12
4
1.
67%
57
1.
08%
Will
ard
Con
stru
ctio
n Com
pan y
Con
stru
ctio
n34
0.
46%
9
0.17
%Cen
tral
Tel
epho
ne C
ompa
n yTel
epho
ne U
tilit
y24
0.
32%
28
0.
53%
Fran
klin
Rea
l Es
tate
Com
pan y
Rea
l Es
tate
21
0.28
%25
0.47
%Fr
ankl
in M
emor
ial H
ospi
tal
Hea
lth
Car
e16
0.
22%
9
0.17
%M
cAir
laid
sM
anuf
actu
ring
11
0.15
%-
0.
00%
Wal
Mar
tRet
ail
10
0.13
%8
0.
15%
Roc
ky M
ount
Dev
elop
men
t C
oRea
l Es
tate
10
0.13
%-
0.
00%
RKL
Hol
ding
s LL
cRea
l Es
tate
9
0.
12%
-
0.00
%N
orfo
lk &
Wes
tern
Rai
lwa y
Rai
lroa
d9
0.12
%-
0.
00%
Jem
site
Dev
elop
men
t LL
CRea
l Es
tate
-
0.
00%
15
0.
28%
Lake
Wat
ch L
LcRea
l Es
tate
-
0.
00%
12
0.
23%
Win
dsta
r Pr
oper
ties
LLC
Rea
l Es
tate
-
0.
00%
10
0.
19%
PG M
ulti
-16
LPRea
l Es
tate
-
0.
00%
9
0.17
%26
8
3.
60%
182
3.
43%
Sour
ce:
Fra
nklin
Cou
nty
Com
mis
sion
er o
f Rev
enue
Fis
cal Y
ear
2015
Fis
cal Y
ear
2006
-125-

CO
UN
TY
OF F
RA
NK
LIN
, V
IRG
INIA
Tab
le 9
Prop
erty
Tax
Lev
ies
and
Col
lect
ions
Last
Ten
Fis
cal Ye
ars
Col
lect
ed w
ithin
the
Fis
cal
Tot
al T
axY
ear
of t
he
Levy
Col
lect
ions
Tot
al C
olle
ctio
ns
to D
ate
Fis
cal
Levy
for
Am
ount
Per
centa
gein
Subse
quen
tA
mou
nt
Per
centa
geY
ear
Fis
cal Y
ear
Col
lect
ed o
f Le
vyY
ears
Col
lect
ed o
f Le
vy
2015
47,7
87,4
35
46,4
94,7
90
97
.30%
-
46,4
94,7
90
97.3
0%20
1446
,835
,889
45
,285
,604
96.6
9%1,
053,
313
46,3
38,9
17
98.9
4%20
1345
,660
,712
44
,159
,107
96.7
1%1,
216,
521
45,3
75,6
28
99.3
8%20
1245
,722
,994
45
,007
,522
98.4
4%55
8,98
4
45
,566
,506
99
.66%
2011
45,2
37,0
44
43,5
61,2
79
96
.30%
1,55
0,03
3
45
,111
,312
99
.72%
2010
42,6
42,7
55
41,0
35,2
49
96
.23%
1,44
3,11
8
42
,478
,367
99
.61%
2009
43,1
03,6
76
41,5
69,6
80
96
.44%
1,36
9,76
6
42
,939
,446
99
.62%
2008
36,5
42,1
53
35,3
70,0
19
96
.79%
1,02
2,13
4
36
,392
,153
99
.59%
2007
35,2
20,1
50
34,0
85,2
39
96
.78%
984,
911
35,0
70,1
50
99.5
7%20
0633
,219
,244
32
,075
,823
96.5
6%99
3,42
1
33
,069
,244
99
.55%
Sour
ce:
Com
mis
sion
er o
f Rev
enue
, Cou
nty
Tre
asur
er's
offi
ce
-126-

CO
UN
TY
OF F
RA
NK
LIN
, V
IRG
INIA
Tab
le 1
0
Rat
ios
of O
utst
andi
ng D
ebt
by T
ype
Last
Ten
Fis
cal Ye
ars
Gov
ernm
enta
l A
ctiv
itie
sBusi
nes
s-T
ype
Act
ivit
ies
Gen
eral
Gen
eral
Tot
alPer
centa
geFis
cal
Obliga
tion
Lite
rary
Cap
ital
Obliga
tion
Cap
ital
Pri
mar
yof
Per
sonal
Per
Yea
rsBon
ds
and N
otes
Fund L
oans
(2)
Leas
esBon
ds
Leas
esG
over
nm
ent
Inco
me
(1)
Cap
ita
(1)
2015
41,8
41,7
33
-
26
4,91
1
-
-
42,1
06,6
44
0.
08%
741
20
1433
,164
,494
-
39
4,72
3
-
-
33,5
59,2
17
0.
10%
593
20
1326
,429
,558
-
53
4,77
0
-
-
26,9
64,3
28
0.
13%
476
20
1225
,339
,439
3,70
2,75
0
16
3,14
1
-
-
29,2
05,3
30
0.
11%
518
20
1127
,583
,771
4,31
6,50
0
33
3,74
1
-
-
32,2
34,0
12
0.
10%
573
20
1029
,877
,385
4,93
0,25
0
54
8,39
7
-
-
35,3
56,0
32
0.
09%
634
20
0930
,874
,271
5,54
4,00
0
78
9,68
2
-
-
37,2
07,9
53
0.
09%
673
20
0829
,817
,038
6,15
7,75
0
96
3,75
1
2,
135,
700
-
39,0
74,2
39
0.
08%
718
20
0725
,905
,826
6,77
1,50
0
32
6,55
7
2,
285,
700
-
35,2
89,5
83
0.
08%
665
20
0620
,667
,755
7,38
5,25
0
45
4,04
6
2,
429,
600
-
30,9
36,6
51
0.
09%
595
Not
e: D
etai
ls r
egar
ding
the
Cou
nty'
s ou
tsta
ndin
g de
bt c
an b
e fo
und
in n
ote
6 in
the
not
es t
o th
e fi
nanc
ial st
atem
ents
.Am
ount
s ab
ove
incl
ude
any
unam
orti
zed
disc
ount
s or
pre
miu
ms.
(1)
See
the
Sche
dule
of
Dem
ogra
phic
and
Eco
nom
ic S
tati
stic
s -
Tab
le 1
4(2
) Li
tera
ry f
und
loan
s w
ere
fully
defe
ased
in
FY20
13.
Sour
ce:
Cou
nty
fina
ncia
l re
port
s
-127-

COUNTY OF FRANKLIN, VIRGINIA Table 11
Ratio of Net General Bonded Debt toAssessed Value and Net Bonded Debt Per CapitaLast Ten Fiscal Years
Ratio of NetGeneral
Gross Obligation NetGross Less: Amounts and Net Debt to Bonded
Bonded Reserved for Bonded Assessed Debt perDebt Debt Service Debt (3) Value (2) Capita (1)
2015 41,841,733 - 41,841,733 0.56% 736.742014 33,164,494 - 33,164,494 0.45% 585.782013 26,429,558 - 26,429,558 0.36% 466.822012 29,042,189 - 29,042,189 0.34% 514.762011 31,900,271 - 31,900,271 0.38% 567.372010 34,807,635 - 34,807,635 0.42% 624.552009 36,418,271 - 36,418,271 0.44% 658.752008 36,938,539 - 36,938,539 0.61% 678.432007 33,003,883 - 33,003,883 0.59% 622.282006 28,507,051 - 28,507,051 0.54% 548.47
(1) Population data can be found in the Schedule of Demographic and Economic Statistics - Table 14(2) See the Schedule of Assessed Value and Estimated Actual Value of Taxable Property - Table 6
(3) Includes all long-term general obligation bonded debt, Literary Fund Loans, excludes revenue bonds, capital leases, and compensated absences.
FiscalYear
-128-

COUNTY OF FRANKLIN, VIRGINIA Table 12
Direct and Overlapping Governmental Activities DebtAs of June 30, 2015
Estimated
Estimated Share ofDebt Percentage Overlapping
Governmental Unit Outstanding Applicable (1) Debt
Debt repaid with property taxes: Town of Rocky Mount 2,154,500 100% 2,154,500 Subtotal, overlapping debt 2,154,500
County of Franklin, direct debt 42,106,644
Total direct and overlapping debt 44,261,144
Note: Overlapping governments are those that coincide, at least in part, with the geographic boundaries of theCounty. This table estimates the portion of the outstanding debt of those overlapping government's that isborne by the residents and businesses of the County of Franklin. This process recognizes that, when consideringthe County's ability to issue and repay long-term debt, the entire debt burden borne by the residents and businesses should be taken into account. However, this does not imply that every taxpayer is a resident andtherefore responsible for repaying the debt, of each overlapping government.
(1) The percentage of overlapping debt applicable is estimated using taxable assessed property values. Applicable percentages were estimated by determining the portion of the Town's taxable assessed value that iswithin the government's boundaries and dividing it by the Town's total taxable assessed value.
-129-

CO
UN
TY
OF F
RA
NK
LIN
, V
IRG
INIA
Tab
le 1
3
Lega
l D
ebt
Mar
gin
Info
rmat
ion
Last
Ten
Fis
cal Ye
ars
2006
2007
2008
2009
2010
2011
2012
2013
2014
2015
Deb
t lim
i t45
8,54
9,33
7
480,
704,
579
53
1,20
8,93
4
749,
561,
108
76
0,62
1,49
5
765,
894,
954
77
1,47
5,34
9
651,
221,
387
65
6,36
9,22
5
658,
612,
569
Tot
al n
et d
ebt
appl
icab
le t
o lim
it23
,223
,697
28,5
07,0
51
32,6
77,3
26
36,9
38,5
39
34,8
07,6
35
31,9
00,2
71
29,0
42,1
89
26,4
29,5
58
33,1
64,4
94
41,8
41,7
33
Lega
l de
bt m
argi
n43
5,32
5,64
0
452,
197,
528
49
8,53
1,60
8
712,
622,
569
72
5,81
3,86
0
733,
994,
683
74
2,43
3,16
0
624,
791,
829
62
3,20
4,73
1
616,
770,
836
Tot
al n
et d
ebt
appl
icab
le t
o th
e lim
it a
s a
perc
enta
ge o
f de
bt lim
it5.
06%
5.93
%6.
15%
4.93
%4.
58%
4.17
%3.
76%
4.06
%5.
05%
6.35
%
Lega
l D
ebt
Mar
gin
Cal
cula
tion
for
Fis
cal Ye
ar 2
015
Ass
esse
d va
lue
of r
eal es
tate
6,58
6,12
5,69
0
D
ebt
limit
(10
% o
f to
tal as
sess
ed v
alue
)65
8,61
2,56
9
N
et d
ebt
appl
icab
le t
o lim
it41
,841
,733
Le
gal de
bt m
argi
n61
6,77
0,83
6
-130-

COUNTY OF FRANKLIN, VIRGINIA Table 14
Demographic and Economic StatisticsLast Ten Fiscal Years
TotalPer Capita Personal
Fiscal Personal Income Median School UnemploymentYear Population Income (thousands) Age Enrollment Rate
2015 56,793 35,374 2,008,996 40 7,098 5.20%2014 56,616 34,614 1,959,706 40 7,037 5.20%2013 56,616 34,028 1,926,513 40 7,095 4.90%2012 56,419 32,626 1,840,735 40 7,080 6.20%2011 56,225 31,096 1,748,378 40 7,069 6.40%2010 55,732 30,701 1,711,035 40 7,200 7.50%2009 55,284 32,145 1,777,109 40 7,166 8.40%2008 54,447 31,133 1,695,115 40 7,283 4.70%2007 53,037 29,081 1,542,380 40 7,305 3.80%2006 51,976 27,675 1,438,454 40 7,194 2.80%
Souce: Weldon Cooper Center, Annual school report - prepared by the County School Board, www.fedstats.govBureau of Economic Analysis
-131-

COUNTY OF FRANKLIN, VIRGINIA Table 15
Principal EmployersCurrent Year and Nine Years Ago
% of Total % of TotalCounty County
Employer Employees Rank Employment Employees Rank Employment
Franklin County Public Schools 1,231 1 8.72% 1,094 2 7.75%Ply Gem Windows 950 2 6.73% 1,367 1 9.68%Wal-Mart 400 3 2.83% 343 3 2.43%Franklin County 334 4 2.37% 304 4 2.15%Ferrum College 325 5 2.30% 272 8 1.93%Trinity Packaging, Inc. 300 6 2.12% 300 5 2.12%Ronile. Inc. 300 7 2.12% 289 6 2.05%Carilion Franklin Memorial Hospital 275 8 1.95% 270 9 1.91%Uttermost Company 168 9 1.19% 280 7 1.98%Mod-U-Kraf Homes, Inc. 125 10 0.89% 245 10 1.74%Totals 4,408 31.22% 4,764 33.74%
Source: Individual companies
Fiscal Year 2015 Fiscal Year 2006
-132-

CO
UN
TY
OF F
RA
NK
LIN
, V
IRG
INIA
Tab
le 1
6
Full-t
ime
Equi
vale
nt C
ount
y G
over
nmen
t Em
ploy
ees
by F
unct
ion
Last
Ten
Fis
cal Ye
ars
Funct
ion
2006
2007
2008
2009
2010
2011
2012
2013
2014
2015
Gen
eral
Gov
ernm
ent
Adm
inis
trat
ion
Le
gisl
ativ
e1
11
11
11
11
1
Gen
eral
and
fin
anci
al a
dmin
istr
atio
n31
3436
3634
3434
3434
34
Judi
cial
Adm
inis
trat
ion
Cou
rts
1311
1111
1111
108
69
Cle
rk o
f Cou
rt9
1011
1110
1010
1010
10
Com
mon
wea
lth
Att
orne
y7
78
88
89
99
9
Publ
ic S
afet
y
Sher
iff:
Law
Enf
orce
men
t43
4441
3836
3434
3943
54
Cor
rect
ion
and
Det
enti
on27
3235
3736
3939
3735
21
Build
ing
insp
ecti
ons
78
87
77
78
89
Ani
mal
con
trol
34
44
33
33
33
Pu
blic
Saf
ety
1624
2424
2424
2428
2929
E9
1114
1414
1414
1515
1514
14
Publ
ic W
orks
So
lid W
aste
1416
1616
1515
1618
1816
G
ener
al b
uild
ings
and
gro
unds
58
87
77
77
88
Pu
blic
Wor
ks3
44
44
33
33
3
Hea
lth
and
Wel
fare
D
epar
tmen
t of
soc
ial se
rvic
es61
6162
6258
5964
6464
72
CSA
22
22
22
22
22
Fa
mily
Res
ourc
es6
65
53
22
33
5
Agi
ng S
ervi
ces
32
22
22
22
21
Rec
reat
ion
and
Cul
tura
l
Park
s an
d re
crea
tion
810
1010
1010
1011
1010
Li
brar
y6
68
88
88
88
8
Com
mun
ity
Dev
elop
men
t
GIS
and
Map
ping
22
21
22
22
2
Econ
omic
Dev
elop
men
t1
11
11
11
12
2
Wor
k Fo
rce
Con
sort
ium
23
33
33
33
33
Pl
anni
ng
811
119
88
88
99
Tot
als
290
321
327
322
306
308
314
324
326
334
Sour
ce:
Fran
klin
Cou
nty
Ado
pted
Bud
gets
-133-

COUNTY OF FRANKLIN, VIRGINIA Table 17
Operating Indicators by FunctionLast Ten Fiscal Years
Function 2006 2007 2008 2009 2010 2011 2012 2013 2014 2015
General and financial administration Commissioner of Revenue: Personal Property tax assessments 98,719 106,470 171,742 181,850 195,080 196,000 196,000 Real Estate tax assessments 55,080 54,307 64,465 66,717 65,742 65,000 65,000 Finance: GFOA Award for CAFR Yes Yes Yes Yes Yes Yes Yes Yes Yes Yes GFOA Award for Adopted Budget Book Yes Yes Yes Yes Yes Yes Yes Yes Yes Yes Information Technology: Tech support (In Days) 4.5 4.5 3 5 5 5 5 5 3 4 Voter Registrar: Number of Registered Voters 30,170 31,413 31,892 34,003 34,034 34,406 35,026 35,282 35,235 35,363
Judicial Administration Clerk of Court: Criminal Cases Commenced 1,927 1,817 1,704 2,250 2,070 1,661 1,517 1,837 1,900 1,635 Deeds Recorded 14,234 12,736 11,033 10,832 11,280 9,581 9,789 9,521 9,600 7,481
Public safety Sheriffs department: calls for service 16,000 26,047 19,501 18,877 19,237 20,768 21,837 27,969 35,935 41,137
Fire and rescue: number of fire calls 1,298 1,225 1,348 1,115 1,309 1,462 1,729 3,917 3,065 1,541 Number of rescue calls 4,057 4,254 4,679 5,989 4,947 5,123 5,540 6,484 6,625 6,714 Fire Investigations 118 165 182 132 96 200 157 148 129 212
Building inspections: Permits issued 1,552 1,358 1,018 1,042 974 980 1,029 1,137 1,024 1,050 Total Value of Permits 133,737,342 58,752,602 60,857,340 54,910,190 51,347,040 62,465,201 60,805,382
Public works Landfill: Refuse collected (tons) 61,866 61,367 59,842 55,491 49,355 54,398 52,908 52,910 51,646 46,784 Mulch Recycled (tons) 1,888 1,463 1,331 1,227 1,349 1,352 1,459 1,804
Health and Welfare Social Services: Children in Foster Care 98 88 77 95 94 116 107 105 SNAP Applications 1,774 2,072 2,422 2,282 2,226 2,126 2,006 2,068 On-going Medicaid Participants 6,154 6,767 7,021 7,189 9,931 8,535 7,820 8,707
CSA: Case Load - Number of Children 177 242 260 279 284 280 256 235 249 270
Aging Services: Transportation Clients 894 1,104 572 553 614 621 465 466 444 326
Culture and recreation Parks and recreation: Sports registration/classes 4,655 4,700 4,566 5,746 5,449 5,451 5,350 4,537 4,527 3,685 Shelter reservations 250 252 283 301 358 268 278 167 160 3,670 Park Acreage 692 692 692 696 696 696 696 696 696 11,179 Library: Program Attendance 22,806 24,928 25,700 25,987 24,871 25,013 24,117 7,872 Circulation 180,738 191,267 233,626 230,280 236,758 254,099 242,338 218,037
Community development Planning and Community Development: Zoning permits issued 816 941 714 1,165 1,251 256 250 94
Component Unit - School Board Education: Local expenditures per pupil 3,523 3,569 3,995 4,326 4,203 4,478 3,990 4,498 4,603 4,605
Source: Individual County departments and the Franklin County School Board
Fiscal Year
-134-

CO
UN
TY
OF F
RA
NK
LIN
, V
IRG
INIA
Tab
le 1
8
Cap
ital
Ass
et S
tati
stic
s by
Fun
ctio
nLa
st T
en F
isca
l Ye
ars
Funct
ion
2006
2007
2008
2009
2010
2011
2012
2013
2014
2015
Gen
eral
gov
ernm
ent
adm
inis
trat
ion
Adm
inis
trat
ion
buildi
ngs
11
11
11
11
11
Judi
cial
adm
inis
trat
ion
Cou
rtho
uses
11
11
11
11
11
Publ
ic s
afet
y
Sher
iffs
dep
artm
ent:
Patr
ol u
nits
5858
5858
5858
5858
5858
Bu
ildin
g in
spec
tion
s:
V
ehic
les
56
66
66
66
66
Ani
mal
con
trol
:
V
ehic
les
33
33
33
33
33
Pu
blic
Saf
ety:
Fir
e St
atio
n s10
1010
1010
1010
1010
10
Publ
ic w
orks
La
ndfi
ll:
Col
lect
ion
Tru
cks
77
77
77
77
77
Gre
en B
ox S
ites
7474
7474
7474
7474
7469
Hea
lth
and
wel
fare
D
epar
tmen
t of
Soc
ial Se
rvic
es:
Veh
icle
s8
88
810
1213
1313
13
Cul
ture
and
rec
reat
ion
Pa
rks
and
recr
eati
on:
Park
s9
99
99
99
99
9
Li
brar
ies
11
22
22
22
22
Com
pone
nt U
nit
- Sc
hool
Boa
rd
Edu
cati
on:
Sch
ools
1414
1414
1515
1515
1515
Sch
ool bu
ses
162
162
162
162
162
162
162
162
162
162
Sour
ce:
Indi
vidu
al C
ount
y de
part
men
ts
-135-

COMPLIANCE SECTION

ROBINSON, FARMER, COX ASSOCIATES
A PROFESSIONAL LIMITED LIABILITY COMPANY CERTIFIED PUBLIC ACCOUNTANTS
Independent Auditors’ Report on Internal Control over Financial Reporting and on
Compliance and Other Matters Based on an Audit of Financial Statements Performed in Accordance with Government Auditing Standards
To the Honorable Members of The Board of Supervisors County of Franklin, Virginia We have audited, in accordance with the auditing standards generally accepted in the United States of America; the standards applicable to financial audits contained in Government Auditing Standards, issued by the Comptroller General of the United States; and the Specifications for Audits of Counties, Cities and Towns, issued by the Auditor of Public Accounts of the Commonwealth of Virginia, the financial statements of the governmental activities, the business-type activities, the discretely presented component unit, each major fund, and the aggregate remaining fund information of the County of Franklin, Virginia as of and for the year ended June 30, 2015, and the related notes to the financial statements, which collectively comprise the County of Franklin, Virginia’s basic financial statements and have issued our report thereon dated December 2, 2015. Internal Control over Financial Reporting In planning and performing our audit of the financial statements, we considered the County of Franklin, Virginia’s internal control over financial reporting (internal control) to determine the audit procedures that are appropriate in the circumstances for the purpose of expressing our opinions on the financial statements, but not for the purpose of expressing an opinion on the effectiveness of the County of Franklin, Virginia’s internal control. Accordingly, we do not express an opinion on the effectiveness of the County of Franklin, Virginia’s internal control. Our consideration of internal control was for the limited purpose described in the preceding paragraph and was not designed to identify all deficiencies in internal control that might be material weaknesses or significant deficiencies and therefore, material weaknesses or significant deficiencies may exist that were not identified. However, as described in the accompanying schedule of findings and questioned costs, we identified certain deficiencies in internal control that we consider to be material weaknesses. A deficiency in internal control exists when the design or operation of a control does not allow management or employees, in the normal course of performing their assigned functions, to prevent, or detect and correct, misstatements on a timely basis. A material weakness is a deficiency, or a combination of deficiencies, in internal control such that there is a reasonable possibility that a material misstatement of the entity’s financial statements will not be prevented, or detected and corrected on a timely basis. We consider the deficiency described in the accompanying schedule of findings and questioned costs to be a material weakness. [2015-001]
-136-

Compliance and Other Matters As part of obtaining reasonable assurance about whether the County of Franklin, Virginia’s financial statements are free from material misstatement, we performed tests of its compliance with certain provisions of laws, regulations, contracts, and grant agreements, noncompliance with which could have a direct and material effect on the determination of financial statement amounts. However, providing an opinion on compliance with those provisions was not an objective of our audit, and accordingly, we do not express such an opinion. The results of our tests disclosed no instances of noncompliance or other matters that are required to be reported under Government Auditing Standards. County of Franklin, Virginia’s Response to Findings County of Franklin, Virginia’s response to the findings identified in our audit is described in the accompanying schedule of findings and questioned costs. County of Franklin, Virginia’s response was not subjected to the auditing procedures applied in the audit of the financial statements and, accordingly, we express no opinion on it. Purpose of this Report The purpose of this report is solely to describe the scope of our testing of internal control and compliance and the results of that testing, and not to provide an opinion on the effectiveness of the entity’s internal control or on compliance. This report is an integral part of an audit performed in accordance with Government Auditing Standards in considering the entity’s internal control and compliance. Accordingly, this communication is not suitable for any other purpose.
Blacksburg, Virginia December 2, 2015
-137-

ROBINSON, FARMER, COX ASSOCIATES
A PROFESSIONAL LIMITED LIABILITY COMPANY CERTIFIED PUBLIC ACCOUNTANTS
Independent Auditors’ Report on Compliance For Each Major Program and on Internal Control over Compliance Required by OMB Circular A-133
To the Honorable Members of The Board of Supervisors County of Franklin, Virginia Report on Compliance for Each Major Federal Program We have audited the County of Franklin, Virginia’s compliance with the types of compliance requirements described in the OMB Circular A-133 Compliance Supplement that could have a direct and material effect on each of the County of Franklin, Virginia’s major federal programs for the year ended June 30, 2015. County of Franklin, Virginia’s major federal programs are identified in the summary of auditors’ results section of the accompanying schedule of findings and questioned costs. Management’s Responsibility Management is responsible for compliance with the requirements of laws, regulations, contracts, and grants applicable to its federal programs. Auditors’ Responsibility Our responsibility is to express an opinion on compliance for each of the County of Franklin, Virginia’s major federal programs based on our audit of the types of compliance requirements referred to above. We conducted our audit of compliance in accordance with auditing standards generally accepted in the United States of America; the standards applicable to financial audits contained in Government Auditing Standards, issued by the Comptroller General of the United States; and OMB Circular A-133, Audits of States, Local Governments, and Non-Profit Organizations. Those standards and OMB Circular A-133 require that we plan and perform the audit to obtain reasonable assurance about whether noncompliance with the types of compliance requirements referred to above that could have a direct and material effect on a major federal program occurred. An audit includes examining, on a test basis, evidence about the County of Franklin, Virginia’s compliance with those requirements and performing such other procedures as we considered necessary in the circumstances. We believe that our audit provides a reasonable basis for our opinion on compliance for each major federal program. However, our audit does not provide a legal determination of the County of Franklin, Virginia’s compliance. Opinion on Each Major Federal Program In our opinion, the County of Franklin, Virginia complied, in all material respects, with the types of compliance requirements referred to above that could have a direct and material effect on each of its major federal programs for the year ended June 30, 2015.
-138-

Report on Internal Control over Compliance Management of the County of Franklin, Virginia is responsible for establishing and maintaining effective internal control over compliance with the types of compliance requirements referred to above. In planning and performing our audit of compliance, we considered the County of Franklin, Virginia’s internal control over compliance with the types of requirements that could have a direct and material effect on each major federal program to determine the auditing procedures that are appropriate in the circumstances for the purpose of expressing an opinion on compliance for each major federal program and to test and report on internal control over compliance in accordance with OMB Circular A-133, but not for the purpose of expressing an opinion on the effectiveness of internal control over compliance. Accordingly, we do not express an opinion on the effectiveness of the County of Franklin, Virginia’s internal control over compliance. A deficiency in internal control over compliance exists when the design or operation of a control over compliance does not allow management or employees, in the normal course of performing their assigned functions, to prevent, or detect and correct, noncompliance with a type of compliance requirement of a federal program on a timely basis. A material weakness in internal control over compliance is a deficiency, or combination of deficiencies, in internal control over compliance, such that there is a reasonable possibility that material noncompliance with a type of compliance requirement of a federal program will not be prevented, or detected and corrected, on a timely basis. A significant deficiency in internal control over compliance is a deficiency, or a combination of deficiencies, in internal control over compliance with a type of compliance requirement of a federal program that is less severe than a material weakness in internal control over compliance, yet important enough to merit attention by those charged with governance. Our consideration of internal control over compliance was for the limited purpose described in the first paragraph of this section and was not designed to identify all deficiencies in internal control over compliance that might be material weaknesses or significant deficiencies. We did not identify any deficiencies in internal control over compliance that we consider to be material weaknesses. However, material weaknesses may exist that have not been identified. The purpose of this report on internal control over compliance is solely to describe the scope of our testing of internal control over compliance and the results of that testing based on the requirements of OMB Circular A-133. Accordingly, this report is not suitable for any other purpose.
Blacksburg, Virginia December 2, 2015
-139-

Pass-throughFederal Entity
Federal Grantor/State Pass - Through Grantor/ CFDA Identifying FederalProgram (or Cluster) Title Number Number Expenditures
Department of Health and Human Services: Pass Through Payments: Department of Social Services: Promoting Safe and Stable Families 93.556 0950110/0950111 36,237$ Temporary Assistance for Needy Families (TANF) 93.558 0400111 395,675 Refugee and Entrant Assistance - State Administered Programs 93.566 0500110/0500111 569 Low Income Home Energy Assistance 93.568 0600410/0600411 33,871 Child Care Mandatory and Matching Funds of the Child Care and Development Fund 93.596 0760110/0760111 47,936 Chafee Education and Training Vouchers Program 93.599 9160110 4,687 Stephanie Tubbs Jones Child Welfare Services Program 93.645 0900110/0900111 2,320 Adoption Assistance 93.659 1120110/1120111 478,469 Social Services Block Grant 93.667 1000110/1000111 320,171 Chafee Foster Care Independence Program 93.674 9150110/9150111 16,248 Foster Care - Title IV-E 93.658 1100110/1100111 392,105 Children's Health Insurance Program 93.767 0540110/0540111 15,613 Medical Assistance Program 93.778 1200110/1200111 535,122
Total Department of Health and Human Services 2,279,023$
Department of Agriculture: Pass Through Payments: Department of Agriculture: Community Facilities Loans and Grants 10.766 Not available 50,000$ Food Distribution (Note C) - (Child Nutrition Cluster) 10.555 40623 224,809$
Department of Education: National School Lunch Program - (Child Nutrition Cluster) 10.555 40623 1,663,521 1,888,330 School Breakfast Program - (Child Nutrition Cluster) 10.553 40591 664,830
Department of Social Services: State Administrative Matching Grants for the Supplemental Nutrition Assistance Program 10.561 0010110/0040110 463,093
Total Department of Agriculture 3,066,253$
Department of the Justice: Pass Through Payments: Office of the Virginia Attorney General Equitable Sharing Program 16.922 Not available 10,630$ Department of Criminal Justice Services: Violence Against Women Formula Grants 16.588 10WFAX0041 35,390
Total Department of Justice 46,020$
Department of Housing and Urban Development: Pass Through Payments: Department of Housing and Community Development: Community Development Block Grants/State's Program and Non-Entitlement Grants in Hawaii 14.228 50797 30,000$
Total Department of Housing and Urban Development 30,000$
Department of Homeland Security: Pass Through Payments: Department of Emergency Management: State Homeland Security Program 97.073 52707/52708 36,498$
Total Department of Homeland Security 36,498$
Department of Transportation: Pass Through Payments: Department of Motor Vehicles: Alcohol Open Container Requirements 20.607 52208 35,248$
Total Department of Transportation 35,248$
County of Franklin, VirginiaSchedule of Expenditures of Federal Awards
For the Year Ended June 30, 2015
-140-

Pass-throughFederal Entity
Federal Grantor/State Pass - Through Grantor/ CFDA Identifying FederalProgram (or Cluster) Title Number Number Expenditures
Department of Education: Pass Through Payments: Department of Education: Adult Education - Basic Grants to States 84.002 42801 531,004$ Title I, Grants to Local Educational Agencies 84.010 42901 1,875,814 Special Education_Grants to States (Special Education Cluster) 84.027 73071 2,200,558 Career and Technical Education -- Basic Grants to States 84.048 61095 130,447 Special Education_Preschool Grants (Special Education Cluster) 84.173 87063A 32,803 Advanced Placement Program 84.330 NA 1,739 English Language Acquisition State Grants 84.365 60509/60512 2,409 Improving Teacher Quality State Grants 84.367 61480 246,920
Total Department of Education 5,021,694$
Total Expenditures of Federal Awards 10,514,736$
Notes to Schedule of Expenditures of Federal Awards
Note A-Basis of Presentation:
Note B-Summary of Significant Accounting Policies
Note C-Food Distribution
Nonmonetary assistance is reported in the schedule at the fair market value of the commodities received and disbursed.
Note D-Subrecipients
Of the federal expenditures presented in this schedule, the School Board provided federal awards to subrecipients as follows: Adult Education - Basic Grants to States 84.002 427,309$
Note E-Relationship to Financial StatementsFederal expenditures, revenues and capital contributions are reported in the County's basic financial statements as follows:
Intergovernmental federal revenues per the basic financial statements: Primary government: General Fund 2,906,474$ Less: Payments in Lieu of Taxes (16,592) Capital Projects Fund 50,000 Total primary government: 2,939,882$
Component Unit School Board: School Operating Fund 7,574,854$
Total federal expenditures per the Schedule of Expenditures of Federal Awards 10,514,736$
County of Franklin, VirginiaSchedule of Expenditures of Federal Awards (Continued)
For the Year Ended June 30, 2015
The accompanying schedule of expenditures of federal awards (the Schedule) includes the federal grant activity of the County of Franklin, Virginia under programs ofthe federal government for the year ended June 30, 2015. The information in the Schedule is presented in accordance with the requirements of OMB Circular A-133,Audits of States, Local Governments, and Non-Profit Organizations . Because the Schedule presents only a selected portion of the operations of the County ofFranklin, Virginia, it is not intended to and does not present the financial position, changes in net position, or cash flows of the County of Franklin, Virginia.
(2) Pass-through entity identifying numbers are presented where available.
(1) Expenditures reported on the Schedule are reported on the accrual basis of accounting. Such expenditures are recognized following the cost principles containedin OMB Circular A-87, Cost Principles for State, Local, and Indian Tribal Governments, wherein certain types of expenditures are not allowed or are limited as toreimbursement.
-141-

County of Franklin, Virginia
Schedule of Findings and Questioned CostsFor th Year Ended June 30, 2015
Section I - Summary of Auditors' Results
Financial Statements
Type of auditors' report issued: Unmodified
Internal control over financial reporting:Material weakness(es) identified? YesSignificant deficiency(ies) identified? None reported
Noncompliance material to financial statements noted? No
Federal Awards
Internal control over major programs:Material weakness(es) identified? None reportedSignificant deficiency(ies) identified? None reported
Type of auditors' report issued on compliance for major programs: Unmodified
Any audit findings disclosed that are required to be reported in accordance with Circular A-133, Section .51 No
Identification of major programs:
CFDA #
10.553/10.55584.00284.010
84.027/84.17393.667
Dollar threshold used to distinguish between Type A and Type B programs $315,442
Auditee qualified as low-risk auditee? No
Social Services Block Grant
Name of Federal Program or Cluster
Child Nutrition ClusterAdult Education - Basic Grants to States
Title I - Grants to Local Educational AgenciesSpecial Education Cluster
-142-

County of Franklin, Virginia
Schedule of Findings and Questioned CostsFor the Year Ended June 30, 2015 (continued)
Section II - Financial Statement Findings
Finding 2015-001(Material Weakness)
Criteria:
Condition:
Cause of Condition:
Effect of Condition:
Recommendation:
Managements Response:
Section III - Federal Award Findings and Questioned Costs
There are no federal award findings and questioned costs to report.
Section IV - Status of Prior Audit Findings
Finding 2014-001 and 2014-002 were corrected during the fiscal year.
Per Statement on Auditing Standards 115, identification of a material adjustment to thefinancial statements that was not detected by the entity's internal controls indicates that amaterial weakness may exist.
The Component-unit School Board financial statements required material adjusting entriesby the Auditor to ensure such statements complied with Generally Accepted AccountingPrinciples. The auditor did not identify a significant number of entries, but some of theentries were significant to the financial statements in terms of dollar amount.
There is more than a remote likelihood that a misstatement of the entity’s financialstatements that is more than inconsequential will not be prevented or detected by theentity's internal controls over financial reporting.
Historically, the School Board has identified year end adjusting entries. We recommendthat the School Board perform an analysis of material transactions that occur during thefiscal year and after year end, to ensure they are reported in the proper accounting period.
Management will implement the procedures recommended by the Auditor above.
The School Board had staff turnover during the fiscal year and failed to identify all year endaccounting adjustments necessary for the books to be prepared in accordance with currentreporting standards.
-143-