A Century of Geology in Indiana. - Proceedings of the Indiana ...
Upload
khangminh22Category
view
1download
0

Table of Contents
Section 1: Stormwater Calculations Summary
Pre-Development Conditions… ........................................................................... 1
Post-Development Conditions… .................................................................................. 1-2
Storm Sewer Design… .................................................................................................. ...2
Exhibit 1: Vicinity and Location Map… .............................................................. 3
Exhibit 2: FEMA Flood Insurance Rate Map … ................................................... 4
Exhibit 3: Pre-Development Watershed Map… ................................................... 5
Exhibit 4: Post-Development Watershed Map… .......................................................... 6
Section 2: Hydrologic Modeling Calculations……………………………………….7-9
Soils Map ................................................................................................... 10-12
NOAA Rainfall Data… ............................................................................... ….13
Section 3: Water Quality Calculations… ...................................................... ….14
Routed 1.25” Storm Event Hydrograph ....................................................................... 15
Section 4: Detention Calculations…............................................................... 16-17
Exhibit 5: Detention Details. ......................................................................................... 18
Section 5: Storm Sewer Sizing Calculations… ............................................. ….19
Minimum Pipe Slope Calculations...........................................................................20-23
Exhibit 6: Storm Sewer Watershed Map. .................................................................... 24
Composite Runoff Coefficient Calculations. ................................................................ 25
Indianapolis Rainfall Data Table. ................................................................................. 26
Hydraflow Storm Sewer Schematic. ............................................................................. 27
Exhibit 5: Detention Details. ......................................................................................... 18

Hydraflow Storm Sewer Tabulation (10-Yr Storm Event) ........................................ 28
Section 6: Storm Inlet/Grate Calculations… ................................................ ….29
Exhibit 7: Inlet Basin Watershed Map. 30 Section 7: General Model Setup… ................................................................. 31-33
Appendix A: Pre-Development Runoff Data
2 yr Hydrographs…………………………………………..………...……….….…….A-1
10 yr Hydrographs…………………..…………………………….………….….…….A-2
2 yr-24 hr Peak Storm Event Analysis Results………………………....…..….A-3 – A-8
10 yr-24 hr Peak Storm Event Analysis Results………………………..…….A-9 – A-14
Appendix B: Post-Development Runoff Data
10 yr Hydrographs…………………..…………………………….…………..….…….B-1
100 yr Hydrographs…………………..………………………..….……….….….…….B-2
1.25” Storm Event Analysis Results……….....…......…….………………..…..B-3 – B-7
10 yr-24 hr Peak Storm Event Analysis Results…………..……….........…….B-8 – B-12
100 yr-24 hr Peak Storm Event Analysis Results………….……..…..…….B–13 – B-17
Appendix C: Proposed Pond & Routed Storm Event Data
1.25” Storm Event Analysis Results……….............………………....……….C-1 – C-13
10 yr-24 hr Peak Storm Event Analysis Results…………..….…..…...…….C-14 – C-26
100 yr-24 hr Peak Storm Event Analysis Results………….……..………..C–27 – C-39

Section 1: Stormwater Calculations Summary
Pre-Development Conditions The project site is located in the northwest corner of the Paris Drive roundabout in the City of Franklin, Johnson County, Indiana (see Exhibit 1: Vicinity and Location Map). The existing site is a ±11.28 acre tract consisting of cultivated agricultural field with landscape mounds along the west and north perimeter. By graphic plotting, the project site lies within Zone ‘X’, areas outside of the 0.2% annual chance floodplain, as shown on the Flood Insurance Rate Map (FIRM) for Johnson County, Indiana, Community Panel No. 18081 C 0232D, dated August 2, 2007. (see Exhibit 2: FEMA FIRM Map) Under pre-development conditions, runoff exits the site at three (3) different outlet points. Runoff from the southern portion of the site drains south towards Longest Drive. Runoff from the eastern portion of the site drains east into the roadside ditch along the northwest side of the Paris Drive roundabout which drains northeast towards I-65. Runoff from the northwest portion of the site drains north over a spillway and into an existing detention pond located in the Fairway Lakes – Section 1 subdivision (see Exhibit 3: Pre-Development Watershed Map). For the runoff and detention analysis, the enclosed calculations focus entirely on the pre-development basin draining north into Fairway Lakes since the entire property will drain north in the post-development condition.
Post-Development Conditions This project involves the construction of a one (1) lot, two (2) block commercial subdivision to be known as Paris Drive Park West. All curbs, roads, sanitary sewers, water mains, and storm sewers necessary for future developments shall be constructed with the subdivision. All stormwater runoff shall be collected via a storm sewer network and directed towards a wet detention pond which will be constructed in the northwest corner of the site. The wet detention pond will provide stormwater quantity and quality treatment in accordance with Section 6.19 of the City of Franklin Subdivision Control Ordinance (see Exhibit 4: Post-Development Watershed Map). As indicated in the “Pre-Development Conditions” above, it is anticipated that the entire commercial subdivision will drain into the proposed wet detention pond in the post-development conditions. Runoff exiting the detention pond will be discharged into the existing Fairway Lakes – Section 1 pond which is consistent with the pre-development conditions. To achieve water quantity detention standards, the pond and outlet structure will be sized to restrict the peak discharge rate of the 10-year post-developed storm to the peak 2-year pre-developed rate for pre-development watershed basin. Likewise, the peak discharge rate of the 100-year post-developed storm will be restricted to the peak 10-year pre-developed rate. It should be noted that, in the post-development condition, runoff from the eastern portion of Lot #1 cannot be directed into the detention pond due to topographical constraints. Although the area in question cannot be detained, it will remain an unimproved, grass area as shown on the Marriott Fairfield Inn & Suites construction plans which is currently under construction (case number PC 2017-034 (SPR)). Furthermore, the outlet point for said area will be maintained between the pre- and post-development conditions; therefore, no negative impacts to downstream
1/12/18 1

drainage facilities will be realized as a result of this direct discharge. As such, the direct discharge area will not be analyzed as a part of this report. In addition to water quantity, the ponds will also be designed to detain, for over 24 hours after the peak runoff from a 24-hour storm, at least 20% of the runoff from either a 1-1/4 inch rainfall depth storm or 1/2 inch direct runoff, whichever is greater, for water quality treatment. The minimum water quality outlet orifice shall be two (2) inches in diameter. The pond will also be designed to include an emergency overflow spillway facility that is sufficient to convey 1.25 times the peak discharge resulting from the 100-year post-developed design storm. The wet detention pond will be designed to meet the requirements of Section 6.19, G and H of the Franklin SCO.
Storm Sewer Design The proposed storm sewer network is designed to accommodate a 10-year storm event. The Rational Method was used to perform the storm sewer pipe sizing calculations. On-street structures and grates within pavement areas will be designed and placed so that the depth of ponding above the inlet does not exceed 6 inches with the inlet grate 50% plugged. Furthermore, the storm sewer network will be designed so that the subdivision street will have a minimum of a 12-foot-wide open lane during a 10-year storm event. Off-street structures and grates, including those located within grass areas, will be designed so that the depth of ponding above the inlet does not exceed 9 inches with the inlet grate 50% plugged.
1/12/18 2

LOCATION MAP
NOT TO SCALE
VICINITY MAP
NOT TO SCALE
EXHIBIT 1: VICINITY & LOCATION MAPS
PROJECT
SITE
PROJECT
SITE
1/12/18 3

EXHIBIT 2: FEMA FIRM MAP
PROJECTSITE
1/12/18 4

SS
S
S
S
P
A
R
I
S
D
R
.
FA
IR
WA
Y LA
KE
S D
R.
LONGEST DR.
KING ST.
~
f
i
e
l
d
~
~
f
i
e
l
d
~
~
f
i
e
l
d
~
~
f
i
e
l
d
~
~
p
o
n
d
~
EXHIBIT 3: PRE-DEVELOPMENT WATERSHED MAP
NO
RT
H
1/12/18 5

SS
S
S
S
P
A
R
I
S
D
R
.
FA
IR
WA
Y LA
KE
S D
R.
LONGEST DR.
KING ST.
~
p
o
n
d
~
S
S
S
S
EXHIBIT 4: POST-DEVELOPMENT WATERSHED MAP
NO
RT
H
1/12/18 6

Section 2: Hydrologic Modeling Calculations All drainage calculations were completed using Autodesk Storm and Sanitary Analysis software. The SCS Curvilinear method utilizing SCS II rainfall distribution was used to calculate the hydrographs. The TR-55 Method was used to calculate times of concentration. Curve numbers were computed based on the applicable cover for fully developed urban areas and the percentage by area of each hydrologic soil type obtained from the USDA Web Soils Survey for the project area. Per Section 6.19.C.6 of the City of Franklin SCO, pre-developed runoff rates shall be based on pasture, meadow, brush or woods ground cover in good hydrologic conditions. As the existing site is predominately cultivated field, the existing ground cover for the entire site will be considered to be pasture cover in good hydrologic condition.
Soil Hydrologic Group Percentage Calculations Table 1
Soil Hydrologic Group Percentage Calculations
Soil Type Hydrologic Group – B
(acres) Hydrologic Group – C
(acres) Brookston, Br 3.2 -- Crosby, CrA -- 5.7 Miami, MnB2 2.2 -- Miami, MnC2 1.7 -- Miami, MnD2 0.1 --
Totals 7.2 5.7
Percentages of Hydrologic Groups
56% 44%
Runoff Curve Number Calculations Pre-Development Conditions
Table 2 Pre-Development Runoff Curve Number Calculations - PRE #1
Land Use Description
Runoff Curve No. For Hydrologic Group –
B
Runoff Curve No. For Hydrologic Group – C
Average Runoff Curve
Number
Land Use Area
Overall Weighted Curve No. Percentag
e Used* 56%
Percentage Used*
44%
Pasture/Open Space
61 74 67 4.50 ac. 67
*See Soil Hydrologic Group Percentage Calculations, Table 1.
1/12/18 7

Post-Development Conditions
Table 3 Post-Development Runoff Curve Number Calculations
Land Use Description
Runoff Curve No. For Hydrologic Group – B
Runoff Curve No. For Hydrologic Group – C
Average Runoff Curve
Number
Land Use Area
Overall Weighted Curve No. Percentage
Used* 56%
Percentage Used*
44%
Wet Pond 98 98 98 0.77 ac.
90.33 Open Space 61 74 67 1.25 ac.
Commercial 92 94 93 8.71 ac.
*See Soil Hydrologic Group Percentage Calculations, Table 1.
Hydrologic Modeling Runoff Summary Pre-Development Conditions The City of Franklin Subdivision Control Ordinance requires a detention design that outlets stormwater at the following rates:
Post-Development: Pre-Development: Post 10-yr Q ≤ Pre 2-yr Q Post 100-yr Q ≤ Pre 10-yr Q The 2-year, 10-year and 100-year storm events are calculated at durations of 1, 2, 3, 6, 12 and 24 hours to identify the critical storm events which are to be used for the respective limiting pre-development rates. Table 4 summarizes the peak runoff rates (cfs) resulting from the hydrologic modeling of the Pre-Development Watershed Basin which is representative of the contributing watershed area in the existing condition. Entries in bold indicate the critical storm event for the respective return period. See Appendix ‘A’ for the pre-development hydrograph and peak storm event analysis results.
Table 4 Pre-Development Hydrograph Peak Runoff Rate Summary
Return Period (years)
Storm Duration
1 Hour 2 Hours 3 Hours 6 Hours 12 Hours 24 Hours
2 0.02 0.07 0.11 0.44 1.07 2.10 10 0.40 0.96 1.24 2.33 3.58 5.41
Basin Allowable Discharge:
Allowable discharge for the critical 10-year post-development storm=
Pre-Development 2-year Peak = 2.10 cfs
Allowable discharge for the critical 100-year post-development storm= Pre-Development 10-year Peak = 5.41 cfs
1/12/18 8

Post-Development Conditions Table 5 summarizes the peak runoff rates (cfs) resulting from the hydrologic modeling of the Post-Development Watershed Basin which is representative of the contributing watershed area in the proposed condition. See Appendix ‘B’ for the post-development hydrographs and peak storm event analysis results.
Table 5 Post-Development Hydrograph Peak Runoff Rate Summary
Return Period (years)
Storm Duration
1 Hour 2 Hours 3 Hours 6 Hours 12 Hours 24 Hours
10 14.44 18.34 20.10 25.77 31.53 39.14 100 25.57 32.94 36.16 45.70 52.49 59.93
1/12/18 9

Soil Map—Johnson County, Indiana
4370
820
4370
870
4370
920
4370
970
4371
020
4371
070
4371
120
4371
170
4371
220
4371
270
4370
820
4370
870
4370
920
4370
970
4371
020
4371
070
4371
120
4371
170
4371
220
4371
270
584220 584270 584320 584370 584420 584470 584520
584220 584270 584320 584370 584420 584470 584520
39° 29' 13'' N86
° 1
' 15'
' W39° 29' 13'' N
86° 1
' 0'' W
39° 28' 58'' N
86° 1
' 15'' W
39° 28' 58'' N
86° 1
' 0'' W
N
Map projection: Web Mercator Corner coordinates: WGS84 Edge tics: UTM Zone 16N WGS840 100 200 400 600
Feet0 30 60 120 180
MetersMap Scale: 1:2,240 if printed on A portrait (8.5" x 11") sheet.
Soil Map may not be valid at this scale.
1/12/18 10

MAP LEGEND MAP INFORMATION
Area of Interest (AOI)Area of Interest (AOI)
SoilsSoil Map Unit Polygons
Soil Map Unit Lines
Soil Map Unit Points
Special Point FeaturesBlowout
Borrow Pit
Clay Spot
Closed Depression
Gravel Pit
Gravelly Spot
Landfill
Lava Flow
Marsh or swamp
Mine or Quarry
Miscellaneous Water
Perennial Water
Rock Outcrop
Saline Spot
Sandy Spot
Severely Eroded Spot
Sinkhole
Slide or Slip
Sodic Spot
Spoil Area
Stony Spot
Very Stony Spot
Wet Spot
Other
Special Line Features
Water FeaturesStreams and Canals
TransportationRails
Interstate Highways
US Routes
Major Roads
Local Roads
BackgroundAerial Photography
The soil surveys that comprise your AOI were mapped at1:15,800.
Warning: Soil Map may not be valid at this scale.
Enlargement of maps beyond the scale of mapping can causemisunderstanding of the detail of mapping and accuracy of soilline placement. The maps do not show the small areas ofcontrasting soils that could have been shown at a more detailedscale.
Please rely on the bar scale on each map sheet for mapmeasurements.
Source of Map: Natural Resources Conservation ServiceWeb Soil Survey URL:Coordinate System: Web Mercator (EPSG:3857)
Maps from the Web Soil Survey are based on the Web Mercatorprojection, which preserves direction and shape but distortsdistance and area. A projection that preserves area, such as theAlbers equal-area conic projection, should be used if moreaccurate calculations of distance or area are required.
This product is generated from the USDA-NRCS certified data asof the version date(s) listed below.
Soil Survey Area: Johnson County, IndianaSurvey Area Data: Version 24, Sep 15, 2016
Soil map units are labeled (as space allows) for map scales1:50,000 or larger.
Date(s) aerial images were photographed: Sep 24, 2014—Mar20, 2017
The orthophoto or other base map on which the soil lines werecompiled and digitized probably differs from the backgroundimagery displayed on these maps. As a result, some minorshifting of map unit boundaries may be evident.
Soil Map—Johnson County, Indiana
1/12/18 11

Map Unit Legend
Johnson County, Indiana (IN081)
Map Unit Symbol Map Unit Name Acres in AOI Percent of AOI
Br Brookston silty clay loam, 0 to2 percent slopes
3.2 24.9%
CrA Crosby silt loam, fine-loamysubsoil, 0 to 2 percentslopes
5.7 43.9%
MnB2 Miami silt loam, 2 to 6 percentslopes, eroded
2.2 17.1%
MnC2 Miami silt loam, 6 to 12 percentslopes, eroded
1.7 13.1%
MnD2 Miami silt loam, 12 to 18percent slopes, eroded
0.1 0.9%
Totals for Area of Interest 12.9 100.0%
Soil Map—Johnson County, Indiana
1/12/18 12

NOAA Atlas 14, Volume 2, Version 3 Location name: Franklin, Indiana, USA* Latitude: 39.5167°, Longitude: -86.0667°
Elevation: 764.49 ft** * source: ESRI Maps
** source: USGS
POINT PRECIPITATION FREQUENCY ESTIMATES
G.M. Bonnin, D. Martin, B. Lin, T. Parzybok, M.Yekta, and D. Riley
NOAA, National Weather Service, Silver Spring, Maryland
PF_tabular | PF_graphical | Maps_&_aerials
PF tabularPDS-based point precipitation frequency estimates with 90% confidence intervals (in inches)1
DurationAverage recurrence interval (years)
1 2 5 10 25 50 100 200 500 1000
5-min 0.373(0.333-0.422)
0.444(0.396-0.502)
0.532(0.472-0.601)
0.602(0.533-0.679)
0.693(0.609-0.782)
0.764(0.666-0.864)
0.833(0.720-0.945)
0.906(0.775-1.03)
1.00(0.844-1.15)
1.08(0.892-1.24)
10-min 0.580(0.517-0.656)
0.694(0.618-0.783)
0.827(0.734-0.934)
0.929(0.822-1.05)
1.06(0.931-1.20)
1.16(1.01-1.31)
1.25(1.08-1.42)
1.35(1.16-1.54)
1.48(1.24-1.69)
1.57(1.30-1.81)
15-min 0.711(0.634-0.804)
0.848(0.755-0.958)
1.02(0.902-1.15)
1.14(1.01-1.29)
1.31(1.15-1.48)
1.43(1.25-1.62)
1.56(1.35-1.77)
1.68(1.44-1.92)
1.84(1.55-2.11)
1.96(1.62-2.26)
30-min 0.940(0.839-1.06)
1.14(1.01-1.28)
1.39(1.24-1.57)
1.59(1.41-1.79)
1.85(1.62-2.09)
2.05(1.79-2.32)
2.25(1.94-2.55)
2.46(2.10-2.80)
2.73(2.30-3.13)
2.94(2.43-3.39)
60-min 1.15(1.02-1.30)
1.39(1.24-1.57)
1.75(1.55-1.97)
2.02(1.79-2.28)
2.40(2.11-2.71)
2.70(2.35-3.05)
3.01(2.60-3.41)
3.33(2.85-3.80)
3.77(3.17-4.33)
4.12(3.42-4.76)
2-hr 1.34(1.20-1.52)
1.63(1.45-1.85)
2.04(1.82-2.32)
2.38(2.10-2.69)
2.85(2.50-3.22)
3.24(2.82-3.65)
3.65(3.13-4.12)
4.08(3.45-4.61)
4.68(3.89-5.33)
5.17(4.23-5.94)
3-hr 1.42(1.27-1.62)
1.72(1.53-1.95)
2.17(1.93-2.46)
2.53(2.24-2.86)
3.05(2.67-3.44)
3.48(3.01-3.93)
3.93(3.37-4.46)
4.42(3.73-5.02)
5.11(4.21-5.85)
5.68(4.59-6.54)
6-hr 1.70(1.51-1.94)
2.05(1.82-2.35)
2.59(2.29-2.95)
3.03(2.67-3.45)
3.66(3.19-4.16)
4.19(3.62-4.75)
4.76(4.05-5.40)
5.37(4.50-6.12)
6.25(5.11-7.14)
6.98(5.59-8.02)
12-hr 2.03(1.82-2.30)
2.44(2.19-2.77)
3.04(2.72-3.44)
3.53(3.14-3.98)
4.21(3.71-4.73)
4.77(4.17-5.35)
5.36(4.63-6.02)
5.98(5.09-6.74)
6.86(5.72-7.78)
7.56(6.21-8.64)
24-hr 2.43(2.24-2.65)
2.91(2.68-3.18)
3.57(3.28-3.89)
4.08(3.74-4.45)
4.77(4.36-5.20)
5.32(4.84-5.81)
5.87(5.32-6.42)
6.44(5.81-7.05)
7.21(6.44-7.92)
7.81(6.92-8.73)
2-day 2.84(2.63-3.08)
3.41(3.15-3.69)
4.15(3.83-4.50)
4.73(4.36-5.12)
5.51(5.05-5.97)
6.12(5.59-6.64)
6.74(6.12-7.32)
7.37(6.66-8.02)
8.21(7.35-8.96)
8.86(7.88-9.71)
3-day 3.05(2.84-3.28)
3.64(3.39-3.92)
4.42(4.11-4.75)
5.02(4.66-5.39)
5.82(5.39-6.26)
6.45(5.95-6.94)
7.09(6.51-7.63)
7.73(7.07-8.33)
8.59(7.80-9.28)
9.25(8.36-10.0)
4-day 3.26(3.05-3.48)
3.88(3.63-4.15)
4.68(4.38-5.00)
5.30(4.95-5.66)
6.13(5.72-6.55)
6.78(6.31-7.23)
7.44(6.90-7.93)
8.10(7.48-8.64)
8.98(8.26-9.59)
9.65(8.83-10.3)
7-day 3.86(3.60-4.14)
4.59(4.28-4.92)
5.50(5.13-5.89)
6.23(5.80-6.67)
7.21(6.70-7.71)
7.99(7.40-8.54)
8.78(8.11-9.39)
9.58(8.82-10.2)
10.7(9.76-11.4)
11.5(10.5-12.3)
10-day 4.40(4.12-4.71)
5.23(4.90-5.59)
6.25(5.85-6.68)
7.06(6.60-7.54)
8.16(7.61-8.70)
9.02(8.39-9.61)
9.89(9.18-10.5)
10.8(9.96-11.5)
12.0(11.0-12.8)
12.9(11.8-13.8)
20-day 6.03(5.68-6.42)
7.14(6.72-7.60)
8.42(7.92-8.96)
9.41(8.84-10.0)
10.7(10.1-11.4)
11.7(11.0-12.5)
12.8(11.9-13.5)
13.7(12.8-14.6)
15.0(13.9-16.0)
16.0(14.8-17.0)
30-day 7.43(7.00-7.87)
8.74(8.24-9.27)
10.2(9.58-10.8)
11.3(10.6-11.9)
12.7(12.0-13.5)
13.8(13.0-14.6)
14.9(13.9-15.8)
15.9(14.9-16.9)
17.3(16.1-18.4)
18.3(16.9-19.5)
45-day 9.42(8.87-9.98)
11.1(10.4-11.7)
12.8(12.0-13.5)
14.0(13.2-14.9)
15.7(14.7-16.6)
17.0(15.9-17.9)
18.2(17.0-19.2)
19.3(18.0-20.4)
20.8(19.3-22.0)
21.8(20.2-23.2)
60-day 11.3(10.6-11.9)
13.2(12.4-14.0)
15.1(14.2-16.0)
16.6(15.6-17.6)
18.5(17.4-19.6)
19.9(18.7-21.1)
21.3(19.9-22.6)
22.6(21.1-24.0)
24.2(22.6-25.7)
25.4(23.7-27.1)
1 Precipitation frequency (PF) estimates in this table are based on frequency analysis of partial duration series (PDS). Numbers in parenthesis are PF estimates at lower and upper bounds of the 90% confidence interval. The probability that precipitation frequency estimates (for a given duration and average recurrence interval) will be greater than the upper bound (or less than the lower bound) is 5%. Estimates at upper bounds are not checked against probable maximum precipitation (PMP) estimates and may be higher than currently valid PMP values. Please refer to NOAA Atlas 14 document for more information.
Back to Top
Page 1 of 4Precipitation Frequency Data Server
1/12/18 13

Section 3: Water Quality Calculations The City of Franklin Subdivision Control Ordinance requires all paved areas to be routed through a water quality detention system. The water quality detention system shall be designed to detain, for over 24 hours after peak runoff, at least 20% of the volume of runoff from either a 1 ¼” rainfall depth storm or 0.5” of direct runoff, whichever is greater. The minimum water quality outlet shall be 2” in diameter. See Appendix B for the water quality hydrograph and water quality storm event analysis results. See Appendix C for additional water quality data and routed water quality hydrograph. Water Quality Volume Volume of Runoff from 1 ¼” Rainfall Depth Storm, V1 = 5.46 ac.-in. = 0.455 ac.-ft. Volume of Runoff from 0.5” Direct Runoff,
V2 = 10.73 ac. * (0.5”/12) = 0.447 ac.-ft. Water Quality Volume, WQv = 20% * V2 = 0.2 * 0.455 ac.-ft. = 0.091 ac.-ft.
At a time of 24 hours after the peak runoff rate of the inflow hydrograph, the detention pond must have at least 0.091 ac.-ft. remaining in the basin.
Routed Water Quality Storm Hydrograph The 1 ¼” storm event is routed through the proposed detention pond with a 7.5” diameter
circular water quality orifice. The Routed 1.25” Storm Event Hydrograph (see following page) is used to verify the water quality volume, WQv, is remaining after 24 hours after peak runoff.
Time to Peak Runoff = 925 min. Time of 24 hours Past Peak Runoff = 925 min. + 1,440 min. = 2,365 min. Storage Volume at Time 2,365 min.= 4,181.43 c.f. = 0.096 ac.-ft. > 0.091 ac.-ft. (WQv) The storage volume 24 hours after peak runoff is greater than the required water
quality volume due to using the minimum size water quality orifice of 7.5”.
The water quality orifice is discussed further in Section 4: Detention Calculations.
1/12/18 14

1/12/18 15

Section 4: Detention Calculations Per ordinance, stormwater detention is addressed by restricting the release rate of runoff as previously described in Section 2: Hydrologic Modeling Calculations. The following information is provided as verification that the proposed wet detention pond and outlet structure are capable of detaining and restricting the release rate of runoff from the post-development site. Allowable Discharge Rate (see Section 2: Hydrologic Modeling Calculations, Hydrologic
Modeling Runoff Summary) Allowable discharge for the critical 10-year post-development storm=
Pre-Development 2-year Peak = 2.10 cfs
Allowable discharge for the critical 100-year post-development storm= Pre-Development 10-year Peak = 5.41 cfs Post-Development Peak Flowrate (see Section 2: Hydrologic Modeling Calculations,
Hydrologic Modeling Runoff Summary)
Q10 = 39.14 cfs Q100 = 59.93 cfs Outlet Structure Summary (see Appendix C: Post-Development Runoff & Routed Storm
Data) The proposed outlet structure shall utilize a Modified Inlet Type “E” with one (1) circular 7.5” diameter orifice to meet the detention and allowable discharge requirements for the water quality and 10-year critical storm events. One (1) 8” (H) x 24” (W) rectangular orifice shall be utilized to meet the detention and allowable discharge requirements for 100-year critical storm events. Discharge will be conveyed to the existing Fairway Lakes detention pond via a 12” diameter outlet pipe leaving the control structure. (See Exhibit 5: Detention Details).
Routed Storm Hydrographs (see Appendix C: Post-Development Runoff & Routed Storm Data)
Peak 10 Year Post-Development Discharge Rate = 1.75 cfs < 2.10 cfs (allowable)
Peak Water Surface Elev. = 744.28 < 745.25 (top of emergency spillway) Peak 100 Year Post-Development Discharge Rate = 5.40 cfs < 5.41 cfs (allowable) Peak Water Surface Elev. = 745.09 < 745.25 (top of emergency spillway)
All post-development storms are discharged at a flowrate less than their respective allowable discharge rates. All post-development storms produce a peak water surface elevation below the maximum detention pond elevation.
1/12/18 16

Emergency Scenario An emergency spillway will be constructed on the north side of the detention pond. The emergency spillway was designed to convey 1.25 x Q100 where Q100 equals the peak 100-year inflow to the basin from the entire contributing watershed. The spillway will discharge into the existing Fairway Lakes – Section 1 detention pond as shown which is consistent with the existing drainage patterns. Below are calculations for the emergency spillway: L = 1.25Q100 / (CDH1.5) = 1.25 x 59.93 / (3.08*1.01.5) = 24.32’ use 25’ Q100 Inflow = 59.93 cfs Top of Detention Basin Elevation = 748.25 Spillway Crest Elevation = 745.25 Water Surface Elevation = 746.25 Max. Head, H = 746.25 – 745.25 = 1.0 ft. Freeboard = 748.25 – 746.25 = 2.0 ft.
1/12/18 17

S
EXHIBIT 5: DETENTION DETAILS
NO
RT
H
TYPICAL DETENTION POND SECTION
SPILLWAY DETAIL
OUTLET STRUCTURE (STR. #1) DETAIL
1/12/18 18
Section 5: Storm Sewer Sizing Calculations
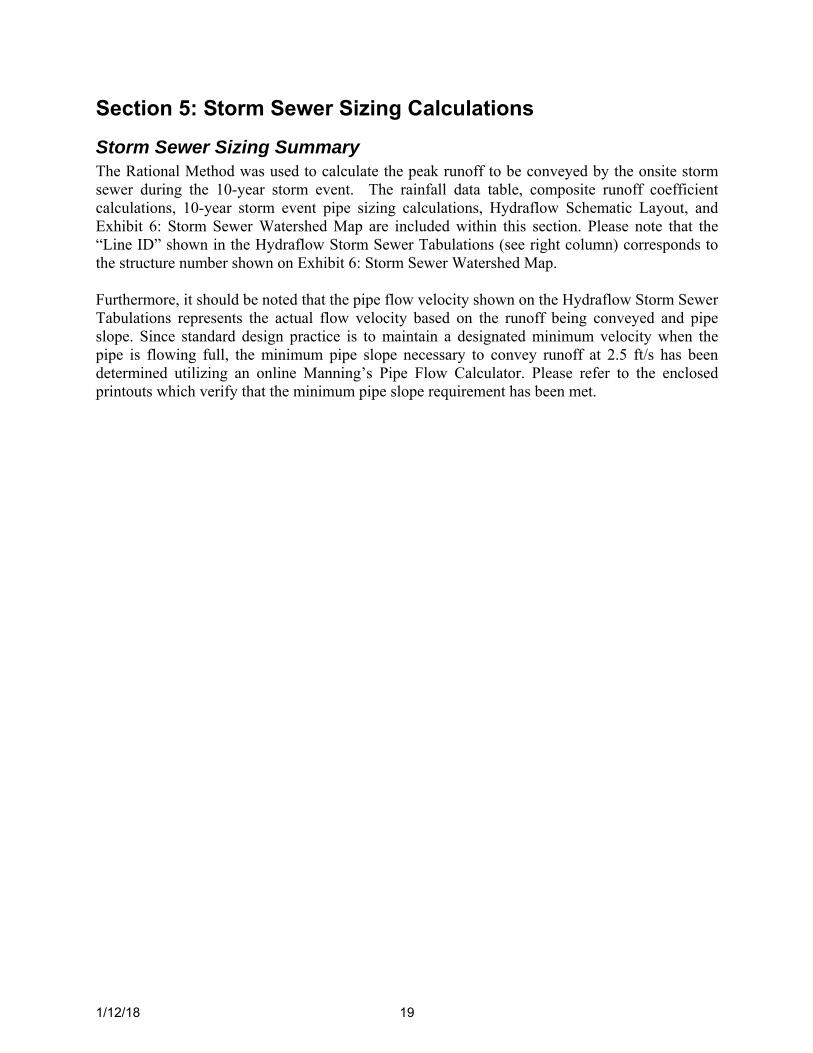
Storm Sewer Sizing Summary The Rational Method was used to calculate the peak runoff to be conveyed by the onsite storm sewer during the 10-year storm event. The rainfall data table, composite runoff coefficient calculations, 10-year storm event pipe sizing calculations, Hydraflow Schematic Layout, and Exhibit 6: Storm Sewer Watershed Map are included within this section. Please note that the “Line ID” shown in the Hydraflow Storm Sewer Tabulations (see right column) corresponds to the structure number shown on Exhibit 6: Storm Sewer Watershed Map. Furthermore, it should be noted that the pipe flow velocity shown on the Hydraflow Storm Sewer Tabulations represents the actual flow velocity based on the runoff being conveyed and pipe slope. Since standard design practice is to maintain a designated minimum velocity when the pipe is flowing full, the minimum pipe slope necessary to convey runoff at 2.5 ft/s has been determined utilizing an online Manning’s Pipe Flow Calculator. Please refer to the enclosed printouts which verify that the minimum pipe slope requirement has been met.
1/12/18 19

Free Online Manning Pipe Flow Calculator
Manning Formula Uniform Pipe Flow at Given Slope and DepthCan you help me translate, program, or host these calculators? (../contact.php) [Hide this request]
Check out our newest spreadsheet update: Download Spreadsheet (spreadsheet/Manning-Pipe-Flow.xlsx) Open Google Sheets version (spreadsheet/Manning-Pipe-Flow.php) View All Spreadsheets(http://www.hawsedc.com/engcalcs/SpreadsheetLibrary.php)
Paris Drive Park WestMinimum Slope of 12" Pipe for Flow Velocity > 2.5 ft/s
m mm ft inSet units:
Pipe diameter, d 12in
Manning roughness, n ?(http://www.engineeringtoolbox.com/mannings-roughness-d_799.html)
0.012
Pressure slope (possibly ? (../pressureslope.php)equal to pipe slope), S
0.26% rise/run
Percent of (or ratio to) full depth (100% or 1 if flowing full)
1fraction
Results Flow, Q 1.9679 cfs Velocity, v 2.5057 ft/sec Velocity head, h 1.1709 in Flow area 113.0976 sq. in. Wetted perimeter 37.6991 in Hydraulic radius 3.0000 in Top width, T 0.0000 in Froude number, F 0.00
Shear stress (tractive force), tau
7.7711 N/m^2
0
0
v
Free Online Manning Pipe Flow Calculator
1/12/18 20

Free Online Manning Pipe Flow Calculator
Manning Formula Uniform Pipe Flow at Given Slope and DepthCan you help me translate, program, or host these calculators? (../contact.php) [Hide this request]
Check out our newest spreadsheet update: Download Spreadsheet (spreadsheet/Manning-Pipe-Flow.xlsx) Open Google Sheets version (spreadsheet/Manning-Pipe-Flow.php) View All Spreadsheets(http://www.hawsedc.com/engcalcs/SpreadsheetLibrary.php)
Paris Drive Park WestMinimum Slope of 18" Pipe for Flow Velocity > 2.5 ft/s
m mm ft inSet units:
Pipe diameter, d 18in
Manning roughness, n ?(http://www.engineeringtoolbox.com/mannings-roughness-d_799.html)
0.012
Pressure slope (possibly ? (../pressureslope.php)equal to pipe slope), S
0.16% rise/run
Percent of (or ratio to) full depth (100% or 1 if flowing full)
1fraction
Results Flow, Q 4.5514 cfs Velocity, v 2.5757 ft/sec Velocity head, h 1.2373 in Flow area 254.4695 sq. in. Wetted perimeter 56.5487 in Hydraulic radius 4.5000 in Top width, T 0.0000 in Froude number, F 0.00
Shear stress (tractive force), tau
7.1733 N/m^2
0
0
v
Free Online Manning Pipe Flow Calculator
1/12/18 21

Free Online Manning Pipe Flow Calculator
Manning Formula Uniform Pipe Flow at Given Slope and DepthCan you help me translate, program, or host these calculators? (../contact.php) [Hide this request]
Check out our newest spreadsheet update: Download Spreadsheet (spreadsheet/Manning-Pipe-Flow.xlsx) Open Google Sheets version (spreadsheet/Manning-Pipe-Flow.php) View All Spreadsheets(http://www.hawsedc.com/engcalcs/SpreadsheetLibrary.php)
Paris Drive Park WestMinimum Slope of 24" Pipe for Flow Velocity > 2.5 ft/s
m mm ft inSet units:
Pipe diameter, d 24in
Manning roughness, n ?(http://www.engineeringtoolbox.com/mannings-roughness-d_799.html)
0.012
Pressure slope (possibly ? (../pressureslope.php)equal to pipe slope), S
0.11% rise/run
Percent of (or ratio to) full depth (100% or 1 if flowing full)
1fraction
Results Flow, Q 8.1275 cfs Velocity, v 2.5871 ft/sec Velocity head, h 1.2483 in Flow area 452.3902 sq. in. Wetted perimeter 75.3982 in Hydraulic radius 6.0000 in Top width, T 0.0000 in Froude number, F 0.00
Shear stress (tractive force), tau
6.5755 N/m^2
0
0
v
Free Online Manning Pipe Flow Calculator
1/12/18 22
Free Online Manning Pipe Flow Calculator
Manning Formula Uniform Pipe Flow at Given Slope and DepthCan you help me translate, program, or host these calculators? (../contact.php) [Hide this request]
Check out our newest spreadsheet update: Download Spreadsheet (spreadsheet/Manning-Pipe-Flow.xlsx) Open Google Sheets version (spreadsheet/Manning-Pipe-Flow.php) View All Spreadsheets(http://www.hawsedc.com/engcalcs/SpreadsheetLibrary.php)
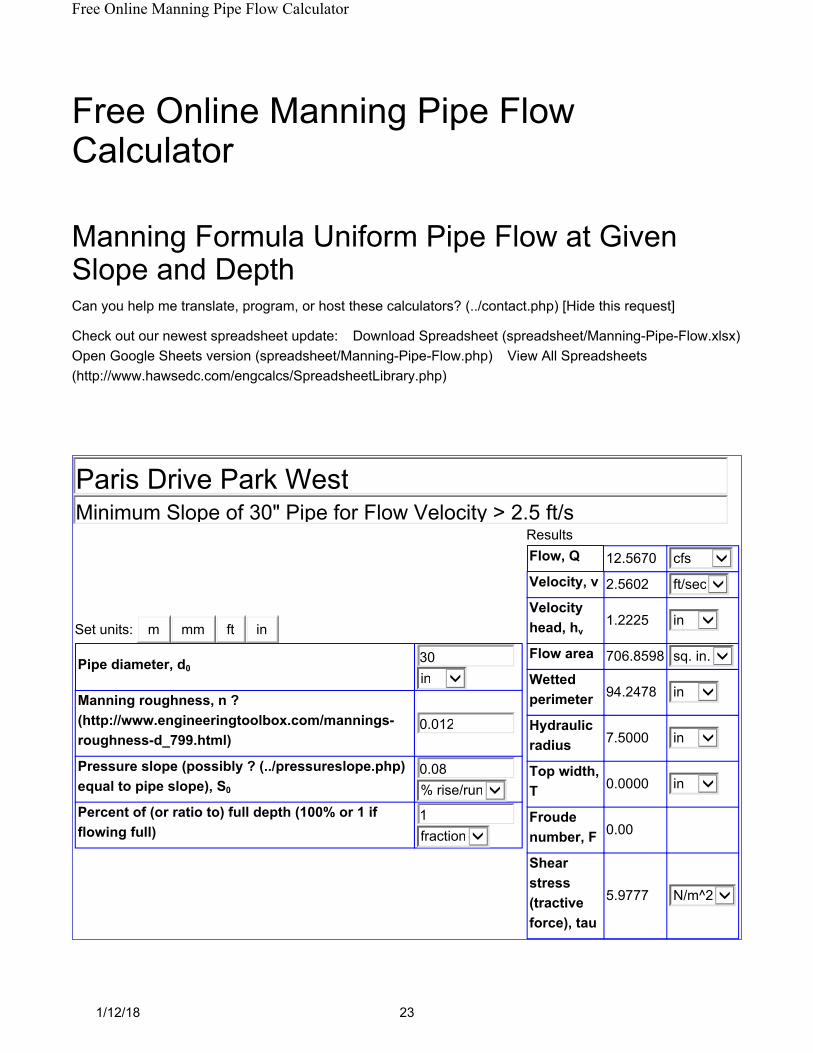
Paris Drive Park WestMinimum Slope of 30" Pipe for Flow Velocity > 2.5 ft/s
m mm ft inSet units:
Pipe diameter, d 30in
Manning roughness, n ?(http://www.engineeringtoolbox.com/mannings-roughness-d_799.html)
0.012
Pressure slope (possibly ? (../pressureslope.php)equal to pipe slope), S
0.08% rise/run
Percent of (or ratio to) full depth (100% or 1 if flowing full)
1fraction
Results Flow, Q 12.5670 cfs Velocity, v 2.5602 ft/sec Velocity head, h 1.2225 in Flow area 706.8598 sq. in. Wetted perimeter 94.2478 in Hydraulic radius 7.5000 in Top width, T 0.0000 in Froude number, F 0.00
Shear stress (tractive force), tau
5.9777 N/m^2
0
0
v
Free Online Manning Pipe Flow Calculator
1/12/18 23

SS
S
S
S
P
A
R
I
S
D
R
.
FA
IR
WA
Y LA
KE
S D
R.
LONGEST DR.
KING ST.
S
S
S
S
EXHIBIT 6: STORM SEWER WATERSHED MAP
NO
RT
H
NOTE: ALL TIME OF CONCENTRATION VALUES
ASSUMED TO BE 5 MINUTES.
1/12/18 24

Paris Drive Park West Commercial Subdivision
Composite Runoff Coefficient Calculations
Cover
Runoff
Coefficient 'C'
Grass 0.25
Pavement 0.85
Commercial 0.70
Str. No. Total Area Grass Pavement Commercial Composite 'C' C x A
2 0.085 0.015 0.069 0.74 0.063
3 0.119 0.012 0.107 0.79 0.094
5 0.048 0.009 0.039 0.74 0.036
6 0.149 0.016 0.132 0.78 0.117
7 1.562 1.562 0.70 1.093
8 1.504 1.504 0.70 1.053
9 1.144 1.144 0.70 0.801
TOTALS = 4.611 0.053 0.347 4.211 N/A 3.256
NOTE: The values shown above in the "Storm Sewer Watershed Coefficients" table assume the following storm sewer connections
for the future blocks/lots within the subdivision:
1) North Portion of Block A ‐ Discharges directly into pond
2) South Portion of Block A ‐ Connects to pipe between STR #7 & STR #4
3) East Half of Block B ‐ Connects to STR #9
4) West Half of Block B ‐ Connects to STR #8
Str. No. Total Area Grass Pavement Composite 'C' C x A
2 0.085 0.015 0.069 0.74 0.063
3 0.119 0.012 0.107 0.79 0.094
4 0.101 0.101 0.25 0.025
5 0.048 0.009 0.039 0.74 0.036
6 0.149 0.016 0.132 0.78 0.117
8 0.334 0.334 0.25 0.084
9 0.098 0.098 0.25 0.024
TOTALS = 0.934 0.586 0.347 N/A 0.442
NOTE: The values shown above in the "Inlet Basin Watershed Coefficients" table represent the assumed watershed area to be
conveyed to the structure & open grate in the fully‐developed scenario.
INLET BASIN WATERSHED COEFFICIENTS
STORM SEWER WATERSHED COEFFICIENTS
1/12/18 25

City of Indianapolis Appendix page A2-2 Stormwater Specifications Manual January 2011 - FINAL
Hours Minutes Return Period - Rainfall Intensity (in/hr)
2 5 10 25 50 100
0.08 5 4.75 6.14 6.99 8.08 8.83 9.69 0.17 10 3.63 4.75 5.48 6.40 7.07 7.77 0.25 15 2.97 3.92 4.55 5.34 5.94 6.53 0.5 30 1.98 2.64 3.09 3.65 4.10 4.50 1 60 1.25 1.67 1.96 2.31 2.62 2.88 2 120 0.76 1.02 1.20 1.40 1.59 1.75 3 180 0.56 0.75 0.88 1.03 1.17 1.29 6 360 0.33 0.44 0.52 0.60 0.68 0.75 12 720 0.20 0.26 0.30 0.35 0.39 0.43 24 1440 0.11 0.15 0.17 0.20 0.22 0.25
Hours Minutes Return Period - Rainfall Depth (in)
2 5 10 25 50 100
0.08 5 0.40 0.51 0.58 0.67 0.74 0.81 0.17 10 0.61 0.79 0.91 1.07 1.18 1.30 0.25 15 0.74 0.98 1.14 1.34 1.49 1.63 0.5 30 0.99 1.32 1.55 1.83 2.05 2.25 1 60 1.25 1.67 1.96 2.31 2.62 2.88 2 120 1.52 2.04 2.40 2.80 3.18 3.50 3 180 1.68 2.25 2.64 3.09 3.51 3.87 6 360 1.98 2.64 3.12 3.60 4.08 4.50 12 720 2.40 3.12 3.60 4.20 4.68 5.16 24 1440 2.64 3.60 4.08 4.80 5.28 6.00
TABLE 202-02: IDF and IDD Tables for Indianapolis, IN
1/12/18 26

1/12/18 27

1/12/18 28

Section 6: Storm Inlet/Grate Calculations
Storm Inlet Summary Storm inlets were placed throughout the site to ensure that sag inlets will be adequate to pass the design 10-year flow with 50% of the sag inlet clogged with the maximum depth of water not exceeding 3.5 inches in the roadway and 9 inches in grass areas. It should be noted that although the Subdivision Control Ordinance allows ponding up to 6 inches in the roadway, the allowable ponding was reduced to ensure runoff does not overtop the roll curb which has a height of approximately 3.5 inches. Castings located in the roadway sag are Neenah R-3501-TL or R-3501-TR (depending on direction of flow). The castings used for the grass areas, located in a sag, are Neenah R-2561-A or Neenah R-4215-C. The perimeter and open area of each inlet grate are as follows:
R-3501-TL or TR → Perimeter = 4.6 ft. and Open Area = 1.4 ft.2 R-2561-A → Perimeter = 6.7 ft. and Open Area = 1.2 ft.2 R-4215-C → Perimeter = 11.3 ft. and Open Area = 3.3 ft.2
To simulate a clogged inlet, the dimensions above are reduced by 50%. For depths less than 0.3 feet, the inlet grate acts as a weir and the maximum capacity of the grate, assuming 50% clogged and ponding depths equal to the maximum allowable, can be calculated as follows:
Q = 3.3P(h)1.5 Where: P = perimeter of the grate; h = head above the casting; Q = Capacity For depths greater than 0.4 feet, the inlet grate acts as an orifice and the maximum capacity of the grate, assuming 50% clogged and ponding depths equal to the maximum allowable, can be calculated as follows:
Q = 0.6A√2gh Where: A = open area of the grate, h = head above the casting; Q = Capacity
The following table indicates the maximum inlet capacity assuming a 50% clogged condition with ponding depths up to the maximum allowable. Please refer to Exhibit 7: Inlet Basin Watershed Map for additional information.
Structure No.
Casting Type Inlet Basin Watershed
Runoff
Max. Allowable Ponding Depth
Max. Grate Capacity @ 50%
Clogged 2 R-3501-TL 0.44 cfs 0.29’ 1.2 cfs 3 R-3501-TR 0.66 cfs 0.29’ 1.2 cfs
4* R-2561-A 0.18 cfs 0.75’ 2.5 cfs 5 R-3501-TL 0.25 cfs 0.29’ 1.2 cfs 6 R-3501-TR 0.82 cfs 0.29’ 1.2 cfs
8* R-2561-A 0.59 cfs 0.75’ 2.5 cfs 9* R-4215-C 0.17 cfs 0.75’ 6.9 cfs
1/12/18 29

SS
S
S
S
P
A
R
I
S
D
R
.
FA
IR
WA
Y LA
KE
S D
R.
LONGEST DR.
KING ST.
S
S
S
S
EXHIBIT 7: INLET BASIN WATERSHED MAP
NO
RT
H
NOTE: ALL TIME OF CONCENTRATION VALUES
ASSUMED TO BE 5 MINUTES.
1/12/18 30

Section 7: General Model Setup The following information provides detailed explanations of the general model setup, input and output reports for each of the Autodesk Storm and Sanitary Analysis hydrologic models (pre-development, post-development, and detention) utilized to design the stormwater detention system.
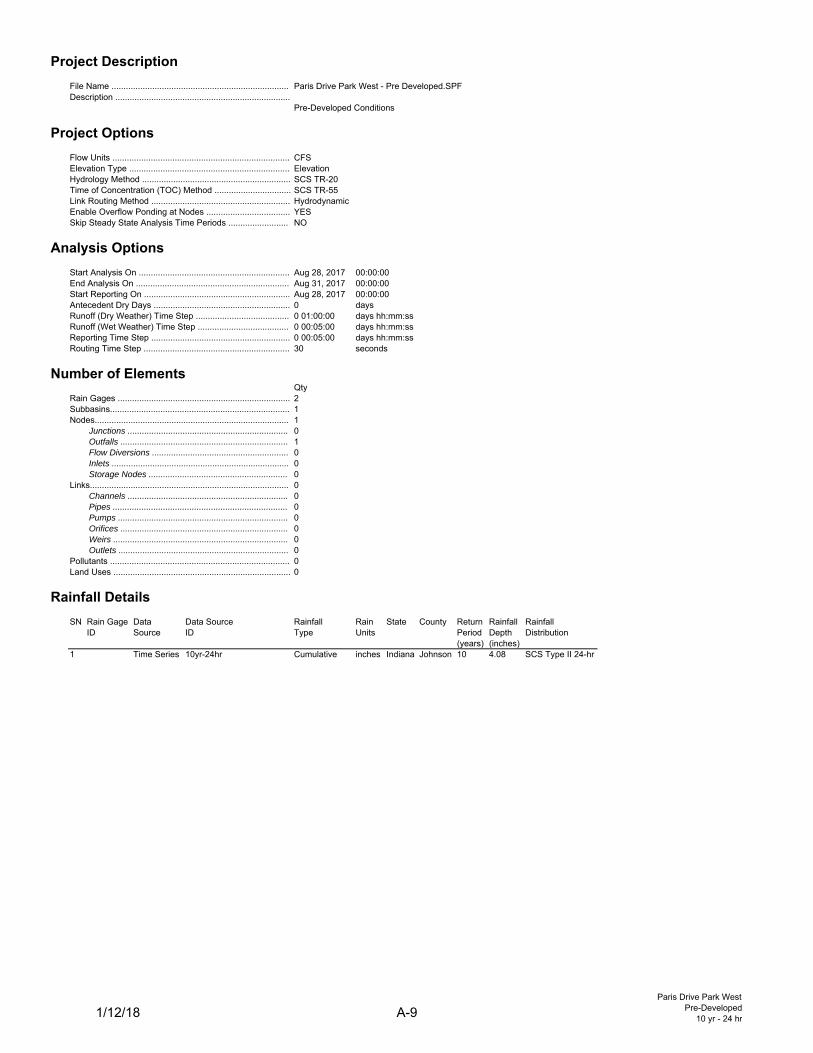
A. Project Description / Analysis Options
The “Project Description” spreadsheets indicate the general network analysis options, number of network items (i.e. subbasins, links, junctions, storage nodes, etc.), and rainfall details utilized for each network design.
B. Subbasin Summary
Drainage areas for each subbasin were delineated using survey data collected, GIS contours, the construction plans and site visit investigations. The “Subbasin Summary” spreadsheets indicate the user defined input data for each individual subbasin including the subbasin ID, area, weighted curve number, and time of concentration.
As previously stated, the analysis uses the SCS TR-55 method to calculate subbasin time of concentrations. The “Subbasin Summary” spreadsheets indicate the subbasin ID, total subbasin area, weighted curve number or weighted runoff coefficient, total rainfall, total runoff, total runoff volume, peak runoff, and time of concentration for each subbasin. The respective subbasins, “Sub-Pre” and “Sub-Post”, correspond to the drainage basins in each individual model (i.e. Pre-Development, Post-Development, and Detention Models).
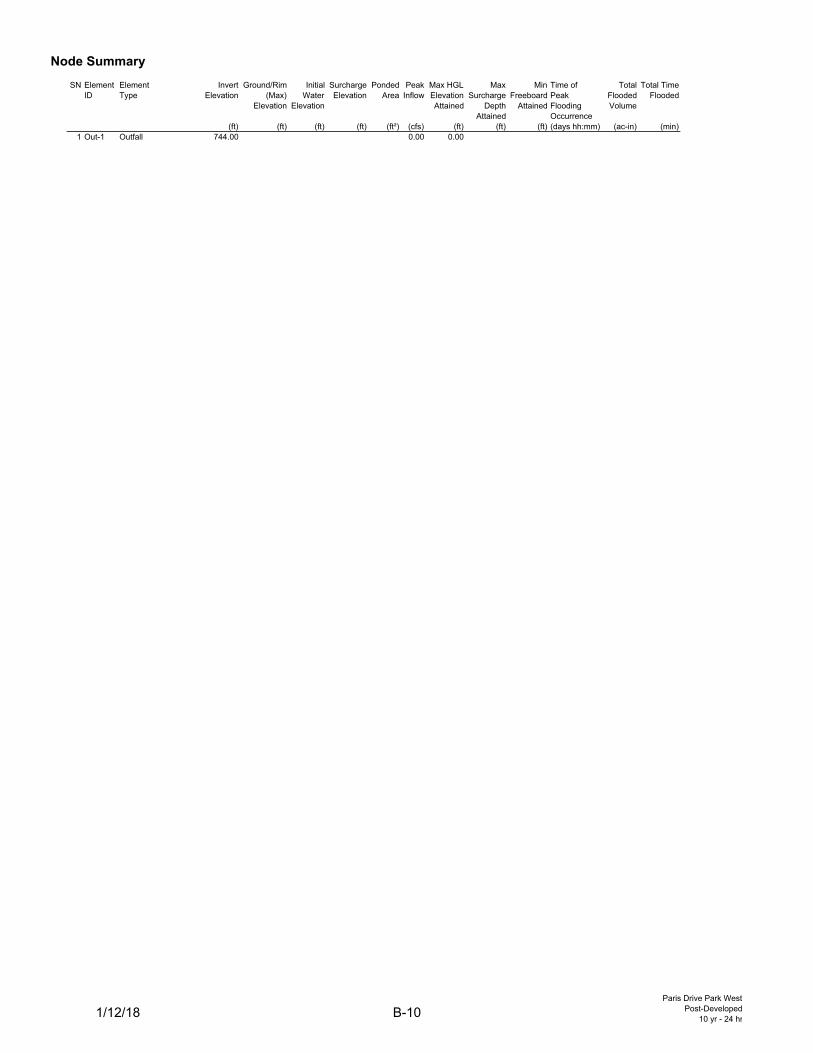
C. Node Summary
The “Node Summary” spreadsheets indicate the user defined input data for each individual junction, outfall or storage node including the node ID, type, invert elevation, rim elevation and initial water surface elevation. User defined input data for each node was entered based on topographic survey information. The “Node Summary” spreadsheets also indicate the surcharge elevation (if applicable), pond area (if applicable), peak inflow, maximum HGL elevation attained, maximum surcharge depth (if applicable), minimum freeboard. In the pre-development conditions model, the node listed in the “Node Summary” corresponds to the outlet point where runoff leaves the existing site (“Out-1”). In the post-development conditions model, the node listed in the “Node Summary” corresponds to the outlet point where runoff will leave the proposed pond (“Out-1”).
1/12/18 31

In the detention model, the nodes listed in the “Node Summary” correspond to the actual detention pond outlet (“Out-1”) which is the pipe end section at the downstream end of Str. No. 1, the detention pond outlet structure (“Jun-01”), and the proposed detention pond (“Stor-01”).
D. Link Summary
The “Link Summary” spreadsheets indicate the user defined input data for each individual pipe, orifice or weir link including the link ID, type, inlet node, outlet node, length, inlet invert elevation, outlet invert elevation, slope, diameter and Manning’s roughness coefficient.
The “Link Summary” spreadsheets also indicate the peak flow, design flow capacity, peak flow to design flow ratio, peak flow velocity, peak flow depth, peak flow depth to design flow depth, total time the link is surcharged and the condition of the link at peak flow.
In the detention model, the links listed in the “Link Summary” spreadsheet correspond to the 12” RCP leaving the detention pond outlet structure (“Link-01”) and the outlet structure orifices (“Orifice-WQ” and “Orifice-100yr”).
E. Subbasin Hydrology
The “Subbasin Hydrology” spreadsheets include the detailed composite curve number and time of concentration calculations for each subbasin. The “Subbasin Hydrology” spreadsheets also include the subbasin runoff results, rainfall intensity graph and runoff hydrograph for each subbasin.
F. Junction Input
The “Junction Input” spreadsheets indicate the user defined input data for each individual junction including the ID, invert elevation, rim elevation, initial water surface elevation, surcharge elevation and ponded area.
G. Junction Results
The “Junction Results” spreadsheets include modeling results at the user defined junctions as a result of the storm event being routed through the system. The “Junction Results” spreadsheets include the peak inflow, peak lateral inflow, maximum HGL elevation attained, maximum HGL depth attained, maximum surcharge depth attained, minimum freeboard attained, average HGL elevation attained, average HGL depth attained, time of maximum HGL occurrence, time of peak flooding occurrence, total flooded volume and total time flooded.
H. Pipe Input
The “Pipe Input” spreadsheets indicate the user defined input data for each individual pipe including the ID, length, inlet invert elevation, outlet invert elevation, average slope, pipe shape, diameter, Manning’s roughness coefficient, losses and the number of barrels.
1/12/18 32

I. Pipe Results
The “Pipe Results” spreadsheets include modeling results at the user defined pipes as a result of the storm event being routed through the system. The “Pipe Results” spreadsheets include the peak inflow, time of peak flow occurrence, design flow capacity, peak flow to design flow ratio, peak flow velocity, travel time, peak flow depth, peak flow depth to total depth ratio, total time surcharged and reported condition of the pipe at peak flow.
J. Storage Nodes
In the detention model, the “Storage Nodes” spreadsheets indicate the user defined input data for the storage node (i.e. detention pond) including the invert elevation, maximum elevation, initial water elevation, ponded area and the outflow weir or orifice for the storage node. The “Storage Nodes” spreadsheets also include the user defined Storage Area Volume Curves which calculates the storage volume at a defined stage depth using the storage area. The Storage Area Volume Curves were defined using the proposed contours from the construction plans.
The “Storage Nodes” spreadsheets also include the output summary results obtained by routing the storm event through the system. The critical results included in the spreadsheet are the peak inflow, peak lateral inflow, peak outflow and maximum HGL attained.
1/12/18 33

Appendix A: Pre-Development Runoff Data
2 yr Hydrographs…………………………………………..………...……….….…….A-1
10 yr Hydrographs…………………..…………………………….………….….…….A-2
2 yr-24 hr Peak Storm Event Analysis Results………………………....…..….A-3 – A-8
10 yr-24 hr Peak Storm Event Analysis Results………………………..…….A-9 – A-14

1/12/18 A-1

1/12/18 A-2

Project Description
Paris Drive Park West - Pre Developed.SPF
Project Options
CFSElevationSCS TR-20SCS TR-55HydrodynamicYESNO
Analysis Options
Aug 28, 2017 00:00:00Aug 31, 2017 00:00:00Aug 28, 2017 00:00:000 days0 01:00:00 days hh:mm:ss0 00:05:00 days hh:mm:ss0 00:05:00 days hh:mm:ss30 seconds
Number of ElementsQty21101000000000000
Rainfall Details
SN Rain Gage Data Data Source Rainfall Rain State County Return Rainfall RainfallID Source ID Type Units Period Depth Distribution
(years) (inches)1 Time Series 2yr-24hr Cumulative inches Indiana Johnson 2 2.91 SCS Type II 24-hr
File Name ...........................................................................Description .........................................................................
Pre-Developed Conditions
Flow Units ...........................................................................Elevation Type ....................................................................Hydrology Method ..............................................................Time of Concentration (TOC) Method ................................Link Routing Method ...........................................................Enable Overflow Ponding at Nodes ...................................Skip Steady State Analysis Time Periods ..........................
Start Analysis On ................................................................End Analysis On .................................................................Start Reporting On ..............................................................Antecedent Dry Days ..........................................................Runoff (Dry Weather) Time Step ........................................Runoff (Wet Weather) Time Step .......................................Reporting Time Step ..........................................................Routing Time Step ..............................................................
Pumps ........................................................................
Rain Gages ........................................................................Subbasins............................................................................Nodes.................................................................................. Junctions .................................................................... Outfalls ....................................................................... Flow Diversions ..........................................................
Orifices ....................................................................... Weirs .......................................................................... Outlets .......................................................................Pollutants ............................................................................Land Uses ..........................................................................
Inlets .......................................................................... Storage Nodes ...........................................................Links.................................................................................... Channels .................................................................... Pipes ..........................................................................
Paris Drive Park WestPre-Developed
2 yr - 24 hr1/12/18 A-3

Subbasin Summary
SN Subbasin Area Weighted Total Total Total Peak Time ofID Curve Rainfall Runoff Runoff Runoff Concentration
Number Volume(ac) (in) (in) (ac-in) (cfs) (days hh:mm:ss)
1 Sub-Pre1 4.50 67.00 2.91 0.54 2.43 2.10 0 00:20:54
Paris Drive Park WestPre-Developed
2 yr - 24 hr1/12/18 A-4

Node Summary
SN Element Element Invert Ground/Rim Initial Surcharge Ponded Peak Max HGL Max Min Time of Total Total TimeID Type Elevation (Max) Water Elevation Area Inflow Elevation Surcharge Freeboard Peak Flooded Flooded
Elevation Elevation Attained Depth Attained Flooding VolumeAttained Occurrence
(ft) (ft) (ft) (ft) (ft²) (cfs) (ft) (ft) (ft) (days hh:mm) (ac-in) (min)1 Out-1 Outfall 744.00 0.00 0.00
Paris Drive Park WestPre-Developed
2 yr - 24 hr1/12/18 A-5

Subbasin Hydrology
Subbasin : Sub-Pre1
Input Data
Area (ac) ..................................................................... 4.50Weighted Curve Number ............................................. 67.00Rain Gage ID ...............................................................
Composite Curve Number Area Soil CurveSoil/Surface Description (acres) Group NumberPasture/OpenSpace 4.50 - 67.00Composite Area & Weighted CN 4.50 67.00
Time of Concentration
TOC Method : SCS TR-55
Sheet Flow Equation :
Tc = (0.007 * ((n * Lf)^0.8)) / ((P^0.5) * (Sf^0.4))
Where :
Tc = Time of Concentration (hr) n = Manning's roughness Lf = Flow Length (ft) P = 2 yr, 24 hr Rainfall (inches) Sf = Slope (ft/ft)
Shallow Concentrated Flow Equation :
V = 16.1345 * (Sf^0.5) (unpaved surface) V = 20.3282 * (Sf^0.5) (paved surface) V = 15.0 * (Sf^0.5) (grassed waterway surface) V = 10.0 * (Sf^0.5) (nearly bare & untilled surface) V = 9.0 * (Sf^0.5) (cultivated straight rows surface) V = 7.0 * (Sf^0.5) (short grass pasture surface) V = 5.0 * (Sf^0.5) (woodland surface) V = 2.5 * (Sf^0.5) (forest w/heavy litter surface) Tc = (Lf / V) / (3600 sec/hr)
Where:
Tc = Time of Concentration (hr) Lf = Flow Length (ft) V = Velocity (ft/sec) Sf = Slope (ft/ft)
Channel Flow Equation :
V = (1.49 * (R^(2/3)) * (Sf^0.5)) / n R = Aq / Wp Tc = (Lf / V) / (3600 sec/hr)
Where :
Tc = Time of Concentration (hr) Lf = Flow Length (ft) R = Hydraulic Radius (ft) Aq = Flow Area (ft²) Wp = Wetted Perimeter (ft) V = Velocity (ft/sec) Sf = Slope (ft/ft) n = Manning's roughness
Paris Drive Park WestPre-Developed
2 yr - 24 hr1/12/18 A-6

Subarea Subarea SubareaSheet Flow Computations A B C Manning's Roughness : 0.20 0.00 0.00 Flow Length (ft) : 100 0.00 0.00 Slope (%) : 2.50 0.00 0.00 2 yr, 24 hr Rainfall (in) : 2.64 0.00 0.00 Velocity (ft/sec) : 0.13 0.00 0.00 Computed Flow Time (min) : 12.42 0.00 0.00
Subarea Subarea SubareaShallow Concentrated Flow Computations A B C Flow Length (ft) : 458 0.00 0.00 Slope (%) : 1.65 0.00 0.00 Surface Type : Grass pasture Unpaved Unpaved Velocity (ft/sec) : 0.90 0.00 0.00 Computed Flow Time (min) : 8.48 0.00 0.00Total TOC (min) ..................20.90
Subbasin Runoff Results
Total Rainfall (in) .......................................................... 2.91Total Runoff (in) ........................................................... 0.54Peak Runoff (cfs) ......................................................... 2.10Weighted Curve Number ............................................. 67.00Time of Concentration (days hh:mm:ss) ....................... 0 00:20:54
Paris Drive Park WestPre-Developed
2 yr - 24 hr1/12/18 A-7

Subbasin : Sub-Pre1
Paris Drive Park WestPre-Developed
2 yr - 24 hr1/12/18 A-8
Project Description
Paris Drive Park West - Pre Developed.SPF
Project Options
CFSElevationSCS TR-20SCS TR-55HydrodynamicYESNO
Analysis Options
Aug 28, 2017 00:00:00Aug 31, 2017 00:00:00Aug 28, 2017 00:00:000 days0 01:00:00 days hh:mm:ss0 00:05:00 days hh:mm:ss0 00:05:00 days hh:mm:ss30 seconds
Number of ElementsQty21101000000000000
Rainfall Details
SN Rain Gage Data Data Source Rainfall Rain State County Return Rainfall RainfallID Source ID Type Units Period Depth Distribution
(years) (inches)1 Time Series 10yr-24hr Cumulative inches Indiana Johnson 10 4.08 SCS Type II 24-hr
Orifices ...................................................................... Weirs ......................................................................... Outlets .......................................................................Pollutants ...........................................................................Land Uses ..........................................................................
Inlets .......................................................................... Storage Nodes ..........................................................Links................................................................................... Channels ................................................................... Pipes ......................................................................... Pumps .......................................................................
Rain Gages ........................................................................Subbasins...........................................................................Nodes................................................................................. Junctions ................................................................... Outfalls ...................................................................... Flow Diversions .........................................................
Start Reporting On .............................................................Antecedent Dry Days .........................................................Runoff (Dry Weather) Time Step .......................................Runoff (Wet Weather) Time Step ......................................Reporting Time Step ..........................................................Routing Time Step .............................................................
Time of Concentration (TOC) Method ................................Link Routing Method ..........................................................Enable Overflow Ponding at Nodes ...................................Skip Steady State Analysis Time Periods .........................
Start Analysis On ...............................................................End Analysis On ................................................................
File Name ..........................................................................Description .........................................................................
Pre-Developed Conditions
Flow Units ..........................................................................Elevation Type ...................................................................Hydrology Method ..............................................................
Paris Drive Park WestPre-Developed
10 yr - 24 hr1/12/18 A-9

Subbasin Summary
SN Subbasin Area Weighted Total Total Total Peak Time ofID Curve Rainfall Runoff Runoff Runoff Concentration
Number Volume(ac) (in) (in) (ac-in) (cfs) (days hh:mm:ss)
1 Sub-Pre1 4.50 67.00 4.08 1.19 5.37 5.41 0 00:20:54
Paris Drive Park WestPre-Developed
10 yr - 24 hr1/12/18 A-10

Node Summary
SN Element Element Invert Ground/Rim Initial Surcharge Ponded Peak Max HGL Max Min Time of Total Total TimeID Type Elevation (Max) Water Elevation Area Inflow Elevation Surcharge Freeboard Peak Flooded Flooded
Elevation Elevation Attained Depth Attained Flooding VolumeAttained Occurrence
(ft) (ft) (ft) (ft) (ft²) (cfs) (ft) (ft) (ft) (days hh:mm) (ac-in) (min)1 Out-1 Outfall 744.00 0.00 0.00
Paris Drive Park WestPre-Developed
10 yr - 24 hr1/12/18 A-11

Subbasin Hydrology
Subbasin : Sub-Pre1
Input Data
Area (ac) ..................................................................... 4.50Weighted Curve Number ............................................. 67.00Rain Gage ID ...............................................................
Composite Curve Number Area Soil CurveSoil/Surface Description (acres) Group NumberPasture/OpenSpace 4.50 - 67.00Composite Area & Weighted CN 4.50 67.00
Time of Concentration
TOC Method : SCS TR-55
Sheet Flow Equation :
Tc = (0.007 * ((n * Lf)^0.8)) / ((P^0.5) * (Sf^0.4))
Where :
Tc = Time of Concentration (hr) n = Manning's roughness Lf = Flow Length (ft) P = 2 yr, 24 hr Rainfall (inches) Sf = Slope (ft/ft)
Shallow Concentrated Flow Equation :
V = 16.1345 * (Sf^0.5) (unpaved surface) V = 20.3282 * (Sf^0.5) (paved surface) V = 15.0 * (Sf^0.5) (grassed waterway surface) V = 10.0 * (Sf^0.5) (nearly bare & untilled surface) V = 9.0 * (Sf^0.5) (cultivated straight rows surface) V = 7.0 * (Sf^0.5) (short grass pasture surface) V = 5.0 * (Sf^0.5) (woodland surface) V = 2.5 * (Sf^0.5) (forest w/heavy litter surface) Tc = (Lf / V) / (3600 sec/hr)
Where:
Tc = Time of Concentration (hr) Lf = Flow Length (ft) V = Velocity (ft/sec) Sf = Slope (ft/ft)
Channel Flow Equation :
V = (1.49 * (R^(2/3)) * (Sf^0.5)) / n R = Aq / Wp Tc = (Lf / V) / (3600 sec/hr)
Where :
Tc = Time of Concentration (hr) Lf = Flow Length (ft) R = Hydraulic Radius (ft) Aq = Flow Area (ft²) Wp = Wetted Perimeter (ft) V = Velocity (ft/sec) Sf = Slope (ft/ft) n = Manning's roughness
Paris Drive Park WestPre-Developed
10 yr - 24 hr1/12/18 A-12

Subarea Subarea SubareaSheet Flow Computations A B C Manning's Roughness : 0.20 0.00 0.00 Flow Length (ft) : 100 0.00 0.00 Slope (%) : 2.50 0.00 0.00 2 yr, 24 hr Rainfall (in) : 2.64 0.00 0.00 Velocity (ft/sec) : 0.13 0.00 0.00 Computed Flow Time (min) : 12.42 0.00 0.00
Subarea Subarea SubareaShallow Concentrated Flow Computations A B C Flow Length (ft) : 458 0.00 0.00 Slope (%) : 1.65 0.00 0.00 Surface Type : Grass pasture Unpaved Unpaved Velocity (ft/sec) : 0.90 0.00 0.00 Computed Flow Time (min) : 8.48 0.00 0.00Total TOC (min) ..................20.90
Subbasin Runoff Results
Total Rainfall (in) .......................................................... 4.08Total Runoff (in) ........................................................... 1.19Peak Runoff (cfs) ......................................................... 5.41Weighted Curve Number ............................................. 67.00Time of Concentration (days hh:mm:ss) ....................... 0 00:20:54
Paris Drive Park WestPre-Developed
10 yr - 24 hr1/12/18 A-13

Subbasin : Sub-Pre1
Paris Drive Park WestPre-Developed
10 yr - 24 hr1/12/18 A-14

Appendix B: Post-Development Runoff Data
10 yr Hydrographs…………………..…………………………….…………..….…….B-1
100 yr Hydrographs…………………..………………………..….……….….….…….B-2
1.25” Storm Event Analysis Results……….....…......…….………………..…..B-3 – B-7
10 yr-24 hr Peak Storm Event Analysis Results…………..……….........…….B-8 – B-12
100 yr-24 hr Peak Storm Event Analysis Results………….……..…..…….B–13 – B-17

1/12/18 B-1

1/12/18 B-2

Project Description
Paris Drive Park West - Post Developed.SPF
Project Options
CFSElevationSCS TR-20SCS TR-55HydrodynamicYESNO
Analysis Options
Aug 28, 2017 00:00:00Aug 31, 2017 00:00:00Aug 28, 2017 00:00:000 days0 01:00:00 days hh:mm:ss0 00:05:00 days hh:mm:ss0 00:05:00 days hh:mm:ss30 seconds
Number of ElementsQty31101000000000000
Rainfall Details
SN Rain Gage Data Data Source Rainfall Rain State County Return Rainfall RainfallID Source ID Type Units Period Depth Distribution
(years) (inches)1 Time Series 1.25" Storm Cumulative inches Indiana Johnson 1 1.25 SCS Type II 24-hr
Land Uses ................................................................
Pipes ................................................................ Pumps ............................................................. Orifices ............................................................. Weirs ............................................................... Outlets .............................................................Pollutants .................................................................
Outfalls ............................................................ Flow Diversions ............................................... Inlets ................................................................ Storage Nodes .................................................Links.......................................................................... Channels .........................................................
Reporting Time Step ................................................Routing Time Step ...................................................
Rain Gages ..............................................................Subbasins.................................................................Nodes........................................................................ Junctions .........................................................
Start Analysis On .....................................................End Analysis On .......................................................Start Reporting On ...................................................Antecedent Dry Days ...............................................Runoff (Dry Weather) Time Step ..............................Runoff (Wet Weather) Time Step .............................
Elevation Type .........................................................Hydrology Method ....................................................Time of Concentration (TOC) Method ......................Link Routing Method ................................................Enable Overflow Ponding at Nodes .........................Skip Steady State Analysis Time Periods ................
File Name .................................................................Description ...............................................................
Paris Drive Park West
Post-Developed Conditions
Flow Units ................................................................
Paris Drive Park WestPost-Developed
1.25" Storm1/12/18 B-3

Subbasin Summary
SN Subbasin Area Weighted Total Total Total Peak Time ofID Curve Rainfall Runoff Runoff Runoff Concentration
Number Volume(ac) (in) (in) (ac-in) (cfs) (days hh:mm:ss)
1 Sub-Post 10.73 90.33 1.25 0.51 5.46 6.74 0 00:15:00
Paris Drive Park WestPost-Developed
1.25" Storm1/12/18 B-4

Node Summary
SN Element Element Invert Ground/Rim Initial Surcharge Ponded Peak Max HGL Max Min Time of Total Total TimeID Type Elevation (Max) Water Elevation Area Inflow Elevation Surcharge Freeboard Peak Flooded Flooded
Elevation Elevation Attained Depth Attained Flooding VolumeAttained Occurrence
(ft) (ft) (ft) (ft) (ft²) (cfs) (ft) (ft) (ft) (days hh:mm) (ac-in) (min)1 Out-1 Outfall 744.00 0.00 0.00
Paris Drive Park WestPost-Developed
1.25" Storm1/12/18 B-5

Subbasin Hydrology
Subbasin : Sub-Post
Input Data
Area (ac) ........................................................................ 10.73Weighted Curve Number ............................................... 90.33Rain Gage ID .................................................................
Composite Curve Number Area Soil CurveSoil/Surface Description (acres) Group NumberWetPond 0.77 - 98.00OpenSpace 1.25 - 67.00Commercial 8.71 - 93.00Composite Area & Weighted CN 10.73 90.33
Time of Concentration
TOC Method : SCS TR-55
Sheet Flow Equation :
Tc = (0.007 * ((n * Lf)^0.8)) / ((P^0.5) * (Sf^0.4))
Where :
Tc = Time of Concentration (hr) n = Manning's roughness Lf = Flow Length (ft) P = 2 yr, 24 hr Rainfall (inches) Sf = Slope (ft/ft)
Shallow Concentrated Flow Equation :
V = 16.1345 * (Sf^0.5) (unpaved surface) V = 20.3282 * (Sf^0.5) (paved surface) V = 15.0 * (Sf^0.5) (grassed waterway surface) V = 10.0 * (Sf^0.5) (nearly bare & untilled surface) V = 9.0 * (Sf^0.5) (cultivated straight rows surface) V = 7.0 * (Sf^0.5) (short grass pasture surface) V = 5.0 * (Sf^0.5) (woodland surface) V = 2.5 * (Sf^0.5) (forest w/heavy litter surface) Tc = (Lf / V) / (3600 sec/hr)
Where:
Tc = Time of Concentration (hr) Lf = Flow Length (ft) V = Velocity (ft/sec) Sf = Slope (ft/ft)
Channel Flow Equation :
V = (1.49 * (R^(2/3)) * (Sf^0.5)) / n R = Aq / Wp Tc = (Lf / V) / (3600 sec/hr)
Where :
Tc = Time of Concentration (hr) Lf = Flow Length (ft) R = Hydraulic Radius (ft) Aq = Flow Area (ft²) Wp = Wetted Perimeter (ft) V = Velocity (ft/sec) Sf = Slope (ft/ft) n = Manning's roughness
User-Defined TOC override (minutes): 15.00
Subbasin Runoff Results
Total Rainfall (in) ............................................................1.25Total Runoff (in) ............................................................. 0.51Peak Runoff (cfs) ........................................................... 6.74Weighted Curve Number ............................................... 90.33Time of Concentration (days hh:mm:ss) ....................... 0 00:15:00
Paris Drive Park WestPost-Developed
1.25" Storm1/12/18 B-6

Subbasin : Sub-Post
Paris Drive Park WestPost-Developed
1.25" Storm1/12/18 B-7

Project Description
Paris Drive Park West - Post Developed.SPF
Project Options
CFSElevationSCS TR-20SCS TR-55HydrodynamicYESNO
Analysis Options
Aug 28, 2017 00:00:00Aug 31, 2017 00:00:00Aug 28, 2017 00:00:000 days0 01:00:00 days hh:mm:ss0 00:05:00 days hh:mm:ss0 00:05:00 days hh:mm:ss30 seconds
Number of ElementsQty21101000000000000
Rainfall Details
SN Rain Gage Data Data Source Rainfall Rain State County Return Rainfall RainfallID Source ID Type Units Period Depth Distribution
(years) (inches)1 Time Series 10yr-24hr Cumulative inches Indiana Johnson 10 4.08 SCS Type II 24-hr
Land Uses ...................................................................
Pipes ................................................................... Pumps ................................................................ Orifices ................................................................ Weirs .................................................................. Outlets ................................................................Pollutants .....................................................................
Outfalls ............................................................... Flow Diversions .................................................. Inlets ................................................................... Storage Nodes ....................................................Links............................................................................. Channels ............................................................
Reporting Time Step ...................................................Routing Time Step ......................................................
Rain Gages .................................................................Subbasins....................................................................Nodes........................................................................... Junctions ............................................................
Start Analysis On ........................................................End Analysis On ..........................................................Start Reporting On ......................................................Antecedent Dry Days ..................................................Runoff (Dry Weather) Time Step ................................Runoff (Wet Weather) Time Step ...............................
Elevation Type ............................................................Hydrology Method .......................................................Time of Concentration (TOC) Method .........................Link Routing Method ...................................................Enable Overflow Ponding at Nodes ............................Skip Steady State Analysis Time Periods ...................
File Name ....................................................................Description ..................................................................
Paris Drive Park West
Post-Developed Conditions
Flow Units ...................................................................
Paris Drive Park WestPost-Developed
10 yr - 24 hr1/12/18 B-8

Subbasin Summary
SN Subbasin Area Weighted Total Total Total Peak Time ofID Curve Rainfall Runoff Runoff Runoff Concentration
Number Volume(ac) (in) (in) (ac-in) (cfs) (days hh:mm:ss)
1 Sub-Post 10.73 90.33 4.08 3.03 32.49 39.14 0 00:15:00
Paris Drive Park WestPost-Developed
10 yr - 24 hr1/12/18 B-9
Node Summary
SN Element Element Invert Ground/Rim Initial Surcharge Ponded Peak Max HGL Max Min Time of Total Total TimeID Type Elevation (Max) Water Elevation Area Inflow Elevation Surcharge Freeboard Peak Flooded Flooded
Elevation Elevation Attained Depth Attained Flooding VolumeAttained Occurrence
(ft) (ft) (ft) (ft) (ft²) (cfs) (ft) (ft) (ft) (days hh:mm) (ac-in) (min)1 Out-1 Outfall 744.00 0.00 0.00
Paris Drive Park WestPost-Developed
10 yr - 24 hr1/12/18 B-10

Subbasin Hydrology
Subbasin : Sub-Post
Input Data
Area (ac) ........................................................................ 10.73Weighted Curve Number ............................................... 90.33Rain Gage ID .................................................................
Composite Curve Number Area Soil CurveSoil/Surface Description (acres) Group NumberWetPond 0.77 - 98.00OpenSpace 1.25 - 67.00Commercial 8.71 - 93.00Composite Area & Weighted CN 10.73 90.33
Time of Concentration
TOC Method : SCS TR-55
Sheet Flow Equation :
Tc = (0.007 * ((n * Lf)^0.8)) / ((P^0.5) * (Sf^0.4))
Where :
Tc = Time of Concentration (hr) n = Manning's roughness Lf = Flow Length (ft) P = 2 yr, 24 hr Rainfall (inches) Sf = Slope (ft/ft)
Shallow Concentrated Flow Equation :
V = 16.1345 * (Sf^0.5) (unpaved surface) V = 20.3282 * (Sf^0.5) (paved surface) V = 15.0 * (Sf^0.5) (grassed waterway surface) V = 10.0 * (Sf^0.5) (nearly bare & untilled surface) V = 9.0 * (Sf^0.5) (cultivated straight rows surface) V = 7.0 * (Sf^0.5) (short grass pasture surface) V = 5.0 * (Sf^0.5) (woodland surface) V = 2.5 * (Sf^0.5) (forest w/heavy litter surface) Tc = (Lf / V) / (3600 sec/hr)
Where:
Tc = Time of Concentration (hr) Lf = Flow Length (ft) V = Velocity (ft/sec) Sf = Slope (ft/ft)
Channel Flow Equation :
V = (1.49 * (R^(2/3)) * (Sf^0.5)) / n R = Aq / Wp Tc = (Lf / V) / (3600 sec/hr)
Where :
Tc = Time of Concentration (hr) Lf = Flow Length (ft) R = Hydraulic Radius (ft) Aq = Flow Area (ft²) Wp = Wetted Perimeter (ft) V = Velocity (ft/sec) Sf = Slope (ft/ft) n = Manning's roughness
User-Defined TOC override (minutes): 15.00
Subbasin Runoff Results
Total Rainfall (in) ............................................................4.08Total Runoff (in) ............................................................. 3.03Peak Runoff (cfs) ........................................................... 39.14Weighted Curve Number ............................................... 90.33Time of Concentration (days hh:mm:ss) ....................... 0 00:15:00
Paris Drive Park WestPost-Developed
10 yr - 24 hr1/12/18 B-11

Subbasin : Sub-Post
Paris Drive Park WestPost-Developed
10 yr - 24 hr1/12/18 B-12

Project Description
Paris Drive Park West - Post Developed.SPF
Project Options
CFSElevationSCS TR-20SCS TR-55HydrodynamicYESNO
Analysis Options
Aug 28, 2017 00:00:00Aug 31, 2017 00:00:00Aug 28, 2017 00:00:000 days0 01:00:00 days hh:mm:ss0 00:05:00 days hh:mm:ss0 00:05:00 days hh:mm:ss30 seconds
Number of ElementsQty21101000000000000
Rainfall Details
SN Rain Gage Data Data Source Rainfall Rain State County Return Rainfall RainfallID Source ID Type Units Period Depth Distribution
(years) (inches)1 Time Series 100yr-24hr Cumulative inches Indiana Johnson 100 5.87 SCS Type II 24-hr
Land Uses ...............................................................
Pipes ............................................................... Pumps ............................................................ Orifices ........................................................... Weirs .............................................................. Outlets ............................................................Pollutants ................................................................
Outfalls ........................................................... Flow Diversions .............................................. Inlets ............................................................... Storage Nodes ...............................................Links......................................................................... Channels ........................................................
Reporting Time Step ...............................................Routing Time Step ..................................................
Rain Gages .............................................................Subbasins................................................................Nodes....................................................................... Junctions ........................................................
Start Analysis On ....................................................End Analysis On ......................................................Start Reporting On ..................................................Antecedent Dry Days ..............................................Runoff (Dry Weather) Time Step ............................Runoff (Wet Weather) Time Step ...........................
Elevation Type ........................................................Hydrology Method ...................................................Time of Concentration (TOC) Method .....................Link Routing Method ...............................................Enable Overflow Ponding at Nodes ........................Skip Steady State Analysis Time Periods ...............
File Name ................................................................Description ..............................................................
Paris Drive Park West
Post-Developed Conditions
Flow Units ...............................................................
Paris Drive Park WestPost-Developed
100 yr - 24 hr1/12/18 B-13

Subbasin Summary
SN Subbasin Area Weighted Total Total Total Peak Time ofID Curve Rainfall Runoff Runoff Runoff Concentration
Number Volume(ac) (in) (in) (ac-in) (cfs) (days hh:mm:ss)
1 Sub-Post 10.73 90.33 5.87 4.76 51.03 59.93 0 00:15:00
Paris Drive Park WestPost-Developed
100 yr - 24 hr1/12/18 B-14

Node Summary
SN Element Element Invert Ground/Rim Initial Surcharge Ponded Peak Max HGL Max Min Time of Total Total TimeID Type Elevation (Max) Water Elevation Area Inflow Elevation Surcharge Freeboard Peak Flooded Flooded
Elevation Elevation Attained Depth Attained Flooding VolumeAttained Occurrence
(ft) (ft) (ft) (ft) (ft²) (cfs) (ft) (ft) (ft) (days hh:mm) (ac-in) (min)1 Out-1 Outfall 744.00 0.00 0.00
Paris Drive Park WestPost-Developed
100 yr - 24 hr1/12/18 B-15

Subbasin Hydrology
Subbasin : Sub-Post
Input Data
Area (ac) ........................................................................ 10.73Weighted Curve Number ............................................... 90.33Rain Gage ID .................................................................
Composite Curve Number Area Soil CurveSoil/Surface Description (acres) Group NumberWetPond 0.77 - 98.00OpenSpace 1.25 - 67.00Commercial 8.71 - 93.00Composite Area & Weighted CN 10.73 90.33
Time of Concentration
TOC Method : SCS TR-55
Sheet Flow Equation :
Tc = (0.007 * ((n * Lf)^0.8)) / ((P^0.5) * (Sf^0.4))
Where :
Tc = Time of Concentration (hr) n = Manning's roughness Lf = Flow Length (ft) P = 2 yr, 24 hr Rainfall (inches) Sf = Slope (ft/ft)
Shallow Concentrated Flow Equation :
V = 16.1345 * (Sf^0.5) (unpaved surface) V = 20.3282 * (Sf^0.5) (paved surface) V = 15.0 * (Sf^0.5) (grassed waterway surface) V = 10.0 * (Sf^0.5) (nearly bare & untilled surface) V = 9.0 * (Sf^0.5) (cultivated straight rows surface) V = 7.0 * (Sf^0.5) (short grass pasture surface) V = 5.0 * (Sf^0.5) (woodland surface) V = 2.5 * (Sf^0.5) (forest w/heavy litter surface) Tc = (Lf / V) / (3600 sec/hr)
Where:
Tc = Time of Concentration (hr) Lf = Flow Length (ft) V = Velocity (ft/sec) Sf = Slope (ft/ft)
Channel Flow Equation :
V = (1.49 * (R^(2/3)) * (Sf^0.5)) / n R = Aq / Wp Tc = (Lf / V) / (3600 sec/hr)
Where :
Tc = Time of Concentration (hr) Lf = Flow Length (ft) R = Hydraulic Radius (ft) Aq = Flow Area (ft²) Wp = Wetted Perimeter (ft) V = Velocity (ft/sec) Sf = Slope (ft/ft) n = Manning's roughness
User-Defined TOC override (minutes): 15.00
Subbasin Runoff Results
Total Rainfall (in) ............................................................5.87Total Runoff (in) ............................................................. 4.76Peak Runoff (cfs) ........................................................... 59.93Weighted Curve Number ............................................... 90.33Time of Concentration (days hh:mm:ss) ....................... 0 00:15:00
Paris Drive Park WestPost-Developed
100 yr - 24 hr1/12/18 B-16

Subbasin : Sub-Post
Paris Drive Park WestPost-Developed
100 yr - 24 hr1/12/18 B-17

Appendix C: Proposed Pond & Routed Storm Event Data
1.25” Storm Event Analysis Results……….............………………....……….C-1 – C-13
10 yr-24 hr Peak Storm Event Analysis Results…………..….…..…...…….C-14 – C-26
100 yr-24 hr Peak Storm Event Analysis Results………….……..………..C–27 – C-39

Project Description
Paris Drive Park West - Detention.SPF
Project Options
CFSElevationSCS TR-20SCS TR-55HydrodynamicYESNO
Analysis Options
Aug 28, 2017 00:00:00Aug 31, 2017 00:00:00Aug 28, 2017 00:00:000 days0 01:00:00 days hh:mm:ss0 00:05:00 days hh:mm:ss0 00:05:00 days hh:mm:ss30 seconds
Number of ElementsQty31311001201010000
Rainfall Details
SN Rain Gage Data Data Source Rainfall Rain State County Return Rainfall RainfallID Source ID Type Units Period Depth Distribution
(years) (inches)1 Time Series 1.25'' Storm Cumulative inches User Defined
Land Uses .................................................................
Pipes ................................................................. Pumps ............................................................... Orifices .............................................................. Weirs ................................................................. Outlets ...............................................................Pollutants ...................................................................
Outfalls .............................................................. Flow Diversions ................................................. Inlets ................................................................. Storage Nodes ..................................................Links........................................................................... Channels ...........................................................
Reporting Time Step ..................................................Routing Time Step .....................................................
Rain Gages ................................................................Subbasins...................................................................Nodes......................................................................... Junctions ...........................................................
Start Analysis On .......................................................End Analysis On ........................................................Start Reporting On .....................................................Antecedent Dry Days .................................................Runoff (Dry Weather) Time Step ...............................Runoff (Wet Weather) Time Step ..............................
Elevation Type ...........................................................Hydrology Method .....................................................Time of Concentration (TOC) Method .......................Link Routing Method ..................................................Enable Overflow Ponding at Nodes ...........................Skip Steady State Analysis Time Periods .................
File Name ..................................................................Description .................................................................
Paris Drive Park West
Detention Model
Flow Units ..................................................................
Paris Drive Park WestDetention Model
Routed 1.25" Storm1/12/18 C-1

Subbasin Summary
SN Subbasin Area Weighted Total Total Total Peak Time ofID Curve Rainfall Runoff Runoff Runoff Concentration
Number Volume(ac) (in) (in) (ac-in) (cfs) (days hh:mm:ss)
1 Sub-Post 10.73 90.33 1.25 0.51 5.46 6.74 0 00:15:00
Paris Drive Park WestDetention Model
Routed 1.25" Storm1/12/18 C-2

Node Summary
SN Element Element Invert Ground/Rim Initial Surcharge Ponded Peak Max HGL Max Min Time of Total Total TimeID Type Elevation (Max) Water Elevation Area Inflow Elevation Surcharge Freeboard Peak Flooded Flooded
Elevation Elevation Attained Depth Attained Flooding VolumeAttained Occurrence
(ft) (ft) (ft) (ft) (ft²) (cfs) (ft) (ft) (ft) (days hh:mm) (ac-in) (min)1 Jun-01 Junction 742.25 748.25 742.25 0.00 33539.00 0.27 742.47 0.00 5.78 0 00:00 0.00 0.002 Out-1 Outfall 742.00 0.27 742.213 Stor-01 Storage Node 742.25 748.25 742.25 33539.00 6.54 742.60 0.00 0.00
Paris Drive Park WestDetention Model
Routed 1.25" Storm1/12/18 C-3

Link Summary
SN Element Element From To (Outlet) Length Inlet Outlet Average Diameter or Manning's Peak Design Flow Peak Flow/ Peak Flow Peak Flow Peak Flow Total Time ReportedID Type (Inlet) Node Invert Invert Slope Height Roughness Flow Capacity Design Flow Velocity Depth Depth/ Surcharged Condition
Node Elevation Elevation Ratio Total DepthRatio
(ft) (ft) (ft) (%) (in) (cfs) (cfs) (ft/sec) (ft) (min)1 Link-01 Pipe Jun-01 Out-1 46.00 742.25 742.00 0.5400 12.000 0.0120 0.27 2.85 0.10 2.16 0.22 0.22 0.00 Calculated2 Orifice-WQ Orifice Stor-01 Jun-01 742.25 742.25 7.500 0.27
Paris Drive Park WestDetention Model
Routed 1.25" Storm1/12/18 C-4

Subbasin Hydrology
Subbasin : Sub-Post
Input Data
Area (ac) ........................................................................ 10.73Weighted Curve Number ............................................... 90.33Rain Gage ID .................................................................
Composite Curve Number Area Soil CurveSoil/Surface Description (acres) Group NumberWetPond 0.77 - 98.00OpenSpace 1.25 - 67.00Commercial 8.71 - 93.00Composite Area & Weighted CN 10.73 90.33
Time of Concentration
TOC Method : SCS TR-55
Sheet Flow Equation :
Tc = (0.007 * ((n * Lf)^0.8)) / ((P^0.5) * (Sf^0.4))
Where :
Tc = Time of Concentration (hr) n = Manning's roughness Lf = Flow Length (ft) P = 2 yr, 24 hr Rainfall (inches) Sf = Slope (ft/ft)
Shallow Concentrated Flow Equation :
V = 16.1345 * (Sf^0.5) (unpaved surface) V = 20.3282 * (Sf^0.5) (paved surface) V = 15.0 * (Sf^0.5) (grassed waterway surface) V = 10.0 * (Sf^0.5) (nearly bare & untilled surface) V = 9.0 * (Sf^0.5) (cultivated straight rows surface) V = 7.0 * (Sf^0.5) (short grass pasture surface) V = 5.0 * (Sf^0.5) (woodland surface) V = 2.5 * (Sf^0.5) (forest w/heavy litter surface) Tc = (Lf / V) / (3600 sec/hr)
Where:
Tc = Time of Concentration (hr) Lf = Flow Length (ft) V = Velocity (ft/sec) Sf = Slope (ft/ft)
Channel Flow Equation :
V = (1.49 * (R^(2/3)) * (Sf^0.5)) / n R = Aq / Wp Tc = (Lf / V) / (3600 sec/hr)
Where :
Tc = Time of Concentration (hr) Lf = Flow Length (ft) R = Hydraulic Radius (ft) Aq = Flow Area (ft²) Wp = Wetted Perimeter (ft) V = Velocity (ft/sec) Sf = Slope (ft/ft) n = Manning's roughness
User-Defined TOC override (minutes): 15.00
Subbasin Runoff Results
Total Rainfall (in) ............................................................1.25Total Runoff (in) ............................................................. 0.51Peak Runoff (cfs) ........................................................... 6.74Weighted Curve Number ............................................... 90.33Time of Concentration (days hh:mm:ss) ....................... 0 00:15:00
Paris Drive Park WestDetention Model
Routed 1.25" Storm1/12/18 C-5

Subbasin : Sub-Post
Paris Drive Park WestDetention Model
Routed 1.25" Storm1/12/18 C-6

Junction Input
SN Element Invert Ground/Rim Ground/Rim Initial Initial Surcharge Surcharge Ponded MinimumID Elevation (Max) (Max) Water Water Elevation Depth Area Pipe
Elevation Offset Elevation Depth Cover(ft) (ft) (ft) (ft) (ft) (ft) (ft) (ft²) (in)
1 Jun-01 742.25 748.25 6.00 742.25 0.00 0.00 -748.25 33539.00 0.00
Paris Drive Park WestDetention Model
Routed 1.25" Storm1/12/18 C-7

Junction Results
SN Element Peak Peak Max HGL Max HGL Max Min Average HGL Average HGL Time of Time of Total Total TimeID Inflow Lateral Elevation Depth Surcharge Freeboard Elevation Depth Max HGL Peak Flooded Flooded
Inflow Attained Attained Depth Attained Attained Attained Occurrence Flooding VolumeAttained Occurrence
(cfs) (cfs) (ft) (ft) (ft) (ft) (ft) (ft) (days hh:mm) (days hh:mm) (ac-in) (min)1 Jun-01 0.27 0.00 742.47 0.22 0.00 5.78 742.34 0.09 0 15:27 0 00:00 0.00 0.00
Paris Drive Park WestDetention Model
Routed 1.25" Storm1/12/18 C-8

Pipe Input
SN Element Length Inlet Inlet Outlet Outlet Total Average Pipe Pipe Pipe Manning's Entrance Exit/Bend Additional Initial Flap No. ofID Invert Invert Invert Invert Drop Slope Shape Diameter or Width Roughness Losses Losses Losses Flow Gate Barrels
Elevation Offset Elevation Offset Height(ft) (ft) (ft) (ft) (ft) (ft) (%) (in) (in) (cfs)
1 Link-01 46.00 742.25 0.00 742.00 0.00 0.25 0.5400 CIRCULAR 12.000 12.000 0.0120 0.5000 0.5000 0.0000 0.00 No 1
Paris Drive Park WestDetention Model
Routed 1.25" Storm1/12/18 C-9

Pipe Results
SN Element Peak Time of Design Flow Peak Flow/ Peak Flow Travel Peak Flow Peak Flow Total Time Froude ReportedID Flow Peak Flow Capacity Design Flow Velocity Time Depth Depth/ Surcharged Number Condition
Occurrence Ratio Total DepthRatio
(cfs) (days hh:mm) (cfs) (ft/sec) (min) (ft) (min)1 Link-01 0.27 0 15:28 2.85 0.10 2.16 0.35 0.22 0.22 0.00 Calculated
Paris Drive Park WestDetention Model
Routed 1.25" Storm1/12/18 C-10

Storage Nodes
Storage Node : Stor-01
Input Data
742.25748.256.00742.250.0033539.000.00
Storage Area Volume CurvesStorage Curve : WetPond
Stage Storage StorageArea Volume
(ft) (ft²) (ft³)0 33538.98 0.000
0.75 36203.77 26153.531.75 39844.78 64177.812.75 43586.33 105893.373.75 47428.40 151400.744.75 51371.01 200800.455.75 55414.14 254193.03
6 56440.64 268174.88
Evaporation Loss ..............................................................................
Invert Elevation (ft) ............................................................................Max (Rim) Elevation (ft) ....................................................................Max (Rim) Offset (ft) .........................................................................Initial Water Elevation (ft) .................................................................Initial Water Depth (ft) .......................................................................Ponded Area (ft²) ..............................................................................
Paris Drive Park WestDetention Model
Routed 1.25" Storm1/12/18 C-11

Paris Drive Park WestDetention Model
Routed 1.25" Storm1/12/18 C-12

Storage Node : Stor-01 (continued)
Outflow Orifices
SN Element Orifice Orifice Flap Circular Rectangular Rectangular Orifice OrificeID Type Shape Gate Orifice Orifice Orifice Invert Coefficient
Diameter Height Width Elevation(in) (in) (in) (ft)
1 Orifice-WQ Side CIRCULAR No 7.50 742.25 0.61
Output Summary Results
6.546.540.270.00742.600.35742.380.130 15:260.000000.00
Total Time Flooded (min) ..................................................................Total Retention Time (sec) ................................................................
Max HGL Depth Attained (ft) .............................................................Average HGL Elevation Attained (ft) .................................................Average HGL Depth Attained (ft) ......................................................Time of Max HGL Occurrence (days hh:mm) ...................................Total Exfiltration Volume (1000-ft³) ...................................................Total Flooded Volume (ac-in) ...........................................................
Peak Inflow (cfs) ...............................................................................Peak Lateral Inflow (cfs) ...................................................................Peak Outflow (cfs) .............................................................................Peak Exfiltration Flow Rate (cfm) .....................................................Max HGL Elevation Attained (ft) .......................................................
Paris Drive Park WestDetention Model
Routed 1.25" Storm1/12/18 C-13

Project Description
Paris Drive Park West - Detention.SPF
Project Options
CFSElevationSCS TR-20SCS TR-55HydrodynamicYESNO
Analysis Options
Aug 28, 2017 00:00:00Aug 31, 2017 00:00:00Aug 28, 2017 00:00:000 days0 01:00:00 days hh:mm:ss0 00:05:00 days hh:mm:ss0 00:05:00 days hh:mm:ss30 seconds
Number of ElementsQty31311001301020000
Rainfall Details
SN Rain Gage Data Data Source Rainfall Rain State County Return Rainfall RainfallID Source ID Type Units Period Depth Distribution
(years) (inches)1 Time Series 10yr-24hr Cumulative inches Indiana Johnson 10 4.08 SCS Type II 24-hr
Land Uses ....................................................................
Pipes .................................................................... Pumps .................................................................. Orifices ................................................................. Weirs .................................................................... Outlets .................................................................Pollutants ......................................................................
Outfalls ................................................................. Flow Diversions .................................................... Inlets .................................................................... Storage Nodes .....................................................Links.............................................................................. Channels ..............................................................
Reporting Time Step ....................................................Routing Time Step ........................................................
Rain Gages ..................................................................Subbasins......................................................................Nodes............................................................................ Junctions ..............................................................
Start Analysis On ..........................................................End Analysis On ...........................................................Start Reporting On ........................................................Antecedent Dry Days ....................................................Runoff (Dry Weather) Time Step ..................................Runoff (Wet Weather) Time Step .................................
Elevation Type ..............................................................Hydrology Method ........................................................Time of Concentration (TOC) Method ..........................Link Routing Method .....................................................Enable Overflow Ponding at Nodes .............................Skip Steady State Analysis Time Periods ....................
File Name .....................................................................Description ...................................................................
Paris Drive Park West
Detention Model
Flow Units .....................................................................
Paris Drive Park WestDetention Model
Routed 10 yr - 24 hr1/12/18 C-14

Subbasin Summary
SN Subbasin Area Weighted Total Total Total Peak Time ofID Curve Rainfall Runoff Runoff Runoff Concentration
Number Volume(ac) (in) (in) (ac-in) (cfs) (days hh:mm:ss)
1 Sub-Post 10.73 90.33 4.08 3.03 32.49 39.14 0 00:15:00
Paris Drive Park WestDetention Model
Routed 10 yr - 24 hr1/12/18 C-15

Node Summary
SN Element Element Invert Ground/Rim Initial Surcharge Ponded Peak Max HGL Max Min Time of Total Total TimeID Type Elevation (Max) Water Elevation Area Inflow Elevation Surcharge Freeboard Peak Flooded Flooded
Elevation Elevation Attained Depth Attained Flooding VolumeAttained Occurrence
(ft) (ft) (ft) (ft) (ft²) (cfs) (ft) (ft) (ft) (days hh:mm) (ac-in) (min)1 Jun-01 Junction 742.25 748.25 742.25 0.00 33539.00 1.75 742.93 0.00 5.32 0 00:00 0.00 0.002 Out-1 Outfall 742.00 1.75 742.563 Stor-01 Storage Node 742.25 748.25 742.25 33539.00 37.86 744.28 0.00 0.00
Paris Drive Park WestDetention Model
Routed 10 yr - 24 hr1/12/18 C-16

Link Summary
SN Element Element From To (Outlet) Length Inlet Outlet Average Diameter or Manning's Peak Design Flow Peak Flow/ Peak Flow Peak Flow Peak Flow Total Time ReportedID Type (Inlet) Node Invert Invert Slope Height Roughness Flow Capacity Design Flow Velocity Depth Depth/ Surcharged Condition
Node Elevation Elevation Ratio Total DepthRatio
(ft) (ft) (ft) (%) (in) (cfs) (cfs) (ft/sec) (ft) (min)1 Link-01 Pipe Jun-01 Out-1 46.00 742.25 742.00 0.5400 12.000 0.0120 1.75 2.85 0.62 3.42 0.62 0.62 0.00 Calculated2 Orifice-100yr Orifice Stor-01 Jun-01 742.25 742.25 8.000 0.003 Orifice-WQ Orifice Stor-01 Jun-01 742.25 742.25 7.500 1.75
Paris Drive Park WestDetention Model
Routed 10 yr - 24 hr1/12/18 C-17

Subbasin Hydrology
Subbasin : Sub-Post
Input Data
Area (ac) ........................................................................ 10.73Weighted Curve Number ............................................... 90.33Rain Gage ID ................................................................. *
Composite Curve Number Area Soil CurveSoil/Surface Description (acres) Group NumberWetPond 0.77 - 98.00OpenSpace 1.25 - 67.00Commercial 8.71 - 93.00Composite Area & Weighted CN 10.73 90.33
Time of Concentration
TOC Method : SCS TR-55
Sheet Flow Equation :
Tc = (0.007 * ((n * Lf)^0.8)) / ((P^0.5) * (Sf^0.4))
Where :
Tc = Time of Concentration (hr) n = Manning's roughness Lf = Flow Length (ft) P = 2 yr, 24 hr Rainfall (inches) Sf = Slope (ft/ft)
Shallow Concentrated Flow Equation :
V = 16.1345 * (Sf^0.5) (unpaved surface) V = 20.3282 * (Sf^0.5) (paved surface) V = 15.0 * (Sf^0.5) (grassed waterway surface) V = 10.0 * (Sf^0.5) (nearly bare & untilled surface) V = 9.0 * (Sf^0.5) (cultivated straight rows surface) V = 7.0 * (Sf^0.5) (short grass pasture surface) V = 5.0 * (Sf^0.5) (woodland surface) V = 2.5 * (Sf^0.5) (forest w/heavy litter surface) Tc = (Lf / V) / (3600 sec/hr)
Where:
Tc = Time of Concentration (hr) Lf = Flow Length (ft) V = Velocity (ft/sec) Sf = Slope (ft/ft)
Channel Flow Equation :
V = (1.49 * (R^(2/3)) * (Sf^0.5)) / n R = Aq / Wp Tc = (Lf / V) / (3600 sec/hr)
Where :
Tc = Time of Concentration (hr) Lf = Flow Length (ft) R = Hydraulic Radius (ft) Aq = Flow Area (ft²) Wp = Wetted Perimeter (ft) V = Velocity (ft/sec) Sf = Slope (ft/ft) n = Manning's roughness
User-Defined TOC override (minutes): 15.00
Subbasin Runoff Results
Total Rainfall (in) ............................................................4.08Total Runoff (in) ............................................................. 3.03Peak Runoff (cfs) ........................................................... 39.14Weighted Curve Number ............................................... 90.33Time of Concentration (days hh:mm:ss) ....................... 0 00:15:00
Paris Drive Park WestDetention Model
Routed 10 yr - 24 hr1/12/18 C-18

Subbasin : Sub-Post
Paris Drive Park WestDetention Model
Routed 10 yr - 24 hr1/12/18 C-19

Junction Input
SN Element Invert Ground/Rim Ground/Rim Initial Initial Surcharge Surcharge Ponded MinimumID Elevation (Max) (Max) Water Water Elevation Depth Area Pipe
Elevation Offset Elevation Depth Cover(ft) (ft) (ft) (ft) (ft) (ft) (ft) (ft²) (in)
1 Jun-01 742.25 748.25 6.00 742.25 0.00 0.00 -748.25 33539.00 0.00
Paris Drive Park WestDetention Model
Routed 10 yr - 24 hr1/12/18 C-20

Junction Results
SN Element Peak Peak Max HGL Max HGL Max Min Average HGL Average HGL Time of Time of Total Total TimeID Inflow Lateral Elevation Depth Surcharge Freeboard Elevation Depth Max HGL Peak Flooded Flooded
Inflow Attained Attained Depth Attained Attained Attained Occurrence Flooding VolumeAttained Occurrence
(cfs) (cfs) (ft) (ft) (ft) (ft) (ft) (ft) (days hh:mm) (days hh:mm) (ac-in) (min)1 Jun-01 1.75 0.00 742.93 0.68 0.00 5.32 742.49 0.24 0 14:00 0 00:00 0.00 0.00
Paris Drive Park WestDetention Model
Routed 10 yr - 24 hr1/12/18 C-21
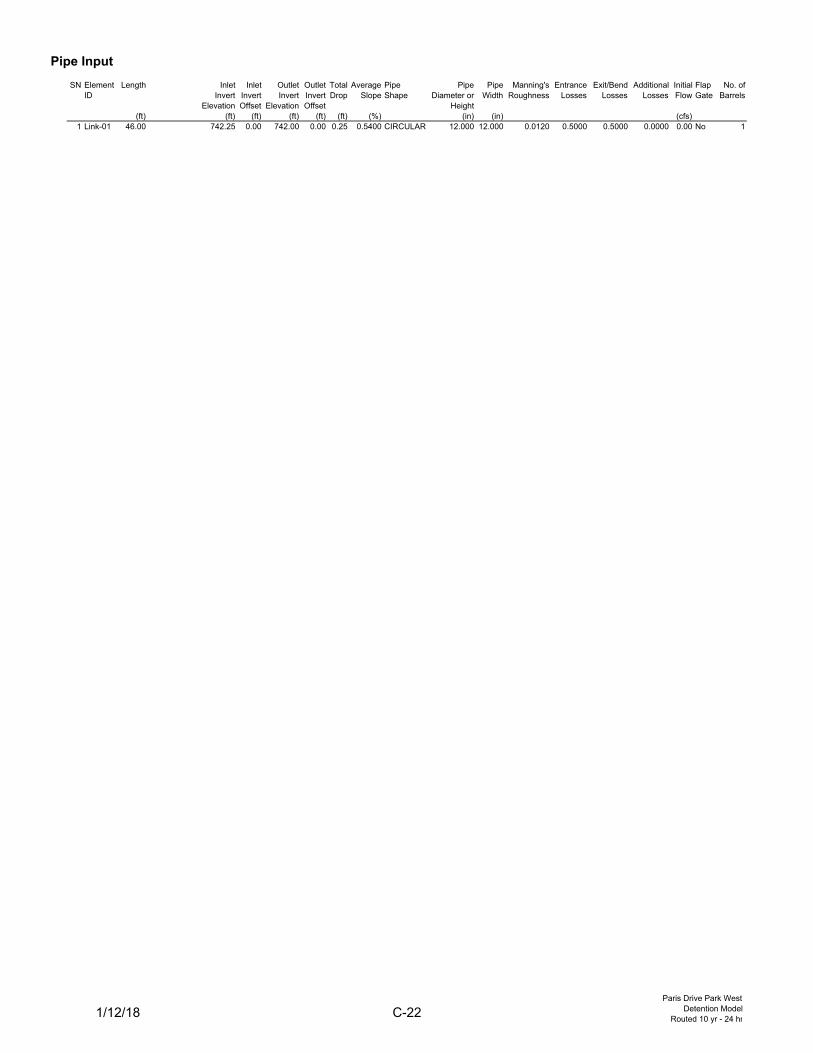
Pipe Input
SN Element Length Inlet Inlet Outlet Outlet Total Average Pipe Pipe Pipe Manning's Entrance Exit/Bend Additional Initial Flap No. ofID Invert Invert Invert Invert Drop Slope Shape Diameter or Width Roughness Losses Losses Losses Flow Gate Barrels
Elevation Offset Elevation Offset Height(ft) (ft) (ft) (ft) (ft) (ft) (%) (in) (in) (cfs)
1 Link-01 46.00 742.25 0.00 742.00 0.00 0.25 0.5400 CIRCULAR 12.000 12.000 0.0120 0.5000 0.5000 0.0000 0.00 No 1
Paris Drive Park WestDetention Model
Routed 10 yr - 24 hr1/12/18 C-22

Pipe Results
SN Element Peak Time of Design Flow Peak Flow/ Peak Flow Travel Peak Flow Peak Flow Total Time Froude ReportedID Flow Peak Flow Capacity Design Flow Velocity Time Depth Depth/ Surcharged Number Condition
Occurrence Ratio Total DepthRatio
(cfs) (days hh:mm) (cfs) (ft/sec) (min) (ft) (min)1 Link-01 1.75 0 14:01 2.85 0.62 3.42 0.22 0.62 0.62 0.00 Calculated
Paris Drive Park WestDetention Model
Routed 10 yr - 24 hr1/12/18 C-23

Storage Nodes
Storage Node : Stor-01
Input Data
742.25748.256.00742.250.0033539.000.00
Storage Area Volume CurvesStorage Curve : WetPond
Stage Storage StorageArea Volume
(ft) (ft²) (ft³)0 33538.98 0.000
0.75 36203.77 26153.531.75 39844.78 64177.812.75 43586.33 105893.373.75 47428.40 151400.744.75 51371.01 200800.455.75 55414.14 254193.03
6 56440.64 268174.88
Evaporation Loss ....................................................................................
Invert Elevation (ft) .................................................................................Max (Rim) Elevation (ft) ..........................................................................Max (Rim) Offset (ft) ...............................................................................Initial Water Elevation (ft) .......................................................................Initial Water Depth (ft) ............................................................................Ponded Area (ft²) ....................................................................................
Paris Drive Park WestDetention Model
Routed 10 yr - 24 hr1/12/18 C-24

Paris Drive Park WestDetention Model
Routed 10 yr - 24 hr1/12/18 C-25

Storage Node : Stor-01 (continued)
Outflow Orifices
SN Element Orifice Orifice Flap Circular Rectangular Rectangular Orifice OrificeID Type Shape Gate Orifice Orifice Orifice Invert Coefficient
Diameter Height Width Elevation(in) (in) (in) (ft)
1 Orifice-100yr Side Rectangular No 8.00 24.00 744.35 0.632 Orifice-WQ Side CIRCULAR No 7.50 742.25 0.61
Output Summary Results
37.8637.861.750.00744.282.03742.770.520 14:000.000000.00
Total Time Flooded (min) .......................................................................Total Retention Time (sec) .....................................................................
Max HGL Depth Attained (ft) ..................................................................Average HGL Elevation Attained (ft) ......................................................Average HGL Depth Attained (ft) ............................................................Time of Max HGL Occurrence (days hh:mm) .........................................Total Exfiltration Volume (1000-ft³) .........................................................Total Flooded Volume (ac-in) .................................................................
Peak Inflow (cfs) .....................................................................................Peak Lateral Inflow (cfs) .........................................................................Peak Outflow (cfs) ..................................................................................Peak Exfiltration Flow Rate (cfm) ...........................................................Max HGL Elevation Attained (ft) .............................................................
Paris Drive Park WestDetention Model
Routed 10 yr - 24 hr1/12/18 C-26

Project Description
Paris Drive Park West - Detention.SPF
Project Options
CFSElevationSCS TR-20SCS TR-55HydrodynamicYESNO
Analysis Options
Aug 28, 2017 00:00:00Aug 31, 2017 00:00:00Aug 28, 2017 00:00:000 days0 01:00:00 days hh:mm:ss0 00:05:00 days hh:mm:ss0 00:05:00 days hh:mm:ss30 seconds
Number of ElementsQty31311001301020000
Rainfall Details
SN Rain Gage Data Data Source Rainfall Rain State County Return Rainfall RainfallID Source ID Type Units Period Depth Distribution
(years) (inches)1 Time Series 100yr-24hr Cumulative inches Indiana Johnson 100 5.87 SCS Type II 24-hr
File Name ..................................................................Description ................................................................
Paris Drive Park West
Detention Model
Flow Units .................................................................Elevation Type ..........................................................Hydrology Method .....................................................Time of Concentration (TOC) Method .......................Link Routing Method .................................................Enable Overflow Ponding at Nodes ..........................Skip Steady State Analysis Time Periods .................
Start Analysis On .......................................................End Analysis On ........................................................Start Reporting On ....................................................Antecedent Dry Days ................................................Runoff (Dry Weather) Time Step ...............................Runoff (Wet Weather) Time Step ..............................Reporting Time Step .................................................Routing Time Step .....................................................
Rain Gages ...............................................................Subbasins...................................................................Nodes......................................................................... Junctions ........................................................... Outfalls .............................................................. Flow Diversions ................................................ Inlets ................................................................. Storage Nodes ..................................................Links........................................................................... Channels ...........................................................
Land Uses .................................................................
Pipes ................................................................. Pumps ............................................................... Orifices .............................................................. Weirs ................................................................. Outlets ..............................................................Pollutants ...................................................................
Paris Drive Park WestDetention Model
Routed 100 yr - 24 hr1/12/18 C-27

Subbasin Summary
SN Subbasin Area Weighted Total Total Total Peak Time ofID Curve Rainfall Runoff Runoff Runoff Concentration
Number Volume(ac) (in) (in) (ac-in) (cfs) (days hh:mm:ss)
1 Sub-Post 10.73 90.33 5.87 4.76 51.03 59.93 0 00:15:00
Paris Drive Park WestDetention Model
Routed 100 yr - 24 hr1/12/18 C-28

Node Summary
SN Element Element Invert Ground/Rim Initial Surcharge Ponded Peak Max HGL Max Min Time of Total Total TimeID Type Elevation (Max) Water Elevation Area Inflow Elevation Surcharge Freeboard Peak Flooded Flooded
Elevation Elevation Attained Depth Attained Flooding VolumeAttained Occurrence
(ft) (ft) (ft) (ft) (ft²) (cfs) (ft) (ft) (ft) (days hh:mm) (ac-in) (min)1 Jun-01 Junction 742.25 748.25 742.25 0.00 33539.00 5.40 744.56 0.00 3.69 0 00:00 0.00 0.002 Out-1 Outfall 742.00 5.40 742.933 Stor-01 Storage Node 742.25 748.25 742.25 33539.00 58.25 745.09 0.00 0.00
Paris Drive Park WestDetention Model
Routed 100 yr - 24 hr1/12/18 C-29

Link Summary
SN Element Element From To (Outlet) Length Inlet Outlet Average Diameter or Manning's Peak Design Flow Peak Flow/ Peak Flow Peak Flow Peak Flow Total Time ReportedID Type (Inlet) Node Invert Invert Slope Height Roughness Flow Capacity Design Flow Velocity Depth Depth/ Surcharged Condition
Node Elevation Elevation Ratio Total DepthRatio
(ft) (ft) (ft) (%) (in) (cfs) (cfs) (ft/sec) (ft) (min)1 Link-01 Pipe Jun-01 Out-1 46.00 742.25 742.00 0.5400 12.000 0.0120 5.40 2.85 1.90 6.95 0.97 0.97 0.00 > CAPACITY2 Orifice-100yr Orifice Stor-01 Jun-01 742.25 742.25 8.000 4.293 Orifice-WQ Orifice Stor-01 Jun-01 742.25 742.25 7.500 1.83
Paris Drive Park WestDetention Model
Routed 100 yr - 24 hr1/12/18 C-30

Subbasin Hydrology
Subbasin : Sub-Post
Input Data
Area (ac) ........................................................................ 10.73Weighted Curve Number ............................................... 90.33Rain Gage ID .................................................................
Composite Curve Number Area Soil CurveSoil/Surface Description (acres) Group NumberWetPond 0.77 - 98.00OpenSpace 1.25 - 67.00Commercial 8.71 - 93.00Composite Area & Weighted CN 10.73 90.33
Time of Concentration
TOC Method : SCS TR-55
Sheet Flow Equation :
Tc = (0.007 * ((n * Lf)^0.8)) / ((P^0.5) * (Sf^0.4))
Where :
Tc = Time of Concentration (hr) n = Manning's roughness Lf = Flow Length (ft) P = 2 yr, 24 hr Rainfall (inches) Sf = Slope (ft/ft)
Shallow Concentrated Flow Equation :
V = 16.1345 * (Sf^0.5) (unpaved surface) V = 20.3282 * (Sf^0.5) (paved surface) V = 15.0 * (Sf^0.5) (grassed waterway surface) V = 10.0 * (Sf^0.5) (nearly bare & untilled surface) V = 9.0 * (Sf^0.5) (cultivated straight rows surface) V = 7.0 * (Sf^0.5) (short grass pasture surface) V = 5.0 * (Sf^0.5) (woodland surface) V = 2.5 * (Sf^0.5) (forest w/heavy litter surface) Tc = (Lf / V) / (3600 sec/hr)
Where:
Tc = Time of Concentration (hr) Lf = Flow Length (ft) V = Velocity (ft/sec) Sf = Slope (ft/ft)
Channel Flow Equation :
V = (1.49 * (R^(2/3)) * (Sf^0.5)) / n R = Aq / Wp Tc = (Lf / V) / (3600 sec/hr)
Where :
Tc = Time of Concentration (hr) Lf = Flow Length (ft) R = Hydraulic Radius (ft) Aq = Flow Area (ft²) Wp = Wetted Perimeter (ft) V = Velocity (ft/sec) Sf = Slope (ft/ft) n = Manning's roughness
User-Defined TOC override (minutes): 15.00
Subbasin Runoff Results
Total Rainfall (in) ............................................................ 5.87Total Runoff (in) ............................................................. 4.76Peak Runoff (cfs) ........................................................... 59.93Weighted Curve Number ............................................... 90.33Time of Concentration (days hh:mm:ss) ........................ 0 00:15:00
Paris Drive Park WestDetention Model
Routed 100 yr - 24 hr1/12/18 C-31

Subbasin : Sub-Post
Paris Drive Park WestDetention Model
Routed 100 yr - 24 hr1/12/18 C-32

Junction Input
SN Element Invert Ground/Rim Ground/Rim Initial Initial Surcharge Surcharge Ponded MinimumID Elevation (Max) (Max) Water Water Elevation Depth Area Pipe
Elevation Offset Elevation Depth Cover(ft) (ft) (ft) (ft) (ft) (ft) (ft) (ft²) (in)
1 Jun-01 742.25 748.25 6.00 742.25 0.00 0.00 -748.25 33539.00 0.00
Paris Drive Park WestDetention Model
Routed 100 yr - 24 hr1/12/18 C-33

Junction Results
SN Element Peak Peak Max HGL Max HGL Max Min Average HGL Average HGL Time of Time of Total Total TimeID Inflow Lateral Elevation Depth Surcharge Freeboard Elevation Depth Max HGL Peak Flooded Flooded
Inflow Attained Attained Depth Attained Attained Attained Occurrence Flooding VolumeAttained Occurrence
(cfs) (cfs) (ft) (ft) (ft) (ft) (ft) (ft) (days hh:mm) (days hh:mm) (ac-in) (min)1 Jun-01 5.40 0.00 744.56 2.31 0.00 3.69 742.66 0.41 0 12:52 0 00:00 0.00 0.00
Paris Drive Park WestDetention Model
Routed 100 yr - 24 hr1/12/18 C-34

Pipe Input
SN Element Length Inlet Inlet Outlet Outlet Total Average Pipe Pipe Pipe Manning's Entrance Exit/Bend Additional Initial Flap No. ofID Invert Invert Invert Invert Drop Slope Shape Diameter or Width Roughness Losses Losses Losses Flow Gate Barrels
Elevation Offset Elevation Offset Height(ft) (ft) (ft) (ft) (ft) (ft) (%) (in) (in) (cfs)
1 Link-01 46.00 742.25 0.00 742.00 0.00 0.25 0.5400 CIRCULAR 12.000 12.000 0.0120 0.5000 0.5000 0.0000 0.00 No 1
Paris Drive Park WestDetention Model
Routed 100 yr - 24 hr1/12/18 C-35

Pipe Results
SN Element Peak Time of Design Flow Peak Flow/ Peak Flow Travel Peak Flow Peak Flow Total Time Froude ReportedID Flow Peak Flow Capacity Design Flow Velocity Time Depth Depth/ Surcharged Number Condition
Occurrence Ratio Total DepthRatio
(cfs) (days hh:mm) (cfs) (ft/sec) (min) (ft) (min)1 Link-01 5.40 0 12:52 2.85 1.90 6.95 0.11 0.97 0.97 0.00 > CAPACITY
Paris Drive Park WestDetention Model
Routed 100 yr - 24 hr1/12/18 C-36

Storage Nodes
Storage Node : Stor-01
Input Data
742.25748.256.00742.250.0033539.000.00
Storage Area Volume CurvesStorage Curve : WetPond
Stage Storage StorageArea Volume
(ft) (ft²) (ft³)0 33538.98 0.000
0.75 36203.77 26153.531.75 39844.78 64177.812.75 43586.33 105893.373.75 47428.40 151400.744.75 51371.01 200800.455.75 55414.14 254193.03
6 56440.64 268174.88
Invert Elevation (ft) ...............................................................Max (Rim) Elevation (ft) .......................................................Max (Rim) Offset (ft) .............................................................Initial Water Elevation (ft) .....................................................Initial Water Depth (ft) ..........................................................Ponded Area (ft²) ..................................................................Evaporation Loss .................................................................
Paris Drive Park WestDetention Model
Routed 100 yr - 24 hr1/12/18 C-37

Paris Drive Park WestDetention Model
Routed 100 yr - 24 hr1/12/18 C-38

Storage Node : Stor-01 (continued)
Outflow Orifices
SN Element Orifice Orifice Flap Circular Rectangular Rectangular Orifice OrificeID Type Shape Gate Orifice Orifice Orifice Invert Coefficient
Diameter Height Width Elevation(in) (in) (in) (ft)
1 Orifice-100yr Side Rectangular No 8.00 24.00 744.35 0.632 Orifice-WQ Side CIRCULAR No 7.50 742.25 0.61
Output Summary Results
58.2558.255.400.00745.092.84743.030.780 12:490.000000.00
Peak Inflow (cfs) ...................................................................Peak Lateral Inflow (cfs) .......................................................Peak Outflow (cfs) ................................................................Peak Exfiltration Flow Rate (cfm) .........................................Max HGL Elevation Attained (ft) ...........................................
Total Time Flooded (min) .....................................................Total Retention Time (sec) ...................................................
Max HGL Depth Attained (ft) ................................................Average HGL Elevation Attained (ft) ....................................Average HGL Depth Attained (ft) .........................................Time of Max HGL Occurrence (days hh:mm) .......................Total Exfiltration Volume (1000-ft³) ......................................Total Flooded Volume (ac-in) ...............................................
Paris Drive Park WestDetention Model
Routed 100 yr - 24 hr1/12/18 C-39
Copyright © 2022 FDOKUMEN