Annual Report - Franklin Templeton Investments
420
Annual Report and Audited Financial Statements Legg Mason Global Funds Plc An umbrella fund with segregated liability between sub-funds For the financial year ended 28 February 2021
-
Upload
khangminh22 -
Category
Documents
-
view
3 -
download
0
Transcript of Annual Report - Franklin Templeton Investments

Annual Reportand AuditedFinancialStatements
Legg MasonGlobal Funds PlcAn umbrella fund with segregatedliability between sub-fundsFor the financial year ended 28 February 2021


Legg Mason Global Funds Plc Annual Report 28 February 2021
Table of ContentsGeneral Information 3
Letter to Shareholders 16
Directors’ Report 17
Independent Auditors’ Report 31
Depositary’s Report 33
Portfolio of Investments – Legg Mason Western Asset US Government Liquidity Fund 34Portfolio of Investments – Legg Mason Western Asset US Core Bond Fund 35Portfolio of Investments – Legg Mason Western Asset US Core Plus Bond Fund 49Portfolio of Investments – Legg Mason Western Asset Euro Core Plus Bond Fund 71Portfolio of Investments – Legg Mason Western Asset Short Duration High Income Bond Fund 75Portfolio of Investments – Legg Mason Western Asset Global Multi Strategy Fund 79Portfolio of Investments – Legg Mason Western Asset US High Yield Fund 85Portfolio of Investments – Legg Mason Western Asset Emerging Markets Total Return Bond Fund 90Portfolio of Investments – Legg Mason Western Asset Emerging Markets Corporate Bond Fund 93Portfolio of Investments – Legg Mason Western Asset Global High Yield Fund 96Portfolio of Investments – Legg Mason Western Asset Global Inflation Management Fund 100Portfolio of Investments – Legg Mason Western Asset Asian Opportunities Fund 103Portfolio of Investments – Legg Mason Western Asset Short Duration Blue Chip Bond Fund 106Portfolio of Investments – Legg Mason Western Asset Global Core Plus Bond Fund^ 110Portfolio of Investments – Legg Mason Western Asset Global Credit Fund^ 117Portfolio of Investments – Legg Mason Western Asset Euro High Yield Fund 122Portfolio of Investments – Legg Mason Western Asset Macro Opportunities Bond Fund^ 124Portfolio of Investments – Legg Mason Western Asset Multi-Asset Credit Fund^ 135Portfolio of Investments – Legg Mason Western Asset Structured Opportunities Fund^ 146Portfolio of Investments – Legg Mason Western Asset US Mortgage-Backed Securities Fund^ 152Portfolio of Investments – Legg Mason Western Asset UK Investment Grade Credit Fund^ 160Portfolio of Investments – Legg Mason Western Asset US Corporate Bond Fund^ 163Portfolio of Investments – Western Asset UCITS SMASh Series Core Plus Completion Fund^ 171Portfolio of Investments – Legg Mason Brandywine Global Fixed Income Fund 175Portfolio of Investments – Legg Mason Brandywine Global Fixed Income Absolute Return Fund^ 178Portfolio of Investments – Legg Mason Brandywine Global High Yield Fund^ 180Portfolio of Investments – Legg Mason Brandywine Global Opportunistic Fixed Income Fund 182Portfolio of Investments – Legg Mason Brandywine Global Sovereign Credit Fund^ 185Portfolio of Investments – Legg Mason Brandywine Global Income Optimiser Fund^ 187Portfolio of Investments – Legg Mason Brandywine Global Credit Opportunities Fund^ 191Portfolio of Investments – Legg Mason Brandywine Global Defensive High Yield Fund^ 194Portfolio of Investments – Legg Mason Brandywine Global Enhanced Absolute Return Fund^ 196Portfolio of Investments – Legg Mason Brandywine Global Dynamic US Equity Fund^ 198Portfolio of Investments – Legg Mason ClearBridge Value Fund 200Portfolio of Investments – Legg Mason ClearBridge US Appreciation Fund 201Portfolio of Investments – Legg Mason ClearBridge US Large Cap Growth Fund 202Portfolio of Investments – Legg Mason ClearBridge US Aggressive Growth Fund 203Portfolio of Investments – Legg Mason ClearBridge Tactical Dividend Income Fund 204Portfolio of Investments – Legg Mason ClearBridge US Equity Sustainability Leaders Fund^ 206Portfolio of Investments – Legg Mason ClearBridge Global Growth Fund^ 207Portfolio of Investments – Legg Mason ClearBridge Infrastructure Value Fund^ 208Portfolio of Investments – Legg Mason ClearBridge Emerging Markets Infrastructure Fund^ 210Portfolio of Investments – Legg Mason Royce US Small Cap Opportunity Fund 211Portfolio of Investments – Legg Mason Royce US Smaller Companies Fund 214Portfolio of Investments – Legg Mason QS MV European Equity Growth and Income Fund 216Portfolio of Investments – Legg Mason QS MV Asia Pacific Ex Japan Equity Growth and Income Fund 218Portfolio of Investments – Legg Mason QS Emerging Markets Equity Fund 220Portfolio of Investments – Legg Mason QS MV Global Equity Growth and Income Fund 225Portfolio of Investments – Legg Mason Martin Currie Asia Long-Term Unconstrained Fund^ 227Portfolio of Investments – Legg Mason Martin Currie European Absolute Alpha Fund^ 228Portfolio of Investments – Legg Mason Martin Currie Global Long-Term Unconstrained Fund^ 230Portfolio of Investments – Legg Mason Martin Currie Asia Pacific Ex Japan Real Income Fund 231Portfolio of Investments – Legg Mason Martin Currie Global Emerging Markets Fund^ 232Portfolio of Investments – Legg Mason Martin Currie European Unconstrained Fund^ 233
Statement of Financial Position – Legg Mason Global Funds Plc 234Statement of Comprehensive Income – Legg Mason Global Funds Plc 254Statement of Changes in Net Assets Attributable to Holders of Redeemable Participating Shares – Legg Mason Global Funds Plc 264
Notes to Financial Statements – Legg Mason Global Funds Plc 295
^ Not authorised for sale to the public in Hong Kong.
1

Legg Mason Global Funds Plc Annual Report 28 February 2021
Table of Contents – (continued)Supplemental Information – Total Expense Ratios (TER) (unaudited) – Legg Mason Global Funds Plc 371Supplemental Information – Fund Performance Data (unaudited) – Legg Mason Global Funds Plc 378
Statement of Major Portfolio Changes (unaudited) – Legg Mason Western Asset US Government Liquidity Fund 391Statement of Major Portfolio Changes (unaudited) – Legg Mason Western Asset US Core Bond Fund 391Statement of Major Portfolio Changes (unaudited) – Legg Mason Western Asset US Core Plus Bond Fund 391Statement of Major Portfolio Changes (unaudited) – Legg Mason Western Asset Euro Core Plus Bond Fund 392Statement of Major Portfolio Changes (unaudited) – Legg Mason Western Asset Short Duration High Income Bond Fund 392Statement of Major Portfolio Changes (unaudited) – Legg Mason Western Asset Global Multi Strategy Fund 392Statement of Major Portfolio Changes (unaudited) – Legg Mason Western Asset US High Yield Fund 393Statement of Major Portfolio Changes (unaudited) – Legg Mason Western Asset Emerging Markets Total Return Bond Fund 393Statement of Major Portfolio Changes (unaudited) – Legg Mason Western Asset Emerging Markets Corporate Bond Fund 393Statement of Major Portfolio Changes (unaudited) – Legg Mason Western Asset Global High Yield Fund 394Statement of Major Portfolio Changes (unaudited) – Legg Mason Western Asset Global Inflation Management Fund 394Statement of Major Portfolio Changes (unaudited) – Legg Mason Western Asset Asian Opportunities Fund 395Statement of Major Portfolio Changes (unaudited) – Legg Mason Western Asset Short Duration Blue Chip Bond Fund 395Statement of Major Portfolio Changes (unaudited) – Legg Mason Western Asset Global Core Plus Bond Fund^ 395Statement of Major Portfolio Changes (unaudited) – Legg Mason Western Asset Global Credit Fund^ 396Statement of Major Portfolio Changes (unaudited) – Legg Mason Western Asset Euro High Yield Fund 396Statement of Major Portfolio Changes (unaudited) – Legg Mason Western Asset Macro Opportunities Bond Fund^ 397Statement of Major Portfolio Changes (unaudited) – Legg Mason Western Asset Multi-Asset Credit Fund^ 397Statement of Major Portfolio Changes (unaudited) – Legg Mason Western Asset Structured Opportunities Fund^ 397Statement of Major Portfolio Changes (unaudited) – Legg Mason Western Asset US Mortgage-Backed Securities Fund^ 398Statement of Major Portfolio Changes (unaudited) – Legg Mason Western Asset UK Investment Grade Credit Fund^ 398Statement of Major Portfolio Changes (unaudited) – Legg Mason Western Asset US Corporate Bond Fund^ 399Statement of Major Portfolio Changes (unaudited) – Western Asset UCITS SMASh Series Core Plus Completion Fund^ 399Statement of Major Portfolio Changes (unaudited) – Legg Mason Brandywine Global Fixed Income Fund 399Statement of Major Portfolio Changes (unaudited) – Legg Mason Brandywine Global Fixed Income Absolute Return Fund^ 399Statement of Major Portfolio Changes (unaudited) – Legg Mason Brandywine Global High Yield Fund^ 400Statement of Major Portfolio Changes (unaudited) – Legg Mason Brandywine Global Opportunistic Fixed Income Fund 400Statement of Major Portfolio Changes (unaudited) – Legg Mason Brandywine Global Sovereign Credit Fund^ 400Statement of Major Portfolio Changes (unaudited) – Legg Mason Brandywine Global Income Optimiser Fund^ 401Statement of Major Portfolio Changes (unaudited) – Legg Mason Brandywine Global Credit Opportunities Fund^ 401Statement of Major Portfolio Changes (unaudited) – Legg Mason Brandywine Global Defensive High Yield Fund^ 402Statement of Major Portfolio Changes (unaudited) – Legg Mason Brandywine Global Enhanced Absolute Return Fund^ 402Statement of Major Portfolio Changes (unaudited) – Legg Mason Brandywine Global Dynamic US Equity Fund^ 402Statement of Major Portfolio Changes (unaudited) – Legg Mason ClearBridge Value Fund 403Statement of Major Portfolio Changes (unaudited) – Legg Mason ClearBridge US Appreciation Fund 403Statement of Major Portfolio Changes (unaudited) – Legg Mason ClearBridge US Large Cap Growth Fund 404Statement of Major Portfolio Changes (unaudited) – Legg Mason ClearBridge US Aggressive Growth Fund 404Statement of Major Portfolio Changes (unaudited) – Legg Mason ClearBridge Tactical Dividend Income Fund 405Statement of Major Portfolio Changes (unaudited) – Legg Mason ClearBridge US Equity Sustainability Leaders Fund^ 405Statement of Major Portfolio Changes (unaudited) – Legg Mason ClearBridge Global Growth Fund^ 406Statement of Major Portfolio Changes (unaudited) – Legg Mason ClearBridge Infrastructure Value Fund^ 407Statement of Major Portfolio Changes (unaudited) – Legg Mason ClearBridge Emerging Markets Infrastructure Fund^ 407Statement of Major Portfolio Changes (unaudited) – Legg Mason Royce US Small Cap Opportunity Fund 408Statement of Major Portfolio Changes (unaudited) – Legg Mason Royce US Smaller Companies Fund 408Statement of Major Portfolio Changes (unaudited) – Legg Mason QS MV European Equity Growth and Income Fund 408Statement of Major Portfolio Changes (unaudited) – Legg Mason QS MV Asia Pacific Ex Japan Equity Growth and Income Fund 409Statement of Major Portfolio Changes (unaudited) – Legg Mason QS Emerging Markets Equity Fund 409Statement of Major Portfolio Changes (unaudited) – Legg Mason QS MV Global Equity Growth and Income Fund 409Statement of Major Portfolio Changes (unaudited) – Legg Mason Martin Currie Asia Long-Term Unconstrained Fund^ 410Statement of Major Portfolio Changes (unaudited) – Legg Mason Martin Currie European Absolute Alpha Fund^ 410Statement of Major Portfolio Changes (unaudited) – Legg Mason Martin Currie Global Long-Term Unconstrained Fund^ 411Statement of Major Portfolio Changes (unaudited) – Legg Mason Martin Currie Asia Pacific Ex Japan Real Income Fund 411Statement of Major Portfolio Changes (unaudited) – Legg Mason Martin Currie Global Emerging Markets Fund^ 412Statement of Major Portfolio Changes (unaudited) – Legg Mason Martin Currie European Unconstrained Fund^ 412
UCITS V Remuneration Policy (unaudited) 413
Appendix: Securities Financing Transactions Regulation (SFTR) 415
Appendix: Connected Persons Disclosure 416
^ Not authorised for sale to the public in Hong Kong.
2
Legg Mason Global Funds Plc Annual Report 28 February 2021
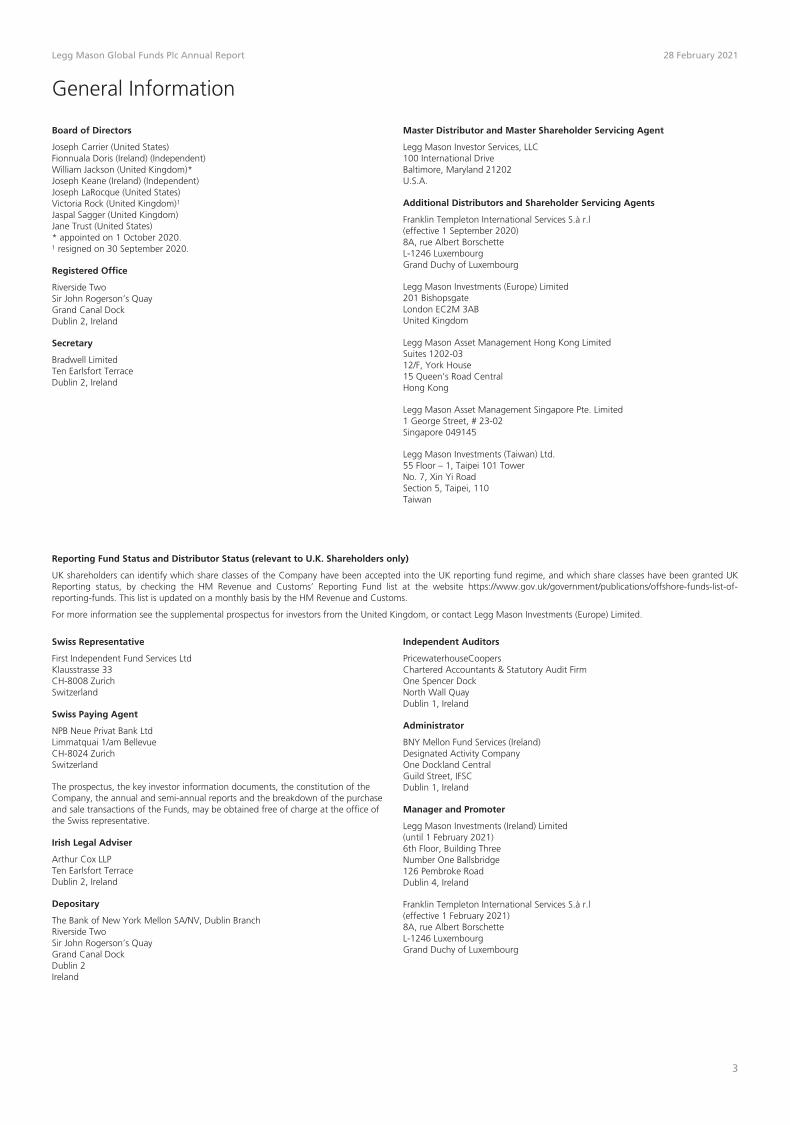
General Information
Board of Directors
Joseph Carrier (United States)Fionnuala Doris (Ireland) (Independent)William Jackson (United Kingdom)*Joseph Keane (Ireland) (Independent)Joseph LaRocque (United States)Victoria Rock (United Kingdom)1
Jaspal Sagger (United Kingdom)Jane Trust (United States)* appointed on 1 October 2020.1 resigned on 30 September 2020.
Registered Office
Riverside TwoSir John Rogerson’s QuayGrand Canal DockDublin 2, Ireland
Secretary
Bradwell LimitedTen Earlsfort TerraceDublin 2, Ireland
Master Distributor and Master Shareholder Servicing Agent
Legg Mason Investor Services, LLC100 International DriveBaltimore, Maryland 21202U.S.A.
Additional Distributors and Shareholder Servicing Agents
Franklin Templeton International Services S.à r.l(effective 1 September 2020)8A, rue Albert BorschetteL-1246 LuxembourgGrand Duchy of Luxembourg
Legg Mason Investments (Europe) Limited201 BishopsgateLondon EC2M 3ABUnited Kingdom
Legg Mason Asset Management Hong Kong LimitedSuites 1202-0312/F, York House15 Queen’s Road CentralHong Kong
Legg Mason Asset Management Singapore Pte. Limited1 George Street, # 23-02Singapore 049145
Legg Mason Investments (Taiwan) Ltd.55 Floor – 1, Taipei 101 TowerNo. 7, Xin Yi RoadSection 5, Taipei, 110Taiwan
Reporting Fund Status and Distributor Status (relevant to U.K. Shareholders only)
UK shareholders can identify which share classes of the Company have been accepted into the UK reporting fund regime, and which share classes have been granted UKReporting status, by checking the HM Revenue and Customs’ Reporting Fund list at the website https://www.gov.uk/government/publications/offshore-funds-list-of-reporting-funds. This list is updated on a monthly basis by the HM Revenue and Customs.
For more information see the supplemental prospectus for investors from the United Kingdom, or contact Legg Mason Investments (Europe) Limited.
Swiss Representative
First Independent Fund Services LtdKlausstrasse 33CH-8008 ZurichSwitzerland
Swiss Paying Agent
NPB Neue Privat Bank LtdLimmatquai 1/am BellevueCH-8024 ZurichSwitzerland
The prospectus, the key investor information documents, the constitution of theCompany, the annual and semi-annual reports and the breakdown of the purchaseand sale transactions of the Funds, may be obtained free of charge at the office ofthe Swiss representative.
Irish Legal Adviser
Arthur Cox LLPTen Earlsfort TerraceDublin 2, Ireland
Depositary
The Bank of New York Mellon SA/NV, Dublin BranchRiverside TwoSir John Rogerson’s QuayGrand Canal DockDublin 2Ireland
Independent Auditors
PricewaterhouseCoopersChartered Accountants & Statutory Audit FirmOne Spencer DockNorth Wall QuayDublin 1, Ireland
Administrator
BNY Mellon Fund Services (Ireland)Designated Activity CompanyOne Dockland CentralGuild Street, IFSCDublin 1, Ireland
Manager and Promoter
Legg Mason Investments (Ireland) Limited(until 1 February 2021)6th Floor, Building ThreeNumber One Ballsbridge126 Pembroke RoadDublin 4, Ireland
Franklin Templeton International Services S.à r.l(effective 1 February 2021)8A, rue Albert BorschetteL-1246 LuxembourgGrand Duchy of Luxembourg
3

Legg Mason Global Funds Plc Annual Report 28 February 2021
General Information – (continued)
Fund Name Fund Launch Date Investment Manager / Sub-Investment Manager(s)
Legg Mason Western Asset US Government LiquidityFundµ
27 February 2004 Investment Manager:Western Asset Management Company Limited10 Exchange SquarePrimrose StreetLondon EC2A 2ENUnited Kingdom
Sub-Investment Manager:Western Asset Management Company, LLC385 East Colorado BoulevardPasadena, California 91101U.S.A.
Legg Mason Western Asset US Core Bond Fund* 30 August 2002 Investment Manager:Western Asset Management Company Limited10 Exchange SquarePrimrose StreetLondon EC2A 2ENUnited Kingdom
Sub-Investment Manager:Western Asset Management Company, LLC385 East Colorado BoulevardPasadena, California 91101U.S.A.
Legg Mason Western Asset US Core Plus Bond Fund* 20 April 2007 Investment Manager:Western Asset Management Company Limited10 Exchange SquarePrimrose StreetLondon EC2A 2ENUnited Kingdom
Sub-Investment Managers:Western Asset Management Company, LLC385 East Colorado BoulevardPasadena, California 91101U.S.A.
Western Asset Management Company Ltd.Shin-Marunouchi Building5-1 Marunouchi1-Chome, Chiyoda-kuTokyo 100-6536Japan
Legg Mason Western Asset Euro Core PlusBond Fund*
1 October 2003 Investment Manager:Western Asset Management Company Limited10 Exchange SquarePrimrose StreetLondon EC2A 2ENUnited Kingdom
Sub-Investment Manager:Western Asset Management Company, LLC385 East Colorado BoulevardPasadena, California 91101U.S.A.
Legg Mason Western Asset Short Duration HighIncome Bond Fund*
24 February 2004 Investment Manager:Western Asset Management Company Limited10 Exchange SquarePrimrose StreetLondon EC2A 2ENUnited Kingdom
Sub-Investment Manager:Western Asset Management Company, LLC385 East Colorado BoulevardPasadena, California 91101U.S.A.
Legg Mason Western Asset Global MultiStrategy Fund*
29 August 2002 Investment Manager:Western Asset Management Company Limited10 ExchangeSquare Primrose StreetLondon EC2A 2ENUnited Kingdom
Sub-Investment Managers:Western Asset Management Company, LLC385 East Colorado BoulevardPasadena, California 91101U.S.A.
Western Asset Management Company Pte. Ltd1 George Street, #23-01Singapore 049145
4

Legg Mason Global Funds Plc Annual Report 28 February 2021
General Information – (continued)
Fund Name Fund Launch Date Investment Manager / Sub-Investment Manager(s)
Legg Mason Western Asset US High Yield Fund* 27 February 2004 Investment Manager:Western Asset Management Company Limited10 Exchange SquarePrimrose StreetLondon EC2A 2ENUnited Kingdom
Sub-Investment Manager:Western Asset Management Company, LLC385 East Colorado BoulevardPasadena, California 91101U.S.A.
Legg Mason Western Asset Emerging Markets TotalReturn Bond Fund*
24 February 2004 Investment Manager:Western Asset Management Company Limited10 Exchange SquarePrimrose StreetLondon EC2A 2ENUnited Kingdom
Sub-Investment Managers:Western Asset Management Company, LLC385 East Colorado BoulevardPasadena, California 91101U.S.A.
Western Asset Management Company Pte. Ltd1 George Street, #23-01Singapore 049145
Legg Mason Western Asset Emerging MarketsCorporate Bond Fund*
21 October 2011 Investment Manager:Western Asset Management Company Limited10 Exchange SquarePrimrose StreetLondon EC2A 2ENUnited Kingdom
Sub-Investment Managers:Western Asset Management Company, LLC385 East Colorado BoulevardPasadena, California 91101U.S.A.
Western Asset Management Company Ltd.Shin-Marunouchi Building5-1 Marunouchi1-Chome, Chiyoda-kuTokyo 100-6536Japan
Western Asset Management Company Pte. Ltd1 George Street, #23-01Singapore 049145
Western Asset Management CompanyDistribuidora de Titulos e Valores Mobiliarios LimitadaAv. Pres. Juscelino KubitschekNo. 1455 – 15th Floor – 04543011Sao Paulo – Brazil
Legg Mason Western Asset Global High Yield Fund* 20 April 2007 Investment Manager:Western Asset Management Company Limited10 Exchange SquarePrimrose StreetLondon EC2A 2ENUnited Kingdom
Sub-Investment Managers:Western Asset Management Company, LLC385 East Colorado BoulevardPasadena, California 91101U.S.A.
Western Asset Management Company Pte. Ltd1 George Street, #23-01Singapore 049145
Legg Mason Western Asset US Short-TermGovernment Fund^*þ
20 April 2007(ceased trading on 8 November 2019)
Investment Manager:Western Asset Management Company Limited10 Exchange SquarePrimrose StreetLondon EC2A 2ENUnited Kingdom
Sub-Investment Manager:Western Asset Management Company, LLC385 East Colorado BoulevardPasadena, California 91101U.S.A.
5
Legg Mason Global Funds Plc Annual Report 28 February 2021
General Information – (continued)
Fund Name Fund Launch Date Investment Manager / Sub-Investment Manager(s)
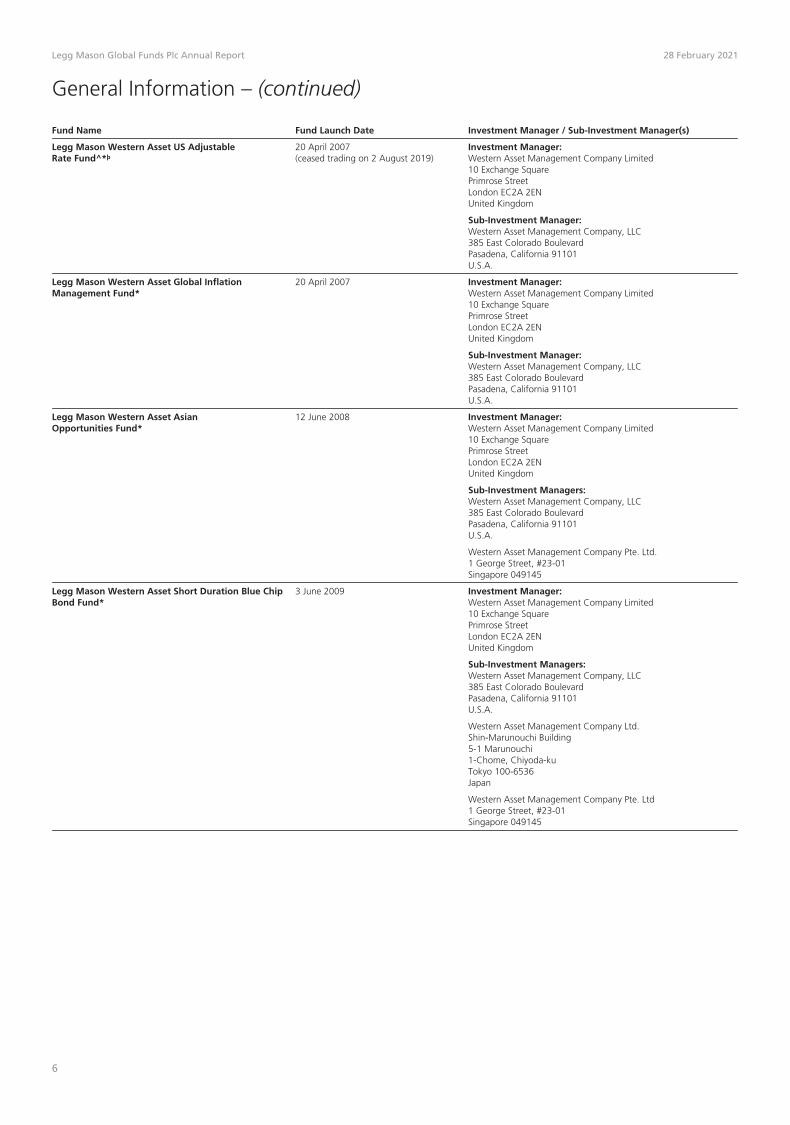
Legg Mason Western Asset US AdjustableRate Fund^*þ
20 April 2007(ceased trading on 2 August 2019)
Investment Manager:Western Asset Management Company Limited10 Exchange SquarePrimrose StreetLondon EC2A 2ENUnited Kingdom
Sub-Investment Manager:Western Asset Management Company, LLC385 East Colorado BoulevardPasadena, California 91101U.S.A.
Legg Mason Western Asset Global InflationManagement Fund*
20 April 2007 Investment Manager:Western Asset Management Company Limited10 Exchange SquarePrimrose StreetLondon EC2A 2ENUnited Kingdom
Sub-Investment Manager:Western Asset Management Company, LLC385 East Colorado BoulevardPasadena, California 91101U.S.A.
Legg Mason Western Asset AsianOpportunities Fund*
12 June 2008 Investment Manager:Western Asset Management Company Limited10 Exchange SquarePrimrose StreetLondon EC2A 2ENUnited Kingdom
Sub-Investment Managers:Western Asset Management Company, LLC385 East Colorado BoulevardPasadena, California 91101U.S.A.
Western Asset Management Company Pte. Ltd.1 George Street, #23-01Singapore 049145
Legg Mason Western Asset Short Duration Blue ChipBond Fund*
3 June 2009 Investment Manager:Western Asset Management Company Limited10 Exchange SquarePrimrose StreetLondon EC2A 2ENUnited Kingdom
Sub-Investment Managers:Western Asset Management Company, LLC385 East Colorado BoulevardPasadena, California 91101U.S.A.
Western Asset Management Company Ltd.Shin-Marunouchi Building5-1 Marunouchi1-Chome, Chiyoda-kuTokyo 100-6536Japan
Western Asset Management Company Pte. Ltd1 George Street, #23-01Singapore 049145
6

Legg Mason Global Funds Plc Annual Report 28 February 2021
General Information – (continued)
Fund Name Fund Launch Date Investment Manager / Sub-Investment Manager(s)
Legg Mason Western Asset Global Credit AbsoluteReturn Fund^*þ
20 May 2010(ceased trading on 29 April 2016)
Investment Manager:Western Asset Management Company Limited10 Exchange SquarePrimrose StreetLondon EC2A 2ENUnited Kingdom
Sub-Investment Managers:Western Asset Management Company, LLC385 East Colorado BoulevardPasadena, California 91101U.S.A.
Western Asset Management Company Ltd.Shin-Marunouchi Building5-1 Marunouchi1-Chome, Chiyoda-kuTokyo 100-6536Japan
Western Asset Management Company Pte. Ltd1 George Street, #23-01Singapore 049145
Western Asset Management CompanyDistribuidora de Titulos e Valores Mobiliarios LimitadaAv. Pres. Juscelino KubitschekNo. 1455 – 15th Floor – 04543011Sao Paulo – Brazil
Legg Mason Western Asset UK£ Core PlusBond Fund^*þ
19 November 2010(ceased trading on 24 February 2014)
Investment Manager:Western Asset Management Company Limited10 Exchange SquarePrimrose StreetLondon EC2A 2ENUnited Kingdom
Sub-Investment Managers:Western Asset Management Company, LLC385 East Colorado BoulevardPasadena, California 91101U.S.A.
Western Asset Management Company Pte. Ltd1 George Street, #23-01Singapore 049145
Legg Mason Western Asset Global Core PlusBond Fund^*
3 December 2010 Investment Manager:Western Asset Management Company Limited10 Exchange SquarePrimrose Street London EC2A 2ENUnited Kingdom
Sub-Investment Managers:Western Asset Management Company, LLC385 East Colorado BoulevardPasadena, California 91101U.S.A.
Western Asset Management Company Pte. Ltd1 George Street, #23-01Singapore 049145
Western Asset Management Company Ltd.Shin-Marunouchi Building5-1 Marunouchi1-Chome, Chiyoda-kuTokyo 100-6536Japan
7

Legg Mason Global Funds Plc Annual Report 28 February 2021
General Information – (continued)
Fund Name Fund Launch Date Investment Manager / Sub-Investment Manager(s)
Legg Mason Western Asset UK£ LongDuration Fund^*þ
19 November 2010(ceased trading on 24 February 2014)
Investment Manager:Western Asset Management Company Limited10 Exchange SquarePrimrose StreetLondon EC2A 2ENUnited Kingdom
Sub-Investment Managers:Western Asset Management Company, LLC385 East Colorado BoulevardPasadena, California 91101U.S.A.
Western Asset Management Company Pte. Ltd1 George Street, #23-01Singapore 049145
Legg Mason Western Asset Global Credit Fund^* 19 November 2010 Investment Manager:Western Asset Management Company Limited10 Exchange SquarePrimrose StreetLondon EC2A 2ENUnited Kingdom
Sub-Investment Managers:Western Asset Management Company, LLC385 East Colorado BoulevardPasadena, California 91101U.S.A.
Western Asset Management Company Pte. Ltd1 George Street, #23-01Singapore 049145
Western Asset Management Company Pty LimitedLevel 48120 Collins StreetMelbourne Vic 3000, Australia
Legg Mason Western Asset Euro High Yield Fund* 3 December 2010 Investment Manager:Western Asset Management Company Limited10 Exchange SquarePrimrose StreetLondon EC2A 2ENUnited Kingdom
Sub-Investment Managers:Western Asset Management Company, LLC385 East Colorado BoulevardPasadena, California 91101U.S.A.
Western Asset Management Company Pte. Ltd1 George Street, #23-01Singapore 049145
Legg Mason Western Asset Macro OpportunitiesBond Fund^*
5 September 2013 Investment Manager:Western Asset Management Company Limited10 Exchange SquarePrimrose StreetLondon EC2A 2ENUnited Kingdom
Sub-Investment Managers:Western Asset Management Company, LLC385 East Colorado BoulevardPasadena, California 91101U.S.A.
Western Asset Management Company Ltd.Shin-Marunouchi Building5-1 Marunouchi1-Chome, Chiyoda-kuTokyo 100-6536Japan
Western Asset Management Company Pte. Ltd1 George Street, #23-01Singapore 049145
8

Legg Mason Global Funds Plc Annual Report 28 February 2021
General Information – (continued)
Fund Name Fund Launch Date Investment Manager / Sub-Investment Manager(s)
Legg Mason Western Asset EM Local Currency DebtFund^*þ
16 December 2015(ceased trading on 10 December 2019)
Investment Manager:Western Asset Management Company Limited10 Exchange SquarePrimrose StreetLondon EC2A 2ENUnited Kingdom
Sub-Investment Manager:Western Asset Management Company, LLC385 East Colorado BoulevardPasadena, California 91101U.S.A.
Legg Mason Western Asset Multi-Asset CreditFund^*
16 December 2015 Investment Manager:Western Asset Management Company Limited10 Exchange SquarePrimrose StreetLondon EC2A 2ENUnited Kingdom
Sub-Investment Managers:Western Asset Management Company, LLC385 East Colorado BoulevardPasadena, California 91101U.S.A.
Western Asset Management CompanyDistribuidora de Titulos e Valores Mobiliarios LimitadaAv. Pres. Juscelino KubitschekNo. 1455 – 15th Floor – 04543011Sao Paulo – Brazil
Western Asset Management Company Pte. Ltd1 George Street, #23-01Singapore 049145
Western Asset Management Company Ltd.Shin-Marunouchi Building5-1 Marunouchi1-Chome, Chiyoda-kuTokyo 100-6536Japan
Legg Mason Western Asset Global Total ReturnInvestment Grade Bond Fund^*þ
31 December 2015(ceased trading on 13 November 2019)
Investment Manager:Western Asset Management Company Limited10 Exchange SquarePrimrose StreetLondon EC2A 2ENUnited Kingdom
Sub-Investment Managers:Western Asset Management Company, LLC385 East Colorado BoulevardPasadena, California 91101U.S.A.
Western Asset Management Company Pte. Ltd1 George Street, #23-01Singapore 049145
Western Asset Management Company Ltd.Shin-Marunouchi Building5-1 Marunouchi1-Chome, Chiyoda-kuTokyo 100-6536Japan
Western Asset Management Company Pty LimitedLevel 48120 Collins StreetMelbourne Vic 3000, Australia
Western Asset Management CompanyDistribuidora de Titulos e Valores Mobiliarios LimitadaAv. Pres. Juscelino KubitschekNo. 1455 – 15th Floor – 04543011Sao Paulo – Brazil
Legg Mason Western Asset Structured OpportunitiesFund^*
13 January 2016 Investment Manager:Western Asset Management Company Limited10 Exchange SquarePrimrose StreetLondon EC2A 2ENUnited Kingdom
Sub-Investment Manager:Western Asset Management Company, LLC385 East Colorado BoulevardPasadena, California 91101U.S.A
9
Legg Mason Global Funds Plc Annual Report 28 February 2021
General Information – (continued)
Fund Name Fund Launch Date Investment Manager / Sub-Investment Manager(s)
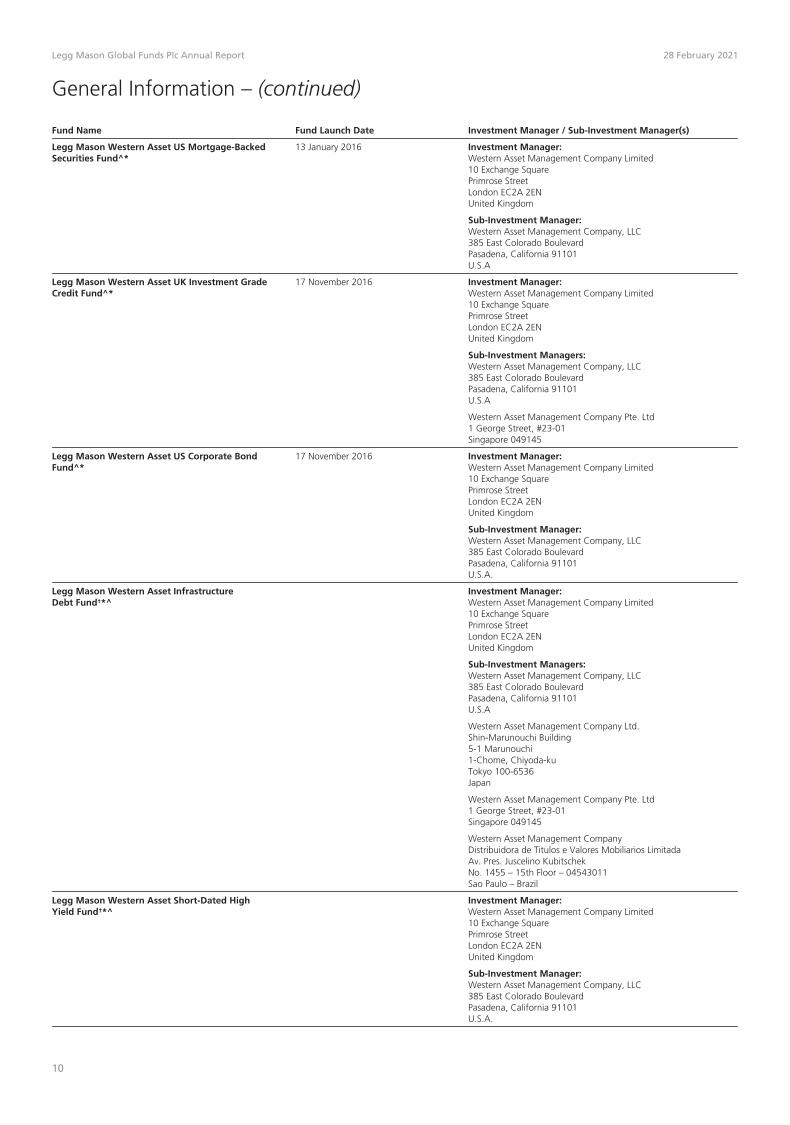
Legg Mason Western Asset US Mortgage-BackedSecurities Fund^*
13 January 2016 Investment Manager:Western Asset Management Company Limited10 Exchange SquarePrimrose StreetLondon EC2A 2ENUnited Kingdom
Sub-Investment Manager:Western Asset Management Company, LLC385 East Colorado BoulevardPasadena, California 91101U.S.A
Legg Mason Western Asset UK Investment GradeCredit Fund^*
17 November 2016 Investment Manager:Western Asset Management Company Limited10 Exchange SquarePrimrose StreetLondon EC2A 2ENUnited Kingdom
Sub-Investment Managers:Western Asset Management Company, LLC385 East Colorado BoulevardPasadena, California 91101U.S.A
Western Asset Management Company Pte. Ltd1 George Street, #23-01Singapore 049145
Legg Mason Western Asset US Corporate BondFund^*
17 November 2016 Investment Manager:Western Asset Management Company Limited10 Exchange SquarePrimrose StreetLondon EC2A 2ENUnited Kingdom
Sub-Investment Manager:Western Asset Management Company, LLC385 East Colorado BoulevardPasadena, California 91101U.S.A.
Legg Mason Western Asset InfrastructureDebt Fund†*^
Investment Manager:Western Asset Management Company Limited10 Exchange SquarePrimrose StreetLondon EC2A 2ENUnited Kingdom
Sub-Investment Managers:Western Asset Management Company, LLC385 East Colorado BoulevardPasadena, California 91101U.S.A
Western Asset Management Company Ltd.Shin-Marunouchi Building5-1 Marunouchi1-Chome, Chiyoda-kuTokyo 100-6536Japan
Western Asset Management Company Pte. Ltd1 George Street, #23-01Singapore 049145
Western Asset Management CompanyDistribuidora de Titulos e Valores Mobiliarios LimitadaAv. Pres. Juscelino KubitschekNo. 1455 – 15th Floor – 04543011Sao Paulo – Brazil
Legg Mason Western Asset Short-Dated HighYield Fund†*^
Investment Manager:Western Asset Management Company Limited10 Exchange SquarePrimrose StreetLondon EC2A 2ENUnited Kingdom
Sub-Investment Manager:Western Asset Management Company, LLC385 East Colorado BoulevardPasadena, California 91101U.S.A.
10

Legg Mason Global Funds Plc Annual Report 28 February 2021
General Information – (continued)
Fund Name Fund Launch Date Investment Manager / Sub-Investment Manager(s)
Legg Mason Western Asset Asian Income Fund*† Investment Manager:Western Asset Management Company Limited10 Exchange SquarePrimrose StreetLondon EC2A 2ENUnited Kingdom
Sub-Investment Managers:Western Asset Management Company, LLC385 East Colorado BoulevardPasadena, California 91101U.S.A.
Western Asset Management Company Pte. Ltd1 George Street, #23-01Singapore 049145
Western Asset UCITS SMASh Series Core PlusCompletion Fund^*
11 January 2021 Investment Manager:Western Asset Management Company Limited10 Exchange SquarePrimrose StreetLondon EC2A 2ENUnited Kingdom
Sub-Investment Manager:Western Asset Management Company, LLC385 East Colorado BoulevardPasadena, California 91101U.S.A.
Legg Mason Brandywine Global Fixed Income Fund* 1 October 2003 Investment Manager:Brandywine Global Investment Management, LLC1735 Market StreetSuite 1800Philadelphia, Pennsylvania 19103U.S.A.
Legg Mason Brandywine Global Fixed IncomeAbsolute Return Fund^*
3 April 2012 Investment Manager:Brandywine Global Investment Management, LLC1735 Market StreetSuite 1800Philadelphia, Pennsylvania 19103U.S.A.
Legg Mason Brandywine Global High Yield Fund^* 30 November 2012 Investment Manager:Brandywine Global Investment Management, LLC1735 Market StreetSuite 1800Philadelphia, Pennsylvania 19103U.S.A.
Legg Mason Brandywine Global Opportunistic FixedIncome Fund*
25 June 2010 Investment Manager:Brandywine Global Investment Management, LLC1735 Market StreetSuite 1800Philadelphia, Pennsylvania 19103U.S.A.
Legg Mason Brandywine Global SovereignCredit Fund^*þ
10 May 2012(ceased trading on 25 February 2021)
Investment Manager:Brandywine Global Investment Management, LLC1735 Market StreetSuite 1800Philadelphia, Pennsylvania 19103U.S.A.
Legg Mason Brandywine Global IncomeOptimiser Fund^*
3 June 2013 Investment Manager:Brandywine Global Investment Management, LLC1735 Market StreetSuite 1800Philadelphia, Pennsylvania 19103U.S.A.
Legg Mason Brandywine Global CreditOpportunities Fund^*
30 June 2014 Investment Manager:Brandywine Global Investment Management, LLC1735 Market StreetSuite 1800Philadelphia, Pennsylvania 19103U.S.A.
Legg Mason Brandywine Global DynamicUS Equity Fund^**
31 December 2015 Investment Manager:Brandywine Global Investment Management, LLC1735 Market StreetSuite 1800Philadelphia, Pennsylvania 19103U.S.A.
11

Legg Mason Global Funds Plc Annual Report 28 February 2021
General Information – (continued)
Fund Name Fund Launch Date Investment Manager / Sub-Investment Manager(s)
Legg Mason Brandywine Global Defensive HighYield Fund*^
6 April 2017 Investment Manager:Brandywine Global Investment Management, LLC1735 Market StreetSuite 1800Philadelphia, Pennsylvania 19103U.S.A.
Legg Mason Brandywine Global – US High YieldFund*^þ
30 October 2017(ceased trading on 29 January 2020)
Investment Manager:Brandywine Global Investment Management, LLC1735 Market StreetSuite 1800Philadelphia, Pennsylvania 19103U.S.A.
Legg Mason Brandywine Global Enhanced AbsoluteReturn Fund*^
16 August 2018 Investment Manager:Brandywine Global Investment Management, LLC1735 Market StreetSuite 1800Philadelphia, Pennsylvania 19103U.S.A.
Legg Mason Brandywine Global – EM Macro BondFund*†^
Investment Manager:Brandywine Global Investment Management, LLC1735 Market StreetSuite 1800Philadelphia, Pennsylvania 19103U.S.A.
Legg Mason ClearBridge Value Fund** 23 March 1998 Investment Manager:ClearBridge Investments, LLC620 Eighth Avenue, 48th FloorNew York, New York 10018U.S.A.
Legg Mason ClearBridge Growth Fund^**þ 25 February 2004(ceased trading on 15 February 2019)
Investment Manager:ClearBridge Investments, LLC620 Eighth Avenue, 48th FloorNew York, New York 10018U.S.A.
Legg Mason ClearBridge Global Equity Fund^**þ 1 September 2006(ceased trading on 22 November 2019)
Investment Manager:ClearBridge Investments, LLC620 Eighth Avenue, 48th FloorNew York, New York 10018U.S.A.
Legg Mason ClearBridge Global Equity IncomeFund^**þ
15 September 2014(ceased trading on 22 July 2019)
Investment Manager:ClearBridge Investments, LLC620 Eighth Avenue, 48th FloorNew York, New York 10018U.S.A.
Legg Mason ClearBridge US Appreciation Fund** 20 April 2007 Investment Manager:ClearBridge Investments, LLC620 Eighth Avenue, 48th FloorNew York, New York 10018U.S.A.
Legg Mason ClearBridge US Large CapGrowth Fund**
20 April 2007 Investment Manager:ClearBridge Investments, LLC620 Eighth Avenue, 48th FloorNew York, New York 10018U.S.A.
Legg Mason ClearBridge US AggressiveGrowth Fund**
20 April 2007 Investment Manager:ClearBridge Investments, LLC620 Eighth Avenue, 48th FloorNew York, New York 10018U.S.A.
Legg Mason ClearBridge Tactical DividendIncome Fund**
3 June 2013 Investment Manager:ClearBridge Investments, LLC620 Eighth Avenue, 48th FloorNew York, New York 10018U.S.A.
Legg Mason ClearBridge US Equity SustainabilityLeaders Fund^**
30 September 2015 Investment Manager:ClearBridge Investments, LLC620 Eighth Avenue, 48th FloorNew York, New York 10018U.S.A.
12

Legg Mason Global Funds Plc Annual Report 28 February 2021
General Information – (continued)
Fund Name Fund Launch Date Investment Manager / Sub-Investment Manager(s)
Legg Mason ClearBridge Global Growth Fund**^ 29 June 2018 Investment Manager:ClearBridge Investments, LLC620 Eighth Avenue, 48th FloorNew York, New York 10018U.S.A.
Legg Mason ClearBridge Global SRI Equity Fund†**^ Investment Manager:ClearBridge Investments, LLC620 Eighth Avenue, 48th FloorNew York, New York 10018U.S.A.
Legg Mason ClearBridge Infrastructure ValueFund**^
9 December 2016 Investment Manager:ClearBridge RARE Infrastructure International Pty LimitedLevel 13, 35 Clarence StreetSydney NSW 2000Australia
Legg Mason ClearBridge Emerging MarketsInfrastructure Fund**^
31 March 2017 Investment Manager:ClearBridge RARE Infrastructure International Pty LimitedLevel 13, 35 Clarence StreetSydney NSW 2000Australia
Legg Mason ClearBridge Global InfrastructureIncome Fund**†^
30 April 2021 Investment Manager:ClearBridge RARE Infrastructure International Pty LimitedLevel 13, 35 Clarence StreetSydney NSW 2000Australia
Legg Mason Royce US Small Cap OpportunityFund**
8 November 2002 Investment Manager:Royce & Associates, LP745 5th AvenueNew York, New York 10151U.S.A.
Legg Mason Royce US Smaller Companies Fund** 1 March 2004 Investment Manager:Royce & Associates, LP745 5th AvenueNew York, New York 10151U.S.A.
Legg Mason QS MV European Equity Growth andIncome Fund**
30 August 2002 Investment Manager:QS Investors, LLC880 Third Avenue, 7th FloorNew York, NY 10022U.S.A.
Legg Mason QS MV Asia Pacific Ex Japan EquityGrowth and Income Fund**
25 February 2004 Investment Manager:QS Investors, LLC880 Third Avenue, 7th FloorNew York, NY 10022U.S.A.
Legg Mason Batterymarch International Large CapFund^**þ
20 April 2007(ceased trading on 25 February 2015)
Legg Mason QS Emerging Markets Equity Fund**þ 28 April 2008(ceased trading on 14 April 2021)
Investment Manager:QS Investors, LLC880 Third Avenue, 7th FloorNew York, NY 10022U.S.A.
Legg Mason QS MV Global Equity Growth andIncome Fund**
29 December 2010 Investment Manager:QS Investors, LLC880 Third Avenue, 7th FloorNew York, NY 10022U.S.A.
Legg Mason QS US Large Cap Fund^†** Investment Manager:QS Investors, LLC880 Third Avenue, 7th FloorNew York, NY 10022U.S.A.
Legg Mason Martin Currie Asia Long-TermUnconstrained Fund**^
11 March 2016 Investment Manager:Martin Currie Investment Management LtdSaltire Court20 Castle TerraceEdinburgh EH1 2ESScotland
Sub-Investment Manager:Legg Mason Asset Management Singapore Pte. Limited1 George Street, #23-02Singapore 049145
13

Legg Mason Global Funds Plc Annual Report 28 February 2021
General Information – (continued)
Fund Name Fund Launch Date Investment Manager / Sub-Investment Manager(s)
Legg Mason Martin Currie Asia Pacific Fund**^þ 11 March 2016(ceased trading on 21 August 2019)
Investment Manager:Martin Currie Investment Management LtdSaltire Court20 Castle TerraceEdinburgh EH1 2ESScotland
Sub-Investment Manager:Legg Mason Asset Management Singapore Pte. Limited1 George Street, #23-02Singapore 049145
Legg Mason Martin Currie European Absolute AlphaFund**^þ
11 March 2016(ceased trading on 1 June 2021)
Investment Manager:Martin Currie Investment Management LtdSaltire Court20 Castle TerraceEdinburgh EH1 2ESScotland
Legg Mason Martin Currie Global ResourcesFund**^þ
11 March 2016(ceased trading on 31 July 2017)
Legg Mason Martin Currie Greater China Fund**^þ 11 March 2016(ceased trading on 15 November 2019)
Investment Manager:Martin Currie Investment Management LtdSaltire Court20 Castle TerraceEdinburgh EH1 2ESScotland
Legg Mason Martin Currie Japan Absolute AlphaFund**^þ
11 March 2016(ceased trading on 31 May 2019)
Investment Manager:Martin Currie Investment Management LtdSaltire Court20 Castle TerraceEdinburgh EH1 2ESScotland
Legg Mason Martin Currie North American Fund**^þ 11 March 2016(ceased trading on 5 October 2017)
Investment Manager:Martin Currie Investment Management LtdSaltire Court20 Castle TerraceEdinburgh EH1 2ESScotland
Legg Mason Martin Currie Global Long-TermUnconstrained Fund**^
28 June 2016 Investment Manager:Martin Currie Investment Management LtdSaltire Court20 Castle TerraceEdinburgh EH1 2ESScotland
Legg Mason Martin Currie Asia Pacific Ex Japan RealIncome Fund**
28 June 2016 Investment Manager:Legg Mason Asset Management Australia Limited(trading under the name “Martin Currie Australia”)Level 47120 Collins Street,Melbourne VIC 3000Australia
Legg Mason Martin Currie Global Emerging MarketsFund**^
24 November 2017 Investment Manager:Martin Currie Investment Management LtdSaltire Court20 Castle TerraceEdinburgh EH1 2ESScotland
Legg Mason Martin Currie European Select AbsoluteAlpha Fund**†^
Investment Manager:Martin Currie Investment Management LtdSaltire Court20 Castle TerraceEdinburgh EH1 2ESScotland
Legg Mason Martin Currie Global DividendOpportunities Fund**^þ
1 March 2018(ceased trading on 20 September 2019)
Investment Manager:Martin Currie Investment Management LtdSaltire Court20 Castle TerraceEdinburgh EH1 2ESScotland
Legg Mason Martin Currie European UnconstrainedFund**^
9 November 2018 Investment Manager:Martin Currie Investment Management LtdSaltire Court20 Castle TerraceEdinburgh EH1 2ESScotland
14

Legg Mason Global Funds Plc Annual Report 28 February 2021
General Information – (continued)
Fund Name Fund Launch Date Investment Manager / Sub-Investment Manager(s)
Legg Mason Multi-Asset Infrastructure IncomeFund***†^
Investment Managers:Western Asset Management Company, LLC385 East Colorado BoulevardPasadena, California 91101U.S.A.
ClearBridge RARE Infrastructure International Pty LimitedLevel 13, 35 Clarence StreetSydney NSW 2000Australia
Legg Mason PCM US Equity Fund^þ 8 January 2008(ceased trading on 24 August 2010,re-launched on 13 April 2012 and ceasedtrading on 30 August 2013)
Legg Mason Congruix Japan Equity Fund^þ 2 October 2008(ceased trading on 30 November 2010)
† As at the financial year end, these Funds have not commenced trading.^ Not authorised for sale to the public in Hong Kong.µ Money Market Fund.* Fixed Income Funds (Funds which invest mainly in fixed income and interest bearing securities).** Equity Funds (Funds which invest mainly in equities).*** Multi-Asset Fund (any Fund defined as a "Multi-Asset Fund" in the relevant Supplement of the Prospectus).þ Pending revocation of authorisation from the Central Bank.
For More InformationFor further information on the range of Funds within Legg Mason Global Funds Plc, contact:
For professional investors in Europe (excluding UK & Switzerland)
Franklin Templeton International Services S.à r.l8A, rue Albert BorschetteL-1246 LuxembourgGrand Duchy of Luxembourg
www.leggmasonglobal.com
For authorised dealers in the Americas
Legg Mason Investments1395 Brickell AvenueSuite 1550Miami, Florida 33131, U.S.A.Tel: + 305 529 4400
www.leggmasonamericas.com
Go to the relevant website for information on:
• Daily prices
• Literature, including fact sheets providing the latest information on each Fund
• More information about Franklin Templeton’s asset management affiliates managing the Funds
15

Legg Mason Global Funds Plc Annual Report 28 February 2021
Letter to ShareholdersDear Shareholder,We are pleased to provide you with the annual report for Legg Mason Global FundsPlc (the “Company”) for the twelve-month reporting period ended 28 February2021. In this report, we highlight the key drivers behind the performance of bondand equity markets over the period.
Global Economic ReviewThe global economy was significantly impacted by the repercussions from theCOVID-19 pandemic during the reporting period. As the virus spread, governmentsaround the world instituted lockdowns in an attempt to stem the outbreak. Thistriggered a severe global recession in the second quarter of 2020. Global centralbanks were extremely aggressive in their response to support their economies. Inaddition, many governments introduced substantial fiscal measures. These actions,along with the introduction of several highly effective vaccines, helped the globaleconomy to rebound as the reporting period progressed. In its January 2021 WorldEconomic Outlook (“WEO”) Update, the International Monetary Fund (“IMF”) said,“Multiple vaccine approvals and the launch of vaccination in some countries inDecember have raised hopes of an eventual end to the pandemic. Moreover,economic data released after the October 2020 WEO forecast suggest stronger thanprojected momentum on average across regions in the second half of 2020.” Froma regional perspective, the IMF projects that 2021 gross domestic product (“GDP”)growth in the U.S., Eurozone, UK and Japan will be 5.1%, 4.2%, 4.5% and 3.1%,respectively. For comparison purposes, the GDP of these economies were forecastto be -3.4%, -7.2%, -10.0% and -5.1%, respectively, in 2020.
Market Review – Fixed Incomei
The global fixed income market was volatile amid periods of both investor riskaversion and risk appetite. In the US, short-term U.S. Treasury yields moved sharplylower, as the Federal Reserve Board (“Fed”)ii held the federal funds rateiii in a rangebetween 0.00% and 0.25% for much of the reporting period. Two-year Treasuryyieldsiv began the period at 0.86% and ended the period at 0.14% (yields andprices move in the opposite direction). In contrast, long-term US Treasury yieldsmoved sharply higher. Much of this increase occurred late in the period, as positiveeconomic data triggered inflationary concerns and fears that the Fed may remove itsmonetary policy accommodation sooner than previously anticipated. US ten-yearTreasury yields began the reporting period at 1.13%. Their low of 0.52% occurredon 4 August 2020 and they ended the period at 1.44%. This trend also occurred ina number of developed market countries outside the US. All told, most spreadsectors (non-US Treasuries) posted positive, albeit in many cases modest returns,over the reporting period. These included investment-gradev corporate bondsvi andUS dollar-denominated emerging market sovereign debt. In contrast, lower-ratedcorporate bonds generated strong results.
Market Review – Global Equitiesvii
Following the initial negative impact from COVID-19, the global equity market thenrallied sharply. This turnaround was due to a number of factors, including theaggressive actions by global central banks and governments, the rollout of severalCOVID-19 vaccines, the resolution of the US election and the long-awaited Brexitagreement. Against this backdrop, investor risk appetite was generally robust, as
they anticipated a sustainable global economic recovery and improving corporateresults in 2021. All told, equities in the US and other developed market countries, aswell as emerging market countries, produced outstanding results during thereporting period.
We thank you for your continued support.
Yours sincerely,
Franklin Templeton International Services S.à r.l
March 2021
Past performance is no guarantee of future results. The information is not intendedto be a forecast of future events, a guarantee of future results or investment advice.
All data as at 28 February 2021 unless otherwise stated.
Legg Mason Global Funds plc is an umbrella fund with segregated liability betweensub-funds, established as an open-ended investment company with variable capital,authorised in Ireland by the Central Bank of Ireland as an undertaking for collectiveinvestment in transferable securities.
All investments involve risk, including the possible loss of principal. Pastperformance is no guide to future returns and may not be repeated.
This information has been prepared from sources believed reliable but is notguaranteed by Franklin Resources, Inc. company or affiliate (together “FranklinTempleton”) and is not a complete summary or statement of all available data.
Individual securities mentioned are intended as examples of portfolio holdings andare not intended as buy or sell recommendations.
Opinions expressed are subject to change without notice and do not take intoaccount the particular investment objectives, financial situation or needs ofindividual investors.
Before investing you should read the key investor information document and theprospectus, which describe the sub-funds’ full objectives and risk factors. These andother relevant documents may be obtained in a number of languages at BNYMellon Fund Services (Ireland) Designated Activity Company, One Dockland Central,Guild Street, IFSC, Dublin 1, Ireland, www.leggmasonglobal.com and the registeredoffice.
Issued and approved by Franklin Templeton International Services S.à r.l, 8A, rueAlbert Borschette, L-1246 Luxembourg, Grand Duchy of Luxembourg, incorporatedin Luxembourg and regulated by the Commission de Surveillance du SecteurFinancier.
This material is not intended for any person or use that would be contrary to locallaw or regulation. Franklin Templeton is not responsible and takes no liability for theonward transmission of this material.
i Fixed income – bonds.
ii US Federal Reserve – the central bank of the United States and the most powerful financialinstitution in the world.
iii The federal funds rate is the target interest rate set by the Federal Open Market Committeeat which commercial banks borrow and lend their excess reserves to each other overnight.
iv Treasury yield – interest rates on borrowing that is paid by the government.
v Investment grade – a credit rating that means a government or corporate bond has arelatively low risk of default.
vi Corporate bond – a bond issued by a corporation to raise money effectively in order toexpand its business.
vii Equity – ownership interest in a corporation in the form of common stock or preferredstock.
16

Legg Mason Global Funds Plc Annual Report 28 February 2021
Directors’ Report
The directors of the Company (the ‘‘Directors’’) submit their annual report together with the audited financial statements for the financial year ended 28 February 2021.
Statement of Directors’ Responsibilities
The Directors are responsible for preparing the directors’ report and the financial statements in accordance with Irish law.
Irish company law requires the Directors to prepare financial statements for each financial year that give a true and fair view of the Company’s assets, liabilities and financialposition as at the end of the financial year and of the profit or loss of the Company for the financial year. The Directors have prepared the financial statements inaccordance with the accounting standards generally accepted in Ireland, including Financial Reporting Standard (“FRS”) 102: “The Financial Reporting Standard applicable inthe United Kingdom and the Republic of Ireland” (“FRS 102”).
Under Irish company law, the Directors shall not approve the financial statements unless they are satisfied that they give a true and fair view of the Company’s assets,liabilities and financial position as at the end of the financial year and the profit or loss of the Company for the financial year.
In preparing these financial statements, the Directors are required to:
• select suitable accounting policies and then apply them consistently;
• make judgements and estimates that are reasonable and prudent;
• state whether the financial statements have been prepared in accordance with applicable accounting standards and identify the standards in question, subject to anymaterial departures from those standards being disclosed and explained in the notes to the financial statements; and
• prepare the financial statements on the going concern basis unless it is inappropriate to presume that the Company will continue in business.
The Directors are responsible for ensuring that adequate accounting records are kept that are sufficient to:
• correctly record and explain the transactions of the Company;
• enable, at any time, the assets, liabilities, financial position and profit or loss of the Company to be determined with reasonable accuracy; and
• enable the Directors to ensure that the financial statements comply with the requirements of the Companies Act 2014 and enable those financial statements to beaudited.
To achieve this, the Directors have appointed an experienced administrator, BNY Mellon Fund Services (Ireland) Designated Activity Company, to maintain the accountingrecords and perform additional administrative duties.
The Directors are also responsible for safeguarding the assets of the Company. In fulfilment of this responsibility, they have appointed The Bank of New York Mellon SA/NV,Dublin Branch, to safekeep the Company’s assets in accordance with the constitution of the Company. In addition, the Directors are responsible for taking reasonable stepsfor the prevention and detection of fraud and other irregularities.
The Directors are responsible for the maintenance and integrity of the financial statements of the Company included on the website of Franklin Templeton affiliates thatdistribute the Funds. Legislation in Ireland governing the preparation and dissemination of financial statements may differ from legislation in other jurisdictions.
Review of Business and Future Developments
The Letter to Shareholders on page 16 contains a review of the factors which contributed to the performance of the Funds for the year. The Directors do not anticipate anychanges to the investment objectives of the existing Funds, except as noted in Note 16 – Subsequent Events of these Financial Statements.
As at 28 February 2021, the Company has 53 active Funds (2020: 53 Funds) in operation. Details of their net asset values as at 28 February 2021 are disclosed in theStatement of Financial Position on pages 234 to 253.
Effective 11 January 2021, Western Asset UCITS SMASh Series Core Plus Completion Fund^ commenced trading.
Risk Management Objectives and Policies
Information in relation to certain of the Company’s risk management objectives and policies are included in Note 12 to financial statements.
Results for the Year and State of Affairs at 29 February 2020
The Statement of Financial Position as at 28 February 2021 and 29 February 2020 and the Statement of Comprehensive Income for the financial year ended 28 February2021 and 29 February 2020 are set out on pages 234 to 253 and 254 to 262, respectively.
Distributions to Holders of Redeemable Participating Shares
The distributions to holders of Redeemable Participating Shares for the financial year ended 28 February 2021 and 29 February 2020 are set out in the Statement ofComprehensive Income.
Significant Events
See Note 14 for details of significant events during the year.
Subsequent Events
See Note 16 for details of significant events subsequent to the year end.
Directors
The names of the persons who are currently Directors or who served as a Director at any time during the financial year are set out below.
Joseph Carrier (United States)Fionnuala Doris (Ireland) (Independent)William Jackson (United Kingdom)*Joseph Keane (Ireland) (Independent)Joseph LaRocque (United States)Victoria Rock (United Kingdom)1
17

Legg Mason Global Funds Plc Annual Report 28 February 2021
Directors’ Report – (continued)
Directors – (continued)
Jaspal Sagger (United Kingdom)Jane Trust (United States)* appointed on 1 October 2020.1 resigned on 30 September 2020.
Directors’ and Secretary’s Interests
The Directors and secretary and their families had no interests in the shares of the Company at 28 February 2021 and 29 February 2020. No Director had at any time duringthe year, a material interest in any contract of significance, subsisting during or at the end of the year, in relation to the business of the Company.
Corporate Governance Statement
The Board of Directors of the Company (the ‘‘Board’’) has assessed all measures included in the voluntary Corporate Governance Code for Collective Investment Schemesand Management Companies as published by the Irish Funds in December 2011 (the “Irish Funds Code”). The Board has adopted all corporate governance practices andprocedures in the Irish Funds Code.
Director’s Compliance Statement
It is the policy of the Company to comply with its relevant obligations (as defined in the Companies Act 2014). As required by Section 225(2) of the Companies Act 2014,the Directors acknowledge that they are responsible for securing the Company’s compliance with the relevant obligations. The Directors have drawn up a compliance policystatement as defined in Section 225(3)(a) of the Companies Act 2014 and a compliance policy which refers to the arrangements and structures that are in place and whichare, in the Directors’ opinion, designed to secure material compliance with the Company’s relevant obligations. In discharging their responsibilities under Section 225, theDirectors relied upon, among other things, the services provided, advice and/or representations from third parties whom the Directors believe have the requisite knowledgeand experience in order to secure material compliance with the Company’s relevant obligations.
Relevant Audit Information
So far as the Directors are aware, there is no relevant audit information of which the Company’s auditors are unaware and the Directors have taken all the steps that oughtto have been taken as Directors in order to make themselves aware of any relevant audit information and to establish that the Company’s auditors are aware of thatinformation.
Connected Person Transactions
Regulation 43(1) of the Central Bank (Supervision and Enforcement) Act 2013 (Section 48(1)) (Undertakings for Collective Investment in Transferable Securities) Regulations2019 (the “Central Bank UCITS Regulations”) states that a “responsible person shall ensure that any transaction between a UCITS and a connected person is (a) conductedat arm’s length; and (b) in the best interests of the unit-holders of the UCITS”.
As required under Regulation 81(4) of the Central Bank UCITS Regulations, the Board is satisfied that (a) there are arrangements in place, evidenced by written procedures,to ensure that the obligations that are prescribed by Regulation 43(1) are applied to all transactions with connected persons; and (b) all transactions with connected personsthat were entered into during the financial year complied with the obligations that are prescribed by Regulation 43(1).
Independent Auditors
PricewaterhouseCoopers have indicated their willingness to remain in office in accordance with Section 383(2) of the Companies Act 2014.
Investment Objectives and Investment Policies
All active Funds, except Legg Mason Western Asset Global Core Plus Bond Fund^, Legg Mason Western Asset Global Credit Fund^, Legg Mason Western Asset MacroOpportunities Bond Fund^, Legg Mason Western Asset Multi-Asset Credit Fund^, Western Asset UCITS SMASh Series Core Plus Completion Fund^, Legg Mason WesternAsset Structured Opportunities Fund^, Legg Mason Western Asset US Mortgage-Backed Securities Fund^, Legg Mason Western Asset UK Investment Grade Credit Fund^,Legg Mason Western Asset US Corporate Bond Fund^, Legg Mason Brandywine Global Fixed Income Absolute Return Fund^, Legg Mason Brandywine Global High YieldFund^, Legg Mason Brandywine Global Income Optimiser Fund^, Legg Mason Brandywine Global Credit Opportunities Fund^, Legg Mason Brandywine Global DefensiveHigh Yield Fund^, Legg Mason Brandywine Global Enhanced Absolute Return Fund^, Legg Mason Brandywine Global Dynamic US Equity Fund^, Legg Mason ClearBridgeUS Equity Sustainability Leaders Fund^, Legg Mason ClearBridge Global Growth Fund^, Legg Mason ClearBridge Infrastructure Value Fund^, Legg Mason ClearBridgeEmerging Markets Infrastructure Fund^, Legg Mason Martin Currie Asia Long-Term Unconstrained Fund^, Legg Mason Martin Currie European Absolute Alpha Fund^, LeggMason Martin Currie Global Long-Term Unconstrained Fund^, Legg Mason Martin Currie Global Emerging Markets Fund^ and Legg Mason Martin Currie EuropeanUnconstrained Fund^, have been authorised by the Securities and Futures Commission in Hong Kong. Therefore, the Funds noted above are not authorised for sale to thepublic in Hong Kong. The authorisation by the Securities and Futures Commission of Hong Kong does not imply recommendation for investment into the Funds.
The principal investment objective and policies of all active Funds at 28 February 2021 are listed below and on the subsequent pages. There can be no assurance that anyFund will achieve its objective and there is no guarantee that an investment strategy will succeed or attain any particular results or level of profitability (defined terms are asdefined in the prospectus for the relevant Fund (the “Prospectus’’). A more detailed description of the investment policies of each Fund is set out in the relevant Prospectus.
Legg Mason Western Asset US Government Liquidity Fund
Investment Objective – To maintain the principal of the Fund and provide a return in line with money market rates.
Investment Policies – The Fund invests at least 99.5% of its net asset value in: (i) eligible money market instruments issued or guaranteed separately by the European Union,the national, regional and local administrations of the Member States or their central banks, the European Central Bank, the European Investment Bank, the EuropeanInvestment Fund, the European Stability Mechanism, the European Financial Stability Facility, a central authority or central bank of a third country (including the US), theInternational Monetary Fund, the International Bank for Reconstruction and Development, the Council of Europe Development Bank, the European Bank for Reconstructionand Development, the Bank for International Settlements, and any other relevant international financial institution or organisation to which one or more Member Statesbelong and which issuers may include, without limitation, Federal National Mortgage Association (Fannie Mae), Federal Home Loan Mortgage Corporation (Freddie Mac)Government National Mortgage Association (Ginnie Mae), Student Loan Marketing Association (Sallie Mae) and Federal Home Loan Bank (“Public Debt money marketinstruments”); (ii) eligible reverse repurchase agreements secured with Public Debt money market instruments; and (iii) cash deposits held in US Dollars.
By way of derogation, the Fund is authorised by the Central Bank to invest up to 100% of its net asset value in Public Debt money market instruments provided that (i) itholds Public Debt money market instruments from at least six different issues by issuer, (ii) and that it limits the investment in Public Debt money market instruments fromthe same issue to a maximum of 30% of its net asset value. The Fund invests at least two-thirds of its net asset value in Public Debt money market instruments denominatedin US Dollars and issued by US issuers. The Fund does not intend to use financial derivative instruments for any purpose.
The Fund is a short-term public debt Constant Net Asset Value (“CNAV”) Money Market Fund in accordance with the requirements of the Central Bank Regulations.
^ Not authorised for sale to the public in Hong Kong.
18

Legg Mason Global Funds Plc Annual Report 28 February 2021
Directors’ Report – (continued)
Legg Mason Western Asset US Core Bond Fund
Investment Objective – To maximise total return through income and capital appreciation.
Investment Policies – The Fund invests at least 75 per cent of its net asset value in debt securities that are (i) listed or traded on Regulated Markets located in DevelopedCountries and Emerging Markets Countries; (ii) denominated in US Dollars and (iii) rated at the time of purchase at least BBB by S&P or equivalent by another NRSRO or, ifnot rated, deemed by the Fund’s Investment Manager and Sub-Investment Manager to be of comparable quality. The Fund may invest in the following types of securitiesthat are listed or traded on Regulated Markets: debt securities issued or guaranteed by the US government, its agencies or instrumentalities and political sub-divisions(including inflation-protected securities), corporate debt securities such as freely transferable promissory notes debentures, bonds (including zero coupon bonds), convertibleand non-convertible notes, credit-linked notes, commercial paper, certificates of deposits, and bankers acceptances issued by industrial, utility, finance, commercial bankingor bank holding company organisations; mortgage-backed and asset-backed securities; preferred shares and other open ended collective investment schemes within themeaning of Regulation 68(1)(e) of the UCITS Regulations.
A maximum of 10 per cent of the Fund’s net asset value may be invested in units or shares of other collective investment schemes within the meaning of Regulation 68(1)(e)of the UCITS Regulations. At least two-thirds of the Fund’s net asset value will be invested in investments of issuers or companies that have their registered office in theUnited States or that conduct a significant portion of their business activities in the United States.
The Fund may be leveraged to up to 100 per cent of its net asset value (as calculated using the commitment approach) as a result of its use of derivative instruments. TheFund may have exposure to reverse repurchase agreements for efficient portfolio management purposes and subject to the requirements of the Central Bank. The Fund’smaximum exposure to total return swaps and Securities Financing Transactions (SFTs), based on the notional value of such instruments, is 100 per cent of its net asset value.
Legg Mason Western Asset US Core Plus Bond Fund
Investment Objective – To maximise total return, consisting of capital appreciation and income.
Investment Policies – The Fund invests at least 70 per cent of its net asset value in debt securities listed or traded on Regulated Markets in the United States listed inSchedule III of the Prospectus that are rated Investment Grade or if unrated deemed by the Investment Manager and Sub-Investment Manager to be of comparable creditquality and which are issued by US Issuers. The securities in which the Fund may invest include debt securities issued or guaranteed by the US government, its agencies,instrumentalities and political sub-divisions; debt securities issued by other national governments, their agencies, instrumentalities and political sub-divisions; debt securitiesof supranational organisations such as freely transferable promissory notes, bonds and debentures; corporate debt securities, including freely transferable promissory notes,debentures, bonds; non-convertible notes; credit-linked notes, commercial paper, certificates of deposits, and bankers acceptances issued by industrial, utility, finance,commercial banking or bank holding company organisations; and mortgage-backed and asset-backed securities structured as debt securities.
A maximum of 10 per cent of the Fund’s net asset value may be invested in units or shares of other collective investment schemes within the meaning of Regulation 68(1)(e)of the UCITS Regulations. Subject to the limits set out in the investment policies the Fund may also invest in aggregate up to 30 per cent of its net asset value in non-publiclytraded securities, Rule 144A securities, zero coupon securities, money market instruments and debt securities of non-US issuers. The Fund may have exposure to reverserepurchase agreements for efficient portfolio management purposes and subject to the requirements of the Central Bank.
The allocation and reallocation of the Fund’s assets will be undertaken by the Investment Manager and Sub-Investment Manager on the basis of its analysis of economicsand market conditions and the relative risks and opportunities of particular types of fixed income securities. The average portfolio duration will vary based on theSub-Investment Manager’s forecast for interest rates.
The Fund may purchase unsecuritised participations in or assignments of floating rate mortgages or other commercial loans that are liquid and will provide for interest rateadjustments at least every 397 days and which may be secured by real estate or other assets. The Fund may invest in certain types of derivatives and may be leveraged to upto 100 per cent of its net asset value as a result of its use of derivatives. The Fund’s maximum exposure to total return swaps and Securities Financing Transactions (SFTs),based on the notional value of such instruments, is 100 per cent of its net asset value.
Legg Mason Western Asset Euro Core Plus Bond Fund
Investment Objective – To maximise total return, through capital appreciation and income.
Investment Policies – The Fund invests at least 70 per cent of its net asset value in debt securities denominated in Euro that are listed or traded on Regulated Markets locatedin Developed Countries and Emerging Market Countries as set out in Schedule III of the Prospectus. The Fund invests in the following types of securities that are listed ortraded on Regulated Markets: debt securities issued or guaranteed by national governments of Developed Countries and Emerging Market Countries, their agencies,instrumentalities, and political sub-divisions (including inflation-protected securities); debt securities of supranational organisations such as freely transferable promissorynotes, bonds and debentures; corporate debt securities of issuers located in or whose securities are listed or traded on Regulated Markets in Developed Countries andEmerging Market Countries, including freely transferable promissory notes, debentures, commercial paper, certificates of deposits, and bankers acceptances issued byindustrial, utility, finance, commercial banking or bank holding company organisations; mortgage-backed and asset-backed securities; preferred shares; and other open-ended collective investment schemes within the meaning of Regulation 68(1)(e) of the UCITS Regulations. A maximum of 10 per cent of the Fund’s net asset value may beinvested in units or shares of other collective investment schemes within the meaning of Regulation 68(1)(e) of the UCITS Regulations.
The Fund will not invest in equity securities, including warrants, except for (1) preferred shares to a maximum of 10 per cent of the Fund’s net asset value; and (2) equitysecurities acquired via conversions of convertible debt securities or via corporate actions of issuers (such as issuing equities to replace previously issued debt securities). TheFund may invest in certain types of derivatives and may be leveraged up to 100 per cent of its net asset value (as calculated using the commitment approach) as a result ofits use of derivatives. The Fund may have exposure to reverse repurchase agreements for efficient portfolio management purposes and subject to the requirements of theCentral Bank. The Fund’s maximum exposure to total return swaps and Securities Financing Transactions (SFTs), based on the notional value of such instruments, is 100 percent of its net asset value. The Fund may purchase unsecuritised participations in or assignments of floating rate mortgages or other commercial loans that are liquid andwill provide for interest rate adjustments at least every 397 days and which may be secured by real estate or other assets.
Legg Mason Western Asset Short Duration High Income Bond Fund
Investment Objective – To provide a high level of current income.
Investment Policies – The Fund invests at least 80 per cent of its net asset value in high-yielding debt securities and instruments that are (i) denominated in US Dollars andcurrencies of a variety of other Developed Countries and (ii) listed or traded on Regulated Markets as set out in Schedule III of the Prospectus. Such high-yielding debtsecurities and instruments include: (i) corporate debt securities, including (a) freely transferable promissory notes, (b) debentures, (c) bonds (including zero coupon bonds),(d) convertible and non-convertible notes, (e) credit-linked notes, (f) commercial paper, (g) certificates of deposits, and (h) bankers acceptances issued by industrial, utility,finance, commercial banking or bank holding company organisations; (ii) structured notes that are transferable securities, whose underlying exposure may be to fixedincome securities; (iii) mortgage-backed securities; (iv) asset-backed securities; and (v) unsecuritised participations in or assignments of floating rate mortgages or othercommercial loans that are liquid and will provide for interest rate adjustments at least every 397 days and which may be secured by real estate or other assets, provided thatthe Fund invests at least two thirds of its net asset value in non-convertible debt securities. The Fund may invest in debt securities rated as low as D by S&P or the equivalentby another NRSRO, which ratings indicate that the obligations are highly speculative and may be in default or in danger of default as to principal and interest.
The Fund’s remaining assets may be invested in the following types of securities that are listed or traded on Regulated Markets: debt securities rated Investment Grade, orunrated securities deemed by the Investment Manager and Sub-Investment Manager to be of equivalent quality; preferred shares and other open ended collectiveinvestment schemes within the meaning of Regulation 68(1)(e) of the UCITS Regulations, as well as cash and Money Market Instruments. A maximum of 10 per cent of theFund’s net asset value may be invested in units or shares of open-ended collective investment schemes within the meaning of Regulation 68(1)(e) of the UCITS Regulations.
19

Legg Mason Global Funds Plc Annual Report 28 February 2021
Directors’ Report – (continued)
Legg Mason Western Asset Short Duration High Income Bond Fund – (continued)
The Fund may have exposure to reverse repurchase agreements for efficient portfolio management purposes and subject to the requirements of the Central Bank. TheFund’s maximum exposure to total return swaps and Securities Financing Transactions (SFTs), based on the notional value of such instruments, is 100 per cent of its netasset value.
Legg Mason Western Asset Global Multi Strategy Fund
Investment Objective – To maximise total return through income and capital appreciation.
Investment Policies – The Fund invests primarily in debt securities denominated in US Dollars, Japanese Yen, Pound Sterling, Euro and a variety of other currencies and thatare traded on or listed on any of the Regulated Markets located in Developed Countries and Emerging Market Countries as set out in Schedule III of the Prospectus. TheFund may invest in the following types of securities that are listed or traded on Regulated Markets: debt securities issued or guaranteed by national governments ofDeveloped Countries and Emerging Market Countries, their agencies or instrumentalities and political subdivisions (including inflation-protected securities); debt securities ofsupranational organisations such as freely transferable promissory notes, bonds and debentures; corporate debt securities of issuers located in or whose securities are listedor traded on Regulated Markets in Developed Countries and Emerging Market Countries, including freely transferable promissory notes, debentures, bonds (including zerocoupon bonds), Emerging Market debt securities (including Brady Bonds, Eurobonds, domestic and international bonds issued under the laws of a developing country),convertible and non-convertible notes, credit-linked notes, commercial paper, certificates of deposits, and bankers acceptances issued by industrial, utility, finance,commercial banking or bank holding company organisations; mortgage-backed and asset-backed securities; preferred shares and other open ended collective investmentschemes within the meaning of Regulation 68(1)(e) of the UCITS Regulations. A maximum of 10 per cent of the Fund’s net asset value may be invested in units or shares ofother collective investment schemes within the meaning of Regulation 68(1)(e) of the UCITS Regulations. The Fund may purchase unsecuritised participations in orassignments of floating rate mortgages or other commercial loans that are liquid and will provide for interest rate adjustments at least every 397 days and which may besecured by real estate or other assets. Such participations, combined with any other investments that are subject to Clause 2.1 in Schedule II.A. of the Prospectus, will notexceed 10 per cent of the net asset value of the Fund in the aggregate.
The Fund may have exposure to reverse repurchase agreements for efficient portfolio management purposes and subject to the requirements of the Central Bank. TheFund’s maximum exposure to total return swaps and Securities Financing Transactions (SFTs), based on the notional value of such instruments, is 100 per cent of its netasset value.
Legg Mason Western Asset US High Yield Fund
Investment Objective – To provide a high level of current income.
Investment Policies – The Fund invests at least 70 per cent of its net asset value in the following types of high-yielding debt securities of US Issuers that are denominated inUS Dollars that are listed or traded on Regulated Markets as listed in Schedule III of the Prospectus: corporate debt securities, including freely transferable promissory notes,debentures, bonds (including zero coupon bonds), non-convertible notes, commercial paper, certificates of deposits, and bankers’ acceptances issued by industrial, utility,finance, commercial banking or bank holding company organisations; structured notes that are transferable securities whose underlying exposure may be to fixed incomesecurities; and mortgage-backed and asset-backed securities that are structured as debt securities; provided that at least two-thirds of the Fund’s net asset value is investedin non-convertible debt securities. The Fund may invest in debt securities rated as low as D by S&P or the equivalent by another NRSRO, which ratings indicate that theobligations are highly speculative and may be in default or in danger of default as to principal and interest.
The Fund’s remaining assets may be held in debt securities listed or traded on Regulated Markets that are rated above BB+ by S&P or or the equivalent by another NRSRO,or unrated securities deemed by the Investment Manager and Sub-Investment Manager to be of equivalent quality; preferred shares and other equity securities that arelisted or traded on Regulated Markets when such investments are consistent with the Fund’s investment objective of high current income; as well as cash or short termmoney market instruments with remaining maturities of 13 months or less. The Fund may invest up to 20 per cent of its net asset value in high-yielding corporate debtsecurities of non-US Issuers located in Developed Countries and Emerging Market Countries provided that such debt securities are denominated in US Dollars and suchissuers are domiciled in or have their principal activities located in OECD member countries. A maximum of 10 per cent of the Fund’s net asset value may be invested in unitsor shares of other collective investment schemes within the meaning of Regulation 68(1)(e) of the UCITS Regulations. At least 95 per cent of the Fund’s net asset value willbe US$-denominated. The Fund may have exposure to reverse repurchase agreements for efficient portfolio management purposes and subject to the requirements of theCentral Bank. The Fund’s maximum exposure to total return swaps and Securities Financing Transactions (SFTs), based on the notional value of such instruments, is 100 percent of its net asset value.
Legg Mason Western Asset Emerging Markets Total Return Bond Fund
Investment Objective – To maximise total return, consisting of income and capital appreciation.
Investment Policies – The Fund invests at least 80 per cent of its net asset value in (i) debt securities of issuers located in Emerging Market Countries (hereinafter ‘‘EmergingMarket Debt Securities’’) that are listed or traded on Regulated Markets as listed in Schedule III of the Prospectus, and (ii) units or shares of other collective investmentschemes within the meaning of Regulation 68(1)(e) of the UCITS Regulations and such investments will be for the purpose of gaining exposure to the types of instrumentsdescribed herein or otherwise to pursue the investment objective and policies of the Fund. The Fund may invest in the following types of securities that are listed or tradedon Regulated Market: debt securities issued or guaranteed by national governments located in Developed Countries and Emerging Market Countries, their agencies orinstrumentalities and political sub-divisions (including inflation protected securities); corporate debt securities of issuers located in developed and emerging markets whosesecurities are listed or traded on Regulated Markets, including freely transferable promissory notes, debentures, bonds (including zero coupon bonds), convertible and non-convertible notes, commercial paper, certificates of deposits, and bankers acceptances issued by industrial, utility, finance, commercial banking or bank holding companyorganisations; mortgage-backed securities (including collateralised debt obligations), securitised participations in loans that are freely transferable securities, structured notesthat are transferable securities whose underlying exposure may be to fixed income securities; asset-backed securities; preferred shares and other open-ended collectiveinvestment schemes within the meaning of Regulation 68(1)(e) of the UCITS Regulations; and provided that at least two-thirds of the Fund’s net asset value is invested innon-convertible debt securities.
A maximum of 10 per cent of the Fund’s net asset value may be invested in units or shares of other UCITS or other collective investment schemes within the meaning ofRegulation 68(1)(e) of the UCITS Regulations. The Fund may purchase unsecuritised participations in or assignments of floating rate mortgages or other commercial loansthat are liquid and will provide for interest rate adjustments at least every 397 days and which may be secured by real estate or other assets. Such participations, combinedwith any other investments that are subject to Clause 2.1 in Schedule II.A. of the Prospectus, will not exceed 10 per cent of the net asset value of the Fund in the aggregate.The Fund’s investments may be denominated in currencies other than the Base Currency. The Fund may have exposure to reverse repurchase agreements for efficientportfolio management purposes and subject to the requirements of the Central Bank. The Fund’s maximum exposure to total return swaps and Securities FinancingTransactions (SFTs), based on the notional value of such instruments, is 100 per cent of its net asset value.
Legg Mason Western Asset Emerging Markets Corporate Bond Fund
Investment Objective – To maximise total return, consisting of income and capital appreciation.
Investment Policies – The Fund invests at least 70 per cent of its net asset value in Emerging Market Corporate Bonds denominated in any currency, that are listed or tradedon Regulated Markets, including (i) freely transferable promissory notes, debentures, fixed and floating rate bonds (including zero coupon bonds), convertible andnon-convertible notes, commercial paper, certificates of deposits, and bankers acceptances issued by industrial, utility, finance, commercial banking or bank holdingcompany organisations; (ii) mortgage-backed securities (including collateralised debt obligations); (iii) securitised participations in loans that are freely transferable securities;(iv) structured notes that are transferable securities whose underlying exposure may be to fixed income securities; and (v) asset-backed securities.
20
Legg Mason Global Funds Plc Annual Report 28 February 2021
Directors’ Report – (continued)
Legg Mason Western Asset Emerging Markets Corporate Bond Fund – (continued)
The Fund may invest up to 30 per cent of its net asset value in the following types of securities that are listed or traded on Regulated Markets (the following may bedenominated in any currency) and where they are not Emerging Market Corporate Bonds: (i) debt securities issued or guaranteed by national governments located in anycountry, their agencies or instrumentalities and political sub-divisions (including inflation protected securities);(ii) corporate debt securities of issuers located in countriesother than Emerging Market Countries whose securities are listed or traded on Regulated Markets, including freely transferable promissory notes, debentures, fixed andfloating rate bonds (including zero coupon bonds), convertible and non-convertible notes, commercial paper, certificates of deposits, and bankers acceptances issued byindustrial, utility, finance, commercial banking or bank holding company organisations; (iii) mortgage-backed securities (including collateralised debt obligations);(iv) securitised participations in loans that are freely transferable securities; (v) structured notes that are transferable securities whose underlying exposure may be to fixedincome securities; (vi) asset-backed securities; (vii) preferred shares; and (viii) other open-ended collective investment schemes within the meaning of Regulation 68(1)(e) ofthe UCITS Regulations.
The Fund may invest in common stocks, preferred securities, convertible securities, warrants, rights and their equivalents. The Fund will not invest more than 25 per cent ofits net asset value in convertible debt securities issued in independent offerings and not more than 10 per cent of its net asset value in preferred shares issued inindependent offerings. Investments in common stocks, preferred securities, warrants, rights and their equivalents (including through independent offerings and otherwise)in aggregate will not exceed 30 per cent of the Fund’s net asset value. As restrictions to the foregoing, the Fund may not invest more than 10 per cent of its net asset value,respectively, for the following types of securities: (i) mortgage-backed securities (including collateralised debt obligations); (ii) structured notes that are transferable securitieswhose underlying exposure may be to fixed income securities; and (iii) asset-backed securities. The mortgage-backed securities, asset-backed securities, structured notes andcredit-linked notes in which the Fund may invest may contain embedded derivatives and/or leverage. A maximum of 10 per cent of the Fund’s net asset value may beinvested in units or shares of other UCITS or other collective investment schemes within the meaning of Regulation 68(1)(e) of the UCITS Regulations.
The Fund may be leveraged to up to 100 per cent of its net asset value (as calculated using the commitment approach) as a result of its use of derivative instruments. TheFund may have exposure to reverse repurchase agreements for efficient portfolio management purposes and subject to the requirements of the Central Bank. The Fund’smaximum exposure to total return swaps and Securities Financing Transactions (SFTs), based on the notional value of such instruments, is 100 per cent of its net asset value.
Legg Mason Western Asset Global High Yield Fund
Investment Objective – To generate total return. The generation of high current income is a secondary objective.
Investment Policies – The Fund invests at least 70 per cent of its net asset value in high yielding debt securities listed or traded on Regulated Markets as listed in Schedule III ofthe Prospectus. Higher yields are generally available from securities rated BB+ or lower by S&P, or the equivalent by another NRSRO, or unrated securities of equivalent quality.Debt securities rated below Investment Grade are deemed by these agencies to be predominantly speculative with respect to the issuer’s capacity to pay interest and repayprincipal and may involve major risk of exposure to adverse conditions. The Fund may invest in debt securities rated as low as D by S&P or the equivalent by another NRSRO,which ratings indicate that the obligations are highly speculative and may be in default or in danger of default as to principal and interest. It is not expected that the Fund willinvest more than 45 per cent of its net asset value in high yield securities issued in Emerging Market Countries, Emerging European Countries and/or Emerging Asia/PacificCountries. It is expected that the Fund will invest in at least 10 different countries. The Fund is a global fund, however, and is not confined to investing in any specific countryor region. The Fund may purchase unsecuritised participations in or assignments of floating rate mortgages or other commercial loans that are liquid and will provide forinterest rate adjustments at least every 397 days and which may be secured by real estate or other assets. Such participations, combined with any other investments that aresubject to Clause 2.1 in Schedule II.A. of the Prospectus, will not exceed 10 per cent of the net asset value of the Fund in the aggregate. A maximum of 10 per cent of theFund’s net asset value may be invested in units or shares of other collective investment schemes within the meaning of Regulation 68(1)(e) of the UCITS Regulations.
The Fund may be leveraged to up to 100 per cent of its net asset value (as calculated using the commitment approach) as a result of its use of derivative instruments. TheFund may have exposure to reverse repurchase agreements for efficient portfolio management purposes and subject to the requirements of the Central Bank. The Fund’smaximum exposure to total return swaps and Securities Financing Transactions (SFTs), based on the notional value of such instruments, is 100 per cent of its net asset value.
Legg Mason Western Asset Global Inflation Management Fund
Investment Objective – To generate total return. The generation of current income is a secondary objective.
Investment Policies – The Fund seeks to achieve its investment objective by investing at all times at least 80 per cent of its net asset value in inflation-protected securities orother securities that the Investment Manager and Sub-Investment Manager believe will provide protection against inflation that are issued by national governments ofcountries that are members of the OECD, their agencies, instrumentalities and political sub-divisions, supranational organisations and corporate issuers such as freelytransferable promissory notes, debentures and bonds and are listed or traded on Regulated Markets as set out in Schedule III of the Prospectus. The Fund may also invest upto 20 per cent of its net asset value in any other types of debt securities listed or traded on Regulated Markets listed in Schedule III of the Prospectus that may or may not beindexed to inflation including debt securities issued or guaranteed by the national governments, their agencies, instrumentalities, and political subdivisions (including STRIPsecurities); corporate debt securities such as freely transferable promissory notes, debentures, bonds (including zero coupon bonds, step-up securities, and payment-in-kindsecurities), commercial paper, certificates of deposit, and bankers’ acceptances issued by industrial, utility, finance, commercial banking or bank holding companyorganisations; mortgage-backed and asset-backed securities structured as debt instruments; reverse repurchase agreements with debt securities as the underlyinginstruments (for efficient portfolio management purposes only and subject to the requirements of the Central Bank); structured notes that are transferable securities whoseunderlying exposure may be to fixed income securities; securitised participations in loans that are freely transferable securities; Money Market Instruments; units or shares ofother open-ended collective investment schemes within the meaning of Regulation 68(1)(e) of the UCITS Regulations; and (subject to a limit of 10 per cent of the Fund’s netasset value) preferred shares and other equity and equity related securities. A maximum of 10 per cent of the Fund’s net asset value may be invested in units or shares ofother collective investment schemes within the meaning of Regulation 68 (1)(e) of the UCITS Regulations. The Fund will not invest in securities rated below InvestmentGrade. A maximum of 10 per cent of the Fund’s net asset value may be invested in securities which are listed or traded on a Regulated Market in any Emerging MarketCountry, Emerging European Country or Emerging Asia/Pacific Country. It is expected that the Fund will maintain an average credit quality between A and AAA (S&P) / A2and Aaa (Moody’s). The Fund’s average portfolio duration is expected to be between one and fifteen years. However, the Fund may invest in individual securities of anyduration.
The Fund may invest in certain types of derivatives, and may be leveraged to up to 100 per cent of its net asset value (as calculated using the commitment approach) as aresult of its use of derivative instruments. The Fund may have exposure to reverse repurchase agreements for efficient portfolio management purposes and subject to therequirements of the Central Bank. The Fund’s maximum exposure to total return swaps and Securities Financing Transactions (SFTs), based on the notional value of suchinstruments, is 100 per cent of its net asset value.
Legg Mason Western Asset Asian Opportunities Fund
Investment Objective – To maximise total return, through income and capital appreciation.
Investment Policies – The Fund invests at least 70 per cent of its net asset value in debt securities issued by Asian issuers and in derivatives on Asian interest rates andcurrencies, which debt securities and derivatives are listed or traded on Regulated Markets as set out in Schedule III of the Prospectus. The Fund invests primarily in (i) debtsecurities issued or guaranteed by national governments located in Asian countries, their agencies, instrumentalities or political sub-divisions; (ii) corporate debt securitiesissued by Asian companies such as freely transferable promissory notes, debentures, bonds (including zero coupon bonds), commercial paper, certificates of deposits andbankers acceptances issued by industrial, utility, finance, commercial banking or bank holding company organisations; (iii) securitised participations in loans that are freelytransferable securities; (iv) structured notes that are transferable securities whose underlying exposure may be to fixed income securities; (v) mortgage-backed and asset-backed securities that are structured as debt securities; (vi) derivatives on Asian interest rates and Asian bonds concluded with highly rated Asian or global credit institutions;(vii) Asian currencies and derivatives on those currencies. For purposes of this Fund, an Asian company is a company which has its registered office located in an Asiancountry or that conducts the predominant portion of its economic activities in Asia.
21

Legg Mason Global Funds Plc Annual Report 28 February 2021
Directors’ Report – (continued)
Legg Mason Western Asset Asian Opportunities Fund – (continued)
The Fund may invest no more than 10 per cent of its net asset value in units or shares of other open-ended collective investment schemes within the meaning ofRegulation 68(1)(e) of the UCITS Regulations. A maximum of 25 per cent of the Fund’s net asset value may be invested in convertible notes and up to 10 per cent of theFund’s net asset value may be invested in preferred shares, other equity securities and/or warrants. A maximum of 5 per cent of the Fund’s net asset value may be investedin warrants.
The Fund may be leveraged to up to 100 per cent of its net asset value (as calculated using the commitment approach) as a result of its use of derivative instruments. TheFund may have exposure to reverse repurchase agreements for efficient portfolio management purposes and subject to the requirements of the Central Bank. The Fund’smaximum exposure to total return swaps and Securities Financing Transactions (SFTs), based on the notional value of such instruments, is 100 per cent of its net asset value.
Legg Mason Western Asset Short Duration Blue Chip Bond Fund
Investment Objective – To achieve total return, through income and capital appreciation.
Investment Policies – The Fund invests primarily in debt securities that are (i) rated A- or higher by S&P or the equivalent by another NRSRO, or if unrated deemed to be ofcomparable quality; (ii) (a) issued by corporate issuers domiciled in any jurisdiction other than an Emerging Market Country which are, at the time of purchase and in theopinion of the Sub-Investment Managers, ‘‘blue chip’’ companies, meaning they have a long-term debt rating of A- or higher by S&P or the equivalent by another NRSRO, orif unrated are deemed to be of comparable quality; and/or (b) issued by supranational organisations which have a long-term debt rating of A- or higher by S&P or theequivalent by another NRSRO, or if unrated are deemed to be of comparable quality; and (iii) listed or traded on Regulated Markets set out in Schedule III of the Prospectus.
The Fund will only invest in those corporate debt securities that in the opinion of the relevant Investment Manager and Sub-Investment Manager are ranked at least seniorunsecured corporate debt securities of the relevant issuer. In addition, the Fund may invest in securities issued or guaranteed by national governments (including STRIPS andinflation index-linked securities), their agencies, instrumentalities and political sub-divisions, securities of supranational organisations such as freely transferable promissorynotes, bonds and debentures; reverse repurchase agreements with debt securities as the underlying instruments (for efficient portfolio management purposes only andsubject to the requirements of the Central Bank of Ireland); and other open-ended collective investment schemes within the meaning of Regulation 68(1) (e) of the UCITSRegulations. The Fund may invest no more than 10 per cent of its net asset value in units or shares of other UCITS or other collective investment schemes within themeaning of Regulation 68(1)(e) of the UCITS Regulations.
The Fund may invest in certain types of derivatives, and the Fund’s leverage arising from derivatives is not expected to exceed 50 per cent (as calculated using thecommitment approach) of its total net asset value. The Fund’s maximum exposure to total return swaps and Securities Financing Transactions (SFTs), based on the notionalvalue of such instruments, is 100 per cent of its net asset value.
Legg Mason Western Asset Global Core Plus Bond Fund^
Investment Objective – To maximise total return through income and capital appreciation.
Investment Policies – The Fund invests at least two-thirds of its net asset value in the global fixed income markets. The Fund invests primarily in debt securities (either directlyor indirectly in other collective investment schemes that primarily invest in such securities, subject to the restrictions herein) that are denominated in US Dollars, Euro,Japanese Yen, Pound Sterling and variety of other currencies and are listed or traded on Regulated Markets in Developed Countries and Emerging Market Countries with abias toward non-sovereign debt securities, especially corporate debt securities and mortgage-backed securities. The Fund may invest in non-US denominated securities,currencies and derivatives, provided that the aggregate exposure to currencies other than US Dollars (after hedging) is no more than 50 per cent of the Fund’s net assetvalue.
The Fund invests in securities issued or guaranteed by national governments, their agencies, instrumentalities, and political sub-divisions (including STRIPS and inflationindex-linked securities); securities of supranational organisations such as freely transferable promissory notes, bonds and debentures; corporate debt securities such as freelytransferable promissory notes, debentures, Brady Bonds, adjustable rate bonds, floating rate bonds, planned amortisation bonds, targeted amortisation bonds, principal onlybonds, Eurobonds, Eurodollar bonds and Yankee dollar instruments, payment-in-kind bonds, zero coupon bonds, non-convertible notes, commercial paper, certificates ofdeposit, and bankers’ acceptances issued by industrial, utility, finance, commercial banking or bank holding company organisations; mortgage-backed and asset-backedsecurities that are structured as debt securities; and reverse repurchase agreements with debt securities as the underlying instruments (for efficient portfolio managementpurposes only and subject to the requirements of the Central Bank). The Fund may invest no more than 10 per cent of its net asset value in units or shares of other UCITS orother collective investment schemes within the meaning of Regulation 68(1)(e) of the UCITS Regulations.
The Fund may purchase unsecuritised participations in or assignments of floating rate mortgages or other commercial loans that are liquid and will provide for interest rateadjustments at least every 397 days and which may be secured by real estate or other assets. The Fund may invest in certain types of derivatives and may be leveraged to upto 100 per cent of its net asset value as a result of its use of derivatives. The Fund’s maximum exposure to total return swaps and Securities Financing Transactions (SFTs),based on the notional value of such instruments, is 100 per cent of its net asset value.
Legg Mason Western Asset Global Credit Fund^
Investment Objective – To maximise total return through income and capital appreciation.
Investment Policies – The Fund invests at least two-thirds of its net asset value in corporate debt securities and debts securities issued by supranational organisations that are(i) denominated in US Dollars, Japanese Yen, Euro, Pound Sterling and a variety of other currencies, and (ii) listed or traded on Regulated Markets set out in Schedule III ofthe Prospectus. The types of corporate debt securities in which the Fund may invest include freely transferable promissory notes, fixed and floating rate bonds, zero couponbonds, debentures, non-convertible notes, commercial paper, certificates of deposit and bankers’ acceptances issued by industrial, utility, finance, commercial banking orbank holding company organisations. In addition, the Fund may invest in securities issued or guaranteed by national governments (including STRIPS and inflation index-linked securities), their agencies, instrumentalities and political sub-divisions, securities of supranational organisations such as freely transferable promissory notes, bonds anddebentures; securitised participations in loans that are freely transferable securities; structured notes that are freely transferable securities; mortgage-backed securities(including collateralised mortgage obligations); asset-backed securities structured as debt instruments; reverse repurchase agreements with debt securities as the underlyinginstruments (for efficient portfolio management purposes only and subject to the requirements of the Central Bank); and other open-ended collective investment schemeswithin the meaning of Regulation 68(1)(e) of the UCITS Regulations.
The Fund will not purchase equity securities or beneficial interests in equity securities except for preferred shares or warrants, provided that no more than 10 per cent of theFund’s net asset value may be invested in preferred shares and/or warrants; and equity securities acquired via conversions of convertible debt securities or via corporateactions of issuers. The Fund may invest no more than 10 per cent of its net asset value in units or shares of other UCITS or other collective investment schemes within themeaning of Regulation 68(1)(e) of the UCITS Regulations.
The Fund may purchase securities that at the time of purchase are rated below Investment Grade or, if unrated, deemed by the Investment Manager and Sub-InvestmentManagers to be of comparable quality, so long as such purchase would not cause more than 10 per cent of the Fund’s net asset value to be comprised of investments thatare rated below Investment Grade or if unrated deemed by the Investment Manager and Sub-Investment Managers to be of comparable quality. The Fund may invest incertain types of derivatives and may be leveraged to up to 100 per cent of its net asset value (as calculated using the commitment approach) as a result of its use ofderivatives. The Fund’s maximum exposure to total return swaps and Securities Financing Transactions (SFTs), based on the notional value of such instruments, is 100 percent of its net asset value.
^ Not authorised for sale to the public in Hong Kong.
22

Legg Mason Global Funds Plc Annual Report 28 February 2021
Directors’ Report – (continued)
Legg Mason Western Asset Euro High Yield Fund
Investment Objective – To provide a high level of current income.
Investment Policies – The Fund invests at least two-thirds of its net asset value in high-yielding debt securities that are denominated in Euro, listed or traded on RegulatedMarkets listed in Schedule III of the Prospectus and from issuers located anywhere in the world.
The Fund seeks to achieve its investment objective by investing in debt securities issued or guaranteed by national governments, their agencies, instrumentalities and politicalsub-divisions; corporate debt securities, including freely transferable promissory notes, debentures, Brady Bonds, adjustable rate bonds, floating rate bonds, plannedamortisation bonds, targeted amortisation bonds, principal only bonds, Eurobonds, Eurodollar bonds and Yankee dollar instruments, payment-in-kind bonds, zero couponbonds, non-convertible notes, commercial paper, certificates of deposit, and bankers’ acceptances issued by industrial, utility, finance, commercial banking or bank holdingcompany organisations; securitised participations in loans that are transferable securities; structured notes that are transferable securities; mortgage-backed securities; andasset-backed securities that are structured as debt securities.
Subject to the above restrictions, the Fund’s remaining assets (being not more than one-third of its net asset value) may be held in (i) debt securities rated above BB+ by S&Por the equivalent by another NRSRO, or unrated securities deemed by the Investment Manager and Sub-Investment Managers to be of equivalent quality; (ii) preferredshares and warrants when such investments are consistent with the Fund’s investment objective of high current income; as well as (iii) cash or short term money marketinstruments with remaining maturities of 13 months or less, which are instruments normally dealt in on the money market which are liquid (i.e., capable of being convertedto cash within 7 business days at a price closely approximating its current valuation and may include any of the following investments with maturities of 13 months of less:(a) debt securities that are issued or guaranteed by the national governments, their agencies, instrumentalities or political sub-divisions; (b) corporate debt securitiesincluding freely transferable promissory notes, debentures, bonds (including zero coupon bonds), convertible and non-convertible notes, commercial paper, certificates ofdeposit, and bankers’ acceptances issued by industrial, utility, finance, commercial banking or bank holding company organisations; (c) mortgage-backed securities;(d) structured notes that are transferable securities; (e) securitised participations in loans that are transferable securities; (f) warrants; (g) asset-backed securities; and(h) reverse repurchase agreements (for efficient portfolio management purposes only and subject to the requirements of the Central Bank). The Fund may invest no morethan 10 per cent of its net asset value in units or shares of other UCITS or other collective investment schemes within the meaning of Regulation 68(1)(e) of the UCITSRegulations.
The Fund may invest in certain types of derivatives and may be leveraged to up to 100 per cent of its net asset value (as calculated using the commitment approach) as aresult of its use of derivative instruments. The Fund’s maximum exposure to total return swaps and Securities Financing Transactions (SFTs), based on the notional value ofsuch instruments, is 25 per cent of its net asset value.
Legg Mason Western Asset Macro Opportunities Bond Fund^
Investment Objective – To maximise total return, consisting of income and capital appreciation.
Investment Policies – The Fund invests in (i) debt securities, convertible bonds, preferred shares and warrants that are listed or traded on Regulated Markets locatedanywhere in the world, including Emerging Market Countries; (ii) units or shares of other collective investment schemes within the meaning of Regulation 68(1)(e) of theUCITS Regulations and such investments will be for the purposes of gaining exposure to the types of instruments described herein or otherwise to pursue the investmentobjective and policies of the Fund, and (iii) derivatives. A maximum of 10 per cent of the Fund’s net asset value may be invested in units or shares of open-ended collectiveinvestment schemes within the meaning of Regulation 68(1)(e) of the UCITS Regulations.
The Fund may invest in corporate debt securities such as freely transferable promissory notes, debentures, fixed and floating rate bonds, zero coupon bonds, non-convertiblenotes, commercial paper, certificates of deposit, and bankers’ acceptances issued by industrial, utility, finance, commercial banking or bank holding company organisations;structured notes that are transferable securities, whose underlying exposure may be to fixed income securities, provided that the Fund would be permitted to invest directlyin such underlying fixed income securities; securitised participations in loans that are transferable securities; mortgage-backed and asset-backed securities that are structuredas debt securities; and reverse repurchase agreements with debt securities as the underlying instruments (for efficient portfolio management purposes only); debt securitiesissued or guaranteed by national governments and their agencies, instrumentalities and political sub-divisions; STRIPS and inflation index-linked securities; and debtsecurities of supranational organisations such as freely transferable promissory notes, bonds and debentures.
The Fund may extensively invest (whether for investment purposes or the purposes of efficient portfolio management) in certain types of financial derivative instruments.The Fund has a high leverage limit. The Fund’s maximum exposure to total return swaps and Securities Financing Transactions (SFTs), based on the notional value of suchinstruments, is 100 per cent of its net asset value.
Legg Mason Western Asset Multi-Asset Credit Fund^
Investment Objective – To generate total return through income and capital appreciation.
Investment Policies – The Fund invests in a globally diverse portfolio of debt securities and derivatives that may provide exposure to debt securities, interest rates, currenciesand indices. The Fund may invest in corporate debt securities such as freely transferable promissory notes, debentures, fixed and floating rate bonds, zero coupon bonds,non-convertible notes, credit-linked notes, commercial paper, certificates of deposit, and bankers’ acceptances; Money Market Instruments; securitised participations inloans that are transferable securities; mortgage-backed and asset-backed securities that are structured as debt securities; and reverse repurchase agreements with debtsecurities as the underlying instruments (for efficient portfolio management purposes only); debt securities issued or guaranteed by national governments and theiragencies, instrumentalities and political sub-divisions; STRIPS and inflation index-linked securities; and debt securities of supranational organisations such as freelytransferable promissory notes, bonds and debentures. Securitised participations in loans are listed securities and investment in such securities will be limited to 50 per cent ofthe Fund’s net asset value.
The Investment Manager and Sub-Investment Managers expect the average duration of the Fund’s investments to range between 0 and 10 years, depending on theInvestment Manager and Sub-Investment Managers’ forecast for interest rates and yields. The Fund may invest up to 10 per cent of its net asset value in units or shares ofother UCITS or other collective investment schemes within the meaning of Regulation 68(1)(e) of the UCITS Regulations, including open-ended exchange traded funds(including equity exchange traded funds).
The Fund may invest extensively in certain types of derivatives. The Fund’s maximum exposure to total return swaps and Securities Financing Transactions (SFTs), based onthe notional value of such instruments, is 100 per cent of its net asset value.
Legg Mason Western Asset Structured Opportunities Fund^
Investment Objective – To maximise total return, consisting of income and capital appreciation.
Investment Policies – The Fund invests at least 65 per cent of its net asset value in mortgage-backed securities (“MBS”) and asset-backed securities (“ABS”) which are issuedby non-governmental issuers and are not guaranteed by US government-sponsored entities such as FNMA or FHLMC and/or by agencies of the US government such asGNMA. Such securities will be listed or traded on Regulated Markets located anywhere in the world, including Emerging Market Countries.
The Fund may invest up to 35 per cent of its net asset value in aggregate in: mortgage-backed securities issued or guaranteed by an Agency; asset-backed securities whichare guaranteed by an Agency; debt issued or guaranteed by corporations such as promissory notes, bonds (including zero coupon bonds), convertible and non-convertiblenotes and debentures, securitised participations in loans that are transferable securities, structured notes, preferred stocks, commercial paper, certificates of deposit, timedeposits, repurchase agreements and reverse repurchase agreements (that may be used for efficient portfolio management purposes) and dollar rolls; bankers acceptances,including debt securities of corporations that are owned, partially owned, or whose obligations are guaranteed by a federal government, its agencies, or other federal
^ Not authorised for sale to the public in Hong Kong.
23

Legg Mason Global Funds Plc Annual Report 28 February 2021
Directors’ Report – (continued)
Legg Mason Western Asset Structured Opportunities Fund^ – (continued)
government entities; debt securities issued or guaranteed by federal, state, local and city governments and their agencies, instrumentalities, municipalities, and sub-divisions;commercial paper; cash and Money Market Instruments. The Fund may invest no more than 10 per cent of its net asset value in units or shares of other UCITS or othercollective investment schemes (including open-ended exchange-traded funds) within the meaning of Regulation 68(1)(e) of the UCITS Regulations.
The Fund may extensively invest (whether for investment purposes or the purposes of efficient portfolio management) in certain types of derivatives. The Fund’s maximumexposure to Securities Financing Transactions (SFTs) and total return swaps, based on the notional value of such instruments, is 100 per cent of the Fund’s net asset value.
Legg Mason Western Asset US Mortgage-Backed Securities Fund^
Investment Objective – To maximise total return, consisting of income and capital appreciation.
Investment Policies – The Fund invests at least 80 per cent of its net asset value in mortgage-backed securities (including collateralised mortgage obligations) that are(i) denominated in US Dollars, (ii) issued or guaranteed by the US government, its agencies, instrumentalities and political sub-divisions, and by US-government sponsoredentities, and (iii) listed or traded on Regulated Markets located in the United States and set out in Schedule III of the Prospectus. The Fund may invest or hold up to 20 percent of its net asset value in obligations of the US Treasury, obligations issued or guaranteed by US government agencies, and US Dollar denominated cash equivalents,including money market funds and reverse repurchase agreements (for efficient portfolio management purposes only). The Fund will only purchase debt securities rated atleast B- by S&P or its equivalent by another NRSRO or, if unrated, deemed to be of comparable quality by the Investment Manager and Sub-Investment Managers. Amaximum of 10 per cent of the Fund‘s net asset value may be invested in units or shares of other collective investment schemes within the meaning of Regulation 68(1)(e)of the UCITS Regulations.
The Fund will not be leveraged in excess of 100 per cent of its net asset value. The Fund’s maximum exposure to Securities Financing Transactions (SFTs) and total returnswaps, based on the notional value of such instruments, is 100 per cent of the Fund’s net asset value.
Legg Mason Western Asset UK Investment Grade Credit Fund^
Investment Objective – To maximise total return through income and capital appreciation.
Investment Policies – The Fund invests at least 70 per cent of its net asset value in corporate debt securities and debt securities issued by supranational organisations that arelisted or traded on Regulated Markets in the United Kingdom and other Regulated Markets and are denominated in Pound Sterling.
The Fund may invest in corporate debt securities, including freely transferable promissory notes, fixed and floating rate bonds, zero coupon bonds, debentures, non-convertiblenotes, commercial paper, certificates of deposit and bankers’ acceptances issued by industrial, utility, finance, commercial banking or bank holding company organisations.
In addition, the Fund may invest in securities issued or guaranteed by national governments and their agencies, instrumentalities and political sub-divisions; STRIPS andinflation index-linked securities; securities of supranational organisations such as freely transferable promissory notes, bonds and debentures, securitised participations inloans that are freely transferable securities; structured notes that are freely transferable securities whose underlying exposure may be to fixed income securities;mortgage-backed securities (including collateralised mortgage obligations) and asset-backed securities that are structured as debt securities. The Fund may invest no morethan 10 per cent of its net asset value in units or shares of other UCITS or other collective investment schemes within the meaning of Regulation 68(1)(e) of the UCITSRegulations. The Fund may have exposure to reverse repurchase agreements for efficient portfolio management purposes and subject to the requirements of the CentralBank. The Fund’s maximum exposure to total return swaps and Securities Financing Transactions (SFTs), based on the notional value of such instruments, is 100 per cent ofits net asset value.
Legg Mason Western Asset US Corporate Bond Fund^
Investment Objective – To maximise total return through income and capital appreciation.
Investment Policies – The Fund invests at all times at least two-thirds of its net asset value in corporate debt securities that are (i) denominated in US Dollars, and (ii) listed ortraded on Regulated Markets set out in Schedule III of the Prospectus.
The types of corporate debt securities in which the Fund may invest include freely transferable promissory notes, fixed and floating rate bonds, zero coupon bonds,debentures, non-convertible notes, commercial paper, certificates of deposit and bankers‘ acceptances issued by industrial, utility, finance, commercial banking or bankholding company organisations.
In addition, the Fund may invest in securities issued or guaranteed by national governments (including STRIPS and inflation index-linked securities), their agencies,instrumentalities and political sub-divisions, securities of supranational organisations such as freely transferable promissory notes, bonds and debentures; securitisedparticipations in loans that are freely transferable securities; structured notes that are freely transferable securities; mortgage-backed securities (including collateralisedmortgage obligations); asset-backed securities structured as debt instruments; reverse repurchase agreements with debt securities as the underlying instruments (for efficientportfolio management purposes only and subject to the requirements of the Central Bank); and other open-ended collective investment schemes within the meaning ofRegulation 68(1)(e) of the UCITS Regulations, and such investments will be for the purposes of gaining exposure to the types of instruments described herein or otherwiseto pursue the investment objective and policies of the Fund. The Fund may invest no more than 10 per cent of its net asset value in units or shares of other UCITS or othercollective investment schemes within the meaning of Regulation 68(1)(e) of the UCITS Regulations.
The Fund may invest in certain types of derivatives, and may be leveraged to up to 100 per cent of its net asset value as a result of its use of derivative instruments. The Fund’smaximum exposure to total return swaps and Securities Financing Transactions (SFTs), based on the notional value of such instruments, is 100 per cent of its net asset value.
Western Asset UCITS SMASh Series Core Plus Completion Fund^
Investment Objective – To maximise total return, consisting of capital appreciation and income.
Investment Policies – The Fund invests at least 70% of its NAV in debt securities listed or traded on Regulated Markets in the United States listed in Schedule III of theProspectus and which are issued by issuers located anywhere in the world. The types of debt securities in which the Fund may invest include: debt securities issued orguaranteed by the United States government, its agencies, instrumentalities and political sub-divisions; debt securities issued by other national governments, their agencies,instrumentalities and political sub-divisions; debt securities of supranational organisations such as freely transferable promissory notes, bonds and debentures; corporatedebt securities, including freely transferable promissory notes, debentures, fixed or floating bonds; convertible debt; non-convertible notes; credit-linked notes, commercialpaper, certificates of deposits, and bankers acceptances issued by industrial, utility, finance, commercial banking or bank holding company organisations; and mortgage-backed and asset-backed securities structured as debt securities.
The Fund may have exposure of up to 75% of its net asset value to mortgage-backed and asset-backed securities. The mortgage-backed and asset-backed securities andcredit-linked notes in which the Fund invests may contain embedded derivatives and/or leverage, and the Fund may be leveraged as a result, subject to the overall leveragelimits set forth below.
A maximum of 25% of the Fund’s net asset value may be invested in convertible debt securities. Up to 10% of the Fund’s net asset value may be invested in preferredshares or other equity securities, including warrants (a maximum of 5% of the Fund’s net asset value may be invested in warrants). A maximum of 20% of the Fund’s netasset value may be invested in units or shares of other collective investment schemes within the meaning of Regulation 68(1)(e) of the UCITS Regulations. Subject to theabove limitations, the Fund may also invest in aggregate no more than 30% of its net asset value in non-publicly traded securities, Rule 144A securities, zero couponsecurities (excluding securities issued by the United States government and its agencies), and Money Market Instruments.
^ Not authorised for sale to the public in Hong Kong.
24

Legg Mason Global Funds Plc Annual Report 28 February 2021
Directors’ Report – (continued)
Legg Mason Brandywine Global Fixed Income Fund
Investment Objective – To maximise total return consisting of income and capital appreciation.
Investment Policies – The Fund invests at all times at least two-thirds of its net asset value in debt securities that are (i) listed or traded on Regulated Markets primarily in thefollowing countries; and (ii) denominated in currencies of, or issuers located in, primarily the following countries: the United States, Canada, Australia, Japan, Austria,Belgium, Finland, France, Germany, Greece, Ireland, Italy, the Netherlands, Portugal, Spain, Denmark, Sweden, Switzerland, the United Kingdom, New Zealand, Norway,Hungary, Poland, and the Czech Republic. The Fund may also invest in debt securities that are listed or traded on Regulated Markets located in other Developed Countriesas set out in Schedule III of the Prospectus.
All debt securities purchased by the Fund will be rated Investment Grade at the time of purchase. If an investment so purchased is subsequently downgraded to belowInvestment Grade after the time of purchase, the Investment Manager may in its discretion continue to hold the debt security if it determines that doing so is the bestinterests of shareholders. The Fund may invest up to 20 per cent of its net asset value in debt securities of issuers located in countries where both of the following criteriaapply: (i) the country’s local currency denominated long-term debt is rated below A- by S&P or the equivalent by all NRSROs rating the debt and (ii) the country is notrepresented in the Citigroup World Government Bond Index. A maximum of 25 per cent of the Fund’s net asset value may be invested in convertible debt securities and upto 10 per cent of the Fund’s net asset value may be invested in equity securities and/or warrants. No more than 5 per cent of the Fund’s net asset value will be invested inwarrants. The Fund may invest no more than 10 per cent of its net asset value in units or shares of other collective investment schemes within the meaning ofRegulation 68(1)(e) of the UCITS Regulations. The Fund may have exposure to reverse repurchase agreements for efficient portfolio management purposes and subject tothe requirements of the Central Bank. The Fund’s maximum exposure to total return swaps and Securities Financing Transactions (SFTs), based on the notional value of suchinstruments, is 25 per cent of its net asset value. The Fund will not be leveraged, including any synthetic short positions, in excess of 100 per cent of its net asset value (ascalculated using the commitment approach).
Legg Mason Brandywine Global Fixed Income Absolute Return Fund^
Investment Objective – To generate positive returns that are independent of market cycles.
Investment Policies – The Fund invests at least 70 per cent of its net asset value in (i) debt securities, convertible securities and preferred shares that are listed or traded onRegulated Markets located anywhere in the world (ii) units or shares of other collective investment schemes within the meaning of Regulation 68(1)(e) of the UCITSRegulations; and (iii) derivatives providing exposure to any or all of the following: debt securities, interest rates, currencies and fixed income indices meeting the eligibilityrequirements of the Central Bank. The Fund may not invest more than 10 per cent of its net asset value in units or shares of other collective investment schemes within themeaning of Regulation 68(1)(e) of the UCITS Regulations, and such investments will be for the purposes of gaining exposure to the types of instruments described in theinvestment policies or otherwise to pursue the investment objective and policy of the Fund.
The Fund may invest extensively in certain types of derivatives whether for investment purposes or the purposes of efficient portfolio management, as described in the‘‘Investment Techniques and Instruments and Financial Derivative Instruments’’ section of the Prospectus, including, but not limited to, options, futures and options onfutures, forward currency exchange contracts and warrants. Reverse repurchase agreements which will have debt securities as the underlying instruments may be utilised forefficient portfolio management purposes. The Fund may also utilise swaps, including but not limited to interest rate, total return and inflation swaps. The Fund’s maximumexposure to total return swaps and Securities Financing Transactions (SFTs), based on the notional value of such instruments, is 25 per cent of its net asset value.
Legg Mason Brandywine Global High Yield Fund^
Investment Objective – To generate high levels of income. The generation of capital gains is a secondary objective.
Investment Policies – The Fund invests at all times at least 80 per cent of its net asset value in corporate debt securities considered high yielding by the Investment Managerand listed or traded on Regulated Markets located anywhere in the world. Higher yields are generally available from securities rated BB+ or lower by S&P, or Ba1 or lower byMoody’s, or the equivalent or lower from another NRSRO, or if unrated deemed by the Investment Manager to be of comparable quality. Debt securities rated belowInvestment Grade are deemed by ratings agencies to be predominantly speculative with respect to the issuer’s capacity to pay interest and repay principal and may involvemajor risk of exposure to adverse conditions. The Fund may invest in debt securities rated as low as C by Moody’s or D by S&P, which ratings indicate that the obligationsare highly speculative and may be in default or in danger of default as to principal and interest. The Investment Manager does not rely solely on the ratings of ratedsecurities in making investment decisions, but instead uses a quantitative and qualitative process to determine which securities offer value. Factors that help determinewhich corporate debt securities offer value include the strength of the sovereign economy of the issuer, relative value of the currency of the securities, the quality of theissuer’s business model, the position of the securities in the capital structure of the issuer, the quality of the covenants in the securities, and the likely recovery rate on thesecurities in the event of stress. The Investment Manager’s investment approach incorporates analysis of material environmental, social and governance (ESG) issues thatmay impact an investment’s performance. The Fund will be able to invest up to 100 per cent of its net asset value in securities issued in Emerging Market Countries. Amaximum of 10 per cent of the Fund’s net asset value may be invested in units or shares of other collective investment schemes within the meaning of Regulation 68(1)(e)of the UCITS Regulations. The Fund may have exposure to reverse repurchase agreements for efficient portfolio management purposes and subject to the requirements ofthe Central Bank. The Fund’s maximum exposure to total return swaps and Securities Financing Transactions (SFTs), based on the notional value of such instruments, is 100per cent of its net asset value. With regard to currency exposure, the Investment Manager may not be net short any currency, or long more than 105 per cent of the netasset value of the Fund.
Legg Mason Brandywine Global Opportunistic Fixed Income Fund
Investment Objective – To maximise total return consisting of income and capital appreciation.
Investment Policies – The Fund invests at least two-thirds of its net asset value in debt securities that are listed or traded on Regulated Markets located anywhere in theworld, including Emerging Market Countries, and as set out in Schedule III of the Prospectus.
The Fund’s investments may include: – (i) debt securities issued or guaranteed by national governments, their agencies or instrumentalities and political sub-divisions(including inflation protected securities); (ii) debt securities of supranational organisations such as freely transferable promissory notes, fixed or floating rate bonds anddebentures; (iii) corporate debt securities of issuers (diversified across a variety of industry sectors, including but not limited to communications, consumer, energy, financial,industrial, technology and utilities, etc.) located in or whose securities are listed or traded on Regulated Markets, including freely transferable promissory notes, debentures,fixed or floating rate bonds (including zero coupon bonds), convertible and non-convertible notes, commercial paper, certificates of deposits, and bankers acceptancesissued by industrial, utility, finance, commercial banking or bank holding company organisations; and (iv) mortgage-backed securities (including collateralised debtobligations) and asset-backed securities; preferred shares and other open-ended collective investment schemes within the meaning of Regulation 68(1)(e) of the UCITSRegulations. The Investment Manager’s investment approach incorporates analysis of material environmental, social and governance (ESG) issues that may impact aninvestment’s performance. The Fund may invest no more than 10 per cent of its net asset value in units or shares of other collective investment schemes within the meaningof Regulation 68(1)(e) of the UCITS Regulations. The Fund may have exposure to reverse repurchase agreements for efficient portfolio management purposes and subject tothe requirements of the Central Bank. The Fund’s maximum exposure to total return swaps and Securities Financing Transactions (SFTs), based on the notional value of suchinstruments, is 25 per cent of its net asset value. The Fund will not be leveraged, including any synthetic short positions, in excess of 100 per cent of its net asset value.Subject to this limit, the Fund is expected to have net long exposure. With regard to currency exposure, the Investment Manager may not be net short any currency, or longmore than 105 per cent of the net asset value of the Fund.
^ Not authorised for sale to the public in Hong Kong.
25

Legg Mason Global Funds Plc Annual Report 28 February 2021
Directors’ Report – (continued)
Legg Mason Brandywine Global Sovereign Credit Fund^ (ceased trading on 25 February 2021)
Investment Objective – To maximise total return consisting of income and capital appreciation.
Investment Policies – The Fund invested at least two-thirds of its net asset value in debt securities that are issued or guaranteed by national governments, their agencies orinstrumentalities and political sub-divisions (and the agencies and instrumentalities of such sub-divisions) and that are listed or traded on Regulated Markets locatedanywhere in the world, including Emerging Market Countries. In selecting investments, the Investment Manager applied a macro, top-down, value-driven investmentprocess focused on identifying currencies and interest rate valuation opportunities.
The Fund may have invested up to one third of its net asset value in: (i) debt securities issued or guaranteed by supranational organisations, such as freely transferablepromissory notes, bonds and debentures; (ii) short-term obligations of commercial banks, including freely transferable promissory notes, bankers’ acceptances, commercialpaper, certificates of deposits, deposits and bank notes; (iii) derivatives; and (iv) other collective investment schemes.
The Fund did not directly hold short securities but instead as part of its investment strategy held short positions exclusively through derivatives on currencies, interest rates orbonds.
The Fund may have only purchased debt securities that at the time of purchase were rated at least BB- by S&P, Ba3 by Moody’s or the equivalent by another NRSRO. The Fundmay have only purchased short-term obligations that at the time of purchase are rated at least A1 by S&P, P-1 by Moody’s or the equivalent by another NRSRO. The weightedaverage credit rating of the Fund’s fixed income securities, short-term obligations and cash would be at least A- or its equivalent (cash will be considered rated AAA). Amaximum of 10 per cent of the Fund’s net asset value may have been invested in units or shares of other collective investment schemes within the meaning of Regulation68(1)(e) of the UCITS Regulations. The Investment Manager’s investment approach incorporated analysis of material environmental, social and governance (ESG) issues that mayhave impacted an investment’s performance.
The Fund may have had exposure to reverse repurchase agreements for efficient portfolio management purposes and subject to the requirements of the Central Bank. The Fund’smaximum exposure to total return swaps and Securities Financing Transactions (SFTs), based on the notional value of such instruments, was 25 per cent of its net asset value.
Legg Mason Brandywine Global Income Optimiser Fund^
Investment Objective – To maximise income yield in all market conditions, while preserving capital.
Investment Policies – The Fund invests in: (i) debt securities and convertible securities that are listed or traded on Regulated Markets located anywhere in the world; (ii) unitsor shares of other collective investment schemes within the meaning of Regulation 68(1)(e) of the UCITS Regulations; and (iii) derivatives providing exposure to any or all ofthe following: debt securities, interest rates, currencies, equities and indices (including fixed income, equity and commodity indices) meeting the eligibility requirements ofthe Central Bank. The Fund invests at least 70 per cent of its net asset value in debt securities and derivatives providing exposure to debt securities. The Fund will invest atleast 85% of its net asset value in US Dollars. However, when opportunities are available this may from time to time be a minimum of 80% in US Dollars. The InvestmentManager utilises a multifaceted approach to assess the environmental, social, governance (“ESG”) factors (as described in the section of the Prospectus entitled“Sustainability Risk”) across at least 90% of its current and prospective holdings. The Fund may invest no more than 10 per cent of its net asset value in units or shares ofother collective investment schemes within the meaning of Regulation 68(1)(e) of the UCITS Regulations. Reverse repurchase agreements which will have debt securities asthe underlying instruments may be utilised for efficient portfolio management purposes. The Fund’s maximum exposure to total return swaps and Securities FinancingTransactions (SFTs), based on the notional value of such instruments, is 100 per cent of its net asset value.
Legg Mason Brandywine Global Credit Opportunities Fund^
Investment Objective – To maximise total return through a high level of income and capital appreciation.
Investment Policies – The Fund seeks to achieve its investment objective primarily by taking a flexible investment approach to debt securities of issuers domiciled in any country,through both long exposure and short exposure (via derivatives). The Fund will invest a maximum of 25% of its net asset value in mortgage-backed securities within a singlenon-US country. The Fund will also invest, in aggregate, a maximum of 40% of its net asset value in mortgage-backed securities of non-US countries. The Fund will invest amaximum of 10% of its net asset value in collateralised debt obligations and collateralised loan obligations. The Investment Manager’s investment approach incorporates analysisof material environmental, social and governance (ESG) issues that may impact an investment’s performance. The types of debt securities in which the Fund may invest include:agency and non-agency mortgage-backed securities that are structured as debt securities; asset-backed securities; corporate debt securities, including freely transferable promissorynotes; convertible and non-convertible bonds; commercial paper, certificates of deposits, and bankers acceptances issued by industrial, utility, finance, commercial banking or bankholding company organisations; debt securities issued or guaranteed by national governments, their agencies, instrumentalities and political sub-divisions; debt securities ofsupranational organisations such as freely transferable promissory notes, bonds and debentures; structured notes that are transferable securities whose underlying exposure maybe to fixed income securities; securitised participations in loans that are transferable securities; Eurodollar bonds and Yankee dollar instruments (including senior and subordinatednotes); and Rule 144A securities. The structured notes in which the Fund will invest may contain embedded derivatives, and the Fund may be leveraged as a result. The Fund’sleverage, as calculated using the sum of the notionals of the derivatives held by the Fund, will be less than 700 per cent of the Fund’s net asset value. The Fund’s maximumexposure to total return swaps and Securities Financing Transactions (SFTs), based on the notional value of such instruments, is 100 per cent of its net asset value. The Fund maynot invest more than 10 per cent of its net asset value in units or shares of other collective investment schemes within the meaning of Regulation 68(1)(e) of the UCITS Regulations.
Legg Mason Brandywine Global Defensive High Yield Fund^
Investment Objective – To generate income as well as long-term capital gains.
Investment Policies – The Fund invests at all times at least 80 per cent of its net asset value in corporate debt securities considered high yielding by the Investment Managerand listed or traded on Regulated Markets located anywhere in the world, as set out in Schedule III of the Prospectus, including direct investment or indirect investmentthrough derivatives on such securities, provided that the Fund invests at least 70 per cent of its net asset value directly in such securities.
The Fund may invest in aggregate up to 20 per cent of its net asset value in Money Market Instruments listed or traded on a Regulated Market and debt securities, of thetypes listed in the Prospectus, which are not listed or traded on a Regulated Market, provided however that a maximum of 10 per cent of the Fund’s net asset value may beinvested in debt securities not listed or traded on a Regulated Market. A maximum of 20 per cent of the Fund’s net asset value may be invested in convertible debtsecurities. Up to 20 per cent of the Fund’s net asset value may be invested in preferred shares. A maximum of 20 per cent may be invested in equity securities, includingwarrants (a maximum of 15 per cent of the Fund’s net asset value may be invested in warrants). A maximum of 10 per cent of the Fund’s net asset value may be invested inunits or shares of other collective investment schemes within the meaning of Regulation 68(1)(e) of the UCITS Regulations. The Fund may have exposure to reverserepurchase agreements for efficient portfolio management purposes and subject to the requirements of the Central Bank. The Fund’s maximum exposure to total returnswaps and Securities Financing Transactions (SFTs), based on the notional value of such instruments, is 100 per cent of its net asset value. With regard to currency exposure,the Investment Manager may not be net short any currency, or long more than 105 per cent of the net asset value of the Fund.
Legg Mason Brandywine Global Enhanced Absolute Return Fund^
Investment Objective – To generate positive returns that are independent of market cycles.
Investment Policies – The Fund invests at least 80 per cent of its net asset value in: (i) debt securities, convertible securities and preferred shares that are listed or traded onRegulated Markets located anywhere in the world, as set out in Schedule III of the prospectus; (ii) units or shares of other collective investment schemes within the meaningof Regulation 68(1)(e) of the UCITS Regulations; and (iii) derivatives providing exposure to any or all of the following: debt securities, interest rates, currencies and fixedincome indices meeting the eligibility requirements of the Central Bank. The Fund may not invest more than 10 per cent of its net asset value in units or shares of othercollective investment schemes, and such investments will be for the purpose of gaining exposure to the types of instruments described herein or otherwise to pursue theinvestment objective and policies of the Fund. Reverse repurchase agreements which will have debt securities as the underlying instruments may be utilised for efficientportfolio management purposes.^ Not authorised for sale to the public in Hong Kong.
26

Legg Mason Global Funds Plc Annual Report 28 February 2021
Directors’ Report – (continued)
Legg Mason Brandywine Global Enhanced Absolute Return Fund^ – (continued)
The Fund may invest extensively in certain types of derivatives whether for investment purposes or for the purpose of efficient portfolio management, namely options,futures and options on futures, forward currency exchange contracts and warrants. The Fund may also utilise swaps, including but not limited to interest rate, total return,credit default and inflation swaps.
Legg Mason Brandywine Global Dynamic US Equity Fund^
Investment Objective – To provide long term capital appreciation.
Investment Policies – The Fund invests at least 80 per cent of its net asset value in equity securities of companies with large market capitalisations that (1) have their seat orregistered office in the United States or carry on a predominant portion of their activities in the United States and (2) are listed or traded on Regulated Markets as set out inSchedule III of the Prospectus.
The Fund invests in common stocks and preferred stocks. Subject to the limit above on investment in equity securities, the Fund may also invest in debt securities issued orguaranteed by US-domiciled issuers, including the US government, its agencies, instrumentalities, and political sub-divisions; corporate debt securities that are listed ortraded on Regulated Markets, including freely transferable promissory notes, debentures, commercial paper, certificates of deposits, and bankers acceptances issued byindustrial, utility, finance, commercial banking or bank holding company organisations; and warrants. The Fund will only purchase debt securities that are rated InvestmentGrade at the time of purchase. A maximum of 10 per cent of the Fund‘s net asset value may be invested in units or shares of other collective investment schemes within themeaning of Regulation 68(1)(e) of the UCITS Regulations.
Legg Mason ClearBridge Value Fund
Investment Objective – To achieve long-term capital appreciation.
Investment Policies – The Fund invests principally in securities of US issuers, which the Investment Manager believes are undervalued. The Fund may also invest up to20 per cent of its net asset value in the securities of non-US Issuers. At least 50 per cent of the net asset value of the Fund will be invested in equity securities. TheInvestment Manager uses an established proprietary research and engagement process to determine a company’s profile on environmental, social and governance (“ESG”)issues. The Fund may also invest up to 5 per cent of its net asset value in units or shares open-ended collective investment schemes within the meaning of Regulation68(1)(e) of the UCITS Regulations.
Legg Mason ClearBridge US Appreciation Fund
Investment Objective – To generate long-term capital appreciation.
Investment Policies – The Fund will invest at least 70 per cent of its net asset value in equity securities of US Companies, which are listed or traded on Regulated Markets inthe United States listed in Schedule III of the Prospectus. The Fund’s investments will include common stocks, preferred stocks and equity related securities. The InvestmentManager uses an established proprietary research and engagement process to determine a company’s profile on environmental, social and governance (“ESG”) issues. Amaximum of 10 per cent of the Fund’s net asset value may be invested in units or shares of other collective investment schemes within the meaning of Regulation 68(1)(e)of the UCITS Regulations. The Fund may also invest in certain types of derivatives, but only for efficient portfolio management purposes. The Investment Manager mayincrease the Fund’s allocation to Money Market Instruments and ancillary liquid assets when, in the Investment Manager’s opinion, market valuation levels becomeexcessive.
Legg Mason ClearBridge US Large Cap Growth Fund
Investment Objective – To generate long-term capital appreciation.
Investment Policies – The Fund invests at least 70 per cent of its net asset value in equity securities of a concentrated group of US Companies with large marketcapitalisations, which are listed or traded on Regulated Markets in the United States listed on Schedule III of the Prospectus. The core holdings of the Fund will be largemarket capitalisation US Companies that are dominant in their respective industries, global in scope and have a long-term history of performance. The Investment Manageruses an established proprietary research and engagement process to determine a company’s profile on environmental, social and governance (“ESG”) issues. The Fund’sinvestments will consist of common stocks and to a lesser extent preferred stock and equity-related securities issued by or related to large market capitalisation USCompanies, which are believed to afford attractive opportunities for investment growth. The Fund will not invest in securities listed or traded on Regulated Markets in anyEmerging Market Countries, Emerging European Countries or Emerging Asia/Pacific Countries. A maximum of 10 per cent of the Fund’s net asset value may be invested inunits or shares of other collective investment schemes within the meaning of Regulation 68(1)(e) of the UCITS Regulations.
Legg Mason ClearBridge US Aggressive Growth Fund
Investment Objective – To generate long-term capital appreciation.
Investment Policies – The Fund invests at least 70 per cent of its net asset value in common stocks of US Companies which are listed or traded on Regulated Markets in theUnited States listed in Schedule III of the Prospectus and that the Investment Manager believes are experiencing, or have potential to experience, growth of earnings and/orcash flow that exceed the average earnings and/or cash flow growth rate of companies having securities included in the Standard & Poor’s Daily Price Index of 500 CommonStocks (the ‘‘S&P 500 Index’’). The Investment Manager focuses its stock selection for the Fund on the diversified group of emerging growth companies that may havepassed their ‘‘start-up’’ phase and show positive earnings and the prospect of achieving significant profit gains in the two to three years after the Fund acquires their stocks.The Investment Manager uses an established proprietary research and engagement process to determine a company’s profile on environmental, social and governance(“ESG”) issues. A maximum of 10 per cent of the Fund’s net asset value may be invested in units or shares of other collective investment schemes within the meaning ofRegulation 68(1)(e) of the UCITS Regulations.
Legg Mason ClearBridge Tactical Dividend Income Fund
Investment Objective – To provide a high level of income. Long-term capital appreciation is a secondary objective.
Investment Policies – The Fund invests at least 80 per cent of its net asset value in equity and equity-related securities that are expected to provide investment income,dividend payments or other distributions, which are listed or traded on Regulated Markets listed in Schedule III of the Prospectus and from issuers located anywhere in theworld. The Fund may invest in equity and equity-related securities of issuers with any market capitalisation. In selecting securities, the Investment Manager uses a combinedfundamental and macroeconomic approach to identify assets that have attractive dividends and future earnings prospects. A maximum of 10 per cent of the Fund’s netasset value may be invested in units or shares of other collective investment schemes within the meaning of Regulation 68(1)(e) of the UCITS Regulations.
Legg Mason ClearBridge US Equity Sustainability Leaders Fund^
Investment Objective – To provide long term capital appreciation.
Investment Policies – The Fund invests at all times at least 85 per cent of its net asset value in US equity securities (including common stock and preferred shares) that arelisted or traded on Regulated Markets in the United States as set out in Schedule III of the Prospectus and that are issued by companies that meet the Investment Manager’sfinancial criteria and its criteria for sustainability and environmental, social and governance (“ESG”) policies (“Sustainability Leaders”). The Investment Manager’s ESG ratingsystem consists of four rating levels: AAA, AA, A and B, which are assigned to companies based on their sustainability strategy and performance on an absolute basis andcompared to their peers.
^ Not authorised for sale to the public in Hong Kong.
27

Legg Mason Global Funds Plc Annual Report 28 February 2021
Directors’ Report – (continued)
Legg Mason ClearBridge US Equity Sustainability Leaders Fund^ – (continued)
The Investment Manager seeks to invest over the long term in companies that it considers to be of high quality with sustainable competitive advantages as evidenced by highreturns on capital, strong balance sheets, and capable management teams that allocate capital in an efficient manner. The Fund will not invest in companies with significantdirect involvement in extraction of fossil fuels and mining, and instead will seek other attractive sustainable opportunities in the energy, industrials, and materials sectors.
Although the assets of the Fund ordinarily will be invested primarily in common stocks of US companies, the Fund may also invest in aggregate up to 15 per cent of its netasset value in convertible securities (which may contain embedded derivatives and/or leverage), preferred stocks, warrants, REITs, Rule 144A securities and Money MarketInstruments securities, which are listed or traded on Regulated Markets in the US. A maximum of 10 per cent of the Fund’s net asset value may be invested in units or sharesof other collective investment schemes within the meaning of Regulation 68(1)(e) of the UCITS Regulations.
Legg Mason ClearBridge Global Growth Fund^
Investment Objective – To provide long-term capital appreciation.
Investment Policies – The Fund invests at least 80 per cent of its net asset value in equity securities that are listed or traded on Regulated Markets located anywhere in theworld as set out in Schedule III of the Prospectus. Up to 25 per cent of the Fund’s net asset value may be invested in equity securities of issuers located in Emerging MarketCountries. The Fund’s exposure to Russian securities will not exceed 15 per cent of the Fund’s net asset value. A maximum of 10 per cent of the Fund’s net asset value maybe invested in units or shares of other collective investment schemes within the meaning of Regulation 68(1)(e) of the UCITS Regulations, and such investments will be forthe purposes of gaining exposure to the types of instruments described herein or otherwise to pursue the investment objective and policies of the Fund. No more than 5 percent of the Fund’s net asset value will be invested in warrants. To manage capital flows, the Fund may hold cash or invest in Money Market Instruments. The InvestmentManager uses an established proprietary research and engagement process to determine a company’s profile on environmental, social and governance (“ESG”) issues.
Legg Mason ClearBridge Infrastructure Value Fund^
Investment Objective – To achieve long-term stable growth comprised of regular and consistent income from dividends and interest, plus capital growth, from a portfolio ofglobal infrastructure securities.
Investment Policies – The Fund invests at least 80 per cent of its net asset value in infrastructure companies via equity and equity-related securities listed or traded onRegulated Markets in the G7 countries of the United States, United Kingdom, Japan, Germany, France, Italy and Canada, and equity and equity-related securities listed ortraded on Regulated Markets of other developed countries and Emerging Market Countries, including India. The equity and equity-related securities in which the Fund mayinvest includes common stock, preferred stock, depositary receipts, rights, warrants and participation notes of infrastructure companies. The Fund may invest in Americanand global depositary receipts (ADRs / GDRs) of companies which are listed or traded on a Regulated Market as set out in Schedule III of the Prospectus.
For this Fund, environmental, social and governance (“ESG”) risks and opportunities, to the extent possible, are considered via an integrated approach to ESG, and as aresult, the Investment Manager applies its ESG process to at least 90% of the portfolio of the Fund. The Fund will maintain a portfolio ESG rating higher than that of theFund’s investment universe.
The Fund may invest up to 20 per cent of its net asset value in closed-ended collective investment schemes such as REITs. Any REIT in which the Fund will invest shall belisted or traded on a Regulated Market. The Fund may invest up to 10 per cent of its net asset value in units or shares of other open-ended UCITS or other collectiveinvestment schemes within the meaning of Regulation 68(1)(e) of the UCITS Regulations, provided the investment policies and liquidity provisions of these collectiveinvestment schemes are consistent with those of the Fund.
Legg Mason ClearBridge Emerging Markets Infrastructure Fund^
Investment Objective – To achieve long-term stable growth comprised of regular and consistent income from dividends and interest, plus capital growth, from a portfolio ofemerging markets infrastructure securities.
Investment Policies – The Fund invests at least 80 per cent of its net asset value in infrastructure companies via equity and equity-related securities listed or traded on RegulatedMarkets that are issued by companies that derive at least 50 per cent of their earnings before interest, tax, depreciation and amortisation from assets located in Emerging MarketCountries, including India. It is intended that no single Emerging Market Country shall make up more than 40 per cent of the Fund’s net asset value. The equity and equity-related securities in which the Fund may invest includes common stock, preferred stock, depositary receipts, rights, warrants and participation notes of infrastructure companies.
The Fund may invest up to 20 per cent of its net asset value in securities traded on Russian markets and investment in securities traded on Russian markets will only be madein equity securities which are listed and/or traded on the Moscow Exchange. The Fund may invest in American, international and global depositary receipts (ADRs / GDRs) ofcompanies which are listed or traded on a Regulated Market as set out in Schedule III of the Prospectus. The Fund may invest up to 20 per cent of its net asset value inclosed-ended collective investment schemes such as REITs where the investment policies are consistent with the Fund’s investment policies. Any REITs in which the Fund willinvest shall be listed or traded on a Regulated Market. The Fund may invest up to 10 per cent of its net asset value in units or shares of other open-ended UCITS or othercollective investment schemes within the meaning of Regulation 68(1)(e) of the UCITS Regulations, provided the investment policies and liquidity provisions of thesecollective investment schemes are consistent with those of the Fund.
Legg Mason Royce US Small Cap Opportunity Fund
Investment Objective – To achieve long-term capital appreciation.
Investment Policies – The Fund invests at least 70 per cent of its net asset value in a diversified portfolio of equity securities issued by small-cap US companies (i.e., USCompanies with market capitalisations of less than US$3 billion) that are listed or traded on Regulated Markets in the United States. The Investment Manager invests theFund’s assets in these companies in an attempt to take advantage of what it believes are opportunistic situations for undervalued securities. Such opportunistic situationsmay include turnarounds, emerging growth companies with interrupted earnings patterns, companies with unrecognised asset values or undervalued growth companies. Amaximum of 10 per cent of the Fund’s net asset value may be invested in units or shares of other collective investment schemes within the meaning of Regulation 68(1)(e)of the UCITS Regulations. The Investment Manager uses a value method in managing the Fund’s assets.
Legg Mason Royce US Smaller Companies Fund
Investment Objective – To achieve long-term capital appreciation.
Investment Policies – The Fund invests at least two-thirds of its net asset value in equity securities issued by US companies with stock market capitalisations less thanUS$5 billion, measured at the time of investment, that are listed or traded on Regulated Markets as set out in Schedule III of the Prospectus. Up to one-third of the Fund’snet asset value may invested in (i) equity securities (including common stock, preferred shares and convertible securities) of companies with stock market capitalisationsexceeding US$5 billion, measured at the time of investment, that are listed or traded on Regulated Markets, (ii) debt securities issued or guaranteed by nationalgovernments and their agencies, instrumentalities and political sub-divisions, (iii) corporate debt securities of issuers located in or whose securities are listed or traded onRegulated Markets, and (iv) cash for efficient portfolio management purposes. No more than 10 per cent of the Fund’s net asset value, measured at the time of investment,will be invested in securities of issuers that are listed or traded on Regulated Markets outside of the United States. Furthermore, no more than 5 per cent of the Fund’s netasset value may be invested in debt securities rated below Investment Grade at the time of purchase. A maximum of 10 per cent of the Fund’s net asset value may beinvested in units or shares of other collective investment schemes within the meaning of Regulation 68(1)(e) of the UCITS Regulations.
^ Not authorised for sale to the public in Hong Kong.
28

Legg Mason Global Funds Plc Annual Report 28 February 2021
Directors’ Report – (continued)
Legg Mason QS MV European Equity Growth and Income Fund
Investment Objective – To provide long-term capital appreciation.
Investment Policies – The Fund invests at all times at least two-thirds of its net asset value in equity securities of companies that are listed or traded on Regulated Marketsand that are domiciled in or are conducting a predominant portion of their economic activities in Europe, including but not limited to Austria, Belgium, Denmark, Finland,France, Germany, Greece, Hungary, Ireland, Italy, the Netherlands, Norway, Poland, Portugal, Spain, Sweden, Switzerland, and the United Kingdom, subject to applicablelimitations on investments by foreigners. The Fund seeks to achieve its investment objective by investing primarily in securities of companies believed to afford attractiveopportunities for long-term capital appreciation. A maximum of 10 per cent of the Fund’s net asset value may be invested in units or shares of other collective investmentschemes within the meaning of Regulation 68(1)(e) of the UCITS Regulations.
Legg Mason QS MV Asia Pacific Ex Japan Equity Growth and Income Fund
Investment Objective – To provide long-term capital appreciation.
Investment Policies – The Fund invests at least two-thirds of its net asset value in equity securities listed or traded on Regulated Markets of companies domiciled in orconducting a predominant portion of their economic activities in one or more of the following emerging Asian countries, subject to applicable limitations established bysuch countries on investments by foreign investors: China, Hong Kong, Indonesia, Malaysia, the Philippines, Singapore, South Korea, Taiwan, India, Thailand, Australia andNew Zealand. In addition, the Fund may, from time to time, also invest in equity securities of companies domiciled in Pakistan and Sri Lanka. A maximum of 10 per cent ofthe Fund’s net asset value may be invested in units or shares of other collective investment schemes within the meaning of Regulation 68(1)(e) of the UCITS Regulations. Amaximum of 10 per cent of the Fund’s net asset value may be invested in equity-linked or structured notes that are transferable securities, whose underlying exposure maybe to equity securities.
Legg Mason QS Emerging Markets Equity Fund
Investment Objective – To provide long-term capital appreciation.
Investment Policies – The Fund invests at all times at least 70 per cent of its net asset value in equity securities (including common stocks and preferred shares) of companieswhose seat, registered office or principal activities are in Emerging Market Countries and that are listed or traded on Regulated Markets, subject to applicable limitationsestablished by such countries on investments by foreign investors. Up to 30 per cent of the Fund’s net asset value may be invested in equity securities of companies domiciledin or having their principal place of business in Developed Countries; debt securities issued or guaranteed by national governments, their agencies, instrumentalities, andpolitical sub-divisions that are rated Investment Grade at the time of purchase and that are listed or traded on Regulated Markets; corporate debt securities that are ratedInvestment Grade at the time of purchase and that are listed or traded on Regulated Markets; including freely transferable promissory notes, debentures, commercial paper,certificates of deposits, and bankers acceptances issued by industrial, utility, finance, commercial banking or bank holding company organisations; other open-ended collectiveinvestment schemes within the meaning of Regulation 68(1)(e) of the UCITS Regulations and warrants. No more than 10 per cent of the Fund’s net asset value may be investedin units or shares of other collective investment schemes within the meaning of Regulation 68(1)(e) of the UCITS Regulations. A maximum of 10 per cent of the Fund’s netasset value may be invested in equity-linked or structured notes that are transferable securities, whose underlying exposure may be to equity securities.
Legg Mason QS MV Global Equity Growth and Income Fund
Investment Objective – To generate long-term capital appreciation.
Investment Policies – The Fund invests at all times at least 70 per cent of its net asset value in equity securities (including common stocks and preferred shares) of companiesdomiciled in, and listed or traded on any Regulated Market in any country of the world. In seeking to achieve the Fund’s investment objective, the Investment Manager willinvest primarily in companies that are domiciled and listed in Developed Countries and it will seek to invest in companies domiciled in Developed Countries and EmergingMarket Countries, across a diversified range of industries. While there are no capitalisation restrictions, the Fund will seek to invest primarily in large-capitalisationcompanies. A maximum of 10 per cent of the Fund’s net asset value may be invested in units or shares of other collective investment schemes within the meaning ofRegulation 68(1)(e) of the UCITS Regulations.
The Fund may be leveraged to up to 100 per cent of its net asset value (as calculated using the commitment approach) as a result of its use of derivatives. The Fund’smaximum exposure to total return swaps, based on the notional value of such instruments, is 20 per cent of its net asset value.
The Fund may invest in certain eligible China A-Shares via the Shanghai-Hong Kong Stock Connect and/or Shenzhen-Hong Kong Stock Connect (the “Stock Connects”).Exposure to China A-Shares through the Stock Connects will not be more than 10 per cent of the Fund’s net asset value. The Fund may also have exposure to China A-Shares indirectly. The aggregate exposure to Russian securities and China A-Shares will not exceed 15 per cent of the Fund’s net asset value.
Legg Mason Martin Currie Asia Long-Term Unconstrained Fund^
Investment Objective – To capture Asian gross domestic product (“GDP”) growth and to provide an attractive risk/return profile in a historically volatile market using a longonly equity strategy.
Investment Policies – The Fund invests at least 80 per cent of its net asset value in equities, whether directly or indirectly through equity-related securities or long positions infinancial derivative instruments on equities and equity-related securities, that are (i) listed or traded on Regulated Markets located in mainland China, Hong Kong, India,Indonesia, Malaysia, Philippines, Singapore, South Korea, Taiwan and Thailand (collectively, the “Primary Countries”) or (ii) listed or traded on Regulated Markets located incountries other than the Primary Countries but are issued by companies whose principal activities are conducted, or who derive the majority of their business profits from,the Primary Countries. The Fund may invest in Chinese equities (meaning equities issued by companies domiciled in or deriving the predominant portion of their revenuefrom China), including certain eligible China A-Shares via the Shanghai-Hong Kong Stock Connect and/or Shenzhen-Hong Kong Stock Connect (the “Stock Connects”).There is no limit on the maximum overall exposure to Chinese equities, including through the Stock Connects.
The Investment Manager assesses environmental, social and governance (“ESG”) factors that could impact the ability of an issuer to generate future sustainable returns. TheInvestment Manager looks for companies that offer sustainable growth, strong management and a strategic market position. The Fund may invest up to 20 per cent of itsnet asset value in aggregate in: Money Market Instruments; deposits; derivatives and units or shares of other collective investment schemes within the meaning ofRegulation 68(1)(e) of the UCITS Regulations provided that the Fund may invest no more than 10 per cent of its net asset value in units or shares of such other collectiveinvestment schemes. The Fund will not take any short positions.
Legg Mason Martin Currie European Absolute Alpha Fund^
Investment Objective – To achieve absolute return over the long term by employing a long/short equity strategy.
Investment Policies – The Investment Manager focuses on fundamental analysis of securities. The Investment Manager seeks to identify valuation anomalies and takeadvantage of them through long or synthetic short positions as appropriate. The Investment Manager assesses environmental, social and governance (“ESG”) factors/characteristics. These factors/characteristics are assessed both quantitatively and qualitatively, through their proprietary ESG rating system and its direct research andengagement process. The gross exposure (including long and short positions) to European equities and equity-related securities (including via derivatives) may be up to200 per cent of the Fund’s net asset value. The net exposure (long exposure minus short exposure) to European equities and equity-related securities (including viaderivatives) is expected to range from -30 per cent to 100 per cent of the Fund’s net asset value. The Fund may invest up to 10 per cent of its net asset value in units orshares of other collective investment schemes within the meaning of Regulation 68(1) of the UCITS Regulations, in order to gain exposure to European equities.
^ Not authorised for sale to the public in Hong Kong.
29

Legg Mason Global Funds Plc Annual Report 28 February 2021
Directors’ Report – (continued)
Legg Mason Martin Currie European Absolute Alpha Fund^ – (continued)
The Fund may have exposure to Securities Financing Transactions (SFTs) subject to the requirements of the Central Bank. The Fund’s maximum exposure to total returnswaps and SFTs, based on the notional value of such instruments, is 200 per cent of its net asset value.
Legg Mason Martin Currie Global Long-Term Unconstrained Fund^Investment Objective – To produce long-term capital appreciation.
Investment Policies – The Fund invests at least 80 per cent of its net asset value in equities, whether directly or indirectly through equity-related securities or long positions infinancial derivative instruments on equities and equity- related securities that are listed or traded on Regulated Markets located anywhere in the world (including EmergingMarket Countries), as set out in Schedule III of the Prospectus. The Investment Manager is primarily interested in companies: (1) that it believes have the potential togenerate and/or sustain a high return on invested capital in excess of their weighted average cost of capital; (2) where goodwill is not a dominant asset on the balancesheet; and (3) where the free float is in excess of $3 billion.
The Investment Manager assesses environmental, social and governance (“ESG”) factors that could impact the ability of an issuer to generate future sustainable returns. TheFund may invest up to 20 per cent of its net asset value in aggregate in: Money Market Instruments; deposits; and units or shares of other collective investment schemeswithin the meaning of Regulation 68(1)(e) of the UCITS Regulations provided that the Fund may invest no more than 10 per cent of its net asset value in units or shares ofsuch other collective investment schemes. The Fund may invest in Chinese equities (meaning equities issued by companies domiciled in or deriving the predominant portionof their revenues from China), including certain eligible China A-Shares via the Shanghai-Hong Kong Stock Connect and/or Shenzhen-Hong Kong Stock Connect (the“Stock Connects”). The maximum indirect investment in China A-Shares will be limited to 10 per cent of the Fund’s net asset value. There is no limit on the maximumoverall exposure to Chinese equities, including through the Stock Connects.
Legg Mason Martin Currie Asia Pacific Ex Japan Real Income FundInvestment Objective – To provide income. Long-term capital appreciation is a secondary objective.
Investment Policies – The Fund invests at least 80% of its net asset value in equity securities and equity-related securities (including preferred shares, Australian trusts and stapledsecurities, REITs, depositary receipts and low exercise price warrants on equity securities) that are (i) listed or traded on Regulated Markets (as set out in Schedule III of theProspectus) located in the Asia Pacific (ex Japan) region, which includes those countries represented in the MSCI AC Asia Pacific ex Japan Index or (ii) listed or traded onRegulated Markets (as set out in Schedule III of the Prospectus) located outside of the Asia Pacific (ex Japan) region but are issued by companies whose principal activities areconducted in countries represented in the MSCI AC Asia Pacific ex Japan Index. This index is currently comprised of approximately 1,200 large- and mid-capitalisation companiesfrom 13 countries in the Asia Pacific (ex Japan) region. The index currently includes four developed countries and nine emerging market countries, and so the Fund may havesignificant exposure to emerging market securities. The Investment Manager’s strategy focuses on issuers from three main sectors: (1) REITs, such as shopping centres, officebuildings and industrial buildings; (2) infrastructure, such as toll roads, shipping ports, airports and railroads; and (3) utilities, such as gas and electricity grids and generators. TheInvestment Manager assesses environmental, social and governance (“ESG”) factors/characteristics. These factors/characteristics are assessed both quantitatively and qualitatively,through their proprietary ESG rating system and its direct research and engagement process. The Fund may from time to time invest in preferred shares when the InvestmentManager believes such securities provide a compelling yield opportunity while keeping with the Fund’s investment objective. The total amount invested in such assets will notexceed 20% of the Fund’s net asset value. The Fund may invest a maximum of 50% of its net asset value in aggregate in equity securities and equity-related securities (includingpreferred shares, Australian trusts and stapled securities, REITs and low exercise price warrants on equity securities) (i) listed or traded on Regulated Markets (as set out inSchedule III of the Prospectus) located in Australia or New Zealand or (ii) listed or traded on Regulated Markets (as set out in Schedule III of the Prospectus) located outside ofAustralia and New Zealand but are issued by companies whose principal activities are conducted in Australia or New Zealand. The Fund may invest a maximum of 60% of its netasset value in aggregate in REITs and property related securities (equity and equity related securities (including preferred shares, Australian trusts and stapled securities and lowexercise price warrants on equity securities) of property companies as included in MSCI’s Global Industry Classification Standard (GICS) Industry Group 6010 – Real Estate). TheFund may invest up to 20% of its net asset value in aggregate in: Money Market Instruments, deposits, derivatives and units or shares of other collective investment schemeswithin the meaning of Regulation 68(1)(e) of the UCITS Regulations, provided that the Fund may invest no more than 10% of its net asset value in units or shares of such othercollective investment schemes, and investments in such schemes will be for the purposes of gaining exposure to the types of instruments described herein or otherwise to pursuethe investment objective and policies of the Fund. The Fund may invest in Chinese equities (meaning equities issued by companies domiciled in or deriving the predominantportion of their revenues from China), including certain eligible China A-Shares via the Shanghai-Hong Kong Stock Connect and/or Shenzhen-Hong Kong Stock Connect (the“Stock Connects”). The Fund’s maximum overall exposure to Chinese equities, including through the Stock Connects, is 75% of the Fund’s Net Asset Value.
Legg Mason Martin Currie Global Emerging Markets Fund^Investment Objective – To produce long-term capital growth.
Investment Policies – The Fund invests at least 80 per cent of its net asset value in equity securities (including warrants) that are listed or traded on a Regulated Market,where the issuer of the equity is domiciled in or derives the predominant portion of their revenue from a country that is included in the MSCI Emerging Markets Index, orthe Regulated Market on which the equity is listed or traded, is located in a country that is included in the MSCI Emerging Markets Index. The MSCI Emerging Markets Indexincludes large- and mid-capitalisation companies across over 20 emerging markets countries and re-balances semi-annually. The Fund’s investments in equities may be madedirectly or indirectly through equity-related securities (including ADRs or GDRs) or long positions in derivatives on equities and equity-related securities. Investments in ADRsand GDRs will not exceed 15 per cent of the Fund’s net asset value.
The Investment Manager assesses environmental, social and governance (“ESG”) factors/characteristics. These factors/characteristics are assessed both quantitatively andqualitatively, through their proprietary ESG rating system and its direct research and engagement process. The Fund may invest up to 20 per cent of its net asset value inaggregate in: Money Market Instruments, deposits and units or shares of other collective investment schemes within the meaning of Regulation 68(1)(e) of the UCITSRegulations, provided that the Fund may invest no more than 10 per cent of its net asset value in units or shares of such other collective investment schemes.
The Fund may invest in Chinese equities (meaning equities issued by companies domiciled in or deriving the predominant portion of their revenue from China), including certaineligible China A-Shares via the Shanghai-Hong Kong Stock Connect and/or Shenzhen-Hong Kong Stock Connect (the “Stock Connects”). The maximum exposure to Chineseequities, including through the Stock Connects, is the extent of Chinese equities’ representation in the MSCI Emerging Markets Index, plus an additional 10 per cent.
Legg Mason Martin Currie European Unconstrained Fund^Investment Objective – To provide long-term capital appreciation through investment in a concentrated portfolio comprised primarily of European equities.
Investment Policies – The Fund invests at least 80 per cent of its net asset value in shares of companies domiciled or listed in Europe, or which conduct the predominant partof their economic activity in Europe. Such investment may be direct or indirect through equity-related securities, depositary receipts or collective investment schemes, or longpositions through derivatives. The Fund will invest in companies that, in the opinion of the Investment Manager in accordance with the Investment Manager’s investmentprocess, (i) have the potential to generate or sustain a high return on invested capital (ROIC) in excess of their weighted average cost of capital; (ii) have the potential toprovide an attractive growth profile and/or cash flow generation over the long term; and (iii) are expected to have supportive accounting practices and environmental, socialand governance (ESG) practices. The Fund may invest in futures on European equity indices for efficient portfolio management and low exercise price warrants forinvestment purposes, for example where local market access via a local securities account is not available or desirable. Forward currency exchange contracts may be usedonly with respect to the hedged share classes offered by the Fund. The Fund will not invest in any other types of derivatives.
The Fund may invest up to 20 per cent of its net asset value in aggregate in: Money Market Instruments; deposits; derivatives; non-European equities; and units or shares ofother collective investment schemes within the meaning of Regulation 68(1)(e) of the UCITS Regulations provided that the Fund may invest no more than 10 per cent of its netasset value in units or shares of such other collective investment schemes, and investments in such schemes will be for the purposes of gaining exposure to European equitiesor otherwise to pursue the investment objective and policies of the Fund. The Fund may invest up to 10 per cent of its net asset value in securities issued by Russian issuers.
On behalf of the Board
Joseph Keane Fionnuala Doris
17 June 2021
^ Not authorised for sale to the public in Hong Kong.
30

Legg Mason Global Funds Plc Annual Report 28 February 2021
Independent Auditors’ Report
Independent auditors’ report to the members of Legg Mason Global Funds Plc
Report on the audit of the financial statements
Opinion
In our opinion, Legg Mason Global Funds Plc’s financial statements:
• give a true and fair view of the Company’s and sub-funds’ assets, liabilities and financial position as at 28 February 2021 and of their results for the year then ended;
• have been properly prepared in accordance with Generally Accepted Accounting Practice in Ireland (accounting standards issued by the Financial Reporting Councilof the UK, including Financial Reporting Standard 102 “The Financial Reporting Standard applicable in the UK and Republic of Ireland” and Irish law); and
• have been properly prepared in accordance with the requirements of the Companies Act 2014 and the European Communities (Undertakings for CollectiveInvestment in Transferable Securities) Regulations 2011 (as amended).
We have audited the financial statements, included within the Annual Report and Audited Financial Statements, which comprise:
• the statement of financial position as at 28 February 2021;
• the statement of comprehensive income for the year then ended;
• the statement of changes in net assets attributable to holders of redeemable participating shares for the year then ended;
• the portfolio of investments for each of the sub-funds as at 28 February 2021; and
• the notes to the financial statements for the Company and for each of its sub-funds, which include a description of the significant accounting policies.
Basis for opinion
We conducted our audit in accordance with International Standards on Auditing (Ireland) (“ISAs (Ireland)”) and applicable law.
Our responsibilities under ISAs (Ireland) are further described in the Auditors’ responsibilities for the audit of the financial statements section of our report. We believe thatthe audit evidence we have obtained is sufficient and appropriate to provide a basis for our opinion.
Independence
We remained independent of the Company in accordance with the ethical requirements that are relevant to our audit of the financial statements in Ireland, which includesIAASA’s Ethical Standard, and we have fulfilled our other ethical responsibilities in accordance with these requirements.
Conclusions relating to going concern for the Company and sub-funds where the going concern basis of accounting has been adopted
Based on the work we have performed, we have not identified any material uncertainties relating to events or conditions that, individually or collectively, may cast significantdoubt on the ability of the Company’s and sub-funds’ where the going concern basis of accounting has been adopted to continue as a going concern for a period of atleast twelve months from the date on which the financial statements are authorised for issue.
In auditing the financial statements, we have concluded that the directors’ use of the going concern basis of accounting in the preparation of the financial statements of thecompany and the sub-funds where the going concern basis of accounting has been adopted is appropriate.
However, because not all future events or conditions can be predicted, this conclusion is not a guarantee as to the ability of the Company’s and the sub-funds’ where thegoing concern basis of accounting has been adopted to continue as a going concern.
Our responsibilities and the responsibilities of the directors with respect to going concern are described in the relevant sections of this report.
Reporting on other information
The other information comprises all of the information in the Annual Report and Audited Financial Statements other than the financial statements and our auditors’ reportthereon. The directors are responsible for the other information. Our opinion on the financial statements does not cover the other information and, accordingly, we do notexpress an audit opinion or, except to the extent otherwise explicitly stated in this report, any form of assurance thereon. In connection with our audit of the financialstatements, our responsibility is to read the other information and, in doing so, consider whether the other information is materially inconsistent with the financialstatements or our knowledge obtained in the audit, or otherwise appears to be materially misstated. If we identify an apparent material inconsistency or materialmisstatement, we are required to perform procedures to conclude whether there is a material misstatement of the financial statements or a material misstatement of theother information. If, based on the work we have performed, we conclude that there is a material misstatement of this other information, we are required to report thatfact. We have nothing to report based on these responsibilities.
With respect to the Directors’ Report, we also considered whether the disclosures required by the Companies Act 2014 have been included.
Based on the responsibilities described above and our work undertaken in the course of the audit, ISAs (Ireland) and the Companies Act 2014 require us to also reportcertain opinions and matters as described below:
• In our opinion, based on the work undertaken in the course of the audit, the information given in the Directors’ Report for the year ended 28 February 2021 isconsistent with the financial statements and has been prepared in accordance with applicable legal requirements.
• Based on our knowledge and understanding of the Company and its environment obtained in the course of the audit, we have not identified any materialmisstatements in the Directors’ Report.
Responsibilities for the financial statements and the audit
Responsibilities of the directors for the financial statements
As explained more fully in the Statement of Directors’ Responsibilities set out on page 17, the directors are responsible for the preparation of the financial statements inaccordance with the applicable framework and for being satisfied that they give a true and fair view.
The directors are also responsible for such internal control as they determine is necessary to enable the preparation of financial statements that are free from materialmisstatement, whether due to fraud or error.
31

Legg Mason Global Funds Plc Annual Report 28 February 2021
Independent Auditors’ Report – (continued)
Responsibilities for the financial statements and the audit – (continued)
Responsibilities of the directors for the financial statements – (continued)
In preparing the financial statements, the directors are responsible for assessing the ability of the Company and sub-funds where the going concern basis of accounting hasbeen adopted to continue as a going concern, disclosing as applicable, matters related to going concern and using the going concern basis of accounting unless thedirectors either intend to liquidate the Company or to cease operations, or have no realistic alternative but to do so.
Auditors’ responsibilities for the audit of the financial statements
Our objectives are to obtain reasonable assurance about whether the financial statements as a whole are free from material misstatement, whether due to fraud or error,and to issue an auditors’ report that includes our opinion. Reasonable assurance is a high level of assurance, but is not a guarantee that an audit conducted in accordancewith ISAs (Ireland) will always detect a material misstatement when it exists. Misstatements can arise from fraud or error and are considered material if, individually or in theaggregate, they could reasonably be expected to influence the economic decisions of users taken on the basis of these financial statements.
Our audit testing might include testing complete populations of certain transactions and balances, possibly using data auditing techniques. However, it typically involvesselecting a limited number of items for testing, rather than testing complete populations. We will often seek to target particular items for testing based on their size or riskcharacteristics. In other cases, we will use audit sampling to enable us to draw a conclusion about the population from which the sample is selected.
A further description of our responsibilities for the audit of the financial statements is located on the IAASA website at:
https://www.iaasa.ie/getmedia/b2389013-1cf6-458b-9b8f-a98202dc9c3a/Description_of_auditors_responsibilities_for_audit.pdf.
This description forms part of our auditors’ report.
Use of this report
This report, including the opinions, has been prepared for and only for the Company’s members as a body in accordance with section 391 of the Companies Act 2014 andfor no other purpose. We do not, in giving these opinions, accept or assume responsibility for any other purpose or to any other person to whom this report is shown orinto whose hands it may come save where expressly agreed by our prior consent in writing.
Other required reporting
Companies Act 2014 opinions on other matters
• We have obtained all the information and explanations which we consider necessary for the purposes of our audit.
• In our opinion the accounting records of the Company were sufficient to permit the financial statements to be readily and properly audited.
• The financial statements are in agreement with the accounting records.
Companies Act 2014 exception reporting
Directors’ remuneration and transactions
Under the Companies Act 2014 we are required to report to you if, in our opinion, the disclosures of directors’ remuneration and transactions specified by sections 305 to312 of that Act have not been made. We have no exceptions to report arising from this responsibility.
Pat Candonfor and on behalf of PricewaterhouseCoopersChartered Accountants and Statutory Audit FirmDublin
17 June 2021
32

Legg Mason Global Funds Plc Annual Report 28 February 2021
Depositary’s Report
Report from the Depositary to the Shareholders Dated 17 June 2021
For the period from 1 March 2020 to 28 February 2021 (the “Period”)
The Bank of New York Mellon SA/NV, Dublin Branch (the “Depositary” “us”, “we”, or “our”) has enquired into the conduct of Legg Mason Global Funds plc (the“Company”) for the Period, in its capacity as depositary to the Company.
This report including the opinion has been prepared for and solely for the shareholders in the Company, in accordance with our role as depositary to the Company and forno other purpose. We do not, in giving this opinion, accept or assume responsibility for any other purpose or to any other person to whom this report is shown.
Responsibilities of the Depositary
Our duties and responsibilities are outlined in Regulation 34 of the of the European Communities (Undertakings for Collective Investment in Transferable Securities)Regulations 2011 (S.I. No 352 of 2011), as amended (the “Regulations”).
Our report shall state whether, in our opinion, the Company has been managed in that period in accordance with the provisions of the Company’s constitutionaldocumentation and the Regulations. It is the overall responsibility of the Company to comply with these provisions. If the Company has not been so managed, we asdepositary must state in what respects it has not been so managed and the steps which we have taken in respect thereof.
Basis of Depositary Opinion
The Depositary conducts such reviews as it, in its reasonable opinion, considers necessary in order to comply with its duties and to ensure that, in all material respects, theCompany has been managed (i) in accordance with the limitations imposed on its investment and borrowing powers by the provisions of its constitutional documentationand the appropriate regulations and (ii) otherwise in accordance with the Company’s constitutional documentation and the appropriate regulations.
Opinion
In our opinion, the Company has been managed during the Period, in all material respects:
(i) in accordance with the limitations imposed on the investment and borrowing powers of the Company by the constitutional documentation and the Regulations;and
(ii) otherwise in accordance with the provisions of the constitutional documentation and the Regulations.
For and on Behalf of The Bank of New York Mellon SA/NV,Dublin Branch,Riverside Two,Sir John Rogerson’s Quay Dublin 2,D02 KV60,Ireland
33

Legg Mason Global Funds Plc Annual Report 28 February 2021
Legg Mason Western Asset US Government Liquidity Fund
Portfolio of Investments as at 28 February 2021
FaceValue(000’s)
Value(000’s)
$
% ofNet
AssetValue
Government Bonds and Notes — 83.70%(29 February 2020: 82.56%)
United States — 83.70% (29 February 2020: 82.56%)
25,000 Federal Farm Credit BanksFunding Corp, Series 00,0.120%, due 15/09/2021 * 25,000 2.83
12,000 Federal Farm Credit DiscountNotes,zero coupon, due 08/03/2021 11,999 1.36
5,000 Federal Farm Credit DiscountNotes,zero coupon, due 26/04/2021 4,999 0.57
15,000 Federal Farm Credit DiscountNotes,zero coupon, due 26/07/2021 14,994 1.70
15,000 Federal Farm Credit DiscountNotes,zero coupon, due 02/09/2021 14,991 1.70
30,000 Federal Home Loan Banks,0.070%, due 03/03/2021 * 30,000 3.40
25,000 Federal Home Loan Banks,Series 00,0.065%, due 13/04/2021 * 25,000 2.83
25,000 Federal Home Loan Banks,0.150%, due 27/04/2021 25,000 2.84
25,000 Federal Home Loan Banks,Series 0001,0.035%, due 14/05/2021 * 25,000 2.83
25,000 Federal Home Loan Banks,Series 00,0.080%, due 26/05/2021 * 25,000 2.83
25,000 Federal Home Loan Banks,Series 0,0.080%, due 14/06/2021 * 25,000 2.83
10,000 Federal Home Loan Banks,0.120%, due 23/06/2021 10,000 1.13
30,000 Federal Home Loan Banks,Series 0,0.075%, due 24/06/2021 * 30,000 3.40
25,000 Federal Home Loan Banks,Series 00,0.080%, due 16/07/2021 * 25,000 2.83
25,000 Federal Home Loan Banks,0.050%, due 09/08/2021 * 25,000 2.83
35,000 Federal Home Loan Banks,0.050%, due 23/08/2021 * 35,000 3.97
25,000 Federal Home Loan Banks,Series 0,0.045%, due 03/09/2021 * 25,000 2.83
3,271 United States Treasury Bill,zero coupon, due 02/03/2021 3,271 0.37
FaceValue(000’s)
Value(000’s)
$
% ofNet
AssetValue
21,748 United States Treasury Bill,zero coupon, due 04/03/2021 21,748 2.47
15,000 United States Treasury Bill,zero coupon, due 11/03/2021 15,000 1.70
15,000 United States Treasury Bill,zero coupon, due 23/03/2021 14,999 1.70
15,000 United States Treasury Bill,zero coupon, due 01/04/2021 15,000 1.70
15,000 United States Treasury Bill,zero coupon, due 15/04/2021 14,998 1.70
50,000 United States Treasury Bill,zero coupon, due 29/04/2021 49,992 5.67
25,000 United States Treasury Bill,zero coupon, due 17/06/2021 24,996 2.83
15,000 United States Treasury Bill,zero coupon, due 12/08/2021 14,990 1.70
15,000 United States Treasury Bill,zero coupon, due 19/08/2021 14,996 1.70
15,000 United States Treasury Bill,zero coupon, due 26/08/2021 14,996 1.70
12,720 United States Treasury Bill,zero coupon, due 04/11/2021 12,708 1.44
5,000 United States Treasury FloatingRate Note,0.184%, due 31/01/2022 * 5,007 0.57
40,000 United States Treasury Note/Bond,2.250%, due 31/03/2021 40,073 4.54
10,000 United States Treasury Note/Bond,2.250%, due 30/04/2021 10,036 1.14
25,000 United States Treasury Note/Bond,2.625%, due 15/05/2021 25,133 2.85
18,000 United States Treasury Note/Bond,8.125%, due 15/05/2021 18,300 2.07
25,000 United States Treasury Note/Bond,2.000%, due 31/05/2021 25,121 2.85
10,000 United States Treasury Note/Bond,1.125%, due 30/06/2021 10,036 1.14
10,000 United States Treasury Note/Bond,1.500%, due 31/10/2021 10,093 1.15
738,476 83.70
Total Government Bonds and Notes(Cost $738,476) 738,476 83.70
FaceValue(000’s)
Value(000’s)
$
% ofNet
AssetValue
Reverse Repurchase Agreements — 19.49%(29 February 2020: 20.06%)
United States — 19.49% (29 February 2020: 20.06%)
85,000 Canadian Imperial Bank ofCommerce, ReverseRepurchase Agreement to berepurchased atUS$85,000,071(collateralised by US TreasuryBonds & Notes to the totalvalue of US$86,700,079),0.010%, due 01/03/2021 85,000 9.63
87,000 JP Morgan, ReverseRepurchase Agreement to berepurchased atUS$87,000,073(collateralised by US TreasuryBonds & Notes to the totalvalue of US$88,740,147),0.010%, due 01/03/2021 87,000 9.86
172,000 19.49
Total Reverse RepurchaseAgreements (Cost $172,000) 172,000 19.49
Total Financial Assets at fair valuethrough profit or loss 910,476 103.19
Total Financial Assets and FinancialLiabilities at fair value throughprofit or loss 910,476 103.19
Liabilities in Excess of Other Assets (28,146) (3.19)
Total Net Assets $ 882,330 100.00
– Amounts designated as “–” are either $0, less than$1,000, less than 1,000 shares or less than 0.01%.
* Variable rate security. The interest rate shown reflectsthe rate in effect at 28 February 2021.
Analysis of Total Assets
% ofTotal
Assets
Transferable securities admitted to an officialexchange listing or traded on a regulated market 81.01
Money market instruments 18.87
Other assets 0.12
Total Assets 100.00
The accompanying notes are an integral part of the Financial Statements
34

Legg Mason Global Funds Plc Annual Report 28 February 2021
Legg Mason Western Asset US Core Bond Fund
Portfolio of Investments as at 28 February 2021
FaceValue(000’s)
Value(000’s)
$
% ofNet
AssetValue
Asset-Backed Securities — 8.11%(29 February 2020: 3.20%)
539 Apex Credit CLO 2017 Ltd,Series 2017 1A, Class A1,144A,1.688%, due 24/04/2029 * 540 0.18
309 Applebee’s Funding LLC /IHOP Funding LLC,Series 2019 1A, Class A2I,144A,4.194%, due 07/06/2049 320 0.11
500 Ares XLIII CLO Ltd,Series 2017 43A, Class A,144A,1.461%, due 15/10/2029 * 500 0.17
415 Argent Securities Inc Asset-Backed Pass-ThroughCertificates Series 2003-W7,Series 2003 W3, Class M1,1.243%, due 25/09/2033 * 407 0.14
92 Avery Point V CLO Ltd,Series 2014 5A, Class AR,144A,1.203%, due 17/07/2026 * 92 0.03
490 Benefit Street Partners CLOVII Ltd, Series 2015 VIIA,Class A2R, 144A,1.423%, due 18/07/2027 * 490 0.16
500 Benefit Street Partners CLOVIII Ltd, Series 2015 8A,Class A1AR, 144A,1.324%, due 20/01/2031 * 500 0.17
485 BLUEMOUNTAIN CLO 2012-2Ltd, Series 2012 2A,Class AR2, 144A,1.232%, due 20/11/2028 * 485 0.16
600 BlueMountain CLO XXII Ltd,Series 2018 22A, Class A1,144A,1.321%, due 15/07/2031 * 600 0.20
243 Carlyle Global MarketStrategies CLO 2015-3 Ltd,Series 2015 3A, Class A1R,144A,1.219%, due 28/07/2028 * 243 0.08
500 CBAM 2017-1 Ltd,Series 2017 1A, Class A1,144A,1.474%, due 20/07/2030 * 501 0.17
500 CIFC Funding 2013-II Ltd,Series 2013 2A, Class A1LR,144A,1.436%, due 18/10/2030 * 501 0.17
119 Credit Suisse First BostonMortgage Securities Corp,Series 2001 HE22, Class A1,0.598%, due 25/02/2032 * 116 0.04
51 Cutwater 2014-I Ltd,Series 2014 1A, Class A1AR,144A,1.491%, due 15/07/2026 * 51 0.02
46 CWABS Asset-BackedCertificates Trust 2007-13,Series 2007 13, Class 2A2,0.918%, due 25/10/2047 * 46 0.01
183 CWABS Inc Asset-BackedCertificates Trust 2004-5,Series 2004 5, Class 2A,0.618%, due 25/10/2034 * 178 0.06
52 CWHEQ Revolving HomeEquity Loan TrustSeries 2006-F, Series 2006 F,Class 2A1A,0.252%, due 15/07/2036 * 49 0.02
398 CWHEQ Revolving HomeEquity Loan TrustSeries 2006-I, Series 2006 I,Class 1A,0.247%, due 15/01/2037 * 385 0.13
291 CWHEQ Revolving HomeEquity Loan TrustSeries 2006-I, Series 2006 I,Class 2A,0.247%, due 15/01/2037 * 281 0.09
438 Denali Capital CLO X LLC,Series 2013 1A, Class A1LR,144A,1.265%, due 26/10/2027 * 440 0.15
FaceValue(000’s)
Value(000’s)
$
% ofNet
AssetValue
543 Domino’s Pizza Master IssuerLLC, Series 2018 1A,Class A2I, 144A,4.116%, due 25/07/2048 572 0.19
190 Dryden XXV Senior LoanFund, Series 2012 25A,Class ARR, 144A,1.141%, due 15/10/2027 * 191 0.06
353 EFS Volunteer No 2 LLC,Series 2012 1, Class A2,144A,1.480%, due 25/03/2036 * 359 0.12
703 Enterprise Fleet FinancingLLC, Series 2017 3, Class A3,144A,2.360%, due 20/05/2023 709 0.24
160 Ford Credit Floorplan MasterOwner Trust A, Series 20184, Class A,4.060%, due 15/11/2030 186 0.06
250 Greenwood Park CLO Ltd,Series 2018 1A, Class A2,144A,1.251%, due 15/04/2031 * 251 0.08
320 Greywolf CLO V Ltd,Series 2015 1A, Class A1R,144A,1.378%, due 27/01/2031 * 320 0.11
500 Grippen Park CLO Ltd,Series 2017 1A, Class A,144A,1.484%, due 20/01/2030 * 501 0.17
1,418 Home Equity Asset Trust2006-4, Series 2006 4,Class 2A4,0.398%, due 25/08/2036 * 1,405 0.47
479 Jackson Mill CLO Ltd,Series 2015 1A, Class AR,144A,1.071%, due 15/04/2027 * 479 0.16
1,096 Long Beach Mortgage LoanTrust 2004-1, Series 2004 1,Class M1,0.868%, due 25/02/2034 * 1,095 0.37
462 Long Beach Mortgage LoanTrust 2004-4, Series 2004 4,Class M1,1.018%, due 25/10/2034 * 459 0.15
597 Merrill Lynch MortgageInvestors Trust Series 2004-WMC5, Series 2004 WMC5,Class M1,1.048%, due 25/07/2035 * 594 0.20
189 Merrill Lynch MortgageInvestors TrustSeries 2006-HE1, Series 2006HE1, Class M1,0.703%, due 25/12/2036 * 188 0.06
500 MKS CLO 2017-2 Ltd,Series 2017 2A, Class A,144A,1.414%, due 20/01/2031 * 501 0.17
594 Morgan Stanley ABS Capital IInc Trust 2004-NC8,Series 2004 NC8, Class M1,1.033%, due 25/09/2034 * 588 0.20
358 Morgan Stanley ABS Capital IInc Trust 2005-NC2,Series 2005 NC2, Class M4,1.033%, due 25/03/2035 * 358 0.12
1,480 Navient Private EducationRefi Loan Trust 2018-C,Series 2018 CA, Class B,144A,4.220%, due 16/06/2042 1,544 0.51
200 Navient Student Loan Trust2017-1, Series 2017 1A,Class A3, 144A,1.268%, due 26/07/2066 * 204 0.07
370 Navient Student Loan Trust2017-3, Series 2017 3A,Class A3, 144A,1.168%, due 26/07/2066 * 378 0.13
800 Navient Student Loan Trust2018-EA, Series 2018 EA,Class B, 144A,4.440%, due 15/12/2059 833 0.28
FaceValue(000’s)
Value(000’s)
$
% ofNet
AssetValue
350 Neuberger Berman LoanAdvisers CLO 29 Ltd,Series 2018 29A, Class A1,144A,1.353%, due 19/10/2031 * 350 0.12
150 NovaStar Mortgage FundingTrust Series 2003-3,Series 2003 3, Class A1,0.828%, due 25/12/2033 * 149 0.05
500 Ocean Trails CLO IX,Series 2020 9A, Class A1,144A,2.153%, due 15/10/2029 * 502 0.17
480 Ocean Trails Clo X,Series 2020 10A, Class A1,144A,1.744%, due 15/10/2031 * 481 0.16
440 OCTAGON INVESTMENTPARTNERS 35 Ltd,Series 2018 1A, Class A1A,144A,1.284%, due 20/01/2031 * 440 0.15
283 Recette Clo Ltd, Series 20151A, Class AR, 144A,1.144%, due 20/10/2027 * 283 0.09
452 Regatta VI Funding Ltd,Series 2016 1A, Class AR,144A,1.304%, due 20/07/2028 * 452 0.15
130 SBA Small BusinessInvestment Cos,Series 2018 10B, Class 1,3.548%, due 10/09/2028 138 0.04
484 Securitized Asset BackedReceivables LLC Trust2005-OP1, Series 2005 OP1,Class M1,0.733%, due 25/01/2035 * 476 0.16
272 Seven Sticks CLO Ltd,Series 2016 1A, Class A1R,144A,1.291%, due 15/07/2028 * 272 0.09
137 SLM Private Credit StudentLoan Trust 2007-A,Series 2007 A, Class A4A,0.457%, due 16/12/2041 * 133 0.04
654 SLM Student Loan Trust2004-3, Series 2004 3A,Class A6A, 144A,0.768%, due 25/10/2064 * 656 0.22
191 Tralee CLO III Ltd,Series 2014 3A, Class AR,144A,1.254%, due 20/10/2027 * 192 0.06
660 Voya CLO 2016-3 Ltd,Series 2016 3A, Class A1R,144A,1.413%, due 18/10/2031 * 661 0.22
300 Voya CLO 2017-3 Ltd,Series 2017 3A, Class A1A,144A,1.454%, due 20/07/2030 * 300 0.10
320 Voya CLO 2018-3 Ltd,Series 2018 3A, Class A1A,144A,1.391%, due 15/10/2031 * 320 0.11
Total Asset-Backed Securities(Cost $23,951) 24,245 8.11
Mortgage-Backed Securities — 35.39%(29 February 2020: 46.15%)
135 Banc of America Mortgage2003-C Trust, Series 2003 C,Class B1,4.107%, due 25/04/2033 * 32 0.01
630 BANK 2018-BNK12,Series 2018 BN12, Class A4,4.255%, due 15/05/2061 * 734 0.25
113 Bear Stearns ALT-A Trust2004-6, Series 2004 6,Class M1,0.943%, due 25/07/2034 * 115 0.04
10,983 Benchmark 2018-B5Mortgage Trust,Series 2018 B5, Class XA,0.486%, due 15/07/2051 * 311 0.10
The accompanying notes are an integral part of the Financial Statements
35

Legg Mason Global Funds Plc Annual Report 28 February 2021
Legg Mason Western Asset US Core Bond Fund
Portfolio of Investments as at 28 February 2021 – (continued)
FaceValue(000’s)
Value(000’s)
$
% ofNet
AssetValue
Mortgage-Backed Securities — (continued)
879 BHMS 2018-ATLS,Series 2018 ATLS, Class A,144A,1.362%, due 15/07/2035 * 880 0.29
330 BXMT 2020-FL2 Ltd,Series 2020 FL2, Class A,144A,1.008%, due 16/02/2037 * 331 0.11
100 CD 2017-CD3 MortgageTrust, Series 2017 CD3,Class A4,3.631%, due 10/02/2050 112 0.04
700 Citigroup CommercialMortgage Trust 2016-P3,Series 2016 P3, Class A3,3.063%, due 15/04/2049 746 0.25
150 COMM 2012-CCRE4Mortgage Trust, Series 2012CR4, Class AM,3.251%, due 15/10/2045 152 0.05
10 COMM 2013-CCRE12Mortgage Trust, Series 2013CR12, Class AM,4.300%, due 10/10/2046 11 –
185 Comm 2014-UBS2 MortgageTrust, Series 2014 UBS2,Class XA,1.145%, due 10/03/2047 * 5 –
121 COMM 2015-LC19Mortgage Trust, Series 2015LC19, Class ASB,3.040%, due 10/02/2048 127 0.04
100 CSAIL 2015-C1 CommercialMortgage Trust, Series 2015C1, Class AS,3.791%, due 15/04/2050 * 109 0.04
340 CSMC 2014-USA OA LLC,Series 2014 USA, Class A2,144A,3.953%, due 15/09/2037 360 0.12
420 CSMC 2014-USA OA LLC,Series 2014 USA, Class B,144A,4.185%, due 15/09/2037 427 0.14
854 CSMC Trust 2018-J1,Series 2018 J1, Class A2,144A,3.500%, due 25/02/2048 * 872 0.29
1,078 CSMC Trust 2018-J1,Series 2018 J1, Class B2,144A,3.638%, due 25/02/2048 * 1,120 0.37
274 Fannie Mae ConnecticutAvenue Securities,Series 2014 C03, Class 1M2,3.130%, due 25/07/2024 * 273 0.09
46 Fannie Mae ConnecticutAvenue Securities,Series 2014 C04, Class 2M2,5.118%, due 25/11/2024 * 47 0.02
2 Fannie Mae Interest Strip390, Class C3,6.000%, due 25/07/2038 – –
6 Fannie Mae Interest Strip407, Class 41,6.000%, due 25/01/2038 1 –
16 Fannie Mae Interest Strip409, Class C13,3.500%, due 25/11/2041 1 –
15 Fannie Mae Interest Strip409, Class C18,4.000%, due 25/04/2042 2 –
14 Fannie Mae Interest Strip409, Class C2,3.000%, due 25/04/2027 1 –
2,300 Fannie Mae or Freddie Mac,15 year, TBA,1.500% ± 2,325 0.78
800 Fannie Mae or Freddie Mac,30 year, TBA,1.500% ± 784 0.26
1,300 Fannie Mae or Freddie Mac,30 year, TBA,1.500% ± 1,277 0.43
4,300 Fannie Mae or Freddie Mac,30 year, TBA,2.000% ± 4,335 1.45
FaceValue(000’s)
Value(000’s)
$
% ofNet
AssetValue
7,000 Fannie Mae or Freddie Mac,30 year, TBA,2.000% ± 7,071 2.36
2,900 Fannie Mae or Freddie Mac,30 year, TBA,2.500% ± 3,001 1.00
1,200 Fannie Mae or Freddie Mac,30 year, TBA,2.500% ± 1,244 0.42
2 Fannie Mae Pool ‘888795’,5.500%, due 01/11/2036 3 –
56 Fannie Mae Pool ‘890604’,4.500%, due 01/10/2044 62 0.02
34 Fannie Mae Pool ‘AB9594’,4.000%, due 01/06/2043 38 0.01
314 Fannie Mae Pool ‘AH4536’,4.000%, due 01/02/2041 346 0.12
14 Fannie Mae Pool ‘AL4324’,6.500%, due 01/05/2040 17 0.01
109 Fannie Mae Pool ‘AL9397’,3.000%, due 01/10/2046 116 0.04
158 Fannie Mae Pool ‘AL9546’,3.500%, due 01/11/2046 169 0.06
62 Fannie Mae Pool ‘AL9631’,3.000%, due 01/12/2046 67 0.02
20 Fannie Mae Pool ‘AM8674’,2.810%, due 01/04/2025 22 0.01
96 Fannie Mae Pool ‘AO7501’,4.000%, due 01/06/2042 106 0.04
36 Fannie Mae Pool ‘AP4781’,3.000%, due 01/09/2042 39 0.01
59 Fannie Mae Pool ‘AS3253’,4.000%, due 01/09/2044 64 0.02
90 Fannie Mae Pool ‘AS6328’,3.500%, due 01/12/2045 97 0.03
545 Fannie Mae Pool ‘AS7313’,3.500%, due 01/06/2046 592 0.20
136 Fannie Mae Pool ‘AS7738’,3.000%, due 01/08/2046 148 0.05
100 Fannie Mae Pool ‘AS7844’,3.000%, due 01/09/2046 107 0.04
93 Fannie Mae Pool ‘AS8359’,3.000%, due 01/11/2046 98 0.03
61 Fannie Mae Pool ‘AS8745’,3.000%, due 01/02/2047 66 0.02
84 Fannie Mae Pool ‘AS9588’,4.000%, due 01/05/2047 92 0.03
35 Fannie Mae Pool ‘AT4281’,4.000%, due 01/06/2043 39 0.01
64 Fannie Mae Pool ‘BC0884’,3.000%, due 01/05/2046 70 0.02
111 Fannie Mae Pool ‘BC1509’,3.000%, due 01/08/2046 119 0.04
157 Fannie Mae Pool ‘BC2817’,3.000%, due 01/09/2046 167 0.06
46 Fannie Mae Pool ‘BC9096’,3.500%, due 01/12/2046 49 0.02
59 Fannie Mae Pool ‘BD2455’,3.000%, due 01/01/2047 64 0.02
59 Fannie Mae Pool ‘BD8104’,3.000%, due 01/10/2046 64 0.02
169 Fannie Mae Pool ‘BE2981’,3.000%, due 01/02/2032 180 0.06
67 Fannie Mae Pool ‘BE3702’,4.000%, due 01/06/2047 73 0.02
286 Fannie Mae Pool ‘BF0104’,4.000%, due 01/02/2056 322 0.11
338 Fannie Mae Pool ‘BF0133’,4.000%, due 01/08/2056 379 0.13
187 Fannie Mae Pool ‘BF0145’,3.500%, due 01/03/2057 206 0.07
86 Fannie Mae Pool ‘BF0163’,5.000%, due 01/11/2046 99 0.03
128 Fannie Mae Pool ‘BF0183’,4.000%, due 01/01/2057 145 0.05
307 Fannie Mae Pool ‘BF0191’,4.000%, due 01/06/2057 344 0.12
183 Fannie Mae Pool ‘BF0222’,4.500%, due 01/09/2057 210 0.07
68 Fannie Mae Pool ‘BF0301’,4.500%, due 01/08/2058 78 0.03
345 Fannie Mae Pool ‘BH2623’,4.000%, due 01/08/2047 374 0.13
41 Fannie Mae Pool ‘BH4095’,4.000%, due 01/10/2047 45 0.02
FaceValue(000’s)
Value(000’s)
$
% ofNet
AssetValue
719 Fannie Mae Pool ‘BH4101’,3.500%, due 01/10/2047 765 0.26
157 Fannie Mae Pool ‘BH9923’,3.500%, due 01/09/2047 168 0.06
85 Fannie Mae Pool ‘BJ0685’,4.000%, due 01/04/2048 91 0.03
137 Fannie Mae Pool ‘BJ2763’,4.500%, due 01/05/2048 150 0.05
39 Fannie Mae Pool ‘BL2454’,3.160%, due 01/05/2029 44 0.01
197 Fannie Mae Pool ‘BL5850’,2.260%, due 01/04/2030 209 0.07
99 Fannie Mae Pool ‘BM1948’,6.000%, due 01/07/2041 119 0.04
36 Fannie Mae Pool ‘BM2005’,4.000%, due 01/12/2047 38 0.01
212 Fannie Mae Pool ‘BM3473’,3.500%, due 01/11/2047 233 0.08
37 Fannie Mae Pool ‘BM3904’,5.000%, due 01/05/2048 41 0.01
542 Fannie Mae Pool ‘BM4579’,3.000%, due 01/04/2047 587 0.20
61 Fannie Mae Pool ‘BM4751’,3.500%, due 01/03/2043 67 0.02
124 Fannie Mae Pool ‘BM4897’,3.500%, due 01/12/2046 134 0.05
237 Fannie Mae Pool ‘BM5119’,4.500%, due 01/12/2048 262 0.09
175 Fannie Mae Pool ‘BM5521’,3.500%, due 01/07/2048 186 0.06
1,135 Fannie Mae Pool ‘BM5526’,3.500%, due 01/02/2048 1,207 0.40
200 Fannie Mae Pool ‘BN0341’,5.000%, due 01/12/2048 222 0.07
110 Fannie Mae Pool ‘BN1623’,4.500%, due 01/11/2048 121 0.04
1,979 Fannie Mae Pool ‘BN3898’,4.500%, due 01/12/2048 2,195 0.73
135 Fannie Mae Pool ‘BN7652’,3.000%, due 01/07/2049 144 0.05
80 Fannie Mae Pool ‘BO2252’,3.500%, due 01/10/2049 87 0.03
105 Fannie Mae Pool ‘BO2878’,3.000%, due 01/11/2049 110 0.04
255 Fannie Mae Pool ‘BO7625’,3.000%, due 01/03/2050 269 0.09
52 Fannie Mae Pool ‘BO8513’,3.000%, due 01/12/2049 54 0.02
12 Fannie Mae Pool ‘BO9692’,3.000%, due 01/01/2050 13 –
78 Fannie Mae Pool ‘BP1662’,3.500%, due 01/02/2050 83 0.03
165 Fannie Mae Pool ‘BP2319’,3.000%, due 01/02/2050 175 0.06
99 Fannie Mae Pool ‘BP8713’,3.000%, due 01/08/2050 105 0.04
98 Fannie Mae Pool ‘BP9421’,3.000%, due 01/07/2050 105 0.04
98 Fannie Mae Pool ‘BQ1150’,2.500%, due 01/10/2050 102 0.03
98 Fannie Mae Pool ‘BQ5876’,2.500%, due 01/11/2050 103 0.03
98 Fannie Mae Pool ‘BQ5881’,2.500%, due 01/11/2050 102 0.03
99 Fannie Mae Pool ‘BQ9226’,2.000%, due 01/01/2051 101 0.03
100 Fannie Mae Pool ‘BR0757’,2.500%, due 01/01/2051 104 0.03
100 Fannie Mae Pool ‘BR2641’,2.000%, due 01/02/2051 101 0.03
100 Fannie Mae Pool ‘BR2643’,2.000%, due 01/02/2051 101 0.03
100 Fannie Mae Pool ‘BR2644’,2.000%, due 01/02/2051 101 0.03
100 Fannie Mae Pool ‘BR3256’,2.000%, due 01/02/2051 102 0.03
100 Fannie Mae Pool ‘BR3257’,2.000%, due 01/02/2051 102 0.03
200 Fannie Mae Pool ‘BR3290’,2.000%, due 01/03/2051 203 0.07
100 Fannie Mae Pool ‘BR4035’,2.000%, due 01/02/2051 101 0.03
136 Fannie Mae Pool ‘CA1053’,3.500%, due 01/01/2048 145 0.05
79 Fannie Mae Pool ‘CA1565’,4.500%, due 01/04/2048 86 0.03
The accompanying notes are an integral part of the Financial Statements
36

Legg Mason Global Funds Plc Annual Report 28 February 2021
Legg Mason Western Asset US Core Bond Fund
Portfolio of Investments as at 28 February 2021 – (continued)
FaceValue(000’s)
Value(000’s)
$
% ofNet
AssetValue
Mortgage-Backed Securities — (continued)
645 Fannie Mae Pool ‘CA1692’,4.000%, due 01/05/2048 701 0.23
149 Fannie Mae Pool ‘CA2047’,4.500%, due 01/07/2048 165 0.06
241 Fannie Mae Pool ‘CA2199’,4.500%, due 01/08/2048 266 0.09
32 Fannie Mae Pool ‘CA2251’,5.000%, due 01/08/2048 35 0.01
163 Fannie Mae Pool ‘CA2471’,4.000%, due 01/10/2048 176 0.06
207 Fannie Mae Pool ‘CA2482’,4.500%, due 01/10/2048 229 0.08
251 Fannie Mae Pool ‘CA2652’,5.000%, due 01/11/2048 278 0.09
579 Fannie Mae Pool ‘CA2798’,4.500%, due 01/12/2048 639 0.21
867 Fannie Mae Pool ‘CA2799’,4.500%, due 01/12/2048 956 0.32
308 Fannie Mae Pool ‘CA3493’,4.000%, due 01/05/2049 337 0.11
64 Fannie Mae Pool ‘CA3809’,3.000%, due 01/07/2049 68 0.02
722 Fannie Mae Pool ‘CA3860’,3.500%, due 01/07/2049 778 0.26
572 Fannie Mae Pool ‘CA4110’,3.000%, due 01/09/2049 610 0.20
409 Fannie Mae Pool ‘CA4979’,3.000%, due 01/01/2050 429 0.14
967 Fannie Mae Pool ‘CA5164’,3.500%, due 01/02/2050 1,033 0.35
194 Fannie Mae Pool ‘CA5216’,3.000%, due 01/02/2050 208 0.07
401 Fannie Mae Pool ‘CA5226’,3.000%, due 01/02/2050 429 0.14
181 Fannie Mae Pool ‘CA6000’,3.000%, due 01/06/2050 193 0.06
185 Fannie Mae Pool ‘CA6427’,3.000%, due 01/07/2050 196 0.07
98 Fannie Mae Pool ‘CA8377’,1.500%, due 01/12/2035 100 0.03
598 Fannie Mae Pool ‘CA8460’,2.500%, due 01/01/2051 622 0.21
800 Fannie Mae Pool ‘FM0062’,3.500%, due 01/02/2050 861 0.29
51 Fannie Mae Pool ‘FM1098’,4.000%, due 01/05/2049 56 0.02
57 Fannie Mae Pool ‘FM1193’,3.500%, due 01/06/2049 61 0.02
61 Fannie Mae Pool ‘FM1241’,3.500%, due 01/08/2049 65 0.02
52 Fannie Mae Pool ‘FM1458’,4.500%, due 01/04/2049 57 0.02
46 Fannie Mae Pool ‘FM1468’,5.000%, due 01/08/2049 51 0.02
48 Fannie Mae Pool ‘FM1539’,4.500%, due 01/09/2049 52 0.02
482 Fannie Mae Pool ‘FM1727’,5.000%, due 01/09/2049 544 0.18
55 Fannie Mae Pool ‘FM1789’,3.000%, due 01/11/2049 58 0.02
643 Fannie Mae Pool ‘FM2075’,3.000%, due 01/12/2049 690 0.23
73 Fannie Mae Pool ‘FM2158’,4.000%, due 01/10/2049 81 0.03
103 Fannie Mae Pool ‘FM2201’,4.000%, due 01/01/2048 111 0.04
205 Fannie Mae Pool ‘FM2333’,3.500%, due 01/02/2050 218 0.07
65 Fannie Mae Pool ‘FM2745’,4.500%, due 01/03/2050 71 0.02
618 Fannie Mae Pool ‘FM2761’,5.000%, due 01/03/2050 685 0.23
274 Fannie Mae Pool ‘FM3141’,3.500%, due 01/11/2048 293 0.10
67 Fannie Mae Pool ‘FM3154’,5.000%, due 01/09/2049 74 0.02
62 Fannie Mae Pool ‘FM3155’,5.000%, due 01/12/2049 68 0.02
71 Fannie Mae Pool ‘FM3158’,4.000%, due 01/11/2048 78 0.03
211 Fannie Mae Pool ‘FM3215’,3.500%, due 01/01/2049 227 0.08
226 Fannie Mae Pool ‘FM3278’,3.500%, due 01/11/2048 240 0.08
301 Fannie Mae Pool ‘FM3347’,3.500%, due 01/05/2047 323 0.11
FaceValue(000’s)
Value(000’s)
$
% ofNet
AssetValue
357 Fannie Mae Pool ‘FM3572’,4.500%, due 01/09/2049 392 0.13
422 Fannie Mae Pool ‘FM3773’,3.500%, due 01/11/2048 453 0.15
119 Fannie Mae Pool ‘FM3904’,4.000%, due 01/03/2049 128 0.04
162 Fannie Mae Pool ‘FM3957’,5.000%, due 01/03/2050 180 0.06
160 Fannie Mae Pool ‘FM3978’,4.000%, due 01/07/2050 174 0.06
90 Fannie Mae Pool ‘FM4281’,3.500%, due 01/08/2050 98 0.03
179 Fannie Mae Pool ‘FM4532’,3.000%, due 01/09/2050 188 0.06
98 Fannie Mae Pool ‘FM4577’,2.500%, due 01/10/2050 103 0.03
481 Fannie Mae Pool ‘FM4595’,3.000%, due 01/09/2050 517 0.17
786 Fannie Mae Pool ‘FM4650’,2.500%, due 01/10/2040 827 0.28
93 Fannie Mae Pool ‘FM4737’,3.500%, due 01/09/2050 98 0.03
94 Fannie Mae Pool ‘FM4925’,3.000%, due 01/11/2050 100 0.03
86 Fannie Mae Pool ‘FM5054’,4.000%, due 01/11/2048 92 0.03
93 Fannie Mae Pool ‘FM5370’,3.000%, due 01/12/2048 99 0.03
198 Fannie Mae Pool ‘FM5423’,2.500%, due 01/01/2051 208 0.07
100 Fannie Mae Pool ‘FM5642’,2.000%, due 01/01/2051 101 0.03
100 Fannie Mae Pool ‘FM5653’,2.500%, due 01/01/2051 104 0.04
100 Fannie Mae Pool ‘FM5713’,2.500%, due 01/02/2051 104 0.04
100 Fannie Mae Pool ‘FM5904’,2.500%, due 01/02/2051 104 0.04
199 Fannie Mae Pool ‘FM5931’,2.500%, due 01/02/2051 208 0.07
200 Fannie Mae Pool ‘FM5944’,2.500%, due 01/01/2051 208 0.07
200 Fannie Mae Pool ‘FM6043’,3.500%, due 01/06/2049 213 0.07
100 Fannie Mae Pool ‘FM6188’,2.500%, due 01/03/2051 104 0.04
60 Fannie Mae Pool ‘MA1217’,4.000%, due 01/10/2042 66 0.02
29 Fannie Mae Pool ‘MA1253’,4.000%, due 01/11/2042 33 0.01
38 Fannie Mae Pool ‘MA1591’,4.500%, due 01/09/2043 43 0.01
595 Fannie Mae Pool ‘MA2806’,3.000%, due 01/11/2046 631 0.21
863 Fannie Mae Pool ‘MA3058’,4.000%, due 01/07/2047 935 0.31
110 Fannie Mae Pool ‘MA3149’,4.000%, due 01/10/2047 119 0.04
200 Fannie Mae Pool ‘MA3501’,5.000%, due 01/10/2048 221 0.07
203 Fannie Mae Pool ‘MA3527’,5.000%, due 01/11/2048 225 0.08
15 Fannie Mae REMICS,Series 2001 81, Class GE,6.000%, due 25/01/2032 17 0.01
27 Fannie Mae REMICS,Series 2005 29, Class ZA,5.500%, due 25/04/2035 31 0.01
16 Fannie Mae REMICS,Series 2011 87, Class SG,6.432%, due 25/04/2040 * 2 –
45 Fannie Mae REMICS,Series 2012 101, Class AI,3.000%, due 25/06/2027 2 –
128 Fannie Mae REMICS,Series 2012 134, Class SK,6.032%, due 25/12/2042 * 29 0.01
9 Fannie Mae REMICS,Series 2012 46, Class BA,6.000%, due 25/05/2042 11 –
8 Fannie Mae REMICS,Series 2012 70, Class YS,6.532%, due 25/02/2041 * – –
13 Fannie Mae REMICS,Series 2012 75, Class NS,6.482%, due 25/07/2042 * 2 –
FaceValue(000’s)
Value(000’s)
$
% ofNet
AssetValue
660 Fannie Mae REMICS,Series 2012 96, Class SB,5.932%, due 25/09/2042 * 112 0.04
14 Fannie Mae REMICS,Series 2013 9, Class BC,6.500%, due 25/07/2042 17 0.01
19 Fannie Mae REMICS,Series 2013 9, Class CB,5.500%, due 25/04/2042 22 0.01
101 Fannie Mae REMICS,Series 2020 47, Class GZ,2.000%, due 25/07/2050 100 0.03
193 Fannie Mae REMICS,Series 2020 56, Class DI,2.500%, due 25/08/2050 32 0.01
97 Fannie Mae REMICS,Series 2020 74, Class EI,2.500%, due 25/10/2050 15 0.01
689 Fannie Mae REMICS,Series 2020 89, Class DI,2.500%, due 25/12/2050 98 0.03
498 Fannie Mae REMICS,Series 2020 97, Class AI,2.000%, due 25/01/2051 68 0.02
299 Fannie Mae REMICS,Series 2021 3, Class IB,2.500%, due 25/02/2051 52 0.02
899 Fannie Mae REMICS,Series 2021 3, Class QI,2.500%, due 25/02/2051 112 0.04
83 Fannie Mae-Aces,Series 2013 M6, Class 1AC,3.440%, due 25/02/2043 * 92 0.03
400 Fannie Mae-Aces,Series 2018 M15, Class 1A2,3.700%, due 25/01/2036 456 0.15
196 Fannie Mae-Aces,Series 2018 M9, Class APT2,3.121%, due 25/04/2028 * 214 0.07
200 Fannie Mae-Aces,Series 2019 M23, Class 3A3,2.720%, due 25/10/2031 * 207 0.07
598 Fannie Mae-Aces,Series 2020 M36, Class X1,1.468%, due 25/09/2034 * 64 0.02
45 Freddie Mac Gold Pool‘C91240’,4.500%, due 01/01/2029 49 0.02
15 Freddie Mac Gold Pool‘G06409’,6.000%, due 01/11/2039 18 0.01
7 Freddie Mac Gold Pool‘G06669’,6.500%, due 01/09/2039 8 –
236 Freddie Mac Gold Pool‘G61637’,3.000%, due 01/09/2047 255 0.09
398 Freddie Mac Gold Pool‘J39656’,3.000%, due 01/09/2033 421 0.14
34 Freddie Mac Gold Pool‘Q17792’,3.500%, due 01/05/2043 38 0.01
70 Freddie Mac Gold Pool‘Q29184’,4.000%, due 01/10/2044 77 0.03
62 Freddie Mac Gold Pool‘Q45560’,3.000%, due 01/01/2047 67 0.02
121 Freddie Mac Gold Pool‘Q45737’,3.000%, due 01/01/2047 131 0.04
64 Freddie Mac Gold Pool‘Q45819’,3.000%, due 01/01/2047 69 0.02
123 Freddie Mac Gold Pool‘Q46955’,4.500%, due 01/03/2047 136 0.05
2,199 Freddie Mac Gold Pool‘Q48875’,4.000%, due 01/06/2047 2,381 0.80
179 Freddie Mac Gold Pool‘Q56683’,3.000%, due 01/04/2048 188 0.06
29 Freddie Mac Gold Pool‘U90316’,4.000%, due 01/10/2042 32 0.01
The accompanying notes are an integral part of the Financial Statements
37

Legg Mason Global Funds Plc Annual Report 28 February 2021
Legg Mason Western Asset US Core Bond Fund
Portfolio of Investments as at 28 February 2021 – (continued)
FaceValue(000’s)
Value(000’s)
$
% ofNet
AssetValue
Mortgage-Backed Securities — (continued)
41 Freddie Mac Gold Pool‘U90503’,3.500%, due 01/11/2042 45 0.02
37 Freddie Mac Gold Pool‘U99045’,3.500%, due 01/03/2043 41 0.01
97 Freddie Mac Gold Pool‘U99124’,3.500%, due 01/03/2045 107 0.04
79 Freddie Mac MultifamilyStructured Pass ThroughCertificates K016, Class X1,1.481%, due 25/10/2021 * – –
90 Freddie Mac MultifamilyStructured Pass ThroughCertificates Q006, Class A2,4.592%, due 25/04/2028 * 95 0.03
169 Freddie Mac Non Gold Pool‘840698’,2.205%, due 01/03/2047 * 175 0.06
75 Freddie Mac Pool ‘QA7238’,3.500%, due 01/02/2050 81 0.03
98 Freddie Mac Pool ‘QB5092’,2.500%, due 01/11/2050 103 0.03
99 Freddie Mac Pool ‘QB5093’,2.500%, due 01/11/2050 104 0.04
100 Freddie Mac Pool ‘QB8604’,2.000%, due 01/02/2051 102 0.03
400 Freddie Mac Pool ‘QB9087’,2.000%, due 01/02/2051 406 0.14
127 Freddie Mac Pool ‘RA1103’,3.000%, due 01/07/2049 135 0.05
153 Freddie Mac Pool ‘RA1293’,3.000%, due 01/09/2049 164 0.06
72 Freddie Mac Pool ‘RA1341’,3.000%, due 01/09/2049 76 0.03
73 Freddie Mac Pool ‘RA1493’,3.000%, due 01/10/2049 78 0.03
474 Freddie Mac Pool ‘RA2117’,3.000%, due 01/02/2050 508 0.17
69 Freddie Mac Pool ‘RA2141’,4.000%, due 01/02/2050 75 0.03
373 Freddie Mac Pool ‘RA2313’,3.500%, due 01/03/2050 399 0.13
673 Freddie Mac Pool ‘RA2335’,3.000%, due 01/03/2050 721 0.24
63 Freddie Mac Pool ‘RA2358’,4.000%, due 01/03/2050 68 0.02
162 Freddie Mac Pool ‘RA2362’,3.500%, due 01/03/2050 174 0.06
866 Freddie Mac Pool ‘RA3474’,3.000%, due 01/09/2050 927 0.31
397 Freddie Mac Pool ‘RA4175’,2.500%, due 01/12/2050 416 0.14
199 Freddie Mac Pool ‘RA4414’,2.500%, due 01/01/2051 208 0.07
300 Freddie Mac Pool ‘RA4703’,2.000%, due 01/02/2051 304 0.10
284 Freddie Mac Pool ‘SD0291’,5.000%, due 01/03/2050 314 0.11
98 Freddie Mac Pool ‘SD0450’,2.500%, due 01/10/2050 103 0.03
47 Freddie Mac Pool ‘ZA5318’,3.500%, due 01/03/2048 51 0.02
265 Freddie Mac Pool ‘ZA5454’,4.000%, due 01/06/2048 288 0.10
449 Freddie Mac Pool ‘ZA6342’,4.500%, due 01/03/2049 497 0.17
13 Freddie Mac Pool ‘ZI7269’,5.000%, due 01/03/2038 15 0.01
43 Freddie Mac Pool ‘ZM1238’,3.000%, due 01/06/2046 46 0.02
40 Freddie Mac Pool ‘ZM8774’,5.000%, due 01/10/2048 44 0.01
38 Freddie Mac Pool ‘ZN1436’,5.000%, due 01/11/2048 42 0.01
7 Freddie Mac Pool ‘ZS3059’,5.500%, due 01/12/2038 8 –
12 Freddie Mac Pool ‘ZS3569’,6.000%, due 01/10/2036 14 –
47 Freddie Mac Pool ‘ZS4697’,3.000%, due 01/01/2047 50 0.02
158 Freddie Mac Pool ‘ZS4699’,4.000%, due 01/01/2047 171 0.06
19 Freddie Mac Pool ‘ZS6518’,4.000%, due 01/10/2025 21 0.01
FaceValue(000’s)
Value(000’s)
$
% ofNet
AssetValue
45 Freddie Mac Pool ‘ZS8673’,3.000%, due 01/10/2032 47 0.02
170 Freddie Mac Pool ‘ZS9316’,3.500%, due 01/01/2038 185 0.06
34 Freddie Mac Pool ‘ZT0714’,5.000%, due 01/10/2048 38 0.01
69 Freddie Mac Pool ‘ZT1257’,3.000%, due 01/01/2046 75 0.03
272 Freddie Mac Pool ‘ZT1493’,3.000%, due 01/09/2048 293 0.10
309 Freddie Mac Pool ‘ZT1596’,5.000%, due 01/01/2049 342 0.11
181 Freddie Mac Pool ‘ZT1854’,4.500%, due 01/03/2049 199 0.07
67 Freddie Mac Pool ‘ZT1970’,3.500%, due 01/04/2033 72 0.02
6 Freddie Mac REMICS 3621,Class SB,6.118%, due 15/01/2040 * 1 –
31 Freddie Mac REMICS 3947,Class SG,5.838%, due 15/10/2041 * 6 –
5 Freddie Mac REMICS 4057,Class CS,5.938%, due 15/04/2039 * – –
24 Freddie Mac REMICS 4194,Class BI,3.500%, due 15/04/2043 3 –
13 Freddie Mac REMICS 4298,Class PI,4.000%, due 15/04/2043 1 –
72 Freddie Mac REMICS 4813,Class CJ,3.000%, due 15/08/2048 74 0.03
94 Freddie Mac REMICS 5010,Class IK,2.500%, due 25/09/2050 13 –
292 Freddie Mac REMICS 5010,Class JI,2.500%, due 25/09/2050 45 0.02
99 Freddie Mac REMICS 5013,Class IN,2.500%, due 25/09/2050 16 0.01
198 Freddie Mac REMICS 5018,Class MI,2.000%, due 25/10/2050 27 0.01
98 Freddie Mac REMICS 5040,Class IB,2.500%, due 25/11/2050 13 –
398 Freddie Mac REMICS 5059,Class IB,2.500%, due 25/01/2051 66 0.02
100 Freddie Mac REMICS 5069,Class MI,2.500%, due 25/02/2051 14 0.01
340 Freddie Mac STACR REMICTrust 2020-DNA6,Series 2020 DNA6, Class M1,144A,0.945%, due 25/12/2050 * 341 0.11
300 Freddie Mac StructuredAgency Credit Risk DebtNotes, Series 2016 DNA1,Class M3,5.680%, due 25/07/2028 * 316 0.11
840 Freddie Mac StructuredAgency Credit Risk DebtNotes, Series 2017 DNA2,Class M2,3.568%, due 25/10/2029 * 872 0.29
85 Freddie Mac Structured Pass-Through Certificates, Series T56, Class 2AF,0.518%, due 25/05/2043 * 85 0.03
22 Ginnie Mae I Pool ‘557522’,7.000%, due 15/07/2031 27 0.01
12 Ginnie Mae I Pool ‘565347’,7.000%, due 15/08/2031 12 –
9 Ginnie Mae I Pool ‘584344’,7.000%, due 15/04/2032 10 –
115 Ginnie Mae I Pool ‘784571’,3.500%, due 15/06/2048 124 0.04
59 Ginnie Mae I Pool ‘AA5649’,3.000%, due 15/09/2042 64 0.02
93 Ginnie Mae I Pool ‘AB2892’,3.000%, due 15/09/2042 98 0.03
FaceValue(000’s)
Value(000’s)
$
% ofNet
AssetValue
190 Ginnie Mae I Pool ‘AB9108’,3.000%, due 15/10/2042 200 0.07
14 Ginnie Mae II Pool ‘4837’,6.000%, due 20/10/2040 16 0.01
11 Ginnie Mae II Pool ‘4923’,4.500%, due 20/01/2041 13 –
8 Ginnie Mae II Pool ‘4961’,6.000%, due 20/02/2041 9 –
27 Ginnie Mae II Pool ‘4978’,4.500%, due 20/03/2041 31 0.01
12 Ginnie Mae II Pool ‘5240’,6.000%, due 20/11/2041 15 0.01
896 Ginnie Mae II Pool ‘784577’,4.000%, due 20/07/2047 971 0.32
81 Ginnie Mae II Pool ‘784825’,3.500%, due 20/10/2049 84 0.03
178 Ginnie Mae II Pool ‘784905’,3.000%, due 20/01/2050 186 0.06
61 Ginnie Mae II Pool ‘784985’,3.500%, due 20/09/2048 65 0.02
99 Ginnie Mae II Pool ‘785218’,2.000%, due 20/12/2050 101 0.03
199 Ginnie Mae II Pool ‘785219’,2.000%, due 20/12/2050 202 0.07
99 Ginnie Mae II Pool ‘785220’,2.000%, due 20/12/2050 101 0.03
198 Ginnie Mae II Pool ‘785221’,2.000%, due 20/12/2050 201 0.07
61 Ginnie Mae II Pool ‘BC4732’,3.500%, due 20/10/2047 65 0.02
88 Ginnie Mae II Pool ‘BM7534’,3.500%, due 20/02/2050 94 0.03
180 Ginnie Mae II Pool ‘BM9743’,4.000%, due 20/11/2049 197 0.07
91 Ginnie Mae II Pool ‘BS1742’,4.000%, due 20/02/2050 99 0.03
100 Ginnie Mae II Pool ‘BS8546’,2.500%, due 20/12/2050 105 0.04
314 Ginnie Mae II Pool ‘BT0812’,3.000%, due 20/03/2050 327 0.11
99 Ginnie Mae II Pool ‘BT1888’,2.500%, due 20/12/2050 103 0.03
55 Ginnie Mae II Pool ‘MA1995’,3.500%, due 20/06/2044 60 0.02
73 Ginnie Mae II Pool ‘MA2677’,3.000%, due 20/03/2045 77 0.03
21 Ginnie Mae II Pool ‘MA2678’,3.500%, due 20/03/2045 22 0.01
185 Ginnie Mae II Pool ‘MA3873’,3.000%, due 20/08/2046 196 0.07
36 Ginnie Mae II Pool ‘MA3937’,3.500%, due 20/09/2046 38 0.01
40 Ginnie Mae II Pool ‘MA4068’,3.000%, due 20/11/2046 42 0.01
42 Ginnie Mae II Pool ‘MA4261’,3.000%, due 20/02/2047 45 0.02
481 Ginnie Mae II Pool ‘MA4511’,4.000%, due 20/06/2047 522 0.17
305 Ginnie Mae II Pool ‘MA4587’,4.000%, due 20/07/2047 331 0.11
314 Ginnie Mae II Pool ‘MA4719’,3.500%, due 20/09/2047 335 0.11
223 Ginnie Mae II Pool ‘MA4838’,4.000%, due 20/11/2047 242 0.08
26 Ginnie Mae II Pool ‘MA4899’,3.000%, due 20/12/2047 27 0.01
147 Ginnie Mae II Pool ‘MA4901’,4.000%, due 20/12/2047 159 0.05
24 Ginnie Mae II Pool ‘MA5018’,3.000%, due 20/02/2048 25 0.01
251 Ginnie Mae II Pool ‘MA5019’,3.500%, due 20/02/2048 269 0.09
73 Ginnie Mae II Pool ‘MA5020’,4.000%, due 20/02/2048 79 0.03
102 Ginnie Mae II Pool ‘MA5078’,4.000%, due 20/03/2048 111 0.04
63 Ginnie Mae II Pool ‘MA5137’,4.000%, due 20/04/2048 67 0.02
257 Ginnie Mae II Pool ‘MA5193’,4.500%, due 20/05/2048 278 0.09
239 Ginnie Mae II Pool ‘MA5265’,4.500%, due 20/06/2048 260 0.09
115 Ginnie Mae II Pool ‘MA5331’,4.500%, due 20/07/2048 126 0.04
586 Ginnie Mae II Pool ‘MA5467’,4.500%, due 20/09/2048 638 0.21
The accompanying notes are an integral part of the Financial Statements
38

Legg Mason Global Funds Plc Annual Report 28 February 2021
Legg Mason Western Asset US Core Bond Fund
Portfolio of Investments as at 28 February 2021 – (continued)
FaceValue(000’s)
Value(000’s)
$
% ofNet
AssetValue
Mortgage-Backed Securities — (continued)
183 Ginnie Mae II Pool ‘MA5529’,4.500%, due 20/10/2048 198 0.07
312 Ginnie Mae II Pool ‘MA5530’,5.000%, due 20/10/2048 342 0.11
79 Ginnie Mae II Pool ‘MA5652’,4.500%, due 20/12/2048 86 0.03
841 Ginnie Mae II Pool ‘MA5711’,4.500%, due 20/01/2049 912 0.31
426 Ginnie Mae II Pool ‘MA5712’,5.000%, due 20/01/2049 467 0.16
36 Ginnie Mae II Pool ‘MA5762’,3.500%, due 20/02/2049 38 0.01
278 Ginnie Mae II Pool ‘MA5818’,4.500%, due 20/03/2049 300 0.10
144 Ginnie Mae II Pool ‘MA5877’,4.500%, due 20/04/2049 156 0.05
367 Ginnie Mae II Pool ‘MA6338’,3.000%, due 20/12/2049 382 0.13
250 Ginnie Mae II Pool ‘MA6656’,3.000%, due 20/05/2050 260 0.09
291 Ginnie Mae II Pool ‘MA6866’,3.000%, due 20/09/2050 304 0.10
390 Ginnie Mae II Pool ‘MA6932’,3.000%, due 20/10/2050 410 0.14
592 Ginnie Mae II Pool ‘MA7053’,3.000%, due 20/12/2050 625 0.21
2,400 Ginnie Mae, 30 year, TBA,2.000% ± 2,436 0.81
1,000 Ginnie Mae, 30 year, TBA,2.500% ± 1,036 0.35
7 Government NationalMortgage Association,Series 2007 51, Class SG,6.469%, due 20/08/2037 * 1 –
22 Government NationalMortgage Association,Series 2009 H01, Class FA,1.261%, due 20/11/2059 * 22 0.01
5 Government NationalMortgage Association,Series 2010 85, Class HS,6.539%, due 20/01/2040 * – –
33 Government NationalMortgage Association,Series 2010 H26, Class LF,0.494%, due 20/08/2058 * 33 0.01
53 Government NationalMortgage Association,Series 2011 H01, Class AF,0.594%, due 20/11/2060 * 53 0.02
71 Government NationalMortgage Association,Series 2011 H09, Class AF,0.644%, due 20/03/2061 * 71 0.02
177 Government NationalMortgage Association,Series 2012 112, Class IO,0.174%, due 16/02/2053 * 1 –
127 Government NationalMortgage Association,Series 2012 27, Class IO,0.889%, due 16/04/2053 * 3 –
26 Government NationalMortgage Association,Series 2012 34, Class SA,5.939%, due 20/03/2042 * 7 –
80 Government NationalMortgage Association,Series 2012 44, Class IO,0.088%, due 16/03/2049 * – –
23 Government NationalMortgage Association,Series 2012 66, Class CI,3.500%, due 20/02/2038 – –
32 Government NationalMortgage Association,Series 2012 H18, Class NA,0.664%, due 20/08/2062 * 32 0.01
70 Government NationalMortgage Association,Series 2012 H27, Class AI,1.741%, due 20/10/2062 * 3 –
40 Government NationalMortgage Association,Series 2012 H30, Class GA,0.494%, due 20/12/2062 * 40 0.01
FaceValue(000’s)
Value(000’s)
$
% ofNet
AssetValue
129 Government NationalMortgage Association,Series 2013 107, Class AD,2.758%, due 16/11/2047 * 135 0.05
49 Government NationalMortgage Association,Series 2013 163, Class IO,1.201%, due 16/02/2046 * 2 –
125 Government NationalMortgage Association,Series 2013 H08, Class BF,0.544%, due 20/03/2063 * 125 0.04
47 Government NationalMortgage Association,Series 2014 105, Class IO,0.217%, due 16/06/2054 * 2 –
24 Government NationalMortgage Association,Series 2014 17, Class AM,2.772%, due 16/06/2048 * 26 0.01
28 Government NationalMortgage Association,Series 2014 47, Class IA,0.128%, due 16/02/2048 * – –
102 Government NationalMortgage Association,Series 2014 50, Class IO,0.659%, due 16/09/2055 * 4 –
288 Government NationalMortgage Association,Series 2014 92, Class IX,0.221%, due 16/05/2054 * 3 –
688 Government NationalMortgage Association,Series 2014 H20, Class FA,0.574%, due 20/10/2064 * 689 0.23
75 Government NationalMortgage Association,Series 2015 167, Class OI,4.000%, due 16/04/2045 11 –
50 Government NationalMortgage Association,Series 2015 36, Class MI,5.500%, due 20/03/2045 11 –
1,068 Government NationalMortgage Association,Series 2015 5, Class IK,0.584%, due 16/11/2054 * 27 0.01
637 Government NationalMortgage Association,Series 2016 128, Class IO,0.869%, due 16/09/2056 * 35 0.01
36 Government NationalMortgage Association,Series 2019 123, Class A,3.000%, due 20/10/2049 38 0.01
99 Government NationalMortgage Association,Series 2020 123, Class IL,2.500%, due 20/08/2050 14 –
198 Government NationalMortgage Association,Series 2020 123, Class NI,2.500%, due 20/08/2050 28 0.01
99 Government NationalMortgage Association,Series 2020 127, Class IN,2.500%, due 20/08/2050 14 0.01
98 Government NationalMortgage Association,Series 2020 129, Class IE,2.500%, due 20/09/2050 14 –
99 Government NationalMortgage Association,Series 2020 160, Class IH,2.500%, due 20/10/2050 15 0.01
99 Government NationalMortgage Association,Series 2020 160, Class VI,2.500%, due 20/10/2050 14 0.01
397 Government NationalMortgage Association,Series 2020 160, Class YI,2.500%, due 20/10/2050 57 0.02
4,748 Government NationalMortgage Association,Series 2020 178, Class IO,1.416%, due 16/10/2060 * 476 0.16
FaceValue(000’s)
Value(000’s)
$
% ofNet
AssetValue
3,651 Government NationalMortgage Association,Series 2020 179, Class IO,1.003%, due 16/09/2062 * 320 0.11
496 Government NationalMortgage Association,Series 2020 181, Class WI,2.000%, due 20/12/2050 57 0.02
2,093 Government NationalMortgage Association,Series 2020 195, Class IO,0.967%, due 16/12/2062 * 190 0.06
380 Government NationalMortgage Association,Series 2020 47, Class MI,3.500%, due 20/04/2050 58 0.02
95 Government NationalMortgage Association,Series 2020 47, Class NI,3.500%, due 20/04/2050 15 0.01
272 Government NationalMortgage Association,Series 2020 H04, Class FP,0.644%, due 20/06/2069 * 273 0.09
299 Government NationalMortgage Association,Series 2020 H09, Class FL,1.261%, due 20/05/2070 * 313 0.10
179 Government NationalMortgage Association,Series 2020 H09, Class NF,1.361%, due 20/04/2070 * 185 0.06
99 Government NationalMortgage Association,Series 2020 H13, Class FA,0.561%, due 20/07/2070 * 100 0.03
6,871 Government NationalMortgage Association,Series 2021 10, Class IO,0.999%, due 16/05/2063 * 614 0.21
7,388 Government NationalMortgage Association,Series 2021 5, Class IO,1.104%, due 16/01/2061 * 679 0.23
520 GS Mortgage SecuritiesCorp II, Series 2018 SRP5,Class A, 144A,1.412%, due 15/09/2031 * 446 0.15
900 GS Mortgage SecuritiesCorp II, Series 2018 SRP5,Class B, 144A,2.612%, due 15/09/2031 * 636 0.21
570 GS Mortgage Securities CorpTrust 2018-3PCK,Series 2018 3PCK, Class B,144A,2.362%, due 15/09/2031 * 508 0.17
10 GS Mortgage Securities Trust2013-GC16, Series 2013GC16, Class B,5.161%, due 10/11/2046 * 11 –
103 HarborView Mortgage LoanTrust 2005-9, Series 2005 9,Class 2A1B,0.851%, due 20/06/2035 * 103 0.03
450 Independence Plaza Trust2018-INDP, Series 2018INDP, Class A, 144A,3.763%, due 10/07/2035 480 0.16
10 JPMBB CommercialMortgage Securities Trust2013-C17, Series 2013 C17,Class B,4.889%, due 15/01/2047 * 11 –
120 JPMBB CommercialMortgage Securities Trust2014-C23, Series 2014 C23,Class AS,4.202%, due 15/09/2047 * 132 0.04
13,599 JPMDB CommercialMortgage Securities Trust2018-C8, Series 2018 C8,Class XA,0.639%, due 15/06/2051 * 445 0.15
The accompanying notes are an integral part of the Financial Statements
39

Legg Mason Global Funds Plc Annual Report 28 February 2021
Legg Mason Western Asset US Core Bond Fund
Portfolio of Investments as at 28 February 2021 – (continued)
FaceValue(000’s)
Value(000’s)
$
% ofNet
AssetValue
Mortgage-Backed Securities — (continued)
100 Morgan Stanley Bank ofAmerica Merrill Lynch Trust2014-C18, Series 2014 C18,Class AS,4.110%, due 15/10/2047 * 109 0.04
80 Morgan Stanley Capital ITrust 2012-C4, Series 2012C4, Class A4,3.244%, due 15/03/2045 81 0.03
235 Morgan Stanley Capital ITrust 2017-ASHF,Series 2017 ASHF, Class A,144A,0.962%, due 15/11/2034 * 234 0.08
550 Natixis Commercial MortgageSecurities Trust 2019-FAME,Series 2019 FAME, Class A,144A,3.047%, due 15/08/2036 548 0.18
286 New Residential MortgageLoan Trust 2015-2,Series 2015 2A, Class A1,144A,3.750%, due 25/08/2055 * 305 0.10
443 New Residential MortgageLoan Trust 2016-3,Series 2016 3A, Class A1B,144A,3.250%, due 25/09/2056 * 470 0.16
303 New Residential MortgageLoan Trust 2017-2,Series 2017 2A, Class B1,144A,4.500%, due 25/03/2057 * 331 0.11
657 Rosslyn Portfolio Trust 2017-ROSS, Series 2017 ROSS,Class A, 144A,1.939%, due 15/06/2033 * 658 0.22
9 Thornburg MortgageSecurities Trust 2007-4,Series 2007 4, Class 1A1,2.396%, due 25/09/2037 * 9 –
300 UBS Commercial MortgageTrust 2018-C15, Series 2018C15, Class C,5.110%, due 15/12/2051 * 320 0.11
556 WaMu Mortgage Pass-Through CertificatesSeries 2005-AR6 Trust,Series 2005 AR6,Class 2A1A,0.578%, due 25/04/2045 * 549 0.18
1,104 Wells Fargo CommercialMortgage Trust 2015-NXS1,Series 2015 NXS1, Class XA,1.095%, due 15/05/2048 * 39 0.01
330 Wells Fargo CommercialMortgage Trust 2016-BNK1,Series 2016 BNK1, Class B,2.967%, due 15/08/2049 335 0.11
1,624 Wells Fargo CommercialMortgage Trust 2016-C36,Series 2016 C36, Class XA,1.278%, due 15/11/2059 * 84 0.03
460 Wells Fargo CommercialMortgage Trust 2017-C41,Series 2017 C41, Class B,4.188%, due 15/11/2050 * 500 0.17
134 Wells Fargo CommercialMortgage Trust 2017-RC1,Series 2017 RC1, Class A2,3.118%, due 15/01/2060 136 0.05
1,700 WFRBS CommercialMortgage Trust 2014-C23,Series 2014 C23, Class XA,0.562%, due 15/10/2057 * 29 0.01
60 WFRBS CommercialMortgage Trust 2014-LC14,Series 2014 LC14, Class ASB,3.522%, due 15/03/2047 62 0.02
Total Mortgage-Backed Securities(Cost $104,994) 105,855 35.39
Corporate Bonds and Notes — 33.90%(29 February 2020: 25.87%)Australia — 0.29% (29 February 2020: 0.11%)
105 BHP Billiton Finance USA Ltd,2.875%, due 24/02/2022 108 0.04
FaceValue(000’s)
Value(000’s)
$
% ofNet
AssetValue
140 BHP Billiton Finance USA Ltd,5.000%, due 30/09/2043 190 0.06
260 Glencore Funding LLC, 144A,4.125%, due 12/03/2024 284 0.09
260 Glencore Funding LLC, 144A,3.875%, due 27/10/2027 290 0.10
872 0.29
Belgium — 0.55% (29 February 2020: 0.42%)
120 Anheuser-Busch Cos LLC /Anheuser-Busch InBevWorldwide Inc,3.650%, due 01/02/2026 133 0.05
160 Anheuser-Busch InBevWorldwide Inc,4.000%, due 13/04/2028 182 0.06
460 Anheuser-Busch InBevWorldwide Inc,4.750%, due 23/01/2029 544 0.18
60 Anheuser-Busch InBevWorldwide Inc,3.500%, due 01/06/2030 66 0.02
180 Anheuser-Busch InBevWorldwide Inc,4.350%, due 01/06/2040 210 0.07
100 Anheuser-Busch InBevWorldwide Inc,4.439%, due 06/10/2048 114 0.04
340 Anheuser-Busch InBevWorldwide Inc,4.500%, due 01/06/2050 393 0.13
1,642 0.55
Brazil — 0.69% (29 February 2020: 0.56%)
10 Petrobras Global Finance BV,6.250%, due 17/03/2024 11 –
50 Petrobras Global Finance BV,6.850%, due 05/06/2115 55 0.02
690 Suzano Austria GmbH,6.000%, due 15/01/2029 823 0.27
270 Vale Overseas Ltd,6.250%, due 10/08/2026 326 0.11
20 Vale Overseas Ltd,6.875%, due 21/11/2036 27 0.01
600 Vale Overseas Ltd,6.875%, due 10/11/2039 826 0.28
2,068 0.69
Canada — 0.42% (29 February 2020: 0.14%)
240 Bank of Montreal,1.850%, due 01/05/2025 248 0.08
30 Bank of Montreal,3.803%, due 15/12/2032 * 34 0.01
130 Bank of Nova Scotia/The,1.300%, due 11/06/2025 131 0.04
40 Barrick North AmericaFinance LLC,5.700%, due 30/05/2041 55 0.02
110 Barrick PD Australia FinancePty Ltd,5.950%, due 15/10/2039 152 0.05
130 Canadian Imperial Bank ofCommerce,0.950%, due 23/06/2023 132 0.05
50 Royal Bank of Canada,3.200%, due 30/04/2021 50 0.02
210 Royal Bank of Canada,1.600%, due 17/04/2023 215 0.07
130 Royal Bank of Canada,1.150%, due 10/06/2025 131 0.04
110 Toronto-Dominion Bank/The,3.250%, due 11/06/2021 111 0.04
1,259 0.42
Chile — 0.30% (29 February 2020: 0.07%)
800 Corp Nacional del Cobre deChile,3.625%, due 01/08/2027 884 0.30
China — 0.17% (29 February 2020: 0.23%)
450 Sinopec Group OverseasDevelopment 2014 Ltd,4.375%, due 10/04/2024 497 0.17
Colombia — 0.24% (29 February 2020: 0.25%)
650 Ecopetrol SA,5.875%, due 28/05/2045 704 0.24
FaceValue(000’s)
Value(000’s)
$
% ofNet
AssetValue
Denmark — 0.29% (29 February 2020: 0.27%)
400 Danske Bank A/S, 144A,5.000%, due 12/01/2022 415 0.14
200 Danske Bank A/S, 144A,3.875%, due 12/09/2023 216 0.07
200 Danske Bank A/S, 144A,5.375%, due 12/01/2024 225 0.08
856 0.29
Finland — 0.08% (29 February 2020: 0.00%)
250 Nordea Bank Abp, 144A,1.000%, due 09/06/2023 254 0.08
France — 0.53% (29 February 2020: 0.45%)
200 BNP Paribas SA, 144A,4.705%, due 10/01/2025 * 222 0.07
400 BNP Paribas SA, 144A,2.219%, due 09/06/2026 * 415 0.14
200 BNP Paribas SA, 144A,4.400%, due 14/08/2028 233 0.08
200 BNP Paribas SA, 144A,5.198%, due 10/01/2030 * 243 0.08
250 Credit Agricole SA/London,144A,1.907%, due 16/06/2026 * 257 0.09
200 Danone SA,2.589%, due 02/11/2023 210 0.07
1,580 0.53
Indonesia — 0.25% (29 February 2020: 0.26%)
700 Perusahaan PerseroanPersero PT Perusahaan ListrikNegara,5.250%, due 24/10/2042 763 0.25
Italy — 0.17% (29 February 2020: 0.22%)
500 Intesa Sanpaolo SpA, 144A,3.125%, due 14/07/2022 516 0.17
Kazakhstan — 0.26% (29 February 2020: 0.24%)
650 KazMunayGas National CoJSC,5.375%, due 24/04/2030 774 0.26
Kuwait — 0.15% (29 February 2020: 0.14%)
400 Equate Petrochemical BV,4.250%, due 03/11/2026 436 0.15
Luxembourg — 0.19% (29 February 2020: 0.17%)
220 ArcelorMittal SA,3.600%, due 16/07/2024 234 0.08
300 ArcelorMittal SA,4.550%, due 11/03/2026 335 0.11
569 0.19
Macau — 0.07% (29 February 2020: 0.07%)
200 Sands China Ltd,5.125%, due 08/08/2025 224 0.07
Mexico — 0.47% (29 February 2020: 0.26%)
200 Comision Federal deElectricidad,4.750%, due 23/02/2027 222 0.07
700 Comision Federal deElectricidad, 144A,3.348%, due 09/02/2031 690 0.23
440 Petroleos Mexicanos,6.625%, due 15/06/2035 419 0.14
20 Petroleos Mexicanos,6.375%, due 23/01/2045 17 0.01
70 Petroleos Mexicanos,5.625%, due 23/01/2046 57 0.02
1,405 0.47
Netherlands — 0.61% (29 February 2020: 0.54%)
20 Cooperatieve Rabobank UA,3.875%, due 08/02/2022 21 0.01
250 Cooperatieve Rabobank UA,4.375%, due 04/08/2025 282 0.10
300 Cooperatieve Rabobank UA,3.750%, due 21/07/2026 334 0.11
260 Cooperatieve Rabobank UA/NY,3.375%, due 21/05/2025 286 0.10
80 NXP BV / NXP Funding LLC /NXP USA Inc, 144A,2.700%, due 01/05/2025 85 0.03
The accompanying notes are an integral part of the Financial Statements
40

Legg Mason Global Funds Plc Annual Report 28 February 2021
Legg Mason Western Asset US Core Bond Fund
Portfolio of Investments as at 28 February 2021 – (continued)
FaceValue(000’s)
Value(000’s)
$
% ofNet
AssetValue
Corporate Bonds and Notes — (continued)
Netherlands — (continued)
120 Shell International FinanceBV,1.875%, due 10/05/2021 120 0.04
110 Shell International FinanceBV,2.875%, due 10/05/2026 119 0.04
120 Shell International FinanceBV,2.750%, due 06/04/2030 127 0.04
10 Shell International FinanceBV,4.550%, due 12/08/2043 12 –
140 Shell International FinanceBV,4.000%, due 10/05/2046 158 0.05
270 Shell International FinanceBV,3.250%, due 06/04/2050 274 0.09
1,818 0.61
Peru — 0.51% (29 February 2020: 0.39%)
400 Petroleos del Peru SA,4.750%, due 19/06/2032 439 0.15
200 Petroleos del Peru SA, 144A,5.625%, due 19/06/2047 221 0.07
680 Southern Copper Corp,5.250%, due 08/11/2042 857 0.29
1,517 0.51
Russia — 0.11% (29 February 2020: 0.00%)
300 Lukoil International FinanceBV, 144A,4.750%, due 02/11/2026 340 0.11
South Africa — 0.11% (29 February 2020: 0.10%)
290 Anglo American Capital Plc,144A,4.750%, due 10/04/2027 340 0.11
Spain — 0.34% (29 February 2020: 0.25%)
200 Banco Santander SA,3.848%, due 12/04/2023 214 0.07
600 Banco Santander SA,2.746%, due 28/05/2025 636 0.21
150 Telefonica Emisiones SA,5.213%, due 08/03/2047 182 0.06
1,032 0.34
Sweden — 0.15% (29 February 2020: 0.08%)
250 Svenska Handelsbanken AB,3.350%, due 24/05/2021 252 0.08
200 Swedbank AB, 144A,1.300%, due 02/06/2023 204 0.07
456 0.15
Switzerland — 0.61% (29 February 2020: 0.56%)
310 Credit Suisse AG/New York NY,1.000%, due 05/05/2023 314 0.11
250 Credit Suisse AG/New York NY,2.950%, due 09/04/2025 270 0.09
500 Credit Suisse Group AG,144A,4.194%, due 01/04/2031 * 570 0.19
230 UBS AG/London, 144A,1.750%, due 21/04/2022 234 0.08
200 UBS Group AG, 144A,2.859%, due 15/08/2023 * 207 0.07
200 UBS Group AG, 144A,3.126%, due 13/08/2030 * 216 0.07
1,811 0.61
United Arab Emirates — 0.29%(29 February 2020: 0.19%)
730 DP World Plc, 144A,5.625%, due 25/09/2048 872 0.29
United Kingdom — 1.30% (29 February 2020: 1.61%)
200 Barclays Bank Plc,1.700%, due 12/05/2022 203 0.07
200 Barclays Plc,4.972%, due 16/05/2029 * 236 0.08
130 BAT Capital Corp,4.540%, due 15/08/2047 134 0.04
10 BP Capital Markets Plc,3.535%, due 04/11/2024 11 –
FaceValue(000’s)
Value(000’s)
$
% ofNet
AssetValue
200 HSBC Holdings Plc,2.633%, due 07/11/2025 * 212 0.07
350 HSBC Holdings Plc,4.300%, due 08/03/2026 397 0.13
200 HSBC Holdings Plc,4.041%, due 13/03/2028 * 224 0.08
200 HSBC Holdings Plc,4.950%, due 31/03/2030 241 0.08
200 Lloyds Banking Group Plc,3.100%, due 06/07/2021 202 0.07
200 Lloyds Banking Group Plc,2.907%, due 07/11/2023 * 208 0.07
200 Lloyds Banking Group Plc,4.650%, due 24/03/2026 228 0.08
200 Lloyds Banking Group Plc,4.375%, due 22/03/2028 231 0.08
200 Nationwide Building Society,144A,4.363%, due 01/08/2024 * 217 0.07
200 Natwest Group Plc,4.519%, due 25/06/2024 * 217 0.07
200 Natwest Group Plc,4.269%, due 22/03/2025 * 219 0.07
200 Natwest Group Plc,4.892%, due 18/05/2029 * 234 0.08
270 Reynolds American Inc,5.850%, due 15/08/2045 322 0.11
140 Vodafone Group Plc,4.375%, due 30/05/2028 164 0.05
3,900 1.30
United States — 24.75% (29 February 2020: 18.20%)
10 3M Co,2.375%, due 26/08/2029 10 –
90 3M Co,3.700%, due 15/04/2050 103 0.03
208 Abbott Laboratories,3.750%, due 30/11/2026 237 0.08
10 Abbott Laboratories,4.750%, due 30/11/2036 13 –
100 Abbott Laboratories,4.900%, due 30/11/2046 136 0.05
20 AbbVie Inc,3.450%, due 15/03/2022 21 0.01
220 AbbVie Inc,2.300%, due 21/11/2022 227 0.08
30 AbbVie Inc,3.750%, due 14/11/2023 32 0.01
380 AbbVie Inc,2.600%, due 21/11/2024 404 0.14
100 AbbVie Inc,3.800%, due 15/03/2025 110 0.04
20 AbbVie Inc,3.600%, due 14/05/2025 22 0.01
90 AbbVie Inc,2.950%, due 21/11/2026 97 0.03
890 AbbVie Inc,3.200%, due 21/11/2029 963 0.32
20 AbbVie Inc,4.250%, due 21/11/2049 23 0.01
210 Adobe Inc,2.300%, due 01/02/2030 217 0.07
10 Aetna Inc,2.800%, due 15/06/2023 10 –
10 Aetna Inc,3.875%, due 15/08/2047 11 –
90 Air Lease Corp,3.375%, due 01/07/2025 96 0.03
30 Alphabet Inc,0.450%, due 15/08/2025 30 0.01
50 Alphabet Inc,0.800%, due 15/08/2027 49 0.02
60 Alphabet Inc,1.100%, due 15/08/2030 57 0.02
110 Alphabet Inc,2.050%, due 15/08/2050 95 0.03
110 Altria Group Inc,4.750%, due 05/05/2021 111 0.04
40 Altria Group Inc,2.350%, due 06/05/2025 42 0.01
68 Altria Group Inc,4.400%, due 14/02/2026 77 0.03
52 Altria Group Inc,4.800%, due 14/02/2029 61 0.02
20 Altria Group Inc,5.800%, due 14/02/2039 25 0.01
FaceValue(000’s)
Value(000’s)
$
% ofNet
AssetValue
100 Altria Group Inc,3.875%, due 16/09/2046 98 0.03
320 Altria Group Inc,5.950%, due 14/02/2049 409 0.14
24 Altria Group Inc,6.200%, due 14/02/2059 31 0.01
160 Amazon.com Inc,0.800%, due 03/06/2025 160 0.05
200 Amazon.com Inc,1.200%, due 03/06/2027 199 0.07
200 Amazon.com Inc,3.150%, due 22/08/2027 222 0.07
180 Amazon.com Inc,1.500%, due 03/06/2030 176 0.06
80 Amazon.com Inc,4.950%, due 05/12/2044 108 0.04
410 Amazon.com Inc,2.500%, due 03/06/2050 380 0.13
30 Amazon.com Inc,4.250%, due 22/08/2057 38 0.01
210 American Express Co,2.500%, due 30/07/2024 223 0.07
250 American Express Co,3.625%, due 05/12/2024 277 0.09
70 American InternationalGroup Inc,2.500%, due 30/06/2025 74 0.02
100 American InternationalGroup Inc,6.250%, due 15/03/2037 * 112 0.04
50 American InternationalGroup Inc,4.750%, due 01/04/2048 62 0.02
11 Amgen Inc,4.663%, due 15/06/2051 14 –
20 Anthem Inc,3.125%, due 15/05/2022 21 0.01
30 Anthem Inc,2.950%, due 01/12/2022 31 0.01
20 Anthem Inc,3.350%, due 01/12/2024 22 0.01
170 Anthem Inc,3.650%, due 01/12/2027 192 0.06
10 Apple Inc,1.550%, due 04/08/2021 10 –
310 Apple Inc,1.125%, due 11/05/2025 314 0.10
130 Apple Inc,2.450%, due 04/08/2026 138 0.05
200 Applied Materials Inc,1.750%, due 01/06/2030 198 0.07
70 AT&T Inc,3.800%, due 15/02/2027 79 0.03
260 AT&T Inc,2.300%, due 01/06/2027 269 0.09
130 AT&T Inc,1.650%, due 01/02/2028 128 0.04
60 AT&T Inc,2.250%, due 01/02/2032 58 0.02
200 AT&T Inc,3.100%, due 01/02/2043 188 0.06
37 AT&T Inc,4.350%, due 15/06/2045 41 0.01
178 AT&T Inc,4.500%, due 09/03/2048 196 0.07
116 AT&T Inc, 144A,3.550%, due 15/09/2055 107 0.04
33 AT&T Inc, 144A,3.650%, due 15/09/2059 30 0.01
10 Bank of America Corp,3.300%, due 11/01/2023 11 –
35 Bank of America Corp,3.004%, due 20/12/2023 * 37 0.01
90 Bank of America Corp,3.550%, due 05/03/2024 * 95 0.03
30 Bank of America Corp,4.000%, due 01/04/2024 33 0.01
110 Bank of America Corp,4.200%, due 26/08/2024 122 0.04
310 Bank of America Corp,4.000%, due 22/01/2025 343 0.12
10 Bank of America Corp,4.450%, due 03/03/2026 11 –
50 Bank of America Corp,3.500%, due 19/04/2026 56 0.02
The accompanying notes are an integral part of the Financial Statements
41

Legg Mason Global Funds Plc Annual Report 28 February 2021
Legg Mason Western Asset US Core Bond Fund
Portfolio of Investments as at 28 February 2021 – (continued)
FaceValue(000’s)
Value(000’s)
$
% ofNet
AssetValue
Corporate Bonds and Notes — (continued)United States — (continued)
400 Bank of America Corp,1.319%, due 19/06/2026 * 403 0.13
320 Bank of America Corp,4.250%, due 22/10/2026 367 0.12
180 Bank of America Corp,3.593%, due 21/07/2028 * 201 0.07
333 Bank of America Corp,3.419%, due 20/12/2028 * 367 0.12
350 Bank of America Corp,3.970%, due 05/03/2029 * 398 0.13
200 Bank of America Corp,3.974%, due 07/02/2030 * 228 0.08
600 Bank of America Corp,2.592%, due 29/04/2031 * 617 0.21
140 Bank of America Corp,5.000%, due 21/01/2044 183 0.06
290 Bank of America Corp,3.946%, due 23/01/2049 * 336 0.11
300 Bank of America Corp,4.083%, due 20/03/2051 * 349 0.12
70 Bank of New York MellonCorp/The,1.600%, due 24/04/2025 72 0.02
160 Becton Dickinson and Co,3.363%, due 06/06/2024 173 0.06
19 Becton Dickinson and Co,3.734%, due 15/12/2024 21 0.01
94 Becton Dickinson and Co,4.685%, due 15/12/2044 117 0.04
130 Berkshire Hathaway FinanceCorp,4.250%, due 15/01/2049 158 0.05
430 Boeing Co/The,4.875%, due 01/05/2025 481 0.16
320 Boeing Co/The,5.150%, due 01/05/2030 373 0.12
340 Boeing Co/The,3.250%, due 01/02/2035 335 0.11
100 Boeing Co/The,5.875%, due 15/02/2040 123 0.04
170 Boeing Co/The,5.705%, due 01/05/2040 214 0.07
140 Boeing Co/The,3.750%, due 01/02/2050 137 0.05
240 Boeing Co/The,5.805%, due 01/05/2050 310 0.10
10 Boeing Co/The,5.930%, due 01/05/2060 13 –
50 BP Capital Markets AmericaInc,3.245%, due 06/05/2022 52 0.02
10 BP Capital Markets AmericaInc,2.937%, due 06/04/2023 11 –
160 BP Capital Markets AmericaInc,3.216%, due 28/11/2023 171 0.06
30 BP Capital Markets AmericaInc,3.790%, due 06/02/2024 33 0.01
40 BP Capital Markets AmericaInc,3.410%, due 11/02/2026 44 0.01
220 BP Capital Markets AmericaInc,3.119%, due 04/05/2026 239 0.08
80 BP Capital Markets AmericaInc,3.633%, due 06/04/2030 90 0.03
330 BP Capital Markets AmericaInc,3.000%, due 24/02/2050 307 0.10
40 Bristol-Myers Squibb Co,2.250%, due 15/08/2021 40 0.01
90 Bristol-Myers Squibb Co,2.600%, due 16/05/2022 93 0.03
10 Bristol-Myers Squibb Co,3.550%, due 15/08/2022 10 –
179 Bristol-Myers Squibb Co,2.900%, due 26/07/2024 193 0.06
43 Bristol-Myers Squibb Co,3.875%, due 15/08/2025 48 0.02
130 Bristol-Myers Squibb Co,3.200%, due 15/06/2026 143 0.05
60 Bristol-Myers Squibb Co,3.400%, due 26/07/2029 67 0.02
FaceValue(000’s)
Value(000’s)
$
% ofNet
AssetValue
150 Bristol-Myers Squibb Co,4.250%, due 26/10/2049 183 0.06
300 Broadcom Inc,4.700%, due 15/04/2025 339 0.11
240 Broadcom Inc,3.150%, due 15/11/2025 258 0.09
70 Cameron LNG LLC, 144A,2.902%, due 15/07/2031 74 0.03
410 Cameron LNG LLC, 144A,3.302%, due 15/01/2035 442 0.15
130 Cargill Inc, 144A,1.375%, due 23/07/2023 133 0.04
50 Carrier Global Corp,3.377%, due 05/04/2040 52 0.02
30 Carrier Global Corp,3.577%, due 05/04/2050 31 0.01
580 Charter CommunicationsOperating LLC / CharterCommunications OperatingCapital,4.908%, due 23/07/2025 662 0.22
460 Charter CommunicationsOperating LLC / CharterCommunications OperatingCapital,4.200%, due 15/03/2028 516 0.17
80 Charter CommunicationsOperating LLC / CharterCommunications OperatingCapital,5.050%, due 30/03/2029 94 0.03
200 Charter CommunicationsOperating LLC / CharterCommunications OperatingCapital,5.375%, due 01/04/2038 240 0.08
90 Charter CommunicationsOperating LLC / CharterCommunications OperatingCapital,6.484%, due 23/10/2045 121 0.04
100 Charter CommunicationsOperating LLC / CharterCommunications OperatingCapital,5.750%, due 01/04/2048 123 0.04
40 Charter CommunicationsOperating LLC / CharterCommunications OperatingCapital,4.800%, due 01/03/2050 44 0.01
160 Chevron Corp,1.554%, due 11/05/2025 164 0.06
140 Chevron Corp,2.954%, due 16/05/2026 152 0.05
40 Chevron Corp,1.995%, due 11/05/2027 42 0.01
210 Chevron Corp,2.978%, due 11/05/2040 216 0.07
70 Chevron USA Inc,3.850%, due 15/01/2028 80 0.03
330 Chevron USA Inc,4.950%, due 15/08/2047 427 0.14
10 Chubb INA Holdings Inc,3.350%, due 03/05/2026 11 –
60 Cigna Corp,3.400%, due 17/09/2021 61 0.02
173 Cigna Corp,3.750%, due 15/07/2023 186 0.06
150 Cigna Corp,4.125%, due 15/11/2025 169 0.06
520 Cigna Corp,4.375%, due 15/10/2028 607 0.20
210 Cimarex Energy Co,3.900%, due 15/05/2027 232 0.08
270 Cimarex Energy Co,4.375%, due 15/03/2029 303 0.10
20 Cintas Corp No 2,2.900%, due 01/04/2022 21 0.01
30 Cintas Corp No 2,3.700%, due 01/04/2027 34 0.01
70 Citigroup Inc,4.500%, due 14/01/2022 73 0.02
80 Citigroup Inc,3.500%, due 15/05/2023 85 0.03
150 Citigroup Inc,1.678%, due 15/05/2024 * 154 0.05
FaceValue(000’s)
Value(000’s)
$
% ofNet
AssetValue
180 Citigroup Inc,3.300%, due 27/04/2025 197 0.07
60 Citigroup Inc,4.400%, due 10/06/2025 67 0.02
120 Citigroup Inc,5.500%, due 13/09/2025 142 0.05
90 Citigroup Inc,3.106%, due 08/04/2026 * 97 0.03
60 Citigroup Inc,4.300%, due 20/11/2026 68 0.02
260 Citigroup Inc,4.450%, due 29/09/2027 300 0.10
150 Citigroup Inc,3.520%, due 27/10/2028 * 166 0.06
200 Citigroup Inc,3.980%, due 20/03/2030 * 227 0.08
570 Citigroup Inc,4.412%, due 31/03/2031 * 664 0.22
280 Citigroup Inc,2.572%, due 03/06/2031 * 287 0.10
400 Citigroup Inc,8.125%, due 15/07/2039 676 0.23
77 Citigroup Inc,4.650%, due 30/07/2045 97 0.03
10 Citigroup Inc,4.750%, due 18/05/2046 12 –
60 Coca-Cola Co/The,2.950%, due 25/03/2025 65 0.02
90 Coca-Cola Co/The,3.375%, due 25/03/2027 101 0.03
140 Coca-Cola Co/The,1.450%, due 01/06/2027 141 0.05
60 Coca-Cola Co/The,2.500%, due 01/06/2040 59 0.02
30 Coca-Cola Co/The,2.600%, due 01/06/2050 28 0.01
10 Comcast Corp,3.100%, due 01/04/2025 11 –
30 Comcast Corp,3.950%, due 15/10/2025 34 0.01
70 Comcast Corp,3.150%, due 01/03/2026 77 0.03
120 Comcast Corp,3.300%, due 01/04/2027 133 0.04
320 Comcast Corp,4.150%, due 15/10/2028 372 0.12
80 Comcast Corp,3.400%, due 01/04/2030 89 0.03
100 Comcast Corp,4.250%, due 15/10/2030 118 0.04
121 Comcast Corp,7.050%, due 15/03/2033 178 0.06
140 Comcast Corp,3.900%, due 01/03/2038 162 0.05
30 Comcast Corp,6.550%, due 01/07/2039 45 0.02
10 Comcast Corp,3.250%, due 01/11/2039 11 –
10 Comcast Corp,3.750%, due 01/04/2040 11 –
20 Comcast Corp,3.400%, due 15/07/2046 21 0.01
20 Comcast Corp,4.000%, due 01/03/2048 23 0.01
40 Comcast Corp,4.700%, due 15/10/2048 51 0.02
310 Comcast Corp,3.450%, due 01/02/2050 329 0.11
40 ConocoPhillips, 144A,3.750%, due 01/10/2027 45 0.02
350 ConocoPhillips, 144A,4.300%, due 15/08/2028 407 0.14
20 ConocoPhillips Co,6.950%, due 15/04/2029 27 0.01
50 Consolidated Edison Co ofNew York Inc, Series 20A,3.350%, due 01/04/2030 55 0.02
30 Consolidated Edison Co ofNew York Inc, Series 20B,3.950%, due 01/04/2050 34 0.01
230 Costco Wholesale Corp,1.375%, due 20/06/2027 232 0.08
100 Costco Wholesale Corp,1.750%, due 20/04/2032 98 0.03
107 CVS Health Corp,3.350%, due 09/03/2021 107 0.04
The accompanying notes are an integral part of the Financial Statements
42

Legg Mason Global Funds Plc Annual Report 28 February 2021
Legg Mason Western Asset US Core Bond Fund
Portfolio of Investments as at 28 February 2021 – (continued)
FaceValue(000’s)
Value(000’s)
$
% ofNet
AssetValue
Corporate Bonds and Notes — (continued)United States — (continued)
50 CVS Health Corp,2.750%, due 01/12/2022 52 0.02
30 CVS Health Corp,3.700%, due 09/03/2023 32 0.01
8 CVS Health Corp,3.875%, due 20/07/2025 9 –
40 CVS Health Corp,3.625%, due 01/04/2027 45 0.02
591 CVS Health Corp,4.300%, due 25/03/2028 681 0.23
110 CVS Health Corp,3.750%, due 01/04/2030 123 0.04
100 CVS Health Corp,4.780%, due 25/03/2038 122 0.04
40 CVS Health Corp,4.125%, due 01/04/2040 46 0.02
40 CVS Health Corp,5.125%, due 20/07/2045 51 0.02
370 CVS Health Corp,5.050%, due 25/03/2048 468 0.16
5 CVS Pass-Through Trust,5.880%, due 10/01/2028 5 –
110 Deere & Co,3.750%, due 15/04/2050 130 0.04
240 Delta Air Lines Inc / SkyMilesIP Ltd, 144A,4.500%, due 20/10/2025 256 0.09
220 Delta Air Lines Inc / SkyMilesIP Ltd, 144A,4.750%, due 20/10/2028 244 0.08
160 Devon Energy Corp,5.850%, due 15/12/2025 188 0.06
20 Devon Energy Corp,5.600%, due 15/07/2041 24 0.01
70 Devon Energy Corp,4.750%, due 15/05/2042 79 0.03
380 Devon Energy Corp,5.000%, due 15/06/2045 445 0.15
50 Diamondback Energy Inc,2.875%, due 01/12/2024 53 0.02
40 Diamondback Energy Inc,5.375%, due 31/05/2025 41 0.01
40 Diamondback Energy Inc,3.500%, due 01/12/2029 42 0.01
10 Dollar General Corp,3.250%, due 15/04/2023 11 –
10 Duke Energy Corp,3.550%, due 15/09/2021 10 –
50 Duke Energy Corp,2.400%, due 15/08/2022 51 0.02
50 Duke Energy Corp,3.150%, due 15/08/2027 55 0.02
150 Eaton Corp,2.750%, due 02/11/2022 156 0.05
50 Eaton Corp,4.150%, due 02/11/2042 59 0.02
100 El Paso Natural Gas Co LLC,8.375%, due 15/06/2032 144 0.05
120 Energy Transfer Operating LP,4.500%, due 15/04/2024 132 0.04
40 Energy Transfer Operating LP,4.950%, due 15/06/2028 46 0.02
50 Energy Transfer Operating LP,5.250%, due 15/04/2029 58 0.02
450 Energy Transfer Operating LP,3.750%, due 15/05/2030 476 0.16
30 Energy Transfer Operating LP,6.250%, due 15/04/2049 36 0.01
20 Enterprise ProductsOperating LLC,3.900%, due 15/02/2024 22 0.01
210 Enterprise ProductsOperating LLC,4.150%, due 16/10/2028 242 0.08
350 Enterprise ProductsOperating LLC,2.800%, due 31/01/2030 368 0.12
20 Enterprise ProductsOperating LLC,7.550%, due 15/04/2038 30 0.01
60 Enterprise ProductsOperating LLC,5.700%, due 15/02/2042 79 0.03
20 Enterprise ProductsOperating LLC,4.850%, due 15/03/2044 24 0.01
FaceValue(000’s)
Value(000’s)
$
% ofNet
AssetValue
150 Enterprise ProductsOperating LLC,4.200%, due 31/01/2050 162 0.05
10 Enterprise ProductsOperating LLC,3.700%, due 31/01/2051 10 –
140 EOG Resources Inc,4.375%, due 15/04/2030 164 0.06
160 EOG Resources Inc,3.900%, due 01/04/2035 179 0.06
320 EOG Resources Inc,4.950%, due 15/04/2050 406 0.14
20 Exxon Mobil Corp,1.571%, due 15/04/2023 20 0.01
340 Exxon Mobil Corp,2.992%, due 19/03/2025 367 0.12
140 Exxon Mobil Corp,3.043%, due 01/03/2026 152 0.05
130 Exxon Mobil Corp,3.482%, due 19/03/2030 145 0.05
130 Exxon Mobil Corp,4.114%, due 01/03/2046 146 0.05
110 Exxon Mobil Corp,4.327%, due 19/03/2050 130 0.04
10 FirstEnergy Corp, Series B,4.250%, due 15/03/2023 11 –
50 FirstEnergy Corp, Series A,1.600%, due 15/01/2026 49 0.02
180 FirstEnergy Corp, Series B,4.400%, due 15/07/2027 198 0.07
650 FirstEnergy Corp, Series C,7.375%, due 15/11/2031 895 0.30
200 FirstEnergy Corp, Series C,5.350%, due 15/07/2047 238 0.08
50 Fox Corp,4.030%, due 25/01/2024 55 0.02
80 Fox Corp,4.709%, due 25/01/2029 94 0.03
280 Fox Corp,5.476%, due 25/01/2039 360 0.12
30 Fox Corp,5.576%, due 25/01/2049 40 0.01
110 General Dynamics Corp,4.250%, due 01/04/2050 137 0.05
40 General Electric Co,6.750%, due 15/03/2032 54 0.02
110 General Electric Co,5.875%, due 14/01/2038 145 0.05
700 General Electric Co,6.875%, due 10/01/2039 1,000 0.33
10 General Motors Co,5.150%, due 01/04/2038 12 –
30 General Motors Co,6.250%, due 02/10/2043 40 0.01
10 General Motors Co,5.950%, due 01/04/2049 13 –
20 General Motors Financial CoInc,3.450%, due 10/04/2022 21 0.01
120 General Motors Financial CoInc,4.350%, due 17/01/2027 135 0.05
40 Gilead Sciences Inc,3.700%, due 01/04/2024 43 0.01
100 Gilead Sciences Inc,3.650%, due 01/03/2026 111 0.04
100 Gilead Sciences Inc,4.750%, due 01/03/2046 123 0.04
3 Goldman Sachs Capital II,4.000%, Perpetual * 3 –
280 Goldman Sachs Group Inc/The,2.876%, due 31/10/2022 * 285 0.10
50 Goldman Sachs Group Inc/The,3.625%, due 22/01/2023 53 0.02
70 Goldman Sachs Group Inc/The,3.200%, due 23/02/2023 74 0.02
150 Goldman Sachs Group Inc/The,3.500%, due 01/04/2025 164 0.06
140 Goldman Sachs Group Inc/The,4.250%, due 21/10/2025 158 0.05
FaceValue(000’s)
Value(000’s)
$
% ofNet
AssetValue
90 Goldman Sachs Group Inc/The,3.500%, due 16/11/2026 99 0.03
500 Goldman Sachs Group Inc/The,3.814%, due 23/04/2029 * 563 0.19
780 Goldman Sachs Group Inc/The,4.223%, due 01/05/2029 * 900 0.30
30 Goldman Sachs Group Inc/The,6.250%, due 01/02/2041 44 0.01
440 Goldman Sachs Group Inc/The,5.150%, due 22/05/2045 581 0.19
10 Goldman Sachs Group Inc/The,4.750%, due 21/10/2045 13 –
50 Guardian Life GlobalFunding, 144A,1.100%, due 23/06/2025 50 0.02
10 Halliburton Co,3.800%, due 15/11/2025 11 –
40 Hershey Co/The,0.900%, due 01/06/2025 40 0.01
90 Home Depot Inc/The,2.500%, due 15/04/2027 97 0.03
10 Home Depot Inc/The,3.900%, due 06/12/2028 12 –
80 Home Depot Inc/The,2.700%, due 15/04/2030 85 0.03
110 Home Depot Inc/The,3.300%, due 15/04/2040 119 0.04
20 Home Depot Inc/The,3.900%, due 15/06/2047 23 0.01
120 Home Depot Inc/The,3.350%, due 15/04/2050 128 0.04
90 Honeywell International Inc,1.350%, due 01/06/2025 92 0.03
30 Humana Inc,3.150%, due 01/12/2022 31 0.01
20 Humana Inc,4.500%, due 01/04/2025 23 0.01
130 Humana Inc,3.950%, due 15/03/2027 148 0.05
10 Humana Inc,4.950%, due 01/10/2044 13 –
150 Humana Inc,3.950%, due 15/08/2049 169 0.06
10 Intel Corp,3.700%, due 29/07/2025 11 –
60 Intel Corp,4.600%, due 25/03/2040 76 0.03
130 Intel Corp,4.750%, due 25/03/2050 169 0.06
310 International BusinessMachines Corp,3.000%, due 15/05/2024 334 0.11
80 Johnson & Johnson,0.550%, due 01/09/2025 79 0.03
160 Johnson & Johnson,0.950%, due 01/09/2027 158 0.05
130 Johnson & Johnson,3.700%, due 01/03/2046 150 0.05
50 JPMorgan Chase & Co,3.625%, due 13/05/2024 55 0.02
380 JPMorgan Chase & Co,1.514%, due 01/06/2024 * 389 0.13
230 JPMorgan Chase & Co,4.023%, due 05/12/2024 * 252 0.08
220 JPMorgan Chase & Co,2.083%, due 22/04/2026 * 229 0.08
70 JPMorgan Chase & Co,4.125%, due 15/12/2026 80 0.03
270 JPMorgan Chase & Co,4.250%, due 01/10/2027 313 0.10
110 JPMorgan Chase & Co,3.625%, due 01/12/2027 122 0.04
260 JPMorgan Chase & Co,4.203%, due 23/07/2029 * 301 0.10
180 JPMorgan Chase & Co,4.452%, due 05/12/2029 * 212 0.07
440 JPMorgan Chase & Co,2.522%, due 22/04/2031 * 453 0.15
195 JPMorgan Chase & Co,4.950%, due 01/06/2045 257 0.09
The accompanying notes are an integral part of the Financial Statements
43

Legg Mason Global Funds Plc Annual Report 28 February 2021
Legg Mason Western Asset US Core Bond Fund
Portfolio of Investments as at 28 February 2021 – (continued)
FaceValue(000’s)
Value(000’s)
$
% ofNet
AssetValue
Corporate Bonds and Notes — (continued)
United States — (continued)
50 JPMorgan Chase & Co,3.109%, due 22/04/2051 * 51 0.02
30 Kimberly-Clark Corp,3.100%, due 26/03/2030 33 0.01
40 Kinder Morgan Inc,4.300%, due 01/06/2025 45 0.02
470 Kinder Morgan Inc,4.300%, due 01/03/2028 537 0.18
30 Kinder Morgan Inc,5.550%, due 01/06/2045 37 0.01
120 L3Harris Technologies Inc,4.854%, due 27/04/2035 151 0.05
160 L3Harris Technologies Inc,5.054%, due 27/04/2045 209 0.07
240 Las Vegas Sands Corp,3.200%, due 08/08/2024 252 0.08
20 Las Vegas Sands Corp,2.900%, due 25/06/2025 21 0.01
280 Lehman Brothers Escrow,zero coupon, Perpetual †∞� – –
270 Lehman Brothers Holding Inc,zero coupon, due28/12/2017 †∞� – –
140 Lehman Brothers HoldingsCapital Trust Escrow, zerocoupon, Perpetual †∞� – –
127 Lehman Escrow Receipt, zerocoupon, Perpetual †∞ 1 –
104 Lehman Swap Receipt, zerocoupon, Perpetual †∞ 1 –
20 Lockheed Martin Corp,3.100%, due 15/01/2023 21 0.01
50 Lockheed Martin Corp,3.550%, due 15/01/2026 56 0.02
100 Lockheed Martin Corp,4.500%, due 15/05/2036 125 0.04
50 Lowe’s Cos Inc,4.500%, due 15/04/2030 60 0.02
60 Mars Inc, 144A,2.700%, due 01/04/2025 64 0.02
260 Mars Inc, 144A,3.200%, due 01/04/2030 288 0.10
400 MassMutual Global FundingII, 144A,0.850%, due 09/06/2023 405 0.14
400 Mastercard Inc,3.850%, due 26/03/2050 471 0.16
90 McDonald’s Corp,3.300%, due 01/07/2025 98 0.03
150 McDonald’s Corp,1.450%, due 01/09/2025 153 0.05
50 McDonald’s Corp,3.700%, due 30/01/2026 56 0.02
30 McDonald’s Corp,3.500%, due 01/03/2027 33 0.01
50 McDonald’s Corp,3.500%, due 01/07/2027 56 0.02
30 McDonald’s Corp,3.800%, due 01/04/2028 34 0.01
80 McDonald’s Corp,2.125%, due 01/03/2030 81 0.03
80 McDonald’s Corp,3.600%, due 01/07/2030 90 0.03
180 McDonald’s Corp,4.875%, due 09/12/2045 228 0.08
20 McDonald’s Corp,3.625%, due 01/09/2049 21 0.01
40 McDonald’s Corp,4.200%, due 01/04/2050 47 0.02
31 Medtronic Inc,3.500%, due 15/03/2025 34 0.01
15 Medtronic Inc,4.625%, due 15/03/2045 20 0.01
150 Merck & Co Inc,0.750%, due 24/02/2026 149 0.05
80 Merck & Co Inc,1.450%, due 24/06/2030 78 0.03
215 MetLife Inc,6.400%, due 15/12/2036 274 0.09
270 Metropolitan Life GlobalFunding I, 144A,0.900%, due 08/06/2023 273 0.09
FaceValue(000’s)
Value(000’s)
$
% ofNet
AssetValue
120 Micron Technology Inc,2.497%, due 24/04/2023 125 0.04
70 Microsoft Corp,1.550%, due 08/08/2021 70 0.02
90 Microsoft Corp,2.400%, due 06/02/2022 92 0.03
300 Microsoft Corp,2.400%, due 08/08/2026 321 0.11
240 Microsoft Corp,3.300%, due 06/02/2027 268 0.09
100 Microsoft Corp,3.700%, due 08/08/2046 118 0.04
60 Microsoft Corp,2.525%, due 01/06/2050 56 0.02
140 MidAmerican Energy Co,3.650%, due 15/04/2029 161 0.05
40 Mondelez International Inc,2.125%, due 13/04/2023 41 0.01
290 Mondelez International Inc,1.500%, due 04/05/2025 296 0.10
370 Morgan Stanley,2.188%, due 28/04/2026 * 385 0.13
290 Morgan Stanley,3.772%, due 24/01/2029 * 326 0.11
400 Morgan Stanley,2.699%, due 22/01/2031 * 416 0.14
200 Morgan Stanley,3.622%, due 01/04/2031 * 223 0.07
190 MPLX LP,4.000%, due 15/03/2028 212 0.07
100 MPLX LP,4.500%, due 15/04/2038 111 0.04
180 MPLX LP,4.700%, due 15/04/2048 198 0.07
250 National Securities ClearingCorp, 144A,1.200%, due 23/04/2023 254 0.09
100 New York Life GlobalFunding, 144A,0.950%, due 24/06/2025 100 0.03
100 Newell Brands Inc,4.700%, due 01/04/2026 111 0.04
60 NIKE Inc,2.400%, due 27/03/2025 64 0.02
110 NIKE Inc,2.750%, due 27/03/2027 119 0.04
110 NIKE Inc,2.850%, due 27/03/2030 119 0.04
60 NIKE Inc,3.250%, due 27/03/2040 65 0.02
10 NIKE Inc,3.375%, due 27/03/2050 11 –
150 Northrop Grumman Corp,2.550%, due 15/10/2022 155 0.05
200 Northrop Grumman Corp,2.930%, due 15/01/2025 214 0.07
20 Northrop Grumman Corp,3.250%, due 15/01/2028 22 0.01
530 Northrop Grumman Corp,5.250%, due 01/05/2050 724 0.24
270 NVIDIA Corp,3.500%, due 01/04/2040 299 0.10
110 NVIDIA Corp,3.700%, due 01/04/2060 123 0.04
60 Otis Worldwide Corp,2.056%, due 05/04/2025 63 0.02
200 Pacific Gas and Electric Co,1.750%, due 16/06/2022 201 0.07
50 Pacific Gas and Electric Co,2.100%, due 01/08/2027 50 0.02
70 Pacific Gas and Electric Co,2.500%, due 01/02/2031 68 0.02
20 Pacific Gas and Electric Co,3.300%, due 01/08/2040 19 0.01
30 Pacific Gas and Electric Co,3.500%, due 01/08/2050 27 0.01
110 PayPal Holdings Inc,1.350%, due 01/06/2023 112 0.04
110 PayPal Holdings Inc,1.650%, due 01/06/2025 113 0.04
150 PepsiCo Inc,0.750%, due 01/05/2023 151 0.05
10 PepsiCo Inc,2.250%, due 19/03/2025 11 –
10 PepsiCo Inc,2.625%, due 19/03/2027 11 –
FaceValue(000’s)
Value(000’s)
$
% ofNet
AssetValue
40 PepsiCo Inc,1.625%, due 01/05/2030 39 0.01
40 PepsiCo Inc,2.875%, due 15/10/2049 40 0.01
20 PepsiCo Inc,3.625%, due 19/03/2050 23 0.01
30 PepsiCo Inc,3.875%, due 19/03/2060 36 0.01
190 Pfizer Inc,0.800%, due 28/05/2025 191 0.06
110 Pfizer Inc,2.625%, due 01/04/2030 117 0.04
110 Pfizer Inc,1.700%, due 28/05/2030 109 0.04
230 Pfizer Inc,2.550%, due 28/05/2040 228 0.08
110 Pfizer Inc,2.700%, due 28/05/2050 105 0.04
20 Philip Morris InternationalInc,2.900%, due 15/11/2021 20 0.01
20 Philip Morris InternationalInc,2.500%, due 22/08/2022 21 0.01
80 Philip Morris InternationalInc,2.500%, due 02/11/2022 83 0.03
80 Philip Morris InternationalInc,1.125%, due 01/05/2023 81 0.03
80 Philip Morris InternationalInc,2.100%, due 01/05/2030 80 0.03
40 Philip Morris InternationalInc,6.375%, due 16/05/2038 57 0.02
10 Philip Morris InternationalInc,4.500%, due 20/03/2042 12 –
60 Philip Morris InternationalInc,4.250%, due 10/11/2044 69 0.02
30 Pioneer Natural Resources Co,1.125%, due 15/01/2026 30 0.01
140 Pioneer Natural Resources Co,2.150%, due 15/01/2031 137 0.05
50 Principal Life GlobalFunding II, 144A,1.250%, due 23/06/2025 50 0.02
30 Procter & Gamble Co/The,2.800%, due 25/03/2027 33 0.01
50 Procter & Gamble Co/The,3.000%, due 25/03/2030 55 0.02
10 Progress Energy Inc,3.150%, due 01/04/2022 10 –
60 Raytheon Technologies Corp,3.150%, due 15/12/2024 65 0.02
120 Raytheon Technologies Corp,2.250%, due 01/07/2030 122 0.04
100 Raytheon Technologies Corp,4.500%, due 01/06/2042 123 0.04
230 Raytheon Technologies Corp,3.125%, due 01/07/2050 229 0.08
160 Republic Services Inc,2.500%, due 15/08/2024 170 0.06
50 salesforce.com Inc,3.250%, due 11/04/2023 53 0.02
100 salesforce.com Inc,3.700%, due 11/04/2028 114 0.04
100 Southern Natural Gas CoLLC,8.000%, due 01/03/2032 140 0.05
10 State Street Corp,3.300%, due 16/12/2024 11 –
10 Sunoco Logistics PartnersOperations LP,5.300%, due 01/04/2044 11 –
130 Target Corp,2.250%, due 15/04/2025 137 0.05
2 Teachers Insurance & AnnuityAssociation of America,6.850%, due 16/12/2039 3 –
60 Tennessee Gas Pipeline CoLLC, 144A,2.900%, due 01/03/2030 62 0.02
50 Texas Instruments Inc,2.250%, due 04/09/2029 51 0.02
The accompanying notes are an integral part of the Financial Statements
44

Legg Mason Global Funds Plc Annual Report 28 February 2021
Legg Mason Western Asset US Core Bond Fund
Portfolio of Investments as at 28 February 2021 – (continued)
FaceValue(000’s)
Value(000’s)
$
% ofNet
AssetValue
Corporate Bonds and Notes — (continued)
United States — (continued)
70 Texas Instruments Inc,1.750%, due 04/05/2030 69 0.02
100 Texas Instruments Inc,3.875%, due 15/03/2039 118 0.04
80 Texas Instruments Inc,4.150%, due 15/05/2048 98 0.03
170 The Vanguard Group Inc,3.050%, due22/08/2050 †∞ 156 0.05
100 Time Warner Cable LLC,5.875%, due 15/11/2040 128 0.04
80 TJX Cos Inc/The,3.500%, due 15/04/2025 88 0.03
20 TJX Cos Inc/The,2.250%, due 15/09/2026 21 0.01
20 TJX Cos Inc/The,3.750%, due 15/04/2027 23 0.01
130 T-Mobile USA Inc, 144A,3.500%, due 15/04/2025 141 0.05
20 T-Mobile USA Inc, 144A,3.750%, due 15/04/2027 22 0.01
30 T-Mobile USA Inc, 144A,2.050%, due 15/02/2028 30 0.01
200 T-Mobile USA Inc, 144A,3.875%, due 15/04/2030 220 0.07
80 T-Mobile USA Inc, 144A,2.550%, due 15/02/2031 80 0.03
180 T-Mobile USA Inc, 144A,2.250%, due 15/11/2031 173 0.06
110 T-Mobile USA Inc, 144A,3.000%, due 15/02/2041 103 0.03
30 T-Mobile USA Inc, 144A,3.300%, due 15/02/2051 28 0.01
400 Transcontinental Gas PipeLine Co LLC,7.850%, due 01/02/2026 515 0.17
70 Union Pacific Corp,3.750%, due 15/07/2025 78 0.03
140 Union Pacific Corp,2.150%, due 05/02/2027 147 0.05
140 Union Pacific Corp,2.400%, due 05/02/2030 145 0.05
130 Union Pacific Corp,3.750%, due 05/02/2070 141 0.05
30 UnitedHealth Group Inc,2.875%, due 15/12/2021 31 0.01
20 UnitedHealth Group Inc,2.375%, due 15/10/2022 21 0.01
40 UnitedHealth Group Inc,3.500%, due 15/06/2023 43 0.01
50 UnitedHealth Group Inc,3.750%, due 15/07/2025 56 0.02
60 UnitedHealth Group Inc,1.250%, due 15/01/2026 61 0.02
30 UnitedHealth Group Inc,3.875%, due 15/12/2028 35 0.01
30 UnitedHealth Group Inc,2.000%, due 15/05/2030 30 0.01
110 UnitedHealth Group Inc,2.750%, due 15/05/2040 111 0.04
50 UnitedHealth Group Inc,4.250%, due 15/03/2043 60 0.02
40 UnitedHealth Group Inc,4.250%, due 15/06/2048 48 0.02
20 UnitedHealth Group Inc,4.450%, due 15/12/2048 25 0.01
50 UnitedHealth Group Inc,3.700%, due 15/08/2049 56 0.02
110 UnitedHealth Group Inc,2.900%, due 15/05/2050 108 0.04
110 UnitedHealth Group Inc,3.875%, due 15/08/2059 125 0.04
20 UnitedHealth Group Inc,3.125%, due 15/05/2060 20 0.01
50 US Bancorp,3.600%, due 11/09/2024 55 0.02
290 US Bancorp,1.450%, due 12/05/2025 296 0.10
250 US Bank NA/Cincinnati OH,3.150%, due 26/04/2021 250 0.08
150 USAA Capital Corp, 144A,2.125%, due 01/05/2030 153 0.05
FaceValue(000’s)
Value(000’s)
$
% ofNet
AssetValue
180 Verizon Communications Inc,3.376%, due 15/02/2025 197 0.07
40 Verizon Communications Inc,0.850%, due 20/11/2025 39 0.01
40 Verizon Communications Inc,2.625%, due 15/08/2026 43 0.01
40 Verizon Communications Inc,4.125%, due 16/03/2027 46 0.02
30 Verizon Communications Inc,3.000%, due 22/03/2027 33 0.01
205 Verizon Communications Inc,4.329%, due 21/09/2028 239 0.08
30 Verizon Communications Inc,3.875%, due 08/02/2029 34 0.01
100 Verizon Communications Inc,3.150%, due 22/03/2030 107 0.04
530 Verizon Communications Inc,4.500%, due 10/08/2033 633 0.21
60 Verizon Communications Inc,4.400%, due 01/11/2034 71 0.02
20 Verizon Communications Inc,5.250%, due 16/03/2037 26 0.01
180 Verizon Communications Inc,2.650%, due 20/11/2040 168 0.06
200 Verizon Communications Inc,3.850%, due 01/11/2042 220 0.07
70 Verizon Communications Inc,4.125%, due 15/08/2046 79 0.03
70 Verizon Communications Inc,4.862%, due 21/08/2046 86 0.03
420 Verizon Communications Inc,4.522%, due 15/09/2048 495 0.17
130 Verizon Communications Inc,4.000%, due 22/03/2050 142 0.05
70 Verizon Communications Inc,2.875%, due 20/11/2050 64 0.02
180 Visa Inc,3.150%, due 14/12/2025 198 0.07
30 Visa Inc,4.300%, due 14/12/2045 38 0.01
50 Visa Inc,3.650%, due 15/09/2047 57 0.02
110 Wachovia Capital Trust III,5.570%, Perpetual * 110 0.04
40 Walmart Inc,3.400%, due 26/06/2023 43 0.01
40 Walmart Inc,3.550%, due 26/06/2025 45 0.02
90 Walmart Inc,3.050%, due 08/07/2026 99 0.03
180 Walmart Inc,3.700%, due 26/06/2028 206 0.07
20 Walt Disney Co/The,6.650%, due 15/11/2037 30 0.01
10 Waste Management Inc,3.500%, due 15/05/2024 11 –
50 Waste Management Inc,4.150%, due 15/07/2049 60 0.02
60 Wells Fargo & Co,4.125%, due 15/08/2023 65 0.02
61 Wells Fargo & Co,4.480%, due 16/01/2024 68 0.02
40 Wells Fargo & Co,3.750%, due 24/01/2024 43 0.01
300 Wells Fargo & Co,1.654%, due 02/06/2024 * 308 0.10
240 Wells Fargo & Co,2.188%, due 30/04/2026 * 250 0.08
200 Wells Fargo & Co,4.100%, due 03/06/2026 227 0.08
180 Wells Fargo & Co,3.000%, due 23/10/2026 195 0.07
260 Wells Fargo & Co,4.300%, due 22/07/2027 300 0.10
420 Wells Fargo & Co,2.393%, due 02/06/2028 * 437 0.15
150 Wells Fargo & Co,4.150%, due 24/01/2029 173 0.06
200 Wells Fargo & Co,2.879%, due 30/10/2030 * 212 0.07
280 Wells Fargo & Co,4.478%, due 04/04/2031 * 331 0.11
20 Wells Fargo & Co,4.650%, due 04/11/2044 24 0.01
50 Wells Fargo & Co,4.900%, due 17/11/2045 62 0.02
FaceValue(000’s)
Value(000’s)
$
% ofNet
AssetValue
430 Wells Fargo & Co,4.400%, due 14/06/2046 506 0.17
350 Wells Fargo & Co,4.750%, due 07/12/2046 431 0.14
880 Wells Fargo & Co,5.013%, due 04/04/2051 * 1,179 0.39
280 Williams Cos Inc/The,3.750%, due 15/06/2027 311 0.10
60 Williams Cos Inc/The,4.850%, due 01/03/2048 70 0.02
30 WPX Energy Inc,5.250%, due 15/10/2027 32 0.01
30 WPX Energy Inc,4.500%, due 15/01/2030 32 0.01
30 Wyeth LLC,5.950%, due 01/04/2037 43 0.01
74,031 24.75
Total Corporate Bonds and Notes(Cost $95,526) 101,420 33.90
Government Bonds and Notes — 26.13%(29 February 2020: 22.91%)
Chile — 0.24% (29 February 2020: 0.00%)
700 Chile GovernmentInternational Bond,3.500%, due 25/01/2050 705 0.24
China — 0.03% (29 February 2020: 0.02%)
CNY 500 China Government Bond,3.310%, due 30/11/2025 79 0.03
Colombia — 0.23% (29 February 2020: 0.55%)
220 Colombia GovernmentInternational Bond,3.125%, due 15/04/2031 219 0.07
400 Colombia GovernmentInternational Bond,5.625%, due 26/02/2044 462 0.16
681 0.23
India — 0.07% (29 February 2020: 0.07%)
200 Export-Import Bank of India,3.375%, due 05/08/2026 214 0.07
Indonesia — 0.54% (29 February 2020: 0.54%)
1,500 Indonesia GovernmentInternational Bond,4.350%, due 11/01/2048 1,631 0.54
Israel — 0.29% (29 February 2020: 0.00%)
800 Israel GovernmentInternational Bond,2.750%, due 03/07/2030 855 0.29
Kazakhstan — 0.08% (29 February 2020: 0.08%)
200 Kazakhstan GovernmentInternational Bond,4.875%, due 14/10/2044 246 0.08
Kuwait — 0.17% (29 February 2020: 0.16%)
460 Kuwait InternationalGovernment Bond,3.500%, due 20/03/2027 514 0.17
Mexico — 0.40% (29 February 2020: 0.75%)
1,140 Mexico GovernmentInternational Bond,4.750%, due 08/03/2044 1,211 0.40
Panama — 0.39% (29 February 2020: 0.41%)
290 Panama GovernmentInternational Bond,2.252%, due 29/09/2032 278 0.09
200 Panama GovernmentInternational Bond,4.500%, due 15/05/2047 223 0.07
620 Panama GovernmentInternational Bond,4.300%, due 29/04/2053 673 0.23
1,174 0.39
Peru — 0.26% (29 February 2020: 0.36%)
180 Peruvian GovernmentInternational Bond,6.550%, due 14/03/2037 249 0.08
390 Peruvian GovernmentInternational Bond,5.625%, due 18/11/2050 536 0.18
785 0.26
The accompanying notes are an integral part of the Financial Statements
45
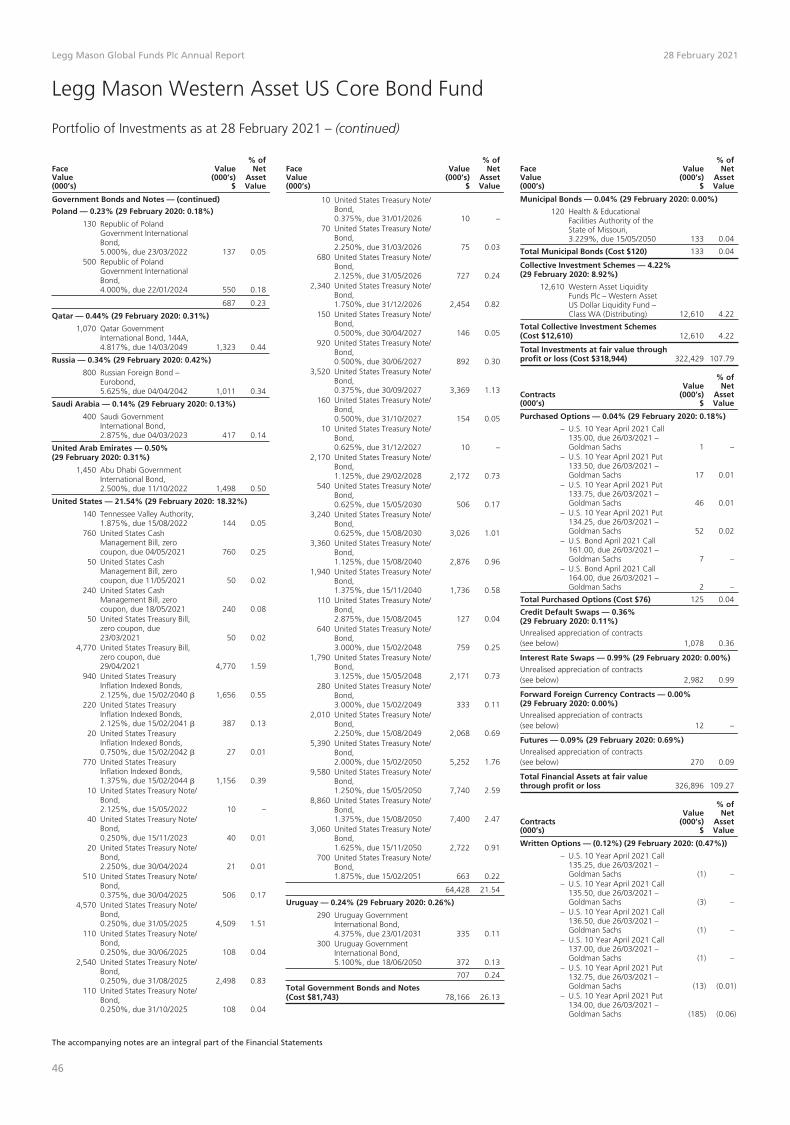
Legg Mason Global Funds Plc Annual Report 28 February 2021
Legg Mason Western Asset US Core Bond Fund
Portfolio of Investments as at 28 February 2021 – (continued)
FaceValue(000’s)
Value(000’s)
$
% ofNet
AssetValue
Government Bonds and Notes — (continued)
Poland — 0.23% (29 February 2020: 0.18%)
130 Republic of PolandGovernment InternationalBond,5.000%, due 23/03/2022 137 0.05
500 Republic of PolandGovernment InternationalBond,4.000%, due 22/01/2024 550 0.18
687 0.23
Qatar — 0.44% (29 February 2020: 0.31%)
1,070 Qatar GovernmentInternational Bond, 144A,4.817%, due 14/03/2049 1,323 0.44
Russia — 0.34% (29 February 2020: 0.42%)
800 Russian Foreign Bond –Eurobond,5.625%, due 04/04/2042 1,011 0.34
Saudi Arabia — 0.14% (29 February 2020: 0.13%)
400 Saudi GovernmentInternational Bond,2.875%, due 04/03/2023 417 0.14
United Arab Emirates — 0.50%(29 February 2020: 0.31%)
1,450 Abu Dhabi GovernmentInternational Bond,2.500%, due 11/10/2022 1,498 0.50
United States — 21.54% (29 February 2020: 18.32%)
140 Tennessee Valley Authority,1.875%, due 15/08/2022 144 0.05
760 United States CashManagement Bill, zerocoupon, due 04/05/2021 760 0.25
50 United States CashManagement Bill, zerocoupon, due 11/05/2021 50 0.02
240 United States CashManagement Bill, zerocoupon, due 18/05/2021 240 0.08
50 United States Treasury Bill,zero coupon, due23/03/2021 50 0.02
4,770 United States Treasury Bill,zero coupon, due29/04/2021 4,770 1.59
940 United States TreasuryInflation Indexed Bonds,2.125%, due 15/02/2040 � 1,656 0.55
220 United States TreasuryInflation Indexed Bonds,2.125%, due 15/02/2041 � 387 0.13
20 United States TreasuryInflation Indexed Bonds,0.750%, due 15/02/2042 � 27 0.01
770 United States TreasuryInflation Indexed Bonds,1.375%, due 15/02/2044 � 1,156 0.39
10 United States Treasury Note/Bond,2.125%, due 15/05/2022 10 –
40 United States Treasury Note/Bond,0.250%, due 15/11/2023 40 0.01
20 United States Treasury Note/Bond,2.250%, due 30/04/2024 21 0.01
510 United States Treasury Note/Bond,0.375%, due 30/04/2025 506 0.17
4,570 United States Treasury Note/Bond,0.250%, due 31/05/2025 4,509 1.51
110 United States Treasury Note/Bond,0.250%, due 30/06/2025 108 0.04
2,540 United States Treasury Note/Bond,0.250%, due 31/08/2025 2,498 0.83
110 United States Treasury Note/Bond,0.250%, due 31/10/2025 108 0.04
FaceValue(000’s)
Value(000’s)
$
% ofNet
AssetValue
10 United States Treasury Note/Bond,0.375%, due 31/01/2026 10 –
70 United States Treasury Note/Bond,2.250%, due 31/03/2026 75 0.03
680 United States Treasury Note/Bond,2.125%, due 31/05/2026 727 0.24
2,340 United States Treasury Note/Bond,1.750%, due 31/12/2026 2,454 0.82
150 United States Treasury Note/Bond,0.500%, due 30/04/2027 146 0.05
920 United States Treasury Note/Bond,0.500%, due 30/06/2027 892 0.30
3,520 United States Treasury Note/Bond,0.375%, due 30/09/2027 3,369 1.13
160 United States Treasury Note/Bond,0.500%, due 31/10/2027 154 0.05
10 United States Treasury Note/Bond,0.625%, due 31/12/2027 10 –
2,170 United States Treasury Note/Bond,1.125%, due 29/02/2028 2,172 0.73
540 United States Treasury Note/Bond,0.625%, due 15/05/2030 506 0.17
3,240 United States Treasury Note/Bond,0.625%, due 15/08/2030 3,026 1.01
3,360 United States Treasury Note/Bond,1.125%, due 15/08/2040 2,876 0.96
1,940 United States Treasury Note/Bond,1.375%, due 15/11/2040 1,736 0.58
110 United States Treasury Note/Bond,2.875%, due 15/08/2045 127 0.04
640 United States Treasury Note/Bond,3.000%, due 15/02/2048 759 0.25
1,790 United States Treasury Note/Bond,3.125%, due 15/05/2048 2,171 0.73
280 United States Treasury Note/Bond,3.000%, due 15/02/2049 333 0.11
2,010 United States Treasury Note/Bond,2.250%, due 15/08/2049 2,068 0.69
5,390 United States Treasury Note/Bond,2.000%, due 15/02/2050 5,252 1.76
9,580 United States Treasury Note/Bond,1.250%, due 15/05/2050 7,740 2.59
8,860 United States Treasury Note/Bond,1.375%, due 15/08/2050 7,400 2.47
3,060 United States Treasury Note/Bond,1.625%, due 15/11/2050 2,722 0.91
700 United States Treasury Note/Bond,1.875%, due 15/02/2051 663 0.22
64,428 21.54
Uruguay — 0.24% (29 February 2020: 0.26%)
290 Uruguay GovernmentInternational Bond,4.375%, due 23/01/2031 335 0.11
300 Uruguay GovernmentInternational Bond,5.100%, due 18/06/2050 372 0.13
707 0.24
Total Government Bonds and Notes(Cost $81,743) 78,166 26.13
FaceValue(000’s)
Value(000’s)
$
% ofNet
AssetValue
Municipal Bonds — 0.04% (29 February 2020: 0.00%)
120 Health & EducationalFacilities Authority of theState of Missouri,3.229%, due 15/05/2050 133 0.04
Total Municipal Bonds (Cost $120) 133 0.04
Collective Investment Schemes — 4.22%(29 February 2020: 8.92%)
12,610 Western Asset LiquidityFunds Plc – Western AssetUS Dollar Liquidity Fund –Class WA (Distributing) 12,610 4.22
Total Collective Investment Schemes(Cost $12,610) 12,610 4.22
Total Investments at fair value throughprofit or loss (Cost $318,944) 322,429 107.79
Contracts(000’s)
Value(000’s)
$
% ofNet
AssetValue
Purchased Options — 0.04% (29 February 2020: 0.18%)
– U.S. 10 Year April 2021 Call135.00, due 26/03/2021 –Goldman Sachs 1 –
– U.S. 10 Year April 2021 Put133.50, due 26/03/2021 –Goldman Sachs 17 0.01
– U.S. 10 Year April 2021 Put133.75, due 26/03/2021 –Goldman Sachs 46 0.01
– U.S. 10 Year April 2021 Put134.25, due 26/03/2021 –Goldman Sachs 52 0.02
– U.S. Bond April 2021 Call161.00, due 26/03/2021 –Goldman Sachs 7 –
– U.S. Bond April 2021 Call164.00, due 26/03/2021 –Goldman Sachs 2 –
Total Purchased Options (Cost $76) 125 0.04
Credit Default Swaps — 0.36%(29 February 2020: 0.11%)Unrealised appreciation of contracts(see below) 1,078 0.36
Interest Rate Swaps — 0.99% (29 February 2020: 0.00%)Unrealised appreciation of contracts(see below) 2,982 0.99
Forward Foreign Currency Contracts — 0.00%(29 February 2020: 0.00%)Unrealised appreciation of contracts(see below) 12 –
Futures — 0.09% (29 February 2020: 0.69%)Unrealised appreciation of contracts(see below) 270 0.09
Total Financial Assets at fair valuethrough profit or loss 326,896 109.27
Contracts(000’s)
Value(000’s)
$
% ofNet
AssetValue
Written Options — (0.12%) (29 February 2020: (0.47%))
– U.S. 10 Year April 2021 Call135.25, due 26/03/2021 –Goldman Sachs (1) –
– U.S. 10 Year April 2021 Call135.50, due 26/03/2021 –Goldman Sachs (3) –
– U.S. 10 Year April 2021 Call136.50, due 26/03/2021 –Goldman Sachs (1) –
– U.S. 10 Year April 2021 Call137.00, due 26/03/2021 –Goldman Sachs (1) –
– U.S. 10 Year April 2021 Put132.75, due 26/03/2021 –Goldman Sachs (13) (0.01)
– U.S. 10 Year April 2021 Put134.00, due 26/03/2021 –Goldman Sachs (185) (0.06)
The accompanying notes are an integral part of the Financial Statements
46

Legg Mason Global Funds Plc Annual Report 28 February 2021
Legg Mason Western Asset US Core Bond Fund
Portfolio of Investments as at 28 February 2021 – (continued)
Contracts(000’s)
Value(000’s)
$
% ofNet
AssetValue
Written Options — (continued)
– U.S. 10 Year June 2021 Call137.00, due 21/05/2021 –Goldman Sachs (4) –
– U.S. 10 Year June 2021 Put131.00, due 21/05/2021 –Goldman Sachs (19) (0.01)
– U.S. 10 Year May 2021 Call134.00, due 23/04/2021 –Goldman Sachs (13) (0.01)
– U.S. 10 Year May 2021 Call136.50, due 23/04/2021 –Goldman Sachs (1) –
– U.S. 5 Year April 2021 Put125.00, due 26/03/2021 –Goldman Sachs (52) (0.02)
– U.S. Bond April 2021 Call163.00, due 26/03/2021 –Goldman Sachs (9) –
– U.S. Bond April 2021 Call166.00, due 26/03/2021 –Goldman Sachs (2) –
– U.S. Bond April 2021 Put155.00, due 26/03/2021 –Goldman Sachs (6) –
– U.S. Bond April 2021 Put160.00, due 26/03/2021 –Goldman Sachs (32) (0.01)
– U.S. Bond May 2021 Call164.00, due 23/04/2021 –Goldman Sachs (12) –
Total Written Options (Cost $(145)) (354) (0.12)
Contracts(000’s)
Value(000’s)
$
% ofNet
AssetValue
Interest Rate Swaps — (0.08%)(29 February 2020: (1.11%))
Unrealised depreciation of contracts(see below) (247) (0.08)
Forward Foreign Currency Contracts — 0.00%(29 February 2020: 0.00%)
Unrealised depreciation of contracts(see below) – –
Futures — (0.32%) (29 February 2020: (0.13%))
Unrealised depreciation of contracts(see below) (949) (0.32)
Total Financial Liabilities at fair valuethrough profit or loss (1,550) (0.52)
Total Financial Assets and FinancialLiabilities at fair value through profitor loss 325,346 108.75
Liabilities in Excess of Other Assets (26,216) (8.75)
Total Net Assets $299,130 100.00
- Amounts designated as “–” are either $0, less than$1,000, less than 1,000 shares or less than 0.01%.
144A Securities exempt from registration under Rule 144A ofthe Securities Act of 1933, as amended. Thesesecurities may only be resold, in transactions exemptfrom registration, to qualified institutional buyers. As at28 February 2021, these securities amounted to$39,284,000 or 13.14% of net assets.
* Variable rate security. The interest rate shown reflectsthe rate in effect at 28 February 2021.
† Illiquid.
∞ Security is valued in good faith at fair value by or at thediscretion of the Manager or the respective InvestmentManager.
� Security is in default as at 28 February 2021 (eitherprincipal and / or interest).
± Securities purchased on a to-be-announced basis.
� The rate of interest on this type of security is tied to theConsumer Price Index (CPI)/Retail Price Index (RPI). Thecoupon rate is the rate as of 28 February 2021.
ABBREVIATIONS:
Perpetual – A bond with no maturity date. Perpetual bondsare not redeemable but pay a steady stream ofinterest.
REMIC – Real Estate Mortgage Investment Conduit.
TBA – To Be Announced.
CNY – Chinese Renminbi
Analysis of Total Assets
% ofTotal
Assets
Transferable securities admitted to an officialexchange listing or traded on a regulated market 90.18
Collective investment schemes 3.67
Financial derivative instruments 1.30
Other assets 4.85
Total Assets 100.00
Schedule of Credit Default Swaps
Counterparty Reference EntityBuy/Sell
ProtectionExpiration
Date
NotionalAmount(000’s)
Value(000’s)
Goldman Sachs CDX.NA.IG, 1.000% Sell 20/12/2025 37,914 $ 794Goldman Sachs CDX.NA.IG, 1.000% Sell 20/06/2025 18,338 284
Unrealised Appreciation of Credit Default Swaps (29 February 2020 (000’s): $341) $ 1,078Unrealised Depreciation of Credit Default Swaps (29 February 2020 (000’s): $–) –
Net Appreciation of Credit Default Swaps (29 February 2020 (000’s): $341) $ 1,078
Schedule of Interest Rate Swaps
Counterparty Rate Expiration DateNotional Amount
(000’s)Value(000’s)
Goldman Sachs Pay Floating USD 3M Libor BBA, Receive Fixed 0.190% 15/06/2022 11,149 $ (1)
Goldman Sachs Pay Floating USD Fed Funds Rate, Receive Fixed 0.100% 30/11/2024 9,078 (116)
Goldman Sachs Pay Floating USD 3M Libor BBA, Receive Fixed 0.380% 28/02/2025 11,229 (127)
Goldman Sachs Pay Fixed 0.260%, Receive Floating USD Fed Funds Rate 15/05/2027 5,555 222
Goldman Sachs Pay Fixed 0.450%, Receive Floating USD 3M Libor BBA 15/05/2027 5,928 236
Goldman Sachs Pay Fixed 0.780%, Receive Floating USD 3M Libor BBA 15/11/2027 4,398 118
Goldman Sachs Pay Fixed 0.560%, Receive Floating USD Sofr Compound 20/07/2045 2,880 651
Goldman Sachs Pay Fixed 0.740%, Receive Floating USD Sofr Compound 19/08/2045 1,170 222
Goldman Sachs Pay Fixed 0.800%, Receive Floating USD 3M Libor BBA 15/11/2045 1,359 315
Goldman Sachs Pay Fixed 1.000%, Receive Floating USD 3M Libor BBA 15/02/2047 2,620 520
Goldman Sachs Pay Fixed 1.200%, Receive Floating USD 3M Libor BBA 15/02/2047 721 112
Goldman Sachs Pay Fixed 1.225%, Receive Floating USD 3M Libor BBA 15/02/2047 362 52
Goldman Sachs Pay Fixed 2.000%, Receive Floating USD 3M Libor BBA 15/02/2047 326 (3)
Goldman Sachs Pay Fixed 0.900%, Receive Floating USD 3M Libor BBA 17/03/2050 1,110 267
Goldman Sachs Pay Fixed 1.200%, Receive Floating USD 3M Libor BBA 07/10/2050 1,544 267
Unrealised Appreciation of Interest Rate Swaps (29 February 2020 (000’s): $–) $ 2,982Unrealised Depreciation of Interest Rate Swaps (29 February 2020 (000’s): $(3,515)) (247)
Net Appreciation of Interest Rate Swaps (29 February 2020 (000’s): $(3,515)) $ 2,735
The accompanying notes are an integral part of the Financial Statements
47

Legg Mason Global Funds Plc Annual Report 28 February 2021
Legg Mason Western Asset US Core Bond Fund
Portfolio of Investments as at 28 February 2021 – (continued)
Schedule of Forward Foreign Currency Contracts
Expiration Date CounterpartyBuy Currency
(000’s)Sell Currency
(000’s)
UnrealisedAppreciation/(Depreciation)of Contracts
(000’s)
12/03/2021 BNY Mellon Buy USD 114 Sell EUR 93 $ 112/03/2021 BNY Mellon Buy EUR 50 Sell USD 61 –12/03/2021 BNY Mellon Buy EUR 3,597 Sell USD 4,331 11
Unrealised Appreciation of Forward Foreign Currency Contracts (29 February 2020 (000’s): $8) $ 12Unrealised Depreciation of Forward Foreign Currency Contracts (29 February 2020 (000’s): $–) –
Net Appreciation of Forward Foreign Currency Contracts (29 February 2020 (000’s): $8) $ 12
Schedule of Futures Contracts
CounterpartyNominal
Value
NotionalValue(000’s)
UnrealisedAppreciation/(Depreciation)of Contracts
(000’s)
90 Day Euro$ December 2021 Goldman Sachs (311) $(77,571) $ (177)
90 Day Euro$ December 2023 Goldman Sachs 120 29,673 (82)
90 Day Euro$ June 2021 Goldman Sachs (35) (8,735) (103)
90 Day Euro$ March 2021 Goldman Sachs (83) (20,713) (34)
U.S. 10 Year Note (CBT) June 2021 Goldman Sachs 12 1,593 (20)
U.S. 10 Year Ultra Note June 2021 Goldman Sachs (53) (7,809) 123
U.S. 2 Year Note (CBT) June 2021 Goldman Sachs (195) (43,049) 38
U.S. 5 Year Note (CBT) June 2021 Goldman Sachs 398 49,339 (425)
U.S. Long Bond (CBT) June 2021 Goldman Sachs (64) (10,190) 109
U.S. Ultra Bond (CBT) June 2021 Goldman Sachs 33 6,239 (108)
Unrealised Appreciation of Futures Contracts (29 February 2020 (000’s): $2,187) $ 270
Unrealised Depreciation of Futures Contracts (29 February 2020 (000’s): $(412)) (949)
Net Depreciation of Futures Contracts (29 February 2020 (000’s): $1,775) $ (679)
The accompanying notes are an integral part of the Financial Statements
48

Legg Mason Global Funds Plc Annual Report 28 February 2021
Legg Mason Western Asset US Core Plus Bond Fund
Portfolio of Investments as at 28 February 2021
FaceValue(000’s)
Value(000’s)
$
% ofNet
AssetValue
Asset-Backed Securities — 7.62%(29 February 2020: 3.37%)
227 Aegis Asset Backed SecCorp Mort Pass Thr CertsSeries 2003-3,Series 2003 3, Class M2,2.593%, due 25/01/2034 * 222 0.01
1,000 Allegro CLO II-S Ltd,Series 2014 1RA, Class A1,144A,1.304%, due 21/10/2028 * 998 0.06
571 Ameriquest MortgageSecurities Inc Asset-BackedPass-Through Ctfs Ser2005-R7, Series 2005 R7,Class M2,0.868%, due 25/09/2035 * 572 0.04
3,060 Ameriquest MortgageSecurities Inc Asset-BackedPass-Through Ctfs Ser2005-R8,Series 2005 R8, Class M4,0.988%, due 25/10/2035 * 3,004 0.18
1,350 AMMC CLO XII Ltd,Series 2013 12A, Class AR,144A,1.395%, due 10/11/2030 * 1,352 0.08
1,521 Apex Credit CLO 2017 Ltd,Series 2017 1A, Class A1,144A,1.688%, due 24/04/2029 * 1,524 0.09
1,250 Apidos CLO XII,Series 2013 12A, Class AR,144A,1.321%, due 15/04/2031 * 1,253 0.08
2,075 Applebee’s Funding LLC /IHOP Funding LLC,Series 2019 1A, Class A2I,144A,4.194%, due 07/06/2049 2,144 0.13
6,069 Asset Backed SecuritiesCorp Home Equity LoanTrust Series RFC2007-HE1, Series 2007HE1, Class A4,0.258%, due 25/12/2036 * 5,932 0.36
2,390 BankAmericaManufactured HousingContract Trust,Series 1996 1, Class B1,7.875%, due 10/10/2026 296 0.02
1,212 BLUEMOUNTAIN CLO2012-2 Ltd, Series 20122A, Class AR2, 144A,1.232%, due 20/11/2028 * 1,213 0.07
735 BlueMountain CLO 2013-2Ltd, Series 2013 2A,Class A1R, 144A,1.402%, due 22/10/2030 * 736 0.04
2,000 BlueMountain CLO XXIILtd, Series 2018 22A,Class A1, 144A,1.321%, due 15/07/2031 * 2,000 0.12
3,564 Carlyle Global MarketStrategies CLO 2014-1 Ltd,Series 2014 1A,Class A1R2, 144A,1.193%, due 17/04/2031 * 3,566 0.22
3,372 Carlyle Global MarketStrategies CLO 2015-3 Ltd,Series 2015 3A, Class A1R,144A,1.219%, due 28/07/2028 * 3,373 0.20
1,750 Cedar Funding VIII Clo Ltd,Series 2017 8A, Class A1,144A,1.473%, due 17/10/2030 * 1,751 0.11
29 ContiMortgage HomeEquity Loan Trust 1999-1,Series 1999 1, Class B,9.000%, due 25/04/2030 30 –
3,511 Countrywide Asset-BackedCertificates, Series 2004 3,Class 1A,0.538%, due 25/08/2034 * 3,405 0.21
FaceValue(000’s)
Value(000’s)
$
% ofNet
AssetValue
965 Countrywide Asset-BackedCertificates, Series 2005 8,Class M4,1.048%, due 25/12/2035 * 967 0.06
1,960 CSMC 2017-RPL1 Trust,Series 2017 RPL1,Class M2, 144A,3.038%, due 25/07/2057 * 1,772 0.11
244 CWABS Asset-BackedCertificates Trust 2004-13,Series 2004 13, Class MF1,5.071%, due 25/04/2035 * 248 0.02
1,499 Dividend Solar Loans2018-2 LLC, Series 2018 2,Class A, 144A,3.720%, due 20/12/2038 1,534 0.09
2,672 Encore Credit ReceivablesTrust 2005-3,Series 2005 3, Class M5,1.078%, due 25/10/2035 * 2,618 0.16
299 Fannie Mae Grantor Trust2017-T1, Series 2017 T1,Class A,2.898%, due 25/06/2027 326 0.02
8,581 Fieldstone MortgageInvestment TrustSeries 2005-2,Series 2005 2, Class M3,0.898%, due 25/12/2035 * 8,265 0.50
3,394 First Franklin MortgageLoan Trust 2006-FF15,Series 2006 FF15,Class A2,0.238%, due 25/11/2036 * 3,246 0.20
2,060 Ford Credit FloorplanMaster Owner Trust A,Series 2018 4, Class A,4.060%, due 15/11/2030 2,394 0.15
200 Freddie Mac StructuredPass-Through CertificatesFRESR 2017-SR01,Series 2017 SR01,Class A3,3.089%, due 25/11/2027 211 0.01
500 Galaxy XXI CLO Ltd,Series 2015 21A, Class AR,144A,1.244%, due 20/04/2031 * 500 0.03
1,100 Greenwood Park CLO Ltd,Series 2018 1A, Class A2,144A,1.251%, due 15/04/2031 * 1,103 0.07
2,534 Greywolf CLO V Ltd,Series 2015 1A, Class A1R,144A,1.378%, due 27/01/2031 * 2,536 0.15
1,890 GSAA Home Equity Trust2005-6, Series 2005 6,Class M4,1.168%, due 25/06/2035 * 1,850 0.11
1,726 GSAMP Trust 2005-NC1,Series 2005 NC1,Class M2,1.213%, due 25/02/2035 * 1,472 0.09
2,660 Hertz Vehicle Financing IILP, Series 2017 2A,Class B, 144A,4.200%, due 25/10/2023 2,672 0.16
880 Jackson Mill CLO Ltd,Series 2015 1A, Class AR,144A,1.071%, due 15/04/2027 * 880 0.05
2,354 Long Beach MortgageLoan Trust 2004-1,Series 2004 1, Class M1,0.868%, due 25/02/2034 * 2,352 0.14
2,000 Magnetite XIV-R Ltd,Series 2015 14RA,Class A2, 144A,1.346%, due 18/10/2031 * 2,005 0.12
1,852 Magnolia Finance,0.000%, due 09/08/2024 ∞ 1,820 0.11
1,687 MP CLO VIII Ltd,Series 2015 2A, Class AR,144A,1.129%, due 28/10/2027 * 1,688 0.10
FaceValue(000’s)
Value(000’s)
$
% ofNet
AssetValue
2,000 Nelnet Student Loan Trust2014-2, Series 2014 2A,Class B, 144A,1.618%, due 25/06/2041 * 2,004 0.12
2,500 Neuberger Berman LoanAdvisers CLO 29 Ltd,Series 2018 29A, Class A1,144A,1.353%, due 19/10/2031 * 2,503 0.15
4,000 Ocean Trails CLO IX,Series 2020 9A, Class A1,144A,2.153%, due 15/10/2029 * 4,015 0.24
4,390 Ocean Trails Clo X,Series 2020 10A, Class A1,144A,1.744%, due 15/10/2031 * 4,395 0.27
4,390 OCTAGON INVESTMENTPARTNERS 35 Ltd,Series 2018 1A,Class A1A, 144A,1.284%, due 20/01/2031 * 4,393 0.27
2,500 Octagon InvestmentPartners 36 Ltd,Series 2018 1A, Class A1,144A,1.211%, due 15/04/2031 * 2,502 0.15
1,473 Option One MortgageLoan Trust 2007-FXD1,Series 2007 FXD1,Class 1A1,5.866%, due 25/01/2037 1,440 0.09
521 Origen ManufacturedHousing Contract Trust2006-A, Series 2006 A,Class A2,1.807%, due 15/10/2037 * 507 0.03
250 Palmer Square CLO2018-1 Ltd, Series 20181A, Class A1, 144A,1.253%, due 18/04/2031 * 250 0.02
3,600 RASC Series 2007-KS1Trust, Series 2007 KS1,Class A4,0.338%, due 25/01/2037 * 3,427 0.21
4,540 RASC Series 2007-KS3Trust, Series 2007 KS3,Class AI4,0.458%, due 25/04/2037 * 4,373 0.27
1,567 Recette Clo Ltd,Series 2015 1A, Class AR,144A,1.144%, due 20/10/2027 * 1,567 0.10
1,341 Regatta VI Funding Ltd,Series 2016 1A, Class AR,144A,1.304%, due 20/07/2028 * 1,341 0.08
2,366 Renaissance Home EquityLoan Trust 2004-1,Series 2004 1, Class AV3,1.058%, due 25/05/2034 * 2,334 0.14
2,010 Saxon Asset SecuritiesTrust 2006-3,Series 2006 3, Class A4,0.358%, due 25/10/2046 * 1,782 0.11
183 SBA Small BusinessInvestment Cos,Series 2018 10B, Class 1,3.548%, due 10/09/2028 195 0.01
457 Shackleton 2014-VI-R CLOLtd, Series 2014 6RA,Class A, 144A,1.243%, due 17/07/2028 * 457 0.03
970 SMB Private EducationLoan Trust 2014-A,Series 2014 A, Class A3,144A,1.607%, due 15/04/2032 * 983 0.06
2 SMB Private EducationLoan Trust 2015-A,Series 2015 A, Class R,144A,0.000%, due 15/10/2048 732 0.04
722 SMB Private EducationLoan Trust, Series 2020 B,Class A1A, 144A,1.290%, due 15/07/2053 726 0.04
The accompanying notes are an integral part of the Financial Statements
49

Legg Mason Global Funds Plc Annual Report 28 February 2021
Legg Mason Western Asset US Core Plus Bond Fund
Portfolio of Investments as at 28 February 2021 – (continued)
FaceValue(000’s)
Value(000’s)
$
% ofNet
AssetValue
Asset-Backed Securities — (continued)
1,730 Structured AssetInvestment Loan Trust2005-HE1, Series 2005HE1, Class M2,0.838%, due 25/07/2035 * 1,699 0.10
750 TCI-Flatiron Clo 2017-1Ltd, Series 2017 1A,Class A, 144A,1.392%, due 18/11/2030 * 751 0.05
354 Towd Point Mortgage Trust2016-3, Series 2016 3,Class A1, 144A,2.250%, due 25/04/2056 * 357 0.02
1,091 Tralee CLO III Ltd,Series 2014 3A, Class AR,144A,1.254%, due 20/10/2027 * 1,093 0.07
650 Tryon Park CLO Ltd,Series 2013 1A,Class A1SR, 144A,1.131%, due 15/04/2029 * 651 0.04
700 Venture XXVIII CLO Ltd,Series 2017 28A, Class A2,144A,1.334%, due 20/07/2030 * 700 0.04
3,900 Voya CLO 2017-3 Ltd,Series 2017 3A, Class A1A,144A,1.454%, due 20/07/2030 * 3,903 0.24
2,690 Voya CLO 2018-3 Ltd,Series 2018 3A, Class A1A,144A,1.391%, due 15/10/2031 * 2,692 0.16
Total Asset-Backed Securities(Cost $123,202) 125,602 7.62
Mortgage-Backed Securities — 28.98%(29 February 2020: 38.86%)
83 Alternative Loan Trust2005-14, Series 2005 14,Class 2A2,0.618%, due 25/05/2035 * 70 –
269 Alternative Loan Trust2005-56, Series 2005 56,Class 4A1,0.738%, due 25/11/2035 * 265 0.02
191 Alternative Loan Trust2005-IM1, Series 2005IM1, Class A1,0.718%, due 25/01/2036 * 184 0.01
49 Alternative Loan Trust2006-18CB, Series 200618CB, Class A6,28.129%, due 25/07/2036 * 74 –
188 APS Resecuritization Trust2015-3, Series 2015 3,Class 1A, 144A,1.043%, due 27/10/2046 * 189 0.01
2,235 BAMLL Re-REMIC Trust2016-RRGG10, Series 2016GG10, Class AJA, 144A,5.829%, due 10/08/2045 * 1,017 0.06
2,613 Banc of America Funding2014-R2 Trust,Series 2014 R2, Class 2A2,144A,0.325%, due 26/05/2037 * 2,461 0.15
780 BANK 2017-BNK7,Series 2017 BNK7,Class A5,3.435%, due 15/09/2060 870 0.05
13,060 BANK 2017-BNK7,Series 2017 BNK7,Class XA,0.777%, due 15/09/2060 * 497 0.03
1,500 BANK 2018-BNK15,Series 2018 BN15, Class B,4.655%, due 15/11/2061 * 1,715 0.10
2,570 BBCCRE Trust 2015-GTP,Series 2015 GTP, Class E,144A,4.563%, due 10/08/2033 * 2,345 0.14
361 Bear Stearns MortgageFunding Trust 2007-AR1,Series 2007 AR1,Class 1A1,0.278%, due 25/01/2037 * 343 0.02
FaceValue(000’s)
Value(000’s)
$
% ofNet
AssetValue
497 BX Commercial MortgageTrust 2018-IND,Series 2018 IND, Class G,144A,2.162%, due 15/11/2035 * 499 0.03
2,324 BX Commercial MortgageTrust 2018-IND,Series 2018 IND, Class H,144A,3.112%, due 15/11/2035 * 2,332 0.14
3,100 BXP Trust 2017-CQHP,Series 2017 CQHP,Class A, 144A,0.962%, due 15/11/2034 * 3,063 0.19
77 CHL Mortgage Pass-Through Trust 2005-3,Series 2005 3, Class 1A2,0.698%, due 25/04/2035 * 72 –
300 Citigroup CommercialMortgage Trust 2015-GC27, Series 2015 GC27,Class AS,3.571%, due 10/02/2048 324 0.02
8,968 Citigroup Mortgage LoanTrust 2006-AR6,Series 2006 AR6,Class 2A4,0.558%, due 25/09/2036 * 2,924 0.18
20 COMM 2013-CCRE12Mortgage Trust,Series 2013 CR12, Class B,4.762%, due 10/10/2046 * 21 –
10 COMM 2013-CCRE12Mortgage Trust,Series 2013 CR12, Class C,5.074%, due 10/10/2046 * 10 –
726 COMM 2013-CCRE6Mortgage Trust,Series 2013 CR6, Class B,144A,3.397%, due 10/03/2046 745 0.05
90 COMM 2015-DC1Mortgage Trust,Series 2015 DC1, Class B,4.035%, due 10/02/2048 * 95 0.01
70 COMM 2015-DC1Mortgage Trust,Series 2015 DC1, Class C,4.308%, due 10/02/2048 * 69 –
2,412 Connecticut AvenueSecurities Trust 2019-R07,Series 2019 R07,Class 1M2, 144A,2.218%, due 25/10/2039 * 2,419 0.15
– Credit Suisse CommercialMortgage TrustSeries 2006-C3,Series 2006 C3, Class AJ,6.169%, due 15/06/2038 * – –
9 Credit Suisse CommercialMortgage TrustSeries 2006-C5,Series 2006 C5, Class AJ,5.373%, due 15/12/2039 2 –
500 CSAIL 2015-C1Commercial MortgageTrust, Series 2015 C1,Class AS,3.791%, due 15/04/2050 * 543 0.03
1,050 CSMC 2014-USA OA LLC,Series 2014 USA,Class A2, 144A,3.953%, due 15/09/2037 1,113 0.07
140 CSMC 2014-USA OA LLC,Series 2014 USA, Class E,144A,4.373%, due 15/09/2037 118 0.01
5,170 CSMC 2014-USA OA LLC,Series 2014 USA, Class F,144A,4.373%, due 15/09/2037 4,073 0.25
600 CSMC Trust 2017-CHOP,Series 2017 CHOP,Class G, 144A,5.462%, due 15/07/2032 * 441 0.03
FaceValue(000’s)
Value(000’s)
$
% ofNet
AssetValue
1,680 DBCG 2017-BBGMortgage Trust,Series 2017 BBG, Class A,144A,0.812%, due 15/06/2034 * 1,681 0.10
191 Deutsche MortgageSecurities Inc MortgageLoan TrustSeries 2006-PR1,Series 2006 PR1,Class 3AF1, 144A,0.392%, due 15/04/2036 * 161 0.01
654 Fannie Mae ConnecticutAvenue Securities,Series 2014 C03,Class 1M2,3.130%, due 25/07/2024 * 650 0.04
926 Fannie Mae ConnecticutAvenue Securities,Series 2016 C04,Class 1M2,4.368%, due 25/01/2029 * 967 0.06
2,554 Fannie Mae ConnecticutAvenue Securities,Series 2018 C03,Class 1B1,3.868%, due 25/10/2030 * 2,658 0.16
2,352 Fannie Mae ConnecticutAvenue Securities,Series 2018 C03,Class 1M2,2.268%, due 25/10/2030 * 2,368 0.14
560 Fannie Mae ConnecticutAvenue Securities,Series 2018 C05,Class 1B1,4.368%, due 25/01/2031 * 585 0.04
19 Fannie Mae Interest Strip390, Class C3,6.000%, due 25/07/2038 4 –
10 Fannie Mae Interest Strip407, Class 22,5.000%, due 25/01/2039 2 –
5 Fannie Mae Interest Strip407, Class 23,5.000%, due 25/01/2039 * 1 –
11 Fannie Mae Interest Strip407, Class 27,5.500%, due 25/01/2039 * 2 –
9 Fannie Mae Interest Strip407, Class 34,5.000%, due 25/01/2038 1 –
25 Fannie Mae Interest Strip407, Class 41,6.000%, due 25/01/2038 5 –
93 Fannie Mae Interest Strip409, Class C13,3.500%, due 25/11/2041 9 –
104 Fannie Mae Interest Strip409, Class C18,4.000%, due 25/04/2042 14 –
149 Fannie Mae Interest Strip409, Class C2,3.000%, due 25/04/2027 9 –
94 Fannie Mae Interest Strip409, Class C22,4.500%, due 25/11/2039 16 –
10,900 Fannie Mae or FreddieMac, 15 year, TBA,1.500% ± 11,020 0.67
1,900 Fannie Mae or FreddieMac, 30 year, TBA,1.500% ± 1,863 0.11
4,900 Fannie Mae or FreddieMac, 30 year, TBA,1.500% ± 4,814 0.29
29,000 Fannie Mae or FreddieMac, 30 year, TBA,2.000% ± 29,296 1.78
23,800 Fannie Mae or FreddieMac, 30 year, TBA,2.000% ± 23,992 1.46
900 Fannie Mae or FreddieMac, 30 year, TBA,2.500% ± 933 0.06
7,700 Fannie Mae or FreddieMac, 30 year, TBA,2.500% ± 7,967 0.48
The accompanying notes are an integral part of the Financial Statements
50

Legg Mason Global Funds Plc Annual Report 28 February 2021
Legg Mason Western Asset US Core Plus Bond Fund
Portfolio of Investments as at 28 February 2021 – (continued)
FaceValue(000’s)
Value(000’s)
$
% ofNet
AssetValue
Mortgage-Backed Securities — (continued)
100 Fannie Mae or FreddieMac, 30 year, TBA,3.000% ± 105 0.01
14 Fannie Mae Pool ‘254793’,5.000%, due 01/07/2033 16 –
17 Fannie Mae Pool ‘555743’,5.000%, due 01/09/2033 20 –
1 Fannie Mae Pool ‘725162’,6.000%, due 01/02/2034 2 –
7 Fannie Mae Pool ‘745000’,6.000%, due 01/10/2035 9 –
10 Fannie Mae Pool ‘843997’,2.488%, due 01/11/2035 * 10 –
17 Fannie Mae Pool ‘865915’,2.607%, due 01/03/2036 * 17 –
21 Fannie Mae Pool ‘888560’,6.000%, due 01/11/2035 25 –
47 Fannie Mae Pool ‘889117’,5.000%, due 01/10/2035 55 –
45 Fannie Mae Pool ‘890248’,6.000%, due 01/08/2037 54 –
585 Fannie Mae Pool ‘890604’,4.500%, due 01/10/2044 656 0.04
62 Fannie Mae Pool ‘890876’,3.500%, due 01/02/2049 68 –
10 Fannie Mae Pool ‘985626’,6.000%, due 01/04/2033 12 –
23 Fannie Mae Pool ‘995072’,5.500%, due 01/08/2038 27 –
53 Fannie Mae Pool‘AB9683’,4.000%, due 01/06/2043 59 –
50 Fannie Mae Pool‘AE0758’,7.000%, due 01/02/2039 59 –
41 Fannie Mae Pool‘AK8441’,4.000%, due 01/04/2042 45 –
– Fannie Mae Pool ‘AL2931’,6.000%, due 01/06/2023 – –
598 Fannie Mae Pool ‘AL3024’,3.500%, due 01/01/2043 654 0.04
52 Fannie Mae Pool ‘AL3026’,3.500%, due 01/12/2042 57 –
39 Fannie Mae Pool ‘AL3508’,4.000%, due 01/04/2043 44 –
34 Fannie Mae Pool ‘AL4741’,4.500%, due 01/01/2044 38 –
153 Fannie Mae Pool ‘AL6613’,2.500%, due 01/06/2028 161 0.01
109 Fannie Mae Pool ‘AL9397’,3.000%, due 01/10/2046 116 0.01
673 Fannie Mae Pool ‘AL9546’,3.500%, due 01/11/2046 717 0.04
498 Fannie Mae Pool ‘AL9631’,3.000%, due 01/12/2046 537 0.03
10 Fannie Mae Pool‘AM8674’,2.810%, due 01/04/2025 11 –
22 Fannie Mae Pool‘AO2711’,4.000%, due 01/05/2042 24 –
30 Fannie Mae Pool‘AO6086’,4.000%, due 01/06/2042 34 –
20 Fannie Mae Pool‘AO9859’,4.000%, due 01/07/2042 22 –
18 Fannie Mae Pool‘AP0692’,4.000%, due 01/07/2042 20 –
24 Fannie Mae Pool‘AP2530’,4.000%, due 01/08/2042 27 –
88 Fannie Mae Pool‘AP4710’,3.500%, due 01/08/2042 96 0.01
361 Fannie Mae Pool‘AP4781’,3.000%, due 01/09/2042 392 0.02
38 Fannie Mae Pool‘AP4903’,4.000%, due 01/09/2042 43 –
84 Fannie Mae Pool‘AP7399’,4.000%, due 01/09/2042 92 0.01
FaceValue(000’s)
Value(000’s)
$
% ofNet
AssetValue
29 Fannie Mae Pool‘AP9229’,4.000%, due 01/10/2042 32 –
114 Fannie Mae Pool‘AP9766’,4.000%, due 01/10/2042 126 0.01
83 Fannie Mae Pool‘AP9862’,4.000%, due 01/10/2042 91 0.01
45 Fannie Mae Pool‘AQ0100’,4.000%, due 01/10/2042 50 –
121 Fannie Mae Pool‘AQ1641’,4.000%, due 01/10/2042 133 0.01
20 Fannie Mae Pool‘AQ3599’,4.000%, due 01/11/2042 22 –
37 Fannie Mae Pool‘AQ4078’,4.000%, due 01/06/2043 42 –
30 Fannie Mae Pool‘AQ4080’,4.000%, due 01/06/2043 33 –
51 Fannie Mae Pool‘AQ4555’,4.000%, due 01/12/2042 57 –
24 Fannie Mae Pool‘AQ5137’,4.000%, due 01/11/2042 27 –
72 Fannie Mae Pool‘AQ7003’,4.000%, due 01/12/2042 80 0.01
94 Fannie Mae Pool‘AQ7082’,4.000%, due 01/01/2043 104 0.01
35 Fannie Mae Pool‘AS0070’,4.000%, due 01/08/2043 38 –
156 Fannie Mae Pool‘AS3253’,4.000%, due 01/09/2044 171 0.01
39 Fannie Mae Pool‘AS4271’,4.500%, due 01/01/2045 44 –
66 Fannie Mae Pool‘AS4347’,4.000%, due 01/01/2045 74 –
869 Fannie Mae Pool‘AS6328’,3.500%, due 01/12/2045 939 0.06
182 Fannie Mae Pool‘AS6340’,3.500%, due 01/12/2045 196 0.01
147 Fannie Mae Pool‘AS6541’,3.500%, due 01/01/2046 160 0.01
130 Fannie Mae Pool‘AS6562’,3.500%, due 01/01/2046 140 0.01
885 Fannie Mae Pool‘AS7738’,3.000%, due 01/08/2046 959 0.06
100 Fannie Mae Pool‘AS7844’,3.000%, due 01/09/2046 107 0.01
1,117 Fannie Mae Pool‘AS8359’,3.000%, due 01/11/2046 1,180 0.07
307 Fannie Mae Pool‘AS8623’,3.000%, due 01/01/2047 331 0.02
1,162 Fannie Mae Pool‘AS8745’,3.000%, due 01/02/2047 1,251 0.08
81 Fannie Mae Pool‘AS9453’,4.000%, due 01/04/2047 89 0.01
42 Fannie Mae Pool‘AS9588’,4.000%, due 01/05/2047 46 –
117 Fannie Mae Pool‘AS9760’,4.500%, due 01/06/2047 129 0.01
34 Fannie Mae Pool‘AT7208’,4.000%, due 01/06/2043 38 –
FaceValue(000’s)
Value(000’s)
$
% ofNet
AssetValue
36 Fannie Mae Pool‘AT8394’,4.000%, due 01/06/2043 41 –
110 Fannie Mae Pool‘AT9637’,4.000%, due 01/07/2043 122 0.01
80 Fannie Mae Pool‘AT9653’,4.000%, due 01/07/2043 90 0.01
66 Fannie Mae Pool‘AT9657’,4.000%, due 01/07/2043 73 –
172 Fannie Mae Pool‘AW0318’,4.500%, due 01/02/2044 188 0.01
579 Fannie Mae Pool‘BC0884’,3.000%, due 01/05/2046 627 0.04
55 Fannie Mae Pool‘BC1509’,3.000%, due 01/08/2046 60 –
157 Fannie Mae Pool‘BC2817’,3.000%, due 01/09/2046 167 0.01
320 Fannie Mae Pool‘BC9096’,3.500%, due 01/12/2046 342 0.02
946 Fannie Mae Pool‘BD2455’,3.000%, due 01/01/2047 1,016 0.06
354 Fannie Mae Pool‘BD8104’,3.000%, due 01/10/2046 382 0.02
202 Fannie Mae Pool ‘BE3702’,4.000%, due 01/06/2047 219 0.01
1,201 Fannie Mae Pool ‘BF0104’,4.000%, due 01/02/2056 1,354 0.08
3,233 Fannie Mae Pool ‘BF0145’,3.500%, due 01/03/2057 3,562 0.22
56 Fannie Mae Pool ‘BF0148’,4.500%, due 01/04/2056 65 –
1,074 Fannie Mae Pool ‘BF0163’,5.000%, due 01/11/2046 1,239 0.08
705 Fannie Mae Pool ‘BF0183’,4.000%, due 01/01/2057 795 0.05
1,350 Fannie Mae Pool ‘BF0191’,4.000%, due 01/06/2057 1,515 0.09
1,159 Fannie Mae Pool ‘BF0222’,4.500%, due 01/09/2057 1,333 0.08
68 Fannie Mae Pool ‘BF0301’,4.500%, due 01/08/2058 78 –
460 Fannie Mae Pool ‘BF0338’,4.500%, due 01/01/2059 525 0.03
307 Fannie Mae Pool‘BH2623’,4.000%, due 01/08/2047 332 0.02
330 Fannie Mae Pool‘BH4095’,4.000%, due 01/10/2047 357 0.02
6,428 Fannie Mae Pool‘BH4101’,3.500%, due 01/10/2047 6,842 0.42
466 Fannie Mae Pool ‘BJ0685’,4.000%, due 01/04/2048 502 0.03
146 Fannie Mae Pool ‘BJ2544’,3.000%, due 01/12/2037 154 0.01
615 Fannie Mae Pool ‘BJ2763’,4.500%, due 01/05/2048 675 0.04
49 Fannie Mae Pool ‘BJ6133’,4.000%, due 01/01/2048 53 –
1,534 Fannie Mae Pool‘BK7700’,4.500%, due 01/10/2048 1,693 0.10
186 Fannie Mae Pool ‘BL2454’,3.160%, due 01/05/2029 207 0.01
984 Fannie Mae Pool ‘BL5850’,2.260%, due 01/04/2030 1,045 0.06
200 Fannie Mae Pool ‘BL6295’,1.950%, due 01/04/2032 206 0.01
1,097 Fannie Mae Pool‘BM1565’,3.000%, due 01/04/2047 1,182 0.07
347 Fannie Mae Pool‘BM1948’,6.000%, due 01/07/2041 418 0.03
The accompanying notes are an integral part of the Financial Statements
51

Legg Mason Global Funds Plc Annual Report 28 February 2021
Legg Mason Western Asset US Core Plus Bond Fund
Portfolio of Investments as at 28 February 2021 – (continued)
FaceValue(000’s)
Value(000’s)
$
% ofNet
AssetValue
Mortgage-Backed Securities — (continued)
107 Fannie Mae Pool‘BM2005’,4.000%, due 01/12/2047 115 0.01
212 Fannie Mae Pool‘BM3473’,3.500%, due 01/11/2047 233 0.01
63 Fannie Mae Pool‘BM3799’,3.000%, due 01/08/2047 68 –
371 Fannie Mae Pool‘BM3904’,5.000%, due 01/05/2048 414 0.03
1,158 Fannie Mae Pool‘BM3933’,4.500%, due 01/05/2048 1,286 0.08
215 Fannie Mae Pool‘BM3934’,4.500%, due 01/05/2048 237 0.01
310 Fannie Mae Pool‘BM4579’,3.000%, due 01/04/2047 336 0.02
63 Fannie Mae Pool‘BM4750’,3.500%, due 01/02/2045 69 –
429 Fannie Mae Pool‘BM4751’,3.500%, due 01/03/2043 468 0.03
164 Fannie Mae Pool‘BM4781’,4.500%, due 01/10/2048 182 0.01
618 Fannie Mae Pool‘BM4897’,3.500%, due 01/12/2046 669 0.04
95 Fannie Mae Pool‘BM5119’,4.500%, due 01/12/2048 105 0.01
1,270 Fannie Mae Pool‘BM5521’,3.500%, due 01/07/2048 1,352 0.08
2,122 Fannie Mae Pool‘BM5526’,3.500%, due 01/02/2048 2,256 0.14
900 Fannie Mae Pool‘BN0341’,5.000%, due 01/12/2048 996 0.06
603 Fannie Mae Pool‘BN1623’,4.500%, due 01/11/2048 666 0.04
1,979 Fannie Mae Pool‘BN3898’,4.500%, due 01/12/2048 2,195 0.13
2,971 Fannie Mae Pool‘BN7652’,3.000%, due 01/07/2049 3,172 0.19
170 Fannie Mae Pool‘BO1858’,3.000%, due 01/08/2049 184 0.01
1,278 Fannie Mae Pool‘BO2252’,3.500%, due 01/10/2049 1,389 0.08
474 Fannie Mae Pool‘BO2878’,3.000%, due 01/11/2049 497 0.03
498 Fannie Mae Pool‘BO7435’,3.000%, due 01/11/2049 522 0.03
207 Fannie Mae Pool‘BO8513’,3.000%, due 01/12/2049 217 0.01
177 Fannie Mae Pool‘BO8932’,3.000%, due 01/01/2050 186 0.01
158 Fannie Mae Pool‘BO9692’,3.000%, due 01/01/2050 169 0.01
156 Fannie Mae Pool ‘BP1662’,3.500%, due 01/02/2050 165 0.01
345 Fannie Mae Pool ‘BP7009’,3.000%, due 01/08/2050 367 0.02
195 Fannie Mae Pool ‘BP9421’,3.000%, due 01/07/2050 209 0.01
590 Fannie Mae Pool‘BQ1150’,2.500%, due 01/10/2050 615 0.04
FaceValue(000’s)
Value(000’s)
$
% ofNet
AssetValue
85 Fannie Mae Pool‘BQ1402’,3.000%, due 01/08/2050 91 0.01
293 Fannie Mae Pool‘BQ5876’,2.500%, due 01/11/2050 308 0.02
687 Fannie Mae Pool‘BQ5881’,2.500%, due 01/11/2050 716 0.04
99 Fannie Mae Pool‘BQ9053’,2.500%, due 01/12/2050 103 0.01
496 Fannie Mae Pool‘BQ9226’,2.000%, due 01/01/2051 503 0.03
200 Fannie Mae Pool ‘BR0757’,2.500%, due 01/01/2051 208 0.01
299 Fannie Mae Pool ‘BR1823’,2.000%, due 01/01/2051 304 0.02
300 Fannie Mae Pool ‘BR2641’,2.000%, due 01/02/2051 304 0.02
500 Fannie Mae Pool ‘BR2643’,2.000%, due 01/02/2051 506 0.03
200 Fannie Mae Pool ‘BR2644’,2.000%, due 01/02/2051 202 0.01
300 Fannie Mae Pool ‘BR3256’,2.000%, due 01/02/2051 305 0.02
500 Fannie Mae Pool ‘BR3257’,2.000%, due 01/02/2051 508 0.03
800 Fannie Mae Pool ‘BR3290’,2.000%, due 01/03/2051 810 0.05
400 Fannie Mae Pool ‘BR4035’,2.000%, due 01/02/2051 405 0.02
200 Fannie Mae Pool ‘BR4548’,2.000%, due 01/02/2051 203 0.01
90 Fannie Mae Pool‘CA1053’,3.500%, due 01/01/2048 96 0.01
157 Fannie Mae Pool‘CA1565’,4.500%, due 01/04/2048 172 0.01
360 Fannie Mae Pool‘CA1707’,4.500%, due 01/05/2048 398 0.02
744 Fannie Mae Pool‘CA2047’,4.500%, due 01/07/2048 827 0.05
1,253 Fannie Mae Pool‘CA2199’,4.500%, due 01/08/2048 1,382 0.08
158 Fannie Mae Pool‘CA2251’,5.000%, due 01/08/2048 175 0.01
2,525 Fannie Mae Pool‘CA2471’,4.000%, due 01/10/2048 2,727 0.17
984 Fannie Mae Pool‘CA2482’,4.500%, due 01/10/2048 1,089 0.07
967 Fannie Mae Pool‘CA2652’,5.000%, due 01/11/2048 1,072 0.07
2,849 Fannie Mae Pool‘CA2798’,4.500%, due 01/12/2048 3,141 0.19
4,478 Fannie Mae Pool‘CA2799’,4.500%, due 01/12/2048 4,939 0.30
291 Fannie Mae Pool‘CA3055’,4.500%, due 01/02/2049 321 0.02
64 Fannie Mae Pool‘CA3809’,3.000%, due 01/07/2049 68 –
378 Fannie Mae Pool‘CA3842’,4.500%, due 01/07/2049 413 0.03
782 Fannie Mae Pool‘CA3860’,3.500%, due 01/07/2049 843 0.05
391 Fannie Mae Pool‘CA4033’,4.500%, due 01/08/2049 428 0.03
527 Fannie Mae Pool‘CA4819’,4.000%, due 01/12/2049 580 0.04
FaceValue(000’s)
Value(000’s)
$
% ofNet
AssetValue
1,555 Fannie Mae Pool‘CA4979’,3.000%, due 01/01/2050 1,631 0.10
622 Fannie Mae Pool‘CA5164’,3.500%, due 01/02/2050 664 0.04
1,187 Fannie Mae Pool‘CA5226’,3.000%, due 01/02/2050 1,269 0.08
1,055 Fannie Mae Pool‘CA5522’,4.000%, due 01/04/2050 1,164 0.07
668 Fannie Mae Pool‘CA5561’,3.500%, due 01/04/2050 712 0.04
1,089 Fannie Mae Pool‘CA6000’,3.000%, due 01/06/2050 1,159 0.07
1,019 Fannie Mae Pool‘CA6427’,3.000%, due 01/07/2050 1,079 0.07
294 Fannie Mae Pool‘CA8377’,1.500%, due 01/12/2035 299 0.02
2,890 Fannie Mae Pool‘CA8460’,2.500%, due 01/01/2051 3,005 0.18
1,526 Fannie Mae Pool‘FM0062’,3.500%, due 01/02/2050 1,643 0.10
308 Fannie Mae Pool‘FM1098’,4.000%, due 01/05/2049 336 0.02
339 Fannie Mae Pool‘FM1193’,3.500%, due 01/06/2049 365 0.02
61 Fannie Mae Pool‘FM1241’,3.500%, due 01/08/2049 65 –
52 Fannie Mae Pool‘FM1458’,4.500%, due 01/04/2049 57 –
1,121 Fannie Mae Pool‘FM1459’,3.000%, due 01/09/2049 1,175 0.07
191 Fannie Mae Pool‘FM1539’,4.500%, due 01/09/2049 209 0.01
571 Fannie Mae Pool‘FM1676’,3.000%, due 01/10/2049 597 0.04
2,471 Fannie Mae Pool‘FM1727’,5.000%, due 01/09/2049 2,787 0.17
76 Fannie Mae Pool‘FM1742’,3.000%, due 01/10/2049 81 0.01
708 Fannie Mae Pool‘FM1789’,3.000%, due 01/11/2049 755 0.05
3,459 Fannie Mae Pool‘FM2075’,3.000%, due 01/12/2049 3,708 0.23
448 Fannie Mae Pool‘FM2091’,3.500%, due 01/12/2049 486 0.03
941 Fannie Mae Pool‘FM2157’,3.500%, due 01/12/2049 1,015 0.06
220 Fannie Mae Pool‘FM2158’,4.000%, due 01/10/2049 242 0.01
89 Fannie Mae Pool‘FM2173’,4.000%, due 01/09/2048 97 0.01
620 Fannie Mae Pool‘FM2201’,4.000%, due 01/01/2048 668 0.04
547 Fannie Mae Pool‘FM2333’,3.500%, due 01/02/2050 582 0.04
648 Fannie Mae Pool‘FM2745’,4.500%, due 01/03/2050 709 0.04
128 Fannie Mae Pool‘FM3023’,4.000%, due 01/02/2048 139 0.01
The accompanying notes are an integral part of the Financial Statements
52

Legg Mason Global Funds Plc Annual Report 28 February 2021
Legg Mason Western Asset US Core Plus Bond Fund
Portfolio of Investments as at 28 February 2021 – (continued)
FaceValue(000’s)
Value(000’s)
$
% ofNet
AssetValue
Mortgage-Backed Securities — (continued)
61 Fannie Mae Pool‘FM3083’,4.500%, due 01/10/2049 66 –
1,657 Fannie Mae Pool‘FM3123’,2.500%, due 01/03/2038 1,720 0.10
1,784 Fannie Mae Pool‘FM3141’,3.500%, due 01/11/2048 1,904 0.12
134 Fannie Mae Pool‘FM3154’,5.000%, due 01/09/2049 148 0.01
178 Fannie Mae Pool‘FM3155’,5.000%, due 01/12/2049 197 0.01
355 Fannie Mae Pool‘FM3158’,4.000%, due 01/11/2048 388 0.02
1,055 Fannie Mae Pool‘FM3215’,3.500%, due 01/01/2049 1,136 0.07
1,185 Fannie Mae Pool‘FM3278’,3.500%, due 01/11/2048 1,258 0.08
3,950 Fannie Mae Pool‘FM3347’,3.500%, due 01/05/2047 4,235 0.26
144 Fannie Mae Pool‘FM3542’,4.000%, due 01/05/2049 157 0.01
570 Fannie Mae Pool‘FM3572’,4.500%, due 01/09/2049 628 0.04
76 Fannie Mae Pool‘FM3753’,3.500%, due 01/04/2048 82 0.01
5,458 Fannie Mae Pool‘FM3773’,3.500%, due 01/11/2048 5,851 0.36
297 Fannie Mae Pool‘FM3904’,4.000%, due 01/03/2049 319 0.02
891 Fannie Mae Pool‘FM3948’,4.000%, due 01/04/2050 983 0.06
730 Fannie Mae Pool‘FM3957’,5.000%, due 01/03/2050 809 0.05
639 Fannie Mae Pool‘FM3978’,4.000%, due 01/07/2050 695 0.04
229 Fannie Mae Pool‘FM4117’,4.500%, due 01/07/2049 253 0.02
1,350 Fannie Mae Pool‘FM4165’,3.000%, due 01/09/2050 1,446 0.09
90 Fannie Mae Pool‘FM4281’,3.500%, due 01/08/2050 98 0.01
1,161 Fannie Mae Pool‘FM4532’,3.000%, due 01/09/2050 1,225 0.07
685 Fannie Mae Pool‘FM4577’,2.500%, due 01/10/2050 718 0.04
494 Fannie Mae Pool‘FM4578’,2.500%, due 01/10/2050 516 0.03
962 Fannie Mae Pool‘FM4595’,3.000%, due 01/09/2050 1,033 0.06
556 Fannie Mae Pool‘FM4737’,3.500%, due 01/09/2050 590 0.04
376 Fannie Mae Pool‘FM4925’,3.000%, due 01/11/2050 401 0.02
600 Fannie Mae Pool‘FM5054’,4.000%, due 01/11/2048 645 0.04
280 Fannie Mae Pool‘FM5370’,3.000%, due 01/12/2048 296 0.02
FaceValue(000’s)
Value(000’s)
$
% ofNet
AssetValue
1,188 Fannie Mae Pool‘FM5423’,2.500%, due 01/01/2051 1,246 0.08
97 Fannie Mae Pool‘FM5434’,4.500%, due 01/05/2046 108 0.01
299 Fannie Mae Pool‘FM5642’,2.000%, due 01/01/2051 304 0.02
799 Fannie Mae Pool‘FM5653’,2.500%, due 01/01/2051 832 0.05
300 Fannie Mae Pool‘FM5713’,2.500%, due 01/02/2051 312 0.02
300 Fannie Mae Pool‘FM5743’,2.500%, due 01/02/2051 312 0.02
100 Fannie Mae Pool‘FM5881’,2.500%, due 01/12/2050 103 0.01
399 Fannie Mae Pool‘FM5904’,2.500%, due 01/02/2051 416 0.03
896 Fannie Mae Pool‘FM5931’,2.500%, due 01/02/2051 937 0.06
700 Fannie Mae Pool‘FM5944’,2.500%, due 01/01/2051 729 0.04
400 Fannie Mae Pool‘FM6188’,2.500%, due 01/03/2051 418 0.03
18 Fannie Mae Pool‘MA0706’,4.500%, due 01/04/2031 20 –
72 Fannie Mae Pool‘MA0734’,4.500%, due 01/05/2031 79 0.01
21 Fannie Mae Pool‘MA0776’,4.500%, due 01/06/2031 23 –
30 Fannie Mae Pool‘MA0913’,4.500%, due 01/11/2031 33 –
32 Fannie Mae Pool‘MA0939’,4.500%, due 01/12/2031 36 –
133 Fannie Mae Pool‘MA1146’,4.000%, due 01/08/2042 146 0.01
31 Fannie Mae Pool‘MA1177’,3.500%, due 01/09/2042 34 –
958 Fannie Mae Pool‘MA1217’,4.000%, due 01/10/2042 1,054 0.06
206 Fannie Mae Pool‘MA1253’,4.000%, due 01/11/2042 228 0.01
527 Fannie Mae Pool‘MA1283’,3.500%, due 01/12/2042 579 0.04
385 Fannie Mae Pool‘MA1437’,3.500%, due 01/05/2043 422 0.03
40 Fannie Mae Pool‘MA1547’,4.000%, due 01/08/2043 44 –
77 Fannie Mae Pool‘MA1591’,4.500%, due 01/09/2043 86 0.01
75 Fannie Mae Pool‘MA1629’,4.500%, due 01/10/2043 84 0.01
38 Fannie Mae Pool‘MA1664’,4.500%, due 01/11/2043 42 –
77 Fannie Mae Pool‘MA1711’,4.500%, due 01/12/2043 86 0.01
321 Fannie Mae Pool‘MA2832’,3.000%, due 01/12/2036 339 0.02
771 Fannie Mae Pool‘MA3058’,4.000%, due 01/07/2047 835 0.05
FaceValue(000’s)
Value(000’s)
$
% ofNet
AssetValue
1,773 Fannie Mae Pool‘MA3088’,4.000%, due 01/08/2047 1,921 0.12
659 Fannie Mae Pool‘MA3149’,4.000%, due 01/10/2047 712 0.04
865 Fannie Mae Pool‘MA3501’,5.000%, due 01/10/2048 959 0.06
1,084 Fannie Mae Pool‘MA3527’,5.000%, due 01/11/2048 1,201 0.07
628 Fannie Mae Pool‘MA3937’,3.000%, due 01/02/2050 657 0.04
64 Fannie Mae Pool‘MA4031’,4.500%, due 01/05/2050 70 –
107 Fannie Mae REMICS,Series 2005 29, Class ZA,5.500%, due 25/04/2035 123 0.01
474 Fannie Mae REMICS,Series 2011 59, Class NZ,5.500%, due 25/07/2041 532 0.03
137 Fannie Mae REMICS,Series 2012 133, Class CS,6.032%, due 25/12/2042 * 29 –
21 Fannie Mae REMICS,Series 2012 28, Class B,6.500%, due 25/06/2039 23 –
252 Fannie Mae REMICS,Series 2012 35, Class SC,6.382%, due 25/04/2042 * 50 –
64 Fannie Mae REMICS,Series 2012 46, Class BA,6.000%, due 25/05/2042 74 –
96 Fannie Mae REMICS,Series 2012 51, Class B,7.000%, due 25/05/2042 117 0.01
8 Fannie Mae REMICS,Series 2012 70, Class YS,6.532%, due 25/02/2041 * – –
87 Fannie Mae REMICS,Series 2012 74, Class SA,6.532%, due 25/03/2042 * 15 –
251 Fannie Mae REMICS,Series 2013 9, Class BC,6.500%, due 25/07/2042 300 0.02
309 Fannie Mae REMICS,Series 2013 9, Class CB,5.500%, due 25/04/2042 355 0.02
1,695 Fannie Mae REMICS,Series 2016 23, Class ST,5.882%, due 25/11/2045 * 370 0.02
277 Fannie Mae REMICS,Series 2016 61, Class BS,5.982%, due 25/09/2046 * 51 –
1,333 Fannie Mae REMICS,Series 2017 76, Class SB,5.982%, due 25/10/2057 * 272 0.02
365 Fannie Mae REMICS,Series 2017 85, Class SC,6.082%, due 25/11/2047 * 70 –
608 Fannie Mae REMICS,Series 2020 47, Class GZ,2.000%, due 25/07/2050 599 0.04
867 Fannie Mae REMICS,Series 2020 56, Class DI,2.500%, due 25/08/2050 145 0.01
878 Fannie Mae REMICS,Series 2020 57, Class NI,2.500%, due 25/08/2050 132 0.01
486 Fannie Mae REMICS,Series 2020 74, Class EI,2.500%, due 25/10/2050 77 –
2,755 Fannie Mae REMICS,Series 2020 89, Class DI,2.500%, due 25/12/2050 391 0.02
1,493 Fannie Mae REMICS,Series 2020 97, Class AI,2.000%, due 25/01/2051 203 0.01
2,093 Fannie Mae REMICS,Series 2021 3, Class IB,2.500%, due 25/02/2051 365 0.02
2,597 Fannie Mae REMICS,Series 2021 3, Class QI,2.500%, due 25/02/2051 324 0.02
The accompanying notes are an integral part of the Financial Statements
53

Legg Mason Global Funds Plc Annual Report 28 February 2021
Legg Mason Western Asset US Core Plus Bond Fund
Portfolio of Investments as at 28 February 2021 – (continued)
FaceValue(000’s)
Value(000’s)
$
% ofNet
AssetValue
Mortgage-Backed Securities — (continued)
417 Fannie Mae-Aces,Series 2013 M6,Class 1AC,3.440%, due 25/02/2043 * 459 0.03
200 Fannie Mae-Aces,Series 2017 M8, Class A2,3.061%, due 25/05/2027 * 221 0.01
800 Fannie Mae-Aces,Series 2018 M15,Class 1A2,3.700%, due 25/01/2036 912 0.06
883 Fannie Mae-Aces,Series 2018 M9,Class APT2,3.121%, due 25/04/2028 * 961 0.06
1,442 Fannie Mae-Aces,Series 2019 M19,Class A2,2.560%, due 25/09/2029 1,558 0.09
1,299 Fannie Mae-Aces,Series 2019 M23,Class 3A3,2.720%, due 25/10/2031 * 1,344 0.08
435 Fannie Mae-Aces,Series 2019 M28,Class AV,2.232%, due 25/02/2027 456 0.03
1,894 Fannie Mae-Aces,Series 2020 M36,Class X1,1.468%, due 25/09/2034 * 202 0.01
956 Flagstar Mortgage Trust2018-2, Series 2018 2,Class A4, 144A,3.500%, due 25/04/2048 * 972 0.06
134 Freddie Mac Gold Pool‘C91981’,3.000%, due 01/02/2038 140 0.01
133 Freddie Mac Gold Pool‘C91987’,3.000%, due 01/04/2038 139 0.01
189 Freddie Mac Gold Pool‘G06409’,6.000%, due 01/11/2039 228 0.01
22 Freddie Mac Gold Pool‘G06669’,6.500%, due 01/09/2039 25 –
651 Freddie Mac Gold Pool‘G08682’,4.000%, due 01/12/2045 712 0.04
13 Freddie Mac Gold Pool‘G13888’,5.000%, due 01/06/2025 14 –
1,980 Freddie Mac Gold Pool‘G60985’,3.000%, due 01/05/2047 2,133 0.13
1,415 Freddie Mac Gold Pool‘G61637’,3.000%, due 01/09/2047 1,533 0.09
1,274 Freddie Mac Gold Pool‘G67701’,3.000%, due 01/10/2046 1,368 0.08
5,608 Freddie Mac Gold Pool‘G67713’,4.000%, due 01/06/2048 6,186 0.38
37 Freddie Mac Gold Pool‘Q19135’,4.000%, due 01/06/2043 41 –
38 Freddie Mac Gold Pool‘Q19254’,4.000%, due 01/06/2043 42 –
39 Freddie Mac Gold Pool‘Q19611’,4.000%, due 01/07/2043 45 –
35 Freddie Mac Gold Pool‘Q19615’,4.000%, due 01/07/2043 39 –
14 Freddie Mac Gold Pool‘Q27298’,4.000%, due 01/07/2044 16 –
778 Freddie Mac Gold Pool‘Q40356’,4.000%, due 01/05/2046 852 0.05
495 Freddie Mac Gold Pool‘Q45560’,3.000%, due 01/01/2047 533 0.03
FaceValue(000’s)
Value(000’s)
$
% ofNet
AssetValue
1,212 Freddie Mac Gold Pool‘Q45737’,3.000%, due 01/01/2047 1,305 0.08
320 Freddie Mac Gold Pool‘Q45819’,3.000%, due 01/01/2047 344 0.02
274 Freddie Mac Gold Pool‘Q45827’,3.000%, due 01/01/2047 293 0.02
938 Freddie Mac Gold Pool‘Q48149’,4.500%, due 01/05/2047 1,034 0.06
146 Freddie Mac Gold Pool‘U90316’,4.000%, due 01/10/2042 160 0.01
84 Freddie Mac Gold Pool‘U91254’,4.000%, due 01/04/2043 93 0.01
37 Freddie Mac Gold Pool‘U95137’,4.000%, due 01/08/2043 41 –
444 Freddie Mac Gold Pool‘U99045’,3.500%, due 01/03/2043 487 0.03
1,057 Freddie Mac Gold Pool‘U99054’,4.000%, due 01/06/2043 1,169 0.07
41 Freddie Mac Gold Pool‘U99114’,3.500%, due 01/02/2044 45 –
166 Freddie Mac MultifamilyStructured Pass ThroughCertificates K016,Class X1,1.481%, due 25/10/2021 * – –
6,741 Freddie Mac MultifamilyStructured Pass ThroughCertificates K058,Class X1,0.924%, due 25/08/2026 * 305 0.02
121 Freddie Mac Non GoldPool ‘840698’,2.205%, due 01/03/2047 * 125 0.01
680 Freddie Mac Pool‘QA4470’,3.000%, due 01/11/2049 712 0.04
147 Freddie Mac Pool‘QA5768’,3.000%, due 01/01/2050 158 0.01
80 Freddie Mac Pool‘QA5770’,3.000%, due 01/01/2050 85 0.01
298 Freddie Mac Pool‘QA7238’,3.500%, due 01/02/2050 323 0.02
1,030 Freddie Mac Pool‘QA7256’,3.000%, due 01/02/2050 1,079 0.07
99 Freddie Mac Pool‘QB2667’,3.000%, due 01/08/2050 105 0.01
99 Freddie Mac Pool‘QB2927’,3.000%, due 01/09/2050 105 0.01
490 Freddie Mac Pool‘QB5092’,2.500%, due 01/11/2050 514 0.03
298 Freddie Mac Pool‘QB5093’,2.500%, due 01/11/2050 313 0.02
99 Freddie Mac Pool‘QB5799’,2.500%, due 01/11/2050 104 0.01
300 Freddie Mac Pool‘QB8602’,2.000%, due 01/02/2051 305 0.02
400 Freddie Mac Pool‘QB8604’,2.000%, due 01/02/2051 406 0.02
200 Freddie Mac Pool‘QB8773’,2.000%, due 01/02/2051 203 0.01
1,600 Freddie Mac Pool‘QB9087’,2.000%, due 01/02/2051 1,624 0.10
697 Freddie Mac Pool‘RA1103’,3.000%, due 01/07/2049 741 0.05
FaceValue(000’s)
Value(000’s)
$
% ofNet
AssetValue
1,072 Freddie Mac Pool‘RA1293’,3.000%, due 01/09/2049 1,146 0.07
358 Freddie Mac Pool‘RA1341’,3.000%, due 01/09/2049 382 0.02
347 Freddie Mac Pool‘RA2141’,4.000%, due 01/02/2050 373 0.02
2,311 Freddie Mac Pool‘RA2313’,3.500%, due 01/03/2050 2,475 0.15
98 Freddie Mac Pool‘RA2353’,4.500%, due 01/03/2050 108 0.01
253 Freddie Mac Pool‘RA2358’,4.000%, due 01/03/2050 273 0.02
648 Freddie Mac Pool‘RA2362’,3.500%, due 01/03/2050 696 0.04
4,136 Freddie Mac Pool‘RA3474’,3.000%, due 01/09/2050 4,431 0.27
1,688 Freddie Mac Pool‘RA4175’,2.500%, due 01/12/2050 1,770 0.11
1,295 Freddie Mac Pool‘RA4414’,2.500%, due 01/01/2051 1,352 0.08
1,600 Freddie Mac Pool‘RA4703’,2.000%, due 01/02/2051 1,620 0.10
213 Freddie Mac Pool‘SD0247’,4.000%, due 01/07/2047 234 0.01
1,531 Freddie Mac Pool‘SD0291’,5.000%, due 01/03/2050 1,695 0.10
194 Freddie Mac Pool‘SD0436’,2.500%, due 01/09/2050 202 0.01
788 Freddie Mac Pool‘SD0450’,2.500%, due 01/10/2050 823 0.05
718 Freddie Mac Pool‘ZA5297’,4.000%, due 01/03/2048 786 0.05
236 Freddie Mac Pool‘ZA5318’,3.500%, due 01/03/2048 254 0.02
1,324 Freddie Mac Pool‘ZA5454’,4.000%, due 01/06/2048 1,438 0.09
2,380 Freddie Mac Pool‘ZA6342’,4.500%, due 01/03/2049 2,633 0.16
1,587 Freddie Mac Pool‘ZA6680’,4.000%, due 01/04/2049 1,741 0.11
174 Freddie Mac Pool ‘ZI7269’,5.000%, due 01/03/2038 202 0.01
217 Freddie Mac Pool‘ZM1238’,3.000%, due 01/06/2046 230 0.01
320 Freddie Mac Pool‘ZM1278’,3.500%, due 01/06/2046 348 0.02
228 Freddie Mac Pool‘ZM3481’,3.500%, due 01/06/2047 247 0.02
345 Freddie Mac Pool‘ZM3746’,5.000%, due 01/07/2047 385 0.02
1,203 Freddie Mac Pool‘ZM5146’,4.000%, due 01/12/2047 1,297 0.08
77 Freddie Mac Pool‘ZM5722’,3.500%, due 01/02/2048 82 0.01
347 Freddie Mac Pool‘ZM7733’,5.000%, due 01/08/2048 386 0.02
81 Freddie Mac Pool‘ZN0480’,3.500%, due 01/10/2042 89 0.01
The accompanying notes are an integral part of the Financial Statements
54

Legg Mason Global Funds Plc Annual Report 28 February 2021
Legg Mason Western Asset US Core Plus Bond Fund
Portfolio of Investments as at 28 February 2021 – (continued)
FaceValue(000’s)
Value(000’s)
$
% ofNet
AssetValue
Mortgage-Backed Securities — (continued)
190 Freddie Mac Pool‘ZN1436’,5.000%, due 01/11/2048 210 0.01
380 Freddie Mac Pool‘ZN2185’,4.500%, due 01/12/2048 422 0.03
1,207 Freddie Mac Pool‘ZN4476’,3.500%, due 01/12/2048 1,280 0.08
5 Freddie Mac Pool‘ZS0823’,5.000%, due 01/12/2034 6 –
9 Freddie Mac Pool‘ZS2059’,5.500%, due 01/04/2038 10 –
31 Freddie Mac Pool‘ZS3059’,5.500%, due 01/12/2038 36 –
176 Freddie Mac Pool‘ZS3204’,5.000%, due 01/06/2041 200 0.01
80 Freddie Mac Pool‘ZS3412’,5.500%, due 01/12/2038 94 0.01
285 Freddie Mac Pool‘ZS4697’,3.000%, due 01/01/2047 302 0.02
552 Freddie Mac Pool‘ZS4699’,4.000%, due 01/01/2047 600 0.04
39 Freddie Mac Pool‘ZS4748’,4.000%, due 01/12/2047 42 –
29 Freddie Mac Pool‘ZS6518’,4.000%, due 01/10/2025 31 –
211 Freddie Mac Pool‘ZS8669’,3.000%, due 01/09/2032 223 0.01
223 Freddie Mac Pool‘ZS8673’,3.000%, due 01/10/2032 236 0.01
49 Freddie Mac Pool‘ZS8779’,5.000%, due 01/07/2025 54 –
965 Freddie Mac Pool‘ZS9316’,3.500%, due 01/01/2038 1,046 0.06
89 Freddie Mac Pool‘ZT0474’,4.500%, due 01/08/2048 98 0.01
482 Freddie Mac Pool‘ZT1257’,3.000%, due 01/01/2046 523 0.03
1,224 Freddie Mac Pool‘ZT1493’,3.000%, due 01/09/2048 1,317 0.08
1,076 Freddie Mac Pool‘ZT1970’,3.500%, due 01/04/2033 1,156 0.07
87 Freddie Mac ReferenceREMIC R007, Class ZA,6.000%, due 15/05/2036 103 0.01
57 Freddie Mac REMICS3621, Class SB,6.118%, due 15/01/2040 * 11 –
466 Freddie Mac REMICS4813, Class CJ,3.000%, due 15/08/2048 483 0.03
565 Freddie Mac REMICS5010, Class IK,2.500%, due 25/09/2050 78 –
1,263 Freddie Mac REMICS5010, Class JI,2.500%, due 25/09/2050 195 0.01
494 Freddie Mac REMICS5013, Class IN,2.500%, due 25/09/2050 79 0.01
988 Freddie Mac REMICS5018, Class MI,2.000%, due 25/10/2050 137 0.01
294 Freddie Mac REMICS5040, Class IB,2.500%, due 25/11/2050 40 –
FaceValue(000’s)
Value(000’s)
$
% ofNet
AssetValue
1,592 Freddie Mac REMICS5059, Class IB,2.500%, due 25/01/2051 263 0.02
599 Freddie Mac REMICS5069, Class MI,2.500%, due 25/02/2051 85 0.01
1,760 Freddie Mac STACR RemicTrust 2020-DNA2,Series 2020 DNA2,Class M2, 144A,1.968%, due 25/02/2050 * 1,769 0.11
1,730 Freddie Mac STACR REMICTrust 2020-DNA6,Series 2020 DNA6,Class M2, 144A,2.045%, due 25/12/2050 * 1,740 0.11
78 Freddie Mac Strips 334,Class S7,5.988%, due 15/08/2044 * 16 –
574 Freddie Mac Strips 353,Class S1,5.888%, due 15/12/2046 * 137 0.01
1,328 Freddie Mac StructuredAgency Credit Risk DebtNotes, Series 2015 HQ2,Class B,8.068%, due 25/05/2025 * 1,369 0.08
277 Freddie Mac StructuredAgency Credit Risk DebtNotes, Series 2016 DNA2,Class M3,4.768%, due 25/10/2028 * 291 0.02
4,010 FREMF 2012-K20Mortgage Trust,Series 2012 K20,Class X2A, 144A,0.200%, due 25/05/2045 8 –
50 Ginnie Mae I Pool‘733600’,5.000%, due 15/04/2040 58 –
81 Ginnie Mae I Pool‘733627’,5.000%, due 15/05/2040 95 0.01
688 Ginnie Mae I Pool‘784571’,3.500%, due 15/06/2048 743 0.05
118 Ginnie Mae I Pool‘AA5649’,3.000%, due 15/09/2042 127 0.01
297 Ginnie Mae I Pool‘AB2892’,3.000%, due 15/09/2042 312 0.02
594 Ginnie Mae I Pool‘AB9108’,3.000%, due 15/10/2042 626 0.04
385 Ginnie Mae I Pool‘AB9109’,3.000%, due 15/10/2042 406 0.02
2 Ginnie Mae I Pool‘AB9205’,3.000%, due 15/11/2042 2 –
340 Ginnie Mae I Pool‘AB9207’,3.000%, due 15/11/2042 358 0.02
25 Ginnie Mae II Pool ‘4040’,6.500%, due 20/10/2037 30 –
35 Ginnie Mae II Pool ‘4617’,4.500%, due 20/01/2040 40 –
41 Ginnie Mae II Pool ‘4696’,4.500%, due 20/05/2040 46 –
134 Ginnie Mae II Pool ‘4747’,5.000%, due 20/07/2040 154 0.01
24 Ginnie Mae II Pool ‘4772’,5.000%, due 20/08/2040 28 –
17 Ginnie Mae II Pool ‘4802’,5.000%, due 20/09/2040 19 –
9 Ginnie Mae II Pool ‘4871’,6.000%, due 20/11/2040 11 –
29 Ginnie Mae II Pool ‘4905’,6.000%, due 20/12/2040 34 –
6 Ginnie Mae II Pool ‘4928’,6.000%, due 20/01/2041 7 –
26 Ginnie Mae II Pool ‘4961’,6.000%, due 20/02/2041 30 –
289 Ginnie Mae II Pool ‘4978’,4.500%, due 20/03/2041 326 0.02
FaceValue(000’s)
Value(000’s)
$
% ofNet
AssetValue
7 Ginnie Mae II Pool‘783050’,5.000%, due 20/07/2040 8 –
86 Ginnie Mae II Pool‘783368’,4.500%, due 20/07/2041 97 0.01
1,973 Ginnie Mae II Pool‘784674’,3.500%, due 20/04/2048 2,210 0.13
566 Ginnie Mae II Pool‘784825’,3.500%, due 20/10/2049 587 0.04
623 Ginnie Mae II Pool‘784905’,3.000%, due 20/01/2050 649 0.04
183 Ginnie Mae II Pool‘784985’,3.500%, due 20/09/2048 195 0.01
795 Ginnie Mae II Pool‘785218’,2.000%, due 20/12/2050 807 0.05
896 Ginnie Mae II Pool‘785219’,2.000%, due 20/12/2050 910 0.06
696 Ginnie Mae II Pool‘785220’,2.000%, due 20/12/2050 709 0.04
892 Ginnie Mae II Pool‘785221’,2.000%, due 20/12/2050 906 0.06
1,953 Ginnie Mae II Pool‘AP6338’,4.000%, due 20/10/2045 2,174 0.13
486 Ginnie Mae II Pool‘BC4732’,3.500%, due 20/10/2047 520 0.03
307 Ginnie Mae II Pool‘BD0384’,3.500%, due 20/10/2047 334 0.02
265 Ginnie Mae II Pool‘BM7534’,3.500%, due 20/02/2050 283 0.02
264 Ginnie Mae II Pool‘BM9734’,4.000%, due 20/10/2049 288 0.02
180 Ginnie Mae II Pool‘BM9743’,4.000%, due 20/11/2049 197 0.01
185 Ginnie Mae II Pool‘BS1728’,4.000%, due 20/01/2050 204 0.01
181 Ginnie Mae II Pool‘BS1742’,4.000%, due 20/02/2050 199 0.01
399 Ginnie Mae II Pool‘BS8546’,2.500%, due 20/12/2050 420 0.03
941 Ginnie Mae II Pool‘BT0812’,3.000%, due 20/03/2050 981 0.06
294 Ginnie Mae II Pool‘MA1995’,3.500%, due 20/06/2044 320 0.02
556 Ginnie Mae II Pool‘MA2677’,3.000%, due 20/03/2045 589 0.04
83 Ginnie Mae II Pool‘MA2678’,3.500%, due 20/03/2045 89 0.01
132 Ginnie Mae II Pool‘MA3375’,3.000%, due 20/01/2046 139 0.01
179 Ginnie Mae II Pool‘MA3937’,3.500%, due 20/09/2046 192 0.01
238 Ginnie Mae II Pool‘MA4068’,3.000%, due 20/11/2046 252 0.02
170 Ginnie Mae II Pool‘MA4261’,3.000%, due 20/02/2047 180 0.01
43 Ginnie Mae II Pool‘MA4381’,3.000%, due 20/04/2047 45 –
1,723 Ginnie Mae II Pool‘MA4451’,3.500%, due 20/05/2047 1,846 0.11
The accompanying notes are an integral part of the Financial Statements
55

Legg Mason Global Funds Plc Annual Report 28 February 2021
Legg Mason Western Asset US Core Plus Bond Fund
Portfolio of Investments as at 28 February 2021 – (continued)
FaceValue(000’s)
Value(000’s)
$
% ofNet
AssetValue
Mortgage-Backed Securities — (continued)
3,621 Ginnie Mae II Pool‘MA4511’,4.000%, due 20/06/2047 3,935 0.24
1,862 Ginnie Mae II Pool‘MA4587’,4.000%, due 20/07/2047 2,024 0.12
614 Ginnie Mae II Pool‘MA4654’,4.500%, due 20/08/2047 672 0.04
34 Ginnie Mae II Pool‘MA4836’,3.000%, due 20/11/2047 36 –
42 Ginnie Mae II Pool‘MA4837’,3.500%, due 20/11/2047 45 –
1,449 Ginnie Mae II Pool‘MA4838’,4.000%, due 20/11/2047 1,571 0.10
359 Ginnie Mae II Pool‘MA4899’,3.000%, due 20/12/2047 378 0.02
623 Ginnie Mae II Pool‘MA4901’,4.000%, due 20/12/2047 674 0.04
1,172 Ginnie Mae II Pool‘MA5019’,3.500%, due 20/02/2048 1,256 0.08
584 Ginnie Mae II Pool‘MA5020’,4.000%, due 20/02/2048 630 0.04
443 Ginnie Mae II Pool‘MA5078’,4.000%, due 20/03/2048 479 0.03
596 Ginnie Mae II Pool‘MA5137’,4.000%, due 20/04/2048 640 0.04
1,073 Ginnie Mae II Pool‘MA5138’,4.500%, due 20/04/2048 1,168 0.07
1,312 Ginnie Mae II Pool‘MA5193’,4.500%, due 20/05/2048 1,420 0.09
357 Ginnie Mae II Pool‘MA5265’,4.500%, due 20/06/2048 389 0.02
431 Ginnie Mae II Pool‘MA5331’,4.500%, due 20/07/2048 471 0.03
1,472 Ginnie Mae II Pool‘MA5399’,4.500%, due 20/08/2048 1,609 0.10
2,138 Ginnie Mae II Pool‘MA5467’,4.500%, due 20/09/2048 2,327 0.14
853 Ginnie Mae II Pool‘MA5529’,4.500%, due 20/10/2048 924 0.06
1,617 Ginnie Mae II Pool‘MA5530’,5.000%, due 20/10/2048 1,772 0.11
536 Ginnie Mae II Pool‘MA5597’,5.000%, due 20/11/2048 587 0.04
368 Ginnie Mae II Pool‘MA5652’,4.500%, due 20/12/2048 401 0.02
1,904 Ginnie Mae II Pool‘MA5711’,4.500%, due 20/01/2049 2,063 0.13
1,809 Ginnie Mae II Pool‘MA5712’,5.000%, due 20/01/2049 1,983 0.12
324 Ginnie Mae II Pool‘MA5762’,3.500%, due 20/02/2049 345 0.02
617 Ginnie Mae II Pool‘MA5818’,4.500%, due 20/03/2049 667 0.04
603 Ginnie Mae II Pool‘MA5819’,5.000%, due 20/03/2049 661 0.04
288 Ginnie Mae II Pool‘MA5877’,4.500%, due 20/04/2049 312 0.02
FaceValue(000’s)
Value(000’s)
$
% ofNet
AssetValue
1,345 Ginnie Mae II Pool‘MA6338’,3.000%, due 20/12/2049 1,401 0.09
1,026 Ginnie Mae II Pool‘MA6342’,5.000%, due 20/12/2049 1,122 0.07
616 Ginnie Mae II Pool‘MA6413’,5.000%, due 20/01/2050 675 0.04
586 Ginnie Mae II Pool‘MA6603’,5.000%, due 20/04/2050 641 0.04
1,647 Ginnie Mae II Pool‘MA6866’,3.000%, due 20/09/2050 1,725 0.10
1,756 Ginnie Mae II Pool‘MA6932’,3.000%, due 20/10/2050 1,846 0.11
8,600 Ginnie Mae, 30 year, TBA,2.000% ± 8,729 0.53
3,100 Ginnie Mae, 30 year, TBA,2.500% ± 3,212 0.20
2,200 Ginnie Mae, 30 year, TBA,3.000% ± 2,290 0.14
383 Government NationalMortgage Association,Series 2009 H01, Class FA,1.261%, due 20/11/2059 * 386 0.02
7 Government NationalMortgage Association,Series 2010 42, Class BS,6.369%, due 20/04/2040 * 2 –
8 Government NationalMortgage Association,Series 2010 85, Class HS,6.539%, due 20/01/2040 * 1 –
462 Government NationalMortgage Association,Series 2010 H11, Class FA,1.128%, due 20/06/2060 * 470 0.03
495 Government NationalMortgage Association,Series 2010 H20, Class AF,0.474%, due 20/10/2060 * 494 0.03
14 Government NationalMortgage Association,Series 2010 H22, Class FE,0.494%, due 20/05/2059 * 14 –
776 Government NationalMortgage Association,Series 2010 H24, Class FA,0.494%, due 20/10/2060 * 775 0.05
33 Government NationalMortgage Association,Series 2010 H26, Class LF,0.494%, due 20/08/2058 * 33 –
287 Government NationalMortgage Association,Series 2011 H01, Class AF,0.594%, due 20/11/2060 * 287 0.02
71 Government NationalMortgage Association,Series 2011 H09, Class AF,0.644%, due 20/03/2061 * 71 –
38 Government NationalMortgage Association,Series 2012 66, Class CI,3.500%, due 20/02/2038 1 –
515 Government NationalMortgage Association,Series 2013 107, Class AD,2.758%, due 16/11/2047 * 541 0.03
14,519 Government NationalMortgage Association,Series 2013 50, Class IO,0.155%, due 16/10/2048 * 137 0.01
1,681 Government NationalMortgage Association,Series 2014 169, Class IO,0.759%, due 16/10/2056 * 59 –
108 Government NationalMortgage Association,Series 2014 17, Class AM,2.772%, due 16/06/2048 * 115 0.01
389 Government NationalMortgage Association,Series 2014 176, Class IA,4.000%, due 20/11/2044 52 –
FaceValue(000’s)
Value(000’s)
$
% ofNet
AssetValue
2,704 Government NationalMortgage Association,Series 2014 H20, Class FA,0.574%, due 20/10/2064 * 2,708 0.16
783 Government NationalMortgage Association,Series 2015 167, Class OI,4.000%, due 16/04/2045 120 0.01
1,731 Government NationalMortgage Association,Series 2015 183, Class IO,0.765%, due 16/09/2057 * 79 –
247 Government NationalMortgage Association,Series 2016 135, Class SB,5.993%, due 16/10/2046 * 66 –
1,263 Government NationalMortgage Association,Series 2016 21, Class ST,6.039%, due 20/02/2046 * 276 0.02
603 Government NationalMortgage Association,Series 2016 84, Class IG,4.500%, due 16/11/2045 107 0.01
1,474 Government NationalMortgage Association,Series 2017 111, Class IO,0.650%, due 16/02/2059 * 75 –
2,797 Government NationalMortgage Association,Series 2017 157, Class IO,0.581%, due 16/12/2059 * 135 0.01
1,465 Government NationalMortgage Association,Series 2017 28, Class IO,0.654%, due 16/02/2057 * 72 –
1,444 Government NationalMortgage Association,Series 2017 41, Class IO,0.698%, due 16/07/2058 * 69 –
166 Government NationalMortgage Association,Series 2017 H15, Class KI,2.308%, due 20/07/2067 * 18 –
6,503 Government NationalMortgage Association,Series 2017 H18, Class BI,1.691%, due 20/09/2067 * 448 0.03
86 Government NationalMortgage Association,Series 2017 H20, Class IB,2.066%, due 20/10/2067 * 8 –
593 Government NationalMortgage Association,Series 2018 H06, Class PF,0.444%, due 20/02/2068 * 592 0.04
1,033 Government NationalMortgage Association,Series 2018 H07, Class FD,0.444%, due 20/05/2068 * 1,032 0.06
255 Government NationalMortgage Association,Series 2019 123, Class A,3.000%, due 20/10/2049 262 0.02
648 Government NationalMortgage Association,Series 2019 90, Class AB,3.000%, due 20/07/2049 672 0.04
395 Government NationalMortgage Association,Series 2020 123, Class IL,2.500%, due 20/08/2050 56 –
1,186 Government NationalMortgage Association,Series 2020 123, Class NI,2.500%, due 20/08/2050 167 0.01
592 Government NationalMortgage Association,Series 2020 127, Class IN,2.500%, due 20/08/2050 87 0.01
492 Government NationalMortgage Association,Series 2020 129, Class IE,2.500%, due 20/09/2050 69 –
18,916 Government NationalMortgage Association,Series 2020 157, Class IO,1.056%, due 16/06/2062 * 1,654 0.10
The accompanying notes are an integral part of the Financial Statements
56

Legg Mason Global Funds Plc Annual Report 28 February 2021
Legg Mason Western Asset US Core Plus Bond Fund
Portfolio of Investments as at 28 February 2021 – (continued)
FaceValue(000’s)
Value(000’s)
$
% ofNet
AssetValue
Mortgage-Backed Securities — (continued)
297 Government NationalMortgage Association,Series 2020 160, Class IH,2.500%, due 20/10/2050 44 –
394 Government NationalMortgage Association,Series 2020 160, Class VI,2.500%, due 20/10/2050 58 –
1,687 Government NationalMortgage Association,Series 2020 160, Class YI,2.500%, due 20/10/2050 242 0.01
13,230 Government NationalMortgage Association,Series 2020 178, Class IO,1.416%, due 16/10/2060 * 1,327 0.08
3,672 Government NationalMortgage Association,Series 2020 181, Class WI,2.000%, due 20/12/2050 419 0.03
1,139 Government NationalMortgage Association,Series 2020 47, Class MI,3.500%, due 20/04/2050 173 0.01
381 Government NationalMortgage Association,Series 2020 47, Class NI,3.500%, due 20/04/2050 61 –
1,294 Government NationalMortgage Association,Series 2020 H09, Class FL,1.261%, due 20/05/2070 * 1,356 0.08
269 Government NationalMortgage Association,Series 2020 H09, Class NF,1.361%, due 20/04/2070 * 277 0.02
198 Government NationalMortgage Association,Series 2020 H12, Class F,0.611%, due 20/07/2070 * 200 0.01
297 Government NationalMortgage Association,Series 2020 H13, Class FA,0.561%, due 20/07/2070 * 299 0.02
183 Government NationalMortgage Association,Series 2020 H13, Class FC,0.561%, due 20/07/2070 * 184 0.01
37,740 Government NationalMortgage Association,Series 2021 5, Class IO,1.104%, due 16/01/2061 * 3,471 0.21
3,180 GS Mortgage SecuritiesCorp II, Series 2018 SRP5,Class A, 144A,1.412%, due 15/09/2031 * 2,725 0.17
2,410 GS Mortgage SecuritiesCorp II, Series 2018 SRP5,Class B, 144A,2.612%, due 15/09/2031 * 1,703 0.10
264 GS Mortgage SecuritiesTrust 2006-GG8,Series 2006 GG8, Class AJ,5.622%, due 10/11/2039 93 0.01
80 GS Mortgage SecuritiesTrust 2013-GC16,Series 2013 GC16, Class B,5.161%, due 10/11/2046 * 86 0.01
1,019 GS Mortgage SecuritiesTrust 2014-GC20,Series 2014 GC20,Class XA,1.009%, due 10/04/2047 * 25 –
22 HarborView Mortgage LoanTrust 2007-7, Series 2007 7,Class 2A1A,1.118%, due 25/10/2037 * 24 –
3,980 J.P. Morgan ChaseCommercial MortgageSecurities Trust 2018-PHH,Series 2018 PHH, Class F,144A,4.510%, due 15/06/2035 *† 1,443 0.09
4,070 JP Morgan ChaseCommercial MortgageSecurities Trust 2020-MKST,Series 2020 MKST, Class F,144A,2.962%, due 15/12/2036 * 3,705 0.23
FaceValue(000’s)
Value(000’s)
$
% ofNet
AssetValue
1,968 JP Morgan Mortgage Trust2017-5, Series 2017 5,Class A2, 144A,3.116%, due 26/10/2048 * 2,063 0.13
624 JP Morgan Mortgage Trust2018-4, Series 2018 4,Class A1, 144A,3.500%, due 25/10/2048 * 639 0.04
30 JPMBB CommercialMortgage Securities Trust2013-C17, Series 2013C17, Class B,4.889%, due 15/01/2047 * 32 –
160 JPMBB CommercialMortgage Securities Trust2015-C31, Series 2015C31, Class B,4.619%, due 15/08/2048 * 177 0.01
1,171 JPMCC CommercialMortgage Securities Trust2019-BOLT, Series 2019BOLT, Class B, 144A,2.312%, due 15/07/2034 * 1,091 0.07
84 MASTR Adjustable RateMortgages Trust 2007-3,Series 2007 3, Class 12A1,0.318%, due 25/05/2047 * 100 0.01
73 ML-CFC CommercialMortgage Trust 2007-5,Series 2007 5, Class AJ,5.450%, due 12/08/2048 * 41 –
28 ML-CFC CommercialMortgage Trust 2007-9,Series 2007 9, Class AJ,6.193%, due 12/09/2049 * 28 –
16 Morgan Stanley Capital ITrust 2006-IQ12,Series 2006 IQ12, Class AJ,5.399%, due 15/12/2043 11 –
5 Morgan Stanley Capital ITrust 2007-IQ13,Series 2007 IQ13, Class AJ,5.438%, due 15/03/2044 5 –
31 Morgan Stanley Capital ITrust 2007-IQ16,Series 2007 IQ16, Class AJ,6.341%, due 12/12/2049 * 18 –
2,081 Morgan Stanley MortgageLoan Trust 2005-2AR,Series 2005 2AR, Class B1,0.618%, due 25/04/2035 * 1,904 0.12
280 MSCG Trust 2015-ALDR,Series 2015 ALDR,Class A2, 144A,3.462%, due 07/06/2035 * 276 0.02
2,870 Natixis CommercialMortgage Securities Trust2019-FAME, Series 2019FAME, Class A, 144A,3.047%, due 15/08/2036 2,857 0.17
632 New Residential MortgageLoan Trust 2016-3,Series 2016 3A, Class A1B,144A,3.250%, due 25/09/2056 * 670 0.04
1,171 New Residential MortgageLoan Trust 2017-6,Series 2017 6A, Class A1,144A,4.000%, due 27/08/2057 * 1,262 0.08
1,363 Prime Mortgage Trust2006-DR1, Series 2006DR1, Class 2A1, 144A,5.500%, due 25/05/2035 1,254 0.08
179 Residential AssetSecuritization Trust2005-A15, Series 2005A15, Class 1A4,5.750%, due 25/02/2036 184 0.01
8 Sequoia Mortgage Trust2004-10, Series 2004 10,Class A1A,0.731%, due 20/11/2034 * 8 –
690 UBS CommercialMortgage Trust 2017-C2,Series 2017 C2, Class A4,3.487%, due 15/08/2050 765 0.05
FaceValue(000’s)
Value(000’s)
$
% ofNet
AssetValue
82,758 UBS CommercialMortgage Trust 2018-C9,Series 2018 C9, Class XA,0.883%, due 15/03/2051 * 4,407 0.27
100 VNDO 2012-6AVEMortgage Trust,Series 2012 6AVE, Class A,144A,2.996%, due 15/11/2030 104 0.01
2,700 WaMu Mortgage Pass-Through CertificatesSeries 2005-AR6 Trust,Series 2005 AR6,Class 2A1A,0.578%, due 25/04/2045 * 2,665 0.16
251 WaMu Mortgage Pass-Through CertificatesSeries 2007-OA2 Trust,Series 2007 OA2,Class 2A,1.710%, due 25/03/2047 * 245 0.02
200 Waterfall CommercialMortgage Trust 2015-SBC5, Series 2015 SBC5,Class A, 144A,4.104%, due 14/09/2022 * 203 0.01
20 Wells Fargo CommercialMortgage Trust 2013-LC12, Series 2013 LC12,Class B,4.274%, due 15/07/2046 * 20 –
250 Wells Fargo CommercialMortgage Trust 2015-LC20, Series 2015 LC20,Class AS,3.467%, due 15/04/2050 269 0.02
160 Wells Fargo CommercialMortgage Trust 2015-NXS1, Series 2015 NXS1,Class AS,3.406%, due 15/05/2048 172 0.01
5,874 Wells Fargo CommercialMortgage Trust 2017-RB1,Series 2017 RB1, Class XA,1.242%, due 15/03/2050 * 356 0.02
2,330 WFRBS CommercialMortgage Trust 2013-C14,Series 2013 C14, Class B,3.841%, due 15/06/2046 * 2,436 0.15
2,010 WFRBS CommercialMortgage Trust 2014-C21,Series 2014 C21, Class B,4.213%, due 15/08/2047 * 2,147 0.13
Total Mortgage-Backed Securities(Cost $477,367) 477,481 28.98
Corporate Bonds and Notes — 34.30%(29 February 2020: 27.68%)
Australia — 0.30% (29 February 2020: 0.19%)
35 BHP Billiton Finance USALtd,2.875%, due 24/02/2022 36 –
300 BHP Billiton Finance USALtd,5.000%, due 30/09/2043 408 0.03
200 Commonwealth Bank ofAustralia, 144A,3.900%, due 12/07/2047 235 0.01
10 Glencore Funding LLC,144A,4.125%, due 30/05/2023 11 –
2,110 Glencore Funding LLC,144A,4.125%, due 12/03/2024 2,302 0.14
1,280 Glencore Funding LLC,144A,4.625%, due 29/04/2024 1,423 0.09
430 Glencore Funding LLC,144A,4.000%, due 27/03/2027 483 0.03
4,898 0.30
Belgium — 0.51% (29 February 2020: 0.39%)
1,990 Anheuser-Busch Cos LLC /Anheuser-Busch InBevWorldwide Inc,3.650%, due 01/02/2026 2,208 0.13
The accompanying notes are an integral part of the Financial Statements
57

Legg Mason Global Funds Plc Annual Report 28 February 2021
Legg Mason Western Asset US Core Plus Bond Fund
Portfolio of Investments as at 28 February 2021 – (continued)
FaceValue(000’s)
Value(000’s)
$
% ofNet
AssetValue
Corporate Bonds and Notes — (continued)
Belgium — (continued)
250 Anheuser-Busch Cos LLC /Anheuser-Busch InBevWorldwide Inc,4.900%, due 01/02/2046 302 0.02
780 Anheuser-Busch InBevWorldwide Inc,4.000%, due 13/04/2028 887 0.05
280 Anheuser-Busch InBevWorldwide Inc,3.500%, due 01/06/2030 310 0.02
840 Anheuser-Busch InBevWorldwide Inc,4.350%, due 01/06/2040 979 0.06
100 Anheuser-Busch InBevWorldwide Inc,4.600%, due 15/04/2048 116 0.01
1,400 Anheuser-Busch InBevWorldwide Inc,5.550%, due 23/01/2049 1,825 0.11
1,570 Anheuser-Busch InBevWorldwide Inc,4.500%, due 01/06/2050 1,814 0.11
8,441 0.51
Brazil — 0.56% (29 February 2020: 0.53%)
57 Petrobras Global FinanceBV,6.250%, due 17/03/2024 65 –
6,520 Petrobras Global FinanceBV,5.299%, due 27/01/2025 7,289 0.44
390 Petrobras Global FinanceBV,7.375%, due 17/01/2027 477 0.03
840 Petrobras Global FinanceBV,6.850%, due 05/06/2115 916 0.06
190 Suzano Austria GmbH,3.750%, due 15/01/2031 201 0.01
210 Vale Overseas Ltd,6.875%, due 21/11/2036 286 0.02
9,234 0.56
Canada — 0.41% (29 February 2020: 0.14%)
124 1011778 BC ULC / NewRed Finance Inc, 144A,4.250%, due 15/05/2024 125 0.01
110 1011778 BC ULC / NewRed Finance Inc, 144A,3.500%, due 15/02/2029 108 0.01
1,190 Bank of Montreal,1.850%, due 01/05/2025 1,230 0.07
160 Bank of Montreal,3.803%, due 15/12/2032 * 180 0.01
290 Barrick North AmericaFinance LLC,5.700%, due 30/05/2041 398 0.02
500 Barrick North AmericaFinance LLC,5.750%, due 01/05/2043 703 0.04
690 Canadian Imperial Bank ofCommerce,0.950%, due 23/06/2023 698 0.04
340 GFL Environmental Inc,144A,4.250%, due 01/06/2025 349 0.02
120 MEG Energy Corp, 144A,5.875%, due 01/02/2029 122 0.01
1,060 Royal Bank of Canada,1.600%, due 17/04/2023 1,088 0.07
660 Royal Bank of Canada,1.150%, due 10/06/2025 664 0.04
20 Teck Resources Ltd,6.000%, due 15/08/2040 25 –
590 Toronto-Dominion Bank/The,3.250%, due 11/06/2021 595 0.04
390 Yamana Gold Inc,4.625%, due 15/12/2027 434 0.03
6,719 0.41
FaceValue(000’s)
Value(000’s)
$
% ofNet
AssetValue
Cayman Islands — 0.00% (29 February 2020: 0.00%)
17 Ambac LSNI LLC, 144A,6.000%, due 12/02/2023 * 17 –
China — 0.19% (29 February 2020: 0.18%)
620 Prosus NV, 144A,4.850%, due 06/07/2027 704 0.04
1,660 Prosus NV, 144A,3.832%, due 08/02/2051 1,511 0.09
820 Sinopec Group OverseasDevelopment 2014 Ltd,144A,4.375%, due 10/04/2024 905 0.06
3,120 0.19
Colombia — 0.06% (29 February 2020: 0.07%)
960 Ecopetrol SA,5.875%, due 28/05/2045 1,040 0.06
Denmark — 0.26% (29 February 2020: 0.24%)
1,380 Danske Bank A/S,144A,5.000%, due 12/01/2022 1,433 0.09
510 Danske Bank A/S,144A,3.001%, due 20/09/2022 * 516 0.03
300 Danske Bank A/S,144A,3.875%, due 12/09/2023 323 0.02
1,020 Danske Bank A/S,144A,5.375%, due 12/01/2024 1,147 0.07
600 Danske Bank A/S,144A,1.226%, due 22/06/2024 608 0.03
280 Danske Bank A/S,144A,3.244%, due 20/12/2025 * 301 0.02
4,328 0.26
Finland — 0.03% (29 February 2020: 0.04%)
550 Nordea Bank Abp,144A,4.875%, due 13/05/2021 555 0.03
France — 0.76% (29 February 2020: 0.74%)
720 Altice France SA/France,144A,7.375%, due 01/05/2026 752 0.05
280 BNP Paribas SA, 144A,3.375%, due 09/01/2025 303 0.02
1,880 BNP Paribas SA, 144A,4.705%, due 10/01/2025 * 2,086 0.13
1,660 BNP Paribas SA, 144A,2.219%, due 09/06/2026 * 1,722 0.10
620 BNP Paribas SA, 144A,4.625%, due 13/03/2027 715 0.04
1,580 BNP Paribas SA, 144A,4.400%, due 14/08/2028 1,845 0.11
360 BNP Paribas SA, 144A,5.198%, due 10/01/2030 * 438 0.03
550 BNP Paribas SA, 144A,4.375%, due 01/03/2033 * 613 0.04
500 BPCE SA, 144A,5.150%, due 21/07/2024 567 0.03
590 Credit Agricole SA, 144A,4.000%, due 10/01/2033 * 644 0.04
340 Danone SA, 144A,2.077%, due 02/11/2021 344 0.02
1,110 Danone SA, 144A,2.589%, due 02/11/2023 1,165 0.07
240 Danone SA, 144A,2.947%, due 02/11/2026 259 0.02
940 WEA Finance LLC /Westfield UK & EuropeFinance Plc, 144A,3.750%, due 17/09/2024 1,001 0.06
12,454 0.76
Ireland — 0.08% (29 February 2020: 0.09%)
160 AerCap Ireland CapitalDAC / AerCap GlobalAviation Trust,4.625%, due 01/07/2022 168 0.01
850 AerCap Ireland CapitalDAC / AerCap GlobalAviation Trust,3.150%, due 15/02/2024 893 0.06
FaceValue(000’s)
Value(000’s)
$
% ofNet
AssetValue
43 Park Aerospace HoldingsLtd, 144A,5.250%, due 15/08/2022 45 –
50 Park Aerospace HoldingsLtd, 144A,4.500%, due 15/03/2023 52 –
120 Park Aerospace HoldingsLtd, 144A,5.500%, due 15/02/2024 131 0.01
1,289 0.08
Israel — 0.36% (29 February 2020: 0.27%)
480 Teva PharmaceuticalFinance Co BV, Series 2,3.650%, due 10/11/2021 485 0.03
1,240 Teva PharmaceuticalFinance Co BV,2.950%, due 18/12/2022 1,245 0.08
180 Teva PharmaceuticalFinance IV BV,3.650%, due 10/11/2021 182 0.01
670 Teva PharmaceuticalFinance Netherlands III BV,2.200%, due 21/07/2021 671 0.04
1,200 Teva PharmaceuticalFinance Netherlands III BV,2.800%, due 21/07/2023 1,177 0.07
210 Teva PharmaceuticalFinance Netherlands III BV,6.000%, due 15/04/2024 219 0.01
790 Teva PharmaceuticalFinance Netherlands III BV,7.125%, due 31/01/2025 857 0.05
1,200 Teva PharmaceuticalFinance Netherlands III BV,3.150%, due 01/10/2026 1,127 0.07
5,963 0.36
Italy — 0.37% (29 February 2020: 0.40%)
1,030 Intesa Sanpaolo SpA,144A,3.125%, due 14/07/2022 1,062 0.06
830 Intesa Sanpaolo SpA,144A,3.375%, due 12/01/2023 868 0.05
1,160 Intesa Sanpaolo SpA,144A,5.017%, due 26/06/2024 1,266 0.08
850 Intesa Sanpaolo SpA,144A,5.710%, due 15/01/2026 958 0.06
1,660 UniCredit SpA, 144A,6.572%, due 14/01/2022 1,739 0.11
200 UniCredit SpA, 144A,7.296%, due 02/04/2034 * 238 0.01
6,131 0.37
Japan — 0.33% (29 February 2020: 0.04%)
250 Mitsubishi UFJ FinancialGroup Inc,2.998%, due 22/02/2022 256 0.01
880 Nissan Motor Co Ltd,144A,3.043%, due 15/09/2023 926 0.06
1,810 Nissan Motor Co Ltd,144A,3.522%, due 17/09/2025 1,929 0.12
1,780 Nissan Motor Co Ltd,144A,4.345%, due 17/09/2027 1,971 0.12
370 Sumitomo Mitsui FinancialGroup Inc,2.058%, due 14/07/2021 373 0.02
5,455 0.33
Kazakhstan — 0.04% (29 February 2020: 0.04%)
520 KazMunayGas National CoJSC, 144A,6.375%, due 24/10/2048 669 0.04
Kuwait — 0.03% (29 February 2020: 0.04%)
520 Equate Petrochemical BV,144A,4.250%, due 03/11/2026 567 0.03
The accompanying notes are an integral part of the Financial Statements
58

Legg Mason Global Funds Plc Annual Report 28 February 2021
Legg Mason Western Asset US Core Plus Bond Fund
Portfolio of Investments as at 28 February 2021 – (continued)
FaceValue(000’s)
Value(000’s)
$
% ofNet
AssetValue
Corporate Bonds and Notes — (continued)
Luxembourg — 0.05% (29 February 2020: 0.27%)
70 ArcelorMittal SA,3.600%, due 16/07/2024 75 0.01
410 ArcelorMittal SA,4.550%, due 11/03/2026 458 0.03
150 ArcelorMittal SA,7.250%, due 15/10/2039 216 0.01
749 0.05
Macau — 0.19% (29 February 2020: 0.13%)
730 Sands China Ltd,4.600%, due 08/08/2023 784 0.05
540 Sands China Ltd,5.125%, due 08/08/2025 605 0.03
580 Sands China Ltd,5.400%, due 08/08/2028 667 0.04
1,090 Wynn Macau Ltd, 144A,5.625%, due 26/08/2028 1,135 0.07
3,191 0.19
Mexico — 0.13% (29 February 2020: 0.15%)
700 America Movil SAB de CV,3.125%, due 16/07/2022 725 0.04
20 America Movil SAB de CV,6.375%, due 01/03/2035 29 –
20 America Movil SAB de CV,6.125%, due 15/11/2037 28 –
590 Petroleos Mexicanos,4.250%, due 15/01/2025 590 0.04
260 Petroleos Mexicanos,6.875%, due 04/08/2026 279 0.02
25 Petroleos Mexicanos,6.625%, due 15/06/2035 24 –
510 Petroleos Mexicanos,5.500%, due 27/06/2044 413 0.03
2,088 0.13
Morocco — 0.08% (29 February 2020: 0.09%)
1,230 OCP SA, 144A,4.500%, due 22/10/2025 1,327 0.08
Netherlands — 0.61% (29 February 2020: 0.52%)
200 ABN AMRO Bank NV,144A,4.750%, due 28/07/2025 227 0.01
1,250 Cooperatieve RabobankUA,4.625%, due 01/12/2023 1,383 0.08
1,840 Cooperatieve RabobankUA,4.375%, due 04/08/2025 2,080 0.13
250 Cooperatieve RabobankUA, 144A,1.339%, due 24/06/2026 * 252 0.01
940 Cooperatieve RabobankUA/NY,3.125%, due 26/04/2021 944 0.06
370 NXP BV / NXP FundingLLC / NXP USA Inc, 144A,2.700%, due 01/05/2025 392 0.02
1,490 Shell InternationalFinance BV,2.875%, due 10/05/2026 1,611 0.10
600 Shell International FinanceBV,2.750%, due 06/04/2030 634 0.04
160 Shell International FinanceBV,4.550%, due 12/08/2043 194 0.01
770 Shell International FinanceBV,4.375%, due 11/05/2045 923 0.06
270 Shell International FinanceBV,4.000%, due 10/05/2046 306 0.02
1,160 Shell International FinanceBV,3.250%, due 06/04/2050 1,176 0.07
10,122 0.61
Peru — 0.18% (29 February 2020: 0.16%)
2,290 Southern Copper Corp,5.250%, due 08/11/2042 2,886 0.18
FaceValue(000’s)
Value(000’s)
$
% ofNet
AssetValue
South Africa — 0.15% (29 February 2020: 0.17%)
670 Anglo American CapitalPlc, 144A,3.625%, due 11/09/2024 732 0.05
1,130 Anglo American CapitalPlc, 144A,4.750%, due 10/04/2027 1,326 0.08
290 Anglo American CapitalPlc, 144A,4.000%, due 11/09/2027 329 0.02
2,387 0.15
Spain — 0.18% (29 February 2020: 0.19%)
200 Banco Santander SA,1.344%, due 12/04/2023 * 203 0.01
400 Banco Santander SA,3.848%, due 12/04/2023 428 0.03
1,200 Banco Santander SA,2.746%, due 28/05/2025 1,273 0.08
500 Telefonica Emisiones SA,4.103%, due 08/03/2027 567 0.03
210 Telefonica Emisiones SA,5.213%, due 08/03/2047 255 0.01
260 Telefonica Emisiones SA,4.895%, due 06/03/2048 303 0.02
3,029 0.18
Switzerland — 0.59% (29 February 2020: 0.83%)
710 Credit Suisse AG/NewYork NY,2.950%, due 09/04/2025 768 0.05
700 Credit Suisse Group AG,144A,2.593%, due 11/09/2025 * 737 0.04
610 Credit Suisse Group AG,144A,2.193%, due 05/06/2026 * 632 0.04
670 Credit Suisse Group AG,144A,4.194%, due 01/04/2031 * 764 0.05
210 Glencore Finance CanadaLtd, 144A,6.000%, due 15/11/2041 265 0.02
700 Syngenta Finance NV,144A,3.933%, due 23/04/2021 702 0.04
1,180 UBS AG/London, 144A,1.750%, due 21/04/2022 1,199 0.07
200 UBS AG/London, 144A,4.500%, due 26/06/2048 260 0.01
790 UBS Group AG, 144A,3.491%, due 23/05/2023 819 0.05
330 UBS Group AG, 144A,4.125%, due 24/09/2025 371 0.02
820 UBS Group AG, 144A,4.253%, due 23/03/2028 942 0.06
2,090 UBS Group AG, 144A,7.000%, Perpetual * 2,287 0.14
9,746 0.59
United Arab Emirates — 0.08%(29 February 2020: 0.08%)
90 DAE Funding LLC, 144A,5.750%, due 15/11/2023 93 0.01
200 DP World Plc, 144A,5.625%, due 25/09/2048 239 0.01
760 DP World Plc,5.625%, due 25/09/2048 907 0.06
1,239 0.08
United Kingdom — 1.18% (29 February 2020: 1.55%)
410 Barclays Plc,4.972%, due 16/05/2029 * 483 0.03
3,540 Barclays Plc,5.088%, due 20/06/2030 * 4,112 0.25
160 BAT Capital Corp,3.557%, due 15/08/2027 174 0.01
2,380 BAT Capital Corp,4.540%, due 15/08/2047 2,445 0.15
190 BP Capital Markets Plc,3.535%, due 04/11/2024 210 0.01
350 BP Capital Markets Plc,3.506%, due 17/03/2025 385 0.02
430 HSBC Holdings Plc,4.250%, due 18/08/2025 480 0.03
330 HSBC Holdings Plc,4.300%, due 08/03/2026 375 0.02
FaceValue(000’s)
Value(000’s)
$
% ofNet
AssetValue
400 HSBC Holdings Plc,4.041%, due 13/03/2028 * 448 0.03
1,480 HSBC Holdings Plc,4.583%, due 19/06/2029 * 1,707 0.10
200 HSBC Holdings Plc,4.950%, due 31/03/2030 241 0.02
340 HSBC Holdings Plc,6.500%, due 02/05/2036 471 0.03
1,500 Lloyds Banking Group Plc,4.650%, due 24/03/2026 1,708 0.10
780 Lloyds Banking Group Plc,4.375%, due 22/03/2028 899 0.06
460 Natwest Group Plc,6.000%, due 19/12/2023 522 0.03
1,300 Natwest Group Plc,5.125%, due 28/05/2024 1,455 0.09
200 Natwest Group Plc,4.519%, due 25/06/2024 * 217 0.01
630 Natwest Group Plc,4.269%, due 22/03/2025 * 691 0.04
230 Natwest Group Plc,4.892%, due 18/05/2029 * 270 0.02
1,000 Natwest Group Plc,5.076%, due 27/01/2030 * 1,188 0.07
290 Reynolds American Inc,5.850%, due 15/08/2045 346 0.02
420 Standard Chartered Plc,144A,5.700%, due 26/03/2044 541 0.03
110 Vodafone Group Plc,5.250%, due 30/05/2048 143 0.01
19,511 1.18
United States — 26.59% (29 February 2020: 20.11%)
470 3M Co,2.375%, due 26/08/2029 491 0.03
130 3M Co,3.050%, due 15/04/2030 143 0.01
920 3M Co,3.700%, due 15/04/2050 1,051 0.06
872 Abbott Laboratories,3.750%, due 30/11/2026 994 0.06
230 Abbott Laboratories,4.750%, due 30/11/2036 299 0.02
420 Abbott Laboratories,4.900%, due 30/11/2046 570 0.03
190 AbbVie Inc,3.450%, due 15/03/2022 195 0.01
120 AbbVie Inc,2.900%, due 06/11/2022 125 0.01
2,460 AbbVie Inc,2.300%, due 21/11/2022 2,540 0.15
140 AbbVie Inc,3.750%, due 14/11/2023 152 0.01
2,150 AbbVie Inc,2.600%, due 21/11/2024 2,287 0.14
590 AbbVie Inc,3.800%, due 15/03/2025 650 0.04
250 AbbVie Inc,3.600%, due 14/05/2025 274 0.02
520 AbbVie Inc,2.950%, due 21/11/2026 563 0.03
1,810 AbbVie Inc,3.200%, due 21/11/2029 1,958 0.12
7 AbbVie Inc,4.750%, due 15/03/2045 9 –
110 AbbVie Inc,4.250%, due 21/11/2049 127 0.01
90 Aetna Inc,2.800%, due 15/06/2023 94 0.01
450 Air Lease Corp,3.375%, due 01/07/2025 479 0.03
160 Alphabet Inc,0.450%, due 15/08/2025 158 0.01
310 Alphabet Inc,0.800%, due 15/08/2027 302 0.02
370 Alphabet Inc,1.100%, due 15/08/2030 350 0.02
600 Alphabet Inc,2.050%, due 15/08/2050 518 0.03
290 Altria Group Inc,4.750%, due 05/05/2021 292 0.02
170 Altria Group Inc,2.350%, due 06/05/2025 178 0.01
846 Altria Group Inc,4.400%, due 14/02/2026 964 0.06
The accompanying notes are an integral part of the Financial Statements
59
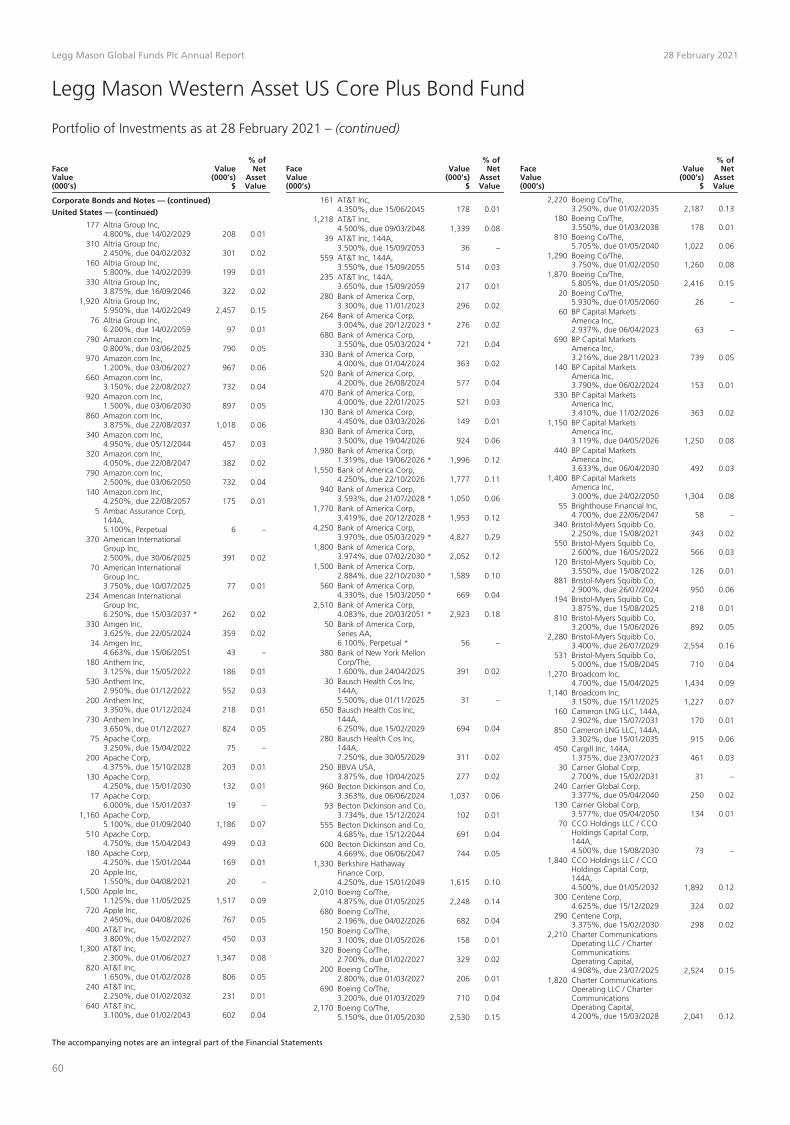
Legg Mason Global Funds Plc Annual Report 28 February 2021
Legg Mason Western Asset US Core Plus Bond Fund
Portfolio of Investments as at 28 February 2021 – (continued)
FaceValue(000’s)
Value(000’s)
$
% ofNet
AssetValue
Corporate Bonds and Notes — (continued)
United States — (continued)
177 Altria Group Inc,4.800%, due 14/02/2029 208 0.01
310 Altria Group Inc,2.450%, due 04/02/2032 301 0.02
160 Altria Group Inc,5.800%, due 14/02/2039 199 0.01
330 Altria Group Inc,3.875%, due 16/09/2046 322 0.02
1,920 Altria Group Inc,5.950%, due 14/02/2049 2,457 0.15
76 Altria Group Inc,6.200%, due 14/02/2059 97 0.01
790 Amazon.com Inc,0.800%, due 03/06/2025 790 0.05
970 Amazon.com Inc,1.200%, due 03/06/2027 967 0.06
660 Amazon.com Inc,3.150%, due 22/08/2027 732 0.04
920 Amazon.com Inc,1.500%, due 03/06/2030 897 0.05
860 Amazon.com Inc,3.875%, due 22/08/2037 1,018 0.06
340 Amazon.com Inc,4.950%, due 05/12/2044 457 0.03
320 Amazon.com Inc,4.050%, due 22/08/2047 382 0.02
790 Amazon.com Inc,2.500%, due 03/06/2050 732 0.04
140 Amazon.com Inc,4.250%, due 22/08/2057 175 0.01
5 Ambac Assurance Corp,144A,5.100%, Perpetual 6 –
370 American InternationalGroup Inc,2.500%, due 30/06/2025 391 0.02
70 American InternationalGroup Inc,3.750%, due 10/07/2025 77 0.01
234 American InternationalGroup Inc,6.250%, due 15/03/2037 * 262 0.02
330 Amgen Inc,3.625%, due 22/05/2024 359 0.02
34 Amgen Inc,4.663%, due 15/06/2051 43 –
180 Anthem Inc,3.125%, due 15/05/2022 186 0.01
530 Anthem Inc,2.950%, due 01/12/2022 552 0.03
200 Anthem Inc,3.350%, due 01/12/2024 218 0.01
730 Anthem Inc,3.650%, due 01/12/2027 824 0.05
75 Apache Corp,3.250%, due 15/04/2022 75 –
200 Apache Corp,4.375%, due 15/10/2028 203 0.01
130 Apache Corp,4.250%, due 15/01/2030 132 0.01
17 Apache Corp,6.000%, due 15/01/2037 19 –
1,160 Apache Corp,5.100%, due 01/09/2040 1,186 0.07
510 Apache Corp,4.750%, due 15/04/2043 499 0.03
180 Apache Corp,4.250%, due 15/01/2044 169 0.01
20 Apple Inc,1.550%, due 04/08/2021 20 –
1,500 Apple Inc,1.125%, due 11/05/2025 1,517 0.09
720 Apple Inc,2.450%, due 04/08/2026 767 0.05
400 AT&T Inc,3.800%, due 15/02/2027 450 0.03
1,300 AT&T Inc,2.300%, due 01/06/2027 1,347 0.08
820 AT&T Inc,1.650%, due 01/02/2028 806 0.05
240 AT&T Inc,2.250%, due 01/02/2032 231 0.01
640 AT&T Inc,3.100%, due 01/02/2043 602 0.04
FaceValue(000’s)
Value(000’s)
$
% ofNet
AssetValue
161 AT&T Inc,4.350%, due 15/06/2045 178 0.01
1,218 AT&T Inc,4.500%, due 09/03/2048 1,339 0.08
39 AT&T Inc, 144A,3.500%, due 15/09/2053 36 –
559 AT&T Inc, 144A,3.550%, due 15/09/2055 514 0.03
235 AT&T Inc, 144A,3.650%, due 15/09/2059 217 0.01
280 Bank of America Corp,3.300%, due 11/01/2023 296 0.02
264 Bank of America Corp,3.004%, due 20/12/2023 * 276 0.02
680 Bank of America Corp,3.550%, due 05/03/2024 * 721 0.04
330 Bank of America Corp,4.000%, due 01/04/2024 363 0.02
520 Bank of America Corp,4.200%, due 26/08/2024 577 0.04
470 Bank of America Corp,4.000%, due 22/01/2025 521 0.03
130 Bank of America Corp,4.450%, due 03/03/2026 149 0.01
830 Bank of America Corp,3.500%, due 19/04/2026 924 0.06
1,980 Bank of America Corp,1.319%, due 19/06/2026 * 1,996 0.12
1,550 Bank of America Corp,4.250%, due 22/10/2026 1,777 0.11
940 Bank of America Corp,3.593%, due 21/07/2028 * 1,050 0.06
1,770 Bank of America Corp,3.419%, due 20/12/2028 * 1,953 0.12
4,250 Bank of America Corp,3.970%, due 05/03/2029 * 4,827 0.29
1,800 Bank of America Corp,3.974%, due 07/02/2030 * 2,052 0.12
1,500 Bank of America Corp,2.884%, due 22/10/2030 * 1,589 0.10
560 Bank of America Corp,4.330%, due 15/03/2050 * 669 0.04
2,510 Bank of America Corp,4.083%, due 20/03/2051 * 2,923 0.18
50 Bank of America Corp,Series AA,6.100%, Perpetual * 56 –
380 Bank of New York MellonCorp/The,1.600%, due 24/04/2025 391 0.02
30 Bausch Health Cos Inc,144A,5.500%, due 01/11/2025 31 –
650 Bausch Health Cos Inc,144A,6.250%, due 15/02/2029 694 0.04
280 Bausch Health Cos Inc,144A,7.250%, due 30/05/2029 311 0.02
250 BBVA USA,3.875%, due 10/04/2025 277 0.02
960 Becton Dickinson and Co,3.363%, due 06/06/2024 1,037 0.06
93 Becton Dickinson and Co,3.734%, due 15/12/2024 102 0.01
555 Becton Dickinson and Co,4.685%, due 15/12/2044 691 0.04
600 Becton Dickinson and Co,4.669%, due 06/06/2047 744 0.05
1,330 Berkshire HathawayFinance Corp,4.250%, due 15/01/2049 1,615 0.10
2,010 Boeing Co/The,4.875%, due 01/05/2025 2,248 0.14
680 Boeing Co/The,2.196%, due 04/02/2026 682 0.04
150 Boeing Co/The,3.100%, due 01/05/2026 158 0.01
320 Boeing Co/The,2.700%, due 01/02/2027 329 0.02
200 Boeing Co/The,2.800%, due 01/03/2027 206 0.01
690 Boeing Co/The,3.200%, due 01/03/2029 710 0.04
2,170 Boeing Co/The,5.150%, due 01/05/2030 2,530 0.15
FaceValue(000’s)
Value(000’s)
$
% ofNet
AssetValue
2,220 Boeing Co/The,3.250%, due 01/02/2035 2,187 0.13
180 Boeing Co/The,3.550%, due 01/03/2038 178 0.01
810 Boeing Co/The,5.705%, due 01/05/2040 1,022 0.06
1,290 Boeing Co/The,3.750%, due 01/02/2050 1,260 0.08
1,870 Boeing Co/The,5.805%, due 01/05/2050 2,416 0.15
20 Boeing Co/The,5.930%, due 01/05/2060 26 –
60 BP Capital MarketsAmerica Inc,2.937%, due 06/04/2023 63 –
690 BP Capital MarketsAmerica Inc,3.216%, due 28/11/2023 739 0.05
140 BP Capital MarketsAmerica Inc,3.790%, due 06/02/2024 153 0.01
330 BP Capital MarketsAmerica Inc,3.410%, due 11/02/2026 363 0.02
1,150 BP Capital MarketsAmerica Inc,3.119%, due 04/05/2026 1,250 0.08
440 BP Capital MarketsAmerica Inc,3.633%, due 06/04/2030 492 0.03
1,400 BP Capital MarketsAmerica Inc,3.000%, due 24/02/2050 1,304 0.08
55 Brighthouse Financial Inc,4.700%, due 22/06/2047 58 –
340 Bristol-Myers Squibb Co,2.250%, due 15/08/2021 343 0.02
550 Bristol-Myers Squibb Co,2.600%, due 16/05/2022 566 0.03
120 Bristol-Myers Squibb Co,3.550%, due 15/08/2022 126 0.01
881 Bristol-Myers Squibb Co,2.900%, due 26/07/2024 950 0.06
194 Bristol-Myers Squibb Co,3.875%, due 15/08/2025 218 0.01
810 Bristol-Myers Squibb Co,3.200%, due 15/06/2026 892 0.05
2,280 Bristol-Myers Squibb Co,3.400%, due 26/07/2029 2,554 0.16
531 Bristol-Myers Squibb Co,5.000%, due 15/08/2045 710 0.04
1,270 Broadcom Inc,4.700%, due 15/04/2025 1,434 0.09
1,140 Broadcom Inc,3.150%, due 15/11/2025 1,227 0.07
160 Cameron LNG LLC, 144A,2.902%, due 15/07/2031 170 0.01
850 Cameron LNG LLC, 144A,3.302%, due 15/01/2035 915 0.06
450 Cargill Inc, 144A,1.375%, due 23/07/2023 461 0.03
30 Carrier Global Corp,2.700%, due 15/02/2031 31 –
240 Carrier Global Corp,3.377%, due 05/04/2040 250 0.02
130 Carrier Global Corp,3.577%, due 05/04/2050 134 0.01
70 CCO Holdings LLC / CCOHoldings Capital Corp,144A,4.500%, due 15/08/2030 73 –
1,840 CCO Holdings LLC / CCOHoldings Capital Corp,144A,4.500%, due 01/05/2032 1,892 0.12
300 Centene Corp,4.625%, due 15/12/2029 324 0.02
290 Centene Corp,3.375%, due 15/02/2030 298 0.02
2,210 Charter CommunicationsOperating LLC / CharterCommunicationsOperating Capital,4.908%, due 23/07/2025 2,524 0.15
1,820 Charter CommunicationsOperating LLC / CharterCommunicationsOperating Capital,4.200%, due 15/03/2028 2,041 0.12
The accompanying notes are an integral part of the Financial Statements
60

Legg Mason Global Funds Plc Annual Report 28 February 2021
Legg Mason Western Asset US Core Plus Bond Fund
Portfolio of Investments as at 28 February 2021 – (continued)
FaceValue(000’s)
Value(000’s)
$
% ofNet
AssetValue
Corporate Bonds and Notes — (continued)
United States — (continued)
1,200 Charter CommunicationsOperating LLC / CharterCommunicationsOperating Capital,5.050%, due 30/03/2029 1,409 0.09
740 Charter CommunicationsOperating LLC / CharterCommunicationsOperating Capital,5.375%, due 01/04/2038 887 0.05
260 Charter CommunicationsOperating LLC / CharterCommunicationsOperating Capital,6.484%, due 23/10/2045 349 0.02
1,000 Charter CommunicationsOperating LLC / CharterCommunicationsOperating Capital,5.750%, due 01/04/2048 1,235 0.08
210 Charter CommunicationsOperating LLC / CharterCommunicationsOperating Capital,4.800%, due 01/03/2050 231 0.01
400 Cheniere Energy Inc,144A,4.625%, due 15/10/2028 416 0.03
700 Chevron Corp,1.554%, due 11/05/2025 718 0.04
340 Chevron Corp,2.954%, due 16/05/2026 369 0.02
240 Chevron Corp,1.995%, due 11/05/2027 249 0.02
80 Chevron Corp,3.078%, due 11/05/2050 80 0.01
950 Chevron USA Inc,3.850%, due 15/01/2028 1,086 0.07
330 Chevron USA Inc,5.250%, due 15/11/2043 446 0.03
180 Chevron USA Inc,4.950%, due 15/08/2047 233 0.01
140 Chubb INA Holdings Inc,3.350%, due 03/05/2026 155 0.01
380 Cigna Corp,3.400%, due 17/09/2021 387 0.02
962 Cigna Corp,3.750%, due 15/07/2023 1,035 0.06
290 Cigna Corp,4.125%, due 15/11/2025 327 0.02
2,980 Cigna Corp,4.375%, due 15/10/2028 3,478 0.21
210 Cimarex Energy Co,4.375%, due 01/06/2024 229 0.01
1,790 Cimarex Energy Co,3.900%, due 15/05/2027 1,976 0.12
560 Cimarex Energy Co,4.375%, due 15/03/2029 629 0.04
270 Cintas Corp No 2,2.900%, due 01/04/2022 277 0.02
270 Cintas Corp No 2,3.700%, due 01/04/2027 306 0.02
10 Citigroup Inc,4.500%, due 14/01/2022 10 –
50 Citigroup Inc,4.050%, due 30/07/2022 53 –
250 Citigroup Inc,3.500%, due 15/05/2023 266 0.02
680 Citigroup Inc,1.678%, due 15/05/2024 * 697 0.04
330 Citigroup Inc,3.300%, due 27/04/2025 362 0.02
440 Citigroup Inc,4.400%, due 10/06/2025 494 0.03
220 Citigroup Inc,5.500%, due 13/09/2025 260 0.02
490 Citigroup Inc,3.106%, due 08/04/2026 * 527 0.03
110 Citigroup Inc,4.300%, due 20/11/2026 126 0.01
2,130 Citigroup Inc,4.450%, due 29/09/2027 2,459 0.15
60 Citigroup Inc,4.125%, due 25/07/2028 68 –
FaceValue(000’s)
Value(000’s)
$
% ofNet
AssetValue
1,360 Citigroup Inc,3.520%, due 27/10/2028 * 1,503 0.09
1,750 Citigroup Inc,4.075%, due 23/04/2029 * 1,994 0.12
2,300 Citigroup Inc,3.980%, due 20/03/2030 * 2,610 0.16
1,590 Citigroup Inc,4.412%, due 31/03/2031 * 1,851 0.11
1,570 Citigroup Inc,2.572%, due 03/06/2031 * 1,610 0.10
1,456 Citigroup Inc,8.125%, due 15/07/2039 2,461 0.15
255 Citigroup Inc,5.300%, due 06/05/2044 337 0.02
100 Citigroup Inc,5.950%, Perpetual * 104 0.01
700 Citigroup Inc, Series P,5.950%, Perpetual * 761 0.05
90 Citigroup Inc, Series M,6.300%, Perpetual * 95 0.01
160 Coca-Cola Co/The,2.950%, due 25/03/2025 174 0.01
720 Coca-Cola Co/The,3.375%, due 25/03/2027 807 0.05
670 Coca-Cola Co/The,1.450%, due 01/06/2027 674 0.04
20 Coca-Cola Co/The,2.500%, due 01/06/2040 20 –
280 Coca-Cola Co/The,2.600%, due 01/06/2050 265 0.02
40 Comcast Corp,3.100%, due 01/04/2025 43 –
130 Comcast Corp,3.950%, due 15/10/2025 146 0.01
640 Comcast Corp,3.150%, due 01/03/2026 701 0.04
280 Comcast Corp,3.300%, due 01/04/2027 310 0.02
2,140 Comcast Corp,4.150%, due 15/10/2028 2,491 0.15
390 Comcast Corp,3.400%, due 01/04/2030 434 0.03
1,420 Comcast Corp,4.250%, due 15/10/2030 1,675 0.10
60 Comcast Corp,4.250%, due 15/01/2033 72 –
60 Comcast Corp,5.650%, due 15/06/2035 81 0.01
60 Comcast Corp,6.500%, due 15/11/2035 87 0.01
1,540 Comcast Corp,3.900%, due 01/03/2038 1,783 0.11
80 Comcast Corp,3.250%, due 01/11/2039 85 0.01
80 Comcast Corp,3.750%, due 01/04/2040 90 0.01
80 Comcast Corp,3.400%, due 15/07/2046 84 0.01
14 Comcast Corp,3.969%, due 01/11/2047 16 –
110 Comcast Corp,4.000%, due 01/03/2048 126 0.01
580 Comcast Corp,4.700%, due 15/10/2048 737 0.05
203 Comcast Corp,3.999%, due 01/11/2049 234 0.01
510 Comcast Corp,3.450%, due 01/02/2050 541 0.03
126 Comcast Corp,4.049%, due 01/11/2052 145 0.01
20 CommonSpirit Health,4.350%, due 01/11/2042 23 –
350 ConocoPhillips, 144A,3.750%, due 01/10/2027 395 0.02
720 ConocoPhillips, 144A,4.300%, due 15/08/2028 838 0.05
85 ConocoPhillips Co,6.950%, due 15/04/2029 116 0.01
240 Consolidated Edison Co ofNew York Inc, Series 20A,3.350%, due 01/04/2030 266 0.02
190 Consolidated Edison Co ofNew York Inc, Series 20B,3.950%, due 01/04/2050 216 0.01
640 Constellation Brands Inc,4.750%, due 15/11/2024 732 0.04
FaceValue(000’s)
Value(000’s)
$
% ofNet
AssetValue
161 Continental Airlines2007-1 Class A PassThrough Trust,Series 071A,5.983%, due 19/04/2022 165 0.01
210 Continental Resources Inc/OK,4.500%, due 15/04/2023 216 0.01
130 Continental Resources Inc/OK,3.800%, due 01/06/2024 133 0.01
1,160 Continental Resources Inc/OK,4.375%, due 15/01/2028 1,222 0.07
10 Continental Resources Inc/OK,4.900%, due 01/06/2044 10 –
1,020 Costco Wholesale Corp,1.375%, due 20/06/2027 1,029 0.06
650 Costco Wholesale Corp,1.600%, due 20/04/2030 636 0.04
300 CSC Holdings LLC, 144A,4.125%, due 01/12/2030 302 0.02
220 CVS Health Corp,2.750%, due 01/12/2022 228 0.01
142 CVS Health Corp,3.700%, due 09/03/2023 151 0.01
761 CVS Health Corp,3.875%, due 20/07/2025 847 0.05
220 CVS Health Corp,3.625%, due 01/04/2027 245 0.02
1,721 CVS Health Corp,4.300%, due 25/03/2028 1,982 0.12
530 CVS Health Corp,3.750%, due 01/04/2030 593 0.04
400 CVS Health Corp,4.780%, due 25/03/2038 488 0.03
220 CVS Health Corp,4.125%, due 01/04/2040 251 0.02
440 CVS Health Corp,5.125%, due 20/07/2045 558 0.03
3,700 CVS Health Corp,5.050%, due 25/03/2048 4,681 0.28
70 CVS Health Corp,4.250%, due 01/04/2050 81 0.01
19 CVS Pass-Through Trust,144A,5.298%, due 11/01/2027 20 –
20 CVS Pass-Through Trust,6.036%, due 10/12/2028 24 –
35 CVS Pass-Through Trust,6.943%, due 10/01/2030 43 –
150 DCP Midstream OperatingLP, 144A,6.450%, due 03/11/2036 168 0.01
140 Deere & Co,3.100%, due 15/04/2030 154 0.01
740 Deere & Co,3.750%, due 15/04/2050 873 0.05
1,690 Delta Air Lines Inc,3.400%, due 19/04/2021 1,694 0.10
710 Delta Air Lines Inc,3.625%, due 15/03/2022 721 0.04
190 Delta Air Lines Inc,3.800%, due 19/04/2023 195 0.01
410 Delta Air Lines Inc,2.900%, due 28/10/2024 408 0.03
3,560 Delta Air Lines Inc, 144A,7.000%, due 01/05/2025 4,151 0.25
810 Delta Air Lines Inc,7.375%, due 15/01/2026 950 0.06
530 Devon Energy Corp,5.850%, due 15/12/2025 621 0.04
40 Devon Energy Corp,5.600%, due 15/07/2041 49 –
240 Devon Energy Corp,4.750%, due 15/05/2042 270 0.02
1,950 Devon Energy Corp,5.000%, due 15/06/2045 2,284 0.14
360 Diamondback Energy Inc,5.375%, due 31/05/2025 372 0.02
50 Diamondback Energy Inc,3.250%, due 01/12/2026 53 –
340 Diamondback Energy Inc,3.500%, due 01/12/2029 358 0.02
The accompanying notes are an integral part of the Financial Statements
61

Legg Mason Global Funds Plc Annual Report 28 February 2021
Legg Mason Western Asset US Core Plus Bond Fund
Portfolio of Investments as at 28 February 2021 – (continued)
FaceValue(000’s)
Value(000’s)
$
% ofNet
AssetValue
Corporate Bonds and Notes — (continued)
United States — (continued)
450 DISH DBS Corp,5.875%, due 15/11/2024 472 0.03
450 DISH DBS Corp,7.750%, due 01/07/2026 496 0.03
60 Dollar General Corp,3.250%, due 15/04/2023 63 –
130 Duke Energy CarolinasLLC,5.300%, due 15/02/2040 174 0.01
640 Duke Energy Ohio Inc,3.650%, due 01/02/2029 722 0.04
660 Eaton Corp,2.750%, due 02/11/2022 686 0.04
420 Eaton Corp,4.150%, due 02/11/2042 500 0.03
36 El Paso Natural Gas CoLLC,8.375%, due 15/06/2032 52 –
800 Energy Transfer OperatingLP,4.500%, due 15/04/2024 878 0.05
210 Energy Transfer OperatingLP,4.950%, due 15/06/2028 240 0.01
530 Energy Transfer OperatingLP,5.250%, due 15/04/2029 615 0.04
1,530 Energy Transfer OperatingLP,3.750%, due 15/05/2030 1,619 0.10
680 Energy Transfer OperatingLP,6.250%, due 15/04/2049 814 0.05
470 Energy Transfer OperatingLP, Series F,6.750%, Perpetual * 446 0.03
90 Energy Transfer PartnersLP / Regency EnergyFinance Corp,5.875%, due 01/03/2022 93 0.01
1,080 Enterprise ProductsOperating LLC,4.150%, due 16/10/2028 1,244 0.08
670 Enterprise ProductsOperating LLC,2.800%, due 31/01/2030 705 0.04
2,150 Enterprise ProductsOperating LLC,4.200%, due 31/01/2050 2,326 0.14
420 Enterprise ProductsOperating LLC,3.700%, due 31/01/2051 425 0.03
90 Enterprise ProductsOperating LLC,3.950%, due 31/01/2060 93 0.01
240 EOG Resources Inc,4.150%, due 15/01/2026 272 0.02
190 EOG Resources Inc,4.375%, due 15/04/2030 223 0.01
690 EOG Resources Inc,3.900%, due 01/04/2035 773 0.05
180 EOG Resources Inc,4.950%, due 15/04/2050 228 0.01
500 EQT Corp,3.000%, due 01/10/2022 504 0.03
50 EQT Corp,7.625%, due 01/02/2025 58 –
200 EQT Corp,3.900%, due 01/10/2027 208 0.01
20 EQT Corp,5.000%, due 15/01/2029 22 –
110 Exxon Mobil Corp,1.571%, due 15/04/2023 113 0.01
1,700 Exxon Mobil Corp,2.992%, due 19/03/2025 1,835 0.11
470 Exxon Mobil Corp,3.043%, due 01/03/2026 510 0.03
650 Exxon Mobil Corp,3.482%, due 19/03/2030 727 0.04
1,130 Exxon Mobil Corp,4.114%, due 01/03/2046 1,273 0.08
80 Exxon Mobil Corp,4.327%, due 19/03/2050 95 0.01
FaceValue(000’s)
Value(000’s)
$
% ofNet
AssetValue
110 FirstEnergy Corp, Series B,4.250%, due 15/03/2023 117 0.01
270 FirstEnergy Corp, Series A,1.600%, due 15/01/2026 266 0.02
3,460 FirstEnergy Corp, Series B,4.400%, due 15/07/2027 3,803 0.23
1,948 FirstEnergy Corp, Series C,7.375%, due 15/11/2031 2,682 0.16
1,000 FirstEnergy Corp, Series C,5.350%, due 15/07/2047 1,192 0.07
150 Ford Motor Co,4.750%, due 15/01/2043 152 0.01
200 Ford Motor Credit Co LLC,3.336%, due 18/03/2021 200 0.01
680 Ford Motor Credit Co LLC,5.875%, due 02/08/2021 693 0.04
200 Ford Motor Credit Co LLC,3.339%, due 28/03/2022 202 0.01
200 Ford Motor Credit Co LLC,5.125%, due 16/06/2025 216 0.01
600 Ford Motor Credit Co LLC,4.125%, due 17/08/2027 632 0.04
260 Ford Motor Credit Co LLC,2.900%, due 16/02/2028 256 0.02
890 Ford Motor Credit Co LLC,4.000%, due 13/11/2030 911 0.06
340 Fox Corp,4.030%, due 25/01/2024 372 0.02
2,160 Fox Corp,5.476%, due 25/01/2039 2,777 0.17
160 Fox Corp,5.576%, due 25/01/2049 211 0.01
10 Freeport-McMoRan Inc,3.875%, due 15/03/2023 10 –
30 Freeport-McMoRan Inc,4.550%, due 14/11/2024 33 –
260 Freeport-McMoRan Inc,4.625%, due 01/08/2030 288 0.02
970 Freeport-McMoRan Inc,5.450%, due 15/03/2043 1,207 0.07
1,380 GE Capital InternationalFunding Co Unlimited Co,4.418%, due 15/11/2035 1,578 0.10
230 General Dynamics Corp,3.250%, due 01/04/2025 250 0.02
90 General Dynamics Corp,3.500%, due 15/05/2025 99 0.01
40 General Dynamics Corp,4.250%, due 01/04/2040 49 –
330 General Dynamics Corp,4.250%, due 01/04/2050 411 0.03
140 General Electric Co,3.450%, due 01/05/2027 154 0.01
280 General Electric Co,3.625%, due 01/05/2030 306 0.02
230 General Electric Co,6.750%, due 15/03/2032 311 0.02
720 General Electric Co,6.150%, due 07/08/2037 958 0.06
450 General Electric Co,5.875%, due 14/01/2038 592 0.04
2,161 General Electric Co,6.875%, due 10/01/2039 3,087 0.19
300 General Electric Co,4.250%, due 01/05/2040 334 0.02
360 General Electric Co,4.350%, due 01/05/2050 401 0.02
240 General Motors Co,5.400%, due 02/10/2023 268 0.02
440 General Motors Co,6.125%, due 01/10/2025 524 0.03
50 General Motors Co,5.150%, due 01/04/2038 60 –
230 General Motors Co,6.250%, due 02/10/2043 310 0.02
330 General Motors Co,5.950%, due 01/04/2049 432 0.03
360 General Motors FinancialCo Inc,4.375%, due 25/09/2021 368 0.02
40 General Motors FinancialCo Inc,3.450%, due 10/04/2022 41 –
10 General Motors FinancialCo Inc,4.250%, due 15/05/2023 11 –
FaceValue(000’s)
Value(000’s)
$
% ofNet
AssetValue
50 General Motors FinancialCo Inc,4.350%, due 17/01/2027 56 –
200 Gilead Sciences Inc,3.500%, due 01/02/2025 218 0.01
250 Gilead Sciences Inc,4.750%, due 01/03/2046 309 0.02
10 GLP Capital LP / GLPFinancing II Inc,5.250%, due 01/06/2025 11 –
80 GLP Capital LP / GLPFinancing II Inc,5.375%, due 15/04/2026 92 0.01
3 Goldman Sachs Capital II,4.000%, Perpetual * 3 –
380 Goldman Sachs Group Inc/The,5.250%, due 27/07/2021 388 0.02
750 Goldman Sachs Group Inc/The,2.876%, due 31/10/2022 * 762 0.05
440 Goldman Sachs Group Inc/The,3.200%, due 23/02/2023 463 0.03
320 Goldman Sachs Group Inc/The,4.000%, due 03/03/2024 352 0.02
800 Goldman Sachs Group Inc/The,3.850%, due 08/07/2024 877 0.05
760 Goldman Sachs Group Inc/The,3.500%, due 01/04/2025 832 0.05
720 Goldman Sachs Group Inc/The,4.250%, due 21/10/2025 813 0.05
1,970 Goldman Sachs Group Inc/The,3.500%, due 16/11/2026 2,171 0.13
4,750 Goldman Sachs Group Inc/The,3.814%, due 23/04/2029 * 5,351 0.33
2,650 Goldman Sachs Group Inc/The,4.223%, due 01/05/2029 * 3,056 0.19
670 Goldman Sachs Group Inc/The,6.250%, due 01/02/2041 986 0.06
560 Goldman Sachs Group Inc/The,5.150%, due 22/05/2045 740 0.05
1,050 Goldman Sachs Group Inc/The,4.750%, due 21/10/2045 1,360 0.08
270 Guardian Life GlobalFunding, 144A,1.100%, due 23/06/2025 270 0.02
29 Halliburton Co,3.800%, due 15/11/2025 32 –
60 Halliburton Co,4.850%, due 15/11/2035 69 –
320 Halliburton Co,5.000%, due 15/11/2045 373 0.02
50 Hanesbrands Inc, 144A,4.625%, due 15/05/2024 52 –
400 Hanesbrands Inc, 144A,5.375%, due 15/05/2025 424 0.03
200 Hanesbrands Inc, 144A,4.875%, due 15/05/2026 216 0.01
150 HCA Inc,4.750%, due 01/05/2023 163 0.01
100 HCA Inc,5.000%, due 15/03/2024 112 0.01
270 HCA Inc,5.375%, due 01/02/2025 303 0.02
10 HCA Inc,5.250%, due 15/04/2025 12 –
170 HCA Inc,5.250%, due 15/06/2026 199 0.01
40 HCA Inc,5.375%, due 01/09/2026 46 –
100 HCA Inc,4.500%, due 15/02/2027 114 0.01
90 HCA Inc,5.625%, due 01/09/2028 105 0.01
660 HCA Inc,5.875%, due 01/02/2029 779 0.05
The accompanying notes are an integral part of the Financial Statements
62

Legg Mason Global Funds Plc Annual Report 28 February 2021
Legg Mason Western Asset US Core Plus Bond Fund
Portfolio of Investments as at 28 February 2021 – (continued)
FaceValue(000’s)
Value(000’s)
$
% ofNet
AssetValue
Corporate Bonds and Notes — (continued)
United States — (continued)
630 HCA Inc,3.500%, due 01/09/2030 656 0.04
400 HCA Inc,5.500%, due 15/06/2047 512 0.03
180 Hershey Co/The,0.900%, due 01/06/2025 181 0.01
500 Hilton Domestic OperatingCo Inc, 144A,5.375%, due 01/05/2025 526 0.03
200 Hilton Domestic OperatingCo Inc, 144A,5.750%, due 01/05/2028 217 0.01
330 Hilton Worldwide FinanceLLC / Hilton WorldwideFinance Corp,4.875%, due 01/04/2027 344 0.02
380 Home Depot Inc/The,2.500%, due 15/04/2027 408 0.03
70 Home Depot Inc/The,3.900%, due 06/12/2028 81 0.01
440 Home Depot Inc/The,2.700%, due 15/04/2030 470 0.03
490 Home Depot Inc/The,3.300%, due 15/04/2040 532 0.03
90 Home Depot Inc/The,3.900%, due 15/06/2047 104 0.01
1,370 Home Depot Inc/The,3.350%, due 15/04/2050 1,463 0.09
440 Honeywell InternationalInc,1.350%, due 01/06/2025 450 0.03
120 Humana Inc,4.500%, due 01/04/2025 136 0.01
430 Humana Inc,3.950%, due 15/03/2027 489 0.03
1,700 Humana Inc,3.125%, due 15/08/2029 1,834 0.11
70 Humana Inc,4.625%, due 01/12/2042 84 0.01
90 Humana Inc,4.950%, due 01/10/2044 113 0.01
20 Humana Inc,4.800%, due 15/03/2047 25 –
50 ILFC E-Capital Trust II,144A,3.480%, due 21/12/2065 * 42 –
80 Intel Corp,3.700%, due 29/07/2025 89 0.01
290 Intel Corp,4.600%, due 25/03/2040 366 0.02
130 Intel Corp,3.734%, due 08/12/2047 146 0.01
640 Intel Corp,4.750%, due 25/03/2050 834 0.05
1,940 International BusinessMachines Corp,3.000%, due 15/05/2024 2,088 0.13
150 International Lease FinanceCorp,5.875%, due 15/08/2022 161 0.01
460 Johnson & Johnson,0.550%, due 01/09/2025 457 0.03
930 Johnson & Johnson,0.950%, due 01/09/2027 917 0.06
1,040 Johnson & Johnson,3.625%, due 03/03/2037 1,212 0.07
1,880 JPMorgan Chase & Co,1.514%, due 01/06/2024 * 1,925 0.12
250 JPMorgan Chase & Co,3.875%, due 10/09/2024 276 0.02
1,400 JPMorgan Chase & Co,4.023%, due 05/12/2024 * 1,533 0.09
1,160 JPMorgan Chase & Co,2.083%, due 22/04/2026 * 1,205 0.07
970 JPMorgan Chase & Co,4.250%, due 01/10/2027 1,124 0.07
1,000 JPMorgan Chase & Co,3.509%, due 23/01/2029 * 1,106 0.07
770 JPMorgan Chase & Co,4.203%, due 23/07/2029 * 892 0.05
780 JPMorgan Chase & Co,4.452%, due 05/12/2029 * 919 0.06
FaceValue(000’s)
Value(000’s)
$
% ofNet
AssetValue
640 JPMorgan Chase & Co,2.522%, due 22/04/2031 * 658 0.04
1,730 JPMorgan Chase & Co,4.950%, due 01/06/2045 2,277 0.14
300 JPMorgan Chase & Co,3.109%, due 22/04/2051 * 306 0.02
380 Kinder Morgan EnergyPartners LP,3.500%, due 01/09/2023 405 0.02
110 Kinder Morgan EnergyPartners LP,4.250%, due 01/09/2024 122 0.01
300 Kinder Morgan Inc,4.300%, due 01/06/2025 336 0.02
680 Kinder Morgan Inc,4.300%, due 01/03/2028 777 0.05
270 Kinder Morgan Inc,5.300%, due 01/12/2034 327 0.02
170 Kinder Morgan Inc,5.550%, due 01/06/2045 209 0.01
60 Kinder Morgan Inc,5.200%, due 01/03/2048 72 –
30 KKR Group Finance Co IILLC, 144A,5.500%, due 01/02/2043 39 –
295 Kraft Heinz Foods Co,3.950%, due 15/07/2025 328 0.02
140 Kraft Heinz Foods Co,3.000%, due 01/06/2026 149 0.01
150 Kraft Heinz Foods Co,4.250%, due 01/03/2031 169 0.01
20 Kraft Heinz Foods Co,6.750%, due 15/03/2032 27 –
80 Kraft Heinz Foods Co,5.000%, due 15/07/2035 97 0.01
50 Kraft Heinz Foods Co,6.875%, due 26/01/2039 70 –
10 Kraft Heinz Foods Co,144A,7.125%, due 01/08/2039 15 –
10 Kraft Heinz Foods Co,4.625%, due 01/10/2039 12 –
170 Kraft Heinz Foods Co,5.000%, due 04/06/2042 201 0.01
520 Kraft Heinz Foods Co,5.200%, due 15/07/2045 626 0.04
210 Kraft Heinz Foods Co,4.375%, due 01/06/2046 229 0.01
370 Kraft Heinz Foods Co,4.875%, due 01/10/2049 434 0.03
300 Kraft Heinz Foods Co,5.500%, due 01/06/2050 387 0.02
770 L3Harris Technologies Inc,4.854%, due 27/04/2035 968 0.06
230 L3Harris Technologies Inc,5.054%, due 27/04/2045 300 0.02
270 Lamb Weston HoldingsInc, 144A,4.875%, due 01/11/2026 280 0.02
1,250 Las Vegas Sands Corp,3.200%, due 08/08/2024 1,313 0.08
1,320 Las Vegas Sands Corp,2.900%, due 25/06/2025 1,369 0.08
170 Lehman Brothers Escrow,zero coupon,Perpetual †∞� – –
160 Lehman Brothers Escrow,Series DMTN,zero coupon,Perpetual †∞� – –
1,110 Lehman Brothers HoldingInc,zero coupon,due 28/12/2017 †∞� – –
960 Lehman Brothers HoldingsCapital Trust Escrow,zero coupon,Perpetual †∞� – –
207 Lehman Escrow Receipt,zero coupon,Perpetual †∞ 2 –
79 Lehman Swap Receipt,zero coupon,Perpetual †∞ – –
160 Lennar Corp,4.500%, due 30/04/2024 176 0.01
FaceValue(000’s)
Value(000’s)
$
% ofNet
AssetValue
50 Lennar Corp,4.750%, due 30/05/2025 56 –
20 Lennar Corp,5.000%, due 15/06/2027 23 –
530 Lennar Corp,4.750%, due 29/11/2027 614 0.04
400 Levi Strauss & Co,5.000%, due 01/05/2025 410 0.03
90 Lockheed Martin Corp,3.100%, due 15/01/2023 94 0.01
460 Lockheed Martin Corp,3.550%, due 15/01/2026 513 0.03
40 Lockheed Martin Corp,4.500%, due 15/05/2036 50 –
280 Lowe’s Cos Inc,4.500%, due 15/04/2030 333 0.02
370 Mars Inc, 144A,2.700%, due 01/04/2025 395 0.02
1,090 Mars Inc, 144A,3.200%, due 01/04/2030 1,207 0.07
110 Mastercard Inc,3.850%, due 26/03/2050 129 0.01
290 McDonald’s Corp,3.375%, due 26/05/2025 317 0.02
430 McDonald’s Corp,3.300%, due 01/07/2025 470 0.03
100 McDonald’s Corp,1.450%, due 01/09/2025 102 0.01
460 McDonald’s Corp,3.700%, due 30/01/2026 514 0.03
510 McDonald’s Corp,3.500%, due 01/03/2027 568 0.03
360 McDonald’s Corp,3.500%, due 01/07/2027 403 0.02
260 McDonald’s Corp,3.800%, due 01/04/2028 295 0.02
410 McDonald’s Corp,3.600%, due 01/07/2030 460 0.03
80 McDonald’s Corp,3.625%, due 01/09/2049 86 0.01
720 McDonald’s Corp,4.200%, due 01/04/2050 847 0.05
220 MDC Holdings Inc,6.000%, due 15/01/2043 291 0.02
290 Medtronic Inc,3.500%, due 15/03/2025 320 0.02
750 Merck & Co Inc,0.750%, due 24/02/2026 747 0.05
450 Merck & Co Inc,1.450%, due 24/06/2030 436 0.03
300 MetLife Inc,6.400%, due 15/12/2036 383 0.02
580 Micron Technology Inc,2.497%, due 24/04/2023 605 0.04
530 Microsoft Corp,1.550%, due 08/08/2021 533 0.03
770 Microsoft Corp,2.400%, due 06/02/2022 784 0.05
820 Microsoft Corp,2.875%, due 06/02/2024 878 0.05
200 Microsoft Corp,2.700%, due 12/02/2025 214 0.01
2,230 Microsoft Corp,2.400%, due 08/08/2026 2,384 0.15
1,400 Microsoft Corp,3.300%, due 06/02/2027 1,563 0.10
20 Microsoft Corp,3.450%, due 08/08/2036 23 –
390 Microsoft Corp,2.525%, due 01/06/2050 367 0.02
207 Microsoft Corp,3.950%, due 08/08/2056 258 0.02
43 Microsoft Corp,2.675%, due 01/06/2060 40 –
730 Mileage Plus HoldingsLLC / Mileage PlusIntellectual Property AssetsLtd, 144A,6.500%, due 20/06/2027 798 0.05
30 Molson Coors BeverageCo,3.500%, due 01/05/2022 31 –
410 Mondelez InternationalHoldings Netherlands BV,144A,2.125%, due 19/09/2022 421 0.03
The accompanying notes are an integral part of the Financial Statements
63
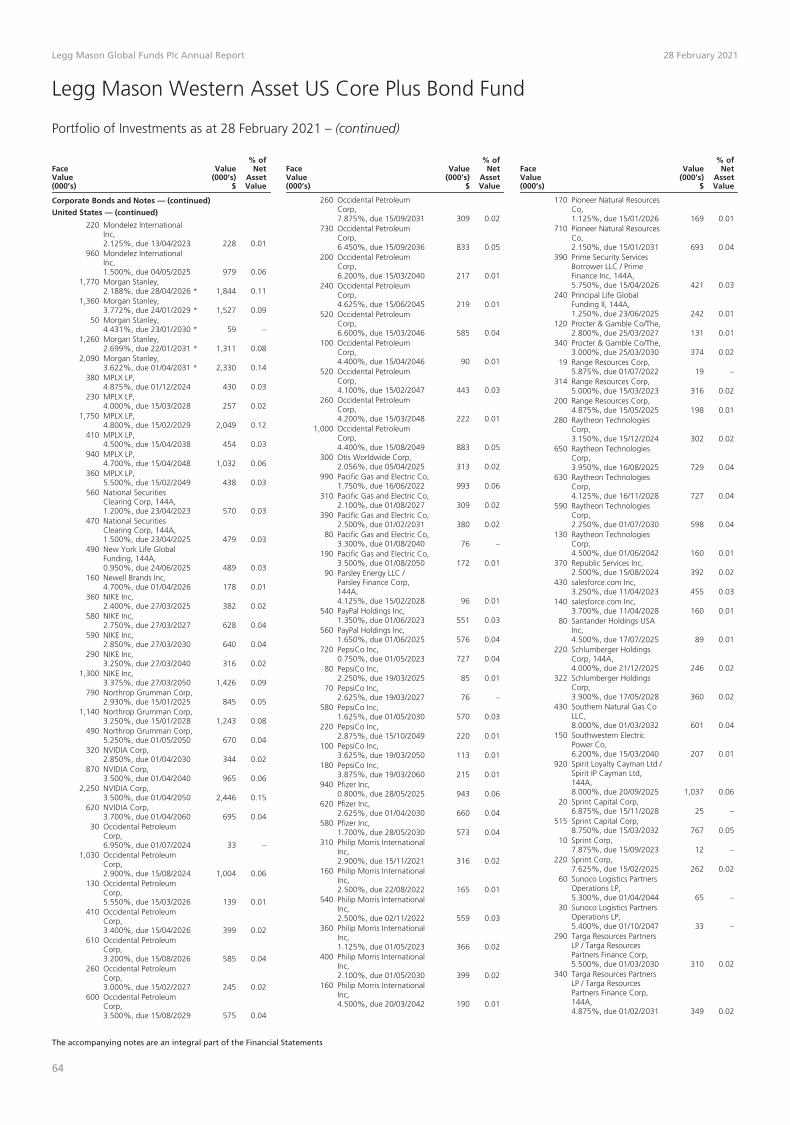
Legg Mason Global Funds Plc Annual Report 28 February 2021
Legg Mason Western Asset US Core Plus Bond Fund
Portfolio of Investments as at 28 February 2021 – (continued)
FaceValue(000’s)
Value(000’s)
$
% ofNet
AssetValue
Corporate Bonds and Notes — (continued)
United States — (continued)
220 Mondelez InternationalInc,2.125%, due 13/04/2023 228 0.01
960 Mondelez InternationalInc,1.500%, due 04/05/2025 979 0.06
1,770 Morgan Stanley,2.188%, due 28/04/2026 * 1,844 0.11
1,360 Morgan Stanley,3.772%, due 24/01/2029 * 1,527 0.09
50 Morgan Stanley,4.431%, due 23/01/2030 * 59 –
1,260 Morgan Stanley,2.699%, due 22/01/2031 * 1,311 0.08
2,090 Morgan Stanley,3.622%, due 01/04/2031 * 2,330 0.14
380 MPLX LP,4.875%, due 01/12/2024 430 0.03
230 MPLX LP,4.000%, due 15/03/2028 257 0.02
1,750 MPLX LP,4.800%, due 15/02/2029 2,049 0.12
410 MPLX LP,4.500%, due 15/04/2038 454 0.03
940 MPLX LP,4.700%, due 15/04/2048 1,032 0.06
360 MPLX LP,5.500%, due 15/02/2049 438 0.03
560 National SecuritiesClearing Corp, 144A,1.200%, due 23/04/2023 570 0.03
470 National SecuritiesClearing Corp, 144A,1.500%, due 23/04/2025 479 0.03
490 New York Life GlobalFunding, 144A,0.950%, due 24/06/2025 489 0.03
160 Newell Brands Inc,4.700%, due 01/04/2026 178 0.01
360 NIKE Inc,2.400%, due 27/03/2025 382 0.02
580 NIKE Inc,2.750%, due 27/03/2027 628 0.04
590 NIKE Inc,2.850%, due 27/03/2030 640 0.04
290 NIKE Inc,3.250%, due 27/03/2040 316 0.02
1,300 NIKE Inc,3.375%, due 27/03/2050 1,426 0.09
790 Northrop Grumman Corp,2.930%, due 15/01/2025 845 0.05
1,140 Northrop Grumman Corp,3.250%, due 15/01/2028 1,243 0.08
490 Northrop Grumman Corp,5.250%, due 01/05/2050 670 0.04
320 NVIDIA Corp,2.850%, due 01/04/2030 344 0.02
870 NVIDIA Corp,3.500%, due 01/04/2040 965 0.06
2,250 NVIDIA Corp,3.500%, due 01/04/2050 2,446 0.15
620 NVIDIA Corp,3.700%, due 01/04/2060 695 0.04
30 Occidental PetroleumCorp,6.950%, due 01/07/2024 33 –
1,030 Occidental PetroleumCorp,2.900%, due 15/08/2024 1,004 0.06
130 Occidental PetroleumCorp,5.550%, due 15/03/2026 139 0.01
410 Occidental PetroleumCorp,3.400%, due 15/04/2026 399 0.02
610 Occidental PetroleumCorp,3.200%, due 15/08/2026 585 0.04
260 Occidental PetroleumCorp,3.000%, due 15/02/2027 245 0.02
600 Occidental PetroleumCorp,3.500%, due 15/08/2029 575 0.04
FaceValue(000’s)
Value(000’s)
$
% ofNet
AssetValue
260 Occidental PetroleumCorp,7.875%, due 15/09/2031 309 0.02
730 Occidental PetroleumCorp,6.450%, due 15/09/2036 833 0.05
200 Occidental PetroleumCorp,6.200%, due 15/03/2040 217 0.01
240 Occidental PetroleumCorp,4.625%, due 15/06/2045 219 0.01
520 Occidental PetroleumCorp,6.600%, due 15/03/2046 585 0.04
100 Occidental PetroleumCorp,4.400%, due 15/04/2046 90 0.01
520 Occidental PetroleumCorp,4.100%, due 15/02/2047 443 0.03
260 Occidental PetroleumCorp,4.200%, due 15/03/2048 222 0.01
1,000 Occidental PetroleumCorp,4.400%, due 15/08/2049 883 0.05
300 Otis Worldwide Corp,2.056%, due 05/04/2025 313 0.02
990 Pacific Gas and Electric Co,1.750%, due 16/06/2022 993 0.06
310 Pacific Gas and Electric Co,2.100%, due 01/08/2027 309 0.02
390 Pacific Gas and Electric Co,2.500%, due 01/02/2031 380 0.02
80 Pacific Gas and Electric Co,3.300%, due 01/08/2040 76 –
190 Pacific Gas and Electric Co,3.500%, due 01/08/2050 172 0.01
90 Parsley Energy LLC /Parsley Finance Corp,144A,4.125%, due 15/02/2028 96 0.01
540 PayPal Holdings Inc,1.350%, due 01/06/2023 551 0.03
560 PayPal Holdings Inc,1.650%, due 01/06/2025 576 0.04
720 PepsiCo Inc,0.750%, due 01/05/2023 727 0.04
80 PepsiCo Inc,2.250%, due 19/03/2025 85 0.01
70 PepsiCo Inc,2.625%, due 19/03/2027 76 –
580 PepsiCo Inc,1.625%, due 01/05/2030 570 0.03
220 PepsiCo Inc,2.875%, due 15/10/2049 220 0.01
100 PepsiCo Inc,3.625%, due 19/03/2050 113 0.01
180 PepsiCo Inc,3.875%, due 19/03/2060 215 0.01
940 Pfizer Inc,0.800%, due 28/05/2025 943 0.06
620 Pfizer Inc,2.625%, due 01/04/2030 660 0.04
580 Pfizer Inc,1.700%, due 28/05/2030 573 0.04
310 Philip Morris InternationalInc,2.900%, due 15/11/2021 316 0.02
160 Philip Morris InternationalInc,2.500%, due 22/08/2022 165 0.01
540 Philip Morris InternationalInc,2.500%, due 02/11/2022 559 0.03
360 Philip Morris InternationalInc,1.125%, due 01/05/2023 366 0.02
400 Philip Morris InternationalInc,2.100%, due 01/05/2030 399 0.02
160 Philip Morris InternationalInc,4.500%, due 20/03/2042 190 0.01
FaceValue(000’s)
Value(000’s)
$
% ofNet
AssetValue
170 Pioneer Natural ResourcesCo,1.125%, due 15/01/2026 169 0.01
710 Pioneer Natural ResourcesCo,2.150%, due 15/01/2031 693 0.04
390 Prime Security ServicesBorrower LLC / PrimeFinance Inc, 144A,5.750%, due 15/04/2026 421 0.03
240 Principal Life GlobalFunding II, 144A,1.250%, due 23/06/2025 242 0.01
120 Procter & Gamble Co/The,2.800%, due 25/03/2027 131 0.01
340 Procter & Gamble Co/The,3.000%, due 25/03/2030 374 0.02
19 Range Resources Corp,5.875%, due 01/07/2022 19 –
314 Range Resources Corp,5.000%, due 15/03/2023 316 0.02
200 Range Resources Corp,4.875%, due 15/05/2025 198 0.01
280 Raytheon TechnologiesCorp,3.150%, due 15/12/2024 302 0.02
650 Raytheon TechnologiesCorp,3.950%, due 16/08/2025 729 0.04
630 Raytheon TechnologiesCorp,4.125%, due 16/11/2028 727 0.04
590 Raytheon TechnologiesCorp,2.250%, due 01/07/2030 598 0.04
130 Raytheon TechnologiesCorp,4.500%, due 01/06/2042 160 0.01
370 Republic Services Inc,2.500%, due 15/08/2024 392 0.02
430 salesforce.com Inc,3.250%, due 11/04/2023 455 0.03
140 salesforce.com Inc,3.700%, due 11/04/2028 160 0.01
80 Santander Holdings USAInc,4.500%, due 17/07/2025 89 0.01
220 Schlumberger HoldingsCorp, 144A,4.000%, due 21/12/2025 246 0.02
322 Schlumberger HoldingsCorp,3.900%, due 17/05/2028 360 0.02
430 Southern Natural Gas CoLLC,8.000%, due 01/03/2032 601 0.04
150 Southwestern ElectricPower Co,6.200%, due 15/03/2040 207 0.01
920 Spirit Loyalty Cayman Ltd /Spirit IP Cayman Ltd,144A,8.000%, due 20/09/2025 1,037 0.06
20 Sprint Capital Corp,6.875%, due 15/11/2028 25 –
515 Sprint Capital Corp,8.750%, due 15/03/2032 767 0.05
10 Sprint Corp,7.875%, due 15/09/2023 12 –
220 Sprint Corp,7.625%, due 15/02/2025 262 0.02
60 Sunoco Logistics PartnersOperations LP,5.300%, due 01/04/2044 65 –
30 Sunoco Logistics PartnersOperations LP,5.400%, due 01/10/2047 33 –
290 Targa Resources PartnersLP / Targa ResourcesPartners Finance Corp,5.500%, due 01/03/2030 310 0.02
340 Targa Resources PartnersLP / Targa ResourcesPartners Finance Corp,144A,4.875%, due 01/02/2031 349 0.02
The accompanying notes are an integral part of the Financial Statements
64

Legg Mason Global Funds Plc Annual Report 28 February 2021
Legg Mason Western Asset US Core Plus Bond Fund
Portfolio of Investments as at 28 February 2021 – (continued)
FaceValue(000’s)
Value(000’s)
$
% ofNet
AssetValue
Corporate Bonds and Notes — (continued)
United States — (continued)
200 Targa Resources PartnersLP / Targa ResourcesPartners Finance Corp,144A,4.000%, due 15/01/2032 196 0.01
640 Target Corp,2.250%, due 15/04/2025 674 0.04
16 Teachers Insurance &Annuity Association ofAmerica,6.850%, due 16/12/2039 24 –
1,010 Teachers Insurance &Annuity Association ofAmerica, 144A,4.900%, due 15/09/2044 1,299 0.08
1,820 Tennessee Gas Pipeline CoLLC, 144A,2.900%, due 01/03/2030 1,874 0.11
380 Texas Instruments Inc,1.750%, due 04/05/2030 376 0.02
980 The Vanguard Group Inc,3.050%, due 22/08/2050 †∞ 900 0.05
420 Time Warner Cable LLC,7.300%, due 01/07/2038 602 0.04
560 Time Warner Cable LLC,5.875%, due 15/11/2040 715 0.04
85 Time Warner EntertainmentCo LP,8.375%, due 15/07/2033 127 0.01
420 TJX Cos Inc/The,3.500%, due 15/04/2025 461 0.03
50 TJX Cos Inc/The,2.250%, due 15/09/2026 53 –
130 TJX Cos Inc/The,3.750%, due 15/04/2027 147 0.01
20 T-Mobile USA Inc,6.000%, due 01/03/2023 20 –
10 T-Mobile USA Inc,6.000%, due 15/04/2024 10 –
2,640 T-Mobile USA Inc, 144A,3.500%, due 15/04/2025 2,857 0.17
160 T-Mobile USA Inc,2.250%, due 15/02/2026 160 0.01
120 T-Mobile USA Inc, 144A,3.750%, due 15/04/2027 132 0.01
140 T-Mobile USA Inc, 144A,2.050%, due 15/02/2028 139 0.01
520 T-Mobile USA Inc,2.625%, due 15/02/2029 508 0.03
1,520 T-Mobile USA Inc, 144A,3.875%, due 15/04/2030 1,673 0.10
450 T-Mobile USA Inc, 144A,2.550%, due 15/02/2031 448 0.03
380 T-Mobile USA Inc,2.875%, due 15/02/2031 373 0.02
70 T-Mobile USA Inc, 144A,2.250%, due 15/11/2031 67 –
220 T-Mobile USA Inc, 144A,3.000%, due 15/02/2041 207 0.01
10 T-Mobile USA Inc, 144A,3.300%, due 15/02/2051 9 –
150 Toll Brothers Finance Corp,4.375%, due 15/04/2023 159 0.01
1,350 Transcontinental Gas PipeLine Co LLC,7.850%, due 01/02/2026 1,739 0.11
340 Union Pacific Corp,3.750%, due 15/07/2025 380 0.02
110 Union Pacific Corp,2.150%, due 05/02/2027 116 0.01
1,090 Union Pacific Corp,3.950%, due 10/09/2028 1,252 0.08
1,260 Union Pacific Corp,3.839%, due 20/03/2060 1,409 0.09
470 Union Pacific Corp,3.750%, due 05/02/2070 510 0.03
180 United Rentals NorthAmerica Inc,5.875%, due 15/09/2026 189 0.01
70 United Rentals NorthAmerica Inc,3.875%, due 15/11/2027 73 –
FaceValue(000’s)
Value(000’s)
$
% ofNet
AssetValue
160 United Rentals NorthAmerica Inc,4.875%, due 15/01/2028 169 0.01
210 United Rentals NorthAmerica Inc,5.250%, due 15/01/2030 231 0.01
1,230 United Rentals NorthAmerica Inc,3.875%, due 15/02/2031 1,260 0.08
230 UnitedHealth Group Inc,2.875%, due 15/12/2021 235 0.01
90 UnitedHealth Group Inc,2.375%, due 15/10/2022 93 0.01
210 UnitedHealth Group Inc,3.500%, due 15/06/2023 225 0.01
410 UnitedHealth Group Inc,3.750%, due 15/07/2025 458 0.03
210 UnitedHealth Group Inc,1.250%, due 15/01/2026 212 0.01
660 UnitedHealth Group Inc,3.875%, due 15/12/2028 762 0.05
200 UnitedHealth Group Inc,2.000%, due 15/05/2030 201 0.01
160 UnitedHealth Group Inc,4.250%, due 15/06/2048 194 0.01
130 UnitedHealth Group Inc,4.450%, due 15/12/2048 163 0.01
940 UnitedHealth Group Inc,3.700%, due 15/08/2049 1,056 0.06
300 UnitedHealth Group Inc,3.875%, due 15/08/2059 342 0.02
80 UnitedHealth Group Inc,3.125%, due 15/05/2060 80 0.01
1,410 US Bancorp,1.450%, due 12/05/2025 1,441 0.09
470 US Bank NA/CincinnatiOH,3.150%, due 26/04/2021 471 0.03
150 USAA Capital Corp, 144A,1.500%, due 01/05/2023 154 0.01
1,190 Verizon CommunicationsInc,3.376%, due 15/02/2025 1,300 0.08
210 Verizon CommunicationsInc,0.850%, due 20/11/2025 207 0.01
260 Verizon CommunicationsInc,2.625%, due 15/08/2026 278 0.02
190 Verizon CommunicationsInc,3.000%, due 22/03/2027 206 0.01
1,062 Verizon CommunicationsInc,4.329%, due 21/09/2028 1,237 0.08
190 Verizon CommunicationsInc,3.875%, due 08/02/2029 217 0.01
500 Verizon CommunicationsInc,3.150%, due 22/03/2030 537 0.03
630 Verizon CommunicationsInc,1.750%, due 20/01/2031 601 0.04
1,390 Verizon CommunicationsInc,4.500%, due 10/08/2033 1,659 0.10
580 Verizon CommunicationsInc,5.250%, due 16/03/2037 746 0.05
1,480 Verizon CommunicationsInc,2.650%, due 20/11/2040 1,385 0.08
510 Verizon CommunicationsInc,3.850%, due 01/11/2042 561 0.03
430 Verizon CommunicationsInc,4.125%, due 15/08/2046 486 0.03
550 Verizon CommunicationsInc,4.862%, due 21/08/2046 680 0.04
50 Verizon CommunicationsInc,5.500%, due 16/03/2047 67 –
FaceValue(000’s)
Value(000’s)
$
% ofNet
AssetValue
910 Verizon CommunicationsInc,4.522%, due 15/09/2048 1,074 0.07
320 Verizon CommunicationsInc,4.000%, due 22/03/2050 350 0.02
2,200 Verizon CommunicationsInc,2.875%, due 20/11/2050 2,003 0.12
830 Visa Inc,3.150%, due 14/12/2025 912 0.06
890 Visa Inc,4.300%, due 14/12/2045 1,118 0.07
390 VOC Escrow Ltd, 144A,5.000%, due 15/02/2028 386 0.02
480 Wachovia Capital Trust III,5.570%, Perpetual * 480 0.03
240 Walmart Inc,3.400%, due 26/06/2023 257 0.02
200 Walmart Inc,3.550%, due 26/06/2025 223 0.01
1,590 Walmart Inc,3.700%, due 26/06/2028 1,824 0.11
170 Walt Disney Co/The,6.650%, due 15/11/2037 252 0.02
140 Waste Management Inc,3.500%, due 15/05/2024 152 0.01
310 Waste Management Inc,4.150%, due 15/07/2049 371 0.02
140 Wells Fargo & Co,Series M,3.450%, due 13/02/2023 148 0.01
410 Wells Fargo & Co,4.480%, due 16/01/2024 455 0.03
240 Wells Fargo & Co,3.750%, due 24/01/2024 261 0.02
1,500 Wells Fargo & Co,1.654%, due 02/06/2024 * 1,538 0.09
1,150 Wells Fargo & Co,2.188%, due 30/04/2026 * 1,198 0.07
870 Wells Fargo & Co,3.000%, due 23/10/2026 945 0.06
3,940 Wells Fargo & Co,4.300%, due 22/07/2027 4,551 0.28
560 Wells Fargo & Co,3.584%, due 22/05/2028 * 620 0.04
750 Wells Fargo & Co,2.393%, due 02/06/2028 * 780 0.05
960 Wells Fargo & Co,4.150%, due 24/01/2029 1,107 0.07
1,620 Wells Fargo & Co,2.879%, due 30/10/2030 * 1,716 0.10
1,140 Wells Fargo & Co,4.478%, due 04/04/2031 * 1,349 0.08
580 Wells Fargo & Co,4.900%, due 17/11/2045 721 0.04
720 Wells Fargo & Co,4.400%, due 14/06/2046 847 0.05
1,890 Wells Fargo & Co,4.750%, due 07/12/2046 2,329 0.14
5,810 Wells Fargo & Co,5.013%, due 04/04/2051 * 7,783 0.47
130 Wells Fargo & Co,Series U,5.875%, Perpetual * 143 0.01
170 Western MidstreamOperating LP,2.325%, due 13/01/2023 * 167 0.01
460 Western MidstreamOperating LP,4.350%, due 01/02/2025 472 0.03
110 Western MidstreamOperating LP,4.500%, due 01/03/2028 114 0.01
1,890 Western MidstreamOperating LP,5.300%, due 01/02/2030 2,051 0.12
50 Western MidstreamOperating LP,5.500%, due 15/08/2048 52 –
310 Western MidstreamOperating LP,6.500%, due 01/02/2050 357 0.02
40 WestRock RKT LLC,4.000%, due 01/03/2023 42 –
The accompanying notes are an integral part of the Financial Statements
65

Legg Mason Global Funds Plc Annual Report 28 February 2021
Legg Mason Western Asset US Core Plus Bond Fund
Portfolio of Investments as at 28 February 2021 – (continued)
FaceValue(000’s)
Value(000’s)
$
% ofNet
AssetValue
Corporate Bonds and Notes — (continued)
United States — (continued)
197 Williams Cos Inc/The,7.875%, due 01/09/2021 204 0.01
100 Williams Cos Inc/The,3.700%, due 15/01/2023 105 0.01
350 Williams Cos Inc/The,Series A,7.500%, due 15/01/2031 476 0.03
760 Williams Cos Inc/The,7.750%, due 15/06/2031 1,033 0.06
1,038 Williams Cos Inc/The,8.750%, due 15/03/2032 1,559 0.09
330 WPX Energy Inc,8.250%, due 01/08/2023 381 0.02
400 WPX Energy Inc,4.500%, due 15/01/2030 426 0.03
110 Wyeth LLC,5.950%, due 01/04/2037 158 0.01
437,974 26.59
Total Corporate Bonds and Notes(Cost $522,361) 565,129 34.30
Government Bonds and Notes — 26.81%(29 February 2020: 22.67%)
Argentina — 0.14% (29 February 2020: 0.19%)
ARS 12,730 Argentina Treasury BondBONCER, Series CER,1.000%, due 05/08/2021 †� 123 0.01
212 Argentine RepublicGovernment InternationalBond,1.000%, due 09/07/2029 84 –
2,566 Argentine RepublicGovernment InternationalBond,0.125%, due 09/07/2030 934 0.06
1,062 Argentine RepublicGovernment InternationalBond,0.125%, due 09/07/2035 341 0.02
1,850 Argentine RepublicGovernment InternationalBond,0.125%, due 09/07/2041 636 0.04
370 Provincia de Buenos Aires/Government Bonds, 144A,6.500%, due 15/02/2023 � 125 0.01
320 Provincia de Buenos Aires/Government Bonds, 144A,7.875%, due 15/06/2027 � 107 –
2,350 0.14
Brazil — 0.82% (29 February 2020: 1.18%)
BRL 11,136 Brazil Notas do TesouroNacional Serie F,Series NTNF,10.000%, due 01/01/2023 2,126 0.13
BRL 17,005 Brazil Notas do TesouroNacional Serie F,Series NTNF,10.000%, due 01/01/2027 3,315 0.20
350 Brazilian GovernmentInternational Bond,2.625%, due 05/01/2023 362 0.02
770 Brazilian GovernmentInternational Bond,4.625%, due 13/01/2028 831 0.05
760 Brazilian GovernmentInternational Bond,5.625%, due 07/01/2041 801 0.05
6,120 Brazilian GovernmentInternational Bond,5.000%, due 27/01/2045 6,006 0.37
13,441 0.82
Colombia — 0.09% (29 February 2020: 0.11%)
1,270 Colombia GovernmentInternational Bond,5.625%, due 26/02/2044 1,467 0.09
Egypt — 0.07% (29 February 2020: 0.08%)
1,110 Egypt GovernmentInternational Bond, 144A,5.577%, due 21/02/2023 1,158 0.07
FaceValue(000’s)
Value(000’s)
$
% ofNet
AssetValue
Indonesia — 0.62% (29 February 2020: 0.66%)
650 Indonesia GovernmentInternational Bond,3.750%, due 25/04/2022 673 0.04
1,510 Indonesia GovernmentInternational Bond, 144A,5.875%, due 15/01/2024 1,716 0.10
200 Indonesia GovernmentInternational Bond, 144A,3.850%, due 18/07/2027 222 0.01
390 Indonesia GovernmentInternational Bond,3.500%, due 11/01/2028 421 0.03
1,610 Indonesia GovernmentInternational Bond, 144A,5.125%, due 15/01/2045 1,916 0.12
280 Indonesia GovernmentInternational Bond,5.125%, due 15/01/2045 333 0.02
200 Indonesia GovernmentInternational Bond, 144A,5.250%, due 08/01/2047 243 0.01
430 Indonesia GovernmentInternational Bond,4.350%, due 11/01/2048 467 0.03
4,260 Indonesia GovernmentInternational Bond,3.700%, due 30/10/2049 4,283 0.26
10,274 0.62
Israel — 0.07% (29 February 2020: 0.00%)
650 Israel GovernmentInternational Bond,2.750%, due 03/07/2030 694 0.04
390 State of Israel,3.375%, due 15/01/2050 394 0.03
1,088 0.07
Italy — 1.26% (29 February 2020: 0.00%)
EUR 16,950 Italy Buoni Poliennali DelTesoro,2.300%, due 15/10/2021 20,796 1.26
Kuwait — 0.10% (29 February 2020: 0.11%)
1,530 Kuwait InternationalGovernment Bond, 144A,3.500%, due 20/03/2027 1,709 0.10
Mexico — 1.96% (29 February 2020: 2.16%)
MXN 6,990 Mexican Bonos,Series M 20,10.000%, due 05/12/2024 394 0.02
MXN 148,560 Mexican Bonos,Series M 20,8.500%, due 31/05/2029 8,314 0.51
MXN 142,047 Mexican Bonos, Series M,7.750%, due 13/11/2042 7,286 0.44
MXN 256,970 Mexican Bonos, Series M,8.000%, due 07/11/2047 13,472 0.82
2,590 Mexico GovernmentInternational Bond,4.600%, due 10/02/2048 2,663 0.16
190 Mexico GovernmentInternational Bond,5.750%, due 12/10/2110 217 0.01
32,346 1.96
Nigeria — 0.02% (29 February 2020: 0.02%)
300 Nigeria GovernmentInternational Bond, 144A,6.500%, due 28/11/2027 322 0.02
Panama — 0.09% (29 February 2020: 0.00%)
470 Panama GovernmentInternational Bond,2.252%, due 29/09/2032 450 0.03
950 Panama GovernmentInternational Bond,4.500%, due 01/04/2056 1,050 0.06
1,500 0.09
Peru — 0.18% (29 February 2020: 0.06%)
1,980 Peruvian GovernmentInternational Bond,2.783%, due 23/01/2031 2,013 0.12
50 Peruvian GovernmentInternational Bond,6.550%, due 14/03/2037 69 0.01
FaceValue(000’s)
Value(000’s)
$
% ofNet
AssetValue
580 Peruvian GovernmentInternational Bond,5.625%, due 18/11/2050 797 0.05
2,879 0.18
Poland — 0.14% (29 February 2020: 0.13%)
2,100 Republic of PolandGovernment InternationalBond,4.000%, due 22/01/2024 2,312 0.14
Qatar — 0.32% (29 February 2020: 0.24%)
620 Qatar GovernmentInternational Bond, 144A,4.000%, due 14/03/2029 710 0.04
2,580 Qatar GovernmentInternational Bond, 144A,4.817%, due 14/03/2049 3,190 0.20
1,090 Qatar GovernmentInternational Bond, 144A,4.400%, due 16/04/2050 1,280 0.08
5,180 0.32
Russia — 1.31% (29 February 2020: 1.54%)
RUB 52,900 Russian Federal Bond –OFZ, Series 6211,7.000%, due 25/01/2023 734 0.05
RUB 116,430 Russian Federal Bond –OFZ, Series 6215,7.000%, due 16/08/2023 1,622 0.10
RUB 16,270 Russian Federal Bond –OFZ, Series 6219,7.750%, due 16/09/2026 233 0.01
RUB 143,230 Russian Federal Bond –OFZ, Series 6207,8.150%, due 03/02/2027 2,091 0.13
RUB 180,331 Russian Federal Bond –OFZ, Series 6212,7.050%, due 19/01/2028 2,499 0.15
RUB 384,660 Russian Federal Bond –OFZ, Series 6224,6.900%, due 23/05/2029 5,248 0.32
RUB 232,730 Russian Federal Bond –OFZ, Series 6228,7.650%, due 10/04/2030 3,330 0.20
RUB 22,030 Russian Federal Bond –OFZ, Series 6225,7.250%, due 10/05/2034 303 0.02
RUB 382,680 Russian Federal Bond –OFZ, Series 6230,7.700%, due 16/03/2039 5,501 0.33
21,561 1.31
United Arab Emirates — 0.27%(29 February 2020: 0.10%)
1,570 Abu Dhabi GovernmentInternational Bond, 144A,2.500%, due 11/10/2022 1,622 0.10
2,610 Abu Dhabi GovernmentInternational Bond, 144A,3.875%, due 16/04/2050 2,875 0.17
4,497 0.27
United States — 19.35% (29 February 2020: 16.07%)
1,440 Federal National MortgageAssociation,6.625%, due 15/11/2030 2,106 0.13
3,140 United States Treasury Bill,zero coupon,due 18/03/2021 3,140 0.19
3,110 United States TreasuryInflation Indexed Bonds,2.125%, due 15/02/2040 � 5,478 0.33
1,160 United States TreasuryInflation Indexed Bonds,2.125%, due 15/02/2041 � 2,041 0.12
3,190 United States TreasuryInflation Indexed Bonds,1.375%, due 15/02/2044 � 4,789 0.29
3,240 United States TreasuryInflation Indexed Bonds,0.750%, due 15/02/2045 � 4,300 0.26
140 United States TreasuryNote/Bond,0.250%, due 15/11/2023 140 0.01
770 United States TreasuryNote/Bond,0.375%, due 30/04/2025 765 0.05
The accompanying notes are an integral part of the Financial Statements
66

Legg Mason Global Funds Plc Annual Report 28 February 2021
Legg Mason Western Asset US Core Plus Bond Fund
Portfolio of Investments as at 28 February 2021 – (continued)
FaceValue(000’s)
Value(000’s)
$
% ofNet
AssetValue
Government Bonds and Notes — (continued)
United States — (continued)
108,670 United States TreasuryNote/Bond,0.250%, due 31/05/2025 107,227 6.51
230 United States TreasuryNote/Bond,0.250%, due 30/06/2025 227 0.01
190 United States TreasuryNote/Bond,0.250%, due 30/09/2025 187 0.01
600 United States TreasuryNote/Bond,0.250%, due 31/10/2025 589 0.04
50 United States TreasuryNote/Bond,0.375%, due 30/11/2025 49 –
560 United States TreasuryNote/Bond,0.375%, due 31/01/2026 551 0.03
30 United States TreasuryNote/Bond,0.500%, due 30/04/2027 29 –
1,600 United States TreasuryNote/Bond,0.500%, due 30/06/2027 1,551 0.10
14,490 United States TreasuryNote/Bond,0.625%, due 31/12/2027 14,045 0.85
3,600 United States TreasuryNote/Bond,0.750%, due 31/01/2028 3,516 0.21
12,010 United States TreasuryNote/Bond,1.125%, due 29/02/2028 12,023 0.73
6,490 United States TreasuryNote/Bond,0.625%, due 15/05/2030 6,081 0.37
1,500 United States TreasuryNote/Bond,0.875%, due 15/11/2030 1,431 0.09
17,510 United States TreasuryNote/Bond,1.125%, due 15/08/2040 14,987 0.91
17,050 United States TreasuryNote/Bond,1.375%, due 15/11/2040 15,254 0.93
8,010 United States TreasuryNote/Bond,2.750%, due 15/08/2047 9,063 0.55
5,130 United States TreasuryNote/Bond,3.000%, due 15/02/2048 6,084 0.37
1,100 United States TreasuryNote/Bond,3.125%, due 15/05/2048 1,334 0.08
10,900 United States TreasuryNote/Bond,2.000%, due 15/02/2050 10,621 0.65
41,450 United States TreasuryNote/Bond,1.250%, due 15/05/2050 33,487 2.03
47,130 United States TreasuryNote/Bond,1.375%, due 15/08/2050 39,361 2.39
16,360 United States TreasuryNote/Bond,1.625%, due 15/11/2050 14,553 0.88
3,910 United States TreasuryNote/Bond,1.875%, due 15/02/2051 3,704 0.23
318,713 19.35
Total Government Bonds and Notes(Cost $460,412) 441,593 26.81
Loan Notes — 5.79% (29 February 2020: 4.63%)
1,914 1011778 BC ULC,1.871%, due 14/11/2026 * 1,898 0.11
2,162 Allied Universal HoldcoLLC,4.371%, due 12/07/2026 * 2,168 0.13
558 Alterra Mountain Co,2.871%, due 31/07/2024 * 557 0.03
FaceValue(000’s)
Value(000’s)
$
% ofNet
AssetValue
275 American Axle &Manufacturing Inc,3.000%, due 06/04/2024 * 275 0.02
690 AmWINS Group, Inc.,0.000%, due 17/02/2028 * 691 0.04
1,265 APi Group Inc,2.621%, due 01/10/2026 * 1,267 0.08
410 Aramark Services Inc,1.871%, due 11/03/2025 * 408 0.02
501 Aramark Services Inc,1.871%, due 15/01/2027 * 496 0.03
2,045 Asplundh Tree Expert LLC,2.621%, due 19/08/2027 * 2,050 0.12
1,013 Asurion LLC,3.371%, due 18/12/2026 * 1,011 0.06
1,100 Asurion LLC,3.121%, due 03/11/2024 * 1,098 0.07
240 Asurion LLC,3.121%, due 03/11/2023 * 240 0.01
1,516 Athenahealth Inc,4.453%, due 11/02/2026 * 1,527 0.09
147 Atlantic Aviation Inc,3.880%, due 30/11/2025 * 148 0.01
360 Avolon TLB Borrower 1(US) LLC,3.250%, due 01/12/2027 * 361 0.02
1,085 Bausch Health AmericasInc,2.871%, due 27/11/2025 * 1,086 0.07
119 Berry Global Inc,2.121%, due 19/01/2024 * 119 0.01
1,059 Berry Global Inc,2.156%, due 01/07/2026 * 1,060 0.06
614 Beta Sub LLC,3.871%, due 06/08/2026 * 615 0.04
263 Brightview LandscapesLLC,2.625%, due 15/08/2025 * 264 0.02
734 Brookfield WEC HoldingsInc.,3.250%, due 01/08/2025 * 733 0.04
888 Caesars Resort CollectionLLC,4.621%, due 19/06/2025 * 892 0.05
1,507 Caesars Resort CollectionLLC,2.871%, due 22/12/2024 * 1,495 0.09
1,862 Change HealthcareHoldings LLC,3.500%, due 01/03/2024 * 1,867 0.11
436 Charter CommunicationsOperating LLC,1.880%, due 01/02/2027 * 436 0.03
2,108 Charter CommunicationsOperating LLC,1.880%, due 30/04/2025 * 2,110 0.13
1,271 Citadel Securities,0.000%, due 27/02/2028 * 1,266 0.08
1,012 CityCenter Holdings LLC,3.000%, due 18/04/2024 * 1,005 0.06
99 CSC Holdings LLC,2.611%, due 15/04/2027 * 99 0.01
340 DCert Buyer, Inc.,4.121%, due 16/10/2026 * 341 0.02
1,558 DCert Buyer, Inc.,4.121%, due 08/08/2026 * 1,561 0.10
1,343 Deerfield Dakota HoldingLLC,4.750%, due 05/03/2027 * 1,353 0.08
1,228 Dell International LLC,0.000%, due 19/09/2025 * 1,233 0.08
70 Delta 2 (Lux) S.a.r.l.,3.500%, due 01/02/2024 * 70 –
1,184 Delta Air Lines Inc,5.750%, due 29/04/2023 * 1,196 0.07
800 Delta Topco Inc,4.500%, due 07/10/2027 * 805 0.05
714 Edelman Financial CenterLLC/The,3.121%, due 19/07/2025 * 710 0.04
674 Elanco Animal Health Inc,1.873%, due 04/02/2027 * 673 0.04
320 Energizer Holdings, Inc.,2.750%, due 16/12/2027 * 321 0.02
332 Entercom Media Corp,2.622%, due 17/11/2024 * 328 0.02
FaceValue(000’s)
Value(000’s)
$
% ofNet
AssetValue
388 Eyecare Partners LLC,3.871%, due 20/02/2027 * 372 0.02
172 FinCo I LLC,2.621%, due 27/06/2025 * 172 0.01
244 First Eagle Holdings Inc,2.754%, due 17/02/2027 * 244 0.02
799 Focus Financial PartnersLLC,2.121%, due 03/07/2024 * 798 0.05
914 Four Seasons Hotels Ltd,2.121%, due 30/11/2023 * 913 0.06
667 Froneri U.S. Inc,2.371%, due 30/01/2027 * 662 0.04
1,170 Gainwell AcquisitionCorp.,0.000%, due 01/10/2027 * 1,169 0.07
350 Garda World SecurityCorp,4.990%, due 23/10/2026 * 352 0.02
2,149 Genesee & Wyoming Inc,2.254%, due 30/12/2026 * 2,154 0.13
177 GFL Environmental Inc.,3.500%, due 31/05/2025 * 178 0.01
508 GoDaddy Operating Co,1.871%, due 15/02/2024 * 508 0.03
508 Golden Nugget LLC,3.250%, due 04/10/2023 * 504 0.03
2,083 Grifols WorldwideOperations USA Inc,2.090%, due 15/11/2027 * 2,081 0.13
1,128 Harbor Freight Tools,4.000%, due 14/10/2027 * 1,134 0.07
285 HCA Inc,1.871%, due 13/03/2025 * 286 0.02
1,435 Hilton Worldwide FinanceLLC,1.868%, due 21/06/2026 * 1,434 0.09
632 iHeartCommunications Inc,3.121%, due 01/05/2026 * 628 0.04
680 Ineos U.S. Petrochemical,0.000%, due 21/01/2026 * 682 0.04
1,367 Jane Street Group, LLC,0.000%, due 21/01/2027 * 1,365 0.08
2,100 Level 3 Parent LLC,1.871%, due 01/03/2027 * 2,095 0.13
1,858 McAfee LLC,3.871%, due 29/09/2024 * 1,865 0.11
273 Michaels Stores,4.250%, due 16/09/2027 * 273 0.02
710 Milano Acquisition Corp,4.750%, due 17/08/2027 * 709 0.04
1,351 MPH Acquisition HoldingsLLC,3.750%, due 07/06/2023 * 1,351 0.08
2,189 Nexstar Broadcasting Inc,2.873%, due 19/09/2026 * 2,195 0.13
776 Panther BF Aggregator 2LP,3.621%, due 18/03/2026 * 776 0.05
670 Parexel InternationalCorporation,2.871%, due 27/09/2024 * 667 0.04
351 PCI Gaming Authority,2.621%, due 31/05/2026 * 351 0.02
635 Phoenix Guarantor Inc,3.361%, due 05/03/2026 * 634 0.04
1,980 PPD, Inc.,2.750%, due 06/01/2028 * 1,989 0.12
1,859 Prime Security,3.500%, due 23/09/2026 * 1,863 0.11
990 Rackspace TechnologyGlobal, Inc,0.000%, due 09/02/2028 * 991 0.06
78 Realogy Group LLC,3.000%, due 08/02/2025 * 78 0.01
1,610 RealPage Inc,0.000%, due 18/02/2028 * 1,614 0.10
1,500 RegionalCare HospitalPartners Holding,3.871%, due 16/11/2025 * 1,503 0.09
1,903 Reynolds ConsumerProducts LLC,1.871%, due 04/02/2027 * 1,906 0.12
420 Reynolds Group HoldingsInc,2.871%, due 05/02/2023 * 420 0.03
The accompanying notes are an integral part of the Financial Statements
67

Legg Mason Global Funds Plc Annual Report 28 February 2021
Legg Mason Western Asset US Core Plus Bond Fund
Portfolio of Investments as at 28 February 2021 – (continued)
FaceValue(000’s)
Value(000’s)
$
% ofNet
AssetValue
Loan Notes — (continued)
2,354 Scientific GamesInternational Inc,2.871%, due 14/08/2024 * 2,320 0.14
1,480 SkyMiles IP Ltd,4.750%, due 16/09/2027 * 1,567 0.10
1,870 Sotera Health,3.250%, due 13/12/2026 * 1,874 0.11
21 Stars Group Holdings BV,3.754%, due 10/07/2025 * 21 –
1,400 Station Casinos LLC,2.500%, due 08/02/2027 * 1,387 0.08
881 Terrier Media Buyer, Inc.,3.623%, due 17/12/2026 * 881 0.05
1,483 TKC Holdings Inc,4.750%, due 01/02/2023 * 1,462 0.09
988 Trans Union LLC,1.871%, due 13/11/2026 * 991 0.06
80 TransDigm Group Inc,2.371%, due 09/12/2025 * 79 0.01
1,482 UFC Holdings LLC,3.750%, due 29/04/2026 * 1,487 0.09
843 Univision CommunicationsInc,4.750%, due 24/03/2026 * 849 0.05
597 US Foods Inc,1.871%, due 27/06/2023 * 593 0.04
219 Valeant PharmaceuticalsInternational,3.121%, due 28/05/2025 * 219 0.01
509 Verscend Holding Corp,4.621%, due 27/08/2025 * 512 0.03
620 Verscend Holding Corp.,0.000%, due 27/08/2025 * 625 0.04
361 VFH Parent LLC,3.111%, due 01/03/2026 * 362 0.02
1,810 VICI Properties 1 LLC,1.861%, due 22/12/2024 * 1,801 0.11
2,102 Virgin Media Bristol LLC,2.612%, due 04/01/2028 * 2,100 0.13
476 Western Digital Corp,1.871%, due 29/04/2023 * 477 0.03
19 Whatabrands LLC,2.862%, due 03/08/2026 * 19 –
1,763 Wynn Resorts Finance LLC,1.880%, due 20/09/2024 * 1,718 0.10
690 Zayo Group Holdings, Inc.,0.000%, due 09/03/2027 * 690 0.04
590 Ziggo BV,2.612%, due 15/04/2028 * 587 0.04
Total Loan Notes (Cost $95,148) 95,370 5.79
Municipal Bonds — 0.04% (29 February 2020: 0.00%)
590 Health & EducationalFacilities Authority of theState of Missouri,3.229%, due 15/05/2050 651 0.04
Total Municipal Bonds (Cost $590) 651 0.04
Collective Investment Schemes — 1.67%(29 February 2020: 0.67%)
1,974 Legg Mason China Funds –Western Asset China BondFund – Class LM ** 27,476 1.67
Total Collective Investment Schemes(Cost $25,384) 27,476 1.67
Total Investments at fair valuethrough profit or loss(Cost $1,704,464) 1,733,302 105.21
Contracts(000’s)
Value(000’s)
$
% ofNet
AssetValue
Purchased Options — 0.05% (29 February 2020: 0.20%)
– U.S. 10 Year April 2021Call 135.00,due 26/03/2021 – MorganStanley 9 –
– U.S. 10 Year April 2021Put 133.50,due 26/03/2021 – MorganStanley 84 0.01
Contracts(000’s)
Value(000’s)
$
% ofNet
AssetValue
– U.S. 10 Year April 2021Put 133.75,due 26/03/2021 – MorganStanley 233 0.01
– U.S. 10 Year April 2021Put 134.25,due 26/03/2021 – MorganStanley 283 0.02
– U.S. Bond April 2021 Call161.00, due 26/03/2021 –Morgan Stanley 40 –
– U.S. Bond April 2021 Call164.00, due 26/03/2021 –Morgan Stanley 11 –
17,080 USD Put/CAD Call1.2685, due 18/03/2021 –BNP Paribas 127 0.01
Total Purchased Options (Cost $648) 787 0.05
Credit Default Swaps — 0.59%(29 February 2020: 0.06%)
Unrealised appreciation of contracts(see below) 9,660 0.59
Interest Rate Swaps — 0.49% (29 February 2020: 0.08%)
Unrealised appreciation of contracts(see below) 8,077 0.49
Forward Foreign Currency Contracts — 0.10%(29 February 2020: 0.10%)
Unrealised appreciation of contracts(see below) 1,679 0.10
Futures — 0.18% (29 February 2020: 0.75%)
Unrealised appreciation of contracts(see below) 2,931 0.18
Total Financial Assets at fair valuethrough profit or loss 1,756,436 106.62
Written Options — (0.12%) (29 February 2020: (0.50%))
– U.S. 10 Year April 2021Call 135.25,due 26/03/2021 – MorganStanley (6) –
– U.S. 10 Year April 2021Call 135.50,due 26/03/2021 – MorganStanley (15) –
– U.S. 10 Year April 2021Call 136.50,due 26/03/2021 – MorganStanley (8) –
– U.S. 10 Year April 2021Call 137.00,due 26/03/2021 – MorganStanley (3) –
– U.S. 10 Year April 2021Put 132.75,due 26/03/2021 – MorganStanley (77) (0.01)
(1) U.S. 10 Year April 2021Put 134.00,due 26/03/2021 – MorganStanley (969) (0.06)
– U.S. 10 Year June 2021Call 137.00,due 21/05/2021 – MorganStanley (23) –
– U.S. 10 Year June 2021Put 131.00,due 21/05/2021 – MorganStanley (111) (0.01)
– U.S. 10 Year May 2021Call 134.00,due 23/04/2021 – MorganStanley (75) (0.01)
– U.S. 10 Year May 2021Call 136.50,due 23/04/2021 – MorganStanley (4) –
– U.S. 5 Year April 2021 Put125.00, due 26/03/2021 –Morgan Stanley (290) (0.02)
– U.S. Bond April 2021 Call163.00, due 26/03/2021 –Morgan Stanley (51) –
– U.S. Bond April 2021 Call166.00, due 26/03/2021 –Morgan Stanley (9) –
Contracts(000’s)
Value(000’s)
$
% ofNet
AssetValue
– U.S. Bond April 2021 Put155.00, due 26/03/2021– Morgan Stanley (31) –
– U.S. Bond April 2021 Put160.00, due 26/03/2021– Morgan Stanley (192) (0.01)
– U.S. Bond May 2021 Call164.00, due 23/04/2021– Morgan Stanley (67) –
Total Written Options (Cost $(802)) (1,931) (0.12)
Interest Rate Swaps — (0.08%)(29 February 2020: (0.66%))
Unrealised depreciation of contracts(see below) (1,290) (0.08)
Forward Foreign Currency Contracts — (0.15%)(29 February 2020: (0.30%))
Unrealised depreciation of contracts(see below) (2,446) (0.15)
Futures — (0.35%) (29 February 2020: (0.46%))
Unrealised depreciation of contracts(see below) (5,784) (0.35)
Total Financial Liabilities at fairvalue through profit or loss (11,451) (0.70)
Total Financial Assets and FinancialLiabilities at fair value throughprofit or loss 1,744,985 105.92
Liabilities in Excess of Other Assets (97,567) (5.92)
Total Net Assets $1,647,418 100.00
– Amounts designated as “–” are either $0, less than$1,000, less than 1,000 shares or less than 0.01%.
144A Securities exempt from registration under Rule 144A ofthe Securities Act of 1933, as amended. Thesesecurities may only be resold, in transactions exemptfrom registration, to qualified institutional buyers. As at28 February 2021, these securities amounted to$218,457,000 or 13.24% of net assets.
* Variable rate security. The interest rate shown reflectsthe rate in effect at 28 February 2021.
† Illiquid.
∞ Security is valued in good faith at fair value by or at thediscretion of the Manager or the respective InvestmentManager.
� Security is in default as at 28 February 2021 (eitherprincipal and / or interest).
± Securities purchased on a to-be-announced basis.
� The rate of interest on this type of security is tied to theConsumer Price Index (CPI)/Retail Price Index (RPI). Thecoupon rate is the rate as of 28 February 2021.
** On 31 March 2021, Class M of the Unit Trust was re-named into Class LM.
ABBREVIATIONS:
Perpetual – A bond with no maturity date. Perpetual bondsare not redeemable but pay a steady stream ofinterest.
REMIC – Real Estate Mortgage Investment Conduit.
TBA – To Be Announced.
ARS – Argentine Peso
BRL – Brazilian Real
EUR – Euro
MXN – Mexican Peso
RUB – Russian Ruble
Analysis of Total Assets
% ofTotal
Assets
Transferable securities admitted to an officialexchange listing or traded on a regulated market 86.21
Other transferable securities dealt in on anotherregulated market 5.11
Collective investment schemes 1.47
Financial derivative instruments 1.24
Other assets 5.97
Total Assets 100.00
The accompanying notes are an integral part of the Financial Statements
68

Legg Mason Global Funds Plc Annual Report 28 February 2021
Legg Mason Western Asset US Core Plus Bond Fund
Portfolio of Investments as at 28 February 2021 – (continued)
Schedule of Credit Default Swaps
Counterparty Reference EntityBuy/Sell
ProtectionExpiration
Date
NotionalAmount(000’s)
Value(000’s)
Morgan Stanley CDX.NA.HY, 5.000% Sell 20/12/2025 49,855 $ 4,140Morgan Stanley CDX.NA.IG, 1.000% Sell 20/12/2025 194,097 4,064Morgan Stanley CDX.NA.IG, 1.000% Sell 20/06/2025 93,883 1,456
Unrealised Appreciation of Credit Default Swaps (29 February 2020 (000’s): $890) $ 9,660Unrealised Depreciation of Credit Default Swaps (29 February 2020 (000’s): $–) –
Net Appreciation of Credit Default Swaps (29 February 2020 (000’s): $890) $ 9,660
Schedule of Interest Rate Swaps
Counterparty Rate Expiration DateNotional Amount
(000’s)Value(000’s)
Morgan Stanley Pay Floating MXN TIIE Banxico, Receive Fixed 7.450% 18/07/2029 142,060 $ 630Morgan Stanley Pay Floating MXN TIIE Banxico, Receive Fixed 7.440% 20/07/2029 147,960 651Citi Pay Floating BRL CDI CETIP, Receive Fixed 7.024% 04/01/2027 16,899 44Citi Pay Floating BRL CDI CETIP, Receive Fixed 7.024% 04/01/2027 15,900 42Citi Pay Floating BRL CDI, Receive Fixed 7.024% 04/01/2027 13,400 35JP Morgan Pay Floating BRL CDI, Receive Fixed 7.044% 04/01/2027 11,000 31Morgan Stanley Pay Floating USD 3M Libor BBA, Receive Fixed 0.190% 15/06/2022 56,215 (4)Morgan Stanley Pay Floating USD 3M Libor BBA, Receive Fixed 0.380% 28/02/2025 104,267 (1,181)Morgan Stanley Pay Fixed 0.260%, Receive Floating USD Fed Funds Rate 15/05/2027 36,140 1,443Morgan Stanley Pay Fixed 0.450%, Receive Floating USD 3M Libor BBA 15/05/2027 6,293 250Morgan Stanley Pay Fixed 0.780%, Receive Floating USD 3M Libor BBA 15/11/2027 22,635 606Morgan Stanley Pay Fixed 1.200%, Receive Floating USD 3M Libor BBA 15/02/2047 7,206 1,123Morgan Stanley Pay Fixed 1.225%, Receive Floating USD 3M Libor BBA 15/02/2047 3,620 524Morgan Stanley Pay Fixed 2.000%, Receive Floating USD 3M Libor BBA 15/02/2047 11,410 (105)Morgan Stanley Pay Fixed 0.900%, Receive Floating USD 3M Libor BBA 17/03/2050 5,517 1,328Morgan Stanley Pay Fixed 1.200%, Receive Floating USD 3M Libor BBA 07/10/2050 7,910 1,370
Unrealised Appreciation of Interest Rate Swaps (29 February 2020 (000’s): $1,221) $ 8,077Unrealised Depreciation of Interest Rate Swaps (29 February 2020 (000’s): $(10,140)) (1,290)
Net Appreciation of Interest Rate Swaps (29 February 2020 (000’s): $(8,919)) $ 6,787
Schedule of Forward Foreign Currency Contracts
Expiration Date CounterpartyBuy Currency
(000’s)Sell Currency
(000’s)
UnrealisedAppreciation/(Depreciation)of Contracts
(000’s)
12/03/2021 BNY Mellon Buy USD 448 Sell AUD 566 $ 1212/03/2021 BNY Mellon Buy USD 1,099 Sell EUR 912 (2)12/03/2021 BNY Mellon Buy USD 6,331 Sell EUR 5,210 4512/03/2021 BNY Mellon Buy USD 2 Sell GBP 2 –12/03/2021 BNY Mellon Buy EUR 77,645 Sell USD 93,479 23212/03/2021 BNY Mellon Buy EUR 16,114 Sell USD 19,528 (81)12/03/2021 BNY Mellon Buy AUD – Sell USD – –12/03/2021 BNY Mellon Buy AUD 2,820 Sell USD 2,155 1512/03/2021 BNY Mellon Buy GBP 53 Sell USD 73 219/04/2021 BNP Paribas Buy USD 36,982 Sell EUR 30,280 40319/04/2021 Citi Buy USD 27,268 Sell CNH 176,871 9819/04/2021 Citi Buy ZAR 29,450 Sell USD 1,977 (43)19/04/2021 Citi Buy RUB 811,960 Sell USD 10,777 3219/04/2021 Citi Buy MXN 176,117 Sell USD 8,728 (357)19/04/2021 Citi Buy GBP 8,592 Sell USD 11,663 31019/04/2021 Citi Buy JPY 2,167,758 Sell USD 21,032 (683)19/04/2021 Citi Buy EUR 1,500 Sell USD 1,811 119/04/2021 Citi Buy EUR 2,000 Sell USD 2,428 (12)19/04/2021 Citi Buy CAD 46,775 Sell USD 36,922 (164)19/04/2021 Citi Buy BRL 22,175 Sell USD 4,152 (202)19/04/2021 Citi Buy AUD 28,783 Sell USD 22,466 (314)19/04/2021 Goldman Sachs Buy USD 33,923 Sell EUR 27,648 52419/04/2021 Goldman Sachs Buy RUB 163,405 Sell USD 2,171 519/04/2021 Goldman Sachs Buy BRL 7,410 Sell USD 1,368 (48)19/04/2021 JP Morgan Buy IDR 219,474,873 Sell USD 15,655 (528)19/04/2021 JP Morgan Buy INR 156,175 Sell USD 2,108 (12)
Unrealised Appreciation of Forward Foreign Currency Contracts (29 February 2020 (000’s): $1,518) $ 1,679Unrealised Depreciation of Forward Foreign Currency Contracts (29 February 2020 (000’s): $(4,601)) (2,446)
Net Depreciation of Forward Foreign Currency Contracts (29 February 2020 (000’s): $(3,083)) $ (767)
The accompanying notes are an integral part of the Financial Statements
69

Legg Mason Global Funds Plc Annual Report 28 February 2021
Legg Mason Western Asset US Core Plus Bond Fund
Portfolio of Investments as at 28 February 2021 – (continued)
Schedule of Futures Contracts
CounterpartyNominal
Value
NotionalValue(000’s)
UnrealisedAppreciation/(Depreciation)of Contracts
(000’s)
90 Day Euro$ December 2021 Morgan Stanley (1,661) $(414,295) $ (902)
90 Day Euro$ December 2023 Morgan Stanley 685 169,383 (467)
90 Day Euro$ June 2021 Morgan Stanley (215) (53,659) (623)
90 Day Euro$ March 2021 Morgan Stanley (873) (217,857) (345)
Euro FX Currency March 2021 Morgan Stanley 9 1,359 (7)
Euro-Bund March 2021 Morgan Stanley (401) (83,896) 1,739
Euro-Buxl 30 Year Bond March 2021 Morgan Stanley (26) (6,582) 392
Euro-OAT March 2021 Morgan Stanley 91 17,944 (392)
Japan 10 Year Bond (OSE) March 2021 Morgan Stanley (13) (18,369) 172
Mexican Peso Currency March 2021 Morgan Stanley 9 215 (11)
U.S. 10 Year Note (CBT) June 2021 Morgan Stanley 161 21,368 (208)
U.S. 10 Year Ultra Note June 2021 Morgan Stanley (267) (39,341) 621
U.S. 2 Year Note (CBT) June 2021 Morgan Stanley (37) (8,168) 7
U.S. 5 Year Note (CBT) June 2021 Morgan Stanley 1,163 144,176 (1,240)
U.S. Long Bond (CBT) June 2021 Morgan Stanley 61 9,712 (192)
U.S. Ultra Bond (CBT) June 2021 Morgan Stanley 474 89,616 (1,397)
Unrealised Appreciation of Futures Contracts (29 February 2020 (000’s): $11,483) $ 2,931
Unrealised Depreciation of Futures Contracts (29 February 2020 (000’s): $(7,061)) (5,784)
Net Depreciation of Futures Contracts (29 February 2020 (000’s): $4,422) $ (2,853)
The accompanying notes are an integral part of the Financial Statements
70

Legg Mason Global Funds Plc Annual Report 28 February 2021
Legg Mason Western Asset Euro Core Plus Bond Fund
Portfolio of Investments as at 28 February 2021
FaceValue(000’s)
Value(000’s)
€
% ofNet
AssetValue
Corporate Bonds and Notes — 39.27%(29 February 2020: 47.73%)
Australia — 0.92% (29 February 2020: 0.00%)
970 Glencore Finance Europe Ltd,1.750%, due 17/03/2025 1,022 0.92
Belgium — 1.79% (29 February 2020: 1.59%)
140 Anheuser-Busch InBev SA/NV,2.125%, due 02/12/2027 157 0.14
USD 90 Anheuser-Busch InBevWorldwide Inc,4.350%, due 01/06/2040 87 0.08
USD 140 Anheuser-Busch InBevWorldwide Inc,4.500%, due 01/06/2050 134 0.12
1,100 KBC Group NV,0.007%, due 24/11/2022 * 1,108 0.99
500 KBC Group NV,1.875%, due 11/03/2027 * 509 0.46
1,995 1.79
Canada — 0.10% (29 February 2020: 1.52%)
USD 68 1011778 BC ULC / New RedFinance Inc, 144A,4.250%, due 15/05/2024 57 0.05
USD 60 1011778 BC ULC / New RedFinance Inc, 144A,3.500%, due 15/02/2029 49 0.04
USD 10 MEG Energy Corp, 144A,5.875%, due 01/02/2029 8 0.01
114 0.10
Denmark — 0.36% (29 February 2020: 1.06%)
390 Danske Bank A/S,0.750%, due 02/06/2023 398 0.36
France — 2.58% (29 February 2020: 3.30%)
310 Altice France SA/France,3.375%, due 15/01/2028 304 0.27
460 BNP Paribas SA,2.875%, due 20/03/2026 * 461 0.42
600 Dassault Systemes SE,0.125%, due 16/09/2026 601 0.54
540 RCI Banque SA,0.100%, due 12/04/2021 * 540 0.49
200 RTE Reseau de Transportd’Electricite SADIR,2.125%, due 27/09/2038 245 0.22
700 Thales SA,0.750%, due 23/01/2025 716 0.64
2,867 2.58
Germany — 3.83% (29 February 2020: 5.58%)
100 Allianz Finance II BV,5.750%, due 08/07/2041 * 102 0.09
100 Allianz SE,4.750%, Perpetual * 111 0.10
200 Bayer AG,2.375%, due 12/11/2079 * 202 0.18
300 MuenchenerRueckversicherungs-Gesellschaft AG in Muenchen,6.250%, due 26/05/2042 * 322 0.29
400 MuenchenerRueckversicherungs-Gesellschaft AG in Muenchen,3.250%, due 26/05/2049 * 463 0.42
1,020 NRW Bank,0.375%, due 16/05/2029 1,056 0.95
900 Volkswagen Leasing GmbH,0.000%, due 06/07/2021 * 901 0.81
1,100 Vonovia Finance BV,0.000%, due 22/12/2022 * 1,106 0.99
4,263 3.83
Israel — 0.29% (29 February 2020: 0.27%)
USD 370 Teva Pharmaceutical FinanceCo BV,2.950%, due 18/12/2022 308 0.27
USD 10 Teva Pharmaceutical FinanceNetherlands III BV,2.800%, due 21/07/2023 8 0.01
USD 10 Teva Pharmaceutical FinanceNetherlands III BV,3.150%, due 01/10/2026 8 0.01
324 0.29
FaceValue(000’s)
Value(000’s)
€
% ofNet
AssetValue
Italy — 0.56% (29 February 2020: 0.72%)
620 UniCredit SpA,2.000%, due 23/09/2029 * 618 0.56
Japan — 0.59% (29 February 2020: 0.53%)
300 Asahi Group Holdings Ltd,1.151%, due 19/09/2025 314 0.28
340 Mitsubishi UFJ Financial GroupInc,0.680%, due 26/01/2023 345 0.31
659 0.59
Jersey — 0.26% (29 February 2020: 0.24%)
290 LHC3 Plc,4.125%, due 15/08/2024 295 0.26
Luxembourg — 1.26% (29 February 2020: 1.13%)
528 Blackstone Property PartnersEurope Holdings Sarl,2.200%, due 24/07/2025 565 0.51
260 Prologis International Funding IISA,2.375%, due 14/11/2030 305 0.27
500 SELP Finance Sarl,1.500%, due 20/11/2025 528 0.48
1,398 1.26
Netherlands — 2.09% (29 February 2020: 2.40%)
850 ABN AMRO Bank NV,7.125%, due 06/07/2022 932 0.84
200 Cooperatieve Rabobank UA,6.625%, Perpetual * 204 0.18
250 CTP BV,0.625%, due 27/11/2023 253 0.23
320 Enexis Holding NV,0.750%, due 02/07/2031 333 0.30
300 ING Groep NV,3.000%, due 11/04/2028 * 316 0.28
100 IPD 3 BV,5.500%, due 01/12/2025 104 0.09
USD 10 NXP BV / NXP Funding LLC /NXP USA Inc, 144A,2.700%, due 01/05/2025 9 0.01
USD 40 Shell International Finance BV,2.750%, due 06/04/2030 35 0.03
USD 170 Shell International Finance BV,3.250%, due 06/04/2050 143 0.13
2,329 2.09
Norway — 1.25% (29 February 2020: 1.45%)
1,030 DNB Bank ASA,0.050%, due 14/11/2023 1,037 0.93
350 DNB Bank ASA,1.250%, due 01/03/2027 * 354 0.32
1,391 1.25
Poland — 0.47% (29 February 2020: 0.42%)
520 Powszechna Kasa OszczednosciBank Polski SA,0.750%, due 25/07/2021 521 0.47
Singapore — 0.50% (29 February 2020: 0.47%)
500 Temasek Financial I Ltd,1.250%, due 20/11/2049 552 0.50
South Africa — 0.29% (29 February 2020: 0.26%)
310 Anglo American Capital Plc,1.625%, due 18/09/2025 328 0.29
Spain — 0.66% (29 February 2020: 0.90%)
300 Banco Santander SA,2.500%, due 18/03/2025 322 0.29
440 Tendam Brands SAU,5.250%, due 15/09/2024 * 413 0.37
735 0.66
Supranational — 4.09% (29 February 2020: 8.08%)
780 African Development Bank,0.500%, due 21/03/2029 812 0.73
3,480 European Stability Mechanism,Series EUR,0.750%, due 05/09/2028 3,745 3.36
4,557 4.09
Sweden — 0.84% (29 February 2020: 1.76%)
760 Svenska Handelsbanken AB,1.250%, due 02/03/2028 * 777 0.70
FaceValue(000’s)
Value(000’s)
€
% ofNet
AssetValue
160 Verisure Holding AB,5.000%, due 15/04/2025 * 164 0.14
941 0.84
Switzerland — 1.20% (29 February 2020: 1.93%)
230 Credit Suisse Group AG,3.250%, due 02/04/2026 * 258 0.23
160 Holcim Finance LuxembourgSA,3.000%, Perpetual * 166 0.15
330 UBS Group AG,1.750%, due 16/11/2022 341 0.31
550 UBS Group AG,1.500%, due 30/11/2024 572 0.51
1,337 1.20
United Arab Emirates — 0.20%(29 February 2020: 0.00%)
USD 250 MDGH – GMTN BV,2.875%, due 21/05/2030 218 0.20
United Kingdom — 4.29% (29 February 2020: 4.80%)
373 Aviva Plc,6.125%, due 05/07/2043 * 425 0.38
100 Aviva Plc,3.375%, due 04/12/2045 * 111 0.10
360 Barclays Plc,3.375%, due 02/04/2025 * 394 0.35
270 Leeds Building Society,1.375%, due 05/05/2022 275 0.25
1,110 Lloyds Banking Group Plc,0.239%, due 21/06/2024 * 1,123 1.01
530 Natwest Group Plc,2.500%, due 22/03/2023 557 0.50
GBP 140 Pinewood Finance Co Ltd,3.250%, due 30/09/2025 166 0.15
420 Rentokil Initial Plc,0.950%, due 22/11/2024 434 0.39
USD 280 Standard Chartered Plc,3.950%, due 11/01/2023 244 0.22
580 Standard Chartered Plc,3.125%, due 19/11/2024 638 0.57
GBP 140 Virgin Media Secured FinancePlc,5.250%, due 15/05/2029 173 0.16
100 Wellcome Trust Ltd/The,1.125%, due 21/01/2027 107 0.10
125 Yorkshire Building Society,1.250%, due 17/03/2022 127 0.11
4,774 4.29
United States — 10.85% (29 February 2020: 8.98%)
USD 50 3M Co,3.700%, due 15/04/2050 47 0.04
430 AbbVie Inc,1.250%, due 01/06/2024 446 0.40
USD 40 Amazon.com Inc,4.250%, due 22/08/2057 41 0.04
USD 30 American International GroupInc,2.500%, due 30/06/2025 26 0.02
220 AT&T Inc,3.550%, due 17/12/2032 277 0.25
720 Bank of America Corp,1.379%, due 07/02/2025 * 748 0.67
250 Becton Dickinson and Co,1.000%, due 15/12/2022 254 0.23
420 Berkshire Hathaway Inc,1.125%, due 16/03/2027 444 0.40
USD 290 Boeing Co/The,5.150%, due 01/05/2030 280 0.25
USD 150 Boeing Co/The,5.805%, due 01/05/2050 161 0.14
USD 60 BP Capital Markets AmericaInc,3.633%, due 06/04/2030 56 0.05
USD 13 Bristol-Myers Squibb Co,2.900%, due 26/07/2024 12 0.01
USD 70 Broadcom Inc,3.150%, due 15/11/2025 62 0.06
USD 70 CCO Holdings LLC / CCOHoldings Capital Corp, 144A,4.500%, due 01/05/2032 60 0.05
The accompanying notes are an integral part of the Financial Statements
71

Legg Mason Global Funds Plc Annual Report 28 February 2021
Legg Mason Western Asset Euro Core Plus Bond Fund
Portfolio of Investments as at 28 February 2021 – (continued)
FaceValue(000’s)
Value(000’s)
€
% ofNet
AssetValue
Corporate Bonds and Notes — (continued)
United States — (continued)
USD 20 Charter CommunicationsOperating LLC / CharterCommunications OperatingCapital,4.908%, due 23/07/2025 19 0.02
USD 30 Cheniere Energy Inc, 144A,4.625%, due 15/10/2028 26 0.02
790 Citigroup Inc,1.750%, due 28/01/2025 842 0.76
USD 10 Coca-Cola Co/The,2.500%, due 01/06/2040 8 0.01
USD 10 Coca-Cola Co/The,2.600%, due 01/06/2050 8 0.01
USD 50 Coca-Cola Co/The,2.500%, due 15/03/2051 38 0.03
USD 80 Costco Wholesale Corp,1.600%, due 20/04/2030 65 0.06
USD 290 CSC Holdings LLC, 144A,4.125%, due 01/12/2030 242 0.22
USD 140 CVS Health Corp,3.750%, due 01/04/2030 130 0.12
USD 90 Delta Air Lines Inc,3.800%, due 19/04/2023 77 0.07
USD 170 Delta Air Lines Inc, 144A,7.000%, due 01/05/2025 164 0.15
USD 100 Delta Air Lines Inc / SkyMiles IPLtd, 144A,4.500%, due 20/10/2025 89 0.08
USD 90 Delta Air Lines Inc / SkyMiles IPLtd, 144A,4.750%, due 20/10/2028 83 0.07
430 DH Europe Finance II Sarl,1.800%, due 18/09/2049 468 0.42
USD 60 Exxon Mobil Corp,3.452%, due 15/04/2051 51 0.05
USD 200 Ford Motor Credit Co LLC,4.000%, due 13/11/2030 170 0.15
USD 20 Freeport-McMoRan Inc,4.625%, due 01/08/2030 18 0.02
USD 200 Freeport-McMoRan Inc,5.450%, due 15/03/2043 206 0.18
520 Goldman Sachs Group Inc/The,2.000%, due 27/07/2023 546 0.49
540 Goldman Sachs Group Inc/The,2.125%, due 30/09/2024 578 0.52
USD 50 Goldman Sachs Group Inc/The,3.500%, due 01/04/2025 45 0.04
680 Goldman Sachs Group Inc/The,2.000%, due 01/11/2028 756 0.68
USD 70 Home Depot Inc/The,2.700%, due 15/04/2030 62 0.05
USD 20 Home Depot Inc/The,3.300%, due 15/04/2040 18 0.02
USD 210 Home Depot Inc/The,3.350%, due 15/04/2050 186 0.17
580 John Deere Bank SA,0.000%, due 03/10/2022 * 583 0.52
USD 60 JPMorgan Chase & Co,2.522%, due 22/04/2031 * 51 0.05
USD 110 JPMorgan Chase & Co,3.109%, due 22/04/2051 * 93 0.08
USD 20 McDonald’s Corp,3.625%, due 01/09/2049 18 0.02
USD 70 McDonald’s Corp,4.200%, due 01/04/2050 68 0.06
USD 230 Morgan Stanley,3.622%, due 01/04/2031 * 213 0.19
USD 120 Netflix Inc,5.500%, due 15/02/2022 104 0.09
USD 40 Northrop Grumman Corp,5.250%, due 01/05/2050 45 0.04
USD 90 NVIDIA Corp,3.500%, due 01/04/2050 81 0.07
USD 50 PayPal Holdings Inc,1.350%, due 01/06/2023 42 0.04
USD 50 PayPal Holdings Inc,1.650%, due 01/06/2025 43 0.04
450 Prologis Euro Finance LLC,1.875%, due 05/01/2029 500 0.45
USD 40 Raytheon Technologies Corp,2.250%, due 01/07/2030 34 0.03
USD 70 Spirit Loyalty Cayman Ltd / SpiritIP Cayman Ltd, 144A,8.000%, due 20/09/2025 65 0.06
FaceValue(000’s)
Value(000’s)
€
% ofNet
AssetValue
USD 40 State Street Corp,3.152%, due 30/03/2031 * 37 0.03
USD 30 Targa Resources Partners LP /Targa Resources PartnersFinance Corp, 144A,4.875%, due 01/02/2031 26 0.02
USD 20 Targa Resources Partners LP /Targa Resources PartnersFinance Corp, 144A,4.000%, due 15/01/2032 16 0.01
USD 60 Texas Instruments Inc,1.750%, due 04/05/2030 49 0.04
USD 50 T-Mobile USA Inc,4.000%, due 15/04/2022 43 0.04
USD 10 T-Mobile USA Inc,2.250%, due 15/02/2026 8 0.01
USD 40 T-Mobile USA Inc,2.625%, due 15/02/2029 32 0.03
USD 110 T-Mobile USA Inc, 144A,3.875%, due 15/04/2030 100 0.09
USD 30 T-Mobile USA Inc,2.875%, due 15/02/2031 24 0.02
USD 20 UnitedHealth Group Inc,3.750%, due 15/07/2025 19 0.02
USD 50 Visa Inc,2.050%, due 15/04/2030 42 0.04
USD 60 Visa Inc,2.700%, due 15/04/2040 51 0.04
930 Wells Fargo & Co,0.080%, due 26/04/2021 * 931 0.84
390 Wells Fargo & Co,2.250%, due 02/05/2023 410 0.37
450 Wells Fargo & Co,1.625%, due 02/06/2025 477 0.43
USD 70 WPX Energy Inc,8.250%, due 01/08/2023 67 0.06
12,081 10.85
Total Corporate Bonds and Notes(Cost €42,060) 43,717 39.27
Government Bonds and Notes — 53.84%(29 February 2020: 50.18%)
Australia — 0.81% (29 February 2020: 0.00%)
AUD 1,830 Australia Government Bond,Series 162,1.750%, due 21/06/2051 897 0.81
Belgium — 3.11% (29 February 2020: 3.38%)
2,020 Kingdom of BelgiumGovernment Bond, Series 71,3.750%, due 22/06/2045 3,457 3.11
Canada — 0.17% (29 February 2020: 0.00%)
CAD 250 Canadian Government RealReturn Bond, Series CPI,0.500%, due 01/12/2050 � 187 0.17
China — 1.15% (29 February 2020: 1.12%)
680 China GovernmentInternational Bond,1.000%, due 12/11/2039 688 0.62
590 Export-Import Bank of China/The,0.300%, due 06/03/2022 593 0.53
1,281 1.15
France — 9.40% (29 February 2020: 9.82%)
1,510 French Republic GovernmentBond OAT,1.000%, due 25/05/2027 1,637 1.47
2,935 French Republic GovernmentBond OAT,3.250%, due 25/05/2045 4,738 4.26
880 French Republic GovernmentBond OAT, 144A,1.500%, due 25/05/2050 1,071 0.96
590 French Republic GovernmentBond OAT,4.000%, due 25/04/2060 1,226 1.10
1,600 UNEDIC ASSEO,1.250%, due 25/05/2033 1,794 1.61
10,466 9.40
Germany — 9.93% (29 February 2020: 0.00%)
4,080 Bundesrepublik DeutschlandBundesanleihe,0.250%, due 15/02/2027 4,273 3.84
FaceValue(000’s)
Value(000’s)
€
% ofNet
AssetValue
330 Bundesrepublik DeutschlandBundesanleihe, Series 98,4.750%, due 04/07/2028 459 0.41
2,700 Bundesrepublik DeutschlandBundesanleihe,0.000%, due 15/08/2030 2,778 2.50
2,670 Bundesrepublik DeutschlandBundesanleihe,0.000%, due 15/02/2031 2,742 2.46
500 Bundesrepublik DeutschlandBundesanleihe,2.500%, due 15/08/2046 802 0.72
11,054 9.93
Indonesia — 2.28% (29 February 2020: 0.87%)
240 Indonesia GovernmentInternational Bond,1.450%, due 18/09/2026 247 0.22
530 Indonesia GovernmentInternational Bond,0.900%, due 14/02/2027 530 0.47
USD 1,950 Indonesia GovernmentInternational Bond,4.200%, due 15/10/2050 1,766 1.59
2,543 2.28
Italy — 10.10% (29 February 2020: 13.91%)
2,650 Italy Buoni Poliennali DelTesoro,4.500%, due 01/03/2024 3,018 2.71
940 Italy Buoni Poliennali DelTesoro,2.000%, due 01/12/2025 1,025 0.92
1,900 Italy Buoni Poliennali DelTesoro, Series CPI, 144A,0.400%, due 15/05/2030 � 2,042 1.83
3,795 Italy Buoni Poliennali DelTesoro, 144A,3.250%, due 01/09/2046 5,161 4.64
11,246 10.10
Mexico — 1.94% (29 February 2020: 0.98%)
850 Mexico GovernmentInternational Bond,2.875%, due 08/04/2039 890 0.80
USD 1,500 Mexico GovernmentInternational Bond,4.600%, due 23/01/2046 1,273 1.14
2,163 1.94
Qatar — 0.65% (29 February 2020: 0.00%)
USD 710 Qatar GovernmentInternational Bond,4.817%, due 14/03/2049 728 0.65
Romania — 0.71% (29 February 2020: 0.64%)
780 Romanian GovernmentInternational Bond,2.000%, due 28/01/2032 787 0.71
Saudi Arabia — 0.61% (29 February 2020: 0.55%)
640 Saudi GovernmentInternational Bond,2.000%, due 09/07/2039 674 0.61
South Africa — 1.48% (29 February 2020: 0.00%)
USD 2,000 Republic of South AfricaGovernment InternationalBond,4.300%, due 12/10/2028 1,646 1.48
South Korea — 1.05% (29 February 2020: 0.95%)
1,150 Export-Import Bank of Korea,0.375%, due 26/03/2024 1,170 1.05
Spain — 7.79% (29 February 2020: 8.57%)
1,350 Spain Government Bond,0.450%, due 31/10/2022 1,371 1.23
1,600 Spain Government Bond,144A,1.300%, due 31/10/2026 1,729 1.55
790 Spain Government Bond,144A,1.400%, due 30/04/2028 865 0.78
1,330 Spain Government Bond,144A,2.900%, due 31/10/2046 1,851 1.66
The accompanying notes are an integral part of the Financial Statements
72

Legg Mason Global Funds Plc Annual Report 28 February 2021
Legg Mason Western Asset Euro Core Plus Bond Fund
Portfolio of Investments as at 28 February 2021 – (continued)
FaceValue(000’s)
Value(000’s)
€
% ofNet
AssetValue
Government Bonds and Notes — (continued)
Spain — (continued)
2,110 Spain Government Bond,Series 30Y, 144A,2.700%, due 31/10/2048 2,861 2.57
8,677 7.79
United Arab Emirates — 0.68%(29 February 2020: 0.00%)
USD 290 Abu Dhabi GovernmentInternational Bond,3.125%, due 16/04/2030 261 0.24
USD 540 Abu Dhabi GovernmentInternational Bond,3.875%, due 16/04/2050 493 0.44
754 0.68
United Kingdom — 1.42% (29 February 2020: 0.00%)
GBP 970 United Kingdom Gilt,2.500%, due 22/07/2065 1,577 1.42
United States — 0.56% (29 February 2020: 3.45%)
USD 550 United States TreasuryInflation Indexed Bonds,1.000%, due 15/02/2049 � 609 0.55
USD 20 United States TreasuryInflation Indexed Bonds,0.250%, due 15/02/2050 � 18 0.01
627 0.56
Total Government Bonds and Notes(Cost €57,831) 59,934 53.84
Collective Investment Schemes — 1.28%(29 February 2020: 0.58%)
USD 1,717 Western Asset Liquidity FundsPlc – Western Asset US DollarLiquidity Fund – Class WA(Distributing) 1,423 1.28
Total Collective Investment Schemes(Cost €1,413) 1,423 1.28
Total Investments at fair value throughprofit or loss (Cost €101,304) 105,074 94.39
Interest Rate Swaps — 0.19% (29 February 2020: 0.00%)
Unrealised appreciation of contracts(see below) 217 0.19
FaceValue(000’s)
Value(000’s)
€
% ofNet
AssetValue
Forward Foreign Currency Contracts — 0.04%(29 February 2020: 0.09%)
Unrealised appreciation of contracts(see below) 42 0.04
Futures — 0.77% (29 February 2020: 0.71%)
Unrealised appreciation of contracts(see below) 855 0.77
Total Financial Assets at fair valuethrough profit or loss 106,188 95.39
Contracts(000’s)
Value(000’s)
€
% ofNet
AssetValue
Written Options — (0.03%) (29 February 2020: (0.12%))
USD – U.S. 10 Year April 2021 Put133.50, due 26/03/2021 –Bank of America MerrillLynch (31) (0.03)
Total Written Options (Cost €(7)) (31) (0.03)
Credit Default Swaps — (0.09%)(29 February 2020: (0.06%))
Unrealised depreciation of contracts(see below) (105) (0.09)
Forward Foreign Currency Contracts — (0.17%)(29 February 2020: (0.04%))
Unrealised depreciation of contracts(see below) (187) (0.17)
Futures — (0.46%) (29 February 2020: (0.91%))
Unrealised depreciation of contracts(see below) (509) (0.46)
Total Financial Liabilities at fair valuethrough profit or loss (832) (0.75)
Total Financial Assets and FinancialLiabilities at fair value through profitor loss 105,356 94.64
Other Assets in Excess of Liabilities 5,967 5.36
Total Net Assets €111,323 100.00
– Amounts designated as “–” are either €0, less than€1,000, less than 1,000 shares or less than 0.01%.
144A Securities exempt from registration under Rule 144A ofthe Securities Act of 1933, as amended. Thesesecurities may only be resold, in transactions exemptfrom registration, to qualified institutional buyers. As at28 February 2021, these securities amounted to€16,574,000 or 14.87% of net assets.
* Variable rate security. The interest rate shown reflectsthe rate in effect at 28 February 2021.
� The rate of interest on this type of security is tied to theConsumer Price Index (CPI)/Retail Price Index (RPI). Thecoupon rate is the rate as of 28 February 2021.
ABBREVIATIONS:
Perpetual – A bond with no maturity date. Perpetual bondsare not redeemable but pay a steady stream ofinterest.
AUD – Australian Dollar
CAD – Canadian Dollar
GBP – British Pound
USD – United States Dollar
Analysis of Total Assets
% ofTotal
Assets
Transferable securities admitted to an officialexchange listing or traded on a regulated market 92.07
Collective investment schemes 1.26
Financial derivative instruments 0.99
Other assets 5.68
Total Assets 100.00
Schedule of Credit Default Swaps
Counterparty Reference EntityBuy/Sell
ProtectionExpiration
Date
NotionalAmount(000’s)
Value(000’s)
Bank of America Merrill Lynch iTraxx Europe, 1.000% Buy 20/12/2025 4,450 € (105)
Unrealised Appreciation of Credit Default Swaps (29 February 2020 (000’s): €–) € –Unrealised Depreciation of Credit Default Swaps (29 February 2020 (000’s): €(77)) (105)
Net Depreciation of Credit Default Swaps (29 February 2020 (000’s): €(77)) € (105)
Schedule of Interest Rate Swaps
Counterparty Rate Expiration DateNotional Amount
(000’s)Value(000’s)
Bank of America Merrill Lynch Pay Fixed 0.800%, Receive Floating CZK 6M Pribor PRBO 19/11/2025 148,990 € 172
Bank of America Merrill Lynch Pay Fixed -0.235%, Receive Floating EUR 6M Euribor Reuters 15/08/2029 3,100 45
Unrealised Appreciation of Interest Rate Swaps (29 February 2020 (000’s): €–) € 217Unrealised Depreciation of Interest Rate Swaps (29 February 2020 (000’s): €(4)) –
Net Appreciation of Interest Rate Swaps (29 February 2020 (000’s): €(4)) € 217
Schedule of Forward Foreign Currency Contracts
Expiration Date CounterpartyBuy Currency
(000’s)Sell Currency
(000’s)
UnrealisedAppreciation/(Depreciation)of Contracts
(000’s)
18/05/2021 Citi Buy PLN 5,070 Sell EUR 1,131 € (11)18/05/2021 Citi Buy EUR 1,147 Sell PLN 5,170 518/05/2021 Goldman Sachs Buy NOK 22,577 Sell EUR 2,205 (51)18/05/2021 Goldman Sachs Buy EUR 1,072 Sell NOK 10,970 2518/05/2021 Goldman Sachs Buy EUR 394 Sell SEK 3,980 4
The accompanying notes are an integral part of the Financial Statements
73

Legg Mason Global Funds Plc Annual Report 28 February 2021
Legg Mason Western Asset Euro Core Plus Bond Fund
Portfolio of Investments as at 28 February 2021 – (continued)
Schedule of Forward Foreign Currency Contracts – (continued)
Expiration Date CounterpartyBuy Currency
(000’s)Sell Currency
(000’s)
UnrealisedAppreciation/(Depreciation)of Contracts
(000’s)
18/05/2021 Goldman Sachs Buy EUR 6,437 Sell USD 7,828 € (40)18/05/2021 JP Morgan Buy EUR 1,282 Sell AUD 2,012 118/05/2021 JP Morgan Buy EUR 343 Sell CAD 530 (1)18/05/2021 JP Morgan Buy EUR 4 Sell CZK 105 –18/05/2021 JP Morgan Buy HUF 809,300 Sell EUR 2,258 (31)18/05/2021 JP Morgan Buy GBP 200 Sell EUR 228 318/05/2021 JP Morgan Buy EUR 2,568 Sell GBP 2,255 (33)18/05/2021 JP Morgan Buy EUR 6,090 Sell USD 7,382 (17)18/05/2021 UBS Buy SEK 3,981 Sell EUR 393 (3)18/05/2021 UBS Buy AUD 140 Sell EUR 89 –18/05/2021 UBS Buy EUR 1,536 Sell USD 1,851 4
Unrealised Appreciation of Forward Foreign Currency Contracts (29 February 2020 (000’s): €116) € 42Unrealised Depreciation of Forward Foreign Currency Contracts (29 February 2020 (000’s): €(56)) (187)
Net Depreciation of Forward Foreign Currency Contracts (29 February 2020 (000’s): €60) € (145)
Schedule of Futures Contracts
CounterpartyNominal
Value
NotionalValue(000’s)
UnrealisedAppreciation/
(Depreciation)of Contracts
(000’s)
90 Day Euro$ December 2021 Bank of America Merrill Lynch (82) €(16,952) € –
90 Day Euro$ December 2023 Bank of America Merrill Lynch 82 16,805 (68)
Canadian 10 Year Bond June 2021 Bank of America Merrill Lynch (8) (728) 14
Euro-Bobl March 2021 Bank of America Merrill Lynch 4 537 (6)
Euro-BTP March 2021 Bank of America Merrill Lynch (10) (1,498) 10
Euro-Bund March 2021 Bank of America Merrill Lynch 75 13,005 (122)
Euro-Buxl 30 Year Bond March 2021 Bank of America Merrill Lynch (24) (5,036) 303
Euro-OAT March 2021 Bank of America Merrill Lynch 15 2,451 (56)
Long Gilt June 2021 Bank of America Merrill Lynch (25) (3,688) 34
U.S. 10 Year Note (CBT) June 2021 Bank of America Merrill Lynch (272) (29,920) 445
U.S. 10 Year Ultra Note June 2021 Bank of America Merrill Lynch (13) (1,588) 25
U.S. 2 Year Note (CBT) June 2021 Bank of America Merrill Lynch (37) (6,770) 6
U.S. 5 Year Note (CBT) June 2021 Bank of America Merrill Lynch 249 25,584 (230)
U.S. Long Bond (CBT) June 2021 Bank of America Merrill Lynch (13) (1,715) 18
U.S. Ultra Bond (CBT) June 2021 Bank of America Merrill Lynch 15 2,351 (27)
Unrealised Appreciation of Futures Contracts (29 February 2020 (000’s): €881) € 855
Unrealised Depreciation of Futures Contracts (29 February 2020 (000’s): €(1,133)) (509)
Net Appreciation of Futures Contracts (29 February 2020 (000’s): €(252)) € 346
The accompanying notes are an integral part of the Financial Statements
74

Legg Mason Global Funds Plc Annual Report 28 February 2021
Legg Mason Western Asset Short Duration High Income Bond Fund
Portfolio of Investments as at 28 February 2021
FaceValue(000’s)
Value(000’s)
$
% ofNet
AssetValue
Asset-Backed Securities — 0.75%(29 February 2020: 0.50%)
61 First Franklin Mortgage Loan Trust2004-FFH1, Series 2004 FFH1,Class M1,0.793%, due 25/03/2034 * 60 0.23
50 New Century Home Equity LoanTrust 2003-6, Series 2003 6,Class M1,1.198%, due 25/01/2034 * 49 0.19
86 Option One Mortgage Loan Trust2007-FXD1, Series 2007 FXD1,Class 3A4,5.860%, due 25/01/2037 88 0.33
Total Asset-Backed Securities (Cost $192) 197 0.75
Mortgage-Backed Securities — 3.01%(29 February 2020: 6.08%)
75 Credit Suisse First Boston MortgageSecurities Corp, Series 2004 AR1,Class 6M2,2.218%, due 25/02/2034 * 79 0.30
100 Fannie Mae Pool ‘BQ9191’,2.000%, due 01/01/2051 101 0.38
260 Freddie Mac Structured AgencyCredit Risk Debt Notes, Series 2017DNA3, Class B1,4.568%, due 25/03/2030 * 276 1.05
41 Impac CMB Trust Series 2004-6,Series 2004 6, Class 2A,6.060%, due 25/10/2034 44 0.17
124 Lehman XS Trust Series 2006-12N,Series 2006 12N, Class A31A,0.318%, due 25/08/2046 * 122 0.46
66 Nomura Asset Acceptance CorpAlternative Loan TrustSeries 2003-A1, Series 2003 A1,Class M,6.570%, due 25/05/2033 * 46 0.17
62 Structured Adjustable RateMortgage Loan Trust, Series 20058XS, Class M1,0.763%, due 25/04/2035 * 61 0.23
105 WaMu Mortgage Pass-ThroughCertificates Series 2005-AR15 Trust,Series 2005 AR15, Class A1C4,0.918%, due 25/11/2045 * 67 0.25
Total Mortgage-Backed Securities(Cost $778) 796 3.01
Corporate Bonds and Notes — 82.67%(29 February 2020: 75.47%)
Bermuda — 0.80% (29 February 2020: 0.00%)
200 Highlands Holdings Bond Issuer Ltd /Highlands Holdings Bond Co-IssuerInc, 144A,7.625%, due 15/10/2025 212 0.80
Brazil — 0.09% (29 February 2020: 0.26%)
20 Petrobras Global Finance BV,6.250%, due 17/03/2024 23 0.09
Canada — 2.46% (29 February 2020: 3.46%)
80 Cascades Inc/Cascades USA Inc,5.125%, due 15/01/2026 86 0.32
90 Empire Communities Corp, 144A,7.000%, due 15/12/2025 95 0.36
20 GFL Environmental Inc, 144A,3.750%, due 01/08/2025 20 0.08
90 GFL Environmental Inc, 144A,5.125%, due 15/12/2026 95 0.36
80 GFL Environmental Inc, 144A,8.500%, due 01/05/2027 88 0.33
66 MEG Energy Corp,6.500%, due 15/01/2025 68 0.26
100 MEG Energy Corp,7.125%, due 01/02/2027 105 0.40
50 Primo Water Holdings Inc,5.500%, due 01/04/2025 52 0.19
40 Primo Water Holdings Inc, 144A,5.500%, due 01/04/2025 41 0.16
650 2.46
Cayman Islands — 1.17% (29 February 2020: 0.80%)
1 Ambac LSNI LLC, 144A,6.000%, due 12/02/2023 * 1 –
155 Global Aircraft Leasing Co Ltd,144A, 6.500%, due 15/09/2024 145 0.55
FaceValue(000’s)
Value(000’s)
$
% ofNet
AssetValue
176 Global Aircraft Leasing Co Ltd,6.500%, due 15/09/2024 164 0.62
310 1.17
Chile — 0.11% (29 February 2020: 0.00%)
30 Liberty Latin America Ltd,2.000%, due 15/07/2024 29 0.11
France — 1.56% (29 February 2020: 0.95%)
200 Altice France SA/France, 144A,7.375%, due 01/05/2026 209 0.79
200 Banijay Entertainment SASU,5.375%, due 01/03/2025 204 0.77
413 1.56
Germany — 1.68% (29 February 2020: 0.43%)
200 Cheplapharm Arzneimittel GmbH,144A,5.500%, due 15/01/2028 204 0.77
30 Mercer International Inc, 144A,5.125%, due 01/02/2029 31 0.12
200 Vertical US Newco Inc, 144A,5.250%, due 15/07/2027 209 0.79
444 1.68
Israel — 1.25% (29 February 2020: 1.33%)
70 Teva Pharmaceutical FinanceNetherlands III BV,2.200%, due 21/07/2021 70 0.27
240 Teva Pharmaceutical FinanceNetherlands III BV,7.125%, due 31/01/2025 260 0.98
330 1.25
Luxembourg — 1.58% (29 February 2020: 1.94%)
200 ARD Finance SA,6.500%, due 30/06/2027 212 0.80
200 Intelsat Jackson Holdings SA,8.000%, due 15/02/2024 � 207 0.78
419 1.58
Macau — 0.79% (29 February 2020: 0.00%)
200 Wynn Macau Ltd, 144A,5.500%, due 15/01/2026 209 0.79
Peru — 0.08% (29 February 2020: 0.00%)
20 Hudbay Minerals Inc, 144A,4.500%, due 01/04/2026 20 0.08
South Korea — 0.32% (29 February 2020: 0.00%)
80 Clark Equipment Co, 144A,5.875%, due 01/06/2025 85 0.32
Switzerland — 1.66% (29 February 2020: 0.00%)
200 Credit Suisse Group AG, 144A,7.500%, Perpetual * 219 0.83
200 UBS Group AG, 144A,7.000%, Perpetual * 219 0.83
438 1.66
United Arab Emirates — 1.00%(29 February 2020: 1.06%)
130 DAE Funding LLC,4.500%, due 01/08/2022 131 0.49
130 DAE Funding LLC, 144A,5.000%, due 01/08/2024 134 0.51
265 1.00
United Kingdom — 1.61% (29 February 2020: 4.43%)
210 Natwest Group Plc,8.625%, Perpetual * 217 0.82
200 Virgin Media Secured Finance Plc,144A,5.500%, due 15/08/2026 209 0.79
426 1.61
United States — 64.91% (29 February 2020: 58.91%)
30 Academy Ltd, 144A,6.000%, due 15/11/2027 32 0.12
180 ADT Security Corp/The,4.125%, due 15/06/2023 188 0.71
90 Akumin Inc, 144A,7.000%, due 01/11/2025 94 0.36
100 Allied Universal Holdco LLC / AlliedUniversal Finance Corp,6.625%, due 15/07/2026 106 0.40
50 Allison Transmission Inc, 144A,4.750%, due 01/10/2027 52 0.20
FaceValue(000’s)
Value(000’s)
$
% ofNet
AssetValue
– Ambac Assurance Corp, 144A,5.100%, Perpetual – –
40 American Axle & Manufacturing Inc,6.250%, due 01/04/2025 41 0.16
100 American Axle & Manufacturing Inc,6.250%, due 15/03/2026 102 0.39
140 Antero Midstream Partners LP /Antero Midstream Finance Corp,5.375%, due 15/09/2024 141 0.53
20 Apache Corp,4.875%, due 15/11/2027 21 0.08
160 Apollo Commercial Real EstateFinance Inc,4.750%, due 23/08/2022 157 0.59
200 Ardagh Packaging Finance Plc /Ardagh Holdings USA Inc,6.000%, due 15/02/2025 207 0.78
50 Bank of America Corp, Series FF,5.875%, Perpetual * 55 0.21
120 Bausch Health Americas Inc, 144A,9.250%, due 01/04/2026 133 0.50
170 Bausch Health Cos Inc,7.000%, due 15/03/2024 174 0.66
140 Bausch Health Cos Inc,6.125%, due 15/04/2025 144 0.54
40 Bausch Health Cos Inc, 144A,5.750%, due 15/08/2027 43 0.16
90 Berry Petroleum Co LLC,7.000%, due 15/02/2026 87 0.33
110 Berry Petroleum Co LLC, 144A,7.000%, due 15/02/2026 106 0.40
60 Blackstone Mortgage Trust Inc,4.375%, due 05/05/2022 61 0.23
110 Blue Racer Midstream LLC / BlueRacer Finance Corp, 144A,7.625%, due 15/12/2025 118 0.45
140 Boyne USA Inc, 144A,7.250%, due 01/05/2025 146 0.55
90 Brundage-Bone Concrete PumpingHoldings Inc, 144A,6.000%, due 01/02/2026 93 0.35
190 Caesars Entertainment Inc, 144A,6.250%, due 01/07/2025 201 0.76
100 Carnival Corp, 144A,5.750%, due 01/03/2027 102 0.38
170 Carriage Services Inc, 144A,6.625%, due 01/06/2026 179 0.68
70 CCO Holdings LLC / CCO HoldingsCapital Corp, 144A,5.125%, due 01/05/2027 73 0.28
80 CDW LLC / CDW Finance Corp,4.125%, due 01/05/2025 83 0.31
40 Centene Corp, 144A,5.375%, due 01/06/2026 42 0.16
100 Centene Corp, 144A,5.375%, due 15/08/2026 106 0.40
130 Centene Corp,4.250%, due 15/12/2027 136 0.51
280 Century Communities Inc,5.875%, due 15/07/2025 293 1.11
90 Charter Communications OperatingLLC / Charter CommunicationsOperating Capital,4.908%, due 23/07/2025 103 0.39
50 Cheniere Energy Inc,4.250%, due 15/03/2045 41 0.16
60 Cheniere Energy Partners LP, 144A,4.000%, due 01/03/2031 61 0.23
20 Chesapeake Energy Corp, 144A,5.500%, due 01/02/2026 21 0.08
60 CHS/Community Health Systems Inc,144A,8.000%, due 15/03/2026 64 0.24
170 CHS/Community Health Systems Inc,8.000%, due 15/03/2026 182 0.69
40 Citigroup Inc, Series M,6.300%, Perpetual * 42 0.16
120 Cogent Communications Group Inc,5.375%, due 01/03/2022 123 0.47
150 CommScope Inc, 144A,8.250%, due 01/03/2027 158 0.60
100 Comstock Resources Inc,9.750%, due 15/08/2026 109 0.41
11 Continental Resources Inc/OK,5.000%, due 15/09/2022 11 0.04
The accompanying notes are an integral part of the Financial Statements
75

Legg Mason Global Funds Plc Annual Report 28 February 2021
Legg Mason Western Asset Short Duration High Income Bond Fund
Portfolio of Investments as at 28 February 2021 – (continued)
FaceValue(000’s)
Value(000’s)
$
% ofNet
AssetValue
Corporate Bonds and Notes — (continued)
United States — (continued)
40 CoreCivic Inc,5.000%, due 15/10/2022 40 0.15
50 CoreCivic Inc,4.625%, due 01/05/2023 49 0.18
50 Covanta Holding Corp,5.875%, due 01/07/2025 52 0.20
100 CTR Partnership LP / CareTrustCapital Corp,5.250%, due 01/06/2025 103 0.39
130 DCP Midstream Operating LP,4.950%, due 01/04/2022 134 0.51
5 Delta Air Lines 2007-1 Class B PassThrough Trust, Series 071B,8.021%, due 10/08/2022 5 0.02
60 Delta Air Lines Inc,2.900%, due 28/10/2024 60 0.23
40 Delta Air Lines Inc, 144A,7.000%, due 01/05/2025 47 0.18
110 Delta Air Lines Inc,7.375%, due 15/01/2026 129 0.49
130 Delta Air Lines Inc / SkyMiles IP Ltd,144A,4.500%, due 20/10/2025 139 0.53
220 DISH DBS Corp,5.875%, due 15/11/2024 231 0.87
260 DISH DBS Corp,7.750%, due 01/07/2026 286 1.08
70 Diversified Healthcare Trust,9.750%, due 15/06/2025 79 0.30
70 Diversified Healthcare Trust,4.750%, due 15/02/2028 69 0.26
70 Donnelley Financial Solutions Inc,8.250%, due 15/10/2024 73 0.28
10 Dropbox Inc, 144A,zero coupon, due 01/03/2026 10 0.04
10 Dropbox Inc, 144A,zero coupon, due 01/03/2028 10 0.04
40 Endeavor Energy Resources LP / EERFinance Inc, 144A,6.625%, due 15/07/2025 42 0.16
70 Entegris Inc, 144A,4.375%, due 15/04/2028 74 0.28
210 EQM Midstream Partners LP,4.000%, due 01/08/2024 212 0.80
30 EQM Midstream Partners LP, 144A,6.000%, due 01/07/2025 32 0.12
80 EQM Midstream Partners LP,4.125%, due 01/12/2026 78 0.30
30 EQM Midstream Partners LP, 144A,6.500%, due 01/07/2027 32 0.12
10 EQM Midstream Partners LP,5.500%, due 15/07/2028 10 0.04
70 EQT Corp,7.625%, due 01/02/2025 82 0.31
90 EQT Corp,5.000%, due 15/01/2029 99 0.37
50 ESH Hospitality Inc, 144A,5.250%, due 01/05/2025 51 0.19
80 ESH Hospitality Inc,5.250%, due 01/05/2025 82 0.31
50 Exterran Energy Solutions LP / EESFinance Corp,8.125%, due 01/05/2025 46 0.17
110 Five Point Operating Co LP / FivePoint Capital Corp,7.875%, due 15/11/2025 116 0.44
80 Ford Motor Co,9.000%, due 22/04/2025 97 0.37
200 Ford Motor Credit Co LLC,3.087%, due 09/01/2023 203 0.77
200 Ford Motor Credit Co LLC,5.125%, due 16/06/2025 216 0.82
110 Forestar Group Inc, 144A,8.000%, due 15/04/2024 115 0.43
200 Freeport-McMoRan Inc,4.550%, due 14/11/2024 221 0.83
70 Full House Resorts Inc, 144A,8.250%, due 15/02/2028 74 0.28
50 GEO Corrections Holdings Inc, 144A,6.500%, due 23/02/2026 52 0.20
50 GEO Group Inc/The,5.125%, due 01/04/2023 46 0.17
FaceValue(000’s)
Value(000’s)
$
% ofNet
AssetValue
100 GEO Group Inc/The,5.875%, due 15/10/2024 78 0.30
20 GEO Group Inc/The,6.000%, due 15/04/2026 15 0.06
50 Global Medical Response Inc, 144A,6.500%, due 01/10/2025 52 0.20
100 Golden Nugget Inc,6.750%, due 15/10/2024 102 0.39
120 Granite US Holdings Corp, 144A,11.000%, due 01/10/2027 135 0.51
130 Greif Inc, 144A,6.500%, due 01/03/2027 137 0.52
50 Hanesbrands Inc, 144A,4.875%, due 15/05/2026 54 0.20
70 Hawaiian Brand Intellectual PropertyLtd / HawaiianMiles Loyalty Ltd,144A,5.750%, due 20/01/2026 74 0.28
240 HCA Inc,5.375%, due 01/02/2025 269 1.02
80 Hilton Domestic Operating Co Inc,144A,5.375%, due 01/05/2025 84 0.32
40 IRB Holding Corp, 144A,7.000%, due 15/06/2025 43 0.16
50 iStar Inc,4.250%, due 01/08/2025 50 0.19
100 Ken Garff Automotive LLC, 144A,4.875%, due 15/09/2028 103 0.39
70 Kraton Polymers LLC / KratonPolymers Capital Corp, 144A,4.250%, due 15/12/2025 71 0.27
90 L Brands Inc, 144A,6.875%, due 01/07/2025 98 0.37
50 L Brands Inc, 144A,9.375%, due 01/07/2025 62 0.23
50 Ladder Capital Finance HoldingsLLLP / Ladder Capital Finance Corp,144A,5.250%, due 15/03/2022 50 0.19
70 Ladder Capital Finance HoldingsLLLP / Ladder Capital Finance Corp,144A,4.250%, due 01/02/2027 68 0.26
120 Lamb Weston Holdings Inc,4.625%, due 01/11/2024 125 0.47
100 LD Holdings Group LLC, 144A,6.500%, due 01/11/2025 106 0.40
40 Legacy LifePoint Health LLC,4.375%, due 15/02/2027 40 0.15
120 Legends Hospitality Holding Co LLC /Legends Hospitality Co-Issuer Inc,144A,5.000%, due 01/02/2026 122 0.46
43 Lehman Escrow Receipt,zero coupon, Perpetual †∞ – –
100 Lennar Corp,4.875%, due 15/12/2023 110 0.42
60 Lennar Corp,4.500%, due 30/04/2024 66 0.25
50 Levi Strauss & Co,5.000%, due 01/05/2025 51 0.19
100 Lions Gate Capital Holdings LLC,6.375%, due 01/02/2024 102 0.39
50 Michaels Stores Inc, 144A,8.000%, due 15/07/2027 53 0.20
50 Microchip Technology Inc, 144A,4.250%, due 01/09/2025 52 0.20
70 Mileage Plus Holdings LLC / MileagePlus Intellectual Property Assets Ltd,144A,6.500%, due 20/06/2027 77 0.29
150 Murphy Oil Corp,5.750%, due 15/08/2025 149 0.56
70 Murphy Oil USA Inc,5.625%, due 01/05/2027 74 0.28
100 Navient Corp,6.750%, due 15/06/2026 107 0.41
60 Navient Corp,5.000%, due 15/03/2027 59 0.22
100 NCL Corp Ltd, 144A,12.250%, due 15/05/2024 119 0.45
30 NCL Corp Ltd, 144A,3.625%, due 15/12/2024 28 0.11
50 NCL Corp Ltd,3.625%, due 15/12/2024 47 0.18
90 NCL Corp Ltd, 144A,10.250%, due 01/02/2026 105 0.40
FaceValue(000’s)
Value(000’s)
$
% ofNet
AssetValue
50 NCL Corp Ltd, 144A,5.875%, due 15/03/2026 50 0.19
110 Netflix Inc,4.375%, due 15/11/2026 124 0.47
90 NMI Holdings Inc, 144A,7.375%, due 01/06/2025 102 0.39
40 Northern Oil and Gas Inc, 144A,8.125%, due 01/03/2028 40 0.15
20 Occidental Petroleum Corp,1.644%, due 15/08/2022 * 20 0.07
25 Occidental Petroleum Corp,2.700%, due 15/02/2023 25 0.09
80 Occidental Petroleum Corp,2.900%, due 15/08/2024 78 0.29
40 Occidental Petroleum Corp,5.550%, due 15/03/2026 43 0.16
70 Occidental Petroleum Corp,3.400%, due 15/04/2026 68 0.26
100 Party City Holdings Inc, 144A,8.750%, due 15/02/2026 102 0.39
30 PBF Holding Co LLC / PBF FinanceCorp, 144A,9.250%, due 15/05/2025 29 0.11
100 PM General Purchaser LLC, 144A,9.500%, due 01/10/2028 110 0.42
70 Prime Security Services BorrowerLLC / Prime Finance Inc, 144A,5.750%, due 15/04/2026 76 0.29
150 Prime Security Services BorrowerLLC / Prime Finance Inc,5.750%, due 15/04/2026 162 0.61
90 Rackspace Technology Global Inc,144A,3.500%, due 15/02/2028 88 0.33
90 Range Resources Corp,4.875%, due 15/05/2025 89 0.34
30 Range Resources Corp,9.250%, due 01/02/2026 33 0.12
80 Realogy Group LLC / RealogyCo-Issuer Corp, 144A,7.625%, due 15/06/2025 87 0.33
70 RegionalCare Hospital PartnersHoldings Inc / LifePoint Health Inc,144A,9.750%, due 01/12/2026 76 0.29
60 Resolute Forest Products Inc, 144A,4.875%, due 01/03/2026 60 0.23
99 RR Donnelley & Sons Co,8.250%, due 01/07/2027 117 0.44
130 Sally Holdings LLC / Sally Capital Inc,5.625%, due 01/12/2025 133 0.50
60 Service Properties Trust,5.500%, due 15/12/2027 65 0.24
150 Shift4 Payments LLC / Shift4Payments Finance Sub Inc, 144A,4.625%, due 01/11/2026 157 0.59
70 Signature Aviation US Holdings Inc,144A,5.375%, due 01/05/2026 72 0.27
250 Silversea Cruise Finance Ltd, 144A,7.250%, due 01/02/2025 259 0.98
40 Silversea Cruise Finance Ltd,7.250%, due 01/02/2025 41 0.16
60 Sizzling Platter LLC / Sizzling PlatterFinance Corp, 144A,8.500%, due 28/11/2025 62 0.24
130 Southwestern Energy Co,4.100%, due 15/03/2022 131 0.49
130 Spirit Loyalty Cayman Ltd / Spirit IPCayman Ltd, 144A,8.000%, due 20/09/2025 147 0.55
200 Sprint Communications Inc,11.500%, due 15/11/2021 214 0.81
50 Sprint Communications Inc,6.000%, due 15/11/2022 54 0.20
125 Sprint Corp,7.875%, due 15/09/2023 144 0.55
160 Sprint Corp,7.125%, due 15/06/2024 184 0.70
70 Starwood Property Trust Inc,5.000%, due 15/12/2021 71 0.27
40 Starwood Property Trust Inc, 144A,5.500%, due 01/11/2023 42 0.16
30 StoneX Group Inc, 144A,8.625%, due 15/06/2025 32 0.12
The accompanying notes are an integral part of the Financial Statements
76
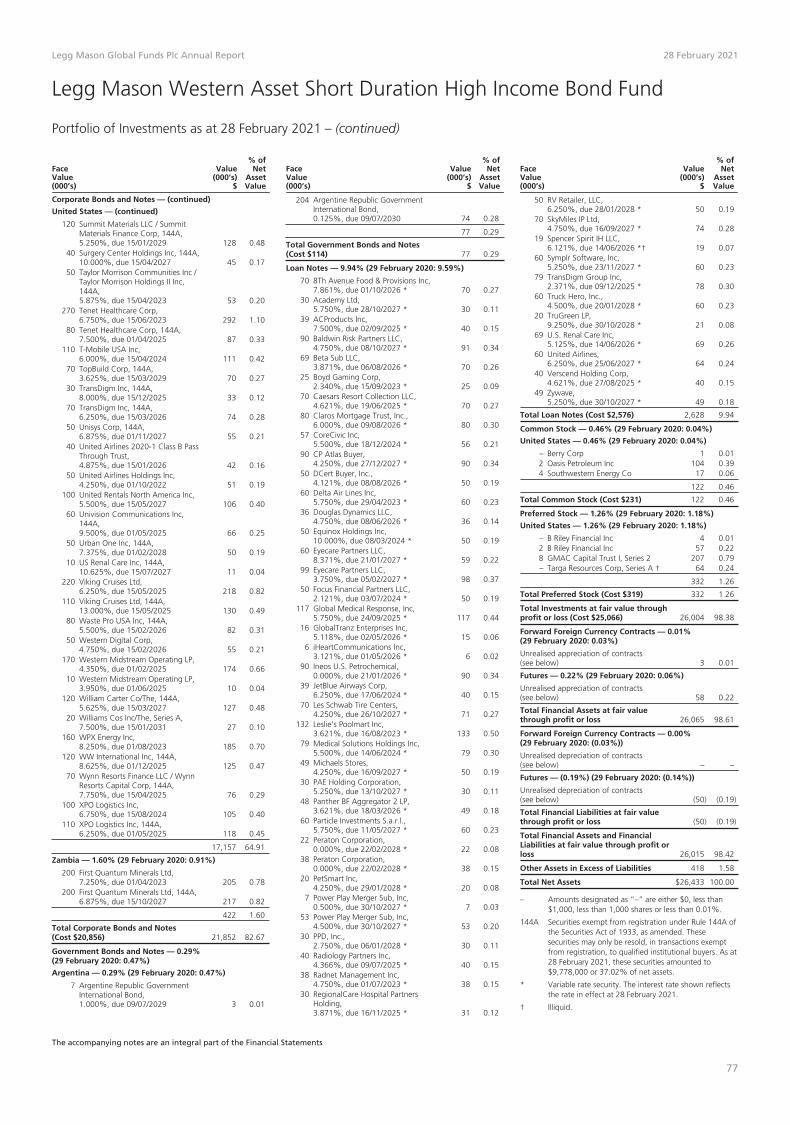
Legg Mason Global Funds Plc Annual Report 28 February 2021
Legg Mason Western Asset Short Duration High Income Bond Fund
Portfolio of Investments as at 28 February 2021 – (continued)
FaceValue(000’s)
Value(000’s)
$
% ofNet
AssetValue
Corporate Bonds and Notes — (continued)
United States — (continued)
120 Summit Materials LLC / SummitMaterials Finance Corp, 144A,5.250%, due 15/01/2029 128 0.48
40 Surgery Center Holdings Inc, 144A,10.000%, due 15/04/2027 45 0.17
50 Taylor Morrison Communities Inc /Taylor Morrison Holdings II Inc,144A,5.875%, due 15/04/2023 53 0.20
270 Tenet Healthcare Corp,6.750%, due 15/06/2023 292 1.10
80 Tenet Healthcare Corp, 144A,7.500%, due 01/04/2025 87 0.33
110 T-Mobile USA Inc,6.000%, due 15/04/2024 111 0.42
70 TopBuild Corp, 144A,3.625%, due 15/03/2029 70 0.27
30 TransDigm Inc, 144A,8.000%, due 15/12/2025 33 0.12
70 TransDigm Inc, 144A,6.250%, due 15/03/2026 74 0.28
50 Unisys Corp, 144A,6.875%, due 01/11/2027 55 0.21
40 United Airlines 2020-1 Class B PassThrough Trust,4.875%, due 15/01/2026 42 0.16
50 United Airlines Holdings Inc,4.250%, due 01/10/2022 51 0.19
100 United Rentals North America Inc,5.500%, due 15/05/2027 106 0.40
60 Univision Communications Inc,144A,9.500%, due 01/05/2025 66 0.25
50 Urban One Inc, 144A,7.375%, due 01/02/2028 50 0.19
10 US Renal Care Inc, 144A,10.625%, due 15/07/2027 11 0.04
220 Viking Cruises Ltd,6.250%, due 15/05/2025 218 0.82
110 Viking Cruises Ltd, 144A,13.000%, due 15/05/2025 130 0.49
80 Waste Pro USA Inc, 144A,5.500%, due 15/02/2026 82 0.31
50 Western Digital Corp,4.750%, due 15/02/2026 55 0.21
170 Western Midstream Operating LP,4.350%, due 01/02/2025 174 0.66
10 Western Midstream Operating LP,3.950%, due 01/06/2025 10 0.04
120 William Carter Co/The, 144A,5.625%, due 15/03/2027 127 0.48
20 Williams Cos Inc/The, Series A,7.500%, due 15/01/2031 27 0.10
160 WPX Energy Inc,8.250%, due 01/08/2023 185 0.70
120 WW International Inc, 144A,8.625%, due 01/12/2025 125 0.47
70 Wynn Resorts Finance LLC / WynnResorts Capital Corp, 144A,7.750%, due 15/04/2025 76 0.29
100 XPO Logistics Inc,6.750%, due 15/08/2024 105 0.40
110 XPO Logistics Inc, 144A,6.250%, due 01/05/2025 118 0.45
17,157 64.91
Zambia — 1.60% (29 February 2020: 0.91%)
200 First Quantum Minerals Ltd,7.250%, due 01/04/2023 205 0.78
200 First Quantum Minerals Ltd, 144A,6.875%, due 15/10/2027 217 0.82
422 1.60
Total Corporate Bonds and Notes(Cost $20,856) 21,852 82.67
Government Bonds and Notes — 0.29%(29 February 2020: 0.47%)
Argentina — 0.29% (29 February 2020: 0.47%)
7 Argentine Republic GovernmentInternational Bond,1.000%, due 09/07/2029 3 0.01
FaceValue(000’s)
Value(000’s)
$
% ofNet
AssetValue
204 Argentine Republic GovernmentInternational Bond,0.125%, due 09/07/2030 74 0.28
77 0.29
Total Government Bonds and Notes(Cost $114) 77 0.29
Loan Notes — 9.94% (29 February 2020: 9.59%)
70 8Th Avenue Food & Provisions Inc,7.861%, due 01/10/2026 * 70 0.27
30 Academy Ltd,5.750%, due 28/10/2027 * 30 0.11
39 ACProducts Inc,7.500%, due 02/09/2025 * 40 0.15
90 Baldwin Risk Partners LLC,4.750%, due 08/10/2027 * 91 0.34
69 Beta Sub LLC,3.871%, due 06/08/2026 * 70 0.26
25 Boyd Gaming Corp,2.340%, due 15/09/2023 * 25 0.09
70 Caesars Resort Collection LLC,4.621%, due 19/06/2025 * 70 0.27
80 Claros Mortgage Trust, Inc.,6.000%, due 09/08/2026 * 80 0.30
57 CoreCivic Inc,5.500%, due 18/12/2024 * 56 0.21
90 CP Atlas Buyer,4.250%, due 27/12/2027 * 90 0.34
50 DCert Buyer, Inc.,4.121%, due 08/08/2026 * 50 0.19
60 Delta Air Lines Inc,5.750%, due 29/04/2023 * 60 0.23
36 Douglas Dynamics LLC,4.750%, due 08/06/2026 * 36 0.14
50 Equinox Holdings Inc,10.000%, due 08/03/2024 * 50 0.19
60 Eyecare Partners LLC,8.371%, due 21/01/2027 * 59 0.22
99 Eyecare Partners LLC,3.750%, due 05/02/2027 * 98 0.37
50 Focus Financial Partners LLC,2.121%, due 03/07/2024 * 50 0.19
117 Global Medical Response, Inc,5.750%, due 24/09/2025 * 117 0.44
16 GlobalTranz Enterprises Inc,5.118%, due 02/05/2026 * 15 0.06
6 iHeartCommunications Inc,3.121%, due 01/05/2026 * 6 0.02
90 Ineos U.S. Petrochemical,0.000%, due 21/01/2026 * 90 0.34
39 JetBlue Airways Corp,6.250%, due 17/06/2024 * 40 0.15
70 Les Schwab Tire Centers,4.250%, due 26/10/2027 * 71 0.27
132 Leslie’s Poolmart Inc,3.621%, due 16/08/2023 * 133 0.50
79 Medical Solutions Holdings Inc,5.500%, due 14/06/2024 * 79 0.30
49 Michaels Stores,4.250%, due 16/09/2027 * 50 0.19
30 PAE Holding Corporation,5.250%, due 13/10/2027 * 30 0.11
48 Panther BF Aggregator 2 LP,3.621%, due 18/03/2026 * 49 0.18
60 Particle Investments S.a.r.l.,5.750%, due 11/05/2027 * 60 0.23
22 Peraton Corporation,0.000%, due 22/02/2028 * 22 0.08
38 Peraton Corporation,0.000%, due 22/02/2028 * 38 0.15
20 PetSmart Inc,4.250%, due 29/01/2028 * 20 0.08
7 Power Play Merger Sub, Inc,0.500%, due 30/10/2027 * 7 0.03
53 Power Play Merger Sub, Inc,4.500%, due 30/10/2027 * 53 0.20
30 PPD, Inc.,2.750%, due 06/01/2028 * 30 0.11
40 Radiology Partners Inc,4.366%, due 09/07/2025 * 40 0.15
38 Radnet Management Inc,4.750%, due 01/07/2023 * 38 0.15
30 RegionalCare Hospital PartnersHolding,3.871%, due 16/11/2025 * 31 0.12
FaceValue(000’s)
Value(000’s)
$
% ofNet
AssetValue
50 RV Retailer, LLC,6.250%, due 28/01/2028 * 50 0.19
70 SkyMiles IP Ltd,4.750%, due 16/09/2027 * 74 0.28
19 Spencer Spirit IH LLC,6.121%, due 14/06/2026 *† 19 0.07
60 Symplr Software, Inc,5.250%, due 23/11/2027 * 60 0.23
79 TransDigm Group Inc,2.371%, due 09/12/2025 * 78 0.30
60 Truck Hero, Inc.,4.500%, due 20/01/2028 * 60 0.23
20 TruGreen LP,9.250%, due 30/10/2028 * 21 0.08
69 U.S. Renal Care Inc,5.125%, due 14/06/2026 * 69 0.26
60 United Airlines,6.250%, due 25/06/2027 * 64 0.24
40 Verscend Holding Corp,4.621%, due 27/08/2025 * 40 0.15
49 Zywave,5.250%, due 30/10/2027 * 49 0.18
Total Loan Notes (Cost $2,576) 2,628 9.94
Common Stock — 0.46% (29 February 2020: 0.04%)
United States — 0.46% (29 February 2020: 0.04%)
– Berry Corp 1 0.012 Oasis Petroleum Inc 104 0.394 Southwestern Energy Co 17 0.06
122 0.46
Total Common Stock (Cost $231) 122 0.46
Preferred Stock — 1.26% (29 February 2020: 1.18%)
United States — 1.26% (29 February 2020: 1.18%)
– B Riley Financial Inc 4 0.012 B Riley Financial Inc 57 0.228 GMAC Capital Trust I, Series 2 207 0.79– Targa Resources Corp, Series A † 64 0.24
332 1.26
Total Preferred Stock (Cost $319) 332 1.26
Total Investments at fair value throughprofit or loss (Cost $25,066) 26,004 98.38
Forward Foreign Currency Contracts — 0.01%(29 February 2020: 0.03%)
Unrealised appreciation of contracts(see below) 3 0.01
Futures — 0.22% (29 February 2020: 0.06%)
Unrealised appreciation of contracts(see below) 58 0.22
Total Financial Assets at fair valuethrough profit or loss 26,065 98.61
Forward Foreign Currency Contracts — 0.00%(29 February 2020: (0.03%))
Unrealised depreciation of contracts(see below) – –
Futures — (0.19%) (29 February 2020: (0.14%))
Unrealised depreciation of contracts(see below) (50) (0.19)
Total Financial Liabilities at fair valuethrough profit or loss (50) (0.19)
Total Financial Assets and FinancialLiabilities at fair value through profit orloss 26,015 98.42
Other Assets in Excess of Liabilities 418 1.58
Total Net Assets $26,433 100.00
– Amounts designated as “–” are either $0, less than$1,000, less than 1,000 shares or less than 0.01%.
144A Securities exempt from registration under Rule 144A ofthe Securities Act of 1933, as amended. Thesesecurities may only be resold, in transactions exemptfrom registration, to qualified institutional buyers. As at28 February 2021, these securities amounted to$9,778,000 or 37.02% of net assets.
* Variable rate security. The interest rate shown reflectsthe rate in effect at 28 February 2021.
† Illiquid.
The accompanying notes are an integral part of the Financial Statements
77

Legg Mason Global Funds Plc Annual Report 28 February 2021
Legg Mason Western Asset Short Duration High Income Bond Fund
Portfolio of Investments as at 28 February 2021 – (continued)
∞ Security is valued in good faith at fair value by or at thediscretion of the Manager or the respective InvestmentManager.
� Security is in default as at 28 February 2021 (eitherprincipal and / or interest).
ABBREVIATIONS:
Perpetual – A bond with no maturity date. Perpetual bondsare not redeemable but pay a steady stream ofinterest.
Analysis of Total Assets
% ofTotal
Assets
Transferable securities admitted to an officialexchange listing or traded on a regulated market 86.64
Other transferable securities dealt in on anotherregulated market 9.74
Financial derivative instruments 0.23
Other assets 3.39
Total Assets 100.00
Schedule of Forward Foreign Currency Contracts
Expiration Date CounterpartyBuy Currency
(000’s)Sell Currency
(000’s)
UnrealisedAppreciation/(Depreciation)of Contracts
(000’s)
12/03/2021 BNY Mellon Buy USD – Sell AUD – $ –12/03/2021 BNY Mellon Buy EUR 874 Sell USD 1,052 312/03/2021 BNY Mellon Buy EUR 23 Sell USD 29 –12/03/2021 BNY Mellon Buy AUD 43 Sell USD 33 –19/04/2021 Citi Buy USD 1 Sell CAD 1 –
Unrealised Appreciation of Forward Foreign Currency Contracts (29 February 2020 (000’s): $6) $ 3Unrealised Depreciation of Forward Foreign Currency Contracts (29 February 2020 (000’s): $(6)) –
Net Appreciation of Forward Foreign Currency Contracts (29 February 2020 (000’s): $–) $ 3
Schedule of Futures Contracts
CounterpartyNominal
Value
NotionalValue(000’s)
UnrealisedAppreciation/(Depreciation)of Contracts
(000’s)
U.S. 10 Year Note (CBT) June 2021 Bank of America Merrill Lynch (29) $ (3,849) $ 58U.S. 5 Year Note (CBT) June 2021 Bank of America Merrill Lynch 44 5,455 (50)
Unrealised Appreciation of Futures Contracts (29 February 2020 (000’s): $13) $ 58Unrealised Depreciation of Futures Contracts (29 February 2020 (000’s): $(30)) (50)
Net Appreciation of Futures Contracts (29 February 2020 (000’s): $(17)) $ 8
The accompanying notes are an integral part of the Financial Statements
78
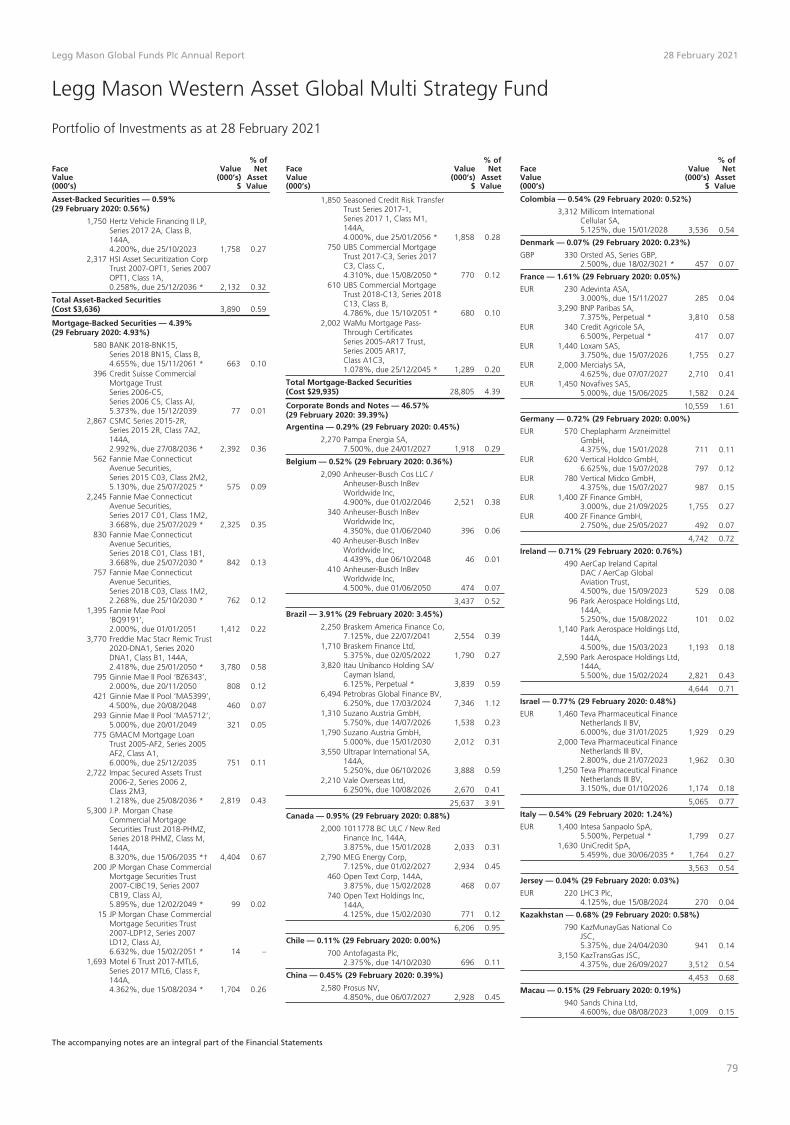
Legg Mason Global Funds Plc Annual Report 28 February 2021
Legg Mason Western Asset Global Multi Strategy Fund
Portfolio of Investments as at 28 February 2021
FaceValue(000’s)
Value(000’s)
$
% ofNet
AssetValue
Asset-Backed Securities — 0.59%(29 February 2020: 0.56%)
1,750 Hertz Vehicle Financing II LP,Series 2017 2A, Class B,144A,4.200%, due 25/10/2023 1,758 0.27
2,317 HSI Asset Securitization CorpTrust 2007-OPT1, Series 2007OPT1, Class 1A,0.258%, due 25/12/2036 * 2,132 0.32
Total Asset-Backed Securities(Cost $3,636) 3,890 0.59
Mortgage-Backed Securities — 4.39%(29 February 2020: 4.93%)
580 BANK 2018-BNK15,Series 2018 BN15, Class B,4.655%, due 15/11/2061 * 663 0.10
396 Credit Suisse CommercialMortgage TrustSeries 2006-C5,Series 2006 C5, Class AJ,5.373%, due 15/12/2039 77 0.01
2,867 CSMC Series 2015-2R,Series 2015 2R, Class 7A2,144A,2.992%, due 27/08/2036 * 2,392 0.36
562 Fannie Mae ConnecticutAvenue Securities,Series 2015 C03, Class 2M2,5.130%, due 25/07/2025 * 575 0.09
2,245 Fannie Mae ConnecticutAvenue Securities,Series 2017 C01, Class 1M2,3.668%, due 25/07/2029 * 2,325 0.35
830 Fannie Mae ConnecticutAvenue Securities,Series 2018 C01, Class 1B1,3.668%, due 25/07/2030 * 842 0.13
757 Fannie Mae ConnecticutAvenue Securities,Series 2018 C03, Class 1M2,2.268%, due 25/10/2030 * 762 0.12
1,395 Fannie Mae Pool‘BQ9191’,2.000%, due 01/01/2051 1,412 0.22
3,770 Freddie Mac Stacr Remic Trust2020-DNA1, Series 2020DNA1, Class B1, 144A,2.418%, due 25/01/2050 * 3,780 0.58
795 Ginnie Mae II Pool ‘BZ6343’,2.000%, due 20/11/2050 808 0.12
421 Ginnie Mae II Pool ‘MA5399’,4.500%, due 20/08/2048 460 0.07
293 Ginnie Mae II Pool ‘MA5712’,5.000%, due 20/01/2049 321 0.05
775 GMACM Mortgage LoanTrust 2005-AF2, Series 2005AF2, Class A1,6.000%, due 25/12/2035 751 0.11
2,722 Impac Secured Assets Trust2006-2, Series 2006 2,Class 2M3,1.218%, due 25/08/2036 * 2,819 0.43
5,300 J.P. Morgan ChaseCommercial MortgageSecurities Trust 2018-PHMZ,Series 2018 PHMZ, Class M,144A,8.320%, due 15/06/2035 *† 4,404 0.67
200 JP Morgan Chase CommercialMortgage Securities Trust2007-CIBC19, Series 2007CB19, Class AJ,5.895%, due 12/02/2049 * 99 0.02
15 JP Morgan Chase CommercialMortgage Securities Trust2007-LDP12, Series 2007LD12, Class AJ,6.632%, due 15/02/2051 * 14 –
1,693 Motel 6 Trust 2017-MTL6,Series 2017 MTL6, Class F,144A,4.362%, due 15/08/2034 * 1,704 0.26
FaceValue(000’s)
Value(000’s)
$
% ofNet
AssetValue
1,850 Seasoned Credit Risk TransferTrust Series 2017-1,Series 2017 1, Class M1,144A,4.000%, due 25/01/2056 * 1,858 0.28
750 UBS Commercial MortgageTrust 2017-C3, Series 2017C3, Class C,4.310%, due 15/08/2050 * 770 0.12
610 UBS Commercial MortgageTrust 2018-C13, Series 2018C13, Class B,4.786%, due 15/10/2051 * 680 0.10
2,002 WaMu Mortgage Pass-Through CertificatesSeries 2005-AR17 Trust,Series 2005 AR17,Class A1C3,1.078%, due 25/12/2045 * 1,289 0.20
Total Mortgage-Backed Securities(Cost $29,935) 28,805 4.39
Corporate Bonds and Notes — 46.57%(29 February 2020: 39.39%)
Argentina — 0.29% (29 February 2020: 0.45%)
2,270 Pampa Energia SA,7.500%, due 24/01/2027 1,918 0.29
Belgium — 0.52% (29 February 2020: 0.36%)
2,090 Anheuser-Busch Cos LLC /Anheuser-Busch InBevWorldwide Inc,4.900%, due 01/02/2046 2,521 0.38
340 Anheuser-Busch InBevWorldwide Inc,4.350%, due 01/06/2040 396 0.06
40 Anheuser-Busch InBevWorldwide Inc,4.439%, due 06/10/2048 46 0.01
410 Anheuser-Busch InBevWorldwide Inc,4.500%, due 01/06/2050 474 0.07
3,437 0.52
Brazil — 3.91% (29 February 2020: 3.45%)
2,250 Braskem America Finance Co,7.125%, due 22/07/2041 2,554 0.39
1,710 Braskem Finance Ltd,5.375%, due 02/05/2022 1,790 0.27
3,820 Itau Unibanco Holding SA/Cayman Island,6.125%, Perpetual * 3,839 0.59
6,494 Petrobras Global Finance BV,6.250%, due 17/03/2024 7,346 1.12
1,310 Suzano Austria GmbH,5.750%, due 14/07/2026 1,538 0.23
1,790 Suzano Austria GmbH,5.000%, due 15/01/2030 2,012 0.31
3,550 Ultrapar International SA,144A,5.250%, due 06/10/2026 3,888 0.59
2,210 Vale Overseas Ltd,6.250%, due 10/08/2026 2,670 0.41
25,637 3.91
Canada — 0.95% (29 February 2020: 0.88%)
2,000 1011778 BC ULC / New RedFinance Inc, 144A,3.875%, due 15/01/2028 2,033 0.31
2,790 MEG Energy Corp,7.125%, due 01/02/2027 2,934 0.45
460 Open Text Corp, 144A,3.875%, due 15/02/2028 468 0.07
740 Open Text Holdings Inc,144A,4.125%, due 15/02/2030 771 0.12
6,206 0.95
Chile — 0.11% (29 February 2020: 0.00%)
700 Antofagasta Plc,2.375%, due 14/10/2030 696 0.11
China — 0.45% (29 February 2020: 0.39%)
2,580 Prosus NV,4.850%, due 06/07/2027 2,928 0.45
FaceValue(000’s)
Value(000’s)
$
% ofNet
AssetValue
Colombia — 0.54% (29 February 2020: 0.52%)
3,312 Millicom InternationalCellular SA,5.125%, due 15/01/2028 3,536 0.54
Denmark — 0.07% (29 February 2020: 0.23%)
GBP 330 Orsted AS, Series GBP,2.500%, due 18/02/3021 * 457 0.07
France — 1.61% (29 February 2020: 0.05%)
EUR 230 Adevinta ASA,3.000%, due 15/11/2027 285 0.04
3,290 BNP Paribas SA,7.375%, Perpetual * 3,810 0.58
EUR 340 Credit Agricole SA,6.500%, Perpetual * 417 0.07
EUR 1,440 Loxam SAS,3.750%, due 15/07/2026 1,755 0.27
EUR 2,000 Mercialys SA,4.625%, due 07/07/2027 2,710 0.41
EUR 1,450 Novafives SAS,5.000%, due 15/06/2025 1,582 0.24
10,559 1.61
Germany — 0.72% (29 February 2020: 0.00%)
EUR 570 Cheplapharm ArzneimittelGmbH,4.375%, due 15/01/2028 711 0.11
EUR 620 Vertical Holdco GmbH,6.625%, due 15/07/2028 797 0.12
EUR 780 Vertical Midco GmbH,4.375%, due 15/07/2027 987 0.15
EUR 1,400 ZF Finance GmbH,3.000%, due 21/09/2025 1,755 0.27
EUR 400 ZF Finance GmbH,2.750%, due 25/05/2027 492 0.07
4,742 0.72
Ireland — 0.71% (29 February 2020: 0.76%)
490 AerCap Ireland CapitalDAC / AerCap GlobalAviation Trust,4.500%, due 15/09/2023 529 0.08
96 Park Aerospace Holdings Ltd,144A,5.250%, due 15/08/2022 101 0.02
1,140 Park Aerospace Holdings Ltd,144A,4.500%, due 15/03/2023 1,193 0.18
2,590 Park Aerospace Holdings Ltd,144A,5.500%, due 15/02/2024 2,821 0.43
4,644 0.71
Israel — 0.77% (29 February 2020: 0.48%)
EUR 1,460 Teva Pharmaceutical FinanceNetherlands II BV,6.000%, due 31/01/2025 1,929 0.29
2,000 Teva Pharmaceutical FinanceNetherlands III BV,2.800%, due 21/07/2023 1,962 0.30
1,250 Teva Pharmaceutical FinanceNetherlands III BV,3.150%, due 01/10/2026 1,174 0.18
5,065 0.77
Italy — 0.54% (29 February 2020: 1.24%)
EUR 1,400 Intesa Sanpaolo SpA,5.500%, Perpetual * 1,799 0.27
1,630 UniCredit SpA,5.459%, due 30/06/2035 * 1,764 0.27
3,563 0.54
Jersey — 0.04% (29 February 2020: 0.03%)
EUR 220 LHC3 Plc,4.125%, due 15/08/2024 270 0.04
Kazakhstan — 0.68% (29 February 2020: 0.58%)
790 KazMunayGas National CoJSC,5.375%, due 24/04/2030 941 0.14
3,150 KazTransGas JSC,4.375%, due 26/09/2027 3,512 0.54
4,453 0.68
Macau — 0.15% (29 February 2020: 0.19%)
940 Sands China Ltd,4.600%, due 08/08/2023 1,009 0.15
The accompanying notes are an integral part of the Financial Statements
79

Legg Mason Global Funds Plc Annual Report 28 February 2021
Legg Mason Western Asset Global Multi Strategy Fund
Portfolio of Investments as at 28 February 2021 – (continued)
FaceValue(000’s)
Value(000’s)
$
% ofNet
AssetValue
Corporate Bonds and Notes — (continued)Mexico — 1.58% (29 February 2020: 1.40%)
3,130 Banco Mercantil del NorteSA/Grand Cayman,6.875%, Perpetual * 3,224 0.49
2,470 BBVA Bancomer SA/Texas,5.125%, due 18/01/2033 * 2,607 0.40
3,790 Orbia Advance Corp SAB deCV,5.875%, due 17/09/2044 4,510 0.69
10,341 1.58
Morocco — 0.58% (29 February 2020: 0.52%)
3,530 OCP SA,4.500%, due 22/10/2025 3,808 0.58
Netherlands — 2.14% (29 February 2020: 1.81%)
EUR 1,600 Cooperatieve Rabobank UA,6.625%, Perpetual * 1,969 0.30
8,120 ING Groep NV,6.875%, Perpetual * 8,476 1.29
EUR 290 IPD 3 BV,5.500%, due 01/12/2025 362 0.06
EUR 640 Maxeda DIY Holding BV,5.875%, due 01/10/2026 797 0.12
270 Shell International FinanceBV,2.750%, due 06/04/2030 285 0.04
570 Shell International FinanceBV,3.250%, due 06/04/2050 578 0.09
1,510 Trivium Packaging FinanceBV,5.500%, due 15/08/2026 1,583 0.24
14,050 2.14
Peru — 2.02% (29 February 2020: 1.34%)
1,630 Hudbay Minerals Inc, 144A,7.625%, due 15/01/2025 1,700 0.26
1,050 Petroleos del Peru SA,Series FEB,5.625%, due 19/06/2047 1,160 0.18
4,050 Southern Copper Corp,5.250%, due 08/11/2042 5,104 0.78
4,720 Transportadora de Gas delPeru SA,4.250%, due 30/04/2028 5,286 0.80
13,250 2.02
South Africa — 0.04% (29 February 2020: 0.03%)
200 Anglo American Capital Plc,144A,4.750%, due 10/04/2027 235 0.04
Spain — 0.42% (29 February 2020: 0.22%)
EUR 900 Telefonica Europe BV,2.376%, Perpetual * 1,054 0.16
EUR 370 Tendam Brands SAU,5.000%, due 15/09/2024 418 0.06
EUR 1,130 Tendam Brands SAU,5.250%, due 15/09/2024 * 1,280 0.20
2,752 0.42
Sweden — 0.83% (29 February 2020: 0.51%)
EUR 3,400 Samhallsbyggnadsbolaget iNorden AB,2.624%, Perpetual * 4,069 0.62
800 Svenska Handelsbanken AB,4.750%, Perpetual * 849 0.13
EUR 420 Verisure Midholding AB,5.250%, due 15/02/2029 523 0.08
5,441 0.83
Switzerland — 1.27% (29 February 2020: 0.84%)
720 Credit Suisse Group AG,7.500%, Perpetual * 789 0.12
1,438 Glencore Finance CanadaLtd,6.000%, due 15/11/2041 1,817 0.28
EUR 630 Holcim Finance LuxembourgSA,3.000%, Perpetual * 787 0.12
1,060 Syngenta Finance NV,4.441%, due 24/04/2023 1,110 0.17
3,500 UBS Group AG,7.000%, Perpetual * 3,831 0.58
8,334 1.27
FaceValue(000’s)
Value(000’s)
$
% ofNet
AssetValue
United Arab Emirates — 0.59%(29 February 2020: 0.50%)
20 DAE Funding LLC, 144A,4.500%, due 01/08/2022 20 –
3,240 DP World Plc,5.625%, due 25/09/2048 3,869 0.59
3,889 0.59
United Kingdom — 3.32% (29 February 2020: 2.49%)
888 Barclays Bank Plc,7.625%, due 21/11/2022 977 0.15
GBP 570 Barclays Plc,1.700%, due 03/11/2026 * 807 0.12
GBP 620 Barclays Plc,7.125%, Perpetual * 965 0.15
GBP 150 Bellis Acquisition Co Plc,3.250%, due 16/02/2026 212 0.03
GBP 750 Grainger Plc,3.000%, due 03/07/2030 1,098 0.17
GBP 1,459 Greene King Finance Plc,Series B2,2.123%, due 15/03/2036 *† 1,687 0.26
GBP 1,050 HSBC Holdings Plc,7.000%, due 07/04/2038 2,198 0.34
2,550 HSBC Holdings Plc,6.375%, Perpetual * 2,795 0.43
EUR 110 INEOS Quattro Finance 1 Plc,3.750%, due 15/07/2026 135 0.02
EUR 1,600 Lloyds Banking Group Plc,4.947%, Perpetual * 2,089 0.32
GBP 2,545 Marston’s Issuer Plc,Series B1,2.578%, due 16/07/2035 *† 2,820 0.43
GBP 1,150 Saga Plc,3.375%, due 12/05/2024 1,480 0.23
EUR 740 Synlab Bondco Plc,4.750%, due 01/07/2025 * 909 0.14
GBP 1,070 Tesco Property Finance 6 Plc,5.411%, due 13/07/2044 1,932 0.29
GBP 240 Travis Perkins Plc,3.750%, due 17/02/2026 355 0.05
450 Virgin Media SecuredFinance Plc, 144A,5.500%, due 15/08/2026 469 0.07
GBP 340 Whitbread Group Plc,2.375%, due 31/05/2027 468 0.07
GBP 260 Whitbread Group Plc,3.000%, due 31/05/2031 356 0.05
21,752 3.32
United States — 21.25% (29 February 2020: 19.11%)
720 3M Co,3.700%, due 15/04/2050 823 0.12
1,550 AbbVie Inc,4.850%, due 15/06/2044 1,924 0.29
260 Antero Midstream PartnersLP / Antero MidstreamFinance Corp,5.375%, due 15/09/2024 263 0.04
3,300 Ardagh Packaging FinancePlc / Ardagh Holdings USAInc, 144A,6.000%, due 15/02/2025 3,414 0.52
1,790 Ardagh Packaging FinancePlc / Ardagh Holdings USAInc, 144A,5.250%, due 15/08/2027 1,856 0.28
320 Bank of America Corp,4.083%, due 20/03/2051 * 373 0.06
650 Bausch Health Americas Inc,144A,9.250%, due 01/04/2026 721 0.11
1,580 Boeing Co/The,4.875%, due 01/05/2025 1,767 0.27
400 Boeing Co/The,3.750%, due 01/02/2050 391 0.06
320 BP Capital Markets AmericaInc,3.633%, due 06/04/2030 358 0.05
501 Bristol-Myers Squibb Co,5.000%, due 15/08/2045 670 0.10
850 CCO Holdings LLC / CCOHoldings Capital Corp,144A,5.750%, due 15/02/2026 880 0.13
FaceValue(000’s)
Value(000’s)
$
% ofNet
AssetValue
2,380 CCO Holdings LLC / CCOHoldings Capital Corp, 144A,5.125%, due 01/05/2027 2,496 0.38
860 Centene Corp,4.625%, due 15/12/2029 929 0.14
1,000 Charter CommunicationsOperating LLC / CharterCommunications OperatingCapital,3.500%, due 01/06/2041 968 0.15
640 Cigna Corp,4.800%, due 15/08/2038 793 0.12
170 Coca-Cola Co/The,2.500%, due 15/03/2051 157 0.02
1,650 Comcast Corp,4.700%, due 15/10/2048 2,097 0.32
600 Comcast Corp,4.950%, due 15/10/2058 817 0.12
3,548 Continental Resources Inc/OK,4.900%, due 01/06/2044 3,554 0.54
1,000 CSC Holdings LLC, 144A,6.500%, due 01/02/2029 1,108 0.17
1,240 DCP Midstream Operating LP,144A,6.450%, due 03/11/2036 1,392 0.21
340 Deere & Co,3.750%, due 15/04/2050 401 0.06
1,720 Dell International LLC / EMCCorp, 144A,5.875%, due 15/06/2021 1,722 0.26
1,500 Dell International LLC / EMCCorp, 144A,7.125%, due 15/06/2024 1,554 0.24
265 Delta Air Lines 2007-1 Class BPass Through Trust,Series 071B,8.021%, due 10/08/2022 267 0.04
80 Delta Air Lines Inc,2.900%, due 28/10/2024 80 0.01
1,950 Delta Air Lines Inc, 144A,7.000%, due 01/05/2025 2,273 0.35
790 Delta Air Lines Inc,7.375%, due 15/01/2026 926 0.14
1,690 Delta Air Lines Inc / SkyMilesIP Ltd, 144A,4.500%, due 20/10/2025 1,806 0.27
1,110 Delta Air Lines Inc / SkyMilesIP Ltd, 144A,4.750%, due 20/10/2028 1,233 0.19
2,275 DISH DBS Corp,5.875%, due 15/07/2022 2,374 0.36
1,620 DISH DBS Corp,5.875%, due 15/11/2024 1,698 0.26
2,250 DISH DBS Corp,7.750%, due 01/07/2026 2,479 0.38
2,210 Diversified Healthcare Trust,9.750%, due 15/06/2025 2,492 0.38
200 El Paso Natural Gas Co LLC,8.375%, due 15/06/2032 289 0.04
970 Energy Transfer Partners LP /Regency Energy FinanceCorp,5.875%, due 01/03/2022 1,007 0.15
580 Energy Transfer Partners LP /Regency Energy FinanceCorp,5.000%, due 01/10/2022 612 0.09
1,850 Energy Transfer Partners LP /Regency Energy FinanceCorp,4.500%, due 01/11/2023 2,008 0.31
1,600 Enterprise Products OperatingLLC,4.800%, due 01/02/2049 1,879 0.29
200 EOG Resources Inc,4.375%, due 15/04/2030 235 0.04
50 EOG Resources Inc,4.950%, due 15/04/2050 63 0.01
290 Exxon Mobil Corp,4.327%, due 19/03/2050 343 0.05
310 Exxon Mobil Corp,3.452%, due 15/04/2051 319 0.05
3,370 FirstEnergy Corp, Series C,7.375%, due 15/11/2031 4,641 0.71
The accompanying notes are an integral part of the Financial Statements
80

Legg Mason Global Funds Plc Annual Report 28 February 2021
Legg Mason Western Asset Global Multi Strategy Fund
Portfolio of Investments as at 28 February 2021 – (continued)
FaceValue(000’s)
Value(000’s)
$
% ofNet
AssetValue
Corporate Bonds and Notes — (continued)
United States — (continued)
3,160 Ford Motor Co,8.500%, due 21/04/2023 3,535 0.54
GBP 1,010 Ford Motor Credit Co LLC,2.748%, due 14/06/2024 1,422 0.22
390 Ford Motor Credit Co LLC,3.815%, due 02/11/2027 403 0.06
3,080 Freeport-McMoRan Inc,5.450%, due 15/03/2043 3,833 0.58
3,719 GE Capital InternationalFunding Co Unlimited Co,4.418%, due 15/11/2035 4,252 0.65
90 General Dynamics Corp,4.250%, due 01/04/2040 110 0.02
740 General Dynamics Corp,4.250%, due 01/04/2050 922 0.14
50 General Electric Co,6.750%, due 15/03/2032 68 0.01
1,046 General Electric Co,6.875%, due 10/01/2039 1,494 0.23
390 General Electric Co,4.250%, due 01/05/2040 434 0.07
350 General Electric Co,4.350%, due 01/05/2050 390 0.06
840 General Motors Co,5.400%, due 02/10/2023 937 0.14
405 Goldman Sachs Capital II,4.000%, Perpetual * 391 0.06
1,290 Hilton Worldwide FinanceLLC / Hilton WorldwideFinance Corp,4.875%, due 01/04/2027 1,344 0.20
240 Home Depot Inc/The,3.300%, due 15/04/2040 260 0.04
670 Home Depot Inc/The,3.350%, due 15/04/2050 715 0.11
30 JPMorgan Chase & Co,3.109%, due 22/04/2051 * 31 –
47 JPMorgan Chase & Co,Series I,3.682%, Perpetual * 47 0.01
3,510 JPMorgan Chase & Co,Series U,6.125%, Perpetual * 3,792 0.58
40 Kinder Morgan EnergyPartners LP,3.950%, due 01/09/2022 42 0.01
550 Kinder Morgan Inc,8.050%, due 15/10/2030 762 0.12
1,735 Kinder Morgan Inc,7.800%, due 01/08/2031 2,495 0.38
565 Kinder Morgan Inc,7.750%, due 15/01/2032 814 0.12
500 Kraft Heinz Foods Co,5.200%, due 15/07/2045 602 0.09
2,026 L3Harris Technologies Inc,5.054%, due 27/04/2045 2,643 0.40
40 Lamb Weston Holdings Inc,144A,4.625%, due 01/11/2024 42 0.01
1,530 Lamb Weston Holdings Inc,144A,4.875%, due 01/11/2026 1,588 0.24
590 Legacy LifePoint Health LLC,144A,4.375%, due 15/02/2027 588 0.09
318 Lehman Escrow Receipt, zerocoupon, Perpetual †∞ 4 –
880 Lumen Technologies Inc,Series W,6.750%, due 01/12/2023 978 0.15
1,443 Match Group Holdings IILLC, 144A,5.000%, due 15/12/2027 1,517 0.23
110 McDonald’s Corp,3.625%, due 01/09/2049 118 0.02
800 McDonald’s Corp,4.200%, due 01/04/2050 942 0.14
280 Morgan Stanley,5.597%, due 24/03/2051 * 406 0.06
GBP 820 MPT Operating PartnershipLP / MPT Finance Corp,2.550%, due 05/12/2023 1,163 0.18
FaceValue(000’s)
Value(000’s)
$
% ofNet
AssetValue
1,750 MPT Operating PartnershipLP / MPT Finance Corp,4.625%, due 01/08/2029 1,884 0.29
450 Navient Corp,5.875%, due 25/10/2024 475 0.07
1,390 NCL Corp Ltd, 144A,10.250%, due 01/02/2026 1,619 0.25
2,000 Netflix Inc, 144A,4.875%, due 15/06/2030 2,302 0.35
501 Newell Brands Inc,4.350%, due 01/04/2023 527 0.08
1,010 NGPL PipeCo LLC, 144A,7.768%, due 15/12/2037 1,360 0.21
310 NIKE Inc,3.375%, due 27/03/2050 340 0.05
1,250 NVIDIA Corp,3.500%, due 01/04/2050 1,359 0.21
210 NVIDIA Corp,3.700%, due 01/04/2060 235 0.04
690 Occidental Petroleum Corp,3.500%, due 15/08/2029 661 0.10
40 Occidental Petroleum Corp,7.875%, due 15/09/2031 47 0.01
2,000 Prime Security ServicesBorrower LLC / Prime FinanceInc, 144A,6.250%, due 15/01/2028 2,075 0.32
1,080 Radiology Partners Inc,144A,9.250%, due 01/02/2028 1,172 0.18
355 Southern Natural Gas CoLLC,8.000%, due 01/03/2032 496 0.08
1,550 Spirit Loyalty Cayman Ltd /Spirit IP Cayman Ltd, 144A,8.000%, due 20/09/2025 1,747 0.27
3,000 Sprint Capital Corp,8.750%, due 15/03/2032 4,467 0.68
120 Targa Resources Partners LP /Targa Resources PartnersFinance Corp,5.375%, due 01/02/2027 125 0.02
1,280 Targa Resources Partners LP /Targa Resources PartnersFinance Corp,5.500%, due 01/03/2030 1,370 0.21
990 T-Mobile USA Inc, 144A,3.875%, due 15/04/2030 1,090 0.17
380 Transcontinental Gas PipeLine Co LLC,3.250%, due 15/05/2030 408 0.06
780 United Rentals NorthAmerica Inc,5.500%, due 15/05/2027 826 0.13
1,200 United Rentals NorthAmerica Inc,3.875%, due 15/11/2027 1,251 0.19
870 Verizon Communications Inc,4.000%, due 22/03/2050 952 0.14
1,760 VICI Properties LP / VICI NoteCo Inc, 144A,4.625%, due 01/12/2029 1,850 0.28
460 Viking Cruises Ltd, 144A,5.875%, due 15/09/2027 444 0.07
530 Viking Ocean Cruises Ship VIILtd, 144A,5.625%, due 15/02/2029 535 0.08
240 Visa Inc,2.700%, due 15/04/2040 245 0.04
1,370 VOC Escrow Ltd, 144A,5.000%, due 15/02/2028 1,357 0.21
970 Wells Fargo & Co,5.013%, due 04/04/2051 * 1,299 0.20
1,910 Wells Fargo & Co, Series U,5.875%, Perpetual * 2,095 0.32
452 Williams Cos Inc/The,Series A,7.500%, due 15/01/2031 615 0.09
2,155 Williams Cos Inc/The,5.750%, due 24/06/2044 2,706 0.41
960 WPX Energy Inc,5.250%, due 15/10/2027 1,027 0.16
380 WPX Energy Inc,5.875%, due 15/06/2028 416 0.06
2,420 XPO Logistics Inc, 144A,6.125%, due 01/09/2023 2,464 0.38
139,377 21.25
FaceValue(000’s)
Value(000’s)
$
% ofNet
AssetValue
Zambia — 0.47% (29 February 2020: 0.39%)
290 First Quantum Minerals Ltd,144A,7.250%, due 01/04/2023 296 0.04
570 First Quantum Minerals Ltd,144A,6.500%, due 01/03/2024 583 0.09
1,050 First Quantum Minerals Ltd,144A,7.500%, due 01/04/2025 1,085 0.17
1,090 First Quantum Minerals Ltd,6.875%, due 01/03/2026 1,140 0.17
3,104 0.47
Total Corporate Bonds and Notes(Cost $277,136) 305,453 46.57
Government Bonds and Notes — 24.57%(29 February 2020: 33.29%)
Argentina — 0.20% (29 February 2020: 0.60%)
ARS 10,242 Argentina Treasury BondBONCER, Series CER,1.000%, due 05/08/2021 †� 99 0.02
38 Argentine RepublicGovernment InternationalBond,1.000%, due 09/07/2029 15 –
349 Argentine RepublicGovernment InternationalBond,0.125%, due 09/07/2030 127 0.02
640 Argentine RepublicGovernment InternationalBond,0.125%, due 09/07/2035 205 0.03
2,510 Provincia de Buenos Aires/Government Bonds,7.875%, due 15/06/2027 � 841 0.13
1,287 0.20
Australia — 0.85% (29 February 2020: 0.00%)
AUD 9,400 Australia Government Bond,Series 162,1.750%, due 21/06/2051 5,562 0.85
Brazil — 1.06% (29 February 2020: 1.26%)
BRL 24,604 Brazil Notas do TesouroNacional Serie F,Series NTNF,10.000%, due 01/01/2023 4,698 0.71
BRL 11,694 Brazil Notas do TesouroNacional Serie F,Series NTNF,10.000%, due 01/01/2027 2,280 0.35
6,978 1.06
Colombia — 0.56% (29 February 2020: 1.48%)
3,140 Colombia GovernmentInternational Bond,5.625%, due 26/02/2044 3,628 0.55
COP 171,800 Colombian TES, Series B,10.000%, due 24/07/2024 56 0.01
3,684 0.56
Cote d’Ivoire (Ivory Coast) — 0.29%(29 February 2020: 0.00%)
EUR 1,500 Ivory Coast GovernmentInternational Bond,5.250%, due 22/03/2030 1,917 0.29
Egypt — 0.54% (29 February 2020: 0.15%)
2,350 Egypt GovernmentInternational Bond,3.875%, due 16/02/2026 2,304 0.35
EUR 960 Egypt GovernmentInternational Bond,6.375%, due 11/04/2031 1,212 0.19
3,516 0.54
Germany — 0.21% (29 February 2020: 0.00%)
EUR 1,110 Bundesrepublik DeutschlandBundesanleihe,0.000%, due 15/02/2030 1,381 0.21
Ghana — 0.27% (29 February 2020: 0.24%)
1,730 Ghana GovernmentInternational Bond,7.625%, due 16/05/2029 1,810 0.27
The accompanying notes are an integral part of the Financial Statements
81
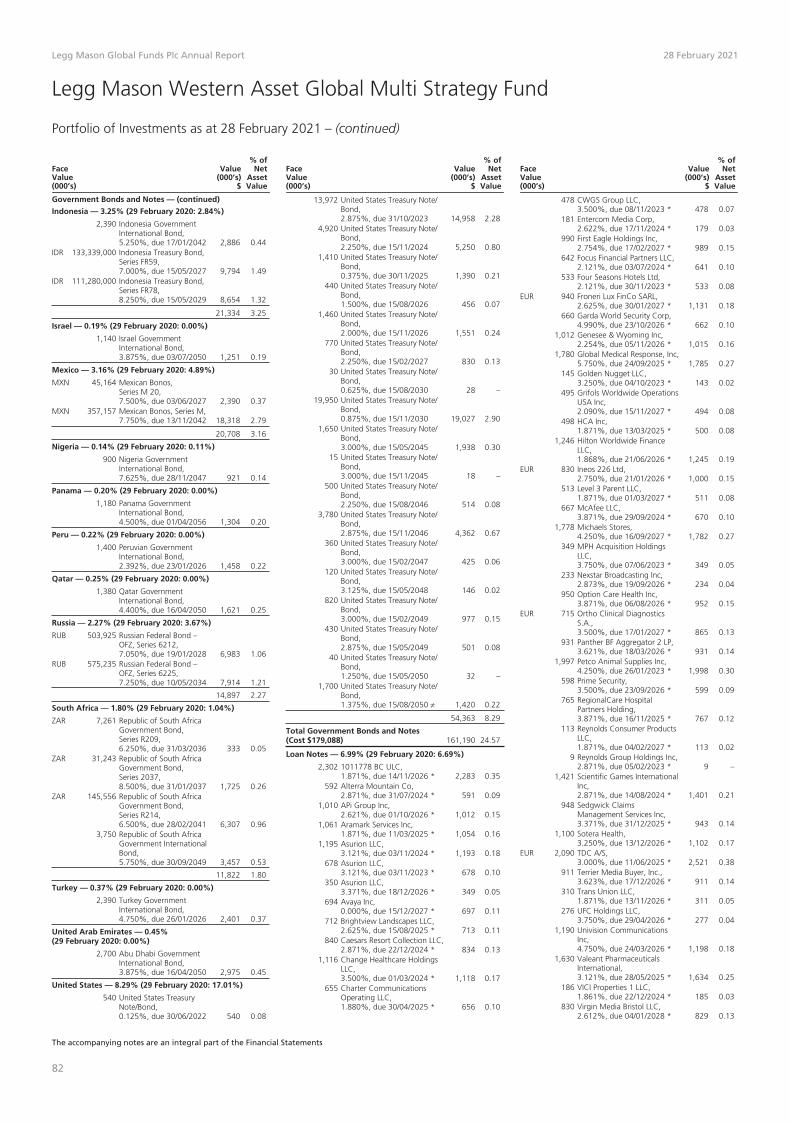
Legg Mason Global Funds Plc Annual Report 28 February 2021
Legg Mason Western Asset Global Multi Strategy Fund
Portfolio of Investments as at 28 February 2021 – (continued)
FaceValue(000’s)
Value(000’s)
$
% ofNet
AssetValue
Government Bonds and Notes — (continued)
Indonesia — 3.25% (29 February 2020: 2.84%)
2,390 Indonesia GovernmentInternational Bond,5.250%, due 17/01/2042 2,886 0.44
IDR 133,339,000 Indonesia Treasury Bond,Series FR59,7.000%, due 15/05/2027 9,794 1.49
IDR 111,280,000 Indonesia Treasury Bond,Series FR78,8.250%, due 15/05/2029 8,654 1.32
21,334 3.25
Israel — 0.19% (29 February 2020: 0.00%)
1,140 Israel GovernmentInternational Bond,3.875%, due 03/07/2050 1,251 0.19
Mexico — 3.16% (29 February 2020: 4.89%)
MXN 45,164 Mexican Bonos,Series M 20,7.500%, due 03/06/2027 2,390 0.37
MXN 357,157 Mexican Bonos, Series M,7.750%, due 13/11/2042 18,318 2.79
20,708 3.16
Nigeria — 0.14% (29 February 2020: 0.11%)
900 Nigeria GovernmentInternational Bond,7.625%, due 28/11/2047 921 0.14
Panama — 0.20% (29 February 2020: 0.00%)
1,180 Panama GovernmentInternational Bond,4.500%, due 01/04/2056 1,304 0.20
Peru — 0.22% (29 February 2020: 0.00%)
1,400 Peruvian GovernmentInternational Bond,2.392%, due 23/01/2026 1,458 0.22
Qatar — 0.25% (29 February 2020: 0.00%)
1,380 Qatar GovernmentInternational Bond,4.400%, due 16/04/2050 1,621 0.25
Russia — 2.27% (29 February 2020: 3.67%)
RUB 503,925 Russian Federal Bond –OFZ, Series 6212,7.050%, due 19/01/2028 6,983 1.06
RUB 575,235 Russian Federal Bond –OFZ, Series 6225,7.250%, due 10/05/2034 7,914 1.21
14,897 2.27
South Africa — 1.80% (29 February 2020: 1.04%)
ZAR 7,261 Republic of South AfricaGovernment Bond,Series R209,6.250%, due 31/03/2036 333 0.05
ZAR 31,243 Republic of South AfricaGovernment Bond,Series 2037,8.500%, due 31/01/2037 1,725 0.26
ZAR 145,556 Republic of South AfricaGovernment Bond,Series R214,6.500%, due 28/02/2041 6,307 0.96
3,750 Republic of South AfricaGovernment InternationalBond,5.750%, due 30/09/2049 3,457 0.53
11,822 1.80
Turkey — 0.37% (29 February 2020: 0.00%)
2,390 Turkey GovernmentInternational Bond,4.750%, due 26/01/2026 2,401 0.37
United Arab Emirates — 0.45%(29 February 2020: 0.00%)
2,700 Abu Dhabi GovernmentInternational Bond,3.875%, due 16/04/2050 2,975 0.45
United States — 8.29% (29 February 2020: 17.01%)
540 United States TreasuryNote/Bond,0.125%, due 30/06/2022 540 0.08
FaceValue(000’s)
Value(000’s)
$
% ofNet
AssetValue
13,972 United States Treasury Note/Bond,2.875%, due 31/10/2023 14,958 2.28
4,920 United States Treasury Note/Bond,2.250%, due 15/11/2024 5,250 0.80
1,410 United States Treasury Note/Bond,0.375%, due 30/11/2025 1,390 0.21
440 United States Treasury Note/Bond,1.500%, due 15/08/2026 456 0.07
1,460 United States Treasury Note/Bond,2.000%, due 15/11/2026 1,551 0.24
770 United States Treasury Note/Bond,2.250%, due 15/02/2027 830 0.13
30 United States Treasury Note/Bond,0.625%, due 15/08/2030 28 –
19,950 United States Treasury Note/Bond,0.875%, due 15/11/2030 19,027 2.90
1,650 United States Treasury Note/Bond,3.000%, due 15/05/2045 1,938 0.30
15 United States Treasury Note/Bond,3.000%, due 15/11/2045 18 –
500 United States Treasury Note/Bond,2.250%, due 15/08/2046 514 0.08
3,780 United States Treasury Note/Bond,2.875%, due 15/11/2046 4,362 0.67
360 United States Treasury Note/Bond,3.000%, due 15/02/2047 425 0.06
120 United States Treasury Note/Bond,3.125%, due 15/05/2048 146 0.02
820 United States Treasury Note/Bond,3.000%, due 15/02/2049 977 0.15
430 United States Treasury Note/Bond,2.875%, due 15/05/2049 501 0.08
40 United States Treasury Note/Bond,1.250%, due 15/05/2050 32 –
1,700 United States Treasury Note/Bond,1.375%, due 15/08/2050 ≠ 1,420 0.22
54,363 8.29
Total Government Bonds and Notes(Cost $179,088) 161,190 24.57
Loan Notes — 6.99% (29 February 2020: 6.69%)
2,302 1011778 BC ULC,1.871%, due 14/11/2026 * 2,283 0.35
592 Alterra Mountain Co,2.871%, due 31/07/2024 * 591 0.09
1,010 APi Group Inc,2.621%, due 01/10/2026 * 1,012 0.15
1,061 Aramark Services Inc,1.871%, due 11/03/2025 * 1,054 0.16
1,195 Asurion LLC,3.121%, due 03/11/2024 * 1,193 0.18
678 Asurion LLC,3.121%, due 03/11/2023 * 678 0.10
350 Asurion LLC,3.371%, due 18/12/2026 * 349 0.05
694 Avaya Inc,0.000%, due 15/12/2027 * 697 0.11
712 Brightview Landscapes LLC,2.625%, due 15/08/2025 * 713 0.11
840 Caesars Resort Collection LLC,2.871%, due 22/12/2024 * 834 0.13
1,116 Change Healthcare HoldingsLLC,3.500%, due 01/03/2024 * 1,118 0.17
655 Charter CommunicationsOperating LLC,1.880%, due 30/04/2025 * 656 0.10
FaceValue(000’s)
Value(000’s)
$
% ofNet
AssetValue
478 CWGS Group LLC,3.500%, due 08/11/2023 * 478 0.07
181 Entercom Media Corp,2.622%, due 17/11/2024 * 179 0.03
990 First Eagle Holdings Inc,2.754%, due 17/02/2027 * 989 0.15
642 Focus Financial Partners LLC,2.121%, due 03/07/2024 * 641 0.10
533 Four Seasons Hotels Ltd,2.121%, due 30/11/2023 * 533 0.08
EUR 940 Froneri Lux FinCo SARL,2.625%, due 30/01/2027 * 1,131 0.18
660 Garda World Security Corp,4.990%, due 23/10/2026 * 662 0.10
1,012 Genesee & Wyoming Inc,2.254%, due 05/11/2026 * 1,015 0.16
1,780 Global Medical Response, Inc,5.750%, due 24/09/2025 * 1,785 0.27
145 Golden Nugget LLC,3.250%, due 04/10/2023 * 143 0.02
495 Grifols Worldwide OperationsUSA Inc,2.090%, due 15/11/2027 * 494 0.08
498 HCA Inc,1.871%, due 13/03/2025 * 500 0.08
1,246 Hilton Worldwide FinanceLLC,1.868%, due 21/06/2026 * 1,245 0.19
EUR 830 Ineos 226 Ltd,2.750%, due 21/01/2026 * 1,000 0.15
513 Level 3 Parent LLC,1.871%, due 01/03/2027 * 511 0.08
667 McAfee LLC,3.871%, due 29/09/2024 * 670 0.10
1,778 Michaels Stores,4.250%, due 16/09/2027 * 1,782 0.27
349 MPH Acquisition HoldingsLLC,3.750%, due 07/06/2023 * 349 0.05
233 Nexstar Broadcasting Inc,2.873%, due 19/09/2026 * 234 0.04
950 Option Care Health Inc,3.871%, due 06/08/2026 * 952 0.15
EUR 715 Ortho Clinical DiagnosticsS.A.,3.500%, due 17/01/2027 * 865 0.13
931 Panther BF Aggregator 2 LP,3.621%, due 18/03/2026 * 931 0.14
1,997 Petco Animal Supplies Inc,4.250%, due 26/01/2023 * 1,998 0.30
598 Prime Security,3.500%, due 23/09/2026 * 599 0.09
765 RegionalCare HospitalPartners Holding,3.871%, due 16/11/2025 * 767 0.12
113 Reynolds Consumer ProductsLLC,1.871%, due 04/02/2027 * 113 0.02
9 Reynolds Group Holdings Inc,2.871%, due 05/02/2023 * 9 –
1,421 Scientific Games InternationalInc,2.871%, due 14/08/2024 * 1,401 0.21
948 Sedgwick ClaimsManagement Services Inc,3.371%, due 31/12/2025 * 943 0.14
1,100 Sotera Health,3.250%, due 13/12/2026 * 1,102 0.17
EUR 2,090 TDC A/S,3.000%, due 11/06/2025 * 2,521 0.38
911 Terrier Media Buyer, Inc.,3.623%, due 17/12/2026 * 911 0.14
310 Trans Union LLC,1.871%, due 13/11/2026 * 311 0.05
276 UFC Holdings LLC,3.750%, due 29/04/2026 * 277 0.04
1,190 Univision CommunicationsInc,4.750%, due 24/03/2026 * 1,198 0.18
1,630 Valeant PharmaceuticalsInternational,3.121%, due 28/05/2025 * 1,634 0.25
186 VICI Properties 1 LLC,1.861%, due 22/12/2024 * 185 0.03
830 Virgin Media Bristol LLC,2.612%, due 04/01/2028 * 829 0.13
The accompanying notes are an integral part of the Financial Statements
82

Legg Mason Global Funds Plc Annual Report 28 February 2021
Legg Mason Western Asset Global Multi Strategy Fund
Portfolio of Investments as at 28 February 2021 – (continued)
FaceValue(000’s)
Value(000’s)
$
% ofNet
AssetValue
Loan Notes — (continued)
561 Western Digital Corp,1.871%, due 29/04/2023 * 563 0.09
979 Whatabrands LLC,2.862%, due 03/08/2026 * 981 0.15
1,238 Wynn Resorts Finance LLC,1.880%, due 20/09/2024 * 1,207 0.18
Total Loan Notes (Cost $45,472) 45,816 6.99
Collective Investment Schemes — 9.89%(29 February 2020: 8.53%)
1,001 Legg Mason China Funds –Western Asset China BondFund – Class LM ** 13,933 2.12
85 Legg Mason Global FundsPlc – Western AssetEmerging Markets CorporateBond Fund – LM Class US$Distributing (M) 8,757 1.34
EUR 74 Legg Mason Global FundsPlc – Western Asset EuroHigh Yield Fund – LMClass Euro (Accumulating) 16,553 2.52
116 Legg Mason Global FundsPlc – Western Asset US HighYield Fund – LM Class US$Distributing (M) 10,371 1.58
59 Legg Mason QualifiedInvestor Funds (II) Plc – LeggMason Western Asset IndiaBond – LM Class US$Accumulating 8,025 1.22
EUR 57 Legg Mason QualifiedInvestor Funds (II) Plc –Western Asset EuropeanLoan Fund – LM Class EuroAccumulating 7,251 1.11
Total Collective Investment Schemes(Cost $53,817) 64,890 9.89
Common Stock — 0.05% (29 February 2020: 0.05%)
United States — 0.05% (29 February 2020: 0.05%)
44 Berry Corp 217 0.0357 Hercules Offshore Inc †∞ 34 0.0116 Southwestern Energy Co 66 0.01
317 0.05
Total Common Stock (Cost $1,380) 317 0.05
Total Investments and PledgedInvestments at fair value through profitor loss (Cost $590,464) 610,361 93.05
Contracts(000’s)
Value(000’s)
$
% ofNet
AssetValue
Purchased Options — 0.03% (29 February 2020: 0.10%)
20,100 USD Call/AUD Put0.76, due 09/04/2021 –Morgan Stanley 213 0.03
Total Purchased Options (Cost $189) 213 0.03
Forward Foreign Currency Contracts — 1.46%(29 February 2020: 0.37%)
Unrealised appreciation of contracts(see below) 9,596 1.46
Futures — 0.17% (29 February 2020: 0.00%)
Unrealised appreciation of contracts(see below) 1,115 0.17
Total Financial Assets at fair valuethrough profit or loss 621,285 94.71
Forward Foreign Currency Contracts — (0.32%)(29 February 2020: (1.05%))
Unrealised depreciation of contracts(see below) (2,105) (0.32)
Futures — (0.08%) (29 February 2020: (0.29%))
Unrealised depreciation of contracts(see below) (501) (0.08)
Total Financial Liabilities at fair valuethrough profit or loss (2,606) (0.40)
Total Financial Assets and FinancialLiabilities at fair value through profit orloss 618,679 94.31
Other Assets in Excess of Liabilities 37,252 5.69
Total Net Assets $655,931 100.00
– Amounts designated as “–” are either $0, less than$1,000, less than 1,000 shares or less than 0.01%.
144A Securities exempt from registration under Rule 144A ofthe Securities Act of 1933, as amended. Thesesecurities may only be resold, in transactions exemptfrom registration, to qualified institutional buyers. As at28 February 2021, these securities amounted to$73,764,000 or 11.26% of net assets.
* Variable rate security. The interest rate shown reflectsthe rate in effect at 28 February 2021.
† Illiquid.
∞ Security is valued in good faith at fair value by or at thediscretion of the Manager or the respective InvestmentManager.
� Security is in default as at 28 February 2021 (eitherprincipal and / or interest).
≠ Security (in whole or part) pledged as collateral forderivatives trading as at 28 February 2021.
� The rate of interest on this type of security is tied to theConsumer Price Index (CPI)/Retail Price Index (RPI). Thecoupon rate is the rate as of 28 February 2021.
** On 31 March 2021, Class M of the Unit Trust was re-named into Class LM.
ABBREVIATIONS:
Perpetual – A bond with no maturity date. Perpetual bondsare not redeemable but pay a steady stream ofinterest.
REMIC – Real Estate Mortgage Investment Conduit.
ARS – Argentine Peso
AUD – Australian Dollar
BRL – Brazilian Real
COP – Colombia Peso
EUR – Euro
GBP – British Pound
IDR – Indonesian Rupiah
MXN – Mexican Peso
RUB – Russian Ruble
ZAR – South Africa Rand
Analysis of Total Assets
% ofTotal
Assets
Transferable securities admitted to an officialexchange listing or traded on a regulated market 74.87
Other transferable securities dealt in on anotherregulated market 6.87
Collective investment schemes 9.72
Financial derivative instruments 1.64
Other assets 6.90
Total Assets 100.00
Schedule of Forward Foreign Currency Contracts
Expiration Date CounterpartyBuy Currency
(000’s)Sell Currency
(000’s)
UnrealisedAppreciation/(Depreciation)of Contracts
(000’s)
04/03/2021 Citi Buy USD 2,417 Sell IDR 34,311,880 $ 1304/03/2021 Citi Buy USD 1,501 Sell INR 108,790 2304/03/2021 Citi Buy INR 108,790 Sell USD 1,455 2304/03/2021 Citi Buy IDR 34,311,880 Sell USD 2,399 604/03/2021 Goldman Sachs Buy USD 3,488 Sell RUB 257,290 3904/03/2021 Goldman Sachs Buy RUB 257,290 Sell USD 3,355 9404/03/2021 Morgan Stanley Buy USD 6,768 Sell BRL 36,567 24404/03/2021 Morgan Stanley Buy BRL 36,567 Sell USD 6,812 (288)12/03/2021 BNY Mellon Buy USD 983 Sell AUD 1,251 2112/03/2021 BNY Mellon Buy USD 25 Sell CHF 23 –12/03/2021 BNY Mellon Buy USD 226 Sell EUR 188 –12/03/2021 BNY Mellon Buy USD 567 Sell EUR 467 312/03/2021 BNY Mellon Buy USD 183 Sell GBP 131 (1)12/03/2021 BNY Mellon Buy USD 4,960 Sell GBP 3,541 2812/03/2021 BNY Mellon Buy USD 250 Sell PLN 929 312/03/2021 BNY Mellon Buy USD 58 Sell SGD 77 –12/03/2021 BNY Mellon Buy USD 3 Sell SGD 4 –12/03/2021 BNY Mellon Buy ZAR 18,959 Sell USD 1,265 (14)12/03/2021 BNY Mellon Buy AUD 105,410 Sell USD 80,540 57112/03/2021 BNY Mellon Buy EUR 16,507 Sell USD 19,873 5012/03/2021 BNY Mellon Buy CHF 1,817 Sell USD 2,021 (24)12/03/2021 BNY Mellon Buy SGD 2 Sell USD 1 –
The accompanying notes are an integral part of the Financial Statements
83

Legg Mason Global Funds Plc Annual Report 28 February 2021
Legg Mason Western Asset Global Multi Strategy Fund
Portfolio of Investments as at 28 February 2021 – (continued)
Schedule of Forward Foreign Currency Contracts – (continued)
Expiration Date CounterpartyBuy Currency
(000’s)Sell Currency
(000’s)
UnrealisedAppreciation/(Depreciation)of Contracts
(000’s)
12/03/2021 BNY Mellon Buy PLN 27,522 Sell USD 7,389 $ (45)12/03/2021 BNY Mellon Buy SGD 1,397 Sell USD 1,050 (1)12/03/2021 BNY Mellon Buy EUR 27 Sell USD 32 –12/03/2021 BNY Mellon Buy GBP 273,992 Sell USD 373,819 7,94012/03/2021 BNY Mellon Buy USD 22 Sell ZAR 329 –18/05/2021 Bank of America Merrill Lynch Buy USD 18,293 Sell SGD 24,444 (35)18/05/2021 BNP Paribas Buy USD 13,033 Sell EUR 10,830 (58)18/05/2021 BNP Paribas Buy USD 6,187 Sell GBP 4,497 (80)18/05/2021 Citi Buy TRY 47,580 Sell USD 6,437 (259)18/05/2021 Citi Buy MXN 36,560 Sell USD 1,793 (60)18/05/2021 Goldman Sachs Buy USD 1,663 Sell GBP 1,200 (10)18/05/2021 Goldman Sachs Buy EUR 1,300 Sell USD 1,581 (10)18/05/2021 Goldman Sachs Buy MXN 68,509 Sell USD 3,380 (133)18/05/2021 HSBC Buy USD 57,897 Sell EUR 48,027 (156)18/05/2021 JP Morgan Buy USD 7,335 Sell AUD 9,500 2418/05/2021 JP Morgan Buy USD 2,387 Sell GBP 1,730 (23)18/05/2021 JP Morgan Buy USD 6,615 Sell MXN 134,180 25618/05/2021 JP Morgan Buy EUR 18,363 Sell USD 22,311 (115)18/05/2021 JP Morgan Buy CZK 580 Sell USD 28 –18/05/2021 Morgan Stanley Buy USD 6,512 Sell EUR 5,400 (15)18/05/2021 Morgan Stanley Buy USD 16,714 Sell JPY 1,764,228 14818/05/2021 Morgan Stanley Buy CAD 1,230 Sell USD 963 418/05/2021 Morgan Stanley Buy JPY 3,185,010 Sell USD 30,191 (284)18/05/2021 Morgan Stanley Buy USD 8,442 Sell ZAR 127,930 7218/05/2021 UBS Buy USD 8,100 Sell GBP 5,908 (134)18/05/2021 UBS Buy EUR 9,705 Sell USD 11,697 3410/06/2021 Citi Buy IDR 34,311,880 Sell USD 2,386 (38)10/06/2021 Citi Buy INR 108,790 Sell USD 1,479 (28)10/06/2021 Goldman Sachs Buy RUB 257,290 Sell USD 3,451 (46)10/06/2021 Morgan Stanley Buy BRL 36,567 Sell USD 6,742 (248)
Unrealised Appreciation of Forward Foreign Currency Contracts (29 February 2020 (000’s): $2,729) $ 9,596Unrealised Depreciation of Forward Foreign Currency Contracts (29 February 2020 (000’s): $(7,723)) (2,105)
Net Appreciation of Forward Foreign Currency Contracts (29 February 2020 (000’s): $(4,994)) $ 7,491
Schedule of Futures Contracts
CounterpartyNominal
Value
NotionalValue(000’s)
UnrealisedAppreciation/(Depreciation)of Contracts
(000’s)
90 Day Euro$ December 2021 Bank of America Merrill Lynch (273) $(68,093) $ (1)
90 Day Euro$ December 2023 Bank of America Merrill Lynch 273 67,506 (304)
Euro-Bund June 2021 Bank of America Merrill Lynch (34) (6,996) (4)
Euro-Bund March 2021 Bank of America Merrill Lynch (87) (18,202) 382
Euro-Buxl 30 Year Bond March 2021 Bank of America Merrill Lynch (1) (253) 15
Long Gilt June 2021 Bank of America Merrill Lynch 117 20,827 (192)
U.S. 10 Year Note (CBT) June 2021 Bank of America Merrill Lynch (125) (16,590) 232
U.S. 5 Year Note (CBT) June 2021 Bank of America Merrill Lynch (592) (73,389) 486
Unrealised Appreciation of Futures Contracts (29 February 2020 (000’s): $23) $ 1,115
Unrealised Depreciation of Futures Contracts (29 February 2020 (000’s): $(2,161)) (501)
Net Appreciation of Futures Contracts (29 February 2020 (000’s): $(2,138)) $ 614
The accompanying notes are an integral part of the Financial Statements
84

Legg Mason Global Funds Plc Annual Report 28 February 2021
Legg Mason Western Asset US High Yield Fund
Portfolio of Investments as at 28 February 2021
FaceValue(000’s)
Value(000’s)
$
% ofNet
AssetValue
Asset-Backed Securities — 4.30%(29 February 2020: 4.31%)
400 Apex Credit CLO 2019-II Ltd,Series 2019 2A, Class D, 144A,4.268%, due 25/10/2032 * 402 0.18
250 Ares XLI Clo Ltd, Series 2016 41A,Class D, 144A,4.441%, due 15/01/2029 * 250 0.12
710 Ares XLII Clo Ltd, Series 2017 42A,Class D, 144A,3.672%, due 22/01/2028 * 706 0.32
250 Ares XXXVR CLO Ltd,Series 2015 35RA, Class D, 144A,3.241%, due 15/07/2030 * 250 0.12
460 Avery Point VI CLO Ltd,Series 2015 6A, Class DR, 144A,3.145%, due 05/08/2027 * 457 0.21
440 Ballyrock CLO 2018-1 Ltd,Series 2018 1A, Class C, 144A,3.374%, due 20/04/2031 * 440 0.20
300 BLUEMOUNTAIN CLO 2012-2 Ltd,Series 2012 2A, Class ER2, 144A,5.932%, due 20/11/2028 * 291 0.13
500 BlueMountain CLO 2015-2 Ltd,Series 2015 2A, Class ER, 144A,5.423%, due 18/07/2027 * 473 0.22
400 Catskill Park CLO Ltd,Series 2017 1A, Class D, 144A,6.224%, due 20/04/2029 * 400 0.18
250 CIFC Funding 2017-I Ltd,Series 2017 1A, Class D, 144A,3.724%, due 23/04/2029 * 249 0.11
250 Cumberland Park CLO Ltd,Series 2015 2A, Class ER, 144A,5.874%, due 20/07/2028 * 246 0.11
300 GoldenTree Loan Opportunities IXLtd, Series 2014 9A, Class DR2,144A,3.212%, due 29/10/2029 * 301 0.14
250 Greenwood Park CLO Ltd,Series 2018 1A, Class E, 144A,5.191%, due 15/04/2031 * 238 0.11
510 Grippen Park CLO Ltd,Series 2017 1A, Class E, 144A,5.924%, due 20/01/2030 * 510 0.23
567 Jackson Mill CLO Ltd,Series 2015 1A, Class DR, 144A,3.041%, due 15/04/2027 * 566 0.26
300 LCM XXII Ltd 22A, Class DR,144A,5.724%, due 20/10/2028 * 288 0.13
693 Magnetite XII Ltd,Series 2015 12A, Class ER, 144A,5.921%, due 15/10/2031 * 675 0.31
250 Neuberger Berman CLO XVIII Ltd,Series 2014 18A, Class DR2,144A,6.144%, due 21/10/2030 * 247 0.11
390 Neuberger Berman CLO XX Ltd,Series 2015 20A, Class DR, 144A,2.641%, due 15/01/2028 * 382 0.18
500 Ocean Trails Clo X,Series 2020 10A, Class D, 144A,4.894%, due 15/10/2031 * 506 0.23
580 Saranac CLO III Ltd,Series 2014 3A, Class DR, 144A,3.486%, due 22/06/2030 * 553 0.25
250 Sound Point Clo XV Ltd,Series 2017 1A, Class E, 144A,6.178%, due 23/01/2029 * 225 0.10
320 Venture XVII CLO Ltd,Series 2014 17A, Class DRR,144A,3.061%, due 15/04/2027 * 308 0.14
100 Venture XVII CLO Ltd,Series 2014 17A, Class ERR, 144A,5.981%, due 15/04/2027 * 87 0.04
370 Wellfleet CLO 2017-2A Ltd,Series 2017 2A, Class C, 144A,3.624%, due 20/10/2029 * 369 0.17
Total Asset-Backed Securities(Cost $9,438) 9,419 4.30
FaceValue(000’s)
Value(000’s)
$
% ofNet
AssetValue
Corporate Bonds and Notes — 82.68%(29 February 2020: 82.38%)
Argentina — 0.39% (29 February 2020: 0.77%)
200 Transportadora de Gas del Sur SA,144A,6.750%, due 02/05/2025 176 0.08
818 YPF SA, 144A,4.000%, due 12/02/2026 688 0.31
864 0.39
Bermuda — 0.36% (29 February 2020: 0.00%)
740 Highlands Holdings Bond IssuerLtd / Highlands Holdings BondCo-Issuer Inc, 144A,7.625%, due 15/10/2025 786 0.36
Brazil — 0.28% (29 February 2020: 0.36%)
200 Itau Unibanco Holding SA/CaymanIsland, 144A,6.125%, Perpetual * 201 0.09
330 Petrobras Global Finance BV,7.375%, due 17/01/2027 404 0.19
605 0.28
Canada — 2.83% (29 February 2020: 3.85%)
570 ATS Automation Tooling SystemsInc, 144A,4.125%, due 15/12/2028 577 0.26
500 Cascades Inc/Cascades USA Inc,144A,5.375%, due 15/01/2028 529 0.24
220 Cenovus Energy Inc,5.375%, due 15/07/2025 249 0.11
110 Cenovus Energy Inc,6.750%, due 15/11/2039 143 0.07
50 Cenovus Energy Inc,5.400%, due 15/06/2047 58 0.03
850 Empire Communities Corp, 144A,7.000%, due 15/12/2025 897 0.41
500 GFL Environmental Inc, 144A,3.750%, due 01/08/2025 512 0.23
558 GFL Environmental Inc, 144A,8.500%, due 01/05/2027 615 0.28
1,190 MEG Energy Corp, 144A,7.125%, due 01/02/2027 1,251 0.57
520 MEG Energy Corp, 144A,5.875%, due 01/02/2029 529 0.24
500 Open Text Holdings Inc, 144A,4.125%, due 15/02/2030 521 0.24
320 Primo Water Holdings Inc, 144A,5.500%, due 01/04/2025 330 0.15
6,211 2.83
Cayman Islands — 1.04% (29 February 2020: 0.67%)
2,456 Global Aircraft Leasing Co Ltd,144A,6.500%, due 15/09/2024 2,285 1.04
Chile — 0.10% (29 February 2020: 0.00%)
220 Liberty Latin America Ltd,2.000%, due 15/07/2024 216 0.10
Colombia — 0.09% (29 February 2020: 0.12%)
180 Millicom International Cellular SA,144A,5.125%, due 15/01/2028 192 0.09
France — 1.11% (29 February 2020: 1.89%)
1,080 Altice France SA/France, 144A,7.375%, due 01/05/2026 1,128 0.51
1,200 Altice France SA/France, 144A,8.125%, due 01/02/2027 1,309 0.60
2,437 1.11
Germany — 1.23% (29 February 2020: 0.49%)
1,260 Cheplapharm Arzneimittel GmbH,144A,5.500%, due 15/01/2028 1,287 0.59
290 Mercer International Inc, 144A,5.125%, due 01/02/2029 294 0.13
1,070 Vertical US Newco Inc, 144A,5.250%, due 15/07/2027 1,118 0.51
2,699 1.23
Hong Kong — 0.22% (29 February 2020: 0.14%)
450 Melco Resorts Finance Ltd, 144A,5.375%, due 04/12/2029 477 0.22
FaceValue(000’s)
Value(000’s)
$
% ofNet
AssetValue
Ireland — 0.43% (29 February 2020: 0.00%)
920 Virgin Media Vendor FinancingNotes IV DAC, 144A,5.000%, due 15/07/2028 942 0.43
Israel — 0.40% (29 February 2020: 0.92%)
410 Teva Pharmaceutical Finance CoLLC,6.150%, due 01/02/2036 448 0.21
450 Teva Pharmaceutical FinanceNetherlands III BV,3.150%, due 01/10/2026 423 0.19
871 0.40
Italy — 0.61% (29 February 2020: 1.05%)
530 UniCredit SpA, 144A,7.296%, due 02/04/2034 * 630 0.29
660 UniCredit SpA, 144A,5.459%, due 30/06/2035 * 714 0.32
1,344 0.61
Luxembourg — 0.71% (29 February 2020: 0.80%)
200 Altice France Holding SA, 144A,10.500%, due 15/05/2027 225 0.10
500 ARD Finance SA, 144A,6.500%, due 30/06/2027 529 0.24
780 Intelsat Jackson Holdings SA,144A,8.000%, due 15/02/2024 � 807 0.37
1,561 0.71
Macau — 1.08% (29 February 2020: 0.26%)
200 Sands China Ltd,3.800%, due 08/01/2026 218 0.10
200 Sands China Ltd,5.400%, due 08/08/2028 230 0.11
1,380 Wynn Macau Ltd, 144A,5.625%, due 26/08/2028 1,438 0.66
460 Wynn Macau Ltd, 144A,5.125%, due 15/12/2029 470 0.21
2,356 1.08
Netherlands — 0.20% (29 February 2020: 0.36%)
420 UPC Holding BV, 144A,5.500%, due 15/01/2028 433 0.20
Peru — 0.46% (29 February 2020: 0.00%)
320 Hudbay Minerals Inc, 144A,7.625%, due 15/01/2025 334 0.15
260 Hudbay Minerals Inc, 144A,4.500%, due 01/04/2026 264 0.12
390 Hudbay Minerals Inc, 144A,6.125%, due 01/04/2029 421 0.19
1,019 0.46
South Korea — 0.30% (29 February 2020: 0.00%)
630 Clark Equipment Co, 144A,5.875%, due 01/06/2025 667 0.30
Switzerland — 0.34% (29 February 2020: 0.68%)
200 Credit Suisse Group AG, 144A,7.250%, Perpetual * 227 0.10
470 Credit Suisse Group AG, 144A,6.375%, Perpetual * 525 0.24
752 0.34
United Arab Emirates — 0.24%(29 February 2020: 1.07%)
500 DAE Funding LLC, 144A,5.000%, due 01/08/2024 517 0.24
United Kingdom — 1.02% (29 February 2020: 2.84%)
252 Barclays Bank Plc,7.625%, due 21/11/2022 277 0.13
480 Barclays Plc,8.000%, Perpetual * 542 0.25
1,310 Virgin Media Secured Finance Plc,144A,5.500%, due 15/05/2029 1,406 0.64
2,225 1.02
United States — 68.04% (29 February 2020: 65.02%)
590 Academy Ltd, 144A,6.000%, due 15/11/2027 624 0.28
410 AdaptHealth LLC, 144A,6.125%, due 01/08/2028 436 0.20
550 AdaptHealth LLC, 144A,4.625%, due 01/08/2029 552 0.25
The accompanying notes are an integral part of the Financial Statements
85

Legg Mason Global Funds Plc Annual Report 28 February 2021
Legg Mason Western Asset US High Yield Fund
Portfolio of Investments as at 28 February 2021 – (continued)
FaceValue(000’s)
Value(000’s)
$
% ofNet
AssetValue
Corporate Bonds and Notes — (continued)
United States — (continued)
1,100 Adtalem Global Education Inc,144A,5.500%, due 01/03/2028 1,098 0.50
80 Air Methods Corp, 144A,8.000%, due 15/05/2025 76 0.03
880 Akumin Inc, 144A,7.000%, due 01/11/2025 922 0.42
1,070 Allen Media LLC / Allen MediaCo-Issuer Inc, 144A,10.500%, due 15/02/2028 1,129 0.52
430 Alliance Data Systems Corp, 144A,4.750%, due 15/12/2024 439 0.20
550 Allied Universal Holdco LLC / AlliedUniversal Finance Corp, 144A,6.625%, due 15/07/2026 583 0.27
180 American Axle & ManufacturingInc,6.250%, due 15/03/2026 184 0.08
770 American Axle & ManufacturingInc,6.500%, due 01/04/2027 805 0.37
747 American News Co LLC, 144A,8.500%, due 01/09/2026 840 0.38
76 Anagram International Inc /Anagram Holdings LLC, 144A,10.000%, due 15/08/2026 77 0.04
170 Antero Midstream Partners LP /Antero Midstream Finance Corp,5.375%, due 15/09/2024 172 0.08
390 Apache Corp,7.750%, due 15/12/2029 450 0.21
290 Apache Corp,5.100%, due 01/09/2040 296 0.14
650 Apollo Commercial Real EstateFinance Inc,4.750%, due 23/08/2022 639 0.29
250 Ardagh Packaging Finance Plc /Ardagh Holdings USA Inc, 144A,6.000%, due 15/02/2025 259 0.12
300 Ardagh Packaging Finance Plc /Ardagh Holdings USA Inc, 144A,5.250%, due 15/08/2027 311 0.14
650 Bausch Health Americas Inc, 144A,9.250%, due 01/04/2026 721 0.33
1,120 Bausch Health Cos Inc, 144A,5.000%, due 15/02/2029 1,135 0.52
2,000 Bausch Health Cos Inc, 144A,6.250%, due 15/02/2029 2,134 0.97
750 Bausch Health Cos Inc, 144A,5.250%, due 30/01/2030 763 0.35
1,570 Berry Petroleum Co LLC, 144A,7.000%, due 15/02/2026 1,517 0.69
250 Black Knight InfoServ LLC, 144A,3.625%, due 01/09/2028 249 0.11
490 Blue Racer Midstream LLC / BlueRacer Finance Corp, 144A,7.625%, due 15/12/2025 528 0.24
1,020 Blue Racer Midstream LLC / BlueRacer Finance Corp, 144A,6.625%, due 15/07/2026 1,033 0.47
360 Boeing Co/The,5.150%, due 01/05/2030 420 0.19
1,000 Boyne USA Inc, 144A,7.250%, due 01/05/2025 1,043 0.48
800 Brundage-Bone Concrete PumpingHoldings Inc, 144A,6.000%, due 01/02/2026 829 0.38
450 BWX Technologies Inc, 144A,4.125%, due 30/06/2028 469 0.21
340 Caesars Entertainment Inc, 144A,6.250%, due 01/07/2025 360 0.16
600 Calpine Corp, 144A,5.000%, due 01/02/2031 595 0.27
770 Carnival Corp, 144A,5.750%, due 01/03/2027 783 0.36
389 Carriage Services Inc, 144A,6.625%, due 01/06/2026 410 0.19
560 CCO Holdings LLC / CCO HoldingsCapital Corp, 144A,4.500%, due 15/08/2030 581 0.27
500 CCO Holdings LLC / CCO HoldingsCapital Corp, 144A,4.250%, due 01/02/2031 507 0.23
FaceValue(000’s)
Value(000’s)
$
% ofNet
AssetValue
1,710 CCO Holdings LLC / CCO HoldingsCapital Corp, 144A,4.500%, due 01/05/2032 1,759 0.80
250 CDW LLC / CDW Finance Corp,3.250%, due 15/02/2029 246 0.11
250 Centene Corp, 144A,5.375%, due 01/06/2026 262 0.12
580 Centene Corp, 144A,5.375%, due 15/08/2026 612 0.28
780 Centene Corp,4.625%, due 15/12/2029 843 0.38
990 Century Communities Inc,5.875%, due 15/07/2025 1,036 0.47
530 Charter CommunicationsOperating LLC / CharterCommunications OperatingCapital,6.484%, due 23/10/2045 712 0.33
1,013 Cheniere Energy Inc,4.250%, due 15/03/2045 838 0.38
180 Cheniere Energy Partners LP,4.500%, due 01/10/2029 190 0.09
520 Cheniere Energy Partners LP,144A,4.000%, due 01/03/2031 525 0.24
100 Chesapeake Energy Corp, 144A,5.500%, due 01/02/2026 104 0.05
110 Chesapeake Energy Corp, 144A,5.875%, due 01/02/2029 118 0.05
300 CHS/Community Health SystemsInc, 144A,6.625%, due 15/02/2025 316 0.14
400 CHS/Community Health SystemsInc, 144A,8.000%, due 15/03/2026 427 0.20
1,350 CHS/Community Health SystemsInc, 144A,6.875%, due 15/04/2029 1,387 0.63
280 CNX Midstream Partners LP / CNXMidstream Finance Corp, 144A,6.500%, due 15/03/2026 289 0.13
800 CommScope Inc, 144A,8.250%, due 01/03/2027 844 0.39
170 CommScope Technologies LLC,144A,5.000%, due 15/03/2027 167 0.08
340 Comstock Resources Inc, 144A,7.500%, due 15/05/2025 355 0.16
470 Comstock Resources Inc,9.750%, due 15/08/2026 512 0.23
400 Continental Resources Inc/OK,4.375%, due 15/01/2028 421 0.19
940 Continental Resources Inc/OK,144A,5.750%, due 15/01/2031 1,061 0.48
190 CoreCivic Inc,5.000%, due 15/10/2022 192 0.09
110 CoreCivic Inc,4.625%, due 01/05/2023 107 0.05
510 Cornerstone Building Brands Inc,144A,6.125%, due 15/01/2029 524 0.24
580 CP Atlas Buyer Inc, 144A,7.000%, due 01/12/2028 604 0.28
750 CSC Holdings LLC, 144A,6.500%, due 01/02/2029 831 0.38
450 CSC Holdings LLC, 144A,4.125%, due 01/12/2030 452 0.21
250 DCP Midstream Operating LP,144A,6.450%, due 03/11/2036 281 0.13
600 DCP Midstream Operating LP,144A,6.750%, due 15/09/2037 678 0.31
500 Delta Air Lines Inc / SkyMiles IPLtd, 144A,4.500%, due 20/10/2025 534 0.24
400 Delta Air Lines Inc / SkyMiles IPLtd, 144A,4.750%, due 20/10/2028 444 0.20
2,563 DISH DBS Corp,7.750%, due 01/07/2026 2,824 1.29
300 DISH Network Corp,3.375%, due 15/08/2026 283 0.13
860 Diversified Healthcare Trust,9.750%, due 15/06/2025 970 0.44
FaceValue(000’s)
Value(000’s)
$
% ofNet
AssetValue
630 Diversified Healthcare Trust,4.750%, due 15/02/2028 622 0.28
290 Diversified Healthcare Trust,4.375%, due 01/03/2031 287 0.13
250 Donnelley Financial Solutions Inc,8.250%, due 15/10/2024 261 0.12
60 Dropbox Inc, 144A,zero coupon, due 01/03/2026 59 0.03
50 Dropbox Inc, 144A,zero coupon, due 01/03/2028 49 0.02
380 Edgewell Personal Care Co, 144A,4.125%, due 01/04/2029 379 0.17
290 Endeavor Energy Resources LP /EER Finance Inc, 144A,6.625%, due 15/07/2025 305 0.14
160 Endeavor Energy Resources LP /EER Finance Inc, 144A,5.500%, due 30/01/2026 164 0.07
80 Endeavor Energy Resources LP /EER Finance Inc, 144A,5.750%, due 30/01/2028 85 0.04
570 Endo Dac / Endo Finance LLC /Endo Finco Inc, 144A,9.500%, due 31/07/2027 643 0.29
150 Entegris Inc, 144A,4.375%, due 15/04/2028 158 0.07
250 EQM Midstream Partners LP,4.000%, due 01/08/2024 253 0.12
210 EQM Midstream Partners LP,144A,6.000%, due 01/07/2025 222 0.10
200 EQM Midstream Partners LP,144A,6.500%, due 01/07/2027 215 0.10
490 EQM Midstream Partners LP,5.500%, due 15/07/2028 506 0.23
500 EQM Midstream Partners LP,6.500%, due 15/07/2048 474 0.22
300 EQT Corp,3.000%, due 01/10/2022 302 0.14
460 EQT Corp,7.625%, due 01/02/2025 536 0.24
90 EQT Corp,3.900%, due 01/10/2027 93 0.04
720 EQT Corp,5.000%, due 15/01/2029 790 0.36
290 ESH Hospitality Inc, 144A,5.250%, due 01/05/2025 296 0.14
170 ESH Hospitality Inc, 144A,4.625%, due 01/10/2027 173 0.08
510 FirstCash Inc, 144A,4.625%, due 01/09/2028 531 0.24
1,060 Five Point Operating Co LP / FivePoint Capital Corp, 144A,7.875%, due 15/11/2025 1,120 0.51
500 Flex Acquisition Co Inc, 144A,7.875%, due 15/07/2026 520 0.24
830 Ford Motor Co,9.000%, due 22/04/2025 1,005 0.46
810 Ford Motor Credit Co LLC,5.125%, due 16/06/2025 876 0.40
1,030 Ford Motor Credit Co LLC,5.113%, due 03/05/2029 1,129 0.52
610 Ford Motor Credit Co LLC,4.000%, due 13/11/2030 624 0.29
730 Forestar Group Inc, 144A,8.000%, due 15/04/2024 762 0.35
360 Forestar Group Inc, 144A,5.000%, due 01/03/2028 377 0.17
360 Foundation Building Materials Inc,144A,6.000%, due 01/03/2029 360 0.16
230 Freeport-McMoRan Inc,4.625%, due 01/08/2030 255 0.12
950 Freeport-McMoRan Inc,5.450%, due 15/03/2043 1,182 0.54
580 Frontier Communications Corp,144A,6.750%, due 01/05/2029 608 0.28
600 Full House Resorts Inc, 144A,8.250%, due 15/02/2028 637 0.29
790 Gartner Inc, 144A,3.750%, due 01/10/2030 801 0.37
460 GEO Corrections Holdings Inc,144A,6.500%, due 23/02/2026 474 0.22
The accompanying notes are an integral part of the Financial Statements
86

Legg Mason Global Funds Plc Annual Report 28 February 2021
Legg Mason Western Asset US High Yield Fund
Portfolio of Investments as at 28 February 2021 – (continued)
FaceValue(000’s)
Value(000’s)
$
% ofNet
AssetValue
Corporate Bonds and Notes — (continued)
United States — (continued)
110 GEO Group Inc/The,5.875%, due 15/10/2024 86 0.04
1,390 GEO Group Inc/The,6.000%, due 15/04/2026 1,018 0.46
400 Global Medical Response Inc,144A,6.500%, due 01/10/2025 416 0.19
650 Golden Nugget Inc, 144A,6.750%, due 15/10/2024 662 0.30
390 Greif Inc, 144A,6.500%, due 01/03/2027 410 0.19
960 H&E Equipment Services Inc,144A,3.875%, due 15/12/2028 925 0.42
40 Halozyme Therapeutics Inc, 144A,0.250%, due 01/03/2027 39 0.02
640 Hawaiian Brand IntellectualProperty Ltd / HawaiianMilesLoyalty Ltd, 144A,5.750%, due 20/01/2026 672 0.31
140 HCA Inc,5.625%, due 01/09/2028 163 0.07
207 HCA Inc,7.500%, due 15/11/2095 283 0.13
130 Hilton Domestic Operating Co Inc,144A,5.375%, due 01/05/2025 137 0.06
352 HLF Financing Sarl LLC / HerbalifeInternational Inc, 144A,7.250%, due 15/08/2026 366 0.17
560 iHeartCommunications Inc, 144A,5.250%, due 15/08/2027 575 0.26
240 iHeartCommunications Inc, 144A,4.750%, due 15/01/2028 245 0.11
450 Installed Building Products Inc,144A,5.750%, due 01/02/2028 480 0.22
300 IRB Holding Corp, 144A,7.000%, due 15/06/2025 326 0.15
850 Ken Garff Automotive LLC, 144A,4.875%, due 15/09/2028 873 0.40
770 Kennedy-Wilson Inc,5.000%, due 01/03/2031 796 0.36
210 Kraft Heinz Foods Co,5.000%, due 04/06/2042 248 0.11
420 Kraft Heinz Foods Co,5.200%, due 15/07/2045 505 0.23
750 Kraft Heinz Foods Co,4.375%, due 01/06/2046 819 0.37
820 Kraft Heinz Foods Co,5.500%, due 01/06/2050 1,059 0.48
600 Kraton Polymers LLC / KratonPolymers Capital Corp, 144A,4.250%, due 15/12/2025 608 0.28
310 L Brands Inc, 144A,9.375%, due 01/07/2025 384 0.18
1,092 L Brands Inc,5.250%, due 01/02/2028 1,170 0.53
250 L Brands Inc,7.500%, due 15/06/2029 283 0.13
730 L Brands Inc, 144A,6.625%, due 01/10/2030 819 0.37
540 Ladder Capital Finance HoldingsLLLP / Ladder Capital FinanceCorp, 144A,4.250%, due 01/02/2027 522 0.24
860 LD Holdings Group LLC, 144A,6.500%, due 01/11/2025 914 0.42
500 Legacy LifePoint Health LLC, 144A,4.375%, due 15/02/2027 498 0.23
1,010 Legends Hospitality Holding CoLLC / Legends Hospitality Co-IssuerInc, 144A,5.000%, due 01/02/2026 1,029 0.47
70 Liberty Broadband Corp, 144A,1.250%, due 30/09/2050 70 0.03
530 Match Group Holdings II LLC,144A,4.625%, due 01/06/2028 551 0.25
500 MDC Holdings Inc,6.000%, due 15/01/2043 661 0.30
610 Michaels Stores Inc, 144A,8.000%, due 15/07/2027 652 0.30
FaceValue(000’s)
Value(000’s)
$
% ofNet
AssetValue
100 Microchip Technology Inc, 144A,4.250%, due 01/09/2025 105 0.05
860 Mileage Plus Holdings LLC /Mileage Plus Intellectual PropertyAssets Ltd, 144A,6.500%, due 20/06/2027 941 0.43
460 Mohegan Gaming &Entertainment, 144A,7.875%, due 15/10/2024 482 0.22
740 MPH Acquisition Holdings LLC,144A,5.750%, due 01/11/2028 735 0.34
250 MPT Operating Partnership LP /MPT Finance Corp,5.000%, due 15/10/2027 266 0.12
1,000 MPT Operating Partnership LP /MPT Finance Corp,3.500%, due 15/03/2031 1,019 0.47
670 Murphy Oil Corp,5.750%, due 15/08/2025 665 0.30
240 Navient Corp,6.750%, due 15/06/2026 257 0.12
180 Navient Corp,5.000%, due 15/03/2027 177 0.08
640 NCL Corp Ltd, 144A,12.250%, due 15/05/2024 762 0.35
1,360 NCL Corp Ltd, 144A,3.625%, due 15/12/2024 1,274 0.58
490 NCL Corp Ltd, 144A,10.250%, due 01/02/2026 571 0.26
350 NCL Corp Ltd, 144A,5.875%, due 15/03/2026 352 0.16
860 Netflix Inc,6.375%, due 15/05/2029 1,070 0.49
220 Netflix Inc, 144A,5.375%, due 15/11/2029 260 0.12
140 Netflix Inc, 144A,4.875%, due 15/06/2030 161 0.07
590 NMI Holdings Inc, 144A,7.375%, due 01/06/2025 668 0.30
340 Northern Oil and Gas Inc, 144A,8.125%, due 01/03/2028 336 0.15
760 Northwest Acquisitions ULC /Dominion Finco Inc, 144A,7.125%, due 01/11/2022 †∞� – –
20 Occidental Petroleum Corp,1.644%, due 15/08/2022 * 20 0.01
189 Occidental Petroleum Corp,2.700%, due 15/02/2023 185 0.08
660 Occidental Petroleum Corp,2.900%, due 15/08/2024 643 0.29
700 Occidental Petroleum Corp,8.875%, due 15/07/2030 896 0.41
510 Occidental Petroleum Corp,6.125%, due 01/01/2031 571 0.26
150 Occidental Petroleum Corp,zero coupon, due 10/10/2036 73 0.03
500 Olin Corp,5.000%, due 01/02/2030 525 0.24
600 Par Pharmaceutical Inc, 144A,7.500%, due 01/04/2027 646 0.30
520 Park Intermediate Holdings LLC /PK Domestic Property LLC / PKFinance Co-Issuer, 144A,5.875%, due 01/10/2028 549 0.25
780 Party City Holdings Inc, 144A,8.750%, due 15/02/2026 797 0.36
250 PBF Holding Co LLC / PBF FinanceCorp, 144A,9.250%, due 15/05/2025 244 0.11
250 PetSmart Inc / PetSmart FinanceCorp, 144A,4.750%, due 15/02/2028 259 0.12
250 PetSmart Inc / PetSmart FinanceCorp, 144A,7.750%, due 15/02/2029 268 0.12
1,130 PM General Purchaser LLC, 144A,9.500%, due 01/10/2028 1,245 0.57
740 Prime Security Services BorrowerLLC / Prime Finance Inc, 144A,5.750%, due 15/04/2026 798 0.36
730 Prime Security Services BorrowerLLC / Prime Finance Inc, 144A,3.375%, due 31/08/2027 713 0.33
490 Prime Security Services BorrowerLLC / Prime Finance Inc, 144A,6.250%, due 15/01/2028 508 0.23
FaceValue(000’s)
Value(000’s)
$
% ofNet
AssetValue
730 Quicken Loans LLC, 144A,5.250%, due 15/01/2028 772 0.35
720 Quicken Loans LLC / QuickenLoans Co-Issuer Inc, 144A,3.875%, due 01/03/2031 716 0.33
750 Rackspace Technology Global Inc,144A,3.500%, due 15/02/2028 737 0.34
700 Radiology Partners Inc, 144A,9.250%, due 01/02/2028 759 0.35
231 Range Resources Corp,5.000%, due 15/03/2023 233 0.11
340 Range Resources Corp,9.250%, due 01/02/2026 370 0.17
600 Range Resources Corp, 144A,8.250%, due 15/01/2029 646 0.30
310 Real Hero Merger Sub 2 Inc, 144A,6.250%, due 01/02/2029 320 0.15
570 Realogy Group LLC / RealogyCo-Issuer Corp, 144A,7.625%, due 15/06/2025 622 0.28
610 Realogy Group LLC / RealogyCo-Issuer Corp, 144A,5.750%, due 15/01/2029 615 0.28
290 RegionalCare Hospital PartnersHoldings Inc / LifePoint Health Inc,144A,9.750%, due 01/12/2026 313 0.14
530 Rent-A-Center Inc/TX, 144A,6.375%, due 15/02/2029 553 0.25
650 Sally Holdings LLC / Sally CapitalInc,5.625%, due 01/12/2025 666 0.30
750 Scientific Games International Inc,144A,5.000%, due 15/10/2025 772 0.35
222 Service Corp International/US,7.500%, due 01/04/2027 270 0.12
1,000 Service Properties Trust,5.500%, due 15/12/2027 1,078 0.49
355 ServiceMaster Co LLC/The,7.450%, due 15/08/2027 425 0.19
840 Shift4 Payments LLC / Shift4Payments Finance Sub Inc, 144A,4.625%, due 01/11/2026 881 0.40
600 Signature Aviation US HoldingsInc, 144A,5.375%, due 01/05/2026 615 0.28
1,400 Silversea Cruise Finance Ltd, 144A,7.250%, due 01/02/2025 1,452 0.66
660 Simmons Foods Inc/SimmonsPrepared Foods Inc/Simmons PetFood Inc/Simmons Feed, 144A,4.625%, due 01/03/2029 670 0.31
550 Sizzling Platter LLC / SizzlingPlatter Finance Corp, 144A,8.500%, due 28/11/2025 572 0.26
640 Speedway Motorsports LLC /Speedway Funding II Inc, 144A,4.875%, due 01/11/2027 640 0.29
1,080 Spirit Loyalty Cayman Ltd / Spirit IPCayman Ltd, 144A,8.000%, due 20/09/2025 1,217 0.56
700 Sprint Capital Corp,8.750%, due 15/03/2032 1,042 0.48
1,073 Sprint Communications Inc,11.500%, due 15/11/2021 1,147 0.52
950 Sprint Corp,7.875%, due 15/09/2023 1,098 0.50
920 Sprint Corp,7.625%, due 15/02/2025 1,096 0.50
1,190 SRM Escrow Issuer LLC, 144A,6.000%, due 01/11/2028 1,238 0.57
270 Starwood Property Trust Inc,144A,5.500%, due 01/11/2023 282 0.13
240 StoneX Group Inc, 144A,8.625%, due 15/06/2025 255 0.12
230 Sugarhouse HSP Gaming PropMezz LP / Sugarhouse HSPGaming Finance Corp, 144A,5.875%, due 15/05/2025 224 0.10
260 Summit Materials LLC / SummitMaterials Finance Corp, 144A,5.125%, due 01/06/2025 265 0.12
The accompanying notes are an integral part of the Financial Statements
87

Legg Mason Global Funds Plc Annual Report 28 February 2021
Legg Mason Western Asset US High Yield Fund
Portfolio of Investments as at 28 February 2021 – (continued)
FaceValue(000’s)
Value(000’s)
$
% ofNet
AssetValue
Corporate Bonds and Notes — (continued)
United States — (continued)
730 Summit Materials LLC / SummitMaterials Finance Corp, 144A,5.250%, due 15/01/2029 776 0.35
100 Surgery Center Holdings Inc,144A,10.000%, due 15/04/2027 111 0.05
540 Switch Ltd, 144A,3.750%, due 15/09/2028 551 0.25
720 Syneos Health Inc, 144A,3.625%, due 15/01/2029 707 0.32
350 Talen Energy Supply LLC, 144A,10.500%, due 15/01/2026 335 0.15
300 Talen Energy Supply LLC, 144A,6.625%, due 15/01/2028 311 0.14
870 Tallgrass Energy Partners LP /Tallgrass Energy Finance Corp,144A,6.000%, due 31/12/2030 867 0.40
540 Targa Resources Partners LP /Targa Resources Partners FinanceCorp, 144A,4.875%, due 01/02/2031 555 0.25
150 Tenet Healthcare Corp,6.750%, due 15/06/2023 162 0.07
250 Tenet Healthcare Corp,4.625%, due 15/07/2024 254 0.12
480 Tenet Healthcare Corp, 144A,7.500%, due 01/04/2025 522 0.24
500 Tenet Healthcare Corp, 144A,5.125%, due 01/11/2027 525 0.24
860 Tenet Healthcare Corp, 144A,4.625%, due 15/06/2028 896 0.41
270 Time Warner Cable LLC,7.300%, due 01/07/2038 387 0.18
610 TopBuild Corp, 144A,3.625%, due 15/03/2029 614 0.28
340 TransDigm Inc, 144A,8.000%, due 15/12/2025 370 0.17
880 TransDigm Inc, 144A,6.250%, due 15/03/2026 929 0.42
1,070 TransDigm Inc, 144A,4.625%, due 15/01/2029 1,054 0.48
700 Unisys Corp, 144A,6.875%, due 01/11/2027 772 0.35
370 United Airlines 2020-1 Class BPass Through Trust,4.875%, due 15/01/2026 387 0.18
300 United Airlines Holdings Inc,4.250%, due 01/10/2022 304 0.14
130 United Rentals North America Inc,5.500%, due 15/05/2027 138 0.06
950 United Rentals North America Inc,5.250%, due 15/01/2030 1,047 0.48
630 Univision Communications Inc,144A,9.500%, due 01/05/2025 690 0.32
410 Urban One Inc, 144A,7.375%, due 01/02/2028 413 0.19
560 US Renal Care Inc, 144A,10.625%, due 15/07/2027 614 0.28
610 VICI Properties LP / VICI Note CoInc, 144A,4.125%, due 15/08/2030 635 0.29
800 Viking Cruises Ltd, 144A,13.000%, due 15/05/2025 943 0.43
400 Viking Cruises Ltd, 144A,5.875%, due 15/09/2027 386 0.18
980 Viking Cruises Ltd, 144A,7.000%, due 15/02/2029 997 0.46
2,570 VOC Escrow Ltd, 144A,5.000%, due 15/02/2028 2,545 1.16
90 Western Midstream Operating LP,4.350%, due 01/02/2025 92 0.04
910 Western Midstream Operating LP,5.500%, due 15/08/2048 942 0.43
240 Western Midstream Operating LP,6.500%, due 01/02/2050 277 0.13
970 WW International Inc, 144A,8.625%, due 01/12/2025 1,014 0.46
230 Wyndham Hotels & Resorts Inc,144A,5.375%, due 15/04/2026 236 0.11
FaceValue(000’s)
Value(000’s)
$
% ofNet
AssetValue
490 Wynn Resorts Finance LLC / WynnResorts Capital Corp, 144A,7.750%, due 15/04/2025 532 0.24
690 XPO CNW Inc,6.700%, due 01/05/2034 807 0.37
330 XPO Logistics Inc, 144A,6.250%, due 01/05/2025 355 0.16
320 ZoomInfo Technologies LLC/ZoomInfo Finance Corp, 144A,3.875%, due 01/02/2029 318 0.15
149,086 68.04
Zambia — 1.20% (29 February 2020: 0.95%)
630 First Quantum Minerals Ltd, 144A,7.250%, due 01/04/2023 644 0.29
350 First Quantum Minerals Ltd, 144A,7.500%, due 01/04/2025 362 0.16
600 First Quantum Minerals Ltd, 144A,6.875%, due 01/03/2026 627 0.29
920 First Quantum Minerals Ltd, 144A,6.875%, due 15/10/2027 999 0.46
2,632 1.20
Total Corporate Bonds and Notes(Cost $171,970) 181,177 82.68
Government Bonds and Notes — 0.29%(29 February 2020: 0.55%)
Argentina — 0.29% (29 February 2020: 0.46%)
55 Argentine Republic GovernmentInternational Bond,1.000%, due 09/07/2029 22 0.01
650 Argentine Republic GovernmentInternational Bond,0.125%, due 09/07/2030 237 0.11
514 Argentine Republic GovernmentInternational Bond,0.125%, due 09/07/2035 165 0.07
640 Provincia de Buenos Aires/Government Bonds,7.875%, due 15/06/2027 � 214 0.10
638 0.29
Total Government Bonds and Notes(Cost $1,333) 638 0.29
Loan Notes — 9.85% (29 February 2020: 7.82%)
367 Acrisure LLC,3.621%, due 15/02/2027 * 366 0.17
930 Adtalem Global Education Inc,0.000%, due 12/02/2028 * 923 0.42
507 Allen Media LLC,5.754%, due 10/02/2027 * 507 0.23
119 Amerilife Holdings LLC,4.123%, due 06/02/2027 * 120 0.05
512 Athenahealth Inc,4.453%, due 11/02/2026 * 515 0.23
296 Beta Sub LLC,3.871%, due 06/08/2026 * 296 0.13
998 Caesars Resort Collection LLC,4.621%, due 20/07/2025 * 1,002 0.46
483 Caesars Resort Collection LLC,2.871%, due 22/12/2024 * 479 0.22
680 CNT Holdings I Corp,4.500%, due 16/10/2027 * 684 0.31
352 CoreCivic Inc,5.500%, due 18/12/2024 * 343 0.16
570 DCert Buyer, Inc.,0.000%, due 16/02/2029 * 576 0.26
997 DCert Buyer, Inc.,4.121%, due 16/10/2026 * 999 0.46
480 Deerfield Dakota Holding LLC,9.000%, due 20/02/2028 * 491 0.22
499 Endo International Plc,5.000%, due 27/04/2024 * 498 0.23
348 Equinox Holdings Inc,10.000%, due 08/03/2024 * 352 0.16
330 Eyecare Partners LLC,8.371%, due 21/01/2027 * 325 0.15
398 Eyecare Partners LLC,3.750%, due 05/02/2027 * 392 0.18
730 Gannett Holdings LLC,7.750%, due 08/02/2026 * 732 0.33
997 Genesee & Wyoming Inc,2.254%, due 30/12/2026 * 1,000 0.46
587 GFL Environmental Inc.,3.500%, due 31/05/2025 * 591 0.27
FaceValue(000’s)
Value(000’s)
$
% ofNet
AssetValue
512 Global Tel’Link Corp,4.371%, due 29/11/2025 * 484 0.22
648 Harbor Freight Tools,4.000%, due 14/10/2027 * 652 0.30
278 iHeartCommunications Inc,3.121%, due 01/05/2026 * 276 0.13
429 JetBlue Airways Corp,6.250%, due 17/06/2024 * 444 0.20
426 McAfee LLC,3.871%, due 29/09/2024 * 428 0.19
50 Michaels Stores,4.250%, due 16/09/2027 * 50 0.02
330 Panther BF Aggregator 2 LP,3.621%, due 18/03/2026 * 330 0.15
620 PetSmart Inc,4.250%, due 29/01/2028 * 625 0.28
473 Phoenix Guarantor Inc,3.361%, due 05/03/2026 * 472 0.22
61 Power Play Merger Sub, Inc,0.500%, due 30/10/2027 * 61 0.03
469 Power Play Merger Sub, Inc,4.500%, due 30/10/2027 * 470 0.21
357 Prime Security,3.500%, due 23/09/2026 * 358 0.16
493 Radnet Management Inc,4.750%, due 01/07/2023 * 495 0.23
710 Rent-A-Center,0.000%, due 04/02/2028 * 716 0.33
438 Spencer Spirit IH LLC,6.121%, due 14/06/2026 *† 437 0.20
910 Symplr Software, Inc,5.250%, due 23/11/2027 * 916 0.42
68 Terrier Media Buyer, Inc.,3.623%, due 17/12/2026 * 68 0.03
420 Truck Hero, Inc.,4.500%, due 20/01/2028 * 421 0.19
140 TruGreen LP,9.250%, due 30/10/2028 * 145 0.07
724 U.S. Renal Care Inc,5.125%, due 14/06/2026 * 724 0.33
400 United Airlines,6.250%, due 25/06/2027 * 428 0.20
962 Whatabrands LLC,2.862%, due 03/08/2026 * 964 0.44
439 Zywave,5.250%, due 30/10/2027 * 438 0.20
Total Loan Notes (Cost $21,331) 21,593 9.85
Collective Investment Schemes — 2.37%(29 February 2020: 4.29%)
5,196 Western Asset Liquidity FundsPlc – Western Asset US DollarLiquidity Fund – Class WA(Distributing) 5,196 2.37
Total Collective Investment Schemes(Cost $5,196) 5,196 2.37
Common Stock — 0.72% (29 February 2020: 0.59%)
United States — 0.72% (29 February 2020: 0.59%)
116 Berry Corp 574 0.2696 Hercules Offshore Inc †∞ 57 0.0311 Oasis Petroleum Inc 605 0.2814 Party City Holdings Inc 107 0.0556 Southwestern Energy Co 225 0.10
1,568 0.72
Total Common Stock (Cost $4,150) 1,568 0.72
Preferred Stock — 1.21% (29 February 2020: 0.70%)
United States — 1.21% (29 February 2020: 0.70%)
3 B Riley Financial Inc 80 0.0418 B Riley Financial Inc 454 0.2135 GMAC Capital Trust I, Series 2 908 0.4120 MPLX LP, Series A †∞ 645 0.29
1 Targa Resources Corp, Series A † 563 0.26
2,650 1.21
Total Preferred Stock (Cost $2,649) 2,650 1.21
Total Investments at fair value throughprofit or loss (Cost $216,067) 222,241 101.42
Credit Default Swaps — 0.02%(29 February 2020: 0.00%)
Unrealised appreciation of contracts(see below) 39 0.02
The accompanying notes are an integral part of the Financial Statements
88

Legg Mason Global Funds Plc Annual Report 28 February 2021
Legg Mason Western Asset US High Yield Fund
Portfolio of Investments as at 28 February 2021 – (continued)
FaceValue(000’s)
Value(000’s)
$
% ofNet
AssetValue
Forward Foreign Currency Contracts — 0.01%(29 February 2020: 0.01%)
Unrealised appreciation of contracts(see below) 28 0.01
Total Financial Assets at fair valuethrough profit or loss 222,308 101.45
Credit Default Swaps — (0.01%)(29 February 2020: 0.00%)
Unrealised depreciation of contracts(see below) (26) (0.01)
Forward Foreign Currency Contracts — 0.00%(29 February 2020: (0.01%))
Unrealised depreciation of contracts(see below) (1) –
Futures — (0.04%) (29 February 2020: (0.06%))
Unrealised depreciation of contracts(see below) (85) (0.04)
Total Financial Liabilities at fair valuethrough profit or loss (112) (0.05)
Total Financial Assets and FinancialLiabilities at fair value through profitor loss 222,196 101.40
Liabilities in Excess of Other Assets (3,069) (1.40)
Total Net Assets $219,127 100.00
– Amounts designated as “–” are either $0, less than$1,000, less than 1,000 shares or less than 0.01%.
144A Securities exempt from registration under Rule 144A ofthe Securities Act of 1933, as amended. Thesesecurities may only be resold, in transactions exemptfrom registration, to qualified institutional buyers. As at28 February 2021, these securities amounted to$140,373,000 or 64.05% of net assets.
* Variable rate security. The interest rate shown reflectsthe rate in effect at 28 February 2021.
† Illiquid.
∞ Security is valued in good faith at fair value by or at thediscretion of the Manager or the respective InvestmentManager.
� Security is in default as at 28 February 2021 (eitherprincipal and / or interest).
ABBREVIATIONS:
Perpetual – A bond with no maturity date. Perpetual bondsare not redeemable but pay a steady stream ofinterest.
Analysis of Total Assets
% ofTotal
Assets
Transferable securities admitted to an officialexchange listing or traded on a regulated market 85.75
Other transferable securities dealt in on anotherregulated market 9.47
Collective investment schemes 2.28
Financial derivative instruments 0.03
Other assets 2.47
Total Assets 100.00
Schedule of Credit Default Swaps
Counterparty Reference EntityBuy/Sell
ProtectionExpiration
Date
NotionalAmount(000’s)
Value(000’s)
Goldman Sachs Ford Motor Credit Co LLc, 5.000% Sell 20/06/2023 480 $ 39JP Morgan Occidental Petroleum Corporation, 1.000% Sell 20/12/2023 920 (26)
Unrealised Appreciation of Credit Default Swaps (29 February 2020 (000’s): $4) $ 39Unrealised Depreciation of Credit Default Swaps (29 February 2020 (000’s): $–) (26)
Net Appreciation of Credit Default Swaps (29 February 2020 (000’s): $4) $ 13
Schedule of Forward Foreign Currency Contracts
Expiration Date CounterpartyBuy Currency
(000’s)Sell Currency
(000’s)
UnrealisedAppreciation/(Depreciation)of Contracts
(000’s)
12/03/2021 BNY Mellon Buy USD 5 Sell EUR 4 $ –12/03/2021 BNY Mellon Buy USD 2 Sell SGD 3 –12/03/2021 BNY Mellon Buy GBP 791 Sell USD 1,079 2312/03/2021 BNY Mellon Buy EUR 1,546 Sell USD 1,861 512/03/2021 BNY Mellon Buy SGD 733 Sell USD 550 (1)19/04/2021 Citi Buy USD 6 Sell CAD 8 –
Unrealised Appreciation of Forward Foreign Currency Contracts (29 February 2020 (000’s): $13) $ 28Unrealised Depreciation of Forward Foreign Currency Contracts (29 February 2020 (000’s): $(15)) (1)
Net Appreciation of Forward Foreign Currency Contracts (29 February 2020 (000’s): $(2)) $ 27
Schedule of Futures Contracts
CounterpartyNominal
Value
NotionalValue(000’s)
UnrealisedAppreciation/(Depreciation)of Contracts
(000’s)
U.S. 5 Year Note (CBT) June 2021 Goldman Sachs 76 $ 9,422 $ (85)
Unrealised Appreciation of Futures Contracts (29 February 2020 (000’s): $51) $ –Unrealised Depreciation of Futures Contracts (29 February 2020 (000’s): $(97)) (85)
Net Depreciation of Futures Contracts (29 February 2020 (000’s): $(46)) $ (85)
The accompanying notes are an integral part of the Financial Statements
89

Legg Mason Global Funds Plc Annual Report 28 February 2021
Legg Mason Western Asset Emerging Markets Total Return Bond Fund
Portfolio of Investments as at 28 February 2021
FaceValue(000’s)
Value(000’s)
$
% ofNet
AssetValue
Corporate Bonds and Notes — 60.10%(29 February 2020: 59.25%)
Argentina — 0.88% (29 February 2020: 0.00%)
200 MercadoLibre Inc,2.375%, due 14/01/2026 201 0.88
Brazil — 3.48% (29 February 2020: 4.72%)
200 Itau Unibanco Holding SA/Cayman Island,6.125%, Perpetual * 201 0.88
200 Klabin Austria GmbH,3.200%, due 12/01/2031 198 0.87
160 Petrobras Global FinanceBV,6.850%, due 05/06/2115 175 0.77
200 Ultrapar International SA,5.250%, due 06/10/2026 219 0.96
793 3.48
Chile — 0.94% (29 February 2020: 3.71%)
200 VTR Comunicaciones SpA,5.125%, due 15/01/2028 214 0.94
China — 8.36% (29 February 2020: 8.08%)
200 China Aoyuan Group Ltd,7.950%, due 19/02/2023 211 0.93
200 China SCE Group HoldingsLtd,7.375%, due 09/04/2024 209 0.92
200 Chinalco Capital HoldingsLtd,4.000%, due 25/08/2021 202 0.89
200 Coastal Emerald Ltd,3.950%, due 01/08/2022 204 0.89
200 Country Garden HoldingsCo Ltd,4.750%, due 28/09/2023 205 0.90
200 Logan Group Co Ltd,6.500%, due 16/07/2023 206 0.90
230 Prosus NV,5.500%, due 21/07/2025 262 1.15
200 Shimao Group HoldingsLtd,3.450%, due 11/01/2031 202 0.89
200 Yuzhou Group Holdings CoLtd,6.000%, due 25/01/2022 203 0.89
1,904 8.36
Colombia — 4.81% (29 February 2020: 5.54%)
220 Banco Bilbao VizcayaArgentaria Colombia SA,4.875%, due 21/04/2025 238 1.05
200 Ecopetrol SA,5.875%, due 28/05/2045 217 0.95
200 Grupo Energia Bogota SAESP,4.875%, due 15/05/2030 223 0.98
180 Millicom InternationalCellular SA,6.250%, due 25/03/2029 203 0.89
200 Oleoducto Central SA,4.000%, due 14/07/2027 214 0.94
1,095 4.81
Hong Kong — 3.53% (29 February 2020: 1.06%)
200 AIA Group Ltd,3.200%, due 16/09/2040 201 0.88
200 Elect Global InvestmentsLtd,4.850%, Perpetual 205 0.90
200 Melco Resorts Finance Ltd,5.375%, due 04/12/2029 212 0.93
200 Panther Ventures Ltd,3.500%, Perpetual 187 0.82
805 3.53
India — 0.87% (29 February 2020: 0.00%)
200 REC Ltd,2.250%, due 01/09/2026 198 0.87
Indonesia — 4.26% (29 February 2020: 4.43%)
300 Hutama Karya Persero PT,3.750%, due 11/05/2030 323 1.42
200 Indonesia AsahanAluminium Persero PT,6.530%, due 15/11/2028 246 1.08
FaceValue(000’s)
Value(000’s)
$
% ofNet
AssetValue
200 Minejesa Capital BV,5.625%, due 10/08/2037 212 0.93
200 Perusahaan PerseroanPersero PT PerusahaanListrik Negara,4.000%, due 30/06/2050 189 0.83
970 4.26
Israel — 1.82% (29 February 2020: 1.07%)
200 Bank Leumi Le-Israel BM,144A,3.275%, due 29/01/2031 * 206 0.90
200 Teva PharmaceuticalFinance Netherlands III BV,6.000%, due 15/04/2024 209 0.92
415 1.82
Kazakhstan — 2.11% (29 February 2020: 3.68%)
200 KazMunayGas National CoJSC,6.375%, due 24/10/2048 258 1.13
200 KazTransGas JSC,4.375%, due 26/09/2027 223 0.98
481 2.11
Kuwait — 1.94% (29 February 2020: 0.00%)
200 MEGlobal Canada ULC,5.875%, due 18/05/2030 242 1.07
200 NBK Tier 1 Financing Ltd,3.625%, Perpetual * 199 0.87
441 1.94
Macau — 0.92% (29 February 2020: 1.20%)
200 Wynn Macau Ltd,5.625%, due 26/08/2028 208 0.92
Malaysia — 1.02% (29 February 2020: 0.00%)
250 Axiata Spv5 Labuan Ltd,3.064%, due 19/08/2050 233 1.02
Mexico — 4.71% (29 February 2020: 2.31%)
200 Banco Mercantil del NorteSA/Grand Cayman,7.625%, Perpetual * 225 0.99
200 BBVA Bancomer SA/Texas,5.125%, due 18/01/2033 * 211 0.93
200 Fresnillo Plc,4.250%, due 02/10/2050 202 0.89
200 Orbia Advance Corp SABde CV,5.875%, due 17/09/2044 238 1.04
200 Petroleos Mexicanos,4.500%, due 23/01/2026 197 0.86
1,073 4.71
Morocco — 0.95% (29 February 2020: 1.15%)
200 OCP SA,4.500%, due 22/10/2025 216 0.95
Netherlands — 1.03% (29 February 2020: 0.00%)
230 VEON Holdings BV,3.375%, due 25/11/2027 235 1.03
Oman — 0.91% (29 February 2020: 0.00%)
200 OmGrid Funding Ltd,5.196%, due 16/05/2027 207 0.91
Panama — 1.79% (29 February 2020: 0.00%)
200 Banco Nacional de Panama,2.500%, due 11/08/2030 193 0.85
200 ENA Master Trust,4.000%, due 19/05/2048 215 0.94
408 1.79
Peru — 2.10% (29 February 2020: 2.05%)
50 Banco de Credito del Peru,3.125%, due 01/07/2030 * 51 0.22
200 Petroleos del Peru SA,5.625%, due 19/06/2047 221 0.97
200 Volcan Cia Minera SAA,4.375%, due 11/02/2026 206 0.91
478 2.10
Russia — 3.00% (29 February 2020: 3.68%)
320 Lukoil International FinanceBV,6.656%, due 07/06/2022 343 1.51
FaceValue(000’s)
Value(000’s)
$
% ofNet
AssetValue
300 Russian Agricultural BankOJSC Via RSHB Capital SA,8.500%, due 16/10/2023 339 1.49
682 3.00
Singapore — 3.72% (29 February 2020: 3.38%)
200 BOC Aviation Ltd,2.625%, due 17/01/2025 205 0.90
200 DBS Group Holdings Ltd,3.300%, Perpetual * 206 0.91
200 Oversea-Chinese BankingCorp Ltd,4.250%, due 19/06/2024 220 0.97
200 United Overseas Bank Ltd,3.750%, due 15/04/2029 * 215 0.94
846 3.72
South Africa — 0.95% (29 February 2020: 1.13%)
200 Eskom Holdings SOC Ltd,6.350%, due 10/08/2028 216 0.95
Supranational — 2.45% (29 February 2020: 0.00%)
UAH 3,000 Asian Development Bank,8.000%, due 25/02/2022 106 0.47
IDR 328,500 European Bank forReconstruction &Development,6.450%, due 13/12/2022 23 0.10
IDR 2,540,000 Inter-AmericanDevelopment Bank,7.875%, due 14/03/2023 187 0.82
INR 17,600 International Finance Corp,5.850%, due 25/11/2022 242 1.06
558 2.45
Thailand — 0.80% (29 February 2020: 0.00%)
200 Thaioil Treasury Center CoLtd,3.500%, due 17/10/2049 182 0.80
Turkey — 1.01% (29 February 2020: 3.27%)
220 Turk TelekomunikasyonAS,4.875%, due 19/06/2024 229 1.01
United Arab Emirates — 0.57%(29 February 2020: 6.46%)
35 DAE Funding LLC, 144A,5.000%, due 01/08/2024 36 0.16
90 DAE Funding LLC,5.000%, due 01/08/2024 93 0.41
129 0.57
United Kingdom — 0.88% (29 February 2020: 0.00%)
200 HSBC Holdings Plc,4.600%, Perpetual * 202 0.88
United States — 0.29% (29 February 2020: 0.00%)
20 General Electric Co,3.450%, due 01/05/2027 22 0.09
10 Mastercard Inc,3.850%, due 26/03/2050 12 0.05
30 New York Life InsuranceCo,3.750%, due 15/05/2050 33 0.15
67 0.29
Total Corporate Bonds and Notes(Cost $13,189) 13,686 60.10
Government Bonds and Notes — 28.65%(29 February 2020: 25.29%)
Bahamas — 1.76% (29 February 2020: 0.00%)
200 Bahamas GovernmentInternational Bond,5.750%, due 16/01/2024 200 0.88
200 Bahamas GovernmentInternational Bond, 144A,5.750%, due 16/01/2024 201 0.88
401 1.76
Bahrain — 0.98% (29 February 2020: 1.21%)
200 Bahrain GovernmentInternational Bond,6.750%, due 20/09/2029 222 0.98
The accompanying notes are an integral part of the Financial Statements
90

Legg Mason Global Funds Plc Annual Report 28 February 2021
Legg Mason Western Asset Emerging Markets Total Return Bond Fund
Portfolio of Investments as at 28 February 2021 – (continued)
FaceValue(000’s)
Value(000’s)
$
% ofNet
AssetValue
Government Bonds and Notes — (continued)
Brazil — 0.93% (29 February 2020: 2.28%)
BRL 530 Brazil Notas do TesouroNacional Serie F,Series NTNF,10.000%, due 01/01/2025 103 0.45
BRL 560 Brazil Notas do TesouroNacional Serie F,Series NTNF,10.000%, due 01/01/2027 109 0.48
212 0.93
Cote d’Ivoire (Ivory Coast) — 1.90%(29 February 2020: 0.48%)
EUR 170 Ivory Coast GovernmentInternational Bond,4.875%, due 30/01/2032 206 0.90
226 Ivory Coast GovernmentInternational Bond,5.750%, due 31/12/2032 227 1.00
433 1.90
Dominican Republic — 0.98% (29 February 2020: 0.80%)
220 Dominican RepublicInternational Bond,4.500%, due 30/01/2030 223 0.98
Egypt — 0.94% (29 February 2020: 1.56%)
200 Egypt GovernmentInternational Bond,7.625%, due 29/05/2032 214 0.94
Ghana — 1.15% (29 February 2020: 1.06%)
200 Ghana GovernmentInternational Bond,10.750%, due 14/10/2030 262 1.15
Guatemala — 1.04% (29 February 2020: 0.00%)
200 Guatemala GovernmentBond,5.375%, due 24/04/2032 236 1.04
Honduras — 0.75% (29 February 2020: 0.00%)
150 Honduras GovernmentInternational Bond,6.250%, due 19/01/2027 170 0.75
Indonesia — 0.80% (29 February 2020: 4.28%)
IDR 2,338,000 Indonesia Treasury Bond,Series FR68,8.375%, due 15/03/2034 182 0.80
Jamaica — 1.03% (29 February 2020: 0.00%)
200 Jamaica GovernmentInternational Bond,6.750%, due 28/04/2028 236 1.03
Jordan — 0.94% (29 February 2020: 0.00%)
200 Jordan GovernmentInternational Bond,5.850%, due 07/07/2030 214 0.94
Kenya — 0.97% (29 February 2020: 0.00%)
200 Kenya GovernmentInternational Bond,7.250%, due 28/02/2028 222 0.97
Mexico — 1.24% (29 February 2020: 1.01%)
MXN 3,910 Mexican Bonos, Series M,5.750%, due 05/03/2026 192 0.85
MXN 1,740 Mexican Bonos, Series M,7.750%, due 13/11/2042 89 0.39
281 1.24
Morocco — 0.82% (29 February 2020: 0.00%)
200 Morocco GovernmentInternational Bond,4.000%, due 15/12/2050 187 0.82
Nigeria — 0.94% (29 February 2020: 1.06%)
200 Nigeria GovernmentInternational Bond,6.500%, due 28/11/2027 214 0.94
Oman — 0.90% (29 February 2020: 1.04%)
200 Oman GovernmentInternational Bond,4.125%, due 17/01/2023 204 0.90
FaceValue(000’s)
Value(000’s)
$
% ofNet
AssetValue
Panama — 1.26% (29 February 2020: 0.00%)
260 Panama GovernmentInternational Bond,4.500%, due 01/04/2056 287 1.26
Paraguay — 0.85% (29 February 2020: 0.00%)
200 Paraguay GovernmentInternational Bond,2.739%, due 29/01/2033 193 0.85
Peru — 0.99% (29 February 2020: 0.00%)
200 Corp Financiera deDesarrollo SA,4.750%, due 15/07/2025 225 0.99
Qatar — 1.03% (29 February 2020: 2.51%)
200 Qatar GovernmentInternational Bond,4.400%, due 16/04/2050 235 1.03
Russia — 1.77% (29 February 2020: 1.72%)
RUB 2,650 Russian Federal Bond –OFZ, Series 6209,7.600%, due 20/07/2022 37 0.16
RUB 12,619 Russian Federal Bond –OFZ, Series 6212,7.050%, due 19/01/2028 175 0.77
RUB 13,360 Russian Federal Bond –OFZ, Series 6230,7.700%, due 16/03/2039 192 0.84
404 1.77
Senegal — 0.94% (29 February 2020: 1.12%)
200 Senegal GovernmentInternational Bond,6.250%, due 23/05/2033 213 0.94
South Africa — 0.49% (29 February 2020: 0.00%)
ZAR 2,020 Republic of South AfricaGovernment Bond,Series 2037,8.500%, due 31/01/2037 112 0.49
Ukraine — 1.45% (29 February 2020: 0.56%)
200 Ukraine GovernmentInternational Bond,8.994%, due 01/02/2024 222 0.97
100 Ukraine GovernmentInternational Bond,7.750%, due 01/09/2025 109 0.48
331 1.45
United Arab Emirates — 0.81%(29 February 2020: 0.00%)
200 Finance DepartmentGovernment of Sharjah,4.000%, due 28/07/2050 184 0.81
Vietnam — 0.99% (29 February 2020: 1.17%)
200 Vietnam GovernmentInternational Bond, 144A,4.800%, due 19/11/2024 225 0.99
Total Government Bonds and Notes(Cost $6,457) 6,522 28.65
Collective Investment Schemes — 9.15%(29 February 2020: 9.48%)
20 Legg Mason Global FundsPlc – Western AssetEmerging MarketsCorporate Bond Fund – LMClass US$ Distributing (M) 2,084 9.15
Total Collective Investment Schemes(Cost $1,895) 2,084 9.15
Total Investments at fair value throughprofit or loss (Cost $21,541) 22,292 97.90
Contracts(000’s)
Value(000’s)
$
% ofNet
AssetValue
Purchased Options — 0.03% (29 February 2020: 0.01%)
300 USD Put/CNH Call6.55, due 13/11/2021 –JP Morgan 5 0.02
450 USD Put/IDR Call13,800.00, due 05/03/2021– JP Morgan – –
Contracts(000’s)
Value(000’s)
$
% ofNet
AssetValue
460 USD Put/IDR Call14,000.00, due 24/08/2021 –Citi 3 0.01
180 USD Put/INR Call72.00, due 06/04/2021 –Barclays – –
230 USD Put/MXN Call19.40, due 06/03/2021 –Goldman Sachs – –
Total Purchased Options (Cost $15) 8 0.03
Forward Foreign Currency Contracts — 0.28%(29 February 2020: 0.60%)
Unrealised appreciation of contracts(see below) 62 0.28
Futures — 0.34% (29 February 2020: 0.00%)
Unrealised appreciation of contracts(see below) 77 0.34
Total Financial Assets at fair valuethrough profit or loss 22,439 98.55
Written Options — (0.06%) (29 February 2020: (0.05%))
(300) USD Call/CNH Put7.11, due 13/11/2021 –JP Morgan (1) (0.01)
(450) USD Call/IDR Put14,800.00, due 05/03/2021– JP Morgan – –
(460) USD Call/IDR Put15,000.00, due 24/08/2021– Citi (10) (0.04)
(180) USD Call/INR Put78.00, due 06/04/2021 –Barclays – –
(230) USD Call/MXN Put21.00, due 06/03/2021 –Goldman Sachs (3) (0.01)
Total Written Options (Cost $(16)) (14) (0.06)
Credit Default Swaps — (0.05%)(29 February 2020: 0.00%)
Unrealised depreciation of contracts(see below) (12) (0.05)
Forward Foreign Currency Contracts — (0.06%)(29 February 2020: (0.13%))
Unrealised depreciation of contracts(see below) (13) (0.06)
Total Financial Liabilities at fair valuethrough profit or loss (39) (0.17)
Total Financial Assets and FinancialLiabilities at fair value through profit orloss 22,400 98.38
Other Assets in Excess of Liabilities 369 1.62
Total Net Assets $22,769 100.00
– Amounts designated as “–” are either $0, less than$1,000, less than 1,000 shares or less than 0.01%.
144A Securities exempt from registration under Rule 144A ofthe Securities Act of 1933, as amended. Thesesecurities may only be resold, in transactions exemptfrom registration, to qualified institutional buyers. As at28 February 2021, these securities amounted to$668,000 or 2.93% of net assets.
* Variable rate security. The interest rate shown reflectsthe rate in effect at 28 February 2021.
ABBREVIATIONS:
Perpetual – A bond with no maturity date. Perpetual bondsare not redeemable but pay a steady stream ofinterest.
BRL – Brazilian Real
EUR – Euro
IDR – Indonesian Rupiah
INR – Indian Rupee
MXN – Mexican Peso
RUB – Russian Ruble
UAH – Ukrainian Hryvnia
ZAR – South Africa Rand
The accompanying notes are an integral part of the Financial Statements
91

Legg Mason Global Funds Plc Annual Report 28 February 2021
Legg Mason Western Asset Emerging Markets Total Return Bond Fund
Portfolio of Investments as at 28 February 2021 – (continued)
Analysis of Total Assets
% ofTotal
Assets
Transferable securities admitted to an officialexchange listing or traded on a regulated market 87.03
Collective investment schemes 8.98
Financial derivative instruments 0.63
Other assets 3.36
Total Assets 100.00
Schedule of Credit Default Swaps
Counterparty Reference EntityBuy/Sell
ProtectionExpiration
Date
NotionalAmount(000’s)
Value(000’s)
Goldman Sachs Chile Government Bond, 1.000% Buy 20/12/2024 250 $ (6)Goldman Sachs State of Qatar, 1.000% Buy 20/12/2024 250 (6)
Unrealised Appreciation of Credit Default Swaps (29 February 2020 (000’s): $–) $ –Unrealised Depreciation of Credit Default Swaps (29 February 2020 (000’s): $–) (12)
Net Depreciation of Credit Default Swaps (29 February 2020 (000’s): $–) $ (12)
Schedule of Forward Foreign Currency Contracts
Expiration Date CounterpartyBuy Currency
(000’s)Sell Currency
(000’s)
UnrealisedAppreciation/(Depreciation)of Contracts
(000’s)
12/03/2021 BNY Mellon Buy USD 673 Sell EUR 554 $ 412/03/2021 BNY Mellon Buy USD 11 Sell EUR 9 –12/03/2021 BNY Mellon Buy USD – Sell GBP – –12/03/2021 BNY Mellon Buy USD 8 Sell SGD 12 –12/03/2021 BNY Mellon Buy EUR 35 Sell USD 43 –12/03/2021 BNY Mellon Buy EUR 4,010 Sell USD 4,828 1212/03/2021 BNY Mellon Buy GBP 83 Sell USD 113 212/03/2021 BNY Mellon Buy SGD 18 Sell USD 13 –15/03/2021 Bank of America Merrill Lynch Buy USD 248 Sell RUB 18,311 315/03/2021 Bank of America Merrill Lynch Buy USD 540 Sell SAR 2,028 (1)15/03/2021 Goldman Sachs Buy USD 219 Sell EUR 180 115/03/2021 Goldman Sachs Buy USD 269 Sell SAR 1,009 –15/03/2021 JP Morgan Buy CNH 436 Sell USD 66 115/04/2021 Bank of America Merrill Lynch Buy USD 269 Sell IDR 3,794,773 815/04/2021 JP Morgan Buy USD 473 Sell BRL 2,591 1215/04/2021 JP Morgan Buy USD 168 Sell IDR 2,410,940 115/04/2021 JP Morgan Buy USD 167 Sell INR 12,252 215/04/2021 JP Morgan Buy USD 410 Sell MXN 8,292 1615/04/2021 JP Morgan Buy MXN 1,127 Sell USD 54 (1)15/04/2021 JP Morgan Buy BRL 1,359 Sell USD 253 (11)
Unrealised Appreciation of Forward Foreign Currency Contracts (29 February 2020 (000’s): $114) $ 62Unrealised Depreciation of Forward Foreign Currency Contracts (29 February 2020 (000’s): $(25)) (13)
Net Appreciation of Forward Foreign Currency Contracts (29 February 2020 (000’s): $89) $ 49
Schedule of Futures Contracts
CounterpartyNominal
Value
NotionalValue(000’s)
UnrealisedAppreciation/(Depreciation)of Contracts
(000’s)
U.S. 10 Year Note (CBT) June 2021 Goldman Sachs (25) $ (3,318) $ 50U.S. Long Bond (CBT) June 2021 Goldman Sachs (16) (2,547) 27
Unrealised Appreciation of Futures Contracts (29 February 2020 (000’s): $–) $ 77Unrealised Depreciation of Futures Contracts (29 February 2020 (000’s): $(64)) –
Net Appreciation of Futures Contracts (29 February 2020 (000’s): $(64)) $ 77
The accompanying notes are an integral part of the Financial Statements
92

Legg Mason Global Funds Plc Annual Report 28 February 2021
Legg Mason Western Asset Emerging Markets Corporate Bond Fund
Portfolio of Investments as at 28 February 2021
FaceValue(000’s)
Value(000’s)
$
% ofNet
AssetValue
Corporate Bonds and Notes — 89.01%(29 February 2020: 88.07%)
Argentina — 0.49% (29 February 2020: 0.00%)
200 MercadoLibre Inc,3.125%, due 14/01/2031 197 0.49
Brazil — 9.01% (29 February 2020: 13.10%)
200 Braskem Finance Ltd,6.450%, due 03/02/2024 221 0.55
280 BRF SA,4.875%, due 24/01/2030 292 0.73
400 Itau Unibanco Holding SA/Cayman Island,5.650%, due 19/03/2022 416 1.03
300 Itau Unibanco Holding SA/Cayman Island,6.125%, Perpetual * 302 0.75
200 Klabin Austria GmbH,3.200%, due 12/01/2031 198 0.49
760 Petrobras Global Finance BV,6.250%, due 17/03/2024 860 2.14
100 Petrobras Global Finance BV,5.999%, due 27/01/2028 114 0.28
560 Petrobras Global Finance BV,6.850%, due 05/06/2115 611 1.52
200 Suzano Austria GmbH,5.000%, due 15/01/2030 225 0.56
280 Vale Overseas Ltd,6.875%, due 10/11/2039 385 0.96
3,624 9.01
Chile — 4.81% (29 February 2020: 3.47%)
200 Enel Chile SA,4.875%, due 12/06/2028 234 0.58
200 GNL Quintero SA,4.634%, due 31/07/2029 218 0.54
200 Inversiones CMPC SA,4.750%, due 15/09/2024 220 0.55
200 Inversiones CMPC SA,3.850%, due 13/01/2030 218 0.54
350 Sociedad Quimica y Minera deChile SA,4.250%, due 07/05/2029 400 0.99
200 Transelec SA,4.625%, due 26/07/2023 216 0.54
400 VTR Comunicaciones SpA,5.125%, due 15/01/2028 428 1.07
1,934 4.81
China — 6.35% (29 February 2020: 13.49%)
200 Alibaba Group Holding Ltd,3.600%, due 28/11/2024 219 0.55
200 Alibaba Group Holding Ltd,4.000%, due 06/12/2037 226 0.56
200 China Aoyuan Group Ltd,7.950%, due 07/09/2021 203 0.51
400 Country Garden Holdings CoLtd,4.750%, due 28/09/2023 410 1.02
200 Logan Group Co Ltd,6.500%, due 16/07/2023 206 0.51
200 Longfor Group Holdings Ltd,3.900%, due 16/04/2023 210 0.52
190 Prosperous Ray Ltd,4.625%, due 12/11/2023 207 0.51
200 Prosus NV,5.500%, due 21/07/2025 228 0.57
200 Prosus NV,4.850%, due 06/07/2027 227 0.56
200 Tencent Holdings Ltd,3.925%, due 19/01/2038 218 0.54
200 Yuzhou Group Holdings Co Ltd,7.900%, due 11/05/2021 202 0.50
2,556 6.35
Colombia — 6.29% (29 February 2020: 4.57%)
200 Banco Bilbao Vizcaya ArgentariaColombia SA,4.875%, due 21/04/2025 216 0.54
200 Ecopetrol SA,6.875%, due 29/04/2030 244 0.61
230 Ecopetrol SA,5.875%, due 28/05/2045 249 0.62
200 Grupo de InversionesSuramericana SA,5.500%, due 29/04/2026 228 0.56
FaceValue(000’s)
Value(000’s)
$
% ofNet
AssetValue
200 Grupo Energia Bogota SA ESP,4.875%, due 15/05/2030 223 0.55
450 Millicom International CellularSA,6.250%, due 25/03/2029 507 1.26
400 Oleoducto Central SA,4.000%, due 14/07/2027 429 1.06
200 Promigas SA ESP / Gases delPacifico SAC,3.750%, due 16/10/2029 208 0.52
200 Transportadora de GasInternacional SA ESP,5.550%, due 01/11/2028 228 0.57
2,532 6.29
Hong Kong — 2.90% (29 February 2020: 3.31%)
500 Goodman HK Finance,4.375%, due 19/06/2024 544 1.35
400 Melco Resorts Finance Ltd,4.875%, due 06/06/2025 411 1.02
200 Melco Resorts Finance Ltd,144A,5.375%, due 04/12/2029 212 0.53
1,167 2.90
India — 4.34% (29 February 2020: 2.69%)
400 Adani Ports & Special EconomicZone Ltd,3.100%, due 02/02/2031 388 0.97
400 Bharti Airtel Ltd,4.375%, due 10/06/2025 434 1.08
200 Oil India Ltd,5.375%, due 17/04/2024 222 0.55
204 ONGC Videsh Ltd,4.625%, due 15/07/2024 225 0.56
200 REC Ltd,2.250%, due 01/09/2026 198 0.49
250 Reliance Industries Ltd,3.667%, due 30/11/2027 278 0.69
1,745 4.34
Indonesia — 1.65% (29 February 2020: 1.61%)
200 Cikarang Listrindo Tbk PT,4.950%, due 14/09/2026 207 0.52
200 Minejesa Capital BV,4.625%, due 10/08/2030 211 0.52
230 Minejesa Capital BV,5.625%, due 10/08/2037 244 0.61
662 1.65
Ireland — 0.21% (29 February 2020: 0.49%)
80 Avolon Holdings Funding Ltd,144A,4.250%, due 15/04/2026 85 0.21
Israel — 2.97% (29 February 2020: 2.98%)
200 Bank Leumi Le-Israel BM, 144A,3.275%, due 29/01/2031 * 206 0.51
400 Teva Pharmaceutical FinanceNetherlands III BV,2.800%, due 21/07/2023 392 0.98
550 Teva Pharmaceutical FinanceNetherlands III BV,7.125%, due 31/01/2025 596 1.48
1,194 2.97
Kazakhstan — 1.70% (29 February 2020: 1.55%)
200 KazMunayGas National Co JSC,5.375%, due 24/04/2030 238 0.59
400 KazTransGas JSC,4.375%, due 26/09/2027 446 1.11
684 1.70
Kuwait — 2.67% (29 February 2020: 0.98%)
200 Equate Petrochemical BV,4.250%, due 03/11/2026 218 0.54
200 MEGlobal Canada ULC,5.875%, due 18/05/2030 243 0.61
200 NBK SPC Ltd,2.750%, due 30/05/2022 205 0.51
410 NBK Tier 1 Financing Ltd,3.625%, Perpetual * 407 1.01
1,073 2.67
Macau — 2.44% (29 February 2020: 1.77%)
200 MGM China Holdings Ltd,5.375%, due 15/05/2024 206 0.51
FaceValue(000’s)
Value(000’s)
$
% ofNet
AssetValue
200 Sands China Ltd,5.400%, due 08/08/2028 230 0.57
200 Wynn Macau Ltd,5.625%, due 26/08/2028 208 0.52
330 Wynn Macau Ltd,5.125%, due 15/12/2029 337 0.84
981 2.44
Malaysia — 1.69% (29 February 2020: 0.98%)
500 Axiata Spv5 Labuan Ltd,3.064%, due 19/08/2050 465 1.16
200 Gohl Capital Ltd,4.250%, due 24/01/2027 215 0.53
680 1.69
Mexico — 6.63% (29 February 2020: 5.09%)
200 Banco Mercantil del Norte SA/Grand Cayman,7.500%, Perpetual * 223 0.55
200 Banco Mercantil del Norte SA/Grand Cayman,6.875%, Perpetual * 206 0.51
200 BBVA Bancomer SA/Texas,6.750%, due 30/09/2022 217 0.54
200 BBVA Bancomer SA/Texas,1.875%, due 18/09/2025 202 0.50
250 BBVA Bancomer SA/Texas,5.125%, due 18/01/2033 * 264 0.65
200 Cemex SAB de CV,3.875%, due 11/07/2031 200 0.50
200 Fomento Economico MexicanoSAB de CV,3.500%, due 16/01/2050 204 0.51
300 Fresnillo Plc,4.250%, due 02/10/2050 303 0.75
200 Grupo Bimbo SAB de CV,4.700%, due 10/11/2047 228 0.57
400 Kimberly-Clark de Mexico SABde CV,2.431%, due 01/07/2031 402 1.00
200 Orbia Advance Corp SAB de CV,4.000%, due 04/10/2027 220 0.55
2,669 6.63
Morocco — 1.22% (29 February 2020: 1.16%)
250 OCP SA,5.625%, due 25/04/2024 275 0.68
200 OCP SA,4.500%, due 22/10/2025 216 0.54
491 1.22
Netherlands — 1.64% (29 February 2020: 0.48%)
200 VEON Holdings BV,4.000%, due 09/04/2025 212 0.53
440 VEON Holdings BV,3.375%, due 25/11/2027 449 1.11
661 1.64
Panama — 2.59% (29 February 2020: 1.00%)
400 Banco Nacional de Panama,2.500%, due 11/08/2030 386 0.96
200 Banistmo SA,3.650%, due 19/09/2022 206 0.51
220 Cable Onda SA,4.500%, due 30/01/2030 235 0.58
200 ENA Master Trust,4.000%, due 19/05/2048 215 0.54
1,042 2.59
Peru — 5.92% (29 February 2020: 3.33%)
200 Banco BBVA Peru SA,5.250%, due 22/09/2029 * 219 0.54
190 Banco de Credito del Peru,3.125%, due 01/07/2030 * 194 0.48
200 Consorcio Transmantaro SA,4.700%, due 16/04/2034 232 0.58
200 Kallpa Generacion SA,4.125%, due 16/08/2027 217 0.54
220 Petroleos del Peru SA,Series FEB,5.625%, due 19/06/2047 243 0.60
150 Southern Copper Corp,3.875%, due 23/04/2025 166 0.41
105 Southern Copper Corp,7.500%, due 27/07/2035 155 0.39
The accompanying notes are an integral part of the Financial Statements
93

Legg Mason Global Funds Plc Annual Report 28 February 2021
Legg Mason Western Asset Emerging Markets Corporate Bond Fund
Portfolio of Investments as at 28 February 2021 – (continued)
FaceValue(000’s)
Value(000’s)
$
% ofNet
AssetValue
Corporate Bonds and Notes — (continued)
Peru — (continued)
300 Transportadora de Gas del PeruSA,4.250%, due 30/04/2028 336 0.84
600 Volcan Cia Minera SAA,4.375%, due 11/02/2026 618 1.54
2,380 5.92
Qatar — 2.52% (29 February 2020: 1.66%)
200 ABQ Finance Ltd,3.500%, due 22/02/2022 205 0.51
200 CBQ Finance Ltd,5.000%, due 24/05/2023 217 0.54
300 QNB Finance Ltd,1.625%, due 22/09/2025 302 0.75
250 Ras Laffan Liquefied Natural GasCo Ltd 3,5.838%, due 30/09/2027 290 0.72
1,014 2.52
Russia — 3.72% (29 February 2020: 4.47%)
200 Gazprom PJSC Via Gaz CapitalSA,4.950%, due 23/03/2027 226 0.56
200 Gazprom PJSC Via Gaz CapitalSA,4.950%, due 06/02/2028 226 0.56
370 Lukoil International Finance BV,6.656%, due 07/06/2022 397 0.99
200 Lukoil International Finance BV,4.563%, due 24/04/2023 214 0.53
200 Lukoil International Finance BV,4.750%, due 02/11/2026 226 0.56
200 MMC Norilsk Nickel OJSC ViaMMC Finance DAC,4.100%, due 11/04/2023 208 0.52
1,497 3.72
Singapore — 3.81% (29 February 2020: 3.59%)
400 BOC Aviation Ltd,2.750%, due 18/09/2022 409 1.02
200 DBS Group Holdings Ltd,4.520%, due 11/12/2028 * 218 0.54
530 Oversea-Chinese Banking CorpLtd,4.250%, due 19/06/2024 584 1.45
300 United Overseas Bank Ltd,3.750%, due 15/04/2029 * 322 0.80
1,533 3.81
South Africa — 1.74% (29 February 2020: 0.52%)
470 Liquid TelecommunicationsFinancing Plc,5.500%, due 04/09/2026 477 1.18
200 Sasol Financing USA LLC,6.500%, due 27/09/2028 225 0.56
702 1.74
South Korea — 3.76% (29 February 2020: 3.99%)
200 GS Caltex Corp,3.000%, due 12/06/2022 205 0.51
330 KEB Hana Bank,4.250%, due 14/10/2024 367 0.91
200 Kia Motors Corp,3.000%, due 25/04/2023 210 0.52
660 Shinhan Bank Co Ltd,3.875%, due 24/03/2026 731 1.82
1,513 3.76
Thailand — 0.56% (29 February 2020: 0.56%)
200 Thaioil Treasury Center Co Ltd,4.625%, due 20/11/2028 227 0.56
Turkey — 2.61% (29 February 2020: 2.80%)
400 Mersin Uluslararasi LimanIsletmeciligi AS,5.375%, due 15/11/2024 429 1.07
200 TC Ziraat Bankasi AS,5.125%, due 03/05/2022 203 0.50
400 Turk Telekomunikasyon AS,4.875%, due 19/06/2024 417 1.04
1,049 2.61
FaceValue(000’s)
Value(000’s)
$
% ofNet
AssetValue
United Arab Emirates — 3.08%(29 February 2020: 4.38%)
400 Abu Dhabi Crude Oil PipelineLLC,4.600%, due 02/11/2047 462 1.15
200 Abu Dhabi National Energy CoPJSC,3.625%, due 12/01/2023 * 211 0.52
200 DAE Funding LLC,5.000%, due 01/08/2024 207 0.52
300 DP World Plc,5.625%, due 25/09/2048 358 0.89
1,238 3.08
United Kingdom — 0.85% (29 February 2020: 1.93%)
310 Hutchison WhampoaInternational 14 Ltd,3.625%, due 31/10/2024 343 0.85
United States — 0.84% (29 February 2020: 1.22%)
40 General Electric Co,3.450%, due 01/05/2027 44 0.11
300 Hilton Domestic Operating CoInc, 144A,3.625%, due 15/02/2032 296 0.73
340 0.84
Total Corporate Bonds and Notes(Cost $33,677) 35,813 89.01
Government Bonds and Notes — 9.01%(29 February 2020: 9.69%)
Bahamas — 0.50% (29 February 2020: 0.00%)
200 Bahamas GovernmentInternational Bond,5.750%, due 16/01/2024 201 0.50
Bahrain — 0.48% (29 February 2020: 0.00%)
200 Bahrain GovernmentInternational Bond,6.250%, due 25/01/2051 193 0.48
Costa Rica — 0.44% (29 February 2020: 0.00%)
200 Costa Rica GovernmentInternational Bond,5.625%, due 30/04/2043 177 0.44
Cote d’Ivoire (Ivory Coast) — 0.84%(29 February 2020: 0.48%)
EUR 100 Ivory Coast GovernmentInternational Bond,4.875%, due 30/01/2032 121 0.30
200 Ivory Coast GovernmentInternational Bond,6.125%, due 15/06/2033 216 0.54
337 0.84
Dominican Republic — 0.76% (29 February 2020: 0.47%)
310 Dominican RepublicInternational Bond,5.300%, due 21/01/2041 306 0.76
Egypt — 0.53% (29 February 2020: 0.88%)
200 Egypt Government InternationalBond,7.625%, due 29/05/2032 214 0.53
Ghana — 0.54% (29 February 2020: 0.00%)
200 Ghana GovernmentInternational Bond,7.875%, due 26/03/2027 218 0.54
India — 0.53% (29 February 2020: 0.98%)
200 Export-Import Bank of India,3.375%, due 05/08/2026 214 0.53
Nigeria — 0.54% (29 February 2020: 0.48%)
200 Nigeria GovernmentInternational Bond,7.875%, due 16/02/2032 216 0.54
Oman — 1.02% (29 February 2020: 0.95%)
200 Oman Government InternationalBond,4.125%, due 17/01/2023 204 0.51
200 Oman Government InternationalBond,5.625%, due 17/01/2028 207 0.51
411 1.02
FaceValue(000’s)
Value(000’s)
$
% ofNet
AssetValue
Paraguay — 0.48% (29 February 2020: 0.00%)
200 Paraguay GovernmentInternational Bond,2.739%, due 29/01/2033 192 0.48
Senegal — 0.53% (29 February 2020: 0.49%)
200 Senegal GovernmentInternational Bond,6.250%, due 23/05/2033 213 0.53
Turkey — 0.52% (29 February 2020: 0.47%)
200 Turkiye Ihracat Kredi BankasiAS,6.125%, due 03/05/2024 207 0.52
Ukraine — 1.30% (29 February 2020: 1.03%)
200 Ukraine GovernmentInternational Bond,7.750%, due 01/09/2025 218 0.54
300 Ukraine GovernmentInternational Bond,7.253%, due 15/03/2033 306 0.76
524 1.30
Total Government Bonds and Notes(Cost $3,527) 3,623 9.01
Total Investments at fair value throughprofit or loss (Cost $37,204) 39,436 98.02
Contracts(000’s)
Value(000’s)
$
% ofNet
AssetValue
Purchased Options — 0.02% (29 February 2020: 0.00%)
570 USD Put/CNHCall 6.55, due 13/11/2021 –JP Morgan 9 0.02
380 USD Put/IDRCall 13,800.00, due 05/03/2021– JP Morgan – –
Total Purchased Options (Cost $7) 9 0.02
Forward Foreign Currency Contracts — 0.01%(29 February 2020: 0.01%)
Unrealised appreciation of contracts(see below) 6 0.01
Futures — 0.16% (29 February 2020: 0.00%)
Unrealised appreciation of contracts(see below) 65 0.16
Total Financial Assets at fair valuethrough profit or loss 39,516 98.21
Written Options — 0.00% (29 February 2020: 0.00%)
(570) USD Call/CNHPut 7.11, due 13/11/2021 –JP Morgan (3) –
(380) USD Call/IDRPut 14,800.00, due 05/03/2021– JP Morgan – –
Total Written Options (Cost $(8)) (3) –
Forward Foreign Currency Contracts — (0.01%)(29 February 2020: 0.00%)
Unrealised depreciation of contracts(see below) (5) (0.01)
Total Financial Liabilities at fair valuethrough profit or loss (8) (0.01)
Total Financial Assets and FinancialLiabilities at fair value through profit orloss 39,508 98.20
Other Assets in Excess of Liabilities 725 1.80
Total Net Assets $40,233 100.00
– Amounts designated as “–” are either $0, less than$1,000, less than 1,000 shares or less than 0.01%.
144A Securities exempt from registration under Rule 144A ofthe Securities Act of 1933, as amended. Thesesecurities may only be resold, in transactions exemptfrom registration, to qualified institutional buyers. As at28 February 2021, these securities amounted to$799,000 or 1.98% of net assets.
* Variable rate security. The interest rate shown reflectsthe rate in effect at 28 February 2021.
The accompanying notes are an integral part of the Financial Statements
94

Legg Mason Global Funds Plc Annual Report 28 February 2021
Legg Mason Western Asset Emerging Markets Corporate Bond Fund
Portfolio of Investments as at 28 February 2021 – (continued)
ABBREVIATIONS:
Perpetual – A bond with no maturity date. Perpetual bondsare not redeemable but pay a steady stream ofinterest.
EUR – Euro
Analysis of Total Assets
% ofTotal
Assets
Transferable securities admitted to an officialexchange listing or traded on a regulated market 96.30
Financial derivative instruments 0.19
Other assets 3.51
Total Assets 100.00
Schedule of Forward Foreign Currency Contracts
Expiration Date CounterpartyBuy Currency
(000’s)Sell Currency
(000’s)
UnrealisedAppreciation/(Depreciation)of Contracts
(000’s)
12/03/2021 BNY Mellon Buy EUR 468 Sell USD 563 $ 215/03/2021 Bank of America Merrill Lynch Buy USD 721 Sell SAR 2,708 (2)15/03/2021 Goldman Sachs Buy USD 129 Sell EUR 106 115/03/2021 Goldman Sachs Buy USD 1,181 Sell SAR 4,435 (1)15/04/2021 Bank of America Merrill Lynch Buy USD 111 Sell IDR 1,572,248 315/04/2021 JP Morgan Buy IDR 1,196,699 Sell USD 84 (2)
Unrealised Appreciation of Forward Foreign Currency Contracts (29 February 2020 (000’s): $3) $ 6Unrealised Depreciation of Forward Foreign Currency Contracts (29 February 2020 (000’s): $–) (5)
Net Appreciation of Forward Foreign Currency Contracts (29 February 2020 (000’s): $3) $ 1
Schedule of Futures Contracts
CounterpartyNominal
Value
NotionalValue(000’s)
UnrealisedAppreciation/(Depreciation)of Contracts
(000’s)
U.S. 10 Year Note (CBT) June 2021 UBS (30) $ (3,982) $ 60U.S. Ultra Bond (CBT) June 2021 UBS (2) (378) 5
Unrealised Appreciation of Futures Contracts (29 February 2020 (000’s): $–) $ 65Unrealised Depreciation of Futures Contracts (29 February 2020 (000’s): $(71)) –
Net Appreciation of Futures Contracts (29 February 2020 (000’s): $(71)) $ 65
The accompanying notes are an integral part of the Financial Statements
95

Legg Mason Global Funds Plc Annual Report 28 February 2021
Legg Mason Western Asset Global High Yield Fund
Portfolio of Investments as at 28 February 2021
FaceValue(000’s)
Value(000’s)
$
% ofNet
AssetValue
Asset-Backed Securities — 0.24%(29 February 2020: 0.00%)
250 Magnetite XII Ltd,Series 2015 12A, Class ER,144A,5.921%, due 15/10/2031 * 243 0.24
Total Asset-Backed Securities (Cost $246) 243 0.24
Corporate Bonds and Notes — 71.80%(29 February 2020: 54.16%)Argentina — 2.22% (29 February 2020: 1.81%)
900 MercadoLibre Inc,3.125%, due 14/01/2031 888 0.87
210 Pampa Energia SA, 144A,7.500%, due 24/01/2027 177 0.17
810 Transportadora de Gas delSur SA, 144A,6.750%, due 02/05/2025 714 0.70
280 YPF SA, 144A,8.500%, due 28/07/2025 201 0.19
350 YPF SA, 144A,4.000%, due 12/02/2026 294 0.29
2,274 2.22
Brazil — 2.75% (29 February 2020: 4.19%)
400 Braskem NetherlandsFinance BV, 144A,4.500%, due 10/01/2028 414 0.40
450 Itau Unibanco Holding SA/Cayman Island,5.650%, due 19/03/2022 468 0.46
860 Petrobras Global FinanceBV,7.375%, due 17/01/2027 1,052 1.02
530 Petrobras Global FinanceBV,5.750%, due 01/02/2029 594 0.58
270 Ultrapar International SA,144A,5.250%, due 06/10/2026 296 0.29
2,824 2.75
Canada — 2.89% (29 February 2020: 1.35%)
840 1011778 BC ULC / NewRed Finance Inc, 144A,3.500%, due 15/02/2029 825 0.80
440 ATS Automation ToolingSystems Inc, 144A,4.125%, due 15/12/2028 446 0.43
210 Cascades Inc/Cascades USAInc,5.375%, due 15/01/2028 222 0.22
380 GFL Environmental Inc,144A,3.750%, due 01/08/2025 389 0.38
240 GFL Environmental Inc,144A,5.125%, due 15/12/2026 253 0.25
160 MEG Energy Corp, 144A,7.125%, due 01/02/2027 168 0.16
180 MEG Energy Corp, 144A,5.875%, due 01/02/2029 183 0.18
100 Open Text Corp, 144A,3.875%, due 15/02/2028 102 0.10
220 Open Text Holdings Inc,144A,4.125%, due 15/02/2030 229 0.22
EUR 120 Primo Water Holdings Inc,3.875%, due 31/10/2028 149 0.15
2,966 2.89
Cayman Islands — 0.79% (29 February 2020: 0.00%)
867 Global Aircraft Leasing CoLtd, 144A,6.500%, due 15/09/2024 807 0.79
France — 0.51% (29 February 2020: 0.78%)
500 Altice France SA/France,144A,7.375%, due 01/05/2026 522 0.51
Germany — 0.58% (29 February 2020: 0.57%)
200 Cheplapharm ArzneimittelGmbH, 144A,5.500%, due 15/01/2028 204 0.20
EUR 310 Vertical Midco GmbH,4.375%, due 15/07/2027 393 0.38
597 0.58
FaceValue(000’s)
Value(000’s)
$
% ofNet
AssetValue
Hong Kong — 0.27% (29 February 2020: 0.24%)
260 Melco Resorts Finance Ltd,5.375%, due 04/12/2029 276 0.27
Indonesia — 0.47% (29 February 2020: 0.81%)
460 Minejesa Capital BV, 144A,4.625%, due 10/08/2030 486 0.47
Ireland — 0.46% (29 February 2020: 0.00%)
420 AerCap Ireland CapitalDAC / AerCap GlobalAviation Trust,4.625%, due 15/10/2027 471 0.46
Israel — 3.72% (29 February 2020: 4.09%)
250 Teva PharmaceuticalFinance Co BV,2.950%, due 18/12/2022 251 0.25
EUR 280 Teva PharmaceuticalFinance Netherlands II BV,1.125%, due 15/10/2024 319 0.31
190 Teva PharmaceuticalFinance Netherlands III BV,2.800%, due 21/07/2023 187 0.18
3,260 Teva PharmaceuticalFinance Netherlands III BV,3.150%, due 01/10/2026 3,061 2.98
3,818 3.72
Italy — 1.26% (29 February 2020: 2.46%)
200 Intesa Sanpaolo SpA, 144A,5.017%, due 26/06/2024 218 0.21
520 Intesa Sanpaolo SpA, 144A,5.710%, due 15/01/2026 586 0.57
100 Telecom Italia Capital SA,7.200%, due 18/07/2036 129 0.13
300 UniCredit SpA, 144A,7.296%, due 02/04/2034 * 356 0.35
1,289 1.26
Kazakhstan — 0.22% (29 February 2020: 0.00%)
220 KazMunayGas National CoJSC, 144A,3.500%, due 14/04/2033 225 0.22
Luxembourg — 0.69% (29 February 2020: 0.80%)
390 ARD Finance SA, 144A,6.500%, due 30/06/2027 413 0.40
EUR 230 Summer BC Holdco B SARL,5.750%, due 31/10/2026 293 0.29
706 0.69
Macau — 1.56% (29 February 2020: 0.19%)
470 Wynn Macau Ltd, 144A,5.625%, due 26/08/2028 489 0.48
1,090 Wynn Macau Ltd, 144A,5.125%, due 15/12/2029 1,114 1.08
1,603 1.56
Mexico — 3.64% (29 February 2020: 1.73%)
1,330 BBVA Bancomer SA/Texas,144A,5.125%, due 18/01/2033 * 1,404 1.37
470 Cemex SAB de CV, 144A,7.375%, due 05/06/2027 528 0.52
1,310 Petroleos Mexicanos,6.625%, due 15/06/2035 1,246 1.21
600 Petroleos Mexicanos,6.625%, due 15/06/2038 553 0.54
3,731 3.64
Peru — 0.08% (29 February 2020: 0.75%)
80 Hudbay Minerals Inc, 144A,4.500%, due 01/04/2026 81 0.08
South Korea — 0.27% (29 February 2020: 0.00%)
260 Clark Equipment Co, 144A,5.875%, due 01/06/2025 275 0.27
Switzerland — 1.03% (29 February 2020: 0.47%)
300 Credit Suisse Group AG,144A,7.250%, Perpetual * 341 0.33
300 Credit Suisse Group AG,144A,7.500%, Perpetual * 329 0.32
350 UBS Group AG, 144A,7.000%, Perpetual * 383 0.38
1,053 1.03
FaceValue(000’s)
Value(000’s)
$
% ofNet
AssetValue
Turkey — 1.28% (29 February 2020: 1.16%)
320 TC Ziraat Bankasi AS, 144A,5.125%, due 03/05/2022 325 0.32
300 TC Ziraat Bankasi AS, 144A,5.125%, due 29/09/2023 306 0.30
610 Turk Telekomunikasyon AS,144A,6.875%, due 28/02/2025 680 0.66
1,311 1.28
United Kingdom — 4.80% (29 February 2020: 3.77%)
220 Barclays Plc,5.088%, due 20/06/2030 * 256 0.25
300 Barclays Plc,8.000%, Perpetual * 339 0.33
EUR 760 INEOS Quattro Finance 1Plc,3.750%, due 15/07/2026 933 0.91
EUR 110 INEOS Quattro Finance 1Plc, 144A,3.750%, due 15/07/2026 135 0.13
GBP 510 Marston’s Issuer Plc,Series B1,2.578%, due 16/07/2035 *† 565 0.55
670 Natwest Group Plc,8.625%, Perpetual * 693 0.68
GBP 210 Pinnacle Bidco Plc,6.375%, due 15/02/2025 298 0.29
GBP 580 Saga Plc,3.375%, due 12/05/2024 746 0.73
GBP 400 Santander UK GroupHoldings Plc,7.375%, Perpetual * 581 0.57
349 Virgin Media SecuredFinance Plc, 144A,5.500%, due 15/05/2029 375 0.36
4,921 4.80
United States — 41.90% (29 February 2020: 27.25%)
290 Adient Global Holdings Ltd,144A,4.875%, due 15/08/2026 293 0.29
360 American Axle &Manufacturing Inc,6.500%, due 01/04/2027 376 0.37
170 Apache Corp,5.100%, due 01/09/2040 174 0.17
780 Ardagh Packaging FinancePlc / Ardagh Holdings USAInc, 144A,6.000%, due 15/02/2025 807 0.79
690 Ball Corp,2.875%, due 15/08/2030 671 0.65
300 Bausch Health AmericasInc, 144A,9.250%, due 01/04/2026 333 0.32
200 Bausch Health Cos Inc,144A,5.750%, due 15/08/2027 216 0.21
60 Berry Petroleum Co LLC,144A,7.000%, due 15/02/2026 58 0.06
340 Blue Racer Midstream LLC /Blue Racer Finance Corp,144A,7.625%, due 15/12/2025 366 0.36
470 Blue Racer Midstream LLC /Blue Racer Finance Corp,144A,6.625%, due 15/07/2026 476 0.46
340 Boise Cascade Co, 144A,4.875%, due 01/07/2030 363 0.35
330 BWX Technologies Inc,144A,4.125%, due 30/06/2028 344 0.34
150 Carnival Corp, 144A,7.625%, due 01/03/2026 158 0.15
350 Carnival Corp, 144A,5.750%, due 01/03/2027 356 0.35
180 Carriage Services Inc,144A,6.625%, due 01/06/2026 190 0.18
130 CCO Holdings LLC / CCOHoldings Capital Corp,144A,4.250%, due 01/02/2031 132 0.13
The accompanying notes are an integral part of the Financial Statements
96

Legg Mason Global Funds Plc Annual Report 28 February 2021
Legg Mason Western Asset Global High Yield Fund
Portfolio of Investments as at 28 February 2021 – (continued)
FaceValue(000’s)
Value(000’s)
$
% ofNet
AssetValue
Corporate Bonds and Notes — (continued)
United States — (continued)
2,750 CCO Holdings LLC / CCOHoldings Capital Corp,144A,4.500%, due 01/05/2032 2,828 2.76
290 CDW LLC / CDW FinanceCorp,4.250%, due 01/04/2028 301 0.29
230 CDW LLC / CDW FinanceCorp,3.250%, due 15/02/2029 227 0.22
150 Cheniere Energy Inc, 144A,4.625%, due 15/10/2028 156 0.15
240 Cheniere Energy PartnersLP, 144A,4.000%, due 01/03/2031 242 0.24
50 Chesapeake Energy Corp,144A,5.500%, due 01/02/2026 52 0.05
50 Chesapeake Energy Corp,144A,5.875%, due 01/02/2029 53 0.05
360 Cogent CommunicationsGroup Inc, 144A,5.375%, due 01/03/2022 369 0.36
244 CommScope TechnologiesLLC, 144A,6.000%, due 15/06/2025 248 0.24
100 CoreCivic Inc,4.750%, due 15/10/2027 90 0.09
220 Crowdstrike Holdings Inc,3.000%, due 15/02/2029 220 0.21
290 CSC Holdings LLC, 144A,6.500%, due 01/02/2029 321 0.31
170 Delta Air Lines Inc,3.800%, due 19/04/2023 174 0.17
310 Delta Air Lines Inc,2.900%, due 28/10/2024 309 0.30
810 Delta Air Lines Inc, 144A,7.000%, due 01/05/2025 944 0.92
500 Delta Air Lines Inc,7.375%, due 15/01/2026 586 0.57
130 Delta Air Lines Inc /SkyMiles IP Ltd, 144A,4.750%, due 20/10/2028 144 0.14
230 DISH DBS Corp,5.875%, due 15/11/2024 241 0.24
360 DISH DBS Corp,7.750%, due 01/07/2026 397 0.39
800 DISH Network Corp,3.375%, due 15/08/2026 754 0.74
100 Diversified Healthcare Trust,4.375%, due 01/03/2031 99 0.10
150 EnLink Midstream LLC,144A,5.625%, due 15/01/2028 152 0.15
100 EQM Midstream PartnersLP, 144A,6.000%, due 01/07/2025 106 0.10
90 EQM Midstream PartnersLP, 144A,6.500%, due 01/07/2027 97 0.09
490 EQT Corp,3.000%, due 01/10/2022 494 0.48
700 EQT Corp,3.900%, due 01/10/2027 727 0.71
290 EQT Corp,5.000%, due 15/01/2029 318 0.31
350 Fair Isaac Corp, 144A,4.000%, due 15/06/2028 363 0.35
200 Ford Motor Credit Co LLC,3.336%, due 18/03/2021 200 0.20
200 Ford Motor Credit Co LLC,3.087%, due 09/01/2023 203 0.20
240 Ford Motor Credit Co LLC,5.125%, due 16/06/2025 260 0.25
630 Ford Motor Credit Co LLC,3.375%, due 13/11/2025 641 0.63
350 Ford Motor Credit Co LLC,3.815%, due 02/11/2027 362 0.35
1,100 Ford Motor Credit Co LLC,2.900%, due 16/02/2028 1,085 1.06
200 Ford Motor Credit Co LLC,4.000%, due 13/11/2030 205 0.20
FaceValue(000’s)
Value(000’s)
$
% ofNet
AssetValue
370 Freeport-McMoRan Inc,3.875%, due 15/03/2023 386 0.38
210 Frontier CommunicationsCorp, 144A,5.000%, due 01/05/2028 217 0.21
190 Full House Resorts Inc,144A,8.250%, due 15/02/2028 202 0.20
590 H&E Equipment ServicesInc, 144A,3.875%, due 15/12/2028 569 0.55
540 Hanesbrands Inc, 144A,4.875%, due 15/05/2026 582 0.57
390 Hawaiian Brand IntellectualProperty Ltd / HawaiianMilesLoyalty Ltd, 144A,5.750%, due 20/01/2026 410 0.40
280 HCA Inc,5.625%, due 01/09/2028 326 0.32
130 Hilton Domestic OperatingCo Inc, 144A,5.750%, due 01/05/2028 141 0.14
160 IRB Holding Corp, 144A,7.000%, due 15/06/2025 174 0.17
810 JB Poindexter & Co Inc,144A,7.125%, due 15/04/2026 857 0.84
10 Kraft Heinz Foods Co,3.875%, due 15/05/2027 11 0.01
250 Kraft Heinz Foods Co,4.625%, due 30/01/2029 290 0.28
50 Kraft Heinz Foods Co,4.250%, due 01/03/2031 56 0.05
320 Kraft Heinz Foods Co,144A,7.125%, due 01/08/2039 471 0.46
230 Kraft Heinz Foods Co,4.375%, due 01/06/2046 251 0.24
170 L Brands Inc, 144A,6.875%, due 01/07/2025 186 0.18
250 Ladder Capital FinanceHoldings LLLP / LadderCapital Finance Corp,144A,4.250%, due 01/02/2027 242 0.24
140 Legacy LifePoint HealthLLC, 144A,6.750%, due 15/04/2025 149 0.15
750 Level 3 Financing Inc, 144A,3.625%, due 15/01/2029 739 0.72
400 Lumen Technologies Inc,144A,4.500%, due 15/01/2029 400 0.39
150 Match Group Holdings IILLC, 144A,5.000%, due 15/12/2027 158 0.15
390 Mileage Plus Holdings LLC /Mileage Plus IntellectualProperty Assets Ltd, 144A,6.500%, due 20/06/2027 427 0.42
420 NCL Corp Ltd, 144A,12.250%, due 15/05/2024 500 0.49
360 NCL Corp Ltd, 144A,10.250%, due 01/02/2026 419 0.41
20 Occidental Petroleum Corp,2.900%, due 15/08/2024 20 0.02
110 Occidental Petroleum Corp,6.625%, due 01/09/2030 125 0.12
380 Occidental Petroleum Corp,6.125%, due 01/01/2031 425 0.41
200 Party City Holdings Inc,144A,8.750%, due 15/02/2026 204 0.20
120 PBF Holding Co LLC / PBFFinance Corp, 144A,9.250%, due 15/05/2025 117 0.11
250 PetSmart Inc / PetSmartFinance Corp, 144A,4.750%, due 15/02/2028 259 0.25
250 PetSmart Inc / PetSmartFinance Corp, 144A,7.750%, due 15/02/2029 268 0.26
170 Prime Security ServicesBorrower LLC / PrimeFinance Inc, 144A,5.750%, due 15/04/2026 183 0.18
FaceValue(000’s)
Value(000’s)
$
% ofNet
AssetValue
340 Rackspace TechnologyGlobal Inc, 144A,3.500%, due 15/02/2028 334 0.33
180 Range Resources Corp,5.000%, due 15/03/2023 181 0.18
590 Range Resources Corp,4.875%, due 15/05/2025 585 0.57
440 Sensata Technologies Inc,144A,4.375%, due 15/02/2030 470 0.46
100 Sensata Technologies Inc,4.375%, due 15/02/2030 107 0.10
200 Service Properties Trust,5.500%, due 15/12/2027 216 0.21
620 Silversea Cruise Finance Ltd,144A,7.250%, due 01/02/2025 643 0.63
300 Simmons Foods Inc/Simmons Prepared FoodsInc/Simmons Pet Food Inc/Simmons Feed, 144A,4.625%, due 01/03/2029 304 0.30
600 Sirius XM Radio Inc, 144A,4.125%, due 01/07/2030 607 0.59
140 Spectrum Brands Inc,5.750%, due 15/07/2025 144 0.14
1,100 Spirit Loyalty Cayman Ltd /Spirit IP Cayman Ltd, 144A,8.000%, due 20/09/2025 1,240 1.21
450 Sprint Capital Corp,6.875%, due 15/11/2028 570 0.56
490 Sprint Corp,7.875%, due 15/09/2023 566 0.55
230 SRM Escrow Issuer LLC,144A,6.000%, due 01/11/2028 239 0.23
200 Targa Resources PartnersLP / Targa ResourcesPartners Finance Corp,5.875%, due 15/04/2026 209 0.20
140 Targa Resources PartnersLP / Targa ResourcesPartners Finance Corp,5.375%, due 01/02/2027 146 0.14
110 Targa Resources PartnersLP / Targa ResourcesPartners Finance Corp,6.500%, due 15/07/2027 119 0.12
300 Tenet Healthcare Corp,144A,7.500%, due 01/04/2025 326 0.32
100 Tenet Healthcare Corp,144A,4.625%, due 15/06/2028 104 0.10
300 T-Mobile USA Inc,2.625%, due 15/02/2029 293 0.29
230 T-Mobile USA Inc,2.875%, due 15/02/2031 226 0.22
290 TopBuild Corp, 144A,3.625%, due 15/03/2029 292 0.28
540 TransDigm Inc, 144A,8.000%, due 15/12/2025 588 0.57
260 Twitter Inc,3.875%, due 15/12/2027 278 0.27
70 United Airlines 2020-1Class B Pass Through Trust,4.875%, due 15/01/2026 73 0.07
1,020 United Airlines HoldingsInc,4.250%, due 01/10/2022 1,034 1.01
140 United Airlines HoldingsInc,5.000%, due 01/02/2024 144 0.14
290 United Rentals NorthAmerica Inc,4.875%, due 15/01/2028 307 0.30
280 Univision CommunicationsInc, 144A,9.500%, due 01/05/2025 307 0.30
780 Viking Cruises Ltd, 144A,7.000%, due 15/02/2029 794 0.77
220 Viking Ocean Cruises ShipVII Ltd, 144A,5.625%, due 15/02/2029 222 0.22
915 VOC Escrow Ltd, 144A,5.000%, due 15/02/2028 906 0.88
The accompanying notes are an integral part of the Financial Statements
97

Legg Mason Global Funds Plc Annual Report 28 February 2021
Legg Mason Western Asset Global High Yield Fund
Portfolio of Investments as at 28 February 2021 – (continued)
FaceValue(000’s)
Value(000’s)
$
% ofNet
AssetValue
Corporate Bonds and Notes — (continued)
United States — (continued)
360 Western MidstreamOperating LP,4.650%, due 01/07/2026 373 0.36
250 Western MidstreamOperating LP,4.750%, due 15/08/2028 263 0.26
20 Western MidstreamOperating LP,5.300%, due 01/02/2030 22 0.02
160 WW International Inc,144A,8.625%, due 01/12/2025 167 0.16
400 Wynn Resorts Finance LLC /Wynn Resorts Capital Corp,144A,7.750%, due 15/04/2025 435 0.42
90 Yum! Brands Inc, 144A,7.750%, due 01/04/2025 99 0.10
42,978 41.90
Zambia — 0.41% (29 February 2020: 0.56%)
390 First Quantum Minerals Ltd,144A,6.875%, due 15/10/2027 424 0.41
Total Corporate Bonds and Notes(Cost $69,443) 73,638 71.80
Government Bonds and Notes — 15.65%(29 February 2020: 26.73%)
Argentina — 1.22% (29 February 2020: 2.07%)
ARS 1,473 Argentina Treasury BondBONCER, Series CER,1.000%, due 05/08/2021 †� 14 0.01
161 Argentine RepublicGovernment InternationalBond,1.000%, due 09/07/2029 64 0.06
917 Argentine RepublicGovernment InternationalBond,0.125%, due 09/07/2030 334 0.33
1,631 Argentine RepublicGovernment InternationalBond,0.125%, due 09/07/2035 523 0.51
910 Provincia de Buenos Aires/Government Bonds, 144A,9.950%, due 09/06/2021 � 314 0.31
1,249 1.22
Brazil — 1.39% (29 February 2020: 4.10%)
BRL 1,108 Brazil Notas do TesouroNacional Serie F,Series NTNF,10.000%, due 01/01/2023 212 0.20
500 Brazilian GovernmentInternational Bond,4.250%, due 07/01/2025 541 0.53
350 Brazilian GovernmentInternational Bond,4.625%, due 13/01/2028 377 0.37
300 Brazilian GovernmentInternational Bond,3.875%, due 12/06/2030 299 0.29
1,429 1.39
Costa Rica — 0.20% (29 February 2020: 0.44%)
200 Costa Rica GovernmentInternational Bond,6.125%, due 19/02/2031 203 0.20
Dominican Republic — 0.53% (29 February 2020: 0.50%)
500 Dominican RepublicInternational Bond, 144A,5.500%, due 27/01/2025 549 0.53
Egypt — 0.36% (29 February 2020: 0.34%)
350 Egypt GovernmentInternational Bond, 144A,5.577%, due 21/02/2023 365 0.36
El Salvador — 0.19% (29 February 2020: 0.20%)
200 El Salvador GovernmentInternational Bond, 144A,6.375%, due 18/01/2027 197 0.19
FaceValue(000’s)
Value(000’s)
$
% ofNet
AssetValue
Ghana — 0.66% (29 February 2020: 0.61%)
360 Ghana GovernmentInternational Bond, 144A,10.750%, due 14/10/2030 471 0.46
200 Ghana GovernmentInternational Bond, 144A,8.125%, due 26/03/2032 205 0.20
676 0.66
Guatemala — 0.39% (29 February 2020: 0.56%)
370 Guatemala GovernmentBond, 144A,4.375%, due 05/06/2027 401 0.39
Honduras — 0.39% (29 February 2020: 0.57%)
350 Honduras GovernmentInternational Bond, 144A,6.250%, due 19/01/2027 396 0.39
Indonesia — 1.79% (29 February 2020: 2.84%)
1,020 Indonesia GovernmentInternational Bond,1.850%, due 12/03/2031 969 0.94
IDR 1,966,000 Indonesia Treasury Bond,Series FR53,8.250%, due 15/07/2021 141 0.14
IDR 10,034,000 Indonesia Treasury Bond,Series FR61,7.000%, due 15/05/2022 730 0.71
1,840 1.79
Jamaica — 0.23% (29 February 2020: 0.00%)
200 Jamaica GovernmentInternational Bond,6.750%, due 28/04/2028 235 0.23
Nigeria — 0.32% (29 February 2020: 0.47%)
300 Nigeria GovernmentInternational Bond, 144A,7.875%, due 16/02/2032 324 0.32
Oman — 0.50% (29 February 2020: 0.00%)
500 Oman GovernmentInternational Bond, 144A,5.625%, due 17/01/2028 518 0.50
Paraguay — 0.84% (29 February 2020: 0.61%)
590 Paraguay GovernmentInternational Bond, 144A,5.000%, due 15/04/2026 665 0.65
200 Paraguay GovernmentInternational Bond, 144A,2.739%, due 29/01/2033 193 0.19
858 0.84
Russia — 0.94% (29 February 2020: 1.02%)
RUB 69,969 Russian Federal Bond –OFZ, Series 6212,7.050%, due 19/01/2028 970 0.94
South Africa — 0.64% (29 February 2020: 0.22%)
400 Republic of South AfricaGovernment InternationalBond,4.875%, due 14/04/2026 423 0.41
250 Republic of South AfricaGovernment InternationalBond,5.650%, due 27/09/2047 231 0.23
654 0.64
Turkey — 1.68% (29 February 2020: 2.35%)
1,760 Turkey GovernmentInternational Bond,4.250%, due 14/04/2026 1,726 1.68
Ukraine — 0.74% (29 February 2020: 1.49%)
700 Ukraine GovernmentInternational Bond, 144A,7.750%, due 01/09/2026 759 0.74
United States — 2.64% (29 February 2020: 3.38%)
150 United States TreasuryNote/Bond,1.125%, due 28/02/2022 151 0.15
600 United States TreasuryNote/Bond,1.875%, due 31/08/2022 616 0.60
FaceValue(000’s)
Value(000’s)
$
% ofNet
AssetValue
500 United States TreasuryNote/Bond,0.375%, due 31/07/2027 480 0.47
700 United States TreasuryNote/Bond,0.625%, due 15/05/2030 656 0.64
650 United States TreasuryNote/Bond,0.625%, due 15/08/2030 607 0.59
200 United States TreasuryNote/Bond,1.125%, due 15/02/2031 195 0.19
2,705 2.64
Total Government Bonds and Notes(Cost $16,282) 16,054 15.65
Loan Notes — 3.03% (29 February 2020: 7.78%)
1,194 Delta Air Lines Inc,5.750%, due 29/04/2023 * 1,206 1.18
400 Ineos U.S. Petrochemical,0.000%, due 21/01/2026 * 401 0.39
283 JetBlue Airways Corp,6.250%, due 17/06/2024 * 292 0.28
310 PetSmart Inc,4.250%, due 29/01/2028 * 312 0.30
290 Royal Caribbean CruisesLtd,0.000%, due 05/04/2022 * 273 0.27
250 SkyMiles IP Ltd,4.750%, due 16/09/2027 * 265 0.26
340 United Airlines,6.250%, due 25/06/2027 * 364 0.35
Total Loan Notes (Cost $3,041) 3,113 3.03
Collective Investment Schemes — 8.85%(29 February 2020: 9.60%)
20 Legg Mason Global FundsPlc – Western AssetEmerging MarketsCorporate Bond Fund – LMClass US$ Distributing (M) 2,083 2.03
EUR 26 Legg Mason Global FundsPlc – Western Asset EuroHigh Yield Fund – LMClass Euro (Accumulating) 5,867 5.72
EUR 9 Legg Mason QualifiedInvestor Funds (II) Plc –Western Asset EuropeanLoan Fund – LM Class EuroAccumulating 1,126 1.10
Total Collective Investment Schemes(Cost $7,382) 9,076 8.85
Common Stock — 0.31% (29 February 2020: 0.14%)
United States — 0.31% (29 February 2020: 0.14%)
57 Hercules Offshore Inc †∞ 34 0.034 Oasis Petroleum Inc 210 0.21
10 Party City Holdings Inc 75 0.07
319 0.31
Total Common Stock (Cost $950) 319 0.31
Preferred Stock — 0.26% (29 February 2020: 0.00%)
United States — 0.26% (29 February 2020: 0.00%)
– Targa Resources Corp,Series A † 266 0.26
Total Preferred Stock (Cost $262) 266 0.26
Total Investments at fair value throughprofit or loss (Cost $97,606) 102,709 100.14
Forward Foreign Currency Contracts — 0.15%(29 February 2020: 0.05%)
Unrealised appreciation of contracts(see below) 158 0.15
Futures — 0.05% (29 February 2020: 0.07%)
Unrealised appreciation of contracts(see below) 52 0.05
Total Financial Assets at fair valuethrough profit or loss 102,919 100.34
The accompanying notes are an integral part of the Financial Statements
98

Legg Mason Global Funds Plc Annual Report 28 February 2021
Legg Mason Western Asset Global High Yield Fund
Portfolio of Investments as at 28 February 2021 – (continued)
FaceValue(000’s)
Value(000’s)
$
% ofNet
AssetValue
Forward Foreign Currency Contracts — (0.07%)(29 February 2020: (0.34%))
Unrealised depreciation of contracts(see below) (76) (0.07)
Total Financial Liabilities at fair valuethrough profit or loss (76) (0.07)
Total Financial Assets and FinancialLiabilities at fair value through profit orloss 102,843 100.27
Liabilities in Excess of Other Assets (281) (0.27)
Total Net Assets $102,562 100.00
– Amounts designated as “–” are either $0, less than$1,000, less than 1,000 shares or less than 0.01%.
144A Securities exempt from registration under Rule 144A ofthe Securities Act of 1933, as amended. Thesesecurities may only be resold, in transactions exempt
from registration, to qualified institutional buyers. As at28 February 2021, these securities amounted to$47,415,000 or 46.22% of net assets.
* Variable rate security. The interest rate shown reflectsthe rate in effect at 28 February 2021.
† Illiquid.
∞ Security is valued in good faith at fair value by or at thediscretion of the Manager or the respective InvestmentManager.
� Security is in default as at 28 February 2021 (eitherprincipal and / or interest).
� The rate of interest on this type of security is tied to theConsumer Price Index (CPI)/Retail Price Index (RPI). Thecoupon rate is the rate as of 28 February 2021.
ABBREVIATIONS:
Perpetual – A bond with no maturity date. Perpetual bondsare not redeemable but pay a steady stream ofinterest.
ARS – Argentine Peso
BRL – Brazilian Real
EUR – Euro
GBP – British Pound
IDR – Indonesian Rupiah
RUB – Russian Ruble
Analysis of Total Assets
% ofTotal
Assets
Transferable securities admitted to an officialexchange listing or traded on a regulated market 84.37
Other transferable securities dealt in on anotherregulated market 2.90
Collective investment schemes 8.46
Financial derivative instruments 0.20
Other assets 4.07
Total Assets 100.00
Schedule of Forward Foreign Currency Contracts
Expiration Date CounterpartyBuy Currency
(000’s)Sell Currency
(000’s)
UnrealisedAppreciation/(Depreciation)of Contracts
(000’s)
03/03/2021 BNY Mellon Buy AUD 19 Sell USD 15 $ (1)12/03/2021 BNY Mellon Buy USD 129 Sell AUD 165 212/03/2021 BNY Mellon Buy USD 14 Sell EUR 11 –12/03/2021 BNY Mellon Buy USD 10 Sell GBP 8 –12/03/2021 BNY Mellon Buy USD 67 Sell GBP 48 112/03/2021 BNY Mellon Buy USD 179 Sell SGD 237 –12/03/2021 BNY Mellon Buy USD 6 Sell SGD 8 –12/03/2021 BNY Mellon Buy EUR 9 Sell USD 11 –12/03/2021 BNY Mellon Buy EUR 2,071 Sell USD 2,492 712/03/2021 BNY Mellon Buy AUD 12,195 Sell USD 9,317 6612/03/2021 BNY Mellon Buy AUD 169 Sell USD 132 (4)12/03/2021 BNY Mellon Buy GBP 182 Sell USD 257 (3)12/03/2021 BNY Mellon Buy GBP 2,147 Sell USD 2,931 6212/03/2021 BNY Mellon Buy SGD 13 Sell USD 10 –12/03/2021 BNY Mellon Buy SGD 13,894 Sell USD 10,426 (5)19/04/2021 Citi Buy USD 946 Sell EUR 778 619/04/2021 Citi Buy USD 12 Sell EUR 10 –19/04/2021 Citi Buy USD 1,604 Sell GBP 1,183 (44)19/04/2021 Citi Buy GBP 78 Sell USD 107 219/04/2021 Goldman Sachs Buy EUR 860 Sell USD 1,057 (19)18/05/2021 Goldman Sachs Buy USD 1,950 Sell EUR 1,603 12
Unrealised Appreciation of Forward Foreign Currency Contracts (29 February 2020 (000’s): $59) $ 158Unrealised Depreciation of Forward Foreign Currency Contracts (29 February 2020 (000’s): $(370)) (76)
Net Appreciation of Forward Foreign Currency Contracts (29 February 2020 (000’s): $(311)) $ 82
Schedule of Futures Contracts
CounterpartyNominal
Value
NotionalValue(000’s)
UnrealisedAppreciation/(Depreciation)of Contracts
(000’s)
Euro FX Currency March 2021 UBS (47) $ (7,098) $ 52
Unrealised Appreciation of Futures Contracts (29 February 2020 (000’s): $72) $ 52Unrealised Depreciation of Futures Contracts (29 February 2020 (000’s): $–) –
Net Appreciation of Futures Contracts (29 February 2020 (000’s): $72) $ 52
The accompanying notes are an integral part of the Financial Statements
99

Legg Mason Global Funds Plc Annual Report 28 February 2021
Legg Mason Western Asset Global Inflation Management Fund
Portfolio of Investments as at 28 February 2021
FaceValue(000’s)
Value(000’s)
$
% ofNet
AssetValue
Government Bonds and Notes — 95.06%(29 February 2020: 92.80%)
Australia — 1.52% (29 February 2020: 0.15%)
AUD 310 Australia Government Bond,Series 30CI,2.500%, due 20/09/2030 � 364 0.75
AUD 640 Australia Government Bond,Series 162,1.750%, due 21/06/2051 379 0.77
743 1.52
Canada — 0.91% (29 February 2020: 1.85%)
CAD 90 Canadian Government RealReturn Bond, Series CPI,4.000%, due 01/12/2031 � 157 0.32
CAD 170 Canadian Government RealReturn Bond, Series CPI,1.500%, due 01/12/2044 � 205 0.42
CAD 90 Canadian Government RealReturn Bond, Series CPI,0.500%, due 01/12/2050 � 81 0.17
443 0.91
France — 5.20% (29 February 2020: 3.00%)
EUR 1,000 French Republic GovernmentBond OAT, Series OATe,1.850%, due 25/07/2027 � 1,647 3.37
EUR 340 French Republic GovernmentBond OAT, Series OATe, 144A,1.800%, due 25/07/2040 � 780 1.60
EUR 70 French Republic GovernmentBond OAT, Series OATe, 144A,0.100%, due 25/07/2047 � 112 0.23
2,539 5.20
Germany — 3.09% (29 February 2020: 0.00%)
EUR 180 Bundesrepublik DeutschlandBundesanleihe,2.500%, due 15/08/2046 348 0.71
EUR 250 Bundesrepublik DeutschlandBundesanleihe,1.250%, due 15/08/2048 391 0.80
EUR 430 Deutsche BundesrepublikInflation Linked Bond,Series I/L,0.100%, due 15/04/2046 � 770 1.58
1,509 3.09
Indonesia — 1.43% (29 February 2020: 0.00%)
640 Indonesia GovernmentInternational Bond,4.200%, due 15/10/2050 699 1.43
Italy — 6.49% (29 February 2020: 8.52%)
EUR 1,700 Italy Buoni Poliennali DelTesoro, Series CPI, 144A,3.100%, due 15/09/2026 � 2,771 5.68
EUR 140 Italy Buoni Poliennali DelTesoro, Series CPI, 144A,0.400%, due 15/05/2030 � 182 0.37
EUR 130 Italy Buoni Poliennali DelTesoro, 144A,3.250%, due 01/09/2046 213 0.44
3,166 6.49
Japan — 9.61% (29 February 2020: 12.05%)
JPY 14,400 Japanese Government CPILinked Bond, Series 21,0.100%, due 10/03/2026 � 138 0.28
JPY 342,000 Japanese Government CPILinked Bond, Series 22,0.100%, due 10/03/2027 � 3,278 6.72
JPY 133,900 Japanese Government CPILinked Bond, Series 23,0.100%, due 10/03/2028 � 1,272 2.61
4,688 9.61
Mexico — 3.51% (29 February 2020: 2.81%)
MXN 17,002 Mexican Bonos, Series M,8.000%, due 07/11/2047 892 1.83
EUR 650 Mexico GovernmentInternational Bond,2.875%, due 08/04/2039 821 1.68
1,713 3.51
FaceValue(000’s)
Value(000’s)
$
% ofNet
AssetValue
New Zealand — 0.40% (29 February 2020: 1.09%)
NZD 190 New Zealand GovernmentInflation Linked Bond,Series 0930,3.000%, due 20/09/2030 � 194 0.40
Qatar — 0.51% (29 February 2020: 1.06%)
200 Qatar GovernmentInternational Bond,4.817%, due 14/03/2049 247 0.51
South Africa — 1.67% (29 February 2020: 1.29%)
ZAR 18,820 Republic of South AfricaGovernment Bond,Series R214,6.500%, due 28/02/2041 816 1.67
Spain — 3.83% (29 February 2020: 2.62%)
EUR 1,290 Spain Government InflationLinked Bond, 144A,0.700%, due 30/11/2033 � 1,870 3.83
United Kingdom — 1.52% (29 February 2020: 0.42%)
GBP 230 United Kingdom Gilt,2.500%, due 22/07/2065 451 0.92
GBP 70 United Kingdom Gilt InflationLinked, Series 3MO,0.125%, due 22/03/2068 � 290 0.60
741 1.52
United States — 55.37% (29 February 2020: 57.94%)
3,700 United States Treasury InflationIndexed Bonds,0.125%, due 15/01/2022 � 4,356 8.93
3,790 United States Treasury InflationIndexed Bonds,0.375%, due 15/07/2025 � 4,589 9.40
1,670 United States Treasury InflationIndexed Bonds,0.625%, due 15/01/2026 � 2,043 4.19
4,230 United States Treasury InflationIndexed Bonds,0.375%, due 15/01/2027 � 5,059 10.37
1,340 United States Treasury InflationIndexed Bonds,0.500%, due 15/01/2028 � 1,588 3.26
1,760 United States Treasury InflationIndexed Bonds,3.875%, due 15/04/2029 � 3,950 8.09
3,160 United States Treasury InflationIndexed Bonds,0.125%, due 15/01/2030 � 3,496 7.16
820 United States Treasury InflationIndexed Bonds,0.750%, due 15/02/2045 � 1,088 2.23
600 United States Treasury Note/Bond,2.000%, due 15/02/2050 585 1.20
280 United States Treasury Note/Bond,1.875%, due 15/02/2051 265 0.54
27,019 55.37
Total Government Bonds and Notes(Cost $43,569) 46,387 95.06
Collective Investment Schemes — 1.93%(29 February 2020: 0.79%)
940 Western Asset Liquidity FundsPlc – Western Asset US DollarLiquidity Fund – Class WA(Distributing) 940 1.93
Total Collective Investment Schemes(Cost $940) 940 1.93
Total Investments at fair value throughprofit or loss (Cost $44,509) 47,327 96.99
Interest Rate Swaps — 0.12% (29 February 2020: 0.00%)
Unrealised appreciation of contracts(see below) 56 0.12
Forward Foreign Currency Contracts — 0.36%(29 February 2020: 0.07%)
Unrealised appreciation of contracts(see below) 175 0.36
FaceValue(000’s)
Value(000’s)
$
% ofNet
AssetValue
Futures — 0.57% (29 February 2020: 0.12%)
Unrealised appreciation of contracts(see below) 281 0.57
Total Financial Assets at fair valuethrough profit or loss 47,839 98.04
Contracts(000’s)
Value(000’s)
$
% ofNet
AssetValue
Written Options — (0.03%) (29 February 2020: (0.10%))
– U.S. 10 Year April 2021Put 133.50, due 26/03/2021 –Citi (13) (0.03)
Total Written Options (Cost $(3)) (13) (0.03)
Forward Foreign Currency Contracts — (0.25%)(29 February 2020: (0.51%))
Unrealised depreciation of contracts(see below) (119) (0.25)
Futures — (0.21%) (29 February 2020: (0.84%))
Unrealised depreciation of contracts(see below) (104) (0.21)
Total Financial Liabilities at fair valuethrough profit or loss (236) (0.49)
Total Financial Assets and FinancialLiabilities at fair value through profit orloss 47,603 97.55
Other Assets in Excess of Liabilities 1,195 2.45
Total Net Assets $48,798 100.00
– Amounts designated as “–” are either $0, less than$1,000, less than 1,000 shares or less than 0.01%.
144A Securities exempt from registration under Rule 144A ofthe Securities Act of 1933, as amended. Thesesecurities may only be resold, in transactions exemptfrom registration, to qualified institutional buyers. As at28 February 2021, these securities amounted to$5,928,000 or 12.15% of net assets.
� The rate of interest on this type of security is tied to theConsumer Price Index (CPI)/Retail Price Index (RPI). Thecoupon rate is the rate as of 28 February 2021.
ABBREVIATIONS:
CPI – Consumer Price Index.
AUD – Australian Dollar
CAD – Canadian Dollar
EUR – Euro
GBP – British Pound
JPY – Japanese Yen
MXN – Mexican Peso
NZD – New Zealand Dollar
ZAR – South Africa Rand
Analysis of Total Assets
% ofTotal
Assets
Transferable securities admitted to an officialexchange listing or traded on a regulated market 92.04
Collective investment schemes 1.87
Financial derivative instruments 1.02
Other assets 5.07
Total Assets 100.00
The accompanying notes are an integral part of the Financial Statements
100

Legg Mason Global Funds Plc Annual Report 28 February 2021
Legg Mason Western Asset Global Inflation Management Fund
Portfolio of Investments as at 28 February 2021 – (continued)
Schedule of Interest Rate Swaps
Counterparty Rate Expiration DateNotional Amount
(000’s)Value(000’s)
Citi Pay Fixed 0.800%, Receive Floating CZK 6M Pribor PRBO 19/11/2025 26,470 $ 37Citi Pay Fixed -0.235%, Receive Floating EUR 6M Euribor Reuters 15/08/2029 1,120 19
Unrealised Appreciation of Interest Rate Swaps (29 February 2020 (000’s): $–) $ 56Unrealised Depreciation of Interest Rate Swaps (29 February 2020 (000’s): $–) –
Net Appreciation of Interest Rate Swaps (29 February 2020 (000’s): $–) $ 56
Schedule of Forward Foreign Currency Contracts
Expiration Date CounterpartyBuy Currency
(000’s)Sell Currency
(000’s)
UnrealisedAppreciation/(Depreciation)of Contracts
(000’s)
04/03/2021 JP Morgan Buy USD 500 Sell RUB 36,880 $ 504/03/2021 JP Morgan Buy RUB 36,880 Sell USD 498 (3)04/03/2021 Morgan Stanley Buy USD 396 Sell BRL 2,140 1404/03/2021 Morgan Stanley Buy BRL 2,140 Sell USD 399 (17)18/05/2021 BNP Paribas Buy USD 355 Sell EUR 295 (2)18/05/2021 BNP Paribas Buy USD 96 Sell GBP 70 (2)18/05/2021 Citi Buy USD 272 Sell AUD 350 318/05/2021 Citi Buy USD 24 Sell CZK 521 118/05/2021 Citi Buy USD 66 Sell EUR 55 –18/05/2021 Citi Buy USD 850 Sell JPY 89,571 918/05/2021 Citi Buy USD 485 Sell PLN 1,820 (1)18/05/2021 Citi Buy PLN 1,790 Sell USD 482 (4)18/05/2021 Citi Buy AUD 881 Sell USD 676 218/05/2021 Goldman Sachs Buy USD 552 Sell CAD 700 218/05/2021 Goldman Sachs Buy USD 2,785 Sell EUR 2,290 1718/05/2021 Goldman Sachs Buy USD 2,645 Sell JPY 276,300 5018/05/2021 Goldman Sachs Buy USD 721 Sell NZD 997 118/05/2021 Goldman Sachs Buy AUD 360 Sell USD 279 (2)18/05/2021 Goldman Sachs Buy NOK 9,330 Sell USD 1,108 (32)18/05/2021 HSBC Buy USD 344 Sell EUR 285 (1)18/05/2021 JP Morgan Buy USD 1,636 Sell AUD 2,119 518/05/2021 JP Morgan Buy USD 94 Sell CAD 120 –18/05/2021 JP Morgan Buy USD 1,904 Sell EUR 1,571 518/05/2021 JP Morgan Buy USD 453 Sell GBP 320 818/05/2021 JP Morgan Buy USD 414 Sell GBP 300 (4)18/05/2021 JP Morgan Buy USD 1,437 Sell JPY 151,450 1518/05/2021 JP Morgan Buy USD 492 Sell MXN 9,980 1918/05/2021 JP Morgan Buy USD 1,064 Sell NOK 9,064 1918/05/2021 JP Morgan Buy HUF 145,580 Sell USD 491 (7)18/05/2021 JP Morgan Buy JPY 7,029 Sell USD 67 (1)18/05/2021 JP Morgan Buy MXN 1,341 Sell USD 66 (3)18/05/2021 JP Morgan Buy EUR 107 Sell USD 128 –18/05/2021 JP Morgan Buy CAD 134 Sell USD 105 –18/05/2021 JP Morgan Buy EUR 295 Sell USD 359 (2)18/05/2021 UBS Buy USD 5,161 Sell EUR 4,282 (15)18/05/2021 UBS Buy EUR 320 Sell USD 389 (2)10/06/2021 JP Morgan Buy RUB 36,880 Sell USD 495 (6)10/06/2021 Morgan Stanley Buy BRL 2,140 Sell USD 395 (15)
Unrealised Appreciation of Forward Foreign Currency Contracts (29 February 2020 (000’s): $31) $ 175Unrealised Depreciation of Forward Foreign Currency Contracts (29 February 2020 (000’s): $(241)) (119)
Net Appreciation of Forward Foreign Currency Contracts (29 February 2020 (000’s): $(210)) $ 56
Schedule of Futures Contracts
CounterpartyNominal
Value
NotionalValue(000’s)
UnrealisedAppreciation/(Depreciation)of Contracts
(000’s)
90 Day Euro$ December 2021 Citi (30) $ (7,483) $ –90 Day Euro$ December 2023 Citi 30 7,418 (30)Australian 10 Year Bond March 2021 Citi 1 106 (7)Canadian 10 Year Bond June 2021 Citi (3) (329) 6Euro-Bobl March 2021 Citi 9 1,457 (9)Euro-BTP March 2021 Citi (4) (723) 5Euro-Bund June 2021 Citi (2) (411) –Euro-Bund March 2021 Citi (5) (1,046) 24Euro-Buxl 30 Year Bond March 2021 Citi (7) (1,772) 104Japan 10 Year Bond (OSE) March 2021 Citi (2) (2,826) 26Long Gilt June 2021 Citi 14 2,492 (23)
The accompanying notes are an integral part of the Financial Statements
101

Legg Mason Global Funds Plc Annual Report 28 February 2021
Legg Mason Western Asset Global Inflation Management Fund
Portfolio of Investments as at 28 February 2021 – (continued)
Schedule of Futures Contracts – (continued)
CounterpartyNominal
Value
NotionalValue(000’s)
UnrealisedAppreciation/(Depreciation)of Contracts
(000’s)
U.S. 10 Year Note (CBT) June 2021 Citi (29) $ (3,849) $ 45U.S. 10 Year Ultra Note June 2021 Citi (47) (6,925) 71U.S. 5 Year Note (CBT) June 2021 Citi 22 2,727 (21)U.S. Long Bond (CBT) June 2021 Citi 13 2,070 (13)U.S. Ultra Bond (CBT) June 2021 Citi 3 567 (1)
Unrealised Appreciation of Futures Contracts (29 February 2020 (000’s): $59) $ 281Unrealised Depreciation of Futures Contracts (29 February 2020 (000’s): $(400)) (104)
Net Appreciation of Futures Contracts (29 February 2020 (000’s): $(341)) $ 177
The accompanying notes are an integral part of the Financial Statements
102

Legg Mason Global Funds Plc Annual Report 28 February 2021
Legg Mason Western Asset Asian Opportunities Fund
Portfolio of Investments as at 28 February 2021
FaceValue(000’s)
Value(000’s)
$
% ofNet
AssetValue
Corporate Bonds and Notes — 21.02%(29 February 2020: 29.63%)
Australia — 0.19% (29 February 2020: 1.71%)
SGD 1,500 National Australia Bank Ltd,4.150%, due 19/05/2028 * 1,193 0.19
China — 6.40% (29 February 2020: 11.71%)
CNY 9,000 Bank of China Ltd/Macau,3.300%, due 17/04/2022 1,391 0.22
1,800 China Huaneng GroupHong Kong TreasuryManagement Holding Ltd,3.080%, Perpetual * 1,833 0.29
3,150 China Minmetals Corp,3.750%, Perpetual * 3,229 0.51
1,600 China SCE Group HoldingsLtd,5.875%, due 10/03/2022 1,619 0.26
5,000 Chinalco Capital HoldingsLtd,4.250%, due 21/04/2022 5,115 0.82
1,000 Chinalco Capital HoldingsLtd,4.100%, Perpetual * 1,040 0.17
CNY 30,000 CNI Capital Ltd,3.970%, due 01/11/2022 4,603 0.73
5,000 Coastal Emerald Ltd,4.300%, Perpetual * 5,189 0.83
CNY 11,000 Country Garden HoldingsCo Ltd,5.800%, due 12/03/2021 1,697 0.27
4,200 Huaneng Hong KongCapital Ltd,3.600%, Perpetual * 4,297 0.69
1,100 Longfor Group HoldingsLtd,4.500%, due 16/01/2028 1,217 0.19
CNY 23,000 Shimao Group Holdings Ltd,5.750%, due 15/03/2021 3,549 0.57
2,100 Vanke Real Estate HongKong Co Ltd,5.350%, due 11/03/2024 2,342 0.37
3,000 Yuzhou Group Holdings CoLtd,7.900%, due 11/05/2021 3,028 0.48
40,149 6.40
France — 1.30% (29 February 2020: 1.30%)
SGD 10,000 Credit Agricole SA,3.800%, due 30/04/2031 * 8,128 1.30
Hong Kong — 2.27% (29 February 2020: 2.77%)
3,700 Bank of East Asia Ltd/The,4.000%, due 03/11/2026 * 3,746 0.60
1,200 Dah Sing Bank Ltd,4.250%, due 30/11/2026 * 1,218 0.19
HKD 28,000 Guotai Junan InternationalHoldings Ltd,2.900%, due 12/05/2021 3,624 0.58
6,000 Panther Ventures Ltd,3.500%, Perpetual 5,625 0.90
14,213 2.27
India — 1.62% (29 February 2020: 0.00%)
INR 450,000 NTPC Ltd,7.250%, due 03/05/2022 6,172 0.99
4,000 REC Ltd,2.250%, due 01/09/2026 3,963 0.63
10,135 1.62
Indonesia — 2.15% (29 February 2020: 5.54%)
3,000 Minejesa Capital BV,5.625%, due 10/08/2037 3,180 0.51
1,000 Pelabuhan Indonesia II PT,4.250%, due 05/05/2025 1,094 0.17
4,150 Pelabuhan Indonesia II PT,5.375%, due 05/05/2045 4,887 0.78
4,000 Perusahaan PerseroanPersero PT PerusahaanListrik Negara,4.125%, due 15/05/2027 4,347 0.69
13,508 2.15
Qatar — 1.28% (29 February 2020: 1.33%)
CNY 35,000 QNB Finance Ltd,5.100%, due 14/05/2021 5,418 0.86
FaceValue(000’s)
Value(000’s)
$
% ofNet
AssetValue
CNY 16,700 QNB Finance Ltd,4.350%, due 29/01/2022 2,605 0.42
8,023 1.28
Singapore — 2.18% (29 February 2020: 1.81%)
SGD 2,750 AIMS APAC REIT,3.600%, due 12/11/2024 2,066 0.33
SGD 4,500 AIMS APAC REIT,5.650%, Perpetual * 3,445 0.55
SGD 2,750 Mapletree CommercialTrust Treasury Co Pte Ltd,3.110%, due 24/08/2026 2,215 0.35
SGD 2,500 Singapore Airlines Ltd,3.030%, due 28/03/2024 1,924 0.31
SGD 2,500 Singapore Airlines Ltd,3.035%, due 11/04/2025 1,925 0.31
SGD 1,000 Singapore Airlines Ltd,3.130%, due 17/11/2026 769 0.12
SGD 1,750 Surbana Jurong Pte Ltd,2.480%, due 10/02/2031 1,323 0.21
13,667 2.18
Supranational — 3.20% (29 February 2020: 3.46%)
IDR 200,000,000 European InvestmentBank,7.400%, due 24/01/2022 14,207 2.27
IDR 77,000,000 International FinanceCorp,8.000%, due 09/10/2023 5,861 0.93
20,068 3.20
Thailand — 0.43% (29 February 2020: 0.00%)
3,000 Thaioil Treasury Center CoLtd,3.500%, due 17/10/2049 2,729 0.43
Total Corporate Bonds and Notes(Cost $127,643) 131,813 21.02
Government Bonds and Notes — 73.06%(29 February 2020: 61.80%)
China — 16.02% (29 February 2020: 7.91%)
CNY 110,000 Agricultural DevelopmentBank of China,Series 1806,4.650%, due 11/05/2028 18,106 2.89
CNY 10,000 China Development Bank,Series 1803,4.620%, due 09/03/2021 1,549 0.25
CNY 40,000 China Development Bank,Series 2008,2.890%, due 22/06/2025 6,059 0.97
HKD 7,500 China Development BankCorp/Hong Kong,0.790%, due 24/01/2024 * 964 0.15
CNY 33,000 China Government Bond,3.380%, due 21/11/2024 5,234 0.84
CNY 50,000 China Government Bond,Series INBK,2.680%, due 21/05/2030 7,342 1.17
CNY 96,500 China Government Bond,3.600%, due 21/05/2030 15,754 2.51
CNY 130,000 China Government Bond,Series INBK,3.390%, due 16/03/2050 18,580 2.96
CNY 60,000 China Government Bond,Series INBK,3.810%, due 14/09/2050 9,290 1.48
CNY 5,000 Export-Import Bank ofChina/The,4.400%, due 14/05/2024 809 0.13
CNY 40,000 Export-Import Bank ofChina/The, Series 2007,3.260%, due 24/02/2027 6,107 0.97
CNY 30,000 Export-Import Bank ofChina/The, Series 1910,3.860%, due 20/05/2029 4,686 0.75
CNY 40,000 Export-Import Bank ofChina/The, Series 2010,3.230%, due 23/03/2030 5,945 0.95
100,425 16.02
India — 7.05% (29 February 2020: 10.35%)
INR 280,000 India Government Bond,8.150%, due 24/11/2026 4,164 0.67
FaceValue(000’s)
Value(000’s)
$
% ofNet
AssetValue
INR 980,000 India Government Bond,Series SPB,8.240%, due 15/02/2027 14,627 2.33
INR 450,000 India Government Bond,7.170%, due 08/01/2028 6,390 1.02
INR 700,000 India Government Bond,7.610%, due 09/05/2030 10,177 1.63
INR 190,000 India Government Bond,6.570%, due 05/12/2033 2,589 0.41
INR 450,000 National HighwaysAuthority of India,7.300%, due 18/05/2022 6,228 0.99
44,175 7.05
Indonesia — 6.74% (29 February 2020: 8.41%)
IDR 51,000,000 Indonesia Treasury Bond,Series FR77,8.125%, due 15/05/2024 3,884 0.62
IDR 96,000,000 Indonesia Treasury Bond,Series FR56,8.375%, due 15/09/2026 7,533 1.20
IDR 108,875,000 Indonesia Treasury Bond,Series FR59,7.000%, due 15/05/2027 7,998 1.27
IDR 20,000,000 Indonesia Treasury Bond,Series FR47,10.000%, due 15/02/2028 1,679 0.27
IDR 27,500,000 Indonesia Treasury Bond,Series FR64,6.125%, due 15/05/2028 1,919 0.31
IDR 114,000,000 Indonesia Treasury Bond,Series FR54,9.500%, due 15/07/2031 9,625 1.53
IDR 25,000,000 Indonesia Treasury Bond,Series FR58,8.250%, due 15/06/2032 1,954 0.31
IDR 5,000,000 Lembaga PembiayaanEkspor Indonesia,Series OB,8.350%, due 25/08/2021 357 0.06
IDR 100,000,000 Lembaga PembiayaanEkspor Indonesia,Series OB,8.250%, due 15/08/2024 7,321 1.17
42,270 6.74
Malaysia — 9.31% (29 February 2020: 10.94%)
MYR 20,490 Malaysia GovernmentBond, Series 0118,3.882%, due 14/03/2025 5,395 0.86
MYR 52,380 Malaysia GovernmentBond, Series 0115,3.955%, due 15/09/2025 13,851 2.21
MYR 1,200 Malaysia GovernmentBond, Series 0308,5.248%, due 15/09/2028 344 0.05
MYR 26,850 Malaysia GovernmentBond, Series 0219,3.885%, due 15/08/2029 7,074 1.13
MYR 78,000 Malaysia GovernmentBond, Series 0411,4.232%, due 30/06/2031 21,008 3.35
MYR 22,510 Malaysia GovernmentBond, Series 0413,3.844%, due 15/04/2033 5,623 0.90
MYR 20,360 Malaysia GovernmentBond, Series 0419,3.828%, due 05/07/2034 5,055 0.81
58,350 9.31
Philippines — 9.34% (29 February 2020: 9.38%)
CNY 20,000 Philippine GovernmentInternational Bond,5.000%, due 23/03/2021 3,100 0.50
PHP 1,016,000 Philippine GovernmentInternational Bond,3.900%, due 26/11/2022 21,571 3.44
PHP 1,256,000 Philippine GovernmentInternational Bond,6.250%, due 14/01/2036 33,851 5.40
58,522 9.34
Singapore — 1.88% (29 February 2020: 5.40%)
SGD 15,600 Singapore GovernmentBond,1.875%, due 01/03/2050 11,791 1.88
The accompanying notes are an integral part of the Financial Statements
103

Legg Mason Global Funds Plc Annual Report 28 February 2021
Legg Mason Western Asset Asian Opportunities Fund
Portfolio of Investments as at 28 February 2021 – (continued)
FaceValue(000’s)
Value(000’s)
$
% ofNet
AssetValue
Government Bonds and Notes — (continued)South Korea — 17.77% (29 February 2020: 2.99%)
IDR 80,000,000 Export-Import Bank ofKorea,8.400%, due 30/11/2021 5,745 0.92
1,300 Industrial Bank of Korea,3.900%, Perpetual * 1,337 0.21
CNY 69,000 Korea Development Bank/The,4.650%, due 12/03/2021 10,645 1.70
KRW 52,200,000 Korea Treasury Bond,Series 2912,1.375%, due 10/12/2029 44,489 7.10
KRW 46,300,000 Korea Treasury Bond,Series 3006,1.375%, due 10/06/2030 39,237 6.26
KRW 13,000,000 Korea Treasury Bond,Series 3909,1.125%, due 10/09/2039 9,944 1.58
111,397 17.77
Thailand — 4.89% (29 February 2020: 5.46%)
THB 801,030 Thailand Government Bond,3.300%, due 17/06/2038 30,666 4.89
United States — 0.06% (29 February 2020: 0.00%)
500 United States Treasury Note/Bond,1.250%, due 15/05/2050 404 0.06
Total Government Bonds and Notes(Cost $448,795) 458,000 73.06
Total Return Swaps — 1.26% (29 February 2020: 1.34%)Indonesia — 1.26% (29 February 2020: 1.34%)
IDR 10,000,000 Indonesia Treasury Bond,Series FR46,9.500%, due 15/07/2023 ∞ 774 0.12
IDR 45,000,000 Indonesia Treasury Bond,Series FR52,10.500%, due 15/08/2030 ∞ 3,993 0.64
IDR 37,000,000 Indonesia Treasury Bond,Series FR54,9.500%, due 15/07/2031 ∞ 3,124 0.50
7,891 1.26
Total Total Return Swaps (Cost $10,366) 7,891 1.26
FaceValue(000’s)
Value(000’s)
$
% ofNet
AssetValue
Collective Investment Schemes — 3.67%(29 February 2020: 5.82%)
SGD 3,712 Legg Mason Western AssetAsian Bond Trust – Class A(SGD) Accumulating ∞ 4,838 0.78
18,146 Western Asset LiquidityFunds Plc – Western AssetUS Dollar Liquidity Fund –Class WA (Distributing) 18,146 2.89
Total Collective Investment Schemes(Cost $21,876) 22,984 3.67
Total Investments at fair value throughprofit or loss (Cost $608,680) 620,688 99.01
Forward Foreign Currency Contracts — 0.05%(29 February 2020: 0.19%)
Unrealised appreciation of contracts(see below) 310 0.05
Total Financial Assets at fair valuethrough profit or loss 620,998 99.06
Forward Foreign Currency Contracts — (0.15%)(29 February 2020: (0.25%))
Unrealised depreciation of contracts(see below) (948) (0.15)
Futures — (0.19%) (29 February 2020: 0.00%)
Unrealised depreciation of contracts(see below) (1,195) (0.19)
Total Financial Liabilities at fair valuethrough profit or loss (2,143) (0.34)
Total Financial Assets and FinancialLiabilities at fair value through profit orloss 618,855 98.72
Other Assets in Excess of Liabilities 8,054 1.28
Total Net Assets $626,909 100.00
– Amounts designated as “–” are either $0, less than$1,000, less than 1,000 shares or less than 0.01%.
* Variable rate security. The interest rate shown reflectsthe rate in effect at 28 February 2021.
∞ Security is valued in good faith at fair value by or at thediscretion of the Manager or the respective InvestmentManager.
ABBREVIATIONS:
Perpetual – A bond with no maturity date. Perpetual bondsare not redeemable but pay a steady stream ofinterest.
CNY – Chinese Renminbi
HKD – Hong Kong Dollar
IDR – Indonesian Rupiah
INR – Indian Rupee
KRW – South Korean Won
MYR – Malaysian Ringgit
PHP – Philippine Peso
SGD – Singapore Dollar
THB – Thai Baht
Analysis of Total Assets
% ofTotal
Assets
Transferable securities admitted to an officialexchange listing or traded on a regulated market 93.60
Collective investment schemes 3.60
Financial derivative instruments 0.05
Other assets 2.75
Total Assets 100.00
Schedule of Forward Foreign Currency Contracts
Expiration Date CounterpartyBuy Currency
(000’s)Sell Currency
(000’s)
UnrealisedAppreciation/(Depreciation)of Contracts
(000’s)
02/03/2021 BNY Mellon Buy AUD 50 Sell USD 40 $ (1)03/03/2021 BNY Mellon Buy AUD 246 Sell USD 193 (4)08/03/2021 BNY Mellon Buy SGD 8,578 Sell USD 6,500 (68)11/03/2021 JP Morgan Buy KRW 13,612,500 Sell USD 12,500 (399)12/03/2021 BNY Mellon Buy USD 1,338 Sell AUD 1,704 2712/03/2021 BNY Mellon Buy USD 9 Sell CHF 8 –12/03/2021 BNY Mellon Buy USD 377 Sell CNH 2,435 212/03/2021 BNY Mellon Buy USD 729 Sell EUR 609 (6)12/03/2021 BNY Mellon Buy USD 112 Sell EUR 91 112/03/2021 BNY Mellon Buy USD 661 Sell SGD 881 112/03/2021 BNY Mellon Buy USD – Sell SGD – –12/03/2021 BNY Mellon Buy EUR 84 Sell USD 101 –12/03/2021 BNY Mellon Buy EUR 8,636 Sell USD 10,397 2612/03/2021 BNY Mellon Buy AUD 24 Sell USD 19 –12/03/2021 BNY Mellon Buy CNH 55,596 Sell USD 8,590 (26)12/03/2021 BNY Mellon Buy CHF 779 Sell USD 867 (10)12/03/2021 BNY Mellon Buy SGD 11 Sell USD 8 –12/03/2021 BNY Mellon Buy SGD 8,443 Sell USD 6,335 (3)12/03/2021 BNY Mellon Buy AUD 45,412 Sell USD 34,699 24619/03/2021 Citi Buy USD 4,207 Sell SGD 5,600 719/03/2021 Citi Buy SGD 28,457 Sell USD 21,461 (121)03/26/2021 Citi Buy KRW 16,500,000 Sell USD 14,862 (218)16/04/2021 BNY Mellon Buy SGD 7,800 Sell USD 5,884 (35)24/05/2021 State Street Bank & Trust Co Buy SGD 8,619 Sell USD 6,490 (27)25/05/2021 Citi Buy SGD 4,361 Sell USD 3,300 (30)
Unrealised Appreciation of Forward Foreign Currency Contracts (29 February 2020 (000’s): $1,095) $ 310Unrealised Depreciation of Forward Foreign Currency Contracts (29 February 2020 (000’s): $(1,462)) (948)
Net Depreciation of Forward Foreign Currency Contracts (29 February 2020 (000’s): $(367)) $ (638)
The accompanying notes are an integral part of the Financial Statements
104

Legg Mason Global Funds Plc Annual Report 28 February 2021
Legg Mason Western Asset Asian Opportunities Fund
Portfolio of Investments as at 28 February 2021 – (continued)
Schedule of Futures Contracts
CounterpartyNominal
Value
NotionalValue(000’s)
UnrealisedAppreciation/(Depreciation)of Contracts
(000’s)
Korea 10 Year Bond March 2021 UBS 410 $ 46,528 $ (1,119)U.S. Long Bond (CBT) June 2021 UBS 40 6,369 (76)
Unrealised Appreciation of Futures Contracts (29 February 2020 (000’s): $2,657) $ –Unrealised Depreciation of Futures Contracts (29 February 2020 (000’s): $–) (1,195)
Net Depreciation of Futures Contracts (29 February 2020 (000’s): $2,657) $ (1,195)
The accompanying notes are an integral part of the Financial Statements
105

Legg Mason Global Funds Plc Annual Report 28 February 2021
Legg Mason Western Asset Short Duration Blue Chip Bond Fund
Portfolio of Investments as at 28 February 2021
FaceValue(000’s)
Value(000’s)
$
% ofNet
AssetValue
Corporate Bonds and Notes — 76.86%(29 February 2020: 79.27%)
Australia — 2.15% (29 February 2020: 1.81%)
GBP 1,770 BHP Billiton Finance Ltd,Series 11,3.250%, due 25/09/2024 2,694 0.52
300 BHP Billiton Finance USA Ltd,2.875%, due 24/02/2022 308 0.06
EUR 720 Optus Finance Pty Ltd,1.000%, due 20/06/2029 901 0.17
EUR 287 Telstra Corp Ltd,3.750%, due 16/05/2022 363 0.07
EUR 1,670 Toyota Finance Australia Ltd,1.584%, due 21/04/2022 2,059 0.40
GBP 550 Toyota Finance Australia Ltd,1.625%, due 11/07/2022 780 0.15
GBP 230 Westpac Banking Corp,2.625%, due 14/12/2022 334 0.06
EUR 3,000 Westpac Banking Corp,0.625%, due 22/11/2024 3,728 0.72
11,167 2.15
Belgium — 0.35% (29 February 2020: 1.49%)
EUR 650 Euroclear Bank SA,0.500%, due 10/07/2023 799 0.15
EUR 400 Euroclear Investments SA,1.125%, due 07/12/2026 513 0.10
EUR 400 KBC Group NV,0.750%, due 01/03/2022 488 0.10
1,800 0.35
Canada — 2.54% (29 February 2020: 4.39%)
500 Bank of Montreal, Series D,3.100%, due 13/04/2021 502 0.10
GBP 2,970 Bank of Nova Scotia/The,1.375%, due 05/12/2023 4,220 0.81
EUR 2,200 Bank of Nova Scotia/The,0.500%, due 30/04/2024 2,700 0.52
1,300 Royal Bank of Canada,3.700%, due 05/10/2023 1,410 0.27
GBP 1,230 Royal Bank of Canada,1.375%, due 09/12/2024 1,755 0.34
EUR 2,110 Toronto-Dominion Bank/The,0.375%, due 25/04/2024 2,581 0.50
13,168 2.54
Denmark — 1.79% (29 February 2020: 0.86%)
EUR 550 Danske Bank A/S,0.875%, due 22/05/2023 677 0.13
1,580 Danske Bank A/S, 144A,5.375%, due 12/01/2024 1,777 0.34
EUR 5,700 Nykredit Realkredit AS,0.250%, due 13/01/2026 6,848 1.32
9,302 1.79
Finland — 0.23% (29 February 2020: 0.39%)
EUR 950 Nordea Bank Abp,0.875%, due 26/06/2023 1,174 0.23
France — 8.91% (29 February 2020: 12.23%)
EUR 300 Air Liquide Finance SA,1.000%, due 02/04/2025 377 0.07
EUR 1,000 APRR SA,0.000%, due 20/01/2023 1,211 0.23
EUR 2,300 APRR SA,0.125%, due 18/01/2029 2,756 0.53
EUR 800 APRR SA,1.500%, due 25/01/2030 1,067 0.21
GBP 2,600 Banque Federative du CreditMutuel SA,1.500%, due 07/10/2026 3,707 0.71
670 BNP Paribas SA,3.250%, due 03/03/2023 711 0.14
230 BNP Paribas SA,4.705%, due 10/01/2025 * 255 0.05
EUR 2,700 BNP Paribas SA,0.375%, due 14/10/2027 * 3,263 0.63
EUR 1,100 BNP Paribas SA,1.375%, due 28/05/2029 1,413 0.27
EUR 1,000 BPCE SA,1.000%, due 01/04/2025 1,246 0.24
GBP 2,600 BPCE SA,1.375%, due 23/12/2026 3,666 0.71
EUR 300 Credit Agricole SA/London,1.250%, due 14/04/2026 384 0.07
FaceValue(000’s)
Value(000’s)
$
% ofNet
AssetValue
6,350 Credit Agricole SA/London,1.907%, due 16/06/2026 * 6,522 1.26
EUR 300 Credit Agricole SA/London,1.750%, due 05/03/2029 395 0.08
EUR 1,000 Engie SA,1.375%, due 27/03/2025 1,272 0.24
EUR 400 Engie SA,1.000%, due 13/03/2026 505 0.10
EUR 400 Engie SA,2.375%, due 19/05/2026 542 0.10
EUR 1,100 Engie SA,0.500%, due 24/10/2030 1,336 0.26
EUR 2,200 EssilorLuxottica SA,0.000%, due 27/05/2023 2,665 0.51
GBP 3,200 LVMH Moet Hennessy LouisVuitton SE,1.000%, due 11/02/2023 4,496 0.87
EUR 600 RTE Reseau de Transportd’Electricite SADIR,1.000%, due 19/10/2026 762 0.15
EUR 300 Sanofi, Series 5FXD,0.500%, due 21/03/2023 367 0.07
EUR 400 Sanofi,1.000%, due 01/04/2025 504 0.10
1,040 Sanofi,3.625%, due 19/06/2028 1,183 0.23
EUR 1,000 Schneider Electric SE,0.000%, due 12/06/2023 1,212 0.23
EUR 400 Thales SA,0.875%, due 19/04/2024 495 0.09
EUR 1,100 Total Capital InternationalSA,1.023%, due 04/03/2027 1,400 0.27
GBP 1,700 Vinci SA,2.250%, due 15/03/2027 2,521 0.49
46,233 8.91
Germany — 3.81% (29 February 2020: 5.68%)
EUR 900 adidas AG,0.000%, due 09/09/2024 1,090 0.21
EUR 900 Allianz Finance II BV,0.000%, due 14/01/2025 1,093 0.21
EUR 700 Allianz Finance II BV,1.500%, due 15/01/2030 944 0.18
GBP 200 BASF SE,1.375%, due 21/06/2022 283 0.05
EUR 300 BASF SE,0.875%, due 15/11/2027 381 0.07
EUR 600 Clearstream Banking AG,0.000%, due 01/12/2025 724 0.14
EUR 500 Deutsche Boerse AG,1.125%, due 26/03/2028 648 0.13
GBP 6,000 Kreditanstalt fuerWiederaufbau,0.875%, due 18/07/2024 8,508 1.64
EUR 500 SAP SE,0.250%, due 10/03/2022 607 0.12
EUR 300 SAP SE,1.750%, due 22/02/2027 398 0.08
GBP 1,200 SiemensFinancieringsmaatschappijNV,0.875%, due 05/06/2023 1,685 0.32
EUR 200 Vier Gas Transport GmbH,1.500%, due 25/09/2028 265 0.05
EUR 200 Volkswagen Bank GmbH,0.625%, due 08/09/2021 243 0.05
EUR 360 Volkswagen Bank GmbH,0.750%, due 15/06/2023 441 0.09
EUR 920 Volkswagen FinancialServices AG,1.500%, due 01/10/2024 1,157 0.22
GBP 900 Volkswagen FinancialServices NV,1.625%, due 30/11/2022 1,273 0.25
19,740 3.81
Italy — 0.46% (29 February 2020: 0.78%)
EUR 1,960 Enel Finance InternationalNV,0.000%, due 17/06/2024 2,371 0.46
Japan — 1.96% (29 February 2020: 2.06%)
1,450 Mitsubishi UFJ FinancialGroup Inc,3.218%, due 07/03/2022 1,493 0.29
EUR 120 Mitsubishi UFJ FinancialGroup Inc,0.680%, due 26/01/2023 147 0.03
FaceValue(000’s)
Value(000’s)
$
% ofNet
AssetValue
EUR 750 Mitsubishi UFJ FinancialGroup Inc,0.980%, due 09/10/2023 930 0.18
EUR 550 Mizuho Financial Group Inc,1.598%, due 10/04/2028 722 0.14
EUR 3,370 NTT Finance Corp,0.010%, due 03/03/2025 4,078 0.78
EUR 270 Sumitomo Mitsui BankingCorp,2.750%, due 24/07/2023 349 0.07
EUR 2,000 Sumitomo Mitsui FinancialGroup Inc,0.632%, due 23/10/2029 2,429 0.47
10,148 1.96
Luxembourg — 0.58% (29 February 2020: 0.16%)
EUR 2,275 Prologis InternationalFunding II SA,1.750%, due 15/03/2028 3,018 0.58
Netherlands — 3.21% (29 February 2020: 3.77%)
EUR 3,000 ABN AMRO Bank NV,0.875%, due 15/01/2024 3,731 0.72
EUR 220 ABN AMRO Bank NV,1.000%, due 16/04/2025 278 0.05
150 Cooperatieve Rabobank UA,3.875%, due 08/02/2022 155 0.03
EUR 200 Cooperatieve Rabobank UA,0.750%, due 29/08/2023 247 0.05
GBP 2,500 Cooperatieve Rabobank UA,1.250%, due 14/01/2025 3,523 0.68
250 Cooperatieve Rabobank UA/NY,3.125%, due 26/04/2021 251 0.05
270 Cooperatieve Rabobank UA/NY,3.375%, due 21/05/2025 297 0.06
EUR 2,010 Enexis Holding NV,0.750%, due 02/07/2031 2,526 0.49
EUR 400 Euronext NV,1.000%, due 18/04/2025 499 0.10
EUR 400 ING Groep NV,0.750%, due 09/03/2022 488 0.09
EUR 200 ING Groep NV,1.000%, due 20/09/2023 249 0.05
EUR 300 ING Groep NV,2.125%, due 10/01/2026 395 0.08
1,780 Shell International FinanceBV,3.250%, due 11/05/2025 1,941 0.37
1,700 Shell International FinanceBV,2.750%, due 06/04/2030 1,796 0.34
EUR 220 TenneT Holding BV,1.375%, due 05/06/2028 288 0.05
16,664 3.21
Norway — 0.77% (29 February 2020: 0.53%)
EUR 940 Avinor AS,0.750%, due 01/10/2030 1,158 0.22
EUR 1,000 Equinor ASA,0.750%, due 22/05/2026 1,249 0.24
EUR 540 Equinor ASA,1.250%, due 17/02/2027 696 0.14
EUR 390 Sparebank 1 Oestlandet,0.875%, due 13/03/2023 481 0.09
EUR 330 Sparebanken Vest,0.500%, due 29/11/2022 404 0.08
3,988 0.77
Singapore — 0.16% (29 February 2020: 0.30%)
810 Temasek Financial I Ltd,2.375%, due 23/01/2023 841 0.16
Spain — 0.77% (29 February 2020: 0.55%)
2,400 Banco Bilbao VizcayaArgentaria SA,0.875%, due 18/09/2023 2,421 0.47
800 Banco Santander SA,3.848%, due 12/04/2023 856 0.16
GBP 500 Banco Santander SA,2.750%, due 12/09/2023 729 0.14
4,006 0.77
Supranational — 2.49% (29 February 2020: 1.40%)
GBP 3,000 European Investment Bank,0.750%, due 14/07/2023 4,229 0.81
The accompanying notes are an integral part of the Financial Statements
106

Legg Mason Global Funds Plc Annual Report 28 February 2021
Legg Mason Western Asset Short Duration Blue Chip Bond Fund
Portfolio of Investments as at 28 February 2021 – (continued)
FaceValue(000’s)
Value(000’s)
$
% ofNet
AssetValue
Corporate Bonds and Notes — (continued)Supranational — (continued)
GBP 6,300 Inter-American DevelopmentBank,0.500%, due 15/09/2026 8,706 1.68
12,935 2.49
Sweden — 1.98% (29 February 2020: 2.32%)
EUR 2,190 Hemso Treasury Oyj,0.000%, due 19/01/2028 2,594 0.50
EUR 1,240 Skandinaviska EnskildaBanken AB,0.050%, due 01/07/2024 1,507 0.29
540 Svenska Handelsbanken AB,1.875%, due 07/09/2021 545 0.10
GBP 500 Svenska Handelsbanken AB,1.625%, due 18/06/2022 709 0.14
EUR 450 Swedbank AB,0.300%, due 06/09/2022 548 0.11
EUR 3,050 Swedbank AB,0.250%, due 09/10/2024 3,706 0.71
EUR 550 Volvo Treasury AB,0.125%, due 17/09/2024 666 0.13
10,275 1.98
Switzerland — 3.20% (29 February 2020: 1.82%)
EUR 800 Cloverie Plc for ZurichInsurance Co Ltd,1.500%, due 15/12/2028 1,057 0.20
2,130 Credit Suisse AG/New YorkNY,2.800%, due 08/04/2022 2,189 0.42
500 Credit Suisse AG/New YorkNY,3.625%, due 09/09/2024 550 0.11
GBP 1,050 Credit Suisse Group AG,2.125%, due 12/09/2025 * 1,516 0.29
GBP 320 Nestle Finance InternationalLtd,2.250%, due 30/11/2023 469 0.09
EUR 680 Nestle Finance InternationalLtd,1.500%, due 01/04/2030 911 0.18
EUR 180 Novartis Finance SA,0.500%, due 14/08/2023 221 0.04
EUR 3,000 Novartis Finance SA,0.000%, due 23/09/2028 3,569 0.69
EUR 380 Richemont InternationalHolding SA,1.000%, due 26/03/2026 481 0.09
EUR 1,500 Richemont InternationalHolding SA,0.750%, due 26/05/2028 1,883 0.36
400 UBS Group AG,3.000%, due 15/04/2021 401 0.08
EUR 200 UBS Group AG,1.750%, due 16/11/2022 250 0.05
EUR 2,400 UBS Group AG,2.125%, due 04/03/2024 3,085 0.60
16,582 3.20
United Kingdom — 5.78% (29 February 2020: 7.01%)
EUR 800 Aviva Plc,1.875%, due 13/11/2027 1,072 0.21
2,055 BP Capital Markets Plc,3.506%, due 17/03/2025 2,259 0.44
GBP 1,700 British Land Co Plc/The,2.375%, due 14/09/2029 2,385 0.46
EUR 400 CK Hutchison EuropeFinance 18 Ltd,1.250%, due 13/04/2025 505 0.10
GBP 180 Close Brothers Finance Plc,3.875%, due 27/06/2021 253 0.05
GBP 150 Close Brothers Group Plc,2.750%, due 26/04/2023 217 0.04
GBP 1,440 Experian Finance Plc,0.739%, due 29/10/2025 1,988 0.38
190 GlaxoSmithKline Capital Plc,2.850%, due 08/05/2022 196 0.04
EUR 270 GlaxoSmithKline Capital Plc,1.250%, due 21/05/2026 345 0.07
EUR 550 GlaxoSmithKline Capital Plc,1.000%, due 12/09/2026 696 0.13
EUR 520 HSBC Holdings Plc,0.875%, due 06/09/2024 646 0.12
1,660 HSBC Holdings Plc,3.803%, due 11/03/2025 * 1,803 0.35
FaceValue(000’s)
Value(000’s)
$
% ofNet
AssetValue
390 HSBC Holdings Plc,1.645%, due 18/04/2026 * 394 0.08
1,220 HSBC Holdings Plc,2.099%, due 04/06/2026 * 1,259 0.24
EUR 1,630 HSBC Holdings Plc,Series GEN,0.309%, due 13/11/2026 * 1,970 0.38
GBP 300 HSBC Holdings Plc,3.000%, due 22/07/2028 * 451 0.09
EUR 280 Leeds Building Society,2.625%, due 01/04/2021 339 0.06
GBP 1,500 Lloyds Bank CorporateMarkets Plc,1.500%, due 23/06/2023 2,132 0.41
GBP 270 Lloyds Bank Plc,2.500%, due 01/06/2022 386 0.07
EUR 1,000 Lloyds Banking Group Plc,0.500%, due 12/11/2025 * 1,220 0.23
EUR 890 Lloyds Banking Group Plc,3.500%, due 01/04/2026 * 1,213 0.23
EUR 200 London Stock ExchangeGroup Plc,0.875%, due 19/09/2024 249 0.05
EUR 690 London Stock ExchangeGroup Plc,1.750%, due 06/12/2027 911 0.18
EUR 1,560 Motability Operations GroupPlc,0.125%, due 20/07/2028 1,862 0.36
650 Nationwide Building Society,144A,3.622%, due 26/04/2023 * 672 0.13
680 Reckitt Benckiser TreasuryServices Plc,2.375%, due 24/06/2022 697 0.13
GBP 400 Santander UK Plc,1.625%, due 10/05/2021 559 0.11
850 Unilever Capital Corp,3.250%, due 07/03/2024 919 0.18
EUR 480 Unilever Finance NetherlandsBV,1.250%, due 25/03/2025 610 0.12
EUR 550 Unilever Finance NetherlandsBV,1.125%, due 12/02/2027 705 0.14
EUR 810 Wellcome Trust Ltd/The,1.125%, due 21/01/2027 1,044 0.20
29,957 5.78
United States — 35.72% (29 February 2020: 31.72%)
2,100 3M Co,2.375%, due 26/08/2029 2,196 0.42
EUR 2,260 Abbott Ireland FinancingDAC,0.100%, due 19/11/2024 2,742 0.53
1,900 Abbott Laboratories,3.750%, due 30/11/2026 2,166 0.42
1,240 Adobe Inc,1.900%, due 01/02/2025 1,293 0.25
1,700 Adobe Inc,2.150%, due 01/02/2027 1,786 0.34
4,500 Alphabet Inc,0.800%, due 15/08/2027 4,379 0.84
1,980 Amazon.com Inc,3.800%, due 05/12/2024 2,203 0.43
2,200 Amazon.com Inc,1.200%, due 03/06/2027 2,192 0.42
340 Apple Inc,3.200%, due 13/05/2025 373 0.07
EUR 1,520 Apple Inc,0.000%, due 15/11/2025 1,840 0.36
GBP 1,500 Apple Inc,3.050%, due 31/07/2029 2,409 0.46
200 Bank of America Corp,3.300%, due 11/01/2023 211 0.04
646 Bank of America Corp,3.004%, due 20/12/2023 * 675 0.13
7,680 Bank of America Corp,3.550%, due 05/03/2024 * 8,145 1.57
EUR 800 Bank of America Corp,3.648%, due 31/03/2029 * 1,175 0.23
5,000 Bank of New York MellonCorp/The,0.350%, due 07/12/2023 5,009 0.97
EUR 500 Berkshire Hathaway Inc,1.125%, due 16/03/2027 638 0.12
FaceValue(000’s)
Value(000’s)
$
% ofNet
AssetValue
EUR 530 BlackRock Inc,1.250%, due 06/05/2025 676 0.13
EUR 550 Blackstone Holdings FinanceCo LLC,1.000%, due 05/10/2026 690 0.13
1,276 Bristol-Myers Squibb Co,2.900%, due 26/07/2024 1,376 0.27
1,900 Bristol-Myers Squibb Co,3.400%, due 26/07/2029 2,128 0.41
200 Caterpillar Financial ServicesCorp,1.931%, due 01/10/2021 202 0.04
1,700 Caterpillar Inc,2.600%, due 09/04/2030 1,800 0.35
800 Chevron Corp,2.355%, due 05/12/2022 826 0.16
2,400 Chevron Corp,1.554%, due 11/05/2025 2,462 0.47
310 Chubb INA Holdings Inc,3.350%, due 03/05/2026 343 0.07
EUR 1,300 Chubb INA Holdings Inc,0.875%, due 15/06/2027 1,627 0.31
EUR 800 Chubb INA Holdings Inc,1.550%, due 15/03/2028 1,040 0.20
150 Citigroup Inc,1.178%, due 25/04/2022 * 151 0.03
GBP 230 Citigroup Inc,2.750%, due 24/01/2024 338 0.07
7,940 Citigroup Inc,3.300%, due 27/04/2025 8,701 1.68
EUR 860 Colgate-Palmolive Co,0.000%, due 12/11/2021 1,040 0.20
EUR 1,300 Colgate-Palmolive Co,0.500%, due 06/03/2026 1,612 0.31
1,000 Comcast Corp,3.700%, due 15/04/2024 1,097 0.21
2,640 Comcast Corp,3.100%, due 01/04/2025 2,859 0.55
390 Comcast Corp,3.150%, due 01/03/2026 427 0.08
1,800 Costco Wholesale Corp,1.375%, due 20/06/2027 1,815 0.35
1,600 Deere & Co,3.100%, due 15/04/2030 1,759 0.34
2,000 Estee Lauder Cos Inc/The,2.375%, due 01/12/2029 2,095 0.40
EUR 5,860 Exxon Mobil Corp,0.142%, due 26/06/2024 7,109 1.37
2,200 Exxon Mobil Corp,2.992%, due 19/03/2025 2,374 0.46
780 Exxon Mobil Corp,3.043%, due 01/03/2026 847 0.16
1,830 Gilead Sciences Inc,3.650%, due 01/03/2026 2,033 0.39
2,100 Goldman Sachs Group Inc/The,3.625%, due 22/01/2023 2,227 0.43
EUR 1,750 Goldman Sachs Group Inc/The,0.125%, due 19/08/2024 2,113 0.41
4,500 Goldman Sachs Group Inc/The,2.600%, due 07/02/2030 4,697 0.91
2,800 Home Depot Inc/The,2.500%, due 15/04/2027 3,007 0.58
180 Home Depot Inc/The,2.700%, due 15/04/2030 192 0.04
EUR 1,260 Honeywell International Inc,0.000%, due 10/03/2024 1,526 0.29
2,060 Honeywell International Inc,2.500%, due 01/11/2026 2,222 0.43
EUR 1,020 Illinois Tool Works Inc,0.250%, due 05/12/2024 1,245 0.24
3,880 Intel Corp,3.400%, due 25/03/2025 4,254 0.82
EUR 350 Johnson & Johnson,0.250%, due 20/01/2022 425 0.08
110 Johnson & Johnson,3.375%, due 05/12/2023 120 0.02
310 JPMorgan Chase & Co,3.200%, due 25/01/2023 327 0.06
3,090 JPMorgan Chase & Co,4.023%, due 05/12/2024 * 3,383 0.65
EUR 320 JPMorgan Chase & Co,1.500%, due 29/10/2026 416 0.08
The accompanying notes are an integral part of the Financial Statements
107

Legg Mason Global Funds Plc Annual Report 28 February 2021
Legg Mason Western Asset Short Duration Blue Chip Bond Fund
Portfolio of Investments as at 28 February 2021 – (continued)
FaceValue(000’s)
Value(000’s)
$
% ofNet
AssetValue
Corporate Bonds and Notes — (continued)United States — (continued)
4,400 JPMorgan Chase & Co,1.045%, due 19/11/2026 * 4,358 0.84
240 Kimberly-Clark Corp,1.050%, due 15/09/2027 237 0.05
910 Kimberly-Clark Corp,3.950%, due 01/11/2028 1,057 0.20
1,150 Mars Inc,2.700%, due 01/04/2025 1,228 0.24
1,700 Mars Inc, 144A,2.700%, due 01/04/2025 1,815 0.35
280 Mastercard Inc,3.375%, due 01/04/2024 305 0.06
EUR 500 Medtronic Global HoldingsSCA, Series 0000,0.375%, due 07/03/2023 610 0.12
EUR 1,400 Medtronic Global HoldingsSCA,0.250%, due 02/07/2025 1,709 0.33
EUR 2,550 Medtronic Global HoldingsSCA,0.000%, due 15/10/2025 3,071 0.59
570 Microsoft Corp,2.700%, due 12/02/2025 610 0.12
2,400 Microsoft Corp,2.400%, due 08/08/2026 2,566 0.50
120 Morgan Stanley,2.500%, due 21/04/2021 120 0.02
EUR 330 Morgan Stanley,1.375%, due 27/10/2026 422 0.08
EUR 2,790 Morgan Stanley,0.495%, due 26/10/2029 * 3,356 0.65
5,410 NIKE Inc,2.400%, due 27/03/2025 5,742 1.11
2,080 Nuveen LLC,4.000%, due 01/11/2028 2,406 0.46
1,600 NVIDIA Corp,2.850%, due 01/04/2030 1,722 0.33
220 Oracle Corp,2.500%, due 15/10/2022 228 0.04
GBP 300 PepsiCo Inc,2.500%, due 01/11/2022 434 0.08
EUR 1,510 PepsiCo Inc,0.250%, due 06/05/2024 1,843 0.36
EUR 310 PepsiCo Inc,0.750%, due 18/03/2027 388 0.08
EUR 1,250 Procter & Gamble Co/The,0.625%, due 30/10/2024 1,551 0.30
EUR 350 Prologis Euro Finance LLC,1.875%, due 05/01/2029 469 0.09
2,120 Prudential Financial Inc,1.500%, due 10/03/2026 2,171 0.42
570 salesforce.com Inc,3.250%, due 11/04/2023 604 0.12
430 Schlumberger Holdings Corp,4.000%, due 21/12/2025 482 0.09
560 Texas Instruments Inc,1.375%, due 12/03/2025 574 0.11
1,150 Texas Instruments Inc,2.900%, due 03/11/2027 1,265 0.24
2,000 TJX Cos Inc/The,3.500%, due 15/04/2025 2,196 0.42
1,630 TJX Cos Inc/The,1.600%, due 15/05/2031 1,573 0.30
538 Toyota Motor Credit Corp,3.400%, due 15/09/2021 547 0.11
GBP 1,340 Toyota Motor Credit Corp,0.750%, due 19/11/2026 1,836 0.35
EUR 2,000 United Parcel Service Inc,1.625%, due 15/11/2025 2,598 0.50
2,150 UnitedHealth Group Inc,3.750%, due 15/07/2025 2,402 0.46
4,043 Verizon Communications Inc,4.329%, due 21/09/2028 4,708 0.91
540 Visa Inc,3.150%, due 14/12/2025 594 0.11
FaceValue(000’s)
Value(000’s)
$
% ofNet
AssetValue
4,000 Visa Inc,1.900%, due 15/04/2027 4,148 0.80
1,900 Walmart Inc,3.250%, due 08/07/2029 2,124 0.41
2,130 Walmart Inc,2.375%, due 24/09/2029 2,248 0.43
1,660 Waste Management Inc,3.500%, due 15/05/2024 1,799 0.35
230 Wells Fargo & Co,3.500%, due 08/03/2022 238 0.05
700 Wells Fargo & Co,3.069%, due 24/01/2023 717 0.14
2,940 Wells Fargo & Co,3.196%, due 17/06/2027 * 3,201 0.62
185,285 35.72
Total Corporate Bonds and Notes(Cost $376,981) 398,654 76.86
Government Bonds and Notes — 15.74%(29 February 2020: 18.04%)
Canada — 0.32% (29 February 2020: 0.56%)
GBP 1,200 CPPIB Capital Inc,0.875%, due 17/12/2024 1,699 0.32
Germany — 0.24% (29 February 2020: 0.45%)
EUR 990 Bundesrepublik DeutschlandBundesanleihe,0.000%, due 15/08/2029 1,232 0.24
South Korea — 0.39% (29 February 2020: 0.68%)
EUR 1,000 Export-Import Bank of Korea,0.625%, due 11/07/2023 1,231 0.24
EUR 660 Korea Development Bank/The,0.000%, due 10/07/2024 798 0.15
2,029 0.39
United States — 14.79% (29 February 2020: 16.35%)
12,040 United States Treasury Note/Bond,1.750%, due 31/03/2022 12,256 2.37
170 United States Treasury Note/Bond,0.125%, due 31/07/2022 170 0.03
11,690 United States Treasury Note/Bond,1.375%, due 15/02/2023 11,975 2.31
590 United States Treasury Note/Bond,0.250%, due 31/07/2025 581 0.11
19,510 United States Treasury Note/Bond,2.250%, due 15/11/2027 21,015 4.05
9,510 United States Treasury Note/Bond,1.500%, due 15/02/2030 9,657 1.86
22,480 United States Treasury Note/Bond,0.625%, due 15/05/2030 21,062 4.06
76,716 14.79
Total Government Bonds and Notes(Cost $83,031) 81,676 15.74
Collective Investment Schemes — 4.64%(29 February 2020: 2.88%)
24,052 Western Asset LiquidityFunds Plc – Western AssetUS Dollar Liquidity Fund –Class WA (Distributing) 24,052 4.64
Total Collective Investment Schemes(Cost $24,052) 24,052 4.64
Total Investments at fair value throughprofit or loss (Cost $484,064) 504,382 97.24
FaceValue(000’s)
Value(000’s)
$
% ofNet
AssetValue
Forward Foreign Currency Contracts — 1.45%(29 February 2020: 0.28%)
Unrealised appreciation of contracts(see below) 7,530 1.45
Futures — 0.27% (29 February 2020: 0.00%)
Unrealised appreciation of contracts(see below) 1,417 0.27
Total Financial Assets at fair valuethrough profit or loss 513,329 98.96
Credit Default Swaps — (0.20%)(29 February 2020: (0.20%))
Unrealised depreciation of contracts(see below) (1,036) (0.20)
Forward Foreign Currency Contracts — (0.29%)(29 February 2020: (1.04%))
Unrealised depreciation of contracts(see below) (1,529) (0.29)
Futures — 0.00% (29 February 2020: (0.42%))
Unrealised depreciation of contracts(see below) (6) –
Total Financial Liabilities at fair valuethrough profit or loss (2,571) (0.49)
Total Financial Assets and FinancialLiabilities at fair value through profitor loss 510,758 98.47
Other Assets in Excess of Liabilities 7,941 1.53
Total Net Assets $518,699 100.00
– Amounts designated as “–” are either $0, less than$1,000, less than 1,000 shares or less than 0.01%.
144A Securities exempt from registration under Rule 144A ofthe Securities Act of 1933, as amended. Thesesecurities may only be resold, in transactions exemptfrom registration, to qualified institutional buyers. As at28 February 2021, these securities amounted to$4,264,000 or 0.82% of net assets.
* Variable rate security. The interest rate shown reflectsthe rate in effect at 28 February 2021.
ABBREVIATIONS:
EUR – Euro
GBP – British Pound
Analysis of Total Assets
% ofTotal
Assets
Transferable securities admitted to an officialexchange listing or traded on a regulated market 91.23
Collective investment schemes 4.57
Financial derivative instruments 1.70
Other assets 2.50
Total Assets 100.00
Schedule of Credit Default Swaps
Counterparty Reference EntityBuy/Sell
ProtectionExpiration
Date
NotionalAmount(000’s)
Value(000’s)
Bank of America Merrill Lynch iTraxx Europe, 1.000% Buy 20/12/2025 36,330 $(1,036)
Unrealised Appreciation of Credit Default Swaps (29 February 2020 (000’s): $–) $ –Unrealised Depreciation of Credit Default Swaps (29 February 2020 (000’s): $(564)) (1,036)
Net Depreciation of Credit Default Swaps (29 February 2020 (000’s): $(564)) $(1,036)
The accompanying notes are an integral part of the Financial Statements
108

Legg Mason Global Funds Plc Annual Report 28 February 2021
Legg Mason Western Asset Short Duration Blue Chip Bond Fund
Portfolio of Investments as at 28 February 2021 – (continued)
Schedule of Forward Foreign Currency Contracts
Expiration Date CounterpartyBuy Currency
(000’s)Sell Currency
(000’s)
UnrealisedAppreciation/(Depreciation)of Contracts
(000’s)
12/03/2021 BNY Mellon Buy USD 690 Sell AUD 886 $ 812/03/2021 BNY Mellon Buy USD 322 Sell EUR 266 –12/03/2021 BNY Mellon Buy USD 542 Sell EUR 447 212/03/2021 BNY Mellon Buy USD 2,816 Sell GBP 2,039 (27)12/03/2021 BNY Mellon Buy USD 1,583 Sell GBP 1,126 1712/03/2021 BNY Mellon Buy USD 81 Sell SEK 674 112/03/2021 BNY Mellon Buy SEK 3,327 Sell USD 396 (2)12/03/2021 BNY Mellon Buy AUD 2,911 Sell USD 2,224 1612/03/2021 BNY Mellon Buy AUD 1 Sell USD 1 –12/03/2021 BNY Mellon Buy EUR 2,754 Sell USD 3,344 (16)12/03/2021 BNY Mellon Buy EUR 45,369 Sell USD 54,616 13712/03/2021 BNY Mellon Buy GBP 2,933 Sell USD 4,112 (26)12/03/2021 BNY Mellon Buy GBP 247,494 Sell USD 337,709 7,13318/05/2021 Citi Buy USD 27,639 Sell EUR 22,916 (60)18/05/2021 Citi Buy USD 13,952 Sell GBP 10,177 (232)18/05/2021 Goldman Sachs Buy USD 14,038 Sell EUR 11,542 8718/05/2021 HSBC Buy USD 28,473 Sell EUR 23,619 (77)18/05/2021 JP Morgan Buy USD 46,552 Sell EUR 38,406 12918/05/2021 JP Morgan Buy USD 1,932 Sell GBP 1,400 (19)18/05/2021 Royal Bank of Canada Buy USD 2,482 Sell GBP 1,806 (35)18/05/2021 UBS Buy USD 43,246 Sell EUR 35,881 (126)18/05/2021 UBS Buy USD 54,989 Sell GBP 40,108 (909)
Unrealised Appreciation of Forward Foreign Currency Contracts (29 February 2020 (000’s): $766) $ 7,530Unrealised Depreciation of Forward Foreign Currency Contracts (29 February 2020 (000’s): $(2,868)) (1,529)
Net Appreciation of Forward Foreign Currency Contracts (29 February 2020 (000’s): $(2,102)) $ 6,001
Schedule of Futures Contracts
CounterpartyNominal
Value
NotionalValue(000’s)
UnrealisedAppreciation/
(Depreciation)of Contracts
(000’s)
Euro-Bobl March 2021 Bank of America Merrill Lynch (293) $(47,446) $ 317Euro-Bund June 2021 Bank of America Merrill Lynch (49) (10,082) (6)Euro-Bund March 2021 Bank of America Merrill Lynch (128) (26,780) 611Long Gilt June 2021 Bank of America Merrill Lynch (225) (40,052) 371U.S. 5 Year Note (CBT) June 2021 Bank of America Merrill Lynch (144) (17,851) 118
Unrealised Appreciation of Futures Contracts (29 February 2020 (000’s): $–) $ 1,417Unrealised Depreciation of Futures Contracts (29 February 2020 (000’s): $(1,174)) (6)
Net Appreciation of Futures Contracts (29 February 2020 (000’s): $(1,174)) $ 1,411
The accompanying notes are an integral part of the Financial Statements
109

Legg Mason Global Funds Plc Annual Report 28 February 2021
Legg Mason Western Asset Global Core Plus Bond Fund^
Portfolio of Investments as at 28 February 2021
FaceValue(000’s)
Value(000’s)
$
% ofNet
AssetValue
Mortgage-Backed Securities — 9.04%(29 February 2020: 13.62%)
900 Fannie Mae or Freddie Mac,15 year, TBA,1.500% ± 910 0.32
600 Fannie Mae or Freddie Mac,30 year, TBA,1.500% ± 589 0.21
100 Fannie Mae or Freddie Mac,30 year, TBA,1.500% ± 98 0.03
700 Fannie Mae or Freddie Mac,30 year, TBA,2.000% ± 706 0.25
900 Fannie Mae or Freddie Mac,30 year, TBA,2.000% ± 909 0.32
600 Fannie Mae or Freddie Mac,30 year, TBA,2.500% ± 621 0.22
600 Fannie Mae or Freddie Mac,30 year, TBA,2.500% ± 622 0.22
10 Fannie Mae Pool ‘255984’,4.500%, due 01/11/2025 11 –
18 Fannie Mae Pool ‘975097’,5.000%, due 01/06/2038 21 0.01
100 Fannie Mae Pool ‘AL3024’,3.500%, due 01/01/2043 109 0.04
17 Fannie Mae Pool ‘AL3572’,5.000%, due 01/07/2041 19 0.01
118 Fannie Mae Pool ‘AL7093’,4.000%, due 01/05/2045 130 0.05
39 Fannie Mae Pool ‘AS4271’,4.500%, due 01/01/2045 44 0.02
419 Fannie Mae Pool ‘AS8359’,3.000%, due 01/11/2046 442 0.15
426 Fannie Mae Pool ‘AX0756’,3.500%, due 01/07/2044 457 0.16
530 Fannie Mae Pool ‘BH7558’,4.500%, due 01/08/2047 582 0.20
195 Fannie Mae Pool ‘BJ2544’,3.000%, due 01/12/2037 205 0.07
227 Fannie Mae Pool ‘BK7700’,4.500%, due 01/10/2048 251 0.09
62 Fannie Mae Pool ‘BM4897’,3.500%, due 01/12/2046 67 0.02
100 Fannie Mae Pool ‘BN0341’,5.000%, due 01/12/2048 111 0.04
55 Fannie Mae Pool ‘BN1623’,4.500%, due 01/11/2048 61 0.02
60 Fannie Mae Pool ‘BO0968’,4.000%, due 01/06/2049 65 0.02
62 Fannie Mae Pool ‘BO6985’,3.500%, due 01/11/2049 67 0.02
70 Fannie Mae Pool ‘BP1585’,3.500%, due 01/01/2050 76 0.03
165 Fannie Mae Pool ‘BP2319’,3.000%, due 01/02/2050 175 0.06
86 Fannie Mae Pool ‘BP7009’,3.000%, due 01/08/2050 92 0.03
99 Fannie Mae Pool ‘BP8713’,3.000%, due 01/08/2050 105 0.04
99 Fannie Mae Pool ‘BQ9226’,2.000%, due 01/01/2051 101 0.03
100 Fannie Mae Pool ‘BR2641’,2.000%, due 01/02/2051 101 0.04
100 Fannie Mae Pool ‘BR2643’,2.000%, due 01/02/2051 101 0.04
100 Fannie Mae Pool ‘BR2644’,2.000%, due 01/02/2051 101 0.03
100 Fannie Mae Pool ‘BR3256’,2.000%, due 01/02/2051 102 0.04
100 Fannie Mae Pool ‘BR3257’,2.000%, due 01/02/2051 102 0.04
200 Fannie Mae Pool ‘BR3290’,2.000%, due 01/03/2051 203 0.07
100 Fannie Mae Pool ‘BR4035’,2.000%, due 01/02/2051 101 0.04
60 Fannie Mae Pool ‘CA0148’,4.500%, due 01/08/2047 65 0.02
67 Fannie Mae Pool ‘CA0717’,4.500%, due 01/11/2047 73 0.03
99 Fannie Mae Pool ‘CA2047’,4.500%, due 01/07/2048 110 0.04
FaceValue(000’s)
Value(000’s)
$
% ofNet
AssetValue
193 Fannie Mae Pool ‘CA2199’,4.500%, due 01/08/2048 213 0.07
32 Fannie Mae Pool ‘CA2251’,5.000%, due 01/08/2048 35 0.01
81 Fannie Mae Pool ‘CA2471’,4.000%, due 01/10/2048 88 0.03
104 Fannie Mae Pool ‘CA2482’,4.500%, due 01/10/2048 115 0.04
36 Fannie Mae Pool ‘CA2652’,5.000%, due 01/11/2048 40 0.01
215 Fannie Mae Pool ‘CA4110’,3.000%, due 01/09/2049 229 0.08
61 Fannie Mae Pool ‘CA4122’,3.500%, due 01/09/2049 65 0.02
69 Fannie Mae Pool ‘CA5164’,3.500%, due 01/02/2050 74 0.03
74 Fannie Mae Pool ‘CA5561’,3.500%, due 01/04/2050 79 0.03
100 Fannie Mae Pool ‘CA8460’,2.500%, due 01/01/2051 104 0.04
73 Fannie Mae Pool ‘FM0062’,3.500%, due 01/02/2050 78 0.03
57 Fannie Mae Pool ‘FM1193’,3.500%, due 01/06/2049 61 0.02
177 Fannie Mae Pool ‘FM1459’,3.000%, due 01/09/2049 185 0.06
48 Fannie Mae Pool ‘FM1539’,4.500%, due 01/09/2049 52 0.02
253 Fannie Mae Pool ‘FM1578’,3.500%, due 01/09/2034 272 0.09
178 Fannie Mae Pool ‘FM1579’,3.500%, due 01/10/2034 190 0.07
362 Fannie Mae Pool ‘FM1727’,5.000%, due 01/09/2049 408 0.14
178 Fannie Mae Pool ‘FM2793’,3.000%, due 01/03/2050 193 0.07
141 Fannie Mae Pool ‘FM3215’,3.500%, due 01/01/2049 151 0.05
747 Fannie Mae Pool ‘FM3347’,3.500%, due 01/05/2047 801 0.28
1,029 Fannie Mae Pool ‘FM3773’,3.500%, due 01/11/2048 1,103 0.38
81 Fannie Mae Pool ‘FM3957’,5.000%, due 01/03/2050 90 0.03
160 Fannie Mae Pool ‘FM3978’,4.000%, due 01/07/2050 174 0.06
1,161 Fannie Mae Pool ‘FM4532’,3.000%, due 01/09/2050 1,225 0.43
93 Fannie Mae Pool ‘FM4737’,3.500%, due 01/09/2050 98 0.03
93 Fannie Mae Pool ‘FM5370’,3.000%, due 01/12/2048 99 0.03
199 Fannie Mae Pool ‘FM5931’,2.500%, due 01/02/2051 208 0.07
100 Fannie Mae Pool ‘FM6188’,2.500%, due 01/03/2051 104 0.04
991 Fannie Mae Pool ‘MA2806’,3.000%, due 01/11/2046 1,052 0.37
1,264 Fannie Mae Pool ‘MA3058’,4.000%, due 01/07/2047 1,369 0.48
169 Fannie Mae Pool ‘MA3527’,5.000%, due 01/11/2048 188 0.07
213 Flagstar Mortgage Trust2018-2, Series 2018 2,Class A4, 144A,3.500%, due 25/04/2048 * 217 0.08
179 Freddie Mac Gold Pool‘C91981’,3.000%, due 01/02/2038 187 0.06
133 Freddie Mac Gold Pool‘C91987’,3.000%, due 01/04/2038 139 0.05
90 Freddie Mac Gold Pool‘G61374’,4.500%, due 01/04/2048 100 0.03
47 Freddie Mac Gold Pool‘G67721’,4.500%, due 01/04/2049 52 0.02
40 Freddie Mac Non Gold Pool‘840698’,2.205%, due 01/03/2047 * 42 0.01
124 Freddie Mac Pool‘QA4470’,3.000%, due 01/11/2049 129 0.04
FaceValue(000’s)
Value(000’s)
$
% ofNet
AssetValue
75 Freddie Mac Pool‘QA7238’,3.500%, due 01/02/2050 81 0.03
129 Freddie Mac Pool‘QA7256’,3.000%, due 01/02/2050 135 0.05
100 Freddie Mac Pool ‘QB8604’,2.000%, due 01/02/2051 102 0.04
63 Freddie Mac Pool ‘RA1103’,3.000%, due 01/07/2049 67 0.02
73 Freddie Mac Pool ‘RA1493’,3.000%, due 01/10/2049 78 0.03
148 Freddie Mac Pool ‘RA2140’,3.500%, due 01/02/2050 160 0.06
63 Freddie Mac Pool ‘RA2358’,4.000%, due 01/03/2050 68 0.02
162 Freddie Mac Pool ‘RA2362’,3.500%, due 01/03/2050 174 0.06
66 Freddie Mac Pool ‘RA2608’,4.500%, due 01/05/2050 71 0.02
99 Freddie Mac Pool ‘RA4175’,2.500%, due 01/12/2050 104 0.04
199 Freddie Mac Pool ‘RA4414’,2.500%, due 01/01/2051 208 0.07
200 Freddie Mac Pool ‘RA4703’,2.000%, due 01/02/2051 202 0.07
170 Freddie Mac Pool ‘SD0291’,5.000%, due 01/03/2050 188 0.07
38 Freddie Mac Pool ‘ZA5454’,4.000%, due 01/06/2048 41 0.01
164 Freddie Mac Pool ‘ZA6680’,4.000%, due 01/04/2049 180 0.06
86 Freddie Mac Pool‘ZM5146’,4.000%, due 01/12/2047 93 0.03
132 Freddie Mac Pool ‘ZS3204’,5.000%, due 01/06/2041 150 0.05
208 Freddie Mac Pool ‘ZS3940’,4.500%, due 01/06/2038 231 0.08
197 Freddie Mac Pool ‘ZS4699’,4.000%, due 01/01/2047 214 0.07
54 Freddie Mac Pool ‘ZS9826’,3.000%, due 01/10/2046 58 0.02
68 Freddie Mac Pool ‘ZT1493’,3.000%, due 01/09/2048 73 0.03
630 Ginnie Mae I Pool‘784571’,3.500%, due 15/06/2048 681 0.24
29 Ginnie Mae I Pool‘AA5649’,3.000%, due 15/09/2042 32 0.01
19 Ginnie Mae I Pool‘AB2892’,3.000%, due 15/09/2042 19 0.01
71 Ginnie Mae I Pool‘AB9108’,3.000%, due 15/10/2042 75 0.03
48 Ginnie Mae I Pool‘AB9109’,3.000%, due 15/10/2042 51 0.02
42 Ginnie Mae I Pool‘AB9207’,3.000%, due 15/11/2042 45 0.02
121 Ginnie Mae II Pool‘784825’,3.500%, due 20/10/2049 126 0.04
99 Ginnie Mae II Pool‘785218’,2.000%, due 20/12/2050 101 0.03
199 Ginnie Mae II Pool‘785219’,2.000%, due 20/12/2050 202 0.07
99 Ginnie Mae II Pool‘785220’,2.000%, due 20/12/2050 101 0.04
198 Ginnie Mae II Pool‘785221’,2.000%, due 20/12/2050 201 0.07
100 Ginnie Mae II Pool‘BS8546’,2.500%, due 20/12/2050 105 0.04
99 Ginnie Mae II Pool‘BT1888’,2.500%, due 20/12/2050 103 0.04
^ Not authorised for sale to the public in Hong Kong.The accompanying notes are an integral part of the Financial Statements
110
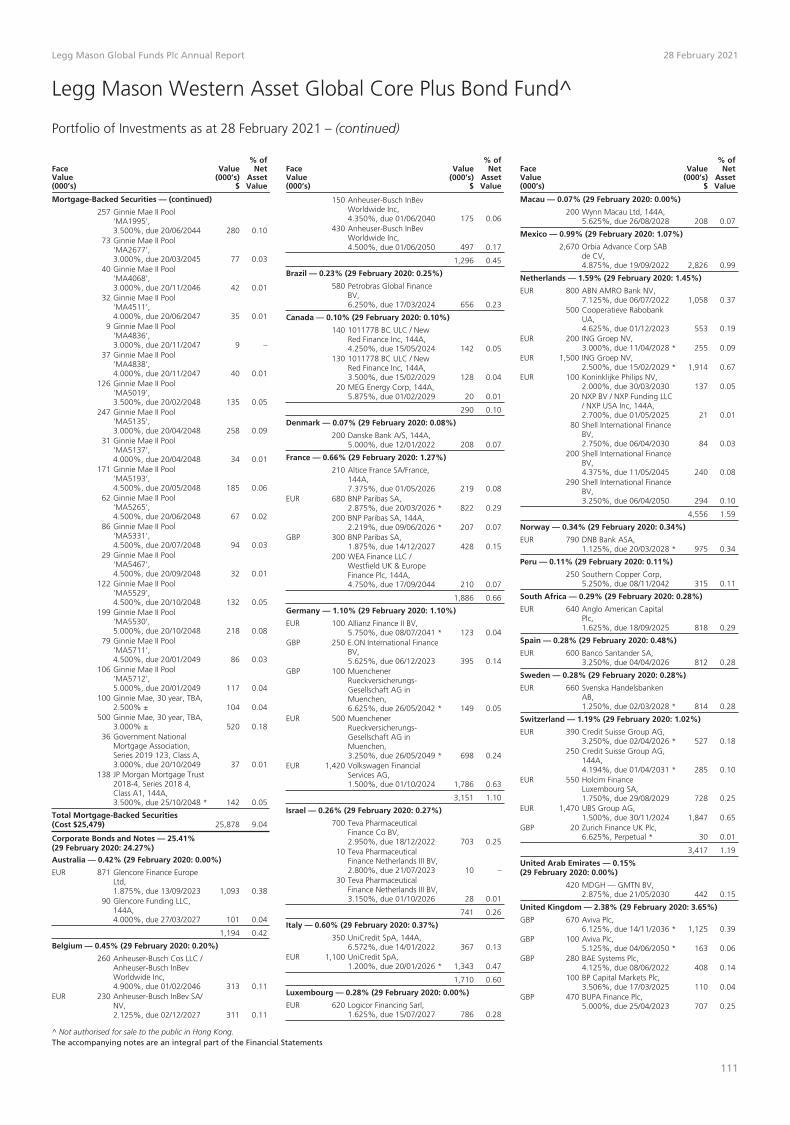
Legg Mason Global Funds Plc Annual Report 28 February 2021
Legg Mason Western Asset Global Core Plus Bond Fund^
Portfolio of Investments as at 28 February 2021 – (continued)
FaceValue(000’s)
Value(000’s)
$
% ofNet
AssetValue
Mortgage-Backed Securities — (continued)
257 Ginnie Mae II Pool‘MA1995’,3.500%, due 20/06/2044 280 0.10
73 Ginnie Mae II Pool‘MA2677’,3.000%, due 20/03/2045 77 0.03
40 Ginnie Mae II Pool‘MA4068’,3.000%, due 20/11/2046 42 0.01
32 Ginnie Mae II Pool‘MA4511’,4.000%, due 20/06/2047 35 0.01
9 Ginnie Mae II Pool‘MA4836’,3.000%, due 20/11/2047 9 –
37 Ginnie Mae II Pool‘MA4838’,4.000%, due 20/11/2047 40 0.01
126 Ginnie Mae II Pool‘MA5019’,3.500%, due 20/02/2048 135 0.05
247 Ginnie Mae II Pool‘MA5135’,3.000%, due 20/04/2048 258 0.09
31 Ginnie Mae II Pool‘MA5137’,4.000%, due 20/04/2048 34 0.01
171 Ginnie Mae II Pool‘MA5193’,4.500%, due 20/05/2048 185 0.06
62 Ginnie Mae II Pool‘MA5265’,4.500%, due 20/06/2048 67 0.02
86 Ginnie Mae II Pool‘MA5331’,4.500%, due 20/07/2048 94 0.03
29 Ginnie Mae II Pool‘MA5467’,4.500%, due 20/09/2048 32 0.01
122 Ginnie Mae II Pool‘MA5529’,4.500%, due 20/10/2048 132 0.05
199 Ginnie Mae II Pool‘MA5530’,5.000%, due 20/10/2048 218 0.08
79 Ginnie Mae II Pool‘MA5711’,4.500%, due 20/01/2049 86 0.03
106 Ginnie Mae II Pool‘MA5712’,5.000%, due 20/01/2049 117 0.04
100 Ginnie Mae, 30 year, TBA,2.500% ± 104 0.04
500 Ginnie Mae, 30 year, TBA,3.000% ± 520 0.18
36 Government NationalMortgage Association,Series 2019 123, Class A,3.000%, due 20/10/2049 37 0.01
138 JP Morgan Mortgage Trust2018-4, Series 2018 4,Class A1, 144A,3.500%, due 25/10/2048 * 142 0.05
Total Mortgage-Backed Securities(Cost $25,479) 25,878 9.04
Corporate Bonds and Notes — 25.41%(29 February 2020: 24.27%)
Australia — 0.42% (29 February 2020: 0.00%)
EUR 871 Glencore Finance EuropeLtd,1.875%, due 13/09/2023 1,093 0.38
90 Glencore Funding LLC,144A,4.000%, due 27/03/2027 101 0.04
1,194 0.42
Belgium — 0.45% (29 February 2020: 0.20%)
260 Anheuser-Busch Cos LLC /Anheuser-Busch InBevWorldwide Inc,4.900%, due 01/02/2046 313 0.11
EUR 230 Anheuser-Busch InBev SA/NV,2.125%, due 02/12/2027 311 0.11
FaceValue(000’s)
Value(000’s)
$
% ofNet
AssetValue
150 Anheuser-Busch InBevWorldwide Inc,4.350%, due 01/06/2040 175 0.06
430 Anheuser-Busch InBevWorldwide Inc,4.500%, due 01/06/2050 497 0.17
1,296 0.45
Brazil — 0.23% (29 February 2020: 0.25%)
580 Petrobras Global FinanceBV,6.250%, due 17/03/2024 656 0.23
Canada — 0.10% (29 February 2020: 0.10%)
140 1011778 BC ULC / NewRed Finance Inc, 144A,4.250%, due 15/05/2024 142 0.05
130 1011778 BC ULC / NewRed Finance Inc, 144A,3.500%, due 15/02/2029 128 0.04
20 MEG Energy Corp, 144A,5.875%, due 01/02/2029 20 0.01
290 0.10
Denmark — 0.07% (29 February 2020: 0.08%)
200 Danske Bank A/S, 144A,5.000%, due 12/01/2022 208 0.07
France — 0.66% (29 February 2020: 1.27%)
210 Altice France SA/France,144A,7.375%, due 01/05/2026 219 0.08
EUR 680 BNP Paribas SA,2.875%, due 20/03/2026 * 822 0.29
200 BNP Paribas SA, 144A,2.219%, due 09/06/2026 * 207 0.07
GBP 300 BNP Paribas SA,1.875%, due 14/12/2027 428 0.15
200 WEA Finance LLC /Westfield UK & EuropeFinance Plc, 144A,4.750%, due 17/09/2044 210 0.07
1,886 0.66
Germany — 1.10% (29 February 2020: 1.10%)
EUR 100 Allianz Finance II BV,5.750%, due 08/07/2041 * 123 0.04
GBP 250 E.ON International FinanceBV,5.625%, due 06/12/2023 395 0.14
GBP 100 MuenchenerRueckversicherungs-Gesellschaft AG inMuenchen,6.625%, due 26/05/2042 * 149 0.05
EUR 500 MuenchenerRueckversicherungs-Gesellschaft AG inMuenchen,3.250%, due 26/05/2049 * 698 0.24
EUR 1,420 Volkswagen FinancialServices AG,1.500%, due 01/10/2024 1,786 0.63
3,151 1.10
Israel — 0.26% (29 February 2020: 0.27%)
700 Teva PharmaceuticalFinance Co BV,2.950%, due 18/12/2022 703 0.25
10 Teva PharmaceuticalFinance Netherlands III BV,2.800%, due 21/07/2023 10 –
30 Teva PharmaceuticalFinance Netherlands III BV,3.150%, due 01/10/2026 28 0.01
741 0.26
Italy — 0.60% (29 February 2020: 0.37%)
350 UniCredit SpA, 144A,6.572%, due 14/01/2022 367 0.13
EUR 1,100 UniCredit SpA,1.200%, due 20/01/2026 * 1,343 0.47
1,710 0.60
Luxembourg — 0.28% (29 February 2020: 0.00%)
EUR 620 Logicor Financing Sarl,1.625%, due 15/07/2027 786 0.28
FaceValue(000’s)
Value(000’s)
$
% ofNet
AssetValue
Macau — 0.07% (29 February 2020: 0.00%)
200 Wynn Macau Ltd, 144A,5.625%, due 26/08/2028 208 0.07
Mexico — 0.99% (29 February 2020: 1.07%)
2,670 Orbia Advance Corp SABde CV,4.875%, due 19/09/2022 2,826 0.99
Netherlands — 1.59% (29 February 2020: 1.45%)
EUR 800 ABN AMRO Bank NV,7.125%, due 06/07/2022 1,058 0.37
500 Cooperatieve RabobankUA,4.625%, due 01/12/2023 553 0.19
EUR 200 ING Groep NV,3.000%, due 11/04/2028 * 255 0.09
EUR 1,500 ING Groep NV,2.500%, due 15/02/2029 * 1,914 0.67
EUR 100 Koninklijke Philips NV,2.000%, due 30/03/2030 137 0.05
20 NXP BV / NXP Funding LLC/ NXP USA Inc, 144A,2.700%, due 01/05/2025 21 0.01
80 Shell International FinanceBV,2.750%, due 06/04/2030 84 0.03
200 Shell International FinanceBV,4.375%, due 11/05/2045 240 0.08
290 Shell International FinanceBV,3.250%, due 06/04/2050 294 0.10
4,556 1.59
Norway — 0.34% (29 February 2020: 0.34%)
EUR 790 DNB Bank ASA,1.125%, due 20/03/2028 * 975 0.34
Peru — 0.11% (29 February 2020: 0.11%)
250 Southern Copper Corp,5.250%, due 08/11/2042 315 0.11
South Africa — 0.29% (29 February 2020: 0.28%)
EUR 640 Anglo American CapitalPlc,1.625%, due 18/09/2025 818 0.29
Spain — 0.28% (29 February 2020: 0.48%)
EUR 600 Banco Santander SA,3.250%, due 04/04/2026 812 0.28
Sweden — 0.28% (29 February 2020: 0.28%)
EUR 660 Svenska HandelsbankenAB,1.250%, due 02/03/2028 * 814 0.28
Switzerland — 1.19% (29 February 2020: 1.02%)
EUR 390 Credit Suisse Group AG,3.250%, due 02/04/2026 * 527 0.18
250 Credit Suisse Group AG,144A,4.194%, due 01/04/2031 * 285 0.10
EUR 550 Holcim FinanceLuxembourg SA,1.750%, due 29/08/2029 728 0.25
EUR 1,470 UBS Group AG,1.500%, due 30/11/2024 1,847 0.65
GBP 20 Zurich Finance UK Plc,6.625%, Perpetual * 30 0.01
3,417 1.19
United Arab Emirates — 0.15%(29 February 2020: 0.00%)
420 MDGH — GMTN BV,2.875%, due 21/05/2030 442 0.15
United Kingdom — 2.38% (29 February 2020: 3.65%)
GBP 670 Aviva Plc,6.125%, due 14/11/2036 * 1,125 0.39
GBP 100 Aviva Plc,5.125%, due 04/06/2050 * 163 0.06
GBP 280 BAE Systems Plc,4.125%, due 08/06/2022 408 0.14
100 BP Capital Markets Plc,3.506%, due 17/03/2025 110 0.04
GBP 470 BUPA Finance Plc,5.000%, due 25/04/2023 707 0.25
^ Not authorised for sale to the public in Hong Kong.The accompanying notes are an integral part of the Financial Statements
111

Legg Mason Global Funds Plc Annual Report 28 February 2021
Legg Mason Western Asset Global Core Plus Bond Fund^
Portfolio of Investments as at 28 February 2021 – (continued)
FaceValue(000’s)
Value(000’s)
$
% ofNet
AssetValue
Corporate Bonds and Notes — (continued)
United Kingdom — (continued)
200 HSBC Holdings Plc,3.803%, due 11/03/2025 * 217 0.08
565 HSBC Holdings Plc,4.250%, due 18/08/2025 631 0.22
GBP 100 HSBC Holdings Plc,7.000%, due 07/04/2038 209 0.07
GBP 1,000 Lloyds Bank Plc,7.625%, due 22/04/2025 1,742 0.61
EUR 210 Lloyds Banking Group Plc,3.500%, due 01/04/2026 * 286 0.10
GBP 260 Scottish Widows Ltd,5.500%, due 16/06/2023 397 0.14
EUR 420 Sky Ltd,2.250%, due 17/11/2025 561 0.19
230 Virgin Media SecuredFinance Plc, 144A,5.500%, due 15/05/2029 247 0.09
6,803 2.38
United States — 13.57% (29 February 2020: 11.95%)
100 3M Co,3.700%, due 15/04/2050 114 0.04
30 AbbVie Inc,2.900%, due 06/11/2022 31 0.01
EUR 120 AbbVie Inc,1.500%, due 15/11/2023 151 0.05
310 AbbVie Inc,3.800%, due 15/03/2025 341 0.12
150 AbbVie Inc,3.200%, due 21/11/2029 162 0.06
100 AbbVie Inc,4.875%, due 14/11/2048 127 0.04
470 AbbVie Inc,4.250%, due 21/11/2049 544 0.19
80 Amazon.com Inc,4.250%, due 22/08/2057 100 0.04
40 American InternationalGroup Inc,2.500%, due 30/06/2025 42 0.01
40 American InternationalGroup Inc,4.500%, due 16/07/2044 48 0.02
150 AT&T Inc,2.250%, due 01/02/2032 144 0.05
184 AT&T Inc,4.500%, due 09/03/2048 202 0.07
34 AT&T Inc, 144A,3.650%, due 15/09/2059 31 0.01
20 Bank of America Corp,3.300%, due 11/01/2023 21 0.01
150 Bank of America Corp,4.200%, due 26/08/2024 167 0.06
330 Bank of America Corp,4.250%, due 22/10/2026 378 0.13
1,075 Bank of America Corp,2.592%, due 29/04/2031 * 1,105 0.39
97 Becton Dickinson and Co,3.734%, due 15/12/2024 107 0.04
680 Boeing Co/The,5.150%, due 01/05/2030 793 0.28
100 Boeing Co/The,3.300%, due 01/03/2035 98 0.03
350 Boeing Co/The,5.805%, due 01/05/2050 452 0.16
160 BP Capital Markets AmericaInc,3.245%, due 06/05/2022 166 0.06
200 BP Capital Markets AmericaInc,3.633%, due 06/04/2030 224 0.08
26 Bristol-Myers Squibb Co,2.900%, due 26/07/2024 28 0.01
140 Broadcom Inc,3.150%, due 15/11/2025 151 0.05
140 CCO Holdings LLC / CCOHoldings Capital Corp,144A,4.500%, due 01/05/2032 144 0.05
130 Charter CommunicationsOperating LLC / CharterCommunications OperatingCapital,4.908%, due 23/07/2025 148 0.05
FaceValue(000’s)
Value(000’s)
$
% ofNet
AssetValue
100 Charter CommunicationsOperating LLC / CharterCommunications OperatingCapital,4.200%, due 15/03/2028 112 0.04
300 Charter CommunicationsOperating LLC / CharterCommunications OperatingCapital,5.050%, due 30/03/2029 352 0.12
200 Charter CommunicationsOperating LLC / CharterCommunications OperatingCapital,5.750%, due 01/04/2048 247 0.09
60 Cheniere Energy Inc, 144A,4.625%, due 15/10/2028 62 0.02
500 Cigna Corp,4.375%, due 15/10/2028 584 0.20
310 Cigna Corp,3.200%, due 15/03/2040 319 0.11
30 Citigroup Inc,3.500%, due 15/05/2023 32 0.01
EUR 290 Citigroup Inc,1.750%, due 28/01/2025 373 0.13
250 Citigroup Inc,5.500%, due 13/09/2025 296 0.10
510 Citigroup Inc,4.600%, due 09/03/2026 586 0.20
560 Citigroup Inc,4.300%, due 20/11/2026 639 0.22
360 Citigroup Inc,4.450%, due 29/09/2027 416 0.15
120 Citigroup Inc,4.412%, due 31/03/2031 * 140 0.05
93 Citigroup Inc,5.300%, due 06/05/2044 123 0.04
85 Citigroup Inc,4.650%, due 30/07/2045 107 0.04
20 Coca-Cola Co/The,2.500%, due 01/06/2040 20 0.01
20 Coca-Cola Co/The,2.600%, due 01/06/2050 19 0.01
80 Coca-Cola Co/The,2.500%, due 15/03/2051 74 0.03
66 Comcast Corp,3.999%, due 01/11/2049 76 0.03
97 Comcast Corp,4.049%, due 01/11/2052 112 0.04
140 Costco Wholesale Corp,1.600%, due 20/04/2030 137 0.05
550 CSC Holdings LLC, 144A,4.125%, due 01/12/2030 553 0.19
540 CVS Health Corp,3.750%, due 01/04/2030 605 0.21
200 CVS Health Corp,2.700%, due 21/08/2040 190 0.07
200 CVS Health Corp,5.050%, due 25/03/2048 253 0.09
120 Delta Air Lines Inc,3.800%, due 19/04/2023 123 0.04
550 Delta Air Lines Inc, 144A,7.000%, due 01/05/2025 641 0.22
170 Delta Air Lines Inc /SkyMiles IP Ltd, 144A,4.500%, due 20/10/2025 182 0.06
150 Delta Air Lines Inc /SkyMiles IP Ltd, 144A,4.750%, due 20/10/2028 167 0.06
590 Devon Energy Corp,5.850%, due 15/12/2025 692 0.24
170 DISH DBS Corp,5.875%, due 15/11/2024 178 0.06
60 Duke Energy Progress LLC,4.375%, due 30/03/2044 73 0.03
1,010 Energy Transfer OperatingLP,3.750%, due 15/05/2030 1,068 0.37
20 Enterprise ProductsOperating LLC,3.350%, due 15/03/2023 21 0.01
280 Enterprise ProductsOperating LLC,2.800%, due 31/01/2030 294 0.10
FaceValue(000’s)
Value(000’s)
$
% ofNet
AssetValue
370 Enterprise ProductsOperating LLC,5.100%, due 15/02/2045 451 0.16
10 EQT Corp,7.625%, due 01/02/2025 12 –
10 Exelon Corp,5.625%, due 15/06/2035 13 –
100 Exxon Mobil Corp,3.452%, due 15/04/2051 103 0.04
315 FirstEnergy Corp, Series C,7.375%, due 15/11/2031 434 0.15
320 Ford Motor Credit Co LLC,4.000%, due 13/11/2030 328 0.11
200 Fox Corp,5.476%, due 25/01/2039 257 0.09
310 Freeport-McMoRan Inc,4.550%, due 14/11/2024 342 0.12
40 Freeport-McMoRan Inc,4.625%, due 01/08/2030 44 0.02
70 Freeport-McMoRan Inc,5.450%, due 15/03/2043 87 0.03
325 GE Capital InternationalFunding Co Unlimited Co,4.418%, due 15/11/2035 372 0.13
522 General Electric Co,6.875%, due 10/01/2039 746 0.26
110 General Electric Co,4.250%, due 01/05/2040 122 0.04
50 General Motors Co,6.600%, due 01/04/2036 68 0.02
10 General Motors Co,5.200%, due 01/04/2045 12 –
20 General Motors Co,6.750%, due 01/04/2046 28 0.01
120 General Motors FinancialCo Inc,4.375%, due 25/09/2021 123 0.04
150 Gilead Sciences Inc,4.800%, due 01/04/2044 187 0.07
30 Gilead Sciences Inc,4.750%, due 01/03/2046 37 0.01
GBP 201 Goldman Sachs Group Inc/The,5.500%, due 12/10/2021 289 0.10
280 Goldman Sachs Group Inc/The,3.850%, due 08/07/2024 307 0.11
450 Goldman Sachs Group Inc/The,3.500%, due 01/04/2025 492 0.17
800 Goldman Sachs Group Inc/The,6.750%, due 01/10/2037 1,168 0.41
640 Goldman Sachs Group Inc/The,6.250%, due 01/02/2041 942 0.33
380 Goldman Sachs Group Inc/The,5.150%, due 22/05/2045 502 0.18
570 HCA Inc,5.000%, due 15/03/2024 639 0.22
380 HCA Inc,5.250%, due 15/06/2026 445 0.16
200 HCA Inc,4.500%, due 15/02/2027 229 0.08
110 HCA Inc,5.625%, due 01/09/2028 128 0.04
130 Home Depot Inc/The,2.700%, due 15/04/2030 139 0.05
40 Home Depot Inc/The,3.300%, due 15/04/2040 43 0.02
470 Home Depot Inc/The,3.350%, due 15/04/2050 502 0.18
150 ILFC E-Capital Trust I,144A,3.230%, due 21/12/2065 * 122 0.04
80 JPMorgan Chase & Co,3.625%, due 13/05/2024 88 0.03
200 JPMorgan Chase & Co,4.125%, due 15/12/2026 229 0.08
300 JPMorgan Chase & Co,4.452%, due 05/12/2029 * 353 0.12
670 JPMorgan Chase & Co,2.522%, due 22/04/2031 * 689 0.24
300 JPMorgan Chase & Co,2.956%, due 13/05/2031 * 314 0.11
^ Not authorised for sale to the public in Hong Kong.The accompanying notes are an integral part of the Financial Statements
112

Legg Mason Global Funds Plc Annual Report 28 February 2021
Legg Mason Western Asset Global Core Plus Bond Fund^
Portfolio of Investments as at 28 February 2021 – (continued)
FaceValue(000’s)
Value(000’s)
$
% ofNet
AssetValue
Corporate Bonds and Notes — (continued)
United States — (continued)
180 JPMorgan Chase & Co,3.109%, due 22/04/2051 * 184 0.06
960 Lehman Brothers HoldingsCapital Trust Escrow, zerocoupon, Perpetual †∞� – –
177 Lehman Escrow Receipt,zero coupon, Perpetual †∞ 2 –
30 McDonald’s Corp,3.625%, due 01/09/2049 32 0.01
110 McDonald’s Corp,4.200%, due 01/04/2050 129 0.05
29 Medtronic Inc,4.625%, due 15/03/2045 38 0.01
40 MetLife Inc,6.400%, due 15/12/2036 51 0.02
10 Morgan Stanley,4.431%, due 23/01/2030 * 12 –
490 Morgan Stanley,3.622%, due 01/04/2031 * 546 0.19
170 NGPL PipeCo LLC, 144A,4.875%, due 15/08/2027 194 0.07
80 Northrop Grumman Corp,5.250%, due 01/05/2050 109 0.04
250 NVIDIA Corp,3.500%, due 01/04/2050 272 0.10
320 Occidental Petroleum Corp,3.500%, due 15/08/2029 306 0.11
80 Occidental Petroleum Corp,6.600%, due 15/03/2046 90 0.03
320 Occidental Petroleum Corp,4.400%, due 15/04/2046 287 0.10
600 Occidental Petroleum Corp,4.400%, due 15/08/2049 530 0.19
80 PayPal Holdings Inc,1.350%, due 01/06/2023 82 0.03
80 PayPal Holdings Inc,1.650%, due 01/06/2025 82 0.03
53 Range Resources Corp,5.000%, due 15/03/2023 53 0.02
10 Range Resources Corp,4.875%, due 15/05/2025 10 –
70 Raytheon TechnologiesCorp,2.250%, due 01/07/2030 71 0.02
640 Spirit Loyalty Cayman Ltd /Spirit IP Cayman Ltd, 144A,8.000%, due 20/09/2025 721 0.25
10 Sprint Capital Corp,8.750%, due 15/03/2032 15 0.01
70 State Street Corp,3.152%, due 30/03/2031 * 77 0.03
210 Targa Resources Partners LP/ Targa Resources PartnersFinance Corp,5.875%, due 15/04/2026 219 0.08
70 Targa Resources Partners LP/ Targa Resources PartnersFinance Corp,6.875%, due 15/01/2029 78 0.03
50 Targa Resources Partners LP/ Targa Resources PartnersFinance Corp, 144A,4.875%, due 01/02/2031 51 0.02
30 Targa Resources Partners LP/ Targa Resources PartnersFinance Corp, 144A,4.000%, due 15/01/2032 29 0.01
4 Teachers Insurance &Annuity Association ofAmerica,6.850%, due 16/12/2039 6 –
90 Texas Instruments Inc,1.750%, due 04/05/2030 89 0.03
100 Time Warner Cable LLC,7.300%, due 01/07/2038 143 0.05
40 Time Warner Cable LLC,6.750%, due 15/06/2039 55 0.02
30 T-Mobile USA Inc,2.250%, due 15/02/2026 30 0.01
90 T-Mobile USA Inc,2.625%, due 15/02/2029 88 0.03
340 T-Mobile USA Inc, 144A,3.875%, due 15/04/2030 374 0.13
FaceValue(000’s)
Value(000’s)
$
% ofNet
AssetValue
60 T-Mobile USA Inc,2.875%, due 15/02/2031 59 0.02
200 T-Mobile USA Inc, 144A,3.000%, due 15/02/2041 188 0.07
30 UnitedHealth Group Inc,3.750%, due 15/07/2025 34 0.01
250 Verizon CommunicationsInc,4.500%, due 10/08/2033 298 0.10
50 Verizon CommunicationsInc,5.250%, due 16/03/2037 64 0.02
10 Verizon CommunicationsInc,4.862%, due 21/08/2046 12 –
10 Verizon CommunicationsInc,5.500%, due 16/03/2047 13 –
90 Visa Inc,2.050%, due 15/04/2030 92 0.03
90 Visa Inc,2.700%, due 15/04/2040 92 0.03
340 VOC Escrow Ltd, 144A,5.000%, due 15/02/2028 337 0.12
2,110 Wachovia Capital Trust III,5.570%, Perpetual * 2,112 0.74
43 Wells Fargo & Co,4.480%, due 16/01/2024 48 0.02
1,140 Wells Fargo & Co,5.013%, due 04/04/2051 * 1,527 0.53
790 Western MidstreamOperating LP,5.300%, due 01/02/2030 857 0.30
550 Western MidstreamOperating LP,6.500%, due 01/02/2050 634 0.22
140 WPX Energy Inc,8.250%, due 01/08/2023 162 0.06
38,855 13.57
Total Corporate Bonds and Notes(Cost $67,507) 72,759 25.41
Government Bonds and Notes: 54.39%(29 February 2020: 53.84%)Australia — 1.16% (29 February 2020: 0.00%)
AUD 5,620 Australia GovernmentBond, Series 162,1.750%, due 21/06/2051 3,325 1.16
Belgium — 0.68% (29 February 2020: 1.01%)
EUR 750 Kingdom of BelgiumGovernment Bond,Series 71,3.750%, due 22/06/2045 1,548 0.54
EUR 260 Kingdom of BelgiumGovernment Bond,Series 88, 144A,1.700%, due 22/06/2050 396 0.14
1,944 0.68
Canada — 1.25% (29 February 2020: 2.48%)
CAD 1,640 Canadian GovernmentBond,2.250%, due 01/06/2025 1,365 0.48
CAD 540 Canadian Government RealReturn Bond, Series CPI,0.500%, due 01/12/2050 � 487 0.17
CAD 1,030 Province of OntarioCanada,3.450%, due 02/06/2045 940 0.33
CAD 860 Province of QuebecCanada,3.500%, due 01/12/2045 792 0.27
3,584 1.25
France — 3.51% (29 February 2020: 3.58%)
EUR 5,810 French RepublicGovernment Bond OAT,1.000%, due 25/05/2027 7,599 2.65
EUR 770 French RepublicGovernment Bond OAT,144A,1.500%, due 25/05/2050 1,131 0.40
EUR 530 French RepublicGovernment Bond OAT,4.000%, due 25/04/2060 1,329 0.46
10,059 3.51
FaceValue(000’s)
Value(000’s)
$
% ofNet
AssetValue
Germany — 3.69% (29 February 2020: 0.00%)
EUR 400 BundesrepublikDeutschlandBundesanleihe, Series 98,4.750%, due 04/07/2028 672 0.23
EUR 6,090 BundesrepublikDeutschlandBundesanleihe,0.250%, due 15/02/2029 7,737 2.70
EUR 1,120 BundesrepublikDeutschlandBundesanleihe,2.500%, due 15/08/2046 2,167 0.76
10,576 3.69
Indonesia — 4.13% (29 February 2020: 2.39%)
4,400 Indonesia GovernmentInternational Bond,4.200%, due 15/10/2050 4,808 1.68
IDR 91,384,000 Indonesia Treasury Bond,Series FR79,8.375%, due 15/04/2039 7,011 2.45
11,819 4.13
Italy — 1.45% (29 February 2020: 4.66%)
EUR 2,530 Italy Buoni Poliennali DelTesoro, 144A,3.250%, due 01/09/2046 4,151 1.45
Japan — 5.33% (29 February 2020: 5.51%)
JPY 86,500 Japan Government ThirtyYear Bond, Series 59,0.700%, due 20/06/2048 810 0.28
JPY 689,650 Japan Government ThirtyYear Bond, Series 66,0.400%, due 20/03/2050 5,898 2.06
JPY 63,350 Japan Government TwentyYear Bond,Series 128, 1.900%, due20/06/2031 699 0.24
JPY 24,400 Japanese Government CPILinked Bond, Series 19,0.100%, due 10/09/2024 � 233 0.08
JPY 796,800 Japanese Government CPILinked Bond, Series 21,0.100%, due 10/03/2026 � 7,627 2.67
15,267 5.33
Mexico — 4.28% (29 February 2020: 4.18%)
MXN 136,269 Mexican Bonos, Series M,7.750%, due 13/11/2042 6,989 2.44
EUR 1,100 Mexico GovernmentInternational Bond,2.875%, due 08/04/2039 1,390 0.49
1,090 Mexico GovernmentInternational Bond,5.550%, due 21/01/2045 1,278 0.45
2,530 Mexico GovernmentInternational Bond,4.600%, due 23/01/2046 2,591 0.90
12,248 4.28
Qatar — 0.77% (29 February 2020: 0.00%)
1,770 Qatar GovernmentInternational Bond,4.817%, due 14/03/2049 2,189 0.77
South Africa — 1.14% (29 February 2020: 1.95%)
ZAR 10,240 Republic of South AfricaGovernment Bond,Series 2037, 8.500%, due31/01/2037 566 0.20
ZAR 62,022 Republic of South AfricaGovernment Bond,Series R214, 6.500%, due28/02/2041 2,687 0.94
3,253 1.14
South Korea — 0.80% (29 February 2020: 0.82%)
KRW 2,533,840 Korea Treasury Bond, Series2606,1.875%, due 10/06/2026 2,293 0.80
Spain — 2.30% (29 February 2020: 3.46%)
EUR 640 Spain Government Bond,144A,5.150%, due 31/10/2044 1,430 0.50
^ Not authorised for sale to the public in Hong Kong.The accompanying notes are an integral part of the Financial Statements
113

Legg Mason Global Funds Plc Annual Report 28 February 2021
Legg Mason Western Asset Global Core Plus Bond Fund^
Portfolio of Investments as at 28 February 2021 – (continued)
FaceValue(000’s)
Value(000’s)
$
% ofNet
AssetValue
Government Bonds and Notes: — (continued)
Spain — (continued)
EUR 3,150 Spain Government Bond,Series 30Y, 144A,2.700%, due 31/10/2048 5,155 1.80
6,585 2.30
Turkey — 0.51% (29 February 2020: 0.00%)
750 Turkey GovernmentInternational Bond,4.750%, due 26/01/2026 754 0.26
700 Turkey GovernmentInternational Bond,5.950%, due 15/01/2031 700 0.25
1,454 0.51
United Arab Emirates — 0.61% (29 February 2020: 0.00%)
480 Abu Dhabi GovernmentInternational Bond,3.125%, due 16/04/2030 522 0.18
1,120 Abu Dhabi GovernmentInternational Bond,3.875%, due 16/04/2050 1,234 0.43
1,756 0.61
United Kingdom — 3.04% (29 February 2020: 1.98%)
GBP 2,230 United Kingdom Gilt,4.250%, due 07/12/2040 4,720 1.65
GBP 2,030 United Kingdom Gilt,2.500%, due 22/07/2065 3,982 1.39
8,702 3.04
United States — 19.74% (29 February 2020: 16.98%)
1,210 United States TreasuryInflation Indexed Bonds,1.000%, due 15/02/2049 � 1,615 0.56
880 United States TreasuryInflation Indexed Bonds,0.250%, due 15/02/2050 � 961 0.33
480 United States Treasury Note/Bond,1.875%, due 31/03/2022 489 0.17
3,940 United States Treasury Note/Bond,1.625%, due 15/08/2022 4,027 1.41
2,110 United States Treasury Note/Bond,1.625%, due 15/11/2022 2,164 0.76
444 United States Treasury Note/Bond,2.875%, due 31/10/2023 475 0.17
6,320 United States Treasury Note/Bond,2.375%, due 15/08/2024 6,757 2.36
4,510 United States Treasury Note/Bond,1.500%, due 30/11/2024 4,686 1.64
17,210 United States Treasury Note/Bond,0.375%, due 30/04/2025 ≠ 17,090 5.97
4,730 United States Treasury Note/Bond,0.250%, due 30/06/2025 ≠ 4,662 1.63
3,460 United States Treasury Note/Bond,0.250%, due 31/08/2025 3,403 1.19
130 United States Treasury Note/Bond,0.375%, due 31/01/2026 128 0.04
1,620 United States Treasury Note/Bond,2.750%, due 15/11/2047 1,833 0.64
FaceValue(000’s)
Value(000’s)
$
% ofNet
AssetValue
4,680 United States TreasuryNote/Bond,2.875%, due 15/05/2049 5,452 1.90
2,250 United States TreasuryNote/Bond,2.000%, due 15/02/2050 2,193 0.77
680 United States TreasuryNote/Bond,1.375%, due 15/08/2050 568 0.20
56,503 19.74
Total Government Bonds and Notes(Cost $155,223) 155,708 54.39
Collective Investment Schemes — 10.05%(29 February 2020: 9.06%)
2,066 Legg Mason China Funds –Western Asset China BondFund – Class LM ** 28,758 10.05
Total Collective Investment Schemes(Cost $26,858) 28,758 10.05
Total Investments and PledgedInvestments at fair value through profitor loss (Cost $275,067) 283,103 98.89
Interest Rate Swaps — 0.19% (29 February 2020: 0.00%)
Unrealised appreciation of contracts(see below) 531 0.19
Forward Foreign Currency Contracts — 0.58%(29 February 2020: 0.40%)
Unrealised appreciation of contracts(see below) 1,652 0.58
Futures — 0.43% (29 February 2020: 0.73%)
Unrealised appreciation of contracts(see below) 1,236 0.43
Total Financial Assets at fair valuethrough profit or loss 286,522 100.09
Contracts(000’s)
Value(000’s)
$
% ofNet
AssetValue
Written Options — (0.03%) (29 February 2020: (0.15%))
– U.S. 10 Year April 2021 Put133.50, due 26/03/2021 –Bank of America MerrillLynch (81) (0.03)
Total Written Options (Cost $(19)) (81) (0.03)
Forward Foreign Currency Contracts — (0.43%)(29 February 2020: (1.02%))
Unrealised depreciation of contracts(see below) (1,236) (0.43)
Futures — (0.26%) (29 February 2020: (0.79%))
Unrealised depreciation of contracts(see below) (742) (0.26)
Total Financial Liabilities at fair valuethrough profit or loss (2,059) (0.72)
Total Financial Assets and FinancialLiabilities at fair value through profit orloss 284,463 99.37
Other Assets in Excess of Liabilities 1,829 0.63
Total Net Assets $286,292 100.00
– Amounts designated as “–” are either $0, less than$1,000, less than 1,000 shares or less than 0.01%.
144A Securities exempt from registration under Rule 144A ofthe Securities Act of 1933, as amended. Thesesecurities may only be resold, in transactions exemptfrom registration, to qualified institutional buyers. As at28 February 2021, these securities amounted to$18,781,000 or 6.57% of net assets.
* Variable rate security. The interest rate shown reflectsthe rate in effect at 28 February 2021.
† Illiquid.
∞ Security is valued in good faith at fair value by or at thediscretion of the Manager or the respective InvestmentManager.
� Security is in default as at 28 February 2021 (eitherprincipal and / or interest).
≠ Security (in whole or part) pledged as collateral forderivatives trading as at 28 February 2021.
± Securities purchased on a to-be-announced basis.
� The rate of interest on this type of security is tied to theConsumer Price Index (CPI)/Retail Price Index (RPI). Thecoupon rate is the rate as of 28 February 2021.
** On 31 March 2021, Class M of the Unit Trust was re-named into Class LM.
ABBREVIATIONS:
CPI - Consumer Price Index.
Perpetual - A bond with no maturity date. Perpetual bondsare not redeemable but pay a steady stream ofinterest.
TBA - To Be Announced.
AUD - Australian Dollar
CAD - Canadian Dollar
EUR - Euro
GBP - British Pound
IDR - Indonesian Rupiah
JPY - Japanese Yen
KRW - South Korean Won
MXN - Mexican Peso
ZAR - South Africa Rand
Analysis of Total Assets
% ofTotal
Assets
Transferable securities admitted to an officialexchange listing or traded on a regulated market 84.84
Collective investment schemes 9.59
Financial derivative instruments 1.14
Other assets 4.43
Total Assets 100.00
Schedule of Interest Rate Swaps
Counterparty RateExpiration
Date
NotionalAmount(000’s)
Value(000’s)
Bank of America Merrill Lynch Pay Fixed 0.800%, Receive Floating CZK 6M Pribor PRBO 19/11/2025 302,690 $ 420
Bank of America Merrill Lynch Pay Fixed -0.235%, Receive Floating EUR 6M Euribor Reuters 15/08/2029 6,300 111
Unrealised Appreciation of Interest Rate Swaps (29 February 2020 (000’s): $–) $ 531Unrealised Depreciation of Interest Rate Swaps (29 February 2020 (000’s): $(10)) –
Net Appreciation of Interest Rate Swaps (29 February 2020 (000’s): $(10)) $ 531
^ Not authorised for sale to the public in Hong Kong.The accompanying notes are an integral part of the Financial Statements
114

Legg Mason Global Funds Plc Annual Report 28 February 2021
Legg Mason Western Asset Global Core Plus Bond Fund^
Portfolio of Investments as at 28 February 2021 – (continued)
Schedule of Forward Foreign Currency Contracts
Expiration Date CounterpartyBuy Currency
(000’s)Sell Currency
(000’s)
UnrealisedAppreciation/(Depreciation)of Contracts
(000’s)
04/03/2021 Citi Buy USD 2,228 Sell CNH 14,760 $ (47)04/03/2021 Citi Buy USD 2,883 Sell RUB 212,460 3504/03/2021 Citi Buy RUB 212,460 Sell USD 2,889 (40)04/03/2021 Citi Buy CNH 14,760 Sell USD 2,279 (4)04/03/2021 JP Morgan Buy USD 1,172 Sell CNH 7,600 –04/03/2021 JP Morgan Buy USD 15,925 Sell CNH 105,340 (313)04/03/2021 JP Morgan Buy USD 1,190 Sell IDR 17,005,090 (2)04/03/2021 JP Morgan Buy USD 2,370 Sell KRW 2,635,805 2404/03/2021 JP Morgan Buy USD 4,945 Sell RUB 364,911 5304/03/2021 JP Morgan Buy IDR 17,005,090 Sell USD 1,207 (15)04/03/2021 JP Morgan Buy KRW 2,635,805 Sell USD 2,370 (25)04/03/2021 JP Morgan Buy RUB 144,461 Sell USD 1,881 5604/03/2021 JP Morgan Buy CNH 112,940 Sell USD 17,440 (31)04/03/2021 JP Morgan Buy RUB 220,450 Sell USD 2,975 (20)12/03/2021 BNY Mellon Buy USD 1,375 Sell CAD 1,732 1412/03/2021 BNY Mellon Buy USD 599 Sell EUR 492 512/03/2021 BNY Mellon Buy USD 130 Sell NZD 178 212/03/2021 BNY Mellon Buy EUR 68 Sell USD 82 –12/03/2021 BNY Mellon Buy NZD 14,174 Sell USD 10,217 2412/03/2021 BNY Mellon Buy CAD 139,610 Sell USD 109,211 49712/03/2021 BNY Mellon Buy EUR 37,915 Sell USD 45,648 11418/05/2021 Citi Buy USD 2,725 Sell PLN 10,230 (6)18/05/2021 Citi Buy AUD 5,266 Sell USD 4,041 1218/05/2021 Citi Buy EUR 2,180 Sell USD 2,629 618/05/2021 Citi Buy PLN 10,220 Sell USD 2,749 (20)18/05/2021 Goldman Sachs Buy USD 3,029 Sell CAD 3,840 1118/05/2021 Goldman Sachs Buy USD 17,714 Sell EUR 14,565 11018/05/2021 Goldman Sachs Buy USD 3,798 Sell JPY 396,738 7218/05/2021 Goldman Sachs Buy USD 821 Sell MXN 16,633 3218/05/2021 Goldman Sachs Buy NOK 41,901 Sell USD 4,977 (145)18/05/2021 Goldman Sachs Buy AUD 1,611 Sell USD 1,249 (10)18/05/2021 HSBC Buy USD 14,758 Sell EUR 12,242 (40)18/05/2021 JP Morgan Buy USD 11,692 Sell AUD 15,143 3818/05/2021 JP Morgan Buy USD 966 Sell CAD 1,228 218/05/2021 JP Morgan Buy USD 94 Sell CZK 2,000 218/05/2021 JP Morgan Buy USD 16,282 Sell EUR 13,432 4518/05/2021 JP Morgan Buy USD 13,955 Sell GBP 10,111 (136)18/05/2021 JP Morgan Buy USD 11,030 Sell JPY 1,158,495 15218/05/2021 JP Morgan Buy USD 2,939 Sell MXN 59,640 11218/05/2021 JP Morgan Buy USD 5,369 Sell NOK 45,760 9318/05/2021 JP Morgan Buy NOK 5,120 Sell USD 604 (13)18/05/2021 JP Morgan Buy EUR 1,520 Sell USD 1,847 (10)18/05/2021 JP Morgan Buy HUF 820,450 Sell USD 2,768 (40)18/05/2021 JP Morgan Buy TRY 20,940 Sell USD 2,835 (116)18/05/2021 JP Morgan Buy EUR 3,550 Sell USD 4,270 2018/05/2021 JP Morgan Buy CZK 2,000 Sell USD 94 (2)18/05/2021 Morgan Stanley Buy USD 434 Sell EUR 360 (1)18/05/2021 Morgan Stanley Buy USD 2,055 Sell GBP 1,500 (36)18/05/2021 Morgan Stanley Buy AUD 2,530 Sell USD 1,938 918/05/2021 Morgan Stanley Buy MXN 15,520 Sell USD 761 (25)18/05/2021 UBS Buy USD 12,374 Sell EUR 10,267 (36)18/05/2021 UBS Buy USD 1,289 Sell JPY 136,000 1218/05/2021 UBS Buy USD 437 Sell MXN 8,901 1510/06/2021 Citi Buy USD 2,261 Sell CNH 14,760 210/06/2021 Citi Buy RUB 212,460 Sell USD 2,852 (40)10/06/2021 JP Morgan Buy USD 17,310 Sell CNH 112,940 2310/06/2021 JP Morgan Buy USD 1,192 Sell IDR 17,005,090 2910/06/2021 JP Morgan Buy USD 2,370 Sell KRW 2,635,805 3110/06/2021 JP Morgan Buy RUB 364,911 Sell USD 4,892 (63)
Unrealised Appreciation of Forward Foreign Currency Contracts (29 February 2020 (000’s): $1,064) $ 1,652Unrealised Depreciation of Forward Foreign Currency Contracts (29 February 2020 (000’s): $(2,689)) (1,236)
Net Appreciation of Forward Foreign Currency Contracts (29 February 2020 (000’s): $(1,625)) $ 416
^ Not authorised for sale to the public in Hong Kong.The accompanying notes are an integral part of the Financial Statements
115

Legg Mason Global Funds Plc Annual Report 28 February 2021
Legg Mason Western Asset Global Core Plus Bond Fund^
Portfolio of Investments as at 28 February 2021 – (continued)
Schedule of Futures Contracts
CounterpartyNominal
Value
NotionalValue(000’s)
UnrealisedAppreciation/(Depreciation)of Contracts
(000’s)
90 Day Euro$December 2021 Bank of America Merrill Lynch (178) $(44,398) $ –
90 Day Euro$December 2023 Bank of America Merrill Lynch 178 44,015 (179)
Australian 10 Year Bond March 2021 Bank of America Merrill Lynch 27 2,848 (199)
Canadian 10 Year Bond June 2021 Bank of America Merrill Lynch 4 439 (9)
Euro-Bobl March 2021 Bank of America Merrill Lynch (6) (972) 7
Euro-BTP March 2021 Bank of America Merrill Lynch (7) (1,265) 8
Euro-Bund June 2021 Bank of America Merrill Lynch (5) (1,029) (1)
Euro-Bund March 2021 Bank of America Merrill Lynch 7 1,465 3
Euro-OAT March 2021 Bank of America Merrill Lynch (10) (1,972) 45
Japan 10 Year Bond (OSE) March 2021 Bank of America Merrill Lynch 4 5,652 (53)
Long Gilt June 2021 Bank of America Merrill Lynch 3 534 (5)
U.S. 10 Year Note (CBT) June 2021 Bank of America Merrill Lynch (544) (72,199) 1,082
U.S. 10 Year Ultra Note June 2021 Bank of America Merrill Lynch (39) (5,746) 91
U.S. 2 Year Note (CBT) June 2021 Bank of America Merrill Lynch 31 6,844 (5)
U.S. 5 Year Note (CBT) June 2021 Bank of America Merrill Lynch 224 27,769 (251)
U.S. Long Bond (CBT) June 2021 Bank of America Merrill Lynch 9 1,433 (31)
U.S. Ultra Bond (CBT) June 2021 Bank of America Merrill Lynch 34 6,428 (9)
Unrealised Appreciation of Futures Contracts (29 February 2020 (000’s): $1,911) $ 1,236
Unrealised Depreciation of Futures Contracts (29 February 2020 (000’s): $(2,079)) (742)
Net Appreciation of Futures Contracts (29 February 2020 (000’s): $(168)) $ 494
^ Not authorised for sale to the public in Hong Kong.The accompanying notes are an integral part of the Financial Statements
116
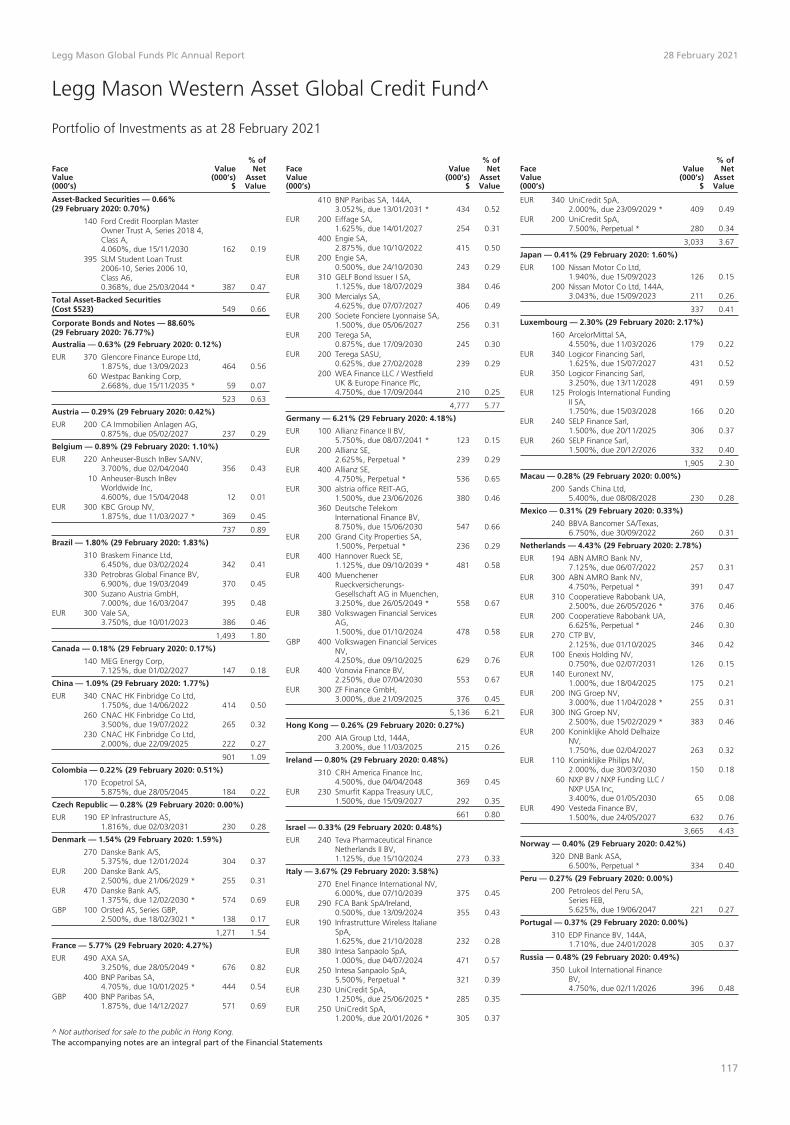
Legg Mason Global Funds Plc Annual Report 28 February 2021
Legg Mason Western Asset Global Credit Fund^
Portfolio of Investments as at 28 February 2021
FaceValue(000’s)
Value(000’s)
$
% ofNet
AssetValue
Asset-Backed Securities — 0.66%(29 February 2020: 0.70%)
140 Ford Credit Floorplan MasterOwner Trust A, Series 2018 4,Class A,4.060%, due 15/11/2030 162 0.19
395 SLM Student Loan Trust2006-10, Series 2006 10,Class A6,0.368%, due 25/03/2044 * 387 0.47
Total Asset-Backed Securities(Cost $523) 549 0.66
Corporate Bonds and Notes — 88.60%(29 February 2020: 76.77%)
Australia — 0.63% (29 February 2020: 0.12%)
EUR 370 Glencore Finance Europe Ltd,1.875%, due 13/09/2023 464 0.56
60 Westpac Banking Corp,2.668%, due 15/11/2035 * 59 0.07
523 0.63
Austria — 0.29% (29 February 2020: 0.42%)
EUR 200 CA Immobilien Anlagen AG,0.875%, due 05/02/2027 237 0.29
Belgium — 0.89% (29 February 2020: 1.10%)
EUR 220 Anheuser-Busch InBev SA/NV,3.700%, due 02/04/2040 356 0.43
10 Anheuser-Busch InBevWorldwide Inc,4.600%, due 15/04/2048 12 0.01
EUR 300 KBC Group NV,1.875%, due 11/03/2027 * 369 0.45
737 0.89
Brazil — 1.80% (29 February 2020: 1.83%)
310 Braskem Finance Ltd,6.450%, due 03/02/2024 342 0.41
330 Petrobras Global Finance BV,6.900%, due 19/03/2049 370 0.45
300 Suzano Austria GmbH,7.000%, due 16/03/2047 395 0.48
EUR 300 Vale SA,3.750%, due 10/01/2023 386 0.46
1,493 1.80
Canada — 0.18% (29 February 2020: 0.17%)
140 MEG Energy Corp,7.125%, due 01/02/2027 147 0.18
China — 1.09% (29 February 2020: 1.77%)
EUR 340 CNAC HK Finbridge Co Ltd,1.750%, due 14/06/2022 414 0.50
260 CNAC HK Finbridge Co Ltd,3.500%, due 19/07/2022 265 0.32
230 CNAC HK Finbridge Co Ltd,2.000%, due 22/09/2025 222 0.27
901 1.09
Colombia — 0.22% (29 February 2020: 0.51%)
170 Ecopetrol SA,5.875%, due 28/05/2045 184 0.22
Czech Republic — 0.28% (29 February 2020: 0.00%)
EUR 190 EP Infrastructure AS,1.816%, due 02/03/2031 230 0.28
Denmark — 1.54% (29 February 2020: 1.59%)
270 Danske Bank A/S,5.375%, due 12/01/2024 304 0.37
EUR 200 Danske Bank A/S,2.500%, due 21/06/2029 * 255 0.31
EUR 470 Danske Bank A/S,1.375%, due 12/02/2030 * 574 0.69
GBP 100 Orsted AS, Series GBP,2.500%, due 18/02/3021 * 138 0.17
1,271 1.54
France — 5.77% (29 February 2020: 4.27%)
EUR 490 AXA SA,3.250%, due 28/05/2049 * 676 0.82
400 BNP Paribas SA,4.705%, due 10/01/2025 * 444 0.54
GBP 400 BNP Paribas SA,1.875%, due 14/12/2027 571 0.69
FaceValue(000’s)
Value(000’s)
$
% ofNet
AssetValue
410 BNP Paribas SA, 144A,3.052%, due 13/01/2031 * 434 0.52
EUR 200 Eiffage SA,1.625%, due 14/01/2027 254 0.31
400 Engie SA,2.875%, due 10/10/2022 415 0.50
EUR 200 Engie SA,0.500%, due 24/10/2030 243 0.29
EUR 310 GELF Bond Issuer I SA,1.125%, due 18/07/2029 384 0.46
EUR 300 Mercialys SA,4.625%, due 07/07/2027 406 0.49
EUR 200 Societe Fonciere Lyonnaise SA,1.500%, due 05/06/2027 256 0.31
EUR 200 Terega SA,0.875%, due 17/09/2030 245 0.30
EUR 200 Terega SASU,0.625%, due 27/02/2028 239 0.29
200 WEA Finance LLC / WestfieldUK & Europe Finance Plc,4.750%, due 17/09/2044 210 0.25
4,777 5.77
Germany — 6.21% (29 February 2020: 4.18%)
EUR 100 Allianz Finance II BV,5.750%, due 08/07/2041 * 123 0.15
EUR 200 Allianz SE,2.625%, Perpetual * 239 0.29
EUR 400 Allianz SE,4.750%, Perpetual * 536 0.65
EUR 300 alstria office REIT-AG,1.500%, due 23/06/2026 380 0.46
360 Deutsche TelekomInternational Finance BV,8.750%, due 15/06/2030 547 0.66
EUR 200 Grand City Properties SA,1.500%, Perpetual * 236 0.29
EUR 400 Hannover Rueck SE,1.125%, due 09/10/2039 * 481 0.58
EUR 400 MuenchenerRueckversicherungs-Gesellschaft AG in Muenchen,3.250%, due 26/05/2049 * 558 0.67
EUR 380 Volkswagen Financial ServicesAG,1.500%, due 01/10/2024 478 0.58
GBP 400 Volkswagen Financial ServicesNV,4.250%, due 09/10/2025 629 0.76
EUR 400 Vonovia Finance BV,2.250%, due 07/04/2030 553 0.67
EUR 300 ZF Finance GmbH,3.000%, due 21/09/2025 376 0.45
5,136 6.21
Hong Kong — 0.26% (29 February 2020: 0.27%)
200 AIA Group Ltd, 144A,3.200%, due 11/03/2025 215 0.26
Ireland — 0.80% (29 February 2020: 0.48%)
310 CRH America Finance Inc,4.500%, due 04/04/2048 369 0.45
EUR 230 Smurfit Kappa Treasury ULC,1.500%, due 15/09/2027 292 0.35
661 0.80
Israel — 0.33% (29 February 2020: 0.48%)
EUR 240 Teva Pharmaceutical FinanceNetherlands II BV,1.125%, due 15/10/2024 273 0.33
Italy — 3.67% (29 February 2020: 3.58%)
270 Enel Finance International NV,6.000%, due 07/10/2039 375 0.45
EUR 290 FCA Bank SpA/Ireland,0.500%, due 13/09/2024 355 0.43
EUR 190 Infrastrutture Wireless ItalianeSpA,1.625%, due 21/10/2028 232 0.28
EUR 380 Intesa Sanpaolo SpA,1.000%, due 04/07/2024 471 0.57
EUR 250 Intesa Sanpaolo SpA,5.500%, Perpetual * 321 0.39
EUR 230 UniCredit SpA,1.250%, due 25/06/2025 * 285 0.35
EUR 250 UniCredit SpA,1.200%, due 20/01/2026 * 305 0.37
FaceValue(000’s)
Value(000’s)
$
% ofNet
AssetValue
EUR 340 UniCredit SpA,2.000%, due 23/09/2029 * 409 0.49
EUR 200 UniCredit SpA,7.500%, Perpetual * 280 0.34
3,033 3.67
Japan — 0.41% (29 February 2020: 1.60%)
EUR 100 Nissan Motor Co Ltd,1.940%, due 15/09/2023 126 0.15
200 Nissan Motor Co Ltd, 144A,3.043%, due 15/09/2023 211 0.26
337 0.41
Luxembourg — 2.30% (29 February 2020: 2.17%)
160 ArcelorMittal SA,4.550%, due 11/03/2026 179 0.22
EUR 340 Logicor Financing Sarl,1.625%, due 15/07/2027 431 0.52
EUR 350 Logicor Financing Sarl,3.250%, due 13/11/2028 491 0.59
EUR 125 Prologis International FundingII SA,1.750%, due 15/03/2028 166 0.20
EUR 240 SELP Finance Sarl,1.500%, due 20/11/2025 306 0.37
EUR 260 SELP Finance Sarl,1.500%, due 20/12/2026 332 0.40
1,905 2.30
Macau — 0.28% (29 February 2020: 0.00%)
200 Sands China Ltd,5.400%, due 08/08/2028 230 0.28
Mexico — 0.31% (29 February 2020: 0.33%)
240 BBVA Bancomer SA/Texas,6.750%, due 30/09/2022 260 0.31
Netherlands — 4.43% (29 February 2020: 2.78%)
EUR 194 ABN AMRO Bank NV,7.125%, due 06/07/2022 257 0.31
EUR 300 ABN AMRO Bank NV,4.750%, Perpetual * 391 0.47
EUR 310 Cooperatieve Rabobank UA,2.500%, due 26/05/2026 * 376 0.46
EUR 200 Cooperatieve Rabobank UA,6.625%, Perpetual * 246 0.30
EUR 270 CTP BV,2.125%, due 01/10/2025 346 0.42
EUR 100 Enexis Holding NV,0.750%, due 02/07/2031 126 0.15
EUR 140 Euronext NV,1.000%, due 18/04/2025 175 0.21
EUR 200 ING Groep NV,3.000%, due 11/04/2028 * 255 0.31
EUR 300 ING Groep NV,2.500%, due 15/02/2029 * 383 0.46
EUR 200 Koninklijke Ahold DelhaizeNV,1.750%, due 02/04/2027 263 0.32
EUR 110 Koninklijke Philips NV,2.000%, due 30/03/2030 150 0.18
60 NXP BV / NXP Funding LLC /NXP USA Inc,3.400%, due 01/05/2030 65 0.08
EUR 490 Vesteda Finance BV,1.500%, due 24/05/2027 632 0.76
3,665 4.43
Norway — 0.40% (29 February 2020: 0.42%)
320 DNB Bank ASA,6.500%, Perpetual * 334 0.40
Peru — 0.27% (29 February 2020: 0.00%)
200 Petroleos del Peru SA,Series FEB,5.625%, due 19/06/2047 221 0.27
Portugal — 0.37% (29 February 2020: 0.00%)
310 EDP Finance BV, 144A,1.710%, due 24/01/2028 305 0.37
Russia — 0.48% (29 February 2020: 0.49%)
350 Lukoil International FinanceBV,4.750%, due 02/11/2026 396 0.48
^ Not authorised for sale to the public in Hong Kong.The accompanying notes are an integral part of the Financial Statements
117

Legg Mason Global Funds Plc Annual Report 28 February 2021
Legg Mason Western Asset Global Credit Fund^
Portfolio of Investments as at 28 February 2021 – (continued)
FaceValue(000’s)
Value(000’s)
$
% ofNet
AssetValue
Corporate Bonds and Notes — (continued)
Singapore — 0.30% (29 February 2020: 0.00%)
EUR 200 Cromwell Ereit Lux Finco Sarl,Series JAN,2.125%, due 19/11/2025 248 0.30
South Africa — 0.49% (29 February 2020: 0.50%)
GBP 270 Anglo American Capital Plc,3.375%, due 11/03/2029 409 0.49
Spain — 2.13% (29 February 2020: 2.67%)
EUR 200 Banco Bilbao VizcayaArgentaria SA,5.875%, Perpetual * 249 0.30
GBP 500 Banco Santander SA,1.750%, due 17/02/2027 701 0.85
EUR 200 Banco Santander SA,5.250%, Perpetual * 252 0.30
EUR 100 Cellnex Finance Co SA,2.000%, due 15/02/2033 117 0.14
EUR 200 Cellnex Telecom SA,1.875%, due 26/06/2029 245 0.30
140 Telefonica Emisiones SA,7.045%, due 20/06/2036 201 0.24
1,765 2.13
Sweden — 1.45% (29 February 2020: 1.22%)
EUR 140 H&M Finance BV,0.250%, due 25/08/2029 166 0.20
EUR 350 Samhallsbyggnadsbolaget iNorden AB,2.624%, Perpetual * 419 0.51
EUR 320 Svenska Handelsbanken AB,1.250%, due 02/03/2028 * 394 0.48
200 Svenska Handelsbanken AB,6.250%, Perpetual * 219 0.26
1,198 1.45
Switzerland — 4.02% (29 February 2020: 2.60%)
EUR 340 Credit Suisse Group AG,3.250%, due 02/04/2026 * 459 0.55
GBP 300 Credit Suisse Group AG,2.250%, due 09/06/2028 * 433 0.52
200 Credit Suisse Group AG,7.250%, Perpetual * 227 0.27
230 Credit Suisse Group AG,6.375%, Perpetual * 257 0.31
EUR 100 ELM BV for FirmenichInternational SA,3.750%, Perpetual * 130 0.16
EUR 160 Firmenich ProductionsParticipations SAS,1.750%, due 30/04/2030 211 0.26
280 Glencore Finance Canada Ltd,6.000%, due 15/11/2041 354 0.43
EUR 320 UBS Group AG,1.750%, due 16/11/2022 399 0.48
EUR 300 UBS Group AG,1.500%, due 30/11/2024 377 0.46
200 UBS Group AG,4.253%, due 23/03/2028 230 0.28
230 UBS Group AG,7.000%, Perpetual * 252 0.30
3,329 4.02
United Kingdom — 12.21% (29 February 2020: 11.10%)
EUR 400 Annington Funding Plc,1.650%, due 12/07/2024 505 0.61
EUR 350 Barclays Plc,3.375%, due 02/04/2025 * 462 0.56
GBP 130 Barclays Plc,1.700%, due 03/11/2026 * 184 0.22
EUR 280 Barclays Plc,2.000%, due 07/02/2028 * 346 0.42
GBP 210 Barclays Plc,6.375%, Perpetual * 317 0.38
GBP 150 BUPA Finance Plc,5.000%, due 25/04/2023 226 0.27
EUR 170 Cadent Finance Plc,0.750%, due 11/03/2032 207 0.25
GBP 190 Close Brothers Group Plc,2.750%, due 26/04/2023 274 0.33
GBP 250 Co-Operative Bank Plc/The,4.750%, due 11/11/2021 358 0.43
GBP 220 CPUK Finance Ltd,7.239%, due 28/02/2024 355 0.43
FaceValue(000’s)
Value(000’s)
$
% ofNet
AssetValue
GBP 220 CPUK Finance Ltd,3.588%, due 28/08/2025 328 0.40
EUR 190 easyJet FinCo BV,1.875%, due 03/03/2028 229 0.28
GBP 180 Grainger Plc,3.000%, due 03/07/2030 264 0.32
200 HSBC Holdings Plc,2.357%, due 18/08/2031 * 199 0.24
GBP 260 HSBC Holdings Plc,5.875%, Perpetual * 400 0.48
EUR 250 HSBC Holdings Plc,6.000%, Perpetual * 328 0.40
GBP 160 Legal & General Group Plc,4.500%, due 01/11/2050 * 248 0.30
200 Lloyds Bank Plc,12.000%, Perpetual * 223 0.27
EUR 240 Lloyds Banking Group Plc,3.500%, due 01/04/2026 * 327 0.39
200 Lloyds Banking Group Plc,4.375%, due 22/03/2028 231 0.28
GBP 200 Lloyds Banking Group Plc,5.125%, Perpetual * 288 0.35
GBP 200 Marston’s Issuer Plc, Series B1,2.578%, due 16/07/2035 *† 222 0.27
EUR 450 Natwest Group Plc,2.500%, due 22/03/2023 571 0.69
200 Natwest Group Plc,4.269%, due 22/03/2025 * 219 0.26
420 Natwest Group Plc,3.754%, due 01/11/2029 * 446 0.54
EUR 120 RELX Finance BV,0.500%, due 10/03/2028 146 0.18
EUR 100 RELX Finance BV,0.875%, due 10/03/2032 124 0.15
260 Standard Chartered Plc,3.950%, due 11/01/2023 273 0.33
270 Standard Chartered Plc,3.516%, due 12/02/2030 * 280 0.34
EUR 270 Standard Chartered Plc,2.500%, due 09/09/2030 * 346 0.42
GBP 190 Tesco Corporate TreasuryServices Plc,2.500%, due 02/05/2025 280 0.34
EUR 150 Tesco Corporate TreasuryServices Plc,0.375%, due 27/07/2029 178 0.21
GBP 100 Tesco Corporate TreasuryServices Plc,2.750%, due 27/04/2030 148 0.18
GBP 190 UNITE Group Plc/The,3.500%, due 15/10/2028 291 0.35
GBP 100 Whitbread Group Plc,2.375%, due 31/05/2027 137 0.17
GBP 100 Whitbread Group Plc,3.000%, due 31/05/2031 137 0.17
10,097 12.21
United States — 34.79% (29 February 2020: 29.52%)
EUR 410 Abbott Ireland Financing DAC,0.375%, due 19/11/2027 500 0.60
EUR 230 AbbVie Inc,1.250%, due 01/06/2024 288 0.35
830 AbbVie Inc,3.200%, due 21/11/2029 898 1.09
380 AbbVie Inc,4.875%, due 14/11/2048 484 0.59
140 Aetna Inc,2.800%, due 15/06/2023 147 0.18
EUR 190 American International GroupInc,1.500%, due 08/06/2023 237 0.29
90 Anthem Inc,3.650%, due 01/12/2027 102 0.12
160 Apple Inc,2.650%, due 11/05/2050 151 0.18
EUR 170 AT&T Inc,2.600%, due 19/05/2038 229 0.28
GBP 125 AT&T Inc,4.250%, due 01/06/2043 207 0.25
EUR 400 AT&T Inc, Series B,2.875%, Perpetual * 478 0.58
340 Bank of America Corp,3.550%, due 05/03/2024 * 361 0.44
140 Bank of America Corp,4.443%, due 20/01/2048 * 172 0.21
FaceValue(000’s)
Value(000’s)
$
% ofNet
AssetValue
310 Berkshire Hathaway FinanceCorp,4.200%, due 15/08/2048 374 0.45
250 Boeing Co/The,4.875%, due 01/05/2025 280 0.34
120 Boeing Co/The,3.950%, due 01/08/2059 118 0.14
570 Bristol-Myers Squibb Co,3.400%, due 26/07/2029 638 0.77
380 Broadcom Inc,4.300%, due 15/11/2032 428 0.52
160 Carlyle Holdings II FinanceLLC, 144A,5.625%, due 30/03/2043 198 0.24
190 Centene Corp,4.625%, due 15/12/2029 205 0.25
80 Charter CommunicationsOperating LLC / CharterCommunications OperatingCapital,3.500%, due 01/06/2041 77 0.09
210 Charter CommunicationsOperating LLC / CharterCommunications OperatingCapital,5.375%, due 01/05/2047 247 0.30
190 Chevron USA Inc,3.850%, due 15/01/2028 217 0.26
580 Cigna Corp,2.400%, due 15/03/2030 590 0.71
400 Cigna Corp,3.400%, due 15/03/2050 408 0.49
150 Cimarex Energy Co,3.900%, due 15/05/2027 166 0.20
500 Citigroup Inc,8.125%, due 15/07/2039 845 1.02
40 Coca-Cola Co/The,2.500%, due 15/03/2051 37 0.04
510 Comcast Corp,3.100%, due 01/04/2025 552 0.67
70 Comcast Corp,4.950%, due 15/10/2058 95 0.12
440 CVS Health Corp,5.050%, due 25/03/2048 557 0.67
EUR 130 Danaher Corp,2.500%, due 30/03/2030 183 0.22
150 DCP Midstream Operating LP,5.625%, due 15/07/2027 163 0.20
90 Devon Energy Corp,5.000%, due 15/06/2045 105 0.13
EUR 110 Digital Dutch Finco BV,1.500%, due 15/03/2030 140 0.17
EUR 260 Digital Dutch Finco BV,1.000%, due 15/01/2032 309 0.37
70 Energy Transfer Operating LP,6.250%, due 15/04/2049 84 0.10
60 Energy Transfer Operating LP,5.000%, due 15/05/2050 64 0.08
40 Enterprise Products OperatingLLC,3.950%, due 31/01/2060 41 0.05
250 Enterprise Products OperatingLLC,5.375%, due 15/02/2078 * 250 0.30
EUR 280 Equinix Inc,1.000%, due 15/03/2033 333 0.40
220 Exelon Corp,3.400%, due 15/04/2026 243 0.29
190 Fidelity & Guaranty LifeHoldings Inc,5.500%, due 01/05/2025 220 0.27
200 FirstEnergy Corp, Series C,7.375%, due 15/11/2031 275 0.33
370 Ford Motor Co,8.500%, due 21/04/2023 414 0.50
GBP 200 GE Capital UK FundingUnlimited Co,8.000%, due 14/01/2039 462 0.56
320 General Electric Co,6.875%, due 10/01/2039 457 0.55
80 General Motors Co,5.400%, due 02/10/2023 89 0.11
110 General Motors Co,6.125%, due 01/10/2025 131 0.16
50 General Motors Co,6.600%, due 01/04/2036 68 0.08
^ Not authorised for sale to the public in Hong Kong.The accompanying notes are an integral part of the Financial Statements
118

Legg Mason Global Funds Plc Annual Report 28 February 2021
Legg Mason Western Asset Global Credit Fund^
Portfolio of Investments as at 28 February 2021 – (continued)
FaceValue(000’s)
Value(000’s)
$
% ofNet
AssetValue
Corporate Bonds and Notes — (continued)United States — (continued)
130 General Motors Co,6.750%, due 01/04/2046 181 0.22
200 Genting New York LLC /GENNY Capital Inc, 144A,3.300%, due 15/02/2026 201 0.24
16 Goldman Sachs Capital II,4.000%, Perpetual * 15 0.02
EUR 280 Goldman Sachs Group Inc/The,2.875%, due 03/06/2026 384 0.46
110 Goldman Sachs Group Inc/The,3.800%, due 15/03/2030 125 0.15
460 Goldman Sachs Group Inc/The,5.150%, due 22/05/2045 608 0.73
70 Halliburton Co,5.000%, due 15/11/2045 82 0.10
340 HCA Inc,5.250%, due 15/06/2026 398 0.48
EUR 270 Honeywell International Inc,0.750%, due 10/03/2032 334 0.40
150 Humana Inc,3.125%, due 15/08/2029 162 0.20
20 Intercontinental Exchange Inc,4.250%, due 21/09/2048 23 0.03
450 International Lease FinanceCorp,5.875%, due 15/08/2022 483 0.58
EUR 250 JPMorgan Chase & Co,1.090%, due 11/03/2027 * 314 0.38
150 Lam Research Corp,1.900%, due 15/06/2030 150 0.18
270 Las Vegas Sands Corp,3.500%, due 18/08/2026 286 0.35
210 Lehman Brothers Holding Inc,zero coupon, due28/12/2017 †∞� – –
320 Lehman Brothers HoldingsCapital Trust Escrow,zero coupon, Perpetual †∞� – –
30 Lowe’s Cos Inc,3.000%, due 15/10/2050 29 0.03
130 Mars Inc,4.200%, due 01/04/2059 158 0.19
20 Massachusetts Mutual LifeInsurance Co, 144A,3.375%, due 15/04/2050 21 0.03
370 McDonald’s Corp,3.700%, due 30/01/2026 413 0.50
50 MDC Holdings Inc,2.500%, due 15/01/2031 49 0.06
230 MDC Holdings Inc,6.000%, due 15/01/2043 304 0.37
500 Microsoft Corp,3.700%, due 08/08/2046 591 0.71
170 MPLX LP,4.500%, due 15/04/2038 188 0.23
250 MPT Operating Partnership LP/ MPT Finance Corp,5.000%, due 15/10/2027 266 0.32
GBP 530 MPT Operating Partnership LP/ MPT Finance Corp,3.692%, due 05/06/2028 784 0.95
112 MUFG Americas HoldingsCorp,3.000%, due 10/02/2025 120 0.15
180 Northrop Grumman Corp,3.250%, due 15/01/2028 196 0.24
270 Northwest Pipeline LLC,4.000%, due 01/04/2027 305 0.37
60 NRG Energy Inc, 144A,2.450%, due 02/12/2027 61 0.07
100 Nuveen LLC,4.000%, due 01/11/2028 116 0.14
80 Pioneer Natural Resources Co,2.150%, due 15/01/2031 78 0.09
EUR 420 Prologis Euro Finance LLC,0.625%, due 10/09/2031 505 0.61
240 Prudential Financial Inc,3.000%, due 10/03/2040 247 0.30
410 Schlumberger Holdings Corp,4.000%, due 21/12/2025 459 0.56
360 Stellantis NV,5.250%, due 15/04/2023 391 0.47
FaceValue(000’s)
Value(000’s)
$
% ofNet
AssetValue
70 Targa Resources Partners LP /Targa Resources PartnersFinance Corp,5.000%, due 15/01/2028 73 0.09
340 Texas Instruments Inc,3.875%, due 15/03/2039 400 0.48
310 Time Warner Cable LLC,7.300%, due 01/07/2038 444 0.54
150 Transcontinental Gas PipeLine Co LLC,7.850%, due 01/02/2026 193 0.23
30 United Airlines 2020-1Class B Pass Through Trust,4.875%, due 15/01/2026 31 0.04
420 UnitedHealth Group Inc,4.450%, due 15/12/2048 525 0.64
EUR 290 US Bancorp,0.850%, due 07/06/2024 361 0.44
60 Verizon Communications Inc,5.250%, due 16/03/2037 77 0.09
260 VICI Properties LP / VICI NoteCo Inc,4.125%, due 15/08/2030 271 0.33
200 Viking Ocean Cruises Ship VIILtd, 144A,5.625%, due 15/02/2029 202 0.24
410 Wachovia Capital Trust III,5.570%, Perpetual * 410 0.50
100 Walmart Inc,4.050%, due 29/06/2048 123 0.15
EUR 250 Wells Fargo & Co,2.250%, due 02/05/2023 317 0.38
EUR 590 Wells Fargo & Co,1.338%, due 04/05/2025 * 738 0.89
GBP 200 Wells Fargo & Co,4.875%, due 29/11/2035 364 0.44
150 Western MidstreamOperating LP,4.650%, due 01/07/2026 156 0.19
130 Western MidstreamOperating LP,6.500%, due 01/02/2050 150 0.18
400 Williams Cos Inc/The,4.300%, due 04/03/2024 438 0.53
30 WPX Energy Inc,5.250%, due 15/10/2027 32 0.04
120 WPX Energy Inc,4.500%, due 15/01/2030 128 0.15
28,777 34.79
Total Corporate Bonds and Notes(Cost $66,957) 73,294 88.60
Government Bonds and Notes — 7.75%(29 February 2020: 15.22%)
Germany — 1.24% (29 February 2020: 7.96%)
EUR 170 Bundesrepublik DeutschlandBundesanleihe,0.500%, due 15/02/2028 219 0.27
EUR 240 Bundesrepublik DeutschlandBundesanleihe,0.000%, due 15/02/2030 299 0.36
EUR 90 Bundesrepublik DeutschlandBundesanleihe, Series 2007,4.250%, due 04/07/2039 194 0.23
EUR 200 Bundesrepublik DeutschlandBundesanleihe,1.250%, due 15/08/2048 313 0.38
1,025 1.24
Indonesia — 0.52% (29 February 2020: 1.43%)
EUR 350 Indonesia GovernmentInternational Bond,1.400%, due 30/10/2031 431 0.52
Mexico — 0.22% (29 February 2020: 0.25%)
MXN 3,570 Mexican Bonos, Series M,7.750%, due 13/11/2042 183 0.22
Panama — 0.23% (29 February 2020: 0.00%)
200 Panama GovernmentInternational Bond,2.252%, due 29/09/2032 191 0.23
Romania — 0.43% (29 February 2020: 0.41%)
EUR 290 Romanian GovernmentInternational Bond,2.000%, due 28/01/2032 353 0.43
FaceValue(000’s)
Value(000’s)
$
% ofNet
AssetValue
Russia — 0.67% (29 February 2020: 0.70%)
RUB 11,680 Russian Federal Bond – OFZ,Series 6224,6.900%, due 23/05/2029 159 0.19
EUR 300 Russian Foreign Bond –Eurobond,2.875%, due 04/12/2025 399 0.48
558 0.67
United Kingdom — 0.65% (29 February 2020: 0.07%)
GBP 170 United Kingdom Gilt,1.000%, due 22/04/2024 243 0.29
GBP 120 United Kingdom Gilt,4.250%, due 07/03/2036 239 0.29
GBP 26 United Kingdom Gilt,4.500%, due 07/12/2042 58 0.07
540 0.65
United States — 3.79% (29 February 2020: 3.96%)
240 United States Treasury Note/Bond,0.125%, due 31/12/2022 240 0.29
160 United States Treasury Note/Bond,0.375%, due 30/11/2025 158 0.19
120 United States Treasury Note/Bond,0.375%, due 31/12/2025 118 0.14
410 United States Treasury Note/Bond,0.375%, due 30/09/2027 392 0.48
140 United States Treasury Note/Bond,0.625%, due 30/11/2027 136 0.16
10 United States Treasury Note/Bond,2.625%, due 15/02/2029 11 0.01
40 United States Treasury Note/Bond,1.500%, due 15/02/2030 41 0.05
80 United States Treasury Note/Bond,0.625%, due 15/05/2030 75 0.09
270 United States Treasury Note/Bond,0.625%, due 15/08/2030 252 0.31
400 United States Treasury Note/Bond,0.875%, due 15/11/2030 382 0.46
420 United States Treasury Note/Bond,2.000%, due 15/02/2050 409 0.50
790 United States Treasury Note/Bond,1.250%, due 15/05/2050 638 0.77
335 United States Treasury Note/Bond,1.375%, due 15/08/2050 280 0.34
3,132 3.79
Total Government Bonds and Notes(Cost $6,583) 6,413 7.75
Loan Notes — 0.09% (29 February 2020: 0.00%)
70 Murphy USA Inc.,0.000%, due 21/01/2028 * 71 0.09
Total Loan Notes(Cost $70) 71 0.09
Collective Investment Schemes — 1.14%(29 February 2020: 0.70%)
940 Western Asset Liquidity FundsPlc – Western Asset US DollarLiquidity Fund – Class WA(Distributing) 940 1.14
Total Collective Investment Schemes(Cost $940) 940 1.14
Total Investments at fair value throughprofit or loss(Cost $75,073) 81,267 98.24
Forward Foreign Currency Contracts — 0.13%(29 February 2020: 0.14%)
Unrealised appreciation of contracts (seebelow) 110 0.13
^ Not authorised for sale to the public in Hong Kong.The accompanying notes are an integral part of the Financial Statements
119

Legg Mason Global Funds Plc Annual Report 28 February 2021
Legg Mason Western Asset Global Credit Fund^
Portfolio of Investments as at 28 February 2021 – (continued)
FaceValue(000’s)
Value(000’s)
$
% ofNet
AssetValue
Futures — 0.16% (29 February 2020: 0.41%)
Unrealised appreciation of contracts(see below) 128 0.16
Total Financial Assets at fair valuethrough profit or loss 81,505 98.53
Credit Default Swaps — (0.77%)(29 February 2020: (1.02%))
Unrealised depreciation of contracts(see below) (636) (0.77)
Forward Foreign Currency Contracts — (0.23%)(29 February 2020: (0.53%))
Unrealised depreciation of contracts(see below) (193) (0.23)
Futures — (0.18%) (29 February 2020: (0.31%))
Unrealised depreciation of contracts(see below) (147) (0.18)
Total Financial Liabilities at fair valuethrough profit or loss (976) (1.18)
Total Financial Assets and FinancialLiabilities at fair value through profit orloss 80,529 97.35
Other Assets in Excess of Liabilities 2,196 2.65
Total Net Assets $82,725 100.00
– Amounts designated as “–” are either $0, less than$1,000, less than 1,000 shares or less than 0.01%.
144A Securities exempt from registration under Rule 144A ofthe Securities Act of 1933, as amended. Thesesecurities may only be resold, in transactions exemptfrom registration, to qualified institutional buyers. As at28 February 2021, these securities amounted to$1,848,000 or 2.23% of net assets.
* Variable rate security. The interest rate shown reflectsthe rate in effect at 28 February 2021.
† Illiquid.
∞ Security is valued in good faith at fair value by or at thediscretion of the Manager or the respective InvestmentManager.
� Security is in default as at 28 February 2021 (eitherprincipal and / or interest).
ABBREVIATIONS:
Perpetual – A bond with no maturity date. Perpetual bondsare not redeemable but pay a steady stream ofinterest.
EUR – Euro
GBP – British Pound
MXN – Mexican Peso
RUB – Russian Ruble
Analysis of Total Assets
% ofTotal
Assets
Transferable securities admitted to an officialexchange listing or traded on a regulated market 94.58
Other transferable securities dealt in on anotherregulated market 0.08
Collective investment schemes 1.11
Financial derivative instruments 0.28
Other assets 3.95
Total Assets 100.00
Schedule of Credit Default Swaps
Counterparty Reference EntityBuy/Sell
ProtectionExpiration
Date
NotionalAmount(000’s)
Value(000’s)
Bank of America Merrill Lynch iTraxx Europe, 1.000% Buy 20/12/2025 6,970 $ (199)
Bank of America Merrill Lynch iTraxx Europe, 5.000% Buy 20/12/2025 3,483 (437)
Unrealised Appreciation of Credit Default Swaps (29 February 2020 (000’s): $–) $ –Unrealised Depreciation of Credit Default Swaps (29 February 2020 (000’s): $(805)) (636)
Net Depreciation of Credit Default Swaps (29 February 2020 (000’s): $(805)) $ (636)
Schedule of Forward Foreign Currency Contracts
Expiration Date CounterpartyBuy Currency
(000’s)Sell Currency
(000’s)
UnrealisedAppreciation/(Depreciation)of Contracts
(000’s)
04/03/2021 Morgan Stanley Buy USD 296 Sell BRL 1,600 $ 1104/03/2021 Morgan Stanley Buy BRL 1,600 Sell USD 298 (13)12/03/2021 BNY Mellon Buy USD 12 Sell EUR 10 –12/03/2021 BNY Mellon Buy USD 57 Sell EUR 46 112/03/2021 BNY Mellon Buy EUR 4,386 Sell USD 5,281 1312/03/2021 BNY Mellon Buy EUR 71 Sell USD 87 (1)18/05/2021 Citi Buy USD 631 Sell EUR 520 318/05/2021 Citi Buy USD 8,870 Sell EUR 7,354 (19)18/05/2021 Citi Buy USD 1,307 Sell GBP 952 (19)18/05/2021 Goldman Sachs Buy USD 12 Sell EUR 10 –18/05/2021 Goldman Sachs Buy USD 9,510 Sell EUR 7,819 5918/05/2021 Goldman Sachs Buy USD 1,382 Sell GBP 997 (8)18/05/2021 JP Morgan Buy USD 8,416 Sell EUR 6,943 2318/05/2021 JP Morgan Buy USD 5,914 Sell GBP 4,285 (58)18/05/2021 JP Morgan Buy EUR 85 Sell USD 103 (1)18/05/2021 Morgan Stanley Buy USD 1,882 Sell EUR 1,561 (4)18/05/2021 UBS Buy USD 7,619 Sell EUR 6,321 (22)18/05/2021 UBS Buy USD 1,457 Sell GBP 1,063 (25)18/05/2021 UBS Buy EUR 1,825 Sell USD 2,218 (12)10/06/2021 Morgan Stanley Buy BRL 1,600 Sell USD 295 (11)
Unrealised Appreciation of Forward Foreign Currency Contracts (29 February 2020 (000’s): $105) $ 110Unrealised Depreciation of Forward Foreign Currency Contracts (29 February 2020 (000’s): $(418)) (193)
Net Depreciation of Forward Foreign Currency Contracts (29 February 2020 (000’s): $(313)) $ (83)
^ Not authorised for sale to the public in Hong Kong.The accompanying notes are an integral part of the Financial Statements
120

Legg Mason Global Funds Plc Annual Report 28 February 2021
Legg Mason Western Asset Global Credit Fund^
Portfolio of Investments as at 28 February 2021 – (continued)
Schedule of Futures Contracts
CounterpartyNominal
Value
NotionalValue(000’s)
UnrealisedAppreciation/(Depreciation)of Contracts
(000’s)
Euro-Bund June 2021 Bank of America Merrill Lynch (8) $ (1,646) $ (1)
Euro-Bund March 2021 Bank of America Merrill Lynch (21) (4,394) 89
Long Gilt June 2021 Bank of America Merrill Lynch (11) (1,958) 18
U.S. 10 Year Note (CBT) June 2021 Bank of America Merrill Lynch 8 1,062 (10)
U.S. 5 Year Note (CBT) June 2021 Bank of America Merrill Lynch 39 4,835 (44)
U.S. Long Bond (CBT) June 2021 Bank of America Merrill Lynch (11) (1,751) 21
U.S. Ultra Bond (CBT) June 2021 Bank of America Merrill Lynch 24 4,537 (92)
Unrealised Appreciation of Futures Contracts (29 February 2020 (000’s): $327) $ 128
Unrealised Depreciation of Futures Contracts (29 February 2020 (000’s): $(245)) (147)
Net Depreciation of Futures Contracts (29 February 2020 (000’s): $82) $ (19)
^ Not authorised for sale to the public in Hong Kong.The accompanying notes are an integral part of the Financial Statements
121

Legg Mason Global Funds Plc Annual Report 28 February 2021
Legg Mason Western Asset Euro High Yield Fund
Portfolio of Investments as at 28 February 2021
FaceValue(000’s)
Value(000’s)
€
% ofNet
AssetValue
Corporate Bonds and Notes — 82.03% (29 February2020: 90.00%)
Brazil — 1.96% (29 February 2020: 1.90%)
GBP 770 Petrobras Global Finance BV,6.625%, due 16/01/2034 1,066 1.96
Canada — 0.43% (29 February 2020: 0.00%)
230 Primo Water Holdings Inc,3.875%, due 31/10/2028 236 0.43
Denmark — 0.21% (29 February 2020: 0.00%)
GBP 100 Orsted AS, Series GBP,2.500%, due 18/02/3021 * 115 0.21
France — 8.12% (29 February 2020: 9.34%)
940 3AB Optique DeveloppementSAS,4.000%, due 01/10/2023 950 1.75
100 Adevinta ASA,3.000%, due 15/11/2027 103 0.19
200 Banijay Entertainment SASU,3.500%, due 01/03/2025 199 0.37
500 Faurecia SE,3.750%, due 15/06/2028 526 0.97
360 Goldstory SASU,5.375%, due 01/03/2026 371 0.68
910 Kapla Holding SAS,3.375%, due 15/12/2026 905 1.67
200 Mercialys SA,4.625%, due 07/07/2027 225 0.41
410 Novafives SAS,5.000%, due 15/06/2025 371 0.68
500 Parts Europe SA,6.500%, due 16/07/2025 524 0.96
230 SPCM SA,2.625%, due 01/02/2029 236 0.44
4,410 8.12
Germany — 9.58% (29 February 2020: 7.29%)
200 Bayer AG,2.375%, due 12/11/2079 * 202 0.37
950 Cheplapharm ArzneimittelGmbH,4.375%, due 15/01/2028 982 1.81
230 HT Troplast GmbH,9.250%, due 15/07/2025 256 0.47
530 IHO Verwaltungs GmbH,3.750%, due 15/09/2026 540 0.99
825 Nidda BondCo GmbH,5.000%, due 30/09/2025 839 1.54
800 Platin 1426 GmbH,5.375%, due 15/06/2023 804 1.48
500 Rebecca Bidco GmbH,5.750%, due 15/07/2025 522 0.96
100 Vertical Holdco GmbH,6.625%, due 15/07/2028 107 0.20
120 Vertical Midco GmbH,4.375%, due 15/07/2027 126 0.23
700 ZF Finance GmbH,3.000%, due 21/09/2025 727 1.34
100 ZF Finance GmbH,2.750%, due 25/05/2027 102 0.19
5,207 9.58
Greece — 1.31% (29 February 2020: 1.23%)
692 Crystal Almond SARL,4.250%, due 15/10/2024 713 1.31
Ireland — 2.25% (29 February 2020: 1.17%)
680 eircom Finance DAC,2.625%, due 15/02/2027 673 1.24
520 Smurfit Kappa Treasury ULC,1.500%, due 15/09/2027 547 1.01
1,220 2.25
Israel — 3.30% (29 February 2020: 2.95%)
1,370 Teva Pharmaceutical FinanceNetherlands II BV,1.125%, due 15/10/2024 1,293 2.38
170 Teva Pharmaceutical FinanceNetherlands II BV,6.000%, due 31/01/2025 186 0.34
300 Teva Pharmaceutical FinanceNetherlands II BV,4.500%, due 01/03/2025 314 0.58
1,793 3.30
FaceValue(000’s)
Value(000’s)
€
% ofNet
AssetValue
Italy — 6.53% (29 February 2020: 7.80%)
614 ASR Media and Sponsorship SpA,5.125%, due 01/08/2024 595 1.10
360 Brunello Bidco SpA,3.750%, due 15/02/2028 * 361 0.66
470 doValue SpA,5.000%, due 04/08/2025 491 0.90
250 Gamma Bidco SpA,6.250%, due 15/07/2025 262 0.48
315 KME SE,6.750%, due 01/02/2023 279 0.51
1,410 Telecom Italia SpA/Milano,3.625%, due 25/05/2026 1,562 2.88
3,550 6.53
Luxembourg — 3.42% (29 February 2020: 6.69%)
940 Altice France Holding SA,8.000%, due 15/05/2027 1,027 1.89
140 PLT VII Finance Sarl,4.625%, due 05/01/2026 145 0.27
650 Summer BC Holdco B SARL,5.750%, due 31/10/2026 688 1.26
1,860 3.42
Mexico — 1.54% (29 February 2020: 0.00%)
920 Petroleos Mexicanos,2.750%, due 21/04/2027 837 1.54
Netherlands — 5.99% (29 February 2020: 6.49%)
100 IPD 3 BV,5.500%, due 01/12/2025 104 0.19
280 Maxeda DIY Holding BV,5.875%, due 01/10/2026 289 0.53
540 PPF Telecom Group BV,3.250%, due 29/09/2027 578 1.07
1,000 Schoeller Packaging BV,6.375%, due 01/11/2024 1,038 1.91
500 Trivium Packaging Finance BV,3.750%, due 15/08/2026 512 0.94
740 United Group BV,4.000%, due 15/11/2027 733 1.35
3,254 5.99
Romania — 1.87% (29 February 2020: 1.70%)
1,000 RCS & RDS SA,3.250%, due 05/02/2028 1,016 1.87
Spain — 7.38% (29 February 2020: 8.08%)
200 Cellnex Finance Co SA,2.000%, due 15/02/2033 195 0.36
300 Cirsa Finance International Sarl,6.250%, due 20/12/2023 300 0.55
450 Codere Finance 2 LuxembourgSA,10.750%, due 01/11/2023 267 0.49
690 Repsol International Finance BV,4.500%, due 25/03/2075 * 754 1.39
900 Telefonica Europe BV,4.375%, Perpetual * 974 1.79
700 Telefonica Europe BV,Series NC5, 3.000%, Perpetual * 722 1.33
590 Tendam Brands SAU,5.000%, due 15/09/2024 552 1.02
260 Tendam Brands SAU,5.250%, due 15/09/2024 * 244 0.45
4,008 7.38
Sweden — 2.41% (29 February 2020: 1.22%)
700 Samhallsbyggnadsbolaget iNorden AB,2.624%, Perpetual * 695 1.28
500 Verisure Holding AB,3.875%, due 15/07/2026 514 0.94
100 Verisure Midholding AB,5.250%, due 15/02/2029 103 0.19
1,312 2.41
Switzerland — 0.56% (29 February 2020: 0.27%)
140 ELM BV for FirmenichInternational SA,3.750%, Perpetual * 151 0.28
150 Holcim Finance Luxembourg SA,3.000%, Perpetual * 155 0.28
306 0.56
FaceValue(000’s)
Value(000’s)
€
% ofNet
AssetValue
United Kingdom — 17.09% (29 February 2020: 17.80%)
GBP 300 B&M European Value Retail SA,3.625%, due 15/07/2025 360 0.66
GBP 220 Co-operative Group Holdings2011 Ltd,7.500%, due 08/07/2026 309 0.57
1,090 FCE Bank Plc,0.869%, due 13/09/2021 1,092 2.01
GBP 540 Galaxy Bidco Ltd,6.500%, due 31/07/2026 662 1.22
270 INEOS Quattro Finance 1 Plc,3.750%, due 15/07/2026 275 0.51
GBP 450 Ladbrokes Group Finance Plc,5.125%, due 08/09/2023 550 1.01
GBP 250 Marks & Spencer Plc,3.750%, due 19/05/2026 297 0.55
GBP 350 Marston’s Issuer Plc, Series B1,2.578%, due 16/07/2035 *† 321 0.59
GBP 580 Miller Homes Group Holdings Plc,5.500%, due 15/10/2024 687 1.26
GBP 320 Pinewood Finance Co Ltd,3.250%, due 30/09/2025 378 0.70
GBP 700 Pinnacle Bidco Plc,6.375%, due 15/02/2025 823 1.51
GBP 680 Saga Plc,3.375%, due 12/05/2024 725 1.33
GBP 260 TalkTalk Telecom Group Plc,3.875%, due 20/02/2025 296 0.54
GBP 235 Tesco Property Finance 6 Plc,5.411%, due 13/07/2044 351 0.65
GBP 100 Travis Perkins Plc,3.750%, due 17/02/2026 123 0.23
550 Victoria Plc,3.625%, due 26/08/2026 552 1.02
GBP 790 Virgin Media Secured Finance Plc,5.250%, due 15/05/2029 978 1.80
500 Viridian Group FinanceCo Plc /Viridian Power & Energy HoldingsDAC,4.000%, due 15/09/2025 507 0.93
9,286 17.09
United States — 8.08% (29 February 2020: 15.80%)
440 Ashland Services BV,2.000%, due 30/01/2028 442 0.81
620 Belden Inc,4.125%, due 15/10/2026 639 1.17
240 Carnival Corp,10.125%, due 01/02/2026 280 0.52
GBP 180 Ford Motor Credit Co LLC,2.748%, due 14/06/2024 210 0.39
450 International Game TechnologyPlc,2.375%, due 15/04/2028 438 0.80
720 James Hardie InternationalFinance DAC,3.625%, due 01/10/2026 743 1.37
540 Kronos International Inc,3.750%, due 15/09/2025 549 1.01
GBP 190 MPT Operating Partnership LP /MPT Finance Corp,2.550%, due 05/12/2023 223 0.41
520 Netflix Inc,3.625%, due 15/06/2030 612 1.13
250 OI European Group BV,2.875%, due 15/02/2025 254 0.47
4,390 8.08
Total Corporate Bonds and Notes(Cost €43,024) 44,579 82.03
Loan Notes — 1.97% (29 February 2020: 6.05%)
270 Froneri Lux FinCo SARL,2.625%, due 30/01/2027 * 269 0.50
200 Hestia Holding,4.000%, due 30/06/2027 * 202 0.37
300 Ineos 226 Ltd,2.750%, due 21/01/2026 * 300 0.55
159 Ortho Clinical Diagnostics S.A.,3.500%, due 17/01/2027 * 159 0.29
140 Verisure Holding AB,2.750%, due 21/10/2022 * 140 0.26
Total Loan Notes (Cost €1,061) 1,070 1.97
The accompanying notes are an integral part of the Financial Statements
122

Legg Mason Global Funds Plc Annual Report 28 February 2021
Legg Mason Western Asset Euro High Yield Fund
Portfolio of Investments as at 28 February 2021 – (continued)
FaceValue(000’s)
Value(000’s)
€
% ofNet
AssetValue
Collective Investment Schemes — 0.62% (29 February2020: 0.77%)
USD 405 Western Asset Liquidity Funds Plc– Western Asset US DollarLiquidity Fund – Class WA(Distributing) 336 0.62
Total Collective Investment Schemes(Cost €368) 336 0.62
Total Investments at fair value throughprofit or loss (Cost €44,453) 45,985 84.62
Credit Default Swaps — 0.46% (29 February 2020:0.00%)
Unrealised appreciation of contracts(see below) 252 0.46
Forward Foreign Currency Contracts — 0.01%(29 February 2020: 0.64%)
Unrealised appreciation of contracts (seebelow) 4 0.01
Total Financial Assets at fair valuethrough profit or loss 46,241 85.09
FaceValue(000’s)
Value(000’s)
€
% ofNet
AssetValue
Forward Foreign Currency Contracts — (0.20%)(29 February 2020: (0.21%))
Unrealised depreciation of contracts(see below) (109) (0.20)
Total Financial Liabilities at fair valuethrough profit or loss (109) (0.20)
Total Financial Assets and FinancialLiabilities at fair value through profit orloss 46,132 84.89
Other Assets in Excess of Liabilities 8,213 15.11
Total Net Assets €54,345 100.00
– Amounts designated as “–” are either €0, less than€1,000, less than 1,000 shares or less than 0.01%.
* Variable rate security. The interest rate shown reflectsthe rate in effect at 28 February 2021.
† Illiquid.
ABBREVIATIONS:
Perpetual - A bond with no maturity date. Perpetual bondsare not redeemable but pay a steady stream ofinterest.
GBP - British Pound
USD - United States Dollar
Analysis of Total Assets
% ofTotal
Assets
Transferable securities admitted to an officialexchange listing or traded on a regulated market 80.51
Other transferable securities dealt in on anotherregulated market 1.93
Collective investment schemes 0.61
Financial derivative instruments 0.46
Other assets 16.49
Total Assets 100.00
Schedule of Credit Default Swaps
Counterparty Reference EntityBuy/Sell
ProtectionExpiration
Date
NotionalAmount(000’s)
Value(000’s)
Bank of America Merrill Lynch iTraxx Europe, 5.000% Sell 20/12/2025 2,417 € 252
Unrealised Appreciation of Credit Default Swaps (29 February 2020 (000’s): €–) € 252Unrealised Depreciation of Credit Default Swaps (29 February 2020 (000’s): €–) –
Net Appreciation of Credit Default Swaps (29 February 2020 (000’s): €–) € 252
Schedule of Forward Foreign Currency Contracts
Expiration Date CounterpartyBuy Currency
(000’s)Sell Currency
(000’s)
UnrealisedAppreciation/(Depreciation)of Contracts
(000’s)
12/03/2021 BNY Mellon Buy GBP 127 Sell EUR 144 € 312/03/2021 BNY Mellon Buy EUR 146 Sell GBP 126 118/05/2021 BNP Paribas Buy EUR 264 Sell GBP 231 (3)18/05/2021 JP Morgan Buy EUR 1,077 Sell GBP 946 (14)18/05/2021 JP Morgan Buy EUR 145 Sell USD 176 –18/05/2021 Royal Bank of Canada Buy EUR 403 Sell GBP 354 (4)18/05/2021 Societe Generale Buy EUR 142 Sell GBP 124 (2)18/05/2021 UBS Buy EUR 6,369 Sell GBP 5,598 (86)18/05/2021 UBS Buy EUR 166 Sell USD 200 –
Unrealised Appreciation of Forward Foreign Currency Contracts (29 February 2020 (000’s): €365) € 4Unrealised Depreciation of Forward Foreign Currency Contracts (29 February 2020 (000’s): €(117)) (109)
Net Depreciation of Forward Foreign Currency Contracts (29 February 2020 (000’s): €248) € (105)
The accompanying notes are an integral part of the Financial Statements
123

Legg Mason Global Funds Plc Annual Report 28 February 2021
Legg Mason Western Asset Macro Opportunities Bond Fund^
Portfolio of Investments as at 28 February 2021
FaceValue(000’s)
Value(000’s)
$
% ofNet
AssetValue
Asset-Backed Securities — 0.99%(29 February 2020: 1.67%)
28 Argent Securities Inc Asset-Backed Pass-ThroughCertificatesSeries 2004-W8, Series2004 W8, Class A2,1.078%, due 25/05/2034 * 28 –
5,130 CSMC 2017-RPL1 Trust,Series 2017 RPL1,Class A1, 144A,2.750%, due 25/07/2057 * 5,359 0.08
14,410 CSMC 2017-RPL1 Trust,Series 2017 RPL1,Class A2, 144A,3.038%, due 25/07/2057 * 15,467 0.23
5,705 CWHEQ Revolving HomeEquity Loan TrustSeries 2006-I, Series 2006 I,Class 2A,0.247%, due 15/01/2037 * 5,522 0.08
8,000 Ford Credit FloorplanMaster Owner Trust A,Series 2018 4, Class A,4.060%, due 15/11/2030 9,296 0.14
4,386 Hertz Vehicle Financing IILP, Series 2018 1A,Class A, 144A,3.290%, due 25/02/2024 4,412 0.07
4,987 Mosaic Solar Loan Trust2018-2-GS, Series 20182GS, Class A, 144A,4.200%, due 22/02/2044 5,350 0.08
19,602 Sonic Capital LLC,Series 2020 1A, Class A2I,144A,3.845%, due 20/01/2050 20,704 0.31
Total Asset-Backed Securities(Cost $61,760) 66,138 0.99
Mortgage-Backed Securities — 1.37%(29 February 2020: 2.06%)
18,790 BBCCRE Trust 2015-GTP,Series 2015 GTP, Class D,144A,4.563%, due 10/08/2033 * 18,341 0.28
4,061 Connecticut AvenueSecurities Trust 2020-R01,Series 2020 R01,Class 1M1, 144A,0.918%, due 25/01/2040 * 4,065 0.06
7,000 CSAIL 2016-C7Commercial MortgageTrust, Series 2016 C7,Class D, 144A,4.386%, due 15/11/2049 * 5,140 0.08
6,014 CSMC Series 2015-12R,Series 2015 12R,Class 2A1, 144A,0.648%, due 30/11/2037 * 6,008 0.09
41,731 CSMC Trust 2018-J1,Series 2018 J1, Class B2,144A,3.638%, due 25/02/2048 * 43,355 0.65
58 Fannie Mae Pool‘CA0907’,3.500%, due 01/12/2047 64 –
591 Flagstar Mortgage Trust2018-2, Series 2018 2,Class A4, 144A,3.500%, due 25/04/2048 * 601 0.01
4,635 Freddie Mac STACR REMICTrust 2020-DNA5,Series 2020 DNA5,Class M1, 144A,1.345%, due 25/10/2050 * 4,646 0.07
2,661 MortgageIT Trust 2005-3,Series 2005 3, Class A1,0.718%, due 25/08/2035 * 2,692 0.04
5,708 New Residential MortgageLoan Trust 2017-4,Series 2017 4A, Class A1,144A,4.000%, due 25/05/2057 * 6,121 0.09
Total Mortgage-Backed Securities(Cost $86,442) 91,033 1.37
FaceValue(000’s)
Value(000’s)
$
% ofNet
AssetValue
Corporate Bonds and Notes — 43.42%(29 February 2020: 30.28%)
Australia — 0.10% (29 February 2020: 0.14%)
210 Glencore Funding LLC,144A,4.125%, due 12/03/2024 229 –
5,640 Glencore Funding LLC,144A,3.875%, due 27/10/2027 6,300 0.10
6,529 0.10
Belgium — 0.62% (29 February 2020: 0.54%)
4,690 Anheuser-Busch InBevWorldwide Inc,4.350%, due 01/06/2040 5,468 0.08
17,840 Anheuser-Busch InBevWorldwide Inc,5.550%, due 23/01/2049 23,250 0.35
7,800 Anheuser-Busch InBevWorldwide Inc,4.500%, due 01/06/2050 9,010 0.14
2,570 Anheuser-Busch InBevWorldwide Inc,5.800%, due 23/01/2059 3,556 0.05
41,284 0.62
Brazil — 0.94% (29 February 2020: 0.88%)
11,200 Petrobras Global FinanceBV,7.375%, due 17/01/2027 13,700 0.20
27,820 Petrobras Global FinanceBV,5.999%, due 27/01/2028 31,732 0.48
13,890 Petrobras Global FinanceBV,6.850%, due 05/06/2115 15,147 0.23
1,820 Suzano Austria GmbH,3.750%, due 15/01/2031 1,925 0.03
62,504 0.94
Canada — 0.17% (29 February 2020: 0.15%)
1,580 1011778 BC ULC / NewRed Finance Inc, 144A,4.250%, due 15/05/2024 1,598 0.02
1,440 1011778 BC ULC / NewRed Finance Inc, 144A,3.500%, due 15/02/2029 1,414 0.02
510 MEG Energy Corp, 144A,5.875%, due 01/02/2029 519 0.01
1,770 Primo Water Holdings Inc,144A,5.500%, due 01/04/2025 1,823 0.03
5,220 Yamana Gold Inc,4.625%, due 15/12/2027 5,803 0.09
11,157 0.17
China — 0.41% (29 February 2020: 0.13%)
8,930 Prosus NV, 144A,4.850%, due 06/07/2027 10,135 0.15
18,720 Prosus NV, 144A,3.832%, due 08/02/2051 17,044 0.26
27,179 0.41
Colombia — 0.33% (29 February 2020: 0.30%)
9,010 Ecopetrol SA,5.375%, due 26/06/2026 10,136 0.15
10,720 Ecopetrol SA,5.875%, due 28/05/2045 11,616 0.18
21,752 0.33
Denmark — 0.46% (29 February 2020: 0.38%)
1,170 Danske Bank A/S, 144A,5.000%, due 12/01/2022 1,215 0.02
4,760 Danske Bank A/S, 144A,5.375%, due 12/01/2024 5,354 0.08
EUR 18,920 Danske Bank A/S,5.875%, Perpetual * 23,827 0.36
30,396 0.46
France — 1.48% (29 February 2020: 1.63%)
10,943 Altice France SA/France,144A,7.375%, due 01/05/2026 11,424 0.17
2,380 BNP Paribas SA, 144A,4.705%, due 10/01/2025 * 2,641 0.04
FaceValue(000’s)
Value(000’s)
$
% ofNet
AssetValue
5,390 BNP Paribas SA, 144A,5.198%, due 10/01/2030 * 6,558 0.10
520 BNP Paribas SA, 144A,7.625%, Perpetual * 523 0.01
EUR 10,859 BNP Paribas SA,6.125%, Perpetual * 13,781 0.21
400 BNP Paribas SA, 144A,7.000%, Perpetual * 468 –
9,600 BNP Paribas SA, 144A,7.375%, Perpetual * 11,116 0.17
11,610 Credit Agricole SA, 144A,8.125%, Perpetual * 14,067 0.21
EUR 15,857 Credit Agricole SA,6.500%, Perpetual * 19,456 0.29
GBP 11,220 Credit Agricole SA,7.500%, Perpetual * 18,485 0.28
98,519 1.48
Germany — 0.09% (29 February 2020: 0.00%)
EUR 5,000 Hamburg CommercialBank AG,0.750%, due 23/11/2023 6,075 0.09
India — 0.39% (29 February 2020: 0.38%)
INR 500,000 NTPC Ltd, Series 53,9.170%, due 22/09/2024 7,528 0.11
INR 500,000 Power Finance Corp Ltd,Series 130C,8.390%, due 19/04/2025 7,270 0.11
INR 250,000 Power Grid Corp of IndiaLtd, Series C,8.200%, due 23/01/2025 3,674 0.06
INR 500,000 REC Ltd, Series 133,8.300%, due 10/04/2025 7,234 0.11
25,706 0.39
Israel — 1.50% (29 February 2020: 0.94%)
710 Teva PharmaceuticalFinance Co BV, Series 2,3.650%, due 10/11/2021 717 0.01
9,512 Teva PharmaceuticalFinance Co BV,2.950%, due 18/12/2022 9,552 0.14
1,185 Teva PharmaceuticalFinance IV BV,3.650%, due 10/11/2021 1,197 0.02
4,320 Teva PharmaceuticalFinance Netherlands III BV,2.200%, due 21/07/2021 4,328 0.06
5,853 Teva PharmaceuticalFinance Netherlands III BV,2.800%, due 21/07/2023 5,743 0.09
22,413 Teva PharmaceuticalFinance Netherlands III BV,7.125%, due 31/01/2025 24,304 0.37
7,975 Teva PharmaceuticalFinance Netherlands III BV,3.150%, due 01/10/2026 7,489 0.11
2,390 Teva PharmaceuticalFinance Netherlands III BV,6.750%, due 01/03/2028 2,645 0.04
51,712 Teva PharmaceuticalFinance Netherlands III BV,4.100%, due 01/10/2046 43,826 0.66
99,801 1.50
Italy — 0.98% (29 February 2020: 1.94%)
8,930 Enel Finance InternationalNV, 144A,6.000%, due 07/10/2039 12,399 0.19
2,675 Intesa Sanpaolo SpA,144A,5.017%, due 26/06/2024 2,918 0.04
1,690 Intesa Sanpaolo SpA,144A,5.710%, due 15/01/2026 1,906 0.03
EUR 27,280 Intesa Sanpaolo SpA,5.875%, Perpetual * 36,321 0.55
2,210 Telecom Italia SpA/Milano,144A,5.303%, due 30/05/2024 2,396 0.04
8,490 UniCredit SpA, 144A,6.572%, due 14/01/2022 8,893 0.13
64,833 0.98
^ Not authorised for sale to the public in Hong Kong.The accompanying notes are an integral part of the Financial Statements
124

Legg Mason Global Funds Plc Annual Report 28 February 2021
Legg Mason Western Asset Macro Opportunities Bond Fund^
Portfolio of Investments as at 28 February 2021 – (continued)
FaceValue(000’s)
Value(000’s)
$
% ofNet
AssetValue
Corporate Bonds and Notes — (continued)
Japan — 0.33% (29 February 2020: 0.00%)
8,580 Nissan Motor Co Ltd,144A,4.345%, due 17/09/2027 9,503 0.14
11,190 Nissan Motor Co Ltd,144A,4.810%, due 17/09/2030 12,498 0.19
22,001 0.33
Luxembourg — 0.17% (29 February 2020: 0.19%)
8,580 ArcelorMittal SA,3.600%, due 16/07/2024 9,111 0.14
1,550 ArcelorMittal SA,7.250%, due 15/10/2039 2,234 0.03
11,345 0.17
Macau — 0.19% (29 February 2020: 0.11%)
2,980 Sands China Ltd,4.600%, due 08/08/2023 3,200 0.05
4,380 Sands China Ltd,5.125%, due 08/08/2025 4,905 0.07
3,920 Wynn Macau Ltd, 144A,5.625%, due 26/08/2028 4,084 0.06
400 Wynn Macau Ltd, 144A,5.125%, due 15/12/2029 409 0.01
12,598 0.19
Malaysia — 0.26% (29 February 2020: 0.00%)
18,750 Axiata Spv5 Labuan Ltd,3.064%, due 19/08/2050 17,447 0.26
Mexico — 0.41% (29 February 2020: 0.38%)
3,900 Banco Mercantil del NorteSA/Grand Cayman, 144A,6.875%, Perpetual * 4,017 0.06
8,900 Banco Mercantil del NorteSA/Grand Cayman, 144A,7.625%, Perpetual * 10,021 0.15
15,780 Petroleos Mexicanos,6.375%, due 23/01/2045 13,531 0.20
27,569 0.41
Netherlands — 1.02% (29 February 2020: 1.13%)
EUR 19,200 Cooperatieve RabobankUA,6.625%, Perpetual * 23,633 0.35
EUR 27,600 Cooperatieve RabobankUA,4.625%, Perpetual * 36,380 0.55
1,300 Shell International FinanceBV,2.750%, due 06/04/2030 1,373 0.02
6,580 Shell International FinanceBV,3.250%, due 06/04/2050 6,670 0.10
68,056 1.02
South Africa — 0.09% (29 February 2020: 0.08%)
1,400 Anglo American CapitalPlc, 144A,4.000%, due 11/09/2027 1,590 0.02
3,950 Anglo American CapitalPlc, 144A,4.500%, due 15/03/2028 4,583 0.07
6,173 0.09
Spain — 0.69% (29 February 2020: 0.80%)
EUR 17,800 Banco Bilbao VizcayaArgentaria SA,8.875%, Perpetual * 21,687 0.33
EUR 19,800 Banco Santander SA,6.250%, Perpetual * 24,293 0.36
45,980 0.69
Supranational — 0.19% (29 February 2020: 0.17%)
IDR 175,900,000 International Bank forReconstruction &Development,8.400%, due 12/10/2021 12,541 0.19
Sweden — 0.22% (29 February 2020: 0.00%)
13,600 Svenska HandelsbankenAB,4.750%, Perpetual * 14,436 0.22
FaceValue(000’s)
Value(000’s)
$
% ofNet
AssetValue
Switzerland — 1.38% (29 February 2020: 0.89%)
2,970 Credit Suisse Group AG,144A,4.194%, due 01/04/2031 * 3,388 0.05
2,520 Credit Suisse Group AG,4.875%, due 15/05/2045 3,247 0.05
770 Credit Suisse Group AG,144A,7.250%, Perpetual * 875 0.01
8,680 Credit Suisse Group AG,144A,7.500%, Perpetual * 9,516 0.14
23,330 Credit Suisse Group AG,144A,5.250%, Perpetual * 24,846 0.38
200 Credit Suisse Group AG,144A,6.375%, Perpetual * 223 –
15,800 UBS Group AG, 144A,7.000%, Perpetual * 17,292 0.26
11,160 UBS Group AG,6.875%, Perpetual * 12,653 0.19
EUR 9,400 UBS Group AG,5.750%, Perpetual * 11,785 0.18
7,050 UBS Group AG,7.000%, Perpetual * 8,099 0.12
91,924 1.38
United Arab Emirates — 0.40% (29 February 2020: 0.01%)
770 DAE Funding LLC, 144A,5.750%, due 15/11/2023 792 0.01
24,000 MDGH – GMTN BV,3.950%, due 21/05/2050 25,750 0.39
26,542 0.40
United Kingdom — 2.57% (29 February 2020: 2.76%)
588 Barclays Bank Plc,7.625%, due 21/11/2022 647 0.01
9,340 Barclays Plc,4.972%, due 16/05/2029 * 11,013 0.16
340 Barclays Plc,5.088%, due 20/06/2030 * 395 0.01
14,720 Barclays Plc,8.000%, Perpetual * 16,623 0.25
9,260 Barclays Plc,7.750%, Perpetual * 10,068 0.15
13,360 BAT Capital Corp,3.557%, due 15/08/2027 14,517 0.22
10,340 BAT Capital Corp,4.540%, due 15/08/2047 10,623 0.16
10,750 HSBC Holdings Plc,4.583%, due 19/06/2029 * 12,399 0.19
8,028 HSBC Holdings Plc,6.500%, Perpetual * 9,127 0.14
3,280 Lloyds Banking Group Plc,7.500%, Perpetual * 3,644 0.05
6,410 Natwest Group Plc,6.000%, due 19/12/2023 7,275 0.11
57,370 Natwest Group Plc,5.125%, due 28/05/2024 64,227 0.97
6,970 Natwest Group Plc,8.625%, Perpetual * 7,212 0.11
900 Reynolds American Inc,6.150%, due 15/09/2043 1,125 0.02
1,530 Virgin Media SecuredFinance Plc, 144A,5.500%, due 15/05/2029 1,642 0.02
170,537 2.57
United States — 28.03% (29 February 2020: 16.27%)
2,150 3M Co,3.700%, due 15/04/2050 2,457 0.04
6,550 AbbVie Inc,2.950%, due 21/11/2026 7,087 0.11
14,790 AbbVie Inc,4.050%, due 21/11/2039 17,008 0.26
1,204 Altria Group Inc,4.400%, due 14/02/2026 1,373 0.02
1,045 Altria Group Inc,4.800%, due 14/02/2029 1,226 0.02
1,880 Altria Group Inc,2.450%, due 04/02/2032 1,827 0.03
3,000 Altria Group Inc,5.950%, due 14/02/2049 3,839 0.06
3,265 Altria Group Inc,6.200%, due 14/02/2059 4,166 0.06
FaceValue(000’s)
Value(000’s)
$
% ofNet
AssetValue
2,540 Amazon.com Inc,4.950%, due 05/12/2044 3,417 0.05
40,420 Amazon.com Inc,4.050%, due 22/08/2047 48,291 0.73
45,097 Amazon.com Inc,4.250%, due 22/08/2057 56,403 0.85
77,830 Amazon.com Inc,2.700%, due 03/06/2060 72,065 1.08
4,990 American InternationalGroup Inc,3.400%, due 30/06/2030 5,475 0.08
25,906 Apache Corp,5.100%, due 01/09/2040 26,481 0.40
5,610 Apache Corp,4.750%, due 15/04/2043 5,492 0.08
7,120 Apache Corp,4.250%, due 15/01/2044 6,675 0.10
5,990 Ardagh Packaging FinancePlc / Ardagh Holdings USAInc, 144A,6.000%, due 15/02/2025 6,198 0.09
3,250 Ardagh Packaging FinancePlc / Ardagh Holdings USAInc, 144A,5.250%, due 15/08/2027 3,370 0.05
25,580 BAC Capital Trust XIV,Series G,4.000%, Perpetual * 25,075 0.38
3,270 Bank of America Corp,2.592%, due 29/04/2031 * 3,361 0.05
550 Bank of America Corp,4.083%, due 20/03/2051 * 640 0.01
20,180 Bank of America Corp,Series X,6.250%, Perpetual * 22,121 0.33
29,340 Bank of America Corp,Series FF,5.875%, Perpetual * 32,119 0.48
31,390 Bank of America Corp,Series AA,6.100%, Perpetual * 34,899 0.53
1,504 Bausch Health AmericasInc, 144A,8.500%, due 31/01/2027 1,666 0.03
31,490 Bausch Health Cos Inc,144A,7.000%, due 15/03/2024 32,205 0.48
2,600 Bausch Health Cos Inc,144A,5.500%, due 01/11/2025 2,679 0.04
1,416 Bausch Health Cos Inc,144A,5.250%, due 30/01/2030 1,441 0.02
2,510 Blue Racer Midstream LLC /Blue Racer Finance Corp,144A,7.625%, due 15/12/2025 2,703 0.04
4,210 Boeing Co/The,5.150%, due 01/05/2030 4,909 0.07
9,590 Boeing Co/The,3.250%, due 01/02/2035 9,445 0.14
780 Boeing Co/The,3.550%, due 01/03/2038 772 0.01
600 Boeing Co/The,3.750%, due 01/02/2050 586 0.01
10,000 Boeing Co/The,5.805%, due 01/05/2050 12,920 0.19
3,000 Boeing Co/The,3.950%, due 01/08/2059 2,954 0.04
8,862 Boeing Co/The,5.930%, due 01/05/2060 11,659 0.18
2,500 Broadcom Inc,4.150%, due 15/11/2030 2,767 0.04
4,540 California Institute ofTechnology,3.650%, due 01/09/2119 4,823 0.07
8,870 Cameron LNG LLC, 144A,3.302%, due 15/01/2035 9,553 0.14
5,230 Cameron LNG LLC, 144A,3.701%, due 15/01/2039 5,726 0.09
1,280 Carrier Global Corp,2.700%, due 15/02/2031 1,321 0.02
1,670 CCO Holdings LLC / CCOHoldings Capital Corp,144A,5.000%, due 01/02/2028 1,751 0.03
^ Not authorised for sale to the public in Hong Kong.The accompanying notes are an integral part of the Financial Statements
125

Legg Mason Global Funds Plc Annual Report 28 February 2021
Legg Mason Western Asset Macro Opportunities Bond Fund^
Portfolio of Investments as at 28 February 2021 – (continued)
FaceValue(000’s)
Value(000’s)
$
% ofNet
AssetValue
Corporate Bonds and Notes — (continued)
United States — (continued)
600 CCO Holdings LLC / CCOHoldings Capital Corp,144A,4.500%, due 15/08/2030 622 0.01
2,910 CCO Holdings LLC / CCOHoldings Capital Corp,144A,4.500%, due 01/05/2032 2,993 0.05
680 Centene Corp,4.750%, due 15/01/2025 697 0.01
1,490 Centene Corp, 144A,5.375%, due 01/06/2026 1,559 0.02
13,380 Charter CommunicationsOperating LLC / CharterCommunicationsOperating Capital,4.200%, due 15/03/2028 15,008 0.23
5,740 Charter CommunicationsOperating LLC / CharterCommunicationsOperating Capital,5.375%, due 01/04/2038 6,878 0.10
1,540 Charter CommunicationsOperating LLC / CharterCommunicationsOperating Capital,4.800%, due 01/03/2050 1,696 0.03
10,730 Charter CommunicationsOperating LLC / CharterCommunicationsOperating Capital,6.834%, due 23/10/2055 15,384 0.23
1,780 Cheniere Corpus ChristiHoldings LLC,5.125%, due 30/06/2027 2,080 0.03
1,620 Cheniere Energy Inc, 144A,4.625%, due 15/10/2028 1,686 0.03
1,000 Chevron Corp,3.078%, due 11/05/2050 1,000 0.02
2,000 Chevron USA Inc,3.850%, due 15/01/2028 2,285 0.03
2,650 Cimarex Energy Co,3.900%, due 15/05/2027 2,926 0.04
5,690 Cimarex Energy Co,4.375%, due 15/03/2029 6,395 0.10
6,095 Citigroup Inc,8.125%, due 15/07/2039 10,302 0.15
4,834 Citigroup Inc,5.300%, due 06/05/2044 6,388 0.10
990 Citigroup Inc,4.750%, due 18/05/2046 1,226 0.02
2,600 Citigroup Inc,4.650%, due 23/07/2048 3,320 0.05
51,985 Citigroup Inc, Series P,5.950%, Perpetual * 56,534 0.85
1,660 Comcast Corp,3.400%, due 01/04/2030 1,847 0.03
320 Comcast Corp,3.750%, due 01/04/2040 362 0.01
370 Comcast Corp,3.400%, due 15/07/2046 390 0.01
560 Comcast Corp,4.700%, due 15/10/2048 712 0.01
1,750 Comcast Corp,3.450%, due 01/02/2050 1,857 0.03
8,789 CommonSpirit Health,4.350%, due 01/11/2042 10,056 0.15
2,890 CommonSpirit Health,3.817%, due 01/10/2049 3,161 0.05
1,530 CommScope TechnologiesLLC, 144A,5.000%, due 15/03/2027 1,502 0.02
6,107 ConocoPhillips, 144A,4.850%, due 15/08/2048 7,713 0.12
60 Continental Resources Inc/OK,4.375%, due 15/01/2028 63 –
5,060 Continental Resources Inc/OK, 144A,5.750%, due 15/01/2031 5,711 0.09
8,260 Continental Resources Inc/OK,4.900%, due 01/06/2044 8,273 0.12
FaceValue(000’s)
Value(000’s)
$
% ofNet
AssetValue
5,110 CSC Holdings LLC, 144A,6.500%, due 01/02/2029 5,661 0.09
1,400 CVS Health Corp,4.780%, due 25/03/2038 1,708 0.03
3,870 CVS Health Corp,4.125%, due 01/04/2040 4,412 0.07
33,380 CVS Health Corp,5.050%, due 25/03/2048 42,226 0.64
160 CVS Health Corp,4.250%, due 01/04/2050 186 –
4,342 DCP Midstream LP,Series A,7.375%, Perpetual * 3,788 0.06
2,405 DCP Midstream OperatingLP, 144A,6.450%, due 03/11/2036 2,701 0.04
5,990 DCP Midstream OperatingLP, 144A,6.750%, due 15/09/2037 6,769 0.10
6,150 Delta Air Lines Inc,3.400%, due 19/04/2021 6,164 0.09
6,530 Delta Air Lines Inc,3.625%, due 15/03/2022 6,632 0.10
2,940 Delta Air Lines Inc,3.800%, due 19/04/2023 3,015 0.05
3,916 Delta Air Lines Inc,2.900%, due 28/10/2024 3,900 0.06
7,440 Delta Air Lines Inc, 144A,7.000%, due 01/05/2025 8,674 0.13
4,020 Delta Air Lines Inc,7.375%, due 15/01/2026 4,713 0.07
354 Delta Air Lines Inc /SkyMiles IP Ltd,4.500%, due 20/10/2025 378 0.01
11,030 Delta Air Lines Inc /SkyMiles IP Ltd, 144A,4.500%, due 20/10/2025 11,784 0.18
354 Delta Air Lines Inc /SkyMiles IP Ltd,4.750%, due 20/10/2028 393 0.01
4,920 Delta Air Lines Inc /SkyMiles IP Ltd, 144A,4.750%, due 20/10/2028 5,466 0.08
8,660 Devon Energy Corp,5.850%, due 15/12/2025 10,150 0.15
1,690 Devon Energy Corp,7.875%, due 30/09/2031 2,348 0.04
1,440 Devon Energy Corp,7.950%, due 15/04/2032 2,032 0.03
3,512 Devon Energy Corp,5.600%, due 15/07/2041 4,291 0.06
2,650 Devon Energy Corp,4.750%, due 15/05/2042 2,978 0.04
3,265 Devon Energy Corp,5.000%, due 15/06/2045 3,824 0.06
1,380 Diamondback Energy Inc,2.875%, due 01/12/2024 1,462 0.02
2,100 Diamondback Energy Inc,3.250%, due 01/12/2026 2,235 0.03
400 Diamondback Energy Inc,3.500%, due 01/12/2029 421 0.01
3,720 Dignity Health,5.267%, due 01/11/2064 4,737 0.07
5,650 DISH DBS Corp,5.875%, due 15/11/2024 5,920 0.09
190 DISH DBS Corp,7.750%, due 01/07/2026 209 –
2,520 Energy Transfer OperatingLP,6.500%, due 01/02/2042 3,072 0.05
4,065 Energy Transfer OperatingLP,5.950%, due 01/10/2043 4,634 0.07
4,980 Energy Transfer OperatingLP,6.000%, due 15/06/2048 5,810 0.09
4,610 Energy Transfer OperatingLP,6.250%, due 15/04/2049 5,521 0.08
4,240 Energy Transfer OperatingLP,5.000%, due 15/05/2050 4,500 0.07
8,070 Energy Transfer OperatingLP, Series F,6.750%, Perpetual * 7,659 0.12
FaceValue(000’s)
Value(000’s)
$
% ofNet
AssetValue
8,380 Energy Transfer OperatingLP, Series G,7.125%, Perpetual * 8,104 0.12
2,970 Energy Transfer OperatingLP, Series B,6.625%, Perpetual * 2,628 0.04
2,568 Enterprise ProductsOperating LLC,6.125%, due 15/10/2039 3,502 0.05
4,131 Enterprise ProductsOperating LLC,6.450%, due 01/09/2040 5,738 0.09
1,566 Enterprise ProductsOperating LLC,5.950%, due 01/02/2041 2,086 0.03
2,330 Enterprise ProductsOperating LLC,5.100%, due 15/02/2045 2,838 0.04
2,995 Enterprise ProductsOperating LLC,4.250%, due 15/02/2048 3,264 0.05
4,680 Enterprise ProductsOperating LLC,5.375%, due 15/02/2078 * 4,676 0.07
420 EOG Resources Inc,4.375%, due 15/04/2030 494 0.01
1,320 EOG Resources Inc,4.950%, due 15/04/2050 1,674 0.03
380 EQT Corp,3.000%, due 01/10/2022 383 0.01
200 EQT Corp,7.625%, due 01/02/2025 233 –
570 EQT Corp,3.900%, due 01/10/2027 592 0.01
700 EQT Corp,5.000%, due 15/01/2029 768 0.01
5,690 Exxon Mobil Corp,4.327%, due 19/03/2050 6,727 0.10
2,920 Exxon Mobil Corp,3.452%, due 15/04/2051 3,002 0.05
28,515 FirstEnergy Corp, Series C,7.375%, due 15/11/2031 39,266 0.59
2,950 FirstEnergy Corp, Series C,5.350%, due 15/07/2047 3,516 0.05
200 Ford Motor Credit Co LLC,5.125%, due 16/06/2025 216 –
3,310 Ford Motor Credit Co LLC,3.375%, due 13/11/2025 3,368 0.05
4,445 Ford Motor Credit Co LLC,4.125%, due 17/08/2027 4,684 0.07
1,040 Ford Motor Credit Co LLC,2.900%, due 16/02/2028 1,026 0.02
3,770 Ford Motor Credit Co LLC,4.000%, due 13/11/2030 3,860 0.06
5,200 Fox Corp,5.476%, due 25/01/2039 6,685 0.10
70 Freeport-McMoRan Inc,3.875%, due 15/03/2023 73 –
250 Freeport-McMoRan Inc,4.550%, due 14/11/2024 276 –
1,120 Freeport-McMoRan Inc,4.625%, due 01/08/2030 1,240 0.02
4,450 Freeport-McMoRan Inc,5.450%, due 15/03/2043 5,537 0.08
5,370 GE Capital InternationalFunding Co Unlimited Co,4.418%, due 15/11/2035 6,140 0.09
180 General Dynamics Corp,4.250%, due 01/04/2040 220 –
840 General Dynamics Corp,4.250%, due 01/04/2050 1,047 0.02
590 General Electric Co,3.450%, due 01/05/2027 648 0.01
1,220 General Electric Co,3.625%, due 01/05/2030 1,333 0.02
5,483 General Electric Co,5.875%, due 14/01/2038 7,210 0.11
11,060 General Electric Co,6.875%, due 10/01/2039 15,800 0.24
1,270 General Electric Co,4.250%, due 01/05/2040 1,412 0.02
6,630 General Electric Co,4.350%, due 01/05/2050 7,386 0.11
915 Goldman Sachs Capital II,4.000%, Perpetual * 883 0.01
^ Not authorised for sale to the public in Hong Kong.The accompanying notes are an integral part of the Financial Statements
126

Legg Mason Global Funds Plc Annual Report 28 February 2021
Legg Mason Western Asset Macro Opportunities Bond Fund^
Portfolio of Investments as at 28 February 2021 – (continued)
FaceValue(000’s)
Value(000’s)
$
% ofNet
AssetValue
Corporate Bonds and Notes — (continued)
United States — (continued)
655 Goldman Sachs Capital III,Series APEX,4.000%, Perpetual * 640 0.01
12,340 Goldman Sachs Group Inc/The,6.750%, due 01/10/2037 18,023 0.27
16,590 Goldman Sachs Group Inc/The,5.150%, due 22/05/2045 21,918 0.33
16,180 Goldman Sachs Group Inc/The,4.750%, due 21/10/2045 20,951 0.32
5,990 Hackensack MeridianHealth Inc,4.211%, due 01/07/2048 7,244 0.11
610 HCA Inc,5.375%, due 01/02/2025 685 0.01
2,370 HCA Inc,7.690%, due 15/06/2025 2,876 0.04
380 HCA Inc,5.625%, due 01/09/2028 442 0.01
1,110 HCA Inc,5.875%, due 01/02/2029 1,310 0.02
1,610 HCA Inc,3.500%, due 01/09/2030 1,677 0.03
5,130 Hilton Worldwide FinanceLLC / Hilton WorldwideFinance Corp,4.875%, due 01/04/2027 5,345 0.08
280 Home Depot Inc/The,3.300%, due 15/04/2040 304 –
550 Home Depot Inc/The,3.350%, due 15/04/2050 587 0.01
6,290 ILFC E-Capital Trust I,144A,3.230%, due 21/12/2065 * 5,103 0.08
530 Intel Corp,4.600%, due 25/03/2040 668 0.01
3,140 JPMorgan Chase & Co,2.522%, due 22/04/2031 * 3,229 0.05
10,480 JPMorgan Chase & Co,2.956%, due 13/05/2031 * 10,963 0.16
4,320 JPMorgan Chase & Co,3.109%, due 22/04/2051 * 4,413 0.07
1,265 Kinder Morgan EnergyPartners LP,6.950%, due 15/01/2038 1,736 0.03
6,189 Kinder Morgan EnergyPartners LP,6.500%, due 01/09/2039 8,086 0.12
5,130 Kinder Morgan EnergyPartners LP,6.550%, due 15/09/2040 6,851 0.10
5,250 Kinder Morgan EnergyPartners LP,6.375%, due 01/03/2041 6,890 0.10
6,450 Kinder Morgan Inc,5.300%, due 01/12/2034 7,803 0.12
451 Kraft Heinz Foods Co,3.950%, due 15/07/2025 502 0.01
170 Kraft Heinz Foods Co,6.750%, due 15/03/2032 230 –
480 Kraft Heinz Foods Co,6.875%, due 26/01/2039 675 0.01
120 Kraft Heinz Foods Co,144A,7.125%, due 01/08/2039 176 –
120 Kraft Heinz Foods Co,4.625%, due 01/10/2039 138 –
60 Kraft Heinz Foods Co,5.000%, due 04/06/2042 71 –
1,750 Kraft Heinz Foods Co,4.375%, due 01/06/2046 1,911 0.03
1,930 Kraft Heinz Foods Co,4.875%, due 01/10/2049 2,263 0.03
1,550 Lamb Weston Holdings Inc,144A,4.875%, due 01/11/2026 1,609 0.02
8,050 Las Vegas Sands Corp,3.200%, due 08/08/2024 8,457 0.13
610 Las Vegas Sands Corp,2.900%, due 25/06/2025 633 0.01
1,740 Levi Strauss & Co,5.000%, due 01/05/2025 1,782 0.03
FaceValue(000’s)
Value(000’s)
$
% ofNet
AssetValue
1,190 Lowe’s Cos Inc,4.500%, due 15/04/2030 1,417 0.02
7,940 Mastercard Inc,3.850%, due 26/03/2050 9,344 0.14
4,050 McDonald’s Corp,4.450%, due 01/03/2047 4,882 0.07
3,370 McDonald’s Corp,4.450%, due 01/09/2048 4,049 0.06
340 McDonald’s Corp,3.625%, due 01/09/2049 366 0.01
1,090 McDonald’s Corp,4.200%, due 01/04/2050 1,283 0.02
1,380 MDC Holdings Inc,2.500%, due 15/01/2031 1,349 0.02
940 MDC Holdings Inc,6.000%, due 15/01/2043 1,243 0.02
3,140 Mileage Plus Holdings LLC /Mileage Plus IntellectualProperty Assets Ltd, 144A,6.500%, due 20/06/2027 3,434 0.05
910 Morgan Stanley,5.597%, due 24/03/2051 * 1,321 0.02
3,930 MPLX LP,4.800%, due 15/02/2029 4,602 0.07
7,720 MPLX LP,5.200%, due 01/03/2047 9,009 0.14
4,580 MPLX LP,4.700%, due 15/04/2048 5,027 0.08
8,730 MPLX LP,5.500%, due 15/02/2049 10,624 0.16
710 NIKE Inc,3.375%, due 27/03/2050 779 0.01
10,130 Northrop Grumman Corp,5.250%, due 01/05/2050 13,844 0.21
1,060 NVIDIA Corp,3.500%, due 01/04/2040 1,176 0.02
5,070 NVIDIA Corp,3.500%, due 01/04/2050 5,512 0.08
1,890 NVIDIA Corp,3.700%, due 01/04/2060 2,117 0.03
6,040 Occidental PetroleumCorp,6.950%, due 01/07/2024 6,674 0.10
1,940 Occidental PetroleumCorp,5.550%, due 15/03/2026 2,074 0.03
13,300 Occidental PetroleumCorp,6.625%, due 01/09/2030 15,149 0.23
28,830 Occidental PetroleumCorp,6.125%, due 01/01/2031 32,263 0.49
112,933 Occidental PetroleumCorp, zero coupon,due 10/10/2036 55,055 0.83
5,320 Occidental PetroleumCorp,6.200%, due 15/03/2040 5,759 0.09
11,725 Occidental PetroleumCorp,4.500%, due 15/07/2044 10,494 0.16
17,150 Occidental PetroleumCorp,4.625%, due 15/06/2045 15,649 0.24
7,820 Occidental PetroleumCorp,6.600%, due 15/03/2046 8,795 0.13
5,500 Occidental PetroleumCorp,4.400%, due 15/04/2046 4,932 0.07
2,360 Occidental PetroleumCorp,4.100%, due 15/02/2047 2,010 0.03
14,270 Occidental PetroleumCorp,4.200%, due 15/03/2048 12,183 0.18
2,860 Pacific Gas and Electric Co,2.500%, due 01/02/2031 2,783 0.04
890 Pacific Gas and Electric Co,3.300%, due 01/08/2040 848 0.01
3,190 Pacific Gas and Electric Co,3.500%, due 01/08/2050 2,892 0.04
1,980 Prime Security ServicesBorrower LLC / PrimeFinance Inc, 144A,5.750%, due 15/04/2026 2,136 0.03
FaceValue(000’s)
Value(000’s)
$
% ofNet
AssetValue
1,420 Procter & Gamble Co/The,3.000%, due 25/03/2030 1,560 0.02
2,325 PulteGroup Inc,6.375%, due 15/05/2033 3,081 0.05
835 Range Resources Corp,5.875%, due 01/07/2022 843 0.01
1,809 Range Resources Corp,5.000%, due 15/03/2023 1,821 0.03
4,760 Range Resources Corp,4.875%, due 15/05/2025 4,717 0.07
6,910 Rockies Express PipelineLLC, 144A,6.875%, due 15/04/2040 7,670 0.12
3,770 Spirit Loyalty Cayman Ltd /Spirit IP Cayman Ltd, 144A,8.000%, due 20/09/2025 4,250 0.06
2,740 Sprint Capital Corp,8.750%, due 15/03/2032 4,080 0.06
2,220 Sprint CommunicationsInc,11.500%, due 15/11/2021 2,374 0.04
210 Sprint Corp,7.875%, due 15/09/2023 243 –
2,135 Sunoco Logistics PartnersOperations LP,6.100%, due 15/02/2042 2,444 0.04
8,342 Sunoco Logistics PartnersOperations LP,5.400%, due 01/10/2047 9,172 0.14
310 Targa Resources PartnersLP / Targa ResourcesPartners Finance Corp,5.375%, due 01/02/2027 322 –
3,810 Targa Resources PartnersLP / Targa ResourcesPartners Finance Corp,5.500%, due 01/03/2030 4,078 0.06
1,440 Targa Resources PartnersLP / Targa ResourcesPartners Finance Corp,144A,4.875%, due 01/02/2031 1,479 0.02
810 Targa Resources PartnersLP / Targa ResourcesPartners Finance Corp,144A,4.000%, due 15/01/2032 795 0.01
1,730 Teachers Insurance &Annuity Association ofAmerica, 144A,4.900%, due 15/09/2044 2,224 0.03
11,910 The Vanguard Group Inc,3.050%,due 22/08/2050 †∞ 10,939 0.16
1,300 Time Warner Cable LLC,7.300%, due 01/07/2038 1,862 0.03
100 T-Mobile USA Inc,6.000%, due 01/03/2023 101 –
70 T-Mobile USA Inc,6.000%, due 15/04/2024 71 –
670 T-Mobile USA Inc,2.250%, due 15/02/2026 668 0.01
2,100 T-Mobile USA Inc,2.625%, due 15/02/2029 2,050 0.03
2,940 T-Mobile USA Inc, 144A,3.875%, due 15/04/2030 3,236 0.05
1,550 T-Mobile USA Inc,2.875%, due 15/02/2031 1,523 0.02
3,630 T-Mobile USA Inc, 144A,4.500%, due 15/04/2050 4,039 0.06
10,190 Toll Road InvestorsPartnership II LP, 144A,zero coupon,due 15/02/2024 9,326 0.14
2,100 Toll Road InvestorsPartnership II LP, 144A,zero coupon,due 15/02/2038 784 0.01
5,580 Transcontinental Gas PipeLine Co LLC,7.850%, due 01/02/2026 7,186 0.11
920 United Rentals NorthAmerica Inc,5.875%, due 15/09/2026 968 0.01
1,750 United Rentals NorthAmerica Inc,3.875%, due 15/11/2027 1,825 0.03
^ Not authorised for sale to the public in Hong Kong.The accompanying notes are an integral part of the Financial Statements
127

Legg Mason Global Funds Plc Annual Report 28 February 2021
Legg Mason Western Asset Macro Opportunities Bond Fund^
Portfolio of Investments as at 28 February 2021 – (continued)
FaceValue(000’s)
Value(000’s)
$
% ofNet
AssetValue
Corporate Bonds and Notes — (continued)United States — (continued)
3,340 United Rentals NorthAmerica Inc,5.250%, due 15/01/2030 3,680 0.06
320 United Rentals NorthAmerica Inc,3.875%, due 15/02/2031 328 –
530 VerizonCommunications Inc,4.000%, due 22/03/2050 580 0.01
106,289 Wachovia Capital Trust III,5.570%, Perpetual * 106,387 1.60
1,890 Wells Fargo & Co,4.478%, due 04/04/2031 * 2,236 0.03
7,400 Wells Fargo & Co,4.650%, due 04/11/2044 8,862 0.13
5,420 Wells Fargo & Co,4.400%, due 14/06/2046 6,374 0.10
2,930 Wells Fargo & Co,4.750%, due 07/12/2046 3,610 0.05
36,230 Wells Fargo & Co,5.013%, due 04/04/2051 * 48,534 0.73
3,926 Wells Fargo & Co, Series U,5.875%, Perpetual * 4,306 0.06
3,490 Wesleyan University,4.781%, due 01/07/2116 4,495 0.07
1,460 Western MidstreamOperating LP,4.350%, due 01/02/2025 1,497 0.02
4,630 Western MidstreamOperating LP,3.950%, due 01/06/2025 4,685 0.07
765 Western MidstreamOperating LP,4.650%, due 01/07/2026 793 0.01
5,100 Western MidstreamOperating LP,4.500%, due 01/03/2028 5,304 0.08
5,040 Western MidstreamOperating LP,4.750%, due 15/08/2028 5,292 0.08
9,610 Western MidstreamOperating LP,5.300%, due 01/02/2030 10,428 0.16
8,751 Western MidstreamOperating LP,5.450%, due 01/04/2044 9,298 0.14
3,370 Western MidstreamOperating LP,5.300%, due 01/03/2048 3,547 0.05
7,650 Western MidstreamOperating LP,5.500%, due 15/08/2048 7,918 0.12
1,330 Western MidstreamOperating LP,6.500%, due 01/02/2050 1,533 0.02
7,630 Williams Cos Inc/The,3.750%, due 15/06/2027 8,467 0.13
7,350 Williams Cos Inc/The,Series A,7.500%, due 15/01/2031 9,995 0.15
9,840 Williams Cos Inc/The,8.750%, due 15/03/2032 14,777 0.22
3,600 Williams Cos Inc/The,6.300%, due 15/04/2040 4,724 0.07
8,940 Williams Cos Inc/The,5.750%, due 24/06/2044 11,225 0.17
665 Williams Cos Inc/The,5.100%, due 15/09/2045 790 0.01
3,980 Willis-Knighton MedicalCenter, Series 2018,4.813%, due 01/09/2048 5,025 0.08
6,980 WPX Energy Inc,8.250%, due 01/08/2023 8,053 0.12
2,670 WPX Energy Inc,5.250%, due 15/10/2027 2,856 0.04
2,570 WPX Energy Inc,5.875%, due 15/06/2028 2,815 0.04
2,210 WPX Energy Inc,4.500%, due 15/01/2030 2,352 0.04
7,313 XPO CNW Inc,6.700%, due 01/05/2034 8,551 0.13
1,862,792 28.03
Total Corporate Bonds and Notes(Cost $2,661,674) 2,885,676 43.42
FaceValue(000’s)
Value(000’s)
$
% ofNet
AssetValue
Government Bonds and Notes — 42.35%(29 February 2020: 60.16%)Australia — 1.56% (29 February 2020: 0.52%)
AUD 99,260 Australia GovernmentBond, Series 150,3.000%, due 21/03/2047 78,792 1.19
AUD 41,790 Australia GovernmentBond, Series 162,1.750%, due 21/06/2051 24,727 0.37
103,519 1.56
Brazil — 2.06% (29 February 2020: 4.29%)
BRL 305,118 Brazil Notas do TesouroNacional Serie F,Series NTNF,10.000%, due 01/01/2023 58,264 0.88
BRL 144,130 Brazil Notas do TesouroNacional Serie F,Series NTNF,10.000%, due 01/01/2027 28,096 0.42
8,530 Brazilian GovernmentInternational Bond,4.250%, due 07/01/2025 9,226 0.14
41,800 Brazilian GovernmentInternational Bond,5.000%, due 27/01/2045 41,018 0.62
136,604 2.06
China — 3.58% (29 February 2020: 0.37%)
CNY 54,500 China Government Bond,3.380%, due 21/11/2024 8,643 0.13
CNY 121,000 China Government Bond,3.480%, due 29/06/2027 19,476 0.29
CNY 11,000 China Government Bond,3.600%, due 27/06/2028 1,782 0.03
CNY 490,000 China Government Bond,Series INBK,3.390%, due 16/03/2050 70,032 1.06
CNY 890,000 China Government Bond,Series INBK,3.810%, due 14/09/2050 137,800 2.07
237,733 3.58
Cote d’Ivoire (Ivory Coast) — 0.38%(29 February 2020: 0.00%)
EUR 4,020 Ivory Coast GovernmentInternational Bond, 144A,4.875%, due 30/01/2032 4,867 0.08
EUR 4,010 Ivory Coast GovernmentInternational Bond,4.875%, due 30/01/2032 4,854 0.07
1,414 Ivory Coast GovernmentInternational Bond,6.125%, due 15/06/2033 1,526 0.02
13,040 Ivory Coast GovernmentInternational Bond, 144A,6.125%, due 15/06/2033 14,074 0.21
25,321 0.38
Dominican Republic — 0.16% (29 February 2020: 0.00%)
11,020 Dominican RepublicInternational Bond, 144A,5.875%, due 30/01/2060 10,772 0.16
Egypt — 0.29% (29 February 2020: 1.25%)
EGP 22,000 Egypt Government Bond,Series 7YR,18.400%, due 30/05/2024 1,560 0.02
11,970 Egypt GovernmentInternational Bond, 144A,5.750%, due 29/05/2024 12,687 0.19
4,900 Egypt GovernmentInternational Bond, 144A,7.625%, due 29/05/2032 5,245 0.08
19,492 0.29
Ghana — 0.17% (29 February 2020: 0.03%)
2,180 Ghana GovernmentInternational Bond, 144A,7.875%, due 26/03/2027 2,375 0.04
3,170 Ghana GovernmentInternational Bond, 144A,10.750%, due 14/10/2030 4,152 0.06
4,700 Ghana GovernmentInternational Bond, 144A,8.950%, due 26/03/2051 4,613 0.07
11,140 0.17
FaceValue(000’s)
Value(000’s)
$
% ofNet
AssetValue
India — 1.88% (29 February 2020: 1.80%)
INR 300,000 Export-Import Bank ofIndia, Series P-03,9.300%, due 11/05/2022 4,307 0.07
INR 1,100,000 India Government Bond,7.800%, due 11/04/2021 15,035 0.23
INR 1,580,000 India Government Bond,Series SPB,8.130%, due 21/09/2022 22,722 0.34
INR 500,000 India Government Bond,7.160%, due 20/05/2023 7,129 0.11
INR 1,200,000 India Government Bond,8.830%, due 25/11/2023 17,862 0.27
INR 900,000 India Government Bond,6.180%, due 04/11/2024 12,584 0.19
INR 1,480,000 India Government Bond,8.150%, due 24/11/2026 22,009 0.33
INR 300,000 India Government Bond,7.170%, due 08/01/2028 4,260 0.06
INR 1,300,000 India Government Bond,7.590%, due 20/03/2029 18,806 0.28
124,714 1.88
Indonesia — 6.60% (29 February 2020: 5.96%)
IDR 18,941,000 Indonesia Treasury Bond,Series FR56,8.375%, due 15/09/2026 1,486 0.02
IDR 854,703,000 Indonesia Treasury Bond,Series FR59,7.000%, due 15/05/2027 62,784 0.94
IDR 547,847,000 Indonesia Treasury Bond,Series FR71,9.000%, due 15/03/2029 44,588 0.67
IDR 1,186,761,000 Indonesia Treasury Bond,Series FR78,8.250%, due 15/05/2029 92,292 1.39
IDR 1,057,630,000 Indonesia Treasury Bond,Series FR82,7.000%, due 15/09/2030 76,411 1.15
IDR 428,475,000 Indonesia Treasury Bond,Series FR87,6.500%, due 15/02/2031 29,735 0.45
IDR 1,311,792,000 Indonesia Treasury Bond,Series FR68,8.375%, due 15/03/2034 101,999 1.54
IDR 276,928,000 Indonesia Treasury Bond,Series FR72,8.250%, due 15/05/2036 21,334 0.32
IDR 39,561,000 Indonesia Treasury Bond,Series FR79,8.375%, due 15/04/2039 3,035 0.05
IDR 69,231,000 Indonesia Treasury Bond,Series FR76,7.375%, due 15/05/2048 4,959 0.07
438,623 6.60
Italy — 0.76% (29 February 2020: 0.75%)
EUR 27,680 Italy Buoni Poliennali DelTesoro, 144A,3.850%, due 01/09/2049 50,543 0.76
Mexico — 6.69% (29 February 2020: 6.27%)
MXN 6,476,784 Mexican Bonos, Series M,7.750%, due 13/11/2042 332,189 5.00
MXN 2,150,630 Mexican Bonos, Series M,8.000%, due 07/11/2047 112,750 1.69
444,939 6.69
Russia — 10.07% (29 February 2020: 8.32%)
RUB 1,043,860 Russian Federal Bond –OFZ, Series 6219,7.750%, due 16/09/2026 14,956 0.22
RUB 1,043,840 Russian Federal Bond –OFZ, Series 6226,7.950%, due 07/10/2026 15,077 0.23
RUB 9,834,551 Russian Federal Bond –OFZ, Series 6207,8.150%, due 03/02/2027 143,600 2.16
RUB 443,320 Russian Federal Bond –OFZ, Series 6232,6.000%, due 06/10/2027 5,804 0.09
RUB 11,647,347 Russian Federal Bond –OFZ, Series 6212,7.050%, due 19/01/2028 161,410 2.43
RUB 5,087,330 Russian Federal Bond –OFZ, Series 6224,6.900%, due 23/05/2029 69,402 1.04
^ Not authorised for sale to the public in Hong Kong.The accompanying notes are an integral part of the Financial Statements
128

Legg Mason Global Funds Plc Annual Report 28 February 2021
Legg Mason Western Asset Macro Opportunities Bond Fund^
Portfolio of Investments as at 28 February 2021 – (continued)
FaceValue(000’s)
Value(000’s)
$
% ofNet
AssetValue
Government Bonds and Notes — (continued)
Russia — (continued)
RUB 1,396,220 Russian Federal Bond –OFZ, Series 6228,7.650%, due 10/04/2030 19,976 0.30
RUB 514,670 Russian Federal Bond –OFZ, Series 6221,7.700%, due 23/03/2033 7,340 0.11
RUB 5,294,380 Russian Federal Bond –OFZ, Series 6225,7.250%, due 10/05/2034 72,837 1.10
RUB 11,060,250 Russian Federal Bond –OFZ, Series 6230,7.700%, due 16/03/2039 158,987 2.39
669,389 10.07
South Africa — 1.54% (29 February 2020: 1.30%)
ZAR 932,800 Republic of South AfricaGovernment Bond,Series R209,6.250%, due 31/03/2036 42,756 0.64
ZAR 440,120 Republic of South AfricaGovernment Bond,Series 2037,8.500%, due 31/01/2037 24,306 0.37
35,340 Republic of South AfricaGovernment InternationalBond,4.300%, due 12/10/2028 35,089 0.53
102,151 1.54
Ukraine — 0.10% (29 February 2020: 0.00%)
6,370 Ukraine GovernmentInternational Bond, 144A,7.375%, due 25/09/2032 6,571 0.10
United Arab Emirates — 0.87% (29 February 2020: 0.80%)
18,180 Abu Dhabi GovernmentInternational Bond, 144A,4.125%, due 11/10/2047 20,793 0.31
38,620 Abu Dhabi GovernmentInternational Bond, 144A,3.125%, due 30/09/2049 37,351 0.56
58,144 0.87
United States — 5.64% (29 February 2020: 24.51%)
1,820 Morongo Band of MissionIndians/The, 144A,7.000%, due 01/10/2039 2,185 0.03
12,270 United States TreasuryNote/Bond,0.500%, due 28/02/2026 12,143 0.18
96,880 United States TreasuryNote/Bond,1.125%, due 29/02/2028 96,986 1.46
24,530 United States TreasuryNote/Bond,1.125%, due 15/02/2031 23,932 0.36
7,650 United States TreasuryNote/Bond,4.500%, due 15/02/2036 10,518 0.16
1,470 United States TreasuryNote/Bond,1.375%, due 15/11/2040 1,315 0.02
12,320 United States TreasuryNote/Bond,1.875%, due 15/02/2041 12,060 0.18
29,440 United States TreasuryNote/Bond,3.125%, due 15/02/2043 35,169 0.53
10,710 United States TreasuryNote/Bond,2.375%, due 15/11/2049 11,322 0.17
11,990 United States TreasuryNote/Bond,2.000%, due 15/02/2050 11,683 0.18
27,850 United States TreasuryNote/Bond,1.250%, due 15/05/2050 22,500 0.34
5,130 United States TreasuryNote/Bond,1.375%, due 15/08/2050 4,284 0.06
115,180 United States TreasuryNote/Bond,1.625%, due 15/11/2050 ≠ 102,456 1.54
FaceValue(000’s)
Value(000’s)
$
% ofNet
AssetValue
29,800 United States TreasuryNote/Bond,1.875%, due 15/02/2051 28,226 0.43
374,779 5.64
Total Government Bonds and Notes(Cost $2,973,175) 2,814,434 42.35
Loan Notes — 1.47% (29 February 2020: 1.69%)
5,484 1011778 BC ULC,1.871%, due 14/11/2026 * 5,438 0.08
1,454 Alterra Mountain Co,2.871%, due 31/07/2024 * 1,450 0.02
234 Aramark Services Inc,1.871%, due 11/03/2025 * 233 –
2,810 Asurion LLC,3.121%, due 03/11/2024 * 2,806 0.04
1,169 Athenahealth Inc,4.453%, due 11/02/2026 * 1,178 0.02
1,553 Berry Global Inc,2.121%, due 19/01/2024 * 1,555 0.02
6,329 Caesars Resort CollectionLLC,2.871%, due 22/12/2024 * 6,279 0.10
4,903 Change HealthcareHoldings LLC,3.500%, due 01/03/2024 * 4,915 0.07
6,193 Charter CommunicationsOperating LLC,1.880%, due 30/04/2025 * 6,199 0.09
2,124 CityCenter Holdings LLC,3.000%, due 18/04/2024 * 2,110 0.03
2,848 Dell International LLC,0.000%, due 19/09/2025 * 2,860 0.04
1,451 Edelman Financial CenterLLC/The,3.121%, due 19/07/2025 * 1,443 0.02
2,504 Entercom Media Corp,2.622%, due 17/11/2024 * 2,476 0.04
1,056 Golden Nugget LLC,3.250%, due 04/10/2023 * 1,048 0.02
2,163 Hilton Worldwide FinanceLLC,1.868%, due 21/06/2026 * 2,160 0.03
1,641 Jane Street Group, LLC,0.000%, due 21/01/2027 * 1,638 0.03
4,206 Level 3 Parent LLC,1.871%, due 01/03/2027 * 4,195 0.06
2,579 Michaels Stores,4.250%, due 16/09/2027 * 2,584 0.04
4,171 MPH Acquisition HoldingsLLC,3.750%, due 07/06/2023 * 4,172 0.06
1,350 Phoenix Guarantor Inc,3.361%, due 05/03/2026 * 1,346 0.02
5,816 Prime Security,3.500%, due 23/09/2026 * 5,829 0.09
3,814 RegionalCare HospitalPartners Holding,3.871%, due 16/11/2025 * 3,823 0.06
1,645 Reynolds ConsumerProducts LLC,1.871%, due 04/02/2027 * 1,648 0.03
1,051 Reynolds Group HoldingsInc,2.871%, due 05/02/2023 * 1,050 0.02
6,750 Scientific GamesInternational Inc,2.871%, due 14/08/2024 * 6,652 0.10
4,354 SFR Group SA,3.800%, due 06/01/2026 * 4,358 0.07
4,743 TKC Holdings Inc,4.750%, due 01/02/2023 * 4,678 0.07
2,226 Trans Union LLC,1.871%, due 13/11/2026 * 2,231 0.03
7,973 Univision CommunicationsInc,4.750%, due 24/03/2026 * 8,028 0.12
1,226 Valeant PharmaceuticalsInternational,3.121%, due 28/05/2025 * 1,230 0.02
420 VFH Parent LLC,3.111%, due 01/03/2026 * 421 0.01
1,550 Virgin Media Bristol LLC,2.612%, due 04/01/2028 * 1,548 0.02
Total Loan Notes (Cost $97,971) 97,581 1.47
FaceValue(000’s)
Value(000’s)
$
% ofNet
AssetValue
Municipal Bonds — 0.35% (29 February 2020: 0.52%)
4,240 City of Detroit MI,4.000%, due 01/04/2044 4,043 0.06
950 Regents of the University ofCalifornia Medical CenterPooled Revenue,3.706%, due 15/05/2120 990 0.01
16,530 State of Illinois,5.100%, due 01/06/2033 18,479 0.28
Total Municipal Bonds (Cost $20,643) 23,512 0.35
Collective Investment Schemes — 2.38%(29 February 2020: 0.57%)
5,374 Legg Mason China Funds –Western Asset China BondFund – Class LM ** 74,803 1.13
EUR 122 Legg Mason QualifiedInvestor Funds (II) Plc –Western Asset EuropeanLoan Fund – LM Class EuroAccumulating 15,425 0.23
67,809 Western Asset LiquidityFunds Plc – Western AssetUS Dollar Liquidity Fund –Class WA (Distributing) 67,809 1.02
Total Collective Investment Schemes(Cost $153,212) 158,037 2.38
Total Investments and PledgedInvestments at fair value through profitor loss (Cost $6,054,877) 6,136,411 92.33
Contracts(000’s)
Value(000’s)
$
% ofNet
AssetValue
Purchased Options — 0.48% (29 February 2020: 0.40%)
– Australian Dollar CurrencyFuture March 2021 Call76.00, due 05/03/2021 –Bank of America MerrillLynch 340 0.01
1 Euro Currency FutureApril 2021 Put1.21, due 09/04/2021 –Bank of America MerrillLynch 815 0.01
– Euro Currency FutureMarch 2021 Call1.20, due 05/03/2021 –Bank of America MerrillLynch 161 –
– Euro Currency FutureMarch 2021 Call1.2050, due 05/03/2021 –Bank of America MerrillLynch 321 –
– Euro Currency FutureMarch 2021 Put1.2150, due 05/03/2021 –Bank of America MerrillLynch 430 0.01
– U.S. 10 Year April 2021Call133.50, due 26/03/2021 –Bank of America MerrillLynch 123 –
1 U.S. 10 Year April 2021Call134.00, due 26/03/2021 –Bank of America MerrillLynch 307 –
– U.S. 10 Year April 2021 Put134.25, due 26/03/2021 –Bank of America MerrillLynch 436 0.01
1 U.S. 10 Year April 2021 Put135.50, due 26/03/2021 –Bank of America MerrillLynch 3,523 0.05
1 U.S. Bond April 2021 Call159.00, due 26/03/2021 –Bank of America MerrillLynch 2,292 0.03
^ Not authorised for sale to the public in Hong Kong.The accompanying notes are an integral part of the Financial Statements
129

Legg Mason Global Funds Plc Annual Report 28 February 2021
Legg Mason Western Asset Macro Opportunities Bond Fund^
Portfolio of Investments as at 28 February 2021 – (continued)
Contracts(000’s)
Value(000’s)
$
% ofNet
AssetValue
Purchased Options — (continued)
– U.S. Bond April 2021 Call161.00, due 26/03/2021 –Bank of America MerrillLynch 510 0.01
– U.S. Bond April 2021 Call162.00, due 26/03/2021 –Bank of America MerrillLynch 329 0.01
– U.S. Bond April 2021 Call164.00, due 26/03/2021 –Bank of America MerrillLynch 98 –
1 U.S. Bond May 2021 Call159.00, due 23/04/2021 –Bank of America MerrillLynch 1,333 0.02
– U.S. Long Bond W1 March2021 Call159.00, due 05/03/2021 –Bank of America MerrillLynch 314 –
70,860 USD Call/BRL Put5.20, due 17/03/2021 –Morgan Stanley 5,154 0.08
70,590 USD Call/BRL Put5.45, due 01/03/2021 –Morgan Stanley 1,905 0.03
70,410 USD Call/MXN Put20.00, due 05/03/2021 –Goldman Sachs 3,197 0.05
70,590 USD Call/MXN Put20.60, due 01/03/2021 –Morgan Stanley 1,153 0.02
70,250 USD Put/CNH Call6.50, due 21/05/2021 –JP Morgan 568 0.01
74,360 USD Put/MXN Call20.45, due 24/05/2021 –Citi 1,193 0.02
34,740 USD Put/RUB Call72.46, due 12/05/2021 –Goldman Sachs 330 0.01
36,990 USD Put/RUB Call72.60, due 21/05/2021 –Goldman Sachs 410 0.01
34,740 USD Put/RUB Call72.80, due 12/03/2021 –Goldman Sachs 71 –
36,990 USD Put/RUB Call72.90, due 01/04/2021 –Goldman Sachs 254 –
74,760 USD Put/RUB Call74.7179, due 04/05/2021– Morgan Stanley 1,573 0.02
69,737 USD Put/RUB Call75.10, due 26/04/2021 –Goldman Sachs 1,574 0.02
74,760 USD Put/RUB Call75.1375, due 02/03/2021– Morgan Stanley 567 0.01
75,070 USD Put/RUB Call76.00, due 05/05/2021 –Citi 2,347 0.04
Total Purchased Options (Cost $25,136) 31,628 0.48
Credit Default Swaps — 0.30% (29 February 2020: 0.15%)
Unrealised appreciation of contracts(see below) 19,851 0.30
Interest Rate Swaps — 9.24% (29 February 2020: 0.06%)
Unrealised appreciation of contracts(see below) 614,088 9.24
Forward Foreign Currency Contracts — 1.37%(29 February 2020: 1.24%)
Unrealised appreciation of contracts(see below) 90,962 1.37
Futures — 1.77% (29 February 2020: 3.79%)
Unrealised appreciation of contracts(see below) 117,968 1.77
Total Financial Assets at fair valuethrough profit or loss 7,010,908 105.49
Contracts(000’s)
Value(000’s)
$
% ofNet
AssetValue
Written Options — (0.51%) (29 February 2020: (1.49%))
– Australian DollarCurrency Future April2021 Call 78.50, due09/04/2021 – Bank ofAmerica Merrill Lynch (159) –
(1) Australian DollarCurrency Future March2021 Call 77.50, due05/03/2021 – Bank ofAmerica Merrill Lynch (235) –
(1) Australian DollarCurrency Future March2021 Call78.00, due 05/03/2021 –Bank of America MerrillLynch (130) –
– British Pound CurrencyFuture March 2021 Call137.50, due 05/03/2021– Bank of America MerrillLynch (342) (0.01)
– Canadian Dollar CurrencyFuture April 2021 Call79.50, due 09/04/2021 –Bank of America MerrillLynch (62) –
– Canadian Dollar CurrencyFuture April 2021 Call80.00, due 09/04/2021 –Bank of America MerrillLynch (42) –
– Canadian Dollar CurrencyFuture March 2021 Call79.00, due 05/03/2021 –Bank of America MerrillLynch (97) –
– Euro Currency FutureMarch 2021 Call1.21, due 05/03/2021 –Bank of America MerrillLynch (53) –
– Euro Currency FutureMarch 2021 Call1.2150, due 05/03/2021– Bank of America MerrillLynch (38) –
– Euro Currency FutureMarch 2021 Call1.22, due 05/03/2021 –Bank of America MerrillLynch (61) –
– Euro Currency FutureMarch 2021 Put1.21, due 05/03/2021 –Bank of America MerrillLynch (238) –
EUR – Euro-Bund April 2021Call172.00, due 26/03/2021– Bank of America MerrillLynch (131) –
(1) U.S. 10 Year April 2021Call134.50, due 26/03/2021– Bank of America MerrillLynch (230) –
(1) U.S. 10 Year April 2021Call134.75, due 26/03/2021– Bank of America MerrillLynch (78) –
(1) U.S. 10 Year April 2021Call135.00, due 26/03/2021– Bank of America MerrillLynch (155) –
(1) U.S. 10 Year April 2021Call135.50, due 26/03/2021– Bank of America MerrillLynch (46) –
(3) U.S. 10 Year April 2021Call136.00, due 26/03/2021– Bank of America MerrillLynch (85) –
Contracts(000’s)
Value(000’s)
$
% ofNet
AssetValue
(7) U.S. 10 Year April 2021Call136.50, due 26/03/2021– Bank of America MerrillLynch (216) –
– U.S. 10 Year April 2021Call137.00, due 26/03/2021– Bank of America MerrillLynch (2) –
– U.S. 10 Year April 2021Call137.50, due 26/03/2021– Bank of America MerrillLynch (5) –
– U.S. 10 Year April 2021Put134.50, due 26/03/2021– Bank of America MerrillLynch (969) (0.02)
(1) U.S. 10 Year April 2021Put135.00, due 26/03/2021– Bank of America MerrillLynch (1,776) (0.03)
– U.S. 10 Year June 2021Call135.50, due 21/05/2021– Bank of America MerrillLynch (126) –
(1) U.S. 10 Year May 2021Call134.00, due 23/04/2021– Bank of America MerrillLynch (591) (0.01)
(2) U.S. 10 Year May 2021Call135.00, due 23/04/2021– Bank of America MerrillLynch (420) (0.01)
(1) U.S. 10 Year May 2021Call135.50, due 23/04/2021– Bank of America MerrillLynch (95) –
(1) U.S. 10 Year May 2021Call136.00, due 23/04/2021– Bank of America MerrillLynch (184) –
(2) U.S. 10 Year May 2021Call136.50, due 23/04/2021– Bank of America MerrillLynch (174) –
– U.S. 10 Year W1 March2021 Call133.75, due 05/03/2021– Bank of America MerrillLynch (61) –
– U.S. 10 Year W2 March2021 Call134.75, due 12/03/2021– Bank of America MerrillLynch (31) –
(1) U.S. 5 Year April 2021Call124.75, due 26/03/2021– Bank of America MerrillLynch (130) –
(1) U.S. 5 Year April 2021Call125.00, due 26/03/2021– Bank of America MerrillLynch (96) –
(1) U.S. 5 Year April 2021Call125.25, due 26/03/2021– Bank of America MerrillLynch (38) –
(5) U.S. 5 Year April 2021Call125.75, due 26/03/2021– Bank of America MerrillLynch (74) –
(1) U.S. Bond April 2021 Call163.00, due 26/03/2021– Bank of America MerrillLynch (517) (0.01)
^ Not authorised for sale to the public in Hong Kong.The accompanying notes are an integral part of the Financial Statements
130

Legg Mason Global Funds Plc Annual Report 28 February 2021
Legg Mason Western Asset Macro Opportunities Bond Fund^
Portfolio of Investments as at 28 February 2021 – (continued)
Contracts(000’s)
Value(000’s)
$
% ofNet
AssetValue
Written Options — (continued)
(2) U.S. Bond April 2021 Call166.00, due 26/03/2021– Bank of America MerrillLynch (175) –
– U.S. Bond April 2021 Call167.00, due 26/03/2021– Bank of America MerrillLynch (29) –
– U.S. Bond April 2021 Call168.00, due 26/03/2021– Bank of America MerrillLynch (24) –
(1) U.S. Bond April 2021 Call169.00, due 26/03/2021– Bank of America MerrillLynch (46) –
(1) U.S. Bond April 2021 Call170.00, due 26/03/2021– Bank of America MerrillLynch (19) –
– U.S. Bond April 2021 Put162.00, due 26/03/2021– Bank of America MerrillLynch (1,706) (0.03)
– U.S. Bond April 2021 Put165.00, due 26/03/2021– Bank of America MerrillLynch (2,215) (0.03)
– U.S. Bond April 2021 Put166.00, due 26/03/2021– Bank of America MerrillLynch (854) (0.01)
(2) U.S. Bond June 2021 Call165.00, due 21/05/2021– Bank of America MerrillLynch (1,688) (0.03)
– U.S. Bond June 2021 Call166.00, due 21/05/2021– Bank of America MerrillLynch (330) (0.01)
(1) U.S. Bond May 2021 Call164.00, due 23/04/2021– Bank of America MerrillLynch (531) (0.01)
(1) U.S. Bond May 2021 Call165.00, due 23/04/2021– Bank of America MerrillLynch (592) (0.01)
(1) U.S. Bond May 2021 Call166.00, due 23/04/2021– Bank of America MerrillLynch (269) (0.01)
(1) U.S. Long Bond W1March 2021 Call162.00, due 05/03/2021– Bank of America MerrillLynch (173) –
– U.S. Long Bond W1March 2021 Call163.00, due 05/03/2021– Bank of America MerrillLynch (15) –
Contracts(000’s)
Value(000’s)
$
% ofNet
AssetValue
(1) U.S. Long Bond W2March 2021 Call161.00, due 12/03/2021– Bank of America MerrillLynch (471) (0.01)
(141,720) USD Call/BRL Put5.48, due 17/03/2021 –Morgan Stanley (4,246) (0.07)
(69,880) USD Call/BRL Put5.5720, due 06/04/2021– Morgan Stanley (1,942) (0.03)
(74,760) USD Call/BRL Put5.6455, due 30/04/2021– BNP Paribas (2,106) (0.03)
(141,180) USD Call/BRL Put5.7250, due 01/03/2021– Morgan Stanley – –
(70,250) USD Call/CNH Put6.90, due 21/05/2021 –JP Morgan (75) –
(140,820) USD Call/MXN Put20.85, due 05/03/2021 –Goldman Sachs (1,745) (0.03)
(141,180) USD Call/MXN Put21.50, due 01/03/2021 –Morgan Stanley – –
(70,850) USD Call/RUB Put75.8360, due 11/03/2021– Goldman Sachs (416) (0.01)
(37,220) USD Put/BRL Call5.2630, due 10/05/2021– Morgan Stanley (327) (0.01)
(37,220) USD Put/BRL Call5.3340, due 10/03/2021– Morgan Stanley (37) –
(74,760) USD Put/BRL Call5.3625, due 30/04/2021– BNP Paribas (901) (0.01)
(148,720) USD Put/MXN Call19.90, due 24/05/2021 –Citi (1,199) (0.02)
(139,474) USD Put/RUB Call73.0890, due 26/04/2021– Goldman Sachs (1,423) (0.02)
(150,140) USD Put/RUB Call73.80, due 05/05/2021 –Citi (2,291) (0.04)
Total Written Options (Cost $(44,489)) (33,532) (0.51)
Credit Default Swaps — (0.13%)(29 February 2020: (0.03%))
Unrealised depreciation of contracts(see below) (9,000) (0.13)
Interest Rate Swaps — (0.33%)(29 February 2020: (9.13%))
Unrealised depreciation of contracts(see below) (21,745) (0.33)
Forward Foreign Currency Contracts — (0.60%)(29 February 2020: (1.44%))
Unrealised depreciation of contracts(see below) (39,458) (0.60)
Contracts(000’s)
Value(000’s)
$
% ofNet
AssetValue
Futures — (2.93%) (29 February 2020: (2.12%))
Unrealised depreciation of contracts(see below) (194,870) (2.93)
Total Financial Liabilities at fair valuethrough profit or loss (298,605) (4.50)
Total Financial Assets and FinancialLiabilities at fair value through profitor loss 6,712,303 100.99
Liabilities in Excess of Other Assets (66,223) (0.99)
Total Net Assets $6,646,080 100.00
– Amounts designated as “–” are either $0, less than$1,000, less than 1,000 shares or less than 0.01%.
144A Securities exempt from registration under Rule 144A ofthe Securities Act of 1933, as amended. Thesesecurities may only be resold, in transactions exemptfrom registration, to qualified institutional buyers. As at28 February 2021, these securities amounted to$718,410,000 or 10.79% of net assets.
* Variable rate security. The interest rate shown reflectsthe rate in effect at 28 February 2021.
† Illiquid.
∞ Security is valued in good faith at fair value by or at thediscretion of the Manager or the respective InvestmentManager.
≠ Security (in whole or part) pledged as collateral forderivatives trading as at 28 February 2021.
� The rate of interest on this type of security is tied to theConsumer Price Index (CPI)/Retail Price Index (RPI). Thecoupon rate is the rate as of 28 February 2021.
** On 31 March 2021, Class M of the Unit Trust was re-named into Class LM.
ABBREVIATIONS:
Perpetual – A bond with no maturity date. Perpetual bondsare not redeemable but pay a steady stream ofinterest.
REMIC – Real Estate Mortgage Investment Conduit.
AUD – Australian Dollar
BRL – Brazilian Real
CNY – Chinese Renminbi
EGP – Egyptian Pound
EUR – Euro
GBP – British Pound
IDR – Indonesian Rupiah
INR – Indian Rupee
MXN – Mexican Peso
RUB – Russian Ruble
ZAR – South Africa Rand
Analysis of Total Assets
% ofTotal
Assets
Transferable securities admitted to an officialexchange listing or traded on a regulated market 75.28
Other transferable securities dealt in on anotherregulated market 1.25
Collective investment schemes 2.02
Financial derivative instruments 11.19
Other assets 10.26
Total Assets 100.00
Schedule of Credit Default Swaps
Counterparty Reference EntityBuy/Sell
ProtectionExpiration
Date
NotionalAmount(000’s)
Value(000’s)
Bank of America Merrill Lynch CDX.NA.HY, 5.000% Buy 20/12/2025 109,672 $ (9,000)Bank of America Merrill Lynch CDX.NA.IG, 1.000% Sell 20/06/2025 337,579 5,236Bank of America Merrill Lynch CDX.NA.IG, 1.000% Sell 20/12/2025 697,962 14,615
Unrealised Appreciation of Credit Default Swaps (29 February 2020 (000’s): $11,398) $ 19,851Unrealised Depreciation of Credit Default Swaps (29 February 2020 (000’s): $(1,987)) (9,000)
Net Appreciation of Credit Default Swaps (29 February 2020 (000’s): $9,411) $ 10,851
^ Not authorised for sale to the public in Hong Kong.The accompanying notes are an integral part of the Financial Statements
131

Legg Mason Global Funds Plc Annual Report 28 February 2021
Legg Mason Western Asset Macro Opportunities Bond Fund^
Portfolio of Investments as at 28 February 2021 – (continued)
Schedule of Interest Rate Swaps
Counterparty RateExpiration
Date
NotionalAmount(000’s)
Value(000’s)
Bank of America Merrill Lynch Pay Floating USD 3M Libor BBA, Receive Fixed 0.190% 15/06/2022 990,564 $ (76)
Bank of America Merrill Lynch Pay Floating USD Fed Funds Rate, Receive Fixed 0.100% 30/11/2024 387,061 (4,963)
Bank of America Merrill Lynch Pay Floating USD 3M Libor BBA, Receive Fixed 0.380% 28/02/2025 443,228 (5,021)
Bank of America Merrill Lynch Pay Floating USD 3M Libor BBA, Receive Fixed 1.410% 01/03/2025 663,700 (66)
Bank of America Merrill Lynch Pay Floating USD 3M Libor BBA, Receive Fixed 0.840% 27/11/2025 704,168 (5,841)
Bank of America Merrill Lynch Pay Floating USD 3M Libor BBA, Receive Fixed 1.100% 18/12/2025 776,706 (4,571)
Bank of America Merrill Lynch Pay Fixed 0.260%, Receive Floating USD Fed Funds Rate 15/05/2027 490,643 19,584
Bank of America Merrill Lynch Pay Fixed 0.450%, Receive Floating USD 3M Libor BBA 15/05/2027 4,504,080 178,983
Bank of America Merrill Lynch Pay Fixed 0.713%, Receive Floating USD 3M Libor BBA 20/05/2030 644,729 43,522
Bank of America Merrill Lynch Pay Fixed 0.689%, Receive Floating USD 3M Libor BBA 24/06/2030 681,080 48,452
Bank of America Merrill Lynch Pay Fixed 0.680%, Receive Floating USD 3M Libor BBA 08/07/2030 678,310 49,190
Bank of America Merrill Lynch Pay Fixed 0.560%, Receive Floating USD Sofr Compound 20/07/2045 21,760 4,920
Bank of America Merrill Lynch Pay Fixed 0.800%, Receive Floating USD 3M Libor BBA 15/11/2045 905,572 209,614
Bank of America Merrill Lynch Pay Fixed 1.000%, Receive Floating USD 3M Libor BBA 15/02/2047 209,330 41,577
Bank of America Merrill Lynch Pay Fixed 1.200%, Receive Floating USD 3M Libor BBA 15/02/2047 30,447 4,744
Bank of America Merrill Lynch Pay Fixed 1.225%, Receive Floating USD 3M Libor BBA 15/02/2047 14,842 2,148
Bank of America Merrill Lynch Pay Fixed 1.600%, Receive Floating USD 3M Libor BBA 15/02/2047 34,952 2,498
Bank of America Merrill Lynch Pay Fixed 1.200%, Receive Floating USD 3M Libor BBA 07/10/2050 23,117 4,004
Goldman Sachs Pay Floating RUB 3M MosPrime Reuters, Receive Fixed 6.500% 20/11/2021 17,825,900 2,046
Goldman Sachs Pay Floating RUB 3M MosPrime Reuters, Receive Fixed 6.500% 20/11/2021 15,279,400 1,754
Goldman Sachs Pay Floating RUB 3M MosPrime Reuters, Receive Fixed 6.500% 20/11/2021 9,167,700 1,052
Goldman Sachs Pay Floating BRL CDI, Receive Fixed 3.383% 04/01/2022 4,329,056 (1,207)
Unrealised Appreciation of Interest Rate Swaps (29 February 2020 (000’s): $4,535) $ 614,088
Unrealised Depreciation of Interest Rate Swaps (29 February 2020 (000’s): $(697,710)) (21,745)
Net Appreciation of Interest Rate Swaps (29 February 2020 (000’s): $(693,175)) $ 592,343
Schedule of Forward Foreign Currency Contracts
Expiration Date CounterpartyBuy Currency
(000’s)Sell Currency
(000’s)
UnrealisedAppreciation/(Depreciation)of Contracts
(000’s)
01/03/2021 BNY Mellon Buy USD 184,427 Sell BRL 1,007,950 $ 4,57201/03/2021 BNY Mellon Buy BRL 1,007,950 Sell USD 185,944 (6,088)02/03/2021 Morgan Stanley Buy USD 3,378 Sell BRL 18,226 12602/03/2021 Morgan Stanley Buy USD 555 Sell MXN 11,287 1502/03/2021 Morgan Stanley Buy USD 29,455 Sell RUB 2,247,008 (689)08/03/2021 Goldman Sachs Buy USD 1,006 Sell MXN 20,047 4908/03/2021 Goldman Sachs Buy MXN 20,047 Sell USD 1,005 (48)11/03/2021 Citi Buy USD 13,654 Sell BRL 74,235 41311/03/2021 Goldman Sachs Buy USD 19,484 Sell RUB 1,437,414 23711/03/2021 Morgan Stanley Buy BRL 74,235 Sell USD 13,647 (407)11/03/2021 Morgan Stanley Buy RUB 1,437,414 Sell USD 19,477 (231)12/03/2021 BNY Mellon Buy USD 61 Sell AUD 81 –12/03/2021 BNY Mellon Buy USD 17,889 Sell AUD 22,820 32912/03/2021 BNY Mellon Buy USD 14,716 Sell CHF 13,252 14612/03/2021 BNY Mellon Buy USD 409 Sell CNH 2,646 –12/03/2021 BNY Mellon Buy USD 27,591 Sell EUR 22,909 (60)12/03/2021 BNY Mellon Buy USD 183,761 Sell EUR 151,247 1,21312/03/2021 BNY Mellon Buy USD 48,768 Sell GBP 34,715 39912/03/2021 BNY Mellon Buy USD 38,115 Sell GBP 27,475 (168)12/03/2021 BNY Mellon Buy USD 4,954 Sell JPY 522,747 4812/03/2021 BNY Mellon Buy USD 239 Sell NOK 2,020 412/03/2021 BNY Mellon Buy USD 187 Sell PLN 693 212/03/2021 BNY Mellon Buy USD 3,134 Sell SEK 25,961 5912/03/2021 BNY Mellon Buy USD 1 Sell SEK 8 –12/03/2021 BNY Mellon Buy USD 96 Sell SGD 127 –12/03/2021 BNY Mellon Buy USD 8,047 Sell SGD 10,663 5212/03/2021 BNY Mellon Buy NOK 30,713 Sell USD 3,582 (38)12/03/2021 BNY Mellon Buy CNH 50,966 Sell USD 7,875 (24)12/03/2021 BNY Mellon Buy CHF 92,789 Sell USD 103,252 (1,203)12/03/2021 BNY Mellon Buy SEK 572,309 Sell USD 68,140 (349)12/03/2021 BNY Mellon Buy GBP 684,818 Sell USD 934,430 19,74112/03/2021 BNY Mellon Buy EUR 24,946 Sell USD 30,304 (199)12/03/2021 BNY Mellon Buy GBP 4,681 Sell USD 6,586 (63)12/03/2021 BNY Mellon Buy PLN 15,769 Sell USD 4,234 (26)12/03/2021 BNY Mellon Buy SGD 133,646 Sell USD 100,274 (49)12/03/2021 BNY Mellon Buy EUR 1,776,912 Sell USD 2,139,326 5,31812/03/2021 BNY Mellon Buy JPY 11,698,798 Sell USD 111,368 (1,602)
^ Not authorised for sale to the public in Hong Kong.The accompanying notes are an integral part of the Financial Statements
132

Legg Mason Global Funds Plc Annual Report 28 February 2021
Legg Mason Western Asset Macro Opportunities Bond Fund^
Portfolio of Investments as at 28 February 2021 – (continued)
Schedule of Forward Foreign Currency Contracts – (continued)
Expiration Date CounterpartyBuy Currency
(000’s)Sell Currency
(000’s)
UnrealisedAppreciation/(Depreciation)of Contracts
(000’s)
12/03/2021 BNY Mellon Buy AUD 3,510 Sell USD 2,748 $ (46)12/03/2021 BNY Mellon Buy AUD 291,394 Sell USD 222,642 1,58412/03/2021 BNY Mellon Buy SGD 692 Sell USD 518 112/03/2021 Goldman Sachs Buy USD 13,201 Sell RUB 974,645 15301/04/2021 BNY Mellon Buy USD 2,628 Sell BRL 14,469 5001/04/2021 BNY Mellon Buy BRL 965,994 Sell USD 176,606 (4,449)01/04/2021 Goldman Sachs Buy USD 14,056 Sell RUB 1,042,970 14107/04/2021 Morgan Stanley Buy USD 20,814 Sell BRL 111,606 92819/04/2021 BNP Paribas Buy USD 260,851 Sell EUR 213,580 2,84319/04/2021 BNP Paribas Buy USD 78,886 Sell NOK 679,860 48219/04/2021 BNP Paribas Buy MXN 197,854 Sell USD 9,526 (121)19/04/2021 BNP Paribas Buy EUR 28,000 Sell USD 33,853 (29)19/04/2021 Citi Buy USD 2,895 Sell AUD 3,800 (30)19/04/2021 Citi Buy USD 112,606 Sell AUD 144,284 1,56519/04/2021 Citi Buy USD 2,635 Sell CAD 3,347 519/04/2021 Citi Buy USD 80,333 Sell CNH 519,070 59619/04/2021 Citi Buy USD 34,815 Sell GBP 25,647 (926)19/04/2021 Citi Buy USD 77,029 Sell JPY 7,939,359 2,50119/04/2021 Citi Buy USD 412,864 Sell MXN 8,326,930 17,05419/04/2021 Citi Buy USD 165,078 Sell RUB 12,529,872 (1,717)19/04/2021 Citi Buy CAD 117,431 Sell USD 92,695 (412)19/04/2021 Citi Buy CNH 1,656,562 Sell USD 255,386 (915)19/04/2021 Citi Buy EUR 7,000 Sell USD 8,405 5119/04/2021 Citi Buy EUR 80,000 Sell USD 97,273 (632)19/04/2021 Citi Buy GBP 24,000 Sell USD 33,053 39319/04/2021 Citi Buy GBP 7,500 Sell USD 10,601 (149)19/04/2021 Citi Buy BRL 1,017,963 Sell USD 190,602 (9,295)19/04/2021 Citi Buy USD 65,475 Sell ZAR 975,521 1,43019/04/2021 Goldman Sachs Buy USD 59,472 Sell BRL 327,960 1,06019/04/2021 Goldman Sachs Buy USD 239,207 Sell EUR 194,957 3,69519/04/2021 Goldman Sachs Buy USD 15,645 Sell GBP 11,381 (216)19/04/2021 Goldman Sachs Buy USD 1,839 Sell IDR 26,023,004 4619/04/2021 Goldman Sachs Buy USD 114,813 Sell MXN 2,316,263 4,71219/04/2021 Goldman Sachs Buy USD 77,553 Sell RUB 5,776,386 65819/04/2021 Goldman Sachs Buy MXN 718,141 Sell USD 34,265 (129)19/04/2021 Goldman Sachs Buy EUR 7,230 Sell USD 8,865 (131)19/04/2021 Goldman Sachs Buy BRL 341,472 Sell USD 63,033 (2,214)19/04/2021 JP Morgan Buy USD 127,897 Sell CNH 827,775 74019/04/2021 JP Morgan Buy USD 360,831 Sell IDR 5,058,664,522 12,17219/04/2021 JP Morgan Buy USD 11,227 Sell INR 834,485 2619/04/2021 JP Morgan Buy USD 147,770 Sell TWD 4,061,017 1,91719/04/2021 JP Morgan Buy TWD 65,996 Sell USD 2,400 (30)19/04/2021 JP Morgan Buy INR 5,343,250 Sell USD 72,133 (411)19/04/2021 JP Morgan Buy IDR 9,755,155 Sell USD 692 (20)19/04/2021 Morgan Stanley Buy USD 67,008 Sell MXN 1,363,746 2,18419/04/2021 Morgan Stanley Buy BRL 130,241 Sell USD 24,240 (1,043)19/04/2021 Morgan Stanley Buy MXN 1,032,257 Sell USD 50,013 (945)19/04/2021 Morgan Stanley Buy RUB 1,680,211 Sell USD 22,018 34919/04/2021 Morgan Stanley Buy NOK 695,812 Sell USD 81,343 (1,101)19/04/2021 UBS Buy EUR 116,000 Sell USD 141,168 (1,038)03/05/2021 BNP Paribas Buy BRL 17,824 Sell USD 3,240 (67)04/05/2021 Morgan Stanley Buy USD 29,655 Sell RUB 2,277,785 (614)05/05/2021 Citi Buy RUB 802,949 Sell USD 10,510 15911/05/2021 Citi Buy USD 13,753 Sell BRL 74,919 42311/05/2021 Morgan Stanley Buy BRL 74,919 Sell USD 13,747 (417)12/05/2021 Goldman Sachs Buy USD 13,549 Sell RUB 1,007,203 17514/05/2021 JP Morgan Buy RUB 2,111,066 Sell USD 28,343 (319)21/05/2021 Goldman Sachs Buy USD 14,056 Sell RUB 1,048,593 14624/05/2021 JP Morgan Buy USD 32,183 Sell CNH 214,818 (738)25/05/2021 Citi Buy MXN 123,294 Sell USD 5,899 (60)
Unrealised Appreciation of Forward Foreign Currency Contracts (29 February 2020 (000’s): $94,894) $ 90,962Unrealised Depreciation of Forward Foreign Currency Contracts (29 February 2020 (000’s): $(109,828)) (39,458)
Net Appreciation of Forward Foreign Currency Contracts (29 February 2020 (000’s): $(14,934)) $ 51,504
^ Not authorised for sale to the public in Hong Kong.The accompanying notes are an integral part of the Financial Statements
133

Legg Mason Global Funds Plc Annual Report 28 February 2021
Legg Mason Western Asset Macro Opportunities Bond Fund^
Portfolio of Investments as at 28 February 2021 – (continued)
Schedule of Futures Contracts
CounterpartyNominal
Value
NotionalValue(000’s)
UnrealisedAppreciation/(Depreciation)of Contracts
(000’s)
90 Day Euro$ December 2021 Bank of America Merrill Lynch (5,487) $(1,368,595) $ 18990 Day Euro$ December 2023 Bank of America Merrill Lynch 10,865 2,686,643 (9,062)90 Day Euro$ June 2021 Bank of America Merrill Lynch (13,620) (3,399,212) (39,450)90 Day Euro$ March 2021 Bank of America Merrill Lynch (4,540) (1,132,957) (540)Australian 10 Year Bond March 2021 Bank of America Merrill Lynch 615 64,864 (1,652)Australian Dollar Currency March 2021 Bank of America Merrill Lynch 3,623 279,351 3,326British Pound Currency March 2021 Bank of America Merrill Lynch (170) (14,818) (262)Canadian Dollar Currency March 2021 Bank of America Merrill Lynch 1,551 122,056 527Euro FX Currency June 2021 Bank of America Merrill Lynch 145 21,942 (114)Euro FX Currency March 2021 Bank of America Merrill Lynch (2,867) (432,971) (925)Euro-BTP March 2021 Bank of America Merrill Lynch (2,356) (425,826) 4,631Euro-Bund June 2021 Bank of America Merrill Lynch (6,774) (1,393,771) (1,202)Euro-Bund March 2021 Bank of America Merrill Lynch (15,208) (3,181,755) 71,864Euro-Buxl 30 Year Bond March 2021 Bank of America Merrill Lynch (181) (45,822) 2,751Euro-OAT March 2021 Bank of America Merrill Lynch 4 789 (17)Japanese Yen Currency March 2021 Bank of America Merrill Lynch 2,304 270,086 (6,430)Long Gilt June 2021 Bank of America Merrill Lynch (3,134) (557,881) 5,355Mexican Peso Currency March 2021 Bank of America Merrill Lynch 10,514 250,654 (9,641)RUB/USD March 2021 Bank of America Merrill Lynch 3,408 113,870 694U.S. 10 Year Note (CBT) June 2021 Bank of America Merrill Lynch (18,398) (2,441,759) 27,007U.S. 10 Year Ultra Note June 2021 Bank of America Merrill Lynch (732) (107,856) 1,097U.S. 2 Year Note (CBT) June 2021 Bank of America Merrill Lynch (2,722) (600,924) 527U.S. 5 Year Note (CBT) June 2021 Bank of America Merrill Lynch 18,182 2,254,000 (16,231)U.S. Long Bond (CBT) June 2021 Bank of America Merrill Lynch 45,895 7,307,345 (84,022)U.S. Ultra Bond (CBT) June 2021 Bank of America Merrill Lynch 11,880 2,246,062 (25,322)
Unrealised Appreciation of Futures Contracts (29 February 2020 (000’s): $289,066) $ 117,968Unrealised Depreciation of Futures Contracts (29 February 2020 (000’s): $(161,732)) (194,870)
Net Depreciation of Futures Contracts (29 February 2020 (000’s): $127,334) $ (76,902)
^ Not authorised for sale to the public in Hong Kong.The accompanying notes are an integral part of the Financial Statements
134
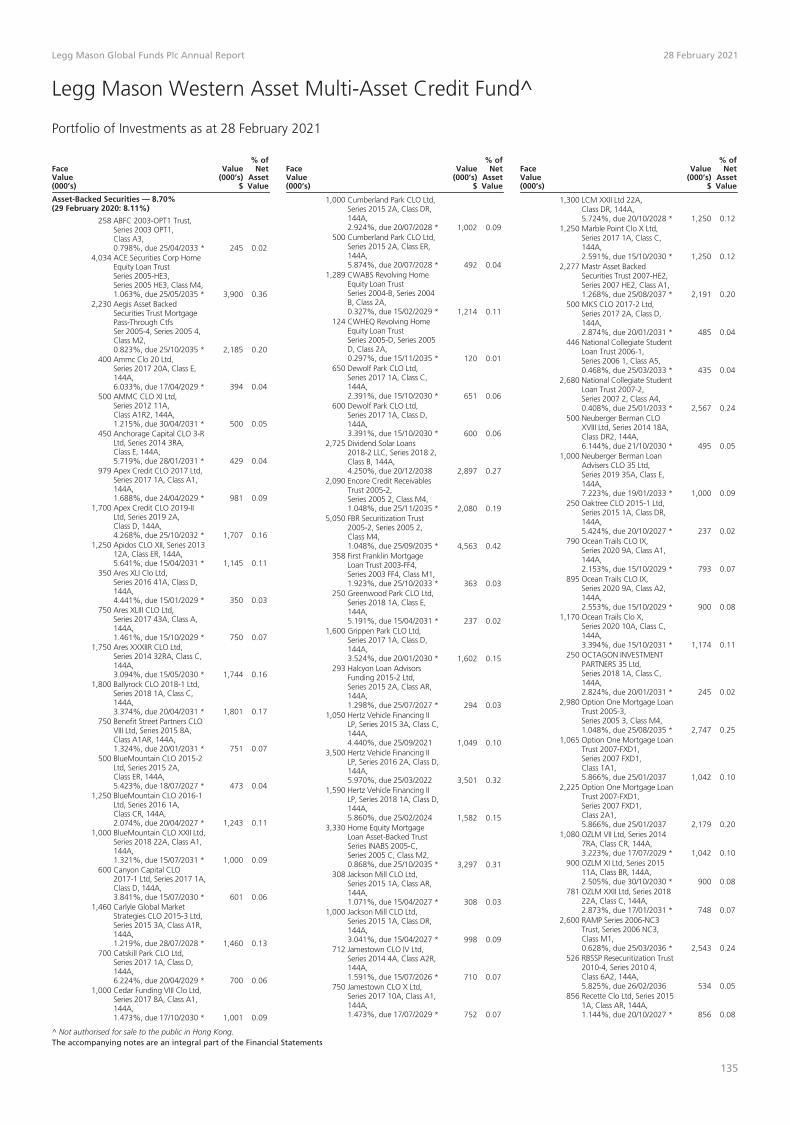
Legg Mason Global Funds Plc Annual Report 28 February 2021
Legg Mason Western Asset Multi-Asset Credit Fund^
Portfolio of Investments as at 28 February 2021
FaceValue(000’s)
Value(000’s)
$
% ofNet
AssetValue
Asset-Backed Securities — 8.70%(29 February 2020: 8.11%)
258 ABFC 2003-OPT1 Trust,Series 2003 OPT1,Class A3,0.798%, due 25/04/2033 * 245 0.02
4,034 ACE Securities Corp HomeEquity Loan TrustSeries 2005-HE3,Series 2005 HE3, Class M4,1.063%, due 25/05/2035 * 3,900 0.36
2,230 Aegis Asset BackedSecurities Trust MortgagePass-Through CtfsSer 2005-4, Series 2005 4,Class M2,0.823%, due 25/10/2035 * 2,185 0.20
400 Ammc Clo 20 Ltd,Series 2017 20A, Class E,144A,6.033%, due 17/04/2029 * 394 0.04
500 AMMC CLO XI Ltd,Series 2012 11A,Class A1R2, 144A,1.215%, due 30/04/2031 * 500 0.05
450 Anchorage Capital CLO 3-RLtd, Series 2014 3RA,Class E, 144A,5.719%, due 28/01/2031 * 429 0.04
979 Apex Credit CLO 2017 Ltd,Series 2017 1A, Class A1,144A,1.688%, due 24/04/2029 * 981 0.09
1,700 Apex Credit CLO 2019-IILtd, Series 2019 2A,Class D, 144A,4.268%, due 25/10/2032 * 1,707 0.16
1,250 Apidos CLO XII, Series 201312A, Class ER, 144A,5.641%, due 15/04/2031 * 1,145 0.11
350 Ares XLI Clo Ltd,Series 2016 41A, Class D,144A,4.441%, due 15/01/2029 * 350 0.03
750 Ares XLIII CLO Ltd,Series 2017 43A, Class A,144A,1.461%, due 15/10/2029 * 750 0.07
1,750 Ares XXXIIR CLO Ltd,Series 2014 32RA, Class C,144A,3.094%, due 15/05/2030 * 1,744 0.16
1,800 Ballyrock CLO 2018-1 Ltd,Series 2018 1A, Class C,144A,3.374%, due 20/04/2031 * 1,801 0.17
750 Benefit Street Partners CLOVIII Ltd, Series 2015 8A,Class A1AR, 144A,1.324%, due 20/01/2031 * 751 0.07
500 BlueMountain CLO 2015-2Ltd, Series 2015 2A,Class ER, 144A,5.423%, due 18/07/2027 * 473 0.04
1,250 BlueMountain CLO 2016-1Ltd, Series 2016 1A,Class CR, 144A,2.074%, due 20/04/2027 * 1,243 0.11
1,000 BlueMountain CLO XXII Ltd,Series 2018 22A, Class A1,144A,1.321%, due 15/07/2031 * 1,000 0.09
600 Canyon Capital CLO2017-1 Ltd, Series 2017 1A,Class D, 144A,3.841%, due 15/07/2030 * 601 0.06
1,460 Carlyle Global MarketStrategies CLO 2015-3 Ltd,Series 2015 3A, Class A1R,144A,1.219%, due 28/07/2028 * 1,460 0.13
700 Catskill Park CLO Ltd,Series 2017 1A, Class D,144A,6.224%, due 20/04/2029 * 700 0.06
1,000 Cedar Funding VIII Clo Ltd,Series 2017 8A, Class A1,144A,1.473%, due 17/10/2030 * 1,001 0.09
FaceValue(000’s)
Value(000’s)
$
% ofNet
AssetValue
1,000 Cumberland Park CLO Ltd,Series 2015 2A, Class DR,144A,2.924%, due 20/07/2028 * 1,002 0.09
500 Cumberland Park CLO Ltd,Series 2015 2A, Class ER,144A,5.874%, due 20/07/2028 * 492 0.04
1,289 CWABS Revolving HomeEquity Loan TrustSeries 2004-B, Series 2004B, Class 2A,0.327%, due 15/02/2029 * 1,214 0.11
124 CWHEQ Revolving HomeEquity Loan TrustSeries 2005-D, Series 2005D, Class 2A,0.297%, due 15/11/2035 * 120 0.01
650 Dewolf Park CLO Ltd,Series 2017 1A, Class C,144A,2.391%, due 15/10/2030 * 651 0.06
600 Dewolf Park CLO Ltd,Series 2017 1A, Class D,144A,3.391%, due 15/10/2030 * 600 0.06
2,725 Dividend Solar Loans2018-2 LLC, Series 2018 2,Class B, 144A,4.250%, due 20/12/2038 2,897 0.27
2,090 Encore Credit ReceivablesTrust 2005-2,Series 2005 2, Class M4,1.048%, due 25/11/2035 * 2,080 0.19
5,050 FBR Securitization Trust2005-2, Series 2005 2,Class M4,1.048%, due 25/09/2035 * 4,563 0.42
358 First Franklin MortgageLoan Trust 2003-FF4,Series 2003 FF4, Class M1,1.923%, due 25/10/2033 * 363 0.03
250 Greenwood Park CLO Ltd,Series 2018 1A, Class E,144A,5.191%, due 15/04/2031 * 237 0.02
1,600 Grippen Park CLO Ltd,Series 2017 1A, Class D,144A,3.524%, due 20/01/2030 * 1,602 0.15
293 Halcyon Loan AdvisorsFunding 2015-2 Ltd,Series 2015 2A, Class AR,144A,1.298%, due 25/07/2027 * 294 0.03
1,050 Hertz Vehicle Financing IILP, Series 2015 3A, Class C,144A,4.440%, due 25/09/2021 1,049 0.10
3,500 Hertz Vehicle Financing IILP, Series 2016 2A, Class D,144A,5.970%, due 25/03/2022 3,501 0.32
1,590 Hertz Vehicle Financing IILP, Series 2018 1A, Class D,144A,5.860%, due 25/02/2024 1,582 0.15
3,330 Home Equity MortgageLoan Asset-Backed TrustSeries INABS 2005-C,Series 2005 C, Class M2,0.868%, due 25/10/2035 * 3,297 0.31
308 Jackson Mill CLO Ltd,Series 2015 1A, Class AR,144A,1.071%, due 15/04/2027 * 308 0.03
1,000 Jackson Mill CLO Ltd,Series 2015 1A, Class DR,144A,3.041%, due 15/04/2027 * 998 0.09
712 Jamestown CLO IV Ltd,Series 2014 4A, Class A2R,144A,1.591%, due 15/07/2026 * 710 0.07
750 Jamestown CLO X Ltd,Series 2017 10A, Class A1,144A,1.473%, due 17/07/2029 * 752 0.07
FaceValue(000’s)
Value(000’s)
$
% ofNet
AssetValue
1,300 LCM XXII Ltd 22A,Class DR, 144A,5.724%, due 20/10/2028 * 1,250 0.12
1,250 Marble Point Clo X Ltd,Series 2017 1A, Class C,144A,2.591%, due 15/10/2030 * 1,250 0.12
2,277 Mastr Asset BackedSecurities Trust 2007-HE2,Series 2007 HE2, Class A1,1.268%, due 25/08/2037 * 2,191 0.20
500 MKS CLO 2017-2 Ltd,Series 2017 2A, Class D,144A,2.874%, due 20/01/2031 * 485 0.04
446 National Collegiate StudentLoan Trust 2006-1,Series 2006 1, Class A5,0.468%, due 25/03/2033 * 435 0.04
2,680 National Collegiate StudentLoan Trust 2007-2,Series 2007 2, Class A4,0.408%, due 25/01/2033 * 2,567 0.24
500 Neuberger Berman CLOXVIII Ltd, Series 2014 18A,Class DR2, 144A,6.144%, due 21/10/2030 * 495 0.05
1,000 Neuberger Berman LoanAdvisers CLO 35 Ltd,Series 2019 35A, Class E,144A,7.223%, due 19/01/2033 * 1,000 0.09
250 Oaktree CLO 2015-1 Ltd,Series 2015 1A, Class DR,144A,5.424%, due 20/10/2027 * 237 0.02
790 Ocean Trails CLO IX,Series 2020 9A, Class A1,144A,2.153%, due 15/10/2029 * 793 0.07
895 Ocean Trails CLO IX,Series 2020 9A, Class A2,144A,2.553%, due 15/10/2029 * 900 0.08
1,170 Ocean Trails Clo X,Series 2020 10A, Class C,144A,3.394%, due 15/10/2031 * 1,174 0.11
250 OCTAGON INVESTMENTPARTNERS 35 Ltd,Series 2018 1A, Class C,144A,2.824%, due 20/01/2031 * 245 0.02
2,980 Option One Mortgage LoanTrust 2005-3,Series 2005 3, Class M4,1.048%, due 25/08/2035 * 2,747 0.25
1,065 Option One Mortgage LoanTrust 2007-FXD1,Series 2007 FXD1,Class 1A1,5.866%, due 25/01/2037 1,042 0.10
2,225 Option One Mortgage LoanTrust 2007-FXD1,Series 2007 FXD1,Class 2A1,5.866%, due 25/01/2037 2,179 0.20
1,080 OZLM VII Ltd, Series 20147RA, Class CR, 144A,3.223%, due 17/07/2029 * 1,042 0.10
900 OZLM XI Ltd, Series 201511A, Class BR, 144A,2.505%, due 30/10/2030 * 900 0.08
781 OZLM XXII Ltd, Series 201822A, Class C, 144A,2.873%, due 17/01/2031 * 748 0.07
2,600 RAMP Series 2006-NC3Trust, Series 2006 NC3,Class M1,0.628%, due 25/03/2036 * 2,543 0.24
526 RBSSP Resecuritization Trust2010-4, Series 2010 4,Class 6A2, 144A,5.825%, due 26/02/2036 534 0.05
856 Recette Clo Ltd, Series 20151A, Class AR, 144A,1.144%, due 20/10/2027 * 856 0.08
^ Not authorised for sale to the public in Hong Kong.The accompanying notes are an integral part of the Financial Statements
135

Legg Mason Global Funds Plc Annual Report 28 February 2021
Legg Mason Western Asset Multi-Asset Credit Fund^
Portfolio of Investments as at 28 February 2021 – (continued)
FaceValue(000’s)
Value(000’s)
$
% ofNet
AssetValue
Asset-Backed Securities — (continued)
705 Regatta VI Funding Ltd,Series 2016 1A, Class AR,144A,1.304%, due 20/07/2028 * 705 0.06
1,000 Romark CLO Ltd,Series 2017 1A, Class D,144A,6.868%, due 23/10/2030 * 974 0.09
1,320 Saranac CLO III Ltd,Series 2014 3A, Class DR,144A,3.486%, due 22/06/2030 * 1,259 0.12
481 Shackleton 2014-VI-R CLOLtd, Series 2014 6RA,Class A, 144A,1.243%, due 17/07/2028 * 481 0.04
1,000 SMB Private Education LoanTrust 2015-C, Series 2015C, Class C, 144A,4.500%, due 17/09/2046 1,081 0.10
530 Symphony CLO XIX Ltd,Series 2018 19A, Class E,144A,5.423%, due 16/04/2031 * 501 0.05
750 TCI-Flatiron Clo 2017-1 Ltd,Series 2017 1A, Class A,144A,1.392%, due 18/11/2030 * 751 0.07
530 TCI-Symphony CLO 2016-1Ltd, Series 2016 1A,Class DR, 144A,3.224%, due 13/10/2029 * 533 0.05
450 TCI-Symphony CLO 2016-1Ltd, Series 2016 1A,Class ER, 144A,5.724%, due 13/10/2029 * 440 0.04
400 Thayer Park CLO Ltd,Series 2017 1A, Class D,144A,6.324%, due 20/04/2029 * 400 0.04
306 Tralee CLO III Ltd,Series 2014 3A, Class AR,144A,1.254%, due 20/10/2027 * 307 0.03
600 Venture XVII CLO Ltd,Series 2014 17A,Class DRR, 144A,3.061%, due 15/04/2027 * 577 0.05
500 Venture XVII CLO Ltd,Series 2014 17A, Class ERR,144A,5.981%, due 15/04/2027 * 436 0.04
750 Voya CLO 2016-3 Ltd,Series 2016 3A, Class A1R,144A,1.413%, due 18/10/2031 * 751 0.07
1,500 Voya CLO 2017-1 Ltd,Series 2017 1A, Class C,144A,3.553%, due 17/04/2030 * 1,486 0.14
200 VOYA CLO 2017-2,Series 2017 2A, Class D,144A,6.261%, due 07/06/2030 * 195 0.02
1,000 Voya CLO 2018-3 Ltd,Series 2018 3A, Class A1A,144A,1.391%, due 15/10/2031 * 1,001 0.09
2,446 WaMu Asset-BackedCertificates WaMuSeries 2007-HE4 Trust,Series 2007 HE4, Class 1A,0.288%, due 25/07/2047 * 2,067 0.19
1,000 Webster Park CLO Ltd,Series 2015 1A, Class CR,144A,3.124%, due 20/07/2030 * 992 0.09
1,050 Wellfleet CLO 2017-2A Ltd,Series 2017 2A, Class C,144A,3.624%, due 20/10/2029 * 1,047 0.10
FaceValue(000’s)
Value(000’s)
$
% ofNet
AssetValue
890 Whitehorse XII Ltd,Series 2018 12A, Class D,144A,3.891%, due 15/10/2031 * 866 0.08
Total Asset-Backed Securities(Cost $91,462) 94,135 8.70
Mortgage-Backed Securities — 11.67%(29 February 2020: 13.63%)
1,364 Alternative Loan Trust2007-4CB, Series 20074CB, Class 1A5,5.750%, due 25/04/2037 1,361 0.13
1,192 BAMLL Re-REMIC Trust2016-RRGG10, Series 2016GG10, Class AJA, 144A,5.829%, due 10/08/2045 * 543 0.05
1,896 Banc of America FundingCorp, Series 2015 R3,Class 1A2, 144A,0.582%, due 27/03/2036 * 1,622 0.15
440 BBCCRE Trust 2015-GTP,Series 2015 GTP, Class D,144A,4.563%, due 10/08/2033 * 429 0.04
2,660 BBSG 2016-MRPMortgage Trust,Series 2016 MRP, Class A,144A,3.275%, due 05/06/2036 2,622 0.24
530 BX Commercial MortgageTrust 2018-BIOA,Series 2018 BIOA, Class A,144A,0.783%, due 15/03/2037 * 532 0.05
3,220 BXMT 2020-FL2 Ltd,Series 2020 FL2, Class A,144A,1.008%, due 16/02/2037 * 3,227 0.30
36,267 Citigroup CommercialMortgage Trust 2017-P8,Series 2017 P8, Class XA,0.903%, due 15/09/2050 * 1,763 0.16
2,260 COMM 2015-DC1Mortgage Trust,Series 2015 DC1, Class C,4.308%, due 10/02/2048 * 2,227 0.21
2,310 Connecticut AvenueSecurities Trust 2018-R07,Series 2018 R07, Class 1B1,144A,4.468%, due 25/04/2031 * 2,388 0.22
– Credit Suisse CommercialMortgage TrustSeries 2006-C3,Series 2006 C3, Class AJ,6.169%, due 15/06/2038 * – –
302 Credit Suisse CommercialMortgage TrustSeries 2006-C5,Series 2006 C5, Class AJ,5.373%, due 15/12/2039 59 0.01
1,050 CSAIL 2017-C8Commercial MortgageTrust, Series 2017 C8,Class C,4.320%, due 15/06/2050 * 1,031 0.10
4,690 CSMC 2014-USA OA LLC,Series 2014 USA, Class F,144A,4.373%, due 15/09/2037 3,695 0.34
2,000 CSMC Trust 2017-CHOP,Series 2017 CHOP, Class F,144A,4.462%, due 15/07/2032 * 1,632 0.15
1,400 CSMC Trust 2017-CHOP,Series 2017 CHOP, Class H,144A,7.462%, due 15/07/2032 * 968 0.09
2,936 CSWF 2018-TOP,Series 2018 TOP, Class D,144A,1.912%, due 15/08/2035 * 2,942 0.27
2,420 DSLA Mortgage Loan Trust2007-AR1, Series 2007AR1, Class 1A1B,0.251%, due 19/04/2047 * 2,155 0.20
FaceValue(000’s)
Value(000’s)
$
% ofNet
AssetValue
2,220 Eagle RE 2020-1 Ltd,Series 2020 1, Class M1C,144A,1.918%, due 25/01/2030 * 2,207 0.21
2,500 Fannie Mae ConnecticutAvenue Securities,Series 2017 C05, Class 1B1,3.718%, due 25/01/2030 * 2,604 0.24
2,149 Fannie Mae ConnecticutAvenue Securities,Series 2017 C05,Class 1M2,2.318%, due 25/01/2030 * 2,174 0.20
3,400 Fannie Mae ConnecticutAvenue Securities,Series 2017 C06, Class 1B1,4.268%, due 25/02/2030 * 3,550 0.33
2,000 Fannie Mae ConnecticutAvenue Securities,Series 2017 C07, Class 1B1,4.118%, due 25/05/2030 * 2,071 0.19
3,000 Fannie Mae ConnecticutAvenue Securities,Series 2018 C01, Class 1B1,3.668%, due 25/07/2030 * 3,044 0.28
3,320 Fannie Mae ConnecticutAvenue Securities,Series 2018 C05, Class 1B1,4.368%, due 25/01/2031 * 3,466 0.32
790 Freddie Mac Stacr RemicTrust 2020-DNA1,Series 2020 DNA1,Class B1, 144A,2.418%, due 25/01/2050 * 792 0.07
2,170 Freddie Mac STACR REMICTrust 2020-DNA6,Series 2020 DNA6,Class B1, 144A,3.045%, due 25/12/2050 * 2,198 0.20
1,420 Freddie Mac STACR Trust2018-DNA2, Series 2018DNA2, Class B1, 144A,3.818%, due 25/12/2030 * 1,475 0.14
2,958 Freddie Mac StructuredAgency Credit Risk DebtNotes, Series 2016 DNA3,Class M3,5.118%, due 25/12/2028 * 3,123 0.29
1,630 GS Mortgage SecuritiesCorp II, Series 2018 SRP5,Class C, 144A,3.862%, due 15/09/2031 * 409 0.04
94 GS Mortgage SecuritiesTrust 2006-GG8,Series 2006 GG8, Class AJ,5.622%, due 10/11/2039 33 –
243 GSMPS Mortgage LoanTrust 2006-RP1,Series 2006 RP1,Class 1A2, 144A,7.500%, due 25/01/2036 254 0.02
4,147 Impac Secured Assets Trust2006-3, Series 2006 3,Class A7,0.388%, due 25/11/2036 * 3,403 0.31
3,190 J.P. Morgan ChaseCommercial MortgageSecurities Trust 2018-PHMZ,Series 2018 PHMZ, Class M,144A,8.320%, due 15/06/2035 *† 2,651 0.24
61 JP Morgan ChaseCommercial MortgageSecurities Trust 2007-CIBC19, Series 2007 CB19,Class AJ,5.895%, due 12/02/2049 * 30 –
4 JP Morgan ChaseCommercial MortgageSecurities Trust 2007-LDP12, Series 2007 LD12,Class AJ,6.632%, due 15/02/2051 * 4 –
4,130 JP Morgan ChaseCommercial MortgageSecurities Trust 2018-WPT,Series 2018 WPT, Class FFL,144A,3.013%, due 05/07/2033 * 3,984 0.37
^ Not authorised for sale to the public in Hong Kong.The accompanying notes are an integral part of the Financial Statements
136
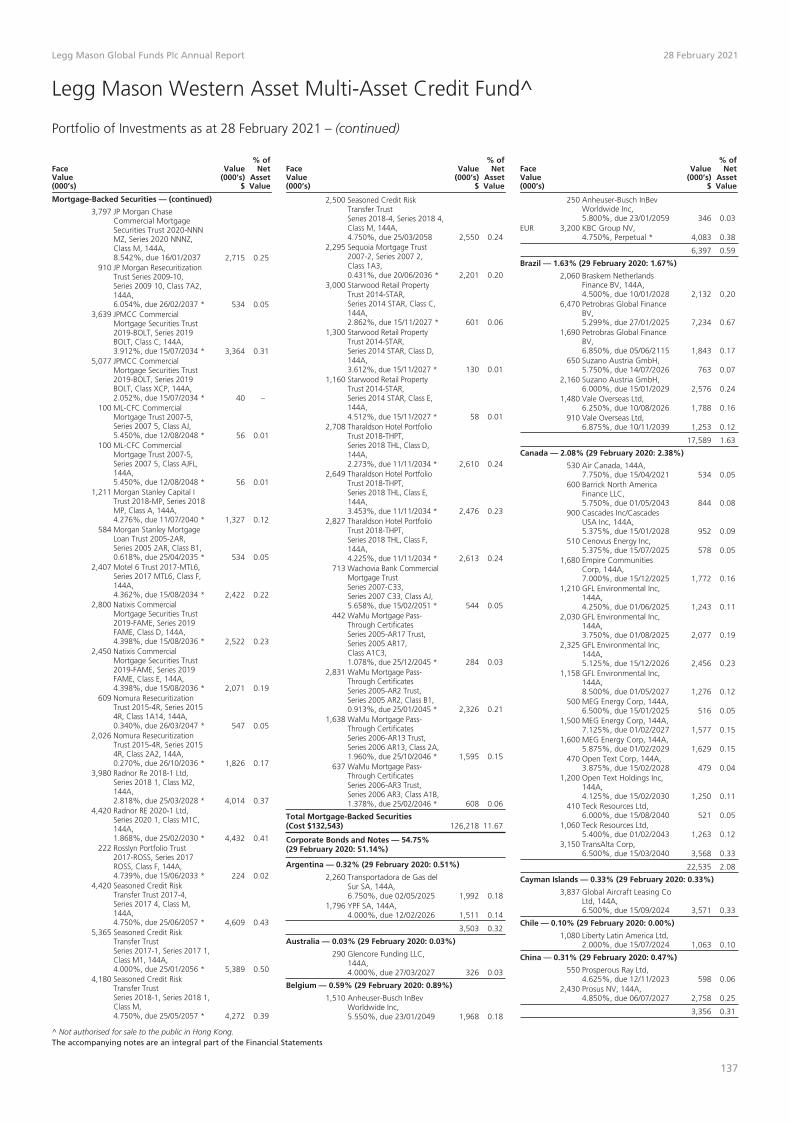
Legg Mason Global Funds Plc Annual Report 28 February 2021
Legg Mason Western Asset Multi-Asset Credit Fund^
Portfolio of Investments as at 28 February 2021 – (continued)
FaceValue(000’s)
Value(000’s)
$
% ofNet
AssetValue
Mortgage-Backed Securities — (continued)
3,797 JP Morgan ChaseCommercial MortgageSecurities Trust 2020-NNNMZ, Series 2020 NNNZ,Class M, 144A,8.542%, due 16/01/2037 2,715 0.25
910 JP Morgan ResecuritizationTrust Series 2009-10,Series 2009 10, Class 7A2,144A,6.054%, due 26/02/2037 * 534 0.05
3,639 JPMCC CommercialMortgage Securities Trust2019-BOLT, Series 2019BOLT, Class C, 144A,3.912%, due 15/07/2034 * 3,364 0.31
5,077 JPMCC CommercialMortgage Securities Trust2019-BOLT, Series 2019BOLT, Class XCP, 144A,2.052%, due 15/07/2034 * 40 –
100 ML-CFC CommercialMortgage Trust 2007-5,Series 2007 5, Class AJ,5.450%, due 12/08/2048 * 56 0.01
100 ML-CFC CommercialMortgage Trust 2007-5,Series 2007 5, Class AJFL,144A,5.450%, due 12/08/2048 * 56 0.01
1,211 Morgan Stanley Capital ITrust 2018-MP, Series 2018MP, Class A, 144A,4.276%, due 11/07/2040 * 1,327 0.12
584 Morgan Stanley MortgageLoan Trust 2005-2AR,Series 2005 2AR, Class B1,0.618%, due 25/04/2035 * 534 0.05
2,407 Motel 6 Trust 2017-MTL6,Series 2017 MTL6, Class F,144A,4.362%, due 15/08/2034 * 2,422 0.22
2,800 Natixis CommercialMortgage Securities Trust2019-FAME, Series 2019FAME, Class D, 144A,4.398%, due 15/08/2036 * 2,522 0.23
2,450 Natixis CommercialMortgage Securities Trust2019-FAME, Series 2019FAME, Class E, 144A,4.398%, due 15/08/2036 * 2,071 0.19
609 Nomura ResecuritizationTrust 2015-4R, Series 20154R, Class 1A14, 144A,0.340%, due 26/03/2047 * 547 0.05
2,026 Nomura ResecuritizationTrust 2015-4R, Series 20154R, Class 2A2, 144A,0.270%, due 26/10/2036 * 1,826 0.17
3,980 Radnor Re 2018-1 Ltd,Series 2018 1, Class M2,144A,2.818%, due 25/03/2028 * 4,014 0.37
4,420 Radnor RE 2020-1 Ltd,Series 2020 1, Class M1C,144A,1.868%, due 25/02/2030 * 4,432 0.41
222 Rosslyn Portfolio Trust2017-ROSS, Series 2017ROSS, Class F, 144A,4.739%, due 15/06/2033 * 224 0.02
4,420 Seasoned Credit RiskTransfer Trust 2017-4,Series 2017 4, Class M,144A,4.750%, due 25/06/2057 * 4,609 0.43
5,365 Seasoned Credit RiskTransfer TrustSeries 2017-1, Series 2017 1,Class M1, 144A,4.000%, due 25/01/2056 * 5,389 0.50
4,180 Seasoned Credit RiskTransfer TrustSeries 2018-1, Series 2018 1,Class M,4.750%, due 25/05/2057 * 4,272 0.39
FaceValue(000’s)
Value(000’s)
$
% ofNet
AssetValue
2,500 Seasoned Credit RiskTransfer TrustSeries 2018-4, Series 2018 4,Class M, 144A,4.750%, due 25/03/2058 2,550 0.24
2,295 Sequoia Mortgage Trust2007-2, Series 2007 2,Class 1A3,0.431%, due 20/06/2036 * 2,201 0.20
3,000 Starwood Retail PropertyTrust 2014-STAR,Series 2014 STAR, Class C,144A,2.862%, due 15/11/2027 * 601 0.06
1,300 Starwood Retail PropertyTrust 2014-STAR,Series 2014 STAR, Class D,144A,3.612%, due 15/11/2027 * 130 0.01
1,160 Starwood Retail PropertyTrust 2014-STAR,Series 2014 STAR, Class E,144A,4.512%, due 15/11/2027 * 58 0.01
2,708 Tharaldson Hotel PortfolioTrust 2018-THPT,Series 2018 THL, Class D,144A,2.273%, due 11/11/2034 * 2,610 0.24
2,649 Tharaldson Hotel PortfolioTrust 2018-THPT,Series 2018 THL, Class E,144A,3.453%, due 11/11/2034 * 2,476 0.23
2,827 Tharaldson Hotel PortfolioTrust 2018-THPT,Series 2018 THL, Class F,144A,4.225%, due 11/11/2034 * 2,613 0.24
713 Wachovia Bank CommercialMortgage TrustSeries 2007-C33,Series 2007 C33, Class AJ,5.658%, due 15/02/2051 * 544 0.05
442 WaMu Mortgage Pass-Through CertificatesSeries 2005-AR17 Trust,Series 2005 AR17,Class A1C3,1.078%, due 25/12/2045 * 284 0.03
2,831 WaMu Mortgage Pass-Through CertificatesSeries 2005-AR2 Trust,Series 2005 AR2, Class B1,0.913%, due 25/01/2045 * 2,326 0.21
1,638 WaMu Mortgage Pass-Through CertificatesSeries 2006-AR13 Trust,Series 2006 AR13, Class 2A,1.960%, due 25/10/2046 * 1,595 0.15
637 WaMu Mortgage Pass-Through CertificatesSeries 2006-AR3 Trust,Series 2006 AR3, Class A1B,1.378%, due 25/02/2046 * 608 0.06
Total Mortgage-Backed Securities(Cost $132,543) 126,218 11.67
Corporate Bonds and Notes — 54.75%(29 February 2020: 51.14%)
Argentina — 0.32% (29 February 2020: 0.51%)
2,260 Transportadora de Gas delSur SA, 144A,6.750%, due 02/05/2025 1,992 0.18
1,796 YPF SA, 144A,4.000%, due 12/02/2026 1,511 0.14
3,503 0.32
Australia — 0.03% (29 February 2020: 0.03%)
290 Glencore Funding LLC,144A,4.000%, due 27/03/2027 326 0.03
Belgium — 0.59% (29 February 2020: 0.89%)
1,510 Anheuser-Busch InBevWorldwide Inc,5.550%, due 23/01/2049 1,968 0.18
FaceValue(000’s)
Value(000’s)
$
% ofNet
AssetValue
250 Anheuser-Busch InBevWorldwide Inc,5.800%, due 23/01/2059 346 0.03
EUR 3,200 KBC Group NV,4.750%, Perpetual * 4,083 0.38
6,397 0.59
Brazil — 1.63% (29 February 2020: 1.67%)
2,060 Braskem NetherlandsFinance BV, 144A,4.500%, due 10/01/2028 2,132 0.20
6,470 Petrobras Global FinanceBV,5.299%, due 27/01/2025 7,234 0.67
1,690 Petrobras Global FinanceBV,6.850%, due 05/06/2115 1,843 0.17
650 Suzano Austria GmbH,5.750%, due 14/07/2026 763 0.07
2,160 Suzano Austria GmbH,6.000%, due 15/01/2029 2,576 0.24
1,480 Vale Overseas Ltd,6.250%, due 10/08/2026 1,788 0.16
910 Vale Overseas Ltd,6.875%, due 10/11/2039 1,253 0.12
17,589 1.63
Canada — 2.08% (29 February 2020: 2.38%)
530 Air Canada, 144A,7.750%, due 15/04/2021 534 0.05
600 Barrick North AmericaFinance LLC,5.750%, due 01/05/2043 844 0.08
900 Cascades Inc/CascadesUSA Inc, 144A,5.375%, due 15/01/2028 952 0.09
510 Cenovus Energy Inc,5.375%, due 15/07/2025 578 0.05
1,680 Empire CommunitiesCorp, 144A,7.000%, due 15/12/2025 1,772 0.16
1,210 GFL Environmental Inc,144A,4.250%, due 01/06/2025 1,243 0.11
2,030 GFL Environmental Inc,144A,3.750%, due 01/08/2025 2,077 0.19
2,325 GFL Environmental Inc,144A,5.125%, due 15/12/2026 2,456 0.23
1,158 GFL Environmental Inc,144A,8.500%, due 01/05/2027 1,276 0.12
500 MEG Energy Corp, 144A,6.500%, due 15/01/2025 516 0.05
1,500 MEG Energy Corp, 144A,7.125%, due 01/02/2027 1,577 0.15
1,600 MEG Energy Corp, 144A,5.875%, due 01/02/2029 1,629 0.15
470 Open Text Corp, 144A,3.875%, due 15/02/2028 479 0.04
1,200 Open Text Holdings Inc,144A,4.125%, due 15/02/2030 1,250 0.11
410 Teck Resources Ltd,6.000%, due 15/08/2040 521 0.05
1,060 Teck Resources Ltd,5.400%, due 01/02/2043 1,263 0.12
3,150 TransAlta Corp,6.500%, due 15/03/2040 3,568 0.33
22,535 2.08
Cayman Islands — 0.33% (29 February 2020: 0.33%)
3,837 Global Aircraft Leasing CoLtd, 144A,6.500%, due 15/09/2024 3,571 0.33
Chile — 0.10% (29 February 2020: 0.00%)
1,080 Liberty Latin America Ltd,2.000%, due 15/07/2024 1,063 0.10
China — 0.31% (29 February 2020: 0.47%)
550 Prosperous Ray Ltd,4.625%, due 12/11/2023 598 0.06
2,430 Prosus NV, 144A,4.850%, due 06/07/2027 2,758 0.25
3,356 0.31
^ Not authorised for sale to the public in Hong Kong.The accompanying notes are an integral part of the Financial Statements
137

Legg Mason Global Funds Plc Annual Report 28 February 2021
Legg Mason Western Asset Multi-Asset Credit Fund^
Portfolio of Investments as at 28 February 2021 – (continued)
FaceValue(000’s)
Value(000’s)
$
% ofNet
AssetValue
Corporate Bonds and Notes — (continued)Colombia — 0.23% (29 February 2020: 0.26%)
1,143 Millicom InternationalCellular SA, 144A,6.625%, due 15/10/2026 1,232 0.11
1,098 Millicom InternationalCellular SA, 144A,6.250%, due 25/03/2029 1,237 0.12
2,469 0.23
Denmark — 0.05% (29 February 2020: 0.31%)
450 Danske Bank A/S, 144A,5.375%, due 12/01/2024 506 0.05
France — 0.78% (29 February 2020: 1.21%)
3,205 Altice France SA/France,144A,7.375%, due 01/05/2026 3,346 0.31
500 Altice France SA/France,144A,8.125%, due 01/02/2027 546 0.05
400 BNP Paribas SA, 144A,3.052%, due 13/01/2031 * 424 0.04
1,500 Credit Agricole SA, 144A,8.125%, Perpetual * 1,817 0.17
EUR 1,070 Credit Agricole SA,6.500%, Perpetual * 1,313 0.12
930 WEA Finance LLC /Westfield UK & EuropeFinance Plc, 144A,4.750%, due 17/09/2044 976 0.09
8,422 0.78
Germany — 0.22% (29 February 2020: 0.20%)
1,440 Cheplapharm ArzneimittelGmbH, 144A,5.500%, due 15/01/2028 1,471 0.14
520 Mercer International Inc,144A,5.125%, due 01/02/2029 528 0.05
EUR 270 Nidda BondCo GmbH,5.000%, due 30/09/2025 331 0.03
2,330 0.22
Hong Kong — 0.23% (29 February 2020: 0.27%)
2,320 Melco Resorts Finance Ltd,144A,5.375%, due 04/12/2029 2,459 0.23
Ireland — 0.32% (29 February 2020: 0.49%)
1,040 AerCap Ireland CapitalDAC / AerCap GlobalAviation Trust,4.500%, due 15/09/2023 1,124 0.10
330 Avolon Holdings FundingLtd, 144A,5.125%, due 01/10/2023 354 0.03
990 Avolon Holdings FundingLtd, 144A,4.250%, due 15/04/2026 1,047 0.10
153 Park Aerospace HoldingsLtd, 144A,5.250%, due 15/08/2022 160 0.02
730 Park Aerospace HoldingsLtd, 144A,4.500%, due 15/03/2023 764 0.07
3,449 0.32
Israel — 0.23% (29 February 2020: 0.51%)
1,030 Teva PharmaceuticalFinance Co LLC,6.150%, due 01/02/2036 1,126 0.11
340 Teva PharmaceuticalFinance Netherlands III BV,7.125%, due 31/01/2025 369 0.03
990 Teva PharmaceuticalFinance Netherlands III BV,3.150%, due 01/10/2026 929 0.09
2,424 0.23
Italy — 1.15% (29 February 2020: 1.28%)
4,010 Intesa Sanpaolo SpA,144A,5.017%, due 26/06/2024 4,375 0.40
2,600 Intesa Sanpaolo SpA,144A,5.710%, due 15/01/2026 2,932 0.27
FaceValue(000’s)
Value(000’s)
$
% ofNet
AssetValue
400 Intesa Sanpaolo SpA,Series XR, 144A,4.700%, due 23/09/2049 472 0.04
2,050 UniCredit SpA, 144A,7.296%, due 02/04/2034 * 2,435 0.23
2,080 UniCredit SpA, 144A,5.459%, due 30/06/2035 * 2,251 0.21
12,465 1.15
Jersey — 0.01% (29 February 2020: 0.01%)
EUR 100 LHC3 Plc,4.125%, due 15/08/2024 123 0.01
Kazakhstan — 0.55% (29 February 2020: 0.54%)
2,570 KazMunayGas National CoJSC, 144A,4.750%, due 19/04/2027 2,949 0.27
200 KazMunayGas National CoJSC, 144A,6.375%, due 24/10/2048 257 0.03
2,440 KazTransGas JSC, 144A,4.375%, due 26/09/2027 2,721 0.25
5,927 0.55
Luxembourg — 0.54% (29 February 2020: 0.87%)
2,540 Altice France Holding SA,144A,10.500%, due 15/05/2027 2,861 0.26
50 ArcelorMittal SA,3.600%, due 16/07/2024 53 0.01
2,000 ArcelorMittal SA,4.550%, due 11/03/2026 2,235 0.21
660 ARD Finance SA, 144A,6.500%, due 30/06/2027 699 0.06
5,848 0.54
Macau — 0.64% (29 February 2020: 0.29%)
1,000 Sands China Ltd,5.125%, due 08/08/2025 1,120 0.10
400 Sands China Ltd,3.800%, due 08/01/2026 436 0.04
3,780 Wynn Macau Ltd, 144A,5.625%, due 26/08/2028 3,938 0.37
1,410 Wynn Macau Ltd, 144A,5.125%, due 15/12/2029 1,441 0.13
6,935 0.64
Malaysia — 0.22% (29 February 2020: 0.00%)
2,500 Axiata Spv5 Labuan Ltd,3.064%, due 19/08/2050 2,326 0.22
Mexico — 0.26% (29 February 2020: 0.33%)
200 Banco Mercantil del NorteSA/Grand Cayman, 144A,6.875%, Perpetual * 206 0.02
2,330 Banco Mercantil del NorteSA/Grand Cayman, 144A,7.625%, Perpetual * 2,623 0.24
2,829 0.26
Netherlands — 0.39% (29 February 2020: 0.51%)
EUR 3,200 Cooperatieve RabobankUA,4.625%, Perpetual * 4,218 0.39
Peru — 0.36% (29 February 2020: 0.00%)
1,310 Hudbay Minerals Inc,144A,7.625%, due 15/01/2025 1,366 0.13
910 Hudbay Minerals Inc,144A,4.500%, due 01/04/2026 923 0.08
1,520 Hudbay Minerals Inc,144A,6.125%, due 01/04/2029 1,642 0.15
3,931 0.36
Russia — 0.30% (29 February 2020: 0.45%)
1,010 Gazprom PJSC Via GazCapital SA, 144A,4.950%, due 23/03/2027 1,142 0.11
1,820 Lukoil InternationalFinance BV, 144A,4.750%, due 02/11/2026 2,060 0.19
3,202 0.30
FaceValue(000’s)
Value(000’s)
$
% ofNet
AssetValue
Singapore — 0.07% (29 February 2020: 0.09%)
710 Oversea-Chinese BankingCorp Ltd,4.250%, due 19/06/2024 783 0.07
South Africa — 0.04% (29 February 2020: 0.05%)
410 Anglo American CapitalPlc, 144A,4.000%, due 11/09/2027 465 0.04
Spain — 0.22% (29 February 2020: 0.28%)
EUR 1,600 Banco Bilbao VizcayaArgentaria SA,5.875%, Perpetual * 2,041 0.19
EUR 100 Tendam Brands SAU,5.000%, due 15/09/2024 113 0.01
EUR 230 Tendam Brands SAU,5.250%, due 15/09/2024 * 261 0.02
2,415 0.22
Switzerland — 0.54% (29 February 2020: 0.75%)
500 Credit Suisse Group AG,144A,4.194%, due 01/04/2031 * 570 0.05
200 Credit Suisse Group AG,144A,7.250%, Perpetual * 228 0.02
200 Credit Suisse Group AG,144A,7.500%, Perpetual * 222 0.02
670 Credit Suisse Group AG,144A,7.500%, Perpetual * 735 0.07
3,740 UBS Group AG, 144A,7.000%, Perpetual * 4,093 0.38
5,848 0.54
United Arab Emirates — 0.61%(29 February 2020: 0.84%)
3,250 DAE Funding LLC, 144A,5.750%, due 15/11/2023 3,343 0.31
2,710 DP World Plc, 144A,5.625%, due 25/09/2048 3,236 0.30
6,579 0.61
United Kingdom — 1.60% (29 February 2020: 2.85%)
EUR 1,730 Barclays Plc,2.000%, due 07/02/2028 * 2,138 0.20
1,200 Barclays Plc,5.088%, due 20/06/2030 * 1,394 0.13
1,550 Barclays Plc,8.000%, Perpetual * 1,750 0.16
540 Barclays Plc,7.750%, Perpetual * 587 0.05
GBP 470 CPUK Finance Ltd,7.239%, due 28/02/2024 758 0.07
EUR 1,500 HSBC Holdings Plc,5.250%, Perpetual * 1,885 0.17
270 HSBC Holdings Plc,4.600%, Perpetual * 272 0.03
EUR 2,100 Lloyds Banking Group Plc,4.947%, Perpetual * 2,741 0.25
200 Lloyds Banking Group Plc,7.500%, Perpetual * 222 0.02
800 Natwest Group Plc,8.625%, Perpetual * 828 0.08
GBP 1,220 Saga Plc,3.375%, due 12/05/2024 1,570 0.14
GBP 340 Santander UK GroupHoldings Plc,7.375%, Perpetual * 494 0.05
2,500 Virgin Media SecuredFinance Plc, 144A,5.500%, due 15/05/2029 2,684 0.25
17,323 1.60
United States — 39.02% (29 February 2020: 31.73%)
3,070 AbbVie Inc,4.050%, due 21/11/2039 3,530 0.33
960 AdaptHealth LLC, 144A,6.125%, due 01/08/2028 1,020 0.09
1,220 AdaptHealth LLC, 144A,4.625%, due 01/08/2029 1,223 0.11
2,630 Adtalem Global EducationInc, 144A,5.500%, due 01/03/2028 2,624 0.24
^ Not authorised for sale to the public in Hong Kong.The accompanying notes are an integral part of the Financial Statements
138

Legg Mason Global Funds Plc Annual Report 28 February 2021
Legg Mason Western Asset Multi-Asset Credit Fund^
Portfolio of Investments as at 28 February 2021 – (continued)
FaceValue(000’s)
Value(000’s)
$
% ofNet
AssetValue
Corporate Bonds and Notes — (continued)United States — (continued)
800 Advanced Micro DevicesInc,7.500%, due 15/08/2022 869 0.08
1,020 AES Corp/The, 144A,2.450%, due 15/01/2031 1,003 0.09
170 Air Methods Corp, 144A,8.000%, due 15/05/2025 161 0.02
1,880 Akumin Inc, 144A,7.000%, due 01/11/2025 1,969 0.18
490 Alcoa Nederland HoldingBV, 144A,6.750%, due 30/09/2024 509 0.05
1,380 Alcoa Nederland HoldingBV, 144A,6.125%, due 15/05/2028 1,500 0.14
1,860 Allen Media LLC / AllenMedia Co-Issuer Inc, 144A,10.500%, due 15/02/2028 1,962 0.18
3,660 Allied Universal HoldcoLLC / Allied UniversalFinance Corp, 144A,6.625%, due 15/07/2026 3,881 0.36
2,150 Altria Group Inc,5.950%, due 14/02/2049 2,751 0.25
4,320 American News Co LLC,144A,8.500%, due 01/09/2026 4,862 0.45
6,880 Apollo Commercial RealEstate Finance Inc,4.750%, due 23/08/2022 6,760 0.62
390 Ardagh Packaging FinancePlc / Ardagh Holdings USAInc, 144A,4.125%, due 15/08/2026 404 0.04
900 Aviation Capital GroupLLC, 144A,2.875%, due 20/01/2022 915 0.08
1,150 Aviation Capital GroupLLC, 144A,5.500%, due 15/12/2024 1,297 0.12
1,790 Ball Corp,2.875%, due 15/08/2030 1,741 0.16
440 Bally’s Corp, 144A,6.750%, due 01/06/2027 472 0.04
2,520 Bausch Health AmericasInc, 144A,8.500%, due 31/01/2027 2,791 0.26
40 Bausch Health Cos Inc,144A,9.000%, due 15/12/2025 44 –
300 Becton Dickinson and Co,3.363%, due 06/06/2024 324 0.03
828 Becton Dickinson and Co,3.700%, due 06/06/2027 929 0.09
2,430 Bed Bath & Beyond Inc,5.165%, due 01/08/2044 2,180 0.20
4,780 Berry Petroleum Co LLC,144A,7.000%, due 15/02/2026 4,618 0.43
1,320 Black Knight InfoServ LLC,144A,3.625%, due 01/09/2028 1,314 0.12
3,320 Blackstone Mortgage TrustInc,4.375%, due 05/05/2022 3,388 0.31
1,650 Blast Motion Inc, Series 2021,144A,7.000%, due 15/01/2024 †∞ 1,650 0.15
2,060 Blue Racer MidstreamLLC / Blue Racer FinanceCorp, 144A,7.625%, due 15/12/2025 2,219 0.21
2,650 Boeing Co/The,2.196%, due 04/02/2026 2,656 0.25
380 Boeing Co/The,2.700%, due 01/02/2027 390 0.04
500 Boeing Co/The,5.150%, due 01/05/2030 583 0.05
1,310 Boeing Co/The,3.250%, due 01/02/2035 1,290 0.12
1,510 Boeing Co/The,5.930%, due 01/05/2060 1,986 0.18
1,430 Boyd Gaming Corp, 144A,8.625%, due 01/06/2025 1,575 0.15
2,220 Boyne USA Inc, 144A,7.250%, due 01/05/2025 2,316 0.21
FaceValue(000’s)
Value(000’s)
$
% ofNet
AssetValue
1,133 Brink’s Co/The, 144A,4.625%, due 15/10/2027 1,170 0.11
92 Bristol-Myers Squibb Co,5.000%, due 15/08/2045 123 0.01
440 Bristol-Myers Squibb Co,4.250%, due 26/10/2049 537 0.05
1,600 Broadcom Inc,4.150%, due 15/11/2030 1,771 0.16
1,460 Caesars Entertainment Inc,144A,6.250%, due 01/07/2025 1,548 0.14
10 CalAtlantic Group Inc/old,5.250%, due 01/06/2026 10 –
1,850 Carnival Corp, 144A,5.750%, due 01/03/2027 1,880 0.17
810 Carnival Corp, 144A,9.875%, due 01/08/2027 933 0.09
1,810 Carriage Services Inc,144A,6.625%, due 01/06/2026 1,907 0.18
2,530 CCO Holdings LLC / CCOHoldings Capital Corp,144A,5.000%, due 01/02/2028 2,653 0.25
2,500 CCO Holdings LLC / CCOHoldings Capital Corp,144A,4.500%, due 15/08/2030 2,592 0.24
1,800 CCO Holdings LLC / CCOHoldings Capital Corp,144A,4.500%, due 01/05/2032 1,851 0.17
800 CDK Global Inc, 144A,5.250%, due 15/05/2029 862 0.08
1,220 CDW LLC / CDW FinanceCorp,4.125%, due 01/05/2025 1,265 0.12
540 CDW LLC / CDW FinanceCorp,3.250%, due 15/02/2029 532 0.05
1,250 Centene Corp, 144A,5.375%, due 01/06/2026 1,308 0.12
2,270 Centene Corp, 144A,5.375%, due 15/08/2026 2,395 0.22
360 Centene Corp,3.375%, due 15/02/2030 371 0.03
710 Charter CommunicationsOperating LLC / CharterCommunicationsOperating Capital,4.200%, due 15/03/2028 796 0.07
80 Charter CommunicationsOperating LLC / CharterCommunicationsOperating Capital,6.384%, due 23/10/2035 106 0.01
310 Charter CommunicationsOperating LLC / CharterCommunicationsOperating Capital,5.375%, due 01/04/2038 371 0.03
2,800 Charter CommunicationsOperating LLC / CharterCommunicationsOperating Capital,5.125%, due 01/07/2049 3,225 0.30
4,605 Cheniere Energy Inc,4.250%, due 15/03/2045 3,809 0.35
1,500 Cheniere Energy PartnersLP,4.500%, due 01/10/2029 1,581 0.15
230 Chesapeake Energy Corp,144A,5.500%, due 01/02/2026 240 0.02
260 Chesapeake Energy Corp,144A,5.875%, due 01/02/2029 278 0.03
510 CHS/Community HealthSystems Inc, 144A,8.125%, due 30/06/2024 533 0.05
2,960 CHS/Community HealthSystems Inc, 144A,6.875%, due 15/04/2029 3,042 0.28
1,000 Cigna Corp,4.800%, due 15/08/2038 1,239 0.11
300 Citigroup Inc,8.125%, due 15/07/2039 507 0.05
FaceValue(000’s)
Value(000’s)
$
% ofNet
AssetValue
400 Citigroup Inc,4.650%, due 30/07/2045 502 0.05
500 Citigroup Inc,4.650%, due 23/07/2048 639 0.06
1,470 Clear Channel WorldwideHoldings Inc,9.250%, due 15/02/2024 1,533 0.14
1,110 CNX Midstream PartnersLP / CNX MidstreamFinance Corp, 144A,6.500%, due 15/03/2026 1,146 0.11
1,790 Cogent CommunicationsGroup Inc, 144A,5.375%, due 01/03/2022 1,837 0.17
600 Comcast Corp,4.700%, due 15/10/2048 762 0.07
1,900 CommScope Inc, 144A,8.250%, due 01/03/2027 2,004 0.19
370 CommScope TechnologiesLLC, 144A,5.000%, due 15/03/2027 363 0.03
3,100 Comstock Resources Inc,9.750%, due 15/08/2026 3,375 0.31
946 CoreCivic Inc,4.625%, due 01/05/2023 918 0.08
760 Cornerstone BuildingBrands Inc, 144A,6.125%, due 15/01/2029 780 0.07
3,580 CSC Holdings LLC, 144A,6.500%, due 01/02/2029 3,966 0.37
750 CSC Holdings LLC, 144A,4.125%, due 01/12/2030 754 0.07
3,300 CVS Health Corp,4.780%, due 25/03/2038 4,027 0.37
EUR 910 CyrusOne LP / CyrusOneFinance Corp,1.450%, due 22/01/2027 1,106 0.10
325 DCP Midstream OperatingLP,3.875%, due 15/03/2023 336 0.03
120 DCP Midstream OperatingLP,5.625%, due 15/07/2027 130 0.01
600 DCP Midstream OperatingLP, 144A,6.750%, due 15/09/2037 678 0.06
760 Delta Air Lines Inc,3.400%, due 19/04/2021 762 0.07
2,170 Delta Air Lines Inc,3.800%, due 19/04/2023 2,226 0.21
5,070 Delta Air Lines Inc, 144A,7.000%, due 01/05/2025 5,911 0.55
760 Delta Air Lines Inc /SkyMiles IP Ltd, 144A,4.750%, due 20/10/2028 844 0.08
1,880 Devon Energy Corp,5.000%, due 15/06/2045 2,202 0.20
980 Diamondback Energy Inc,5.375%, due 31/05/2025 1,014 0.09
3,970 DISH DBS Corp,7.750%, due 01/07/2026 4,374 0.40
2,660 DISH Network Corp,3.375%, due 15/08/2026 2,508 0.23
1,340 Diversified HealthcareTrust,9.750%, due 15/06/2025 1,511 0.14
650 Diversified HealthcareTrust,4.750%, due 15/02/2028 642 0.06
530 Diversified HealthcareTrust,4.375%, due 01/03/2031 525 0.05
1,610 Downstream DevelopmentAuthority of the QuapawTribe of Oklahoma, 144A,10.500%, due 15/02/2023 1,648 0.15
280 Dropbox Inc, 144A, zerocoupon, due 01/03/2026 277 0.03
220 Dropbox Inc, 144A, zerocoupon, due 01/03/2028 217 0.02
1,140 Endeavor EnergyResources LP / EER FinanceInc, 144A,6.625%, due 15/07/2025 1,200 0.11
^ Not authorised for sale to the public in Hong Kong.The accompanying notes are an integral part of the Financial Statements
139

Legg Mason Global Funds Plc Annual Report 28 February 2021
Legg Mason Western Asset Multi-Asset Credit Fund^
Portfolio of Investments as at 28 February 2021 – (continued)
FaceValue(000’s)
Value(000’s)
$
% ofNet
AssetValue
Corporate Bonds and Notes — (continued)
United States — (continued)
827 Endeavor EnergyResources LP / EER FinanceInc, 144A,5.500%, due 30/01/2026 846 0.08
1,183 Endeavor EnergyResources LP / EER FinanceInc, 144A,5.750%, due 30/01/2028 1,252 0.12
2,350 Endo Dac / Endo FinanceLLC / Endo Finco Inc,144A,9.500%, due 31/07/2027 2,651 0.25
1,120 Entegris Inc, 144A,4.375%, due 15/04/2028 1,178 0.11
300 Enterprise ProductsOperating LLC,3.700%, due 31/01/2051 304 0.03
1,000 Enterprise ProductsOperating LLC,3.950%, due 31/01/2060 1,034 0.10
550 EQM Midstream PartnersLP, 144A,6.000%, due 01/07/2025 582 0.05
490 EQM Midstream PartnersLP, 144A,6.500%, due 01/07/2027 526 0.05
1,000 EQT Corp,7.625%, due 01/02/2025 1,165 0.11
660 Exxon Mobil Corp,4.327%, due 19/03/2050 780 0.07
750 Exxon Mobil Corp,3.452%, due 15/04/2051 771 0.07
1,330 Ferrellgas LP / FerrellgasFinance Corp,6.750%, due 15/06/2023 1,332 0.12
1,270 Finance of AmericaFunding LLC, 144A,7.875%, due 15/11/2025 1,289 0.12
700 FirstEnergy Corp, Series B,4.400%, due 15/07/2027 769 0.07
1,500 FirstEnergy Corp, Series C,7.375%, due 15/11/2031 2,066 0.19
3,500 Five Point Operating CoLP / Five Point CapitalCorp, 144A,7.875%, due 15/11/2025 3,700 0.34
1,510 Ford Motor Co,8.500%, due 21/04/2023 1,689 0.16
2,010 Ford Motor Co,9.000%, due 22/04/2025 2,434 0.23
1,260 Ford Motor Credit Co LLC,3.087%, due 09/01/2023 1,281 0.12
1,060 Ford Motor Credit Co LLC,5.125%, due 16/06/2025 1,146 0.11
350 Ford Motor Credit Co LLC,2.900%, due 16/02/2028 345 0.03
1,210 Fox Corp,5.476%, due 25/01/2039 1,555 0.14
4,000 Freeport-McMoRan Inc,5.450%, due 15/03/2043 4,977 0.46
1,070 Frontier CommunicationsCorp, 144A,5.875%, due 15/10/2027 1,147 0.11
1,100 Frontier CommunicationsCorp, 144A,6.750%, due 01/05/2029 1,154 0.11
1,940 Gartner Inc, 144A,3.750%, due 01/10/2030 1,967 0.18
4,520 General Electric Co,6.875%, due 10/01/2039 6,457 0.60
420 General Electric Co,4.250%, due 01/05/2040 467 0.04
180 General Electric Co,4.350%, due 01/05/2050 201 0.02
920 General Motors Co,6.125%, due 01/10/2025 1,096 0.10
520 General Motors Co,6.250%, due 02/10/2043 700 0.06
1,960 GEO Corrections HoldingsInc, 144A,6.500%, due 23/02/2026 2,021 0.19
965 GEO Group Inc/The,5.875%, due 15/01/2022 966 0.09
1,250 GEO Group Inc/The,5.875%, due 15/10/2024 979 0.09
FaceValue(000’s)
Value(000’s)
$
% ofNet
AssetValue
1,437 GEO Group Inc/The,6.000%, due 15/04/2026 1,053 0.10
1,440 Golden Nugget Inc, 144A,6.750%, due 15/10/2024 1,466 0.14
1,580 Goldman Sachs Group Inc/The,5.150%, due 22/05/2045 2,087 0.19
400 Goldman Sachs Group Inc/The,4.750%, due 21/10/2045 518 0.05
2,650 Granite US Holdings Corp,144A,11.000%, due 01/10/2027 2,975 0.28
1,940 H&E Equipment ServicesInc, 144A,3.875%, due 15/12/2028 1,870 0.17
200 Halozyme TherapeuticsInc, 144A,0.250%, due 01/03/2027 197 0.02
1,380 Hawaiian BrandIntellectual Property Ltd /HawaiianMiles Loyalty Ltd,144A,5.750%, due 20/01/2026 1,449 0.13
600 HCA Inc,5.375%, due 01/02/2025 674 0.06
2,600 HCA Inc,5.625%, due 01/09/2028 3,027 0.28
2,710 HCA Inc,5.500%, due 15/06/2047 3,468 0.32
2,020 Hilton Domestic OperatingCo Inc, 144A,5.375%, due 01/05/2025 2,127 0.20
2,400 iHeartCommunications Inc,144A,4.750%, due 15/01/2028 2,455 0.23
950 International GameTechnology Plc, 144A,5.250%, due 15/01/2029 1,007 0.09
401 Kraft Heinz Foods Co,3.950%, due 15/07/2025 446 0.04
60 Kraft Heinz Foods Co,3.875%, due 15/05/2027 66 0.01
200 Kraft Heinz Foods Co,4.250%, due 01/03/2031 225 0.02
120 Kraft Heinz Foods Co,4.875%, due 01/10/2049 141 0.01
1,020 Kraft Heinz Foods Co,5.500%, due 01/06/2050 1,317 0.12
570 L Brands Inc, 144A,6.875%, due 01/07/2025 624 0.06
3,130 L Brands Inc,5.250%, due 01/02/2028 3,355 0.31
910 L Brands Inc, 144A,6.625%, due 01/10/2030 1,021 0.09
850 Las Vegas Sands Corp,3.200%, due 08/08/2024 893 0.08
70 Las Vegas Sands Corp,2.900%, due 25/06/2025 73 0.01
600 Las Vegas Sands Corp,3.500%, due 18/08/2026 636 0.06
1,000 Legacy LifePoint HealthLLC, 144A,4.375%, due 15/02/2027 997 0.09
2,260 Legends HospitalityHolding Co LLC / LegendsHospitality Co-Issuer Inc,144A,5.000%, due 01/02/2026 2,302 0.21
1,010 Lennar Corp,4.500%, due 30/04/2024 1,109 0.10
800 Lennar Corp,4.750%, due 29/11/2027 927 0.09
310 Liberty Broadband Corp,144A,1.250%, due 30/09/2050 310 0.03
1,260 Liberty Interactive LLC,4.000%, due 15/11/2029 995 0.09
1,500 Liberty Interactive LLC,3.750%, due 15/02/2030 1,185 0.11
2,370 Lions Gate CapitalHoldings LLC, 144A,5.875%, due 01/11/2024 2,421 0.22
220 Massachusetts Mutual LifeInsurance Co, 144A,3.375%, due 15/04/2050 226 0.02
FaceValue(000’s)
Value(000’s)
$
% ofNet
AssetValue
350 Mastercard Inc,3.850%, due 26/03/2050 412 0.04
1,220 Match Group Holdings IILLC, 144A,4.625%, due 01/06/2028 1,269 0.12
1,000 MDC Holdings Inc,6.000%, due 15/01/2043 1,322 0.12
2,500 Michaels Stores Inc, 144A,8.000%, due 15/07/2027 2,673 0.25
1,910 Mohegan Gaming &Entertainment, 144A,7.875%, due 15/10/2024 2,000 0.18
1,590 MPH Acquisition HoldingsLLC, 144A,5.750%, due 01/11/2028 1,580 0.15
2,700 MPT OperatingPartnership LP / MPTFinance Corp,5.000%, due 15/10/2027 2,870 0.27
GBP 1,326 MPT OperatingPartnership LP / MPTFinance Corp,3.692%, due 05/06/2028 1,962 0.18
1,840 NCL Corp Ltd, 144A,12.250%, due 15/05/2024 2,190 0.20
1,490 NCL Corp Ltd, 144A,3.625%, due 15/12/2024 1,395 0.13
1,690 NCL Corp Ltd, 144A,10.250%, due 01/02/2026 1,969 0.18
10 Netflix Inc,5.875%, due 15/11/2028 12 –
2,380 Netflix Inc,6.375%, due 15/05/2029 2,960 0.27
1,000 Netflix Inc, 144A,4.875%, due 15/06/2030 1,151 0.11
440 New York Life InsuranceCo, 144A,3.750%, due 15/05/2050 490 0.05
730 Newell Brands Inc,4.875%, due 01/06/2025 805 0.07
3,050 Newell Brands Inc,4.700%, due 01/04/2026 3,387 0.31
3,820 NGPL PipeCo LLC, 144A,7.768%, due 15/12/2037 5,143 0.48
1,420 NMI Holdings Inc, 144A,7.375%, due 01/06/2025 1,607 0.15
780 Northern Oil and Gas Inc,144A,8.125%, due 01/03/2028 770 0.07
2,790 Northwest Acquisitions ULC /Dominion Finco Inc, 144A,7.125%, due 01/11/2022 †∞� – –
1,430 NRG Energy Inc, 144A,3.625%, due 15/02/2031 1,411 0.13
410 NVIDIA Corp,3.500%, due 01/04/2050 446 0.04
4,462 Occidental PetroleumCorp,7.150%, due 15/05/2028 4,808 0.44
450 Occidental PetroleumCorp,7.200%, due 15/03/2029 495 0.05
300 Occidental PetroleumCorp,6.125%, due 01/01/2031 336 0.03
3,780 Occidental PetroleumCorp,zero coupon,due 10/10/2036 1,843 0.17
500 Olin Corp,5.000%, due 01/02/2030 525 0.05
1,210 ON Semiconductor Corp,144A,3.875%, due 01/09/2028 1,266 0.12
1,750 Parsley Energy LLC /Parsley Finance Corp,144A,5.625%, due 15/10/2027 1,923 0.18
560 PBF Holding Co LLC / PBFFinance Corp, 144A,9.250%, due 15/05/2025 547 0.05
500 PetSmart Inc / PetSmartFinance Corp, 144A,4.750%, due 15/02/2028 518 0.05
550 PetSmart Inc / PetSmartFinance Corp, 144A,7.750%, due 15/02/2029 591 0.05
^ Not authorised for sale to the public in Hong Kong.The accompanying notes are an integral part of the Financial Statements
140

Legg Mason Global Funds Plc Annual Report 28 February 2021
Legg Mason Western Asset Multi-Asset Credit Fund^
Portfolio of Investments as at 28 February 2021 – (continued)
FaceValue(000’s)
Value(000’s)
$
% ofNet
AssetValue
Corporate Bonds and Notes — (continued)United States — (continued)
2,900 PM General Purchaser LLC,144A,9.500%, due 01/10/2028 3,196 0.30
1,440 Prime Security ServicesBorrower LLC / PrimeFinance Inc, 144A,5.750%, due 15/04/2026 1,553 0.14
2,560 Prime Security ServicesBorrower LLC / PrimeFinance Inc, 144A,3.375%, due 31/08/2027 2,499 0.23
780 Prime Security ServicesBorrower LLC / PrimeFinance Inc, 144A,6.250%, due 15/01/2028 809 0.07
2,100 QEP Resources Inc,5.625%, due 01/03/2026 2,365 0.22
1,710 Rackspace TechnologyGlobal Inc, 144A,3.500%, due 15/02/2028 1,681 0.16
1,550 Radiology Partners Inc,144A,9.250%, due 01/02/2028 1,682 0.16
810 Range Resources Corp,5.750%, due 01/06/2021 813 0.08
1,360 Range Resources Corp,5.875%, due 01/07/2022 1,373 0.13
767 Range Resources Corp,5.000%, due 15/08/2022 777 0.07
404 Range Resources Corp,5.000%, due 15/03/2023 407 0.04
4,090 Range Resources Corp,9.250%, due 01/02/2026 4,456 0.41
1,020 Range Resources Corp,144A,8.250%, due 15/01/2029 1,098 0.10
790 Realogy Group LLC /Realogy Co-Issuer Corp,144A,7.625%, due 15/06/2025 862 0.08
1,310 Realogy Group LLC /Realogy Co-Issuer Corp,144A,5.750%, due 15/01/2029 1,321 0.12
1,190 Rent-A-Center Inc/TX,144A,6.375%, due 15/02/2029 1,241 0.11
1,415 RR Donnelley & Sons Co,8.250%, due 01/07/2027 1,672 0.15
640 Sally Holdings LLC / SallyCapital Inc,5.500%, due 01/11/2023 645 0.06
830 Scientific GamesInternational Inc, 144A,7.000%, due 15/05/2028 881 0.08
510 Sensata Technologies Inc,144A,4.375%, due 15/02/2030 545 0.05
1,930 Service Properties Trust,5.500%, due 15/12/2027 2,081 0.19
500 ServiceMaster Co LLC/The,7.450%, due 15/08/2027 598 0.06
624 Shift4 Payments LLC /Shift4 Payments FinanceSub Inc, 144A,4.625%, due 01/11/2026 654 0.06
2,667 Silversea Cruise FinanceLtd, 144A,7.250%, due 01/02/2025 2,766 0.26
1,590 Simmons Foods Inc/Simmons Prepared FoodsInc/Simmons Pet Food Inc/Simmons Feed, 144A,4.625%, due 01/03/2029 1,613 0.15
2,580 Spirit Loyalty Cayman Ltd /Spirit IP Cayman Ltd,144A,8.000%, due 20/09/2025 2,908 0.27
3,610 Sprint Capital Corp,8.750%, due 15/03/2032 5,375 0.50
2,090 SRM Escrow Issuer LLC,144A,6.000%, due 01/11/2028 2,175 0.20
750 Summit Materials LLC /Summit Materials FinanceCorp, 144A,5.250%, due 15/01/2029 797 0.07
FaceValue(000’s)
Value(000’s)
$
% ofNet
AssetValue
1,340 Switch Ltd, 144A,3.750%, due 15/09/2028 1,368 0.13
1,450 Syneos Health Inc, 144A,3.625%, due 15/01/2029 1,424 0.13
1,200 Talen Energy Supply LLC,144A,10.500%, due 15/01/2026 1,149 0.11
1,080 Tallgrass Energy PartnersLP / Tallgrass EnergyFinance Corp, 144A,6.000%, due 31/12/2030 1,076 0.10
300 Targa Resources PartnersLP / Targa ResourcesPartners Finance Corp,6.500%, due 15/07/2027 323 0.03
160 Targa Resources PartnersLP / Targa ResourcesPartners Finance Corp,6.875%, due 15/01/2029 178 0.02
1,480 Targa Resources PartnersLP / Targa ResourcesPartners Finance Corp,144A,4.875%, due 01/02/2031 1,520 0.14
1,230 Targa Resources PartnersLP / Targa ResourcesPartners Finance Corp,144A,4.000%, due 15/01/2032 1,207 0.11
1,200 Tenet Healthcare Corp,144A,7.500%, due 01/04/2025 1,305 0.12
600 Tenet Healthcare Corp,144A,5.125%, due 01/11/2027 630 0.06
540 Tenet Healthcare Corp,144A,4.625%, due 15/06/2028 562 0.05
1,200 Tennessee Gas Pipeline CoLLC, 144A,2.900%, due 01/03/2030 1,236 0.11
50 Time Warner Cable LLC,6.550%, due 01/05/2037 68 0.01
220 Time Warner Cable LLC,6.750%, due 15/06/2039 304 0.03
1,690 T-Mobile USA Inc,4.750%, due 01/02/2028 1,789 0.17
1,470 TopBuild Corp, 144A,3.625%, due 15/03/2029 1,479 0.14
400 Transcontinental Gas PipeLine Co LLC,3.250%, due 15/05/2030 429 0.04
2,360 TransDigm Inc, 144A,8.000%, due 15/12/2025 2,572 0.24
2,360 TransDigm Inc, 144A,6.250%, due 15/03/2026 2,490 0.23
2,090 TransDigm Inc, 144A,4.625%, due 15/01/2029 2,059 0.19
1,760 Twitter Inc, 144A,3.875%, due 15/12/2027 1,880 0.17
690 Union Pacific Corp,3.839%, due 20/03/2060 772 0.07
640 United Airlines 2015-1Class A Pass ThroughTrust,3.700%, due 01/12/2022 647 0.06
260 United Airlines 2020-1Class B Pass ThroughTrust,4.875%, due 15/01/2026 272 0.03
730 United Rentals NorthAmerica Inc,5.500%, due 15/05/2027 773 0.07
1,480 United Rentals NorthAmerica Inc,3.875%, due 15/11/2027 1,544 0.14
1,510 United Rentals NorthAmerica Inc,5.250%, due 15/01/2030 1,664 0.15
2,170 Univision CommunicationsInc, 144A,9.500%, due 01/05/2025 2,375 0.22
1,200 US Renal Care Inc, 144A,10.625%, due 15/07/2027 1,316 0.12
780 Verizon CommunicationsInc,4.522%, due 15/09/2048 920 0.09
FaceValue(000’s)
Value(000’s)
$
% ofNet
AssetValue
1,469 VICI Properties LP / VICINote Co Inc, 144A,4.125%, due 15/08/2030 1,530 0.14
2,150 Viking Cruises Ltd, 144A,7.000%, due 15/02/2029 2,188 0.20
230 Visa Inc,2.700%, due 15/04/2040 235 0.02
4,500 VOC Escrow Ltd, 144A,5.000%, due 15/02/2028 4,457 0.41
730 Wells Fargo & Co,4.650%, due 04/11/2044 874 0.08
1,730 Wells Fargo & Co,5.013%, due 04/04/2051 * 2,317 0.21
1,710 Wendy’s International LLC,7.000%, due 15/12/2025 1,914 0.18
730 Western MidstreamOperating LP,4.350%, due 01/02/2025 748 0.07
3,450 Western MidstreamOperating LP,5.450%, due 01/04/2044 3,666 0.34
1,780 Western MidstreamOperating LP,5.300%, due 01/03/2048 1,873 0.17
1,736 Williams Cos Inc/The,8.750%, due 15/03/2032 2,607 0.24
1,100 WPX Energy Inc,8.250%, due 01/08/2023 1,269 0.12
130 WPX Energy Inc,5.250%, due 15/10/2027 139 0.01
1,430 WPX Energy Inc,4.500%, due 15/01/2030 1,522 0.14
1,360 WW International Inc,144A,8.625%, due 01/12/2025 1,422 0.13
2,830 Wynn Resorts FinanceLLC / Wynn Resorts CapitalCorp, 144A,7.750%, due 15/04/2025 3,075 0.28
2,117 XPO CNW Inc,6.700%, due 01/05/2034 2,475 0.23
700 ZoomInfo TechnologiesLLC/ZoomInfo FinanceCorp, 144A,3.875%, due 01/02/2029 696 0.06
422,184 39.02
Zambia — 0.78% (29 February 2020: 0.58%)
2,380 First Quantum MineralsLtd, 144A,7.250%, due 01/04/2023 2,431 0.22
3,040 First Quantum MineralsLtd, 144A,6.500%, due 01/03/2024 3,107 0.29
2,700 First Quantum MineralsLtd, 144A,6.875%, due 15/10/2027 2,933 0.27
8,471 0.78
Total Corporate Bonds and Notes(Cost $555,836) 592,271 54.75
Government Bonds and Notes — 10.34%(29 February 2020: 14.92%)
Argentina — 0.48% (29 February 2020: 1.10%)
ARS 15,093 Argentina Treasury BondBONCER, Series CER,1.000%, due 05/08/2021 †� 146 0.01
28 Argentine RepublicGovernment InternationalBond,1.000%, due 09/07/2029 11 –
147 Argentine RepublicGovernment InternationalBond,0.125%, due 09/07/2030 54 –
270 Argentine RepublicGovernment InternationalBond,0.125%, due 09/07/2035 86 0.01
637 Provincia de Buenos Aires/Government Bonds,10.875%, due 26/01/2021 †� 244 0.02
1,190 Provincia de Buenos Aires/Government Bonds,9.950%, due 09/06/2021 � 410 0.04
^ Not authorised for sale to the public in Hong Kong.The accompanying notes are an integral part of the Financial Statements
141
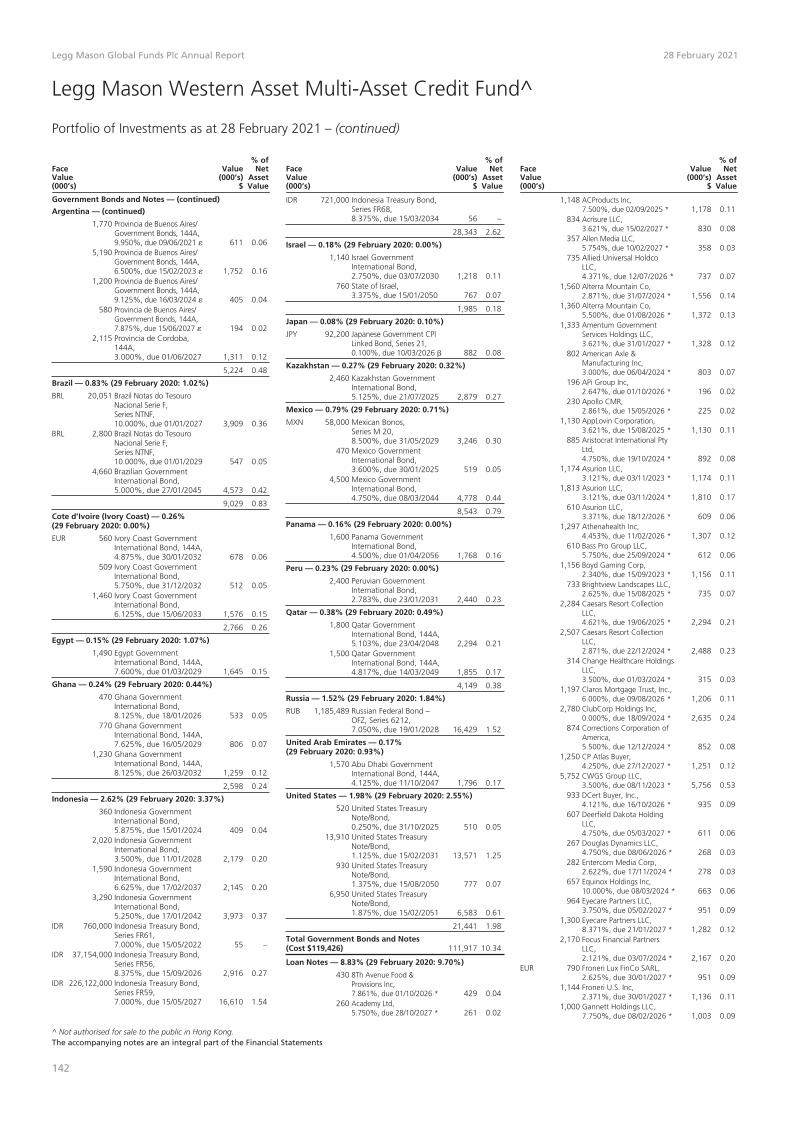
Legg Mason Global Funds Plc Annual Report 28 February 2021
Legg Mason Western Asset Multi-Asset Credit Fund^
Portfolio of Investments as at 28 February 2021 – (continued)
FaceValue(000’s)
Value(000’s)
$
% ofNet
AssetValue
Government Bonds and Notes — (continued)
Argentina — (continued)
1,770 Provincia de Buenos Aires/Government Bonds, 144A,9.950%, due 09/06/2021 � 611 0.06
5,190 Provincia de Buenos Aires/Government Bonds, 144A,6.500%, due 15/02/2023 � 1,752 0.16
1,200 Provincia de Buenos Aires/Government Bonds, 144A,9.125%, due 16/03/2024 � 405 0.04
580 Provincia de Buenos Aires/Government Bonds, 144A,7.875%, due 15/06/2027 � 194 0.02
2,115 Provincia de Cordoba,144A,3.000%, due 01/06/2027 1,311 0.12
5,224 0.48
Brazil — 0.83% (29 February 2020: 1.02%)
BRL 20,051 Brazil Notas do TesouroNacional Serie F,Series NTNF,10.000%, due 01/01/2027 3,909 0.36
BRL 2,800 Brazil Notas do TesouroNacional Serie F,Series NTNF,10.000%, due 01/01/2029 547 0.05
4,660 Brazilian GovernmentInternational Bond,5.000%, due 27/01/2045 4,573 0.42
9,029 0.83
Cote d’Ivoire (Ivory Coast) — 0.26%(29 February 2020: 0.00%)
EUR 560 Ivory Coast GovernmentInternational Bond, 144A,4.875%, due 30/01/2032 678 0.06
509 Ivory Coast GovernmentInternational Bond,5.750%, due 31/12/2032 512 0.05
1,460 Ivory Coast GovernmentInternational Bond,6.125%, due 15/06/2033 1,576 0.15
2,766 0.26
Egypt — 0.15% (29 February 2020: 1.07%)
1,490 Egypt GovernmentInternational Bond, 144A,7.600%, due 01/03/2029 1,645 0.15
Ghana — 0.24% (29 February 2020: 0.44%)
470 Ghana GovernmentInternational Bond,8.125%, due 18/01/2026 533 0.05
770 Ghana GovernmentInternational Bond, 144A,7.625%, due 16/05/2029 806 0.07
1,230 Ghana GovernmentInternational Bond, 144A,8.125%, due 26/03/2032 1,259 0.12
2,598 0.24
Indonesia — 2.62% (29 February 2020: 3.37%)
360 Indonesia GovernmentInternational Bond,5.875%, due 15/01/2024 409 0.04
2,020 Indonesia GovernmentInternational Bond,3.500%, due 11/01/2028 2,179 0.20
1,590 Indonesia GovernmentInternational Bond,6.625%, due 17/02/2037 2,145 0.20
3,290 Indonesia GovernmentInternational Bond,5.250%, due 17/01/2042 3,973 0.37
IDR 760,000 Indonesia Treasury Bond,Series FR61,7.000%, due 15/05/2022 55 –
IDR 37,154,000 Indonesia Treasury Bond,Series FR56,8.375%, due 15/09/2026 2,916 0.27
IDR 226,122,000 Indonesia Treasury Bond,Series FR59,7.000%, due 15/05/2027 16,610 1.54
FaceValue(000’s)
Value(000’s)
$
% ofNet
AssetValue
IDR 721,000 Indonesia Treasury Bond,Series FR68,8.375%, due 15/03/2034 56 –
28,343 2.62
Israel — 0.18% (29 February 2020: 0.00%)
1,140 Israel GovernmentInternational Bond,2.750%, due 03/07/2030 1,218 0.11
760 State of Israel,3.375%, due 15/01/2050 767 0.07
1,985 0.18
Japan — 0.08% (29 February 2020: 0.10%)
JPY 92,200 Japanese Government CPILinked Bond, Series 21,0.100%, due 10/03/2026 � 882 0.08
Kazakhstan — 0.27% (29 February 2020: 0.32%)
2,460 Kazakhstan GovernmentInternational Bond,5.125%, due 21/07/2025 2,879 0.27
Mexico — 0.79% (29 February 2020: 0.71%)
MXN 58,000 Mexican Bonos,Series M 20,8.500%, due 31/05/2029 3,246 0.30
470 Mexico GovernmentInternational Bond,3.600%, due 30/01/2025 519 0.05
4,500 Mexico GovernmentInternational Bond,4.750%, due 08/03/2044 4,778 0.44
8,543 0.79
Panama — 0.16% (29 February 2020: 0.00%)
1,600 Panama GovernmentInternational Bond,4.500%, due 01/04/2056 1,768 0.16
Peru — 0.23% (29 February 2020: 0.00%)
2,400 Peruvian GovernmentInternational Bond,2.783%, due 23/01/2031 2,440 0.23
Qatar — 0.38% (29 February 2020: 0.49%)
1,800 Qatar GovernmentInternational Bond, 144A,5.103%, due 23/04/2048 2,294 0.21
1,500 Qatar GovernmentInternational Bond, 144A,4.817%, due 14/03/2049 1,855 0.17
4,149 0.38
Russia — 1.52% (29 February 2020: 1.84%)
RUB 1,185,489 Russian Federal Bond –OFZ, Series 6212,7.050%, due 19/01/2028 16,429 1.52
United Arab Emirates — 0.17%(29 February 2020: 0.93%)
1,570 Abu Dhabi GovernmentInternational Bond, 144A,4.125%, due 11/10/2047 1,796 0.17
United States — 1.98% (29 February 2020: 2.55%)
520 United States TreasuryNote/Bond,0.250%, due 31/10/2025 510 0.05
13,910 United States TreasuryNote/Bond,1.125%, due 15/02/2031 13,571 1.25
930 United States TreasuryNote/Bond,1.375%, due 15/08/2050 777 0.07
6,950 United States TreasuryNote/Bond,1.875%, due 15/02/2051 6,583 0.61
21,441 1.98
Total Government Bonds and Notes(Cost $119,426) 111,917 10.34
Loan Notes — 8.83% (29 February 2020: 9.70%)
430 8Th Avenue Food &Provisions Inc,7.861%, due 01/10/2026 * 429 0.04
260 Academy Ltd,5.750%, due 28/10/2027 * 261 0.02
FaceValue(000’s)
Value(000’s)
$
% ofNet
AssetValue
1,148 ACProducts Inc,7.500%, due 02/09/2025 * 1,178 0.11
834 Acrisure LLC,3.621%, due 15/02/2027 * 830 0.08
357 Allen Media LLC,5.754%, due 10/02/2027 * 358 0.03
735 Allied Universal HoldcoLLC,4.371%, due 12/07/2026 * 737 0.07
1,560 Alterra Mountain Co,2.871%, due 31/07/2024 * 1,556 0.14
1,360 Alterra Mountain Co,5.500%, due 01/08/2026 * 1,372 0.13
1,333 Amentum GovernmentServices Holdings LLC,3.621%, due 31/01/2027 * 1,328 0.12
802 American Axle &Manufacturing Inc,3.000%, due 06/04/2024 * 803 0.07
196 APi Group Inc,2.647%, due 01/10/2026 * 196 0.02
230 Apollo CMR,2.861%, due 15/05/2026 * 225 0.02
1,130 AppLovin Corporation,3.621%, due 15/08/2025 * 1,130 0.11
885 Aristocrat International PtyLtd,4.750%, due 19/10/2024 * 892 0.08
1,174 Asurion LLC,3.121%, due 03/11/2023 * 1,174 0.11
1,813 Asurion LLC,3.121%, due 03/11/2024 * 1,810 0.17
610 Asurion LLC,3.371%, due 18/12/2026 * 609 0.06
1,297 Athenahealth Inc,4.453%, due 11/02/2026 * 1,307 0.12
610 Bass Pro Group LLC,5.750%, due 25/09/2024 * 612 0.06
1,156 Boyd Gaming Corp,2.340%, due 15/09/2023 * 1,156 0.11
733 Brightview Landscapes LLC,2.625%, due 15/08/2025 * 735 0.07
2,284 Caesars Resort CollectionLLC,4.621%, due 19/06/2025 * 2,294 0.21
2,507 Caesars Resort CollectionLLC,2.871%, due 22/12/2024 * 2,488 0.23
314 Change Healthcare HoldingsLLC,3.500%, due 01/03/2024 * 315 0.03
1,197 Claros Mortgage Trust, Inc.,6.000%, due 09/08/2026 * 1,206 0.11
2,780 ClubCorp Holdings Inc,0.000%, due 18/09/2024 * 2,635 0.24
874 Corrections Corporation ofAmerica,5.500%, due 12/12/2024 * 852 0.08
1,250 CP Atlas Buyer,4.250%, due 27/12/2027 * 1,251 0.12
5,752 CWGS Group LLC,3.500%, due 08/11/2023 * 5,756 0.53
933 DCert Buyer, Inc.,4.121%, due 16/10/2026 * 935 0.09
607 Deerfield Dakota HoldingLLC,4.750%, due 05/03/2027 * 611 0.06
267 Douglas Dynamics LLC,4.750%, due 08/06/2026 * 268 0.03
282 Entercom Media Corp,2.622%, due 17/11/2024 * 278 0.03
657 Equinox Holdings Inc,10.000%, due 08/03/2024 * 663 0.06
964 Eyecare Partners LLC,3.750%, due 05/02/2027 * 951 0.09
1,300 Eyecare Partners LLC,8.371%, due 21/01/2027 * 1,282 0.12
2,170 Focus Financial PartnersLLC,2.121%, due 03/07/2024 * 2,167 0.20
EUR 790 Froneri Lux FinCo SARL,2.625%, due 30/01/2027 * 951 0.09
1,144 Froneri U.S. Inc,2.371%, due 30/01/2027 * 1,136 0.11
1,000 Gannett Holdings LLC,7.750%, due 08/02/2026 * 1,003 0.09
^ Not authorised for sale to the public in Hong Kong.The accompanying notes are an integral part of the Financial Statements
142

Legg Mason Global Funds Plc Annual Report 28 February 2021
Legg Mason Western Asset Multi-Asset Credit Fund^
Portfolio of Investments as at 28 February 2021 – (continued)
FaceValue(000’s)
Value(000’s)
$
% ofNet
AssetValue
Loan Notes — (continued)
1,493 Garda World Security Corp,4.990%, due 23/10/2026 * 1,499 0.14
530 Global Medical Response,Inc,5.750%, due 24/09/2025 * 532 0.05
1,298 Global Tel’Link Corp,4.371%, due 29/11/2025 * 1,228 0.11
310 Global Tel’Link Corp,8.371%, due 29/11/2026 * 241 0.02
783 GlobalTranz Enterprises Inc,5.118%, due 02/05/2026 * 746 0.07
640 Hilton Worldwide FinanceLLC,1.868%, due 21/06/2026 * 639 0.06
1,225 iHeartCommunications Inc,3.121%, due 01/05/2026 * 1,216 0.11
1,130 Ineos U.S. Petrochemical,0.000%, due 21/01/2026 * 1,133 0.11
2,613 JetBlue Airways Corp,6.250%, due 17/06/2024 * 2,702 0.25
179 Leslie’s Poolmart Inc,3.621%, due 16/08/2023 * 179 0.02
22 MA FinanceCo. LLC,2.871%, due 18/04/2024 * 22 –
1,446 McAfee LLC,3.871%, due 29/09/2024 * 1,452 0.13
1,108 Mister Car Wash,3.361%, due 14/05/2026 * 1,095 0.10
1,266 MPH Acquisition HoldingsLLC,3.750%, due 07/06/2023 * 1,266 0.12
248 Nielsen Finance LLC,4.750%, due 30/06/2025 * 251 0.02
3,168 Option Care Health Inc,3.871%, due 06/08/2026 * 3,174 0.29
1,445 Panther BF Aggregator 2 LP,3.621%, due 18/03/2026 * 1,446 0.13
985 Particle Investments S.a.r.l.,5.750%, due 11/05/2027 * 995 0.09
312 Peraton Corporation,0.000%, due 22/02/2028 * 312 0.03
548 Peraton Corporation,0.000%, due 22/02/2028 * 548 0.05
1,234 Petco Animal Supplies Inc,4.250%, due 26/01/2023 * 1,235 0.11
532 Phoenix Guarantor Inc,3.361%, due 05/03/2026 * 531 0.05
790 Planview Parent, Inc.,4.750%, due 11/12/2027 * 794 0.07
190 Planview Parent, Inc.,0.000%, due 31/03/2021 * 191 0.02
202 Power Play Merger Sub, Inc,0.500%, due 30/10/2027 * 202 0.02
1,548 Power Play Merger Sub, Inc,4.500%, due 30/10/2027 * 1,552 0.14
2,030 Radiology Partners Inc,4.366%, due 09/07/2025 * 2,024 0.19
1,592 Radnet Management Inc,4.750%, due 01/07/2023 * 1,596 0.15
572 RegionalCare HospitalPartners Holding,3.871%, due 16/11/2025 * 574 0.05
319 Reynolds ConsumerProducts LLC,1.871%, due 04/02/2027 * 320 0.03
1,150 Royal Caribbean CruisesLtd,0.000%, due 05/04/2022 * 1,083 0.10
1,419 Scientific GamesInternational Inc,2.871%, due 14/08/2024 * 1,398 0.13
150 Seattle SpinCo Inc,2.871%, due 18/04/2024 * 149 0.01
866 Sedgwick ClaimsManagement Services Inc,5.250%, due 03/09/2026 * 873 0.08
980 Sedgwick ClaimsManagement Services Inc,3.371%, due 05/11/2025 * 975 0.09
1,124 Surf Holdings LLC,3.726%, due 14/10/2026 * 1,122 0.10
1,139 TKC Holdings Inc,4.750%, due 01/02/2023 * 1,123 0.10
2,390 U.S. Renal Care Inc,5.125%, due 14/06/2026 * 2,389 0.22
FaceValue(000’s)
Value(000’s)
$
% ofNet
AssetValue
1,765 UFC Holdings LLC,3.750%, due 29/04/2026 * 1,771 0.16
1,349 Ultimate Software GroupInc,3.871%, due 08/04/2026 * 1,358 0.13
1,139 Univision CommunicationsInc,4.750%, due 24/03/2026 * 1,147 0.11
1,240 USI Inc,3.254%, due 16/05/2024 * 1,233 0.11
1,092 Valeant PharmaceuticalsInternational,3.121%, due 28/05/2025 * 1,095 0.10
49 VFH Parent LLC,3.111%, due 01/03/2026 * 50 0.01
800 Virgin Media Bristol LLC,2.612%, due 04/01/2028 * 799 0.07
1,901 WP CityMD Bidco LLC,5.500%, due 13/08/2026 * 1,909 0.18
600 WP CPP Holdings LLC,4.750%, due 30/04/2025 * 579 0.05
1,000 Ziggo BV,2.612%, due 15/04/2028 * 995 0.09
Total Loan Notes(Cost $94,328) 95,483 8.83
Collective Investment Schemes — 1.75%(29 February 2020: 1.02%)
92 Legg Mason Global FundsPlc – Western AssetEmerging MarketsCorporate Bond Fund –LM Class US$Distributing (M) 9,508 0.88
EUR 74 Legg Mason QualifiedInvestor Funds (II) Plc –Western Asset EuropeanLoan Fund – LMClass Euro Accumulating 9,390 0.87
Total Collective Investment Schemes(Cost $17,235) 18,898 1.75
Preferred Stock — 0.78% (29 February 2020: 0.19%)
United States — 0.78% (29 February 2020: 0.19%)
31 B Riley Financial Inc 787 0.0770 MPLX LP, Series A †∞ 2,288 0.21
5 Targa Resources Corp,Series A † 5,408 0.50
8,483 0.78
Total Preferred Stock(Cost $8,404) 8,483 0.78
Total Investments at fair value throughprofit or loss (Cost $1,019,234) 1,047,405 96.82
Contracts(000’s)
Value(000’s)
$
% ofNet
AssetValue
Purchased Options — 0.08% (29 February 2020: 0.53%)
– S&P 500 E-miniMarch 2021Put 3,300.00,due 19/03/2021 – Bank ofAmerica Merrill Lynch 38 –
– S&P 500 E-miniMarch 2021Put 3,400.00,due 19/03/2021 – Bankof America Merrill Lynch 127 0.01
– S&P 500 E-mini W3April 2021Put 3,600.00,due 16/04/2021 – Bank ofAmerica Merrill Lynch 241 0.02
– U.S. Bond April 2021Call 168.00,due 26/03/2021 – Bank ofAmerica Merrill Lynch 17 –
9,653 USD Put/CADCall 1.2620,due 10/05/2021 – Citi 103 0.01
14,430 USD Put/EURCall 1.2035,due 01/04/2021 – Citi 155 0.02
Contracts(000’s)
Value(000’s)
$
% ofNet
AssetValue
7,240 USD Put/MXNCall 19.91, due 30/04/2021 –Goldman Sachs 44 0.01
5,790 USD Put/MXNCall 20.60, due 21/05/2021 –Morgan Stanley 109 0.01
2,900 USD Put/RUBCall 72.46, due 12/05/2021 –Goldman Sachs 28 –
2,900 USD Put/RUBCall 72.80, due 12/03/2021 –Goldman Sachs 6 –
Total Purchased Options(Cost $1,851) 868 0.08
Interest Rate Swaps — 0.67% (29 February 2020: 0.19%)
Unrealised appreciation of contracts(see below) 7,272 0.67
Forward Foreign Currency Contracts — 2.05%(29 February 2020: 0.45%)
Unrealised appreciation of contracts(see below) 22,104 2.05
Futures — 0.19% (29 February 2020: 0.75%)
Unrealised appreciation of contracts(see below) 2,034 0.19
Total Financial Assets at fair valuethrough profit or loss 1,079,683 99.81
Written Options — (0.08%) (29 February 2020: (0.30%))
– S&P 500 E-mini March 2021Put 3,100.00,due 19/03/2021 – Bank ofAmerica Merrill Lynch (28) –
– S&P 500 E-mini W3April 2021 Put 3,300.00,due 16/04/2021 – Bank ofAmerica Merrill Lynch (104) (0.01)
– U.S. Bond April 2021 Call171.00, due 26/03/2021 –Bank of America MerrillLynch (3) –
– U.S. Bond April 2021 Put161.00, due 26/03/2021 –Bank of America MerrillLynch (107) (0.01)
– U.S. Bond April 2021 Put162.00, due 26/03/2021 –Bank of America MerrillLynch (262) (0.02)
– U.S. Bond April 2021 Put164.00, due 26/03/2021 –Bank of America MerrillLynch (192) (0.02)
(9,990) USD Call/CNH Put 6.5815,due 30/04/2021 – JPMorgan (50) (0.01)
(9,653) USD Put/CAD Call 1.2340,due 10/05/2021 – JPMorgan (35) –
(14,430) USD Put/EUR Call 1.23, due01/04/2021 – GoldmanSachs (33) –
(11,580) USD Put/MXN Call 20.00,due 21/05/2021 – MorganStanley (106) (0.01)
Total Written Options (Cost $(693)) (920) (0.08)
Credit Default Swaps — (0.09%)(29 February 2020: (0.05%))
Unrealised depreciation of contracts(see below) (982) (0.09)
Interest Rate Swaps — (0.07%)(29 February 2020: (0.72%))
Unrealised depreciation of contracts(see below) (802) (0.07)
Forward Foreign Currency Contracts — (0.09%)(29 February 2020: (1.15%))
Unrealised depreciation of contracts(see below) (949) (0.09)
^ Not authorised for sale to the public in Hong Kong.The accompanying notes are an integral part of the Financial Statements
143

Legg Mason Global Funds Plc Annual Report 28 February 2021
Legg Mason Western Asset Multi-Asset Credit Fund^
Portfolio of Investments as at 28 February 2021 – (continued)
Contracts(000’s)
Value(000’s)
$
% ofNet
AssetValue
Futures — (0.20%) (29 February 2020: (0.53%))
Unrealised depreciation of contracts(see below) (2,125) (0.20)
Total Financial Liabilities at fair valuethrough profit or loss (5,778) (0.53)
Total Financial Assets and FinancialLiabilities at fair value through profitor loss 1,073,905 99.28
Other Assets in Excess of Liabilities 7,953 0.72
Total Net Assets $1,081,858 100.00
– Amounts designated as “-” are either $0, less than$1,000, less than 1,000 shares or less than 0.01%.
144A Securities exempt from registration under Rule 144A ofthe Securities Act of 1933, as amended. Thesesecurities may only be resold, in transactions exemptfrom registration, to qualified institutional buyers. As at28 February 2021, these securities amounted to$483,657,000 or 44.73% of net assets.
* Variable rate security. The interest rate shown reflectsthe rate in effect at 28 February 2021.
† Illiquid.
∞ Security is valued in good faith at fair value by or at thediscretion of the Manager or the respective InvestmentManager.
� Security is in default as at 28 February 2021 (eitherprincipal and / or interest).
� The rate of interest on this type of security is tied to theConsumer Price Index (CPI)/Retail Price Index (RPI). Thecoupon rate is the rate as of 28 February 2021.
ABBREVIATIONS:
CPI – Consumer Price Index.
Perpetual – A bond with no maturity date. Perpetual bondsare not redeemable but pay a steady stream ofinterest.
REMIC – Real Estate Mortgage Investment Conduit.
ARS – Argentine Peso
BRL – Brazilian Real
EUR – Euro
GBP – British Pound
IDR – Indonesian Rupiah
JPY – Japanese Yen
MXN – Mexican Peso
RUB – Russian Ruble
Analysis of Total Assets
% ofTotal
Assets
Transferable securities admitted to an officialexchange listing or traded on a regulated market 83.74
Other transferable securities dealt in on anotherregulated market 8.57
Collective investment schemes 1.70
Financial derivative instruments 2.90
Other assets 3.09
Total Assets 100.00
Schedule of Credit Default Swaps
Counterparty Reference EntityBuy/Sell
ProtectionExpiration
Date
NotionalAmount(000’s)
Value(000’s)
Bank of America Merrill Lynch CDX.NA.HY, 5.000% Buy 20/12/2025 11,972 $ (982)
Unrealised Appreciation of Credit Default Swaps (29 February 2020 (000’s): $–) $ –Unrealised Depreciation of Credit Default Swaps (29 February 2020 (000’s): $(447)) (982)
Net Depreciation of Credit Default Swaps (29 February 2020 (000’s): $(447)) $ (982)
Schedule of Interest Rate Swaps
Counterparty Rate Expiration DateNotional Amount
(000’s)Value(000’s)
Bank of America Merrill Lynch Pay Floating MXN TIIE Banxico, Receive Fixed 7.200% 17/07/2024 227,766 $ 782Bank of America Merrill Lynch Pay Floating USD 3M Libor BBA, Receive Fixed 0.840% 27/11/2025 49,931 (414)Bank of America Merrill Lynch Pay Floating USD 3M Libor BBA, Receive Fixed 1.100% 18/12/2025 56,161 (331)Bank of America Merrill Lynch Pay Floating MXN TIIE Banxico, Receive Fixed 7.450% 18/07/2029 170,990 759Bank of America Merrill Lynch Pay Floating MXN TIIE Banxico, Receive Fixed 7.440% 20/07/2029 178,050 784Bank of America Merrill Lynch Pay Fixed 0.560%, Receive Floating USD Sofr Compound 20/07/2045 14,690 3,321Bank of America Merrill Lynch Pay Fixed 0.740%, Receive Floating USD Sofr Compound 19/08/2045 2,060 391Bank of America Merrill Lynch Pay Fixed 1.000%, Receive Floating USD 3M Libor BBA 15/02/2047 4,649 923Bank of America Merrill Lynch Pay Fixed 1.600%, Receive Floating USD 3M Libor BBA 15/02/2047 2,527 181Bank of America Merrill Lynch Pay Fixed 2.000%, Receive Floating USD 3M Libor BBA 15/02/2047 6,194 (57)Citi Pay Floating BRL CDI CETIP, Receive Fixed 7.024% 04/01/2027 9,829 26Citi Pay Floating BRL CDI CETIP, Receive Fixed 7.024% 04/01/2027 9,200 24Citi Pay Floating BRL CDI, Receive Fixed 7.024% 04/01/2027 7,800 20JP Morgan Pay Floating BRL CDI, Receive Fixed 6.870% 04/01/2027 32,130 43
JP Morgan Pay Floating BRL CDI, Receive Fixed 7.044% 04/01/2027 6,400 18
Unrealised Appreciation of Interest Rate Swaps (29 February 2020 (000’s): $1,698) $ 7,272Unrealised Depreciation of Interest Rate Swaps (29 February 2020 (000’s): $(6,314)) (802)
Net Appreciation of Interest Rate Swaps (29 February 2020 (000’s): $(4,616)) $ 6,470
Schedule of Forward Foreign Currency Contracts
Expiration Date CounterpartyBuy Currency
(000’s)Sell Currency
(000’s)
UnrealisedAppreciation
(Depreciation)of Contracts
(000’s)
12/03/2021 BNY Mellon Buy USD – Sell CHF – $ –12/03/2021 BNY Mellon Buy USD 452 Sell GBP 326 (4)12/03/2021 BNY Mellon Buy USD 103 Sell GBP 72 –12/03/2021 BNY Mellon Buy AUD 121,615 Sell USD 92,922 66012/03/2021 BNY Mellon Buy CHF 47 Sell USD 52 (1)12/03/2021 BNY Mellon Buy EUR 53,239 Sell USD 64,099 16012/03/2021 BNY Mellon Buy GBP 666,425 Sell USD 909,239 19,30712/03/2021 BNY Mellon Buy GBP 228 Sell USD 320 (2)12/03/2021 BNY Mellon Buy EUR 77 Sell USD 94 (1)12/03/2021 Goldman Sachs Buy USD 1,102 Sell RUB 81,361 1306/04/2021 Citi Buy USD 7,462 Sell EUR 6,200 (26)06/04/2021 Goldman Sachs Buy EUR 2,597 Sell USD 3,150 (14)
^ Not authorised for sale to the public in Hong Kong.The accompanying notes are an integral part of the Financial Statements
144

Legg Mason Global Funds Plc Annual Report 28 February 2021
Legg Mason Western Asset Multi-Asset Credit Fund^
Portfolio of Investments as at 28 February 2021 – (continued)
Expiration Date CounterpartyBuy Currency
(000’s)Sell Currency
(000’s)
UnrealisedAppreciation
(Depreciation)of Contracts
(000’s)
15/04/2021 JP Morgan Buy USD 8,537 Sell SAR 32,040 $ (5)19/04/2021 BNP Paribas Buy USD 9,514 Sell EUR 7,790 10419/04/2021 Citi Buy USD 5,740 Sell BRL 30,365 33219/04/2021 Citi Buy USD 1,165 Sell CAD 1,469 1019/04/2021 Citi Buy USD 5,868 Sell GBP 4,314 (144)19/04/2021 Citi Buy USD 2,080 Sell JPY 214,820 6319/04/2021 Citi Buy CAD 21,011 Sell USD 16,596 (85)19/04/2021 Citi Buy MXN 137,769 Sell USD 6,797 (248)19/04/2021 Citi Buy RUB 578,770 Sell USD 7,682 2319/04/2021 Citi Buy JPY 588,377 Sell USD 5,660 (137)19/04/2021 Citi Buy AUD 4,929 Sell USD 3,847 (53)19/04/2021 Citi Buy EUR 1,400 Sell USD 1,685 719/04/2021 Citi Buy USD 1 Sell ZAR 12 –19/04/2021 Goldman Sachs Buy USD 24,239 Sell EUR 19,778 34719/04/2021 Goldman Sachs Buy USD 8,188 Sell RUB 605,446 12919/04/2021 Goldman Sachs Buy USD 7,723 Sell RUB 582,649 (33)19/04/2021 Goldman Sachs Buy MXN 30,580 Sell USD 1,485 (31)19/04/2021 Goldman Sachs Buy RUB 116,466 Sell USD 1,547 319/04/2021 Goldman Sachs Buy RUB 292,430 Sell USD 3,923 (31)19/04/2021 JP Morgan Buy USD 1,432 Sell CAD 1,820 219/04/2021 JP Morgan Buy USD 17,145 Sell IDR 240,362,624 57819/04/2021 JP Morgan Buy USD – Sell INR 2 –19/04/2021 JP Morgan Buy USD 2,760 Sell JPY 289,810 3919/04/2021 JP Morgan Buy JPY 957,340 Sell USD 9,040 (53)19/04/2021 Morgan Stanley Buy USD 2,181 Sell JPY 229,850 2419/04/2021 Morgan Stanley Buy USD 1,178 Sell NZD 1,640 (7)19/04/2021 Morgan Stanley Buy RUB 984,830 Sell USD 12,905 20519/04/2021 Morgan Stanley Buy NOK 14,240 Sell USD 1,665 (23)03/05/2021 Goldman Sachs Buy USD 2,896 Sell MXN 59,252 8310/05/2021 Citi Buy USD 5,213 Sell CAD 6,672 (31)10/05/2021 Citi Buy CAD 2,436 Sell USD 1,931 (16)12/05/2021 Goldman Sachs Buy USD 1,131 Sell RUB 84,079 1524/05/2021 Morgan Stanley Buy MXN 9,488 Sell USD 454 (4)
Unrealised Appreciation of Forward Foreign Currency Contracts (29 February 2020 (000’s): $3,957) $ 22,104Unrealised Depreciation of Forward Foreign Currency Contracts (29 February 2020 (000’s): $(10,082)) (949)
Net Appreciation of Forward Foreign Currency Contracts (29 February 2020 (000’s): $(6,125)) $ 21,155
Schedule of Futures Contracts
CounterpartyNominal
Value
NotionalValue(000’s)
UnrealisedAppreciation/(Depreciation)of Contracts
(000’s)
90 Day Euro$ December 2023 Bank of America Merrill Lynch 353 $ 87,288 $ (178)
90 Day Euro$ March 2021 Bank of America Merrill Lynch (508) (126,772) (194)
Australian 10 Year Bond March 2021 Bank of America Merrill Lynch 46 4,851 (340)
Euro-Bund June 2021 Bank of America Merrill Lynch (21) (4,321) (3)
Euro-Bund March 2021 Bank of America Merrill Lynch (55) (11,507) 263
Euro-Buxl 30 Year Bond March 2021 Bank of America Merrill Lynch (2) (506) 30
U.S. 10 Year Note (CBT) June 2021 Bank of America Merrill Lynch (550) (72,995) 1,094
U.S. 10 Year Ultra Note June 2021 Bank of America Merrill Lynch 5 737 (6)
U.S. 2 Year Note (CBT) June 2021 Bank of America Merrill Lynch 1,161 256,309 (191)
U.S. 5 Year Note (CBT) June 2021 Bank of America Merrill Lynch (164) (20,331) 136
U.S. Long Bond (CBT) June 2021 Bank of America Merrill Lynch (301) (47,925) 511
U.S. Ultra Bond (CBT) June 2021 Bank of America Merrill Lynch 362 68,441 (1,213)
Unrealised Appreciation of Futures Contracts (29 February 2020 (000’s): $6,584) $ 2,034Unrealised Depreciation of Futures Contracts (29 February 2020 (000’s): $(4,663)) (2,125)
Net Depreciation of Futures Contracts (29 February 2020 (000’s): $1,921) $ (91)
^ Not authorised for sale to the public in Hong Kong.The accompanying notes are an integral part of the Financial Statements
145

Legg Mason Global Funds Plc Annual Report 28 February 2021
Legg Mason Western Asset Structured Opportunities Fund^
Portfolio of Investments as at 28 February 2021
FaceValue(000’s)
Value(000’s)
$
% ofNet
AssetValue
Asset-Backed Securities — 14.45%(29 February 2020: 19.98%)
1,190 Accredited Mortgage LoanTrust 2005-1, Series 2005 1,Class M5,3.418%, due 25/04/2035 * 1,240 0.11
4,560 Aegis Asset Backed SecuritiesTrust 2005-3, Series 2005 3,Class M3,0.608%, due 25/08/2035 * 4,152 0.38
31 AFC Trust Series 2000-3,Series 2000 3, Class 1A, 144A,0.868%, due 25/10/2030 * 30 –
2,229 Applebee’s Funding LLC / IHOPFunding LLC, Series 2019 1A,Class A2I, 144A,4.194%, due 07/06/2049 2,304 0.21
11,970 Applebee’s Funding LLC / IHOPFunding LLC, Series 2019 1A,Class A2II, 144A,4.723%, due 07/06/2049 12,228 1.11
4,210 Asset Backed Securities CorpHome Equity Loan TrustSeries OOMC 2006-HE5,Series 2006 HE5, Class M1,0.398%, due 25/07/2036 * 3,696 0.33
2,390 BankAmerica ManufacturedHousing Contract Trust,Series 1996 1, Class B1,7.875%, due 10/10/2026 296 0.03
913 Bayview Financial MortgagePass-Through Trust 2007-B,Series 2007 B, Class 1A2,6.831%, due 28/08/2047 904 0.08
1,244 Bayview Financial MortgagePass-Through Trust 2007-B,Series 2007 B, Class 1A3,7.219%, due 28/08/2047 482 0.04
159 Bear Stearns Asset BackedSecurities I Trust 2005-CL1,Series 2005 CL1, Class A1,0.500%, due 25/09/2034 * 153 0.01
3,251 Blackbird Capital Aircraft LeaseSecuritization Ltd 2016-1,Series 2016 1A, Class B, 144A,5.682%, due 16/12/2041 3,229 0.29
4,090 Citigroup Mortgage Loan TrustInc, Series 2006 WFH2,Class M3,0.583%, due 25/08/2036 * 3,930 0.36
2,025 Citigroup Mortgage Loan TrustSeries 2004-OPT1 Asset BackedPass-Through Certifi,Series 2004 OPT1, Class M5,1.693%, due 25/10/2034 * 2,015 0.18
5,710 Conseco FinanceSecuritizations Corp,Series 2000 3, Class A, 144A,8.260%, due 01/12/2030 * 2,309 0.21
121 Countrywide Asset-BackedCertificates, Series 2003 BC5,Class 2A2,0.818%, due 25/12/2033 * 118 0.01
1,075 Countrywide Asset-BackedCertificates, Series 2007 SD1,Class A1, 144A,0.568%, due 25/03/2047 * 939 0.09
2,500 Credit-Based Asset Servicingand Securitization LLC,Series 2007 MX1, Class A4,144A,6.231%, due 25/12/2036 2,630 0.24
4,373 CSMC 2017-RPL1 Trust,Series 2017 RPL1, Class B1,144A,3.038%, due 25/07/2057 * 3,332 0.30
5,017 CSMC 2017-RPL1 Trust,Series 2017 RPL1, Class B2,144A,3.038%, due 25/07/2057 * 3,497 0.32
4,266 CSMC 2017-RPL1 Trust,Series 2017 RPL1, Class B3,144A,3.038%, due 25/07/2057 * 2,403 0.22
FaceValue(000’s)
Value(000’s)
$
% ofNet
AssetValue
4,667 CSMC 2017-RPL1 Trust,Series 2017 RPL1, Class B4,144A,3.038%, due 25/07/2057 * 817 0.07
1,888 CWABS Asset-BackedCertificates Trust 2004-9,Series 2004 9, Class MF2,5.572%, due 25/11/2034 * 1,963 0.18
1,289 CWABS Revolving Home EquityLoan Trust Series 2004-B,Series 2004 B, Class 2A,0.327%, due 15/02/2029 * 1,214 0.11
475 CWABS Revolving Home EquityLoan Trust Series 2004-J,Series 2004 J, Class 1A,0.397%, due 15/12/2033 * 464 0.04
16 CWABS Revolving Home EquityLoan Trust Series 2004-J,Series 2004 J, Class 2A,0.397%, due 15/12/2033 * 16 –
2,053 Dividend Solar Loans 2018-1LLC, Series 2018 1, Class D,144A,6.390%, due 20/07/2038 2,051 0.19
4,102 Dividend Solar Loans 2018-2LLC, Series 2018 2, Class D,144A,5.910%, due 20/12/2038 4,005 0.36
4,869 Fieldstone MortgageInvestment Trust Series 2005-2,Series 2005 2, Class M3,0.898%, due 25/12/2035 * 4,690 0.42
6 First Franklin Mortgage LoanTrust 2002-FF1, Series 2002FF1, Class 1A2,1.248%, due 25/04/2032 * 6 –
7,327 Fremont Home Loan Trust2006-B, Series 2006 B,Class 1A,0.268%, due 25/08/2036 * 3,616 0.33
5,463 HERO Funding Trust 2016-1,Series 2016 1A, Class R, 144A,0.000%, due 20/09/2041 994 0.09
2,650 Home Equity Mortgage LoanAsset-Backed TrustSeries INABS 2005-B,Series 2005 B, Class M6,1.183%, due 25/08/2035 * 2,601 0.24
1,814 KeyCorp Student Loan Trust2004-A, Series 2004 A,Class 1B,0.643%, due 27/01/2043 * 1,725 0.16
7,910 KeyCorp Student Loan Trust2005-A, Series 2005 A,Class 2C,1.551%, due 27/12/2038 * 7,515 0.68
47 Long Beach Mortgage LoanTrust 2002-2, Series 2002 2,Class M2,1.930%, due 25/07/2032 * 47 –
4,899 Magnolia Finance,0.000%, due 09/08/2024 ∞ 4,814 0.44
135 Mastr Specialized Loan Trust,Series 2006 2, Class A, 144A,0.378%, due 25/02/2036 * 131 0.01
5 Morgan Stanley ABS Capital IInc Trust Series 2003-SD1,Series 2003 SD1, Class A1,1.118%, due 25/03/2033 * 5 –
2,178 National Collegiate StudentLoan Trust 2006-1,Series 2006 1, Class A5,0.468%, due 25/03/2033 * 2,120 0.19
2,500 National Collegiate StudentLoan Trust 2006-3,Series 2006 3, Class B,0.478%, due 26/01/2032 * 2,021 0.18
7,838 National Collegiate StudentLoan Trust 2006-4,Series 2006 4, Class A4,0.428%, due 25/05/2032 * 7,606 0.69
5,987 National Collegiate VCommutation Trust,Series 2007 33A5, Class 1O,144A,0.000%, due 25/03/2038 * 1,904 0.17
FaceValue(000’s)
Value(000’s)
$
% ofNet
AssetValue
1,903 Option One Mortgage LoanTrust 2007-FXD1, Series 2007FXD1, Class 3A4,5.860%, due 25/01/2037 1,949 0.18
1,123 Ownit Mortgage Loan TrustSeries 2005-3, Series 2005 3,Class M1,0.793%, due 25/06/2036 * 1,102 0.10
1,562 PFCA Home Equity InvestmentTrust, Series 2003 IFC6,Class A, 144A,4.598%, due 22/04/2035 * 1,576 0.14
2,559 Popular ABS Mortgage Pass-Through Trust 2005-2,Series 2005 2, Class M2,5.717%, due 25/04/2035 1,921 0.17
2,555 Popular ABS Mortgage Pass-Through Trust 2005-5,Series 2005 5, Class MV2,0.748%, due 25/11/2035 * 2,308 0.21
4,135 RASC Series 2005-KS12 Trust,Series 2005 KS12, Class M4,1.078%, due 25/01/2036 * 4,004 0.36
3,900 RASC Series 2006-KS2 Trust,Series 2006 KS2, Class M3,0.733%, due 25/03/2036 * 3,782 0.34
3,000 Saxon Asset Securities Trust2005-3, Series 2005 3,Class M4,1.018%, due 25/11/2035 * 2,807 0.25
5,435 Saxon Asset Securities Trust2006-2, Series 2006 2,Class M2,0.418%, due 25/09/2036 * 5,080 0.46
8,109 SLM Student Loan Trust2004-10, Series 2004 10,Class B,0.588%, due 25/01/2040 * 7,459 0.67
120 SOFI PROFESSIONAL LOANPROGRAM 2017-F LLC,Series 2017 F, Class R1, 144A,0.000%, due 25/01/2041 4,241 0.38
1 Southern Pacific Secured AssetCorp, Series 1998 1, Class A7,6.510%, due 25/12/2027 * 1 –
3,235 Structured Asset SecuritiesCorp Mortgage Loan Trust2005-9XS, Series 2005 9XS,Class M2,1.093%, due 25/06/2035 * 2,835 0.26
3,197 Structured Asset SecuritiesCorp Mortgage Loan Trust2005-WF4, Series 2005 WF4,Class M8,2.743%, due 25/11/2035 * 3,261 0.30
1,986 Structured Asset SecuritiesCorp Trust 2005-SC1,Series 2005 SC1, Class 1A1,144A,0.388%, due 25/05/2031 * 1,512 0.14
5,587 Sunnova Sol Issuer LLC,Series 2020 1A, Class B, 144A,5.540%, due 01/02/2055 5,809 0.53
3,900 Towd Point Mortgage Trust2018-2, Series 2018 2,Class B2, 144A,3.413%, due 25/03/2058 * 3,770 0.34
7,118 Towd Point Mortgage Trust2018-4, Series 2018 4,Class B2, 144A,3.340%, due 25/06/2058 * 6,096 0.55
Total Asset-Backed Securities(Cost $161,834) 159,725 14.45
Mortgage-Backed Securities — 73.52%(29 February 2020: 68.88%)
635 Alternative Loan Trust 2005-56,Series 2005 56, Class 4A1,0.738%, due 25/11/2035 * 626 0.06
628 Alternative Loan Trust 2005-59,Series 2005 59, Class 1A1,0.771%, due 20/11/2035 * 596 0.05
^ Not authorised for sale to the public in Hong Kong.The accompanying notes are an integral part of the Financial Statements
146

Legg Mason Global Funds Plc Annual Report 28 February 2021
Legg Mason Western Asset Structured Opportunities Fund^
Portfolio of Investments as at 28 February 2021 – (continued)
FaceValue(000’s)
Value(000’s)
$
% ofNet
AssetValue
Mortgage-Backed Securities — (continued)
1,786 Alternative Loan Trust2005-80CB, Series 2005 80CB,Class 2A1,6.000%, due 25/02/2036 1,800 0.16
2,782 Alternative Loan Trust2006-19CB, Series 2006 19CB,Class A14,6.000%, due 25/08/2036 2,278 0.21
708 Alternative Loan Trust2006-19CB, Series 2006 19CB,Class A15,6.000%, due 25/08/2036 579 0.05
724 Alternative Loan Trust2006-19CB, Series 2006 19CB,Class A16,6.000%, due 25/08/2036 593 0.05
821 Alternative Loan Trust2006-19CB, Series 2006 19CB,Class A20,36.494%, due 25/08/2036 * 1,158 0.10
793 Alternative Loan Trust2006-19CB, Series 2006 19CB,Class A24,6.000%, due 25/08/2036 649 0.06
1,009 Alternative Loan Trust2006-19CB, Series 2006 19CB,Class A3,6.000%, due 25/08/2036 * 826 0.07
107 Alternative Loan Trust2006-19CB, Series 2006 19CB,Class A7,6.000%, due 25/08/2036 88 0.01
481 Alternative Loan Trust2006-19CB, Series 2006 19CB,Class A8,6.000%, due 25/08/2036 393 0.04
5,642 Alternative Loan Trust2006-28CB, Series 2006 28CB,Class A12,5.782%, due 25/10/2036 *† 1,515 0.14
7,184 Alternative Loan Trust2007-12T1, Series 2007 12T1,Class A3,6.000%, due 25/06/2037 5,129 0.46
1,138 Alternative Loan Trust2007-23CB, Series 2007 23CB,Class A8,27.929%, due 25/09/2037 * 1,467 0.13
8,142 Alternative Loan Trust2007-5CB, Series 2007 5CB,Class 1A20,5.342%, due 25/04/2037 *† 1,838 0.17
4,000 Ashford Hospitality Trust2018-ASHF, Series 2018 ASHF,Class E, 144A,3.212%, due 15/04/2035 * 3,632 0.33
9,000 Ashford Hospitality Trust2018-KEYS, Series 2018 KEYS,Class C, 144A,1.962%, due 15/06/2035 * 8,809 0.80
5,579 BAMLL Re-REMIC Trust2016-RRGG10, Series 2016GG10, Class AJA, 144A,5.829%, due 10/08/2045 * 2,539 0.23
8,244 Banc of America CommercialMortgage Trust 2017-BNK3,Series 2017 BNK3, Class E,144A,4.534%, due 15/02/2050 * 5,872 0.53
3,632 Banc of America Funding2015-R4 Trust, Series 2015 R4,Class 4A2, 144A,4.500%, due 27/01/2030 * 3,805 0.34
3,378 Banc of America Funding2015-R4 Trust, Series 2015 R4,Class 4A3, 144A,8.749%, due 27/01/2030 * 1,514 0.14
9,000 Banc of America Funding2015-R5 Trust, Series 2015 R5,Class 1A3, 144A,0.260%, due 26/10/2036 * 8,386 0.76
9,000 BBCCRE Trust 2015-GTP,Series 2015 GTP, Class F, 144A,4.563%, due 10/08/2033 * 7,928 0.72
FaceValue(000’s)
Value(000’s)
$
% ofNet
AssetValue
6,650 BBCMS Trust 2018-BXH,Series 2018 BXH, Class C,144A,1.612%, due 15/10/2037 * 6,606 0.60
1,058 BCAP LLC 2011-RR2 Trust,Series 2011 RR2, Class 1A4,144A,3.147%, due 26/07/2036 * 671 0.06
6,413 BCAP LLC 2014-RR2,Series 2014 RR2, Class 10A2,144A,0.568%, due 26/07/2046 * 6,042 0.55
6,162 BCAP LLC 2014-RR2,Series 2014 RR2, Class 11A2,144A,0.314%, due 26/05/2037 * 5,576 0.50
1,457 BCAP LLC Trust 2007-AA3,Series 2007 AA3, Class 1A2,0.658%, due 25/04/2037 * 1,340 0.12
1,824 Bear Stearns Asset BackedSecurities I Trust 2004-AC6,Series 2004 AC6, Class A1,5.750%, due 25/11/2034 1,824 0.17
3,537 Bellemeade Re 2017-1 Ltd,Series 2017 1, Class M2, 144A,3.468%, due 25/10/2027 * 3,604 0.33
3,970 Bellemeade Re 2018-1 Ltd,Series 2018 1A, Class M2,144A,3.018%, due 25/04/2028 * 4,008 0.36
6,676 Bellemeade Re 2018-3 Ltd,Series 2018 3A, Class B1,144A,4.018%, due 25/10/2028 * 6,649 0.60
5,810 Bellemeade Re 2018-3 Ltd,Series 2018 3A, Class M2,144A,2.868%, due 25/10/2028 * 5,849 0.53
3,000 BHMS 2018-ATLS, Series 2018ATLS, Class C, 144A,2.012%, due 15/07/2035 * 2,981 0.27
24,000 BHMS 2018-MZB, Series 2018MZB, Class MZB, 144A,6.749%, due 15/07/2020 * 19,224 1.74
2,140 BX Commercial Mortgage Trust2018-BIOA, Series 2018 BIOA,Class A, 144A,0.783%, due 15/03/2037 * 2,147 0.19
3,613 BX Trust 2017-SLCT,Series 2017 SLCT, Class F,144A,4.362%, due 15/07/2034 * 3,561 0.32
4,500 BX Trust 2018-GW MZ,Series 2018 GWMZ, Class MC,144A,5.600%, due 15/05/2037 * 4,170 0.38
1,106 Chevy Chase Funding LLCMortgage-Backed CertificatesSeries 2004-4, Series 2004 4A,Class B1, 144A,0.578%, due 25/10/2035 * 794 0.07
528 Chevy Chase Funding LLCMortgage-Backed CertificatesSeries 2005-1, Series 2005 1A,Class A2, 144A,0.318%, due 25/01/2036 * 500 0.05
620 Chevy Chase Funding LLCMortgage-Backed CertificatesSeries 2005-B, Series 2005 BA,Class B1, 144A,0.518%, due 25/06/2036 * 554 0.05
585 CHL Mortgage Pass-ThroughTrust 2004-25, Series 2004 25,Class 2A1,0.798%, due 25/02/2035 * 544 0.05
584 CHL Mortgage Pass-ThroughTrust 2005-11, Series 2005 11,Class 3A3,2.624%, due 25/04/2035 * 481 0.04
685 CHL Mortgage Pass-ThroughTrust 2005-11, Series 2005 11,Class 6A1,0.718%, due 25/03/2035 * 571 0.05
316 CHL Mortgage Pass-ThroughTrust 2005-25, Series 2005 25,Class A15,27.971%, due 25/11/2035 * 342 0.03
FaceValue(000’s)
Value(000’s)
$
% ofNet
AssetValue
1,652 Citicorp Mortgage SecuritiesTrust Series 2007-3,Series 2007 3, Class 1A4,6.000%, due 25/04/2037 1,679 0.15
9,200 Citigroup Mortgage Loan Trust2006-AR6, Series 2006 AR6,Class 2A4,0.558%, due 25/09/2036 * 3,000 0.27
786 Citigroup Mortgage Loan Trust2008-3, Series 2008 3,Class A3, 144A,6.100%, due 25/04/2037 380 0.03
3,529 Citigroup Mortgage Loan Trust2014-J2, Series 2014 J2,Class B5, 144A,3.914%, due 25/11/2044 * 2,659 0.24
1,908 Comm 2014-UBS2 MortgageTrust, Series 2014 UBS2,Class E, 144A,4.993%, due 10/03/2047 * 1,556 0.14
6,500 Connecticut Avenue SecuritiesTrust 2019-R05, Series 2019R05, Class 1B1, 144A,4.218%, due 25/07/2039 * 6,527 0.59
8,330 Connecticut Avenue SecuritiesTrust 2019-R07, Series 2019R07, Class 1B1, 144A,3.518%, due 25/10/2039 * 8,180 0.74
10,360 Connecticut Avenue SecuritiesTrust 2020-R01, Series 2020R01, Class 1B1, 144A,3.368%, due 25/01/2040 * 10,127 0.92
4,500 Connecticut Avenue SecuritiesTrust 2020-SBT1, Series 2020SBT1, Class 1M2, 144A,3.768%, due 25/02/2040 * 4,657 0.42
404 Credit Suisse CommercialMortgage TrustSeries 2006-C5, Series 2006C5, Class AJ,5.373%, due 15/12/2039 78 0.01
156 Credit Suisse First BostonMortgage Securities Corp,Series 2005 C2, Class AMFX,4.877%, due 15/04/2037 155 0.01
455 CSFB Mortgage-Backed Pass-Through CertificatesSeries 2004-AR5, Series 2004AR5, Class CB2,3.282%, due 25/06/2034 * 387 0.04
12,200 CSMC 2014-USA OA LLC,Series 2014 USA, Class E,144A,4.373%, due 15/09/2037 10,317 0.93
9,200 CSMC 2014-USA OA LLC,Series 2014 USA, Class F,144A,4.373%, due 15/09/2037 7,248 0.66
2,492 CSMC 2017-RPL3 Trust,Series 2017 RPL3, Class B3,144A,4.561%, due 01/08/2057 * 2,635 0.24
6,706 CSMC 2017-RPL3 Trust,Series 2017 RPL3, Class B4,144A,4.561%, due 01/08/2057 * 7,025 0.64
8,786 CSMC Mortgage-Backed Trust2006-7, Series 2006 7,Class 11A2,6.382%, due 25/08/2036 *† 2,726 0.25
209 CSMC Resecuritization Trust2006-1R, Series 2006 1R,Class 1A2, 144A,19.174%, due 27/07/2036 * 282 0.03
4,633 CSMC Series 2015-2R,Series 2015 2R, Class 7A2,144A,2.992%, due 27/08/2036 * 3,867 0.35
4,231 CSMC Trust 2013-IVR5,Series 2013 IVR5, Class B5,144A,3.641%, due 25/10/2043 * 3,144 0.28
11,730 CSMC Trust 2017-CHOP,Series 2017 CHOP, Class F,144A,4.462%, due 15/07/2032 * 9,569 0.87
^ Not authorised for sale to the public in Hong Kong.The accompanying notes are an integral part of the Financial Statements
147

Legg Mason Global Funds Plc Annual Report 28 February 2021
Legg Mason Western Asset Structured Opportunities Fund^
Portfolio of Investments as at 28 February 2021 – (continued)
FaceValue(000’s)
Value(000’s)
$
% ofNet
AssetValue
Mortgage-Backed Securities — (continued)
5,900 CSMC Trust 2017-CHOP,Series 2017 CHOP, Class H,144A,7.462%, due 15/07/2032 * 4,078 0.37
27,048 CSMC Trust 2018-J1,Series 2018 J1, Class B7, 144A,7.620%, due 25/02/2048 * 28,860 2.61
– CSMC Trust 2018-J1,Series 2018 J1, Class SA, 144A,0.000%, due 25/02/2048 – –
4,000 CSWF 2018-TOP, Series 2018TOP, Class H, 144A,3.526%, due 15/08/2035 * 3,745 0.34
2,100 DBUBS 2011-LC3 MortgageTrust, Series 2011 LC3A,Class G, 144A,3.750%, due 10/08/2044 † 721 0.07
1,109 DSLA Mortgage Loan Trust2004-AR4, Series 2004 AR4,Class 2A2B,0.951%, due 19/01/2045 * 784 0.07
2,682 DSLA Mortgage Loan Trust2005-AR3, Series 2005 AR3,Class 2A1B,0.351%, due 19/07/2045 * 2,566 0.23
3,087 DSLA Mortgage Loan Trust2005-AR5, Series 2005 AR5,Class 2A1B,0.451%, due 19/09/2045 * 2,911 0.26
548 DSLA Mortgage Loan Trust2007-AR1, Series 2007 AR1,Class 2A1B,0.291%, due 19/04/2047 * 508 0.05
5,349 Fannie Mae ConnecticutAvenue Securities, Series 2016C01, Class 1B,11.868%, due 25/08/2028 * 6,543 0.59
3,667 Fannie Mae ConnecticutAvenue Securities, Series 2016C02, Class 1B,12.368%, due 25/09/2028 * 4,573 0.41
2,941 Fannie Mae ConnecticutAvenue Securities, Series 2016C03, Class 1B,11.868%, due 25/10/2028 * 3,610 0.33
4,892 Fannie Mae ConnecticutAvenue Securities, Series 2016C04, Class 1B,10.368%, due 25/01/2029 * 5,755 0.52
7,189 Fannie Mae ConnecticutAvenue Securities, Series 2016C06, Class 1B,9.368%, due 25/04/2029 * 8,071 0.73
3,500 Fannie Mae ConnecticutAvenue Securities, Series 2017C01, Class 1B1,5.868%, due 25/07/2029 * 3,860 0.35
2,550 Fannie Mae ConnecticutAvenue Securities, Series 2017C05, Class 1B1,3.718%, due 25/01/2030 * 2,656 0.24
8,696 Fannie Mae ConnecticutAvenue Securities, Series 2017C05, Class 1M2C,2.318%, due 25/01/2030 * 8,760 0.79
6,000 Fannie Mae ConnecticutAvenue Securities, Series 2017C06, Class 1B1,4.268%, due 25/02/2030 * 6,265 0.57
5,060 Fannie Mae ConnecticutAvenue Securities, Series 2018C03, Class 1B1,3.868%, due 25/10/2030 * 5,267 0.48
3,426 Fannie Mae ConnecticutAvenue Securities, Series 2018C03, Class 1M2C,2.268%, due 25/10/2030 * 3,415 0.31
6,088 Fannie Mae ConnecticutAvenue Securities, Series 2018C05, Class 1B1,4.368%, due 25/01/2031 * 6,355 0.58
7,750 Fannie Mae ConnecticutAvenue Securities, Series 2018C06, Class 1B1,3.868%, due 25/03/2031 * 7,888 0.71
FaceValue(000’s)
Value(000’s)
$
% ofNet
AssetValue
2,916 Fannie Mae REMICS,Series 2017 85, Class SC,6.082%, due 25/11/2047 * 558 0.05
6,605 Freddie Mac MultifamilyStructured Pass ThroughCertificates K038, Class X3,2.490%, due 25/06/2042 * 462 0.04
19,370 Freddie Mac MultifamilyStructured Pass ThroughCertificates K052, Class X3,1.613%, due 25/01/2044 * 1,359 0.12
9,000 Freddie Mac Stacr Remic Trust2020-DNA1, Series 2020DNA1, Class B2, 144A,5.368%, due 25/01/2050 * 8,767 0.79
8,000 Freddie Mac STACR RemicTrust 2020-DNA2, Series 2020DNA2, Class B2, 144A,4.918%, due 25/02/2050 * 7,695 0.70
6,000 Freddie Mac STACR Trust2019-DNA1, Series 2019DNA1, Class B2, 144A,10.868%, due 25/01/2049 * 7,026 0.64
5,250 Freddie Mac STACR Trust2019-DNA2, Series 2019DNA2, Class B2, 144A,10.618%, due 25/03/2049 * 6,016 0.54
4,600 Freddie Mac STACR Trust2019-DNA3, Series 2019DNA3, Class B1, 144A,3.368%, due 25/07/2049 * 4,656 0.42
6,100 Freddie Mac STACR Trust2019-DNA3, Series 2019DNA3, Class B2, 144A,8.268%, due 25/07/2049 * 6,564 0.59
5,550 Freddie Mac STACR Trust2019-DNA4, Series 2019DNA4, Class B2, 144A,6.368%, due 25/10/2049 * 5,752 0.52
10,000 Freddie Mac Stacr Trust2019-FTR4, Series 2019 FTR4,Class B2, 144A,5.118%, due 25/11/2047 * 9,839 0.89
4,938 Freddie Mac Structured AgencyCredit Risk Debt Notes,Series 2016 DNA1, Class B,10.130%, due 25/07/2028 * 5,618 0.51
2,513 Freddie Mac Structured AgencyCredit Risk Debt Notes,Series 2016 DNA2, Class B,10.618%, due 25/10/2028 * 2,964 0.27
2,555 Freddie Mac Structured AgencyCredit Risk Debt Notes,Series 2016 DNA3, Class B,11.368%, due 25/12/2028 * 3,035 0.27
5,504 Freddie Mac Structured AgencyCredit Risk Debt Notes,Series 2016 DNA4, Class B,8.718%, due 25/03/2029 * 5,784 0.52
6,948 Freddie Mac Structured AgencyCredit Risk Debt Notes,Series 2017 DNA2, Class B2,11.368%, due 25/10/2029 * 7,699 0.70
6,561 Freddie Mac Structured AgencyCredit Risk Debt Notes,Series 2017 HRP1, Class B2D,3.118%, due 25/12/2042 * 4,007 0.36
5,500 Freddie Mac Structured AgencyCredit Risk Debt Notes,Series 2018 SPI1, Class B,144A,3.727%, due 25/02/2048 * 5,054 0.46
14,395 Freddie Mac Structured AgencyCredit Risk Debt Notes,Series 2018 SPI3, Class B,144A,4.146%, due 25/08/2048 * 13,772 1.25
31,283 FRESB 2018-SB48 MortgageTrust, Series 2018 SB48,Class B, 144A,3.667%, due 25/02/2038 * 24,009 2.17
761 Government NationalMortgage Association,Series 2010 102, Class IO,0.010%, due 16/06/2052 * – –
FaceValue(000’s)
Value(000’s)
$
% ofNet
AssetValue
4,054 Government NationalMortgage Association,Series 2010 13, Class IO,0.000%, due 16/11/2051 * – –
9,912 Government NationalMortgage Association,Series 2011 127, Class IO,0.145%, due 16/03/2047 * 45 –
25,910 Government NationalMortgage Association,Series 2011 95, Class IO,0.009%, due 16/04/2051 * 22 –
17,047 Government NationalMortgage Association,Series 2012 114, Class IO,0.692%, due 16/01/2053 * 448 0.04
8,518 Government NationalMortgage Association,Series 2013 163, Class IO,1.201%, due 16/02/2046 * 277 0.03
9,694 Government NationalMortgage Association,Series 2014 16, Class IO,0.547%, due 16/06/2055 * 205 0.02
9,438 Government NationalMortgage Association,Series 2014 171, Class IO,0.548%, due 16/11/2055 * 200 0.02
1,953 Government NationalMortgage Association,Series 2014 47, Class IA,0.128%, due 16/02/2048 * 29 –
7,308 Government NationalMortgage Association,Series 2014 50, Class IO,0.659%, due 16/09/2055 * 267 0.02
863 Government NationalMortgage Association,Series 2016 135, Class SB,5.993%, due 16/10/2046 * 230 0.02
1,098 Government NationalMortgage Association,Series 2016 51, Class NS,5.939%, due 20/04/2046 * 217 0.02
7,585 Government NationalMortgage Association,Series 2018 125, Class HS,6.139%, due 20/09/2048 * 1,177 0.11
28,679 GS Mortgage Securities Corp II,Series 2018 SRP5, Class D,144A,6.112%, due 15/09/2031 * 2,965 0.27
7,000 GS Mortgage Securities CorpTrust 2018-3PCK, Series 20183PCK, Class B, 144A,2.362%, due 15/09/2031 * 6,240 0.56
1,250 GS Mortgage Securities Trust2014-GC26, Series 2014GC26, Class D, 144A,4.511%, due 10/11/2047 * 918 0.08
4,250 GSMSC Resecuritization Trust2014-2R, Series 2014 2R,Class 3B, 144A,0.740%, due 26/11/2037 * 3,768 0.34
5,503 GSR Mortgage Loan Trust2006-1F, Series 2006 1F,Class 6A1,0.518%, due 25/02/2036 * 440 0.04
129 HarborView Mortgage LoanTrust 2004-11, Series 2004 11,Class 3A3,0.871%, due 19/01/2035 * 124 0.01
85 HarborView Mortgage LoanTrust 2005-1, Series 2005 1,Class 2A1A,0.651%, due 19/03/2035 * 85 0.01
365 HarborView Mortgage LoanTrust 2005-10, Series 2005 10,Class 2A1A,0.731%, due 19/11/2035 * 340 0.03
643 HarborView Mortgage LoanTrust 2005-2, Series 2005 2,Class 2A1A,0.551%, due 19/05/2035 * 621 0.06
^ Not authorised for sale to the public in Hong Kong.The accompanying notes are an integral part of the Financial Statements
148

Legg Mason Global Funds Plc Annual Report 28 February 2021
Legg Mason Western Asset Structured Opportunities Fund^
Portfolio of Investments as at 28 February 2021 – (continued)
FaceValue(000’s)
Value(000’s)
$
% ofNet
AssetValue
Mortgage-Backed Securities — (continued)
372 HarborView Mortgage LoanTrust 2005-3, Series 2005 3,Class 2A1A,0.591%, due 19/06/2035 * 371 0.03
3,588 HarborView Mortgage LoanTrust 2005-8, Series 2005 8,Class 2A2,1.878%, due 19/09/2035 * 3,300 0.30
681 HarborView Mortgage LoanTrust 2006-10, Series 2006 10,Class 2A1A,0.309%, due 19/11/2036 * 692 0.06
3,532 HarborView Mortgage LoanTrust 2006-10, Series 2006 10,Class 2A1B,0.369%, due 19/11/2036 * 3,266 0.30
1,573 Impac CMB TrustSeries 2005-1, Series 2005 1,Class M1,0.808%, due 25/04/2035 * 1,539 0.14
2,549 Impac CMB TrustSeries 2005-3, Series 2005 3,Class A2,0.718%, due 25/08/2035 * 2,492 0.23
1,247 Impac CMB TrustSeries 2005-4, Series 2005 4,Class 1M1,0.763%, due 25/05/2035 * 1,256 0.11
1,933 Impac CMB TrustSeries 2005-7, Series 2005 7,Class A1,0.638%, due 25/11/2035 * 1,822 0.16
2,807 Impac Secured Assets CorpSeries 2004-4, Series 2004 4,Class M5,1.768%, due 25/02/2035 * 2,392 0.22
1,268 Impac Secured Assets Trust2006-2, Series 2006 2,Class 2B,1.218%, due 25/08/2036 * 1,262 0.11
1,548 Impac Secured Assets Trust2006-2, Series 2006 2,Class 2M3,1.218%, due 25/08/2036 * 1,603 0.15
5,300 Independence Plaza Trust2018-INDP, Series 2018 INDP,Class B, 144A,3.911%, due 10/07/2035 5,591 0.51
818 IndyMac INDX Mortgage LoanTrust 2005-AR13, Series 2005AR13, Class 1A1,3.131%, due 25/08/2035 * 620 0.06
989 IndyMac INDX Mortgage LoanTrust 2005-AR2, Series 2005AR2, Class 2A1B,0.898%, due 25/02/2035 * 500 0.05
2,324 IndyMac INDX Mortgage LoanTrust 2005-AR6, Series 2005AR6, Class 2A2,0.778%, due 25/04/2035 * 1,793 0.16
9,650 J.P. Morgan Chase CommercialMortgage Securities Trust2017-FL11, Series 2017 FL11,Class E, 144A,4.132%, due 15/10/2032 * 8,847 0.80
2,250 J.P. Morgan Chase CommercialMortgage Securities Trust2017-FL11, Series 2017 FL11,Class F, 144A,5.432%, due 15/10/2032 * 2,002 0.18
3,000 J.P. Morgan Chase CommercialMortgage Securities Trust2018-ASH8, Series 2018 ASH8,Class C, 144A,1.412%, due 15/02/2035 * 2,923 0.26
28,545 J.P. Morgan Chase CommercialMortgage Securities Trust2018-PHMZ, Series 2018PHMZ, Class M, 144A,8.320%, due 15/06/2035 *† 23,722 2.15
277 JP Morgan Chase CommercialMortgage Securities Trust2007-CIBC19, Series 2007CB19, Class AJ,5.895%, due 12/02/2049 * 137 0.01
FaceValue(000’s)
Value(000’s)
$
% ofNet
AssetValue
830 JP Morgan Chase CommercialMortgage Securities Trust2012-C8, Series 2012 C8,Class E, 144A,4.670%, due 15/10/2045 * 571 0.05
4,509 JP Morgan Chase CommercialMortgage Securities Trust2015-FL7, Series 2015 FL7,Class D, 144A,3.862%, due 15/05/2028 * 4,139 0.37
6,800 JP Morgan Chase CommercialMortgage Securities Trust2018-WPT, Series 2018 WPT,Class GFL, 144A,3.513%, due 05/07/2033 * 6,136 0.56
13,865 JP Morgan Chase CommercialMortgage Securities Trust2020-MKST, Series 2020MKST, Class G, 144A,4.362%, due 15/12/2036 * 12,047 1.09
13,875 JP Morgan Chase CommercialMortgage Securities Trust2020-MKST, Series 2020MKST, Class H, 144A,6.862%, due 15/12/2036 * 11,475 1.04
4,659 JP Morgan Chase CommercialMortgage Securities Trust2020-NNN MZ, Series 2020NNNZ, Class M, 144A,8.542%, due 16/01/2037 3,332 0.30
4,405 JP Morgan Mortgage Trust2007-S3, Series 2007 S3,Class 1A18,0.618%, due 25/08/2037 * 1,500 0.14
5,699 JP Morgan Mortgage Trust2013-2, Series 2013 2,Class B5, 144A,3.606%, due 25/05/2043 * 4,524 0.41
33,749 JP Morgan Mortgage Trust2018-4, Series 2018 4,Class AX1, 144A,0.256%, due 25/10/2048 *† 127 0.01
32,788 JP MORGAN MORTGAGETRUST 2018-5, Series 2018 5,Class AX1, 144A,0.301%, due 25/10/2048 *† 149 0.01
7,036 JP MORGAN MORTGAGETRUST 2018-5, Series 2018 5,Class B3, 144A,3.801%, due 25/10/2048 * 7,298 0.66
4,282 JP MORGAN MORTGAGETRUST 2018-5, Series 2018 5,Class B4, 144A,3.801%, due 25/10/2048 * 3,843 0.35
1,952 JP MORGAN MORTGAGETRUST 2018-5, Series 2018 5,Class B5, 144A,3.801%, due 25/10/2048 * 1,217 0.11
2,859 JP MORGAN MORTGAGETRUST 2018-5, Series 2018 5,Class B6, 144A,3.801%, due 25/10/2048 * 1,396 0.13
5,420 JPMBB Commercial MortgageSecurities Trust 2014-C25,Series 2014 C25, Class D,144A,3.949%, due 15/11/2047 * 4,304 0.39
5,535 JPMCC Commercial MortgageSecurities Trust 2019-BOLT,Series 2019 BOLT, Class C,144A,3.912%, due 15/07/2034 * 5,117 0.46
11,441 JPMCC Commercial MortgageSecurities Trust 2019-BOLT,Series 2019 BOLT, Class D,144A,6.662%, due 15/07/2034 * 9,887 0.89
18,149 JPMCC Commercial MortgageSecurities Trust 2019-BOLT,Series 2019 BOLT, Class XCP,144A,2.052%, due 15/07/2034 * 142 0.01
17 MASTR Adjustable RateMortgages Trust 2004-15,Series 2004 15, Class 6A1,0.448%, due 25/12/2034 * 17 –
FaceValue(000’s)
Value(000’s)
$
% ofNet
AssetValue
2,050 MASTR Adjustable RateMortgages Trust 2004-6,Series 2004 6, Class B1,2.762%, due 25/07/2034 * 2,024 0.18
1,360 MASTR Adjustable RateMortgages Trust 2004-8,Series 2004 8, Class B1,2.848%, due 25/09/2034 * 1,108 0.10
864 MASTR Reperforming LoanTrust 2005-1, Series 2005 1,Class 1A1, 144A,6.000%, due 25/08/2034 668 0.06
1,031 MASTR Reperforming LoanTrust 2005-2, Series 2005 2,Class 1A1F, 144A,0.468%, due 25/05/2035 * 572 0.05
385 ML-CFC Commercial MortgageTrust 2007-5, Series 2007 5,Class AJ,5.450%, due 12/08/2048 * 215 0.02
190 ML-CFC Commercial MortgageTrust 2007-5, Series 2007 5,Class AJFL, 144A,5.450%, due 12/08/2048 * 106 0.01
5,000 Morgan Stanley Bank ofAmerica Merrill Lynch Trust2016-C32, Series 2016 C32,Class D, 144A,3.396%, due 15/12/2049 * 3,911 0.35
6 Morgan Stanley Capital I Trust2007-IQ13, Series 2007 IQ13,Class AJ,5.438%, due 15/03/2044 6 –
2,461 Morgan Stanley MortgageLoan Trust 2004-11AR,Series 2004 11AR, Class 1B1,0.718%, due 25/01/2035 * 2,132 0.19
3,870 Morgan Stanley MortgageLoan Trust 2006-8AR,Series 2006 8AR, Class 1A3,0.438%, due 25/06/2036 * 1,293 0.12
6,781 Motel 6 Trust 2017-MTL6,Series 2017 MTL6, Class F,144A,4.362%, due 15/08/2034 * 6,823 0.62
971 Multifamily Trust 2016-1,Series 2016 1, Class B, 144A,11.664%, due 25/04/2046 * 1,112 0.10
14,560 Natixis Commercial MortgageSecurities Trust 2019-FAME,Series 2019 FAME, Class D,144A,4.398%, due 15/08/2036 * 13,115 1.19
4,870 Natixis Commercial MortgageSecurities Trust 2019-FAME,Series 2019 FAME, Class E,144A,4.398%, due 15/08/2036 * 4,117 0.37
4,202 New Residential MortgageLoan Trust 2016-4, Series 20164A, Class B5, 144A,4.936%, due 25/11/2056 * 4,307 0.39
4,255 Nomura Resecuritization Trust2015-4R, Series 2015 4R,Class 4A7, 144A,3.393%, due 26/03/2037 * 4,216 0.38
198 Opteum Mortgage AcceptanceCorp Trust 2006-1,Series 2006 1, Class M1,0.673%, due 25/04/2036 * 1,374 0.12
10,139 PMT Credit Risk Transfer Trust2019-3R, Series 2019 3R,Class A, 144A,2.815%, due 27/10/2022 * 10,161 0.92
7,760 Radnor Re 2018-1 Ltd,Series 2018 1, Class M2, 144A,2.818%, due 25/03/2028 * 7,827 0.71
925 RALI Series 2006-QA2 Trust,Series 2006 QA2, Class 1A1,0.368%, due 25/02/2036 * 666 0.06
8,490 RBSGC Mortgage Loan Trust2007-A, Series 2007 A,Class 3A1,0.468%, due 25/01/2037 * 1,407 0.13
^ Not authorised for sale to the public in Hong Kong.The accompanying notes are an integral part of the Financial Statements
149

Legg Mason Global Funds Plc Annual Report 28 February 2021
Legg Mason Western Asset Structured Opportunities Fund^
Portfolio of Investments as at 28 February 2021 – (continued)
FaceValue(000’s)
Value(000’s)
$
% ofNet
AssetValue
Mortgage-Backed Securities — (continued)
17,681 Redwood Funding Trust2019-1, Series 2019 1,Class PT, 144A,4.213%, due 27/09/2024 17,866 1.62
1,802 Reperforming Loan REMICTrust 2006-R2, Series 2006 R2,Class AF1, 144A,0.538%, due 25/07/2036 * 1,665 0.15
4,457 Residential AssetSecuritization Trust 2006-A7CB, Series 2006 A7CB,Class 1A3,6.250%, due 25/07/2036 4,526 0.41
13,219 Seasoned Credit Risk TransferTrust 2017-4, Series 2017 4,Class B, 144A,0.000%, due 25/06/2057 † 2,432 0.22
20,124 Seasoned Credit Risk TransferTrust 2017-4, Series 2017 4,Class BIO, 144A,0.000%, due 25/06/2057 *† 4,576 0.41
4,446 Seasoned Credit Risk TransferTrust Series 2016-1,Series 2016 1, Class B, 144A,0.000%, due 25/09/2055 † 568 0.05
9,964 Seasoned Credit Risk TransferTrust Series 2016-1,Series 2016 1, Class BIO,144A,0.472%, due 25/09/2055 *† 912 0.08
9,640 Seasoned Credit Risk TransferTrust Series 2016-1,Series 2016 1, Class M2,144A,3.750%, due 25/09/2055 * 9,708 0.88
67,810 Seasoned Credit Risk TransferTrust Series 2016-1,Series 2016 1, Class XSIO,144A,0.075%, due 25/09/2055 *† 266 0.02
13,259 Seasoned Credit Risk TransferTrust Series 2017-2,Series 2017 2, Class B, 144A,0.000%, due 25/08/2056 † 1,922 0.17
22,284 Seasoned Credit Risk TransferTrust Series 2017-2,Series 2017 2, Class BIO,144A,0.000%, due 25/08/2056 *† 2,392 0.22
5,710 Seasoned Credit Risk TransferTrust Series 2017-2,Series 2017 2, Class M1,144A,4.000%, due 25/08/2056 * 5,867 0.53
4,457 Seasoned Credit Risk TransferTrust Series 2017-2,Series 2017 2, Class M2,144A,4.000%, due 25/08/2056 * 4,515 0.41
531,607 Seasoned Credit Risk TransferTrust Series 2017-2,Series 2017 2, Class XSIO,144A,0.075%, due 25/08/2056 *† 2,375 0.22
6,500 Seasoned Credit Risk TransferTrust Series 2017-3,Series 2017 3, Class M2,144A,4.750%, due 25/07/2056 * 6,525 0.59
2,937 Seasoned Credit Risk TransferTrust Series 2018-1,Series 2018 1, Class M,4.750%, due 25/05/2057 * 3,002 0.27
16,460 Seasoned Credit Risk TransferTrust Series 2018-3,Series 2018 3, Class BX,144A,0.476%, due 25/08/2057 * 5,898 0.53
2,630 STACR Trust 2018-DNA3,Series 2018 DNA3, Class B1,144A,4.018%, due 25/09/2048 * 2,759 0.25
6,000 STACR Trust 2018-DNA3,Series 2018 DNA3, Class B2,144A,7.868%, due 25/09/2048 * 6,304 0.57
FaceValue(000’s)
Value(000’s)
$
% ofNet
AssetValue
650 Starwood Retail Property Trust2014-STAR, Series 2014 STAR,Class D, 144A,3.612%, due 15/11/2027 * 65 0.01
14,332 Starwood Retail Property Trust2014-STAR, Series 2014 STAR,Class E, 144A,4.512%, due 15/11/2027 * 718 0.07
6,742 Structured Adjustable RateMortgage Loan TrustSeries 2005-19XS, Series 200519XS, Class 1A2B,0.478%, due 25/10/2035 * 6,493 0.59
394 Structured Adjustable RateMortgage Loan Trust,Series 2004 2, Class 1A1,3.239%, due 25/03/2034 * 397 0.04
964 Structured Adjustable RateMortgage Loan Trust,Series 2005 8XS, Class M1,0.763%, due 25/04/2035 * 946 0.09
4,666 Structured Asset MortgageInvestments II Trust 2006-AR5,Series 2006 AR5, Class 4A1,0.558%, due 25/05/2046 * 2,485 0.22
80 Structured Asset MortgageInvestments II Trust 2006-AR6,Series 2006 AR6, Class 1A1,0.298%, due 25/07/2046 * 70 0.01
1,215 Tharaldson Hotel Portfolio Trust2018-THPT, Series 2018 THL,Class E, 144A,3.453%, due 11/11/2034 * 1,136 0.10
5,706 UBS-Barclays CommercialMortgage Trust 2012-C2,Series 2012 C2, Class G, 144A,5.000%, due 10/05/2063 * 284 0.03
990 UBS-Barclays CommercialMortgage Trust 2012-C2,Series 2012 C2, Class H, 144A,5.000%, due 10/05/2063 * 40 –
3,629 WaMu Mortgage Pass-ThroughCertificates Series 2005-AR11Trust, Series 2005 AR11,Class B1,1.033%, due 25/08/2045 * 3,097 0.28
814 WaMu Mortgage Pass-ThroughCertificates Series 2005-AR15Trust, Series 2005 AR15,Class A1C4,0.918%, due 25/11/2045 * 518 0.05
6,598 WaMu Mortgage Pass-ThroughCertificates Series 2005-AR2Trust, Series 2005 AR2,Class B1,0.913%, due 25/01/2045 * 5,421 0.49
1,658 WaMu Mortgage Pass-ThroughCertificates Series 2005-AR9Trust, Series 2005 AR9,Class B1,1.063%, due 25/07/2045 * 1,350 0.12
22 Washington Mutual MSCMortgage Pass-ThroughCertificates Series 2005-RA1Trust, Series 2005 RA1,Class 3A,2.872%, due 25/01/2035 * 23 –
1,343 Waterfall CommercialMortgage Trust 2015-SBC5,Series 2015 SBC5, Class B,144A,6.259%, due 14/09/2022 * 1,085 0.10
1,252 WFRBS Commercial MortgageTrust 2014-C22, Series 2014C22, Class D, 144A,3.901%, due 15/09/2057 * 1,111 0.10
Total Mortgage-Backed Securities(Cost $886,555) 812,529 73.52
Loan Notes — 4.89% (29 February 2020: 3.02%)
30,000 American Dream,10.750%, due 29/06/2024 *∞ 26,921 2.44
1,613 Freehand Hotel,4.750%, due 17/12/2024 *∞ 1,575 0.14
FaceValue(000’s)
Value(000’s)
$
% ofNet
AssetValue
2,935 Freehand Hotel,4.750%, due 17/12/2024 *∞ 2,865 0.26
5,452 Freehand Hotel,4.750%, due 17/12/2024 *∞ 5,323 0.48
7,540 Palmetto Skilled Nursing,6.250%, due 11/01/2022 *∞ 7,477 0.68
10,000 Sono Retail Loan,4.015%, due 06/08/2021 *∞ 9,857 0.89
Total Loan Notes (Cost $57,460) 54,018 4.89
Collective Investment Schemes — 5.34%(29 February 2020: 8.17%)
59,043 Western Asset Liquidity FundsPlc – Western Asset US DollarLiquidity Fund – Class WA(Distributing) 59,043 5.34
Total Collective Investment Schemes(Cost $59,043) 59,043 5.34
Total Investments at fair valuethrough profit or loss(Cost $1,164,892) 1,085,315 98.20
Credit Default Swaps — 0.01% (29 February 2020: 0.05%)
Unrealised appreciation of contracts(see below) 109 0.01
Forward Foreign Currency Contracts — 0.09%(29 February 2020: 0.18%)
Unrealised appreciation of contracts(see below) 962 0.09
Total Financial Assets at fair valuethrough profit or loss 1,086,386 98.30
Credit Default Swaps — (0.06%)(29 February 2020: (0.13%))
Unrealised depreciation of contracts(see below) (646) (0.06)
Interest Rate Swaps — (0.08%) (29 February 2020: 0.00%)
Unrealised depreciation of contracts(see below) (868) (0.08)
Forward Foreign Currency Contracts — (0.08%)(29 February 2020: (0.02%))
Unrealised depreciation of contracts(see below) (862) (0.08)
Futures — (0.04%) (29 February 2020: (0.81%))
Unrealised depreciation of contracts(see below) (492) (0.04)
Total Financial Liabilities at fair valuethrough profit or loss (2,868) (0.26)
Total Financial Assets and FinancialLiabilities at fair value through profitor loss 1,083,518 98.04
Other Assets in Excess of Liabilities 21,644 1.96
Total Net Assets $1,105,162 100.00
– Amounts designated as “–” are either $0, less than$1,000, less than 1,000 shares or less than 0.01%.
144A Securities exempt from registration under Rule 144A ofthe Securities Act of 1933, as amended. Thesesecurities may only be resold, in transactions exemptfrom registration, to qualified institutional buyers. As at28 February 2021, these securities amounted to$666,559,000 or 60.32% of net assets.
* Variable rate security. The interest rate shown reflectsthe rate in effect at 28 February 2021.
† Illiquid.
∞ Security is valued in good faith at fair value by or at thediscretion of the Manager or the respective InvestmentManager.
^ Not authorised for sale to the public in Hong Kong.The accompanying notes are an integral part of the Financial Statements
150

Legg Mason Global Funds Plc Annual Report 28 February 2021
Legg Mason Western Asset Structured Opportunities Fund^
Portfolio of Investments as at 28 February 2021 – (continued)
ABBREVIATIONS:
REMIC – Real Estate Mortgage Investment Conduit.
Analysis of Total Assets
% ofTotal
Assets
Transferable securities admitted to an officialexchange listing or traded on a regulated market 87.09
Other transferable securities dealt in on anotherregulated market 4.84
Collective investment schemes 5.29
Financial derivative instruments 0.10
Other assets 2.68
Total Assets 100.00
Schedule of Credit Default Swaps
Counterparty Reference EntityBuy/Sell
ProtectionExpiration
Date
NotionalAmount(000’s)
Value(000’s)
Bank of America Merrill Lynch CMBX.NA.BBB, 3.000% Buy 17/08/2061 1,550 $ 109Goldman Sachs CMBX.NA.BBB, 3.000% Sell 17/10/2057 3,280 (513)Goldman Sachs CMBX.NA.BBB, 3.000% Sell 17/10/2057 850 (133)
Unrealised Appreciation of Credit Default Swaps (29 February 2020 (000’s): $906) $ 109Unrealised Depreciation of Credit Default Swaps (29 February 2020 (000’s): $(2,507)) (646)
Net Depreciation of Credit Default Swaps (29 February 2020 (000’s): $(1,601)) $ (537)
Schedule of Interest Rate Swaps
Counterparty RateExpiration
Date
NotionalAmount(000’s)
Value(000’s)
Bank of America Merrill Lynch Pay Floating USD 3M Libor BBA, Receive Fixed 0.840% 27/11/2025 104,599 $ (868)
Unrealised Appreciation of Interest Rate Swaps (29 February 2020 (000’s): $–) $ –Unrealised Depreciation of Interest Rate Swaps (29 February 2020 (000’s): $–) (868)
Net Depreciation of Interest Rate Swaps (29 February 2020 (000’s): $–) $ (868)
Schedule of Forward Foreign Currency Contracts
Expiration Date CounterpartyBuy Currency
(000’s)Sell Currency
(000’s)
UnrealisedAppreciation/(Depreciation)of Contracts
(000’s)
12/03/2021 BNY Mellon Buy USD 4,037 Sell EUR 3,319 $ 3112/03/2021 BNY Mellon Buy USD 1,300 Sell EUR 1,080 (3)12/03/2021 BNY Mellon Buy USD 315 Sell GBP 228 (2)12/03/2021 BNY Mellon Buy GBP 9,067 Sell USD 12,370 26412/03/2021 BNY Mellon Buy EUR 222,675 Sell USD 268,091 66712/03/2021 BNY Mellon Buy EUR 723 Sell USD 879 (7)12/03/2021 BNY Mellon Buy CHF 1,789 Sell USD 1,990 (23)12/03/2021 BNY Mellon Buy JPY 6,035,219 Sell USD 57,453 (827)
Unrealised Appreciation of Forward Foreign Currency Contracts (29 February 2020 (000’s): $3,417) $ 962Unrealised Depreciation of Forward Foreign Currency Contracts (29 February 2020 (000’s): $(334)) (862)
Net Appreciation of Forward Foreign Currency Contracts (29 February 2020 (000’s): $3,083) $ 100
Schedule of Futures Contracts
CounterpartyNominal
Value
NotionalValue(000’s)
UnrealisedAppreciation/(Depreciation)of Contracts
(000’s)
U.S. Ultra Bond (CBT) June 2021 Bank of America Merrill Lynch 128 $ 24,200 $ (492)
Unrealised Appreciation of Futures Contracts (29 February 2020 (000’s): $6,904) $ –Unrealised Depreciation of Futures Contracts (29 February 2020 (000’s): $(15,538)) (492)
Net Depreciation of Futures Contracts (29 February 2020 (000’s): $(8,634)) $ (492)
^ Not authorised for sale to the public in Hong Kong.The accompanying notes are an integral part of the Financial Statements
151

Legg Mason Global Funds Plc Annual Report 28 February 2021
Legg Mason Western Asset US Mortgage-Backed Securities Fund^
Portfolio of Investments as at 28 February 2021
FaceValue(000’s)
Value(000’s)
$
% ofNet
AssetValue
Asset-Backed Securities — 0.16%(29 February 2020: 0.98%)
1,191 SBA Small Business InvestmentCos, Series 2018 10B, Class 1,3.548%, due 10/09/2028 1,266 0.16
Total Asset-Backed Securities(Cost $1,191) 1,266 0.16
Mortgage-Backed Securities — 100.65%(29 February 2020: 100.34%)
65,324 BANK 2017-BNK8, Series 2017BNK8, Class XA,0.734%, due 15/11/2050 * 2,671 0.32
3,400 BANK 2018-BNK10, Series 2018BN10, Class A5,3.688%, due 15/02/2061 3,827 0.46
2,210 Benchmark 2018-B1 MortgageTrust, Series 2018 B1, Class A5,3.666%, due 15/01/2051 * 2,487 0.30
4,050 BHMS 2018-ATLS, Series 2018ATLS, Class A, 144A,1.362%, due 15/07/2035 * 4,056 0.49
3,870 BXMT 2020-FL2 Ltd, Series 2020FL2, Class A, 144A,1.008%, due 16/02/2037 * 3,878 0.47
37,393 CD 2017-CD6 Mortgage Trust,Series 2017 CD6, Class XA,0.921%, due 13/11/2050 * 1,512 0.18
2,167 Fannie Mae Interest Strip 406,Class 2,4.000%, due 25/02/2041 304 0.04
493 Fannie Mae Interest Strip 407,Class 9,5.000%, due 25/02/2041 * 79 0.01
1,008 Fannie Mae Interest Strip 407,Class C10,5.000%, due 25/01/2038 179 0.02
748 Fannie Mae Interest Strip 409,Class C13,3.500%, due 25/11/2041 70 0.01
3,784 Fannie Mae Interest Strip 417,Class C5,3.500%, due 25/02/2043 434 0.05
8,425 Fannie Mae Interest Strip 418,Class C15,3.500%, due 25/08/2043 1,116 0.14
19,500 Fannie Mae or Freddie Mac,15 year, TBA,1.500% ± 19,715 2.39
6,100 Fannie Mae or Freddie Mac,30 year, TBA,1.500% ± 5,993 0.73
1,500 Fannie Mae or Freddie Mac,30 year, TBA,1.500% ± 1,471 0.18
19,300 Fannie Mae or Freddie Mac,30 year, TBA,2.000% ± 19,456 2.36
66,930 Fannie Mae or Freddie Mac,30 year, TBA,2.000% ± 67,612 8.21
20,900 Fannie Mae or Freddie Mac,30 year, TBA,2.500% ± 21,625 2.63
9,800 Fannie Mae or Freddie Mac,30 year, TBA,2.500% ± 10,161 1.23
1 Fannie Mae Pool ‘252875’,8.000%, due 01/11/2029 1 –
– Fannie Mae Pool ‘253184’,8.000%, due 01/04/2030 1 –
– Fannie Mae Pool ‘253399’,8.500%, due 01/08/2030 – –
– Fannie Mae Pool ‘253438’,8.500%, due 01/09/2030 – –
1 Fannie Mae Pool ‘253598’,8.500%, due 01/12/2030 1 –
135 Fannie Mae Pool ‘254793’,5.000%, due 01/07/2033 156 0.02
5,310 Fannie Mae Pool ‘387771’,3.790%, due 01/08/2028 5,988 0.73
– Fannie Mae Pool ‘535270’,8.500%, due 01/04/2030 – –
15 Fannie Mae Pool ‘535299’,7.500%, due 01/05/2030 17 –
FaceValue(000’s)
Value(000’s)
$
% ofNet
AssetValue
1 Fannie Mae Pool ‘535332’,8.500%, due 01/04/2030 2 –
– Fannie Mae Pool ‘535351’,8.000%, due 01/06/2030 – –
– Fannie Mae Pool ‘535435’,8.500%, due 01/08/2030 – –
1 Fannie Mae Pool ‘535608’,9.500%, due 01/04/2030 1 –
6 Fannie Mae Pool ‘535996’,7.500%, due 01/06/2031 7 –
– Fannie Mae Pool ‘537715’,8.500%, due 01/09/2030 – –
28 Fannie Mae Pool ‘545189’,7.500%, due 01/08/2031 32 –
28 Fannie Mae Pool ‘545190’,7.500%, due 01/08/2031 33 –
2 Fannie Mae Pool ‘545612’,8.000%, due 01/04/2032 3 –
3 Fannie Mae Pool ‘545990’,7.500%, due 01/04/2031 4 –
– Fannie Mae Pool ‘546591’,8.500%, due 01/06/2030 – –
3 Fannie Mae Pool ‘548965’,8.500%, due 01/07/2030 3 –
14 Fannie Mae Pool ‘555676’,7.500%, due 01/12/2032 16 –
166 Fannie Mae Pool ‘555743’,5.000%, due 01/09/2033 192 0.02
42 Fannie Mae Pool ‘727181’,5.000%, due 01/08/2033 49 0.01
33 Fannie Mae Pool ‘735578’,5.000%, due 01/06/2035 39 –
25 Fannie Mae Pool ‘745248’,7.500%, due 01/08/2034 29 –
742 Fannie Mae Pool ‘745580’,5.000%, due 01/06/2036 863 0.10
178 Fannie Mae Pool ‘745802’,6.000%, due 01/07/2036 214 0.03
16 Fannie Mae Pool ‘745959’,5.500%, due 01/11/2036 18 –
253 Fannie Mae Pool ‘836390’,5.000%, due 01/10/2035 294 0.04
735 Fannie Mae Pool ‘836398’,2.389%, due 01/10/2035 * 778 0.09
14 Fannie Mae Pool ‘836852’,2.393%, due 01/10/2035 * 15 –
17 Fannie Mae Pool ‘843823’,2.361%, due 01/11/2035 * 18 –
209 Fannie Mae Pool ‘843997’,2.488%, due 01/11/2035 * 222 0.03
89 Fannie Mae Pool ‘865915’,2.607%, due 01/03/2036 * 91 0.01
216 Fannie Mae Pool ‘888218’,5.000%, due 01/03/2037 251 0.03
17 Fannie Mae Pool ‘889117’,5.000%, due 01/10/2035 20 –
621 Fannie Mae Pool ‘890345’,5.000%, due 01/06/2041 719 0.09
919 Fannie Mae Pool ‘890604’,4.500%, due 01/10/2044 1,031 0.13
62 Fannie Mae Pool ‘890876’,3.500%, due 01/02/2049 68 0.01
19 Fannie Mae Pool ‘902663’,6.000%, due 01/11/2036 23 –
7 Fannie Mae Pool ‘909856’,6.000%, due 01/03/2037 8 –
298 Fannie Mae Pool ‘934231’,5.000%, due 01/01/2039 342 0.04
135 Fannie Mae Pool ‘961907’,5.000%, due 01/03/2038 158 0.02
781 Fannie Mae Pool ‘962687’,5.000%, due 01/04/2038 909 0.11
19 Fannie Mae Pool ‘973013’,4.500%, due 01/03/2038 22 –
1 Fannie Mae Pool ‘974763’,4.500%, due 01/04/2038 1 –
40 Fannie Mae Pool ‘981766’,4.500%, due 01/04/2038 44 0.01
7 Fannie Mae Pool ‘995072’,5.500%, due 01/08/2038 8 –
754 Fannie Mae Pool ‘995948’,5.000%, due 01/03/2039 878 0.11
93 Fannie Mae Pool ‘AA8438’,4.500%, due 01/06/2039 105 0.01
FaceValue(000’s)
Value(000’s)
$
% ofNet
AssetValue
72 Fannie Mae Pool ‘AB0129’,5.000%, due 01/04/2035 84 0.01
857 Fannie Mae Pool ‘AB0131’,5.000%, due 01/12/2038 997 0.12
38 Fannie Mae Pool ‘AB2725’,5.500%, due 01/04/2041 43 0.01
22 Fannie Mae Pool ‘AB2817’,5.000%, due 01/04/2041 26 –
1,412 Fannie Mae Pool ‘AB3882’,4.500%, due 01/11/2041 1,588 0.19
738 Fannie Mae Pool ‘AB5692’,4.000%, due 01/06/2042 811 0.10
70 Fannie Mae Pool ‘AB7668’,3.000%, due 01/01/2043 75 0.01
288 Fannie Mae Pool ‘AB8144’,5.000%, due 01/04/2037 331 0.04
239 Fannie Mae Pool ‘AB9107’,3.500%, due 01/04/2033 259 0.03
46 Fannie Mae Pool ‘AC2389’,5.000%, due 01/02/2037 54 0.01
1,444 Fannie Mae Pool ‘AD1645’,5.000%, due 01/03/2040 1,681 0.20
113 Fannie Mae Pool ‘AD2963’,5.000%, due 01/04/2040 132 0.02
23 Fannie Mae Pool ‘AD3336’,5.500%, due 01/04/2040 26 –
19 Fannie Mae Pool ‘AD3796’,5.000%, due 01/04/2040 23 –
7 Fannie Mae Pool ‘AD4567’,5.500%, due 01/04/2040 8 –
5 Fannie Mae Pool ‘AD4598’,5.500%, due 01/05/2040 6 –
12 Fannie Mae Pool ‘AD4614’,5.500%, due 01/06/2040 13 –
65 Fannie Mae Pool ‘AD4898’,5.000%, due 01/05/2040 72 0.01
9 Fannie Mae Pool ‘AD8281’,5.500%, due 01/07/2040 10 –
49 Fannie Mae Pool ‘AD8326’,5.500%, due 01/07/2040 54 0.01
116 Fannie Mae Pool ‘AD8642’,5.500%, due 01/08/2040 132 0.02
72 Fannie Mae Pool ‘AD9893’,5.500%, due 01/07/2040 82 0.01
18 Fannie Mae Pool ‘AE0758’,7.000%, due 01/02/2039 21 –
86 Fannie Mae Pool ‘AH4029’,5.000%, due 01/04/2041 96 0.01
168 Fannie Mae Pool ‘AH5036’,5.500%, due 01/02/2041 190 0.02
52 Fannie Mae Pool ‘AH8309’,5.000%, due 01/04/2041 57 0.01
16 Fannie Mae Pool ‘AH9785’,5.500%, due 01/04/2041 18 –
67 Fannie Mae Pool ‘AI0199’,5.000%, due 01/04/2041 74 0.01
27 Fannie Mae Pool ‘AI9532’,5.500%, due 01/09/2041 30 –
16 Fannie Mae Pool ‘AJ2033’,5.500%, due 01/10/2041 18 –
51 Fannie Mae Pool ‘AJ4713’,4.500%, due 01/11/2041 56 0.01
71 Fannie Mae Pool ‘AL0521’,5.000%, due 01/06/2041 83 0.01
238 Fannie Mae Pool ‘AL1051’,4.500%, due 01/09/2041 268 0.03
757 Fannie Mae Pool ‘AL1469’,7.000%, due 01/02/2039 885 0.11
372 Fannie Mae Pool ‘AL1470’,7.000%, due 01/04/2037 443 0.05
6,581 Fannie Mae Pool ‘AL3024’,3.500%, due 01/01/2043 7,197 0.87
52 Fannie Mae Pool ‘AL3026’,3.500%, due 01/12/2042 57 0.01
2,157 Fannie Mae Pool ‘AL4324’,6.500%, due 01/05/2040 2,517 0.31
235 Fannie Mae Pool ‘AL4741’,4.500%, due 01/01/2044 265 0.03
397 Fannie Mae Pool ‘AL6613’,2.500%, due 01/06/2028 418 0.05
7,914 Fannie Mae Pool ‘AL7093’,4.000%, due 01/05/2045 8,748 1.06
1,409 Fannie Mae Pool ‘AL7877’,4.000%, due 01/12/2045 1,559 0.19
^ Not authorised for sale to the public in Hong Kong.The accompanying notes are an integral part of the Financial Statements
152

Legg Mason Global Funds Plc Annual Report 28 February 2021
Legg Mason Western Asset US Mortgage-Backed Securities Fund^
Portfolio of Investments as at 28 February 2021 – (continued)
FaceValue(000’s)
Value(000’s)
$
% ofNet
AssetValue
Mortgage-Backed Securities — (continued)
198 Fannie Mae Pool ‘AL9546’,3.500%, due 01/11/2046 211 0.03
4,610 Fannie Mae Pool ‘AN8048’,3.080%, due 01/01/2028 5,107 0.62
211 Fannie Mae Pool ‘AO4102’,4.000%, due 01/06/2042 232 0.03
682 Fannie Mae Pool ‘AP9766’,4.000%, due 01/10/2042 754 0.09
2,005 Fannie Mae Pool ‘AQ6295’,3.500%, due 01/12/2032 2,157 0.26
179 Fannie Mae Pool ‘AQ7130’,3.500%, due 01/12/2032 193 0.02
522 Fannie Mae Pool ‘AQ7270’,3.500%, due 01/12/2032 562 0.07
530 Fannie Mae Pool ‘AQ7306’,3.000%, due 01/01/2043 569 0.07
627 Fannie Mae Pool ‘AQ7864’,3.500%, due 01/12/2032 674 0.08
155 Fannie Mae Pool ‘AQ7869’,3.500%, due 01/11/2032 166 0.02
219 Fannie Mae Pool ‘AQ7913’,3.500%, due 01/12/2032 235 0.03
361 Fannie Mae Pool ‘AQ8677’,3.500%, due 01/12/2032 389 0.05
125 Fannie Mae Pool ‘AR1198’,3.000%, due 01/01/2043 134 0.02
405 Fannie Mae Pool ‘AR1202’,3.000%, due 01/01/2043 434 0.05
759 Fannie Mae Pool ‘AS0462’,3.500%, due 01/09/2033 824 0.10
328 Fannie Mae Pool ‘AS0469’,4.000%, due 01/09/2033 361 0.04
170 Fannie Mae Pool ‘AS1281’,3.500%, due 01/12/2033 182 0.02
5,806 Fannie Mae Pool ‘AS4347’,4.000%, due 01/01/2045 6,439 0.78
2,273 Fannie Mae Pool ‘AS4363’,4.500%, due 01/02/2045 2,619 0.32
726 Fannie Mae Pool ‘AS6340’,3.500%, due 01/12/2045 785 0.10
1,741 Fannie Mae Pool ‘AS6396’,3.500%, due 01/12/2045 1,876 0.23
489 Fannie Mae Pool ‘AS6541’,3.500%, due 01/01/2046 533 0.06
432 Fannie Mae Pool ‘AS6562’,3.500%, due 01/01/2046 468 0.06
486 Fannie Mae Pool ‘AS9453’,4.000%, due 01/04/2047 531 0.06
352 Fannie Mae Pool ‘AS9760’,4.500%, due 01/06/2047 387 0.05
380 Fannie Mae Pool ‘AT2486’,3.500%, due 01/06/2033 412 0.05
4,291 Fannie Mae Pool ‘AT3070’,3.500%, due 01/04/2043 4,685 0.57
129 Fannie Mae Pool ‘AU4395’,4.000%, due 01/10/2033 144 0.02
72 Fannie Mae Pool ‘AU4397’,4.000%, due 01/10/2033 79 0.01
128 Fannie Mae Pool ‘AU7248’,4.000%, due 01/10/2033 141 0.02
163 Fannie Mae Pool ‘AU9562’,4.000%, due 01/10/2033 179 0.02
200 Fannie Mae Pool ‘AU9567’,4.000%, due 01/10/2033 224 0.03
153 Fannie Mae Pool ‘AU9570’,4.000%, due 01/10/2033 169 0.02
3 Fannie Mae Pool ‘AV3286’,5.000%, due 01/11/2043 3 –
28 Fannie Mae Pool ‘AV6366’,4.500%, due 01/01/2044 31 –
42 Fannie Mae Pool ‘AV7116’,4.500%, due 01/03/2044 47 0.01
114 Fannie Mae Pool ‘AV7681’,3.500%, due 01/01/2034 121 0.01
250 Fannie Mae Pool ‘AV7683’,3.500%, due 01/01/2034 272 0.03
363 Fannie Mae Pool ‘AV7694’,3.500%, due 01/01/2034 398 0.05
377 Fannie Mae Pool ‘AV7696’,3.500%, due 01/01/2034 410 0.05
5,825 Fannie Mae Pool ‘AY1321’,3.500%, due 01/03/2035 6,291 0.76
4,015 Fannie Mae Pool ‘AZ9645’,4.000%, due 01/09/2035 4,412 0.54
FaceValue(000’s)
Value(000’s)
$
% ofNet
AssetValue
137 Fannie Mae Pool ‘BC9096’,3.500%, due 01/12/2046 146 0.02
11,752 Fannie Mae Pool ‘BF0145’,3.500%, due 01/03/2057 12,947 1.57
3,514 Fannie Mae Pool ‘BF0161’,5.000%, due 01/10/2046 4,053 0.49
6,833 Fannie Mae Pool ‘BF0162’,5.000%, due 01/11/2045 7,882 0.96
1,534 Fannie Mae Pool ‘BF0191’,4.000%, due 01/06/2057 1,722 0.21
2,867 Fannie Mae Pool ‘BF0222’,4.500%, due 01/09/2057 3,296 0.40
3,817 Fannie Mae Pool ‘BF0301’,4.500%, due 01/08/2058 4,389 0.53
1,227 Fannie Mae Pool ‘BF0338’,4.500%, due 01/01/2059 1,401 0.17
124 Fannie Mae Pool ‘BH4095’,4.000%, due 01/10/2047 134 0.02
2,266 Fannie Mae Pool ‘BH6684’,4.000%, due 01/08/2047 2,443 0.30
212 Fannie Mae Pool ‘BJ0685’,4.000%, due 01/04/2048 228 0.03
2,242 Fannie Mae Pool ‘BJ2544’,3.000%, due 01/12/2037 2,358 0.29
820 Fannie Mae Pool ‘BJ2763’,4.500%, due 01/05/2048 900 0.11
98 Fannie Mae Pool ‘BJ6133’,4.000%, due 01/01/2048 106 0.01
45 Fannie Mae Pool ‘BJ8078’,3.500%, due 01/03/2048 48 0.01
53 Fannie Mae Pool ‘BK0751’,3.500%, due 01/03/2048 58 0.01
1,892 Fannie Mae Pool ‘BK4770’,4.500%, due 01/08/2048 2,064 0.25
194 Fannie Mae Pool ‘BK7603’,4.500%, due 01/10/2048 213 0.03
821 Fannie Mae Pool ‘BM1660’,4.000%, due 01/08/2047 901 0.11
36 Fannie Mae Pool ‘BM2005’,4.000%, due 01/12/2047 38 –
2,095 Fannie Mae Pool ‘BM3934’,4.500%, due 01/05/2048 2,305 0.28
1,582 Fannie Mae Pool ‘BM4696’,3.000%, due 01/03/2047 1,688 0.21
306 Fannie Mae Pool ‘BM4751’,3.500%, due 01/03/2043 334 0.04
219 Fannie Mae Pool ‘BM4781’,4.500%, due 01/10/2048 243 0.03
433 Fannie Mae Pool ‘BM4897’,3.500%, due 01/12/2046 468 0.06
4,258 Fannie Mae Pool ‘BM4951’,4.500%, due 01/09/2048 4,716 0.57
1,320 Fannie Mae Pool ‘BM5073’,3.000%, due 01/04/2048 1,407 0.17
4,608 Fannie Mae Pool ‘BM5100’,4.500%, due 01/11/2048 5,023 0.61
284 Fannie Mae Pool ‘BM5119’,4.500%, due 01/12/2048 315 0.04
2,675 Fannie Mae Pool ‘BM5507’,3.000%, due 01/09/2048 2,823 0.34
832 Fannie Mae Pool ‘BM5521’,3.500%, due 01/07/2048 886 0.11
750 Fannie Mae Pool ‘BN0341’,5.000%, due 01/12/2048 830 0.10
211 Fannie Mae Pool ‘BO2878’,3.000%, due 01/11/2049 221 0.03
221 Fannie Mae Pool ‘BO7435’,3.000%, due 01/11/2049 232 0.03
104 Fannie Mae Pool ‘BO8513’,3.000%, due 01/12/2049 108 0.01
295 Fannie Mae Pool ‘BO8932’,3.000%, due 01/01/2050 311 0.04
4,773 Fannie Mae Pool ‘BP0060’,3.000%, due 01/01/2050 5,182 0.63
1,238 Fannie Mae Pool ‘BP2319’,3.000%, due 01/02/2050 1,313 0.16
2,223 Fannie Mae Pool ‘BP6171’,3.500%, due 01/04/2050 2,371 0.29
1,088 Fannie Mae Pool ‘BP8713’,3.000%, due 01/08/2050 1,157 0.14
98 Fannie Mae Pool ‘BP9421’,3.000%, due 01/07/2050 105 0.01
885 Fannie Mae Pool ‘BQ1150’,2.500%, due 01/10/2050 922 0.11
FaceValue(000’s)
Value(000’s)
$
% ofNet
AssetValue
85 Fannie Mae Pool ‘BQ1402’,3.000%, due 01/08/2050 91 0.01
1,883 Fannie Mae Pool ‘BQ3719’,3.000%, due 01/09/2050 2,018 0.25
391 Fannie Mae Pool ‘BQ5876’,2.500%, due 01/11/2050 411 0.05
295 Fannie Mae Pool ‘BQ5881’,2.500%, due 01/11/2050 307 0.04
1,191 Fannie Mae Pool ‘BQ7564’,2.500%, due 01/11/2050 1,244 0.15
99 Fannie Mae Pool ‘BQ9053’,2.500%, due 01/12/2050 103 0.01
199 Fannie Mae Pool ‘BQ9226’,2.000%, due 01/01/2051 201 0.02
1,098 Fannie Mae Pool ‘BR0751’,2.500%, due 01/01/2051 1,148 0.14
100 Fannie Mae Pool ‘BR0757’,2.500%, due 01/01/2051 104 0.01
100 Fannie Mae Pool ‘BR1823’,2.000%, due 01/01/2051 101 0.01
200 Fannie Mae Pool ‘BR2641’,2.000%, due 01/02/2051 202 0.02
200 Fannie Mae Pool ‘BR2643’,2.000%, due 01/02/2051 202 0.02
100 Fannie Mae Pool ‘BR2644’,2.000%, due 01/02/2051 101 0.01
100 Fannie Mae Pool ‘BR3256’,2.000%, due 01/02/2051 102 0.01
300 Fannie Mae Pool ‘BR3257’,2.000%, due 01/02/2051 305 0.04
400 Fannie Mae Pool ‘BR3290’,2.000%, due 01/03/2051 405 0.05
200 Fannie Mae Pool ‘BR4035’,2.000%, due 01/02/2051 202 0.02
100 Fannie Mae Pool ‘BR4548’,2.000%, due 01/02/2051 101 0.01
388 Fannie Mae Pool ‘CA0148’,4.500%, due 01/08/2047 423 0.05
1,738 Fannie Mae Pool ‘CA0717’,4.500%, due 01/11/2047 1,897 0.23
234 Fannie Mae Pool ‘CA0907’,3.500%, due 01/12/2047 254 0.03
9,722 Fannie Mae Pool ‘CA0917’,3.500%, due 01/12/2047 10,483 1.27
393 Fannie Mae Pool ‘CA1565’,4.500%, due 01/04/2048 430 0.05
360 Fannie Mae Pool ‘CA1707’,4.500%, due 01/05/2048 398 0.05
45 Fannie Mae Pool ‘CA2369’,4.500%, due 01/09/2048 49 0.01
1,039 Fannie Mae Pool ‘CA2652’,5.000%, due 01/11/2048 1,151 0.14
582 Fannie Mae Pool ‘CA3055’,4.500%, due 01/02/2049 641 0.08
647 Fannie Mae Pool ‘CA3842’,4.500%, due 01/07/2049 709 0.09
670 Fannie Mae Pool ‘CA4033’,4.500%, due 01/08/2049 733 0.09
1,724 Fannie Mae Pool ‘CA6000’,3.000%, due 01/06/2050 1,835 0.22
835 Fannie Mae Pool ‘CA6053’,3.000%, due 01/06/2050 889 0.11
463 Fannie Mae Pool ‘CA6427’,3.000%, due 01/07/2050 491 0.06
589 Fannie Mae Pool ‘CA8377’,1.500%, due 01/12/2035 598 0.07
3,987 Fannie Mae Pool ‘CA8460’,2.500%, due 01/01/2051 4,145 0.50
3,197 Fannie Mae Pool ‘FM1002’,3.500%, due 01/01/2048 3,458 0.42
154 Fannie Mae Pool ‘FM1098’,4.000%, due 01/05/2049 168 0.02
185 Fannie Mae Pool ‘FM1159’,4.500%, due 01/02/2048 201 0.02
1,482 Fannie Mae Pool ‘FM1349’,3.500%, due 01/03/2047 1,609 0.20
157 Fannie Mae Pool ‘FM1458’,4.500%, due 01/04/2049 171 0.02
531 Fannie Mae Pool ‘FM1459’,3.000%, due 01/09/2049 556 0.07
96 Fannie Mae Pool ‘FM1539’,4.500%, due 01/09/2049 104 0.01
2,662 Fannie Mae Pool ‘FM1637’,4.500%, due 01/05/2049 2,926 0.36
^ Not authorised for sale to the public in Hong Kong.The accompanying notes are an integral part of the Financial Statements
153

Legg Mason Global Funds Plc Annual Report 28 February 2021
Legg Mason Western Asset US Mortgage-Backed Securities Fund^
Portfolio of Investments as at 28 February 2021 – (continued)
FaceValue(000’s)
Value(000’s)
$
% ofNet
AssetValue
Mortgage-Backed Securities — (continued)
1,789 Fannie Mae Pool ‘FM1676’,3.000%, due 01/10/2049 1,871 0.23
1,627 Fannie Mae Pool ‘FM1727’,5.000%, due 01/09/2049 1,835 0.22
76 Fannie Mae Pool ‘FM1742’,3.000%, due 01/10/2049 81 0.01
709 Fannie Mae Pool ‘FM2173’,4.000%, due 01/09/2048 775 0.09
258 Fannie Mae Pool ‘FM2201’,4.000%, due 01/01/2048 278 0.03
1,037 Fannie Mae Pool ‘FM2745’,4.500%, due 01/03/2050 1,134 0.14
3,131 Fannie Mae Pool ‘FM2770’,3.500%, due 01/04/2050 3,362 0.41
2,125 Fannie Mae Pool ‘FM2804’,3.000%, due 01/04/2050 2,267 0.28
192 Fannie Mae Pool ‘FM3023’,4.000%, due 01/02/2048 208 0.03
183 Fannie Mae Pool ‘FM3083’,4.500%, due 01/10/2049 198 0.02
412 Fannie Mae Pool ‘FM3141’,3.500%, due 01/11/2048 439 0.05
497 Fannie Mae Pool ‘FM3158’,4.000%, due 01/11/2048 544 0.07
564 Fannie Mae Pool ‘FM3278’,3.500%, due 01/11/2048 599 0.07
3,517 Fannie Mae Pool ‘FM3347’,3.500%, due 01/05/2047 3,770 0.46
4,298 Fannie Mae Pool ‘FM3445’,4.000%, due 01/09/2048 4,654 0.57
144 Fannie Mae Pool ‘FM3542’,4.000%, due 01/05/2049 157 0.02
1,887 Fannie Mae Pool ‘FM3589’,4.500%, due 01/02/2046 2,123 0.26
893 Fannie Mae Pool ‘FM3957’,5.000%, due 01/03/2050 989 0.12
229 Fannie Mae Pool ‘FM4117’,4.500%, due 01/07/2049 253 0.03
8,391 Fannie Mae Pool ‘FM4165’,3.000%, due 01/09/2050 8,987 1.09
179 Fannie Mae Pool ‘FM4532’,3.000%, due 01/09/2050 188 0.02
881 Fannie Mae Pool ‘FM4577’,2.500%, due 01/10/2050 923 0.11
790 Fannie Mae Pool ‘FM4578’,2.500%, due 01/10/2050 825 0.10
257 Fannie Mae Pool ‘FM5054’,4.000%, due 01/11/2048 277 0.03
1,584 Fannie Mae Pool ‘FM5423’,2.500%, due 01/01/2051 1,661 0.20
290 Fannie Mae Pool ‘FM5434’,4.500%, due 01/05/2046 324 0.04
3,576 Fannie Mae Pool ‘FM5566’,4.000%, due 01/09/2048 3,849 0.47
100 Fannie Mae Pool ‘FM5642’,2.000%, due 01/01/2051 101 0.01
399 Fannie Mae Pool ‘FM5653’,2.500%, due 01/01/2051 416 0.05
200 Fannie Mae Pool ‘FM5713’,2.500%, due 01/02/2051 208 0.03
100 Fannie Mae Pool ‘FM5743’,2.500%, due 01/02/2051 104 0.01
200 Fannie Mae Pool ‘FM5904’,2.500%, due 01/02/2051 208 0.03
398 Fannie Mae Pool ‘FM5931’,2.500%, due 01/02/2051 416 0.05
300 Fannie Mae Pool ‘FM5944’,2.500%, due 01/01/2051 313 0.04
500 Fannie Mae Pool ‘FM6117’,3.000%, due 01/04/2051 530 0.06
200 Fannie Mae Pool ‘FM6188’,2.500%, due 01/03/2051 209 0.03
13 Fannie Mae Pool ‘MA0440’,5.500%, due 01/05/2040 15 –
39 Fannie Mae Pool ‘MA0619’,5.500%, due 01/11/2040 45 0.01
9 Fannie Mae Pool ‘MA0706’,4.500%, due 01/04/2031 10 –
21 Fannie Mae Pool ‘MA0734’,4.500%, due 01/05/2031 23 –
24 Fannie Mae Pool ‘MA0766’,5.500%, due 01/05/2041 27 –
10 Fannie Mae Pool ‘MA0776’,4.500%, due 01/06/2031 11 –
FaceValue(000’s)
Value(000’s)
$
% ofNet
AssetValue
173 Fannie Mae Pool ‘MA0823’,5.500%, due 01/07/2041 198 0.02
80 Fannie Mae Pool ‘MA0867’,5.500%, due 01/09/2041 91 0.01
238 Fannie Mae Pool ‘MA0913’,4.500%, due 01/11/2031 263 0.03
292 Fannie Mae Pool ‘MA0939’,4.500%, due 01/12/2031 321 0.04
55 Fannie Mae Pool ‘MA0968’,4.500%, due 01/12/2031 60 0.01
346 Fannie Mae Pool ‘MA1177’,3.500%, due 01/09/2042 378 0.05
24 Fannie Mae Pool ‘MA1221’,4.500%, due 01/09/2042 27 –
81 Fannie Mae Pool ‘MA1363’,3.000%, due 01/02/2043 87 0.01
2,735 Fannie Mae Pool ‘MA1393’,4.000%, due 01/03/2043 3,024 0.37
536 Fannie Mae Pool ‘MA1591’,4.500%, due 01/09/2043 602 0.07
449 Fannie Mae Pool ‘MA1629’,4.500%, due 01/10/2043 505 0.06
300 Fannie Mae Pool ‘MA1664’,4.500%, due 01/11/2043 337 0.04
383 Fannie Mae Pool ‘MA1711’,4.500%, due 01/12/2043 430 0.05
779 Fannie Mae Pool ‘MA2832’,3.000%, due 01/12/2036 823 0.10
4,650 Fannie Mae Pool ‘MA3057’,3.500%, due 01/07/2047 4,957 0.60
586 Fannie Mae Pool ‘MA3058’,4.000%, due 01/07/2047 634 0.08
836 Fannie Mae Pool ‘MA3088’,4.000%, due 01/08/2047 906 0.11
293 Fannie Mae Pool ‘MA3149’,4.000%, due 01/10/2047 317 0.04
266 Fannie Mae Pool ‘MA3501’,5.000%, due 01/10/2048 295 0.04
1,885 Fannie Mae Pool ‘MA3937’,3.000%, due 01/02/2050 1,972 0.24
193 Fannie Mae Pool ‘MA4031’,4.500%, due 01/05/2050 210 0.03
1,541 Fannie Mae REMICS,Series 2010 2, Class AI,5.500%, due 25/02/2040 283 0.03
1,724 Fannie Mae REMICS,Series 2012 124, Class SD,6.032%, due 25/11/2042 * 349 0.04
2,568 Fannie Mae REMICS,Series 2012 22, Class SM,6.382%, due 25/03/2042 * 479 0.06
1,006 Fannie Mae REMICS,Series 2012 9, Class PT,11.630%, due 25/07/2036 * 1,378 0.17
1,267 Fannie Mae REMICS,Series 2013 9, Class BC,6.500%, due 25/07/2042 1,517 0.18
5,984 Fannie Mae REMICS,Series 2013 9, Class CB,5.500%, due 25/04/2042 6,884 0.84
10,219 Fannie Mae REMICS,Series 2016 48, Class IA,4.500%, due 25/06/2038 1,580 0.19
1,916 Fannie Mae REMICS,Series 2017 74, Class PZ,3.500%, due 25/10/2047 2,197 0.27
6,778 Fannie Mae REMICS,Series 2018 3, Class IO,4.000%, due 25/02/2048 1,041 0.13
1,609 Fannie Mae REMICS,Series 2019 25, Class PI,5.000%, due 25/05/2048 313 0.04
8,463 Fannie Mae REMICS,Series 2019 38, Class SH,5.920%, due 25/07/2049 * 1,608 0.20
3,711 Fannie Mae REMICS,Series 2019 44, Class SM,5.932%, due 25/08/2049 * 715 0.09
4,170 Fannie Mae REMICS,Series 2019 45, Class BS,5.932%, due 25/08/2049 * 782 0.10
17,287 Fannie Mae REMICS,Series 2019 45, Class SE,5.932%, due 25/08/2049 * 3,421 0.42
FaceValue(000’s)
Value(000’s)
$
% ofNet
AssetValue
6,693 Fannie Mae REMICS,Series 2019 5, Class IO,4.500%, due 25/03/2049 1,142 0.14
3,900 Fannie Mae REMICS,Series 2019 54, Class SA,5.932%, due 25/09/2049 * 671 0.08
2,874 Fannie Mae REMICS,Series 2019 57, Class NS,5.882%, due 25/10/2049 * 488 0.06
3,727 Fannie Mae REMICS,Series 2019 58, Class HS,5.882%, due 25/10/2049 * 642 0.08
6,311 Fannie Mae REMICS,Series 2019 59, Class SH,5.882%, due 25/10/2049 * 1,140 0.14
1,988 Fannie Mae REMICS,Series 2020 26, Class SA,5.832%, due 25/05/2050 * 472 0.06
912 Fannie Mae REMICS,Series 2020 47, Class GZ,2.000%, due 25/07/2050 899 0.11
2,215 Fannie Mae REMICS,Series 2020 62, Class BI,2.000%, due 25/09/2050 274 0.03
2,846 Fannie Mae REMICS,Series 2020 67, Class IH,2.000%, due 25/09/2050 395 0.05
194 Fannie Mae REMICS,Series 2020 74, Class EI,2.500%, due 25/10/2050 31 –
1,378 Fannie Mae REMICS,Series 2020 89, Class DI,2.500%, due 25/12/2050 196 0.02
12,051 Fannie Mae REMICS,Series 2020 91, Class IO,2.500%, due 25/12/2050 1,748 0.21
7,761 Fannie Mae REMICS,Series 2020 93, Class LI,2.500%, due 25/01/2051 1,080 0.13
728 Fannie Mae-Aces, Series 2016M11, Class AL,2.944%, due 25/07/2039 733 0.09
21,744 Fannie Mae-Aces, Series 2019M11, Class X1,1.168%, due 25/06/2029 * 1,505 0.18
22,832 Fannie Mae-Aces, Series 2019M13, Class X1,0.831%, due 25/06/2034 * 1,332 0.16
39,763 Fannie Mae-Aces, Series 2019M14, Class X1,0.591%, due 25/06/2029 * 1,674 0.20
5,898 Fannie Mae-Aces, Series 2020M11, Class IO,1.770%, due 25/12/2028 * 685 0.08
34,598 Fannie Mae-Aces, Series 2020M16, Class X1,0.475%, due 25/04/2032 * 1,246 0.15
6,143 Fannie Mae-Aces, Series 2020M24, Class X1,1.780%, due 25/01/2037 * 854 0.10
19,145 Fannie Mae-Aces, Series 2020M31, Class X2,1.352%, due 25/12/2032 * 1,943 0.24
80 Freddie Mac Gold Pool‘A29586’,5.000%, due 01/01/2035 93 0.01
17 Freddie Mac Gold Pool‘A30703’,5.500%, due 01/12/2034 19 –
136 Freddie Mac Gold Pool‘A35950’,5.000%, due 01/07/2035 158 0.02
26 Freddie Mac Gold Pool‘A36526’,5.000%, due 01/08/2035 30 –
57 Freddie Mac Gold Pool‘A39036’,5.000%, due 01/05/2035 65 0.01
11 Freddie Mac Gold Pool‘A39302’,5.500%, due 01/11/2035 13 –
141 Freddie Mac Gold Pool‘A81215’,6.500%, due 01/08/2038 158 0.02
– Freddie Mac Gold Pool‘A84166’,6.500%, due 01/01/2039 1 –
^ Not authorised for sale to the public in Hong Kong.The accompanying notes are an integral part of the Financial Statements
154
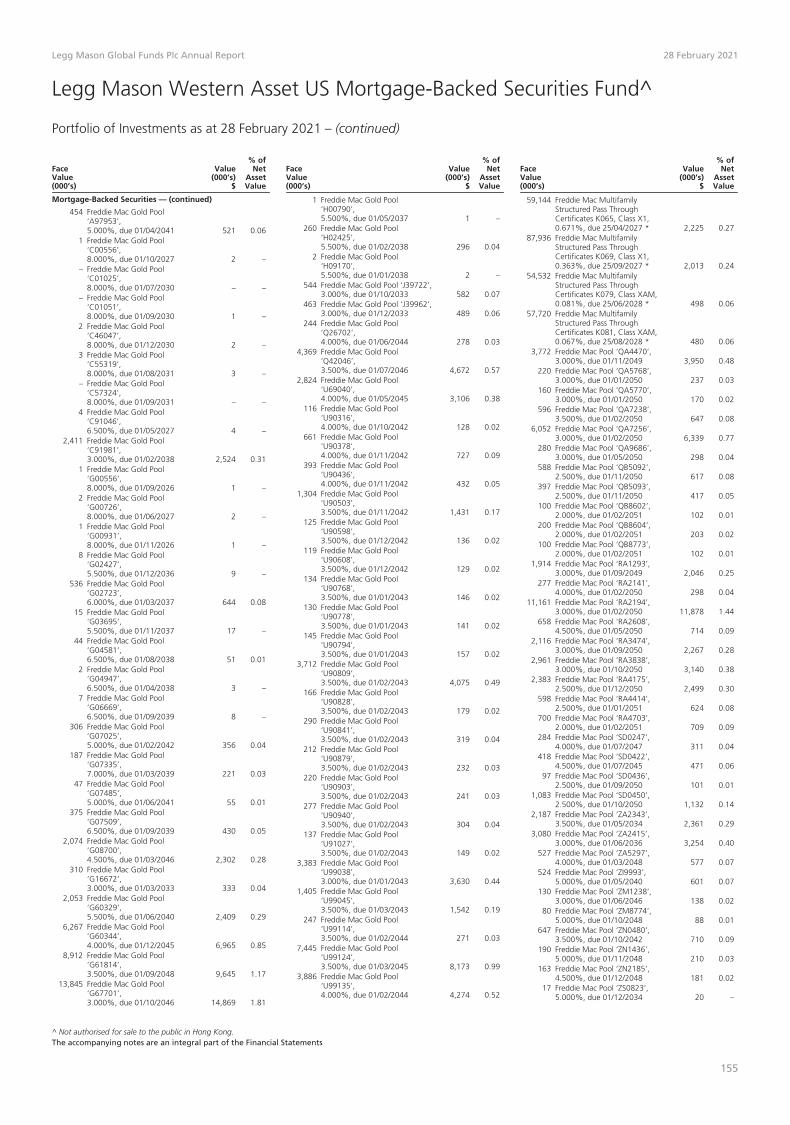
Legg Mason Global Funds Plc Annual Report 28 February 2021
Legg Mason Western Asset US Mortgage-Backed Securities Fund^
Portfolio of Investments as at 28 February 2021 – (continued)
FaceValue(000’s)
Value(000’s)
$
% ofNet
AssetValue
Mortgage-Backed Securities — (continued)
454 Freddie Mac Gold Pool‘A97953’,5.000%, due 01/04/2041 521 0.06
1 Freddie Mac Gold Pool‘C00556’,8.000%, due 01/10/2027 2 –
– Freddie Mac Gold Pool‘C01025’,8.000%, due 01/07/2030 – –
– Freddie Mac Gold Pool‘C01051’,8.000%, due 01/09/2030 1 –
2 Freddie Mac Gold Pool‘C46047’,8.000%, due 01/12/2030 2 –
3 Freddie Mac Gold Pool‘C55319’,8.000%, due 01/08/2031 3 –
– Freddie Mac Gold Pool‘C57324’,8.000%, due 01/09/2031 – –
4 Freddie Mac Gold Pool‘C91046’,6.500%, due 01/05/2027 4 –
2,411 Freddie Mac Gold Pool‘C91981’,3.000%, due 01/02/2038 2,524 0.31
1 Freddie Mac Gold Pool‘G00556’,8.000%, due 01/09/2026 1 –
2 Freddie Mac Gold Pool‘G00726’,8.000%, due 01/06/2027 2 –
1 Freddie Mac Gold Pool‘G00931’,8.000%, due 01/11/2026 1 –
8 Freddie Mac Gold Pool‘G02427’,5.500%, due 01/12/2036 9 –
536 Freddie Mac Gold Pool‘G02723’,6.000%, due 01/03/2037 644 0.08
15 Freddie Mac Gold Pool‘G03695’,5.500%, due 01/11/2037 17 –
44 Freddie Mac Gold Pool‘G04581’,6.500%, due 01/08/2038 51 0.01
2 Freddie Mac Gold Pool‘G04947’,6.500%, due 01/04/2038 3 –
7 Freddie Mac Gold Pool‘G06669’,6.500%, due 01/09/2039 8 –
306 Freddie Mac Gold Pool‘G07025’,5.000%, due 01/02/2042 356 0.04
187 Freddie Mac Gold Pool‘G07335’,7.000%, due 01/03/2039 221 0.03
47 Freddie Mac Gold Pool‘G07485’,5.000%, due 01/06/2041 55 0.01
375 Freddie Mac Gold Pool‘G07509’,6.500%, due 01/09/2039 430 0.05
2,074 Freddie Mac Gold Pool‘G08700’,4.500%, due 01/03/2046 2,302 0.28
310 Freddie Mac Gold Pool‘G16672’,3.000%, due 01/03/2033 333 0.04
2,053 Freddie Mac Gold Pool‘G60329’,5.500%, due 01/06/2040 2,409 0.29
6,267 Freddie Mac Gold Pool‘G60344’,4.000%, due 01/12/2045 6,965 0.85
8,912 Freddie Mac Gold Pool‘G61814’,3.500%, due 01/09/2048 9,645 1.17
13,845 Freddie Mac Gold Pool‘G67701’,3.000%, due 01/10/2046 14,869 1.81
FaceValue(000’s)
Value(000’s)
$
% ofNet
AssetValue
1 Freddie Mac Gold Pool‘H00790’,5.500%, due 01/05/2037 1 –
260 Freddie Mac Gold Pool‘H02425’,5.500%, due 01/02/2038 296 0.04
2 Freddie Mac Gold Pool‘H09170’,5.500%, due 01/01/2038 2 –
544 Freddie Mac Gold Pool ‘J39722’,3.000%, due 01/10/2033 582 0.07
463 Freddie Mac Gold Pool ‘J39962’,3.000%, due 01/12/2033 489 0.06
244 Freddie Mac Gold Pool‘Q26702’,4.000%, due 01/06/2044 278 0.03
4,369 Freddie Mac Gold Pool‘Q42046’,3.500%, due 01/07/2046 4,672 0.57
2,824 Freddie Mac Gold Pool‘U69040’,4.000%, due 01/05/2045 3,106 0.38
116 Freddie Mac Gold Pool‘U90316’,4.000%, due 01/10/2042 128 0.02
661 Freddie Mac Gold Pool‘U90378’,4.000%, due 01/11/2042 727 0.09
393 Freddie Mac Gold Pool‘U90436’,4.000%, due 01/11/2042 432 0.05
1,304 Freddie Mac Gold Pool‘U90503’,3.500%, due 01/11/2042 1,431 0.17
125 Freddie Mac Gold Pool‘U90598’,3.500%, due 01/12/2042 136 0.02
119 Freddie Mac Gold Pool‘U90608’,3.500%, due 01/12/2042 129 0.02
134 Freddie Mac Gold Pool‘U90768’,3.500%, due 01/01/2043 146 0.02
130 Freddie Mac Gold Pool‘U90778’,3.500%, due 01/01/2043 141 0.02
145 Freddie Mac Gold Pool‘U90794’,3.500%, due 01/01/2043 157 0.02
3,712 Freddie Mac Gold Pool‘U90809’,3.500%, due 01/02/2043 4,075 0.49
166 Freddie Mac Gold Pool‘U90828’,3.500%, due 01/02/2043 179 0.02
290 Freddie Mac Gold Pool‘U90841’,3.500%, due 01/02/2043 319 0.04
212 Freddie Mac Gold Pool‘U90879’,3.500%, due 01/02/2043 232 0.03
220 Freddie Mac Gold Pool‘U90903’,3.500%, due 01/02/2043 241 0.03
277 Freddie Mac Gold Pool‘U90940’,3.500%, due 01/02/2043 304 0.04
137 Freddie Mac Gold Pool‘U91027’,3.500%, due 01/02/2043 149 0.02
3,383 Freddie Mac Gold Pool‘U99038’,3.000%, due 01/01/2043 3,630 0.44
1,405 Freddie Mac Gold Pool‘U99045’,3.500%, due 01/03/2043 1,542 0.19
247 Freddie Mac Gold Pool‘U99114’,3.500%, due 01/02/2044 271 0.03
7,445 Freddie Mac Gold Pool‘U99124’,3.500%, due 01/03/2045 8,173 0.99
3,886 Freddie Mac Gold Pool‘U99135’,4.000%, due 01/02/2044 4,274 0.52
FaceValue(000’s)
Value(000’s)
$
% ofNet
AssetValue
59,144 Freddie Mac MultifamilyStructured Pass ThroughCertificates K065, Class X1,0.671%, due 25/04/2027 * 2,225 0.27
87,936 Freddie Mac MultifamilyStructured Pass ThroughCertificates K069, Class X1,0.363%, due 25/09/2027 * 2,013 0.24
54,532 Freddie Mac MultifamilyStructured Pass ThroughCertificates K079, Class XAM,0.081%, due 25/06/2028 * 498 0.06
57,720 Freddie Mac MultifamilyStructured Pass ThroughCertificates K081, Class XAM,0.067%, due 25/08/2028 * 480 0.06
3,772 Freddie Mac Pool ‘QA4470’,3.000%, due 01/11/2049 3,950 0.48
220 Freddie Mac Pool ‘QA5768’,3.000%, due 01/01/2050 237 0.03
160 Freddie Mac Pool ‘QA5770’,3.000%, due 01/01/2050 170 0.02
596 Freddie Mac Pool ‘QA7238’,3.500%, due 01/02/2050 647 0.08
6,052 Freddie Mac Pool ‘QA7256’,3.000%, due 01/02/2050 6,339 0.77
280 Freddie Mac Pool ‘QA9686’,3.000%, due 01/05/2050 298 0.04
588 Freddie Mac Pool ‘QB5092’,2.500%, due 01/11/2050 617 0.08
397 Freddie Mac Pool ‘QB5093’,2.500%, due 01/11/2050 417 0.05
100 Freddie Mac Pool ‘QB8602’,2.000%, due 01/02/2051 102 0.01
200 Freddie Mac Pool ‘QB8604’,2.000%, due 01/02/2051 203 0.02
100 Freddie Mac Pool ‘QB8773’,2.000%, due 01/02/2051 102 0.01
1,914 Freddie Mac Pool ‘RA1293’,3.000%, due 01/09/2049 2,046 0.25
277 Freddie Mac Pool ‘RA2141’,4.000%, due 01/02/2050 298 0.04
11,161 Freddie Mac Pool ‘RA2194’,3.000%, due 01/02/2050 11,878 1.44
658 Freddie Mac Pool ‘RA2608’,4.500%, due 01/05/2050 714 0.09
2,116 Freddie Mac Pool ‘RA3474’,3.000%, due 01/09/2050 2,267 0.28
2,961 Freddie Mac Pool ‘RA3838’,3.000%, due 01/10/2050 3,140 0.38
2,383 Freddie Mac Pool ‘RA4175’,2.500%, due 01/12/2050 2,499 0.30
598 Freddie Mac Pool ‘RA4414’,2.500%, due 01/01/2051 624 0.08
700 Freddie Mac Pool ‘RA4703’,2.000%, due 01/02/2051 709 0.09
284 Freddie Mac Pool ‘SD0247’,4.000%, due 01/07/2047 311 0.04
418 Freddie Mac Pool ‘SD0422’,4.500%, due 01/07/2045 471 0.06
97 Freddie Mac Pool ‘SD0436’,2.500%, due 01/09/2050 101 0.01
1,083 Freddie Mac Pool ‘SD0450’,2.500%, due 01/10/2050 1,132 0.14
2,187 Freddie Mac Pool ‘ZA2343’,3.500%, due 01/05/2034 2,361 0.29
3,080 Freddie Mac Pool ‘ZA2415’,3.000%, due 01/06/2036 3,254 0.40
527 Freddie Mac Pool ‘ZA5297’,4.000%, due 01/03/2048 577 0.07
524 Freddie Mac Pool ‘ZI9993’,5.000%, due 01/05/2040 601 0.07
130 Freddie Mac Pool ‘ZM1238’,3.000%, due 01/06/2046 138 0.02
80 Freddie Mac Pool ‘ZM8774’,5.000%, due 01/10/2048 88 0.01
647 Freddie Mac Pool ‘ZN0480’,3.500%, due 01/10/2042 710 0.09
190 Freddie Mac Pool ‘ZN1436’,5.000%, due 01/11/2048 210 0.03
163 Freddie Mac Pool ‘ZN2185’,4.500%, due 01/12/2048 181 0.02
17 Freddie Mac Pool ‘ZS0823’,5.000%, due 01/12/2034 20 –
^ Not authorised for sale to the public in Hong Kong.The accompanying notes are an integral part of the Financial Statements
155

Legg Mason Global Funds Plc Annual Report 28 February 2021
Legg Mason Western Asset US Mortgage-Backed Securities Fund^
Portfolio of Investments as at 28 February 2021 – (continued)
FaceValue(000’s)
Value(000’s)
$
% ofNet
AssetValue
Mortgage-Backed Securities — (continued)
10 Freddie Mac Pool ‘ZS1530’,5.500%, due 01/07/2037 12 –
224 Freddie Mac Pool ‘ZS3059’,5.500%, due 01/12/2038 263 0.03
708 Freddie Mac Pool ‘ZS3399’,5.000%, due 01/11/2041 824 0.10
526 Freddie Mac Pool ‘ZS3901’,5.000%, due 01/11/2041 606 0.07
318 Freddie Mac Pool ‘ZS6518’,4.000%, due 01/10/2025 339 0.04
312 Freddie Mac Pool ‘ZS8673’,3.000%, due 01/10/2032 330 0.04
375 Freddie Mac Pool ‘ZS9826’,3.000%, due 01/10/2046 403 0.05
89 Freddie Mac Pool ‘ZT0474’,4.500%, due 01/08/2048 98 0.01
206 Freddie Mac Pool ‘ZT1257’,3.000%, due 01/01/2046 224 0.03
756 Freddie Mac Pool ‘ZT1596’,5.000%, due 01/01/2049 837 0.10
90 Freddie Mac Pool ‘ZT1854’,4.500%, due 01/03/2049 100 0.01
269 Freddie Mac Pool ‘ZT1970’,3.500%, due 01/04/2033 289 0.04
4,600 Freddie Mac REMICS 3810,Class WA,5.985%, due 15/06/2040 * 5,468 0.66
5,378 Freddie Mac REMICS 3998,Class DS,6.388%, due 15/02/2042 * 1,071 0.13
3,809 Freddie Mac REMICS 4134,Class IM,3.500%, due 15/11/2042 549 0.07
601 Freddie Mac REMICS 4143,Class AZ,2.000%, due 15/12/2042 516 0.06
2,285 Freddie Mac REMICS 4280,Class AI,3.000%, due 15/02/2028 101 0.01
1,159 Freddie Mac REMICS 4403,Class IG,3.500%, due 15/07/2032 53 0.01
2,335 Freddie Mac REMICS 4715,Class JS,6.038%, due 15/08/2047 * 491 0.06
1,219 Freddie Mac REMICS 4759,Class MI,4.000%, due 15/09/2045 108 0.01
2,455 Freddie Mac REMICS 4808,Class SB,6.088%, due 15/07/2048 * 515 0.06
466 Freddie Mac REMICS 4813,Class CJ,3.000%, due 15/08/2048 483 0.06
2,633 Freddie Mac REMICS 4856,Class IO,5.000%, due 15/01/2049 472 0.06
1,608 Freddie Mac REMICS 4870,Class ES,5.888%, due 15/04/2049 * 291 0.04
3,826 Freddie Mac REMICS 4882,Class S,5.938%, due 15/05/2049 * 613 0.07
6,290 Freddie Mac REMICS 4915,Class SG,5.932%, due 25/09/2049 * 1,397 0.17
3,797 Freddie Mac REMICS 4921,Class SN,5.932%, due 25/10/2049 * 743 0.09
1,032 Freddie Mac REMICS 4936,Class YZ,2.500%, due 25/12/2049 1,035 0.13
3,127 Freddie Mac REMICS 4962,Class SP,5.932%, due 25/03/2050 * 496 0.06
4,560 Freddie Mac REMICS 4988,Class AZ,2.000%, due 25/07/2050 4,482 0.54
14,225 Freddie Mac REMICS 4988,Class BI,2.500%, due 25/06/2050 1,999 0.24
3,200 Freddie Mac REMICS 4995,Class IQ,2.500%, due 25/07/2050 396 0.05
FaceValue(000’s)
Value(000’s)
$
% ofNet
AssetValue
13,868 Freddie Mac REMICS 4995,Class QI,2.500%, due 25/07/2050 1,749 0.21
6,135 Freddie Mac REMICS 5000,Class IB,2.500%, due 25/07/2050 846 0.10
4,779 Freddie Mac REMICS 5000,Class UI,2.500%, due 25/07/2050 713 0.09
1,964 Freddie Mac REMICS 5027,Class HI,2.000%, due 25/10/2050 265 0.03
196 Freddie Mac REMICS 5040,Class IB,2.500%, due 25/11/2050 26 –
2,767 Freddie Mac REMICS 5058,Class IL,2.500%, due 25/01/2051 434 0.05
796 Freddie Mac REMICS 5059,Class IB,2.500%, due 25/01/2051 132 0.02
5,588 Freddie Mac REMICS 5070,Class NI,2.000%, due 25/02/2051 757 0.09
2,283 Freddie Mac Strips 312,Class S1,5.838%, due 15/09/2043 * 477 0.06
– Ginnie Mae I Pool ‘410304’,7.500%, due 15/12/2025 – –
1 Ginnie Mae I Pool ‘417463’,7.000%, due 15/09/2025 1 –
– Ginnie Mae I Pool ‘430208’,7.000%, due 15/09/2027 – –
1 Ginnie Mae I Pool ‘462669’,7.000%, due 15/04/2028 1 –
– Ginnie Mae I Pool ‘486470’,6.500%, due 15/08/2028 – –
– Ginnie Mae I Pool ‘486516’,6.500%, due 15/09/2028 – –
– Ginnie Mae I Pool ‘519569’,8.000%, due 15/05/2030 – –
75 Ginnie Mae I Pool ‘646044’,6.500%, due 15/10/2037 84 0.01
2 Ginnie Mae I Pool ‘652203’,5.000%, due 15/03/2036 2 –
4 Ginnie Mae I Pool ‘658182’,6.000%, due 15/11/2036 4 –
1 Ginnie Mae I Pool ‘675375’,5.000%, due 15/05/2038 2 –
2 Ginnie Mae I Pool ‘676940’,5.000%, due 15/04/2038 2 –
9 Ginnie Mae I Pool ‘683926’,5.000%, due 15/02/2038 11 –
7 Ginnie Mae I Pool ‘684334’,5.000%, due 15/02/2038 7 –
4 Ginnie Mae I Pool ‘684754’,5.000%, due 15/04/2038 5 –
2 Ginnie Mae I Pool ‘684848’,5.000%, due 15/04/2038 3 –
3 Ginnie Mae I Pool ‘686062’,5.000%, due 15/05/2038 3 –
55 Ginnie Mae I Pool ‘698086’,6.000%, due 15/04/2039 63 0.01
18 Ginnie Mae I Pool ‘701501’,5.000%, due 15/12/2038 21 –
420 Ginnie Mae I Pool ‘701947’,5.000%, due 15/06/2039 491 0.06
200 Ginnie Mae I Pool ‘733600’,5.000%, due 15/04/2040 232 0.03
430 Ginnie Mae I Pool ‘733627’,5.000%, due 15/05/2040 503 0.06
– Ginnie Mae I Pool ‘780574’,10.000%, due 15/12/2021 – –
2 Ginnie Mae I Pool ‘780732’,7.000%, due 15/03/2028 2 –
– Ginnie Mae I Pool ‘780991’,9.000%, due 15/11/2024 – –
1 Ginnie Mae I Pool ‘781001’,7.500%, due 15/03/2029 1 –
75 Ginnie Mae I Pool ‘781590’,5.500%, due 15/04/2033 87 0.01
519 Ginnie Mae I Pool ‘781994’,5.500%, due 15/11/2033 603 0.07
4 Ginnie Mae I Pool ‘782198’,6.000%, due 15/10/2037 4 –
FaceValue(000’s)
Value(000’s)
$
% ofNet
AssetValue
516 Ginnie Mae I Pool ‘784571’,3.500%, due 15/06/2048 557 0.07
206 Ginnie Mae I Pool ‘AA5649’,3.000%, due 15/09/2042 223 0.03
260 Ginnie Mae I Pool ‘AB2892’,3.000%, due 15/09/2042 273 0.03
71 Ginnie Mae I Pool ‘AB9108’,3.000%, due 15/10/2042 75 0.01
385 Ginnie Mae I Pool ‘AB9109’,3.000%, due 15/10/2042 406 0.05
340 Ginnie Mae I Pool ‘AB9207’,3.000%, due 15/11/2042 358 0.04
4,008 Ginnie Mae I Pool ‘BS8462’,3.500%, due 15/06/2050 4,327 0.53
10 Ginnie Mae II Pool ‘4040’,6.500%, due 20/10/2037 12 –
15 Ginnie Mae II Pool ‘4170’,6.000%, due 20/06/2038 18 –
1,097 Ginnie Mae II Pool ‘4245’,6.000%, due 20/09/2038 1,295 0.16
159 Ginnie Mae II Pool ‘4602’,6.000%, due 20/12/2039 188 0.02
195 Ginnie Mae II Pool ‘4617’,4.500%, due 20/01/2040 220 0.03
98 Ginnie Mae II Pool ‘4696’,4.500%, due 20/05/2040 111 0.01
60 Ginnie Mae II Pool ‘4747’,5.000%, due 20/07/2040 69 0.01
65 Ginnie Mae II Pool ‘4772’,5.000%, due 20/08/2040 75 0.01
5 Ginnie Mae II Pool ‘4774’,6.000%, due 20/08/2040 6 –
136 Ginnie Mae II Pool ‘4802’,5.000%, due 20/09/2040 156 0.02
53 Ginnie Mae II Pool ‘4855’,5.000%, due 20/11/2040 61 0.01
22 Ginnie Mae II Pool ‘4923’,4.500%, due 20/01/2041 25 –
15 Ginnie Mae II Pool ‘4928’,6.000%, due 20/01/2041 18 –
760 Ginnie Mae II Pool ‘4978’,4.500%, due 20/03/2041 856 0.10
1,695 Ginnie Mae II Pool ‘783050’,5.000%, due 20/07/2040 1,929 0.23
1,269 Ginnie Mae II Pool ‘783298’,4.500%, due 20/04/2041 1,426 0.17
4,001 Ginnie Mae II Pool ‘784577’,4.000%, due 20/07/2047 4,339 0.53
89 Ginnie Mae II Pool ‘784905’,3.000%, due 20/01/2050 93 0.01
397 Ginnie Mae II Pool ‘785218’,2.000%, due 20/12/2050 404 0.05
398 Ginnie Mae II Pool ‘785219’,2.000%, due 20/12/2050 405 0.05
298 Ginnie Mae II Pool ‘785220’,2.000%, due 20/12/2050 304 0.04
396 Ginnie Mae II Pool ‘785221’,2.000%, due 20/12/2050 403 0.05
3,556 Ginnie Mae II Pool ‘892346’,2.833%, due 20/08/2059 * 3,738 0.45
266 Ginnie Mae II Pool ‘892614’,2.204%, due 20/08/2060 * 281 0.03
1,427 Ginnie Mae II Pool ‘AV0243’,3.500%, due 20/08/2046 1,577 0.19
2,154 Ginnie Mae II Pool ‘AV8311’,3.500%, due 20/08/2046 2,356 0.29
2,347 Ginnie Mae II Pool ‘AV8312’,3.500%, due 20/08/2046 2,558 0.31
1,406 Ginnie Mae II Pool ‘AZ3074’,4.000%, due 20/02/2047 1,522 0.18
977 Ginnie Mae II Pool ‘BC5293’,3.500%, due 20/08/2047 1,056 0.13
6,470 Ginnie Mae II Pool ‘BC5429’,3.500%, due 20/10/2047 7,020 0.85
1,030 Ginnie Mae II Pool ‘BD3554’,3.500%, due 20/10/2047 1,124 0.14
1,519 Ginnie Mae II Pool ‘BD3636’,3.500%, due 20/10/2047 1,664 0.20
119 Ginnie Mae II Pool ‘BG7951’,4.500%, due 20/06/2048 130 0.02
1,927 Ginnie Mae II Pool ‘BH1521’,4.500%, due 20/07/2048 2,082 0.25
2,890 Ginnie Mae II Pool ‘BH1870’,4.500%, due 20/08/2048 3,185 0.39
^ Not authorised for sale to the public in Hong Kong.The accompanying notes are an integral part of the Financial Statements
156

Legg Mason Global Funds Plc Annual Report 28 February 2021
Legg Mason Western Asset US Mortgage-Backed Securities Fund^
Portfolio of Investments as at 28 February 2021 – (continued)
FaceValue(000’s)
Value(000’s)
$
% ofNet
AssetValue
Mortgage-Backed Securities — (continued)
1,943 Ginnie Mae II Pool ‘BM7534’,3.500%, due 20/02/2050 2,073 0.25
352 Ginnie Mae II Pool ‘BM9734’,4.000%, due 20/10/2049 384 0.05
1,204 Ginnie Mae II Pool ‘BS1728’,4.000%, due 20/01/2050 1,326 0.16
1,178 Ginnie Mae II Pool ‘BS1742’,4.000%, due 20/02/2050 1,292 0.16
100 Ginnie Mae II Pool ‘BS8546’,2.500%, due 20/12/2050 105 0.01
594 Ginnie Mae II Pool ‘BT1888’,2.500%, due 20/12/2050 617 0.08
4,073 Ginnie Mae II Pool ‘BT9472’,4.000%, due 20/05/2050 4,451 0.54
5,627 Ginnie Mae II Pool ‘BU3196’,4.000%, due 20/05/2050 6,265 0.76
1,686 Ginnie Mae II Pool ‘BW7380’,4.500%, due 20/07/2050 1,920 0.23
1,456 Ginnie Mae II Pool ‘BW7384’,4.000%, due 20/08/2050 1,637 0.20
2,342 Ginnie Mae II Pool ‘BX2423’,3.000%, due 20/10/2050 2,517 0.31
4,112 Ginnie Mae II Pool ‘MA2677’,3.000%, due 20/03/2045 4,352 0.53
11,731 Ginnie Mae II Pool ‘MA4003’,3.000%, due 20/10/2046 12,408 1.51
1,528 Ginnie Mae II Pool ‘MA4261’,3.000%, due 20/02/2047 1,617 0.20
929 Ginnie Mae II Pool ‘MA4511’,4.000%, due 20/06/2047 1,010 0.12
203 Ginnie Mae II Pool ‘MA4587’,4.000%, due 20/07/2047 221 0.03
279 Ginnie Mae II Pool ‘MA4654’,4.500%, due 20/08/2047 305 0.04
385 Ginnie Mae II Pool ‘MA4781’,5.000%, due 20/10/2047 428 0.05
483 Ginnie Mae II Pool ‘MA4838’,4.000%, due 20/11/2047 524 0.06
440 Ginnie Mae II Pool ‘MA4901’,4.000%, due 20/12/2047 476 0.06
146 Ginnie Mae II Pool ‘MA5020’,4.000%, due 20/02/2048 158 0.02
238 Ginnie Mae II Pool ‘MA5078’,4.000%, due 20/03/2048 258 0.03
493 Ginnie Mae II Pool ‘MA5138’,4.500%, due 20/04/2048 537 0.07
371 Ginnie Mae II Pool ‘MA5193’,4.500%, due 20/05/2048 401 0.05
53 Ginnie Mae II Pool ‘MA5265’,4.500%, due 20/06/2048 58 0.01
402 Ginnie Mae II Pool ‘MA5331’,4.500%, due 20/07/2048 439 0.05
5,166 Ginnie Mae II Pool ‘MA5399’,4.500%, due 20/08/2048 5,649 0.69
117 Ginnie Mae II Pool ‘MA5467’,4.500%, due 20/09/2048 128 0.02
113 Ginnie Mae II Pool ‘MA5530’,5.000%, due 20/10/2048 124 0.02
184 Ginnie Mae II Pool ‘MA5652’,4.500%, due 20/12/2048 201 0.02
625 Ginnie Mae II Pool ‘MA5711’,4.500%, due 20/01/2049 678 0.08
3,219 Ginnie Mae II Pool ‘MA5712’,5.000%, due 20/01/2049 3,529 0.43
401 Ginnie Mae II Pool ‘MA5818’,4.500%, due 20/03/2049 434 0.05
36 Ginnie Mae II Pool ‘MA5877’,4.500%, due 20/04/2049 39 –
408 Ginnie Mae II Pool ‘MA6412’,4.500%, due 20/01/2050 441 0.05
369 Ginnie Mae II Pool ‘MA6602’,4.500%, due 20/04/2050 399 0.05
13,700 Ginnie Mae, 30 year, TBA,2.000% ± 13,906 1.69
14,000 Ginnie Mae, 30 year, TBA,2.500% ± 14,506 1.76
1,084 Government National MortgageAssociation, Series 2004 81,Class SK,6.093%, due 16/10/2034 * 173 0.02
1,869 Government National MortgageAssociation, Series 2008 40,Class SC,6.243%, due 16/05/2038 * 383 0.05
FaceValue(000’s)
Value(000’s)
$
% ofNet
AssetValue
2,426 Government NationalMortgage Association,Series 2008 79, Class ID,6.689%, due 20/06/2035 * 517 0.06
619 Government National MortgageAssociation, Series 2010 H02,Class FA,0.808%, due 20/02/2060 * 622 0.08
1,237 Government National MortgageAssociation, Series 2010 H20,Class AF,0.474%, due 20/10/2060 * 1,235 0.15
2,195 Government National MortgageAssociation, Series 2010 H22,Class FE,0.494%, due 20/05/2059 * 2,195 0.27
612 Government National MortgageAssociation, Series 2010 H28,Class FE,0.544%, due 20/12/2060 * 612 0.07
1,073 Government National MortgageAssociation, Series 2011 146,Class KS,5.993%, due 16/11/2041 * 230 0.03
1,361 Government National MortgageAssociation, Series 2011 79,Class KS,5.289%, due 20/05/2041 * 256 0.03
4,336 Government National MortgageAssociation, Series 2012 H21,Class FA,0.644%, due 20/07/2062 * 4,349 0.53
15,921 Government National MortgageAssociation, Series 2013 93,Class SA,6.093%, due 16/06/2043 * 3,301 0.40
4,567 Government National MortgageAssociation, Series 2014 117,Class SJ,5.489%, due 20/08/2044 * 876 0.11
826 Government National MortgageAssociation, Series 2014 118,Class HS,6.089%, due 20/08/2044 * 184 0.02
1,312 Government National MortgageAssociation, Series 2014 2,Class CI,4.500%, due 20/01/2044 280 0.03
3,905 Government National MortgageAssociation, Series 2014 60,Class SA,5.993%, due 16/04/2044 * 778 0.09
12,607 Government National MortgageAssociation, Series 2015 136,Class IO,0.533%, due 16/08/2055 * 391 0.05
6,473 Government National MortgageAssociation, Series 2015 177,Class MI,5.000%, due 20/10/2044 1,208 0.15
41,765 Government National MortgageAssociation, Series 2017 111,Class IO,0.650%, due 16/02/2059 * 2,131 0.26
3,029 Government National MortgageAssociation, Series 2017 19,Class SE,6.043%, due 16/02/2047 * 605 0.07
6,573 Government National MortgageAssociation, Series 2017 26,Class IQ,5.000%, due 20/02/2040 1,223 0.15
16,378 Government National MortgageAssociation, Series 2017 8,Class IO,0.585%, due 16/08/2058 * 735 0.09
4,026 Government National MortgageAssociation, Series 2018 125,Class HS,6.139%, due 20/09/2048 * 625 0.08
7,441 Government National MortgageAssociation, Series 2018 134,Class SM,6.089%, due 20/10/2048 * 1,159 0.14
FaceValue(000’s)
Value(000’s)
$
% ofNet
AssetValue
1,316 Government National MortgageAssociation, Series 2018 37,Class QA,2.750%, due 20/03/2048 1,400 0.17
5,644 Government National MortgageAssociation, Series 2019 1,Class LS,5.939%, due 20/01/2049 * 1,062 0.13
547 Government National MortgageAssociation, Series 2019 123,Class A,3.000%, due 20/10/2049 562 0.07
500 Government National MortgageAssociation, Series 2019 128,Class AL,2.500%, due 20/10/2049 514 0.06
1,459 Government National MortgageAssociation, Series 2019 28,Class AB,3.150%, due 16/06/2060 1,528 0.19
24,920 Government National MortgageAssociation, Series 2019 85,Class LS,3.179%, due 20/07/2049 * 2,096 0.25
7,225 Government National MortgageAssociation, Series 2020 116,Class GI,2.500%, due 20/08/2050 1,009 0.12
2,362 Government National MortgageAssociation, Series 2020 122,Class IM,2.500%, due 20/08/2050 337 0.04
5,039 Government National MortgageAssociation, Series 2020 123,Class EI,2.500%, due 20/08/2050 763 0.09
591 Government National MortgageAssociation, Series 2020 129,Class IE,2.500%, due 20/09/2050 83 0.01
198 Government National MortgageAssociation, Series 2020 160,Class IH,2.500%, due 20/10/2050 29 –
6,024 Government National MortgageAssociation, Series 2020 160,Class QI,2.500%, due 20/10/2050 1,175 0.14
296 Government National MortgageAssociation, Series 2020 160,Class VI,2.500%, due 20/10/2050 43 0.01
893 Government National MortgageAssociation, Series 2020 160,Class YI,2.500%, due 20/10/2050 128 0.02
1,588 Government National MortgageAssociation, Series 2020 181,Class WI,2.000%, due 20/12/2050 181 0.02
4,482 Government National MortgageAssociation, Series 2020 191,Class IX,2.500%, due 20/12/2050 886 0.11
7,053 Government National MortgageAssociation, Series 2020 36,Class GS,5.989%, due 20/03/2050 * 1,473 0.18
760 Government National MortgageAssociation, Series 2020 47,Class MI,3.500%, due 20/04/2050 115 0.01
286 Government National MortgageAssociation, Series 2020 47,Class NI,3.500%, due 20/04/2050 46 0.01
2,000 Government National MortgageAssociation, Series 2020 61,Class CI,4.000%, due 20/03/2050 231 0.03
1,543 Government National MortgageAssociation, Series 2020 85,Class CI,3.500%, due 20/04/2050 176 0.02
^ Not authorised for sale to the public in Hong Kong.The accompanying notes are an integral part of the Financial Statements
157

Legg Mason Global Funds Plc Annual Report 28 February 2021
Legg Mason Western Asset US Mortgage-Backed Securities Fund^
Portfolio of Investments as at 28 February 2021 – (continued)
FaceValue(000’s)
Value(000’s)
$
% ofNet
AssetValue
Mortgage-Backed Securities — (continued)
10,311 Government National MortgageAssociation, Series 2020 H08,Class BI,1.770%, due 01/04/2070 * 534 0.06
2,090 Government National MortgageAssociation, Series 2020 H09,Class FL,1.261%, due 20/05/2070 * 2,190 0.27
297 Government National MortgageAssociation, Series 2020 H12,Class F,0.611%, due 20/07/2070 * 300 0.04
1,682 Government National MortgageAssociation, Series 2020 H13,Class FA,0.561%, due 20/07/2070 * 1,692 0.21
5,788 Government National MortgageAssociation, Series 2021 7,Class TI,2.500%, due 16/01/2051 1,056 0.13
3,740 GS Mortgage Securities Corp II,Series 2018 SRP5, Class A,144A,1.412%, due 15/09/2031 * 3,205 0.39
3,880 GS Mortgage Securities Corp II,Series 2018 SRP5, Class B,144A,2.612%, due 15/09/2031 * 2,742 0.33
2,120 GS Mortgage Securities Trust2017-GS8, Series 2017 GS8,Class A4,3.469%, due 10/11/2050 2,346 0.28
23,984 JP MORGAN MORTGAGE TRUST2018-5, Series 2018 5,Class AX1, 144A,0.301%, due 25/10/2048 *† 109 0.01
1,895 New Residential Mortgage LoanTrust 2018-3, Series 2018 3A,Class A1, 144A,4.500%, due 25/05/2058 * 2,062 0.25
Total Mortgage-Backed Securities(Cost $812,342) 828,761 100.65
FaceValue(000’s)
Value(000’s)
$
% ofNet
AssetValue
Government Bonds and Notes — 8.38%(29 February 2020: 0.00%)
United States: 8.38% (29 February 2020: 0.00%)
11,040 United States CashManagement Bill,zero coupon, due 04/05/2021 11,040 1.34
10,210 United States CashManagement Bill,zero coupon, due 11/05/2021 10,209 1.24
25,930 United States CashManagement Bill,zero coupon, due 18/05/2021 25,928 3.15
10,210 United States Treasury Bill,zero coupon, due 23/03/2021 10,210 1.24
11,540 United States Treasury Bill,zero coupon, due 29/04/2021 11,539 1.40
60 United States Treasury Note/Bond,1.125%, due 28/02/2025 62 0.01
68,988 8.38
Total Government Bonds and Notes(Cost $68,980) 68,988 8.38
Collective Investment Schemes — 9.00%(29 February 2020: 8.90%)
74,145 Western Asset Liquidity FundsPlc – Western Asset US DollarLiquidity Fund – Class WA(Distributing) 74,145 9.00
Total Collective Investment Schemes(Cost $74,145) 74,145 9.00
Total Investments at fair value throughprofit or loss (Cost $956,658) 973,160 118.19
Forward Foreign Currency Contracts — 0.00%(29 February 2020: 0.00%)
Unrealised appreciation of contracts(see below) 9 –
Futures — 0.15% (29 February 2020: 0.25%)
Unrealised appreciation of contracts(see below) 1,252 0.15
Total Financial Assets at fair valuethrough profit or loss 974,421 118.34
FaceValue(000’s)
Value(000’s)
$
% ofNet
AssetValue
Interest Rate Swaps — (0.04%)(29 February 2020: 0.00%)
Unrealised depreciation of contracts(see below) (332) (0.04)
Futures — (0.15%) (29 February 2020: (0.56%))
Unrealised depreciation of contracts(see below) (1,278) (0.15)
Total Financial Liabilities at fair valuethrough profit or loss (1,610) (0.19)
Total Financial Assets and FinancialLiabilities at fair value through profitor loss 972,811 118.15
Liabilities in Excess of Other Assets (149,395) (18.15)
Total Net Assets $ 823,416 100.00
– Amounts designated as “–” are either $0, less than$1,000, less than 1,000 shares or less than 0.01%.
144A Securities exempt from registration under Rule 144A ofthe Securities Act of 1933, as amended. Thesesecurities may only be resold, in transactions exemptfrom registration, to qualified institutional buyers. As at28 February 2021, these securities amounted to$16,052,000 or 1.94% of net assets.
* Variable rate security. The interest rate shown reflectsthe rate in effect at 28 February 2021.
† Illiquid.
± Securities purchased on a to-be-announced basis.
ABBREVIATIONS:
REMIC – Real Estate Mortgage Investment Conduit.
TBA – To Be Announced.
Analysis of Total Assets
% ofTotal
Assets
Transferable securities admitted to an officialexchange listing or traded on a regulated market 84.31
Collective investment schemes 6.95
Financial derivative instruments 0.12
Other assets 8.62
Total Assets 100.00
Schedule of Interest Rate Swaps
Counterparty Rate Expiration DateNotional Amount
(000’s)Value(000’s)
Bank of America MerrillLynch Pay Floating USD 3M Libor BBA, Receive Fixed 0.840% 27/11/2025 39,962 $ (332)
Unrealised Appreciation of Interest Rate Swaps (29 February 2020 (000’s): $–) $ –Unrealised Depreciation of Interest Rate Swaps (29 February 2020 (000’s): $–) (332)
Net Depreciation of Interest Rate Swaps (29 February 2020 (000’s): $–) $ (332)
Schedule of Forward Foreign Currency Contracts
Expiration Date CounterpartyBuy Currency
(000’s)Sell Currency
(000’s)
UnrealisedAppreciation/(Depreciation)of Contracts
(000’s)
12/03/2021 BNY Mellon Buy USD 46 Sell EUR 37 $ –12/03/2021 BNY Mellon Buy EUR 2,891 Sell USD 3,481 9
Unrealised Appreciation of Forward Foreign Currency Contracts (29 February 2020 (000’s): $15) $ 9Unrealised Depreciation of Forward Foreign Currency Contracts (29 February 2020 (000’s): $–) –
Net Appreciation of Forward Foreign Currency Contracts (29 February 2020 (000’s): $15) $ 9
^ Not authorised for sale to the public in Hong Kong.The accompanying notes are an integral part of the Financial Statements
158

Legg Mason Global Funds Plc Annual Report 28 February 2021
Legg Mason Western Asset US Mortgage-Backed Securities Fund^
Portfolio of Investments as at 28 February 2021 – (continued)
Schedule of Futures Contracts
CounterpartyNominal
ValueNotional Value
(000’s)
UnrealisedAppreciation/(Depreciation)of Contracts
(000’s)
90 Day Euro$ December 2021 Bank of America Merrill Lynch (164) $ (40,905) $ 490 Day Euro$ December 2023 Bank of America Merrill Lynch 164 40,553 (113)U.S. 10 Year Note (CBT) June 2021 Bank of America Merrill Lynch (498) (66,094) 983U.S. 10 Year Ultra Note June 2021 Bank of America Merrill Lynch 112 16,502 (140)U.S. 2 Year Note (CBT) June 2021 Bank of America Merrill Lynch (614) (135,550) 119U.S. 5 Year Note (CBT) June 2021 Bank of America Merrill Lynch 335 41,530 (378)U.S. Long Bond (CBT) June 2021 Bank of America Merrill Lynch (86) (13,693) 146U.S. Ultra Bond (CBT) June 2021 Bank of America Merrill Lynch 180 34,031 (647)
Unrealised Appreciation of Futures Contracts (29 February 2020 (000’s): $2,661) $ 1,252Unrealised Depreciation of Futures Contracts (29 February 2020 (000’s): $(6,039)) (1,278)
Net Depreciation of Futures Contracts (29 February 2020 (000’s): $(3,378)) $ (26)
^ Not authorised for sale to the public in Hong Kong.The accompanying notes are an integral part of the Financial Statements
159

Legg Mason Global Funds Plc Annual Report 28 February 2021
Legg Mason Western Asset UK Investment Grade Credit Fund^
Portfolio of Investments as at 28 February 2021
FaceValue(000’s)
Value(000’s)
£
% ofNet
AssetValue
Corporate Bonds and Notes — 90.39%(29 February 2020: 90.54%)
Australia — 1.16% (29 February 2020: 0.72%)
360 APT Pipelines Ltd,3.125%, due 18/07/2031 392 0.51
100 BHP Billiton Finance Ltd,6.500%, due 22/10/2077 * 108 0.14
370 Glencore Finance Europe Ltd,6.000%, due 03/04/2022 392 0.51
892 1.16
Belgium — 1.05% (29 February 2020: 0.54%)
166 Anheuser-Busch InBev SA/NV,4.000%, due 24/09/2025 189 0.25
380 Anheuser-Busch InBev SA/NV,2.850%, due 25/05/2037 406 0.53
USD 210 Anheuser-Busch InBevWorldwide Inc,5.800%, due 23/01/2059 209 0.27
804 1.05
Canada — 1.17% (29 February 2020: 1.19%)
340 Bank of Montreal,1.375%, due 29/12/2021 343 0.45
540 Royal Bank of Canada,1.375%, due 09/12/2024 553 0.72
896 1.17
China — 0.62% (29 February 2020: 0.62%)
470 Industrial & Commercial Bankof China Ltd/London,1.500%, due 31/07/2022 475 0.62
Denmark — 1.20% (29 February 2020: 1.11%)
350 Danske Bank A/S,2.250%, due 14/01/2028 * 359 0.47
145 Orsted AS,4.875%, due 12/01/2032 191 0.25
250 Orsted AS,2.500%, due 16/05/2033 272 0.35
100 Orsted AS, Series GBP,2.500%, due 18/02/3021 * 99 0.13
921 1.20
Finland — 0.29% (29 February 2020: 0.29%)
220 Nordea Bank Abp,2.375%, due 02/06/2022 226 0.29
France — 5.28% (29 February 2020: 6.25%)
150 AXA SA,5.625%, due 16/01/2054 * 189 0.25
184 AXA SA,6.686%, Perpetual * 226 0.29
290 BNP Paribas SA,3.375%, due 23/01/2026 319 0.42
500 BNP Paribas SA,1.875%, due 14/12/2027 512 0.67
300 BNP Paribas SA,1.250%, due 13/07/2031 280 0.36
200 BPCE SA,5.250%, due 16/04/2029 247 0.32
100 CNP Assurances,7.375%, due 30/09/2041 * 104 0.13
220 Credit Agricole SA,7.500%, Perpetual * 260 0.34
300 Electricite de France SA,5.500%, due 27/03/2037 423 0.55
100 Electricite de France SA,5.500%, due 17/10/2041 145 0.19
100 Electricite de France SA,6.000%, due 23/01/2114 167 0.22
431 Orange SA,5.750%, Perpetual * 470 0.61
400 Total Capital International SA,1.405%, due 03/09/2031 395 0.52
200 Veolia Environnement SA,6.125%, due 29/10/2037 313 0.41
4,050 5.28
Germany — 6.82% (29 February 2020: 7.13%)
370 BMW International InvestmentBV,1.000%, due 17/11/2021 372 0.49
190 Deutsche Telekom AG,3.125%, due 06/02/2034 216 0.28
FaceValue(000’s)
Value(000’s)
£
% ofNet
AssetValue
200 Deutsche Telekom InternationalFinance BV,6.500%, due 08/04/2022 214 0.28
550 E.ON International Finance BV,6.125%, due 06/07/2039 852 1.11
1,590 Kreditanstalt fuerWiederaufbau,6.000%, due 07/12/2028 2,204 2.87
300 MuenchenerRueckversicherungs-Gesellschaft AG in Muenchen,6.625%, due 26/05/2042 * 321 0.42
400 Volkswagen Financial ServicesNV,1.625%, due 30/11/2022 406 0.53
200 Volkswagen Financial ServicesNV,2.125%, due 27/06/2024 207 0.27
400 Volkswagen InternationalFinance NV,3.375%, due 16/11/2026 439 0.57
5,231 6.82
Italy — 1.91% (29 February 2020: 1.77%)
481 Enel Finance International NV,5.750%, due 14/09/2040 721 0.94
397 FCA Bank SpA/Ireland,1.625%, due 29/09/2021 399 0.52
USD 400 UniCredit SpA,7.296%, due 02/04/2034 * 341 0.45
1,461 1.91
Netherlands — 2.04% (29 February 2020: 2.46%)
300 Cooperatieve Rabobank UA,Series 2541,4.000%, due 19/09/2022 317 0.41
600 Cooperatieve Rabobank UA,4.625%, due 23/05/2029 716 0.93
100 ING Bank NV,5.375%, due 15/04/2021 100 0.13
400 ING Groep NV,3.000%, due 18/02/2026 435 0.57
1,568 2.04
South Africa — 0.38% (29 February 2020: 0.43%)
270 Anglo American Capital Plc,3.375%, due 11/03/2029 294 0.38
Spain — 0.88% (29 February 2020: 1.29%)
400 Banco Santander SA,2.750%, due 12/09/2023 418 0.55
200 Telefonica Emisiones SA,5.445%, due 08/10/2029 255 0.33
673 0.88
Supranational — 5.15% (29 February 2020: 6.22%)
772 European Investment Bank,5.375%, due 07/06/2021 783 1.02
810 European Investment Bank,1.375%, due 07/03/2025 840 1.10
1,940 European Investment Bank,3.750%, due 07/12/2027 2,324 3.03
3,947 5.15
Sweden — 0.89% (29 February 2020: 0.93%)
380 Svenska Handelsbanken AB,2.375%, due 18/01/2022 387 0.51
290 Swedbank AB,1.250%, due 29/12/2021 293 0.38
680 0.89
Switzerland — 1.85% (29 February 2020: 1.87%)
110 Credit Suisse Group AG,2.125%, due 12/09/2025 * 114 0.15
350 Credit Suisse Group AG,2.250%, due 09/06/2028 * 363 0.47
389 Credit Suisse Group FundingGuernsey Ltd,3.000%, due 27/05/2022 401 0.52
USD 350 Glencore Finance Canada Ltd,6.000%, due 15/11/2041 317 0.41
210 LafargeHolcim Sterling FinanceNetherlands BV,3.000%, due 12/05/2032 227 0.30
1,422 1.85
FaceValue(000’s)
Value(000’s)
£
% ofNet
AssetValue
United Kingdom — 42.16% (29 February 2020: 41.53%)
220 Anglian Water ServicesFinancing Plc,1.625%, due 10/08/2025 228 0.30
603 Annington Funding Plc,2.646%, due 12/07/2025 636 0.83
470 Aspire Defence Finance Plc,Series A,4.674%, due 31/03/2040 608 0.79
470 Assura Financing Plc,3.000%, due 19/07/2028 523 0.68
237 Aviva Plc,5.125%, due 04/06/2050 * 277 0.36
190 Aviva Plc,6.875%, due 20/05/2058 * 288 0.38
140 Aviva Plc,6.125%, Perpetual * 149 0.19
444 BAE Systems Plc,4.125%, due 08/06/2022 464 0.60
610 Barclays Plc,2.375%, due 06/10/2023 * 625 0.82
EUR 360 Barclays Plc,3.375%, due 02/04/2025 * 341 0.45
260 Barclays Plc,1.700%, due 03/11/2026 * 264 0.34
493 Barclays Plc,3.250%, due 12/02/2027 535 0.70
630 BP Capital Markets Plc,2.030%, due 14/02/2025 658 0.86
310 BP Capital Markets Plc,2.274%, due 03/07/2026 328 0.43
800 British Land Co Plc/The,2.375%, due 14/09/2029 806 1.05
260 Bunzl Finance Plc,2.250%, due 11/06/2025 273 0.36
193 BUPA Finance Plc,5.000%, due 25/04/2023 209 0.27
130 Burberry Group Plc,1.125%, due 21/09/2025 129 0.17
350 Cadent Finance Plc,2.625%, due 22/09/2038 364 0.47
200 Chancellor Masters & Scholarsof The University of Cambridge/The,2.350%, due 27/06/2078 261 0.34
300 Clarion Funding Plc,1.250%, due 13/11/2032 286 0.37
300 Clarion Funding Plc,1.875%, due 22/01/2035 300 0.39
150 Clarion Funding Plc,3.125%, due 19/04/2048 178 0.23
189 Close Brothers Finance Plc,2.750%, due 19/10/2026 203 0.27
420 Close Brothers Group Plc,2.750%, due 26/04/2023 436 0.57
191 Clydesdale Bank Plc,4.625%, due 08/06/2026 229 0.30
257 Coventry Building Society,5.875%, due 28/09/2022 278 0.36
606 CPUK Finance Ltd,3.588%, due 28/08/2025 649 0.85
195 Crh Finance UK Plc,4.125%, due 02/12/2029 234 0.30
160 Dignity Finance Plc, Series A,3.546%, due 31/12/2034 167 0.22
152 Eastern Power Networks Plc,5.750%, due 08/03/2024 175 0.23
92 Eastern Power Networks Plc,6.250%, due 12/11/2036 146 0.19
144 Experian Finance Plc,3.500%, due 15/10/2021 146 0.19
370 Experian Finance Plc,0.739%, due 29/10/2025 367 0.48
170 Experian Finance Plc,3.250%, due 07/04/2032 195 0.25
319 FCE Bank Plc,2.727%, due 03/06/2022 324 0.42
220 Folio Residential Finance NO 1Plc,1.246%, due 31/10/2027 220 0.29
278 Gatwick Funding Ltd,6.125%, due 02/03/2026 332 0.43
340 Gatwick Funding Ltd,3.250%, due 26/02/2048 336 0.44
^ Not authorised for sale to the public in Hong Kong.The accompanying notes are an integral part of the Financial Statements
160

Legg Mason Global Funds Plc Annual Report 28 February 2021
Legg Mason Western Asset UK Investment Grade Credit Fund^
Portfolio of Investments as at 28 February 2021 – (continued)
FaceValue(000’s)
Value(000’s)
£
% ofNet
AssetValue
Corporate Bonds and Notes — (continued)
United Kingdom — (continued)
190 GlaxoSmithKline Capital Plc,6.375%, due 09/03/2039 315 0.41
104 GlaxoSmithKline Capital Plc,4.250%, due 18/12/2045 147 0.19
210 Grainger Plc,3.375%, due 24/04/2028 228 0.30
190 Grainger Plc,3.000%, due 03/07/2030 200 0.26
173 Greene King Finance Plc,Series A2,5.318%, due 15/09/2031 195 0.25
230 Greene King Finance Plc,Series B1,1.843%, due 15/12/2034 *† 192 0.25
310 Guinness Partnership Ltd/The,2.000%, due 22/04/2055 304 0.40
400 HSBC Holdings Plc,7.000%, due 07/04/2038 601 0.78
387 HSBC Holdings Plc,6.000%, due 29/03/2040 538 0.70
430 HSBC Holdings Plc,5.875%, Perpetual * 475 0.62
100 Hutchison Whampoa FinanceUK Plc, Series B,5.625%, due 24/11/2026 124 0.16
210 Land Securities Capital MarketsPlc,2.399%, due 08/02/2029 220 0.29
100 Land Securities Capital MarketsPlc,2.625%, due 22/09/2037 106 0.14
190 Leeds Building Society,3.750%, due 25/04/2029 * 200 0.26
240 Legal & General Group Plc,3.750%, due 26/11/2049 * 253 0.33
190 Legal & General Group Plc,4.500%, due 01/11/2050 * 211 0.28
330 Liberty Living Finance Plc,3.375%, due 28/11/2029 356 0.46
120 LiveWest Treasury Plc,2.250%, due 10/10/2043 124 0.16
430 Lloyds Bank Plc,5.125%, due 07/03/2025 507 0.66
510 Lloyds Bank Plc,7.625%, due 22/04/2025 638 0.83
453 Lloyds Bank Plc,6.500%, due 17/09/2040 787 1.03
340 Lloyds Banking Group Plc,5.125%, Perpetual * 352 0.46
350 Logicor 2019-1 UK Plc,1.875%, due 17/11/2026 364 0.48
177 Manchester Airport GroupFunding Plc,4.125%, due 02/04/2024 192 0.25
340 Manchester Airport GroupFunding Plc,4.750%, due 31/03/2034 413 0.54
160 Manchester Airport GroupFunding Plc,2.875%, due 30/09/2044 155 0.20
305 Marston’s Issuer Plc, Series A3,5.177%, due 15/07/2032 * 306 0.40
108 Marston’s Issuer Plc, Series B1,2.578%, due 16/07/2035 *† 86 0.11
41 Mitchells & Butlers Finance Plc,Series B1,5.965%, due 15/12/2023 † 42 0.06
97 Mitchells & Butlers Finance Plc,Series B2,6.013%, due 15/12/2028 † 105 0.14
300 National Express Group Plc,2.375%, due 20/11/2028 308 0.40
250 National Grid ElectricityTransmission Plc,2.000%, due 17/04/2040 248 0.32
310 National Grid Gas Plc,1.375%, due 07/02/2031 303 0.40
100 Nationwide Building Society,3.000%, due 06/05/2026 111 0.14
206 Nationwide Building Society,3.250%, due 20/01/2028 234 0.31
230 Natwest Group Plc,3.125%, due 28/03/2027 * 248 0.32
120 Notting Hill Genesis,2.875%, due 31/01/2029 130 0.17
FaceValue(000’s)
Value(000’s)
£
% ofNet
AssetValue
190 RSA Insurance Group Plc,5.125%, due 10/10/2045 * 217 0.28
120 Sanctuary Capital Plc,5.000%, due 26/04/2047 189 0.25
190 Sanctuary Capital Plc,2.375%, due 14/04/2050 196 0.26
440 Santander UK Group HoldingsPlc,2.920%, due 08/05/2026 * 466 0.61
170 Santander UK Plc,5.750%, due 02/03/2026 212 0.28
467 Santander UK Plc,3.875%, due 15/10/2029 559 0.73
120 Scotland Gas Networks Plc,Series A3S,4.875%, due 21/12/2034 160 0.21
198 Scottish Widows Ltd,7.000%, due 16/06/2043 287 0.37
350 Segro Plc,2.875%, due 11/10/2037 395 0.51
180 Severn Trent Utilities FinancePlc,2.000%, due 02/06/2040 177 0.23
100 Severn Trent Utilities FinancePlc,4.875%, due 24/01/2042 145 0.19
252 South Eastern Power NetworksPlc,5.500%, due 05/06/2026 308 0.40
191 Southern Gas Networks Plc,2.500%, due 03/02/2025 203 0.26
333 Telereal Secured Finance Plc,4.010%, due 10/12/2031 367 0.48
380 Tesco Corporate TreasuryServices Plc,2.500%, due 02/05/2025 402 0.52
190 Tesco Corporate TreasuryServices Plc,2.750%, due 27/04/2030 202 0.26
401 Tesco Property Finance 3 Plc,5.744%, due 13/04/2040 530 0.69
190 UNITE Group Plc/The,3.500%, due 15/10/2028 209 0.27
350 UNITE USAF II Plc,3.921%, due 30/06/2025 383 0.50
220 United Utilities Water FinancePlc,1.875%, due 03/06/2042 212 0.28
170 University of Oxford,2.544%, due 08/12/2117 206 0.27
460 Vodafone Group Plc,3.375%, due 08/08/2049 507 0.66
410 Vodafone Group Plc,3.000%, due 12/08/2056 416 0.54
260 Wellcome Trust Ltd/The,2.517%, due 07/02/2118 320 0.42
362 Western Power DistributionEast Midlands Plc,5.250%, due 17/01/2023 393 0.51
275 Western Power DistributionEast Midlands Plc,6.250%, due 10/12/2040 449 0.59
100 Whitbread Group Plc,2.375%, due 31/05/2027 99 0.13
100 Whitbread Group Plc,3.000%, due 31/05/2031 98 0.13
320 Wm Morrison SupermarketsPlc,2.500%, due 01/10/2031 335 0.44
180 Yorkshire Building Society,3.500%, due 21/04/2026 201 0.26
32,328 42.16
United States — 17.54% (29 February 2020: 16.19%)
USD 700 AbbVie Inc,3.200%, due 21/11/2029 544 0.71
141 Amgen Inc,4.000%, due 13/09/2029 169 0.22
USD 100 Apache Corp,4.750%, due 15/04/2043 70 0.09
420 AT&T Inc, Series GBP,2.900%, due 04/12/2026 454 0.59
383 AT&T Inc,4.250%, due 01/06/2043 456 0.59
900 Bank of America Corp,6.125%, due 15/09/2021 929 1.21
FaceValue(000’s)
Value(000’s)
£
% ofNet
AssetValue
174 Bank of America Corp,5.500%, due 22/11/2021 180 0.24
200 Bank of America Corp,7.000%, due 31/07/2028 280 0.37
180 Becton Dickinson and Co,3.020%, due 24/05/2025 193 0.25
260 Berkshire Hathaway FinanceCorp,2.625%, due 19/06/2059 300 0.39
519 Citigroup Inc,7.375%, due 01/09/2039 948 1.24
190 Comcast Corp,1.875%, due 20/02/2036 187 0.24
USD 60 CVS Health Corp,4.125%, due 01/04/2040 49 0.06
200 Digital Stout Holding LLC,3.750%, due 17/10/2030 230 0.30
330 GE Capital UK FundingUnlimited Co,5.875%, due 18/01/2033 444 0.58
210 GE Capital UK FundingUnlimited Co,8.000%, due 14/01/2039 348 0.45
USD 250 General Electric Co,6.875%, due 10/01/2039 256 0.33
560 General Motors Financial CoInc,2.350%, due 03/09/2025 578 0.75
247 Goldman Sachs Group Inc/The,5.500%, due 12/10/2021 255 0.33
309 Goldman Sachs Group Inc/The,7.125%, due 07/08/2025 390 0.51
580 Goldman Sachs Group Inc/The,3.125%, due 25/07/2029 649 0.85
110 Goldman Sachs Group Inc/The,6.875%, due 18/01/2038 175 0.23
191 Kraft Heinz Foods Co,4.125%, due 01/07/2027 213 0.28
200 McDonald’s Corp,2.950%, due 15/03/2034 223 0.29
92 MetLife Inc,5.375%, due 09/12/2024 108 0.14
220 Mondelez International Inc,4.500%, due 03/12/2035 275 0.36
440 Morgan Stanley,2.625%, due 09/03/2027 475 0.62
380 MPT Operating Partnership LP /MPT Finance Corp,3.692%, due 05/06/2028 403 0.53
210 Prologis LP,2.250%, due 30/06/2029 224 0.29
365 Time Warner Cable LLC,5.750%, due 02/06/2031 460 0.60
300 Toyota Motor Credit Corp,0.750%, due 19/11/2026 295 0.39
590 Verizon Communications Inc,1.875%, due 19/09/2030 593 0.77
110 Verizon Communications Inc,2.500%, due 08/04/2031 116 0.15
320 Verizon Communications Inc,1.875%, due 03/11/2038 300 0.39
26 Walmart Inc,5.250%, due 28/09/2035 39 0.05
310 Wells Fargo & Co,1.375%, due 30/06/2022 313 0.41
850 Wells Fargo & Co,4.875%, due 29/11/2035 1,110 1.45
200 Wells Fargo Bank NA,5.250%, due 01/08/2023 220 0.29
13,451 17.54
Total Corporate Bonds and Notes(Cost £65,311) 69,319 90.39
Government Bonds and Notes — 6.75%(29 February 2020: 6.87%)
Germany — 0.43% (29 February 2020: 0.00%)
EUR 370 Bundesrepublik DeutschlandBundesanleihe,0.000%, due 15/02/2030 330 0.43
United Kingdom — 5.39% (29 February 2020: 5.86%)
250 United Kingdom Gilt,1.000%, due 22/04/2024 256 0.34
2,560 United Kingdom Gilt,2.750%, due 07/09/2024 2,789 3.64
^ Not authorised for sale to the public in Hong Kong.The accompanying notes are an integral part of the Financial Statements
161

Legg Mason Global Funds Plc Annual Report 28 February 2021
Legg Mason Western Asset UK Investment Grade Credit Fund^
Portfolio of Investments as at 28 February 2021 – (continued)
FaceValue(000’s)
Value(000’s)
£
% ofNet
AssetValue
Government Bonds and Notes — (continued)
United Kingdom — (continued)
140 United Kingdom Gilt,2.000%, due 07/09/2025 151 0.20
380 United Kingdom Gilt,1.500%, due 22/07/2026 402 0.52
90 United Kingdom Gilt,0.875%, due 22/10/2029 91 0.12
170 United Kingdom Gilt,4.750%, due 07/12/2030 233 0.30
130 United Kingdom Gilt,4.500%, due 07/12/2042 208 0.27
4,130 5.39
United States — 0.93% (29 February 2020: 1.01%)
USD 510 United States Treasury Note/Bond,1.500%, due 31/10/2024 380 0.50
USD 140 United States Treasury Note/Bond,2.875%, due 15/05/2049 117 0.15
USD 230 United States Treasury Note/Bond,2.250%, due 15/08/2049 170 0.22
USD 70 United States Treasury Note/Bond,2.000%, due 15/02/2050 49 0.06
716 0.93
Total Government Bonds and Notes(Cost £5,245) 5,176 6.75
Total Investments at fair value throughprofit or loss (Cost £70,556) 74,495 97.14
FaceValue(000’s)
Value(000’s)
£
% ofNet
AssetValue
Forward Foreign Currency Contracts — 0.06%(29 February 2020: 0.01%)
Unrealised appreciation of contracts(see below) 49 0.06
Futures — 0.05% (29 February 2020: 0.08%)
Unrealised appreciation of contracts(see below) 38 0.05
Total Financial Assets at fair valuethrough profit or loss 74,582 97.25
Futures — (0.08%) (29 February 2020: (0.09%))
Unrealised depreciation of contracts(see below) (65) (0.08)
Total Financial Liabilities at fair valuethrough profit or loss (65) (0.08)
Total Financial Assets and FinancialLiabilities at fair value through profit orloss 74,517 97.17
Other Assets in Excess of Liabilities 2,168 2.83
Total Net Assets £76,685 100.00
– Amounts designated as “–” are either £0, less than£1,000, less than 1,000 shares or less than 0.01%.
* Variable rate security. The interest rate shown reflectsthe rate in effect at 28 February 2021.
† Illiquid.
ABBREVIATIONS:
Perpetual – A bond with no maturity date. Perpetual bondsare not redeemable but pay a steady stream ofinterest.
EUR – Euro
USD – United States Dollar
Analysis of Total Assets
% ofTotal
Assets
Transferable securities admitted to an officialexchange listing or traded on a regulated market 97.01
Financial derivative instruments 0.11
Other assets 2.88
Total Assets 100.00
Schedule of Forward Foreign Currency Contracts
Expiration Date CounterpartyBuy Currency
(000’s)Sell Currency
(000’s)
UnrealisedAppreciation/(Depreciation)of Contracts
(000’s)
18/05/2021 Citi Buy GBP 893 Sell USD 1,224 £ 1518/05/2021 Goldman Sachs Buy GBP 1,294 Sell USD 1,793 718/05/2021 JP Morgan Buy GBP 188 Sell USD 260 218/05/2021 UBS Buy GBP 892 Sell EUR 1,014 1218/05/2021 UBS Buy GBP 779 Sell USD 1,068 13
Unrealised Appreciation of Forward Foreign Currency Contracts (29 February 2020 (000’s): £10) £ 49Unrealised Depreciation of Forward Foreign Currency Contracts (29 February 2020 (000’s): £(70)) –
Net Appreciation of Forward Foreign Currency Contracts (29 February 2020 (000’s): £(60)) £ 49
Schedule of Futures Contracts
CounterpartyNominal
Value
NotionalValue(000’s)
UnrealisedAppreciation/
(Depreciation)of Contracts
(000’s)
Euro-Bund March 2021 Bank of America Merrill Lynch (2) £ (301) £ 7
Long Gilt June 2021 Bank of America Merrill Lynch 16 2,045 (18)
U.S. 10 Year Note (CBT) June 2021 Bank of America Merrill Lynch (15) (1,429) 21
U.S. 5 Year Note (CBT) June 2021 Bank of America Merrill Lynch 37 3,292 (30)
U.S. Long Bond (CBT) June 2021 Bank of America Merrill Lynch 7 800 (17)
U.S. Ultra Bond (CBT) June 2021 Bank of America Merrill Lynch (6) (814) 10
Unrealised Appreciation of Futures Contracts (29 February 2020 (000’s): £91) £ 38
Unrealised Depreciation of Futures Contracts (29 February 2020 (000’s): £(98)) (65)
Net Depreciation of Futures Contracts (29 February 2020 (000’s): £(7)) £ (27)
^ Not authorised for sale to the public in Hong Kong.The accompanying notes are an integral part of the Financial Statements
162

Legg Mason Global Funds Plc Annual Report 28 February 2021
Legg Mason Western Asset US Corporate Bond Fund^
Portfolio of Investments as at 28 February 2021
FaceValue(000’s)
Value(000’s)
$
% ofNet
AssetValue
Asset-Backed Securities — 0.16%(29 February 2020: 0.00%)
300 SMB Private Education LoanTrust 2020-A, Series 2020 A,Class A2A, 144A,2.230%, due 15/09/2037 311 0.16
Total Asset-Backed Securities(Cost $310) 311 0.16
Corporate Bonds and Notes — 87.35%(29 February 2020: 95.50%)
Argentina — 0.29% (29 February 2020: 0.00%)
560 MercadoLibre Inc,3.125%, due 14/01/2031 552 0.29
Australia — 0.73% (29 February 2020: 0.26%)
200 Commonwealth Bank ofAustralia, 144A,3.743%, due 12/09/2039 219 0.12
30 Glencore Funding LLC, 144A,3.000%, due 27/10/2022 31 0.02
320 Glencore Funding LLC, 144A,4.125%, due 12/03/2024 349 0.18
460 Glencore Funding LLC, 144A,4.625%, due 29/04/2024 511 0.27
120 Glencore Funding LLC, 144A,1.625%, due 01/09/2025 122 0.06
40 Glencore Funding LLC, 144A,3.875%, due 27/10/2027 45 0.02
120 Westpac Banking Corp,2.668%, due 15/11/2035 * 117 0.06
1,394 0.73
Belgium — 0.52% (29 February 2020: 1.25%)
280 Anheuser-Busch Cos LLC /Anheuser-Busch InBevWorldwide Inc,3.650%, due 01/02/2026 311 0.16
590 Anheuser-Busch InBevWorldwide Inc,4.600%, due 15/04/2048 685 0.36
996 0.52
Bermuda — 0.25% (29 February 2020: 0.00%)
450 Highlands Holdings BondIssuer Ltd / Highlands HoldingsBond Co-Issuer Inc, 144A,7.625%, due 15/10/2025 478 0.25
Brazil — 0.22% (29 February 2020: 0.86%)
200 Klabin Austria GmbH, 144A,3.200%, due 12/01/2031 199 0.10
200 Petrobras Global Finance BV,6.900%, due 19/03/2049 224 0.12
423 0.22
Canada — 2.46% (29 February 2020: 0.68%)
180 Air Canada, 144A,7.750%, due 15/04/2021 181 0.09
140 Barrick North America FinanceLLC,5.700%, due 30/05/2041 192 0.10
60 Barrick PD Australia FinancePty Ltd,5.950%, due 15/10/2039 83 0.04
1,840 Canadian Imperial Bank ofCommerce,0.500%, due 14/12/2023 1,843 0.96
1,100 CI Financial Corp,3.200%, due 17/12/2030 1,107 0.58
100 GFL Environmental Inc, 144A,5.125%, due 15/12/2026 106 0.05
200 MEG Energy Corp, 144A,7.125%, due 01/02/2027 210 0.11
90 MEG Energy Corp, 144A,5.875%, due 01/02/2029 92 0.05
50 Teck Resources Ltd,3.900%, due 15/07/2030 54 0.03
290 Teck Resources Ltd,6.250%, due 15/07/2041 379 0.20
10 Teck Resources Ltd,5.400%, due 01/02/2043 12 0.01
60 TransAlta Corp,6.500%, due 15/03/2040 68 0.04
FaceValue(000’s)
Value(000’s)
$
% ofNet
AssetValue
350 Yamana Gold Inc,4.625%, due 15/12/2027 389 0.20
4,716 2.46
Cayman Islands — 0.14% (29 February 2020: 0.31%)
284 Global Aircraft Leasing Co Ltd,144A,6.500%, due 15/09/2024 264 0.14
China — 0.52% (29 February 2020: 0.00%)
200 Alibaba Group Holding Ltd,2.125%, due 09/02/2031 195 0.10
200 Alibaba Group Holding Ltd,2.700%, due 09/02/2041 190 0.10
640 Alibaba Group Holding Ltd,3.150%, due 09/02/2051 614 0.32
999 0.52
Colombia — 0.09% (29 February 2020: 0.26%)
160 Ecopetrol SA,5.875%, due 28/05/2045 173 0.09
Denmark — 1.11% (29 February 2020: 2.34%)
1,210 Danske Bank A/S, 144A,5.000%, due 12/01/2022 1,256 0.65
200 Danske Bank A/S, 144A,3.001%, due 20/09/2022 * 203 0.11
220 Danske Bank A/S, 144A,5.375%, due 12/01/2024 247 0.13
400 Danske Bank A/S, 144A,3.244%, due 20/12/2025 * 430 0.22
2,136 1.11
France — 3.34% (29 February 2020: 0.70%)
560 BNP Paribas SA, 144A,2.819%, due 19/11/2025 * 595 0.31
480 BNP Paribas SA, 144A,2.219%, due 09/06/2026 * 498 0.26
320 BNP Paribas SA, 144A,1.323%, due 13/01/2027 * 317 0.17
680 BNP Paribas SA, 144A,3.052%, due 13/01/2031 * 721 0.38
600 BNP Paribas SA, 144A,2.824%, due 26/01/2041 564 0.29
300 Credit Agricole SA, 144A,1.247%, due 26/01/2027 * 297 0.15
3,000 Societe Generale SA, 144A,1.488%, due 14/12/2026 * 2,984 1.56
200 WEA Finance LLC, 144A,3.150%, due 05/04/2022 205 0.11
200 WEA Finance LLC / WestfieldUK & Europe Finance Plc,144A,4.750%, due 17/09/2044 210 0.11
6,391 3.34
Germany — 0.04% (29 February 2020: 0.06%)
50 Deutsche TelekomInternational Finance BV,8.750%, due 15/06/2030 76 0.04
Ireland — 1.52% (29 February 2020: 0.84%)
270 AerCap Ireland Capital DAC /AerCap Global Aviation Trust,4.500%, due 15/09/2023 292 0.15
410 AerCap Ireland Capital DAC /AerCap Global Aviation Trust,3.150%, due 15/02/2024 431 0.22
530 AerCap Ireland Capital DAC /AerCap Global Aviation Trust,1.750%, due 30/01/2026 518 0.27
28 Avolon Holdings Funding Ltd,144A,3.625%, due 01/05/2022 29 0.02
180 Avolon Holdings Funding Ltd,144A,5.125%, due 01/10/2023 193 0.10
500 Avolon Holdings Funding Ltd,144A,2.875%, due 15/02/2025 504 0.26
610 Avolon Holdings Funding Ltd,144A,4.250%, due 15/04/2026 645 0.34
290 SMBC Aviation Capital FinanceDAC, 144A,4.125%, due 15/07/2023 310 0.16
2,922 1.52
FaceValue(000’s)
Value(000’s)
$
% ofNet
AssetValue
Israel — 0.53% (29 February 2020: 1.79%)
40 Teva Pharmaceutical FinanceCo BV,2.950%, due 18/12/2022 40 0.02
970 Teva Pharmaceutical FinanceNetherlands III BV,2.200%, due 21/07/2021 972 0.51
1,012 0.53
Italy — 1.88% (29 February 2020: 4.41%)
730 Intesa Sanpaolo SpA, 144A,3.125%, due 14/07/2022 753 0.39
800 Intesa Sanpaolo SpA, 144A,3.375%, due 12/01/2023 837 0.44
400 Intesa Sanpaolo SpA,Series XR, 144A,4.700%, due 23/09/2049 472 0.25
80 Telecom Italia Capital SA,7.200%, due 18/07/2036 103 0.05
60 Telecom Italia Capital SA,7.721%, due 04/06/2038 80 0.04
1,290 UniCredit SpA, 144A,6.572%, due 14/01/2022 1,351 0.71
3,596 1.88
Japan — 1.24% (29 February 2020: 0.95%)
200 Nippon Life Insurance Co,144A,3.400%, due 23/01/2050 * 208 0.11
540 Nippon Life Insurance Co,144A,2.750%, due 21/01/2051 * 537 0.28
810 Nissan Motor Co Ltd, 144A,3.043%, due 15/09/2023 852 0.44
340 Nissan Motor Co Ltd, 144A,4.810%, due 17/09/2030 380 0.20
200 NTT Finance Corp, 144A,1.162%, due 03/04/2026 199 0.10
200 NTT Finance Corp, 144A,2.065%, due 03/04/2031 201 0.11
2,377 1.24
Kazakhstan — 0.11% (29 February 2020: 0.00%)
200 KazMunayGas National CoJSC, 144A,3.500%, due 14/04/2033 205 0.11
Kuwait — 0.21% (29 February 2020: 0.32%)
390 NBK SPC Ltd, 144A,2.750%, due 30/05/2022 400 0.21
Luxembourg — 0.03% (29 February 2020: 0.83%)
40 ArcelorMittal SA,7.250%, due 15/10/2039 58 0.03
Macau — 0.67% (29 February 2020: 1.04%)
200 Sands China Ltd,4.600%, due 08/08/2023 215 0.11
200 Sands China Ltd,4.600%, due 08/08/2023 215 0.11
580 Sands China Ltd,5.125%, due 08/08/2025 649 0.34
200 Wynn Macau Ltd, 144A,5.125%, due 15/12/2029 204 0.11
1,283 0.67
Mexico — 0.44% (29 February 2020: 0.31%)
200 Banco Mercantil del Norte SA/Grand Cayman, 144A,8.375%, Perpetual * 237 0.12
200 Comision Federal deElectricidad, 144A,3.348%, due 09/02/2031 197 0.10
200 Comision Federal deElectricidad, 144A,4.677%, due 09/02/2051 189 0.10
220 Fresnillo Plc, 144A,4.250%, due 02/10/2050 222 0.12
845 0.44
Netherlands — 1.20% (29 February 2020: 1.24%)
830 Cooperatieve Rabobank UA,4.625%, due 01/12/2023 919 0.48
540 NatWest Markets NV,Series B,7.750%, due 15/05/2023 608 0.32
^ Not authorised for sale to the public in Hong Kong.The accompanying notes are an integral part of the Financial Statements
163

Legg Mason Global Funds Plc Annual Report 28 February 2021
Legg Mason Western Asset US Corporate Bond Fund^
Portfolio of Investments as at 28 February 2021 – (continued)
FaceValue(000’s)
Value(000’s)
$
% ofNet
AssetValue
Corporate Bonds and Notes — (continued)
Netherlands — (continued)
80 NXP BV / NXP Funding LLC /NXP USA Inc, 144A,3.400%, due 01/05/2030 87 0.04
290 Shell International Finance BV,4.375%, due 11/05/2045 348 0.18
340 Shell International Finance BV,3.250%, due 06/04/2050 344 0.18
2,306 1.20
Peru — 0.17% (29 February 2020: 0.07%)
200 Petroleos del Peru SA, 144A,5.625%, due 19/06/2047 221 0.12
80 Southern Copper Corp,5.250%, due 08/11/2042 101 0.05
322 0.17
Portugal — 0.16% (29 February 2020: 0.00%)
310 EDP Finance BV, 144A,1.710%, due 24/01/2028 305 0.16
Singapore — 0.26% (29 February 2020: 0.00%)
510 BOC Aviation Ltd, 144A,2.625%, due 17/09/2030 496 0.26
South Africa — 0.27% (29 February 2020: 0.30%)
200 Anglo American Capital Plc,144A,4.750%, due 10/04/2027 235 0.12
240 Anglo American Capital Plc,144A,4.500%, due 15/03/2028 278 0.15
513 0.27
Spain — 0.11% (29 February 2020: 0.17%)
200 Banco Santander SA,3.306%, due 27/06/2029 219 0.11
Switzerland — 1.70% (29 February 2020: 3.39%)
250 Credit Suisse Group AG,144A,2.193%, due 05/06/2026 * 259 0.14
500 Credit Suisse Group AG,144A,4.194%, due 01/04/2031 * 570 0.30
1,040 Credit Suisse Group AG,144A,5.250%, Perpetual * 1,107 0.58
70 Credit Suisse USA Inc,7.125%, due 15/07/2032 105 0.05
660 Glencore Finance Canada Ltd,144A,4.250%, due 25/10/2022 699 0.36
200 UBS Group AG, 144A,3.126%, due 13/08/2030 * 216 0.11
280 UBS Group AG, 144A,7.000%, Perpetual * 306 0.16
3,262 1.70
United Arab Emirates — 0.15%(29 February 2020: 0.62%)
250 Abu Dhabi National Energy CoPJSC, 144A,4.375%, due 23/04/2025 281 0.15
United Kingdom — 3.23% (29 February 2020: 6.00%)
410 Barclays Bank Plc, 144A,10.179%, due 12/06/2021 421 0.22
680 Barclays Plc,5.088%, due 20/06/2030 * 790 0.41
640 Barclays Plc,6.125%, Perpetual * 703 0.37
200 Barclays Plc,7.875%, Perpetual * 211 0.11
810 BAT Capital Corp,2.259%, due 25/03/2028 811 0.42
60 BAT International Finance Plc,1.668%, due 25/03/2026 60 0.03
50 British TelecommunicationsPlc,9.625%, due 15/12/2030 79 0.04
210 HSBC Holdings Plc,1.589%, due 24/05/2027 * 210 0.11
400 HSBC Holdings Plc,4.950%, due 31/03/2030 481 0.25
FaceValue(000’s)
Value(000’s)
$
% ofNet
AssetValue
440 HSBC Holdings Plc,3.973%, due 22/05/2030 * 492 0.26
60 HSBC Holdings Plc,7.625%, due 17/05/2032 85 0.04
400 Lloyds Banking Group Plc,4.375%, due 22/03/2028 461 0.24
200 Natwest Group Plc,2.359%, due 22/05/2024 * 207 0.11
200 Natwest Group Plc,3.073%, due 22/05/2028 * 213 0.11
340 Natwest Group Plc,3.754%, due 01/11/2029 * 362 0.19
200 Natwest Group Plc,8.625%, Perpetual * 207 0.11
165 Reynolds American Inc,8.125%, due 01/05/2040 241 0.12
80 Vodafone Group Plc,6.150%, due 27/02/2037 110 0.06
40 Vodafone Group Plc,5.250%, due 30/05/2048 52 0.03
6,196 3.23
United States — 63.76% (29 February 2020: 65.62%)
160 Abbott Laboratories,4.750%, due 30/11/2036 208 0.11
30 Abbott Laboratories,4.900%, due 30/11/2046 41 0.02
1,160 AbbVie Inc,2.600%, due 21/11/2024 1,234 0.64
40 AbbVie Inc,3.800%, due 15/03/2025 44 0.02
700 AbbVie Inc,2.950%, due 21/11/2026 757 0.40
810 AbbVie Inc,3.200%, due 21/11/2029 876 0.46
20 AbbVie Inc,4.550%, due 15/03/2035 24 0.01
770 AbbVie Inc,4.050%, due 21/11/2039 885 0.46
110 Activision Blizzard Inc,2.500%, due 15/09/2050 97 0.05
350 Adobe Inc,2.150%, due 01/02/2027 368 0.19
200 Aetna Inc,2.800%, due 15/06/2023 210 0.11
330 Air Lease Corp,3.875%, due 01/04/2021 330 0.17
700 Air Lease Corp,0.700%, due 15/02/2024 694 0.36
440 Air Lease Corp,3.375%, due 01/07/2025 468 0.24
260 Alexandria Real Estate EquitiesInc,2.000%, due 18/05/2032 254 0.13
320 Alexandria Real Estate EquitiesInc,3.000%, due 18/05/2051 307 0.16
120 Alphabet Inc,1.100%, due 15/08/2030 113 0.06
190 Alphabet Inc,1.900%, due 15/08/2040 171 0.09
120 Alphabet Inc,2.050%, due 15/08/2050 104 0.05
260 Alphabet Inc,2.250%, due 15/08/2060 220 0.12
296 Altria Group Inc,4.400%, due 14/02/2026 337 0.18
170 Altria Group Inc,4.800%, due 14/02/2029 199 0.10
420 Altria Group Inc,2.450%, due 04/02/2032 408 0.21
710 Altria Group Inc,3.400%, due 04/02/2041 667 0.35
270 Amazon.com Inc,1.200%, due 03/06/2027 269 0.14
120 Amazon.com Inc,3.875%, due 22/08/2037 142 0.07
200 Amazon.com Inc,2.500%, due 03/06/2050 185 0.10
260 American International GroupInc,3.400%, due 30/06/2030 285 0.15
90 American International GroupInc,4.750%, due 01/04/2048 112 0.06
FaceValue(000’s)
Value(000’s)
$
% ofNet
AssetValue
80 Amgen Inc,4.400%, due 01/05/2045 96 0.05
70 Amgen Inc,4.663%, due 15/06/2051 88 0.05
70 Anthem Inc,4.375%, due 01/12/2047 84 0.04
10 Apache Corp,4.750%, due 15/04/2043 10 0.01
150 Apache Corp,5.350%, due 01/07/2049 150 0.08
410 Apple Inc,2.650%, due 11/05/2050 386 0.20
220 AT&T Inc,3.800%, due 15/02/2027 248 0.13
60 AT&T Inc,1.650%, due 01/02/2028 59 0.03
410 AT&T Inc,4.300%, due 15/02/2030 471 0.25
280 AT&T Inc,4.500%, due 15/05/2035 323 0.17
360 AT&T Inc,3.100%, due 01/02/2043 338 0.18
13 AT&T Inc, 144A,3.500%, due 15/09/2053 12 0.01
163 AT&T Inc, 144A,3.550%, due 15/09/2055 150 0.08
260 AT&T Inc,3.500%, due 01/02/2061 234 0.12
120 Aviation Capital Group LLC,144A,5.500%, due 15/12/2024 135 0.07
290 Bank of America Corp,4.200%, due 26/08/2024 322 0.17
120 Bank of America Corp,1.319%, due 19/06/2026 * 121 0.06
132 Bank of America Corp,3.419%, due 20/12/2028 * 146 0.08
250 Bank of America Corp,4.271%, due 23/07/2029 * 290 0.15
70 Bank of America Corp,3.974%, due 07/02/2030 * 80 0.04
420 Bank of America Corp,2.884%, due 22/10/2030 * 445 0.23
110 Bank of America Corp,2.592%, due 29/04/2031 * 113 0.06
70 Bank of America Corp,1.898%, due 23/07/2031 * 68 0.04
850 Bank of America Corp,1.922%, due 24/10/2031 * 826 0.43
140 Bank of America Corp,2.676%, due 19/06/2041 * 136 0.07
20 Bank of America Corp,4.443%, due 20/01/2048 * 25 0.01
170 Bank of America Corp,4.330%, due 15/03/2050 * 203 0.11
140 Bank of America Corp,4.083%, due 20/03/2051 * 163 0.09
240 Bank of America Corp,2.831%, due 24/10/2051 * 230 0.12
90 Becton Dickinson and Co,3.700%, due 06/06/2027 101 0.05
320 Bed Bath & Beyond Inc,3.749%, due 01/08/2024 327 0.17
420 Berry Petroleum Co LLC,144A,7.000%, due 15/02/2026 406 0.21
1,310 Blackstone Mortgage Trust Inc,4.375%, due 05/05/2022 1,337 0.70
80 Blackstone Mortgage Trust Inc,4.750%, due 15/03/2023 82 0.04
1,150 Boeing Co/The,2.196%, due 04/02/2026 1,153 0.60
1,140 Boeing Co/The,3.100%, due 01/05/2026 1,199 0.63
400 Boeing Co/The,3.250%, due 01/02/2028 420 0.22
110 Boeing Co/The,3.300%, due 01/03/2035 108 0.06
170 Boeing Co/The,3.750%, due 01/02/2050 166 0.09
500 Boeing Co/The,3.950%, due 01/08/2059 492 0.26
70 Bon Secours Mercy Health Inc,3.464%, due 01/06/2030 77 0.04
^ Not authorised for sale to the public in Hong Kong.The accompanying notes are an integral part of the Financial Statements
164

Legg Mason Global Funds Plc Annual Report 28 February 2021
Legg Mason Western Asset US Corporate Bond Fund^
Portfolio of Investments as at 28 February 2021 – (continued)
FaceValue(000’s)
Value(000’s)
$
% ofNet
AssetValue
Corporate Bonds and Notes — (continued)
United States — (continued)
440 BP Capital Markets AmericaInc,3.410%, due 11/02/2026 484 0.25
160 BP Capital Markets AmericaInc,3.119%, due 04/05/2026 174 0.09
800 BP Capital Markets AmericaInc,3.000%, due 24/02/2050 745 0.39
320 Bristol-Myers Squibb Co,2.350%, due 13/11/2040 307 0.16
190 Bristol-Myers Squibb Co,4.250%, due 26/10/2049 232 0.12
630 Broadcom Inc,5.000%, due 15/04/2030 733 0.38
90 Broadcom Inc,4.150%, due 15/11/2030 100 0.05
580 Broadcom Inc,4.300%, due 15/11/2032 653 0.34
130 Burlington Northern Santa FeLLC,4.400%, due 15/03/2042 160 0.08
90 California Institute ofTechnology,3.650%, due 01/09/2119 96 0.05
70 Cameron LNG LLC, 144A,3.701%, due 15/01/2039 77 0.04
110 Carlyle Finance LLC, 144A,5.650%, due 15/09/2048 140 0.07
60 Carlyle Finance Subsidiary LLC,144A,3.500%, due 19/09/2029 64 0.03
80 Carlyle Holdings II Finance LLC,144A,5.625%, due 30/03/2043 99 0.05
140 Carrier Global Corp,2.493%, due 15/02/2027 147 0.08
100 Carrier Global Corp,3.377%, due 05/04/2040 104 0.05
510 Centene Corp,3.000%, due 15/10/2030 519 0.27
240 CenterPoint Energy HoustonElectric LLC,Series AA,3.000%, due 01/02/2027 261 0.14
920 Charles Schwab Corp/The,0.900%, due 11/03/2026 915 0.48
600 Charles Schwab Corp/The,Series H,4.000%, Perpetual * 603 0.31
390 Charter CommunicationsOperating LLC / CharterCommunications OperatingCapital,3.750%, due 15/02/2028 428 0.22
50 Charter CommunicationsOperating LLC / CharterCommunications OperatingCapital,4.200%, due 15/03/2028 56 0.03
340 Charter CommunicationsOperating LLC / CharterCommunications OperatingCapital,3.500%, due 01/06/2041 329 0.17
50 Charter CommunicationsOperating LLC / CharterCommunications OperatingCapital,5.375%, due 01/05/2047 59 0.03
240 Charter CommunicationsOperating LLC / CharterCommunications OperatingCapital,5.750%, due 01/04/2048 296 0.15
60 Charter CommunicationsOperating LLC / CharterCommunications OperatingCapital,5.125%, due 01/07/2049 69 0.04
230 Chevron USA Inc,5.250%, due 15/11/2043 311 0.16
40 Chevron USA Inc,2.343%, due 12/08/2050 35 0.02
FaceValue(000’s)
Value(000’s)
$
% ofNet
AssetValue
160 Cigna Corp,4.375%, due 15/10/2028 187 0.10
620 Cigna Corp,2.400%, due 15/03/2030 630 0.33
130 Cigna Corp,4.800%, due 15/08/2038 161 0.08
580 Cigna Corp,3.200%, due 15/03/2040 597 0.31
290 Cimarex Energy Co,4.375%, due 01/06/2024 316 0.16
580 Cimarex Energy Co,3.900%, due 15/05/2027 640 0.33
70 Cintas Corp No 2,3.700%, due 01/04/2027 79 0.04
130 Citigroup Inc,3.980%, due 20/03/2030 * 148 0.08
280 Citigroup Inc,2.976%, due 05/11/2030 * 297 0.16
580 Citigroup Inc,8.125%, due 15/07/2039 980 0.51
270 Citigroup Inc,4.650%, due 23/07/2048 345 0.18
400 Cleveland Electric IlluminatingCo/The, 144A,3.500%, due 01/04/2028 418 0.22
200 Clorox Co/The,1.800%, due 15/05/2030 197 0.10
100 Coca-Cola Co/The,1.375%, due 15/03/2031 95 0.05
210 Coca-Cola Co/The,2.500%, due 01/06/2040 205 0.11
50 Comcast Corp,3.400%, due 01/04/2030 56 0.03
260 Comcast Corp,4.250%, due 15/10/2030 307 0.16
40 Comcast Corp,7.050%, due 15/03/2033 59 0.03
450 Comcast Corp,6.500%, due 15/11/2035 653 0.34
140 Comcast Corp,4.600%, due 15/10/2038 175 0.09
80 Comcast Corp,3.750%, due 01/04/2040 90 0.05
50 Comcast Corp,3.969%, due 01/11/2047 57 0.03
190 Comcast Corp,4.950%, due 15/10/2058 259 0.14
70 CommonSpirit Health,2.782%, due 01/10/2030 73 0.04
80 CommonSpirit Health,3.910%, due 01/10/2050 85 0.04
240 Commonwealth Edison Co,6.450%, due 15/01/2038 349 0.18
30 Commonwealth Edison Co,4.000%, due 01/03/2048 35 0.02
120 ConocoPhillips, 144A,3.750%, due 01/10/2027 135 0.07
40 Constellation Brands Inc,3.700%, due 06/12/2026 45 0.02
30 Constellation Brands Inc,3.500%, due 09/05/2027 33 0.02
100 Consumers Energy Co,2.500%, due 01/05/2060 89 0.05
31 Continental Airlines 2007-1Class A Pass Through Trust,Series 071A,5.983%, due 19/04/2022 32 0.02
38 Continental Resources Inc/OK,5.000%, due 15/09/2022 38 0.02
50 Continental Resources Inc/OK,4.500%, due 15/04/2023 51 0.03
110 Corning Inc,3.900%, due 15/11/2049 124 0.06
80 Costco Wholesale Corp,1.375%, due 20/06/2027 81 0.04
110 Costco Wholesale Corp,1.600%, due 20/04/2030 108 0.06
30 Costco Wholesale Corp,1.750%, due 20/04/2032 29 0.02
40 CVS Health Corp,3.000%, due 15/08/2026 43 0.02
486 CVS Health Corp,4.300%, due 25/03/2028 560 0.29
70 CVS Health Corp,3.250%, due 15/08/2029 76 0.04
FaceValue(000’s)
Value(000’s)
$
% ofNet
AssetValue
10 CVS Health Corp,4.780%, due 25/03/2038 12 0.01
880 CVS Health Corp,2.700%, due 21/08/2040 837 0.44
110 CVS Health Corp,5.125%, due 20/07/2045 140 0.07
240 CVS Health Corp,5.050%, due 25/03/2048 304 0.16
70 DCP Midstream LP,Series A,7.375%, Perpetual * 61 0.03
40 DCP Midstream Operating LP,144A,6.450%, due 03/11/2036 45 0.02
640 Delta Air Lines Inc,2.900%, due 28/10/2024 637 0.33
200 Delta Air Lines Inc, 144A,7.000%, due 01/05/2025 233 0.12
240 Delta Air Lines Inc,7.375%, due 15/01/2026 281 0.15
110 Delta Air Lines Inc,3.750%, due 28/10/2029 110 0.06
400 Delta Air Lines Inc / SkyMiles IPLtd, 144A,4.500%, due 20/10/2025 427 0.22
360 Delta Air Lines Inc / SkyMiles IPLtd, 144A,4.750%, due 20/10/2028 400 0.21
630 Dermira Inc,3.000%, due 15/05/2022 639 0.33
320 Devon Energy Corp,5.850%, due 15/12/2025 375 0.20
30 Devon Energy Corp,7.950%, due 15/04/2032 42 0.02
400 Devon Energy Corp,5.600%, due 15/07/2041 489 0.26
370 Devon Energy Corp,5.000%, due 15/06/2045 433 0.23
680 Diamondback Energy Inc,5.375%, due 31/05/2025 703 0.37
240 Diamondback Energy Inc,3.250%, due 01/12/2026 255 0.13
430 Diamondback Energy Inc,3.500%, due 01/12/2029 452 0.24
110 Diversified Healthcare Trust,4.750%, due 01/05/2024 112 0.06
380 DR Horton Inc,2.500%, due 15/10/2024 402 0.21
220 Duke Energy Carolinas LLC,5.300%, due 15/02/2040 295 0.15
60 Duke Energy Corp,3.150%, due 15/08/2027 66 0.03
240 Duke Energy Indiana LLC,Series YYY,3.250%, due 01/10/2049 247 0.13
110 Duke Energy Ohio Inc,2.125%, due 01/06/2030 112 0.06
180 Eaton Corp,4.150%, due 02/11/2042 214 0.11
150 Edison International,4.950%, due 15/04/2025 169 0.09
190 Electronic Arts Inc,1.850%, due 15/02/2031 186 0.10
50 Electronic Arts Inc,2.950%, due 15/02/2051 48 0.03
200 Energy Transfer Operating LP,Series 5Y,4.200%, due 15/09/2023 216 0.11
250 Energy Transfer Operating LP,5.500%, due 01/06/2027 293 0.15
250 Energy Transfer Operating LP,4.950%, due 15/06/2028 285 0.15
10 Energy Transfer Operating LP,Series 20Y,5.800%, due 15/06/2038 12 0.01
320 Energy Transfer Operating LP,6.125%, due 15/12/2045 371 0.19
190 Energy Transfer Operating LP,Series F,6.750%, Perpetual * 180 0.09
500 Energy Transfer Operating LP,Series G,7.125%, Perpetual * 484 0.25
430 Enterprise Products OperatingLLC,4.150%, due 16/10/2028 495 0.26
^ Not authorised for sale to the public in Hong Kong.The accompanying notes are an integral part of the Financial Statements
165

Legg Mason Global Funds Plc Annual Report 28 February 2021
Legg Mason Western Asset US Corporate Bond Fund^
Portfolio of Investments as at 28 February 2021 – (continued)
FaceValue(000’s)
Value(000’s)
$
% ofNet
AssetValue
Corporate Bonds and Notes — (continued)
United States — (continued)
110 Enterprise Products OperatingLLC, Series D,6.875%, due 01/03/2033 152 0.08
540 Enterprise Products OperatingLLC,4.250%, due 15/02/2048 589 0.31
80 Enterprise Products OperatingLLC,3.950%, due 31/01/2060 83 0.04
450 Enterprise Products OperatingLLC,5.375%, due 15/02/2078 * 450 0.23
190 EOG Resources Inc,4.150%, due 15/01/2026 216 0.11
290 EOG Resources Inc,4.375%, due 15/04/2030 341 0.18
30 EOG Resources Inc,4.950%, due 15/04/2050 38 0.02
420 EQT Corp,3.000%, due 01/10/2022 423 0.22
10 Estee Lauder Cos Inc/The,3.125%, due 01/12/2049 11 0.01
240 Exelon Corp,4.050%, due 15/04/2030 275 0.14
60 Exxon Mobil Corp,3.482%, due 19/03/2030 67 0.04
30 Exxon Mobil Corp,2.995%, due 16/08/2039 30 0.02
360 Exxon Mobil Corp,4.227%, due 19/03/2040 415 0.22
40 Exxon Mobil Corp,4.114%, due 01/03/2046 45 0.02
80 Exxon Mobil Corp,3.452%, due 15/04/2051 82 0.04
150 Fidelity & Guaranty LifeHoldings Inc, 144A,5.500%, due 01/05/2025 173 0.09
150 Fidelity National InformationServices Inc,3.100%, due 01/03/2041 152 0.08
200 Finance of America FundingLLC, 144A,7.875%, due 15/11/2025 203 0.11
290 FirstEnergy Corp, Series B,4.400%, due 15/07/2027 319 0.17
280 FirstEnergy Corp, Series C,7.375%, due 15/11/2031 386 0.20
30 FirstEnergy Corp, Series C,5.350%, due 15/07/2047 36 0.02
50 Florida Power & Light Co,3.150%, due 01/10/2049 53 0.03
760 Ford Motor Credit Co LLC,3.350%, due 01/11/2022 773 0.40
200 Ford Motor Credit Co LLC,4.125%, due 17/08/2027 211 0.11
240 Fortinet Inc,1.000%, due 15/03/2026 238 0.12
360 Fortinet Inc,2.200%, due 15/03/2031 360 0.19
570 Fox Corp,5.476%, due 25/01/2039 733 0.38
EUR 100 GE Capital European FundingUnlimited Co,6.025%, due 01/03/2038 190 0.10
GBP 100 GE Capital UK FundingUnlimited Co,8.000%, due 14/01/2039 231 0.12
50 General Dynamics Corp,3.500%, due 01/04/2027 56 0.03
160 General Dynamics Corp,3.625%, due 01/04/2030 182 0.10
340 General Dynamics Corp,4.250%, due 01/04/2040 416 0.22
240 General Electric Co,6.150%, due 07/08/2037 319 0.17
30 General Electric Co,5.875%, due 14/01/2038 39 0.02
1,660 General Electric Co,6.875%, due 10/01/2039 2,371 1.24
120 General Motors Co,1.130%, due 10/09/2021 * 120 0.06
130 General Motors Co,4.875%, due 02/10/2023 143 0.07
FaceValue(000’s)
Value(000’s)
$
% ofNet
AssetValue
250 General Motors Co,5.400%, due 02/10/2023 279 0.15
80 General Motors Co,6.125%, due 01/10/2025 95 0.05
140 General Motors Co,6.600%, due 01/04/2036 191 0.10
20 General Motors Co,6.750%, due 01/04/2046 28 0.01
130 General Motors Co,5.950%, due 01/04/2049 170 0.09
627 General Motors Financial CoInc,1.550%, due 30/06/2022 * 635 0.33
120 General Motors Financial CoInc,3.700%, due 09/05/2023 127 0.07
630 Genting New York LLC /GENNY Capital Inc, 144A,3.300%, due 15/02/2026 633 0.33
100 Gilead Sciences Inc,4.000%, due 01/09/2036 116 0.06
100 Gilead Sciences Inc,4.750%, due 01/03/2046 124 0.06
250 Goldman Sachs Group Inc/The,4.250%, due 21/10/2025 282 0.15
430 Goldman Sachs Group Inc/The,0.855%, due 12/02/2026 * 427 0.22
810 Goldman Sachs Group Inc/The,3.500%, due 16/11/2026 893 0.47
1,840 Goldman Sachs Group Inc/The,Series VAR,1.093%, due 09/12/2026 * 1,827 0.95
240 Goldman Sachs Group Inc/The,3.800%, due 15/03/2030 273 0.14
90 Goldman Sachs Group Inc/The,5.150%, due 22/05/2045 119 0.06
2,000 Guardian Life Global Funding,144A,0.875%, due 10/12/2025 1,979 1.03
50 Halliburton Co,2.920%, due 01/03/2030 51 0.03
120 Halliburton Co,5.000%, due 15/11/2045 140 0.07
100 HCA Inc,5.125%, due 15/06/2039 124 0.06
10 HCA Inc,5.500%, due 15/06/2047 13 0.01
150 Hershey Co/The,1.700%, due 01/06/2030 149 0.08
340 High Street Funding Trust I,144A,4.111%, due 15/02/2028 385 0.20
140 Home Depot Inc/The,2.950%, due 15/06/2029 152 0.08
50 Home Depot Inc/The,3.300%, due 15/04/2040 54 0.03
100 Home Depot Inc/The,3.350%, due 15/04/2050 107 0.06
130 Humana Inc,3.850%, due 01/10/2024 143 0.07
80 Humana Inc,3.950%, due 15/03/2027 91 0.05
150 Humana Inc,4.950%, due 01/10/2044 188 0.10
150 Huntington Ingalls IndustriesInc,3.483%, due 01/12/2027 166 0.09
810 ILFC E-Capital Trust I, 144A,3.230%, due 21/12/2065 * 657 0.34
100 ILFC E-Capital Trust II, 144A,3.480%, due 21/12/2065 * 84 0.04
40 Intel Corp,4.750%, due 25/03/2050 52 0.03
150 Intel Corp,4.950%, due 25/03/2060 206 0.11
470 Interpublic Group of Cos Inc/The,2.400%, due 01/03/2031 471 0.25
80 Jersey Central Power & LightCo, 144A,4.300%, due 15/01/2026 89 0.05
370 Johnson & Johnson,2.100%, due 01/09/2040 347 0.18
10 Johnson & Johnson,2.250%, due 01/09/2050 9 –
FaceValue(000’s)
Value(000’s)
$
% ofNet
AssetValue
200 Johnson & Johnson,2.450%, due 01/09/2060 184 0.10
330 Johnson Controls Internationalplc / Tyco Fire & SecurityFinance SCA,1.750%, due 15/09/2030 322 0.17
340 JPMorgan Chase & Co,0.563%, due 16/02/2025 * 339 0.18
70 JPMorgan Chase & Co,4.203%, due 23/07/2029 * 81 0.04
840 JPMorgan Chase & Co,2.739%, due 15/10/2030 * 884 0.46
20 JPMorgan Chase & Co,2.522%, due 22/04/2031 * 21 0.01
450 JPMorgan Chase & Co,2.956%, due 13/05/2031 * 471 0.25
900 JPMorgan Chase & Co,1.953%, due 04/02/2032 * 879 0.46
90 JPMorgan Chase & Co,4.950%, due 01/06/2045 118 0.06
140 JPMorgan Chase & Co,4.260%, due 22/02/2048 * 171 0.09
160 JPMorgan Chase & Co,3.964%, due 15/11/2048 * 186 0.10
100 Kaiser Foundation Hospitals,Series 2019,3.266%, due 01/11/2049 107 0.06
1,830 KeyBank NA/Cleveland OH,Series BKNt,0.423%, due 03/01/2024 * 1,835 0.96
100 Kinder Morgan Inc,5.300%, due 01/12/2034 121 0.06
90 Kinder Morgan Inc,5.200%, due 01/03/2048 108 0.06
210 KKR Group Finance Co III LLC,144A,5.125%, due 01/06/2044 264 0.14
40 KKR Group Finance Co VII LLC,144A,3.625%, due 25/02/2050 42 0.02
320 L3Harris Technologies Inc,2.900%, due 15/12/2029 343 0.18
230 L3Harris Technologies Inc,4.854%, due 27/04/2035 289 0.15
130 Lam Research Corp,1.900%, due 15/06/2030 130 0.07
50 Lam Research Corp,2.875%, due 15/06/2050 49 0.03
1,070 Las Vegas Sands Corp,2.900%, due 25/06/2025 1,110 0.58
220 Legends Hospitality HoldingCo LLC / Legends HospitalityCo-Issuer Inc, 144A,5.000%, due 01/02/2026 224 0.12
100 Lennox International Inc,1.700%, due 01/08/2027 101 0.05
290 Lockheed Martin Corp,1.850%, due 15/06/2030 292 0.15
390 Lowe’s Cos Inc,1.700%, due 15/10/2030 375 0.20
150 Lowe’s Cos Inc,3.000%, due 15/10/2050 143 0.07
140 Marriott International Inc/MD,3.600%, due 15/04/2024 150 0.08
100 Mars Inc, 144A,3.200%, due 01/04/2030 111 0.06
220 Mars Inc, 144A,2.375%, due 16/07/2040 210 0.11
60 Massachusetts Mutual LifeInsurance Co, 144A,3.375%, due 15/04/2050 62 0.03
140 Massachusetts Mutual LifeInsurance Co, 144A,4.900%, due 01/04/2077 185 0.10
200 Mastercard Inc,3.300%, due 26/03/2027 223 0.12
300 Mastercard Inc,3.350%, due 26/03/2030 337 0.18
80 Mastercard Inc,3.850%, due 26/03/2050 94 0.05
120 McDonald’s Corp,2.125%, due 01/03/2030 121 0.06
90 McDonald’s Corp,4.450%, due 01/03/2047 108 0.06
230 McDonald’s Corp,4.450%, due 01/09/2048 276 0.14
^ Not authorised for sale to the public in Hong Kong.The accompanying notes are an integral part of the Financial Statements
166

Legg Mason Global Funds Plc Annual Report 28 February 2021
Legg Mason Western Asset US Corporate Bond Fund^
Portfolio of Investments as at 28 February 2021 – (continued)
FaceValue(000’s)
Value(000’s)
$
% ofNet
AssetValue
Corporate Bonds and Notes — (continued)
United States — (continued)
360 MDC Holdings Inc,2.500%, due 15/01/2031 352 0.18
230 MDC Holdings Inc,6.000%, due 15/01/2043 304 0.16
80 Merck & Co Inc,1.450%, due 24/06/2030 78 0.04
190 Merck & Co Inc,2.350%, due 24/06/2040 183 0.10
90 Merck & Co Inc,2.450%, due 24/06/2050 82 0.04
970 Microchip Technology Inc,144A,0.972%, due 15/02/2024 974 0.51
470 Microsoft Corp,3.450%, due 08/08/2036 546 0.29
113 Microsoft Corp,4.100%, due 06/02/2037 140 0.07
67 Microsoft Corp,2.525%, due 01/06/2050 63 0.03
90 MidAmerican Energy Co,3.650%, due 15/04/2029 103 0.05
180 MidAmerican Energy Co,3.150%, due 15/04/2050 188 0.10
240 Mileage Plus Holdings LLC /Mileage Plus IntellectualProperty Assets Ltd, 144A,6.500%, due 20/06/2027 262 0.14
40 Molson Coors Beverage Co,3.000%, due 15/07/2026 43 0.02
80 Molson Coors Beverage Co,4.200%, due 15/07/2046 86 0.04
60 Mondelez International Inc,2.625%, due 04/09/2050 54 0.03
270 Morgan Stanley,2.188%, due 28/04/2026 * 281 0.15
1,830 Morgan Stanley,0.985%, due 10/12/2026 * 1,809 0.94
110 Morgan Stanley,2.699%, due 22/01/2031 * 114 0.06
70 Morgan Stanley,1.794%, due 13/02/2032 * 67 0.04
130 Morgan Stanley,5.597%, due 24/03/2051 * 189 0.10
210 Morgan Stanley,2.802%, due 25/01/2052 * 200 0.10
20 MPLX LP,4.800%, due 15/02/2029 23 0.01
410 MPLX LP,4.500%, due 15/04/2038 454 0.24
GBP 330 MPT Operating PartnershipLP / MPT Finance Corp,3.692%, due 05/06/2028 488 0.25
130 MPT Operating PartnershipLP / MPT Finance Corp,4.625%, due 01/08/2029 140 0.07
950 Nasdaq Inc,0.445%, due 21/12/2022 951 0.50
730 Nasdaq Inc,2.500%, due 21/12/2040 673 0.35
260 NCL Corp Ltd, 144A,12.250%, due 15/05/2024 309 0.16
320 New York Life Insurance Co,144A,3.750%, due 15/05/2050 357 0.19
80 New York Life Insurance Co,144A,4.450%, due 15/05/2069 100 0.05
120 Norfolk Southern Railway Co,7.875%, due 15/05/2043 196 0.10
160 Northrop Grumman Corp,5.150%, due 01/05/2040 209 0.11
450 Northrop Grumman Corp,4.030%, due 15/10/2047 514 0.27
160 Northrop Grumman Corp,5.250%, due 01/05/2050 219 0.11
480 Northwest Pipeline LLC,4.000%, due 01/04/2027 543 0.28
390 Northwestern Mutual LifeInsurance Co/The, 144A,3.850%, due 30/09/2047 440 0.23
90 Northwestern Mutual LifeInsurance Co/The, 144A,3.625%, due 30/09/2059 96 0.05
FaceValue(000’s)
Value(000’s)
$
% ofNet
AssetValue
30 NRG Energy Inc, 144A,2.450%, due 02/12/2027 30 0.02
130 Nuveen LLC, 144A,4.000%, due 01/11/2028 150 0.08
50 NVIDIA Corp,3.500%, due 01/04/2040 55 0.03
20 NVIDIA Corp,3.500%, due 01/04/2050 22 0.01
40 NVIDIA Corp,3.700%, due 01/04/2060 45 0.02
49 Occidental Petroleum Corp,2.700%, due 15/02/2023 48 0.02
130 Occidental Petroleum Corp,3.200%, due 15/08/2026 125 0.07
50 Occidental Petroleum Corp,7.875%, due 15/09/2031 59 0.03
230 Occidental Petroleum Corp,6.450%, due 15/09/2036 263 0.14
50 Occidental Petroleum Corp,7.950%, due 15/06/2039 60 0.03
40 Occidental Petroleum Corp,4.400%, due 15/04/2046 36 0.02
100 Occidental Petroleum Corp,4.100%, due 15/02/2047 85 0.04
190 Ohio Edison Co,6.875%, due 15/07/2036 255 0.13
20 Oncor Electric Delivery Co LLC,3.100%, due 15/09/2049 21 0.01
80 Otis Worldwide Corp,2.565%, due 15/02/2030 82 0.04
20 Otis Worldwide Corp,3.112%, due 15/02/2040 21 0.01
70 Pacific Gas and Electric Co,1.750%, due 16/06/2022 70 0.04
130 Pacific Gas and Electric Co,4.250%, due 01/08/2023 139 0.07
100 Pacific Gas and Electric Co,2.100%, due 01/08/2027 100 0.05
190 Pacific Gas and Electric Co,2.500%, due 01/02/2031 185 0.10
10 Pacific Gas and Electric Co,3.300%, due 01/08/2040 10 –
10 Pacific Gas and Electric Co,3.500%, due 01/08/2050 9 –
100 Parsley Energy LLC / ParsleyFinance Corp, 144A,5.625%, due 15/10/2027 110 0.06
170 Parsley Energy LLC / ParsleyFinance Corp, 144A,4.125%, due 15/02/2028 181 0.09
90 PayPal Holdings Inc,2.300%, due 01/06/2030 92 0.05
150 PayPal Holdings Inc,3.250%, due 01/06/2050 158 0.08
540 PDC Energy Inc,1.125%, due 15/09/2021 537 0.28
150 PepsiCo Inc,2.625%, due 29/07/2029 160 0.08
47 Pfizer Inc,3.000%, due 15/12/2026 52 0.03
60 Pfizer Inc,2.550%, due 28/05/2040 59 0.03
50 Pfizer Inc,2.700%, due 28/05/2050 48 0.02
480 Philip Morris International Inc,1.750%, due 01/11/2030 464 0.24
380 Pioneer Natural Resources Co,2.150%, due 15/01/2031 371 0.19
70 Plains All American Pipeline LP,Series B,6.125%, Perpetual * 58 0.03
10 Procter & Gamble Co/The,3.000%, due 25/03/2030 11 0.01
360 Procter & Gamble Co/The,1.200%, due 29/10/2030 344 0.18
200 Prologis LP,1.250%, due 15/10/2030 189 0.10
130 Prudential Financial Inc,1.500%, due 10/03/2026 133 0.07
80 Range Resources Corp,5.750%, due 01/06/2021 80 0.04
16 Range Resources Corp,5.875%, due 01/07/2022 16 0.01
70 Range Resources Corp,5.000%, due 15/08/2022 71 0.04
FaceValue(000’s)
Value(000’s)
$
% ofNet
AssetValue
100 Range Resources Corp,4.875%, due 15/05/2025 99 0.05
470 Range Resources Corp,9.250%, due 01/02/2026 512 0.27
190 Range Resources Corp, 144A,8.250%, due 15/01/2029 205 0.11
20 Raymond James Financial Inc,4.650%, due 01/04/2030 24 0.01
80 Raymond James Financial Inc,4.950%, due 15/07/2046 101 0.05
130 Raytheon Technologies Corp,4.625%, due 16/11/2048 161 0.08
280 Reliance Standard Life GlobalFunding II, 144A,2.500%, due 30/10/2024 295 0.15
180 Republic Services Inc,3.375%, due 15/11/2027 201 0.10
130 S&P Global Inc,1.250%, due 15/08/2030 123 0.06
40 S&P Global Inc,3.250%, due 01/12/2049 42 0.02
40 S&P Global Inc,2.300%, due 15/08/2060 34 0.02
200 San Diego Gas & Electric Co,Series VVV,1.700%, due 01/10/2030 194 0.10
230 San Diego Gas & Electric Co,Series RRR,3.750%, due 01/06/2047 259 0.14
110 Service Properties Trust,4.500%, due 15/06/2023 111 0.06
290 Service Properties Trust,4.350%, due 01/10/2024 288 0.15
80 Service Properties Trust,4.750%, due 01/10/2026 79 0.04
350 Simon Property Group LP,3.500%, due 01/09/2025 382 0.20
520 Southern California Edison Co,2.250%, due 01/06/2030 523 0.27
10 Southern California Edison Co,4.000%, due 01/04/2047 11 0.01
160 Southern California Edison Co,Series C,4.125%, due 01/03/2048 177 0.09
100 Southern California Edison Co,3.650%, due 01/02/2050 103 0.05
560 Southwest Airlines Co,4.750%, due 04/05/2023 609 0.32
260 Southwest Airlines Co,5.250%, due 04/05/2025 298 0.16
320 Southwest Airlines Co,5.125%, due 15/06/2027 375 0.20
233 Sprint Spectrum Co LLC /Sprint Spectrum Co II LLC /Sprint Spectrum Co III LLC,144A,3.360%, due 20/09/2021 235 0.12
90 Sunoco Logistics PartnersOperations LP,3.900%, due 15/07/2026 98 0.05
200 Targa Resources Partners LP /Targa Resources PartnersFinance Corp,4.250%, due 15/11/2023 201 0.10
170 Targa Resources Partners LP /Targa Resources PartnersFinance Corp, 144A,4.000%, due 15/01/2032 167 0.09
50 Target Corp,3.375%, due 15/04/2029 56 0.03
110 Teachers Insurance & AnnuityAssociation of America, 144A,4.900%, due 15/09/2044 141 0.07
160 Teachers Insurance & AnnuityAssociation of America, 144A,4.270%, due 15/05/2047 188 0.10
160 Teachers Insurance & AnnuityAssociation of America, 144A,3.300%, due 15/05/2050 163 0.08
270 Tennessee Gas Pipeline CoLLC,7.000%, due 15/03/2027 344 0.18
340 Tennessee Gas Pipeline CoLLC,7.000%, due 15/10/2028 441 0.23
^ Not authorised for sale to the public in Hong Kong.The accompanying notes are an integral part of the Financial Statements
167

Legg Mason Global Funds Plc Annual Report 28 February 2021
Legg Mason Western Asset US Corporate Bond Fund^
Portfolio of Investments as at 28 February 2021 – (continued)
FaceValue(000’s)
Value(000’s)
$
% ofNet
AssetValue
Corporate Bonds and Notes — (continued)
United States — (continued)
320 Tennessee Gas Pipeline CoLLC, 144A,2.900%, due 01/03/2030 330 0.17
60 Texas Instruments Inc,2.900%, due 03/11/2027 66 0.03
120 Texas Instruments Inc,2.250%, due 04/09/2029 124 0.06
650 Texas Instruments Inc,3.875%, due 15/03/2039 765 0.40
480 Time Warner Cable LLC,7.300%, due 01/07/2038 688 0.36
90 Time Warner Cable LLC,6.750%, due 15/06/2039 124 0.06
254 Time Warner EntertainmentCo LP,8.375%, due 15/07/2033 380 0.20
140 T-Mobile USA Inc,2.625%, due 15/02/2029 137 0.07
260 T-Mobile USA Inc, 144A,2.550%, due 15/02/2031 259 0.14
90 T-Mobile USA Inc,2.875%, due 15/02/2031 88 0.05
120 T-Mobile USA Inc, 144A,2.250%, due 15/11/2031 115 0.06
50 T-Mobile USA Inc, 144A,4.375%, due 15/04/2040 56 0.03
310 T-Mobile USA Inc, 144A,3.000%, due 15/02/2041 291 0.15
70 T-Mobile USA Inc, 144A,4.500%, due 15/04/2050 78 0.04
150 T-Mobile USA Inc, 144A,3.300%, due 15/02/2051 139 0.07
335 Transcontinental Gas Pipe LineCo LLC,7.850%, due 01/02/2026 431 0.23
460 Transcontinental Gas Pipe LineCo LLC,7.250%, due 01/12/2026 594 0.31
50 Transcontinental Gas Pipe LineCo LLC,4.450%, due 01/08/2042 57 0.03
410 Transcontinental Gas Pipe LineCo LLC,3.950%, due 15/05/2050 439 0.23
380 Truist Financial Corp,1.267%, due 02/03/2027 * 382 0.20
320 Union Pacific Corp, 144A,2.973%, due 16/09/2062 299 0.16
90 Union Pacific Corp,3.750%, due 05/02/2070 98 0.05
185 United Airlines 2014-1 Class BPass Through Trust, Series B,4.750%, due 11/04/2022 188 0.10
260 United Airlines 2020-1 Class BPass Through Trust,4.875%, due 15/01/2026 272 0.14
100 United Airlines Holdings Inc,4.250%, due 01/10/2022 101 0.05
360 UnitedHealth Group Inc,3.850%, due 15/06/2028 412 0.22
110 UnitedHealth Group Inc,2.000%, due 15/05/2030 110 0.06
120 UnitedHealth Group Inc,3.500%, due 15/08/2039 133 0.07
130 UnitedHealth Group Inc,2.750%, due 15/05/2040 131 0.07
120 UnitedHealth Group Inc,4.750%, due 15/07/2045 155 0.08
30 UnitedHealth Group Inc,4.450%, due 15/12/2048 38 0.02
230 Verizon Communications Inc,1.500%, due 18/09/2030 217 0.11
760 Verizon Communications Inc,4.272%, due 15/01/2036 886 0.46
10 Verizon Communications Inc,5.250%, due 16/03/2037 13 0.01
100 Verizon Communications Inc,2.650%, due 20/11/2040 94 0.05
40 Verizon Communications Inc,6.550%, due 15/09/2043 60 0.03
60 Verizon Communications Inc,4.125%, due 15/08/2046 68 0.04
FaceValue(000’s)
Value(000’s)
$
% ofNet
AssetValue
410 Verizon Communications Inc,4.522%, due 15/09/2048 484 0.25
70 Verizon Communications Inc,4.000%, due 22/03/2050 77 0.04
110 Verizon Communications Inc,2.875%, due 20/11/2050 100 0.05
200 Verizon Communications Inc,3.000%, due 20/11/2060 180 0.09
90 Visa Inc,2.050%, due 15/04/2030 92 0.05
70 Visa Inc,2.700%, due 15/04/2040 71 0.04
70 Visa Inc,3.650%, due 15/09/2047 80 0.04
60 Walmart Inc,3.700%, due 26/06/2028 69 0.04
200 Walmart Inc,4.050%, due 29/06/2048 245 0.13
20 Walt Disney Co/The,6.200%, due 15/12/2034 29 0.01
23 Walt Disney Co/The,6.400%, due 15/12/2035 34 0.02
80 Walt Disney Co/The,6.650%, due 15/11/2037 118 0.06
50 Walt Disney Co/The,5.400%, due 01/10/2043 68 0.04
10 Walt Disney Co/The,4.950%, due 15/10/2045 13 0.01
170 Waste Management Inc,3.150%, due 15/11/2027 188 0.10
110 Wells Fargo & Co,2.406%, due 30/10/2025 * 116 0.06
10 Wells Fargo & Co,3.000%, due 23/10/2026 11 0.01
300 Wells Fargo & Co,3.196%, due 17/06/2027 * 327 0.17
110 Wells Fargo & Co,3.584%, due 22/05/2028 * 122 0.06
350 Wells Fargo & Co,4.478%, due 04/04/2031 * 414 0.22
80 Wells Fargo & Co,3.068%, due 30/04/2041 * 82 0.04
270 Wells Fargo & Co,5.375%, due 02/11/2043 349 0.18
200 Wells Fargo & Co,4.750%, due 07/12/2046 246 0.13
220 Wells Fargo & Co,5.013%, due 04/04/2051 * 295 0.15
170 Western Midstream OperatingLP,2.325%, due 13/01/2023 * 167 0.09
230 Western Midstream OperatingLP,3.950%, due 01/06/2025 233 0.12
250 Western Midstream OperatingLP,4.750%, due 15/08/2028 263 0.14
80 Western Midstream OperatingLP,5.500%, due 15/08/2048 83 0.04
130 Western Midstream OperatingLP,6.500%, due 01/02/2050 150 0.08
280 WPX Energy Inc,5.875%, due 15/06/2028 307 0.16
350 WPX Energy Inc,4.500%, due 15/01/2030 373 0.19
122,165 63.76
Total Corporate Bonds and Notes(Cost $160,823) 167,361 87.35
Government Bonds and Notes — 4.05%(29 February 2020: 2.85%)
Bermuda — 0.17% (29 February 2020: 0.00%)
330 Bermuda GovernmentInternational Bond, 144A,2.375%, due 20/08/2030 327 0.17
Ghana — 0.13% (29 February 2020: 0.41%)
250 Ghana GovernmentInternational Bond, 144A,8.627%, due 16/06/2049 242 0.13
FaceValue(000’s)
Value(000’s)
$
% ofNet
AssetValue
Israel — 0.43% (29 February 2020: 0.32%)
360 Israel GovernmentInternational Bond,3.250%, due 17/01/2028 404 0.21
400 Israel GovernmentInternational Bond,2.750%, due 03/07/2030 427 0.22
831 0.43
Panama — 0.24% (29 February 2020: 0.00%)
470 Panama GovernmentInternational Bond,2.252%, due 29/09/2032 450 0.24
Paraguay — 0.16% (29 February 2020: 0.00%)
260 Paraguay GovernmentInternational Bond, 144A,5.400%, due 30/03/2050 300 0.16
Peru — 0.05% (29 February 2020: 0.00%)
100 Peruvian GovernmentInternational Bond,2.783%, due 23/01/2031 102 0.05
Qatar — 0.39% (29 February 2020: 0.53%)
230 Qatar GovernmentInternational Bond, 144A,4.817%, due 14/03/2049 284 0.15
400 Qatar GovernmentInternational Bond, 144A,4.400%, due 16/04/2050 470 0.24
754 0.39
Russia — 0.13% (29 February 2020: 0.23%)
RUB 18,110 Russian Federal Bond – OFZ,Series 6224,6.900%, due 23/05/2029 247 0.13
United Arab Emirates — 0.46%(29 February 2020: 0.19%)
200 Abu Dhabi GovernmentInternational Bond, 144A,3.125%, due 16/04/2030 217 0.11
230 Abu Dhabi GovernmentInternational Bond, 144A,3.125%, due 30/09/2049 223 0.12
400 Abu Dhabi GovernmentInternational Bond, 144A,3.875%, due 16/04/2050 441 0.23
881 0.46
United States — 1.89% (29 February 2020: 0.10%)
230 United States Treasury Note/Bond,0.625%, due 30/11/2027 223 0.12
380 United States Treasury Note/Bond,0.625%, due 15/08/2030 355 0.18
90 United States Treasury Note/Bond,1.250%, due 15/05/2050 73 0.04
1,110 United States Treasury Note/Bond,1.375%, due 15/08/2050 927 0.48
1,860 United States Treasury Note/Bond,1.625%, due 15/11/2050 1,654 0.86
420 United States Treasury Note/Bond,1.875%, due 15/02/2051 398 0.21
3,630 1.89
Total Government Bonds and Notes(Cost $7,986) 7,764 4.05
Loan Notes — 0.98% (29 February 2020: 0.00%)
429 Air Canada,1.861%, due 06/10/2023 * 422 0.22
170 Asplundh Tree Expert LLC,2.621%, due 19/08/2027 * 170 0.09
350 Asurion LLC,3.121%, due 03/11/2023 * 350 0.18
227 CoreCivic Inc,5.500%, due 18/12/2024 * 221 0.12
100 Delta Air Lines Inc,5.750%, due 29/04/2023 * 100 0.05
369 Four Seasons Hotels Ltd,2.121%, due 30/11/2023 * 369 0.19
^ Not authorised for sale to the public in Hong Kong.The accompanying notes are an integral part of the Financial Statements
168

Legg Mason Global Funds Plc Annual Report 28 February 2021
Legg Mason Western Asset US Corporate Bond Fund^
Portfolio of Investments as at 28 February 2021 – (continued)
FaceValue(000’s)
Value(000’s)
$
% ofNet
AssetValue
Loan Notes — (continued)
80 Schweitzer-MauduitInternational, Inc.,0.000%, due 23/02/2028 * 80 0.04
150 SkyMiles IP Ltd,4.750%, due 16/09/2027 * 159 0.09
Total Loan Notes (Cost $1,839) 1,871 0.98
Municipal Bonds — 0.66% (29 February 2020: 1.08%)
120 Alabama Economic SettlementAuthority,3.163%, due 15/09/2025 126 0.07
150 American Municipal Power Inc,7.834%, due 15/02/2041 236 0.12
210 Port Authority of New York &New Jersey,4.458%, due 01/10/2062 270 0.14
220 Regents of the University ofCalifornia Medical CenterPooled Revenue,3.006%, due 15/05/2050 226 0.12
210 State of California,7.300%, due 01/10/2039 332 0.17
70 State of Illinois,5.100%, due 01/06/2033 78 0.04
Total Municipal Bonds(Cost $1,103) 1,268 0.66
Collective Investment Schemes — 5.08%(29 February 2020: 0.08%)
9,727 Western Asset Liquidity FundsPlc – Western Asset US DollarLiquidity Fund – Class WA(Distributing) 9,727 5.08
Total Collective Investment Schemes(Cost $9,727) 9,727 5.08
Preferred Stock — 0.26% (29 February 2020: 0.00%)United States — 0.26% (29 February 2020: 0.00%)
– Targa Resources Corp,Series A † 489 0.26
Total Preferred Stock(Cost $483) 489 0.26
Total Investments at fair value throughprofit or loss (Cost $182,271) 188,791 98.54
FaceValue(000’s)
Value(000’s)
$
% ofNet
AssetValue
Credit Default Swaps — 0.01%(29 February 2020: 0.00%)
Unrealised appreciation of contracts(see below) 16 0.01
Forward Foreign Currency Contracts — 1.84%(29 February 2020: 0.03%)
Unrealised appreciation of contracts(see below) 3,528 1.84
Futures — 0.02% (29 February 2020: 0.26%)
Unrealised appreciation of contracts(see below) 48 0.02
Total Financial Assets at fair valuethrough profit or loss 192,383 100.41
Forward Foreign Currency Contracts — (0.02%)(29 February 2020: (0.54%))
Unrealised depreciation of contracts(see below) (48) (0.02)
Futures — (0.10%) (29 February 2020: (0.13%))
Unrealised depreciation of contracts(see below) (197) (0.10)
Total Financial Liabilities at fair valuethrough profit or loss (245) (0.12)
Total Financial Assets and FinancialLiabilities at fair value through profitor loss 192,138 100.29
Liabilities in Excess of Other Assets (542) (0.29)
Total Net Assets $191,596 100.00
– Amounts designated as “–” are either $0, less than$1,000, less than 1,000 shares or less than 0.01%.
144A Securities exempt from registration under Rule 144A ofthe Securities Act of 1933, as amended. Thesesecurities may only be resold, in transactions exemptfrom registration, to qualified institutional buyers. As at28 February 2021, these securities amounted to$42,767,000 or 22.34% of net assets.
* Variable rate security. The interest rate shown reflectsthe rate in effect at 28 February 2021.
† Illiquid.
ABBREVIATIONS:
Perpetual – A bond with no maturity date. Perpetual bondsare not redeemable but pay a steady stream ofinterest.
EUR – Euro
GBP – British Pound
RUB – Russian Ruble
Analysis of Total Assets
% ofTotal
Assets
Transferable securities admitted to an officialexchange listing or traded on a regulated market 90.72
Other transferable securities dealt in on anotherregulated market 0.96
Collective investment schemes 4.98
Financial derivative instruments 1.84
Other assets 1.50
Total Assets 100.00
Schedule of Credit Default Swaps
Counterparty Reference EntityBuy/Sell
ProtectionExpiration
Date
NotionalAmount(000’s)
Value(000’s)
Bank of America Merrill Lynch CDX.NA.IG, 1.000% Sell 20/12/2030 8,200 $ 16
Unrealised Appreciation of Credit Default Swaps (29 February 2020 (000’s): $–) $ 16Unrealised Depreciation of Credit Default Swaps (29 February 2020 (000’s): $–) –
Net Appreciation of Credit Default Swaps (29 February 2020 (000’s): $–) $ 16
Schedule of Forward Foreign Currency Contracts
Expiration Date CounterpartyBuy Currency
(000’s)Sell Currency
(000’s)
UnrealisedAppreciation/(Depreciation)of Contracts
(000’s)
12/03/2021 BNY Mellon Buy USD 33 Sell EUR 27 $ –12/03/2021 BNY Mellon Buy USD 3,931 Sell GBP 2,799 3112/03/2021 BNY Mellon Buy GBP 120,493 Sell USD 164,394 3,49212/03/2021 BNY Mellon Buy EUR 1,158 Sell USD 1,394 319/04/2021 BNP Paribas Buy USD 73 Sell EUR 60 119/04/2021 BNP Paribas Buy USD 666 Sell GBP 491 (18)19/04/2021 Goldman Sachs Buy USD 86 Sell EUR 70 119/04/2021 Goldman Sachs Buy MXN 12,140 Sell USD 607 (30)
Unrealised Appreciation of Forward Foreign Currency Contracts (29 February 2020 (000’s): $33) $ 3,528Unrealised Depreciation of Forward Foreign Currency Contracts (29 February 2020 (000’s): $(668)) (48)
Net Appreciation of Forward Foreign Currency Contracts (29 February 2020 (000’s): $(635)) $ 3,480
^ Not authorised for sale to the public in Hong Kong.The accompanying notes are an integral part of the Financial Statements
169

Legg Mason Global Funds Plc Annual Report 28 February 2021
Legg Mason Western Asset US Corporate Bond Fund^
Portfolio of Investments as at 28 February 2021 – (continued)
Schedule of Futures Contracts
CounterpartyNominal
Value
NotionalValue(000’s)
UnrealisedAppreciation/(Depreciation)of Contracts
(000’s)
Euro-Bund March 2021 Bank of America Merrill Lynch (1) $ (209) $ 4
Long Gilt June 2021 Bank of America Merrill Lynch (5) (890) 8
U.S. 10 Year Note (CBT) June 2021 Bank of America Merrill Lynch 131 17,386 (171)
U.S. 2 Year Note (CBT) June 2021 Bank of America Merrill Lynch (43) (9,493) 8
U.S. 5 Year Note (CBT) June 2021 Bank of America Merrill Lynch (31) (3,843) 23
U.S. Long Bond (CBT) June 2021 Bank of America Merrill Lynch 6 955 5
U.S. Ultra Bond (CBT) June 2021 Bank of America Merrill Lynch 7 1,324 (26)
Unrealised Appreciation of Futures Contracts (29 February 2020 (000’s): $318) $ 48
Unrealised Depreciation of Futures Contracts (29 February 2020 (000’s): $(152)) (197)
Net Depreciation of Futures Contracts (29 February 2020 (000’s): $166) $ (149)
^ Not authorised for sale to the public in Hong Kong.The accompanying notes are an integral part of the Financial Statements
170

Legg Mason Global Funds Plc Annual Report 28 February 2021
Western Asset UCITS SMASh Series Core Plus Completion Fund^
Portfolio of Investments as at 28 February 2021
FaceValue(000’s)
Value(000’s)
$
% ofNet
AssetValue
Asset-Backed Securities — 3.47%
260 ecopetrol SA,5.875%, due 28/05/2045 262 1.18
161 Navient Student Loan Trust2014-5, Series 2014 5,Class A,0.738%, due 25/03/2083 * 162 0.73
100 Saxon Asset Securities Trust2006-3, Series 2006 3,Class A4,0.358%, due 25/10/2046 * 89 0.40
250 Towd Point Mortgage Trust2017-4, Series 2017 4,Class B2, 144A,3.512%, due 25/06/2057 * 259 1.16
Total Asset-Backed Securities (Cost $771) 772 3.47
Mortgage-Backed Securities — 24.54%
100 BANK 2017-BNK7,Series 2017 BNK7, Class C,4.048%, due 15/09/2060 * 108 0.49
230 BX Commercial MortgageTrust 2018-BIOA, Series 2018BIOA, Class A, 144A,0.783%, due 15/03/2037 * 231 1.04
122 Fannie Mae ConnecticutAvenue Securities,Series 2018 C01, Class 1M2,2.368%, due 25/07/2030 * 124 0.56
227 Fannie Mae ConnecticutAvenue Securities,Series 2018 C05, Class 1M2,2.468%, due 25/01/2031 * 228 1.03
300 Fannie Mae or Freddie Mac,15 year, TBA,1.500% ± 303 1.37
500 Fannie Mae or Freddie Mac,30 year, TBA,2.000% ± 504 2.27
700 Fannie Mae or Freddie Mac,30 year, TBA,3.500% ± 742 3.34
614 Fannie Mae Pool ‘FM3445’,4.000%, due 01/09/2048 665 3.00
475 Fannie Mae Pool ‘MA3057’,3.500%, due 01/07/2047 507 2.28
230 Freddie Mac STACR RemicTrust 2020-DNA2,Series 2020 DNA2, Class M2,144A,1.968%, due 25/02/2050 * 231 1.04
304 Ginnie Mae II Pool ‘784985’,3.500%, due 20/09/2048 325 1.46
413 Ginnie Mae II Pool‘MA6283’,3.000%, due 20/11/2049 431 1.94
403 Ginnie Mae II Pool‘MA6658’,4.000%, due 20/05/2050 432 1.95
300 Ginnie Mae, 30 year, TBA,2.000% ± 304 1.37
300 Ginnie Mae, 30 year, TBA,2.500% ± 311 1.40
Total Mortgage-Backed Securities(Cost $5,471) 5,446 24.54
Corporate Bonds and Notes — 31.01%
Australia — 0.33%
20 BHP Billiton Finance USA Ltd,5.000%, due 30/09/2043 27 0.13
40 Glencore Funding LLC, 144A,4.000%, due 27/03/2027 45 0.20
72 0.33
Belgium — 0.81%
60 Anheuser-Busch InBevWorldwide Inc,4.150%, due 23/01/2025 67 0.30
40 Anheuser-Busch InBevWorldwide Inc,3.500%, due 01/06/2030 44 0.20
20 Anheuser-Busch InBevWorldwide Inc,4.350%, due 01/06/2040 24 0.10
FaceValue(000’s)
Value(000’s)
$
% ofNet
AssetValue
40 Anheuser-Busch InBevWorldwide Inc,4.500%, due 01/06/2050 46 0.21
181 0.81
Brazil — 1.62%
200 Petrobras Global Finance BV,5.750%, due 01/02/2029 224 1.01
100 Vale Overseas Ltd,6.875%, due 21/11/2036 136 0.61
360 1.62
Canada — 0.99%
30 Bank of Montreal,1.850%, due 01/05/2025 31 0.14
20 Bank of Nova Scotia/The,1.300%, due 11/06/2025 20 0.09
20 Barrick North AmericaFinance LLC,5.700%, due 30/05/2041 28 0.12
20 Canadian Imperial Bank ofCommerce,0.950%, due 23/06/2023 20 0.09
10 MEG Energy Corp, 144A,5.875%, due 01/02/2029 10 0.05
40 Royal Bank of Canada,1.150%, due 10/06/2025 40 0.18
70 Toronto-Dominion Bank/The,1.150%, due 12/06/2025 71 0.32
220 0.99
Colombia — 0.49%
100 Ecopetrol SA,5.875%, due 28/05/2045 108 0.49
France — 1.05%
200 BNP Paribas SA, 144A,4.400%, due 14/08/2028 234 1.05
Israel — 1.04%
120 Teva Pharmaceutical FinanceNetherlands III BV,2.800%, due 21/07/2023 118 0.53
120 Teva Pharmaceutical FinanceNetherlands III BV,3.150%, due 01/10/2026 112 0.51
230 1.04
Macau — 0.94%
200 Wynn Macau Ltd, 144A,5.625%, due 26/08/2028 208 0.94
Peru — 0.57%
100 Southern Copper Corp,5.250%, due 08/11/2042 126 0.57
Switzerland — 0.11%
20 Glencore Finance CanadaLtd, 144A,6.000%, due 15/11/2041 25 0.11
United Kingdom — 1.43%
200 Barclays Plc,5.088%, due 20/06/2030 * 232 1.05
40 BAT Capital Corp,3.557%, due 15/08/2027 44 0.20
40 BAT Capital Corp,4.540%, due 15/08/2047 41 0.18
317 1.43
United States — 21.63%
10 Abbott Laboratories,3.750%, due 30/11/2026 11 0.05
10 Abbott Laboratories,4.750%, due 30/11/2036 13 0.06
20 Abbott Laboratories,4.900%, due 30/11/2046 27 0.12
100 AbbVie Inc,3.600%, due 14/05/2025 110 0.49
80 AbbVie Inc,3.200%, due 21/11/2029 87 0.39
20 AbbVie Inc,4.250%, due 21/11/2049 23 0.10
20 Alphabet Inc,1.100%, due 15/08/2030 19 0.09
20 Alphabet Inc,2.050%, due 15/08/2050 17 0.08
FaceValue(000’s)
Value(000’s)
$
% ofNet
AssetValue
32 Altria Group Inc,4.400%, due 14/02/2026 37 0.16
8 Altria Group Inc,4.800%, due 14/02/2029 9 0.04
20 Altria Group Inc,5.800%, due 14/02/2039 25 0.11
30 Altria Group Inc,5.950%, due 14/02/2049 38 0.17
40 Amazon.com Inc,1.500%, due 03/06/2030 39 0.18
50 Amazon.com Inc,2.500%, due 03/06/2050 46 0.21
30 Anthem Inc,3.650%, due 01/12/2027 34 0.15
50 AT&T Inc,1.650%, due 01/02/2028 49 0.22
20 AT&T Inc,3.100%, due 01/02/2043 19 0.08
20 Berkshire Hathaway FinanceCorp,4.250%, due 15/01/2049 24 0.11
40 Boeing Co/The,4.875%, due 01/05/2025 45 0.20
50 Boeing Co/The,5.150%, due 01/05/2030 58 0.26
40 Boeing Co/The,5.705%, due 01/05/2040 50 0.23
50 Boeing Co/The,5.805%, due 01/05/2050 65 0.29
40 BP Capital Markets AmericaInc,3.119%, due 04/05/2026 44 0.20
20 BP Capital Markets AmericaInc,3.633%, due 06/04/2030 22 0.10
20 BP Capital Markets AmericaInc,3.000%, due 24/02/2050 19 0.08
40 Bristol-Myers Squibb Co,3.400%, due 26/07/2029 45 0.20
16 Bristol-Myers Squibb Co,5.000%, due 15/08/2045 21 0.10
260 CCO Holdings LLC / CCOHoldings Capital Corp, 144A,4.500%, due 01/05/2032 267 1.21
40 Charter CommunicationsOperating LLC / CharterCommunications OperatingCapital,4.908%, due 23/07/2025 46 0.21
80 Charter CommunicationsOperating LLC / CharterCommunications OperatingCapital,4.200%, due 15/03/2028 90 0.40
40 Charter CommunicationsOperating LLC / CharterCommunications OperatingCapital,5.375%, due 01/04/2038 48 0.22
40 Charter CommunicationsOperating LLC / CharterCommunications OperatingCapital,4.800%, due 01/03/2050 44 0.20
40 Cigna Corp,4.375%, due 15/10/2028 47 0.21
20 Cigna Corp,4.800%, due 15/08/2038 25 0.11
20 Cigna Corp,4.900%, due 15/12/2048 25 0.11
60 Cimarex Energy Co,4.375%, due 15/03/2029 67 0.30
150 Citigroup Inc,5.500%, due 13/09/2025 178 0.80
200 Citigroup Inc,2.572%, due 03/06/2031 * 205 0.92
10 Citigroup Inc,8.125%, due 15/07/2039 17 0.08
50 Citigroup Inc,4.650%, due 23/07/2048 64 0.29
50 Coca-Cola Co/The,2.500%, due 15/03/2051 46 0.21
40 ConocoPhillips, 144A,4.300%, due 15/08/2028 47 0.21
^ Not authorised for sale to the public in Hong Kong.The accompanying notes are an integral part of the Financial Statements
171

Legg Mason Global Funds Plc Annual Report 28 February 2021
Western Asset UCITS SMASh Series Core Plus Completion Fund^
Portfolio of Investments as at 28 February 2021 – (continued)
FaceValue(000’s)
Value(000’s)
$
% ofNet
AssetValue
Corporate Bonds and Notes — (continued)
United States — (continued)
10 Consolidated Edison Co ofNew York Inc, Series 20A,3.350%, due 01/04/2030 11 0.05
30 Deere & Co,3.750%, due 15/04/2050 35 0.16
150 Delta Air Lines Inc,7.375%, due 15/01/2026 176 0.79
160 Delta Air Lines Inc / SkyMilesIP Ltd, 144A,4.750%, due 20/10/2028 178 0.80
40 Devon Energy Corp,5.850%, due 15/12/2025 47 0.21
40 Devon Energy Corp,5.000%, due 15/06/2045 47 0.21
20 Diamondback Energy Inc,3.500%, due 01/12/2029 21 0.10
20 Energy Transfer OperatingLP,5.250%, due 15/04/2029 23 0.10
20 Energy Transfer OperatingLP,6.250%, due 15/04/2049 24 0.11
20 EOG Resources Inc,4.375%, due 15/04/2030 24 0.11
20 EOG Resources Inc,4.950%, due 15/04/2050 25 0.11
150 EQT Corp,5.000%, due 15/01/2029 165 0.74
10 Exelon Corp,5.625%, due 15/06/2035 13 0.06
220 Ford Motor Credit Co LLC,4.000%, due 13/11/2030 225 1.02
20 General Motors Co,5.950%, due 01/04/2049 26 0.12
40 Home Depot Inc/The,3.300%, due 15/04/2040 43 0.20
20 Kinder Morgan Inc,5.200%, due 01/03/2048 24 0.11
40 Las Vegas Sands Corp,3.200%, due 08/08/2024 42 0.19
10 MDC Holdings Inc,6.000%, due 15/01/2043 13 0.06
30 Merck & Co Inc,1.450%, due 24/06/2030 29 0.13
110 Mileage Plus Holdings LLC /Mileage Plus IntellectualProperty Assets Ltd, 144A,6.500%, due 20/06/2027 120 0.54
40 Mondelez International Inc,1.500%, due 04/05/2025 41 0.18
110 Morgan Stanley,2.188%, due 28/04/2026 * 115 0.52
70 Morgan Stanley,3.622%, due 01/04/2031 * 78 0.35
10 Morgan Stanley,5.597%, due 24/03/2051 * 15 0.07
20 MPLX LP,4.800%, due 15/02/2029 23 0.11
20 MPLX LP,5.500%, due 15/02/2049 24 0.11
40 NIKE Inc,3.375%, due 27/03/2050 44 0.20
40 Northrop Grumman Corp,3.250%, due 15/01/2028 44 0.20
20 Northrop Grumman Corp,5.250%, due 01/05/2050 27 0.12
20 PepsiCo Inc,1.625%, due 01/05/2030 20 0.09
30 PepsiCo Inc,3.625%, due 19/03/2050 34 0.15
20 Philip Morris InternationalInc,2.100%, due 01/05/2030 20 0.09
20 Philip Morris InternationalInc,4.500%, due 20/03/2042 24 0.11
40 Raytheon Technologies Corp,2.250%, due 01/07/2030 41 0.18
10 Raytheon Technologies Corp,4.500%, due 01/06/2042 12 0.06
100 Spirit Loyalty Cayman Ltd /Spirit IP Cayman Ltd, 144A,8.000%, due 20/09/2025 113 0.51
FaceValue(000’s)
Value(000’s)
$
% ofNet
AssetValue
10 Targa Resources PartnersLP / Targa ResourcesPartners Finance Corp,144A,4.000%, due 15/01/2032 10 0.04
10 T-Mobile USA Inc,2.250%, due 15/02/2026 10 0.05
10 T-Mobile USA Inc,2.625%, due 15/02/2029 10 0.04
70 T-Mobile USA Inc, 144A,2.550%, due 15/02/2031 70 0.31
10 T-Mobile USA Inc,2.875%, due 15/02/2031 10 0.04
20 Transcontinental Gas PipeLine Co LLC,7.850%, due 01/02/2026 26 0.12
50 Union Pacific Corp,3.950%, due 10/09/2028 57 0.26
40 Union Pacific Corp,3.839%, due 20/03/2060 45 0.20
40 UnitedHealth Group Inc,2.000%, due 15/05/2030 40 0.18
20 UnitedHealth Group Inc,2.750%, due 15/05/2040 20 0.09
20 UnitedHealth Group Inc,3.700%, due 15/08/2049 22 0.10
40 US Bancorp,1.450%, due 12/05/2025 41 0.18
20 Visa Inc,2.050%, due 15/04/2030 20 0.09
30 Visa Inc,4.300%, due 14/12/2045 38 0.17
140 Western MidstreamOperating LP,6.500%, due 01/02/2050 161 0.73
20 Williams Cos Inc/The,4.850%, due 01/03/2048 23 0.11
4,801 21.63
Total Corporate Bonds and Notes(Cost $7,001) 6,882 31.01
Government Bonds and Notes — 37.30%
Brazil — 1.41%
BRL 600 Brazil Notas do TesouroNacional Serie F,Series NTNF,10.000%, due 01/01/2027 117 0.53
200 Brazilian GovernmentInternational Bond,5.000%, due 27/01/2045 196 0.88
313 1.41
Indonesia — 1.38%
200 Indonesia GovernmentInternational Bond,4.625%, due 15/04/2043 222 1.00
IDR 1,145,000 Indonesia Treasury Bond,Series FR59,7.000%, due 15/05/2027 84 0.38
306 1.38
Mexico — 4.27%
MXN 14,610 Mexican Bonos, Series M,7.750%, due 13/11/2042 749 3.38
200 Mexico GovernmentInternational Bond,4.350%, due 15/01/2047 199 0.89
948 4.27
Peru — 0.31%
50 Peruvian GovernmentInternational Bond,6.550%, due 14/03/2037 69 0.31
Poland — 0.25%
50 Republic of PolandGovernment InternationalBond,4.000%, due 22/01/2024 55 0.25
Russia — 2.34%
RUB 38,010 Russian Federal Bond –OFZ, Series 6224,6.900%, due 23/05/2029 519 2.34
FaceValue(000’s)
Value(000’s)
$
% ofNet
AssetValue
United States — 27.34%
2,080 United States CashManagement Bill,zero coupon,due 04/05/2021 2,080 9.37
290 United States TreasuryInflation Indexed Bonds,2.125%, due 15/02/2040 � 511 2.30
490 United States Treasury Note/Bond,0.375%, due 31/12/2025 483 2.18
1,730 United States Treasury Note/Bond,0.625%, due 31/12/2027 1,677 7.56
320 United States Treasury Note/Bond,0.750%, due 31/01/2028 312 1.41
330 United States Treasury Note/Bond,1.125%, due 29/02/2028 330 1.49
10 United States Treasury Note/Bond,1.875%, due 15/02/2041 10 0.04
660 United States Treasury Note/Bond,1.375%, due 15/08/2050 551 2.48
120 United States Treasury Note/Bond,1.875%, due 15/02/2051 114 0.51
6,068 27.34
Total Government Bonds and Notes(Cost $8,555) 8,278 37.30
Loan Notes — 10.40%
70 1011778 BC ULC,1.871%, due 14/11/2026 * 69 0.31
60 Allied Universal Holdco LLC,4.371%, due 12/07/2026 * 60 0.27
10 AmWINS Group, Inc.,0.000%, due 17/02/2028 * 10 0.04
50 Athenahealth Inc,4.453%, due 11/02/2026 * 51 0.23
60 Avolon TLB Borrower 1 (US)LLC,3.250%, due 01/12/2027 * 60 0.27
70 Bausch Health Americas Inc,2.871%, due 27/11/2025 * 70 0.32
60 Berry Global Inc,2.149%, due 01/10/2022 * 60 0.27
20 Berry Global Inc,2.156%, due 01/07/2026 * 20 0.09
50 Brookfield WEC HoldingsInc.,3.250%, due 01/08/2025 * 50 0.22
70 Caesars Resort CollectionLLC,2.871%, due 22/12/2024 * 70 0.31
50 Change Healthcare HoldingsLLC,3.500%, due 01/03/2024 * 50 0.23
70 Charter CommunicationsOperating LLC,1.880%, due 30/04/2025 * 70 0.32
50 Citadel Securities,0.000%, due 27/02/2028 * 50 0.22
100 CityCenter Holdings LLC,3.000%, due 18/04/2024 * 99 0.45
10 DCert Buyer, Inc.,4.121%, due 16/10/2026 * 10 0.04
90 Dell International LLC,0.000%, due 19/09/2025 * 91 0.41
60 Endo International Plc,5.000%, due 27/04/2024 * 60 0.27
50 Energizer Holdings, Inc.,2.750%, due 16/12/2027 * 50 0.23
10 Four Seasons Hotels Ltd,2.121%, due 30/11/2023 * 10 0.05
20 Gainwell Acquisition Corp.,0.000%, due 01/10/2027 * 20 0.09
70 Genesee & Wyoming Inc,2.254%, due 30/12/2026 * 70 0.32
60 GoDaddy Operating Co,1.871%, due 15/02/2024 * 60 0.27
70 Grifols WorldwideOperations USA Inc,0.000%, due 15/11/2027 * 70 0.31
^ Not authorised for sale to the public in Hong Kong.The accompanying notes are an integral part of the Financial Statements
172

Legg Mason Global Funds Plc Annual Report 28 February 2021
Western Asset UCITS SMASh Series Core Plus Completion Fund^
Portfolio of Investments as at 28 February 2021 – (continued)
FaceValue(000’s)
Value(000’s)
$
% ofNet
AssetValue
Loan Notes — (continued)
60 Harbor Freight Tools,0.000%, due 19/10/2027 * 60 0.27
10 iHeartCommunications Inc,0.000%, due 01/05/2026 * 10 0.04
50 Ineos U.S. Petrochemical,0.000%, due 21/01/2026 * 50 0.23
20 Level 3 Parent LLC,1.871%, due 01/03/2027 * 20 0.09
60 McAfee LLC,3.871%, due 29/09/2024 * 60 0.27
60 Nexstar Broadcasting Inc,2.873%, due 19/09/2026 * 60 0.27
70 Option Care Health Inc,3.871%, due 06/08/2026 * 70 0.32
60 PPD, Inc.,2.750%, due 06/01/2028 * 60 0.27
10 Rackspace TechnologyGlobal, Inc,0.000%, due 09/02/2028 * 10 0.04
20 RealPage Inc,0.000%, due 18/02/2028 * 20 0.09
57 Reynolds Consumer ProductsLLC,1.871%, due 04/02/2027 * 58 0.26
50 Reynolds Group HoldingsInc,2.871%, due 05/02/2023 * 50 0.22
60 Scientific GamesInternational Inc,2.871%, due 14/08/2024 * 59 0.27
60 Sotera Health,3.250%, due 13/12/2026 * 60 0.27
30 Station Casinos LLC,2.500%, due 08/02/2027 * 30 0.13
20 Trans Union LLC,1.871%, due 13/11/2026 * 20 0.09
20 UFC Holdings LLC,3.750%, due 29/04/2026 * 20 0.09
10 Univision CommunicationsInc,4.750%, due 24/03/2026 * 10 0.05
70 Verscend Holding Corp,4.621%, due 27/08/2025 * 71 0.32
70 VFH Parent LLC,3.111%, due 01/03/2026 * 70 0.32
40 VICI Properties 1 LLC,1.861%, due 22/12/2024 * 40 0.18
60 Virgin Media Bristol LLC,2.612%, due 04/01/2028 * 60 0.27
50 Western Digital Corp,1.871%, due 29/04/2023 * 50 0.23
60 Whatabrands LLC,2.862%, due 03/08/2026 * 60 0.27
Total Loan Notes (Cost $2,314) 2,308 10.40
Collective Investment Schemes — 6.64%
41 Legg Mason China Funds –Western Asset China BondFund – Class LM ** 572 2.58
901 Western Asset LiquidityFunds Plc – Western AssetUS Dollar Liquidity Fund –Class WA (Distributing) 901 4.06
Total Collective Investment Schemes(Cost $1,474) 1,473 6.64
Total Investments at fair value throughprofit or loss (Cost $25,586) 25,159 113.36
Contracts(000’s)
Value(000’s)
$
% ofNet
AssetValue
Purchased Options — 0.01%
– U.S. 10 Year April 2021 Put135.50, due 26/03/2021 –Morgan Stanley 3 0.01
– U.S. Bond April 2021 Call163.00, due 26/03/2021 –Morgan Stanley – –
Total Purchased Options (Cost $2) 3 0.01
Credit Default Swaps — 1.17%
Unrealised appreciation of contracts(see below) 260 1.17
Interest Rate Swaps — 1.49%
Unrealised appreciation of contracts(see below) 330 1.49
Forward Foreign Currency Contracts — 0.09%
Unrealised appreciation of contracts(see below) 21 0.09
Futures — 0.31%
Unrealised appreciation of contracts(see below) 69 0.31
Total Financial Assets at fair valuethrough profit or loss 25,842 116.43
Written Options — (0.05%)
– U.S. 10 Year April 2021 Call134.75, due 26/03/2021 –Morgan Stanley – –
– U.S. 10 Year April 2021 Call136.00, due 26/03/2021 –Morgan Stanley – –
– U.S. 10 Year April 2021 Call136.50, due 26/03/2021 –Morgan Stanley – –
– U.S. 10 Year April 2021 Put135.00, due 26/03/2021 –Morgan Stanley (2) (0.01)
– U.S. 10 Year May 2021 Call134.00, due 23/04/2021 –Morgan Stanley (2) (0.01)
– U.S. 10 Year May 2021 Call135.50, due 23/04/2021 –Morgan Stanley – –
– U.S. 10 Year May 2021 Call136.50, due 23/04/2021 –Morgan Stanley – –
– U.S. 5 Year April 2021 Call124.75, due 26/03/2021 –Morgan Stanley – –
– U.S. 5 Year April 2021 Call125.00, due 26/03/2021 –Morgan Stanley – –
– U.S. 5 Year April 2021 Call125.75, due 26/03/2021 –Morgan Stanley – –
– U.S. Bond April 2021 Call169.00, due 26/03/2021 –Morgan Stanley – –
– U.S. Bond April 2021 Put162.00, due 26/03/2021 –Morgan Stanley (4) (0.02)
– U.S. Bond May 2021 Call164.00, due 23/04/2021 –Morgan Stanley (2) (0.01)
– U.S. Bond May 2021 Call165.00, due 23/04/2021 –Morgan Stanley (1) –
Total Written Options (Cost $(12)) (11) (0.05)
Contracts(000’s)
Value(000’s)
$
% ofNet
AssetValue
Forward Foreign Currency Contracts — (0.33%)
Unrealised depreciation of contracts(see below) (73) (0.33)
Futures — (0.76%)
Unrealised depreciation of contracts(see below) (168) (0.76)
Total Financial Liabilities at fair valuethrough profit or loss (252) (1.14)
Total Financial Assets and FinancialLiabilities at fair value through profit orloss 25,590 115.29
Liabilities in Excess of Other Assets (3,397) (15.29)
Total Net Assets $22,193 100.00
– Amounts designated as “–” are either $0, less than$1,000, less than 1,000 shares or less than 0.01%.
144A Securities exempt from registration under Rule 144A ofthe Securities Act of 1933, as amended. Thesesecurities may only be resold, in transactions exemptfrom registration, to qualified institutional buyers. As at28 February 2021, these securities amounted to$2,048,000 or 9.21% of net assets.
* Variable rate security. The interest rate shown reflectsthe rate in effect at 28 February 2021.
± Securities purchased on a to-be-announced basis.
� The rate of interest on this type of security is tied to theConsumer Price Index (CPI)/Retail Price Index (RPI). Thecoupon rate is the rate as of 28 February 2021.
** On 31 March 2021, Class M of the Unit Trust was re-named into Class LM.
ABBREVIATIONS:
REMIC – Real Estate Mortgage Investment Conduit.
TBA – To Be Announced.
BRL – Brazilian Real
IDR – Indonesian Rupiah
MXN – Mexican Peso
RUB – Russian Ruble
Analysis of Total Assets
% ofTotal
Assets
Transferable securities admitted to an officialexchange listing or traded on a regulated market 79.24
Other transferable securities dealt in on anotherregulated market 8.55
Collective investment schemes 5.46
Financial derivative instruments 2.53
Other assets 4.22
Total Assets 100.00
Schedule of Credit Default Swaps
Counterparty Reference EntityBuy/Sell
ProtectionExpiration
Date
NotionalAmount(000’s)
Value(000’s)
Morgan Stanley CDX.NA.HY, 5.000% Sell 20/12/2025 1,260 $ 104Morgan Stanley CDX.NA.IG, 1.000% Sell 20/12/2025 7,450 156
Unrealised Appreciation of Credit Default Swaps $ 260Unrealised Depreciation of Credit Default Swaps –
Net Appreciation of Credit Default Swaps $ 260
^ Not authorised for sale to the public in Hong Kong.The accompanying notes are an integral part of the Financial Statements
173
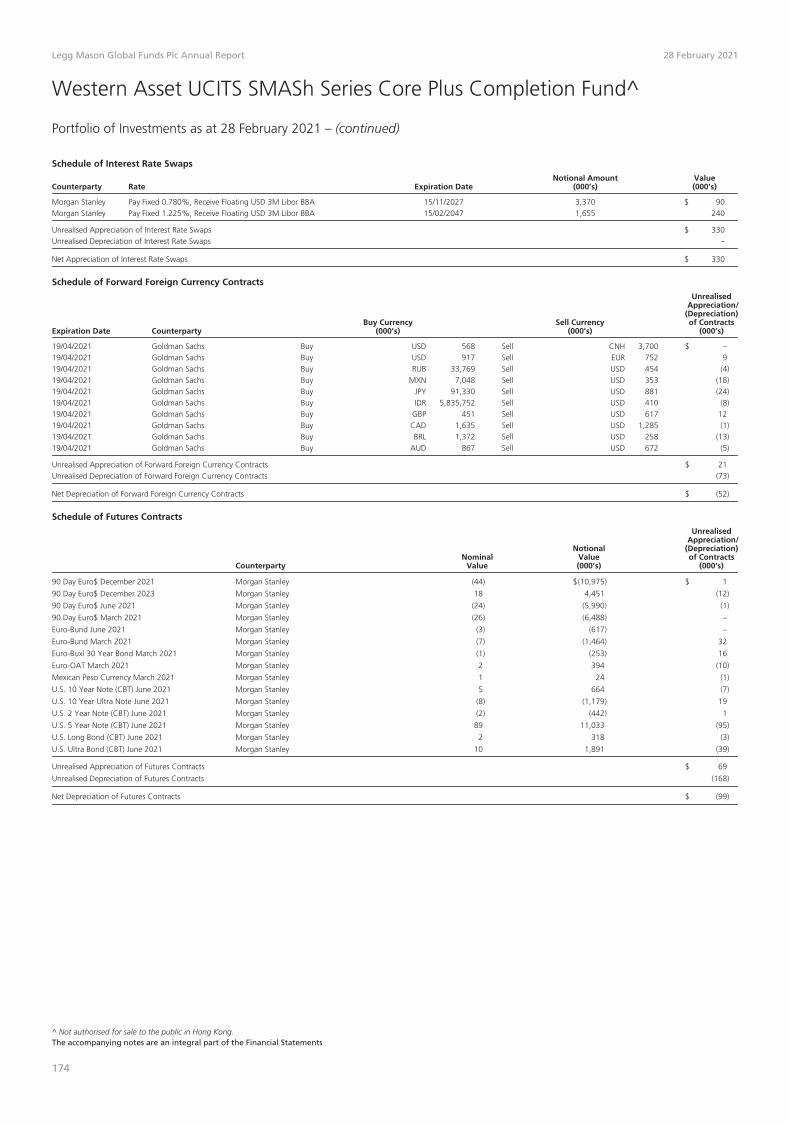
Legg Mason Global Funds Plc Annual Report 28 February 2021
Western Asset UCITS SMASh Series Core Plus Completion Fund^
Portfolio of Investments as at 28 February 2021 – (continued)
Schedule of Interest Rate Swaps
Counterparty Rate Expiration DateNotional Amount
(000’s)Value(000’s)
Morgan Stanley Pay Fixed 0.780%, Receive Floating USD 3M Libor BBA 15/11/2027 3,370 $ 90Morgan Stanley Pay Fixed 1.225%, Receive Floating USD 3M Libor BBA 15/02/2047 1,655 240
Unrealised Appreciation of Interest Rate Swaps $ 330Unrealised Depreciation of Interest Rate Swaps –
Net Appreciation of Interest Rate Swaps $ 330
Schedule of Forward Foreign Currency Contracts
Expiration Date CounterpartyBuy Currency
(000’s)Sell Currency
(000’s)
UnrealisedAppreciation/
(Depreciation)of Contracts
(000’s)
19/04/2021 Goldman Sachs Buy USD 568 Sell CNH 3,700 $ –19/04/2021 Goldman Sachs Buy USD 917 Sell EUR 752 919/04/2021 Goldman Sachs Buy RUB 33,769 Sell USD 454 (4)19/04/2021 Goldman Sachs Buy MXN 7,048 Sell USD 353 (18)19/04/2021 Goldman Sachs Buy JPY 91,330 Sell USD 881 (24)19/04/2021 Goldman Sachs Buy IDR 5,835,752 Sell USD 410 (8)19/04/2021 Goldman Sachs Buy GBP 451 Sell USD 617 1219/04/2021 Goldman Sachs Buy CAD 1,635 Sell USD 1,285 (1)19/04/2021 Goldman Sachs Buy BRL 1,372 Sell USD 258 (13)19/04/2021 Goldman Sachs Buy AUD 867 Sell USD 672 (5)
Unrealised Appreciation of Forward Foreign Currency Contracts $ 21Unrealised Depreciation of Forward Foreign Currency Contracts (73)
Net Depreciation of Forward Foreign Currency Contracts $ (52)
Schedule of Futures Contracts
CounterpartyNominal
Value
NotionalValue(000’s)
UnrealisedAppreciation/
(Depreciation)of Contracts
(000’s)
90 Day Euro$ December 2021 Morgan Stanley (44) $(10,975) $ 1
90 Day Euro$ December 2023 Morgan Stanley 18 4,451 (12)
90 Day Euro$ June 2021 Morgan Stanley (24) (5,990) (1)
90 Day Euro$ March 2021 Morgan Stanley (26) (6,488) –
Euro-Bund June 2021 Morgan Stanley (3) (617) –
Euro-Bund March 2021 Morgan Stanley (7) (1,464) 32
Euro-Buxl 30 Year Bond March 2021 Morgan Stanley (1) (253) 16
Euro-OAT March 2021 Morgan Stanley 2 394 (10)
Mexican Peso Currency March 2021 Morgan Stanley 1 24 (1)
U.S. 10 Year Note (CBT) June 2021 Morgan Stanley 5 664 (7)
U.S. 10 Year Ultra Note June 2021 Morgan Stanley (8) (1,179) 19
U.S. 2 Year Note (CBT) June 2021 Morgan Stanley (2) (442) 1
U.S. 5 Year Note (CBT) June 2021 Morgan Stanley 89 11,033 (95)
U.S. Long Bond (CBT) June 2021 Morgan Stanley 2 318 (3)
U.S. Ultra Bond (CBT) June 2021 Morgan Stanley 10 1,891 (39)
Unrealised Appreciation of Futures Contracts $ 69
Unrealised Depreciation of Futures Contracts (168)
Net Depreciation of Futures Contracts $ (99)
^ Not authorised for sale to the public in Hong Kong.The accompanying notes are an integral part of the Financial Statements
174

Legg Mason Global Funds Plc Annual Report 28 February 2021
Legg Mason Brandywine Global Fixed Income Fund
Portfolio of Investments as at 28 February 2021
FaceValue(000’s)
Value(000’s)
$
% ofNet
AssetValue
Corporate Bonds and Notes — 4.07%(29 February 2020: 10.01%)
Mexico — 1.72% (29 February 2020: 1.97%)
1,010 Petroleos Mexicanos,6.750%, due 21/09/2047 891 0.24
5,680 Petroleos Mexicanos,7.690%, due 23/01/2050 5,440 1.48
6,331 1.72
Saudi Arabia — 0.16% (29 February 2020: 0.00%)
610 Saudi Arabian Oil Co,144A,3.250%, due 24/11/2050 574 0.16
Supranational — 2.19% (29 February 2020: 8.04%)
RUB 368,000 International Bank forReconstruction &Development,4.250%, due 22/01/2026 4,817 1.31
MXN 71,300 International Bank forReconstruction &Development,4.250%, due 22/01/2026 3,255 0.88
8,072 2.19
Total Corporate Bonds and Notes(Cost $16,076) 14,977 4.07
Government Bonds and Notes — 92.34%(29 February 2020: 88.64%)
Australia — 4.66% (29 February 2020: 4.59%)
AUD 9,970 Australia GovernmentBond, Series 128,5.750%, due 15/07/2022 8,267 2.25
AUD 2,270 New South Wales TreasuryCorp,4.000%, due 08/04/2021 1,754 0.47
AUD 4,550 Queensland Treasury Corp,Series 21,5.500%, due 21/06/2021 3,559 0.97
AUD 4,520 Western AustralianTreasury Corp, Series 21,7.000%, due 15/07/2021 3,568 0.97
17,148 4.66
Brazil — 2.24% (29 February 2020: 4.18%)
BRL 42,600 Brazil Notas do TesouroNacional Serie F,Series NTNF,10.000%, due 01/01/2025 8,238 2.24
Chile — 0.47% (29 February 2020: 0.00%)
1,690 Chile GovernmentInternational Bond,2.450%, due 31/01/2031 1,718 0.47
Colombia — 4.26% (29 February 2020: 4.47%)
COP 55,190,000 Colombian TES, Series B,6.000%, due 28/04/2028 15,689 4.26
Indonesia — 3.82% (29 February 2020: 0.00%)
IDR 172,500,000 Indonesia Treasury Bond,Series FR71,9.000%, due 15/03/2029 14,039 3.82
Malaysia — 1.46% (29 February 2020: 1.77%)
MYR 7,030 Malaysia GovernmentBond, Series 0115,3.955%, due 15/09/2025 1,859 0.50
MYR 13,360 Malaysia GovernmentBond, Series 0417,3.899%, due 16/11/2027 3,526 0.96
5,385 1.46
FaceValue(000’s)
Value(000’s)
$
% ofNet
AssetValue
Mexico — 9.96% (29 February 2020: 12.10%)
MXN 177,900 Mexican Bonos,Series M 20,8.500%, due 31/05/2029 9,956 2.71
MXN 188,600 Mexican Bonos,Series M 30,8.500%, due 18/11/2038 10,439 2.84
MXN 238,000 Mexican Bonos, Series M,7.750%, due 13/11/2042 12,207 3.32
MXN 76,800 Mexican Bonos, Series M,8.000%, due 07/11/2047 4,027 1.09
36,629 9.96
Poland — 0.75% (29 February 2020: 5.36%)
PLN 10,350 Republic of PolandGovernment Bond,Series 0421,2.000%, due 25/04/2021 2,772 0.75
South Africa — 3.53% (29 February 2020: 3.87%)
ZAR 131,400 Republic of South AfricaGovernment Bond,Series R214,6.500%, due 28/02/2041 5,694 1.55
ZAR 134,100 Republic of South AfricaGovernment Bond,Series 2048,8.750%, due 28/02/2048 7,308 1.98
13,002 3.53
United Kingdom — 14.73% (29 February 2020: 7.28%)
GBP 37,920 United Kingdom Gilt,1.750%, due 07/09/2022 54,203 14.73
United States — 46.46% (29 February 2020: 39.12%)
25,770 United States TreasuryFloating Rate Note,0.144%, due 30/04/2022 * 25,800 7.01
95,700 United States TreasuryFloating Rate Note,0.085%, due 31/07/2022 * 95,738 26.02
15,500 United States TreasuryFloating Rate Note,0.085%, due 31/10/2022 * 15,507 4.22
15,535 United States TreasuryFloating Rate Note,0.079%, due 31/01/2023 * 15,539 4.22
22,700 United States TreasuryNote/Bond,1.250%, due 15/05/2050 18,339 4.99
170,923 46.46
Total Government Bonds and Notes(Cost $346,007) 339,746 92.34
Collective Investment Schemes — 4.16%(29 February 2020: 1.21%)
15,295 Goldman Sachs US$ LiquidReserves Fund –Institutional Class 15,295 4.16
Total Collective Investment Schemes(Cost $15,295) 15,295 4.16
Total Investments at fair value throughprofit or loss (Cost $377,378) 370,018 100.57
Forward Foreign Currency Contracts — 1.12%(29 February 2020: 0.45%)
Unrealised appreciation of contracts(see below) 4,100 1.12
Total Financial Assets at fair valuethrough profit or loss 374,118 101.69
FaceValue(000’s)
Value(000’s)
$
% ofNet
AssetValue
Forward Foreign Currency Contracts — (0.74%)(29 February 2020: (1.84%))
Unrealised depreciation of contracts(see below) (2,715) (0.74)
Total Financial Liabilities at fair valuethrough profit or loss (2,715) (0.74)
Total Financial Assets and FinancialLiabilities at fair value through profitor loss 371,403 100.95
Liabilities in Excess of Other Assets (3,496) (0.95)
Total Net Assets $367,907 100.00
– Amounts designated as “–” are either $0, less than$1,000, less than 1,000 shares or less than 0.01%.
144A Securities exempt from registration under Rule 144A ofthe Securities Act of 1933, as amended. Thesesecurities may only be resold, in transactions exemptfrom registration, to qualified institutional buyers. As at28 February 2021, these securities amounted to$574,000 or 0.16% of net assets.
* Variable rate security. The interest rate shown reflectsthe rate in effect at 28 February 2021.
ABBREVIATIONS:
AUD – Australian Dollar
BRL – Brazilian Real
COP – Colombia Peso
GBP – British Pound
IDR – Indonesian Rupiah
MXN – Mexican Peso
MYR – Malaysian Ringgit
PLN – Polish Zloty
RUB – Russian Ruble
ZAR – South Africa Rand
Analysis of Total Assets
% ofTotal
Assets
Transferable securities admitted to an officialexchange listing or traded on a regulated market 93.66
Collective investment schemes 4.04
Financial derivative instruments 1.08
Other assets 1.22
Total Assets 100.00
Schedule of Forward Foreign Currency Contracts
Expiration Date CounterpartyBuy Currency
(000’s)Sell Currency
(000’s)
UnrealisedAppreciation/(Depreciation)of Contracts
(000’s)
05/03/2021 HSBC Buy USD 1,252 Sell CLP 910,000 $ (5)05/03/2021 HSBC Buy CLP 910,000 Sell USD 1,198 6009/03/2021 Citi Buy NOK 229,800 Sell USD 26,090 41409/03/2021 Goldman Sachs Buy USD 7,384 Sell NOK 62,600 16510/03/2021 BNY Mellon Buy EUR 1,848 Sell AUD 2,911 (10)10/03/2021 BNY Mellon Buy EUR 4 Sell AUD 5 –
The accompanying notes are an integral part of the Financial Statements
175

Legg Mason Global Funds Plc Annual Report 28 February 2021
Legg Mason Brandywine Global Fixed Income Fund
Portfolio of Investments as at 28 February 2021 – (continued)
Schedule of Forward Foreign Currency Contracts – (continued)
Expiration Date CounterpartyBuy Currency
(000’s)Sell Currency
(000’s)
UnrealisedAppreciation/(Depreciation)of Contracts
(000’s)
10/03/2021 BNY Mellon Buy GBP 428 Sell AUD 764 $ 810/03/2021 BNY Mellon Buy USD 296 Sell AUD 388 (2)10/03/2021 BNY Mellon Buy EUR – Sell CAD 1 –10/03/2021 BNY Mellon Buy EUR 1,335 Sell CAD 2,055 (4)10/03/2021 BNY Mellon Buy USD 214 Sell CAD 273 (1)10/03/2021 BNY Mellon Buy GBP – Sell CAD – –10/03/2021 BNY Mellon Buy GBP 308 Sell CAD 536 810/03/2021 BNY Mellon Buy USD 56 Sell DKK 349 –10/03/2021 BNY Mellon Buy EUR 352 Sell DKK 2,615 –10/03/2021 BNY Mellon Buy EUR – Sell DKK 5 –10/03/2021 BNY Mellon Buy GBP 80 Sell DKK 686 210/03/2021 BNY Mellon Buy GBP – Sell DKK – –10/03/2021 BNY Mellon Buy USD 747 Sell EUR 617 110/03/2021 BNY Mellon Buy NOK – Sell EUR – –10/03/2021 BNY Mellon Buy PLN 2 Sell EUR 1 –10/03/2021 BNY Mellon Buy NOK 44 Sell EUR 3 –10/03/2021 BNY Mellon Buy AUD 70 Sell EUR 43 –10/03/2021 BNY Mellon Buy DKK 20 Sell EUR 3 –10/03/2021 BNY Mellon Buy SEK – Sell EUR – –10/03/2021 BNY Mellon Buy ILS 1 Sell EUR – –10/03/2021 BNY Mellon Buy AUD 15 Sell EUR 10 –10/03/2021 BNY Mellon Buy CAD 38 Sell EUR 24 –10/03/2021 BNY Mellon Buy SEK 66 Sell EUR 5 –10/03/2021 BNY Mellon Buy SGD 1 Sell EUR – –10/03/2021 BNY Mellon Buy USD 4,777 Sell EUR 3,970 (13)10/03/2021 BNY Mellon Buy JPY 48,500 Sell EUR 382 (4)10/03/2021 BNY Mellon Buy GBP 6,621 Sell EUR 7,503 16610/03/2021 BNY Mellon Buy SGD 11 Sell EUR 7 –10/03/2021 BNY Mellon Buy PLN 51 Sell EUR 11 –10/03/2021 BNY Mellon Buy CAD 20 Sell EUR 15 –10/03/2021 BNY Mellon Buy JPY 3,270 Sell EUR 25 –10/03/2021 BNY Mellon Buy ILS 31 Sell EUR 8 –10/03/2021 BNY Mellon Buy DKK 57 Sell EUR 7 –10/03/2021 BNY Mellon Buy MXN 15 Sell EUR 1 –10/03/2021 BNY Mellon Buy MXN 375 Sell EUR 14 –10/03/2021 BNY Mellon Buy GBP 14 Sell EUR 19 –10/03/2021 BNY Mellon Buy CAD 4 Sell GBP 1 –10/03/2021 BNY Mellon Buy CAD 10 Sell GBP 3 –10/03/2021 BNY Mellon Buy MXN 82 Sell GBP 2 –10/03/2021 BNY Mellon Buy MXN 8 Sell GBP – –10/03/2021 BNY Mellon Buy PLN 12 Sell GBP 1 –10/03/2021 BNY Mellon Buy NOK 10 Sell GBP – –10/03/2021 BNY Mellon Buy NOK – Sell GBP – –10/03/2021 BNY Mellon Buy ILS 1 Sell GBP – –10/03/2021 BNY Mellon Buy ILS 3 Sell GBP – –10/03/2021 BNY Mellon Buy JPY 2,915 Sell GBP 20 –10/03/2021 BNY Mellon Buy JPY 8,999 Sell GBP 61 –10/03/2021 BNY Mellon Buy PLN 2 Sell GBP – –10/03/2021 BNY Mellon Buy SEK 17 Sell GBP – –10/03/2021 BNY Mellon Buy SEK – Sell GBP – –10/03/2021 BNY Mellon Buy EUR 4,717 Sell GBP 4,162 (106)10/03/2021 BNY Mellon Buy SGD – Sell GBP – –10/03/2021 BNY Mellon Buy USD 134 Sell GBP 94 110/03/2021 BNY Mellon Buy EUR 74 Sell GBP 63 –10/03/2021 BNY Mellon Buy USD 837 Sell GBP 613 (16)10/03/2021 BNY Mellon Buy AUD – Sell GBP – –10/03/2021 BNY Mellon Buy DKK 8 Sell GBP – –10/03/2021 BNY Mellon Buy DKK 13 Sell GBP – –10/03/2021 BNY Mellon Buy SGD 1 Sell GBP – –10/03/2021 BNY Mellon Buy AUD 23 Sell GBP 12 –10/03/2021 BNY Mellon Buy USD 50 Sell ILS 165 –10/03/2021 BNY Mellon Buy EUR 311 Sell ILS 1,237 210/03/2021 BNY Mellon Buy EUR – Sell ILS – –10/03/2021 BNY Mellon Buy GBP 70 Sell ILS 322 310/03/2021 BNY Mellon Buy GBP – Sell ILS 1 –10/03/2021 BNY Mellon Buy GBP 13 Sell JPY 1,995 –10/03/2021 BNY Mellon Buy GBP 3,267 Sell JPY 468,187 16010/03/2021 BNY Mellon Buy EUR 14,182 Sell JPY 1,792,990 29410/03/2021 BNY Mellon Buy EUR 4 Sell JPY 572 –10/03/2021 BNY Mellon Buy USD 2,271 Sell JPY 238,592 33
The accompanying notes are an integral part of the Financial Statements
176

Legg Mason Global Funds Plc Annual Report 28 February 2021
Legg Mason Brandywine Global Fixed Income Fund
Portfolio of Investments as at 28 February 2021 – (continued)
Schedule of Forward Foreign Currency Contracts – (continued)
Expiration Date CounterpartyBuy Currency
(000’s)Sell Currency
(000’s)
UnrealisedAppreciation/(Depreciation)of Contracts
(000’s)
10/03/2021 BNY Mellon Buy EUR – Sell MXN – $ –10/03/2021 BNY Mellon Buy GBP 129 Sell MXN 3,550 1010/03/2021 BNY Mellon Buy USD 89 Sell MXN 1,808 310/03/2021 BNY Mellon Buy GBP – Sell MXN 14 –10/03/2021 BNY Mellon Buy EUR 556 Sell MXN 13,593 2310/03/2021 BNY Mellon Buy USD 25 Sell NOK 214 –10/03/2021 BNY Mellon Buy GBP 36 Sell NOK 421 110/03/2021 BNY Mellon Buy EUR 155 Sell NOK 1,610 210/03/2021 BNY Mellon Buy USD 71 Sell PLN 264 –10/03/2021 BNY Mellon Buy EUR 441 Sell PLN 1,989 510/03/2021 BNY Mellon Buy GBP 102 Sell PLN 520 310/03/2021 BNY Mellon Buy GBP – Sell PLN – –10/03/2021 BNY Mellon Buy EUR 230 Sell SEK 2,319 210/03/2021 BNY Mellon Buy USD 37 Sell SEK 308 –10/03/2021 BNY Mellon Buy GBP 53 Sell SEK 606 210/03/2021 BNY Mellon Buy GBP 67 Sell SGD 124 210/03/2021 BNY Mellon Buy EUR 294 Sell SGD 472 210/03/2021 BNY Mellon Buy USD 47 Sell SGD 63 –10/03/2021 BNY Mellon Buy EUR – Sell SGD – –10/03/2021 BNY Mellon Buy GBP – Sell SGD 1 –10/03/2021 BNY Mellon Buy GBP 6,693 Sell USD 9,126 19710/03/2021 BNY Mellon Buy GBP 28 Sell USD 40 –10/03/2021 BNY Mellon Buy EUR 53 Sell USD 66 –10/03/2021 BNY Mellon Buy EUR 29,015 Sell USD 34,932 8611/03/2021 HSBC Buy USD 3,731 Sell KRW 4,110,000 7811/03/2021 HSBC Buy KRW 4,110,000 Sell USD 3,780 (127)15/03/2021 BNY Mellon Buy USD 2 Sell AUD 2 –15/03/2021 BNY Mellon Buy USD 21 Sell EUR 17 –15/03/2021 BNY Mellon Buy USD 1 Sell EUR 1 –15/03/2021 BNY Mellon Buy USD 441 Sell GBP 316 315/03/2021 BNY Mellon Buy USD 856 Sell GBP 621 (13)15/03/2021 BNY Mellon Buy GBP 36,903 Sell USD 50,331 1,08615/03/2021 BNY Mellon Buy AUD 1,016 Sell USD 777 515/03/2021 BNY Mellon Buy GBP 38 Sell USD 53 –15/03/2021 BNY Mellon Buy EUR 34,812 Sell USD 41,916 10515/03/2021 BNY Mellon Buy EUR 17 Sell USD 22 –12/04/2021 Citi Buy USD 4,525 Sell PLN 16,810 3712/04/2021 Citi Buy PLN 55,380 Sell USD 15,103 (319)13/04/2021 Barclays Buy MYR 45,400 Sell USD 11,187 (40)15/04/2021 Citi Buy USD 4,784 Sell KRW 5,280,000 9815/04/2021 Citi Buy KRW 28,830,000 Sell USD 26,264 (680)20/04/2021 JP Morgan Buy CZK 124,700 Sell USD 5,805 (55)22/04/2021 JP Morgan Buy USD 1,591 Sell COP 5,635,000 4922/04/2021 JP Morgan Buy COP 8,455,000 Sell USD 2,407 (93)27/04/2021 Citi Buy PLN 35,690 Sell USD 9,578 (49)28/04/2021 HSBC Buy HUF 1,530,000 Sell USD 5,200 (111)28/04/2021 JP Morgan Buy USD 5,178 Sell HUF 1,530,000 8930/04/2021 HSBC Buy CLP 6,360,000 Sell USD 8,876 (82)10/05/2021 HSBC Buy USD 3,502 Sell INR 258,000 4710/05/2021 HSBC Buy INR 1,058,000 Sell USD 14,308 (143)10/05/2021 HSBC Buy HUF 3,875,000 Sell USD 13,018 (131)10/05/2021 JP Morgan Buy HUF 225,000 Sell USD 762 (13)12/05/2021 Citi Buy RUB 416,000 Sell USD 5,443 8112/05/2021 HSBC Buy CLP 5,060,000 Sell USD 7,212 (215)12/05/2021 HSBC Buy USD 17,281 Sell ZAR 258,200 37612/05/2021 Morgan Stanley Buy ZAR 69,300 Sell USD 4,677 (140)14/05/2021 Goldman Sachs Buy CAD 31,800 Sell USD 24,757 23314/05/2021 HSBC Buy USD 6,141 Sell CAD 7,800 1220/05/2021 JP Morgan Buy CZK 183,900 Sell USD 8,650 (170)21/05/2021 Citi Buy RUB 393,000 Sell USD 5,257 (44)25/05/2021 JP Morgan Buy USD 6,542 Sell AUD 8,310 14628/05/2021 HSBC Buy CLP 6,980,000 Sell USD 9,782 (129)
Unrealised Appreciation of Forward Foreign Currency Contracts (29 February 2020 (000’s): $4,164) $ 4,100Unrealised Depreciation of Forward Foreign Currency Contracts (29 February 2020 (000’s): $(17,082)) (2,715)
Net Appreciation of Forward Foreign Currency Contracts (29 February 2020 (000’s): $(12,918)) $ 1,385
The accompanying notes are an integral part of the Financial Statements
177

Legg Mason Global Funds Plc Annual Report 28 February 2021
Legg Mason Brandywine Global Fixed Income Absolute Return Fund^
Portfolio of Investments as at 28 February 2021
FaceValue(000’s)
Value(000’s)
$
% ofNet
AssetValue
Asset-Backed Securities — 2.16%(29 February 2020: 1.92%)
2,570 Towd Point Mortgage Trust2018-3, Series 2018 3,Class A2, 144A,3.875%, due 25/05/2058 * 2,807 0.38
12,348 Towd Point Mortgage Trust2018-5, Series 2018 5,Class A1, 144A,3.250%, due 25/07/2058 * 12,939 1.78
Total Asset-Backed Securities(Cost $15,230) 15,746 2.16
Mortgage-Backed Securities — 8.13%(29 February 2020: 6.35%)
5,217 Angel Oak Mortgage Trust2019-6, Series 2019 6,Class A1, 144A,2.620%, due 25/11/2059 * 5,278 0.72
17,917 Angel Oak Mortgage Trust2020-1, Series 2020 1,Class A1, 144A,2.466%, due 25/12/2059 * 18,166 2.49
2,675 Angel Oak MortgageTrust I LLC 2019-2,Series 2019 2, Class A1,144A,3.628%, due 25/03/2049 * 2,742 0.38
11,380 COMM 2017-COR2Mortgage Trust,Series 2017 COR2,Class A3,3.510%, due 10/09/2050 12,702 1.74
4,950 COMM 2017-PANWMortgage Trust,Series 2017 PANW,Class D, 144A,3.935%, due 10/10/2029 * 5,138 0.71
8,350 Morgan Stanley Bank ofAmerica Merrill Lynch Trust2017-C34, Series 2017C34, Class A3,3.276%, due 15/11/2052 9,113 1.25
EUR 2,134 Newgate Funding Plc,Series 2007 1X, Class BB,0.000%, due 01/12/2050 * 2,368 0.33
EUR 3,388 Newgate Funding Plc,Series 2007 2X, Class BB,0.000%, due 15/12/2050 * 3,735 0.51
Total Mortgage-Backed Securities(Cost $57,532) 59,242 8.13
Corporate Bonds and Notes — 28.98%(29 February 2020: 31.30%)
Canada — 6.07% (29 February 2020: 1.69%)
15,090 Bank of Montreal,0.741%, due 10/03/2023 * 15,239 2.09
14,705 Bank of Nova Scotia/The,0.609%, due 15/09/2023 * 14,811 2.03
14,020 Canadian Imperial Bank ofCommerce,0.856%, due 17/03/2023 * 14,183 1.95
44,233 6.07
Mexico — 3.17% (29 February 2020: 2.22%)
13,175 Petroleos Mexicanos,6.750%, due 21/09/2047 11,617 1.59
11,995 Petroleos Mexicanos,7.690%, due 23/01/2050 11,488 1.58
23,105 3.17
Saudi Arabia — 0.13% (29 February 2020: 0.00%)
990 Saudi Arabian Oil Co,144A,3.250%, due 24/11/2050 932 0.13
South Africa — 1.12% (29 February 2020: 0.00%)
6,600 Anglo American CapitalPlc, 144A,5.625%, due 01/04/2030 8,191 1.12
United States — 18.49% (29 February 2020: 20.50%)
6,770 American Express Co,0.795%, due 05/11/2021 * 6,793 0.93
5,085 Apache Corp,4.750%, due 15/04/2043 4,978 0.68
FaceValue(000’s)
Value(000’s)
$
% ofNet
AssetValue
1,550 Apache Corp,4.250%, due 15/01/2044 1,453 0.20
1,646 Apache Corp,5.350%, due 01/07/2049 1,642 0.23
1,690 Boeing Co/The,5.705%, due 01/05/2040 2,132 0.29
3,515 Boeing Co/The,5.805%, due 01/05/2050 4,541 0.62
2,310 Boeing Co/The,5.930%, due 01/05/2060 3,039 0.42
10,380 Caterpillar FinancialServices Corp,0.447%, due 15/03/2021 * 10,381 1.42
2,350 Delta Air Lines Inc, 144A,7.000%, due 01/05/2025 2,740 0.38
2,765 Delta Air Lines Inc,7.375%, due 15/01/2026 3,242 0.45
1,615 Delta Air Lines Inc,3.750%, due 28/10/2029 1,613 0.22
5,065 Exxon Mobil Corp,3.452%, due 15/04/2051 5,207 0.71
21,080 Ford Motor Credit Co LLC,1.048%, due 05/04/2021 * 21,064 2.89
2,465 General Motors Co,6.800%, due 01/10/2027 3,129 0.43
3,915 General Motors Co,6.250%, due 02/10/2043 5,269 0.72
6,305 General Motors Co,5.950%, due 01/04/2049 8,253 1.13
10,330 General Motors FinancialCo Inc,1.231%, due 17/11/2023 * 10,461 1.44
17,150 Goldman Sachs Group Inc/The,0.925%, due 23/02/2023 * 17,342 2.38
1,365 Hess Corp,5.600%, due 15/02/2041 1,640 0.23
1,845 Hess Corp,5.800%, due 01/04/2047 2,309 0.32
3,065 Jabil Inc,3.000%, due 15/01/2031 3,137 0.43
6,395 Southwest Airlines Co,5.125%, due 15/06/2027 7,497 1.03
6,835 Wells Fargo & Co,1.240%, due 26/07/2021 * 6,862 0.94
134,724 18.49
Total Corporate Bonds and Notes(Cost $197,915) 211,185 28.98
Government Bonds and Notes — 54.36%(29 February 2020: 58.05%)
Brazil — 2.99% (29 February 2020: 4.26%)
BRL 84,665 Brazil Notas do TesouroNacional Serie F,Series NTNF,10.000%, due 01/01/2027 16,504 2.27
BRL 26,845 Brazil Notas do TesouroNacional Serie F,Series NTNF,10.000%, due 01/01/2029 5,249 0.72
21,753 2.99
Colombia — 4.10% (29 February 2020: 4.63%)
COP 104,990,000 Colombian TES, Series B,6.000%, due 28/04/2028 29,845 4.10
Indonesia — 3.73% (29 February 2020: 3.99%)
IDR 264,100,000 Indonesia Treasury Bond,Series FR71,9.000%, due 15/03/2029 21,495 2.95
IDR 70,500,000 Indonesia Treasury Bond,Series FR67,8.750%, due 15/02/2044 5,656 0.78
27,151 3.73
Mexico — 4.50% (29 February 2020: 8.57%)
MXN 86,200 Mexican Bonos,Series M 20,8.500%, due 31/05/2029 4,824 0.66
MXN 366,800 Mexican Bonos,Series M 30,8.500%, due 18/11/2038 20,303 2.79
MXN 146,800 Mexican Bonos, Series M,8.000%, due 07/11/2047 7,696 1.05
32,823 4.50
FaceValue(000’s)
Value(000’s)
$
% ofNet
AssetValue
South Africa — 4.75% (29 February 2020: 0.00%)
ZAR 291,500 Republic of South AfricaGovernment Bond,Series R213,7.000%, due 28/02/2031 16,249 2.23
ZAR 309,110 Republic of South AfricaGovernment Bond,Series 2032,8.250%, due 31/03/2032 18,363 2.52
34,612 4.75
United States — 34.29% (29 February 2020: 32.22%)
112,845 United States TreasuryFloating Rate Note,0.144%, due 30/04/2022 * 112,975 15.50
53,445 United States TreasuryFloating Rate Note,0.085%, due 31/07/2022 * 53,466 7.34
30,755 United States TreasuryFloating Rate Note,0.085%, due 31/10/2022 * 30,768 4.22
52,650 United States TreasuryFloating Rate Note,0.079%, due 31/01/2023 * 52,665 7.23
249,874 34.29
Total Government Bonds and Notes(Cost $403,780) 396,058 54.36
Collective Investment Schemes — 5.77%(29 February 2020: 1.72%)
42,056 Goldman Sachs US$ LiquidReserves Fund –Institutional Class 42,056 5.77
Total Collective Investment Schemes(Cost $42,056) 42,056 5.77
Total Investments at fair value throughprofit or loss (Cost $716,513) 724,287 99.40
Forward Foreign Currency Contracts — 2.71%(29 February 2020: 1.71%)
Unrealised appreciation of contracts(see below) 19,726 2.71
Futures — 0.07% (29 February 2020: 0.07%)
Unrealised appreciation of contracts(see below) 545 0.07
Total Financial Assets at fair valuethrough profit or loss 744,558 102.18
Forward Foreign Currency Contracts — (0.68%)(29 February 2020: (3.49%))
Unrealised depreciation of contracts(see below) (4,911) (0.68)
Total Financial Liabilities at fair valuethrough profit or loss (4,911) (0.68)
Total Financial Assets and FinancialLiabilities at fair value through profitor loss 739,647 101.50
Liabilities in Excess of Other Assets (10,973) (1.50)
Total Net Assets $728,674 100.00
– Amounts designated as “–” are either $0, less than$1,000, less than 1,000 shares or less than 0.01%.
144A Securities exempt from registration under Rule 144A ofthe Securities Act of 1933, as amended. Thesesecurities may only be resold, in transactions exemptfrom registration, to qualified institutional buyers. As at28 February 2021, these securities amounted to$58,933,000 or 8.09% of net assets.
* Variable rate security. The interest rate shown reflectsthe rate in effect at 28 February 2021.
ABBREVIATIONS:
BRL – Brazilian Real
COP – Colombia Peso
EUR – Euro
IDR – Indonesian Rupiah
MXN – Mexican Peso
ZAR – South Africa Rand
^ Not authorised for sale to the public in Hong Kong.The accompanying notes are an integral part of the Financial Statements
178

Legg Mason Global Funds Plc Annual Report 28 February 2021
Legg Mason Brandywine Global Fixed Income Absolute Return Fund^
Portfolio of Investments as at 28 February 2021 – (continued)
Analysis of Total Assets
% ofTotal
Assets
Transferable securities admitted to an officialexchange listing or traded on a regulated market 89.96
Collective investment schemes 5.55
Financial derivative instruments 2.67
Other assets 1.82
Total Assets 100.00
Schedule of Forward Foreign Currency Contracts
Expiration Date CounterpartyBuy Currency
(000’s)Sell Currency
(000’s)
UnrealisedAppreciation/(Depreciation)of Contracts
(000’s)
05/03/2021 HSBC Buy USD 1,292 Sell CLP 920,000 $ 2105/03/2021 HSBC Buy USD 2,053 Sell CLP 1,490,000 (6)05/03/2021 HSBC Buy CLP 40,240,000 Sell USD 53,608 1,98508/03/2021 Citi Buy GBP 30,180 Sell USD 40,253 1,79608/03/2021 JP Morgan Buy USD 4,294 Sell GBP 3,150 (95)08/03/2021 JP Morgan Buy GBP 17,830 Sell USD 24,141 70208/03/2021 Morgan Stanley Buy USD 3,549 Sell GBP 2,610 (88)09/03/2021 Citi Buy USD 23,142 Sell NOK 197,500 36409/03/2021 Citi Buy NOK 209,100 Sell USD 23,740 37609/03/2021 Morgan Stanley Buy USD 1,365 Sell NOK 11,600 2711/03/2021 Citi Buy USD 38,312 Sell CHF 34,070 84411/03/2021 Goldman Sachs Buy USD 91,024 Sell CHF 80,640 2,34311/03/2021 Goldman Sachs Buy CHF 4,550 Sell USD 5,128 (124)11/03/2021 JP Morgan Buy CHF 4,060 Sell USD 4,604 (139)15/03/2021 BNY Mellon Buy USD 2 Sell EUR 1 –15/03/2021 BNY Mellon Buy USD 3,472 Sell GBP 2,496 (6)15/03/2021 BNY Mellon Buy GBP 13,591 Sell USD 18,538 40015/03/2021 BNY Mellon Buy EUR 107,031 Sell USD 128,870 32315/03/2021 BNY Mellon Buy GBP 4 Sell USD 6 –15/03/2021 BNY Mellon Buy AUD 478,856 Sell USD 366,031 2,45015/03/2021 BNY Mellon Buy SGD 179,028 Sell USD 134,311 (54)15/03/2021 BNY Mellon Buy SEK 1,488 Sell USD 177 (1)12/04/2021 Citi Buy USD 119,411 Sell EUR 97,250 1,94712/04/2021 Citi Buy EUR 16,700 Sell USD 20,342 (171)12/04/2021 Citi Buy PLN 150,870 Sell USD 41,145 (869)12/04/2021 Goldman Sachs Buy EUR 9,970 Sell USD 12,204 (162)12/04/2021 HSBC Buy USD 3,970 Sell PLN 14,750 3312/04/2021 HSBC Buy EUR 18,810 Sell USD 22,906 (186)14/04/2021 HSBC Buy USD 42,374 Sell BRL 233,630 75514/04/2021 HSBC Buy BRL 105,740 Sell USD 19,233 (396)22/04/2021 JP Morgan Buy COP 93,260,000 Sell USD 26,108 (584)26/04/2021 JP Morgan Buy USD 28,045 Sell IDR 397,740,000 66227/04/2021 Citi Buy PLN 295,150 Sell USD 79,397 (597)10/05/2021 Citi Buy KRW 41,350,000 Sell USD 37,017 (315)10/05/2021 HSBC Buy INR 4,330,000 Sell USD 58,556 (583)12/05/2021 Citi Buy USD 20,809 Sell RUB 1,563,000 5612/05/2021 Citi Buy RUB 3,769,000 Sell USD 49,310 73412/05/2021 HSBC Buy CLP 10,490,000 Sell USD 14,952 (446)12/05/2021 HSBC Buy USD 35,097 Sell ZAR 524,400 76313/05/2021 Citi Buy MXN 69,600 Sell USD 3,390 (89)24/05/2021 Citi Buy USD 110,667 Sell JPY 11,450,000 3,145
Unrealised Appreciation of Forward Foreign Currency Contracts (29 February 2020 (000’s): $14,297) $ 19,726Unrealised Depreciation of Forward Foreign Currency Contracts (29 February 2020 (000’s): $(29,124)) (4,911)
Net Appreciation of Forward Foreign Currency Contracts (29 February 2020 (000’s): $(14,827)) $ 14,815
Schedule of Futures Contracts
CounterpartyNominal
Value
NotionalValue(000’s)
UnrealisedAppreciation/(Depreciation)of Contracts
(000’s)
Long Gilt June 2021 Morgan Stanley (244) $(43,434) $ 545
Unrealised Appreciation of Futures Contracts (29 February 2020 (000’s): $595) $ 545
Unrealised Depreciation of Futures Contracts (29 February 2020 (000’s): $(1,426)) –
Net Appreciation of Futures Contracts (29 February 2020 (000’s): $(831)) $ 545
^ Not authorised for sale to the public in Hong Kong.The accompanying notes are an integral part of the Financial Statements
179

Legg Mason Global Funds Plc Annual Report 28 February 2021
Legg Mason Brandywine Global High Yield Fund^
Portfolio of Investments as at 28 February 2021
FaceValue(000’s)
Value(000’s)
$
% ofNet
AssetValue
Corporate Bonds and Notes — 93.43%(29 February 2020: 96.49%)
Brazil — 11.68% (29 February 2020: 4.34%)
200 Amaggi LuxembourgInternational Sarl,5.250%, due 28/01/2028 208 1.73
200 Banco do Brasil SA/Cayman,6.250%, Perpetual * 197 1.63
200 Braskem Netherlands Finance BV,8.500%, due 23/01/2081 * 226 1.88
200 CSN Inova Ventures, 144A,6.750%, due 28/01/2028 216 1.79
200 Embraer Netherlands Finance BV,144A,6.950%, due 17/01/2028 225 1.86
205 Itau Unibanco Holding SA/Cayman Island,6.125%, Perpetual * 206 1.71
120 Petrobras Global Finance BV,5.600%, due 03/01/2031 130 1.08
1,408 11.68
Canada — 3.98% (29 February 2020: 3.15%)
CAD 145 Air Canada,9.000%, due 22/06/2024 121 1.00
35 Cascades Inc/Cascades USA Inc,5.125%, due 15/01/2026 38 0.31
75 Cascades Inc/Cascades USA Inc,144A,5.125%, due 15/01/2026 80 0.67
55 Methanex Corp,5.125%, due 15/10/2027 57 0.47
180 Taseko Mines Ltd, 144A,7.000%, due 15/02/2026 184 1.53
480 3.98
Chile — 1.73% (29 February 2020: 0.00%)
200 Kenbourne Invest SA,4.700%, due 22/01/2028 209 1.73
China — 1.78% (29 February 2020: 0.00%)
205 Sunac China Holdings Ltd,8.350%, due 19/04/2023 215 1.78
Colombia — 1.70% (29 February 2020: 0.00%)
200 Geopark Ltd, 144A,5.500%, due 17/01/2027 205 1.70
France — 0.98% (29 February 2020: 1.01%)
EUR 100 Altice France SA/France,3.375%, due 15/01/2028 118 0.98
Israel — 1.28% (29 February 2020: 3.33%)
165 Teva Pharmaceutical FinanceNetherlands III BV,3.150%, due 01/10/2026 155 1.28
Luxembourg — 1.63% (29 February 2020: 1.81%)
200 Altice France Holding SA,6.000%, due 15/02/2028 196 1.63
Mexico — 8.52% (29 February 2020: 0.00%)
200 Braskem Idesa SAPI,7.450%, due 15/11/2029 201 1.67
200 Credito Real SAB de CV SOFOMER, 144A,8.000%, due 21/01/2028 211 1.75
50 Petroleos Mexicanos,4.875%, due 24/01/2022 51 0.42
275 Petroleos Mexicanos,5.350%, due 12/02/2028 267 2.22
335 Petroleos Mexicanos,6.950%, due 28/01/2060 297 2.46
1,027 8.52
Panama — 1.76% (29 February 2020: 0.00%)
200 AES Panama GenerationHoldings SRL,4.375%, due 31/05/2030 212 1.76
Turkey — 1.73% (29 February 2020: 0.00%)
200 Yapi ve Kredi Bankasi AS,7.875%, due 22/01/2031 * 209 1.73
United Kingdom — 2.11% (29 February 2020: 2.34%)
245 Connect Finco SARL / ConnectUS Finco LLC, 144A,6.750%, due 01/10/2026 254 2.11
FaceValue(000’s)
Value(000’s)
$
% ofNet
AssetValue
United States — 51.51% (29 February 2020: 77.57%)
60 Antero Resources Corp,5.625%, due 01/06/2023 60 0.50
120 Antero Resources Corp,5.000%, due 01/03/2025 120 0.99
60 Antero Resources Corp, 144A,8.375%, due 15/07/2026 66 0.55
109 Apache Corp,4.875%, due 15/11/2027 114 0.95
45 Arconic Corp, 144A,6.125%, due 15/02/2028 48 0.39
200 Ardagh Packaging Finance Plc /Ardagh Holdings USA Inc, 144A,5.250%, due 15/08/2027 207 1.72
230 Bausch Health Cos Inc, 144A,6.125%, due 15/04/2025 236 1.95
65 Bausch Health Cos Inc, 144A,6.250%, due 15/02/2029 69 0.58
45 Bausch Health Cos Inc,7.250%, due 30/05/2029 50 0.41
105 Big River Steel LLC / BRS FinanceCorp, 144A,6.625%, due 31/01/2029 113 0.94
35 Boise Cascade Co, 144A,4.875%, due 01/07/2030 37 0.31
110 Central Garden & Pet Co,4.125%, due 15/10/2030 114 0.95
50 Century Aluminum Co, 144A,12.000%, due 01/07/2025 53 0.44
120 CITGO Petroleum Corp, 144A,6.375%, due 15/06/2026 122 1.01
130 Clearway Energy Operating LLC,5.000%, due 15/09/2026 134 1.11
50 Cleveland-Cliffs Inc,4.875%, due 15/01/2024 51 0.43
55 Cleveland-Cliffs Inc,5.750%, due 01/03/2025 56 0.47
165 Cleveland-Cliffs Inc,5.875%, due 01/06/2027 169 1.40
115 CNX Resources Corp, 144A,6.000%, due 15/01/2029 121 1.00
45 CommScope Inc,6.000%, due 01/03/2026 47 0.39
35 CommScope Inc, 144A,7.125%, due 01/07/2028 37 0.30
35 Consolidated Communications Inc,6.500%, due 01/10/2028 38 0.31
255 DISH Network Corp,3.375%, due 15/08/2026 240 1.99
35 Edgewell Personal Care Co,5.500%, due 01/06/2028 37 0.31
100 Embarq Corp,7.995%, due 01/06/2036 119 0.99
200 Endo Dac / Endo Finance LLC /Endo Finco Inc,5.875%, due 15/10/2024 201 1.67
180 Ford Motor Co,8.500%, due 21/04/2023 201 1.67
95 Gap Inc/The, 144A,8.875%, due 15/05/2027 111 0.92
60 Genworth Holdings Inc,4.900%, due 15/08/2023 57 0.47
100 Harsco Corp, 144A,5.750%, due 31/07/2027 105 0.87
175 Icahn Enterprises LP / IcahnEnterprises Finance Corp,6.250%, due 15/05/2026 184 1.53
25 L Brands Inc, 144A,6.625%, due 01/10/2030 28 0.23
95 Level 3 Financing Inc, 144A,4.625%, due 15/09/2027 99 0.82
75 Liberty Interactive LLC,8.250%, due 01/02/2030 88 0.73
125 Macy’s Retail Holdings LLC,2.875%, due 15/02/2023 124 1.03
120 Mohegan Gaming &Entertainment,8.000%, due 01/02/2026 119 0.99
50 Navios Maritime Acquisition Corp /Navios Acquisition Finance US Inc,144A,8.125%, due 15/11/2021 39 0.32
125 Occidental Petroleum Corp,3.000%, due 15/02/2027 118 0.97
105 Occidental Petroleum Corp,6.625%, due 01/09/2030 120 0.99
FaceValue(000’s)
Value(000’s)
$
% ofNet
AssetValue
95 Owl Rock Capital Corp,4.000%, due 30/03/2025 101 0.83
45 Rackspace Technology Global Inc,144A,3.500%, due 15/02/2028 44 0.37
205 Realogy Group LLC / RealogyCo-Issuer Corp, 144A,7.625%, due 15/06/2025 224 1.85
50 Realogy Group LLC / RealogyCo-Issuer Corp, 144A,5.750%, due 15/01/2029 51 0.42
105 Scientific Games International Inc,144A,8.625%, due 01/07/2025 113 0.94
75 Scientific Games International Inc,144A,5.000%, due 15/10/2025 77 0.64
55 Scientific Games International Inc,144A,7.000%, due 15/05/2028 58 0.48
60 Select Medical Corp, 144A,6.250%, due 15/08/2026 64 0.53
35 Sensata Technologies Inc, 144A,4.375%, due 15/02/2030 37 0.31
90 Simmons Foods Inc/SimmonsPrepared Foods Inc/Simmons PetFood Inc/Simmons Feed, 144A,4.625%, due 01/03/2029 91 0.76
115 Sinclair Television Group Inc,144A,5.875%, due 15/03/2026 118 0.98
55 Sinclair Television Group Inc,144A,5.500%, due 01/03/2030 55 0.46
35 TEGNA Inc, 144A,4.625%, due 15/03/2028 36 0.30
100 Travel + Leisure Co, 144A,6.625%, due 31/07/2026 113 0.94
100 Travel + Leisure Co,6.000%, due 01/04/2027 112 0.92
20 Tronox Inc, 144A,6.500%, due 01/05/2025 21 0.18
75 Tronox Inc,6.500%, due 01/05/2025 80 0.67
100 Tronox Inc,6.500%, due 15/04/2026 104 0.86
45 Uber Technologies Inc, 144A,6.250%, due 15/01/2028 48 0.40
105 Vector Group Ltd,5.750%, due 01/02/2029 109 0.90
105 Viasat Inc, 144A,5.625%, due 15/09/2025 107 0.89
115 Vishay Intertechnology Inc,2.250%, due 15/06/2025 128 1.06
205 Vista Outdoor Inc,5.875%, due 01/10/2023 209 1.73
60 Vista Outdoor Inc, 144A,4.500%, due 15/03/2029 60 0.49
6,212 51.51
Uruguay — 1.01% (29 February 2020: 1.08%)
110 Navios South American LogisticsInc / Navios Logistics Finance USInc, 144A,10.750%, due 01/07/2025 122 1.01
Zambia — 2.03% (29 February 2020: 1.86%)
225 First Quantum Minerals Ltd, 144A,6.875%, due 15/10/2027 244 2.03
Total Corporate Bonds and Notes(Cost $10,684) 11,266 93.43
Government Bonds and Notes — 3.35%(29 February 2020: 1.80%)
Turkey — 1.66% (29 February 2020: 0.00%)
200 Turkey Government InternationalBond,5.950%, due 15/01/2031 201 1.66
Ukraine — 1.69% (29 February 2020: 0.00%)
200 Ukraine Government InternationalBond,7.253%, due 15/03/2033 204 1.69
Total Government Bonds and Notes(Cost $399) 405 3.35
^ Not authorised for sale to the public in Hong Kong.The accompanying notes are an integral part of the Financial Statements
180

Legg Mason Global Funds Plc Annual Report 28 February 2021
Legg Mason Brandywine Global High Yield Fund^
Portfolio of Investments as at 28 February 2021 – (continued)
FaceValue(000’s)
Value(000’s)
$
% ofNet
AssetValue
Collective Investment Schemes — 1.79%(29 February 2020: 4.51%)
216 Goldman Sachs US$ LiquidReserves Fund – Institutional Class 216 1.79
Total Collective Investment Schemes(Cost $216) 216 1.79
Total Investments at fair value throughprofit or loss (Cost $11,299) 11,887 98.57
Credit Default Swaps — 2.19%(29 February 2020: 1.08%)
Unrealised appreciation of contracts(see below) 264 2.19
Forward Foreign Currency Contracts — 0.43%(29 February 2020: 0.01%)
Unrealised appreciation of contracts(see below) 52 0.43
Total Financial Assets at fair valuethrough profit or loss 12,203 101.19
Credit Default Swaps — (0.07%)(29 February 2020: 0.00%)
Unrealised depreciation of contracts(see below) (8) (0.07)
FaceValue(000’s)
Value(000’s)
$
% ofNet
AssetValue
Forward Foreign Currency Contracts — (0.25%)(29 February 2020: (1.49%))
Unrealised depreciation of contracts(see below) (30) (0.25)
Total Financial Liabilities at fair valuethrough profit or loss (38) (0.32)
Total Financial Assets and FinancialLiabilities at fair value through profitor loss 12,165 100.87
Liabilities in Excess of Other Assets (106) (0.87)
Total Net Assets $12,059 100.00
– Amounts designated as “–” are either $0, less than$1,000, less than 1,000 shares or less than 0.01%.
144A Securities exempt from registration under Rule 144A ofthe Securities Act of 1933, as amended. Thesesecurities may only be resold, in transactions exemptfrom registration, to qualified institutional buyers. As at28 February 2021, these securities amounted to$4,549,000 or 37.74% of net assets.
* Variable rate security. The interest rate shown reflectsthe rate in effect at 28 February 2021.
ABBREVIATIONS:
Perpetual – A bond with no maturity date. Perpetual bondsare not redeemable but pay a steady stream ofinterest.
CAD – Canadian Dollar
EUR – Euro
Analysis of Total Assets
% ofTotal
Assets
Transferable securities admitted to an officialexchange listing or traded on a regulated market 93.54
Collective investment schemes 1.74
Financial derivative instruments 2.52
Other assets 2.20
Total Assets 100.00
Schedule of Credit Default Swaps
Counterparty Reference EntityBuy/Sell
ProtectionExpiration
Date
NotionalAmount(000’s)
Value(000’s)
Barclays CCO Holdings LLC, 5.000% Sell 20/06/2021 180 $ 3Barclays Sprint Communications Inc, 5.000% Sell 20/06/2021 365 5Barclays T-Mobile USA Inc, 5.000% Sell 20/06/2022 335 20Citi CDX.NA.HY, 5.000% Sell 20/12/2025 555 46Citi CenturyLink Inc, 1.000% Sell 20/06/2023 105 (1)Citi CenturyLink Inc, 1.000% Sell 20/06/2025 115 (7)Citi Cleveland Cliffs Inc, 5.000% Sell 20/06/2021 95 1Citi iTraxx Europe, 5.000% Sell 20/12/2025 1,140 143Citi Occidental Petroleum Corporation, 1.000% Sell 20/06/2021 105 –Goldman Sachs The Goodyear Tire & Rubber Co, 5.000% Sell 20/06/2022 345 19JP Morgan Altice France S.A., 5.000% Sell 20/12/2025 175 14JP Morgan Altice Luxembourg S.A., 5.000% Sell 20/12/2025 180 8JP Morgan United States Steel Corp, 5.000% Sell 20/06/2021 180 2Morgan Stanley Dell Inc, 1.000% Sell 20/06/2022 185 1Morgan Stanley Dell Inc, 1.000% Sell 20/06/2022 280 2
Unrealised Appreciation of Credit Default Swaps (29 February 2020 (000’s): $115) $ 264Unrealised Depreciation of Credit Default Swaps (29 February 2020 (000’s): $–) (8)
Net Appreciation of Credit Default Swaps (29 February 2020 (000’s): $115) $ 256
Schedule of Forward Foreign Currency Contracts
Expiration Date CounterpartyBuy Currency
(000’s)Sell Currency
(000’s)
UnrealisedAppreciation/(Depreciation)of Contracts
(000’s)
10/03/2021 BNY Mellon Buy GBP – Sell CHF – $ –10/03/2021 BNY Mellon Buy CAD 6 Sell CHF 4 –10/03/2021 BNY Mellon Buy GBP 14 Sell EUR 15 –10/03/2021 BNY Mellon Buy CAD 2,523 Sell EUR 1,640 410/03/2021 BNY Mellon Buy CAD 245 Sell GBP 140 (4)10/03/2021 BNY Mellon Buy GBP – Sell SEK – –10/03/2021 BNY Mellon Buy CAD 3 Sell SEK 19 –10/03/2021 BNY Mellon Buy GBP 62 Sell USD 85 210/03/2021 BNY Mellon Buy CAD 11,534 Sell USD 9,023 4112/04/2021 Citi Buy EUR 460 Sell USD 565 (9)22/04/2021 JP Morgan Buy COP 820,000 Sell USD 233 (9)13/05/2021 Citi Buy MXN 4,800 Sell USD 234 (6)19/05/2021 HSBC Buy GBP 150 Sell USD 207 221/05/2021 Citi Buy USD 241 Sell RUB 18,000 321/05/2021 Citi Buy RUB 18,000 Sell USD 241 (2)
Unrealised Appreciation of Forward Foreign Currency Contracts (29 February 2020 (000’s): $2) $ 52Unrealised Depreciation of Forward Foreign Currency Contracts (29 February 2020 (000’s): $(159)) (30)
Net Appreciation of Forward Foreign Currency Contracts (29 February 2020 (000’s): $(157)) $ 22
^ Not authorised for sale to the public in Hong Kong.The accompanying notes are an integral part of the Financial Statements
181
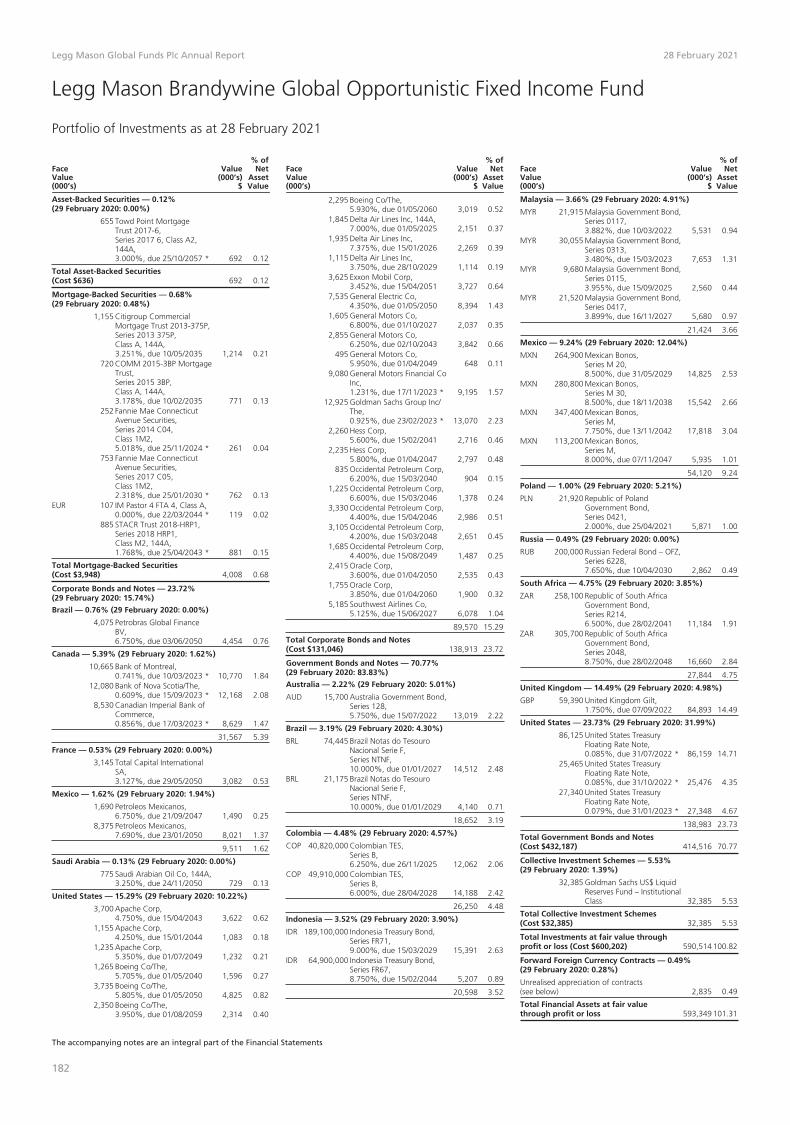
Legg Mason Global Funds Plc Annual Report 28 February 2021
Legg Mason Brandywine Global Opportunistic Fixed Income Fund
Portfolio of Investments as at 28 February 2021
FaceValue(000’s)
Value(000’s)
$
% ofNet
AssetValue
Asset-Backed Securities — 0.12%(29 February 2020: 0.00%)
655 Towd Point MortgageTrust 2017-6,Series 2017 6, Class A2,144A,3.000%, due 25/10/2057 * 692 0.12
Total Asset-Backed Securities(Cost $636) 692 0.12
Mortgage-Backed Securities — 0.68%(29 February 2020: 0.48%)
1,155 Citigroup CommercialMortgage Trust 2013-375P,Series 2013 375P,Class A, 144A,3.251%, due 10/05/2035 1,214 0.21
720 COMM 2015-3BP MortgageTrust,Series 2015 3BP,Class A, 144A,3.178%, due 10/02/2035 771 0.13
252 Fannie Mae ConnecticutAvenue Securities,Series 2014 C04,Class 1M2,5.018%, due 25/11/2024 * 261 0.04
753 Fannie Mae ConnecticutAvenue Securities,Series 2017 C05,Class 1M2,2.318%, due 25/01/2030 * 762 0.13
EUR 107 IM Pastor 4 FTA 4, Class A,0.000%, due 22/03/2044 * 119 0.02
885 STACR Trust 2018-HRP1,Series 2018 HRP1,Class M2, 144A,1.768%, due 25/04/2043 * 881 0.15
Total Mortgage-Backed Securities(Cost $3,948) 4,008 0.68
Corporate Bonds and Notes — 23.72%(29 February 2020: 15.74%)
Brazil — 0.76% (29 February 2020: 0.00%)
4,075 Petrobras Global FinanceBV,6.750%, due 03/06/2050 4,454 0.76
Canada — 5.39% (29 February 2020: 1.62%)
10,665 Bank of Montreal,0.741%, due 10/03/2023 * 10,770 1.84
12,080 Bank of Nova Scotia/The,0.609%, due 15/09/2023 * 12,168 2.08
8,530 Canadian Imperial Bank ofCommerce,0.856%, due 17/03/2023 * 8,629 1.47
31,567 5.39
France — 0.53% (29 February 2020: 0.00%)
3,145 Total Capital InternationalSA,3.127%, due 29/05/2050 3,082 0.53
Mexico — 1.62% (29 February 2020: 1.94%)
1,690 Petroleos Mexicanos,6.750%, due 21/09/2047 1,490 0.25
8,375 Petroleos Mexicanos,7.690%, due 23/01/2050 8,021 1.37
9,511 1.62
Saudi Arabia — 0.13% (29 February 2020: 0.00%)
775 Saudi Arabian Oil Co, 144A,3.250%, due 24/11/2050 729 0.13
United States — 15.29% (29 February 2020: 10.22%)
3,700 Apache Corp,4.750%, due 15/04/2043 3,622 0.62
1,155 Apache Corp,4.250%, due 15/01/2044 1,083 0.18
1,235 Apache Corp,5.350%, due 01/07/2049 1,232 0.21
1,265 Boeing Co/The,5.705%, due 01/05/2040 1,596 0.27
3,735 Boeing Co/The,5.805%, due 01/05/2050 4,825 0.82
2,350 Boeing Co/The,3.950%, due 01/08/2059 2,314 0.40
FaceValue(000’s)
Value(000’s)
$
% ofNet
AssetValue
2,295 Boeing Co/The,5.930%, due 01/05/2060 3,019 0.52
1,845 Delta Air Lines Inc, 144A,7.000%, due 01/05/2025 2,151 0.37
1,935 Delta Air Lines Inc,7.375%, due 15/01/2026 2,269 0.39
1,115 Delta Air Lines Inc,3.750%, due 28/10/2029 1,114 0.19
3,625 Exxon Mobil Corp,3.452%, due 15/04/2051 3,727 0.64
7,535 General Electric Co,4.350%, due 01/05/2050 8,394 1.43
1,605 General Motors Co,6.800%, due 01/10/2027 2,037 0.35
2,855 General Motors Co,6.250%, due 02/10/2043 3,842 0.66
495 General Motors Co,5.950%, due 01/04/2049 648 0.11
9,080 General Motors Financial CoInc,1.231%, due 17/11/2023 * 9,195 1.57
12,925 Goldman Sachs Group Inc/The,0.925%, due 23/02/2023 * 13,070 2.23
2,260 Hess Corp,5.600%, due 15/02/2041 2,716 0.46
2,235 Hess Corp,5.800%, due 01/04/2047 2,797 0.48
835 Occidental Petroleum Corp,6.200%, due 15/03/2040 904 0.15
1,225 Occidental Petroleum Corp,6.600%, due 15/03/2046 1,378 0.24
3,330 Occidental Petroleum Corp,4.400%, due 15/04/2046 2,986 0.51
3,105 Occidental Petroleum Corp,4.200%, due 15/03/2048 2,651 0.45
1,685 Occidental Petroleum Corp,4.400%, due 15/08/2049 1,487 0.25
2,415 Oracle Corp,3.600%, due 01/04/2050 2,535 0.43
1,755 Oracle Corp,3.850%, due 01/04/2060 1,900 0.32
5,185 Southwest Airlines Co,5.125%, due 15/06/2027 6,078 1.04
89,570 15.29
Total Corporate Bonds and Notes(Cost $131,046) 138,913 23.72
Government Bonds and Notes — 70.77%(29 February 2020: 83.83%)
Australia — 2.22% (29 February 2020: 5.01%)
AUD 15,700 Australia Government Bond,Series 128,5.750%, due 15/07/2022 13,019 2.22
Brazil — 3.19% (29 February 2020: 4.30%)
BRL 74,445 Brazil Notas do TesouroNacional Serie F,Series NTNF,10.000%, due 01/01/2027 14,512 2.48
BRL 21,175 Brazil Notas do TesouroNacional Serie F,Series NTNF,10.000%, due 01/01/2029 4,140 0.71
18,652 3.19
Colombia — 4.48% (29 February 2020: 4.57%)
COP 40,820,000 Colombian TES,Series B,6.250%, due 26/11/2025 12,062 2.06
COP 49,910,000 Colombian TES,Series B,6.000%, due 28/04/2028 14,188 2.42
26,250 4.48
Indonesia — 3.52% (29 February 2020: 3.90%)
IDR 189,100,000 Indonesia Treasury Bond,Series FR71,9.000%, due 15/03/2029 15,391 2.63
IDR 64,900,000 Indonesia Treasury Bond,Series FR67,8.750%, due 15/02/2044 5,207 0.89
20,598 3.52
FaceValue(000’s)
Value(000’s)
$
% ofNet
AssetValue
Malaysia — 3.66% (29 February 2020: 4.91%)
MYR 21,915 Malaysia Government Bond,Series 0117,3.882%, due 10/03/2022 5,531 0.94
MYR 30,055 Malaysia Government Bond,Series 0313,3.480%, due 15/03/2023 7,653 1.31
MYR 9,680 Malaysia Government Bond,Series 0115,3.955%, due 15/09/2025 2,560 0.44
MYR 21,520 Malaysia Government Bond,Series 0417,3.899%, due 16/11/2027 5,680 0.97
21,424 3.66
Mexico — 9.24% (29 February 2020: 12.04%)
MXN 264,900 Mexican Bonos,Series M 20,8.500%, due 31/05/2029 14,825 2.53
MXN 280,800 Mexican Bonos,Series M 30,8.500%, due 18/11/2038 15,542 2.66
MXN 347,400 Mexican Bonos,Series M,7.750%, due 13/11/2042 17,818 3.04
MXN 113,200 Mexican Bonos,Series M,8.000%, due 07/11/2047 5,935 1.01
54,120 9.24
Poland — 1.00% (29 February 2020: 5.21%)
PLN 21,920 Republic of PolandGovernment Bond,Series 0421,2.000%, due 25/04/2021 5,871 1.00
Russia — 0.49% (29 February 2020: 0.00%)
RUB 200,000 Russian Federal Bond – OFZ,Series 6228,7.650%, due 10/04/2030 2,862 0.49
South Africa — 4.75% (29 February 2020: 3.85%)
ZAR 258,100 Republic of South AfricaGovernment Bond,Series R214,6.500%, due 28/02/2041 11,184 1.91
ZAR 305,700 Republic of South AfricaGovernment Bond,Series 2048,8.750%, due 28/02/2048 16,660 2.84
27,844 4.75
United Kingdom — 14.49% (29 February 2020: 4.98%)
GBP 59,390 United Kingdom Gilt,1.750%, due 07/09/2022 84,893 14.49
United States — 23.73% (29 February 2020: 31.99%)
86,125 United States TreasuryFloating Rate Note,0.085%, due 31/07/2022 * 86,159 14.71
25,465 United States TreasuryFloating Rate Note,0.085%, due 31/10/2022 * 25,476 4.35
27,340 United States TreasuryFloating Rate Note,0.079%, due 31/01/2023 * 27,348 4.67
138,983 23.73
Total Government Bonds and Notes(Cost $432,187) 414,516 70.77
Collective Investment Schemes — 5.53%(29 February 2020: 1.39%)
32,385 Goldman Sachs US$ LiquidReserves Fund – InstitutionalClass 32,385 5.53
Total Collective Investment Schemes(Cost $32,385) 32,385 5.53
Total Investments at fair value throughprofit or loss (Cost $600,202) 590,514 100.82
Forward Foreign Currency Contracts — 0.49%(29 February 2020: 0.28%)
Unrealised appreciation of contracts(see below) 2,835 0.49
Total Financial Assets at fair valuethrough profit or loss 593,349 101.31
The accompanying notes are an integral part of the Financial Statements
182

Legg Mason Global Funds Plc Annual Report 28 February 2021
Legg Mason Brandywine Global Opportunistic Fixed Income Fund
Portfolio of Investments as at 28 February 2021 – (continued)
FaceValue(000’s)
Value(000’s)
$
% ofNet
AssetValue
Forward Foreign Currency Contracts — (0.68%)(29 February 2020: (3.00%))
Unrealised depreciation of contracts(see below) (3,975) (0.68)
Futures — (0.12%) (29 February 2020: 0.00%)
Unrealised depreciation of contracts(see below) (723) (0.12)
Total Financial Liabilities at fair valuethrough profit or loss (4,698) (0.80)
Total Financial Assets and FinancialLiabilities at fair value through profitor loss 588,651 100.51
Liabilities in Excess of Other Assets (2,930) (0.51)
Total Net Assets $585,721 100.00
– Amounts designated as “–” are either $0, less than$1,000, less than 1,000 shares or less than 0.01%.
144A Securities exempt from registration under Rule 144A ofthe Securities Act of 1933, as amended. These
securities may only be resold, in transactions exemptfrom registration, to qualified institutional buyers. As at28 February 2021, these securities amounted to$6,438,000 or 1.11% of net assets.
* Variable rate security. The interest rate shown reflectsthe rate in effect at 28 February 2021.
ABBREVIATIONS:
AUD – Australian Dollar
BRL – Brazilian Real
COP – Colombia Peso
EUR – Euro
GBP – British Pound
IDR – Indonesian Rupiah
MXN – Mexican Peso
MYR – Malaysian Ringgit
PLN – Polish Zloty
RUB – Russian Ruble
ZAR – South Africa Rand
Analysis of Total Assets
% ofTotal
Assets
Transferable securities admitted to an officialexchange listing or traded on a regulated market 91.90
Collective investment schemes 5.33
Financial derivative instruments 0.47
Other assets 2.30
Total Assets 100.00
Schedule of Forward Foreign Currency Contracts
Expiration Date CounterpartyBuy Currency
(000’s)Sell Currency
(000’s)
UnrealisedAppreciation/(Depreciation)of Contracts
(000’s)
05/03/2021 HSBC Buy CLP 3,270,000 Sell USD 4,304 $ 21409/03/2021 Citi Buy NOK 166,300 Sell USD 18,881 29909/03/2021 JP Morgan Buy USD 1,231 Sell NOK 10,700 (3)10/03/2021 BNY Mellon Buy USD 20 Sell AUD 27 –10/03/2021 BNY Mellon Buy NZD 7,144 Sell AUD 6,745 (28)10/03/2021 BNY Mellon Buy GBP 65 Sell AUD 117 110/03/2021 BNY Mellon Buy NZD 25 Sell AUD 23 –10/03/2021 BNY Mellon Buy USD 15 Sell CAD 19 –10/03/2021 BNY Mellon Buy NZD 5,151 Sell CAD 4,745 (7)10/03/2021 BNY Mellon Buy NZD 20 Sell CAD 19 –10/03/2021 BNY Mellon Buy GBP 47 Sell CAD 82 110/03/2021 BNY Mellon Buy NZD 1,359 Sell DKK 6,058 (1)10/03/2021 BNY Mellon Buy USD 4 Sell DKK 24 –10/03/2021 BNY Mellon Buy GBP 13 Sell DKK 104 –10/03/2021 BNY Mellon Buy NZD 5 Sell DKK 23 –10/03/2021 BNY Mellon Buy NZD 108,773 Sell EUR 65,173 (63)10/03/2021 BNY Mellon Buy NZD 413 Sell EUR 247 110/03/2021 BNY Mellon Buy GBP 993 Sell EUR 1,126 2510/03/2021 BNY Mellon Buy USD 313 Sell EUR 260 (1)10/03/2021 BNY Mellon Buy USD 51 Sell GBP 37 (1)10/03/2021 BNY Mellon Buy NZD 17,829 Sell GBP 9,419 (242)10/03/2021 BNY Mellon Buy USD 3 Sell ILS 11 –10/03/2021 BNY Mellon Buy NZD 1,205 Sell ILS 2,871 410/03/2021 BNY Mellon Buy GBP 11 Sell ILS 49 –10/03/2021 BNY Mellon Buy USD 157 Sell JPY 16,538 210/03/2021 BNY Mellon Buy NZD 54,943 Sell JPY 4,163,383 63510/03/2021 BNY Mellon Buy GBP 500 Sell JPY 71,635 2410/03/2021 BNY Mellon Buy USD 6 Sell MXN 125 –10/03/2021 BNY Mellon Buy NZD 2,157 Sell MXN 31,540 5310/03/2021 BNY Mellon Buy GBP 20 Sell MXN 542 110/03/2021 BNY Mellon Buy USD 2 Sell NOK 15 –10/03/2021 BNY Mellon Buy NZD 602 Sell NOK 3,732 510/03/2021 BNY Mellon Buy GBP 5 Sell NOK 64 –10/03/2021 BNY Mellon Buy JPY 1,346 Sell NZD 17 –10/03/2021 BNY Mellon Buy GBP 25 Sell NZD 48 –10/03/2021 BNY Mellon Buy GBP 29 Sell NZD 56 –10/03/2021 BNY Mellon Buy AUD 39 Sell NZD 42 –10/03/2021 BNY Mellon Buy DKK 30 Sell NZD 7 –10/03/2021 BNY Mellon Buy DKK 5 Sell NZD 1 –10/03/2021 BNY Mellon Buy SEK 31 Sell NZD 5 –10/03/2021 BNY Mellon Buy ILS 15 Sell NZD 7 –10/03/2021 BNY Mellon Buy CAD 24 Sell NZD 26 –10/03/2021 BNY Mellon Buy NOK 22 Sell NZD 3 –10/03/2021 BNY Mellon Buy MXN 169 Sell NZD 12 –10/03/2021 BNY Mellon Buy MXN 15 Sell NZD 1 –10/03/2021 BNY Mellon Buy CAD 4 Sell NZD 4 –10/03/2021 BNY Mellon Buy EUR 52 Sell NZD 86 110/03/2021 BNY Mellon Buy EUR 328 Sell NZD 551 (2)
The accompanying notes are an integral part of the Financial Statements
183

Legg Mason Global Funds Plc Annual Report 28 February 2021
Legg Mason Brandywine Global Opportunistic Fixed Income Fund
Portfolio of Investments as at 28 February 2021 – (continued)
Schedule of Forward Foreign Currency Contracts – (continued)
Expiration Date CounterpartyBuy Currency
(000’s)Sell Currency
(000’s)
UnrealisedAppreciation/(Depreciation)of Contracts
(000’s)
10/03/2021 BNY Mellon Buy USD 410 Sell NZD 568 $ –10/03/2021 BNY Mellon Buy USD 65 Sell NZD 89 210/03/2021 BNY Mellon Buy PLN 2 Sell NZD 1 –10/03/2021 BNY Mellon Buy ILS 1 Sell NZD – –10/03/2021 BNY Mellon Buy PLN 25 Sell NZD 9 –10/03/2021 BNY Mellon Buy SGD 1 Sell NZD 1 –10/03/2021 BNY Mellon Buy JPY 23,020 Sell NZD 303 (3)10/03/2021 BNY Mellon Buy SGD 5 Sell NZD 6 –10/03/2021 BNY Mellon Buy USD 5 Sell PLN 18 –10/03/2021 BNY Mellon Buy NZD 1,713 Sell PLN 4,610 710/03/2021 BNY Mellon Buy GBP 15 Sell PLN 79 110/03/2021 BNY Mellon Buy GBP 8 Sell SEK 92 –10/03/2021 BNY Mellon Buy NZD 889 Sell SEK 5,383 410/03/2021 BNY Mellon Buy USD 3 Sell SEK 21 –10/03/2021 BNY Mellon Buy NZD 1,141 Sell SGD 1,097 210/03/2021 BNY Mellon Buy GBP 10 Sell SGD 19 –10/03/2021 BNY Mellon Buy USD 3 Sell SGD 4 –10/03/2021 BNY Mellon Buy NZD 112,261 Sell USD 80,921 19410/03/2021 BNY Mellon Buy GBP 1,023 Sell USD 1,397 3010/03/2021 BNY Mellon Buy NZD 319 Sell USD 231 –11/03/2021 HSBC Buy KRW 13,160,000 Sell USD 12,104 (405)15/03/2021 BNY Mellon Buy USD – Sell GBP – –15/03/2021 BNY Mellon Buy EUR 1 Sell USD 1 –15/03/2021 BNY Mellon Buy GBP 58 Sell USD 80 212/04/2021 Citi Buy PLN 69,880 Sell USD 19,058 (403)13/04/2021 Barclays Buy MYR 9,300 Sell USD 2,292 (8)14/04/2021 HSBC Buy BRL 41,320 Sell USD 7,515 (155)15/04/2021 Citi Buy KRW 8,020,000 Sell USD 7,306 (189)16/04/2021 HSBC Buy CLP 5,500,000 Sell USD 7,589 1520/04/2021 JP Morgan Buy CZK 177,100 Sell USD 8,244 (78)27/04/2021 Citi Buy PLN 41,760 Sell USD 11,207 (58)28/04/2021 HSBC Buy HUF 2,330,000 Sell USD 7,918 (168)29/04/2021 Citi Buy KRW 16,460,000 Sell USD 14,934 (324)30/04/2021 HSBC Buy CLP 8,540,000 Sell USD 11,918 (110)10/05/2021 HSBC Buy HUF 4,080,000 Sell USD 13,706 (138)10/05/2021 HSBC Buy INR 1,251,000 Sell USD 16,918 (169)12/05/2021 Citi Buy RUB 653,000 Sell USD 8,543 12712/05/2021 HSBC Buy CLP 8,370,000 Sell USD 11,930 (356)12/05/2021 HSBC Buy USD 27,976 Sell ZAR 418,000 60813/05/2021 Citi Buy MXN 173,200 Sell USD 8,435 (222)14/05/2021 Goldman Sachs Buy CAD 22,630 Sell USD 17,618 16620/05/2021 JP Morgan Buy CZK 299,400 Sell USD 14,083 (277)21/05/2021 Citi Buy RUB 981,000 Sell USD 13,122 (109)25/05/2021 Barclays Buy USD 13,502 Sell AUD 17,010 41125/05/2021 JP Morgan Buy AUD 21,870 Sell USD 17,216 (385)28/05/2021 HSBC Buy CLP 3,760,000 Sell USD 5,269 (70)
Unrealised Appreciation of Forward Foreign Currency Contracts (29 February 2020 (000’s): $1,529) $ 2,835Unrealised Depreciation of Forward Foreign Currency Contracts (29 February 2020 (000’s): $(16,435)) (3,975)
Net Depreciation of Forward Foreign Currency Contracts (29 February 2020 (000’s): $(14,906)) $ (1,140)
CounterpartyNominal
Value
NotionalValue(000’s)
UnrealisedAppreciation/(Depreciation)of Contracts
(000’s)
U.S. Ultra Bond (CBT) June 2021 Morgan Stanley (246) $(46,509) $ (723)
Unrealised Appreciation of Futures Contracts (29 February 2020 (000’s): $–) $ –
Unrealised Depreciation of Futures Contracts (29 February 2020 (000’s): $–) (723)
Net Depreciation of Futures Contracts (29 February 2020 (000’s): $–) $ (723)
The accompanying notes are an integral part of the Financial Statements
184

Legg Mason Global Funds Plc Annual Report 28 February 2021
Legg Mason Brandywine Global Sovereign Credit Fund^�
Portfolio of Investments as at 28 February 2021
Value(000’s)
$
Forward Foreign Currency Contracts — 0.00%(29 February 2020: 0.93%)
Unrealised appreciation of contracts (see below) 926
Total Financial Assets at fair value throughprofit or loss 926
Forward Foreign Currency Contracts — 0.00%(29 February 2020: (2.94%))
Unrealised depreciation of contracts (see below) (1,932)
Total Financial Liabilities at fair value throughprofit or loss (1,932)
Total Financial Assets and Financial Liabilities atfair value through profit or loss (1,006)
Other Assets in Excess of Liabilities 1,006
Total Net Assets $ –
– Amounts designated as “–” are either $0, less than$1,000, less than 1,000 shares or less than 0.01%.
� Effective 25 February 2021, Legg Mason BrandywineGlobal Sovereign Credit Fund^ ceased trading.
Analysis of Total Assets
% ofTotal
Assets
Financial derivative instruments 1.07
Other assets 98.93
Total Assets 100.00
Schedule of Forward Foreign Currency Contracts
Expiration Date CounterpartyBuy Currency
(000’s)Sell Currency
(000’s)
UnrealisedAppreciation/
(Depreciation)of Contracts
(000’s)
01/03/2021 BNY Mellon Buy EUR 746 Sell USD 908 $ (8)02/03/2021 BNY Mellon Buy USD 9,023 Sell AUD 11,461 20402/03/2021 BNY Mellon Buy EUR 194 Sell AUD 307 (1)02/03/2021 BNY Mellon Buy CAD 891 Sell AUD 898 902/03/2021 BNY Mellon Buy EUR 9,304 Sell AUD 14,388 15502/03/2021 BNY Mellon Buy GBP 2,176 Sell AUD 3,874 5102/03/2021 BNY Mellon Buy JPY 872,601 Sell AUD 10,442 15102/03/2021 BNY Mellon Buy NOK 488 Sell AUD 73 –02/03/2021 BNY Mellon Buy DKK 854 Sell AUD 178 202/03/2021 BNY Mellon Buy NZD 133 Sell AUD 125 –02/03/2021 BNY Mellon Buy HKD 64 Sell AUD 10 –02/03/2021 BNY Mellon Buy SEK 818 Sell AUD 125 –02/03/2021 BNY Mellon Buy CHF 97 Sell AUD 136 202/03/2021 BNY Mellon Buy SGD 163 Sell AUD 157 202/03/2021 BNY Mellon Buy EUR 192 Sell CAD 295 (1)02/03/2021 BNY Mellon Buy AUD 14 Sell CAD 14 –02/03/2021 BNY Mellon Buy AUD 897 Sell CAD 876 102/03/2021 BNY Mellon Buy AUD 5 Sell CHF 4 –02/03/2021 BNY Mellon Buy AUD 136 Sell CHF 93 202/03/2021 BNY Mellon Buy EUR 29 Sell CHF 31 102/03/2021 BNY Mellon Buy EUR – Sell CHF – –02/03/2021 BNY Mellon Buy EUR 38 Sell DKK 282 –02/03/2021 BNY Mellon Buy AUD 177 Sell DKK 837 102/03/2021 BNY Mellon Buy AUD 3 Sell DKK 16 –02/03/2021 BNY Mellon Buy CAD 188 Sell EUR 123 –02/03/2021 BNY Mellon Buy DKK 112 Sell EUR 15 –02/03/2021 BNY Mellon Buy JPY 9,611 Sell EUR 75 –02/03/2021 BNY Mellon Buy CHF 31 Sell EUR 28 –02/03/2021 BNY Mellon Buy DKK 170 Sell EUR 23 –02/03/2021 BNY Mellon Buy AUD 14,552 Sell EUR 9,240 4902/03/2021 BNY Mellon Buy CHF 1 Sell EUR 1 –02/03/2021 BNY Mellon Buy HKD 21 Sell EUR 2 –02/03/2021 BNY Mellon Buy CAD 108 Sell EUR 70 –02/03/2021 BNY Mellon Buy AUD 403 Sell EUR 261 (4)02/03/2021 BNY Mellon Buy USD 98 Sell EUR 81 102/03/2021 BNY Mellon Buy USD 2,594 Sell EUR 2,159 (13)02/03/2021 BNY Mellon Buy SGD – Sell EUR – –02/03/2021 BNY Mellon Buy SGD 54 Sell EUR 33 –02/03/2021 BNY Mellon Buy SEK 271 Sell EUR 27 –02/03/2021 BNY Mellon Buy NZD 27 Sell EUR 16 –02/03/2021 BNY Mellon Buy NZD 18 Sell EUR 11 –02/03/2021 BNY Mellon Buy JPY 273,199 Sell EUR 2,159 (43)02/03/2021 BNY Mellon Buy HKD 1 Sell EUR – –02/03/2021 BNY Mellon Buy GBP 702 Sell EUR 801 1102/03/2021 BNY Mellon Buy GBP 30 Sell EUR 35 –02/03/2021 BNY Mellon Buy NOK 161 Sell EUR 16 –02/03/2021 BNY Mellon Buy AUD 3,885 Sell GBP 2,176 (42)02/03/2021 BNY Mellon Buy EUR 829 Sell GBP 732 (19)02/03/2021 BNY Mellon Buy AUD 10 Sell HKD 62 –02/03/2021 BNY Mellon Buy EUR 2 Sell HKD 21 –02/03/2021 BNY Mellon Buy AUD – Sell HKD 2 –02/03/2021 BNY Mellon Buy EUR – Sell HKD – –
^ Not authorised for sale to the public in Hong Kong.The accompanying notes are an integral part of the Financial Statements
185

Legg Mason Global Funds Plc Annual Report 28 February 2021
Legg Mason Brandywine Global Sovereign Credit Fund^
Portfolio of Investments as at 28 February 2021 – (continued)
Schedule of Forward Foreign Currency Contracts – (continued)
Expiration Date CounterpartyBuy Currency
(000’s)Sell Currency
(000’s)
UnrealisedAppreciation/
(Depreciation)of Contracts
(000’s)
02/03/2021 BNY Mellon Buy EUR 2 Sell JPY 222 $ –02/03/2021 BNY Mellon Buy AUD 10,427 Sell JPY 836,601 17502/03/2021 BNY Mellon Buy AUD 430 Sell JPY 35,999 (6)02/03/2021 BNY Mellon Buy EUR 2,236 Sell JPY 282,587 4602/03/2021 BNY Mellon Buy AUD 1 Sell NOK 10 –02/03/2021 BNY Mellon Buy EUR 16 Sell NOK 161 –02/03/2021 BNY Mellon Buy AUD 73 Sell NOK 479 102/03/2021 BNY Mellon Buy AUD 125 Sell NZD 133 102/03/2021 BNY Mellon Buy AUD 1 Sell NZD 1 –02/03/2021 BNY Mellon Buy EUR – Sell NZD – –02/03/2021 BNY Mellon Buy EUR 27 Sell NZD 45 –02/03/2021 BNY Mellon Buy AUD 2 Sell SEK 14 –02/03/2021 BNY Mellon Buy EUR 27 Sell SEK 271 –02/03/2021 BNY Mellon Buy AUD 125 Sell SEK 804 102/03/2021 BNY Mellon Buy AUD 156 Sell SGD 159 102/03/2021 BNY Mellon Buy EUR 33 Sell SGD 54 –02/03/2021 BNY Mellon Buy EUR – Sell SGD – –02/03/2021 BNY Mellon Buy AUD 4 Sell SGD 4 –02/03/2021 BNY Mellon Buy AUD 101,974 Sell USD 80,259 (1,795)02/03/2021 BNY Mellon Buy AUD 10,427 Sell USD 7,970 5302/03/2021 BNY Mellon Buy EUR 14 Sell USD 17 –02/03/2021 BNY Mellon Buy EUR 2,232 Sell USD 2,687 6
Unrealised Appreciation of Forward Foreign Currency Contracts (29 February 2020 (000’s): $14,764) $ 926Unrealised Depreciation of Forward Foreign Currency Contracts (29 February 2020 (000’s): $(46,726)) (1,932)
Net Depreciation of Forward Foreign Currency Contracts (29 February 2020 (000’s): $(31,962)) $ (1,006)
^ Not authorised for sale to the public in Hong Kong.The accompanying notes are an integral part of the Financial Statements
186

Legg Mason Global Funds Plc Annual Report 28 February 2021
Legg Mason Brandywine Global Income Optimiser Fund^
Portfolio of Investments as at 28 February 2021
FaceValue(000’s)
Value(000’s)
$
% ofNet
AssetValue
Asset-Backed Securities — 1.55%(29 February 2020: 11.96%)
775 CWABS Revolving HomeEquity Loan TrustSeries 2004-I, Series 2004 I,Class A,0.397%, due 15/02/2034 * 771 0.17
529 Merrill Lynch MortgageInvestors TrustSeries 2006-HE1, Series 2006HE1, Class M1,0.703%, due 25/12/2036 * 528 0.12
1,319 Towd Point Mortgage Trust2017-4,Series 2017 4, Class A1,144A,2.750%, due 25/06/2057 * 1,364 0.30
223 Towd Point Mortgage Trust2018-3,Series 2018 3, Class A1,144A,3.750%, due 25/05/2058 * 237 0.05
4,155 Tryon Park CLO Ltd,Series 2013 1A, Class DR,144A,6.191%, due 15/04/2029 * 4,138 0.91
Total Asset-Backed Securities(Cost $6,949) 7,038 1.55
Mortgage-Backed Securities — 10.60%(29 February 2020: 10.58%)
2,455 Connecticut Avenue SecuritiesTrust 2019-R01,Series 2019 R01, Class 2B1,144A,4.468%, due 25/07/2031 * 2,511 0.55
5,000 Connecticut Avenue SecuritiesTrust 2019-R03,Series 2019 R03, Class 1B1,144A,4.218%, due 25/09/2031 * 5,160 1.14
1,893 Connecticut Avenue SecuritiesTrust 2019-R04,Series 2019 R04, Class 2M2,144A,2.218%, due 25/06/2039 * 1,900 0.42
3,380 Connecticut Avenue SecuritiesTrust 2019-R05,Series 2019 R05, Class 1B1,144A,4.218%, due 25/07/2039 * 3,394 0.75
950 Connecticut Avenue SecuritiesTrust 2019-R07,Series 2019 R07, Class 1B1,144A,3.518%, due 25/10/2039 * 933 0.21
3,527 Fannie Mae ConnecticutAvenue Securities,Series 2017 C06, Class 2M2,2.918%, due 25/02/2030 * 3,588 0.79
11,000 Fannie Mae ConnecticutAvenue Securities,Series 2018 C03,Class 1M2C,2.268%, due 25/10/2030 * 10,964 2.42
2,056 Fannie Mae ConnecticutAvenue Securities,Series 2018 C05, Class 1M2,2.468%, due 25/01/2031 * 2,064 0.45
2,245 Freddie Mac STACR REMICTrust 2020-DNA3,Series 2020 DNA3, Class B1,144A,5.218%, due 25/06/2050 * 2,351 0.52
945 Freddie Mac STACR REMICTrust 2020-HQA3,Series 2020 HQA3, Class M2,144A,3.718%, due 25/07/2050 * 961 0.21
2,760 Freddie Mac STACR REMICTrust 2020-HQA4,Series 2020 HQA4, Class B1,144A,5.368%, due 25/09/2050 * 2,896 0.64
FaceValue(000’s)
Value(000’s)
$
% ofNet
AssetValue
674 Freddie Mac STACR Trust2019-DNA2,Series 2019 DNA2,Class M2, 144A,2.568%, due 25/03/2049 * 681 0.15
678 Freddie Mac STACR Trust2019-HQA2,Series 2019 HQA2,Class M2, 144A,2.168%, due 25/04/2049 * 681 0.15
10,016 STACR Trust 2018-DNA3,Series 2018 DNA3,Class M2B, 144A,2.218%, due 25/09/2048 * 9,980 2.20
Total Mortgage-Backed Securities(Cost $47,712) 48,064 10.60
Corporate Bonds and Notes — 69.16%(29 February 2020: 65.12%)
Brazil — 2.84% (29 February 2020: 0.00%)
1,880 Amaggi LuxembourgInternational Sarl,5.250%, due 28/01/2028 1,958 0.43
1,385 Banco do Brasil SA/Cayman,144A,6.250%, Perpetual * 1,362 0.30
1,205 BRF SA, 144A,3.950%, due 22/05/2023 1,255 0.28
525 CSN Inova Ventures, 144A,6.750%, due 28/01/2028 568 0.13
1,020 CSN Resources SA, 144A,7.625%, due 17/04/2026 1,106 0.24
1,335 Embraer Netherlands FinanceBV, 144A,6.950%, due 17/01/2028 1,499 0.33
1,505 Itau Unibanco Holding SA/Cayman Island,6.125%, Perpetual * 1,512 0.33
1,510 MARB BondCo Plc,3.950%, due 29/01/2031 1,467 0.32
2,008 Petrobras Global Finance BV,5.600%, due 03/01/2031 2,169 0.48
12,896 2.84
Canada — 3.14% (29 February 2020: 3.15%)
CAD 4,550 Air Canada,4.750%, due 06/10/2023 3,645 0.80
2,935 Air Canada 2020-2 Class APass Through Trust, 144A,5.250%, due 01/04/2029 3,150 0.69
1,110 Canadian Imperial Bank ofCommerce,0.856%, due 17/03/2023 * 1,123 0.25
1,555 Methanex Corp,5.125%, due 15/10/2027 1,610 0.36
4,385 Taseko Mines Ltd, 144A,7.000%, due 15/02/2026 4,479 0.99
200 Teck Resources Ltd,3.900%, due 15/07/2030 218 0.05
14,225 3.14
Chile — 0.80% (29 February 2020: 0.00%)
2,435 Kenbourne Invest SA,6.875%, due 26/11/2024 2,630 0.58
955 Kenbourne Invest SA,4.700%, due 22/01/2028 997 0.22
3,627 0.80
China — 2.15% (29 February 2020: 0.00%)
2,830 Alibaba Group Holding Ltd,3.400%, due 06/12/2027 3,100 0.68
1,060 JD.com Inc,3.375%, due 14/01/2030 1,134 0.25
340 Tencent Music EntertainmentGroup,2.000%, due 03/09/2030 328 0.07
1,585 Weibo Corp,3.375%, due 08/07/2030 1,615 0.36
3,505 Xiaomi Best TimeInternational Ltd, 144A,3.375%, due 29/04/2030 3,573 0.79
9,750 2.15
FaceValue(000’s)
Value(000’s)
$
% ofNet
AssetValue
Germany — 0.07% (29 February 2020: 0.46%)
320 Volkswagen Group ofAmerica Finance LLC,144A,2.700%, due 26/09/2022 331 0.07
Israel — 0.62% (29 February 2020: 0.31%)
2,590 Teva PharmaceuticalFinance Netherlands III BV,7.125%, due 31/01/2025 2,808 0.62
Japan — 0.97% (29 February 2020: 0.00%)
3,985 Nissan Motor Co Ltd,144A,4.345%, due 17/09/2027 4,414 0.97
Luxembourg — 0.82% (29 February 2020: 0.00%)
3,770 Altice France Holding SA,144A,6.000%, due 15/02/2028 3,697 0.82
Mexico — 3.02% (29 February 2020: 0.00%)
8,035 Petroleos Mexicanos,5.350%, due 12/02/2028 7,810 1.73
6,610 Petroleos Mexicanos,6.950%, due 28/01/2060 5,858 1.29
13,668 3.02
Netherlands — 0.09% (29 February 2020: 0.00%)
390 NXP BV / NXP Funding LLC /NXP USA Inc, 144A,3.400%, due 01/05/2030 425 0.09
Panama — 0.82% (29 February 2020: 0.00%)
3,495 AES Panama GenerationHoldings SRL,4.375%, due 31/05/2030 3,707 0.82
Supranational — 1.90% (29 February 2020: 0.00%)
RUB 222,000 International Bank forReconstruction &Development,4.250%, due 22/01/2026 2,906 0.64
MXN 61,000 International Bank forReconstruction &Development,4.250%, due 22/01/2026 2,785 0.62
BRL 17,100 International Bank forReconstruction &Development,5.000%, due 22/01/2026 2,917 0.64
8,608 1.90
United Kingdom — 0.46% (29 February 2020: 2.13%)
GBP 1,075 Nationwide BuildingSociety,5.750%, Perpetual * 1,668 0.37
400 Natwest Group Plc,2.359%, due 22/05/2024 * 414 0.09
2,082 0.46
United States — 50.60% (29 February 2020: 55.99%)
170 AES Corp/The, 144A,3.300%, due 15/07/2025 182 0.04
1,365 AES Corp/The, 144A,2.450%, due 15/01/2031 1,342 0.30
905 Air Lease Corp,2.250%, due 15/01/2023 930 0.21
4,827 Alaska Airlines 2020-1Class A Pass Through Trust,144A,4.800%, due 15/08/2027 5,345 1.18
1,528 Amdocs Ltd,2.538%, due 15/06/2030 1,546 0.34
975 AmeriGas Partners LP /AmeriGas Finance Corp,5.625%, due 20/05/2024 1,081 0.24
915 Amgen Inc,2.300%, due 25/02/2031 924 0.20
2,805 Antero Resources Corp,5.625%, due 01/06/2023 2,812 0.62
4,195 Antero Resources Corp,5.000%, due 01/03/2025 4,178 0.92
1,305 Antero Resources Corp,144A,8.375%, due 15/07/2026 1,430 0.32
2,803 Apache Corp,4.875%, due 15/11/2027 2,942 0.65
^ Not authorised for sale to the public in Hong Kong.The accompanying notes are an integral part of the Financial Statements
187

Legg Mason Global Funds Plc Annual Report 28 February 2021
Legg Mason Brandywine Global Income Optimiser Fund^
Portfolio of Investments as at 28 February 2021 – (continued)
FaceValue(000’s)
Value(000’s)
$
% ofNet
AssetValue
Corporate Bonds and Notes — (continued)
United States — (continued)
232 Ardagh Packaging FinancePlc / Ardagh Holdings USAInc, 144A,6.000%, due 15/02/2025 240 0.05
930 Ardagh Packaging FinancePlc / Ardagh Holdings USAInc, 144A,4.125%, due 15/08/2026 964 0.21
435 Ardagh Packaging FinancePlc / Ardagh Holdings USAInc, 144A,5.250%, due 15/08/2027 451 0.10
515 Ares Capital Corp,4.200%, due 10/06/2024 560 0.12
555 Ares Capital Corp,4.250%, due 01/03/2025 601 0.13
595 Ares Capital Corp,3.250%, due 15/07/2025 624 0.14
3,065 Ares Capital Corp,3.875%, due 15/01/2026 3,277 0.72
105 AutoNation Inc,4.750%, due 01/06/2030 124 0.03
460 Bausch Health Cos Inc, 144A,7.000%, due 15/03/2024 470 0.10
2,840 Bausch Health Cos Inc, 144A,5.000%, due 30/01/2028 2,900 0.64
1,450 Blackstone Secured LendingFund, 144A,3.650%, due 14/07/2023 1,518 0.33
3,080 Blackstone Secured LendingFund, 144A,3.625%, due 15/01/2026 3,198 0.71
4,315 Block Financial LLC,3.875%, due 15/08/2030 4,543 1.00
345 Boeing Co/The,2.700%, due 01/05/2022 353 0.08
4,505 Boeing Co/The,5.040%, due 01/05/2027 5,198 1.15
335 Broadcom Inc,4.700%, due 15/04/2025 378 0.08
2,430 Broadcom Inc,3.459%, due 15/09/2026 2,638 0.58
4,105 Broadcom Inc, 144A,1.950%, due 15/02/2028 4,049 0.89
455 Broadcom Inc,4.110%, due 15/09/2028 505 0.11
365 CF Industries Inc, 144A,3.400%, due 01/12/2021 373 0.08
890 CIT Group Inc,5.000%, due 15/08/2022 940 0.21
475 CIT Group Inc,3.929%, due 19/06/2024 * 504 0.11
5,055 Citrix Systems Inc,1.250%, due 01/03/2026 5,037 1.11
535 CNH Industrial Capital LLC,1.875%, due 15/01/2026 551 0.12
1,795 CNX Resources Corp, 144A,6.000%, due 15/01/2029 1,881 0.42
464 CommScope Inc, 144A,6.000%, due 01/03/2026 488 0.11
2,635 CommScope Inc, 144A,7.125%, due 01/07/2028 2,767 0.61
160 Crown Castle InternationalCorp,3.700%, due 15/06/2026 177 0.04
3,910 Crown Castle InternationalCorp,1.050%, due 15/07/2026 3,831 0.85
1,560 Dell International LLC / EMCCorp, 144A,6.020%, due 15/06/2026 1,871 0.41
425 Delta Air Lines Inc / SkyMilesIP Ltd, 144A,4.500%, due 20/10/2025 454 0.10
1,020 Delta Air Lines Inc / SkyMilesIP Ltd, 144A,4.750%, due 20/10/2028 1,133 0.25
405 Discovery CommunicationsLLC,3.625%, due 15/05/2030 446 0.10
9,500 DISH Network Corp,3.375%, due 15/08/2026 8,957 1.98
1,060 Dow Chemical Co/The,2.100%, due 15/11/2030 1,047 0.23
FaceValue(000’s)
Value(000’s)
$
% ofNet
AssetValue
680 DPL Inc, 144A,4.125%, due 01/07/2025 728 0.16
185 Embarq Corp,7.995%, due 01/06/2036 220 0.05
4,675 Endo Dac / Endo Finance LLC /Endo Finco Inc, 144A,5.875%, due 15/10/2024 4,701 1.04
390 Equifax Inc,3.100%, due 15/05/2030 417 0.09
2,305 Flex Ltd,4.875%, due 12/05/2030 2,686 0.59
460 FMC Corp,3.450%, due 01/10/2029 505 0.11
1,310 Ford Motor Co,8.500%, due 21/04/2023 1,466 0.32
1,620 Ford Motor Co,6.625%, due 01/10/2028 1,912 0.42
2,650 Ford Motor Credit Co LLC,4.271%, due 09/01/2027 2,807 0.62
5,000 Ford Motor Credit Co LLC,2.900%, due 16/02/2028 4,932 1.09
341 FS KKR Capital Corp,4.750%, due 15/05/2022 354 0.08
2,785 FS KKR Capital Corp,4.625%, due 15/07/2024 2,986 0.66
515 FS KKR Capital Corp,4.125%, due 01/02/2025 535 0.12
2,010 Gap Inc/The, 144A,8.625%, due 15/05/2025 2,244 0.50
2,465 General Electric Co,3.625%, due 01/05/2030 2,693 0.59
1,695 General Motors Co,4.200%, due 01/10/2027 1,898 0.42
1,335 General Motors Co,6.800%, due 01/10/2027 1,694 0.37
515 General Motors Co,6.250%, due 02/10/2043 693 0.15
3,600 General Motors Financial CoInc,2.700%, due 20/08/2027 3,744 0.83
2,160 Global Payments Inc,1.200%, due 01/03/2026 2,145 0.47
2,010 GLP Capital LP / GLPFinancing II Inc,5.375%, due 01/11/2023 2,203 0.49
1,895 GLP Capital LP / GLPFinancing II Inc,3.350%, due 01/09/2024 2,018 0.45
5,215 GLP Capital LP / GLPFinancing II Inc,5.375%, due 15/04/2026 5,998 1.32
3,545 Goldman Sachs Group Inc/The,0.855%, due 12/02/2026 * 3,519 0.78
3,270 Golub Capital BDC Inc,2.500%, due 24/08/2026 3,248 0.72
320 Hyundai Capital America,144A,2.850%, due 01/11/2022 331 0.07
1,280 Icahn Enterprises LP / IcahnEnterprises Finance Corp,6.250%, due 15/05/2026 1,348 0.30
1,010 Icahn Enterprises LP / IcahnEnterprises Finance Corp,5.250%, due 15/05/2027 1,063 0.23
740 Intercontinental Exchange Inc,1.850%, due 15/09/2032 704 0.16
2,455 International GameTechnology Plc, 144A,5.250%, due 15/01/2029 2,603 0.57
2,770 Iron Mountain Inc, 144A,5.250%, due 15/03/2028 2,900 0.64
2,255 Jabil Inc,3.600%, due 15/01/2030 2,424 0.53
1,175 Kroger Co/The,1.700%, due 15/01/2031 1,132 0.25
865 Liberty Interactive LLC,8.250%, due 01/02/2030 1,010 0.22
1,613 Macy’s Retail Holdings LLC,3.875%, due 15/01/2022 1,625 0.36
2,315 Macy’s Retail Holdings LLC,2.875%, due 15/02/2023 2,304 0.51
2,320 Main Street Capital Corp,5.200%, due 01/05/2024 2,518 0.56
3,000 Main Street Capital Corp,3.000%, due 14/07/2026 3,018 0.67
FaceValue(000’s)
Value(000’s)
$
% ofNet
AssetValue
3,900 McCormick & Co Inc/MD,0.900%, due 15/02/2026 3,841 0.85
1,025 Mileage Plus Holdings LLC /Mileage Plus IntellectualProperty Assets Ltd, 144A,6.500%, due 20/06/2027 1,121 0.25
2,643 Occidental Petroleum Corp,2.700%, due 15/02/2023 2,589 0.57
2,855 Occidental Petroleum Corp,3.000%, due 15/02/2027 2,686 0.59
1,050 Occidental Petroleum Corp,6.625%, due 01/09/2030 1,196 0.26
1,750 Owens Corning,3.875%, due 01/06/2030 1,960 0.43
1,085 Owl Rock Capital Corp,4.000%, due 30/03/2025 1,147 0.25
975 Owl Rock Capital Corp,4.250%, due 15/01/2026 1,040 0.23
480 Owl Rock TechnologyFinance Corp, 144A,4.750%, due 15/12/2025 515 0.11
9,345 Owl Rock TechnologyFinance Corp, 144A,3.750%, due 17/06/2026 9,685 2.14
2,000 PetSmart Inc / PetSmartFinance Corp, 144A,4.750%, due 15/02/2028 2,071 0.46
250 PetSmart Inc / PetSmartFinance Corp, 144A,7.750%, due 15/02/2029 268 0.06
2,615 Reynolds Group Issuer Inc /Reynolds Group Issuer LLC /Reynolds Group Issuer Lu,144A,4.000%, due 15/10/2027 2,610 0.58
1,555 Scientific Games InternationalInc, 144A,5.000%, due 15/10/2025 1,601 0.35
890 Seagate HDD Cayman, 144A,4.125%, due 15/01/2031 919 0.20
2,620 Sinclair Television Group Inc,144A,5.875%, due 15/03/2026 2,688 0.59
3,685 Sixth Street Specialty LendingInc,2.500%, due 01/08/2026 3,655 0.81
310 Smithfield Foods Inc, 144A,3.000%, due 15/10/2030 317 0.07
265 Southwest Airlines Co,5.250%, due 04/05/2025 304 0.07
945 Southwest Airlines Co,5.125%, due 15/06/2027 1,108 0.24
252 Sprint Spectrum Co LLC /Sprint Spectrum Co II LLC /Sprint Spectrum Co III LLC,144A,3.360%, due 20/09/2021 254 0.06
1,110 Sprint Spectrum Co LLC /Sprint Spectrum Co II LLC /Sprint Spectrum Co III LLC,144A,5.152%, due 20/03/2028 1,291 0.28
1,220 Stellantis NV,5.250%, due 15/04/2023 1,326 0.29
1,130 T-Mobile USA Inc, 144A,3.875%, due 15/04/2030 1,244 0.27
2,315 T-Mobile USA Inc, 144A,2.550%, due 15/02/2031 2,305 0.51
2,340 Universal Health Services Inc,144A,2.650%, due 15/10/2030 2,318 0.51
3,215 Vishay Intertechnology Inc,2.250%, due 15/06/2025 3,581 0.79
1,070 Vista Outdoor Inc, 144A,4.500%, due 15/03/2029 1,063 0.23
2,695 Walgreens Boots Alliance Inc,4.800%, due 18/11/2044 3,075 0.68
5,060 Western Digital Corp,1.500%, due 01/02/2024 5,344 1.18
1,100 William Carter Co/The, 144A,5.625%, due 15/03/2027 1,161 0.26
229,369 50.60
^ Not authorised for sale to the public in Hong Kong.The accompanying notes are an integral part of the Financial Statements
188

Legg Mason Global Funds Plc Annual Report 28 February 2021
Legg Mason Brandywine Global Income Optimiser Fund^
Portfolio of Investments as at 28 February 2021 – (continued)
FaceValue(000’s)
Value(000’s)
$
% ofNet
AssetValue
Corporate Bonds and Notes — (continued)
Zambia — 0.86% (29 February 2020: 0.00%)
3,580 First Quantum Minerals Ltd,144A,6.875%, due 15/10/2027 3,889 0.86
Total Corporate Bonds and Notes(Cost $309,299) 313,496 69.16
Government Bonds and Notes — 5.18%(29 February 2020: 8.62%)
Egypt — 2.15% (29 February 2020: 2.05%)
EGP 97,100 Egypt Treasury Bills,Series 182D, zero coupon,due 09/03/2021 6,183 1.37
EGP 55,600 Egypt Treasury Bills,Series 182D, zero coupon,due 09/03/2021 3,540 0.78
9,723 2.15
Turkey — 0.53% (29 February 2020: 0.00%)
2,390 Turkey GovernmentInternational Bond,5.950%, due 15/01/2031 2,392 0.53
United States — 2.50% (29 February 2020: 0.00%)
11,340 United States TreasuryFloating Rate Note,0.085%, due 31/10/2022 * 11,345 2.50
Total Government Bonds and Notes(Cost $23,452) 23,460 5.18
Collective Investment Schemes — 7.73%(29 February 2020: 2.03%)
35,025 Goldman Sachs US$ LiquidReserves Fund – InstitutionalClass 35,025 7.73
Total Collective Investment Schemes(Cost $35,025) 35,025 7.73
Total Investments at fair value throughprofit or loss (Cost $422,437) 427,083 94.22
FaceValue(000’s)
Value(000’s)
$
% ofNet
AssetValue
Credit Default Swaps — 2.30%(29 February 2020: 0.69%)
Unrealised appreciation of contracts(see below) 10,441 2.30
Forward Foreign Currency Contracts — 0.44%(29 February 2020: 0.53%)
Unrealised appreciation of contracts(see below) 2,025 0.44
Futures — 0.05% (29 February 2020: 0.39%)
Unrealised appreciation of contracts(see below) 234 0.05
Total Financial Assets at fair valuethrough profit or loss 439,783 97.01
Forward Foreign Currency Contracts — (0.39%)(29 February 2020: (0.31%))
Unrealised depreciation of contracts(see below) (1,778) (0.39)
Futures — (0.08%) (29 February 2020: 0.00%)
Unrealised depreciation of contracts(see below) (379) (0.08)
Total Financial Liabilities at fair valuethrough profit or loss (2,157) (0.47)
Total Financial Assets and FinancialLiabilities at fair value through profitor loss 437,626 96.54
Other Assets in Excess of Liabilities 15,659 3.46
Total Net Assets $453,285 100.00
– Amounts designated as “–” are either $0, less than$1,000, less than 1,000 shares or less than 0.01%.
144A Securities exempt from registration under Rule 144A ofthe Securities Act of 1933, as amended. Thesesecurities may only be resold, in transactions exemptfrom registration, to qualified institutional buyers. As at
28 February 2021, these securities amounted to$142,929,000 or 31.52% of net assets.
* Variable rate security. The interest rate shown reflectsthe rate in effect at 28 February 2021.
ABBREVIATIONS:
Perpetual – A bond with no maturity date. Perpetual bondsare not redeemable but pay a steady stream ofinterest.
REMIC – Real Estate Mortgage Investment Conduit.
BRL – Brazilian Real
CAD – Canadian Dollar
EGP – Egyptian Pound
GBP – British Pound
MXN – Mexican Peso
RUB – Russian Ruble
Analysis of Total Assets
% ofTotal
Assets
Transferable securities admitted to an officialexchange listing or traded on a regulated market 85.05
Collective investment schemes 7.60
Financial derivative instruments 2.76
Other assets 4.59
Total Assets 100.00
Schedule of Credit Default Swaps
Counterparty Reference EntityBuy/Sell
ProtectionExpiration
Date
NotionalAmount(000’s)
Value(000’s)
Barclays CCO Holdings LLC, 5.000% Sell 20/06/2021 900 $ 13Barclays Sprint Communications Inc, 5.000% Sell 20/06/2021 1,915 27Barclays The Goodyear Tire & Rubber Co, 5.000% Sell 20/06/2022 1,725 96Citi CDX.NA.HY, 5.000% Sell 20/12/2025 20,470 1,680Citi CDX.NA.IG, 1.000% Sell 20/06/2025 55,620 863Citi iTrax Europe, 1.000% Sell 20/12/2024 3,160 81Citi iTraxx Europe, 1.000% Sell 20/06/2025 23,060 604Citi iTraxx Europe, 5.000% Sell 20/12/2025 50,547 6,351JP Morgan Altice France S.A., 5.000% Sell 20/12/2025 1,605 127JP Morgan Altice France S.A., 5.000% Sell 20/12/2025 3,390 268JP Morgan Altice Luxembourg S.A., 5.000% Sell 20/12/2025 1,605 68JP Morgan Altice Luxembourg S.A., 5.000% Sell 20/12/2025 3,495 148JP Morgan Liberty Media LLC, 5.000% Sell 20/06/2022 1,700 86Morgan Stanley Dell Inc, 1.000% Sell 20/12/2022 1,925 16Morgan Stanley Dell Inc, 1.000% Sell 20/06/2022 715 5Morgan Stanley Dell Inc, 1.000% Sell 20/06/2022 1,115 8
Unrealised Appreciation of Credit Default Swaps (29 February 2020 (000’s): $488) $ 10,441Unrealised Depreciation of Credit Default Swaps (29 February 2020 (000’s): $–) –
Net Appreciation of Credit Default Swaps (29 February 2020 (000’s): $488) $ 10,441
^ Not authorised for sale to the public in Hong Kong.The accompanying notes are an integral part of the Financial Statements
189
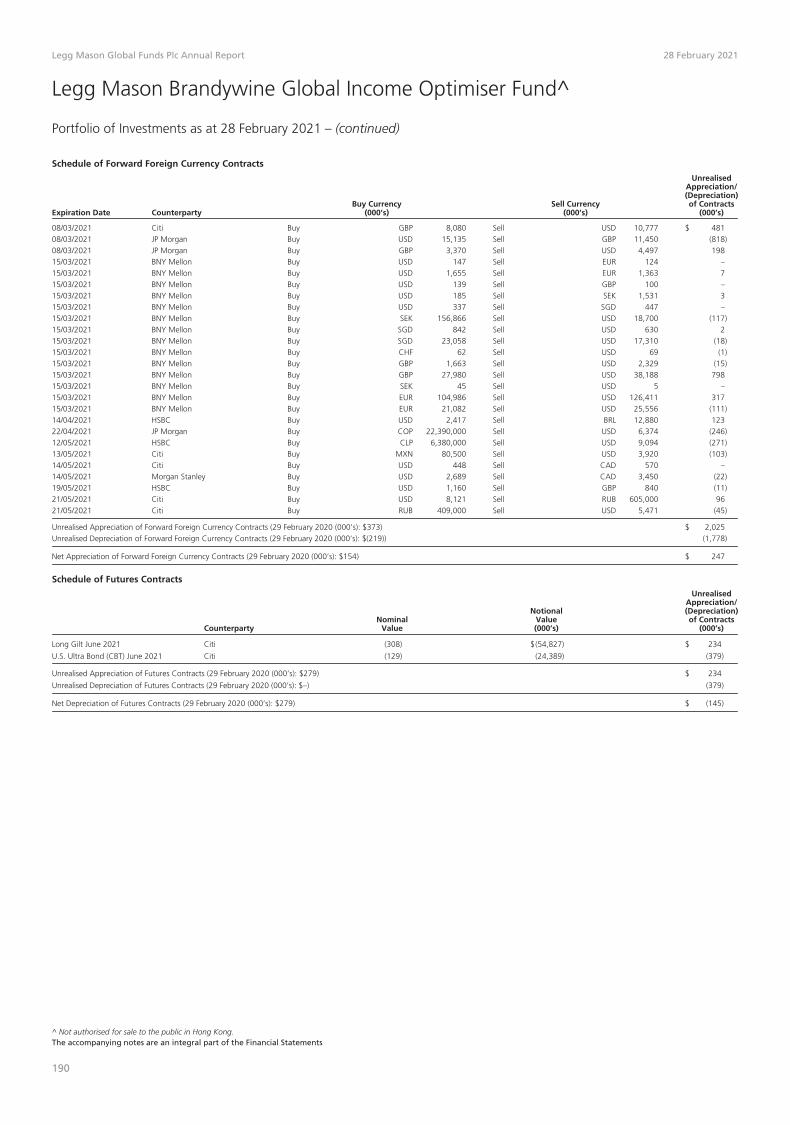
Legg Mason Global Funds Plc Annual Report 28 February 2021
Legg Mason Brandywine Global Income Optimiser Fund^
Portfolio of Investments as at 28 February 2021 – (continued)
Schedule of Forward Foreign Currency Contracts
Expiration Date CounterpartyBuy Currency
(000’s)Sell Currency
(000’s)
UnrealisedAppreciation/(Depreciation)of Contracts
(000’s)
08/03/2021 Citi Buy GBP 8,080 Sell USD 10,777 $ 48108/03/2021 JP Morgan Buy USD 15,135 Sell GBP 11,450 (818)08/03/2021 JP Morgan Buy GBP 3,370 Sell USD 4,497 19815/03/2021 BNY Mellon Buy USD 147 Sell EUR 124 –15/03/2021 BNY Mellon Buy USD 1,655 Sell EUR 1,363 715/03/2021 BNY Mellon Buy USD 139 Sell GBP 100 –15/03/2021 BNY Mellon Buy USD 185 Sell SEK 1,531 315/03/2021 BNY Mellon Buy USD 337 Sell SGD 447 –15/03/2021 BNY Mellon Buy SEK 156,866 Sell USD 18,700 (117)15/03/2021 BNY Mellon Buy SGD 842 Sell USD 630 215/03/2021 BNY Mellon Buy SGD 23,058 Sell USD 17,310 (18)15/03/2021 BNY Mellon Buy CHF 62 Sell USD 69 (1)15/03/2021 BNY Mellon Buy GBP 1,663 Sell USD 2,329 (15)15/03/2021 BNY Mellon Buy GBP 27,980 Sell USD 38,188 79815/03/2021 BNY Mellon Buy SEK 45 Sell USD 5 –15/03/2021 BNY Mellon Buy EUR 104,986 Sell USD 126,411 31715/03/2021 BNY Mellon Buy EUR 21,082 Sell USD 25,556 (111)14/04/2021 HSBC Buy USD 2,417 Sell BRL 12,880 12322/04/2021 JP Morgan Buy COP 22,390,000 Sell USD 6,374 (246)12/05/2021 HSBC Buy CLP 6,380,000 Sell USD 9,094 (271)13/05/2021 Citi Buy MXN 80,500 Sell USD 3,920 (103)14/05/2021 Citi Buy USD 448 Sell CAD 570 –14/05/2021 Morgan Stanley Buy USD 2,689 Sell CAD 3,450 (22)19/05/2021 HSBC Buy USD 1,160 Sell GBP 840 (11)21/05/2021 Citi Buy USD 8,121 Sell RUB 605,000 9621/05/2021 Citi Buy RUB 409,000 Sell USD 5,471 (45)
Unrealised Appreciation of Forward Foreign Currency Contracts (29 February 2020 (000’s): $373) $ 2,025Unrealised Depreciation of Forward Foreign Currency Contracts (29 February 2020 (000’s): $(219)) (1,778)
Net Appreciation of Forward Foreign Currency Contracts (29 February 2020 (000’s): $154) $ 247
Schedule of Futures Contracts
CounterpartyNominal
Value
NotionalValue(000’s)
UnrealisedAppreciation/(Depreciation)of Contracts
(000’s)
Long Gilt June 2021 Citi (308) $(54,827) $ 234
U.S. Ultra Bond (CBT) June 2021 Citi (129) (24,389) (379)
Unrealised Appreciation of Futures Contracts (29 February 2020 (000’s): $279) $ 234
Unrealised Depreciation of Futures Contracts (29 February 2020 (000’s): $–) (379)
Net Depreciation of Futures Contracts (29 February 2020 (000’s): $279) $ (145)
^ Not authorised for sale to the public in Hong Kong.The accompanying notes are an integral part of the Financial Statements
190
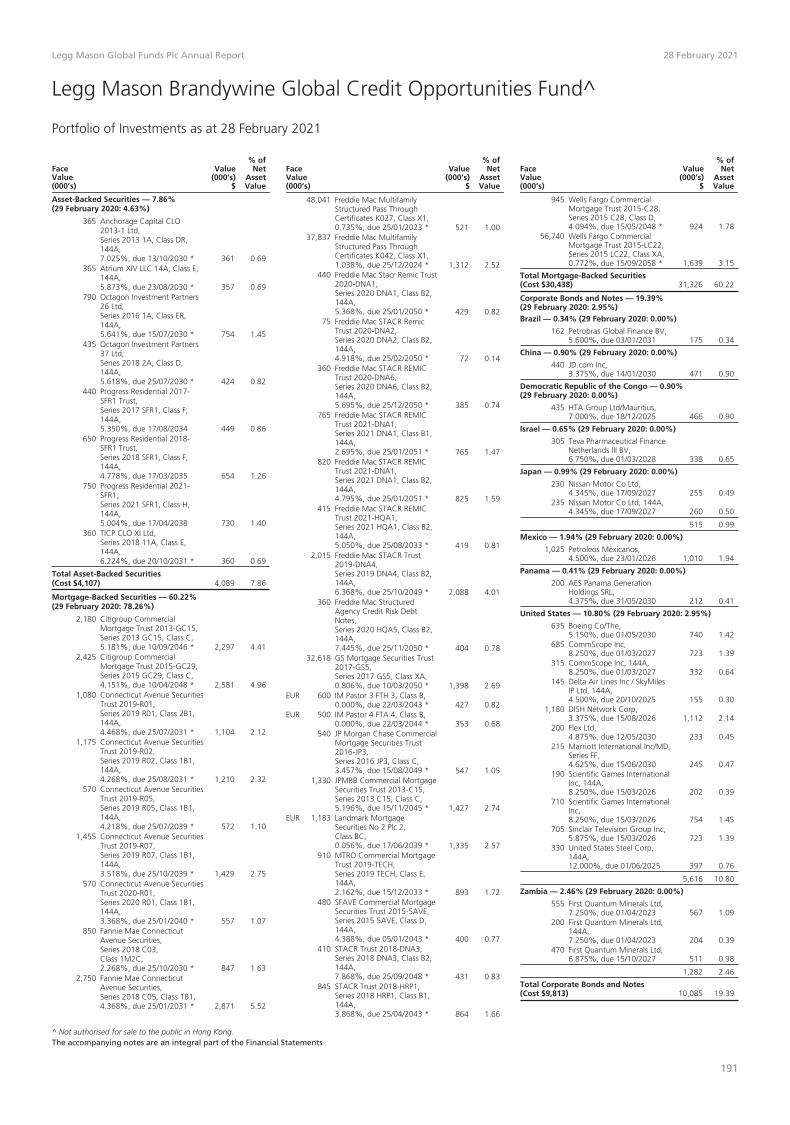
Legg Mason Global Funds Plc Annual Report 28 February 2021
Legg Mason Brandywine Global Credit Opportunities Fund^
Portfolio of Investments as at 28 February 2021
FaceValue(000’s)
Value(000’s)
$
% ofNet
AssetValue
Asset-Backed Securities — 7.86%(29 February 2020: 4.63%)
365 Anchorage Capital CLO2013-1 Ltd,Series 2013 1A, Class DR,144A,7.025%, due 13/10/2030 * 361 0.69
365 Atrium XIV LLC 14A, Class E,144A,5.873%, due 23/08/2030 * 357 0.69
790 Octagon Investment Partners26 Ltd,Series 2016 1A, Class ER,144A,5.641%, due 15/07/2030 * 754 1.45
435 Octagon Investment Partners37 Ltd,Series 2018 2A, Class D,144A,5.618%, due 25/07/2030 * 424 0.82
440 Progress Residential 2017-SFR1 Trust,Series 2017 SFR1, Class F,144A,5.350%, due 17/08/2034 449 0.86
650 Progress Residential 2018-SFR1 Trust,Series 2018 SFR1, Class F,144A,4.778%, due 17/03/2035 654 1.26
750 Progress Residential 2021-SFR1,Series 2021 SFR1, Class H,144A,5.004%, due 17/04/2038 730 1.40
360 TICP CLO XI Ltd,Series 2018 11A, Class E,144A,6.224%, due 20/10/2031 * 360 0.69
Total Asset-Backed Securities(Cost $4,107) 4,089 7.86
Mortgage-Backed Securities — 60.22%(29 February 2020: 78.26%)
2,180 Citigroup CommercialMortgage Trust 2013-GC15,Series 2013 GC15, Class C,5.181%, due 10/09/2046 * 2,297 4.41
2,425 Citigroup CommercialMortgage Trust 2015-GC29,Series 2015 GC29, Class C,4.151%, due 10/04/2048 * 2,581 4.96
1,080 Connecticut Avenue SecuritiesTrust 2019-R01,Series 2019 R01, Class 2B1,144A,4.468%, due 25/07/2031 * 1,104 2.12
1,175 Connecticut Avenue SecuritiesTrust 2019-R02,Series 2019 R02, Class 1B1,144A,4.268%, due 25/08/2031 * 1,210 2.32
570 Connecticut Avenue SecuritiesTrust 2019-R05,Series 2019 R05, Class 1B1,144A,4.218%, due 25/07/2039 * 572 1.10
1,455 Connecticut Avenue SecuritiesTrust 2019-R07,Series 2019 R07, Class 1B1,144A,3.518%, due 25/10/2039 * 1,429 2.75
570 Connecticut Avenue SecuritiesTrust 2020-R01,Series 2020 R01, Class 1B1,144A,3.368%, due 25/01/2040 * 557 1.07
850 Fannie Mae ConnecticutAvenue Securities,Series 2018 C03,Class 1M2C,2.268%, due 25/10/2030 * 847 1.63
2,750 Fannie Mae ConnecticutAvenue Securities,Series 2018 C05, Class 1B1,4.368%, due 25/01/2031 * 2,871 5.52
FaceValue(000’s)
Value(000’s)
$
% ofNet
AssetValue
48,041 Freddie Mac MultifamilyStructured Pass ThroughCertificates K027, Class X1,0.735%, due 25/01/2023 * 521 1.00
37,837 Freddie Mac MultifamilyStructured Pass ThroughCertificates K042, Class X1,1.038%, due 25/12/2024 * 1,312 2.52
440 Freddie Mac Stacr Remic Trust2020-DNA1,Series 2020 DNA1, Class B2,144A,5.368%, due 25/01/2050 * 429 0.82
75 Freddie Mac STACR RemicTrust 2020-DNA2,Series 2020 DNA2, Class B2,144A,4.918%, due 25/02/2050 * 72 0.14
360 Freddie Mac STACR REMICTrust 2020-DNA6,Series 2020 DNA6, Class B2,144A,5.695%, due 25/12/2050 * 385 0.74
765 Freddie Mac STACR REMICTrust 2021-DNA1,Series 2021 DNA1, Class B1,144A,2.695%, due 25/01/2051 * 765 1.47
820 Freddie Mac STACR REMICTrust 2021-DNA1,Series 2021 DNA1, Class B2,144A,4.795%, due 25/01/2051 * 825 1.59
415 Freddie Mac STACR REMICTrust 2021-HQA1,Series 2021 HQA1, Class B2,144A,5.050%, due 25/08/2033 * 419 0.81
2,015 Freddie Mac STACR Trust2019-DNA4,Series 2019 DNA4, Class B2,144A,6.368%, due 25/10/2049 * 2,088 4.01
360 Freddie Mac StructuredAgency Credit Risk DebtNotes,Series 2020 HQA5, Class B2,144A,7.445%, due 25/11/2050 * 404 0.78
32,618 GS Mortgage Securities Trust2017-GS5,Series 2017 GS5, Class XA,0.806%, due 10/03/2050 * 1,398 2.69
EUR 600 IM Pastor 3 FTH 3, Class B,0.000%, due 22/03/2043 * 427 0.82
EUR 500 IM Pastor 4 FTA 4, Class B,0.000%, due 22/03/2044 * 353 0.68
540 JP Morgan Chase CommercialMortgage Securities Trust2016-JP3,Series 2016 JP3, Class C,3.457%, due 15/08/2049 * 547 1.05
1,330 JPMBB Commercial MortgageSecurities Trust 2013-C15,Series 2013 C15, Class C,5.196%, due 15/11/2045 * 1,427 2.74
EUR 1,183 Landmark MortgageSecurities No 2 Plc 2,Class BC,0.056%, due 17/06/2039 * 1,335 2.57
910 MTRO Commercial MortgageTrust 2019-TECH,Series 2019 TECH, Class E,144A,2.162%, due 15/12/2033 * 893 1.72
480 SFAVE Commercial MortgageSecurities Trust 2015-5AVE,Series 2015 5AVE, Class D,144A,4.388%, due 05/01/2043 * 400 0.77
410 STACR Trust 2018-DNA3,Series 2018 DNA3, Class B2,144A,7.868%, due 25/09/2048 * 431 0.83
845 STACR Trust 2018-HRP1,Series 2018 HRP1, Class B1,144A,3.868%, due 25/04/2043 * 864 1.66
FaceValue(000’s)
Value(000’s)
$
% ofNet
AssetValue
945 Wells Fargo CommercialMortgage Trust 2015-C28,Series 2015 C28, Class D,4.094%, due 15/05/2048 * 924 1.78
56,740 Wells Fargo CommercialMortgage Trust 2015-LC22,Series 2015 LC22, Class XA,0.772%, due 15/09/2058 * 1,639 3.15
Total Mortgage-Backed Securities(Cost $30,438) 31,326 60.22
Corporate Bonds and Notes — 19.39%(29 February 2020: 2.95%)Brazil — 0.34% (29 February 2020: 0.00%)
162 Petrobras Global Finance BV,5.600%, due 03/01/2031 175 0.34
China — 0.90% (29 February 2020: 0.00%)
440 JD.com Inc,3.375%, due 14/01/2030 471 0.90
Democratic Republic of the Congo — 0.90%(29 February 2020: 0.00%)
435 HTA Group Ltd/Mauritius,7.000%, due 18/12/2025 466 0.90
Israel — 0.65% (29 February 2020: 0.00%)
305 Teva Pharmaceutical FinanceNetherlands III BV,6.750%, due 01/03/2028 338 0.65
Japan — 0.99% (29 February 2020: 0.00%)
230 Nissan Motor Co Ltd,4.345%, due 17/09/2027 255 0.49
235 Nissan Motor Co Ltd, 144A,4.345%, due 17/09/2027 260 0.50
515 0.99
Mexico — 1.94% (29 February 2020: 0.00%)
1,025 Petroleos Mexicanos,4.500%, due 23/01/2026 1,010 1.94
Panama — 0.41% (29 February 2020: 0.00%)
200 AES Panama GenerationHoldings SRL,4.375%, due 31/05/2030 212 0.41
United States — 10.80% (29 February 2020: 2.95%)
635 Boeing Co/The,5.150%, due 01/05/2030 740 1.42
685 CommScope Inc,8.250%, due 01/03/2027 723 1.39
315 CommScope Inc, 144A,8.250%, due 01/03/2027 332 0.64
145 Delta Air Lines Inc / SkyMilesIP Ltd, 144A,4.500%, due 20/10/2025 155 0.30
1,180 DISH Network Corp,3.375%, due 15/08/2026 1,112 2.14
200 Flex Ltd,4.875%, due 12/05/2030 233 0.45
215 Marriott International Inc/MD,Series FF,4.625%, due 15/06/2030 245 0.47
190 Scientific Games InternationalInc, 144A,8.250%, due 15/03/2026 202 0.39
710 Scientific Games InternationalInc,8.250%, due 15/03/2026 754 1.45
705 Sinclair Television Group Inc,5.875%, due 15/03/2026 723 1.39
330 United States Steel Corp,144A,12.000%, due 01/06/2025 397 0.76
5,616 10.80
Zambia — 2.46% (29 February 2020: 0.00%)
555 First Quantum Minerals Ltd,7.250%, due 01/04/2023 567 1.09
200 First Quantum Minerals Ltd,144A,7.250%, due 01/04/2023 204 0.39
470 First Quantum Minerals Ltd,6.875%, due 15/10/2027 511 0.98
1,282 2.46
Total Corporate Bonds and Notes(Cost $9,813) 10,085 19.39
^ Not authorised for sale to the public in Hong Kong.The accompanying notes are an integral part of the Financial Statements
191

Legg Mason Global Funds Plc Annual Report 28 February 2021
Legg Mason Brandywine Global Credit Opportunities Fund^
Portfolio of Investments as at 28 February 2021 – (continued)
FaceValue(000’s)
Value(000’s)
$
% ofNet
AssetValue
Collective Investment Schemes — 4.88%(29 February 2020: 2.93%)
2,540 Goldman Sachs US$ LiquidReserves Fund – InstitutionalClass 2,540 4.88
Total Collective Investment Schemes(Cost $2,540) 2,540 4.88
Common Stock — 4.96% (29 February 2020: 0.00%)France — 1.02% (29 February 2020: 0.00%)
11 TOTAL SE ADR 530 1.02
United Kingdom: 1.14% (29 February 2020: 0.00%)
24 BP Plc ADR 596 1.14
United States: 2.80% (29 February 2020: 0.00%)
22 Canadian Natural ResourcesLtd 587 1.13
6 Chevron Corp 549 1.068 Danimer Scientific Inc 320 0.61
1,456 2.80
Total Common Stock (Cost $2,513) 2,582 4.96
Real Estate Investment Trusts — 1.98%(29 February 2020: 0.00%)United States — 1.98% (29 February 2020: 0.00%)
124 Annaly Capital ManagementInc 1,030 1.98
Total Real Estate Investment Trusts(Cost $976) 1,030 1.98
Total Investments at fair value throughprofit or loss (Cost $50,387) 51,652 99.29
FaceValue(000’s)
Value(000’s)
$
% ofNet
AssetValue
Credit Default Swaps — 0.20%(29 February 2020: 0.46%)
Unrealised appreciation of contracts(see below) 105 0.20
Forward Foreign Currency Contracts — 0.48%(29 February 2020: 0.18%)
Unrealised appreciation of contracts(see below) 250 0.48
Futures — 0.08% (29 February 2020: 0.26%)
Unrealised appreciation of contracts(see below) 41 0.08
Total Financial Assets at fair valuethrough profit or loss 52,048 100.05
Forward Foreign Currency Contracts — (0.67%)(29 February 2020: (0.51%))
Unrealised depreciation of contracts(see below) (346) (0.67)
Futures — (0.15%) (29 February 2020: 0.00%)
Unrealised depreciation of contracts(see below) (79) (0.15)
Total Financial Liabilities at fair valuethrough profit or loss (425) (0.82)
Total Financial Assets and FinancialLiabilities at fair value through profit orloss 51,623 99.23
Other Assets in Excess of Liabilities 397 0.77
Total Net Assets $52,020 100.00
– Amounts designated as “–” are either $0, less than$1,000, less than 1,000 shares or less than 0.01%.
144A Securities exempt from registration under Rule 144A ofthe Securities Act of 1933, as amended. Thesesecurities may only be resold, in transactions exemptfrom registration, to qualified institutional buyers. As at28 February 2021, these securities amounted to$18,486,000 or 35.54% of net assets.
* Variable rate security. The interest rate shown reflectsthe rate in effect at 28 February 2021.
ABBREVIATIONS:
ADR – American Depositary Receipt.
REMIC – Real Estate Mortgage Investment Conduit.
EUR – Euro
Analysis of Total Assets
% ofTotal
Assets
Transferable securities admitted to an officialexchange listing or traded on a regulated market 91.87
Collective investment schemes 4.75
Financial derivative instruments 0.74
Other assets 2.64
Total Assets 100.00
Schedule of Credit Default Swaps
Counterparty Reference EntityBuy/Sell
ProtectionExpiration
Date
NotionalAmount(000’s)
Value(000’s)
Barclays Sprint Communications Inc, 5.000% Sell 20/06/2021 795 $ 11Barclays The Goodyear Tire & Rubber Co, 5.000% Sell 20/06/2022 731 41Barclays T-Mobile USA Inc, 5.000% Sell 20/06/2022 725 42Morgan Stanley Dell Inc, 1.000% Sell 20/12/2022 925 8Morgan Stanley Dell Inc, 1.000% Sell 20/06/2022 520 3
Unrealised Appreciation of Credit Default Swaps (29 February 2020 (000’s): $201) $ 105Unrealised Depreciation of Credit Default Swaps (29 February 2020 (000’s): $(568)) –
Net Appreciation of Credit Default Swaps (29 February 2020 (000’s): $(367)) $ 105
Schedule of Forward Foreign Currency Contracts
Expiration Date CounterpartyBuy Currency
(000’s)Sell Currency
(000’s)
UnrealisedAppreciation/(Depreciation)of Contracts
(000’s)
01/03/2021 BNY Mellon Buy USD 2,010 Sell BRL 10,990 $ 4901/03/2021 BNY Mellon Buy BRL 10,990 Sell USD 2,027 (66)08/03/2021 Citi Buy GBP 1,810 Sell USD 2,414 10808/03/2021 HSBC Buy GBP 740 Sell USD 1,044 (13)08/03/2021 JP Morgan Buy USD 2,393 Sell GBP 1,810 (129)09/03/2021 Barclays Buy NOK 8,700 Sell USD 992 1109/03/2021 JP Morgan Buy USD 503 Sell NOK 4,300 715/03/2021 BNY Mellon Buy EUR 3 Sell USD 4 –16/03/2021 Goldman Sachs Buy USD 461 Sell CNH 3,000 (1)16/03/2021 Goldman Sachs Buy CNH 6,300 Sell USD 960 1001/04/2021 BNY Mellon Buy BRL 11,127 Sell USD 2,034 (51)12/04/2021 Citi Buy USD 1,903 Sell EUR 1,550 3013/04/2021 Barclays Buy USD 468 Sell MYR 1,900 113/04/2021 Barclays Buy MYR 4,000 Sell USD 986 (4)14/04/2021 HSBC Buy USD 927 Sell BRL 5,050 2814/04/2021 HSBC Buy BRL 5,050 Sell USD 919 (19)27/04/2021 Citi Buy USD 513 Sell PLN 1,920 127/04/2021 Citi Buy PLN 3,840 Sell USD 1,030 (5)03/05/2021 National Australia Bank Buy NZD 710 Sell USD 513 –12/05/2021 HSBC Buy CLP 740,000 Sell USD 1,055 (32)13/05/2021 Citi Buy MXN 15,500 Sell USD 755 (20)14/05/2021 Goldman Sachs Buy CAD 650 Sell USD 506 521/05/2021 Citi Buy RUB 58,000 Sell USD 776 (6)
Unrealised Appreciation of Forward Foreign Currency Contracts (29 February 2020 (000’s): $79) $ 250Unrealised Depreciation of Forward Foreign Currency Contracts (29 February 2020 (000’s): $(224)) (346)
Net Depreciation of Forward Foreign Currency Contracts (29 February 2020 (000’s): $(145)) $ (96)
^ Not authorised for sale to the public in Hong Kong.The accompanying notes are an integral part of the Financial Statements
192

Legg Mason Global Funds Plc Annual Report 28 February 2021
Legg Mason Brandywine Global Credit Opportunities Fund^
Portfolio of Investments as at 28 February 2021 – (continued)
Schedule of Futures Contracts
CounterpartyNominal
Value
NotionalValue(000’s)
UnrealisedAppreciation/(Depreciation)of Contracts
(000’s)
Long Gilt June 2021 Citi (36) $ (6,408) $ 41
U.S. Ultra Bond (CBT) June 2021 Citi (27) (5,105) (79)
Unrealised Appreciation of Futures Contracts (29 February 2020 (000’s): $112) $ 41
Unrealised Depreciation of Futures Contracts (29 February 2020 (000’s): $–) (79)
Net Depreciation of Futures Contracts (29 February 2020 (000’s): $112) $ (38)
^ Not authorised for sale to the public in Hong Kong.The accompanying notes are an integral part of the Financial Statements
193

Legg Mason Global Funds Plc Annual Report 28 February 2021
Legg Mason Brandywine Global Defensive High Yield Fund^
Portfolio of Investments as at 28 February 2021
FaceValue(000’s)
Value(000’s)
$
% ofNet
AssetValue
Corporate Bonds and Notes — 91.89%(29 February 2020: 92.50%)
Brazil — 11.97% (29 February 2020: 3.81%)
200 Amaggi LuxembourgInternational Sarl,5.250%, due 28/01/2028 208 1.77
200 Braskem Netherlands FinanceBV,8.500%, due 23/01/2081 * 227 1.92
200 BRF SA,3.950%, due 22/05/2023 208 1.77
200 CSN Inova Ventures, 144A,6.750%, due 28/01/2028 216 1.84
200 Embraer Netherlands FinanceBV, 144A,6.950%, due 17/01/2028 225 1.91
200 Itau Unibanco Holding SA/Cayman Island,6.125%, Perpetual * 201 1.71
115 Petrobras Global Finance BV,5.600%, due 03/01/2031 124 1.05
1,409 11.97
Canada — 4.59% (29 February 2020: 2.80%)
130 Air Canada, 144A,7.750%, due 15/04/2021 131 1.11
CAD 140 Air Canada,9.000%, due 22/06/2024 117 0.99
105 Cascades Inc/Cascades USA Inc,144A,5.125%, due 15/01/2026 112 0.96
55 Methanex Corp,5.125%, due 15/10/2027 57 0.49
120 Taseko Mines Ltd, 144A,7.000%, due 15/02/2026 123 1.04
540 4.59
Chile — 1.77% (29 February 2020: 0.00%)
200 Kenbourne Invest SA,4.700%, due 22/01/2028 209 1.77
China — 1.82% (29 February 2020: 0.00%)
205 Sunac China Holdings Ltd,8.350%, due 19/04/2023 215 1.82
Colombia — 1.74% (29 February 2020: 0.00%)
200 Geopark Ltd, 144A,5.500%, due 17/01/2027 205 1.74
France — 1.11% (29 February 2020: 1.13%)
EUR 110 Altice France SA/France,3.375%, due 15/01/2028 130 1.11
Israel — 2.92% (29 February 2020: 3.12%)
200 Teva Pharmaceutical FinanceNetherlands III BV,7.125%, due 31/01/2025 217 1.84
135 Teva Pharmaceutical FinanceNetherlands III BV,3.150%, due 01/10/2026 127 1.08
344 2.92
Macau — 1.72% (29 February 2020: 0.00%)
200 Studio City Finance Ltd, 144A,5.000%, due 15/01/2029 203 1.72
Mexico — 8.57% (29 February 2020: 0.00%)
200 Braskem Idesa SAPI,7.450%, due 15/11/2029 201 1.71
200 Credito Real SAB de CV SOFOMER, 144A,8.000%, due 21/01/2028 211 1.79
50 Petroleos Mexicanos,4.875%, due 24/01/2022 51 0.43
265 Petroleos Mexicanos,5.350%, due 12/02/2028 257 2.19
325 Petroleos Mexicanos,6.950%, due 28/01/2060 288 2.45
1,008 8.57
Panama — 1.80% (29 February 2020: 0.00%)
200 AES Panama GenerationHoldings SRL,4.375%, due 31/05/2030 212 1.80
FaceValue(000’s)
Value(000’s)
$
% ofNet
AssetValue
United Kingdom — 1.41% (29 February 2020: 4.03%)
160 Connect Finco SARL / ConnectUS Finco LLC,6.750%, due 01/10/2026 166 1.41
United States — 51.44% (29 February 2020: 75.64%)
150 AmeriGas Partners LP / AmeriGasFinance Corp,5.625%, due 20/05/2024 166 1.41
55 Antero Resources Corp,5.625%, due 01/06/2023 55 0.47
115 Antero Resources Corp,5.000%, due 01/03/2025 115 0.97
55 Antero Resources Corp, 144A,8.375%, due 15/07/2026 60 0.51
107 Apache Corp,4.875%, due 15/11/2027 112 0.95
45 Arconic Corp, 144A,6.125%, due 15/02/2028 48 0.40
200 Ardagh Packaging Finance Plc /Ardagh Holdings USA Inc,4.125%, due 15/08/2026 207 1.76
95 Bausch Health Cos Inc, 144A,7.000%, due 15/03/2024 97 0.82
100 Bausch Health Cos Inc, 144A,6.125%, due 15/04/2025 103 0.87
65 Bausch Health Cos Inc, 144A,6.250%, due 15/02/2029 69 0.59
45 Bausch Health Cos Inc, 144A,7.250%, due 30/05/2029 50 0.42
35 Boise Cascade Co, 144A,4.875%, due 01/07/2030 37 0.32
120 CITGO Petroleum Corp, 144A,6.375%, due 15/06/2026 122 1.04
120 Clearway Energy Operating LLC,5.000%, due 15/09/2026 124 1.05
50 Cleveland-Cliffs Inc,4.875%, due 15/01/2024 51 0.43
20 Cleveland-Cliffs Inc,9.875%, due 17/10/2025 23 0.20
115 CNX Resources Corp, 144A,6.000%, due 15/01/2029 121 1.02
45 CommScope Inc,6.000%, due 01/03/2026 47 0.40
35 CommScope Inc, 144A,7.125%, due 01/07/2028 37 0.31
35 Consolidated CommunicationsInc, 144A,6.500%, due 01/10/2028 38 0.32
95 Dell International LLC / EMCCorp, 144A,7.125%, due 15/06/2024 98 0.84
40 Dell International LLC / EMCCorp,7.125%, due 15/06/2024 41 0.35
35 Edgewell Personal Care Co,5.500%, due 01/06/2028 37 0.32
90 Embarq Corp,7.995%, due 01/06/2036 107 0.91
110 Encompass Health Corp,4.500%, due 01/02/2028 115 0.97
50 Entegris Inc, 144A,4.375%, due 15/04/2028 53 0.45
175 Ford Motor Co,8.500%, due 21/04/2023 196 1.66
95 Gap Inc/The, 144A,8.875%, due 15/05/2027 111 0.95
55 Genworth Holdings Inc,4.900%, due 15/08/2023 52 0.44
100 GLP Capital LP / GLP Financing IIInc,5.375%, due 15/04/2026 115 0.98
100 Harsco Corp, 144A,5.750%, due 31/07/2027 104 0.89
170 Icahn Enterprises LP / IcahnEnterprises Finance Corp,6.250%, due 15/05/2026 179 1.52
120 Iron Mountain Inc, 144A,5.250%, due 15/03/2028 126 1.07
25 L Brands Inc, 144A,6.625%, due 01/10/2030 28 0.24
95 Level 3 Financing Inc, 144A,4.625%, due 15/09/2027 98 0.84
100 Levi Strauss & Co, 144A,3.500%, due 01/03/2031 101 0.86
FaceValue(000’s)
Value(000’s)
$
% ofNet
AssetValue
200 Liberty Interactive LLC,8.250%, due 01/02/2030 234 1.98
125 Macy’s Retail Holdings LLC,2.875%, due 15/02/2023 124 1.06
35 Navios Maritime Acquisition Corp/ Navios Acquisition Finance USInc, 144A,8.125%, due 15/11/2021 27 0.23
40 Nexstar Broadcasting Inc, 144A,4.750%, due 01/11/2028 41 0.35
100 NRG Energy Inc,6.625%, due 15/01/2027 104 0.88
125 Occidental Petroleum Corp,3.000%, due 15/02/2027 118 1.00
105 Occidental Petroleum Corp,6.625%, due 01/09/2030 120 1.02
80 Owl Rock Capital Corp,4.000%, due 30/03/2025 85 0.72
100 Par Pharmaceutical Inc,7.500%, due 01/04/2027 108 0.91
45 Rackspace Technology GlobalInc, 144A,3.500%, due 15/02/2028 44 0.38
50 Scientific Games InternationalInc, 144A,5.000%, due 15/10/2025 52 0.44
45 Select Medical Corp, 144A,6.250%, due 15/08/2026 48 0.41
30 Sensata Technologies Inc, 144A,4.375%, due 15/02/2030 32 0.27
90 Simmons Foods Inc/SimmonsPrepared Foods Inc/Simmons PetFood Inc/Simmons Feed, 144A,4.625%, due 01/03/2029 91 0.78
275 Sinclair Television Group Inc,144A,5.875%, due 15/03/2026 282 2.40
55 Sinclair Television Group Inc,144A,5.500%, due 01/03/2030 55 0.47
115 Sirius XM Radio Inc,5.375%, due 15/07/2026 119 1.01
105 TEGNA Inc, 144A,4.625%, due 15/03/2028 108 0.91
100 Travel + Leisure Co,6.000%, due 01/04/2027 112 0.95
90 Tronox Inc, 144A,6.500%, due 01/05/2025 96 0.82
80 Tronox Inc,6.500%, due 15/04/2026 83 0.70
90 Univision Communications Inc,144A,6.625%, due 01/06/2027 94 0.80
100 Vector Group Ltd, 144A,5.750%, due 01/02/2029 104 0.88
100 Viasat Inc, 144A,5.625%, due 15/09/2025 102 0.87
95 Viasat Inc, 144A,5.625%, due 15/04/2027 100 0.85
110 Vishay Intertechnology Inc,2.250%, due 15/06/2025 123 1.04
60 Vista Outdoor Inc, 144A,4.500%, due 15/03/2029 60 0.51
50 Winnebago Industries Inc, 144A,6.250%, due 15/07/2028 54 0.46
90 WR Grace & Co-Conn, 144A,4.875%, due 15/06/2027 93 0.79
6,056 51.44
Uruguay — 1.03% (29 February 2020: 0.00%)
40 Navios South American LogisticsInc / Navios Logistics Finance USInc, 144A,10.750%, due 01/07/2025 44 0.37
70 Navios South American LogisticsInc / Navios Logistics Finance USInc,10.750%, due 01/07/2025 78 0.66
122 1.03
Total Corporate Bonds and Notes(Cost $10,250) 10,819 91.89
^ Not authorised for sale to the public in Hong Kong.The accompanying notes are an integral part of the Financial Statements
194

Legg Mason Global Funds Plc Annual Report 28 February 2021
Legg Mason Brandywine Global Defensive High Yield Fund^
Portfolio of Investments as at 28 February 2021 – (continued)
FaceValue(000’s)
Value(000’s)
$
% ofNet
AssetValue
Government Bonds and Notes — 3.43%(29 February 2020: 1.82%)
Turkey — 1.70% (29 February 2020: 0.00%)
200 Turkey Government InternationalBond,5.950%, due 15/01/2031 200 1.70
Ukraine — 1.73% (29 February 2020: 0.00%)
200 Ukraine GovernmentInternational Bond,7.253%, due 15/03/2033 204 1.73
Total Government Bonds and Notes(Cost $399) 404 3.43
Collective Investment Schemes — 3.65%(29 February 2020: 6.54%)
430 Goldman Sachs US$ LiquidReserves Fund – InstitutionalClass 430 3.65
Total Collective Investment Schemes(Cost $430) 430 3.65
Total Investments at fair value throughprofit or loss (Cost $11,079) 11,653 98.97
Credit Default Swaps — 1.90%(29 February 2020: 0.52%)
Unrealised appreciation of contracts(see below) 223 1.90
FaceValue(000’s)
Value(000’s)
$
% ofNet
AssetValue
Forward Foreign Currency Contracts — 0.23%(29 February 2020: 0.26%)
Unrealised appreciation of contracts(see below) 27 0.23
Total Financial Assets at fair valuethrough profit or loss 11,903 101.10
Credit Default Swaps — (0.07%)(29 February 2020: 0.00%)
Unrealised depreciation of contracts(see below) (8) (0.07)
Forward Foreign Currency Contracts: (0.25%)(29 February 2020: (0.48%))
Unrealised depreciation of contracts(see below) (29) (0.25)
Total Financial Liabilities at fair valuethrough profit or loss (37) (0.32)
Total Financial Assets and FinancialLiabilities at fair value through profit orloss 11,866 100.78
Liabilities in Excess of Other Assets (92) (0.78)
Total Net Assets $11,774 100.00
– Amounts designated as “–” are either $0, less than$1,000, less than 1,000 shares or less than 0.01%.
144A Securities exempt from registration under Rule 144A ofthe Securities Act of 1933, as amended. Thesesecurities may only be resold, in transactions exemptfrom registration, to qualified institutional buyers. As at28 February 2021, these securities amounted to$4,454,000 or 37.86% of net assets.
* Variable rate security. The interest rate shown reflectsthe rate in effect at 28 February 2021.
ABBREVIATIONS:
Perpetual – A bond with no maturity date. Perpetual bondsare not redeemable but pay a steady stream ofinterest.
CAD – Canadian Dollar
EUR – Euro
Analysis of Total Assets
% ofTotal
Assets
Transferable securities admitted to an officialexchange listing or traded on a regulated market 92.69
Collective investment schemes 3.55
Financial derivative instruments 2.06
Other assets 1.70
Total Assets 100.00
Schedule of Credit Default Swaps
Counterparty Reference EntityBuy/Sell
ProtectionExpiration
Date
NotionalAmount(000’s)
Value(000’s)
Barclays CCO Holdings LLC, 5.000% Sell 20/06/2021 95 $ 1Barclays Sprint Communications Inc, 5.000% Sell 20/06/2021 195 3Barclays T-Mobile USA Inc, 5.000% Sell 20/06/2022 130 8Citi CDX.NA.HY, 5.000% Sell 20/12/2025 545 45Citi CenturyLink Inc, 1.000% Sell 20/06/2025 115 (7)Citi CenturyLink Inc, 1.000% Sell 20/06/2023 105 (1)Citi iTraxx Europe, 5.000% Sell 20/12/2025 1,115 140Citi Occidental Petroleum Corporation, 1.000% Sell 20/06/2021 105 –Goldman Sachs The Goodyear Tire & Rubber Co, 5.000% Sell 20/06/2022 185 10JP Morgan Altice France S.A., 5.000% Sell 20/12/2025 170 13Morgan Stanley Dell Inc, 1.000% Sell 20/12/2022 205 2Morgan Stanley Dell Inc, 1.000% Sell 20/06/2022 165 1
Unrealised Appreciation of Credit Default Swaps (29 February 2020 (000’s): $55) $ 223Unrealised Depreciation of Credit Default Swaps (29 February 2020 (000’s): $–) (8)
Net Appreciation of Credit Default Swaps (29 February 2020 (000’s): $55) $ 215
Schedule of Forward Foreign Currency Contracts
Expiration Date CounterpartyBuy Currency
(000’s)Sell Currency
(000’s)
UnrealisedAppreciation/(Depreciation)of Contracts
(000’s)
10/03/2021 BNY Mellon Buy EUR 43 Sell CAD 66 $ –10/03/2021 BNY Mellon Buy EUR 208 Sell GBP 184 (5)10/03/2021 BNY Mellon Buy EUR 7,553 Sell USD 9,093 2212/04/2021 Citi Buy EUR 390 Sell USD 479 (7)22/04/2021 JP Morgan Buy COP 790,000 Sell USD 225 (9)13/05/2021 Citi Buy MXN 4,700 Sell USD 229 (6)19/05/2021 HSBC Buy GBP 150 Sell USD 207 221/05/2021 Citi Buy USD 228 Sell RUB 17,000 321/05/2021 Citi Buy RUB 17,000 Sell USD 227 (2)
Unrealised Appreciation of Forward Foreign Currency Contracts (29 February 2020 (000’s): $28) $ 27Unrealised Depreciation of Forward Foreign Currency Contracts (29 February 2020 (000’s): $(51)) (29)
Net Depreciation of Forward Foreign Currency Contracts (29 February 2020 (000’s): $(23)) $ (2)
^ Not authorised for sale to the public in Hong Kong.The accompanying notes are an integral part of the Financial Statements
195

Legg Mason Global Funds Plc Annual Report 28 February 2021
Legg Mason Brandywine Global Enhanced Absolute Return Fund^
Portfolio of Investments as at 28 February 2021
FaceValue(000’s)
Value(000’s)
$
% ofNet
AssetValue
Corporate Bonds and Notes — 17.02%(29 February 2020: 9.32%)
Brazil — 0.76% (29 February 2020: 0.00%)
2,710 Petrobras Global FinanceBV,6.750%, due 03/06/2050 2,962 0.76
Canada — 3.43% (29 February 2020: 1.73%)
7,140 Bank of Nova Scotia/The,0.609%, due 15/09/2023 * 7,192 1.84
6,180 Canadian Imperial Bank ofCommerce,0.856%, due 17/03/2023 * 6,251 1.59
13,443 3.43
France — 0.51% (29 February 2020: 0.00%)
2,020 Total Capital InternationalSA,3.127%, due 29/05/2050 1,980 0.51
Mexico — 1.73% (29 February 2020: 2.06%)
1,180 Petroleos Mexicanos,6.750%, due 21/09/2047 1,041 0.26
6,005 Petroleos Mexicanos,7.690%, due 23/01/2050 5,751 1.47
6,792 1.73
Saudi Arabia — 0.11% (29 February 2020: 0.00%)
455 Saudi Arabian Oil Co,144A,3.250%, due 24/11/2050 428 0.11
United States — 10.48% (29 February 2020: 5.53%)
1,875 American Express Co,0.795%, due 05/11/2021 * 1,881 0.48
2,325 Apache Corp,4.750%, due 15/04/2043 2,276 0.58
785 Apache Corp,4.250%, due 15/01/2044 736 0.19
835 Apache Corp,5.350%, due 01/07/2049 833 0.21
990 Boeing Co/The,5.705%, due 01/05/2040 1,249 0.32
1,545 Boeing Co/The,5.805%, due 01/05/2050 1,996 0.51
1,235 Boeing Co/The,5.930%, due 01/05/2060 1,625 0.42
5,420 Caterpillar FinancialServices Corp,0.447%, due 15/03/2021 * 5,421 1.39
5,580 Ford Motor Credit Co LLC,1.048%, due 05/04/2021 * 5,576 1.42
1,030 General Motors Co,6.800%, due 01/10/2027 1,307 0.33
1,685 General Motors Co,6.250%, due 02/10/2043 2,268 0.58
755 Hess Corp,5.600%, due 15/02/2041 907 0.23
675 Hess Corp,5.800%, due 01/04/2047 845 0.22
4,595 Metropolitan Life GlobalFunding I, 144A,0.611%, due 13/01/2023 * 4,626 1.18
530 Occidental PetroleumCorp,6.200%, due 15/03/2040 574 0.15
830 Occidental PetroleumCorp,6.600%, due 15/03/2046 933 0.24
2,045 Occidental PetroleumCorp,4.400%, due 15/04/2046 1,834 0.47
1,900 Occidental PetroleumCorp,4.200%, due 15/03/2048 1,622 0.41
960 Occidental PetroleumCorp,4.400%, due 15/08/2049 847 0.22
3,115 Southwest Airlines Co,5.125%, due 15/06/2027 3,652 0.93
41,008 10.48
Total Corporate Bonds and Notes(Cost $63,039) 66,613 17.02
FaceValue(000’s)
Value(000’s)
$
% ofNet
AssetValue
Government Bonds and Notes — 72.51%(29 February 2020: 87.81%)
Brazil — 5.93% (29 February 2020: 9.49%)
BRL 118,690 Brazil Notas do TesouroNacional Serie F,Series NTNF,10.000%, due 01/01/2029 23,208 5.93
Colombia — 3.97% (29 February 2020: 4.86%)
COP 54,640,000 Colombian TES, Series B,6.000%, due 28/04/2028 15,533 3.97
Indonesia — 8.59% (29 February 2020: 9.99%)
IDR 413,100,000 Indonesia Treasury Bond,Series FR71,9.000%, due 15/03/2029 33,622 8.59
Malaysia — 3.84% (29 February 2020: 4.61%)
MYR 27,595 Malaysia GovernmentBond, Series 0117,3.882%, due 10/03/2022 6,965 1.78
MYR 10,275 Malaysia GovernmentBond, Series 0313,3.480%, due 15/03/2023 2,616 0.67
MYR 7,475 Malaysia GovernmentBond, Series 0115,3.955%, due 15/09/2025 1,977 0.51
MYR 13,080 Malaysia GovernmentBond, Series 0417,3.899%, due 16/11/2027 3,452 0.88
15,010 3.84
Mexico — 17.67% (29 February 2020: 22.31%)
MXN 180,700 Mexican Bonos,Series M 20,8.500%, due 31/05/2029 10,113 2.58
MXN 177,900 Mexican Bonos,Series M 30,8.500%, due 18/11/2038 9,847 2.52
MXN 765,700 Mexican Bonos,Series M,7.750%, due 13/11/2042 39,272 10.04
MXN 188,800 Mexican Bonos,Series M,8.000%, due 07/11/2047 9,898 2.53
69,130 17.67
Russia — 2.65% (29 February 2020: 0.00%)
RUB 726,000 Russian Federal Bond –OFZ,Series 6228,7.650%, due 10/04/2030 10,387 2.65
South Africa — 8.74% (29 February 2020: 10.74%)
ZAR 139,385 Republic of South AfricaGovernment Bond,Series R214,6.500%, due 28/02/2041 6,040 1.54
ZAR 516,600 Republic of South AfricaGovernment Bond,Series 2048,8.750%, due 28/02/2048 28,154 7.20
34,194 8.74
United States — 21.12% (29 February 2020: 23.91%)
28,505 United States TreasuryFloating Rate Note,0.085%, due 31/07/2022 * 28,516 7.29
36,165 United States TreasuryFloating Rate Note,0.085%, due 31/10/2022 * 36,181 9.25
17,920 United States TreasuryFloating Rate Note,0.079%, due 31/01/2023 * 17,925 4.58
82,622 21.12
Total Government Bonds and Notes(Cost $278,787) 283,706 72.51
Collective Investment Schemes — 4.23%(29 February 2020: 3.90%)
5,463 Goldman Sachs US$Liquid Reserves Fund –Institutional Class 5,463 1.40
FaceValue(000’s)
Value(000’s)
$
% ofNet
AssetValue
88 Legg Mason Global FundsPlc – Brandywine GlobalCredit Opportunities Fund– LM Class US$Accumulating 11,097 2.83
Total Collective Investment Schemes(Cost $15,773) 16,560 4.23
Total Investments at fair value throughprofit or loss (Cost $357,599) 366,879 93.76
Forward Foreign Currency Contracts — 1.35%(29 February 2020: 1.51%)
Unrealised appreciation of contracts(see below) 5,291 1.35
Futures — 0.25% (29 February 2020: 0.00%)
Unrealised appreciation of contracts(see below) 998 0.25
Total Financial Assets at fair valuethrough profit or loss 373,168 95.36
Forward Foreign Currency Contracts — (0.48%)(29 February 2020: (5.15%))
Unrealised depreciation of contracts(see below) (1,896) (0.48)
Futures — (0.30%) (29 February 2020: (4.45%))
Unrealised depreciation of contracts(see below) (1,176) (0.30)
Total Financial Liabilities at fair valuethrough profit or loss (3,072) (0.78)
Total Financial Assets and FinancialLiabilities at fair value through profit orloss 370,096 94.58
Other Assets in Excess of Liabilities 21,200 5.42
Total Net Assets $391,296 100.00
– Amounts designated as “–” are either $0, less than$1,000, less than 1,000 shares or less than 0.01%.
144A Securities exempt from registration under Rule 144A ofthe Securities Act of 1933, as amended. Thesesecurities may only be resold, in transactions exemptfrom registration, to qualified institutional buyers. As at28 February 2021, these securities amounted to$5,054,000 or 1.29% of net assets.
* Variable rate security. The interest rate shown reflectsthe rate in effect at 28 February 2021.
ABBREVIATIONS:
BRL – Brazilian Real
COP – Colombia Peso
IDR – Indonesian Rupiah
MXN – Mexican Peso
MYR – Malaysian Ringgit
RUB – Russian Ruble
ZAR – South Africa Rand
Analysis of Total Assets
% ofTotal
Assets
Transferable securities admitted to an officialexchange listing or traded on a regulated market 88.39
Collective investment schemes 4.18
Financial derivative instruments 1.59
Other assets 5.84
Total Assets 100.00
^ Not authorised for sale to the public in Hong Kong.The accompanying notes are an integral part of the Financial Statements
196

Legg Mason Global Funds Plc Annual Report 28 February 2021
Legg Mason Brandywine Global Enhanced Absolute Return Fund^
Portfolio of Investments as at 28 February 2021 – (continued)
Schedule of Forward Foreign Currency Contracts
Expiration Date CounterpartyBuy Currency
(000’s)Sell Currency
(000’s)
UnrealisedAppreciation/(Depreciation)of Contracts
(000’s)
09/03/2021 Barclays Buy NOK 371,100 Sell USD 42,319 $ 48109/03/2021 Goldman Sachs Buy USD 6,535 Sell NOK 55,300 15811/03/2021 HSBC Buy KRW 5,200,000 Sell USD 4,783 (160)15/03/2021 BNY Mellon Buy USD – Sell GBP – –15/03/2021 BNY Mellon Buy USD 5 Sell SGD 7 –15/03/2021 BNY Mellon Buy GBP 14 Sell USD 20 –15/03/2021 BNY Mellon Buy EUR 9 Sell USD 11 –15/03/2021 BNY Mellon Buy SGD 7,213 Sell USD 5,436 (27)15/03/2021 BNY Mellon Buy AUD 489,194 Sell USD 373,933 2,50316/03/2021 HSBC Buy CNH 178,000 Sell USD 27,436 (25)16/03/2021 HSBC Buy CNH 24,000 Sell USD 3,650 4612/04/2021 Barclays Buy PLN 123,000 Sell USD 32,965 (130)12/04/2021 Citi Buy USD 7,819 Sell EUR 6,370 12512/04/2021 HSBC Buy EUR 950 Sell USD 1,157 (9)13/04/2021 Barclays Buy USD 9,602 Sell MYR 39,000 2713/04/2021 Barclays Buy MYR 131,700 Sell USD 32,451 (117)14/04/2021 HSBC Buy USD 5,780 Sell BRL 30,300 38214/04/2021 HSBC Buy BRL 51,380 Sell USD 9,345 (192)15/04/2021 Citi Buy KRW 5,610,000 Sell USD 5,111 (132)20/04/2021 Citi Buy CZK 200,000 Sell USD 9,304 (83)20/04/2021 JP Morgan Buy CZK 79,000 Sell USD 3,677 (35)22/04/2021 JP Morgan Buy COP 53,850,000 Sell USD 15,330 (591)26/04/2021 JP Morgan Buy USD 5,712 Sell IDR 81,000,000 13529/04/2021 Citi Buy KRW 9,450,000 Sell USD 8,574 (186)03/05/2021 National Australia Bank Buy NZD 12,030 Sell USD 8,699 (7)12/05/2021 Citi Buy RUB 2,485,000 Sell USD 32,511 48412/05/2021 HSBC Buy CLP 4,750,000 Sell USD 6,770 (202)12/05/2021 HSBC Buy USD 5,957 Sell ZAR 89,000 13013/05/2021 Citi Buy USD 11,737 Sell MXN 241,000 30819/05/2021 HSBC Buy GBP 39,310 Sell USD 54,274 512
Unrealised Appreciation of Forward Foreign Currency Contracts (29 February 2020 (000’s): $5,780)$
5,291Unrealised Depreciation of Forward Foreign Currency Contracts (29 February 2020 (000’s): $(19,699)) (1,896)
Net Appreciation of Forward Foreign Currency Contracts (29 February 2020 (000’s): $(13,919))$
3,395
Schedule of Futures Contracts
CounterpartyNominal
Value
NotionalValue(000’s)
UnrealisedAppreciation/(Depreciation)of Contracts
(000’s)
Euro-Buxl 30 Year Bond March 2021 Morgan Stanley (64) $(16,202) $ 998
U.S. Ultra Bond (CBT) June 2021 Morgan Stanley (400) (75,625) (1,176)
Unrealised Appreciation of Futures Contracts (29 February 2020 (000’s): $–) $ 998Unrealised Depreciation of Futures Contracts (29 February 2020 (000’s): $(16,987)) (1,176)
Net Depreciation of Futures Contracts (29 February 2020 (000’s): $(16,987)) $ (178)
^ Not authorised for sale to the public in Hong Kong.The accompanying notes are an integral part of the Financial Statements
197

Legg Mason Global Funds Plc Annual Report 28 February 2021
Legg Mason Brandywine Global Dynamic US Equity Fund^
Portfolio of Investments as at 28 February 2021
Shares(000’s)
Value(000’s)
$
% ofNet
AssetValue
Collective Investment Schemes — 2.93%(29 February 2020: 1.38%)
55 Goldman Sachs US$ Liquid ReservesFund – Institutional Class 55 2.93
Total Collective Investment Schemes(Cost $55) 55 2.93
Common Stock — 98.33% (29 February 2020: 98.25%)
Aerospace & Defense — 1.06%(29 February 2020: 0.00%)
1 Howmet Aerospace Inc 20 1.06
Agriculture — 0.83% (29 February 2020: 0.00%)
– Darling Ingredients Inc 16 0.83
Apparel — 0.54% (29 February 2020: 0.35%)
1 Hanesbrands Inc 10 0.54
Auto Manufacturers — 5.01% (29 February 2020: 1.81%)
– Cummins Inc 60 3.221 General Motors Co 34 1.79
94 5.01
Banks — 19.00% (29 February 2020: 7.97%)
2 Bank of America Corp 82 4.34– Bank OZK 1 0.061 Citigroup Inc 76 4.03– Citizens Financial Group Inc 20 1.08– East West Bancorp Inc 11 0.58– First Citizens BancShares Inc/NC 2 0.12– Goldman Sachs Group Inc/The 83 4.42– Popular Inc 3 0.15– Prosperity Bancshares Inc 1 0.07– State Street Corp 25 1.35– TCF Financial Corp 3 0.131 US Bancorp 37 1.98– Western Alliance Bancorp 4 0.20– Zions Bancorp NA 9 0.49
357 19.00
Biotechnology — 6.09% (29 February 2020: 4.27%)
– Amgen Inc 14 0.73– Biogen Inc 61 3.25– Regeneron Pharmaceuticals Inc 39 2.11
114 6.09
Building Materials — 2.11% (29 February 2020: 0.00%)
1 Johnson Controls International plc 40 2.11
Chemicals — 5.90% (29 February 2020: 2.28%)
– Celanese Corp ‘A’ 25 1.30– CF Industries Holdings Inc 14 0.74– Eastman Chemical Co 23 1.23– LyondellBasell Industries NV 49 2.63
111 5.90
Commercial Services — 3.06% (29 February 2020: 0.47%)
– ManpowerGroup Inc 8 0.43– Quanta Services Inc 10 0.53– Service Corp International/US 6 0.35– United Rentals Inc 33 1.75
57 3.06
Cosmetics & Personal Care — 1.11%(29 February 2020: 1.34%)
– Procter & Gamble Co/The 21 1.11
Diversified Financial Services — 11.42%(29 February 2020: 7.76%)
– Affiliated Managers Group Inc 3 0.13– Ally Financial Inc 17 0.88– Ameriprise Financial Inc 28 1.47– BlackRock Inc 15 0.78– Capital One Financial Corp 14 0.73– Credit Acceptance Corp 4 0.23– Discover Financial Services 30 1.61– Invesco Ltd 10 0.56– Jefferies Financial Group Inc 8 0.43– OneMain Holdings Inc 7 0.36– Santander Consumer USA Holdings
Inc 8 0.45– SLM Corp 3 0.181 Synchrony Financial 23 1.24– T Rowe Price Group Inc 45 2.37
215 11.42
Shares(000’s)
Value(000’s)
$
% ofNet
AssetValue
Electric — 2.31% (29 February 2020: 2.82%)
– American Electric Power Co Inc 4 0.23– Duke Energy Corp 5 0.26– Exelon Corp 5 0.29– NextEra Energy Inc 13 0.69– Southern Co/The 16 0.84
43 2.31
Electrical Components & Equipment — 0.05%(29 February 2020: 0.00%)
– Acuity Brands Inc 1 0.05
Electronics — 0.71% (29 February 2020: 2.66%)
– Arrow Electronics Inc 13 0.71
Engineering & Construction — 0.56%(29 February 2020: 0.00%)
– AECOM 1 0.03– MasTec Inc 1 0.07– TopBuild Corp 8 0.46
10 0.56
Food — 0.83% (29 February 2020: 0.74%)
– Kroger Co/The 3 0.13– Sysco Corp 13 0.70
16 0.83
Healthcare-Services — 2.96% (29 February 2020: 0.14%)
– Anthem Inc 15 0.81– DaVita Inc 23 1.23– Molina Healthcare Inc 18 0.92
56 2.96
Home Builders — 4.54% (29 February 2020: 0.00%)
– DR Horton Inc 33 1.74– Lennar Corp 26 1.41– PulteGroup Inc 16 0.86– Toll Brothers Inc 10 0.53
85 4.54
Home Furnishings — 0.31% (29 February 2020: 0.00%)
– Whirlpool Corp 6 0.31
Insurance — 3.54% (29 February 2020: 0.00%)
– Aflac Inc 14 0.76– Allstate Corp/The 33 1.73– Lincoln National Corp 5 0.24– Primerica Inc 6 0.31– Progressive Corp/The 8 0.44– Voya Financial Inc 1 0.06
67 3.54
Internet — 3.30% (29 February 2020: 6.21%)
1 eBay Inc 62 3.30
Iron/Steel — 0.17% (29 February 2020: 1.15%)
– Steel Dynamics Inc 3 0.17
Leisure Time — 0.28% (29 February 2020: 0.37%)
– Brunswick Corp/DE 5 0.28
Lodging — 1.51% (29 February 2020: 2.01%)
1 MGM Resorts International 28 1.51
Machinery — Construction & Mining: 1.48%(29 February 2020: 2.67%)
– Caterpillar Inc 28 1.48
Machinery — Diversified: 0.18%(29 February 2020: 1.28%)
– AGCO Corp 3 0.13– Crane Co 1 0.05
4 0.18
Media — 2.04% (29 February 2020: 0.00%)
– Comcast Corp 11 0.58– Discovery Inc 2 0.12– Fox Corp 7 0.35– Nexstar Media Group Inc ‘A’ 4 0.23– Walt Disney Co/The 14 0.76
38 2.04
Mining — 1.96% (29 February 2020: 0.46%)
1 Newmont Corp 37 1.96
Miscellaneous Manufacturing — 0.22%(29 February 2020: 3.74%)
– Carlisle Cos Inc 4 0.22
Shares(000’s)
Value(000’s)
$
% ofNet
AssetValue
Oil & Gas — 0.57% (29 February 2020: 1.93%)
1 Cabot Oil & Gas Corp 11 0.57
Pharmaceuticals — 3.11% (29 February 2020: 4.01%)
– Johnson & Johnson 24 1.27– McKesson Corp 16 0.83– Merck & Co Inc 6 0.32– Pfizer Inc 13 0.69
59 3.11
Retail — 1.80% (29 February 2020: 6.19%)
– Advance Auto Parts Inc 5 0.26– AutoNation Inc 5 0.27– Foot Locker Inc 2 0.08– Penske Automotive Group Inc 6 0.34– Qurate Retail Inc 3 0.15– Walmart Inc 13 0.70
34 1.80
Savings & Loans — 0.17% (29 February 2020: 0.06%)
– New York Community Bancorp Inc 1 0.07– People’s United Financial Inc 2 0.10
3 0.17
Semiconductors — 5.06% (29 February 2020: 7.82%)
2 Intel Corp 95 5.06
Software — 1.88% (29 February 2020: 2.52%)
– Citrix Systems Inc 7 0.38– J2 Global Inc 3 0.15– Oracle Corp 25 1.35
35 1.88
Telecommunications — 1.76% (29 February 2020: 3.45%)
– AT&T Inc 10 0.51– Juniper Networks Inc 5 0.28– Verizon Communications Inc 18 0.97
33 1.76
Textiles — 0.82% (29 February 2020: 0.00%)
– Mohawk Industries Inc 15 0.82
Transportation — 0.08% (29 February 2020: 6.36%)
– Knight-Swift Transportation HoldingsInc 2 0.08
Total Common Stock (Cost $1,485) 1,848 98.33
Total Investments at fair value throughprofit or loss (Cost $1,540) 1,903 101.26
Forward Foreign Currency Contracts — 0.17%(29 February 2020: 0.21%)
Unrealised appreciation of contracts(see below) 3 0.17
Total Financial Assets at fair valuethrough profit or loss 1,906 101.43
Forward Foreign Currency Contracts — (0.02%)(29 February 2020: (0.04%))
Unrealised depreciation of contracts(see below) – (0.02)
Total Financial Liabilities at fair valuethrough profit or loss – (0.02)
Total Financial Assets and FinancialLiabilities at fair value through profit orloss 1,906 101.41
Liabilities in Excess of Other Assets (27) (1.41)
Total Net Assets $1,879 100.00
– Amounts designated as “–” are either $0, less than$1,000, less than 1,000 shares or less than 0.01%.
Analysis of Total Assets
% ofTotal
Assets
Transferable securities admitted to an officialexchange listing or traded on a regulated market 96.50
Collective investment schemes 2.87
Financial derivative instruments 0.16
Other assets 0.47
Total Assets 100.00
^ Not authorised for sale to the public in Hong Kong.The accompanying notes are an integral part of the Financial Statements
198

Legg Mason Global Funds Plc Annual Report 28 February 2021
Legg Mason Brandywine Global Dynamic US Equity Fund^
Portfolio of Investments as at 28 February 2021 – (continued)
Schedule of Forward Foreign Currency Contracts
Expiration Date CounterpartyBuy Currency
(000’s)Sell Currency
(000’s)
UnrealisedAppreciation/(Depreciation)of Contracts
(000’s)
15/03/2021 BNY Mellon Buy EUR 81 Sell USD 99 $ –15/03/2021 BNY Mellon Buy EUR 1,077 Sell USD 1,296 3
Unrealised Appreciation of Forward Foreign Currency Contracts (29 February 2020 (000’s): $7) $ 3Unrealised Depreciation of Forward Foreign Currency Contracts (29 February 2020 (000’s): $(1)) –
Net Appreciation of Forward Foreign Currency Contracts (29 February 2020 (000’s): $6) $ 3
^ Not authorised for sale to the public in Hong Kong.The accompanying notes are an integral part of the Financial Statements
199

Legg Mason Global Funds Plc Annual Report 28 February 2021
Legg Mason ClearBridge Value Fund
Portfolio of Investments as at 28 February 2021
Shares(000’s)
Value(000’s)
$
% ofNet
AssetValue
Common Stock — 94.72% (29 February 2020: 90.80%)Aerospace & Defense — 1.97%(29 February 2020: 0.53%)
13 Northrop Grumman Corp 3,657 0.72149 Spirit AeroSystems Holdings
Inc ‘A’ 6,395 1.25
10,052 1.97
Airlines — 1.47% (29 February 2020: 0.90%)
129 Southwest Airlines Co 7,471 1.47
Auto Manufacturers — 1.25%(29 February 2020: 0.00%)
124 General Motors Co 6,380 1.25
Banks — 9.77% (29 February 2020: 6.98%)
460 Bank of America Corp 15,942 3.1377 Citigroup Inc 5,094 1.0041 Goldman Sachs Group Inc/The 13,100 2.58
431 Wells Fargo & Co 15,589 3.06
49,725 9.77
Beverages — 1.24% (29 February 2020: 1.28%)
30 Constellation Brands Inc ‘A’ 6,335 1.24
Biotechnology — 2.71% (29 February 2020: 4.03%)
10 Biogen Inc 2,742 0.5455 BioMarin Pharmaceutical Inc 4,258 0.83
111 Gilead Sciences Inc 6,820 1.34
13,820 2.71
Computers — 1.98% (29 February 2020: 2.66%)
401 DXC Technology Co 10,104 1.98
Diversified Financial Services — 6.02%(29 February 2020: 5.30%)
155 Charles Schwab Corp/The 9,572 1.88204 OneMain Holdings Inc 9,570 1.88298 Synchrony Financial 11,508 2.26
30,650 6.02
Electric — 3.02% (29 February 2020: 4.76%)
373 AES Corp/The 9,902 1.94317 Vistra Corp 5,481 1.08
15,383 3.02
Healthcare-Products — 1.44% (29 February 2020: 0.00%)
63 Medtronic Plc 7,310 1.44
Healthcare-Services — 1.51% (29 February 2020: 0.00%)
23 UnitedHealth Group Inc 7,664 1.51
Holding Companies – Diversified — 0.60%(29 February 2020: 0.00%)
283 East Resources Acquisition Co 3,072 0.60
Home Builders — 1.05% (29 February 2020: 1.69%)
100 Toll Brothers Inc 5,346 1.05
Home Furnishings — 1.61% (29 February 2020: 0.00%)
77 Sony Corp ADR 8,181 1.61
Industrial — 2.19% (29 February 2020: 0.00%)
888 General Electric Co 11,130 2.19
Insurance — 6.75% (29 February 2020: 7.86%)
333 American International GroupInc 14,643 2.88
501 Equitable Holdings Inc 14,797 2.9197 Hartford Financial Services
Group Inc/The 4,919 0.96
34,359 6.75
Shares(000’s)
Value(000’s)
$
% ofNet
AssetValue
Internet — 3.96% (29 February 2020: 10.61%)
4 Alphabet Inc 9,152 1.801 Amazon.com Inc 3,710 0.73
12 Facebook Inc ‘A’ 3,118 0.6181 Uber Technologies Inc 4,179 0.82
20,159 3.96
Leisure Time — 1.68% (29 February 2020: 0.00%)
320 Carnival Corp 8,558 1.68
Lodging — 3.21% (29 February 2020: 0.87%)
360 Melco Resorts & EntertainmentLtd ADR 7,799 1.53
226 MGM Resorts International 8,526 1.68
16,325 3.21
Machinery – Construction & Mining — 1.14%(29 February 2020: 0.00%)
55 Oshkosh Corp 5,820 1.14
Machinery – Diversified — 2.19%(29 February 2020: 1.03%)
37 Curtiss-Wright Corp 4,062 0.80EUR 84 KION Group AG 7,104 1.39
11,166 2.19
Media — 4.07% (29 February 2020: 0.73%)
94 Comcast Corp 4,928 0.97145 Liberty Media Corp-Liberty
SiriusXM 6,414 1.2650 Walt Disney Co/The 9,357 1.84
20,699 4.07
Mining — 3.39% (29 February 2020: 3.80%)
390 Freeport-McMoRan Inc 13,221 2.5975 Newmont Corp 4,063 0.80
17,284 3.39
Miscellaneous Manufacturing — 0.64%(29 February 2020: 0.00%)
25 Eaton Corp Plc 3,262 0.64
Oil & Gas — 7.67% (29 February 2020: 4.08%)
768 EQT Corp 13,662 2.68121 Pioneer Natural Resources Co 18,002 3.54159 TOTAL SE ADR 7,378 1.45
39,042 7.67
Pharmaceuticals — 5.74% (29 February 2020: 7.29%)
126 AbbVie Inc 13,619 2.67113 CVS Health Corp 7,724 1.52
39 Eli Lilly and Co 7,899 1.55
29,242 5.74
Pipelines — 0.46% (29 February 2020: 5.39%)
158 Kinder Morgan Inc 2,322 0.46
Real Estate — 0.93% (29 February 2020: 0.00%)
50 Howard Hughes Corp/The 4,729 0.93
Retail — 3.99% (29 February 2020: 0.00%)
40 Darden Restaurants Inc 5,533 1.0945 MSC Industrial Direct Co Inc ‘A’ 3,838 0.7588 TJX Cos Inc/The 5,808 1.1416 Ulta Beauty Inc 5,115 1.01
20,294 3.99
Semiconductors — 4.69% (29 February 2020: 3.44%)
100 Micron Technology Inc 9,156 1.8034 NXP Semiconductors NV 6,190 1.22
Shares(000’s)
Value(000’s) $
% ofNet
AssetValue
212 ON Semiconductor Corp 8,520 1.67
23,866 4.69
Software — 2.85% (29 February 2020: 9.36%)
40 Fidelity National InformationServices Inc 5,499 1.08
140 Oracle Corp 9,002 1.77
14,501 2.85
Telecommunications — 2.30% (29 February 2020: 1.29%)
18 Arista Networks Inc 4,954 0.9756 T-Mobile US Inc 6,771 1.33
11,725 2.30
Transportation — 1.23% (29 February 2020: 0.00%)
25 FedEx Corp 6,246 1.23
Total Common Stock (Cost $371,881) 482,222 94.72
Preferred Stock — 1.60% (29 February 2020: 1.53%)Auto Manufacturers — 1.60% (29 February 2020: 1.53%)
EUR 39 Volkswagen AG 8,131 1.60
Total Preferred Stock (Cost $6,851) 8,131 1.60
Real Estate Investment Trusts — 0.60%(29 February 2020: 1.82%)REITS — 0.60% (29 February 2020: 1.82%)
167 Kimco Realty Corp 3,066 0.60
Total Real Estate Investment Trusts(Cost $2,325) 3,066 0.60
Total Investments at fair valuethrough profit or loss (Cost $381,057) 493,419 96.92
Forward Foreign Currency Contracts — 0.00%(29 February 2020: 0.00%)
Unrealised appreciation of contracts(see below) – –
Total Financial Assets at fair valuethrough profit or loss 493,419 96.92
Forward Foreign Currency Contracts — 0.00%(29 February 2020: 0.00%)
Unrealised depreciation of contracts(see below) (1) –
Total Financial Liabilities at fair valuethrough profit or loss (1) –
Total Financial Assets and FinancialLiabilities at fair value through profitor loss 493,418 96.92
Other Assets in Excess of Liabilities 15,667 3.08
Total Net Assets $509,085 100.00
– Amounts designated as “–” are either $0, less than$1,000, less than 1,000 shares or less than 0.01%.
ABBREVIATIONS:
ADR – American Depositary Receipt.
EUR – Euro
Analysis of Total Assets
% ofTotal
Assets
Transferable securities admitted to an officialexchange listing or traded on a regulated market 96.83
Other assets 3.17
Total Assets 100.00
Schedule of Forward Foreign Currency Contracts
Expiration Date CounterpartyBuy Currency
(000’s)Sell Currency
(000’s)
UnrealisedAppreciation/(Depreciation)of Contracts
(000’s)
12/03/2021 BNY Mellon Buy USD 33 Sell SGD 44 $ –12/03/2021 BNY Mellon Buy SGD 581 Sell USD 437 (1)12/03/2021 BNY Mellon Buy SGD 2 Sell USD 1 –12/03/2021 BNY Mellon Buy EUR 2 Sell USD 2 –12/03/2021 BNY Mellon Buy EUR 27 Sell USD 33 –
Unrealised Appreciation of Forward Foreign Currency Contracts (29 February 2020 (000’s): $–) –Unrealised Depreciation of Forward Foreign Currency Contracts (29 February 2020 (000’s): $–) (1)
Net Depreciation of Forward Foreign Currency Contracts (29 February 2020 (000’s): $–) $ (1)
The accompanying notes are an integral part of the Financial Statements
200

Legg Mason Global Funds Plc Annual Report 28 February 2021
Legg Mason ClearBridge US Appreciation Fund
Portfolio of Investments as at 28 February 2021
Shares(000’s)
Value(000’s)
$
% ofNet
AssetValue
Common Stock — 97.69% (29 February 2020: 97.55%)
Auto Manufacturers — 0.57%(29 February 2020: 0.00%)
23 General Motors Co 1,178 0.57
Banks — 6.02% (29 February 2020: 7.79%)
93 Bank of America Corp 3,241 1.5753 JPMorgan Chase & Co 7,849 3.8126 US Bancorp 1,306 0.64
12,396 6.02
Beverages — 1.89% (29 February 2020: 2.51%)
35 Coca-Cola Co/The 1,691 0.8217 PepsiCo Inc 2,206 1.07
3,897 1.89
Biotechnology — 0.45% (29 February 2020: 0.52%)
4 Amgen Inc 924 0.45
Building Materials — 0.64% (29 February 2020: 0.84%)
8 Vulcan Materials Co 1,309 0.64
Chemicals — 5.74% (29 February 2020: 5.35%)
14 Air Products & Chemicals Inc 3,537 1.7111 Ecolab Inc 2,260 1.1032 PPG Industries Inc 4,284 2.08
3 Sherwin-Williams Co/The 1,747 0.85
11,828 5.74
Commercial Services — 1.58%(29 February 2020: 1.93%)
19 Automatic Data Processing Inc 3,264 1.58
Computers — 6.85% (29 February 2020: 5.93%)
92 Apple Inc 11,177 5.4325 Cognizant Technology Solutions
Corp 1,823 0.889 International Business Machines
Corp 1,110 0.54
14,110 6.85
Cosmetics & Personal Care — 1.41%(29 February 2020: 1.45%)
24 Procter & Gamble Co/The 2,903 1.41
Diversified Financial Services — 4.21%(29 February 2020: 4.52%)
6 CME Group Inc 1,109 0.5413 Intercontinental Exchange Inc 1,412 0.6829 Visa Inc ‘A’ 6,159 2.99
8,680 4.21
Electric — 0.65% (29 February 2020: 0.56%)
9 NextEra Energy Inc 640 0.316 Sempra Energy 709 0.34
1,349 0.65
Electronics — 2.51% (29 February 2020: 2.25%)
26 Honeywell International Inc 5,167 2.51
Environmental Control — 1.04%(29 February 2020: 1.39%)
19 Waste Management Inc 2,137 1.04
Shares(000’s)
Value(000’s)
$
% ofNet
AssetValue
Food — 0.83% (29 February 2020: 0.78%)
32 Mondelez International Inc 1,706 0.83
Healthcare-Products — 3.89% (29 February 2020: 3.44%)
29 Medtronic Plc 3,389 1.6510 Thermo Fisher Scientific Inc 4,615 2.24
8,004 3.89
Healthcare-Services — 2.20% (29 February 2020: 2.18%)
14 UnitedHealth Group Inc 4,532 2.20
Home Builders — 0.59% (29 February 2020: 0.00%)
23 Toll Brothers Inc 1,209 0.59
Insurance — 5.58% (29 February 2020: 5.84%)
– Berkshire Hathaway Inc 6,548 3.182 Chubb Ltd 341 0.17
32 Travelers Cos Inc/The 4,600 2.23
11,489 5.58
Internet — 11.37% (29 February 2020: 7.38%)
2 Alphabet Inc 4,188 2.032 Alphabet Inc ‘A’ 3,714 1.803 Amazon.com Inc 7,933 3.85
18 Facebook Inc ‘A’ 4,540 2.2038 Pinterest Inc 3,059 1.49
23,434 11.37
Iron/Steel — 0.86% (29 February 2020: 0.00%)
76 ArcelorMittal SA 1,776 0.86
Media — 4.98% (29 February 2020: 5.23%)
111 Comcast Corp 5,837 2.8323 Walt Disney Co/The 4,427 2.15
10,264 4.98
Miscellaneous Manufacturing — 0.55%(29 February 2020: 0.89%)
6 3M Co 1,137 0.55
Oil & Gas — 1.84% (29 February 2020: 3.47%)
24 Chevron Corp 2,425 1.189 Pioneer Natural Resources Co 1,363 0.66
3,788 1.84
Packaging & Containers — 0.65%(29 February 2020: 0.00%)
16 Ball Corp 1,346 0.65
Pharmaceuticals — 6.60% (29 February 2020: 7.32%)
5 Becton Dickinson and Co 1,128 0.559 Eli Lilly and Co 1,915 0.93
31 Johnson & Johnson 4,834 2.3450 Merck & Co Inc 3,667 1.7861 Pfizer Inc 2,056 1.00
13,600 6.60
Pipelines — 0.46% (29 February 2020: 0.90%)
65 Kinder Morgan Inc 949 0.46
Retail — 4.21% (29 February 2020: 6.91%)
20 Home Depot Inc/The 5,246 2.5552 TJX Cos Inc/The 3,428 1.66
8,674 4.21
Shares(000’s)
Value(000’s)
$
% ofNet
AssetValue
Semiconductors — 2.04% (29 February 2020: 1.18%)
5 ASML Holding NV 2,793 1.368 Texas Instruments Inc 1,402 0.68
4,195 2.04
Software — 12.01% (29 February 2020: 11.57%)
10 Adobe Inc 4,539 2.2012 Fidelity National Information
Services Inc 1,722 0.8468 Microsoft Corp 15,892 7.7120 Oracle Corp 1,290 0.63
6 salesforce.com Inc 1,300 0.63
24,743 12.01
Telecommunications — 2.79% (29 February 2020: 3.91%)
4 Arista Networks Inc 1,259 0.6120 T-Mobile US Inc 2,345 1.1439 Verizon Communications Inc 2,138 1.04
5,742 2.79
Transportation — 2.68% (29 February 2020: 1.28%)
4 Canadian Pacific Railway Ltd 1,585 0.773 Union Pacific Corp 689 0.33
21 United Parcel Service Inc ‘B’ 3,252 1.58
5,526 2.68
Total Common Stock (Cost $128,241) 201,256 97.69
Real Estate Investment Trusts — 1.31%(29 February 2020: 1.89%)
REITS — 1.31% (29 February 2020: 1.89%)
12 American Tower Corp 2,699 1.31
Total Real Estate Investment Trusts(Cost $1,683) 2,699 1.31
Total Financial Assets at fair valuethrough profit or loss 203,955 99.00
Total Financial Assets and FinancialLiabilities at fair value through profitor loss 203,955 99.00
Other Assets in Excess of Liabilities 2,053 1.00
Total Net Assets $206,008 100.00
– Amounts designated as “–” are either $0, less than$1,000, less than 1,000 shares or less than 0.01%.
ABBREVIATIONS:
Analysis of Total Assets
% ofTotal
Assets
Transferable securities admitted to an officialexchange listing or traded on a regulated market 98.45
Other assets 1.55
Total Assets 100.00
The accompanying notes are an integral part of the Financial Statements
201

Legg Mason Global Funds Plc Annual Report 28 February 2021
Legg Mason ClearBridge US Large Cap Growth Fund
Portfolio of Investments as at 28 February 2021
Shares(000’s)
Value(000’s)
$
% ofNet
AssetValue
Common Stock — 98.47% (29 February 2020: 94.48%)
Auto Parts & Equipment — 1.83%(29 February 2020: 0.28%)
222 Aptiv Plc 33,181 1.83
Beverages — 2.37% (29 February 2020: 1.22%)
263 Anheuser-Busch InBev SA/NV ADR 15,178 0.84317 Monster Beverage Corp 27,806 1.53
42,984 2.37
Biotechnology — 3.50% (29 February 2020: 2.41%)
61 Alexion Pharmaceuticals Inc 9,359 0.52174 Amgen Inc 39,048 2.15195 BioMarin Pharmaceutical Inc 15,065 0.83
63,472 3.50
Chemicals — 1.40% (29 February 2020: 2.57%)
121 Ecolab Inc 25,286 1.40
Commercial Services — 1.78% (29 February 2020: 1.81%)
357 IHS Markit Ltd 32,201 1.78
Computers — 4.74% (29 February 2020: 3.69%)
708 Apple Inc 85,893 4.74
Distribution & Wholesale — 1.72%(29 February 2020: 1.73%)
83 WW Grainger Inc 31,085 1.72
Diversified Financial Services — 4.74%(29 February 2020: 7.97%)
404 Visa Inc ‘A’ 85,759 4.74
Electronics — 2.12% (29 February 2020: 1.96%)
190 Honeywell International Inc 38,390 2.12
Healthcare-Products — 3.95% (29 February 2020: 2.45%)
348 Alcon Inc 23,776 1.31106 Thermo Fisher Scientific Inc 47,846 2.64
71,622 3.95
Healthcare-Services — 3.29% (29 February 2020: 3.13%)
180 UnitedHealth Group Inc 59,565 3.29
Internet — 22.03% (29 February 2020: 22.81%)
110 Alibaba Group Holding Ltd ADR 26,286 1.4553 Amazon.com Inc 164,769 9.1012 Booking Holdings Inc 26,783 1.48
388 Facebook Inc ‘A’ 99,810 5.51
Shares(000’s)
Value(000’s)
$
% ofNet
AssetValue
117 Palo Alto Networks Inc 41,983 2.32761 Uber Technologies Inc 39,425 2.17
399,056 22.03
Media — 3.52% (29 February 2020: 4.27%)
473 Comcast Corp 24,888 1.38205 Walt Disney Co/The 38,817 2.14
63,705 3.52
Pharmaceuticals — 2.44% (29 February 2020: 4.52%)
285 Zoetis Inc 44,165 2.44
Retail — 7.53% (29 February 2020: 5.00%)
161 Advance Auto Parts Inc 25,842 1.4353 Costco Wholesale Corp 17,482 0.97
150 Home Depot Inc/The 38,784 2.14108 Tractor Supply Co 17,115 0.94115 Ulta Beauty Inc 37,117 2.05
136,340 7.53
Semiconductors — 9.60% (29 February 2020: 5.22%)
41 ASML Holding NV 23,511 1.3093 NVIDIA Corp 50,832 2.81
140 NXP Semiconductors NV 25,506 1.41351 QUALCOMM Inc 47,848 2.64151 Texas Instruments Inc 26,069 1.44
173,766 9.60
Software — 19.68% (29 February 2020: 19.22%)
122 Adobe Inc 56,164 3.10255 Akamai Technologies Inc 24,065 1.33
79 Atlassian Corp Plc 18,723 1.03222 Fidelity National Information
Services Inc 30,682 1.69411 Microsoft Corp 95,384 5.27426 Nutanix Inc 12,895 0.71220 salesforce.com Inc 47,569 2.63208 Splunk Inc 29,746 1.64168 VMware Inc 23,270 1.29
73 Workday Inc ‘A’ 17,988 0.99
356,486 19.68
Transportation — 2.23% (29 February 2020: 2.42%)
256 United Parcel Service Inc ‘B’ 40,437 2.23
Total Common Stock(Cost $1,204,066) 1,783,393 98.47
Shares(000’s)
Value(000’s)
$
% ofNet
AssetValue
Real Estate Investment Trusts — 1.52%(29 February 2020: 1.79%)
REITS — 1.52% (29 February 2020: 1.79%)
43 Equinix Inc 27,564 1.52
Total Real Estate Investment Trusts(Cost $19,055) 27,564 1.52
Total Investments at fair valuethrough profit or loss(Cost $1,223,121) 1,810,957 99.99
Forward Foreign Currency Contracts — 0.06%(29 February 2020: 0.05%)
Unrealised appreciation of contracts(see below) 1,202 0.06
Total Financial Assets at fair valuethrough profit or loss 1,812,159 100.05
Forward Foreign Currency Contracts — (0.13%)(29 February 2020: (0.05%))
Unrealised depreciation of contracts(see below) (2,409) (0.13)
Total Financial Liabilities at fairvalue through profit or loss (2,409) (0.13)
Total Financial Assets and FinancialLiabilities at fair value throughprofit or loss 1,809,750 99.92
Other Assets in Excess of Liabilities 1,302 0.08
Total Net Assets $1,811,052 100.00
– Amounts designated as “–” are either $0, less than$1,000, less than 1,000 shares or less than 0.01%.
ABBREVIATIONS:
ADR – American Depositary Receipt.
Analysis of Total Assets
% ofTotal
Assets
Transferable securities admitted to an officialexchange listing or traded on a regulated market 98.29
Financial derivative instruments 0.07
Other assets 1.64
Total Assets 100.00
Schedule of Forward Foreign Currency Contracts
Expiration Date CounterpartyBuy Currency
(000’s)Sell Currency
(000’s)
UnrealisedAppreciation/(Depreciation)of Contracts
(000’s)
01/03/2021 BNY Mellon Buy USD 39,880 Sell BRL 217,964 $ 98701/03/2021 BNY Mellon Buy BRL 217,964 Sell USD 40,208 (1,316)12/03/2021 BNY Mellon Buy USD 6,454 Sell EUR 5,314 4112/03/2021 BNY Mellon Buy USD 323 Sell EUR 269 (1)12/03/2021 BNY Mellon Buy EUR 50,822 Sell USD 61,187 15312/03/2021 BNY Mellon Buy EUR 2,123 Sell USD 2,575 (12)01/04/2021 BNY Mellon Buy USD 1,123 Sell BRL 6,183 2101/04/2021 BNY Mellon Buy BRL 231,149 Sell USD 42,274 (1,080)
Unrealised Appreciation of Forward Foreign Currency Contracts (29 February 2020 (000’s): $749) $ 1,202Unrealised Depreciation of Forward Foreign Currency Contracts (29 February 2020 (000’s): $(778)) (2,409)
Net Depreciation of Forward Foreign Currency Contracts (29 February 2020 (000’s): $(29)) $ (1,207)
The accompanying notes are an integral part of the Financial Statements
202

Legg Mason Global Funds Plc Annual Report 28 February 2021
Legg Mason ClearBridge US Aggressive Growth Fund
Portfolio of Investments as at 28 February 2021
Shares(000’s)
Value(000’s)
$
% ofNet
AssetValue
Common Stock — 99.88% (29 February 2020: 100.45%)
Biotechnology — 16.26% (29 February 2020: 19.82%)
58 Amgen Inc 13,138 1.66144 Biogen Inc 39,334 4.97
75 Guardant Health Inc 11,046 1.40234 ImmunoGen Inc 2,053 0.26272 Ionis Pharmaceuticals Inc 14,247 1.80
71 Ultragenyx Pharmaceutical Inc 10,095 1.28182 Vertex Pharmaceuticals Inc 38,674 4.89
128,587 16.26
Building Materials — 1.70% (29 February 2020: 1.76%)
240 Johnson Controls International plc 13,409 1.70
Computers — 5.92% (29 February 2020: 7.09%)
434 Seagate Technology Plc 31,744 4.01220 Western Digital Corp 15,074 1.91
46,818 5.92
Diversified Financial Services — 0.29%(29 February 2020: 0.24%)
36 Cohen & Steers Inc 2,315 0.29
Electronics — 4.51% (29 February 2020: 3.80%)
274 TE Connectivity Ltd 35,684 4.51
Entertainment — 3.87% (29 February 2020: 3.51%)
255 Lions Gate Entertainment Corp 3,196 0.40104 Madison Square Garden
Entertainment Corp 11,225 1.4284 Madison Square Garden Sports
Corp 16,173 2.05
30,594 3.87
Environmental Control — 0.32%(29 February 2020: 0.19%)
45 Pentair Plc 2,501 0.32
Healthcare-Products — 0.62% (29 February 2020: 1.08%)
42 Medtronic Plc 4,905 0.62
Healthcare-Services — 3.83% (29 February 2020: 4.28%)
91 UnitedHealth Group Inc 30,248 3.83
Home Furnishings — 1.34% (29 February 2020: 0.81%)
108 Dolby Laboratories Inc ‘A’ 10,588 1.34
Internet — 7.85% (29 February 2020: 4.54%)
7 Facebook Inc ‘A’ 1,780 0.23
Shares(000’s)
Value(000’s)
$
% ofNet
AssetValue
509 FireEye Inc 9,824 1.24655 Twitter Inc 50,478 6.38
62,082 7.85
Iron/Steel — 0.34% (29 February 2020: 0.74%)
44 Nucor Corp 2,655 0.34
Media — 26.56% (29 February 2020: 24.55%)
366 AMC Networks Inc 23,992 3.031,229 Comcast Corp 64,749 8.19
465 Discovery Inc 24,656 3.12430 Discovery Inc 19,347 2.45
88 Liberty Broadband Corp 12,728 1.61109 Liberty Broadband Corp 16,311 2.06
73 Liberty Media Corp-LibertyFormula One 2,813 0.35
128 Liberty Media Corp-LibertyFormula One ‘C’ 5,606 0.71
380 Liberty Media Corp-LibertySiriusXM 16,766 2.12
235 Liberty Media Corp-LibertySiriusXM 10,426 1.32
502 MSG Networks Inc 8,516 1.0839 ViacomCBS Inc ‘B’ 2,534 0.3232 World Wrestling Entertainment
Inc ‘A’ 1,579 0.20
210,023 26.56
Oil & Gas Services — 1.93% (29 February 2020: 2.85%)
275 Core Laboratories NV 9,778 1.24364 NOV Inc 5,501 0.69
15,279 1.93
Pharmaceuticals — 3.19% (29 February 2020: 3.56%)
41 AbbVie Inc 4,372 0.55181 Agios Pharmaceuticals Inc 8,603 1.09
43 Alkermes Plc 826 0.11330 Bausch Health Cos Inc 10,382 1.31184 Voyager Therapeutics Inc 1,038 0.13
25,221 3.19
Retail — 0.26% (29 February 2020: 0.12%)
168 Qurate Retail Inc 2,090 0.26
Semiconductors — 9.67% (29 February 2020: 7.59%)
73 Broadcom Inc 34,360 4.35332 Cree Inc 37,679 4.76
Shares(000’s)
Value(000’s)
$
% ofNet
AssetValue
73 Intel Corp 4,416 0.56
76,455 9.67
Software — 11.42% (29 February 2020: 11.37%)
91 Autodesk Inc 24,997 3.16107 Cerence Inc 11,962 1.51131 Citrix Systems Inc 17,541 2.22804 Nuance Communications Inc 35,832 4.53
90,332 11.42
Total Common Stock (Cost $491,670) 789,786 99.88
Total Investments at fair valuethrough profit or loss (Cost $491,670) 789,786 99.88
Forward Foreign Currency Contracts — 0.02%(29 February 2020: 0.03%)
Unrealised appreciation of contracts(see below) 141 0.02
Total Financial Assets at fair valuethrough profit or loss 789,927 99.90
Forward Foreign Currency Contracts — (0.01%)(29 February 2020: (0.05%))
Unrealised depreciation of contracts(see below) (32) (0.01)
Total Financial Liabilities at fair valuethrough profit or loss (32) (0.01)
Total Financial Assets and FinancialLiabilities at fair value through profitor loss 789,895 99.89
Other Assets in Excess of Liabilities 803 0.11
Total Net Assets $790,698 100.00
– Amounts designated as “–” are either $0, less than$1,000, less than 1,000 shares or less than 0.01%.
Analysis of Total Assets
% ofTotal
Assets
Transferable securities admitted to an officialexchange listing or traded on a regulated market 99.48
Financial derivative instruments 0.02
Other assets 0.50
Total Assets 100.00
Schedule of Forward Foreign Currency Contracts
Expiration Date CounterpartyBuy Currency
(000’s)Sell Currency
(000’s)
UnrealisedAppreciation/(Depreciation)of Contracts
(000’s)
01/03/2021 BNY Mellon Buy CNH 1,412 Sell USD 218 $ (1)01/03/2021 BNY Mellon Buy AUD 71 Sell USD 56 (2)02/03/2021 BNY Mellon Buy AUD 51 Sell USD 41 (2)12/03/2021 BNY Mellon Buy USD 212 Sell AUD 271 512/03/2021 BNY Mellon Buy USD 244 Sell AUD 319 (2)12/03/2021 BNY Mellon Buy USD 841 Sell CNH 5,434 312/03/2021 BNY Mellon Buy USD 2 Sell EUR 1 –12/03/2021 BNY Mellon Buy USD 19 Sell GBP 14 –12/03/2021 BNY Mellon Buy USD 81 Sell SGD 107 –12/03/2021 BNY Mellon Buy USD 5 Sell SGD 6 –12/03/2021 BNY Mellon Buy AUD 859 Sell USD 668 (7)12/03/2021 BNY Mellon Buy CHF 64 Sell USD 72 (1)12/03/2021 BNY Mellon Buy CNH 9,680 Sell USD 1,495 (4)12/03/2021 BNY Mellon Buy EUR 1,681 Sell USD 2,025 612/03/2021 BNY Mellon Buy SGD 100 Sell USD 75 –12/03/2021 BNY Mellon Buy GBP 850 Sell USD 1,160 2412/03/2021 BNY Mellon Buy PLN 4,961 Sell USD 1,332 (9)12/03/2021 BNY Mellon Buy SEK 277 Sell USD 33 –12/03/2021 BNY Mellon Buy SGD 4,237 Sell USD 3,181 (4)12/03/2021 BNY Mellon Buy EUR 94 Sell USD 117 –12/03/2021 BNY Mellon Buy AUD 18,915 Sell USD 14,451 103
Unrealised Appreciation of Forward Foreign Currency Contracts (29 February 2020 (000’s): $314) $ 141Unrealised Depreciation of Forward Foreign Currency Contracts (29 February 2020 (000’s): $(531)) (32)
Net Appreciation of Forward Foreign Currency Contracts (29 February 2020 (000’s): $(217)) $ 109
The accompanying notes are an integral part of the Financial Statements
203

Legg Mason Global Funds Plc Annual Report 28 February 2021
Legg Mason ClearBridge Tactical Dividend Income Fund
Portfolio of Investments as at 28 February 2021
Shares(000’s)
Value(000’s)
$
% ofNet
AssetValue
Common Stock — 68.97% (29 February 2020: 71.36%)
Aerospace & Defense — 1.44%(29 February 2020: 3.41%)
8 Raytheon Technologies Corp 559 1.44
Banks — 3.62% (29 February 2020: 1.25%)
19 Bank of America Corp 674 1.745 JPMorgan Chase & Co 725 1.88
1,399 3.62
Beverages — 1.01% (29 February 2020: 1.55%)
8 Coca-Cola Co/The 390 1.01
Biotechnology — 1.28% (29 February 2020: 0.59%)
2 Amgen Inc 495 1.28
Chemicals — 2.07% (29 February 2020: 1.03%)
2 Air Products & Chemicals Inc 417 1.0814 Huntsman Corp 384 0.99
801 2.07
Computers — 6.00% (29 February 2020: 5.61%)
19 Apple Inc 2,323 6.00
Cosmetics & Personal Care — 1.43%(29 February 2020: 1.74%)
4 Procter & Gamble Co/The 552 1.43
Diversified Financial Services — 2.12%(29 February 2020: 1.10%)
2 CME Group Inc 303 0.795 Intercontinental Exchange Inc 516 1.33
819 2.12
Electric — 3.92% (29 February 2020: 5.25%)
4 Brookfield Renewable Corporation 193 0.5019 Brookfield Renewable Energy
Partners LP/CA, MLP # 822 2.134 NextEra Energy Inc 312 0.802 Sempra Energy 188 0.49
1,515 3.92
Electrical Components & Equipment — 0.99%(29 February 2020: 0.81%)
4 Emerson Electric Co 383 0.99
Electronics — 1.66% (29 February 2020: 0.00%)
5 TE Connectivity Ltd 644 1.66
Energy – Alternate Sources — 0.92%(29 February 2020: 0.00%)
5 NextEra Energy Partners LP 355 0.92
Hand/Machine Tools — 2.25%(29 February 2020: 1.88%)
5 Stanley Black & Decker Inc 872 2.25
Household Products & Wares — 1.06%(29 February 2020: 1.30%)
3 Kimberly-Clark Corp 412 1.06
Insurance — 0.80% (29 February 2020: 0.00%)
2 Chubb Ltd 311 0.80
Internet — 0.71% (29 February 2020: 1.10%)
14 NortonLifeLock Inc 273 0.71
Investment Companies — 3.79%(29 February 2020: 4.19%)
9 Ares Capital Corp 162 0.4229 Barings BDC Inc 284 0.7328 Trinity Capital Inc 425 1.1042 TriplePoint Venture Growth BDC
Corp 595 1.54
1,466 3.79
Machinery – Diversified — 1.49%(29 February 2020: 0.00%)
9 Otis Worldwide Corp 576 1.49
Shares(000’s)
Value(000’s)
$
% ofNet
AssetValue
Pharmaceuticals — 5.49% (29 February 2020: 5.94%)
2 AbbVie Inc 223 0.584 Johnson & Johnson 606 1.57
12 Merck & Co Inc 856 2.2113 Pfizer Inc 439 1.13
2,124 5.49
Pipelines — 6.00% (29 February 2020: 9.22%)
11 Enbridge Inc 360 0.9338 Kinder Morgan Inc 557 1.4464 Plains GP Holdings LP ‘A’ 550 1.4230 Rattler Midstream LP, MLP # 327 0.8423 Williams Cos Inc/The 529 1.37
2,323 6.00
Private Equity — 1.70% (29 February 2020: 3.34%)
4 Apollo Global Management Inc ‘A’ 203 0.527 Blackstone Group Inc/The 455 1.18
658 1.70
Semiconductors — 9.21% (29 February 2020: 7.85%)
– ASML Holding NV 278 0.725 Microchip Technology Inc 728 1.883 NXP Semiconductors NV 634 1.64
10 QUALCOMM Inc 1,316 3.402 Taiwan Semiconductor
Manufacturing Co Ltd ADR 293 0.762 Texas Instruments Inc 315 0.81
3,564 9.21
Software — 7.47% (29 February 2020: 7.49%)
10 Microsoft Corp 2,243 5.807 Oracle Corp 422 1.092 Paychex Inc 224 0.58
2,889 7.47
Telecommunications — 0.25% (29 February 2020: 4.29%)
2 Verizon Communications Inc 95 0.25
Transportation — 2.29% (29 February 2020: 1.68%)
41 KNOT Offshore Partners LP, MLP # 683 1.761 United Parcel Service Inc ‘B’ 205 0.53
888 2.29
Total Common Stock (Cost $19,434) 26,686 68.97
Corporate Bonds and Notes — 2.57%(29 February 2020: 0.00%)
Airlines — 1.90% (29 February 2020: 0.00%)
469 American Airlines Group Inc,6.500%, due 01/07/2025 734 1.90
Leisure Time — 0.67% (29 February 2020: 0.00%)
170 Royal Caribbean Cruises Ltd, 144A,4.250%, due 15/06/2023 259 0.67
Total Corporate Bonds and Notes(Cost $698) 993 2.57
Preferred Stock — 15.84% (29 February 2020: 6.14%)
Auto Parts & Equipment — 1.58%(29 February 2020: 0.00%)
4 Aptiv Plc, Series A 610 1.58
Electric — 2.68% (29 February 2020: 1.81%)
11 DTE Energy Co 485 1.2511 NextEra Energy Inc 551 1.43
1,036 2.68
Gas — 0.41% (29 February 2020: 0.00%)
3 Spire Inc, Series A 158 0.41
Healthcare – Products — 1.96%(29 February 2020: 1.21%)
1 Boston Scientific Corp, Series A 141 0.36– Danaher Corp, Series A 618 1.60
759 1.96
Shares(000’s)
Value(000’s)
$
% ofNet
AssetValue
Pharmaceuticals — 0.49% (29 February 2020: 0.77%)
4 Becton Dickinson and Co, Series B 192 0.49
Private Equity — 2.50% (29 February 2020: 0.00%)
15 KKR & Co Inc, Series C 968 2.50
Semiconductors — 6.22% (29 February 2020: 2.35%)
2 Broadcom Inc, Series A 2,405 6.22
Total Preferred Stock (Cost $4,430) 6,128 15.84
Real Estate Investment Trusts — 8.34%(29 February 2020: 19.16%)
REITS — 8.34% (29 February 2020: 19.16%)
27 AGNC Investment Corp 435 1.124 Alexandria Real Estate Equities Inc 581 1.502 American Tower Corp 495 1.287 Apartment Income REIT Corp 281 0.732 Crown Castle International Corp 333 0.861 Duke Realty Corp 55 0.141 Equinix Inc 457 1.183 Equity LifeStyle Properties Inc 174 0.452 Prologis Inc 196 0.511 SBA Communications Corp ‘A’ 219 0.57
3,226 8.34
Total Real Estate Investment Trusts(Cost $2,809) 3,226 8.34
Total Investments at fair value throughprofit or loss (Cost $27,371) 37,033 95.72
Forward Foreign Currency Contracts — 0.04%(29 February 2020: 0.03%)
Unrealised appreciation of contracts(see below) 16 0.04
Total Financial Assets at fair valuethrough profit or loss 37,049 95.76
Forward Foreign Currency Contracts — 0.00%(29 February 2020: (0.18%))
Unrealised depreciation of contracts(see below) (2) –
Total Financial Liabilities at fair valuethrough profit or loss (2) –
Total Financial Assets and FinancialLiabilities at fair value through profit orloss 37,047 95.76
Other Assets in Excess of Liabilities 1,642 4.24
Total Net Assets $38,689 100.00
– Amounts designated as “–” are either $0, less than$1,000, less than 1,000 shares or less than 0.01%.
144A Securities exempt from registration under Rule 144A ofthe Securities Act of 1933, as amended. Thesesecurities may only be resold, in transactions exemptfrom registration, to qualified institutional buyers. As at28 February 2021, these securities amounted to$259,000 or 0.67% of net assets.
# Master Limited Partnership.
ABBREVIATIONS:
ADR – American Depositary Receipt.
Analysis of Total Assets
% ofTotal
Assets
Transferable securities admitted to an officialexchange listing or traded on a regulated market 95.33
Financial derivative instruments 0.04
Other assets 4.63
Total Assets 100.00
The accompanying notes are an integral part of the Financial Statements
204

Legg Mason Global Funds Plc Annual Report 28 February 2021
Legg Mason ClearBridge Tactical Dividend Income Fund
Portfolio of Investments as at 28 February 2021 – (continued)
Schedule of Forward Foreign Currency Contracts
Expiration Date CounterpartyBuy Currency
(000’s)Sell Currency
(000’s)
UnrealisedAppreciation/(Depreciation)of Contracts
(000’s)
01/03/2021 BNY Mellon Buy AUD 50 Sell USD 39 $ (1)03/03/2021 BNY Mellon Buy AUD 29 Sell USD 23 (1)12/03/2021 BNY Mellon Buy USD 90 Sell AUD 115 212/03/2021 BNY Mellon Buy USD – Sell CNH 3 –12/03/2021 BNY Mellon Buy USD – Sell EUR – –12/03/2021 BNY Mellon Buy USD 1 Sell SGD 1 –12/03/2021 BNY Mellon Buy USD 1 Sell SGD 1 –12/03/2021 BNY Mellon Buy SGD 214 Sell USD 161 –12/03/2021 BNY Mellon Buy EUR 1,327 Sell USD 1,596 412/03/2021 BNY Mellon Buy CNH 629 Sell USD 97 –12/03/2021 BNY Mellon Buy AUD – Sell USD 1 –12/03/2021 BNY Mellon Buy AUD 1,795 Sell USD 1,372 10
Unrealised Appreciation of Forward Foreign Currency Contracts (29 February 2020 (000’s): $12) $ 16Unrealised Depreciation of Forward Foreign Currency Contracts (29 February 2020 (000’s): $(71)) (2)
Net Appreciation of Forward Foreign Currency Contracts (29 February 2020 (000’s): $(59)) $ 14
The accompanying notes are an integral part of the Financial Statements
205

Legg Mason Global Funds Plc Annual Report 28 February 2021
Legg Mason ClearBridge US Equity Sustainability Leaders Fund^
Portfolio of Investments as at 28 February 2021
Shares(000’s)
Value(000’s)
$
% ofNet
AssetValue
Common Stock — 97.17% (29 February 2020: 94.73%)
Agriculture — 0.85% (29 February 2020: 0.00%)
202 Vital Farms Inc 5,467 0.85
Apparel — 1.75% (29 February 2020: 2.36%)
84 NIKE Inc 11,280 1.75
Auto Parts & Equipment — 2.12%(29 February 2020: 0.00%)
91 Aptiv Plc 13,689 2.12
Banks — 6.68% (29 February 2020: 5.91%)
544 Bank of America Corp 18,851 2.9273 First Republic Bank/CA 11,946 1.85
160 Morgan Stanley 12,283 1.91
43,080 6.68
Biotechnology — 5.16% (29 February 2020: 3.56%)
54 Amgen Inc 12,095 1.88116 BioMarin Pharmaceutical Inc 8,990 1.39199 Gilead Sciences Inc 12,218 1.89
33,303 5.16
Building Materials — 1.87% (29 February 2020: 1.83%)
131 Trex Co Inc 12,044 1.87
Chemicals — 1.54% (29 February 2020: 2.18%)
47 Ecolab Inc 9,917 1.54
Computers — 5.49% (29 February 2020: 5.58%)
292 Apple Inc 35,402 5.49
Cosmetics & Personal Care — 1.44%(29 February 2020: 3.99%)
179 Unilever Plc ADR 9,313 1.44
Distribution & Wholesale — 1.21%(29 February 2020: 0.00%)
325 Resideo Technologies Inc 7,812 1.21
Diversified Financial Services — 5.28%(29 February 2020: 5.74%)
15 BlackRock Inc 10,207 1.58212 Charles Schwab Corp/The 13,059 2.02
51 Visa Inc ‘A’ 10,812 1.68
34,078 5.28
Electric — 3.33% (29 February 2020: 4.91%)
295 Brookfield Renewable EnergyPartners LP/CA, MLP # 12,433 1.93
123 NextEra Energy Inc 9,023 1.40
21,456 3.33
Electronics — 4.24% (29 February 2020: 1.55%)
82 Keysight Technologies Inc 11,574 1.79122 TE Connectivity Ltd 15,796 2.45
27,370 4.24
Energy – Alternate Sources: 4.94%(29 February 2020: 3.87%)
154 Array Technologies Inc 5,690 0.8851 Enphase Energy Inc 8,974 1.39
Shares(000’s)
Value(000’s)
$
% ofNet
AssetValue
31 SolarEdge Technologies Inc 9,362 1.45125 Vestas Wind Systems A/S ADR 7,831 1.22
31,857 4.94
Food — 1.67% (29 February 2020: 1.49%)
256 Hain Celestial Group Inc/The 10,793 1.67
Hand/Machine Tools — 2.05% (29 February 2020: 0.00%)
97 Regal Beloit Corp 13,215 2.05
Healthcare – Products — 2.05% (29 February 2020: 2.45%)
60 Danaher Corp 13,232 2.05
Healthcare – Services — 2.31% (29 February 2020: 1.59%)
45 UnitedHealth Group Inc 14,932 2.31
Home Furnishings — 1.76% (29 February 2020: 0.00%)
296 Herman Miller Inc 11,334 1.76
Insurance — 3.66% (29 February 2020: 4.60%)
249 Hartford Financial Services GroupInc/The 12,613 1.95
128 Progressive Corp/The 11,017 1.71
23,630 3.66
Internet — 1.80% (29 February 2020: 2.97%)
5 Booking Holdings Inc 11,629 1.80
Lodging — 2.14% (29 February 2020: 0.00%)
93 Marriott International Inc/MD 13,795 2.14
Media — 4.59% (29 February 2020: 3.98%)
281 Comcast Corp 14,809 2.2978 Walt Disney Co/The 14,821 2.30
29,630 4.59
Miscellaneous Manufacturing — 2.19%(29 February 2020: 2.13%)
92 Trane Technologies Plc 14,124 2.19
Packaging & Containers — 2.15%(29 February 2020: 1.92%)
163 Ball Corp 13,901 2.15
Pharmaceuticals — 3.63% (29 February 2020: 4.34%)
43 Becton Dickinson and Co 10,464 1.62190 CVS Health Corp 12,943 2.01
23,407 3.63
Retail — 4.14% (29 February 2020: 7.38%)
41 Costco Wholesale Corp 13,504 2.0951 Home Depot Inc/The 13,225 2.05
26,729 4.14
Semiconductors — 2.07% (29 February 2020: 2.25%)
24 Lam Research Corp 13,375 2.07
Software — 11.99% (29 February 2020: 7.22%)
30 Autodesk Inc 8,278 1.28174 Microsoft Corp 40,455 6.27
42 salesforce.com Inc 9,070 1.4147 Synopsys Inc 11,394 1.77
Shares(000’s)
Value(000’s)
$
% ofNet
AssetValue
33 Workday Inc ‘A’ 8,155 1.26
77,352 11.99
Telecommunications — 1.36% (29 February 2020: 0.00%)
73 T-Mobile US Inc 8,757 1.36
Toys, Games & Hobbies — 1.71%(29 February 2020: 0.49%)
118 Hasbro Inc 11,038 1.71
Total Common Stock (Cost $573,329) 626,941 97.17
Real Estate Investment Trusts — 1.33%(29 February 2020: 2.31%)
REITS — 1.33% (29 February 2020: 2.31%)
13 Equinix Inc 8,619 1.33
Total Real Estate Investment Trusts(Cost $9,436) 8,619 1.33
Total Investments at fair valuethrough profit or loss (Cost $582,765) 635,560 98.50
Forward Foreign Currency Contracts — 0.27%(29 February 2020: 0.02%)
Unrealised appreciation of contracts(see below) 1,741 0.27
Total Financial Assets at fair valuethrough profit or loss 637,301 98.77
Forward Foreign Currency Contracts — (0.01%)(29 February 2020: (0.07%))
Unrealised depreciation of contracts(see below) (45) (0.01)
Total Financial Liabilities at fair valuethrough profit or loss (45) (0.01)
Total Financial Assets and FinancialLiabilities at fair value through profitor loss 637,256 98.76
Other Assets in Excess of Liabilities 7,968 1.24
Total Net Assets $645,224 100.00
– Amounts designated as “–” are either $0, less than$1,000, less than 1,000 shares or less than 0.01%.
# Master Limited Partnership.
ABBREVIATIONS:
ADR – American Depositary Receipt.
Analysis of Total Assets
% ofTotal
Assets
Transferable securities admitted to an officialexchange listing or traded on a regulated market 98.37
Financial derivative instruments 0.27
Other assets 1.36
Total Assets 100.00
Schedule of Forward Foreign Currency Contracts
Expiration Date CounterpartyBuy Currency
(000’s)Sell Currency
(000’s)
UnrealisedAppreciation/
(Depreciation)of Contracts
(000’s)
12/03/2021 BNY Mellon Buy USD – Sell EUR – $ –12/03/2021 BNY Mellon Buy USD 12 Sell EUR 10 –12/03/2021 BNY Mellon Buy USD 439 Sell GBP 314 412/03/2021 BNY Mellon Buy USD 218 Sell GBP 158 (2)12/03/2021 BNY Mellon Buy GBP 1,483 Sell USD 2,084 (17)12/03/2021 BNY Mellon Buy GBP 60,122 Sell USD 82,055 1,71412/03/2021 BNY Mellon Buy EUR 4,015 Sell USD 4,871 (26)12/03/2021 BNY Mellon Buy EUR 7,601 Sell USD 9,149 23
Unrealised Appreciation of Forward Foreign Currency Contracts (29 February 2020 (000’s): $10) $ 1,741Unrealised Depreciation of Forward Foreign Currency Contracts (29 February 2020 (000’s): $(34)) (45)
Net Appreciation of Forward Foreign Currency Contracts (29 February 2020 (000’s): $(24)) $ 1,696
^ Not authorised for sale to the public in Hong Kong.The accompanying notes are an integral part of the Financial Statements
206

Legg Mason Global Funds Plc Annual Report 28 February 2021
Legg Mason ClearBridge Global Growth Fund^
Portfolio of Investments as at 28 February 2021
Shares(000’s)
Value(000’s)
$
% ofNet
AssetValue
Common Stock — 97.85% (29 February 2020: 95.33%)
Argentina — 0.94% (29 February 2020: 0.00%)
– MercadoLibre Inc 105 0.94
Australia — 0.77% (29 February 2020: 0.00%)
AUD 3 Ansell Ltd 86 0.77
Brazil — 1.67% (29 February 2020: 2.39%)
1 StoneCo Ltd ‘A’ 111 1.002 XP Inc ‘A’ 74 0.67
185 1.67
Canada — 2.27% (29 February 2020: 2.57%)
– Canadian Pacific Railway Ltd 111 1.00CAD 2 Thomson Reuters Corp 141 1.27
252 2.27
China — 2.70% (29 February 2020: 3.74%)
3 Tencent Holdings Ltd ADR 240 2.16– Zai Lab Ltd ADR 60 0.54
300 2.70
Denmark — 0.95% (29 February 2020: 1.09%)
DKK 1 Vestas Wind Systems A/S 105 0.95
France — 2.21% (29 February 2020: 4.89%)
EUR 1 Legrand SA 104 0.94EUR – L’Oreal SA 141 1.27
245 2.21
Germany — 3.72% (29 February 2020: 2.44%)
1 adidas AG ADR 134 1.20EUR 1 Just Eat Takeaway.com NV, 144A 74 0.67
3 MorphoSys AG ADR 77 0.70EUR 2 TeamViewer AG, 144A 128 1.15
413 3.72
Hong Kong — 1.79% (29 February 2020: 2.02%)
HKD 16 AIA Group Ltd 198 1.79
Ireland — 0.76% (29 February 2020: 1.29%)
2 CRH Plc ADR 84 0.76
Japan — 6.55% (29 February 2020: 5.64%)
JPY 3 Daiichi Sankyo Co Ltd 91 0.82JPY – FANUC Corp 79 0.71JPY 2 Nihon M&A Center Inc 85 0.77JPY – Nintendo Co Ltd 239 2.15JPY 1 Shiseido Co Ltd 83 0.75JPY – Tokyo Electron Ltd 150 1.35
727 6.55
Netherlands — 2.67% (29 February 2020: 2.13%)
EUR – Adyen NV, 144A 84 0.76– Argenx SE ADR 53 0.47
EUR – ASML Holding NV 159 1.44
296 2.67
Poland — 0.66% (29 February 2020: 0.00%)
EUR 3 InPost SA 73 0.66
Portugal — 1.28% (29 February 2020: 0.00%)
2 EDP – Energias de Portugal SAADR 141 1.28
Shares(000’s)
Value(000’s)
$
% ofNet
AssetValue
South Korea — 1.54% (29 February 2020: 0.85%)
KRW 2 Samsung Electronics Co Ltd 171 1.54
Spain — 2.43% (29 February 2020: 0.82%)
EUR 2 Amadeus IT Group SA 167 1.50EUR 2 Cellnex Telecom SA, 144A 103 0.93
270 2.43
Sweden — 1.39% (29 February 2020: 0.25%)
2 Atlas Copco AB ADR 124 1.12SEK 1 Sandvik AB 30 0.27
154 1.39
Switzerland — 3.69% (29 February 2020: 6.87%)
CHF 2 Alcon Inc 139 1.26CHF – Nestle SA 35 0.31
1 Nestle SA ADR 132 1.19CHF – Roche Holding AG 103 0.93
409 3.69
Taiwan — 1.81% (29 February 2020: 1.29%)
2 Taiwan SemiconductorManufacturing Co Ltd ADR 200 1.81
United Kingdom — 5.61% (29 February 2020: 4.33%)
1 Diageo Plc ADR 121 1.10GBP 11 Dr. Martens Plc 75 0.68GBP 2 London Stock Exchange Group Plc 218 1.96GBP 4 Ocado Group Plc 126 1.13GBP 13 Rentokil Initial Plc 82 0.74
622 5.61
United States — 52.44% (29 February 2020: 49.73%)
– Alphabet Inc ‘A’ 281 2.53– Amazon.com Inc 334 3.014 Apple Inc 456 4.11– Arista Networks Inc 130 1.181 Atlassian Corp Plc 158 1.424 Avantor Inc 124 1.12– DexCom Inc 75 0.681 Ecolab Inc 194 1.751 Elastic NV 133 1.201 Fidelity National Information
Services Inc 144 1.291 Guardant Health Inc 174 1.571 Intercontinental Exchange Inc 110 0.99– Kodiak Sciences Inc 52 0.471 Marriott International Inc/MD 133 1.201 Merck & Co Inc 96 0.862 Microsoft Corp 397 3.582 NextEra Energy Inc 126 1.14– NVIDIA Corp 133 1.202 Pinterest Inc 127 1.152 Procter & Gamble Co/The 225 2.031 S&P Global Inc 166 1.501 salesforce.com Inc 240 2.172 Sensient Technologies Corp 122 1.10– Spotify Technology SA 88 0.791 TE Connectivity Ltd 127 1.15– Tesla Inc 167 1.50– Thermo Fisher Scientific Inc 129 1.16
Shares(000’s)
Value(000’s)
$
% ofNet
AssetValue
3 TJX Cos Inc/The 169 1.522 T-Mobile US Inc 200 1.812 Trex Co Inc 184 1.661 Ulta Beauty Inc 179 1.611 Union Pacific Corp 218 1.961 United Parcel Service Inc ‘B’ 135 1.22– Workday Inc ‘A’ 90 0.81
5,816 52.44
Total Common Stock (Cost $8,364) 10,852 97.85
Real Estate Investment Trusts — 0.68%(29 February 2020: 0.85%)
United States — 0.68% (29 February 2020: 0.85%)
– Equinix Inc 75 0.68
Total Real Estate Investment Trusts(Cost $55) 75 0.68
Total Financial Assets at fair valuethrough profit or loss 10,927 98.53
Total Financial Assets and FinancialLiabilities at fair value through profit orloss 10,927 98.53
Other Assets in Excess of Liabilities 162 1.47
Total Net Assets $11,089 100.00
– Amounts designated as “–” are either $0, less than$1,000, less than 1,000 shares or less than 0.01%.
144A Securities exempt from registration under Rule 144A ofthe Securities Act of 1933, as amended. Thesesecurities may only be resold, in transactions exemptfrom registration, to qualified institutional buyers. As at28 February 2021, these securities amounted to$389,000 or 3.51% of net assets.
ABBREVIATIONS:
ADR – American Depositary Receipt.
AUD – Australian Dollar
CAD – Canadian Dollar
CHF – Swiss Franc
DKK – Danish Krone
EUR – Euro
GBP – British Pound
HKD – Hong Kong Dollar
JPY – Japanese Yen
KRW – South Korean Won
SEK – Swedish Krona
Analysis of Total Assets
% ofTotal
Assets
Transferable securities admitted to an officialexchange listing or traded on a regulated market 95.59
Other assets 4.41
Total Assets 100.00
^ Not authorised for sale to the public in Hong Kong.The accompanying notes are an integral part of the Financial Statements
207

Legg Mason Global Funds Plc Annual Report 28 February 2021
Legg Mason ClearBridge Infrastructure Value Fund^
Portfolio of Investments as at 28 February 2021
Shares(000’s)
Value(000’s)
€
% ofNet
AssetValue
Common Stock — 94.46% (29 February 2020: 94.17%)
Australia — 7.31% (29 February 2020: 5.35%)
AUD 2,898 Atlas Arteria Ltd 10,212 1.69AUD 3,331 Sydney Airport 12,528 2.07AUD 2,615 Transurban Group 21,460 3.55
44,200 7.31
Canada — 3.14% (29 February 2020: 11.89%)
CAD 678 Enbridge Inc 19,008 3.14
Denmark — 3.06% (29 February 2020: 0.00%)
DKK 139 Orsted AS, 144A 18,482 3.06
France — 13.21% (29 February 2020: 5.92%)
109 Aeroports de Paris 11,444 1.89116 Eiffage SA 9,895 1.64
2,109 Getlink SE 28,658 4.74347 Vinci SA 29,911 4.94
79,908 13.21
Italy — 7.02% (29 February 2020: 6.04%)
1,247 Atlantia SpA 19,216 3.181,573 Snam SpA 6,750 1.122,862 Terna Rete Elettrica
Nazionale SpA 16,478 2.72
42,444 7.02
Japan — 2.10% (29 February 2020: 0.00%)
JPY 206 East Japan Railway Co 12,729 2.10
Portugal — 2.15% (29 February 2020: 0.00%)
2,739 EDP – Energias de PortugalSA 13,015 2.15
Spain — 9.62% (29 February 2020: 8.07%)
99 Aena SME SA, 144A 13,928 2.30345 Cellnex Telecom SA, 144A 15,545 2.57823 Ferrovial SA 16,940 2.80
1,138 Iberdrola SA 11,815 1.95
58,228 9.62
United Kingdom — 5.22% (29 February 2020: 13.92%)
GBP 484 Severn Trent Plc 12,287 2.03GBP 1,254 SSE Plc 19,270 3.19
31,557 5.22
Shares(000’s)
Value(000’s)
€
% ofNet
AssetValue
United States — 41.63% (29 February 2020: 38.59%)
USD 423 Brookfield RenewableCorporation 16,181 2.67
USD 533 Cheniere Energy Inc 29,690 4.91USD 534 Clearway Energy Inc ‘C’ 12,165 2.01USD 309 CMS Energy Corp 13,831 2.29USD 324 CSX Corp 24,622 4.07USD 536 Exelon Corp 17,147 2.83USD 377 NextEra Energy Inc 22,965 3.80USD 182 NextEra Energy Partners LP 10,974 1.81USD 225 Pinnacle West Capital Corp 13,050 2.16USD 639 Public Service Enterprise
Group Inc 28,495 4.71USD 175 Sempra Energy 16,842 2.78USD 259 Southern Co/The 12,187 2.01USD 198 Union Pacific Corp 33,744 5.58
251,893 41.63
Total Common Stock (Cost €572,326) 571,464 94.46
Real Estate Investment Trusts — 5.96%(29 February 2020: 2.82%)
United States — 5.96% (29 February 2020: 2.82%)
USD 103 American Tower Corp 18,421 3.04USD 137 Crown Castle International
Corp 17,666 2.92
36,087 5.96
Total Real Estate Investment Trusts(Cost €40,263) 36,087 5.96
Total Investments at fair value throughprofit or loss (Cost €612,589) 607,551 100.42
Forward Foreign Currency Contracts — 0.04%(29 February 2020: 0.16%)
Unrealised appreciation of contracts(see below) 230 0.04
Total Financial Assets at fair valuethrough profit or loss 607,781 100.46
Shares(000’s)
Value(000’s)
€
% ofNet
AssetValue
Forward Foreign Currency Contracts — (0.09%)(29 February 2020: (0.48%))
Unrealised depreciation of contracts(see below) (558) (0.09)
Total Financial Liabilities at fair valuethrough profit or loss (558) (0.09)
Total Financial Assets and FinancialLiabilities at fair value through profitor loss 607,223 100.37
Liabilities in Excess of Other Assets (2,210) (0.37)
Total Net Assets €605,013 100.00
– Amounts designated as “–” are either €0, less than€1,000, less than 1,000 shares or less than 0.01%.
144A Securities exempt from registration under Rule 144A ofthe Securities Act of 1933, as amended. Thesesecurities may only be resold, in transactions exemptfrom registration, to qualified institutional buyers. As at28 February 2021, these securities amounted to€47,955,000 or 7.93% of net assets.
AUD – Australian Dollar
CAD – Canadian Dollar
DKK – Danish Krone
GBP – British Pound
JPY – Japanese Yen
USD – United States Dollar
Analysis of Total Assets
% ofTotal
Assets
Transferable securities admitted to an officialexchange listing or traded on a regulated market 92.07
Financial derivative instruments 0.03
Other assets 7.90
Total Assets 100.00
Schedule of Forward Foreign Currency Contracts
Expiration Date CounterpartyBuy Currency
(000’s)Sell Currency
(000’s)
UnrealisedAppreciation/(Depreciation)of Contracts
(000’s)
01/03/2021 BNY Mellon Buy EUR 3,617 Sell BRL 24,017 € 6501/03/2021 BNY Mellon Buy BRL 24,017 Sell EUR 3,646 (94)12/03/2021 BNY Mellon Buy EUR 55 Sell AUD 84 112/03/2021 BNY Mellon Buy EUR 80 Sell CNH 627 –12/03/2021 BNY Mellon Buy EUR 113 Sell CNH 891 (1)12/03/2021 BNY Mellon Buy USD 1,578 Sell EUR 1,299 912/03/2021 BNY Mellon Buy SGD 1 Sell EUR 1 –12/03/2021 BNY Mellon Buy CNH 28,403 Sell EUR 3,645 (20)12/03/2021 BNY Mellon Buy CNH 64 Sell EUR 8 –12/03/2021 BNY Mellon Buy AUD 2,270 Sell EUR 1,441 612/03/2021 BNY Mellon Buy AUD 10 Sell EUR 6 –12/03/2021 BNY Mellon Buy SGD 2,434 Sell EUR 1,517 (4)12/03/2021 BNY Mellon Buy USD 108,207 Sell EUR 89,887 (230)12/03/2021 BNY Mellon Buy EUR 62 Sell SGD 100 –12/03/2021 BNY Mellon Buy EUR 4,982 Sell USD 6,057 (38)12/03/2021 BNY Mellon Buy EUR 1,631 Sell USD 1,959 624/03/2021 BNY Mellon Buy EUR 629 Sell AUD 979 624/03/2021 BNY Mellon Buy GBP 4,413 Sell AUD 7,931 3924/03/2021 BNY Mellon Buy CAD 4,632 Sell AUD 4,690 2524/03/2021 BNY Mellon Buy GBP 60 Sell CAD 106 –24/03/2021 BNY Mellon Buy EUR 9 Sell CAD 14 –24/03/2021 BNY Mellon Buy EUR 269 Sell CAD 413 –24/03/2021 BNY Mellon Buy USD 1,127 Sell CAD 1,420 1024/03/2021 BNY Mellon Buy GBP 1,968 Sell CAD 3,491 (1)24/03/2021 BNY Mellon Buy CAD 1,589 Sell EUR 1,039 (5)24/03/2021 BNY Mellon Buy GBP 11 Sell EUR 12 –24/03/2021 BNY Mellon Buy GBP 21,061 Sell EUR 24,303 424/03/2021 BNY Mellon Buy CAD 21,150 Sell EUR 13,757 9
^ Not authorised for sale to the public in Hong Kong.The accompanying notes are an integral part of the Financial Statements
208

Legg Mason Global Funds Plc Annual Report 28 February 2021
Legg Mason ClearBridge Infrastructure Value Fund^
Portfolio of Investments as at 28 February 2021 – (continued)
Schedule of Forward Foreign Currency Contracts – (continued)
Expiration Date CounterpartyBuy Currency
(000’s)Sell Currency
(000’s)
UnrealisedAppreciation/(Depreciation)of Contracts
(000’s)
24/03/2021 BNY Mellon Buy USD 239 Sell EUR 196 € 224/03/2021 BNY Mellon Buy CAD 142 Sell GBP 80 –24/03/2021 BNY Mellon Buy AUD 310 Sell GBP 174 (3)24/03/2021 BNY Mellon Buy EUR 464 Sell GBP 402 –24/03/2021 BNY Mellon Buy CAD 3,413 Sell GBP 1,923 224/03/2021 BNY Mellon Buy USD 4,127 Sell GBP 2,922 4624/03/2021 BNY Mellon Buy CAD 473 Sell JPY 39,796 (2)24/03/2021 BNY Mellon Buy GBP 445 Sell JPY 66,082 –24/03/2021 BNY Mellon Buy EUR 64 Sell JPY 8,338 –24/03/2021 BNY Mellon Buy CAD 31,194 Sell USD 24,541 (23)24/03/2021 BNY Mellon Buy GBP 31,053 Sell USD 43,353 (68)24/03/2021 BNY Mellon Buy EUR 4,243 Sell USD 5,130 (7)01/04/2021 BNY Mellon Buy BRL 22,346 Sell EUR 3,359 (62)
Unrealised Appreciation of Forward Foreign Currency Contracts (29 February 2020 (000’s): €1,208) € 230Unrealised Depreciation of Forward Foreign Currency Contracts (29 February 2020 (000’s): €(3,700)) (558)
Net Depreciation of Forward Foreign Currency Contracts (29 February 2020 (000’s): €(2,492)) € (328)
^ Not authorised for sale to the public in Hong Kong.The accompanying notes are an integral part of the Financial Statements
209

Legg Mason Global Funds Plc Annual Report 28 February 2021
Legg Mason ClearBridge Emerging Markets Infrastructure Fund^
Portfolio of Investments as at 28 February 2021
Shares(000’s)
Value(000’s)
$
% ofNet
AssetValue
Common Stock — 96.36% (29 February 2020: 89.94%)
Brazil — 13.56% (29 February 2020: 16.08%)
BRL 34 CCR SA 69 2.53BRL 14 CPFL Energia SA 73 2.70BRL 24 EcoRodovias Infraestrutura e
Logistica SA 48 1.76BRL 19 Equatorial Energia SA 67 2.48BRL 31 Neoenergia SA 90 3.29BRL 4 Transmissora Alianca de Energia
Eletrica SA 22 0.80
369 13.56
Chile — 1.73% (29 February 2020: 1.96%)
CLP 165 Aguas Andinas SA 47 1.73
China — 24.76% (29 February 2020: 17.70%)
HKD 36 China Gas Holdings Ltd 145 5.32HKD 10 China Resources Gas Group Ltd 50 1.84HKD 310 China Tower Corp Ltd, 144A 47 1.71HKD 8 ENN Energy Holdings Ltd 116 4.26HKD 50 Guangdong Investment Ltd 89 3.27HKD 52 Jiangsu Expressway Co Ltd 61 2.22CNY 7 Shanghai International Airport
Co Ltd 64 2.35HKD 66 Shenzhen Expressway Co Ltd 64 2.35HKD 68 Xinyi Energy Holdings Ltd 39 1.44
675 24.76
India — 26.53% (29 February 2020: 26.47%)
INR 18 Container Corp Of India Ltd 136 4.98INR 20 Gujarat Gas Ltd 138 5.06INR 14 Gujarat State Petronet Ltd 47 1.71INR 21 Indraprastha Gas Ltd 141 5.19INR 10 Indus Towers Ltd 36 1.34INR 4 Mahanagar Gas Ltd 65 2.39INR 9 Petronet LNG Ltd 31 1.13INR 44 Power Grid Corp of India Ltd 129 4.73
723 26.53
Indonesia — 4.20% (29 February 2020: 4.42%)
IDR 392 Jasa Marga Persero Tbk PT 114 4.20
Malaysia — 5.36% (29 February 2020: 2.56%)
MYR 66 Malaysia Airports Holdings Bhd 98 3.61MYR 19 Tenaga Nasional Bhd 48 1.75
146 5.36
Shares(000’s)
Value(000’s)
$
% ofNet
AssetValue
Mexico — 11.78% (29 February 2020: 14.48%)
MXN 28 ALEATICA SAB de CV 27 1.01MXN 41 GMexico Transportes SAB de
CV, 144A 55 2.01MXN 7 Grupo Aeroportuario del Centro
Norte SAB de CV ‘B’ 42 1.53MXN 7 Grupo Aeroportuario del Pacifico
SAB de CV 67 2.45MXN 8 Infraestructura Energetica Nova
SAB de CV 26 0.96MXN 118 Telesites SAB de CV 104 3.82
321 11.78
Philippines — 5.91% (29 February 2020: 4.55%)
PHP 38 International Container TerminalServices Inc 95 3.49
PHP 784 Metro Pacific Investments Corp 66 2.42
161 5.91
Thailand — 2.53% (29 February 2020: 1.23%)
THB 7 Electricity Generating PCL 39 1.44THB 18 Ratch Group PCL 30 1.09
69 2.53
Total Common Stock (Cost $2,651) 2,625 96.36
Real Estate Investment Trusts — 3.70%(29 February 2020: 4.16%)
Mexico — 3.70% (29 February 2020: 4.16%)
MXN 74 CFE Capital S de RL de CV 101 3.70
Total Real Estate Investment Trusts(Cost $70) 101 3.70
Total Investments at fair value throughprofit or loss (Cost $2,721) 2,726 100.06
Forward Foreign Currency Contracts — 0.15%(29 February 2020: 0.42%)
Unrealised appreciation of contracts(see below) 4 0.15
Total Financial Assets at fair valuethrough profit or loss 2,730 100.21
Total Financial Assets and FinancialLiabilities at fair value through profit orloss 2,730 100.21
Liabilities in Excess of Other Assets (5) (0.21)
Total Net Assets $2,725 100.00
– Amounts designated as “–” are either $0, less than$1,000, less than 1,000 shares or less than 0.01%.
144A Securities exempt from registration under Rule 144A ofthe Securities Act of 1933, as amended. Thesesecurities may only be resold, in transactions exemptfrom registration, to qualified institutional buyers. As at28 February 2021, these securities amounted to$102,000 or 3.72% of net assets.
ABBREVIATIONS:
BRL – Brazilian Real
CLP – Chilean Peso
CNY – Chinese Renminbi
HKD – Hong Kong Dollar
IDR – Indonesian Rupiah
INR – Indian Rupee
MXN – Mexican Peso
MYR – Malaysian Ringgit
PHP – Philippine Peso
THB – Thai Baht
Analysis of Total Assets
% ofTotal
Assets
Transferable securities admitted to an officialexchange listing or traded on a regulated market 95.28
Financial derivative instruments 0.14
Other assets 4.58
Total Assets 100.00
Schedule of Forward Foreign Currency Contracts
Expiration Date CounterpartyBuy Currency
(000’s)Sell Currency
(000’s)
UnrealisedAppreciation/(Depreciation)of Contracts
(000’s)
12/03/2021 BNY Mellon Buy EUR 1,413 Sell USD 1,701 $ 4
Unrealised Appreciation of Forward Foreign Currency Contracts (29 February 2020 (000’s): $12) $ 4Unrealised Depreciation of Forward Foreign Currency Contracts (29 February 2020 (000’s): $(2)) –
Net Appreciation of Forward Foreign Currency Contracts (29 February 2020 (000’s): $10) $ 4
^ Not authorised for sale to the public in Hong Kong.The accompanying notes are an integral part of the Financial Statements
210

Legg Mason Global Funds Plc Annual Report 28 February 2021
Legg Mason Royce US Small Cap Opportunity Fund
Portfolio of Investments as at 28 February 2021
Shares(000’s)
Value(000’s)
$
% ofNet
AssetValue
Collective Investment Schemes — 7.12%(29 February 2020: 4.68%)
91,807 Western Asset Liquidity FundsPlc – Western Asset US DollarLiquidity Fund – Class WA(Distributing) 91,807 7.12
Total Collective Investment Schemes(Cost $91,807) 91,807 7.12
Common Stock — 86.40% (29 February 2020: 94.48%)
Aerospace & Defense — 1.97%(29 February 2020: 0.98%)
173 AAR Corp 6,865 0.5398 Astronics Corp 1,550 0.1263 Ducommun Inc 3,544 0.2882 Hexcel Corp 4,394 0.34
124 Spirit AeroSystems HoldingsInc ‘A’ 5,321 0.41
256 Triumph Group Inc 3,736 0.29
25,410 1.97
Agriculture — 0.10% (29 February 2020: 0.35%)
80 Tejon Ranch Co 1,318 0.10
Airlines — 2.33% (29 February 2020: 0.39%)
103 Alaska Air Group Inc 6,690 0.5231 Allegiant Travel Co ‘A’ 7,782 0.60
460 JetBlue Airways Corp 8,472 0.66583 Mesa Air Group Inc 7,097 0.55
30,041 2.33
Apparel — 0.94% (29 February 2020: 0.65%)
46 Jerash Holdings US Inc 269 0.0276 Tapestry Inc 3,190 0.25
208 Under Armour Inc ‘A’ 4,556 0.35166 Unifi Inc 4,133 0.32
12,148 0.94
Auto Manufacturers — 0.55% (29 February 2020: 0.09%)
429 Wabash National Corp 7,118 0.55
Auto Parts & Equipment — 2.93%(29 February 2020: 2.28%)
455 Commercial Vehicle Group Inc 4,188 0.33242 Dana Inc 5,773 0.45173 Meritor Inc 5,257 0.41505 Modine Manufacturing Co 7,012 0.54188 Shyft Group Inc/The 6,166 0.48
65 Unique Fabricating Inc 446 0.03949 Westport Fuel Systems Inc 8,865 0.69
37,707 2.93
Banks — 2.45% (29 February 2020: 5.21%)
66 First Foundation Inc 1,518 0.12270 Hilltop Holdings Inc 8,929 0.69201 Seacoast Banking Corp of
Florida 7,221 0.56184 TriState Capital Holdings Inc 4,232 0.33
97 Walker & Dunlop Inc 9,661 0.75
31,561 2.45
Beverages — 0.42% (29 February 2020: 0.47%)
64 MGP Ingredients Inc 4,119 0.321,222 Reed’s Inc 1,277 0.10
5,396 0.42
Biotechnology — 0.42% (29 February 2020: 1.08%)
57 Emergent BioSolutions Inc 5,475 0.42
Building Materials — 3.78% (29 February 2020: 3.88%)
92 American Woodmark Corp 8,567 0.6787 Apogee Enterprises Inc 3,243 0.2555 Boise Cascade Co 2,724 0.2125 Builders FirstSource Inc 1,072 0.08
251 Forterra Inc 5,846 0.4528 Gibraltar Industries Inc 2,405 0.19
141 Griffon Corp 3,469 0.2799 JELD-WEN Holding Inc 2,945 0.23
136 Louisiana-Pacific Corp 6,473 0.50242 LSI Industries Inc 2,185 0.17106 PGT Innovations Inc 2,513 0.20140 US Concrete Inc 7,252 0.56
48,694 3.78
Shares(000’s)
Value(000’s)
$
% ofNet
AssetValue
Chemicals — 4.15% (29 February 2020: 1.67%)
131 AdvanSix Inc 3,658 0.29284 American Vanguard Corp 5,540 0.43399 Ferro Corp 6,334 0.49260 Huntsman Corp 7,084 0.55300 Intrepid Potash Inc 8,897 0.69228 Kraton Corp 8,490 0.66355 Olin Corp 10,986 0.85133 Tronox Holdings Plc 2,449 0.19
53,438 4.15
Commercial Services — 3.13% (29 February 2020: 4.40%)
98 American Public Education Inc 2,877 0.22600 Cross Country Healthcare Inc 6,667 0.52240 GP Strategies Corp 3,192 0.25
48 Heidrick & StrugglesInternational Inc 1,729 0.14
136 Herc Holdings Inc 11,897 0.9258 Korn Ferry 3,572 0.28
212 R1 RCM Inc 5,845 0.45217 TrueBlue Inc 4,519 0.35
40,298 3.13
Computers — 0.62% (29 February 2020: 1.16%)
22 Cubic Corp 1,507 0.1152 Perspecta Inc 1,512 0.12
348 SecureWorks Corp 5,029 0.39
8,048 0.62
Distribution & Wholesale — 1.14%(29 February 2020: 0.18%)
251 KAR Auction Services Inc 3,491 0.27258 Manitex International Inc 1,957 0.15152 Resideo Technologies Inc 3,643 0.28
70 WESCO International Inc 5,651 0.44
14,742 1.14
Diversified Financial Services — 3.23%(29 February 2020: 2.14%)
230 Air Lease Corp ‘A’ 10,539 0.82204 B Riley Financial Inc 13,384 1.04
52 Evercore Inc ‘A’ 6,269 0.4964 Houlihan Lokey Inc ‘A’ 4,046 0.31
144 Moelis & Co ‘A’ 7,423 0.57
41,661 3.23
Electric — 0.90% (29 February 2020: 1.04%)
59 Ameresco Inc 3,382 0.2699 Black Hills Corp 5,827 0.4568 Hawaiian Electric Industries Inc 2,393 0.19
11,602 0.90
Electrical Components & Equipment — 0.39%(29 February 2020: 1.41%)
45 Encore Wire Corp 2,953 0.2368 Insteel Industries Inc 2,091 0.16
5,044 0.39
Electronics — 4.06% (29 February 2020: 4.49%)
75 Advanced Energy Industries Inc 7,852 0.61144 Avnet Inc 5,469 0.42289 Comtech Telecommunications
Corp 7,796 0.60127 Identiv Inc 1,399 0.11
74 II-VI Inc 6,208 0.48305 IntriCon Corp 7,037 0.55207 Knowles Corp 4,297 0.33154 Stoneridge Inc 4,734 0.37318 Vishay Intertechnology Inc 7,581 0.59
52,373 4.06
Energy – Alternate Sources — 0.06%(29 February 2020: 0.00%)
20 SunPower Corp 707 0.06
Engineering & Construction — 2.60%(29 February 2020: 3.21%)
73 Aegion Corp ‘A’ 1,888 0.15145 Arcosa Inc 8,212 0.64
67 Comfort Systems USA Inc 4,144 0.32295 Concrete Pumping Holdings Inc 1,820 0.14106 Construction Partners Inc ‘A’ 3,075 0.24
95 frontdoor Inc 4,994 0.3928 Great Lakes Dredge & Dock
Corp 421 0.03
Shares(000’s)
Value(000’s)
$
% ofNet
AssetValue
581 Iteris Inc 3,210 0.25146 Mistras Group Inc 1,169 0.09248 Orion Group Holdings Inc 1,441 0.11
94 Primoris Services Corp 3,142 0.24
33,516 2.60
Entertainment — 0.55% (29 February 2020: 0.10%)
159 Six Flags Entertainment Corp 7,066 0.55
Environmental Control — 0.54%(29 February 2020: 0.31%)
28 CECO Environmental Corp 233 0.02241 Covanta Holding Corp 3,384 0.26
82 Heritage-Crystal Clean Inc 2,158 0.1792 Pure Cycle Corp 1,082 0.0854 Quest Resource Holding Corp 161 0.01
7,018 0.54
Food — 0.90% (29 February 2020: 0.28%)
161 Chefs’ Warehouse Inc/The 5,010 0.39237 Natural Grocers by Vitamin
Cottage Inc 3,334 0.26211 SunOpta Inc 3,267 0.25
11,611 0.90
Forest Products & Paper — 0.21%(29 February 2020: 0.37%)
171 Glatfelter Corp 2,744 0.21
Hand/Machine Tools — 0.11% (29 February 2020: 0.00%)
74 Luxfer Holdings Plc 1,425 0.11
Healthcare – Products — 3.35%(29 February 2020: 4.93%)
519 Accuray Inc 2,587 0.20161 Alphatec Holdings Inc 2,586 0.20
24 CareDx Inc 1,927 0.15152 Cutera Inc 5,373 0.42323 Invacare Corp 2,944 0.23
54 Misonix Inc 905 0.07159 Orthofix Medical Inc 7,440 0.58102 RA Medical Systems Inc 698 0.05617 Sientra Inc 4,808 0.37365 SmileDirectClub Inc 4,237 0.33968 Surgalign Holdings Inc 2,367 0.18170 Varex Imaging Corp 3,899 0.30781 ViewRay Inc 3,412 0.27
43,183 3.35
Healthcare – Services — 2.81%(29 February 2020: 3.73%)
50 Acadia Healthcare Co Inc 2,780 0.221,047 Community Health Systems Inc 8,965 0.69
221 Neuronetics Inc 3,442 0.27188 Ortho Clinical Diagnostics
Holdings Plc 3,245 0.2582 RadNet Inc 1,511 0.12
196 Select Medical Holdings Corp 6,187 0.48254 Surgery Partners Inc 10,021 0.78
36,151 2.81
Home Builders — 3.20% (29 February 2020: 3.84%)
200 Beazer Homes USA Inc 3,538 0.2817 Cavco Industries Inc 3,520 0.2774 Century Communities Inc 4,085 0.32
785 Horizon Global Corp 7,385 0.5719 Installed Building Products Inc 2,104 0.1653 LGI Homes Inc 5,789 0.45
387 New Home Co Inc/The 1,841 0.1477 Skyline Champion Corp 3,416 0.27
118 Taylor Morrison Home Corp ‘A’ 3,250 0.2556 Toll Brothers Inc 2,965 0.23
133 Tri Pointe Homes Inc 2,524 0.2011 Winnebago Industries Inc 771 0.06
41,188 3.20
Home Furnishings — 0.40% (29 February 2020: 0.14%)
146 Ethan Allen Interiors Inc 3,735 0.29105 VIA Optronics AG ADR 1,379 0.11
5,114 0.40
Household Products & Wares — 0.27%(29 February 2020: 0.05%)
84 Central Garden & Pet Co ‘A’ 3,488 0.27
The accompanying notes are an integral part of the Financial Statements
211

Legg Mason Global Funds Plc Annual Report 28 February 2021
Legg Mason Royce US Small Cap Opportunity Fund
Portfolio of Investments as at 28 February 2021 – (continued)
Shares(000’s)
Value(000’s)
$
% ofNet
AssetValue
Common Stock — (continued)
Insurance — 3.41% (29 February 2020: 3.30%)
164 Brighthouse Financial Inc 6,535 0.5187 HCI Group Inc 5,022 0.39
242 Heritage Insurance Holdings Inc 2,352 0.18295 MGIC Investment Corp 3,591 0.28240 NMI Holdings Inc ‘A’ 5,474 0.43307 Old Republic International Corp 5,940 0.46204 Radian Group Inc 4,154 0.32150 Stewart Information Services
Corp 7,095 0.55128 United Fire Group Inc 3,762 0.29
43,925 3.41
Internet — 0.98% (29 February 2020: 1.94%)
153 Cars.com Inc 1,789 0.14890 comScore Inc 3,257 0.25121 Eventbrite Inc 2,408 0.19215 QuinStreet Inc 5,134 0.40
12,588 0.98
Iron/Steel — 1.71% (29 February 2020: 1.72%)
381 Allegheny Technologies Inc 7,488 0.5888 Carpenter Technology Corp 3,572 0.28
483 Cleveland-Cliffs Inc 6,446 0.50126 Commercial Metals Co 3,166 0.25127 Universal Stainless & Alloy
Products Inc 1,302 0.10
21,974 1.71
Lodging — 0.08% (29 February 2020: 0.50%)
125 Century Casinos Inc 1,007 0.08
Machinery – Construction & Mining — 0.55%(29 February 2020: 1.54%)
133 Babcock & Wilcox Enterprises Inc 945 0.0799 Bloom Energy Corp 2,814 0.2239 Hyster-Yale Materials Handling
Inc 3,334 0.26
7,093 0.55
Machinery – Diversified — 0.92%(29 February 2020: 2.11%)
76 CIRCOR International Inc 2,725 0.2137 Gencor Industries Inc 527 0.04
103 Ichor Holdings Ltd 4,398 0.34402 Intevac Inc 2,569 0.20230 Power Solutions International Inc 1,657 0.13
11,876 0.92
Media — 0.12% (29 February 2020: 0.00%)
257 Houghton Mifflin Harcourt Co 1,569 0.12
Metal Fabricate & Hardware — 0.69%(29 February 2020: 2.16%)
96 Northwest Pipe Co 3,258 0.2520 Olympic Steel Inc 354 0.03
109 Park-Ohio Holdings Corp 3,541 0.28118 Synalloy Corp 1,034 0.08
80 TimkenSteel Corp 643 0.05
8,830 0.69
Mining — 1.81% (29 February 2020: 0.94%)
314 Alcoa Corp 7,695 0.60369 Century Aluminum Co 5,066 0.39917 Ferroglobe Plc 3,436 0.26386 Livent Corp 7,185 0.56
23,382 1.81
Miscellaneous Manufacturing — 2.29%(29 February 2020: 2.18%)
58 EnPro Industries Inc 4,666 0.3610 Fabrinet 868 0.07
161 Haynes International Inc 4,510 0.35328 LiqTech International Inc 3,617 0.28285 LSB Industries Inc 1,265 0.10250 Lydall Inc 8,727 0.67184 Trinity Industries Inc 5,895 0.46
29,548 2.29
Office & Business Equipment — 0.52%(29 February 2020: 0.25%)
788 Pitney Bowes Inc 6,689 0.52
Shares(000’s)
Value(000’s)
$
% ofNet
AssetValue
Office Furnishings — 0.48% (29 February 2020: 0.14%)
261 Interface Inc ‘A’ 3,248 0.25214 Steelcase Inc 2,987 0.23
6,235 0.48
Oil & Gas — 1.13% (29 February 2020: 1.70%)
723 Baytex Energy Corp 707 0.0683 Chesapeake Energy Corp 3,637 0.28
427 Earthstone Energy Inc ‘A’ 3,029 0.24173 Matador Resources Co 3,615 0.28327 Southwestern Energy Co 1,319 0.10310 Trecora Resources 2,215 0.17
14,522 1.13
Oil & Gas Services — 0.40% (29 February 2020: 1.83%)
264 Archrock Inc 2,723 0.2170 Ranger Energy Services Inc 387 0.0331 TETRA Technologies Inc 78 0.01
149 US Silica Holdings Inc 1,989 0.15
5,177 0.40
Packaging & Containers — 0.26%(29 February 2020: 0.00%)
101 TriMas Corp 3,398 0.26
Pharmaceuticals — 1.78% (29 February 2020: 2.01%)
193 Flexion Therapeutics Inc 2,134 0.17396 Option Care Health Inc 7,598 0.59300 Owens & Minor Inc 10,225 0.79
40 Pacira BioSciences Inc 2,925 0.23
22,882 1.78
Real Estate — 0.28% (29 February 2020: 0.36%)
237 Realogy Holdings Corp 3,582 0.28
Retail — 4.65% (29 February 2020: 2.85%)
50 America’s Car-Mart Inc/TX 6,811 0.5380 Aspen Aerogels Inc 1,781 0.14
140 BJ’s Restaurants Inc 7,776 0.60568 Carrols Restaurant Group Inc 3,513 0.27412 Chico’s FAS Inc 1,107 0.09183 Chuy’s Holdings Inc 7,516 0.58105 J Alexander’s Holdings Inc 918 0.07137 Kirkland’s Inc 3,563 0.28
19 Kura Sushi USA Inc 571 0.046 Lithia Motors Inc ‘A’ 2,394 0.19
172 Lumber Liquidators Holdings Inc 4,257 0.33475 Noodles & Co ‘A’ 4,499 0.35
46 Red Robin Gourmet Burgers Inc 1,397 0.11355 Regis Corp 4,177 0.32251 Ruth’s Hospitality Group Inc 5,715 0.44
85 Sonic Automotive Inc ‘A’ 3,938 0.31
59,933 4.65
Savings & Loans — 0.17% (29 February 2020: 0.24%)
48 Axos Financial Inc 2,236 0.17
Semiconductors — 5.31% (29 February 2020: 7.38%)
346 Alpha & Omega SemiconductorLtd 12,209 0.95
400 Amkor Technology Inc 9,547 0.74122 Amtech Systems Inc 1,166 0.09128 Cohu Inc 5,550 0.43135 CTS Corp 4,329 0.34
76 FormFactor Inc 3,438 0.27128 Kulicke & Soffa Industries Inc 6,357 0.49
39 MACOM Technology SolutionsHoldings Inc 2,504 0.19
13 MKS Instruments Inc 2,143 0.17132 Onto Innovation Inc 8,269 0.64174 Ultra Clean Holdings Inc 8,066 0.62228 Veeco Instruments Inc 4,909 0.38
68,487 5.31
Software — 3.77% (29 February 2020: 4.13%)
353 Avaya Holdings Corp 10,465 0.81513 Avid Technology Inc 9,954 0.77966 Castlight Health Inc 1,647 0.13333 Cloudera Inc 5,371 0.42289 Digi International Inc 6,747 0.52164 Evolent Health Inc ‘A’ 3,304 0.26358 Kaleyra Inc 6,708 0.52
64 New Relic Inc 3,932 0.30
Shares(000’s)
Value(000’s)
$
% ofNet
AssetValue
90 Zovio Inc ‘A’ 465 0.04
48,593 3.77
Telecommunications — 3.94% (29 February 2020: 4.29%)
564 A10 Networks Inc 5,263 0.41339 ADTRAN Inc 5,726 0.44
69 Aviat Networks Inc 4,251 0.33514 CalAmp Corp 5,750 0.45400 Ceragon Networks Ltd 1,760 0.14
36 Ciena Corp 1,871 0.15365 DZS Inc 6,091 0.47168 Frequency Electronics Inc 1,996 0.15672 Infinera Corp 6,605 0.51
66 InterDigital Inc 4,145 0.3231 Iridium Communications Inc 1,173 0.09
193 Ooma Inc 3,053 0.24416 PCTEL Inc 3,149 0.24
50,833 3.94
Textiles — 0.08% (29 February 2020: 0.00%)
190 Dixie Group Inc/The 1,036 0.08
Transportation — 2.37% (29 February 2020: 3.11%)
282 Ardmore Shipping Corp 1,108 0.09163 Atlas Air Worldwide Holdings
Inc 8,952 0.6995 Daseke Inc 525 0.04
256 Diana Shipping Inc 780 0.06370 Dorian LPG Ltd 4,605 0.36100 Hub Group Inc ‘A’ 5,750 0.45379 Navigator Holdings Ltd 3,795 0.29320 Radiant Logistics Inc 2,174 0.17123 Teekay LNG Partners LP 1,667 0.13122 US Xpress Enterprises Inc 1,128 0.09
30,484 2.37
Trucking & Leasing — 0.19% (29 February 2020: 0.20%)
231 General Finance Corp 2,399 0.19
Total Common Stock (Cost $825,688) 1,113,563 86.40
Real Estate Investment Trusts — 3.37%(29 February 2020: 0.78%)
REITS — 3.37% (29 February 2020: 0.78%)
210 ACRES Commercial Realty Corp 2,794 0.22269 Alexander & Baldwin Inc 4,705 0.36395 Armada Hoffler Properties Inc 5,101 0.40127 Braemar Hotels & Resorts Inc 887 0.07212 CatchMark Timber Trust Inc ‘A’ 2,168 0.17
93 Chatham Lodging Trust 1,295 0.10575 Diversified Healthcare Trust 2,589 0.20351 Kimco Realty Corp 6,423 0.50254 Macerich Co/The 3,275 0.25113 Ryman Hospitality Properties
Inc 8,771 0.68346 Tanger Factory Outlet Centers
Inc 5,436 0.42
43,444 3.37
Total Real Estate Investment Trusts(Cost $34,830) 43,444 3.37
Total Investments at fair valuethrough profit or loss (Cost $952,325) 1,248,814 96.89
Forward Foreign Currency Contracts — 0.04%(29 February 2020: 0.03%)
Unrealised appreciation of contracts(see below) 503 0.04
Total Financial Assets at fair valuethrough profit or loss 1,249,317 96.93
Forward Foreign Currency Contracts — (0.05%)(29 February 2020: (0.09%))
Unrealised depreciation of contracts(see below) (611) (0.05)
Total Financial Liabilities at fair valuethrough profit or loss (611) (0.05)
Total Financial Assets and FinancialLiabilities at fair value through profitor loss 1,248,706 96.88
Other Assets in Excess of Liabilities 40,164 3.12
Total Net Assets $1,288,870 100.00
– Amounts designated as “–” are either $0, less than$1,000, less than 1,000 shares or less than 0.01%.
The accompanying notes are an integral part of the Financial Statements
212

Legg Mason Global Funds Plc Annual Report 28 February 2021
Legg Mason Royce US Small Cap Opportunity Fund
Portfolio of Investments as at 28 February 2021 – (continued)
ABBREVIATIONS:
ADR – American Depositary Receipt.
Analysis of Total Assets
% ofTotal
Assets
Transferable securities admitted to an officialexchange listing or traded on a regulated market 88.28
Collective investment schemes 7.00
Financial derivative instruments 0.04
Other assets 4.68
Total Assets 100.00
Schedule of Forward Foreign Currency Contracts
Expiration Date CounterpartyBuy Currency
(000’s)Sell Currency
(000’s)
UnrealisedAppreciation/(Depreciation)of Contracts
(000’s)
01/03/2021 BNY Mellon Buy USD 5,120 Sell BRL 27,982 $ 12601/03/2021 BNY Mellon Buy BRL 27,982 Sell USD 5,167 (175)01/03/2021 BNY Mellon Buy CNH 2,257 Sell USD 349 (1)02/03/2021 BNY Mellon Buy CNH 3,455 Sell USD 536 (3)02/03/2021 BNY Mellon Buy AUD 34 Sell USD 27 (1)03/03/2021 BNY Mellon Buy CNH 479 Sell USD 74 –12/03/2021 BNY Mellon Buy USD 332 Sell AUD 436 (2)12/03/2021 BNY Mellon Buy USD 1,707 Sell AUD 2,186 2612/03/2021 BNY Mellon Buy USD 205 Sell CNH 1,331 –12/03/2021 BNY Mellon Buy USD 4,207 Sell CNH 27,191 1712/03/2021 BNY Mellon Buy USD 2,636 Sell EUR 2,171 1912/03/2021 BNY Mellon Buy USD 27,751 Sell EUR 23,032 (45)12/03/2021 BNY Mellon Buy USD 225 Sell GBP 163 (1)12/03/2021 BNY Mellon Buy USD 28 Sell GBP 20 –12/03/2021 BNY Mellon Buy USD 33 Sell SEK 274 112/03/2021 BNY Mellon Buy USD 3,861 Sell SGD 5,122 2112/03/2021 BNY Mellon Buy USD 21 Sell SGD 28 –12/03/2021 BNY Mellon Buy EUR 12,884 Sell USD 15,634 (83)12/03/2021 BNY Mellon Buy GBP 17 Sell USD 24 –12/03/2021 BNY Mellon Buy SGD 668 Sell USD 501 112/03/2021 BNY Mellon Buy SEK 125 Sell USD 15 –12/03/2021 BNY Mellon Buy SEK 6,152 Sell USD 737 (8)12/03/2021 BNY Mellon Buy SGD 51,118 Sell USD 38,385 (52)12/03/2021 BNY Mellon Buy AUD 15,356 Sell USD 11,738 7912/03/2021 BNY Mellon Buy AUD 4,027 Sell USD 3,155 (59)12/03/2021 BNY Mellon Buy CNH 49,696 Sell USD 7,682 (26)12/03/2021 BNY Mellon Buy CNH 5,335 Sell USD 822 –12/03/2021 BNY Mellon Buy EUR 74,094 Sell USD 89,230 19512/03/2021 BNY Mellon Buy PLN 11,926 Sell USD 3,207 (27)12/03/2021 BNY Mellon Buy GBP 665 Sell USD 907 1801/04/2021 BNY Mellon Buy BRL 27,913 Sell USD 5,103 (128)
Unrealised Appreciation of Forward Foreign Currency Contracts (29 February 2020 (000’s): $138) $ 503Unrealised Depreciation of Forward Foreign Currency Contracts (29 February 2020 (000’s): $(424)) (611)
Net Depreciation of Forward Foreign Currency Contracts (29 February 2020 (000’s): $(286)) $ (108)
The accompanying notes are an integral part of the Financial Statements
213

Legg Mason Global Funds Plc Annual Report 28 February 2021
Legg Mason Royce US Smaller Companies Fund
Portfolio of Investments as at 28 February 2021
Shares(000’s)
Value(000’s)
$
% ofNet
AssetValue
Collective Investment Schemes — 3.34%(29 February 2020: 3.23%)
11 iShares Russell 2000 ValueETF – ETF 1,622 1.78
1,422 Western Asset Liquidity FundsPlc – Western Asset US DollarLiquidity Fund – Class WA(Distributing) 1,422 1.56
Total Collective Investment Schemes(Cost $2,634) 3,044 3.34
Common Stock — 95.57% (29 February 2020: 97.13%)
Apparel — 2.22% (29 February 2020: 1.52%)
58 Wolverine World Wide Inc 2,027 2.22
Auto Parts & Equipment — 5.32%(29 February 2020: 3.60%)
32 Gentex Corp 1,149 1.2665 Meritor Inc 1,968 2.1644 Miller Industries Inc/TN 1,731 1.90
4,848 5.32
Building Materials — 4.64% (29 February 2020: 5.92%)
20 Gibraltar Industries Inc 1,764 1.9316 Patrick Industries Inc 1,291 1.42
CAD 32 Stella-Jones Inc 1,173 1.29
4,228 4.64
Chemicals — 1.89% (29 February 2020: 1.77%)
6 Quaker Chemical Corp 1,718 1.89
Commercial Services — 9.16% (29 February 2020: 6.04%)
19 Cass Information Systems Inc 840 0.9236 Forrester Research Inc 1,617 1.7863 Heidrick & Struggles
International Inc 2,270 2.4930 Korn Ferry 1,852 2.0332 Vectrus Inc 1,762 1.94
8,341 9.16
Computers — 3.34% (29 February 2020: 3.40%)
27 Insight Enterprises Inc 2,267 2.4910 MAXIMUS Inc 776 0.85
3,043 3.34
Cosmetics & Personal Care — 2.25%(29 February 2020: 1.78%)
28 Inter Parfums Inc 2,049 2.25
Diversified Financial Services — 6.81%(29 February 2020: 4.90%)
33 Air Lease Corp ‘A’ 1,536 1.6916 Artisan Partners Asset
Management Inc 777 0.8550 GCM Grosvenor Inc 621 0.6821 Houlihan Lokey Inc ‘A’ 1,330 1.4640 Lazard Ltd ‘A’ 1,538 1.69
CAD 12 Sagen MI Canada Inc 401 0.44
6,203 6.81
Electrical Components & Equipment — 0.83%(29 February 2020: 1.28%)
20 nLight Inc 757 0.83
Electronics — 6.45% (29 February 2020: 6.73%)
2 Coherent Inc 421 0.4617 FARO Technologies Inc 1,597 1.7564 Kimball Electronics Inc 1,506 1.6660 Vishay Intertechnology Inc 1,439 1.5828 Vishay Precision Group Inc 910 1.00
5,873 6.45
Engineering & Construction — 2.61%(29 February 2020: 4.30%)
33 Arcosa Inc 1,869 2.058 Comfort Systems USA Inc 504 0.56
2,373 2.61
Shares(000’s)
Value(000’s)
$
% ofNet
AssetValue
Food — 0.25% (29 February 2020: 2.79%)
8 Tootsie Roll Industries Inc 232 0.25
Healthcare – Products — 3.73%(29 February 2020: 1.87%)
4 Bio-Techne Corp 1,620 1.7859 Meridian Bioscience Inc 1,251 1.3720 Natus Medical Inc 528 0.58
3,399 3.73
Home Builders — 2.30% (29 February 2020: 1.66%)
8 LCI Industries 1,163 1.2821 Skyline Champion Corp 929 1.02
2,092 2.30
Household Products & Wares — 0.48%(29 February 2020: 0.00%)
10 Central Garden & Pet Co 441 0.48
Insurance — 2.44% (29 February 2020: 6.26%)
6 FBL Financial Group Inc 357 0.3940 ProSight Global Inc 501 0.5513 RLI Corp 1,368 1.50
2,226 2.44
Internet — 1.00% (29 February 2020: 0.00%)
40 ChannelAdvisor Corp 911 1.00
Leisure Time — 2.74% (29 February 2020: 2.25%)
6 Johnson Outdoors Inc 695 0.7670 MasterCraft Boat Holdings Inc 1,799 1.98
2,494 2.74
Lodging — 1.39% (29 February 2020: 1.61%)
157 Century Casinos Inc 1,263 1.39
Machinery – Diversified — 4.18%(29 February 2020: 1.89%)
43 Colfax Corp 1,915 2.1011 Kadant Inc 1,895 2.08
3,810 4.18
Metal Fabricate & Hardware — 1.06%(29 February 2020: 1.01%)
28 Northwest Pipe Co 967 1.06
Miscellaneous Manufacturing — 5.33%(29 February 2020: 3.51%)
18 ESCO Technologies Inc 1,918 2.119 Fabrinet 806 0.88
14 John Bean Technologies Corp 2,128 2.34
4,852 5.33
Oil & Gas Services — 2.88% (29 February 2020: 4.10%)
CAD 250 Pason Systems Inc 1,877 2.06NOK 47 TGS NOPEC Geophysical Co
ASA 745 0.82
2,622 2.88
Packaging & Containers — 0.55%(29 February 2020: 0.64%)
10 UFP Technologies Inc 504 0.55
Pharmaceuticals — 0.48% (29 February 2020: 1.51%)
113 Catalyst Pharmaceuticals Inc 440 0.48
Real Estate — 3.23% (29 February 2020: 1.37%)
128 Kennedy-Wilson Holdings Inc 2,405 2.6414 Marcus & Millichap Inc 539 0.59
2,944 3.23
Retail — 0.78% (29 February 2020: 3.25%)
60 Regis Corp 708 0.78
Semiconductors — 10.27% (29 February 2020: 7.47%)
12 CMC Materials Inc 2,015 2.2117 Cohu Inc 751 0.8342 Kulicke & Soffa Industries Inc 2,096 2.3014 MKS Instruments Inc 2,234 2.45
Shares(000’s)
Value(000’s)
$
% ofNet
AssetValue
16 Nova Measuring InstrumentsLtd 1,359 1.49
14 Onto Innovation Inc 902 0.99
9,357 10.27
Software — 3.68% (29 February 2020: 3.33%)
16 J2 Global Inc 1,775 1.9522 Simulations Plus Inc 1,578 1.73
3,353 3.68
Textiles — 0.56% (29 February 2020: 0.67%)
2 UniFirst Corp/MA 506 0.56
Transportation — 2.72% (29 February 2020: 2.54%)
12 Landstar System Inc 1,853 2.033 Saia Inc 625 0.69
2,478 2.72
Total Common Stock (Cost $62,464) 87,059 95.57
Total Investments at fair value throughprofit or loss (Cost $65,098) 90,103 98.91
Forward Foreign Currency Contracts — 0.00%(29 February 2020: 0.00%)
Unrealised appreciation of contracts(see below) 3 –
Total Financial Assets at fair valuethrough profit or loss 90,106 98.91
Forward Foreign Currency Contracts — 0.00%(29 February 2020: 0.00%)
Unrealised depreciation of contracts(see below) (3) –
Total Financial Liabilities at fair valuethrough profit or loss (3) –
Total Financial Assets and FinancialLiabilities at fair value through profit orloss 90,103 98.91
Other Assets in Excess of Liabilities 993 1.09
Total Net Assets $91,096 100.00
– Amounts designated as “–” are either $0, less than$1,000, less than 1,000 shares or less than 0.01%.
ABBREVIATIONS:
ETF – Exchange Traded Fund.
CAD – Canadian Dollar
NOK – Norwegian Krone
Analysis of Total Assets
% ofTotal
Assets
Transferable securities admitted to an officialexchange listing or traded on a regulated market 93.68
Collective investment schemes 3.28
Financial derivative instruments –
Other assets 3.04
Total Assets 100.00
The accompanying notes are an integral part of the Financial Statements
214

Legg Mason Global Funds Plc Annual Report 28 February 2021
Legg Mason Royce US Smaller Companies Fund
Portfolio of Investments as at 28 February 2021 – (continued)
Schedule of Forward Foreign Currency Contracts
Expiration Date CounterpartyBuy Currency
(000’s)Sell Currency
(000’s)
UnrealisedAppreciation/
(Depreciation)of Contracts
(000’s)
12/03/2021 BNY Mellon Buy USD 52 Sell EUR 43 $ 112/03/2021 BNY Mellon Buy USD 1 Sell SEK 3 –12/03/2021 BNY Mellon Buy SEK 88 Sell USD 10 –12/03/2021 BNY Mellon Buy EUR 473 Sell USD 573 (3)12/03/2021 BNY Mellon Buy EUR 633 Sell USD 762 2
Unrealised Appreciation of Forward Foreign Currency Contracts (29 February 2020 (000’s): $–) $ 3Unrealised Depreciation of Forward Foreign Currency Contracts (29 February 2020 (000’s): $–) (3)
Net Depreciation of Forward Foreign Currency Contracts (29 February 2020 (000’s): $–) $ –
The accompanying notes are an integral part of the Financial Statements
215

Legg Mason Global Funds Plc Annual Report 28 February 2021
Legg Mason QS MV European Equity Growth and Income Fund
Portfolio of Investments as at 28 February 2021
Shares(000’s)
Value(000’s)
€
% ofNet
AssetValue
Common Stock — 98.10% (29 February 2020: 98.46%)
Australia — 2.84% (29 February 2020: 2.60%)
GBP 16 BHP Group Plc 408 1.22GBP 8 Rio Tinto Plc 539 1.62
947 2.84
Belgium — 1.82% (29 February 2020: 0.65%)
7 Etablissements Franz Colruyt NV 358 1.078 Telenet Group Holding NV 251 0.75
609 1.82
Denmark — 6.08% (29 February 2020: 6.09%)
DKK 4 Coloplast A/S 509 1.53DKK 15 Novo Nordisk A/S 914 2.74DKK 4 Pandora A/S 283 0.85DKK 3 SimCorp A/S 322 0.96
2,028 6.08
Finland — 4.52% (29 February 2020: 6.83%)
23 Kesko Oyj 478 1.436 Kone Oyj ‘B’ 415 1.25
SEK 45 Nordea Bank Abp 341 1.028 Orion Oyj 274 0.82
1,508 4.52
France — 9.51% (29 February 2020: 9.87%)
40 Eutelsat Communications SA 400 1.2044 Orange SA 420 1.2612 Publicis Groupe SA 560 1.6818 Quadient SA 333 1.0010 Sanofi 727 2.1810 TOTAL SE 387 1.16
4 Vinci SA 345 1.03
3,172 9.51
Germany — 11.28% (29 February 2020: 14.82%)
4 Allianz SE 778 2.3311 Deutsche Post AG 434 1.3036 Deutsche Telekom AG 545 1.63
2 Hannover Rueck SE 311 0.933 LEG Immobilien AG 389 1.171 Muenchener Rueckversicherungs-
Gesellschaft AG in Muenchen 346 1.043 SAP SE 258 0.77
10 Talanx AG 354 1.06157 Telefonica Deutschland Holding
AG 349 1.05
3,764 11.28
Ireland — 1.47% (29 February 2020: 0.00%)
14 CRH Plc 489 1.47
Italy — 2.24% (29 February 2020: 4.24%)
9 Recordati Industria Chimica eFarmaceutica SpA 369 1.11
88 Snam SpA 377 1.13
746 2.24
Jordan — 1.01% (29 February 2020: 0.00%)
GBP 13 Hikma Pharmaceuticals Plc 337 1.01
Shares(000’s)
Value(000’s)
€
% ofNet
AssetValue
Netherlands — 3.56% (29 February 2020: 2.03%)
25 Koninklijke Ahold Delhaize NV 542 1.627 Unilever Plc Eur 3.1100 310 0.935 Wolters Kluwer NV 335 1.01
1,187 3.56
Norway — 1.33% (29 February 2020: 3.94%)
NOK 33 Telenor ASA 445 1.33
Portugal — 1.08% (29 February 2020: 1.20%)
39 Galp Energia SGPS SA 361 1.08
Russia — 1.89% (29 February 2020: 0.90%)
GBP 95 Evraz Plc 632 1.89
Spain — 4.84% (29 February 2020: 7.84%)
23 Enagas SA 400 1.2021 Endesa SA 428 1.2831 Red Electrica Corp SA 432 1.30
100 Telefonica SA 354 1.06
1,614 4.84
Sweden — 4.31% (29 February 2020: 5.51%)
SEK 11 ICA Gruppen AB 432 1.30SEK 52 Skandinaviska Enskilda Banken
AB 495 1.48SEK 9 Swedish Match AB 511 1.53
1,438 4.31
Switzerland — 20.27% (29 February 2020: 16.61%)
CHF 2 Baloise Holding AG 298 0.89CHF 4 Banque Cantonale Vaudoise 348 1.04CHF 6 Galenica AG, 144A 341 1.02CHF 3 Helvetia Holding AG 316 0.95CHF 2 Kuehne + Nagel International AG 413 1.24CHF 6 Logitech International SA 555 1.66CHF 9 Nestle SA 779 2.34CHF 15 Novartis AG 1,035 3.10CHF 4 Roche Holding AG 1,196 3.59CHF – SGS SA 474 1.42CHF 3 Swiss Prime Site AG 233 0.70CHF 6 Swiss Re AG 475 1.42CHF 1 Swisscom AG 302 0.90
6,765 20.27
United Kingdom — 20.05% (29 February 2020: 15.33%)
GBP 14 Admiral Group Plc 502 1.50GBP 88 BP Plc 300 0.90GBP 12 British American Tobacco Plc 346 1.04GBP 19 Bunzl Plc 494 1.48GBP 155 Direct Line Insurance Group Plc 574 1.72GBP 45 GlaxoSmithKline Plc 622 1.87GBP 60 IG Group Holdings Plc 538 1.61GBP 23 Imperial Brands Plc 357 1.07GBP 130 Kingfisher Plc 399 1.20GBP 801 Lloyds Banking Group Plc 362 1.08
22 Royal Dutch Shell Plc ‘A’ 377 1.13GBP 34 Sage Group Plc/The 217 0.65GBP 57 Tate & Lyle Plc 479 1.43GBP 12 Unilever Plc 499 1.50GBP 440 Vodafone Group Plc 624 1.87
6,690 20.05
Total Common Stock (Cost €35,077) 32,732 98.10
Shares(000’s)
Value(000’s)
€
% ofNet
AssetValue
Real Estate Investment Trusts — 0.82%(29 February 2020: 1.19%)
France — 0.82% (29 February 2020: 1.19%)
14 Klepierre SA 274 0.82
Total Real Estate Investment Trusts(Cost €585) 274 0.82
Total Investments at fair value throughprofit or loss (Cost €35,662) 33,006 98.92
Forward Foreign Currency Contracts — 0.02%(29 February 2020: 0.05%)
Unrealised appreciation of contracts(see below) 7 0.02
Total Financial Assets at fair valuethrough profit or loss 33,013 98.94
Forward Foreign Currency Contracts — (0.04%)(29 February 2020: (0.37%))
Unrealised depreciation of contracts(see below) (15) (0.04)
Total Financial Liabilities at fair valuethrough profit or loss (15) (0.04)
Total Financial Assets and FinancialLiabilities at fair value through profitor loss 32,998 98.90
Other Assets in Excess of Liabilities 370 1.10
Total Net Assets €33,368 100.00
– Amounts designated as “–” are either €0, less than€1,000, less than 1,000 shares or less than 0.01%.
144A Securities exempt from registration under Rule 144A ofthe Securities Act of 1933, as amended. Thesesecurities may only be resold, in transactions exemptfrom registration, to qualified institutional buyers. As at28 February 2021, these securities amounted to€341,000 or 1.02% of net assets.
ABBREVIATIONS:
CHF – Swiss Franc
DKK – Danish Krone
GBP – British Pound
NOK – Norwegian Krone
SEK – Swedish Krona
Analysis of Total Assets
% ofTotal
Assets
Transferable securities admitted to an officialexchange listing or traded on a regulated market 98.10
Financial derivative instruments 0.02
Other assets 1.88
Total Assets 100.00
Schedule of Forward Foreign Currency Contracts
Expiration Date CounterpartyBuy Currency
(000’s)Sell Currency
(000’s)
UnrealisedAppreciation/(Depreciation)of Contracts
(000’s)
02/03/2021 BNY Mellon Buy USD 59 Sell EUR 48 € –12/03/2021 BNY Mellon Buy EUR 6 Sell AUD 9 –12/03/2021 BNY Mellon Buy EUR 24 Sell AUD 38 –12/03/2021 BNY Mellon Buy EUR – Sell CNH 2 –12/03/2021 BNY Mellon Buy USD 2 Sell EUR 1 –12/03/2021 BNY Mellon Buy USD 5,748 Sell EUR 4,775 (12)12/03/2021 BNY Mellon Buy SGD 209 Sell EUR 129 –12/03/2021 BNY Mellon Buy PLN 880 Sell EUR 196 (2)12/03/2021 BNY Mellon Buy CNH 328 Sell EUR 42 –12/03/2021 BNY Mellon Buy AUD 40 Sell EUR 26 –12/03/2021 BNY Mellon Buy AUD 2,614 Sell EUR 1,659 7
The accompanying notes are an integral part of the Financial Statements
216

Legg Mason Global Funds Plc Annual Report 28 February 2021
Legg Mason QS MV European Equity Growth and Income Fund
Portfolio of Investments as at 28 February 2021 – (continued)
Schedule of Forward Foreign Currency Contracts – (continued)
Expiration Date CounterpartyBuy Currency
(000’s)Sell Currency
(000’s)
UnrealisedAppreciation/(Depreciation)of Contracts
(000’s)
12/03/2021 BNY Mellon Buy EUR 24 Sell SGD 40 € –12/03/2021 BNY Mellon Buy EUR 133 Sell USD 162 (1)12/03/2021 BNY Mellon Buy EUR 2 Sell USD 3 –
Unrealised Appreciation of Forward Foreign Currency Contracts (29 February 2020 (000’s): €19) € 7Unrealised Depreciation of Forward Foreign Currency Contracts (29 February 2020 (000’s): €(149)) (15)
Net Depreciation of Forward Foreign Currency Contracts (29 February 2020 (000’s): €(130)) € (8)
The accompanying notes are an integral part of the Financial Statements
217

Legg Mason Global Funds Plc Annual Report 28 February 2021
Legg Mason QS MV Asia Pacific Ex Japan Equity Growth and Income Fund
Portfolio of Investments as at 28 February 2021
Shares(000’s)
Value(000’s)
$
% ofNet
AssetValue
Common Stock — 97.28% (29 February 2020: 94.41%)
Australia — 4.66% (29 February 2020: 5.45%)
AUD 127 Aurizon Holdings Ltd 375 1.21AUD 32 McMillan Shakespeare Ltd 306 0.99AUD 119 Orora Ltd 266 0.86AUD 5 Rio Tinto Ltd 498 1.60
1,445 4.66
China — 34.16% (29 February 2020: 27.34%)
HKD 637 Bank of Communications CoLtd 361 1.16
HKD 1,912 CGN Power Co Ltd, 144A 422 1.36HKD 414 China Aircraft Leasing Group
Holdings Ltd 390 1.26HKD 510 China CITIC Bank Corp Ltd 241 0.78HKD 574 China Communications
Services Corp Ltd 271 0.87HKD 878 China Construction Bank Corp 704 2.27HKD 255 China Medical System Holdings
Ltd 398 1.28HKD 81 China Pacific Insurance Group
Co Ltd 373 1.20HKD 734 China Railway Group Ltd 387 1.25HKD 203 China Shenhua Energy Co Ltd 387 1.25HKD 63 China Vanke Co Ltd 266 0.86HKD 358 China Yuhua Education Corp
Ltd, 144A 296 0.95HKD 497 CITIC Ltd 420 1.35HKD 1,147 CITIC Telecom International
Holdings Ltd 374 1.20HKD 725 Dali Foods Group Co Ltd, 144A 442 1.42HKD 127 EEKA Fashion Holdings Ltd 172 0.55HKD 418 Far East Horizon Ltd 450 1.45HKD 338 Fu Shou Yuan International
Group Ltd 338 1.09HKD 248 Guangdong Investment Ltd 443 1.43HKD 54 Hengan International Group
Co Ltd 373 1.20HKD 953 Huaneng Power International
Inc 325 1.05HKD 609 Postal Savings Bank of China
Co Ltd, 144A 454 1.46HKD 184 Shanghai Pharmaceuticals
Holding Co Ltd 337 1.09HKD 503 Sinopec Engineering Group Co
Ltd 268 0.86HKD 190 Tingyi Cayman Islands Holding
Corp 381 1.23HKD 344 Uni-President China Holdings
Ltd 413 1.33HKD 2,150 Yuexiu Property Co Ltd 478 1.54HKD 616 Yuexiu Transport Infrastructure
Ltd 439 1.42
10,603 34.16
Hong Kong — 10.61% (29 February 2020: 6.18%)
HKD 68 AIA Group Ltd 853 2.75HKD 43 CLP Holdings Ltd 421 1.35HKD 1,026 Giordano International Ltd 204 0.65HKD 237 HKT Trust & HKT Ltd 322 1.04HKD 81 Hysan Development Co Ltd 345 1.11HKD 201 Lifestyle International Holdings
Ltd 179 0.58HKD 68 Luk Fook Holdings
International Ltd 172 0.56HKD 271 Stella International Holdings
Ltd 322 1.04HKD 34 VTech Holdings Ltd 286 0.92HKD 89 Yue Yuen Industrial Holdings
Ltd 190 0.61
3,294 10.61
Shares(000’s)
Value(000’s)
$
% ofNet
AssetValue
India — 7.41% (29 February 2020: 8.46%)
INR 28 HCL Technologies Ltd 345 1.11INR 37 Infosys Ltd 636 2.05INR 1,269 NHPC Ltd 419 1.35INR 135 Power Grid Corp of India Ltd 394 1.27INR 182 REC Ltd 335 1.08INR 61 Vedanta Ltd 170 0.55
2,299 7.41
Indonesia — 2.29% (29 February 2020: 3.77%)
IDR 761 Indofood Sukses MakmurTbk PT 323 1.04
IDR 1,574 Telkom Indonesia PerseroTbk PT 386 1.25
709 2.29
Malaysia — 2.93% (29 February 2020: 3.26%)
MYR 1,389 Astro Malaysia Holdings Bhd 320 1.03MYR 223 MISC Bhd 370 1.20MYR 212 Public Bank Bhd 218 0.70
908 2.93
Pakistan — 0.78% (29 February 2020: 0.65%)
PKR 208 MCB Bank Ltd 243 0.78
Philippines — 2.11% (29 February 2020: 2.18%)
PHP 677 Aboitiz Power Corp 339 1.09PHP 8 Globe Telecom Inc 317 1.02
656 2.11
Singapore — 0.86% (29 February 2020: 0.00%)
SGD 17 Jardine Cycle & Carriage Ltd 266 0.86
South Korea — 12.32% (29 February 2020: 10.40%)
KRW 10 GS Retail Co Ltd 332 1.07KRW 4 Hansol Paper Co Ltd 52 0.17KRW 6 KB Financial Group Inc 229 0.74
25 KT Corp ADR 287 0.92KRW 6 KT&G Corp 425 1.37KRW 30 LG Uplus Corp 311 1.00KRW 25 Samsung Electronics Co Ltd 1,799 5.80KRW 2 SK Telecom Co Ltd 389 1.25
3,824 12.32
Taiwan — 18.14% (29 February 2020: 17.23%)
TWD 264 Asia Cement Corp 404 1.30TWD 51 Chicony Electronics Co Ltd 171 0.55TWD 336 Kindom Development Co Ltd 435 1.40TWD 240 Lite-On Technology Corp 511 1.65TWD 162 Nan Kang Rubber Tire Co Ltd 243 0.78TWD 58 Pacific Hospital Supply Co Ltd 145 0.47TWD 14 Poya International Co Ltd 312 1.01TWD 39 President Chain Store Corp 367 1.18TWD 77 SCI Pharmtech Inc 254 0.82TWD 213 Synnex Technology
International Corp 377 1.21TWD 89 Taiwan Semiconductor
Manufacturing Co Ltd 1,946 6.27TWD 193 Uni-President Enterprises Corp 465 1.50
5,630 18.14
Thailand — 1.01% (29 February 2020: 6.41%)
THB 101 Tisco Financial Group PCL,NVDR 314 1.01
Total Common Stock (Cost $30,605) 30,191 97.28
Real Estate Investment Trusts — 1.45%(29 February 2020: 4.42%)
Australia — 0.87% (29 February 2020: 1.08%)
AUD 76 Charter Hall Long Wale REIT 269 0.87
Shares(000’s)
Value(000’s)
$
% ofNet
AssetValue
Hong Kong — 0.58% (29 February 2020: 0.51%)
HKD 194 Fortune Real EstateInvestment Trust 182 0.58
Total Real Estate Investment Trusts(Cost $511) 451 1.45
Total Investments at fair value throughprofit or loss (Cost $31,116) 30,642 98.73
Forward Foreign Currency Contracts — 0.13%(29 February 2020: 0.01%)
Unrealised appreciation of contracts(see below) 43 0.13
Total Financial Assets at fair valuethrough profit or loss 30,685 98.86
Forward Foreign Currency Contracts — (0.09%)(29 February 2020: (0.33%))
Unrealised depreciation of contracts(see below) (29) (0.09)
Total Financial Liabilities at fair valuethrough profit or loss (29) (0.09)
Total Financial Assets and FinancialLiabilities at fair value through profit orloss 30,656 98.77
Other Assets in Excess of Liabilities 381 1.23
Total Net Assets $31,037 100.00
– Amounts designated as “–” are either $0, less than$1,000, less than 1,000 shares or less than 0.01%.
144A Securities exempt from registration under Rule 144A ofthe Securities Act of 1933, as amended. Thesesecurities may only be resold, in transactions exemptfrom registration, to qualified institutional buyers. As at28 February 2021, these securities amounted to$1,614,000 or 5.19% of net assets.
ABBREVIATIONS:
ADR – American Depositary Receipt.
NVDR – Non Voting Depository Receipt.
AUD – Australian Dollar
HKD – Hong Kong Dollar
IDR – Indonesian Rupiah
INR – Indian Rupee
KRW – South Korean Won
MYR – Malaysian Ringgit
PHP – Philippine Peso
PKR – Pakistan Rupee
SGD – Singapore Dollar
THB – Thai Baht
TWD – Taiwanese Dollar
Analysis of Total Assets
% ofTotal
Assets
Transferable securities admitted to an officialexchange listing or traded on a regulated market 95.31
Financial derivative instruments 0.13
Other assets 4.56
Total Assets 100.00
The accompanying notes are an integral part of the Financial Statements
218

Legg Mason Global Funds Plc Annual Report 28 February 2021
Legg Mason QS MV Asia Pacific Ex Japan Equity Growth and Income Fund
Portfolio of Investments as at 28 February 2021 – (continued)
Schedule of Forward Foreign Currency Contracts
Expiration Date CounterpartyBuy Currency
(000’s)Sell Currency
(000’s)
UnrealisedAppreciation/
(Depreciation)of Contracts
(000’s)
01/03/2021 BNY Mellon Buy HKD 1 Sell USD – $ –01/03/2021 BNY Mellon Buy HKD 250 Sell USD 32 –02/03/2021 BNY Mellon Buy AUD 230 Sell USD 183 (6)12/03/2021 BNY Mellon Buy USD 618 Sell AUD 782 1612/03/2021 BNY Mellon Buy USD 1 Sell AUD 1 –12/03/2021 BNY Mellon Buy USD 1 Sell CNH 7 –12/03/2021 BNY Mellon Buy USD – Sell SGD – –12/03/2021 BNY Mellon Buy SGD 104 Sell USD 80 –12/03/2021 BNY Mellon Buy PLN 11,585 Sell USD 3,110 (19)12/03/2021 BNY Mellon Buy CNH 1,459 Sell USD 225 (1)12/03/2021 BNY Mellon Buy AUD 163 Sell USD 128 (3)12/03/2021 BNY Mellon Buy AUD 4,884 Sell USD 3,731 27
Unrealised Appreciation of Forward Foreign Currency Contracts (29 February 2020 (000’s): $8) $ 43Unrealised Depreciation of Forward Foreign Currency Contracts (29 February 2020 (000’s): $(215)) (29)
Net Appreciation of Forward Foreign Currency Contracts (29 February 2020 (000’s): $(207)) $ 14
The accompanying notes are an integral part of the Financial Statements
219

Legg Mason Global Funds Plc Annual Report 28 February 2021
Legg Mason QS Emerging Markets Equity Fund
Portfolio of Investments as at 28 February 2021
Shares(000’s)
Value(000’s)
$
% ofNet
AssetValue
Common Stock — 97.68% (29 February 2020: 95.20%)
Brazil — 2.55% (29 February 2020: 6.79%)
BRL 6 Ambev SA 14 0.10BRL 1 Atacadao SA 4 0.03BRL – B2W Cia Digital 4 0.03BRL 1 B3 SA – Brasil Bolsa Balcao 11 0.07BRL 17 CCR SA 34 0.23BRL 1 Centrais Eletricas Brasileiras
SA 4 0.03BRL 1 Cia de Saneamento Basico
do Estado de Sao Paulo 5 0.03BRL – Cosan SA 3 0.02BRL 1 Energisa SA 4 0.03BRL 1 Engie Brasil Energia SA 4 0.03BRL 2 Equatorial Energia SA 8 0.06BRL 5 Hapvida Participacoes e
Investimentos SA, 144A 12 0.08BRL 2 Hypera SA 10 0.07BRL 2 Klabin SA 8 0.05BRL 2 Localiza Rent a Car SA 16 0.11BRL 2 Lojas Renner SA 11 0.07BRL 4 Magazine Luiza SA 19 0.13BRL 1 Natura & Co Holding SA 8 0.06BRL 2 Notre Dame Intermedica
Participacoes SA 30 0.21BRL 2 Petrobras Distribuidora SA 7 0.05BRL 4 Petroleo Brasileiro SA 17 0.11BRL 2 Raia Drogasil SA 6 0.04BRL 3 Rumo SA 8 0.05BRL 1 Suzano SA 8 0.05BRL 3 Telefonica Brasil SA 24 0.17BRL 6 TIM SA/Brazil 14 0.09BRL – Ultrapar Participacoes SA 1 0.01BRL 3 Vale SA 52 0.35BRL 2 Via Varejo S/A 4 0.02BRL 2 WEG SA 26 0.17
376 2.55
Chile — 2.03% (29 February 2020: 2.19%)
CLP 532 Banco de Chile 58 0.40CLP 1 Banco de Credito e
Inversiones SA 26 0.18CLP 711 Banco Santander Chile 41 0.28CLP 15 Cencosud SA 30 0.20CLP 1 Cia Cervecerias Unidas SA 10 0.06CLP 83 Colbun SA 16 0.10CLP 16 Empresas CMPC SA 46 0.31CLP 347 Enel Americas SA 53 0.36CLP 272 Enel Chile SA 20 0.14
300 2.03
China — 30.45% (29 February 2020: 25.51%)
HKD 5 3SBio Inc, 144A 5 0.03– 51job Inc ADR 4 0.03
HKD 3 AAC Technologies HoldingsInc 13 0.09
CNY 1 AECC Aviation Power Co Ltd 9 0.06HKD 6 Agile Group Holdings Ltd 8 0.06HKD 9 Agricultural Bank of China
Ltd 3 0.02CNY 2 Aier Eye Hospital Group Co
Ltd 21 0.14HKD 8 Air China Ltd 7 0.04TWD 1 Airtac International Group 35 0.24
1 Alibaba Group Holding LtdADR 167 1.13
HKD 10 Alibaba Health InformationTechnology Ltd 33 0.23
HKD 2 A-Living Smart City ServicesCo Ltd, 144A 6 0.04
HKD 44 Aluminum Corp of China Ltd 22 0.15CNY 3 Anhui Conch Cement Co Ltd 26 0.17HKD 9 Anhui Conch Cement Co Ltd 58 0.39HKD 1 Anhui Gujing Distillery Co
Ltd 13 0.09HKD 1 ANTA Sports Products Ltd 15 0.10CNY 5 AVIC Electromechanical
Systems Co Ltd 9 0.06HKD 10 AviChina Industry &
Technology Co Ltd 7 0.05CNY 1 AVICOPTER Plc 8 0.06
– Baidu Inc ADR 57 0.38HKD 62 Bank of China Ltd 22 0.15
Shares(000’s)
Value(000’s)
$
% ofNet
AssetValue
HKD 6 Bank of Communications CoLtd 3 0.02
CNY 29 Baoshan Iron & Steel Co Ltd 34 0.23– BeiGene Ltd ADR 32 0.22
HKD 8 Beijing Capital InternationalAirport Co Ltd 6 0.04
HKD 5 Beijing Enterprises HoldingsLtd 17 0.12
HKD 38 Beijing Enterprises WaterGroup Ltd 15 0.10
CNY 3 Beijing Oriental YuhongWaterproof Technology CoLtd 22 0.15
CNY 6 BOE Technology Group CoLtd 6 0.04
HKD 2 BYD Electronic InternationalCo Ltd 11 0.08
HKD – CanSino Biologics Inc, 144A 10 0.06HKD 69 CGN Power Co Ltd, 144A 15 0.10HKD 5 China Aoyuan Group Ltd 5 0.03CNY 3 China Avionics Systems Co
Ltd 8 0.05HKD 10 China Communications
Services Corp Ltd 5 0.03HKD 5 China Conch Venture
Holdings Ltd 22 0.15HKD 82 China Construction Bank
Corp 66 0.45HKD 8 China Everbright
Environment Group Ltd 5 0.03HKD 6 China Evergrande Group 12 0.08HKD 3 China Feihe Ltd, 144A 8 0.06CNY 5 China Fortune Land
Development Co Ltd 7 0.04HKD 19 China Gas Holdings Ltd 75 0.51HKD 13 China Hongqiao Group Ltd 16 0.11HKD 16 China Jinmao Holdings
Group Ltd 7 0.05HKD 4 China Lesso Group Holdings
Ltd 7 0.05HKD 6 China Life Insurance Co Ltd 13 0.09HKD 25 China Longyuan Power
Group Corp Ltd 37 0.25HKD 5 China Medical System
Holdings Ltd 8 0.05HKD 10 China Mengniu Dairy Co Ltd 55 0.37CNY 4 China Merchants Bank Co
Ltd 34 0.23HKD 3 China Merchants Bank Co
Ltd 23 0.16CNY 2 China Merchants Energy
Shipping Co Ltd 2 0.01HKD 4 China Merchants Port
Holdings Co Ltd 6 0.04CNY 11 China Molybdenum Co Ltd 11 0.08HKD 27 China Molybdenum Co Ltd 21 0.14HKD 30 China National Building
Material Co Ltd 45 0.31HKD 12 China Oilfield Services Ltd 14 0.09HKD 31 China Overseas Land &
Investment Ltd 79 0.53HKD 5 China Overseas Property
Holdings Ltd 3 0.02HKD 2 China Pacific Insurance
Group Co Ltd 11 0.07HKD 166 China Petroleum & Chemical
Corp 93 0.63CNY 28 China Petroleum & Chemical
Corp 19 0.13HKD 46 China Power International
Development Ltd 10 0.07HKD 10 China Railway Group Ltd 5 0.04HKD 4 China Resources Beer
Holdings Co Ltd 30 0.20HKD 18 China Resources Cement
Holdings Ltd 21 0.15HKD 6 China Resources Gas Group
Ltd 30 0.20HKD 8 China Resources Land Ltd 38 0.26HKD 12 China Resources Power
Holdings Co Ltd 14 0.10HKD 22 China Shenhua Energy Co
Ltd 42 0.28CNY 6 China Shenhua Energy Co
Ltd 16 0.11
Shares(000’s)
Value(000’s)
$
% ofNet
AssetValue
HKD 10 China Southern Airlines CoLtd 7 0.05
CNY 25 China State ConstructionEngineering Corp Ltd 20 0.13
HKD 4 China Taiping InsuranceHoldings Co Ltd 9 0.06
HKD 34 China Tower Corp Ltd, 144A 5 0.03HKD 5 China Vanke Co Ltd 19 0.13CNY 2 China Vanke Co Ltd 11 0.08CNY 11 China Yangtze Power Co Ltd 33 0.22HKD 12 Chongqing Rural Commercial
Bank Co Ltd 5 0.04CNY – Chongqing Zhifei Biological
Products Co Ltd 5 0.04HKD 10 CIFI Holdings Group Co Ltd 9 0.06HKD 16 CITIC Ltd 14 0.09HKD 6 CITIC Securities Co Ltd 12 0.08CNY – Contemporary Amperex
Technology Co Ltd 20 0.14HKD 10 COSCO SHIPPING Energy
Transportation Co Ltd 4 0.03HKD 19 Country Garden Holdings Co
Ltd 24 0.16HKD 4 Country Garden Services
Holdings Co Ltd 33 0.22HKD 24 CSPC Pharmaceutical Group
Ltd 25 0.17CNY – Da An Gene Co Ltd of Sun
Yat-Sen University 2 0.01HKD 8 Dali Foods Group Co Ltd,
144A 5 0.03HKD 6 ENN Energy Holdings Ltd 84 0.57CNY 1 Foshan Haitian Flavouring &
Food Co Ltd 24 0.16HKD 8 Fosun International Ltd 11 0.08CNY 1 Ganfeng Lithium Co Ltd 12 0.08
– GDS Holdings Ltd ADR 20 0.14HKD 5 Geely Automobile Holdings
Ltd 16 0.11HKD 2 Genscript Biotech Corp 3 0.02HKD 1 Greentown China Holdings
Ltd 1 0.01HKD 6 Greentown Service Group Co
Ltd 6 0.04HKD 18 Guangdong Investment Ltd 32 0.22HKD 4 Guangzhou R&F Properties
Co Ltd 6 0.04HKD 2 Hansoh Pharmaceutical
Group Co Ltd, 144A 10 0.07HKD 2 Hebei Construction Group
Corp Ltd 1 –HKD 3 Hengan International Group
Co Ltd 17 0.12CNY 5 Hengli Petrochemical Co Ltd 26 0.18HKD 2 Hopson Development
Holdings Ltd 7 0.04HKD 1 Hua Hong Semiconductor
Ltd, 144A 6 0.04HKD 24 Huaneng Power International
Inc 8 0.06CNY 10 Huaxia Bank Co Ltd 9 0.06HKD 49 Industrial & Commercial Bank
of China Ltd 32 0.22CNY 3 Inner Mongolia Junzheng
Energy & Chemical IndustryGroup Co Ltd 3 0.02
CNY 5 Inner Mongolia Yili IndustrialGroup Co Ltd 34 0.23
HKD 3 Innovent Biologics Inc, 144A 26 0.17– iQIYI Inc ADR 3 0.02– JD.com Inc ADR 38 0.25
HKD 4 Jiangsu Expressway Co Ltd 5 0.03CNY 2 Jiangsu Hengrui Medicine Co
Ltd 28 0.19CNY 1 Jiangsu Yanghe Brewery
Joint-Stock Co Ltd 21 0.14HKD 10 Jiangxi Copper Co Ltd 24 0.16
– KE Holdings Inc ADR 17 0.12HKD 5 Kingboard Holdings Ltd 21 0.14HKD 7 Kingdee International
Software Group Co Ltd 25 0.17HKD 3 Kingsoft Corp Ltd 21 0.14HKD 32 Kunlun Energy Co Ltd 29 0.20CNY – Kweichow Moutai Co Ltd 98 0.67HKD 5 KWG Group Holdings Ltd 7 0.05
The accompanying notes are an integral part of the Financial Statements
220

Legg Mason Global Funds Plc Annual Report 28 February 2021
Legg Mason QS Emerging Markets Equity Fund
Portfolio of Investments as at 28 February 2021 – (continued)
Shares(000’s)
Value(000’s)
$
% ofNet
AssetValue
Common Stock — (continued)
China — (continued)
HKD 11 Lee & Man PaperManufacturing Ltd 10 0.07
HKD 26 Lenovo Group Ltd 33 0.22HKD 4 Logan Group Co Ltd 6 0.04HKD 6 Longfor Group Holdings Ltd,
144A 33 0.22CNY 1 Luzhou Laojiao Co Ltd 26 0.17HKD 2 Meituan, 144A 67 0.46HKD 1 Microport Scientific Corp 6 0.04
– Momo Inc ADR 6 0.04CNY 1 Muyuan Foods Co Ltd 12 0.08CNY 9 NanJi E-Commerce Co Ltd 15 0.10
1 NetEase Inc ADR 55 0.37CNY 1 New Hope Liuhe Co Ltd 4 0.03
– New Oriental Education &Technology Group Inc ADR 18 0.12
– NIO Inc ADR 14 0.10CNY 7 Offshore Oil Engineering Co
Ltd 5 0.04CNY 24 PetroChina Co Ltd 16 0.11HKD 134 PetroChina Co Ltd 48 0.33HKD 8 PICC Property & Casualty Co
Ltd 6 0.04– Pinduoduo Inc ADR 17 0.12
HKD 1 Ping An Healthcare andTechnology Co Ltd, 144A 14 0.10
HKD 5 Ping An Insurance Group Coof China Ltd 56 0.38
CNY 3 Ping An Insurance Group Coof China Ltd ‘A’ 42 0.29
CNY 8 Poly Developments andHoldings Group Co Ltd 20 0.14
HKD 7 Postal Savings Bank of ChinaCo Ltd, 144A 5 0.04
CNY 5 Rongsheng Petro ChemicalCo Ltd 27 0.18
CNY 4 Sany Heavy Industry Co Ltd 28 0.19HKD 8 Seazen Group Ltd 10 0.07CNY 1 SF Holding Co Ltd 21 0.14CNY 2 Shandong Gold Mining Co
Ltd 6 0.04HKD 4 Shandong Weigao Group
Medical Polymer Co Ltd 7 0.05HKD 2 Shanghai Fosun
Pharmaceutical Group Co Ltd 9 0.06CNY 5 Shanxi Meijin Energy Co Ltd 6 0.04CNY 4 Shenzhen Airport Co Ltd 5 0.03HKD 5 Shenzhen International
Holdings Ltd 7 0.05CNY – Shenzhen Mindray
Bio-Medical Electronics CoLtd 6 0.04
HKD 1 Shenzhou InternationalGroup Holdings Ltd 10 0.07
HKD 4 Shimao Group Holdings Ltd 12 0.08HKD 4 Sinopharm Group Co Ltd 8 0.06HKD 3 Sinotruk Hong Kong Ltd 8 0.05HKD 1 Smoore International
Holdings Ltd, 144A 8 0.06HKD 9 Sun Art Retail Group Ltd 8 0.05HKD 7 Sunac China Holdings Ltd 30 0.20HKD 2 Sunny Optical Technology
Group Co Ltd 57 0.39– TAL Education Group ADR 16 0.11
HKD 4 Tencent Holdings Ltd 305 2.07HKD 8 Tingyi Cayman Islands
Holding Corp 16 0.11CNY – Tongwei Co Ltd 2 0.01HKD 4 TravelSky Technology Ltd 10 0.07
– Trip.com Group Ltd ADR 12 0.08HKD 2 Tsingtao Brewery Co Ltd 16 0.11HKD 5 Uni-President China Holdings
Ltd 6 0.04– Vipshop Holdings Ltd ADR 11 0.08
CNY – Walvax Biotechnology Co Ltd 2 0.01CNY 3 Wanhua Chemical Group Co
Ltd 51 0.34HKD 17 Want Want China Holdings
Ltd 12 0.08HKD 7 Weichai Power Co Ltd 21 0.14CNY 4 Wens Foodstuffs Group Co
Ltd 12 0.08CNY 1 Wuliangye Yibin Co Ltd 48 0.32
Shares(000’s)
Value(000’s)
$
% ofNet
AssetValue
CNY 3 WUS Printed Circuit KunshanCo Ltd 7 0.05
CNY 1 WuXi AppTec Co Ltd 22 0.15HKD 1 WuXi AppTec Co Ltd, 144A 15 0.10HKD 8 Wuxi Biologics Cayman Inc,
144A 93 0.63HKD 29 Xiaomi Corp ‘B’, 144A 95 0.65HKD 12 Xinyi Solar Holdings Ltd 25 0.17CNY 1 Yantai Jereh Oilfield Services
Group Co Ltd 6 0.04HKD 36 Yanzhou Coal Mining Co Ltd 33 0.23HKD 2 Yihai International Holding
Ltd 27 0.19– Yum China Holdings Inc 12 0.08– Zai Lab Ltd ADR 14 0.09
HKD 10 Zhaojin Mining Industry CoLtd 10 0.06
HKD 8 Zhejiang Expressway Co Ltd 7 0.05HKD 3 Zhuzhou CRRC Times Electric
Co Ltd 11 0.08CNY 14 Zijin Mining Group Co Ltd 26 0.18HKD 42 Zijin Mining Group Co Ltd 62 0.42HKD 2 ZTE Corp 6 0.04CNY 1 ZTE Corp 5 0.03
1 ZTO Express Cayman Inc ADR 30 0.21
4,488 30.45
Colombia — 0.28% (29 February 2020: 0.52%)
COP 3 Bancolombia SA 24 0.16COP 3 Grupo de Inversiones
Suramericana SA 18 0.12
42 0.28
Egypt — 0.41% (29 February 2020: 0.75%)
EGP 16 Commercial InternationalBank Egypt SAE 61 0.41
Greece — 0.66% (29 February 2020: 1.13%)
EUR 1 FF Group †∞ 5 0.04EUR 3 Hellenic Telecommunications
Organization SA 45 0.30EUR 1 JUMBO SA 19 0.13EUR 2 OPAP SA 28 0.19
97 0.66
Hong Kong — 0.67% (29 February 2020: 0.89%)
HKD 16 China Youzan Ltd 7 0.05HKD 38 Hanergy Mobile Energy
Holding Group Co Ltd †∞ – –– Hutchison China MediTech
Ltd ADR 9 0.06CNY 2 Luxshare Precision Industry
Co Ltd 12 0.08HKD 14 Nine Dragons Paper Holdings
Ltd 23 0.15HKD 26 Sino Biopharmaceutical Ltd 29 0.20HKD 8 SSY Group Ltd 4 0.03HKD 1 Vinda International Holdings
Ltd 3 0.02HKD 5 Wharf Holdings Ltd/The 12 0.08
99 0.67
Hungary — 0.60% (29 February 2020: 1.07%)
HUF 2 OTP Bank Nyrt 88 0.60
India — 8.36% (29 February 2020: 6.29%)
INR 2 Adani Green Energy Ltd 24 0.16INR 3 Adani Ports & Special
Economic Zone Ltd 32 0.22INR 2 Ambuja Cements Ltd 8 0.06INR 1 Asian Paints Ltd 27 0.18INR 1 Aurobindo Pharma Ltd 14 0.10INR – Avenue Supermarts Ltd,
144A 9 0.06INR 1 Axis Bank Ltd 13 0.09INR – Bajaj Auto Ltd 16 0.11INR – Bajaj Finance Ltd 15 0.10INR 1 Berger Paints India Ltd 6 0.04INR 1 Bharat Petroleum Corp Ltd 5 0.03INR 8 Bharti Airtel Ltd 64 0.43INR 2 Biocon Ltd 9 0.06INR – Britannia Industries Ltd 4 0.02INR 2 Cipla Ltd/India 20 0.13INR 2 Container Corp Of India Ltd 12 0.08INR 1 Dabur India Ltd 5 0.03INR – Divi’s Laboratories Ltd 16 0.11
Shares(000’s)
Value(000’s)
$
% ofNet
AssetValue
INR – Dr Reddy’s Laboratories Ltd 29 0.20INR – Eicher Motors Ltd 14 0.10INR 12 GAIL India Ltd 23 0.16INR 1 Godrej Consumer Products
Ltd 8 0.05INR 1 Grasim Industries Ltd 16 0.11INR 2 Havells India Ltd 31 0.21INR 1 HCL Technologies Ltd 12 0.08INR 1 HDFC Life Insurance Co Ltd,
144A 6 0.04INR – Hero MotoCorp Ltd 12 0.08INR 3 Hindalco Industries Ltd 13 0.09INR 1 Hindustan Unilever Ltd 35 0.24INR 1 Housing Development Finance
Corp Ltd 49 0.33INR 4 ICICI Bank Ltd 34 0.23INR 2 Indraprastha Gas Ltd 13 0.09INR 2 Indus Towers Ltd 7 0.05INR – Info Edge India Ltd 20 0.13INR 3 Infosys Ltd 47 0.32INR 1 InterGlobe Aviation Ltd, 144A 12 0.08INR 6 ITC Ltd 16 0.11INR 1 JSW Steel Ltd 6 0.04INR – Jubilant Foodworks Ltd 11 0.07INR 3 Larsen & Toubro Ltd 64 0.43INR 1 Lupin Ltd 15 0.10INR 2 Mahindra & Mahindra Ltd 22 0.15INR – Maruti Suzuki India Ltd 27 0.18INR – Nestle India Ltd 8 0.06INR 20 NTPC Ltd 30 0.20INR 3 Oil & Natural Gas Corp Ltd 5 0.03INR – Pidilite Industries Ltd 9 0.06INR – Piramal Enterprises Ltd 10 0.07INR 15 Power Grid Corp of India Ltd 45 0.31INR 3 Reliance Industries Ltd 85 0.58INR – Shree Cement Ltd 11 0.08INR 1 Siemens Ltd 16 0.11INR 2 State Bank of India 9 0.06INR 4 Sun Pharmaceutical Industries
Ltd 29 0.20INR 1 Tata Consultancy Services Ltd 28 0.19INR 4 Tata Motors Ltd 19 0.13INR 1 Tata Steel Ltd 10 0.07INR 1 Titan Co Ltd 13 0.09INR – Torrent Pharmaceuticals Ltd 8 0.05INR – UltraTech Cement Ltd 25 0.17INR 1 United Spirits Ltd 4 0.03INR 2 UPL Ltd 11 0.08INR 3 Vedanta Ltd 7 0.05INR 3 Zee Entertainment Enterprises
Ltd 9 0.06
1,232 8.36
Indonesia — 3.89% (29 February 2020: 4.62%)
IDR 84 Ace Hardware IndonesiaTbk PT 9 0.06
IDR 192 Adaro Energy Tbk PT 16 0.11IDR 236 Astra International Tbk PT 89 0.61IDR 22 Bank Central Asia Tbk PT 51 0.34IDR 45 Bank Mandiri Persero Tbk PT 19 0.13IDR 19 Bank Negara Indonesia
Persero Tbk PT 8 0.05IDR 128 Bank Rakyat Indonesia Persero
Tbk PT 42 0.29IDR 349 Barito Pacific Tbk PT 27 0.18IDR 46 Charoen Pokphand Indonesia
Tbk PT 20 0.13IDR 4 Gudang Garam Tbk PT 10 0.07IDR 36 Indah Kiat Pulp & Paper Corp
Tbk PT 33 0.23IDR 20 Indocement Tunggal Prakarsa
Tbk PT 17 0.12IDR 16 Indofood CBP Sukses Makmur
Tbk PT 10 0.07IDR 35 Indofood Sukses Makmur
Tbk PT 15 0.10IDR 33 Merdeka Copper Gold Tbk PT 6 0.04IDR 129 Sarana Menara Nusantara
Tbk PT 12 0.08IDR 45 Semen Indonesia Persero
Tbk PT 32 0.22IDR 412 Telkom Indonesia Persero
Tbk PT 101 0.68
The accompanying notes are an integral part of the Financial Statements
221

Legg Mason Global Funds Plc Annual Report 28 February 2021
Legg Mason QS Emerging Markets Equity Fund
Portfolio of Investments as at 28 February 2021 – (continued)
Shares(000’s)
Value(000’s)
$
% ofNet
AssetValue
Common Stock — (continued)
Indonesia — (continued)
IDR 45 Unilever Indonesia Tbk PT 22 0.15IDR 22 United Tractors Tbk PT 34 0.23
573 3.89
Malaysia — 6.57% (29 February 2020: 4.08%)
MYR 29 Axiata Group Bhd 25 0.17MYR 23 CIMB Group Holdings Bhd 24 0.16MYR 114 Dialog Group Bhd 91 0.62MYR 31 DiGi.Com Bhd 29 0.20MYR 1 Fraser & Neave Holdings Bhd 6 0.04MYR 15 Gamuda Bhd 12 0.09MYR 62 Genting Bhd 70 0.47MYR 81 Genting Malaysia Bhd 58 0.39MYR 1 Genting Plantations Bhd 2 0.01MYR 6 HAP Seng Consolidated Bhd 12 0.08MYR 9 Hartalega Holdings Bhd 22 0.15MYR 2 Hong Leong Bank Bhd 7 0.05MYR 13 IHH Healthcare Bhd 17 0.11MYR 14 IOI Corp Bhd 14 0.10MYR 7 Kossan Rubber Industries 7 0.05MYR 2 Kuala Lumpur Kepong Bhd 11 0.08MYR 12 Malayan Banking Bhd 24 0.16MYR 22 Malaysia Airports Holdings
Bhd 32 0.22MYR 27 Maxis Bhd 31 0.21MYR 12 MISC Bhd 21 0.14MYR – Nestle Malaysia Bhd 13 0.09MYR 44 Petronas Chemicals Group
Bhd 80 0.54MYR 6 Petronas Dagangan Bhd 31 0.21MYR 8 Petronas Gas Bhd 30 0.21MYR 3 PPB Group Bhd 14 0.10MYR 26 Press Metal Aluminium
Holdings Bhd 61 0.41MYR 45 Public Bank Bhd 46 0.31MYR 6 QL Resources Bhd 10 0.07MYR 7 RHB Bank Bhd 9 0.06MYR 25 Sime Darby Bhd 14 0.10MYR 11 Sime Darby Plantation Bhd 14 0.09MYR 8 Supermax Corp Bhd 9 0.06MYR 14 Telekom Malaysia Bhd 21 0.14MYR 23 Tenaga Nasional Bhd 58 0.39MYR 26 Top Glove Corp Bhd 33 0.22MYR 10 Westports Holdings Bhd 10 0.07
968 6.57
Mexico — 2.95% (29 February 2020: 2.22%)
MXN 20 Alfa SAB de CV 11 0.07MXN 87 America Movil SAB de CV 56 0.38MXN 1 Arca Continental SAB de CV 4 0.03MXN 53 Cemex SAB de CV 36 0.24MXN 2 Coca-Cola Femsa SAB de CV 6 0.04MXN 4 Fomento Economico
Mexicano SAB de CV 24 0.16MXN – Gruma SAB de CV 5 0.03MXN 3 Grupo Aeroportuario del
Pacifico SAB de CV 30 0.21MXN 2 Grupo Aeroportuario del
Sureste SAB de CV ‘B’ 30 0.21MXN 3 Grupo Bimbo SAB de CV 6 0.04MXN 3 Grupo Carso SAB de CV 6 0.04MXN 16 Grupo Financiero Banorte
SAB de CV 80 0.55MXN 16 Grupo Financiero Inbursa
SAB de CV 15 0.10MXN 12 Grupo Mexico SAB de CV 55 0.37MXN 6 Grupo Televisa SAB 9 0.06MXN 1 Industrias Penoles SAB de CV 10 0.07MXN 3 Kimberly-Clark de Mexico
SAB de CV 5 0.03MXN 5 Orbia Advance Corp SAB de
CV 10 0.07MXN 2 Promotora y Operadora de
Infraestructura SAB de CV 11 0.08MXN 9 Wal-Mart de Mexico SAB de
CV 25 0.17
434 2.95
Peru — 0.79% (29 February 2020: 0.65%)
2 Cia de Minas BuenaventuraSAA ADR 19 0.13
– Credicorp Ltd 48 0.32
Shares(000’s)
Value(000’s)
$
% ofNet
AssetValue
1 Southern Copper Corp 50 0.34
117 0.79
Philippines — 2.87% (29 February 2020: 2.13%)
PHP 13 Aboitiz Equity Ventures Inc 12 0.08PHP 2 Ayala Corp 25 0.17PHP 53 Ayala Land Inc 43 0.29PHP 13 Bank of the Philippine Islands 23 0.16PHP 23 BDO Unibank Inc 51 0.34PHP 1 Globe Telecom Inc 35 0.24PHP 2 GT Capital Holdings Inc 25 0.17PHP 6 International Container
Terminal Services Inc 15 0.10PHP 15 JG Summit Holdings Inc 20 0.14PHP 72 Megaworld Corp 5 0.04PHP 131 Metro Pacific Investments
Corp 11 0.07PHP 22 Metropolitan Bank & Trust
Co 23 0.16PHP 2 PLDT Inc 62 0.42PHP 1 SM Investments Corp 24 0.16PHP 66 SM Prime Holdings Inc 49 0.33
423 2.87
Poland — 1.57% (29 February 2020: 1.83%)
PLN 1 Bank Polska Kasa Opieki SA 17 0.12PLN 1 CD Projekt SA 52 0.35PLN 2 Cyfrowy Polsat SA 15 0.10PLN 4 Orange Polska SA 7 0.05PLN 3 Polski Koncern Naftowy
ORLEN SA 53 0.36PLN 16 Polskie Gornictwo Naftowe i
Gazownictwo SA 24 0.16PLN 4 Powszechna Kasa
Oszczednosci Bank Polski SA 33 0.23PLN 3 Powszechny Zaklad
Ubezpieczen SA 21 0.14PLN – Santander Bank Polska SA 9 0.06
231 1.57
Qatar — 0.66% (29 February 2020: 1.01%)
QAR 19 Industries Qatar QSC 59 0.40QAR 5 Masraf Al Rayan QSC 6 0.04QAR 2 Qatar Islamic Bank SAQ 7 0.05QAR 5 Qatar National Bank QPSC 25 0.17
97 0.66
Romania — 0.16% (29 February 2020: 0.24%)
ZAR 4 NEPI Rockcastle Plc 24 0.16
Russia — 3.38% (29 February 2020: 2.62%)
6 Alrosa PJSC 8 0.065 Gazprom PJSC ADR 29 0.20– LUKOIL PJSC 24 0.164 Magnit PJSC GDR 48 0.32– Mail.Ru Group Ltd GDR 9 0.061 MMC Norilsk Nickel PJSC
ADR 44 0.304 Mobile TeleSystems PJSC
ADR 35 0.235 Moscow Exchange
MICEX-RTS PJSC 12 0.08– Novatek PJSC GDR 12 0.082 Novolipetsk Steel PJSC 7 0.051 PhosAgro PJSC GDR 10 0.07
RUB 1 Polymetal International Plc 11 0.08– Polyus PJSC 14 0.091 Rosneft Oil Co PJSC GDR 5 0.04
25 Sberbank of Russia PJSC 89 0.601 Severstal PJSC 10 0.073 Surgutneftegas OAO 1 0.013 Tatneft PJSC 20 0.14
11,340 VTB Bank PJSC 6 0.041 X5 Retail Group NV GDR 39 0.261 Yandex NV ‘A’ 65 0.44
498 3.38
South Africa — 2.96% (29 February 2020: 6.91%)
ZAR – Anglo American Platinum Ltd 14 0.10ZAR 6 Aspen Pharmacare Holdings
Ltd 55 0.37ZAR 1 Bid Corp Ltd 15 0.10ZAR 1 Clicks Group Ltd 11 0.08ZAR 3 FirstRand Ltd 10 0.07ZAR 2 Gold Fields Ltd 13 0.09
Shares(000’s)
Value(000’s)
$
% ofNet
AssetValue
ZAR 1 Harmony Gold Mining CoLtd 2 0.01
ZAR 1 Impala Platinum Holdings Ltd 24 0.16ZAR – Kumba Iron Ore Ltd 6 0.04ZAR 6 MTN Group 28 0.19ZAR 2 MultiChoice Group 13 0.09ZAR – Naspers Ltd 115 0.78ZAR 1 Nedbank Group Ltd 7 0.05ZAR 1 Northam Platinum Ltd 12 0.08ZAR 8 Old Mutual Ltd 7 0.05ZAR 2 Sanlam Ltd 8 0.05ZAR 1 Sasol Ltd 16 0.11ZAR 1 Shoprite Holdings Ltd 13 0.09ZAR 4 Sibanye Stillwater Ltd 19 0.13ZAR 1 SPAR Group Ltd/The 7 0.05ZAR 1 Standard Bank Group Ltd 12 0.08ZAR – Tiger Brands Ltd 6 0.04ZAR 2 Vodacom Group Ltd 17 0.11ZAR 2 Woolworths Holdings Ltd/
South Africa 6 0.04
436 2.96
South Korea — 7.82% (29 February 2020: 7.15%)
KRW – Alteogen Inc 2 0.02KRW – Amorepacific Corp 22 0.15KRW – Celltrion Healthcare Co Ltd 11 0.07KRW – Celltrion Inc 38 0.25KRW – Celltrion Pharm Inc 3 0.02KRW – CJ CheilJedang Corp 10 0.07KRW – Coway Co Ltd 7 0.05KRW – DL E&C Co Ltd 5 0.03KRW – DL Holdings Co Ltd 3 0.02KRW – Doosan Heavy Industries &
Construction Co Ltd 2 0.01KRW – E-MART Inc 11 0.08KRW 1 GS Holdings Corp 18 0.12KRW 1 Hana Financial Group Inc 18 0.12KRW – Hanmi Pharm Co Ltd 5 0.04KRW – HLB Inc 4 0.03KRW – Hyundai Engineering &
Construction Co Ltd 12 0.08KRW – Hyundai Heavy Industries
Holdings Co Ltd 8 0.06KRW – Hyundai Mobis Co Ltd 29 0.20KRW – Hyundai Motor Co 45 0.30KRW – Kakao Corp 32 0.21KRW – Kangwon Land Inc 7 0.04KRW 1 KB Financial Group Inc 26 0.17KRW – Kia Motors Corp 24 0.16KRW – Korea Aerospace Industries
Ltd 11 0.07KRW 5 Korea Electric Power Corp 95 0.65KRW – Korea Gas Corp 13 0.09KRW – Korea Shipbuilding &
Offshore Engineering Co Ltd 7 0.05KRW – Korea Zinc Co Ltd 8 0.06KRW – KT&G Corp 22 0.15KRW – LG Chem Ltd 52 0.35KRW – LG Corp 16 0.11KRW – LG Electronics Inc 28 0.19KRW – LG Household & Health Care
Ltd 34 0.23KRW 1 LG Uplus Corp 7 0.05KRW – Lotte Chemical Corp 13 0.09KRW – NAVER Corp 57 0.39KRW – NCSoft Corp 24 0.16KRW – Orion Corp/Republic of
Korea 9 0.06KRW – POSCO 34 0.23KRW – Samsung Biologics Co Ltd,
144A 17 0.12KRW – Samsung C&T Corp 17 0.11KRW 1 Samsung Electronics Co Ltd 74 0.50KRW – Samsung Fire & Marine
Insurance Co Ltd 5 0.04KRW 1 Samsung Heavy Industries
Co Ltd 8 0.05KRW – Samsung Life Insurance Co
Ltd 13 0.09KRW – Samsung SDI Co Ltd 14 0.09KRW – Seegene Inc 3 0.02KRW – Shin Poong Pharmaceutical
Co Ltd 3 0.02KRW 1 Shinhan Financial Group Co
Ltd 21 0.14
The accompanying notes are an integral part of the Financial Statements
222

Legg Mason Global Funds Plc Annual Report 28 February 2021
Legg Mason QS Emerging Markets Equity Fund
Portfolio of Investments as at 28 February 2021 – (continued)
Shares(000’s)
Value(000’s)
$
% ofNet
AssetValue
Common Stock — (continued)
South Korea — (continued)
KRW – SK Chemicals Co Ltd 2 0.01KRW – SK Holdings Co Ltd 16 0.11KRW – SK Hynix Inc 10 0.07KRW – SK Innovation Co Ltd 113 0.77KRW – SK Telecom Co Ltd 10 0.07KRW – S-Oil Corp 34 0.23KRW 1 Woori Financial Group Inc 10 0.07KRW – Yuhan Corp 11 0.08
1,153 7.82
Taiwan — 7.02% (29 February 2020: 4.21%)
TWD 5 Asia Cement Corp 8 0.05TWD 7 Cathay Financial Holding Co
Ltd 11 0.07TWD 2 Chailease Holding Co Ltd 12 0.08TWD 7 Cheng Shin Rubber Industry
Co Ltd 11 0.07TWD 24 China Development Financial
Holding Corp 8 0.05TWD 24 China Steel Corp 22 0.15TWD 18 Chunghwa Telecom Co Ltd 71 0.48TWD 20 CTBC Financial Holding Co
Ltd 14 0.10TWD 12 E.Sun Financial Holding Co
Ltd 11 0.07TWD 1 Eclat Textile Co Ltd 16 0.11TWD 31 Evergreen Marine Corp
Taiwan Ltd 42 0.29TWD 30 Far Eastern New Century
Corp 31 0.21TWD 7 Far EasTone
Telecommunications Co Ltd 16 0.11TWD 2 Feng TAY Enterprise Co Ltd 16 0.11TWD 12 First Financial Holding Co Ltd 9 0.06TWD 8 Formosa Chemicals & Fibre
Corp 25 0.17TWD 30 Formosa Petrochemical Corp 107 0.73TWD 9 Formosa Plastics Corp 32 0.21TWD 9 Fubon Financial Holding Co
Ltd 16 0.11TWD 2 Giant Manufacturing Co Ltd 20 0.14TWD 2 Hiwin Technologies Corp 34 0.23TWD 3 Hon Hai Precision Industry
Co Ltd 13 0.09TWD 2 Hotai Motor Co Ltd 42 0.29TWD 11 Hua Nan Financial Holdings
Co Ltd 7 0.05TWD 1 MediaTek Inc 32 0.22TWD 10 Mega Financial Holding Co
Ltd 10 0.07TWD 12 Nan Ya Plastics Corp 31 0.21TWD 1 Nien Made Enterprise Co Ltd 14 0.09TWD 17 Pou Chen Corp 18 0.12TWD 4 President Chain Store Corp 38 0.26TWD 5 Shanghai Commercial &
Savings Bank Ltd/The 7 0.05TWD 20 SinoPac Financial Holdings
Co Ltd 9 0.06TWD 3 Standard Foods Corp 6 0.04TWD 15 Taishin Financial Holding Co
Ltd 7 0.05TWD 11 Taiwan Cement Corp 16 0.11TWD 9 Taiwan Cooperative Financial
Holding Co Ltd 7 0.04TWD 19 Taiwan High Speed Rail Corp 21 0.14TWD 8 Taiwan Mobile Co Ltd 28 0.19TWD 5 Taiwan Semiconductor
Manufacturing Co Ltd 109 0.74TWD 31 Uni-President Enterprises
Corp 75 0.51TWD 17 Yuanta Financial Holding Co
Ltd 13 0.09
1,035 7.02
Thailand — 7.00% (29 February 2020: 8.00%)
THB 7 Advanced Info Service PCL ∞ 37 0.25THB 1 Advanced Info Service PCL 7 0.05THB 28 Airports of Thailand PCL 59 0.40THB 83 Asset World Corp PCL 13 0.09THB 6 B Grimm Power PCL 9 0.06THB 4 Bangkok Bank PCL 16 0.11THB 11 Bangkok Commercial Asset
Management PCL 8 0.05
Shares(000’s)
Value(000’s)
$
% ofNet
AssetValue
THB 87 Bangkok Dusit MedicalServices PCL 57 0.39
THB 54 Bangkok Expressway & MetroPCL 14 0.10
THB 4 Berli Jucker PCL 5 0.03THB 59 BTS Group Holdings PCL 18 0.12THB 4 Bumrungrad Hospital PCL 16 0.11THB 51 Central Pattana PCL 87 0.59THB 21 Central Retail Corp PCL,
144A 23 0.15THB 13 Charoen Pokphand Foods
PCL ∞ 12 0.08THB 9 CP ALL PCL 17 0.11THB 22 CP ALL PCL ∞ 43 0.29THB 3 Electricity Generating PCL 14 0.10THB 14 Energy Absolute PCL 29 0.20THB 5 Global Power Synergy PCL 12 0.08THB 15 Gulf Energy Development
PCL 17 0.11THB 26 Home Product Center PCL 11 0.08THB 44 Home Product Center PCL ∞ 19 0.13THB 11 Indorama Ventures PCL 14 0.10THB 16 Intouch Holdings PCL 30 0.20THB 10 Kasikornbank PCL 44 0.30THB – Kasikornbank PCL 1 0.01THB 12 Krung Thai Bank PCL 5 0.03THB 25 Krung Thai Bank PCL ∞ 10 0.07THB 6 Krungthai Card PCL 12 0.08THB 147 Land & Houses PCL 38 0.26THB 35 Minor International PCL 35 0.24THB 21 Minor International PCL ∞ 21 0.14THB 5 Muangthai Capital PCL 11 0.08THB 3 Osotspa PCL 3 0.02THB 7 PTT Exploration & Production
PCL 26 0.17THB 8 PTT Global Chemical PCL ∞ 16 0.11THB 8 PTT Global Chemical PCL 15 0.10THB 19 PTT PCL ∞ 25 0.17THB 32 PTT PCL 42 0.28THB 6 Ratch Group PCL 9 0.06THB 4 Siam Cement PCL/The 52 0.35THB 2 Siam Commercial Bank PCL/
The 5 0.04THB 4 Siam Commercial Bank PCL/
The ∞ 14 0.10THB 9 Sri Trang Gloves Thailand PCL 12 0.08THB 4 Srisawad Corp PCL 9 0.06THB 9 Thai Oil PCL 17 0.12THB 12 Thai Union Group PCL ∞ 6 0.04THB 6 Thai Union Group PCL 3 0.02THB 6 Total Access Communication
PCL 7 0.04THB 72 True Corp PCL ∞ 7 0.05
1,032 7.00
Turkey — 1.71% (29 February 2020: 2.42%)
TRY 37 Akbank T.A.S. 30 0.20TRY 8 BIM Birlesik Magazalar AS 75 0.51TRY 13 Haci Omer Sabanci Holding
AS 19 0.12TRY 13 KOC Holding AS 37 0.25TRY 11 Turk Hava Yollari AO 20 0.14TRY 25 Turkiye Garanti Bankasi AS 31 0.21TRY 17 Turkiye Is Bankasi AS 13 0.09TRY 15 Turkiye Sise ve Cam
Fabrikalari AS 14 0.10TRY 37 Yapi ve Kredi Bankasi AS 13 0.09
252 1.71
United Arab Emirates — 2.16%(29 February 2020: 1.06%)
AED 19 Abu Dhabi Commercial BankPJSC 32 0.21
AED 78 Aldar Properties PJSC 76 0.52AED 13 Dubai Islamic Bank PJSC 17 0.11AED 59 Emaar Malls PJSC 26 0.18AED 76 Emaar Properties PJSC 71 0.48AED 9 Emirates NBD Bank PJSC 26 0.18AED 18 First Abu Dhabi Bank PJSC 71 0.48
319 2.16
United Republic of Tanzania — 0.11%(29 February 2020: 0.00%)
ZAR 1 AngloGold Ashanti Ltd 16 0.11
Shares(000’s)
Value(000’s)
$
% ofNet
AssetValue
United States — 0.05% (29 February 2020: 0.13%)
BRL 2 JBS SA 7 0.05
Total Common Stock (Cost $11,804) 14,398 97.68
Preferred Stock — 1.50% (29 February 2020: 2.69%)
Brazil — 0.41% (29 February 2020: 1.99%)
BRL 3 Banco Bradesco SA 11 0.07BRL 3 Cia Energetica de Minas
Gerais 7 0.05BRL 2 Itau Unibanco Holding SA 11 0.08BRL 2 Itausa SA 4 0.03BRL 1 Lojas Americanas SA 6 0.04BRL 5 Petroleo Brasileiro SA 22 0.14
61 0.41
Chile — 0.63% (29 February 2020: 0.26%)
CLP 3 Embotelladora Andina SA 8 0.06CLP 2 Sociedad Quimica y Minera
de Chile SA 85 0.57
93 0.63
Colombia — 0.29% (29 February 2020: 0.27%)
COP 5 Bancolombia SA 42 0.29
Russia — 0.01% (29 February 2020: 0.00%)
3 Surgutneftegas OAO 1 0.01
South Korea — 0.16% (29 February 2020: 0.17%)
KRW – LG Chem Ltd 8 0.05KRW – Samsung Electronics Co Ltd 16 0.11
24 0.16
Total Preferred Stock (Cost $178) 221 1.50
Real Estate Investment Trusts — 0.18%(29 February 2020: 1.14%)
South Africa — 0.18% (29 February 2020: 0.56%)
ZAR 29 Growthpoint Properties Ltd 27 0.18
Total Real Estate Investment Trusts(Cost $37) 27 0.18
Total Investments at fair value throughprofit or loss (Cost $12,019) 14,646 99.36
Futures — 0.09% (29 February 2020: 0.00%)
Unrealised appreciation of contracts(see below) 13 0.09
Total Financial Assets at fair valuethrough profit or loss 14,659 99.45
Total Financial Assets and FinancialLiabilities at fair value through profit orloss 14,659 99.45
Other Assets in Excess of Liabilities 80 0.55
Total Net Assets $14,739 100.00
– Amounts designated as “–” are either $0, less than$1,000, less than 1,000 shares or less than 0.01%.
144A Securities exempt from registration under Rule 144A ofthe Securities Act of 1933, as amended. Thesesecurities may only be resold, in transactions exemptfrom registration, to qualified institutional buyers. As at28 February 2021, these securities amounted to$505,000 or 3.42% of net assets.
† Illiquid.
∞ Security is valued in good faith at fair value by or at thediscretion of the Manager or the respective InvestmentManager.
ABBREVIATIONS:
ADR – American Depositary Receipt.
GDR – Global Depositary Receipt.
AED – United Arab Emirates Dirham
BRL – Brazilian Real
CLP – Chilean Peso
CNY – Chinese Renminbi
COP – Colombia Peso
EGP – Egyptian Pound
EUR – Euro
HKD – Hong Kong Dollar
HUF – Hungarian Forint
The accompanying notes are an integral part of the Financial Statements
223

Legg Mason Global Funds Plc Annual Report 28 February 2021
Legg Mason QS Emerging Markets Equity Fund
Portfolio of Investments as at 28 February 2021 – (continued)
IDR – Indonesian Rupiah
INR – Indian Rupee
KRW – South Korean Won
MXN – Mexican Peso
MYR – Malaysian Ringgit
PHP – Philippine Peso
PLN – Polish Zloty
QAR – Qatari Riyal
RUB – Russian Ruble
THB – Thai Baht
TRY – Turkish Lira
TWD – Taiwanese Dollar
ZAR – South Africa Rand
Analysis of Total Assets
% ofTotal
Assets
Transferable securities admitted to an officialexchange listing or traded on a regulated market 98.47
Financial derivative instruments 0.09
Other assets 1.44
Total Assets 100.00
Schedule of Futures Contracts
CounterpartyNominal
Value
NotionalValue(000’s)
UnrealisedAppreciation/
(Depreciation)of Contracts
(000’s)
Mini MSCI Emerging Markets Index March 2021 UBS 3 $ 201 $ 13
Unrealised Appreciation of Futures Contracts (29 February 2020 (000’s): $–) $ 13Unrealised Depreciation of Futures Contracts (29 February 2020 (000’s): $(20)) –
Net Appreciation of Futures Contracts (29 February 2020 (000’s): $(20)) $ 13
The accompanying notes are an integral part of the Financial Statements
224

Legg Mason Global Funds Plc Annual Report 28 February 2021
Legg Mason QS MV Global Equity Growth and Income Fund
Portfolio of Investments as at 28 February 2021
Shares(000’s)
Value(000’s)
$
% ofNet
AssetValue
Common Stock — 94.92% (29 February 2020: 87.85%)
Australia — 2.47% (29 February 2020: 2.78%)
AUD 47 Aurizon Holdings Ltd 137 1.08AUD 2 Rio Tinto Ltd 177 1.39
314 2.47
Austria — 1.28% (29 February 2020: 0.96%)
EUR 4 Oesterreichische Post AG 163 1.28
Brazil — 0.64% (29 February 2020: 0.99%)
BRL 23 Petrobras Distribuidora SA 81 0.64
Canada — 2.75% (29 February 2020: 3.97%)
CAD 2 Canadian Imperial Bank ofCommerce 148 1.16
CAD 5 Canadian Utilities Ltd 116 0.92CAD 3 Sagen MI Canada Inc 85 0.67
349 2.75
China — 4.24% (29 February 2020: 5.18%)
HKD 266 China Petroleum & ChemicalCorp 148 1.17
HKD 57 Chow Tai Fook Jewellery GroupLtd 79 0.62
HKD 102 CITIC Ltd 86 0.68HKD 252 Huishang Bank Corp Ltd † 87 0.68HKD 185 Postal Savings Bank of China Co
Ltd, 144A 138 1.09
538 4.24
Finland — 0.86% (29 February 2020: 0.00%)
EUR 3 Orion Oyj 109 0.86
France — 1.37% (29 February 2020: 2.50%)
EUR 2 Sanofi 174 1.37
Germany — 3.60% (29 February 2020: 3.59%)
EUR 8 Deutsche Telekom AG 144 1.14EUR 1 Muenchener
Rueckversicherungs-GesellschaftAG in Muenchen 175 1.38
EUR 3 Talanx AG 138 1.08
457 3.60
Hong Kong — 2.03% (29 February 2020: 2.03%)
HKD 13 CLP Holdings Ltd 127 1.00HKD 96 HKT Trust & HKT Ltd 131 1.03
258 2.03
Italy — 1.59% (29 February 2020: 1.44%)
EUR 8 Assicurazioni Generali SpA 154 1.22EUR 9 Snam SpA 47 0.37
201 1.59
Japan — 10.96% (29 February 2020: 8.87%)
JPY 1 Daito Trust Construction Co Ltd 112 0.88JPY 6 KDDI Corp 175 1.38JPY 24 Marubeni Corp 177 1.39JPY 22 Mitsubishi Chemical Holdings
Corp 154 1.22JPY – Nintendo Co Ltd 184 1.45JPY 7 Nippon Telegraph & Telephone
Corp 171 1.35JPY 11 SoftBank Corp 144 1.14JPY 4 Sumitomo Mitsui Financial
Group Inc 148 1.17JPY 14 Tohoku Electric Power Co Inc 125 0.98
1,390 10.96
Malaysia — 1.59% (29 February 2020: 2.02%)
MYR 428 Astro Malaysia Holdings Bhd 99 0.78MYR 52 Malayan Banking Bhd 103 0.81
202 1.59
Netherlands — 1.00% (29 February 2020: 0.00%)
EUR 5 Koninklijke Ahold Delhaize NV 127 1.00
Russia — 0.87% (29 February 2020: 0.86%)
19 Gazprom PJSC ADR 110 0.87
Singapore — 0.14% (29 February 2020: 1.56%)
SGD 1 Venture Corp Ltd 17 0.14
Spain — 3.81% (29 February 2020: 4.13%)
EUR 5 Enagas SA 107 0.84EUR 5 Endesa SA 129 1.02
Shares(000’s)
Value(000’s)
$
% ofNet
AssetValue
EUR 5 Naturgy Energy Group SA 126 1.00EUR 7 Red Electrica Corp SA 121 0.95
483 3.81
Sweden — 0.47% (29 February 2020: 1.54%)
SEK 3 Swedbank AB 60 0.47
Switzerland — 3.72% (29 February 2020: 2.72%)
CHF 1 Logitech International SA 128 1.00CHF 1 Roche Holding AG 205 1.62CHF 1 Swiss Re AG 139 1.10
472 3.72
Taiwan — 6.29% (29 February 2020: 3.08%)
TWD 85 Asia Cement Corp 130 1.03TWD 126 King Yuan Electronics Co Ltd 180 1.42TWD 48 Quanta Computer Inc 147 1.15TWD 39 Radiant Opto-Electronics Corp 167 1.32TWD 13 Simplo Technology Co Ltd 174 1.37
798 6.29
Turkey — 0.87% (29 February 2020: 0.95%)
TRY 56 Eregli Demir ve Celik FabrikalariTAS 111 0.87
United Kingdom — 3.66% (29 February 2020: 5.54%)
GBP 39 Direct Line Insurance Group Plc 177 1.39GBP 7 GlaxoSmithKline Plc 123 0.97GBP 6 Imperial Brands Plc 103 0.82GBP 17 Legal & General Group Plc 61 0.48
464 3.66
United States — 40.71% (29 February 2020: 25.86%)
1 3M Co 126 0.992 AbbVie Inc 201 1.596 AES Corp/The 157 1.243 Altria Group Inc 121 0.961 Amgen Inc 176 1.394 AT&T Inc 117 0.923 Bristol-Myers Squibb Co 172 1.351 Broadcom Inc 241 1.902 Cardinal Health Inc 93 0.734 Cisco Systems Inc/Delaware 179 1.421 Clorox Co/The 127 1.003 CVS Health Corp 173 1.365 Flowers Foods Inc 111 0.87
12 Ford Motor Co 143 1.122 General Mills Inc 121 0.953 Gilead Sciences Inc 161 1.277 H&R Block Inc 138 1.091 Hershey Co/The 146 1.155 HP Inc 156 1.233 Intel Corp 152 1.201 International Business Machines
Corp 149 1.173 International Paper Co 129 1.021 J M Smucker Co/The 112 0.881 Johnson & Johnson 130 1.021 Kimberly-Clark Corp 117 0.924 Kroger Co/The 122 0.97– Lockheed Martin Corp 150 1.181 Microsoft Corp 139 1.10– Northrop Grumman Corp 122 0.975 Pfizer Inc 176 1.391 Pinnacle West Capital Corp 56 0.442 Prudential Financial Inc 139 1.092 Southern Co/The 91 0.721 Target Corp 198 1.563 Walgreens Boots Alliance Inc 148 1.171 Walmart Inc 175 1.38
5,164 40.71
Total Common Stock (Cost $11,322) 12,042 94.92
Real Estate Investment Trusts — 5.10%(29 February 2020: 7.57%)
France — 0.84% (29 February 2020: 1.01%)
EUR 5 Klepierre SA 106 0.84
United States — 4.26% (29 February 2020: 4.37%)
5 Blackstone Mortgage TrustInc ‘A’ 133 1.05
8 Kimco Realty Corp 143 1.13
Shares(000’s)
Value(000’s)
$
% ofNet
AssetValue
1 Public Storage 117 0.926 Starwood Property Trust Inc 147 1.16
540 4.26
Total Real Estate Investment Trusts(Cost $662) 646 5.10
Total Investments at fair value throughprofit or loss (Cost $11,984) 12,688 100.02
Forward Foreign Currency Contracts — 0.04%(29 February 2020: 0.12%)
Unrealised appreciation of contracts(see below) 5 0.04
Total Financial Assets at fair valuethrough profit or loss 12,693 100.06
Forward Foreign Currency Contracts — 0.00%(29 February 2020: (0.51%))
Unrealised depreciation of contracts(see below) – –
Total Financial Liabilities at fair valuethrough profit or loss – –
Total Financial Assets and FinancialLiabilities at fair value through profit orloss 12,693 100.06
Liabilities in Excess of Other Assets (8) (0.06)
Total Net Assets $12,685 100.00
– Amounts designated as “–” are either $0, less than$1,000, less than 1,000 shares or less than 0.01%.
144A Securities exempt from registration under Rule 144A ofthe Securities Act of 1933, as amended. Thesesecurities may only be resold, in transactions exemptfrom registration, to qualified institutional buyers. As at28 February 2021, these securities amounted to$138,000 or 1.09% of net assets.
† Illiquid.
ABBREVIATIONS:
ADR – American Depositary Receipt.
AUD – Australian Dollar
BRL – Brazilian Real
CAD – Canadian Dollar
CHF – Swiss Franc
EUR – Euro
GBP – British Pound
HKD – Hong Kong Dollar
JPY – Japanese Yen
MYR – Malaysian Ringgit
SEK – Swedish Krona
SGD – Singapore Dollar
TRY – Turkish Lira
TWD – Taiwanese Dollar
Analysis of Total Assets
% ofTotal
Assets
Transferable securities admitted to an officialexchange listing or traded on a regulated market 99.40
Financial derivative instruments 0.04
Other assets 0.56
Total Assets 100.00
The accompanying notes are an integral part of the Financial Statements
225

Legg Mason Global Funds Plc Annual Report 28 February 2021
Legg Mason QS MV Global Equity Growth and Income Fund
Portfolio of Investments as at 28 February 2021 – (continued)
Schedule of Forward Foreign Currency Contracts
Expiration Date CounterpartyBuy Currency
(000’s)Sell Currency
(000’s)
UnrealisedAppreciation/
(Depreciation)of Contracts
(000’s)
12/03/2021 BNY Mellon Buy USD 3 Sell AUD 3 $ –12/03/2021 BNY Mellon Buy USD – Sell SGD – –12/03/2021 BNY Mellon Buy SGD 44 Sell USD 33 –12/03/2021 BNY Mellon Buy AUD 901 Sell USD 689 5
Unrealised Appreciation of Forward Foreign Currency Contracts (29 February 2020 (000’s): $16) $ 5Unrealised Depreciation of Forward Foreign Currency Contracts (29 February 2020 (000’s): $(68)) –
Net Appreciation of Forward Foreign Currency Contracts (29 February 2020 (000’s): $(52)) $ 5
The accompanying notes are an integral part of the Financial Statements
226

Legg Mason Global Funds Plc Annual Report 28 February 2021
Legg Mason Martin Currie Asia Long-Term Unconstrained Fund^
Portfolio of Investments as at 28 February 2021
Shares(000’s)
Value(000’s)
$
% ofNet
AssetValue
Common Stock — 96.27% (29 February 2020: 95.83%)
China — 37.92% (29 February 2020: 41.14%)
HKD 156 Alibaba Group Holding Ltd 4,683 5.855 Alibaba Group Holding Ltd
ADR 1,231 1.54HKD 1,646 CSPC Pharmaceutical Group
Ltd 1,721 2.15HKD 199 ENN Energy Holdings Ltd 3,040 3.80HKD 1,520 Guangdong Investment Ltd 2,713 3.39HKD 646 Minth Group Ltd 2,830 3.53HKD 244 Ping An Insurance Group Co
of China Ltd 3,012 3.76HKD 107 Shenzhou International Group
Holdings Ltd 2,219 2.77HKD 86 Tencent Holdings Ltd 7,487 9.35HKD 569 TravelSky Technology Ltd 1,430 1.78
30,366 37.92
Hong Kong — 8.84% (29 February 2020: 9.67%)
HKD 287 AIA Group Ltd 3,617 4.5226 Jardine Matheson Holdings Ltd 1,341 1.67
HKD 140 Techtronic Industries Co Ltd 2,122 2.65
7,080 8.84
India — 12.58% (29 February 2020: 10.97%)
INR 108 Godrej Consumer Products Ltd 1,004 1.25INR 176 HDFC Bank Ltd 3,707 4.63
– HDFC Bank Ltd ADR 9 0.01INR 68 Hero MotoCorp Ltd 2,982 3.72INR 60 Tata Consultancy Services Ltd 2,376 2.97
10,078 12.58
Shares(000’s)
Value(000’s)
$
% ofNet
AssetValue
Singapore — 8.92% (29 February 2020: 9.20%)
SGD 806 Singapore TechnologiesEngineering Ltd 2,261 2.82
SGD 150 United Overseas Bank Ltd 2,755 3.44SGD 149 Venture Corp Ltd 2,126 2.66
7,142 8.92
South Korea — 17.83% (29 February 2020: 13.31%)
KRW 32 Coway Co Ltd 1,838 2.30KRW 1 LG Chem Ltd 715 0.89KRW 2 LG Household & Health Care
Ltd 2,414 3.01KRW 20 Orion Corp/Republic of Korea 2,334 2.92KRW 95 Samsung Electronics Co Ltd 6,974 8.71
14,275 17.83
Taiwan — 10.18% (29 February 2020: 5.96%)
TWD 196 Feng TAY Enterprise Co Ltd 1,306 1.63TWD 313 Taiwan Semiconductor
Manufacturing Co Ltd 6,844 8.55
8,150 10.18
Total Common Stock (Cost $58,204) 77,091 96.27
Total Financial Assets at fair valuethrough profit or loss 77,091 96.27
Total Financial Assets and FinancialLiabilities at fair value through profit orloss 77,091 96.27
Other Assets in Excess of Liabilities 2,989 3.73
Total Net Assets $80,080 100.00
– Amounts designated as “–” are either $0, less than$1,000, less than 1,000 shares or less than 0.01%.
ABBREVIATIONS:
ADR – American Depositary Receipt.
HKD – Hong Kong Dollar
INR – Indian Rupee
KRW – South Korean Won
SGD – Singapore Dollar
TWD – Taiwanese Dollar
Analysis of Total Assets
% ofTotal
Assets
Transferable securities admitted to an officialexchange listing or traded on a regulated market 95.58
Other assets 4.42
Total Assets 100.00
^ Not authorised for sale to the public in Hong Kong.The accompanying notes are an integral part of the Financial Statements
227

Legg Mason Global Funds Plc Annual Report 28 February 2021
Legg Mason Martin Currie European Absolute Alpha Fund^
Portfolio of Investments as at 28 February 2021
Shares(000’s)
Value(000’s)
€
% ofNet
AssetValue
Common Stock — 90.57% (29 February 2020: 86.57%)
Austria — 2.81% (29 February 2020: 0.00%)
18 Verbund AG 1,135 2.81
Denmark — 12.07% (29 February 2020: 5.67%)
DKK 5 Carlsberg AS 696 1.73DKK 22 Novo Nordisk A/S 1,320 3.27DKK 6 Orsted AS, 144A 747 1.85DKK 11 Royal Unibrew A/S 908 2.25DKK 8 Vestas Wind Systems A/S 1,197 2.97
4,868 12.07
Faroe Islands — 2.31% (29 February 2020: 2.29%)
NOK 16 Bakkafrost P/F 933 2.31
France — 15.50% (29 February 2020: 13.22%)
10 Air Liquide SA 1,248 3.104 BioMerieux 420 1.04
74 Bureau Veritas SA 1,652 4.0928 Cie de Saint-Gobain 1,236 3.0613 Nexans SA 838 2.08
7 Schneider Electric SE 858 2.13
6,252 15.50
Germany — 4.09% (29 February 2020: 0.00%)
8 Linde Plc 1,648 4.09
Hungary — 3.52% (29 February 2020: 4.16%)
HUF 38 OTP Bank Nyrt 1,419 3.52
Ireland — 1.79% (29 February 2020: 1.49%)
12 Kingspan Group Plc 721 1.79
Italy — 4.93% (29 February 2020: 5.81%)
127 Poste Italiane SpA, 144A 1,194 2.9694 UniCredit SpA 797 1.97
1,991 4.93
Netherlands — 3.08% (29 February 2020: 6.38%)
6 Alfen Beheer BV, 144A 386 0.9626 JDE Peet’s NV 858 2.12
1,244 3.08
Norway — 1.59% (29 February 2020: 0.84%)
NOK 200 Aker Carbon Capture AS 286 0.71NOK 10 TOMRA Systems ASA 354 0.88
640 1.59
Spain — 5.48% (29 February 2020: 0.00%)
35 Fluidra SA 781 1.9347 Siemens Gamesa Renewable
Energy SA 1,431 3.55
2,212 5.48
Shares(000’s)
Value(000’s)
€
% ofNet
AssetValue
Sweden — 3.32% (29 February 2020: 7.81%)
SEK 12 Autoliv Inc 855 2.12SEK 33 Swedbank AB 484 1.20
1,339 3.32
Switzerland — 20.36% (29 February 2020: 12.98%)
CHF 37 ABB Ltd 883 2.19CHF 1 SGS SA 1,879 4.66CHF 8 Sika AG 1,699 4.21
38 STMicroelectronics NV 1,239 3.07CHF 5 VAT Group AG, 144A 1,188 2.95CHF 21 Vontobel Holding AG 1,325 3.28
8,213 20.36
Turkey — 3.95% (29 February 2020: 1.60%)
TRY 214 BIM Birlesik Magazalar AS 1,592 3.95
United Kingdom — 5.77% (29 February 2020: 23.22%)
GBP 122 Auto Trader Group Plc, 144A 778 1.92GBP 316 Barclays Plc 585 1.45GBP 103 Britvic Plc 967 2.40
2,330 5.77
Total Common Stock (Cost €34,040) 36,537 90.57
Total Investments at fair value throughprofit or loss (Cost €34,040) 36,537 90.57
Forward Foreign Currency Contracts — 0.86%(29 February 2020: 0.64%)
Unrealised appreciation of contracts(see below) 347 0.86
Contracts for Difference — 0.19%(29 February 2020: 3.73%)
Unrealised appreciation on contracts(see below) 77 0.19
Total Financial Assets at fair valuethrough profit or loss 36,961 91.62
Forward Foreign Currency Contracts — (0.71%)(29 February 2020: (0.35%))
Unrealised depreciation of contracts(see below) (286) (0.71)
Shares(000’s)
Value(000’s)
€
% ofNet
AssetValue
Contracts for Difference — (1.22%)(29 February 2020: (1.22%))
Unrealised depreciation on contracts(see below) (492) (1.22)
Total Financial Liabilities at fair valuethrough profit or loss (778) (1.93)
Total Financial Assets and FinancialLiabilities at fair value through profitor loss 36,183 89.69
Other Assets in Excess of Liabilities 4,160 10.31
Total Net Assets €40,343 100.00
– Amounts designated as “–” are either €0, less than€1,000, less than 1,000 shares or less than 0.01%.
144A Securities exempt from registration under Rule 144A ofthe Securities Act of 1933, as amended. Thesesecurities may only be resold, in transactions exemptfrom registration, to qualified institutional buyers. As at28 February 2021, these securities amounted to€4,293,000 or 10.64% of net assets.
ABBREVIATIONS:
CHF – Swiss Franc
DKK – Danish Krone
GBP – British Pound
HUF – Hungarian Forint
NOK – Norwegian Krone
SEK – Swedish Krona
TRY – Turkish Lira
Analysis of Total Assets
% ofTotal
Assets
Transferable securities admitted to an officialexchange listing or traded on a regulated market 86.72
Financial derivative instruments 1.01
Other assets 12.27
Total Assets 100.00
Schedule of Forward Foreign Currency Contracts
Expiration Date CounterpartyBuy Currency
(000’s)Sell Currency
(000’s)
UnrealisedAppreciation/(Depreciation)of Contracts
(000’s)
01/03/2021 BNY Mellon Buy EUR 2,412 Sell BRL 16,011 € 4401/03/2021 BNY Mellon Buy BRL 16,011 Sell EUR 2,430 (62)12/03/2021 BNY Mellon Buy EUR 8,292 Sell CHF 8,971 11712/03/2021 BNY Mellon Buy EUR 6,222 Sell DKK 46,286 (2)12/03/2021 BNY Mellon Buy TRY 1,785 Sell EUR 207 (10)12/03/2021 BNY Mellon Buy GBP 57 Sell EUR 66 –12/03/2021 BNY Mellon Buy GBP 1,029 Sell EUR 1,178 1012/03/2021 BNY Mellon Buy HUF 51,013 Sell EUR 143 (2)12/03/2021 BNY Mellon Buy NOK 2,420 Sell EUR 236 (5)12/03/2021 BNY Mellon Buy SEK 12,944 Sell EUR 1,283 (13)12/03/2021 BNY Mellon Buy DKK 9,821 Sell EUR 1,322 –12/03/2021 BNY Mellon Buy CHF 1,121 Sell EUR 1,030 (8)12/03/2021 BNY Mellon Buy EUR 3,557 Sell GBP 3,139 (67)12/03/2021 BNY Mellon Buy EUR 1,546 Sell HUF 549,631 3012/03/2021 BNY Mellon Buy EUR 2,096 Sell NOK 21,589 3312/03/2021 BNY Mellon Buy EUR 2,626 Sell SEK 26,560 2112/03/2021 BNY Mellon Buy EUR 1,812 Sell TRY 15,801 6015/03/2021 BNY Mellon Buy SEK 16,885 Sell EUR 1,670 (13)15/03/2021 BNY Mellon Buy NOK 236 Sell EUR 22 –15/03/2021 BNY Mellon Buy GBP – Sell EUR – –15/03/2021 BNY Mellon Buy GBP 1,230 Sell EUR 1,393 26
^ Not authorised for sale to the public in Hong Kong.The accompanying notes are an integral part of the Financial Statements
228

Legg Mason Global Funds Plc Annual Report 28 February 2021
Legg Mason Martin Currie European Absolute Alpha Fund^
Portfolio of Investments as at 28 February 2021 – (continued)
Schedule of Forward Foreign Currency Contracts – (continued)
Expiration Date CounterpartyBuy Currency
(000’s)Sell Currency
(000’s)
UnrealisedAppreciation/(Depreciation)of Contracts
(000’s)
15/03/2021 BNY Mellon Buy USD 25,871 Sell EUR 21,484 € (51)15/03/2021 BNY Mellon Buy USD 381 Sell EUR 314 115/03/2021 BNY Mellon Buy EUR 87 Sell GBP 76 –15/03/2021 BNY Mellon Buy EUR 43 Sell GBP 37 –15/03/2021 BNY Mellon Buy EUR – Sell NOK 14 –15/03/2021 BNY Mellon Buy EUR 735 Sell SEK 7,433 415/03/2021 BNY Mellon Buy EUR 2,025 Sell USD 2,460 (11)01/04/2021 BNY Mellon Buy EUR 33 Sell BRL 220 101/04/2021 BNY Mellon Buy BRL 15,042 Sell EUR 2,261 (42)
Unrealised Appreciation of Forward Foreign Currency Contracts (29 February 2020 (000’s): €1,215) € 347Unrealised Depreciation of Forward Foreign Currency Contracts (29 February 2020 (000’s): €(662)) (286)
Net Appreciation of Forward Foreign Currency Contracts (29 February 2020 (000’s): €553) € 61
Schedule of Contracts for Difference
Contracts
NotionalValue(000’s)
UnrealisedAppreciation/(Depreciation)of Contracts
(000’s)
Aareal Bank AG (16,000) € (352) € (50)
ArcelorMittal SA (28,000) (542) (29)
BASF SE (3,400) (231) (14)
British Land Co Plc/The (77,064) (437) (37)
Derwent London Plc (10,777) (411) (17)
Deutsche EuroShop AG (19,627) (349) (2)
dormakaba Holding AG (1,697) (857) (30)
Eni SpA (80,031) (755) (87)
Getinge AB (22,040) (463) 4
Heineken NV (11,985) (982) 48
Muenchener Rueckversicherungs-Gesellschaft AG in Muenchen (3,000) (731) (75)
Roche Holding AG (3,066) (833) 25
Royal Dutch Shell A Shares (42,776) (732) (77)
Schaeffler AG (33,000) (233) (18)
Siegfried Holding AG (331) (214) (19)
voestalpine AG (21,000) (685) (37)
Unrealised Appreciation of Contracts for Difference (29 February 2020 (000’s): €7,084) € 77
Unrealised Depreciation of Contracts for Difference (29 February 2020 (000’s): €(2,319)) (492)
Net Depreciation of Contracts for Difference (29 February 2020 (000’s): €4,765) € (415)
The counterparty for Contracts for Difference is UBS.
^ Not authorised for sale to the public in Hong Kong.The accompanying notes are an integral part of the Financial Statements
229

Legg Mason Global Funds Plc Annual Report 28 February 2021
Legg Mason Martin Currie Global Long-Term Unconstrained Fund^
Portfolio of Investments as at 28 February 2021
Shares(000’s)
Value(000’s)
$
% ofNet
AssetValue
Common Stock — 94.80% (29 February 2020: 94.47%)
Australia — 2.74% (29 February 2020: 3.96%)
AUD 14 CSL Ltd 2,864 2.74
China — 9.84% (29 February 2020: 5.71%)
12 Alibaba Group Holding Ltd ADR 2,843 2.72HKD 43 Tencent Holdings Ltd 3,761 3.61HKD 296 Wuxi Biologics Cayman Inc,
144A 3,666 3.51
10,270 9.84
Denmark — 2.76% (29 February 2020: 3.52%)
DKK 19 Coloplast A/S 2,879 2.76
France — 5.86% (29 February 2020: 5.83%)
EUR 4 Kering SA 2,635 2.53EUR 10 L’Oreal SA 3,480 3.33
6,115 5.86
Germany — 2.85% (29 February 2020: 2.74%)
EUR 8 adidas AG 2,972 2.85
Hong Kong — 3.16% (29 February 2020: 3.63%)
HKD 262 AIA Group Ltd 3,302 3.16
Ireland — 6.00% (29 February 2020: 2.53%)
EUR 21 Kerry Group Plc 2,472 2.37EUR 52 Kingspan Group Plc 3,786 3.63
6,258 6.00
Italy — 6.43% (29 February 2020: 5.89%)
EUR 14 Ferrari NV 2,790 2.67EUR 63 Moncler SpA 3,925 3.76
6,715 6.43
Sweden — 9.66% (29 February 2020: 7.73%)
SEK 112 Assa Abloy AB 2,814 2.70SEK 73 Atlas Copco AB 4,178 4.00SEK 37 Hexagon AB 3,084 2.96
10,076 9.66
Taiwan — 5.85% (29 February 2020: 3.95%)
TWD 279 Taiwan SemiconductorManufacturing Co Ltd 6,100 5.85
Shares(000’s)
Value(000’s)
$
% ofNet
AssetValue
United Kingdom — 4.06% (29 February 2020: 8.67%)
GBP 128 Dr. Martens Plc 881 0.8414 Linde Plc 3,357 3.22
4,238 4.06
United States — 35.59% (29 February 2020: 34.94%)
8 Accenture Plc ‘A’ 2,008 1.926 Adobe Inc 2,963 2.849 ANSYS Inc 3,224 3.09
16 CyberArk Software Ltd 2,354 2.269 Illumina Inc 3,877 3.72
17 Masimo Corp 4,223 4.0510 Mastercard Inc 3,573 3.42
3 Mettler-Toledo InternationalInc 2,937 2.81
18 Microsoft Corp 4,178 4.0018 ResMed Inc 3,419 3.2819 Starbucks Corp 2,056 1.97
8 Veeva Systems Inc ‘A’ 2,325 2.23
37,137 35.59
Total Common Stock (Cost $79,318) 98,926 94.80
Total Investments at fair valuethrough profit or loss (Cost $79,318) 98,926 94.80
Forward Foreign Currency Contracts — 0.03%(29 February 2020: 0.00%)
Unrealised appreciation of contracts(see below) 36 0.03
Total Financial Assets at fair valuethrough profit or loss 98,962 94.83
Forward Foreign Currency Contracts — 0.00%(29 February 2020: (0.01%))
Unrealised depreciation of contracts(see below) – –
Total Financial Liabilities at fair valuethrough profit or loss – –
Total Financial Assets and FinancialLiabilities at fair value through profitor loss 98,962 94.83
Other Assets in Excess of Liabilities 5,387 5.17
Total Net Assets $104,349 100.00
– Amounts designated as “–” are either $0, less than$1,000, less than 1,000 shares or less than 0.01%.
144A Securities exempt from registration under Rule 144A ofthe Securities Act of 1933, as amended. Thesesecurities may only be resold, in transactions exemptfrom registration, to qualified institutional buyers. As at28 February 2021, these securities amounted to$3,666,000 or 3.51% of net assets.
ABBREVIATIONS:
ADR – American Depositary Receipt.
AUD – Australian Dollar
DKK – Danish Krone
EUR – Euro
GBP – British Pound
HKD – Hong Kong Dollar
SEK – Swedish Krona
TWD – Taiwanese Dollar
Analysis of Total Assets
% ofTotal
Assets
Transferable securities admitted to an officialexchange listing or traded on a regulated market 94.73
Financial derivative instruments 0.03
Other assets 5.24
Total Assets 100.00
Expiration Date CounterpartyBuy Currency
(000’s)Sell Currency
(000’s)
UnrealisedAppreciation/(Depreciation)of Contracts
(000’s)
15/03/2021 BNY Mellon Buy USD 75 Sell GBP 54 $ –15/03/2021 BNY Mellon Buy USD 22 Sell GBP 16 –15/03/2021 BNY Mellon Buy GBP 1,228 Sell USD 1,675 36
Unrealised Appreciation of Forward Foreign Currency Contracts (29 February 2020 (000’s): $–) $ 36Unrealised Depreciation of Forward Foreign Currency Contracts (29 February 2020 (000’s): $(2)) –
Net Appreciation of Forward Foreign Currency Contracts (29 February 2020 (000’s): $(2)) $ 36
^ Not authorised for sale to the public in Hong Kong.The accompanying notes are an integral part of the Financial Statements
230

Legg Mason Global Funds Plc Annual Report 28 February 2021
Legg Mason Martin Currie Asia Pacific Ex Japan Real Income Fund
Portfolio of Investments as at 28 February 2021
Shares(000’s)
Value(000’s)
$
% ofNet
AssetValue
Common Stock — 53.23% (29 February 2020: 45.42%)
Australia — 15.32% (29 February 2020: 15.71%)
AUD 149 APA Group 1,068 4.02AUD 325 Aurizon Holdings Ltd 956 3.60AUD 782 AusNet Services 1,000 3.76AUD 358 Spark Infrastructure Group 563 2.12AUD 49 Transurban Group 484 1.82
4,071 15.32
China — 7.49% (29 February 2020: 4.68%)
HKD 720 Guangdong Investment Ltd 1,285 4.83HKD 990 Yuexiu Transport Infrastructure
Ltd 706 2.66
1,991 7.49
Hong Kong — 7.41% (29 February 2020: 7.37%)
HKD 114 CLP Holdings Ltd 1,111 4.18HKD 181 HK Electric Investments & HK
Electric Investments Ltd 178 0.67HKD 114 Wharf Real Estate Investment
Co Ltd 681 2.56
1,970 7.41
India — 7.87% (29 February 2020: 3.87%)
INR 3,017 NHPC Ltd 995 3.74INR 377 Power Grid Corp of India Ltd 1,097 4.13
2,092 7.87
Malaysia — 4.32% (29 February 2020: 4.19%)
MYR 178 Petronas Gas Bhd 722 2.72MYR 424 Westports Holdings Bhd 426 1.60
1,148 4.32
New Zealand — 1.88% (29 February 2020: 1.54%)
NZD 101 Contact Energy Ltd 500 1.88
Philippines — 2.12% (29 February 2020: 4.19%)
PHP 101 Manila Electric Co 562 2.12
Singapore — 3.69% (29 February 2020: 0.00%)
SGD 491 Ascendas India Trust 552 2.07SGD 601 NetLink NBN Trust 429 1.62
981 3.69
Thailand — 3.13% (29 February 2020: 3.87%)
THB 2,222 Digital TelecommunicationsInfrastructure Fund 832 3.13
Total Common Stock (Cost $13,711) 14,147 53.23
Shares(000’s)
Value(000’s)
$
% ofNet
AssetValue
Real Estate Investment Trusts — 45.81%(29 February 2020: 49.86%)
Australia — 19.08% (29 February 2020: 19.79%)
AUD 135 Charter Hall Long Wale REIT 478 1.80AUD 387 Charter Hall Retail REIT 1,108 4.17AUD 60 Dexus 412 1.55AUD 142 GPT Group/The 465 1.75AUD 273 Scentre Group 603 2.27AUD 328 Shopping Centres Australasia
Property Group 593 2.23AUD 89 Stockland 283 1.06AUD 704 Vicinity Centres 886 3.33AUD 133 Waypoint REIT 244 0.92
5,072 19.08
Hong Kong — 10.41% (29 February 2020: 8.48%)
HKD 957 Fortune Real Estate InvestmentTrust 894 3.36
CNY 2,532 Hui Xian Real Estate InvestmentTrust 691 2.60
HKD 125 Link REIT 1,181 4.45
2,766 10.41
India — 3.61% (29 February 2020: 4.38%)
INR 221 Embassy Office Parks REIT 958 3.61
New Zealand — 2.32% (29 February 2020: 1.43%)
NZD 717 Kiwi Property Group Ltd 616 2.32
Singapore — 10.39% (29 February 2020: 14.32%)
SGD 859 CapitaLand IntegratedCommercial Trust 1,347 5.07
SGD 110 Frasers Centrepoint Trust 206 0.77SGD 197 Keppel DC REIT 401 1.51SGD 408 Mapletree Industrial Trust 808 3.04
2,762 10.39
Total Real Estate Investment Trusts(Cost $11,844) 12,174 45.81
Total Investments at fair value throughprofit or loss (Cost $25,555) 26,321 99.04
Forward Foreign Currency Contracts — 0.01%(29 February 2020: 0.00%)
Unrealised appreciation of contracts(see below) 3 0.01
Total Financial Assets at fair valuethrough profit or loss 26,324 99.05
Shares(000’s)
Value(000’s)
$
% ofNet
AssetValue
Forward Foreign Currency Contracts — 0.00%(29 February 2020: 0.00%)
Unrealised depreciation of contracts(see below) (1) –
Total Financial Liabilities at fair valuethrough profit or loss (1) –
Total Financial Assets and FinancialLiabilities at fair value through profit orloss 26,323 99.05
Other Assets in Excess of Liabilities 253 0.95
Total Net Assets $26,576 100.00
– Amounts designated as “–” are either $0, less than$1,000, less than 1,000 shares or less than 0.01%.
ABBREVIATIONS:
AUD – Australian Dollar
CNY – Chinese Renminbi
HKD – Hong Kong Dollar
INR – Indian Rupee
MYR – Malaysian Ringgit
NZD – New Zealand Dollar
PHP – Philippine Peso
SGD – Singapore Dollar
THB – Thai Baht
Analysis of Total Assets
% ofTotal
Assets
Transferable securities admitted to an officialexchange listing or traded on a regulated market 98.59
Financial derivative instruments 0.01
Other assets 1.40
Total Assets 100.00
Schedule of Forward Foreign Currency Contracts
Expiration Date CounterpartyBuy Currency
(000’s)Sell Currency
(000’s)
UnrealisedAppreciation/(Depreciation)of Contracts
(000’s)
12/03/2021 BNY Mellon Buy USD 6 Sell AUD 8 $ –12/03/2021 BNY Mellon Buy USD – Sell CNH – –12/03/2021 BNY Mellon Buy USD 17 Sell SGD 23 –12/03/2021 BNY Mellon Buy SGD 1,398 Sell USD 1,049 (1)12/03/2021 BNY Mellon Buy CNH 7 Sell USD 1 –12/03/2021 BNY Mellon Buy AUD 9 Sell USD 7 –12/03/2021 BNY Mellon Buy AUD 500 Sell USD 381 3
Unrealised Appreciation of Forward Foreign Currency Contracts (29 February 2020 (000’s): $–) $ 3Unrealised Depreciation of Forward Foreign Currency Contracts (29 February 2020 (000’s): $–) (1)
Net Appreciation of Forward Foreign Currency Contracts (29 February 2020 (000’s): $–) $ 2
The accompanying notes are an integral part of the Financial Statements
231

Legg Mason Global Funds Plc Annual Report 28 February 2021
Legg Mason Martin Currie Global Emerging Markets Fund^
Portfolio of Investments as at 28 February 2021
Shares(000’s)
Value(000’s)
$
% ofNet
AssetValue
Common Stock — 98.03% (29 February 2020: 95.14%)
Brazil — 2.97% (29 February 2020: 4.17%)
BRL 50 B3 SA – Brasil Bolsa Balcao 483 1.1628 Cosan Ltd 514 1.23
BRL 105 Odontoprev SA 243 0.58
1,240 2.97
Chile — 1.38% (29 February 2020: 0.00%)
GBP 23 Antofagasta Plc 579 1.38
China — 37.67% (29 February 2020: 31.30%)
HKD 53 Alibaba Group Holding Ltd 1,588 3.804 Alibaba Group Holding Ltd
ADR 964 2.31HKD 198 Brilliance China Automotive
Holdings Ltd 177 0.42HKD 165 China Gas Holdings Ltd 665 1.59CNH 11 Contemporary Amperex
Technology Co Ltd 530 1.27HKD 841 Industrial & Commercial Bank
of China Ltd 551 1.328 JD.com Inc ADR 777 1.86
HKD 38 Meituan, 144A 1,708 4.09HKD 100 Minth Group Ltd 438 1.05CNH 134 Ping An Bank Co Ltd 441 1.06HKD 96 Ping An Insurance Group Co of
China Ltd 1,188 2.84EUR 10 Prosus NV 1,133 2.71HKD 94 Shanghai Fosun Pharmaceutical
Group Co Ltd 441 1.05HKD 28 Sunny Optical Technology
Group Co Ltd 707 1.69HKD 43 Tencent Holdings Ltd 3,761 9.00CNH 23 Wuxi Lead Intelligent
Equipment Co Ltd 299 0.71HKD 180 Xinyi Solar Holdings Ltd 378 0.90
15,746 37.67
Hong Kong — 2.21% (29 February 2020: 2.48%)
HKD 73 AIA Group Ltd 924 2.21
Hungary — 1.90% (29 February 2020: 2.92%)
HUF 18 OTP Bank Nyrt 796 1.90
India — 10.67% (29 February 2020: 11.87%)
INR 17 Asian Paints Ltd 526 1.26INR 27 HDFC Bank Ltd 572 1.37INR 51 ICICI Bank Ltd 419 1.00INR 13 Kotak Mahindra Bank Ltd 312 0.75INR 6 Maruti Suzuki India Ltd 559 1.34
Shares(000’s)
Value(000’s)
$
% ofNet
AssetValue
INR 26 Reliance Industries Ltd 736 1.76INR 46 Titan Co Ltd 879 2.10INR 5 UltraTech Cement Ltd 456 1.09
4,459 10.67
Indonesia — 2.17% (29 February 2020: 2.89%)
IDR 1,883 Bank Rakyat Indonesia PerseroTbk PT 621 1.48
IDR 1,174 Telkom Indonesia Persero TbkPT 287 0.69
908 2.17
Mexico — 0.57% (29 February 2020: 2.06%)
MXN 103 Orbia Advance Corp SAB deCV 238 0.57
Peru — 1.54% (29 February 2020: 3.17%)
3 Credicorp Ltd 460 1.103 Southern Copper Corp 183 0.44
643 1.54
Philippines — 0.38% (29 February 2020: 0.65%)
PHP 137 Robinsons Retail Holdings Inc 159 0.38
Russia — 2.96% (29 February 2020: 3.72%)
6 LUKOIL PJSC ADR 439 1.0527 Sberbank of Russia PJSC ADR 389 0.93
8 TCS Group Holding Plc GDR 408 0.98
1,236 2.96
South Korea — 17.49% (29 February 2020: 15.26%)
KRW 2 LG Chem Ltd 1,269 3.03KRW – LG Household & Health Care
Ltd 431 1.03KRW 2 NAVER Corp 688 1.65KRW 47 Samsung Electronics Co Ltd 3,457 8.27KRW 1 Samsung SDI Co Ltd 631 1.51KRW 7 SK Hynix Inc 836 2.00
7,312 17.49
Taiwan — 12.86% (29 February 2020: 10.83%)
TWD 47 Delta Electronics Inc 473 1.13TWD 23 Globalwafers Co Ltd 612 1.46TWD 3 Largan Precision Co Ltd 355 0.85TWD 180 Taiwan Semiconductor
Manufacturing Co Ltd 3,936 9.42
5,376 12.86
Turkey — 0.44% (29 February 2020: 0.64%)
TRY 84 Turkcell Iletisim Hizmetleri AS 184 0.44
Shares(000’s)
Value(000’s)
$
% ofNet
AssetValue
United States — 2.82% (29 February 2020: 2.33%)
3 EPAM Systems Inc 1,178 2.82
Total Common Stock (Cost $30,664) 40,978 98.03
Total Financial Assets at fair valuethrough profit or loss 40,978 98.03
Total Financial Assets and FinancialLiabilities at fair value through profit orloss 40,978 98.03
Other Assets in Excess of Liabilities 823 1.97
Total Net Assets $41,801 100.00
– Amounts designated as “–” are either $0, less than$1,000, less than 1,000 shares or less than 0.01%.
144A Securities exempt from registration under Rule 144A ofthe Securities Act of 1933, as amended. Thesesecurities may only be resold, in transactions exemptfrom registration, to qualified institutional buyers. As at28 February 2021, these securities amounted to$1,708,000 or 4.09% of net assets.
ABBREVIATIONS:
ADR – American Depositary Receipt.
GDR – Global Depositary Receipt.
BRL – Brazilian Real
CNH – Chinese Renminbi
EUR – Euro
GBP – British Pound
HKD – Hong Kong Dollar
HUF – Hungarian Forint
IDR – Indonesian Rupiah
INR – Indian Rupee
KRW – South Korean Won
MXN – Mexican Peso
PHP – Philippine Peso
TRY – Turkish Lira
TWD – Taiwanese Dollar
Analysis of Total Assets
% ofTotal
Assets
Transferable securities admitted to an officialexchange listing or traded on a regulated market 97.25
Other assets 2.75
Total Assets 100.00
^ Not authorised for sale to the public in Hong Kong.The accompanying notes are an integral part of the Financial Statements
232

Legg Mason Global Funds Plc Annual Report 28 February 2021
Legg Mason Martin Currie European Unconstrained Fund^
Portfolio of Investments as at 28 February 2021
Shares(000’s)
Value(000’s)
€
% ofNet
AssetValue
Common Stock — 97.24% (29 February 2020: 94.82%)
Denmark — 2.82% (29 February 2020: 4.64%)
DKK 25 Coloplast A/S 3,140 2.82
France — 17.33% (29 February 2020: 10.18%)
22 Dassault Systemes SE 3,866 3.4711 Kering SA 5,864 5.2714 L’Oreal SA 4,371 3.9314 Sartorius Stedim Biotech 5,194 4.66
19,295 17.33
Germany — 16.60% (29 February 2020: 13.81%)
19 adidas AG 5,603 5.03174 Infineon Technologies AG 6,283 5.64
20 Linde Plc 4,089 3.6748 Nemetschek SE 2,510 2.26
18,485 16.60
Ireland — 6.44% (29 February 2020: 2.16%)
32 Kerry Group Plc 3,146 2.8267 Kingspan Group Plc 4,032 3.62
7,178 6.44
Italy — 13.12% (29 February 2020: 12.65%)
42 Ferrari NV 6,851 6.15151 Moncler SpA 7,757 6.97
14,608 13.12
Netherlands — 8.97% (29 February 2020: 5.81%)
21 ASML Holding NV 9,652 8.6610 JDE Peet’s NV 342 0.31
9,994 8.97
Shares(000’s)
Value(000’s) €
% ofNet
AssetValue
Poland — 1.75% (29 February 2020: 0.00%)
107 InPost SA 1,949 1.75
Sweden — 13.31% (29 February 2020: 16.12%)
SEK 222 Assa Abloy AB 4,619 4.15SEK 112 Atlas Copco AB 5,319 4.77SEK 71 Hexagon AB 4,890 4.39
14,828 13.31
Switzerland — 5.47% (29 February 2020: 13.59%)
CHF 3 Partners Group Holding AG 3,434 3.08CHF 24 Temenos AG 2,655 2.39
6,089 5.47
United Kingdom — 4.67% (29 February 2020: 6.74%)
GBP 177 Dr. Martens Plc 1,008 0.90GBP 514 THG Plc 4,195 3.77
5,203 4.67
United States — 6.76% (29 February 2020: 6.30%)
USD 23 CyberArk Software Ltd 2,752 2.47USD 5 Mettler-Toledo International
Inc 4,779 4.29
7,531 6.76
Total Common Stock (Cost €108,222) 108,300 97.24
Total Financial Assets at fair valuethrough profit or loss 108,300 97.24
Total Financial Assets and FinancialLiabilities at fair value through profitor loss 108,300 97.24
Other Assets in Excess of Liabilities 3,071 2.76
Total Net Assets €111,371 100.00
– Amounts designated as “–” are either €0, less than€1,000, less than 1,000 shares or less than 0.01%.
ABBREVIATIONS:
CHF – Swiss Franc
DKK – Danish Krone
GBP – British Pound
SEK – Swedish Krona
USD – United States Dollar
Analysis of Total Assets
% ofTotal
Assets
Transferable securities admitted to an officialexchange listing or traded on a regulated market 97.18
Other assets 2.82
Total Assets 100.00
^ Not authorised for sale to the public in Hong Kong.The accompanying notes are an integral part of the Financial Statements
233

Legg Mason Global Funds Plc Annual Report 28 February 2021
Statement of Financial PositionLegg Mason
Western AssetUS Government Liquidity Fund
Legg Mason Western AssetUS Core Bond Fund
Legg Mason Western AssetUS Core Plus Bond Fund
Legg Mason Western AssetEuro Core Plus Bond Fund
(in 000’s)
As at28 February
2021
As at29 February
2020
As at28 February
2021
As at29 February
2020
As at28 February
2021
As at29 February
2020
As at28 February
2021
As at29 February
2020CURRENT ASSETS:
Cash and cash equivalents (Note 8) $ 1 $ – $ 611 $ 2,554 $ 43,021 $ 20,621 € 4,405 € 749Margin accounts and restricted cash (Note 8) – – 3,468 5,233 10,044 27,902 1,119 2,069Financial assets at fair value through profit or loss (Note 2):
Investments 910,476 1,023,332 322,429 338,709 1,733,256 1,561,330 105,074 122,256Pledged investments – – – – 46 726 – –Options – – 125 562 787 3,099 – 39Swap contracts – – 4,060 341 17,737 2,111 217 –Swaptions – – – – – 110 – –Unrealised appreciation on forward foreign currencycontracts – – 12 8 1,679 1,518 42 116Unrealised appreciation on futures contracts – – 270 2,187 2,931 11,483 855 881Unrealised appreciation on contracts for difference – – – – – – – –
Receivable for investments sold (Note 2) – – 10,194 15,617 45,144 60,528 – –Receivable for redeemable participating shares sold – – 806 3,101 3,754 18,714 – –Interest receivable 1,135 436 1,562 1,498 9,724 7,633 842 830Dividend receivable – – 3 38 12 10 26 52Management fees receivable – – – – – – – –Other assets – – – – – – – –
Total Current Assets 911,612 1,023,768 343,540 369,848 1,868,135 1,715,785 112,580 126,992
CURRENT LIABILITIES:Cash overdraft (Note 8) – – – – 5 3 – –Margin accounts and restricted cash (Note 8) – – 4,191 1,946 5,760 9,926 361 665Financial liabilities at fair value through profit or loss (Note 2):
Options – – 354 1,473 1,931 7,695 31 146Swap contracts – – 247 3,515 1,290 10,140 105 81Swaptions – – – – – 463 – –Unrealised depreciation on forward foreign currencycontracts – – – – 2,446 4,601 187 56Unrealised depreciation on futures contracts – – 949 412 5,784 7,061 509 1,133Unrealised depreciation on contracts for difference – – – – – – – –
Payable for investments purchased (Note 2) 28,840 25,000 38,192 44,120 179,021 136,526 – 711Distributions payable to holders of redeemable participatingshares 6 640 50 81 57 50 – –Management fees payable (Note 4) 22 474 185 212 802 690 3 3Performance fees payable (Note 4) – – – – – – – –Administrator and depositary fees payable (Note 4) 21 23 18 17 81 73 7 8Shareholder service fees payable (Note 4) – – 20 28 53 39 – –Payable for redeemable participating shares reacquired – – 119 1,550 23,242 3,622 – –Interest payable – – – – – – – –Dividend payable – – – – – – – –Accrued expenses and other liabilities 393 387 85 87 245 253 54 61
Liabilities (excluding Net Assets attributable to Holders ofRedeemable Participating Shares) 29,282 26,524 44,410 53,441 220,717 181,142 1,257 2,864
Total Net Assets attributable to Holders of RedeemableParticipating Shares at fair value $ 882,330 $ 997,244 $ 299,130 $ 316,407 $ 1,647,418 $ 1,534,643 € 111,323 € 124,128
Legg Mason Western AssetGlobal High Yield Fund
Legg MasonWestern Asset US Short-Term
Government Fund^
Legg MasonWestern Asset
US Adjustable Rate Fund^
Legg MasonWestern Asset Global
Inflation Management Fund
(in 000’s)
As at28 February
2021
As at29 February
2020
As at28 February
2021
As at29 February
2020
As at28 February
2021
As at29 February
2020
As at28 February
2021
As at29 February
2020CURRENT ASSETS:
Cash and cash equivalents (Note 8) $ 1,647 $ 1,080 $ 14 $ 23 $ 16 $ 1 $ 1,409 $ 14,007Margin accounts and restricted cash (Note 8) 225 109 – – – – 536 821Financial assets at fair value through profit or loss (Note 2):
Investments 102,709 106,032 – – – – 47,327 44,460Pledged investments – – – – – – – –Options – – – – – – – 17Swap contracts – – – – – – 56 –Swaptions – – – – – – – –Unrealised appreciation on forward foreign currencycontracts 158 59 – – – – 175 31Unrealised appreciation on futures contracts 52 72 – – – – 281 59Unrealised appreciation on contracts for difference – – – – – – – –
Receivable for investments sold (Note 2) 1,252 705 – – – – 446 –Receivable for redeemable participating shares sold 262 505 – – – – – 26,389Interest receivable 978 999 – – – – 168 123Dividend receivable 7 23 – – – – 1 1Management fees receivable – – – – – 23 – –Other assets – – – – – – – 22
Total Current Assets 107,290 109,584 14 23 16 24 50,399 85,930
CURRENT LIABILITIES:Cash overdraft (Note 8) 1 – – – – – 7 95Margin accounts and restricted cash (Note 8) 52 96 – – – – 144 67Financial liabilities at fair value through profit or loss (Note 2):
Options – – – – – – 13 45Swap contracts – – – – – – – –Swaptions – – – – – – – –Unrealised depreciation on forward foreign currencycontracts 76 370 – – – – 119 241Unrealised depreciation on futures contracts – – – – – – 104 400Unrealised depreciation on contracts for difference – – – – – – – –
Payable for investments purchased (Note 2) 3,209 1,102 – – – – 1,156 9,271Distributions payable to holders of redeemable participatingshares 28 32 – – – – – –Management fees payable (Note 4) 89 96 – – – – 6 7Performance fees payable (Note 4) – – – – – – – –Administrator and depositary fees payable (Note 4) 9 8 5 3 2 – 6 4Shareholder service fees payable (Note 4) 7 9 – – – – 1 1Payable for redeemable participating shares reacquired 1,152 16 1 – – – – 28,249Interest payable – – – – – – – –Dividend payable – – – – – – – –Accrued expenses and other liabilities 105 112 8 20 14 24 45 42
Liabilities (excluding Net Assets attributable to Holders ofRedeemable Participating Shares) 4,728 1,841 14 23 16 24 1,601 38,422
Total Net Assets attributable to Holders of RedeemableParticipating Shares at fair value $ 102,562 $ 107,743 $ – $ – $ – $ – $ 48,798 $ 47,508
The accompanying notes are an integral part of the Financial Statements
234
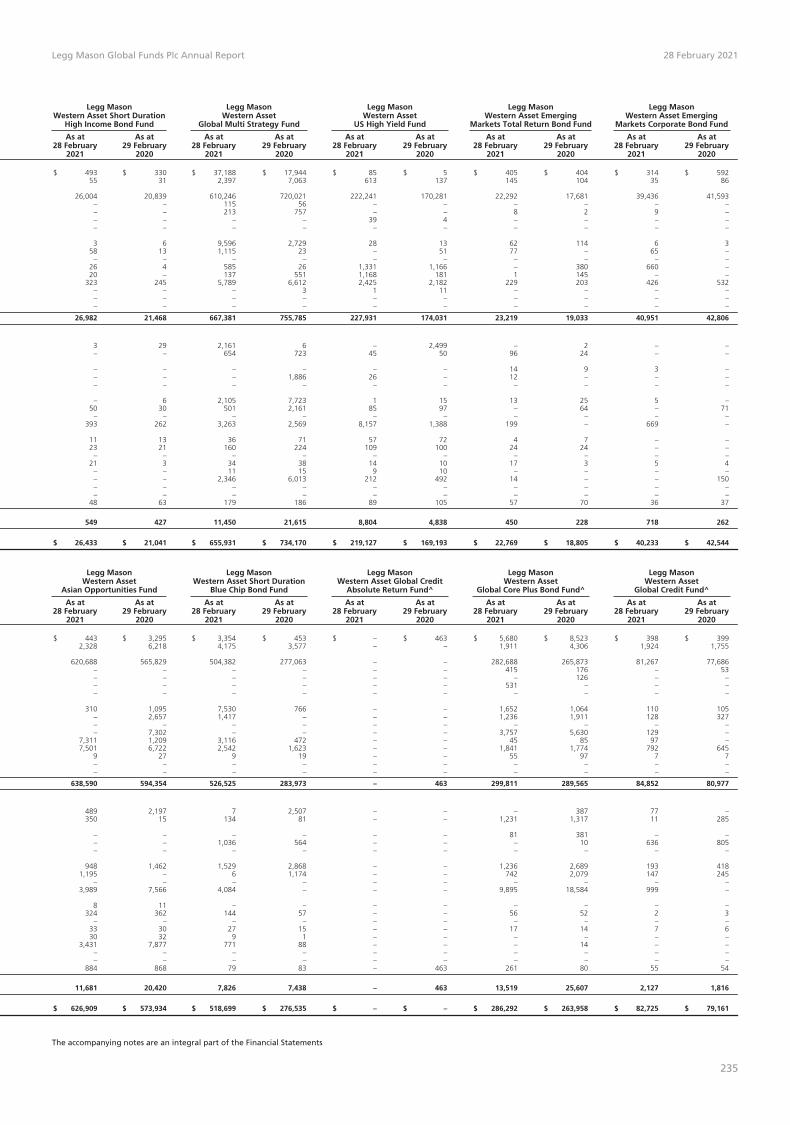
Legg Mason Global Funds Plc Annual Report 28 February 2021
Legg MasonWestern Asset Short Duration
High Income Bond Fund
Legg MasonWestern Asset
Global Multi Strategy Fund
Legg MasonWestern Asset
US High Yield Fund
Legg MasonWestern Asset Emerging
Markets Total Return Bond Fund
Legg MasonWestern Asset Emerging
Markets Corporate Bond Fund
As at28 February
2021
As at29 February
2020
As at28 February
2021
As at29 February
2020
As at28 February
2021
As at29 February
2020
As at28 February
2021
As at29 February
2020
As at28 February
2021
As at29 February
2020
$ 493 $ 330 $ 37,188 $ 17,944 $ 85 $ 5 $ 405 $ 404 $ 314 $ 59255 31 2,397 7,063 613 137 145 104 35 86
26,004 20,839 610,246 720,021 222,241 170,281 22,292 17,681 39,436 41,593– – 115 56 – – – – – –– – 213 757 – – 8 2 9 –– – – – 39 4 – – – –– – – – – – – – – –
3 6 9,596 2,729 28 13 62 114 6 358 13 1,115 23 – 51 77 – 65 –
– – – – – – – – – –26 4 585 26 1,331 1,166 – 380 660 –20 – 137 551 1,168 181 1 145 – –
323 245 5,789 6,612 2,425 2,182 229 203 426 532– – – 3 1 11 – – – –– – – – – – – – – –– – – – – – – – – –
26,982 21,468 667,381 755,785 227,931 174,031 23,219 19,033 40,951 42,806
3 29 2,161 6 – 2,499 – 2 – –– – 654 723 45 50 96 24 – –
– – – – – – 14 9 3 –– – – 1,886 26 – 12 – – –– – – – – – – – – –
– 6 2,105 7,723 1 15 13 25 5 –50 30 501 2,161 85 97 – 64 – 71
– – – – – – – – – –393 262 3,263 2,569 8,157 1,388 199 – 669 –
11 13 36 71 57 72 4 7 – –23 21 160 224 109 100 24 24 – –
– – – – – – – – – –21 3 34 38 14 10 17 3 5 4
– – 11 15 9 10 – – – –– – 2,346 6,013 212 492 14 – – 150– – – – – – – – – –– – – – – – – – – –
48 63 179 186 89 105 57 70 36 37
549 427 11,450 21,615 8,804 4,838 450 228 718 262
$ 26,433 $ 21,041 $ 655,931 $ 734,170 $ 219,127 $ 169,193 $ 22,769 $ 18,805 $ 40,233 $ 42,544
Legg MasonWestern Asset
Asian Opportunities Fund
Legg MasonWestern Asset Short Duration
Blue Chip Bond Fund
Legg MasonWestern Asset Global Credit
Absolute Return Fund^
Legg MasonWestern Asset
Global Core Plus Bond Fund^
Legg MasonWestern Asset
Global Credit Fund^
As at28 February
2021
As at29 February
2020
As at28 February
2021
As at29 February
2020
As at28 February
2021
As at29 February
2020
As at28 February
2021
As at29 February
2020
As at28 February
2021
As at29 February
2020
$ 443 $ 3,295 $ 3,354 $ 453 $ – $ 463 $ 5,680 $ 8,523 $ 398 $ 3992,328 6,218 4,175 3,577 – – 1,911 4,306 1,924 1,755
620,688 565,829 504,382 277,063 – – 282,688 265,873 81,267 77,686– – – – – – 415 176 – 53– – – – – – – 126 – –– – – – – – 531 – – –– – – – – – – – – –
310 1,095 7,530 766 – – 1,652 1,064 110 105– 2,657 1,417 – – – 1,236 1,911 128 327– – – – – – – – – –– 7,302 – – – – 3,757 5,630 129 –
7,311 1,209 3,116 472 – – 45 85 97 –7,501 6,722 2,542 1,623 – – 1,841 1,774 792 645
9 27 9 19 – – 55 97 7 7– – – – – – – – – –– – – – – – – – – –
638,590 594,354 526,525 283,973 – 463 299,811 289,565 84,852 80,977
489 2,197 7 2,507 – – – 387 77 –350 15 134 81 – – 1,231 1,317 11 285
– – – – – – 81 381 – –– – 1,036 564 – – – 10 636 805– – – – – – – – – –
948 1,462 1,529 2,868 – – 1,236 2,689 193 4181,195 – 6 1,174 – – 742 2,079 147 245
– – – – – – – – – –3,989 7,566 4,084 – – – 9,895 18,584 999 –
8 11 – – – – – – – –324 362 144 57 – – 56 52 2 3
– – – – – – – – – –33 30 27 15 – – 17 14 7 630 32 9 1 – – – – – –
3,431 7,877 771 88 – – – 14 – –– – – – – – – – – –– – – – – – – – – –
884 868 79 83 – 463 261 80 55 54
11,681 20,420 7,826 7,438 – 463 13,519 25,607 2,127 1,816
$ 626,909 $ 573,934 $ 518,699 $ 276,535 $ – $ – $ 286,292 $ 263,958 $ 82,725 $ 79,161
The accompanying notes are an integral part of the Financial Statements
235

Legg Mason Global Funds Plc Annual Report 28 February 2021
Statement of Financial Position – (continued)Legg Mason
Western AssetEuro High Yield Fund
Legg MasonWestern Asset
Macro OpportunitiesBond Fund^
Legg MasonWestern Asset
EM Local CurrencyDebt Fund^
Legg MasonWestern Asset
Multi-Asset Credit Fund^
(in 000’s)
As at28 February
2021
As at29 February
2020
As at28 February
2021
As at29 February
2020
As at28 February
2021
As at29 February
2020
As at28 February
2021
As at29 February
2020CURRENT ASSETS:
Cash and cash equivalents (Note 8) € 8,537 € 2,361 $ 154,233 $ 107,536 $ 31 $ 37 $ 18,081 $ 13,084Margin accounts and restricted cash (Note 8) – 210 539,919 1,099,657 – – 3,043 8,596Financial assets at fair value through profit or loss (Note 2):
Investments 45,985 55,285 6,127,577 7,363,283 – – 1,047,405 859,741Pledged investments – – 8,834 41,845 – – – 1,007Options – – 31,628 30,509 – – 868 4,581Swap contracts 252 – 633,939 15,933 – – 7,272 1,698Swaptions – – – 1,098 – – – –Unrealised appreciation on forward foreign currency contracts 4 365 90,962 94,894 – – 22,104 3,957Unrealised appreciation on futures contracts – – 117,968 289,066 – – 2,034 6,584Unrealised appreciation on contracts for difference – – – – – – – –
Receivable for investments sold (Note 2) – – – 2,804 – – 3,832 3,514Receivable for redeemable participating shares sold – – 28,771 15,051 – – 326 302Interest receivable 593 771 78,282 72,434 – – 9,183 8,408Dividend receivable – – 26 455 – – 31 33Management fees receivable – 6 – – – 2 – –Other assets – – – – – – – –
Total Current Assets 55,371 58,998 7,812,139 9,134,565 31 39 1,114,179 911,505
CURRENT LIABILITIES:Cash overdraft (Note 8) 1 – 138,953 25,108 – – 90 –Margin accounts and restricted cash (Note 8) 61 – 520,034 233,792 – – 3,962 3,283Financial liabilities at fair value through profit or loss (Note 2):
Options – – 33,532 114,048 – – 920 2,572Swap contracts – – 30,745 700,274 – – 1,784 6,761Swaptions – – – 577 – – – –Unrealised depreciation on forward foreign currency contracts 109 117 39,458 109,828 – – 949 10,082Unrealised depreciation on futures contracts – – 194,870 161,732 – – 2,125 4,663Unrealised depreciation on contracts for difference – – – – – – – –
Payable for investments purchased (Note 2) 554 1,720 146,253 111,386 – – 22,201 11,879Distributions payable to holders of redeemable participating shares – – – – – – – –Management fees payable (Note 4) – – 6,299 7,781 – – 21 21Performance fees payable (Note 4) – – – – – – – –Administrator and depositary fees payable (Note 4) 5 5 341 390 5 3 52 44Shareholder service fees payable (Note 4) – – 407 515 – – – –Payable for redeemable participating shares reacquired 246 – 48,497 22,152 – – 47 25Interest payable – – – – – – – –Dividend payable – – – – – – – –Accrued expenses and other liabilities 50 53 6,670 9,032 26 36 170 178
Liabilities (excluding Net Assets attributable to Holders of RedeemableParticipating Shares) 1,026 1,895 1,166,059 1,496,615 31 39 32,321 39,508
Total Net Assets attributable to Holders of Redeemable ParticipatingShares at fair value € 54,345 € 57,103 $ 6,646,080 $ 7,637,950 $ – $ – $ 1,081,858 $ 871,997
Western Asset UCITSSMASh Series Core Plus
Completion Fund^�Legg Mason BrandywineGlobal Fixed Income Fund
Legg Mason BrandywineGlobal Fixed Income Absolute
Return Fund^Legg Mason BrandywineGlobal High Yield Fund^
(in 000’s)
As at28 February
2021
As at29 February
2020
As at28 February
2021
As at29 February
2020
As at28 February
2021
As at29 February
2020
As at28 February
2021
As at29 February
2020CURRENT ASSETS:
Cash and cash equivalents (Note 8) $ 200 $ – $ 672 $ 14 $ 669 $ 7,233 $ 60 $ –Margin accounts and restricted cash (Note 8) 453 – 61 5,741 7,455 8,575 15 64Financial assets at fair value through profit or loss (Note 2):
Investments 25,159 – 370,018 929,385 724,287 829,077 11,887 10,955Pledged investments – – – – – – – –Options 3 – – – – – – –Swap contracts 590 – – – – – 264 115Swaptions – – – – – – – –Unrealised appreciation on forward foreign currency contracts 21 – 4,100 4,164 19,726 14,297 52 2Unrealised appreciation on futures contracts 69 – – – 545 595 – –Unrealised appreciation on contracts for difference – – – – – – – –
Receivable for investments sold (Note 2) 315 – – – – – – –Receivable for redeemable participating shares sold – – 497 5,353 – 622 – –Interest receivable 128 – 2,665 8,613 5,221 6,054 198 173Dividend receivable – – 723 979 483 707 – –Management fees receivable 41 – – – – – – –Other assets – – – – – – – –
Total Current Assets 26,979 – 378,736 954,249 758,386 867,160 12,476 11,309
CURRENT LIABILITIES:Cash overdraft (Note 8) – – 2,340 310 18,219 2 – 143Margin accounts and restricted cash (Note 8) – – 3,610 – 5,485 598 128 110Financial liabilities at fair value through profit or loss (Note 2):
Options 11 – – – – – – –Swap contracts – – – – – – 8 –Swaptions – – – – – – – –Unrealised depreciation on forward foreign currency contracts 73 – 2,715 17,082 4,911 29,124 30 159Unrealised depreciation on futures contracts 168 – – – – 1,426 – 65Unrealised depreciation on contracts for difference – – – – – – – –
Payable for investments purchased (Note 2) 4,493 – – – – – 198 120Distributions payable to holders of redeemable participating shares – – – – – – – 1Management fees payable (Note 4) – – 235 477 246 418 – 5Performance fees payable (Note 4) – – – – – – – –Administrator and depositary fees payable (Note 4) 4 – 26 48 37 44 4 3Shareholder service fees payable (Note 4) – – 26 45 – 5 – –Payable for redeemable participating shares reacquired – – 940 3,670 – – – –Interest payable – – – – – – – –Dividend payable – – – – – – – –Accrued expenses and other liabilities 37 – 937 1,950 814 940 49 47
Liabilities (excluding Net Assets attributable to Holders of RedeemableParticipating Shares) 4,786 – 10,829 23,582 29,712 32,557 417 653
Total Net Assets attributable to Holders of Redeemable ParticipatingShares at fair value $ 22,193 $ – $ 367,907 $ 930,667 $ 728,674 $ 834,603 $ 12,059 $ 10,656
The accompanying notes are an integral part of the Financial Statements
236
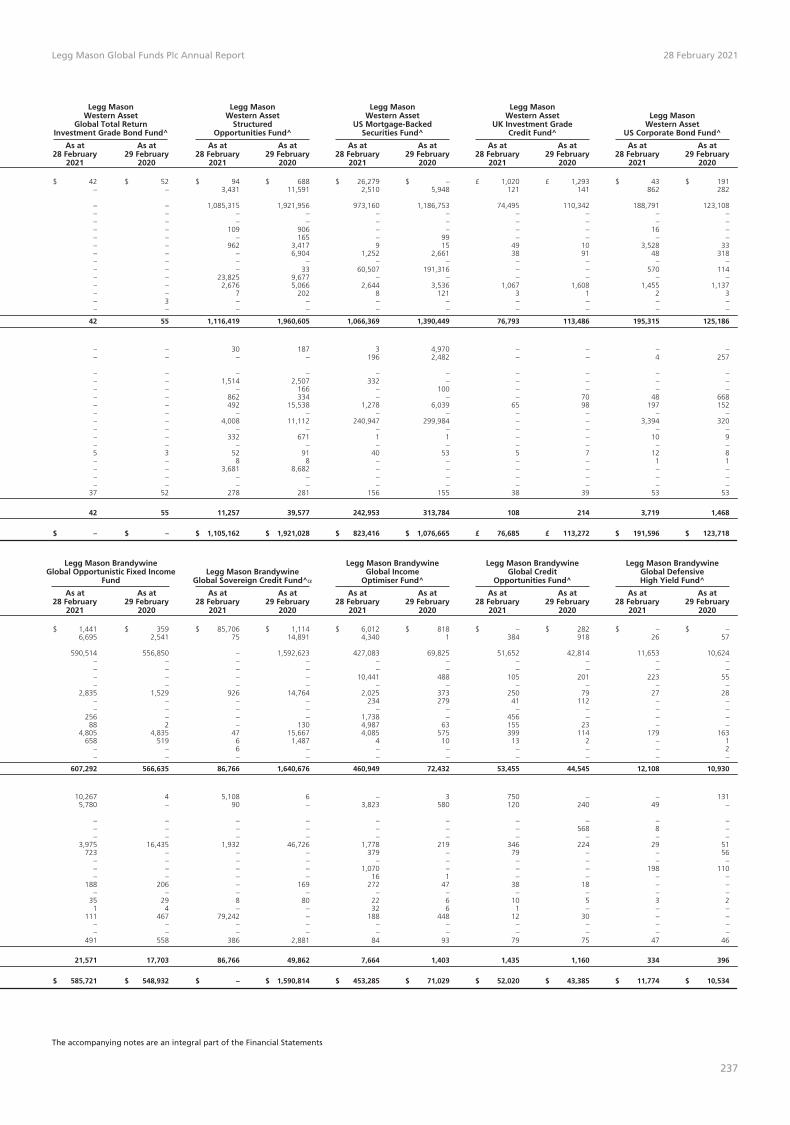
Legg Mason Global Funds Plc Annual Report 28 February 2021
Legg MasonWestern Asset
Global Total ReturnInvestment Grade Bond Fund^
Legg MasonWestern Asset
StructuredOpportunities Fund^
Legg MasonWestern Asset
US Mortgage-BackedSecurities Fund^
Legg MasonWestern Asset
UK Investment GradeCredit Fund^
Legg MasonWestern Asset
US Corporate Bond Fund^
As at28 February
2021
As at29 February
2020
As at28 February
2021
As at29 February
2020
As at28 February
2021
As at29 February
2020
As at28 February
2021
As at29 February
2020
As at28 February
2021
As at29 February
2020
$ 42 $ 52 $ 94 $ 688 $ 26,279 $ – £ 1,020 £ 1,293 $ 43 $ 191– – 3,431 11,591 2,510 5,948 121 141 862 282
– – 1,085,315 1,921,956 973,160 1,186,753 74,495 110,342 188,791 123,108– – – – – – – – – –– – – – – – – – – –– – 109 906 – – – – 16 –– – – 165 – 99 – – – –– – 962 3,417 9 15 49 10 3,528 33– – – 6,904 1,252 2,661 38 91 48 318– – – – – – – – – –– – – 33 60,507 191,316 – – 570 114– – 23,825 9,677 – – – – – –– – 2,676 5,066 2,644 3,536 1,067 1,608 1,455 1,137– – 7 202 8 121 3 1 2 3– 3 – – – – – – – –– – – – – – – – – –
42 55 1,116,419 1,960,605 1,066,369 1,390,449 76,793 113,486 195,315 125,186
– – 30 187 3 4,970 – – – –– – – – 196 2,482 – – 4 257
– – – – – – – – – –– – 1,514 2,507 332 – – – – –– – – 166 – 100 – – – –– – 862 334 – – – 70 48 668– – 492 15,538 1,278 6,039 65 98 197 152– – – – – – – – – –– – 4,008 11,112 240,947 299,984 – – 3,394 320– – – – – – – – – –– – 332 671 1 1 – – 10 9– – – – – – – – – –5 3 52 91 40 53 5 7 12 8– – 8 8 – – – – 1 1– – 3,681 8,682 – – – – – –– – – – – – – – – –– – – – – – – – – –
37 52 278 281 156 155 38 39 53 53
42 55 11,257 39,577 242,953 313,784 108 214 3,719 1,468
$ – $ – $ 1,105,162 $ 1,921,028 $ 823,416 $ 1,076,665 £ 76,685 £ 113,272 $ 191,596 $ 123,718
Legg Mason BrandywineGlobal Opportunistic Fixed Income
FundLegg Mason Brandywine
Global Sovereign Credit Fund^�
Legg Mason BrandywineGlobal Income
Optimiser Fund^
Legg Mason BrandywineGlobal Credit
Opportunities Fund^
Legg Mason BrandywineGlobal DefensiveHigh Yield Fund^
As at28 February
2021
As at29 February
2020
As at28 February
2021
As at29 February
2020
As at28 February
2021
As at29 February
2020
As at28 February
2021
As at29 February
2020
As at28 February
2021
As at29 February
2020
$ 1,441 $ 359 $ 85,706 $ 1,114 $ 6,012 $ 818 $ – $ 282 $ – $ –6,695 2,541 75 14,891 4,340 1 384 918 26 57
590,514 556,850 – 1,592,623 427,083 69,825 51,652 42,814 11,653 10,624– – – – – – – – – –– – – – – – – – – –– – – – 10,441 488 105 201 223 55– – – – – – – – – –
2,835 1,529 926 14,764 2,025 373 250 79 27 28– – – – 234 279 41 112 – –– – – – – – – – – –
256 – – – 1,738 – 456 – – –88 2 – 130 4,987 63 155 23 – –
4,805 4,835 47 15,667 4,085 575 399 114 179 163658 519 6 1,487 4 10 13 2 – 1
– – 6 – – – – – – 2– – – – – – – – – –
607,292 566,635 86,766 1,640,676 460,949 72,432 53,455 44,545 12,108 10,930
10,267 4 5,108 6 – 3 750 – – 1315,780 – 90 – 3,823 580 120 240 49 –
– – – – – – – – – –– – – – – – – 568 8 –– – – – – – – – – –
3,975 16,435 1,932 46,726 1,778 219 346 224 29 51723 – – – 379 – 79 – – 56
– – – – – – – – – –– – – – 1,070 – – – 198 110– – – – 16 1 – – – –
188 206 – 169 272 47 38 18 – –– – – – – – – – – –
35 29 8 80 22 6 10 5 3 21 4 – – 32 6 1 – – –
111 467 79,242 – 188 448 12 30 – –– – – – – – – – – –– – – – – – – – – –
491 558 386 2,881 84 93 79 75 47 46
21,571 17,703 86,766 49,862 7,664 1,403 1,435 1,160 334 396
$ 585,721 $ 548,932 $ – $ 1,590,814 $ 453,285 $ 71,029 $ 52,020 $ 43,385 $ 11,774 $ 10,534
The accompanying notes are an integral part of the Financial Statements
237

Legg Mason Global Funds Plc Annual Report 28 February 2021
Statement of Financial Position – (continued)Legg Mason
Brandywine Global –US High Yield Fund^
Legg Mason BrandywineGlobal Enhanced Absolute
Return Fund^
Legg MasonBrandywine Global Dynamic
US Equity Fund^Legg Mason ClearBridge
Value Fund
(in 000’s)
As at28 February
2021
As at29 February
2020
As at28 February
2021
As at29 February
2020
As at28 February
2021
As at29 February
2020
As at28 February
2021
As at29 February
2020CURRENT ASSETS:
Cash and cash equivalents (Note 8) $ 16 $ 24 $ 7,852 $ 2,077 $ 1 $ 2 $ 11,359 $ 20,766Margin accounts and restricted cash (Note 8) – – 11,245 24,871 – – – –Financial assets at fair value through profit or loss (Note 2):
Investments – – 366,879 386,019 1,903 3,289 493,419 306,850Pledged investments – – – – – – – –Options – – – – – – – –Swap contracts – – – – – – – –Swaptions – – – – – – – –Unrealised appreciation on forward foreign currencycontracts – – 5,291 5,780 3 7 – –Unrealised appreciation on futures contracts – – 998 – – – – –Unrealised appreciation on contracts for difference – – – – – – – –
Receivable for investments sold (Note 2) – – – – – – – 1,917Receivable for redeemable participating shares sold – – – 694 – – 4,692 30Interest receivable – – 4,080 4,473 – – – 4Dividend receivable – – 1 11 1 7 109 231Management fees receivable – 6 – – 7 30 – –Other assets – – – – – – – –
Total Current Assets 16 30 396,346 423,925 1,915 3,335 509,579 329,798
CURRENT LIABILITIES:Cash overdraft (Note 8) – – – 3,872 – – – –Margin accounts and restricted cash (Note 8) – – 1,037 62 – – – –Financial liabilities at fair value through profit or loss (Note 2):
Options – – – – – – – –Swap contracts – – – – – – – –Swaptions – – – – – – – –Unrealised depreciation on forward foreign currencycontracts – – 1,896 19,699 – 1 1 –Unrealised depreciation on futures contracts – – 1,176 16,987 – – – –Unrealised depreciation on contracts for difference – – – – – – – –
Payable for investments purchased (Note 2) – – – – – – – 2,365Distributions payable to holders of redeemable participatingshares – – – – – – – –Management fees payable (Note 4) – – 19 25 – – 281 228Performance fees payable (Note 4) – – – – – – – –Administrator and depositary fees payable (Note 4) 3 3 24 23 4 3 36 24Shareholder service fees payable (Note 4) – – – 1 – – 19 14Payable for redeemable participating shares reacquired – – 5 – – – 55 1,160Interest payable – – – – – – – –Dividend payable – – – – – – – –Accrued expenses and other liabilities 13 27 893 1,174 32 30 102 107
Liabilities (excluding Net Assets attributable to Holders ofRedeemable Participating Shares) 16 30 5,050 41,843 36 34 494 3,898
Total Net Assets attributable to Holders of RedeemableParticipating Shares at fair value $ – $ – $ 391,296 $ 382,082 $ 1,879 $ 3,301 $ 509,085 $ 325,900
Legg Mason ClearBridgeUS Aggressive Growth Fund
Legg MasonClearBridge Tactical
Dividend Income Fund
Legg MasonClearBridge US Equity
Sustainability Leaders Fund^
Legg MasonClearBridge Global
Growth Fund^
(in 000’s)
As at28 February
2021
As at29 February
2020
As at28 February
2021
As at29 February
2020
As at28 February
2021
As at29 February
2020
As at28 February
2021
As at29 February
2020CURRENT ASSETS:
Cash and cash equivalents (Note 8) $ 3,461 $ 3 $ 1,728 $ 2,639 $ 3,086 $ 1,635 $ 216 $ 339Margin accounts and restricted cash (Note 8) – – – – – – – –Financial assets at fair value through profit or loss (Note 2):
Investments 789,786 950,054 37,033 38,453 635,560 48,203 10,927 8,140Pledged investments – – – – – – – –Options – – – – – – – –Swap contracts – – – – – – – –Swaptions – – – – – – – –Unrealised appreciation on forward foreign currencycontracts 141 314 16 12 1,741 10 – –Unrealised appreciation on futures contracts – – – – – – – –Unrealised appreciation on contracts for difference – – – – – – – –
Receivable for investments sold (Note 2) – 8,542 – – – – 278 –Receivable for redeemable participating shares sold 367 758 – 30 5,155 396 – –Interest receivable – 4 6 1 – 1 – –Dividend receivable 175 344 62 46 542 47 10 5Management fees receivable – – – – – 15 – 1Other assets – – – – – – – –
Total Current Assets 793,930 960,019 38,845 41,181 646,084 50,307 11,431 8,485
CURRENT LIABILITIES:Cash overdraft (Note 8) 1,096 5,158 – 63 2 – 1 –Margin accounts and restricted cash (Note 8) – – – – – – – –Financial liabilities at fair value through profit or loss (Note 2):
Options – – – – – – – –Swap contracts – – – – – – – –Swaptions – – – – – – – –Unrealised depreciation on forward foreign currencycontracts 32 531 2 71 45 34 – –Unrealised depreciation on futures contracts – – – – – – – –Unrealised depreciation on contracts for difference – – – – – – – –
Payable for investments purchased (Note 2) – 2,346 – 548 – 507 313 –Distributions payable to holders of redeemable participatingshares – – – – – – – –Management fees payable (Note 4) 546 764 31 41 246 – 4 –Performance fees payable (Note 4) – – – – – – – –Administrator and depositary fees payable (Note 4) 64 65 7 5 33 5 4 3Shareholder service fees payable (Note 4) 71 96 3 7 27 2 – –Payable for redeemable participating shares reacquired 1,082 4,892 61 611 482 58 – –Interest payable – – – – – – – –Dividend payable – – – – – – – –Accrued expenses and other liabilities 341 341 52 51 25 29 20 19
Liabilities (excluding Net Assets attributable to Holders ofRedeemable Participating Shares) 3,232 14,193 156 1,397 860 635 342 22
Total Net Assets attributable to Holders of RedeemableParticipating Shares at fair value $ 790,698 $ 945,826 $ 38,689 $ 39,784 $ 645,224 $ 49,672 $ 11,089 $ 8,463
The accompanying notes are an integral part of the Financial Statements
238

Legg Mason Global Funds Plc Annual Report 28 February 2021
Legg Mason ClearBridgeGrowth Fund^
Legg Mason ClearBridgeGlobal Equity Fund^
Legg Mason ClearBridgeGlobal Equity Income Fund^
Legg Mason ClearBridgeUS Appreciation Fund
Legg Mason ClearBridgeUS Large Cap Growth Fund
As at28 February
2021
As at29 February
2020
As at28 February
2021
As at29 February
2020
As at28 February
2021
As at29 February
2020
As at28 February
2021
As at29 February
2020
As at28 February
2021
As at29 February
2020
$ 74 $ 70 $ 57 $ 21 $ 28 $ 24 $ 2,979 $ 2,343 $ 20,383 $ 63,917– – – – – – – – – 270
– – – – – – 203,955 192,364 1,810,957 1,464,212– – – – – – – – – –– – – – – – – – – –– – – – – – – – – –– – – – – – – – – –
– – – – – – – – 1,202 749– – – – – – – – – –– – – – – – – – – –– – – – – – – 440 – 4,161– – – – – – 45 131 8,722 9,007– – – – – – – 2 1 11– – – – – – 192 235 1,268 1,122– – – 39 – 9 – – – –– – – – – – – – – –
74 70 57 60 28 33 207,171 195,515 1,842,533 1,543,449
– – – – – – 4 630 6,848 66– – – – – – – – 620 –
– – – – – – – – – –– – – – – – – – – –– – – – – – – – – –
– – – – – – – – 2,409 778– – – – – – – – – –– – – – – – – – – –– – – – – – 199 648 2,660 8,136
– – – – – – – – – –– – – – – – 184 203 1,186 1,083– – – – – – – – – –– – 4 2 2 – 19 15 142 97– – – – – – 27 34 159 160
44 45 – – – – 655 475 17,184 11,837– – – – – – – – – –– – – – – – – – – –
30 25 53 58 26 33 75 72 273 286
74 70 57 60 28 33 1,163 2,077 31,481 22,443
$ – $ – $ – $ – $ – $ – $ 206,008 $ 193,438 $ 1,811,052 $ 1,521,006
Legg MasonClearBridge Infrastructure
Value Fund^
Legg MasonClearBridge Emerging
Markets Infrastructure Fund^
Legg MasonRoyce US Small CapOpportunity Fund
Legg MasonRoyce US SmallerCompanies Fund
Legg MasonPCM US Equity Fund^
As at28 February
2021
As at29 February
2020
As at28 February
2021
As at29 February
2020
As at28 February
2021
As at29 February
2020
As at28 February
2021
As at29 February
2020
As at28 February
2021
As at29 February
2020
€ 21,227 € 32,179 $ 99 $ 146 $ 26,924 $ 686 $ 848 $ 358 $ 23 $ 23– – – – – – – – – –
607,551 750,612 2,726 2,588 1,248,814 447,792 90,103 68,300 – –– – – – – – – – – –– – – – – – – – – –– – – – – – – – – –– – – – – – – – – –
230 1,208 4 12 503 138 3 – – –– – – – – – – – – –– – – – – – – – – –
28,556 7,525 27 18 3,301 2,163 475 – – –783 14,523 – – 30,654 287 1,465 53 – –
– – – – 29 – – – – –1,545 1,269 1 – 371 203 34 34 – –
– – 4 15 – – – – – –– – – – – – – – – –
659,892 807,316 2,861 2,779 1,310,596 451,269 92,928 68,745 23 23
6 381 – – 8 2 – – – –250 930 – – 1,310 – – – – –
– – – – – – – – – –– – – – – – – – – –– – – – – – – – – –
558 3,700 – 2 611 424 3 – – –– – – – – – – – – –– – – – – – – – – –
50,148 12,236 69 – 12,581 590 1,554 – – –
1,725 3,400 – – – – – – – –457 614 – – 963 470 91 86 – –
– – – – – – – – – –50 45 4 2 71 31 9 7 – –50 67 – – 164 83 15 16 – –
1,534 11,893 – – 5,816 1,408 94 510 – –– – – – – – – – – –– – – – – – – – – –
101 112 63 89 202 203 66 69 23 23
54,879 33,378 136 93 21,726 3,211 1,832 688 23 23
€ 605,013 € 773,938 $ 2,725 $ 2,686 $ 1,288,870 $ 448,058 $ 91,096 $ 68,057 $ – $ –
The accompanying notes are an integral part of the Financial Statements
239

Legg Mason Global Funds Plc Annual Report 28 February 2021
Statement of Financial Position – (continued)Legg Mason QS
MV European EquityGrowth and Income Fund
Legg Mason QS MV AsiaPacific Ex Japan Equity
Growth and Income Fund
Legg MasonBatterymarch International
Large Cap Fund^
Legg MasonQS Emerging Markets
Equity Fund
(in 000’s)
As at28 February
2021
As at29 February
2020
As at28 February
2021
As at29 February
2020
As at28 February
2021
As at29 February
2020
As at28 February
2021
As at29 February
2020CURRENT ASSETS:
Cash and cash equivalents (Note 8) € 181 € 11 $ 1,094 $ 772 $ 60 $ 1 $ 178 $ 198Margin accounts and restricted cash (Note 8) – – – – – – 18 30Financial assets at fair value through profit or loss (Note 2):
Investments 33,006 40,633 30,642 63,289 – – 14,646 12,067Pledged investments – – – – – – – –Options – – – – – – – –Swap contracts – – – – – – – –Swaptions – – – – – – – –Unrealised appreciation on forward foreign currency contracts 7 19 43 8 – – – –Unrealised appreciation on futures contracts – – – – – – 13 –Unrealised appreciation on contracts for difference – – – – – – – –
Receivable for investments sold (Note 2) – – 234 25 – – – –Receivable for redeemable participating shares sold 2 32 – 141 – – – 20Interest receivable – – – – – – – –Dividend receivable 450 509 136 272 – – 19 22Management fees receivable – – – – – – – 4Other assets – – – – – – – –
Total Current Assets 33,646 41,204 32,149 64,507 60 1 14,874 12,341
CURRENT LIABILITIES:Cash overdraft (Note 8) – 13 482 – – – – –Margin accounts and restricted cash (Note 8) – – – – – – – –Financial liabilities at fair value through profit or loss (Note 2):
Options – – – – – – – –Swap contracts – – – – – – – –Swaptions – – – – – – – –Unrealised depreciation on forward foreign currency contracts 15 149 29 215 – – – –Unrealised depreciation on futures contracts – – – – – – – 20Unrealised depreciation on contracts for difference – – – – – – – –
Payable for investments purchased (Note 2) – – 55 – – – – –Distributions payable to holders of redeemable participating shares – – – – – – – –Management fees payable (Note 4) 29 43 36 42 – – – –Performance fees payable (Note 4) – – – – – – – –Administrator and depositary fees payable (Note 4) 6 5 7 6 – – 5 3Shareholder service fees payable (Note 4) 1 5 3 11 – – – –Payable for redeemable participating shares reacquired 120 100 285 34 59 – – –Interest payable – – – – – – – –Dividend payable – – – – – – – –Accrued expenses and other liabilities 107 115 215 163 1 1 130 133
Liabilities (excluding Net Assets attributable to Holders ofRedeemable Participating Shares) 278 430 1,112 471 60 1 135 156
Total Net Assets attributable to Holders of RedeemableParticipating Shares at fair value € 33,368 € 40,774 $ 31,037 $ 64,036 $ – $ – $ 14,739 $ 12,185
Legg MasonMartin Currie Global
Resources Fund^Legg Mason Martin Currie
Greater China Fund^Legg Mason Martin Currie Japan
Absolute Alpha Fund^
Legg MasonMartin Currie
North American Fund^
(in 000’s)
As at28 February
2021
As at29 February
2020
As at28 February
2021
As at29 February
2020
As at28 February
2021
As at29 February
2020
As at28 February
2021
As at29 February
2020CURRENT ASSETS:
Cash and cash equivalents (Note 8) $ 51 $ 103 $ 119 $ 149 ¥ 1,340 ¥ 2,264 $ – $ 129Margin accounts and restricted cash (Note 8) – – – – – – – –Financial assets at fair value through profit or loss (Note 2):
Investments – – – – – – – –Pledged investments – – – – – – – –Options – – – – – – – –Swap contracts – – – – – – – –Swaptions – – – – – – – –Unrealised appreciation on forward foreign currency contracts – – – – – – – –Unrealised appreciation on futures contracts – – – – – – – –Unrealised appreciation on contracts for difference – – – – – – – –
Receivable for investments sold (Note 2) – – – – – – – –Receivable for redeemable participating shares sold – – – – – – – –Interest receivable – – – – – – – –Dividend receivable – – – – – – – –Management fees receivable – – – 7 – 940 – –Other assets – – – – – – – –
Total Current Assets 51 103 119 156 1,340 3,204 – 129
CURRENT LIABILITIES:Cash overdraft (Note 8) – – – – – – – –Margin accounts and restricted cash (Note 8) – – – – – – – –Financial liabilities at fair value through profit or loss (Note 2):
Options – – – – – – – –Swap contracts – – – – – – – –Swaptions – – – – – – – –Unrealised depreciation on forward foreign currency contracts – – – – – – – –Unrealised depreciation on futures contracts – – – – – – – –Unrealised depreciation on contracts for difference – – – – – – – –
Payable for investments purchased (Note 2) – – – – – – – –Distributions payable to holders of redeemable participating shares – – – – – – – –Management fees payable (Note 4) – – – – – – – –Performance fees payable (Note 4) – – – – – – – –Administrator and depositary fees payable (Note 4) – – 3 – 76 60 – –Shareholder service fees payable (Note 4) – – – – – – – –Payable for redeemable participating shares reacquired 51 – 96 123 – – – –Interest payable – – – – – – – –Dividend payable – – – – – – – –Accrued expenses and other liabilities – 103 20 33 1,264 3,144 – 129
Liabilities (excluding Net Assets attributable to Holders ofRedeemable Participating Shares) 51 103 119 156 1,340 3,204 – 129
Total Net Assets attributable to Holders of RedeemableParticipating Shares at fair value $ – $ – $ – $ – ¥ – ¥ – $ – $ –
The accompanying notes are an integral part of the Financial Statements
240

Legg Mason Global Funds Plc Annual Report 28 February 2021
Legg Mason QSMV Global Equity
Growth and Income Fund
Legg MasonCongruix JapanEquity Fund^
Legg MasonMartin Currie Asia Long-Term
Unconstrained Fund^
Legg MasonMartin Currie
Asia Pacific Fund^
Legg MasonMartin Currie EuropeanAbsolute Alpha Fund^
As at28 February
2021
As at29 February
2020
As at28 February
2021
As at29 February
2020
As at28 February
2021
As at29 February
2020
As at28 February
2021
As at29 February
2020
As at28 February
2021
As at29 February
2020
$ 38 $ 66 ¥ 90,733 ¥ 91,494 $ 2,907 $ 8,660 $ 30 $ 16 € 3,508 € 5,541– – – – – – – – 798 4,697
12,688 13,490 – – 77,091 157,851 – – 36,537 176,973– – – – – – – – – –– – – – – – – – – –– – – – – – – – – –– – – – – – – – – –5 16 – – – – – – 347 1,215– – – – – – – – – –– – – – – – – – 77 7,084– – – – 447 – – – 819 1,815– 25 – – – 19 – – – 100– – – – – – – – – –
34 40 – – 207 416 – – 44 198– – – – – – – 29 – –– – – – – – – – – –
12,765 13,637 90,733 91,494 80,652 166,946 30 45 42,130 197,623
– 22 – – – – – – 33 251– – – – – – – – – –
– – – – – – – – – –– – – – – – – – – –– – – – – – – – – –– 68 – – – – – – 286 662– – – – – – – – – –– – – – – – – – 492 2,319– – – – 104 – – – 589 3,954– – – – 313 1,966 – – – –
11 16 – – 58 141 – – 53 242– – – – – – – – – 225 3 – – 11 14 5 3 11 14– 1 – – 1 13 – – 3 281 – – – – 14 – – 235 108– – – – – – – – 7 44– – – – – – – – 6 51
63 58 90,733 91,494 85 80 25 42 72 81
80 168 90,733 91,494 572 2,228 30 45 1,787 7,776
$ 12,685 $ 13,469 ¥ – ¥ – $ 80,080 $ 164,718 $ – $ – € 40,343 € 189,847
Legg MasonMartin Currie Global Long-Term
Unconstrained Fund^
Legg MasonMartin Currie Asia Pacific
Ex Japan Real Income Fund
Legg MasonMartin Currie Global
Emerging Markets Fund^
Legg MasonMartin Currie Global Dividend
Opportunities Fund^
Legg Mason Martin CurrieEuropean Unconstrained
Fund^
As at28 February
2021
As at29 February
2020
As at28 February
2021
As at29 February
2020
As at28 February
2021
As at29 February
2020
As at28 February
2021
As at29 February
2020
As at28 February
2021
As at29 February
2020
$ 5,338 $ 2,041 $ 196 $ 382 $ 762 $ 843 $ 22 $ 15 € 3,107 € 323– – – – – – – – – –
98,926 32,289 26,321 7,853 40,978 28,397 – – 108,300 5,819– – – – – – – – – –– – – – – – – – – –– – – – – – – – – –– – – – – – – – – –
36 – 3 – – – – – – –– – – – – – – – – –– – – – – – – – – –– – – 50 49 248 – – – –
103 6 1 – 242 – – – – 1– – – – – – – – – –
28 34 178 53 105 52 – – 34 6– – – 16 – – – 17 – 24– – – – – – – – – –
104,431 34,370 26,699 8,354 42,136 29,540 22 32 111,441 6,173
– – – – – – – – – –– – – – – – – – – –
– – – – – – – – – –– – – – – – – – – –– – – – – – – – – –– 2 1 – – – – – – –– – – – – – – – – –– – – – – – – – – –– – – 50 98 – – – – –– – – – – – – – – –
34 16 17 – 26 6 – – 30 –– – – – – – – – – –
10 5 4 3 7 4 2 3 20 32 1 3 – 2 1 – – – –– 133 – – – 1 – – – –– – – – – – – – – –– – – – – – – – – –
36 33 98 60 202 107 20 29 20 32
82 190 123 113 335 119 22 32 70 35
$ 104,349 $ 34,180 $ 26,576 $ 8,241 $ 41,801 $ 29,421 $ – $ – € 111,371 € 6,138
The accompanying notes are an integral part of the Financial Statements
241
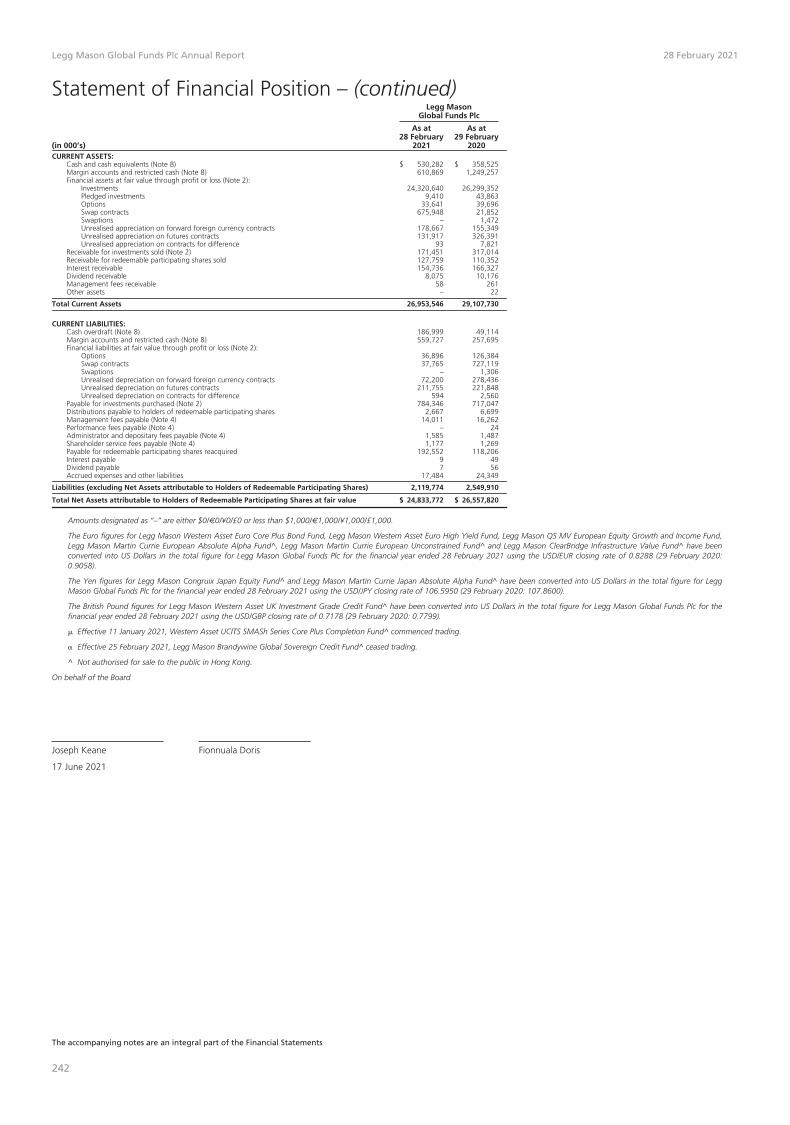
Legg Mason Global Funds Plc Annual Report 28 February 2021
Statement of Financial Position – (continued)Legg Mason
Global Funds Plc
(in 000’s)
As at28 February
2021
As at29 February
2020CURRENT ASSETS:
Cash and cash equivalents (Note 8) $ 530,282 $ 358,525Margin accounts and restricted cash (Note 8) 610,869 1,249,257Financial assets at fair value through profit or loss (Note 2):
Investments 24,320,640 26,299,352Pledged investments 9,410 43,863Options 33,641 39,696Swap contracts 675,948 21,852Swaptions – 1,472Unrealised appreciation on forward foreign currency contracts 178,667 155,349Unrealised appreciation on futures contracts 131,917 326,391Unrealised appreciation on contracts for difference 93 7,821
Receivable for investments sold (Note 2) 171,451 317,014Receivable for redeemable participating shares sold 127,759 110,352Interest receivable 154,736 166,327Dividend receivable 8,075 10,176Management fees receivable 58 261Other assets – 22
Total Current Assets 26,953,546 29,107,730
CURRENT LIABILITIES:Cash overdraft (Note 8) 186,999 49,114Margin accounts and restricted cash (Note 8) 559,727 257,695Financial liabilities at fair value through profit or loss (Note 2):
Options 36,896 126,384Swap contracts 37,765 727,119Swaptions – 1,306Unrealised depreciation on forward foreign currency contracts 72,200 278,436Unrealised depreciation on futures contracts 211,755 221,848Unrealised depreciation on contracts for difference 594 2,560
Payable for investments purchased (Note 2) 784,346 717,047Distributions payable to holders of redeemable participating shares 2,667 6,699Management fees payable (Note 4) 14,011 16,262Performance fees payable (Note 4) – 24Administrator and depositary fees payable (Note 4) 1,585 1,487Shareholder service fees payable (Note 4) 1,177 1,269Payable for redeemable participating shares reacquired 192,552 118,206Interest payable 9 49Dividend payable 7 56Accrued expenses and other liabilities 17,484 24,349
Liabilities (excluding Net Assets attributable to Holders of Redeemable Participating Shares) 2,119,774 2,549,910
Total Net Assets attributable to Holders of Redeemable Participating Shares at fair value $ 24,833,772 $ 26,557,820
Amounts designated as “–” are either $0/€0/¥0/£0 or less than $1,000/€1,000/¥1,000/£1,000.
The Euro figures for Legg Mason Western Asset Euro Core Plus Bond Fund, Legg Mason Western Asset Euro High Yield Fund, Legg Mason QS MV European Equity Growth and Income Fund,Legg Mason Martin Currie European Absolute Alpha Fund^, Legg Mason Martin Currie European Unconstrained Fund^ and Legg Mason ClearBridge Infrastructure Value Fund^ have beenconverted into US Dollars in the total figure for Legg Mason Global Funds Plc for the financial year ended 28 February 2021 using the USD/EUR closing rate of 0.8288 (29 February 2020:0.9058).
The Yen figures for Legg Mason Congruix Japan Equity Fund^ and Legg Mason Martin Currie Japan Absolute Alpha Fund^ have been converted into US Dollars in the total figure for LeggMason Global Funds Plc for the financial year ended 28 February 2021 using the USD/JPY closing rate of 106.5950 (29 February 2020: 107.8600).
The British Pound figures for Legg Mason Western Asset UK Investment Grade Credit Fund^ have been converted into US Dollars in the total figure for Legg Mason Global Funds Plc for thefinancial year ended 28 February 2021 using the USD/GBP closing rate of 0.7178 (29 February 2020: 0.7799).
� Effective 11 January 2021, Western Asset UCITS SMASh Series Core Plus Completion Fund^ commenced trading.
� Effective 25 February 2021, Legg Mason Brandywine Global Sovereign Credit Fund^ ceased trading.
^ Not authorised for sale to the public in Hong Kong.
On behalf of the Board
Joseph Keane Fionnuala Doris
17 June 2021
The accompanying notes are an integral part of the Financial Statements
242

Legg Mason Global Funds Plc Annual Report 28 February 2021
Statement of Financial Position – (continued)28 February 2021 29 February 2020 28 February 2019
Total NAV(000’s)
No. Shares(000’s) NAV/Share:
Total NAV(000’s)
No. Shares(000’s) NAV/Share:
Total NAV(000’s)
No. Shares(000’s) NAV/Share:
Legg Mason Western Asset US Government Liquidity FundClass A US$ Accumulating $ 153,935 1,404 109.61 $ 158,319 1,445 109.56 $ 122,389 1,133 108.01Class A US$ Distributing (D) 624,449 624,463 1.00 745,435 745,135 1.00 819,631 819,350 1.00Class B US$ Accumulating 73 1 104.90 221 2 104.87 264 3 103.84Class B US$ Distributing (D) 300 300 1.00 – – – 51 51 1.00Class C US$ Accumulating 5,098 49 103.68 5,263 51 103.67 5,247 51 102.92Class C US$ Distributing (D) 235 235 1.00 374 374 1.00 225 225 1.00Class X US$ Distributing (D) 97,422 97,424 1.00 86,585 86,583 1.00 1 1 1.00Class A (G) US$ Accumulating 491 4 109.84 499 5 109.79 541 5 108.23Class A (G) US$ Distributing (D) 285 285 1.00 404 404 1.00 426 426 1.00Class L (G) US$ Distributing (D) 42 42 1.00 144 144 1.00 330 330 1.00
Legg Mason Western Asset US Core Bond FundClass A US$ Accumulating $ 47,716 316 151.06 $ 73,304 497 147.58 $ 11,129 83 133.30Class A US$ Distributing (D) 87,128 789 110.48 141,618 1,294 109.46 120,608 1,193 101.07Class B US$ Distributing (D) 2 – 110.58 2 – 109.55 67 1 101.04Class C US$ Accumulating 14,666 104 140.75 9,868 71 138.19 4,668 37 125.45Class C US$ Distributing (D) 8,392 76 110.52 5,715 52 109.49 2,819 28 101.09Class E US$ Accumulating 5,613 54 104.43 1,348 13 102.63 – – –Class F US$ Accumulating 84,508 619 136.50 43,800 330 132.62 7,668 64 119.13Class F US$ Distributing (D) 19,500 179 108.64 7,147 66 107.62 3,169 32 99.37Class X US$ Accumulating 4,213 35 119.38 3,239 28 116.08 2,044 20 104.35Class X US$ Distributing (D) 341 3 107.49 476 4 106.50 525 5 98.34Premier Class US$ Accumulating 21,197 178 119.17 27,203 236 115.50 196 2 103.48Premier Class Euro Accumulating (Hedged) 4,329 32 110.80 1,155 10 108.78 – – –Class GA US$ Accumulating 1,462 10 148.76 1,449 10 144.93 1,518 12 130.54Class GE US$ Accumulating 63 – 139.67 83 1 136.88 75 1 124.04
Legg Mason Western Asset US Core Plus Bond FundClass A US$ Accumulating $ 199,266 1,165 171.09 $ 168,516 1,006 167.57 $ 134,687 899 149.79Class A US$ Distributing (D) 55,980 461 121.54 51,550 426 121.11 33,130 299 110.86Class A US$ Distributing (M) Plus 29,227 282 103.46 1,524 15 105.04 1,872 19 97.71Class A AUD Distributing (M) (Hedged) Plus 1,749 22 101.27 5,306 78 103.86 3,039 44 97.55Class A Euro Accumulating (Hedged) 9,308 70 110.74 5,446 45 109.90 703 6 101.06Class B US$ Accumulating – – – – – – 24 – 142.17Class B US$ Distributing (D) 218 2 121.48 195 2 120.93 141 1 110.70Class C US$ Accumulating 36,691 235 156.16 23,443 153 153.71 8,384 61 138.09Class C US$ Distributing (D) 14,460 118 122.39 11,847 97 121.97 4,904 44 111.64Class E US$ Accumulating 40,138 314 128.02 23,217 184 126.14 8,192 72 113.44Class F US$ Accumulating 448,724 3,348 134.01 459,375 3,526 130.28 191,012 1,653 115.58Class F US$ Distributing (D) 15,158 133 113.97 9,964 88 113.58 51 – 103.89Class X US$ Accumulating 29,448 236 124.81 42,091 346 121.54 4,863 45 108.03Class X US$ Distributing (D) 4,093 39 106.00 1,655 16 105.63 967 10 96.67Class X Euro Accumulating (Hedged) 17,281 138 103.98 3,117 28 102.61 39 – 101.99Class X Euro Distributing (M) (Hedged) 421 4 97.03 – – – – – –Premier Class US$ Accumulating 658,972 4,111 160.28 598,264 3,849 155.43 440,775 3,204 137.55Premier Class US$ Distributing (M) 1,627 14 115.10 51,121 445 114.80 1,060 10 105.06Premier Class Euro Accumulating (Hedged) 79,619 570 115.80 71,846 572 113.82 87,784 744 103.72LM Class Euro Accumulating 2,000 14 120.86 2,404 17 127.75 1,945 16 109.40LM Class GBP Accumulating (Hedged) 73 – 156.34 27 – 152.63 35 – 136.94Class A (G) US$ Accumulating 209 1 173.50 923 5 169.67 824 5 151.45Class A (G) US$ Distributing (D) 1,267 10 122.48 1,340 11 122.06 1,554 14 111.73Class B (G) US$ Distributing (D) 4 – 122.50 4 – 122.07 4 – 111.73Class L (G) US$ Accumulating 246 2 161.87 247 2 159.09 222 2 142.72Class L (G) US$ Distributing (D) 1,239 10 122.50 1,221 10 122.08 1,099 10 111.74
Legg Mason Western Asset Euro Core Plus Bond FundClass A US$ Distributing (D) € 258 2 132.74 € 236 2 120.04 € 220 2 115.33Class A Euro Distributing (D) 1,293 11 114.08 1,353 12 112.77 1,591 15 105.14Class C US$ Distributing (D) 162 1 132.39 161 1 120.34 215 2 115.94Class F Euro Distributing (Q) 1 – 130.68 1 – 129.00 1 – 120.12Class X Euro Distributing (D) – – – – – – 1 – 100.02Premier Class Euro Accumulating 1,181 11 110.48 868 8 108.30 – – –LM Class Euro Accumulating 106,972 939 113.90 119,975 1,078 111.32 110,763 1,080 102.52Class GA Euro Accumulating 907 7 138.44 976 7 136.40 1,057 8 126.66Class GA Euro Distributing (A) 431 3 126.21 441 4 124.82 449 4 116.25Class GE Euro Accumulating 118 1 129.98 117 1 128.83 201 2 120.35
Legg Mason Western Asset Short Duration High IncomeBond FundClass A US$ Accumulating $ 7,428 46 161.04 $ 3,640 24 148.98 $ 3,067 21 145.70Class A US$ Distributing (D) 3,027 34 89.16 3,560 41 86.11 4,463 51 87.89Class A US$ Distributing (M) 194 2 94.22 259 3 90.97 89 1 92.84Class A US$ Distributing (M) Plus 323 3 95.63 370 4 93.51 1,643 17 96.75Class A AUD Distributing (M) (Hedged) Plus 33 – 93.23 66 1 92.19 75 1 96.34Class A Euro Accumulating (Hedged) 817 5 142.45 893 6 133.53 82 1 134.21Class A HKD Distributing (M) Plus 461 38 95.29 519 43 93.64 1,295 104 97.59Class B US$ Accumulating 28 – 154.71 110 1 143.50 132 1 140.73Class B US$ Distributing (D) 99 1 89.14 93 1 86.09 145 2 87.88Class C US$ Accumulating 3,374 22 150.15 1,275 9 139.60 1,947 14 137.21Class C US$ Distributing (D) 1,842 21 89.13 2,201 26 86.08 2,669 30 87.87Class F US$ Accumulating 2,234 21 106.56 1,425 15 98.18 – – –Premier Class Euro Accumulating (Hedged) 268 2 115.77 – – – – – –Class A (G) US$ Accumulating 748 5 159.33 845 6 147.53 990 7 144.47Class A (G) US$ Distributing (D) 4,507 50 90.76 4,741 54 87.65 5,442 61 89.47Class B (G) US$ Distributing (D) 5 – 90.85 5 – 87.75 5 – 89.57Class L (G) US$ Accumulating 884 6 148.76 885 6 138.43 874 6 136.24Class L (G) US$ Distributing (D) 161 2 90.76 154 2 87.65 242 3 89.48
Legg Mason Western Asset Global Multi Strategy FundClass A US$ Accumulating $ 17,681 103 172.05 $ 23,852 144 165.19 $ 23,839 155 153.85Class A US$ Distributing (D) 30,274 258 117.46 43,654 376 116.09 40,316 359 112.44Class A US$ Distributing (M) 2,766 28 99.54 3,272 33 98.40 3,780 40 95.34Class A US$ Distributing (M) Plus 1,188 13 94.09 1,462 15 95.21 1,001 11 94.13Class A AUD Distributing (M) (Hedged) Plus 60 1 91.77 182 3 94.10 74 1 93.95Class A Euro Accumulating (Hedged) 7,761 43 149.53 7,931 49 145.60 7,689 48 139.53Class A Euro Distributing (M) (Hedged) 4,956 48 85.25 5,568 59 85.46 6,317 65 85.22Class A Euro Distributing (M) (Hedged) Plus (e) 337 4 73.99 491 6 75.18 491 6 75.98Class A GBP Distributing (M) (Hedged) 655 5 98.21 740 6 98.15 943 7 96.69Class A HKD Distributing (M) Plus 119 10 90.69 121 10 92.23 115 10 91.82Class A SGD Distributing (M) (Hedged) Plus 989 1,353 0.97 1,035 1,455 0.99 1,177 1,614 0.99Class B US$ Accumulating 34 – 161.33 33 – 155.29 31 – 144.99Class B US$ Distributing (D) 506 4 117.46 710 6 116.11 375 3 112.44Class C US$ Accumulating 8,648 55 156.41 10,470 69 150.92 10,996 78 141.27Class C US$ Distributing (D) 12,439 106 117.45 16,220 140 116.08 17,968 160 112.42Class A ZAR Distributing (M) (Hedged) Plus 1,219 21 882.77 1,549 26 925.46 243 4 938.40Class E US$ Accumulating 1,995 14 137.57 2,669 20 132.88 1,887 15 124.50Class E US$ Distributing (D) 784 8 97.82 811 8 96.67 1,078 12 93.63Class E Euro Accumulating (Hedged) 268 2 112.17 603 5 109.90 534 4 105.96Class E Euro Distributing (M) (Hedged) 42 – 86.96 50 1 87.17 40 – 86.92Class F US$ Accumulating 20,252 128 158.42 3,602 24 151.20 5,818 42 139.98Class F US$ Distributing (D) 7,007 72 97.83 11,793 122 96.70 9,695 104 93.66
The accompanying notes are an integral part of the Financial Statements
243

Legg Mason Global Funds Plc Annual Report 28 February 2021
Statement of Financial Position – (continued)28 February 2021 29 February 2020 28 February 2019
Total NAV(000’s)
No. Shares(000’s) NAV/Share:
Total NAV(000’s)
No. Shares(000’s) NAV/Share:
Total NAV(000’s)
No. Shares(000’s) NAV/Share:
Legg Mason Western Asset Global Multi Strategy Fund(continued)Class X US$ Distributing (D) $ 2,769 28 97.99 $ 3,241 33 96.85 $ 64 1 93.80Class X GBP Distributing (D) (Hedged) 85 1 94.05 117 1 93.98 109 1 92.41Premier Class US$ Accumulating 53,511 280 191.11 121,997 670 181.95 45,900 273 168.02Premier Class US$ Distributing (M) 8,814 72 121.64 21,905 182 120.24 33,682 289 116.50Premier Class CHF Accumulating (Hedged) 1,972 15 115.93 1,842 16 112.25 30,024 280 107.12Premier Class Euro Accumulating (Hedged) 5,709 32 147.15 5,982 38 142.07 4,185 27 134.97Premier Class Euro Distributing (M) (Hedged) 80 1 82.36 78 1 82.56 95 1 82.32Premier Class GBP Accumulating (Hedged) 67,295 336 143.71 64,023 361 138.31 105,616 613 129.83Premier Class GBP Distributing (M) (Hedged) 25,240 191 94.73 48,664 401 94.69 52,466 424 93.26Premier Class GBP Distributing (M) (Hedged) Plus (e) 185 2 83.56 1,129 10 83.96 1,856 17 83.11Premier Class GBP Distributing (Q) (Hedged) – – – 43 – 90.86 293 2 89.72Premier Class PLN Accumulating (Hedged) 7,095 203 131.13 7,472 233 125.91 4,445 143 117.23LM Class AUD Distributing (M) (Hedged) 80,077 947 109.85 71,162 994 109.92 76,692 1,005 107.57LM Class GBP Accumulating (Hedged) 283,119 1,361 149.34 249,697 1,360 143.15 241,425 1,360 133.81
Legg Mason Western Asset US High Yield FundClass A US$ Accumulating $ 22,041 113 194.57 $ 21,792 122 178.18 $ 25,597 153 167.57Class A US$ Distributing (D) 34,730 428 81.22 36,152 465 77.78 31,703 413 76.72Class A US$ Distributing (M) 1,568 16 97.97 1,572 17 93.82 1,063 11 92.50Class A US$ Distributing (M) Plus 7,832 91 85.88 993 12 83.46 591 7 83.54Class A Euro Distributing (M) (Hedged) 1,543 15 83.50 1,376 15 81.10 1,446 15 82.27Class A SGD Distributing (M) (Hedged) Plus 548 891 0.82 412 715 0.80 383 642 0.81Class B US$ Accumulating 14 – 193.00 13 – 177.18 45 – 167.04Class B US$ Distributing (D) 904 11 81.26 1,040 13 77.81 1,394 18 76.75Class C US$ Accumulating 3,766 20 186.64 4,137 24 171.77 4,824 30 162.35Class C US$ Distributing (D) 2,914 36 81.24 3,987 51 77.80 4,319 56 76.74Class E US$ Accumulating 3,706 21 176.53 3,752 23 162.63 4,942 32 153.86Class E US$ Distributing (D) 1,123 11 101.51 2,765 28 97.22 2,985 31 95.90Class E Euro Accumulating (Hedged) 319 2 106.80 272 2 99.79 – – –Class F US$ Accumulating 6,330 36 177.08 1,514 9 161.20 1,138 8 150.68Class F US$ Distributing (D) 42 – 96.61 1,048 11 92.72 297 3 91.43Class X GBP Accumulating (Hedged) 2 – 109.71 1 – 101.04 – – –Class X GBP Distributing (D) (Hedged) – – – – – – 149 1 102.86Premier Class US$ Accumulating 67,635 369 183.40 34,426 207 166.53 3,034 20 155.28Premier Class GBP Accumulating (Hedged) 972 6 110.82 822 6 101.84 – – –LM Class US$ Accumulating 45,078 232 194.69 25,201 143 176.00 23,392 143 163.37LM Class US$ Distributing (M) 15,196 170 89.59 24,780 289 85.79 38,226 452 84.58LM Class GBP Accumulating (Hedged) 130 1 112.05 11 – 102.83 41 – 158.41Class A (G) US$ Accumulating 238 1 198.94 294 2 181.91 291 2 170.82Class A (G) US$ Distributing (D) 1,335 17 80.58 1,537 20 77.17 1,799 24 76.12Class L (G) US$ Accumulating 186 1 185.59 190 1 170.55 249 2 160.96Class L (G) US$ Distributing (D) 827 10 80.57 922 12 77.16 1,257 17 76.12Class GF US$ Accumulating 148 1 176.59 184 1 161.15 2,091 14 151.03
Legg Mason Western Asset Emerging Markets Total ReturnBond FundClass A US$ Accumulating $ 8,296 44 186.70 $ 3,616 21 176.11 $ 3,984 24 167.11Class A US$ Distributing (D) 2,117 19 111.90 2,213 20 108.56 3,860 36 107.45Class A US$ Distributing (M) 1,147 11 101.20 1,277 13 98.18 1,822 19 97.16Class A US$ Distributing (M) Plus 65 1 77.88 10 – 77.54 55 1 78.18Class A Euro Accumulating (Hedged) 295 2 140.72 135 1 134.44 247 2 131.27Class A Euro Distributing (D) (Hedged) 397 4 77.14 427 5 75.79 484 6 77.16Class A GBP Distributing (D) (Hedged) 52 – 95.23 46 – 93.14 48 – 93.65Class A SGD Distributing (M) (Hedged) Plus 5 8 0.80 88 152 0.81 113 187 0.82Class B US$ Distributing (D) – – – – – – 7 – 107.40Class C US$ Accumulating 410 2 170.41 386 2 161.54 462 3 154.06Class C US$ Distributing (D) 1,548 14 111.85 1,874 17 108.51 2,626 24 107.38Class E US$ Distributing (D) 732 8 95.61 1,960 21 92.78 1,521 17 91.81Class E Euro Accumulating (Hedged) 12 – 99.00 11 – 95.37 11 – 93.81Class E Euro Distributing (M) (Hedged) 69 1 86.16 21 – 84.67 21 – 86.24Class F US$ Accumulating 98 1 165.41 173 1 155.02 176 1 146.08Class X US$ Accumulating – – – – – – 1 – 113.89Class X GBP Distributing (D) (Hedged) 17 – 92.43 16 – 90.40 24 – 90.92Premier Class US$ Accumulating 101 1 101.47 – – – 1,479 6 237.85Premier Class Euro Accumulating (Hedged) 3,388 21 135.63 1,504 11 128.44 1,301 9 124.19Premier Class GBP Distributing (D) (Hedged) 46 – 82.85 21 – 81.06 57 1 81.61Class A (G) US$ Accumulating 750 4 194.69 787 4 183.30 1,239 7 173.51Class A (G) US$ Distributing (D) 995 10 100.32 1,183 12 97.32 1,280 13 96.30Class L (G) US$ Accumulating 1,236 7 181.62 1,275 7 171.85 1,251 8 163.49Class L (G) US$ Distributing (D) 993 10 100.29 1,782 18 97.31 2,124 22 96.29
Legg Mason Western Asset Emerging Markets CorporateBond FundClass A US$ Accumulating $ 1 – 119.07 $ 1 – 113.96 $ 1 – 105.11Class A US$ Distributing (M) 1 – 103.39 1 – 100.73 1 – 94.72Premier Class Euro Accumulating (Hedged) 559 4 104.70 381 3 99.71 – – –LM Class US$ Distributing (M) 39,672 384 103.43 42,161 418 100.79 37,500 396 94.77
Legg Mason Western Asset Global High Yield FundClass A US$ Accumulating $ 10,843 58 186.88 $ 10,569 61 173.88 $ 26,325 160 164.59Class A US$ Distributing (D) 9,793 124 78.92 11,164 147 76.09 12,816 170 75.55Class A US$ Distributing (M) 13,355 153 87.32 15,940 189 84.19 17,625 211 83.58Class A US$ Distributing (M) Plus 7,846 97 81.26 4,200 52 80.29 4,817 59 81.08Class A AUD Distributing (M) (Hedged) Plus 9,349 127 95.70 9,438 151 95.88 12,124 175 97.83Class A Euro Accumulating 2,039 15 110.41 2,491 20 112.26 2,860 24 103.14Class A Euro Distributing (D) (Hedged) 637 6 81.71 555 6 79.97 621 7 81.69Class A SGD Distributing (M) (Hedged) Plus 10,208 17,351 0.78 2,293 4,095 0.78 2,394 4,085 0.79Class B US$ Accumulating 75 – 183.97 99 1 171.60 149 1 162.85Class B US$ Distributing (D) 341 4 78.75 337 4 75.93 539 7 75.41Class C US$ Accumulating 1,663 9 178.91 1,734 10 167.29 1,539 10 159.15Class C US$ Distributing (D) 4,827 61 78.57 6,063 80 75.76 7,344 98 75.22Class E US$ Accumulating 1,086 7 164.08 1,334 9 153.60 1,770 12 146.29Class E US$ Distributing (D) 224 2 96.74 273 3 93.27 229 2 92.60Class E Euro Accumulating (Hedged) – – – 111 1 102.81 3 – 100.65Class E Euro Distributing (M) (Hedged) 20 – 81.17 38 – 79.37 32 – 81.07Class F US$ Accumulating 396 2 167.08 538 3 154.40 311 2 145.16Class F US$ Distributing (D) 912 10 91.86 940 11 88.59 975 11 87.95Class X US$ Accumulating – – – – – – 85 1 118.78Class X US$ Distributing (D) 3,840 37 102.93 2,799 28 99.23 1,655 17 98.52Class X GBP Distributing (D) (Hedged) 3,119 27 83.60 1,914 18 81.56 762 7 82.35Premier Class US$ Accumulating 14,056 64 220.31 24,054 118 203.09 2,432 13 190.43Premier Class US$ Distributing (M) Plus (e) – – – 1,975 23 85.33 8,811 103 85.21Premier Class Euro Accumulating (Hedged) 1,829 11 132.11 2,507 18 123.53 5,855 43 119.22Premier Class GBP Distributing (D) (Hedged) 39 – 90.91 35 – 88.70 42 – 89.58LM Class US$ Accumulating – – – – – – 1,421 12 113.75Class A (G) US$ Accumulating 2,521 13 190.27 2,469 14 176.79 2,891 17 167.11Class A (G) US$ Distributing (D) 2,197 28 78.93 2,316 30 76.10 2,409 32 75.56Class L (G) US$ Accumulating 605 3 177.52 638 4 165.78 675 4 157.49Class L (G) US$ Distributing (D) 742 9 78.93 919 12 76.11 1,299 17 75.56
The accompanying notes are an integral part of the Financial Statements
244

Legg Mason Global Funds Plc Annual Report 28 February 2021
Statement of Financial Position – (continued)28 February 2021 29 February 2020 28 February 2019
Total NAV(000’s)
No. Shares(000’s) NAV/Share:
Total NAV(000’s)
No. Shares(000’s) NAV/Share:
Total NAV(000’s)
No. Shares(000’s) NAV/Share:
Legg Mason Western Asset US Short-Term GovernmentFund^Class A US$ Accumulating $ – – – $ – – – $ 4,630 41 112.61Class A US$ Distributing (D) – – – – – – 494 5 98.69Class B US$ Accumulating – – – – – – 39 – 106.25Class C US$ Accumulating – – – – – – 2,869 28 103.10Class C US$ Distributing (D) – – – – – – 1,705 18 96.53Class A (G) US$ Accumulating – – – – – – 617 5 112.49Class A (G) US$ Distributing (D) – – – – – – 2,555 26 98.55Class L (G) US$ Accumulating – – – – – – 35 – 105.99Class L (G) US$ Distributing (D) – – – – – – 299 3 96.30
Legg Mason Western Asset US Adjustable Rate Fund^Class A US$ Accumulating $ – – – $ – – – $ 3,968 40 99.17Class B US$ Distributing (D) – – – – – – 47 1 90.07Class C US$ Distributing (D) – – – – – – 189 2 87.96Class A (G) US$ Accumulating – – – – – – 321 3 97.03Class A (G) US$ Distributing (D) – – – – – – 502 6 90.84Class L (G) US$ Distributing (D) – – – – – – 177 2 86.64
Legg Mason Western Asset Global Inflation ManagementFundClass A US$ Accumulating $ 1,881 13 149.48 $ 1,774 12 143.51 $ 3,809 28 137.81Class A US$ Distributing (A) 5,428 42 128.65 6,067 48 125.31 7,235 60 121.27Class B US$ Accumulating 59 1 104.74 57 1 100.82 74 1 97.05Class C US$ Accumulating – – – 71 1 105.91 505 5 102.20Class C US$ Distributing (A) 511 4 125.73 505 4 122.44 691 6 118.51LM Class US$ Accumulating 40,849 369 110.79 38,826 369 105.30 25,026 250 100.10Class A (G) US$ Accumulating 5 – 156.66 5 – 150.09 474 3 143.81Class A (G) US$ Distributing (A) 51 – 125.55 57 – 122.31 55 – 118.37Class L (G) US$ Accumulating – – – 132 1 140.44 128 1 135.27Class L (G) US$ Distributing (A) 14 – 116.06 14 – 113.02 13 – 109.39
Legg Mason Western Asset Asian Opportunities FundClass A US$ Accumulating $ 44,824 269 166.82 $ 52,900 329 160.69 $ 59,949 404 148.54Class A US$ Distributing (D) 7,638 67 113.74 10,398 92 112.49 10,842 101 107.40Class A US$ Distributing (M) 20,694 198 104.75 27,023 261 103.60 13,996 142 98.90Class A US$ Distributing (M) Plus 81,474 1,015 80.31 68,262 841 81.14 44,949 570 78.83Class A AUD Distributing (M) (Hedged) Plus 33,416 480 90.52 31,171 520 92.03 18,510 289 90.32Class A CHF Accumulating (Hedged) 840 8 101.76 350 3 99.57 323 3 95.08Class A CNH Distributing (M) (Hedged) Plus 8,143 592 89.20 17,638 1,366 90.13 8,696 664 87.72Class A Euro Accumulating 4,757 18 217.73 5,202 21 229.25 1,679 7 205.71Class A Euro Accumulating (Hedged) 2,884 22 110.91 2,203 18 108.23 1,843 16 102.98Class A Euro Distributing (A) 665 5 113.12 679 5 122.98 870 7 113.99Class A GBP Distributing (D) (Hedged) – – – – – – 34 – 89.10Class A HKD Distributing (M) Plus 23,309 1,882 96.06 20,206 1,614 97.57 20,181 1,658 95.53Class A SGD Accumulating (Hedged) 1,649 1,416 1.55 1,809 1,679 1.50 2,160 2,091 1.40Class A SGD Distributing (M) (Hedged) Plus 3,984 6,341 0.84 2,115 3,466 0.85 1,524 2,479 0.83Class A SGD Distributing (M) Plus 987 1,514 0.87 3,251 4,919 0.92 137 213 0.87Class B US$ Accumulating 64 – 161.52 113 1 155.97 105 1 144.54Class B US$ Distributing (D) 112 1 113.66 137 1 112.42 227 2 107.38Class C US$ Accumulating 2,210 14 156.11 2,515 17 151.12 2,501 18 140.40Class C US$ Distributing (D) 2,241 20 113.77 2,867 25 112.53 3,247 30 107.43Class E US$ Accumulating 906 7 134.91 557 4 130.72 568 5 121.57Class E US$ Distributing (D) 237 2 104.56 230 2 103.42 214 2 98.74Class F US$ Accumulating 11,537 76 151.67 6,703 46 145.51 2,444 18 133.97Class F US$ Distributing (D) 689 7 104.62 500 5 103.47 477 5 98.78Class X US$ Accumulating 7,895 70 112.93 299 3 99.72 1 – 101.82Class X US$ Distributing (M) 3,672 36 100.69 2,490 25 99.59 2,708 28 95.06Class X CHF Accumulating (Hedged) – – – – – – 608 6 96.52Class X Euro Accumulating 570 5 98.39 – – – – – –Class X Euro Accumulating (Hedged) 297 2 102.39 – – – 1,250 11 96.84Premier Class US$ Accumulating 80,687 446 180.73 50,697 293 172.96 53,625 338 158.85Premier Class US$ Distributing (M) 170 2 100.83 88 1 111.82 15,331 144 106.68Premier Class Euro Accumulating 130,921 721 150.58 121,577 699 157.51 99,919 626 140.43Premier Class Euro Accumulating (Hedged) 6,424 43 123.15 5,180 39 119.39 5,742 45 112.83Premier Class Euro Distributing (A) 83,139 688 100.09 80,602 671 108.84 61,640 537 100.88Premier Class Euro Distributing (M) 12,865 102 104.95 12,724 102 113.45 10,005 84 105.09Premier Class GBP Distributing (M) 225 1 112.95 169 1 121.21 117 1 111.91LM Class US$ Accumulating 46,784 242 193.24 43,279 235 183.83 55,218 329 167.81
Legg Mason Western Asset Short Duration Blue Chip BondFundClass A US$ Accumulating $ 32,132 247 130.34 $ 1,468 12 127.36 $ 912 8 121.11Class A US$ Distributing (M) 10,545 96 109.95 554 5 107.64 628 6 103.14Class A Euro Accumulating (Hedged) 12,195 101 100.26 693 6 99.10 16 – 96.90Class A SEK Accumulating (Hedged) 312 26 100.13 – – – – – –Class A SEK Distributing (M) (Hedged) 1 – 100.01 – – – – – –Class B US$ Accumulating 335 3 110.43 328 3 108.17 313 3 103.12Class C US$ Accumulating 5,301 43 122.95 700 6 120.73 715 6 115.39Class C US$ Distributing (M) 416 4 109.37 302 3 107.42 100 1 102.93Class E US$ Accumulating 3,972 34 115.98 491 4 114.00 822 8 109.06Class E US$ Distributing (D) 5,448 52 105.19 1,152 11 103.39 1,138 11 99.14Class F US$ Accumulating 13,216 102 130.00 194 2 126.52 183 2 119.83Class F US$ Distributing (D) 100 1 100.48 – – – – – –Class X US$ Distributing (M) – – – – – – 1 – 97.76Class X Euro Accumulating (Hedged) 2,968 25 100.14 – – – – – –Premier Class US$ Accumulating 23,015 163 141.38 1,996 15 137.25 1,316 10 129.66Premier Class Euro Accumulating (Hedged) 37,172 294 104.95 3,172 28 103.06 – – –Premier Class Euro Distributing (M) (Hedged) 514 4 97.87 191 2 96.94 194 2 95.58Premier Class GBP Accumulating (Hedged) 54 – 133.95 118 1 130.96 76 – 125.73Premier Class GBP Distributing (M) (Hedged) 2,453 17 105.05 1,951 15 103.56 2,253 17 100.83S Class US$ Distributing (M) Plus (e) 22,076 211 104.79 12,698 123 102.93 6,333 64 98.97S Class Euro Distributing (M) (Hedged) Plus (e) 4,128 35 97.13 3,330 31 96.54 440 4 95.47S Class GBP Distributing (M) (Hedged) Plus (e) 340,795 2,442 100.19 247,197 1,945 99.11 84,941 661 96.82S Class AUD Distributing (M) (Hedged) Plus (e) 1,551 20 99.63 – – – – – –
Legg Mason Western Asset Global Core Plus Bond Fund^Class A US$ Distributing (A) $ 1 – 107.12 $ 57 1 107.42 $ 52 1 99.43Class A US$ Distributing (D) – – – – – – 2,514 22 115.12Class X US$ Accumulating 173 1 119.24 102 1 117.22 1,447 14 106.11Premier Class US$ Accumulating 119,487 741 161.26 97,723 618 158.05 115,046 807 142.65Premier Class Euro Accumulating (Hedged) 44,983 324 114.96 57,901 460 114.12 49,307 409 105.99Premier Class NZD Accumulating (Hedged) 10,056 126 110.51 4,962 73 108.94 3,781 56 99.14LM Class US$ Accumulating 3,845 34 112.59 2,954 27 109.91 – – –LM Class CAD Accumulating (Hedged) 107,747 1,177 116.50 100,259 1,177 114.34 77,746 989 103.42
Legg Mason Western Asset Global Credit Fund^Class A US$ Accumulating $ 1,759 12 149.41 $ 3,147 22 143.70 $ 409 3 127.85Class A US$ Distributing (D) – – – – – – 1,741 16 109.57Class A Euro Accumulating (Hedged) 663 4 132.35 547 4 129.02 423 3 118.12
The accompanying notes are an integral part of the Financial Statements
245

Legg Mason Global Funds Plc Annual Report 28 February 2021
Statement of Financial Position – (continued)28 February 2021 29 February 2020 28 February 2019
Total NAV(000’s)
No. Shares(000’s) NAV/Share:
Total NAV(000’s)
No. Shares(000’s) NAV/Share:
Total NAV(000’s)
No. Shares(000’s) NAV/Share:
Legg Mason Western Asset Global Credit Fund^ (continued)Class X US$ Distributing (D) $ – – – $ – – – $ 1 – 102.06LM Class US$ Accumulating 75,669 432 174.98 75,467 454 166.28 66,342 454 146.17LM Class Euro Accumulating (Hedged) 4,634 39 98.28 – – – – – –
Legg Mason Western Asset Euro High Yield FundClass A Euro Distributing (D) € 50 – 101.58 € 259 3 101.31 € 177 2 101.21Premier Class Euro Accumulating – – – 670 6 103.79 – – –Premier Class GBP Accumulating (Hedged) 1 – 106.20 211 2 101.71 – – –LM Class Euro Accumulating 45,868 248 184.67 46,826 266 176.36 65,144 385 169.05LM Class Euro Distributing (Q) 8,426 82 102.24 9,137 90 102.03 10,818 106 102.06
Legg Mason Western Asset Macro Opportunities BondFund^Class A US$ Accumulating $ 1,113,975 7,721 144.28 $ 1,259,519 8,988 140.13 $ 1,245,618 9,644 129.17Class A US$ Distributing (M) Plus (e) 306,584 3,054 100.39 440,689 4,332 101.73 387,644 3,917 98.97Class A US$ Distributing (S) 69,201 610 113.39 110,113 970 113.49 164,019 1,506 108.90Class A AUD Accumulating (Hedged) 3,476 42 107.62 7,586 110 106.03 2,659 38 98.86Class A AUD Distributing (M) (Hedged) Plus (e) 47,368 621 99.08 58,259 878 101.85 27,044 380 100.24Class A CHF Accumulating (Hedged) 24,026 179 121.93 25,222 202 120.46 26,798 233 114.74Class A CNH Accumulating (Hedged) 2,098 91 149.98 2,269 110 143.52 4,627 235 131.96Class A CNH Distributing (M) (Hedged) Plus (e) 5,411 309 113.75 5,228 321 113.54 4,263 259 110.20Class A Euro Accumulating (Hedged) 527,701 3,474 125.91 677,301 4,946 124.04 678,424 5,067 117.72Class A Euro Distributing (A) 11,415 95 99.74 16,676 137 110.46 9,368 80 102.35Class A Euro Distributing (M) (Hedged) Plus (e) 15,400 131 97.33 32,274 292 100.01 – – –Class A Euro Distributing (S) (Hedged) 13,660 108 104.74 27,380 233 106.28 34,699 290 105.10Class A GBP Accumulating 679 3 149.10 557 3 157.36 1,488 8 140.33Class A GBP Accumulating (Hedged) 80,106 438 131.16 100,871 605 130.06 55,357 343 121.84Class A GBP Distributing (M) (Hedged) Plus (e) 24,353 187 93.46 35,547 289 95.88 20,864 166 94.97Class A HKD Distributing (M) Plus 821 65 98.41 839 65 101.12 – – –Class A HKD Distributing (M) Plus (e) – – – 5 – 100.35 – – –Class A SEK Accumulating (Hedged) 65,000 4,774 114.96 63,521 5,375 113.55 63,285 5,428 107.68Class A SGD Accumulating (Hedged) 23,348 22,675 1.37 41,277 42,863 1.34 38,168 41,450 1.24Class A SGD Distributing (M) (Hedged) Plus (e) 64,576 87,738 0.98 98,354 137,007 1.00 53,142 73,347 0.98Class B US$ Accumulating 564 4 130.23 551 4 126.80 733 6 117.17Class C US$ Accumulating 77,546 595 130.34 86,190 678 127.22 84,384 716 117.85Class C US$ Distributing (S) 8,547 76 112.24 11,422 102 112.29 13,618 126 107.76Class A JPY Distributing (M) Plus (e) 202 2 9,360.01 205 2 9,597.54 – – –Class A NOK Accumulating (Hedged) 3,335 278 103.89 1,340 122 103.16 723 64 96.30Class E US$ Accumulating 35,437 275 128.70 44,635 355 125.75 45,442 390 116.61Class E US$ Distributing (S) 2,926 26 111.93 4,480 40 111.97 5,705 53 107.46Class E Euro Accumulating (Hedged) 9,964 73 113.66 11,825 95 112.62 12,631 103 107.53Class F US$ Accumulating 179,479 1,311 136.86 197,803 1,494 132.39 160,329 1,319 121.54Class F US$ Distributing (S) 11,942 104 114.87 16,560 144 115.00 23,485 213 110.33Class X US$ Accumulating 266,393 1,838 144.94 288,619 2,061 140.07 298,902 2,327 128.46Class X US$ Distributing (M) Plus (e) 55,862 529 105.61 69,812 656 106.49 71,346 692 103.08Class X US$ Distributing (S) 26,356 233 113.02 32,868 290 113.15 17,550 162 108.56Class X CHF Accumulating (Hedged) 38,488 280 125.16 39,146 307 123.05 42,944 368 116.61Class X Euro Accumulating 18,964 103 152.32 23,044 130 160.90 5,143 32 143.30Class X Euro Accumulating (Hedged) 239,226 1,518 130.58 246,582 1,745 127.98 276,085 2,008 120.86Class X Euro Distributing (A) (Hedged) 16,549 137 99.76 26,698 236 102.51 17,946 156 100.87Class X Euro Distributing (M) (Hedged) 8,524 70 101.14 8,629 77 102.14 8,113 71 100.57Class X GBP Accumulating 4,753 22 154.01 8,782 42 161.72 5,980 31 143.38Class X GBP Accumulating (Hedged) 123,193 646 136.98 131,924 768 134.02 126,647 763 125.13Class X GBP Distributing (M) (Hedged) Plus (e) 9,661 70 99.15 10,745 83 101.20 8,385 63 99.74Class X SGD Accumulating (Hedged) 5,456 5,119 1.42 4,288 4,324 1.38 2,746 2,911 1.28Premier Class US$ Accumulating 687,346 4,546 151.21 886,628 6,077 145.91 520,945 3,899 133.62Premier Class US$ Distributing (S) 100,741 893 112.76 119,928 1,062 112.91 64,386 594 108.32Premier Class AUD Accumulating (Hedged) 4,895 57 112.53 3,930 55 110.16 2,997 41 102.03Premier Class AUD Distributing (S) (Hedged) 56,082 650 112.06 47,810 643 114.07 53,297 678 110.76Premier Class BRL Accumulating (Hedged) 171,166 5,814 165.00 211,643 5,879 160.99 187,702 4,862 145.01Premier Class CHF Accumulating (Hedged) 23,377 178 119.50 22,667 186 117.33 31,032 279 111.04Premier Class CHF Distributing (S) (Hedged) 2,231 20 101.00 11,898 112 102.79 12,050 118 101.95Premier Class Euro Accumulating 40,171 210 158.22 23,876 130 166.92 6,567 39 148.41Premier Class Euro Accumulating (Hedged) 792,826 5,126 128.18 809,243 5,844 125.44 877,414 6,522 118.27Premier Class Euro Distributing (S) (Hedged) 116,650 937 103.20 73,703 637 104.73 77,615 659 103.56Premier Class GBP Accumulating (Hedged) 276,937 1,544 128.72 351,520 2,180 125.75 374,134 2,406 117.24Premier Class GBP Distributing (M) (Hedged) Plus (e) 366,571 2,716 96.89 371,070 2,931 98.75 307,196 2,384 97.17Premier Class JPY Accumulating (Hedged) 96,121 851 12,036.16 105,369 969 11,734.52 84,544 854 11,035.98Premier Class JPY Distributing (S) (Hedged) 9,547 100 10,176.83 9,538 100 10,288.34 – – –Premier Class PLN Accumulating (Hedged) 4,054 137 110.55 5,195 189 107.64 3,925 149 99.51Premier Class SEK Accumulating (Hedged) 211 15 119.05 5,575 458 116.90 7,443 624 110.14S Class US$ Accumulating 15,089 97 155.64 30,464 204 149.59 41,131 301 136.44S Class Euro Accumulating (Hedged) 238,793 1,427 138.74 208,694 1,398 135.24 225,498 1,561 127.00LM Class AUD Distributing (S) (Hedged) 99,146 1,203 107.10 67,660 952 109.05 56,143 748 105.86LM Class Euro Accumulating 1,561 10 134.29 1,904 12 140.27 1,546 11 123.42
Legg Mason Western Asset EM Local Currency Debt Fund^Class A US$ Distributing (D) $ – – – $ – – – $ 59 1 94.77Premier Class US$ Accumulating – – – – – – 33,791 287 117.71LM Class US$ Distributing (M) – – – – – – 1,633 19 85.70
Legg Mason Western Asset Multi-Asset Credit Fund^Class A US$ Accumulating $ 25 – 117.40 $ 25 – 114.29 $ 23 – 106.76Class A US$ Distributing (M) Plus (e) 1 – 96.28 1 – 98.10 3 – 96.12Class A Euro Accumulating (Hedged) 32 – 106.04 94 1 104.59 104 1 100.52Class C US$ Accumulating 1 – 116.81 1 – 113.85 1 – 106.43Class E US$ Accumulating – – – 1 – 113.85 1 – 106.43Class F US$ Accumulating 57 – 120.73 8,552 73 116.83 4,756 44 108.48Class X CHF Distributing (M) (Hedged) 51 1 88.00 50 1 90.14 66 1 90.64Premier Class Euro Accumulating (Hedged) 6,928 53 107.41 4,855 42 105.11 – – –Premier Class GBP Distributing (M) (Hedged) Plus (e) 739 5 97.54 893 7 99.94 – – –S Class US$ Accumulating 1,837 18 99.62 – – – – – –S Class Euro Accumulating (Hedged) 22,329 178 103.76 14,536 130 101.34 – – –S Class GBP Accumulating (Hedged) 30,991 213 104.46 25,563 196 101.65 – – –LM Class AUD Accumulating (Hedged) 93,024 1,060 114.07 51,649 716 110.67 17,913 245 102.89LM Class Euro Accumulating (Hedged) 34,648 276 104.10 30,112 269 101.27 – – –LM Class GBP Accumulating (Hedged) 891,195 5,014 127.59 735,665 4,640 123.66 706,649 4,603 115.75
Legg Mason Western Asset Global Total Return InvestmentGrade Bond Fund^Class A US$ Distributing (M) Plus (e) $ – – – $ – – – $ 100 1 92.57Class A Euro Accumulating (Hedged) – – – – – – 97 1 94.39Class A Euro Distributing (A) (Hedged) – – – – – – 97 1 92.25Class X Euro Distributing (A) (Hedged) – – – – – – 11 – 93.12Class X GBP Distributing (M) (Hedged) Plus (e) – – – – – – 394 3 91.26Premier Class US$ Accumulating – – – – – – 1,103 11 103.43Premier Class Euro Accumulating (Hedged) – – – – – – 592 5 96.61Premier Class JPY Accumulating (Hedged) – – – – – – 5,245 60 9,743.84Premier Class JPY Distributing (S) (Hedged) – – – – – – 41,813 495 9,412.17S Class GBP Distributing (M) (Hedged) Plus (e) – – – – – – 22 – 93.53
The accompanying notes are an integral part of the Financial Statements
246

Legg Mason Global Funds Plc Annual Report 28 February 2021
Statement of Financial Position – (continued)28 February 2021 29 February 2020 28 February 2019
Total NAV(000’s)
No. Shares(000’s) NAV/Share:
Total NAV(000’s)
No. Shares(000’s) NAV/Share:
Total NAV(000’s)
No. Shares(000’s) NAV/Share:
Legg Mason Western Asset Structured OpportunitiesFund^Class D AUD Distributing (M) (Hedged) Plus $ – – – $ 77 1 99.23 $ 84 1 98.49Class D Euro Accumulating (Hedged) 956 8 98.05 2,112 18 105.72 1,815 16 100.56Class D Euro Distributing (M) (Hedged) 470 5 86.54 3,486 32 97.58 1,884 17 97.34Class D US$ Accumulating 23,854 224 106.44 39,063 344 113.53 23,357 223 104.95Class D US$ Distributing (M) 24,978 271 92.27 8,939 87 103.00 12,231 122 99.86Class D US$ Distributing (M) Plus 9,749 110 88.49 2,008 20 100.38 1,974 20 98.71Class M CHF Accumulating (Hedged) 1,956 18 98.68 1,433 13 106.07 601 6 100.64Class M GBP Distributing (M) (Hedged) 743 6 88.90 1,021 8 99.50 1,040 8 98.04Class F US$ Accumulating 445 4 108.97 571 5 116.05 5,458 51 107.11Class M US$ Accumulating 1,412 15 96.69 742 7 102.52 – – –Class M US$ Distributing (M) 1,669 18 91.89 1,819 18 102.57 752 8 99.43Class M Euro Accumulating (Hedged) 61 1 101.10 60 1 108.31 196 2 102.50Premier Class US$ Accumulating 279,362 2,098 133.17 776,683 5,509 140.98 381,663 2,951 129.35Premier Class US$ Distributing (Q) 12,555 134 93.74 16,447 157 104.69 7,494 74 101.67Premier Class Euro Accumulating (Hedged) 234,526 1,612 120.58 464,987 3,266 128.97 200,844 1,451 121.71Premier Class Euro Distributing (Q) (Hedged) 26,899 255 87.43 29,216 269 98.57 19,616 175 98.51Premier Class GBP Distributing (M) (Hedged) Plus (e) 11,514 94 87.60 42,436 337 98.09 34,877 270 97.31Premier Class JPY Accumulating (Hedged) 56,345 500 12,014.65 – – – – – –LM Class US$ Accumulating 417,668 3,031 137.79 529,928 3,654 145.01 482,993 3,652 132.25
Legg Mason Western Asset US Mortgage-Backed SecuritiesFund^Class A US$ Distributing (M) Plus (e) $ 11 – 91.69 $ 10 – 95.11 $ 10 – 92.16Premier Class US$ Accumulating 1,822 18 103.98 1,681 16 103.59 – – –Premier Class Euro Accumulating (Hedged) 3,460 28 103.96 2,322 20 104.74 – – –LM Class US$ Accumulating 818,123 7,199 113.64 1,072,652 9,503 112.87 893,928 8,542 104.66
Legg Mason Western Asset UK Investment Grade CreditFund^Class A GBP Accumulating £ 1 – 117.41 £ 1 – 115.54 £ 1 – 105.05LM Class GBP Accumulating 76,684 637 120.47 113,271 964 117.55 85,166 801 106.27
Legg Mason Western Asset US Corporate Bond Fund^Class A US$ Accumulating $ 9,524 75 127.66 $ 7,621 63 121.93 $ 4,611 43 107.20Premier Class US$ Accumulating 15,160 132 114.85 17,437 160 108.98 – – –Premier Class Euro Accumulating (Hedged) 1,377 10 115.94 964 8 111.57 – – –LM Class GBP Accumulating (Hedged) 165,535 951 124.94 97,696 638 119.44 112,071 800 105.65
Western Asset UCITS SMASh Series Core Plus CompletionFund^µLM Class US$ Distributing (Q) $ 22,193 226 98.11 $ – – – $ – – –
Legg Mason Brandywine Global Fixed Income FundClass A US$ Accumulating $ 19,033 122 155.92 $ 21,756 146 148.61 $ 36,078 247 145.82Class A US$ Distributing (M) 1,610 16 100.20 2,356 24 96.74 2,740 28 97.20Class A US$ Distributing (M) Plus 293 3 99.20 290 3 97.59 – – –Class A US$ Distributing (S) 25,630 209 122.72 56,954 478 119.08 56,302 469 120.00Class A AUD Distributing (M) (Hedged) Plus 766 13 78.08 1,328 26 78.13 392 7 80.68Class A Euro Accumulating (Hedged) 645 6 91.29 711 7 88.46 43,370 427 89.39Class A Euro Accumulating (Hedged) (IH) 42,849 232 153.27 58,026 343 153.41 65,247 378 151.68Class A Euro Distributing (A) (Hedged) 874 9 80.04 779 9 79.60 877 9 82.56Class A Euro Distributing (S) 55 1 90.48 71 1 95.98 77 1 93.88Class A Euro Distributing (S) (Hedged) (IH) 10,173 80 104.76 11,798 100 106.75 15,251 124 108.28Class A GBP Accumulating 110 1 100.97 105 1 104.56 103 1 99.19Class A GBP Distributing (M) (Hedged) 395 3 84.89 455 4 83.23 531 5 85.15Class A GBP Distributing (S) (Hedged) (IH) 6,577 42 113.52 7,154 48 115.60 8,505 55 115.98Class A HKD Distributing (M) Plus – – – 4 – 97.23 – – –Class A SGD Accumulating 131 165 1.06 503 663 1.06 140 186 1.01Class B US$ Accumulating 51 – 141.97 72 1 135.65 130 1 133.44Class B US$ Distributing (S) 203 2 122.66 265 2 119.04 322 3 119.97Class C US$ Accumulating 1,083 8 137.44 1,169 9 131.64 1,115 9 129.82Class C US$ Distributing (S) 2,046 17 122.16 3,205 27 118.50 5,542 46 119.42Class E US$ Accumulating 1,301 12 105.04 1,604 16 100.71 2,291 23 99.42Class E Euro Accumulating (Hedged) 22 – 93.60 20 – 91.24 41 – 92.77Class E Euro Accumulating (Hedged) (IH) 1,480 11 109.94 2,347 19 110.69 3,587 29 109.95Class F US$ Accumulating 1,047 9 110.31 2,992 29 104.72 3,225 32 102.34Class F US$ Distributing (S) 159 2 90.55 152 2 87.87 107 1 88.55Class R US$ Distributing (S) – – – 75 1 87.79 125 1 88.46Class R GBP Distributing (S) (Hedged) (IH) 123 1 93.71 224 2 95.33 5,966 47 95.65Class X US$ Accumulating 3,376 31 110.50 10,989 105 104.79 17,085 167 102.31Class X US$ Distributing (S) 321 4 91.00 384 4 88.31 607 7 88.99Class X Euro Accumulating (Hedged) 422 4 98.90 2,500 24 95.33 92,473 848 95.89Class X Euro Accumulating (Hedged) (IH) 1,445 12 103.54 1,389 12 103.13 19,599 170 101.27Class X Euro Distributing (S) (Hedged) (IH) 1,065 10 92.37 1,367 13 94.19 2,473 23 95.58Class X GBP Accumulating 29,863 176 121.47 54,671 341 125.23 121,124 772 118.22Class X GBP Accumulating (Hedged) 26,554 192 99.19 40,952 334 95.53 8,469 67 94.93Class X GBP Accumulating (Hedged) (IH) 449 3 107.37 5,529 40 106.92 5,427 39 103.94Class X GBP Distributing (S) (Hedged) 21,758 187 83.45 31,695 300 82.35 34,251 306 84.48Class X GBP Distributing (S) (Hedged) (IH) 15,679 118 95.74 38,786 310 97.59 54,794 422 97.92Premier Class US$ Accumulating 46,937 366 128.17 190,725 1,572 121.36 142,026 1,200 118.31Premier Class US$ Distributing (S) 1,119 12 93.89 10,374 114 91.12 10,558 115 91.82Premier Class Euro Accumulating 5,368 31 145.47 18,781 113 150.75 41,806 257 142.76Premier Class Euro Accumulating (Hedged) 39,291 339 95.96 46,941 460 92.39 28,457 270 92.74Premier Class Euro Accumulating (Hedged) (IH) 37,310 238 129.75 97,818 686 129.15 77,022 535 126.59Premier Class Euro Distributing (S) – – – – – – 1,644 15 96.79Premier Class GBP Distributing (M) (Hedged) 573 5 84.17 52,009 491 82.58 15,474 138 84.46Premier Class GBP Distributing (S) (Hedged) (IH) 2,457 17 103.16 18,765 139 105.35 11,026 79 105.65LM Class US$ Accumulating 4,363 40 108.78 3,398 33 102.39 – – –LM Class US$ Accumulating (Hedged) (IH) 12,901 107 120.78 129,179 1,096 117.88 124,224 1,111 111.77
Legg Mason Brandywine Global Fixed Income AbsoluteReturn Fund^Class A US$ Accumulating $ 959 8 123.34 $ 23,730 210 113.18 $ 25,225 221 114.01Class A US$ Distributing (A) 224 2 100.65 11,264 119 94.63 11,561 118 97.91Class A Euro Accumulating (Hedged) 424 3 101.30 614 6 94.35 977 9 97.81Class A SEK Accumulating (Hedged) – – 96.72 – – 89.90 1 – 92.62Class A SGD Accumulating – – – 1,133 1,555 1.01 – – –Class C US$ Accumulating 129 1 107.92 119 1 99.56 120 1 100.79Class E US$ Accumulating 179 2 107.17 292 3 98.96 704 7 100.28Class E US$ Distributing (A) 324 3 101.84 367 4 95.78 330 3 99.11Class F US$ Accumulating 827 7 113.12 956 9 103.42 3,209 31 103.76Class F US$ Distributing (A) 34 – 99.33 32 – 93.50 33 – 96.75Class X US$ Accumulating 66 1 104.28 60 1 95.29 659 7 95.61Class X Euro Accumulating (Hedged) – – – – – – 12 – 92.87Class X GBP Accumulating (Hedged) 3,088 21 106.90 2,676 21 98.72 2,769 21 100.74Class X GBP Distributing (M) (Hedged) 279 2 93.36 179 2 87.55 280 2 91.92Premier Class US$ Accumulating 67,943 580 117.19 108,776 1,017 106.93 189,466 1,770 107.07
The accompanying notes are an integral part of the Financial Statements
247

Legg Mason Global Funds Plc Annual Report 28 February 2021
Statement of Financial Position – (continued)28 February 2021 29 February 2020 28 February 2019
Total NAV(000’s)
No. Shares(000’s) NAV/Share:
Total NAV(000’s)
No. Shares(000’s) NAV/Share:
Total NAV(000’s)
No. Shares(000’s) NAV/Share:
Legg Mason Brandywine Global Fixed Income AbsoluteReturn Fund^ (continued)Premier Class US$ Distributing (A) $ 158 2 99.26 $ 7,764 83 93.55 $ 10,710 111 96.80Premier Class Euro Accumulating (Hedged) 89,753 650 114.42 109,195 934 105.85 165,190 1,332 109.06Premier Class Euro Distributing (A) (Hedged) 38,828 381 84.42 55,318 621 80.63 69,294 709 85.96Premier Class GBP Distributing (M) (Hedged) 12,113 96 90.60 24,931 229 85.01 39,623 335 89.24Premier Class SEK Accumulating (Hedged) 176 15 98.11 145 15 90.82 488 48 93.52Premier Class SGD Accumulating (Hedged) 134,176 151,908 1.18 192,557 248,517 1.08 200,035 248,517 1.09LM Class US$ Accumulating 10,675 87 122.30 9,654 87 110.59 164,148 1,496 109.73LM Class AUD Accumulating (Hedged) 368,319 3,149 152.00 284,841 3,149 138.84 300,802 3,043 139.37LM Class GBP Accumulating (Hedged) – – – – – – 22,795 161 106.65
Legg Mason Brandywine Global High Yield Fund^Class A US$ Accumulating $ 21 – 126.05 $ 64 1 113.97 $ 3,966 37 108.61Class A US$ Distributing (D) 112 1 101.27 86 1 97.18 216 2 97.34Premier Class US$ Accumulating 564 4 153.88 687 5 138.24 3,962 30 130.83Premier Class GBP Accumulating (Hedged) (IH) 108 1 148.84 21 – 137.59 21 – 131.13LM Class US$ Accumulating – – – – – – 80,679 720 112.05S Class CAD Accumulating (Hedged) (IH) 11,254 100 143.52 9,798 100 131.78 8,720 92 124.22
Legg Mason Brandywine Global Opportunistic Fixed IncomeFundClass A US$ Accumulating $ 3,277 25 131.11 $ 18,015 152 118.20 $ 28,381 246 115.41Class A US$ Distributing (M) 686 6 116.22 12,442 117 106.78 13,531 126 107.00Class A Euro Accumulating (Hedged) 1 – 97.56 7 – 89.51 19 – 90.01Class A SGD Accumulating 155 188 1.10 – – – – – –Class C US$ Accumulating 1,354 11 120.64 1,366 12 109.31 1,511 14 107.27Class E US$ Accumulating 633 5 118.29 684 6 107.28 2,658 25 105.38Class F US$ Accumulating 3,833 34 113.88 2,307 23 102.27 2,162 22 99.45Class F US$ Distributing (M) 1,198 12 99.61 843 9 91.51 868 9 91.69Class X US$ Accumulating 329 3 118.78 295 3 106.56 286 3 103.52Class X GBP Distributing (M) (Hedged) 79 1 90.21 57 1 84.27 46 – 85.94Class X GBP Distributing (M) (Hedged) (IH) 824 6 106.09 – – – 4 – 102.42Premier Class US$ Accumulating 338,663 2,467 137.30 291,302 2,369 122.99 344,914 2,891 119.30Premier Class US$ Accumulating (Hedged) (IH) 897 7 124.58 2,323 20 115.68 2,204 20 109.81Premier Class US$ Distributing (M) – – – – – – 8,065 86 93.26Premier Class GBP Distributing (M) (Hedged) (IH) 3,143 22 101.31 2,968 24 97.71 3,571 28 97.50Premier Class NZD Accumulating (Hedged) (IH) 6,794 57 164.79 17,450 180 155.06 18,214 180 148.65LM Class US$ Accumulating – – – – – – 40,400 374 107.99LM Class Euro Accumulating 5,719 40 117.77 6,753 53 114.60 5,445 45 107.20LM Class NZD Accumulating (Hedged) (IH) 218,136 1,575 191.70 192,120 1,714 179.29 179,551 1,544 170.77
Legg Mason Brandywine Global Sovereign Credit Fund^�Class A US$ Accumulating $ – – – $ 1,307 13 101.20 $ 166 2 98.81Class A US$ Distributing (M) Plus (e) – – – 5 – 100.01 – – –BW LM Class AUD Accumulating (Hedged) (IH) – – – 71,037 1,000 109.05 – – –BW LM Class GBP Accumulating (Hedged) (IH) – – – 241,581 1,311 143.76 418,149 2,342 134.64BW LM Class GBP Distributing (S) (Hedged) (IH) – – – 734,473 5,183 110.52 742,293 5,183 107.98BW Premier Class Euro Accumulating (Hedged) (IH) – – – 269,871 2,289 106.82 240,311 2,090 101.11BW Premier Class GBP Accumulating (Hedged) (IH) – – – 165,634 855 151.16 302,835 1,605 142.28BW Premier Class GBP Distributing (S) (Hedged) (IH) – – – 49,823 351 110.77 188,533 1,313 108.25BW Premier Class US$ Accumulating – – – 1 – 123.72 1 – 119.05BW Premier Class US$ Accumulating (Hedged) (IH) – – – 32,198 304 105.91 20,441 203 100.94Class X US$ Accumulating – – – 6 – 106.45 1 – 102.91Premier Class US$ Accumulating – – – 24,873 238 104.50 33,680 333 101.07Premier Class US$ Distributing (M) Plus (e) – – – 5 – 100.72 – – –
Legg Mason Brandywine Global Income Optimiser Fund^Class A US$ Accumulating $ 81,165 548 148.11 $ 4,938 37 134.03 $ 2,016 17 119.89Class A US$ Distributing (A) 1,351 13 103.79 – – – – – –Class A US$ Distributing (D) 13,849 136 102.16 – – – – – –Class A US$ Distributing (M) Plus 1,071 11 99.70 – – – – – –Class A US$ Distributing (M) Plus (e) 63,441 613 103.50 5,733 59 97.92 19,359 213 90.75Class A Euro Accumulating 1 – 100.09 – – – – – –Class A Euro Accumulating (Hedged) 19,226 138 115.37 5,590 48 106.04 9,549 86 97.65Class A Euro Distributing (A) (Hedged) 22,787 180 105.03 17,384 159 98.81 16,258 152 94.05Class A Euro Distributing (M) (Hedged) Plus (e) 34,495 311 92.06 12,205 125 88.46 14,255 148 84.40Class A GBP Distributing (M) (Hedged) Plus (e) 4,651 34 97.19 646 5 93.04 817 7 87.59Class A SGD Distributing (M) (Hedged) Plus 17,338 21,270 1.09 275 368 1.04 49 69 0.97Class A SGD Distributing (M) (Hedged) Plus (e) 223 299 0.99 – – – – – –Class A SGD Distributing (M) Plus 149 198 1.01 – – – – – –Class C US$ Accumulating 2,104 20 104.06 – – – – – –Class C US$ Distributing (D) 447 4 100.31 30 – 107.57 30 – 98.36Class E US$ Accumulating 14,474 128 112.91 – – – – – –Class E US$ Distributing (D) 64 1 100.01 – – – – – –Class E Euro Accumulating (Hedged) 1,809 13 112.81 1 – 104.20 1 – 96.45Class F US$ Accumulating 3,755 36 103.97 – – – – – –Class F US$ Distributing (D) 1,807 16 111.52 1,100 11 104.12 – – –Class X US$ Accumulating 313 3 105.03 – – – – – –Class X US$ Distributing (D) 141 1 111.95 234 2 104.54 481 5 95.60Class X US$ Distributing (M) Plus (e) 8,793 82 107.23 244 2 100.87 407 4 92.96Class X CHF Distributing (A) (Hedged) 68 1 99.46 – – – – – –Class X Euro Accumulating 1,012 8 99.34 – – – – – –Class X Euro Accumulating (Hedged) 81 1 99.21 – – – – – –Class X Euro Distributing (M) (Hedged) Plus (e) 22,878 198 95.80 3,478 34 91.55 3,607 37 86.86Class X GBP Distributing (M) (Hedged) Plus (e) 3,347 24 101.32 1,328 11 96.49 2,221 19 90.37Premier Class US$ Accumulating 2,094 20 103.69 – – – – – –Premier Class US$ Distributing (M) Plus (e) 3,130 29 109.42 931 9 102.80 492 5 94.61Premier Class Euro Accumulating (Hedged) 15,687 102 127.20 667 5 116.01 9,303 77 106.06Premier Class Euro Distributing (M) (Hedged) Plus (e) 6,553 56 97.01 1,139 11 92.58 2,554 26 87.74Premier Class GBP Distributing (M) (Hedged) Plus (e) 373 3 101.87 204 2 96.85 219 2 90.56Premier Class SEK Accumulating (Hedged) 18,380 1,222 127.05 4,256 353 115.90 5,967 521 105.75S Class US$ Accumulating 27,021 252 107.09 – – – – – –S Class Euro Accumulating (Hedged) 20,156 142 117.25 3,648 31 106.82 9,253 83 97.60S Class Euro Distributing (M) (Hedged) Plus (e) 6,314 48 109.17 4,188 36 104.02 2,456 22 98.42S Class GBP Distributing (M) (Hedged) Plus (e) 1,920 13 105.14 2,609 20 99.77 3,127 25 93.18LM Class AUD Distributing (Q) (Hedged) – – – 201 3 104.41 195 3 96.35LM Class GBP Accumulating (Hedged) 30,817 213 103.78 – – – – – –
Legg Mason Brandywine Global Credit OpportunitiesFund^Class A US$ Accumulating $ 14,059 125 112.29 $ 508 4 117.05 $ 806 7 109.05Class A Euro Accumulating (Hedged) 3 – 100.53 5 – 106.09 8 – 101.75Premier Class US$ Accumulating 24,883 212 117.27 28,965 238 121.46 29,466 262 112.42Premier Class BRL Accumulating (Hedged) – – – – – – 2,729 99 103.94Premier Class GBP Accumulating (Hedged) – – – – – – 418 3 106.29LM Class US$ Accumulating 11,098 88 126.33 11,363 88 129.35 10,397 88 118.35S Class BRL Accumulating (Hedged) 1,977 103 107.73 2,544 103 110.61 – – –
The accompanying notes are an integral part of the Financial Statements
248

Legg Mason Global Funds Plc Annual Report 28 February 2021
Statement of Financial Position – (continued)28 February 2021 29 February 2020 28 February 2019
Total NAV(000’s)
No. Shares(000’s) NAV/Share:
Total NAV(000’s)
No. Shares(000’s) NAV/Share:
Total NAV(000’s)
No. Shares(000’s) NAV/Share:
Legg Mason Brandywine Global Defensive High Yield Fund^Class A US$ Distributing (M) Plus (e) $ 12 – 97.50 $ 11 – 93.91 $ 11 – 93.53S Class Euro Distributing (A) (Hedged) (IH) 11,762 100 97.48 10,523 100 95.32 10,914 100 95.96
Legg Mason Brandywine Global - US High Yield Fund^Class A US$ Accumulating $ – – – $ – – – $ 1 – 99.49Class A US$ Distributing (M) Plus (e) – – – – – – 1 – 92.19S Class Euro Accumulating (Hedged) – – – – – – 28,135 255 97.09
Legg Mason Brandywine Global Enhanced Absolute ReturnFund^Class A US$ Accumulating $ 10 – 100.31 $ 10 – 94.12 $ 11 – 103.75Class A SGD Accumulating (Hedged) 5,272 7,003 1.00 3,745 5,470 0.95 – – –Class X US$ Accumulating 10 – 102.35 10 – 95.26 11 – 104.19Class X GBP Distributing (M) (Hedged) Plus (e) 20 – 84.13 16 – 83.96 11 – 100.26Premier Class US$ Accumulating 14,917 145 102.76 16,992 178 95.49 1,067 10 104.27Premier Class Euro Accumulating (Hedged) 11 – 96.41 9 – 91.11 11 – 102.47LM Class AUD Accumulating (Hedged) 371,056 4,740 101.74 295,192 4,740 95.60 351,762 4,740 104.62LM Class SGD Accumulating (Hedged) – – – 66,108 96,043 0.96 10 14 1.04
Legg Mason Brandywine Global Dynamic US Equity Fund^Class A US$ Accumulating $ 21 – 171.02 $ 153 1 126.81 $ 208 2 131.29Premier Class US$ Accumulating 508 3 179.61 373 3 131.92 676 5 135.28S Class US$ Accumulating – – – 1,857 16 115.54 1,900 16 118.20S Class Euro Accumulating (Hedged) 1,350 7 164.09 918 7 122.03 1,947 13 128.32
Legg Mason ClearBridge Value FundClass A US$ Accumulating $ 11,396 78 147.02 $ 13,068 125 104.51 $ 15,603 144 108.62Class A US$ Distributing (A) 25,305 91 279.33 21,259 107 198.56 25,581 124 206.36Class A Euro Accumulating 766 4 154.30 289 2 119.85 1,881 14 121.00Class A Euro Distributing (A) (Hedged) 35 – 142.06 23 – 102.60 25 – 109.57Class A GBP Distributing (A) 20 – 189.53 28 – 146.53 29 – 147.22Class A SGD Accumulating 2,399 2,627 1.22 1,818 2,801 0.90 2,408 3,570 0.91Class A SGD Accumulating (Hedged) 398 225 2.36 140 114 1.70 640 487 1.78Class C US$ Accumulating 693 5 149.60 868 8 106.87 1,307 12 111.64Class C US$ Distributing (A) 1,548 6 254.63 2,185 12 181.90 2,576 14 190.01Class F US$ Accumulating 2,411 8 289.75 1,780 9 204.74 1,978 9 211.51Class F US$ Distributing (A) 304 2 160.78 158 1 114.09 182 2 117.98Class X US$ Distributing (A) 25,887 129 201.13 1,437 10 142.77 1,582 11 147.63Class X Euro Accumulating 540 4 99.74 – – – – – –Premier Class US$ Accumulating 398,734 1,528 261.00 282,618 1,539 183.65 287,897 1,524 188.92Premier Class US$ Distributing (A) 52 – 179.63 90 1 127.72 312 2 132.05Premier Class Euro Accumulating 38,597 161 198.65 139 1 153.40 471 3 153.06Galleon Class – – – – – – 28 – 140.85
Legg Mason ClearBridge Global Equity Fund^Class A US$ Accumulating $ – – – $ – – – $ 754 7 100.67Class A US$ Distributing (A) – – – – – – 374 3 110.67Class C US$ Accumulating – – – – – – 144 1 98.42Class C US$ Distributing (A) – – – – – – 68 1 108.03Premier Class US$ Accumulating – – – – – – 15,958 149 107.14LM Class US$ Accumulating – – – – – – 14,761 152 97.10
Legg Mason ClearBridge Global Equity Income Fund^Class A US$ Accumulating $ – – – $ – – – $ 138 1 102.87Class A US$ Distributing (M) Plus (e) – – – – – – 515 6 88.87Class A US$ Distributing (Q) – – – – – – 514 5 96.23Class A Euro Accumulating (Hedged) – – – – – – 422 4 94.80Class A Euro Distributing (M) (Hedged) Plus (e) – – – – – – 503 5 81.84Premier Class US$ Distributing (M) Plus (e) – – – – – – 534 6 92.31Premier Class Euro Accumulating (Hedged) – – – – – – 433 4 98.51Premier Class Euro Distributing (M) (Hedged) Plus (e) – – – – – – 433 4 85.02LM Class US$ Accumulating – – – – – – 918 9 105.61
Legg Mason ClearBridge US Appreciation FundClass A US$ Accumulating $ 31,487 116 271.85 $ 31,070 141 219.93 $ 34,723 168 206.53Class A US$ Distributing (A) 12,287 45 271.66 12,343 56 219.77 16,128 78 206.38Class A Euro Accumulating 927 2 330.04 2,785 9 291.79 4,555 15 265.98Class B US$ Accumulating 227 1 247.74 543 3 201.41 574 3 190.09Class B US$ Distributing (A) 676 3 253.69 931 5 206.25 1,258 6 194.67Class C US$ Accumulating 15,828 64 247.70 16,745 83 201.39 18,119 95 190.07Class C US$ Distributing (A) 19,398 76 253.62 17,974 87 206.19 24,665 127 194.61Class E US$ Accumulating 19,773 68 288.70 14,773 63 235.31 14,450 65 222.65Class E US$ Distributing (A) 1,062 4 288.87 837 4 235.45 915 4 222.78Class F US$ Accumulating 24,575 97 252.65 16,642 82 203.18 18,458 97 189.66Class F US$ Distributing (A) 3,588 11 335.67 2,634 10 270.97 1,810 7 253.74Class X US$ Distributing (A) 1,913 9 217.01 3,494 20 175.20 11,507 70 164.05Class X Euro Accumulating 252 1 250.22 101 – 219.79 209 1 199.06Premier Class US$ Accumulating 5,971 17 345.82 12,704 46 277.08 3,542 14 257.66Premier Class US$ Distributing (A) 3,359 8 405.51 3,398 10 327.66 3,251 11 306.76Premier Class Euro Accumulating 32,007 74 358.89 29,678 85 314.83 27,598 85 284.15LM Class US$ Accumulating 16,734 89 188.04 11,152 74 149.73 2,571 19 138.36LM Class Euro Accumulating 2,988 14 177.19 3,257 19 154.24 2,894 18 138.34Class A (G) US$ Accumulating 4,259 15 283.76 3,815 17 228.77 4,579 21 214.08Class B (G) US$ Accumulating 4 – 264.48 3 – 214.43 6 – 201.68Class L (G) US$ Accumulating 3,315 13 264.81 3,789 18 214.55 3,764 19 201.78Class GA US$ Accumulating 4,253 15 285.51 3,739 16 230.57 3,693 17 216.13Class GA Euro Accumulating 381 1 340.21 309 1 300.28 346 1 273.27Class GA Euro Distributing (A) 628 2 339.19 599 2 299.34 625 2 272.33Class GE US$ Accumulating 107 – 265.46 116 1 215.98 165 1 203.99Class GE Euro Accumulating 9 – 316.10 7 – 281.04 46 – 257.63
Legg Mason ClearBridge US Large Cap Growth FundClass A US$ Accumulating $270,968 669 404.79 $224,061 747 300.13 $241,848 875 276.38Class A US$ Distributing (A) 44,968 111 404.97 37,898 126 300.28 41,887 151 276.51Class A Euro Accumulating 101,712 156 539.07 91,081 189 436.94 86,866 196 390.56Class A Euro Accumulating (Hedged) 10,652 41 213.55 8,053 45 160.52 11,494 67 151.80Class A Euro Distributing (A) – – – – – – 38 – 109.63Class B US$ Accumulating 286 1 372.10 347 1 277.28 529 2 256.61Class B US$ Distributing (A) 153 – 377.79 130 – 281.51 120 – 260.54Class C US$ Accumulating 29,420 79 372.23 20,993 76 277.37 19,575 76 256.71Class C US$ Distributing (A) 14,406 38 377.86 13,344 47 281.56 39,719 152 260.59Class E US$ Accumulating 13,376 60 221.49 18,161 110 165.46 14,742 96 153.52Class E US$ Distributing (A) 543 3 214.81 1,182 7 160.46 1,720 12 148.89Class F US$ Accumulating 127,217 582 218.74 106,377 660 161.22 79,268 537 147.57Class F US$ Distributing (A) 23,530 108 218.27 22,217 138 160.88 19,654 133 147.26Class U US$ Accumulating 279,870 1,707 163.97 225,116 1,872 120.28 318,493 2,907 109.57Class U US$ Distributing (Q) 1 – 100.36 – – – – – –Class U Euro Accumulating 78,474 389 167.22 135,651 917 134.01 103,769 770 118.49Class X US$ Accumulating 37,103 152 244.77 52,159 289 180.36 54,938 333 165.05Class X Euro Accumulating 2,519 13 158.78 4,274 30 127.99 2,343 18 113.70
The accompanying notes are an integral part of the Financial Statements
249

Legg Mason Global Funds Plc Annual Report 28 February 2021
Statement of Financial Position – (continued)28 February 2021 29 February 2020 28 February 2019
Total NAV(000’s)
No. Shares(000’s) NAV/Share:
Total NAV(000’s)
No. Shares(000’s) NAV/Share:
Total NAV(000’s)
No. Shares(000’s) NAV/Share:
Legg Mason ClearBridge US Large Cap Growth Fund(continued)Class X Euro Accumulating (Hedged) $ 22,281 96 191.59 $ 16,764 106 143.04 $ 6,523 43 134.46Class X Euro Distributing (A) (Hedged) – – – – – – 1,631 10 143.42Class X GBP Accumulating 11,471 35 235.79 14,274 59 189.02 570 3 167.52Premier Class US$ Accumulating 343,437 1,337 256.95 281,696 1,493 188.68 273,110 1,587 172.06Premier Class US$ Distributing (A) 6,075 50 121.25 4,428 50 89.08 – – –Premier Class BRL Accumulating (Hedged) 40,126 1,361 165.25 6,587 237 124.16 3,367 114 111.29Premier Class Euro Accumulating 151,313 625 200.76 56,380 317 161.08 410 3 142.58Premier Class Euro Accumulating (Hedged) 24,183 94 212.30 44,911 257 158.02 23,769 141 147.88Premier Class Euro Distributing (A) 3,028 23 108.63 1,408 15 87.28 – – –Premier Class GBP Accumulating 76,820 232 237.99 51,320 211 190.00 4,004 18 167.83LM Class US$ Accumulating 73,392 311 236.06 62,981 366 172.27 83,007 532 156.11LM Class Euro Accumulating 715 3 222.40 793 4 177.44 687 4 156.06Class A (G) US$ Accumulating 9,623 23 421.52 7,718 25 311.46 7,980 28 285.80Class B (G) US$ Accumulating – – – – – – 3 – 269.46Class L (G) US$ Accumulating 11,773 30 393.31 9,129 31 292.06 8,578 32 269.36Class GA US$ Accumulating 1,599 3 500.44 1,300 4 370.39 1,731 5 340.46Class GA Euro Accumulating 18 – 529.17 273 1 427.98 255 1 381.82Class GE US$ Distributing (A) – – – – – – 7 – 319.34
Legg Mason ClearBridge US Aggressive Growth FundClass A US$ Accumulating $112,488 409 274.96 $111,269 570 195.16 $186,764 951 196.43Class A US$ Distributing (A) 26,846 98 275.13 25,352 130 195.28 42,369 216 196.55Class A AUD Accumulating (Hedged) 15,024 92 211.12 10,783 107 154.79 14,264 128 157.64Class A CHF Accumulating (Hedged) 72 – 146.13 237 2 105.17 237 2 109.08Class A CNH Accumulating (Hedged) 649 23 183.04 442 24 128.59 758 39 129.30Class A Euro Accumulating 13,920 31 367.91 16,599 53 285.66 23,525 74 279.08Class A Euro Accumulating (Hedged) 1,685 7 196.27 32,233 207 141.21 19,792 119 146.05Class A Euro Distributing (A) (Hedged) 19 – 141.97 12 – 102.11 399 3 105.87Class A GBP Accumulating 876 3 186.61 734 4 143.96 988 5 140.07Class A HKD Accumulating 319 15 164.15 2,112 140 117.18 1,901 125 118.92Class A SEK Accumulating (Hedged) 33 1 204.05 28 2 149.31 43 3 154.65Class A SGD Accumulating (Hedged) 3,193 1,878 2.27 1,839 1,573 1.63 2,446 2,005 1.65Class B US$ Accumulating 834 3 267.82 873 5 191.03 1,731 9 193.15Class B US$ Distributing (A) 1,297 5 256.63 1,556 8 183.06 1,849 10 185.18Class C US$ Accumulating 11,861 44 267.74 10,458 55 190.98 14,764 76 193.19Class C US$ Distributing (A) 16,444 64 256.64 16,594 91 183.06 31,683 171 185.18Class E US$ Accumulating 13,783 52 266.35 14,611 77 190.46 18,726 97 193.15Class E US$ Distributing (A) 1,448 5 266.39 1,105 6 190.49 2,148 11 193.18Class E Euro Accumulating (Hedged) 254 1 167.02 212 2 121.05 281 2 126.19Class F US$ Accumulating 15,332 50 305.78 13,095 61 215.74 19,799 92 215.84Class F US$ Distributing (A) 2,523 8 306.00 1,734 8 215.89 2,664 12 215.99Class X US$ Accumulating 8,992 41 219.30 13,156 85 154.65 35,409 229 154.64Class X US$ Distributing (A) 1,284 5 243.75 1,785 10 171.89 11,479 67 171.88Class X Euro Accumulating 1,245 5 208.45 811 5 160.66 1,807 10 155.88Class X Euro Accumulating (Hedged) 202 1 162.89 2,729 21 116.41 4,635 34 119.67Class X GBP Accumulating 34,880 100 251.61 33,635 136 192.88 67,134 271 186.50Premier Class US$ Accumulating 362,817 997 363.87 438,890 1,716 255.71 490,790 1,926 254.80Premier Class US$ Distributing (A) – – – – – – 147 1 103.40Premier Class Euro Accumulating 4,163 10 352.84 2,859 10 271.11 18,505 62 262.43Premier Class Euro Accumulating (Hedged) – – – 458 3 120.60 851 6 123.55Premier Class Euro Distributing (A) 14 – 332.81 10 – 256.58 21 – 248.86Premier Class GBP Accumulating 190 1 137.65 653 5 105.23 59,027 439 101.36Premier Class GBP Accumulating (Hedged) 1,187 5 170.27 11,997 77 122.01 16,174 99 123.70Premier Class GBP Distributing (A) 100,113 231 311.15 147,586 482 238.61 402,225 1,315 230.62Premier Class PLN Accumulating (Hedged) 1,336 30 169.20 764 25 120.98 1,154 36 121.52LM Class US$ Accumulating – – – – – – 1,736 17 102.34LM Class Euro Accumulating 932 4 182.94 967 6 139.65 873 6 134.19Class A (G) US$ Accumulating 23,544 82 287.69 18,912 93 203.48 22,005 108 204.09Class B (G) US$ Accumulating 8 – 268.49 12 – 190.84 13 – 192.37Class L (G) US$ Accumulating 10,510 39 268.44 8,451 44 190.81 9,269 48 192.34Class GA Euro Accumulating 173 – 386.56 125 – 299.18 138 – 291.55Class GA Euro Distributing (A) 81 – 385.09 57 – 298.04 70 – 290.53Class GE US$ Accumulating 81 – 338.37 58 – 241.40 58 – 244.25Class GE Euro Accumulating 46 – 358.81 33 – 279.78 33 – 274.74
Legg Mason ClearBridge Tactical Dividend Income FundClass A US$ Accumulating $ 11,278 85 132.81 $ 10,649 89 119.27 $ 10,906 96 113.27Class A US$ Distributing (A) 82 1 105.63 246 3 97.73 346 4 94.98Class A US$ Distributing (M) Plus 2,309 28 83.55 3,497 44 78.72 8,382 107 78.65Class A US$ Distributing (M) Plus (e) 115 1 98.95 106 1 91.54 124 1 90.36Class A US$ Distributing (Q) 1,116 11 104.39 1,147 12 95.83 332 4 92.68Class A AUD Distributing (M) (Hedged) Plus 1,266 21 78.42 1,562 31 76.44 3,634 66 77.21Class A CNH Distributing (M) (Hedged) Plus 95 7 84.96 83 7 80.47 154 13 80.55Class A Euro Accumulating 125 1 108.79 119 1 106.77 133 1 98.42Class A Euro Accumulating (Hedged) 1,150 9 104.85 208 2 95.62 80 1 93.33Class A Euro Distributing (M) (Hedged) Plus (e) 358 4 82.05 308 4 77.11 322 4 78.23Class A HKD Distributing (M) Plus 697 65 83.45 1,442 142 79.05 3,537 349 79.60Class A SGD Distributing (M) (Hedged) Plus 156 257 0.81 232 419 0.77 517 899 0.78Class B US$ Accumulating – – – 13 – 105.60 45 – 100.80Class B US$ Distributing (A) – – – 13 – 97.20 12 – 94.50Class C US$ Accumulating 724 6 127.12 1,232 11 114.73 1,318 12 109.51Class C US$ Distributing (A) 219 2 105.27 255 3 97.21 245 3 94.50Class C US$ Distributing (Q) 72 1 96.92 65 1 88.93 221 3 86.03Class F US$ Accumulating 18,703 150 124.91 18,346 165 111.50 20,510 195 105.26Class F Euro Accumulating 52 – 112.95 47 – 110.19 50 – 100.96Class F Euro Distributing (A) 78 1 95.69 72 1 96.98 70 1 91.45Class X US$ Distributing (M) Plus (e) 34 – 103.38 90 1 95.04 31 – 93.24Class X Euro Distributing (M) (Hedged) Plus (e) 60 1 98.61 52 1 92.10 54 1 92.85Premier Class US$ Distributing (M) Plus (e) – – – – – – 24 – 95.49
Legg Mason ClearBridge US Equity Sustainability LeadersFund^Class A US$ Accumulating $ 5,832 40 146.35 $ – – – $ – – –Class A US$ Distributing (A) 1,827 8 229.43 340 2 166.89 147 1 146.53Class A Euro Accumulating (Hedged) 11,129 45 205.65 175 1 151.88 144 1 137.01Class A SEK Accumulating 65,440 5,012 110.24 1 – 92.29 – – –Class F US$ Accumulating 2,693 18 147.06 – – – – – –Class X US$ Accumulating 8,802 72 123.01 – – – – – –Class X US$ Distributing (A) 745 3 236.80 1,525 9 171.27 333 2 149.54Class X Euro Accumulating (Hedged) 2,081 8 212.45 154 1 155.97 142 1 139.88Class X GBP Accumulating 28,773 85 243.38 5,475 22 191.19 471 2 161.29Class X GBP Accumulating (Hedged) 4,373 24 128.91 864 7 95.14 – – –Premier Class US$ Accumulating 63,369 480 132.00 – – – – – –Premier Class US$ Distributing (A) 4,771 20 238.06 348 2 172.11 303 2 150.18Premier Class Euro Accumulating (Hedged) 63 – 216.57 313 2 158.43 288 2 141.59Premier Class GBP Accumulating 686 2 261.26 1,003 4 204.63 576 3 172.00S Class US$ Accumulating 197,075 1,164 169.25 19,697 162 121.55 6,589 63 105.08S Class Euro Accumulating 25,552 176 120.17 – – – – – –S Class Euro Accumulating (Hedged) 391 3 127.30 – – – – – –S Class GBP Accumulating 137,242 774 127.22 16,095 126 99.30 – – –S Class GBP Accumulating (Hedged) 79,258 426 133.44 2,887 23 97.74 – – –S Class GBP Distributing (Q) 5,122 29 126.04 795 6 99.14 – – –
The accompanying notes are an integral part of the Financial Statements
250
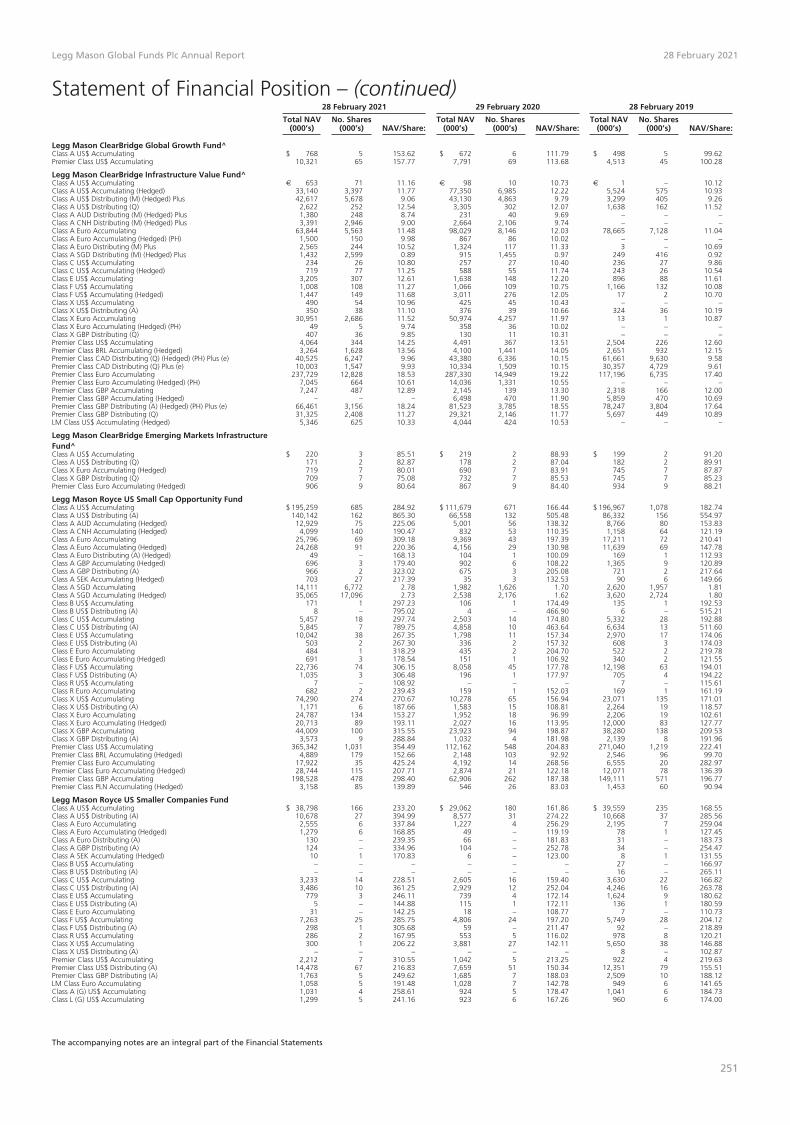
Legg Mason Global Funds Plc Annual Report 28 February 2021
Statement of Financial Position – (continued)28 February 2021 29 February 2020 28 February 2019
Total NAV(000’s)
No. Shares(000’s) NAV/Share:
Total NAV(000’s)
No. Shares(000’s) NAV/Share:
Total NAV(000’s)
No. Shares(000’s) NAV/Share:
Legg Mason ClearBridge Global Growth Fund^Class A US$ Accumulating $ 768 5 153.62 $ 672 6 111.79 $ 498 5 99.62Premier Class US$ Accumulating 10,321 65 157.77 7,791 69 113.68 4,513 45 100.28
Legg Mason ClearBridge Infrastructure Value Fund^Class A US$ Accumulating € 653 71 11.16 € 98 10 10.73 € 1 – 10.12Class A US$ Accumulating (Hedged) 33,140 3,397 11.77 77,350 6,985 12.22 5,524 575 10.93Class A US$ Distributing (M) (Hedged) Plus 42,617 5,678 9.06 43,130 4,863 9.79 3,299 405 9.26Class A US$ Distributing (Q) 2,622 252 12.54 3,305 302 12.07 1,638 162 11.52Class A AUD Distributing (M) (Hedged) Plus 1,380 248 8.74 231 40 9.69 – – –Class A CNH Distributing (M) (Hedged) Plus 3,391 2,946 9.00 2,664 2,106 9.74 – – –Class A Euro Accumulating 63,844 5,563 11.48 98,029 8,146 12.03 78,665 7,128 11.04Class A Euro Accumulating (Hedged) (PH) 1,500 150 9.98 867 86 10.02 – – –Class A Euro Distributing (M) Plus 2,565 244 10.52 1,324 117 11.33 3 – 10.69Class A SGD Distributing (M) (Hedged) Plus 1,432 2,599 0.89 915 1,455 0.97 249 416 0.92Class C US$ Accumulating 234 26 10.80 257 27 10.40 236 27 9.86Class C US$ Accumulating (Hedged) 719 77 11.25 588 55 11.74 243 26 10.54Class E US$ Accumulating 3,205 307 12.61 1,638 148 12.20 896 88 11.61Class F US$ Accumulating 1,008 108 11.27 1,066 109 10.75 1,166 132 10.08Class F US$ Accumulating (Hedged) 1,447 149 11.68 3,011 276 12.05 17 2 10.70Class X US$ Accumulating 490 54 10.96 425 45 10.43 – – –Class X US$ Distributing (A) 350 38 11.10 376 39 10.66 324 36 10.19Class X Euro Accumulating 30,951 2,686 11.52 50,974 4,257 11.97 13 1 10.87Class X Euro Accumulating (Hedged) (PH) 49 5 9.74 358 36 10.02 – – –Class X GBP Distributing (Q) 407 36 9.85 130 11 10.31 – – –Premier Class US$ Accumulating 4,064 344 14.25 4,491 367 13.51 2,504 226 12.60Premier Class BRL Accumulating (Hedged) 3,264 1,628 13.56 4,100 1,441 14.05 2,651 932 12.15Premier Class CAD Distributing (Q) (Hedged) (PH) Plus (e) 40,525 6,247 9.96 43,380 6,336 10.15 61,661 9,630 9.58Premier Class CAD Distributing (Q) Plus (e) 10,003 1,547 9.93 10,334 1,509 10.15 30,357 4,729 9.61Premier Class Euro Accumulating 237,729 12,828 18.53 287,330 14,949 19.22 117,196 6,735 17.40Premier Class Euro Accumulating (Hedged) (PH) 7,045 664 10.61 14,036 1,331 10.55 – – –Premier Class GBP Accumulating 7,247 487 12.89 2,145 139 13.30 2,318 166 12.00Premier Class GBP Accumulating (Hedged) – – – 6,498 470 11.90 5,859 470 10.69Premier Class GBP Distributing (A) (Hedged) (PH) Plus (e) 66,461 3,156 18.24 81,523 3,785 18.55 78,247 3,804 17.64Premier Class GBP Distributing (Q) 31,325 2,408 11.27 29,321 2,146 11.77 5,697 449 10.89LM Class US$ Accumulating (Hedged) 5,346 625 10.33 4,044 424 10.53 – – –
Legg Mason ClearBridge Emerging Markets InfrastructureFund^Class A US$ Accumulating $ 220 3 85.51 $ 219 2 88.93 $ 199 2 91.20Class A US$ Distributing (Q) 171 2 82.87 178 2 87.04 182 2 89.91Class X Euro Accumulating (Hedged) 719 7 80.01 690 7 83.91 745 7 87.87Class X GBP Distributing (Q) 709 7 75.08 732 7 85.53 745 7 85.23Premier Class Euro Accumulating (Hedged) 906 9 80.64 867 9 84.40 934 9 88.21
Legg Mason Royce US Small Cap Opportunity FundClass A US$ Accumulating $ 195,259 685 284.92 $ 111,679 671 166.44 $ 196,967 1,078 182.74Class A US$ Distributing (A) 140,142 162 865.30 66,558 132 505.48 86,332 156 554.97Class A AUD Accumulating (Hedged) 12,929 75 225.06 5,001 56 138.32 8,766 80 153.83Class A CNH Accumulating (Hedged) 4,099 140 190.47 832 53 110.35 1,158 64 121.19Class A Euro Accumulating 25,796 69 309.18 9,369 43 197.39 17,211 72 210.41Class A Euro Accumulating (Hedged) 24,268 91 220.36 4,156 29 130.98 11,639 69 147.78Class A Euro Distributing (A) (Hedged) 49 – 168.13 104 1 100.09 169 1 112.93Class A GBP Accumulating (Hedged) 696 3 179.40 902 6 108.22 1,365 9 120.89Class A GBP Distributing (A) 966 2 323.02 675 3 205.08 721 2 217.64Class A SEK Accumulating (Hedged) 703 27 217.39 35 3 132.53 90 6 149.66Class A SGD Accumulating 14,111 6,772 2.78 1,982 1,626 1.70 2,620 1,957 1.81Class A SGD Accumulating (Hedged) 35,065 17,096 2.73 2,538 2,176 1.62 3,620 2,724 1.80Class B US$ Accumulating 171 1 297.23 106 1 174.49 135 1 192.53Class B US$ Distributing (A) 8 – 795.02 4 – 466.90 6 – 515.21Class C US$ Accumulating 5,457 18 297.74 2,503 14 174.80 5,332 28 192.88Class C US$ Distributing (A) 5,845 7 789.75 4,858 10 463.64 6,634 13 511.60Class E US$ Accumulating 10,042 38 267.35 1,798 11 157.34 2,970 17 174.06Class E US$ Distributing (A) 503 2 267.30 336 2 157.32 608 3 174.03Class E Euro Accumulating 484 1 318.29 435 2 204.70 522 2 219.78Class E Euro Accumulating (Hedged) 691 3 178.54 151 1 106.92 340 2 121.55Class F US$ Accumulating 22,736 74 306.15 8,058 45 177.78 12,198 63 194.01Class F US$ Distributing (A) 1,035 3 306.48 196 1 177.97 705 4 194.22Class R US$ Accumulating 7 – 108.92 – – – 7 – 115.61Class R Euro Accumulating 682 2 239.43 159 1 152.03 169 1 161.19Class X US$ Accumulating 74,290 274 270.67 10,278 65 156.94 23,071 135 171.01Class X US$ Distributing (A) 1,171 6 187.66 1,583 15 108.81 2,264 19 118.57Class X Euro Accumulating 24,787 134 153.27 1,952 18 96.99 2,206 19 102.61Class X Euro Accumulating (Hedged) 20,713 89 193.11 2,027 16 113.95 12,000 83 127.77Class X GBP Accumulating 44,009 100 315.55 23,923 94 198.87 38,280 138 209.53Class X GBP Distributing (A) 3,573 9 288.84 1,032 4 181.98 2,139 8 191.96Premier Class US$ Accumulating 365,342 1,031 354.49 112,162 548 204.83 271,040 1,219 222.41Premier Class BRL Accumulating (Hedged) 4,889 179 152.66 2,148 103 92.92 2,546 96 99.70Premier Class Euro Accumulating 17,922 35 425.24 4,192 14 268.56 6,555 20 282.97Premier Class Euro Accumulating (Hedged) 28,744 115 207.71 2,874 21 122.18 12,071 78 136.39Premier Class GBP Accumulating 198,528 478 298.40 62,906 262 187.38 149,111 571 196.77Premier Class PLN Accumulating (Hedged) 3,158 85 139.89 546 26 83.03 1,453 60 90.94
Legg Mason Royce US Smaller Companies FundClass A US$ Accumulating $ 38,798 166 233.20 $ 29,062 180 161.86 $ 39,559 235 168.55Class A US$ Distributing (A) 10,678 27 394.99 8,577 31 274.22 10,668 37 285.56Class A Euro Accumulating 2,555 6 337.84 1,227 4 256.29 2,195 7 259.04Class A Euro Accumulating (Hedged) 1,279 6 168.85 49 – 119.19 78 1 127.45Class A Euro Distributing (A) 130 – 239.35 66 – 181.83 31 – 183.73Class A GBP Distributing (A) 124 – 334.96 104 – 252.78 34 – 254.47Class A SEK Accumulating (Hedged) 10 1 170.83 6 – 123.00 8 1 131.55Class B US$ Accumulating – – – – – – 27 – 166.97Class B US$ Distributing (A) – – – – – – 16 – 265.11Class C US$ Accumulating 3,233 14 228.51 2,605 16 159.40 3,630 22 166.82Class C US$ Distributing (A) 3,486 10 361.25 2,929 12 252.04 4,246 16 263.78Class E US$ Accumulating 779 3 246.11 739 4 172.14 1,624 9 180.62Class E US$ Distributing (A) 5 – 144.88 115 1 172.11 136 1 180.59Class E Euro Accumulating 31 – 142.25 18 – 108.77 7 – 110.73Class F US$ Accumulating 7,263 25 285.75 4,806 24 197.20 5,749 28 204.12Class F US$ Distributing (A) 298 1 305.68 59 – 211.47 92 – 218.89Class R US$ Accumulating 286 2 167.95 553 5 116.02 978 8 120.21Class X US$ Accumulating 300 1 206.22 3,881 27 142.11 5,650 38 146.88Class X US$ Distributing (A) – – – – – – 8 – 102.87Premier Class US$ Accumulating 2,212 7 310.55 1,042 5 213.25 922 4 219.63Premier Class US$ Distributing (A) 14,478 67 216.83 7,659 51 150.34 12,351 79 155.51Premier Class GBP Distributing (A) 1,763 5 249.62 1,685 7 188.03 2,509 10 188.12LM Class Euro Accumulating 1,058 5 191.48 1,028 7 142.78 949 6 141.65Class A (G) US$ Accumulating 1,031 4 258.61 924 5 178.47 1,041 6 184.73Class L (G) US$ Accumulating 1,299 5 241.16 923 6 167.26 960 6 174.00
The accompanying notes are an integral part of the Financial Statements
251

Legg Mason Global Funds Plc Annual Report 28 February 2021
Statement of Financial Position – (continued)28 February 2021 29 February 2020 28 February 2019
Total NAV(000’s)
No. Shares(000’s) NAV/Share:
Total NAV(000’s)
No. Shares(000’s) NAV/Share:
Total NAV(000’s)
No. Shares(000’s) NAV/Share:
Legg Mason QS MV European Equity Growth and IncomeFundClass A US$ Accumulating € 589 7 96.37 € 749 9 88.69 € 1,102 14 92.52Class A US$ Accumulating (Hedged) 1,105 10 127.44 1,687 15 126.85 2,435 22 125.14Class A US$ Distributing (A) 848 6 178.41 1,113 7 170.87 1,678 10 182.78Class A US$ Distributing (M) (Hedged) Plus 3,462 46 90.33 7,006 82 94.83 7,931 90 99.88Class A US$ Distributing (Q) (Hedged) – – – 1 – 99.97 1 – 101.42Class A AUD Distributing (M) (Hedged) Plus 1,638 30 85.96 1,602 29 92.45 4,067 66 98.32Class A CNH Distributing (M) (Hedged) Plus 41 3 94.91 211 16 99.81 109 8 105.31Class A Euro Accumulating 300 2 174.14 328 2 175.15 461 3 177.20Class A Euro Distributing (A) 88 1 150.48 557 4 157.47 2,758 17 163.47Class A Euro Distributing (M) Plus 263 3 90.68 327 3 94.90 382 4 99.80Class A SGD Distributing (M) (Hedged) Plus 105 208 0.81 241 432 0.86 334 566 0.91Class B US$ Accumulating 110 1 89.46 120 2 82.74 255 3 86.79Class B US$ Distributing (A) 50 – 175.95 51 – 168.09 52 – 179.74Class C US$ Accumulating 130 2 91.38 709 9 84.51 940 12 88.54Class C US$ Distributing (A) 1,172 8 175.82 1,219 8 167.96 1,444 9 179.62Class C US$ Distributing (Q) (Hedged) – – – – – – 19 – 101.03Class E US$ Accumulating (Hedged) – – – 333 4 103.69 321 4 103.08Class E US$ Distributing (Q) (Hedged) – – – – – – 1 – 100.83Class F US$ Accumulating 1,700 17 118.52 1,640 17 108.41 1,430 14 112.34Class F US$ Distributing (Q) (Hedged) – – – 1 – 100.01 1 – 101.45Class X Euro Accumulating – – – – – – 1 – 112.36Premier Class US$ Accumulating 1,201 15 99.89 1,643 20 90.98 – – –Premier Class Euro Accumulating 47 – 127.12 48 – 126.58 185 1 126.79Premier Class PLN Accumulating (Hedged) 192 8 111.34 150 6 111.13 55 2 109.27LM Class US$ Accumulating 3,967 38 126.84 2,961 28 114.89 3,986 38 117.90LM Class Euro Accumulating 2,251 19 119.96 2,672 23 118.76 2,310 20 118.17Class A (G) US$ Accumulating 882 11 99.58 902 11 91.42 1,037 12 95.01Class B (G) US$ Accumulating 2 – 92.36 1 – 85.16 2 – 88.98Class L (G) US$ Accumulating 128 2 92.95 191 2 85.93 194 2 89.75Class GA US$ Accumulating 836 6 170.54 839 6 156.67 1,022 7 162.92Class GA Euro Accumulating 12,130 68 178.93 13,318 74 179.66 18,525 102 181.34Class GA Euro Distributing (A) 92 1 143.16 114 1 150.04 119 1 155.69Class GE US$ Accumulating 39 – 157.10 40 – 145.40 40 – 152.36
Legg Mason QS MV Asia Pacific Ex Japan Equity Growthand Income FundClass A US$ Accumulating $ 2,643 17 151.45 $ 5,640 43 132.68 $ 6,194 42 145.76Class A US$ Distributing (A) 3,494 14 254.57 4,295 19 230.43 6,329 24 258.91Class A US$ Distributing (M) Plus 6,019 61 98.58 10,723 119 90.09 15,914 154 103.25Class A AUD Distributing (M) (Hedged) Plus 3,221 42 99.18 4,288 71 92.51 7,552 99 107.46Class A CNH Distributing (M) (Hedged) Plus 220 16 89.12 368 31 81.55 294 21 93.78Class A Euro Accumulating 73 – 127.23 118 1 121.76 516 3 129.92Class A HKD Distributing (M) Plus 2,429 192 98.24 3,367 291 90.24 6,714 506 104.17Class A SGD Distributing (M) (Hedged) Plus 78 97 1.07 137 194 0.98 172 205 1.13Class B US$ Distributing (A) 42 – 248.16 79 – 224.31 88 – 252.04Class C US$ Accumulating 100 1 104.71 194 2 92.18 214 2 101.78Class C US$ Distributing (A) 1,711 7 246.82 1,784 8 223.09 2,289 9 250.67Class E US$ Accumulating 78 1 143.65 100 1 126.89 111 1 140.49Class E US$ Distributing (A) 11 – 104.55 10 – 94.48 12 – 106.14Class F US$ Accumulating 28 – 134.31 24 – 117.06 73 1 127.85Class F US$ Distributing (A) – – – – – – 208 2 113.27Class X US$ Distributing (A) – – – – – – 1 – 126.96Class X Euro Accumulating – – – 4,586 43 96.16 4,656 40 101.82Premier Class PLN Accumulating (Hedged) 3,041 82 139.65 2,393 76 122.75 3,134 88 134.78S Class US$ Accumulating – – – – – – 2,371 23 105.38Class GA US$ Accumulating 7,174 47 152.29 7,271 54 133.42 8,636 59 146.49Class GA Euro Accumulating 149 1 160.59 202 1 153.73 234 1 163.82Class GA Euro Distributing (A) 23 – 139.53 21 – 138.15 31 – 150.62LM Class SGD Accumulating (Hedged) – – – 17,978 27,864 0.90 20,217 27,952 0.98Class GE US$ Accumulating 503 4 140.75 444 4 124.24 491 4 137.44Class GE Euro Accumulating – – 151.55 14 – 143.53 15 – 154.11
Legg Mason QS Emerging Markets Equity FundClass A US$ Accumulating $ 141 2 81.33 $ 154 2 66.82 $ 290 4 73.23Class A US$ Distributing (A) 69 1 84.68 61 1 70.77 110 1 78.51Class A Euro Accumulating 1 – 119.52 4 – 101.53 3 – 108.00Class A GBP Distributing (A) 40 – 105.28 33 – 95.61 37 – 102.53Class B US$ Accumulating – – – 127 1 97.35 – – –Class B US$ Distributing (A) 9 – 82.73 8 – 69.02 9 – 76.57Class C US$ Accumulating 9 – 84.77 40 1 70.01 44 1 77.11Class C US$ Distributing (A) 91 1 82.69 74 1 68.98 82 1 76.54Class E US$ Accumulating 32 – 95.64 37 – 79.18 117 1 87.44Class X GBP Distributing (A) – – – – – – 2 – 125.28Premier Class US$ Accumulating – – – – – – 1 – 103.14Premier Class Euro Accumulating 14,347 90 132.45 11,647 89 117.89 12,611 89 124.28
Legg Mason QS MV Global Equity Growth and Income FundClass A US$ Accumulating $ 2,204 12 178.06 $ 2,144 13 167.25 $ 2,263 13 169.48Class A US$ Distributing (M) Plus 738 8 98.07 1,278 13 96.81 1,574 15 102.82Class A AUD Distributing (M) (Hedged) Plus 693 10 92.91 930 15 94.24 1,101 15 101.28Class A HKD Distributing (M) Plus 1,174 93 97.94 1,189 95 97.16 579 44 103.97Class A SGD Distributing (M) (Hedged) Plus 33 44 0.99 13 19 0.99 32 41 1.06Class X US$ Accumulating – – – – – – 40 – 119.82Premier Class US$ Accumulating 1,872 19 98.27 1,736 19 91.36 – – –Class GA US$ Accumulating 3,683 20 181.40 3,700 22 170.54 3,797 22 172.85Class GA Euro Accumulating 1,656 6 215.40 1,794 7 221.32 3,258 13 217.80Class GA Euro Distributing (A) 321 1 186.39 362 2 198.41 382 2 200.23Class GE US$ Accumulating 44 – 168.67 42 – 159.76 43 – 163.15Class GE Euro Accumulating 267 1 200.13 281 1 207.22 302 1 205.38
Legg Mason Martin Currie Asia Long-Term UnconstrainedFund^Class A US$ Accumulating $ 2 – 159.99 $ 1 – 122.73 $ 4 – 128.67Class M GBP Distributing (A) 2,890 105 19.71 66,097 3,138 16.35 73,014 3,282 16.72Class E US$ Accumulating – – – 1 – 119.66 1 – 126.09Class F US$ Accumulating 1 – 164.53 1 – 125.42 1 – 130.70Class M US$ Distributing (A) 57,186 3,332 17.16 43,809 3,334 13.14 84,791 6,111 13.88Class M Euro Distributing (A) 286 13 18.44 26,826 1,585 15.40 46,400 2,596 15.65Premier Class US$ Accumulating 19,627 162 121.06 8,127 88 91.83 8,421 88 95.16Premier Class GBP Accumulating 88 1 120.25 19,856 156 98.52 42,006 319 98.88
Legg Mason Martin Currie Asia Pacific Fund^Class A US$ Distributing (A) $ – – – $ – – – $ 2,791 196 14.27Class A Euro Distributing (A) – – – – – – 111 6 15.30Class X US$ Distributing (A) – – – – – – 1 – 138.62
The accompanying notes are an integral part of the Financial Statements
252

Legg Mason Global Funds Plc Annual Report 28 February 2021
Statement of Financial Position – (continued)28 February 2021 29 February 2020 28 February 2019
Total NAV(000’s)
No. Shares(000’s) NAV/Share:
Total NAV(000’s)
No. Shares(000’s) NAV/Share:
Total NAV(000’s)
No. Shares(000’s) NAV/Share:
Legg Mason Martin Currie European Absolute Alpha Fund^Class A (PF) US$ Accumulating € 1 – 97.46 € 1 – 95.92 € 1 – 101.53Class A (PF) US$ Accumulating (Hedged) 1 – 100.77 1 – 107.81 1 – 106.76Class A (PF) US$ Distributing (A) (Hedged) 6,106 538 13.70 8,361 628 14.63 11,269 888 14.49Class A (PF) Euro Accumulating 2,601 28 91.77 5,417 55 99.31 6,879 68 101.21Class A (PF) Euro Distributing (A) 2,836 238 11.92 8,237 640 12.88 16,113 1,230 13.10Class A (PF) GBP Distributing (A) (Hedged) 4 – 12.54 256 16 13.50 359 23 13.59Class E (PF) US$ Accumulating – – – 1 – 93.03 1 – 99.36Class E (PF) US$ Accumulating (Hedged) – – – 1 – 104.61 1 – 104.42Class F (PF) US$ Accumulating 1 – 99.51 1 – 97.37 1 – 102.62Class F (PF) US$ Accumulating (Hedged) 1 – 102.68 1 – 109.36 1 – 107.82Class J (PF) US$ Accumulating (Hedged) – – – 1,834 20 100.79 1,732 20 98.86Class J (PF) JPY Accumulating (Hedged) – – – 43,642 560 9,311.54 59,723 808 9,345.95Class M (PF) US$ Distributing (A) (Hedged) 2,236 195 13.84 2,484 186 14.72 4,730 372 14.50Class M (PF) Euro Accumulating 3,504 37 93.51 32,284 321 100.67 63,519 622 102.08Class M (PF) Euro Distributing (A) 7,263 582 12.47 59,347 4,428 13.40 87,235 6,428 13.57Class M (PF) GBP Distributing (A) (Hedged) 1,284 85 13.06 2,199 134 14.01 8,582 525 14.03Class M (PF) NOK Distributing (A) (Hedged) 21 2 94.45 23 2 102.03 98 9 101.46Class M (PF) SEK Distributing (A) (Hedged) 928 102 92.98 1,841 197 99.89 2,989 310 101.02Premier (PF) Class US$ Accumulating (Hedged) 11,374 135 101.29 21,333 218 107.53 9,495 102 106.12Premier (PF) Class BRL Accumulating (Hedged) 2,182 152 97.18 2,583 124 103.14 2,247 96 99.84
Legg Mason Martin Currie Greater China Fund^Class A US$ Distributing (A) $ – – – $ – – – $ 15,297 503 30.42Class A Euro Distributing (A) – – – – – – 201 20 8.96Class X US$ Distributing (A) – – – – – – 341 2 153.82
Legg Mason Martin Currie Japan Absolute Alpha Fund^Class A (PF) US$ Accumulating ¥ – – – ¥ – – – ¥ 118 – 106.41Class A (PF) US$ Accumulating (Hedged) – – – – – – 122 – 109.81Class A (PF) Euro Accumulating (Hedged) – – – – – – 133 – 104.93Class A (PF) Euro Distributing (A) (Hedged) – – – – – – 52,608 36 11.44Class A (PF) GBP Distributing (A) (Hedged) – – – – – – 10,026 6 11.90Class E (PF) US$ Accumulating – – – – – – 115 – 104.19Class E (PF) US$ Accumulating (Hedged) – – – – – – 119 – 107.84Class F (PF) US$ Accumulating – – – – – – 119 – 107.60Class F (PF) US$ Accumulating (Hedged) – – – – – – 123 – 111.39Class M (PF) US$ Distributing (A) (Hedged) – – – – – – 311,380 224 12.55Class M (PF) Euro Distributing (A) – – – – – – 125 – 98.44Class M (PF) Euro Distributing (A) (Hedged) – – – – – – 4,665,324 3,160 11.67Class M (PF) GBP Distributing (A) (Hedged) – – – – – – 128,986 71 12.30
Legg Mason Martin Currie Global Long-Term UnconstrainedFund^Class A US$ Accumulating $ 1,557 8 202.89 $ 319 2 153.08 $ 6 – 140.20Class A Euro Accumulating 2,320 10 186.03 992 6 153.71 9 – 135.46Class E US$ Accumulating 1,896 14 135.92 1 – 103.20 – – –Class X Euro Accumulating 81 – 192.44 11 – 158.08 10 – 138.35Class X GBP Accumulating 1,685 6 198.38 883 4 160.85 478 3 141.67Class X GBP Accumulating (Hedged) 851 3 193.82 159 1 147.96 86 – 137.09Premier Class US$ Accumulating 14,752 69 213.26 5,674 36 159.16 7 – 144.17Premier Class GBP Accumulating (Hedged) 749 4 133.90 324 2 101.84 – – –S Class US$ Accumulating 33,171 296 111.88 – – – – – –S Class GBP Accumulating 47,287 164 207.39 25,817 120 166.80 22,634 117 145.78
Legg Mason Martin Currie Asia Pacific Ex Japan Real IncomeFundClass A US$ Distributing (M) Plus $ – – – $ 5 – 90.98 $ – – –Class A US$ Distributing (M) Plus (e) 5,757 60 96.60 457 5 101.08 450 4 104.25Class A AUD Distributing (M) (Hedged) Plus – – – 3 – 90.84 – – –Class A AUD Distributing (M) Plus 455 6 93.44 455 6 115.43 447 6 108.96Class A Euro Distributing (M) Plus (e) 458 4 88.46 457 4 101.17 450 4 101.27Class A HKD Distributing (M) Plus – – – 3 – 91.23 – – –Class A SGD Distributing (M) Plus 67 95 0.94 76 103 1.03 37 49 1.03Class D AUD Distributing (M) (Hedged) Plus 379 5 109.14 – – – – – –Class D CNH Distributing (M) (Hedged) Plus 1 – 110.34 – – – – – –Class D HKD Distributing (M) Plus 1 – 110.55 – – – – – –Class D SGD Distributing (M) (Hedged) Plus 1,015 1,230 1.10 – – – – – –Class D US$ Distributing (M) Plus 505 5 110.45 – – – – – –Class D US$ Accumulating 5,734 50 114.42 – – – – – –Class X AUD Accumulating 233 3 111.09 85 1 130.12 70 1 116.57Class X US$ Accumulating 5,601 45 124.63 440 4 123.73 361 3 120.68S Class GBP Accumulating 474 3 123.09 468 3 131.91 453 3 123.51S Class GBP Distributing (M) Plus (e) 474 3 98.77 468 3 110.75 453 3 108.81LM Class AUD Accumulating 5,422 64 110.28 5,324 64 127.89 3,616 45 113.58
Legg Mason Martin Currie Global Emerging Markets Fund^Class A US$ Accumulating $ 4,928 37 133.66 $ 1,598 17 93.97 $ 1,077 12 90.45Class E US$ Accumulating 477 3 150.92 1 – 106.74 1 – 103.45Class F US$ Accumulating 2,510 15 167.30 1 – 116.91 1 – 111.74Class X US$ Accumulating 801 6 142.84 559 6 99.68 534 6 95.22Premier Class US$ Accumulating 7,740 54 144.46 2,796 28 100.46 895 9 95.63S Class US$ Accumulating 3,225 18 174.89 1,725 14 121.37 2,079 18 115.31S Class Euro Accumulating 22,120 135 135.80 22,741 200 103.45 21,606 200 94.62
Legg Mason Martin Currie Global Dividend OpportunitiesFund^Class A US$ Distributing (M) Plus (e) $ – – – $ – – – $ 1,422 15 92.92Class X US$ Distributing (M) Plus (e) – – – – – – 1,432 15 93.62S Class GBP Distributing (M) Plus (e) – – – – – – 199 2 96.74
Legg Mason Martin Currie European Unconstrained Fund^Class A Euro Accumulating € 869 6 148.44 € 569 5 119.97 € 465 4 106.43Class X Euro Accumulating 661 4 151.02 546 5 121.14 467 4 106.67Premier Class Euro Accumulating 17,885 117 152.24 2,129 17 121.70 1,868 17 106.78S Class US$ Accumulating 87,876 1,077 98.43 – – – – – –S Class Euro Accumulating 4,080 31 132.14 2,894 28 105.21 – – –
Amounts designated as “–” are either $0/€0/¥0/£0 or less than $1,000/€1,000/¥1,000/£1,000.
NAV per share information represents Redeemable Participating Shares denominated in the respective currency of each relevant share class.
� Effective 11 January 2021, Western Asset UCITS SMASh Series Core Plus Completion Fund^ commenced trading.
� Effective 25 February 2021, Legg Mason Brandywine Global Sovereign Credit Fund^ ceased trading.
^ Not authorised for sale to the public in Hong Kong.
The accompanying notes are an integral part of the Financial Statements
253

Legg Mason Global Funds Plc Annual Report 28 February 2021
Statement of Comprehensive IncomeLegg Mason Western Asset
US Government Liquidity FundLegg Mason Western Asset
US Core Bond FundLegg Mason Western Asset
US Core Plus Bond FundLegg Mason Western AssetEuro Core Plus Bond Fund
(in 000’s)
for theyar ended
28 February2021
for theyear ended29 February
2020
for theyear ended28 February
2021
for theyear ended29 February
2020
for theyear ended28 February
2021
for theyear ended29 February
2020
for theyear ended28 February
2021
for theyear ended29 February
2020INVESTMENT INCOME:
Gross dividend income and bond interest (Note 2) $ 3,018 $ 19,550 $ 7,853 $ 6,873 $ 46,680 $ 46,894 € 1,390 € 1,625Interest (Note 2) – – – – – 1 – –Equalisation (Note 2) – – – – – – – –Other income – – – – – – – –Net gain/(loss) on financial assets and liabilities at fair value throughprofit or loss (Note 2):
Net realised gain/(loss) on financial instruments held for trading 30 24 8,777 3,975 44,789 22,199 4,661 1,663Net unrealised gain/(loss) on financial instruments held fortrading – – (6,864) 12,688 (35,271) 82,278 (3,518) 6,676
Total Investment Income/(Loss) 3,048 19,574 9,766 23,536 56,198 151,372 2,533 9,964
EXPENSES:Management fees (Note 4) 6,036 5,594 2,556 1,938 9,611 7,397 34 36Performance fees (Note 4) – – – – – – – –Administrator and depositary fees (Note 4) 269 242 200 131 1,007 765 73 75Shareholder service fees (Note 4) – – 301 275 613 461 3 3Legal fees 18 15 2 1 13 7 1 1Audit fees (Note 4) 21 20 43 40 43 40 24 24Printing fees 88 65 25 14 125 87 8 8Dividend expense – – – – – – – –Interest expense – – – – 21 10 22 3Directors’ fees and expenses (Note 4) 5 7 1 1 7 8 – 1Adjustment to accrued expenses and other liabilities – – – – – – – –Other expenses 170 185 66 49 287 219 27 28
Total Expenses 6,607 6,128 3,194 2,449 11,727 8,994 192 179
Expense waivers and reimbursements/recoupment (Note 4) (4,024) – (1) – (4) – – –Total Net Expenses 2,583 6,128 3,193 2,449 11,723 8,994 192 179
Net Profit/(Loss) before finance costs 465 13,446 6,573 21,087 44,475 142,378 2,341 9,785
FINANCE COSTS:Distributions to holders of redeemable participating shares (Note 5) (706) (11,463) (2,014) (3,127) (2,564) (1,772) (1) (3)
Profit/(Loss) for the financial year (241) 1,983 4,559 17,960 41,911 140,606 2,340 9,782Withholding taxes on dividends and other taxation – – (8) (2) (175) (179) (8) –
Net Increase/(Decrease) in Net Assets attributable to Holders ofRedeemable Participating Shares from Operations $ (241) $ 1,983 $ 4,551 $ 17,958 $ 41,736 $ 140,427 € 2,332 € 9,782
Legg Mason Western AssetGlobal High Yield Fund
Legg Mason Western AssetUS Short-Term
Government Fund^
Legg Mason Western AssetUS Adjustable
Rate Fund^
Legg Mason Western AssetGlobal Inflation
Management Fund
(in 000’s)
for theyear ended28 February
2021
for theyear ended29 February
2020
for theyear ended28 February
2021
for theyear ended29 February
2020
for theyear ended28 February
2021
for theyear ended29 February
2020
for theyear ended28 February
2021
for theyear ended29 February
2020INVESTMENT INCOME:
Gross dividend income and bond interest (Note 2) $ 4,865 $ 7,119 $ – $ 202 $ – $ 28 $ 480 $ 898Interest (Note 2) – – – – – – – –Equalisation (Note 2) – – – – – – – –Other income – – – – – – – –Net gain/(loss) on financial assets and liabilities at fair value throughprofit or loss (Note 2):
Net realised gain/(loss) on financial instruments held for trading (4,236) (2,267) – 82 – (5) (548) (259)Net unrealised gain/(loss) on financial instruments held fortrading 8,283 1,209 – 13 – 3 2,440 1,227
Total Investment Income/(Loss) 8,912 6,061 – 297 – 26 2,372 1,866
EXPENSES:Management fees (Note 4) 1,030 1,301 – 125 – 13 67 96Performance fees (Note 4) – – – – – – – –Administrator and depositary fees (Note 4) 66 71 – 12 – 2 35 24Shareholder service fees (Note 4) 100 131 – 11 – 1 10 15Legal fees 1 – – – – – – –Audit fees (Note 4) 40 40 – 10 – 14 29 26Printing fees 8 7 – 1 – – 4 3Dividend expense – – – – – – – –Interest expense 1 – – – – – – –Directors’ fees and expenses (Note 4) – 1 – – – – – –Adjustment to accrued expenses and other liabilities – – – – – – – –Other expenses 40 46 – 4 – 9 19 14
Total Expenses 1,286 1,597 – 163 – 39 164 178
Expense waivers and reimbursements/recoupment (Note 4) (5) (4) – (12) – (19) (3) (5)Total Net Expenses 1,281 1,593 – 151 – 20 161 173
Net Profit/(Loss) before finance costs 7,631 4,468 – 146 – 6 2,211 1,693
FINANCE COSTS:Distributions to holders of redeemable participating shares (Note 5) (2,520) (3,716) – (21) – (1) (86) (53)
Profit/(Loss) for the financial year 5,111 752 – 125 – 5 2,125 1,640Withholding taxes on dividends and other taxation (33) (31) – – – – (3) –
Net Increase/(Decrease) in Net Assets attributable to Holders ofRedeemable Participating Shares from Operations $ 5,078 $ 721 $ – $ 125 $ – $ 5 $ 2,122 $ 1,640
The accompanying notes are an integral part of the Financial Statements
254

Legg Mason Global Funds Plc Annual Report 28 February 2021
Legg Mason Western AssetShort Duration
High Income Bond FundLegg Mason Western AssetGlobal Multi Strategy Fund
Legg Mason Western AssetUS High Yield Fund
Legg Mason Western AssetEmerging Markets Total
Return Bond Fund
Legg Mason Western AssetEmerging Markets Corporate
Bond Fund
for theyear ended28 February
2021
for theyear ended29 February
2020
for theyear ended28 February
2021
for theyear ended29 February
2020
for theyear ended28 February
2021
for theyear ended29 February
2020
for theyear ended28 February
2021
for theyear ended29 February
2020
for theyear ended28 February
2021
for theyear ended29 February
2020
$ 1,393 $ 1,208 $ 28,430 $ 37,457 $ 11,258 $ 9,874 $ 913 $ 1,290 $ 1,656 $ 1,897– – 5 6 – – – – – –– – (2) (7) (1) – – – – –– – – – – – – – – –
(186) (263) 10,211 (23,754) (1,450) (646) 784 (1,531) 576 (546)
1,320 (214) 35,027 14,965 9,906 2,173 (27) 1,630 (16) 2,891
2,527 731 73,671 28,667 19,713 11,401 1,670 1,389 2,216 4,242
297 269 2,246 2,562 1,289 1,168 291 328 3 –– – – – – – – – – –
22 17 411 415 128 98 19 17 29 2624 21 160 185 121 124 19 21 – –
– – 6 3 1 1 – – – –29 26 43 40 40 39 29 26 21 192 2 55 46 13 11 2 1 3 3– – – – – – – – – –– – 12 7 1 2 – – – –– – 3 5 1 1 – – – –– – – – – – – – – –
19 22 147 117 46 49 21 17 15 15
393 357 3,083 3,380 1,640 1,493 381 410 71 63
(26) (25) – (1) (2) – (24) (19) – –367 332 3,083 3,379 1,638 1,493 357 391 71 63
2,160 399 70,588 25,288 18,075 9,908 1,313 998 2,145 4,179
(454) (593) (7,692) (11,149) (3,510) (4,262) (234) (517) (1,570) (1,822)
1,706 (194) 62,896 14,139 14,565 5,646 1,079 481 575 2,357(2) – (488) (416) (21) (26) (12) (17) – (3)
$ 1,704 $ (194) $ 62,408 $ 13,723 $ 14,544 $ 5,620 $ 1,067 $ 464 $ 575 $ 2,354
Legg Mason Western AssetAsian Opportunities Fund
Legg Mason Western AssetShort Duration
Blue Chip Bond Fund
Legg Mason Western AssetGlobal Credit Absolute
Return Fund^Legg Mason Western Asset
Global Core Plus Bond Fund^Legg Mason Western Asset
Global Credit Fund^
for the yearended
28 February2021
for the yearended
29 February2020
for the yearended
28 February2021
for the yearended
29 February2020
for the yearended
28 February2021
for the yearended
29 February2020
for the yearended
28 February2021
for the yearended
29 February2020
for the yearended
28 February2021
for the yearended
29 February2020
$ 23,190 $ 25,228 $ 4,964 $ 3,764 $ – $ – $ 5,062 $ 7,262 $ 2,186 $ 2,3134 – – – – – – 1 – –
27 (3) – 1 – – – – – –– – – – – 192 – – – –
7,481 (13,383) 9,602 1,252 – – 20,051 (9,568) (813) 2,596
3,280 33,087 25,711 1,673 – – (12,457) 24,344 2,602 4,696
33,982 44,929 40,277 6,690 – 192 12,656 22,039 3,975 9,605
4,259 3,966 1,263 544 – – 572 657 43 37– – – – – – – – – –
353 319 247 125 – – 158 158 53 47340 326 48 7 – – – 7 6 5
5 3 2 2 – – 2 1 1 –43 39 29 26 – – 29 26 29 2645 36 25 13 – – 18 17 7 5
– – – – – – – – – –1 1 6 2 – – 3 1 2 23 4 1 1 – – 1 2 – 1– – – – – 192 – – – –
134 130 72 49 – – 61 65 24 25
5,183 4,824 1,693 769 – 192 844 934 165 148
(87) (59) – (5) – – – – – –5,096 4,765 1,693 764 – 192 844 934 165 148
28,886 40,164 38,584 5,926 – – 11,812 21,105 3,810 9,457
(10,908) (10,507) (3,876) (3,469) – – (1) (31) – (9)
17,978 29,657 34,708 2,457 – – 11,811 21,074 3,810 9,448(843) (1,083) (29) (7) – – (169) (135) (15) (8)
$ 17,135 $ 28,574 $ 34,679 $ 2,450 $ – $ – $ 11,642 $ 20,939 $ 3,795 $ 9,440
The accompanying notes are an integral part of the Financial Statements
255

Legg Mason Global Funds Plc Annual Report 28 February 2021
Statement of Comprehensive Income – (continued)
Legg Mason Western AssetEuro High Yield Fund
Legg Mason WesternAsset Macro
Opportunities Bond Fund^
Legg Mason WesternAsset EM Local Currency
Debt Fund^
Legg Mason WesternAsset Multi-Asset Credit
Fund^
(in 000’s)
for theyear ended28 February
2021
for theyear ended29 February
2020
for theyear ended28 February
2021
for theyear ended29 February
2020
for theyear ended28 February
2021
for theyear ended29 February
2020
for theyear ended28 February
2021
for theyear ended29 February
2020INVESTMENT INCOME:
Gross dividend income and bond interest (Note 2) € 2,351 € 2,922 $ 315,872 $ 386,582 $ – $ 2,234 $ 45,529 $ 45,737Interest (Note 2) – 2 22 23 – – 2 1Equalisation (Note 2) (1) (13) (427) 495 – – – –Other income – – – – – – – –Net gain/(loss) on financial assets and liabilities at fair value through profitor loss (Note 2):
Net realised gain/(loss) on financial instruments held for trading (731) (1,055) (803,493) 233,031 – (6,346) 27,141 (15,742)Net unrealised gain/(loss) on financial instruments held for trading 810 1,658 935,818 (165,196) – 4,663 56,458 (6,648)
Total Investment Income/(Loss) 2,429 3,514 447,792 454,935 – 551 129,130 23,348
EXPENSES:Management fees (Note 4) 3 5 80,912 85,648 – 131 262 94Performance fees (Note 4) – – – – – – – –Administrator and depositary fees (Note 4) 38 44 4,198 4,280 – 23 575 467Shareholder service fees (Note 4) – – 5,282 5,822 – – – –Legal fees 1 – 64 26 – – 7 4Audit fees (Note 4) 24 24 43 40 – 13 43 26Printing fees 4 5 566 469 – 6 69 52Dividend expense – – – – – – – –Interest expense 19 21 143 74 – 1 5 3Directors’ fees and expenses (Note 4) – 1 37 51 – – 4 5Adjustment to accrued expenses and other liabilities – – – – – – – –Other expenses 18 21 1,272 932 – 10 156 144
Total Expenses 107 121 92,517 97,342 – 184 1,121 795
Expense waivers and reimbursements/recoupment (Note 4) (1) – (2) – – (26) – –Total Net Expenses 106 121 92,515 97,342 – 158 1,121 795
Net Profit/(Loss) before finance costs 2,323 3,393 355,277 357,593 – 393 128,009 22,553
FINANCE COSTS:Distributions to holders of redeemable participating shares (Note 5) (369) (480) (58,267) (79,053) – (98) (50) (8)
Profit/(Loss) for the financial year 1,954 2,913 297,010 278,540 – 295 127,959 22,545Withholding taxes on dividends and other taxation – (3) (13,830) (15,293) – (125) (405) (509)
Net Increase/(Decrease) in Net Assets attributable to Holders ofRedeemable Participating Shares from Operations € 1,954 € 2,910 $ 283,180 $ 263,247 $ – $ 170 $127,554 $ 22,036
Western Asset UCITSSMASh Series Core Plus
Completion Fund^�Legg Mason BrandywineGlobal Fixed Income Fund
Legg Mason BrandywineGlobal Fixed Income
Absolute Return Fund^Legg Mason BrandywineGlobal High Yield Fund^
(in 000’s)
for theyear ended28 February
2021
for theyear ended29 February
2020
for theyear ended28 February
2021
for theyear ended29 February
2020
for theyear ended28 February
2021
for theyear ended29 February
2020
for theyear ended28 February
2021
for theyear ended29 February
2020INVESTMENT INCOME:
Gross dividend income and bond interest (Note 2) $ 55 $ – $ 16,880 $ 37,581 $ 22,249 $ 40,320 $ 636 $ 2,678Interest (Note 2) – – – – 4 – – –Equalisation (Note 2) – – (99) (55) (100) (163) – –Other income – – – – – – – –Net gain/(loss) on financial assets and liabilities at fair value through profitor loss (Note 2):
Net realised gain/(loss) on financial instruments held for trading (62) – (32,336) (49,824) 74,459 (126,401) 322 (170)Net unrealised gain/(loss) on financial instruments held for trading (420) – 58,549 29,206 51,432 51,396 664 173
Total Investment Income/(Loss) (427) – 42,994 16,908 148,044 (34,848) 1,622 2,681
EXPENSES:Management fees (Note 4) – – 4,131 6,262 3,967 5,780 50 93Performance fees (Note 4) – – – – – – – –Administrator and depositary fees (Note 4) 3 – 398 586 476 589 12 33Shareholder service fees (Note 4) – – 402 702 19 62 – 5Legal fees – – 9 4 9 3 – –Audit fees (Note 4) 35 – 43 40 29 26 29 26Printing fees – – 65 66 65 68 1 4Dividend expense – – – – – – – –Interest expense – – 5 – 4 7 – –Directors’ fees and expenses (Note 4) – – 5 7 4 7 – –Adjustment to accrued expenses and other liabilities – – – – – – – –Other expenses 3 – 189 180 155 154 14 15
Total Expenses 41 – 5,247 7,847 4,728 6,696 106 176
Expense waivers and reimbursements/recoupment (Note 4) (41) – (1) – – (1) (40) (11)Total Net Expenses – – 5,246 7,847 4,728 6,695 66 165
Net Profit/(Loss) before finance costs (427) – 37,748 9,061 143,316 (41,543) 1,556 2,516
FINANCE COSTS:Distributions to holders of redeemable participating shares (Note 5) – – (3,363) (6,312) (2,177) (3,977) (6) (40)
Profit/(Loss) for the financial year (427) – 34,385 2,749 141,139 (45,520) 1,550 2,476Withholding taxes on dividends and other taxation (2) – (375) (859) (940) (1,281) (1) (15)
Net Increase/(Decrease) in Net Assets attributable to Holders ofRedeemable Participating Shares from Operations $ (429) $ – $ 34,010 $ 1,890 $140,199 $ (46,801) $ 1,549 $ 2,461
The accompanying notes are an integral part of the Financial Statements
256

Legg Mason Global Funds Plc Annual Report 28 February 2021
Legg Mason Western AssetGlobal Total Return
Investment Grade Bond Fund^
Legg Mason Western AssetStructured Opportunities
Fund^
Legg Mason Western Asset USMortgage-Backed Securities
Fund^
Legg Mason Western Asset UKInvestment Grade Credit
Fund^Legg Mason Western Asset US
Corporate Bond Fund^
for theyear ended28 February
2021
for theyear ended29 February
2020
for theyear ended28 February
2021
for theyear ended29 February
2020
for theyear ended28 February
2021
for theyear ended29 February
2020
for theyear ended28 February
2021
for theyear ended29 February
2020
for theyear ended28 February
2021
for theyear ended29 February
2020
$ – $ 1,134 $ 58,210 $ 90,852 $ 26,192 $ 30,477 £ 2,471 £ 2,551 $ 4,588 $ 5,000– – 12 – 2 – – 1 – –– – – 38 – – – – – –– – – – – – – – – –
– (116) (106,904) (38,472) (5,961) (3,775) 4,049 563 8,184 (1,235)– 1,323 (125,752) 58,378 (16,030) 45,573 (2,986) 7,100 1,400 6,779
– 2,341 (174,434) 110,796 4,203 72,275 3,534 10,215 14,172 10,544
– 219 4,837 6,098 14 7 – – 105 80– – – – – – – – – –– 27 706 901 502 563 69 64 88 72– – 91 66 – – – – 12 8– – 15 5 9 4 1 – 1 1– 13 32 26 29 26 16 15 29 26– 5 103 100 70 64 8 7 9 8– – – – – – – – – –– 1 13 4 2 2 2 1 1 –– 1 8 8 5 6 1 1 1 1– – – – – – – – – –– 18 242 214 151 142 22 23 30 24
– 284 6,047 7,422 782 814 119 111 276 220
– (9) (1) (18) – – – – – –– 275 6,046 7,404 782 814 119 111 276 220
– 2,066 (180,480) 103,392 3,421 71,461 3,415 10,104 13,896 10,324
– (1,030) (4,391) (5,127) – (2) – – – –
– 1,036 (184,871) 98,265 3,421 71,459 3,415 10,104 13,896 10,324– (31) – – – – (2) 1 (23) 5
$ – $ 1,005 $(184,871) $ 98,265 $ 3,421 $ 71,459 £ 3,413 £ 10,105 $ 13,873 $ 10,329
Legg Mason BrandywineGlobal Opportunistic Fixed
Income Fund
Legg Mason BrandywineGlobal Sovereign Credit
Fund^�
Legg Mason BrandywineGlobal Income Optimiser
Fund^
Legg Mason BrandywineGlobal Credit Opportunities
Fund^
Legg Mason BrandywineGlobal Defensive High Yield
Fund^
for the yearended
28 February2021
for the yearended
29 February2020
for the yearended
28 February2021
for the yearended
29 February2020
for the yearended
28 February2021
for the yearended
29 February2020
for the yearended
28 February2021
for the yearended
29 February2020
for the yearended
28 February2021
for the yearended
29 February2020
$ 18,957 $ 24,688 $ 28,258 $ 78,018 $ 5,997 $ 2,829 $ 1,692 $ 1,688 $ 584 $ 524– – 7 1 – – – – – –– – – (945) 107 (1) – – – –– – – – – – – – – –
47,886 (23,415) (105,505) (29,767) 13,767 2,869 (1,966) 969 759 (408)21,623 7,634 61,577 14,096 2,501 1,563 (475) 792 491 162
88,466 8,907 (15,663) 61,403 22,372 7,260 (749) 3,449 1,834 278
2,426 2,712 1,370 2,528 1,329 801 424 346 42 42– – – – – – – – – –
359 359 459 1,032 112 63 41 30 12 917 65 1 – 152 93 13 1 – –5 2 15 5 1 – 1 – – –
40 40 7 26 29 26 29 26 29 2644 41 101 118 7 6 3 3 1 1
– – – – – – – – – –– – 10 1 1 – – 1 – –3 4 8 12 – 1 – – – –– – – – – – – – – –
111 104 209 197 49 44 21 28 18 17
3,005 3,327 2,180 3,919 1,680 1,034 532 435 102 95
– – (29) – (9) (9) (27) (25) (44) (37)3,005 3,327 2,151 3,919 1,671 1,025 505 410 58 58
85,461 5,580 (17,814) 57,484 20,701 6,235 (1,254) 3,039 1,776 220
(148) (649) (17,563) (38,078) (3,208) (2,078) – – (536) (611)
85,313 4,931 (35,377) 19,406 17,493 4,157 (1,254) 3,039 1,240 (391)(686) (808) 1,073 (3,566) (41) 5 (26) (45) (1) (1)
$ 84,627 $ 4,123 $ (34,304) $ 15,840 $ 17,452 $ 4,162 $ (1,280) $ 2,994 $ 1,239 $ (392)
The accompanying notes are an integral part of the Financial Statements
257

Legg Mason Global Funds Plc Annual Report 28 February 2021
Statement of Comprehensive Income – (continued)Legg Mason Brandywine
Global - US High YieldFund^
Legg Mason BrandywineGlobal Enhanced Absolute
Return Fund^
Legg Mason BrandywineGlobal Dynamic US Equity
Fund^Legg Mason ClearBridge
Value Fund
(in 000’s)
for theyear ended28 February
2021
for theyear ended29 February
2020
for theyear ended28 February
2021
for theyear ended29 February
2020
for theyear ended28 February
2021
for theyear ended29 February
2020
for theyear ended28 February
2021
for theyear ended29 February
2020INVESTMENT INCOME:
Gross dividend income and bond interest (Note 2) $ – $ 1,323 $ 19,559 $ 28,462 $ 48 $ 89 $ 7,285 $ 7,029Interest (Note 2) – – – – – – – –Equalisation (Note 2) – – – – – – 54 (1)Other income – – – – – – – –Net gain/(loss) on financial assets and liabilities at fair value through profitor loss (Note 2):
Net realised gain/(loss) on financial instruments held for trading – (892) 30,120 (57,781) 176 203 39,277 (6,626)Net unrealised gain/(loss) on financial instruments held for trading – 313 30,820 (35,095) 376 (370) 94,033 (5,227)
Total Investment Income/(Loss) – 744 80,499 (64,414) 600 (78) 140,649 (4,825)
EXPENSES:Management fees (Note 4) – 91 195 120 8 16 2,612 2,771Performance fees (Note 4) – – – – – – – –Administrator and depositary fees (Note 4) – 24 230 239 7 5 231 229Shareholder service fees (Note 4) – – 3 4 – 1 147 183Legal fees – – 4 3 – – 3 2Audit fees (Note 4) – 13 28 26 29 26 27 26Printing fees – 2 29 27 – – 27 24Dividend expense – – – – – – – –Interest expense – – – – – – – –Directors’ fees and expenses (Note 4) – – 2 2 – – 2 2Adjustment to accrued expenses and other liabilities – – – – – – – –Other expenses – 19 70 64 10 7 73 61
Total Expenses – 149 561 485 54 55 3,122 3,298
Expense waivers and reimbursements/recoupment (Note 4) – (23) (2) – (42) (33) – –Total Net Expenses – 126 559 485 12 22 3,122 3,298
Net Profit/(Loss) before finance costs – 618 79,940 (64,899) 588 (100) 137,527 (8,123)
FINANCE COSTS:Distributions to holders of redeemable participating shares (Note 5) – – (1) (1) – – (7) (5)
Profit/(Loss) for the financial year – 618 79,939 (64,900) 588 (100) 137,520 (8,128)Withholding taxes on dividends and other taxation – – (862) (918) (13) (26) (1,927) (1,832)
Net Increase/(Decrease) in Net Assets attributable to Holders ofRedeemable Participating Shares from Operations $ – $ 618 $ 79,077 $ (65,818) $ 575 $ (126) $135,593 $ (9,960)
Legg Mason ClearBridgeUS Aggressive Growth
Fund
Legg Mason ClearBridgeTactical Dividend Income
Fund
Legg Mason ClearBridgeUS Equity Sustainability
Leaders Fund^Legg Mason ClearBridge
Global Growth Fund^
(in 000’s)
for theyear ended28 February
2021
for theyear ended29 February
2020
for theyear ended28 February
2021
for theyear ended29 February
2020
for theyear ended28 February
2021
for theyear ended29 February
2020
for theyear ended28 February
2021
for theyear ended29 February
2020INVESTMENT INCOME:
Gross dividend income and bond interest (Note 2) $ 8,267 $ 15,967 $ 1,547 $ 2,169 $ 3,297 $ 307 $ 101 $ 80Interest (Note 2) – – – – – – – –Equalisation (Note 2) (67) (363) (1) (1) 8 – – –Other income – – – – – – – –Net gain/(loss) on financial assets and liabilities at fair value through profitor loss (Note 2):
Net realised gain/(loss) on financial instruments held for trading 29,692 (11,006) (1,276) 1,750 16,605 1,293 743 328Net unrealised gain/(loss) on financial instruments held for trading 210,182 16,490 5,091 (366) 54,743 (969) 2,259 178
Total Investment Income/(Loss) 248,074 21,088 5,361 3,552 74,653 631 3,103 586
EXPENSES:Management fees (Note 4) 6,632 10,553 420 523 1,311 34 65 43Performance fees (Note 4) – – – – – – – –Administrator and depositary fees (Note 4) 490 782 31 33 155 18 12 11Shareholder service fees (Note 4) 866 1,366 68 86 227 13 2 2Legal fees 11 3 – – 1 – – –Audit fees (Note 4) 43 40 29 26 16 13 14 13Printing fees 70 84 3 3 8 1 1 –Dividend expense – – – – – – – –Interest expense 23 14 – – – – – –Directors’ fees and expenses (Note 4) 5 9 – 1 – – – –Adjustment to accrued expenses and other liabilities – – – – – – – –Other expenses 188 191 28 20 37 11 10 8
Total Expenses 8,328 13,042 579 692 1,755 90 104 77
Expense waivers and reimbursements/recoupment (Note 4) – – (35) (19) (71) (15) (23) (23)Total Net Expenses 8,328 13,042 544 673 1,684 75 81 54
Net Profit/(Loss) before finance costs 239,746 8,046 4,817 2,879 72,969 556 3,022 532
FINANCE COSTS:Distributions to holders of redeemable participating shares (Note 5) (419) (1,197) (297) (517) (15) (3) – –
Profit/(Loss) for the financial year 239,327 6,849 4,520 2,362 72,954 553 3,022 532Withholding taxes on dividends and other taxation (1,584) (2,926) (432) (456) (890) (82) (24) (19)
Net Increase/(Decrease) in Net Assets attributable to Holders ofRedeemable Participating Shares from Operations $237,743 $ 3,923 $ 4,088 $ 1,906 $ 72,064 $ 471 $ 2,998 $ 513
The accompanying notes are an integral part of the Financial Statements
258

Legg Mason Global Funds Plc Annual Report 28 February 2021
Legg Mason ClearBridgeGrowth Fund^
Legg Mason ClearBridgeGlobal Equity Fund^
Legg Mason ClearBridgeGlobal Equity Income
Fund^Legg Mason ClearBridge US
Appreciation FundLegg Mason ClearBridge US
Large Cap Growth Fund
for theyear ended28 February
2021
for theyear ended29 February
2020
for theyear ended28 February
2021
for theyear ended29 February
2020
for theyear ended28 February
2021
for theyear ended29 February
2020
for theyear ended28 February
2021
for theyear ended29 February
2020
for theyear ended28 February
2021
for theyear ended29 February
2020
$ – $ – $ – $ 629 $ – $ 125 $ 3,277 $ 4,001 $ 13,652 $ 14,475– – – – – – – – – –– – – – – – (2) (13) – –4 – 1 – 1 – – – – –
– – – (3,316) – (31) 28,387 21,610 156,809 116,077– – – 1,708 – (122) 14,228 (8,769) 385,923 6,221
4 – 1 (979) 1 (28) 45,890 16,829 556,384 136,773
– – – 55 – 15 2,194 2,448 13,960 12,085– – – – – – – – – –– – – 15 – 3 132 132 1,135 938– – – 3 – 3 338 426 1,895 1,864– – – – – – 2 1 13 6– – – 10 – 12 29 26 43 39– – – 3 – – 15 14 134 98– – – – – – – – – –– – – – – – – – 2 4– – – – – – 1 1 8 94 – 1 – 1 – – – – –– – – 36 – 5 56 41 319 236
4 – 1 122 1 38 2,767 3,089 17,509 15,279
– – – (34) – (14) (3) – – (4)4 – 1 88 1 24 2,764 3,089 17,509 15,275
– – – (1,067) – (52) 43,126 13,740 538,875 121,498
– – – (4) – (60) (44) (67) (3) –
– – – (1,071) – (112) 43,082 13,673 538,872 121,498– – – (71) – (17) (953) (1,150) (3,962) (3,640)
$ – $ – $ – $ (1,142) $ – $ (129) $ 42,129 $ 12,523 $ 534,910 $ 117,858
Legg Mason ClearBridgeInfrastructure Value Fund^
Legg Mason ClearBridgeEmerging Markets
Infrastructure Fund^Legg Mason Royce US Small
Cap Opportunity FundLegg Mason Royce US Smaller
Companies FundLegg Mason PCM US Equity
Fund^
for theyear ended28 February
2021
for theyear ended29 February
2020
for theyear ended28 February
2021
for theyear ended29 February
2020
for theyear ended28 February
2021
for theyear ended29 February
2020
for theyear ended28 February
2021
for theyear ended29 February
2020
for theyear ended28 February
2021
for theyear ended29 February
2020
€ 16,920 € 19,245 $ 79 $ 79 $ 4,337 $ 4,328 $ 995 $ 1,455 $ – $ –1 1 – – – – – – – –
(154) – – – – – 12 (6) – –– – – – – – – – – –
(55,839) 27,071 (134) (218) 9,382 (40,457) (440) 2,411 – –(4,587) (13,903) 100 68 350,473 (14,398) 26,368 (4,632) – –
(43,659) 32,414 45 (71) 364,192 (50,527) 26,935 (772) – –
6,179 4,674 26 31 5,900 6,663 877 1,114 – –– – – – – – – – – –
429 339 7 5 352 388 49 56 – –748 372 4 5 1,020 1,127 160 214 – –
4 3 – – 21 – 1 – – –24 24 20 19 44 39 29 26 – –51 33 – – 34 41 5 5 – –
– – – – – – – – – –150 101 – – – – – – – –
3 3 – – 3 5 – 1 – –– – – – – – – – – –
123 104 13 19 111 85 31 23 – –
7,711 5,653 70 79 7,485 8,348 1,152 1,439 – –
(6) (12) (37) (39) (1) (1) (7) (2) – –7,705 5,641 33 40 7,484 8,347 1,145 1,437 – –
(51,364) 26,773 12 (111) 356,708 (58,874) 25,790 (2,209) – –
(4,601) (7,092) (12) (11) – – (64) (64) – –
(55,965) 19,681 – (122) 356,708 (58,874) 25,726 (2,273) – –(3,064) (2,590) 18 (35) (1,206) (1,055) (15) (309) – –
€ (59,029) € 17,091 $ 18 $ (157) $ 355,502 $ (59,929) $ 25,711 $ (2,582) $ – $ –
The accompanying notes are an integral part of the Financial Statements
259
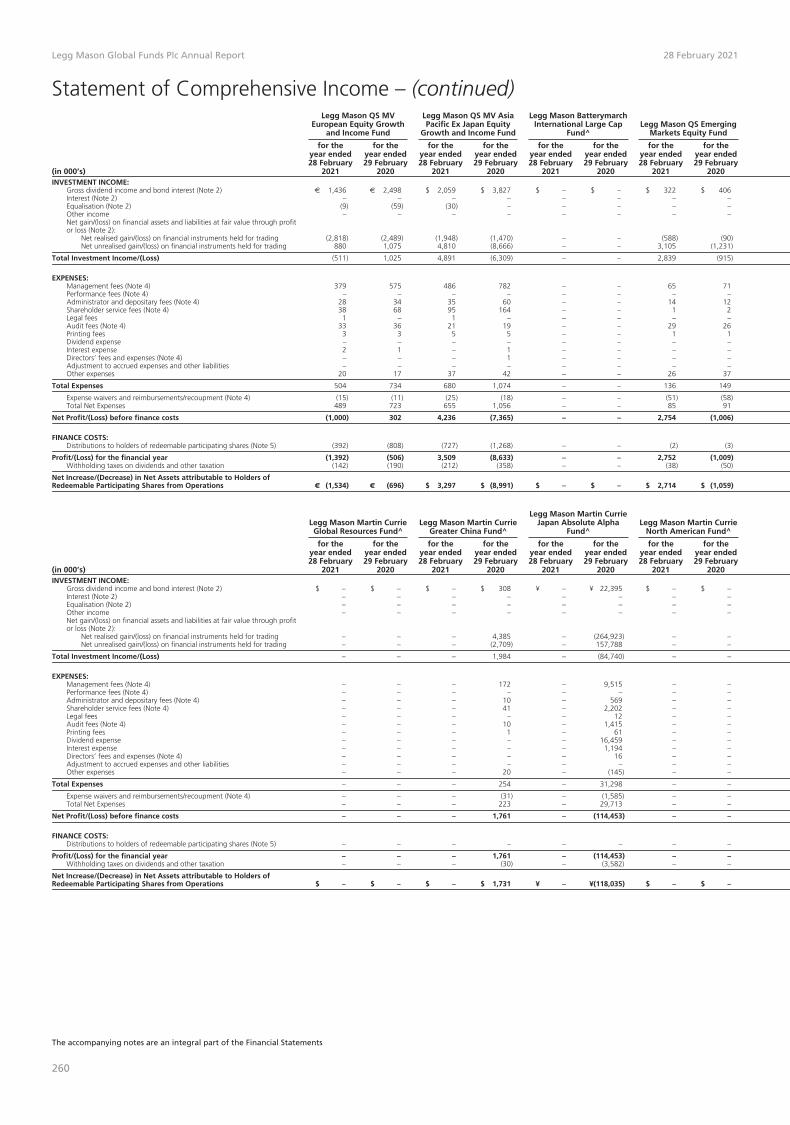
Legg Mason Global Funds Plc Annual Report 28 February 2021
Statement of Comprehensive Income – (continued)Legg Mason QS MV
European Equity Growthand Income Fund
Legg Mason QS MV AsiaPacific Ex Japan Equity
Growth and Income Fund
Legg Mason BatterymarchInternational Large Cap
Fund^Legg Mason QS Emerging
Markets Equity Fund
(in 000’s)
for theyear ended28 February
2021
for theyear ended29 February
2020
for theyear ended28 February
2021
for theyear ended29 February
2020
for theyear ended28 February
2021
for theyear ended29 February
2020
for theyear ended28 February
2021
for theyear ended29 February
2020INVESTMENT INCOME:
Gross dividend income and bond interest (Note 2) € 1,436 € 2,498 $ 2,059 $ 3,827 $ – $ – $ 322 $ 406Interest (Note 2) – – – – – – – –Equalisation (Note 2) (9) (59) (30) – – – – –Other income – – – – – – – –Net gain/(loss) on financial assets and liabilities at fair value through profitor loss (Note 2):
Net realised gain/(loss) on financial instruments held for trading (2,818) (2,489) (1,948) (1,470) – – (588) (90)Net unrealised gain/(loss) on financial instruments held for trading 880 1,075 4,810 (8,666) – – 3,105 (1,231)
Total Investment Income/(Loss) (511) 1,025 4,891 (6,309) – – 2,839 (915)
EXPENSES:Management fees (Note 4) 379 575 486 782 – – 65 71Performance fees (Note 4) – – – – – – – –Administrator and depositary fees (Note 4) 28 34 35 60 – – 14 12Shareholder service fees (Note 4) 38 68 95 164 – – 1 2Legal fees 1 – 1 – – – – –Audit fees (Note 4) 33 36 21 19 – – 29 26Printing fees 3 3 5 5 – – 1 1Dividend expense – – – – – – – –Interest expense 2 1 – 1 – – – –Directors’ fees and expenses (Note 4) – – – 1 – – – –Adjustment to accrued expenses and other liabilities – – – – – – – –Other expenses 20 17 37 42 – – 26 37
Total Expenses 504 734 680 1,074 – – 136 149
Expense waivers and reimbursements/recoupment (Note 4) (15) (11) (25) (18) – – (51) (58)Total Net Expenses 489 723 655 1,056 – – 85 91
Net Profit/(Loss) before finance costs (1,000) 302 4,236 (7,365) – – 2,754 (1,006)
FINANCE COSTS:Distributions to holders of redeemable participating shares (Note 5) (392) (808) (727) (1,268) – – (2) (3)
Profit/(Loss) for the financial year (1,392) (506) 3,509 (8,633) – – 2,752 (1,009)Withholding taxes on dividends and other taxation (142) (190) (212) (358) – – (38) (50)
Net Increase/(Decrease) in Net Assets attributable to Holders ofRedeemable Participating Shares from Operations € (1,534) € (696) $ 3,297 $ (8,991) $ – $ – $ 2,714 $ (1,059)
Legg Mason Martin CurrieGlobal Resources Fund^
Legg Mason Martin CurrieGreater China Fund^
Legg Mason Martin CurrieJapan Absolute Alpha
Fund^Legg Mason Martin Currie
North American Fund^
(in 000’s)
for theyear ended28 February
2021
for theyear ended29 February
2020
for theyear ended28 February
2021
for theyear ended29 February
2020
for theyear ended28 February
2021
for theyear ended29 February
2020
for theyear ended28 February
2021
for theyear ended29 February
2020INVESTMENT INCOME:
Gross dividend income and bond interest (Note 2) $ – $ – $ – $ 308 ¥ – ¥ 22,395 $ – $ –Interest (Note 2) – – – – – – – –Equalisation (Note 2) – – – – – – – –Other income – – – – – – – –Net gain/(loss) on financial assets and liabilities at fair value through profitor loss (Note 2):
Net realised gain/(loss) on financial instruments held for trading – – – 4,385 – (264,923) – –Net unrealised gain/(loss) on financial instruments held for trading – – – (2,709) – 157,788 – –
Total Investment Income/(Loss) – – – 1,984 – (84,740) – –
EXPENSES:Management fees (Note 4) – – – 172 – 9,515 – –Performance fees (Note 4) – – – – – – – –Administrator and depositary fees (Note 4) – – – 10 – 569 – –Shareholder service fees (Note 4) – – – 41 – 2,202 – –Legal fees – – – – – 12 – –Audit fees (Note 4) – – – 10 – 1,415 – –Printing fees – – – 1 – 61 – –Dividend expense – – – – – 16,459 – –Interest expense – – – – – 1,194 – –Directors’ fees and expenses (Note 4) – – – – – 16 – –Adjustment to accrued expenses and other liabilities – – – – – – – –Other expenses – – – 20 – (145) – –
Total Expenses – – – 254 – 31,298 – –
Expense waivers and reimbursements/recoupment (Note 4) – – – (31) – (1,585) – –Total Net Expenses – – – 223 – 29,713 – –
Net Profit/(Loss) before finance costs – – – 1,761 – (114,453) – –
FINANCE COSTS:Distributions to holders of redeemable participating shares (Note 5) – – – – – – – –
Profit/(Loss) for the financial year – – – 1,761 – (114,453) – –Withholding taxes on dividends and other taxation – – – (30) – (3,582) – –
Net Increase/(Decrease) in Net Assets attributable to Holders ofRedeemable Participating Shares from Operations $ – $ – $ – $ 1,731 ¥ – ¥(118,035) $ – $ –
The accompanying notes are an integral part of the Financial Statements
260

Legg Mason Global Funds Plc Annual Report 28 February 2021
Legg Mason QS MV GlobalEquity Growth and Income Fund
Legg Mason Congruix JapanEquity Fund^
Legg Mason Martin CurrieAsia Long-Term Unconstrained
Fund^Legg Mason Martin Currie
Asia Pacific Fund^
Legg Mason Martin CurrieEuropean Absolute Alpha
Fund^
for theyear ended28 February
2021
for theyear ended29 February
2020
for theyear ended28 February
2021
for theyear ended29 February
2020
for theyear ended28 February
2021
for theyear ended29 February
2020
for theyear ended28 February
2021
for theyear ended29 February
2020
for theyear ended28 February
2021
for theyear ended29 February
2020
$ 587 $ 704 ¥ – ¥ – $ 2,107 $ 6,823 $ – $ 48 € 1,351 € 3,221– – – – – – – – 1 –
(1) – – – (338) – – – – –– – – – – – – – – –
(384) 630 – – (5,335) 19,572 – 363 (7,302) 1,981879 (1,357) – – 21,330 (26,075) – (537) (6,252) 8,129
1,081 (23) – – 17,764 320 – (126) (12,202) 13,331
158 187 – – 839 2,263 – 21 1,516 3,262– – – – – – – – – 22
14 12 – – 67 161 – 5 76 15017 20 – – 244 667 – 5 262 540
– – – – 2 1 – – 2 129 26 – – 14 13 – 7 24 241 1 – – 11 17 – – 11 16– – – – – – – – 1,328 4,336– – – – – – – – 605 1,649– – – – 1 2 – – 1 1– – – – – – – – – –
19 18 – – 44 60 – 21 39 47
238 264 – – 1,222 3,184 – 59 3,864 10,048
(24) (17) – – (211) (490) – (32) (110) (169)214 247 – – 1,011 2,694 – 27 3,754 9,879
867 (270) – – 16,753 (2,374) – (153) (15,956) 3,452
(146) (157) – – (313) (1,966) – – – –
721 (427) – – 16,440 (4,340) – (153) (15,956) 3,452(96) (105) – – (166) (424) – 4 (224) 13
$ 625 $ (532) ¥ – ¥ – $ 16,274 $ (4,764) $ – $ (149) € (16,180) € 3,465
Legg Mason Martin CurrieGlobal Long-Term
Unconstrained Fund^
Legg Mason Martin CurrieAsia Pacific Ex Japan Real
Income Fund
Legg Mason Martin CurrieGlobal Emerging Markets
Fund^
Legg Mason Martin CurrieGlobal Dividend Opportunities
Fund^
Legg Mason Martin CurrieEuropean Unconstrained
Fund^
for theyear ended28 February
2021
for theyear ended29 February
2020
for theyear ended28 February
2021
for theyear ended29 February
2020
for theyear ended28 February
2021
for theyear ended29 February
2020
for theyear ended28 February
2021
for theyear ended29 February
2020
for theyear ended28 February
2021
for theyear ended29 February
2020
$ 497 $ 379 $ 802 $ 385 $ 715 $ 659 $ – $ 63 € 98 € 64– – – – – – – – 11 –– – – – – – – – – –– – – – – – – – – –
1,563 2,070 (517) 318 3,289 (339) – 274 450 10816,334 (66) 1,220 (568) 11,274 1,351 – (48) (507) 407
18,394 2,383 1,505 135 15,278 1,671 – 289 52 579
342 127 110 30 243 172 – 19 78 36– – – – – – – – – –
48 20 15 9 29 29 – 9 14 1118 5 32 7 12 7 – 6 4 4
– – – – – – – – – –16 13 21 19 14 13 – 7 12 124 2 1 1 3 2 – – – –– – – – – – – – – –– – – – – – – – 2 1– – – – – – – – – –– – – – – – – – – –
24 14 19 24 27 28 – 16 9 20
452 181 198 90 328 251 – 57 119 84
(6) (10) (33) (31) (18) (33) – (29) (18) (35)446 171 165 59 310 218 – 28 101 49
17,948 2,212 1,340 76 14,968 1,453 – 261 (49) 530
– – (217) (95) – – – (50) – –
17,948 2,212 1,123 (19) 14,968 1,453 – 211 (49) 530(61) (47) (77) (28) (95) (79) – (9) (11) (6)
$ 17,887 $ 2,165 $ 1,046 $ (47) $ 14,873 $ 1,374 $ – $ 202 € (60) € 524
The accompanying notes are an integral part of the Financial Statements
261

Legg Mason Global Funds Plc Annual Report 28 February 2021
Statement of Comprehensive Income – (continued)Legg Mason
Global Funds Plc
(in 000’s)
for the yearended
28 February2021
for the yearended
29 February2020
INVESTMENT INCOME:Gross dividend income and bond interest (Note 2) $ 786,050 $1,050,543Interest (Note 2) 73 38Equalisation (Note 2) (1,050) (1,104)Other income 6 192Net gain/(loss) on financial assets and liabilities at fair value through profit or loss (Note 2):
Net realised gain/(loss) on financial instruments held for trading (548,015) (4,184)Net unrealised gain/(loss) on financial instruments held for trading 2,291,604 160,826
Total Investment Income/(Loss) 2,528,668 1,206,311
EXPENSES:Management fees (Note 4) 175,374 186,891Performance fees (Note 4) – 24Administrator and depositary fees (Note 4) 14,844 15,522Shareholder service fees (Note 4) 14,104 15,754Legal fees 258 109Audit fees (Note 4) 1,593 1,562Printing fees 1,976 1,736Dividend expense 1,540 4,979Interest expense 1,186 2,127Directors’ fees and expenses (Note 4) 125 175Adjustment to accrued expenses and other liabilities 6 192Other expenses 5,185 4,636
Total Expenses 216,191 233,707
Expense waivers and reimbursements/recoupment (Note 4) (5,133) (1,508)Total Net Expenses 211,058 232,199
Net Profit/(Loss) before finance costs 2,317,610 974,112
FINANCE COSTS:Distributions to holders of redeemable participating shares (Note 5) (132,689) (202,210)
Profit/(Loss) for the financial year 2,184,921 771,902Withholding taxes on dividends and other taxation (33,653) (41,214)
Net Increase/(Decrease) in Net Assets attributable to Holders of Redeemable Participating Shares from Operations $2,151,268 $ 730,688
Amounts designated as “–” are either $0/€0/¥0/£0 or less than $1,000/€1,000/¥1,000/£1,000.
Gains and losses are solely from continuing operations except for Legg Mason Asset US Short-Term Government Fund^, Legg Mason Western Asset US Adjustable Rate Fund^, Legg MasonWestern Assest EM Local Currency Debt Fund^, Legg Mason Western Asset Global Total Return Investment Grade Bond Fund^, Legg Mason Brandywine Global Sovereign Credit Fund^, LeggMason Brandywine Global – US High Yield Fund^, Legg Mason ClearBridge Global Equity Fund^, Legg Mason ClearBridge Global Equity Income Fund^, Legg Mason Martin Currie Asia PacificFund^, Legg Mason Martin Currie Greater China Fund^, Legg Mason Martin Curie Japan Absolute Alpha Fund^ and Legg Mason Martin Currie Global Dividend Opportunities Fund^ whichhave discontinued operations. There were no other gains or losses other than those dealt with in the Statement of Comprehensive Income.
The Euro figures for Legg Mason Western Asset Euro Core Plus Bond Fund, Legg Mason Western Asset Euro High Yield Fund, Legg Mason QS MV European Equity Growth and Income Fund,Legg Mason Martin Currie European Absolute Alpha Fund^, Legg Mason Martin Currie European Unconstrained Fund^ and Legg Mason ClearBridge Infrastructure Value Fund^ have beenconverted into US Dollars in the total figure for Legg Mason Global Funds Plc for the financial year ended 28 February 2021 using the USD/EUR average rate of 0.8635 (29 February 2020:0.8983).
The Yen figures for Legg Mason Martin Currie Japan Absolute Alpha Fund^ have been converted into US Dollars in the total figure for Legg Mason Global Funds Plc for the financial year ended28 February 2021 using the USD/JPY average rate of 105.9538 (29 February 2020: 109.0043).
British Pound figures for Legg Mason Western Asset UK Investment Grade Credit Fund^ have been converted into US Dollars in the total figure for Legg Mason Global Funds Plc for thefinancial year ended 28 February 2021 using the USD/GBP average rate of 0.7733 (29 February 2020: 0.7828).
µ Effective 11 January 2021, Western Asset UCITS SMASh Series Core Plus Completion Fund^ commenced trading.
� Effective 25 February 2021, Legg Mason Brandywine Global Sovereign Credit Fund^ ceased trading.
^ Not authorised for sale to the public in Hong Kong.
The accompanying notes are an integral part of the Financial Statements
262

[This Page Intentionally Left Blank]
263

Legg Mason Global Funds Plc Annual Report 28 February 2021
Statement of Changes in Net Assets Attributable to Holders of RedeemableParticipating Shares
Legg MasonWestern Asset US
Government Liquidity Fund
Legg MasonWestern Asset
US Core Bond Fund
Legg MasonWestern Asset
US Core Plus Bond Fund
Legg MasonWestern Asset
Euro Core Plus Bond Fund
(000’s)
for the yearended
28 February2021
for the yearended
29 February2020
for the yearended
28 February2021
for the yearended
29 February2020
for the yearended
28 February2021
for the yearended
29 February2020
for the yearended
28 February2021
for the yearended
29 February2020
Net Increase/(Decrease) in Net Assets attributable toHolders of Redeemable Participating Shares fromOperations $ (241) $ 1,983 $ 4,551 $ 17,958 $ 41,736 $ 140,427 € 2,332 € 9,782
REDEEMABLE PARTICIPATING SHARE TRANSACTIONSNet proceeds from sales of shares 1,607,880 1,527,343 206,495 193,024 993,778 1,157,746 399 1,432Net proceeds from reinvested distributions 1,031 11,687 950 802 1,662 1,185 – 2Cost of shares reacquired (1,723,584) (1,492,874) (229,273) (49,863) (924,401) (692,025) (15,536) (1,586)
Increase/(Decrease) in Net Assets from RedeemableParticipating Share transactions (114,673) 46,156 (21,828) 143,963 71,039 466,906 (15,137) (152)
Increase/(Decrease) in Net Assets attributable to Holders ofRedeemable Participating Shares (114,914) 48,139 (17,277) 161,921 112,775 607,333 (12,805) 9,630
NET ASSETS ATTRIBUTABLE TO HOLDERS OFREDEEMABLE PARTICIPATING SHARES
Beginning of year 997,244 949,105 316,407 154,486 1,534,643 927,310 124,128 114,498Currency translation – – – – – – – –
End of year $ 882,330 $ 997,244 $ 299,130 $ 316,407 $ 1,647,418 $ 1,534,643 € 111,323 € 124,128
Legg MasonWestern Asset
Global High Yield Fund
Legg MasonWestern Asset US Short-Term
Government Fund^
Legg MasonWestern Asset
US Adjustable Rate Fund^
Legg MasonWestern Asset Global
Inflation Management Fund
(000’s)
for the yearended
28 February2021
for the yearended
29 February2020
for the yearended
28 February2021
for the yearended
29 February2020
for the yearended
28 February2021
for the yearended
29 February2020
for the yearended
28 February2021
for the yearended
29 February2020
Net Increase/(Decrease) in Net Assets attributable toHolders of Redeemable Participating Shares fromOperations $ 5,078 $ 721 $ – $ 125 $ – $ 5 $ 2,122 $ 1,640
REDEEMABLE PARTICIPATING SHARE TRANSACTIONSNet proceeds from sales of shares 63,594 66,904 – 2,792 – 66 43,825 41,702Net proceeds from reinvested distributions 474 626 – 21 – 1 48 12Cost of shares reacquired (74,327) (81,318) – (16,181) – (5,276) (44,705) (33,856)
Increase/(Decrease) in Net Assets from RedeemableParticipating Share transactions (10,259) (13,788) – (13,368) – (5,209) (832) 7,858
Increase/(Decrease) in Net Assets attributable to Holders ofRedeemable Participating Shares (5,181) (13,067) – (13,243) – (5,204) 1,290 9,498
NET ASSETS ATTRIBUTABLE TO HOLDERS OFREDEEMABLE PARTICIPATING SHARES
Beginning of year 107,743 120,810 – 13,243 – 5,204 47,508 38,010Currency translation – – – – – – – –
End of year $ 102,562 $ 107,743 $ – $ – $ – $ – $ 48,798 $ 47,508
Legg MasonWestern Asset
Euro High Yield Fund
Legg MasonWestern Asset Macro
Opportunities Bond Fund^
Legg MasonWestern Asset EM Local
Currency Debt Fund^
Legg MasonWestern Asset Multi-Asset
Credit Fund^
(000’s)
for the yearended
28 February2021
for the yearended
29 February2020
for the yearended
28 February2021
for the yearended
29 February2020
for the yearended
28 February2021
for the yearended
29 February2020
for the yearended
28 February2021
for the yearended
29 February2020
Net Increase/(Decrease) in Net Assets attributable toHolders of Redeemable Participating Shares fromOperations € 1,954 € 2,910 $ 283,180 $ 263,247 $ – $ 170 $ 127,554 $ 22,036
REDEEMABLE PARTICIPATING SHARE TRANSACTIONSNet proceeds from sales of shares 52 1,629 1,866,934 2,859,949 – 7 161,052 131,104Net proceeds from reinvested distributions 367 362 1,304 2,848 – 88 – –Cost of shares reacquired (5,131) (23,937) (3,143,288) (2,469,963) – (35,748) (78,745) (10,659)
Increase/(Decrease) in Net Assets from RedeemableParticipating Share transactions (4,712) (21,946) (1,275,050) 392,834 – (35,653) 82,307 120,445
Increase/(Decrease) in Net Assets attributable to Holders ofRedeemable Participating Shares (2,758) (19,036) (991,870) 656,081 – (35,483) 209,861 142,481
NET ASSETS ATTRIBUTABLE TO HOLDERS OFREDEEMABLE PARTICIPATING SHARES
Beginning of year 57,103 76,139 7,637,950 6,981,869 – 35,483 871,997 729,516Currency translation – – – – – – – –
End of year € 54,345 € 57,103 $ 6,646,080 $ 7,637,950 $ – $ – $ 1,081,858 $ 871,997
The accompanying notes are an integral part of the Financial Statements
264

Legg Mason Global Funds Plc Annual Report 28 February 2021
Legg MasonWestern Asset Short Duration
High Income Bond Fund
Legg MasonWestern Asset GlobalMulti Strategy Fund
Legg MasonWestern Asset
US High Yield Fund
Legg MasonWestern Asset Emerging
Markets Total Return Bond Fund
Legg MasonWestern Asset Emerging
Markets Corporate Bond Fund
for the yearended
28 February2021
for the yearended
29 February2020
for the yearended
28 February2021
for the yearended
29 February2020
for the yearended
28 February2021
for the yearended
29 February2020
for the yearended
28 February2021
for the yearended
29 February2020
for the yearended
28 February2021
for the yearended
29 February2020
$ 1,704 $ (194) $ 62,408 $ 13,723 $ 14,544 $ 5,620 $ 1,067 $ 464 $ 575 $ 2,354
9,546 4,193 94,278 192,981 171,839 99,058 10,613 2,974 6,159 8,470515 522 1,312 1,519 2,490 3,160 268 493 1,570 1,566
(6,373) (6,640) (236,237) (205,312) (138,939) (89,901) (7,984) (9,319) (10,615) (7,348)
3,688 (1,925) (140,647) (10,812) 35,390 12,317 2,897 (5,852) (2,886) 2,688
5,392 (2,119) (78,239) 2,911 49,934 17,937 3,964 (5,388) (2,311) 5,042
21,041 23,160 734,170 731,259 169,193 151,256 18,805 24,193 42,544 37,502– – – – – – – – – –
$ 26,433 $ 21,041 $ 655,931 $ 734,170 $ 219,127 $ 169,193 $ 22,769 $ 18,805 $ 40,233 $ 42,544
Legg MasonWestern Asset AsianOpportunities Fund
Legg MasonWestern Asset Short Duration
Blue Chip Bond Fund
Legg MasonWestern Asset Global
Credit Absolute Return Fund^
Legg MasonWestern Asset GlobalCore Plus Bond Fund^
Legg MasonWestern Asset
Global Credit Fund^
for the yearended
28 February2021
for the yearended
29 February2020
for the yearended
28 February2021
for the yearended
29 February2020
for the yearended
28 February2021
for the yearended
29 February2020
for the yearended
28 February2021
for the yearended
29 February2020
for the yearended
28 February2021
for the yearended
29 February2020
$ 17,135 $ 28,574 $ 34,679 $ 2,450 $ – $ – $ 11,642 $ 20,939 $ 3,795 $ 9,440
221,546 286,652 333,427 193,629 – – 116,108 77,476 15,996 10,061250 303 37 2 – – – 2 – –
(185,956) (243,235) (125,979) (19,927) – – (105,416) (84,352) (16,227) (9,256)
35,840 43,720 207,485 173,704 – – 10,692 (6,874) (231) 805
52,975 72,294 242,164 176,154 – – 22,334 14,065 3,564 10,245
573,934 501,640 276,535 100,381 – – 263,958 249,893 79,161 68,916– – – – – – – – – –
$ 626,909 $ 573,934 $ 518,699 $ 276,535 $ – $ – $ 286,292 $ 263,958 $ 82,725 $ 79,161
Legg MasonWestern Asset Global
Total Return InvestmentGrade Bond Fund^
Legg MasonWestern Asset Structured
Opportunities Fund^
Legg MasonWestern Asset
US Mortgage-BackedSecurities Fund^
Legg MasonWestern Asset UKInvestment Grade
Credit Fund^
Legg MasonWestern Asset US
Corporate Bond Fund^
for the yearended
28 February2021
for the yearended
29 February2020
for the yearended
28 February2021
for the yearended
29 February2020
for the yearended
28 February2021
for the yearended
29 February2020
for the yearended
28 February2021
for the yearended
29 February2020
for the yearended
28 February2021
for the yearended
29 February2020
$ – $ 1,005 $ (184,871) $ 98,265 $ 3,421 $ 71,459 £ 3,413 £ 10,105 $ 13,873 $ 10,329
– 4,223 269,105 812,883 25,373 112,555 – 18,000 62,788 21,240– – 19 17 1 – – – – –– (54,702) (900,119) (167,016) (282,044) (1,287) (40,000) – (8,783) (24,533)
– (50,479) (630,995) 645,884 (256,670) 111,268 (40,000) 18,000 54,005 (3,293)
– (49,474) (815,866) 744,149 (253,249) 182,727 (36,587) 28,105 67,878 7,036
– 49,474 1,921,028 1,176,879 1,076,665 893,938 113,272 85,167 123,718 116,682– – – – – – – – – –
$ – $ – $ 1,105,162 $ 1,921,028 $ 823,416 $ 1,076,665 £ 76,685 £ 113,272 $ 191,596 $ 123,718
The accompanying notes are an integral part of the Financial Statements
265
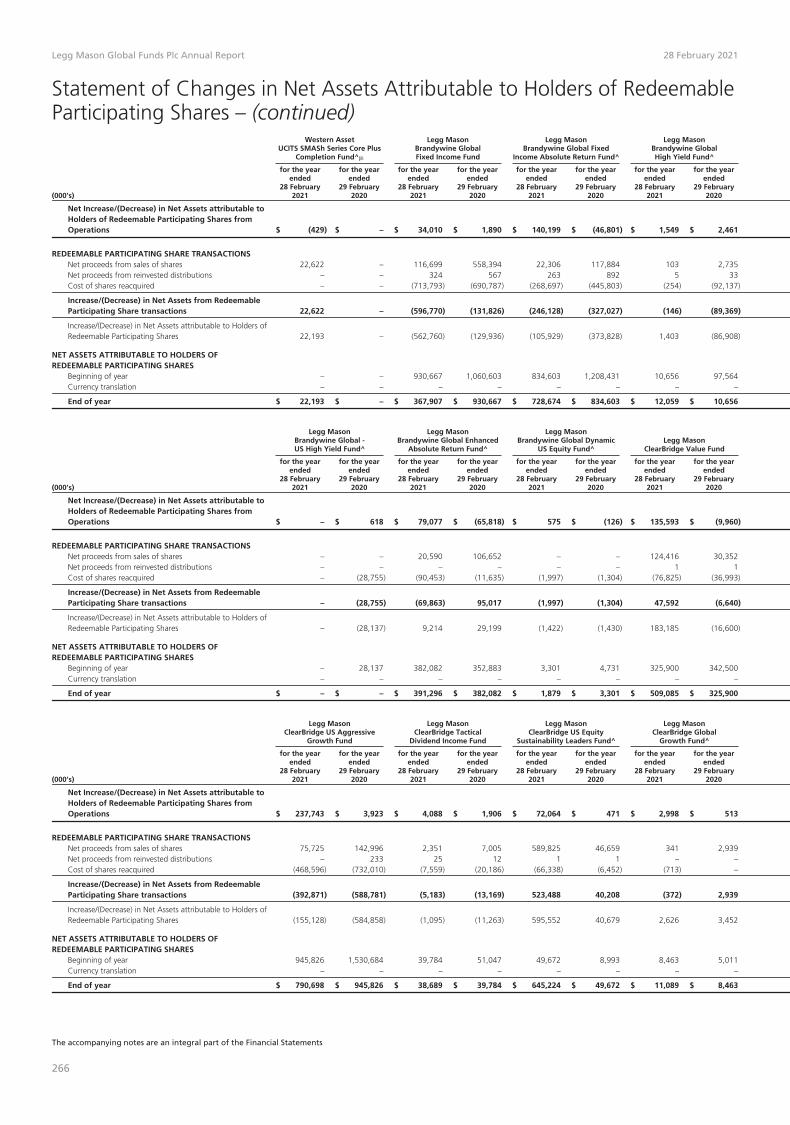
Legg Mason Global Funds Plc Annual Report 28 February 2021
Statement of Changes in Net Assets Attributable to Holders of RedeemableParticipating Shares – (continued)
Western AssetUCITS SMASh Series Core Plus
Completion Fund^�
Legg MasonBrandywine GlobalFixed Income Fund
Legg MasonBrandywine Global Fixed
Income Absolute Return Fund^
Legg MasonBrandywine GlobalHigh Yield Fund^
(000’s)
for the yearended
28 February2021
for the yearended
29 February2020
for the yearended
28 February2021
for the yearended
29 February2020
for the yearended
28 February2021
for the yearended
29 February2020
for the yearended
28 February2021
for the yearended
29 February2020
Net Increase/(Decrease) in Net Assets attributable toHolders of Redeemable Participating Shares fromOperations $ (429) $ – $ 34,010 $ 1,890 $ 140,199 $ (46,801) $ 1,549 $ 2,461
REDEEMABLE PARTICIPATING SHARE TRANSACTIONSNet proceeds from sales of shares 22,622 – 116,699 558,394 22,306 117,884 103 2,735Net proceeds from reinvested distributions – – 324 567 263 892 5 33Cost of shares reacquired – – (713,793) (690,787) (268,697) (445,803) (254) (92,137)
Increase/(Decrease) in Net Assets from RedeemableParticipating Share transactions 22,622 – (596,770) (131,826) (246,128) (327,027) (146) (89,369)
Increase/(Decrease) in Net Assets attributable to Holders ofRedeemable Participating Shares 22,193 – (562,760) (129,936) (105,929) (373,828) 1,403 (86,908)
NET ASSETS ATTRIBUTABLE TO HOLDERS OFREDEEMABLE PARTICIPATING SHARES
Beginning of year – – 930,667 1,060,603 834,603 1,208,431 10,656 97,564Currency translation – – – – – – – –
End of year $ 22,193 $ – $ 367,907 $ 930,667 $ 728,674 $ 834,603 $ 12,059 $ 10,656
Legg MasonBrandywine Global -US High Yield Fund^
Legg MasonBrandywine Global Enhanced
Absolute Return Fund^
Legg MasonBrandywine Global Dynamic
US Equity Fund^Legg Mason
ClearBridge Value Fund
(000’s)
for the yearended
28 February2021
for the yearended
29 February2020
for the yearended
28 February2021
for the yearended
29 February2020
for the yearended
28 February2021
for the yearended
29 February2020
for the yearended
28 February2021
for the yearended
29 February2020
Net Increase/(Decrease) in Net Assets attributable toHolders of Redeemable Participating Shares fromOperations $ – $ 618 $ 79,077 $ (65,818) $ 575 $ (126) $ 135,593 $ (9,960)
REDEEMABLE PARTICIPATING SHARE TRANSACTIONSNet proceeds from sales of shares – – 20,590 106,652 – – 124,416 30,352Net proceeds from reinvested distributions – – – – – – 1 1Cost of shares reacquired – (28,755) (90,453) (11,635) (1,997) (1,304) (76,825) (36,993)
Increase/(Decrease) in Net Assets from RedeemableParticipating Share transactions – (28,755) (69,863) 95,017 (1,997) (1,304) 47,592 (6,640)
Increase/(Decrease) in Net Assets attributable to Holders ofRedeemable Participating Shares – (28,137) 9,214 29,199 (1,422) (1,430) 183,185 (16,600)
NET ASSETS ATTRIBUTABLE TO HOLDERS OFREDEEMABLE PARTICIPATING SHARES
Beginning of year – 28,137 382,082 352,883 3,301 4,731 325,900 342,500Currency translation – – – – – – – –
End of year $ – $ – $ 391,296 $ 382,082 $ 1,879 $ 3,301 $ 509,085 $ 325,900
Legg MasonClearBridge US Aggressive
Growth Fund
Legg MasonClearBridge Tactical
Dividend Income Fund
Legg MasonClearBridge US Equity
Sustainability Leaders Fund^
Legg MasonClearBridge Global
Growth Fund^
(000’s)
for the yearended
28 February2021
for the yearended
29 February2020
for the yearended
28 February2021
for the yearended
29 February2020
for the yearended
28 February2021
for the yearended
29 February2020
for the yearended
28 February2021
for the yearended
29 February2020
Net Increase/(Decrease) in Net Assets attributable toHolders of Redeemable Participating Shares fromOperations $ 237,743 $ 3,923 $ 4,088 $ 1,906 $ 72,064 $ 471 $ 2,998 $ 513
REDEEMABLE PARTICIPATING SHARE TRANSACTIONSNet proceeds from sales of shares 75,725 142,996 2,351 7,005 589,825 46,659 341 2,939Net proceeds from reinvested distributions – 233 25 12 1 1 – –Cost of shares reacquired (468,596) (732,010) (7,559) (20,186) (66,338) (6,452) (713) –
Increase/(Decrease) in Net Assets from RedeemableParticipating Share transactions (392,871) (588,781) (5,183) (13,169) 523,488 40,208 (372) 2,939
Increase/(Decrease) in Net Assets attributable to Holders ofRedeemable Participating Shares (155,128) (584,858) (1,095) (11,263) 595,552 40,679 2,626 3,452
NET ASSETS ATTRIBUTABLE TO HOLDERS OFREDEEMABLE PARTICIPATING SHARES
Beginning of year 945,826 1,530,684 39,784 51,047 49,672 8,993 8,463 5,011Currency translation – – – – – – – –
End of year $ 790,698 $ 945,826 $ 38,689 $ 39,784 $ 645,224 $ 49,672 $ 11,089 $ 8,463
The accompanying notes are an integral part of the Financial Statements
266

Legg Mason Global Funds Plc Annual Report 28 February 2021
Legg MasonBrandywine Global
OpportunisticFixed Income Fund
Legg MasonBrandywine Global
Sovereign Credit Fund^�
Legg MasonBrandywine Global
Income Optimiser Fund^
Legg MasonBrandywine Global
Credit Opportunities Fund^
Legg MasonBrandywine Global
Defensive High Yield Fund^
for the yearended
28 February2021
for the yearended
29 February2020
for the yearended
28 February2021
for the yearended
29 February2020
for the yearended
28 February2021
for the yearended
29 February2020
for the yearended
28 February2021
for the yearended
29 February2020
for the yearended
28 February2021
for the yearended
29 February2020
$ 84,627 $ 4,123 $ (34,304) $ 15,840 $ 17,452 $ 4,162 $ (1,280) $ 2,994 $ 1,239 $ (392)
145,613 81,732 11,511 106,212 474,352 24,812 16,798 7,142 – –56 895 1 – 169 60 – – 1 1
(193,507) (189,648) (1,568,022) (477,648) (109,717) (60,621) (6,883) (10,575) – –
(47,838) (107,021) (1,556,510) (371,436) 364,804 (35,749) 9,915 (3,433) 1 1
36,789 (102,898) (1,590,814) (355,596) 382,256 (31,587) 8,635 (439) 1,240 (391)
548,932 651,830 1,590,814 1,946,410 71,029 102,616 43,385 43,824 10,534 10,925– – – – – – – – – –
$ 585,721 $ 548,932 $ – $ 1,590,814 $ 453,285 $ 71,029 $ 52,020 $ 43,385 $ 11,774 $ 10,534
Legg MasonClearBridge Growth Fund^
Legg MasonClearBridge Global Equity
Fund^
Legg MasonClearBridge Global Equity
Income Fund^
Legg MasonClearBridge US
Appreciation Fund
Legg MasonClearBridge US Large Cap
Growth Fund
for the yearended
28 February2021
for the yearended
29 February2020
for the yearended
28 February2021
for the yearended
29 February2020
for the yearended
28 February2021
for the yearended
29 February2020
for the yearended
28 February2021
for the yearended
29 February2020
for the yearended
28 February2021
for the yearended
29 February2020
$ – $ – $ – $ (1,142) $ – $ (129) $ 42,129 $ 12,523 $ 534,910 $ 117,858
– – – 983 – 25 71,625 57,973 742,393 766,118– – – 2 – 33 8 5 – –– – – (31,902) – (4,339) (101,192) (77,514) (987,257) (815,605)
– – – (30,917) – (4,281) (29,559) (19,536) (244,864) (49,487)
– – – (32,059) – (4,410) 12,570 (7,013) 290,046 68,371
– – – 32,059 – 4,410 193,438 200,451 1,521,006 1,452,635– – – – – – – – – –
$ – $ – $ – $ – $ – $ – $ 206,008 $ 193,438 $ 1,811,052 $ 1,521,006
Legg MasonClearBridge Infrastructure
Value Fund^
Legg MasonClearBridge Emerging
Markets Infrastructure Fund^
Legg MasonRoyce US Small CapOpportunity Fund
Legg MasonRoyce US SmallerCompanies Fund
Legg MasonPCM US Equity Fund^
for the yearended
28 February2021
for the yearended
29 February2020
for the yearended
28 February2021
for the yearended
29 February2020
for the yearended
28 February2021
for the yearended
29 February2020
for the yearended
28 February2021
for the yearended
29 February2020
for the yearended
28 February2021
for the yearended
29 February2020
€ (59,029) € 17,091 $ 18 $ (157) $ 355,502 $ (59,929) $ 25,711 $ (2,582) $ – $ –
452,639 694,563 19 37 861,431 107,239 22,281 10,727 – –1 26 2 1 – – – – – –
(562,536) (336,506) – – (376,121) (482,272) (24,953) (33,556) – –
(109,896) 358,083 21 38 485,310 (375,033) (2,672) (22,829) – –
(168,925) 375,174 39 (119) 840,812 (434,962) 23,039 (25,411) – –
773,938 398,764 2,686 2,805 448,058 883,020 68,057 93,468 – –– – – – – – – – – –
€ 605,013 € 773,938 $ 2,725 $ 2,686 $ 1,288,870 $ 448,058 $ 91,096 $ 68,057 $ – $ –
The accompanying notes are an integral part of the Financial Statements
267

Legg Mason Global Funds Plc Annual Report 28 February 2021
Statement of Changes in Net Assets Attributable to Holders of RedeemableParticipating Shares – (continued)
Legg MasonQS MV European
Equity Growth and Income Fund
Legg MasonQS MV Asia Pacific Ex Japan
Equity Growth and Income Fund
Legg MasonBatterymarch International
Large Cap Fund^
Legg MasonQS Emerging Markets
Equity Fund
(000’s)
for the yearended
28 February2021
for the yearended
29 February2020
for the yearended
28 February2021
for the yearended
29 February2020
for the yearended
28 February2021
for the yearended
29 February2020
for the yearended
28 February2021
for the yearended
29 February2020
Net Increase/(Decrease) in Net Assets attributable toHolders of Redeemable Participating Shares fromOperations € (1,534) € (696) $ 3,297 $ (8,991) $ – $ – $ 2,714 $ (1,059)
REDEEMABLE PARTICIPATING SHARE TRANSACTIONSNet proceeds from sales of shares 3,214 8,825 9,201 37,357 – – 56 237Net proceeds from reinvested distributions – – 93 100 – – 2 2Cost of shares reacquired (9,086) (20,552) (45,590) (50,896) – – (218) (301)
Increase/(Decrease) in Net Assets from RedeemableParticipating Share transactions (5,872) (11,727) (36,296) (13,439) – – (160) (62)
Increase/(Decrease) in Net Assets attributable to Holders ofRedeemable Participating Shares (7,406) (12,423) (32,999) (22,430) – – 2,554 (1,121)
NET ASSETS ATTRIBUTABLE TO HOLDERS OFREDEEMABLE PARTICIPATING SHARES
Beginning of year 40,774 53,197 64,036 86,466 – – 12,185 13,306Currency translation – – – – – – – –
End of year € 33,368 € 40,774 $ 31,037 $ 64,036 $ – $ – $ 14,739 $ 12,185
Legg MasonMartin Currie Global
Resources Fund^
Legg MasonMartin Currie Greater
China Fund^
Legg MasonMartin Currie Japan
Absolute Alpha Fund^
Legg MasonMartin Currie
North American Fund^
(000’s)
for the yearended
28 February2021
for the yearended
29 February2020
for the yearended
28 February2021
for the yearended
29 February2020
for the yearended
28 February2021
for the yearended
29 February2020
for the yearended
28 February2021
for the yearended
29 February2020
Net Increase/(Decrease) in Net Assets attributable toHolders of Redeemable Participating Shares fromOperations $ – $ – $ – $ 1,731 ¥ – ¥ (118,035) $ – $ –
REDEEMABLE PARTICIPATING SHARE TRANSACTIONSNet proceeds from sales of shares – – – 100 – 351,570 – –Net proceeds from reinvested distributions – – – – – – – –Cost of shares reacquired – – – (17,670) – (5,402,833) – –
Increase/(Decrease) in Net Assets from RedeemableParticipating Share transactions – – – (17,570) – (5,051,263) – –
Increase/(Decrease) in Net Assets attributable to Holders ofRedeemable Participating Shares – – – (15,839) – (5,169,298) – –
NET ASSETS ATTRIBUTABLE TO HOLDERS OFREDEEMABLE PARTICIPATING SHARES
Beginning of year – – – 15,839 – 5,169,298 – –Currency translation – – – – – – – –
End of year $ – $ – $ – $ – ¥ – ¥ – $ – $ –
The accompanying notes are an integral part of the Financial Statements
268

Legg Mason Global Funds Plc Annual Report 28 February 2021
Legg MasonQS MV Global Equity
Growth and Income Fund
Legg MasonCongruix JapanEquity Fund^
Legg MasonMartin Currie Asia Long-Term
Unconstrained Fund^
Legg MasonMartin Currie
Asia Pacific Fund^
Legg MasonMartin Currie EuropeanAbsolute Alpha Fund^
for the yearended
28 February2021
for the yearended
29 February2020
for the yearended
28 February2021
for the yearended
29 February2020
for the yearended
28 February2021
for the yearended
29 February2020
for the yearended
28 February2021
for the yearended
29 February2020
for the yearended
28 February2021
for the yearended
29 February2020
$ 625 $ (532) ¥ – ¥ – $ 16,274 $ (4,764) $ – $ (149) € (16,180) € 3,465
279 3,900 – – 12,621 23,588 – 53 15,123 42,995– – – – – – – – – –
(1,688) (3,270) – – (113,533) (108,744) – (2,807) (148,447) (131,589)
(1,409) 630 – – (100,912) (85,156) – (2,754) (133,324) (88,594)
(784) 98 – – (84,638) (89,920) – (2,903) (149,504) (85,129)
13,469 13,371 – – 164,718 254,638 – 2,903 189,847 274,976– – – – – – – – – –
$ 12,685 $ 13,469 ¥ – ¥ – $ 80,080 $ 164,718 $ – $ – € 40,343 € 189,847
Legg MasonMartin Currie Global Long-Term
Unconstrained Fund^
Legg MasonMartin Currie Asia Pacific
Ex Japan Real Income Fund
Legg MasonMartin Currie Global
Emerging Markets Fund^
Legg MasonMartin Currie Global
Dividend Opportunities Fund^
Legg MasonMartin Currie EuropeanUnconstrained Fund^
for the yearended
28 February2021
for the yearended
29 February2020
for the yearended
28 February2021
for the yearended
29 February2020
for the yearended
28 February2021
for the yearended
29 February2020
for the yearended
28 February2021
for the yearended
29 February2020
for the yearended
28 February2021
for the yearended
29 February2020
$ 17,887 $ 2,165 $ 1,046 $ (47) $ 14,873 $ 1,374 $ – $ 202 € (60) € 524
72,272 10,965 18,055 2,947 10,934 2,813 – 46 106,019 2,858– – 99 21 – – – 6 – –
(19,990) (2,180) (865) (1,017) (13,427) (959) – (3,307) (726) (44)
52,282 8,785 17,289 1,951 (2,493) 1,854 – (3,255) 105,293 2,814
70,169 10,950 18,335 1,904 12,380 3,228 – (3,053) 105,233 3,338
34,180 23,230 8,241 6,337 29,421 26,193 – 3,053 6,138 2,800– – – – – – – – – –
$ 104,349 $ 34,180 $ 26,576 $ 8,241 $ 41,801 $ 29,421 $ – $ – € 111,371 € 6,138
The accompanying notes are an integral part of the Financial Statements
269

Legg Mason Global Funds Plc Annual Report 28 February 2021
Statement of Changes in Net Assets Attributable to Holders of RedeemableParticipating Shares – (continued)
Legg MasonGlobal Funds Plc
(000’s)
for the yearended
28 February2021
for the yearended
29 February2020
Net Increase/(Decrease) in Net Assets attributable to Holders of Redeemable Participating Shares from Operations $ 2,151,268 $ 730,688
REDEEMABLE PARTICIPATING SHARE TRANSACTIONSNet proceeds from sales of shares 10,386,883 10,921,424Net proceeds from reinvested distributions 13,408 28,153Cost of shares reacquired (14,395,846) (10,855,627)
Increase/(Decrease) in Net Assets from Redeemable Participating Share transactions (3,995,555) 93,950
Increase/(Decrease) in Net Assets attributable to Holders of Redeemable Participating Shares (1,844,287) 824,638
NET ASSETS ATTRIBUTABLE TO HOLDERS OF REDEEMABLE PARTICIPATING SHARESBeginning of year 26,557,820 25,769,136Currency translation 120,239 (35,954)
End of year $ 24,833,772 $ 26,557,820
Amounts designated as “–” are either $0/€0/¥0/£0 or less than $1,000/€1,000/¥1,000/£1,000.
All Euro figures, except for the beginning of the year Net Assets Attributable to Holders of Redeemable Participating Shares, for Legg Mason Western Asset Euro Core Plus Bond Fund, LeggMason Western Asset Euro High Yield Fund, Legg Mason QS MV European Equity Growth and Income Fund, Legg Mason Martin Currie European Absolute Alpha Fund^, Legg Mason MartinCurrie European Unconstrained Fund^ and Legg Mason ClearBridge Infrastructure Value Fund^ have been converted into US Dollars in the total figure for Legg Mason Global Funds Plc for thefinancial year ended 28 February 2021, using the USD/EUR average rate of 0.8635 (29 February 2020: 0.8983).
The beginning of year Net Assets Attributable to Holders of Redeemable Participating Shares for Legg Mason Western Asset Euro Core Plus Bond Fund, Legg Mason Western Asset Euro HighYield Fund, Legg Mason QS MV European Equity Growth and Income Fund, Legg Mason Martin Currie European Absolute Alpha Fund^, Legg Mason Martin Currie European UnconstrainedFund^ and Legg Mason ClearBridge Infrastructure Value Fund^ have been converted into US Dollars in the total figure using the USD/EUR closing rate as at 29 February 2020 of 0.9058 (28February 2019: 0.8792).
All Yen figures have been converted into US Dollars in the total figure for Legg Mason Global Funds Plc for the financial year ended 28 February 2021, using the USD/JPY average rate of105.9538 (29 February 2020: 109.0044).
All British Pound figures, except for the beginning of the year Net Assets Attributable to Holders of Redeemable Participating Shares, for Legg Mason Western Asset UK Investment GradeCredit Fund^ have been converted into US Dollars in the total figure for Legg Mason Global Funds Plc for the financial year ended 28 February 2021, using the USD/GBP average rate of 0.7733(29 February 2020: 0.7828).
The beginning of year Net Assets Attributable to Holders of Redeemable Participating Shares for Legg Mason Western Asset UK Investment Grade Credit Fund^ have been converted into USDollars in the total figure using the USD/GBP closing rate as at 29 February 2020 of 0.7799 (28 February 2019: 0.7539).
� Effective 11 January 2021, Western Asset UCITS SMASh Series Core Plus Completion Fund^ commenced trading.
� Effective 25 February 2021, Legg Mason Brandywine Global Sovereign Credit Fund^ ceased trading.
^ Not authorised for sale to the public in Hong Kong.
The accompanying notes are an integral part of the financial statements
270

Legg Mason Global Funds Plc Annual Report 28 February 2021
Statement of Changes in Net Assets Attributable to Holders of RedeemableParticipating Shares – (continued)
For the year ended
28 February 2021Shares(000’s)
29 February 2020Shares(000’s)
Legg Mason Western Asset US Government Liquidity FundClass A US$ AccumulatingSold 1,291 1,544Redeemed (1,332) (1,232)
Net (Decrease)/increase (41) 312
Class A US$ Distributing (D)Sold 912,236 970,595Redeemed (1,032,908) (1,044,810)
Net Decrease (120,672) (74,215)
Class B US$ AccumulatingRedeemed (1) (1)
Net Decrease (1) (1)
Class B US$ Distributing (D)Sold 300 –Redeemed – (51)
Net Increase/(decrease) 300 (51)
Class C US$ AccumulatingSold 14 –Redeemed (16) –
Net Decrease (2) –
Class C US$ Distributing (D)Sold 515 369Redeemed (654) (220)
Net (Decrease)/increase (139) 149
Class X US$ Distributing (D)Sold 554,123 412,989Redeemed (543,282) (326,407)
Net Increase 10,841 86,582
Class A (G) US$ AccumulatingRedeemed (1) –
Net Decrease (1) –
Class A (G) US$ Distributing (D)Sold 1 5Redeemed (120) (27)
Net Decrease (119) (22)
Class L (G) US$ Distributing (D)Sold – 3Redeemed (102) (189)
Net Decrease (102) (186)
Legg Mason Western Asset US Core Bond FundClass A US$ AccumulatingSold 406 491Redeemed (587) (77)
Net (Decrease)/increase (181) 414
Class A US$ Distributing (D)Sold 243 441Redeemed (748) (340)
Net (Decrease)/increase (505) 101
Class B US$ Distributing (D)Redeemed – (1)
Net Decrease – (1)
Class C US$ AccumulatingSold 50 46Redeemed (17) (12)
Net Increase 33 34
Class C US$ Distributing (D)Sold 50 28Redeemed (26) (4)
Net Increase 24 24
Class E US$ AccumulatingSold 44 14Redeemed (3) (1)
Net Increase 41 13
Class F US$ AccumulatingSold 488 315Redeemed (199) (49)
Net Increase 289 266
Class F US$ Distributing (D)Sold 139 41Redeemed (26) (7)
Net Increase 113 34
For the year ended
28 February 2021Shares(000’s)
29 February 2020Shares(000’s)
Class X US$ AccumulatingSold 12 10Redeemed (5) (2)
Net Increase 7 8
Class X US$ Distributing (D)Redeemed (1) (1)
Net Decrease (1) (1)
Premier Class US$ AccumulatingSold 128 234Redeemed (186) –
Net (Decrease)/increase (58) 234
Premier Class Euro Accumulating (Hedged)Sold 22 10
Net Increase 22 10
Class GA US$ AccumulatingRedeemed – (2)
Net Decrease – (2)
Class GE US$ AccumulatingRedeemed (1) –
Net Decrease (1) –
Legg Mason Western Asset US Core Plus Bond FundClass A US$ AccumulatingSold 887 1,161Redeemed (728) (1,054)
Net Increase 159 107
Class A US$ Distributing (D)Sold 225 328Redeemed (190) (201)
Net Increase 35 127
Class A US$ Distributing (M) PlusSold 331 46Redeemed (64) (50)
Net Increase/(decrease) 267 (4)
Class A AUD Distributing (M) (Hedged) PlusSold 28 146Redeemed (84) (112)
Net (Decrease)/increase (56) 34
Class A Euro Accumulating (Hedged)Sold 77 45Redeemed (52) (6)
Net Increase 25 39
Class B US$ Distributing (D)Sold 1 1Redeemed (1) –
Net Increase – 1
Class C US$ AccumulatingSold 120 109Redeemed (38) (17)
Net Increase 82 92
Class C US$ Distributing (D)Sold 40 60Redeemed (19) (7)
Net Increase 21 53
Class E US$ AccumulatingSold 204 140Redeemed (74) (28)
Net Increase 130 112
Class F US$ AccumulatingSold 1,832 2,605Redeemed (2,010) (732)
Net (Decrease)/increase (178) 1,873
Class F US$ Distributing (D)Sold 116 90Redeemed (71) (2)
Net Increase 45 88
Class X US$ AccumulatingSold 133 375Redeemed (243) (74)
Net (Decrease)/increase (110) 301
Class X US$ Distributing (D)Sold 24 6Redeemed (1) –
Net Increase 23 6
The accompanying notes are an integral part of the financial statements
271

Legg Mason Global Funds Plc Annual Report 28 February 2021
Statement of Changes in Net Assets Attributable to Holders of RedeemableParticipating Shares – (continued)
For the year ended
28 February 2021Shares(000’s)
29 February 2020Shares(000’s)
Legg Mason Western Asset US Core Plus Bond Fund – (continued)Class X Euro Accumulating (Hedged)Sold 136 40Redeemed (26) (12)
Net Increase 110 28
Class X Euro Distributing (M) (Hedged)Sold 4 –
Net Increase 4 –
Premier Class US$ AccumulatingSold 2,320 2,542Redeemed (2,058) (1,897)
Net Increase 262 645
Premier Class US$ Distributing (M)Sold 11 443Redeemed (442) (8)
Net (Decrease)/increase (431) 435
Premier Class Euro Accumulating (Hedged)Sold 408 674Redeemed (410) (846)
Net Decrease (2) (172)
LM Class Euro AccumulatingSold 1 4Redeemed (4) (3)
Net (Decrease)/increase (3) 1
Class A (G) US$ AccumulatingRedeemed (4) –
Net Decrease (4) –
Class A (G) US$ Distributing (D)Sold 1 1Redeemed (2) (4)
Net Decrease (1) (3)
Legg Mason Western Asset Euro Core Plus Bond FundClass A US$ Distributing (D)Sold – 2Redeemed – (2)
Net Increase – –
Class A Euro Distributing (D)Sold – 5Redeemed (1) (8)
Net Decrease (1) (3)
Class C US$ Distributing (D)Redeemed – (1)
Net Decrease – (1)
Premier Class Euro AccumulatingSold 3 8
Net Increase 3 8
LM Class Euro AccumulatingRedeemed (139) (2)
Net Decrease (139) (2)
Class GA Euro AccumulatingRedeemed – (1)
Net Decrease – (1)
Class GA Euro Distributing (A)Redeemed (1) –
Net Decrease (1) –
Class GE Euro AccumulatingRedeemed – (1)
Net Decrease – (1)
Legg Mason Western Asset Short Duration High Income Bond FundClass A US$ AccumulatingSold 33 11Redeemed (11) (8)
Net Increase 22 3
Class A US$ Distributing (D)Sold 6 9Redeemed (13) (19)
Net Decrease (7) (10)
Class A US$ Distributing (M) PlusRedeemed (1) (13)
Net Decrease (1) (13)
For the year ended
28 February 2021Shares(000’s)
29 February 2020Shares(000’s)
Class A US$ Distributing (M)Sold 1 2Redeemed (2) –
Net (Decrease)/increase (1) 2
Class A AUD Distributing (M) (Hedged) PlusRedeemed (1) –
Net Decrease (1) –
Class A Euro Accumulating (Hedged)Sold 2 7Redeemed (3) (2)
Net (Decrease)/increase (1) 5
Class A HKD Distributing (M) PlusRedeemed (5) (61)
Net Decrease (5) (61)
Class B US$ AccumulatingRedeemed (1) –
Net Decrease (1) –
Class B US$ Distributing (D)Redeemed – (1)
Net Decrease – (1)
Class C US$ AccumulatingSold 18 –Redeemed (5) (5)
Net Increase/(decrease) 13 (5)
Class C US$ Distributing (D)Sold 1 3Redeemed (6) (7)
Net Decrease (5) (4)
Class F US$ AccumulatingSold 14 16Redeemed (8) (1)
Net Increase 6 15
Premier Class Euro Accumulating (Hedged)Sold 4 –Redeemed (2) –
Net Increase 2 –
Class A (G) US$ AccumulatingSold – 1Redeemed (1) (2)
Net Decrease (1) (1)
Class A (G) US$ Distributing (D)Sold 2 2Redeemed (6) (9)
Net Decrease (4) (7)
Class L (G) US$ Distributing (D)Redeemed – (1)
Net Decrease – (1)
Legg Mason Western Asset Global Multi Strategy FundClass A US$ AccumulatingSold 38 121Redeemed (79) (132)
Net Decrease (41) (11)
Class A US$ Distributing (D)Sold 35 96Redeemed (153) (79)
Net (Decrease)/increase (118) 17
Class A US$ Distributing (M) PlusSold 10 20Redeemed (12) (16)
Net (Decrease)/increase (2) 4
Class A US$ Distributing (M)Sold 4 14Redeemed (9) (21)
Net Decrease (5) (7)
Class A AUD Distributing (M) (Hedged) PlusSold – 3Redeemed (2) (1)
Net (Decrease)/increase (2) 2
Class A Euro Accumulating (Hedged)Sold 4 20Redeemed (10) (19)
Net (Decrease)/increase (6) 1
The accompanying notes are an integral part of the financial statements
272

Legg Mason Global Funds Plc Annual Report 28 February 2021
Statement of Changes in Net Assets Attributable to Holders of RedeemableParticipating Shares – (continued)
For the year ended
28 February 2021Shares(000’s)
29 February 2020Shares(000’s)
Legg Mason Western Asset Global Multi Strategy Fund – (continued)Class A Euro Distributing (M) (Hedged) Plus (e)Redeemed (2) –
Net Decrease (2) –
Class A Euro Distributing (M) (Hedged)Sold – 26Redeemed (11) (32)
Net Decrease (11) (6)
Class A GBP Distributing (M) (Hedged)Sold – 1Redeemed (1) (2)
Net Decrease (1) (1)
Class A HKD Distributing (M) PlusSold – 1Redeemed – (1)
Net Increase – –
Class A SGD Distributing (M) (Hedged) PlusSold 755 483Redeemed (857) (642)
Net Decrease (102) (159)
Class B US$ Distributing (D)Sold 3 6Redeemed (5) (3)
Net (Decrease)/increase (2) 3
Class C US$ AccumulatingSold 3 11Redeemed (17) (20)
Net Decrease (14) (9)
Class C US$ Distributing (D)Sold 4 24Redeemed (38) (44)
Net Decrease (34) (20)
Class A ZAR Distributing (M) (Hedged) PlusSold 13 88Redeemed (18) (66)
Net (Decrease)/increase (5) 22
Class E US$ AccumulatingSold – 9Redeemed (6) (4)
Net (Decrease)/increase (6) 5
Class E US$ Distributing (D)Sold – 3Redeemed – (7)
Net Decrease – (4)
Class E Euro Accumulating (Hedged)Sold – 3Redeemed (3) (2)
Net (Decrease)/increase (3) 1
Class E Euro Distributing (M) (Hedged)Sold – 1Redeemed (1) –
Net (Decrease)/increase (1) 1
Class F US$ AccumulatingSold 115 11Redeemed (11) (29)
Net Increase/(decrease) 104 (18)
Class F US$ Distributing (D)Sold 14 47Redeemed (64) (29)
Net (Decrease)/increase (50) 18
Class X US$ Distributing (D)Sold 8 33Redeemed (13) (1)
Net (Decrease)/increase (5) 32
Class X GBP Distributing (D) (Hedged)Sold – 1Redeemed – (1)
Net Increase – –
Premier Class US$ AccumulatingSold 117 515Redeemed (507) (118)
Net (Decrease)/increase (390) 397
Premier Class US$ Distributing (M)Sold 227 224Redeemed (337) (331)
Net Decrease (110) (107)
For the year ended
28 February 2021Shares(000’s)
29 February 2020Shares(000’s)
Premier Class CHF Accumulating (Hedged)Redeemed (1) (264)
Net Decrease (1) (264)
Premier Class Euro Accumulating (Hedged)Sold 10 22Redeemed (16) (11)
Net (Decrease)/increase (6) 11
Premier Class GBP Accumulating (Hedged)Sold – 52Redeemed (25) (304)
Net Decrease (25) (252)
Premier Class GBP Distributing (M) (Hedged) Plus (e)Redeemed (8) (7)
Net Decrease (8) (7)
Premier Class GBP Distributing (M) (Hedged)Sold 1 2Redeemed (211) (25)
Net Decrease (210) (23)
Premier Class GBP Distributing (Q) (Hedged)Redeemed – (2)
Net Decrease – (2)
Premier Class PLN Accumulating (Hedged)Sold 32 98Redeemed (62) (8)
Net (Decrease)/increase (30) 90
LM Class AUD Distributing (M) (Hedged)Sold 126 52Redeemed (173) (63)
Net Decrease (47) (11)
LM Class GBP Accumulating (Hedged)Sold 1 –
Net Increase 1 –
Legg Mason Western Asset US High Yield FundClass A US$ AccumulatingSold 118 211Redeemed (127) (242)
Net Decrease (9) (31)
Class A US$ Distributing (D)Sold 173 175Redeemed (210) (123)
Net (Decrease)/increase (37) 52
Class A US$ Distributing (M) PlusSold 113 11Redeemed (34) (6)
Net Increase 79 5
Class A US$ Distributing (M)Sold 18 10Redeemed (19) (4)
Net (Decrease)/increase (1) 6
Class A Euro Distributing (M) (Hedged)Sold – 28Redeemed – (28)
Net Increase – –
Class A SGD Distributing (M) (Hedged) PlusSold 303 644Redeemed (127) (571)
Net Increase 176 73
Class B US$ Distributing (D)Sold 3 –Redeemed (5) (5)
Net Decrease (2) (5)
Class C US$ AccumulatingSold 3 14Redeemed (7) (20)
Net Decrease (4) (6)
Class C US$ Distributing (D)Sold 12 16Redeemed (27) (21)
Net Decrease (15) (5)
Class E US$ AccumulatingSold 3 4Redeemed (5) (13)
Net Decrease (2) (9)
The accompanying notes are an integral part of the financial statements
273

Legg Mason Global Funds Plc Annual Report 28 February 2021
Statement of Changes in Net Assets Attributable to Holders of RedeemableParticipating Shares – (continued)
For the year ended
28 February 2021Shares(000’s)
29 February 2020Shares(000’s)
Legg Mason Western Asset US High Yield Fund – (continued)Class E US$ Distributing (D)Sold 1 1Redeemed (18) (4)
Net Decrease (17) (3)
Class E Euro Accumulating (Hedged)Sold – 2Net Increase – 2
Class F US$ AccumulatingSold 36 5
Redeemed (9) (4)
Net Increase 27 1
Class F US$ Distributing (D)Sold 1 10Redeemed (12) (2)
Net (Decrease)/increase (11) 8
Class X GBP Accumulating (Hedged)Sold – 1Redeemed – (1)
Net Increase – –
Class X GBP Distributing (D) (Hedged)Redeemed – (1)
Net Decrease – (1)
Premier Class US$ AccumulatingSold 603 253Redeemed (441) (66)
Net Increase 162 187
Premier Class Euro Accumulating (Hedged)Sold – 4Redeemed – (4)
Net Increase – –
Premier Class GBP Accumulating (Hedged)Sold – 6
Net Increase – 6
LM Class US$ AccumulatingSold 89 –
Net Increase 89 –
LM Class US$ Distributing (M)Sold 15 24Redeemed (134) (187)
Net Decrease (119) (163)
LM Class GBP Accumulating (Hedged)Sold 1 –
Net Increase 1 –
Class A (G) US$ AccumulatingRedeemed (1) –
Net Decrease (1) –
Class A (G) US$ Distributing (D)Sold 1 1Redeemed (4) (5)
Net Decrease (3) (4)
Class L (G) US$ AccumulatingRedeemed – (1)
Net Decrease – (1)
Class L (G) US$ Distributing (D)Sold – 2Redeemed (2) (7)
Net Decrease (2) (5)
Class GF US$ AccumulatingRedeemed – (13)
Net Decrease – (13)
Legg Mason Western Asset Emerging Markets Total Return Bond FundClass A US$ AccumulatingSold 40 6Redeemed (17) (9)
Net Increase/(decrease) 23 (3)
Class A US$ Distributing (D)Sold 2 2Redeemed (3) (18)
Net Decrease (1) (16)
Class A US$ Distributing (M) PlusSold 1 1Redeemed – (2)
Net Increase/(decrease) 1 (1)
For the year ended
28 February 2021Shares(000’s)
29 February 2020Shares(000’s)
Class A US$ Distributing (M)Sold 3 3Redeemed (5) (9)
Net Decrease (2) (6)
Class A Euro Accumulating (Hedged)Sold 1 –Redeemed – (1)
Net Increase/(decrease) 1 (1)
Class A Euro Distributing (D) (Hedged)Sold – 4Redeemed (1) (5)
Net Decrease (1) (1)
Class A SGD Distributing (M) (Hedged) PlusSold 126 156Redeemed (270) (191)
Net Decrease (144) (35)
Class C US$ AccumulatingSold 1 4Redeemed (1) (5)
Net Decrease – (1)
Class C US$ Distributing (D)Sold 1 1Redeemed (4) (8)
Net Decrease (3) (7)
Class E US$ Distributing (D)Sold 1 9Redeemed (14) (5)
Net (Decrease)/increase (13) 4
Class E Euro Distributing (M) (Hedged)Sold 1 –
Net Increase 1 –
Class F US$ AccumulatingSold 1 –Redeemed (1) –
Net Increase – –
Premier Class US$ AccumulatingSold 1 –Redeemed – (6)
Net Increase/(decrease) 1 (6)
Premier Class Euro Accumulating (Hedged)Sold 15 3Redeemed (5) (1)
Net Increase 10 2
Premier Class GBP Distributing (D) (Hedged)Redeemed – (1)
Net Decrease – (1)
Class A (G) US$ AccumulatingRedeemed – (3)
Net Decrease – (3)
Class A (G) US$ Distributing (D)Sold – 1Redeemed (2) (2)
Net Decrease (2) (1)
Class L (G) US$ AccumulatingRedeemed – (1)
Net Decrease – (1)
Class L (G) US$ Distributing (D)Sold 1 4Redeemed (9) (8)
Net Decrease (8) (4)
Legg Mason Western Asset Emerging Markets Corporate Bond FundPremier Class Euro Accumulating (Hedged)Sold 1 3
Net Increase 1 3
LM Class US$ Distributing (M)Sold 76 97Redeemed (110) (75)
Net (Decrease)/increase (34) 22
Legg Mason Western Asset Global High Yield FundClass A US$ AccumulatingSold 62 113Redeemed (65) (212)
Net Decrease (3) (99)
The accompanying notes are an integral part of the financial statements
274

Legg Mason Global Funds Plc Annual Report 28 February 2021
Statement of Changes in Net Assets Attributable to Holders of RedeemableParticipating Shares – (continued)
For the year ended
28 February 2021Shares(000’s)
29 February 2020Shares(000’s)
Legg Mason Western Asset Global High Yield Fund – (continued)Class A US$ Distributing (D)Sold 32 11Redeemed (55) (34)
Net Decrease (23) (23)
Class A US$ Distributing (M) PlusSold 97 32Redeemed (52) (39)
Net Increase/(decrease) 45 (7)
Class A US$ Distributing (M)Sold 15 31Redeemed (51) (53)
Net Decrease (36) (22)
Class A AUD Distributing (M) (Hedged) PlusSold 26 32Redeemed (50) (56)
Net Decrease (24) (24)
Class A Euro AccumulatingSold – 1Redeemed (5) (5)
Net Decrease (5) (4)
Class A Euro Distributing (D) (Hedged)Sold 5 15Redeemed (5) (16)
Net Decrease – (1)
Class A SGD Distributing (M) (Hedged) PlusSold 18,385 2,387Redeemed (5,129) (2,377)
Net Increase 13,256 10
Class B US$ AccumulatingRedeemed (1) –
Net Decrease (1) –
Class B US$ Distributing (D)Redeemed – (3)
Net Decrease – (3)
Class C US$ AccumulatingSold 1 1Redeemed (2) (1)
Net Decrease (1) –
Class C US$ Distributing (D)Sold 2 4Redeemed (21) (22)
Net Decrease (19) (18)
Class E US$ AccumulatingSold 1 5Redeemed (3) (8)
Net Decrease (2) (3)
Class E US$ Distributing (D)Sold – 1Redeemed (1) –
Net (Decrease)/increase (1) 1
Class E Euro Accumulating (Hedged)Sold – 1Redeemed (1) –
Net (Decrease)/increase (1) 1
Class F US$ AccumulatingSold 1 4Redeemed (2) (3)
Net (Decrease)/increase (1) 1
Class F US$ Distributing (D)Sold 4 6Redeemed (5) (6)
Net Decrease (1) –
Class X US$ AccumulatingRedeemed – (1)
Net Decrease – (1)
Class X US$ Distributing (D)Sold 11 13Redeemed (2) (2)
Net Increase 9 11
Class X GBP Distributing (D) (Hedged)Sold 12 12Redeemed (3) (1)
Net Increase 9 11
For the year ended
28 February 2021Shares(000’s)
29 February 2020Shares(000’s)
Premier Class US$ AccumulatingSold 122 147Redeemed (176) (42)
Net (Decrease)/increase (54) 105
Premier Class US$ Distributing (M) Plus (e)Sold – 23Redeemed (23) (103)
Net Decrease (23) (80)
Premier Class Euro Accumulating (Hedged)Sold 4 34Redeemed (11) (59)
Net Decrease (7) (25)
LM Class US$ AccumulatingSold – 2Redeemed – (14)
Net Decrease – (12)
Class A (G) US$ AccumulatingSold – 6Redeemed (1) (9)
Net Decrease (1) (3)
Class A (G) US$ Distributing (D)Sold 1 2Redeemed (3) (4)
Net Decrease (2) (2)
Class L (G) US$ AccumulatingRedeemed (1) –
Net Decrease (1) –
Class L (G) US$ Distributing (D)Sold 1 4Redeemed (4) (9)
Net Decrease (3) (5)
Legg Mason Western Asset US Short-Term Government Fund^Class A US$ AccumulatingSold – 6Redeemed – (47)
Net Decrease – (41)
Class A US$ Distributing (D)Redeemed – (5)
Net Decrease – (5)
Class C US$ AccumulatingRedeemed – (28)
Net Decrease – (28)
Class C US$ Distributing (D)Sold – 21Redeemed – (39)
Net Decrease – (18)
Class A (G) US$ AccumulatingRedeemed – (5)
Net Decrease – (5)
Class A (G) US$ Distributing (D)Sold – 1Redeemed – (27)
Net Decrease – (26)
Class L (G) US$ Distributing (D)Redeemed – (3)
Net Decrease – (3)
Legg Mason Western Asset US Adjustable Rate Fund^Class A US$ AccumulatingSold – 1Redeemed – (41)
Net Decrease – (40)
Class B US$ Distributing (D)Redeemed – (1)
Net Decrease – (1)
Class C US$ Distributing (D)Redeemed – (2)
Net Decrease – (2)
Class A (G) US$ AccumulatingRedeemed – (3)
Net Decrease – (3)
The accompanying notes are an integral part of the financial statements
275

Legg Mason Global Funds Plc Annual Report 28 February 2021
Statement of Changes in Net Assets Attributable to Holders of RedeemableParticipating Shares – (continued)
For the year ended
28 February 2021Shares(000’s)
29 February 2020Shares(000’s)
Legg Mason Western Asset US Adjustable Rate Fund^ – (continued)Class A (G) US$ Distributing (D)Redeemed – (6)
Net Decrease – (6)
Class L (G) US$ Distributing (D)Redeemed – (2)
Net Decrease – (2)
Legg Mason Western Asset Global Inflation Management FundClass A US$ AccumulatingSold 6 7Redeemed (17) (23)
Net Decrease (11) (16)
Class A US$ Distributing (A)Sold 13 20Redeemed (19) (32)
Net Decrease (6) (12)
Class C US$ AccumulatingRedeemed (1) (4)
Net Decrease (1) (4)
Class C US$ Distributing (A)Redeemed – (2)
Net Decrease – (2)
LM Class US$ AccumulatingSold 738 369Redeemed (619) (250)
Net Increase 119 119
Class A (G) US$ AccumulatingRedeemed – (3)
Net Decrease – (3)
Class L (G) US$ AccumulatingRedeemed (1) –
Net Decrease (1) –
Legg Mason Western Asset Asian Opportunities FundClass A US$ AccumulatingSold 117 352Redeemed (177) (427)
Net Decrease (60) (75)
Class A US$ Distributing (D)Sold 8 46Redeemed (33) (55)
Net Decrease (25) (9)
Class A US$ Distributing (M) PlusSold 705 917Redeemed (531) (646)
Net Increase 174 271
Class A US$ Distributing (M)Sold 54 301Redeemed (117) (182)
Net (Decrease)/increase (63) 119
Class A AUD Distributing (M) (Hedged) PlusSold 230 424Redeemed (270) (193)
Net (Decrease)/increase (40) 231
Class A CHF Accumulating (Hedged)Sold 5 –
Net Increase 5 –
Class A CNH Distributing (M) (Hedged) PlusSold 339 1,163Redeemed (1,113) (461)
Net (Decrease)/increase (774) 702
Class A Euro Accumulating (Hedged)Sold 54 67Redeemed (50) (65)
Net Increase 4 2
Class A Euro AccumulatingSold 8 23Redeemed (11) (9)
Net (Decrease)/increase (3) 14
Class A Euro Distributing (A)Redeemed – (2)
Net Decrease – (2)
For the year ended
28 February 2021Shares(000’s)
29 February 2020Shares(000’s)
Class A HKD Distributing (M) PlusSold 1,111 1,808Redeemed (843) (1,852)
Net Increase/(decrease) 268 (44)
Class A SGD Accumulating (Hedged)Sold 197 698Redeemed (460) (1,110)
Net Decrease (263) (412)
Class A SGD Distributing (M) (Hedged) PlusSold 10,961 1,654Redeemed (8,086) (667)
Net Increase 2,875 987
Class A SGD Distributing (M) PlusSold 2,677 5,810Redeemed (6,082) (1,104)
Net (Decrease)/increase (3,405) 4,706
Class B US$ AccumulatingRedeemed (1) –
Net Decrease (1) –
Class B US$ Distributing (D)Redeemed – (1)
Net Decrease – (1)
Class C US$ AccumulatingRedeemed (3) (1)
Net Decrease (3) (1)
Class C US$ Distributing (D)Sold 1 –Redeemed (6) (5)
Net Decrease (5) (5)
Class E US$ AccumulatingSold 3 1Redeemed – (2)
Net Increase/(decrease) 3 (1)
Class E US$ Distributing (D)Sold – 1Redeemed – (1)
Net Increase – –
Class F US$ AccumulatingSold 73 36Redeemed (43) (8)
Net Increase 30 28
Class F US$ Distributing (D)Sold 3 –Redeemed (1) –
Net Increase 2 –
Class X US$ AccumulatingSold 78 3Redeemed (11) –
Net Increase 67 3
Class X US$ Distributing (M)Sold 12 –Redeemed (1) (3)
Net Increase/(decrease) 11 (3)
Class X CHF Accumulating (Hedged)Redeemed – (6)
Net Decrease – (6)
Class X Euro Accumulating (Hedged)Sold 2 –Redeemed – (11)
Net Increase/(decrease) 2 (11)
Class X Euro AccumulatingSold 5 –
Net Increase 5 –
Premier Class US$ AccumulatingSold 209 106Redeemed (56) (151)
Net Increase/(decrease) 153 (45)
Premier Class US$ Distributing (M)Sold 156 261Redeemed (155) (404)
Net Increase/(decrease) 1 (143)
Premier Class Euro Accumulating (Hedged)Sold 9 39Redeemed (5) (45)
Net Increase/(decrease) 4 (6)
The accompanying notes are an integral part of the financial statements
276

Legg Mason Global Funds Plc Annual Report 28 February 2021
Statement of Changes in Net Assets Attributable to Holders of RedeemableParticipating Shares – (continued)
For the year ended
28 February 2021Shares(000’s)
29 February 2020Shares(000’s)
Legg Mason Western Asset Asian Opportunities Fund – (continued)Premier Class Euro AccumulatingSold 22 203Redeemed – (130)
Net Increase 22 73
Premier Class Euro Distributing (A)Sold 17 159Redeemed – (25)
Net Increase 17 134
Premier Class Euro Distributing (M)Sold – 120Redeemed – (102)
Net Increase – 18
Premier Class GBP Distributing (M)Sold 1 –Redeemed (1) –
Net Increase – –
LM Class US$ AccumulatingSold 23 –Redeemed (16) (94)
Net Increase/(decrease) 7 (94)
Legg Mason Western Asset Short Duration Blue Chip Bond FundClass A US$ AccumulatingSold 318 7Redeemed (83) (3)
Net Increase 235 4
Class A US$ Distributing (M)Sold 91 –Redeemed – (1)
Net Increase/(decrease) 91 (1)
Class A Euro Accumulating (Hedged)Sold 117 6Redeemed (22) –
Net Increase 95 6
Class A SEK Accumulating (Hedged)Sold 35 –Redeemed (9) –
Net Increase 26 –
Class B US$ AccumulatingSold – 3Redeemed – (3)
Net Increase – –
Class C US$ AccumulatingSold 41 –Redeemed (4) –
Net Increase 37 –
Class C US$ Distributing (M)Sold 3 3Redeemed (2) (1)
Net Increase 1 2
Class E US$ AccumulatingSold 35 –Redeemed (5) (4)
Net Increase/(decrease) 30 (4)
Class E US$ Distributing (D)Sold 42 10Redeemed (1) (10)
Net Increase 41 –
Class F US$ AccumulatingSold 107 –Redeemed (7) –
Net Increase 100 –
Class F US$ Distributing (D)Sold 5 –Redeemed (4) –
Net Increase 1 –
Class X Euro Accumulating (Hedged)Sold 25 –
Net Increase 25 –
Premier Class US$ AccumulatingSold 239 35Redeemed (91) (30)
Net Increase 148 5
For the year ended
28 February 2021Shares(000’s)
29 February 2020Shares(000’s)
Premier Class Euro Accumulating (Hedged)Sold 584 28Redeemed (318) –
Net Increase 266 28
Premier Class Euro Distributing (M) (Hedged)Sold 2 –
Net Increase 2 –
Premier Class GBP Accumulating (Hedged)Sold – 1Redeemed (1) –
Net (Decrease)/increase (1) 1
Premier Class GBP Distributing (M) (Hedged)Sold 3 1Redeemed (1) (3)
Net Increase/(decrease) 2 (2)
S Class US$ Distributing (M) Plus (e)Sold 117 72Redeemed (29) (13)
Net Increase 88 59
S Class Euro Distributing (M) (Hedged) Plus (e)Sold 17 28Redeemed (13) (1)
Net Increase 4 27
S Class GBP Distributing (M) (Hedged) Plus (e)Sold 897 1,405Redeemed (400) (121)
Net Increase 497 1,284
S Class AUD Distributing (M) (Hedged) Plus (e)Sold 29 –Redeemed (9) –
Net Increase 20 –
Legg Mason Western Asset Global Core Plus Bond Fund^Class A US$ Distributing (A)Redeemed (1) –
Net Decrease (1) –
Class A US$ Distributing (D)Redeemed – (22)
Net Decrease – (22)
Class X US$ AccumulatingSold – 12Redeemed – (25)
Net Decrease – (13)
Premier Class US$ AccumulatingSold 522 368Redeemed (399) (557)
Net Increase/(decrease) 123 (189)
Premier Class Euro Accumulating (Hedged)Sold 202 171Redeemed (338) (120)
Net (Decrease)/increase (136) 51
Premier Class NZD Accumulating (Hedged)Sold 53 17
Net Increase 53 17
LM Class US$ AccumulatingSold 12 94Redeemed (5) (67)
Net Increase 7 27
LM Class CAD Accumulating (Hedged)Sold – 188
Net Increase – 188
Legg Mason Western Asset Global Credit Fund^Class A US$ AccumulatingSold 70 71Redeemed (80) (52)
Net (Decrease)/increase (10) 19
Class A US$ Distributing (D)Redeemed – (16)
Net Decrease – (16)
Class A Euro Accumulating (Hedged)Sold 1 2Redeemed (1) (1)
Net Increase – 1
The accompanying notes are an integral part of the financial statements
277

Legg Mason Global Funds Plc Annual Report 28 February 2021
Statement of Changes in Net Assets Attributable to Holders of RedeemableParticipating Shares – (continued)
For the year ended
28 February 2021Shares(000’s)
29 February 2020Shares(000’s)
Legg Mason Western Asset Global Credit Fund^ – (continued)LM Class US$ AccumulatingSold 6 –Redeemed (28) –
Net Decrease (22) –
LM Class Euro Accumulating (Hedged)Sold 39 –
Net Increase 39 –
Legg Mason Western Asset Euro High Yield FundClass A Euro Distributing (D)Sold – 4Redeemed (3) (3)
Net (Decrease)/increase (3) 1
Premier Class Euro AccumulatingSold 1 8Redeemed (7) (2)
Net (Decrease)/increase (6) 6
Premier Class GBP Accumulating (Hedged)Sold – 2Redeemed (2) –
Net (Decrease)/increase (2) 2
LM Class Euro AccumulatingRedeemed (18) (119)
Net Decrease (18) (119)
LM Class Euro Distributing (Q)Sold 3 5Redeemed (11) (21)
Net Decrease (8) (16)
Legg Mason Western Asset Macro Opportunities Bond Fund^Class A US$ AccumulatingSold 1,666 2,739Redeemed (2,933) (3,395)
Net Decrease (1,267) (656)
Class A US$ Distributing (M) Plus (e)Sold 859 2,152Redeemed (2,137) (1,737)
Net (Decrease)/increase (1,278) 415
Class A US$ Distributing (S)Sold 1,073 196Redeemed (1,433) (732)
Net Decrease (360) (536)
Class A AUD Accumulating (Hedged)Sold 4 115Redeemed (72) (43)
Net (Decrease)/increase (68) 72
Class A AUD Distributing (M) (Hedged) Plus (e)Sold 86 612Redeemed (343) (114)
Net (Decrease)/increase (257) 498
Class A CHF Accumulating (Hedged)Sold 17 54Redeemed (40) (85)
Net Decrease (23) (31)
Class A CNH Accumulating (Hedged)Sold 7 19Redeemed (26) (144)
Net Decrease (19) (125)
Class A CNH Distributing (M) (Hedged) Plus (e)Sold 84 76Redeemed (96) (14)
Net (Decrease)/increase (12) 62
Class A Euro Accumulating (Hedged)Sold 1,470 2,228Redeemed (2,942) (2,349)
Net Decrease (1,472) (121)
Class A Euro Distributing (A)Sold 22 78Redeemed (64) (21)
Net (Decrease)/increase (42) 57
Class A Euro Distributing (M) (Hedged) Plus (e)Sold 37 444Redeemed (198) (152)
Net (Decrease)/increase (161) 292
For the year ended
28 February 2021Shares(000’s)
29 February 2020Shares(000’s)
Class A Euro Distributing (S) (Hedged)Sold 20 62Redeemed (145) (119)
Net Decrease (125) (57)
Class A GBP Accumulating (Hedged)Sold 532 333Redeemed (699) (71)
Net (Decrease)/increase (167) 262
Class A GBP AccumulatingSold 2 –Redeemed (2) (5)
Net Decrease – (5)
Class A GBP Distributing (M) (Hedged) Plus (e)Sold 22 151Redeemed (124) (28)
Net (Decrease)/increase (102) 123
Class A HKD Distributing (M) PlusSold 1 65Redeemed (1) –
Net Increase – 65
Class A SEK Accumulating (Hedged)Sold 298 313Redeemed (899) (366)
Net Decrease (601) (53)
Class A SGD Accumulating (Hedged)Sold 13,644 41,106Redeemed (33,832) (39,693)
Net (Decrease)/increase (20,188) 1,413
Class A SGD Distributing (M) (Hedged) Plus (e)Sold 15,278 88,014Redeemed (64,547) (24,354)
Net (Decrease)/increase (49,269) 63,660
Class A SGD Distributing (M) Plus (e)Sold 122 44Redeemed (122) (44)
Net Increase – –
Class B US$ AccumulatingSold – 1Redeemed – (3)
Net Decrease – (2)
Class C US$ AccumulatingSold 64 158Redeemed (147) (196)
Net Decrease (83) (38)
Class C US$ Distributing (S)Sold 3 11Redeemed (29) (35)
Net Decrease (26) (24)
Class A JPY Distributing (M) Plus (e)Sold – 2
Net Increase – 2
Class A NOK Accumulating (Hedged)Sold 229 89Redeemed (73) (31)
Net Increase 156 58
Class E US$ AccumulatingSold 27 94Redeemed (107) (129)
Net Decrease (80) (35)
Class E US$ Distributing (S)Sold 4 5Redeemed (18) (18)
Net Decrease (14) (13)
Class E Euro Accumulating (Hedged)Sold 7 20Redeemed (29) (28)
Net Decrease (22) (8)
Class F US$ AccumulatingSold 355 581Redeemed (538) (406)
Net (Decrease)/increase (183) 175
Class F US$ Distributing (S)Sold 33 38Redeemed (73) (107)
Net Decrease (40) (69)
The accompanying notes are an integral part of the financial statements
278

Legg Mason Global Funds Plc Annual Report 28 February 2021
Statement of Changes in Net Assets Attributable to Holders of RedeemableParticipating Shares – (continued)
For the year ended
28 February 2021Shares(000’s)
29 February 2020Shares(000’s)
Legg Mason Western Asset Macro Opportunities Bond Fund^ – (continued)Class X US$ AccumulatingSold 587 829Redeemed (810) (1,095)
Net Decrease (223) (266)
Class X US$ Distributing (M) Plus (e)Sold 290 165Redeemed (417) (201)
Net Decrease (127) (36)
Class X US$ Distributing (S)Sold 26 165Redeemed (83) (37)
Net (Decrease)/increase (57) 128
Class X CHF Accumulating (Hedged)Sold 33 114Redeemed (60) (175)
Net Decrease (27) (61)
Class X Euro Accumulating (Hedged)Sold 584 930Redeemed (811) (1,193)
Net Decrease (227) (263)
Class X Euro AccumulatingSold 6 112Redeemed (33) (14)
Net (Decrease)/increase (27) 98
Class X Euro Distributing (A) (Hedged)Sold 17 112Redeemed (116) (32)
Net (Decrease)/increase (99) 80
Class X Euro Distributing (M) (Hedged)Sold 2 6Redeemed (9) –
Net (Decrease)/increase (7) 6
Class X GBP Accumulating (Hedged)Sold 138 239Redeemed (260) (234)
Net (Decrease)/increase (122) 5
Class X GBP AccumulatingSold 12 17Redeemed (32) (6)
Net (Decrease)/increase (20) 11
Class X GBP Distributing (M) (Hedged) Plus (e)Sold 11 36Redeemed (24) (16)
Net (Decrease)/increase (13) 20
Class X SGD Accumulating (Hedged)Sold 1,827 2,238Redeemed (1,032) (825)
Net Increase 795 1,413
Premier Class US$ AccumulatingSold 1,491 6,543Redeemed (3,022) (4,365)
Net (Decrease)/increase (1,531) 2,178
Premier Class US$ Distributing (S)Sold 215 655Redeemed (384) (187)
Net (Decrease)/increase (169) 468
Premier Class AUD Accumulating (Hedged)Sold 6 55Redeemed (4) (41)
Net Increase 2 14
Premier Class AUD Distributing (S) (Hedged)Sold 91 214Redeemed (84) (249)
Net Increase/(decrease) 7 (35)
Premier Class BRL Accumulating (Hedged)Sold 1,211 1,901Redeemed (1,276) (884)
Net (Decrease)/increase (65) 1,017
Premier Class CHF Accumulating (Hedged)Sold 76 71Redeemed (84) (164)
Net Decrease (8) (93)
Premier Class CHF Distributing (S) (Hedged)Sold 3 16Redeemed (95) (22)
Net Decrease (92) (6)
For the year ended
28 February 2021Shares(000’s)
29 February 2020Shares(000’s)
Premier Class Euro Accumulating (Hedged)Sold 1,372 2,835Redeemed (2,090) (3,513)
Net Decrease (718) (678)
Premier Class Euro AccumulatingSold 144 111Redeemed (64) (20)
Net Increase 80 91
Premier Class Euro Distributing (S) (Hedged)Sold 481 185Redeemed (181) (207)
Net Increase/(decrease) 300 (22)
Premier Class GBP Accumulating (Hedged)Sold 210 625Redeemed (846) (851)
Net Decrease (636) (226)
Premier Class GBP Distributing (M) (Hedged) Plus (e)Sold 748 1,794Redeemed (963) (1,247)
Net (Decrease)/increase (215) 547
Premier Class JPY Accumulating (Hedged)Sold 52 343Redeemed (170) (228)
Net (Decrease)/increase (118) 115
Premier Class JPY Distributing (S) (Hedged)Sold – 106Redeemed – (6)
Net Increase – 100
Premier Class PLN Accumulating (Hedged)Sold 22 57Redeemed (74) (17)
Net (Decrease)/increase (52) 40
Premier Class SEK Accumulating (Hedged)Sold 17 81Redeemed (460) (247)
Net Decrease (443) (166)
S Class US$ AccumulatingRedeemed (107) (97)
Net Decrease (107) (97)
S Class Euro Accumulating (Hedged)Sold 52 151Redeemed (23) (314)
Net Increase/(decrease) 29 (163)
LM Class AUD Distributing (S) (Hedged)Sold 562 491Redeemed (311) (287)
Net Increase 251 204
LM Class Euro AccumulatingSold 1 2Redeemed (3) (1)
Net (Decrease)/increase (2) 1
Legg Mason Western Asset EM Local Currency Debt Fund^Class A US$ Distributing (D)Redeemed – (1)
Net Decrease – (1)
Premier Class US$ AccumulatingRedeemed – (287)
Net Decrease – (287)
LM Class US$ Distributing (M)Sold – 1Redeemed – (20)
Net Decrease – (19)
Legg Mason Western Asset Multi-Asset Credit Fund^Class A Euro Accumulating (Hedged)Redeemed (1) –
Net Decrease (1) –
Class F US$ AccumulatingSold 15 29Redeemed (88) –
Net (Decrease)/increase (73) 29
Premier Class Euro Accumulating (Hedged)Sold 15 42Redeemed (4) –
Net Increase 11 42
The accompanying notes are an integral part of the financial statements
279
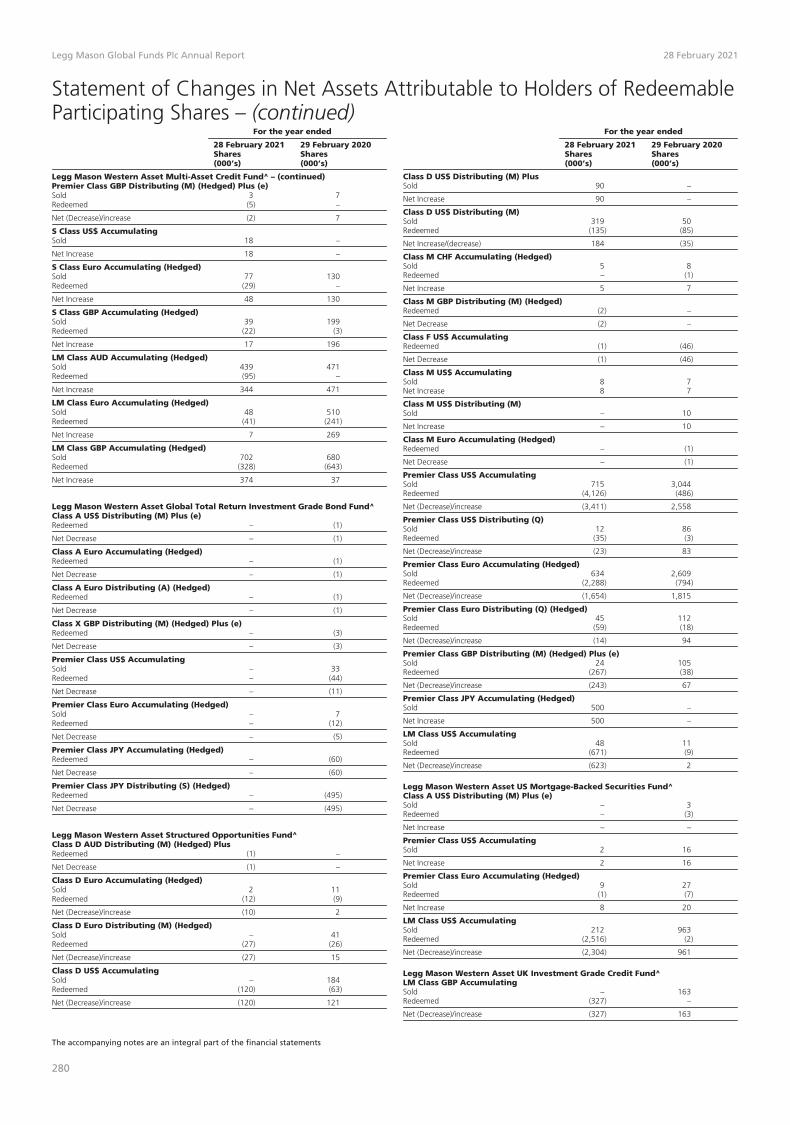
Legg Mason Global Funds Plc Annual Report 28 February 2021
Statement of Changes in Net Assets Attributable to Holders of RedeemableParticipating Shares – (continued)
For the year ended
28 February 2021Shares(000’s)
29 February 2020Shares(000’s)
Legg Mason Western Asset Multi-Asset Credit Fund^ – (continued)Premier Class GBP Distributing (M) (Hedged) Plus (e)Sold 3 7Redeemed (5) –
Net (Decrease)/increase (2) 7
S Class US$ AccumulatingSold 18 –
Net Increase 18 –
S Class Euro Accumulating (Hedged)Sold 77 130Redeemed (29) –
Net Increase 48 130
S Class GBP Accumulating (Hedged)Sold 39 199Redeemed (22) (3)
Net Increase 17 196
LM Class AUD Accumulating (Hedged)Sold 439 471Redeemed (95) –
Net Increase 344 471
LM Class Euro Accumulating (Hedged)Sold 48 510Redeemed (41) (241)
Net Increase 7 269
LM Class GBP Accumulating (Hedged)Sold 702 680Redeemed (328) (643)
Net Increase 374 37
Legg Mason Western Asset Global Total Return Investment Grade Bond Fund^Class A US$ Distributing (M) Plus (e)Redeemed – (1)
Net Decrease – (1)
Class A Euro Accumulating (Hedged)Redeemed – (1)
Net Decrease – (1)
Class A Euro Distributing (A) (Hedged)Redeemed – (1)
Net Decrease – (1)
Class X GBP Distributing (M) (Hedged) Plus (e)Redeemed – (3)
Net Decrease – (3)
Premier Class US$ AccumulatingSold – 33Redeemed – (44)
Net Decrease – (11)
Premier Class Euro Accumulating (Hedged)Sold – 7Redeemed – (12)
Net Decrease – (5)
Premier Class JPY Accumulating (Hedged)Redeemed – (60)
Net Decrease – (60)
Premier Class JPY Distributing (S) (Hedged)Redeemed – (495)
Net Decrease – (495)
Legg Mason Western Asset Structured Opportunities Fund^Class D AUD Distributing (M) (Hedged) PlusRedeemed (1) –
Net Decrease (1) –
Class D Euro Accumulating (Hedged)Sold 2 11Redeemed (12) (9)
Net (Decrease)/increase (10) 2
Class D Euro Distributing (M) (Hedged)Sold – 41Redeemed (27) (26)
Net (Decrease)/increase (27) 15
Class D US$ AccumulatingSold – 184Redeemed (120) (63)
Net (Decrease)/increase (120) 121
For the year ended
28 February 2021Shares(000’s)
29 February 2020Shares(000’s)
Class D US$ Distributing (M) PlusSold 90 –
Net Increase 90 –
Class D US$ Distributing (M)Sold 319 50Redeemed (135) (85)
Net Increase/(decrease) 184 (35)
Class M CHF Accumulating (Hedged)Sold 5 8Redeemed – (1)
Net Increase 5 7
Class M GBP Distributing (M) (Hedged)Redeemed (2) –
Net Decrease (2) –
Class F US$ AccumulatingRedeemed (1) (46)
Net Decrease (1) (46)
Class M US$ AccumulatingSold 8 7Net Increase 8 7
Class M US$ Distributing (M)Sold – 10
Net Increase – 10
Class M Euro Accumulating (Hedged)Redeemed – (1)
Net Decrease – (1)
Premier Class US$ AccumulatingSold 715 3,044Redeemed (4,126) (486)
Net (Decrease)/increase (3,411) 2,558
Premier Class US$ Distributing (Q)Sold 12 86Redeemed (35) (3)
Net (Decrease)/increase (23) 83
Premier Class Euro Accumulating (Hedged)Sold 634 2,609Redeemed (2,288) (794)
Net (Decrease)/increase (1,654) 1,815
Premier Class Euro Distributing (Q) (Hedged)Sold 45 112Redeemed (59) (18)
Net (Decrease)/increase (14) 94
Premier Class GBP Distributing (M) (Hedged) Plus (e)Sold 24 105Redeemed (267) (38)
Net (Decrease)/increase (243) 67
Premier Class JPY Accumulating (Hedged)Sold 500 –
Net Increase 500 –
LM Class US$ AccumulatingSold 48 11Redeemed (671) (9)
Net (Decrease)/increase (623) 2
Legg Mason Western Asset US Mortgage-Backed Securities Fund^Class A US$ Distributing (M) Plus (e)Sold – 3Redeemed – (3)
Net Increase – –
Premier Class US$ AccumulatingSold 2 16
Net Increase 2 16
Premier Class Euro Accumulating (Hedged)Sold 9 27Redeemed (1) (7)
Net Increase 8 20
LM Class US$ AccumulatingSold 212 963Redeemed (2,516) (2)
Net (Decrease)/increase (2,304) 961
Legg Mason Western Asset UK Investment Grade Credit Fund^LM Class GBP AccumulatingSold – 163Redeemed (327) –
Net (Decrease)/increase (327) 163
The accompanying notes are an integral part of the financial statements
280

Legg Mason Global Funds Plc Annual Report 28 February 2021
Statement of Changes in Net Assets Attributable to Holders of RedeemableParticipating Shares – (continued)
For the year ended
28 February 2021Shares(000’s)
29 February 2020Shares(000’s)
Legg Mason Western Asset US Corporate Bond Fund^Class A US$ AccumulatingSold 29 34Redeemed (17) (14)
Net Increase 12 20
Premier Class US$ AccumulatingSold 44 160Redeemed (72) –
Net (Decrease)/increase (28) 160
Premier Class Euro Accumulating (Hedged)Sold 2 8
Net Increase 2 8
LM Class GBP Accumulating (Hedged)Sold 313 –Redeemed – (162)
Net Increase/(decrease) 313 (162)
Western Asset UCITS SMASh Series Core Plus Completion Fund^�LM Class US$ Distributing (Q)Sold 226 –
Net Increase 226 –
Legg Mason Brandywine Global Fixed Income FundClass A US$ AccumulatingSold 30 73Redeemed (54) (174)
Net Decrease (24) (101)
Class A US$ Distributing (M) PlusSold – 3
Net Increase – 3
Class A US$ Distributing (M)Sold 6 31Redeemed (14) (35)
Net Decrease (8) (4)
Class A US$ Distributing (S)Sold 20 98Redeemed (289) (89)
Net (Decrease)/increase (269) 9
Class A AUD Distributing (M) (Hedged) PlusSold 2 21Redeemed (15) (2)
Net (Decrease)/increase (13) 19
Class A Euro Accumulating (Hedged) (IH)Sold 9 322Redeemed (120) (357)
Net Decrease (111) (35)
Class A Euro Accumulating (Hedged)Sold 2 65Redeemed (3) (485)
Net Decrease (1) (420)
Class A Euro Distributing (A) (Hedged)Sold 1 1Redeemed (1) (1)
Net Increase – –
Class A Euro Distributing (S) (Hedged) (IH)Sold 2 10Redeemed (22) (34)
Net Decrease (20) (24)
Class A GBP Distributing (M) (Hedged)Sold 2 –Redeemed (3) (1)
Net Decrease (1) (1)
Class A GBP Distributing (S) (Hedged) (IH)Sold 2 4Redeemed (8) (11)
Net Decrease (6) (7)
Class A SGD AccumulatingSold 897 13,938Redeemed (1,395) (13,461)
Net (Decrease)/increase (498) 477
Class B US$ AccumulatingRedeemed (1) –
Net Decrease (1) –
For the year ended
28 February 2021Shares(000’s)
29 February 2020Shares(000’s)
Class B US$ Distributing (S)Redeemed – (1)
Net Decrease – (1)
Class C US$ AccumulatingSold – 5Redeemed (1) (5)
Net Decrease (1) –
Class C US$ Distributing (S)Sold – 6Redeemed (10) (25)
Net Decrease (10) (19)
Class E US$ AccumulatingSold – 1Redeemed (4) (8)
Net Decrease (4) (7)
Class E Euro Accumulating (Hedged) (IH)Sold – 3Redeemed (8) (13)
Net Decrease (8) (10)
Class F US$ AccumulatingSold 2 5Redeemed (22) (8)
Net Decrease (20) (3)
Class F US$ Distributing (S)Sold – 1
Net Increase – 1
Class R US$ Distributing (S)Redeemed (1) –
Net Decrease (1) –
Class R GBP Distributing (S) (Hedged) (IH)Sold – 21Redeemed (1) (66)
Net Decrease (1) (45)
Class X US$ AccumulatingSold 3 38Redeemed (77) (100)
Net Decrease (74) (62)
Class X US$ Distributing (S)Sold – 3Redeemed – (6)
Net Decrease – (3)
Class X Euro Accumulating (Hedged) (IH)Sold 1 90Redeemed (1) (248)
Net Decrease – (158)
Class X Euro Accumulating (Hedged)Sold 5 35Redeemed (25) (859)
Net Decrease (20) (824)
Class X Euro Distributing (S) (Hedged) (IH)Sold – 14Redeemed (3) (24)
Net Decrease (3) (10)
Class X GBP Accumulating (Hedged) (IH)Sold 2 25Redeemed (39) (24)
Net (Decrease)/increase (37) 1
Class X GBP Accumulating (Hedged)Sold 82 303Redeemed (224) (36)
Net (Decrease)/increase (142) 267
Class X GBP AccumulatingSold 47 130Redeemed (212) (561)
Net Decrease (165) (431)
Class X GBP Distributing (S) (Hedged) (IH)Sold 48 306Redeemed (240) (418)
Net Decrease (192) (112)
Class X GBP Distributing (S) (Hedged)Sold 67 147Redeemed (180) (153)
Net Decrease (113) (6)
The accompanying notes are an integral part of the financial statements
281

Legg Mason Global Funds Plc Annual Report 28 February 2021
Statement of Changes in Net Assets Attributable to Holders of RedeemableParticipating Shares – (continued)
For the year ended
28 February 2021Shares(000’s)
29 February 2020Shares(000’s)
Legg Mason Brandywine Global Fixed Income Fund – (continued)Premier Class US$ AccumulatingSold 401 961Redeemed (1,607) (589)
Net (Decrease)/increase (1,206) 372
Premier Class US$ Distributing (S)Sold – 261Redeemed (102) (262)
Net Decrease (102) (1)
Premier Class Euro Accumulating (Hedged) (IH)Sold 110 445Redeemed (558) (294)
Net (Decrease)/increase (448) 151
Premier Class Euro Accumulating (Hedged)Sold – 493Redeemed (121) (303)
Net (Decrease)/increase (121) 190
Premier Class Euro AccumulatingSold 18 103Redeemed (100) (247)
Net Decrease (82) (144)
Premier Class Euro Distributing (S)Sold – 1Redeemed – (16)
Net Decrease – (15)
Premier Class GBP Distributing (M) (Hedged)Sold 54 527Redeemed (540) (174)
Net (Decrease)/increase (486) 353
Premier Class GBP Distributing (S) (Hedged) (IH)Sold 11 133Redeemed (133) (73)
Net (Decrease)/increase (122) 60
LM Class US$ Accumulating (Hedged) (IH)Sold – 92Redeemed (989) (107)
Net Decrease (989) (15)
LM Class US$ AccumulatingSold 13 36Redeemed (6) (3)
Net Increase 7 33
Legg Mason Brandywine Global Fixed Income Absolute Return Fund^Class A US$ AccumulatingSold – 1Redeemed (202) (12)
Net Decrease (202) (11)
Class A US$ Distributing (A)Sold 3 4Redeemed (120) (3)
Net (Decrease)/increase (117) 1
Class A Euro Accumulating (Hedged)Sold 59 2Redeemed (62) (5)
Net Decrease (3) (3)
Class A SEK Accumulating (Hedged)Sold 51 –Redeemed (51) –
Net Increase – –
Class A SGD AccumulatingSold 1,844 7,699Redeemed (3,399) (6,144)
Net (Decrease)/increase (1,555) 1,555
Class E US$ AccumulatingSold – 1Redeemed (1) (5)
Net Decrease (1) (4)
Class E US$ Distributing (A)Sold – 1Redeemed (1) –
Net (Decrease)/increase (1) 1
Class F US$ AccumulatingRedeemed (2) (22)
Net Decrease (2) (22)
For the year ended
28 February 2021Shares(000’s)
29 February 2020Shares(000’s)
Class X US$ AccumulatingSold – 1Redeemed – (7)
Net Decrease – (6)
Class X GBP Distributing (M) (Hedged)Sold – 6Redeemed – (6)
Net Increase – –
Premier Class US$ AccumulatingSold 74 142Redeemed (511) (895)
Net Decrease (437) (753)
Premier Class US$ Distributing (A)Sold – 3Redeemed (81) (31)
Net Decrease (81) (28)
Premier Class Euro Accumulating (Hedged)Sold 20 13Redeemed (304) (411)
Net Decrease (284) (398)
Premier Class Euro Distributing (A) (Hedged)Sold 19 19Redeemed (259) (107)
Net Decrease (240) (88)
Premier Class GBP Distributing (M) (Hedged)Sold 17 14Redeemed (150) (120)
Net Decrease (133) (106)
Premier Class SEK Accumulating (Hedged)Redeemed – (33)
Net Decrease – (33)
Premier Class SGD Accumulating (Hedged)Redeemed (96,609) –
Net Decrease (96,609) –
LM Class US$ AccumulatingRedeemed – (1,409)
Net Decrease – (1,409)
LM Class AUD Accumulating (Hedged)Sold – 995Redeemed – (889)
Net Increase – 106
LM Class GBP Accumulating (Hedged)Redeemed – (161)
Net Decrease – (161)
Legg Mason Brandywine Global High Yield Fund^Class A US$ AccumulatingSold – 9Redeemed (1) (45)
Net Decrease (1) (36)
Class A US$ Distributing (D)Sold – 10Redeemed – (11)
Net Decrease – (1)
Class F US$ Distributing (D)Sold – 5Redeemed – (5)
Net Increase – –
Premier Class US$ AccumulatingRedeemed (1) (25)
Net Decrease (1) (25)
Premier Class GBP Accumulating (Hedged) (IH)Sold 1 –
Net Increase 1 –
LM Class US$ AccumulatingRedeemed – (720)
Net Decrease – (720)
S Class CAD Accumulating (Hedged) (IH)Sold – 8
Net Increase – 8
The accompanying notes are an integral part of the financial statements
282

Legg Mason Global Funds Plc Annual Report 28 February 2021
Statement of Changes in Net Assets Attributable to Holders of RedeemableParticipating Shares – (continued)
For the year ended
28 February 2021Shares(000’s)
29 February 2020Shares(000’s)
Legg Mason Brandywine Global Opportunistic Fixed Income FundClass A US$ AccumulatingSold 13 12Redeemed (140) (106)
Net Decrease (127) (94)
Class A US$ Distributing (M)Sold 3 135Redeemed (114) (144)
Net Decrease (111) (9)
Class A SGD AccumulatingSold 9,613 –Redeemed (9,425) –
Net Increase 188 –
Class C US$ AccumulatingSold – 2Redeemed (1) (4)
Net Decrease (1) (2)
Class E US$ AccumulatingSold – 11Redeemed (1) (30)
Net Decrease (1) (19)
Class F US$ AccumulatingSold 13 4Redeemed (2) (3)
Net Increase 11 1
Class F US$ Distributing (M)Sold 3 1Redeemed – (1)
Net Increase 3 –
Class X GBP Distributing (M) (Hedged) (IH)Sold 6 –
Net Increase 6 –
Class X GBP Distributing (M) (Hedged)Sold – 1
Net Increase – 1
Premier Class US$ Accumulating (Hedged) (IH)Redeemed (13) –
Net Decrease (13) –
Premier Class US$ AccumulatingSold 870 1,231Redeemed (772) (1,753)
Net Increase/(decrease) 98 (522)
Premier Class US$ Distributing (M)Redeemed – (86)
Net Decrease – (86)
Premier Class GBP Distributing (M) (Hedged) (IH)Sold – 22Redeemed (2) (26)
Net Decrease (2) (4)
Premier Class NZD Accumulating (Hedged) (IH)Redeemed (123) –
Net Decrease (123) –
LM Class US$ AccumulatingRedeemed – (374)
Net Decrease – (374)
LM Class Euro AccumulatingSold 4 13Redeemed (17) (5)
Net (Decrease)/increase (13) 8
LM Class NZD Accumulating (Hedged) (IH)Sold 183 291Redeemed (322) (121)
Net (Decrease)/increase (139) 170
Legg Mason Brandywine Global Sovereign Credit Fund^�Class A US$ AccumulatingSold 5 11Redeemed (18) –
Net (Decrease)/increase (13) 11
BW LM Class AUD Accumulating (Hedged) (IH)Sold – 1,000Redeemed (1,000) –
Net (Decrease)/increase (1,000) 1,000
BW LM Class GBP Accumulating (Hedged) (IH)Redeemed (1,311) (1,031)
Net Decrease (1,311) (1,031)
For the year ended
28 February 2021Shares(000’s)
29 February 2020Shares(000’s)
BW LM Class GBP Distributing (S) (Hedged) (IH)Redeemed (5,183) –
Net Decrease (5,183) –
BW Premier Class Euro Accumulating (Hedged) (IH)Sold 7 766Redeemed (2,296) (567)
Net (Decrease)/increase (2,289) 199
BW Premier Class GBP Accumulating (Hedged) (IH)Sold 54 –Redeemed (909) (750)
Net Decrease (855) (750)
BW Premier Class GBP Distributing (S) (Hedged) (IH)Redeemed (351) (962)
Net Decrease (351) (962)
BW Premier Class US$ Accumulating (Hedged) (IH)Sold – 101Redeemed (304) –
Net (Decrease)/increase (304) 101
Premier Class US$ AccumulatingRedeemed (238) (95)
Net Decrease (238) (95)
Legg Mason Brandywine Global Income Optimiser Fund^Class A US$ AccumulatingSold 582 38Redeemed (71) (18)
Net Increase 511 20
Class A US$ Distributing (A)Sold 15 –Redeemed (2) –
Net Increase 13 –
Class A US$ Distributing (D)Sold 136 –
Net Increase 136 –
Class A US$ Distributing (M) Plus (e)Sold 580 6Redeemed (26) (160)
Net Increase/(decrease) 554 (154)
Class A US$ Distributing (M) PlusSold 11 –
Net Increase 11 –
Class A Euro Accumulating (Hedged)Sold 101 14Redeemed (11) (52)
Net Increase/(decrease) 90 (38)
Class A Euro Distributing (A) (Hedged)Sold 60 28Redeemed (39) (21)
Net Increase 21 7
Class A Euro Distributing (M) (Hedged) Plus (e)Sold 213 51Redeemed (27) (74)
Net Increase/(decrease) 186 (23)
Class A GBP Distributing (M) (Hedged) Plus (e)Sold 30 1Redeemed (1) (3)
Net Increase/(decrease) 29 (2)
Class A SGD Distributing (M) (Hedged) Plus (e)Sold 299 –
Net Increase 299 –
Class A SGD Distributing (M) (Hedged) PlusSold 34,596 3,186Redeemed (13,694) (2,887)
Net Increase 20,902 299
Class A SGD Distributing (M) PlusSold 198 –
Net Increase 198 –
Class C US$ AccumulatingSold 20 –
Net Increase 20 –
Class C US$ Distributing (D)Sold 4 –
Net Increase 4 –
The accompanying notes are an integral part of the financial statements
283

Legg Mason Global Funds Plc Annual Report 28 February 2021
Statement of Changes in Net Assets Attributable to Holders of RedeemableParticipating Shares – (continued)
For the year ended
28 February 2021Shares(000’s)
29 February 2020Shares(000’s)
Legg Mason Brandywine Global Income Optimiser Fund^ – (continued)Class E US$ AccumulatingSold 139 –Redeemed (11) –
Net Increase 128 –
Class E US$ Distributing (D)Sold 2 –Redeemed (1) –
Net Increase 1 –
Class E Euro Accumulating (Hedged)Sold 13 –
Net Increase 13 –
Class F US$ AccumulatingSold 36 –
Net Increase 36 –
Class F US$ Distributing (D)Sold 7 11Redeemed (2) –
Net Increase 5 11
Class X US$ AccumulatingSold 3 –
Net Increase 3 –
Class X US$ Distributing (D)Redeemed (1) (3)
Net Decrease (1) (3)
Class X US$ Distributing (M) Plus (e)Sold 211 2Redeemed (131) (4)
Net Increase/(decrease) 80 (2)
Class X CHF Distributing (A) (Hedged)Sold 1 –
Net Increase 1 –
Class X Euro Accumulating (Hedged)Sold 1 –
Net Increase 1 –
Class X Euro AccumulatingSold 8 –
Net Increase 8 –
Class X Euro Distributing (M) (Hedged) Plus (e)Sold 168 16Redeemed (4) (19)
Net Increase/(decrease) 164 (3)
Class X GBP Distributing (M) (Hedged) Plus (e)Sold 21 1Redeemed (8) (9)
Net Increase/(decrease) 13 (8)
Premier Class US$ AccumulatingSold 25 –Redeemed (5) –
Net Increase 20 –
Premier Class US$ Distributing (M) Plus (e)Sold 22 4Redeemed (2) –
Net Increase 20 4
Premier Class Euro Accumulating (Hedged)Sold 126 46Redeemed (29) (118)
Net Increase/(decrease) 97 (72)
Premier Class Euro Distributing (M) (Hedged) Plus (e)Sold 53 13Redeemed (8) (28)
Net Increase/(decrease) 45 (15)
Premier Class GBP Distributing (M) (Hedged) Plus (e)Sold 2 –Redeemed (1) –
Net Increase 1 –
Premier Class SEK Accumulating (Hedged)Sold 1,227 223Redeemed (358) (391)
Net Increase/(decrease) 869 (168)
S Class US$ AccumulatingSold 604 –Redeemed (352) –
Net Increase 252 –
For the year ended
28 February 2021Shares(000’s)
29 February 2020Shares(000’s)
S Class Euro Accumulating (Hedged)Sold 125 14Redeemed (14) (66)
Net Increase/(decrease) 111 (52)
S Class Euro Distributing (M) (Hedged) Plus (e)Sold 92 21Redeemed (80) (7)
Net Increase 12 14
S Class GBP Distributing (M) (Hedged) Plus (e)Sold – 1Redeemed (7) (6)
Net Decrease (7) (5)
LM Class AUD Distributing (Q) (Hedged)Redeemed (3) –
Net Decrease (3) –
LM Class GBP Accumulating (Hedged)Sold 216 –Redeemed (3) –
Net Increase 213 –
Legg Mason Brandywine Global Credit Opportunities Fund^Class A US$ AccumulatingSold 130 1Redeemed (9) (4)
Net Increase/(decrease) 121 (3)
Premier Class US$ AccumulatingSold 29 63Redeemed (55) (87)
Net Decrease (26) (24)
Premier Class BRL Accumulating (Hedged)Redeemed – (99)
Net Decrease – (99)
Premier Class GBP Accumulating (Hedged)Redeemed – (3)
Net Decrease – (3)
S Class BRL Accumulating (Hedged)Sold – 103
Net Increase – 103
Legg Mason Brandywine Global – US High Yield Fund^S Class Euro Accumulating (Hedged)Redeemed – (255)
Net Decrease – (255)
Legg Mason Brandywine Global Enhanced Absolute Return Fund^Class A SGD Accumulating (Hedged)Sold 25,768 17,680Redeemed (24,235) (12,210)
Net Increase 1,533 5,470
Premier Class US$ AccumulatingSold 35 190Redeemed (68) (22)
Net (Decrease)/increase (33) 168
LM Class SGD Accumulating (Hedged)Sold – 96,261Redeemed (96,043) (232)
Net (Decrease)/increase (96,043) 96,029
Legg Mason Brandywine Global Dynamic US Equity Fund^Class A US$ AccumulatingRedeemed (1) (1)
Net Decrease (1) (1)
Premier Class US$ AccumulatingRedeemed – (2)
Net Decrease – (2)
S Class US$ AccumulatingRedeemed (16) –
Net Decrease (16) –
S Class Euro Accumulating (Hedged)Redeemed – (6)
Net Decrease – (6)
The accompanying notes are an integral part of the financial statements
284

Legg Mason Global Funds Plc Annual Report 28 February 2021
Statement of Changes in Net Assets Attributable to Holders of RedeemableParticipating Shares – (continued)
For the year ended
28 February 2021Shares(000’s)
29 February 2020Shares(000’s)
Legg Mason ClearBridge Value FundClass A US$ AccumulatingSold 58 75Redeemed (105) (94)
Net Decrease (47) (19)
Class A US$ Distributing (A)Sold 8 8Redeemed (24) (25)
Net Decrease (16) (17)
Class A Euro AccumulatingSold 2 11Redeemed – (23)
Net Increase/(decrease) 2 (12)
Class A SGD Accumulating (Hedged)Sold 316 19Redeemed (205) (392)
Net Increase/(decrease) 111 (373)
Class A SGD AccumulatingSold 293 435Redeemed (467) (1,204)
Net Decrease (174) (769)
Class B US$ Distributing (A)Sold – 1Redeemed – (1)
Net Increase – –
Class C US$ AccumulatingSold 2 1Redeemed (5) (5)
Net Decrease (3) (4)
Class C US$ Distributing (A)Sold – 4Redeemed (6) (6)
Net Decrease (6) (2)
Class F US$ AccumulatingSold – 1Redeemed (1) (1)
Net Decrease (1) –
Class F US$ Distributing (A)Sold 1 –Redeemed – (1)
Net Increase/(decrease) 1 (1)
Class X US$ Distributing (A)Sold 122 –Redeemed (3) (1)
Net Increase/(decrease) 119 (1)
Class X Euro AccumulatingSold 4 –
Net Increase 4 –
Premier Class US$ AccumulatingSold 293 99Redeemed (304) (84)
Net (Decrease)/increase (11) 15
Premier Class US$ Distributing (A)Redeemed (1) (1)
Net Decrease (1) (1)
Premier Class Euro AccumulatingSold 161 1Redeemed (1) (3)
Net Increase/(decrease) 160 (2)
Legg Mason ClearBridge Global Equity Fund^Class A US$ AccumulatingRedeemed – (7)
Net Decrease – (7)
Class A US$ Distributing (A)Redeemed – (3)
Net Decrease – (3)
Class C US$ AccumulatingSold – 1Redeemed – (2)
Net Decrease – (1)
Class C US$ Distributing (A)Redeemed – (1)
Net Decrease – (1)
For the year ended
28 February 2021Shares(000’s)
29 February 2020Shares(000’s)
Premier Class US$ AccumulatingSold – 9Redeemed – (158)
Net Decrease – (149)
LM Class US$ AccumulatingRedeemed – (152)
Net Decrease – (152)
Legg Mason ClearBridge Global Equity Income Fund^Class A US$ AccumulatingRedeemed – (1)
Net Decrease – (1)
Class A US$ Distributing (M) Plus (e)Redeemed – (6)
Net Decrease – (6)
Class A US$ Distributing (Q)Redeemed – (5)
Net Decrease – (5)
Class A Euro Accumulating (Hedged)Redeemed – (4)
Net Decrease – (4)
Class A Euro Distributing (M) (Hedged) Plus (e)Redeemed – (5)
Net Decrease – (5)
Premier Class US$ Distributing (M) Plus (e)Redeemed – (6)
Net Decrease – (6)
Premier Class Euro Accumulating (Hedged)Redeemed – (4)
Net Decrease – (4)
Premier Class Euro Distributing (M) (Hedged) Plus (e)Redeemed – (4)
Net Decrease – (4)
LM Class US$ AccumulatingRedeemed – (9)
Net Decrease – (9)
Legg Mason ClearBridge US Appreciation FundClass A US$ AccumulatingSold 31 64Redeemed (56) (91)
Net Decrease (25) (27)
Class A US$ Distributing (A)Sold 3 5Redeemed (14) (27)
Net Decrease (11) (22)
Class A Euro AccumulatingSold – 3Redeemed (7) (9)
Net Decrease (7) (6)
Class B US$ AccumulatingRedeemed (2) –
Net Decrease (2) –
Class B US$ Distributing (A)Redeemed (2) (1)
Net Decrease (2) (1)
Class C US$ AccumulatingSold 9 23Redeemed (28) (35)
Net Decrease (19) (12)
Class C US$ Distributing (A)Sold 1 2Redeemed (12) (42)
Net Decrease (11) (40)
Class E US$ AccumulatingSold 16 19Redeemed (11) (21)
Net Increase/(decrease) 5 (2)
Class F US$ AccumulatingSold 30 88Redeemed (15) (103)
Net Increase/(decrease) 15 (15)
The accompanying notes are an integral part of the financial statements
285

Legg Mason Global Funds Plc Annual Report 28 February 2021
Statement of Changes in Net Assets Attributable to Holders of RedeemableParticipating Shares – (continued)
For the year ended
28 February 2021Shares(000’s)
29 February 2020Shares(000’s)
Legg Mason ClearBridge US Appreciation Fund – (continued)Class F US$ Distributing (A)Sold 3 5Redeemed (2) (2)
Net Increase 1 3
Class X US$ Distributing (A)Sold – 1Redeemed (11) (51)
Net Decrease (11) (50)
Class X Euro AccumulatingSold 2 –Redeemed (1) (1)
Net Increase/(decrease) 1 (1)
Premier Class US$ AccumulatingSold 11 52Redeemed (40) (20)
Net (Decrease)/increase (29) 32
Premier Class US$ Distributing (A)Redeemed (2) (1)
Net Decrease (2) (1)
Premier Class Euro AccumulatingSold 100 –Redeemed (111) –
Net Decrease (11) –
LM Class US$ AccumulatingSold 27 63Redeemed (12) (8)
Net Increase 15 55
LM Class Euro AccumulatingSold 1 4Redeemed (6) (3)
Net (Decrease)/increase (5) 1
Class A (G) US$ AccumulatingSold – 1Redeemed (2) (5)
Net Decrease (2) (4)
Class L (G) US$ AccumulatingRedeemed (5) (1)
Net Decrease (5) (1)
Class GA US$ AccumulatingSold – 6Redeemed (1) (7)
Net Decrease (1) (1)
Class GA Euro AccumulatingSold – 1Redeemed – (1)
Net Increase – –
Class GE US$ AccumulatingRedeemed (1) –
Net Decrease (1) –
Legg Mason ClearBridge US Large Cap Growth FundClass A US$ AccumulatingSold 273 420Redeemed (351) (548)
Net Decrease (78) (128)
Class A US$ Distributing (A)Sold 26 33Redeemed (41) (58)
Net Decrease (15) (25)
Class A Euro Accumulating (Hedged)Sold 27 19Redeemed (31) (41)
Net Decrease (4) (22)
Class A Euro AccumulatingSold 82 98Redeemed (115) (105)
Net Decrease (33) (7)
Class B US$ AccumulatingRedeemed – (1)
Net Decrease – (1)
Class C US$ AccumulatingSold 34 28Redeemed (31) (28)
Net Increase 3 –
For the year ended
28 February 2021Shares(000’s)
29 February 2020Shares(000’s)
Class C US$ Distributing (A)Sold 4 14Redeemed (13) (119)
Net Decrease (9) (105)
Class E US$ AccumulatingSold 38 69Redeemed (88) (55)
Net (Decrease)/increase (50) 14
Class E US$ Distributing (A)Sold – 11Redeemed (4) (16)
Net Decrease (4) (5)
Class F US$ AccumulatingSold 330 374Redeemed (408) (251)
Net (Decrease)/increase (78) 123
Class F US$ Distributing (A)Sold 23 38Redeemed (53) (33)
Net (Decrease)/increase (30) 5
Class U US$ AccumulatingSold 481 737Redeemed (646) (1,772)
Net Decrease (165) (1,035)
Class U Euro AccumulatingSold 522 365Redeemed (1,050) (218)
Net (Decrease)/increase (528) 147
Class X US$ AccumulatingSold 47 89Redeemed (184) (133)
Net Decrease (137) (44)
Class X Euro Accumulating (Hedged)Sold 48 132Redeemed (58) (69)
Net (Decrease)/increase (10) 63
Class X Euro AccumulatingSold 4 24Redeemed (21) (12)
Net (Decrease)/increase (17) 12
Class X Euro Distributing (A) (Hedged)Redeemed – (10)
Net Decrease – (10)
Class X GBP AccumulatingSold 40 64Redeemed (64) (8)
Net (Decrease)/increase (24) 56
Premier Class US$ AccumulatingSold 649 998Redeemed (805) (1,092)
Net Decrease (156) (94)
Premier Class US$ Distributing (A)Sold 17 50Redeemed (17) –
Net Increase – 50
Premier Class BRL Accumulating (Hedged)Sold 1,124 129Redeemed – (6)
Net Increase 1,124 123
Premier Class Euro Accumulating (Hedged)Sold 120 370Redeemed (283) (254)
Net (Decrease)/increase (163) 116
Premier Class Euro AccumulatingSold 351 330Redeemed (43) (16)
Net Increase 308 314
Premier Class Euro Distributing (A)Sold 14 15Redeemed (6) –
Net Increase 8 15
Premier Class GBP AccumulatingSold 95 203Redeemed (74) (10)
Net Increase 21 193
The accompanying notes are an integral part of the financial statements
286

Legg Mason Global Funds Plc Annual Report 28 February 2021
Statement of Changes in Net Assets Attributable to Holders of RedeemableParticipating Shares – (continued)
For the year ended
28 February 2021Shares(000’s)
29 February 2020Shares(000’s)
Legg Mason ClearBridge US Large Cap Growth Fund – (continued)LM Class US$ AccumulatingSold 75 92Redeemed (130) (258)
Net Decrease (55) (166)
LM Class Euro AccumulatingSold – 1Redeemed (1) (1)
Net Decrease (1) –
Class A (G) US$ AccumulatingRedeemed (2) (3)
Net Decrease (2) (3)
Class L (G) US$ AccumulatingRedeemed (1) (1)
Net Decrease (1) (1)
Class GA US$ AccumulatingRedeemed (1) (1)
Net Decrease (1) (1)
Class GA Euro AccumulatingRedeemed (1) –
Net Decrease (1) –
Legg Mason ClearBridge US Aggressive Growth FundClass A US$ AccumulatingSold 62 110Redeemed (223) (491)
Net Decrease (161) (381)
Class A US$ Distributing (A)Sold 6 13Redeemed (38) (99)
Net Decrease (32) (86)
Class A AUD Accumulating (Hedged)Sold 67 55Redeemed (82) (76)
Net Decrease (15) (21)
Class A CHF Accumulating (Hedged)Sold – 2Redeemed (2) (2)
Net Decrease (2) –
Class A CNH Accumulating (Hedged)Sold 74 8Redeemed (75) (23)
Net Decrease (1) (15)
Class A Euro Accumulating (Hedged)Sold 43 131Redeemed (243) (43)
Net (Decrease)/increase (200) 88
Class A Euro AccumulatingSold 2 5Redeemed (24) (26)
Net Decrease (22) (21)
Class A Euro Distributing (A) (Hedged)Sold – 1Redeemed – (4)
Net Decrease – (3)
Class A GBP AccumulatingSold – 1Redeemed (1) (2)
Net Decrease (1) (1)
Class A HKD AccumulatingSold 24 357Redeemed (149) (342)
Net (Decrease)/increase (125) 15
Class A SEK Accumulating (Hedged)Redeemed (1) (1)
Net Decrease (1) (1)
Class A SGD Accumulating (Hedged)Sold 869 175Redeemed (564) (607)
Net Increase/(decrease) 305 (432)
Class B US$ AccumulatingRedeemed (2) (4)
Net Decrease (2) (4)
For the year ended
28 February 2021Shares(000’s)
29 February 2020Shares(000’s)
Class B US$ Distributing (A)Sold – 2Redeemed (3) (4)
Net Decrease (3) (2)
Class C US$ AccumulatingSold 3 2Redeemed (14) (23)
Net Decrease (11) (21)
Class C US$ Distributing (A)Sold 2 12Redeemed (29) (92)
Net Decrease (27) (80)
Class E US$ AccumulatingSold 1 4Redeemed (26) (24)
Net Decrease (25) (20)
Class E US$ Distributing (A)Sold – 2Redeemed (1) (7)
Net Decrease (1) (5)
Class E Euro Accumulating (Hedged)Sold – 1Redeemed (1) (1)
Net Decrease (1) –
Class F US$ AccumulatingSold 9 14Redeemed (20) (45)
Net Decrease (11) (31)
Class F US$ Distributing (A)Sold 1 2Redeemed (1) (6)
Net Decrease – (4)
Class X US$ AccumulatingSold 11 64Redeemed (55) (208)
Net Decrease (44) (144)
Class X US$ Distributing (A)Sold – 2Redeemed (5) (59)
Net Decrease (5) (57)
Class X Euro Accumulating (Hedged)Sold – 3Redeemed (20) (16)
Net Decrease (20) (13)
Class X Euro AccumulatingSold – 4Redeemed – (9)
Net Decrease – (5)
Class X GBP AccumulatingSold 31 29Redeemed (67) (164)
Net Decrease (36) (135)
Premier Class US$ AccumulatingSold 89 509Redeemed (808) (719)
Net Decrease (719) (210)
Premier Class US$ Distributing (A)Redeemed – (1)
Net Decrease – (1)
Premier Class Euro Accumulating (Hedged)Redeemed (3) (3)
Net Decrease (3) (3)
Premier Class Euro AccumulatingSold 3 4Redeemed (3) (56)
Net Decrease – (52)
Premier Class GBP Accumulating (Hedged)Sold 1 23Redeemed (73) (45)
Net Decrease (72) (22)
Premier Class GBP AccumulatingSold – 17Redeemed (4) (451)
Net Decrease (4) (434)
The accompanying notes are an integral part of the financial statements
287

Legg Mason Global Funds Plc Annual Report 28 February 2021
Statement of Changes in Net Assets Attributable to Holders of RedeemableParticipating Shares – (continued)
For the year ended
28 February 2021Shares(000’s)
29 February 2020Shares(000’s)
Legg Mason ClearBridge US Aggressive Growth Fund – (continued)Premier Class GBP Distributing (A)Sold 5 84Redeemed (256) (917)
Net Decrease (251) (833)
Premier Class PLN Accumulating (Hedged)Sold 12 4Redeemed (7) (15)
Net Increase/(decrease) 5 (11)
LM Class US$ AccumulatingSold – 3Redeemed – (20)
Net Decrease – (17)
LM Class Euro AccumulatingSold – 1Redeemed (2) (1)
Net Decrease (2) –
Class A (G) US$ AccumulatingSold – 13Redeemed (11) (28)
Net Decrease (11) (15)
Class L (G) US$ AccumulatingSold – 2Redeemed (5) (6)
Net Decrease (5) (4)
Legg Mason ClearBridge Tactical Dividend Income FundClass A US$ AccumulatingSold 2 8Redeemed (6) (15)
Net Decrease (4) (7)
Class A US$ Distributing (A)Redeemed (2) (1)
Net Decrease (2) (1)
Class A US$ Distributing (M) Plus (e)Sold – 1Redeemed – (1)
Net Increase – –
Class A US$ Distributing (M) PlusSold 6 26Redeemed (22) (89)
Net Decrease (16) (63)
Class A US$ Distributing (Q)Sold 1 8Redeemed (2) –
Net (Decrease)/increase (1) 8
Class A AUD Distributing (M) (Hedged) PlusSold 3 21Redeemed (13) (56)
Net Decrease (10) (35)
Class A CNH Distributing (M) (Hedged) PlusRedeemed – (6)
Net Decrease – (6)
Class A Euro Accumulating (Hedged)Sold 10 2Redeemed (3) (1)
Net Increase 7 1
Class A Euro Distributing (M) (Hedged) Plus (e)Sold – 3Redeemed – (3)
Net Increase – –
Class A HKD Distributing (M) PlusSold 28 135Redeemed (105) (342)
Net Decrease (77) (207)
Class A SGD Distributing (M) (Hedged) PlusSold 846 322Redeemed (1,008) (802)
Net Decrease (162) (480)
Class C US$ AccumulatingSold – 1Redeemed (5) (2)
Net Decrease (5) (1)
Class C US$ Distributing (A)Redeemed (1) –
Net Decrease (1) –
For the year ended
28 February 2021Shares(000’s)
29 February 2020Shares(000’s)
Class C US$ Distributing (Q)Redeemed – (2)
Net Decrease – (2)
Class F US$ AccumulatingSold – 8Redeemed (15) (38)
Net Decrease (15) (30)
Class X US$ Distributing (M) Plus (e)Sold – 1Redeemed (1) –
Net (Decrease)/increase (1) 1
Legg Mason ClearBridge US Equity Sustainability Leaders Fund^Class A US$ AccumulatingSold 40 –
Net Increase 40 –
Class A US$ Distributing (A)Sold 8 1Redeemed (2) –
Net Increase 6 1
Class A Euro Accumulating (Hedged)Sold 46 –Redeemed (2) –
Net Increase 44 –
Class A SEK AccumulatingSold 5,422 –Redeemed (410) –
Net Increase 5,012 –
Class F US$ AccumulatingSold 18 –
Net Increase 18 –
Class X US$ AccumulatingSold 89 –Redeemed (17) –
Net Increase 72 –
Class X US$ Distributing (A)Sold 4 7Redeemed (10) –
Net (Decrease)/increase (6) 7
Class X Euro Accumulating (Hedged)Sold 31 –Redeemed (24) –
Net Increase 7 –
Class X GBP Accumulating (Hedged)Sold 34 7Redeemed (17) –
Net Increase 17 7
Class X GBP AccumulatingSold 84 28Redeemed (21) (8)
Net Increase 63 20
Premier Class US$ AccumulatingSold 485 –Redeemed (5) –
Net Increase 480 –
Premier Class US$ Distributing (A)Sold 20 3Redeemed (2) (3)
Net Increase 18 –
Premier Class Euro Accumulating (Hedged)Redeemed (2) –
Net Decrease (2) –
Premier Class GBP AccumulatingSold 7 1Redeemed (9) –
Net (Decrease)/increase (2) 1
S Class US$ AccumulatingSold 1,156 164Redeemed (154) (65)
Net Increase 1,002 99
S Class Euro Accumulating (Hedged)Sold 3 –
Net Increase 3 –
The accompanying notes are an integral part of the financial statements
288
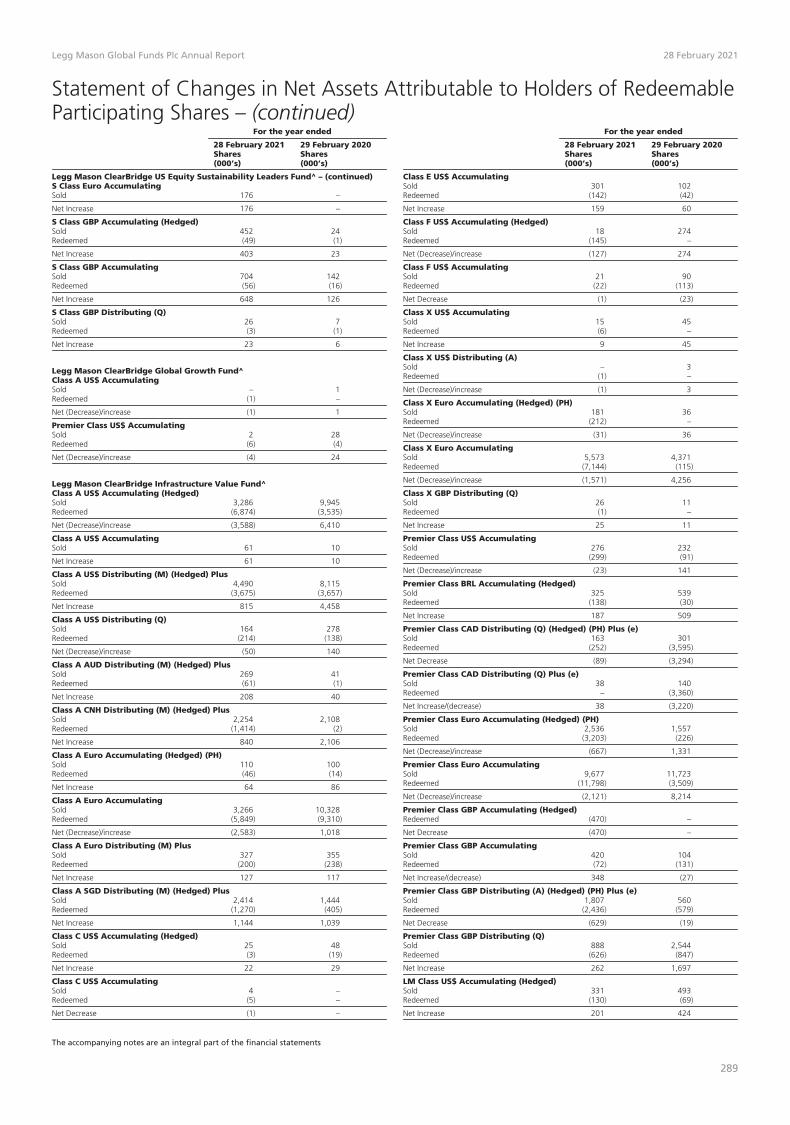
Legg Mason Global Funds Plc Annual Report 28 February 2021
Statement of Changes in Net Assets Attributable to Holders of RedeemableParticipating Shares – (continued)
For the year ended
28 February 2021Shares(000’s)
29 February 2020Shares(000’s)
Legg Mason ClearBridge US Equity Sustainability Leaders Fund^ – (continued)S Class Euro AccumulatingSold 176 –
Net Increase 176 –
S Class GBP Accumulating (Hedged)Sold 452 24Redeemed (49) (1)
Net Increase 403 23
S Class GBP AccumulatingSold 704 142Redeemed (56) (16)
Net Increase 648 126
S Class GBP Distributing (Q)Sold 26 7Redeemed (3) (1)
Net Increase 23 6
Legg Mason ClearBridge Global Growth Fund^Class A US$ AccumulatingSold – 1Redeemed (1) –
Net (Decrease)/increase (1) 1
Premier Class US$ AccumulatingSold 2 28Redeemed (6) (4)
Net (Decrease)/increase (4) 24
Legg Mason ClearBridge Infrastructure Value Fund^Class A US$ Accumulating (Hedged)Sold 3,286 9,945Redeemed (6,874) (3,535)
Net (Decrease)/increase (3,588) 6,410
Class A US$ AccumulatingSold 61 10
Net Increase 61 10
Class A US$ Distributing (M) (Hedged) PlusSold 4,490 8,115Redeemed (3,675) (3,657)
Net Increase 815 4,458
Class A US$ Distributing (Q)Sold 164 278Redeemed (214) (138)
Net (Decrease)/increase (50) 140
Class A AUD Distributing (M) (Hedged) PlusSold 269 41Redeemed (61) (1)
Net Increase 208 40
Class A CNH Distributing (M) (Hedged) PlusSold 2,254 2,108Redeemed (1,414) (2)
Net Increase 840 2,106
Class A Euro Accumulating (Hedged) (PH)Sold 110 100Redeemed (46) (14)
Net Increase 64 86
Class A Euro AccumulatingSold 3,266 10,328Redeemed (5,849) (9,310)
Net (Decrease)/increase (2,583) 1,018
Class A Euro Distributing (M) PlusSold 327 355Redeemed (200) (238)
Net Increase 127 117
Class A SGD Distributing (M) (Hedged) PlusSold 2,414 1,444Redeemed (1,270) (405)
Net Increase 1,144 1,039
Class C US$ Accumulating (Hedged)Sold 25 48Redeemed (3) (19)
Net Increase 22 29
Class C US$ AccumulatingSold 4 –Redeemed (5) –
Net Decrease (1) –
For the year ended
28 February 2021Shares(000’s)
29 February 2020Shares(000’s)
Class E US$ AccumulatingSold 301 102Redeemed (142) (42)
Net Increase 159 60
Class F US$ Accumulating (Hedged)Sold 18 274Redeemed (145) –
Net (Decrease)/increase (127) 274
Class F US$ AccumulatingSold 21 90Redeemed (22) (113)
Net Decrease (1) (23)
Class X US$ AccumulatingSold 15 45Redeemed (6) –
Net Increase 9 45
Class X US$ Distributing (A)Sold – 3Redeemed (1) –
Net (Decrease)/increase (1) 3
Class X Euro Accumulating (Hedged) (PH)Sold 181 36Redeemed (212) –
Net (Decrease)/increase (31) 36
Class X Euro AccumulatingSold 5,573 4,371Redeemed (7,144) (115)
Net (Decrease)/increase (1,571) 4,256
Class X GBP Distributing (Q)Sold 26 11Redeemed (1) –
Net Increase 25 11
Premier Class US$ AccumulatingSold 276 232Redeemed (299) (91)
Net (Decrease)/increase (23) 141
Premier Class BRL Accumulating (Hedged)Sold 325 539Redeemed (138) (30)
Net Increase 187 509
Premier Class CAD Distributing (Q) (Hedged) (PH) Plus (e)Sold 163 301Redeemed (252) (3,595)
Net Decrease (89) (3,294)
Premier Class CAD Distributing (Q) Plus (e)Sold 38 140Redeemed – (3,360)
Net Increase/(decrease) 38 (3,220)
Premier Class Euro Accumulating (Hedged) (PH)Sold 2,536 1,557Redeemed (3,203) (226)
Net (Decrease)/increase (667) 1,331
Premier Class Euro AccumulatingSold 9,677 11,723Redeemed (11,798) (3,509)
Net (Decrease)/increase (2,121) 8,214
Premier Class GBP Accumulating (Hedged)Redeemed (470) –
Net Decrease (470) –
Premier Class GBP AccumulatingSold 420 104Redeemed (72) (131)
Net Increase/(decrease) 348 (27)
Premier Class GBP Distributing (A) (Hedged) (PH) Plus (e)Sold 1,807 560Redeemed (2,436) (579)
Net Decrease (629) (19)
Premier Class GBP Distributing (Q)Sold 888 2,544Redeemed (626) (847)
Net Increase 262 1,697
LM Class US$ Accumulating (Hedged)Sold 331 493Redeemed (130) (69)
Net Increase 201 424
The accompanying notes are an integral part of the financial statements
289

Legg Mason Global Funds Plc Annual Report 28 February 2021
Statement of Changes in Net Assets Attributable to Holders of RedeemableParticipating Shares – (continued)
For the year ended
28 February 2021Shares(000’s)
29 February 2020Shares(000’s)
Legg Mason ClearBridge Emerging Markets Infrastructure Fund^Class A US$ AccumulatingSold 1 –
Net Increase 1 –
Legg Mason Royce US Small Cap Opportunity FundClass A US$ AccumulatingSold 696 214Redeemed (682) (621)
Net Increase/(decrease) 14 (407)
Class A US$ Distributing (A)Sold 83 6Redeemed (53) (30)
Net Increase/(decrease) 30 (24)
Class A AUD Accumulating (Hedged)Sold 130 51Redeemed (111) (75)
Net Increase/(decrease) 19 (24)
Class A CNH Accumulating (Hedged)Sold 713 35Redeemed (626) (46)
Net Increase/(decrease) 87 (11)
Class A Euro Accumulating (Hedged)Sold 98 10Redeemed (36) (50)
Net Increase/(decrease) 62 (40)
Class A Euro AccumulatingSold 57 32Redeemed (31) (61)
Net Increase/(decrease) 26 (29)
Class A Euro Distributing (A) (Hedged)Sold 5 –Redeemed (6) –
Net Decrease (1) –
Class A GBP Accumulating (Hedged)Sold 1 3Redeemed (4) (6)
Net Decrease (3) (3)
Class A GBP Distributing (A)Sold – 1Redeemed (1) –
Net (Decrease)/increase (1) 1
Class A SEK Accumulating (Hedged)Sold 46 3Redeemed (22) (6)
Net Increase/(decrease) 24 (3)
Class A SGD Accumulating (Hedged)Sold 21,259 1,202Redeemed (6,339) (1,750)
Net Increase/(decrease) 14,920 (548)
Class A SGD AccumulatingSold 8,186 455Redeemed (3,040) (786)
Net Increase/(decrease) 5,146 (331)
Class C US$ AccumulatingSold 7 1Redeemed (3) (15)
Net Increase/(decrease) 4 (14)
Class C US$ Distributing (A)Sold – 1Redeemed (3) (4)
Net Decrease (3) (3)
Class E US$ AccumulatingSold 30 5Redeemed (3) (11)
Net Increase/(decrease) 27 (6)
Class E US$ Distributing (A)Redeemed – (1)
Net Decrease – (1)
Class E Euro Accumulating (Hedged)Sold 3 –Redeemed (1) (1)
Net Increase/(decrease) 2 (1)
For the year ended
28 February 2021Shares(000’s)
29 February 2020Shares(000’s)
Class E Euro AccumulatingSold 1 1Redeemed (2) (1)
Net Decrease (1) –
Class F US$ AccumulatingSold 41 3Redeemed (12) (21)
Net Increase/(decrease) 29 (18)
Class F US$ Distributing (A)Sold 2 –Redeemed – (3)
Net Increase/(decrease) 2 (3)
Class R Euro AccumulatingSold 1 –
Net Increase 1 –
Class X US$ AccumulatingSold 265 35Redeemed (56) (105)
Net Increase/(decrease) 209 (70)
Class X US$ Distributing (A)Sold – 1Redeemed (9) (5)
Net Decrease (9) (4)
Class X Euro Accumulating (Hedged)Sold 203 58Redeemed (130) (125)
Net Increase/(decrease) 73 (67)
Class X Euro AccumulatingSold 154 8Redeemed (38) (9)
Net Increase/(decrease) 116 (1)
Class X GBP AccumulatingSold 59 19Redeemed (53) (63)
Net Increase/(decrease) 6 (44)
Class X GBP Distributing (A)Sold 7 4Redeemed (2) (8)
Net Increase/(decrease) 5 (4)
Premier Class US$ AccumulatingSold 720 211Redeemed (237) (882)
Net Increase/(decrease) 483 (671)
Premier Class BRL Accumulating (Hedged)Sold 82 7Redeemed (6) –
Net Increase 76 7
Premier Class Euro Accumulating (Hedged)Sold 117 47Redeemed (23) (104)
Net Increase/(decrease) 94 (57)
Premier Class Euro AccumulatingSold 29 14Redeemed (8) (20)
Net Increase/(decrease) 21 (6)
Premier Class GBP AccumulatingSold 356 108Redeemed (140) (417)
Net Increase/(decrease) 216 (309)
Premier Class PLN Accumulating (Hedged)Sold 107 8Redeemed (48) (42)
Net Increase/(decrease) 59 (34)
Legg Mason Royce US Smaller Companies FundClass A US$ AccumulatingSold 51 46Redeemed (65) (101)
Net Decrease (14) (55)
Class A US$ Distributing (A)Sold 2 8Redeemed (6) (14)
Net Decrease (4) (6)
The accompanying notes are an integral part of the financial statements
290

Legg Mason Global Funds Plc Annual Report 28 February 2021
Statement of Changes in Net Assets Attributable to Holders of RedeemableParticipating Shares – (continued)
For the year ended
28 February 2021Shares(000’s)
29 February 2020Shares(000’s)
Legg Mason Royce US Smaller Companies Fund – (continued)Class A Euro Accumulating (Hedged)Sold 7 –Redeemed (1) (1)
Net Increase/(decrease) 6 (1)
Class A Euro AccumulatingSold 7 3Redeemed (5) (6)
Net Increase/(decrease) 2 (3)
Class A SEK Accumulating (Hedged)Sold 3 1Redeemed (2) (2)
Net Increase/(decrease) 1 (1)
Class C US$ AccumulatingSold 2 –Redeemed (4) (6)
Net Decrease (2) (6)
Class C US$ Distributing (A)Sold – 1Redeemed (2) (5)
Net Decrease (2) (4)
Class E US$ AccumulatingSold – 1Redeemed (1) (6)
Net Decrease (1) (5)
Class E US$ Distributing (A)Sold – 1Redeemed (1) (1)
Net Decrease (1) –
Class F US$ AccumulatingSold 6 11Redeemed (5) (15)
Net Increase/(decrease) 1 (4)
Class F US$ Distributing (A)Sold 1 –
Net Increase 1 –
Class R US$ AccumulatingSold – 5Redeemed (3) (8)
Net Decrease (3) (3)
Class X US$ AccumulatingSold 3 2Redeemed (29) (13)
Net Decrease (26) (11)
Premier Class US$ AccumulatingSold 4 9Redeemed (2) (8)
Net Increase 2 1
Premier Class US$ Distributing (A)Sold 25 4Redeemed (9) (32)
Net Increase/(decrease) 16 (28)
Premier Class GBP Distributing (A)Sold – 8Redeemed (2) (11)
Net Decrease (2) (3)
LM Class Euro AccumulatingSold 1 2Redeemed (3) (1)
Net (Decrease)/increase (2) 1
Class A (G) US$ AccumulatingRedeemed (1) (1)
Net Decrease (1) (1)
Class L (G) US$ AccumulatingRedeemed (1) –
Net Decrease (1) –
Legg Mason QS MV European Equity Growth and Income FundClass A US$ Accumulating (Hedged)Sold – 3Redeemed (5) (10)
Net Decrease (5) (7)
Class A US$ AccumulatingSold – 1Redeemed (2) (6)
Net Decrease (2) (5)
For the year ended
28 February 2021Shares(000’s)
29 February 2020Shares(000’s)
Class A US$ Distributing (A)Sold – 1Redeemed (1) (4)
Net Decrease (1) (3)
Class A US$ Distributing (M) (Hedged) PlusSold 7 24Redeemed (43) (32)
Net Decrease (36) (8)
Class A AUD Distributing (M) (Hedged) PlusSold 8 5Redeemed (7) (42)
Net Increase/(decrease) 1 (37)
Class A CNH Distributing (M) (Hedged) PlusSold – 13Redeemed (13) (5)
Net (Decrease)/increase (13) 8
Class A Euro AccumulatingSold 1 1Redeemed (1) (2)
Net Decrease – (1)
Class A Euro Distributing (A)Sold – 1Redeemed (3) (14)
Net Decrease (3) (13)
Class A Euro Distributing (M) PlusRedeemed – (1)
Net Decrease – (1)
Class A SGD Distributing (M) (Hedged) PlusSold 220 1,749Redeemed (444) (1,883)
Net Decrease (224) (134)
Class B US$ AccumulatingRedeemed (1) (1)
Net Decrease (1) (1)
Class C US$ AccumulatingSold – 2Redeemed (7) (5)
Net Decrease (7) (3)
Class C US$ Distributing (A)Sold – 4Redeemed – (5)
Net Decrease – (1)
Class E US$ Accumulating (Hedged)Sold – 4Redeemed (4) (4)
Net Decrease (4) –
Class F US$ AccumulatingSold 1 9Redeemed (1) (6)
Net Increase – 3
Premier Class US$ AccumulatingSold 2 20Redeemed (7) –
Net (Decrease)/increase (5) 20
Premier Class Euro AccumulatingSold – 1Redeemed – (2)
Net Decrease – (1)
Premier Class PLN Accumulating (Hedged)Sold 4 8Redeemed (2) (4)
Net Increase 2 4
LM Class US$ AccumulatingSold 12 12Redeemed (2) (22)
Net Increase/(decrease) 10 (10)
LM Class Euro AccumulatingSold 3 5Redeemed (7) (2)
Net (Decrease)/increase (4) 3
Class A (G) US$ AccumulatingRedeemed – (1)
Net Decrease – (1)
Class GA US$ AccumulatingRedeemed – (1)
Net Decrease – (1)
The accompanying notes are an integral part of the financial statements
291

Legg Mason Global Funds Plc Annual Report 28 February 2021
Statement of Changes in Net Assets Attributable to Holders of RedeemableParticipating Shares – (continued)
For the year ended
28 February 2021Shares(000’s)
29 February 2020Shares(000’s)
Legg Mason QS MV European Equity Growth and Income Fund – (continued)Class GA Euro AccumulatingSold – 16Redeemed (6) (44)
Net Decrease (6) (28)
Legg Mason QS MV Asia Pacific Ex Japan Equity Growth and Income FundClass A US$ AccumulatingSold 1 43Redeemed (27) (42)
Net (Decrease)/increase (26) 1
Class A US$ Distributing (A)Sold 32 84Redeemed (37) (89)
Net Decrease (5) (5)
Class A US$ Distributing (M) PlusSold 10 61Redeemed (68) (96)
Net Decrease (58) (35)
Class A AUD Distributing (M) (Hedged) PlusSold 4 28Redeemed (33) (56)
Net Decrease (29) (28)
Class A CNH Distributing (M) (Hedged) PlusSold 6 10Redeemed (21) –
Net (Decrease)/increase (15) 10
Class A Euro AccumulatingSold – 1Redeemed (1) (3)
Net Decrease (1) (2)
Class A HKD Distributing (M) PlusSold 43 230Redeemed (142) (445)
Net Decrease (99) (215)
Class A SGD Distributing (M) (Hedged) PlusSold 111 34Redeemed (208) (45)
Net Decrease (97) (11)
Class C US$ AccumulatingRedeemed (1) –
Net Decrease (1) –
Class C US$ Distributing (A)Sold – 2Redeemed (1) (3)
Net Decrease (1) (1)
Class F US$ AccumulatingSold – 4Redeemed – (5)
Net Decrease – (1)
Class F US$ Distributing (A)Redeemed – (2)
Net Decrease – (2)
Class X Euro AccumulatingSold – 3Redeemed (43) –
Net (Decrease)/increase (43) 3
Premier Class PLN Accumulating (Hedged)Sold 15 –Redeemed (9) (12)
Net Increase/(decrease) 6 (12)
S Class US$ AccumulatingRedeemed – (23)
Net Decrease – (23)
Class GA US$ AccumulatingSold – 5Redeemed (7) (10)
Net Decrease (7) (5)
LM Class SGD Accumulating (Hedged)Redeemed (27,864) (88)
Net Decrease (27,864) (88)
Legg Mason QS Emerging Markets Equity FundClass A US$ AccumulatingRedeemed – (2)
Net Decrease – (2)
For the year ended
28 February 2021Shares(000’s)
29 February 2020Shares(000’s)
Class B US$ AccumulatingSold – 2Redeemed (1) (1)
Net (Decrease)/increase (1) 1
Class C US$ AccumulatingRedeemed (1) –
Net Decrease (1) –
Class E US$ AccumulatingRedeemed – (1)
Net Decrease – (1)
Premier Class Euro AccumulatingSold 1 –
Net Increase 1 –
Legg Mason QS MV Global Equity Growth and Income FundClass A US$ AccumulatingSold – 2Redeemed (1) (2)
Net Decrease (1) –
Class A US$ Distributing (M) PlusSold – 5Redeemed (5) (7)
Net Decrease (5) (2)
Class A AUD Distributing (M) (Hedged) PlusSold 2 2Redeemed (7) (2)
Net Decrease (5) –
Class A HKD Distributing (M) PlusSold 1 79Redeemed (3) (28)
Net (Decrease)/increase (2) 51
Class A SGD Distributing (M) (Hedged) PlusSold 113 8Redeemed (88) (30)
Net Increase/(decrease) 25 (22)
Premier Class US$ AccumulatingSold 1 19Redeemed (1) –
Net Increase – 19
Class GA US$ AccumulatingSold – 3Redeemed (2) (3)
Net Decrease (2) –
Class GA Euro AccumulatingSold – 1Redeemed (1) (7)
Net Decrease (1) (6)
Class GA Euro Distributing (A)Redeemed (1) –
Net Decrease (1) –
Class GE Euro AccumulatingSold – 1Redeemed – (1)
Net Increase – –
Legg Mason Martin Currie Asia Long-Term Unconstrained Fund^Class M GBP Distributing (A)Sold 92 62Redeemed (3,125) (206)
Net Decrease (3,033) (144)
Class M US$ Distributing (A)Sold – 30Redeemed (2) (2,807)
Net Decrease (2) (2,777)
Class M Euro Distributing (A)Sold 25 44Redeemed (1,597) (1,055)
Net Decrease (1,572) (1,011)
Premier Class US$ AccumulatingSold 74 –
Net Increase 74 –
Premier Class GBP AccumulatingSold 19 160Redeemed (174) (323)
Net Decrease (155) (163)
The accompanying notes are an integral part of the financial statements
292

Legg Mason Global Funds Plc Annual Report 28 February 2021
Statement of Changes in Net Assets Attributable to Holders of RedeemableParticipating Shares – (continued)
For the year ended
28 February 2021Shares(000’s)
29 February 2020Shares(000’s)
Legg Mason Martin Currie Asia Pacific Fund^Class A US$ Distributing (A)Sold – 1Redeemed – (197)
Net Decrease – (196)
Class A Euro Distributing (A)Sold – 2Redeemed – (8)
Net Decrease – (6)
Legg Mason Martin Currie European Absolute Alpha Fund^Class A (PF) US$ Accumulating (Hedged)Sold – 1Redeemed – (1)
Net Increase – –
Class A (PF) US$ Distributing (A) (Hedged)Sold 205 47Redeemed (295) (307)
Net Decrease (90) (260)
Class A (PF) Euro AccumulatingSold 3 19Redeemed (30) (32)
Net Decrease (27) (13)
Class A (PF) Euro Distributing (A)Sold 1 310Redeemed (403) (900)
Net Decrease (402) (590)
Class A (PF) GBP Distributing (A) (Hedged)Redeemed (16) (7)
Net Decrease (16) (7)
Class J (PF) US$ Accumulating (Hedged)Redeemed (20) –
Net Decrease (20) –
Class J (PF) JPY Accumulating (Hedged)Sold – 15Redeemed (560) (263)
Net Decrease (560) (248)
Class M (PF) US$ Distributing (A) (Hedged)Sold 139 19Redeemed (130) (205)
Net Increase/(decrease) 9 (186)
Class M (PF) Euro AccumulatingSold 6 54Redeemed (290) (355)
Net Decrease (284) (301)
Class M (PF) Euro Distributing (A)Sold 673 1,311Redeemed (4,519) (3,311)
Net Decrease (3,846) (2,000)
Class M (PF) GBP Distributing (A) (Hedged)Sold 4 3Redeemed (53) (394)
Net Decrease (49) (391)
Class M (PF) NOK Distributing (A) (Hedged)Redeemed – (7)
Net Decrease – (7)
Class M (PF) SEK Distributing (A) (Hedged)Sold 5 –Redeemed (100) (113)
Net Decrease (95) (113)
Premier (PF) Class US$ Accumulating (Hedged)Sold 18 160Redeemed (101) (44)
Net (Decrease)/increase (83) 116
Premier (PF) Class BRL Accumulating (Hedged)Sold 28 28
Net Increase 28 28
Legg Mason Martin Currie Greater China Fund^Class A US$ Distributing (A)Sold — 3Redeemed — (506)
Net Decrease — (503)
For the year ended
28 February 2021Shares(000’s)
29 February 2020Shares(000’s)
Class A Euro Distributing (A)Sold — 1Redeemed — (21)
Net Decrease — (20)
Class X US$ Distributing (A)Redeemed — (2)
Net Decrease — (2)
Legg Mason Martin Currie Japan Absolute Alpha Fund^Class A (PF) Euro Distributing (A) (Hedged)Redeemed — (36)
Net Decrease — (36)
Class A (PF) GBP Distributing (A) (Hedged)Redeemed — (6)
Net Decrease — (6)
Class M (PF) US$ Distributing (A) (Hedged)Sold — 252Redeemed — (476)
Net Decrease — (224)
Class M (PF) Euro Distributing (A) (Hedged)Redeemed — (3,160)
Net Decrease — (3,160)
Class M (PF) GBP Distributing (A) (Hedged)Sold — 1Redeemed — (72)
Net Decrease — (71)
Legg Mason Martin Currie Global Long-Term Unconstrained Fund^Class A US$ AccumulatingSold 6 6Redeemed – (4)
Net Increase 6 2
Class A Euro AccumulatingSold 32 8Redeemed (28) (2)
Net Increase 4 6
Class E US$ AccumulatingSold 14 1Redeemed – (1)
Net Increase 14 –
Class X GBP Accumulating (Hedged)Sold 3 1Redeemed (1) –
Net Increase 2 1
Class X GBP AccumulatingSold 4 2Redeemed (2) (1)
Net Increase 2 1
Premier Class US$ AccumulatingSold 98 36Redeemed (65) –
Net Increase 33 36
Premier Class GBP Accumulating (Hedged)Sold 3 2Redeemed (1) –
Net Increase 2 2
S Class US$ AccumulatingSold 312 –Redeemed (16) –
Net Increase 296 –
S Class GBP AccumulatingSold 44 6Redeemed – (3)
Net Increase 44 3
Legg Mason Martin Currie Asia Pacific Ex Japan Real Income FundClass A US$ Distributing (M) Plus (e)Sold 55 1
Net Increase 55 1
Class A SGD Distributing (M) PlusSold 78 78Redeemed (86) (24)
Net (Decrease)/increase (8) 54
The accompanying notes are an integral part of the financial statements
293

Legg Mason Global Funds Plc Annual Report 28 February 2021
Statement of Changes in Net Assets Attributable to Holders of RedeemableParticipating Shares – (continued)
For the year ended
28 February 2021Shares(000’s)
29 February 2020Shares(000’s)
Legg Mason Martin Currie Asia Pacific Ex Japan Real Income Fund – (continued)Class D AUD Distributing (M) (Hedged) PlusSold 8 –Redeemed (3) –
Net Increase 5 –
Class D SGD Distributing (M) (Hedged) PlusSold 1,411 –Redeemed (181) –
Net Increase 1,230 –
Class D US$ Distributing (M) PlusSold 7 –Redeemed (2) –
Net Increase 5 –
Class D US$ AccumulatingSold 50 –
Net Increase 50 –
Class X AUD AccumulatingSold 2 –
Net Increase 2 –
Class X US$ AccumulatingSold 43 1Redeemed (2) –
Net Increase 41 1
LM Class AUD AccumulatingSold – 30Redeemed – (11)
Net Increase – 19
Legg Mason Martin Currie Global Emerging Markets Fund^Class A US$ AccumulatingSold 26 7Redeemed (6) (2)
Net Increase 20 5
Class E US$ AccumulatingSold 3 –
Net Increase 3 –
Class F US$ AccumulatingSold 21 –Redeemed (6) –
Net Increase 15 –
Premier Class US$ AccumulatingSold 28 20Redeemed (2) (1)
Net Increase 26 19
S Class US$ AccumulatingSold 7 2Redeemed (3) (6)
Net Increase/(decrease) 4 (4)
S Class Euro AccumulatingRedeemed (65) –
Net Decrease (65) –
Legg Mason Martin Currie Global Dividend Opportunities Fund^Class A US$ Distributing (M) Plus (e)Redeemed — (15)
Net Decrease — (15)
Class X US$ Distributing (M) Plus (e)Redeemed — (15)
Net Decrease — (15)
S Class GBP Distributing (M) Plus (e)Redeemed — (2)
Net Decrease — (2)
Legg Mason Martin Currie European Unconstrained Fund^Class A Euro AccumulatingSold 1 1
Net Increase 1 1
Class X Euro AccumulatingSold – 1Redeemed (1) –
Net (Decrease)/increase (1) 1
Premier Class Euro AccumulatingSold 100 –
Net Increase 100 –
For the year ended
28 February 2021Shares(000’s)
29 February 2020Shares(000’s)
S Class US$ AccumulatingSold 1,077 –
Net Increase 1,077 –
S Class Euro AccumulatingSold 9 28Redeemed (6) –
Net Increase 3 28
Amounts designated as “–” are either 0 or less than 1,000.
Only classes with transactions during the financial year are shown.
� Effective 11 January 2021, Western Asset UCITS SMASh Series Core Plus Completion Fund^commenced trading.
� Effective 25 February 2021, Legg Mason Brandywine Global Sovereign Credit Fund^ ceasedtrading.
^ Not authorised for sale to the public in Hong Kong.
The accompanying notes are an integral part of the financial statements.
294

Legg Mason Global Funds Plc Annual Report 28 February 2021
Notes to Financial Statements1. General
Legg Mason Global Funds plc (the ‘‘Company’’) is an open-ended investment company with variable capital incorporated under the laws of Ireland as a public limited company pursuant to theCompanies Act 2014, the European Communities (Undertakings for Collective Investment in Transferable Securities) Regulations 2011 (as amended) (the “UCITS Regulations”) and the Central BankUCITS Regulations. It was incorporated on 13 January 1998 with registration number 278601.
Its objective, as set out in its constitutional documents is the collective investment in transferable securities and other liquid financial assets of capital raised from the public and which operate on theprinciple of risk spreading. The Company is organised in the form of an umbrella fund. The constitutional documents of the Company provide that the Company may offer separate classes of shares,each representing interests in a sub-fund (the “Fund” or the “Funds” collectively) comprising a distinct portfolio of investments. A separate portfolio of assets shall not be maintained for a class. TheFunds established by the Company are included in the General Information section of this report. Investment objectives and investment policies for all active Funds are listed in the Directors’ Report.
2. Significant Accounting Policies
The significant accounting policies and estimation techniques adopted by the Company in the preparation of these financial statements are set out below.
Statement of Compliance
The financial statements for the financial year ended 28 February 2021 have been prepared in accordance with the accounting standards generally accepted in Ireland, including Financial ReportingStandard (“FRS”) 102: “The Financial Reporting Standard applicable in the United Kingdom and the Republic of Ireland” (“FRS 102”) and Irish statute comprising the Companies Act 2014, the UCITSRegulations and the Central Bank UCITS Regulations. These policies are consistent with the policies applied in the financial statements for the financial year ended 29 February 2020.
Basis of Preparation
The financial statements have been prepared on a going concern basis for the Company under the historical cost convention as modified by the revaluation of financial assets and liabilities held at fairvalue through the profit or loss. The financial statements of Legg Mason Western Asset US Short-Term Government Fund^, Legg Mason Western Asset US Adjustable Rate Fund^, Legg Mason WesternAsset Global Credit Absolute Return Fund^, Legg Mason Western Asset EM Local Currency Debt Fund^, Legg Mason Western Asset Global Total Return Investment Grade Bond Fund^, Legg MasonBrandywine Global Sovereign Credit Fund^, Legg Mason Brandywine Global – US High Yield Fund^, Legg Mason ClearBridge Growth Fund^, Legg Mason ClearBridge Global Equity Fund^, Legg MasonClearBridge Global Equity Income Fund^, Legg Mason PCM US Equity Fund^, Legg Mason Batterymarch International Large Cap Fund^, Legg Mason QS Emerging Markets Equity Fund, Legg MasonCongruix Japan Equity Fund^, Legg Mason Martin Currie Asia Pacific Fund^, Legg Mason Martin Currie European Absolute Alpha Fund^, Legg Mason Martin Currie Global Resources Fund^, LeggMason Martin Currie Greater China Fund^, Legg Mason Martin Currie Japan Absolute Alpha Fund^, Legg Mason Martin Currie North American Fund^ and Legg Mason Martin Currie Global DividendOpportunities Fund^ have been prepared on a non-going concern basis as these Funds were closed during the current and previous financial years or subsequent to the Statement of Financial Positiondate.
The format and certain wordings of the financial statements have been adapted from those contained in the Companies Act 2014 so that, in the opinion of the Directors, they more appropriately reflectthe nature of the Company’s business as an investment fund.
The Company has availed of the exemption available to open-ended investment funds under Section 7 “Statement of Cash Flows” of FRS 102 not to prepare a cash flow statement on the basis thatsubstantially all of the Company’s investments are highly liquid and carried at fair value, and the Company provides a statement of changes in net assets attributable to holders of redeemable participatingshares.
(a) Investments at Fair Value
The Company classified all financial instruments, including its investments in debt and equity securities, and related derivatives, as financial assets or financial liabilities at fair value through profit or loss.These financial assets and financial liabilities are classified as held for trading at fair value through profit or loss. Financial assets or financial liabilities held for trading are acquired or incurred principallyfor the purpose of selling or repurchasing in the short term. Derivatives are also categorised as held for trading, as the Company does not classify any derivatives as hedges in a hedging relationship.
Financial assets and financial liabilities at fair value through profit or loss are initially recognised at fair value. Transaction costs are expensed in the Statement of Comprehensive Income. Subsequent toinitial recognition, all financial assets and financial liabilities at fair value through profit or loss are measured at fair value. Gains and losses arising from changes in the fair value of the financial assets orfinancial liabilities at fair value through profit or loss category are presented in the Statement of Comprehensive Income in the financial year in which they arise.
The fair value of financial instruments traded in active markets (such as publicly traded derivatives and trading securities) is based on quoted market prices at the Statement of Financial Position date.The fair value of collective investment schemes is based on the traded net asset value of the relevant fund at the Statement of Financial Position date as provided by the fund’s administrator.
The Company may from time to time invest in financial instruments that are not traded in an active market (for example in over-the-counter derivatives). The fair value is determined by using valuationtechniques. The Company uses a variety of methods and makes assumptions that are based on market conditions existing at each Statement of Financial Position date. Valuation techniques used includethe use of comparable recent arm’s length transactions, discounted cash flow analysis and other valuation techniques commonly used by market participants. The values assigned to these instruments arebased upon the best available information and because of the uncertainty of the valuation, these values may differ significantly from the values that would have been realised had a ready market for theseinstruments existed and the differences could be material. Entering into these agreements involves, to varying degrees, elements of credit, legal, market and documentation risk in excess of amountsrecognised in the Statement of Comprehensive Income. Such risks involve the possibility that there will be no liquid market for these agreements, that the counterparties to the agreements may default ontheir obligations to perform or disagree as to the meaning of contractual terms in the agreements, or that there may be unfavourable changes in interest rates or the price of the index or securityunderlying these transactions. The prices used at the year end which have been sourced from a single broker source or based upon valuation techniques are the best estimate of fair value as at the yearend date. However, there is a degree of uncertainty in respect of these prices. It may not always be possible to close out the positions at the stated market value with the given counterparty.
(b) Recognition/Derecognition
Regular-way purchases and sales of investments are recognised on trade date plus one – the date on which the Company commits to purchase or sell the asset. Investments are initially recognised at fairvalue and transaction costs for all financial assets carried at fair value through profit or loss are expensed as incurred. Investments cease to be recognised when the rights to receive cash flows from theinvestments have expired or the Company has transferred substantially all risks and rewards of ownership.
(c) Single Broker Pricing
The prices used at the year end which have been sourced from a single broker source are the best estimate of fair value as at the year end date. However, there is a degree of uncertainty in respect ofthese prices. It may not always be possible to close out the positions at the stated mark with the given counterparty. Values of securities for each Fund which have been priced using single brokersources as at 28 February 2021 and 29 February 2020 are disclosed in Note 12.1 (d).
(d) Accounting for Investments
Security transactions are accounted for on trade date plus one. Investments are initially recognised at fair value and transaction costs for all ‘‘fair-valued-through profit or loss’’ securities are expensed asincurred. Gains or losses on the sale of securities are calculated by using the First-In-First-Out (‘‘FIFO’’) basis.
(e) Income from Investments
Interest income and expense are recognised in the Statement of Comprehensive Income for all debt instruments using the effective interest method. The Investment Managers monitor interest incomereceivable for any delinquent interest receivable amounts. The accounts have been reviewed for delinquent interest receivable and as at 28 February 2021 and 29 February 2020 all amounts weredeemed to be recoverable.
Dividends are reported in the Statement of Comprehensive Income on the dates on which the relevant securities are listed as ‘‘ex-dividend’’. Dividend income is shown gross of any non-recoverablewithholding taxes, which is disclosed separately in the Statement of Comprehensive Income.
(f) Offsetting Financial Instruments
Financial assets and financial liabilities are offset and the net amount reported in the Statement of Financial Position when there is a legally enforceable right to offset the recognised amounts and thereis an intention to settle on a net basis, or realise the asset and settle the liability simultaneously. There are no offsetting financial instruments as at 28 February 2021 and 29 February 2020.
(g) Critical Accounting Estimates and Assumptions
Management makes estimates and assumptions concerning the future. The resulting accounting estimates will, by definition, seldom equal the related actual results. The estimates and assumptions thathave a significant risk of causing a material adjustment to the carrying amounts of assets and liabilities within the next financial year are outlined below.
Fair Value of Derivative Financial Instruments
The Company may, from time to time, hold financial instruments that are not quoted in active markets, such as over-the-counter derivatives. Fair values of such instruments are determined by usingvaluation techniques as discussed in Note 2(a). Where valuation techniques (for example, models) are used to determine fair values, they are validated and periodically reviewed and compared to theprice provided by an independent pricing service provider, where available.
Models use observable data, to the extent practicable. However, areas such as credit risk (both own and counterparty), volatilities and correlations require management to make estimates. Changes inassumptions about these factors could affect the reported fair value of financial instruments.
^ Not authorised for sale to the public in Hong Kong.
295

Legg Mason Global Funds Plc Annual Report 28 February 2021
Notes to Financial Statements – (continued)2. Significant Accounting Policies – (continued)
(g) Critical Accounting Estimates and Assumptions – (continued)
The values assigned to these instruments are based upon the best available information and because of the uncertainty of the valuation, these values may differ significantly from the values that wouldhave been realised had a ready market for these instruments existed and the differences could be material. Entering into these agreements involves, to varying degrees, elements of credit, legal, marketand documentation risk in excess of the amounts recognised in the Statement of Comprehensive Income. Such risks involve the possibility that there will be no liquid market for these agreements, thatthe counterparties to the agreements may default on their obligations to perform or disagree as to the meaning of contractual terms in the agreements, or that there may be unfavourable changes ininterest rates or the price of the index or security underlying these transactions.
(h) Lending of Securities
Certain Funds may lend securities to brokers, dealers and other financial organisations to earn additional income. Each security loan is collateralised with collateral assets in an amount equal to or greater thanthe current market value of the loaned securities. There is a risk of delay in receiving collateral or in recovering the securities loaned or even a loss of rights in collateral should the borrower fail financially.
As at 28 February 2021 and 29 February 2020, no Funds were engaged in securities lending.
(i) Equalisation
An equalisation account is maintained so that the amount distributed is the same for all shares of the same type notwithstanding different dates of issue. Equalisation income and expense are recordedin the Statement of Comprehensive Income.
Equalisation Income
A sum equal to that part of the issued price of a share which reflects income (if any) accrued but undistributed up to the date of issue will be deemed to be an equalisation payment and treated asrepaid by shareholders in the first dividend to which the shareholder was entitled in the same accounting period as that in which the shares are issued.
Equalisation Expense
A sum equal to that part of the issued price of a share which reflects expense (if any) accrued but undistributed up to the date of issue will be deemed to be an equalisation receipt and treated as repaidto shareholders to the first dividend to which the shareholder was entitled in the same accounting period as that in which the shares are issued.
(j) Expenses
Expenses are accounted for on an accruals basis. Certain expenses are share class specific expenses and are charged directly to the share class. General Fund expenses are allocated to the various shareclasses on the basis of relative net asset value.
(k) Transaction Costs
Transaction costs are incremental costs that are directly attributable to the acquisition, issue or disposal of a financial asset or financial liability. An incremental cost is one that would not have beenincurred if the entity had not acquired, issued or disposed of the financial instrument. When a financial asset or financial liability is recognised initially, an entity shall measure it at its fair value withtransaction costs for such instruments being recognised directly in the Statement of Comprehensive Income.
Transaction costs charged by the Depositary on the settlement of purchases and sales of investments are disclosed within administrator and depositary fees in the Statement of Comprehensive Incomefor each Fund.
Transaction costs on purchases and sales of equities, collective investment schemes, futures contracts and options are disclosed in Note 4 for each Fund.
Transaction costs on the purchase and sale of bonds and other derivative instruments are included in the purchase and sale price of the investment. These costs cannot be practically or reliably gatheredas they are embedded in the cost of the investment and cannot be separately verified or disclosed.
(l) Foreign Exchange Translation
(a) Functional and presentation currency: Items included in the Company’s financial statements are measured using the currency of the primary economic environment in which it operates(the ‘‘functional currency’’). This is US Dollars (United States Dollars) for all Funds except Legg Mason Western Asset Euro Core Plus Bond Fund, Legg Mason Western Asset Euro High YieldFund, Legg Mason ClearBridge Infrastructure Value Fund^, Legg Mason QS MV European Equity Growth and Income Fund, Legg Mason Martin Currie European Absolute Alpha Fund^and Legg Mason Martin Currie European Unconstrained Fund^ for which the functional currency is Euro, Legg Mason Western Asset UK Investment Grade Credit Fund^ for which thefunctional currency is Pound Sterling (British Pound), and Legg Mason Congruix Japan Equity Fund^ and Legg Mason Martin Currie Japan Absolute Alpha Fund^ for which the functionalcurrency is Japanese Yen. The Company has adopted the functional currency of each Fund as the presentation currency for these financial statements. The financial statements of theCompany are presented in US Dollars.
(b) Purchases and sales of securities, and income and expenses are translated at the rate of exchange quoted on the respective date that such transactions are recorded. Assets and liabilitiesare translated at the foreign exchange rate at the end of the financial year. Differences between income and expense amounts recorded and collected or paid are recorded as foreignexchange gains/losses in the Statement of Comprehensive Income under net gain/(loss) on financial assets and liabilities at fair value through profit or loss.
(m) Forward and Spot Foreign Currency Contracts
A forward foreign currency contract (‘‘forward contract’’) is a commitment to purchase or sell a foreign currency at a future date, at a negotiated rate. Forward contracts are used to seek to manage foreigncurrency risks and to tactically shift portfolio currency risk. Forward contracts are generally entered into as a hedge upon the purchase or sale of a security denominated in a foreign currency. The Fund willrealise a gain or loss upon the closing or settlement of the forward transaction. Unrealised appreciation or depreciation on forward contracts is reported in the Statement of Financial Position and Statementof Comprehensive Income. Realised gains and losses are reported with all other foreign currency gains and losses in the Statement of Comprehensive Income. Risks relating to forward contracts include thepotential inability of the counterparty to meet the terms of the contract and unanticipated movements in the value of a foreign currency relative to the base currency of the Fund. Forward contracts are fairvalued by an independent price source by reference to the price at which a new forward contract of the same size and maturity could be undertaken. For each relevant Fund, gains or losses on open spotforeign currency contracts are included in cash in the Statement of Financial Position.
(n) Futures Contracts
Initial margin deposits are made upon entering into futures contracts and are generally made in cash. Futures contracts are fair valued based upon their quoted daily settlement prices. Changes in thevalue of open futures contracts are recognised as unrealised gains or losses on futures contracts until the contracts are terminated, at which time realised gains and losses are recognised as a realisedgain or loss and included in net gain/(loss) on financial assets and liabilities at fair value through profit and loss in the Statement of Comprehensive Income. Unrealised appreciation or depreciation onfutures contracts are shown in the Statement of Financial Position. Realised gains and losses not yet delivered are shown within margin accounts and restricted cash in the Statement of FinancialPosition.
(o) Option Contracts
The premium on purchased put options exercised is subtracted from the proceeds of the sale of the underlying security or foreign currency in determining the realised gain or loss. The premium onpurchased call options exercised is added to the cost of the securities or foreign currency purchased. Premiums paid from the purchase of options, which expire unexercised, are treated as realisedlosses. The unrealised gain or loss on open option positions is calculated and recorded as the fair value of the option less the premium paid on that option. Unrealised gains or losses on open optionpositions are reflected as assets or liabilities in the Statement of Financial Position.
The premium on written call options exercised is added to the proceeds from the sale of the underlying security or foreign currency in determining the realised gain or loss. The premium on written putoptions exercised is subtracted from the cost of the securities or foreign currencies purchased. Premiums received from written options, which expire unexercised, are treated as realised gains.
(p) Swap Instruments
Swap Instruments are recognised at fair value on the date on which the derivative contract is entered into and are subsequently remeasured at their fair value. Fair values are obtained from quotedmarket prices in active markets, including recent market transactions, and valuation techniques, including discounted cash flow models and options pricing models, as appropriate. All derivatives arecarried as assets when fair value is positive and as liabilities when fair value is negative. Movement in the fair value of the swap instruments and interest paid and earned from the swap instruments arerecognised in the Statement of Comprehensive Income under net gain/(loss) on financial assets and liabilities at fair value through profit or loss.
Credit Default Swaps
Each Fixed Income Fund (Fixed Income Fund as defined on page 15), except Legg Mason Western Asset US Government Liquidity Fund may enter into credit default swap agreements, provided that (i)the credit default swap agreement must be subject to daily valuation by the Funds and independently verified at least weekly, and (ii) the risks attached to the credit default swap must be independentlyassessed on a half-yearly basis and the report must be submitted to the Directors for review. A Fund may be either the buyer or seller in a credit default swap transaction. The ‘‘buyer’’ in a credit defaultcontract is obligated to pay the counterparty a periodic stream of payments over the term of the contract provided that no event of default on an underlying reference obligation has occurred. If a Fund
^ Not authorised for sale to the public in Hong Kong.
296

Legg Mason Global Funds Plc Annual Report 28 February 2021
Notes to Financial Statements – (continued)2. Significant Accounting Policies – (continued)
(p) Swap Instruments – (continued)
is a buyer and no event of default occurs, the Fund will lose its investment and recover nothing. On the other hand, if the Fund is a buyer and an event of default does occur, the Fund (the buyer) willreceive the full notional value of the reference obligation that may have little or no value. Conversely, if the Fund is a seller and an event of default occurs, the Fund (the seller) must pay the counterpartythe full notional value, or ‘‘par value’’, of the reference obligation in exchange for the reference obligation. As a seller, a Fund receives a fixed rate of income throughout the term of the contract, whichtypically is between six months and three years, provided that there is no default event.
The Funds purchase credit default swap contracts in order to hedge against the risk of a fall in the capital price, or default, of debt securities they hold. The Funds sell credit default swap contracts inorder to get exposure to the rise in the capital price, and the risk of default is transferred from the purchaser of credit default contracts to the Fund as a seller of the credit default swap contract. Thisinvolves the risk that the swap may expire worthless and the credit risk that the seller may fail to satisfy its payment obligations to the Funds in the event of a default. The Funds may only enter into suchtransactions with counterparties rated A- or higher.
Interest Rate Swaps
An interest rate swap or cross currency interest rate swap involves the exchange by a Fund with another party of their respective commitments to pay or receive cash flows e.g., an exchange of floatingrate payments for fixed-rate payments in base or foreign currencies. The purchase of a cap entitles the purchaser, to the extent that a specified index exceeds a predetermined value, to receive paymentson a notional principal amount from the party selling the cap. The purchase of a floor entitles the purchaser, to the extent that a specified index falls below a predetermined value, to receive paymentson a notional principal amount from the party selling the floor. A collar combines elements of buying a cap and selling a floor. Spread locks are contracts that guarantee the ability to enter into aninterest rate swap at a predetermined rate above some benchmark rate.
Equity Swaps
Equity swaps are agreements between a Fund and third parties, which allow the Funds to acquire an exposure to the price movement of specific securities without actually purchasing the securities. Thechanges in contract values are recorded as unrealised gains or losses and the Funds recognise a realised gain or loss when the contract is closed.
Total Return Swaps
Certain of the Funds may invest in total return swaps to reduce their long-term exposure to market risk and credit risk. Total return swaps are contracts in which a Fund pays or receives a series of cashflows based upon the total return of a specified asset in return for paying or receiving, respectively, a fixed or floating rate of interest based upon that same specified asset. Total return swaps are fairvalued by an independent pricing vendor. If the price is not available they are fair valued by the Franklin Templeton Global Valuation Committee (the “Valuation Committee”). These positions arereconciled to the counterparty price on a monthly basis.
Cross Currency Swaps
Cross currency swaps involve the exchange of two different currencies with an agreement to reverse the exchange at a later date at specified exchange rates. The exchange of currencies at the inceptiondate of the contract takes place at the current spot rate. The re-exchange at maturity may take place at the same exchange rate, a specified rate, or the then current spot rate. Interest payments, ifapplicable, are made between the parties based on interest rates available in the two currencies at the inception of the contract.
Inflation Swaps
Inflation swaps involve an exchange of a fixed rate on a notional principal amount and a floating rate linked to an inflation index. The party paying the floating rate pays the inflation adjusted ratemultiplied by the notional principal amount.
(q) Contracts for Difference
A contract for difference is an arrangement between two parties to exchange the difference between the opening price and closing price of a contract. In a long contracts for difference contract, thecounterparty agrees to pay the Fund the amount, if any, by which the notional amount of the contract would have increased in value had it been invested in the underlying security or securities, plusany dividends that would have been received on those stocks. In a short contracts for difference contract, the counterparty agrees to pay the Fund the amount, if any, by which the notional amount ofthe contract would have decreased in value had it been invested in the underlying security or securities. The Fund must also pay the counterparty the value of any dividends that would have beenreceived on those stocks.
(r) Securities Traded on a ‘‘To-Be-Announced’’ Basis
The Funds may trade securities on a ‘‘to-be-announced’’ (‘‘TBA’’) basis. In a TBA transaction, a Fund commits to purchase or sell securities for which specific information is not yet known at the time ofthe trade. Securities purchased on a TBA basis are not settled until they are delivered to or from the relevant Fund, normally 15 to 45 days later. These transactions are subject to market fluctuations andtheir current value is determined in the same manner as for other securities.
(s) Short-Term Investments
Certificates of deposit, time deposits and other short-term investments maintained with financial institutions are fair valued at their face value with interest accrued, as applicable.
(t) Repurchase and Reverse Repurchase Agreements
Repurchase agreement means any agreement pursuant to which a Fund transfers securities, or any rights related to a title or security, to a counterparty subject to a commitment to repurchase them at aspecified price on a future date specified or to be specified. Reverse repurchase agreement means any agreement pursuant to which a Fund receives securities, or any rights related to a title or security, froma counterparty subject to a commitment to sell them back at a specific price on a future date specified or to be specified.
Securities purchased under agreements to resell are fair valued at their face value and adjusted for any movements in foreign exchange rates. Interest rates vary for each agreement and are set at the initiationof the agreement. It is the Company’s policy to take custody of securities purchased under reverse repurchase agreements and to value the securities on a daily basis to protect the Company in the event thesecurities are not repurchased by the counterparty. The Company will generally obtain additional collateral if the market value of the underlying securities is less than the face value of the reverse repurchaseagreement plus any accrued interest. In the event of default on the obligation to repurchase, the Company has the right to liquidate the collateral and apply the proceeds in satisfaction of the obligation. In theevent of default or bankruptcy by the counterparty to the agreement, realisation and/or retention of the collateral or proceeds may be subject to legal proceedings. Reverse repurchase agreements have beenused during the financial year for the purpose of efficient portfolio management.
(u) Exchange Traded Funds
The Funds may invest in exchange traded funds (‘‘ETFs’’). ETFs are securities that track an index, a commodity or a basket of assets like an index fund, but trade like a stock on an exchange. Thesesecurities are subject to market fluctuations and their current value is determined in the same manner as for other securities.
(v) Shares in Collective Investment Schemes
The fair value of investments in open-ended investment funds is based upon the unaudited net asset value per share as supplied by the respective funds’ administrator.
(w) Swaptions
Certain of the Funds may invest in swaptions for the purposes of hedging against adverse movements in interest rates. Such instruments combine the features of two other financial instruments namelyan option and an interest rate swap. The Funds record an unrealised gain/(loss) (fair value) for the amount expected to be received or paid under the agreement if such amount was terminated onvaluation. The fair value is provided on a daily basis by Markit as the vendor. The unrealised gain/(loss) are reflected as a financial asset or financial liability in the Statement of Financial Position.
(x) Treasury Inflationary Index Obligations (TIPS)
Certain of the Funds may invest in indexed securities. Indexed securities are securities whose prices are indexed to the prices of securities indices, currencies, or other financial statistics. Indexed securitiestypically are debt securities or deposits whose value at maturity and/or coupon rate is determined by reference to a specific instrument or statistic. The performance of indexed securities fluctuates(either directly or inversely, depending upon the instrument) with the performance of the index, security or currency. The securities are fair valued daily by the relevant vendor and the change in fairvalue is recorded by the Funds as an unrealised gain or loss.
(y) Loan Notes & Loan Participations
Loan notes & loan participations are fixed and floating rate loans arranged through private negotiations between a corporation or other type of entity and one or more financial institution. Suchinvestments are expected to be in the form of participations in, or assignment of, the loans, which may or may not be securitised. Loan notes & loan participations are classified by the Company asfinancial assets at fair value through profit or loss, and are initially recognised at fair value. Gains and losses arising from changes in the fair value of the financial assets are presented in the Statement ofComprehensive Income, in the financial year in which they arise.
297
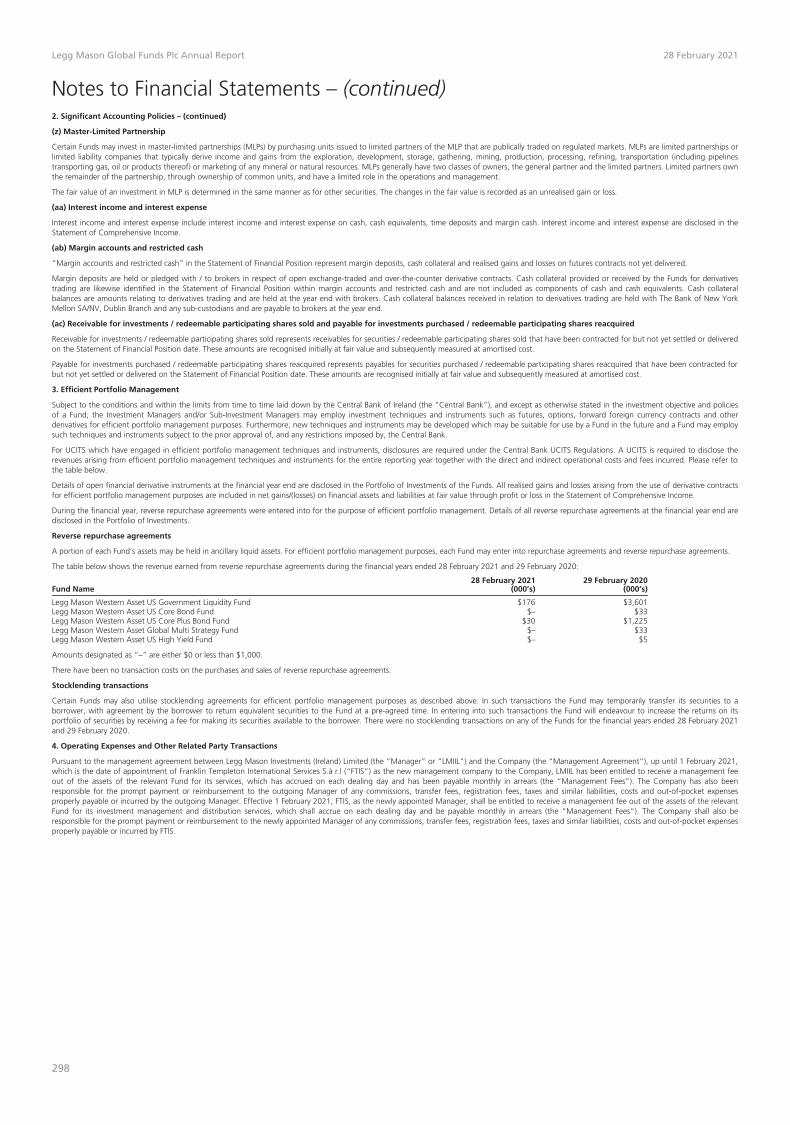
Legg Mason Global Funds Plc Annual Report 28 February 2021
Notes to Financial Statements – (continued)2. Significant Accounting Policies – (continued)
(z) Master-Limited Partnership
Certain Funds may invest in master-limited partnerships (MLPs) by purchasing units issued to limited partners of the MLP that are publically traded on regulated markets. MLPs are limited partnerships orlimited liability companies that typically derive income and gains from the exploration, development, storage, gathering, mining, production, processing, refining, transportation (including pipelinestransporting gas, oil or products thereof) or marketing of any mineral or natural resources. MLPs generally have two classes of owners, the general partner and the limited partners. Limited partners ownthe remainder of the partnership, through ownership of common units, and have a limited role in the operations and management.
The fair value of an investment in MLP is determined in the same manner as for other securities. The changes in the fair value is recorded as an unrealised gain or loss.
(aa) Interest income and interest expense
Interest income and interest expense include interest income and interest expense on cash, cash equivalents, time deposits and margin cash. Interest income and interest expense are disclosed in theStatement of Comprehensive Income.
(ab) Margin accounts and restricted cash
“Margin accounts and restricted cash” in the Statement of Financial Position represent margin deposits, cash collateral and realised gains and losses on futures contracts not yet delivered.
Margin deposits are held or pledged with / to brokers in respect of open exchange-traded and over-the-counter derivative contracts. Cash collateral provided or received by the Funds for derivativestrading are likewise identified in the Statement of Financial Position within margin accounts and restricted cash and are not included as components of cash and cash equivalents. Cash collateralbalances are amounts relating to derivatives trading and are held at the year end with brokers. Cash collateral balances received in relation to derivatives trading are held with The Bank of New YorkMellon SA/NV, Dublin Branch and any sub-custodians and are payable to brokers at the year end.
(ac) Receivable for investments / redeemable participating shares sold and payable for investments purchased / redeemable participating shares reacquired
Receivable for investments / redeemable participating shares sold represents receivables for securities / redeemable participating shares sold that have been contracted for but not yet settled or deliveredon the Statement of Financial Position date. These amounts are recognised initially at fair value and subsequently measured at amortised cost.
Payable for investments purchased / redeemable participating shares reacquired represents payables for securities purchased / redeemable participating shares reacquired that have been contracted forbut not yet settled or delivered on the Statement of Financial Position date. These amounts are recognised initially at fair value and subsequently measured at amortised cost.
3. Efficient Portfolio Management
Subject to the conditions and within the limits from time to time laid down by the Central Bank of Ireland (the “Central Bank”), and except as otherwise stated in the investment objective and policiesof a Fund, the Investment Managers and/or Sub-Investment Managers may employ investment techniques and instruments such as futures, options, forward foreign currency contracts and otherderivatives for efficient portfolio management purposes. Furthermore, new techniques and instruments may be developed which may be suitable for use by a Fund in the future and a Fund may employsuch techniques and instruments subject to the prior approval of, and any restrictions imposed by, the Central Bank.
For UCITS which have engaged in efficient portfolio management techniques and instruments, disclosures are required under the Central Bank UCITS Regulations. A UCITS is required to disclose therevenues arising from efficient portfolio management techniques and instruments for the entire reporting year together with the direct and indirect operational costs and fees incurred. Please refer tothe table below.
Details of open financial derivative instruments at the financial year end are disclosed in the Portfolio of Investments of the Funds. All realised gains and losses arising from the use of derivative contractsfor efficient portfolio management purposes are included in net gains/(losses) on financial assets and liabilities at fair value through profit or loss in the Statement of Comprehensive Income.
During the financial year, reverse repurchase agreements were entered into for the purpose of efficient portfolio management. Details of all reverse repurchase agreements at the financial year end aredisclosed in the Portfolio of Investments.
Reverse repurchase agreements
A portion of each Fund’s assets may be held in ancillary liquid assets. For efficient portfolio management purposes, each Fund may enter into repurchase agreements and reverse repurchase agreements.
The table below shows the revenue earned from reverse repurchase agreements during the financial years ended 28 February 2021 and 29 February 2020:
Fund Name28 February 2021
(000’s)29 February 2020
(000’s)
Legg Mason Western Asset US Government Liquidity Fund $176 $3,601Legg Mason Western Asset US Core Bond Fund $– $33Legg Mason Western Asset US Core Plus Bond Fund $30 $1,225Legg Mason Western Asset Global Multi Strategy Fund $– $33Legg Mason Western Asset US High Yield Fund $– $5
Amounts designated as “–” are either $0 or less than $1,000.
There have been no transaction costs on the purchases and sales of reverse repurchase agreements.
Stocklending transactions
Certain Funds may also utilise stocklending agreements for efficient portfolio management purposes as described above. In such transactions the Fund may temporarily transfer its securities to aborrower, with agreement by the borrower to return equivalent securities to the Fund at a pre-agreed time. In entering into such transactions the Fund will endeavour to increase the returns on itsportfolio of securities by receiving a fee for making its securities available to the borrower. There were no stocklending transactions on any of the Funds for the financial years ended 28 February 2021and 29 February 2020.
4. Operating Expenses and Other Related Party Transactions
Pursuant to the management agreement between Legg Mason Investments (Ireland) Limited (the “Manager” or “LMIIL”) and the Company (the “Management Agreement”), up until 1 February 2021,which is the date of appointment of Franklin Templeton International Services S.à r.l (“FTIS”) as the new management company to the Company, LMIIL has been entitled to receive a management feeout of the assets of the relevant Fund for its services, which has accrued on each dealing day and has been payable monthly in arrears (the “Management Fees”). The Company has also beenresponsible for the prompt payment or reimbursement to the outgoing Manager of any commissions, transfer fees, registration fees, taxes and similar liabilities, costs and out-of-pocket expensesproperly payable or incurred by the outgoing Manager. Effective 1 February 2021, FTIS, as the newly appointed Manager, shall be entitled to receive a management fee out of the assets of the relevantFund for its investment management and distribution services, which shall accrue on each dealing day and be payable monthly in arrears (the “Management Fees”). The Company shall also beresponsible for the prompt payment or reimbursement to the newly appointed Manager of any commissions, transfer fees, registration fees, taxes and similar liabilities, costs and out-of-pocket expensesproperly payable or incurred by FTIS.
298

Legg Mason Global Funds Plc Annual Report 28 February 2021
Notes to Financial Statements – (continued)4. Operating Expenses and Other Related Party Transactions – (continued)
The maximum Management Fee for each share class (expressed as a percentage of the relevant Fund’s net asset value attributable to such class) as at financial year end is as follows:
Fund NameMaximumManagement Fee
Legg Mason Western Asset US Government Liquidity FundClass A 0.800%Class B 1.050%Class C 1.300%Class E 1.400%Class X 0.600%Premier Class 0.300%LM Class NoneClass A (G) 0.800%Class L (G) 0.800%
Legg Mason Western Asset US Core Bond FundClass A 0.950%Class B 1.200%Class C 1.450%Class E 1.550%Class F 0.550%Class R 0.550%Class T 0.950%Class X 0.475%Premier Class 0.300%S Class 0.200%LM Class NoneClass GA 0.820%Class GE 1.420%
Legg Mason Western Asset US Core Plus Bond FundClass A 1.150%Class B 1.400%Class C 1.650%Class E 1.750%Class F 0.550%Class R 0.750%Class T 1.150%Class X 0.575%Premier Class 0.300%LM Class NoneClass A (G) 1.150%Class B (G) 1.650%Class L (G) 1.650%
Legg Mason Western Asset Euro Core Plus Bond FundClass A 1.000%Class B 1.250%Class C 1.500%Class E 1.600%Class F 0.550%Class R 0.600%Class T 1.000%Class X 0.500%Premier Class 0.300%S Class 0.200%LM Class NoneClass GA 0.820%Class GE 1.420%
Legg Mason Western Asset Short Duration High Income BondFundClass A 1.100%Class B 1.350%Class C 1.600%Class E 1.700%Class F 0.850%Class R 0.700%Class X 0.600%Premier Class 0.600%S Class 0.550%LM Class NoneClass A (G) 1.200%Class B (G) 1.700%Class L (G) 1.700%
Legg Mason Western Asset Global Multi Strategy FundClass A 1.100%Class B 1.350%Class C 1.600%Class E 1.700%Class F 0.650%Class R 0.700%Class T 1.100%Class X 0.550%Premier Class 0.400%LM Class None
Fund NameMaximumManagement Fee
Legg Mason Western Asset US High Yield FundClass A 1.150%Class B 1.400%Class C 1.650%Class E 1.750%Class F 0.700%Class R 0.750%Class T 1.150%Class X 0.575%Premier Class 0.450%LM Class NoneClass A (G) 1.150%Class L (G) 1.650%Class GF 0.950%
Legg Mason Western Asset Emerging Markets Total ReturnBond FundClass A 1.500%Class B 1.750%Class C 2.000%Class E 2.100%Class F 0.800%Class R 1.100%Class T 1.500%Class X 0.750%Premier Class 0.550%S Class 0.450%LM Class NoneClass A (G) 1.250%Class B (G) 1.750%Class L (G) 1.750%
Legg Mason Western Asset Emerging Markets CorporateBond FundClass A 1.500%Class B 1.750%Class C 2.000%Class E 2.100%Class F 0.800%Class R 1.100%Class T 1.500%Class X 0.750%Premier Class 0.550%S Class 0.450%LM Class None
Legg Mason Western Asset Global High Yield FundClass A 1.250%Class B 1.500%Class C 1.750%Class E 1.850%Class F 0.700%Class R 0.850%Class T 1.250%Class X 0.625%Premier Class 0.450%LM Class NoneClass A (G) 1.250%Class L (G) 1.750%
Legg Mason Western Asset Global Inflation ManagementFundClass A 0.900%Class B 1.150%Class C 1.400%Class E 1.500%Class F 0.600%Class R 0.550%Class T 0.900%Class X 0.450%Premier Class 0.350%S Class 0.250%LM Class NoneClass A (G) 1.100%Class L (G) 1.600%
Legg Mason Western Asset Asian Opportunities FundClass A 1.100%Class B 1.350%Class C 1.600%Class E 1.700%Class F 0.850%Class R 0.700%Class T 1.100%Class X 0.600%Premier Class 0.600%LM Class None
299

Legg Mason Global Funds Plc Annual Report 28 February 2021
Notes to Financial Statements – (continued)4. Operating Expenses and Other Related Party Transactions – (continued)
Fund NameMaximumManagement Fee
Legg Mason Western Asset Short Duration Blue Chip Bond FundClass A 0.850%Class B 1.100%Class C 1.350%Class E 1.450%Class F 0.600%Class R 0.450%Class T 0.850%Class X 0.425%Premier Class 0.350%S Class 0.250%LM Class None
Legg Mason Western Asset Global Core Plus Bond Fund^Class A 1.100%Class B 1.350%Class C 1.600%Class E 1.700%Class F 0.650%Class R 0.700%Class T 1.100%Class X 0.550%Premier Class 0.400%LM Class None
Legg Mason Western Asset Global Credit Fund^Class A 1.050%Class B 1.300%Class C 1.550%Class E 1.650%Class F 0.600%Class R 0.650%Class T 1.050%Class X 0.525%Premier Class 0.350%S Class 0.250%LM Class None
Legg Mason Western Asset Euro High Yield FundClass A 1.150%Class B 1.400%Class C 1.650%Class E 1.750%Class F 0.700%Class R 0.750%Class T 1.150%Class X 0.575%Premier Class 0.450%S Class 0.350%LM Class None
Legg Mason Western Asset Macro Opportunities Bond Fund^Class A 1.500%Class B 1.750%Class C 2.000%Class E 2.100%Class F 1.250%Class R 1.100%Class T 1.500%Class X 1.000%Class Y 1.000%Premier Class 1.000%S Class 0.600%LM Class None
Legg Mason Western Asset Multi-Asset Credit Fund^Class A 1.250%Class B 1.500%Class C 1.750%Class E 1.850%Class F 0.800%Class R 0.750%Class T 1.250%Class X 0.625%Premier Class 0.600%S Class 0.400%LM Class None
Legg Mason Western Asset Structured Opportunities Fund^Class D 1.200%Class F 1.200%Class M 0.600%Premier Class 0.600%LM Class None
Legg Mason Western Asset US Mortgage-Backed SecuritiesFund^Class A 1.000%Class B 1.250%Class C 1.500%Class E 1.600%Class F 0.550%Class R 0.600%Class X 0.500%Premier Class 0.300%LM Class None
Fund NameMaximumManagement Fee
Legg Mason Western Asset UK Investment Grade CreditFund^Class A 0.800%Class R 0.500%Class T 0.800%Class X 0.400%Premier Class 0.300%S Class 0.200%LM Class None
Legg Mason Western Asset US Corporate Bond Fund^Class A 0.800%Class R 0.500%Class T 0.800%Class X 0.400%Premier Class 0.300%S Class 0.200%LM Class None
Western Asset UCITS SMASh Series Core Plus Completion Fund^LM Class None
Legg Mason Brandywine Global Fixed Income FundClass A 1.100%Class B 1.350%Class C 1.600%Class E 1.700%Class F 0.850%Class R 0.700%Class T 1.100%Class X 0.600%Premier Class 0.600%LM Class None
Legg Mason Brandywine Global Fixed Income AbsoluteReturn Fund^Class A 1.350%Class B 1.600%Class C 1.850%Class E 1.950%Class F 1.100%Class J 0.900%Class R 0.950%Class X 0.900%Premier Class 0.900%LM Class None
Legg Mason Brandywine Global High Yield Fund^Class A 1.100%Class F 0.750%Class T 1.100%Class X 0.550%Premier Class 0.550%S Class 0.450%LM Class None
Legg Mason Brandywine Global Opportunistic Fixed IncomeFundClass A 1.150%Class B 1.400%Class C 1.650%Class E 1.750%Class F 0.900%Class R 0.750%Class T 1.150%Class X 0.650%Premier Class 0.650%LM Class None
Legg Mason Brandywine Global Sovereign Credit Fund^Class A 1.600%Class B 1.850%Class C 2.100%Class E 2.350%Class F 1.350%Class R 0.900%Class T 1.600%Class X 0.800%BW Premier Class 0.350%Premier Class 0.800%BW LM Class NoneLM Class None
Legg Mason Brandywine Global Income Optimiser Fund^Class A 1.100%Class B 1.350%Class C 1.600%Class E 1.700%Class F 0.800%Class J 0.450%Class R 0.700%Class T 1.100%Class X 0.550%Premier Class 0.550%S Class 0.450%LM Class None
^ Not authorised for sale to the public in Hong Kong.
300

Legg Mason Global Funds Plc Annual Report 28 February 2021
Notes to Financial Statements – (continued)4. Operating Expenses and Other Related Party Transactions – (continued)
Fund NameMaximumManagement Fee
Legg Mason Brandywine Global Credit Opportunities Fund^Class A 1.650%Class B 1.900%Class C 2.150%Class E 2.250%Class F 1.300%Class J 0.750%Class R 1.250%Class T 1.650%Class X 1.150%Premier Class 1.150%S Class 0.750%LM Class None
Legg Mason Brandywine Global Defensive High Yield Fund^Class A 1.050%Class B 1.300%Class C 1.550%Class E 1.650%Class F 0.700%Class T 1.050%Class X 0.525%Premier Class 0.525%S Class 0.400%LM Class None
Legg Mason Brandywine Global Enhanced Absolute ReturnFund^Class A 2.000%Class T 2.000%Class U 1.000%Class X 1.150%Premier Class 1.150%LM Class None
Legg Mason Brandywine Global Dynamic US Equity Fund^Class A 1.200%Class E 1.950%Class F 0.950%Class R 0.700%Class T 1.200%Class X 0.600%Premier Class 0.600%S Class 0.500%LM Class None
Legg Mason ClearBridge Value FundClass A 1.350%Class B 1.850%Class C 1.850%Class E 2.100%Class F 1.100%Class R 0.850%Class T 1.350%Class X 0.675%Premier Class 0.675%LM Class None
Legg Mason ClearBridge US Appreciation FundClass A 1.250%Class B 1.750%Class C 1.750%Class E 2.000%Class F 1.000%Class R 0.750%Class T 1.250%Class X 0.625%Premier Class 0.625%LM Class NoneClass A (G) 1.250%Class B (G) 1.750%Class L (G) 1.750%Class GA 1.420%Class GE 2.170%
Legg Mason ClearBridge US Large Cap Growth FundClass A 1.250%Class B 1.750%Class C 1.750%Class E 2.000%Class F 1.000%Class R 0.750%Class T 1.250%Class U 0.525%Class X 0.625%Premier Class 0.625%LM Class NoneClass A (G) 1.250%Class L (G) 1.750%Class GA 1.420%
Fund NameMaximumManagement Fee
Legg Mason ClearBridge US Aggressive Growth FundClass A 1.300%Class B 1.800%Class C 1.800%Class E 2.050%Class F 1.050%Class R 0.800%Class T 1.300%Class X 0.650%Premier Class 0.650%LM Class NoneClass A (G) 1.300%Class B (G) 1.800%Class L (G) 1.800%Class GA 1.420%Class GE 2.170%
Legg Mason ClearBridge Tactical Dividend Income FundClass A 1.250%Class B 1.750%Class C 1.750%Class E 2.000%Class F 1.000%Class R 0.800%Class T 1.250%Class X 0.625%Premier Class 0.625%LM Class None
Legg Mason ClearBridge US Equity Sustainability LeadersFund^Class A 1.200%Class B 1.700%Class C 1.700%Class E 1.950%Class F 0.950%Class R 0.700%Class T 1.200%Class X 0.600%Premier Class 0.600%S Class 0.400%LM Class None
Legg Mason ClearBridge Global Growth Fund^Class A 1.300%Class B 1.800%Class C 1.800%Class E 2.050%Class F 1.050%Class R 0.800%Class T 1.300%Class X 0.650%Premier Class 0.650%S Class 0.550%LM Class None
Legg Mason ClearBridge Infrastructure Value Fund^Class A 1.500%Class B 2.000%Class C 2.000%Class E 2.250%Class F 1.250%Class R 1.000%Class T 1.500%Class X 0.850%Premier Class 0.850%LM Class None
Legg Mason ClearBridge Emerging Markets InfrastructureFund^Class A 1.650%Class B 2.150%Class C 2.150%Class E 2.400%Class F 1.400%Class R 1.150%Class T 1.650%Class X 1.000%Premier Class 1.000%S Class 0.600%LM Class None
Legg Mason Royce US Small Cap Opportunity FundClass A 1.500%Class B 2.000%Class C 2.000%Class E 2.250%Class F 1.250%Class R 1.000%Class T 1.500%Class X 0.750%Premier Class 0.750%LM Class None
^ Not authorised for sale to the public in Hong Kong.
301

Legg Mason Global Funds Plc Annual Report 28 February 2021
Notes to Financial Statements – (continued)4. Operating Expenses and Other Related Party Transactions – (continued)
Fund NameMaximumManagement Fee
Legg Mason Royce US Smaller Companies FundClass A 1.500%Class B 2.000%Class C 2.000%Class E 2.250%Class F 1.250%Class R 1.000%Class T 1.500%Class X 0.750%Premier Class 0.750%LM Class NoneClass A (G) 1.250%Class L (G) 1.750%
Legg Mason QS MV European Equity Growth and IncomeFundClass A 1.350%Class B 1.850%Class C 1.850%Class E 2.100%Class F 1.100%Class R 0.850%Class T 1.350%Class X 0.675%Premier Class 0.675%S Class 0.500%LM Class NoneClass A (G) 1.350%Class B (G) 1.850%Class L (G) 1.850%Class GA 1.420%Class GE 2.170%Class GP 0.850%
Legg Mason QS MV Asia Pacific Ex Japan Equity Growth andIncome FundClass A 1.350%Class B 1.850%Class C 1.850%Class E 2.100%Class F 1.100%Class R 0.850%Class T 1.350%Class X 0.675%Premier Class 0.675%S Class 0.500%LM Class NoneClass GA 1.620%Class GE 2.370%
Legg Mason QS Emerging Markets Equity FundClass A 1.000%Class B 1.500%Class C 1.500%Class E 1.750%Class F 0.750%Class R 0.650%Class T 1.000%Class X 0.500%Premier Class 0.500%S Class 0.400%LM Class None
Legg Mason QS MV Global Equity Growth and Income FundClass A 1.350%Class B 1.850%Class C 1.850%Class E 2.100%Class F 1.100%Class R 0.850%Class T 1.350%Class X 0.675%Premier Class 0.675%S Class 0.500%LM Class NoneClass GA 1.420%Class GE 2.170%
Legg Mason Martin Currie Asia Long-Term UnconstrainedFund^Class A 1.500%Class B 2.000%Class C 2.000%Class E 2.250%Class F 1.250%Class M 1.000%Class R 1.000%Class T 1.500%Premier Class 0.750%LM Class None
Fund NameMaximumManagement Fee
Legg Mason Martin Currie European Absolute Alpha Fund^Class A (PF) 2.000%Class E (PF) 2.750%Class F (PF) 1.750%Class J (PF) 1.000%Class M (PF) 1.500%Class R (PF) 1.500%Premier Class (PF) 1.500%LM Class None
Legg Mason Martin Currie Global Long-Term UnconstrainedFund^Class A 1.500%Class B 2.000%Class C 2.000%Class E 2.250%Class F 1.250%Class R 1.000%Class T 1.500%Class X 0.750%Premier Class 0.750%S Class 0.650%LM Class None
Legg Mason Martin Currie Asia Pacific Ex Japan Real IncomeFundClass A 1.500%Class B 2.000%Class C 2.000%Class D 1.100%Class E 2.250%Class F 1.250%Class R 1.000%Class T 1.500%Class X 0.750%Premier Class 0.750%S Class 0.440%LM Class None
Legg Mason Martin Currie Global Emerging Markets Fund^Class A 1.500%Class B 2.000%Class C 2.000%Class E 2.250%Class F 1.250%Class J 0.650%Class R 1.000%Class T 1.500%Class X 0.750%Premier Class 0.750%S Class 0.650%LM Class None
Legg Mason Martin Currie European Unconstrained Fund^Class A 1.500%Class B 2.000%Class C 2.000%Class E 2.250%Class F 1.250%Class R 1.000%Class X 0.750%Premier Class 0.750%S Class 0.650%LM Class None
^ Not authorised for sale to the public in Hong Kong.
302

Legg Mason Global Funds Plc Annual Report 28 February 2021
Notes to Financial Statements – (continued)4. Operating Expenses and Other Related Party Transactions – (continued)
In the tables above, the Management Fees provided for each Fund apply to any of the share classes listed in the relevant column that are offered by the Fund. Not all share classes are offered by each Fundand not all share classes were in issue as at 28 February 2021. The Prospectus, as it may be amended or supplemented from time to time, indicates which share classes are offered by each Fund.
Pursuant to each Investment Management Agreement, the Manager shall be responsible for paying the fees and out-of-pocket expenses of the relevant Investment Manager.
The Manager has voluntarily agreed to waive a portion of their fees and/or reimburse for certain expenses so that the total expenses would not exceed certain voluntary expense limitations establishedfor the Funds. The Manager, at its discretion, may revise or discontinue the voluntary waivers and/or expense reimbursements at any time.
For the years ended 28 February 2021 and 29 February 2020, the Management Fees waived, reimbursed and other expenses recouped were as follows:
28 February 2021in (000’s)
29 February 2020in (000’s)
Fund NameManagement
Fee Waived
ManagementFee Reimbursed
and OtherExpenses Recouped
ManagementFee Waived
ManagementFee Reimbursed
and OtherExpenses Recouped
Legg Mason Western Asset US Government Liquidity Fund $3,786 $238 $– $–Legg Mason Western Asset US Core Plus Bond Fund $2 $– $– $–Legg Mason Western Asset Short Duration High Income Bond Fund $6 $– $4 $–Legg Mason Western Asset Global Multi Strategy Fund $– $– $– $1Legg Mason Western Asset US High Yield Fund $– $2 $– $–Legg Mason Western Asset Emerging Markets Total Return Bond Fund $7 $– $1 $–Legg Mason Western Asset US Short-Term Government Fund^ $– $– $3 $–Legg Mason Western Asset US Adjustable Rate Fund^ $– $– $3 $15Legg Mason Western Asset Global Inflation Management Fund $1 $– $– $–Legg Mason Western Asset Asian Opportunities Fund $87 $– $59 $–Legg Mason Western Asset Short Duration Blue Chip Bond Fund $– $– $1 $4Legg Mason Western Asset Euro High Yield Fund €– €1 €– €–Legg Mason Western Asset Macro Opportunities Bond Fund^ $– $2 $– $–Legg Mason Western Asset EM Local Currency Debt Fund^ $– $– $24 $2Legg Mason Western Asset Global Total Return Investment Grade Bond Fund^ $– $– $8 $1Legg Mason Western Asset Structured Opportunities Fund^ $1 $– $2 $16Western Asset UCITS SMASh Series Core Plus Completion Fund^ $– $41 $– $–Legg Mason Brandywine Global Fixed Income Fund $– $1 $– $–Legg Mason Brandywine Global Fixed Income Absolute Return Fund^ $– $– $– $1Legg Mason Brandywine Global High Yield Fund^ $40 $– $9 $–Legg Mason Brandywine Global Sovereign Credit Fund^ $17 $12 $– $–Legg Mason Brandywine Global Income Optimiser Fund^ $2 $2 $2 $4Legg Mason Brandywine Global Credit Opportunities Fund^ $15 $8 $19 $6Legg Mason Brandywine Global Defensive High Yield Fund^ $41 $3 $35 $2Legg Mason Brandywine Global – US High Yield Fund^ $– $– $19 $4Legg Mason Brandywine Global Enhanced Absolute Return Fund^ $– $2 $– $–Legg Mason Brandywine Global Dynamic US Equity Fund^ $8 $34 $14 $18Legg Mason ClearBridge Global Equity Fund^ $– $– $2 $31Legg Mason ClearBridge Global Equity Income Fund^ $– $– $8 $3Legg Mason ClearBridge US Appreciation Fund $2 $– $– $–Legg Mason ClearBridge US Large Cap Growth Fund $– $– $3 $1Legg Mason ClearBridge Tactical Dividend Income Fund $17 $1 $8 $–Legg Mason ClearBridge US Equity Sustainability Leaders Fund^ $8 $7 $2 $11Legg Mason ClearBridge Global Growth Fund^ $21 $– $18 $3Legg Mason ClearBridge Infrastructure Value Fund^ €1 €4 €3 €9Legg Mason ClearBridge Emerging Markets Infrastructure Fund^ $22 $11 $25 $9Legg Mason Royce US Small Cap Opportunity Fund $– $– $– $1Legg Mason QS MV European Equity Growth and Income Fund €3 €– €1 €–Legg Mason QS MV Asia Pacific Ex Japan Equity Growth and Income Fund $– $2 $– $9Legg Mason QS Emerging Markets Equity Fund $49 $1 $52 $4Legg Mason QS MV Global Equity Growth and Income Fund $8 $– $1 $–Legg Mason Martin Currie Asia Long-Term Unconstrained Fund^ $4 $– $1 $2Legg Mason Martin Currie Asia Pacific Fund^ $– $– $9 $19Legg Mason Martin Currie European Absolute Alpha Fund^ €6 €– €3 €1Legg Mason Martin Currie Greater China Fund^ $– $– $– $6Legg Mason Martin Currie Japan Absolute Alpha Fund^ ¥– ¥– ¥253 ¥309Legg Mason Martin Currie Global Long-Term Unconstrained Fund^ $4 $2 $10 $–Legg Mason Martin Currie Asia Pacific Ex Japan Real Income Fund $4 $15 $9 $15Legg Mason Martin Currie Global Emerging Markets Fund^ $16 $– $22 $9Legg Mason Martin Currie Global Dividend Opportunities Fund^ $– $– $12 $12Legg Mason Martin Currie European Unconstrained Fund^ €14 €1 €22 €10
Amounts designated as “–” are either $0/€0/¥0 or less than $1,000/€1,000/¥1,000.
Pursuant to each Investment Management Agreement, each Investment Manager is entitled to receive an investment management fee and each Investment Manager shall be responsible for paying thefees and out-of-pocket expenses of any Sub-Investment Managers out of its own Investment Management Fee (which may include “performance fees”).
Under the terms of the Master Distribution Agreement between the Manager, the Company and Legg Mason Investor Services, LLC (“LMIS”), LMIS is authorised to market, promote, offer and arrangefor the sale and redemption of shares of the Company (collectively, “distribution services”). In addition, LMIS is authorised at its own costs and expenses to engage one or more distributors for thepurpose of assisting it with carrying out its duties and responsibilities, provided the appointments of such other firms are made in accordance with the requirements of the Central Bank rules. Under theterms of the Master Distribution Agreement between the Manager, the Company and LMIS, LMIS in such instances shall remain responsible to the Manager for the performance of its obligations undersuch agreement. Accordingly, LMIS has appointed Legg Mason Investments (Europe) Limited (“LMI Europe”) as an additional Distributor of the Funds. Similarly, under the terms of the DistributionAgreement with LMIS, LMI Europe is authorised at its own costs and expenses to engage one or more distributors for the purpose of assisting it with carrying out its duties and responsibilities, providedthe appointments of such other firms are made in accordance with the requirements of the Central Bank rules. Under the terms of the Distribution Agreement between LMIS and LMI Europe, LMIEurope in such instances shall remain responsible to LMIS for the performance of its obligations under such agreement. LMI Europe, pursuant to the Distribution Agreement with LMIS and inaccordance with the requirements of the Central Bank, has appointed Legg Mason Asset Management Hong Kong Limited, Legg Mason Asset Management Singapore Pte. Limited and Legg MasonInvestments (Taiwan) Ltd., and, effective 1 September 2020, Franklin Templeton International Services S.a`r.l, as additional Distributors of the Funds.
The Company shall also be responsible for the prompt payment or reimbursement to the Manager of any commissions, transfer fees, registration fees, taxes and similar liabilities, costs and out-of-pocket expenses properly payable or incurred by the Manager.
Shareholder Services Fee
Pursuant to the Management Agreement between the Company and the Manager, the Manager shall be entitled to receive a shareholder services fee out of the assets of the relevant Funds for itsservices, which shall accrue on each dealing day and be payable monthly in arrears (the “Shareholder Services Fees”). The Shareholder Services Fees shall be payable monthly in arrears and shall accrueon each dealing day. Under the Master Shareholder Servicing Agreement between the Manager, the Company and LMIS, LMIS shall be entitled to receive from the Manager a shareholder services feefrom certain of the share classes for their services as Shareholder Servicing Agent.
The Manager and the Company have appointed LMIS as Master Shareholder Servicing Agent of the Company. Under the terms of the Master Shareholder Servicing Agent Agreement, LMIS isauthorised at its own costs and expenses to engage one or more parties for the purpose of assisting it with carrying out its duties under the agreement, provided that LMIS shall remain responsible tothe Manager for the performance of its obligations under such agreement. Pursuant to this, LMIS has appointed LMI Europe as an additional Shareholder Servicing Agent. Similarly, under the terms ofthe Shareholder Servicing Agent Agreement with LMIS, LMI Europe is authorised at its own costs and expenses to engage one or more parties for the purpose of assisting it with carrying out its dutiesunder the agreement, provided that LMI Europe shall remain responsible to the Manager and LMIS for the performance of its obligations under such agreement. Pursuant to this, LMI Europe hasappointed Legg Mason Asset Management Hong Kong Limited, Legg Mason Asset Management Singapore Pte. Limited and Legg Mason Investments (Taiwan) Ltd. as Shareholder Servicing Agents ofthe Company. Effective 1 September 2020, Franklin Templeton International Services S.à r.l has been appointed as additional Shareholder Servicing Agent.
^ Not authorised for sale to the public in Hong Kong.
303

Legg Mason Global Funds Plc Annual Report 28 February 2021
Notes to Financial Statements – (continued)4. Operating Expenses and Other Related Party Transactions – (continued)
The aggregate amount of Shareholder Services Fees paid by each share class shall be or has been equal to the following:
(i) 0.15 per cent, per annum of the net asset value of Legg Mason Western Asset US Core Bond Fund, Legg Mason Western Asset US Core Plus Bond Fund, Legg Mason Western Asset EuroCore Plus Bond Fund, Legg Mason Western Asset Short Duration High Income Bond Fund, Legg Mason Western Asset Global Multi Strategy Fund, Legg Mason Western Asset US HighYield Fund, Legg Mason Western Asset Emerging Markets Total Return Bond Fund, Legg Mason Western Asset Emerging Markets Corporate Bond Fund, Legg Mason Western AssetGlobal High Yield Fund, Legg Mason Western Asset Global Inflation Management Fund, Legg Mason Western Asset Asian Opportunities Fund, Legg Mason Western Asset Short DurationBlue Chip Bond Fund, Legg Mason Western Asset Global Core Plus Bond Fund^, Legg Mason Western Asset Global Credit Fund^, Legg Mason Western Asset Euro High Yield Fund, LeggMason Western Asset Macro Opportunities Bond Fund^, Legg Mason Western Asset Multi-Asset Credit Fund^, Legg Mason Western Asset Structured Opportunities Fund^, Legg MasonWestern Asset US Mortgage-Backed Securities Fund^, Legg Mason Western Asset UK Investment Grade Credit Fund^, Legg Mason Western Asset US Corporate Bond Fund^, Legg MasonBrandywine Global Fixed Income Fund, Legg Mason Brandywine Global Fixed Income Absolute Return Fund^, Legg Mason Brandywine Global High Yield Fund^, Legg Mason BrandywineGlobal Opportunistic Fixed Income Fund, Legg Mason Brandywine Global Sovereign Credit Fund^, Legg Mason Brandywine Global Income Optimiser Fund^, Legg Mason BrandywineGlobal Credit Opportunities Fund^, Legg Mason Brandywine Global Defensive High Yield Fund^ and Legg Mason Brandywine Global Enhanced Absolute Return Fund^; and
(ii) 0.35 per cent, per annum, of the net asset value of Legg Mason Brandywine Global Dynamic US Equity Fund^, Legg Mason ClearBridge Value Fund, Legg Mason ClearBridge USAppreciation Fund, Legg Mason ClearBridge US Large Cap Growth Fund, Legg Mason ClearBridge US Aggressive Growth Fund, Legg Mason ClearBridge Tactical Dividend Income Fund,Legg Mason ClearBridge US Equity Sustainability Leaders Fund^, Legg Mason ClearBridge Global Growth Fund^, Legg Mason Royce US Small Cap Opportunity Fund, Legg Mason RoyceUS Smaller Companies Fund, Legg Mason QS MV European Equity Growth and Income Fund, Legg Mason QS MV Asia Pacific Ex Japan Equity Growth and Income Fund, Legg MasonQS Emerging Markets Equity Fund, Legg Mason QS MV Global Equity Growth and Income Fund, Legg Mason Martin Currie Asia Long-Term Unconstrained Fund^, Legg Mason MartinCurrie European Absolute Alpha Fund^, Legg Mason Martin Currie Global Long-Term Unconstrained Fund^, Legg Mason Martin Currie Asia Pacific Ex Japan Real Income Fund, LeggMason Martin Currie Global Emerging Markets Fund^, Legg Mason Martin Currie European Unconstrained Fund^, Legg Mason ClearBridge Infrastructure Value Fund^ and Legg MasonClearBridge Emerging Markets Infrastructure Fund^.
Shareholder Services Fees are payable on all classes except Class F Share Classes, Class J Share Classes, Class U Share Classes, Class Y Share Classes, Premier Share Classes, LM Share Classes,Grandfathered Share Classes and Galleon Share Classes (each as defined in the Prospectus), nor these are payable on all share classes offered by Legg Mason Western Asset US Government LiquidityFund and Western Asset UCITS SMASh Series Core Plus Completion Fund^.
During the financial years ended 28 February 2021 and 29 February 2020, the Shareholder Services Fees waived were as follows:
Shareholder Services Fee Waived
Fund Name28 February 2021
(000’s)29 February 2020
(000’s)
Legg Mason Western Asset US Core Bond Fund $1 $–Legg Mason Western Asset US Core Plus Bond Fund $2 $–Legg Mason Western Asset Short Duration High Income Bond Fund $20 $21Legg Mason Western Asset Emerging Markets Total Return Bond Fund $17 $18Legg Mason Western Asset Global High Yield Fund $5 $4Legg Mason Western Asset US Short-Term Government Fund^ $– $9Legg Mason Western Asset US Adjustable Rate Fund^ $– $1Legg Mason Western Asset Global Inflation Management Fund $2 $5Legg Mason Brandywine Global High Yield Fund^ $– $2Legg Mason Brandywine Global Income Optimiser Fund^ $5 $3Legg Mason Brandywine Global Credit Opportunities Fund^ $4 $–Legg Mason Brandywine Global Dynamic US Equity Fund^ $– $1Legg Mason ClearBridge Global Equity Fund^ $– $1Legg Mason ClearBridge Global Equity Income Fund^ $– $3Legg Mason ClearBridge US Appreciation Fund $1 $–Legg Mason ClearBridge Tactical Dividend Income Fund $17 $11Legg Mason ClearBridge US Equity Sustainability Leaders Fund^ $56 $2Legg Mason ClearBridge Global Growth Fund^ $2 $2Legg Mason ClearBridge Infrastructure Value Fund^ €1 €–Legg Mason ClearBridge Emerging Markets Infrastructure Fund^ $4 $5Legg Mason Royce US Small Cap Opportunity Fund $1 $–Legg Mason Royce US Smaller Companies Fund $7 $2Legg Mason QS MV European Equity Growth and Income Fund €12 €10Legg Mason QS MV Asia Pacific Ex Japan Equity Growth and Income Fund $23 $9Legg Mason QS Emerging Markets Equity Fund $1 $2Legg Mason QS MV Global Equity Growth and Income Fund $16 $16Legg Mason Martin Currie Asia Long-Term Unconstrained Fund^ $207 $487Legg Mason Martin Currie Asia Pacific Fund^ $– $4Legg Mason Martin Currie European Absolute Alpha Fund^ €104 €165Legg Mason Martin Currie Greater China Fund^ $– $25Legg Mason Martin Currie Japan Absolute Alpha Fund^ ¥– ¥1,023Legg Mason Martin Currie Asia Pacific Ex Japan Real Income Fund $14 $7Legg Mason Martin Currie Global Emerging Markets Fund^ $2 $2Legg Mason Martin Currie Global Dividend Opportunities Fund^ $– $5Legg Mason Martin Currie European Unconstrained Fund^ €3 €3
Amounts designated as “–” are either $0/€0/¥0 or less than $1,000/€1,000/¥1,000.
Additionally, certain operating expenses, including but not limited to, fees payable to subsidiaries of Franklin Templeton for the provision of governance support and reporting to the Board, insuranceservices to the Board and ongoing registration services for jurisdictions where the Funds are publicly offered. For the financial year ended 28 February 2021, these expenses amounted to $1,361,748 (29February 2020: $1,495,656).
Related Parties
During the financial year and up to the date of appointment of FTIS as the management company to the Company, which was effective 1 February 2021, Jane Trust, Joseph Carrier, Jaspal Sagger andVictoria Rock (up to the date of her resignation on 30 September 2020), and William Jackson (as of 1 October 2020), have been Directors of the Company and have been, also directors and/orexecutives of certain affiliates of the Manager, the Investment Managers, the Distributors and the Shareholder Servicing Agents. Effective 1 February 2021, William Jackson is a Director of the newlyappointed management company, FTIS. The remaining Directors of the Company, as listed above, are all employees of either FTIS or one of its affiliates. Save as disclosed above, none of the Directorshas or has had any interest, direct or indirect, in any contract or arrangement subsisting at the date hereof which is significant in relation to the business of the Company.
As at 28 February 2021 and 29 February 2020, the Funds in the table below held investments in collective investment schemes which have appointed the same Manager, Investment Managers, or Sub-Investment Managers as the Fund, or have appointed a related party of that Manager, Investment Managers or Sub-Investment Managers.
^ Not authorised for sale to the public in Hong Kong.
304

Legg Mason Global Funds Plc Annual Report 28 February 2021
Notes to Financial Statements – (continued)4. Operating Expenses and Other Related Party Transactions – (continued)
Below is a table that shows the percentage ownership of such collective investment schemes held by the Company:
28 February 2021 29 February 2020
Fund Underlying Collective Investment Scheme %Value
(000’s) %Value
(000’s)
Legg Mason Western Asset US Core Bond Fund Western Asset Liquidity Funds Plc – Western Asset US Dollar LiquidityFund – Class WA (Distributing) 0.54% $12,610 1.46% $28,230
Legg Mason Western Asset US Core Plus Bond Fund Legg Mason China Funds – Western Asset China Bond Fund – Class LM 5.15% $27,476 5.85% $10,265Legg Mason Western Asset Euro Core Plus Bond Fund Western Asset Liquidity Funds Plc – Western Asset US Dollar Liquidity
Fund – Class WA (Distributing) 0.07% €1,423 0.04% €720Legg Mason Western Asset Global Multi Strategy Fund Legg Mason China Funds – Western Asset China Bond Fund – Class LM 2.61% $13,933 7.35% $12,882Legg Mason Western Asset Global Multi Strategy Fund Legg Mason Qualified Investor Funds (II) Plc – Legg Mason Western
Asset India Bond Fund – LM Class US$ Accumulating 24.50% $8,025 14.23% $9,427Legg Mason Western Asset Global Multi Strategy Fund Legg Mason Qualified Investor Funds (II) Plc – Western Asset European
Loan Fund – LM Class Euro Accumulating 11.08% $7,251 – –Legg Mason Western Asset US High Yield Fund Western Asset Liquidity Funds Plc – Western Asset US Dollar Liquidity
Fund – Class WA (Distributing) 0.22% $5,196 0.37% $7,254Legg Mason Western Asset Global High Yield Fund Legg Mason Qualified Investor Funds (II) Plc – Western Asset European
Loan Fund – LM Class Euro Accumulating 1.72% $1,126 – –Legg Mason Western Asset Global Inflation Management Fund Western Asset Liquidity Funds Plc – Western Asset US Dollar Liquidity
Fund – Class WA (Distributing) 0.04% $940 0.02% $374Legg Mason Western Asset Asian Opportunities Fund Legg Mason China Funds – Western Asset China Bond Fund – Class LM – – 7.34% $12,870Legg Mason Western Asset Asian Opportunities Fund Legg Mason Western Asset Asian Bond Trust – Class A (SGD)
Accumulating 26.35% $4,838 24.50% $5,249Legg Mason Western Asset Asian Opportunities Fund Western Asset Liquidity Funds Plc – Western Asset US Dollar Liquidity
Fund – Class WA (Distributing) 0.77% $18,146 0.79% $15,279Legg Mason Western Asset Short Duration Blue Chip Bond Fund Western Asset Liquidity Funds Plc – Western Asset US Dollar Liquidity
Fund – Class WA (Distributing) 1.03% $24,052 0.41% $7,953Legg Mason Western Asset Global Core Plus Bond Fund^ Legg Mason China Funds – Western Asset China Bond Fund – Class LM 5.39% $28,758 8.24% $14,446Legg Mason Western Asset Global Core Plus Bond Fund^ Legg Mason Qualified Investor Funds (II) Plc – Legg Mason Western
Asset India Bond Fund – LM Class US$ Accumulating – – 8.12% €5,377Legg Mason Western Asset Global Core Plus Bond Fund^ Western Asset Liquidity Funds Plc – Western Asset US Dollar Liquidity
Fund – Class WA (Distributing) – – 0.21% $4,088Legg Mason Western Asset Global Credit Fund^ Western Asset Liquidity Funds Plc – Western Asset US Dollar Liquidity
Fund – Class WA (Distributing) 0.04% $940 0.03% $552Legg Mason Western Asset Euro High Yield Fund Western Asset Liquidity Funds Plc – Western Asset US Dollar Liquidity
Fund – Class WA (Distributing) 0.02% €336 0.02% €436Legg Mason Western Asset Macro Opportunities Bond Fund^ Legg Mason China Funds – Western Asset China Bond Fund – Class LM 14.03% $74,803 15.44% $27,068Legg Mason Western Asset Macro Opportunities Bond Fund^ Legg Mason Qualified Investor Funds (II) Plc – Western Asset European
Loan Fund – LM Class Euro Accumulating 23.57% $15,425 – –Legg Mason Western Asset Macro Opportunities Bond Fund^ Western Asset Liquidity Funds Plc – Western Asset US Dollar Liquidity
Fund – Class WA (Distributing) 2.89% $67,809 0.84% $16,323Legg Mason Western Asset Multi-Asset Credit Fund^ Legg Mason Qualified Investor Funds (II) Plc – Western Asset European
Loan Fund – LM Class Euro Accumulating 14.35% $9,390 – –Legg Mason Western Asset Structured Opportunities Fund^ Western Asset Liquidity Funds Plc – Western Asset US Dollar Liquidity
Fund – Class WA (Distributing) 2.52% $59,043 8.09% $156,945Legg Mason Western Asset US Mortgage-Backed Securities Fund^ Western Asset Liquidity Funds Plc – Western Asset US Dollar Liquidity
Fund – Class WA (Distributing) 3.16% $74,145 4.94% $95,860Legg Mason Western Asset US Corporate Bond Fund^ Western Asset Liquidity Funds Plc – Western Asset US Dollar Liquidity
Fund – Class WA (Distributing) 0.41% $9,727 0.01% $99Western Asset UCITS SMASh Series Core Plus Completion Fund^ Legg Mason China Funds – Western Asset China Bond Fund – Class LM 0.11% $572 – –Western Asset UCITS SMASh Series Core Plus Completion Fund^ Western Asset Liquidity Funds Plc – Western Asset US Dollar Liquidity
Fund – Class WA (Distributing) 0.04% $901 – –Legg Mason Royce US Small Cap Opportunity Fund Western Asset Liquidity Funds Plc – Western Asset US Dollar Liquidity
Fund – Class WA (Distributing) 3.92% $91,807 1.08% $20,967Legg Mason Royce US Smaller Companies Fund Western Asset Liquidity Funds Plc – Western Asset US Dollar Liquidity
Fund – Class WA (Distributing) 0.06% $1,422 0.03% $539
Cross investments by Funds within the Company are disclosed in Note 13 to the financial statements.
Transaction costs
Transaction costs on purchases and sales of equities, collective investment schemes, futures contracts and options for the financial years ended 28 February 2021 and 29 February 2020 are detailed inthe table below:
Fund Name28 February 2021
(000’s)29 February 2020
(000’s)
Legg Mason Western Asset US Core Bond Fund $52 $54Legg Mason Western Asset US Core Plus Bond Fund $281 $333Legg Mason Western Asset Euro Core Plus Bond Fund €12 €15Legg Mason Western Asset Short Duration High Income Bond Fund $1 $–Legg Mason Western Asset Global Multi Strategy Fund $18 $17Legg Mason Western Asset US High Yield Fund $1 $1Legg Mason Western Asset Global High Yield Fund $1 $2Legg Mason Western Asset Global Inflation Management Fund $4 $5Legg Mason Western Asset Asian Opportunities Fund $30 $31Legg Mason Western Asset Short Duration Blue Chip Bond Fund $12 $7Legg Mason Western Asset Global Core Plus Bond Fund^ $26 $36Legg Mason Western Asset Global Credit Fund^ $2 $3Legg Mason Western Asset Macro Opportunities Bond Fund^ $6,683 $11,362Legg Mason Western Asset Multi-Asset Credit Fund^ $75 $77Legg Mason Western Asset Global Total Return Investment Grade Bond Fund^ $– $10Legg Mason Western Asset Structured Opportunities Fund^ $47 $160Legg Mason Western Asset US Mortgage-Backed Securities Fund^ $40 $40Legg Mason Western Asset UK Investment Grade Credit Fund^ £1 £1Legg Mason Western Asset US Corporate Bond Fund^ $8 $4Western Asset UCITS SMASh Series Core Plus Completion Fund^ $1 $–Legg Mason Brandywine Global Fixed Income Fund $4 $–Legg Mason Brandywine Global Fixed Income Absolute Return Fund^ $22 $34Legg Mason Brandywine Global High Yield Fund^ $– $1Legg Mason Brandywine Global Opportunistic Fixed Income Fund $7 $–Legg Mason Brandywine Global Sovereign Credit Fund^ $7 $1Legg Mason Brandywine Global Income Optimiser Fund^ $4 $2Legg Mason Brandywine Global Credit Opportunities Fund^ $4 $2
^ Not authorised for sale to the public in Hong Kong.
305

Legg Mason Global Funds Plc Annual Report 28 February 2021
Notes to Financial Statements – (continued)4. Operating Expenses and Other Related Party Transactions – (continued)
Fund Name28 February 2021
(000’s)29 February 2020
(000’s)
Legg Mason Brandywine Global – US High Yield Fund^ $– $1Legg Mason Brandywine Global Enhanced Absolute Return Fund^ $30 $39Legg Mason Brandywine Global Dynamic US Equity Fund^ $2 $2Legg Mason ClearBridge Value Fund $147 $77Legg Mason ClearBridge Global Equity Fund^ $– $20Legg Mason ClearBridge Global Equity Income Fund^ $– $3Legg Mason ClearBridge US Appreciation Fund $14 $7Legg Mason ClearBridge US Large Cap Growth Fund $67 $69Legg Mason ClearBridge US Aggressive Growth Fund $157 $149Legg Mason ClearBridge Tactical Dividend Income Fund $6 $5Legg Mason ClearBridge US Equity Sustainability Leaders Fund^ $41 $3Legg Mason ClearBridge Global Growth Fund^ $9 $4Legg Mason ClearBridge Infrastructure Value Fund^ €769 €970Legg Mason ClearBridge Emerging Markets Infrastructure Fund^ $2 $3Legg Mason Royce US Small Cap Opportunity Fund $1,332 $1,439Legg Mason Royce US Smaller Companies Fund $106 $105Legg Mason QS MV European Equity Growth and Income Fund €34 €22Legg Mason QS MV Asia Pacific Ex Japan Equity Growth and Income Fund $105 $83Legg Mason QS Emerging Markets Equity Fund $13 $13Legg Mason QS MV Global Equity Growth and Income Fund $4 $9Legg Mason Martin Currie Asia Long-Term Unconstrained Fund^ $229 $339Legg Mason Martin Currie Asia Pacific Fund^ $– $4Legg Mason Martin Currie European Absolute Alpha Fund^ €363 €991Legg Mason Martin Currie Greater China Fund^ $– $35Legg Mason Martin Currie Japan Absolute Alpha Fund^ ¥– ¥1,984Legg Mason Martin Currie Global Long-Term Unconstrained Fund^ $111 $30Legg Mason Martin Currie Asia Pacific Ex Japan Real Income Fund $24 $10Legg Mason Martin Currie Global Emerging Markets Fund^ $45 $9Legg Mason Martin Currie Global Dividend Opportunities Fund^ $– $3Legg Mason Martin Currie European Unconstrained Fund^ €198 €6
Amounts designated as “–” are either $0/€0/£0/¥0 or less than $1,000/€1,000/£1,000/¥1,000.
Performance Fee
In addition to the Investment Management Fees described above, the Investment Manager may be entitled to receive a fee (a ‘‘Performance Fee’’) depending on the performance of the PF Class Shares(Performance Fee Classes, as indicated by “(PF)” in the name of the share class).
Legg Mason Martin Currie European Absolute Alpha Fund^
For Legg Mason Martin Currie European Absolute Alpha Fund^, for each PF Share Class, the Performance Fee will normally be (or has normally been, as applicable) calculated in respect of each periodof twelve months ending on the last dealing day in each fiscal year (a “Calculation Period”). For each PF Share Class, the first Calculation Period will be the period commencing on the business dayimmediately following the dealing day on which the net asset value is first calculated for the share class (the “First Dealing Day”) and ending on the last dealing day of the fiscal year in which the FirstDealing Day occurs (the “First Calculation Period”).
For each Calculation Period for each PF Class Share, the Investment Manager shall be entitled to a Performance Fee equal to 20 per cent of the amount, if any, by which the performance of the netasset value per share during that period exceeds the High Water Mark (as defined below) as at the end of the previous Calculation Period. For distributing share classes, for purposes of measuring theperformance of the net asset value per share during a Calculation Period, any distributions paid during the period shall be added back in to the net asset value. For each PF Share Class, once payable inrespect of a Calculation Period, a Performance Fee will not be affected by any losses experienced by the Funds or the PF Share Class in any subsequent Calculation Period. Any Performance Fee will beaccrued on each dealing day and will normally be paid within 21 days of the end of the relevant Calculation Period, after verification by the Depositary. If the Investment Management Agreement isterminated before the last dealing day in any fiscal year, for each PF Share Class the Performance Fee in respect of the then-current Calculation Period will be calculated and paid as though the date oftermination were the end of the Calculation Period. In the event that a shareholder redeems their PF Class Shares prior to the end of a Calculation Period, any accrued Performance Fee attributable totheir shares will crystallise and be paid to the Investment Manager.
The High Water Mark with respect to each PF Share Class of Legg Mason Martin Currie European Absolute Alpha Fund^ means the greater of: (i) the initial offer price per share; (ii) the highest net assetvalue per share in effect immediately after the end of any previous Calculation Period; and (iii) if the PF Share Class launched via a merger of a share class in another fund managed by theSub-Investment Manager, the high water mark for such share class on the date of the merger as calculated according to the relevant offering document for such other fund.
Legg Mason Martin Currie European Absolute Alpha Fund^ does not operate equalisation accounts for shareholders with respect to the performance fee accruals.
Performance Fees charged during the financial years ended 28 February 2021 and 29 February 2020 are disclosed in the Statement of Comprehensive Income.
Administrator and Depositary Fees
The Bank of New York Mellon SA/NV, Dublin Branch acts as depositary (the “Depositary”) and BNY Mellon Fund Services (Ireland) Designated Activity Company acts as administrator (the“Administrator”) to all Funds in the Company. For administration, accounting, shareholder, trustee and depositary services, they collectively receive from the Funds a fee of up to 0.15% of the net assetvalue of each Fund.
Directors’ Remuneration
Directors’ fees and out-of-pocket expenses charged through profit and loss in the Statement of Comprehensive Income and which pertain to the financial year ended 28 February 2021 were $125,000(29 February 2020: $175,000).
Auditors’ Remuneration
Fees paid to the auditors, PricewaterhouseCoopers of €1,055,300 (excluding VAT), in respect of the financial year, relate to statutory audit of the financial statements of the Company (29 February2020: €1,135,750 (excluding VAT)). The total audit fee for the Company as detailed within the Statement of Comprehensive Income on page 262 is inclusive of VAT at 23% and is presented in thepresentational currency of the Company (US Dollar).
The out-of-pocket expenses paid to the auditors were €11,735 (excluding VAT) (29 February 2020: €12,512 (excluding VAT)).
^ Not authorised for sale to the public in Hong Kong.
306
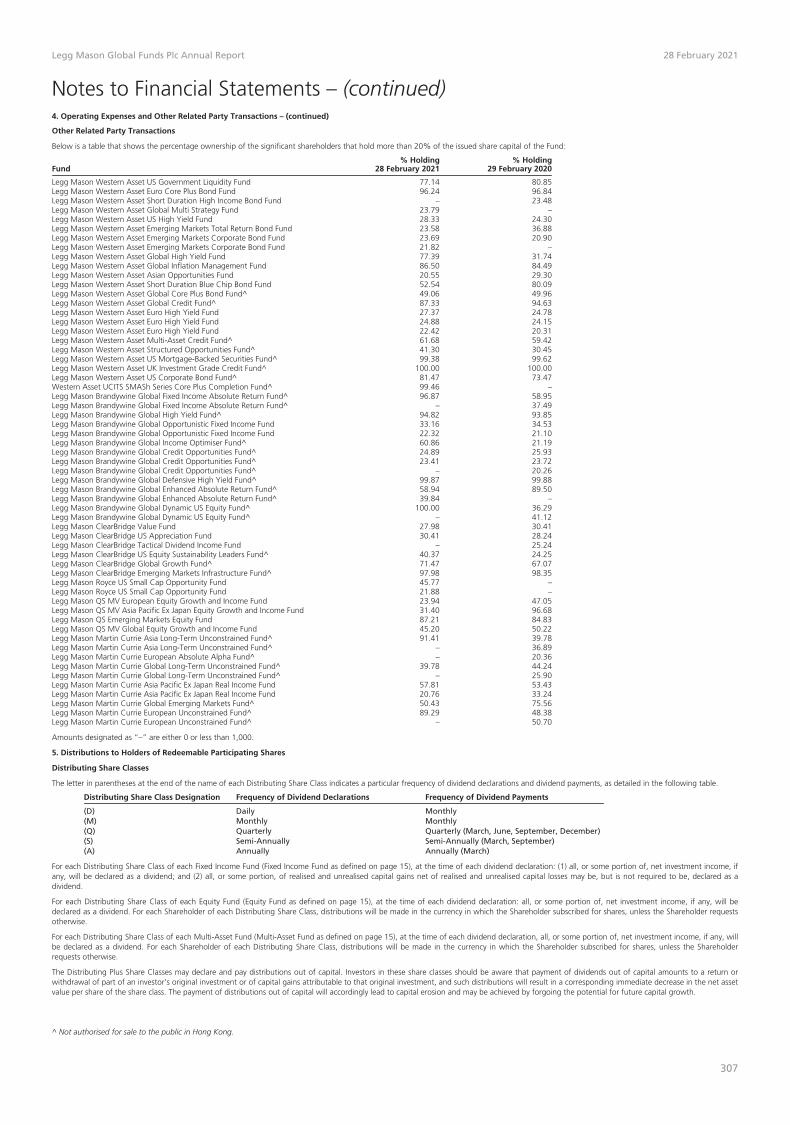
Legg Mason Global Funds Plc Annual Report 28 February 2021
Notes to Financial Statements – (continued)4. Operating Expenses and Other Related Party Transactions – (continued)
Other Related Party Transactions
Below is a table that shows the percentage ownership of the significant shareholders that hold more than 20% of the issued share capital of the Fund:
Fund% Holding
28 February 2021% Holding
29 February 2020
Legg Mason Western Asset US Government Liquidity Fund 77.14 80.85Legg Mason Western Asset Euro Core Plus Bond Fund 96.24 96.84Legg Mason Western Asset Short Duration High Income Bond Fund – 23.48Legg Mason Western Asset Global Multi Strategy Fund 23.79 –Legg Mason Western Asset US High Yield Fund 28.33 24.30Legg Mason Western Asset Emerging Markets Total Return Bond Fund 23.58 36.88Legg Mason Western Asset Emerging Markets Corporate Bond Fund 23.69 20.90Legg Mason Western Asset Emerging Markets Corporate Bond Fund 21.82 –Legg Mason Western Asset Global High Yield Fund 77.39 31.74Legg Mason Western Asset Global Inflation Management Fund 86.50 84.49Legg Mason Western Asset Asian Opportunities Fund 20.55 29.30Legg Mason Western Asset Short Duration Blue Chip Bond Fund 52.54 80.09Legg Mason Western Asset Global Core Plus Bond Fund^ 49.06 49.96Legg Mason Western Asset Global Credit Fund^ 87.33 94.63Legg Mason Western Asset Euro High Yield Fund 27.37 24.78Legg Mason Western Asset Euro High Yield Fund 24.88 24.15Legg Mason Western Asset Euro High Yield Fund 22.42 20.31Legg Mason Western Asset Multi-Asset Credit Fund^ 61.68 59.42Legg Mason Western Asset Structured Opportunities Fund^ 41.30 30.45Legg Mason Western Asset US Mortgage-Backed Securities Fund^ 99.38 99.62Legg Mason Western Asset UK Investment Grade Credit Fund^ 100.00 100.00Legg Mason Western Asset US Corporate Bond Fund^ 81.47 73.47Western Asset UCITS SMASh Series Core Plus Completion Fund^ 99.46 –Legg Mason Brandywine Global Fixed Income Absolute Return Fund^ 96.87 58.95Legg Mason Brandywine Global Fixed Income Absolute Return Fund^ – 37.49Legg Mason Brandywine Global High Yield Fund^ 94.82 93.85Legg Mason Brandywine Global Opportunistic Fixed Income Fund 33.16 34.53Legg Mason Brandywine Global Opportunistic Fixed Income Fund 22.32 21.10Legg Mason Brandywine Global Income Optimiser Fund^ 60.86 21.19Legg Mason Brandywine Global Credit Opportunities Fund^ 24.89 25.93Legg Mason Brandywine Global Credit Opportunities Fund^ 23.41 23.72Legg Mason Brandywine Global Credit Opportunities Fund^ – 20.26Legg Mason Brandywine Global Defensive High Yield Fund^ 99.87 99.88Legg Mason Brandywine Global Enhanced Absolute Return Fund^ 58.94 89.50Legg Mason Brandywine Global Enhanced Absolute Return Fund^ 39.84 –Legg Mason Brandywine Global Dynamic US Equity Fund^ 100.00 36.29Legg Mason Brandywine Global Dynamic US Equity Fund^ – 41.12Legg Mason ClearBridge Value Fund 27.98 30.41Legg Mason ClearBridge US Appreciation Fund 30.41 28.24Legg Mason ClearBridge Tactical Dividend Income Fund – 25.24Legg Mason ClearBridge US Equity Sustainability Leaders Fund^ 40.37 24.25Legg Mason ClearBridge Global Growth Fund^ 71.47 67.07Legg Mason ClearBridge Emerging Markets Infrastructure Fund^ 97.98 98.35Legg Mason Royce US Small Cap Opportunity Fund 45.77 –Legg Mason Royce US Small Cap Opportunity Fund 21.88 –Legg Mason QS MV European Equity Growth and Income Fund 23.94 47.05Legg Mason QS MV Asia Pacific Ex Japan Equity Growth and Income Fund 31.40 96.68Legg Mason QS Emerging Markets Equity Fund 87.21 84.83Legg Mason QS MV Global Equity Growth and Income Fund 45.20 50.22Legg Mason Martin Currie Asia Long-Term Unconstrained Fund^ 91.41 39.78Legg Mason Martin Currie Asia Long-Term Unconstrained Fund^ – 36.89Legg Mason Martin Currie European Absolute Alpha Fund^ – 20.36Legg Mason Martin Currie Global Long-Term Unconstrained Fund^ 39.78 44.24Legg Mason Martin Currie Global Long-Term Unconstrained Fund^ – 25.90Legg Mason Martin Currie Asia Pacific Ex Japan Real Income Fund 57.81 53.43Legg Mason Martin Currie Asia Pacific Ex Japan Real Income Fund 20.76 33.24Legg Mason Martin Currie Global Emerging Markets Fund^ 50.43 75.56Legg Mason Martin Currie European Unconstrained Fund^ 89.29 48.38Legg Mason Martin Currie European Unconstrained Fund^ – 50.70
Amounts designated as “–” are either 0 or less than 1,000.
5. Distributions to Holders of Redeemable Participating Shares
Distributing Share Classes
The letter in parentheses at the end of the name of each Distributing Share Class indicates a particular frequency of dividend declarations and dividend payments, as detailed in the following table.
Distributing Share Class Designation Frequency of Dividend Declarations Frequency of Dividend Payments
(D) Daily Monthly(M) Monthly Monthly(Q) Quarterly Quarterly (March, June, September, December)(S) Semi-Annually Semi-Annually (March, September)(A) Annually Annually (March)
For each Distributing Share Class of each Fixed Income Fund (Fixed Income Fund as defined on page 15), at the time of each dividend declaration: (1) all, or some portion of, net investment income, ifany, will be declared as a dividend; and (2) all, or some portion, of realised and unrealised capital gains net of realised and unrealised capital losses may be, but is not required to be, declared as adividend.
For each Distributing Share Class of each Equity Fund (Equity Fund as defined on page 15), at the time of each dividend declaration: all, or some portion of, net investment income, if any, will bedeclared as a dividend. For each Shareholder of each Distributing Share Class, distributions will be made in the currency in which the Shareholder subscribed for shares, unless the Shareholder requestsotherwise.
For each Distributing Share Class of each Multi-Asset Fund (Multi-Asset Fund as defined on page 15), at the time of each dividend declaration, all, or some portion of, net investment income, if any, willbe declared as a dividend. For each Shareholder of each Distributing Share Class, distributions will be made in the currency in which the Shareholder subscribed for shares, unless the Shareholderrequests otherwise.
The Distributing Plus Share Classes may declare and pay distributions out of capital. Investors in these share classes should be aware that payment of dividends out of capital amounts to a return orwithdrawal of part of an investor’s original investment or of capital gains attributable to that original investment, and such distributions will result in a corresponding immediate decrease in the net assetvalue per share of the share class. The payment of distributions out of capital will accordingly lead to capital erosion and may be achieved by forgoing the potential for future capital growth.
^ Not authorised for sale to the public in Hong Kong.
307

Legg Mason Global Funds Plc Annual Report 28 February 2021
Notes to Financial Statements – (continued)5. Distributions to Holders of Redeemable Participating Shares – (continued)
During the financial year, the following Funds have paid distributions out of capital on Distributing Plus Share Classes:
Distributionsout of capital
for the year ended28 February 2021
(000’s)
Distributionsout of capital
for the year ended29 February 2020
(000’s)
Legg Mason Western Asset US Core Plus Bond Fund – Class A US$ Distributing (M) Plus $324 $23Legg Mason Western Asset US Core Plus Bond Fund – Class A AUD Distributing (M) (Hedged) Plus $108 $90Legg Mason Western Asset Short Duration High Income Bond Fund – Class A US$ Distributing (M) Plus $4 $12Legg Mason Western Asset Short Duration High Income Bond Fund – Class A AUD Distributing (M) (Hedged) Plus $– $1Legg Mason Western Asset Short Duration High Income Bond Fund – Class A HKD Distributing (M) Plus $6 $10Legg Mason Western Asset Global Multi Strategy Fund – Class A US$ Distributing (M) Plus $31 $26Legg Mason Western Asset Global Multi Strategy Fund – Class A AUD Distributing (M) (Hedged) Plus $2 $3Legg Mason Western Asset Global Multi Strategy Fund – Class A HKD Distributing (M) Plus $3 $2Legg Mason Western Asset Global Multi Strategy Fund – Class A SGD Distributing (M) (Hedged) Plus $24 $21Legg Mason Western Asset Global Multi Strategy Fund – Class A ZAR Distributing (M) (Hedged) Plus $119 $147Legg Mason Western Asset US High Yield Fund – Class A US$ Distributing (M) Plus $99 $14Legg Mason Western Asset US High Yield Fund – Class A SGD Distributing (M) (Hedged) Plus $7 $6Legg Mason Western Asset Emerging Markets Total Return Bond Fund – Class A US$ Distributing (M) Plus $1 $1Legg Mason Western Asset Emerging Markets Total Return Bond Fund – Class A SGD Distributing (M) (Hedged) Plus $1 $2Legg Mason Western Asset Global High Yield Fund – Class A US$ Distributing (M) Plus $106 $75Legg Mason Western Asset Global High Yield Fund – Class A AUD Distributing (M) (Hedged) Plus $211 $183Legg Mason Western Asset Global High Yield Fund – Class A SGD Distributing (M) (Hedged) Plus $133 $41Legg Mason Western Asset Asian Opportunities Fund – Class A US$ Distributing (M) Plus $1,391 $1,034Legg Mason Western Asset Asian Opportunities Fund – Class A AUD Distributing (M) (Hedged) Plus $679 $465Legg Mason Western Asset Asian Opportunities Fund – Class A CNH Distributing (M) (Hedged) Plus $421 $324Legg Mason Western Asset Asian Opportunities Fund – Class A HKD Distributing (M) Plus $407 $319Legg Mason Western Asset Asian Opportunities Fund – Class A SGD Distributing (M) (Hedged) Plus $66 $30Legg Mason Western Asset Asian Opportunities Fund – Class A SGD Distributing (M) Plus $26 $16Legg Mason Western Asset Macro Opportunities Bond Fund^ – Class A HKD Distributing (M) Plus $22 $7Legg Mason Western Asset Structured Opportunities Fund^ – Class D US$ Distributing (M) Plus $141 $29Legg Mason Western Asset Structured Opportunities Fund^ – Class D AUD Distributing (M) (Hedged) Plus $1 $1Legg Mason Brandywine Global Fixed Income Fund – Class A AUD Distributing (M) (Hedged) Plus $16 $16Legg Mason Brandywine Global Fixed Income Fund – Class A US$ Distributing (M) Plus $5 $–Legg Mason Brandywine Global Income Optimiser Fund^ – Class A US$ Distributing (M) Plus $2 $–Legg Mason Brandywine Global Income Optimiser Fund^ – Class A SGD Distributing (M) Plus $– $–Legg Mason Brandywine Global Income Optimiser Fund^ – Class A SGD Distributing (M) (Hedged) Plus $74 $3Legg Mason ClearBridge Global Equity Income Fund^ – Class A US$ Distributing (M) Plus $– $–Legg Mason ClearBridge Tactical Dividend Income Fund – Class A US$ Distributing (M) Plus $84 $131Legg Mason ClearBridge Tactical Dividend Income Fund – Class A AUD Distributing (M) (Hedged) Plus $44 $65Legg Mason ClearBridge Tactical Dividend Income Fund – Class A CNH Distributing (M) (Hedged) Plus $4 $4Legg Mason ClearBridge Tactical Dividend Income Fund – Class A HKD Distributing (M) Plus $28 $62Legg Mason ClearBridge Tactical Dividend Income Fund – Class A SGD Distributing (M) (Hedged) Plus $7 $5Legg Mason ClearBridge Infrastructure Value Fund^ – Class A US$ Distributing (M) (Hedged) Plus €1,377 €731Legg Mason ClearBridge Infrastructure Value Fund^ – Class A AUD Distributing (M) (Hedged) Plus €22 €2Legg Mason ClearBridge Infrastructure Value Fund^ – Class A CNH Distributing (M) (Hedged) Plus €145 €25Legg Mason ClearBridge Infrastructure Value Fund^ – Class A Euro Distributing (M) Plus €46 €12Legg Mason ClearBridge Infrastructure Value Fund^ – Class A SGD Distributing (M) (Hedged) Plus €32 €13Legg Mason QS MV European Equity Growth and Income Fund – Class A US$ Distributing (M) (Hedged) Plus €116 €255Legg Mason QS MV European Equity Growth and Income Fund – Class A AUD Distributing (M) (Hedged) Plus €47 €71Legg Mason QS MV European Equity Growth and Income Fund – Class A CNH Distributing (M) (Hedged) Plus €3 €7Legg Mason QS MV European Equity Growth and Income Fund – Class A Euro Distributing (M) Plus €5 €4Legg Mason QS MV European Equity Growth and Income Fund – Class A SGD Distributing (M) (Hedged) Plus €5 €9Legg Mason QS MV Asia Pacific Ex Japan Equity Growth and Income Fund – Class A US$ Distributing (M) Plus $111 $240Legg Mason QS MV Asia Pacific Ex Japan Equity Growth and Income Fund – Class A AUD Distributing (M) (Hedged) Plus $65 $91Legg Mason QS MV Asia Pacific Ex Japan Equity Growth and Income Fund – Class A CNH Distributing (M) (Hedged) Plus $8 $8Legg Mason QS MV Asia Pacific Ex Japan Equity Growth and Income Fund – Class A HKD Distributing (M) Plus $39 $78Legg Mason QS MV Asia Pacific Ex Japan Equity Growth and Income Fund – Class A SGD Distributing (M) (Hedged) Plus $1 $3Legg Mason QS MV Global Equity Growth and Income Fund – Class A US$ Distributing (M) Plus $23 $27Legg Mason QS MV Global Equity Growth and Income Fund – Class A AUD Distributing (M) (Hedged) Plus $20 $20Legg Mason QS MV Global Equity Growth and Income Fund – Class A HKD Distributing (M) Plus $30 $10Legg Mason QS MV Global Equity Growth and Income Fund – Class A SGD Distributing (M) (Hedged) Plus $1 $–Legg Mason Martin Currie Asia Pacific Ex Japan Real Income Fund – Class A AUD Distributing (M) Plus $8 $8Legg Mason Martin Currie Asia Pacific Ex Japan Real Income Fund – Class A SGD Distributing (M) Plus $1 $1Legg Mason Martin Currie Asia Pacific Ex Japan Real Income Fund – Class D AUD Distributing (M) (Hedged) Plus $4 $–Legg Mason Martin Currie Asia Pacific Ex Japan Real Income Fund – Class D CNH Distributing (M) (Hedged) Plus $– $–Legg Mason Martin Currie Asia Pacific Ex Japan Real Income Fund – Class D SGD Distributing (M) (Hedged) Plus $10 $–Legg Mason Martin Currie Asia Pacific Ex Japan Real Income Fund – Class D USD Distributing (M) Plus $5 $–Legg Mason Martin Currie Asia Pacific Ex Japan Real Income Fund – Class D HKD Distributing (M) Plus $– $–
Amounts designated as “–” are either $0/€0 or less than $1,000/€1,000.
The Distributing Plus (e) and Distributing Plus (u) Share Classes offered by certain of the Funds may charge certain fees and expenses to capital rather than income. Charging all or part of the fees andexpenses to capital will result in income being increased for distribution; however, the capital that these Distributing Plus (e) and Distributing Plus (u) Share Classes have available for investment in thefuture, and capital growth, may be reduced. Shareholders should note that there is an increased risk that on the redemption of shares of Distributing Plus (e) and Distributing Plus (u) Share Classes,shareholders may not receive back the full amount invested. For investors in Distributing Plus (e) and Distributing Plus (u) Share Classes, this may result in the erosion of investors’ capital investmentnotwithstanding the performance of the relevant Fund, or capital gains attributable to that original investment, which will likely diminish the value of future returns. The increased dividend payout as aresult of charging fees and expenses to capital effectively amounts to a return or withdrawal of an investor’s original capital investment or of capital gains attributable to that original investment. Thehigher level of dividend payout under this charging mechanism will result in a corresponding immediate decrease in the net asset value of the share classes on the ex-dividend date. Shareholders shouldnote that to the extent expenses are charged to capital, some or all of the distributions made by the Distributing Plus (e) and Distributing Plus (u) Share Classes should be considered to be a form ofcapital reimbursement. All expenses of the Distributing Plus (e) Share Classes have been charged to capital.
^ Not authorised for sale to the public in Hong Kong.
308

Legg Mason Global Funds Plc Annual Report 28 February 2021
Notes to Financial Statements – (continued)5. Distributions to Holders of Redeemable Participating Shares – (continued)
During the financial year, the following Funds have charged fees and expenses to capital on Distributing Plus (e) Share Classes:
Fees and expensescharged to capital for the year ended
28 February 2021(000’s)
29 February 2020(000’s)
Legg Mason Western Asset Global Multi Strategy Fund – Class A Euro Distributing (M) (Hedged) Plus (e) $5 $7Legg Mason Western Asset Global Multi Strategy Fund – Premier Class GBP Distributing (M) (Hedged) Plus (e) $1 $7Legg Mason Western Asset Global High Yield Fund – Premier Class US$ Distributing (M) Plus (e) $1 $40Legg Mason Western Asset Short Duration Blue Chip Bond Fund – S Class US$ Distributing (M) Plus (e) $62 $37Legg Mason Western Asset Short Duration Blue Chip Bond Fund – S Class Euro Distributing (M) (Hedged) Plus (e) $11 $8Legg Mason Western Asset Short Duration Blue Chip Bond Fund – S Class GBP Distributing (M) (Hedged) Plus (e) $922 $630Legg Mason Western Asset Short Duration Blue Chip Bond Fund – S Class AUD Distributing (M) (Hedged) Plus (e) $4 $–Legg Mason Western Asset Macro Opportunities Bond Fund^ – Class A US$ Distributing (M) Plus (e) $5,051 $7,031Legg Mason Western Asset Macro Opportunities Bond Fund^ – Class A AUD Distributing (M) (Hedged) Plus (e) $800 $704Legg Mason Western Asset Macro Opportunities Bond Fund^ – Class A CNH Distributing (M) (Hedged) Plus (e) $79 $78Legg Mason Western Asset Macro Opportunities Bond Fund^ – Class A GBP Distributing (M) (Hedged) Plus (e) $448 $458Legg Mason Western Asset Macro Opportunities Bond Fund^ – Class A JPY Distributing (M) Plus (e) $3 $1Legg Mason Western Asset Macro Opportunities Bond Fund^ – Class A SGD Distributing (M) (Hedged) Plus (e) $1,138 $1,345Legg Mason Western Asset Macro Opportunities Bond Fund^ – Class X US$ Distributing (M) Plus (e) $534 $895Legg Mason Western Asset Macro Opportunities Bond Fund^ – Class X GBP Distributing (M) (Hedged) Plus (e) $105 $117Legg Mason Western Asset Macro Opportunities Bond Fund^ – Class A Euro Distributing (M) (Hedged) Plus (e) $301 $439Legg Mason Western Asset Macro Opportunities Bond Fund^ – Class A HKD Distributing (M) Plus (e) $– $–Legg Mason Western Asset Macro Opportunities Bond Fund^ – Premier Class GBP Distributing (M) (Hedged) Plus (e) $3,501 $3,919Legg Mason Western Asset Multi-Asset Credit Fund^ – Premier Class GBP Distributing (M) (Hedged) Plus (e) $6 $–Legg Mason Western Asset Global Total Return Investment Grade Bond Fund^ – Class A US$ Distributing (M) Plus (e) $– $–Legg Mason Western Asset Global Total Return Investment Grade Bond Fund^ – Class X GBP Distributing (M) (Hedged) Plus (e) $– $–Legg Mason Western Asset Global Total Return Investment Grade Bond Fund^ – S Class GBP Distributing (M) (Hedged) Plus (e) $– $–Legg Mason Western Asset Structured Opportunities Fund^ – Premier Class GBP Distributing (M) (Hedged) Plus (e) $59 $258Legg Mason Western Asset US Mortgage-Backed Securities Fund^ – Class A US$ Distributing (M) Plus (e) $– $1Legg Mason Brandywine Global Sovereign Credit Fund^ – Class A US$ Distributing (M) Plus (e) $– $–Legg Mason Brandywine Global Sovereign Credit Fund^ – Premier Class US$ Distributing (M) Plus (e) $– $–Legg Mason Brandywine Global Income Optimiser Fund^ – Class A US$ Distributing (M) Plus (e) $160 $194Legg Mason Brandywine Global Income Optimiser Fund^ – Class A Euro Distributing (M) (Hedged) Plus (e) $230 $181Legg Mason Brandywine Global Income Optimiser Fund^ – Class A GBP Distributing (M) (Hedged) Plus (e) $13 $10Legg Mason Brandywine Global Income Optimiser Fund^ – Class X US$ Distributing (M) Plus (e) $41 $4Legg Mason Brandywine Global Income Optimiser Fund^ – Class X Euro Distributing (M) (Hedged) Plus (e) $43 $30Legg Mason Brandywine Global Income Optimiser Fund^ – Class X GBP Distributing (M) (Hedged) Plus (e) $7 $12Legg Mason Brandywine Global Income Optimiser Fund^ – Premier Class US$ Distributing (M) Plus (e) $12 $5Legg Mason Brandywine Global Income Optimiser Fund^ – Premier Class Euro Distributing (M) (Hedged) Plus (e) $15 $12Legg Mason Brandywine Global Income Optimiser Fund^ – Premier Class GBP Distributing (M) (Hedged) Plus (e) $1 $1Legg Mason Brandywine Global Income Optimiser Fund^ – S Class Euro Distributing (M) (Hedged) Plus (e) $29 $21Legg Mason Brandywine Global Income Optimiser Fund^ – S Class GBP Distributing (M) (Hedged) Plus (e) $8 $18Legg Mason Brandywine Global Defensive High Yield Fund^ – Class A US$ Distributing (M) Plus (e) $– $–Legg Mason Brandywine Global – US High Yield Fund^ – Class A US$ Distributing (M) Plus (e) $– $–Legg Mason Brandywine Global Enhanced Absolute Return Fund^ – Class X GBP Distributing (M) (Hedged) Plus (e) $– $–Legg Mason ClearBridge Global Equity Income Fund^ – Class A US$ Distributing (M) Plus (e) $– $4Legg Mason ClearBridge Global Equity Income Fund^ – Class A Euro Distributing (M) (Hedged) Plus (e) $– $4Legg Mason ClearBridge Global Equity Income Fund^ – Premier Class US$ Distributing (M) Plus (e) $– $2Legg Mason ClearBridge Global Equity Income Fund^ – Premier Class Euro Distributing (M) (Hedged) Plus (e) $– $2Legg Mason ClearBridge Tactical Dividend Income Fund – Class A US$ Distributing (M) Plus (e) $2 $2Legg Mason ClearBridge Tactical Dividend Income Fund – Class A Euro Distributing (M) (Hedged) Plus (e) $5 $6Legg Mason ClearBridge Tactical Dividend Income Fund – Class X US$ Distributing (M) Plus (e) $1 $1Legg Mason ClearBridge Tactical Dividend Income Fund – Class X Euro Distributing (M) (Hedged) Plus (e) $– $–Legg Mason ClearBridge Tactical Dividend Income Fund – Premier Class US$ Distributing (M) Plus (e) $– $–Legg Mason ClearBridge Infrastructure Value Fund^ – Premier Class GBP Distributing (A) (Hedged) (PH) Plus (e) €535 €703Legg Mason ClearBridge Infrastructure Value Fund^ – Premier Class CAD Distributing (Q) Plus (e) €62 €181Legg Mason ClearBridge Infrastructure Value Fund^ – Premier Class CAD Distributing (Q) (Hedged) (PH) Plus (e) €250 €452Legg Mason Martin Currie Asia Pacific Ex Japan Real Income Fund – Class A US$ Distributing (M) Plus (e) $51 $10Legg Mason Martin Currie Asia Pacific Ex Japan Real Income Fund – Class A Euro Distributing (M) Plus (e) $9 $10Legg Mason Martin Currie Asia Pacific Ex Japan Real Income Fund – S Class GBP Distributing (M) Plus (e) $3 $3Legg Mason Martin Currie Global Dividend Opportunities Fund^ – Class A US$ Distributing (M) Plus (e) $– $15Legg Mason Martin Currie Global Dividend Opportunities Fund^ – Class X US$ Distributing (M) Plus (e) $– $9Legg Mason Martin Currie Global Dividend Opportunities Fund^ – S Class GBP Distributing (M) Plus (e) $– $–
Amounts designated as “–” are either $0/€0 or less than $1,000/€1,000.
Accumulating Share Classes
With respect to Accumulating Share Classes, it is intended that, in the normal course of business, distributions will not be declared and that any net investment income attributable to eachAccumulating Share Class will be accumulated daily in the respective net asset value per share of each respective share class.
6. Share Capital and Redeemable Participating Shares
Share Capital
The Company was incorporated with an initial share capital of Euro 39,000 represented by 39,000 subscriber shares of no par value. All but three of the subscriber shares have been repurchased by theCompany. Shareholders of these three subscriber shares are entitled to attend and vote at all of the meetings of the Company, but are not entitled to participate in the dividends or net assets of anyFund or of the Company.
Redeemable Participating Shares
The share capital of the Company shall at all times equal the net asset value. The Directors are empowered to issue up to five hundred billion shares of no par value in the Company at the net assetvalue per share on such terms as they may see fit. There are no rights of pre-emption upon the issue of shares in the Company.
Each of the shares entitles the Shareholder to participate equally on a pro rata basis in the dividends, where applicable, and net assets of the Fund in respect of which they are issued, save in the case ofdividends declared prior to becoming a shareholder.
The proceeds from the issue of shares shall be applied in the books of the Company to the relevant Fund and shall be used in the acquisition on behalf of the relevant Fund of assets in which the Fundmay invest. The records and accounts of each Fund shall be maintained separately.
Each Fund has different share classes offered as indicated in the Company’s Prospectus. These different classes of shares differ principally in terms of their sales charges, fees, rates of expenses, distributionpolicy, and currency denomination. Investors are thus able to choose a share class that best suits their investment needs, considering the amount of investment and anticipated holding period.
Each share class is designated as a Distributing Share Class or an Accumulating Share Class. Accumulating Share Classes do not distribute net income, net realised or net unrealised capital gains whereasDistributing Share Classes will distribute at certain intervals, which will vary depending on the letter in parentheses at the end of the name of the Distributing Share Class, as explained under Note 5 -Distributions to Holders of Redeemable Participating Shares. In addition, the Company has subscriber shares outstanding. The subscriber shares do not entitle the holders to participate in the assets ofany Fund.
^ Not authorised for sale to the public in Hong Kong.
309

Legg Mason Global Funds Plc Annual Report 28 February 2021
Notes to Financial Statements – (continued)6. Share Capital and Redeemable Participating Shares – (continued)
Each Fund may offer share classes designated in currencies other than the base currency of the Fund. For each such share class, unless indicated by ‘‘(Hedged)’’ in the name of the share class, therelevant Investment Manager and Sub-Investment Manager will not employ any techniques to hedge the share class’s exposure to changes in exchange rates between the base currency of the Fund andthe currency of the share class.
Class A Shares are available to all investors. Commission/rebate payments may be made by distributors to dealers or other investors who have an agreement with a distributor with respect to suchshares. Class B, C, D and E Shares are available to all investors who are clients of dealers appointed by a distributor with respect to such shares. Commission payments may be made by distributors todealers or other investors who have an agreement with a distributor with respect to such shares. Class F Shares are available to professional investors and investors with a discretionary investmentagreement with a dealer appointed by the distributor with respect to such shares. Commission/rebate payments may be made by distributors to dealers or other investors who have an agreement withthe distributor with respect to such shares. Class J Shares are for Japanese distribution, at the discretion of the Directors or distributors. Class M Shares are available to professional investors andinvestors with a discretionary investment agreement with a dealer or other entity appointed by a distributor with respect to such shares. Class R Shares are available to all investors who have a fee-basedarrangement with an intermediary from whom they have received a personal recommendation in relation to their investment in the Funds. Class X Shares are available to dealers, portfolio managers orplatforms which, according to regulatory requirements or based on fee arrangements with their clients, are not allowed to accept and retain trail commissions; and institutional investors (for investors inthe European Union, this means “Eligible Counterparties” as defined under MIFID II) investing for their own account. Class U, Y and S Shares are available to institutional investors at the discretion ofthe Directors or distributors. BW LM Share Classes are available at the discretion of the Directors or distributors to qualifying investors who are members of the Franklin Templeton group or clients ofsuch members. LM Share Classes are available at the discretion of the Directors or distributors to qualifying investors who are members of the Franklin Templeton group, retirement schemes andschemes of similar nature sponsored by members of the Franklin Templeton group, or clients of such members. For investors based in the European Union, BW Premier Share Classes are available at thediscretion of the Directors or distributors to “Eligible Counterparties” as defined under MIFID II; for investors based outside the European Union, BW Premier Share Classes are available to institutionalinvestors at the discretion of the Directors or distributors or to qualifying investors who are members of the Franklin Templeton group or clients of such members. For investors based in the EuropeanUnion, Premier Share Classes are available to “Eligible Counterparties” as defined under MIFID II; for investors based outside the European Union, Premier Share Classes are available to institutionalinvestors.
For share classes that include “(Hedged)” in their name after the currency denomination, it is intended that such share classes will be hedged against movements in exchange rates between thecurrency of the share class and the base currency of the relevant Fund. Certain share classes in Funds managed by Brandywine Global Investment Management, LLC are hedged relative to an index, asindicated by the inclusion of an “(IH)” in the Share Class name. The Funds managed by Brandywine Global Investment Management, LLC and the Legg Mason ClearBridge Infrastructure Value Fundmanaged by ClearBridge RARE Infrastructure International Pty Limited offers portfolio hedged share classes, as indicated by the inclusion of a “(PH)” in the share class name. Certain Funds offer shareclasses that may pay a performance fee, as indicated by “(PF)” in the name of the share class.
Certain Funds also have issued shares of Grandfathered Share Classes, as indicated by the inclusion of “GA”, “GE”, “GP” or “(G)” in the name of the share class. The Grandfathered Share Classes areavailable only to unitholders of the affiliated funds. The Grandfathered Class Shares are closed to any subsequent subscriptions, both by existing shareholders in the share class and by new investors,except that shares may continue to be acquired through (1) dividend reinvestment; (2) automatic conversions from a Class B (G) Share Class of the Fund to a Class A (G) Share Class of the same Fund;and (3) exchanges of shares of a Grandfathered Share Class with the same letter designation. Notwithstanding the foregoing, as indicated in the Fund Supplements, certain Grandfathered Share Classesfor certain Funds may be made available for subsequent subscriptions by existing shareholders in the share class in the sole discretion of the Directors.
7. Taxation
Under current Irish law and practice, the Company qualifies as an investment undertaking as defined in Section 739B of the Taxes Consolidation Act, 1997 (as amended). On that basis, the Companywill not generally be liable to Irish tax in respect of its income and gains, other than on the occurrence of a chargeable event. Generally a chargeable event arises on any distribution, redemption,repurchase, cancellation, transfer of shares or on the ending of a ‘Relevant Period’, a ‘Relevant Period’ being an eight year period beginning with the acquisition of the shares by the Shareholders andeach subsequent period of eight years beginning immediately after the preceding Relevant Period.
No Irish tax will arise on the Company in respect of chargeable events in respect of:
(i) a shareholder who is neither Irish resident nor ordinarily resident in Ireland for tax purposes, at the time of the chargeable event, provided an appropriate valid declaration is in place, orthe Company has been authorised by Irish Revenue to make gross payments in the absence of appropriate declarations; and
(ii) certain exempted Irish tax resident shareholders who have provided the Company with the necessary signed statutory declarations.
In addition, any transaction (which might otherwise be a chargeable event) in relation to shares held in a recognised clearing system as designated by order of the Irish Revenue Commissioners will notconstitute a chargeable event.
In the absence of an appropriate declaration, the Company will be liable to Irish tax on the occurrence of a chargeable event.
Capital gains, dividends and interest received may be subject to taxes, including withholding taxes imposed by the country of origin and such taxes may not be recoverable by the Fund or itsshareholders.
8. Cash and Cash Equivalents and Margin Accounts
Cash and cash equivalents are valued at their face value with interest accrued, where applicable. The cash and cash equivalents and cash overdraft balances of any Fund are held with the Depositary.“Margin accounts and restricted cash” in the Statement of Financial Position represent margin deposits, cash collateral and realised gains and losses on futures contracts not yet delivered. Margindeposits and cash collateral, held in relation to OTCs and exchange traded derivatives trading as at 28 February 2021, are held with the following brokers: Bank of America Merrill Lynch, Barclays, BNPParibas, BNY Mellon, Citi, Goldman Sachs, HSBC, JP Morgan, Morgan Stanley and UBS.
9. Commitments and Contingent Liabilities
There were no significant commitments or contingent liabilities as at 28 February 2021 and 29 February 2020.
10. Soft Commission Arrangements
The Company has policies designed to ensure that its service providers act in the Funds’ best interests when executing decisions to deal on behalf of those Funds in the context of managing the Funds’portfolios. For these purposes, all reasonable steps must be taken to obtain the best possible result for the Funds, taking into account price, costs, speed, likelihood of execution and settlement, ordersize and nature, or any other consideration relevant to the execution of the order. Any cash rebates received from a broker or dealer in consideration of Fund brokerage transactions directed to thatbroker or dealer will not be retained by the Investment Manager, the Sub-Investment Manager or any of their connected persons. The Company will not bear the costs of external research obtained bythe Investment Managers and the Sub-Investment Managers. Such costs will be borne by the relevant Investment Manager or Sub-Investment Manager. Information about the Funds’ execution policiesis available to Shareholders at no charge upon request.
During the financial year ended 28 February 2021, Royce & Associates, LP (“Royce”) entered into soft commission arrangements with brokers, but reimbursed the relevant Funds for any research costsincurred as part of such arrangements (During the year ended 29 February 2020, Royce and ClearBridge Investments, LLC (‘‘ClearBridge’’) entered into soft commission arrangements with brokers, butreimbursed the relevant Funds for any research costs incurred as part of such arrangements).
310

Legg Mason Global Funds Plc Annual Report 28 February 2021
Notes to Financial Statements – (continued)11. Exchange Rates
The following exchange rates were used in these financial statements to obtain the equivalent US Dollar, Euro and British Pound amounts for the respective Funds with US Dollar, Euro and British Poundbased currencies, respectively:
CurrencyExchange rates as at
28 February 2021Exchange rates as at
29 February 2020USD Based Funds Argentine Peso 148.7469* 62.1236
Australian Dollar 1.2996 1.5350Brazilian Real 5.6042 4.4719British Pound 0.7178 0.7799Canadian Dollar 1.2726 1.3423Chilean Peso 723.8900 817.9000Chinese Renminbi (CNH) 6.4855 6.9783Chinese Renminbi (CNY) 6.4600 6.9900Colombian Peso 3,647.0000 3,519.2000Czech Koruna 21.6908 23.0459Danish Krone 6.1632 6.7694Egyptian Pound 15.7000 15.6325Euro 0.8288 0.9058Hong Kong Dollar 7.7565 7.7950Hungarian Forint 300.4559 306.3138Indian Rupee 73.4850 72.1675Indonesian Rupiah 14,240.0000 14,347.5000Israeli Shekel 3.3101 3.4685Japanese Yen 106.5950 107.8600Malaysian Ringgit 4.0475 4.2150Mexican Peso 20.9210 19.6830New Zealand Dollar 1.3840 1.5999Norwegian Krone 8.6706 9.4085Pakistan Rupee 158.1000 154.5550Philippine Peso 48.5200 50.9750Polish Zloty 3.7475 3.9219Qatari Rial 3.6418 3.6413Russian Ruble 74.5413 66.8963Singapore Dollar 1.3334 1.3929South African Rand 15.1313 15.6000South Korean Won 1,123.5000 1,214.5000Swedish Krona 8.4439 9.6094Swiss Franc 0.9097 0.9648Taiwan Dollar 27.8525 30.2795Thai Baht 30.1350 31.5550Turkish Lira 7.4268 6.2308United Arab Emirates Dirham 3.6732 3.6729
CurrencyExchange rates as at
28 February 2021Exchange rates as at
29 February 2020EUR Based Funds Australian Dollar 1.5681 1.6946
Brazilian Real 6.7618 4.9368British Pound 0.8660 0.8610Canadian Dollar 1.5355 1.4818Czech Krona 26.1710 –Danish Krone 7.4362 7.4730Hong Kong Dollar – 8.6053Hungarian Forint 362.5152 338.1552Japanese Yen 128.6123 119.0721Mexican Peso – 21.7291Norwegian Krone 10.4615 10.3865Polish Zloty 4.5215 4.3295South African Rand 18.2566 17.2216Swedish Krona 10.1880 10.6082Swiss Franc 1.0975 1.0651Turkish Lira 8.9608 6.8784United States Dollar 1.2066 1.1040
CurrencyExchange rates as at
28 February 2021Exchange rates as at
29 February 2020GBP Based Funds Euro 1.1547 1.1614
United States Dollar 1.3932 1.2822
* Discounted daily rate, based on ARS Eqy EqWgt Impli (UNOFFICIAL) Index, as per instructions from FTIS.
12. Risk Exposure and Risk Management
Following its appointment as the UCITS management company of the Company, with responsibility for managing the Company and for certain investment management, administration and distributionfunctions in respect of the Company as set out in the UCITS Regulations, FTIS (the “Manager”) has made the decision to delegate some, but not all investment management activities to relevantInvestment Managers and / or Sub-Investment Managers, provided that the Manager remains responsible to the Funds for the performance of their agreed upon obligations (please refer to the GeneralInformation pages for the line-up of Investment Managers and Sub-Investment Managers for each Fund, as applicable, as per the Prospectus).
The Company, in conjunction with the Manager and the Investment Managers, has determined that certain of its material risks are market risk, credit risk and liquidity risk. In respect of the use of financialderivative instruments, the risks are counterparty risk, credit risk, increased margin calls and unlimited risk of loss. Further details of these and other risks are set out below and in the Prospectus under ‘‘RiskFactors’’.
Market risk includes market price risk, foreign currency risk, interest rate risk and other price risk.
Market price risk is the risk that the fair value or future cash flows of a financial instrument will fluctuate because of changes in market prices. The maximum price risk resulting from the ownership offinancial instruments is determined by the fair value of financial instruments. The Investment Managers or Sub-Investment Managers may consider the asset allocation of the portfolios in order tominimise the risk associated with particular countries, industry sectors or securities while continuing to follow each Fund’s investment objective as outlined in the Directors’ Report. Risk is managed byeach Investment Manager or Sub-Investment Manager, as applicable, through careful selection of securities and other financial instruments within specified limits and investment mandates. Details ofeach Fund’s investment policies are outlined in the Directors’ Report. Details of each Fund’s financial assets and financial liabilities are presented on the Statement of Financial Position.
Foreign currency risk is the risk that the value of a financial instrument will fluctuate because of changes in the rate of exchange between the currency in which the financial asset or financial liability isdenominated and the functional currency of the Funds. The value of the investments of a Fund denominated in a currency other than the functional currency may rise and fall due to exchange ratefluctuations by the relevant currencies. There is a risk that large exchange rate fluctuations may have a significant impact on the performance of the Funds.
Where a Fund holds investments in a currency other than that Fund’s functional currency, the relevant Investment Manager or Sub-Investment Manager may manage foreign currency risk by eitherhedging foreign currency into the functional currency of the Fund or alternatively by diversifying investments across multiple currencies using a multi-bank foreign exchange trading network.
Interest rate risk is the risk that the value of a financial instrument will fluctuate because of changes in market interest rate. The Funds which hold fixed interest rate debt securities and overdraft positionsare exposed to interest rate risk where the value of these securities or loans may fluctuate as a result of a change in interest rates. Holdings in floating and variable rate securities may also be subject tointerest rate risk although to a lesser degree. Cash assets held via the Depositary have the potential to yield interest income, the level of which will fluctuate according to the prevailing level of marketinterest rates.
311

Legg Mason Global Funds Plc Annual Report 28 February 2021
Notes to Financial Statements – (continued)12. Risk Exposure and Risk Management – (continued)
The Equity Funds generally do not invest in any interest bearing securities other than cash balances held with the Depositary. Cash assets yield interest income, the level of which will fluctuate accordingto the prevailing level of market interest rates. As a result, the Equity Funds are not subject to significant amounts of risk due to fluctuations in the prevailing levels of market interest rates on its financialassets and financial liabilities.
The Fixed Income Funds and Multi-Asset Funds invest in interest bearing financial assets and financial liabilities which expose them to risks associated with the effects of fluctuations in the prevailinglevels of market interest rates on their financial positions and cash flows. The value of investments in fixed rate interest bearing securities may be subject to price volatility due to changes in interestrates. Fluctuations in market interest rates will impact upon the level of interest received by a Fund.
An increase in interest rates will generally reduce the value of debt securities that are issued and outstanding, while a decline in interest rates will generally increase the value of debt securities that areissued and outstanding. The magnitude of these price fluctuations will be greater when the maturity of the outstanding securities is longer. Changes in the value of securities held by a Fund wheninterest rates change mean that a Fund’s net asset value per share can go up or down because of the effect on the value of the Fund’s portfolio of debt securities.
The relevant Investment Manager or Sub-Investment Manager to each Fixed Income Fund monitors the interest-rate environment and evaluates risks on major strategies. Interest rate risk is controlled bymonitoring maturities and duration relative to the Funds’ benchmarks. Techniques such as key rate duration measurement are used to evaluate portfolio curve exposures.
Details of each Fixed Income Fund’s weighted average yield, weighted average years to maturity and an analysis of fixed and non-interest bearing securities are set out in Notes 12.1 (b) and12.1 (c) below.
The risks involved with investing in Equity Funds include changing economic conditions, industry and company conditions and security selection. Fixed Income Funds and Multi-Asset Funds are alsosubject to interest rate risk, credit risk, maturity risk and market risk. International securities are subject to changing exchange rates, less liquid markets and political and economic instability dependingon the country. Developing markets are subject to these same risks however it may be to a greater degree. For the purpose of efficient portfolio management, the Funds may enter into exchange tradedor over-the-counter (‘‘OTC’’) derivatives, including but not limited to, futures, swaps, forwards, options and warrants and may enter into stock lending agreements.
The Investment Management and Portfolio Oversight Committee (“IMPOC” or the “Committee”) has been established within Franklin Templeton to oversee the delegation of investment managementresponsibilities for all Funds. The Committee is comprised of members who, as a group, have experience and specialised knowledge in such areas as investment management including equity, fixedincome and derivatives; investment analysis and reporting; risk management; and compliance. The Committee, on behalf of the Manager, has been responsible for overseeing that the Funds aremanaged within the terms of the Funds’ investment guidelines and limits set out in the Prospectus and the UCITS Regulations as well as the relevant Investment Manager’s or Sub-Investment Manager’sown internal investment guidelines and limits. The Committee generally meets once a month to oversee that the Funds are being managed in accordance with these limits and regulatory requirements.The respective Investment Managers and/or Sub-Investment Managers, as applicable, report to the Committee matters arising in relation to the monitoring of certain material risks arising from a Fund’sinvestments in financial instruments.
12.1 Market Risk
Each Fund using financial derivative instruments (‘‘FDI’’s) will seek to limit the market risk and leverage created through the use of derivatives by using either the commitment approach or by using asophisticated risk measurement technique known as ‘‘value-at-risk’’ (the ‘‘VaR approach’’). Each Fund using FDI (other than Legg Mason Western Asset Macro Opportunities Bond Fund^, Legg MasonWestern Asset Multi-Asset Credit Fund^, Legg Mason Western Asset Structured Opportunities Fund^, Western Asset UCITS SMASh Series Core Plus Completion Fund^, Legg Mason Brandywine GlobalFixed Income Absolute Return Fund^, Legg Mason Brandywine Global Income Optimiser Fund^, Legg Mason Brandywine Global Credit Opportunities Fund^, Legg Mason Brandywine Global EnhancedAbsolute Return Fund^ and Legg Mason Martin Currie European Absolute Alpha Fund^) use the commitment approach. Legg Mason Western Asset Macro Opportunities Bond Fund^, Legg MasonWestern Asset Multi-Asset Credit Fund^, Legg Mason Western Asset Structured Opportunities Fund^, Western Asset UCITS SMASh Series Core Plus Completion Fund^, Legg Mason Brandywine GlobalFixed Income Absolute Return Fund^, Legg Mason Brandywine Global Income Optimiser Fund^, Legg Mason Brandywine Global Credit Opportunities Fund^, Legg Mason Brandywine Global EnhancedAbsolute Return Fund^, and Legg Mason Martin Currie European Absolute Alpha Fund^ use or has used, respectively, the VaR approach.
The respective Investment Manager and/or Sub-Investment Managers, as applicable, of each Fund using FDI have employed a risk management process to enable them to accurately measure, monitorand manage the risks attached to FDI positions.
The commitment approach calculates leverage by measuring the market value of the underlying exposures of derivatives relative to the relevant Fund’s Net Asset Value. VaR is a statistical methodology thatseeks to predict, using historical data, the likely maximum loss that a Fund could suffer, calculated to a specific (e.g., ‘‘one tailed’’ 99 per cent) confidence level. Legg Mason Western Asset MacroOpportunities Bond Fund^, Legg Mason Western Asset Multi-Asset Credit Fund^, Legg Mason Western Asset Structured Opportunities Fund^, Western Asset UCITS SMASh Series Core Plus CompletionFund^, Legg Mason Brandywine Global Fixed Income Absolute Return Fund^, Legg Mason Brandywine Global Income Optimiser Fund^, Legg Mason Brandywine Global Credit Opportunities Fund^, LeggMason Brandywine Global Enhanced Absolute Return Fund^ and Legg Mason Martin Currie European Absolute Alpha Fund^ use or has used, respectively, an ‘‘absolute’’ VaR model where the measurementof VaR is relative to the Net Asset Value of the Fund. A VaR model has certain inherent limitations and it cannot be relied upon to predict or guarantee that the size or frequency of losses incurred by a Fundwill be limited to any extent. As the VaR model relies on historical market data as one of its key inputs, if current market conditions differ from those during the historical observation period, the effectivenessof the VaR model in predicting the VaR of a Fund may be materially impaired. Investors may suffer serious financial consequences under abnormal market conditions.
The effectiveness of the VaR model could be impaired in a similar fashion if other assumptions or components comprised in the VaR model prove to be inadequate or incorrect.
Western Asset Management Company Limited and Western Asset Management Company, LLC (“Western Asset’’) calculate VaR at a 99% confidence level for a 1 day time horizon using an appropriatesample of historical data. The table below indicates the absolute VaR for the Funds:
Fund As at 28 February 2021 As at 29 February 2020
Legg Mason Western Asset Macro Opportunities Bond Fund^ 1.76% 1.25%Legg Mason Western Asset Multi-Asset Credit Fund^ 0.96% 0.91%Legg Mason Western Asset Structured Opportunities Fund^ 1.39% 0.28%Western Asset UCITS SMASh Series Core Plus Completion Fund^ 2.20% n/a
Brandywine Global Investment Management, LLC (“Brandywine”) calculates VaR at a 95% confidence level for a 1 day time horizon using 2 years of historical data. The table below indicates theabsolute VaR for the Funds:
Fund As at 28 February 2021 As at 29 February 2020
Legg Mason Brandywine Global Fixed Income Absolute Return Fund^ 1.59% 0.23%Legg Mason Brandywine Global Income Optimiser Fund^ 1.75% 0.36%Legg Mason Brandywine Global Credit Opportunities Fund^ 2.60% 0.40%Legg Mason Brandywine Global Enhanced Absolute Return Fund^ 2.58% 0.80%
Where Legg Mason Western Asset Macro Opportunities Bond Fund^, Legg Mason Western Asset Multi-Asset Credit Fund^, Legg Mason Western Asset Structured Opportunities Fund^, Western AssetUCITS SMASh Series Core Plus Completion Fund^, Legg Mason Brandywine Global Fixed Income Absolute Return Fund^, Legg Mason Brandywine Global Income Optimiser Fund^, Legg MasonBrandywine Global Credit Opportunities Fund^ and Legg Mason Brandywine Global Enhanced Absolute Return Fund^ use an absolute VaR model, in accordance with the requirements of the CentralBank each of these Funds is subject to an absolute VaR limit of 20% of the Fund’s Net Asset Value. However, each of these Funds may from time to time experience a change in Net Asset Value over a20 day holding period greater than 20% of Net Asset Value.
^ Not authorised for sale to the public in Hong Kong.
312

Legg Mason Global Funds Plc Annual Report 28 February 2021
Notes to Financial Statements – (continued)12. Risk Exposure and Risk Management – (continued)
12.1 Market Risk – (continued)
In addition to using the VaR approach, the respective Investment Managers and/or Sub-Investment Managers of Legg Mason Western Asset Macro Opportunities Bond Fund^, Legg Mason Western AssetMulti-Asset Credit Fund^, Legg Mason Western Asset Structured Opportunities Fund^, Western Asset UCITS SMASh Series Core Plus Completion Fund^, Legg Mason Brandywine Global Fixed IncomeAbsolute Return Fund^, Legg Mason Brandywine Global Income Optimiser Fund^, Legg Mason Brandywine Global Credit Opportunities Fund^, Legg Mason Brandywine Global Enhanced Absolute ReturnFund^ and Legg Mason Martin Currie European Absolute Alpha Fund^ monitor or has been monitoring, as applicable, the leverage levels on a daily basis to monitor changes due to market movements. Inaddition, the respective Investment Managers and/or Sub-Investment Managers of each of these Funds shall carry out pre-trade testing to consider the impact that the trade would have on the relevantFund’s overall leverage and to consider the risk/reward levels of the trade.
The lowest, average and highest VaR levels, at a 99% confidence level for a 20 day time horizon, for relevant Western Asset and Brandywine Funds, were as follows:
As at 28 February 2021
Fund Minimum Average Maximum
Legg Mason Western Asset Macro Opportunities Bond Fund^ 5.75% 11.77% 24.47%Legg Mason Western Asset Multi-Asset Credit Fund^ 4.11% 8.91% 22.13%Legg Mason Western Asset Structured Opportunities Fund^ 1.21% 8.41% 17.90%Western Asset UCITS SMASh Series Core Plus Completion Fund^ 3.82% 4.24% 10.08%Legg Mason Brandywine Global Fixed Income Absolute Return Fund^ 4.73% 11.07% 13.83%Legg Mason Brandywine Global Income Optimiser Fund^ 4.64% 12.00% 15.35%Legg Mason Brandywine Global Credit Opportunities Fund^ 7.36% 12.54% 16.55%Legg Mason Brandywine Global Enhanced Absolute Return Fund^ 12.12% 15.80% 18.59%
As at 29 February 2020
Fund Minimum Average Maximum
Legg Mason Western Asset Macro Opportunities Bond Fund^ 3.85% 5.41% 8.02%Legg Mason Western Asset Multi-Asset Credit Fund^ 1.83% 2.30% 4.19%Legg Mason Western Asset Structured Opportunities Fund^ 0.92% 1.64% 3.07%Legg Mason Western Asset Global Total Return Investment Grade Bond Fund^ 2.20% 2.85% 3.99%Legg Mason Brandywine Global Fixed Income Absolute Return Fund^ 2.06% 3.55% 4.30%Legg Mason Brandywine Global Income Optimiser Fund^ 1.16% 1.72% 2.82%Legg Mason Brandywine Global Credit Opportunities Fund^ 1.16% 3.49% 6.98%Legg Mason Brandywine Global Enhanced Absolute Return Fund^ 6.53% 7.88% 9.04%
In accordance with the requirements of the Central Bank, Martin Currie Investment Management Limited calculates VaR based on a 10 business day holding period and a “one-tailed” 95% confidenceinterval. Legg Mason Martin Currie European Absolute Alpha Fund^ has been subject to an absolute VaR limit of 8.5% of the Fund’s Net Asset Value. The lowest, average and highest VaR levels wereas follows:
As at 28 February 2021
Fund Minimum Average Maximum
Legg Mason Martin Currie European Absolute Alpha Fund^ 1.85% 4.47% 9.87%
As at 29 February 2020
Fund Minimum Average Maximum
Legg Mason Martin Currie European Absolute Alpha Fund^ 1.02% 1.85% 3.84%Legg Mason Martin Currie Japan Absolute Alpha Fund^ 0.00% 1.24% 2.53%
For Funds using VaR, leverage is calculated as the sum of the notionals of the derivatives used.
Average levels of leverage employed were as follows:
Fund
For the financialyear ended
28 February 2021
For the financialyear ended
29 February 2020
Legg Mason Western Asset Macro Opportunities Bond Fund^ 752.50% 922.90%Legg Mason Western Asset Multi-Asset Credit Fund^ 107.40% 115.00%Legg Mason Western Asset Structured Opportunities Fund^ 29.20% 83.00%Legg Mason Western Asset Global Total Return Investment Grade Bond Fund^ n/a 235.20%*Western Asset UCITS SMASh Series Core Plus Completion Fund^ 275%** n/aLegg Mason Brandywine Global Fixed Income Absolute Return Fund^ 125.20% 80.31%Legg Mason Brandywine Global Income Optimiser Fund^ 70.86% 46.27%Legg Mason Brandywine Global Credit Opportunities Fund^ 57.35% 81.59%Legg Mason Brandywine Global Enhanced Absolute Return Fund^ 105.83% 1,091.94%Legg Mason Martin Currie European Absolute Alpha Fund^ 108.12% 91.11%Legg Mason Martin Currie Japan Absolute Alpha Fund^ n/a 28.47%*
* The figures for Legg Mason Western Asset Global Total Return Investment Grade Bond Fund^ and Legg Mason Martin Currie Japan Absolute Alpha Fund^ are for the period from 1 March 2019up to the date when they ceased trading on 13 November 2019 and 31 May 2019, respectively.
** Since 11 January 2021, the date of inception of Western Asset UCITS SMASh Series Core Plus Completion Fund^, to the financial year ended 28 February 2021.
Stress testing is the examination of the potential effects on a Fund’s financial condition of a set of specific changes in risk factors, relating to exceptional but possible events. Western Asset take aconservative approach by applying stress tests that are beyond the range of reasonably likely occurrences. Western Asset expect (although there is no assurance) that if Legg Mason Western Asset USGovernment Liquidity Fund is able to withstand stress tests that are beyond the range of reasonably likely occurrences, that the Net Asset Value per share (or any particular class of share) of this Fund,would remain stable in the event of reasonable negative market events.
A scenario based stress test can be used to meet the sensitivity analysis requirement of FRS 102. FRS 102 does not prescribe a specific basis point movement or percentage movement for sensitivityanalyses. Accordingly for the purposes of this annual report, the currency impact on Legg Mason Western Asset US Government Liquidity Fund of an instantaneous 25 basis points increase in short-terminterest rates is shown:
Legg Mason Western Asset US Government Liquidity Fund
As at 28 February 2021 ($264,893)As at 29 February 2020 ($249,724)
(a) Market Price Risk
Each Fund’s market price risk is monitored, but not managed, relative to an index. The indices as at 28 February 2021 and 29 February 2020 are outlined below.
The following tables set out the index for each Fund, except for Legg Mason Western Asset Macro Opportunities Bond Fund^, Legg Mason Western Asset Multi-Asset Credit Fund^, Legg MasonWestern Asset Structured Opportunities Fund^, Western Asset UCITS SMASh Series Core Plus Completion Fund^, Legg Mason Brandywine Global Fixed Income Absolute Return Fund^, Legg MasonBrandywine Global Income Optimiser Fund^, Legg Mason Brandywine Global Credit Opportunities Fund^, Legg Mason Brandywine Global Enhanced Absolute Return Fund^ and Legg Mason MartinCurrie European Absolute Alpha Fund^; and quantify the probable impact to the value of the net asset value for each Fund based on positive and negative movement in the index, including one yearbeta for each Fund. Beta is a measure of a Fund’s holdings’ volatility in relation to the market or index. While beta offers a clear, quantifiable measure, it does not incorporate new information, and pastprice movements are not accurate predictors of the future.
^ Not authorised for sale to the public in Hong Kong.
313

Legg Mason Global Funds Plc Annual Report 28 February 2021
Notes to Financial Statements – (continued)12. Risk Exposure and Risk Management – (continued)
12.1 Market Risk – (continued)
(a) Market Price Risk – (continued)
As at 28 February 2021
Impact on net asset value due tomovement in index (000’s)
Fund Index Currency Positive 5%* Negative 5%*
Legg Mason Western Asset US Government Liquidity Fund FTSE Treasury Bill 1-Month (USD) USD 18,536 (18,536)Legg Mason Western Asset US Core Bond Fund Bloomberg Barclays U.S. Aggregate Bond Index USD 25,837 (25,837)Legg Mason Western Asset US Core Plus Bond Fund Bloomberg Barclays U.S. Aggregate Bond Index USD 171,404 (171,404)Legg Mason Western Asset Euro Core Plus Bond Fund FTSE Euro Broad Investment-Grade Bond Index EUR 7,042 (7,042)Legg Mason Western Asset Short Duration High Income BondFund
Bloomberg Barclays U.S. High Yield 1-5 Years Cash Pay 2%Constrained Index USD 1,220 (1,220)
Legg Mason Western Asset Global Multi Strategy Fund ICE BofA US Dollar 3-Month Deposit Offered Rate ConstantMaturity USD 912,921 (912,921)
Legg Mason Western Asset US High Yield Fund Bloomberg Barclays U.S. Corporate High Yield Bond Index2% Issuer Capped USD 11,587 (11,587)
Legg Mason Western Asset Emerging Markets Total Return BondFund**
JP Morgan EMBI Global IndexUSD 960 (960)
Legg Mason Western Asset Emerging Markets Corporate BondFund
JP Morgan Corporate Emerging Markets Bond Index – BroadComposite USD 2,337 (2,337)
Legg Mason Western Asset Global High Yield Fund Barclays Global High Yield Bond Hedged Index USD 4,520 (4,520)Legg Mason Western Asset Global Inflation Management Fund Bloomberg Barclays Global Inflation-Linked 1-10 Year
Hedged (USD) USD 4,208 (4,208)Legg Mason Western Asset Asian Opportunities Fund Markit iBoxx Asian Local Bond Index USD 39,176 (39,176)Legg Mason Western Asset Short Duration Blue Chip Bond Fund** ICE BofA U.S. Treasury 1-10 Years Index USD (20,784) 20,784Legg Mason Western Asset Global Core Plus Bond Fund^ Bloomberg Barclays Global Aggregate Bond Index Currency
Hedged to USD USD 26,904 (26,904)Legg Mason Western Asset Global Credit Fund^ Bloomberg Barclays Global Aggregate Credit Index Currency
Hedged to USD USD 4,701 (4,701)Legg Mason Western Asset Euro High Yield Fund ICE BofA European Currency High Yield (ex. Financials) 2%
Constrained Index Currency Hedged (EUR) EUR 2,654 (2,654)Legg Mason Western Asset US Mortgage-Backed Securities Fund^ Bloomberg Barclays U.S. Mortgage-Backed Securities Index USD 3,090 (3,090)Legg Mason Western Asset UK Investment Grade Credit Fund^ ICE Bank of America Merrill Lynch Sterling Non-Gilt Index
Gross Dividends (GBP) GBP 4,177 (4,177)Legg Mason Western Asset US Corporate Bond Fund^ Bloomberg Barclays U.S. Credit USD 13,826 (13,826)Legg Mason Brandywine Global Fixed Income Fund FTSE World Government Bond Index USD 30,672 (30,672)Legg Mason Brandywine Global High Yield Fund^ Bloomberg Barclays Global High Yield Bond Index USD 488 (488)Legg Mason Brandywine Global Opportunistic Fixed Income Fund FTSE World Government Bond Index USD 51,605 (51,605)Legg Mason Brandywine Global Defensive High Yield Fund^ ICE Bank of America Merrill Lynch Global High Yield BB-B
Index USD 478 (478)Legg Mason Brandywine Global Dynamic US Equity Fund^ Russell 1000 Value Index USD 88 (88)Legg Mason ClearBridge Value Fund S&P 500 Index USD 31,610 (31,610)Legg Mason ClearBridge US Appreciation Fund S&P 500 Index USD 9,193 (9,193)Legg Mason ClearBridge US Large Cap Growth Fund Russell 1000 Growth Index USD 86,900 (86,900)Legg Mason ClearBridge US Aggressive Growth Fund Russell 3000 Growth Index USD 38,037 (38,037)Legg Mason ClearBridge Tactical Dividend Income Fund Dow Jones US Select Dividend Index USD 1,730 (1,730)Legg Mason ClearBridge US Equity Sustainability Leaders Fund^ Russell 3000 Index USD 25,088 (25,088)Legg Mason ClearBridge Global Growth Fund^ MSCI AC World Net Dividends Index USD 502 (502)Legg Mason ClearBridge Infrastructure Value Fund^ OECD G7 Consumer Price Index +5.5% EUR 203,897 (203,897)Legg Mason ClearBridge Emerging Markets Infrastructure Fund^ S&P Emerging Markets Infrastructure Net Total Return USD 133 (133)Legg Mason Royce US Small Cap Opportunity Fund Russell 2000 Index USD 78,943 (78,943)Legg Mason Royce US Smaller Companies Fund Russell 2000 Index USD 4,609 (4,609)Legg Mason QS MV European Equity Growth and Income Fund MSCI Europe Net Dividends Index EUR 1,617 (1,617)Legg Mason QS MV Asia Pacific Ex Japan Equity Growth andIncome Fund
MSCI AC Asia Pacific ex Japan Net Dividends IndexUSD 1,362 (1,362)
Legg Mason QS Emerging Markets Equity Fund MSCI Emerging Markets Net Dividends Index USD 838 (838)Legg Mason QS MV Global Equity Growth and Income Fund MSCI AC World Net Dividends Index USD 623 (623)Legg Mason Martin Currie Asia Long-Term Unconstrained Fund^ MSCI AC Asia ex-Japan Net Dividends Index USD 3,330 (3,330)Legg Mason Martin Currie Global Long-Term UnconstrainedFund^
MSCI AC World Net Dividends IndexUSD 3,481 (3,481)
Legg Mason Martin Currie Asia Pacific Ex Japan Real Income Fund MSCI AC Asia Pacific Ex Japan Net Dividends Index USD 1,409 (1,409)Legg Mason Martin Currie Global Emerging Markets Fund^ MSCI Emerging Markets Net Dividends Index USD 2,100 (2,100)Legg Mason Martin Currie European Unconstrained Fund^ MSCI Europe Net Dividends (EUR) EUR 4,226 (4,226)
* The most probable outcome is based on a +5% outperformance or -5% underperformance against the actual current year benchmark performance.
** Fund does not have an index as a benchmark, therefore a substitute Index was used as an indicator for the beta calculation.
^ Not authorised for sale to the public in Hong Kong.
314

Legg Mason Global Funds Plc Annual Report 28 February 2021
Notes to Financial Statements – (continued)12. Risk Exposure and Risk Management – (continued)
12.1 Market Risk – (continued)
(a) Market Price Risk – (continued)
As at 29 February 2020Impact on net asset value due to
movement in index (000’s)
Fund Index Currency Positive 5%* Negative 5%*
Legg Mason Western Asset US Government Liquidity Fund FTSE Treasury Bill 1-Month (USD) USD 17,516 (17,516)Legg Mason Western Asset US Core Bond Fund Bloomberg Barclays U.S. Aggregate Bond Index USD 14,107 (14,107)Legg Mason Western Asset US Core Plus Bond Fund Bloomberg Barclays U.S. Aggregate Bond Index USD 62,012 (62,012)Legg Mason Western Asset Euro Core Plus Bond Fund FTSE Euro Broad Investment-Grade Bond Index EUR 5,766 (5,766)Legg Mason Western Asset Short Duration High Income BondFund
Bloomberg Barclays U.S. High Yield 1-5 Years Cash Pay 2%Constrained Index USD 1,163 (1,163)
Legg Mason Western Asset Global Multi Strategy Fund ICE BofA US Dollar 3-Month Deposit Offered Rate ConstantMaturity USD (264,015) 264,015
Legg Mason Western Asset US High Yield Fund Bloomberg Barclays U.S. Corporate High Yield Bond Index2% Issuer Capped USD 9,477 (9,477)
Legg Mason Western Asset Emerging Markets Total Return BondFund **
JP Morgan EMBI Global IndexUSD 779 (779)
Legg Mason Western Asset Emerging Markets Corporate BondFund
JP Morgan Corporate Emerging Markets Bond Index – BroadComposite USD 2,499 (2,499)
Legg Mason Western Asset Global High Yield Fund Barclays Global High Yield Bond Hedged Index USD 7,008 (7,008)Legg Mason Western Asset Global Inflation Management Fund Bloomberg Barclays Global Inflation-Linked 1-10 Year
Hedged (USD) USD 647 (647)Legg Mason Western Asset Asian Opportunities Fund Markit iBoxx Asian Local Bond Index USD 26,291 (26,291)Legg Mason Western Asset Short Duration Blue Chip BondFund **
ICE BofA U.S. Treasury 1-10 Years IndexUSD 2,575 (2,575)
Legg Mason Western Asset Global Core Plus Bond Fund^ Bloomberg Barclays Global Aggregate Bond Index CurrencyHedged to USD USD 8,571 (8,571)
Legg Mason Western Asset Global Credit Fund^ Bloomberg Barclays Global Aggregate Credit Index CurrencyHedged to USD USD 3,366 (3,366)
Legg Mason Western Asset Euro High Yield Fund ICE BofA European Currency High Yield (ex. Financials) 2%Constrained Index Currency Hedged (EUR) EUR 2,812 (2,812)
Legg Mason Western Asset US Mortgage-Backed Securities Fund^ Bloomberg Barclays U.S. Mortgage-Backed Securities Index USD 63,145 (63,145)Legg Mason Western Asset UK Investment Grade Credit Fund^ ICE Bank of America Merrill Lynch Sterling Non-Gilt Index
Gross Dividends (GBP) GBP 5,154 (5,154)Legg Mason Western Asset US Corporate Bond Fund^ Bloomberg Barclays U.S. Credit USD 4,557 (4,557)Legg Mason Brandywine Global Fixed Income Fund FTSE World Government Bond Index USD 24,826 (24,826)Legg Mason Brandywine Global High Yield Fund^ Bloomberg Barclays Global High Yield Bond Index USD 365 (365)Legg Mason Brandywine Global Opportunistic Fixed Income Fund FTSE World Government Bond Index USD 14,795 (14,795)Legg Mason Brandywine Global Sovereign Credit Fund^ Bloomberg Barclays 60% Emerging Market Local Currency
Government 40% Global Treasury Country Capped BondIndex USD 123,168 (123,168)
Legg Mason Brandywine Global Defensive High Yield Fund^ ICE Bank of America Merrill Lynch Global High YieldBB-B Index USD 423 (423)
Legg Mason Brandywine Global Dynamic US Equity Fund^ Russell 1000 Value Index USD 182 (182)Legg Mason ClearBridge Value Fund S&P 500 Index USD 17,827 (17,827)Legg Mason ClearBridge US Appreciation Fund S&P 500 Index USD 8,771 (8,771)Legg Mason ClearBridge US Large Cap Growth Fund Russell 1000 Growth Index USD 75,340 (75,340)Legg Mason ClearBridge US Aggressive Growth Fund Russell 3000 Growth Index USD 50,313 (50,313)Legg Mason ClearBridge Tactical Dividend Income Fund Dow Jones US Select Dividend Index USD 1,459 (1,459)Legg Mason ClearBridge US Equity Sustainability Leaders Fund^ Russell 3000 Index USD 2,140 (2,140)Legg Mason ClearBridge Global Growth Fund^ MSCI AC World Net Dividends Index USD 356 (356)Legg Mason Royce US Small Cap Opportunity Fund Russell 2000 Index USD 28,697 (28,697)Legg Mason Royce US Smaller Companies Fund Russell 2000 Index USD 4,380 (4,380)Legg Mason QS MV European Equity Growth and Income Fund MSCI Europe Net Dividends Index EUR 1,627 (1,627)Legg Mason QS MV Asia Pacific Ex Japan Equity Growth andIncome Fund
MSCI AC Asia Pacific ex Japan Net Dividends IndexUSD 2,410 (2,410)
Legg Mason QS Emerging Markets Equity Fund MSCI Emerging Markets Net Dividends Index USD 527 (527)Legg Mason QS MV Global Equity Growth and Income Fund MSCI AC World Net Dividends Index USD 594 (594)Legg Mason Martin Currie Asia Long-Term Unconstrained Fund^ MSCI AC Asia ex-Japan Net Dividends Index USD 5,936 (5,936)Legg Mason Martin Currie Global Long-Term UnconstrainedFund^
MSCI AC World Net Dividends IndexUSD 1,507 (1,507)
Legg Mason Martin Currie Asia Pacific Ex Japan Real Income Fund MSCI AC Asia Pacific Ex Japan Net Dividends Index USD 158 (158)Legg Mason Martin Currie Global Emerging Markets Fund^ MSCI Emerging Markets Net Dividends Index USD 1,534 (1,534)Legg Mason Martin Currie European Unconstrained Fund^ MSCI Europe Net Dividends (EUR) EUR 310 (310)Legg Mason ClearBridge Infrastructure Value Fund^ OECD G7 Consumer Price Index +5.5% EUR (7,927) 7,927Legg Mason ClearBridge Emerging Markets Infrastructure Fund^ S&P Emerging Markets Infrastructure Net Total Return USD 64 (64)
* The most probable outcome is based on a +5% outperformance or -5% underperformance against the actual current year benchmark performance.
** Fund does not have an index as a benchmark, therefore a substitute index was used as an indicator for the beta calculation.
The sensitivity analysis set out above should not be used as an indication of future performance.
The market price risk sensitivity analysis for Legg Mason Western Asset Macro Opportunities Bond Fund^, Legg Mason Western Asset Multi-Asset Credit Fund^, Legg Mason Western Asset StructuredOpportunities Fund^, Western Asset UCITS SMASh Series Core Plus Completion Fund^, Legg Mason Brandywine Global Fixed Income Absolute Return Fund^, Legg Mason Brandywine Global IncomeOptimiser Fund^, Legg Mason Brandywine Global Credit Opportunities Fund^, Legg Mason Brandywine Global Enhanced Absolute Return Fund^ and Legg Mason Martin Currie European Absolute AlphaFund^ has been incorporated into the calculation of the market risk using the VaR approach (Note 12.1 above).
^ Not authorised for sale to the public in Hong Kong.
315

Legg Mason Global Funds Plc Annual Report 28 February 2021
Notes to Financial Statements – (continued)12. Risk Exposure and Risk Management – (continued)
12.1 Market Risk – (continued)
(b) Foreign Currency Risk
A portion of the financial assets of the Funds are denominated in currencies other than the US Dollar, Euro and British Pound (the functional currencies of the Funds) with the effect that the Statementof Financial Position and total return can be significantly affected by currency movements.
Western Asset have a strong bias to hedge all foreign currencies into the functional currency of the Fund’s portfolio. Western Asset will typically leave only a small portion of the portfolio unhedged,and then only if the outlook strongly suggests that currency risk is attractive. In other portfolios, hedges are implemented whenever a currency is seen to be at risk of depreciating by more than the costof the hedge transaction. Western Asset may cross-hedge into non-functional currencies – when permitted by guidelines, under severe limits (typically less than 5% of the portfolio), and seeking toreflect an exposure relative to the benchmark.
The following tables set out the Funds’ net exposure to foreign currency as at 28 February 2021 and 29 February 2020.
Amounts represented below primarily are monetary assets and monetary liabilities except for investments in non-interest bearing securities, which include equities, which are non-monetary assets.Amounts noted below for forward foreign currency contracts represent the values to be received under the currency contracts and include foreign exchange hedging transactions. Whilst amounts notedfor other derivatives represent the unrealised appreciation/(depreciation) at year end.
As at 28 February 2021
Currency
Investments inFixed Interest
Securities(000’s)
Investments inVariable Interest
Securities(000’s)
Investments inNon-Interest
Bearing Securities(000’s)
Forward ForeignCurrency Contracts
(000’s)Other Derivatives
(000’s)
Net Other Assets/(Liabilities)
(000’s)
Total NetAsset Value
(000’s)
Legg Mason Western Asset US Government Liquidity Fund
United States Dollar $ 610,469 $ 300,007 $ – $ – $ – $ (28,146) $ 882,330
Total $ 610,469 $ 300,007 $ – $ – $ – $ (28,146) $ 882,330
Legg Mason Western Asset US Core Bond Fund
Chinese Renminbi $ 79 $ – $ – $ – $ – $ 14 $ 93Euro – – – 4,290 – – 4,290United States Dollar 252,252 57,488 12,610 (4,278) 2,905 (26,230) 294,747
Total $ 252,331 $ 57,488 $ 12,610 $ 12 $ 2,905 $ (26,216) $ 299,130
Legg Mason Western Asset US Core Plus Bond Fund
Argentine Peso $ – $ 123 $ – $ – $ – $ 12 $ 135Australian Dollar – – – 23,886 – 1 23,887Brazilian Real 5,441 – – 5,269 152 3,436 14,298British Pound – – – 12,046 – 1,763 13,809Canadian Dollar – – – 36,758 – – 36,758Chinese Renminbi – – – (27,170) – – (27,170)Euro 20,796 – – 40,021 1,739 3,360 65,916Indian Rupee – – – 2,096 – – 2,096Indonesian Rupiah – – – 15,127 – – 15,127Japanese Yen – – – 20,349 172 1,506 22,027Malaysian Ringgit – – – – – 28 28Mexican Peso 29,466 – – 8,372 1,281 568 39,687Russian Ruble 21,561 – – 12,984 – 3,267 37,812South African Rand – – – 1,934 – (1) 1,933United States Dollar 1,223,701 404,738 27,476 (152,439) 9,106 (111,507) 1,401,075
Total $ 1,300,965 $ 404,861 $ 27,476 $ (767) $ 12,450 $ (97,567) $ 1,647,418
Legg Mason Western Asset Euro Core Plus Bond Fund
Australian Dollar € 897 € – € – € (1,192) € – € 127 € (168)British Pound 1,916 – – (2,369) 34 349 (70)Canadian Dollar – 187 – (345) 14 155 11Czech Koruna – – – (4) 172 (91) 77Euro 73,276 15,452 – 14,569 69 4,818 108,184Hungarian Forint – – – 2,226 – – 2,226Norwegian Krone – – – 1,107 – – 1,107Polish Zloty – – – (22) – 31 9United States Dollar 10,902 1,021 1,423 (14,115) 138 578 (53)
Total € 86,991 € 16,660 € 1,423 € (145) € 427 € 5,967 € 111,323
Legg Mason Western Asset Short Duration High Income Bond Fund
Australian Dollar $ – $ – $ – $ 33 $ – $ – $ 33Canadian Dollar – – – (1) – – (1)Euro – – – 1,083 – 3 1,086United States Dollar 21,389 4,161 454 (1,112) 8 415 25,315
Total $ 21,389 $ 4,161 $ 454 $ 3 $ 8 $ 418 $ 26,433
316

Legg Mason Global Funds Plc Annual Report 28 February 2021
Notes to Financial Statements – (continued)12. Risk Exposure and Risk Management – (continued)
12.1 Market Risk – (continued)
(b) Foreign Currency Risk – (continued)
As at 28 February 2021 – (continued)
Currency
Investments inFixed Interest
Securities(000’s)
Investments inVariable Interest
Securities(000’s)
Investments inNon-Interest
Bearing Securities(000’s)
Forward ForeignCurrency Contracts
(000’s)Other Derivatives
(000’s)
Net Other Assets/(Liabilities)
(000’s)
Total NetAsset Value
(000’s)
Legg Mason Western Asset Global Multi Strategy Fund
Argentine Peso $ – $ 99 $ – $ – $ – $ 945 $ 1,044Australian Dollar 5,562 – – 72,838 – 171 78,571Brazilian Real 6,978 – – 6,494 – 725 14,197British Pound 10,684 6,736 – 358,060 (192) 3,589 378,877Canadian Dollar – – – 967 – 2 969Colombian Peso 56 – – – – 28 84Czech Koruna – – – 27 – 39 66Euro 20,018 19,890 23,804 (23,010) 393 2,123 43,218Indian Rupee – – – 1,451 – – 1,451Indonesian Rupiah 18,448 – – 2,348 – 1,897 22,693Japanese Yen – – – 13,341 – – 13,341Mexican Peso 20,708 – – (1,380) – 1,967 21,295Polish Zloty – – – 7,097 – – 7,097Russian Ruble 14,897 – – 3,405 – 1,597 19,899Singapore Dollar – – – (17,339) – (2) (17,341)South African Rand 8,365 – – (7,141) – 896 2,120Swiss Franc – – – 1,973 – – 1,973Turkish Lira – – – 6,178 – – 6,178United States Dollar 304,888 107,825 41,403 (417,818) 626 23,275 60,199
Total $ 410,604 $ 134,550 $ 65,207 $ 7,491 $ 827 $ 37,252 $ 655,931
Legg Mason Western Asset US High Yield Fund
Australian Dollar $ – $ – $ – $ – $ – $ 3 $ 3British Pound – – – 1,102 – – 1,102Canadian Dollar – – – (7) – – (7)Euro – – – 1,861 – – 1,861Mexican Peso – – – – – 2 2Singapore Dollar – – – 548 – (9) 539United States Dollar 178,956 33,871 9,414 (3,477) (72) (3,065) 215,627
Total $ 178,956 $ 33,871 $ 9,414 $ 27 $ (72) $ (3,069) $ 219,127
Legg Mason Western Asset Emerging Markets Total Return Bond Fund
Brazilian Real $ 212 $ – $ – $ (219) $ – $ 2 $ (5)British Pound – – – 116 – – 116Chinese Renminbi – – – 67 – – 67Euro 206 – – 3,986 – 2 4,194Indian Rupee 242 – – (165) – 4 81Indonesian Rupiah 392 – – (428) – 19 (17)Mexican Peso 281 – – (341) – 13 (47)Russian Ruble 404 – – (245) – 14 173Saudi Riyal – – – (810) – – (810)Singapore Dollar – – – 5 – – 5South African Rand 112 – – – – 6 118Ukrainian Hryvnia 106 – – – – – 106United States Dollar 16,537 1,716 2,084 (1,917) 59 309 18,788
Total $ 18,492 $ 1,716 $ 2,084 $ 49 $ 59 $ 369 $ 22,769
Legg Mason Western Asset Emerging Markets Corporate Bond Fund
Euro $ 121 $ – $ – $ 437 $ – $ 1 $ 559Indonesian Rupiah – – – (26) – – (26)Saudi Riyal – – – (1,905) – 1 (1,904)United States Dollar 36,543 2,772 – 1,495 71 723 41,604
Total $ 36,664 $ 2,772 $ – $ 1 $ 71 $ 725 $ 40,233
Legg Mason Western Asset Global High Yield Fund
Argentine Peso $ – $ 14 $ – $ – $ – $ 1 $ 15Australian Dollar – – – 9,401 – 44 9,445Brazilian Real 212 – – – – 18 230British Pound 1,044 1,146 – 1,630 – 28 3,848Euro 2,222 – 6,993 644 – 27 9,886Indonesian Rupiah 871 – – – – 41 912Mexican Peso – – – – – 9 9Polish Zloty – – – – – 6 6Russian Ruble 970 – – – – 145 1,115Singapore Dollar – – – 10,246 – (12) 10,234Turkish Lira – – – – – 2 2United States Dollar 79,112 7,457 2,668 (21,839) 52 (590) 66,860
Total $ 84,431 $ 8,617 $ 9,661 $ 82 $ 52 $ (281) $ 102,562
317

Legg Mason Global Funds Plc Annual Report 28 February 2021
Notes to Financial Statements – (continued)12. Risk Exposure and Risk Management – (continued)
12.1 Market Risk – (continued)
(b) Foreign Currency Risk – (continued)
As at 28 February 2021 – (continued)
Currency
Investments inFixed Interest
Securities(000’s)
Investments inVariable Interest
Securities(000’s)
Investments inNon-Interest
Bearing Securities(000’s)
Forward ForeignCurrency Contracts
(000’s)Other Derivatives
(000’s)
Net Other Assets/(Liabilities)
(000’s)
Total NetAsset Value
(000’s)
Legg Mason Western Asset Global Inflation Management Fund
Australian Dollar $ 379 $ 364 $ – $ (945) $ (7) $ 112 $ (97)Brazilian Real – – – 380 – – 380British Pound 451 290 – (962) (23) 137 (107)Canadian Dollar – 443 – (539) 6 62 (28)Czech Koruna – – – (24) 37 9 22Euro 1,773 8,132 – (9,738) 143 133 443Hungarian Forint – – – 484 – – 484Japanese Yen – 4,688 – (4,792) 26 80 2Mexican Peso 892 – – (409) – 90 573New Zealand Dollar – 194 – (720) – 665 139Norwegian Krone – – – 31 – – 31Polish Zloty – – – (8) – 9 1Russian Ruble – – – 488 – – 488South African Rand 816 – – – – 40 856Swedish Krona – – – – – 3 3United States Dollar 1,796 26,169 940 16,810 38 (145) 45,608
Total $ 6,107 $ 40,280 $ 940 $ 56 $ 220 $ 1,195 $ 48,798
Legg Mason Western Asset Asian Opportunities Fund
Australian Dollar $ – $ – $ – $ 33,880 $ – $ 322 $ 34,202Chinese Renminbi 132,469 – – 8,189 – 3,365 144,023Euro – – – 9,681 – (1) 9,680Hong Kong Dollar 3,624 964 – – – 209 4,797Indian Rupee 50,347 – – – – 1,148 51,495Indonesian Rupiah 75,974 – – – – 305 76,279Malaysian Ringgit 58,350 – – – – 590 58,940Philippine Peso 55,422 – – – – 335 55,757Singapore Dollar 22,013 12,766 4,838 44,833 – 375 84,825South Korean Won 93,670 – – 26,745 (1,119) 2,217 121,513Swiss Franc – – – 848 – – 848Thai Baht 30,666 – – – – 178 30,844United States Dollar 39,550 21,889 18,146 (124,814) (76) (989) (46,294)
Total $ 562,085 $ 35,619 $ 22,984 $ (638) $ (1,195) $ 8,054 $ 626,909
Legg Mason Western Asset Short Duration Blue Chip Bond Fund
Australian Dollar $ – $ – $ – $ 1,558 $ – $ 1 $ 1,559British Pound 68,923 1,967 – 269,967 371 2,851 344,079Euro 147,587 12,197 – (102,776) (114) (861) 56,033Swedish Krona – – – 314 – – 314United States Dollar 218,838 30,818 24,052 (163,062) 118 5,950 116,714
Total $ 435,348 $ 44,982 $ 24,052 $ 6,001 $ 375 $ 7,941 $ 518,699
Legg Mason Western Asset Global Core Plus Bond Fund^
Australian Dollar $ 3,325 $ – $ – $ (4,415) $ (199) $ 433 $ (856)Brazilian Real – – – – – 7 7British Pound 13,277 1,467 – (16,182) (5) 402 (1,041)Canadian Dollar 3,097 487 – 104,365 (9) 337 108,277Chinese Renminbi – – – (19,546) – – (19,546)Czech Koruna – – – – 420 (137) 283Euro 45,166 7,757 – (7,472) 173 1,002 46,626Hungarian Forint – – – 2,728 – – 2,728Indonesian Rupiah 7,011 – – (1,164) – (22) 5,825Japanese Yen 7,407 7,860 – (15,881) (53) 418 (249)Mexican Peso 6,989 – – (3,301) – 130 3,818New Zealand Dollar – – – 10,113 – – 10,113Norwegian Krone – – – 145 – – 145Polish Zloty – – – (3) – 48 45Russian Ruble – – – 7,642 – – 7,642South African Rand 3,253 – – – – 137 3,390South Korean Won 2,293 – – (2,339) – 115 69Turkish Lira – – – 2,719 – 1 2,720United States Dollar 134,089 10,867 28,758 (56,993) 617 (1,042) 116,296
Total $ 225,907 $ 28,438 $ 28,758 $ 416 $ 944 $ 1,829 $ 286,292
^ Not authorised for sale to the public in Hong Kong.
318

Legg Mason Global Funds Plc Annual Report 28 February 2021
Notes to Financial Statements – (continued)12. Risk Exposure and Risk Management – (continued)
12.1 Market Risk – (continued)
(b) Foreign Currency Risk – (continued)
As at 28 February 2021 – (continued)
Currency
Investments inFixed Interest
Securities(000’s)
Investments inVariable Interest
Securities(000’s)
Investments inNon-Interest
Bearing Securities(000’s)
Forward ForeignCurrency Contracts
(000’s)Other Derivatives
(000’s)
Net Other Assets/(Liabilities)
(000’s)
Total NetAsset Value
(000’s)
Legg Mason Western Asset Global Credit Fund^
Brazilian Real $ – $ – $ – $ 284 $ – $ – $ 284British Pound 7,465 2,230 – (10,168) 18 407 (48)Euro 21,376 12,540 – (29,281) (548) 977 5,064Mexican Peso 183 – – – – 23 206Polish Zloty – – – – – 16 16Russian Ruble 159 – – – – 19 178United States Dollar 31,115 5,259 940 39,082 (125) 754 77,025
Total $ 60,298 $ 20,029 $ 940 $ (83) $ (655) $ 2,196 $ 82,725
Legg Mason Western Asset Euro High Yield Fund
British Pound € 8,038 € 436 € – € (8,362) € – € 608 € 720Euro 31,847 5,328 – 8,568 252 7,605 53,600United States Dollar – – 336 (311) – – 25
Total € 39,885 € 5,764 € 336 € (105) € 252 € 8,213 € 54,345
Legg Mason Western Asset Macro Opportunities Bond Fund^
Australian Dollar $ 103,519 $ – $ – $ 95,341 $ (1,652) $ 1,436 $ 198,644Brazilian Real 86,360 – – 356,523 (1,207) 58,269 499,945British Pound – 18,485 – 866,340 5,355 39,525 929,705Canadian Dollar – – – 89,653 – 57 89,710Chinese Renminbi 237,733 – – 22,100 – 4,900 264,733Egyptian Pound 1,560 – – – – 154 1,714Euro 66,339 211,163 15,425 1,758,820 77,896 73,231 2,202,874Indian Rupee 150,420 – – 60,521 – 38,777 249,718Indonesian Rupiah 451,164 – – (349,780) – 5,568 106,952Japanese Yen – – – 30,334 – 7,821 38,155Mexican Peso 444,939 – – (472,828) – 38,465 10,576Norwegian Krone – – – 5,149 – (25) 5,124Polish Zloty – – – 4,023 – 203 4,226Russian Ruble 669,389 – – (297,288) 4,852 30,774 407,727Singapore Dollar – – – 92,652 – 274 92,926South African Rand 67,062 – – (64,045) – 5,990 9,007Swedish Krona – – – 64,713 – (35) 64,678Swiss Franc – – – 87,473 – (419) 87,054Taiwan Dollar – – – (143,483) – – (143,483)United States Dollar 2,654,476 815,765 142,612 (2,154,714) 439,144 (371,188) 1,526,095
Total $ 4,932,961 $ 1,045,413 $ 158,037 $ 51,504 $ 524,388 $ (66,223) $ 6,646,080
Legg Mason Western Asset Multi-Asset Credit Fund^
Argentine Peso $ – $ 146 $ – $ – $ – $ 3 $ 149Australian Dollar – – – 97,376 (340) 618 97,654Brazilian Real 4,456 – – (5,408) 131 298 (523)British Pound 4,290 494 – 922,295 – 1,255 928,334Canadian Dollar – – – 10,598 – 144 10,742Euro 2,351 19,631 9,390 28,387 290 1,273 61,322Indonesian Rupiah 19,637 – – (16,566) – 791 3,862Japanese Yen – 882 – 7,615 – 5 8,502Mexican Peso 3,246 – – 5,639 2,325 (895) 10,315New Zealand Dollar – – – (1,185) – 33 (1,152)Norwegian Krone – – – 1,642 – – 1,642Russian Ruble 16,429 – – 8,236 – 648 25,313Saudi Riyal – – – (8,542) – – (8,542)South African Rand – – – (1) – – (1)Swedish Krona – – – – – 10 10Swiss Franc – – – 52 – – 52Turkish Lira – – – – – 26 26United States Dollar 637,757 310,705 17,991 (1,028,983) 2,939 3,744 (55,847)
Total $ 688,166 $ 331,858 $ 27,381 $ 21,155 $ 5,345 $ 7,953 $ 1,081,858
Legg Mason Western Asset Structured Opportunities Fund^
British Pound $ – $ – $ – $ 12,317 $ – $ (1) $ 12,316Euro – – – 264,323 – 2,856 267,179Japanese Yen – – – 56,627 – – 56,627Swiss Franc – – – 1,967 – – 1,967United States Dollar 145,600 880,672 59,043 (335,134) (1,897) 18,789 767,073
Total $ 145,600 $ 880,672 $ 59,043 $ 100 $ (1,897) $ 21,644 $ 1,105,162
^ Not authorised for sale to the public in Hong Kong.
319

Legg Mason Global Funds Plc Annual Report 28 February 2021
Notes to Financial Statements – (continued)12. Risk Exposure and Risk Management – (continued)
12.1 Market Risk – (continued)
(b) Foreign Currency Risk – (continued)
As at 28 February 2021 – (continued)
Currency
Investments inFixed Interest
Securities(000’s)
Investments inVariable Interest
Securities(000’s)
Investments inNon-Interest
Bearing Securities(000’s)
Forward ForeignCurrency Contracts
(000’s)Other Derivatives
(000’s)
Net Other Assets/(Liabilities)
(000’s)
Total NetAsset Value
(000’s)
Legg Mason Western Asset US Mortgage-Backed Securities Fund^
Euro $ – $ – $ – $ 3,445 $ – $ – $ 3,445United States Dollar 802,205 96,810 74,145 (3,436) (358) (149,395) 819,971
Total $ 802,205 $ 96,810 $ 74,145 $ 9 $ (358) $ (149,395) $ 823,416
Legg Mason Western Asset UK Investment Grade Credit Fund^
British Pound £ 64,100 £ 7,222 £ – £ 4,046 £ (18) £ 1,377 £ 76,727Euro 330 341 – (880) 7 247 45United States Dollar 2,161 341 – (3,117) (16) 544 (87)
Total £ 66,591 £ 7,904 £ – £ 49 £ (27) £ 2,168 £ 76,685
Legg Mason Western Asset US Corporate Bond Fund^
British Pound $ 719 $ – $ – $ 163,302 $ 8 $ 101 $ 164,130Euro 190 – – 1,207 4 17 1,418Mexican Peso – – – 577 – – 577Russian Ruble 247 – – – – 4 251United States Dollar 144,242 33,177 10,216 (161,606) (145) (664) 25,220
Total $ 145,398 $ 33,177 $ 10,216 $ 3,480 $ (133) $ (542) $ 191,596
Western Asset UCITS SMASh Series Core Plus Completion Fund^
Australian Dollar $ – $ – $ – $ 667 $ – $ – $ 667Brazilian Real 117 – – 244 – 2 363British Pound – – – 629 – – 629Canadian Dollar – – – 1,285 – (1) 1,284Chinese Renminbi – – – (568) – – (568)Euro – – – (908) 38 179 (691)Indonesian Rupiah 84 – – 402 – 2 488Japanese Yen – – – 857 – – 857Mexican Peso 749 – – 335 – 13 1,097Russian Ruble 519 – – 450 – 8 977United States Dollar 17,059 5,158 1,473 (3,445) 445 (3,600) 17,090
Total $ 18,528 $ 5,158 $ 1,473 $ (52) $ 483 $ (3,397) $ 22,193
Legg Mason Brandywine Global Fixed Income Fund
Australian Dollar $ 17,148 $ – $ – $ (8,667) $ – $ 135 $ 8,616Brazilian Real 8,238 – – – – (264) 7,974British Pound 54,203 – – 68,099 – 926 123,228Canadian Dollar – – – 16,665 – – 16,665Chilean Peso – – – 25,444 – – 25,444Colombian Peso 15,689 – – 772 – 599 17,060Czech Koruna – – – 14,230 – – 14,230Danish Krone – – – (578) – – (578)Euro – – – 91,390 – 120 91,510Hungarian Forint – – – 13,635 – – 13,635Indian Rupee – – – 10,711 – – 10,711Indonesian Rupiah 14,039 – – – – 188 14,227Israeli Shekel – – – (508) – – (508)Japanese Yen – – – (22,881) – – (22,881)Malaysian Ringgit 5,385 – – 11,146 – 69 16,600Mexican Peso 39,884 – – (882) – 611 39,613Norwegian Krone – – – 19,031 – – 19,031Polish Zloty 2,772 – – 19,104 – 761 22,637Russian Ruble 4,817 – – 10,737 – 22 15,576Singapore Dollar – – – (483) – – (483)South African Rand 13,002 – – (12,368) – 675 1,309South Korean Won – – – 20,899 – (1) 20,898Swedish Krona – – – (374) – – (374)United States Dollar 26,962 152,584 15,295 (273,737) – (7,337) (86,233)
Total $ 202,139 $ 152,584 $ 15,295 $ 1,385 $ – $ (3,496) $ 367,907
^ Not authorised for sale to the public in Hong Kong.
320

Legg Mason Global Funds Plc Annual Report 28 February 2021
Notes to Financial Statements – (continued)12. Risk Exposure and Risk Management – (continued)
12.1 Market Risk – (continued)
(b) Foreign Currency Risk – (continued)
As at 28 February 2021 – (continued)
Currency
Investments inFixed Interest
Securities(000’s)
Investments inVariable Interest
Securities(000’s)
Investments inNon-Interest
Bearing Securities(000’s)
Forward ForeignCurrency Contracts
(000’s)Other Derivatives
(000’s)
Net Other Assets/(Liabilities)
(000’s)
Total NetAsset Value
(000’s)
Legg Mason Brandywine Global Fixed Income Absolute Return Fund^
Australian Dollar $ – $ – $ – $ 368,481 $ – $ – $ 368,481Brazilian Real 21,753 – – (22,782) – 242 (787)British Pound – – – 74,332 545 (5) 74,872Chilean Peso – – – 66,770 – – 66,770Colombian Peso 29,845 – – 25,524 – 1,093 56,462Euro – 6,103 – 66,660 – – 72,763Indian Rupee – – – 57,973 – – 57,973Indonesian Rupiah 27,151 – – (27,384) – 214 (19)Japanese Yen – – – (107,521) – (1) (107,522)Mexican Peso 32,823 – – 3,300 – 539 36,662Polish Zloty – – – 115,139 – 471 115,610Russian Ruble – – – 29,291 – – 29,291Singapore Dollar – – – 134,257 – – 134,257South African Rand 34,612 – – (34,334) – 1,374 1,652South Korean Won – – – 36,703 – (1) 36,702Swedish Krona – – – 176 – – 176Swiss Franc – – – (116,680) – – (116,680)United States Dollar 115,864 414,080 42,056 (655,090) – (14,899) (97,989)
Total $ 262,048 $ 420,183 $ 42,056 $ 14,815 $ 545 $ (10,973) $ 728,674
Legg Mason Brandywine Global High Yield Fund^
British Pound $ – $ – $ – $ 119 $ – $ – $ 119Canadian Dollar 121 – – 11,245 – 2 11,368Colombian Peso – – – 224 – – 224Euro 118 – – (1,442) 165 (19) (1,178)Mexican Peso – – – 228 – – 228Swedish Krona – – – (2) – – (2)Swiss Franc – – – (4) – – (4)United States Dollar 10,594 838 216 (10,346) 91 (89) 1,304
Total $ 10,833 $ 838 $ 216 $ 22 $ 256 $ (106) $ 12,059
Legg Mason Brandywine Global Opportunistic Fixed Income Fund
Australian Dollar $ 13,019 $ – $ – $ (1,548) $ – $ 77 $ 11,548Brazilian Real 18,652 – – 7,361 – 209 26,222British Pound 84,893 – – (9,242) – 700 76,351Canadian Dollar – – – 13,983 – – 13,983Chilean Peso – – – 40,703 – – 40,703Colombian Peso 26,250 – – – – 648 26,898Czech Koruna – – – 21,972 – – 21,972Danish Krone – – – (1,002) – – (1,002)Euro – 119 – (80,166) – 60 (79,987)Hungarian Forint – – – 21,318 – – 21,318Indian Rupee – – – 16,749 – – 16,749Indonesian Rupiah 20,598 – – – – 257 20,855Israeli Shekel – – – (881) – – (881)Japanese Yen – – – (39,661) – – (39,661)Malaysian Ringgit 21,424 – – 2,283 – 323 24,030Mexican Peso 54,120 – – 6,684 – 882 61,686New Zealand Dollar – – – 226,957 – – 226,957Norwegian Krone – – – 17,509 – – 17,509Polish Zloty 5,871 – – 28,555 – 720 35,146Russian Ruble 2,862 – – 21,684 – 72 24,618Singapore Dollar – – – (836) – 38 (798)South African Rand 27,844 – – (27,368) – 1,450 1,926South Korean Won – – – 33,427 – – 33,427Swedish Krona – – – (647) – – (647)United States Dollar 87,066 195,411 32,385 (298,974) (723) (8,366) 6,799
Total $ 362,599 $ 195,530 $ 32,385 $ (1,140) $ (723) $ (2,930) $ 585,721
Legg Mason Brandywine Global Sovereign Credit Fund^
Australian Dollar $ – $ – $ – $ 78,220 $ – $ 418 $ 78,638British Pound – – – – – 121 121Euro – – – 900 – 1 901Indonesian Rupiah – – – – – 43 43South African Rand – – – – – 180 180United States Dollar – – – (80,126) – 243 (79,883)
Total $ – $ – $ – $ (1,006) $ – $ 1,006 $ –
^ Not authorised for sale to the public in Hong Kong.
321

Legg Mason Global Funds Plc Annual Report 28 February 2021
Notes to Financial Statements – (continued)12. Risk Exposure and Risk Management – (continued)
12.1 Market Risk – (continued)
(b) Foreign Currency Risk – (continued)
As at 28 February 2021 – (continued)
Currency
Investments inFixed Interest
Securities(000’s)
Investments inVariable Interest
Securities(000’s)
Investments inNon-Interest
Bearing Securities(000’s)
Forward ForeignCurrency Contracts
(000’s)Other Derivatives
(000’s)
Net Other Assets/(Liabilities)
(000’s)
Total NetAsset Value
(000’s)
Legg Mason Brandywine Global Income Optimiser Fund^
Brazilian Real $ 2,917 $ – $ – $ (2,294) $ – $ 16 $ 639British Pound – 1,668 – 39,990 234 (78) 41,814Canadian Dollar 3,645 – – (3,159) – 68 554Chilean Peso – – – 8,822 – – 8,822Colombian Peso – – – 6,128 – – 6,128Egyptian Pound 9,723 – – – – 5,976 15,699Euro – – – 150,377 7,647 (3,123) 154,901Mexican Peso 2,785 – – 3,817 – 13 6,615Russian Ruble 2,906 – – (2,600) – 13 319Singapore Dollar – – – 17,588 – (75) 17,513Swedish Krona – – – 18,405 – (51) 18,354Swiss Franc – – – 68 – – 68United States Dollar 293,533 74,881 35,025 (236,895) 2,415 12,900 181,859
Total $ 315,509 $ 76,549 $ 35,025 $ 247 $ 10,296 $ 15,659 $ 453,285
Legg Mason Brandywine Global Credit Opportunities Fund^
Brazilian Real $ – $ – $ – $ 1,983 $ – $ – $ 1,983British Pound – – – 1,031 41 – 1,072Canadian Dollar – – – 511 – – 511Chilean Peso – – – 1,023 – – 1,023Chinese Renminbi – – – 508 – – 508Euro – 2,115 – (1,869) – – 246Malaysian Ringgit – – – 516 – – 516Mexican Peso – – – 735 – – 735New Zealand Dollar – – – 513 – – 513Norwegian Krone – – – 508 – (1) 507Polish Zloty – – – 513 – – 513Russian Ruble – – – 769 – – 769United States Dollar 11,918 31,467 6,152 (6,837) 26 398 43,124
Total $ 11,918 $ 33,582 $ 6,152 $ (96) $ 67 $ 397 $ 52,020
Legg Mason Brandywine Global Defensive High Yield Fund^
British Pound $ – $ – $ – $ (47) $ – $ – $ (47)Canadian Dollar 117 – – (52) – 2 67Colombian Peso – – – 216 – – 216Euro 130 – – 9,890 153 43 10,216Mexican Peso – – – 223 – – 223United States Dollar 10,548 428 430 (10,232) 62 (137) 1,099
Total $ 10,795 $ 428 $ 430 $ (2) $ 215 $ (92) $ 11,774
Legg Mason Brandywine Global Enhanced Absolute Return Fund^
Australian Dollar $ – $ – $ – $ 376,437 $ – $ – $ 376,437Brazilian Real 23,208 – – 3,755 – 239 27,202British Pound – – – 54,806 – – 54,806Chilean Peso – – – 6,568 – – 6,568Chinese Renminbi – – – 31,108 – – 31,108Colombian Peso 15,533 – – 14,738 – 565 30,836Czech Koruna – – – 12,864 – – 12,864Euro – – – (6,536) 998 (7) (5,545)Indonesian Rupiah 33,622 – – (5,577) – 288 28,333Malaysian Ringgit 15,010 – – 22,759 – 237 38,006Mexican Peso 69,130 – – (11,428) – 1,124 58,826New Zealand Dollar – – – 8,692 – – 8,692Norwegian Krone – – – 36,422 – – 36,422Polish Zloty – – – 32,835 – 1 32,836Russian Ruble 10,387 – – 32,995 – 264 43,646Singapore Dollar – – – 5,404 – 5 5,409South African Rand 34,194 – – (5,827) – 1,813 30,180South Korean Won – – – 17,990 – – 17,990United States Dollar 35,666 113,569 16,560 (624,610) (1,176) 16,671 (443,320)
Total $ 236,750 $ 113,569 $ 16,560 $ 3,395 $ (178) $ 21,200 $ 391,296
Legg Mason Brandywine Global Dynamic US Equity Fund^
Euro $ – $ – $ – $ 1,398 $ – $ – $ 1,398United States Dollar – – 1,903 (1,395) – (27) 481
Total $ – $ – $ 1,903 $ 3 $ – $ (27) $ 1,879
^ Not authorised for sale to the public in Hong Kong.
322

Legg Mason Global Funds Plc Annual Report 28 February 2021
Notes to Financial Statements – (continued)12. Risk Exposure and Risk Management – (continued)
12.1 Market Risk – (continued)
(b) Foreign Currency Risk – (continued)
As at 28 February 2021 – (continued)
Currency
Investments inFixed Interest
Securities(000’s)
Investments inVariable Interest
Securities(000’s)
Investments inNon-Interest
Bearing Securities(000’s)
Forward ForeignCurrency Contracts
(000’s)Other Derivatives
(000’s)
Net Other Assets/(Liabilities)
(000’s)
Total NetAsset Value
(000’s)
Legg Mason ClearBridge Value Fund
Euro $ – $ – $ 15,235 $ 35 $ – $ (474) $ 14,796Singapore Dollar – – – 405 – (21) 384United States Dollar – – 478,184 (441) – 16,162 493,905
Total $ – $ – $ 493,419 $ (1) $ – $ 15,667 $ 509,085
Legg Mason ClearBridge US Appreciation Fund
Euro $ – $ – $ – $ – $ – $ 479 $ 479United States Dollar – – 203,955 – – 1,574 205,529
Total $ – $ – $ 203,955 $ – $ – $ 2,053 $ 206,008
Legg Mason ClearBridge US Large Cap Growth Fund
Brazilian Real $ – $ – $ – $ 40,093 $ – $ (3,926) $ 36,167British Pound – – – – – (459) (459)Euro – – – 57,166 – 13,706 70,872United States Dollar – – 1,810,957 (98,466) – (8,019) 1,704,472
Total $ – $ – $ 1,810,957 $ (1,207) $ – $ 1,302 $ 1,811,052
Legg Mason ClearBridge US Aggressive Growth Fund
Australian Dollar $ – $ – $ – $ 14,855 $ – $ (110) $ 14,745British Pound – – – 1,165 – 311 1,476Chinese Renminbi – – – 872 – – 872Euro – – – 2,143 – (18) 2,125Polish Zloty – – – 1,324 – – 1,324Singapore Dollar – – – 3,168 – – 3,168Swedish Krona – – – 33 – – 33Swiss Franc – – – 71 – – 71United States Dollar – – 789,786 (23,522) – 620 766,884
Total $ – $ – $ 789,786 $ 109 $ – $ 803 $ 790,698
Legg Mason ClearBridge Tactical Dividend Income Fund
Australian Dollar $ – $ – $ – $ 1,354 $ – $ – $ 1,354Canadian Dollar – – – – – 5 5Chinese Renminbi – – – 96 – – 96Euro – – – 1,601 – – 1,601Singapore Dollar – – – 159 – – 159United States Dollar 993 – 36,040 (3,196) – 1,637 35,474
Total $ 993 $ – $ 36,040 $ 14 $ – $ 1,642 $ 38,689
Legg Mason ClearBridge US Equity Sustainability Leaders Fund^
British Pound $ – $ – $ – $ 85,178 $ – $ (2,396) $ 82,782Euro – – – 14,006 – (316) 13,690Swedish Krona – – – – – 72 72United States Dollar – – 635,560 (97,488) – 10,608 548,680
Total $ – $ – $ 635,560 $ 1,696 $ – $ 7,968 $ 645,224
Legg Mason ClearBridge Global Growth Fund^
Australian Dollar $ – $ – $ 86 $ – $ – $ – $ 86British Pound – – 501 – – (1) 500Canadian Dollar – – 141 – – 1 142Danish Krone – – 105 – – – 105Euro – – 1,033 – – 1 1,034Hong Kong Dollar – – 198 – – – 198Japanese Yen – – 727 – – – 727South Korean Won – – 171 – – 3 174Swedish Krona – – 30 – – – 30Swiss Franc – – 277 – – – 277United States Dollar – – 7,658 – – 158 7,816
Total $ – $ – $ 10,927 $ – $ – $ 162 $ 11,089
^ Not authorised for sale to the public in Hong Kong.
323

Legg Mason Global Funds Plc Annual Report 28 February 2021
Notes to Financial Statements – (continued)12. Risk Exposure and Risk Management – (continued)
12.1 Market Risk – (continued)
(b) Foreign Currency Risk – (continued)
As at 28 February 2021 – (continued)
Currency
Investments inFixed Interest
Securities(000’s)
Investments inVariable Interest
Securities(000’s)
Investments inNon-Interest
Bearing Securities(000’s)
Forward ForeignCurrency Contracts
(000’s)Other Derivatives
(000’s)
Net Other Assets/(Liabilities)
(000’s)
Total NetAsset Value
(000’s)
Legg Mason ClearBridge Infrastructure Value Fund^
Australian Dollar € – € – € 44,200 € (7,070) € – € (1) € 37,129Brazilian Real – – – 3,298 – – 3,298British Pound – – 31,557 61,757 – 619 93,933Canadian Dollar – – 19,008 37,198 – 273 56,479Chinese Renminbi – – – 3,440 – (9) 3,431Danish Krone – – 18,482 – – 15 18,497Euro – – 193,595 (127,904) – (3,473) 62,218Japanese Yen – – 12,729 (888) – – 11,841Singapore Dollar – – – 1,451 – (1) 1,450United States Dollar – – 287,980 28,390 – 367 316,737
Total € – € – € 607,551 € (328) € – € (2,210) € 605,013
Legg Mason ClearBridge Emerging Markets Infrastructure Fund^
Brazilian Real $ – $ – $ 369 $ – $ – $ (6) $ 363Chilean Peso – – 47 – – (1) 46Chinese Renminbi – – 64 – – – 64Euro – – – 1,705 – – 1,705Hong Kong Dollar – – 611 – – – 611Indian Rupee – – 723 – – (3) 720Indonesian Rupiah – – 114 – – (3) 111Malaysian Ringgit – – 146 – – – 146Mexican Peso – – 422 – – – 422Philippine Peso – – 161 – – – 161Thai Baht – – 69 – – (2) 67United States Dollar – – – (1,701) – 10 (1,691)
Total $ – $ – $ 2,726 $ 4 $ – $ (5) $ 2,725
Legg Mason Royce US Small Cap Opportunity Fund
Australian Dollar $ – $ – $ – $ 12,923 $ – $ (354) $ 12,569Brazilian Real – – – 4,975 – – 4,975British Pound – – – 694 – (371) 323Chinese Renminbi – – – 5,038 – (1,022) 4,016Euro – – – 74,560 – (6,870) 67,690Polish Zloty – – – 3,182 – – 3,182Singapore Dollar – – – 34,973 – (797) 34,176Swedish Krona – – – 711 – (135) 576United States Dollar – – 1,248,814 (137,164) – 49,713 1,161,363
Total $ – $ – $ 1,248,814 $ (108) $ – $ 40,164 $ 1,288,870
Legg Mason Royce US Smaller Companies Fund
Canadian Dollar $ – $ – $ 3,451 $ – $ – $ (48) $ 3,403Euro – – – 1,284 – (836) 448Norwegian Krone – – 745 – – 5 750Swedish Krona – – – 10 – (1) 9United States Dollar – – 85,907 (1,294) – 1,873 86,486
Total $ – $ – $ 90,103 $ – $ – $ 993 $ 91,096
Legg Mason QS MV European Equity Growth and Income Fund
Australian Dollar € – € – € – € 1,661 € – € 1 € 1,662British Pound – – 8,229 – – 40 8,269Chinese Renminbi – – – 42 – – 42Danish Krone – – 2,028 – – 42 2,070Euro – – 13,760 (6,689) – 251 7,322Norwegian Krone – – 445 – – – 445Polish Zloty – – – 195 – – 195Singapore Dollar – – – 106 – (1) 105Swedish Krona – – 1,779 – – – 1,779Swiss Franc – – 6,765 – – – 6,765United States Dollar – – – 4,677 – 37 4,714
Total € – € – € 33,006 € (8) € – € 370 € 33,368
^ Not authorised for sale to the public in Hong Kong.
324

Legg Mason Global Funds Plc Annual Report 28 February 2021
Notes to Financial Statements – (continued)12. Risk Exposure and Risk Management – (continued)
12.1 Market Risk – (continued)
(b) Foreign Currency Risk – (continued)
As at 28 February 2021 – (continued)
Currency
Investments inFixed Interest
Securities(000’s)
Investments inVariable Interest
Securities(000’s)
Investments inNon-Interest
Bearing Securities(000’s)
Forward ForeignCurrency Contracts
(000’s)Other Derivatives
(000’s)
Net Other Assets/(Liabilities)
(000’s)
Total NetAsset Value
(000’s)
Legg Mason QS MV Asia Pacific Ex Japan Equity Growth and Income Fund
Australian Dollar $ – $ – $ 1,714 $ 3,458 $ – $ 11 $ 5,183Chinese Renminbi – – – 224 – – 224Euro – – – – – 8 8Hong Kong Dollar – – 14,079 32 – 12 14,123Indian Rupee – – 2,299 – – 327 2,626Indonesian Rupiah – – 709 – – 129 838Malaysian Ringgit – – 908 – – – 908Pakistan Rupee – – 243 – – 44 287Philippine Peso – – 656 – – 123 779Polish Zloty – – – 3,092 – – 3,092Singapore Dollar – – 266 79 – 5 350South Korean Won – – 3,537 – – 100 3,637Taiwan Dollar – – 5,630 – – 358 5,988Thai Baht – – 314 – – – 314United States Dollar – – 287 (6,871) – (736) (7,320)
Total $ – $ – $ 30,642 $ 14 $ – $ 381 $ 31,037
Legg Mason QS Emerging Markets Equity Fund
Brazilian Real $ – $ – $ 444 $ – $ – $ (17) $ 427British Pound – – – – – 1 1Chilean Peso – – 393 – – 2 395Chinese Renminbi – – 1,010 – – (3) 1,007Colombian Peso – – 84 – – 3 87Egyptian Pound – – 61 – – – 61Euro – – 97 – – – 97Hong Kong Dollar – – 2,990 – – 6 2,996Hungarian Forint – – 88 – – – 88Indian Rupee – – 1,232 – – (29) 1,203Indonesian Rupiah – – 573 – – 1 574Malaysian Ringgit – – 968 – – 5 973Mexican Peso – – 434 – – 1 435Philippine Peso – – 423 – – 4 427Polish Zloty – – 231 – – 1 232Qatari Riyal – – 97 – – 1 98Russian Ruble – – 11 – – 1 12South African Rand – – 503 – – – 503South Korean Won – – 1,177 – – 15 1,192Taiwan Dollar – – 1,070 – – – 1,070Thai Baht – – 1,032 – – 3 1,035Turkish Lira – – 252 – – 3 255United Arab Emirates Dirham – – 319 – – 2 321United States Dollar – – 1,157 – 13 80 1,250
Total $ – $ – $ 14,646 $ – $ 13 $ 80 $ 14,739
Legg Mason QS MV Global Equity Growth and Income Fund
Australian Dollar $ – $ – $ 314 $ 691 $ – $ – $ 1,005Brazilian Real – – 81 – – – 81British Pound – – 464 – – 6 470Canadian Dollar – – 349 – – 2 351Euro – – 1,820 – – 15 1,835Hong Kong Dollar – – 796 – – (1) 795Japanese Yen – – 1,390 – – 1 1,391Malaysian Ringgit – – 202 – – – 202Singapore Dollar – – 17 33 – – 50Swedish Krona – – 60 – – 2 62Swiss Franc – – 472 – – – 472Taiwan Dollar – – 798 – – – 798Turkish Lira – – 111 – – – 111United States Dollar – – 5,814 (719) – (33) 5,062
Total $ – $ – $ 12,688 $ 5 $ – $ (8) $ 12,685
Legg Mason Martin Currie Asia Long-Term Unconstrained Fund^
Hong Kong Dollar $ – $ – $ 34,874 $ – $ – $ 1 $ 34,875Indian Rupee – – 10,069 – – 1 10,070Singapore Dollar – – 7,142 – – (1) 7,141South Korean Won – – 14,275 – – 243 14,518Taiwan Dollar – – 8,150 – – – 8,150United States Dollar – – 2,581 – – 2,745 5,326
Total $ – $ – $ 77,091 $ – $ – $ 2,989 $ 80,080
^ Not authorised for sale to the public in Hong Kong.
325

Legg Mason Global Funds Plc Annual Report 28 February 2021
Notes to Financial Statements – (continued)12. Risk Exposure and Risk Management – (continued)
12.1 Market Risk – (continued)
(b) Foreign Currency Risk – (continued)
As at 28 February 2021 – (continued)
Currency
Investments inFixed Interest
Securities(000’s)
Investments inVariable Interest
Securities(000’s)
Investments inNon-Interest
Bearing Securities(000’s)
Forward ForeignCurrency Contracts
(000’s)Other Derivatives
(000’s)
Net Other Assets/(Liabilities)
(000’s)
Total NetAsset Value
(000’s)
Legg Mason Martin Currie European Absolute Alpha Fund^
Brazilian Real € – € – € – € 2,187 € – € – € 2,187British Pound – – 2,330 (1,082) (54) (1) 1,193Danish Krone – – 4,868 (4,903) – 36 1Euro – – 16,442 (3,550) (341) 4,127 16,678Hungarian Forint – – 1,419 (1,375) – – 44Norwegian Krone – – 1,573 (1,811) – (180) (418)Swedish Krona – – 1,339 (409) 4 126 1,060Swiss Franc – – 6,974 (7,153) (24) (16) (219)Turkish Lira – – 1,592 (1,555) – – 37United States Dollar – – – 19,712 – 68 19,780
Total € – € – € 36,537 € 61 € (415) € 4,160 € 40,343
Legg Mason Martin Currie Global Long-Term Unconstrained Fund^
Australian Dollar $ – $ – $ 2,864 $ – $ – $ – $ 2,864British Pound – – 881 1,615 – (1) 2,495Danish Krone – – 2,879 – – 10 2,889Euro – – 22,060 – – 1 22,061Hong Kong Dollar – – 10,729 – – – 10,729Swedish Krona – – 10,076 – – – 10,076Taiwan Dollar – – 6,100 – – – 6,100United States Dollar – – 43,337 (1,579) – 5,377 47,135
Total $ – $ – $ 98,926 $ 36 $ – $ 5,387 $ 104,349
Legg Mason Martin Currie Asia Pacific Ex Japan Real Income Fund
Australian Dollar $ – $ – $ 9,143 $ 385 $ – $ 119 $ 9,647Chinese Renminbi – – 691 1 – – 692Hong Kong Dollar – – 6,036 – – 30 6,066Indian Rupee – – 3,050 – – 12 3,062Malaysian Ringgit – – 1,148 – – 6 1,154New Zealand Dollar – – 1,116 – – – 1,116Philippine Peso – – 562 – – – 562Singapore Dollar – – 3,743 1,031 – 28 4,802Thai Baht – – 832 – – 18 850United States Dollar – – – (1,415) – 40 (1,375)
Total $ – $ – $ 26,321 $ 2 $ – $ 253 $ 26,576
Legg Mason Martin Currie Global Emerging Markets Fund^
Brazilian Real $ – $ – $ 726 $ – $ – $ 1 $ 727British Pound – – 579 – – – 579Chinese Renminbi – – 1,270 – – – 1,270Euro – – 1,133 – – – 1,133Hong Kong Dollar – – 12,526 – – – 12,526Hungarian Forint – – 796 – – – 796Indian Rupee – – 4,459 – – (126) 4,333Indonesian Rupiah – – 908 – – – 908Mexican Peso – – 238 – – – 238Philippine Peso – – 159 – – – 159South Korean Won – – 7,312 – – 105 7,417Taiwan Dollar – – 5,376 – – – 5,376Turkish Lira – – 184 – – – 184United States Dollar – – 5,312 – – 843 6,155
Total $ – $ – $ 40,978 $ – $ – $ 823 $ 41,801
Legg Mason Martin Currie European Unconstrained Fund^
British Pound € – € – € 5,203 € – € – € – € 5,203Danish Krone – – 3,140 – – 1 3,141Euro – – 71,509 – – 3,069 74,578Swedish Krona – – 14,828 – – – 14,828Swiss Franc – – 6,089 – – – 6,089United States Dollar – – 7,531 – – 1 7,532
Total € – € – € 108,300 € – € – € 3,071 € 111,371
^ Not authorised for sale to the public in Hong Kong.
326

Legg Mason Global Funds Plc Annual Report 28 February 2021
Notes to Financial Statements – (continued)12. Risk Exposure and Risk Management – (continued)
12.1 Market Risk – (continued)
(b) Foreign Currency Risk – (continued)
As at 29 February 2020
Currency
Investments inFixed Interest
Securities(000’s)
Investments inVariable Interest
Securities(000’s)
Investments inNon-Interest
Bearing Securities(000’s)
Forward ForeignCurrency Contracts
(000’s)Other Derivatives
(000’s)
Net Other Assets/(Liabilities)
(000’s)
Total NetAsset Value
(000’s)
Legg Mason Western Asset US Government Liquidity Fund
United States Dollar $ 766,828 $ 256,504 $ – $ – $ – $ (26,088) $ 997,244
Total $ 766,828 $ 256,504 $ – $ – $ – $ (26,088) $ 997,244
Legg Mason Western Asset US Core Bond Fund
Chinese Renminbi $ 74 $ – $ – $ – $ – $ 11 $ 85Euro – – – 1,148 – 46 1,194United States Dollar 266,821 43,584 28,230 (1,140) (2,310) (20,057) 315,128
Total $ 266,895 $ 43,584 $ 28,230 $ 8 $ (2,310) $ (20,000) $ 316,407
Legg Mason Western Asset US Core Plus Bond Fund
Argentine Peso $ 143 $ 93 $ – $ – $ – $ 88 $ 324Australian Dollar – – – 6,384 – – 6,384Brazilian Real 9,792 – – 10,116 465 146 20,519British Pound – – – 11,056 (172) 2,334 13,218Canadian Dollar – – – 34,848 – – 34,848Chinese Renminbi – – – (20,193) – – (20,193)Colombian Peso – – – (118) – – (118)Euro – – – 75,346 (3,022) 5,102 77,426Indian Rupee – – – 9,945 – – 9,945Indonesian Rupiah – – – 15,020 – – 15,020Japanese Yen – – – (1,453) (197) 1,450 (200)Malaysian Ringgit – – – – – 26 26Mexican Peso 30,457 – – 14,704 756 1,664 47,581Philippine Peso – – – (7,846) – – (7,846)Russian Ruble 23,560 – – (3,166) – 1,939 22,333South African Rand – – – 1,875 – (1) 1,874Taiwan Dollar – – – 72 – – 72United States Dollar 1,177,810 309,936 10,265 (149,673) (6,386) (28,522) 1,313,430
Total $ 1,241,762 $ 310,029 $ 10,265 $ (3,083) $ (8,556) $ (15,774) $ 1,534,643
Legg Mason Western Asset Euro Core Plus Bond Fund
Australian Dollar € – € – € – € (84) € – € 112 € 28British Pound – – – (666) (70) 250 (486)Canadian Dollar – – – (52) 2 131 81Euro 83,611 24,609 – 4,936 (627) 2,249 114,778Hungarian Forint – – – 4,381 – – 4,381Norwegian Krone 1,384 – – 1,057 – 12 2,453Polish Zloty 4,324 – – (4,256) (4) 108 172Swedish Krona 1,666 – – 701 – 33 2,400United States Dollar 2,379 3,563 720 (5,957) 259 (643) 321
Total € 93,364 € 28,172 € 720 € 60 € (440) € 2,252 € 124,128
Legg Mason Western Asset Short Duration High Income Bond Fund
Australian Dollar $ – $ – $ – $ 67 $ – $ – $ 67Euro – 231 – 655 – 38 924United States Dollar 16,737 3,613 258 (722) (17) 181 20,050
Total $ 16,737 $ 3,844 $ 258 $ – $ (17) $ 219 $ 21,041
327

Legg Mason Global Funds Plc Annual Report 28 February 2021
Notes to Financial Statements – (continued)12. Risk Exposure and Risk Management – (continued)
12.1 Market Risk – (continued)
(b) Foreign Currency Risk – (continued)
As at 29 February 2020 – (continued)
Currency
Investments inFixed Interest
Securities(000’s)
Investments inVariable Interest
Securities(000’s)
Investments inNon-Interest
Bearing Securities(000’s)
Forward ForeignCurrency Contracts
(000’s)Other Derivatives
(000’s)
Net Other Assets/(Liabilities)
(000’s)
Total NetAsset Value
(000’s)
Legg Mason Western Asset Global Multi Strategy Fund
Argentine Peso $ 499 $ 2,514 $ – $ – $ – $ 2,596 $ 5,609Australian Dollar – – – 72,277 – – 72,277Brazilian Real 9,243 – – 11,429 – 250 20,922British Pound 4,916 5,435 – 365,016 – 3,705 379,072Canadian Dollar – – – – – 918 918Colombian Peso 58 – – – – 24 82Czech Koruna – – – – (109) 70 (39)Euro 7,822 23,111 14,464 (25,054) (2,041) 2,275 20,577Hungarian Forint – – – 7,767 – – 7,767Indian Rupee – – – 4,815 – – 4,815Indonesian Rupiah 17,849 – – 2,358 – 854 21,061Japanese Yen – – – 16,699 – – 16,699Mexican Peso 35,877 – – (9,445) – 1,705 28,137Polish Zloty – – – 7,569 – (510) 7,059Russian Ruble 26,920 – – (3,444) – 4,273 27,749Singapore Dollar – – – (16,509) – 53 (16,456)South African Rand 7,660 – – (284) – 1,092 8,468Swiss Franc – – – 1,869 – – 1,869United States Dollar 411,216 103,968 48,525 (440,057) (1,117) 5,049 127,584
Total $ 522,060 $ 135,028 $ 62,989 $ (4,994) $ (3,267) $ 22,354 $ 734,170
Legg Mason Western Asset US High Yield Fund
Australian Dollar $ – $ – $ – $ – $ – $ 2 $ 2British Pound – – – 849 – – 849Euro – – – 1,662 – – 1,662Mexican Peso – – – – – 2 2Singapore Dollar – – – 415 – – 415United States Dollar 135,072 25,773 9,436 (2,928) (42) (1,048) 166,263
Total $ 135,072 $ 25,773 $ 9,436 $ (2) $ (42) $ (1,044) $ 169,193
Legg Mason Western Asset Emerging Markets Total Return Bond Fund
Brazilian Real $ 428 $ – $ – $ (539) $ – $ 11 $ (100)British Pound – – – 84 – – 84Egyptian Pound 89 – – – – 3 92Euro 105 – – 2,127 (1) – 2,231Indian Rupee – – – 185 – – 185Indonesian Rupiah 625 – – (472) – 32 185Mexican Peso 190 – – – – 14 204Russian Ruble 323 – – (152) – 4 175Saudi Riyal – – – (541) – – (541)Singapore Dollar – – – 89 – – 89United States Dollar 12,401 1,738 1,782 (692) (70) 1,042 16,201
Total $ 14,161 $ 1,738 $ 1,782 $ 89 $ (71) $ 1,106 $ 18,805
Legg Mason Western Asset Emerging Markets Corporate Bond Fund
Argentine Peso $ – $ – $ – $ – $ – $ 16 $ 16Egyptian Pound 169 – – – – 3 172Euro – – – 384 – 1 385Saudi Riyal – – – (722) – – (722)United States Dollar 38,781 2,643 – 341 (71) 999 42,693
Total $ 38,950 $ 2,643 $ – $ 3 $ (71) $ 1,019 $ 42,544
Legg Mason Western Asset Global High Yield Fund
Argentine Peso $ – $ 226 $ – $ – $ – $ 153 $ 379Australian Dollar – – – 9,529 – 3 9,532Brazilian Real 702 – – – – 45 747British Pound 1,105 569 – 939 – (84) 2,529Euro 1,522 – 5,126 2,854 – 73 9,575Indonesian Rupiah 868 – – – – 37 905Mexican Peso 285 – – – – 14 299Polish Zloty – – – – – 46 46Russian Ruble 1,099 – – – – 89 1,188Singapore Dollar – – – 2,314 – 3 2,317Turkish Lira – – – – – 3 3United States Dollar 74,339 14,815 5,376 (15,947) 72 1,568 80,223
Total $ 79,920 $ 15,610 $ 10,502 $ (311) $ 72 $ 1,950 $ 107,743
328
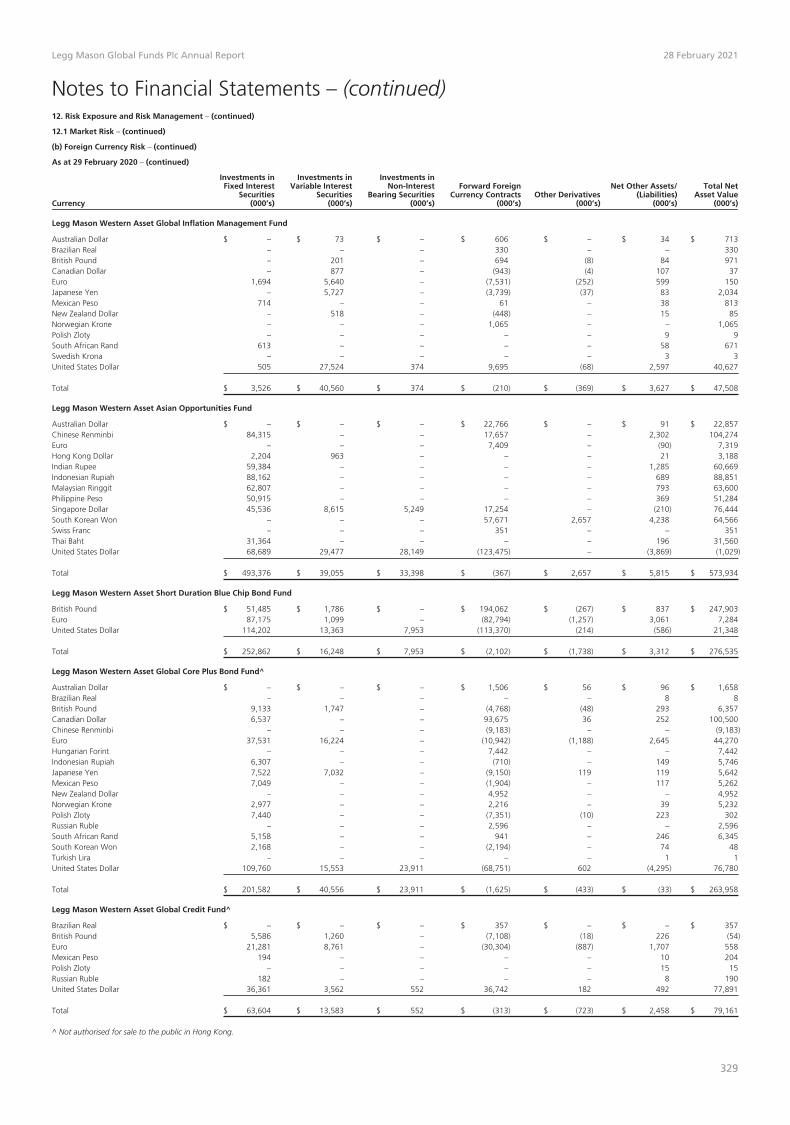
Legg Mason Global Funds Plc Annual Report 28 February 2021
Notes to Financial Statements – (continued)12. Risk Exposure and Risk Management – (continued)
12.1 Market Risk – (continued)
(b) Foreign Currency Risk – (continued)
As at 29 February 2020 – (continued)
Currency
Investments inFixed Interest
Securities(000’s)
Investments inVariable Interest
Securities(000’s)
Investments inNon-Interest
Bearing Securities(000’s)
Forward ForeignCurrency Contracts
(000’s)Other Derivatives
(000’s)
Net Other Assets/(Liabilities)
(000’s)
Total NetAsset Value
(000’s)
Legg Mason Western Asset Global Inflation Management Fund
Australian Dollar $ – $ 73 $ – $ 606 $ – $ 34 $ 713Brazilian Real – – – 330 – – 330British Pound – 201 – 694 (8) 84 971Canadian Dollar – 877 – (943) (4) 107 37Euro 1,694 5,640 – (7,531) (252) 599 150Japanese Yen – 5,727 – (3,739) (37) 83 2,034Mexican Peso 714 – – 61 – 38 813New Zealand Dollar – 518 – (448) – 15 85Norwegian Krone – – – 1,065 – – 1,065Polish Zloty – – – – – 9 9South African Rand 613 – – – – 58 671Swedish Krona – – – – – 3 3United States Dollar 505 27,524 374 9,695 (68) 2,597 40,627
Total $ 3,526 $ 40,560 $ 374 $ (210) $ (369) $ 3,627 $ 47,508
Legg Mason Western Asset Asian Opportunities Fund
Australian Dollar $ – $ – $ – $ 22,766 $ – $ 91 $ 22,857Chinese Renminbi 84,315 – – 17,657 – 2,302 104,274Euro – – – 7,409 – (90) 7,319Hong Kong Dollar 2,204 963 – – – 21 3,188Indian Rupee 59,384 – – – – 1,285 60,669Indonesian Rupiah 88,162 – – – – 689 88,851Malaysian Ringgit 62,807 – – – – 793 63,600Philippine Peso 50,915 – – – – 369 51,284Singapore Dollar 45,536 8,615 5,249 17,254 – (210) 76,444South Korean Won – – – 57,671 2,657 4,238 64,566Swiss Franc – – – 351 – – 351Thai Baht 31,364 – – – – 196 31,560United States Dollar 68,689 29,477 28,149 (123,475) – (3,869) (1,029)
Total $ 493,376 $ 39,055 $ 33,398 $ (367) $ 2,657 $ 5,815 $ 573,934
Legg Mason Western Asset Short Duration Blue Chip Bond Fund
British Pound $ 51,485 $ 1,786 $ – $ 194,062 $ (267) $ 837 $ 247,903Euro 87,175 1,099 – (82,794) (1,257) 3,061 7,284United States Dollar 114,202 13,363 7,953 (113,370) (214) (586) 21,348
Total $ 252,862 $ 16,248 $ 7,953 $ (2,102) $ (1,738) $ 3,312 $ 276,535
Legg Mason Western Asset Global Core Plus Bond Fund^
Australian Dollar $ – $ – $ – $ 1,506 $ 56 $ 96 $ 1,658Brazilian Real – – – – – 8 8British Pound 9,133 1,747 – (4,768) (48) 293 6,357Canadian Dollar 6,537 – – 93,675 36 252 100,500Chinese Renminbi – – – (9,183) – – (9,183)Euro 37,531 16,224 – (10,942) (1,188) 2,645 44,270Hungarian Forint – – – 7,442 – – 7,442Indonesian Rupiah 6,307 – – (710) – 149 5,746Japanese Yen 7,522 7,032 – (9,150) 119 119 5,642Mexican Peso 7,049 – – (1,904) – 117 5,262New Zealand Dollar – – – 4,952 – – 4,952Norwegian Krone 2,977 – – 2,216 – 39 5,232Polish Zloty 7,440 – – (7,351) (10) 223 302Russian Ruble – – – 2,596 – – 2,596South African Rand 5,158 – – 941 – 246 6,345South Korean Won 2,168 – – (2,194) – 74 48Turkish Lira – – – – – 1 1United States Dollar 109,760 15,553 23,911 (68,751) 602 (4,295) 76,780
Total $ 201,582 $ 40,556 $ 23,911 $ (1,625) $ (433) $ (33) $ 263,958
Legg Mason Western Asset Global Credit Fund^
Brazilian Real $ – $ – $ – $ 357 $ – $ – $ 357British Pound 5,586 1,260 – (7,108) (18) 226 (54)Euro 21,281 8,761 – (30,304) (887) 1,707 558Mexican Peso 194 – – – – 10 204Polish Zloty – – – – – 15 15Russian Ruble 182 – – – – 8 190United States Dollar 36,361 3,562 552 36,742 182 492 77,891
Total $ 63,604 $ 13,583 $ 552 $ (313) $ (723) $ 2,458 $ 79,161
^ Not authorised for sale to the public in Hong Kong.
329

Legg Mason Global Funds Plc Annual Report 28 February 2021
Notes to Financial Statements – (continued)12. Risk Exposure and Risk Management – (continued)
12.1 Market Risk – (continued)
(b) Foreign Currency Risk – (continued)
As at 29 February 2020 – (continued)
Currency
Investments inFixed Interest
Securities(000’s)
Investments inVariable Interest
Securities(000’s)
Investments inNon-Interest
Bearing Securities(000’s)
Forward ForeignCurrency Contracts
(000’s)Other Derivatives
(000’s)
Net Other Assets/(Liabilities)
(000’s)
Total NetAsset Value
(000’s)
Legg Mason Western Asset Euro High Yield Fund
British Pound € 10,614 € 354 € – € (11,684) € – € 1,138 € 422Euro 35,501 8,380 – 12,112 – 432 56,425United States Dollar – – 436 (180) – – 256
Total € 46,115 € 8,734 € 436 € 248 € – € 1,570 € 57,103
Legg Mason Western Asset Macro Opportunities Bond Fund^
Argentine Peso $ 8,419 $ – $ – $ – $ – $ – $ 8,419Australian Dollar 39,901 – – 248,099 (12,144) 17,651 293,507Brazilian Real 198,243 23,520 – 517,230 – (1,343) 737,650British Pound – – – 1,180,975 (17,108) 38,847 1,202,714Canadian Dollar – – – (5,111) 3,990 15,402 14,281Chinese Renminbi 28,077 – – (48,992) – 723 (20,192)Colombian Peso – – – 76,158 – – 76,158Egyptian Pound 83,227 – – – – 2,714 85,941Euro 57,005 366,147 – 1,600,077 (63,749) 101,937 2,061,417Indian Rupee 166,899 – – 37,710 – 13,615 218,224Indonesian Rupiah 468,088 – – (213,849) – 19,401 273,640Japanese Yen 36,625 235,734 – (173,049) (29,421) 28,731 98,620Mexican Peso 478,785 – – (166,763) – 39,685 351,707Norwegian Krone – – – 158,969 – 15 158,984Polish Zloty – – – 5,270 – 265 5,535Russian Ruble 635,768 – – (370,871) 4,490 30,797 300,184Singapore Dollar – – – 145,981 – (537) 145,444South African Rand 64,620 – – (1,285) – 2,398 65,733South Korean Won – – – (73,965) – – (73,965)Swedish Krona – – – 213,836 – 6 213,842Swiss Franc – – – 100,440 – 78 100,518United States Dollar 3,118,408 1,352,271 43,391 (3,245,794) (526,083) 577,396 1,319,589
Total $ 5,384,065 $ 1,977,672 $ 43,391 $ (14,934) $ (640,025) $ 887,781 $ 7,637,950
Legg Mason Western Asset Multi-Asset Credit Fund^
Argentine Peso $ – $ 1,892 $ – $ – $ – $ 476 $ 2,368Australian Dollar – – – 39,900 134 180 40,214Brazilian Real 4,444 – – 7,816 477 517 13,254British Pound 2,537 465 – 766,013 (25) 907 769,897Canadian Dollar – – – 9,352 – 137 9,489Colombian Peso – – – (63) – – (63)Egyptian Pound 8,205 – – – – 514 8,719Euro 1,526 19,202 – 27,747 (389) 105 48,191Indian Rupee – – – 3,388 – – 3,388Indonesian Rupiah 18,040 – – (2,093) – 1,584 17,531Japanese Yen – 890 – 8,874 – 3 9,767Mexican Peso 2,048 – – 5,406 1,221 1,026 9,701New Zealand Dollar – – – – – 29 29Polish Zloty – – – (1) – – (1)Russian Ruble 16,013 – – (6,370) – 639 10,282South African Rand – – – (1) – – (1)Swedish Krona – – – (8) – 8 –Swiss Franc – – – 50 – – 50Taiwan Dollar – – – 36 – – 36Turkish Lira – – – (23) – 30 7United States Dollar 516,229 258,751 10,506 (866,148) (2,551) 12,352 (70,861)
Total $ 569,042 $ 281,200 $ 10,506 $ (6,125) $ (1,133) $ 18,507 $ 871,997
Legg Mason Western Asset Structured Opportunities Fund^
Australian Dollar $ – $ – $ – $ 78 $ – $ – $ 78British Pound – – – 43,485 – – 43,485Euro – – – 500,756 – (1,483) 499,273Swiss Franc – – – 1,435 – 1 1,436United States Dollar 309,867 1,455,144 156,945 (542,671) (10,236) 7,707 1,376,756
Total $ 309,867 $ 1,455,144 $ 156,945 $ 3,083 $ (10,236) $ 6,225 $ 1,921,028
Legg Mason Western Asset US Mortgage-Backed Securities Fund^
Euro $ – $ – $ – $ 2,305 $ – $ – $ 2,305United States Dollar 945,924 144,969 95,860 (2,290) (3,379) (106,724) 1,074,360
Total $ 945,924 $ 144,969 $ 95,860 $ 15 $ (3,379) $ (106,724) $ 1,076,665
^ Not authorised for sale to the public in Hong Kong.
330

Legg Mason Global Funds Plc Annual Report 28 February 2021
Notes to Financial Statements – (continued)12. Risk Exposure and Risk Management – (continued)
12.1 Market Risk – (continued)
(b) Foreign Currency Risk – (continued)
As at 29 February 2020 – (continued)
Currency
Investments inFixed Interest
Securities(000’s)
Investments inVariable Interest
Securities(000’s)
Investments inNon-Interest
Bearing Securities(000’s)
Forward ForeignCurrency Contracts
(000’s)Other Derivatives
(000’s)
Net Other Assets/(Liabilities)
(000’s)
Total NetAsset Value
(000’s)
Legg Mason Western Asset UK Investment Grade Credit Fund^
British Pound £ 96,126 £ 10,037 £ – £ 4,729 £ 20 £ 2,308 £ 113,220Euro – – – (165) – 212 47United States Dollar 3,635 544 – (4,624) (27) 477 5
Total £ 99,761 £ 10,581 £ – £ (60) £ (7) £ 2,997 £ 113,272
Legg Mason Western Asset US Corporate Bond Fund^
Argentine Peso $ – $ – $ – $ – $ – $ 36 $ 36British Pound 668 365 – 96,414 (8) 35 97,474Egyptian Pound 553 – – – – – 553Euro 178 255 – 564 (5) 26 1,018Russian Ruble 282 – – – – 13 295United States Dollar 104,728 15,980 99 (97,613) 179 969 24,342
Total $ 106,409 $ 16,600 $ 99 $ (635) $ 166 $ 1,079 $ 123,718
Legg Mason Brandywine Global Fixed Income Fund
Australian Dollar $ 42,716 $ – $ – $ 41,843 $ – $ 329 $ 84,888Brazilian Real 38,946 – – – – (1,061) 37,885British Pound 67,777 – – 237,582 – (660) 304,699Canadian Dollar – – – (5,948) – – (5,948)Chilean Peso – – – 60,557 – – 60,557Colombian Peso 41,644 – – – – 1,677 43,321Czech Koruna – – – 18,050 – – 18,050Danish Krone – – – (1,535) – – (1,535)Euro – – – 111,224 – 304 111,528Indonesian Rupiah 34,890 – – 9,696 – 485 45,071Japanese Yen – – – (70,753) – – (70,753)Malaysian Ringgit 16,437 – – 29,872 – 209 46,518Mexican Peso 112,584 – – (13,287) – 1,874 101,171New Zealand Dollar – – – 35,865 – – 35,865Norwegian Krone 54,927 – – (711) – 1,538 55,754Polish Zloty 49,858 – – (1,806) – 1,606 49,658Russian Ruble – – – 11,461 – – 11,461Singapore Dollar – – – (1,256) – (361) (1,617)South African Rand 35,971 – – (38,006) – 5 (2,030)South Korean Won – – – 27,102 – – 27,102Swedish Krona – – – (877) – – (877)United States Dollar 104,837 317,493 11,305 (461,991) – 8,255 (20,101)
Total $ 600,587 $ 317,493 $ 11,305 $ (12,918) $ – $ 14,200 $ 930,667
Legg Mason Brandywine Global Fixed Income Absolute Return Fund^
Australian Dollar $ – $ – $ – $ 289,295 $ – $ – $ 289,295Brazilian Real 35,580 – – – – 151 35,731British Pound – – – 96,749 – – 96,749Chilean Peso – – – 94,218 – – 94,218Colombian Peso 38,636 – – – – 3,925 42,561Czech Koruna – – – 16,380 – – 16,380Euro – 6,046 – 99,836 (1,426) (3) 104,453Hungarian Forint – – – 68,385 – – 68,385Indonesian Rupiah 33,260 – – (34,357) – 573 (524)Mexican Peso 71,543 – – (8,647) – 1,194 64,090New Zealand Dollar – – – 23 – – 23Norwegian Krone – – – 48,278 – – 48,278Polish Zloty 36,560 – – (18,482) – 1,092 19,170Russian Ruble – – – 10,569 – – 10,569Singapore Dollar – – – 195,547 – (616) 194,931Swedish Krona – – – 148 – – 148Swiss Franc – – – (86,513) – – (86,513)Taiwan Dollar – – – (85,899) – – (85,899)Thai Baht – – – (41,522) – – (41,522)United States Dollar 62,877 530,205 14,370 (658,835) 595 14,868 (35,920)
Total $ 278,456 $ 536,251 $ 14,370 $ (14,827) $ (831) $ 21,184 $ 834,603
^ Not authorised for sale to the public in Hong Kong.
331

Legg Mason Global Funds Plc Annual Report 28 February 2021
Notes to Financial Statements – (continued)12. Risk Exposure and Risk Management – (continued)
12.1 Market Risk – (continued)
(b) Foreign Currency Risk – (continued)
As at 29 February 2020 – (continued)
Currency
Investments inFixed Interest
Securities(000’s)
Investments inVariable Interest
Securities(000’s)
Investments inNon-Interest
Bearing Securities(000’s)
Forward ForeignCurrency Contracts
(000’s)Other Derivatives
(000’s)
Net Other Assets/(Liabilities)
(000’s)
Total NetAsset Value
(000’s)
Legg Mason Brandywine Global High Yield Fund^
British Pound $ – $ – $ – $ 191 $ – $ 1 $ 192Canadian Dollar – – – 9,873 – – 9,873Egyptian Pound – – – 1,065 – – 1,065Euro 108 – – (804) – 1 (695)Swedish Krona – – – (3) – – (3)Swiss Franc – – – (4) – – (4)United States Dollar 10,367 – 480 (10,475) 50 (194) 228
Total $ 10,475 $ – $ 480 $ (157) $ 50 $ (192) $ 10,656
Legg Mason Brandywine Global Opportunistic Fixed Income Fund
Australian Dollar $ 27,483 $ – $ – $ 22,245 $ – $ 218 $ 49,946Brazilian Real 23,622 – – – – 106 23,728British Pound 27,338 – – 39,446 – 59 66,843Canadian Dollar – – – (3,547) – (1) (3,548)Chilean Peso – – – 35,774 – – 35,774Colombian Peso 25,067 – – – – 728 25,795Czech Koruna – – – 10,885 – – 10,885Danish Krone – – – (915) – – (915)Euro – 1,220 – (69,946) – 33 (68,693)Indonesian Rupiah 21,413 – – 4,643 – 384 26,440Japanese Yen – – – (42,176) – – (42,176)Malaysian Ringgit 26,935 – – – – 416 27,351Mexican Peso 66,095 – – (6,916) – 1,099 60,278New Zealand Dollar – – – 235,359 – 156 235,515Norwegian Krone 5,240 – – 27,232 – 147 32,619Polish Zloty 28,596 – – (1,077) – 848 28,367Russian Ruble – – – 7,250 – – 7,250Singapore Dollar – – – (749) – – (749)South African Rand 21,153 – – (22,387) – 3 (1,231)South Korean Won – – – 15,939 – – 15,939Swedish Krona – – – (523) – – (523)United States Dollar 69,653 205,405 7,630 (265,443) – 2,792 20,037
Total $ 342,595 $ 206,625 $ 7,630 $ (14,906) $ – $ 6,988 $ 548,932
Legg Mason Brandywine Global Sovereign Credit Fund^
Australian Dollar $ 44,188 $ – $ – $ 24,749 $ – $ 263 $ 69,200Brazilian Real 67,914 – – (12,753) – 302 55,463British Pound 145,650 – – 443,051 – 318 589,019Canadian Dollar – – – (11,571) – – (11,571)Chilean Peso – – – 89,531 – – 89,531Colombian Peso 73,228 – – 30,752 – 2,654 106,634Czech Koruna – – – 80,460 – – 80,460Danish Krone – – – (2,930) – – (2,930)Euro – – – (187,988) – – (187,988)Hong Kong Dollar – – – (162) – – (162)Hungarian Forint – – – 66,762 – – 66,762Indian Rupee – – – 45,074 – – 45,074Indonesian Rupiah 170,542 – – (30,677) – 2,744 142,609Japanese Yen – – – (165,218) – – (165,218)Malaysian Ringgit 77,647 – – – – 1,023 78,670Mexican Peso 233,180 – – (32,379) – 3,835 204,636New Zealand Dollar – – – (1,254) – – (1,254)Norwegian Krone – – – 80,169 – – 80,169Polish Zloty – – – 88,659 – 1,414 90,073Russian Ruble – – – 38,841 – – 38,841Singapore Dollar – – – (29,567) – – (29,567)South African Rand 47,893 – – (48,578) – 7 (678)South Korean Won – – – 156,734 – – 156,734Swedish Krona – – – (1,780) – – (1,780)Swiss Franc – – – (68,832) – – (68,832)Thai Baht – – – 32,672 – – 32,672United States Dollar 170,085 519,666 42,630 (615,727) – 17,593 134,247
Total $ 1,030,327 $ 519,666 $ 42,630 $ (31,962) $ – $ 30,153 $ 1,590,814
^ Not authorised for sale to the public in Hong Kong.
332

Legg Mason Global Funds Plc Annual Report 28 February 2021
Notes to Financial Statements – (continued)12. Risk Exposure and Risk Management – (continued)
12.1 Market Risk – (continued)
(b) Foreign Currency Risk – (continued)
As at 29 February 2020 – (continued)
Currency
Investments inFixed Interest
Securities(000’s)
Investments inVariable Interest
Securities(000’s)
Investments inNon-Interest
Bearing Securities(000’s)
Forward ForeignCurrency Contracts
(000’s)Other Derivatives
(000’s)
Net Other Assets/(Liabilities)
(000’s)
Total NetAsset Value
(000’s)
Legg Mason Brandywine Global Income Optimiser Fund^
Australian Dollar $ – $ – $ – $ 198 $ – $ – $ 198British Pound – – – 4,713 – 404 5,117Egyptian Pound 1,458 – – 4,136 – – 5,594Euro 3,725 – – 44,088 – (10) 47,803Japanese Yen 593 – – (492) – – 101Polish Zloty – – – – – 7 7Singapore Dollar – – – 271 – 2 273Swedish Krona – – – 4,199 – – 4,199United States Dollar 44,569 18,042 1,438 (56,959) 767 (120) 7,737
Total $ 50,345 $ 18,042 $ 1,438 $ 154 $ 767 $ 283 $ 71,029
Legg Mason Brandywine Global Credit Opportunities Fund^
Brazilian Real $ – $ – $ – $ 2,535 $ – $ 1 $ 2,536Egyptian Pound 4,305 – – – – – 4,305Euro – 5,492 – (5,405) – 1 88Malaysian Ringgit – – – (967) – – (967)Singapore Dollar – – – (970) – – (970)South Korean Won – – – (975) – – (975)Taiwan Dollar – – – (433) – – (433)Thai Baht – – – (983) – – (983)United States Dollar 4,038 27,709 1,270 7,053 (255) 969 40,784
Total $ 8,343 $ 33,201 $ 1,270 $ (145) $ (255) $ 971 $ 43,385
Legg Mason Brandywine Global Defensive High Yield Fund^
British Pound $ – $ – $ – $ 105 $ – $ 1 $ 106Canadian Dollar – – – (39) – – (39)Egyptian Pound – – – 948 – – 948Euro 118 – – 9,530 – 2 9,650United States Dollar 9,817 – 689 (10,567) (1) (69) (131)
Total $ 9,935 $ – $ 689 $ (23) $ (1) $ (66) $ 10,534
Legg Mason Brandywine Global Enhanced Absolute Return Fund^
Australian Dollar $ 7,250 $ – $ – $ 333,796 $ – $ 43 $ 341,089Brazilian Real 36,241 – – – – 162 36,403British Pound – – – 99,217 – – 99,217Chilean Peso – – – 28,417 – – 28,417Colombian Peso 18,556 – – – – 719 19,275Czech Koruna – – – 16,983 – – 16,983Euro – – – (53,887) (8,931) (61) (62,879)Indonesian Rupiah 38,173 – – (40,293) – 428 (1,692)Japanese Yen – – – (12,413) – – (12,413)Malaysian Ringgit 17,627 – – 35,893 – 282 53,802Mexican Peso 85,248 – – 5,343 – 1,415 92,006Norwegian Krone – – – 47,733 – – 47,733Russian Ruble – – – 30,204 – – 30,204Singapore Dollar – – – 73,018 – (693) 72,325South African Rand 41,046 – – – – 6 41,052Thai Baht – – – (43,234) – (1) (43,235)United States Dollar 7,872 119,106 14,900 (534,696) (8,056) 24,669 (376,205)
Total $ 252,013 $ 119,106 $ 14,900 $ (13,919) $ (16,987) $ 26,969 $ 382,082
Legg Mason Brandywine Global Dynamic US Equity Fund^
Euro $ – $ – $ – $ 929 $ – $ – $ 929United States Dollar – – 3,289 (923) – 6 2,372
Total $ – $ – $ 3,289 $ 6 $ – $ 6 $ 3,301
Legg Mason ClearBridge Value Fund
British Pound $ – $ – $ 3,853 $ – $ – $ 32 $ 3,885Euro – – 8,358 23 – 24 8,405Singapore Dollar – – – 141 – 5 146United States Dollar – – 294,639 (164) – 18,989 313,464
Total $ – $ – $ 306,850 $ – $ – $ 19,050 $ 325,900
^ Not authorised for sale to the public in Hong Kong.
333

Legg Mason Global Funds Plc Annual Report 28 February 2021
Notes to Financial Statements – (continued)12. Risk Exposure and Risk Management – (continued)
12.1 Market Risk – (continued)
(b) Foreign Currency Risk – (continued)
As at 29 February 2020 – (continued)
Currency
Investments inFixed Interest
Securities(000’s)
Investments inVariable Interest
Securities(000’s)
Investments inNon-Interest
Bearing Securities(000’s)
Forward ForeignCurrency Contracts
(000’s)Other Derivatives
(000’s)
Net Other Assets/(Liabilities)
(000’s)
Total NetAsset Value
(000’s)
Legg Mason ClearBridge US Appreciation Fund
Euro $ – $ – $ – $ – $ – $ 21 $ 21United States Dollar – – 192,364 – – 1,053 193,417
Total $ – $ – $ 192,364 $ – $ – $ 1,074 $ 193,438
Legg Mason ClearBridge US Large Cap Growth Fund
Brazilian Real $ – $ – $ – $ 6,571 $ – $ – $ 6,571British Pound – – – – – 286 286Euro – – – 69,782 – (3,654) 66,128United States Dollar – – 1,464,212 (76,382) – 60,191 1,448,021
Total $ – $ – $ 1,464,212 $ (29) $ – $ 56,823 $ 1,521,006
Legg Mason ClearBridge US Aggressive Growth Fund
Australian Dollar $ – $ – $ – $ 10,740 $ – $ (78) $ 10,662British Pound – – – 11,947 – 3,582 15,529Chinese Renminbi – – – 440 – – 440Euro – – – 35,519 – 126 35,645Hong Kong Dollar – – – – – (185) (185)Polish Zloty – – – 761 – – 761Singapore Dollar – – – 1,831 – (10) 1,821Swedish Krona – – – 28 – – 28Swiss Franc – – – 236 – – 236United States Dollar – – 950,054 (61,719) – (7,446) 880,889
Total $ – $ – $ 950,054 $ (217) $ – $ (4,011) $ 945,826
Legg Mason ClearBridge Tactical Dividend Income Fund
Australian Dollar $ – $ – $ – $ 1,575 $ – $ 200 $ 1,775Canadian Dollar – – – – – 7 7Chinese Renminbi – – – 84 – – 84Euro – – – 573 – – 573Hong Kong Dollar – – – – – (28) (28)Singapore Dollar – – – 234 – (1) 233United States Dollar – – 38,453 (2,525) – 1,212 37,140
Total $ – $ – $ 38,453 $ (59) $ – $ 1,390 $ 39,784
Legg Mason ClearBridge US Equity Sustainability Leaders Fund^
British Pound $ – $ – $ – $ 3,787 $ – $ (362) $ 3,425Euro – – – 648 – – 648United States Dollar – – 48,203 (4,459) – 1,855 45,599
Total $ – $ – $ 48,203 $ (24) $ – $ 1,493 $ 49,672
Legg Mason ClearBridge Global Growth Fund^
British Pound $ – $ – $ 166 $ – $ – $ – $ 166Canadian Dollar – – 218 – – – 218Euro – – 651 – – 1 652Hong Kong Dollar – – 171 – – – 171Japanese Yen – – 477 – – – 477South Korean Won – – 72 – – – 72Swedish Krona – – 21 – – – 21Swiss Franc – – 207 – – – 207United States Dollar – – 6,157 – – 322 6,479
Total $ – $ – $ 8,140 $ – $ – $ 323 $ 8,463
Legg Mason ClearBridge Infrastructure Value Fund^
Australian Dollar € – € – € 41,433 € (7,358) € – € (1) € 34,074Brazilian Real – – 8,261 2,673 – (298) 10,636British Pound – – 107,737 72,327 – 2,164 182,228Canadian Dollar – – 92,006 25,202 – 391 117,599Chinese Renminbi – – – 2,735 – 1 2,736Euro – – 155,068 (169,825) – 27,070 12,313Hong Kong Dollar – – 14,468 – – – 14,468Mexican Peso – – 11,203 (2,091) – (1) 9,111Singapore Dollar – – – 940 – (17) 923United States Dollar – – 320,436 72,905 – (3,491) 389,850
Total € – € – € 750,612 € (2,492) € – € 25,818 € 773,938
^ Not authorised for sale to the public in Hong Kong.
334

Legg Mason Global Funds Plc Annual Report 28 February 2021
Notes to Financial Statements – (continued)12. Risk Exposure and Risk Management – (continued)
12.1 Market Risk – (continued)
(b) Foreign Currency Risk – (continued)
As at 29 February 2020 – (continued)
Currency
Investments inFixed Interest
Securities(000’s)
Investments inVariable Interest
Securities(000’s)
Investments inNon-Interest
Bearing Securities(000’s)
Forward ForeignCurrency Contracts
(000’s)Other Derivatives
(000’s)
Net Other Assets/(Liabilities)
(000’s)
Total NetAsset Value
(000’s)
Legg Mason ClearBridge Emerging Markets Infrastructure Fund^
Brazilian Real $ – $ – $ 492 $ – $ – $ (24) $ 468Chilean Peso – – 53 – – – 53Chinese Renminbi – – 50 – – – 50Euro – – – 1,603 – – 1,603Hong Kong Dollar – – 438 – – – 438Indian Rupee – – 711 – – (8) 703Indonesian Rupiah – – 119 – – – 119Malaysian Ringgit – – 69 – – – 69Mexican Peso – – 501 – – – 501Philippine Peso – – 122 – – – 122Thai Baht – – 33 – – – 33United States Dollar – – – (1,593) – 120 (1,473)
Total $ – $ – $ 2,588 $ 10 $ – $ 88 $ 2,686
Legg Mason Royce US Small Cap Opportunity Fund
Australian Dollar $ – $ – $ – $ 5,029 $ – $ (1) $ 5,028Brazilian Real – – – 2,154 – – 2,154British Pound – – – 907 – 303 1,210Chinese Renminbi – – – 836 – – 836Euro – – – 9,368 – 477 9,845Polish Zloty – – – 549 – – 549Singapore Dollar – – – 2,551 – (13) 2,538Swedish Krona – – – 35 – 2 37United States Dollar – – 447,792 (21,715) – (216) 425,861
Total $ – $ – $ 447,792 $ (286) $ – $ 552 $ 448,058
Legg Mason Royce US Smaller Companies Fund
Canadian Dollar $ – $ – $ 3,948 $ – $ – $ 12 $ 3,960Euro – – – 50 – (6) 44Norwegian Krone – – 1,155 – – 14 1,169Swedish Krona – – – 5 – 1 6United States Dollar – – 63,197 (55) – (264) 62,878
Total $ – $ – $ 68,300 $ – $ – $ (243) $ 68,057
Legg Mason QS MV European Equity Growth and Income Fund
Australian Dollar € – € – € – € 1,637 € – € 33 € 1,670British Pound – – 7,456 – – 63 7,519Chinese Renminbi – – – 216 – – 216Danish Krone – – 2,486 – – 49 2,535Euro – – 20,067 (11,599) – 129 8,597Norwegian Krone – – 1,605 – – 5 1,610Polish Zloty – – – 153 – – 153Singapore Dollar – – – 246 – (2) 244Swedish Krona – – 2,247 – – 1 2,248Swiss Franc – – 6,772 – – – 6,772United States Dollar – – – 9,217 – (7) 9,210
Total € – € – € 40,633 € (130) € – € 271 € 40,774
Legg Mason QS MV Asia Pacific Ex Japan Equity Growth and Income Fund
Australian Dollar $ – $ – $ 4,182 $ 4,257 $ – $ 56 $ 8,495Chinese Renminbi – – – 377 – – 377Euro – – – – – 11 11Hong Kong Dollar – – 23,253 – – 44 23,297Indian Rupee – – 5,420 – – (23) 5,397Indonesian Rupiah – – 2,412 – – 28 2,440Malaysian Ringgit – – 2,087 – – – 2,087New Zealand Dollar – – 518 – – – 518Pakistan Rupee – – 414 – – – 414Philippine Peso – – 1,393 – – 8 1,401Polish Zloty – – – 2,452 – 1 2,453Singapore Dollar – – 1,814 18,562 – 40 20,416South Korean Won – – 6,018 – – 97 6,115Taiwan Dollar – – 11,034 – – – 11,034Thai Baht – – 4,105 – – – 4,105United States Dollar – – 639 (25,855) – 692 (24,524)
Total $ – $ – $ 63,289 $ (207) $ – $ 954 $ 64,036
^ Not authorised for sale to the public in Hong Kong.
335

Legg Mason Global Funds Plc Annual Report 28 February 2021
Notes to Financial Statements – (continued)12. Risk Exposure and Risk Management – (continued)
12.1 Market Risk – (continued)
(b) Foreign Currency Risk – (continued)
As at 29 February 2020 – (continued)
Currency
Investments inFixed Interest
Securities(000’s)
Investments inVariable Interest
Securities(000’s)
Investments inNon-Interest
Bearing Securities(000’s)
Forward ForeignCurrency Contracts
(000’s)Other Derivatives
(000’s)
Net Other Assets/(Liabilities)
(000’s)
Total NetAsset Value
(000’s)
Legg Mason QS Emerging Markets Equity Fund
Brazilian Real $ – $ – $ 1,085 $ – $ – $ (37) $ 1,048British Pound – – – – – 1 1Chilean Peso – – 299 – – 2 301Chinese Renminbi – – 460 – – – 460Colombian Peso – – 95 – – 2 97Czech Koruna – – 95 – – 2 97Egyptian Pound – – 91 – – – 91Euro – – 138 – – 5 143Hong Kong Dollar – – 2,352 – – 19 2,371Hungarian Forint – – 130 – – 1 131Indian Rupee – – 767 – – (1) 766Indonesian Rupiah – – 563 – – 4 567Malaysian Ringgit – – 497 – – 2 499Mexican Peso – – 341 – – 1 342Philippine Peso – – 259 – – 1 260Polish Zloty – – 222 – – 1 223Qatari Riyal – – 123 – – 2 125Russian Ruble – – – – – 1 1South African Rand – – 940 – – 2 942South Korean Won – – 893 – – 10 903Taiwan Dollar – – 514 – – 5 519Thai Baht – – 975 – – 7 982Turkish Lira – – 295 – – 1 296United Arab Emirates Dirham – – 129 – – – 129United States Dollar – – 804 – (20) 107 891
Total $ – $ – $ 12,067 $ – $ (20) $ 138 $ 12,185
Legg Mason QS MV Global Equity Growth and Income Fund
Australian Dollar $ – $ – $ 251 $ 945 $ – $ 4 $ 1,200Brazilian Real – – 133 – – 2 135British Pound – – 870 (781) – 9 98Canadian Dollar – – 535 (340) – 1 196Danish Krone – – – – – 1 1Euro – – 1,966 (1,793) – 8 181Hong Kong Dollar – – 860 – – – 860Japanese Yen – – 1,195 – – 3 1,198Malaysian Ringgit – – 272 – – – 272Mexican Peso – – 135 – – – 135New Zealand Dollar – – 363 – – 1 364Norwegian Krone – – 303 – – – 303Singapore Dollar – – 505 14 – 2 521South African Rand – – 50 – – – 50Swedish Krona – – 207 – – – 207Swiss Franc – – 366 – – 1 367Taiwan Dollar – – 415 – – – 415Turkish Lira – – 128 – – – 128United States Dollar – – 4,936 1,903 – (1) 6,838
Total $ – $ – $ 13,490 $ (52) $ – $ 31 $ 13,469
Legg Mason Martin Currie Asia Long-Term Unconstrained Fund^
British Pound $ – $ – $ – $ – $ – $ (4) $ (4)Hong Kong Dollar – – 72,204 – – – 72,204Indian Rupee – – 16,963 – – – 16,963Singapore Dollar – – 15,157 – – – 15,157South Korean Won – – 21,927 – – 234 22,161Taiwan Dollar – – 9,808 – – – 9,808Thai Baht – – 3,279 – – – 3,279United States Dollar – – 18,513 – – 6,637 25,150
Total $ – $ – $ 157,851 $ – $ – $ 6,867 $ 164,718
^ Not authorised for sale to the public in Hong Kong.
336

Legg Mason Global Funds Plc Annual Report 28 February 2021
Notes to Financial Statements – (continued)12. Risk Exposure and Risk Management – (continued)
12.1 Market Risk – (continued)
(b) Foreign Currency Risk – (continued)
As at 29 February 2020 – (continued)
Currency
Investments inFixed Interest
Securities(000’s)
Investments inVariable Interest
Securities(000’s)
Investments inNon-Interest
Bearing Securities(000’s)
Forward ForeignCurrency Contracts
(000’s)Other Derivatives
(000’s)
Net Other Assets/(Liabilities)
(000’s)
Total NetAsset Value
(000’s)
Legg Mason Martin Currie European Absolute Alpha Fund^
Brazilian Real € – € – € – € 5,367 € – € (2,710) € 2,657British Pound – – 54,332 (51,919) 1,637 404 4,454Danish Krone – – 10,755 (11,212) (30) 24 (463)Euro 4,463 – 56,990 24,966 2,555 10,059 99,033Hungarian Forint – – 7,901 (8,380) – – (479)Japanese Yen – – – 44,898 – – 44,898Norwegian Krone – – 5,954 (6,229) – – (275)Swedish Krona – – 14,816 (13,419) 627 (41) 1,983Swiss Franc – – 18,731 (15,749) (24) (181) 2,777Turkish Lira – – 3,031 (3,068) – 1 (36)United States Dollar – – – 35,298 – – 35,298
Total € 4,463 € – € 172,510 € 553 € 4,765 € 7,556 € 189,847
Legg Mason Martin Currie Global Long-Term Unconstrained Fund^
Australian Dollar $ – $ – $ 1,352 $ – $ – $ – $ 1,352British Pound – – 1,702 504 – 125 2,331Canadian Dollar – – 538 – – – 538Danish Krone – – 1,205 – – 7 1,212Euro – – 5,809 – – 22 5,831Hong Kong Dollar – – 2,256 – – – 2,256Swedish Krona – – 2,642 – – 1 2,643Swiss Franc – – 1,297 – – 1 1,298Taiwan Dollar – – 1,348 – – – 1,348United States Dollar – – 14,140 (506) – 1,737 15,371
Total $ – $ – $ 32,289 $ (2) $ – $ 1,893 $ 34,180
Legg Mason Martin Currie Asia Pacific Ex Japan Real Income Fund
Australian Dollar $ – $ – $ 2,926 $ 3 $ – $ 48 $ 2,977Chinese Renminbi – – 319 – – – 319Hong Kong Dollar – – 1,374 – – 5 1,379Indian Rupee – – 680 – – 16 696Malaysian Ringgit – – 465 – – 4 469New Zealand Dollar – – 245 – – – 245Philippine Peso – – 345 – – – 345Singapore Dollar – – 1,180 – – 11 1,191Thai Baht – – 319 – – 5 324United States Dollar – – – (3) – 299 296
Total $ – $ – $ 7,853 $ – $ – $ 388 $ 8,241
Legg Mason Martin Currie Global Emerging Markets Fund^
Brazilian Real $ – $ – $ 927 $ – $ – $ (6) $ 921Euro – – 660 – – – 660Hong Kong Dollar – – 6,907 – – 1 6,908Hungarian Forint – – 858 – – – 858Indian Rupee – – 3,491 – – (25) 3,466Indonesian Rupiah – – 850 – – 18 868Malaysian Ringgit – – 250 – – – 250Mexican Peso – – 607 – – – 607Philippine Peso – – 191 – – – 191South Korean Won – – 4,490 – – 24 4,514Taiwan Dollar – – 3,186 – – 1 3,187Turkish Lira – – 189 – – – 189United States Dollar – – 5,791 – – 1,011 6,802
Total $ – $ – $ 28,397 $ – $ – $ 1,024 $ 29,421
Legg Mason Martin Currie European Unconstrained Fund^
British Pound € – € – € 414 € – € – € 3 € 417Danish Krone – – 285 – – 1 286Euro – – 2,910 – – 314 3,224Swedish Krona – – 990 – – – 990Swiss Franc – – 834 – – – 834United States Dollar – – 386 – – 1 387
Total € – € – € 5,819 € – € – € 319 € 6,138
^ Not authorised for sale to the public in Hong Kong.
337

Legg Mason Global Funds Plc Annual Report 28 February 2021
Notes to Financial Statements – (continued)12. Risk Exposure and Risk Management – (continued)
12.1 Market Risk – (continued)
(b) Foreign Currency Risk – (continued)
Certain Funds also have share classes issued in foreign currencies. Certain Funds (as indicated in the relevant Supplement to the Prospectus) may enter into forward foreign currency contracts, bothdeliverable and non-deliverable, to hedge against exchange risk, to increase exposure to a currency, to shift exposure to currency fluctuations from one currency to another, or to enhance return. EachFixed Income Fund may also enter into options on forward foreign currency contracts, both deliverable and non-deliverable, which in exchange for a premium gives the Fund the option, but not theobligation, to enter into such a contract at some time before a specified date.
The following table sets out a sensitivity analysis in relation to foreign currency risk and its effect on the net asset value of the Funds where foreign currency risk is deemed significant. A snapshot of theunderlying positions for all Funds was taken as at 28 February 2021 and 29 February 2020. Exchange rates were appreciated/depreciated by +/- 5% (given the nature of the markets that the Funds areinvested in a 5% increase/decrease has been applied); the corresponding impact was estimated for the total net asset value. All other market parameters are also assumed unchanged.
Impact on net asset value due to movement in foreign exchange rates*(Amount in Fund Base Currency) (000’s)
28 February 2021 29 February 2020Fund Currency Positive 5% Negative 5% Positive 5% Negative 5%
Legg Mason Western Asset Global Multi Strategy Fund Australian Dollar 4,135 (3,741) n/a n/aBritish Pound 19,941 (18,042) 19,951 (18,051)
Legg Mason Western Asset Emerging Markets Total Return Bond Fund Euro 221 (200) 117 (106)Legg Mason Western Asset Asian Opportunities Fund Chinese Renminbi 7,580 (6,858) n/a n/a
Indian Rupee n/a n/a 3,193 (2,889)Indonesian Rupiah 4,015 (3,632) 4,676 (4,231)Malaysian Ringgit n/a n/a 3,347 (3,029)Singapore Dollar 4,464 (4,039) 4,023 (3,640)South Korean Won 6,395 (5,786) 3,398 (3,075)
Legg Mason Western Asset Short Duration Blue Chip Bond Fund British Pound 18,109 (16,385) 13,048 (11,805)Euro 2,949 (2,668) n/a n/a
Legg Mason Western Asset Global Core Plus Bond Fund^ Canadian Dollar 5,699 (5,156) 5,289 (4,786)Euro 2,454 (2,220) 2,330 (2,108)
Legg Mason Western Asset Macro Opportunities Bond Fund^ British Pound 48,932 (44,272) 63,301 (57,272)Euro 115,941 (104,899) 108,496 (98,163)
Legg Mason Western Asset Multi-Asset Credit Fund^ British Pound 48,860 (44,206) 40,521 (36,662)Legg Mason Western Asset Structured Opportunities Fund^ Euro 14,062 (12,723) 26,278 (23,775)Legg Mason Western Asset US Corporate Bond Fund^ British Pound 8,638 (7,816) 5,130 (4,642)Legg Mason Brandywine Global Fixed Income Fund British Pound 6,486 (5,868) 16,037 (14,509)
Euro 4,816 (4,358) 5,870 (5,311)Mexican Peso 2,085 (1,886) 5,325 (4,818)
Legg Mason Brandywine Global Fixed Income Absolute Return Fund^ Australian Dollar 19,394 (17,547) 15,226 (13,776)British Pound 3,941 (3,565) 5,092 (4,607)Chilean Peso n/a n/a 4,959 (4,487)Euro n/a n/a 5,498 (4,974)Japanese Yen (5,659) 5,120 n/a n/aPolish Zloty 6,085 (5,505) n/a n/aSingapore Dollar 7,066 (6,393) 10,260 (9,282)Swiss Franc (6,141) 5,556 (4,553) 4,120Taiwan Dollar n/a n/a (4,521) 4,090
Legg Mason Brandywine Global High Yield Fund^ Canadian Dollar 598 (541) 520 (470)Legg Mason Brandywine Global Opportunistic Fixed Income Fund British Pound 4,018 (3,636) 3,518 (3,183)
Euro (4,210) 3,809 (3,615) 3,271Mexican Peso 3,247 (2,937) 3,173 (2,870)New Zealand Dollar 11,945 (10,807) 12,396 (11,215)
Legg Mason Brandywine Global Sovereign Credit Fund^ British Pound n/a n/a 31,001 (28,049)Euro n/a n/a (9,894) 8,952Japanese Yen n/a n/a (8,696) 7,868Mexican Peso n/a n/a 10,770 (9,745)
Legg Mason Brandywine Global Income Optimiser Fund^ Euro 8,153 (7,376) 2,516 (2,276)Legg Mason Brandywine Global Defensive High Yield Fund^ Euro 538 (486) 508 (460)Legg Mason Brandywine Global Enhanced Absolute Return Fund^ Australian Dollar 19,812 (17,926) 17,952 (16,242)
British Pound 2,885 (2,610) 5,222 (4,725)Euro n/a n/a (3,309) 2,994Malaysian Ringgit n/a n/a 2,832 (2,562)Mexican Peso 3,096 (2,801) 4,842 (4,381)Norwegian Krone n/a n/a 2,512 (2,273)Russian Ruble 2,297 (2,078) n/a n/aSingapore Dollar n/a n/a 3,807 (3,444)South African Rand n/a n/a 2,161 (1,955)Thai Baht n/a n/a (2,276) 2,059
Legg Mason Brandywine Global Dynamic US Equity Fund^ Euro 74 (67) 49 (44)Legg Mason ClearBridge US Equity Sustainability Leaders Fund^ British Pound 4,357 (3,942) n/a n/aLegg Mason ClearBridge Infrastructure Value Fund^ British Pound 4,944 (4,473) 9,591 (8,678)
Canadian Dollar n/a n/a 6,189 (5,600)United States Dollar 16,670 (15,083) 20,518 (18,564)
Legg Mason ClearBridge Emerging Markets Infrastructure Fund^ Brazilian Real 19 (17) 25 (22)Euro 90 (81) 84 (76)Hong Kong Dollar 32 (29) 23 (21)Indian Rupee 38 (34) 37 (33)Mexican Peso 22 (20) 26 (24)
Legg Mason QS MV European Equity Growth and Income Fund British Pound 435 (394) 396 (358)United States Dollar 248 (224) 485 (439)Swiss Franc 356 (322) 356 (322)
Legg Mason QS MV Asia Pacific Ex Japan Equity Growth and Income Fund Australian Dollar 273 (247) 447 (405)Hong Kong Dollar 743 (673) 1,226 (1,109)Singapore Dollar n/a n/a 1,075 (972)South Korean Won 191 (173) n/a n/aTaiwan Dollar 315 (285) 581 (525)
^ Not authorised for sale to the public in Hong Kong.
338

Legg Mason Global Funds Plc Annual Report 28 February 2021
Notes to Financial Statements – (continued)12. Risk Exposure and Risk Management – (continued)
12.1 Market Risk – (continued)
(b) Foreign Currency Risk – (continued)
Impact on net asset value due to movement in foreign exchange rates*(Amount in Fund Base Currency) (000’s)
28 February 2021 29 February 2020Fund Currency Positive 5% Negative 5% Positive 5% Negative 5%
Legg Mason QS Emerging Markets Equity Fund Hong Kong Dollar 158 (143) 125 (113)Legg Mason QS MV Global Equity Growth and Income Fund Euro 97 (87) n/a n/a
Japanese Yen 73 (66) n/a n/aLegg Mason Martin Currie Asia Long-Term Unconstrained Fund^ Hong Kong Dollar 1,836 (1,661) 3,800 (3,438)
Indian Rupee 530 (480) 893 (808)South Korean Won 764 (691) 1,166 (1,055)Taiwan Dollar 429 (388) n/a n/a
Legg Mason Martin Currie European Absolute Alpha Fund^ Japanese Yen n/a n/a 2,363 (2,138)United States Dollar 1,041 (942) 1,858 (1,681)
Legg Mason Martin Currie Global Long-Term Unconstrained Fund^ Euro 1,161 (1,051) 307 (278)Hong Kong Dollar 565 (511) n/a n/a
Legg Mason Martin Currie Asia Pacific Ex Japan Real Income Fund Australian Dollar 508 (459) 157 (142)Hong Kong Dollar 319 (289) 73 (66)Indian Rupee 161 (146) n/a n/aSingapore Dollar 253 (229) 63 (57)
Legg Mason Martin Currie Global Emerging Markets Fund^ Hong Kong Dollar 659 (596) 364 (329)Indian Rupee 228 (206) 182 (165)South Korean Won 390 (353) 238 (215)Taiwan Dollar 283 (256) 168 (152)
Legg Mason Martin Currie European Unconstrained Fund^ Swedish Krona 780 (706) 52 (47)Swiss Franc n/a n/a 44 (40)
Analysis is shown where significant foreign currency exposure is held on the Fund. Significant exposure is deemed to be in excess of 10% of net assets. Movements in all foreign currency exchange rateswill have a direct impact on the net asset value. The foreign currency exchange rates as at 28 February 2021 and 29 February 2020 are listed in Note 11. This sensitivity analysis should not be used as aprediction of future performance.
The foreign currency risk sensitivity analysis for Legg Mason Western Asset Macro Opportunities Bond Fund^, Legg Mason Western Asset Multi-Asset Credit Fund^, Legg Mason Western AssetStructured Opportunities Fund^, Western Asset UCITS SMASh Series Core Plus Completion Fund^, Legg Mason Brandywine Global Fixed Income Absolute Return Fund^, Legg Mason BrandywineGlobal Income Optimiser Fund^, Legg Mason Brandywine Global Credit Opportunities Fund^, Legg Mason Brandywine Global Enhanced Absolute Return Fund^ and Legg Mason Martin CurrieEuropean Absolute Alpha Fund^ has been incorporated into the calculation of the market risk using the VaR approach (Note 12.1 above).
(c) Interest Rate Risk
A sensitivity analysis for the Equity Funds has not been prepared as the majority of the Equity Funds’ assets are non-interest bearing assets and therefore the risk is not sufficiently material.
As at 28 February 2021 and 29 February 2020, all of the cash held by the Funds is held with the Depositary or other brokers and have the potential to yield interest income, the level of which willfluctuate according to the prevailing level of market interest rates.
The analysis of fixed, variable and non-interest bearing securities is disclosed in Note 12.1(b) above.
The weighted average yield and weighted average years to maturity of each Fund on its fixed rate instruments per currency as at 28 February 2021 and 29 February 2020 are as follows:
As at 28 February 2021
CurrencyWeightedAverage Yield
Weighted AverageYears to Maturity
Legg Mason Western Asset US Government Liquidity FundUS Dollar 0.67% 0.17
Legg Mason Western Asset US Core Bond FundChinese Renminbi 3.21% 4.76US Dollar 2.83% 19.30
Legg Mason Western Asset US Core Plus Bond FundBrazilian Real 9.23% 4.28Euro 2.27% 0.48Mexican Peso 7.28% 19.96Russian Ruble 7.03% 9.89US Dollar 2.86% 16.95
Legg Mason Western Asset Euro Core Plus Bond FundAustralian Dollar 2.28% 30.33British Pound 2.18% 37.71Euro 1.53% 12.46US Dollar 3.91% 17.69
Legg Mason Western Asset Short Duration High Income Bond FundUS Dollar 5.78% 4.77
Legg Mason Western Asset Global Multi Strategy FundAustralian Dollar 2.28% 30.33Brazilian Real 9.28% 3.15British Pound 3.54% 10.77Colombian Peso 8.35% 3.40Euro 4.02% 5.96Indonesian Rupiah 7.05% 7.15Mexican Peso 7.17% 19.94Russian Ruble 6.95% 10.24South African Rand 9.93% 18.98US Dollar 4.29% 10.84
Legg Mason Western Asset US High Yield FundUS Dollar 5.71% 7.21
^ Not authorised for sale to the public in Hong Kong.
339

Legg Mason Global Funds Plc Annual Report 28 February 2021
Notes to Financial Statements – (continued)12. Risk Exposure and Risk Management – (continued)
12.1 Market Risk – (continued)
(c) Interest Rate Risk – (continued)
As at 28 February 2021 – (continued)
CurrencyWeightedAverage Yield
Weighted AverageYears to Maturity
Legg Mason Western Asset Emerging Markets Total Return Bond FundBrazilian Real 9.19% 4.88Euro 4.86% 10.93Indian Rupee 5.79% 1.74Indonesian Rupiah 7.48% 7.13Mexican Peso 6.11% 10.31Russian Ruble 7.04% 11.70South African Rand 10.17% 15.93Ukrainian Hryvnia 8.09% 0.99US Dollar 4.88% 14.55
Legg Mason Western Asset Emerging Markets Corporate Bond FundEuro 4.86% 10.93US Dollar 4.48% 9.42
Legg Mason Western Asset Global High Yield FundBrazilian Real 9.34% 1.84British Pound 4.40% 3.42Euro 3.65% 5.50Indonesian Rupiah 6.97% 1.07Russian Ruble 6.82% 6.89US Dollar 5.00% 6.62
Legg Mason Western Asset Asian Opportunities FundChinese Renminbi 3.91% 10.17Hong Kong Dollar 2.89% 0.20Indian Rupee 7.22% 5.89Indonesian Rupiah 7.57% 5.02Malaysian Ringgit 3.78% 8.57Philippine Peso 4.39% 9.77Singapore Dollar 2.40% 17.87South Korean Won 1.43% 10.03Thai Baht 2.86% 17.31US Dollar 4.34% 29.64
Legg Mason Western Asset Short Duration Blue Chip Bond FundEuro 0.62% 4.76British Pound 1.31% 4.09US Dollar 2.16% 5.43
Legg Mason Western Asset Global Core Plus Bond Fund^Australian Dollar 2.28% 30.33British Pound 3.24% 21.71Canadian Dollar 2.60% 15.58Euro 1.62% 14.52Indonesian Rupiah 7.67% 18.14Japanese Yen 0.58% 27.11Mexican Nuevo Peso 7.22% 21.72South African Rand 9.96% 19.30South Korean Won 1.84% 5.28US Dollar 2.77% 14.66
Legg Mason Western Asset Global Credit Fund^British Pound 3.25% 7.66Euro 1.63% 6.92Mexican Peso 7.22% 21.72Russian Ruble 6.79% 8.24US Dollar 3.74% 13.51
Legg Mason Western Asset Euro High Yield FundBritish Pound 4.79% 6.55Euro 4.10% 5.07
Legg Mason Western Asset Macro Opportunities Bond Fund^Australian Dollar 2.76% 27.09Brazilian Real 9.28% 3.14Chinese Renminbi 3.71% 26.40Egyptian Pound 16.53% 3.25Euro 2.72% 23.59Indian Rupee 7.51% 3.73Indonesian Rupiah 7.26% 9.74Mexican Peso 7.24% 22.98Russian Ruble 7.11% 10.23South African Rand 9.43% 15.40US Dollar 3.96% 18.37
^ Not authorised for sale to the public in Hong Kong.
340

Legg Mason Global Funds Plc Annual Report 28 February 2021
Notes to Financial Statements – (continued)12. Risk Exposure and Risk Management – (continued)
12.1 Market Risk – (continued)
(c) Interest Rate Risk – (continued)
As at 28 February 2021 – (continued)
CurrencyWeightedAverage Yield
Weighted AverageYears to Maturity
Legg Mason Western Asset Multi-Asset Credit Fund^Brazilian Real 9.15% 6.09British Pound 4.03% 5.03Euro 3.73% 1.78Indonesian Rupiah 6.81% 6.12Mexican Nuevo Peso 7.26% 8.26Russian Ruble 6.82% 6.89US Dollar 5.13% 9.43
Legg Mason Western Asset Structured Opportunities Fund^US Dollar 6.20% 12.65
Legg Mason Western Asset US Mortgage-Backed Securities Fund^US Dollar 3.42% 24.00
Legg Mason Western Asset UK Investment Grade Credit Fund^British Pound 3.17% 10.48Euro 0.00% 8.97US Dollar 3.26% 17.24
Legg Mason Western Asset US Corporate Bond Fund^British Pound 3.91% 10.68Euro 3.83% 17.01Russian Ruble 6.79% 8.24US Dollar 3.50% 12.35
Western Asset UCITS SMASh Series Core Plus Completion Fund^Brazilian Real 9.15% 5.84Indonesian Rupiah 6.69% 6.21Mexican Peso 7.22% 21.72Russian Ruble 6.79% 8.24US Dollar 2.60% 14.07
Legg Mason Brandywine Global Fixed Income FundAustralian Dollar 5.52% 0.82Brazilian Real 9.23% 3.84British Pound 1.71% 1.52Colombian Peso 5.79% 7.17Indonesian Rupiah 7.77% 8.05Malaysian Ringgit 3.67% 5.97Mexican Peso 7.04% 16.45Polish Zloty 1.99% 0.15Russian Ruble 4.36% 4.90South African Rand 10.31% 23.95US Dollar 3.15% 27.86
Legg Mason Brandywine Global Fixed Income Absolute Return Fund^Brazilian Real 9.15% 6.33Colombian Peso 5.79% 7.17Indonesian Rupiah 7.74% 11.16Mexican Peso 7.32% 18.44South African Rand 8.77% 10.58US Dollar 4.93% 22.71
Legg Mason Brandywine Global High Yield Fund^Canadian Dollar 8.47% 3.32Euro 3.44% 6.88US Dollar 5.86% 7.09
Legg Mason Brandywine Global Opportunistic Fixed Income FundAustralian Dollar 5.34% 1.38Brazilian Real 9.15% 6.29British Pound 1.71% 1.52Colombian Peso 5.79% 6.05Indonesian Rupiah 7.74% 11.82Malaysian Ringgit 3.60% 3.32Mexican Peso 7.27% 17.43Polish Zloty 1.99% 0.15Russian Ruble 7.17% 9.12South African Rand 10.33% 24.20US Dollar 4.90% 24.36
Legg Mason Brandywine Global Income Optimiser Fund^Brazilian Real 5.23% 4.90Canadian Dollar 4.66% 2.60Egyptian Pound 0.00% 0.02Mexican Peso 4.45% 4.90Russian Ruble 4.36% 4.90US Dollar 4.16% 6.92
^ Not authorised for sale to the public in Hong Kong.
341

Legg Mason Global Funds Plc Annual Report 28 February 2021
Notes to Financial Statements – (continued)12. Risk Exposure and Risk Management – (continued)
12.1 Market Risk – (continued)
(c) Interest Rate Risk – (continued)
As at 28 February 2021 – (continued)
CurrencyWeightedAverage Yield
Weighted AverageYears to Maturity
Legg Mason Brandywine Global Credit Opportunities Fund^US Dollar 5.59% 7.39
Legg Mason Brandywine Global Defensive High Yield Fund^Canadian Dollar 8.47% 3.32Euro 3.44% 6.88US Dollar 5.71% 7.03
Legg Mason Brandywine Global Enhanced Absolute Return Fund^Brazilian Real 9.13% 7.85Colombian Peso 5.79% 7.17Indonesian Rupiah 7.77% 8.05Malaysian Ringgit 3.68% 2.98Mexican Peso 7.25% 19.90Russian Ruble 7.17% 9.12South African Rand 10.49% 25.78US Dollar 5.40% 24.10
As at 29 February 2020
CurrencyWeightedAverage Yield
Weighted AverageYears to Maturity
Legg Mason Western Asset US Government Liquidity FundUS Dollar 0.41% 0.13
Legg Mason Western Asset US Core Bond FundChinese Renminbi 3.18% 5.76US Dollar 3.24% 19.70
Legg Mason Western Asset US Core Plus Bond FundArgentine Peso 49.18% 1.59Brazilian Real 9.04% 3.30Mexican Peso 7.36% 21.11Russian Ruble 6.86% 11.04US Dollar 3.42% 19.72
Legg Mason Western Asset Euro Core Plus Bond FundEuro 1.61% 12.70Norwegian Krone 1.66% 9.53Polish Zloty 2.55% 8.16Swedish Krona 2.12% 19.09US Dollar 4.73% 6.01
Legg Mason Western Asset Short Duration High Income Bond FundUS Dollar 6.02% 4.79
Legg Mason Western Asset Global Multi Strategy FundArgentine Peso 49.12% 1.60Brazilian Real 8.78% 4.18British Pound 3.99% 17.29Colombian Peso 8.40% 4.40Euro 4.03% 7.29Indonesian Rupiah 7.23% 8.15Mexican Peso 7.17% 16.83Russian Ruble 6.75% 9.91South African Rand 9.44% 20.80US Dollar 4.27% 10.09
Legg Mason Western Asset US High Yield FundUS Dollar 6.27% 6.88
Legg Mason Western Asset Emerging Markets Total Return Bond FundBrazilian Real 9.27% 2.12Egyptian Pound 0.00% 0.60Euro 4.62% 9.92Indonesian Rupiah 7.68% 10.65Mexican Peso 6.02% 6.02Russian Ruble 6.83% 10.09US Dollar 4.99% 12.36
Legg Mason Western Asset Emerging Markets Corporate Bond FundEgyptian Pound 0.00% 0.60US Dollar 4.66% 10.00
Legg Mason Western Asset Global High Yield FundBrazilian Real 8.95% 2.84British Pound 5.06% 4.04Euro 4.91% 6.15Indonesian Rupiah 6.94% 2.07Mexican Peso 6.51% 2.28Russian Ruble 6.71% 7.89US Dollar 5.50% 5.74
^ Not authorised for sale to the public in Hong Kong.
342

Legg Mason Global Funds Plc Annual Report 28 February 2021
Notes to Financial Statements – (continued)12. Risk Exposure and Risk Management – (continued)
12.1 Market Risk – (continued)
(c) Interest Rate Risk – (continued)
As at 29 February 2020 – (continued)
CurrencyWeightedAverage Yield
Weighted AverageYears to Maturity
Legg Mason Western Asset Asian Opportunities FundChinese Renminbi 4.12% 4.69Hong Kong Dollar 3.26% 0.73Indian Rupee 7.24% 8.16Indonesian Rupiah 7.69% 5.53Malaysian Ringgit 3.69% 9.25Philippine Peso 4.55% 10.73Singapore Dollar 2.22% 16.37Thai Baht 2.91% 8.44US Dollar 4.81% 25.18
Legg Mason Western Asset Short Duration Blue Chip Bond FundEuro 0.74% 5.91British Pound 1.48% 4.89US Dollar 2.57% 4.23
Legg Mason Western Asset Global Core Plus Bond Fund^British Pound 3.70% 13.88Canadian Dollar 2.12% 5.26Euro 2.28% 19.61Indonesian Rupiah 7.81% 19.14Japanese Yen 0.45% 9.02Mexican Peso 7.24% 22.72Norwegian Krone 1.66% 9.53Polish Zloty 2.55% 8.16South African Rand 9.46% 21.01South Korean Won 1.80% 6.28US Dollar 3.26% 17.00
Legg Mason Western Asset Global Credit Fund^British Pound 3.68% 10.65Euro 1.44% 7.51Mexican Peso 7.24% 22.72Russian Ruble 6.63% 9.24US Dollar 3.85% 15.06
Legg Mason Western Asset Euro High Yield FundBritish Pound 5.20% 6.56Euro 4.13% 5.46
Legg Mason Western Asset Macro Opportunities Bond Fund^Argentine Peso 0.00% 0.52Australian Dollar 2.21% 27.07Brazilian Real 9.25% 2.00Chinese Renminbi 3.29% 6.64Egyptian Pound 7.15% 1.73Euro 2.78% 29.53Indian Rupee 7.73% 3.91Indonesian Rupiah 7.41% 9.64Japanese Yen 0.63% 28.33Mexican Peso 7.24% 23.54Russian Ruble 6.95% 10.83South African Rand 8.84% 16.10US Dollar 3.53% 21.55
Legg Mason Western Asset Multi-Asset Credit Fund^Brazilian Real 8.42% 7.18British Pound 4.19% 7.05Egyptian Pound 0.00% 0.45Euro 1.65% 6.52Indonesian Rupiah 7.01% 7.11Mexican Peso 7.59% 9.26Russian Ruble 6.71% 7.89US Dollar 5.39% 9.96
Legg Mason Western Asset Structured Opportunities Fund^US Dollar 6.14% 18.98
Legg Mason Western Asset US Mortgage-Backed Securities Fund^US Dollar 3.65% 25.74
Legg Mason Western Asset UK Investment Grade Credit Fund^British Pound 3.29% 11.20US Dollar 3.44% 18.15
Legg Mason Western Asset US Corporate Bond Fund^British Pound 3.88% 11.72Egyptian Pound 0.00% 0.07Euro 3.74% 18.01Russian Ruble 6.63% 9.24US Dollar 3.97% 11.17
^ Not authorised for sale to the public in Hong Kong.
343

Legg Mason Global Funds Plc Annual Report 28 February 2021
Notes to Financial Statements – (continued)12. Risk Exposure and Risk Management – (continued)
12.1 Market Risk – (continued)
(c) Interest Rate Risk – (continued)
As at 29 February 2020 – (continued)
CurrencyWeightedAverage Yield
Weighted AverageYears to Maturity
Legg Mason Brandywine Global Fixed Income FundAustralian Dollar 5.28% 1.83Brazilian Real 8.76% 4.12British Pound 1.99% 0.39Colombian Peso 5.93% 8.17Indonesian Rupiah 6.37% 2.79Malaysian Ringgit 3.65% 7.04Mexican Peso 7.37% 18.24Norwegian Krone 3.64% 1.24Polish Zloty 3.27% 0.61South African Rand 9.84% 24.87US Dollar 2.99% 29.61
Legg Mason Brandywine Global Fixed Income Absolute Return Fund^Brazilian Real 9.26% 1.82Colombian Peso 5.93% 8.17Indonesian Rupiah 8.09% 11.63Mexican Peso 7.42% 16.06Polish Zloty 2.36% 0.44US Dollar 3.95% 30.29
Legg Mason Brandywine Global High Yield Fund^Euro 3.46% 7.88US Dollar 5.66% 5.55
Legg Mason Brandywine Global Opportunistic Fixed Income Fund^Australian Dollar 5.27% 1.77Brazilian Real 9.25% 1.84British Pound 1.99% 0.39Colombian Peso 5.96% 7.22Indonesian Rupiah 8.09% 12.45Malaysian Ringgit 3.63% 3.65Mexican Peso 7.36% 18.33Norwegian Krone 3.64% 1.24Polish Zloty 3.07% 0.56South African Rand 9.85% 24.97US Dollar 3.20% 29.18
Legg Mason Brandywine Global Sovereign Credit Fund^Australian Dollar 5.12% 2.38Brazilian Real 9.17% 2.13British Pound 1.99% 0.39Colombian Peso 7.61% 5.42Indonesian Rupiah 7.92% 10.37Malaysian Ringgit 3.53% 4.72Mexican Peso 7.29% 22.50South African Rand 9.85% 24.99US Dollar 3.03% 29.66
Legg Mason Brandywine Global Income Optimiser Fund^Egyptian Pound 0.00% 0.08Euro 2.12% 27.50Japanese Yen 0.39% 29.33US Dollar 3.59% 3.77
Legg Mason Brandywine Global Credit Opportunities Fund^Egyptian Pound 0.00% 0.07US Dollar 3.28% 19.22
Legg Mason Brandywine Global Defensive High Yield Fund^Euro 3.46% 7.88US Dollar 5.53% 5.55
Legg Mason Brandywine Global Enhanced Absolute Return Fund^Australian Dollar 5.12% 2.38Brazilian Real 8.95% 2.84Colombian Peso 5.93% 8.17Indonesian Rupiah 8.09% 9.05Malaysian Ringgit 3.67% 3.51Mexican Peso 7.31% 20.97South African Rand 10.03% 26.80US Dollar 7.31% 29.58
^ Not authorised for sale to the public in Hong Kong.
344

Legg Mason Global Funds Plc Annual Report 28 February 2021
Notes to Financial Statements – (continued)12. Risk Exposure and Risk Management – (continued)
12.1 Market Risk – (continued)
(d) Other Price Risk – Fair Value of Financial Assets and Financial Liabilities
In addition to the Committee, Franklin Templeton has established the Valuation Committee to oversee the implementation of the valuation policies and procedures adopted by the Board of Directors(the ‘‘Board’’). The Valuation Committee, including the Chairperson, is comprised of no fewer than four members and no more than ten members. Representatives of Franklin Templeton Legal andCompliance will serve the Valuation Committee in an advisory capacity. The Valuation Committee meets on a monthly basis to review all securities which are manually priced, broker priced, matrixpriced, fair valued, illiquid or stale. A Valuation Committee meeting, however, may be called at any time to consider any question or issue that falls under their procedures. Valuation Committeemeetings can be in person, or via email or other writing.
Some Funds entered into derivative contracts during the year. The value of derivatives is based on certain underlying stocks or bonds, interest rates, currencies or indices and includes futures, options,options on futures, contracts for difference and swap agreements. Derivatives may be hard to sell at an advantageous price or time and are sensitive to changes in the underlying security, interest rate,currency or index. Therefore, derivatives can be highly volatile and could result in a loss to the Fund. Refer to the respective Funds’ Portfolio of Investments for details of open derivative positions as at28 February 2021.
Fair Value Estimation
In accordance with FRS 102, the Company has elected to apply the recognition and measurement provisions of International Accounting Standards (“IAS”) 39 “Financial Instruments: Recognition andMeasurement” (“IAS 39”) as adopted for use in the European Union and the disclosure requirements of Sections 11 and 12 of FRS 102.
The fair value of financial instruments traded in active markets (such as publicly traded derivatives and trading securities) is based on quoted market prices at the Statement of Financial Position date.When a ‘‘readily available market quotation’’ for a security is not available, the Company employs ‘‘fair value’’ methodologies to price securities. As a general principle, fair value is the price that theFund might reasonably expect to receive upon a current sale. The fair valuation process requires the Valuation Committee to make a determination in good faith as to the value of a particular security orgroup of securities depending on the particular facts and circumstances involved.
Circumstances in which a market quotation is not readily available may include, trading suspensions prior to the close of the relevant market; events that unexpectedly close entire markets such asnatural disasters, power blackouts, or similar major events; market holidays; or volume of trading in a security.
When determining the fair value of a portfolio security, the Valuation Committee may consider all relevant methods, including but not limited to any one or all of the following pricing methods:
(i) A multiple of earnings;
(ii) A discount from market of a similar freely traded security;
(iii) A discounted cash-flow analysis;
(iv) The book value or a multiple thereof;
(v) A risk premium/yield analysis;
(vi) Yield to maturity; and/or
(vii) Fundamental investment analysis.
The Valuation Committee reviews the appropriateness and accuracy of the methods used in fair valuing securities on a monthly basis including a comparison of fair values against the last market priceand the next available market price, such as the next-day opening price.
The Company has classified fair value measurements using a fair value hierarchy that reflects the significance of the inputs used in making the measurements. The fair value hierarchy has the followinglevels:
Level 1 inputs are unadjusted quoted prices in an active market for identical assets or liabilities that the entity can access at the measurement date.
Level 2 inputs are inputs other than quoted prices included within Level 1 that are observable (i.e. developed using market data) for the asset or liability, either directly or indirectly.
Level 3 inputs are unobservable inputs (i.e. for which market data is unavailable) for the asset or liability.
An investment is always categorised as level 1, 2 or 3 in its entirety. In certain cases, the fair value measurement for an investment may use a number of different inputs that fall into different levels ofthe fair value hierarchy. In such cases, an investment’s level within the fair value hierarchy is based on the lowest level of input that is significant to the fair value measurement. The assessment of thesignificance of a particular input to the fair value measurement requires judgement and is specific to the investment.
The inputs or methodology used for valuing securities are not necessarily an indication of the risk associated with investing in these securities.
The following table analyses under the fair value hierarchy the Funds’ financial assets and financial liabilities measured at fair value as at 28 February 2021:
Legg MasonWestern AssetUS GovernmentLiquidityFund as at28 February 2021(in 000’s)
Legg MasonWestern AssetUS Core BondFund as at28 February 2021(in 000’s)
Legg MasonWestern AssetUS Core Plus BondFund as at28 February 2021(in 000’s)
Legg MasonWestern AssetEuro Core PlusBond Fund as at28 February 2021(in 000’s)
Legg MasonWestern AssetShort DurationHigh Income BondFund as at28 February 2021(in 000’s)
Level 1Bonds and Notes $ – $ – $ – € – $ –Money Market Instruments – – – – –Equity Instruments – – – – 454Derivative assets held for trading – 395 3,591 855 58Derivative liabilities held for trading – (1,303) (7,715) (540) (50)
– (908) (4,124) 315 462
Level 2Bonds and Notes $ 738,476 $ 309,661 $ 1,702,328 € 103,651 $ 25,074Money Market Instruments 172,000 – – – –Equity Instruments – 12,610 27,476 1,423 –Derivative assets held for trading – 4,072 19,543 259 3Derivative liabilities held for trading – (247) (3,736) (292) –
910,476 326,096 1,745,611 105,041 25,077
Level 3Bonds and Notes $ – $ 158 $ 3,498 € – $ 476Money Market Instruments – – – – –Equity Instruments – – – – –Derivative assets held for trading – – – – –Derivative liabilities held for trading – – – – –
– 158 3,498 – 476
Total Investments $ 910,476 $ 325,346 $ 1,744,985 € 105,356 $ 26,015
345

Legg Mason Global Funds Plc Annual Report 28 February 2021
Notes to Financial Statements – (continued)12. Risk Exposure and Risk Management – (continued)
12.1 Market Risk – (continued)
(d) Other Price Risk – Fair Value of Financial Assets and Financial Liabilities – (continued)
Legg MasonWestern AssetGlobal MultiStrategyFund as at28 February 2021(in 000’s)
Legg MasonWestern Asset USHigh YieldFund as at28 February 2021(in 000’s)
Legg MasonWestern AssetEmerging MarketsTotal ReturnBond Fund as at28 February 2021(in 000’s)
Legg MasonWestern AssetEmerging MarketsCorporate BondFund as at28 February 2021(in 000’s)
Legg MasonWestern AssetGlobal High YieldFund as at28 February 2021(in 000’s)
Level 1Bonds and Notes $ – $ – $ – $ – $ –Money Market Instruments – – – – –Equity Instruments 283 3,516 – – 551Derivative assets held for trading 1,115 – 77 65 52Derivative liabilities held for trading (501) (85) – – –
897 3,431 77 65 603
Level 2Bonds and Notes $ 544,219 $ 209,365 $ 20,208 $ 39,436 $ 93,048Money Market Instruments – – – – –Equity Instruments 64,890 5,196 2,084 – 9,076Derivative assets held for trading 9,809 67 70 15 158Derivative liabilities held for trading (2,105) (27) (39) (8) (76)
616,813 214,601 22,323 39,443 102,206
Level 3Bonds and Notes $ 935 $ 3,462 $ – $ – $ –Money Market Instruments – – – – –Equity Instruments 34 702 – – 34Derivative assets held for trading – – – – –Derivative liabilities held for trading – – – – –
969 4,164 – – 34
Total Investments $ 618,679 $ 222,196 $ 22,400 $ 39,508 $ 102,843
Legg MasonWestern AssetGlobal InflationManagementFund as at28 February 2021(in 000’s)
Legg MasonWestern AssetAsian OpportunitiesFund as at28 February 2021(in 000’s)
Legg MasonWestern AssetShortDuration BlueChip Bond Fundas at28 February 2021(in 000’s)
Legg MasonWesternAsset GlobalCore Plus BondFund^ as at28 February 2021(in 000’s)
Legg MasonWesternAsset GlobalCreditFund^ as at28 February 2021(in 000’s)
Level 1Bonds and Notes $ – $ – $ – $ – $ –Money Market Instruments – – – – –Equity Instruments – – – – –Derivative assets held for trading 281 – 1,417 1,236 128Derivative liabilities held for trading (117) (1,195) (6) (823) (147)
164 (1,195) 1,411 413 (19)
Level 2Bonds and Notes $ 46,387 $ 597,704 $ 480,330 $ 254,343 $ 80,256Money Market Instruments – – – – –Equity Instruments 940 22,984 24,052 28,758 940Derivative assets held for trading 231 310 7,530 2,183 110Derivative liabilities held for trading (119) (948) (2,565) (1,236) (829)
47,439 620,050 509,347 284,048 80,477
Level 3Bonds and Notes $ – $ – $ – $ 2 $ 71Money Market Instruments – – – – –Equity Instruments – – – – –Derivative assets held for trading – – – – –Derivative liabilities held for trading – – – – –
– – – 2 71
Total Investments $ 47,603 $ 618,855 $ 510,758 $ 284,463 $ 80,529
^ Not authorised for sale to the public in Hong Kong.
346

Legg Mason Global Funds Plc Annual Report 28 February 2021
Notes to Financial Statements – (continued)12. Risk Exposure and Risk Management – (continued)
12.1 Market Risk – (continued)
(d) Other Price Risk – Fair Value of Financial Assets and Financial Liabilities – (continued)
Legg MasonWestern AssetEuro High YieldFund as at28 February 2021(in 000’s)
Legg MasonWesternAsset MacroOpportunitiesBondFund^ as at28 February 2021(in 000’s)
Legg MasonWestern AssetMulti-AssetCreditFund^ as at28 February 2021(in 000’s)
Legg MasonWestern AssetStructuredOpportunitiesFund^ as at28 February 2021(in 000’s)
Legg MasonWestern AssetUS Mortgage-Backed SecuritiesFund^ as at28 February 2021(in 000’s)
Level 1Bonds and Notes € – $ – $ – $ – $ –Money Market Instruments – – – – –Equity Instruments – – 6,195 – –Derivative assets held for trading – 129,300 2,457 – 1,252Derivative liabilities held for trading – (211,694) (2,821) (492) (1,278)
– (82,394) 5,831 (492) (26)
Level 2Bonds and Notes € 45,649 $ 5,967,435 $ 1,009,951 $ 942,710 $ 899,015Money Market Instruments – – – – –Equity Instruments 336 158,037 18,898 59,043 74,145Derivative assets held for trading 256 745,197 29,821 1,071 9Derivative liabilities held for trading (109) (86,911) (2,957) (2,376) (332)
46,132 6,783,758 1,055,713 1,000,448 972,837
Level 3Bonds and Notes € – $ 10,939 $ 10,073 $ 83,562 $ –Money Market Instruments – – – – –Equity Instruments – – 2,288 – –Derivative assets held for trading – – – – –Derivative liabilities held for trading – – – – –
– 10,939 12,361 83,562 –
Total Investments € 46,132 $ 6,712,303 $ 1,073,905 $ 1,083,518 $ 972,811
Legg MasonWestern AssetUK InvestmentGrade CreditFund^ as at28 February 2021(in 000’s)
Legg MasonWestern AssetUS Corporate BondFund^ as at28 February 2021(in 000’s)
Western AssetUCITS SMAShSeries Core PlusCompletionFund^ as at28 February 2021(in 000’s)
Legg MasonBrandywineGlobal FixedIncomeFund as at28 February 2021(in 000’s)
Legg MasonBrandywineGlobal FixedIncome AbsoluteReturnFund^ as at28 February 2021(in 000’s)
Level 1Bonds and Notes £ – $ – $ – $ – $ –Money Market Instruments – – – – –Equity Instruments – 489 – – –Derivative assets held for trading 38 48 72 – 545Derivative liabilities held for trading (65) (197) (179) – –
(27) 340 (107) – 545
Level 2Bonds and Notes £ 74,495 $ 178,495 $ 23,686 $ 354,723 $ 682,231Money Market Instruments – – – – –Equity Instruments – 9,727 1,473 15,295 42,056Derivative assets held for trading 49 3,544 611 4,100 19,726Derivative liabilities held for trading – (48) (73) (2,715) (4,911)
74,544 191,718 25,697 371,403 739,102
Level 3Bonds and Notes £ – $ 80 $ – $ – $ –Money Market Instruments – – – – –Equity Instruments – – – – –Derivative assets held for trading – – – – –Derivative liabilities held for trading – – – – –
– 80 – – –
Total Investments £ 74,517 $ 192,138 $ 25,590 $ 371,403 $ 739,647
^ Not authorised for sale to the public in Hong Kong.
347

Legg Mason Global Funds Plc Annual Report 28 February 2021
Notes to Financial Statements – (continued)12. Risk Exposure and Risk Management – (continued)
12.1 Market Risk – (continued)
(d) Other Price Risk – Fair Value of Financial Assets and Financial Liabilities – (continued)
Legg MasonBrandywineGlobal High YieldFund^ as at28 February 2021(in 000’s)
Legg MasonBrandywineGlobalOpportunisticFixed IncomeFund as at28 February 2021(in 000’s)
Legg MasonBrandywineGlobalSovereign CreditFund^ as at28 February 2021(in 000’s)
Legg MasonBrandywineGlobal IncomeOptimiserFund^ as at28 February 2021(in 000’s)
Legg MasonBrandywineGlobal CreditOpportunitiesFund^ as at28 February 2021(in 000’s)
Level 1Bonds and Notes $ – $ – $ – $ – $ –Money Market Instruments – – – – –Equity Instruments – – – – 3,612Derivative assets held for trading – – – 234 41Derivative liabilities held for trading – (723) – (379) (79)
– (723) – (145) 3,574
Level 2Bonds and Notes $ 11,671 $ 558,129 $ – $ 392,058 $ 45,500Money Market Instruments – – – –Equity Instruments 216 32,385 – 35,025 2,540Derivative assets held for trading 316 2,835 926 12,466 355Derivative liabilities held for trading (38) (3,975) (1,932) (1,778) (346)
12,165 589,374 (1,006) 437,771 48,049
Level 3Bonds and Notes $ – $ – $ – $ – $ –Money Market Instruments – – – – –Equity Instruments – – – – –Derivative assets held for trading – – – – –Derivative liabilities held for trading – – – – –
– – – – –
Total Investments $ 12,165 $ 588,651 $ (1,006) $ 437,626 $ 51,623
Legg MasonBrandywineGlobal DefensiveHigh YieldFund^ as at28 February 2021(in 000’s)
Legg MasonBrandywineGlobal EnhancedAbsolute ReturnFund^ as at28 February 2021(in 000’s)
Legg MasonBrandywineGlobal DynamicUS EquityFund^ as at28 February 2021(in 000’s)
Legg MasonClearBridgeValueFund as at28 February 2021(in 000’s)
Legg MasonClearBridge USAppreciationFund as at28 February 2021(in 000’s)
Level 1Bonds and Notes $ – $ – $ – $ – $ –Money Market Instruments – – – – –Equity Instruments – – 1,848 493,419 203,955Derivative assets held for trading – 998 – – –Derivative liabilities held for trading – (1,176) – – –
– (178) 1,848 493,419 203,955
Level 2Bonds and Notes $ 11,223 $ 350,319 $ – $ – $ –Money Market Instruments – – – – –Equity Instruments 430 16,560 55 – –Derivative assets held for trading 250 5,291 3 – –Derivative liabilities held for trading (37) (1,896) – (1) –
11,866 370,274 58 (1) –
Level 3Bonds and Notes $ – $ – $ – $ – $ –Money Market Instruments – – – – –Equity Instruments – – – – –Derivative assets held for trading – – – – –Derivative liabilities held for trading – – – – –
– – – – –
Total Investments $ 11,866 $ 370,096 $ 1,906 $ 493,418 $ 203,955
^ Not authorised for sale to the public in Hong Kong.
348

Legg Mason Global Funds Plc Annual Report 28 February 2021
Notes to Financial Statements – (continued)12. Risk Exposure and Risk Management – (continued)
12.1 Market Risk – (continued)
(d) Other Price Risk – Fair Value of Financial Assets and Financial Liabilities – (continued)
Legg MasonClearBridgeUS LargeCap GrowthFund as at28 February 2021(in 000’s)
Legg MasonClearBridgeUS AggressiveGrowthFund as at28 February 2021(in 000’s)
Legg MasonClearBridgeTactical DividendIncomeFund as at28 February 2021(in 000’s)
Legg MasonClearBridgeUS EquitySustainabilityLeadersFund^ as at28 February 2021(in 000’s)
Legg MasonClearBridgeGlobal GrowthFund^ as at28 February 2021(in 000’s)
Level 1Bonds and Notes $ – $ – $ – $ – $ –Money Market Instruments – – – – –Equity Instruments 1,810,957 789,786 36,040 635,560 10,927Derivative assets held for trading – – – – –Derivative liabilities held for trading – – – – –
1,810,957 789,786 36,040 635,560 10,927
Level 2Bonds and Notes $ – $ – $ 993 $ – $ –Money Market Instruments – – – – –Equity Instruments – – – – –Derivative assets held for trading 1,202 141 16 1,741 –Derivative liabilities held for trading (2,409) (32) (2) (45) –
(1,207) 109 1,007 1,696 –
Level 3Bonds and Notes $ – $ – $ – $ – $ –Money Market Instruments – – – – –Equity Instruments – – – – –Derivative assets held for trading – – – – –Derivative liabilities held for trading – – – – –
– – – – –
Total Investments $ 1,809,750 $ 789,895 $ 37,047 $ 637,256 $ 10,927
Legg MasonClearBridgeInfrastructure ValueFund^ as at28 February 2021(in 000’s)
Legg MasonClearBridgeEmerging MarketsInfrastructureFund^ as at28 February 2021(in 000’s)
Legg MasonRoyce US SmallCap OpportunityFund as at28 February 2021(in 000’s)
Legg MasonRoyce US SmallerCompaniesFund as at28 February 2021(in 000’s)
Legg MasonQS MV EuropeanEquity Growthand IncomeFund as at28 February 2021(in 000’s)
Level 1Bonds and Notes € – $ – $ – $ – € –Money Market Instruments – – – – –Equity Instruments 607,551 2,726 1,157,007 88,681 33,006Derivative assets held for trading – – – – –Derivative liabilities held for trading – – – – –
607,551 2,726 1,157,007 88,681 33,006
Level 2Bonds and Notes € – $ – $ – $ – € –Money Market Instruments – – – – –Equity Instruments – – 91,807 1,422 –Derivative assets held for trading 230 4 503 3 7Derivative liabilities held for trading (558) – (611) (3) (15)
(328) 4 91,699 1,422 (8)
Level 3Bonds and Notes € – $ – $ – $ – € –Money Market Instruments – – – – –Equity Instruments – – – – –Derivative assets held for trading – – – – –Derivative liabilities held for trading – – – – –
– – – – –
Total Investments € 607,223 $ 2,730 $ 1,248,706 $ 90,103 € 32,998
^ Not authorised for sale to the public in Hong Kong.
349

Legg Mason Global Funds Plc Annual Report 28 February 2021
Notes to Financial Statements – (continued)12. Risk Exposure and Risk Management – (continued)
12.1 Market Risk – (continued)
(d) Other Price Risk – Fair Value of Financial Assets and Financial Liabilities – (continued)
Legg Mason QS MVAsia Pacific ExJapan EquityGrowth and IncomeFund as at28 February 2021(in 000’s)
Legg MasonQS EmergingMarkets EquityFund as at28 February 2021(in 000’s)
Legg MasonQS MV Global EquityGrowth and IncomeFund as at28 February 2021(in 000’s)
Legg MasonMartin CurrieAsia Long-TermUnconstrainedFund^ as at28 February 2021(in 000’s)
Legg MasonMartin CurrieEuropeanAbsolute AlphaFund^ as at28 February 2021(in 000’s)
Level 1Bonds and Notes $ – $ – $ – $ – € –Money Market Instruments – – – – –Equity Instruments 30,642 14,431 12,688 77,091 36,537Derivative assets held for trading – 13 – – –Derivative liabilities held for trading – – – – –
30,642 14,444 12,688 77,091 36,537
Level 2Bonds and Notes $ – $ – $ – $ – € –Money Market Instruments – – – – –Equity Instruments – 210 – – –Derivative assets held for trading 43 – 5 – 424Derivative liabilities held for trading (29) – – – (778)
14 210 5 – (354)
Level 3Bonds and Notes $ – $ – $ – $ – € –Money Market Instruments – – – – –Equity Instruments – 5 – – –Derivative assets held for trading – – – – –Derivative liabilities held for trading – – – – –
– 5 – – –
Total Investments $ 30,656 $ 14,659 $ 12,693 $ 77,091 € 36,183
Legg MasonMartin Currie GlobalLong-TermUnconstrainedFund^ as at28 February 2021(in 000’s)
Legg MasonMartin CurrieAsia Pacific ExJapan Real IncomeFund as at28 February 2021(in 000’s)
Legg MasonMartin CurrieGlobal EmergingMarketsFund^ as at28 February 2021(in 000’s)
Legg MasonMartin CurrieEuropeanUnconstrainedFund^ as at28 February 2021(in 000’s)
Level 1Bonds and Notes $ – $ – $ – € –Money Market Instruments – – – –Equity Instruments 98,926 26,321 40,978 108,300Derivative assets held for trading – – – –Derivative liabilities held for trading – – – –
98,926 26,321 40,978 108,300
Level 2Bonds and Notes $ – $ – $ – € –Money Market Instruments – – – –Equity Instruments – – – –Derivative assets held for trading 36 3 – –Derivative liabilities held for trading – (1) – –
36 2 – –
Level 3Bonds and Notes $ – $ – $ – € –Money Market Instruments – – – –Equity Instruments – – – –Derivative assets held for trading – – – –Derivative liabilities held for trading – – – –
– – – –
Total Investments $ 98,962 $ 26,323 $ 40,978 € 108,300
^ Not authorised for sale to the public in Hong Kong.
350

Legg Mason Global Funds Plc Annual Report 28 February 2021
Notes to Financial Statements – (continued)12. Risk Exposure and Risk Management – (continued)
12.1 Market Risk – (continued)
(d) Other Price Risk – Fair Value of Financial Assets and Financial Liabilities – (continued)
The following table analyses under the fair value hierarchy the Funds’ financial assets and financial liabilities measured at fair value as at 29 February 2020:
Legg MasonWestern AssetUS GovernmentLiquidityFund as at29 February 2020(in 000’s)
Legg MasonWestern AssetUS Core BondFund as at29 February 2020(in 000’s)
Legg MasonWestern AssetUS Core Plus BondFund as at29 February 2020(in 000’s)
Legg MasonWestern AssetEuro Core PlusBond Fund as at29 February 2020(in 000’s)
Legg MasonWestern AssetShort DurationHigh Income BondFund as at29 February 2020(in 000’s)
Level 1Bonds and Notes $ – $ – $ – € – $ –Money Market Instruments – – – – –Equity Instruments – – – – 258Derivative assets held for trading – 2,749 14,242 920 13Derivative liabilities held for trading – (1,885) (14,756) (1,279) (30)
– 864 (514) (359) 241
Level 2Bonds and Notes $ 823,332 $ 310,476 $ 1,487,422 € 121,536 $ 19,074Money Market Instruments 200,000 – 60,000 – 1,201Equity Instruments – 28,230 10,265 720 –Derivative assets held for trading – 349 4,079 116 6Derivative liabilities held for trading – (3,515) (15,204) (137) (6)
1,023,332 335,540 1,546,562 122,235 20,275
Level 3Bonds and Notes $ – $ 3 $ 4,369 € – $ 306Money Market Instruments – – – – –Equity Instruments – – – – –Derivative assets held for trading – – – – –Derivative liabilities held for trading – – – – –
– 3 4,369 – 306
Total Investments $ 1,023,332 $ 336,407 $ 1,550,417 € 121,876 $ 20,822
Legg MasonWestern AssetGlobal MultiStrategyFund as at29 February 2020(in 000’s)
Legg MasonWestern AssetUS High YieldFund as at29 February 2020(in 000’s)
Legg MasonWestern AssetEmerging MarketsTotal ReturnBond Fund as at29 February 2020(in 000’s)
Legg MasonWestern AssetEmerging MarketsCorporate BondFund as at29 February 2020(in 000’s)
Legg MasonWestern AssetGlobal High YieldFund as at29 February 2020(in 000’s)
Level 1Bonds and Notes $ – $ – $ – $ – $ –Money Market Instruments – – – – –Equity Instruments 310 2,033 – – –Derivative assets held for trading 23 51 – – 72Derivative liabilities held for trading (2,161) (97) (64) (71) –
(1,828) 1,987 (64) (71) 72
Level 2Bonds and Notes $ 619,573 $ 159,326 $ 15,899 $ 41,593 $ 95,530Money Market Instruments 34,087 – – – –Equity Instruments 62,624 7,254 1,782 – 10,347Derivative assets held for trading 3,486 17 116 3 59Derivative liabilities held for trading (9,609) (15) (34) – (370)
710,161 166,582 17,763 41,596 105,566
Level 3Bonds and Notes $ 3,428 $ 1,519 $ – $ – $ –Money Market Instruments – – – – –Equity Instruments 55 149 – – 155Derivative assets held for trading – – – – –Derivative liabilities held for trading – – – – –
3,483 1,668 – – 155
Total Investments $ 711,816 $ 170,237 $ 17,699 $ 41,525 $ 105,793
^ Not authorised for sale to the public in Hong Kong.
351

Legg Mason Global Funds Plc Annual Report 28 February 2021
Notes to Financial Statements – (continued)12. Risk Exposure and Risk Management – (continued)
12.1 Market Risk – (continued)
(d) Other Price Risk – Fair Value of Financial Assets and Financial Liabilities – (continued)
Legg MasonWestern AssetGlobal InflationManagementFund as at29 February 2020(in 000’s)
Legg MasonWestern AssetAsian OpportunitiesFund as at29 February 2020(in 000’s)
Legg MasonWestern AssetShort DurationBlue Chip BondFund as at29 February 2020(in 000’s)
Legg MasonWestern AssetGlobal Core PlusBond Fund^ as at29 February 2020(in 000’s)
Legg MasonWestern AssetGlobal CreditFund^ as at29 February 2020(in 000’s)
Level 1Bonds and Notes $ – $ – $ – $ – $ –Money Market Instruments – – – – –Equity Instruments – – – – –Derivative assets held for trading 70 2,657 – 1,996 327Derivative liabilities held for trading (445) – (1,174) (2,460) (245)
(375) 2,657 (1,174) (464) 82
Level 2Bonds and Notes $ 44,086 $ 532,431 $ 269,110 $ 242,136 $ 77,187Money Market Instruments – – – – –Equity Instruments 374 33,398 7,953 23,911 552Derivative assets held for trading 37 1,095 766 1,105 105Derivative liabilities held for trading (241) (1,462) (3,432) (2,699) (1,223)
44,256 565,462 274,397 264,453 76,621
Level 3Bonds and Notes $ – $ – $ – $ 2 $ –Money Market Instruments – – – – –Equity Instruments – – – – –Derivative assets held for trading – – – – –Derivative liabilities held for trading – – – – –
– – – 2 –
Total Investments $ 43,881 $ 568,119 $ 273,223 $ 263,991 $ 76,703
Legg MasonWestern AssetEuro High YieldFund as at29 February 2020(in 000’s)
Legg MasonWestern AssetMacro OpportunitiesBond Fund^ as at29 February 2020(in 000’s)
Legg MasonWestern AssetMulti-Asset CreditFund^ as at29 February 2020(in 000’s)
Legg MasonWestern AssetStructuredOpportunitiesFund^ as at29 February 2020(in 000’s)
Legg MasonWestern AssetUS Mortgage-BackedSecuritiesFund^ as at29 February 2020(in 000’s)
Level 1Bonds and Notes € – $ – $ – $ – $ –Money Market Instruments – – – – –Equity Instruments – – 1,620 – –Derivative assets held for trading – 313,446 11,001 6,904 2,661Derivative liabilities held for trading – (272,822) (6,211) (15,538) (6,039)
– 40,624 6,410 (8,634) (3,378)
Level 2Bonds and Notes € 54,849 $ 7,357,546 $ 845,426 $ 1,707,011 $ 1,090,893Money Market Instruments – – – – –Equity Instruments 436 43,391 8,886 156,945 95,860Derivative assets held for trading 365 118,054 5,819 4,488 114Derivative liabilities held for trading (117) (813,637) (17,867) (3,007) (100)
55,533 6,705,354 842,264 1,865,437 1,186,767
Level 3Bonds and Notes € – $ 4,191 $ 4,816 $ 58,000 $ –Money Market Instruments – – – – –Equity Instruments – – – – –Derivative assets held for trading – – – – –Derivative liabilities held for trading – – – – –
– 4,191 4,816 58,000 –
Total Investments € 55,533 $ 6,750,169 $ 853,490 $ 1,914,803 $ 1,183,389
^ Not authorised for sale to the public in Hong Kong.
352

Legg Mason Global Funds Plc Annual Report 28 February 2021
Notes to Financial Statements – (continued)12. Risk Exposure and Risk Management – (continued)
12.1 Market Risk – (continued)
(d) Other Price Risk – Fair Value of Financial Assets and Financial Liabilities – (continued)
Legg MasonWestern Asset UKInvestment GradeCredit Fund^ as at29 February 2020(in 000’s)
Legg MasonWestern AssetUS Corporate BondFund^ as at29 February 2020(in 000’s)
Legg MasonBrandywineGlobal Fixed IncomeFund as at29 February 2020(in 000’s)
Legg MasonBrandywineGlobal FixedIncomeAbsolute ReturnFund^ as at29 February 2020(in 000’s)
Legg MasonBrandywineGlobal High YieldFund^ as at29 February 2020(in 000’s)
Level 1Bonds and Notes £ – $ – $ – $ – $ –Money Market Instruments – – – – –Equity Instruments – – – – –Derivative assets held for trading 91 318 – 595 –Derivative liabilities held for trading (98) (152) – (1,426) (65)
(7) 166 – (831) (65)
Level 2Bonds and Notes £ 110,342 $ 123,009 $ 918,080 $ 814,707 $ 10,475Money Market Instruments – – – – –Equity Instruments – 99 11,305 14,370 480Derivative assets held for trading 10 33 4,164 14,297 117Derivative liabilities held for trading (70) (668) (17,082) (29,124) (159)
110,282 122,473 916,467 814,250 10,913
Level 3Bonds and Notes £ – $ – $ – $ – $ –Money Market Instruments – – – – –Equity Instruments – – – – –Derivative assets held for trading – – – – –Derivative liabilities held for trading – – – – –
– – – – –
Total Investments £ 110,275 $ 122,639 $ 916,467 $ 813,419 $ 10,848
Legg MasonBrandywineGlobal OpportunisticFixed IncomeFund as at29 February 2020(in 000’s)
Legg MasonBrandywineGlobal SovereignCreditFund^ as at29 February 2020(in 000’s)
Legg MasonBrandywineGlobal IncomeOptimiserFund^ as at29 February 2020(in 000’s)
Legg MasonBrandywineGlobal CreditOpportunitiesFund^ as at29 February 2020(in 000’s)
Legg MasonBrandywineGlobal DefensiveHigh YieldFund^ as at29 February 2020(in 000’s)
Level 1Bonds and Notes $ – $ – $ – $ – $ –Money Market Instruments – – – – –Equity Instruments – – – – –Derivative assets held for trading – – 279 112 –Derivative liabilities held for trading – – – – (56)
– – 279 112 (56)
Level 2Bonds and Notes $ 549,220 $ 1,549,993 $ 68,387 $ 41,544 $ 9,935Money Market Instruments – – – – –Equity Instruments 7,630 42,630 1,438 1,270 689Derivative assets held for trading 1,529 14,764 861 280 83Derivative liabilities held for trading (16,435) (46,726) (219) (792) (51)
541,944 1,560,661 70,467 42,302 10,656
Level 3Bonds and Notes $ – $ – $ – $ – $ –Money Market Instruments – – – – –Equity Instruments – – – – –Derivative assets held for trading – – – – –Derivative liabilities held for trading – – – – –
– – – – –
Total Investments $ 541,944 $ 1,560,661 $ 70,746 $ 42,414 $ 10,600
^ Not authorised for sale to the public in Hong Kong.
353

Legg Mason Global Funds Plc Annual Report 28 February 2021
Notes to Financial Statements – (continued)12. Risk Exposure and Risk Management – (continued)
12.1 Market Risk – (continued)
(d) Other Price Risk – Fair Value of Financial Assets and Financial Liabilities – (continued)
Legg MasonBrandywineGlobal EnhancedAbsolute ReturnFund^ as at29 February 2020(in 000’s)
Legg MasonBrandywineGlobal DynamicUS EquityFund^ as at29 February 2020(in 000’s)
Legg MasonClearBridge ValueFund as at29 February 2020(in 000’s)
Legg MasonClearBridgeUS AppreciationFund as at29 February 2020(in 000’s)
Legg MasonClearBridgeUS Large CapGrowthFund as at29 February 2020(in 000’s)
Level 1Bonds and Notes $ – $ – $ – $ – $ –Money Market Instruments – – – – –Equity Instruments – 3,243 306,850 192,364 1,464,212Derivative assets held for trading – – – – –Derivative liabilities held for trading (16,987) – – – –
(16,987) 3,243 306,850 192,364 1,464,212
Level 2Bonds and Notes $ 371,119 $ – $ – $ – $ –Money Market Instruments – – – – –Equity Instruments 14,900 46 – – –Derivative assets held for trading 5,780 7 – – 749Derivative liabilities held for trading (19,699) (1) – – (778)
372,100 52 – – (29)
Level 3Bonds and Notes $ – $ – $ – $ – $ –Money Market Instruments – – – – –Equity Instruments – – – – –Derivative assets held for trading – – – – –Derivative liabilities held for trading – – – – –
– – – – –
Total Investments $ 355,113 $ 3,295 $ 306,850 $ 192,364 $ 1,464,183
Legg MasonClearBridgeUS AggressiveGrowthFund as at29 February 2020(in 000’s)
Legg MasonClearBridgeTactical DividendIncomeFund as at29 February 2020(in 000’s)
Legg MasonClearBridgeUS EquitySustainabilityLeadersFund^ as at29 February 2020(in 000’s)
Legg MasonClearBridgeGlobal GrowthFund^ as at29 February 2020(in 000’s)
Legg MasonClearBridgeInfrastructureValue Fund^ as at29 February 2020(in 000’s)
Level 1Bonds and Notes $ – $ – $ – $ – € –Money Market Instruments – – – – –Equity Instruments 950,054 38,453 48,203 8,140 750,612Derivative assets held for trading – – – – –Derivative liabilities held for trading – – – – –
950,054 38,453 48,203 8,140 750,612
Level 2Bonds and Notes $ – $ – $ – $ – € –Money Market Instruments – – – – –Equity Instruments – – – – –Derivative assets held for trading 314 12 10 – 1,208Derivative liabilities held for trading (531) (71) (34) – (3,700)
(217) (59) (24) – (2,492)
Level 3Bonds and Notes $ – $ – $ – $ – € –Money Market Instruments – – – – –Equity Instruments – – – – –Derivative assets held for trading – – – – –Derivative liabilities held for trading – – – – –
– – – – –
Total Investments $ 949,837 $ 38,394 $ 48,179 $ 8,140 € 748,120
^ Not authorised for sale to the public in Hong Kong.
354

Legg Mason Global Funds Plc Annual Report 28 February 2021
Notes to Financial Statements – (continued)12. Risk Exposure and Risk Management – (continued)
12.1 Market Risk – (continued)
(d) Other Price Risk – Fair Value of Financial Assets and Financial Liabilities – (continued)
Legg MasonClearBridge EmergingMarkets InfrastructureFund^ as at29 February 2020(in 000’s)
Legg MasonRoyce US SmallCap OpportunityFund as at29 February 2020(in 000’s)
Legg MasonRoyce US SmallerCompaniesFund as at29 February 2020(in 000’s)
Legg MasonQS MV European EquityGrowth and IncomeFund as at29 February 2020(in 000’s)
Legg MasonQS MV Asia PacificEx Japan EquityGrowth andIncome Fund as at29 February 2020(in 000’s)
Level 1Bonds and Notes $ – $ – $ – € – $ –Money Market Instruments – – – – –Equity Instruments 2,555 426,825 67,761 40,633 63,289Derivative assets held for trading – – – – –Derivative liabilities held for trading – – – – –
2,555 426,825 67,761 40,633 63,289
Level 2Bonds and Notes $ – $ – $ – € – $ –Money Market Instruments – – – – –Equity Instruments 33 20,967 539 – –Derivative assets held for trading 12 138 – 19 8Derivative liabilities held for trading (2) (424) – (149) (215)
43 20,681 539 (130) (207)
Level 3Bonds and Notes $ – $ – $ – € – $ –Money Market Instruments – – – – –Equity Instruments – – – – –Derivative assets held for trading – – – – –Derivative liabilities held for trading – – – – –
– – – – –
Total Investments $ 2,598 $ 447,506 $ 68,300 € 40,503 $ 63,082
Legg MasonQS EmergingMarkets EquityFund as at29 February 2020(in 000’s)
Legg MasonQS MV GlobalEquity Growthand IncomeFund as at29 February 2020(in 000’s)
Legg MasonMartin CurrieAsia Long-TermUnconstrainedFund^ as at29 February 2020(in 000’s)
Legg MasonMartin CurrieEuropean Absolute AlphaFund^ as at29 February 2020(in 000’s)
Legg MasonMartin CurrieGlobal Long-TermUnconstrainedFund^ as at29 February 2020(in 000’s)
Level 1Bonds and Notes $ – $ – $ – € – $ –Money Market Instruments – – – – –Equity Instruments 11,762 13,490 154,572 172,510 32,289Derivative assets held for trading – – – – –Derivative liabilities held for trading (20) – – – –
11,742 13,490 154,572 172,510 32,289
Level 2Bonds and Notes $ – $ – $ – € – $ –Money Market Instruments – – – 4,463 –Equity Instruments 300 – 3,279 – –Derivative assets held for trading – 16 – 8,299 –Derivative liabilities held for trading – (68) – (2,981) (2)
300 (52) 3,279 9,781 (2)
Level 3Bonds and Notes $ – $ – $ – € – $ –Money Market Instruments – – – – –Equity Instruments 5 – – – –Derivative assets held for trading – – – – –Derivative liabilities held for trading – – – – –
5 – – – –
Total Investments $ 12,047 $ 13,438 $ 157,851 € 182,291 $ 32,287
^ Not authorised for sale to the public in Hong Kong.
355

Legg Mason Global Funds Plc Annual Report 28 February 2021
Notes to Financial Statements – (continued)12. Risk Exposure and Risk Management – (continued)
12.1 Market Risk – (continued)
(d) Other Price Risk – Fair Value of Financial Assets and Financial Liabilities – (continued)
Legg MasonMartin CurrieAsia Pacific ExJapan Real IncomeFund as at29 February 2020(in 000’s)
Legg MasonMartin CurrieGlobal EmergingMarketsFund^ as at29 February 2020(in 000’s)
Legg MasonMartin CurrieEuropeanUnconstrainedFund^ as at29 February 2020(in 000’s)
Level 1Bonds and Notes $ – $ – € –Money Market Instruments – – –Equity Instruments 7,853 28,397 5,819Derivative assets held for trading – – –Derivative liabilities held for trading – – –
7,853 28,397 5,819
Level 2Bonds and Notes $ – $ – € –Money Market Instruments – – –Equity Instruments – – –Derivative assets held for trading – – –Derivative liabilities held for trading – – –
– – –
Level 3Bonds and Notes $ – $ – € –Money Market Instruments – – –Equity Instruments – – –Derivative assets held for trading – – –Derivative liabilities held for trading – – –
– – –
Total Investments $ 7,853 $ 28,397 € 5,819
Securities which are fair valued by the Manager or the respective Investment Manager as at 28 February 2021 are noted on the Portfolio of Investments. In the event a price is not available from aPricing Service, the Valuation Committee may obtain one or more indicative quotes from approved broker-dealers.
Matrix pricing is used for Funds when the Valuation Committee is unable to obtain one or more broker-dealer quotes for a security for which there is no price available from a pricing service. Matrixpricing estimates a US Dollar-denominated security’s current market value by using the most recent quote received from a broker-dealer and adjusting the price by the change in the yield of the UStreasury security most similar in duration to the security being valued.
The following tables set out the value of securities for each Fund which have been priced using single broker sources and fair valued by the Valuation Committee as at 28 February 2021 and29 February 2020:
As at 28 February 2021Single Broker Priced
(in 000’s)
Fair Valued byValuation Committee
(in 000’s)
Legg Mason Western Asset US Core Bond Fund $158 $158Legg Mason Western Asset US Core Plus Bond Fund $2,722 $2,722Legg Mason Western Asset Global Multi Strategy Fund $4 $38Legg Mason Western Asset US High Yield Fund $645 $702Legg Mason Western Asset Global High Yield Fund – $34Legg Mason Western Asset Asian Opportunities Fund – $12,729Legg Mason Western Asset Global Core Plus Bond Fund^ $2 $2Legg Mason Western Asset Macro Opportunities Bond Fund^ $10,939 $10,939Legg Mason Western Asset Multi-Asset Credit Fund^ $3,938 $3,938Legg Mason Western Asset Structured Opportunities Fund^ $4,814 $58,832Legg Mason QS Emerging Markets Equity Fund – $215
As at 29 February 2020Single Broker Priced
(in 000’s)
Fair Valued byValuation Committee
(in 000’s)
Legg Mason Western Asset US Core Bond Fund $3 $3Legg Mason Western Asset US Core Plus Bond Fund $4 $4Legg Mason Western Asset Short Duration High Income Bond Fund $1 $1Legg Mason Western Asset Global Multi Strategy Fund $4 $59Legg Mason Western Asset US High Yield Fund – $149Legg Mason Western Asset Global High Yield Fund – $155Legg Mason Western Asset Asian Opportunities Fund – $12,907Legg Mason Western Asset Global Core Plus Bond Fund^ $2 $2Legg Mason Western Asset Structured Opportunities Fund^ – $58,000Legg Mason QS Emerging Markets Equity Fund – $305Legg Mason Martin Currie Asia Long-Term Unconstrained Fund^ – $3,279Legg Mason ClearBridge Emerging Markets Infrastructure Fund^ – $33
For details of derivative assets and liabilities held for trading which were fair valued as at 28 February 2021, please refer to the Portfolio of Investments.
In certain circumstances the Company employs ICE Data Services (“ICE”) adjusted pricing in the valuation of non-US equities. ICE calculates and supplies an adjusted closing price to use as a fair valueprice.
As at 28 February 2021 ICE adjusted pricing was applied to Legg Mason Brandywine Global Income Optimiser Fund^, Legg Mason Brandywine Global Dynamic US Equity Fund^, Legg MasonClearBridge Value Fund, Legg Mason ClearBridge US Appreciation Fund, Legg Mason ClearBridge US Large Cap Growth Fund, Legg Mason ClearBridge US Aggressive Growth Fund, Legg MasonClearBridge Tactical Dividend Income Fund, Legg Mason ClearBridge US Equity Sustainability Leaders Fund^, Legg Mason ClearBridge Global Growth Fund^, Legg Mason ClearBridge InfrastructureValue Fund^, Legg Mason ClearBridge Emerging Markets Infrastructure Fund^, Legg Mason Royce US Small Cap Opportunity Fund, Legg Mason Royce US Smaller Companies Fund, Legg Mason QS MVEuropean Equity Growth and Income Fund, Legg Mason QS MV Asia Pacific Ex Japan Equity Growth and Income Fund, Legg Mason QS Emerging Markets Equity Fund, Legg Mason QS MV Global EquityGrowth and Income Fund, Legg Mason Martin Currie Asia Long-Term Unconstrained Fund^, Legg Mason Martin Currie European Absolute Alpha Fund^, Legg Mason Martin Currie Global Long-TermUnconstrained Fund^, Legg Mason Martin Currie Asia Pacific Ex Japan Real Income Fund, Legg Mason Martin Currie Global Emerging Markets Fund^ and Legg Mason Martin Currie EuropeanUnconstrained Fund^ (29 February 2020: Legg Mason Brandywine Global Income Optimiser Fund^, Legg Mason Brandywine Global Dynamic US Equity Fund^, Legg Mason ClearBridge Value Fund,
^ Not authorised for sale to the public in Hong Kong.
356

Legg Mason Global Funds Plc Annual Report 28 February 2021
Notes to Financial Statements – (continued)12. Risk Exposure and Risk Management – (continued)
12.1 Market Risk – (continued)
(d) Other Price Risk – Fair Value of Financial Assets and Financial Liabilities – (continued)
Legg Mason ClearBridge US Appreciation Fund, Legg Mason ClearBridge US Large Cap Growth Fund, Legg Mason ClearBridge US Aggressive Growth Fund, Legg Mason ClearBridge Tactical DividendIncome Fund, Legg Mason ClearBridge US Equity Sustainability Leaders Fund^, Legg Mason ClearBridge Global Growth Fund^, Legg Mason Royce US Small Cap Opportunity Fund, Legg Mason RoyceUS Smaller Companies Fund, Legg Mason QS MV European Equity Growth and Income Fund, Legg Mason QS MV Asia Pacific Ex Japan Equity Growth and Income Fund, Legg Mason QS EmergingMarkets Equity Fund, Legg Mason QS MV Global Equity Growth and Income Fund, Legg Mason Martin Currie Asia Long-Term Unconstrained Fund^, Legg Mason Martin Currie European AbsoluteAlpha Fund^, Legg Mason Martin Currie Global Long-Term Unconstrained Fund^, Legg Mason Martin Currie Asia Pacific Ex Japan Real Income Fund, Legg Mason Martin Currie Global EmergingMarkets Fund^, Legg Mason Martin Currie European Unconstrained Fund^, Legg Mason ClearBridge Infrastructure Value Fund^ and Legg Mason ClearBridge Emerging Markets Infrastructure Fund^).
12.2 Credit Risk
Credit risk is the risk that a counterparty to or issuer of a financial instrument will fail to discharge an obligation or commitment that it has entered into with a Fund. The Company will be exposed tocredit risk on parties with whom it trades and will also bear the risk of settlement default. The relevant Investment Manager and/or Sub-Investment Managers minimise concentrations of credit risk byundertaking transactions with a large number of brokers and counterparties on recognised and reputable exchanges. All transactions in listed securities are settled/paid for upon delivery using approvedbrokers. The risk of default is considered minimal, as delivery of securities sold is only made once the broker has received payment. Payment is made on a purchase once the securities have beenreceived by the broker. The trade will fail if either party fails to meet its obligation.
Each Fund will be exposed to credit risk on the counterparties with whom it trades in relation to options, forward contracts and other derivative financial instruments that are not traded on a recognizedexchange. Such instruments are not afforded the same protections as may apply to participants trading swaps, futures or options on organised exchanges, such as the performance guarantee of anexchange clearing house. The Funds will be subject to the possibility of the insolvency, bankruptcy or default of a counterparty with whom the Funds trade such instruments, which could result insubstantial losses to the Funds.
The Company is exposed to credit risk on the OTC counterparties with whom it trades. All OTC counterparties must meet the following criteria as set out in the Regulations namely:
(i) Be a credit institution in accordance with Regulation 7 of the Central Bank UCITS Regulations, or an investment firm authorised in accordance with the Markets in Financial InstrumentsDirective in an EEA Member State, or is an entity subject to regulation as a Consolidated Supervised Entity by the Securities and Exchange Commission, or
(ii) Have a minimum credit rating of A2 or equivalent, or in the opinion of the relevant Investment Manager and/or Sub-Investment Managers, an implied credit minimum rating of A2 orequivalent.
Exposures to individual counterparties are normally limited to 10% of net asset value in the case of authorised credit institutions and 5% of net asset value in the case of other counterparties.
Transactions involving derivative financial instruments are usually with counterparties with whom the Company has signed master netting agreements. Master netting agreements provide for the netsettlement of contracts for a particular Fund with the same counterparty in the event of default. The credit risk associated with derivative financial assets subject to a master netting arrangement iseliminated only to the extent that financial liabilities due to the same counterparty will be settled after the assets are realised.
Transactions resulting in large unrealised gains to a Fund may require a Fund to hold collateral received from a broker. In these instances, the credit risk to the Fund is reduced by the value of thecollateral held. In the event a broker files for bankruptcy, in the U.S. (though regulations may vary by jurisdiction), collateral posted in connection with certain derivative financial instruments is exemptfrom the automatic stay implemented at the inception of a bankruptcy proceeding. This derivative financial instruments exemption would allow a Fund to immediately foreclose on collateral posted bythe insolvent party in order to satisfy claims against such insolvent party.
The value of securities received as collateral in relation to derivatives trading held by the following Funds as at 28 February 2021 and 29 February 2020 was as follows:
Fund Broker
As at 28 February 2021Market Value of Collateral
000’s
As at 29 February 2020Market Value of Collateral
000’s
Legg Mason Western Asset US Core Plus Bond Fund Barclays $– $96Legg Mason Western Asset US Core Plus Bond Fund Citi $– $369Legg Mason Western Asset US Core Plus Bond Fund Goldman Sachs $– $393Legg Mason Western Asset US Core Plus Bond Fund JP Morgan $– $213Legg Mason Western Asset US Core Plus Bond Fund BNP Paribas $241 $–Legg Mason Western Asset Global Multi Strategy Fund Bank of America Merill Lynch $– $222Legg Mason Western Asset Global Multi Strategy Fund Morgan Stanley $– $208Legg Mason Western Asset Global Core Plus Bond Fund^ Citi $– $183Legg Mason Western Asset Macro Opportunities Bond Fund^ Barclays $– $3,384Legg Mason Western Asset Macro Opportunities Bond Fund^ BNP Paribas $– $306Legg Mason Western Asset Macro Opportunities Bond Fund^ Goldman Sachs $17,470 $33,464Legg Mason Western Asset Macro Opportunities Bond Fund^ JP Morgan $6,014 $207Legg Mason Western Asset Macro Opportunities Bond Fund^ Morgan Stanley $2,132 $7,829Legg Mason Western Asset Multi-Asset Credit Fund^ Barclays $– $50Legg Mason Western Asset Multi-Asset Credit Fund^ Citi $– $219Legg Mason Western Asset Multi-Asset Credit Fund^ Goldman Sachs $48 $211Legg Mason Western Asset Multi-Asset Credit Fund^ JP Morgan $232 $51Legg Mason Western Asset Multi-Asset Credit Fund^ Morgan Stanley $318 $397Legg Mason Western Asset Structured Opportunities Fund^ Credit Suisse $– $73
Amounts designated as “–” are either $0 or less than $1,000.
The Company monitors its risk by periodically considering the credit quality and financial positions of the counterparties which the Funds use. The Funds may only trade with approved counterparties. Alist of approved counterparties is maintained and the Funds may only trade with these approved counterparties. Additions to this list are reviewed quarterly and a thorough re-evaluation of allcounterparties is conducted annually. The review includes analysis of the counterparty’s capital adequacy, profitability, liquidity and other factors as may be appropriate.
For efficient portfolio management purposes, each Fund may enter into repurchase agreements, reverse repurchase agreements and stock lending agreements subject to the conditions and limits setout in the Central Bank UCITS Regulations.
Until the expiry of the repurchase agreements, reverse repurchase agreements and the stock lending transactions, collateral obtained under such contracts or transactions:
(i) must be marked to market daily;
(ii) must equal or exceed, in value, at all times the value of the amount invested or securities loaned;
(iii) must be transferred to the trustee, or its agent; and
(iv) must be immediately available to the scheme, without recourse to the counterparty, in the event of a default by that entity.
Any non-cash collateral received by the Company cannot be sold or repledged; must be held at the credit risk of the counterparty; and must be issued by an entity independent of the counterparty.Credit risk is addressed through diversified use of counterparties and issuers, and through minimum security ratings and average portfolio ratings. The respective Investment Manager and/or Sub-Investment Managers may set portfolio limits and may invest based on internal parameters with mutually agreed limits set at a Fund’s inception, including issue and issuer limitations, credit minimums,and an average credit quality, and the account is monitored on an ongoing basis to ensure it continues to meet these parameters. Rigorous independent analysis of all credit securities before purchase,including financial modeling, scenario analysis, and monitoring changes in risk profile may also be performed. Generally no more than 5% of the portfolio may be invested in any single corporate issuerat the time of purchase.
The Valuation Committee meets at least monthly and whenever the circumstances so require, to review and deliberate on valuation concerns including credit risk. The respective Investment Managerand/or Sub-Investment Managers provide risk analysis to the Board and the Committee on a semi-annual basis.
Substantially all of the cash and securities held by the Funds are held via the Depositary, who has a credit rating of AA- (29 February 2020: AA-). Bankruptcy or insolvency by the Depositary may causethe Funds’ rights with respect to the cash held by the Depositary to be delayed or limited. The credit rating of the Depositary is highly rated by prominent rating agencies. If the credit quality or financialposition of the Depositary deteriorates significantly, the respective Investment Manager and/or Sub-Investment Managers may move the cash holdings to another bank.
^ Not authorised for sale to the public in Hong Kong.
357

Legg Mason Global Funds Plc Annual Report 28 February 2021
Notes to Financial Statements – (continued)12. Risk Exposure and Risk Management – (continued)
12.2 Credit Risk – (continued)
Any securities placed as collateral are disclosed on the Portfolio of Investments. Cash and cash equivalents held at the Depositary and margin accounts and restricted cash are disclosed in the Statementof Financial Position.
If a Fund has posted collateral to a counterparty, in a counterparty insolvency, that Fund may have the right under trading agreements with the counterparty to recall such posted collateral. In practice,however, the Fund may seek to reduce any amounts owed to the counterparty to settle any open transactions by setting off the amounts owed against the posted collateral. If the Fund was due backany collateral after setting off against the amounts owed (e.g., the Fund’s position was over collateralised), it is likely the Fund would have an unsecured claim against the counterparty in the insolvencyproceeding for the excess amount due to it.
The following table represents the market value of the securities which have been placed as collateral with brokers as at 28 February 2021 and 29 February 2020 in relation to derivatives trading:
Fund Broker
As at 28 February 2021Market Value of Collateral
000’s
As at 29 February 2020Market Value of Collateral
000’s
Legg Mason Western Asset US Core Plus Bond Fund Citi $46 $726Legg Mason Western Asset Global Multi Strategy Fund Citi $– $56Legg Mason Western Asset Global Multi Strategy Fund Morgan Stanley $115 $–Legg Mason Western Asset Global Core Plus Bond Fund^ Citi $84 $–Legg Mason Western Asset Global Core Plus Bond Fund^ JP Morgan $331 $176Legg Mason Western Asset Global Credit Fund^ Goldman Sachs $– $53Legg Mason Western Asset Macro Opportunities Bond Fund^ Citi $8,834 $41,845Legg Mason Western Asset Multi-Asset Credit Fund^ Citi $– $1,007
Amounts designated as “–” are either $0 or less than $1,000.
To mitigate counterparty credit risk, certain over-the-counter derivatives are cleared through central clearing houses. Under this arrangement, trades entered with counterparties are given up to clearinghouses, which after acceptance effectively replace the counterparty for the risk aspects of the trade.
As at 28 February 2021 and 29 February 2020, margin accounts and restricted cash and other receivables were exposed to credit risk. The total amount of financial assets exposed to credit riskapproximates to their carrying value on the Statement of Financial Position (excluding equities).
The tables below set out a summary of the credit exposure based on credit ratings of the debt securities held in the Fixed Income Funds:
Legg Mason Western AssetUS Government Liquidity Fund
Legg Mason Western AssetUS Core Bond Fund
Legg Mason Western AssetUS Core Plus Bond Fund
Legg Mason Western AssetEuro Core Plus Bond Fund
Rating Feb-21 Feb-20 Rating Feb-21 Feb-20 Rating Feb-21 Feb-20 Rating Feb-21 Feb-20AAA 83.73% 82.48% AAA 55.61% 65.16% AAA 44.61% 53.97% AAA 18.08% 14.43%Not Rated 16.27% 17.52% AA 6.97% 4.01% AA 4.34% 2.51% AA 20.13% 23.46%
A 18.08% 16.30% A 16.57% 17.87% A 29.40% 35.89%BBB 16.31% 14.44% BBB 19.40% 14.77% BBB 27.70% 22.89%BB 0.56% 0.07% BB 7.75% 5.17% BB 3.63% 2.00%B 0.09% 0.02% B 3.10% 3.10% B 0.96% 1.33%CCC & Below 0.01% – CCC & Below 2.00% 1.44% Not Rated 0.10% –Not Rated 2.37% – Not Rated 2.23% 1.17%
100.00% 100.00% 100.00% 100.00% 100.00% 100.00% 100.00% 100.00%
Legg Mason Western AssetShort Duration High Income Bond Fund
Legg Mason Western AssetGlobal Multi Strategy Fund
Legg Mason Western AssetUS High Yield Fund
Legg Mason Western AssetEmerging Markets Total Return Bond Fund
Rating Feb-21 Feb-20 Rating Feb-21 Feb-20 Rating Feb-21 Feb-20 Rating Feb-21 Feb-20AAA 0.39% 1.05% AAA 10.55% 19.03% AAA – – AAA 2.57% –A – 0.05% AA 1.54% – A – 1.09% AA 2.07% 3.89%BBB 9.60% 10.73% A 5.55% 10.10% BBB 9.42% 12.19% A 5.58% 9.52%BB 43.12% 43.54% BBB 37.64% 33.46% BB 42.28% 47.48% BBB 47.80% 50.39%B 37.55% 36.85% BB 27.68% 23.82% B 39.82% 32.75% BB 31.09% 21.36%CCC & Below 5.42% 5.53% B 13.63% 10.39% CCC & Below 6.04% 5.23% B 8.42% 11.71%Not Rated 3.92% 2.25% CCC & Below 1.61% 1.66% Not Rated 2.44% 1.26% Not Rated 2.47% 3.13%
Not Rated 1.80% 1.54%
100.00% 100.00% 100.00% 100.00% 100.00% 100.00% 100.00% 100.00%
Legg Mason Western AssetEmerging Markets Corporate Bond Fund
Legg Mason Western AssetGlobal High Yield Fund
Legg Mason Western AssetGlobal Inflation Management Fund
Legg Mason Western AssetAsian Opportunities Fund
Rating Feb-21 Feb-20 Rating Feb-21 Feb-20 Rating Feb-21 Feb-20 Rating Feb-21 Feb-20AAA – 0.77% AAA 2.61% 2.91% AAA 64.15% 62.29% AAA 5.35% 7.04%AA 4.73% 3.59% AA – 1.70% AA 7.66% 6.24% AA 19.57% 6.58%A 10.13% 18.89% A – 1.02% A 14.13% 20.04% A 28.08% 33.76%BBB 48.70% 45.79% BBB 15.60% 23.31% BBB 12.19% 11.41% BBB 31.73% 43.63%BB 29.49% 23.12% BB 59.23% 47.46% BB 1.75% – BB 0.51% 1.23%B 6.95% 7.50% B 18.77% 19.51% Not Rated 0.12% 0.02% B 0.28% 1.17%Not Rated – 0.34% CCC & Below 3.79% 3.53% Not Rated 14.48% 6.59%
Not Rated – 0.56%
100.00% 100.00% 100.00% 100.00% 100.00% 100.00% 100.00% 100.00%
Legg Mason Western AssetShort Duration Blue Chip Bond Fund
Legg Mason Western AssetGlobal Core Plus Bond Fund^
Legg Mason Western AssetGlobal Credit Fund^
Legg Mason Western AssetEuro High Yield Fund
Rating Feb-21 Feb-20 Rating Feb-21 Feb-20 Rating Feb-21 Feb-20 Rating Feb-21 Feb-20AAA 22.65% 24.43% AAA 34.45% 34.29% AAA 6.56% 18.59% BBB 12.12% 6.20%AA 24.34% 26.06% AA 11.22% 8.30% AA 2.47% 2.30% BB 47.82% 45.82%A 53.01% 49.51% A 26.99% 35.22% A 31.96% 34.36% B 33.92% 42.58%
BBB 22.26% 19.27% BBB 52.03% 38.53% CCC & Below 5.13% 2.80%BB 4.61% 2.67% BB 6.54% 6.22% Not Rated 1.01% 2.60%B 0.29% 0.24% B 0.44% –Not rated 0.18% 0.01%
100.00% 100.00% 100.00% 100.00% 100.00% 100.00% 100.00% 100.00%
^ Not authorised for sale to the public in Hong Kong.
358

Legg Mason Global Funds Plc Annual Report 28 February 2021
Notes to Financial Statements – (continued)12. Risk Exposure and Risk Management – (continued)
12.2 Credit Risk – (continued)
Legg Mason Western AssetMacro Opportunities Bond Fund^
Legg Mason Western AssetMulti-Asset Credit Fund^
Legg Mason Western AssetStructured Opportunities Fund^�
Legg Mason Western AssetUS Mortgage-Backed Securities Fund^
Rating Feb-21 Feb-20 Rating Feb-21 Feb-20 Rating Feb-21 Feb-20 Rating Feb-21 Feb-20AAA 6.98% 25.64% AAA 3.96% 5.19% AAA 0.93% 2.24% AAA 98.52% 98.48%AA 4.93% 2.92% AA 1.26% 1.97% AA 0.31% 1.82% AA 0.07% 0.44%A 9.42% 17.99% A 2.79% 7.72% A 2.46% 2.07% A 0.39% –BBB 50.00% 36.66% BBB 25.54% 28.41% BBB 4.11% 9.35% BBB 0.33% –BB 16.34% 13.47% BB 26.61% 24.83% BB 4.21% 4.96% Not Rated 0.69% 1.08%B 2.24% 3.19% B 24.34% 20.56% B 13.01% 10.68%CCC & Below – 0.13% CCC & Below 7.56% 5.60% CCC & Below 13.99% 17.75%Not Rated 10.09% – Not Rated 7.94% 5.72% Not Rated 60.98% 51.13%
100.00% 100.00% 100.00% 100.00% 100.00% 100.00% 100.00% 100.00%
Legg Mason Western AssetUK Investment Grade Credit Fund^
Legg Mason Western AssetUS Corporate Bond Fund^
Western Asset UCITS SMASh SeriesCore Plus Completion Fund^
Legg Mason Brandywine GlobalFixed Income Fund
Rating Feb-21 Feb-20 Rating Feb-21 Feb-20 Rating Feb-21 Feb-20 Rating Feb-21 Feb-20AAA 11.38% 13.56% AAA 2.89% 1.13% AAA 40.68% – AAA 52.36% 56.46%AA 11.87% 13.52% AA 10.17% 8.53% AA 2.01% – AA 17.84% 9.20%A 45.25% 44.39% A 32.59% 40.06% A 11.42% – A 1.44% 18.31%BBB 30.64% 27.95% BBB 43.17% 40.34% BBB 24.62% – BBB 20.60% 7.94%BB 0.86% 0.58% BB 7.77% 7.61% BB 16.50% – BB 7.76% 8.09%
B 2.24% 1.99% B 3.21%Not Rated 1.17% 0.34% CCC & Below 1.56%
100.00% 100.00% 100.00% 100.00% 100.00% – 100.00% 100.00%
Legg Mason Brandywine GlobalFixed Income Absolute Return Fund^
Legg Mason Brandywine GlobalHigh Yield Fund^
Legg Mason Brandywine GlobalOpportunistic Fixed Income Fund
Legg Mason Brandywine GlobalSovereign Credit Fund^
Rating Feb-21 Feb-20 Rating Feb-21 Feb-20 Rating Feb-21 Feb-20 Rating Feb-21 Feb-20AAA 43.31% 38.59% AAA – – AAA 27.40% 37.69% AAA – 45.05%AA 3.06% 3.88% A – – AA 16.65% 8.35% AA – 9.31%A 13.49% 34.87% BBB 2.76% 5.37% A 9.93% 30.00% A – 14.99%BBB 23.40% 18.29% BB 32.51% 43.72% BBB 31.64% 15.47% BBB – 23.24%BB 16.74% 4.37% B 52.58% 43.94% BB 14.36% 8.33% BB – 7.41%
CCC & Below 12.15% 6.97% B 0.02% 0.16%
100.00% 100.00% 100.00% 100.00% 100.00% 100.00% 0.00% 100.00%
Legg Mason Brandywine GlobalIncome Optimiser Fund^
Legg Mason Brandywine GlobalCredit Opportunities Fund^
Legg Mason Brandywine GlobalDefensive High Yield Fund^
Legg Mason Brandywine GlobalEnhanced Absolute Return Fund^
Rating Feb-21 Feb-20 Rating Feb-21 Feb-20 Rating Feb-21 Feb-20 Rating Feb-21 Feb-20AAA 5.54% 6.67% AAA 7.83% 11.02% AAA – – AAA 23.29% 25.73%AA – 6.77% AA 3.11% 10.50% A – – AA 1.87% 1.25%A 4.40% 19.17% A 15.08% 16.04% BBB 3.72% 7.46% A 5.97% 29.23%BBB 38.93% 40.90% BBB 9.52% 11.42% BB 46.50% 49.31% BBB 45.46% 23.02%BB 26.54% 17.71% BB 9.01% 2.03% B 48.99% 42.68% BB 23.41% 20.77%B 16.49% 8.78% B 6.00% 13.32% CCC & Below 0.79% –CCC & Below 5.05% – CCC & Below 11.61% 10.21% Not Rated – 0.55%Not Rated 3.05% – Not Rated 37.84% 25.46%
100.00% 100.00% 100.00% 100.00% 100.00% 100.00% 100.00% 100.00%
� The portfolio is constructed on a bottom-up basis using Western Asset’s fundamental value process. The investment team does not rely on rating agencies research; however, it evaluates theirwork and enhancement levels in securities. For securities that are not rated by a nationally recognized statistical rating organisation (NRSRO), the investment team assigns an internal credit ratingbased on the investment team’s fundamental analysis.
12.3 Liquidity Risk
The Company’s Prospectus provides for the daily creation and cancellation of shares and the Company is therefore exposed to the liquidity risk of meeting shareholder redemptions at any time.
The Administrator monitors subscription and redemption volumes on a daily basis and notifies the relevant Investment Manager or Sub-Investment Managers of significant movements and unusualtrends as appropriate. If redemption requests on any dealing day (as defined in the Prospectus) exceed 10% of the shares in issue in respect of any Fund, the Company may elect to restrict the totalnumber of shares redeemed on that dealing day to 10% of the outstanding shares of the Fund, in which case all the relevant redemption requests shall be scaled down pro rata. The Company shalldefer the excess redemption requests, and shall treat the deferred requests as if they were received for each subsequent dealing day (in relation to which the Company has the same power of deferral atthe then prevailing limit) until all the shares to which the original request relates have been redeemed. In such cases, the Company may reduce requests pro rata on the next and following dealing daysso as to give effect to the above limitation.
The Company may temporarily suspend the determination of the net asset value and the sale or redemptions of shares in any Fund during any period:
(i) when any market is closed which is the main market for a significant part of the Fund’s investments, or when trading thereon is restricted or suspended;
(ii) when any emergency exists as a result of which disposal by the Company of investments which constitute a substantial portion of the assets of the Fund is not practically feasible;
(iii) when for any reason the prices of any investments of the Fund cannot be reasonably, promptly or accurately ascertained by the Fund;
(iv) when remittance of monies which will, or may be, involved in the realisation of, or in the payment for, investments of the Fund cannot, in the opinion of the Directors, be carried out atnormal rates of exchange; or
(v) when proceeds of the sale or redemption of the shares cannot be transmitted to or from the Fund’s accounts.
The Company has the ability to borrow in the short term to ensure settlement. In accordance with the UCITS Regulations a Fund may borrow money only as follows:
(a) a Fund may acquire foreign currency by means of a ‘‘back-to-back’’ loan; and
(b) a Fund may borrow:
(i) up to 10% of its net asset value provided that such borrowing is on a temporary basis; and
(ii) up to 10% of its net asset value provided that the borrowing is to make possible the acquisition of real property required for the purpose of its business;
provided that such borrowing referred to in subparagraph b (i) and b (ii) may not in total exceed 15% of the borrower’s assets.
One of the responsibilities of the Valuation Committee is to review and deliberate on valuation concerns, including illiquid securities. The Company may from time to time invest in derivative contractstraded over-the-counter, which are not traded in an organised public market and may be illiquid. As a result, the Company may not be able to liquidate quickly its investments in these instruments at anamount close to their fair value in order to meet its liquidity requirements or to respond to specific events such as deterioration in the creditworthiness of any particular issuer.
The tables below have been prepared based on the undiscounted gross cash outflows relating to respective financial liabilities. The forward foreign currency contracts included in the tables below settleon a gross basis. Please refer to the relevant Portfolio of Investment for details of gross settlement amounts on these contracts.
^ Not authorised for sale to the public in Hong Kong.
359

Legg Mason Global Funds Plc Annual Report 28 February 2021
Notes to Financial Statements – (continued)12. Risk Exposure and Risk Management – (continued)
12.3 Liquidity Risk – (continued)
Details of residual contractual maturities of financial liabilities for each Fund are outlined below:
Legg Mason Western AssetUS GovernmentLiquidity Fund
Legg Mason Western AssetUS Core Bond Fund
Legg Mason Western AssetUS Core Plus Bond Fund
Legg Mason Western AssetEuro Core Plus Bond Fund
Liabilities (in 000’s)
as at28 February
2021
as at29 February
2020
as at28 February
2021
as at29 February
2020
as at28 February
2021
as at29 February
2020
as at28 February
2021
as at29 February
2020
Less than 1 monthCash overdraft $ – $ – $ – $ – $ 5 $ 3 € – € –Margin accounts and restricted cash – – 4,191 1,946 5,760 9,926 361 665Options – – 305 1,198 1,651 6,335 31 146Swap contracts – – 247 3,515 1,290 10,140 105 81Swaptions – – – – – – – –Unrealised depreciation on forward foreign currency contracts – – – – 83 171 – –Unrealised depreciation on futures contracts – – 34 36 755 4,505 184 506Unrealised depreciation on contracts for difference – – – – – – – –Payable for investments purchased 28,840 25,000 38,192 44,120 179,021 136,526 – 711Distributions payable to holders of redeemable participating shares 6 640 50 81 57 50 – –Management fees payable 22 474 185 212 802 690 3 3Performance fees payable – – – – – – – –Administrator and depositary fees payable 21 23 18 17 81 73 7 8Shareholder service fees payable – – 20 28 53 39 – –Payable for redeemable participating shares reacquired – – 119 1,550 23,242 3,622 – –Interest payable – – – – – – – –Dividend payable – – – – – – – –Redeemable Participating Shares 882,330 997,244 299,130 316,407 1,647,418 1,534,643 111,323 124,128
1 – 3 monthsOptions – – 49 275 280 1,360 – –Swaptions – – – – – 364 – –Unrealised depreciation on forward foreign currency contracts – – – – 2,363 4,430 187 56Unrealised depreciation on futures contracts – – – – – – – –
Over 3 monthsOptions – – – – – – – –Swaptions – – – – – 99 – –Unrealised depreciation on forward foreign currency contracts – – – – – – – –Unrealised depreciation on futures contracts – – 915 376 5,029 2,556 325 627Accrued expenses and other liabilities 393 387 85 87 245 253 54 61
Total Financial Liabilities $ 911,612 $1,023,768 $ 343,540 $ 369,848 $1,868,135 $1,715,785 € 112,580 € 126,992
Legg Mason Western AssetGlobal High Yield Fund
Legg Mason Western AssetUS Short-Term
Government Fund^Legg Mason Western AssetUS Adjustable Rate Fund^
Legg Mason Western AssetGlobal Inflation
Management Fund
Liabilities (in 000’s)
as at28 February
2021
as at29 February
2020
as at28 February
2021
as at29 February
2020
as at28 February
2021
as at29 February
2020
as at28 February
2021
as at29 February
2020
Less than 1 monthCash overdraft $ 1 $ – $ – $ – $ – $ – $ 7 $ 95Margin accounts and restricted cash 52 96 – – – – 144 67Options – – – – – – 13 45Swap contracts – – – – – – – –Swaptions – – – – – – – –Unrealised depreciation on forward foreign currency contracts 13 310 – – – – 20 –Unrealised depreciation on futures contracts – – – – – – 16 277Unrealised depreciation on contracts for difference – – – – – – – –Payable for investments purchased 3,209 1,102 – – – – 1,156 9,271Distributions payable to holders of redeemable participating shares 28 32 – – – – – –Management fees payable 89 96 – – – – 6 7Performance fees payable – – – – – – – –Administrator and depositary fees payable 9 8 5 3 2 – 6 4Shareholder service fees payable 7 9 – – – – 1 1Payable for redeemable participating shares reacquired 1,152 16 1 – – – – 28,249Interest payable – – – – – – – –Dividend payable – – – – – – – –Redeemable Participating Shares 102,562 107,743 – – – – 48,798 47,508
1 – 3 monthsOptions – – – – – – – –Swaptions – – – – – – – –Unrealised depreciation on forward foreign currency contracts 63 60 – – – – 78 241Unrealised depreciation on futures contracts – – – – – – – –
Over 3 monthsOptions – – – – – – – –Swaptions – – – – – – – –Unrealised depreciation on forward foreign currency contracts – – – – – – 21 –Unrealised depreciation on futures contracts – – – – – – 88 123Accrued expenses and other liabilities 105 112 8 20 14 24 45 42
Total Financial Liabilities $ 107,290 $ 109,584 $ 14 $ 23 $ 16 $ 24 $ 50,399 $ 85,930
^ Not authorised for sale to the public in Hong Kong.
360

Legg Mason Global Funds Plc Annual Report 28 February 2021
Notes to Financial Statements – (continued)12. Risk Exposure and Risk Management – (continued)
12.3 Liquidity Risk – (continued)
Legg Mason Western AssetShort Duration High Income
Bond FundLegg Mason Western AssetGlobal Multi Strategy Fund
Legg Mason Western AssetUS High Yield Fund
Legg Mason Western AssetEmerging Markets Total
Return Bond Fund
Legg Mason Western AssetEmerging Markets Corporate
Bond Fund
as at28 February
2021
as at29 February
2020
as at28 February
2021
as at29 February
2020
as at28 February
2021
as at29 February
2020
as at28 February
2021
as at29 February
2020
as at28 February
2021
as at29 February
2020
$ 3 $ 29 $ 2,161 $ 6 $ – $ 2,499 $ – $ 2 $ – $ –– – 654 723 45 50 96 24 – –– – – – – – 3 – – –– – – 1,886 26 – 12 – – –– – – – – – – – – –– 2 373 4,781 1 15 1 – 3 –– – – 612 – – – – – –– – – – – – – – – –
393 262 3,263 2,569 8,157 1,388 199 – 669 –11 13 36 71 57 72 4 7 – –23 21 160 224 109 100 24 24 – –
– – – – – – – – – –21 3 34 38 14 10 17 3 5 4
– – 11 15 9 10 – – – –– – 2,346 6,013 212 492 14 – – 150– – – – – – – – – –– – – – – – – – – –
26,433 21,041 655,931 734,170 219,127 169,193 22,769 18,805 40,233 42,544
– – – – – – – 9 – –– – – – – – – – – –– 4 1,372 2,942 – – 12 25 2 –– – – – – – – – – –
– – – – – – 11 – 3 –– – – – – – – – – –– – 360 – – – – – – –
50 30 501 1,549 85 97 – 64 – 7148 63 179 186 89 105 57 70 36 37
$ 26,982 $ 21,468 $667,381 $755,785 $227,931 $174,031 $ 23,219 $ 19,033 $ 40,951 $ 42,806
Legg Mason Western AssetAsian Opportunities Fund
Legg Mason Western AssetShort Duration Blue Chip
Bond Fund
Legg Mason Western AssetGlobal Credit Absolute Return
Fund^Legg Mason Western Asset
Global Core Plus Bond Fund^Legg Mason Western Asset
Global Credit Fund^
as at28 February
2021
as at29 February
2020
as at28 February
2021
as at29 February
2020
as at28 February
2021
as at29 February
2020
as at28 February
2021
as at29 February
2020
as at28 February
2021
as at29 February
2020
$ 489 $ 2,197 $ 7 $ 2,507 $ – $ – $ – $ 387 $ 77 $ –350 15 134 81 – – 1,231 1,317 11 285
– – – – – – 81 381 – –– – 1,036 564 – – – 10 636 805– – – – – – – – – –
856 935 71 1,746 – – 497 1,119 14 –1,119 – – 602 – – 252 1,210 – 101
– – – – – – – – – –3,989 7,566 4,084 – – – 9,895 18,584 999 –
8 11 – – – – – – – –324 362 144 57 – – 56 52 2 3
– – – – – – – – – –33 30 27 15 – – 17 14 7 630 32 9 1 – – – – – –
3,431 7,877 771 88 – – – 14 – –– – – – – – – – – –– – – – – – – – – –
626,909 573,934 518,699 276,535 – – 286,292 263,958 82,725 79,161
– – – – – – – – – –– – – – – – – – – –
92 527 1,458 1,122 – – 636 1,570 168 418– – – – – – – – – –
– – – – – – – – – –– – – – – – – – – –– – – – – – 103 – 11 –
76 – 6 572 – – 490 869 147 144884 868 79 83 – 463 261 80 55 54
$638,590 $594,354 $526,525 $283,973 – $ 463 $299,811 $289,565 $ 84,852 $ 80,977
^ Not authorised for sale to the public in Hong Kong.
361

Legg Mason Global Funds Plc Annual Report 28 February 2021
Notes to Financial Statements – (continued)12. Risk Exposure and Risk Management – (continued)
12.3 Liquidity Risk – (continued)
Legg Mason WesternAsset Euro High Yield
Fund
Legg Mason WesternAsset Macro
Opportunities Bond Fund^
Legg Mason WesternAsset EM Local Currency
Debt Fund^
Legg Mason WesternAsset Multi-Asset Credit
Fund^
Liabilities (in 000’s)
as at28 February
2021
as at29 February
2020
as at28 February
2021
as at29 February
2020
as at28 February
2021
as at29 February
2020
as at28 February
2021
as at29 February
2020
Less than 1 monthCash overdraft € 1 € – $ 138,953 $ 25,108 $ – $ – $ 90 $ –Margin accounts and restricted cash 61 – 520,034 233,792 – – 3,962 3,283Options – – 18,005 111,136 – – 592 850Swap contracts – – 30,745 700,274 – – 1,784 6,761Swaptions – – – – – – – –Unrealised depreciation on forward foreign currency contracts – 3 11,290 34,673 – – 8 6,890Unrealised depreciation on futures contracts – – 19,467 78,475 – – 534 238Unrealised depreciation on contracts for difference – – – – – – – –Payable for investments purchased 554 1,720 146,253 111,386 – – 22,201 11,879Distributions payable to holders of redeemable participating shares – – – – – – – –Management fees payable – – 6,299 7,781 – – 21 21Performance fees payable – – – – – – – –Administrator and depositary fees payable 5 5 341 390 5 3 52 44Shareholder service fees payable – – 407 515 – – – –Payable for redeemable participating shares reacquired 246 – 48,497 22,152 – – 47 25Interest payable – – – – – – – –Dividend payable – – – – – – – –Redeemable Participating Shares 54,345 57,103 6,646,080 7,637,950 – – 1,081,858 871,997
1 – 3 monthsOptions – – 15,527 2,912 – – 328 1,722Swaptions – – – – – – – –Unrealised depreciation on forward foreign currency contracts 109 114 28,168 75,155 – – 941 3,192Unrealised depreciation on futures contracts – – – – – – – –
Over 3 monthsOptions – – – – – – – –Swaptions – – – 577 – – – –Unrealised depreciation on forward foreign currency contracts – – – – – – – –Unrealised depreciation on futures contracts – – 175,403 83,257 – – 1,591 4,425Accrued expenses and other liabilities 50 53 6,670 9,032 26 36 170 178
Total Financial Liabilities € 55,371 € 58,998 $7,812,139 $9,134,565 $ 31 $ 39 $1,114,179 $ 911,505
Western Asset UCITSSMASh Series Core Plus
Completion Fund^Legg Mason BrandywineGlobal Fixed Income Fund
Legg Mason BrandywineGlobal Fixed Income
Absolute Return Fund^Legg Mason BrandywineGlobal High Yield Fund^
Liabilities (in 000’s)
as at28 February
2021
as at29 February
2020
as at28 February
2021
as at29 February
2020
as at28 February
2021
as at29 February
2020
as at28 February
2021
as at29 February
2020
Less than 1 monthCash overdraft $ – $ – $ 2,340 $ 310 $ 18,219 $ 2 $ – $ 143Margin accounts and restricted cash – – 3,610 – 5,485 598 128 110Options 6 – – – – – – –Swap contracts – – – – – – 8 –Swaptions – – – – – – – –Unrealised depreciation on forward foreign currency contracts – – 301 6,948 513 14,860 4 127Unrealised depreciation on futures contracts 11 – – – – 1,426 – 65Unrealised depreciation on contracts for difference – – – – – – – –Payable for investments purchased 4,493 – – – – – 198 120Distributions payable to holders of redeemable participating shares – – – – – – – 1Management fees payable – – 235 477 246 418 – 5Performance fees payable – – – – – – – –Administrator and depositary fees payable 4 – 26 48 37 44 4 3Shareholder service fees payable – – 26 45 – 5 – –Payable for redeemable participating shares reacquired – – 940 3,670 – – – –Interest payable – – – – – – – –Dividend payable – – – – – – – –Redeemable Participating Shares 22,193 – 367,907 930,667 728,674 834,603 12,059 10,656
1 – 3 monthsOptions 5 – – – – – – –Swaptions – – – – – – – –Unrealised depreciation on forward foreign currency contracts 73 – 2,285 9,243 4,398 13,891 26 32Unrealised depreciation on futures contracts – – – – – – – –
Over 3 monthsOptions – – – – – – – –Swaptions – – – – – – – –Unrealised depreciation on forward foreign currency contracts – – 129 891 – 373 – –Unrealised depreciation on futures contracts 157 – – – – – – –Accrued expenses and other liabilities 37 – 937 1,950 814 940 49 47
Total Financial Liabilities $ 26,979 – $ 378,736 $ 954,249 $ 758,386 $ 867,160 $ 12,476 $ 11,309
^ Not authorised for sale to the public in Hong Kong.
362

Legg Mason Global Funds Plc Annual Report 28 February 2021
Notes to Financial Statements – (continued)12. Risk Exposure and Risk Management – (continued)
12.3 Liquidity Risk – (continued)
Legg Mason Western AssetGlobal Total Return
Investment Grade Bond Fund^
Legg Mason Western AssetStructured Opportunities
Fund^
Legg Mason Western Asset USMortgage-Backed Securities
Fund^
Legg Mason Western AssetUK Investment Grade Credit
Fund^Legg Mason Western Asset US
Corporate Bond Fund^
as at28 February
2021
as at29 February
2020
as at28 February
2021
as at29 February
2020
as at28 February
2021
as at29 February
2020
as at28 February
2021
as at29 February
2020
as at28 February
2021
as at29 February
2020
$ – $ – $ 30 $ 187 $ 3 $ 4,970 £ – £ – $ – $ –– – – – 196 2,482 – – 4 257– – – – – – – – – –– – 1,514 2,507 332 – – – – –– – – – – – – – – –– – 862 334 – – – – – 668– – – 81 – – – – – 5– – – – – – – – – –– – 4,008 11,112 240,947 299,984 – – 3,394 320– – – – – – – – – –– – 332 671 1 1 – – 10 9– – – – – – – – – –5 3 52 91 40 53 5 7 12 8– – 8 8 – – – – 1 1– – 3,681 8,682 – – – – – –– – – – – – – – – –– – – – – – – – – –– – 1,105,162 1,921,028 823,416 1,076,665 76,685 113,272 191,596 123,718
– – – – – – – – – –– – – – – – – – – –– – – – – – – 70 48 –– – – – – – – – – –
– – – – – – – – – –– – – 166 – 100 – – – –– – – – – – – – – –– – 492 15,457 1,278 6,039 65 98 197 147
37 52 278 281 156 155 38 39 53 53
$ 42 $ 55 $1,116,419 $1,960,605 $1,066,369 $1,390,449 £ 76,793 £ 113,486 $ 195,315 $ 125,186
Legg Mason BrandywineGlobal Opportunistic Fixed
Income FundLegg Mason Brandywine
Global Sovereign Credit Fund^
Legg Mason BrandywineGlobal Income Optimiser
Fund^
Legg Mason BrandywineGlobal Credit Opportunities
Fund^
Legg Mason BrandywineGlobal Defensive High Yield
Fund^
as at28 February
2021
as at29 February
2020
as at28 February
2021
as at29 February
2020
as at28 February
2021
as at29 February
2020
as at28 February
2021
as at29 February
2020
as at28 February
2021
as at29 February
2020
$ 10,267 $ 4 $ 5,108 $ 6 $ – $ 3 $ 750 $ – $ – $ 1315,780 – 90 – 3,823 580 120 240 49 –
– – – – – – – – – –– – – – – – – 568 8 –– – – – – – – – – –
756 11,153 1,932 21,602 1,080 114 209 161 5 22– – – – – – – – – 56– – – – – – – – – –– – – – 1,070 – – – 198 110– – – – 16 1 – – – –
188 206 – 169 272 47 38 18 – –– – – – – – – – – –
35 29 8 80 22 6 10 5 3 21 4 – – 32 6 1 – – –
111 467 79,242 – 188 448 12 30 – –– – – – – – – – – –– – – – – – – – – –
585,721 548,932 – 1,590,814 453,285 71,029 52,020 43,385 11,774 10,534
– – – – – – – – – –– – – – – – – – – –
3,149 4,783 – 24,101 698 105 137 63 24 29– – – – – – – – – –
– – – – – – – – – –– – – – – – – – – –
70 499 – 1,023 – – – – – –723 – – – 379 – 79 – – –491 558 386 2,881 84 93 79 75 47 46
$ 607,292 $ 566,635 $ 86,766 $1,640,676 $ 460,949 $ 72,432 $ 53,455 $ 44,545 $ 12,108 $ 10,930
^ Not authorised for sale to the public in Hong Kong.
363

Legg Mason Global Funds Plc Annual Report 28 February 2021
Notes to Financial Statements – (continued)12. Risk Exposure and Risk Management – (continued)
12.3 Liquidity Risk – (continued)
Legg Mason BrandywineGlobal – US High Yield Fund^
Legg Mason BrandywineGlobal Enhanced Absolute
Return Fund^
Legg Mason BrandywineGlobal Dynamic US Equity
Fund^Legg Mason ClearBridge
Value Fund
Liabilities (in 000’s)
as at28 February
2021
as at29 February
2020
as at28 February
2021
as at29 February
2020
as at28 February
2021
as at29 February
2020
as at28 February
2021
as at29 February
2020
Less than 1 monthCash overdraft $ – $ – $ – $ 3,872 $ – $ – $ – $ –Margin accounts and restricted cash – – 1,037 62 – – – –Options – – – – – – – –Swap contracts – – – – – – – –Swaptions – – – – – – – –Unrealised depreciation on forward foreign currency contracts – – 212 13,344 – 1 1 –Unrealised depreciation on futures contracts – – – 8,931 – – – –Unrealised depreciation on contracts for difference – – – – – – – –Payable for investments purchased – – – – – – – 2,365Distributions payable to holders of redeemable participating shares – – – – – – – –Management fees payable – – 19 25 – – 281 228Performance fees payable – – – – – – – –Administrator and depositary fees payable 3 3 24 23 4 3 36 24Shareholder service fees payable – – – 1 – – 19 14Payable for redeemable participating shares reacquired – – 5 – – – 55 1,160Interest payable – – – – – – – –Dividend payable – – – – – – – –Redeemable Participating Shares – – 391,296 382,082 1,879 3,301 509,085 325,900
1 - 3 monthsOptions – – – – – – – –Swaptions – – – – – – – –Unrealised depreciation on forward foreign currency contracts – – 1,684 5,615 – – – –Unrealised depreciation on futures contracts – – – – – – – –
Over 3 monthsOptions – – – – – – – –Swaptions – – – – – – – –Unrealised depreciation on forward foreign currency contracts – – – 740 – – – –Unrealised depreciation on futures contracts – – 1,176 8,056 – – – –Accrued expenses and other liabilities 13 27 893 1,174 32 30 102 107
Total Financial Liabilities $ 16 $ 30 $396,346 $423,925 $ 1,915 $ 3,335 $509,579 $329,798
Legg Mason ClearBridgeUS Aggressive Growth Fund
Legg Mason ClearBridgeTactical Dividend Income
Fund
Legg Mason ClearBridgeUS Equity Sustainability
Leaders Fund^Legg Mason ClearBridge
Global Growth Fund^
Liabilities (in 000’s)
as at28 February
2021
as at29 February
2020
as at28 February
2021
as at29 February
2020
as at28 February
2021
as at29 February
2020
as at28 February
2021
as at29 February
2020
Less than 1 monthCash overdraft $ 1,096 $ 5,158 $ – $ 63 $ 2 $ – $ 1 $ –Margin accounts and restricted cash – – – – – – – –Options – – – – – – – –Swap contracts – – – – – – – –Swaptions – – – – – – – –Unrealised depreciation on forward foreign currency contracts 32 531 2 71 45 34 – –Unrealised depreciation on futures contracts – – – – – – – –Unrealised depreciation on contracts for difference – – – – – – – –Payable for investments purchased – 2,346 – 548 – 507 313 –Distributions payable to holders of redeemable participating shares – – – – – – – –Management fees payable 546 764 31 41 246 – 4 –Performance fees payable – – – – – – – –Administrator and depositary fees payable 64 65 7 5 33 5 4 3Shareholder service fees payable 71 96 3 7 27 2 – –Payable for redeemable participating shares reacquired 1,082 4,892 61 611 482 58 – –Interest payable – – – – – – – –Dividend payable – – – – – – – –Redeemable Participating Shares 790,698 945,826 38,689 39,784 645,224 49,672 11,089 8,463
1 - 3 monthsOptions – – – – – – – –Swaptions – – – – – – – –Unrealised depreciation on forward foreign currency contracts – – – – – – – –Unrealised depreciation on futures contracts – – – – – – – –
Over 3 monthsOptions – – – – – – – –Swaptions – – – – – – – –Unrealised depreciation on forward foreign currency contracts – – – – – – – –Unrealised depreciation on futures contracts – – – – – – – –Accrued expenses and other liabilities 341 341 52 51 25 29 20 19
Total Financial Liabilities $793,930 $960,019 $ 38,845 $ 41,181 $646,084 $ 50,307 $ 11,431 $ 8,485
^ Not authorised for sale to the public in Hong Kong.
364

Legg Mason Global Funds Plc Annual Report 28 February 2021
Notes to Financial Statements – (continued)12. Risk Exposure and Risk Management – (continued)
12.3 Liquidity Risk – (continued)
Legg Mason ClearBridgeGrowth Fund^
Legg Mason ClearBridgeGlobal Equity Fund^
Legg Mason ClearBridgeGlobal Equity Income Fund^
Legg Mason ClearBridge USAppreciation Fund
Legg Mason ClearBridge USLarge Cap Growth Fund
as at28 February
2021
as at29 February
2020
as at28 February
2021
as at29 February
2020
as at28 February
2021
as at29 February
2020
as at28 February
2021
as at29 February
2020
as at28 February
2021
as at29 February
2020
$ – $ – $ – $ – $ – $ – $ 4 $ 630 $ 6,848 $ 66– – – – – – – – 620 –– – – – – – – – – –– – – – – – – – – –– – – – – – – – – –– – – – – – – – 1,329 668– – – – – – – – – –– – – – – – – – – –– – – – – – 199 648 2,660 8,136– – – – – – – – – –– – – – – – 184 203 1,186 1,083– – – – – – – – – –– – 4 2 2 – 19 15 142 97– – – – – – 27 34 159 160
44 45 – – – – 655 475 17,184 11,837– – – – – – – – – –– – – – – – – – – –– – – – – – 206,008 193,438 1,811,052 1,521,006
– – – – – – – – – –– – – – – – – – – –– – – – – – – – 1,080 110– – – – – – – – – –
– – – – – – – – – –– – – – – – – – – –– – – – – – – – – –– – – – – – – – – –
30 25 53 58 26 33 75 72 273 286
$ 74 $ 70 $ 57 $ 60 $ 28 $ 33 $ 207,171 $ 195,515 $1,842,533 $1,543,449
Legg Mason ClearBridgeInfrastructure Value Fund^
Legg Mason ClearBridgeEmerging Markets
Infrastructure Fund^Legg Mason Royce US
Small Cap Opportunity FundLegg Mason Royce US
Smaller Companies FundLegg Mason PCM US
Equity Fund^
as at28 February
2021
as at29 February
2020
as at28 February
2021
as at29 February
2020
as at28 February
2021
as at29 February
2020
as at28 February
2021
as at29 February
2020
as at28 February
2021
as at29 February
2020
€ 6 € 381 $ – $ – $ 8 $ 2 $ – $ – $ – $ –250 930 – – 1,310 – – – – –
– – – – – – – – – –– – – – – – – – – –– – – – – – – – – –
496 3,563 – 2 483 387 3 – – –– – – – – – – – – –– – – – – – – – – –
50,148 12,236 69 – 12,581 590 1,554 – – –1,725 3,400 – – – – – – – –
457 614 – – 963 470 91 86 – –– – – – – – – – – –
50 45 4 2 71 31 9 7 – –50 67 – – 164 83 15 16 – –
1,534 11,893 – – 5,816 1,408 94 510 – –– – – – – – – – – –– – – – – – – – – –
605,013 773,938 2,725 2,686 1,288,870 448,058 91,096 68,057 – –
– – – – – – – – – –– – – – – – – – – –
62 137 – – 128 37 – – – –– – – – – – – – – –
– – – – – – – – – –– – – – – – – – – –– – – – – – – – – –– – – – – – – – – –
101 112 63 89 202 203 66 69 23 23
€ 659,892 € 807,316 $ 2,861 $ 2,779 $1,310,596 $ 451,269 $ 92,928 $ 68,745 $ 23 $ 23
^ Not authorised for sale to the public in Hong Kong.
365

Legg Mason Global Funds Plc Annual Report 28 February 2021
Notes to Financial Statements – (continued)12. Risk Exposure and Risk Management – (continued)
12.3 Liquidity Risk – (continued)
Legg Mason QS MV EuropeanEquity Growth and
Income Fund
Legg Mason QS MV AsiaPacific Ex Japan Equity
Growth and Income Fund
Legg MasonBatterymarch International
Large Cap Fund^Legg Mason QS Emerging
Markets Equity Fund
Liabilities (in 000’s)
as at28 February
2021
as at29 February
2020
as at28 February
2021
as at29 February
2020
as at28 February
2021
as at29 February
2020
as at28 February
2021
as at29 February
2020
Less than 1 monthCash overdraft € – € 13 $ 482 $ – $ – $ – $ – $ –Margin accounts and restricted cash – – – – – – – –Options – – – – – – – –Swap contracts – – – – – – – –Swaptions – – – – – – – –Unrealised depreciation on forward foreign currency contracts 15 149 29 215 – – – –Unrealised depreciation on futures contracts – – – – – – – 20Unrealised depreciation on contracts for difference – – – – – – – –Payable for investments purchased – – 55 – – – – –Distributions payable to holders of redeemable participating shares – – – – – – – –Management fees payable 29 43 36 42 – – – –Performance fees payable – – – – – – – –Administrator and depositary fees payable 6 5 7 6 – – 5 3Shareholder service fees payable 1 5 3 11 – – – –Payable for redeemable participating shares reacquired 120 100 285 34 59 – – –Interest payable – – – – – – – –Dividend payable – – – – – – – –Redeemable Participating Shares 33,368 40,774 31,037 64,036 – – 14,739 12,185
1 - 3 monthsOptions – – – – – – – –Swaptions – – – – – – – –Unrealised depreciation on forward foreign currency contracts – – – – – – – –Unrealised depreciation on futures contracts – – – – – – – –
Over 3 monthsOptions – – – – – – – –Swaptions – – – – – – – –Unrealised depreciation on forward foreign currency contracts – – – – – – – –Unrealised depreciation on futures contracts – – – – – – – –Accrued expenses and other liabilities 107 115 215 163 1 1 130 133
Total Financial Liabilities €33,646 €41,204 $32,149 $64,507 $ 60 $ 1 $14,874 $12,341
Legg Mason Martin CurrieGlobal Resources Fund^
Legg Mason Martin CurrieGreater China Fund^
Legg Mason Martin CurrieJapan Absolute Alpha Fund^
Legg Mason Martin CurrieNorth American Fund^
Liabilities (in 000’s)
as at28 February
2021
as at29 February
2020
as at28 February
2021
as at29 February
2020
as at28 February
2021
as at29 February
2020
as at28 February
2021
as at29 February
2020
Less than 1 monthCash overdraft $ – $ – $ – $ – ¥ – ¥ – $ – $ –Margin accounts and restricted cash – – – – – – – –Options – – – – – – – –Swap contracts – – – – – – – –Swaptions – – – – – – – –Unrealised depreciation on forward foreign currency contracts – – – – – – – –Unrealised depreciation on futures contracts – – – – – – – –Unrealised depreciation on contracts for difference – – – – – – – –Payable for investments purchased – – – – – – – –Distributions payable to holders of redeemable participating shares – – – – – – – –Management fees payable – – – – – – – –Performance fees payable – – – – – – – –Administrator and depositary fees payable – – 3 – 76 60 – –Shareholder service fees payable – – – – – – – –Payable for redeemable participating shares reacquired 51 – 96 123 – – – –Interest payable – – – – – – – –Dividend payable – – – – – – – –Redeemable Participating Shares – – – – – – – –
1 - 3 monthsOptions – – – – – – – –Swaptions – – – – – – – –Unrealised depreciation on forward foreign currency contracts – – – – – – – –Unrealised depreciation on futures contracts – – – – – – – –
Over 3 monthsOptions – – – – – – – –Swaptions – – – – – – – –Unrealised depreciation on forward foreign currency contracts – – – – – – – –Unrealised depreciation on futures contracts – – – – – – – –Accrued expenses and other liabilities – 103 20 33 1,264 3,144 – 129
Total Financial Liabilities $ 51 $ 103 $ 119 $ 156 ¥ 1,340 ¥ 3,204 $ – $ 129
^ Not authorised for sale to the public in Hong Kong.
366

Legg Mason Global Funds Plc Annual Report 28 February 2021
Notes to Financial Statements – (continued)12. Risk Exposure and Risk Management – (continued)
12.3 Liquidity Risk – (continued)
Legg Mason QS MVGlobal Equity Growth and
Income FundLegg Mason
Congruix Japan Equity Fund^
Legg MasonMartin Currie Asia Long-Term
Unconstrained Fund^Legg Mason Martin Currie
Asia Pacific Fund^
Legg Mason Martin CurrieEuropean Absolute Alpha
Fund^
as at28 February
2021
as at29 February
2020
as at28 February
2021
as at29 February
2020
as at28 February
2021
as at29 February
2020
as at28 February
2021
as at29 February
2020
as at28 February
2021
as at29 February
2020
$ – $ 22 ¥ – ¥ – $ – $ – $ – $ – € 33 € 251– – – – – – – – – –– – – – – – – – – –– – – – – – – – – –– – – – – – – – – –– 68 – – – – – – 244 579– – – – – – – – – –– – – – – – – – 492 2,319– – – – 104 – – – 589 3,954– – – – 313 1,966 – – – –
11 16 – – 58 141 – – 53 242– – – – – – – – – 225 3 – – 11 14 5 3 11 14– 1 – – 1 13 – – 3 281 – – – – 14 – – 235 108– – – – – – – – 7 44– – – – – – – – 6 51
12,685 13,469 – – 80,080 164,718 – – 40,343 189,847
– – – – – – – – – –– – – – – – – – – –– – – – – – – – 42 83– – – – – – – – – –
– – – – – – – – – –– – – – – – – – – –– – – – – – – – – –– – – – – – – – – –
63 58 90,733 91,494 85 80 25 42 72 81
$ 12,765 $ 13,637 ¥ 90,733 ¥ 91,494 $ 80,652 $ 166,946 $ 30 $ 45 € 42,130 € 197,623
Legg Mason Martin CurrieGlobal Long-Term
Unconstrained Fund^
Legg Mason Martin CurrieAsia Pacific Ex Japan Real
Income Fund
Legg Mason Martin CurrieGlobal Emerging Markets
Fund^
Legg Mason Martin CurrieGlobal Dividend Opportunities
Fund^
Legg Mason Martin CurrieEuropean Unconstrained
Fund^
as at28 February
2021
as at29 February
2020
as at28 February
2021
as at29 February
2020
as at28 February
2021
as at29 February
2020
as at28 February
2021
as at29 February
2020
as at28 February
2021
as at29 February
2020
$ – $ – $ – $ – $ – $ – $ – $ – € – € –– – – – – – – – – –– – – – – – – – – –– – – – – – – – – –– – – – – – – – – –– 2 1 – – – – – – –– – – – – – – – – –– – – – – – – – – –– – – 50 98 – – – – –– – – – – – – – – –
34 16 17 – 26 6 – – 30 –– – – – – – – – – –
10 5 4 3 7 4 2 3 20 32 1 3 – 2 1 – – – –– 133 – – – 1 – – – –– – – – – – – – – –– – – – – – – – – –
104,349 34,180 26,576 8,241 41,801 29,421 – – 111,371 6,138
– – – – – – – – – –– – – – – – – – – –– – – – – – – – – –– – – – – – – – – –
– – – – – – – – – –– – – – – – – – – –– – – – – – – – – –– – – – – – – – – –
36 33 98 60 202 107 20 29 20 32
$ 104,431 $ 34,370 $ 26,699 $ 8,354 $ 42,136 $ 29,540 $ 22 $ 32 € 111,441 € 6,173
^ Not authorised for sale to the public in Hong Kong.
367

Legg Mason Global Funds Plc Annual Report 28 February 2021
Notes to Financial Statements – (continued)13. Disclosure for Cross Investments by Funds within the Company
Certain Funds invest in other Funds of the Company. These cross investments have been eliminated in the financial statements of the Company, as follows:
• the market values of the underlying collective investment schemes have been eliminated in the total Company amounts in the Statement of Financial Position;
• the realised gains and losses, including movements in unrealised gains and losses, and the relevant dividend income and distributions on the cross investments have been eliminated in thetotal Company amounts disclosed in the Statement of Comprehensive Income; and
• the monetary amounts of purchases and sales of units in such collective investment schemes have been eliminated from the net proceeds from sales of shares and cost of sharesreacquired, respectively, in the total Company amounts disclosed in the Statement of Changes in Net Assets Attributable to Holders of Redeemable Participating Shares.
Legg Mason Western Asset Global Multi Strategy Fund
Legg Mason Western Asset Global Multi Strategy Fund held 115,764 (2020: 205,925), 84,658 (2020: 81,198) and 74,291 (2020: 74,291) shares in Legg Mason Western Asset US High Yield Fund, LeggMason Western Asset Emerging Markets Corporate Bond Fund and Legg Mason Western Asset Euro High Yield Fund, respectively, at the year end. Transactions involving these shares and the relatedgains, losses and distributions during the financial year were:
Legg Mason Western Asset US HighYield Fund
Legg Mason Western Asset EmergingMarkets Corporate Bond Fund
Legg Mason Western Asset Euro HighYield Fund
For the year ended28 February 2021
(in 000’s)
For the year ended29 February 2020
(in 000’s)
For the year ended28 February 2021
(in 000’s)
For the year ended29 February 2020
(in 000’s)
For the year ended28 February 2021
(in 000’s)
For the year ended29 February 2020
(in 000’s)
Issue of shares $778 $1,150 $344 $365 $– $–Redemption of shares (8,580) (3,500) – – – (7,189)
Net realised (loss)/gain on financial assets atfair value through profit or loss (977) (488) – – – 1,183
Distributions received 778 1,150 344 365 – –
Cost 9,766 18,545 8,733 8,389 12,045 12,045Fair value 10,371 17,667 8,757 8,184 16,553 14,464
Net unrealised gain/(loss) on financial assets atfair value through profit or loss $605 $(878) $24 $(205) $4,508 $2,419
Legg Mason Western Asset Emerging Markets Total Return Bond Fund
Legg Mason Western Asset Emerging Markets Total Return Bond Fund held 20,150 (2020: 17,686) shares in Legg Mason Western Asset Emerging Markets Corporate Bond Fund at the year end.Transactions involving these shares and the related gains, losses and distributions during the financial year were:
Legg Mason Western Asset EmergingMarkets Corporate Bond Fund
For the year ended28 February 2021
(in 000’s)
For the year ended29 February 2020
(in 000’s)
Issue of shares $320 $96Redemption of shares (56) (909)
Net realised gain on financial assets at fair value through profit or loss – 2
Distributions received 75 96
Cost 1,895 1,630Fair value 2,084 1,782
Net unrealised gain on financial assets at fair value through profit or loss $189 $152
Legg Mason Western Asset Global High Yield Fund
Legg Mason Western Asset Global High Yield Fund held 20,137 (2020: 51,801) and 26,331 (2020: 26,331) shares in Legg Mason Western Asset Emerging Markets Corporate Bond Fund and LeggMason Western Asset Euro High Yield Fund, respectively, at the year end. Transactions involving these shares and the related gains, losses and distributions during the financial year were:
Legg Mason Western Asset EmergingMarkets Corporate Bond Fund
Legg Mason Western AssetEuro High Yield Fund
For the year ended28 February 2021
(in 000’s)
For the year ended29 February 2020
(in 000’s)
For the year ended28 February 2021
(in 000’s)
For the year ended29 February 2020
(in 000’s)
Issue of shares $5,872 $6,753 $– $–Redemption of shares (8,582) (6,440) – –
Net realised (loss)/gain on financial assets at fair value through profit or loss (412) 301 – –
Distributions received 72 203 – –
Cost 2,090 5,212 4,299 4,299Fair value 2,083 5,221 5,867 5,126
Net unrealised (loss)/gain on financial assets at fair value through profit or loss $(7) $9 $1,568 $827
368

Legg Mason Global Funds Plc Annual Report 28 February 2021
Notes to Financial Statements – (continued)13. Disclosure for Cross Investments by Funds within the Company – (continued)
Legg Mason Western Asset Multi-Asset Credit Fund^
Legg Mason Western Asset Multi-Asset Credit Fund^ held 91,922 (2020: 88,165) shares in Legg Mason Western Asset Emerging Markets Corporate Bond Fund at the year end. Transactions involvingthese shares and the related gains, losses and distributions during the financial year were:
Legg Mason Western Asset EmergingMarkets Corporate Bond Fund
For the year ended28 February 2021
(in 000’s)
For the year ended29 February 2020
(in 000’s)
Issue of shares $374 $1,632Redemption of shares – –
Net realised gain/(loss) on financial assets at fair value through profit or loss – –
Distributions received 374 351
Cost 8,958 8,584Fair value 9,508 8,886
Net unrealised gain on financial assets at fair value through profit or loss $550 $302
Legg Mason Brandywine Global Enhanced Absolute Return Fund^
Legg Mason Brandywine Global Enhanced Absolute Return Fund^ held 87,846 (2020: 87,846) shares in Legg Mason Brandywine Global Credit Opportunities Fund^ at the year end. Transactionsinvolving these shares and the related gains, losses and distributions during the financial year were:
Legg Mason Brandywine Global CreditOpportunities Fund^
For the year ended28 February 2021
(in 000’s)
For the year ended29 February 2020
(in 000’s)
Issue of shares $– $–Redemption of shares – –
Net realised gain on financial assets at fair value through profit or loss – –
Distributions received – –
Cost 10,311 10,310Fair value 11,097 11,363
Net unrealised gain on financial assets at fair value through profit or loss $786 $1,053
14. Significant Events
On 28 April 2020, an updated Main and Specialist Prospectuses were issued by the Company and noted by the Central Bank. The significant amendments included:
• Revision of disclosure to provide current biographies for the directors of the Company and the Manager;
• For each Fund, disclosure about the benchmark index, if any, was added;
• Regulated Markets list was updated to include Tadawul (Saudi Stock Exchange) and Qatar Stock Exchange;
• Swedish sustainability disclosure has been moved to a schedule to provide information on how the Investment Managers take into account sustainability issues in managing the Funds;
• Exchange-traded options disclosure has been revised, including the obligation that index put options can only be sold if the assets of the relevant Fund can reasonably be expected tobehave in terms of price movement in the same manner as the options contract;
• Disclosure has been added for additional countries noting that the Funds are not registered for public sale in such countries and explaining the restrictions on the offer and sale of theFunds in such countries;
• Disclosure has been added to describe Bond Connect, a trading link by which non-Chinese investors can trade bonds in the China interbank bond market;
• Charging of marketing expenses provision has been deleted;
• Changes to certain Funds’ investment policies, risks, benchmarks and asset exposure, have been made, as described in Schedule B of the Shareholder Notice dated 10 March 2020, as wellas additional Sub-Investment Manager appointments announced to certain Funds.
• The dealing deadline and valuation point for the Funds managed by Martin Currie Investment Management Ltd has changed from 12 noon in London to 4pm in New York (Eastern Time)in the United States.
On 29 June 2020, the Central Bank approved the changes of the names for Legg Mason RARE Emerging Markets Infrastructure Fund, Legg Mason RARE Global Infrastructure Income Fund and LeggMason RARE Infrastructure Value Fund to Legg Mason ClearBridge Emerging Markets Infrastructure Fund, Legg Mason ClearBridge Global Infrastructure Fund and Legg Mason ClearBridgeInfrastructure Value Fund, respectively.
On 31 July 2020, Franklin Resources, Inc., a global investment organization operating as Franklin Templeton closed its acquisition of Legg Mason, Inc.
On 8 September 2020, an updated Main Prospectus was issued by the Company and noted by the Central Bank.
Effective 30 September 2020, Victoria Rock resigned as Director of the Company.
Effective 1 October 2020, William Jackson was appointed as Director to the Board of Directors of the Company.
On 21 December 2020, a Specialist Prospectus was issued by the Company and noted by the Central Bank. The significant amendments included addition of a new fund, Western Asset UCITS SMAShSeries Core Plus Completion Fund.
Effective 11 January 2021, Western Asset UCITS SMASh Series Core Plus Completion Fund^ commenced trading.
On 1 February 2021, an updated Main Prospectus was issued by the Company and noted by the Central Bank. The significant amendments included the appointment of FTIS as the new managementcompany to the Company. Until 1 February 2021, LMIIL acted as management company to the Company. Effective 1 February 2021 (the “Effective Date”), LMIIL merged (the “Merger”) into FTIS. Themanagement company of the Company has changed from LMIIL to FTIS on the Effective Date. After the Merger, LMIIL’s office and staff in Ireland will operate as an Irish branch of Franklin TempletonInternational Services S.a.r.l. Certain other changes were made to the Main Prospectus, including:
• Updated notices to certain country residents;
• Updated remuneration policy;
• Addition of two new currencies to the base prospectus – HUF and CZK;
^ Not authorised for sale to the public in Hong Kong.
369

Legg Mason Global Funds Plc Annual Report 28 February 2021
Notes to Financial Statements – (continued)14. Significant Events – (continued)
• Addition of HUF and CZK to certain investment policies not scheduled to be updated in April 2021;
• Addition of Portfolio Hedged share classes for Brandywine Funds;
• Updated information/paying agents;
• Clarified short securities language for Legg Mason Western Asset Macro Opportunities Bond Fund;
• Corrected fee table of Legg Mason ClearBridge Value Fund.
On 12 February 2021, an updated Specialist Prospectus was issued by the Company and noted by the Central Bank.
Effective 25 February 2021, Legg Mason Brandywine Global Sovereign Credit Fund^ ceased trading.
During the financial year, the spread of COVID-19 continued to severely impact the global economy and financial markets. It is too early to determine the final impact from COVID-19. The length anddepth of the downturn – as well as its impact of financial markets – will be driven by a number of factors, including efforts to “flatten the curve” through public lockdowns, quarantines and socialdistancing. In the meantime, there have been aggressive monetary and fiscal actions taken around the globe.
There have been no other significant events during the financial year ended 28 February 2021.
15. Segregated Liability
The Company is an umbrella fund with segregated liability between its Funds. As such, as matter of Irish law the assets of each of the Funds will not be exposed to the liabilities of the Company’s otherFunds. Notwithstanding the foregoing there can be no assurance that, should an action be brought against the Company in the court of another jurisdiction, the segregated nature of the Funds wouldnecessarily be upheld.
16. Subsequent Events
On 9 March 2021, an updated Main and Specialist Prospectuses were issued by the Company and noted by the Central Bank. The significant amendments included updates made to describe how theManager has implemented the Investment Managers’ policies in respect of the integration of sustainability risks in its investment decision making-process. These amendments are required in order tocomply with Article 6 of the EU Sustainable Finance Disclosure Regulation (Regulation (EU) 2019/2088).
Effective 14 April 2021, Legg Mason QS Emerging Markets Equity Fund ceased trading.
Effective 30 April 2021, Legg Mason ClearBridge Global Infrastructure Income Fund commenced trading.
On 17 May 2021, an updated Main Prospectus was issued by the Company and noted by the Central Bank. The significant amendments included:
• Updating of investment policies of Legg Mason Western Asset Short Duration High Income Bond Fund, Legg Mason Western Asset Emerging Markets Total Return Bond Fund, LeggMason Western Asset Global Core Plus Bond Fund, Legg Mason Brandywine Global Income Optimiser, Legg Mason Brandywine Global Credit Opportunities Fund and Legg Mason MartinCurrie Asia Pacific Ex Japan Real Income Fund;
• Benchmark changes for Legg Mason Western Asset Emerging Markets Corporate Bond Fund, Legg Mason Royce US Small Cap Opportunity Fund and Legg Mason ClearBridge Value Fund;
• Addition of new currencies, HUF and CZK, to certain supplements;
• Removal of shell fund – Legg Mason Western Asset US Dollar Liquidity Fund;
• Correction of replacing RARE with ClearBridge in the Company’s Specialist Prospectus;
• Correction of the dealing deadline to 4pm EST on Legg Mason Martin Currie European Select Absolute Alpha Fund (not launched to date);
• Clarification that the borrowing prohibition does not prevent an overdraft facility on Legg Mason Western Asset US Government Liquidity Fund.
Effective 20 May 2021, Jane Trust was appointed as Director to the Board of Directors of FTIS.
Effective 1 June 2021, Legg Mason Martin Currie European Absolute Alpha Fund^ ceased trading.
There were no other material events subsequent to the Statement of Financial Position date which require disclosure in the financial statements.
17. Approval of the Annual Report and Audited Financial Statements
The Directors approved the Annual Report and Audited Financial Statements on 17 June 2021.
^ Not authorised for sale to the public in Hong Kong.
370

Legg Mason Global Funds Plc Annual Report 28 February 2021
Supplemental Information – Total Expense Ratios (TER) (unaudited)
Ratio of Total OperatingExpenses in CU(1) to averageFund daily net assets in CU(1)(%)For the year ended28 February 2021**
Legg Mason Western Asset US Government Liquidity FundClass A US$ Accumulating 0.25Class A US$ Distributing (D) 0.25Class B US$ Accumulating 0.28Class B US$ Distributing (D) 0.12Class C US$ Accumulating 0.29Class C US$ Distributing (D) 0.32Class X US$ Distributing (D) 0.23Class A (G) US$ Accumulating 0.25Class A (G) US$ Distributing (D) 0.26Class L (G) US$ Distributing (D) 0.35
Legg Mason Western Asset US Core Bond FundClass A US$ Accumulating 1.20Class A US$ Distributing (D) 1.20Class B US$ Distributing (D) 1.54Class C US$ Accumulating 1.70Class C US$ Distributing (D) 1.70Class E US$ Accumulating 1.80Class F US$ Accumulating 0.66Class F US$ Distributing (D) 0.66Class X US$ Accumulating 0.73Class X US$ Distributing (D) 0.73Premier Class US$ Accumulating 0.41Premier Class Euro Accumulating (Hedged) 0.41Class GA US$ Accumulating 0.93Class GE US$ Accumulating 1.52
Legg Mason Western Asset US Core Plus Bond FundClass A US$ Accumulating 1.39Class A US$ Distributing (D) 1.39Class A US$ Distributing (M) Plus 1.39Class A AUD Distributing (M) (Hedged) Plus 1.39Class A Euro Accumulating (Hedged) 1.39Class B US$ Distributing (D) 1.64Class C US$ Accumulating 1.89Class C US$ Distributing (D) 1.89Class E US$ Accumulating 1.99Class F US$ Accumulating 0.64Class F US$ Distributing (D) 0.64Class X US$ Accumulating 0.81Class X US$ Distributing (D) 0.81Class X Euro Accumulating (Hedged) 0.82Class X Euro Distributing (M) (Hedged) 0.83Premier Class US$ Accumulating 0.39Premier Class US$ Distributing (M) 0.39Premier Class Euro Accumulating (Hedged) 0.39LM Class Euro Accumulating 0.09LM Class GBP Accumulating (Hedged) 0.09Class A (G) US$ Accumulating 1.24Class A (G) US$ Distributing (D) 1.24Class B (G) US$ Distributing (D) 1.72Class L (G) US$ Accumulating 1.74Class L (G) US$ Distributing (D) 1.74
Legg Mason Western Asset Euro Core Plus Bond FundClass A US$ Distributing (D) 1.27Class A Euro Distributing (D) 1.27Class C US$ Distributing (D) 1.77Class F Euro Distributing (Q) 0.61Premier Class Euro Accumulating 0.42LM Class Euro Accumulating 0.12Class GA Euro Accumulating 0.94Class GA Euro Distributing (A) 0.94Class GE Euro Accumulating 1.54
Legg Mason Western Asset Short Duration High Income Bond FundClass A US$ Accumulating 1.40Class A US$ Distributing (D) 1.40Class A US$ Distributing (M) 1.40Class A US$ Distributing (M) Plus 1.40Class A AUD Distributing (M) (Hedged) Plus 1.40Class A Euro Accumulating (Hedged) 1.40Class A HKD Distributing (M) Plus 1.40Class B US$ Accumulating 1.65Class B US$ Distributing (D) 1.65Class C US$ Accumulating 1.90Class C US$ Distributing (D) 1.90Class F US$ Accumulating 1.00Premier Class Euro Accumulating (Hedged) 0.75Class A (G) US$ Accumulating 1.50Class A (G) US$ Distributing (D) 1.50Class B (G) US$ Distributing (D) 2.00Class L (G) US$ Accumulating 2.00Class L (G) US$ Distributing (D) 1.99
Ratio of Total OperatingExpenses in CU(1) to averageFund daily net assets in CU(1)(%)For the year ended28 February 2021**
Legg Mason Western Asset Global Multi Strategy FundClass A US$ Accumulating 1.35Class A US$ Distributing (D) 1.35Class A US$ Distributing (M) 1.35Class A US$ Distributing (M) Plus 1.35Class A AUD Distributing (M) (Hedged) Plus 1.35Class A Euro Accumulating (Hedged) 1.35Class A Euro Distributing (M) (Hedged) 1.35Class A Euro Distributing (M) (Hedged) Plus (e) 1.35Class A GBP Distributing (M) (Hedged) 1.35Class A HKD Distributing (M) Plus 1.35Class A SGD Distributing (M) (Hedged) Plus 1.35Class A ZAR Distributing (M) (Hedged) Plus 1.35Class B US$ Accumulating 1.60Class B US$ Distributing (D) 1.60Class C US$ Accumulating 1.85Class C US$ Distributing (D) 1.85Class E US$ Accumulating 1.95Class E US$ Distributing (D) 1.95Class E Euro Accumulating (Hedged) 1.95Class E Euro Distributing (M) (Hedged) 1.95Class F US$ Accumulating 0.75Class F US$ Distributing (D) 0.75Class X US$ Distributing (D) 0.80Class X GBP Distributing (D) (Hedged) 0.80Premier Class US$ Accumulating 0.50Premier Class US$ Distributing (M) 0.50Premier Class CHF Accumulating (Hedged) 0.50Premier Class Euro Accumulating (Hedged) 0.50Premier Class Euro Distributing (M) (Hedged) 0.50Premier Class GBP Accumulating (Hedged) 0.50Premier Class GBP Distributing (M) (Hedged) 0.50Premier Class GBP Distributing (M) (Hedged) Plus (e) 0.50Premier Class PLN Accumulating (Hedged) 0.50LM Class AUD Distributing (M) (Hedged) 0.10LM Class GBP Accumulating (Hedged) 0.10
Legg Mason Western Asset US High Yield FundClass A US$ Accumulating 1.41Class A US$ Distributing (D) 1.42Class A US$ Distributing (M) 1.42Class A US$ Distributing (M) Plus 1.41Class A Euro Distributing (M) (Hedged) 1.42Class A SGD Distributing (M) (Hedged) Plus 1.42Class B US$ Accumulating 1.67Class B US$ Distributing (D) 1.67Class C US$ Accumulating 1.91Class C US$ Distributing (D) 1.91Class E US$ Accumulating 2.02Class E US$ Distributing (D) 2.02Class E Euro Accumulating (Hedged) 2.01Class F US$ Accumulating 0.82Class F US$ Distributing (D) 0.82Class X GBP Accumulating (Hedged) 0.91Premier Class US$ Accumulating 0.56Premier Class GBP Accumulating (Hedged) 0.57LM Class US$ Accumulating 0.12LM Class US$ Distributing (M) 0.12LM Class GBP Accumulating (Hedged) 0.11Class A (G) US$ Accumulating 1.27Class A (G) US$ Distributing (D) 1.27Class L (G) US$ Accumulating 1.77Class L (G) US$ Distributing (D) 1.77Class GF US$ Accumulating 1.07
Legg Mason Western Asset Emerging Markets Total Return Bond FundClass A US$ Accumulating 1.80Class A US$ Distributing (D) 1.80Class A US$ Distributing (M) 1.80Class A US$ Distributing (M) Plus 1.80Class A Euro Accumulating (Hedged) 1.80Class A Euro Distributing (D) (Hedged) 1.80Class A GBP Distributing (D) (Hedged) 1.80Class A SGD Distributing (M) (Hedged) Plus 1.80Class C US$ Accumulating 2.30Class C US$ Distributing (D) 2.30Class E US$ Distributing (D) 2.61Class E Euro Accumulating (Hedged) 2.61Class E Euro Distributing (M) (Hedged) 2.61Class F US$ Accumulating 1.17Class X GBP Distributing (D) (Hedged) 1.26Premier Class US$ Accumulating 0.91Premier Class Euro Accumulating (Hedged) 0.91Premier Class GBP Distributing (D) (Hedged) 0.91Class A (G) US$ Accumulating 1.61Class A (G) US$ Distributing (D) 1.61Class L (G) US$ Accumulating 2.11Class L (G) US$ Distributing (D) 2.11
371

Legg Mason Global Funds Plc Annual Report 28 February 2021
Supplemental Information – Total Expense Ratios (TER) (unaudited) – (continued)
Ratio of Total OperatingExpenses in CU(1) to averageFund daily net assets in CU(1)(%)For the year ended28 February 2021**
Legg Mason Western Asset Emerging Markets Corporate Bond FundClass A US$ Accumulating 1.89Class A US$ Distributing (M) 1.99Premier Class Euro Accumulating (Hedged) 0.73LM Class US$ Distributing (M) 0.18
Legg Mason Western Asset Global High Yield FundClass A US$ Accumulating 1.54Class A US$ Distributing (D) 1.54Class A US$ Distributing (M) 1.56Class A US$ Distributing (M) Plus 1.56Class A AUD Distributing (M) (Hedged) Plus 1.56Class A Euro Accumulating 1.54Class A Euro Distributing (D) (Hedged) 1.56Class A SGD Distributing (M) (Hedged) Plus 1.56Class B US$ Accumulating 1.79Class B US$ Distributing (D) 1.79Class C US$ Accumulating 2.04Class C US$ Distributing (D) 2.04Class E US$ Accumulating 2.16Class E US$ Distributing (D) 2.16Class E Euro Distributing (M) (Hedged) 2.16Class F US$ Accumulating 0.86Class F US$ Distributing (D) 0.86Class X US$ Distributing (D) 0.94Class X GBP Distributing (D) (Hedged) 0.94Premier Class US$ Accumulating 0.61Premier Class Euro Accumulating (Hedged) 0.61Premier Class GBP Distributing (D) (Hedged) 0.61Class A (G) US$ Accumulating 1.41Class A (G) US$ Distributing (D) 1.41Class L (G) US$ Accumulating 1.91Class L (G) US$ Distributing (D) 1.91
Legg Mason Western Asset Global Inflation Management FundClass A US$ Accumulating 1.20Class A US$ Distributing (A) 1.20Class B US$ Accumulating 1.45Class C US$ Distributing (A) 1.70LM Class US$ Accumulating 0.19Class A (G) US$ Accumulating 1.00Class A (G) US$ Distributing (A) 1.00Class L (G) US$ Distributing (A) 1.50
Legg Mason Western Asset Asian Opportunities FundClass A US$ Accumulating 1.34Class A US$ Distributing (D) 1.34Class A US$ Distributing (M) 1.34Class A US$ Distributing (M) Plus 1.33Class A AUD Distributing (M) (Hedged) Plus 1.33Class A CHF Accumulating (Hedged) 1.33Class A CNH Distributing (M) (Hedged) Plus 1.34Class A Euro Accumulating 1.33Class A Euro Accumulating (Hedged) 1.34Class A Euro Distributing (A) 1.34Class A HKD Distributing (M) Plus 1.33Class A SGD Accumulating (Hedged) 1.34Class A SGD Distributing (M) (Hedged) Plus 1.34Class A SGD Distributing (M) Plus 1.34Class B US$ Accumulating 1.59Class B US$ Distributing (D) 1.58Class C US$ Accumulating 1.83Class C US$ Distributing (D) 1.84Class E US$ Accumulating 1.93Class E US$ Distributing (D) 1.93Class F US$ Accumulating 0.92Class F US$ Distributing (D) 0.94Class X US$ Accumulating 0.82Class X US$ Distributing (M) 0.84Class X Euro Accumulating 0.85Class X Euro Accumulating (Hedged) 0.83Premier Class US$ Accumulating 0.69Premier Class US$ Distributing (M) 0.69Premier Class Euro Accumulating 0.69Premier Class Euro Accumulating (Hedged) 0.69Premier Class Euro Distributing (A) 0.69Premier Class Euro Distributing (M) 0.69Premier Class GBP Distributing (M) 0.69LM Class US$ Accumulating 0.09
Ratio of Total OperatingExpenses in CU(1) to averageFund daily net assets in CU(1)(%)For the year ended28 February 2021**
Legg Mason Western Asset Short Duration Blue Chip Bond FundClass A US$ Accumulating 1.09Class A US$ Distributing (M) 1.09Class A Euro Accumulating (Hedged) 1.09Class A SEK Accumulating (Hedged) 1.09Class A SEK Distributing (M) (Hedged) 0.93Class B US$ Accumulating 1.34Class C US$ Accumulating 1.59Class C US$ Distributing (M) 1.59Class E US$ Accumulating 1.69Class E US$ Distributing (D) 1.69Class F US$ Accumulating 0.69Class F US$ Distributing (D) 0.69Class X Euro Accumulating (Hedged) 0.67Premier Class US$ Accumulating 0.44Premier Class Euro Accumulating (Hedged) 0.44Premier Class Euro Distributing (M) (Hedged) 0.44Premier Class GBP Accumulating (Hedged) 0.45Premier Class GBP Distributing (M) (Hedged) 0.45S Class US$ Distributing (M) Plus (e) 0.34S Class Euro Distributing (M) (Hedged) Plus (e) 0.35S Class GBP Distributing (M) (Hedged) Plus (e) 0.35S Class AUD Distributing (M) (Hedged) Plus (e) 0.34
Legg Mason Western Asset Global Core Plus Bond Fund^Class A US$ Distributing (A) 1.40Class X US$ Accumulating 0.81Premier Class US$ Accumulating 0.51Premier Class Euro Accumulating (Hedged) 0.51Premier Class NZD Accumulating (Hedged) 0.51LM Class US$ Accumulating 0.11LM Class CAD Accumulating (Hedged) 0.11
Legg Mason Western Asset Global Credit Fund^Class A US$ Accumulating 1.34Class A Euro Accumulating (Hedged) 1.34LM Class US$ Accumulating 0.15LM Class Euro Accumulating (Hedged) 0.17
Legg Mason Western Asset Euro High Yield FundClass A Euro Distributing (D) 1.45Premier Class GBP Accumulating (Hedged) 0.60LM Class Euro Accumulating 0.16LM Class Euro Distributing (Q) 0.16
^ Not authorised for sale to the public in Hong Kong.
372

Legg Mason Global Funds Plc Annual Report 28 February 2021
Supplemental Information – Total Expense Ratios (TER) (unaudited) – (continued)
Ratio of Total OperatingExpenses in CU(1) to averageFund daily net assets in CU(1)(%)For the year ended28 February 2021**
Legg Mason Western Asset Macro Opportunities Bond Fund^Class A US$ Accumulating 1.74Class A US$ Distributing (M) Plus (e) 1.74Class A US$ Distributing (S) 1.74Class A AUD Accumulating (Hedged) 1.74Class A AUD Distributing (M) (Hedged) Plus (e) 1.74Class A CHF Accumulating (Hedged) 1.74Class A CNH Accumulating (Hedged) 1.74Class A CNH Distributing (M) (Hedged) Plus (e) 1.74Class A Euro Accumulating (Hedged) 1.74Class A Euro Distributing (A) 1.74Class A Euro Distributing (M) (Hedged) Plus (e) 1.74Class A Euro Distributing (S) (Hedged) 1.74Class A GBP Accumulating 1.74Class A GBP Accumulating (Hedged) 1.74Class A GBP Distributing (M) (Hedged) Plus (e) 1.74Class A HKD Distributing (M) Plus 1.74Class A SEK Accumulating (Hedged) 1.74Class A SGD Accumulating (Hedged) 1.74Class A SGD Distributing (M) (Hedged) Plus (e) 1.74Class B US$ Accumulating 1.99Class C US$ Accumulating 2.24Class C US$ Distributing (S) 2.24Class A JPY Distributing (M) Plus (e) 1.74Class A NOK Accumulating (Hedged) 1.74Class E US$ Accumulating 2.34Class E US$ Distributing (S) 2.34Class E Euro Accumulating (Hedged) 2.34Class F US$ Accumulating 1.34Class F US$ Distributing (S) 1.34Class X US$ Accumulating 1.24Class X US$ Distributing (M) Plus (e) 1.24Class X US$ Distributing (S) 1.24Class X CHF Accumulating (Hedged) 1.24Class X Euro Accumulating 1.24Class X Euro Accumulating (Hedged) 1.24Class X Euro Distributing (A) (Hedged) 1.24Class X Euro Distributing (M) (Hedged) 1.24Class X GBP Accumulating 1.24Class X GBP Accumulating (Hedged) 1.24Class X GBP Distributing (M) (Hedged) Plus (e) 1.24Class X SGD Accumulating (Hedged) 1.24Premier Class US$ Accumulating 1.09Premier Class US$ Distributing (S) 1.09Premier Class AUD Accumulating (Hedged) 1.09Premier Class AUD Distributing (S) (Hedged) 1.09Premier Class BRL Accumulating (Hedged) 1.09Premier Class CHF Accumulating (Hedged) 1.09Premier Class CHF Distributing (S) (Hedged) 1.09Premier Class Euro Accumulating 1.09Premier Class Euro Accumulating (Hedged) 1.09Premier Class Euro Distributing (S) (Hedged) 1.09Premier Class GBP Accumulating (Hedged) 1.09Premier Class GBP Distributing (M) (Hedged) Plus (e) 1.09Premier Class JPY Accumulating (Hedged) 1.09Premier Class JPY Distributing (S) (Hedged) 1.10Premier Class PLN Accumulating (Hedged) 1.09Premier Class SEK Accumulating (Hedged) 1.09S Class US$ Accumulating 0.69S Class Euro Accumulating (Hedged) 0.69LM Class AUD Distributing (S) (Hedged) 0.09LM Class Euro Accumulating 0.09
Legg Mason Western Asset Multi-Asset Credit Fund^Class A US$ Accumulating 1.49Class A US$ Distributing (M) Plus (e) 1.55Class A Euro Accumulating (Hedged) 1.49Class C US$ Accumulating 2.05Class F US$ Accumulating 0.89Class X CHF Distributing (M) (Hedged) 0.87Premier Class Euro Accumulating (Hedged) 0.69Premier Class GBP Distributing (M) (Hedged) Plus (e) 0.69S Class US$ Accumulating 0.50S Class Euro Accumulating (Hedged) 0.49S Class GBP Accumulating (Hedged) 0.49LM Class AUD Accumulating (Hedged) 0.09LM Class Euro Accumulating (Hedged) 0.09LM Class GBP Accumulating (Hedged) 0.09
Ratio of Total OperatingExpenses in CU(1) to averageFund daily net assets in CU(1)(%)For the year ended28 February 2021**
Legg Mason Western Asset Structured Opportunities Fund^Class D Euro Accumulating (Hedged) 1.44Class D Euro Distributing (M) (Hedged) 1.44Class D US$ Accumulating 1.44Class D US$ Distributing (M) 1.44Class D US$ Distributing (M) Plus 1.44Class M CHF Accumulating (Hedged) 0.85Class M GBP Distributing (M) (Hedged) 0.85Class F US$ Accumulating 1.29Class M US$ Accumulating 0.85Class M US$ Distributing (M) 0.85Class M Euro Accumulating (Hedged) 0.85Premier Class US$ Accumulating 0.70Premier Class US$ Distributing (Q) 0.70Premier Class Euro Accumulating (Hedged) 0.70Premier Class Euro Distributing (Q) (Hedged) 0.70Premier Class GBP Distributing (M) (Hedged) Plus (e) 0.69Premier Class JPY Accumulating (Hedged) 0.70LM Class US$ Accumulating 0.10
Legg Mason Western Asset US Mortgage-Backed Securities Fund^Class A US$ Distributing (M) Plus (e) 1.25Premier Class US$ Accumulating 0.39Premier Class Euro Accumulating (Hedged) 0.39LM Class US$ Accumulating 0.09
Legg Mason Western Asset UK Investment Grade Credit Fund^Class A GBP Accumulating 1.10LM Class GBP Accumulating 0.11
Legg Mason Western Asset US Corporate Bond Fund^Class A US$ Accumulating 1.07Premier Class US$ Accumulating 0.42Premier Class Euro Accumulating (Hedged) 0.42LM Class GBP Accumulating (Hedged) 0.12
Legg Mason Brandywine Global Fixed Income FundClass A US$ Accumulating 1.36Class A US$ Distributing (M) 1.36Class A US$ Distributing (M) Plus 1.36Class A US$ Distributing (S) 1.36Class A AUD Distributing (M) (Hedged) Plus 1.36Class A Euro Accumulating (Hedged) 1.36Class A Euro Accumulating (Hedged) (IH) 1.36Class A Euro Distributing (A) (Hedged) 1.36Class A Euro Distributing (S) 1.36Class A Euro Distributing (S) (Hedged) (IH) 1.36Class A GBP Accumulating 1.36Class A GBP Distributing (M) (Hedged) 1.36Class A GBP Distributing (S) (Hedged) (IH) 1.36Class A SGD Accumulating 1.36Class B US$ Accumulating 1.61Class B US$ Distributing (S) 1.61Class C US$ Accumulating 1.86Class C US$ Distributing (S) 1.86Class E US$ Accumulating 1.96Class E Euro Accumulating (Hedged) 1.96Class E Euro Accumulating (Hedged) (IH) 1.96Class F US$ Accumulating 0.96Class F US$ Distributing (S) 0.96Class R GBP Distributing (S) (Hedged) (IH) 0.96Class X US$ Accumulating 0.86Class X US$ Distributing (S) 0.86Class X Euro Accumulating (Hedged) 0.86Class X Euro Accumulating (Hedged) (IH) 0.86Class X Euro Distributing (S) (Hedged) (IH) 0.86Class X GBP Accumulating 0.86Class X GBP Accumulating (Hedged) 0.86Class X GBP Accumulating (Hedged) (IH) 0.86Class X GBP Distributing (S) (Hedged) 0.86Class X GBP Distributing (S) (Hedged) (IH) 0.86Premier Class US$ Accumulating 0.71Premier Class US$ Distributing (S) 0.71Premier Class Euro Accumulating 0.71Premier Class Euro Accumulating (Hedged) 0.71Premier Class Euro Accumulating (Hedged) (IH) 0.71Premier Class GBP Distributing (M) (Hedged) 0.71Premier Class GBP Distributing (S) (Hedged) (IH) 0.71LM Class US$ Accumulating 0.12LM Class US$ Accumulating (Hedged) (IH) 0.11
^ Not authorised for sale to the public in Hong Kong.
373

Legg Mason Global Funds Plc Annual Report 28 February 2021
Supplemental Information – Total Expense Ratios (TER) (unaudited) – (continued)
Ratio of Total OperatingExpenses in CU(1) to averageFund daily net assets in CU(1)(%)For the year ended28 February 2021**
Legg Mason Brandywine Global Fixed Income Absolute Return Fund^Class A US$ Accumulating 1.59Class A US$ Distributing (A) 1.59Class A Euro Accumulating (Hedged) 1.59Class A SEK Accumulating (Hedged) 1.58Class C US$ Accumulating 2.09Class E US$ Accumulating 2.19Class E US$ Distributing (A) 2.19Class F US$ Accumulating 1.19Class F US$ Distributing (A) 1.19Class X US$ Accumulating 1.14Class X GBP Accumulating (Hedged) 1.14Class X GBP Distributing (M) (Hedged) 1.15Premier Class US$ Accumulating 0.99Premier Class US$ Distributing (A) 0.99Premier Class Euro Accumulating (Hedged) 0.99Premier Class Euro Distributing (A) (Hedged) 0.99Premier Class GBP Distributing (M) (Hedged) 0.99Premier Class SEK Accumulating (Hedged) 0.99Premier Class SGD Accumulating (Hedged) 0.99LM Class US$ Accumulating 0.10LM Class AUD Accumulating (Hedged) 0.10
Legg Mason Brandywine Global High Yield Fund^Class A US$ Accumulating 1.40Class A US$ Distributing (D) 1.40Premier Class US$ Accumulating 0.75Premier Class GBP Accumulating (Hedged) (IH) 0.75S Class CAD Accumulating (Hedged) (IH) 0.60
Legg Mason Brandywine Global Opportunistic Fixed Income FundClass A US$ Accumulating 1.40Class A US$ Distributing (M) 1.40Class A Euro Accumulating (Hedged) 1.45Class A SGD Accumulating 1.39Class C US$ Accumulating 1.90Class E US$ Accumulating 2.00Class F US$ Accumulating 1.00Class F US$ Distributing (M) 1.00Class X US$ Accumulating 0.90Class X GBP Distributing (M) (Hedged) 0.90Class X GBP Distributing (M) (Hedged) (IH) 0.90Premier Class US$ Accumulating 0.75Premier Class US$ Accumulating (Hedged) (IH) 0.75Premier Class GBP Distributing (M) (Hedged) (IH) 0.75Premier Class NZD Accumulating (Hedged) (IH) 0.75LM Class Euro Accumulating 0.10LM Class NZD Accumulating (Hedged) (IH) 0.10
Legg Mason Brandywine Global Income Optimiser Fund^Class A US$ Accumulating 1.36Class A US$ Distributing (A) 1.35Class A US$ Distributing (D) 1.35Class A US$ Distributing (M) Plus 1.34Class A US$ Distributing (M) Plus (e) 1.36Class A Euro Accumulating 1.40Class A Euro Accumulating (Hedged) 1.36Class A Euro Distributing (A) (Hedged) 1.37Class A Euro Distributing (M) (Hedged) Plus (e) 1.36Class A GBP Distributing (M) (Hedged) Plus (e) 1.36Class A SGD Distributing (M) (Hedged) Plus 1.36Class A SGD Distributing (M) (Hedged) Plus (e) 1.34Class C US$ Accumulating 1.85Class C US$ Distributing (D) 1.85Class E US$ Accumulating 1.95Class E US$ Distributing (D) 1.94Class E Euro Accumulating (Hedged) 1.95Class F US$ Accumulating 0.89Class F US$ Distributing (D) 0.92Class X US$ Accumulating 0.80Class X US$ Distributing (D) 0.83Class X US$ Distributing (M) Plus (e) 0.81Class X CHF Distributing (A) (Hedged) 0.79Class X Euro Accumulating 0.80Class X Euro Accumulating (Hedged) 0.80Class X Euro Distributing (M) (Hedged) Plus (e) 0.81Class X GBP Distributing (M) (Hedged) Plus (e) 0.83Premier Class US$ Accumulating 0.65Premier Class US$ Distributing (M) Plus (e) 0.66Premier Class Euro Accumulating (Hedged) 0.65Premier Class Euro Distributing (M) (Hedged) Plus (e) 0.66Premier Class GBP Distributing (M) (Hedged) Plus (e) 0.68Premier Class SEK Accumulating (Hedged) 0.66S Class US$ Accumulating 0.46S Class Euro Accumulating (Hedged) 0.46S Class Euro Distributing (M) (Hedged) Plus (e) 0.46S Class GBP Distributing (M) (Hedged) Plus (e) 0.47LM Class GBP Accumulating (Hedged) 0.10
Ratio of Total OperatingExpenses in CU(1) to averageFund daily net assets in CU(1)(%)For the year ended28 February 2021**
Legg Mason Brandywine Global Credit Opportunities Fund^Class A US$ Accumulating 1.95Class A Euro Accumulating (Hedged) 1.95Premier Class US$ Accumulating 1.30LM Class US$ Accumulating 0.15S Class BRL Accumulating (Hedged) 0.70
Legg Mason Brandywine Global Defensive High Yield Fund^Class A US$ Distributing (M) Plus (e) 1.35S Class Euro Distributing (A) (Hedged) (IH) 0.55
Legg Mason Brandywine Global Enhanced Absolute Return Fund^Class A US$ Accumulating 2.24Class A SGD Accumulating (Hedged) 2.25Class X US$ Accumulating 1.40Class X GBP Distributing (M) (Hedged) Plus (e) 1.40Premier Class US$ Accumulating 1.25Premier Class Euro Accumulating (Hedged) 1.25LM Class AUD Accumulating (Hedged) 0.10
Legg Mason Brandywine Global Dynamic US Equity Fund^Class A US$ Accumulating 1.70Premier Class US$ Accumulating 0.75S Class Euro Accumulating (Hedged) 0.50
Legg Mason ClearBridge Value FundClass A US$ Accumulating 1.80Class A US$ Distributing (A) 1.80Class A Euro Accumulating 1.80Class A Euro Distributing (A) (Hedged) 1.80Class A GBP Distributing (A) 1.80Class A SGD Accumulating 1.80Class A SGD Accumulating (Hedged) 1.80Class C US$ Accumulating 2.30Class C US$ Distributing (A) 2.30Class F US$ Accumulating 1.20Class F US$ Distributing (A) 1.20Class X US$ Distributing (A) 1.13Class X Euro Accumulating 1.13Premier Class US$ Accumulating 0.78Premier Class US$ Distributing (A) 0.78Premier Class Euro Accumulating 0.78
Legg Mason ClearBridge US Appreciation FundClass A US$ Accumulating 1.71Class A US$ Distributing (A) 1.71Class A Euro Accumulating 1.72Class B US$ Accumulating 2.21Class B US$ Distributing (A) 2.21Class C US$ Accumulating 2.21Class C US$ Distributing (A) 2.21Class E US$ Accumulating 2.47Class E US$ Distributing (A) 2.47Class F US$ Accumulating 1.12Class F US$ Distributing (A) 1.12Class X US$ Distributing (A) 1.09Class X Euro Accumulating 1.09Premier Class US$ Accumulating 0.75Premier Class US$ Distributing (A) 0.74Premier Class Euro Accumulating 0.74LM Class US$ Accumulating 0.12LM Class Euro Accumulating 0.12Class A (G) US$ Accumulating 1.37Class B (G) US$ Accumulating 2.35Class L (G) US$ Accumulating 1.86Class GA US$ Accumulating 1.54Class GA Euro Accumulating 1.54Class GA Euro Distributing (A) 1.54Class GE US$ Accumulating 2.29Class GE Euro Accumulating 2.29
^ Not authorised for sale to the public in Hong Kong.
374

Legg Mason Global Funds Plc Annual Report 28 February 2021
Supplemental Information – Total Expense Ratios (TER) (unaudited) – (continued)
Ratio of Total OperatingExpenses in CU(1) to averageFund daily net assets in CU(1)(%)For the year ended28 February 2021**
Legg Mason ClearBridge US Large Cap Growth FundClass A US$ Accumulating 1.69Class A US$ Distributing (A) 1.69Class A Euro Accumulating 1.69Class A Euro Accumulating (Hedged) 1.69Class B US$ Accumulating 2.19Class B US$ Distributing (A) 2.19Class C US$ Accumulating 2.19Class C US$ Distributing (A) 2.19Class E US$ Accumulating 2.44Class E US$ Distributing (A) 2.44Class F US$ Accumulating 1.09Class F US$ Distributing (A) 1.09Class U US$ Accumulating 0.62Class U US$ Distributing (Q) 0.68Class U Euro Accumulating 0.62Class X US$ Accumulating 1.07Class X Euro Accumulating 1.07Class X Euro Accumulating (Hedged) 1.07Class X GBP Accumulating 1.07Premier Class US$ Accumulating 0.72Premier Class US$ Distributing (A) 0.72Premier Class BRL Accumulating (Hedged) 0.72Premier Class Euro Accumulating 0.72Premier Class Euro Accumulating (Hedged) 0.72Premier Class Euro Distributing (A) 0.72Premier Class GBP Accumulating 0.72LM Class US$ Accumulating 0.10LM Class Euro Accumulating 0.10Class A (G) US$ Accumulating 1.34Class L (G) US$ Accumulating 1.84Class GA US$ Accumulating 1.51Class GA Euro Accumulating 1.51
Legg Mason ClearBridge US Aggressive Growth FundClass A US$ Accumulating 1.76Class A US$ Distributing (A) 1.76Class A AUD Accumulating (Hedged) 1.76Class A CHF Accumulating (Hedged) 1.75Class A CNH Accumulating (Hedged) 1.76Class A Euro Accumulating 1.76Class A Euro Accumulating (Hedged) 1.75Class A Euro Distributing (A) (Hedged) 1.75Class A GBP Accumulating 1.76Class A HKD Accumulating 1.75Class A SEK Accumulating (Hedged) 1.75Class A SGD Accumulating (Hedged) 1.76Class B US$ Accumulating 2.25Class B US$ Distributing (A) 2.25Class C US$ Accumulating 2.25Class C US$ Distributing (A) 2.25Class E US$ Accumulating 2.50Class E US$ Distributing (A) 2.50Class E Euro Accumulating (Hedged) 2.50Class F US$ Accumulating 1.16Class F US$ Distributing (A) 1.16Class X US$ Accumulating 1.11Class X US$ Distributing (A) 1.11Class X Euro Accumulating 1.11Class X Euro Accumulating (Hedged) 1.10Class X GBP Accumulating 1.11Premier Class US$ Accumulating 0.76Premier Class Euro Accumulating 0.76Premier Class Euro Distributing (A) 0.76Premier Class GBP Accumulating 0.76Premier Class GBP Accumulating (Hedged) 0.76Premier Class GBP Distributing (A) 0.76Premier Class PLN Accumulating (Hedged) 0.76LM Class Euro Accumulating 0.11Class A (G) US$ Accumulating 1.41Class B (G) US$ Accumulating 1.90Class L (G) US$ Accumulating 1.91Class GA Euro Accumulating 1.53Class GA Euro Distributing (A) 1.53Class GE US$ Accumulating 2.27Class GE Euro Accumulating 2.27
Ratio of Total OperatingExpenses in CU(1) to averageFund daily net assets in CU(1)(%)For the year ended28 February 2021**
Legg Mason ClearBridge Tactical Dividend Income FundClass A US$ Accumulating 1.75Class A US$ Distributing (A) 1.75Class A US$ Distributing (M) Plus 1.75Class A US$ Distributing (M) Plus (e) 1.75Class A US$ Distributing (Q) 1.75Class A AUD Distributing (M) (Hedged) Plus 1.75Class A CNH Distributing (M) (Hedged) Plus 1.75Class A Euro Accumulating 1.75Class A Euro Accumulating (Hedged) 1.75Class A Euro Distributing (M) (Hedged) Plus (e) 1.75Class A HKD Distributing (M) Plus 1.75Class A SGD Distributing (M) (Hedged) Plus 1.75Class C US$ Accumulating 2.25Class C US$ Distributing (A) 2.25Class C US$ Distributing (Q) 2.25Class F US$ Accumulating 1.15Class F Euro Accumulating 1.15Class F Euro Distributing (A) 1.15Class X US$ Distributing (M) Plus (e) 1.13Class X Euro Distributing (M) (Hedged) Plus (e) 1.13
Legg Mason ClearBridge US Equity Sustainability Leaders Fund^Class A US$ Accumulating 1.63Class A US$ Distributing (A) 1.64Class A Euro Accumulating (Hedged) 1.63Class A SEK Accumulating 1.50Class F US$ Accumulating 1.03Class X US$ Accumulating 1.03Class X US$ Distributing (A) 1.06Class X Euro Accumulating (Hedged) 1.04Class X GBP Accumulating 1.04Class X GBP Accumulating (Hedged) 1.04Premier Class US$ Accumulating 0.68Premier Class US$ Distributing (A) 0.70Premier Class Euro Accumulating (Hedged) 0.72Premier Class GBP Accumulating 0.69S Class US$ Accumulating 0.43S Class Euro Accumulating 0.48S Class Euro Accumulating (Hedged) 0.48S Class GBP Accumulating 0.44S Class GBP Accumulating (Hedged) 0.45S Class GBP Distributing (Q) 0.43
Legg Mason ClearBridge Global Growth Fund^Class A US$ Accumulating 1.80Premier Class US$ Accumulating 0.80
Legg Mason ClearBridge Infrastructure Value Fund^Class A US$ Accumulating 1.94Class A US$ Accumulating (Hedged) 1.94Class A US$ Distributing (M) (Hedged) Plus 1.94Class A US$ Distributing (Q) 1.94Class A AUD Distributing (M) (Hedged) Plus 1.94Class A CNH Distributing (M) (Hedged) Plus 1.94Class A Euro Accumulating 1.94Class A Euro Accumulating (Hedged) (PH) 1.94Class A Euro Distributing (M) Plus 1.94Class A SGD Distributing (M) (Hedged) Plus 1.94Class C US$ Accumulating 2.44Class C US$ Accumulating (Hedged) 2.44Class E US$ Accumulating 2.69Class F US$ Accumulating 1.34Class F US$ Accumulating (Hedged) 1.34Class X US$ Accumulating 1.05Class X US$ Distributing (A) 1.05Class X Euro Accumulating 1.05Class X Euro Accumulating (Hedged) (PH) 1.04Class X GBP Distributing (Q) 1.05Premier Class US$ Accumulating 0.85Premier Class BRL Accumulating (Hedged) 0.84Premier Class CAD Distributing (Q) (Hedged) (PH)Plus (e) 0.85Premier Class CAD Distributing (Q) Plus (e) 0.85Premier Class Euro Accumulating 0.85Premier Class Euro Accumulating (Hedged) (PH) 0.85Premier Class GBP Accumulating 0.85Premier Class GBP Distributing (A) (Hedged) (PH)Plus (e) 0.85Premier Class GBP Distributing (Q) 0.85LM Class US$ Accumulating (Hedged) 0.10
Legg Mason ClearBridge Emerging Markets Infrastructure Fund^Class A US$ Accumulating 2.10Class A US$ Distributing (Q) 2.10Class X Euro Accumulating (Hedged) 1.30Class X GBP Distributing (Q) 1.30Premier Class Euro Accumulating (Hedged) 1.10
^ Not authorised for sale to the public in Hong Kong.
375

Legg Mason Global Funds Plc Annual Report 28 February 2021
Supplemental Information – Total Expense Ratios (TER) (unaudited) – (continued)
Ratio of Total OperatingExpenses in CU(1) to averageFund daily net assets in CU(1)(%)For the year ended28 February 2021**
Legg Mason Royce US Small Cap Opportunity FundClass A US$ Accumulating 1.96Class A US$ Distributing (A) 1.95Class A AUD Accumulating (Hedged) 1.95Class A CNH Accumulating (Hedged) 1.95Class A Euro Accumulating 1.95Class A Euro Accumulating (Hedged) 1.94Class A Euro Distributing (A) (Hedged) 1.96Class A GBP Accumulating (Hedged) 1.96Class A GBP Distributing (A) 1.96Class A SEK Accumulating (Hedged) 1.94Class A SGD Accumulating 1.94Class A SGD Accumulating (Hedged) 1.95Class B US$ Accumulating 2.45Class B US$ Distributing (A) 2.46Class C US$ Accumulating 2.45Class C US$ Distributing (A) 2.46Class E US$ Accumulating 2.70Class E US$ Distributing (A) 2.70Class E Euro Accumulating 2.71Class E Euro Accumulating (Hedged) 2.70Class F US$ Accumulating 1.35Class F US$ Distributing (A) 1.35Class R US$ Accumulating 1.44Class R Euro Accumulating 1.45Class X US$ Accumulating 1.19Class X US$ Distributing (A) 1.21Class X Euro Accumulating 1.20Class X Euro Accumulating (Hedged) 1.19Class X GBP Accumulating 1.21Class X GBP Distributing (A) 1.20Premier Class US$ Accumulating 0.85Premier Class BRL Accumulating (Hedged) 0.85Premier Class Euro Accumulating 0.85Premier Class Euro Accumulating (Hedged) 0.85Premier Class GBP Accumulating 0.85Premier Class PLN Accumulating (Hedged) 0.85
Legg Mason Royce US Smaller Companies FundClass A US$ Accumulating 2.00Class A US$ Distributing (A) 2.02Class A Euro Accumulating 2.02Class A Euro Accumulating (Hedged) 2.03Class A Euro Distributing (A) 2.02Class A GBP Distributing (A) 2.02Class A SEK Accumulating (Hedged) 2.02Class C US$ Accumulating 2.50Class C US$ Distributing (A) 2.52Class E US$ Accumulating 2.77Class E US$ Distributing (A) 2.77Class E Euro Accumulating 2.77Class F US$ Accumulating 1.42Class F US$ Distributing (A) 1.42Class R US$ Accumulating 1.52Class X US$ Accumulating 1.28Premier Class US$ Accumulating 0.92Premier Class US$ Distributing (A) 0.92Premier Class GBP Distributing (A) 0.93LM Class Euro Accumulating 0.18Class A (G) US$ Accumulating 1.42Class L (G) US$ Accumulating 1.92
Ratio of Total OperatingExpenses in CU(1) to averageFund daily net assets in CU(1)(%)For the year ended28 February 2021**
Legg Mason QS MV European Equity Growth and Income FundClass A US$ Accumulating 1.84Class A US$ Accumulating (Hedged) 1.84Class A US$ Distributing (A) 1.84Class A US$ Distributing (M) (Hedged) Plus 1.84Class A AUD Distributing (M) (Hedged) Plus 1.84Class A CNH Distributing (M) (Hedged) Plus 1.84Class A Euro Accumulating 1.84Class A Euro Distributing (A) 1.85Class A Euro Distributing (M) Plus 1.84Class A SGD Distributing (M) (Hedged) Plus 1.84Class B US$ Accumulating 2.34Class B US$ Distributing (A) 2.34Class C US$ Accumulating 2.34Class C US$ Distributing (A) 2.34Class F US$ Accumulating 1.24Premier Class US$ Accumulating 0.83Premier Class Euro Accumulating 0.83Premier Class PLN Accumulating (Hedged) 0.83LM Class US$ Accumulating 0.25LM Class Euro Accumulating 0.25Class A (G) US$ Accumulating 1.60Class B (G) US$ Accumulating 2.07Class L (G) US$ Accumulating 2.10Class GA US$ Accumulating 1.67Class GA Euro Accumulating 1.67Class GA Euro Distributing (A) 1.67Class GE US$ Accumulating 2.41
Legg Mason QS MV Asia Pacific Ex Japan Equity Growth and Income FundClass A US$ Accumulating 1.85Class A US$ Distributing (A) 1.85Class A US$ Distributing (M) Plus 1.85Class A AUD Distributing (M) (Hedged) Plus 1.85Class A CNH Distributing (M) (Hedged) Plus 1.85Class A Euro Accumulating 1.85Class A HKD Distributing (M) Plus 1.85Class A SGD Distributing (M) (Hedged) Plus 1.85Class B US$ Distributing (A) 2.35Class C US$ Accumulating 2.35Class C US$ Distributing (A) 2.35Class E US$ Accumulating 2.69Class E US$ Distributing (A) 2.69Class F US$ Accumulating 1.34Premier Class PLN Accumulating (Hedged) 0.91Class GA US$ Accumulating 1.86Class GA Euro Accumulating 1.86Class GA Euro Distributing (A) 1.86Class GE US$ Accumulating 2.61Class GE Euro Accumulating 2.54
Legg Mason QS Emerging Markets Equity FundClass A US$ Accumulating 1.53Class A US$ Distributing (A) 1.53Class A Euro Accumulating 1.50Class A GBP Distributing (A) 1.53Class B US$ Distributing (A) 2.05Class C US$ Accumulating 2.05Class C US$ Distributing (A) 2.05Class E US$ Accumulating 2.30Premier Class Euro Accumulating 0.65
Legg Mason QS MV Global Equity Growth and Income FundClass A US$ Accumulating 1.85Class A US$ Distributing (M) Plus 1.85Class A AUD Distributing (M) (Hedged) Plus 1.85Class A HKD Distributing (M) Plus 1.85Class A SGD Distributing (M) (Hedged) Plus 1.85Premier Class US$ Accumulating 0.83Class GA US$ Accumulating 1.94Class GA Euro Accumulating 1.94Class GA Euro Distributing (A) 1.94Class GE US$ Accumulating 2.69Class GE Euro Accumulating 2.69
Legg Mason Martin Currie Asia Long-Term Unconstrained Fund^Class A US$ Accumulating 2.00Class M GBP Distributing (A) 1.20Class F US$ Accumulating 1.40Class M US$ Distributing (A) 1.20Class M Euro Distributing (A) 1.20Premier Class US$ Accumulating 0.79Premier Class GBP Accumulating 0.78
^ Not authorised for sale to the public in Hong Kong.
376

Legg Mason Global Funds Plc Annual Report 28 February 2021
Supplemental Information – Total Expense Ratios (TER) (unaudited) – (continued)
Ratio of Total OperatingExpenses in CU(1) to averageFund daily net assets in CU(1)(%)For the year ended28 February 2021**
Legg Mason Martin Currie European Absolute Alpha Fund^Class A (PF) US$ Accumulating 2.50Class A (PF) US$ Accumulating (Hedged) 2.50Class A (PF) US$ Distributing (A) (Hedged) 2.30Class A (PF) Euro Accumulating 2.49Class A (PF) Euro Distributing (A) 2.30Class A (PF) GBP Distributing (A) (Hedged) 2.30Class F (PF) US$ Accumulating 1.90Class F (PF) US$ Accumulating (Hedged) 1.90Class M (PF) US$ Distributing (A) (Hedged) 1.80Class M (PF) Euro Accumulating 1.99Class M (PF) Euro Distributing (A) 1.80Class M (PF) GBP Distributing (A) (Hedged) 1.80Class M (PF) NOK Distributing (A) (Hedged) 1.80Class M (PF) SEK Distributing (A) (Hedged) 1.80Premier (PF) Class US$ Accumulating (Hedged) 1.64Premier (PF) Class BRL Accumulating (Hedged) 1.64
Legg Mason Martin Currie Global Long-Term Unconstrained Fund^Class A US$ Accumulating 1.97Class A Euro Accumulating 1.98Class E US$ Accumulating 2.73Class X Euro Accumulating 1.23Class X GBP Accumulating 1.23Class X GBP Accumulating (Hedged) 1.23Premier Class US$ Accumulating 0.89Premier Class GBP Accumulating (Hedged) 0.89S Class US$ Accumulating 0.53S Class GBP Accumulating 0.54
Legg Mason Martin Currie Asia Pacific Ex Japan Real Income FundClass A US$ Distributing (M) Plus (e) 2.00Class A AUD Distributing (M) Plus 2.00Class A Euro Distributing (M) Plus (e) 2.00Class A SGD Distributing (M) Plus 2.00Class D AUD Distributing (M) (Hedged) Plus 1.60Class D CNH Distributing (M) (Hedged) Plus 1.60Class D HKD Distributing (M) Plus 1.60Class D SGD Distributing (M) (Hedged) Plus 1.60Class D US$ Distributing (M) Plus 1.60Class D US$ Accumulating 1.60Class X AUD Accumulating 1.25Class X US$ Accumulating 1.25S Class GBP Accumulating 0.59S Class GBP Distributing (M) Plus (e) 0.59LM Class AUD Accumulating 0.15
Ratio of Total OperatingExpenses in CU(1) to averageFund daily net assets in CU(1)(%)For the year ended28 February 2021**
Legg Mason Martin Currie Global Emerging Markets Fund^Class A US$ Accumulating 2.00Class E US$ Accumulating 2.75Class F US$ Accumulating 1.40Class X US$ Accumulating 1.25Premier Class US$ Accumulating 0.90S Class US$ Accumulating 0.70S Class Euro Accumulating 0.70
Legg Mason Martin Currie European Unconstrained Fund^Class A Euro Accumulating 1.99Class X Euro Accumulating 1.24Premier Class Euro Accumulating 0.88S Class US$ Accumulating 0.43S Class Euro Accumulating 0.49
The method of calculation of the Total Expense Ratios (TER) is described on the website of the Swiss Funds and Asset Management Association (SFAMA) (www.sfama.ch).
(1) CU = Currency units in the Fund’s accounting currency.
** Annualised for periods less than one year.
^ Not authorised for sale to the public in Hong Kong.
377

Legg Mason Global Funds Plc Annual Report 28 February 2021
Supplemental Information – Fund Performance Data (unaudited)
Fund Share Class Class CCYInception
DateFiscal YTD
01/03/20-28/02/21Calendar
01/01/20-31/12/203 Year Cumulative01/01/18-31/12/20
Legg Mason Western Asset US Government LiquidityFund Class A US$ Accumulating USD 08/05/2007 0.05% 0.20% 3.18%
Class A US$ Distributing (D) USD 27/02/2004 0.05% 0.20% 3.17%Class B US$ Accumulating USD 15/11/2007 0.03% 0.10% 2.16%Class C US$ Accumulating USD 15/11/2007 0.01% 0.05% 1.60%Class C US$ Distributing (D) USD 27/02/2004 0.02% 0.05% 1.58%Class X US$ Distributing (D) USD 10/10/2018 0.08% 0.26% –Class A (G) US$ Accumulating USD 20/04/2007 0.05% 0.20% 3.18%Class A (G) US$ Distributing (D) USD 20/04/2007 0.05% 0.20% 3.17%Class L (G) US$ Distributing (D) USD 20/04/2007 0.05% 0.21% 3.16%
Legg Mason Western Asset US Core Bond Fund Class A US$ Accumulating USD 09/05/2007 2.36% 8.08% 16.67%Class A US$ Distributing (D) USD 30/08/2002 2.38% 8.12% 16.67%Class B US$ Distributing (D) USD 24/02/2004 2.15% 7.90% 16.08%Class C US$ Accumulating USD 15/11/2007 1.85% 7.54% 14.93%Class C US$ Distributing (D) USD 24/02/2004 1.88% 7.59% 14.93%Class E US$ Accumulating USD 16/08/2019 1.75% 7.44% –Class F US$ Accumulating USD 09/08/2013 2.93% 8.68% 18.60%Class F US$ Distributing (D) USD 27/02/2017 2.96% 8.73% 18.63%Class X US$ Accumulating USD 13/05/2016 2.84% 8.60% 18.34%Class X US$ Distributing (D) USD 03/05/2016 2.86% 8.62% 18.81%Premier Class US$ Accumulating USD 19/04/2017 3.18% 8.96% 19.49%Premier Class Euro Accumulating(Hedged) EUR 01/03/2019 1.86% 7.27% –Class GA US$ Accumulating USD 27/08/2010 2.64% 8.39% 17.64%Class GE US$ Accumulating USD 27/08/2010 2.04% 7.74% 15.53%
Legg Mason Western Asset US Core Plus Bond Fund Class A US$ Accumulating USD 20/04/2007 2.10% 7.99% 17.29%Class A US$ Distributing (D) USD 20/04/2007 2.12% 8.02% 17.28%Class A US$ Distributing (M) Plus USD 19/02/2016 2.11% 8.00% 17.29%Class A AUD Distributing (M)(Hedged) Plus AUD 19/02/2016 1.08% 6.85% 14.65%Class A Euro Accumulating (Hedged) EUR 12/06/2018 0.76% 6.31% –Class B US$ Distributing (D) USD 20/04/2007 1.97% 7.85% 16.52%Class C US$ Accumulating USD 15/11/2007 1.59% 7.45% 15.54%Class C US$ Distributing (D) USD 20/04/2007 1.61% 7.47% 15.54%Class E US$ Accumulating USD 03/02/2012 1.49% 7.34% 15.20%Class F US$ Accumulating USD 05/04/2013 2.86% 8.81% 19.96%Class F US$ Distributing (D) USD 31/10/2018 2.88% 8.84% –Class X US$ Accumulating USD 20/03/2015 2.69% 8.62% 19.34%Class X US$ Distributing (D) USD 28/11/2017 2.71% 8.64% 19.33%Class X Euro Accumulating (Hedged) EUR 10/10/2019 1.34% 6.90% –Premier Class US$ Accumulating USD 14/09/2010 3.12% 9.08% 20.86%Premier Class US$ Distributing (M) USD 29/09/2011 3.04% 8.99% 20.78%Premier Class Euro Accumulating(Hedged) EUR 02/03/2016 1.74% 7.32% 12.21%LM Class Euro Accumulating EUR 05/04/2016 (5.39)% 0.43% 19.73%LM Class GBP Accumulating(Hedged) GBP 19/11/2010 2.43% 8.22% 16.38%Class A (G) US$ Accumulating USD 20/04/2007 2.26% 8.16% 17.82%Class A (G) US$ Distributing (D) USD 20/04/2007 2.26% 8.17% 17.78%Class B (G) US$ Distributing (D) USD 20/04/2007 1.78% 7.65% 16.13%Class L (G) US$ Accumulating USD 20/04/2007 1.75% 7.61% 16.07%Class L (G) US$ Distributing (D) USD 20/04/2007 1.76% 7.64% 16.05%
Legg Mason Western Asset Euro Core Plus BondFund Class A US$ Distributing (D) USD 24/02/2004 10.58% 14.52% 12.38%
Class A Euro Distributing (D) EUR 30/09/2003 1.16% 5.16% 10.46%Class C US$ Distributing (D) USD 24/02/2004 10.01% 13.95% 11.03%Class F Euro Distributing (Q) EUR 03/12/2010 1.91% 5.92% 12.69%Premier Class Euro Accumulating EUR 01/03/2019 2.01% 6.06% –LM Class Euro Accumulating EUR 02/05/2017 2.32% 6.38% 14.35%Class GA Euro Accumulating EUR 27/08/2010 1.50% 5.51% 11.57%Class GA Euro Distributing (A) EUR 27/08/2010 1.49% 5.51% 11.56%Class GE Euro Accumulating EUR 27/08/2010 0.89% 4.87% 9.57%
Legg Mason Western Asset Short Duration HighIncome Bond Fund Class A US$ Accumulating USD 09/05/2007 8.10% 4.79% 12.45%
Class A US$ Distributing (D) USD 24/02/2004 8.03% 4.72% 12.31%Class A US$ Distributing (M) USD 08/01/2008 8.10% 4.79% 12.44%Class A US$ Distributing (M) Plus USD 23/03/2017 8.09% 4.79% 12.44%Class A AUD Distributing (M)(Hedged) Plus AUD 23/03/2017 6.89% 3.53% 9.68%Class A Euro Accumulating (Hedged) EUR 08/05/2008 6.68% 3.18% 4.60%Class A HKD Distributing (M) Plus HKD 23/03/2017 7.56% 4.24% 11.52%Class B US$ Accumulating USD 15/11/2007 7.81% 4.52% 11.56%Class B US$ Distributing (D) USD 24/02/2004 7.77% 4.46% 11.49%Class C US$ Accumulating USD 15/11/2007 7.56% 4.27% 10.77%Class C US$ Distributing (D) USD 24/02/2004 7.50% 4.20% 10.64%Class F US$ Accumulating USD 31/01/2020 8.54% – –Class A (G) US$ Accumulating USD 20/04/2007 8.00% 4.70% 12.04%Class A (G) US$ Distributing (D) USD 20/04/2007 7.93% 4.65% 11.92%Class B (G) US$ Distributing (D) USD 20/04/2007 7.37% 4.10% 10.17%Class L (G) US$ Accumulating USD 20/04/2007 7.46% 4.18% 10.38%Class L (G) US$ Distributing (D) USD 20/04/2007 7.41% 4.12% 10.24%
378

Legg Mason Global Funds Plc Annual Report 28 February 2021
Supplemental Information – Fund Performance Data (unaudited) – (continued)
Fund Share Class Class CCYInception
DateFiscal YTD
01/03/20-28/02/21Calendar
01/01/20-31/12/203 Year Cumulative01/01/18-31/12/20
Legg Mason Western Asset Global Multi StrategyFund Class A US$ Accumulating USD 09/05/2007 4.15% 5.63% 12.77%
Class A US$ Distributing (D) USD 30/08/2002 4.14% 5.63% 12.74%Class A US$ Distributing (M) USD 19/02/2008 4.15% 5.63% 12.78%Class A US$ Distributing (M) Plus USD 19/01/2017 4.15% 5.64% 12.79%Class A AUD Distributing (M)(Hedged) Plus AUD 19/01/2017 2.78% 4.19% 9.83%Class A Euro Accumulating (Hedged) EUR 12/02/2008 2.70% 3.93% 4.63%Class A Euro Distributing (M)(Hedged) EUR 28/04/2008 2.69% 3.92% 4.64%Class A Euro Distributing (M)(Hedged) Plus (e) EUR 02/04/2013 2.68% 3.91% 4.62%Class A GBP Distributing (M)(Hedged) GBP 29/05/2008 3.02% 4.33% 7.52%Class A HKD Distributing (M) Plus HKD 07/09/2017 3.63% 5.08% 11.90%Class A SGD Distributing (M)(Hedged) Plus SGD 26/05/2009 3.58% 5.08% 10.44%Class B US$ Accumulating USD 15/11/2007 3.89% 5.35% 11.90%Class B US$ Distributing (D) USD 24/02/2004 3.87% 5.36% 11.90%Class C US$ Accumulating USD 15/11/2007 3.64% 5.10% 11.10%Class C US$ Distributing (D) USD 24/02/2004 3.63% 5.10% 11.05%Class A ZAR Distributing (M)(Hedged) Plus ZAR 26/04/2018 7.73% 9.28% –Class E US$ Accumulating USD 21/01/2010 3.53% 5.00% 10.76%Class E US$ Distributing (D) USD 21/01/2010 3.53% 5.00% 10.71%Class E Euro Accumulating (Hedged) EUR 19/05/2011 2.07% 3.28% 2.73%Class E Euro Distributing (M)(Hedged) EUR 02/08/2013 2.09% 3.30% 2.81%Class F US$ Accumulating USD 04/02/2010 4.78% 6.27% 14.83%Class F US$ Distributing (D) USD 21/01/2010 4.75% 6.25% 14.80%Class X US$ Distributing (D) USD 03/07/2013 4.71% 6.26% 14.61%Class X GBP Distributing (D)(Hedged) GBP 27/06/2016 3.57% 4.93% 5.59%Premier Class US$ Accumulating USD 10/09/2008 5.03% 6.53% 15.69%Premier Class US$ Distributing (M) USD 06/02/2009 5.04% 6.53% 15.69%Premier Class CHF Accumulating(Hedged) CHF 27/10/2015 3.28% 4.53% 6.18%Premier Class Euro Accumulating(Hedged) EUR 17/12/2009 3.58% 4.82% 7.38%Premier Class Euro Distributing (M)(Hedged) EUR 23/11/2012 3.56% 4.81% 7.35%Premier Class GBP Accumulating(Hedged) GBP 03/12/2010 3.90% 5.26% 10.36%Premier Class GBP Distributing (M)(Hedged) GBP 18/04/2008 3.88% 5.22% 10.28%Premier Class GBP Distributing (M)(Hedged) Plus (e) GBP 05/02/2013 3.85% 5.19% 10.26%Premier Class PLN Accumulating(Hedged) PLN 08/10/2015 4.15% 5.70% 12.67%LM Class AUD Distributing (M)(Hedged) AUD 03/12/2010 4.16% 5.61% 14.15%LM Class GBP Accumulating(Hedged) GBP 03/12/2010 4.32% 5.68% 11.73%
Legg Mason Western Asset US High Yield Fund Class A US$ Accumulating USD 09/05/2007 9.20% 6.57% 18.52%Class A US$ Distributing (D) USD 27/02/2004 9.18% 6.55% 18.43%Class A US$ Distributing (M) USD 20/12/2010 9.19% 6.57% 18.52%Class A US$ Distributing (M) Plus USD 21/11/2012 9.19% 6.56% 18.51%Class A Euro Distributing (M)(Hedged) EUR 19/12/2012 7.64% 4.80% 10.02%Class A SGD Distributing (M)(Hedged) Plus SGD 31/01/2013 8.50% 5.87% 15.91%Class B US$ Accumulating USD 15/11/2007 8.93% 6.30% 17.64%Class B US$ Distributing (D) USD 27/02/2004 8.92% 6.27% 17.53%Class C US$ Accumulating USD 15/11/2007 8.66% 6.03% 16.75%Class C US$ Distributing (D) USD 27/02/2004 8.64% 6.00% 16.64%Class E US$ Accumulating USD 21/01/2010 8.55% 5.93% 16.40%Class E US$ Distributing (D) USD 21/01/2010 8.52% 5.87% 16.26%Class E Euro Accumulating (Hedged) EUR 25/09/2019 7.02% 4.23% –Class F US$ Accumulating USD 04/01/2011 9.85% 7.21% 20.70%Class F US$ Distributing (D) USD 04/01/2011 9.55% 6.89% 20.25%Class X GBP Accumulating (Hedged) GBP 29/07/2019 8.58% 5.86% –Premier Class US$ Accumulating USD 08/11/2010 10.13% 7.48% 21.57%Premier Class GBP Accumulating(Hedged) GBP 09/08/2019 8.82% 6.06% –LM Class US$ Accumulating USD 19/11/2010 10.62% 7.96% 23.24%LM Class US$ Distributing (M) USD 27/05/2008 10.62% 7.95% 23.24%Class A (G) US$ Accumulating USD 20/04/2007 9.36% 6.72% 19.05%Class A (G) US$ Distributing (D) USD 20/04/2007 9.34% 6.69% 18.94%Class L (G) US$ Accumulating USD 20/04/2007 8.82% 6.18% 17.27%Class L (G) US$ Distributing (D) USD 20/04/2007 8.80% 6.16% 17.16%Class GF US$ Accumulating USD 19/11/2010 9.58% 6.94% 19.77%
Legg Mason Western Asset Emerging Markets TotalReturn Bond Fund Class A US$ Accumulating USD 04/05/2007 6.01% 7.51% 10.90%
Class A US$ Distributing (D) USD 24/02/2004 5.99% 7.51% 10.86%Class A US$ Distributing (M) USD 03/01/2008 6.01% 7.50% 10.91%Class A US$ Distributing (M) Plus USD 21/11/2012 6.01% 7.52% 10.97%Class A Euro Accumulating (Hedged) EUR 05/01/2010 4.67% 5.91% 2.99%
379

Legg Mason Global Funds Plc Annual Report 28 February 2021
Supplemental Information – Fund Performance Data (unaudited) – (continued)
Fund Share Class Class CCYInception
DateFiscal YTD
01/03/20-28/02/21Calendar
01/01/20-31/12/203 Year Cumulative01/01/18-31/12/20
Legg Mason Western Asset Emerging Markets TotalReturn Bond Fund – (continued)
Class A Euro Distributing (D)(Hedged) EUR 19/12/2012 4.66% 5.92% 3.04%Class A GBP Distributing (D)(Hedged) GBP 30/06/2010 5.13% 6.50% 6.07%Class A SGD Distributing (M)(Hedged) Plus SGD 18/01/2011 5.16% 6.64% 8.19%Class C US$ Accumulating USD 15/11/2007 5.49% 6.97% 9.25%Class C US$ Distributing (D) USD 24/02/2004 5.46% 6.97% 9.24%Class E US$ Distributing (D) USD 04/01/2011 5.11% 6.63% 8.30%Class E Euro Accumulating (Hedged) EUR 13/10/2017 3.81% 5.05% 0.67%Class E Euro Distributing (M)(Hedged) EUR 02/08/2013 3.82% 5.06% 0.60%Class F US$ Accumulating USD 20/04/2010 6.70% 8.23% 13.17%Class X GBP Distributing (D)(Hedged) GBP 19/12/2013 5.70% 7.09% 7.87%Premier Class Euro Accumulating(Hedged) EUR 20/10/2011 5.60% 6.90% 5.97%Premier Class GBP Distributing (D)(Hedged) GBP 19/02/2013 6.03% 7.44% 8.82%Class A (G) US$ Accumulating USD 20/04/2007 6.21% 7.73% 11.65%Class A (G) US$ Distributing (D) USD 20/04/2007 6.19% 7.72% 11.61%Class L (G) US$ Accumulating USD 20/04/2007 5.69% 7.19% 9.98%Class L (G) US$ Distributing (D) USD 20/04/2007 5.65% 7.17% 9.95%
Legg Mason Western Asset Emerging MarketsCorporate Bond Fund Class A US$ Accumulating USD 04/03/2013 4.48% 6.48% 13.28%
Class A US$ Distributing (M) USD 21/10/2011 5.29% 7.45% 16.20%Premier Class Euro Accumulating(Hedged) EUR 22/01/2020 5.00% – –LM Class US$ Distributing (M) USD 21/10/2011 6.97% 9.15% 21.60%
Legg Mason Western Asset Global High Yield Fund Class A US$ Accumulating USD 20/04/2007 7.48% 6.21% 15.68%Class A US$ Distributing (D) USD 20/04/2007 7.61% 6.34% 15.74%Class A US$ Distributing (M) USD 30/01/2008 7.47% 6.20% 15.66%Class A US$ Distributing (M) Plus USD 21/11/2012 7.46% 6.20% 15.64%Class A AUD Distributing (M)(Hedged) Plus AUD 28/06/2010 5.98% 4.67% 12.48%Class A Euro Accumulating EUR 23/05/2017 (1.65)% (2.46)% 13.63%Class A Euro Distributing (D)(Hedged) EUR 25/09/2012 6.02% 4.57% 7.23%Class A SGD Distributing (M)(Hedged) Plus SGD 18/01/2011 6.72% 5.54% 13.04%Class B US$ Accumulating USD 15/11/2007 7.21% 5.94% 14.81%Class B US$ Distributing (D) USD 20/04/2007 7.33% 6.08% 14.82%Class C US$ Accumulating USD 15/11/2007 6.95% 5.67% 13.95%Class C US$ Distributing (D) USD 20/04/2007 7.05% 5.80% 14.03%Class E US$ Accumulating USD 21/01/2010 6.82% 5.56% 13.58%Class E US$ Distributing (D) USD 21/01/2010 6.93% 5.68% 13.65%Class E Euro Distributing (M)(Hedged) EUR 02/08/2013 5.32% 3.85% 5.43%Class F US$ Accumulating USD 04/01/2011 8.21% 6.95% 18.10%Class F US$ Distributing (D) USD 04/01/2011 8.34% 7.09% 17.99%Class X US$ Distributing (D) USD 21/03/2018 8.30% 7.06% –Class X GBP Distributing (D)(Hedged) GBP 15/01/2013 7.03% 5.66% 12.58%Premier Class US$ Accumulating USD 10/08/2009 8.48% 7.21% 19.00%Premier Class Euro Accumulating(Hedged) EUR 12/10/2012 6.95% 5.48% 10.44%Premier Class GBP Distributing (D)(Hedged) GBP 12/08/2011 7.35% 5.97% 13.34%Class A (G) US$ Accumulating USD 20/04/2007 7.62% 6.36% 16.17%Class A (G) US$ Distributing (D) USD 20/04/2007 7.76% 6.50% 16.24%Class L (G) US$ Accumulating USD 20/04/2007 7.08% 5.82% 14.44%Class L (G) US$ Distributing (D) USD 20/04/2007 7.19% 5.94% 14.49%
Legg Mason Western Asset Global InflationManagement Fund Class A US$ Accumulating USD 20/04/2007 4.16% 4.95% 8.89%
Class A US$ Distributing (A) USD 20/04/2007 4.16% 4.95% 8.89%Class B US$ Accumulating USD 29/09/2016 3.89% 4.68% 8.07%Class C US$ Distributing (A) USD 20/04/2007 3.63% 4.42% 7.26%LM Class US$ Accumulating USD 04/01/2018 5.21% 6.04% –Class A (G) US$ Accumulating USD 20/04/2007 4.38% 5.17% 9.57%Class A (G) US$ Distributing (A) USD 20/04/2007 4.36% 5.16% 9.54%Class L (G) US$ Distributing (A) USD 20/04/2007 3.85% 4.63% 7.91%
Legg Mason Western Asset Asian OpportunitiesFund Class A US$ Accumulating USD 02/07/2008 3.81% 7.00% 13.86%
Class A US$ Distributing (D) USD 02/07/2008 3.79% 6.97% 13.81%Class A US$ Distributing (M) USD 07/01/2010 3.82% 7.00% 13.86%Class A US$ Distributing (M) Plus USD 21/11/2012 3.82% 7.00% 13.86%Class A AUD Distributing (M)(Hedged) Plus AUD 28/09/2011 3.18% 6.29% 11.60%Class A CHF Accumulating (Hedged) CHF 26/01/2015 2.20% 5.10% 4.56%Class A CNH Distributing (M)(Hedged) Plus CNH 20/06/2013 5.47% 8.51% 17.14%Class A Euro Accumulating EUR 02/07/2008 (5.03)% (1.78)% 11.83%Class A Euro Accumulating (Hedged) EUR 19/05/2011 2.48% 5.37% 5.69%Class A Euro Distributing (A) EUR 01/04/2011 (4.99)% (1.74)% 11.78%Class A HKD Distributing (M) Plus HKD 27/10/2015 3.27% 6.41% 12.83%
380

Legg Mason Global Funds Plc Annual Report 28 February 2021
Supplemental Information – Fund Performance Data (unaudited) – (continued)
Fund Share Class Class CCYInception
DateFiscal YTD
01/03/20-28/02/21Calendar
01/01/20-31/12/203 Year Cumulative01/01/18-31/12/20
Legg Mason Western Asset Asian OpportunitiesFund – (continued) Class A SGD Accumulating (Hedged) SGD 19/05/2009 3.46% 6.62% 11.54%
Class A SGD Distributing (M)(Hedged) Plus SGD 18/01/2011 3.42% 6.68% 11.53%Class A SGD Distributing (M) Plus SGD 04/08/2010 (0.91)% 4.84% 12.25%Class B US$ Accumulating USD 02/07/2008 3.56% 6.73% 12.99%Class B US$ Distributing (D) USD 02/07/2008 3.53% 6.71% 12.92%Class C US$ Accumulating USD 02/07/2008 3.30% 6.46% 12.16%Class C US$ Distributing (D) USD 02/07/2008 3.27% 6.44% 12.11%Class E US$ Accumulating USD 21/01/2010 3.21% 6.36% 11.82%Class E US$ Distributing (D) USD 21/01/2010 3.17% 6.35% 11.79%Class F US$ Accumulating USD 04/02/2010 4.23% 7.43% 15.23%Class F US$ Distributing (D) USD 21/01/2010 4.20% 7.42% 15.20%Class X US$ Distributing (M) USD 07/05/2015 4.33% 7.54% 15.60%Premier Class US$ Accumulating USD 02/07/2008 4.49% 7.70% 16.11%Premier Class Euro Accumulating EUR 03/09/2010 (4.40)% (1.14)% 14.00%Premier Class Euro Accumulating(Hedged) EUR 10/03/2011 3.15% 6.10% 7.81%Premier Class Euro Distributing (A) EUR 09/01/2013 (4.39)% (1.12)% 14.01%Premier Class Euro Distributing (M) EUR 08/09/2010 (4.40)% (1.11)% 14.04%Premier Class GBP Distributing (M) GBP 16/07/2010 (3.70)% 4.47% 14.59%LM Class US$ Accumulating USD 12/06/2008 5.12% 8.35% 18.21%
Legg Mason Western Asset Short Duration Blue ChipBond Fund Class A US$ Accumulating USD 25/06/2009 2.34% 3.95% 8.97%
Class A US$ Distributing (M) USD 02/06/2009 2.35% 3.96% 8.98%Class A Euro Accumulating (Hedged) EUR 30/01/2014 1.17% 2.51% 1.44%Class B US$ Accumulating USD 29/07/2015 2.09% 3.69% 8.16%Class C US$ Accumulating USD 25/06/2009 1.84% 3.43% 7.34%Class C US$ Distributing (M) USD 25/06/2009 1.83% 3.43% 7.34%Class E US$ Accumulating USD 21/01/2010 1.74% 3.32% 7.02%Class E US$ Distributing (D) USD 21/01/2010 1.74% 3.32% 7.00%Class F US$ Accumulating USD 04/02/2010 2.75% 4.37% 10.29%Premier Class US$ Accumulating USD 02/06/2009 3.01% 4.64% 11.26%Premier Class Euro Accumulating(Hedged) EUR 01/03/2019 1.83% 3.19% –Premier Class Euro Distributing (M)(Hedged) EUR 02/06/2009 1.79% 3.15% 3.49%Premier Class GBP Accumulating(Hedged) GBP 02/06/2009 2.28% 3.77% 6.56%Premier Class GBP Distributing (M)(Hedged) GBP 02/06/2009 2.28% 3.77% 6.61%S Class US$ Distributing (M) Plus (e) USD 15/12/2017 3.11% 4.74% 11.58%S Class Euro Distributing (M)(Hedged) Plus (e) EUR 12/12/2017 1.89% 3.24% 3.85%S Class GBP Distributing (M)(Hedged) Plus (e) GBP 12/12/2017 2.38% 3.88% 6.99%
Legg Mason Western Asset Global Core Plus BondFund^ Class A US$ Distributing (A) USD 05/03/2015 1.14% 5.82% 12.07%
Class X US$ Accumulating USD 17/02/2015 1.72% 6.53% 14.06%Premier Class US$ Accumulating USD 03/12/2010 2.03% 6.84% 15.09%Premier Class Euro Accumulating(Hedged) EUR 27/06/2014 0.74% 5.24% 6.96%Premier Class NZD Accumulating(Hedged) NZD 12/12/2017 1.44% 6.21% 13.26%LM Class US$ Accumulating USD 28/03/2019 2.44% 7.28% –LM Class CAD Accumulating(Hedged) CAD 17/10/2018 1.89% 6.75% –
Legg Mason Western Asset Global Credit Fund^ Class A US$ Accumulating USD 15/11/2011 3.97% 9.23% 19.44%Class A Euro Accumulating (Hedged) EUR 15/11/2011 2.58% 7.48% 10.96%LM Class US$ Accumulating USD 27/01/2011 5.23% 10.55% 23.83%
Legg Mason Western Asset Euro High Yield Fund Class A Euro Distributing (D) EUR 03/12/2010 3.26% 0.88% 5.39%Premier Class GBP Accumulating(Hedged) GBP 09/08/2019 4.41% 2.10% –LM Class Euro Accumulating EUR 03/12/2010 4.71% 2.31% 9.73%LM Class Euro Distributing (Q) EUR 03/12/2010 4.72% 2.31% 9.74%
Legg Mason Western Asset Macro OpportunitiesBond Fund^ Class A US$ Accumulating USD 29/11/2013 2.96% 6.21% 16.86%
Class A US$ Distributing (M) Plus (e) USD 01/08/2014 2.97% 6.21% 16.85%Class A US$ Distributing (S) USD 08/04/2014 2.96% 6.21% 16.85%Class A AUD Accumulating (Hedged) AUD 16/10/2017 1.50% 4.54% 13.26%Class A AUD Distributing (M)(Hedged) Plus (e) AUD 27/02/2015 1.48% 4.53% 13.25%Class A CHF Accumulating (Hedged) CHF 14/02/2014 1.22% 4.19% 7.15%Class A CNH Accumulating (Hedged) CNH 19/09/2014 4.50% 7.60% 20.23%Class A CNH Distributing (M)(Hedged) Plus (e) CNH 03/12/2014 4.51% 7.60% 20.19%Class A Euro Accumulating (Hedged) EUR 14/02/2014 1.51% 4.47% 8.21%Class A Euro Distributing (A) EUR 07/04/2015 (5.93)% (2.64)% 14.56%Class A Euro Distributing (M)(Hedged) Plus (e) EUR 15/03/2019 1.52% 4.48% –Class A Euro Distributing (S)(Hedged) EUR 07/04/2016 1.50% 4.46% 8.17%Class A GBP Accumulating GBP 23/12/2014 (5.25)% 2.84% 15.21%Class A GBP Accumulating (Hedged) GBP 14/02/2014 0.85% 3.89% 10.33%
^ Not authorised for sale to the public in Hong Kong.
381

Legg Mason Global Funds Plc Annual Report 28 February 2021
Supplemental Information – Fund Performance Data (unaudited) – (continued)
Fund Share Class Class CCYInception
DateFiscal YTD
01/03/20-28/02/21Calendar
01/01/20-31/12/203 Year Cumulative01/01/18-31/12/20
Legg Mason Western Asset Macro OpportunitiesBond Fund^ – (continued)
Class A GBP Distributing (M)(Hedged) Plus (e) GBP 18/08/2016 1.71% 4.79% 11.07%Class A HKD Distributing (M) Plus HKD 04/06/2019 2.44% 5.66% –Class A SEK Accumulating (Hedged) SEK 15/05/2015 1.24% 4.21% 7.92%Class A SGD Accumulating (Hedged) SGD 10/03/2014 2.39% 5.56% 14.03%Class A SGD Distributing (M)(Hedged) Plus (e) SGD 03/12/2014 2.35% 5.62% 14.16%Class B US$ Accumulating USD 15/09/2014 2.71% 5.94% 15.88%Class C US$ Accumulating USD 05/05/2014 2.45% 5.67% 15.12%Class C US$ Distributing (S) USD 15/07/2014 2.46% 5.67% 15.12%Class A JPY Distributing (M) Plus (e) JPY 17/12/2019 1.76% 0.93% –Class A NOK Accumulating (Hedged) NOK 21/09/2017 0.71% 3.83% 10.60%Class E US$ Accumulating USD 13/05/2014 2.35% 5.57% 14.76%Class E US$ Distributing (S) USD 28/07/2014 2.36% 5.57% 14.77%Class E Euro Accumulating (Hedged) EUR 25/08/2014 0.92% 3.85% 6.29%Class F US$ Accumulating USD 18/06/2014 3.38% 6.63% 18.27%Class F US$ Distributing (S) USD 16/10/2014 3.37% 6.63% 18.27%Class X US$ Accumulating USD 05/03/2014 3.48% 6.74% 18.62%Class X US$ Distributing (M) Plus (e) USD 26/10/2015 3.48% 6.74% 18.62%Class X US$ Distributing (S) USD 03/02/2015 3.48% 6.74% 18.62%Class X CHF Accumulating (Hedged) CHF 05/03/2014 1.71% 4.71% 8.72%Class X Euro Accumulating EUR 29/07/2014 (5.33)% (2.01)% 16.24%Class X Euro Accumulating (Hedged) EUR 14/02/2014 2.03% 5.00% 9.84%Class X Euro Distributing (A)(Hedged) EUR 11/08/2016 2.00% 5.00% 9.81%Class X Euro Distributing (M)(Hedged) EUR 17/05/2016 2.03% 5.00% 9.89%Class X GBP Accumulating GBP 23/12/2014 (4.77)% 3.39% 17.03%Class X GBP Accumulating (Hedged) GBP 14/02/2014 2.21% 5.30% 12.75%Class X GBP Distributing (M)(Hedged) Plus (e) GBP 20/10/2015 2.23% 5.31% 12.75%Class X SGD Accumulating (Hedged) SGD 10/03/2014 2.90% 6.10% 15.84%Premier Class US$ Accumulating USD 29/11/2013 3.63% 6.90% 19.16%Premier Class US$ Distributing (S) USD 10/02/2015 3.63% 6.90% 19.16%Premier Class AUD Accumulating(Hedged) AUD 03/07/2017 2.15% 5.22% 15.57%Premier Class AUD Distributing (S)(Hedged) AUD 24/07/2015 2.10% 5.17% 15.49%Premier Class BRL Accumulating(Hedged) BRL 22/12/2015 2.49% 5.92% 22.88%Premier Class CHF Accumulating(Hedged) CHF 04/12/2014 1.85% 4.85% 9.21%Premier Class CHF Distributing (S)(Hedged) CHF 27/11/2015 1.85% 4.87% 9.30%Premier Class Euro Accumulating EUR 03/07/2014 (5.21)% (1.88)% 16.84%Premier Class Euro Accumulating(Hedged) EUR 26/03/2014 2.18% 5.17% 10.35%Premier Class Euro Distributing (S)(Hedged) EUR 27/11/2015 2.18% 5.16% 10.32%Premier Class GBP Accumulating(Hedged) GBP 01/12/2014 2.36% 5.45% 13.27%Premier Class GBP Distributing (M)(Hedged) Plus (e) GBP 21/05/2014 2.38% 5.47% 13.27%Premier Class JPY Accumulating(Hedged) JPY 01/12/2016 2.57% 5.63% 11.46%Premier Class JPY Distributing (S)(Hedged) JPY 10/09/2019 2.56% 5.61% –Premier Class PLN Accumulating(Hedged) PLN 21/07/2017 2.70% 5.96% 15.64%Premier Class SEK Accumulating(Hedged) SEK 15/05/2015 1.84% 4.82% 9.93%S Class US$ Accumulating USD 29/11/2013 4.04% 7.32% 20.60%S Class Euro Accumulating (Hedged) EUR 29/11/2013 2.59% 5.59% 11.68%LM Class AUD Distributing (S)(Hedged) AUD 09/08/2016 3.21% 6.33% 19.13%LM Class Euro Accumulating EUR 05/04/2016 (4.26)% (0.89)% 20.55%
Legg Mason Western Asset Multi-Asset Credit Fund^ Class A US$ Accumulating USD 11/08/2016 2.72% 2.70% 9.67%Class A US$ Distributing (M) Plus (e) USD 16/12/2015 3.20% 3.16% 10.70%Class A Euro Accumulating (Hedged) EUR 23/01/2017 1.39% 1.15% 1.83%Class C US$ Accumulating USD 09/08/2016 2.60% 2.57% 9.21%Class F US$ Accumulating USD 09/08/2016 3.34% 3.33% 11.61%Class X CHF Distributing (M)(Hedged) CHF 22/02/2017 1.65% 1.42% 2.45%Premier Class Euro Accumulating(Hedged) EUR 01/03/2019 2.19% 1.96% –Premier Class GBP Distributing (M)(Hedged) Plus (e) GBP 06/12/2019 2.53% 2.40% –S Class Euro Accumulating (Hedged) EUR 18/11/2019 2.39% 2.16% –S Class GBP Accumulating (Hedged) GBP 20/11/2019 2.76% 2.63% –LM Class AUD Accumulating(Hedged) AUD 13/08/2018 3.07% 3.04% –LM Class Euro Accumulating(Hedged) EUR 25/07/2019 2.79% 2.57% –LM Class GBP Accumulating(Hedged) GBP 16/12/2015 3.18% 3.05% 9.33%
^ Not authorised for sale to the public in Hong Kong.
382

Legg Mason Global Funds Plc Annual Report 28 February 2021
Supplemental Information – Fund Performance Data (unaudited) – (continued)
Fund Share Class Class CCYInception
DateFiscal YTD
01/03/20-28/02/21Calendar
01/01/20-31/12/203 Year Cumulative01/01/18-31/12/20
Legg Mason Western Asset Structured OpportunitiesFund^ Class D Euro Accumulating (Hedged) EUR 23/05/2018 (7.26)% (6.29)% –
Class D Euro Distributing (M)(Hedged) EUR 13/06/2018 (7.21)% (6.26)% –Class D US$ Accumulating USD 24/01/2018 (6.25)% (5.06)% –Class D US$ Distributing (M) USD 14/02/2018 (6.25)% (5.05)% –Class D US$ Distributing (M) Plus USD 30/05/2018 (6.24)% (5.06)% –Class M CHF Accumulating (Hedged) CHF 30/05/2018 (6.97)% (6.01)% –Class M GBP Distributing (M)(Hedged) GBP 23/05/2018 (5.94)% (4.86)% –Class F US$ Accumulating USD 08/11/2017 (6.10)% (4.90)% 7.51%Class M US$ Accumulating USD 18/09/2019 (5.69)% (4.48)% –Class M US$ Distributing (M) USD 28/11/2018 (5.68)% (4.48)% –Class M Euro Accumulating (Hedged) EUR 31/01/2018 (6.66)% (5.69)% –Premier Class US$ Accumulating USD 04/05/2016 (5.54)% (4.34)% 9.45%Premier Class US$ Distributing (Q) USD 13/12/2017 (5.54)% (4.33)% 9.41%Premier Class Euro Accumulating(Hedged) EUR 04/05/2016 (6.51)% (5.55)% 2.16%Premier Class Euro Distributing (Q)(Hedged) EUR 27/12/2017 (6.53)% (5.56)% 2.10%Premier Class GBP Distributing (M)(Hedged) Plus (e) GBP 18/04/2018 (5.19)% (4.10)% –LM Class US$ Accumulating USD 13/01/2016 (4.98)% (3.76)% 11.45%
Legg Mason Western Asset US Mortgage-BackedSecurities Fund^ Class A US$ Distributing (M) Plus (e) USD 13/01/2016 (0.49)% 2.10% 7.37%
Premier Class US$ Accumulating USD 19/07/2019 0.38% 3.00% –Premier Class Euro Accumulating(Hedged) EUR 01/03/2019 (0.74)% 1.56% –LM Class US$ Accumulating USD 13/01/2016 0.68% 3.31% 11.21%
Legg Mason Western Asset UK Investment GradeCredit Fund^ Class A GBP Accumulating GBP 17/11/2016 1.62% 7.70% 15.13%
LM Class GBP Accumulating GBP 17/11/2016 2.48% 8.61% 17.25%
Legg Mason Western Asset US Corporate BondFund^ Class A US$ Accumulating USD 17/11/2016 4.70% 10.68% 22.04%
Premier Class US$ Accumulating USD 14/06/2019 5.39% 11.39% –Premier Class Euro Accumulating(Hedged) EUR 01/03/2019 3.92% 9.56% –LM Class GBP Accumulating(Hedged) GBP 17/11/2016 4.60% 10.45% 19.97%
Legg Mason Brandywine Global Fixed Income Fund Class A US$ Accumulating USD 09/05/2007 4.92% 5.04% 6.79%Class A US$ Distributing (M) USD 06/12/2010 4.91% 5.04% 6.79%Class A US$ Distributing (M) Plus USD 29/07/2019 4.92% 5.03% –Class A US$ Distributing (S) USD 01/10/2003 4.92% 5.05% 6.79%Class A AUD Distributing (M)(Hedged) Plus AUD 28/07/2014 3.16% 3.29% 3.19%Class A Euro Accumulating (Hedged) EUR 19/02/2013 3.20% 3.13% (1.46)%Class A Euro Accumulating(Hedged) (IH) EUR 18/01/2008 (0.09)% (0.18)% 0.50%Class A Euro Distributing (A)(Hedged) EUR 07/06/2013 3.20% 3.12% (1.39)%Class A Euro Distributing (S) EUR 14/10/2016 (4.03)% (3.57)% 4.86%Class A Euro Distributing (S)(Hedged) (IH) EUR 22/11/2010 (0.11)% (0.19)% 0.63%Class A GBP Accumulating GBP 22/06/2018 (3.43)% 1.74% –Class A GBP Distributing (M)(Hedged) GBP 14/11/2014 3.31% 3.29% 0.96%Class A GBP Distributing (S)(Hedged) (IH) GBP 07/02/2008 0.03% 0.02% 3.01%Class A SGD Accumulating SGD 08/06/2015 – 2.46% 3.83%Class B US$ Accumulating USD 15/11/2007 4.66% 4.77% 6.00%Class B US$ Distributing (S) USD 24/02/2004 4.63% 4.73% 5.94%Class C US$ Accumulating USD 15/11/2007 4.41% 4.51% 5.19%Class C US$ Distributing (S) USD 24/02/2004 4.40% 4.51% 5.20%Class E US$ Accumulating USD 08/09/2011 4.30% 4.41% 4.88%Class E Euro Accumulating (Hedged) EUR 22/06/2017 2.59% 2.51% (3.26)%Class E Euro Accumulating(Hedged) (IH) EUR 13/07/2012 (0.68)% (0.76)% (1.15)%Class F US$ Accumulating USD 14/09/2012 5.34% 5.46% 8.08%Class F US$ Distributing (S) USD 04/10/2012 5.35% 5.46% 8.08%Class R GBP Distributing (S)(Hedged) (IH) GBP 02/05/2013 0.57% 0.55% 4.39%Class X US$ Accumulating USD 04/06/2013 5.45% 5.57% 8.41%Class X US$ Distributing (S) USD 26/03/2013 5.46% 5.57% 8.40%Class X Euro Accumulating (Hedged) EUR 28/06/2013 3.74% 3.67% 0.05%Class X Euro Accumulating(Hedged) (IH) EUR 19/08/2015 0.40% 0.31% 1.87%Class X Euro Distributing (S)(Hedged) (IH) EUR 11/12/2017 0.34% 0.25% 1.96%Class X GBP Accumulating GBP 23/12/2014 (3.00)% 2.21% 6.96%Class X GBP Accumulating (Hedged) GBP 10/10/2014 3.83% 3.82% 2.56%Class X GBP Accumulating(Hedged) (IH) GBP 19/08/2015 0.42% 0.43% 4.45%Class X GBP Distributing (S) (Hedged) GBP 25/02/2013 3.77% 3.76% 2.49%Class X GBP Distributing (S)(Hedged) (IH) GBP 15/07/2014 0.48% 0.48% 4.53%
^ Not authorised for sale to the public in Hong Kong.
383

Legg Mason Global Funds Plc Annual Report 28 February 2021
Supplemental Information – Fund Performance Data (unaudited) – (continued)
Fund Share Class Class CCYInception
DateFiscal YTD
01/03/20-28/02/21Calendar
01/01/20-31/12/203 Year Cumulative01/01/18-31/12/20
Legg Mason Brandywine Global Fixed IncomeFund – (continued) Premier Class US$ Accumulating USD 24/03/2011 5.61% 5.73% 8.90%
Premier Class US$ Distributing (S) USD 24/02/2012 5.62% 5.73% 8.90%Premier Class Euro Accumulating EUR 25/01/2011 (3.50)% (3.05)% 6.64%Premier Class Euro Accumulating(Hedged) EUR 30/01/2013 3.86% 3.78% 0.49%Premier Class Euro Accumulating(Hedged) (IH) EUR 04/11/2011 0.46% 0.37% 2.59%Premier Class GBP Distributing (M)(Hedged) GBP 10/10/2014 3.91% 3.92% 2.85%Premier Class GBP Distributing (S)(Hedged) (IH) GBP 14/08/2012 0.45% 0.47% 4.89%LM Class US$ Accumulating USD 28/03/2019 6.24% 6.37% –LM Class US$ Accumulating(Hedged) (IH) USD 25/11/2015 2.46% 2.54% 12.35%
Legg Mason Brandywine Global Fixed IncomeAbsolute Return Fund^ Class A US$ Accumulating USD 03/04/2012 8.98% 6.60% 6.36%
Class A US$ Distributing (A) USD 17/09/2013 9.04% 6.67% 6.42%Class A Euro Accumulating (Hedged) EUR 18/06/2013 7.37% 4.82% (1.52)%Class A SEK Accumulating (Hedged) SEK 13/05/2015 7.59% 4.93% (1.01)%Class C US$ Accumulating USD 17/07/2013 8.40% 6.03% 4.74%Class E US$ Accumulating USD 17/07/2013 8.30% 5.93% 4.43%Class E US$ Distributing (A) USD 27/08/2013 8.30% 5.92% 4.42%Class F US$ Accumulating USD 29/07/2014 9.38% 7.00% 7.61%Class F US$ Distributing (A) USD 28/06/2017 9.39% 7.00% 7.66%Class X US$ Accumulating USD 16/03/2018 9.43% 7.06% –Class X GBP Accumulating (Hedged) GBP 16/06/2014 8.29% 5.81% 2.53%Class X GBP Distributing (M)(Hedged) GBP 21/01/2014 8.43% 5.95% 2.56%Premier Class US$ Accumulating USD 25/03/2013 9.60% 7.21% 8.26%Premier Class US$ Distributing (A) USD 13/05/2014 9.49% 7.11% 8.16%Premier Class Euro Accumulating(Hedged) EUR 02/07/2012 8.10% 5.52% 0.37%Premier Class Euro Distributing (A)(Hedged) EUR 23/05/2013 8.07% 5.50% 0.34%Premier Class GBP Distributing (M)(Hedged) GBP 25/03/2013 8.53% 6.04% 3.04%Premier Class SEK Accumulating(Hedged) SEK 25/04/2018 8.03% 5.51% –Premier Class SGD Accumulating(Hedged) SGD 07/02/2014 9.18% 6.67% 5.81%LM Class US$ Accumulating USD 12/06/2014 10.59% 8.18% 11.23%LM Class AUD Accumulating(Hedged) AUD 03/04/2012 9.48% 7.09% 8.51%
Legg Mason Brandywine Global High Yield Fund^ Class A US$ Accumulating USD 14/10/2016 10.60% 8.01% 13.82%Class A US$ Distributing (D) USD 18/07/2016 10.52% 7.93% 13.74%Premier Class US$ Accumulating USD 30/11/2012 11.31% 8.72% 16.19%Premier Class GBP Accumulating(Hedged) (IH) GBP 30/11/2012 8.18% 5.68% 11.27%S Class CAD Accumulating(Hedged) (IH) CAD 23/02/2016 8.91% 6.54% 14.51%
Legg Mason Brandywine Global Opportunistic FixedIncome Fund Class A US$ Accumulating USD 06/05/2011 10.92% 10.19% 12.13%
Class A US$ Distributing (M) USD 25/06/2010 10.91% 10.17% 12.11%Class A Euro Accumulating (Hedged) EUR 04/04/2018 8.99% 8.02% –Class C US$ Accumulating USD 21/03/2012 10.37% 9.63% 10.45%Class E US$ Accumulating USD 17/02/2012 10.26% 9.53% 10.13%Class F US$ Accumulating USD 22/07/2014 11.35% 10.62% 13.48%Class F US$ Distributing (M) USD 19/07/2013 11.36% 10.63% 13.48%Class X US$ Accumulating USD 03/05/2016 11.47% 10.74% 13.83%Class X GBP Distributing (M)(Hedged) GBP 10/10/2014 9.63% 8.79% 7.53%Premier Class US$ Accumulating USD 06/01/2012 11.64% 10.91% 14.34%Premier Class US$ Accumulating(Hedged) (IH) USD 16/06/2015 7.69% 6.97% 15.39%Premier Class GBP Distributing (M)(Hedged) (IH) GBP 24/06/2016 6.35% 5.55% 10.17%Premier Class NZD Accumulating(Hedged) (IH) NZD 19/09/2012 6.27% 5.57% 13.08%LM Class Euro Accumulating EUR 05/04/2016 2.77% 2.46% 14.43%LM Class NZD Accumulating(Hedged) (IH) NZD 13/01/2012 6.92% 6.22% 15.25%
Legg Mason Brandywine Global Income OptimiserFund^ Class A US$ Accumulating USD 30/08/2013 10.51% 14.22% 23.29%
Class A US$ Distributing (M) Plus (e) USD 03/06/2013 10.50% 14.23% 23.30%Class A Euro Accumulating (Hedged) EUR 22/08/2016 8.80% 12.17% 14.21%Class A Euro Distributing (A)(Hedged) EUR 19/05/2015 8.69% 12.08% 14.12%Class A Euro Distributing (M)(Hedged) Plus (e) EUR 21/10/2013 8.78% 12.14% 14.19%Class A GBP Distributing (M)(Hedged) Plus (e) GBP 24/10/2013 9.21% 12.80% 17.55%Class A SGD Distributing (M)(Hedged) Plus SGD 21/10/2015 9.78% 13.54% 20.25%Class E Euro Accumulating (Hedged) EUR 03/04/2017 8.26% 11.60% 12.62%
^ Not authorised for sale to the public in Hong Kong.
384

Legg Mason Global Funds Plc Annual Report 28 February 2021
Supplemental Information – Fund Performance Data (unaudited) – (continued)
Fund Share Class Class CCYInception
DateFiscal YTD
01/03/20-28/02/21Calendar
01/01/20-31/12/203 Year Cumulative01/01/18-31/12/20
Legg Mason Brandywine Global Income OptimiserFund^ – (continued) Class F US$ Distributing (D) USD 24/07/2019 10.93% 14.63% –
Class X US$ Distributing (D) USD 18/07/2017 11.02% 14.72% 25.30%Class X US$ Distributing (M) Plus (e) USD 21/01/2014 11.14% 14.89% 25.39%Class X Euro Distributing (M)(Hedged) Plus (e) EUR 23/12/2013 9.38% 12.78% 16.09%Class X GBP Distributing (M)(Hedged) Plus (e) GBP 20/12/2013 9.77% 13.37% 19.42%Premier Class US$ Distributing (M)Plus (e) USD 03/06/2013 11.28% 15.03% 25.91%Premier Class Euro Accumulating(Hedged) EUR 07/10/2014 9.65% 13.05% 16.81%Premier Class Euro Distributing (M)(Hedged) Plus (e) EUR 13/12/2013 9.52% 12.92% 16.51%Premier Class GBP Distributing (M)(Hedged) Plus (e) GBP 23/10/2014 9.96% 13.56% 20.02%Premier Class SEK Accumulating(Hedged) SEK 22/10/2014 9.62% 13.10% 16.78%S Class Euro Accumulating (Hedged) EUR 10/04/2018 9.76% 13.16% –S Class Euro Distributing (M)(Hedged) Plus (e) EUR 18/09/2018 9.70% 13.10% –S Class GBP Distributing (M)(Hedged) Plus (e) GBP 01/02/2018 10.17% 13.77% –
Legg Mason Brandywine Global Credit OpportunitiesFund^ Class A US$ Accumulating USD 30/06/2014 (4.07)% (2.90)% 2.08%
Class A Euro Accumulating (Hedged) EUR 30/01/2017 (5.24)% (4.35)% (5.12)%Premier Class US$ Accumulating USD 30/06/2014 (3.45)% (2.28)% 4.08%LM Class US$ Accumulating USD 30/06/2014 (2.33)% (1.13)% 7.74%S Class BRL Accumulating (Hedged) BRL 18/03/2019 (2.60)% (1.26)% –
Legg Mason Brandywine Global Defensive High YieldFund^ Class A US$ Distributing (M) Plus (e) USD 06/04/2017 10.74% 8.41% 15.79%
S Class Euro Distributing (A)(Hedged) (IH) EUR 06/04/2017 8.32% 6.02% 11.07%
Legg Mason Brandywine Global Enhanced AbsoluteReturn Fund^ Class A US$ Accumulating USD 16/08/2018 6.58% (3.06)% –
Class A SGD Accumulating (Hedged) SGD 16/09/2019 5.24% (4.20)% –Class X US$ Accumulating USD 16/08/2018 7.44% (2.25)% –Class X GBP Distributing (M)(Hedged) Plus (e) GBP 16/08/2018 5.46% (4.12)% –Premier Class US$ Accumulating USD 16/08/2018 7.61% (2.09)% –Premier Class Euro Accumulating(Hedged) EUR 16/08/2018 5.82% (3.84)% –LM Class AUD Accumulating(Hedged) AUD 16/08/2018 6.42% (3.23)% –
Legg Mason Brandywine Global Dynamic US EquityFund^ Class A US$ Accumulating USD 31/12/2015 34.86% 8.60% 21.39%
Premier Class US$ Accumulating USD 31/12/2015 36.15% 9.64% 24.91%S Class Euro Accumulating (Hedged) EUR 31/12/2015 34.47% 8.24% 16.87%
Legg Mason ClearBridge Value Fund Class A US$ Accumulating USD 24/04/2007 40.68% 11.26% 18.81%Class A US$ Distributing (A) USD 23/03/1998 40.68% 11.26% 18.80%Class A Euro Accumulating EUR 12/06/2007 28.74% 2.16% 16.52%Class A Euro Distributing (A)(Hedged) EUR 02/09/2014 38.46% 9.43% 10.06%Class A GBP Distributing (A) GBP 28/08/2014 29.35% 7.67% 17.18%Class A SGD Accumulating SGD 18/05/2007 34.62% 9.31% 17.42%Class A SGD Accumulating (Hedged) SGD 10/09/2012 38.85% 9.88% 15.09%Class C US$ Accumulating USD 15/11/2007 39.98% 10.70% 17.03%Class C US$ Distributing (A) USD 24/02/2004 39.98% 10.70% 17.03%Class F US$ Accumulating USD 21/01/2010 41.52% 11.93% 20.96%Class F US$ Distributing (A) USD 19/10/2016 41.52% 11.93% 20.96%Class X US$ Distributing (A) USD 07/10/2013 41.62% 12.02% 21.23%Premier Class US$ Accumulating USD 01/07/2008 42.12% 12.41% 22.51%Premier Class US$ Distributing (A) USD 25/04/2014 42.11% 12.41% 22.52%Premier Class Euro Accumulating EUR 30/06/2014 29.50% 2.77% 19.94%
Legg Mason ClearBridge US Appreciation Fund Class A US$ Accumulating USD 20/04/2007 23.61% 12.69% 38.87%Class A US$ Distributing (A) USD 20/04/2007 23.61% 12.68% 38.88%Class A Euro Accumulating EUR 03/06/2008 13.11% 3.48% 36.41%Class B US$ Accumulating USD 15/11/2007 23.00% 12.12% 36.87%Class B US$ Distributing (A) USD 20/04/2007 23.00% 12.12% 36.84%Class C US$ Accumulating USD 15/11/2007 23.00% 12.12% 36.80%Class C US$ Distributing (A) USD 20/04/2007 23.00% 12.12% 36.79%Class E US$ Accumulating USD 21/01/2010 22.69% 11.84% 35.77%Class E US$ Distributing (A) USD 21/01/2010 22.69% 11.84% 35.77%Class F US$ Accumulating USD 17/09/2012 24.35% 13.36% 41.38%Class F US$ Distributing (A) USD 04/02/2010 24.35% 13.36% 41.39%Class X US$ Distributing (A) USD 07/10/2013 24.37% 13.40% 41.50%Class X Euro Accumulating EUR 07/10/2013 13.85% 4.15% 39.05%Premier Class US$ Accumulating USD 06/05/2010 24.81% 13.79% 43.02%Premier Class US$ Distributing (A) USD 09/04/2009 24.81% 13.79% 42.99%Premier Class Euro Accumulating EUR 07/06/2010 13.99% 4.31% 40.26%LM Class US$ Accumulating USD 05/04/2016 25.59% 14.51% 45.70%LM Class Euro Accumulating EUR 05/04/2016 14.88% 5.11% 43.09%Class A (G) US$ Accumulating USD 20/04/2007 24.04% 13.08% 40.33%
^ Not authorised for sale to the public in Hong Kong.
385

Legg Mason Global Funds Plc Annual Report 28 February 2021
Supplemental Information – Fund Performance Data (unaudited) – (continued)
Fund Share Class Class CCYInception
DateFiscal YTD
01/03/20-28/02/21Calendar
01/01/20-31/12/203 Year Cumulative01/01/18-31/12/20
Legg Mason ClearBridge US AppreciationFund – (continued) Class B (G) US$ Accumulating USD 20/04/2007 23.34% 12.43% 38.11%
Class L (G) US$ Accumulating USD 20/04/2007 23.43% 12.51% 38.24%Class GA US$ Accumulating USD 10/06/2011 23.83% 12.89% 39.62%Class GA Euro Accumulating EUR 10/06/2011 13.30% 3.65% 37.09%Class GA Euro Distributing (A) EUR 10/06/2011 13.31% 3.67% 37.15%Class GE US$ Accumulating USD 10/06/2011 22.91% 12.04% 36.51%Class GE Euro Accumulating EUR 10/06/2011 12.48% 2.89% 34.08%
Legg Mason ClearBridge US Large Cap Growth Fund Class A US$ Accumulating USD 20/04/2007 34.87% 30.68% 68.17%Class A US$ Distributing (A) USD 20/04/2007 34.86% 30.67% 68.20%Class A Euro Accumulating EUR 27/08/2008 23.37% 19.97% 65.11%Class A Euro Accumulating (Hedged) EUR 05/02/2016 33.04% 28.76% 56.08%Class B US$ Accumulating USD 15/11/2007 34.20% 30.02% 65.67%Class B US$ Distributing (A) USD 20/04/2007 34.20% 30.02% 65.67%Class C US$ Accumulating USD 15/11/2007 34.20% 30.02% 65.66%Class C US$ Distributing (A) USD 20/04/2007 34.20% 30.02% 65.66%Class E US$ Accumulating USD 14/01/2016 33.86% 29.69% 64.42%Class E US$ Distributing (A) USD 13/10/2015 33.87% 29.69% 64.42%Class F US$ Accumulating USD 19/04/2016 35.68% 31.46% 71.23%Class F US$ Distributing (A) USD 04/11/2015 35.67% 31.47% 71.24%Class U US$ Accumulating USD 02/03/2018 36.32% 32.09% –Class U Euro Accumulating EUR 02/03/2018 24.78% 21.38% –Class X US$ Accumulating USD 29/09/2015 35.71% 31.50% 71.36%Class X Euro Accumulating EUR 17/01/2018 24.06% 20.71% –Class X Euro Accumulating (Hedged) EUR 27/07/2016 33.94% 29.64% 59.08%Class X GBP Accumulating GBP 04/12/2015 24.74% 27.24% 68.78%Premier Class US$ Accumulating USD 19/09/2014 36.18% 31.96% 73.17%Premier Class US$ Distributing (A) USD 21/02/2020 36.18% – –Premier Class BRL Accumulating(Hedged) BRL 15/02/2018 33.09% 29.31% –Premier Class Euro Accumulating EUR 15/09/2016 24.63% 21.20% 70.04%Premier Class Euro Accumulating(Hedged) EUR 02/03/2016 34.35% 30.04% 61.12%Premier Class Euro Distributing (A) EUR 21/02/2020 24.52% – –Premier Class GBP Accumulating GBP 02/12/2015 25.26% 27.50% 70.45%LM Class US$ Accumulating USD 05/04/2016 37.03% 32.79% 76.44%LM Class Euro Accumulating EUR 05/04/2016 25.34% 21.89% 73.25%Class A (G) US$ Accumulating USD 20/04/2007 35.34% 31.14% 69.95%Class L (G) US$ Accumulating USD 20/04/2007 34.67% 30.48% 67.41%Class GA US$ Accumulating USD 27/08/2010 35.11% 30.91% 69.09%Class GA Euro Accumulating EUR 27/08/2010 23.64% 20.22% 66.09%
Legg Mason ClearBridge US Aggressive Growth Fund Class A US$ Accumulating USD 20/04/2007 40.89% 16.92% 31.27%Class A US$ Distributing (A) USD 20/04/2007 40.89% 16.92% 31.32%Class A AUD Accumulating (Hedged) AUD 03/06/2013 36.39% 13.15% 24.46%Class A CHF Accumulating (Hedged) CHF 23/10/2014 38.95% 15.12% 21.21%Class A CNH Accumulating (Hedged) CNH 14/11/2014 42.34% 17.95% 34.68%Class A Euro Accumulating EUR 07/09/2010 28.79% 7.25% 28.76%Class A Euro Accumulating (Hedged) EUR 02/04/2013 38.99% 15.20% 21.82%Class A Euro Distributing (A)(Hedged) EUR 28/08/2014 39.04% 15.24% 21.49%Class A GBP Accumulating GBP 29/09/2014 29.63% 13.22% 29.58%Class A HKD Accumulating HKD 27/10/2015 40.08% 16.25% 29.81%Class A SEK Accumulating (Hedged) SEK 31/01/2013 36.66% 13.23% 19.05%Class A SGD Accumulating (Hedged) SGD 31/01/2013 39.17% 15.57% 27.29%Class B US$ Accumulating USD 15/11/2007 40.20% 16.33% 29.39%Class B US$ Distributing (A) USD 20/04/2007 40.19% 16.33% 29.32%Class C US$ Accumulating USD 15/11/2007 40.19% 16.33% 29.32%Class C US$ Distributing (A) USD 20/04/2007 40.19% 16.34% 29.32%Class E US$ Accumulating USD 04/01/2011 39.85% 16.04% 28.35%Class E US$ Distributing (A) USD 04/01/2011 39.84% 16.04% 28.35%Class E Euro Accumulating (Hedged) EUR 10/09/2013 37.98% 14.35% 19.05%Class F US$ Accumulating USD 04/01/2011 41.74% 17.63% 33.67%Class F US$ Distributing (A) USD 04/01/2011 41.74% 17.63% 33.66%Class X US$ Accumulating USD 17/05/2013 41.80% 17.69% 33.86%Class X US$ Distributing (A) USD 13/02/2013 41.81% 17.69% 33.87%Class X Euro Accumulating EUR 21/01/2014 29.75% 8.06% 31.48%Class X Euro Accumulating (Hedged) EUR 19/02/2014 39.93% 15.98% 24.13%Class X GBP Accumulating GBP 24/04/2013 30.45% 13.95% 32.03%Premier Class US$ Accumulating USD 17/03/2010 42.30% 18.10% 35.28%Premier Class Euro Accumulating EUR 14/12/2010 30.15% 8.40% 32.67%Premier Class Euro Distributing (A) EUR 07/07/2011 30.19% 8.43% 32.89%Premier Class GBP Accumulating GBP 27/02/2017 30.81% 14.25% 33.44%Premier Class GBP Accumulating(Hedged) GBP 22/04/2014 39.55% 15.81% 27.39%Premier Class GBP Distributing (A) GBP 13/12/2012 30.91% 14.35% 33.45%Premier Class PLN Accumulating(Hedged) PLN 08/10/2015 39.86% 16.21% 30.14%LM Class Euro Accumulating EUR 05/04/2016 31.00% 9.11% 35.46%Class A (G) US$ Accumulating USD 20/04/2007 41.38% 17.33% 32.66%Class B (G) US$ Accumulating USD 20/04/2007 40.69% 16.74% 30.73%Class L (G) US$ Accumulating USD 20/04/2007 40.68% 16.74% 30.68%Class GA Euro Accumulating EUR 27/08/2010 29.21% 7.60% 29.74%Class GA Euro Distributing (A) EUR 27/08/2010 29.21% 7.60% 29.81%Class GE US$ Accumulating USD 27/08/2010 40.17% 16.31% 29.24%Class GE Euro Accumulating EUR 27/08/2010 28.25% 6.79% 26.93%
386

Legg Mason Global Funds Plc Annual Report 28 February 2021
Supplemental Information – Fund Performance Data (unaudited) – (continued)
Fund Share Class Class CCYInception
DateFiscal YTD
01/03/20-28/02/21Calendar
01/01/20-31/12/203 Year Cumulative01/01/18-31/12/20
Legg Mason ClearBridge Tactical Dividend IncomeFund Class A US$ Accumulating USD 13/08/2013 11.35% 0.93% 19.43%
Class A US$ Distributing (A) USD 27/03/2015 11.35% 0.92% 19.49%Class A US$ Distributing (M) Plus USD 19/06/2014 11.36% 0.93% 19.42%Class A US$ Distributing (M) Plus (e) USD 03/06/2013 11.35% 0.93% 19.43%Class A US$ Distributing (Q) USD 08/05/2015 11.35% 0.93% 19.43%Class A AUD Distributing (M)(Hedged) Plus AUD 25/06/2014 7.64% (2.41)% 13.58%Class A CNH Distributing (M)(Hedged) Plus CNH 28/07/2014 12.54% 1.85% 22.08%Class A Euro Accumulating EUR 27/03/2015 1.89% (7.33)% 17.29%Class A Euro Accumulating (Hedged) EUR 21/11/2014 9.65% (0.77)% 10.87%Class A Euro Distributing (M)(Hedged) Plus (e) EUR 27/02/2014 9.60% (0.78)% 10.81%Class A HKD Distributing (M) Plus HKD 28/07/2014 10.76% 0.35% 18.14%Class A SGD Distributing (M)(Hedged) Plus SGD 28/07/2014 10.08% (0.31)% 15.84%Class C US$ Accumulating USD 27/09/2013 10.80% 0.42% 17.63%Class C US$ Distributing (A) USD 27/03/2015 10.80% 0.42% 17.64%Class C US$ Distributing (Q) USD 29/08/2014 10.80% 0.42% 17.64%Class F US$ Accumulating USD 27/03/2015 12.03% 1.54% 21.60%Class F Euro Accumulating EUR 27/03/2015 2.50% (6.76)% 19.42%Class F Euro Distributing (A) EUR 27/03/2015 2.50% (6.77)% 19.43%Class X US$ Distributing (M) Plus (e) USD 02/07/2015 12.05% 1.56% 21.67%Class X Euro Distributing (M)(Hedged) Plus (e) EUR 24/04/2017 10.28% (0.15)% 12.91%
Legg Mason ClearBridge US Equity SustainabilityLeaders Fund^ Class A US$ Distributing (A) USD 30/09/2015 37.47% 30.19% 69.91%
Class A Euro Accumulating (Hedged) EUR 30/09/2015 35.40% 28.12% 57.54%Class A SEK Accumulating SEK 21/01/2020 19.45% – –Class X US$ Distributing (A) USD 30/09/2015 38.29% 30.98% 72.98%Class X Euro Accumulating (Hedged) EUR 30/09/2015 36.21% 28.90% 60.43%Class X GBP Accumulating GBP 22/12/2015 27.30% 26.90% 70.99%Class X GBP Accumulating (Hedged) GBP 18/12/2019 35.50% 28.36% –Premier Class US$ Distributing (A) USD 30/09/2015 38.83% 31.49% 74.90%Premier Class Euro Accumulating(Hedged) EUR 30/09/2015 36.70% 29.34% 62.15%Premier Class GBP Accumulating GBP 30/09/2015 27.67% 27.29% 72.57%S Class US$ Accumulating USD 11/07/2018 39.24% 31.97% –S Class GBP Accumulating GBP 31/07/2019 28.12% 27.90% –S Class GBP Accumulating (Hedged) GBP 19/11/2019 36.53% 29.40% –S Class GBP Distributing (Q) GBP 31/07/2019 28.08% 27.79% –
Legg Mason ClearBridge Global Growth Fund^ Class A US$ Accumulating USD 29/06/2018 37.42% 31.73% –Premier Class US$ Accumulating USD 29/06/2018 38.78% 33.05% –
Legg Mason ClearBridge Infrastructure Value Fund^ Class A US$ Accumulating USD 10/11/2017 4.01% 3.78% 17.85%Class A US$ Accumulating (Hedged) USD 16/03/2017 (3.68)% (3.38)% 22.98%Class A US$ Distributing (M)(Hedged) Plus USD 19/06/2017 (3.68)% (3.45)% 22.90%Class A US$ Distributing (Q) USD 12/12/2016 4.30% 4.04% 18.27%Class A AUD Distributing (M)(Hedged) Plus AUD 24/10/2019 (6.12)% (5.97)% –Class A CNH Distributing (M)(Hedged) Plus CNH 24/10/2019 (2.36)% (2.21)% –Class A Euro Accumulating EUR 12/12/2016 (4.57)% (4.46)% 15.70%Class A Euro Accumulating (Hedged)(PH) EUR 03/12/2019 (0.40)% 0.86% –Class A Euro Distributing (M) Plus EUR 22/10/2018 (4.61)% (4.50)% –Class A SGD Distributing (M)(Hedged) Plus SGD 05/06/2017 (4.63)% (4.36)% 20.18%Class C US$ Accumulating USD 26/09/2017 3.85% 3.71% 16.60%Class C US$ Accumulating (Hedged) USD 26/09/2017 (4.17)% (3.92)% 21.22%Class E US$ Accumulating USD 12/12/2016 3.36% 3.16% 15.25%Class F US$ Accumulating USD 10/08/2017 4.84% 4.74% 20.02%Class F US$ Accumulating (Hedged) USD 26/09/2017 (3.07)% (2.79)% 25.26%Class X US$ Accumulating USD 20/03/2019 5.08% 4.98% –Class X US$ Distributing (A) USD 17/05/2017 5.20% 5.03% 21.06%Class X Euro Accumulating EUR 24/10/2018 (3.76)% (3.60)% –Class X GBP Distributing (Q) GBP 30/05/2019 (3.45)% 1.55% –Premier Class US$ Accumulating USD 04/02/2014 5.48% 5.31% 21.93%Premier Class BRL Accumulating(Hedged) BRL 15/02/2018 (3.49)% (3.01)% –Premier Class CAD Distributing (Q)(Hedged) (PH) Plus (e) CAD 16/06/2017 0.19% 1.74% 20.50%Premier Class CAD Distributing(Q) Plus (e) CAD 16/06/2017 (0.10)% 3.11% 23.25%Premier Class Euro Accumulating EUR 11/05/2012 (3.59)% (3.44)% 19.67%Premier Class Euro Accumulating(Hedged) (PH) EUR 17/04/2019 0.57% 1.91% –Premier Class GBP Accumulating GBP 30/06/2016 (3.08)% 1.83% 20.07%Premier Class GBP Distributing (A)(Hedged) (PH) Plus (e) GBP 25/06/2009 0.27% 1.59% 18.51%Premier Class GBP Distributing (Q) GBP 26/04/2018 (3.04)% 1.88% –LM Class US$ Accumulating (Hedged) USD 29/08/2019 (1.90)% (1.55)% –
^ Not authorised for sale to the public in Hong Kong.
387

Legg Mason Global Funds Plc Annual Report 28 February 2021
Supplemental Information – Fund Performance Data (unaudited) – (continued)
Fund Share Class Class CCYInception
DateFiscal YTD
01/03/20-28/02/21Calendar
01/01/20-31/12/203 Year Cumulative01/01/18-31/12/20
Legg Mason ClearBridge Emerging MarketsInfrastructure Fund^ Class A US$ Accumulating USD 31/03/2017 (3.85)% (10.35)% (14.75)%
Class A US$ Distributing (Q) USD 31/03/2017 (3.84)% (10.35)% (14.75)%Class X Euro Accumulating (Hedged) EUR 31/03/2017 (4.65)% (11.19)% (19.35)%Class X GBP Distributing (Q) GBP 31/03/2017 (10.79)% (12.46)% (13.78)%Premier Class Euro Accumulating(Hedged) EUR 31/03/2017 (4.45)% (11.01)% (18.86)%
Legg Mason Royce US Small Cap Opportunity Fund Class A US$ Accumulating USD 09/05/2007 71.18% 24.72% 24.74%Class A US$ Distributing (A) USD 08/11/2002 71.18% 24.72% 24.74%Class A AUD Accumulating (Hedged) AUD 03/06/2013 62.71% 18.61% 15.94%Class A CNH Accumulating (Hedged) CNH 05/12/2016 72.61% 25.58% 26.66%Class A Euro Accumulating EUR 12/07/2007 56.63% 14.48% 22.43%Class A Euro Accumulating (Hedged) EUR 20/02/2013 68.24% 22.49% 15.08%Class A Euro Distributing (A)(Hedged) EUR 16/11/2016 67.98% 22.31% 15.05%Class A GBP Accumulating (Hedged) GBP 20/12/2013 65.77% 20.80% 15.89%Class A GBP Distributing (A) GBP 26/04/2011 57.51% 20.77% 23.19%Class A SEK Accumulating (Hedged) SEK 31/01/2013 64.03% 19.42% 11.74%Class A SGD Accumulating SGD 16/02/2011 63.66% 22.40% 22.99%Class A SGD Accumulating (Hedged) SGD 10/09/2012 68.41% 22.78% 20.22%Class B US$ Accumulating USD 15/11/2007 70.34% 24.10% 22.88%Class B US$ Distributing (A) USD 24/02/2004 70.28% 24.06% 22.79%Class C US$ Accumulating USD 15/11/2007 70.33% 24.10% 22.88%Class C US$ Distributing (A) USD 24/02/2004 70.34% 24.10% 22.88%Class E US$ Accumulating USD 04/01/2011 69.92% 23.79% 21.96%Class E US$ Distributing (A) USD 04/01/2011 69.91% 23.79% 21.96%Class E Euro Accumulating EUR 26/11/2010 55.49% 13.68% 19.78%Class E Euro Accumulating (Hedged) EUR 23/09/2013 66.98% 21.57% 12.53%Class F US$ Accumulating USD 04/01/2011 72.21% 25.48% 27.01%Class F US$ Distributing (A) USD 04/01/2011 72.21% 25.48% 27.01%Class R Euro Accumulating EUR 09/12/2013 57.49% 15.16% 24.37%Class X US$ Accumulating USD 25/02/2013 72.47% 25.67% 27.58%Class X US$ Distributing (A) USD 28/11/2016 72.47% 25.67% 27.59%Class X Euro Accumulating EUR 11/10/2017 58.03% 15.53% 25.29%Class X Euro Accumulating (Hedged) EUR 21/10/2013 69.47% 23.38% 17.58%Class X GBP Accumulating GBP 18/01/2013 58.67% 21.70% 25.86%Class X GBP Distributing (A) GBP 23/04/2013 58.72% 21.76% 25.82%Premier Class US$ Accumulating USD 27/04/2010 73.07% 26.11% 28.93%Premier Class BRL Accumulating(Hedged) BRL 15/02/2018 64.29% 19.82% –Premier Class Euro Accumulating EUR 07/06/2010 58.34% 15.77% 26.55%Premier Class Euro Accumulating(Hedged) EUR 31/08/2015 70.00% 23.83% 19.08%Premier Class GBP Accumulating GBP 15/02/2013 59.25% 22.14% 27.22%Premier Class PLN Accumulating(Hedged) PLN 03/08/2018 68.48% 22.96% –
Legg Mason Royce US Smaller Companies Fund Class A US$ Accumulating USD 09/05/2007 44.08% 9.99% 21.09%Class A US$ Distributing (A) USD 01/03/2004 44.04% 9.97% 21.03%Class A Euro Accumulating EUR 01/10/2008 31.82% 1.02% 18.80%Class A Euro Accumulating (Hedged) EUR 05/06/2013 41.66% 8.06% 11.86%Class A Euro Distributing (A) EUR 09/02/2011 31.63% 0.80% 18.61%Class A GBP Distributing (A) GBP 05/11/2009 32.51% 6.48% 19.44%Class A SEK Accumulating (Hedged) SEK 31/01/2013 38.89% 5.95% 9.31%Class C US$ Accumulating USD 15/11/2007 43.36% 9.43% 19.26%Class C US$ Distributing (A) USD 01/03/2004 43.33% 9.42% 19.22%Class E US$ Accumulating USD 21/01/2010 42.97% 9.14% 18.33%Class E Euro Accumulating EUR 14/01/2019 30.78% 0.19% –Class F US$ Accumulating USD 21/01/2010 44.90% 10.64% 23.23%Class F US$ Distributing (A) USD 04/02/2010 44.90% 10.63% 23.24%Class R US$ Accumulating USD 09/05/2014 44.76% 10.53% 22.87%Class X US$ Accumulating USD 08/02/2013 45.11% 10.79% 23.77%Premier Class US$ Accumulating USD 24/11/2009 45.63% 11.19% 25.09%Premier Class US$ Distributing (A) USD 18/02/2011 45.62% 11.19% 25.10%Premier Class GBP Distributing (A) GBP 20/05/2011 34.04% 7.72% 23.43%LM Class Euro Accumulating EUR 05/04/2016 34.11% 2.77% 25.55%Class A (G) US$ Accumulating USD 20/04/2007 44.90% 10.63% 23.23%Class L (G) US$ Accumulating USD 20/04/2007 44.18% 10.08% 21.39%
Legg Mason QS MV European Equity Growth andIncome Fund Class A US$ Accumulating USD 09/05/2007 8.66% (0.19)% 0.55%
Class A US$ Accumulating (Hedged) USD 30/09/2014 0.47% (7.21)% 5.26%Class A US$ Distributing (A) USD 24/02/2004 8.63% (0.21)% 0.53%Class A US$ Distributing (M)(Hedged) Plus USD 30/09/2014 0.43% (7.25)% 5.25%Class A AUD Distributing (M)(Hedged) Plus AUD 30/09/2014 (1.97)% (9.45)% 1.41%Class A CNH Distributing (M)(Hedged) Plus CNH 28/10/2014 1.85% (6.09)% 8.33%Class A Euro Accumulating EUR 31/08/2010 (0.58)% (8.34)% (1.17)%Class A Euro Distributing (A) EUR 30/08/2002 (0.58)% (8.35)% (1.16)%Class A Euro Distributing (M) Plus EUR 30/09/2014 (0.57)% (8.34)% (1.15)%Class A SGD Distributing (M)(Hedged) Plus SGD 08/07/2015 (0.35)% (8.07)% 2.80%Class B US$ Accumulating USD 15/11/2007 8.12% (0.79)% (0.92)%Class B US$ Distributing (A) USD 24/02/2004 8.13% (0.67)% (0.89)%Class C US$ Accumulating USD 15/11/2007 8.13% (0.69)% (0.97)%
^ Not authorised for sale to the public in Hong Kong.
388

Legg Mason Global Funds Plc Annual Report 28 February 2021
Supplemental Information – Fund Performance Data (unaudited) – (continued)
Fund Share Class Class CCYInception
DateFiscal YTD
01/03/20-28/02/21Calendar
01/01/20-31/12/203 Year Cumulative01/01/18-31/12/20
Legg Mason QS MV European Equity Growth andIncome Fund – (continued) Class C US$ Distributing (A) USD 24/02/2004 8.13% (0.67)% (0.87)%
Class F US$ Accumulating USD 06/05/2016 9.33% 0.45% 2.44%Premier Class US$ Accumulating USD 08/01/2020 9.79% – –Premier Class Euro Accumulating EUR 09/05/2014 0.43% (7.41)% 1.85%Premier Class PLN Accumulating(Hedged) PLN 09/03/2017 0.19% (7.37)% 5.70%LM Class US$ Accumulating USD 05/04/2016 10.40% 1.45% 5.45%LM Class Euro Accumulating EUR 05/04/2016 1.01% (6.84)% 3.81%Class A (G) US$ Accumulating USD 20/04/2007 8.93% 0.09% 1.52%Class B (G) US$ Accumulating USD 20/04/2007 8.45% (0.36)% 0.04%Class L (G) US$ Accumulating USD 20/04/2007 8.17% (0.61)% (0.23)%Class GA US$ Accumulating USD 27/08/2010 8.85% 0.02% 1.28%Class GA Euro Accumulating EUR 27/08/2010 (0.41)% (8.16)% (0.53)%Class GA Euro Distributing (A) EUR 27/08/2010 (0.41)% (8.15)% (0.53)%Class GE US$ Accumulating USD 27/08/2010 8.05% (0.73)% (0.99)%
Legg Mason QS MV Asia Pacific Ex Japan EquityGrowth and Income Fund Class A US$ Accumulating USD 09/05/2007 14.15% (1.24)% (0.73)%
Class A US$ Distributing (A) USD 25/02/2004 14.15% (1.25)% (0.80)%Class A US$ Distributing (M) Plus USD 30/09/2014 14.14% (1.24)% (0.79)%Class A AUD Distributing (M)(Hedged) Plus AUD 21/07/2016 11.83% (3.25)% (4.67)%Class A CNH Distributing (M)(Hedged) Plus CNH 16/04/2018 15.70% (0.11)% –Class A Euro Accumulating EUR 31/10/2007 4.49% (9.29)% (2.57)%Class A HKD Distributing (M) Plus HKD 30/09/2014 13.56% (1.76)% (1.68)%Class A SGD Distributing (M)(Hedged) Plus SGD 24/06/2016 13.23% (2.01)% (3.46)%Class B US$ Distributing (A) USD 25/02/2004 13.58% (1.74)% (2.26)%Class C US$ Accumulating USD 15/11/2007 13.59% (1.74)% (2.27)%Class C US$ Distributing (A) USD 25/02/2004 13.59% (1.74)% (2.28)%Class E US$ Accumulating USD 21/01/2010 13.21% (2.05)% (3.14)%Class E US$ Distributing (A) USD 05/07/2017 13.20% (2.05)% (3.16)%Class F US$ Accumulating USD 04/01/2011 14.74% (0.71)% 0.87%Premier Class PLN Accumulating(Hedged) PLN 08/10/2015 13.77% (1.46)% (1.27)%Class GA US$ Accumulating USD 27/08/2010 14.14% (1.23)% (0.70)%Class GA Euro Accumulating EUR 27/08/2010 4.46% (9.31)% (2.46)%Class GA Euro Distributing (A) EUR 27/08/2010 4.44% (9.31)% (2.48)%Class GE US$ Accumulating USD 27/08/2010 13.29% (1.97)% (2.91)%Class GE Euro Accumulating EUR 27/08/2010 5.59% (8.70)% (3.26)%
Legg Mason QS Emerging Markets Equity Fund Class A US$ Accumulating USD 28/04/2008 21.72% 5.24% (1.56)%Class A US$ Distributing (A) USD 02/07/2008 21.72% 5.23% (1.67)%Class A GBP Distributing (A) GBP 30/04/2008 12.01% 1.93% (2.83)%Class B US$ Distributing (A) USD 02/07/2008 21.09% 4.69% (3.07)%Class C US$ Accumulating USD 02/07/2008 21.08% 4.68% (3.06)%Class C US$ Distributing (A) USD 02/07/2008 21.10% 4.69% (3.06)%Class E US$ Accumulating USD 21/01/2010 20.79% 4.44% (3.78)%Premier Class Euro Accumulating EUR 02/07/2008 12.35% (2.51)% (0.70)%
Legg Mason QS MV Global Equity Growth andIncome Fund Class A US$ Accumulating USD 06/09/2012 6.46% (8.45)% 3.03%
Class A US$ Distributing (M) Plus USD 26/10/2015 6.46% (8.45)% 3.02%Class A AUD Distributing (M)(Hedged) Plus AUD 26/10/2015 3.61% (10.97)% (1.55)%Class A HKD Distributing (M) Plus HKD 26/10/2015 5.93% (8.96)% 2.10%Class A SGD Distributing (M)(Hedged) Plus SGD 24/06/2016 5.20% (9.48)% (0.10)%Premier Class US$ Accumulating USD 03/02/2020 7.56% – –Class GA US$ Accumulating USD 10/06/2011 6.37% (8.49)% 2.77%Class GA Euro Accumulating EUR 10/06/2011 (2.67)% (15.98)% 0.89%Class GA Euro Distributing (A) EUR 10/06/2011 (2.66)% (15.97)% 0.94%Class GE US$ Accumulating USD 10/06/2011 5.58% (9.18)% 0.48%Class GE Euro Accumulating EUR 10/06/2011 (3.42)% (16.61)% (1.33)%
Legg Mason Martin Currie Asia Long-TermUnconstrained Fund^ Class A US$ Accumulating USD 30/03/2016 30.36% 17.10% 14.41%
Class M GBP Distributing (A) GBP 11/03/2016 21.18% 13.66% 15.29%Class F US$ Accumulating USD 30/03/2016 31.18% 17.85% 16.61%Class M US$ Distributing (A) USD 11/03/2016 31.27% 17.95% 16.97%Class M Euro Distributing (A) EUR 11/03/2016 20.34% 9.00% 15.43%Premier Class US$ Accumulating USD 06/06/2018 31.83% 18.41% –Premier Class GBP Accumulating GBP 09/05/2018 22.06% 14.51% –
Legg Mason Martin Currie European Absolute AlphaFund^ Class A (PF) US$ Accumulating USD 23/03/2016 1.61% (0.10)% (10.32)%
Class A (PF) US$ Accumulating(Hedged) USD 23/03/2016 (6.53)% (6.74)% (5.40)%Class A (PF) US$ Distributing (A)(Hedged) USD 11/03/2016 (6.36)% (6.63)% (5.33)%Class A (PF) Euro Accumulating EUR 14/03/2016 (7.59)% (8.26)% (12.12)%Class A (PF) Euro Distributing (A) EUR 11/03/2016 (7.45)% (8.09)% (11.56)%Class A (PF) GBP Distributing (A)(Hedged) GBP 11/03/2016 (7.11)% (7.73)% (9.33)%Class F (PF) US$ Accumulating USD 23/03/2016 2.20% 0.54% (8.98)%Class F (PF) US$ Accumulating(Hedged) USD 23/03/2016 (6.11)% (6.19)% (4.20)%
^ Not authorised for sale to the public in Hong Kong.
389

Legg Mason Global Funds Plc Annual Report 28 February 2021
Supplemental Information – Fund Performance Data (unaudited) – (continued)
Fund Share Class Class CCYInception
DateFiscal YTD
01/03/20-28/02/21Calendar
01/01/20-31/12/203 Year Cumulative01/01/18-31/12/20
Legg Mason Martin Currie European Absolute AlphaFund^ – (continued)
Class M (PF) US$ Distributing (A)(Hedged) USD 11/03/2016 (5.98)% (6.02)% (3.82)%Class M (PF) Euro Accumulating EUR 14/03/2016 (7.11)% (7.79)% (10.79)%Class M (PF) Euro Distributing (A) EUR 11/03/2016 (6.94)% (7.63)% (10.19)%Class M (PF) GBP Distributing (A)(Hedged) GBP 11/03/2016 (6.78)% (7.38)% (8.07)%Class M (PF) NOK Distributing (A)(Hedged) NOK 11/03/2016 (7.43)% (7.90)% (8.09)%Class M (PF) SEK Distributing (A)(Hedged) SEK 11/03/2016 (6.92)% (7.60)% (10.22)%Premier (PF) Class US$ Accumulating(Hedged) USD 15/03/2017 (5.80)% (6.11)% (3.61)%Premier (PF) Class BRL Accumulating(Hedged) BRL 15/03/2018 (5.78)% (5.22)% –
Legg Mason Martin Currie Global Long-TermUnconstrained Fund^ Class A US$ Accumulating USD 28/06/2016 32.54% 24.98% 54.92%
Class A Euro Accumulating EUR 28/06/2016 21.03% 15.21% 52.48%Class E US$ Accumulating USD 14/08/2019 31.71% 23.73% –Class X Euro Accumulating EUR 28/06/2016 21.74% 15.80% 55.58%Class X GBP Accumulating GBP 28/06/2016 23.33% 21.50% 56.26%Class X GBP Accumulating (Hedged) GBP 28/06/2016 30.99% 23.40% 49.06%Premier Class US$ Accumulating USD 28/06/2016 33.99% 26.36% 60.09%Premier Class GBP Accumulating(Hedged) GBP 16/04/2019 31.48% 23.87% –S Class GBP Accumulating GBP 28/06/2016 24.33% 22.49% 59.89%
Legg Mason Martin Currie Asia Pacific Ex Japan RealIncome Fund Class A US$ Distributing (M) Plus (e) USD 28/06/2016 (0.01)% (5.77)% 5.68%
Class A AUD Distributing (M) Plus AUD 28/06/2016 (15.34)% (14.22)% 6.96%Class A Euro Distributing (M) Plus (e) EUR 28/06/2016 (8.51)% (13.48)% 3.80%Class A SGD Distributing (M) Plus SGD 12/09/2018 (4.44)% (7.53)% –Class X AUD Accumulating AUD 31/05/2017 (14.62)% (13.49)% 9.49%Class X US$ Accumulating USD 28/06/2016 0.73% (5.05)% 8.08%S Class GBP Accumulating GBP 28/06/2016 (6.69)% (7.41)% 8.94%S Class GBP Distributing (M) Plus (e) GBP 28/06/2016 (6.69)% (7.41)% 8.95%LM Class AUD Accumulating AUD 10/11/2017 (13.77)% (12.61)% 11.43%
Legg Mason Martin Currie Global Emerging MarketsFund^ Class A US$ Accumulating USD 24/11/2017 42.24% 24.64% 28.58%
Class E US$ Accumulating USD 10/09/2018 41.39% 23.93% –Class F US$ Accumulating USD 13/11/2018 43.10% 25.42% –Class X US$ Accumulating USD 13/12/2017 43.30% 25.58% 31.50%Premier Class US$ Accumulating USD 13/12/2017 43.80% 26.03% 32.89%S Class US$ Accumulating USD 29/10/2018 44.10% 26.27% –
Legg Mason Martin Currie European UnconstrainedFund^ Class A Euro Accumulating EUR 09/11/2018 23.73% 15.36% –
Class X Euro Accumulating EUR 09/11/2018 24.67% 16.23% –Premier Class Euro Accumulating EUR 09/11/2018 25.09% 16.64% –S Class Euro Accumulating EUR 07/05/2019 25.60% 17.10% –
Fund Performance Data do not take account of the commissions and costs incurred on the issue and redemption of shares.
Past performance is no indication of current or future performance.
^ Not authorised for sale to the public in Hong Kong.
390

Legg Mason Global Funds Plc Annual Report 28 February 2021
Statement of Major Portfolio Changes (unaudited)
For the year ended 28 February 2021
In accordance with the UCITS Regulations, a statement of significant changes in the composition of each Fund’s Portfolio of Investments during the reporting year is provided to ensure thatshareholders can identify changes in the investments held by each of the Funds. These are defined as the aggregate purchases and sales of an investment (including maturities but excluding reverserepurchase agreements, overnight discount notes and time deposits, which are employed chiefly as a mean of seeking to ensure efficient portfolio management) exceeding 1.00% of the total value ofpurchases and sales for the year. At a minimum the largest twenty purchases and sales are listed. If a Fund entered into less than twenty purchases or sales during the reporting year, then alltransactions are presented.
Legg Mason Western Asset US Government Liquidity Fund
MAJOR PURCHASESCOST
(in 000’s) $United States Treasury Bill, zero coupon, due 14/07/2020 159,774United States Treasury Bill, zero coupon, due 09/06/2020 137,305United States Treasury Bill, zero coupon, due 21/07/2020 122,902Federal Home Loan Discount Notes, zero coupon, due 09/03/2020 96,742United States Treasury Bill, zero coupon, due 18/02/2021 92,621United States Treasury Bill, zero coupon, due 06/10/2020 86,695United States Treasury Bill, zero coupon, due 17/12/2020 75,730United States Treasury Bill, zero coupon, due 12/05/2020 73,465United States Treasury Bill, zero coupon, due 17/09/2020 72,740United States Treasury Bill, zero coupon, due 21/01/2021 70,942United States Treasury Bill, zero coupon, due 05/03/2020 65,742United States Treasury Bill, zero coupon, due 16/07/2020 64,931United States Treasury Bill, zero coupon, due 03/09/2020 59,913United States Treasury Bill, zero coupon, due 04/02/2021 59,560United States Treasury Bill, zero coupon, due 27/08/2020 57,655United States Treasury Bill, zero coupon, due 07/07/2020 57,361United States Treasury Bill, zero coupon, due 25/02/2021 56,232United States Treasury Bill, zero coupon, due 12/11/2020 55,236Fannie Mae Disocunt Note, zero coupon, due 29/07/2020 54,556United States Treasury Bill, zero coupon, due 22/09/2020 50,271Federal Home Loan Banks FRN, zero coupon, due 23/02/2021 50,000United States Treasury Bill, zero coupon, due 04/06/2020 50,000United States Treasury Bill, zero coupon, due 07/05/2020 50,000Freddie Mac Discount Notes, zero coupon, due 20/08/2020 49,986United States Treasury Bill, zero coupon, due 29/04/2021 49,984Federal Home Loan Discount Notes, zero coupon, due 04/09/2020 49,981United States Treasury Bill, zero coupon, due 15/12/2020 49,425United States Treasury Bill, zero coupon, due 28/05/2020 48,731United States Treasury Bill, zero coupon, due 19/05/2020 48,593Federal Farm Card Discount, zero coupon, due 16/11/2020 48,493United States Treasury Bill, zero coupon, due 18/08/2020 47,387Freddie Mac Discount Notes, zero coupon, due 12/08/2020 45,312Federal Farm Card Discount, zero coupon, due 03/08/2020 44,995United States Treasury Bill, zero coupon, due 24/09/2020 44,995United States Treasury Bill, zero coupon, due 10/09/2020 41,892
MAJOR SALESPROCEEDS(in 000’s) $
United States Treasury Bill, zero coupon, due 14/07/2020 159,782United States Treasury Bill, zero coupon, due 09/06/2020 137,315United States Treasury Bill, zero coupon, due 21/07/2020 122,917Federal Home Loan Discount Notes, zero coupon, due 09/03/2020 96,750United States Treasury Bill, zero coupon, due 18/02/2021 92,654United States Treasury Bill, zero coupon, due 06/10/2020 86,699United States Treasury Bill, zero coupon, due 17/12/2020 75,744United States Treasury Bill, zero coupon, due 12/05/2020 73,469United States Treasury Bill, zero coupon, due 17/09/2020 72,749United States Treasury Bill, zero coupon, due 21/01/2021 70,969United States Treasury Bill, zero coupon, due 05/03/2020 65,746United States Treasury Bill- When Issued, zero coupon, due 04/06/2020 65,000United States Treasury Bill, zero coupon, due 16/07/2020 64,935United States Treasury Bill, zero coupon, due 03/09/2020 59,935United States Treasury Bill, zero coupon, due 04/02/2021 59,575United States Treasury Bill, zero coupon, due 27/08/2020 57,665United States Treasury Bill, zero coupon, due 07/07/2020 57,368United States Treasury Bill, zero coupon, due 25/02/2021 56,263United States Treasury Bill, zero coupon, due 12/11/2020 55,237Fannie Mae Disocunt Note, zero coupon, due 29/07/2020 54,575United States Treasury Bill, zero coupon, due 22/09/2020 50,286Federal Home Loan Banks FRN, zero coupon, due 23/02/2021 50,000United States Treasury Bill, zero coupon, due 23/04/2020 50,000Federal Home Loan Discount Notes, zero coupon, due 04/09/2020 50,000Federal National Mortgage Association, 1.680%, due 30/04/2020 50,000Freddie Mac Discount Notes, zero coupon, due 20/08/2020 50,000United States Treasury Bill, zero coupon, due 14/04/2020 50,000United States Treasury Bill, zero coupon, due 07/05/2020 50,000Federal Home Loan Mortgage Corp, 1.580%, due 13/04/2020 50,000United States Treasury Bill, zero coupon, due 15/12/2020 49,445United States Treasury Bill, zero coupon, due 28/05/2020 48,734Federal Farm Card Discount, zero coupon, due 16/11/2020 48,675Federal Farm Card Discount, zero coupon, due 19/05/2020 48,596United States Treasury Bill, zero coupon, due 18/08/2020 47,389Freddie Mac Discount Notes, zero coupon, due 12/08/2020 45,360Federal Farm Card Discount, zero coupon, due 03/08/2020 45,000United States Treasury Bill, zero coupon, due 24/09/2020 45,000Federal Home Loan Bank Discount Notes, zero coupon, due 02/03/2020 42,606
Legg Mason Western Asset US Core Bond Fund
MAJOR PURCHASESCOST
(in 000’s) $Western Asset Liquidity Funds Plc – Western Asset US Dollar Liquidity Fund –Class WA (Distributing) 206,205Fannie Mae or Freddie Mac, 30 year, TBA, 4.500% 25,599Fannie Mae or Freddie Mac, 30 year, TBA, zero coupon 25,477Fannie Mae or Freddie Mac, 30 year, TBA, zero coupon 24,321Fannie Mae or Freddie Mac, 30 year, TBA, 4.500% 19,812Fannie Mae or Freddie Mac, 30 year, TBA, zero coupon 16,671Fannie Mae or Freddie Mac, 30 year, TBA, 4.500% 15,838Fannie Mae or Freddie Mac, 30 year, TBA, zero coupon 13,328Fannie Mae or Freddie Mac, 30 year, TBA, zero coupon 11,200Fannie Mae or Freddie Mac, 30 year, TBA, 2.000% 9,970Fannie Mae or Freddie Mac, 30 year, TBA, zero coupon 9,875Fannie Mae or Freddie Mac, 30 year, TBA, zero coupon 9,824Fannie Mae or Freddie Mac, 30 year, TBA, zero coupon 9,790United States Treasury Note/Bond, 1.250%, due 15/05/2050 9,137Fannie Mae or Freddie Mac, 30 year, TBA, 4.000% 8,965Fannie Mae or Freddie Mac, 30 year, TBA, zero coupon 8,657United States Treasury Note/Bond, 1.375%, due 15/08/2050 8,465United States Treasury Note/Bond, 2.000%, due 15/02/2050 8,410Fannie Mae or Freddie Mac, 30 year, TBA, zero coupon 7,955Fannie Mae or Freddie Mac, 30 year, TBA, zero coupon 7,929
MAJOR SALESPROCEEDS(in 000’s) $
Western Asset Liquidity Funds Plc – Western Asset US Dollar Liquidity Fund –Class WA (Distributing) 221,824Fannie Mae or Freddie Mac, 30 year, TBA, 4.500% 26,361Fannie Mae or Freddie Mac, 30 year, TBA, zero coupon 25,478Fannie Mae or Freddie Mac, 30 year, TBA, zero coupon 24,344Fannie Mae or Freddie Mac, 30 year, TBA, 4.500% 22,019Fannie Mae or Freddie Mac, 30 year, TBA, 4.500% 19,848Fannie Mae or Freddie Mac, 30 year, TBA, zero coupon 16,742Fannie Mae or Freddie Mac, 30 year, TBA, zero coupon 13,287Fannie Mae or Freddie Mac, 30 year, TBA, zero coupon 11,154Fannie Mae or Freddie Mac, 30 year, TBA, zero coupon 9,875Fannie Mae or Freddie Mac, 30 year, TBA, zero coupon 9,845Fannie Mae or Freddie Mac, 30 year, TBA, zero coupon 9,836Fannie Mae or Freddie Mac, 30 year, TBA, 4.000% 8,965Fannie Mae or Freddie Mac, 30 year, TBA, zero coupon 8,672Fannie Mae or Freddie Mac, 30 year, TBA, zero coupon 7,952Fannie Mae or Freddie Mac, 30 year, TBA, zero coupon 7,946Fannie Mae or Freddie Mac, 30 year, TBA, 3.500% 7,892Fannie Mae or Freddie Mac, 30 year, TBA, 2.500% 7,283Fannie Mae or Freddie Mac, 30 year, TBA, zero coupon 7,160United States Treasury Note/Bond, 1.500%, due 30/09/2024 7,031
Legg Mason Western Asset US Core Plus Bond Fund
MAJOR PURCHASESCOST
(in 000’s) $United States Treasury Note/Bond, 0.250%, due 31/05/2025 157,070Fannie Mae or Freddie Mac, 30 year, TBA, 4.500% 100,003Fannie Mae or Freddie Mac, 30 year, TBA, 2.500% 85,143Fannie Mae or Freddie Mac, 30 year, TBA, 4.500% 74,415Fannie Mae or Freddie Mac, 30 year, TBA, zero coupon 69,737Fannie Mae or Freddie Mac, 15 year, TBA, zero coupon 67,739Fannie Mae or Freddie Mac, 30 year, TBA, 4.500% 66,793
MAJOR SALESPROCEEDS(in 000’s) $
Fannie Mae or Freddie Mac, 30 year, TBA, 4.500% 104,247Fannie Mae or Freddie Mac, 30 year, TBA, 4.500% 94,169Fannie Mae or Freddie Mac, 30 year, TBA, 2.500% 85,355Fannie Mae or Freddie Mac, 30 year, TBA, 4.500% 74,913Fannie Mae or Freddie Mac, 30 year, TBA, zero coupon 69,739Fannie Mae or Freddie Mac, 15 year, TBA, zero coupon 67,724Fannie Mae or Freddie Mac, 30 year, TBA, zero coupon 61,171
391

Legg Mason Global Funds Plc Annual Report 28 February 2021
Statement of Major Portfolio Changes (unaudited) – (continued)
Legg Mason Western Asset US Core Plus Bond Fund – (continued)
MAJOR PURCHASESCOST
(in 000’s) $Fannie Mae or Freddie Mac, 30 year, TBA, zero coupon 61,171Fannie Mae or Freddie Mac, 30 year, TBA, zero coupon 60,121Fannie Mae or Freddie Mac, 30 year, TBA, 2.500% 56,020Fannie Mae or Freddie Mac, 30 year, TBA, zero coupon 54,790Fannie Mae or Freddie Mac, 30 year, TBA, zero coupon 53,431Fannie Mae or Freddie Mac, 15 year, TBA, zero coupon 47,183Fannie Mae or Freddie Mac, 30 year, TBA, zero coupon 46,629United States Treasury Note/Bond, 1.375%, due 15/08/2050 45,242Fannie Mae or Freddie Mac, 30 year, TBA, zero coupon 42,686Fannie Mae or Freddie Mac, 30 year, TBA, zero coupon 41,259Fannie Mae or Freddie Mac, 30 year, TBA, zero coupon 40,058Fannie Mae or Freddie Mac, 15 year, TBA, zero coupon 39,961Fannie Mae or Freddie Mac, 15 year, TBA, zero coupon 39,680Fannie Mae or Freddie Mac, 15 year, TBA, zero coupon 39,625United States Treasury Note/Bond, 1.250%, due 15/05/2050 39,163Fannie Mae or Freddie Mac, 15 year, TBA, zero coupon 38,586
MAJOR SALESPROCEEDS(in 000’s) $
Fannie Mae or Freddie Mac, 30 year, TBA, zero coupon 60,087Fannie Mae or Freddie Mac, 30 year, TBA, 2.500% 56,020Fannie Mae or Freddie Mac, 30 year, TBA, zero coupon 54,790United States Treasury Note/Bond, 3.000%, due 15/02/2048 54,311Fannie Mae or Freddie Mac, 30 year, TBA, zero coupon 53,189United States Treasury Note/Bond, 0.250%, due 31/05/2025 48,767Fannie Mae or Freddie Mac, 30 year, TBA, zero coupon 47,240Fannie Mae or Freddie Mac, 30 year, TBA, zero coupon 46,648Fannie Mae or Freddie Mac, 30 year, TBA, zero coupon 41,311Fannie Mae or Freddie Mac, 30 year, TBA, zero coupon 40,307Fannie Mae or Freddie Mac, 30 year, TBA, zero coupon 40,030Fannie Mae or Freddie Mac, 15 year, TBA, 2.000% 39,966Fannie Mae or Freddie Mac, 15 year, TBA, zero coupon 39,749Fannie Mae or Freddie Mac, 15 year, TBA, zero coupon 38,653Fannie Mae or Freddie Mac, 30 year, TBA, zero coupon 35,709Fannie Mae or Freddie Mac, 30 year, TBA, zero coupon 35,586
Legg Mason Western Asset Euro Core Plus Bond Fund
MAJOR PURCHASESCOST
(in 000’s) €
Western Asset Liquidity Funds Plc – Western Asset US Dollar Liquidity Fund –Class WA (Distributing) 9,729Bundesrepublik Deutschland Bundesanleihe, 0.250%, due 15/02/2027 4,324Bundesrepublik Deutschland Bundesanleihe, 0.000%, due 15/08/2030 2,830Bundesrepublik Deutschland Bundesanleihe, 0.000%, due 15/02/2031 2,776Indonesia Government International Bond, 4.200%, due 15/10/2050 2,048United Kingdom Gilt, 2.500%, due 22/07/2065 1,801Republic of South Africa Government International Bond, 4.300%, due12/10/2028 1,682French Republic Government Bond OAT, 1.000%, due 25/05/2027 1,646French Republic Government Bond OAT, 3.250%, due 25/05/2045 1,533French Republic Government Bond OAT, 1.800%, due 25/07/2045 1,464Mexico Government International Bond, 4.600%, due 23/01/2046 1,411Australia Government Bond, 3.250%, due 21/06/2039 1,105Australia Government Bond, Series 162, 1.750%, due 21/06/2051 1,104Mexico Government International Bond, 2.875%, due 08/04/2039 916United States Treasury Inflation Indexed Bonds, 0.250%, due 15/02/2050 904Bundesrepublik Deutschland Bundesanleihe, 2.500%, due 15/08/2046 829Qatar Government International Bond, 4.817%, due 14/03/2049 825Abu Dhabi Government International Bond, 3.875%, due 16/04/2050 539Kuwait Government International Bond, 3.500%, due 20/03/2027 526Qatar Government International Bond, 4.625%, due 02/06/2046 518
MAJOR SALESPROCEEDS
(in 000’s) €
Western Asset Liquidity Funds Plc – Western Asset US Dollar Liquidity Fund –Class WA (Distributing) 8,829European Financial Stability Facility, 0.750%, due 03/05/2027 4,832Republic of Poland Government Bond, Series 0428, 2.750%, due 25/04/2028 4,071United States Treasury Inflation Indexed Bonds, 0.500%, due 15/04/2024 3,526French Republic Government Bond OAT, Series OATe, 1.850%, due25/07/2027 3,380Italy Buoni Poliennali Del Tesoro, 2.000%, due 01/12/2025 2,754Landwirtschaftliche Rentenbank, 0.050%, due 18/12/2029 2,475Italy Buoni Poliennali Del Tesoro, 144A, 3.250%, due 01/09/2046 2,155Sweden Government Bond, Series 1053, 3.500%, due 30/03/2039 1,672French Republic Government Bond OAT, 1.800%, due 25/07/2045 1,670Skandinaviska Enskilda Banken AB, 0.186%, due 26/05/2020 1,401Norway Government Bond, Series 481, 144A, 1.750%, due 06/09/2029 1,326General Electric Co, 0.375%, due 17/05/2022 1,181Bank of Nova Scotia/The, 0.221%, due 05/10/2022 1,136Australia Government Bond, 3.250%, due 21/06/2039 1,089Italy Buoni Poliennali Del Tesoro, Series CPI, 144A, 2.550%, due 15/09/2041 959United States Treasury Inflation Indexed Bonds, 0.250%, due 15/02/2050 909Nykredit Realkredit A/S, 0.145%, due 02/06/2022 906Banque Federative du Credit Mutuel SA, 0.046%, due 03/06/2020 900Spain Government Bond, 144A, 2.900%, due 31/10/2046 734BP Capital Markets Plc, 0.900%, due 03/07/2024 707
Legg Mason Western Asset Short Duration High Income Bond Fund
MAJOR PURCHASESCOST
(in 000’s) $Altice France SA/France, 144A, 7.375%, due 01/05/2026 426Delta Air Lines Inc, 2.900%, due 28/10/2024 291Century Communities Inc, 5.875%, due 15/07/2025 288Teva Pharmaceuticals Ltd, 7.125%, due 31/01/2025 261Teva Pharmaceutical Finance Netherlands III BV, 7.125%, due 31/01/2025 260Silversea Cruise Finance Ltd, 144A, 7.250%, due 01/02/2025 253Tenet Healthcare Corp, 6.750%, due 15/06/2023 248Tenet Healthcare Corp, 8.130&, due 01/04/2022 243Caesars Entertainment Inc, 144A, 6.250%, due 01/07/2025 216Western Midstream Operating LP, 4.350%, due 01/02/2025 215Credit Suisse Group AG, 144A, 7.500%, Perpetual 213UBS Group AG, 144A, 7.000%, Perpetual 210Telecom Italia SpA, 5.303%, due 30/05/2024 210Virgin Media Secured Finance Plc, 144A, 5.500%, due 15/08/2026 210EQM Midstream Partners LP, 4.000%, due 01/08/2024 207Intesa Sanpaola SpA, 5.017%, due 26/06/2024 203Wynn Macau Ltd, 144A, 5.500%, due 15/01/2026 201Highlands Holdings Bond Issuer Ltd / Highlands Holdings Bond Co-Issuer Inc,144A, 7.625%, due 15/10/2025 200First Quantum Minerals Ltd, 144A, 6.875%, due 15/10/2027 200Cheplapharm Arzneimittel GmbH, 144A, 5.500%, due 15/01/2028 200
MAJOR SALESPROCEEDS(in 000’s) $
CCO Holdings LLC / CCO Holdings Capital Corp, 5.375%, due 01/05/2025 329Reynolds Group Issuer Inc / Reynolds Group Issuer LLC / Reynolds Group IssuerLu, 5.331%, due 15/07/2021 310Tenet Healthcare Corp, 6.750%, due 15/06/2023 277Delta Air Lines Inc, 2.900%, due 28/10/2024 269Tenet Healthcare Corp, 8.130&, due 01/04/2022 264Teva Pharmaceuticals Ltd, 7.125%, due 31/01/2025 260Virgin Media Finance Plc, 5.750%, due 15/01/2025 257Freeport-McMoRan Inc, 4.550%, due 14/11/2024 244Barclays Plc, 8.000%, Perpetual 239Montage Resources Corp, 8.875%, due 15/07/2023 235IndyMac INDX Mortgage Loan Trust 2004-AR7, Series 2004 AR7, Class A2,2.487%, due 25/09/2034 231Barclays Bank Plc, 7.625%, due 21/11/2022 225L Brands Inc, 5.625%, due 15/10/2023 223Telecom Italia SpA, 5.303%, due 30/05/2024 219Teva Pharmaceutical Finance Netherlands III BV, 7.125%, due 31/01/2025 215Intesa Sanpaola SpA, 5.017%, due 26/06/2024 213Rockies Express Pipeline LLC, 5.625%, due 15/04/2020 211Altice France SA/France, 144A, 7.375%, due 01/05/2026 210Fannie Mae Pool ‘CA5227’, 3.000%, due 01/02/2050 209Sands China Ltd, 3.800%, due 08/01/2026 209Clear Channel International BV, 6.625%, due 01/08/2025 207
Legg Mason Western Asset Global Multi Strategy Fund
MAJOR PURCHASESCOST
(in 000’s) $United States Treasury Note/Bond, 0.875%, due 15/11/2030 29,971Italy Government International Bond, 1.350%, due 01/04/2030 11,751Australia Government Bond, Series 162, 1.750%, due 21/06/2051 6,556Legg Mason Qualified Investor Funds (II) Plc – Western Asset European LoanFund – LM Class Euro Accumulating 6,392United States Treasury Note/Bond, 2.875%, due 15/11/2046 4,785BNP Paribas SA, 7.375%, Perpetual VAR 3,693
MAJOR SALESPROCEEDS(in 000’s) $
United States Treasury Note/Bond, 2.250%, due 15/11/2024 32,523United States Treasury Note/Bond, 1.750%, due 31/03/2022 23,298United States Treasury Note/Bond, 2.875%, due 31/10/2023 18,774Italy Government International Bond, 1.350%, due 01/04/2030 12,009United States Treasury Note/Bond, 0.875%, due 15/11/2030 9,955Russian Federal Bond – OFZ, Series 6212, 7.050%, due 19/01/2028 9,026
392

Legg Mason Global Funds Plc Annual Report 28 February 2021
Statement of Major Portfolio Changes (unaudited) – (continued)
Legg Mason Western Asset Global Multi Strategy Fund – (continued)
MAJOR PURCHASESCOST
(in 000’s) $Republic of South Africa Government International Bond, 5.750%, due30/09/2049 3,604Russian Federal Bond – OFZ, Series 6225, 7.250%, due 10/05/2034 3,542AbbVie Inc, 3.200%, due 21/11/2029 3,249Abu Dhabi Government International Bond, 3.875%, due 16/04/2050 3,237Ford Motor Co, 8.500%, due 21/04/2023 3,160Qatar Government International Bond, 3.400%, due 16/04/2025 3,130Abu Dhabi Government International Bond, 2.500%, due 16/04/2050 3,006UBS Group AG, 7.000%, Perpetual VAR 2,696Bertelsmann SE & Co VAR, 3.000%, due 23/04/2075 2,399Turkey Government International Bond, 4.750%, due 26/01/2026 2,374Egypt Government International Bond, 3.875%, due 16/02/2026 2,350Egypt Government International Bond, 5.750%, due 29/05/2024 2,330Mercialys SA, 4.625%, due 07/07/2027 2,214Diversified Healthcare Trust, 9.750%, due 15/06/2025 2,210
MAJOR SALESCOST
(in 000’s) $Legg Mason Global Funds Plc – Western Asset US High Yield Fund – LMClass US$ Distributing (M) 8,580United States Treasury Note/Bond, 3.000%, due 15/11/2045 8,140United States Treasury Note/Bond, 2.250%, due 15/08/2046 8,009Colombia Government International Bond, 5.625%, due 26/02/2044 6,354Mexican Bonos, Series M 20, 7.500%, due 03/06/2027 6,051Fannie Mae Pool ‘CA5227’, 3.000%, due 01/02/2050 5,995United States Treasury Note/Bond, 2.875%, due 15/11/2046 5,321Lone Star Portfolio Trust 2015-LSP, Series 2015 LSP, Class F, 144A, 8.809%,due 15/09/2028 4,778Turk Telekomunikasyon AS, 144A, 4.875%, due 19/06/2024 4,578UniCredit SpA, 6.625%, Perpetual 4,534AbbVie Inc, 3.200%, due 21/11/2029 3,638CVS Health Corp, 4.100%, due 25/03/2025 3,541Citigroup Inc, 4.450%, due 29/09/2027 3,509Qatar Government International Bond, 3.400%, due 16/04/2025 3,421
Legg Mason Western Asset US High Yield Fund
MAJOR PURCHASESCOST
(in 000’s) $Western Asset Liquidity Funds Plc – Western Asset US Dollar Liquidity Fund –Class WA (Distributing) 161,786Bausch Health Cos Inc, 144A, 6.250%, due 15/02/2029 2,020CCO Holdings LLC / CCO Holdings Capital Corp, 144A, 4.500%, due01/05/2032 1,780Spirit Loyalty Cayman Ltd / Spirit IP Cayman Ltd, 144A, 8.000%, due20/09/2025 1,763Centene Corp, 4.625%, due 15/12/2029 1,644Occidental Petroleum Corp, 6.125%, due 01/01/2031 1,550Silversea Cruise Finance Ltd, 144A, 7.250%, due 01/02/2025 1,420Wynn Macau Ltd, 144A, 5.625%, due 26/08/2028 1,400International Game Technology Plc, 5.250%, due 15/01/2029 1,399VOC Escrow Ltd, 144A, 5.000%, due 15/02/2028 1,379TransDigm Inc, 144A, 8.000%, due 15/12/2025 1,366CHS/Community Health Systems Inc, 144A, 6.875%, due 15/04/2029 1,353Bausch Health Americas Inc, 144A, 9.250%, due 01/04/2026 1,297Cheplapharm Arzneimittel GmbH, 144A, 5.500%, due 15/01/2028 1,273Delta Airlines Inc, 7.375%, due 15/01/2026 1,266Berry Petroleum Co LLC, 144A, 7.000%, due 15/02/2026 1,247Endo Dac / Endo Finance LLC / Endo Finco Inc, 144A, 9.500%, due 31/07/2027 1,232Tenet Healthcare Corp, 144A, 4.625%, due 15/06/2028 1,223SRM Escrow Issuer LLC, 144A, 6.000%, due 01/11/2028 1,202Stericycle Inc, 3.875%, due 15/01/2029 1,200
MAJOR SALESPROCEEDS(in 000’s) $
Western Asset Liquidity Funds Plc – Western Asset US Dollar Liquidity Fund –Class WA (Distributing) 163,844Bausch Health Cos Inc, 144A, 9.000%, due 15/12/2025 1,952HCA Inc, 5.625%, due 01/09/2028 1,817Bausch Health Americas Inc, 144A, 9.250%, due 01/04/2026 1,802Freeport-McMoRan Inc, 5.450%, due 15/03/2043 1,620Allied Universal Holdco LLC, 5.895%, due 12/07/2026 1,557International Game Technology Plc, 5.250%, due 15/01/2029 1,483Delta Airlines Inc, 7.375%, due 15/01/2026 1,387DAE Funding LLC, 144A, 5.750%, due 15/11/2023 1,298Kraft Heinz Foods Co, 5.500%, due 01/06/2050 1,237Stericycle Inc, 3.875%, due 15/01/2029 1,236Simmons Foods Inc, 144A, 5.750%, due 01/11/2024 1,207CSC Holdings LLC, 144A, 6.500%, due 01/02/2029 1,192Lennar Corp, 4.750%, due 29/11/2027 1,182Credit Agricole SA, 144A, 8.125%, Perpetual 1,175YPF SA, 144A, 8.500%, due 23/03/2021 1,168Telecom Italia SpA/Milano, 144A, 5.303%, due 30/05/2024 1,158Fidelity & Guaranty Life Holdings Inc, 144A, 5.500%, due 01/05/2025 1,141Hanesbrands Inc, 144A, 4.875%, due 15/05/2026 1,131CCO Holdings LLC / CCO Holdings Capital Corp, 144A, 5.125%, due01/05/2023 1,074
Legg Mason Western Asset Emerging Markets Total Return Bond Fund
MAJOR PURCHASESCOST
(in 000’s) $Morocco Government International Bond, 4.000%, due 15/12/2050 600Colombia Telecomunicaciones S.A., 4.950%, due 17/07/2030 460Panama Government International Bond, 4.500%, due 01/04/2056 460Bahrain Government International Bond, 6.250%, 25/01/2051 400Egypt Government International Bond, 7.625%, due 29/05/2032 400Egypt Government International Bond, 8.875%, due 29/05/2050 400Petronas Capital Ltd, 4.800%, due 21/04/2060 400Republic of Paraguay Government International Bond, 4.950%, due28/04/2031 400State of Isreal Government International Bond, 2.750%, due 03/07/2030 400State of Isreal Government International Bond, 4.500%, due 03/04/2120 400Qatar Government International Bond, 3.750%, due 16/04/2030 399Belarus Government International Bond, 5.875%, due 24/02/2026 395Empresa De Transport, 4.700%, due 07/05/2050 395Fresnillo Plc, 4.250%, due 02/10/2050 392Banco Santander Mexico SA, 5.375%, due 17/04/2025 370Saudi Arabia Government International Bond, 2.250%, due 02/02/2033 367Legg Mason Global Funds Plc – Western Asset Emerging Markets CorporateBond Fund – LM Class US$ Distributing (M) 320Hutama Karya Persero PT, 3.750%, due 11/05/2030 302Simpar Europe SA, 5.200%, due 26/01/2031 300Turkey Government International Bond, 5.875%, due 26/06/2031 288
MAJOR SALESPROCEEDS(in 000’s) $
Petronas Capital Ltd, 4.800%, due 21/04/2060 493Colombia Telecomunicaciones S.A., 4.950%, due 17/07/2030 463Empresa De Transport, 4.700%, due 07/05/2050 450First Abu Dhabi Bank PJSC, 5.250%, Perpetual 450Qatar Government International Bond, 4.817%, due 14/03/2049 425State of Isreal Government International Bond, 4.500%, due 03/04/2120 415Qatar Government International Bond, 3.750%, due 16/04/2030 406Egypt Government International Bond, 8.875%, due 29/05/2050 404State of Isreal Government International Bond, 2.750%, due 03/07/2030 403Morocco Government International Bond, 4.000%, due 15/12/2050 402Bahrain Government International Bond, 6.250%, due 25/01/2051 401Republic of Paraguay Government International Bond, 4.950%, due28/04/2031 401Belarus Government International Bond, 5.875%, due 24/02/2026 382Banco Santander Mexico SA, 5.375%, due 17/04/2025 371Saudi Arabia Government International Bond, 2.250%, due 02/02/2033 367Transportadora de Gas Internacional SA ESP, 5.550%, due 01/11/2028 342GNL Quintero SA, 144A, 4.634%, due 31/07/2029 320Indonesia Government International Bond, 3.500%, due 11/01/2028 310Simpar Europe SA, 5.200%, due 26/01/2031 300MDGH – GMTN BV, 3.950%, due 21/05/2050 296Peru Government International Bond, 2.783%, due 23/01/2031 292Turkey Government International Bond, 5.875%, due 26/06/2031 289Trust Fibraund, 6.390%, due 15/01/2050 285
Legg Mason Western Asset Emerging Markets Corporate Bond Fund
MAJOR PURCHASESCOST
(in 000’s) $Banco Santander Mexico SA, 5.375%, due 17/04/2025 780Enfragen Energia Sur SA, 5.375%, due 30/12/2030 763Saudi Arabia Government International Bond, 2.250%, due 02/02/2023 624Republic of Paraguay Government International Bond, 4.950%, due28/04/2031 600Bahrain Government International Bond, 6.250%, due 25/01/2051 600
MAJOR SALESPROCEEDS(in 000’s) $
Banco Santander Mexico SA, 5.375%, due 17/04/2025 783Enfragen Energia Sur SA, 5.375%, due 30/12/2030 764Abu Dhabi National Energy Co PJSC, 4.875%, due 23/04/2030 632Saudi Arabia Government International Bond, 2.250%, due 02/02/2023 625Republic of Paraguay Government International Bond, 4.950%, due28/04/2031 601
393

Legg Mason Global Funds Plc Annual Report 28 February 2021
Statement of Major Portfolio Changes (unaudited) – (continued)
Legg Mason Western Asset Emerging Markets Corporate Bond Fund – (continued)
MAJOR PURCHASESCOST
(in 000’s) $Volcan Cia Minera SAA, 4.375%, due 11/02/2026 600Kimberly-Clark de Mexico SAB de CV, 2.431%, due 01/07/2031 600Ecopetrol SA, 6.875%, due 29/04/2030 595Trust Fibraund, 6.390%, due 15/01/2050 591Teva Pharmaceutical Finance Netherlands III BV, 7.125%, due 31/01/2025 566Abu Dhabi Government International Bond, 3.125%, due 16/04/2030 564Panama Government Internation Bond, 4.500%, due 01/04/2056 510Axiata Spv5 Labuan Ltd, 3.064%, due 19/08/2050 500Qatar Government International Bond, 3.750%, due 16/04/2030 499Fresnillo Plc, 4.250%, due 02/10/2050 490Turkey Government International Bond, 5.875%, due 26/06/2031 487Liquid Telecommunications Financing Plc, 5.500%, due 04/09/2026 470Colombia Telecomunicaciones S.A., 4.950%, due 17/07/2030 460VEON Holdings BV, 3.375%, due 25/11/2027 440Galaxy Pipeline Assets Bidco Ltd, 3.250%, due 30/09/2040 430HTA Group Ltd/Mauritius, 7.000%, due 18/12/2025 418Fomento Economico Mexicano SAB de CV, 3.500%, due 16/01/2050 410NBK Tier 1 Financing Ltd, 3.625%, Perpetual VAR 410Industrias Penoles SAB de CV, 4.750%, due 06/08/2050 400State of Isreal Government International Bond, 4.500%, due 03/04/2120 400State of Isreal Government International Bond, 2.750%, due 03/07/2030 400Egypt Government International Bond, 8.875%, due 29/05/2050 400Adani Ports & Special Economic Zone Ltd, 3.100%, due 02/02/2031 400VTR Comunicaciones SpA, 5.125%, due 15/01/2028 400Morocco Government Internatiational Bond, 4.000%, due 15/12/2050 400Egypt Government International Bond, 7.625%, due 29/05/2032 400Petronas Capital Ltd, 4.800%, due 21/04/2060 400Guatemala Government International Bond, 6.125%, due 01/06/2050 400Banco Nacional de Panama, 2.500%, due 11/08/2030 400Abu Dhabi Government International Bond, 3.125%, due 16/04/2030 398Brazil Government International Bond, 2.875%, due 06/06/2025 398Nexa Resources SA, 6.500%, due 18/01/2028 397Oleoducto Central SA, 4.000%, due 14/07/2027 397Abu Dhabi Government International Bond, 2.500%, due 16/04/2025 397Empresa De Transport, 4.700%, due 07/05/2050 395Teva Pharmaceutical Finance Netherlands III BV, 2.800%, due 21/07/2023 385
MAJOR SALESCOST
(in 000’s) $Trust Fibraund, 6.390%, due 15/01/2050 591Abu Dhabi Government International Bond, 3.125%, due 16/04/2030 566Teva Pharmaceutical Finance Netherlands III BV, 7.125%, due 31/01/2025 566Panama Government Internation Bond, 4.500%, due 01/04/2056 541Qatar Government International Bond, 3.750%, due 16/04/2030 508Turkey Government International Bond, 5.875%, due 26/06/2031 488Hutchison Whampoa International 14 Ltd, 3.625%, due 31/10/2024 477Colombia Telecomunicaciones S.A., 4.950%, due 17/07/2030 464Qatar Government International Bond, 5.103%, due 23/04/2048 452Petronas Capital Ltd, 4.800%, due 21/04/2060 444Galaxy Pipeline Assets Bidco Ltd, 3.250%, due 30/09/2040 431Ultrapar International SA, 5.250%, due 06/10/2026 426HTA Group Ltd/Mauritius, 7.000%, due 18/12/2025 421Industrias Penoles SAB de CV, 4.750%, due 06/08/2050 414State of Isreal Government International Bond, 4.500%, due 03/04/2120 414Guatemala Government International Bond, 6.125%, due 01/06/2050 412Empresa De Transport, 4.700%, due 07/05/2050 410Nexa Resources SA, 6.500%, due 18/01/2028 409Egypt Government International Bond, 8.875%, due 29/05/2050 406State of Isreal Government International Bond, 2.750%, due 03/07/2030 403Ecopetrol SA, 6.875%, due 29/04/2030 402Morocco Government Internatiational Bond, 4.000%, due 15/12/2050 402Abu Dhabi Government International Bond, 2.500%, due 16/04/2025 401Brazil Government International Bond, 2.875%, due 06/06/2025 401Bahrain Government International Bond, 6.250%, due 25/01/2051 401Abu Dhabi Government International Bond, 3.125%, due 16/04/2030 399
Legg Mason Western Asset Global High Yield Fund
MAJOR PURCHASESCOST
(in 000’s) $Legg Mason Global Funds Plc – Western Asset Emerging Markets CorporateBond Fund – LM Class US$ Distributing (M) 5,872Teva Pharmaceutical Finance Netherlands III BV, 3.150%, due 01/10/2026 3,063CCO Holdings LLC / CCO Holdings Capital Corp, 144A, 4.500%, due 01/05/2032 2,806United States Treasury Note/Bond, 1.750%, due 31/03/2022 2,158United States Treasury Note/Bond, 1.500%, due 31/01/2027 1,812United States Treasury Note/Bond, 0.500%, due 31/05/2027 1,740United States Treasury Note/Bond, 2.500%, due 15/01/2022 1,297Delta Air Lines Inc, 5.750%, due 29/04/2023 1,196Spirit Loyalty Cayman Ltd / Spirit IP Cayman Ltd, 144A, 8.000%, due 20/09/2025 1,141Ford Motor Credit Co LLC, 2.900%, due 16/02/2028 1,095Delta Air Lines Inc, 3.625%, due 15/03/2022 1,037Indonesia Government International Bond, 1.850%, due 12/03/2031 1,015United States Treasury Note/Bond, 1.125%, due 28/02/2022 1,014United States Treasury Note/Bond, 1.375%, due 31/05/2021 1,013United States Treasury Note/Bond, 1.375%, due 31/01/2021 1,011Petroleos Mexicanos, 6.625%, due 15/06/2035 1,008United States Treasury Note/Bond, 0.250%, due 30/06/2025 998Legg Mason Qualified Investor Funds (II) Plc – Western Asset European LoanFund – LM Class Euro Accumulating 993United States Treasury Note/Bond, 0.625%, due 15/05/2030 989United States Treasury Note/Bond, 0.625%, due 15/08/2030 976
MAJOR SALESPROCEEDS(in 000’s) $
Legg Mason Global Funds Plc – Western Asset Emerging Markets CorporateBond Fund – LM Class US$ Distributing (M) 8,582Teva Pharmaceutical Finance Netherlands III BV, 2.800%, due 21/07/2023 3,901Brazilian Government International Bond, 4.250%, due 07/01/2025 2,427United States Treasury Note/Bond, 1.750%, due 31/03/2022 2,157United States Treasury Note/Bond, 1.375%, due 31/05/2021 2,021United States Treasury Note/Bond, 1.500%, due 31/01/2027 1,819Indonesia Government International Bond, 144A, 4.125%, due 15/01/2025 1,796United States Treasury Note/Bond, 0.500%, due 31/05/2027 1,752Abu Dhabi Government International Bond, 144A, 2.125%, due 30/09/2024 1,745Charter Communications Operating LLC / Charter Communications OperatingCapital, 3.413%, due 01/02/2024 1,606PetSmart Inc, 5.660%, due 11/03/2022 1,602Colombia Government International Bond, 4.000%, due 26/02/2024 1,337United States Treasury Note/Bond, 2.500%, due 15/01/2022 1,294Petrobras Global Finance BV, 4.375%, due 20/05/2023 1,218Delta Air Lines Inc, 3.625%, due 15/03/2022 1,128Intesa Sanpaolo SpA, 144A, 5.710%, due 15/01/2026 1,021First Quantum Minerals Ltd, 144A, 7.250%, due 15/05/2022 1,009United States Treasury Note/Bond, 1.375%, due 31/01/2021 1,007United States Treasury Note/Bond, 0.250%, due 30/06/2025 997United States Treasury Note/Bond, 1.500%, due 30/11/2021 967
Legg Mason Western Asset Global Inflation Management Fund
MAJOR PURCHASESCOST
(in 000’s) $Western Asset Liquidity Funds Plc – Western Asset US Dollar Liquidity Fund –Class WA (Distributing) 13,512United States Treasury Inflation Indexed Bonds, 0.125%, due 15/01/2022 4,351United States Treasury Inflation Indexed Bonds, 0.125%, due 15/01/2030 4,030Spain Government Inflation Linked Bond, 144A, 0.700%, due 30/11/2033 1,823United States Treasury Inflation Indexed Bonds, 0.375%, due 15/07/2025 1,819United States Treasury Inflation Indexed Bonds, 3.875%, due 15/04/2029 1,553United States Treasury Inflation Indexed Bonds, 0.375%, due 15/01/2027 1,541United States Treasury Inflation Indexed Bonds, 0.375%, due 15/07/2023 898Indonesia Government International Bond, 4.200%, due 15/10/2050 892Japanese Government CPI Linked Bond, Series 22, 0.100%, due 10/03/2027 839United States Treasury Inflation Indexed Bonds, 0.750%, due 15/02/2045 694Italy Buoni Poliennali Del Tesoro, Series CPI, 144A, 3.100%, due 15/09/2026 673French Republic Government Bond OAT, Series OATe, 144A, 1.800%, due25/07/2040 619United States Treasury Note/Bond, 2.000%, due 15/02/2050 615
MAJOR SALESPROCEEDS(in 000’s) $
Western Asset Liquidity Funds Plc – Western Asset US Dollar Liquidity Fund –Class WA (Distributing) 12,946United States Treasury Inflation Indexed Bonds, 0.375%, due 15/07/2023 3,594United States Treasury Inflation Indexed Bonds, 0.375%, due 15/07/2025 2,549United States Treasury Inflation Indexed Bonds, 0.125%, due 15/01/2023 2,237United States Treasury Inflation Indexed Bonds, 0.500%, due 15/04/2024 1,569Japanese Government CPI Linked Bond, Series 20, 0.100%, due 10/03/2025 1,204United States Treasury Inflation Indexed Bonds, 0.375%, due 15/01/2027 1,048Spain Government Bond, Series 30Y, 144A, 2.700%, due 31/10/2048 851Italy Buoni Poliennali Del Tesoro, Series CPI, 144A, 0.400%, due 15/05/2030 834Canadian Government Real Return Bond, Series CPI, 4.250%, due 01/12/2026 827Spain Government Inflation Linked Bond, 144A, 0.700%, due 30/11/2033 767Qatar Government International Bond, 5.103%, due 23/04/2048 759United States Treasury Inflation Indexed Bonds, 0.125%, due 15/01/2030 694Qatar Government International Bond, 3.750%, due 16/04/2030 673Italy Buoni Poliennali Del Tesoro, Series CPI, 144A, 2.550%, due 15/09/2041 638
394

Legg Mason Global Funds Plc Annual Report 28 February 2021
Statement of Major Portfolio Changes (unaudited) – (continued)
Legg Mason Western Asset Global Inflation Management Fund – (continued)
MAJOR PURCHASESCOST
(in 000’s) $Deutsche Bundesrepublik Inflation Linked Bond, Series I/L, 0.100%, due15/04/2046 607Qatar Government International Bond, 3.750%, due 16/04/2030 599United States Treasury Inflation Indexed Bonds, 0.125%, due 15/01/2023 564United States Treasury Inflation Indexed Bonds, 0.625%, due 15/01/2026 522Japanese Government CPI Linked Bond, Series 23, 0.100%, due 10/03/2028 522United Kingdom Gilt, 2.500%, due 22/07/2065 458Australia Government Bond, Series 162, 3.250%, due 21/06/2039 457Australia Government Bond, Series 162, 1.750%, due 21/06/2051 456
MAJOR SALESCOST
(in 000’s) $New Zealand Government Inflation Linked Bond, Series 0930, 3.000%, due20/09/2030 631Italy Buoni Poliennali Del Tesoro, 144A, 3.250%, due 01/09/2046 526United States Treasury Inflation Indexed Bonds, 0.250%, due 15/02/2050 508Australia Government Bond, Series 162, 3.250%, due 21/06/2039 454French Republic Government Bond OAT, Series OATe, 144A, 0.100%, due25/07/2047 388Canadian Government Real Return Bond, Series CPI, 4.250%, due 01/12/2021 383
Legg Mason Western Asset Asian Opportunities Fund
MAJOR PURCHASESCOST
(in 000’s) $Western Asset Liquidity Funds Plc – Western Asset US Dollar Liquidity Fund –Class WA (Distributing) 231,807Korea Treasury Bond, Series 2912, 1.375%, due 10/12/2029 42,538Korea Treasury Bond, Series 3006, 1.375%, due 10/06/2030 40,176Thailand Government Bond, 3.300%, due 17/06/2038 25,104China Government Bond, Series INBK, 3.390%, due 16/03/2050 17,618China Government Bond, 3.600%, due 21/05/2030 14,463Korea Treasury Bond, Series 3909, 1.125%, due 10/09/2039 10,222China Government Bond, Series INBK, 3.810%, due 14/09/2050 8,957China Government Bond, Series INBK, 2.680%, due 21/05/2030 7,271NTPC Ltd, 7.250%, due 03/05/2022 6,314National Highways Authority of India, 7.300%, due 18/05/2022 6,260Export-Import Bank of China/The, Series 2007, 3.260%, due 24/02/2027 6,115Panther Ventures Ltd, 3.500%, Perpetual 6,000China Development Bank, Series 2008, 2.890%, due 22/06/2025 5,950Export-Import Bank of China/The, Series 2010, 3.230%, due 23/03/2030 5,664Export-Import Bank of China/The, Series 1910, 3.860%, due 20/05/2029 4,500Singapore Government Bond, 1.875%, due 01/03/2050 4,187REC Ltd, 2.250%, due 01/09/2026 3,989Guotai Junan International Holdings Ltd, 2.900%, due 12/05/2021 3,603AIMS APAC REIT, 5.650%, Perpetual 3,284
MAJOR SALESPROCEEDS(in 000’s) $
Western Asset Liquidity Funds Plc – Western Asset US Dollar Liquidity Fund –Class WA (Distributing) 228,940Thailand Government Bond, 3.850%, due 12/12/2025 19,227Singapore Government Bond, 2.750%, due 01/03/2046 17,120Legg Mason China Funds – Western Asset China Bond Fund – Class M 12,770India Government Bond, 8.150%, due 24/11/2026 10,430Commonwealth Bank of Australia, 4.200%, due 26/10/2020 8,959Radiant Access Ltd, 4.600%, Perpetual 8,596Jasa Marga Persero Tbk PT, 7.500%, due 11/12/2020 6,463Thailand Government Bond, 2.125%, due 17/12/2026 5,767India Government Bond, 7.170%, due 08/01/2028 5,733Huarong Finance 2017 Co Ltd, 3.200%, due 27/04/2021 5,689Malaysia Government Bond, Series 0118, 3.882%, due 14/03/2025 5,447China Government Bond, 3.380%, due 21/11/2024 5,116Hubei Science & Technology Investment Group Hong Kong Ltd, 4.375%, due05/03/2021 5,043Indonesia Treasury Bond, Series FR56, 8.375%, due 15/09/2026 5,028HBIS Group Hong Kong Co Ltd, 4.250%, due 07/04/2020 5,000Pelabuhan Indonesia II PT, 5.375%, due 05/05/2045 4,984Monetary Authority of Singapore Bill, Series 84, zero coupon, due 08/05/2020 4,661India Government Bond, 7.610%, due 09/05/2030 4,099Tsinghua Unic Ltd, 4.750%, due 31/01/2021 4,029
Legg Mason Western Asset Short Duration Blue Chip Bond Fund
MAJOR PURCHASESCOST
(in 000’s) $Western Asset Liquidity Funds Plc – Western Asset US Dollar Liquidity Fund –Class WA (Distributing) 285,807United States Treasury Note/Bond, 1.750%, due 31/03/2022 25,997United States Treasury Note/Bond, 0.625%, due 15/05/2030 21,865United States Treasury Note/Bond, 2.250%, due 15/11/2027 20,612United States Treasury Note/Bond, 1.375%, due 15/02/2023 11,625United States Treasury Note/Bond, 1.500%, due 15/02/2030 10,054Inter-American Development Bank, 0.500%, due 15/09/2026 7,992Nykredit Realkredit AS, 0.250%, due 13/01/2026 6,721Exxon Mobil Corp, 0.142%, due 26/06/2024 6,624Credit Agricole SA/London, 1.907%, due 16/06/2026 6,495NIKE Inc, 2.400%, due 27/03/2025 5,403Bank of New York Mellon Corp/The, 0.350%, due 07/12/2023 4,995Citigroup Inc, 3.300%, due 27/04/2025 4,879Goldman Sachs Group Inc/The, 2.600%, due 07/02/2030 4,825Bank of America Corp, 3.550%, due 05/03/2024 4,796Alphabet Inc, 0.800%, due 15/08/2027 4,469JPMorgan Chase & Co, 1.045%, due 19/11/2026 4,400NTT Finance Corp, 0.010%, due 03/03/2025 4,118Credit Suisse AG/New York NY, 2.800%, due 08/04/2022 4,100Intel Corp, 3.400%, due 25/03/2025 4,100
MAJOR SALESPROCEEDS(in 000’s) $
Western Asset Liquidity Funds Plc – Western Asset US Dollar Liquidity Fund –Class WA (Distributing) 269,709United States Treasury Note/Bond, 1.750%, due 31/03/2022 45,556United States Treasury Note/Bond, 2.125%, due 31/03/2024 12,285Bundesrepublik Deutschland Bundesanleihe, 0.000%, due 15/08/2029 4,124Credit Agricole SA, 1.250%, due 02/10/2024 3,327Public Storage, 0.875%, due 24/01/2032 3,160Anheuser-Busch InBev Worldwide Inc, 4.000%, due 13/04/2028 2,238Procter & Gamble Co, 2.450%, due 25/03/2025 2,141Credit Suisse AG/New York NY, 2.800%, due 08/04/2022 2,007Bristol-Myers Squibb Co, 144A, 2.900%, due 26/07/2024 1,996Unibail-Rodamco-Westfield SE, 1.125%, due 15/09/2025 1,948AT&T Inc, 3.400%, due 15/05/2025 1,891Boeing Co/The, 3.100%, due 01/05/2026 1,606Diageo Finance Plc, 0.125%, due 12/10/2023 1,191Siemens Financieringsmaatschappij NV, 1.000%, due 06/09/2027 891Bristol-Myers Squibb Co, 2.900%, due 26/07/2024 785HSBC Holdings Plc, 1.645%, due 18/04/2026 633Coca-Cola Co/The, 0.125%, due 22/09/2022 594American Express Co, 2.650%, due 02/12/2022 548ABB Finance USA Inc, 2.800%, due 03/04/2020 450
Legg Mason Western Asset Global Core Plus Bond Fund^
MAJOR PURCHASESCOST
(in 000’s) $United States Treasury Note/Bond, 0.375%, due 30/04/2025 20,197Legg Mason China Funds – Western Asset China Bond Fund – Class M 18,219Western Asset Liquidity Funds Plc – Western Asset US Dollar Liquidity Fund –Class WA (Distributing) 16,875Bundesrepublik Deutschland Bundesanleihe, 0.250%, due 15/02/2029 10,456United States Treasury Note/Bond, 0.250%, due 30/06/2025 9,104United States Treasury Note/Bond, 2.500%, due 31/01/2021 8,305French Republic Government Bond OAT, 1.000%, due 25/05/2027 7,589Fannie Mae or Freddie Mac, 30 year, TBA, 0.000% 7,459Fannie Mae or Freddie Mac, 30 year, TBA, 4.500% 6,944United States Treasury Note/Bond, 2.375%, due 15/08/2024 6,848Fannie Mae or Freddie Mac, 30 year, TBA, 4.500% 6,394Japanese Government Bond, 0.4000%, due 30/03/2050 6,207Fannie Mae or Freddie Mac, 30 year, TBA, 2.500% 5,694United States Treasury Note/Bond, 0.250%, due 31/08/2025 5,473Indonesia Government Bond, 4.2000%, due 15/10/2050 5,039United States Treasury Note/Bond, 2.875%, due 15/05/2049 4,766United States Treasury Note/Bond, 1.500%, due 30/11/2024 4,755Fannie Mae or Freddie Mac, 30 year, TBA, 0.000% 4,570
MAJOR SALESPROCEEDS(in 000’s) $
Western Asset Liquidity Funds Plc – Western Asset US Dollar Liquidity Fund –Class WA (Distributing) 20,963Italy Buoni Poliennali Del Tesoro, 144A, 3.250%, due 01/09/2046 9,885French Republic Government Bond OAT, Series OATe, 1.850%, due 25/07/2027 9,464United States Treasury Inflation Indexed Bonds, 0.500%, due 15/04/2024 9,002United States Treasury Note/Bond, 2.500%, due 31/01/2021 8,272Fannie Mae or Freddie Mac, 30 year, TBA, 3.500% 8,194Fannie Mae or Freddie Mac, 30 year, TBA, 4.500% 7,754Fannie Mae or Freddie Mac, 30 year, TBA, 0.000% 7,457United States Treasury Note/Bond, 1.625%, due 15/08/2022 7,155Republic of Poland Government Bond, Series 0428, 2.750%, due 25/04/2028 6,875Canadian Government Bond, 2.250%, due 01/06/2025 6,416Fannie Mae or Freddie Mac, 30 year, TBA, 4.500% 6,402Japan Government Ten Year Bond, Series 341, 0.300%, due 20/12/2025 5,877United States Treasury Note/Bond, 2.875%, due 15/05/2049 5,875Fannie Mae or Freddie Mac, 30 year, TBA, 2.500% 5,701Legg Mason China Funds – Western Asset China Bond Fund – Class M 5,616Legg Mason Qualified Investor Funds (II) plc – Legg Mason Western Asset IndiaBond Fund – LM Class US$ Accumulating 5,201
^ Not authorised for sale to the public in Hong Kong.
395

Legg Mason Global Funds Plc Annual Report 28 February 2021
Statement of Major Portfolio Changes (unaudited) – (continued)
Legg Mason Western Asset Global Core Plus Bond Fund^ – (continued)
MAJOR PURCHASESCOST
(in 000’s) $United Kingdom Gilt, 2.5000%, due 22/07/2065 4,448Fannie Mae or Freddie Mac, 30 year, TBA, 0.000% 4,338Australia Treasury Bond, 1.750%, due 21/06/2051 4,005Fannie Mae or Freddie Mac, 30 year, TBA, 0.000% 3,982Australia Government Bond, 3.250%, due 21/06/2039 3,794
MAJOR SALESPROCEEDS(in 000’s) $
Fannie Mae or Freddie Mac, 30 year, TBA, 4.500% 5,143United States Treasury Note/Bond, 3.000%, due 15/11/2045 5,039Fannie Mae or Freddie Mac, 30 year, TBA, 0.000% 4,654United States Treasury Note/Bond, 0.250%, due 30/06/2025 4,343Fannie Mae or Freddie Mac, 30 year, TBA, 0.000% 4,332Fannie Mae or Freddie Mac, 30 year, TBA, 0.000% 3,989Australia Government Bond, 3.250%, due 21/06/2039 3,768
Legg Mason Western Asset Global Credit Fund^
MAJOR PURCHASESCOST
(in 000’s) $Western Asset Liquidity Funds Plc – Western Asset US Dollar Liquidity Fund –Class WA (Distributing) 30,542United States Treasury Note/Bond, 0.625%, due 31/03/2027 3,299United States Treasury Note/Bond, 2.000%, due 15/02/2050 1,849United States Treasury Note/Bond, 1.500%, due 15/02/2030 1,770Autozone Inc, 4.000%, due 15/04/2030 1,599Bundesrepublik Deutschland Bundesanleihe, 0.000%, due 15/02/2030 1,542Bundesrepublik Deutschland Bundesanleihe, 0.500%, due 15/02/2026 1,406United States Treasury Note/Bond, 0.625%, due 15/05/2030 914AbbVie Inc, 3.200%, due 21/11/2029 891Israel Government International Bond, 3.875%, due 03/07/2050 890Logicor Financing Sarl, 1.625%, due 15/07/2027 782Lowe’s Companies Inc, 4.000%, due 15/04/2025 778Vonovia Finance BV, 2.250%, due 07/04/2030 764Bundesrepublik Deutschland Bundesanleihe, 0.000%, due 15/08/2026 762Cox Communications, 2.950%, due 01/10/2050 754United States Treasury Note/Bond, 2.375%, due 15/11/2049 748United States Treasury Note/Bond, 1.250%, due 15/05/2050 735EDP Finance BV, 144A, 1.710%, due 24/01/2028 720Comcast Corp, 3.100%, due 01/04/2025 710Airbus SE, 1.375%, due 09/06/2026 658
MAJOR SALESPROCEEDS(in 000’s) $
Western Asset Liquidity Funds Plc – Western Asset US Dollar Liquidity Fund –Class WA (Distributing) 30,154United States Treasury Note/Bond, 0.625%, due 31/03/2027 3,287Bundesrepublik Deutschland Bundesanleihe, 0.500%, due 15/02/2026 2,133United States Treasury Note/Bond, 1.500%, due 15/02/2030 2,038Autozone Inc, 4.000%, due 15/04/2030 1,644Bundesrepublik Deutschland Bundesanleihe, 0.000%, due 15/08/2026 1,513Bundesrepublik Deutschland Bundesanleihe, Series 2007, 4.250%, due04/07/2039 1,406United States Treasury Note/Bond, 2.000%, due 15/02/2050 1,365Bundesrepublik Deutschland Bundesanleihe, 0.000%, due 15/02/2030 1,257Freddie Mac Pool ‘QA3734’, 3.000%, due 01/10/2049 1,134Mitsubishi UFJ Financial Group Inc, 3.218%, due 07/03/2022 1,093Israel Government International Bond, 3.875%, due 03/07/2050 1,027United States Treasury Note/Bond, 2.375%, due 15/11/2049 1,023Bundesrepublik Deutschland Bundesanleihe, 0.250%, due 15/02/2029 1,003Freddie Mac Pool ‘QA0245’, 3.500%, due 01/06/2049 969Ginnie Mae II Pool ‘MA4509’, 3.000%, due 20/06/2047 961Lowe’s Companies Inc, 4.000%, due 15/04/2025 853United States Treasury Note/Bond, 0.625%, due 15/05/2030 838AbbVie Inc, 3.200%, due 21/11/2029 813China Overseas Finance Cayman VII Ltd, 4.250%, due 26/04/2023 741
Legg Mason Western Asset Euro High Yield Fund
MAJOR PURCHASESCOST
(in 000’s) €
Virgin Media Secured Finance Plc, 5.250%, due 15/05/2029 1,654FCE Bank Plc, 0.869%, due 13/09/2021 1,030Altice France Holding SA, 8.000%, due 15/05/2027 1,007doValue SpA, 5.000%, due 04/08/2025 989Cheplapharm Arzneimittel GmbH, 4.375%, due 15/01/2028 975United Group BV, 4.000%, due 15/11/2027 740Telefonica Europe BV, Series NC5, 3.000%, Perpetual 722ZF Finance GmbH, 3.000%, due 21/09/2025 716Petroleos Mexicanos, 2.750%, due 21/04/2027 667Victoria Plc, 3.625%, due 26/08/2026 555Smurfit Kappa Treasury ULC, 1.500%, due 15/09/2027 547PPF Telecom Group BV, 3.250%, due 29/09/2027 536Parts Europe SA, 6.500%, due 16/07/2025 503Faurecia SE, 3.750%, due 15/06/2028 500Rebecca Bidco GmbH, 5.750%, due 15/07/2025 500Verisure Holding AB, 3.875%, due 15/07/2026 500PVH Corp, 3.630%, due 15/07/2024 498Bertelsmann SE & Co, 3.000%, due 23/04/2075 493HT Troplast GmbH, 9.250%, due 15/07/2025 460Goldstory SASU, 5.375%, due 01/03/2026 365Brunello Bidco SpA, 3.750%, due 15/02/2028 361Informa Plc, 2.125%, due 06/10/2025 358B&M European Value Retail SA, 3.625%, due 15/07/2025 333Stellantis NV, 3.875%, due 05/01/2026 330Swissport Financing S.a.r.l., 0.000%, due 14/08/2024 311Swissport Financing S.a.r.l., 0.000%, due 14/08/2024 311Novafives SAS, 5.000%, due 15/06/2025 303Ineos 226 Ltd, 2.750%, due 21/01/2026 299Maxeda DIY Holding BV, 5.875%, due 01/10/2026 280Marks & Spencer Plc, 3.750%, due 19/05/2026 278INEOS Quattro Finance 1 Plc, 3.750%, due 15/07/2026 275Gamma Bidco SpA, 6.250%, due 15/07/2025 250Motion Finco Sarl, 7.000%, due 15/07/2025 250Pinnacle Bidco Plc, 6.375%, due 15/02/2025 242Carnival Corp, 10.125%, due 01/02/2026 240TalkTalk Telecom Group Plc, 3.875%, due 20/02/2025 233Primo Water Holdings Inc, 3.875%, due 31/10/2028 230SPCM SA, 2.625%, due 01/02/2029 230
MAJOR SALESPROCEEDS
(in 000’s) €
Virgin Media Secured Finance Plc, 5.000%, due 15/04/2027 1,640Eurofins Scientific SE, 4.875%, Perpetual 1,390Bausch Health Cos Inc, 4.500%, due 15/05/2023 1,170IQVIA Inc, 3.250%, due 15/03/2025 1,013Ypso Finance Bis SA, 8.000%, due 15/05/2027 1,007Altice France SA/France, 3.375%, due 15/01/2028 968AI Convoy (Luxembourg) S.a.r.l., 0.000%, due 20/01/2027 948Cott Corp, 5.500%, due 01/07/2024 909Verisure Holding AB, 2.750%, due 21/10/2022 860Kronos International Inc, 3.750%, due 15/09/2025 788Ziggo BV, 4.250%, due 15/01/2027 775Ladbrokes Group Finance Plc, 5.125%, due 08/09/2023 759Virgin Media Secured Finance Plc, 5.250%, due 15/05/2029 735Hercule Debtco Sarl, 6.750%, due 30/06/2024 724Novafives SAS, 5.000%, due 15/06/2025 710Grifols SA, 1.625%, due 15/02/2025 666Leonardo SpA, 4.875%, due 24/03/2025 663CBR Fashion Finance BV, 5.125%, due 01/10/2022 639Swissport Financing S.a.r.l., 0.000%, due 14/08/2024 621Maxeda DIY Holding BV, 6.125%, due 15/07/2022 592TDC A/S, 3.000%, due 11/06/2025 578Jerrold Finco Plc, 6.125%, due 15/01/2024 574Europcar Mobility Group, 4.000%, due 30/04/2026 547Galaxy Bidco Ltd, 6.500%, due 31/07/2026 531Pinnacle Bidco Plc, 6.375%, due 15/02/2025 524doValue SpA, 5.000%, due 04/08/2025 523Bertelsmann SE & Co, 3.000%, due 23/04/2075 516PVH Corp, 3.630%, due 15/07/2024 511Telecom Italia SpA/Milano, 3.000%, due 30/09/2025 510LKQ European Holdings BV, 3.625%, due 01/04/2026 503Trivium Packaging Finance BV, 3.750%, due 15/08/2026 498International Design Group SPA, 6.500%, due 15/11/2025 490Casino Guichard Perrachon SA, 4.498%, due 07/03/2024 489IHO Verwaltungs GmbH, 3.750%, due 15/09/2026 483Netflix Inc, 3.625%, due 15/06/2030 475Burger King France SAS, 5.250%, due 01/05/2023 452ASR Media and Sponsorship SpA, 5.125%, due 01/08/2024 425Stellantis NV, 3.875%, due 05/01/2026 382Informa Plc, 2.125%, due 06/10/2025 375Mclaren Finance Plc, 5.000%, due 01/08/2022 340
^ Not authorised for sale to the public in Hong Kong.
396

Legg Mason Global Funds Plc Annual Report 28 February 2021
Statement of Major Portfolio Changes (unaudited) – (continued)
Legg Mason Western Asset Macro Opportunities Bond Fund^
MAJOR PURCHASESCOST
(in 000’s) $Western Asset Liquidity Funds Plc – Western Asset US Dollar Liquidity Fund –Class WA (Distributing) 4,293,973United States Treasury Note/Bond, 1.250%, due 15/05/2050 887,294United States Treasury Note/Bond, 0.625%, due 31/03/2027 660,262United States Treasury Note/Bond, 0.375%, due 31/07/2027 557,820United States Treasury Note/Bond, 0.500%, due 31/05/2027 495,752United States Treasury Note/Bond, 0.625%, due 15/05/2030 336,982United States Treasury Note/Bond, 0.250%, due 30/06/2025 289,388United States Treasury Note/Bond, 2.000%, due 15/02/2050 276,392United States Treasury Note/Bond, 0.625%, due 30/11/2027 255,610United States Treasury Note/Bond, 0.625%, due 15/08/2030 254,771United States Treasury Note/Bond, 0.500%, due 30/06/2027 246,304United States Treasury Note/Bond, 0.750%, due 31/01/2028 241,764United States Treasury Note/Bond, 1.375%, due 15/08/2050 211,458United States Treasury Note/Bond, 0.875%, due 15/11/2030 190,522United States Treasury Note/Bond, 1.625%, due 15/11/2050 161,450United States Treasury Note/Bond, 1.500%, due 15/02/2030 153,811China Government Bond, Series INBK, 3.810%, due 14/09/2050 139,017United States Treasury Note/Bond, 1.375%, due 15/11/2040 137,065United States Treasury Note/Bond, 0.625%, due 31/12/2027 106,430United States Treasury Note/Bond, 0.500%, due 31/08/2027 104,213
MAJOR SALESPROCEEDS(in 000’s) $
Western Asset Liquidity Funds Plc – Western Asset US Dollar Liquidity Fund –Class WA (Distributing) 4,242,487United States Treasury Note/Bond, 2.375%, due 15/11/2049 1,090,272United States Treasury Note/Bond, 1.250%, due 15/05/2050 844,347United States Treasury Note/Bond, 0.625%, due 31/03/2027 663,210United States Treasury Note/Bond, 0.375%, due 31/07/2027 558,619United States Treasury Note/Bond, 0.500%, due 31/05/2027 497,071United States Treasury Inflation Indexed Bonds, 1.000%, due 15/02/2049 349,613United States Treasury Note/Bond, 0.625%, due 15/05/2030 338,965United States Treasury Note/Bond, 0.250%, due 30/06/2025 290,076United States Treasury Note/Bond, 0.625%, due 30/11/2027 256,092United States Treasury Note/Bond, 2.000%, due 15/02/2050 255,911United States Treasury Note/Bond, 0.625%, due 15/08/2030 254,084United States Treasury Note/Bond, 0.500%, due 30/06/2027 247,394United States Treasury Note/Bond, 0.750%, due 31/01/2028 241,356United States Treasury Note/Bond, 1.375%, due 15/08/2050 204,929United States Treasury Note/Bond, 0.875%, due 15/11/2030 188,356United States Treasury Note/Bond, 1.500%, due 15/02/2030 155,400Italy Buoni Poliennali Del Tesoro, 144A, 3.850%, due 01/09/2049 135,613United States Treasury Note/Bond, 2.250%, due 15/08/2049 132,358United States Treasury Note/Bond, 1.375%, due 15/11/2040 130,431
Legg Mason Western Asset Multi-Asset Credit Fund^
MAJOR PURCHASESCOST
(in 000’s) $United States Treasury Note/Bond, 1.375%, due 31/01/2022 31,557United States Treasury Note/Bond, 1.125%, due 15/02/2031 13,871Legg Mason Qualified Investor Funds (II) Plc – Western Asset European LoanFund – LM Class Euro Accumulating 9,379United States Treasury Note/Bond, 0.125%, due 30/09/2022 6,886United States Treasury Note/Bond, 1.875%, due 15/02/2051 6,859Apollo Commercial Real Estate Finance Inc, 4.750%, due 23/08/2022 6,528CWGS Group LLC, 3.500%, due 08/11/2023 6,110Delta Air Lines Inc, 144A, 7.000%, due 01/05/2025 5,957Targa Resources Corp, Series A 5,345Blackstone Mortgage Trust Inc, 4.375%, due 05/05/2022 4,639Focus Financial Partners LLC, 2.121%, due 03/07/2024 4,335Delta Air Lines Inc, 2.900%, due 28/10/2024 4,152Range Resources Corp, 9.250%, due 01/02/2026 4,036Occidental Petroleum Corp, 7.150%, due 15/05/2028 3,990Wynn Macau Ltd, 144A, 5.625%, due 26/08/2028 3,823Prime Security Services Borrower LLC / Prime Finance Inc, 144A, 3.375%, due31/08/2027 3,710Freddie Mac Structured Agency Credit Risk Debt Notes, Series 2016 DNA3,Class M3, 5.118%, due 25/12/2028 3,696JP Morgan Chase Commercial Mortgage Securities Trust 2018-WPT, Series2018 WPT, Class FFL, 144A, 3.013%, due 05/07/2033 3,696American News Co LLC, 144A, 8.500%, due 01/09/2026 3,510Range Resources Corp, 144A, 9.250%, due 01/02/2026 3,506
MAJOR SALESPROCEEDS(in 000’s) $
United States Treasury Note/Bond, 1.375%, due 31/01/2022 31,533United States Treasury Note/Bond, 1.625%, due 15/03/2020 17,561United States Treasury Note/Bond, 0.125%, due 30/09/2022 6,887Fannie Mae Pool ‘BM5520’, 3.500%, due 01/02/2047 6,393Teva Pharmaceutical Finance Co LLC, Series C, 0.250%, due 01/02/2026 5,951Egypt Treasury Bills, Series 273D, zero coupon, due 06/10/2020 5,852Abu Dhabi Government International Bond, 144A, 2.125%, due 30/09/2024 5,723Delta Air Lines Inc, 2.900%, due 28/10/2024 4,961Range Resources Corp, 144A, 9.250%, due 01/02/2026 4,504GFL Environmental Inc, 144A, 5.375%, due 01/03/2023 4,405AbbVie Inc, 144A, 4.050%, due 21/11/2039 4,282PetSmart Inc, 144A, 8.875%, due 01/06/2025 4,178Montage Resources Corp, 8.875%, due 15/07/2023 3,765Bristol-Myers Squibb Co, 144A, 4.250%, due 26/10/2049 3,616PDC Energy Inc, 1.125%, due 15/09/2021 3,576First Quantum Minerals Ltd, 144A, 7.250%, due 01/04/2023 3,454Kuwait International Government Bond, 144A, 3.500%, due 20/03/2027 3,403Indonesia Government International Bond, 5.250%, due 17/01/2042 3,367Comstock Resources Inc, 144A, 7.500%, due 15/05/2025 3,292VICI Properties LP / VICI Note Co Inc, 144A, 4.625%, due 01/12/2029 3,232
Legg Mason Western Asset Structured Opportunities Fund^
MAJOR PURCHASESCOST
(in 000’s) $Western Asset Liquidity Funds Plc – Western Asset US Dollar Liquidity Fund –Class WA (Distributing) 467,051National Collegiate Student Loan Trust 2006-4, Series 2006 4, Class A4,0.428%, due 25/05/2032 7,805Connecticut Avenue Securities Trust 2020-SBT1, Series 2020 SBT1, Class 1M2,144A, 3.768%, due 25/02/2040 7,500Sunnova Sol Issuer LLC, Series 2020 1A, Class B, 144A, 5.540%, due01/02/2055 5,811Citigroup Mortgage Loan Trust 2018, 4.125%, due 25/03/2059 5,684Independence Plaza Trust 2018-INDP, Series 2018 INDP, Class B, 144A,3.911%, due 10/07/2035 5,624Magnolia Finance, 0.000%, due 09/08/2024 5,000CSWF 2018-TOP, Series 2018 TOP, Class H, 144A, 3.526%, due 15/08/2035 4,773New Residential Mortgage Loan Trust 2016-4, Series 2016 4A, Class B5, 144A,4.936%, due 25/11/2056 4,375Banc of America Commercial Mortgage Trust 2017-BNK3, Series 2017 BNK3,Class E, 144A, 4.534%, due 15/02/2050 4,019Blackbird Capital Aircraft Lease Securitization Ltd 2016-1, Series 2016 1A,Class B, 144A, 5.682%, due 16/12/2041 3,225PMT Credit Risk Transfer Trust 2019-3R, Series 2019 3R, Class A, 144A,2.815%, due 27/10/2022 2,504BX Commercial Mortgage Trust 2018-BIOA, Series 2018 BIOA, Class A, 144A,0.783%, due 15/03/2037 2,143National Collegiate Student Loan Trust 2006-1, Series 2006 1, Class A5,0.468%, due 25/03/2033 2,118National Collegiate Student Loan Trust 2006-3, Series 2006 3, Class B,0.478%, due 26/01/2032 2,009National Collegiate V Commutation Trust, Series 2007 33A5, Class 1O, 144A,0.000%, due 25/03/2038 1,890
MAJOR SALESPROCEEDS(in 000’s) $
Western Asset Liquidity Funds Plc – Western Asset US Dollar Liquidity Fund –Class WA (Distributing) 564,953Sunrun Atlas Issuer 2019-2 LLC, Series 2019 2, Class A, 144A, 3.610%, due01/02/2055 14,934Credit Suisse European Mortgage Capital Ltd, Series 2019 1OTF, Class A,144A, 4.670%, due 09/08/2024 13,582BBCMS Trust 2018-RRI, Series 2018 RRI, Class D, 144A, 3.709%, due15/02/2033 13,567Connecticut Avenue Securities Trust 2018-R07, Series 2018 R07, Class 1B1,144A, 5.977%, due 25/04/2031 13,236Magnolia Finance XI DAC, Series 2019 2, Class A, 144A, 4.377%, due31/07/2021 12,863Seasoned Credit Risk Transfer Trust Series 2018-2, Series 2018 2, Class M,4.750%, due 25/11/2057 12,585Towd Point Mortgage Trust 2017-1, Series 2017 1, Class B3, 144A, 3.970%,due 25/10/2056 12,557Sonic Capital LLC, Series 2020 1A, Class A2I, 144A, 3.845%, due 20/01/2050 12,099Tharaldson Hotel Portfolio Trust 2018-THPT, Series 2018 THL, Class H, 144A,11.470%, due 11/11/2034 11,043EFS Volunteer No 2 LLC, Series 2012 1, Class A2, 144A, 2.977%, due25/03/2036 10,774FREMF 2016-K55 Mortgage Trust, Series 2016 K55, Class B, 144A, 4.163%,due 25/04/2049 10,625Seasoned Credit Risk Transfer Trust Series 2018-3, Series 2018 3, Class M,144A, 4.750%, due 25/08/2057 10,365Structured Asset Securities Corp Mortgage Loan Trust 2007-BC3, Series 2007BC3, Class 2A4, 1.887%, due 25/05/2047 9,800Motel 6 Trust 2017-MTL6, Series 2017 MTL6, Class B, 144A, 2.849%, due15/08/2034 9,705
^ Not authorised for sale to the public in Hong Kong.
397

Legg Mason Global Funds Plc Annual Report 28 February 2021
Statement of Major Portfolio Changes (unaudited) – (continued)
Legg Mason Western Asset Structured Opportunities Fund^ – (continued)
MAJOR PURCHASESCOST
(in 000’s) $Magnolia Finance XI DAC, Series 2019 2, Class A, 144A, 4.377%, due31/07/2021 1,855Starwood Retail Property Trust 2014-STAR, Series 2014 STAR, Class D, 144A,3.612%, due 15/11/2027 520Banc of America Funding 2015-R4 Trust, Series 2015 R4, Class 4A3, 144A,8.749%, due 27/01/2030 294Natixis Commercial Mortgage Securities Trust 2019-FAME, Series 2019 FAME,Class D, 144A, 4.398%, due 15/08/2036 233
MAJOR SALESPROCEEDS(in 000’s) $
CHT 2017-COSMO Mortgage Trust, Series 2017 CSMO, Class B, 144A,3.059%, due 15/11/2036 9,587TES 2017-1 LLC, Series 2017 1A, Class B, 144A, 7.740%, due 20/10/2047 9,434BXMT 2020-FL2 Ltd, Series 2020 FL2, Class A, 144A, 2.560%, due 16/02/2037 9,396BCAP LLC 2011-RR4-I Trust, Series 2011 RR4, Class 1A6, 144A, 4.076%, due26/03/2036 9,110CIT Mortgage Loan Trust 2007-1, Series 2007 1, Class 1M1, 144A, 3.127%,due 25/10/2037 9,000
Legg Mason Western Asset US Mortgage Backed Securities Fund^
MAJOR PURCHASESCOST
(in 000’s) $Western Asset Liquidity Funds Plc – Western Asset US Dollar Liquidity Fund –Class WA (Distributing) 211,130Fannie Mae or Freddie Mac, 30 year, TBA, 4.500% 131,239Fannie Mae or Freddie Mac, 30 year, TBA, 0.000% 108,624Fannie Mae or Freddie Mac, 30 year, TBA, 0.000% 96,648Fannie Mae or Freddie Mac, 30 year, TBA, 0.000% 88,343Fannie Mae or Freddie Mac, 30 year, TBA, 2.000% 82,866Fannie Mae or Freddie Mac, 30 year, TBA, 0.000% 63,480Fannie Mae or Freddie Mac, 30 year, TBA, 0.000% 60,937Fannie Mae or Freddie Mac, 30 year, TBA, 0.000% 53,494Fannie Mae or Freddie Mac, 30 year, TBA, 4.500% 50,192Fannie Mae or Freddie Mac, 30 year, TBA, 2.500% 49,088Fannie Mae or Freddie Mac, 30 year, TBA, 0.000% 48,479Fannie Mae or Freddie Mac, 15 year, TBA, 0.000% 41,046Fannie Mae or Freddie Mac, 30 year, TBA, 0.000% 33,464Fannie Mae or Freddie Mac, 15 year, TBA, 0.000% 32,566Fannie Mae or Freddie Mac, 30 year, TBA, 0.000% 32,325Fannie Mae or Freddie Mac, 15 year, TBA, 0.000% 32,217Fannie Mae or Freddie Mac, 30 year, TBA, 2.500% 26,190United States Cash Management Bill, zero coupon, due 18/05/2021 25,922Ginnie Mae, 30 year, TBA, 2.500% 25,608
MAJOR SALESPROCEEDS(in 000’s) $
Western Asset Liquidity Funds Plc – Western Asset US Dollar Liquidity Fund –Class WA (Distributing) 232,844Fannie Mae or Freddie Mac, 30 year, TBA, 4.500% 139,270Fannie Mae or Freddie Mac, 30 year, TBA, 0.000% 108,646Fannie Mae or Freddie Mac, 30 year, TBA, 0.000% 96,090Fannie Mae or Freddie Mac, 30 year, TBA, 0.000% 88,462Fannie Mae or Freddie Mac, 30 year, TBA, 4.500% 75,169Fannie Mae or Freddie Mac, 30 year, TBA, 0.000% 63,840Fannie Mae or Freddie Mac, 30 year, TBA, 0.000% 61,022Fannie Mae or Freddie Mac, 30 year, TBA, 0.000% 53,492Fannie Mae or Freddie Mac, 30 year, TBA, 0.000% 48,568Fannie Mae or Freddie Mac, 15 year, TBA, 0.000% 41,020Fannie Mae or Freddie Mac, 30 year, TBA, 2.500% 38,686Fannie Mae or Freddie Mac, 30 year, TBA, 0.000% 33,568Fannie Mae or Freddie Mac, 15 year, TBA, 0.000% 32,577Fannie Mae or Freddie Mac, 30 year, TBA, 0.000% 32,325Fannie Mae or Freddie Mac, 15 year, TBA, 0.000% 32,267Ginnie Mae, 30 year, TBA, 2.500% 26,683Fannie Mae or Freddie Mac, 30 year, TBA, 2.500% 26,278Fannie Mae Pool ‘BP1661’, 3.000%, due 01/02/2050 25,994Ginnie Mae, 30 year, TBA, 2.500% 25,597
Legg Mason Western Asset UK Investment Grade Credit Fund^
MAJOR PURCHASESCOST
(in 000’s) £Bank of America Corp, 6.125%, due 15/09/2021 1,257General Motors Financial Co Inc, 2.350%, due 03/09/2025 584Bundesrepublik Deutschland Bundesanleihe, 0.000%, due 15/02/2030 584Heathrow Funding Ltd, 1.500%, due 11/02/2030 569United Kingdom Gilt, 4.250%, due 07/12/2040 558Upjohn Finance BV, 1.908%, due 23/06/2032 537National Grid Electricity Transmission Plc, 2.000%, due 17/04/2040 532Barclays Plc, 3.375%, due 02/04/2025 532Experian Finance Plc, 0.739%, due 29/10/2025 530AbbVie Inc, 3.200%, due 21/11/2029 526Anheuser-Busch InBev SA/NV, 2.850%, due 25/05/2037 511Assura Financing Plc, 3.000%, due 19/07/2028 508Credit Suisse Group AG, 2.250%, due 09/06/2028 498Verizon Communications Inc, 1.875%, due 03/11/2038 467Toyota Motor Credit Corp, 0.750%, due 19/11/2026 458Guinness Partnership Ltd/The, 2.000%, due 22/04/2055 457Clarion Funding Plc, 1.250%, due 13/11/2032 455United Kingdom Gilt, 1.750%, due 07/09/2032 438United Kingdom Gilt, 4.750%, due 07/12/2030 405Folio Residential Finance NO 1 Plc, 1.246%, due 31/10/2027 370United Utilities Water Finance Plc, 1.875%, due 03/06/2042 365United Kingdom Gilt, 1.000%, due 22/04/2024 342Just Group Plc, 7.00%, due 15/04/2031 340Tesco Corporate Treasury Services Plc, 2.750%, due 27/04/2030 329Grainger Plc, 3.000%, due 03/07/2030 328Realty Income Corp, 1.625%, due 15/12/2030 327Anglo American Capital Plc, 3.375%, due 11/03/2029 304United Kingdom Gilt, 1.500%, due 22/07/2026 303BNP Paribas SA, 1.250%, due 13/07/2031 299United Kingdom Gilt, 4.500%, due 07/12/2042 294Legal & General Group Plc, 4.500%, due 01/11/2050 289Heathrow Funding Ltd, 2.750%, due 13/10/2029 288Sanctuary Capital Plc, 2.375%, due 14/04/2050 285Severn Trent Utilities Finance Plc, 2.000%, due 02/06/2040 277Infincon Technologies AG, 2.000%, due 24/06/2032 264Barclays Plc, 1.700%, due 03/11/2026 260United Kingdom Gilt, 2.000%, due 07/09/2025 233Burberry Group Plc, 1.125%, due 21/09/2025 229Direct Line Insurance Group Plc, 4.000%, due 05/06/2032 199
MAJOR SALESPROCEEDS(in 000’s) £
United Kingdom Gilt, 2.750%, due 07/09/2024 3,078European Investment Bank, 5.375%, due 07/06/2021 1,385Kreditanstalt fuer Wiederaufbau, 6.000%, due 07/12/2028 1,192European Investment Bank, 3.750%, due 07/12/2027 1,146United Kingdom Gilt, 4.250%, due 07/12/2040 971Electricite de France SA, 5.500%, due 27/03/2037 873GE Capital UK Funding Unlimited Co, 5.875%, due 04/11/2020 832Electricite de France SA, 5.500%, due 17/10/2041 760Wells Fargo & Co, 4.875%, due 29/11/2035 606ABN AMRO Bank NV, 1.000%, due 30/06/2020 600Heathrow Funding Ltd, 1.500%, due 11/02/2030 563Upjohn Finance BV, 1.908%, due 23/06/2032 551AbbVie Inc, 3.200%, due 21/11/2029 526Wellcome Trust Finance Plc, 4.625%, due 25/07/2036 526Telefonica Emisiones SA, 5.597%, due 12/03/2020 500Informa Plc, 3.125%, due 05/07/2026 500Anglo American Capital Plc, 4.750%, due 10/04/2027 478British Land Co Plc/The, 2.375%, due 14/09/2029 472Citigroup Inc, 7.375%, due 01/09/2039 472Bank of America Corp, 6.125%, due 15/09/2021 470
^ Not authorised for sale to the public in Hong Kong.
398

Legg Mason Global Funds Plc Annual Report 28 February 2021
Statement of Major Portfolio Changes (unaudited) – (continued)
Legg Mason Western Asset US Corporate Bond Fund^
MAJOR PURCHASESCOST
(in 000’s) $Western Asset Liquidity Funds Plc – Western Asset US Dollar Liquidity Fund –Class WA (Distributing) 60,458United States Treasury Note/Bond, 0.875%, due 15/11/2030 5,379United States Treasury Note/Bond, 1.375%, due 15/08/2050 3,996United States Treasury Note/Bond, 0.625%, due 15/05/2030 3,477Societe Generale SA, 144A, 1.488%, due 14/12/2026 3,000United States Treasury Note/Bond, 0.625%, due 15/08/2030 2,863Guardian Life Global Funding, 144A, 0.875%, due 10/12/2025 1,999Goldman Sachs Group Inc/The, Series VAR, 1.093%, due 09/12/2026 1,840Canadian Imperial Bank of Commerce, 0.500%, due 14/12/2023 1,839KeyBank NA/Cleveland OH, Series BKNt, 0.423%, due 03/01/2024 1,830Morgan Stanley, 0.985%, due 10/12/2026 1,830United States Treasury Note/Bond, 1.625%, due 15/11/2050 1,780United States Treasury Note/Bond, 1.500%, due 15/02/2030 1,721United States Treasury Note/Bond, 1.250%, due 15/05/2050 1,581United States Treasury Note/Bond, 2.000%, due 15/02/2050 1,415Banco Santander SA, 2.749%, due 03/12/2030 1,410Blackstone Mortgage Trust Inc, 4.375%, due 05/05/2022 1,304JPMorgan Chase & Co, 1.953%, due 04/02/2032 1,190AbbVie Inc, 2.600%, due 21/11/2024 1,159Boeing Co/The, 2.196%, due 04/02/2026 1,151
MAJOR SALESPROCEEDS(in 000’s) $
Western Asset Liquidity Funds Plc – Western Asset US Dollar Liquidity Fund –Class WA (Distributing) 50,829United States Treasury Note/Bond, 0.875%, due 15/11/2030 5,348United States Treasury Note/Bond, 0.625%, due 15/05/2030 3,477United States Treasury Note/Bond, 1.375%, due 15/08/2050 2,804United States Treasury Note/Bond, 0.625%, due 15/08/2030 2,484United States Treasury Note/Bond, 1.500%, due 15/02/2030 1,728United States Treasury Note/Bond, 1.250%, due 15/05/2050 1,508Banco Santander SA, 2.749%, due 03/12/2030 1,418United States Treasury Note/Bond, 2.000%, due 15/02/2050 1,386Natwest Group Plc, 8.625%, Perpetual 1,197Mitsubishi UFJ Financial Group Inc, 2.193%, due 25/02/2025 1,174AbbVie Inc, 144A, 2.600%, due 21/11/2024 1,159AbbVie Inc, 144A, 2.300%, due 21/11/2022 1,153UniCredit SpA, 144A, 7.296%, due 02/04/2034 1,073Teva Pharmaceutical Finance Netherlands III BV, 2.200%, due 21/07/2021 996Danske Bank A/S, 144A, 5.000%, due 12/01/2022 937United States Treasury Note/Bond, 1.125%, due 28/02/2025 929Intesa Sanpaolo SpA, Series 0000, 144A, 6.500%, due 24/02/2021 920Altria Group Inc, 4.800%, due 14/02/2029 891Citigroup Inc, 4.000%, due 10/03/2070 884
Western Asset UCITS SMASh Series Core Plus Completion Fund^
MAJOR PURCHASESCOST
(in 000’s) $Western Asset Liquidity Funds Plc – Western Asset US Dollar Liquidity Fund –Class WA (Distributing) 3,940United States Cash Management Bill, zero coupon, due 04/05/2021 2,999United States Treasury Note/Bond, 0.625%, due 31/12/2027 2,681United States Treasury Note/Bond, 0.375%, due 31/12/2025 2,430Fannie Mae or Freddie Mac 30 year, TBA, zero coupon 1,802Fannie Mae or Freddie Mac 30 year, TBA, zero coupon 1,286Ginnie Mae II Pool ‘MA6658’, 4.000%, due 20/05/2050 859Ginnie Mae 30 year, TBA, zero coupon 855Ginnie Mae 30 year, TBA, zero coupon 837Mexican Bonos, 7.750%, due 13/11/2042 822United States Treasury Note/Bond, 0.750%, due 31/01/2028 770Fannie Mae or Freddie Mac 30 year, 3.500%, due 31/12/2049 745Fannie Mae Pool ‘FM3445’, 4.000%, due 01/09/2048 670Ginnie Mae 30 year, TBA, zero coupon 635Fannie Mae, 4.000%, due 01/08/2048 623United States Treasury Note/Bond, 1.375%, due 15/08/2050 590Legg Mason China Funds – Western Asset China Bond Fund – Class M 574Russian Federal Bond – OFZ, 6.900%, due 23/05/2029 548United States Treasury Inflation Indexed Bonds, 2.125%, due 15/02/2040 535Freddie Mac, 3.500%, due 01/06/2049 529Fannie Mae or Freddie Mac 30 year, 2.000%, due 31/12/2049 509Fannie Mae Pool ‘MA3057’, 3.500%, due 01/07/2047 508Ginnie Mae II Pool ‘MA6283’, 3.000%, due 20/11/2049 433
MAJOR SALESPROCEEDS(in 000’s) $
Western Asset Liquidity Funds Plc – Western Asset US Dollar Liquidity Fund –Class WA (Distributing) 3,039United States Treasury Note/Bond, 0.375%, due 31/12/2025 1,939Fannie Mae or Freddie Mac 30 year, TBA, zero coupon 1,807Fannie Mae or Freddie Mac 30 year, TBA, zero coupon 1,286United States Treasury Note/Bond, 0.625%, due 31/12/2027 971United States Cash Management Bill, zero coupon, due 04/05/2021 920Ginnie Mae 30 year, TBA, zero coupon 855Ginnie Mae 30 year, TBA, zero coupon 837Ginnie Mae 30 year, TBA, zero coupon 635Fannie Mae, 4.000%, due 01/08/2048 624Freddie Mac, 3.500%, due 01/06/2049 532United States Treasury Note/Bond, 0.750%, due 31/01/2028 445Ginnie Mae II Pool ‘MA6658’, 4.000%, due 20/05/2050 427Ginnie Mae II Pool ‘MA6710’, 3.000%, due 20/06/2050 418Ginnie Mae II Pool ‘MA6711’, 3.500%, due 20/06/2050 318Ginnie Mae 30 year, TBA, zero coupon 316Ginnie Mae 30 year, TBA, zero coupon 314Ginnie Mae 30 year, TBA, zero coupon 311Fannie Mae or Freddie Mac 15 year, TBA, zero coupon 308Dell International LLC, 2.750%, due 19/09/2025 91
Legg Mason Brandywine Global Fixed Income Fund
MAJOR PURCHASESCOST
(in 000’s) $Goldman Sachs US$ Liquid Reserves Fund – Institutional Class 723,707United States Treasury Floating Rate Note, 0.144%, due 30/04/2022 208,538United States Treasury Floating Rate Note, 0.085%, due 31/07/2022 130,388United Kingdom Gilt, 1.500%, due 22/01/2021 115,982United Kingdom Gilt, 1.750%, due 07/09/2022 74,113Italy Government International Bond, 2.450%, due 01/09/2050 62,285New Zealand Government International Bond, 6.000%, due 15/05/2020 37,590Spain Government International Bond, 2.700%, due 31/10/2048 37,556United Kingdom Gilt, 2.000%, due 22/07/2020 30,287United States Treasury Note/Bond, 1.250%, due 15/05/2050 27,904Portugal Government International Bond, 4.100%, due 15/02/2045 22,207United States Treasury Floating Rate Note, 0.304%, due 31/01/2022 21,777Indonesia Treasury Bond, Series FR71, 9.000%, due 15/03/2029 20,744United States Treasury Floating Rate Note, 0.079%, due 31/01/2023 15,536United States Treasury Floating Rate Note, 0.085%, due 31/10/2022 15,502Chile Government International Bond, 3.500%, due 25/01/2050 14,104Republic of Poland Government Bond, Series 1020, 5.250%, due 25/10/2020 13,010Australia Government International Bond, 1.750%, due 21/06/2051 11,201Petroleos Mexicanos, 7.690%, due 23/01/2050 9,114Indonesia Treasury Bond, Series FR71, 8.375%, due 15/03/2034 7,792
MAJOR SALESPROCEEDS(in 000’s) $
Goldman Sachs US$ Liquid Reserves Fund – Institutional Class 719,717United States Treasury Floating Rate Note, 0.144%, due 30/04/2022 182,821United States Treasury Floating Rate Note, 1.811%, due 31/10/2021 128,957United Kingdom Gilt, 1.500%, due 22/01/2021 119,483United States Treasury Floating Rate Note, 1.650%, due 30/04/2021 98,803United Kingdom Gilt, 2.000%, due 22/07/2020 96,865United States Treasury Note/Bond, 2.375%, due 15/11/2049 75,093Italy Government International Bond, 2.450%, due 01/09/2050 69,142Norway Government Bond, Series 474, 144A, 3.750%, due 25/05/2021 53,695United States Treasury Floating Rate Note, 1.731%, due 31/07/2021 49,578Spain Government International Bond, 2.700%, due 31/10/2048 43,251Inter-American Development Bank, 1.671%, due 09/10/2020 39,937New Zealand Government International Bond, 6.000%, due 15/05/2020 38,744Republic of Poland Government Bond, Series 1020, 5.250%, due 25/10/2020 36,647United States Treasury Floating Rate Note, 0.085%, due 31/07/2022 34,677European Bank for Reconstruction & Development, 6.450%, due 13/12/2022 31,637Portugal Government International Bond, 4.100%, due 15/02/2045 26,413Colombian TES, Series B, 6.000%, due 28/04/2028 24,801United States Treasury Floating Rate Note, 0.304%, due 31/01/2022 21,802United Kingdom Gilt, 1.750%, due 07/09/2022 21,076
Legg Mason Brandywine Global Fixed Income Absolute Return Fund^
MAJOR PURCHASESCOST
(in 000’s) $Goldman Sachs US$ Liquid Reserves Fund – Institutional Class 659,097United States Treasury Floating Rate Note, 0.144%, due 30/04/2022 112,914United States Treasury Floating Rate Note, 0.085%, due 31/07/2022 53,453United States Treasury Floating Rate Note, 0.079%, due 31/01/2023 52,658United States Treasury Floating Rate Note, 1.665%, due 31/01/2022 45,206
MAJOR SALESPROCEEDS(in 000’s) $
Goldman Sachs US$ Liquid Reserves Fund – Institutional Class 631,411United States Treasury Floating Rate Note, 1.665%, due 31/01/2022 141,115United States Treasury Floating Rate Note, 1.650%, due 30/04/2021 58,262United States Treasury Floating Rate Note, 1.731%, due 31/07/2021 46,989United States Treasury Floating Rate Note, 1.811%, due 31/10/2021 45,205
^ Not authorised for sale to the public in Hong Kong.
399

Legg Mason Global Funds Plc Annual Report 28 February 2021
Statement of Major Portfolio Changes (unaudited) – (continued)
Legg Mason Brandywine Global Fixed Income Absolute Return Fund^ – (continued)
MAJOR PURCHASESCOST
(in 000’s) $United States Treasury Floating Rate Note, 0.085%, due 31/10/2022 30,760Brazil Notas do Tesouro Nacional Serie F, Series NTNF, 10.000%, due01/01/2027 24,785Republic of South Africa Government Bond, Series 2032, 8.250%, due31/03/2032 20,625Republic of South Africa Government Bond, Series R213, 7.000%, due28/02/2031 18,417Bank of American Corp, 4.083%, due 20/03/2051 18,120Bank of Nova Scotia/The, 0.609%, due 15/09/2023 16,370Bank of Montreal, 0.741%, due 10/03/2023 15,870Petroleos Mexicanos, 7.690%, due 23/01/2050 13,723Australia Government Internationl Bond, 1.750%, due 21/06/2051 12,935General Motors Financial Co Inc, 1.231%, due 17/11/2023 11,605Petroleos Mexicanos, 6.750%, due 21/09/2047 7,975Wells Fargo & Co, 4.478%, due 04/04/2031 7,720Angel Oak Mortgage Trust 2019-6, Series 2019 6, Class A1, 144A, 2.620%,due 25/11/2059 7,582Oracle Corp, 3.600%, due 01/04/2050 7,484General Motors Co, 5.950%, due 01/04/2049 7,448
MAJOR SALESPROCEEDS(in 000’s) $
General Motors Financial Co Inc, 2.778%, due 13/04/2020 26,080NBCUniversal Enterprise Inc, 144A, 2.309%, due 01/04/2021 25,569Daimler Finance North America LLC, 144A, 2.133%, due 22/02/2021 23,791United States Treasury Note/Bond, 2.375%, due 15/11/2049 22,330Bank of American Corp, 4.083%, due 20/03/2051 21,245Citibank NA, 2.063%, due 12/02/2021 20,860Republic of Poland Government Bond, Series 0420, 1.500%, due 25/04/2020 20,727Mexican Bonos, Series M 20, 8.500%, due 31/05/2029 18,786BMW US Capital LLC, 144A, 2.280%, due 06/04/2020 17,721Brazil Notas do Tesouro Nacional Serie F, Series NTNF, 10.000%, due01/01/2021 17,433National Australia Bank Ltd, 144A, 2.193%, due 22/05/2020 15,813Petroleos Mexicanos, 144A, 7.690%, due 23/01/2050 14,976Brazil Notas do Tesouro Nacional Serie F, Series NTNF, 10.000%, due01/01/2023 14,321Wells Fargo & Co, 1.240%, due 26/07/2021 13,511Australia Government Internationl Bond, 1.750%, due 21/06/2051 13,145
Legg Mason Brandywine Global High Yield Fund^
MAJOR PURCHASESCOST
(in 000’s) $Goldman Sachs US$ Liquid Reserves Fund – Institutional Class 7,703Banco Mercantil del Norte SA/Grand VAR, 6.750%, due 27/09/2069 386Petroleos Mexicanos, 6.950%, due 28/01/2060 269Petroleos Mexicanos, 5.350%, due 12/02/2028 258Petrobras Global Finance BV, 5.600%, due 03/01/2031 241DISH Network Corp, 3.375%, due 15/08/2026 238First Quantum Minerals Ltd, 144A, 6.875%, due 15/10/2027 225Sunac China Holdings Ltd, 8.350%, due 19/04/2023 215Cemex SAB de CV, 7.750%, due 16/04/2026 210Realogy Group LLC / Realogy Co-Issuer Corp, 144A, 7.625%, due 15/06/2025 208CSN Inova Ventures, 144A, 6.750%, due 28/01/2028 203Ardagh Packaging Finance Plc / Ardagh Holdings USA Inc, 144A, 5.250%, due15/08/2027 202AES Panama Generation Holdings SRL, 4.375%, due 31/05/2030 200Amaggi Luxembourg International Sarl, 5.250%, due 28/01/2028 200Braskem Netherlands Finance BV, 8.500%, due 23/01/2081 200Credito Real SAB de CV SOFOM ER, 144A, 8.000%, due 21/01/2028 200Hidrocias International Finance SA, 4.950%, due 08/02/2031 200Kenbourne Invest SA, 4.700%, due 22/01/2028 200Ukraine Government International Bond, 7.253%, due 15/03/2033 200Yapi ve Kredi Bankasi AS, 7.875%, due 22/01/2031 200Credicorp Ltd, 2.750%, due 17/06/2025 199Embraer Netherlands Finance BV, 144A, 6.950%, due 17/01/2028 199Turkey Government International Bond, 5.950%, due 15/01/2031 199Apache Corp, 4.875%, due 15/11/2027 198
MAJOR SALESPROCEEDS(in 000’s) $
Goldman Sachs US$ Liquid Reserves Fund – Institutional Class 7,967Banco Mercantil del Norte SA/Grand VAR, 6.750%, due 27/09/2069 403PetSmart Inc, 144A, 5.875%, due 01/06/2025 381BRF SA, 144A, 3.950%, due 22/05/2023 263CCO Holdings LLC / CCO Holdings Capital Corp, 5.125%, due 01/05/2027 258Reynolds Group Issuer Inc / Reynolds Group Issuer LLC / Reynolds Group IssuerLu, 5.125%, due 15/07/2023 249CSC Holdings LLC, 5.250%, due 01/06/2024 247Univision Communications Inc, 144A, 5.125%, due 15/05/2023 247AES Corp/VA, 4.000%, due 15/03/2021 233Cemex SAB de CV, 7.750%, due 16/04/2026 212Tenet Healthcare Corp, 5.125%, due 01/11/2027 212Ardagh Packaging Finance Plc / Ardagh Holdings USA Inc, 6.000%, due15/02/2025 209Realogy Group LLC / Realogy Co-Issuer Corp, 144A, 5.250%, due 01/12/2021 208Teva Pharmaceutical Finance Netherlands III BV, 144A, 7.125%, due31/01/2025 207CommScope Inc, 144A, 6.000%, due 01/03/2026 206Hidrocias International Finance SA, 4.950%, due 08/02/2031 205Credicorp Ltd, 2.750%, due 17/06/2025 204Banco Bradesco SA/Cayman Islands, 144A, 2.850%, due 27/01/2023 203First Quantum Minerals Ltd, 7.250%, due 15/05/2022 200Republic of South Africa Government International Bond, 5.750%, due30/09/2049 200DPL Inc, 7.250%, due 15/10/2021 195
Legg Mason Brandywine Global Opportunistic Fixed Income Fund
MAJOR PURCHASESCOST
(in 000’s) $Goldman Sachs US$ Liquid Reserves Fund – Institutional Class 618,102United States Treasury Floating Rate Note, zero coupon, due 30/04/2022 122,428United Kingdom Gilt, 1.500%, due 22/01/2021 112,023United States Treasury Floating Rate Note, 0.085%, due 31/07/2022 FRN 108,856United Kingdom Gilt, 1.750%, due 07/09/2022 83,387United Kingdom Gilt, 2.000%, due 22/07/2020 35,115United States Treasury Floating Rate Note, 0.079%, due 31/01/2023 FRN 27,347Italy Government International Bond, 2.450%, due 01/09/2050 25,717United States Treasury Floating Rate Note, 0.085%, due 31/10/2022 FRN 25,467Norway Government Bond, Series 474, 144A, 3.750%, due 25/05/2021 23,448New Zealand Government International Bond, 6.000%, due 15/05/2021 22,708Brazil Notas do Tesouro Nacional Serie F, Series NTNF, 10.000%, due01/01/2027 17,618Australia Government Bond, Series 128, 5.750%, due 15/07/2022 13,485Bank of America Corp Var, 4.083%, due 20/03/2051 12,452Bank of Nova Scotia/The, 0.609%, due 15/09/2023 FRN 12,080Republic of Poland Government Bond, Series 1020, 5.250%, due 25/10/2020 11,301General Electric Co, 4.350%, due 01/05/2050 10,894Bank of Montreal, 0.741%, due 10/03/2023 FRN 10,665Spain Government International Bond, 1.000%, due 31/10/2050 10,406Australia Government Bond, Series 128, 1.750%, due 21/06/2051 10,158
MAJOR SALESPROCEEDS(in 000’s) $
Goldman Sachs US$ Liquid Reserves Fund – Institutional Class 593,347United States Treasury Floating Rate Note, 1.500%, due 22/01/2021 122,472United Kingdom Gilt, 1.500%, due 22/01/2021 115,326United Kingdom Gilt, 2.000%, due 22/07/2020 62,323United States Treasury Floating Rate Note, 1.731%, due 31/07/2021 52,247United States Treasury Note/Bond, 2.375%, due 15/11/2049 47,060United States Treasury Floating Rate Note, 1.665%, due 31/01/2022 34,805United States Treasury Floating Rate Note, 1.811%, due 31/10/2021 31,292Italy Government International Bond, 2.450%, due 01/09/2050 29,321Norway Government Bond, Series 474, 144A, 3.750%, due 25/05/2021 29,088New Zealand Government International Bond, 6.000%, due 15/05/2021 23,510Republic of Poland Government Bond, Series 1020, 5.250%, due 25/10/2020 23,439United States Treasury Floating Rate Note, 0.085%, due 31/07/2022 22,715United States Treasury Floating Rate Note, 1.650%, due 30/04/2021 15,387Bank of America Corp Var, 4.083%, due 20/03/2051 14,374Australia Government Bond, Series 128, 5.750%, due 15/07/2022 12,891Spain Government International Bond, 1.000%, due 31/10/2050 12,362General Motors Financial Co Inc, 2.778%, due 13/04/2020 12,320Kommunalbanken AS, 144A, 2.224%, due 16/06/2020 11,566Brazil Notas do Tesouro Nacional Serie F, Series NTNF, 10.000%, due01/01/2021 11,402
Legg Mason Brandywine Global Sovereign Credit Fund^
MAJOR PURCHASESCOST
(in 000’s) $Goldman Sachs US$ Liquid Reserves Fund – Institutional Class 666,703United States Treasury Floating Rate Note, zero coupon, due 30/04/2022 81,960United States Treasury Floating Rate Note, zero coupon, due 31/07/2021 58,244United Kingdom Gilt, 1.500%, due 22/01/2021 39,503
MAJOR SALESPROCEEDS(in 000’s) $
Goldman Sachs US$ Liquid Reserves Fund – Institutional Class 709,333United States Treasury Floating Rate Note, 1.650%, due 30/04/2021 280,402United Kingdom Gilt, 2.000%, due 22/07/2020 141,457United States Treasury Note/Bond, 2.375%, due 15/11/2049 132,496
^ Not authorised for sale to the public in Hong Kong.
400

Legg Mason Global Funds Plc Annual Report 28 February 2021
Statement of Major Portfolio Changes (unaudited) – (continued)
Legg Mason Brandywine Global Sovereign Credit Fund^ – (continued)
MAJOR PURCHASESCOST
(in 000’s) $Russia Government International Bond, 7.650%, due 10/04/2030 38,029Italy Government International Bond, 3.850%, due 01/09/2049 31,853Colombia Government International Bond, 7.000%, due 30/06/2032 28,803Italy Government International Bond, 2.450%, due 01/09/2050 27,348Indonesia Treasury Bond, Series FR71, 9.000%, due 15/03/2029 24,505Spain Government International Bond, 1.000%, due 31/10/2050 24,124Codelco Inc, 3.700%, due 30/01/2050 23,441Brazil Government International Bond, 10.000%, due 01/01/2027 23,299Petrobras Global Finance BV, 6.300%, due 19/03/2049 18,363Malaysia Government International Bond, 4.160%, due 15/07/2021 17,925United States Treasury Note/Bond, 0.375%, due 31/01/2026 16,937United Kingdom Gilt, 1.750%, due 07/09/2022 15,999Colombia Government International Bond, 7.250%, due 26/10/2050 15,559Hungary Government International Bond, 3.000%, due 21/08/2030 14,645Republic of South Africa Government Bond, Series 2048, 8.750%, due28/02/2048 12,607United States Treasury Note/Bond, 1.250%, due 15/05/2050 11,047
MAJOR SALESPROCEEDS(in 000’s) $
Indonesia Treasury Bond, Series FR71, 9.000%, due 15/03/2029 126,548United States Treasury Floating Rate Note, 1.731%, due 31/07/2021 110,413United States Treasury Floating Rate Note, 1.665%, due 31/01/2022 83,296United States Treasury Floating Rate Note, zero coupon, due 30/04/2022 81,980Mexican Bonos, Series M 30, 8.500%, due 18/11/2038 73,107Mexican Bonos, Series M, 8.000%, due 07/11/2047 70,182United States Treasury Floating Rate Note, zero coupon, due 31/07/2022 58,258Mexican Bonos, Series M, 7.750%, due 13/11/2042 56,320Australia Government Bond, Series 128, 5.750%, due 15/07/2022 46,779Indonesia Treasury Bond, Series FR68, 8.375%, due 15/03/2034 45,115United Kingdom Gilt, 1.500%, due 22/01.2021 41,128Brazil Notas do Tesouro Nacional Serie F, Series NTNF, 10.000%, due01/01/2023 37,604Malaysia Government Bond, Series 0313, 3.480%, due 15/03/2023 37,463Republic of South Africa Government Bond, Series 2048, 8.750%, due28/02/2048 36,819Russia Government International Bond, 7.650%, due 10/04/2030 36,591Italy Government International Bond, 3.850%, due 01/09/2049 36,409Colombian TES, Series B, 10.000%, due 24/07/2024 36,360Colombian TES, Series B, 7.500%, due 26/08/2026 34,820Italy Government International Bond, 2.450%, due 01/09/2050 33,652Indonesia Treasury Bond, Series FR78, 8.250%, due 15/05/2029 31,186Colombia Government International Bond, 7.000%, due 30/06/2032 29,604
Legg Mason Brandywine Global Income Optimiser Fund^
MAJOR PURCHASESCOST
(in 000’s) $Goldman Sachs US$ Liquid Reserves Fund – Institutional Class 224,400United States Treasury Floating Rate Note, zero coupon, due 30/04/2022 29,354United States Treasury Floating Rate Note, 0.085%, due 31/10/2022 19,447Fannie Mae Connecticut Avenue Securities, Series 2018 C03, Class 1M2C,2.268%, due 25/10/2030 10,956STACR Trust 2018-DNA3, Series 2018 DNA3, Class M2B, 144A, 2.218%, due25/09/2048 9,964DISH Network Corp, 3.375%, due 15/08/2026 9,642Owl Rock Technology Finance Corp, 144A, 3.750%, due 17/06/2026 9,561Brazil Government International Bond, 10.000%, due 01/01/2027 7,638Petroleos Mexicanos, 5.350%, due 12/02/2028 7,620GLP Capital LP / GLP Financing II Inc, 5.375%, due 15/04/2026 6,047Egypt Treasury Bills, Series 182D, zero coupon, due 09/03/2021 6,018Petroleos Mexicanos, 6.950%, due 28/01/2060 6,010Egypt Treasury Bills, Series 182D, zero coupon, due 23/02/2021 5,824Alaska Airlines 2020-1 Class A Pass Through Trust, 144A, 4.800%, due15/08/2027 5,675Boeing Co/The, 5.040%, due 01/05/2027 5,455Connecticut Avenue Securities Trust 2019-R03, Series 2019 R03, Class 1B1,144A, 4.218%, due 25/09/2031 5,113Western Digital Corp, 1.500%, due 01/02/2024 5,066Citrix Systems Inc, 1.250%, due 01/03/2026 5,055Ford Motor Credit Co LLC, 2.900%, due 16/02/2028 5,000Block Financial LLC, 3.875%, due 15/08/2030 4,895
MAJOR SALESPROCEEDS(in 000’s) $
Goldman Sachs US$ Liquid Reserves Fund – Institutional Class 190,814United States Treasury Floating Rate Note, zero coupon, due 30/04/2022 29,355United States Treasury Floating Rate Note, 0.085%, due 31/10/2022 8,103Brazil Government International Bond, 10.000%, due 01/01/2027 7,124Egypt Treasury Bills, Series 182D, zero coupon, due 23/02/2021 5,984Connecticut Avenue Securities Trust, 4.280%, due 25/08/2031 4,104Portugal Obrigacoes do Tesouro OT, 144A, 4.100%, due 15/02/2045 4,040Italy Government International Bond, 1.700%, due 01/09/2051 4,038PetSmart Inc, 144A, 5.875%, due 01/06/2025 3,453United Kingdom Gilt, 1.750%, due 22/01/2049 3,246Taseko Mines Ltd, 8.750%, due 15/06/2022 3,078Brazil Government International Bond, 10.000%, due 01/01/2023 2,908Spain Government Bond, Series 30Y, 144A, 2.700%, due 31/10/2048 2,791Hungary Government International Bond, 3.000%, due 21/08/2030 2,777Petrobras Global Finance BV, 5.600%, due 03/01/2031 2,755Australia Government International Bond, 1.750%, due 21/06/2051 2,642Petroleos Mexicanos, 6.950%, due 28/01/2060 2,544Freeport-McMoRan Inc, 4.625%, due 01/08/2030 2,493WaMu Mortgage Pass-Through Series 2004-AR5 Trust, Series 2004 AR5,Class A6, 4.688%, due 25/06/2034 2,254Banco Mercantil del Notre SA/Grand Var, 6.750%, due 27/09/2069 2,167
Legg Mason Brandywine Global Credit Opportunities Fund^
MAJOR PURCHASESCOST
(in 000’s) $Goldman Sachs US$ Liquid Reserves Fund – Institutional Class 32,352Fannie Mae Connecticut Avenue Securities, Series 2018 C05, Class 1B1,4.368%, due 25/01/2031 FRN 2,659FREMF Mortgage Trust Var, 4.004%, due 25/02/2050 2,586Citigroup Commercial Mortgage Trust 2013-GC15, Series 2013 GC15,Class C, 5.181%, due 10/09/2046 VAR 2,230Santander Drive Auto Receivables Llc, 3.350%, due 17/07/2023 1,991United States Treasury FRN, zero coupon, due 31/07/2022 1,990Wells Fargo Commercial Mortgage Trust 2015-LC22, Series 2015 LC22,Class XA, 0.772%, due 15/09/2058 VAR 1,917CGDBB Commercial Mortgage Trust 2017-BIOC, Series 2017 BIOC, Class B,144A, 2.629%, due 15/07/2032 1,861Santander Drive Auto Receivables Llc, 2.700%, due 17/05/2027 1,620Freddie Mac STACR Trust 2019-HQA2 FRN, 2.537%, due 25/04/2049 1,609Santander Drive Auto Receivables Llc, 3.180%, due 15/10/2026 1,602GS Mortgage Securities Trust 2017-GS5, Series 2017 GS5, Class XA, 0.806%,due 10/03/2050 VAR 1,544Connecticut Avenue Securities Trust 2019-R07, Series 2019 R07, Class 1B1,144A, 3.518%, due 25/10/2039 FRN 1,480Freddie Mac STACR REMIC Trust 2021-DNA1, Series 2021 DNA1, Class B1,144A, 2.695%, due 25/01/2051 FRN 1,310DISH Network Corp, 3.375%, due 15/08/2026 1,300Connecticut Avenue Securities Trust 2019-R02, Series 2019 R02, Class 1B1,144A, 4.268%, due 25/08/2031 FRN 1,199Freddie Mac STACR REMIC Trust 2021-DNA1, Series 2021 DNA1, Class B2,144A, 4.795%, due 25/01/2051 FRN 1,185Connecticut Avenue Securities Trust 2019-R01, Series 2019 R01, Class 2B1,144A, 4.468%, due 25/07/2031 FRN 1,056
MAJOR SALESPROCEEDS(in 000’s) $
Goldman Sachs US$ Liquid Reserves Fund – Institutional Class 31,081FREMF 2017-K63 Mortgage Trust Var, 4.004%, due 25/02/2050 2,654CGDBB Commercial Mortgage Trust 2017-BIOC, Series 2017 BIOC, Class B,144A, 2.629%, due 15/07/2032 2,635Santander Drive Auto Receivables Llc, 3.350%, due 17/07/2023 2,003United States Treasury FRN, zero coupon, due 31/07/2022 1,990Santander Drive Auto Receivables Llc, 2.700%, due 17/05/2027 1,679Santander Drive Auto Receivables Llc, 3.180%, due 15/10/2026 1,636Freddie Mac STACR Trust 2019-HQA2 FRN, 2.537%, due 25/04/2049 1,633Morgan Stanley Bank of America Merrill Lynch Trust 2013-C7, Series 2013 C7,Class C, 4.122%, due 15/02/2046 1,573JPMBB Commercial Mortgage Securities Trust 2015-C32, Series 2015 C32,Class C, 4.656%, due 15/11/2048 1,470Wells Fargo Re-REMIC Trust 2013-FRR1, Series 2013 FRR1, Class BK20, 144A,0.000%, due 27/05/2045 1,414Egypt Treasury Bills, zero coupon, due 17/03/2020 1,276Egypt Treasury Bills, Series 273D, zero coupon, due 10/03/2020 1,275Bancaja 10 FTA 10, Class C, 0.090%, due 22/05/2050 1,275Sprint Corp, 7.250%, due 15/09/2021 1,241TDA 27 FTA 27, Class A3, 0.000%, due 28/12/2050 1,178COMM 2015-LC21 Mortgage Trust, Series 2015 LC21, Class D, 4.305%, due10/07/2048 1,170Towd Point Mortgage Trust 2017-4, Series 2017 4, Class A1, 144A, 2.750%,due 25/06/2057 1,092COMM 2015-CCRE26 Mortgage Trust, Series 2015 CR26, Class AM, 4.085%,due 10/10/2048 1,060Freddie Mac STACR REMIC Trust 2020, zero coupon, due 25/01/2051 FRN 1,039
^ Not authorised for sale to the public in Hong Kong.
401

Legg Mason Global Funds Plc Annual Report 28 February 2021
Statement of Major Portfolio Changes (unaudited) – (continued)
Legg Mason Brandywine Global Credit Opportunities Fund^ – (continued)
MAJOR PURCHASESCOST
(in 000’s) $Freddie Mac STACR REMIC Trust 2020, zero coupon, due 25/01/2051 FRN 1,034Annaly Capital Management Inc 976
MAJOR SALESPROCEEDS(in 000’s) $
Egypt Treasury Bills, Series 273D, zero coupon, due 21/04/2020 1,024COMM Mortgage Trust Var, 4.768%, due 10/06/2047 946FREMF 2016-K58 Mortgage Trust, Series 2016 K58, Class B, 144A, 3.738%,due 25/09/2049 919Towd Point Mortgage Trust 2017-5, Series 2017 5, Class A1, 144A, 2.227%,due 25/02/2057 898Freddie Mac STACR Trust 2019-DNA2 FRN, 2.635%, due 25/03/2049 881
Legg Mason Brandywine Global Defensive High Yield Fund^
MAJOR PURCHASESCOST
(in 000’s) $Goldman Sachs US$ Liquid Reserves Fund – Institutional Class 8,124Banco Mercantil del Notre SA/Grand Var, 6.750%, due 27/09/2069 386Petroleos Mexicanos, 6.950%, due 28/01/2060 261Petroleos Mexicanos, 5.350%, due 12/02/2028 249Petrobras Global Finance BV, 5.600%, due 03/01/2031 232Sunac China Holdings Ltd, 8.350%, due 19/04/2023 215Cemex SAB de CV, 7.750%, due 16/04/2026 210CSN Inova Ventures, 144A, 6.750%, due 28/01/2028 203Ardagh Packaging Finance Plc / Ardagh Holdings USA Inc, 4.125%, due15/08/2026 201Credito Real SAB de CV SOFOM ER, 144A, 8.000%, due 21/01/2028 200Braskem Netherlands Finance BV, 8.500%, due 23/01/2081 200Ukraine Government International Bond, 7.253%, due 15/03/2033 200Teva Pharmaceutical Finance Netherlands III BV, 7.125%, due 31/01/2025 200Kenbourne Invest SA, 4.700%, due 22/01/2028 200Amaggi Luxembourg International Sarl, 5.250%, due 28/01/2028 200AES Panama Generation Holdings SRL, 4.375%, due 31/05/2030 200Studio City Finance Ltd, 144A, 5.000%, due 15/01/2029 200Embraer Netherlands Finance BV, 144A, 6.950%, due 17/01/2028 199Turkey Government International Bond, 5.950%, due 15/01/2031 199China Evergrande Group, 6.250%, due 28/06/2021 195Apache Corp, 4.875%, due 15/11/2027 193
MAJOR SALESPROCEEDS(in 000’s) $
Goldman Sachs US$ Liquid Reserves Fund – Institutional Class 8,383Banco Mercantil del Notre SA/Grand Var, 6.750%, due 27/09/2069 402PetSmart Inc, 144A, 5.875%, due 01/06/2025 324Sprint Corp, 7.250%, due 15/09/2021 261Fiat Chrysler Automobiles NV, 5.250%, due 15/04/2023 260Gray Television Inc, 144A, 5.125%, due 15/10/2024 231Sprint Capital Corp, 6.875%, due 15/11/2028 227Reynolds Group Issuer Inc / Reynolds Group Issuer LLC / Reynolds Group IssuerLu, 144A, 5.125%, due 15/07/2023 218Cemex SAB de CV, 7.750%, due 16/04/2026 212Sinclair Television Group Inc, 144A, 5.625%, due 01/08/2024 204Banco Bradesco SA/Cayman Islands, 144A, 2.850%, due 27/01/2023 203Teva Pharmaceutical Finance Netherlands III BV, 144A, 7.125%, due31/01/2025 200Republic of South Africa Government International Bond, 5.750%, due30/09/2049 200First Quantum Minerals Ltd, 7.250%, due 15/05/2022 196Perrigo Finance Unlimited Co, 3.900%, due 15/12/2024 192China Evergrande Group. 6.250%, due 28/06/2021 190DPL Inc, 7.250%, due 15/10/2021 189Tenet Healthcare Corp, 5.125%, due 01/11/2027 187Petroleos Mexicanos, 6.950%, due 28/01/2060 180T-Mobile USA Inc, 3.875%, due 15/04/2030 178
Legg Mason Brandywine Global Enhanced Absolute Return Fund^
MAJOR PURCHASESCOST
(in 000’s) $Goldman Sachs US$ Liquid Reserves Fund – Institutional Class 101,679United States Treasury Floating Rate Note, 0.085%, due 31/07/2022 55,790United States Treasury Floating Rate Note, zero coupon, due 30/04/2022 37,881United States Treasury Floating Rate Note, 0.085%, due 31/10/2022 36,170Brazil Notas do Tesouro Nacional Serie F, Series NTNF, 10.000%, due01/01/2029 29,416United States Treasury Floating Rate Note, 1.665%, due 31/01/2022 18,615United States Treasury Floating Rate Note, 0.079%, due 31/01/2023 17,923Russian Federal Bond – OFZ, Series 6228, 7.650%, due 10/04/2030 13,621Bank of Nova Scotia/The, 0.609%, due 15/09/2023 8,175Petroleos Mexicanos, 7.690%, due 23/01/2050 6,935Bank of America Corp, 4.083%, due 20/03/2051 6,910Australia Government Bond, Series 128, 1.750%, due 21/06/2051 6,430Spain Government International Bond, 1.000%, due 31/10/2050 6,402Mexican Bonos, Series M, 7.750%, due 13/11/2042 6,182Indonesia Treasury Bond, Series FR71, 9.000%, due 15/03/2029 4,529Brazil Notas do Tesouro Nacional Serie F, Series NTNF, 10.000%, due01/01/2023 3,786Southwest Airlines Co, 5.125%, due 15/06/2027 3,632Republic of South Africa Government Bond, Series 2048, 8.750%, due28/02/2048 3,509Petrobras Global Finance BV, 6.750%, due 03/06/2050 2,972Wells Fargo & Co, 4.478%, due 04/04/2031 2,895
MAJOR SALESPROCEEDS(in 000’s) $
Goldman Sachs US$ Liquid Reserves Fund – Institutional Class 99,753United States Treasury Floating Rate Note, 1.811%, due 31/10/2021 49,246United States Treasury Floating Rate Note, zero coupon, due 30/04/2022 37,897Brazil Notas do Tesouro Nacional Serie F, Series NTNF, 10.000%, due01/01/2023 32,709United States Treasury Floating Rate Note, 0.085%, due 31/07/2022 27,281United States Treasury Floating Rate Note, 1.665%, due 31/01/2022 26,560United States Treasury Floating Rate Note, 1.650%, due 30/04/2021 24,385Mexican Bonos, Series M, 7.750%, due 13/11/2042 12,324Indonesia Treasury Bond, Series FR71, 9.000%, due 15/03/2029 10,584United States Treasury Floating Rate Note, 1.731%, due 31/07/2021 9,647Republic of South Africa Government Bond, Series 2048, 8.750%, due28/02/2048 8,327Bank of America Corp, 4.083%, due 20/03/2051 8,060Spain Government International Bond, 1.000%, due 31/10/2050 7,562Petroleos Mexicanos, 144A, 7.690%, due 23/01/2050 6,935Australia Government Bond, Series 128, 5.750%, due 15/07/2022 6,852Australia Government Bond, Series 128, 1.750%, due 21/06/2051 6,632Colombian TES, Series B, 6.000%, due 28/04/2028 4,638Brazil Notas do Tesouro Nacional Serie F, Series NTNF, 10.000%, due01/01/2029 4,436Mexican Bonos, Series M 20, 8.500%, due 31/05/2029 3,511Wells Fargo & Co, 4.478%, due 04/04/2031 3,509
Legg Mason Brandywine Global Dynamic US Equity Fund^
MAJOR PURCHASESCOST
(in 000’s) $Goldman Sachs US$ Liquid Reserves Fund – Institutional Class 529Citigroup Inc 85iShares Russell 1000 Value ETF 76Biogen Inc 70Emerson Electric Co 66Goldman Sachs Group Inc/The 54Lowe’s Cos Inc 53Regeneron Pharmaceuticals Inc 49US Bancorp 49Bank of America Corp 47ConocoPhillips Co 47Morgan Stanley 47Newmont Corp 44T Rowe Price Group Inc 44Target Corp 40Bank of New York Mellon Corp 36DR Horton Inc 36
MAJOR SALESPROCEEDS(in 000’s) $
Goldman Sachs US$ Liquid Reserves Fund – Institutional Class 520Apple Inc 193Amgen Inc 130Union Pacific Corp 115Cisco Systems Inc 104Illinois Tool Works Inc 103Honeywell International Inc 101Booking Holdings Inc 99Intel Corp 95CSX Corp 86Wells Fargo & Co 85Oracle Corp 82iShares Russell 1000 Value ETF 81Best Buy Co Inc 79Caterpillar Inc 79Emerson Electric Co 79Morgan Stanley 76
^ Not authorised for sale to the public in Hong Kong.
402

Legg Mason Global Funds Plc Annual Report 28 February 2021
Statement of Major Portfolio Changes (unaudited) – (continued)
Legg Mason Brandywine Global Dynamic US Equity Fund^ – (continued)
MAJOR PURCHASESCOST
(in 000’s) $Allstate Corp/The 34Honeywell International Inc 34Merck & Co Inc 34Johnson Controls International plc 32American Express Co 31Cummins Inc 31General Motors Co 31Walmart Inc 30
MAJOR SALESPROCEEDS(in 000’s) $
Baxter International Inc 75Walmart Inc 75Texas Instruments Inc 74Lowe’s Cos Inc 72eBay Inc 70Johnson & Johnson 68American Express Co 55Bank of America Corp 54International Business Machines Corp 54O’Reilly Automotive Inc 54Norfolk Southern Corp 51Discover Financial Services 48Target Corp 48
Legg Mason ClearBridge Value Fund
MAJOR PURCHASESCOST
(in 000’s) $Bank of America Corp 13,358Amazon.com Inc 10,824Goldman Sachs Group Inc/The 9,018DXC Technology Co 8,997Walt Disney Co/The 8,181Freeport-McMoRan Inc 8,064Eli Lilly and Co 7,668Sony Corp ADR 7,439T-Mobile US Inc 7,369General Electric Co 7,284Gilead Sciences Inc 7,043UnitedHealth Group Inc 6,891Charles Schwab Corp/The 6,806American International Group Inc 6,734Carnival Corp 6,720Wells Fargo & Co 6,649Parsley Energy Inc 6,532MGM Resorts International 6,526FedEx Corp 6,478TOTAL SE ADR 6,477Medtronic Plc 6,233EQT Corp 6,117Constellation Brands Inc ‘A’ 5,960OneMain Holdings Inc 5,922ON Semiconductor Corp 5,822Southwest Airlines Co 5,784Spirit AeroSystems Holdings Inc ‘A’ 5,612Fidelity National Information Services Inc 5,381Baidu Inc ADR 5,263Biogen Inc 5,165Liberty Media Corp-Liberty SiriusXM 5,110Micron Technology Inc 5,040TJX Cos Inc/The 5,008AbbVie Inc 4,795NXP Semiconductors NV 4,783Darden Restaurants Inc 4,743Pioneer Natural Resources Co 4,725ViacomCBS Inc ‘B’ 4,646Melco Resorts & Entertainment Ltd ADR 4,583BioMarin Pharmaceutical Inc 4,359CVS Health Corp 4,323Ulta Beauty Inc 4,202Oshkosh Corp 4,200Hartford Financial Services Group Inc/The 4,164General Motors Co 4,154Advance Auto Parts Inc 4,111Equitable Holdings Inc 4,084Comcast Corp 4,023Raytheon Technologies Corp 3,909Northrop Grumman Corp 3,766
MAJOR SALESPROCEEDS(in 000’s) $
Microsoft Corp 27,525Alphabet Inc 17,525Alexion Pharmaceuticals Inc 17,214Amazon.com Inc 13,267ViacomCBS Inc ‘B’ 11,440Bristol-Myers Squibb Co 9,554Kinder Morgan Inc 9,146DXC Technology Co 8,602Wheaton Precious Metals Corp 8,121Intercontinental Exchange Inc 7,965Exelon Corp 7,862Delta Air Lines Inc 6,685Facebook Inc ‘A’ 6,611Conagra Brands Inc 6,558Baidu Inc ADR 6,430Alibaba Group Holding Ltd ADR 6,031Mondelez International Inc 5,586American International Group Inc 5,397QUALCOMM Inc 5,282Advance Auto Parts Inc 5,273American Homes 4 Rent ‘A’ 5,171Arista Networks Inc 5,041Plains GP Holdings LP ‘A’ 4,920Unilever Plc 4,895Citigroup Inc 4,655Qorvo Inc 4,463Raytheon Technologies Corp 4,217Western Digital Corp 4,216Newmont Corp 4,055Anheuser-Busch InBev SA/NV ADR 3,944Lennar Corp 3,915Voya Financial Inc 3,773Vail Resorts Inc 3,557Pioneer Natural Resources Co 3,416Sony Corp ADR 3,351CVS Health Corp 3,336Capri Holdings Ltd 3,181
Legg Mason ClearBridge US Appreciation Fund
MAJOR PURCHASESCOST
(in 000’s) $Microsoft Corp 2,820Amazon.com Inc 2,671T-Mobile US Inc 2,172Fidelity National Information Services Inc 1,946Travelers Cos Inc/The 1,829Apple Inc 1,694Eli Lilly and Co 1,403Canadian Pacific Railway Ltd 1,307Intercontinental Exchange Inc 1,305Ball Corp 1,171
MAJOR SALESPROCEEDS(in 000’s) $
Microsoft Corp 6,474Walmart Inc 5,751Apple Inc 4,741Adobe Inc 3,017Facebook Inc ‘A’ 2,662Comcast Corp 2,575AT&T Inc 2,333Exxon Mobil Corp 2,174Visa Inc ‘A’ 2,001salesforce.com Inc 1,800
^ Not authorised for sale to the public in Hong Kong.
403

Legg Mason Global Funds Plc Annual Report 28 February 2021
Statement of Major Portfolio Changes (unaudited) – (continued)
Legg Mason ClearBridge US Appreciation Fund – (continued)
MAJOR PURCHASESCOST
(in 000’s) $ArcelorMittal SA 1,089Pinterest Inc 1,077JPMorgan Chase & Co 1,076Visa Inc ‘A’ 1,061Facebook Inc ‘A’ 1,058Comcast Corp 1,040Amgen Inc 1,025Toll Brothers Inc 996Home Depot Inc/The 970Adobe Inc 959Cognizant Technology Solutions Corp 956Bank of America Corp 928Honeywell International Inc 861General Motors Co 856Thermo Fisher Scientific Inc 854Walmart Inc 833UnitedHealth Group Inc 826Oracle Corp 795Johnson & Johnson 788PPG Industries Inc 770Merck & Co Inc 752Air Products & Chemicals Inc 718TJX Cos Inc/The 716Union Pacific Corp 667Berkshire Hathaway Inc 657Alphabet Inc 627Becton Dickinson and Co 619American Tower Corp 618Walt Disney Co/The 618Alphabet Inc ‘A’ 615United Parcel Service Inc ‘B’ 604Procter & Gamble Co/The 575American International Group Inc 571Mondelez International Inc 563Medtronic Plc 559Automatic Data Processing Inc 552
MAJOR SALESPROCEEDS(in 000’s) $
JPMorgan Chase & Co 1,691Home Depot Inc/The 1,665Berkshire Hathaway Inc 1,648Walt Disney Co/The 1,599Wells Fargo & Co 1,579Amazon.com Inc 1,502Cisco Systems Inc 1,443American Tower Corp 1,410UnitedHealth Group Inc 1,408Thermo Fisher Scientific Inc 1,406Becton Dickinson and Co 1,400Automatic Data Processing Inc 1,270Bank of America Corp 1,259Merck & Co Inc 1,232United Parcel Service Inc ‘B’ 1,190Pfizer Inc 1,156McDonald’s Corp 1,083American International Group Inc 1,052Honeywell International Inc 1,042Johnson & Johnson 1,029CVS Health Corp 1,000International Business Machines Corp 969Verizon Communications Inc 962PPG Industries Inc 872
Legg Mason ClearBridge US Large Cap Growth Fund
MAJOR PURCHASESCOST
(in 000’s) $Amgen Inc 42,033Ulta Beauty Inc 27,397Monster Beverage Corp 21,661Alcon Inc 19,526Tractor Supply Co 17,377NXP Semiconductors NV 17,293Visa Inc ‘A’ 16,342Workday Inc ‘A’ 16,309Atlassian Corp Plc 16,071ASML Holding NV 15,598salesforce.com Inc 14,836Aptiv Plc 13,494Home Depot Inc/The 12,825Amazon.com Inc 12,704Fidelity National Information Services Inc 10,198Palo Alto Networks Inc 9,284Facebook Inc ‘A’ 8,983Splunk Inc 7,557Uber Technologies Inc 7,187Apple Inc 7,009Otis Worldwide Corp 5,800UnitedHealth Group Inc 5,753VMware Inc 5,203CH Robinson Worldwide Inc 5,191QUALCOMM Inc 5,172IHS Markit Ltd 4,788
MAJOR SALESPROCEEDS(in 000’s) $
Alphabet Inc 56,079American Express Co 29,212Amazon.com Inc 27,783Microsoft Corp 26,623Alexion Pharmaceuticals Inc 25,492Johnson & Johnson 25,057Charles Schwab Corp/The 23,998Apple Inc 23,395Alphabet Inc ‘A’ 21,464Oracle Corp 21,359CH Robinson Worldwide Inc 20,406Comcast Corp 16,215Linde Plc 14,704Costco Wholesale Corp 14,296Facebook Inc ‘A’ 13,541NVIDIA Corp 12,496United Parcel Service Inc ‘B’ 11,756Akamai Technologies Inc 11,307Thermo Fisher Scientific Inc 11,264McCormick & Co Inc/MD 11,240Visa Inc ‘A’ 10,721Alibaba Group Holding Ltd ADR 10,685Walt Disney Co/The 10,238Pioneer Natural Resources Co 10,169Adobe Inc 8,432Home Depot Inc/The 8,385UnitedHealth Group Inc 8,337IHS Markit Ltd 7,697Zoetis Inc 6,664Otis Worldwide Corp 6,482WW Grainger Inc 6,376
Legg Mason ClearBridge US Aggressive Growth Fund
MAJOR PURCHASESCOST
(in 000’s) $Vertex Pharmaceuticals Inc 5,434Guardant Health Inc 3,553FireEye Inc 2,155Voyager Therapeutics Inc 437
MAJOR SALESPROCEEDS(in 000’s) $
Biogen Inc 37,925Nuance Communications Inc 27,883Seagate Technology Plc 25,634Comcast Corp 24,540Broadcom Inc 23,043Autodesk Inc 22,959
404

Legg Mason Global Funds Plc Annual Report 28 February 2021
Statement of Major Portfolio Changes (unaudited) – (continued)
Legg Mason ClearBridge US Aggressive Growth Fund – (continued)
MAJOR SALESPROCEEDS(in 000’s) $
UnitedHealth Group Inc 19,246Discovery Inc 18,549Twitter Inc 17,800Cree Inc 15,377Vertex Pharmaceuticals Inc 13,135TE Connectivity Ltd 12,628Ionis Pharmaceuticals Inc 12,571Cerence Inc 11,975Amgen Inc 11,407Allergan Plc 10,253Liberty Broadband Corp 10,130Liberty Broadband Corp 9,552AMC Networks Inc 9,153Western Digital Corp 7,471Johnson Controls International plc 7,430Freeport-McMoRan Inc 6,850Medtronic Plc 5,721Liberty Media Corp-Liberty SiriusXM 5,686National Oilwell Varco Inc 4,854Nucor Corp 4,832Madison Square Garden Co/The 4,491Citrix Systems Inc 4,352
Legg Mason ClearBridge Tactical Dividend Income Fund
MAJOR PURCHASESCOST
(in 000’s) $KKR & Co Inc, Series C 760Air Products & Chemicals Inc 665OneMain Holdings Inc 653Equinix Inc 588Broadcom Inc, Series A 567Plains GP Holdings LP ‘A’ 561NextEra Energy Inc 552JPMorgan Chase & Co 545American Airlines Group Inc, 6.500%, due 01/07/2025 522Sempra Energy 472Amgen Inc 471DTE Energy Co 435Carlyle Group Inc/The 431NXP Semiconductors NV 427CME Group Inc 425Coca-Cola Co/The 404Trinity Capital Inc 400NextEra Energy Partners LP 394TE Connectivity Ltd 389Aptiv Plc, Series A 358QUALCOMM Inc 344Oracle Corp 344Otis Worldwide Corp 317Barings BDC Inc 303Taiwan Semiconductor Manufacturing Co Ltd ADR 302Chubb Ltd 284Qurate Retail Group Inc 281Boston Scientific Corp, Series A 275Progressive Corp 270SBA Communications Corp ‘A’ 268Omeros Corp 250Bank of America Corp 207United Parcel Service Inc ‘B’ 203ASML Holding NV 189Royal Caribbean Cruises Ltd, 144A, 4.250%, due 15/06/2023 180Becton Dickinson and Co, Series B 179AbbVie Inc 176Danaher Corp 170
MAJOR SALESPROCEEDS(in 000’s) $
Apple Inc 905AT&T Inc 889Microsoft Corp 851Sempra Energy, Series B 677Blackstone Group Inc/The 658NextEra Energy Inc 622OneMain Holdings Inc 591ONEOK Inc 564Maxim Integrated Products Inc 556Crown Castle International Corp 529Texas Instruments Inc 523Raytheon Technologies Corp 494Edison International 492Intel Corp 488QUALCOMM Inc 432Air Products & Chemicals Inc 424Carlyle Group Inc/The 407Verizon Communications Inc 404Starwood Property Trust Inc 368AvalonBay Communities Inc 320Merck & Co Inc 318American Tower Corp 315Elanco Animal Health Inc 293NortonLifeLock Inc 288PepsiCo Inc 288Owl Rock Capital Corp 283Coca-Cola Co/The 278Paychex Inc 272Omeros Corp 271STORE Capital Corp 271Qurate Retail Group Inc 266Progressive Corp 263Apollo Global Management Inc ‘A’ 259Sempra Energy 238Pfizer Inc 220Procter & Gamble Co/The 219Danaher Corp 218Western Digital Corp 214
Legg Mason ClearBridge US Equity Sustainability Leaders Fund^
MAJOR PURCHASESCOST
(in 000’s) $Microsoft Corp 34,585Apple Inc 31,338Bank of America Corp 14,423CVS Health Corp 13,728UnitedHealth Group Inc 13,657Costco Wholesale Corp 13,133TE Connectivity Ltd 13,133Gilead Sciences Inc 12,643Ball Corp 12,562Amgen Inc 12,557Home Depot Inc/The 12,250Comcast Corp 12,224Danaher Corp 12,156
MAJOR SALESPROCEEDS(in 000’s) $
Alphabet Inc ‘A’ 9,137Ormat Technologies Inc 5,513Rockwell Automation Inc 4,222Automatic Data Processing Inc 3,256SolarEdge Technologies Inc 3,201Vestas Wind Systems A/S ADR 2,906Vail Resorts Inc 2,699Starbucks Corp 2,500Apple Inc 2,471Enphase Energy Inc 2,447Lam Research Corp 2,106Jones Lang LaSalle Inc 1,792Merck & Co Inc 1,673
^ Not authorised for sale to the public in Hong Kong.
405

Legg Mason Global Funds Plc Annual Report 28 February 2021
Statement of Major Portfolio Changes (unaudited) – (continued)
Legg Mason ClearBridge US Equity Sustainability Leaders Fund^ – (continued)
MAJOR PURCHASESCOST
(in 000’s) $Marriott International Inc/MD 11,592Regal Beloit Corp 10,918Trane Technologies Plc 10,877Progressive Corp/The 10,832Brookfield Renewable Energy Partners LP/CA, MLP 10,743Morgan Stanley 10,726Walt Disney Co/The 10,631Synopsys Inc 10,472Hartford Financial Services Group Inc/The 10,392NIKE Inc 10,224Lam Research Corp 10,163Aptiv Plc 10,057BioMarin Pharmaceutical Inc 10,000Hasbro Inc 9,909Trex Co Inc 9,765Booking Holdings Inc 9,761Becton Dickinson and Co 9,712salesforce.com Inc 9,657Visa Inc ‘A’ 9,247Charles Schwab Corp/The 9,244Herman Miller Inc 9,076Equinix Inc 9,018Keysight Technologies Inc 8,878Ecolab Inc 8,801T-Mobile US Inc 8,714First Republic Bank/CA 8,661BlackRock Inc 8,577SolarEdge Technologies Inc 8,424Hain Celestial Group Inc/The 8,354NextEra Energy Inc 7,967Vestas Wind Systems A/S ADR 7,868Workday Inc ‘A’ 7,866Resideo Technologies Inc 7,593Autodesk Inc 7,386Enphase Energy Inc 7,262Array Technologies Inc 6,360Vital Farms Inc 6,033Alphabet Inc ‘A’ 5,934
MAJOR SALESPROCEEDS(in 000’s) $
Alexion Pharmaceuticals Inc 1,623NIKE Inc 1,616Colgate-Palmolive Co 1,354Brookfield Renewable Corp 1,337Danaher Corp 1,258Progressive Corp/The 1,066Equinix Inc 948Trex Co Inc 869Costco Wholesale Corp 855Xylem Inc/NY 780BioMarin Pharmaceutical Inc 747Evoqua Water Technologies Corp 663US Bancorp 623
Legg Mason ClearBridge Global Growth Fund^
MAJOR PURCHASESCOST
(in 000’s) $Union Pacific Corp 215Atlassian Corp Plc 169Amadeus IT Group SA 142United Parcel Service Inc ‘B’ 141Ocado Group Plc 134Alibaba Group Holding Ltd ADR 126Alcon Inc 123Ulta Beauty Inc 123NextEra Energy Inc 121Marriott International Inc/MD 119Tesla Inc 117Sensient Technologies Corp 117Cellnex Telecom SA, 144A 116Legrand SA 116Pinterest Inc 112Atlas Copco AB ADR 112EDP – Energias de Portugal SA ADR 109Ecolab Inc 107adidas AG ADR 105Tokyo Electron Ltd 105MercadoLibre Inc 104Nihon M&A Center Inc 103Canadian Pacific Railway Ltd 102Intercontinental Exchange Inc 101Avantor Inc 98Procter & Gamble Co/The 98Apple Inc 98Vestas Wind Systems A/S 97Brambles Ltd NPV 95TE Connectivity Ltd 95Daiichi Sankyo Co Ltd 93T-Mobile US Inc 90CRH Plc ADR 88Guardant Health Inc 86Tencent Holdings Ltd ADR 85Alphabet Inc ‘A’ 84InPost SA 82Rentokil Initial Plc 82Diageo Plc ADR 82
MAJOR SALESPROCEEDS(in 000’s) $
Chewy Inc 285Alibaba Group Holding Ltd ADR 266Trex Co Inc 229Hain Celestial Group Inc/The 227Novartis AG ADR 206Alexion Pharmaceuticals Inc 187SolarEdge Technologies Inc 169Constellation Software Inc/Canada 167Comcast Corp 156Roche Holding AG 153Adyen NV, 144A 152Lennox International Inc 135Legrand SA ADR 134Coca-Cola Co/The 130NIKE Inc 123Brambles Ltd 118Walt Disney Co/The 114ICON Plc 113Nintendo Co Ltd 107SAP SE ADR 105Tokyo Electron Ltd 102Spotify Technology SA 102StoneCo Ltd ‘A’ 101IHS Markit Ltd 100Novo Nordisk A/S ADR 100TechnoPro Holdings Inc 95JPMorgan Chase & Co 95Apple Inc 93Gilead Sciences Inc 92Palo Alto Networks Inc 88Burberry Group Plc 88Visa Inc ‘A’ 87Charles Schwab Corp/The 87Deutsche Boerse AG NPV 86Linde Plc 85Zai Lab Ltd ADR 84Diageo Plc ADR 84Euronext NV Eur1.6 84Lightspeed POS Inc 81
^ Not authorised for sale to the public in Hong Kong.
406

Legg Mason Global Funds Plc Annual Report 28 February 2021
Statement of Major Portfolio Changes (unaudited) – (continued)
Legg Mason ClearBridge Global Growth Fund^ – (continued)
MAJOR PURCHASESCOST
(in 000’s) $SolarEdge Technologies Inc 81FANUC Corp 80FANUC Corp ADR 80Constellation Software Inc/Canada 80Workday Inc ‘A’ 78DexCom Inc 77Nintendo Co Ltd 77Just Eat Takeaway.com NV, 144A 76Deutsche Boerse AG NPV 74Amazon.com Inc 73IHS Markit Ltd 70London Stock Exchange Group Plc 70
MAJOR SALESPROCEEDS(in 000’s) $
NVIDIA Corp 80FANUC Corp ADR 80FANUC Corp 78Truist Financial Corp 76
Legg Mason ClearBridge Infrastructure Value Fund^
MAJOR PURCHASESCOST
(in 000’s) €
Edison International NPV 34,393Getlink SE 33,082NextEra Energy Inc 30,212American Tower Corp 29,771Atlantia SpA 28,722Public Service Enterprise Group Inc 25,245CSX Corp 24,987Orsted AS, 144A 23,300CMS Energy Corp 23,056Enbridge Inc 20,127Cellnex Telecom SA, 144A 19,648Terraform Power Inc 19,439American Electric Power Co Inc 17,483EDP – Energias de Portugal SA 15,331Transurban Group 14,824Vinci SA 14,460Iberdrola SA 14,040Union Pacific Corp 13,418Southern Co/The 13,051Exelon Corp 12,919Sydney Airport 12,910SSE Plc 12,705East Japan Railway Co 12,589Ferrovial SA 12,286Pinnacle West Capital Corp 10,900Aeroports de Paris 10,010Aena SME SA, 144A 9,929Eiffage SA 9,764Atlas Arteria Ltd 7,571Sempra Energy 7,383Cheniere Energy Inc 7,050Severn Trent Plc 6,647Transmissora Alianca de Energia Electrica NPV 6,451Terna Rete Elettrica Nazionale SpA 6,227
MAJOR SALESPROCEEDS
(in 000’s) €
Red Electrica Corp SA 35,693United Utilities Group Plc 31,632Dominion Energy Inc 31,086Edison International NPV 30,375Hydro One Ltd, 144A 29,968Emera Inc 29,639Severn Trent Plc 29,508Norfolk Southern Corp 29,274American Electric Power Co Inc 27,011Sempra Energy 23,381Union Pacific Corp 22,659Enbridge Inc 21,482Transurban Group 20,711Terna Rete Elettrica Nazionale SpA 20,707National Grid Plc 18,960Brookfield Renewable Corporation 16,007Williams Cos Inc/The 15,339Essential Utilities Inc 14,851Cheniere Energy Inc 13,457Aeroports de Paris 12,526Vinci SA 12,436NextEra Energy Partners LP 12,414Orsted AS, 144A 12,391China Merchants Port Holdings Co Ltd 11,333Atlantia SpA 11,168Snam SpA 11,040Ferrovial SA 10,474AltaGas Ltd 9,718Crown Castle International Corp 9,592Public Service Enterprise Group Inc 9,036NextEra Energy Inc 8,477GMexico Transportes SAB de CV, 144A 8,418American Tower Corp 7,909Clearway Energy Inc ‘C’ 7,840Getlink SE 7,168SSE Plc 6,993
Legg Mason ClearBridge Emerging Markets Infrastructure Fund^
MAJOR PURCHASESCOST
(in 000’s) $Transmissora Alianca de Energia Eletrica SA 75Jiangsu Expressway Co Ltd 69Shenzhen Expressway Co Ltd 68Neoenergia SA 66Electricity Generating PCL 54China Tower Corp Ltd, 144A 53Equatorial Energia SA 52Tenaga Nasional Bhd 52China Resources Gas Group Ltd 48CPFL Energia SA 47Xinyi Energy Holdings Ltd 46Guangdong Investment Ltd 41ENN Energy Holdings Ltd 37CCR SA 34Ratch Group PCL 34EcoRodovias Infraestrutura e Logistica SA 31Malaysia Airports Holdings Bhd 31Power Grid Corp of India Ltd 28Grupo Aeroportuario del Centro Norte SAB de CV ‘B’ 26Gujarat Gas Ltd 17Shanghai International Airport Co Ltd 17China Everbright International Ltd 15China Gas Holdings Ltd 14
MAJOR SALESPROCEEDS(in 000’s) $
China Everbright International Ltd 82China Merchants Port Holdings Co Ltd 79Transmissora Alianca de Energia Eletrica SA 63Mahanagar Gas Ltd 51Infraestructura Energetica Nova SAB de CV 49Indraprastha Gas Ltd 44Cia Energetica de Sao Paulo 40Gujarat State Petronet Ltd 38Grupo Aeroportuario del Sureste SAB de CV ‘B’ 36EcoRodovias Infraestrutura e Logistica SA 32Electricity Generating PCL 29CFE Capital S de RL de CV 28Centrais Eletricas Brasileiras SA 23Neoenergia SA 23Cia de Saneamento Basico do Estado de Sao Paulo 19ENN Energy Holdings Ltd 16Cia de Saneamento de Minas Gerais-COPASA 14Canvest Environmental Protection Group Co Ltd 13Gujarat Gas Ltd 13Jiangsu Expressway Co Ltd 12Guangdong Investment Ltd 11Equatorial Energia SA 4Shanghai International Airport Co Ltd 3
^ Not authorised for sale to the public in Hong Kong.
407
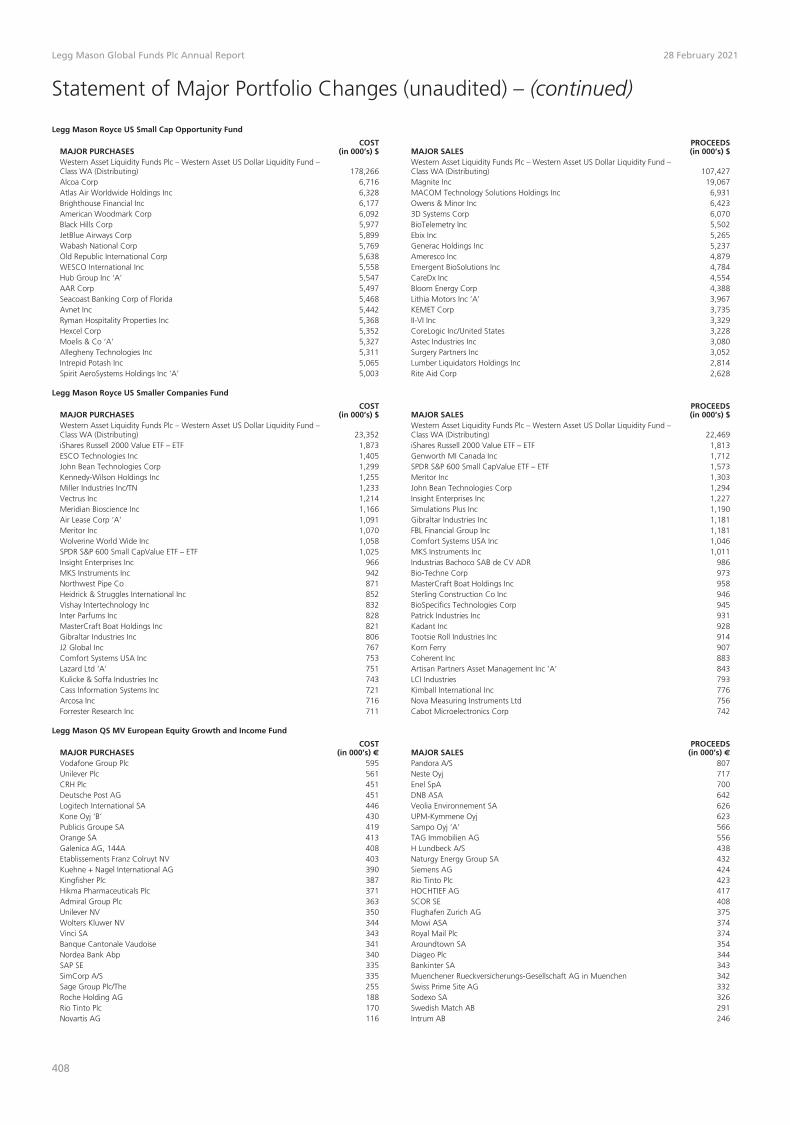
Legg Mason Global Funds Plc Annual Report 28 February 2021
Statement of Major Portfolio Changes (unaudited) – (continued)
Legg Mason Royce US Small Cap Opportunity Fund
MAJOR PURCHASESCOST
(in 000’s) $Western Asset Liquidity Funds Plc – Western Asset US Dollar Liquidity Fund –Class WA (Distributing) 178,266Alcoa Corp 6,716Atlas Air Worldwide Holdings Inc 6,328Brighthouse Financial Inc 6,177American Woodmark Corp 6,092Black Hills Corp 5,977JetBlue Airways Corp 5,899Wabash National Corp 5,769Old Republic International Corp 5,638WESCO International Inc 5,558Hub Group Inc ‘A’ 5,547AAR Corp 5,497Seacoast Banking Corp of Florida 5,468Avnet Inc 5,442Ryman Hospitality Properties Inc 5,368Hexcel Corp 5,352Moelis & Co ‘A’ 5,327Allegheny Technologies Inc 5,311Intrepid Potash Inc 5,065Spirit AeroSystems Holdings Inc ‘A’ 5,003
MAJOR SALESPROCEEDS(in 000’s) $
Western Asset Liquidity Funds Plc – Western Asset US Dollar Liquidity Fund –Class WA (Distributing) 107,427Magnite Inc 19,067MACOM Technology Solutions Holdings Inc 6,931Owens & Minor Inc 6,4233D Systems Corp 6,070BioTelemetry Inc 5,502Ebix Inc 5,265Generac Holdings Inc 5,237Ameresco Inc 4,879Emergent BioSolutions Inc 4,784CareDx Inc 4,554Bloom Energy Corp 4,388Lithia Motors Inc ‘A’ 3,967KEMET Corp 3,735II-VI Inc 3,329CoreLogic Inc/United States 3,228Astec Industries Inc 3,080Surgery Partners Inc 3,052Lumber Liquidators Holdings Inc 2,814Rite Aid Corp 2,628
Legg Mason Royce US Smaller Companies Fund
MAJOR PURCHASESCOST
(in 000’s) $Western Asset Liquidity Funds Plc – Western Asset US Dollar Liquidity Fund –Class WA (Distributing) 23,352iShares Russell 2000 Value ETF – ETF 1,873ESCO Technologies Inc 1,405John Bean Technologies Corp 1,299Kennedy-Wilson Holdings Inc 1,255Miller Industries Inc/TN 1,233Vectrus Inc 1,214Meridian Bioscience Inc 1,166Air Lease Corp ‘A’ 1,091Meritor Inc 1,070Wolverine World Wide Inc 1,058SPDR S&P 600 Small CapValue ETF – ETF 1,025Insight Enterprises Inc 966MKS Instruments Inc 942Northwest Pipe Co 871Heidrick & Struggles International Inc 852Vishay Intertechnology Inc 832Inter Parfums Inc 828MasterCraft Boat Holdings Inc 821Gibraltar Industries Inc 806J2 Global Inc 767Comfort Systems USA Inc 753Lazard Ltd ‘A’ 751Kulicke & Soffa Industries Inc 743Cass Information Systems Inc 721Arcosa Inc 716Forrester Research Inc 711
MAJOR SALESPROCEEDS(in 000’s) $
Western Asset Liquidity Funds Plc – Western Asset US Dollar Liquidity Fund –Class WA (Distributing) 22,469iShares Russell 2000 Value ETF – ETF 1,813Genworth MI Canada Inc 1,712SPDR S&P 600 Small CapValue ETF – ETF 1,573Meritor Inc 1,303John Bean Technologies Corp 1,294Insight Enterprises Inc 1,227Simulations Plus Inc 1,190Gibraltar Industries Inc 1,181FBL Financial Group Inc 1,181Comfort Systems USA Inc 1,046MKS Instruments Inc 1,011Industrias Bachoco SAB de CV ADR 986Bio-Techne Corp 973MasterCraft Boat Holdings Inc 958Sterling Construction Co Inc 946BioSpecifics Technologies Corp 945Patrick Industries Inc 931Kadant Inc 928Tootsie Roll Industries Inc 914Korn Ferry 907Coherent Inc 883Artisan Partners Asset Management Inc ‘A’ 843LCI Industries 793Kimball International Inc 776Nova Measuring Instruments Ltd 756Cabot Microelectronics Corp 742
Legg Mason QS MV European Equity Growth and Income Fund
MAJOR PURCHASESCOST
(in 000’s) €
Vodafone Group Plc 595Unilever Plc 561CRH Plc 451Deutsche Post AG 451Logitech International SA 446Kone Oyj ‘B’ 430Publicis Groupe SA 419Orange SA 413Galenica AG, 144A 408Etablissements Franz Colruyt NV 403Kuehne + Nagel International AG 390Kingfisher Plc 387Hikma Pharmaceuticals Plc 371Admiral Group Plc 363Unilever NV 350Wolters Kluwer NV 344Vinci SA 343Banque Cantonale Vaudoise 341Nordea Bank Abp 340SAP SE 335SimCorp A/S 335Sage Group Plc/The 255Roche Holding AG 188Rio Tinto Plc 170Novartis AG 116
MAJOR SALESPROCEEDS
(in 000’s) €
Pandora A/S 807Neste Oyj 717Enel SpA 700DNB ASA 642Veolia Environnement SA 626UPM-Kymmene Oyj 623Sampo Oyj ‘A’ 566TAG Immobilien AG 556H Lundbeck A/S 438Naturgy Energy Group SA 432Siemens AG 424Rio Tinto Plc 423HOCHTIEF AG 417SCOR SE 408Flughafen Zurich AG 375Mowi ASA 374Royal Mail Plc 374Aroundtown SA 354Diageo Plc 344Bankinter SA 343Muenchener Rueckversicherungs-Gesellschaft AG in Muenchen 342Swiss Prime Site AG 332Sodexo SA 326Swedish Match AB 291Intrum AB 246
408

Legg Mason Global Funds Plc Annual Report 28 February 2021
Statement of Major Portfolio Changes (unaudited) – (continued)
Legg Mason QS MV European Equity Growth and Income Fund – (continued)
MAJOR SALESPROCEEDS
(in 000’s) €
Skandinaviska Enskilda Banken AB 238Orion Oyj 223Safran SA 222Baloise Holding AG 220Hannover Rueck SE 211Swisscom AG 220WPP Plc 211SGS SA 189Publicis Groupe SA 187MAN SE 179Deutsche Telekom AG 174Recordati SpA 166
Legg Mason QS MV Asia Pacific Ex Japan Equity Growth and Income Fund
MAJOR PURCHASESCOST
(in 000’s) $iShares MSCI All Country Asia Ex Japan ETF – ETF 11,817AIA Group Ltd 973Supreme Electronics Co Ltd 589Uni-President China Holdings Ltd 547Rio Tinto Ltd 408Tingyi Cayman Islands Holding Corp 398Synnex Technology International Corp 395Fu Shou Yuan International Group Ltd 384Shanghai Pharmaceuticals Holding Co Ltd 372Poya International Co Ltd 357Power Grid Corp of India Ltd 357EEKA Fashion Holdings Ltd 356Select Harvests Ltd 327KB Financial Group Inc 305Nan Kang Rubber Tire Co Ltd 295Jardine Cycle & Carriage Ltd 270Indiabulls Housing Finance 212Luk Fook Holdings International Ltd 201Chicony Electronics Co Ltd 187Pacific Hospital Supply Co Ltd 162
MAJOR SALESPROCEEDS(in 000’s) $
iShares MSCI All Country Asia Ex Japan ETF – ETF 12,130Samsung Electronics Co Ltd 2,544Taiwan Semiconductor Manufacturing Co Ltd 2,266Dr Reddy’s Laboratories Ltd 1,153Infosys Ltd 1,117CTBC Financial Holding Co Ltd 984TTW PCL, NVDR 980Coca-Cola Amatil Ltd 964Home Product Center PCL, NVDR 898CP ALL PCL, NVDR 828Bioteque Corp 796HCL Technologies Ltd 756Sands China Ltd 662Coretronic Corp 619SCI Pharmtech Inc 617CapitaLand Retail China Trust 616Shenzhen Expressway Co Ltd 584Supreme Electronics Co Ltd 575Mega Financial Holding Co Ltd 568CK Hutchison Holdings Ltd 536
Legg Mason QS Emerging Markets Equity Fund
MAJOR PURCHASESCOST
(in 000’s) $CNOOC Ltd 89Yandex NV ‘A’ 65Dialog Group Bhd 58Central Retail Corp PCL, 144A 52Formosa Petrochemical Corp 48Chunghwa Telecom Co Ltd 46Uni-President Enterprises Corp 46Mobile TeleSystems PJSC ADR 43Hellenic Telecommunications Organization SA 41China Overseas Land & Investment Ltd 41Genting Bhd 40PTT PCL 39CCR SA 39Banco de Chile 39China Petroleum & Chemical Corp 38Sberbank of Russia PJSC 36Ping An Insurance Group Co Ltd 36Meituan, 144A 34Central Pattana PCL 34Emaar Properties PJSC 33
MAJOR SALESPROCEEDS(in 000’s) $
CNOOC Ltd 118Bidvest Group Ltd/The 99Oriental Pearl Group Co Ltd 75Huaxia Bank Co Ltd 68BR Malls Participacoes SA 68Aspen Pharmacare Holdings Ltd 68Celltrion Inc 58MOL Hungarian Oil & Gas Plc 56Mobile TeleSystems PJSC ADR 54Notre Dame Intermedica Participacoes SA 52Tencent Holdings Ltd 51Multiplan Empreendimentos Imobiliarios SA 49Fibra Uno Administracion SA de CV 48Alibaba Group Holding Ltd ADR 47Empresas COPEC SA 45Semiconductor Manufacturing International Corp 41Life Healthcare Group Holdings Ltd 40BIM Birlesik Magazalar AS 39Petroleo Brasileiro SA 39Petroleo Brasileiro SA 39
Legg Mason QS MV Global Equity Growth and Income Fund
MAJOR PURCHASESCOST
(in 000’s) $Nintendo Co Ltd 141General Mills Inc 136NTT DOCOMO Inc 130China Mobile Ltd 129Microsoft Corp 129HP Inc 128International Paper Co 127Clorox Co/The 1263M Co 125Northrop Grumman Corp 125CLP Holdings Ltd 124Johnson & Johnson 124Kroger Co/The 122Rio Tinto Ltd 121Quanta Computer Inc 120Koninklijke Ahold Delhaize NV 118Asia Cement Corp 117
MAJOR SALESPROCEEDS(in 000’s) $
iShares MSCI ACWI ETF – ETF 581Genesis Energy Ltd 198Grupo Mexico SAB de CV 196NTT DOCOMO Inc 177Venture Corp Ltd 162Skandinaviska Enskilda Banken AB 156Salmar ASA 155Austevoll Seafood ASA 152Mapletree Logistics Trust 143Mapletree Commercial Trust 140Brinker International Inc 125Sunac China Holdings Ltd 124Showa Denko KK 118Chow Tai Fook Jewellery Group Ltd 117SCOR SE 109Rio Tinto Plc 108Toronto-Dominion Bank/The 108
409

Legg Mason Global Funds Plc Annual Report 28 February 2021
Statement of Major Portfolio Changes (unaudited) – (continued)
Legg Mason QS MV Global Equity Growth and Income Fund – (continued)
MAJOR PURCHASESCOST
(in 000’s) $Intel Corp 116Orion Oyj 116Walgreens Boots Alliance Inc 116J M Smucker Co/The 115Flowers Foods Inc 113Postal Savings Bank of China Co Ltd, 144A 112Logitech International SA 108Cardinal Health Inc 86Cisco Systems Inc/Delaware 56Daito Trust Construction Co Ltd 35
MAJOR SALESPROCEEDS(in 000’s) $
China Mobile Ltd 101Motor Oil Hellas Corinth Refineries SA 92Valero Energy Corp 91Target Corp 84Royal Mail Plc 77Air New Zealand Ltd 76CNOOC Ltd ADR 75Eregli Demir ve Celik Fabrikalari TAS 72Persimmon Plc 65Qantas Airways Ltd 65BP Plc 64Z Energy Ltd 64Kohl’s Corp 53Muenchener Rueckversicherungs-Gesellschaft AG in Muenchen 52Malayan Banking Bhd 50Huaneng Power International Inc 48AES Corp/VA 47ComfortDelGro Corp Ltd 47Public Storage 47Southern Co/The 47
Legg Mason Martin Currie Asia Long-Term Unconstrained Fund^
MAJOR PURCHASESCOST
(in 000’s) $Venture Corp Ltd 3,367Orion Corp/Republic of Korea 2,646Techtronic Industries Co Ltd 2,567Tata Consultancy Services Ltd 2,520Samsung Electronics Co Ltd 2,064Shenzhou International Group Holdings Ltd 1,769Godrej Consumer Products Ltd 1,282Feng TAY Enterprise Co Ltd 1,171Alibaba Group Holding Ltd 1,066HDFC Bank Ltd 952Minth Group Ltd 946LG Chem Ltd 858Tencent Holdings Ltd 829CSPC Pharmaceutical Group Ltd 817Coway Co Ltd 711Guangdong Investment Ltd 639Taiwan Semiconductor Manufacturing Co Ltd 632Ping An Insurance Group Co of China Ltd 628United Overseas Bank Ltd 573Hero MotoCorp Ltd 369AIA Group Ltd 355LG Household & Health Care Ltd 344
MAJOR SALESPROCEEDS(in 000’s) $
Tencent Holdings Ltd 10,878Samsung Electronics Co Ltd 9,242Taiwan Semiconductor Manufacturing Co Ltd 7,950Alibaba Group Holding Ltd ADR 7,290AIA Group Ltd 5,885Tata Consultancy Services Ltd 5,617ENN Energy Holdings Ltd 5,317HSBC Holdings Plc 5,072Guangdong Investment Ltd 4,826Coway Co Ltd 4,757Singapore Technologies Engineering Ltd 4,751China Mobile Ltd 4,724Ping An Insurance Group Co of China Ltd 4,538United Overseas Bank Ltd 4,378HDFC Bank Ltd 4,285Alibaba Group Holding Ltd 4,162Jardine Matheson Holdings Ltd 3,963Hero MotoCorp Ltd 3,919TravelSky Technology Ltd 3,742LG Household & Health Care Ltd 3,542CSPC Pharmaceutical Group Ltd 3,526Minth Group Ltd 2,946Siam Commercial Bank PCL/The 2,923Techtronic Industries Co Ltd 2,245Venture Corp Ltd 1,858
Legg Mason Martin Currie European Absolute Alpha Fund^
MAJOR PURCHASESCOST
(in 000’s) €
Carlsberg AS 5,521Novartis AG 5,219Sika AG 4,378Sanofi 4,321Rio Tinto Plc 3,733Dometic Group AB, 144A 3,171Heidelbergcement AG 3,025Linde Plc 2,963SKF AB 2,872JDE Peet’s NV 2,776AMS AG 2,722Volkswagen AG 2,437Dassault Systems SA 2,402Royal Unibrew A/S 2,356GN Store Nord AS 2,126Britvic Plc 2,050Mowi ASA 2,039Vestas Wind Systems A/S 1,648Societe Generale SA 1,646Siemens Gamesa Renewable Energy SA 1,624Weir Group Plc 1,602Bayerische Motoren Werke AG 1,541STMicroelectronics NV 1,400Verbund AG 1,375Derwent London Plc 1,370Air Liquide SA 1,360SGS SA 1,256Fluidra SA 1,247
MAJOR SALESPROCEEDS
(in 000’s) €
La Francaise des Jeux SAEM, 144A 9,264Wolters Kluwer NV 7,984Novo Nordisk A/S 7,777Greggs Plc 7,638SGS SA 7,455Arkema SA 6,243Intermediate Capital Group Plc 5,960Carlsberg AS 5,783Cie de Saint-Gobain 5,531STMicroelectronics NV 5,524Novartis AG 5,114OTP Bank Nyrt 4,994Hargreaves Lansdown Plc 4,649Sanofi 4,622Taylor Wimpey Plc 4,456Temenos AG 4,438Moncler SpA 4,420Poste Italiane SpA, 144A 4,347Persimmon Plc 3,921Sika AG 3,888Telefonaktiebolaget LM Ericsson ‘B’ 3,813CRH Plc 3,766Bakkafrost P/F 3,443Heidelbergcement AG 3,413Vontobel Holding AG 3,354Rio Tinto Plc 3,330Dometic Group AB, 144A 3,277Trelleborg AB 3,188
^ Not authorised for sale to the public in Hong Kong.
410

Legg Mason Global Funds Plc Annual Report 28 February 2021
Statement of Major Portfolio Changes (unaudited) – (continued)
Legg Mason Martin Currie European Absolute Alpha Fund^ – (continued)
MAJOR PURCHASESCOST
(in 000’s) €
La Francaise des Jeux SAEM, 144A 1,228Cie de Saint-Gobain 1,198Great Portland Estates Plc 1,149Whitbread Plc 1,001VAT Group AG, 144A 979Logitech International 969UniCredit SpA 966Swedbank AB 936
MAJOR SALESPROCEEDS
(in 000’s) €
Great Portland Estates Plc 3,089Dassault Systems SA 3,060SKF AB 3,038Aalberts NV 3,003AMS AG 3,002DSV PANALPINA A/S 2,921SSAB AB ‘A’ 2,773GN Store Nord AS 2,728LafargeHolcim Ltd 2,715Royal Unibrew A/S 2,572Derwent London Plc 2,505Bureau Veritas SA 2,413Volkswagen AG 2,396Sandvik AB 2,392Autoliv Inc 2,346British Land Co Plc/The 2,239Marshalls Plc 2,178
Legg Mason Martin Currie Global Long-Term Unconstrained Fund^
MAJOR PURCHASESCOST
(in 000’s) $Kingspan Group Plc 4,298Wuxi Biologics Cayman Inc, 144A 3,273Illumina Inc 3,123ANSYS Inc 2,795Masimo Corp 2,328Taiwan Semiconductor Manufacturing Co Ltd 2,328Atlas Copco AB 2,136Veeva Systems Inc ‘A’ 2,107Microsoft Corp 2,031L’Oreal SA 1,860ResMed Inc 1,837Alibaba Group Holding Ltd ADR 1,815Kerry Group Plc 1,795Moncler SpA 1,732Tencent Holdings Ltd 1,694Mettler-Toledo International Inc 1,691Mastercard Inc 1,668Assa Abloy AB 1,666Linde Plc 1,661Coloplast A/S 1,600Ferrari NV 1,525AIA Group Ltd 1,511Kering SA 1,481adidas AG 1,479Adobe Inc 1,474CyberArk Software Ltd 1,111Straumann Holding AG 1,006Accenture Plc ‘A’ 954Starbucks Corp 889CSL Ltd 847Hexagon AB 783Dr. Martens Plc 706CSL Ltd 694Hexagon AB 601
MAJOR SALESPROCEEDS(in 000’s) $
Straumann Holding AG 3,031Automatic Data Processing Inc 1,756Canadian National Railway Co 1,142Spirax-Sarco Engineering Plc 951Waters Corp 896Beazley Plc 785Align Technology Inc 705Mettler-Toledo International Inc 554Masimo Corp 80Microsoft Corp 74Taiwan Semiconductor Manufacturing Co Ltd 69Coloplast A/S 66Mastercard Inc 65ResMed Inc 65Linde Plc 61CSL Ltd 60Atlas Copco AB 59Adobe Inc 56Tencent Holdings Ltd 54L’Oreal SA 54
Legg Mason Martin Currie Asia Pacific Ex Japan Real Income Fund
MAJOR PURCHASESCOST
(in 000’s) $Link REIT 1,123APA Group 1,021Mapletree Industrial Trust 986AusNet Services 955Guangdong Investment Ltd 950Power Grid Corp of India Ltd 839Aurizon Holdings Ltd 828Embassy Office Parks REIT 770Petronas Gas Bhd 768CapitaLand Integrated Commercial Trust 761Digital Telecommunications Infrastructure Fund 740Charter Hall Retail REIT 731NHPC Ltd 727CLP Holdings Ltd 719Vicinity Centres 650Yuexiu Transport Infrastructure Ltd 630Fortune Real Estate Investment Trust 625Spark Infrastructure Group 619Hui Xian Real Estate Investment Trust 519Manila Electric Co 501Kiwi Property Group Ltd 498Contact Energy Ltd 477
MAJOR SALESPROCEEDS(in 000’s) $
Mapletree Industrial Trust 447AGL Energy Ltd 437Transurban Group 342Vicinity Centres 261Link REIT 223Petronas Gas Bhd 219Stockland 212Manila Electric Co 198Scentre Group 184Keppel DC REIT 175NHPC Ltd 163AusNet Services 160HK Electric Investments & HK Electric Investments Ltd 137Contact Energy Ltd 129Waypoint REIT 129Aboitiz Power Corp 115CLP Holdings Ltd 109Spark Infrastructure Group 100Shopping Centres Australasia Property Group 99IGB Real Estate Investment Trust 95APA Group 92CapitaLand Commercial Trust 87
^ Not authorised for sale to the public in Hong Kong.
411

Legg Mason Global Funds Plc Annual Report 28 February 2021
Statement of Major Portfolio Changes (unaudited) – (continued)
Legg Mason Martin Currie Asia Pacific Ex Japan Real Income Fund – (continued)
MAJOR PURCHASESCOST
(in 000’s) $Wharf Real Estate Investment Co Ltd 459Shopping Centres Australasia Property Group 438Transurban Group 430NetLink NBN Trust 428Ascendas India Trust 414Dexus 382Waypoint REIT 378Scentre Group 354Keppel DC REIT 349Westports Holdings Bhd 344GPT Group/The 325HK Electric Investments & HK Electric Investments Ltd 320Charter Hall Long Wale REIT 311CapitaLand Commercial Trust 308Stockland 281
MAJOR SALESPROCEEDS(in 000’s) $
CapitaLand Integrated Commercial Trust 81Hui Xian Real Estate Investment Trust 80Beijing Capital International Airport Co Ltd 71Malaysia Airports Holdings Bhd 67Westports Holdings Bhd 61Kiwi Property Group Ltd 60Wharf Real Estate Investment Co Ltd 50SPH REIT 49
Legg Mason Martin Currie Global Emerging Markets Fund^
MAJOR PURCHASESCOST
(in 000’s) $Meituan, 144A 996Reliance Industries Ltd 917JD.com Inc ADR 855Tencent Holdings Ltd 823Contemporary Amperex Technology Co Ltd 810Samsung Electronics Co Ltd 760Alibaba Group Holding Ltd ADR 652Taiwan Semiconductor Manufacturing Co Ltd 648Xinyi Solar Holdings Ltd 578Antofagasta Plc 578NAVER Corp 527B3 SA – Brasil Bolsa Balcao 507Ping An Insurance Group Co of China Ltd 437Wuxi Lead Intelligent Equipment Co Ltd 423LG Chem Ltd 364Ping An Bank Co Ltd 325Prosus NV 237EPAM Systems Inc 237Titan Co Ltd 218China Gas Holdings Ltd 210AIA Group Ltd 194Odontoprev SA 182SK Hynix Inc 173OTP Bank Nyrt 171Maruti Suzuki India Ltd 148
MAJOR SALESPROCEEDS(in 000’s) $
Taiwan Semiconductor Manufacturing Co Ltd 2,096Alibaba Group Holding Ltd ADR 1,198Samsung Electronics Co Ltd 1,189LG Chem Ltd 1,099Tencent Holdings Ltd 1,049Southern Copper Corp 650CNOOC Ltd 588Samsung SDI Co Ltd 581Meituan, 144A 522Industrial & Commercial Bank of China Ltd 381SK Hynix Inc 343Cosan Ltd 321Prosus NV 315Itau Unibanco Holding SA 299EPAM Systems Inc 299Ping An Insurance Group Co of China Ltd 290AIA Group Ltd 239OTP Bank Nyrt 235Titan Co Ltd 226JD.com Inc ADR 220Sunny Optical Technology Group Co Ltd 207Genting Malaysia Bhd 204HDFC Bank Ltd 202Credicorp Ltd 186Grupo Financiero Banorte SAB de CV 185Reliance Industries Ltd 184NAVER Corp 182Kotak Mahindra Bank Ltd 176ICICI Bank Ltd 175
Legg Mason Martin Currie European Unconstrained Fund^
MAJOR PURCHASESCOST
(in 000’s) €
ASML Holding NV 8,722Moncler SpA 7,011Ferrari NV 6,802Kering SA 5,779Infineon Technologies AG 5,489adidas AG 5,277Sartorius Stedim Biotech 5,256Atlas Copco AB 4,889Hexagon AB 4,820Mettler-Toledo International Inc 4,809Assa Abloy AB 4,478THG Plc 4,243L’Oreal SA 4,087Kingspan Group Plc 4,031Dassault Systemes SE 3,932Linde Plc 3,847Kerry Group Plc 3,497Partners Group Holding AG 3,250Coloplast A/S 3,068Nemetschek SE 2,844CyberArk Software Ltd 2,813Temenos AG 2,335InPost SA 2,119
MAJOR SALESPROCEEDS
(in 000’s) €
EQT AB 638Straumann Holding AG 636adidas AG 351Spirax-Sarco Engineering Plc 202Beazley Plc 175Amadeus IT Group SA 129Coloplast A/S 85Hexagon AB 80Mettler-Toledo International Inc 66Atlas Copco AB 59Ferrari NV 41ASML Holding NV 36Kering SA 36Moncler SpA 34Infineon Technologies AG 30L’Oreal SA 27Linde Plc 21Assa Abloy AB 20Temenos AG 20Partners Group Holding AG 17
^ Not authorised for sale to the public in Hong Kong.
412

Legg Mason Global Funds Plc Annual Report 28 February 2021
UCITS V Remuneration Policy (unaudited)
REMUNERATION POLICY
Legg Mason Global Funds plc (the “Company”)
1. Remuneration Policy
1.1 Introduction and Purpose
The Company has adopted this remuneration policy in order to meet the requirements of the European Communities (Undertakings for Collective Investment inTransferable Securities) Regulations 2011, as amended (the “UCITS Regulations”) in a way and to the extent that is appropriate to the Company’s size, internalorganisation and the nature, scope and complexity of its activities. This policy has been adopted pursuant to ESMA’s Guidelines on Sound Remuneration Policiesunder the UCITS Directive (the “ESMA Guidelines”).
The purpose of this policy is to describe the remuneration principles and practices within the Company. Such principles and practices are designed:
(a) to be consistent with, and promote, sound and effective risk management;
(b) to be in line with the business strategy, objectives, values and interests of the Company;
(c) not to encourage excessive risk-taking as compared to the investment policy of the relevant sub-funds of the Company (each, a “Fund”);
(d) to provide a framework for remuneration to attract, motivate and retain staff (including directors) to which the policy applies in order to achieve the objectivesof the Company; and
(e) to ensure that any relevant conflicts of interest can be managed appropriately at all times.
1.2 Application
This policy applies to identified staff, being those whose professional activities have a material impact on the risk profile of the Company or of the Funds and socovers: (i) senior management; (ii) risk takers1; (iii) control functions2; and (iv) any employees receiving total remuneration that takes them into the sameremuneration bracket3 as senior management and risk takers, whose professional activities have a material impact on the risk profile of the Company. TheCompany currently does not have any employees – the only personnel are the Company’s management body (i.e., the board of directors) (each, a “Director” andcollectively, the “Board”). All members of the Board are non-executive Directors. Certain of the Directors are affiliated with the investment managers of the Funds(each an “Investment Manager”). This policy applies both to the Directors who receive remuneration – namely, those Directors who are not affiliated with theInvestment Manager (the “Independent Directors”) – and the Directors who do not receive remuneration in light of their affiliation with the Investment Manager.
1.3 Governance
UCITS management companies and self-managed investment companies that are significant in terms of their size or of the size of the funds they manage, theirinternal organisation and the nature, the scope and the complexity of their activities are required to establish a remuneration committee. In view of thenon-complex nature of the Company’s internal structure and its activities, it is not considered necessary for the Company to establish a remuneration committee.In particular, the Company has taken account of the following circumstances prevailing as of the date of this document:
• the assets under management of the Company;
• the number of directors on the Board;
• the Company has no employees;
• the Company is not listed;
• the Company does not act as an alternative investment fund manager under Directive 2011/61/EU (“AIFMD”) or provide the services mentioned underArticle 6(3) of the UCITS Directive; and
• the Company is a self-managed investment company and so does not manage UCITS in any other EU or non-EU jurisdictions.
Accordingly, the Company is considered to be a non-complex, UCITS self-managed investment company. The Board is responsible for the remuneration policy ofthe Company and for determining the remuneration of the directors of the Company. The Board is comprised of non-executive directors only. The Board hasadopted this policy and periodically reviews (at least annually) the general principles of this policy and is responsible for, and oversees, its implementation in linewith the UCITS Regulations. The Board considers that its members have appropriate expertise in risk management and remuneration to perform this review. Wherea periodic review reveals that the remuneration system does not operate as intended or prescribed, the Board shall ensure that a timely remedial plan is put inplace.
1.4 Alignment of remuneration and risk-taking
(a) Fixed Salary
The Independent Directors receive a fixed annual fee which is competitive and based on the individual Director’s powers, tasks, expertise and responsibilitiesincluding, without limitation:
(i) nature and complexity of the funds;
(ii) demands of fulfilling regulatory obligations; and
(iii) designated person functions.
Each Director’s performance is subject to annual review by the Board.
(b) Variable Salary
The Independent Directors receive fixed remuneration only. It is not considered appropriate that the Directors receive variable remuneration from theCompany. The following pay-out process rules in the UCITS Regulations applicable to variable remuneration do not apply to the remuneration paid to staff ofthe Company:
• variable remuneration in instruments;
• retention;
1 The Remuneration Guidelines refer in this context to “staff responsible for heading the investment management, administration, marketing, human resources” and “staff members, whoseprofessional activities – either individually or collectively, as members of a group (e.g. a unit or part of a department) – can exert material influence on the management company’s risk profile oron a UCITS it manages, including persons capable of entering into contracts/positions and taking decisions that materially affect the risk positions of the management company or of a UCITS itmanages. Such staff can include, for instance, sales persons, individual traders and specific trading desks.”
2 “Control functions” refers to staff (other than senior management) responsible for risk management, compliance, internal audit and similar functions within a management company.
3 “Remuneration bracket” refers to the range of the total remuneration of each of the staff members in the senior manager and risk taker categories – from the highest paid to the lowest paid inthese categories.
413
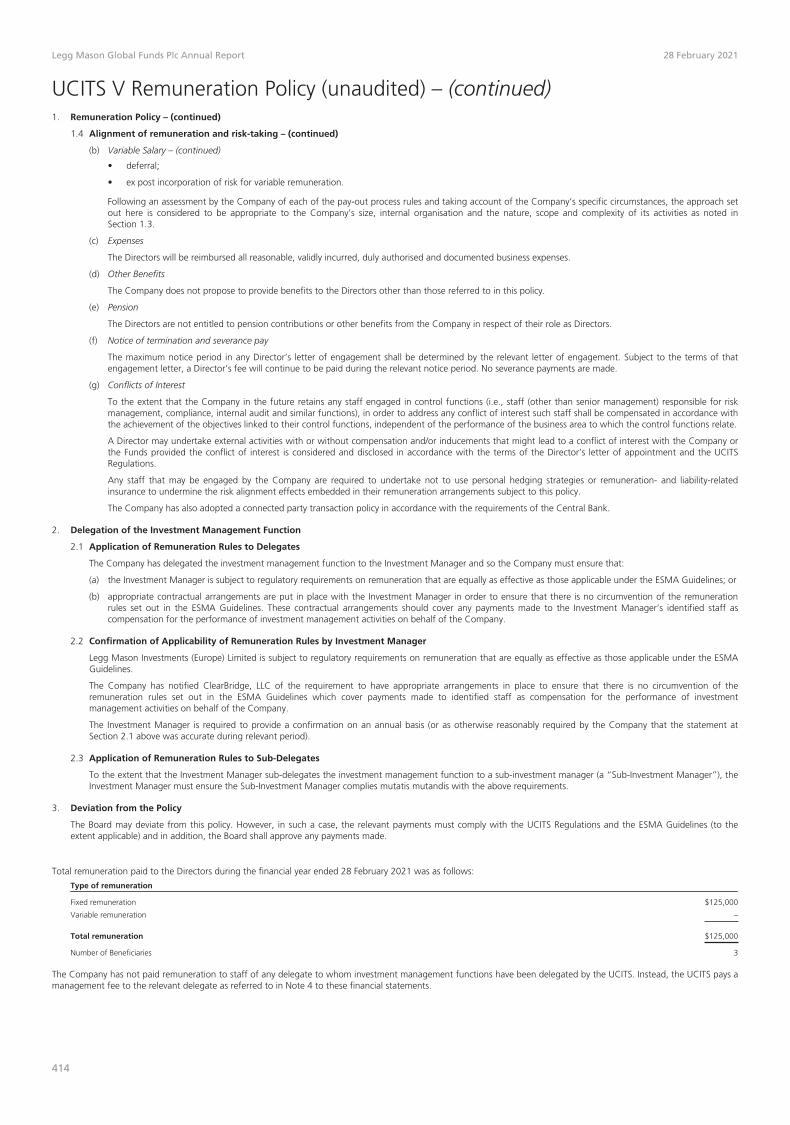
Legg Mason Global Funds Plc Annual Report 28 February 2021
UCITS V Remuneration Policy (unaudited) – (continued)1. Remuneration Policy – (continued)
1.4 Alignment of remuneration and risk-taking – (continued)
(b) Variable Salary – (continued)
• deferral;
• ex post incorporation of risk for variable remuneration.
Following an assessment by the Company of each of the pay-out process rules and taking account of the Company’s specific circumstances, the approach setout here is considered to be appropriate to the Company’s size, internal organisation and the nature, scope and complexity of its activities as noted inSection 1.3.
(c) Expenses
The Directors will be reimbursed all reasonable, validly incurred, duly authorised and documented business expenses.
(d) Other Benefits
The Company does not propose to provide benefits to the Directors other than those referred to in this policy.
(e) Pension
The Directors are not entitled to pension contributions or other benefits from the Company in respect of their role as Directors.
(f) Notice of termination and severance pay
The maximum notice period in any Director’s letter of engagement shall be determined by the relevant letter of engagement. Subject to the terms of thatengagement letter, a Director’s fee will continue to be paid during the relevant notice period. No severance payments are made.
(g) Conflicts of Interest
To the extent that the Company in the future retains any staff engaged in control functions (i.e., staff (other than senior management) responsible for riskmanagement, compliance, internal audit and similar functions), in order to address any conflict of interest such staff shall be compensated in accordance withthe achievement of the objectives linked to their control functions, independent of the performance of the business area to which the control functions relate.
A Director may undertake external activities with or without compensation and/or inducements that might lead to a conflict of interest with the Company orthe Funds provided the conflict of interest is considered and disclosed in accordance with the terms of the Director’s letter of appointment and the UCITSRegulations.
Any staff that may be engaged by the Company are required to undertake not to use personal hedging strategies or remuneration- and liability-relatedinsurance to undermine the risk alignment effects embedded in their remuneration arrangements subject to this policy.
The Company has also adopted a connected party transaction policy in accordance with the requirements of the Central Bank.
2. Delegation of the Investment Management Function
2.1 Application of Remuneration Rules to Delegates
The Company has delegated the investment management function to the Investment Manager and so the Company must ensure that:
(a) the Investment Manager is subject to regulatory requirements on remuneration that are equally as effective as those applicable under the ESMA Guidelines; or
(b) appropriate contractual arrangements are put in place with the Investment Manager in order to ensure that there is no circumvention of the remunerationrules set out in the ESMA Guidelines. These contractual arrangements should cover any payments made to the Investment Manager’s identified staff ascompensation for the performance of investment management activities on behalf of the Company.
2.2 Confirmation of Applicability of Remuneration Rules by Investment Manager
Legg Mason Investments (Europe) Limited is subject to regulatory requirements on remuneration that are equally as effective as those applicable under the ESMAGuidelines.
The Company has notified ClearBridge, LLC of the requirement to have appropriate arrangements in place to ensure that there is no circumvention of theremuneration rules set out in the ESMA Guidelines which cover payments made to identified staff as compensation for the performance of investmentmanagement activities on behalf of the Company.
The Investment Manager is required to provide a confirmation on an annual basis (or as otherwise reasonably required by the Company that the statement atSection 2.1 above was accurate during relevant period).
2.3 Application of Remuneration Rules to Sub-Delegates
To the extent that the Investment Manager sub-delegates the investment management function to a sub-investment manager (a “Sub-Investment Manager”), theInvestment Manager must ensure the Sub-Investment Manager complies mutatis mutandis with the above requirements.
3. Deviation from the Policy
The Board may deviate from this policy. However, in such a case, the relevant payments must comply with the UCITS Regulations and the ESMA Guidelines (to theextent applicable) and in addition, the Board shall approve any payments made.
Total remuneration paid to the Directors during the financial year ended 28 February 2021 was as follows:
Type of remuneration
Fixed remuneration $125,000
Variable remuneration –
Total remuneration $125,000
Number of Beneficiaries 3
The Company has not paid remuneration to staff of any delegate to whom investment management functions have been delegated by the UCITS. Instead, the UCITS pays amanagement fee to the relevant delegate as referred to in Note 4 to these financial statements.
414

Legg Mason Global Funds Plc Annual Report 28 February 2021
Appendix: Securities Financing Transactions Regulation (SFTR)
The following tables detail the gross aggregate notional value for Reverse Repurchase Agreements, Total Return Swaps and Contracts for Difference as well as the absolute fair value as a proportion ofeach Fund’s net asset value, analysed by counterparty, as at 28 February 2021:
Reverse Repurchase Agreements
Legg Mason Western Asset US Government Liquidity Fund
Counterparty Country of Incorporation
Gross AggregateNotional Value
(‘000)$
Absolute FairValue (‘000)
$% of Net
Asset Value
Canadian Imperial Bank of Commerce Canada 85,000 85,000 9.63JP Morgan United States 87,000 87,000 9.86
172,000 172,000 19.49
Total Return Swaps
Legg Mason Western Asset Asian Opportunities Fund
Counterparty Country of Incorporation
Gross AggregateNotional Value
(‘000)$
Absolute FairValue (‘000)
$% of Net
Asset Value
Citi United States 3,898 3,898 0.62JP Morgan United States 3,993 3,993 0.64
7,891 7,891 1.26
Contracts for Difference
Legg Mason Martin Currie European Absolute Alpha Fund^
Counterparty Country of Incorporation
Gross AggregateNotional Value
(‘000)€
Absolute FairValue (‘000)
€
% of NetAsset Value
UBS Switzerland 8,807 569 1.41
8,807 569 1.41
The following table lists the ten largest collateral issuers based on the value of non-cash collateral received and the currency of non-cash collateral received as at 28 February 2021:
Fund Collateral Issuer* Currency
Aggregate value ofcollateral held
(000’s)
Legg Mason Western Asset US Government Liquidity Fund United States** US Dollar $175,440
* Where there are less than ten collateral issuers as at 28 February 2021, all issuers have been included.
** Underlying bonds & notes held as collateral are issued by the United States Treasury.
The following table provides an analysis of the type and quality of non-cash collateral received as at 28 February 2021:
Fund Type of collateral Quality of collateral
Aggregate value ofcollateral held
(000’s)
Legg Mason Western Asset US Government Liquidity Fund Government Bonds and Notes Investment Grade $175,440
The below maturity tenor analysis has been based on the contractual maturity date of the Reverse Repurchase Agreements, Total Return Swaps and Contracts for Difference and the associated collateralreceived/(provided) as at 28 February 2021.
Fund Type of derivative/collateral
Less than1 day(000’s)
1 day to1 week(000’s)
1 week to1 month(000’s)
1 month to3 months
(000’s)
3 months to1 year(000’s)
Above1 year(000’s)
Openmaturity(000’s)
Total(000’s)
Legg Mason Western Asset US Government Liquidity Fund Reverse Repurchase Agreements – $172,000 – – – – – $ 172,000Non-Cash Collateral Received – – – – – $175,440 – $ 175,440
Legg Mason Western Asset Asian Opportunities Fund Total Return Swaps – – – – – $ 7,891 – $ 7,891Legg Mason Martin Currie European Absolute Alpha Fund^ Contracts for Difference – – – – – – €(415) € (415)
Cash Collateral Provided €(798) – – – – – – € (798)
Reverse Repurchase Agreements held on Legg Mason Western Asset US Government Liquidity Fund are tri-party agreements. Collaterals received by the Fund, in respect of the open Reverse RepurchaseAgreements as at 28 February 2021, are held with The Bank of New York Mellon, in segregated accounts in the name of the Company. Collateral received is not reused.
Total Return Swaps and Contracts for Difference are settled on a bilateral basis. There is no collateral provided or received in respect to open Total Return Swaps positions as at 28 February 2021.Collateral provided to the Counterparty in respect to open Contracts for Difference positions as at 28 February 2021 are held by the Counterparty in segregated accounts.
All costs and returns on Reverse Repurchase Agreements, Total Return Swaps and Contracts for Difference accrue to the Funds in full.
^ Not authorised for sale to the public in Hong Kong.
415

Legg Mason Global Funds Plc Annual Report 28 February 2021
Appendix: Connected Persons Disclosure
During the financial year ended 28 February 2021, Pershing Limited, a subsidiary of The Bank of New York Mellon Corporation and a connected person of the Depositary, provided brokerage services inrelation to securities trading to the Hong Kong registered Funds, enacted via the Sub-Investment Managers of the respective Funds. The total aggregate value of transactions with the connected personsof the Depositary in regard securities trading amounted to US$234 million which represents 1.02% of the total value of such transactions entered into by these Funds. Brokerage fees and commissionspaid by the Funds to Pershing Limited in relation to such securities trading for the financial year ended 28 February 2021 amounted to US$162,057 with an average commission rate of 7bps. These havebeen included within the transaction costs on purchases and sales of relevant securities and are disclosed in Note 4 of these Financial Statements.
During the financial year ended 28 February 2021, The Bank of New York Mellon (Institutional Bank) and The Bank of New York Mellon SA/NV, both connected persons of the Depositary, acted incustody foreign exchange transactions and in Currency Administration / Hedging programmes respectively, for the Hong Kong registered Funds. Total commissions paid in relation to these transactionsamounted to US$697,777 with an average commission rate of 0.22bps. The total aggregate value of transactions with the connected persons of the Depositary in that regard amounted to US$32,090million which represents 0.59% of the total value of such transactions entered into by the Funds.
All transactions with the connected persons of the Depositary were entered into the ordinary course of business and on normal commercial terms.
416