Comprehensive Housing Needs Analysis for Renville County ...
194
Comprehensive Housing Needs Analysis for Renville County, Minnesota Prepared for: Renville County Olivia, MN September 2020 7575 Golden Valley Road Suite 385 Golden Valley, MN 55427 612.338.0012 www.maxfieldresearch.com This comprehensive housing needs analysis project was funded by a grant from the Southwest Initiative Foundation and contributions from our cities and the Renville County HRA/EDA.
-
Upload
khangminh22 -
Category
Documents
-
view
5 -
download
0
Transcript of Comprehensive Housing Needs Analysis for Renville County ...
Comprehensive Housing Needs Analysis for
Renville County, Minnesota
Prepared for:
Renville CountyOlivia, MN
September 2020
7575 Golden Valley Road Suite 385 Golden Valley, MN 55427 612.338.0012 www.maxfieldresearch.com
This comprehensive housing needs analysis project was funded by a grant from the Southwest Initiative Foundation and contributions from our cities and the Renville County HRA/EDA.
September 24, 2020 Mr. Jordan Zeller Economic Developer Renville County EDA 105 South 5th Street Olivia, MN 56277
Dear Mr. Zeller: Attached is the Comprehensive Housing Needs Analysis for Renville County, Minnesota con-ducted by Maxfield Research and Consulting, LLC. The study projects housing demand from 2020 through 2030 and provides recommendations on the amount and type of housing that could be built in Renville County to satisfy demand from current and future residents over the next decade. The study identifies a potential demand for nearly 1,400 new housing units through 2030. Demand was generated from the existing household base that will desire new types of housing due to aging, housing preference, and lack of specific inventory in the county. Demand was divided between general-occupancy housing (48%) and age-restricted senior housing (52%). Our inventory of general-occupancy rental housing found a vacancy rate of un-der 4% and senior housing properties posted a vacancy of under 7.3% due to high vacancy rate at Fairview Place however, a continued need for additional rental and senior housing should be explored. Based on the low inventory of vacant developed lots, additional platted lots are needed in select Renville County submarkets. Detailed information regarding recommended housing concepts can be found in the Recommendations and Conclusions section at the end of the report. We have enjoyed performing this study for you and are available should you have any ques-tions or need additional information.
Sincerely,
MAXFIELD RESEARCH AND CONSULTING, LLC
Matt Mullins Dan Gatchell Vice President Research Associate Attachment

TABLE OF CONTENTS Page EXECUTIVE SUMMARY .................................................................................................. 1 PURPOSE & SCOPE........................................................................................................ 5 Purpose and Scope of Study ............................................................................................. 5 Methodology ..................................................................................................................... 5 DEMOGRAPHIC ANALYSIS ............................................................................................. 6 Introduction ...................................................................................................................... 6 Renville County Submarket Definitions ............................................................................ 6 Population and Household Growth from 1990 to 2010 ................................................... 8 Population and Household Estimates and Projections ..................................................... 13 Household Size .................................................................................................................. 17 Age Distribution Trends .................................................................................................... 19 Race of Population ............................................................................................................ 22 Household Income by Age of Householder ...................................................................... 24 Tenure by Age of Householder ......................................................................................... 30 Tenure by Household Size ................................................................................................. 32 Household Type ................................................................................................................ 35 Net Worth ......................................................................................................................... 38 Summary of Demographic Trends .................................................................................... 40 HOUSING CHARACTERISTICS ......................................................................................... 41 Introduction ...................................................................................................................... 41 Building Permit Trends ...................................................................................................... 41 American Community Survey ............................................................................................ 44 Housing Units by Occupancy Status & Tenure .................................................................. 44 Age of Housing Stock......................................................................................................... 48 Renter-Occupied Units by Contract Rent .......................................................................... 50 Owner-Occupied Housing Units by Value ......................................................................... 51 Owner-Occupied Housing Units by Mortgage Status ....................................................... 54 Housing Units by Structure and Tenure or (Housing Stock by Structure Type)................ 56 EMPLOYMENT TRENDS ................................................................................................. 59 Introduction ...................................................................................................................... 59 Employment Growth and Projections ............................................................................... 59
Residential Employment ................................................................................................... 60 Covered Employment & Wage Trends .............................................................................. 61 Business Summary ............................................................................................................ 66 Commuting Patterns ......................................................................................................... 68 Inflow/Outflow .................................................................................................................. 69 Major Employers ............................................................................................................... 72 Employer Survey ............................................................................................................... 72

RENTAL HOUSING ANALYSIS ......................................................................................... 73 Introduction ...................................................................................................................... 73 General-Occupancy Rental Properties .............................................................................. 73 SENIOR HOUSING ANALYSIS ......................................................................................... 84 Senior Housing Defined ..................................................................................................... 84 Senior Housing in Renville County .................................................................................... 85 FOR-SALE HOUSING ANALYSIS ...................................................................................... 92 Introduction ...................................................................................................................... 92 Home Resale Comparison in Renville County ................................................................... 92 County-wide Home Resale Comparison ........................................................................... 98 Resales by Price (2019) ..................................................................................................... 101 Owner-occupied Turnover ................................................................................................ 104 Home Resales per Square Foot (“PSF”) ............................................................................. 105 Current Supply of Homes on the Market .......................................................................... 107 Actively Marketing Subdivisions ....................................................................................... 111 Realtor/Builder/Developer Interviews.............................................................................. 114 PLANNED & PENDING HOUSING DEVELOPMENTS ......................................................... 117 Planned and Proposed Housing Projects ........................................................................... 117 HOUSING AFFORDABILITY ............................................................................................ 118 Introduction ....................................................................................................................... 118 Rent and Income Limits ..................................................................................................... 118 Housing Cost Burden.......................................................................................................... 121 Housing Choice Vouchers .................................................................................................. 123 Housing Costs as Percentage of Household Income ......................................................... 124 HOUSING DEMAND ANALYSIS....................................................................................... 127 Introduction ....................................................................................................................... 127 Demographic Profile and Housing Demand ...................................................................... 127 Housing Demand Overview ............................................................................................... 128 For-Sale Housing Market Demand Analysis ....................................................................... 132 Rental Housing Demand Analysis ...................................................................................... 135 Senior Housing Demand Analysis ...................................................................................... 138 Renville County Demand Summary ................................................................................... 149 RECOMMENDATIONS AND CONCLUSIONS .................................................................... 154 Introduction ...................................................................................................................... 154 Recommended Housing Product Types ............................................................................ 155 Challenges and Opportunities ........................................................................................... 168 APPENDIX..................................................................................................................... 178 Definitions ......................................................................................................................... 179

LIST OF TABLES Table Number and Title Page D1. Historic Population Growth Trends, Renville County, 1990 - 2010 .............................. 10 D2. Historic Household Growth Trends, Renville County, 1990 - 2010 .............................. 12 D3. Population Household Growth Trends and Projections, Renville County Market
Area, 1990 – 2035 ......................................................................................................... 15 D4. Population Age Distribution, Renville County Market Area, 2000 - 2025 .................... 20 D5. Population Distribution by Race, Renville County Market Area, 2010 & 2017 ............ 23 D6. Household Income by Age of Householder, Renville County, 2020 & 2025 ................ 25 D7. Household Income by Age of Householder, Renville Submarket, 2020 & 2025 .......... 26 D8. Household Income by Age of Householder, Olivia Submarket, 2020 & 2025 .............. 27 D9. Household Income by Age of Householder, Buffalo Lake/Hector Submarket,
2020 & 2025 .................................................................................................................. 28 D10. Household Income by Age of Householder, South Submarket, 2020 & 2025 ............. 29 D11. Tenure by Age of Householder, Renville County Market Area, 2010 & 2020 .............. 31 D12. Tenure by Household Size, Renville County, 2010 & 2020 ........................................... 34 D13. Household Type, Renville County Market Area, 2010 & 2020 ..................................... 36 D14. Estimated Net Worth by Age of Householder, Renville County, 2019 ......................... 39 HC1. Residential Construction Building Permitted Units Issued, Renville County,
2010 to 2020 ................................................................................................................. 42 HC2. Residential Construction Building Permitted Units Issued, Renville County,
2010 to 2020 ................................................................................................................. 43 HC3. Housing Units by Occupancy Status & Tenure, Renville County Analysis Area,
2010 & 2018 ................................................................................................................. 47 HC4. Age of Housing Stock, Renville County Analysis Area, 2018......................................... 49 HC5. Renter-Occupied Units by Contract Rent, Renville County, 2018 ................................ 51 HC6. Owner-Occupied Units by Value, Renville County, 2018.............................................. 53 HC7. Owner-Occupied Units by Mortgage Status, Renville County Analysis Area, 2018 ..... 55 HC8. Housing Units by Structure & Tenure, Renville County Analysis Area, 2018 ............... 58 E1. Employment Growth Trends and Projections, Renville County Analysis Area
2016 - 2026 ................................................................................................................... 59 E2. Annual Average Resident Employment, Renville County, 2000 to 2019 ...................... 61 E3. Covered Employment Trends, Renville County Analysis Area, 2013 - Q3 2019 ........... 63 E4. Wage Trends, Renville County Analysis Area, 2013 - Q3 2019 ..................................... 66 E5. Business Summary – By NAICS Code, Renville County Analysis Area, 2019 ................. 67 E6. Commuting Patterns, Renville County Analysis Area, 2017 ......................................... 69 E7. Commuting Inflow/Outflow, Renville County, 2017 .................................................... 71 E8. Major Employers, Renville County, 2020...................................................................... 72

R1. General Occupancy Rental Projects, Renville County, May 2020 ................................ 76 R2. Summary by Unit Type, General Occupancy Rental Projects, Renville County,
May 2020 ...................................................................................................................... 80 R3. General Occupancy Rental Projects, Neighboring Communities Rental Comparison,
June 2020 ...................................................................................................................... 81 R4. Summary of General Occupancy Rental Projects Inventoried by Submarket,
2nd Quarter 2020 ........................................................................................................... 81
S1. Senior Housing Projects, Renville County, May 2020 ................................................... 87 S2. Senior Housing Properties, Vicinity, June 2020 ............................................................ 88 S3. Skilled Nursing Facilities, Renville County, 2020 .......................................................... 89
FS1. Residential Resales Activity, Renville County, 2010 - 2019 .......................................... 93 FS2. Residential Resales Activity by Submarket, Renville County, 2010 to 2019................. 96 FS3. Median Resale Comparison, Renville County & SW Central Region, 2010 to 2019 ..... 99 FS4. Resales by Price Point, Renville County & SW Central Region, 2019 ........................... 102 FS5. Owner-Occupied Turnover, Renville County ................................................................ 104 FS6. Average & Median Sales Price Per Square Foot (PSF), Renville County and Southwest
Central Region, 2010 to 2019 ....................................................................................... 105 FS7. Median Sales Price Per Square Foot (PSF) Comparison, Existing Homes Vs. New
Construction, Renville County and Southwest Central Region, 2010 to 2019 ............. 106 FS8. Homes Currently Listed for Sale, Renville County, May 2020 ...................................... 108 FS9. Active Listings by Type & Submarket, May 2020 .......................................................... 110 FS10. Active Listings by Housing Type, May 2020 .................................................................. 110 FS11. Actively Marketing Single-Family Subdivisions, Renville County, May 2020 ............... 112 FS12. Area Overviews, Renville County & Vicinity, 2019 ....................................................... 113 FS13. Area Historical Median Price, Renville County and Vicinity, 2019 ............................... 113 HA1. MHFA/HUD Income and Rent Limits, Renville County, 2020 ....................................... 119 HA2. Maximum Rent Based on Household Size and Area Median Income, Renville County
2020 .............................................................................................................................. 120 HA3. Housing Cost Burden, Renville County, 2018 ............................................................... 122 HA4. Housing Affordability, Based on Household Income, Renville County ......................... 126
HD1. Demand for Additional For-Sale Housing, Renville County, 2020 to 2030 ................... 133 HD2. Demand for Additional Rental Housing, Renville County Analysis Area, 2020 to 2030... 136 HD3. Demand for Subsidized/Affordable Senior Housing, Renville County, 2020 to 2030 .. 139 HD4. Demand for Market Rate Active Adult Housing, Renville County, 2020 to 2030 ........ 141 HD5. Demand for Independent Living Rental Housing, Renville County, 2020 to 2030 ....... 143 HD6. Demand for Assisted Living Rental Housing, Renville County, 2020 to 2030 ............... 145 HD7. Demand for Memory Care Rental Housing, Renville County, 2020 to 2030 ................ 147 HD8. General Occupancy Excess Demand Summary, Renville County, 2020 to 2030 .......... 151 HD9. Senior Housing Excess Demand Summary, Renville County, 2020 to 2030 ................. 152

CR1. Housing Recommendations by Submarket, 2018 to 2030 ........................................... 167

EXECUTIVE SUMMARY
MAXFIELD RESEARCH AND CONSULTING, LLC 1
Demographic Analysis
• In 2020, the population of Renville County is estimated at 14,600. The most populated sub-market within Renville County was the Olivia Submarket (4,725 people).
• Between 2010 and 2020, the Renville County population is expected to decline by -7.2%
(1,130 people). The South Submarket is forecast to have the highest population decline rate, and the largest percentage of decline in the County.
• Renville County and all submarkets are forecast to experience declining population rates
through 2035. Renville County is expected to decrease by -5% (-725 people) between 2020 and 2030.
• Changes in households are expected to mirror population changes through 2020. The South
Submarket is expected to decline in households by 3.8% (-54 households). The Buffalo Lake/Hector Submarket is projected have household decline by -2.6% (-40 households).
• In 2020, in the median income in Renville County was $58,269 across all ages. The median income is forecast to rise by approximately 7% to $62,566 in 2025.
• The highest median income was recorded among those ages 45 to 54 at $73,325 in 2020. In
2025, this age cohort is expected to remain the highest earners with a median income of $79,281, an approximate increase of 8%.
• The increase in households without children reflects the changing demographics of the
overall Market Area, and the country, as baby boomers age and more households become empty nest households. Additional factors contributing to this trend include couples delay-ing, or forgoing, having children.
Housing Characteristics
• There have been 114 residential unit permits issued between 2010 and 2018. That equates to about 12 residential units permitted annually since 2010. Approximately 99% of the per-mits issued in Renville County since 2010 have been single-family units.
• As of 2018, Renville County was estimated to have 6,180 housing units, of which roughly
79% were owner-occupied and 21% were renter-occupied. The Renville submarket is esti-mated to have the highest share of owner-occupied housing (83%), while the Olivia sub-market has the highest share of renter-occupied housing (25%) in 2018.

EXECUTIVE SUMMARY
MAXFIELD RESEARCH AND CONSULTING, LLC 2
• Approximately 71% of housing units in Renville County were owner-occupied in the 2010 and 66.3% in 2018. The Buffalo Lake/Hector submarket had the highest proportion of owner-occupied households (66.8%), while the South submarket reported the highest share of renter-occupied households (25.5%) in 2018.
• Approximately 46% of Renville County homeowners have a mortgage and about 6% of homeowners with mortgages in Renville County also have a second mortgage and/or home equity loan. The median value of a house with a mortgage is $112,300, while the median value of a house without a mortgage is $95,600.
• The median contract rent in Renville County was $545. Based on a 30% allocation of income to housing, a household in Renville County would need an annual income of about $21,800 (or $1,816/monthly) to afford an average monthly rent of $545.
Employment Trends
• Resident employment (number of employed persons) in Renville County declined by ap-
proximately -108 people between 2000 and 2019 (-1.2%) and the unemployment rate in-creased from 4% in 2000 to 4.4% in 2019. By comparison, Minnesota’s unemployment rate was at 3.3% and the United States was at 3.7% as of 2019.
• Between 2013 and Q3 2019, the number of jobs declined in Renville County by 36, a -9.8% decrease in the County. The Leisure and Hospitality sector gained the greatest number of jobs (551 jobs) between 2013 and Q3 2019. The Natural Resources & Mining, and Education & Trade, Transportation & Utilities sectors all declined between 2013 to Q3 2019.
• Renville County can be considered an exporter of workers, as the number of residents leav-ing the County (outflow) for employment was more than the number of residents coming into the County for work (inflow). Approximately 3,162 workers left Renville County for work while 1,743 workers came into the County, for a net difference of 1,419 workers. Ren-ville County also had an interior flow of 2,314 workers.
Rental Housing Market Analysis
• In total, Maxfield Research surveyed 19 market rate general occupancy rental housing de-velopments, with 8 units or more, for a total of 214 units, with a total vacancy rate of 4%. Typically, a healthy rental market maintains a vacancy rate of roughly 5%, which promotes competitive rates, ensures adequate consumer choice, and allows for unit turnover. Aver-age monthly rent for a market rate one-bedroom unit was $444, $470 for a two-bedroom, and $452 for a three-bedroom. Overall, price per square foot was calculated at $0.61 among surveyed developments in Renville County.

EXECUTIVE SUMMARY
MAXFIELD RESEARCH AND CONSULTING, LLC 3
• We identified 12 affordable/subsidized properties that made up 311 units. Overall, the af-fordable/subsidized properties had a vacancy rate of 2.6%, indicating pent-up demand.
Senior Housing Market Analysis
• Maxfield Research identified eight senior housing projects in the Renville County. These properties contain a total of 173 units. Amongst properties that provided complete survey data, there were one vacancy resulting in an overall vacancy rate of less than 1% for senior housing projects. The equilibrium vacancy rate for senior housing is considered to be be-tween 5% and 7%.
• There are four facilities offering assisted living services in Renville County. As of May 2020, there was only one vacancy between all four developments. Market rate basic service rents range from $1,331 for a studio apartment at Meadows on Main to $3,850 for a one-bed-room apartment at Park View Village. Additional cost is based on service level needed. Some common features include kitchenettes, private bathrooms, meals, laundry, and light housekeeping.
For-Sale Housing Market Analysis
• From 2010 through 2019, there were 1,609 residential resales in Renville County, represent-ing approximately 10% of all sales in the Southwest Central Regional Area. Since 2010, Ren-ville County has averaged about 160 resales per year.
• Residential resale activity in the County climbed steadily after dropping -19.4 between 2010 and 2011, peaking at 188 sales in 2016. However, sales activity slowed slightly in recent years, declining to 138 transactions in 2018 before climbing to 172 transactions in 2019.
• The 2019 median resale price for single-family homes in Renville County is $90,488, -31.4% lower than the Southwest Central Regional Area median sales price of $132,000. As a re-sult, housing is more affordable in Renville County than all the surrounding counties.
• Renville County housing value trends have remained fairly consistent over the past decade. Median resale values remained in the $70,000 to $80,000 price range from 2014 to 2017. Noticeable increases in values since 2018 have occurred due to low interest rates and lack of housing supply.

EXECUTIVE SUMMARY
MAXFIELD RESEARCH AND CONSULTING, LLC 4
Planned & Pending Housing Developments
• Currently, there is a 15 unit (assisted living/memory care) senior housing development; to be owned by the recently formed non-profit, Island Living, LLC. At the time of this study, the USDA funding application was submitted.
Housing Affordability
• In Renville County, 15% of owner households and 45.7% of renter households are consid-ered cost burdened. The South submarket recorded the highest proportion of cost bur-dened owner households, while the Buffalo Lake/Hector Submarket had the highest propor-tion of cost burdened renter households, 51.8%.
• The Renville County HRA’s Housing Choice Voucher Program gives preference to Renville County residents, and elderly and/or disabled head of households. The estimated wait time for those on the waiting list without preference is in excess of three years.
Housing Demand Analysis
• Based on our calculations, demand exists in Renville County for the following general occu-pancy product types between 2020 and 2030:
o Market rate rental 160 units o Affordable rental 59 units o Subsidized rental 24 units o For-sale single-family 331 units o For-sale multifamily 83 units
• In addition, we find demand for multiple senior housing product types. By 2030, demand in Renville County for senior housing is forecast for the following:
o Active adult ownership 154 units o Active adult market rate rental 171 units o Active adult affordable 184 units o Active adult subsidized 56 units o Independent Living 104 units o Assisted Living 22 units o Memory Care 42 units
Detailed demand calculations and recommendation by submarket are provided in more detail in the recommendations and conclusions section of the report.

PURPOSE & SCOPE
MAXFIELD RESEARCH AND CONSULTING, LLC 5
Purpose and Scope of Study Maxfield Research and Consulting, LLC. was engaged by the Renville County HRA/EDA to con-duct a Comprehensive Housing Needs Analysis for Renville County, Minnesota. The Housing Needs Analysis provides recommendations on the amount and types of housing that should be developed in order to meet the needs of current and future households who choose to reside in the County. The scope of this study includes: an analysis of the demographic and economic characteristics of the County; a review of the characteristics of the existing housing stock and building permit trends; an analysis of the market condition for a variety of rental, senior, and for-sale housing products; and an assessment of the need for housing by product type in the County. Recom-mendations on the number and types of housing products that should be considered in the County are also supplied.
Methodology During the course of the study a number of resources were utilized to obtain information in the
analysis. The primary data and information sources include the following:
• U.S. Census Bureau; American Community Survey
• Minnesota Department of Employment and Economic Development (DEED)
• United States Department of Housing and Urban Development (HUD)
• ESRI
• NorthStar Multiple Listing Service of Minnesota (MLS)
• Renville County
• City staff from communities across Renville County
• Longitudinal Employer-Household Dynamics (LEHD)
• Minnesota Geospatial Commons
• Phone calls/emails from property owners/managers, Realtors, brokers, developers, employers, among others, etc.

DEMOGRAPHIC ANALYSIS
MAXFIELD RESEARCH AND CONSULTING, LLC 6
Introduction This section of the report examines factors related to the current and future demand for both owner and renter-occupied housing in Renville County, Minnesota. It includes an analysis of population and household growth trends and projections, projected age distribution, house-hold income, household types and household tenure. A review of these characteristics will pro-vide insight into the demand for various types of housing in the County.
Renville County Submarket Definitions After conversations with local officials, Renville County was divided into four submarkets: Ren-ville, Olivia, Buffalo Lake/Hector and Southern Renville County for purposes of the housing anal-ysis. Subsequent data in the housing analysis is illustrated by submarket and county-wide. In some cases, additional demand for housing will come from individuals moving from just out-side the area, those who return from other locations (particularly young households returning after pursuing their degrees or elderly returning from retirement locations), and seniors who move to be near their adult children living in Renville County. Demand generated from within and outside of Renville County is considered in the demand calculations presented later in this analysis.
Renville County covers 982.7 square miles and is the 22nd largest county in Minnesota by area. Renville County is bordered by nine counties and is part of the Southwest Central Region which also includes Kandiyohi, McLeod, and Meeker Counties.
Renville County
Housing Submarket Definitions
Renville Submarket Olivia Submarket Buffalo Lake/Hector South Submarket
Danube City Bird Island City Hector City Fairfax City
Renville City Olivia City Buffalo Lake City Franklin City
Sacred Heart City Bird Island Township Brookfield Township Morton City
Crooks Township Henryville Township Osceala Township Bandon Township
Emmet Township Kingman Township Boon Lake Township Beaver Falls Township
Erickson Township Norfolk Township Melville Township Birch Cooley Township
Flora Township Troy Township Hector Township Cairo Township
Hawk Creek Township Winfield Township Preston Lake Township Camp Township
Sacred Heart Township Palmyra Township Wellington Township
Wang Township Martinsburg Township

DEMOGRAPHIC ANALYSIS
MAXFIELD RESEARCH AND CONSULTING, LLC 7
Submarket Map

DEMOGRAPHIC ANALYSIS
MAXFIELD RESEARCH AND CONSULTING, LLC 8
Regional Map
Population and Household Growth from 1990 to 2010 Tables D-1 and D-2 present the population and household growth of each submarket in Renville County in 1990, 2000, and 2010. The data is from the U.S. Census. Population
• The population of the Renville County Market Area declining by -2.9% between 1990 and 2000 from 17,673 to 17,154 people. In comparison, the State of Minnesota experienced a 7.2% increase from 1990 to 2000.

DEMOGRAPHIC ANALYSIS
MAXFIELD RESEARCH AND CONSULTING, LLC 9
• From 2000 to 2010, the population of the Renville County Market Area declined to 15,730, a -9.1% decline in population. Renville County’s population decline during this time while the State of Minnesota, grew by 12.4%.
• The most significant population decline occurred in the Olivia Submarket between 2000 and 2010. This submarket declined by -10.3% between 2000 and 2010, decreasing by 497 peo-ple.
-12.0% -10.0% -8.0% -6.0% -4.0% -2.0% 0.0%
Renville Submarket
Olivia Submarket
Buffalo Lake/Hector
South Submarket
Renville County
Percent Population Change, 1990-2010
1990-2000 2000-2010

DEMOGRAPHIC ANALYSIS
MAXFIELD RESEARCH AND CONSULTING, LLC 10
Households Household growth trends are typically a more accurate indicator of housing needs than popula-tion growth since a household is, by definition, an occupied housing unit. However, additional
1990 - 2000 2000 - 20101990 2000 2010 No. Pct. No. Pct.
Renville County 17,673 17,154 15,730 -519 -2.9% -1,424 -9.1%
Renville Submarket
Danube City 562 529 505 -33 -5.9% -24 -4.8%Renville City 1,315 1,323 1,287 8 0.6% -36 -2.8%Sacred Heart City 579 549 548 -30 -5.2% -1 -0.2%Crooks Township 195 213 191 18 9.2% -22 -11.5%Emmet Township 264 259 226 -5 -1.9% -33 -14.6%Erickson Township 266 253 206 -13 -4.9% -47 -22.8%Flora Township 249 245 188 -4 -1.6% -57 -30.3%Hawk Creek Township 233 227 201 -6 -2.6% -26 -12.9%Sacred Heart Township 284 277 270 -7 -2.5% -7 -2.6%Wang Township 310 299 249 -11 -3.5% -50 -20.1%
Submarket Total 4,257 4,174 3,871 -83 -1.9% -60 -1.4%
Olivia Submarket
Bird Island City 1,326 1,195 1,042 -131 -9.9% -153 -14.7%
Olivia City 2,623 2,570 2,484 -53 -2.0% -86 -3.5%
Bird Island Township 289 269 205 -20 -6.9% -64 -31.2%
Henryville Township 254 236 208 -18 -7.1% -28 -13.5%
Kingman Township 267 252 201 -15 -5.6% -51 -25.4%
Norfolk Township 215 207 161 -8 -3.7% -46 -28.6%
Troy Township 337 325 284 -12 -3.6% -41 -14.4%
Winfield Township 264 252 224 -12 -4.5% -28 -12.5%Submarket Total 5,575 5,306 4,809 -269 -4.8% -497 -10.3%
Buffalo Lake/Hector
Hector City 1,145 1,166 1,151 21 1.8% -15 -1.3%
Buffalo Lake City 734 768 733 34 4.6% -35 -4.8%
Brookfield Township 170 163 156 -7 -4.1% -7 -4.5%
Oscealo Township 231 219 158 -12 -5.2% -61 -38.6%
Boon Lake Township 442 400 378 -42 -9.5% -22 -5.8%
Melville Township 259 242 225 -17 -6.6% -17 -7.6%
Hector Township 269 248 226 -21 -7.8% -22 -9.7%
Preston Lake Township 220 215 271 -5 -2.3% 56 20.7%
Palmyra Township 307 293 179 -14 -4.6% -114 -63.7%
Martinsburg Township 263 215 197 -48 -18.3% -18 -9.1%Submarket Total 4,040 3,929 3,674 -111 -2.7% -15 -0.4%
South Submarket
Fairfax City 1,276 1,295 1,235 19 1.5% -60 -4.9%
Franklin City 441 498 510 57 12.9% 12 2.4%
Morton City 448 442 411 -6 -1.3% -31 -7.5%
Bandon Township 218 202 175 -16 -7.3% -27 -15.4%
Beaver Falls Township 355 331 197 -24 -6.8% -134 -68.0%
Birch Cooley Township 272 257 245 -15 -5.5% -12 -4.9%
Cairo Township 284 271 232 -13 -4.6% -39 -16.8%
Camp Township 228 207 186 -21 -9.2% -21 -11.3%
Wellington Township 279 242 185 -37 -13.3% -57 -30.8%Submarket Total 3,801 3,745 3,376 -56 -1.5% -369 -9.9%
Minnesota 4,375,099 4,919,479 5,303,925 544,380 12.4% 384,446 7.2%
Sources: U.S. Census; State Data Center of Minnesota; Maxfield Research & Consulting LLC
Census
TABLE D-1HISTORIC POPULATION GROWTH TRENDS
RENVILLE COUNTY1990 - 2010
Historic Population Change

DEMOGRAPHIC ANALYSIS
MAXFIELD RESEARCH AND CONSULTING, LLC 11
demand can result from changing demographics of the population base, which results in de-mand for different housing products.
• Similar to population trends, the Olivia Submarket reported the largest household declined, -4.8%, between 1990 and 2000.
• From 2000 to 2010, the South Submarket reported the largest household decline, decreas-ing -5.7%.
• Household decline in Renville County is consistent with population decline since 1990. From 1990 to 2000, households declined by -2.9% in Renville County compared to a 15% growth in the State of Minnesota.
• Currently, population growth in Greater Minnesota is largely concentrated in the larger metropolitan-designated counties. Outside of the seven-county Twin Cities area, population growth can be found in three types of counties; counties that are considered recreational (central lakes), counties with a lot of international migration, and in counties with larger cit-ies such as Rochester in Olmsted County.
-6.0% -5.0% -4.0% -3.0% -2.0% -1.0% 0.0%
Renville Submarket
Olivia Submarket
Buffalo Lake/Hector
South Submarket
Percent Household Change, 1990-2010
1990-2000 2000-2010

DEMOGRAPHIC ANALYSIS
MAXFIELD RESEARCH AND CONSULTING, LLC 12
1990 - 2000 2000 - 20101990 2000 2010 No. Pct. No. Pct.
Renville County 6,978 6,779 6,564 -199 -2.9% -215 -3.3%
Renville Submarket
Danube City 228 214 211 -14 -6.1% -3 -1.4%Renville City 501 508 504 7 1.4% -4 -0.8%Sacred Heart City 252 246 242 -6 -2.4% -4 -1.7%Crooks Township 67 76 76 9 13.4% 0 0.0%Emmet Township 98 94 95 -4 -4.1% 1 1.1%Erickson Township 92 88 90 -4 -4.3% 2 2.2%Flora Township 87 83 86 -4 -4.6% 3 3.5%Hakw Creek Township 92 83 78 -9 -9.8% -5 -6.4%Sacred Heart Township 107 104 101 -3 -2.8% -3 -3.0%Wang Township 102 99 98 -3 -2.9% -1 -1.0%Submarket Total 1,626 1,595 1,586 -31 -1.9% -9 -0.6%
Olivia Submarket
Birld Bird Island City 523 499 496 -24 -4.6% -3 -0.6%
Olivia City 1,065 1,075 1,038 10 0.9% -37 -3.6%
Bird Island Township 113 92 87 -21 -18.6% -5 -5.7%
Henryville Township 98 86 82 -12 -12.2% -4 -4.9%
Kingman Township 94 82 76 -12 -12.8% -6 -7.9%
Norfolk Township 84 75 66 -9 -10.7% -9 -13.6%
Troy Township 126 112 105 -14 -11.1% -7 -6.7%
Winfield Township 110 90 85 -20 -18.2% -5 -5.9%Submarket Total 2,213 2,111 2,035 -102 -4.6% -76 -3.7%
Buffalo Lake/Hector
Hectory City 513 510 504 -3 -0.6% -6 -1.2%
Buffalo Lake City 299 295 293 -4 -1.3% -2 -0.7%
Brookfield Township 81 73 69 -8 -9.9% -4 -5.8%
Oscealo Township 83 79 74 -4 -4.8% -5 -6.8%
Boon Lake Township 163 151 143 -12 -7.4% -8 -5.6%
Melville Township 97 94 89 -3 -3.1% -5 -5.6%
Hector Township 104 101 96 -3 -2.9% -5 -5.2%
Preston Lake Township 116 115 110 -1 -0.9% -5 -4.5%
Palmyra Township 87 84 80 -3 -3.4% -4 -5.0%
Martinsburg Township 79 77 70 -2 -2.5% -7 -10.0%Submarket Total 1,622 1,579 1,528 -43 -2.7% -51 -3.3%
South Submarket
Fairfax City 532 534 523 2 0.4% -11 -2.1%
Franklin City 183 195 187 12 6.6% -8 -4.3%
Morton City 203 199 196 -4 -2.0% -3 -1.5%
Bandon Township 83 75 73 -8 -9.6% -2 -2.7%
Beaver Township 127 121 93 -6 -4.7% -28 -30.1%
Birch Cooley Township 101 95 95 -6 -5.9% 0 0.0%
Cairo Township 106 98 87 -8 -7.5% -11 -12.6%
Camp Township 94 92 87 -2 -2.1% -5 -5.7%
Wellington Township 88 86 74 -2 -2.3% -12 -16.2%Submarket Total 1,517 1,495 1,415 -22 -1.5% -80 -5.7%
Minnesota 1,647,853 1,895,127 2,087,227 247,274 15.0% 192,100 9.2%
Sources: U.S. Census; State Data Center of Minnesota; Maxfield Research & Consulting LLC
Census
TABLE D-2HISTORIC HOUSEHOLD GROWTH TRENDS
RENVILLE COUNTY1990 - 2010
Historic Households Change
DEMOGRAPHIC ANALYSIS
MAXFIELD RESEARCH AND CONSULTING, LLC 13
Population and Household Estimates and Projections Table D-3 presents population and household growth trends and projections for Renville County Market Area through 2035. Estimates for 2020 and projections through 2035 are based on information from ESRI (a national demographics service provider), the Minnesota State De-mographic Center, and adjusted by Maxfield Research and Consulting, LLC based on local build-ing permit trends.
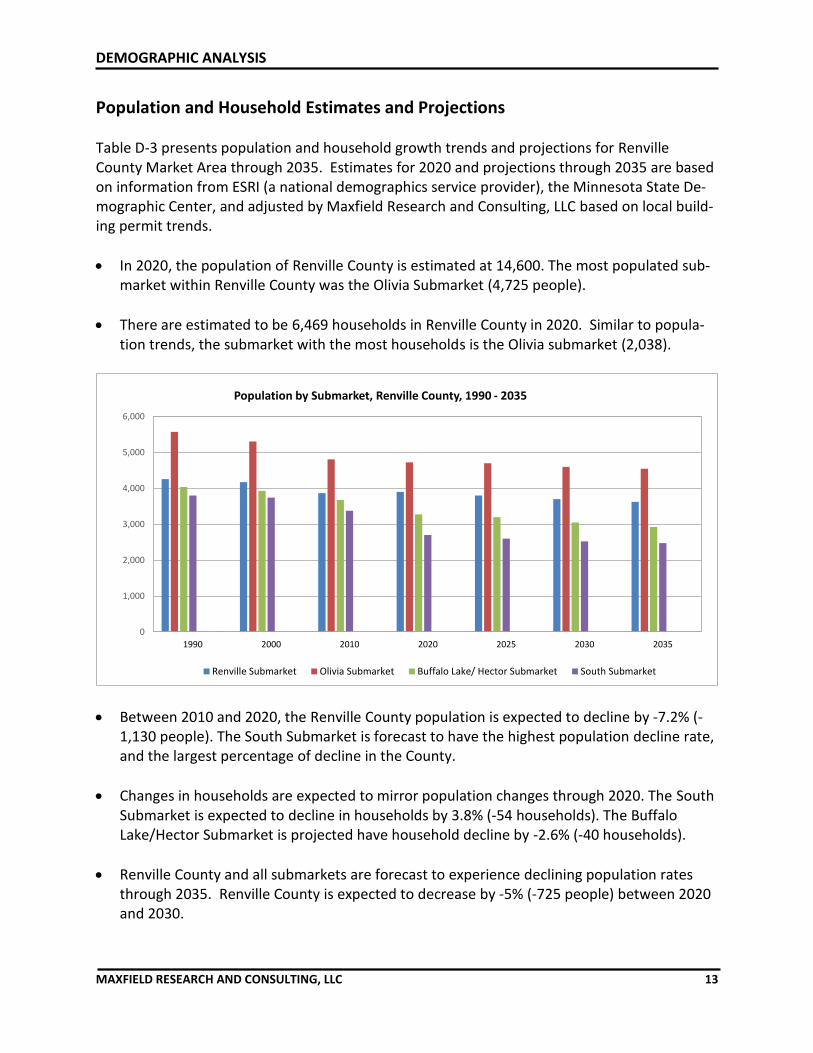
• In 2020, the population of Renville County is estimated at 14,600. The most populated sub-market within Renville County was the Olivia Submarket (4,725 people).
• There are estimated to be 6,469 households in Renville County in 2020. Similar to popula-tion trends, the submarket with the most households is the Olivia submarket (2,038).
• Between 2010 and 2020, the Renville County population is expected to decline by -7.2% (-1,130 people). The South Submarket is forecast to have the highest population decline rate, and the largest percentage of decline in the County.
• Changes in households are expected to mirror population changes through 2020. The South Submarket is expected to decline in households by 3.8% (-54 households). The Buffalo Lake/Hector Submarket is projected have household decline by -2.6% (-40 households).
• Renville County and all submarkets are forecast to experience declining population rates through 2035. Renville County is expected to decrease by -5% (-725 people) between 2020 and 2030.
0
1,000
2,000
3,000
4,000
5,000
6,000
1990 2000 2010 2020 2025 2030 2035
Population by Submarket, Renville County, 1990 - 2035
Renville Submarket Olivia Submarket Buffalo Lake/ Hector Submarket South Submarket

DEMOGRAPHIC ANALYSIS
MAXFIELD RESEARCH AND CONSULTING, LLC 14
• The greatest population rate decrease in Renville County is expected in the Buffalo Lake/Hector Submarket which is projected to decline by -6.9% (-102 people) between 2020 and 2030.
• Household declines in Renville County are consistent with U.S. Census Bureau data which indicates between 2008 and 2017 81% of rural counties in the Midwest showed a decline in population.

DEMOGRAPHIC ANALYSIS
MAXFIELD RESEARCH AND CONSULTING, LLC 15
Estimate
1990 2000 2010 2020 2025 2030 2035 No. Pct. No. Pct. No. Pct. No. Pct.
POPULATION
Renville County 17,673 17,154 15,730 14,600 14,300 13,875 13,575 -1,424 -8.3% -1,130 -7.2% -725 -5.0% -300 -2.1%
Renville Submarket 4,257 4,174 3,871 3,900 3,800 3,700 3,625 -303 -7.3% 29 0.7% -200 -5.1% -75 -2.0%
Olivia Submarket 5,575 5,306 4,809 4,725 4,700 4,600 4,550 -497 -9.4% -84 -1.7% -125 -2.6% -50 -1.1%
Buffalo Lake/ Hector Submarket 4,040 3,929 3,674 3,275 3,200 3,050 2,925 -255 -6.5% -399 -10.9% -225 -6.9% -125 -3.9%
South Submarket 3,801 3,745 3,376 2,700 2,600 2,525 2,475 -369 -9.9% -676 -20.0% -175 -6.5% -50 -1.9%
Minnesota 4,375,099 4,919,479 5,303,925 5,670,102 5,909,800 6,159,631 6,409,461 384,446 7.8% 366,177 6.9% 489,529 8.6% 249,830 4.2%
HOUSEHOLDS
Renville County 6,978 6,779 6,564 6,469 6,336 6,148 6,015 -215 -3.2% -95 -1.4% -321 -5.0% -133 -2.1%
Renville Submarket 1,626 1,595 1,586 1,582 1,541 1,501 1,470 -9 -0.6% -4 -0.3% -81 -5.1% -30 -2.0%
Olivia Submarket 2,213 2,111 2,035 2,038 2,027 1,984 1,963 -76 -3.6% 3 0.1% -54 -2.6% -22 -1.1%
Buffalo Lake/ Hector Submarket 1,622 1,579 1,528 1,488 1,454 1,386 1,329 -51 -3.2% -40 -2.6% -102 -6.9% -57 -3.9%
South Submarket 1,517 1,495 1,415 1,361 1,311 1,273 1,248 -80 -5.4% -54 -3.8% -88 -6.5% -25 -1.9%
Minnesota 1,647,853 1,895,127 2,087,227 2,238,428 2,329,078 2,423,400 2,517,721 192,100 10.1% 151,201 7.2% 184,972 8.3% 94,321 4.0%
PERSONS PER HOUSEHOLD
Renville County 2.53 2.53 2.40 2.26 2.26 2.26 2.26
Renville Submarket 2.62 2.62 2.44 2.47 2.47 2.47 2.47
Olivia Submarket 2.52 2.51 2.36 2.32 2.32 2.32 2.32
Buffalo Lake/Hector Submarket 2.49 2.49 2.40 2.20 2.20 2.20 2.20
South Submarket 2.51 2.51 2.39 2.29 2.09 2.08 2.08
Minnesota 2.66 2.60 2.54 2.53 2.54 2.54 2.55
Sources: US Census Bureau; MN State Demographic Center; ESRI; Maxfield Research & Consulting, LLC
Change
Census Forecast 2000-2010 2010-2020 2020-2030 2030-2035
TABLE D-3POPULATION AND HOUSEHOLD GROWTH TRENDS AND PROJECTIONS
RENVILLE COUNTY MARKET AREA1990 - 2035

DEMOGRAPHIC ANALYSIS
MAXFIELD RESEARCH AND CONSULTING, LLC 16
0%
-2%
2%
0%
4%
-3% -3%
-9%
-3.5%
-13%
-3%
-8%-7.2%
23,693
23,123
23,634
23,645
24,625
23,954
23,249
21,139
20,401
17,673
17,154
15,730
14,600
-16%
-14%
-12%
-10%
-8%
-6%
-4%
-2%
0%
2%
4%
6%
0
5,000
10,000
15,000
20,000
25,000
30,000
19
00
19
10
19
20
19
30
19
40
19
50
19
60
19
70
19
80
19
90
20
00
20
10
20
20
Est
.
Per
cen
t G
row
th
Po
pu
lati
on
Renville County Population Growth1900 - 2020
Pct. Growth Population

DEMOGRAPHIC ANALYSIS
MAXFIELD RESEARCH AND CONSULTING, LLC 17
Household Size Household size is calculated by dividing the number of persons in households by the number of households (or householders). Nationally, the average number of people per household has been declining for over a century; however, there have been sharp declines starting in the 1960s and 1970s. Persons per household in the U.S. were about 4.5 in 1916 and declined to 3.2 in the 1960s. Over the past 50 years, it dropped to 2.57 as of the 2000 Census. During eco-nomic recessions this trend has been temporarily halted as renters and laid-off employees “doubled-up,” which increased the average U.S. household size to 2.59 as of the 2010 Census. The declining household size has been caused by many factors, including aging, higher divorce rates, cohabitation, smaller family sizes, demographic trends in marriage, etc. Most of these changes have resulted from shifts in societal values, the economy, and improvements in health
DEMOGRAPHIC ANALYSIS
MAXFIELD RESEARCH AND CONSULTING, LLC 18
care that have influenced how people organize their lives. Table D-3 highlights the declining household size in the Renville County Market Area and its submarkets.
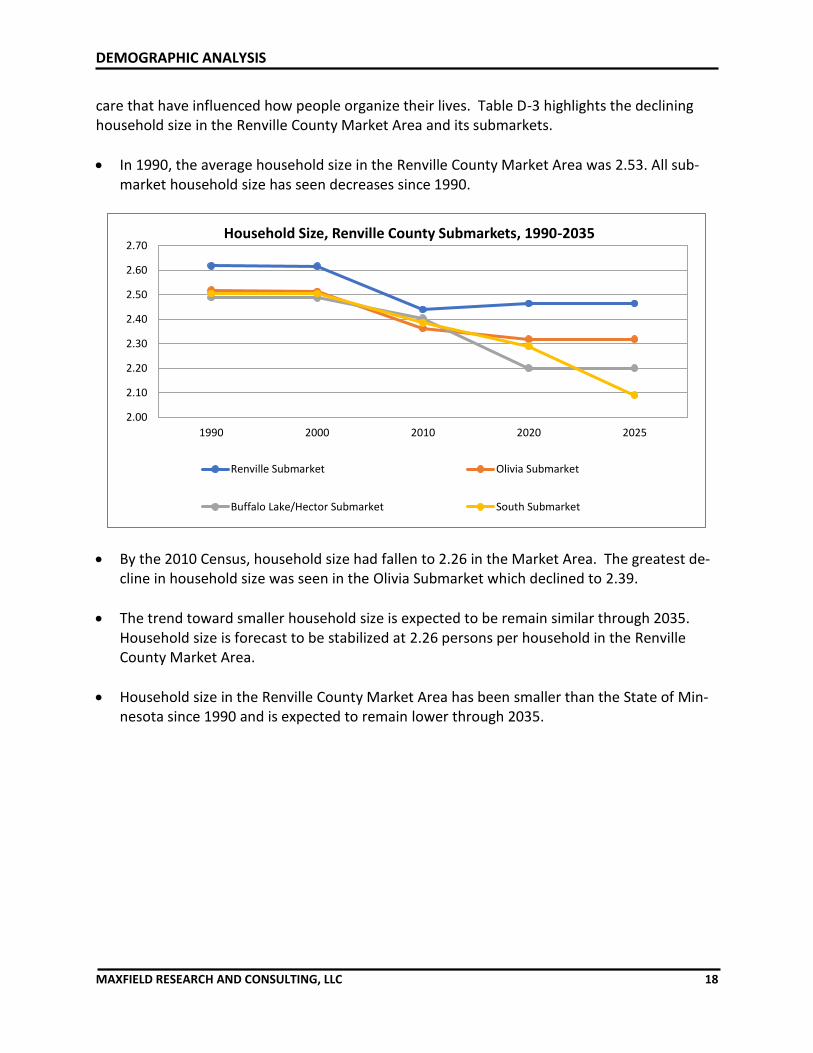
• In 1990, the average household size in the Renville County Market Area was 2.53. All sub-market household size has seen decreases since 1990.
• By the 2010 Census, household size had fallen to 2.26 in the Market Area. The greatest de-cline in household size was seen in the Olivia Submarket which declined to 2.39.
• The trend toward smaller household size is expected to be remain similar through 2035. Household size is forecast to be stabilized at 2.26 persons per household in the Renville County Market Area.
• Household size in the Renville County Market Area has been smaller than the State of Min-nesota since 1990 and is expected to remain lower through 2035.
2.00
2.10
2.20
2.30
2.40
2.50
2.60
2.70
1990 2000 2010 2020 2025
Household Size, Renville County Submarkets, 1990-2035
Renville Submarket Olivia Submarket
Buffalo Lake/Hector Submarket South Submarket

DEMOGRAPHIC ANALYSIS
MAXFIELD RESEARCH AND CONSULTING, LLC 19
Age Distribution Trends
Table D-4 shows the distribution of persons within nine age cohorts for the submarkets in the Renville County Market Area in 2000 and 2010 with estimates for 2020 and projections through 2025. The 2000 and 2010 age distribution is from the U.S. Census Bureau. Maxfield Research and Consulting, LLC derived the 2020 estimates and 2025 projections from ESRI with adjust-ments made to reflect local trends. The key points from the table are found below.
• In 2010, the largest adult age cohort in the Renville County were those age 45 to 54, repre-senting approximately 16% (2,571) of the population.
• By 2025, the largest adult age cohort in the County will be the 55 to 64 age cohort, repre-senting approximately 19% of the adult population in Market Area.
• Between 2010 and 2025, the largest growth is expected in the 65 to 74 age cohort in Ren-ville County, growing by 51.2% (+711). The increasing older adult population reflects larger state and national trends of an aging population, largely due to aging of the sizable baby boom generation.
• The largest proportional growth from 2020 to 2025 is expected to occur in the 75 to 84-year-old age cohort in the Olivia Submarket +20.4% (+62). The Olivia Submarket is expected to see the largest numerical growth in the 65 to 74-year-old age cohort with a 17.1% (+100) increase.
0
500
1,000
1,500
2,000
2,500
3,000
3,500
4,000
Under 18 18 to 24 25 to 34 35 to 44 45 to 54 55 to 64 65 to 74 75 to 84 85 andover
Population Age Distribution, Renville County Market Area, 2010 & 2025
2010 2025

DEMOGRAPHIC ANALYSIS
MAXFIELD RESEARCH AND CONSULTING, LLC 20
Estimate Projection
Age 2000 2010 2020 2025 No. Pct. No. Pct.
Under 18 4,552 3,656 3,132 3,046 -524 -14.3% -86 -2.7%
18 to 24 1,139 1,015 1,047 886 32 3.2% -161 -15.4%
25 to 34 1,763 1,621 1,735 1,606 114 7.0% -129 -7.4%
35 to 44 2,571 1,728 1,671 1,693 -57 -3.3% 22 1.3%
45 to 54 2,185 2,571 1,981 1,763 -590 -22.9% -218 -11.0%
55 to 64 1,543 2,094 2,465 2,200 371 17.7% -265 -10.8%
65 to 74 1,558 1,388 1,803 2,099 415 29.9% 296 16.4%
75 to 84 1,285 1,060 1,030 1,208 -30 -2.8% 178 17.3%
85 and over 558 597 554 523 -43 -7.2% -31 -5.6%
Total 17,154 15,730 15,406 15,024 -324 -2.1% -382 -2.5%
Under 18 1,109 927 831 817 -96 -10.4% -14 -1.7%18 to 24 303 256 251 225 -5 -2.0% -26 -10.4%25 to 34 420 443 454 409 11 2.5% -45 -9.9%35 to 44 583 394 454 458 60 15.2% 4 0.9%45 to 54 562 599 478 459 -121 -20.2% -19 -4.0%55 to 64 379 520 546 469 26 5.0% -77 -14.1%65 to 74 386 342 446 499 104 30.4% 53 11.9%75 to 84 306 249 246 294 -3 -1.2% 48 19.5%85 and over 126 141 125 118 -16 -11.3% -7 -5.6%Total 4,174 3,871 3,831 3,748 -40 -1.0% -83 -2.2%
Under 18 1,423 1,107 967 963 -140 -12.6% -4 -0.4%18 to 24 341 347 354 305 7 2.0% -49 -13.8%25 to 34 528 517 566 538 49 9.5% -28 -4.9%35 to 44 808 531 526 541 -5 -0.9% 15 2.9%45 to 54 691 782 561 488 -221 -28.3% -73 -13.0%55 to 64 478 647 791 709 144 22.3% -82 -10.4%65 to 74 485 216 566 666 350 162.0% 100 17.7%75 to 84 380 497 304 366 -193 -38.8% 62 20.4%85 and over 172 165 160 150 -5 -3.0% -10 -6.3%Total 5,306 4,809 4,782 4,694 -27 -0.6% -88 -1.8%
Under 18 1,008 839 717 717 -122 -14.5% 0 0.0%18 to 24 242 221 241 194 20 9.0% -47 -19.5%25 to 34 441 359 405 366 46 12.8% -39 -9.6%35 to 44 602 434 374 378 -60 -13.8% 4 1.1%45 to 54 487 613 480 414 -133 -21.7% -66 -13.8%55 to 64 383 476 593 542 117 24.6% -51 -8.6%65 to 74 331 186 408 489 222 119.4% 81 19.9%75 to 84 313 394 245 273 -149 -37.8% 28 11.4%85 and over 122 152 142 132 -10 -6.6% -10 -7.0%Total 3,929 3,674 3,562 3,456 -112 -3.0% -106 -3.0%
Under 18 1,012 783 648 619 -135 -17.2% -29 -4.5%18 to 24 253 191 210 167 19 9.9% -43 -20.5%25 to 34 374 302 309 293 7 2.3% -16 -5.2%35 to 44 578 369 320 315 -49 -13.3% -5 -1.6%45 to 54 445 577 462 397 -115 -19.9% -65 -14.1%55 to 64 303 451 535 480 84 18.6% -55 -10.3%65 to 74 356 176 386 445 210 119.3% 59 15.3%75 to 84 286 388 237 276 -151 -38.9% 39 16.5%85 and over 138 139 131 126 -8 -5.8% -5 -3.8%Total 3,745 3,376 3,238 3,118 -138 -4.1% -120 -3.7%
Sources: US Census Bureau; MN State Demographic Center; ESRI; Maxfield Research & Consulting, LLC
TABLE D-4POPULATION AGE DISTRIBUTIONRENVILLE COUNTY MARKET AREA
2000 - 2025
Change
Renville Submarket
Olivia Submarket
Buffalo Laek/Hector
South Submarket
Census 2010-2020 2020-2025
Renville County

DEMOGRAPHIC ANALYSIS
MAXFIELD RESEARCH AND CONSULTING, LLC 21
• From 2020 to 2025, the population of the Renville County Market Area is expected to de-cline by -2.5%. The largest growth areas are forecasted in the 75 to 84 age cohort (+17.3%). The 65 to 74 age cohort is also projected to have significant growth (+16.4%).
-2.7%
-15.4%
-7.4%
1.3%
-11.0%
-10.8%
16.4%
17.3%
-5.6%
3.5%
0.7%
2.1%
7.7%
-1.5%
-2.3%
14.4%
22.5%
4.8%
-20.0% -15.0% -10.0% -5.0% 0.0% 5.0% 10.0% 15.0% 20.0% 25.0%
Under 18
18 to 24
25 to 34
35 to 44
45 to 54
55 to 64
65 to 74
75 to 84
85 and over
Percent
Age
Gro
up
Projected Population Growth by Age Group: 2020-2025
Minnesota Renville County
43.0 43.4 44.7 45.8 44.2
38.8
20.0
25.0
30.0
35.0
40.0
45.0
50.0
55.0
60.0
Me
dia
n A
ge
Renville County Market Area2020 Estimated Median Age

DEMOGRAPHIC ANALYSIS
MAXFIELD RESEARCH AND CONSULTING, LLC 22
Race of Population
The race of the population illustrates the diversity for each submarket in Renville County. Data for 2010 and 2017 was obtained from the U.S. Census and is presented in Table D-5.
• The majority of the Renville County residents reported their race as “White Alone” in 2010 (97.7%) and 2017 (96.5%).
• In 2017, 8.7% of the Renville County residents reported their ethnicity as Hispanic or Latino. The proportion of Hispanic residents varies by submarket. The Olivia Submarket reported 8.5% of the population as Hispanic or Latino, while 0.5% of the population in the Renville Submarket reported themselves as ethnically Hispanic or Latino.
-1,206
34
102
20
-4
0
-5
136
-1,500 -1,000 -500 0 500
White
Black
American Indian
Asian
Pacific Islander
Other
Two+ Races
Hispanic or Latino
Renville County Market Area Population Growth by Race / Ethnicity2010 - 2017

DEMOGRAPHIC ANALYSIS
MAXFIELD RESEARCH AND CONSULTING, LLC 23
2010 2017 2010 2017 2010 2017 2010 2017 2010 2017 2010 2017 2010 2017 2010 2017
Renville County 14,351 13,145 40 74 76 178 4 - 54 74 9 - 150 145 1,046 1,182
Renville Submarket 3,453 3,348 9 9 6 10 - - 7 49 1 - 26 18 369 18
Olivia Submarket 4,448 4,322 25 16 12 24 2 - 9 7 4 - 36 22 273 375
Buffalo Lake/Hector Submarket 3,426 2,981 2 15 7 28 1 - 14 2 - - 27 32 197 194
South Submarket 3,024 2,555 4 27 51 124 1 - 24 26 4 26 61 88 207 201
Percentage
Renville County 97.7% 96.5% 0.3% 0.5% 0.5% 1.3% 0.0% 0.0% 0.4% 0.5% 0.1% 0.0% 1.0% 1.1% 7.1% 8.7%
Renville Submarket 98.6% 97.5% 0.3% 0.3% 0.2% 0.3% 0.0% 0.0% 0.2% 1.4% 0.0% 0.0% 0.7% 0.5% 10.5% 0.5%
Olivia Submarket 98.1% 98.4% 0.6% 0.4% 0.3% 0.5% 0.0% 0.0% 0.2% 0.2% 0.1% 0.0% 0.8% 0.5% 6.0% 8.5%
Buffalo Lake/Hector Submarket 98.5% 97.5% 0.1% 0.5% 0.2% 0.9% 0.0% 0.0% 0.4% 0.1% 0.0% 0.0% 0.8% 1.0% 5.7% 6.3%
South Submarket 95.4% 89.8% 0.1% 0.9% 1.6% 4.4% 0.0% 0.0% 0.8% 0.9% 0.1% 0.9% 1.9% 3.1% 6.5% 7.1%
Two or More Races
Alone
Hispanic or Latino
Ethnicity not Race
Sources: U.S. Census Bureau; Maxfield Research and Consulting, LLC
TABLE D-5POPULATION DISTRIBUTION BY RACE
RENVILLE COUNTY MARKET AREA2010 & 2017
White AloneBlack or African
American Alone
American Indian or
Alaska Native Alone
(AIAN)
Native Hawaiian or
Pacific Islander
Alone (NHPI)
Asian Alone Some Other Race

DEMOGRAPHIC ANALYSIS
MAXFIELD RESEARCH AND CONSULTING, LLC 24
Household Income by Age of Householder
The estimated distribution of household incomes in Renville County and each submarket for 2020 and 2025 are shown in Tables D-6 through D-14. The data was estimated by Maxfield Re-search and Consulting, LLC based on income trends provided by ESRI. The data helps ascertain the demand for different housing products based on the size of the market at specific cost lev-els. The Department of Housing and Urban Development defines affordable housing costs as 30% of a household’s adjusted gross income. For example, a household with an income of $50,000 per year would be able to afford a monthly housing cost of about $1,250. Maxfield Research and Consulting, LLC utilizes a figure of 25% to 30% for younger households and 40% or more for seniors, since seniors generally have lower living expenses and can often sell their homes and use the proceeds toward rent payments. A generally accepted standard for affordable owner-occupied housing is that a typical house-hold can afford to pay 3.0 to 3.5 times their annual income on a single-family home. Thus, a $50,000 income would translate to an affordable single-family home of $150,000 to $175,000. The higher end of this range assumes that the person has adequate funds for down payment and closing costs, but also does not include savings or equity in an existing home.
$5
8,4
50
$5
8,8
78
$6
2,7
04
$5
2,0
48
$5
9,8
78
$7
1,2
67
$6
2,1
93
$6
3,6
45
$6
7,9
46
$5
5,6
36
$6
2,9
33
$7
7,0
32
$0
$10,000
$20,000
$30,000
$40,000
$50,000
$60,000
$70,000
$80,000
$90,000
RenvilleSubmarket
OliviaSubmarket
BuffaloLake/Hector
SouthSubmarket
SW CentralRegion
Minnesota
Median HH Income By Submarket
2020 2025

DEMOGRAPHIC ANALYSIS
MAXFIELD RESEARCH AND CONSULTING, LLC 25
Table D-6 presents household income by the age of the householder in Renville County for 2020 and 2025.
• In 2020, in the median income in Renville County was $58,269 across all ages. The median income is forecast to rise by approximately 7% to $62,566 in 2025.
• The highest median income was recorded among those ages 45 to 54 at $73,325 in 2020. In 2025, this age cohort is expected to remain the highest earners with a median income of $79,281, an approximate increase of 8%.
Total <25 25-34 35-44 45-54 55-64 65 -74 75+
Less than $15,000 1,443 76 143 131 179 307 224 383$15,000 to $24,999 1,215 48 100 74 83 202 186 522$25,000 to $34,999 1,322 52 138 112 117 198 276 429$35,000 to $49,999 2,322 112 269 243 305 424 462 507
$50,000 to $74,999 3,529 71 598 517 650 881 560 252$75,000 to $99,999 2,191 50 307 429 469 550 257 129$100,000 to $199,999 2,679 48 376 441 557 576 412 269$200,000 or more 705 5 69 81 205 200 114 31Total 15,406 462 2,000 2,027 2,565 3,339 2,491 2,522
Median Income $58,269 $41,425 $62,252 $71,632 $73,325 $63,974 $54,014 $33,514
Less than $15,000 1,205 62 112 109 131 216 207 368$15,000 to $24,999 1,072 40 78 67 64 136 181 506$25,000 to $34,999 1,110 31 105 95 78 128 257 416$35,000 to $49,999 2,178 93 238 223 250 330 483 561
$50,000 to $74,999 3,383 69 547 497 535 761 678 297$75,000 to $99,999 2,159 50 295 435 407 509 316 147$100,000 to $199,999 3,112 45 399 506 578 620 573 390$200,000 or more 794 5 64 83 209 231 159 43Total 15,013 395 1,838 2,016 2,251 2,931 2,853 2,729
Median Income $62,566 $44,678 $65,667 $76,644 $79,281 $71,562 $59,478 $37,064
Less than $15,000 -238 -14 -31 -22 -48 -91 -17 -15$15,000 to $24,999 -142 -7 -22 -7 -19 -67 -5 -15$25,000 to $34,999 -212 -21 -34 -17 -38 -69 -20 -13$35,000 to $49,999 -144 -19 -31 -19 -55 -93 21 54$50,000 to $74,999 -146 -3 -51 -20 -115 -120 118 45$75,000 to $99,999 -32 -0 -12 6 -63 -41 59 19$100,000 to $199,999 433 -2 23 66 20 44 161 121$200,000 or more 89 -0 -5 2 4 31 45 12Total -393 -67 -163 -11 -314 -408 362 207
Median Income $4,297 $3,253 $3,415 $5,012 $5,956 $7,588 $5,464 $3,550
Sources: ESRI; US Census Bureau; Maxfield Research & Consulting, LLC
2020
2025
Change 2020-2025
TABLE D-6HOUSEHOLD INCOME BY AGE OF HOUSEHOLDER
RENVILLE COUNTY2020 & 2025
Age of Householder

DEMOGRAPHIC ANALYSIS
MAXFIELD RESEARCH AND CONSULTING, LLC 26
Table D-7 displays the median income among age cohorts for the Renville Submarket.
• The 2020 median income for the Renville Submarket was $58,450 for all age cohorts. The median income is expected to rise to $62,193 in 2025, an 6.4% increase in median income.
• As reflected in the County, the highest income earners were those age 45 to 54 in 2020 ($72,168) and 2025 ($77,709).
Total <25 25-34 35-44 45-54 55-64 65 -74 75+
Less than $15,000 345 10 29 32 58 73 53 90$15,000 to $24,999 274 10 24 12 10 44 41 134$25,000 to $34,999 291 7 36 34 24 49 46 95$35,000 to $49,999 602 22 58 70 73 102 129 148
$50,000 to $74,999 976 17 170 155 168 223 170 73$75,000 to $99,999 534 7 66 114 117 131 66 34$100,000 to $199,999 661 12 102 134 141 126 97 49$200,000 or more 148 0 24 27 39 29 15 15Total 3,833 85 510 578 629 777 617 636
Median Income $58,450 $44,797 $63,145 $72,703 $72,168 $61,863 $54,690 $35,500
Less than $15,000 288 10 27 24 46 46 48 87$15,000 to $24,999 237 7 17 10 10 24 36 133$25,000 to $34,999 237 5 19 24 19 31 46 92$35,000 to $49,999 561 12 48 60 63 80 131 167
$50,000 to $74,999 953 15 155 150 155 189 198 92$75,000 to $99,999 530 7 60 116 109 118 85 34$100,000 to $199,999 779 7 104 152 160 135 140 80$200,000 or more 164 0 19 29 44 31 22 19Total 3,748 63 450 566 605 655 706 704
Median Income $62,193 $46,382 $66,209 $78,341 $77,709 $68,477 $59,597 $38,002
Less than $15,000 -57 -0 -3 -7 -12 -27 -5 -3$15,000 to $24,999 -38 -2 -7 -2 -0 -20 -5 -1$25,000 to $34,999 -55 -2 -17 -10 -5 -17 -0 -3$35,000 to $49,999 -41 -10 -10 -10 -10 -22 2 19$50,000 to $74,999 -24 -2 -15 -6 -13 -35 28 19$75,000 to $99,999 -5 -0 -5 2 -8 -13 19 -0$100,000 to $199,999 118 -5 2 19 19 9 43 31$200,000 or more 16 0 -5 2 5 2 7 5Total -85 -22 -60 -12 -25 -122 89 67
Median Income $3,743 $1,585 $3,064 $5,638 $5,541 $6,614 $4,907 $2,502
Sources: ESRI; US Census Bureau; Maxfield Research & Consulting, LLC
2020
2025
Change 2020-2025
TABLE D-7HOUSEHOLD INCOME BY AGE OF HOUSEHOLDER
RENVILLE SUBMARKET2020 & 2025
Age of Householder

DEMOGRAPHIC ANALYSIS
MAXFIELD RESEARCH AND CONSULTING, LLC 27
Table D-8 displays the median income among age cohorts for the Olivia Submarket.
• Incomes in the Olivia Submarket are expected to rise 8.1% from $58,878 in 2020, to $63,645 in 2025.
• The highest earners in the Olivia Submarket were those age 45 to 54 in 2020 ($73,929) and in 2025 this age cohort will earn ($80,844).
• Between 2020 and 2025 the median income of householders age 55 to 64 is forecast to ex-perience the greatest growth, increasing 13% from $63,853 in 2020 to $72,165 in 2025.
Total <25 25-34 35-44 45-54 55-64 65 -74 75+
Less than $15,000 507 42 59 52 52 108 75 118$15,000 to $24,999 408 19 40 28 35 78 66 141$25,000 to $34,999 412 31 49 31 33 54 90 125$35,000 to $49,999 622 40 80 66 75 118 118 125
$50,000 to $74,999 1,056 26 191 151 174 288 158 68$75,000 to $99,999 658 21 94 132 130 170 78 33$100,000 to $199,999 898 26 130 151 167 167 141 115$200,000 or more 222 2 19 21 49 80 45 5Total 4,782 207 662 632 716 1,063 771 731
Median Income $58,878 $38,975 $61,250 $73,232 $73,929 $63,853 $55,304 $33,864
Less than $15,000 425 33 49 45 35 75 75 113$15,000 to $24,999 355 16 28 21 23 54 68 143$25,000 to $34,999 338 21 35 23 19 31 85 125$35,000 to $49,999 580 33 73 61 63 87 127 136
$50,000 to $74,999 1,015 26 179 148 143 244 193 82$75,000 to $99,999 655 21 94 136 110 155 101 38$100,000 to $199,999 1,057 23 146 179 174 179 193 164$200,000 or more 268 2 16 21 52 96 66 14Total 4,694 176 620 634 620 921 907 815
Median Income $63,645 $42,348 $65,643 $78,474 $80,844 $72,165 $61,453 $38,029
Less than $15,000 -81 -10 -10 -7 -17 -33 -0 -5$15,000 to $24,999 -53 -2 -12 -7 -12 -24 2 2$25,000 to $34,999 -74 -9 -14 -7 -14 -24 -5 -0$35,000 to $49,999 -42 -7 -7 -5 -12 -31 9 11$50,000 to $74,999 -41 -0 -12 -3 -31 -43 35 14$75,000 to $99,999 -2 -0 -0 4 -19 -15 23 5$100,000 to $199,999 159 -2 16 28 7 11 51 49$200,000 or more 46 -0 -2 -0 2 16 21 9Total -88 -31 -42 3 -96 -142 136 85
Median Income $4,767 $3,373 $4,393 $5,242 $6,915 $8,312 $6,149 $4,165
Sources: ESRI; US Census Bureau; Maxfield Research & Consulting, LLC
2020
2025
Change 2020-2025
TABLE D-8HOUSEHOLD INCOME BY AGE OF HOUSEHOLDER
OLIVIA SUBMARKET2020 & 2025
Age of Householder

DEMOGRAPHIC ANALYSIS
MAXFIELD RESEARCH AND CONSULTING, LLC 28
Table D-9 shows the median incomes for the Buffalo Lake/Hector Submarket for 2020 and 2025.
• The median income in the Buffalo Lake/Hector Submarket was $62,704 in 2020, increasing to $67,946 in 2025.
• The highest earners in the Buffalo Lake/Hector Submarket (those ages 45 to 54) have a me-dian income of $78,915 in 2020 and $84,237 in 2025.
• Between 2020 and 2025 the median income of householders age 55 to 64 is forecast to ex-perience the greatest growth, increasing 13.4% from $71,386 in 2020 to $80,936 in 2025.
Total <25 25-34 35-44 45-54 55-64 65 -74 75+
Less than $15,000 247 7 29 15 27 53 39 78$15,000 to $24,999 199 5 10 7 7 39 34 97$25,000 to $34,999 322 5 29 17 27 53 70 121$35,000 to $49,999 504 22 63 58 68 82 75 136
$50,000 to $74,999 870 10 145 116 170 218 141 70$75,000 to $99,999 504 5 73 82 124 124 61 36$100,000 to $199,999 730 5 85 107 148 204 112 70$200,000 or more 184 2 12 22 65 51 27 5Total 3,562 61 446 424 635 824 558 613
Median Income $62,704 $42,868 $63,372 $75,362 $78,915 $71,386 $59,439 $36,430
Less than $15,000 192 5 19 12 15 34 36 70$15,000 to $24,999 162 5 7 7 5 22 34 82$25,000 to $34,999 269 2 22 15 19 32 68 112$35,000 to $49,999 468 17 53 53 56 65 80 143
$50,000 to $74,999 817 10 129 109 133 192 170 75$75,000 to $99,999 497 5 61 85 104 121 82 39$100,000 to $199,999 834 5 92 116 148 213 162 97$200,000 or more 216 2 12 27 61 61 41 12Total 3,456 51 395 424 541 740 674 631
Median Income $67,946 $46,087 $66,692 $79,152 $84,237 $80,936 $66,432 $39,623
Less than $15,000 -56 -2 -10 -2 -12 -19 -2 -7$15,000 to $24,999 -36 0 -2 0 -2 -17 0 -15$25,000 to $34,999 -53 -2 -7 -2 -7 -22 -2 -10$35,000 to $49,999 -36 -5 -10 -5 -12 -17 5 7$50,000 to $74,999 -53 0 -17 -7 -36 -27 29 5$75,000 to $99,999 -7 0 -12 2 -19 -2 22 2$100,000 to $199,999 104 0 7 10 0 10 51 27$200,000 or more 32 0 0 5 -5 10 15 7Total -106 -10 -51 0 -94 -85 117 17
Median Income $5,242 $3,219 $3,320 $3,790 $5,322 $9,550 $6,993 $3,193
Sources: ESRI; US Census Bureau; Maxfield Research & Consulting, LLC
2020
2025
Change 2020-2025
TABLE D-9HOUSEHOLD INCOME BY AGE OF HOUSEHOLDER
BUFFALO LAKE/HECTOR SUBMARKET2020 & 2025
Age of Householder

DEMOGRAPHIC ANALYSIS
MAXFIELD RESEARCH AND CONSULTING, LLC 29
Table D-10 displays the median income among age cohorts for the South Submarket.
• Incomes in the South Submarket are expected to rise 6.9% from $52,048 in 2020, to $55,636 in 2025. The median income in the South submarket was the lowest reported among the Renville County submarkets in 2020 and 2025.
• The highest earners in the South Submarket were those age 45 to 54 in 2020 ($68,698) and in 2025 this age cohort is expected to earn ($76,946).
• Between 2020 and 2025 the median income of householders age 55 to 64 is forecast to ex-perience the greatest growth, increasing 15.8% from $58,407 in 2020 to $67,635 in 2025.
Total <25 25-34 35-44 45-54 55-64 65 -74 75+
Less than $15,000 386 17 26 29 43 87 66 118$15,000 to $24,999 355 9 20 14 29 55 49 179$25,000 to $34,999 271 0 23 26 32 43 58 89$35,000 to $49,999 634 26 66 61 95 130 144 112
$50,000 to $74,999 672 9 101 104 147 159 104 49$75,000 to $99,999 525 17 81 101 107 136 52 32$100,000 to $199,999 401 3 49 52 110 92 58 37$200,000 or more 156 0 12 12 61 40 29 3Total 3,400 81 378 398 623 741 559 620
Median Income $52,048 $42,131 $61,293 $64,647 $68,698 $58,407 $46,099 $26,597
Less than $15,000 358 13 19 26 35 67 67 131$15,000 to $24,999 345 6 16 16 22 38 48 198$25,000 to $34,999 256 0 19 26 19 29 61 102$35,000 to $49,999 653 26 67 61 77 115 166 141
$50,000 to $74,999 717 10 106 112 128 160 141 61$75,000 to $99,999 579 19 90 115 96 144 70 45$100,000 to $199,999 547 3 64 61 125 122 106 67$200,000 or more 195 0 13 13 64 54 48 3Total 3,650 77 393 429 566 729 707 749
Median Income $55,636 $45,421 $66,306 $67,765 $76,946 $67,635 $52,616 $29,146
Less than $15,000 -28 -5 -7 -3 -8 -19 1 13$15,000 to $24,999 -9 -2 -4 2 -6 -16 -1 20$25,000 to $34,999 -15 0 -4 -0 -13 -14 3 13$35,000 to $49,999 18 -0 1 0 -18 -15 22 28$50,000 to $74,999 45 1 5 8 -19 1 37 12$75,000 to $99,999 54 2 9 14 -11 8 18 13$100,000 to $199,999 146 0 15 9 15 29 48 30$200,000 or more 39 0 1 1 3 14 19 0Total 250 -4 16 31 -57 -12 148 129
Median Income $3,588 $3,290 $5,013 $3,118 $8,248 $9,228 $6,517 $2,549
Sources: ESRI; US Census Bureau; Maxfield Research & Consulting, LLC
2020
2025
Change 2020-2025
TABLE D-10HOUSEHOLD INCOME BY AGE OF HOUSEHOLDER
SOUTH SUBMARKET2020 & 2025
Age of Householder
DEMOGRAPHIC ANALYSIS
MAXFIELD RESEARCH AND CONSULTING, LLC 30
Tenure by Age of Householder
Table D-11 shows 2010 and 2020 tenure data for each of the submarkets in Renville County by age cohort from the U.S. Census Bureau and 2020 estimates by Maxfield Research and Consult-ing, LLC. This data is useful in determining demand for certain types of housing since housing preferences change throughout an individual’s life cycle.
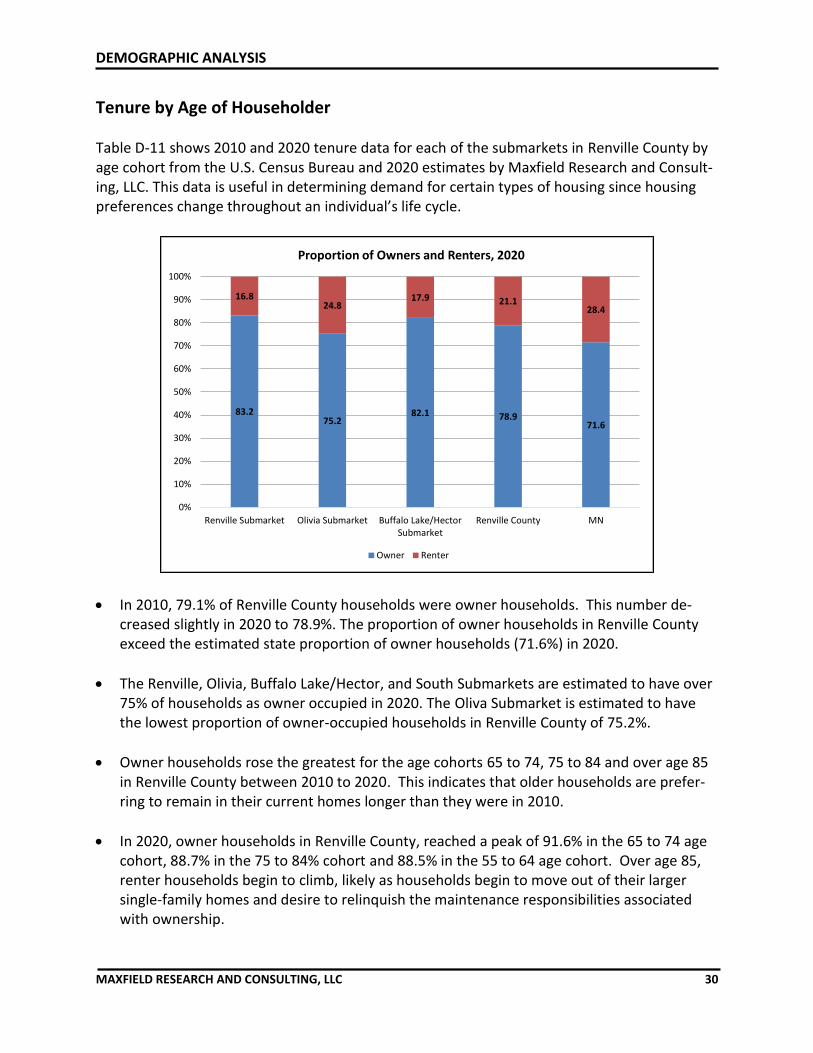
• In 2010, 79.1% of Renville County households were owner households. This number de-creased slightly in 2020 to 78.9%. The proportion of owner households in Renville County exceed the estimated state proportion of owner households (71.6%) in 2020.
• The Renville, Olivia, Buffalo Lake/Hector, and South Submarkets are estimated to have over 75% of households as owner occupied in 2020. The Oliva Submarket is estimated to have the lowest proportion of owner-occupied households in Renville County of 75.2%.
• Owner households rose the greatest for the age cohorts 65 to 74, 75 to 84 and over age 85 in Renville County between 2010 to 2020. This indicates that older households are prefer-ring to remain in their current homes longer than they were in 2010.
• In 2020, owner households in Renville County, reached a peak of 91.6% in the 65 to 74 age cohort, 88.7% in the 75 to 84% cohort and 88.5% in the 55 to 64 age cohort. Over age 85, renter households begin to climb, likely as households begin to move out of their larger single-family homes and desire to relinquish the maintenance responsibilities associated with ownership.
83.275.2
82.1 78.971.6
16.824.8
17.9 21.128.4
0%
10%
20%
30%
40%
50%
60%
70%
80%
90%
100%
Renville Submarket Olivia Submarket Buffalo Lake/HectorSubmarket
Renville County MN
Proportion of Owners and Renters, 2020
Owner Renter

DEMOGRAPHIC ANALYSI
MAXFIELD RESEARCH AND CONSULTING, LLC 31
2010 2020Age No. Pct. No. Pct. No. Pct. No. Pct. No. Pct. No. Pct. No. Pct. No. Pct. No. Pct. No. Pct. Pct. Pct.
15-24 Own 78 36.6 109 38.1 22 48.9 5 10.9 21 23.3 43 39.0 19 51.4 26 57.1 16 39.0 35 42.5 19.8 17.6Rent 135 63.4 177 61.9 23 51.1 42 89.1 69 76.7 67 61.0 18 48.6 19 42.9 25 61.0 47 57.5 80.2 82.4Total 213 100.0 286 100.0 45 100.0 48 100.0 90 100.0 111 100.0 37 100.0 45 100.0 41 100.0 82 100.0 100.0 100.0
25-34 Own 531 65.6 511 61.7 145 69.7 162 84.3 157 57.7 151 49.0 124 71.7 93 66.9 105 66.9 105 55.4 56.1 52.0Rent 279 34.4 317 38.3 63 30.3 30 15.7 115 42.3 157 51.0 49 28.3 46 33.1 52 33.1 84 44.6 43.9 48.0Total 810 100.0 828 100.0 208 100.0 192 100.0 272 100.0 308 100.0 173 100.0 139 100.0 157 100.0 189 100.0 100.0 100.0
35-44 Own 712 78.7 651 74.0 166 77.2 221 74.2 212 77.9 205 78.5 192 85.0 135 72.8 142 74.0 91 66.9 75.0 72.0Rent 193 21.3 228 26.0 49 22.8 77 25.8 60 22.1 56 21.5 34 15.0 50 27.2 50 26.0 45 33.1 25.0 28.0Total 905 100.0 879 100.0 215 100.0 297 100.0 272 100.0 260 100.0 226 100.0 185 100.0 192 100.0 136 100.0 100.0 100.0
45-54 Own 1,246 86.4 970 86.6 300 90.1 237 95.0 362 81.0 275 91.6 304 89.7 270 86.1 280 86.7 189 73.3 81.7 80.0Rent 196 13.6 151 13.4 33 9.9 12 5.0 85 19.0 25 8.4 35 10.3 44 13.9 43 13.3 69 26.7 18.3 20.0Total 1,442 100.0 1,121 100.0 333 100.0 250 100.0 447 100.0 300 100.0 339 100.0 314 100.0 323 100.0 257 100.0 100.0 100.0
55-64 Own 1,080 87.7 1,269 88.5 269 88.2 267 90.8 321 84.5 377 81.9 262 92.6 316 90.5 228 86.4 308 93.2 84.7 82.6Rent 152 12.3 165 11.5 36 11.8 27 9.2 59 15.5 83 18.1 21 7.4 33 9.5 36 13.6 23 6.8 15.3 17.4Total 1,232 100.0 1,434 100.0 305 100.0 294 100.0 380 100.0 461 100.0 283 100.0 350 100.0 264 100.0 330 100.0 100.0 100.0
65-74 Own 735 88.7 869 91.6 173 85.2 271 95.3 217 90.8 234 88.1 184 90.2 198 93.0 161 88.0 165 89.4 84.9 84.4Rent 94 11.3 80 8.4 30 14.8 13 4.7 22 9.2 32 11.9 20 9.8 15 7.0 22 12.0 19 10.6 15.1 15.6Total 829 100.0 948 100.0 203 100.0 285 100.0 239 100.0 266 100.0 204 100.0 213 100.0 183 100.0 185 100.0 100.0 100.0
75-84 Own 596 80.2 503 88.7 140 78.7 111 87.0 183 81.7 162 88.0 133 79.6 131 95.3 140 80.5 99 84.3 77.0 78.4
Rent 147 19.8 64 11.3 38 21.3 17 13.0 41 18.3 22 12.0 34 20.4 6 4.7 34 19.5 18 15.7 23.0 21.6
Total 743 100.0 567 100.0 178 100.0 127 100.0 224 100.0 185 100.0 167 100.0 138 100.0 174 100.0 118 100.0 100.0 100.0
85+ Own 212 54.4 225 55.6 40 40.4 43 48.3 67 60.4 85 57.9 56 56.6 52 50.0 49 60.5 44 69.4 55.3 56.3
Rent 178 45.6 180 44.4 59 59.6 47 51.7 44 39.6 62 42.1 43 43.4 52 50.0 32 39.5 19 30.6 44.7 43.7
Total 390 100.0 405 100.0 99 100.0 90 100.0 111 100.0 148 100.0 99 100.0 105 100.0 81 100.0 64 100.0 100.0 100.0
TOTAL Own 5,190 79.1 5,107 78.9 1,255 79.1 1,317 83.2 1,540 75.7 1,533 75.2 1,274 83.4 1,222 82.1 1,121 79.2 1,036 76.1 73.0 71.6Rent 1,374 20.9 1,362 21.1 331 20.9 265 16.8 495 24.3 505 24.8 254 16.6 266 17.9 294 20.8 325 23.9 27.0 28.4
Total 6,564 100.0 6,469 100.0 1,586 100.0 1,582 100.0 2,035 100.0 2,038 100.0 1,528 100.0 1,488 100.0 1,415 100.0 1,361 100.0 100.0 100.0
Sources: U.S. Census Bureau; Maxfield Research and Consulting, LLC
Renville County MN
RENVILLE COUNTY MARKET AREA
TABLE D-11TENURE BY AGE OF HOUSEHOLDER
2010 & 2020
South SubmarketBuffalo Lake/Hector SubmarketOlivia Submarket
---------- Renville County Submarkets ----------
Renville Submarket2010 2020 2010 20202020 2020 201020102010 2020

DEMOGRAPHIC ANALYSIS
MAXFIELD RESEARCH AND CONSULTING, LLC 32
Tenure by Household Size Table D-12 shows the distribution of households by size and tenure in Renville County in 2010 and 2020 estimates by Maxfield Research and Consulting, LLC. This data is useful in that it sheds insight into unit type that may be most needed in Renville County.
• Household size for renters tends to be smaller than for owners. This trend is a result of the typical market segments for rental housing, including households that are younger and are less likely to be married with children, as well as older adults and seniors who choose to downsize from their single-family homes. In 2020, it is estimated that 36.8% of renter households in Renville County were one-person households.
• The Olivia Submarket has higher proportion of one person households than other Renville County submarkets indicating a higher preference for renting or buying multifamily type homes.
• Owner households were most likely to contain two people in the Renville County, repre-senting 42.4% of owner households.
0% 20% 40% 60% 80% 100%
Renville Submarket
Olivia Submarket
Buffalo Lake/Hector
South Submarket
Renville County
Minnesota
Household Size Distribution by SubmarketRenville County
1-Person 2-Person 3-Person 4-Person 5-Person 6-Person 7-Person

DEMOGRAPHIC ANALYSIS
MAXFIELD RESEARCH AND CONSULTING, LLC 33
0% 10% 20% 30% 40% 50% 60% 70% 80% 90% 100%
Owner Occupied
Renter Occupied
Owner & Renter Persons per Household by Tenure , Renville County 2020
1PP Household 2PP Household 3PP Household 4PP Household
5PP Household 6PP Household 7PP+ Household

DEMOGRAPHIC ANALYSIS
MAXFIELD RESEARCH AND CONSULTING, LLC 34
2010 2020Age No. Pct. No. Pct. No. Pct. No. Pct. No. Pct. No. Pct. No. Pct. No. Pct. No. Pct. No. Pct. Pct. Pct.
1-Person Own 1,216 62.5 1,256 63.2 261 57.9 280 71.4 372 58.3 374 57.5 295 69.9 263 64.4 288 66.2 337 72.3 72.3 0.2Rent 730 37.5 730 36.8 190 42.1 112 28.6 266 41.7 276 42.5 127 30.1 145 35.6 147 33.8 155 33.2 33.2 0.3Total 1,946 100.0 1,986 100.0 451 100.0 392 100.0 638 100.0 651 100.0 422 100.0 408 100.0 435 100.0 112 100.0 100.0 100.0
2-Person Own 2,197 88.4 2,249 89.7 542 90.2 557 90.7 642 86.1 696 86.4 533 89.4 610 92.2 480 88.4 414 86.9 86.9 86.9Rent 289 11.6 258 10.3 59 9.8 57 9.3 104 13.9 110 13.6 63 10.6 51 7.8 63 11.6 63 13.1 13.1 13.1Total 2,486 100.0 2,507 100.0 601 31.0 614 100.0 746 100.0 806 100.0 596 100.0 662 100.0 543 100.0 477 100.0 100.0 100.0
3-Person Own 723 82.3 651 86.1 168 84.4 150 89.8 223 79.4 181 82.7 180 85.7 145 87.2 152 80.9 118 65.0 65.0 65.0Rent 155 17.7 105 13.9 31 15.6 17 10.2 58 20.6 38 17.3 30 14.3 21 12.8 36 19.1 64 35.0 35.0 35.0Total 878 100.0 756 100.0 199 100.0 167 100.0 281 100.0 219 100.0 210 100.0 167 100.0 188 100.0 182 100.0 100.0 100.0
4-Person Own 585 84.5 521 83.2 155 83.8 154 90.6 177 81.9 167 78.6 156 90.7 123 93.5 97 81.5 78 66.7 66.7 66.7Rent 107 15.5 105 16.8 30 16.2 16 9.4 39 18.1 45 21.4 16 9.3 9 6.5 22 18.5 39 33.3 33.3 33.3Total 692 100.0 626 100.0 185 100.0 170 100.0 216 100.0 212 100.0 172 100.0 131 100.0 119 100.0 117 100.0 100.0 100.0
5-Person Own 335 87.0 310 78.8 85 88.5 67 59.8 93 87.7 86 77.4 84 88.4 61 76.0 73 83.0 61 96.7 96.7 96.7Rent 50 13.0 83 21.2 11 11.5 45 40.2 13 12.3 25 22.6 11 11.6 19 24.0 15 17.0 2 3.3 3.3 3.3Total 385 100.0 393 100.0 96 100.0 112 100.0 106 100.0 112 100.0 95 100.0 80 100.0 88 100.0 63 100.0 100.0 100.0
6-Person Own 97 80.2 138 82.1 30 85.7 61 87.1 26 78.8 28 93.1 22 84.6 19 48.6 19 70.4 26 89.3 89.3 89.3Rent 24 19.8 30 17.9 5 14.3 9 12.9 7 21.2 2 6.9 4 15.4 20 51.4 8 29.6 3 10.7 10.7 10.7Total 121 100.0 169 100.0 35 100.0 70 100.0 33 100.0 31 100.0 26 100.0 40 100.0 27 100.0 29 100.0 100.0 100.0
7-Person Own 37 66.1 18 54.8 14 73.7 3 100.0 10 66.7 0 0.0 4 57.1 0 0.0 12 80.0 2 100.0 100.0 100.0Rent 19 33.9 15 45.2 5 26.3 0 0.0 5 33.3 8 100.0 3 42.9 0 0.0 3 20.0 0 0.0 0.0 0.0Total 56 100.0 32 100.0 19 100.0 3 100.0 15 100.0 8 100.0 7 100.0 0 0.0 15 100.0 2 100.0 100.0 100.0
Total Own 5,190 79.1 5,143 79.5 1,255 79.1 1,272 83.2 1,543 75.8 1,533 75.2 1,274 83.4 1,222 82.1 1,121 79.2 1,036 76.1 76.1 76.1Rent 1,374 20.9 1,326 20.5 331 20.9 256 16.8 492 24.2 505 24.8 254 16.6 266 17.9 294 20.8 325 23.9 23.9 23.9Total 6,564 100.0 6,469 100.0 1,586 100.0 1,528 100.0 2,035 100.0 2,038 100.0 1,528 100.0 1,488 100.0 1,415 100.0 1,361 100.0 100.0 100.0
Sources: U.S. Census Bureau; Maxfield Research & Consulting, LLC
2010 2020 2020 2010 2020
MN
2010
TABLE D-12TENURE BY HOUSEHOLD SIZE
RENVILLE COUNTY2010 & 2020
2020 2010 2020
---------- Renville County Submarkets ----------
Renville Submarket Olivia Submarket Buffalo Lake/Hector Submarket South Submarket
2010
Renville County

DEMOGRAPHIC ANALYSIS
MAXFIELD RESEARCH AND CONSULTING, LLC 35
Household Type Table D-13 shows a breakdown of the type of households present in Renville County in 2010 and 2020 estimates by Maxfield Research and Consulting, LLC. The data is useful in assessing housing demand since the household composition often dictates the type of housing needed and preferred. The following key points are summarized from Table D-13.
• Within Renville County, married couples without children represented the largest house-hold type. These households accounted for 36% of all households in the Market Area in 2020, an increase from 35.4% from 2010. The proportion of married couples without chil-dren also rose in the State of Minnesota from 2010 to 2020, although the proportion in Minnesota (30.4%) is lower than Renville County.
• The increase in households without children reflects the changing demographics of the overall Market Area, and the country, as baby boomers age and more households become empty nest households. Additional factors contributing to this trend include couples delay-ing, or forgoing, having children.
• Households without children is the largest household type in all of the submarkets except the South Submarket where Living Alone is the largest household type.
• Living Alone remains the second largest household type in Renville County , representing 28% of households. However, all submarkets except the South Submarket (+10.3%) reported a decline in the proportion of people living alone between 2010 and 2020, ranging from a decline of -0.7% in the Olivia Submarket to -13.1% in the Renville Submarket.
• Other family households, namely single parents with children, also experienced an increase, growing by 7.1% in Renville County between 2010 and 2020.
Living Alone28%
Roommate5%
Married w/ Child18%
Married w/o Child36%
Other Family13%
Renville County Market Area Household Type2020

DEMOGRAPHIC ANALYSIS
MAXFIELD RESEARCH AND CONSULTING, LLC 36
2010 2020 2010 2020 2010 2020 2010 2020 2010 2020 2010 2020
Total Households 6,564 6,469 1,586 1,583 1,958 1,968 1,528 1,488 1,415 1,361 2,087,227 2,238,428
Non-Family Households 2,223 2,135 520 543 714 769 485 456 489 550 738,212 797,448Living Alone 1,946 1,811 451 392 624 617 422 415 435 480 584,008 635,239Other (Roommates) 277 323 69 151 90 152 63 60 54 70 154,204 162,209
Family Households 4,341 4,334 1,066 1,040 1,244 1,199 1,043 1,032 926 811 1,349,015 1,440,980Married w/ Children 1,230 1,164 302 330 339 380 315 297 256 251 443,212 459,033Married w/o Children 2,326 2,329 591 559 654 667 565 532 480 414 617,297 680,570Other Family 785 841 173 151 251 152 163 149 190 146 288,506 301,376
Change (2010-2020)
No. Pct. No. Pct. No. Pct. No. Pct. No. Pct. No. Pct.
Total Households -95 -1.4% -3 -0.2% 10 0.5% -40 -2.6% -54 -3.8% 151,201 7.2%
Non-Family Households -88 -4.0% 23 4.4% 55 7.7% -29 -6.0% 61 12.5% 59,236 8.0%Living Alone -135 -6.9% -59 -13.1% -7 -1.1% -7 -1.7% 45 10.3% 51,231 8.8%Other (Roommates) 46 16.8% 82 118.8% 62 68.9% -3 -4.8% 16 29.6% 8,005 5.2%
Family Households -7 -0.2% -26 -2.4% -45 -3.6% -11 -1.1% -115 -12.4% 91,965 6.8%Married w/ Children -66 -5.3% 28 9.3% 41 12.1% -18 -5.7% -5 -2.0% 15,821 3.6%Married w/o Children 3 0.1% -32 -5.4% 13 2.0% -33 -5.8% -66 -13.8% 63,273 10.3%Other Family 56 7.1% -22 -12.7% -99 -39.4% -14 -8.6% -44 -23.2% 12,870 4.5%
Sources: U.S. Census; MN State Demographic Center; ESRI; Maxfield Research & Consulting, LLC
Buffalo Lake/Hector South Sub.
TABLE D-13HOUSEHOLD TYPE
RENVILLE COUNTY MARKET AREA2010 & 2020
---------- Renville County Submarkets ----------
MinnesotaRenville County Renville Sub. Olivia Sub.

DEMOGRAPHIC ANALYSIS
MAXFIELD RESEARCH AND CONSULTING, LLC 37
28%25%
32%31%
28%28%
31%35%
30%28%
28%35%
4%10%
5%8%
4%4%
4%5%
4%5%
7%7%
19%21%
17%19%
21%20%
18%18%
19%18%
21%21%
37%35%
33%34%
37%36%
34%30%
35%35%
30%30%
11%10%
13%8%
11%10%
13%11%
12%13%
14%
0% 20% 40% 60% 80% 100%
Renville Sub. '10Renville Sub. '20
Olivia Sub. '10Olivia Sub. '20
Buffal Lake/Hector Sub. '10Buffalo Lake/Hector Sub. '20
South Sub. '10South Sub. '20
Renville County Sub. '10Renville County Sub. '20
Minnesota '10Minnesota '20
Household Type Comparison by SubmarketRenville County Market Area
Living Alone Roommates Married w/ Child
Married w/o Child Other Family

DEMOGRAPHIC ANALYSIS
MAXFIELD RESEARCH AND CONSULTING, LLC 38
Net Worth Table D-14 shows household net worth in Renville County in 2019. Simply stated, net worth is the difference between assets and liabilities, or the total value of assets after the debt is sub-tracted. The data was compiled and estimated by ESRI based on the Survey of Consumer Fi-nances and Federal Reserve Board data.
• Renville County reported an average net worth of $850,377 and a median net worth of $275,837. Median net worth is generally a more accurate depiction of wealth than the aver-age figure. A few households with very large net worth can significantly skew the average. Communities with high levels of farming equipment and land assets tend to also increase the average and median net worth in those areas.
• The highest average net worth was reported in the Buffalo Lake/Hector Submarket, $932,781, while the Renville Submarket reported the lowest net worth, $678,294.
• In Renville County, median net worth was highest for households in the age 65 to 74 cohort at $549,405, followed by the 55 to 64 age group at $526,551.
• Among all age cohorts, the Buffalo Lake/Hector Submarket reported the highest median net worth while the Olivia Submarket reported the lowest median net worth.
• The Olivia Submarket age 65+ age cohorts reported the highest median net worth ($388,034) in the Market Area. The South Submarket reported the lowest median net worth for age cohorts between 15 to 24 ($12,143).
$0
$50,000
$100,000
$150,000
$200,000
$250,000
$300,000
$350,000
$400,000
$450,000
15-24 25-34 35-44 45-54 55-64 65-74 75+
Median Net Worth by Age, Renville County Market Area Submarkets, 2019
Renville Submarket
Olivia Submarket
Buffalo Lake/Hector Submarket
South Submarket
Renville County
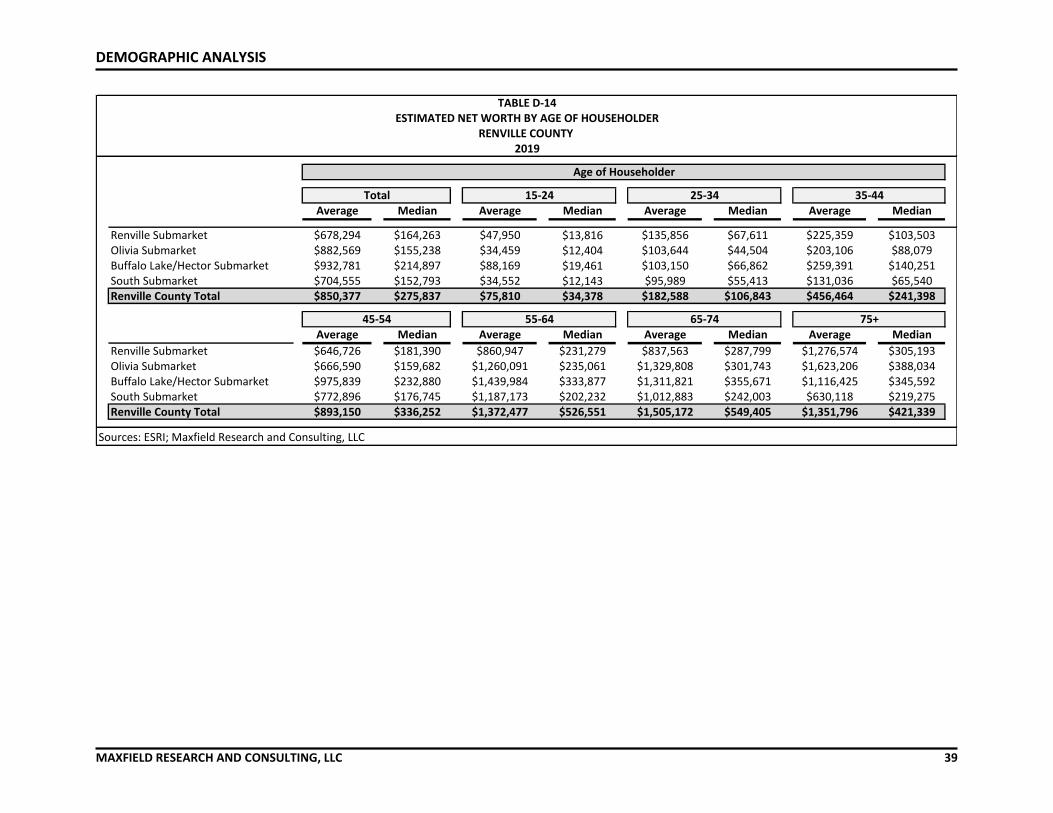
DEMOGRAPHIC ANALYSIS
MAXFIELD RESEARCH AND CONSULTING, LLC 39
Average Median Average Median Average Median Average Median
Renville Submarket $678,294 $164,263 $47,950 $13,816 $135,856 $67,611 $225,359 $103,503Olivia Submarket $882,569 $155,238 $34,459 $12,404 $103,644 $44,504 $203,106 $88,079Buffalo Lake/Hector Submarket $932,781 $214,897 $88,169 $19,461 $103,150 $66,862 $259,391 $140,251South Submarket $704,555 $152,793 $34,552 $12,143 $95,989 $55,413 $131,036 $65,540Renville County Total $850,377 $275,837 $75,810 $34,378 $182,588 $106,843 $456,464 $241,398
Average Median Average Median Average Median Average Median
Renville Submarket $646,726 $181,390 $860,947 $231,279 $837,563 $287,799 $1,276,574 $305,193Olivia Submarket $666,590 $159,682 $1,260,091 $235,061 $1,329,808 $301,743 $1,623,206 $388,034Buffalo Lake/Hector Submarket $975,839 $232,880 $1,439,984 $333,877 $1,311,821 $355,671 $1,116,425 $345,592South Submarket $772,896 $176,745 $1,187,173 $202,232 $1,012,883 $242,003 $630,118 $219,275Renville County Total $893,150 $336,252 $1,372,477 $526,551 $1,505,172 $549,405 $1,351,796 $421,339
Sources: ESRI; Maxfield Research and Consulting, LLC
45-54 55-64 65-74 75+
TABLE D-14ESTIMATED NET WORTH BY AGE OF HOUSEHOLDER
RENVILLE COUNTY 2019
Age of Householder
Total 15-24 25-34 35-44

DEMOGRAPHIC ANALYSIS
MAXFIELD RESEARCH AND CONSULTING, LLC 40
Summary of Demographic Trends The following points summarize key demographic trends that will impact demand for housing throughout Renville County.
• In 2020, the population of Renville County is estimated at 14,600. The most populated sub-market within Renville County was the Olivia Submarket (4,725 people). There are esti-mated to be 6,469 households in Renville County in 2020. Similar to population trends, the submarket with the most household is the Olivia submarket (2,038).
• In 2010, the largest adult age cohort in the Renville County were those age 45 to 54, repre-senting 22% (12,074) of the population over age 18. By 2025, the largest adult age cohort in the County will be the 55 to 64 age cohort, representing approximately 19% of the adult population in Market Area.
• The largest proportional growth from 2020 to 2025 is expected to occur in the 75 to 84-year-old age cohort in the Olivia Submarket +20.4% (+62). The Olivia Submarket is expected to see the largest numerical growth in the 65 to 74-year-old age cohort with a 17.1% (+100) increase.
• From 2020 to 2025, the population of the Renville County Market Area is expected to de-cline by -2.5%. The largest growth areas are forecasted in the 75 to 84 age cohort (+17.3%). The 65 to 74 age cohort is also projected to significant growth (+16.4%).
• The majority of the Renville County residents reported their race as “White Alone” in 2010 (97.7%) and 2017 (96.5%). In 2017, 8.7% of the Renville County residents reported their eth-nicity as Hispanic or Latino. The proportion of Hispanic residents varies by submarket. The Olivia Submarket reported 8.5% of the population as Hispanic or Latino, while 0.5% of the population in the Renville Submarket reported themselves as ethnically Hispanic or Latino.
• In 2020, in the median income in Renville County was $58,269 across all ages. The median income is forecast to rise by approximately 7% to $62,566 in 2025.
• In 2020, the highest median incomes were reported in the Buffalo Lake/Hector Submarket ($62,704), followed by the Olivia Submarket ($58,878). The South Submarket trails the other submarkets in income, with a median income in 2020 of $52,048.
• In 2020, owner households in Renville County, reached a peak of 91.6% in the 65 to 74 age cohort, 88.6% in the 75 to 84% cohort and 88.5% in the 55 to 64 age cohort. Over age 85, renter households begin to climb, likely as households begin to move out of their larger single-family homes and desire to relinquish the maintenance responsibilities associated with ownership.

HOUSING CHARACTERISTICS
MAXFIELD RESEARCH AND CONSULTING, LLC 41
Introduction The variety and condition of the housing stock in a community provides the basis for an attrac-tive living environment. Housing functions as a building block for neighborhoods and goods and services. We initially examined the characteristics of the housing supply in Renville County by reviewing data on the age of the existing housing stock; examining residential building trends; and reviewing housing data from the American Community Survey that relates to Renville County.
Building Permit Trends Maxfield Research obtained data on the number of new construction housing units from 2010 through 2020 from Renville County, the State of the Cities Data Systems (SOCDS), and local planning and building departments. Table HC-1 displays the number of building permits issued for new construction of residential units in Renville County while Table HC-2 displays building permits broken down by submarket. It should be noted that not all cities and townships partici-pated in providing building permit data or collect data consistently. The following are key points from Table HC-1:
• Per the SOCDS, there have been 102 residential unit permits issued between 2010 and 2020. That equates to about 10 residential units permitted annually since 2010. Approxi-mately 99% of the permits issued in Renville County since 2010 have been single-family units.
• Only four multifamily permits have been issues in Renville County averages since 2010. The four multifamily permits were issues in 2015 and 2016 in the City of Olivia.
0
2
4
6
8
10
12
14
16
2010 2011 2012 2013 2014 2015 2016 2017 2018 2019 2020
Un
its
Residential Building Permits TrendsRenville County 2010 - 2018
Single-Family Multifamily
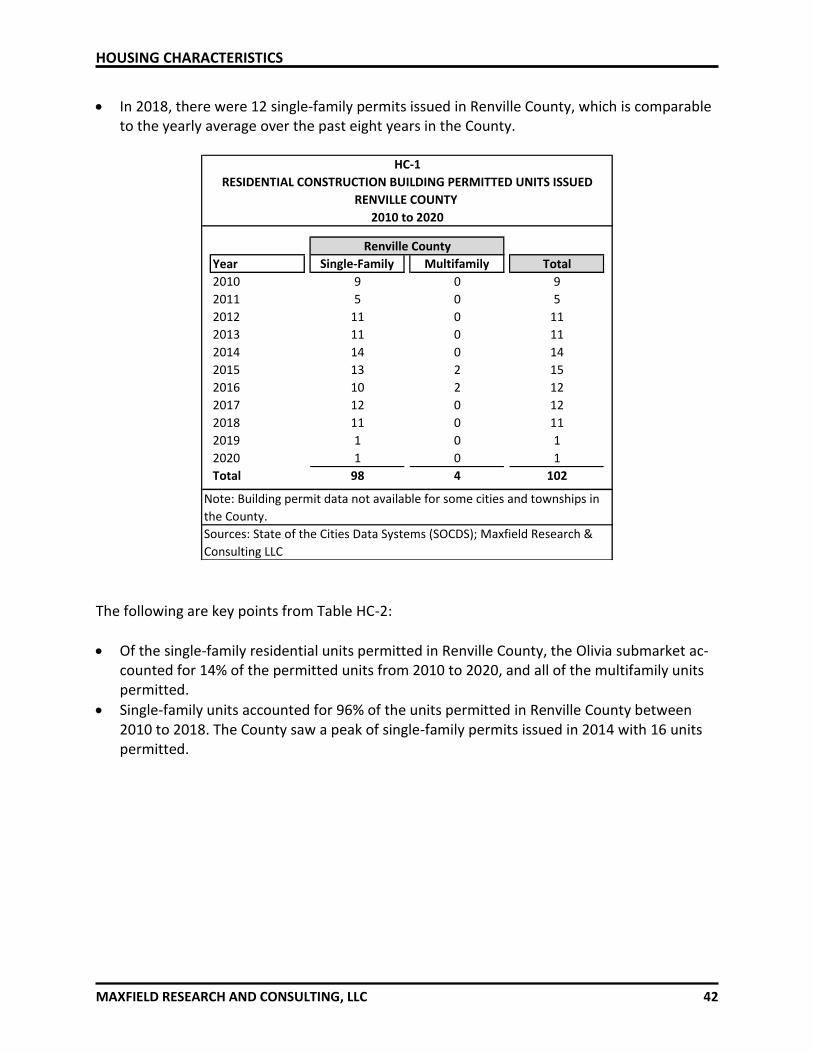
HOUSING CHARACTERISTICS
MAXFIELD RESEARCH AND CONSULTING, LLC 42
• In 2018, there were 12 single-family permits issued in Renville County, which is comparable to the yearly average over the past eight years in the County.
The following are key points from Table HC-2:
• Of the single-family residential units permitted in Renville County, the Olivia submarket ac-counted for 14% of the permitted units from 2010 to 2020, and all of the multifamily units permitted.
• Single-family units accounted for 96% of the units permitted in Renville County between 2010 to 2018. The County saw a peak of single-family permits issued in 2014 with 16 units permitted.
Year Single-Family Multifamily Total
2010 9 0 9
2011 5 0 5
2012 11 0 11
2013 11 0 11
2014 14 0 14
2015 13 2 15
2016 10 2 12
2017 12 0 12
2018 11 0 11
2019 1 0 1
2020 1 0 1
Total 98 4 102
Note: Building permit data not available for some cities and townships in
the County.
Sources: State of the Cities Data Systems (SOCDS); Maxfield Research &
Consulting LLC
HC-1
RESIDENTIAL CONSTRUCTION BUILDING PERMITTED UNITS ISSUED
RENVILLE COUNTY
2010 to 2020
Renville County

HOUSING CHARACTERISTICS
MAXFIELD RESEARCH AND CONSULTING, LLC 43
HC-2
RESIDENTIAL CONSTRUCTION BUILDING PERMITTED UNITS ISSUED
RENVILLE COUNTY
2010 TO 2020
Year Single-Family Multifamily Single-Family Multifamily Single-Family Multifamily Single-Family
Multifamil
y Single-Family Multifamily
Single-
Family Multifamily
2010 0 0 0 2 0 0 0 0 9 0 9 0
2011 0 0 0 0 0 0 0 0 5 0 5 0
2012 1 0 1 0 0 0 0 0 9 0 11 0
2013 0 0 0 0 0 0 0 0 11 0 11 0
2014 2 0 1 0 0 0 0 0 11 0 14 0
2015 0 0 1 2 0 0 0 0 12 0 13 2
2016 0 0 2 0 0 0 0 0 8 0 10 2
2017 1 0 3 0 0 0 0 0 8 0 12 0
2018 1 0 1 0 0 0 0 0 9 0 11 0
2019 0 0 1 0 0 0 0 0 0 0 1 0
2020 0 0 1 0 0 0 0 0 0 0 1 0
Total 5 0 11 4 0 0 0 0 82 0 98 4
Data is not a sum of all submarkets.
Note: Building permit data not available for some cities and townships in the County.
Sources: Renville County; SOCDS; Maxfield Research & Consulting LLC
Renville Submarket Olivia Submarket Buffalo Lake/Hector South Submarket Unicorporated Renville County

HOUSING CHARACTERISTICS
MAXFIELD RESEARCH AND CONSULTING, LLC 44
American Community Survey The American Community Survey (“ACS”) is an ongoing statistical survey administered by the U.S. Census Bureau that is sent to approximately 3 million addresses annually. The survey gath-ers data previously contained only in the long form of the Decennial Census. As a result, the survey is ongoing and provides a more “up-to-date” portrait of demographic, economic, social, and household characteristics every year, not just every ten years. The most recent ACS high-lights data collected between 2014 and 2018. Tables HC-3 to HC-8 show key data for Renville County.
Housing Units by Occupancy Status & Tenure Tenure is a key variable that analyzes the propensity for householders to rent or own their housing unit. Tenure is an integral statistic used by numerous governmental agencies and pri-vate sector industries to assess neighborhood stability. The Follow are key points from Table HC-3:
• Approximately 70.6% of housing units in Renville County were owner-occupied in the 2010 and 66.3% in 2018. The Buffalo Lake/Hector submarket had the highest proportion of owner-occupied households (66.8%), while the South submarket reported the highest share of renter-occupied households (25.5%) in 2018.
• Between 2010 and 2018, the South submarket experienced the greatest increase in propor-tion of renter-occupied units increasing from 294 to 317, a gain of 19.5%.
• About 10.8% of Renville’s housing stock was vacant in 2010 and increased to 16.1% in 2018. It is important to note, however, that the Census’s definition of vacant housing units in-cludes units that have been rented or sold, but not yet occupied, seasonal housing (vacation or second homes), housing for migrant workers, and even boarded-up housing. Thus, the U.S. Census vacancy figures are not always a true indicator of adequate housing available for new households wishing to move into the area.

HOUSING CHARACTERISTICS
MAXFIELD RESEARCH AND CONSULTING, LLC 45
83%75%
82% 80% 79%71%
17%25%
18% 20% 21%29%
0%
10%
20%
30%
40%
50%
60%
70%
80%
90%
Renville Sub. Olivia Sub BuffaloLake/Hector
Sub.
South Sub. RenvilleCounty
Minnesota
Owner vs Renter Comparison
Pct. Owner Pct. Renter

HOUSING CHARACTERISTICS
MAXFIELD RESEARCH AND CONSULTING, LLC 46
Owner Vs. Renter Comparison

HOUSING CHARACTERISTICS
MAXFIELD RESEARCH AND CONSULTING, LLC 47
Year/Occupancy No. Pct. No. Pct. No. Pct. No. Pct. No. Pct. No. Pct.
Owner-Occupied 1,255 70.5 1,540 68.9 1,274 72.5 1,121 70.9 5,190 70.6 1,523,859 64.9Renter-Occupied 331 18.6 495 22.1 254 14.4 294 18.6 1,374 18.7 563,368 24.0 Total Occ. Hsg. Units 1,586 89.1 2,035 91.1 1,528 86.9 1,415 89.4 6,564 89.2 2,087,227 88.9
Vacant 194 10.9 200 8.9 230 13.1 167 10.6 791 10.8 259,974 11.1
Total Hsg. Units 1,780 100.0 2,235 100.0 1,758 100.0 1,582 100.0 7,355 100.0 2,347,201 100.0
Owner-Occupied 1,272 69.9 1,454 64.6 1,143 66.8 1,010 63.9 4,879 66.3 1,567,939 63.9Renter-Occupied 256 14.1 479 21.3 249 14.5 317 20.1 1,301 17.7 626,513 25.5 Total Occ. Hsg. Units 1,528 83.9 1,933 85.9 1,392 81.3 1,327 83.9 6,180 83.9 2,194,452 89.4
Vacant 293 16.1 317 14.1 320 18.7 254 16.1 1,184 16.1 261,185 10.6
Total Hsg. Units 1,821 100.0 2,250 100.0 1,712 100.0 1,581 100.0 7,364 100.0 2,455,637 100.0
Owner-Occupied 17 1.4 -86 -5.6 -131 -10.3 -111 -9.9 -311 -6.0 44,080 2.9Renter-Occupied -75 -22.7 -16 -3.2 -5 -2.0 23 7.8 -73 -5.3 63,145 11.2 Total Occ. Hsg. Units -58 -3.7 -102 -5.0 -136 -8.9 -88 -6.2 -384 -5.9 107,225 5.1
Vacant 99 51.0 117 58.5 90 39.1 87 52.1 393 49.7 1,211 0.5
Total Hsg. Units 41 2.3 15 0.7 -46 -2.7 -1 -0.1 9 0.1 108,436 4.4
Sources: U.S. Census Bureau - American Community Survey; Maxfield Research & Consulting, LLC
Change
2010 & 2018
TABLE HC-3
2010
2018
RENVILLE COUNTY ANALYSIS AREAHOUSING UNITS BY OCCUPANCY STATUS & TENURE
Renville Sub. Olivia Sub. MinnesotaBuffalo Lake/Hector South Sub. Renville County

HOUSING CHARACTERISTICS
MAXFIELD RESEARCH AND CONSULTING, LLC 48
Age of Housing Stock The following table shows the age distribution of the housing stock in 2018 based on data from the U.S. Census Bureau American Community Survey (5-Year). Table HC-4 includes the number of housing units built in Renville County, prior to 1940 and during each decade since.
• As of 2018, Renville County was estimated to have 6,180 housing units, of which roughly 79% were owner-occupied and 21% were renter-occupied. The Renville submarket is esti-mated to have the highest share of owner-occupied housing (83%), while the Olivia sub-market has the highest share of renter-occupied housing (25%) in 2018.
• The Buffalo Lake/Hector submarket has some of the newest housing stock with roughly 11% of its housing stock being built in the 2000s or newer, followed by the South submar-ket (8%). As a whole, 8% of Renville County’s housing stock has been built in the past two decades.
• Within the Olivia submarket, the largest share of housing was built in the 1970s (20%). The Olivia submarket also has the largest share of housing built prior to the 2000s (93%) in Ren-ville County.
0% 10% 20% 30% 40% 50% 60% 70% 80% 90% 100%
Renville Sub.
Olivia Sub.
Buffalo Lake/Hector
South Sub.
Renville County
Minnesota
Housing Units Built by Decade
<1940 1940s 1950s 1960s 1970s 1980s 1990s 2000 2010 +

HOUSING CHARACTERISTICS
MAXFIELD RESEARCH AND CONSULTING, LLC 49
Total Med. Yr.Units Built No. Pct. No. Pct. No. Pct. No. Pct. No. Pct. No. Pct. No. Pct. No. Pct. No. Pct.
Renville SubmarketOwner-Occupied 1,272 1953 136 10.7 45 3.5 67 5.3 125 9.8 149 11.7 67 5.3 73 5.7 48 3.8 6 0.5Renter-Occupied 256 1974 71 27.7 1 0.4 40 15.6 20 7.8 53 20.7 42 16.4 15 5.9 14 5.5 0 0.0Total 1,528 1953 207 13.5 46 3.0 107 7.0 145 9.5 202 13.2 109 7.1 88 5.8 62 4.1 6 0.4
Olivia SubmarketOwner-Occupied 1,454 1957 455 31.3 87 6.0 216 14.9 140 9.6 287 19.7 61 4.2 87 6.0 104 7.2 17 1.2Renter-Occupied 479 1974 71 14.8 26 5.4 42 8.8 74 15.4 96 20.0 23 4.8 124 25.9 23 4.8 0 0.0Total 1,933 1958 526 27.2 113 5.8 258 13.3 214 11.1 383 19.8 84 4.3 211 10.9 127 6.6 17 0.9
Buffalo Lake/HectorOwner-Occupied 1,143 1955 345 30.2 82 7.2 167 14.6 119 10.4 158 13.8 74 6.5 79 6.9 96 8.4 23 2.0Renter-Occupied 249 1962 69 27.7 11 4.4 25 10.0 17 6.8 44 17.7 26 10.4 20 8.0 35 14.1 2 0.8Total 1,392 1958 414 29.7 93 6.7 192 13.8 136 9.8 202 14.5 100 7.2 99 7.1 131 9.4 25 1.8
South SubmarketOwner-Occupied 1,010 1953 393 38.9 72 7.1 185 18.3 82 8.1 98 9.7 46 4.6 38 3.8 60 5.9 36 3.6Renter-Occupied 317 1977 103 32.5 28 8.8 12 3.8 37 11.7 44 13.9 52 16.4 25 7.9 15 4.7 1 0.3Total 1,327 1955 496 37.4 100 7.5 197 14.8 119 9.0 142 10.7 98 7.4 63 4.7 75 5.7 37 2.8
Renville CountyOwner-Occupied 4,879 1955 1,699 34.8 381 7.8 726 14.9 466 9.6 692 14.2 248 5.1 277 5.7 308 6.3 82 1.7Renter-Occupied 1,301 1970 314 24.1 66 5.1 119 9.1 148 11.4 237 18.2 143 11.0 184 14.1 87 6.7 3 0.2Total 6,180 1955 2,013 32.6 447 7.2 845 13.7 614 9.9 929 15.0 391 6.3 461 7.5 395 6.4 85 1.4
MinnesotaOwner-Occupied 1,567,939 1978 250,021 15.9 250,021 15.9 73,236 4.7 135,405 8.6 210,097 13.4 199,393 12.7 229,072 14.6 233,011 14.9 73,474 4.7Renter-Occupied 626,513 1976 626,513 100.0 93,781 15.0 23,960 3.8 72,527 11.6 113,602 18.1 85,580 13.7 71,024 11.3 64,126 10.2 49,232 7.9Total 2,194,452 1977 876,534 39.9 343,802 15.7 97,196 4.4 207,932 9.5 323,699 14.8 284,973 13.0 300,096 13.7 297,137 13.5 122,706 5.6
AGE OF HOUSING STOCKTABLE HC-4
Sources: U.S. Census Bureau - American Community Survey; Maxfield Research & Consulting, LLC
Year Unit Built
2010 or later
2018RENVILLE COUNTY ANALYSIS AREA
1980s 1990s 2000s<1940 1940s 1950s 1960s 1970s

HOUSING CHARACTERISTICS
MAXFIELD RESEARCH AND CONSULTING, LLC 50
Renter-Occupied Units by Contract Rent Table HC-5 presents information on the monthly housing costs for renters called contract rent (also known as asking rent). Contract rent is the monthly rent agreed to regardless of any utili-ties, furnishings, fees, or services that may be included.
• The median contract rent in Renville County was $545. Based on a 30% allocation of income to housing, a household in Renville County would need an annual income of about $21,800 (or $1,816/monthly) to afford an average monthly rent of $545.
• Approximately 9.1% of Renville County renters have monthly rents over $1,000, 4.4% of renters paying between $750 and $999, and 4.4% of renters pay less than $750.
• The $250 - $499 and $500 - $749 were the most prevalent rent ranges in the county. How-ever, the two rent ranges are not evenly distributed throughout the submarkets. In the Oliva submarkets, the most common rent ranges were between $500 to $749 (40.1%), while in the South submarket the highest proportion of rents ranged between $250 to $499 (46.7%).
0.0
10.0
20.0
30.0
40.0
50.0
$0 to $249 $250-$499 $500-$749 $750-$999 $1,000+
Pe
rce
nt
Renter-Occupied Units by Contract Rent
Renville Sub. Olivia Sub. Buffalo Lake/Hector South Sub. Renville County Minnesota

HOUSING CHARACTERISTICS
MAXFIELD RESEARCH AND CONSULTING, LLC 51
Owner-Occupied Housing Units by Value Table HC-6 presents data on housing values summarized by nine price ranges. Housing value refers to the estimated price point the property would sell if the property were for sale. For sin-gle-family and townhome properties, value includes both the land and the structure. For condo-minium units, value refers to only the unit.
• The median home value in Renville County was $145,526. The highest median home value was reported in the Olivia submarket ($159,500), while the lowest was reported in the South sub-market ($120,433).
Contract Rent No. Pct. No. Pct. No. Pct.
No Cash Rent 70 27.3 44 9.2 46 18.5
Cash Rent 186 72.7 435 90.8 203 81.5
$0 to $249 16 6.3 53 11.1 36 14.5
$250-$499 69 27.0 95 19.8 66 26.5
$500-$749 78 30.5 192 40.1 70 28.1
$750-$999 5 2.0 38 7.9 10 4.0
$1,000+ 21 8.2 57 11.9 21 8.4
Total 256 100.0 479 100.0 249 100.0
Median Contract Rent
Contract Rent No. Pct. No. Pct. No. Pct.
No Cash Rent 67 21.1 227 17.4 25,842 4.1
Cash Rent 250 78.9 1,074 82.6 600,671 95.9
$0 to $249 37 11.7 142 10.9 36,402 5.8
$250-$499 148 46.7 378 29.1 67,238 10.7
$500-$749 39 12.3 379 29.1 116,108 18.5
$750-$999 7 2.2 57 4.4 150,469 24.0
$1,000+ 19 6.0 118 9.1 230,454 36.8
Total 317 100.0 1,301 100.0 626,513 100.0
Median Contract Rent
Sources: U.S. Census Bureau - ACS; Maxfield Research & Consulting, LLC
$478 $545 $870
$555 $545 $495
South Sub. Renville County Minnesota
TABLE HC-5
RENTER-OCCUPIED UNITS BY CONTRACT RENT
RENVILLE COUNTY
2018
Renville Sub. Olivia Sub. Buffalo Lake/Hector

HOUSING CHARACTERISTICS
MAXFIELD RESEARCH AND CONSULTING, LLC 52
• Within Renville County, about 20% of homes were valued over $200,000. However, the highest proportion of homes the County were valued in the $50,000 to $99,999 grouping, combining for 33% of all homes.
• The Olivia and Buffalo Lake/Hector submarkets, each reported the highest share of homes valued over $200,000 in Renville County. Both submarkets presented over 65% of owner-occupied homes valued over $200,000.
0
5
10
15
20
25
30
35
40
< $50K $50K-$99.9K
$100K-$149.9K
$150K-$199.9K
$200K-$249.9K
$250K-$299.9K
$300K-$399.9K
$400K-$499.9K
>$500K
Pe
rce
nt
Owner-Occupied Units by Value
Renville Sub. Olivia Sub. Buffalo Lake/Hector South Sub. Renville County Minnesota

HOUSING CHARACTERISTICS
MAXFIELD RESEARCH AND CONSULTING, LLC 53
Home Value No. Pct. No. Pct. No. Pct.
Less than $50,000 295 23.2 140 9.6 165 14.4$50,000-$99,999 431 33.9 486 33.4 289 25.3$100,000-$149,999 213 16.7 283 19.5 239 20.9$150,000-$199,999 133 10.5 207 14.2 179 15.7$200,000-$249,999 66 5.2 89 6.1 93 8.1$250,000-$299,999 56 4.4 81 5.6 52 4.5$300,000-$399,999 51 4.0 95 6.5 70 6.1$400,000-$499,999 10 0.8 34 2.3 26 2.3Greater than $500,000 17 1.3 39 2.7 30 2.6
Total 1,272 100.0 1,454 100.0 1,143 100.0
Median Home Value
Home Value No. Pct. No. Pct. No. Pct.
Less than $50,000 192 19.0 792 16.2 69,519 4.1$50,000-$99,999 380 37.6 1,586 32.5 105,052 6.2$100,000-$149,999 181 17.9 916 18.8 171,114 10.2$150,000-$199,999 124 12.3 643 13.2 259,729 15.4$200,000-$249,999 23 2.3 271 5.6 252,356 15.0$250,000-$299,999 34 3.4 223 4.6 207,359 12.3$300,000-$399,999 44 4.4 260 5.3 250,668 14.9$400,000-$499,999 11 1.1 81 1.7 115,239 6.8Greater than $500,000 21 2.1 107 2.2 252,142 15.0
Total 1,010 100.0 4,879 100.0 1,683,178 100.0
Median Home Value
Sources: U.S. Census Bureau - American Community Survey; Maxfield Research & Consulting, LLC
$120,433 $145,526 $235,400
TABLE HC-6OWNER-OCCUPIED UNITS BY VALUE
RENVILLE COUNTY 2018
Renville County Minnesota
$145,022 $157,100
Olivia Sub.
$159,550
Renville Sub. Buffalo Lake/Hector
South Sub.

HOUSING CHARACTERISTICS
MAXFIELD RESEARCH AND CONSULTING, LLC 54
Owner-Occupied Housing Units by Mortgage Status Table HC-7 shows mortgage status and average values from the American Community Survey for 2018 (5-Year). Mortgage status provides information on the cost of homeownership when analyzed in conjunction with mortgage payment data. A mortgage refers to all forms of debt where the property is pledged as security for repayment of debt. A first mortgage has priority claim over any other mortgage or if it is the only mortgage. A second (and sometimes third) mortgage is called a “junior mortgage,” a home equity line of credit (HELOC) would also fall into this category. Finally, a housing unit without a mortgage is owned free and clear and is debt free.
• Approximately 46% of Renville County homeowners have a mortgage and about 6% of homeowners with mortgages in Renville County also have a second mortgage and/or home equity loan. The median value of a house with a mortgage is $112,300, while the median value of a house without a mortgage is $95,600.
• The Oliva submarket had the highest proportion of homes without a mortgage (57.6%) fol-lowed by the South submarket (57.3%). The Renville submarket posted the highest share of homes with a mortgage/debt (48.7%).
• Where debt other than a mortgage was reported, it was most likely to be a home equity loan only, with 2.4% of homes with a mortgage in Renville County carrying a home equity loan.
• Housing units with a mortgage reported a higher median value than those without a mort-gage in all four submarkets. The South submarket reported the largest disparity as homes with a mortgage had a median value of $86,300, compared to $53,029 for homes without a mortgage.
• In Renville County, 54.5% of housing units do not have a mortgage compared to the State of Minnesota which has 34.6% of housing units without a mortgage.

HOUSING CHARACTERISTICS
MAXFIELD RESEARCH AND CONSULTING, LLC 55
Mortgage Status No. Pct. No. Pct. No. Pct.
Housing units without a mortgage 653 51.3 837 57.6 591 51.7
Housing units with a mortgage/debt 619 48.7 617 42.4 552 48.3Second mortgage only 25 2.0 16 1.1 4 0.3Home equity loan only 16 1.3 30 2.1 44 3.8Both second mortgage and equity loan 3 0.2 1 0.1 1 0.1No second mortgage or equity loan 575 45.2 570 39.2 510 44.6
Total 1,272 100.0 1,454 100.0 1,143 100.0
Median Value by Mortgage StatusHousing units with a mortgageHousing units without a mortgage
Mortgage Status No. Pct. No. Pct. No. Pct.
Housing units without a mortgage 579 57.3 2,653 54.4 542,965 34.6
Housing units with a mortgage/debt 431 42.7 2,226 45.6 1,024,974 65.4Second mortgage only 8 0.8 172 3.5 34,127 2.2Home equity loan only 29 2.9 119 2.4 115,003 7.3Both second mortgage and equity loan 1 0.1 6 0.1 4,730 0.3No second mortgage or equity loan 393 38.9 2,048 42.0 871,114 55.6
Total 1,010 100.0 4,879 100.0 1,567,939 100.0
Median Value by Mortgage StatusHousing units with a mortgageHousing units without a mortgage
Sources: U.S. Census Bureau - American Community Survey; Maxfield Research & Consuilting, LLC
$95,600 $373,584
Renville County Minnesota
Renville Sub. Buffalo Lake/HectorOlivia Sub.
South Sub.
$86,300$53,029
$157,500 $162,500$1,651,988 $403,137
$168,200$766,347
$112,300 $218,800
TABLE HC-7OWNER-OCCUPIED HOUSING UNITS BY MORTGAGE STATUS
RENVILLE COUNTY ANALYSIS AREA2018

HOUSING CHARACTERISTICS
MAXFIELD RESEARCH AND CONSULTING, LLC 56
Housing Units by Structure and Tenure or (Housing Stock by Structure Type) Table HC-8 shows the housing stock throughout Renville County by type of structure and tenure as of 2018.
49%42%
48%43% 46%
65%
51%58%
52%57% 54%
35%
0%
10%
20%
30%
40%
50%
60%
70%
Renville Sub. Olivia Sub. BuffaloLake/Hector
South Sub. RenvilleCounty
Minnesota
Owner Housing Units by Mortgage Status
Units w/ mortgage Units w/o mortgage
61%
4%
4%
28%
2%1%
Rental Housing Units by Structure Type
1 unit 2-4 units 5-9 units 10-49 units 50+ units other

HOUSING CHARACTERISTICS
MAXFIELD RESEARCH AND CONSULTING, LLC 57
Owner Vs Renter-Occupied Housing

HOUSING CHARACTERISTICS
MAXFIELD RESEARCH AND CONSULTING, LLC 58
• 55% of all rental units are single-family rentals in Renville County with over 60% of rentals in
the Renville and Buffalo Lake/Hector Submarkets being single-family rentals.
• Many younger homebuyers want the option of being able to move as their careers dictate and renting a single-family home both allows this freedom and provides some of the ameni-ties of buying but without the long-term commitments.
• With the pandemic continuing, social distancing and limiting human contact is still a con-cern among many. Renting a single-family home provides a greater piece of mind than in an apartment in a multi-family apartment building.
Owner- Renter- Owner- Renter- Owner- Renter-Units in Structure Occupied Pct. Occupied Pct. Occupied Pct. Occupied Pct. Occupied Pct. Occupied Pct.
1, detached 1,248 98.1% 155 60.5% 1,425 98.0% 199 41.5% 1,128 98.7% 149 60%1, attached 2 0.2% 3 1.2% 3 0.2% 14 2.9% 4 0.3% 2 1%2 0 0.0% 6 2.3% 0 0.0% 20 4.2% 0 0.0% 0 0%3 to 4 0 0.0% 4 1.6% 0 0.0% 27 5.6% 1 0.1% 5 2%5 to 9 0 0.0% 9 3.5% 0 0.0% 41 8.6% 0 0.0% 23 9%10 to 19 0 0.0% 45 17.6% 0 0.0% 89 18.6% 0 0.0% 13 5%20 to 49 0 0.0% 26 10.2% 0 0.0% 79 16.5% 0 0.0% 34 14%50 or more 0 0.0% 5 2.0% 0 0.0% 7 1.5% 0 0.0% 4 2%Mobile home 22 1.7% 3 1.2% 26 1.8% 3 0.6% 10 0.9% 19 8%Boat, RV, van, etc. 0 0.0% 0 0.0% 0 0.0% 0 0.0% 0 0.0% 0 0%
Total 1,272 100% 256 100% 1,454 100% 479 100% 1,143 100% 249 100%
Owner- Renter- Owner- Renter- Owner- Renter-Units in Structure Occupied Pct. Occupied Pct. Occupied Pct. Occupied Pct. Occupied Pct. Occupied Pct.
1, detached 978 96.8% 185 58% 4,730 96.9% 688 52.9% 1,337,498 85.3% 120,586 19.2%1, attached 1 0.1% 2 1% 10 0.2% 21 1.6% 120,790 7.7% 48,725 7.8%2 0 0.0% 7 2% 0 0.0% 33 2.5% 9,597 0.6% 36,275 5.8%3 to 4 2 0.2% 11 3% 3 0.1% 47 3.6% 8,241 0.5% 35,624 5.7%5 to 9 0 0.0% 46 15% 0 0.0% 119 9.1% 7,018 0.4% 42,839 6.8%10 to 19 0 0.0% 33 10% 0 0.0% 180 13.8% 5,301 0.3% 67,632 10.8%20 to 49 0 0.0% 26 8% 0 0.0% 165 12.7% 9,891 0.6% 109,044 17.4%50 or more 0 0.0% 0 0% 0 0.0% 16 1.2% 22,188 1.4% 154,270 24.6%Mobile home 29 2.9% 7 2% 136 2.8% 32 2.5% 47,107 3.0% 10,895 1.7%Boat, RV, van, etc. 0 0.0% 0 0% 0 0.0% 0 0.0% 308 0.0% 623 0.1%
Total 1,010 100% 317 100% 4,879 100% 1,301 100% 1,567,939 100% 626,513 100%
Sources: U.S. Census Bureau - American Community Survey; Maxfield Research & Consulting, LLC
Renville County Minnesota
TABLE HC-8HOUSING UNITS BY STRUCTURE & TENURE
RENVILLE COUNTY ANALYSIS AREA2018
Renville Submarket Buffalo Lake/Hector SubmarketOlivia Submarket
South Submarket

EMPLOYMENT TRENDS
MAXFIELD RESEARCH AND CONSULTING, LLC 59
Introduction
Since employment growth generally fuels household growth, employment trends are a reliable indicator of housing demand. Typically, households prefer to live near work for convenience. However, housing is often less expensive in smaller towns, making commuting from outlying communities to work in larger employment centers attractive for households concerned about housing affordability.
Employment Growth and Projections Table E-1 shows projected employment growth for the Southwest Central Region and the Seven County Twin Cities Planning Region. The Southwest Central Region encompasses Kandiyohi, McLeod, Meeker and Renville County and is provides the most recent data available. Table E-1 shows employment growth trends and projections for 2016 to 2026 based on the most recent Minnesota Department of Employment and Economic Development (DEED) employment out-look projections.
• There was an estimated total of 211,618 jobs in the Southwest Central Region in 2016, which was 6.9% of the State of Minnesota total (3,097,300 jobs).
• The number of jobs in the Southwest Central Region is projected to grow by 1,185 jobs from 2016 through 2026 (0.9%). This projection is lower than what is expected for the Twin Cities Metro Area (6.8%) and the State of Minnesota (5.9%).
Forecast
2016 2026 No. Pct.
Southwest Central Region 211,618 213,503 1,885 0.9%
Twin Cities Metro Area 1,878,351 2,006,300 127,949 6.8%
Minnesota 3,097,300 3,278,900 181,600 5.9%
Sources: MN DEED; Maxfield Research & Consulting, LLC.
Note: Southwest Central Region - Kandiyohi, McLeod, Meeker and Renville Counties;
Twin Cities Metro - Anoka, Carver, Dakota, Hennepin, Ramsey, Scott, Washington
Counties.
Estimate 2016 - 2024
TABLE E-1EMPLOYMENT GROWTH TRENDS AND PROJECTIONS
RENVILLE COUNTY ANALYSIS AREA2016 - 2026
Employment Change

EMPLOYMENT TRENDS
MAXFIELD RESEARCH AND CONSULTING, LLC 60
Resident Employment
Recent employment growth trends are shown in Tables E-2, which presents resident employ-ment data for Renville County from 2000 through 2019, as compared to the State of Minnesota and the United States. Resident employment data is calculated as an annual average and re-veals the work force and number of employed persons living in that area. It is important to note that not all of these individuals necessarily work in the associated City or County and could be employed elsewhere. The following are key trends derived from the employment data:
• Resident employment (number of employed persons) in Renville County declined by ap-proximately -108 people between 2000 and 2019 (-1.2%) and the unemployment rate in-creased from 4% in 2000 to 4.4% in 2019. By comparison, Minnesota’s unemployment rate was at 3.3% and the United States was at 3.7% as of 2019.
• Renville County’s unemployment rate higher the Twin Cities Metro Area and Minnesota’s unemployment rate and has remained slightly higher since 2008. The greatest yearly differ-ence was 1.2% higher than Minnesota in 2019.
• The unemployment rate in Renville County increased to a high of 8.1% (2009) which was the peak of the recession. However, as of year-end 2019, the unemployment rate has fallen 3.7% to 4.4%, which is considered below equilibrium (5.0%).

EMPLOYMENT TRENDS
MAXFIELD RESEARCH AND CONSULTING, LLC 61
Covered Employment & Wage Trends Table E-3 presents covered employment numbers as available for Renville County from 2013 through the third quarter of 2019. Covered employment data is calculated as an annual average and reveals the number of jobs in the designated area, which are covered by unemployment in-surance. Many temporary workforce positions, agricultural, self-employed persons, and some other types of jobs are not covered by unemployment insurance and are not included in the ta-ble. Some agricultural businesses and employees are listed in Table E-3, but not all positions are included. The data in both tables is sourced from the Minnesota Department of Employment and Economic Development. The following are key trends derived from the employment data:
LaborYear Force Employed Unemployed Rate
2000 9,182 8,813 369 4.0%
2005 8,437 8,024 413 4.9%
2010 8,993 8,269 724 8.1%
2015 8,590 8,179 411 4.8%
2018 8,787 8,442 345 3.9%
2019 9,109 8,705 405 4.4%
2020* 8,511 7,955 556 6.5%
Change 2000-2019 Number -73 -108 36 -- Percent -0.8% -1.2% 9.8% --
2000 2,812,947 2,724,117 88,830 3.2%
2010 2,938,795 2,721,194 217,601 7.4%
2015 2,997,748 2,887,132 110,616 3.7%
2019 3,113,673 3,011,146 102,527 3.3%
2000 142,583 136,891 5,692 4.0%
2010 153,889 139,064 14,825 9.6%
2015 157,130 148,833 8,297 5.3%
2019 163,539 157,538 6,001 3.7%
2 Estimated in Thousands
* June 2020 data with Covid-19 pandemic challenges
Sources: U.S. Department of Labor, MN Workforce Center, Maxfield
Research & Consulting LLC
Minnesota
Renville County
TABLE E-2
ANNUAL AVERAGE RESIDENT EMPLOYMENT
RENVILLE COUNTY
2000 to 2019
U.S. 2
Note: Data not seasonally adjusted

EMPLOYMENT TRENDS
MAXFIELD RESEARCH AND CONSULTING, LLC 62
• Between 2013 and Q3 2019, the number of jobs declined in Renville County by 36, a -9.8% decrease in the County. The Leisure and Hospitality sector gained the greatest number of jobs (551 jobs) between 2013 and Q3 2019. The Natural Resources & Mining, and Education & Trade, Transportation & Utilities sectors all declined between 2013 to Q3 2019.
• As of Q3 2019, the Education and Health Services sector accounted for the largest share of employment in Renville County, with 1,228 employees accounting for 21.4% of employ-ment. Between 2013 and Q3 2019, the Education and Health Services sector has declined by -90 employees, a decline by approximately -6.8%.
• The next two largest employment sectors were the Trade, Transportation & Utilities, which accounted for 20.7% of employment in Q3 2019 and the Manufacturing sector, which ac-counted for 15% of employment.

EMPLOYMENT TRENDS
MAXFIELD RESEARCH AND CONSULTING, LLC 63
Table E-4 displays information on average weekly wages in Renville County compared to the Twin Cities Metro Area. The Quarterly Census of Employment and Wages (QCEW) data is sourced from Minnesota Employment and Economic Development (MN DEED) for the annual average of 2013 through the third quarter of 2019, the most recent annual data available. All establishments covered under the Unemployment Insurance (UI) Program are required to re-port wage and employment statistics quarterly to MN DEED. Federal government establish-ments are also covered by the QCEW program. It should be noted that certain industries in the table may not display any information which means that there is either no reported economic activity for that industry or the data has been

EMPLOYMENT TRENDS
MAXFIELD RESEARCH AND CONSULTING, LLC 64
suppressed to protect the confidentiality of cooperating employers. This generally occurs when there are too few employers, or one employer comprises too much of the employment in that geography. Additionally, the MN DEED combines any government workers into the Public Ad-ministration sector, rather than the descriptive sector. For instance, a county hospital worker is categorized under Public Administration rather than Educational and Health Services.
• The Leisure and Hospitality sector witnessed the largest growth increasing average weekly wages by $264 (141%) between 2013 to Q3 2019. The Other Services sector experienced the second largest growth, increasing by $185 (50.7%).
• Wages in Renville County were lower in each industry category compared to the Twin Cities Metro Area. The smallest differences resulting in the Education and Health Services sector ($113 lower), while the largest difference was in the Professional and Business Services sec-tor ($725 lower).

EMPLOYMENT TRENDS
MAXFIELD RESEARCH AND CONSULTING, LLC 65

EMPLOYMENT TRENDS
MAXFIELD RESEARCH AND CONSULTING, LLC 66
Business Summary
Table E-5 displays business summary information by North American Industry Classification Sys-tem (NAICS) codes in Renville County. This data sourced from ESRI for 2019. It should be noted that certain industries in Table E-5 may not display any information which means that there is either no reported economic activity for that industry or the data has been suppressed to protect the confidentiality of cooperating employers. This generally occurs when

EMPLOYMENT TRENDS
MAXFIELD RESEARCH AND CONSULTING, LLC 67
there are too few employers, or one employer comprises too much of the employment in that geography.
• As of 2019, there were almost 750 businesses in Renville County.
• The Other Services sector has the highest proportion of establishments (15.6%), while the Construction has the highest proportion of employees (18.2%) in Renville County.
• The Transportation & Warehousing sector accounts for nearly the same share of businesses and employees, accounting for 5.9% of businesses and 5.6% of employees.

EMPLOYMENT TRENDS
MAXFIELD RESEARCH AND CONSULTING, LLC 68
Commuting Patterns Proximity to employment is often a primary consideration when choosing where to live, since transportation costs often account for a large proportion of households’ budgets. Table E-6 highlights the commuting patterns of workers in Renville County in 2017 (the most recent data available), based on Employer-Household Dynamics data from the U.S. Census Bureau. • As Table E-6 illustrates, 13.4% of workers who are employed in Renville County live in the
City of Olivia, and 5% live in the City of Bird Island. Olivia is also the largest work destina-tions located within Renville County, accounting for 13.2% of workers who have jobs in Ren-ville County.
• Approximately 6% of Renville County residents commute to Willmar, which is located out-side of Renville County. The City of Redwood Falls ranks third for work destinations and ac-counts for 409 employees (5.4%) who left Renville County for employment.
• Located outside of Renville County, the Cities of Redwood Falls and Willmar, combine to ac-
count for approximately 6.1% of workers employed in Renville County.

EMPLOYMENT TRENDS
MAXFIELD RESEARCH AND CONSULTING, LLC 69
Inflow/Outflow
Table E-7 provides a summary of the inflow and outflow of workers in Renville County. Outflow reflects the number of workers living in Renville County but employed outside of the County while inflow measures the number of workers that are employed in Renville County but live outside. Interior flow reflects the number of workers that both live and work in Renville County. • Renville County can be considered an exporter of workers, as the number of residents leav-
ing the County (outflow) for employment was more than the number of residents coming into the County for work (inflow). Approximately 3,162 workers left Renville County for work while 1,743 workers came into the County, for a net difference of 1,419 workers. Ren-ville County also had an interior flow of 2,314 workers.
Place of Residence Count Share Place of Employment Count Share
Olivia city, MN 774 13.4% Olivia city, MN 995 13.2%
Bird Island city, MN 291 5.0% Willmar city, MN 414 5.5%
Renville city, MN 237 4.1% Redwood Falls city, MN 409 5.4%
Hector city, MN 203 3.5% Renville city, MN 391 5.2%
Redwood Falls city, MN 183 3.2% Bird Island city, MN 279 3.7%
Fairfax city, MN 173 3.0% Buffalo Lake city, MN 272 3.6%
Willmar city, MN 168 2.9% Hutchinson city, MN 265 3.5%
Danube city, MN 143 2.5% Hector city, MN 192 2.6%
Buffalo Lake city, MN 132 2.3% St. Paul city, MN 185 2.5%
Sacred Heart city, MN 115 2.0% Fairfax city, MN 125 1.7%
All Other Locations 3,360 58.1% All Other Locations 3,992 53.1%
Total All Jobs 5,779 Total All Jobs 7,519
Home Destination = Where workers live who are employed in Renville CountyWork Destination = Where workers are employed who live in Renville County
Sources: US Census Bureau Local Employment Dynamics; Maxfield Research & Consulting, LLC
TABLE E-6COMMUTING PATTERNS
RENVILLE COUNTY ANALYSIS AREA2017
Home Destination Work Destination

EMPLOYMENT TRENDS
MAXFIELD RESEARCH AND CONSULTING, LLC 70
• The inflow of workers in Renville County are typically in the “Goods Producing” industry (48% of total), will earn $3,333 or more per month, and are between the ages of 30 and 54 years old (50% of total).
Renville Co. Commuting Inflow / Outflow
Sources: Longitudinal Employer-Household Dynamics

EMPLOYMENT TRENDS
MAXFIELD RESEARCH AND CONSULTING, LLC 71
Num. Pct.
Employed in the Selection Area 4,057 100%Employed in the Selection Area but Living Outside 1,743 43%Employed and Living in the Selection Area 2,314 57%
Living in the Selection Area 5,476 100%Living in the Selection Area but Employed Outside 3,162 58%Living and Employed in the Selection Area 2,314 42%
Commuting Distance - Work to Home Num. Pct.Less than 10 miles 1,604 40%10 to 24 miles 1,336 33%25 to 50 miles 509 13%Greater than 50 miles 608 15%
Commuting Distance - Home to Work Num. Pct.Less than 10 miles 1,647 30%10 to 24 miles 1,703 31%25 to 50 miles 759 14%Greater than 50 miles 1,367 25%
Outflow Job Characteristics Num. Pct.
Workers Aged 29 or younger 815 26%Workers Aged 30 to 54 1,544 49%Workers Aged 55 or older 803 25%Workers Earning $1,250 per month or less 611 19%Workers Earning $1,251 to $3,333 per month 1,061 34%Workers Earning More than $3,333 per month 1,490 47%Workers in the "Goods Producing" Industry Class 1,044 33%Workers in the "Trade, Transportation, and Utilities" Industry Class 759 24%Workers in the "All Other Services" Industry Class 1,359 43%
Inflow Job Characteristics Num. Pct.
Workers Aged 29 or younger 394 23%Workers Aged 30 to 54 871 50%Workers Aged 55 or older 478 27%Workers Earning $1,250 per month or less 380 22%Workers Earning $1,251 to $3,333 per month 524 30%Workers Earning More than $3,333 per month 839 48%Workers in the "Goods Producing" Industry Class 726 42%Workers in the "Trade, Transportation, and Utilities" Industry Class 555 32%Workers in the "All Other Services" Industry Class 462 27%
Interior Flow Job Characteristics Num. Pct.
Workers Aged 29 or younger 494 21%Workers Aged 30 to 54 1,092 47%Workers Aged 55 or older 728 31%Workers Earning $1,250 per month or less 604 26%Workers Earning $1,251 to $3,333 per month 786 34%Workers Earning More than $3,333 per month 924 40%Workers in the "Goods Producing" Industry Class 867 37%Workers in the "Trade, Transportation, and Utilities" Industry Class 671 29%Workers in the "All Other Services" Industry Class 776 34%
Sources: Longitudinal Employer-Household Dynamics; Maxfield Research & Consulting LLC
Renville County
TABLE E-7COMMUTING INFLOW/OUTFLOW
RENVILLE COUNTY 2017

EMPLOYMENT TRENDS
MAXFIELD RESEARCH AND CONSULTING, LLC 72
Major Employers Table E-8 shows the major employers in Renville County based on data provided by the County. Please note that the table is not a comprehensive list of all employers and presents a selected list of employers and their employees as identified by Cities in Renville County. The data is up-dated and collected by the city in fragmented time periods and is not an official survey. The fol-lowing are key points from the major employer’s table.
• The list of major employers represents several industry sectors, but the highest concentra-tions of large employers are in the Manufacturing sector and account for approximately 465 employees (41% of major employers).
• The Health Care sector ranks second by employee size and accounts for 23% of the major employers (256 employees) in Renville County, followed by the Government sector which totals 19% of major employers (210 employees).
• The top three employers account for approximately 64% of the employee base out of the major employers in Renville County and all have a minimum of 170 employees.
Employer Survey Unfortunately, during the time of our survey COVID-19 has made participation in this survey minimal, however we encourage diving deeper into surveying local employers after the pan-demic has stabilized. Due to the global COVID-19 pandemic, Maxfield Research has reached out to some of the largest local employers in Renville County in an attempt to survey their opinion about issues related to housing in the area. Community economic development information can provide useful job growth data and assists in identifying housing demand in an area. Employers did indicate housing becomes an issue when trying to recruit new staff to their re-spected facilities. Some employers indicated a lack of desirable inventory to select from is an issue and the quality of rental properties was noted to be a concern. In addition, employers
Approximate EmployeeName Location Industry/Service Size
Southern MN Beet Sugar Cooperative Renville Food Manufacturing 350Renville County Olivia Submarket Government 210Olivia Hospital & Clinics Olivia Health Care 170ISD #2534 Bird Island-Olivia-Lake Lilian Olivia Submarket School District 110Renville County Community Residence Bird Island Intermediate Care Facility 69Warner Manufacturing Sacred Heart Manufacturing 65Olivia Rehab and Health Care Olivia Submarket Health Care 56Remington Seeds Olivia Submarket Agricultural Services 50Rural Computer Consultants Bird Island Computer Services 46M.BW. Company Bird Island Intermediate Care Facility 30
TABLE E-8MAJOR EMPLOYERSRENVILLE COUNTY
2020
Source: Renville County; Maxfield Research & Consulting, LLC

EMPLOYMENT TRENDS
MAXFIELD RESEARCH AND CONSULTING, LLC 73
would like to see better options for the senior community as well that would be reasonable and limited up-keep for them.

RENTAL HOUSING ANALYSIS
MAXFIELD RESEARCH AND CONSULTING, LLC 74
Introduction Maxfield Research and Consulting LLC identified and surveyed larger rental properties of eight or more units in Renville County. For purposes of our analysis, rental properties are classified rental projects into two groups, general occupancy and senior (age-restricted). All senior properties are included in the Senior Housing Analysis section of this report. The general occupancy rental properties are divided into three groups: market rate (those without income restrictions); affordable or shallow-sub-sidy housing (those receiving tax credits or another type of shallow-subsidy and where there is a quoted rent for the unit and a maximum income that cannot be exceeded by the tenant); and subsidized or deep-subsidy properties (those with income restrictions at 30% or less of AMI where rental rates are based on 30% of their gross adjusted income.).
General-Occupancy Rental Properties Our research of Renville County’s general occupancy rental market included a survey of 35 af-fordable, subsidized, and market rate apartment properties (buildings with 8 units or more) in May 2020. These properties represent a combined total of 400 units, including, 186 afforda-ble/subsidized and 214 market rate units. Although we were able to contact and obtain up-to-date information on the majority of rental properties, there were a few projects that chose not to participate in this survey or were unable to reach and had to rely on information from third party sources. At the time of our survey, 16 general occupancy units were vacant, resulting in an overall va-cancy rate of 3.1% for all units. The combined overall vacancy rate is well below the industry standard of 5% vacancy for a stabilized rental market rate which promotes competitive rates, ensures adequate choice, and allows for sufficient unit turnover. Table R-1 summarizes year built of Renville County general occupancy projects, while a unit summary is broken down in Table R-2. In addition, Table-3 provides newer construction devel-opments in neighboring communities.
• The peak for multi-family construction in Renville County was in the 1970s as 174 units were built.
• Renville County has added roughly 126 general occupancy rental units since the 1970s.

RENTAL HOUSING ANALYSIS
MAXFIELD RESEARCH AND CONSULTING, LLC 75
Affordable/Subsidized
• In most cases, the rents charged for the apartments are determined by the resident’s in-come. The rent is calculated using gross annual income less any deductions for medical ex-penses and an addition deduction for those over 62 or disabled.
• There are 12 general occupancy affordable properties in Renville County with 186 total units. There were six vacant units as of May 2020 for an overall vacancy rate of 4.3%.
• Typically, tax credit rental properties should be able to maintain vacancy rates of 3% or less in most housing markets. Numerous properties had no vacant units and a waitlist indicating a need for additional housing of this type.
• The most recent development offering tax credit affordable units built was built in the 1980s. Typically affordable housing built after 2000 offer larger unit sizes/types to accom-modate families and larger households.
• Rural renters generally have lower incomes than rural homeowners; rural renter’s median household income is approximately $21,000 compared to $43,000 for rural owners.
• Nearly a quarter of the nation’s rural counties have seen a sizable increase in the percent-age of residents spending more than half their income on housing, a scenario the federal government calls “severely cost-burdened.”
16
174
110
34
0
20
40
60
80
100
120
140
160
180
200
1950s 1970s 1980s 1990s
Un
its
Renville Co. Surveyed Rental Units by Year Built
Note: Chart does not include properties were year built is not available.

RENTAL HOUSING ANALYSIS
MAXFIELD RESEARCH AND CONSULTING, LLC 76
Market Rate
• The vast majority of rental units in Renville County were built before 1990. In many rural ar-eas, it can be difficult to build more rental housing even when needed. There is a national shortage of construction labor, linked to employment declines after the last recession. In addition, builders are facing material price increased and associated cost increases.
• A total of 8 vacancies were found in market rate rental projects, resulting in a vacancy rate of 3.7% as of May 2020. Market rate rental vacancy stabilized equilibrium is considered to be 5% to allow for unit turnover and property choice for renters.
• Sizes for market rate units ranged from 380 square feet for a studio apartment at Evergreen Terrace in Olivia to 1,132 square feet for a two-bedroom apartment at Bayberry Court. The average size of surveyed market rate apartments in Renville County is 879 square feet.
• Rents range from $300 for a one-bedroom apartment at 1st Street Apartments to $740 a two-bedroom apartment at Bayberry Apartments. The average monthly rent of market rate apartments in Renville County is $667.
• Average rent per square foot for market rate rentals is $0.61, with studios being the highest at $0.75 and three-bedroom units being the lowest at $0.46 rent per square foot.

RENTAL HOUSING ANALYSIS
MAXFIELD RESEARCH AND CONSULTING, LLC 77
Year Units/Property Name/Location Built Vacant Amenities/Features/Notes
Affordable/SubsidizedErickson Meadow Apartments 1983 16 8 - 2BR 600 - 600 $502 - $580 $0.84 - $0.97701 N 7th Street 0 8 - 3BR 900 - 900 $610 - $610 $0.68 - $0.68Olivia, MN (Olivia Submarket) 0.0%
Brandon Housing 16 10 - 2BR 750 - 750 $430 - $530 $0.57 - $0.71700 Oak Street 0 6 - 3BR 900 - 900 $455 - $555 $0.51 - $0.62Danube, MN (Renville Submarket) 0.0%
Centennial Apartments 1982 17 16 - 1BR 796 - 796 N/A - N/A N/A - N/A
161 2nd Avenue 0 1 - 2BR 1,097 - 1,134 N/A - N/A N/A - N/AFranklin, MN (South Submarket) 0.0%
Poplar Ridge 1994 8 4 - 1BR 637 - 637 $465 - $540 $0.73 - $0.85130 5th Street W 0 4 - 2BR 805 - 805 $485 - $555 $0.60 - $0.69Hector, MN (Buffalo Lake/Hector) 0.0%
Eastgate Apartments 1978 8 4 - 1BR 600 - 600 $470 - $545 $0.78 - $0.91301 2nd Street East 1 4 - 2BR 900 - 900 $495 - $595 $0.55 - $0.66Hector, MN (Buffalo Lake/Hector Submarket 12.5%
North Villa Apartments 1997 12 12 - 2BR 600 - 600 $600 - $620 $1.00 - $1.03212 1st Avenue 2Sacred Heart, MN (Renville Submarket) 16.7%
Goelz I Apartments 1982 16 8 - 1BR 600 - 600 $535 - $560 $0.89 - $0.93725 South 9th Street 1 8 - 2BR 900 - 900 $585 - $610 $0.65 - $0.68Bird Island, MN (Olivia Submarket) 6.3%
Rural Development Assistance
Two-story community, surface
and garage parking, wall AC units,
community room,
heat/water/sewer/trash included.
Dishwasher, playground, picnic
area, common area laundry
facilities, community center,
surface and garage parking.
Continued
TABLE R-1GENERAL OCCUPANCY RENTAL PROJECTS
RENVILLE COUNTYMAY 2020
Monthly Rent perUnit Mix Unit Size Rent Square Foot
Rural Development Assistance. All
utilities included. Community
room available for all tennats.
30% of Income. Waiting list for
potential residence.
USDA subsidized. Wall A/C, coin
laundry and tenant pays heat. No
garages available.
Section 8 Vouchers accepted.
Community features: laundry
facility and maintenance on site.
Unit ammenities: air conditioning
and heating.
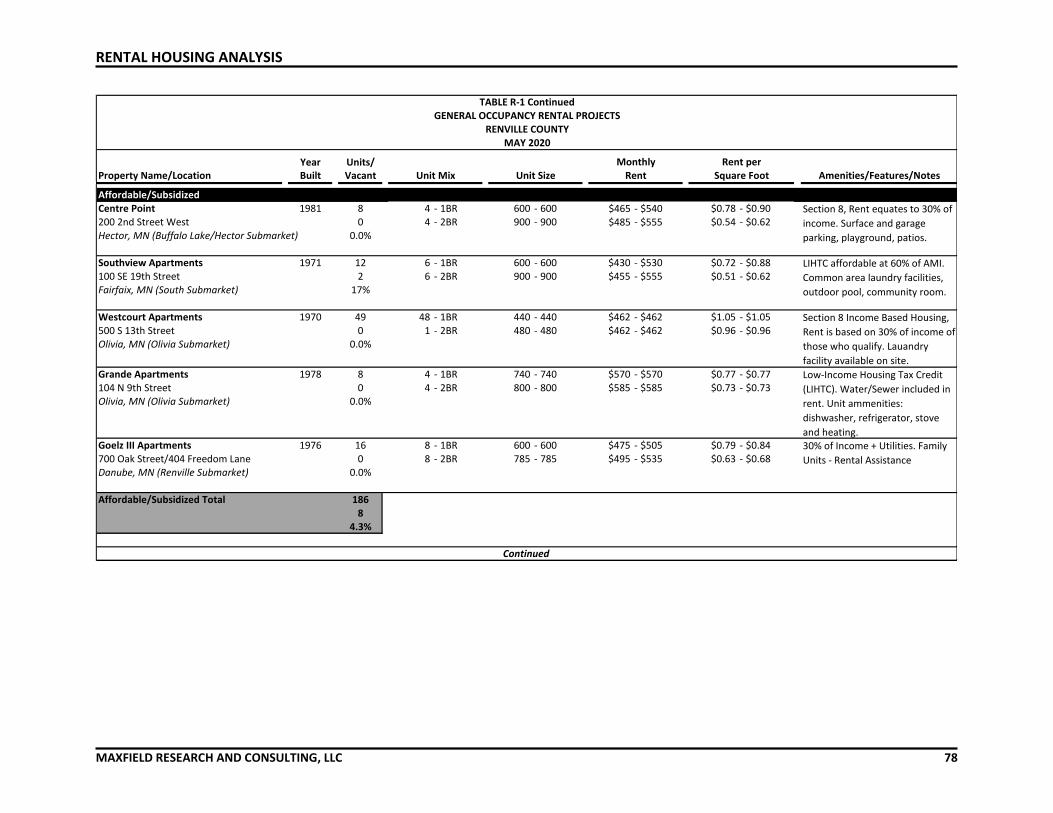
RENTAL HOUSING ANALYSIS
MAXFIELD RESEARCH AND CONSULTING, LLC 78
Year Units/Property Name/Location Built Vacant Amenities/Features/Notes
Affordable/SubsidizedCentre Point 1981 8 4 - 1BR 600 - 600 $465 - $540 $0.78 - $0.90200 2nd Street West 0 4 - 2BR 900 - 900 $485 - $555 $0.54 - $0.62Hector, MN (Buffalo Lake/Hector Submarket) 0.0%
Southview Apartments 1971 12 6 - 1BR 600 - 600 $430 - $530 $0.72 - $0.88100 SE 19th Street 2 6 - 2BR 900 - 900 $455 - $555 $0.51 - $0.62Fairfaix, MN (South Submarket) 17%
Westcourt Apartments 1970 49 48 - 1BR 440 - 440 $462 - $462 $1.05 - $1.05500 S 13th Street 0 1 - 2BR 480 - 480 $462 - $462 $0.96 - $0.96Olivia, MN (Olivia Submarket) 0.0%
Grande Apartments 1978 8 4 - 1BR 740 - 740 $570 - $570 $0.77 - $0.77104 N 9th Street 0 4 - 2BR 800 - 800 $585 - $585 $0.73 - $0.73Olivia, MN (Olivia Submarket) 0.0%
Goelz III Apartments 1976 16 8 - 1BR 600 - 600 $475 - $505 $0.79 - $0.84700 Oak Street/404 Freedom Lane 0 8 - 2BR 785 - 785 $495 - $535 $0.63 - $0.68Danube, MN (Renville Submarket) 0.0%
Affordable/Subsidized Total 1868
4.3%
Low-Income Housing Tax Credit
(LIHTC). Water/Sewer included in
rent. Unit ammenities:
dishwasher, refrigerator, stove
and heating.
Section 8 Income Based Housing,
Rent is based on 30% of income of
those who qualify. Lauandry
facility available on site.
GENERAL OCCUPANCY RENTAL PROJECTS
MAY 2020
TABLE R-1 Continued
RENVILLE COUNTY
Square FootRent per
Unit Mix Unit Size Rent
Continued
LIHTC affordable at 60% of AMI.
Common area laundry facilities,
outdoor pool, community room.
Monthly
Section 8, Rent equates to 30% of
income. Surface and garage
parking, playground, patios.
30% of Income + Utilities. Family
Units - Rental Assistance

RENTAL HOUSING ANALYSIS
MAXFIELD RESEARCH AND CONSULTING, LLC 79
Year Units/Property Name/Location Built Vacant Amenities/Features/Notes
Market RateFlynn Apartments N/A 12 4 - 1BR 625 - 514 $520 - $600 $0.83 - $1.17311 2nd Avenue South 2 8 - 2BR 850 - 850 $635 - $735 $0.75 - $0.86Sacred Heart, MN (Renville Submarket) 16.7%
Security Manor Apartments 1977 16 2 - 1BR 650 - 650 $475 - $545 $0.73 - $0.84419-427 Bryant Avenue NW 1 14 - 2BR 850 - 850 $600 - $675 $0.71 - $0.79Renville, MN (Renville Submarket) 6.3%
Greenhill Apartments 1982 24 12 - 1BR 600 - 600 $495 - $495 $0.83 - $0.83808 Evergreen Avenue 1 12 - 2BR 800 - 800 $550 - $550 $0.69 - $0.69Olivia, MN (Olivia Submarket) 4.2%
Island Estates 1982 6 6 - 1BR 650 - 650 $500 - $600 $0.77 - $0.92421 S. 11th Street 1Bird Island, MN (Olivia Submarket) 16.7%
1st Street Apartments 1971 5 4 - 1BR 650 - 650 $300 - $300 $0.46 - $0.46118 SE 1st SE 0 1 - 2BR 800 - 800 $500 - $500 $0.63 - $0.63Fairfax, MN (South Submarket) 0.0%
Bryant Avenue Apartments 1976 8 4 - 1BR 625 - 625 $495 - $495 $0.79 - $0.79418 NW Bryant Avenue 0 4 - 2BR 790 - 790 $525 - $525 $0.66 - $0.66Renville, MN (Renville Submarket) 0.0%
North Park Apartments 1979 8 8 - 2BR N/A - N/A $475 - $475 N/A - N/A804 E. Evergreen 0Olivia, MN (Olivia Submarket) 0.0%
Manderfeld Apartments/Serbus Apt. 1970 4 4 - 2BR 800 - 900 $500 - $500 $0.56 - $0.63116 E. DePue Ave 0Olivia, MN (Olivia Submarket) 0.0%
Grande Apartments N/A 8 4 - 1BR 740 - 740 $550 - $550 $0.74 - $0.74104 N 9th Street 1 4 - 2BR 800 - 800 $585 - $585 $0.73 - $0.73Olivia, MN (Olivia Submarket) 12.5%
Green Hill Apartments N/A 24 6 - 1BR N/A - N/A $500 - $500 N/A - N/A808 E. Evergreen Avenue 0 18 - 2BR N/A - N/A $550 - $550 N/A - N/AOlivia, MN (Olivia Submarket) 0.0%
Bird Island EDA - (Two 4-Plex Sites) N/A 8 8 - 2BR N/A - N/A $610 - $636 N/A - N/A116 E. DePue Ave N/AOlivia, MN (Olivia Submarket)
1-story units, attached garage,
one year lease required with 60
day notice.
Laundry, fireplace, patio and
indoor parking.
Market rate building offers no
property based subsidies. Buidling
open to households of any
income level.
Heat is included in the rent and
tenant pays electric. Stove,
refrigerator, through wall air
conditioning and coin laundry.
RENVILLE COUNTYGENERAL OCCUPANCY RENTAL PROJECTS
Tenant pays electricity and
garbage and there are no garages.
Units include a stove,
refridgerator, dishwasher, thru-
wall air conditoner and coin
laundry.
Heat is included in the rent and
tenant pays electric. Stove,
refrigerator, through wall air
conditioning and coin laundry.
room, fitness center, common
area laundry facilities.
Garage $50 per month, stove,
refridgerator and coin laundry.
TABLE R-1
Market rate building offers no
property based subsidies. Buidling
open to households of any
income level.
Market rate building offers no
property based subsidies. Buidling
open to households of any
income level although does
qualify for Section 8 Vouchers.
Rent Square Foot
Utilities included, off-street
parking, on-site laundry. One and
two bedrooms are available.
Ammenities include water, heat
and sewer.
MAY 2020
Unit MixRent per
Unit SizeMonthly
Continued

RENTAL HOUSING ANALYSIS
MAXFIELD RESEARCH AND CONSULTING, LLC 80
Year Units/Property Name/Location Built Vacant Amenities/Features/Notes
Market RatePark Lane Apartments I 1999 8 8 - 2BR 850 - 900 $550 - $550 $0.61 - $0.65306 E Park 0Olivia, MN (Olivia Submarket) 0.0%
Park Lane Apartments II 1999 8 8 - 2BR 750 - 800 $550 - $550 $0.69 - $0.73305 S 4th StreetOlivia, MN (Olivia Submarket) 0.0%
22 1st Street NW N/A 8 1 - 1BR 620 - 620 $475 - $475 N/A - N/A22 1st Street NW 0 7 - 2BR 780 - 780 $550 - $550 N/A - N/AFairfax, MN (South Submarket) 0.0%
N/AValley View Apartments N/A 8 1 - 1BR 610 - 610 $400 - $475 N/A - N/A341 E. 3rd Street 0 7 - 2BR 789 - 789 $500 - $525 N/A - N/AFranklin, MN (South Submarket) 0.0%
N/AHummingbird Court 1999 4 4 - 2BR 850 - 900 $595 - $595 $0.66 - $0.70210 3rd Street W 0Hector, MN (Buffalo Lake/Hector Submarket) 0.0%
Valley Drive Apartments 19XX 8 1 - 1BR N/A - N/A $425 - $425 N/A - N/A450 N. Valley Drive 0 7 - 2BR N/A - N/A $450 - $450 N/A - N/AHector, MN (Buffalo Lake/Hector Submarket) 0.0%
Hinderks Properties 1975 4 4 - 2BR 850 - 900 $475 - $495 $0.55 - $0.56417 3rd Street SE 0Renville, MN (Renville Submarket) 0.0%
Evergreen Terrace 1979 12 2 - Studio 380 - 380 $300 - $300 N/A - N/A706 E Evergreen, Olivia 1 2 1BR 600 - 600 $425 - $425 N/A - N/AOlivia, MN (Olivia Submarket) 8.3% 7 - 2BR 800 - 800 $475 - $475 N/A - N/A
1 - 3BR 980 - 980 $575 - $575 N/A - N/A
Bayberry Court 1997 16 8 - 1BR 1,098 - 1,098 $715 - $715 $0.65 - $0.65Bayberry Avenue West 0 8 - 2BR 1,740 - 1,740 $740 - $740 $0.43 - $0.43Olivia, MN (Olivia Submarket) 0.0%
Tall Oak Apartments 1972 8 8 - 2BR 800 - 800 $535 - $550 $0.67 - $0.69410 E Ash Avenue 1Olivia, MN (Olivia Submarket) 12.5%
Wertish Apartments N/A 7 7 - 1BR N/A - N/A N/A - N/A N/A - N/A210 South Main Street N/A 1 - 2BR N/A - N/A N/A - N/A N/A - N/AOlivia, MN (Olivia Submarket)
Market Rate Total 2148
3.7%
Unable to reach management at
the time of study.
Amenities: stove, refridgerator,
wall A/C and coin laundry. Tenant
pays heat.
No garages. Units include stove,
refridgerator, thru-wall air
conditioner, and coin laundry.
Source: Maxfield Research & Consulting
Tenant pays electricity and
garbage and there are no garages.
Units include a stove,
refridgerator, dishwasher, thru-
wall air conditoner and coin
laundry. Heat/water/sewer/trash included,
surface and garage parking, wall
AC unit, dishwasher.
Tenant pays electricity and
garbage and there are no garages.
Units include a stove,
refridgerator, dishwasher, thru-
wall air conditoner and coin
laundry.
No garages. Units include stove,
refridgerator, thru-wall air
conditioner, and coin laundry.
Tenant pays electricity and
garbage and there are no garages.
Units include a stove,
refridgerator, dishwasher, thru-
wall air conditoner and coin
laundry. No garages. Units include stove,
refridgerator, thru-wall air
conditioner, and coin laundry.
Heat/water/sewer/trash included,
surface and garage parking, wall
AC unit, dishwasher.
Attached single car garage and
private entrance. Units include
stove, refridgerator, dishwasher,
washer and dryer. Tenants pay all
utilities.
TABLE R-1 ContinuedGENERAL OCCUPANCY RENTAL PROJECTS
Monthly Rent perUnit Mix Unit Size Rent Square Foot
RENVILLE COUNTYMAY 2020

RENTAL HOUSING ANALYSIS
MAXFIELD RESEARCH AND CONSULTING, LLC 81
• The majority of the properties surveyed have wall air conditioner units, refrigerator, stove, and common area laundry. In-unit washer and dryers has become the norm in new apart-ment developments constructed today.
• A hand full of properties have included either a detached or attached garage in their total rent per month. Although, utility packages differ from property to property, it was common for tenants to pay electricity, internet and cable. In most cases, heat/gas, water, sewer, and trash were included in the monthly rent.
• Many property managers mentioned that they do not have difficulty filling vacant units and said that they never have vacant units sitting for long periods of time.
• Turnover at many apartments is primarily driven by residents purchasing homes or leaving the area for employment opportunities. Many tenants will stay in a unit for longer lease terms.
Total Unit Avg. Avg. Avg. Rent/Unit Type Units Mix Sq. Ft. Low - High Rent Sq. Ft.
Studio 2 1% 380 $300 - $300 $300 $1.271BR 55 26% 732 $300 - $715 $495 $0.682BR 149 70% 923 $450 - $740 $550 $0.603BR 1 0% 980 $575 - $575 $575 $0.59 Total: 214 97% 878 $300 - $740 $540 $0.61
Total Unit Avg. Avg. Avg. Rent/Unit Type Units Mix Sq. Ft. Low - High Rent Sq. Ft.
1BR 102 55% 648 $430 - $844 $553 $0.852BR 70 38% 857 $430 - $1,044 $615 $0.723BR 14 8% 1,132 $455 - $1,069 $833 $0.74 Total: 186 100% 879 $430 - $1,069 $667 $0.76
Source: Maxfield Research & Consulting, LLC
Range
R-2SUMMARY BY UNIT TYPE
GENERAL OCCUPANCY RENTAL PROJECTS
MAY 2020
Monthly Rents
RENVILLE COUNTY
Monthly RentsRange
Note: This table includes data from rental properties that participated and provided complete survey
information.
Market Rate
Affordable
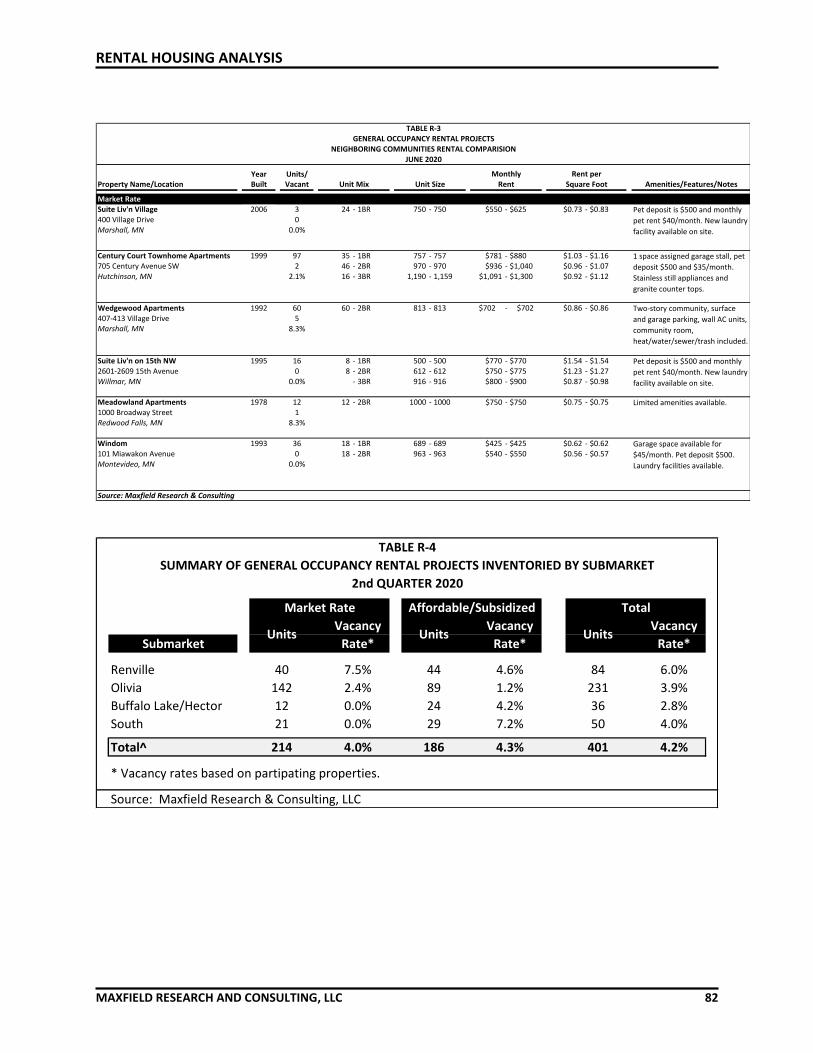
RENTAL HOUSING ANALYSIS
MAXFIELD RESEARCH AND CONSULTING, LLC 82
Year Units/Property Name/Location Built Vacant Amenities/Features/Notes
Market RateSuite Liv'n Village 2006 3 24 - 1BR 750 - 750 $550 - $625 $0.73 - $0.83400 Village Drive 0Marshall, MN 0.0%
Century Court Townhome Apartments 1999 97 35 - 1BR 757 - 757 $781 - $880 $1.03 - $1.16705 Century Avenue SW 2 46 - 2BR 970 - 970 $936 - $1,040 $0.96 - $1.07Hutchinson, MN 2.1% 16 - 3BR 1,190 - 1,159 $1,091 - $1,300 $0.92 - $1.12
Wedgewood Apartments 1992 60 60 - 2BR 813 - 813 $702 - $702 $0.86 - $0.86
407-413 Village Drive 5Marshall, MN 8.3%
Suite Liv'n on 15th NW 1995 16 8 - 1BR 500 - 500 $770 - $770 $1.54 - $1.542601-2609 15th Avenue 0 8 - 2BR 612 - 612 $750 - $775 $1.23 - $1.27Willmar, MN 0.0% - 3BR 916 - 916 $800 - $900 $0.87 - $0.98
Meadowland Apartments 1978 12 12 - 2BR 1000 - 1000 $750 - $750 $0.75 - $0.751000 Broadway Street 1Redwood Falls, MN 8.3%
Windom 1993 36 18 - 1BR 689 - 689 $425 - $425 $0.62 - $0.62101 Miawakon Avenue 0 18 - 2BR 963 - 963 $540 - $550 $0.56 - $0.57Montevideo, MN 0.0%
Source: Maxfield Research & Consulting
TABLE R-3GENERAL OCCUPANCY RENTAL PROJECTS
NEIGHBORING COMMUNITIES RENTAL COMPARISIONJUNE 2020
Monthly Rent per
Garage space available for
$45/month. Pet deposit $500.
Laundry facilities available.
Two-story community, surface
and garage parking, wall AC units,
community room,
heat/water/sewer/trash included.
Pet deposit is $500 and monthly
pet rent $40/month. New laundry
facility available on site.
Limited amenities available.
Unit Mix Unit Size Rent Square Foot
Pet deposit is $500 and monthly
pet rent $40/month. New laundry
facility available on site.
1 space assigned garage stall, pet
deposit $500 and $35/month.
Stainless still appliances and
granite counter tops.
Vacancy Vacancy Vacancy
Submarket Rate* Rate* Rate*
Renville 40 7.5% 44 4.6% 84 6.0%
Olivia 142 2.4% 89 1.2% 231 3.9%
Buffalo Lake/Hector 12 0.0% 24 4.2% 36 2.8%
South 21 0.0% 29 7.2% 50 4.0%
Total^ 214 4.0% 186 4.3% 401 4.2%
* Vacancy rates based on partipating properties.
Source: Maxfield Research & Consulting, LLC
Units Units Units
TABLE R-4
SUMMARY OF GENERAL OCCUPANCY RENTAL PROJECTS INVENTORIED BY SUBMARKET
2nd QUARTER 2020
Market Rate Affordable/Subsidized Total

RENTAL HOUSING ANALYSIS
MAXFIELD RESEARCH AND CONSULTING, LLC 83
Select general occupancy rental projects – Renville County
Westcourt Apartments
Parklane Apartments
Clearview Apartments
Greenhill Apartments
Northpark Apartments
Evergreen Terrace

RENTAL HOUSING ANALYSIS
MAXFIELD RESEARCH AND CONSULTING, LLC 83
General Occupancy Rental Housing

SENIOR HOUSING ANALYSIS
MAXFIELD RESEARCH AND CONSULTING, LLC 85
Senior Housing Defined The term “senior housing” refers to any housing development that is restricted to people age 55 or older. Today, senior housing includes an entire spectrum of housing alternatives, which occasionally overlap, thus making the differences somewhat ambiguous. However, the level of support services offered best distinguishes them. Maxfield Research and Consulting LLC classi-fies senior housing projects into five categories based on the level of support services offered: Active Adult properties (or independent living without services available) are similar to a
general-occupancy building, in that they offer virtually no services but have age-restrictions (typically 55 or 62 or older). Organized activities and occasionally a transportation program are usually all that are available at these properties. Because of the lack of services, active adult properties typically do not command the rent premiums of more service-enriched senior housing. Active adult properties can have a rental or owner-occupied (condominium or cooperative) format.
Congregate properties (or independent living with services available) offer support services
such as meals and/or housekeeping, either on an optional basis or a limited amount included in the rents. These properties typically dedicate a larger share of the overall building area to common areas, in part, because the units are smaller than in adult housing and in part to encourage socialization among residents. Congregate properties attract a slightly older target market than adult housing, typically seniors age 75 or older. Rents are also above those of the active adult buildings, even excluding the services. Sponsorship by a nursing home, hospital or other health care organization is common.
Assisted Living properties come in a variety of forms, but the target market for most is generally the same: very frail seniors, typically age 80 or older (but can be much younger, depending on their particular health situation), who are in need of extensive support services and personal care assistance. Absent an assisted living option, these seniors would otherwise need to move to a nursing facility. At a minimum, assisted living properties include two meals per day and weekly housekeeping in the monthly fee, with the availability of a third meal and personal care (either included in the monthly fee or for an additional cost). Assisted living properties also have either staff on duty 24 hours per day or at least 24-hour emergency response.
Memory Care properties, designed specifically for persons suffering from Alzheimer’s
disease or other dementias, is one of the newest trends in senior housing. Properties consist mostly of suite-style or studio units or occasionally one-bedroom apartment-style units, and large amounts of communal areas for activities and programming. In addition, staff typically undergoes specialized training in the care of this population. Because of the greater amount of individualized personal care required by residents, staffing ratios are much higher than traditional assisted living and thus, the costs of care are also higher. Unlike conventional assisted living, however, which deals almost exclusively with widows or widowers, a higher proportion of persons afflicted with Alzheimer’s disease are in two-
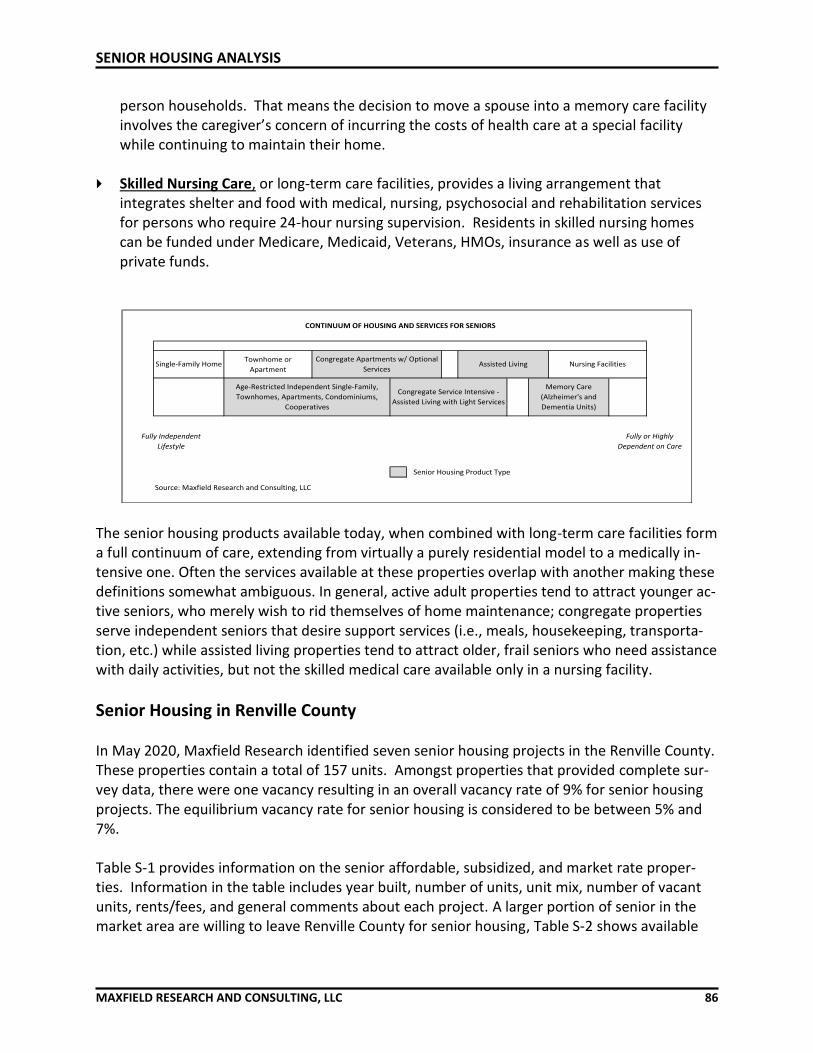
SENIOR HOUSING ANALYSIS
MAXFIELD RESEARCH AND CONSULTING, LLC 86
person households. That means the decision to move a spouse into a memory care facility involves the caregiver’s concern of incurring the costs of health care at a special facility while continuing to maintain their home.
Skilled Nursing Care, or long-term care facilities, provides a living arrangement that
integrates shelter and food with medical, nursing, psychosocial and rehabilitation services for persons who require 24-hour nursing supervision. Residents in skilled nursing homes can be funded under Medicare, Medicaid, Veterans, HMOs, insurance as well as use of private funds.
The senior housing products available today, when combined with long-term care facilities form a full continuum of care, extending from virtually a purely residential model to a medically in-tensive one. Often the services available at these properties overlap with another making these definitions somewhat ambiguous. In general, active adult properties tend to attract younger ac-tive seniors, who merely wish to rid themselves of home maintenance; congregate properties serve independent seniors that desire support services (i.e., meals, housekeeping, transporta-tion, etc.) while assisted living properties tend to attract older, frail seniors who need assistance with daily activities, but not the skilled medical care available only in a nursing facility.
Senior Housing in Renville County In May 2020, Maxfield Research identified seven senior housing projects in the Renville County. These properties contain a total of 157 units. Amongst properties that provided complete sur-vey data, there were one vacancy resulting in an overall vacancy rate of 9% for senior housing projects. The equilibrium vacancy rate for senior housing is considered to be between 5% and 7%. Table S-1 provides information on the senior affordable, subsidized, and market rate proper-ties. Information in the table includes year built, number of units, unit mix, number of vacant units, rents/fees, and general comments about each project. A larger portion of senior in the market area are willing to leave Renville County for senior housing, Table S-2 shows available
Townhome or
ApartmentAssisted Living
Memory Care
(Alzheimer's and
Dementia Units)
Nursing Facilities
Fully or Highly
Dependent on Care
Senior Housing Product Type
Fully Independent
Lifestyle
Source: Maxfield Research and Consulting, LLC
Single-Family Home
CONTINUUM OF HOUSING AND SERVICES FOR SENIORS
Age-Restricted Independent Single-Family,
Townhomes, Apartments, Condominiums,
Cooperatives
Congregate Apartments w/ Optional
Services
Congregate Service Intensive -
Assisted Living with Light Services
SENIOR HOUSING ANALYSIS
MAXFIELD RESEARCH AND CONSULTING, LLC 87
senior developments in the vicinity that developments in Renville County are competing against. Subsidized/Affordable Active Adult • Subsidized active adult senior housing offers affordable rents to qualified low income sen-
iors and handicapped/disabled persons. Typically, incomes are restricted to 30% of the area median income adjusted for household size. For those households meeting the age and in-come qualifications, subsidized senior housing is usually the most affordable rental option available. Affordable projects are typically tax-credit projects that are limited to households earning less than 60% of Renville County’s area median income.
• There is only one subsidized/affordable active adult developments in Renville County. As of
May 2020, there were no vacancies. Equilibrium for senior subsidized housing projects is usually around 3%, allowing for optimal housing availability for potential residents. Many of these properties indicated there was a waitlist. Unit sizes at these senior properties are of-ten smaller than many of the market rate senior rental projects.
Independent Living • There is only independent living facility in Renville County. As of May 2020, there were 11
vacancies available at this development. A new partnership with Northcare LLC will be tak-ing Fairview Place is a new direction with senior apartments.
• Unit types offered are studios, one-bedroom and two-bedroom units. Monthly base rents
range from $970 for a one-bedroom to $1,520 for a two-bedroom unit.
Assisted Living • There are four facilities offering assisted living services in Renville County. As of May 2020,
there was only one vacancy between all four developments. • Market rate basic service rents range from $1,331 for a studio apartment at Meadows on
Main to $3,850 for a one-bedroom apartment at Park View Village. Additional cost is based on service level needed. Some common features include kitchenettes, private bathrooms, meals, laundry, and light housekeeping
Memory Care • There is only one development offering memory care services in Renville County. The devel-
opment is owned and operated by St. Francis Health Services providing 24-hour staff with daily medical check-ins. No vacancies reported as of May 2020.

SENIOR HOUSING ANALYSIS
MAXFIELD RESEARCH AND CONSULTING, LLC 88
Year Units/
Project Name/Location Built/ Reno. Vacant Min - Max Amenities/Features/Notes
East Ridge Court N/A 18 18 - 1BR 540 - 540 N/A - N/A
219 SE Elm Street 0
Renville, MN (Renville Submarket) 0.0%
Centenial Apartments 1973 16 16 - 1BR 796 - 796 N/A - N/A
161 2nd Ave E 0 1 - 2BR 1,097 - 1,134
Franklin, MN (South Submarket) 0.0%
Fairview Place 1996 30 24 - 1BR 400 - 578 $970 - $1,270 $2.20 - $2.43
603 E. Fairview Avenue 0 6 - 2BR 842 - 842 $1,520 - $1,520 $1.81 - $1.81
Olivia, MN (Olivia Submarket) 0.0%
Park View Village 2003 20 20 - 1BR 365 - 408 $3,750 - $3,850 $9.44 - $10.27
1204 Park Avenue W. 1
Olivia, MN (Olivia Submarket) 5.0%
Westview Assisted Living 1992 18 9 - Studio 370 - 370 $2,100 - $2,100 $5.68 - $5.68
703 West Yellowstone Trail 0 9 - 1BR 550 - 550 $2,300 - $2,300 $4.18 - $4.18
Buffalo Lake, MN (Buffalo Lake/Hector Sub.) 0.0%
Prairie View of Hector 2011 28 28 - Studio N/A - N/A $2,461 - $2,461 N/A - N/A
1010 Elm Avenue E 0 2BR N/A - N/A $2,916 - $2,916 N/A - N/A
Hector, MN (Buffalo Lake/Hector Sub.) 0.0%
Meadows on Main N/A 37 15 - Studio 597 - 818 $1,331 - $1,331 $1.63 - $2.23
611 Main Street South 0 15 - 1BR 893 - 893 $1,235 - $1,235 $1.38 - $1.38
Renville, MN (Renville Submarket) 0.0% 7 2BR 921 1,024 $1,468 $1,468 $1.43 - $1.59
Prarie View of Hector 2011 6 6 - Studio 365 - 365 $4,675 - $4,975 $12.81 - $13.63
1010 Elm Avenue E 0
Hector, MN (Buffalo Lake/Hector Sub.) 0.0%
Source: Maxfield Research & Consulting, LLC
30% of Income. Waiting list for potential
residence. Houses elderly, disabled, and single
non-disabled tenants.
30% AGI
30% AGI
Memory Care
All services are ala carte, including typical basics
including services (laundry, housekeeping, etc.).
Affordable/Subsidized Assisted Living
Unit SizeUnit Mix Sale Price
HUD's Section 202 Supportinve Housing for the
Elderly program.
TABLE S-1
SENIOR HOUSING PROJECTS
RENVILLE COUNTY
MAY 2020
Monthly Rent/ Rent/Sales price/PSF
Utilities include electric, heat, water, trash
removal.Three meals daily, limited access entry
system, weekly housekeeping and linen service,
activity programming
Independent Living
Assisted Living
Paid utilities, including A/C (phone & cable not
included). Three meals a day, barber shop service
available, weekly assistance with bathing and a
licensed nurse 24 hours a a day.
Owned and operated by St. Francis Health
Services. 24 hour staff available with daily
medical check-ins.
Comprehensive care package: Three meals per
day, medication management, bathing
assistance, weekly laundry, nightly checks.
Services can also be purchased ala carte.

SENIOR HOUSING ANALYSIS
MAXFIELD RESEARCH AND CONSULTING, LLC. 89
Yr TotalDevelopment Address City Built Units
Prince of Peace 835 NE Boston Parkway Hutchinson 1995 40
Emmaus House 204 N Holcombe Avenue Litchfield 1997 44
Lakeside Apartments 441 William Avenue E Dassel 1984 35
Gloria Dei Manor 218 N Holcome Avenue Litchfield 1961 32
Johnson Park Place 8308 Colby Parkway Redwood Falls 1995 28
Parkwood Aparments 13731 Hickman Road Belview 1995 16
Bridgewood Assisted Living 12675 Woodlands Pwy Belview 2003 6
Westview Village 1425 19th Ave SW Willmar 2007 50
Bethesda 901 Willmar Avenue SE Willmar 1985 32Brookside Senior Living 804 Benson Road Granite Falls 2007 37
Heritage Pointe 207 N 4th Street Marshall 1997 50
Orchard Hill Senior Living 1223 Karl Drive New Ulm 2003 42
Oak Grove 114 Reform Street N NYA 1989 50
River Gables 110 First Street E Chaska 1999 32Total 494
Cedar Crest Estates 6901 Peckham Street Hutchinson 1984 28Cosmos Assisted Living Plus 5815 Winwood Drive Hutchinson 2003 29The Oaks 6750 Corporate Drive Hutchinson 1999 42The Pines 200 SW Brookdale Drive Hutchinson 2005 50St. Benedict's Court Monticello 2000 46Bethany Assisted Living 203 N Armstrong Avenue Litchfield 1963 28Johnson Park Place 8308 Colby Parkway Redwood Falls 1995 10Grand Meadows 1420 Prairie Avenue Hutchinson 2004 20Albion Senior Living 5024 Highview Drive Granite Falls 2002 68Brookside Senior Living 804 Benson Road Granite Falls 2007 37Meadow Creek 1805 MN 7 Granite Falls 1995 28Bethesda 901 Willmar Avenue SE Willmar 1985 24Garnette Gardens 501 South Dekalb Street Redwood Falls 2009 56Prairie Home Fieldcrest 80 East Vermillion Street Cottonwoods 1994 31Woodstone Senior Living 1025 Dale Street Hutchinson 2012 42Heritage Pointe 207 N 4th Street Marshall 1997 32Orchard Hill Senior Living 1223 Karl Drive New Ulm 2003 30Auburn Meadows 591 Cherry Drive Waconia 2005 44Auburn Court 501 Oaks Street N Chaska 1999 40Peace Village Haven 300 Faxon Road N NYA 1998 36Peace Village Harbor 1330 19th Street NYA 1997 25Total 746
Prairie Senior Cottages 6901 Peckham Street Hutchinson 1999 16Cedar Crest Estates 5815 Winwood Drive Hutchinson 1984 20Lakeview Ranch 203 N Armstrong Avenue Dassel 2003 8Harmony River 1555 Sherwood Street SE Hutchinson 2002 18Ecumen Oaks 1015 Century Avenue SW Hutchinson 2014 24Woodstone Senior Living 1025 Dale Street Hutchinson 2012 26Bethesda 901 Willmar Avenue SE Willmar 1985 24Garnette Gardens 501 South Dekalb Street Redwood Falls 2009 15Brookside Senior Living 804 Benson Road Granite Falls 2007 17Peace Village Haven 300 Faxon Road N NYA 1998 12Auburn Meadows 591 Cherry Drive Waconia 2005 24Auburn Court 501 Oaks Street N Chaska 1999 26Total 230
Memory Care
Source: Maxfield Research and Consulting LLC
Assisted Living
TABLE S-2SENIOR HOUSING PROPERTIES
VICINITYJUNE 2020
Independent Living (Congregate)

SENIOR HOUSING ANALYSIS
MAXFIELD RESEARCH AND CONSULTING, LLC. 90
Supply of Skilled Nursing Beds Table S-3 shows the inventory of existing skilled nursing facilities located in the Renville County per the Minnesota Department of Health.
• There are five facilities with 246 skilled nursing beds in the Renville County, Ren Villa Nurs-ing Home is the largest with 56 beds available.
Name Location No. of Beds
Fairfax Community Home Fairfax 40
Ren Villa Nursing Home Renville 56
Buffalo Lake Health Care Center Buffalo Lake 49
Franklin Health Care Center Franklin 46
Olivia Health Care Center Olivia 55
Total 246
Source: MN Dept. of Health, Maxfield Research & Consulting, LLC
TABLE S-3
SKILLED NURSING FACILITIES
RENVILLE COUNTY
2020

SENIOR HOUSING ANALYSIS
MAXFIELD RESEARCH AND CONSULTING, LLC. 91
Select Senior Housing Projects – Renville County
Fairview Place
Parkview Village
Meadows on Main
Prairieview of Hector
East Ridge Court

SENIOR HOUSING ANALYSIS
MAXFIELD RESEARCH AND CONSULTING, LLC. 92
Senior Housing – Renville County Analysis Area

FOR-SALE MARKET ANALYSIS
MAXFIELD RESEARCH AND CONSULTING, LLC 93
Introduction Maxfield Research and Consulting analyzed the for-sale housing market in Renville County by analyzing data on single-family and multifamily home sales and active listings, identifying active subdivisions and pending for-sale developments; and conducting interviews with local real es-tate professionals, developers, builders and planning officials.
Home Resale Comparison in Renville County Table FS-1 on the following page presents home sale data from 2010 through 2019 for Renville County compared to the Southwest Central Regional Area which includes the Counties of Kan-diyohi, McLeod, Meeker and Renville. The table displays the median sale price, number of closed transactions, and marketing time (average days on market) for all detached single-family residential resales (excludes new construction) and attached single-family (referred to as multi-family in this section of the report) residential resales which includes townhomes, twin homes, and condominiums. This data was obtained from the NorthStar Multiple Listing Services and includes all transac-tions sold through a Realtor. Private sales (not sold on the Multiple Listing Service by a Realtor) are not included.
• From 2010 through 2019, there were 1,609 residential resales in Renville County, represent-ing approximately 10% of all sales in the Southwest Central Regional Area. Since 2010, Ren-ville County has averaged 159 resales per year.
'10 '11 '12 '13 '14 '15 '16 '17 '18 '19
Multifamily 3 1 1 1 2 1 1 0 0 0
Single-Family 180 145 136 148 137 169 188 180 138 172
020406080
100120140160180200
Clo
sed
Sal
es
Residential Resale ActivityRenville County
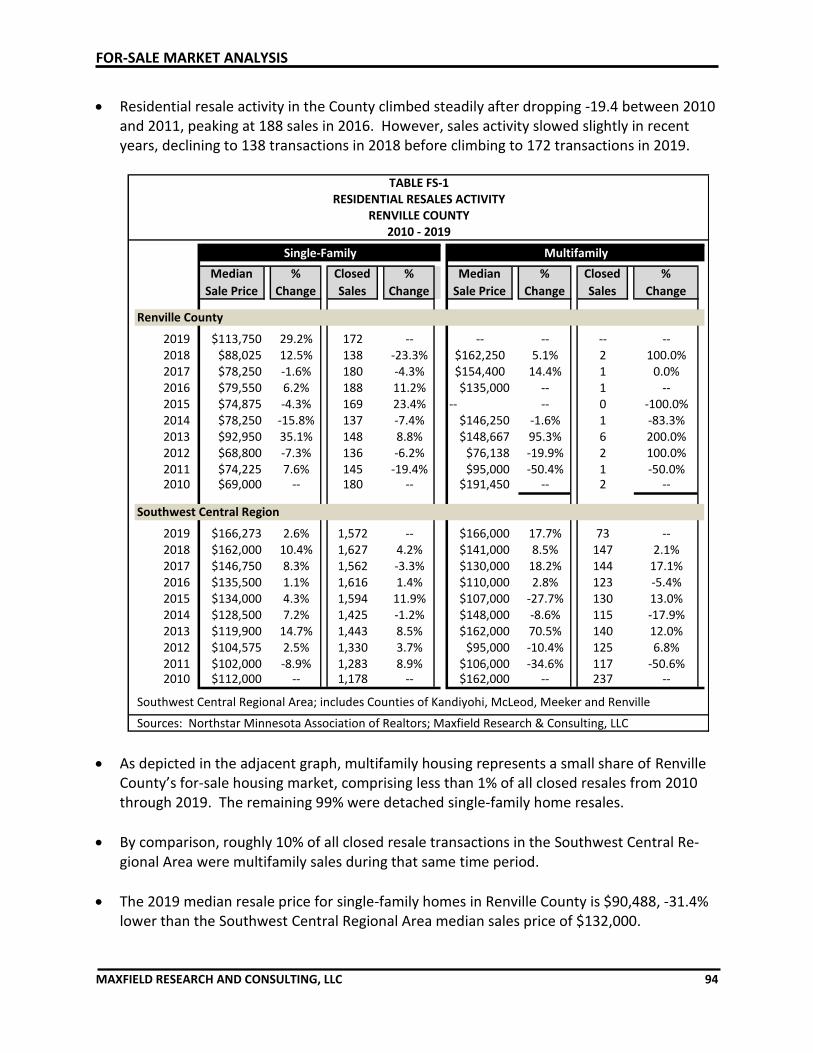
FOR-SALE MARKET ANALYSIS
MAXFIELD RESEARCH AND CONSULTING, LLC 94
• Residential resale activity in the County climbed steadily after dropping -19.4 between 2010 and 2011, peaking at 188 sales in 2016. However, sales activity slowed slightly in recent years, declining to 138 transactions in 2018 before climbing to 172 transactions in 2019.
• As depicted in the adjacent graph, multifamily housing represents a small share of Renville County’s for-sale housing market, comprising less than 1% of all closed resales from 2010 through 2019. The remaining 99% were detached single-family home resales.
• By comparison, roughly 10% of all closed resale transactions in the Southwest Central Re-gional Area were multifamily sales during that same time period.
• The 2019 median resale price for single-family homes in Renville County is $90,488, -31.4% lower than the Southwest Central Regional Area median sales price of $132,000.
Median
Sale Price
%
Change
Closed
Sales
%
Change
Median
Sale Price
%
Change
Closed
Sales
%
Change
2019 $113,750 29.2% 172 -- -- -- -- --2018 $88,025 12.5% 138 -23.3% $162,250 5.1% 2 100.0%2017 $78,250 -1.6% 180 -4.3% $154,400 14.4% 1 0.0%2016 $79,550 6.2% 188 11.2% $135,000 -- 1 --2015 $74,875 -4.3% 169 23.4% -- -- 0 -100.0%2014 $78,250 -15.8% 137 -7.4% $146,250 -1.6% 1 -83.3%2013 $92,950 35.1% 148 8.8% $148,667 95.3% 6 200.0%2012 $68,800 -7.3% 136 -6.2% $76,138 -19.9% 2 100.0%2011 $74,225 7.6% 145 -19.4% $95,000 -50.4% 1 -50.0%2010 $69,000 -- 180 -- $191,450 -- 2 --
2019 $166,273 2.6% 1,572 -- $166,000 17.7% 73 --2018 $162,000 10.4% 1,627 4.2% $141,000 8.5% 147 2.1%2017 $146,750 8.3% 1,562 -3.3% $130,000 18.2% 144 17.1%2016 $135,500 1.1% 1,616 1.4% $110,000 2.8% 123 -5.4%2015 $134,000 4.3% 1,594 11.9% $107,000 -27.7% 130 13.0%2014 $128,500 7.2% 1,425 -1.2% $148,000 -8.6% 115 -17.9%2013 $119,900 14.7% 1,443 8.5% $162,000 70.5% 140 12.0%2012 $104,575 2.5% 1,330 3.7% $95,000 -10.4% 125 6.8%2011 $102,000 -8.9% 1,283 8.9% $106,000 -34.6% 117 -50.6%2010 $112,000 -- 1,178 -- $162,000 -- 237 --
Southwest Central Regional Area; includes Counties of Kandiyohi, McLeod, Meeker and Renville
Sources: Northstar Minnesota Association of Realtors; Maxfield Research & Consulting, LLC
Renville County
Southwest Central Region
TABLE FS-1RESIDENTIAL RESALES ACTIVITY
RENVILLE COUNTY2010 - 2019
Single-Family Multifamily

FOR-SALE MARKET ANALYSIS
MAXFIELD RESEARCH AND CONSULTING, LLC 95
• Median resale prices for detached single-family homes have experienced growth in Renville County since 2017. The median sale price jumped to $78,250 in 2017 and has since climbed to $88,025 in 2018 and $113,750 in 2019.
• Due to the limited sales volume, multifamily pricing trends have been slightly more volatile than single-family. However, in the limited sales within recent years since 2016 have ranged between $135,000 to $162,250.
Table FS-2 on the following pages presents home sale data from 2010 through 2019 for the four submarkets. The table displays the median sale price, number of closed transactions, and mar-keting time (average days on market) for all detached single-family residential resales and mul-tifamily residential resales in each submarket. This data was obtained from the NorthStar Mul-tiple Listing Services.
• The Olivia Submarket lead all Renville County submarkets in sales volume from 2010 through 2019 with 597 sales (37.5% of all sales in the County), followed by the Buffalo Lake/Hector Submarket with 457 closed sales (28.7%) and Renville Submarket with 296 sales (18.6%). Transaction volume was lowest in the South Submarket with 243 sales (15.3%).
• The Renville Submarket was the multifamily sales leader in the County from 2010 through 2019 with eight closed sales (52% of all multifamily sales in the County), followed by Buffalo Lake/Hector with five (29%) and Olivia with four (19%). There were no multifamily sales in the Renville County during that time period.
1,282
14,630
10
1,351
0% 20% 40% 60% 80% 100%
Renville County
Southwest CentralRegion
Residential Resales by Type2010 - 2019
Single-Family Multifamily

FOR-SALE MARKET ANALYSIS
MAXFIELD RESEARCH AND CONSULTING, LLC 96
• In 2019, the Olivia Submarket had the highest median resale price in the County at $165,490 (31% higher than the countywide median).
• The 2019 median resale prices for single-family homes in the Buffalo Lake/Hector and Ren-ville Submarkets were slightly lower than the countywide median at $105,000 and $86,000 respectively.
• Median resale prices are continuing to trend upwards even during this time of COVID-19. Suburban and especially, rural communities are places were social distancing is more of a built-in part of everyday life away from crowded streets and mass transit. As working from home becomes a more common and accepted practice, even after the pandemic.
2010 2011 2012 2013 2014 2015 2016 2017 2018 2019
Renville $60,000 $38,000 $46,250 $86,000 $72,500 $50,775 $74,100 $72,500 $66,050 $86,000
Olivia $113,250 $87,500 $127,815 $137,250 $88,500 $102,000 $125,050 $129,250 $127,500 $165,490
Buffalo Lake/Hector $78,000 $84,450 $77,200 $99,900 $84,000 $83,750 $56,000 $84,000 $110,000 $105,000
South $52,000 $64,000 $60,400 $44,863 $62,450 $66,000 $85,000 $70,000 $63,500 $122,500
Southwest Central $112,000 $102,000 $104,575 $119,900 $128,500 $134,000 $135,500 $146,750 $162,000 $166,273
Renville County $70,000 $53,250 $56,000 $67,700 $73,500 $67,000 $75,000 $79,950 $80,000 $86,000
Minnesota $157,750 $141,900 $157,000 $176,000 $185,900 $199,900 $213,750 $227,500 $244,900 $259,900
$0
$50,000
$100,000
$150,000
$200,000
$250,000
$300,000
Single-family Median Resale Price Trend by Submarket2010 - 2019

FOR-SALE MARKET ANALYSIS
MAXFIELD RESEARCH AND CONSULTING, LLC 97
Median
Sale Price
%
Change
Closed
Sales
%
Change
Median
Sale Price
%
Change
Closed
Sales
%
Change
2019 $86,000 30.2% 27 -- -- -- 0 --2018 $66,050 -8.9% 30 -31.8% $132,900 -13.9% 2 100.0%2017 $72,500 -2.2% 44 15.8% $154,400 14.4% 1 0.0%2016 $74,100 45.9% 38 18.8% $135,000 -- 1 --2015 $50,775 -30.0% 32 3.2% -- -- 0 --2014 $72,500 -15.7% 31 47.6% -- -- 0 --2013 $86,000 85.9% 21 -25.0% $117,500 4.4% 2 100.0%2012 $46,250 21.7% 28 86.7% $112,500 18.4% 1 0.0%2011 $38,000 -36.7% 15 -50.0% $95,000 -- 1 --2010 $60,000 -- 30 -- , -- 0 --
2019 $165,490 -- 72 -- -- -- 0 --2018 $127,500 -1.4% 56 -12.5% -- -- 0 --2017 $129,250 3.4% 64 -20.0% -- -- 0 --2016 $125,050 22.6% 80 23.1% -- -- 0 --2015 $102,000 15.3% 65 44.4% -- -- 0 --2014 $88,500 -35.5% 45 -19.6% $142,500 124.4% 1 -66.7%2013 $137,250 7.4% 56 27.3% $63,500 -- 3 --2012 $127,815 46.1% 44 -17.0% -- -- 0 --2011 $87,500 -22.7% 53 -14.5% -- -- 0 --2010 $113,250 -- 62 -- -- -- 0 --
2019 $105,000 -4.5% 51 -- -- -- 0 --2018 $110,000 31.0% 33 -23.3% -- -- 0 --2017 $84,000 50.0% 43 0.0% -- -- 0 --2016 $56,000 -33.1% 43 -20.4% -- -- 0 --2015 $83,750 -0.3% 54 45.9% -- -- 0 --2014 $84,000 -15.9% 37 -21.3% $150,000 -43.4% 1 0.0%2013 $99,900 29.4% 47 20.5% $265,000 566.2% 1 0.0%2012 $77,200 -8.6% 39 -30.4% $39,775 -- 1 --2011 $84,450 8.3% 56 3.7% -- -- 0 --2010 $78,000 -- 54 -- $191,450 -- 2 --
Renville Submarket
Olivia Submarket
Buffalo Lake/Hector Submarket
TABLE FS-2 RESIDENTIAL RESALES ACTIVITY BY SUBMARKET
RENVILLE COUNTY2010 - 2019
Single-Family Multifamily
---------- continued ----------

FOR-SALE MARKET ANALYSIS
MAXFIELD RESEARCH AND CONSULTING, LLC 98
Median
Sale Price
%
Change
Closed
Sales
%
Change
Median
Sale Price
%
Change
Closed
Sales
%
Change
2019 $122,500 92.9% 22 -- -- -- -- --2018 $63,500 -9.3% 19 -34.5% -- -- -- --2017 $70,000 -17.6% 29 7.4% -- -- -- --2016 $85,000 28.8% 27 50.0% -- -- -- --2015 $66,000 5.7% 18 -25.0% -- -- -- --2014 $62,450 39.2% 24 0.0% -- -- -- --2013 $44,863 -25.7% 24 -4.0% -- -- -- --2012 $60,400 -5.6% 25 19.0% -- -- -- --2011 $64,000 23.1% 21 -38.2% -- -- -- --2010 $52,000 -- 34 -- -- -- -- --
Sources: NorthStar Minnesota Association of Realtors; Maxfield Research & Consulting, LLC
South Submarket
TABLE FS- 2 continuedRESIDENTIAL RESALES ACTIVITY BY SUBMARKET
RENVILLE COUNTY2010 - 2019 Q1
Single-Family Multifamily

FOR-SALE MARKET ANALYSIS
MAXFIELD RESEARCH AND CONSULTING, LLC 99
County-wide Home Resale Comparison Table FS-3 compares Renville County resale data against counties making up the SW Central Re-gion, and the State of Minnesota. The tables show summary-level resale data for single-family and multifamily housing units between 2010 and 2019 according to the NorthStar Multiple List-ing Service of Minnesota, Inc.
• Renville County housing value trends have remained fairly consistent over the past decade. Median resale values remained in the $70,000 to $80,000 price range from 2014 to 2017. Noticeable increases in values since 2018 have occurred due to low interest rates and lack of housing supply.
• Renville County housing values have historically been more affordable than the remainder of the counties located in the SW Central Region including Kandiyohi, McLeod and Meeker Counties which have the advantage of being closer to the Twin Cities Metro Area or have larger cities.
• The median resale value jumped to $113,750 in 2019 from $88,025 which is a trend facing many rural communities. Realtor.com figures, which compared June 2019 to June of 2020; found that homes in rural zip codes saw the biggest jump in average views per property. This shows many people are interested in getting out of more densely populated area and into communities that are more affordable and less dense.
• Views of urban properties were up 19%, suburban properties up 30% while rural properties were up 34% according to the Realtor.com study.

FOR-SALE MARKET ANALYSIS
MAXFIELD RESEARCH AND CONSULTING, LLC 100
County 2010 2011 2012 2013 2014 2015 2016 2017 2018 2019
SW Central Region $105,600 $107,169 $97,375 $114,175 $116,684 $122,176 $125,175 $133,660 $145,856 $154,938
Kandiyohi $133,900 $109,950 $123,125 $135,000 $135,000 $146,430 $139,900 $153,888 $169,000 $165,000
McLeod $115,000 $102,000 $100,700 $113,750 $132,634 $138,400 $142,250 $158,000 $163,000 $177,000
Meeker $104,500 $142,500 $96,875 $115,000 $120,851 $129,000 $139,000 $144,500 $163,400 $164,000
Renville $69,000 $74,225 $68,800 $92,950 $78,250 $74,875 $79,550 $78,250 $88,025 $113,750
State of Minnesota $150,000 $137,500 $150,500 $170,000 $179,013 $195,000 $209,000 $223,000 $239,900 $254,000
Source: Northstar Multiple Listing Service of Minnesota, Maxfield Research & Consulting, LLC
TABLE FS-3
MEDIAN RESALE COMPARISON RENVILLE COUNTY AND SW CENTRAL REGION
2010 to 2019
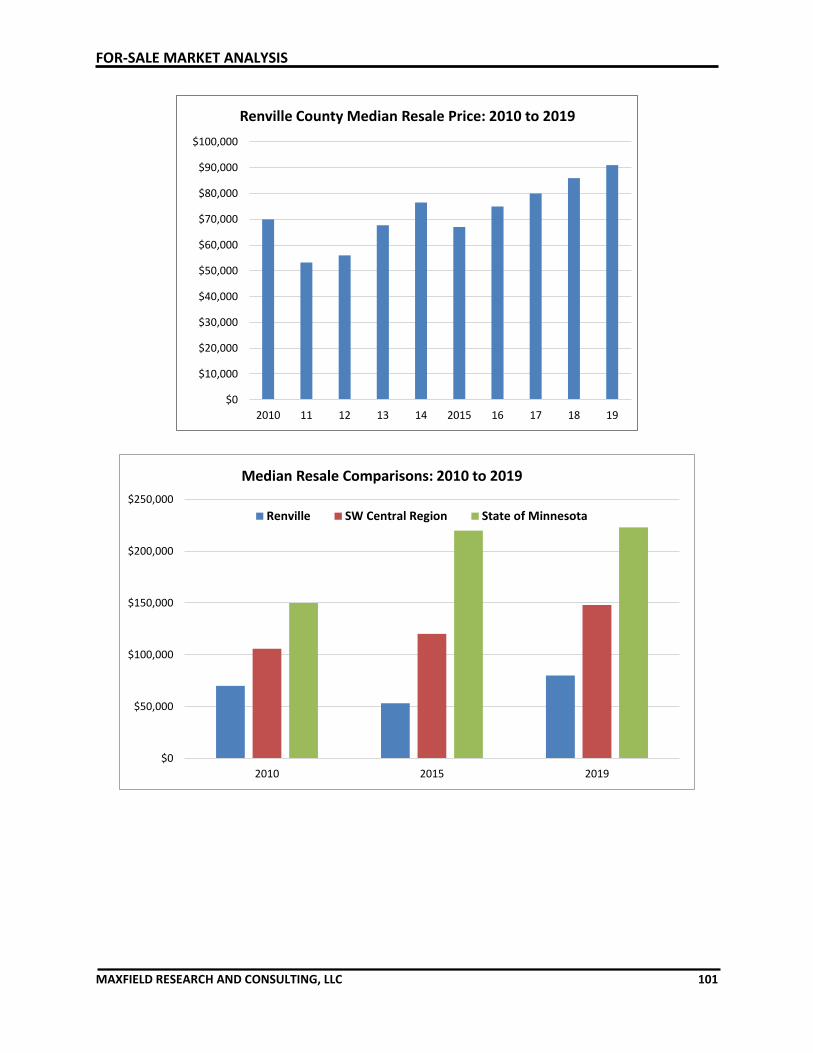
FOR-SALE MARKET ANALYSIS
MAXFIELD RESEARCH AND CONSULTING, LLC 101
$0
$10,000
$20,000
$30,000
$40,000
$50,000
$60,000
$70,000
$80,000
$90,000
$100,000
2010 11 12 13 14 2015 16 17 18 19
Renville County Median Resale Price: 2010 to 2019
$0
$50,000
$100,000
$150,000
$200,000
$250,000
2010 2015 2019
Median Resale Comparisons: 2010 to 2019
Renville SW Central Region State of Minnesota

FOR-SALE MARKET ANALYSIS
MAXFIELD RESEARCH AND CONSULTING, LLC 102
Resales by Price (2019) Table FS-4 shows the distribution of sales within ten price ranges from resales in 2019. The graph on the following page visually displays the sales data.
• Approximately 43% of the single-family homes sold in Renville County in 2019 were priced between under $100,000. Another 16.9% of single-family homes sold from $100,000 to $149,999. About 11% of transactions sold in the $150,000 to $199,999 range.
• Across the county, about 29% of all transactions sold for more than $200,000. About 70% of all transactions sold for under $200,000. The Olivia Submarket had the highest percent-age over $400,000; at 15.5%.
0
50
100
150
200
250
300
350
Under $100k $100k to$199.9k
$200k to$299.9k
$300k to$399.9k
$400k to$499.9k
$500k to$749.9k
$750k+
Resales by Price and Type: 2019

FOR-SALE MARKET ANALYSIS
MAXFIELD RESEARCH AND CONSULTING, LLC 103
Price Range No. Pct. No. Pct. No. Pct. No. Pct. No. Pct. No. Pct.
< $99,999 14 53.8% 0 -- 14 53.8% 19 26.8% 0 -- 19 26.8%
$100,000 to $149,999 4 15.4% 0 -- 4 15.4% 11 15.5% 0 -- 11 15.5%
$150,000 to $199,999 5 19.2% 0 -- 5 19.2% 8 11.3% 0 -- 8 11.3%
$200,000 to $249,999 3 11.5% 0 -- 3 11.5% 3 4.2% 0 -- 3 4.2%
$250,000 to $299,999 0 0.0% 0 -- 0 0.0% 5 7.0% 0 -- 5 7.0%
$300,000 to $349,999 0 0.0% 0 -- 0 0.0% 2 2.8% 0 -- 2 2.8%
$350,000 to $399,999 0 0.0% 0 -- 0 0.0% 12 16.9% 0 -- 12 16.9%
$400,000 to $449,999 0 0.0% 0 -- 0 0.0% 3 4.2% 0 -- 3 4.2%
$450,000 to $499,999 0 0.0% 0 -- 0 0.0% 1 1.4% 0 -- 1 1.4%
$500,000 to $749,999 0 0.0% 0 -- 0 0.0% 7 9.9% 0 -- 7 9.9%
$750,000 to $999,999 0 0.0% 0 -- 0 0.0% 0 0.0% 0 -- 0 0.0%
$1,000,000 and Over 0 0.0% 0 -- 0 0.0% 0 0.0% 0 -- 0 0.0%
26 100% 0 0% 26 100% 71 100% 0 10% 71 100%
Minimum
Maximum
Median
Average
Price Range No. Pct. No. Pct. No. ` No. Pct. No. Pct. No. Pct.
< $99,999 23 88.5% 0 -- 23 71.9% 10 45.5% 0 -- 10 45.5%
$100,000 to $149,999 5 19.2% 0 -- 5 15.6% 6 27.3% 0 -- 6 27.3%
$150,000 to $199,999 2 7.7% 0 -- 2 6.3% 2 9.1% 0 -- 2 9.1%
$200,000 to $249,999 2 7.7% 0 -- 2 6.3% 1 4.5% 0 -- 1 4.5%
$250,000 to $299,999 0 0.0% 0 -- 0 0.0% 1 4.5% 0 -- 1 4.5%
$300,000 to $349,999 0 0.0% 0 -- 0 0.0% 0 0.0% 0 -- 0 0.0%
$350,000 to $399,999 0 0.0% 0 -- 0 0.0% 0 0.0% 0 -- 0 0.0%
$400,000 to $449,999 0 0.0% 0 -- 0 0.0% 2 9.1% 0 -- 2 9.1%
$450,000 to $499,999 0 0.0% 0 -- 0 0.0% 0 0.0% 0 -- 0 0.0%
$500,000 to $749,999 0 0.0% 0 -- 0 0.0% 0 0.0% 0 -- 0 0.0%
$750,000 to $999,999 0 0.0% 0 -- 0 0.0% 0 0.0% 0 -- 0 0.0%
$1,000,000 and Over 0 0.0% 0 -- 0 0.0% 0 0.0% 0 -- 0 0.0%
32 123% 0 0% 32 100% 22 100% 0 0% 22 100%
Minimum
Maximum
Median
Average
Single-Family Multifamily1 Total
Renville Submarket
TABLE FS-4
RESALES BY PRICE POINT
RENVILLE COUNTY & SW CENTRAL REGION
2019
Olivia Submarket
Single-Family Multifamily1 Total
$36,000 --- $36,000
$695,000 -- $695,000
$80,000 -- $80,000
$76,000 -- $76,000
$221,000 -- $221,000
$23,000 --- $23,000
Buffalo Lake/Hector Submarket South Submarket
Single-Family Multifamily1 Total Single-Family Multifamily1 Total
$98,000 -- $98,000
$102,000 -- $102,000
$24,000
$167,000 -- $167,000 $400,000 -- $400,000
$22,000 --- $22,000 $24,000 ---
$66,000
$92,000 -- $92,000 $74,000 -- $74,000
$87,000 -- $87,000 $66,000 --
CONTINUED

FOR-SALE MARKET ANALYSIS
MAXFIELD RESEARCH AND CONSULTING, LLC 104
Price Range No. Pct. No. Pct. No. Pct. No. Pct. No. Pct. No. Pct.
< $99,999 66 42.9% 0 -- 66 42.9% 206 14.4% 4 28.6% 210 14.5%
$100,000 to $149,999 26 16.9% 0 -- 26 16.9% 420 29.3% 7 50.0% 427 29.5%
$150,000 to $199,999 17 11.0% 0 -- 17 11.0% 487 34.0% 1 7.1% 488 33.7%
$200,000 to $249,999 9 5.8% 0 -- 9 5.8% 107 7.5% 1 7.1% 108 7.5%
$250,000 to $299,999 6 3.9% 0 -- 6 3.9% 92 6.4% 1 7.1% 93 6.4%
$300,000 to $349,999 2 1.3% 0 -- 2 1.3% 46 3.2% 0 -- 46 3.2%
$350,000 to $399,999 2 1.3% 0 -- 2 1.3% 32 2.2% 0 -- 32 2.2%
$400,000 to $449,999 5 3.2% 0 -- 5 3.2% 17 1.2% 0 -- 17 1.2%
$450,000 to $499,999 14 9.1% 0 -- 14 9.1% 10 0.7% 0 -- 10 0.7%
$500,000 to $749,999 7 4.5% 0 -- 7 4.5% 6 0.4% 0 -- 6 0.4%
$750,000 to $999,999 0 0.0% 0 -- 0 0.0% 8 0.6% 0 -- 8 0.6%
$1,000,000 and Over 0 0.0% 0 -- 0 0.0% 1 0.1% 0 -- 1 0.1%
154 100% 0 0.0% 154 100% 1432 100% 14 100% 1446 100%
Minimum
Maximum
Median
Average
1 Includes townhomes, detached townhomes, twinhomes, condominiums, and cooperatives
Sources: NorthStar Multiple Listing Service of Minnesota & Maxfield Research & Consulting
2019
Renville County SW Central Region
Single-Family Multifamily1 Total Single-Family Multifamily1 Total
CONTINUED
TABLE FS-4 CONTINUED
RESALES BY PRICE POINT
RENVILLE COUNTY & SW CENTRAL REGION
$47,000
$657,500 -- $657,500 $102,250 $299,900 $299,900
$62,000 -- $62,000 $62,000 $47,000
$183,872
$87,000 -- $87,000 $207,314 $120,000 $206,469
$81,500 -- $81,500 $184,858 $83,000

FOR-SALE MARKET ANALYSIS
MAXFIELD RESEARCH AND CONSULTING, LLC 105
Owner-occupied Turnover
Table FS-5 illustrates existing home turnover as a percentage of owner-occupied units by Ren-ville County submarkets. Resales are based on historic transaction volume between 2015 and 2019 as listed on the Multiple Listing Service. Owner-occupied housing units are sourced to the U.S. Census as of 2018. As displayed in the table, approximately 3.5% of Renville County owner-occupied housing stock is sold annually. Typically, we find owner-occupied turnover ranges from 3% at the low-end to 8% at the high-end in many communities throughout Minnesota. Turnover was lowest in the South Submarket (2.3%) and highest in the Olivia Submarket (4.6%).
Owner-occupied Resales Turnover
Submarket Housing Units1 Annual Avg.2Pct.
Renville 1,272 34 2.7%
Olivia 1,454 67 4.6%
Buffalo Lake/Hector 1,143 45 3.9%
South 1,010 23 2.3%
Renville County 4,879 169 3.5%
1 Owner-occupied housing units in 20182 Average of MLS resales between 2015 and 2019
Source: U.S. Census Bureau, Maxfield Research & Consulting
TABLE FS-5
OWNER-OCCUPIED TURNOVER
RENVILLE COUNTY
2.7%
4.6%
3.9%
2.3%
3.5%
0% 1% 2% 3% 4% 5%
Renville Sub.
Olivia Sub.
Buffalo Lake/Hector
South Sub.
Renville County
Owner-Occupied Annual Turnover: Avg. Annual

FOR-SALE MARKET ANALYSIS
MAXFIELD RESEARCH AND CONSULTING, LLC 106
Home Resales per Square Foot (“PSF”) Table FS-6 shows the distribution of sales by sales price per square foot (“PSF”) from 2010 to 2019. The sales per square foot metric is simply the sales price of the home divided by the fin-ished square footage. Table FS-7 illustrates PSF pricing between existing homes and new con-struction in Renville County and the SW Central Region. The graphs on the following page visu-ally displays the sales data.
• The median and average price sale price per square foot (PSF) remained fairly consistent from 2010 to 2017 fluctuating slightly year by year. In 2018 the median and average PSF jumper to $91 and $90 respectively and increased in 2019 to $97 and $93 PSF.
• Renville County housings costs on a median PSF basis are about 15% less than the SW Cen-tral Region Average.
• On average since 2010, the price of an existing home PSF costs in Renville County is about 25.9% less than the cost of new construction. During the recession the gap between exist-ing construction and new construction was as high as 36.8% in 2011. However, since 2011 the gap has slightly shrunk, and new construction carries a 28.4% premium today.
Year Avg. Median Avg. Median
2010 $78 $75 $85 $82
2011 $72 $68 $87 $83
2012 $75 $73 $89 $85
2013 $81 $78 $91 $87
2014 $76 $75 $93 $86
2015 $81 $80 $95 $91
2016 $77 $76 $94 $93
2017 $85 $84 $98 $89
2018 $91 $90 $101 $98
2019 $97 $93 $104 $100
Source: 10K Research & Marketing, Maxfield Research & Consulting, LLC
TABLE FS-6
AVERAGE & MEDIAN SALES PRICE PER SQUARE FOOT (PSF)
RENVILLE COUNTY AND SOUTHWEST CENTRAL REGION
2010 to 2019
SW Central RegionRenville County
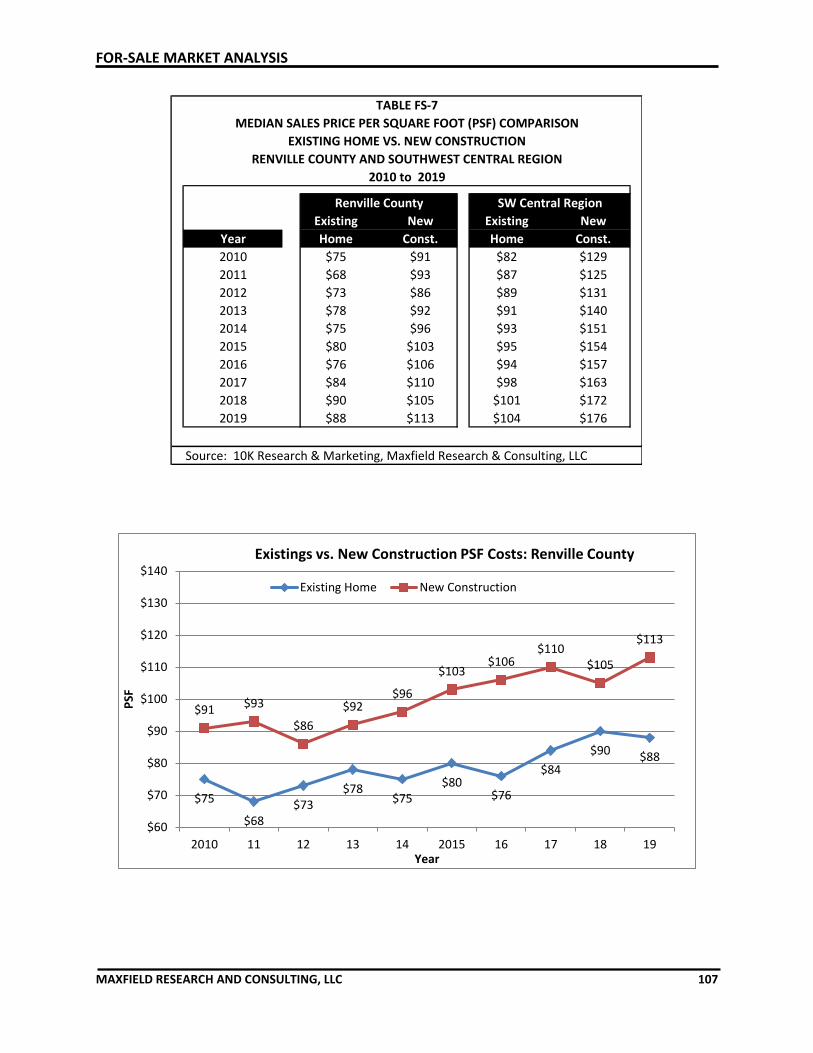
FOR-SALE MARKET ANALYSIS
MAXFIELD RESEARCH AND CONSULTING, LLC 107
Existing New Existing New
Year Home Const. Home Const.
2010 $75 $91 $82 $129
2011 $68 $93 $87 $125
2012 $73 $86 $89 $131
2013 $78 $92 $91 $140
2014 $75 $96 $93 $151
2015 $80 $103 $95 $154
2016 $76 $106 $94 $157
2017 $84 $110 $98 $163
2018 $90 $105 $101 $172
2019 $88 $113 $104 $176
Source: 10K Research & Marketing, Maxfield Research & Consulting, LLC
TABLE FS-7
MEDIAN SALES PRICE PER SQUARE FOOT (PSF) COMPARISON
RENVILLE COUNTY AND SOUTHWEST CENTRAL REGION
SW Central Region
2010 to 2019
Renville County
EXISTING HOME VS. NEW CONSTRUCTION
$75
$68$73
$78$75
$80$76
$84
$90 $88
$91 $93
$86
$92$96
$103$106
$110$105
$113
$60
$70
$80
$90
$100
$110
$120
$130
$140
2010 11 12 13 14 2015 16 17 18 19
PSF
Year
Existings vs. New Construction PSF Costs: Renville County
Existing Home New Construction

FOR-SALE MARKET ANALYSIS
MAXFIELD RESEARCH AND CONSULTING, LLC 108
Current Supply of Homes on the Market To more closely examine the current market for available owner-occupied housing in Renville County, we reviewed the current supply of homes on the market (listed for sale). Table FS-8 shows homes currently listed for sale in Renville County distributed into ten price ranges. The data was provided by the NorthStar Multiple Listing Services of Minnesota and is based on ac-tive listings in May 2020. MLS listings generally account for the vast majority of all residential sale listings in a given area. Table FS-9 summarizes active listings by submarket and housing type. Table FS-10 shows listings by home style (i.e. one-story, two-story, townhome, condo-minium) and illustrate key metrics by each housing type. Key findings from the tables follow.
• As of May 2020, there were 49 homes listed for sale in Renville County. Single-family homes accounted for all listings.
• The median list price in Renville County is approximately $105,200. The median sale price is generally a more accurate indicator of housing values in a community than the average sale price. Average sale prices can be easily skewed by a few very high-priced or low-priced home sales in any given year, whereas the median sale price better represents the pricing of a majority of homes in a given market. List prices are higher than the resale.
$0
$20
$40
$60
$80
$100
$120
$140
$160
$180
$200
2010 11 12 13 14 2015 16 17 18 19
New Construction Median PSF Comparison
Renville County SW Central Region

FOR-SALE MARKET ANALYSIS
MAXFIELD RESEARCH AND CONSULTING, LLC 109
TABLE FS-8HOMES CURRENTLY LISTED FOR SALE
RENVILLE COUNTY MAY 2020
Price Range No. Pct. No. Pct. No. Pct. No. Pct. No. Pct. No. Pct. No. Pct. No. Pct. No. Pct. No. Pct.
< $100,000 5 55.6% 0 0.0% 6 31.6% 0 0.0% 8 57.1% 0 0.0% 1 14.3% 0 0.0% 20 40.8% 0 0.0%$100,000 to $149,999 1 11.1% 0 0.0% 0 0.0% 0 0.0% 1 7.1% 0 0.0% 4 57.1% 0 0.0% 5 10.2% 0 0.0%$150,000 to $199,999 1 11.1% 0 0.0% 3 15.8% 0 0.0% 0 0.0% 0 0.0% 0 0.0% 0 0.0% 4 8.2% 0 0.0%$200,000 to $249,999 1 11.1% 0 0.0% 2 10.5% 0 0.0% 3 21.4% 0 0.0% 1 14.3% 0 0.0% 7 14.3% 0 0.0%$250,000 to $299,999 0 0.0% 0 0.0% 2 10.5% 0 0.0% 0 0.0% 0 0.0% 0 0.0% 0 0.0% 2 4.1% 0 0.0%$300,000 to $399,999 1 11.1% 0 0.0% 3 15.8% 0 0.0% 1 7.1% 0 0.0% 0 0.0% 0 0.0% 5 10.2% 0 0.0%$400,000 to $499,999 0 0.0% 0 0.0% 0 0.0% 0 0.0% 1 7.1% 0 0.0% 1 14.3% 0 0.0% 2 4.1% 0 0.0%$500,000 to $749,999 0 0.0% 0 0.0% 3 15.8% 0 0.0% 0 0.0% 0 0.0% 0 0.0% 0 0.0% 3 6.1% 0 0.0%$750,000 to $999,999 0 0.0% 0 0.0% 0 0.0% 0 0.0% 0 0.0% 0 0.0% 0 0.0% 0 0.0% 0 0.0% 0 0.0%$1,000,000 and Over 0 0.0% 0 0.0% 1 5.3% 0 0.0% 0 0.0% 0 0.0% 0 0.0% 0 0.0% 1 2.0% 0 0.0%
9 100% 0 -- 19 100% 0 -- 14 100% 0 100% 7 100.0% 0 0.0% 49 100.0% 0 0.0%
MinimumMaximum
MedianAverage
Sources: Northstarl Multiple Listing Service of Minnesota, Maxfield Research & Consulting, LLC
$1,150,000 $0$105,200 $0$194,909 $0
Renville County
Single-Family Multifamily1
$13,951 $0
Multifamily1
$23,500 $0 $13,951 $0 $21,500 $0
$215,000 $0 $88,250 $0
Multifamily1Single-Family Multifamily
1Single-Family
Renville Submarket Olivia Submarket Buffalo Lake/Hector Submarket South Submarket
$0
Single-Family
$79,900
Single-Family
$0
$0 $448,000 $0
Multifamily1
$175,671 $0$119,900 $0
$390,000 $0 $1,150,000
$148,000 $0 $304,629 $0 $151,335
$425,000 $0$101,000 $0

FOR-SALE MARKET ANALYSIS
MAXFIELD RESEARCH AND CONSULTING, LLC 110
• Based on a median list price in Renville County of $105,200, the income required to afford a home at this price would be about $30,057 to $35,067, based on the standard of 3.0 to 3.5 times the median income (and assuming these households do not have a high level of debt). A household with significantly more equity (in an existing home and/or savings) could afford a higher priced home.
• Approximately 40% of all homes were prices under a $100,000 in Renville County in May 2020 and another 10% prices between $100,000 to $149,999. The Buffalo Lake/Hector Sub-market had the most listings under $200,000.
• Approximately 18% of single-family listings are priced from $200,000 to $300,000. Within this category, the plurality of listings are priced from $200,000 to $249,999.
• Over 10% of all active listings are priced between $300,000 and $399,999 while only 4% be-tween $400,000 and $499,999. About 8% are priced above $500,000.
• The median list price for single-family homes in the Olivia Submarket are priced significantly higher than the other submarkets with the Buffalo Lake/Hector Submarket having the low-est median list price at $88,250.
$1
01
,00
0
$2
15
,00
0
$8
8,2
50
$1
19
,90
0
$0
$0
$0
$0
$0
$50,000
$100,000
$150,000
$200,000
$250,000
Renville Olivia Buffalo Lake/Hector South
Me
dia
n L
ist
PR
ice
Submarket
Median List Price by Submarket - May 2020
SF MF

FOR-SALE MARKET ANALYSIS
MAXFIELD RESEARCH AND CONSULTING, LLC 111
• One and one-half story properties have the highest sale prices in Renville County, averaging about $242,500. 1.5 story housing types account for 26.5% of the single-family inventory.
• One story homes have the lowest average list price Renville County: averaging about $70,666 ($73 per square foot). This style generally contains the oldest housing stock in the Market Area as the average age of home is over 70 years old.
Submarket Single-Family Townhome/Twinhome Condo/Coop Total
Renville 9 0 0 9
Olivia 19 0 0 19
Buffalo Lake/Hector 14 0 0 14South 7 0 0 7
Renville County 49 0 0 49
Renville 100.0% 0.0% 0.0% 100%
Olivia 100.0% 0.0% 0.0% 100%
Buffalo Lake/Hector 100.0% 0.0% 0.0% 100%South 100.0% 0.0% 0.0% 100%
Renville County 100.0% 0.0% 0.0% 100%
Source: Northstar Multiple Listing Service of MN; Maxfield Research & Consulting, LLC
Listings
Percent
TABLE FS-9
ACTIVE LISTINGS BY TYPE & SUBMARKET
MAY 2020
Product Type
Avg. List Avg. Size Avg. List Price Avg. Avg. Avg. AgeProperty Type Listings Pct. Price (Sq. Ft.) Per Sq. Ft. Bedrooms Bathrooms of Home
One story 28 57.1% $82,066 1,131 $73 2.75 2.00 19551.5-story 13 26.5% $242,500 1,302 $186 4.00 1.50 19402-story 6 12.2% $104,966 1,744 $60 3.33 2.00 1908Modifed 2-story 0 0.0% -- -- -- -- -- --Split entry/Bi-level 1 2.0% -- -- -- -- -- --3-level split 1 2.0% $299,532 1,829 $164 3.29 2.33 20154 or more split-level 0 0.0% -- -- -- -- -- --Total/Avg. 49 100.0% $130,197 1,243 $105 3.11 1.83 1957
Detached 0 -- -- -- -- -- -- --Quad/4 Corners 0 -- -- -- -- -- -- --Side-by-Side 0 -- -- -- -- -- -- --Total/Avg. 0 -- -- -- -- -- -- --
Renville County Total 49
Source: Northstar Multiple Listing Service of MN; Maxfield Research & Consulting, LLC
RENVILLE COUNTY
RENVILLE COUNTY
TABLE FS-10ACTIVE LISTINGS BY HOUSING TYPE
MAY 2020
Single-Family
Townhomes/Twinhomes

FOR-SALE MARKET ANALYSIS
MAXFIELD RESEARCH AND CONSULTING, LLC 112
• Side-by-side townhomes (often referred to as row homes) dominate the townhome-style property types. However, there has recently been resurgence in twin homes or detached townhomes that target older buyers who are looking to downsize.
Actively Marketing Subdivisions Table FS-11 identifies newer subdivisions with available lots in Renville County. The table iden-tifies the number of lots, available lots, typical lot sizes, and assessed values for lots and homes. Please note: the table does not include scattered, infill lots. Key points from the table follow.
• Table FS-11 identifies 16 single-family subdivisions with available lots in Renville County. Collectively, there are about 73 vacant developed lots in Renville County. However, there are potential for future lots in the same subdivisions.
• Olivia has the highest number of vacant developed lots with 17 lots available within nine subdivisions. Renville Estates has the most lots available with 9 ranging from .35 to .45 acres.
• In addition to these subdivided lots, there are also 4 raw land parcels listed for sale in the County, ranging in size from 1.89 acres to over 157 acres. Many of these parcels are builda-ble but are marketed for a variety of land uses, such as agriculture, hunting or recreational land.
0
1
1
6
13
28
0 5 10 15 20 25 30
Townhomes
3-level split+
2-level split
2 story+
1.5-story
One story
No. of Listings
Hsg
. Ty
pe
Listings by Housing Type - Renville County May 2020

FOR-SALE MARKET ANALYSIS
MAXFIELD RESEARCH AND CONSULTING, LLC 113
No. of Vacant/
Subdivion City/Twp. Lots Avail. Lots Min Max Avg. Min Max Avg. Min Max Avg.
Fairview Estates Olivia 9 5 0.16 - 0.32 0.25 $5,300 - $10,500 $8,380 $146,600 - $178,400 $157,766
Bayberry 2nd Addition Olivia 7 1 0.38 - 0.38 0.38 $23,300 - $23,300 $23,300 $90,700 - $311,900 $213,500
Heins Park Addition Olivia 5 1 0.30 - 0.30 0.30 $1,800 - $11,200 $30,000 $146,300 - $182,800 $159,550
Jone's Subdivision Olivia 6 1 1.75 - 1.75 1.75 $20,500 - $20,500 $20,500 $143,400 - $287,800 $205,743
Peterson's 2nd Addition Olivia 8 2 0.02 - 0.31 0.26 $7,000 - $7,000 $7,000 $30,400 - $105,100 $62,028
Baumgartners 1st Addition Olivia 11 3 0.31 - 0.38 0.36 $38,500 - $42,000 $39,666 $233,900 - $375,300 $300,420
Peterson's 3rd Addition Olivia 6 2 0.17 - 0.27 0.25 $2,500 - $4,000 $3,250 $156,500 - $286,000 $190,453
Primrose Lane Subdivision Olivia 8 1 0.54 - 0.54 0.54 $35,000 - $35,000 $7,500 $45,700 - $89,900 $65,125
Nester's 4th Olivia 18 1 0.25 - 0.25 0.25 $41,100 - $41,100 $41,100 $59,000 - $112,800 $75,044
Renville Estates Renville 10 9 0.35 - 0.45 0.43 $5,100 - $15,400 $8,900 $139,500 - $169,500 $154,000
Belt'z Bluff Franklin 4 3 0.45 - 0.45 0.45 $4,800 - $7,200 $5,000 $143,000 - $175,000 $165,000
Franklin Vacant/Platted Lots Franklin 9 9 0.19 - 0.33 0.21 $4,800 - $7,200 $5,000 $143,000 - $175,000 $165,000
Pelican Lake Bird Island 13 13 0.25 - 0.75 0.35 $3,200 - $65,100 $37,614 $190,000 - $241,000 $178,000
Zimmer's 1st Addition Bird Island 25 6 0.34 - 0.34 0.09 $24,800 - $30,000 $25,400 $144,900 - $170,000 $157,150
Zimmer's 2nd Addition Bird Island 13 9 0.22 1.00 0.75 $18,600 - $56,700 $30,898 $56,500 - $254,240 $197,245
Husman Acres Sacred Heart 16 7 0.28 - 0.39 0.35 $800 - $2,200 $1,500 $82,900 - $8,500 $83,500
Subtotal Single Family Homes 168 73
Subtotal Twin and Town Homes 0 0
Renville County Total 168 73
Source: Renville County, Maxfield Research and Consulting, LLC
TABLE FS-11
Avg Size of Lots (Acres) Avg AsssessedLot/Land Value Avg Assessed Home Value
ACTIVELY MARKETING SINGLE-FAMILY SUBDIVISIONS
RENVILLE COUNTY
MAY 2020
0.33 $20,731 $140,440
$00.00 $0
0.31 $20,731 $140,440
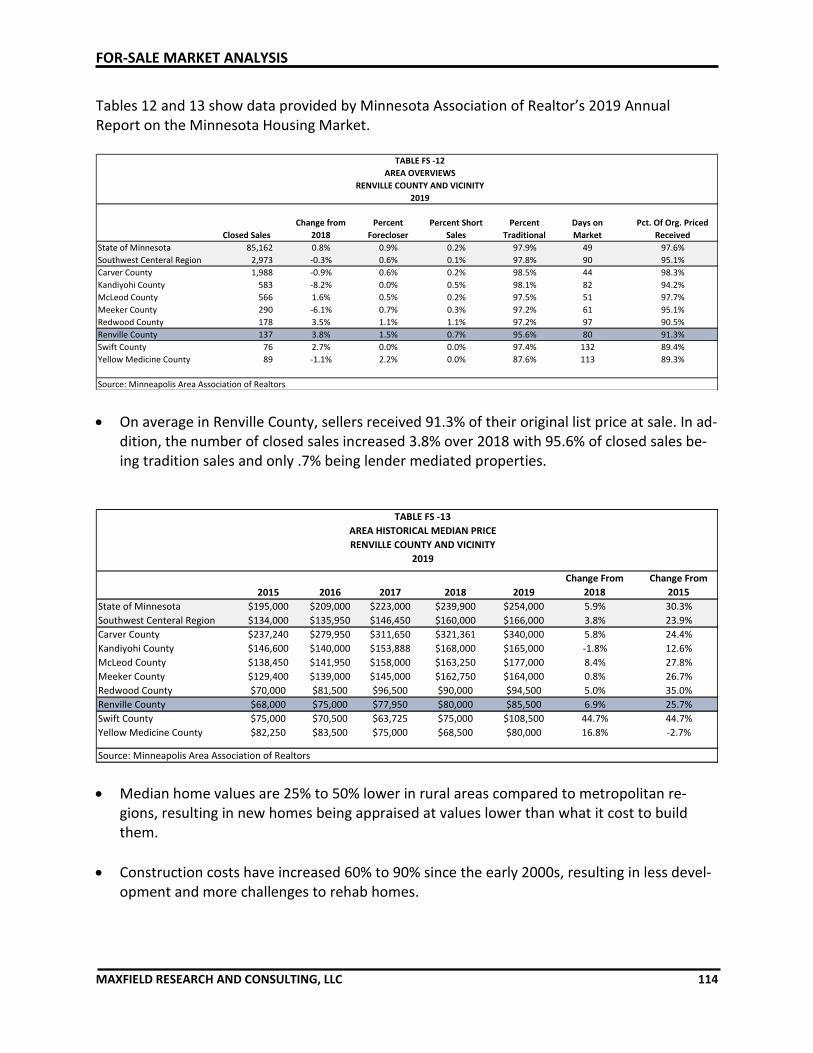
FOR-SALE MARKET ANALYSIS
MAXFIELD RESEARCH AND CONSULTING, LLC 114
Tables 12 and 13 show data provided by Minnesota Association of Realtor’s 2019 Annual Report on the Minnesota Housing Market.
• On average in Renville County, sellers received 91.3% of their original list price at sale. In ad-dition, the number of closed sales increased 3.8% over 2018 with 95.6% of closed sales be-ing tradition sales and only .7% being lender mediated properties.
• Median home values are 25% to 50% lower in rural areas compared to metropolitan re-gions, resulting in new homes being appraised at values lower than what it cost to build them.
• Construction costs have increased 60% to 90% since the early 2000s, resulting in less devel-opment and more challenges to rehab homes.
TABLE FS -12
AREA OVERVIEWS
RENVILLE COUNTY AND VICINITY
2019
Closed Sales
Change from
2018
Percent
Forecloser
Percent Short
Sales
Percent
Traditional
Days on
Market
Pct. Of Org. Priced
Received
State of Minnesota 85,162 0.8% 0.9% 0.2% 97.9% 49 97.6%
Southwest Centeral Region 2,973 -0.3% 0.6% 0.1% 97.8% 90 95.1%
Carver County 1,988 -0.9% 0.6% 0.2% 98.5% 44 98.3%
Kandiyohi County 583 -8.2% 0.0% 0.5% 98.1% 82 94.2%
McLeod County 566 1.6% 0.5% 0.2% 97.5% 51 97.7%
Meeker County 290 -6.1% 0.7% 0.3% 97.2% 61 95.1%
Redwood County 178 3.5% 1.1% 1.1% 97.2% 97 90.5%
Renville County 137 3.8% 1.5% 0.7% 95.6% 80 91.3%
Swift County 76 2.7% 0.0% 0.0% 97.4% 132 89.4%
Yellow Medicine County 89 -1.1% 2.2% 0.0% 87.6% 113 89.3%
Source: Minneapolis Area Association of Realtors
TABLE FS -13
AREA HISTORICAL MEDIAN PRICE
RENVILLE COUNTY AND VICINITY
2019
2015 2016 2017 2018 2019
Change From
2018
Change From
2015
State of Minnesota $195,000 $209,000 $223,000 $239,900 $254,000 5.9% 30.3%
Southwest Centeral Region $134,000 $135,950 $146,450 $160,000 $166,000 3.8% 23.9%
Carver County $237,240 $279,950 $311,650 $321,361 $340,000 5.8% 24.4%
Kandiyohi County $146,600 $140,000 $153,888 $168,000 $165,000 -1.8% 12.6%
McLeod County $138,450 $141,950 $158,000 $163,250 $177,000 8.4% 27.8%
Meeker County $129,400 $139,000 $145,000 $162,750 $164,000 0.8% 26.7%
Redwood County $70,000 $81,500 $96,500 $90,000 $94,500 5.0% 35.0%
Renville County $68,000 $75,000 $77,950 $80,000 $85,500 6.9% 25.7%
Swift County $75,000 $70,500 $63,725 $75,000 $108,500 44.7% 44.7%
Yellow Medicine County $82,250 $83,500 $75,000 $68,500 $80,000 16.8% -2.7%
Source: Minneapolis Area Association of Realtors

FOR-SALE MARKET ANALYSIS
MAXFIELD RESEARCH AND CONSULTING, LLC 115
Realtor/Builder/Developer Interviews Maxfield Research and Consulting interviewed real estate agents, home builders, and other professionals familiar with Renville County’s owner-occupied market to solicit their impressions of the for-sale housing market in the county. Key points are summarized by topic as follows. Please note: most of the interviews occurred after March 2020 after the COVID-19 pandemic began to disrupt the economy. Market Overview
• Despite the COVID-19 pandemic, Realtors from and working in Renville County stated the overall sentiment remains very positive. Many interviewees mentioned the real estate mar-ket has not felt the impact like other industries and there have been few purchase agree-ment cancellations.
• Realtor’s indicated the demand for homes has remained strong during the pandemic. If any-thing, the reduced supply due to potential sellers dropping off has led to weak supply and growing demand resulting in bidding wars for existing inventory.
• Supply has been low; averaging about a three- to four- month supply for the county (equi-librium is about five to six months). Supply has been low across all price points; but espe-cially for homes priced less than $150,000. Sales volumes could be higher if the number of homes for sale increased.
• The lack of supply has contributed to strong appreciation gains. Because it’s a seller’s mar-ket, most sellers are able to command sales prices near the list price. Some Realtors com-mented the supply could even tighten as seniors do not want to sell their homes and down-size due to COVID19.
• Record low interest rates have kept affordability at bay. Most Realtors believe low rates are here to stay for at least another year or more.
• Due to COVID-19, lending requirements have tightened at some banks. This could affect the housing market if lenders continue to implement higher down payment requirements and higher credit scores. Lending has tightened the most on jumbo mortgages and home equity lines of credit (HELOC).
• There is demand for a variety of housing types, particularly for affordable entry-level homes and move-up housing. There is an especially strong need for moderately priced move-up housing.

FOR-SALE MARKET ANALYSIS
MAXFIELD RESEARCH AND CONSULTING, LLC 116
• Housing affordability has been a key driver for many of the communities in Renville County. Buyers generally get more house for the dollar compared to the Twin Cities or neighboring counties.
• Renville County needs homes in the entry-level price range that are move-in ready and would qualify for FHA (Federal Housing Administration), VA (Veterans Affairs), or USDA (United States Department of Agriculture) financing. Much of the current entry-level inven-tory is need of repair and doesn’t qualify for government-backed financing programs.
• Housing costs in Renville County can generally be defined as follows: Entry-level housing priced less than $125,000; Move-up housing priced in the $150,000 to $250,000 range; and, Executive housing priced at $300,000 or higher.
• The development of “affordable” move-up housing products would likely get some house-holds out of their current homes, allowing for more turnover of existing housing units, loos-ening the tight market and creating opportunities for entry-level buyers.
Land/Lots
• Some communities in Renville County offer lots at no cost however, the buyer must pay for the cost of street assessments. In addition, if the construction doesn’t begin within the one-year time frame the lot is returned to the city. All construction must meet all R-1 zoning and other city code standards.
• Many move-up and executive buyers locate outside city limits in adjacent townships on land with acreage, topography, or water frontage. These subdivisions rely on either a private well and septic or a community system.
• Similar to housing costs, the most expensive lots typically are in the Olivia Submarket. Ren-ville and the South Submarket tend to have lower lot costs, while Olivia and Buffalo Lake/Hector Submarkets tend to trend higher.

FOR-SALE MARKET ANALYSIS
MAXFIELD RESEARCH AND CONSULTING, LLC 117
Select Single-Family & Townhome Properties – Renville County
Renville Estate Lots Renville Submarket
Single-Family Olivia Submarket
Single-Family
Buffalo Lake/Hector Submarket Single-Family
Olivia Submarket
Single-Family
Olivia Submarket Single-Family
Renville Submarket

PLANNED & PENDING HOUSING DEVELOPMENTS
MAXFIELD RESEARCH AND CONSULTING, LLC. 118
Planned and Proposed Housing Projects Maxfield Research consulted planning staff members in Renville County in order to identify housing developments under construction, planned, or pending. Table P-1 inventory and sum-marize the number of housing units by product type that are either recently completed, under construction, or are planned to move forward. This is table and the associated information is accurate to the best of our knowledge and was gather during the first quarter of 2020.
• Currently, a 15 unit (assisted living/memory care) senior housing development; to be owned by the recently formed non-profit, Island Living, LLC. At the time of this study, the USDA funding application was submitted.
• The City of Fairfax indicated there is potential possibility for the old local school to be repur-posed into potential apartment units. At the time of this study, this idea is extremely pre-liminary and has not been taken into consideration in rental demand estimates.

HOUSING AFFORDABILITY
MAXFIELD RESEARCH AND CONSULTING, LLC 119
Introduction Affordable housing is a term that has various definitions according to different people and is a product of supply and demand. According to the U.S. Department of Housing and Urban Devel-opment (HUD), the definition of affordability is for a household to pay no more than 30% of its annual income on housing (including utilities). Families who pay more than 30% of their income for housing (either rent or mortgage) are considered cost burdened and may have difficulty af-fording necessities such as food, clothing, transportation and medical care. Generally, housing that is income-restricted to households earning at or below 80% of Area Me-dian Income (AMI) is considered affordable. However, many individual properties have income restrictions set anywhere from 30% to 80% of AMI. Rent is not based on income but instead is a contract amount that is affordable to households within the specific income restriction seg-ment. Moderate-income housing, often referred to as “workforce housing,” refers to both rental and ownership housing. Hence the definition is broadly defined as housing that is in-come-restricted to households earning between 50% and 120% AMI. Figure 1 below summa-rizes income ranges by definition.
Rent and Income Limits Table HA-1 shows the maximum allowable incomes by household size to qualify for affordable housing and maximum gross rents that can be charged by bedroom size in Renville County. These incomes are published and revised annually by the Department of Housing and Urban Development (HUD) and also published separately by the Minnesota Housing Finance Agency based on the date the project was placed into service. Fair market rent is the amount needed to pay gross monthly rent at modest rental housing in a given area. This table is used as a basis for determining the payment standard amount used to calculate the maximum monthly subsidy for families at financially assisted housing.
Definition
Extremely Low Income 0% - 30%
Very Low Income 31% - 50%
Low Income 51% - 80%
Moderate Income 80% - 120%
Note: Renville County 4-person AMI = $73,300 (2020)
AMI Range
FIGURE 1AREA MEDIAN INCOME (AMI) DEFINITIONS
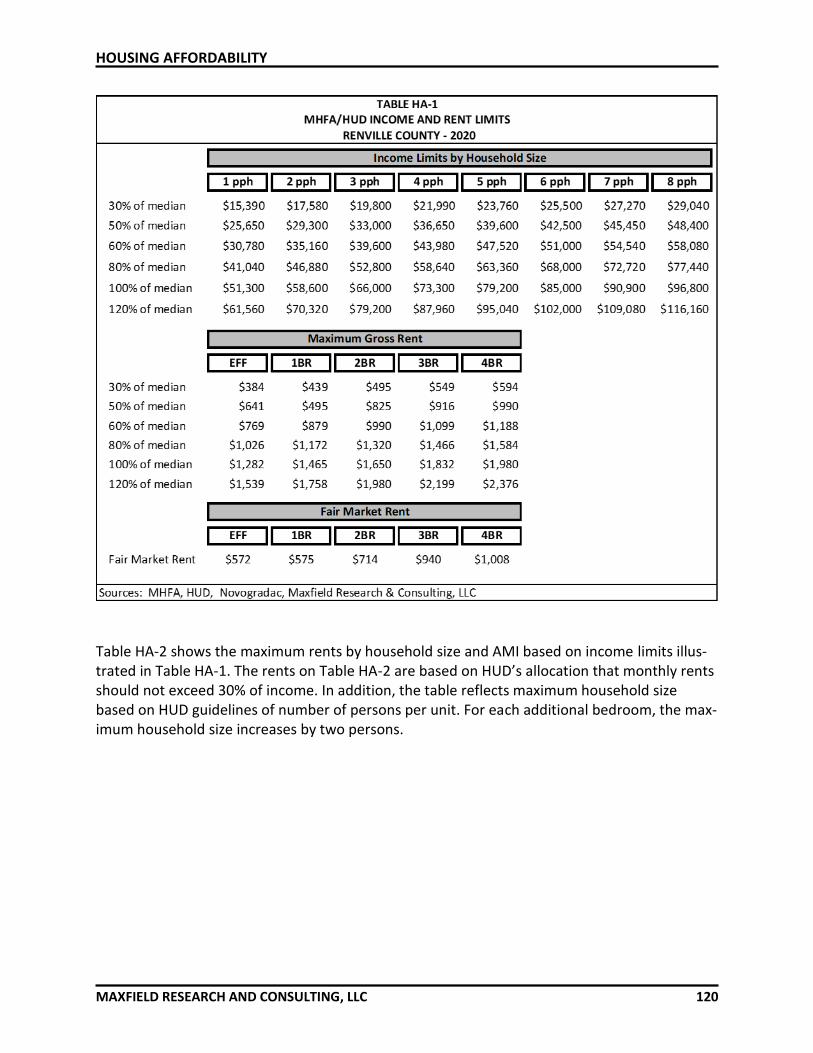
HOUSING AFFORDABILITY
MAXFIELD RESEARCH AND CONSULTING, LLC 120
Table HA-2 shows the maximum rents by household size and AMI based on income limits illus-trated in Table HA-1. The rents on Table HA-2 are based on HUD’s allocation that monthly rents should not exceed 30% of income. In addition, the table reflects maximum household size based on HUD guidelines of number of persons per unit. For each additional bedroom, the max-imum household size increases by two persons.

HOUSING AFFORDABILITY
MAXFIELD RESEARCH AND CONSULTING, LLC 121

HOUSING AFFORDABILITY
MAXFIELD RESEARCH AND CONSULTING, LLC 122
Housing Cost Burden Table HA-3 shows the number and percentage of owner and renter households in Renville County, and the four submarkets that pay 30% or more of their gross income for housing. This information was compiled from the American Community Survey 2018 estimates. This infor-mation is different than the 2000 Census which separated households that paid 35% or more in housing costs. As such, the information presented in the tables may be overstated in terms of households that may be “cost burdened.” The Federal standard for affordability is 30% of in-come for housing costs. Without a separate break out for households that pay 35% or more, there are likely a number of households that elect to pay slightly more than 30% of their gross income to select the housing that they choose. Moderately cost-burdened is defined as house-holds paying between 30% and 50% of their income to housing; while severely cost-burdened is defined as households paying more than 50% of their income for housing. Higher-income households that are cost-burdened may have the option of moving to lower priced housing, but lower-income households often do not. The figures focus on owner house-holds with incomes below $50,000 and renter households with incomes below $35,000. Key findings from Table HA-3 follow.
• In Renville County, 15% of owner households and 45.7% of renter households are consid-ered cost burdened. The South submarket recorded the highest proportion of cost bur-dened owner households, while the Buffalo Lake/Hector Submarket had the highest propor-tion of cost burdened renter households, 51.8%.
• Among owner households earning less than $50,000, 35.8% were cost burdened in Renville County. The Buffalo Lake/Hector submarket reported the highest proportion of cost bur-dened owner households earning less than $50,000, 45.9%.
• Approximately 72.2% of Renville County renter households earning less than $35,000 were cost burdened.

HOUSING AFFORDABILITY
MAXFIELD RESEARCH AND CONSULTING, LLC 123
Community No. Pct. No. Pct. No. Pct. No. Pct. No. Pct.
Owner Households
All Owner Households 1,295 1,476 705 1,019 4,944
Cost Burden 30% or greater 198 15.4% 195 13.3% 114 16.2% 734 73.4% 734 15.0%
Owner Households w/ incomes <$50,000 451 462 157 437 1,755
Cost Burden 30% or greater 154 34.8% 170 37.8% 72 45.9% 127 30.4% 610 35.8%
Renter Households
All Renter Households 256 447 244 328 1,275
Cost Burden 30% or greater 90 48.9% 183 47.3% 102 51.8% 104 37.1% 479 45.7%
Renter Households w/ incomes <$35,000 155 277 136 157 725
Cost Burden 30% or greater 89 70.1% 162 68.4% 93 80.2% 100 74.1% 444 72.2%
Median Contract Rent*
*Median Contract Rent 2018Calculations exclude households not computed.Sum of Submarkets do no equal County total due to geographies outside of the County.Sources: U.S. Census Bureau; American Community Survey; Maxfield Research & Consulting, LLC
TABLE HA-3
HOUSING COST BURDEN
RENVILLE COUNTY - 2018
$821 $845 $890
BLH Sub.
$855
Renville Sub. Olivia Sub. South Sub. Renville County
$678

HOUSING AFFORDABILITY
MAXFIELD RESEARCH AND CONSULTING, LLC 124
Housing Choice Vouchers In addition to subsidized apartments, “tenant-based” subsidies like Housing Choice Vouchers, can help lower income households afford market-rate rental housing. The tenant-based subsidy is funded by the Department of Housing and Urban Development (HUD), and is managed by the Renville Housing and Redevelopment Authority/Economic Development Authority. Under the Housing Choice Voucher program (also referred to as Section 8) qualified households are issued a voucher that the household can take to any rental housing type that has rent levels with Pay-ment Standards. The household then pays approximately 30% of their adjusted gross income for rent and utilities, and the Federal government pays the remainder of the rent to the land-lord. The maximum income limit to be eligible for a Housing Choice Voucher is 50% AMI based on household size, as shown in Table HA-1. The following are key points:
• In 2019, the Renville Housing and Redevelopment Authority/Economic Development Au-thority has 84 vouchers and a total of 23 subsidized affordable units for rental assistance.
• The Renville County HRA’s Housing Choice Voucher Program gives preference to Renville County residents, and elderly and/or disabled head of households. The estimated wait time for those on the waiting list without preference is in excess of three years.
• An additional requirement of the Section 8 program is the voucher must be used in Renville County for at least one year.
0.0%
10.0%
20.0%
30.0%
40.0%
50.0%
60.0%
70.0%
80.0%
90.0%
100.0%
Renville Sub. Olivia Sub. BLH Sub. South Sub. Renville County
Cost Burdened Households, 2018
Renter HHs <$35k Owner HHs <$50k Renter HHs Owner HHs

HOUSING AFFORDABILITY
MAXFIELD RESEARCH AND CONSULTING, LLC 125
• The following includes an age breakdown of households utilizing the Housing Choice Voucher program in 2019:
o Ages 0 to 17 – 43% o Ages 18 to 35 – 24% o Ages 36 to 54 – 20% o Ages 55 to 61 – 6% o Ages 62 and older – 7%
Housing Costs as Percentage of Household Income
Housing costs are generally considered affordable at 30% of a household adjusted gross in-come. Table HA-4 on the following page illustrates key housing metrics based on housing costs and household incomes in Renville County. The table estimates the percentage of Renville County householders that can afford rental and for-sale housing based on a 30% allocation of income to housing. Housing costs are based on the Renville County average. The housing affordability calculations assume the following: For-Sale Housing
▪ 10% down payment with good credit score ▪ Closing costs rolled into mortgage ▪ 30-year mortgage at 3% interest rate ▪ Private mortgage insurance (equity of less than 20%) ▪ Homeowners insurance for single-family homes and association dues for townhomes ▪ Owner household income per 2018 ACS
Rental Housing ▪ Background check on tenant to ensure credit history ▪ 30% allocation of income ▪ Renter household income per 2018 ACS
• The median income of all Renville County households in 2020 was about $58,269. However, the median income varies by tenure. According to the 2018 American Community Survey, the median income of a homeowner is $64,103 compared to $30,389 for renters.
• Approximately 59% of all households and 91% of owner households could afford to pur-chase an entry-level home in Renville County ($90,000). When adjusting for move-up buyers ($200,000) about 46% of all households and about 51% of owner households would income qualify.
• Roughly 88% of all households and 89% of owner households could afford to purchase an entry-level townhome/condo in Renville County ($75,000). When adjusting for move-up

HOUSING AFFORDABILITY
MAXFIELD RESEARCH AND CONSULTING, LLC 126
buyers ($150,000) about 74% of all households and 78% of owner households would in-come qualify.
• About 87% of existing renter households can afford to rent a one-bedroom unit in Renville County ($500/month). The percentage of renter income-qualified households decreases to 83% that can afford an existing three-bedroom unit ($575/month). After adjusting for new construction rental housing, the percentage of renters that are income-qualified decreases slightly. About 86% of renters can afford a new market rate one-bedroom unit while 24% can afford a new three-bedroom unit.

HOUSING AFFORDABILITY
MAXFIELD RESEARCH AND CONSULTING, LLC 127
For-Sale (Assumes 10% down payment and good credit)
Entry-Level Move-Up Executive Entry-Level Move-Up ExecutivePrice of House $90,000 $200,000 $300,000 $75,000 $150,000 $250,000Pct. Down Payment 10.0% 10.0% 10.0% 10.0% 10.0% 10.0%Total Down Payment Amt. $9,000 $20,000 $30,000 $7,500 $15,000 $25,000Estimated Closing Costs (rolled into mortgage) $2,700 $6,000 $9,000 $2,250 $4,500 $7,500Cost of Loan $83,700 $186,000 $279,000 $69,750 $139,500 $232,500
Interest Rate 3.000% 3.000% 3.000% 3.000% 3.000% 3.000%Number of Pmts. 360 360 360 360 360 360
Monthly Payment (P & I) -$353 -$784 -$1,176 -$294 -$588 -$980(plus) Prop. Tax -$75 -$167 -$250 -$63 -$125 -$208(plus) HO Insurance/Assoc. Fee for TH -$30 -$67 -$100 -$100 -$100 -$100(plus) PMI/MIP (less than 20%) -$36 -$81 -$121 -$30 -$60 -$101
Subtotal monthly costs -$494 -$1,098 -$1,647 -$487 -$874 -$1,389
Housing Costs as % of Income 30% 30% 30% 30% 30% 30%
Minimum Income Required $19,766 $43,925 $65,887 $19,472 $34,944 $55,573
Pct. of ALL Renville County HHDS who can afford1 59.4% 55.5% 41.4% 89.8% 74.2% 33.0%
No. of Renville County HHDS who can afford1 9,151 8,550 6,374 13,830 11,435 5,087
Pct. of Renville County owner HHDs who can afford2 91.9% 60.7% 46.1% 92.2% 78.2% 59.0%
No. of Renville County owner HHDs who can afford2 4,546 2,999 2,278 4,559 3,865 2,919
No. of Renville County owner HHDS who cannot afford2 398 1,945 2,666 385 1,079 2,025
Rental (Market Rate)
1BR 2BR 3BR 1BR 2BR 3BRMonthly Rent $500 $550 $575 $550 $625 $700Annual Rent $6,000 $6,600 $6,900 $6,600 $7,500 $8,400
Housing Costs as % of Income 30% 30% 30% 30% 30% 30%
Minimum Income Required $20,000 $22,000 $23,000 $22,000 $25,000 $28,000
Pct. of ALL Renville County HHDS who can afford1 87.0% 85.2% 83.8% 87.2% 82.0% 79.3%
No. of Renville County HHDS who can afford1 13,409 13,129 12,916 13,439 12,634 12,211
Pct. of Renville County renter HHDs who can afford2 65.4% 56.8% 39.0% 59.2% 38.0% 36.4%
No. of Renville County renter HHDs who can afford2 834 724 498 755 484 463
No. of Renville County renter HHDS who cannot afford2 441 551 777 520 791 812
1 Based on 2020 household income for ALL households2 Based on 2018 ACS household income by tenure (i.e. owner and renter incomes. Owner incomes = $64,103 vs. renter incomes = $30,389)Source: Maxfield Research & Consulting, LLC
Existing Rental New Rental
TABLE HA-4
Single-Family Townhome/Twinhome/Condo
RENVILLE COUNTYHOUSING AFFORDABILITY - BASED ON HOUSEHOLD INCOME

HOUSING DEMAND ANALYSIS
MAXFIELD RESEARCH AND CONSULTING, LLC 128
Introduction Previous sections of this study analyzed the existing housing supply and the growth and demo-graphic characteristics of the population and household base in Renville County. This section of the report presents our estimates of housing demand in the County from 2020 through 2030.
Demographic Profile and Housing Demand The demographic profile of a community affects housing demand and the types of housing that are needed. The housing life-cycle stages are:
1. Entry-level householders
• Often prefer to rent basic, inexpensive apartments
• Usually singles or couples in their early 20’s without children
• Will often “double-up” with roommates in apartment setting 2. First-time homebuyers and move-up renters
• Often prefer to purchase modestly priced single-family homes or rent more upscale apartments
• Usually married or cohabiting couples, in their mid-20's or 30's, some with children, but most are without children
3. Move-up homebuyers
• Typically prefer to purchase newer, larger, and therefore more expen-sive single-family homes
• Typically, families with children where householders are in their late 30's to 40's
4. Empty-nesters (persons whose children have grown and left home) and
never-nesters (persons who never have children)
• Prefer owning but will consider renting their housing
• Some will move to alternative lower-maintenance housing products
• Generally, couples in their 50's or 60's 5. Younger independent seniors
• Prefer owning but will consider renting their housing
• Will often move (at least part of the year) to retirement havens in the Sunbelt and desire to reduce their responsibilities for upkeep and maintenance
• Generally, in their late 60's or 70's

HOUSING DEMAND ANALYSIS
MAXFIELD RESEARCH AND CONSULTING, LLC 129
6. Older seniors
• May need to move out of their single-family home due to physical and/or health constraints or a desire to reduce their responsibilities for upkeep and maintenance
• Generally single females (widows) in their mid-70's or older
Demand for housing can come from several sources including household growth, changes in housing preferences, and replacement need. Household growth necessitates building new housing unless there is enough desirable vacant housing available to absorb the increase in households. Demand is also affected by shifting demographic factors such as the aging of the population, which dictates the type of housing preferred. New housing to meet replacement need is required, even in the absence of household growth, when existing units no longer meet the needs of the population and when renovation is not feasible because the structure is physi-cally or functionally obsolete. The following graphic provides greater detail of various housing types supported within each housing life cycle. Information on square footage, average bedrooms/bathrooms, and lot size is provided on the subsequent graphic.
Housing Demand Overview The previous sections of this assessment focused on demographic and economic factors driving demand for housing in Renville County. In this section, we utilize findings from the economic and demographic analysis to calculate demand for new general occupancy housing units in the County. In addition, we present housing demand for each submarket in the County. Housing markets are driven by a range of supply and demand factors that vary by location and submarket. The following pages in this section outline several of the key variables driving hous-ing demand.

HOUSING DEMAND ANALYSIS
MAXFIELD RESEARCH AND CONSULTING, LLC 130
Age Student Rental 1st-time Move-up 2nd Empty Nester/ Senior
Cohort Housing Housing Home Buyer Home Buyer Home Buyer Downsizer Housing
18-24 18 - 24
25-29
30-34
35-39
40-44
45-49
50-54
55-59
60-64
65-69
70-74
75-79
80-84
85+
Source: Maxfield Research & Consulting, LLC
DEMOGRAPHICS & HOUSING DEMAND
18-34
65-79
25-39
30-49
40-64
55-74
55+ & 65+Li
fest
yle
Ren
ters

HOUSING DEMAND ANALYSIS
MAXFIELD RESEARCH AND CONSULTING, LLC 131
Demographics Demographics are major influences that drive housing demand. Household growth and for-mations are critical (natural growth, immigration, etc.), as well as household types, size, age of householders, incomes, etc. Economy & Job Growth The economy and housing market are intertwined; the health of the housing market affects the broader economy and vice versa. Housing market growth depends on job growth (or the pro-spect of); jobs generate income growth which results in the formation of more households. Historically low unemployment rates have driven both existing home purchases and new-home
HOUSING DEMAND ANALYSIS
MAXFIELD RESEARCH AND CONSULTING, LLC 132
purchases. Lack of job growth leads to slow or diminishing household growth, which in-turn re-lates to reduced housing demand. Additionally, low income growth results in fewer move-up buyers which results in diminished housing turnover across all income brackets. Consumer Choice/Preferences A variety of factors contribute to consumer choice and preferences. Many times, a change in family status is the primary factor for a change in housing type (i.e. growing families, empty-nest families, etc.). However, housing demand is also generated from the turnover of existing households who decide to move for a range of reasons. Some households may want to move-up, downsize, change their tenure status (i.e. owner to renter or vice versa), or simply move to a new location. Supply (Existing Housing Stock) The stock of existing housing plays a crucial component in the demand for new housing. There are a variety of unique household types and styles, not all of which are desirable to today’s con-sumers. The age of the housing stock is an important component for housing demand, as com-munities with aging housing stocks have higher demand for remodeling services, replacement new construction, or new home construction as the current inventory does not provide the supply that consumers seek. Pent-up demand may also exist if supply is unavailable as householders postpone a move until new housing product becomes available. Housing Finance Household income is the fundamental measure that dictates what a householder can afford to pay for housing costs. According to the U.S. Department of Housing and Urban Development (HUD), the definition of affordability is for a household to pay no more than 30% of its annual income on housing (including utilities). Families who pay more than 30% of their income for housing (either rent or mortgage) are considered cost burdened and may have difficulty afford-ing necessities such as food, clothing, transportation and medical care. The ability of buyers to obtain mortgage financing has recently become more challenging due to COVID-19. Some lenders are requiring higher down payments and higher credit scores.

HOUSING DEMAND ANALYSIS
MAXFIELD RESEARCH AND CONSULTING, LLC 133
For-Sale Housing Market Demand Analysis Table HD-1 presents our demand calculations for general occupancy for-sale housing in Renville County between 2020 and 2030. This analysis identifies potential demand for general occu-pancy for-sale housing that is generated from both new households and turnover households. The following points summarize our findings.
• Because the 65 and older cohort is typically not a target market for new general occupancy for-sale housing, we limit the majority of demand from household growth to only those households under the age of 65 with 20% of the 65 and older cohort included. According to our projections, all the household growth in Renville County is focused in the 65 and older cohort therefore, demand from new household growth was unavailable for households un-der age 65 between 2020 and 2030.
• As of 2020, there are approximately 3,509 owner households under the age of 65 in Renville County. Based on household turnover data from the 2018 American Community Survey, we estimate that between 57% and 66% of these under-65 owner households will experience turnover between 2020 and 2030 (turnover rate varies by submarket).
• Considering the age of Renville County’s housing stock, we estimate that 10% of the house-holds turning over will desire new housing. This estimate results in demand from existing households for 224 new residential units in Renville County between 2020 and 2030.
• Total demand from household growth and existing household turnover between 2020 and 2030 equates to 338 new for-sale housing units.
• Next, we estimate that a portion of the total demand for new for-sale units in Renville County will come from people currently living outside of the four submarkets. Adding de-mand from outside Renville County to the existing demand potential, results in a total esti-mated demand for 414 for-sale housing units by 2030.

HOUSING DEMAND ANALYSIS
MAXFIELD RESEARCH AND CONSULTING, LLC 134
DEMAND FROM NEW HOUSEHOLD GROWTHHousehold growth under age 65, 2020 to 2030
(times) % propensity to own¹
(times) % propensity to own¹
DEMAND FROM EXISTING HOUSEHOLDSTotal owner households under age 65, 2020
(times) % of owner turnover 2020-2030²
Total owner households over age 65, 2020(times) % of owner turnover 2020-2030²
(times) % desiring new owner housing
TOTAL MARKET DEMANDTotal demand from new HH growth and turnover
(Plus) Demand from outside Submarket
(Equals) Total demand potential for ownership housing
Proportion Single-family vs. Multifamily3 80% 20% 80% 20% 80% 20% 80% 20% -- --
No. of Single-family vs. Multifamily3 Units 82 20 114 28 75 19 61 15 331 83
¹ Based on percent owner households under age 65 in 2010² Based on household turnover and mobility data (2018 American Community Survey, Five Year Estimates)³ Includes twinhomes, townhomes, detached townhomes, condos, etc.
Note: Demand given for each submarket may be lower or higher in any proposed/planned developments move forward.Source: Maxfield Research & Consulting LLC
Renville
Submarket
TABLE HD-1DEMAND FOR ADDITONAL FOR-SALE HOUSING
RENVILLE COUNTY ANALYSIS AREA2020 to 2030
Olivia SubmarketRenville County
Buffalo Lake/Hector
SubmarketSouth Submarket
83% 75% 78.0%0 0 0 0
76%82%0
(Equals) Demand from new household growth 28 38 113
66.0% 64.0% --891 1,051 3,509840 727
25%
94 76
87 107 33880 65
Household growth over age 65, 2020 to 20302 156 221 134 128
--
414
25 23
65.0% 57.0%
5.3% 15.8%1,377
102 142
15% 15%15%
204 482 382 309
639
88% 87% 93% 88% --
224(Equals) Demand from existing households 59 68 55 42
--
10.0% 10.0% 10.0% 10.0% --
13.6% 12.0%

HOUSING DEMAND ANALYSIS
MAXFIELD RESEARCH AND CONSULTING, LLC 135
• Based on land available, building trends, the existing housing stock, and demographic shifts (increasing older adult population), we project between 85% to 90% of the for-sale owners in Renville County will prefer traditional single-family product types while the remaining portion will prefer a maintenance-free multi-family product (i.e. twin homes, townhomes, or condominiums). This results in demand for 331 single-family units and 83 multifamily units in Renville County through 2030.
82
114
75
61
2028
19 15
0
20
40
60
80
100
120
Renville Sub. Olivia Sub. BuffaloLake/Hector
South Sub.
Un
its
For-Sale Demand by Submarket2020 - 2030
SF MF

HOUSING DEMAND ANALYSIS
MAXFIELD RESEARCH AND CONSULTING, LLC 136
Rental Housing Demand Analysis Table HD-2 presents our calculation of market rate, affordable, and subsidized general-occu-pancy rental housing demand for Renville County. This analysis identifies potential demand for rental housing that is generated from both new households and turnover households.
• According to our projections, growth in households in Renville County is expected to in-crease only in the 65 and older cohort. Because the 65 and older cohort is typically not a target market for new general-occupancy market rate rental housing, we limit demand from senior household growth to only 20% of those households over the age of 65.
• We identify the percentage of households that are likely to rent their housing based on 2010 tenure data and estimates from 2020. The propensity to rent ranges from 16% to 24% for non-senior and 15% to 27% for seniors based on the submarket. After adjusting house-hold growth by renters, there is growth of 27 renters through 2030 for renter households in Renville County.
• Secondly, we calculate demand from existing households in Renville County that could be expected to turnover between 2020 and 2030. As of 2020, there are 1,038 non-senior renter households and 1,376 senior renter households in Renville County. Based on house-hold turnover data from the 2018 American Community Survey, we estimate that between 86% and 95% of non-senior households and between 79% and 86% of senior households will experience turnover between 2020 and 2030 (turnover rate varies by submarket).
• We then estimate the percent of existing renter households turning over that would prefer to rent in a new rental development. Considering the age of the Renville County housing stock, we estimate that 15% of the households turning over in Renville County will desire new rental housing. This estimate results in demand from existing households for 178 new residential rental units between 2020 and 2030.
• Combining demand from household growth plus turnover results in total demand in Ren-ville County for 204 rental units between 2020 and 2030.

HOUSING DEMAND ANALYSIS
MAXFIELD RESEARCH AND CONSULTING, LLC 137
DEMAND FROM NEW HOUSEHOLD GROWTH
Household growth under age 65, 2020 to 2030
(times) % propensity to rent¹
(times) % propensity to rent¹
DEMAND FROM EXISTING HOUSEHOLDS
Total renter households under age 65, 2020
(times) % of renter turnover 2020-20303
Total renter households over age 65, 2020
(times) % of renter turnover 2020-20303
(times) % desiring new rental housing
TOTAL MARKET DEMAND
Total demand from new HH growth and turnover
(Plus) Demand from outside Market Area
(Equals) Total demand potential for rental housing
Percent Market Rate4
Number
Percent Affordable4
Number
Percent Subsidized4
Number
¹ Based on percent renter households in 2010 & estimates from 2020
² Based on 20% of senior households (2018 American Community Survey, Five Year Estimates)3 Based on household turnover and mobility data (2018 American Community Survey, Five Year Estimates)4 Based on the pricing of current rental product and household incomes of area renters (i.e. exludes owner incomes)
Source: Maxfield Research & Consulting, LLC
639
18% 27% 15% 21% --
Household growth over age 65, 2020 to 20302 156 221 134 128
0 0 0
16% 24% --
0
18%
0
24%
TABLE HD-2
DEMAND FOR ADDITONAL RENTAL HOUSING
RENVILLE COUNTY ANALYSIS AREA
2020 to 2030
Renville
County
Renville
Submarket
Olivia
Submarket
Buffalo Lake/Hector
Submarket
South
Submarket
309
(Equals) Demand from new household growth 6 12 274 5
91% 93% --86%
188 389 1,038192 268
95%
1,376
86% 86% 86% 79% --
(Equals) Demand from existing households 31 67 178
15%
204 482 382
45 5842 98
28 60 160
71%
32
69%
40
67% 61% --
243
7%
3
11%
6
24% 28% --
10 27 59
22%
10
21%
12
9% 11% --
4 10 24
15% 15%15% 25% --
15% 15% --15%
37 78 204
35
39 51
45

HOUSING DEMAND ANALYSIS
MAXFIELD RESEARCH AND CONSULTING, LLC 138
• Like for-sale housing, we estimate that between 15% and 25% of the total demand for new rental housing units in Renville County will come from people currently living outside of one of the four submarkets.
• Based on a review of renter household incomes and sizes and monthly rents at existing properties, we estimate that 61% to 71% of the total demand will be for market rate hous-ing. Through 2030, demand exists for 160 market rate rental units in Renville County.
• We estimate that 21% to 28% of the total demand in Renville County will be for affordable housing and 7% to 11% will be for subsidized housing. The percentage breakdown varies by submarket. Through 2030, demand exists for 59 affordable rental units and 24 subsidized rental units in Renville County.
28
60
32
40
10
27
10 124 10 3 60
10
20
30
40
50
60
70
Renville Sub. Olivia Sub. Buffalo Lake/Hector South Sub.
Rental Housing Demand by Submarket2020 - 2030
Market Rate
Affordable
Subsidized

HOUSING DEMAND ANALYSIS
MAXFIELD RESEARCH AND CONSULTING, LLC 139
Senior Housing Demand Analysis Tables HD-3 through HD-7 shows demand calculations for senior housing in Renville County by submarket from 2020 to 2030. Demand methodology employed by Maxfield Research utilizes capture and penetration rates that blend national senior housing trends with local market char-acteristics, preferences and patterns. Our demand calculations consider the following target market segments for each product types: Affordable/Subsidized Active Adult Housing: Target market based includes age 55+ older adult and senior households with incomes of $35,000 or less. Market Rate Active Adult Rental and Ownership Housing: Target market based includes age 55+ older adult and senior households with incomes of $35,000 or more and senior homeown-ers with incomes between $25,000 and $34,999. Independent Living Housing: Target market base includes age 65+ seniors who would be finan-cially able to pay for housing and service costs associated with independent living housing. In-come-ranges considered capable of paying for congregate housing are the same as for active adult housing. Assisted Living Housing: Target market base includes older seniors (age 75+) who would be fi-nancially able to pay for private pay assisted living housing (incomes of $40,000 or more and a portion of homeowners with incomes below $40,000). Memory Care Housing: Target market base includes age 65+ seniors who would be financially able to pay for housing and service costs associated with memory care housing. Income ranges considered capable of paying for memory care housing ($60,000 or more) are higher than other service levels due to the increased cost of care. Existing senior housing units are subtracted from overall demand for each product type.

HOUSING DEMAND ANALYSIS
MAXFIELD RESEARCH AND CONSULTING, LLC 140
Households age 55-64(times) % income qualified¹(times) potential capture rate
Households age 65-74(times) % income qualified¹(times) potential capture rate
Households age 75+(times) % income qualified¹(times) potential capture rate
Percent SubsidizedNumber
(minus) Existing and Pending Units2
(equals) Total Subsidized Demand
Percent Affordable²Number
(minus) Existing and Pending Units2
(equals) Total Affordable Demand
2020777 1,063 824 741 3,406
1.5% 1.5% 1.5% 1.5% --21.3% 22.6% 17.6% 25.0%
--617 771 558
TABLE HD-3DEMAND FOR SUBSIDIZED/AFFORDABLE SENIOR HOUSING
RENVILLE COUNTY 2020 to 2030
Renville Sub. Olivia Sub.Buffalo
Lake/HectorSouth Sub.
Renville
County
559 2,50522.9% 30.0% 25.7% 31.0%
--
636 731 613 620 2,601
10.0% 10.0% 10.0% 10.0% --
6.5% 8.0% 6.5% 5.0% --50.0% 52.6% 48.3% 63.0% --
(Equals) total Demand Potential 41 68 40 42
170
(plus) Demand from Outside Market Area) 10% 15% 10% 5% --
(Equals) Demand potential from Market Area Residents 37 57 36 40
191
34
19% 18% 13% 22% --
0 0 0 0 0
8 12 5 9 34
17 0 0 15 32
34 55 35 33 15681% 82% 87% 78% --
8 12 5 9
16 55 35 17 124
CONTINUED

HOUSING DEMAND ANALYSIS
MAXFIELD RESEARCH AND CONSULTING, LLC 141
Households age 55-64(times) % income qualified¹(times) potential capture rate
Households age 65-74(times) % income qualified¹(times) potential capture rate
Households age 75+(times) % income qualified¹(times) potential capture rate
Percent SubsidizedNumber
(minus) Existing and Pending Units2
(equals) Total Subsidized Demand
Percent Affordable²Number
(minus) Existing and Pending Units2
(equals) Total Affordable Demand
¹ Based on households earning $35,000 and under in 2020. Households earning $40,000 and under in 2030.² Based on household turnover and mobility data (2018 American Community Survey, Five Year Estimates)
Source: Maxfield Research & Consulting, LLC
20.5% 31.5% --706
704 815 631 749 2,898
2030655 921 740 729 3,045
1.5% 1.5% 1.5% 1.5% --15.6% 17.4% 11.8% 18.1% --
6.5% 8.0% 6.5% 5.0% --44.4% 46.8% 41.9% 58.0% --
169
(plus) Demand from Outside Market Area) 10% 15% 10% 5% --
(Equals) Demand potential from Market Area Residents 35 56 32 46
189
15% 12% 20% 27% --
(Equals) total Demand Potential 39 66 36 48
0 0 0 0 0
6 8 7 13 34
85% 88% 80% 73% --
6 8 7 35 56
17 0 0 15 32
33 58 29 35 155
3 Existing and pending units are deducted at market equilibrium (95% occupancy).
16 58 29 20 123
10.0% 10.0% 10.0% 10.0% --19.0% 25.2%
TABLE HD-3 CONT.DEMAND FOR SUBSIDIZED/AFFORDABLE SENIOR HOUSING
RENVILLE COUNTY 2020 to 2030
Renville Sub. Olivia Sub.Buffalo
Lake/HectorSouth Sub.
Renville
County
907 674 707 2,994

HOUSING DEMAND ANALYSIS
MAXFIELD RESEARCH AND CONSULTING, LLC 142
Households age 55-64(times) % income qualified¹(times) HO factor $25k-$35k
(plus) Homeowners w/incomes $25k-35k2
(times) potential capture rate(equals) demand potential
Households age 65-74(times) % income qualified¹(times) HO factor $25k-$35k
(plus) Homeowners w/incomes $25k-35k2
(times) potential capture rate(equals) demand potential
Households age 75+(times) % income qualified¹(times) HO factor $25k-$35k
(plus) Homeowners w/incomes $25k-35k2
(times) potential capture rate(equals) demand potential
Percent Owner-OccupiedNumber
(minus) Existing and Pending Units3
(equals) Total Owner-Occupied Demand
Percent Renter-OccupiedNumber
(minus) Existing and Pending Units3
(equals) Total Renter-Occupied Demand
57
(Equals) Demand potential from Market Area
771 558
10.0% 10.0% 10.0%
42.5%
61.5% 51.7% 54.4%617
28 41
636 73131.7%
70
11.7%
17.1%
1.5% 1.5% 1.5%
0
60%
67
613
6.5%
88
6.5%
7.5%
90
8
0
45
10.4%12.6%
8
19.8%
31 36 37
0 0
40%
69
41 125 121
58
5%
6.4%
24
49
5.1% 6.5%
54
40.3%
24
31.7%
1.5%
62.3% 61.7% 57.7%
53
620
10.4%
58
11 8
468.5%
6.4%
55958.9%
58
TABLE HD-4DEMAND FOR MARKET RATE ACTIVE ADULT HOUSING
RENVILLE COUNTY 2020 to 2030
Renville Sub. Olivia Sub.Buffalo
Lake/Hecto
3,406
South Sub.
7412020
777 1,063 824
Renville County
62.4%
--
281
--
0
126
29
2,600
34
0
40%
14.4%
8910.0%
--2,505
--
--
5.5%21
(plus) Demand from Outside Market Area) 10% 15% 10%
(Equals) total Demand Potential 74 103 77
60% 60% 60%
30
30
40% 40%31
041 31
41
--
376
132
115
61
45 62
CONTINUED
102
57
189--
3662 46
0 046 -21
----
214
--
264
132
315--
--

HOUSING DEMAND ANALYSIS
MAXFIELD RESEARCH AND CONSULTING, LLC 143
Households age 55-64(times) % income qualified¹(times) HO factor $30k-$40k
(plus) Homeowners w/incomes $30k-40k2
(times) potential capture rate(equals) demand potential
Households age 65-74(times) % income qualified¹(times) HO factor $30k-$40k
(plus) Homeowners w/incomes $30k-40k2
(times) potential capture rate(equals) demand potential
Households age 75+(times) % income qualified¹(times) HO factor $30k-$40k
(plus) Homeowners w/incomes $30k-40k2
(times) potential capture rate(equals) demand potential
Percent Owner-OccupiedNumber
(minus) Existing and Pending Units3
(equals) Total Owner-Occupied Demand
Percent Renter-OccupiedNumber
(minus) Existing and Pending Units3
(equals) Total Renter-Occupied Demand
Source: Maxfield Research & Consulting, LLC
-15
139
--
375
----
--
--3,045
TABLE HD-4 CONT.DEMAND FOR MARKET RATE ACTIVE ADULT HOUSING
28.0%
40% 40%
81 106
40%28
028
60%
¹ Based on households earning $35,000+ in 2020. 2030 calculations are based on households earning $40,000+ due to inflation.2 Estimated homeowners with incomes between $25,000 and $34,999 in 2020. Incomes between $30,000 and $39,999 in 2030.
0
60% 60%
60 65 46 156
40 43 30
57
142
213--
355--
10.0%509
147
10%
27.2%
127
67
74
47 27
9 6
59.7%
5.5%
16.3%
2,994
--
--
146
31
11.0%
6.7%
--
0
51.5%
1.5%16
2.4% 6.5%
1.5%8
72
707706 907 674
1.5% 1.5%
3 Existing and pending units are deducted at market equilibrium (95% occupancy).
60%60 65 46
5%70
40 142
0 00
42
100 108 76
0
57
(Equals) total Demand Potential
(plus) Demand from Outside Market Area) 10% 15%
(Equals) Demand potential from Market Area
704 631
16.0% 20.2%
90 92 69
10.0% 10.0% 10.0%44 36 35
129 130
35.2%
0
43 30
33
44.0%1.4%
815
6.5% 8.5% 6.5%38
0
122
40%
26
749
Renville CountyCounty
Olivia Sub.Buffalo
Lake/Hecto
RENVILLE COUNTY 2020 to 2030
Renville Sub. South Sub.
2030
9.9%60.2%
729655 921 740
52.0%16.2%
114
56.4%
11.7%
8
72.3% 49.0%1.9%
78.5%
59
--
2,898
--
317

HOUSING DEMAND ANALYSIS
MAXFIELD RESEARCH AND CONSULTING, LLC 144
Households age 65-74(times) % income qualified¹(times) HO factor $30k-$35k
(plus) Homeowners w/incomes $30k-35k2
(times) potential capture rate(equals) demand potential
Households age 75+(times) % income qualified¹(times) HO factor $30k-$35k
(plus) Homeowners w/incomes $30k-35k2
(times) potential capture rate(equals) demand potential
(minus) Existing and Pending Units3
(Equals) Total Independent Living Demand 95
CONTINUED
2933 15 28 18
(Equals) total Demand Potential 33 44 28 18 124
0 29 0 0
110
(plus) Demand from Outside Market Area) 10% 15% 10% 5%
(Equals) Demand potential 30 38 25 18
--
6.5% 8.5% 6.5% 5.0% --24 30 20 12 86
--
95 125 61 44
15.0% 17.1% 9.9% 7.1%
324
636 731 613 620 2,60143% 32% 40% 32% --
--6 7 5 5
1.5% 1.5% 1.5% 1.5%24
7.5% 11.7% 6.3% 5.1% --
46 90 35 29 200
2020617 771 558 559 2,50562% 52% 54% 59% --
TABLE HD-5DEMAND FOR INDEPENDENT LIVING RENTAL HOUSING
RENVILLE COUNTY ANALYSIS AREA2020 to 2030
Renville Sub. Olivia Sub.Buffalo
Lake/HectorSouth Sub.
Renville
County

HOUSING DEMAND ANALYSIS
MAXFIELD RESEARCH AND CONSULTING, LLC 145
Households age 65-74(times) % income qualified¹(times) HO factor $35k-$40k
(plus) Homeowners w/incomes $35k-40k2
(times) potential capture rate(equals) demand potential
Households age 75+(times) % income qualified¹(times) HO factor $35k-$40k
(plus) Homeowners w/incomes $35k-40k2
(times) potential capture rate(equals) demand potential
(minus) Existing and Pending Units3
(Equals) Total Independent Living Demand
Source: Maxfield Research & Consulting, LLC
¹ Based on households earning $35,000+ in 2020. 2030 calculations are based on households earning $40,000+ due to inflation.2 Estimated homeowners with incomes between $30,000 and $34,999 in 2020. Incomes between $35,000 and $39,999 in 2030.3 Existing and pending units are deducted at market equilibrium (95% occupancy).
38 17 28 22
133
0 29 0 0 29
(Equals) total Demand Potential 38 46 28 22
104
26 30 19 14 89
118
3556.5% 8.5% 6.5% 5.0%
83 130 71 70--
44%
(plus) Demand from Outside Market Area) 10% 15% 10% 5% --
(Equals) Demand potential 34 39 25 20
28% 35% 27% --11.8% 16.0% 11.3% 9.4% --
30
704 815 631 749
9 8 6 7
2,898
66 106 40 83 2961.5% 1.5% 1.5% 1.5% --
72% 49% 52% 53% --9.3% 11.7% 6.0% 11.8% --
2030706 907 674 707
2020 to 2030
Renville Sub. Olivia Sub.Buffalo
Lake/HectorSouth Sub.
Renville
County
2,994
TABLE HD-5 CONT.DEMAND FOR INDEPENDENT LIVING RENTAL HOUSING
RENVILLE COUNTY ANALYSIS AREA

HOUSING DEMAND ANALYSIS
MAXFIELD RESEARCH AND CONSULTING, LLC 146
People age 75-79(times) % needing assistance¹
People age 80-84(times) % needing assistance¹
People age 85+(times) % needing assistance¹
(times) Percent Income-Qualified²(times) Percent Living Alone(plus) Proportion of demand from couples (12%)3
(equals) Total Age-Income Qualified market needing assistance
(times) Potential penetration rate4
(minus) Existing and Pending Units5
(Equals) Total Assisted Living Demand 0 5 0 19 24
CONTINUED
(Equals) total Demand Potential 26 24 15 19 84
34 19 43 0 96
40% 40% 40% 40% --
76
(plus) Demand from Outside Market Area) 10% 15% 10% 5% --
(Equals) Demand potential from Market Area Residents 23 20 14 18
61.5% 57.4% 52.3% 53.6% --23
59 50 35 467 6 4 5
189
(Equals) Number needing assistance 135 170 144 135 584
62.1% 45.5% 40.4% 55.5% --
33.6% 33.6% 33.6% 33.6% --
55851.6% 51.6% 51.6% 51.6%
125 160 142 131--
25.5% 25.5% 25.5% 25.5% --
98 121 98 94 411
6182020
147 182 147 142
TABLE HD-6DEMAND FOR ASSISTED LIVING RENTAL HOUSING
RENVILLE COUNTY 2020 to 2030
Renville Sub. Olivia Sub.Buffalo
Lake/HectorSouth Sub.
Renville
County

HOUSING DEMAND ANALYSIS
MAXFIELD RESEARCH AND CONSULTING, LLC 147
People age 75-79(times) % needing assistance¹
People age 80-84(times) % needing assistance¹
People age 85+(times) % needing assistance¹
(times) Percent Income-Qualified²(times) Percent Living Alone(plus) Proportion of demand from couples (12%)3
(equals) Total Age-Income Qualified market needing assistance(times) Potential penetration rate4
(minus) Existing and Pending Units5
(Equals) Total Assisted Living Demand
Source: Maxfield Research & Consulting, LLC
22
¹ The percentage of seniors unable to perform or having difficulting with ADLs, based on the publication Health, United States, 1999 Health and Aging Chartbook,
conducted by the Centers for Disease Control and Prevention and the National Center for Health Statistics.
² Includes households with incomes of $40,000 or more (who could afford monthly rents of $3,000+ per month) plus 40% of the estimated owner households with
incomes below $40,000 (who will spend down assets, including home-equity, in order to live in assisted living housing).
³ The 2009 Overview of Assisted Living (a collaborative project of AAHSA, ASHA, ALFA, NCAL & NIC) found that 12% of assisted living residents are couples.
4 We estimate that 60% of the qualified market needing assistance with ADLs could either remain in their homes or reside at less advanced senior housing with the
assistance of a family member or home health care, or would need greater care provided in a skilled care facility.5 Existing and pending units at 93% occupancy.
0 15 0 7
(Equals) total Demand Potential 23 33 16 7 79
34 19 43 0 96
70
(plus) Demand from Outside Market Area) 10% 15% 10% 5% --
(Equals) Demand potential from Market Area Residents 21 28 14 7
6 8 4 2 21176
40% 40% 40% 40%52 71 36 17
--
53.2% 59.5% 41.5% 19.5% --61.5% 57.4% 52.3% 53.6% --
118 150 132 126 526--
(Equals) Number needing assistance 139 182 146 144
51.6% 51.6% 51.6% 51.6%
611
98 146 109 110 46333.6% 33.6% 33.6% 33.6% --
2030176 219 163 165 723
25.5% 25.5% 25.5% 25.5% --
DEMAND FOR ASSISTED LIVING RENTAL HOUSINGRENVILLE COUNTY
2020 to 2030
Renville Sub. Olivia Sub.Buffalo
Lake/HectorSouth Sub.
Renville
County
TABLE HD-6 CONT.

HOUSING DEMAND ANALYSIS
MAXFIELD RESEARCH AND CONSULTING, LLC 148
People age 65-74(times) Dementia incident rate¹
People age 75-84(times) Dementia incident rate¹
People age 85+(times) Dementia incident rate¹
(times) Percent Income-Qualified²(times) Potential penetration rate
(Equals) Demand potential from Market Area
(minus) Existing and Pending Units3
(Equals) Total Memory Care Demand 46
CONTINUED
6
12 17 8 9
(Equals) total Demand Potential 12 17 14 9 52
0 0 6 0
25.0% 25.0% 25.0% 25.0% --
46
(plus) Demand from Outside Market Area) 10% 15% 10% 5%
11 15 12 8
--
(Equals) Total senior population with dementia 95 120 99 94 408
45.5% 48.8% 49.0% 35.9% --
17.0% 17.0% 17.0% 17.0% --
55832.0% 32.0% 32.0% 32.0%
125 160 142 131--
3.0% --
246 304 245 237 1,032
TABLE HD-7DEMAND FOR MEMORY CARE RENTAL HOUSING
RENVILLE COUNTY2020 to 2030
Renville Sub. Olivia Sub.Buffalo
Lake/HectorSouth Sub.
Renville
County
2020446 566 408 386 1,806
3.0% 3.0% 3.0%
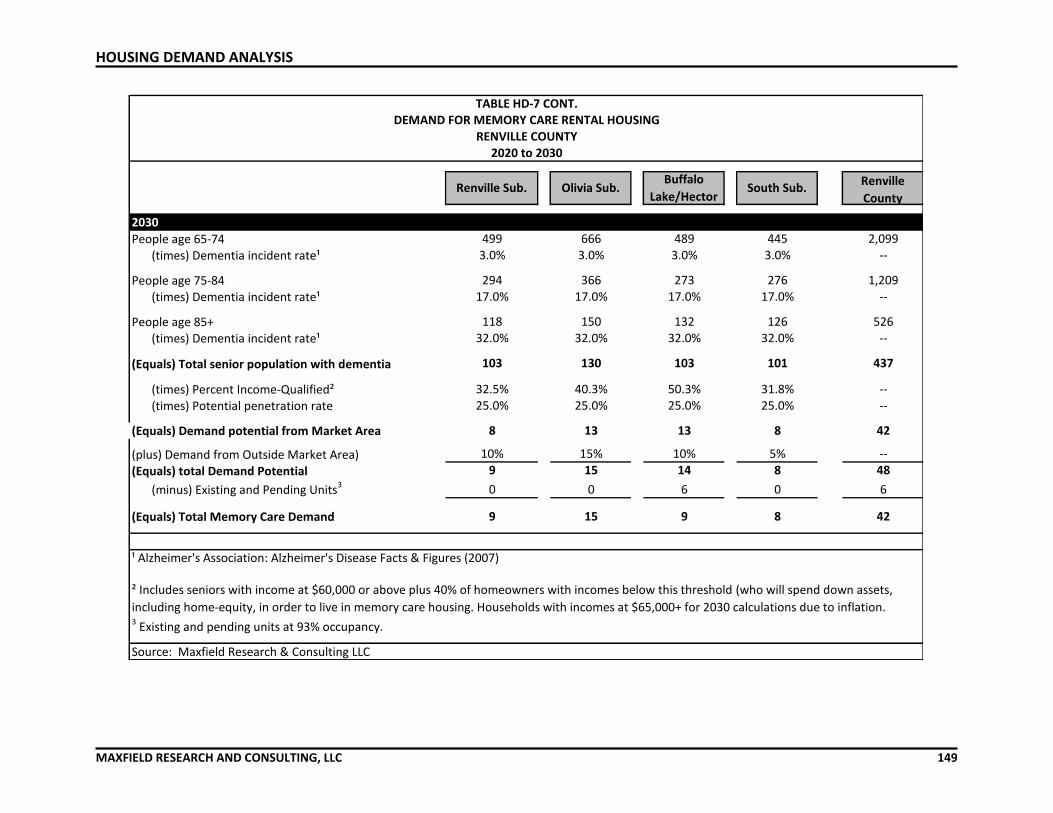
HOUSING DEMAND ANALYSIS
MAXFIELD RESEARCH AND CONSULTING, LLC 149
People age 65-74(times) Dementia incident rate¹
People age 75-84(times) Dementia incident rate¹
People age 85+(times) Dementia incident rate¹
(times) Percent Income-Qualified²(times) Potential penetration rate
(Equals) Demand potential from Market Area
(minus) Existing and Pending Units3
(Equals) Total Memory Care Demand
Source: Maxfield Research & Consulting LLC
² Includes seniors with income at $60,000 or above plus 40% of homeowners with incomes below this threshold (who will spend down assets,
including home-equity, in order to live in memory care housing. Households with incomes at $65,000+ for 2030 calculations due to inflation.3 Existing and pending units at 93% occupancy.
6
9 15 9 8
0 0 6 0
42
(Equals) total Demand Potential 9 15 14 8
¹ Alzheimer's Association: Alzheimer's Disease Facts & Figures (2007)
48
25.0% 25.0% 25.0% 25.0% --
42
(plus) Demand from Outside Market Area) 10% 15% 10% 5%
8 13 13 8
--
(Equals) Total senior population with dementia 103 130 103 101 437
32.5% 40.3% 50.3% 31.8% --
17.0% 17.0% 17.0% 17.0% --
52632.0% 32.0% 32.0% 32.0%
118 150 132 126--
3.0% 3.0% 3.0% 3.0% --
294 366 273 276 1,209
Renville
County
2030499 666 489 445
Renville Sub. Olivia Sub.Buffalo
Lake/HectorSouth Sub.
2,099
TABLE HD-7 CONT.DEMAND FOR MEMORY CARE RENTAL HOUSING
RENVILLE COUNTY2020 to 2030

HOUSING DEMAND ANALYSIS
MAXFIELD RESEARCH AND CONSULTING, LLC 150
Renville County Demand Summary The housing demand calculations in Tables HD-1 through HD-7 indicate that between 2020 and 2030, 414 for-sale housing units, 242 general occupancy rental units, and 769 total senior units will be needed in Renville County to satisfy the housing demand for current and future residents. Summary demand tables for general occupancy and senior housing are broken down by submarket in Tables HD-8 and HD-9.
Table R-1 showed that there is a 4% vacancy rate in the general-occupancy rental market. There are few newer apartment products in Renville County and the existing rental stock is older and lacks features and amenties today’s renters seek. With a strong rental market, we find that new rental units should be added in the short-term to satisfy potential household growth and accommodate employees working at local businesses. We found demand for 212 general-occupancy rental units in Renville County through 2030, 58% are market rate units.
0 50 100 150 200 250 300 350 400
FS - SF
FS - MF
Rental - MR
Rental - Aff
Rental - Subs.
Senior - Subs.
Senior - Aff.
Senior - MR…
Senior - MR…
IL
AL
MC
Renville County Analysis Area Housing Demand by Type2020-2030
Renville
Olivia
BuffaloLake/Hector
South

HOUSING DEMAND ANALYSIS
MAXFIELD RESEARCH AND CONSULTING, LLC 151
331
83
242
732
0 100 200 300 400 500 600 700 800
For-Sale SF
For-Sale MF
GO Rental Total
Senior Total
Renville County Demand By Type2020-2030
331
83
160
59
24
0 50 100 150 200 250 300 350
For-Sale SF
For-Sale MF
GO MR
GO AFF
GO SUB
General-Occupancy Demand by Type: 2020-2030

HOUSING DEMAND ANALYSIS
MAXFIELD RESEARCH AND CONSULTING, LLC 152
Submarket Single-family Multifamily Total
Market
Rate Affordable Subsidized Total
Renville 82 20 102 28 10 4 42
Olivia 114 28 142 60 27 10 97
Buffalo Lake/Hector 75 19 94 32 10 3 44
South 61 15 76 40 12 6 59
Renville County 331 83 414 160 59 24 242
Sources: Maxfield Research & Consulting, LLC
RENTALFOR-SALE
TABLE HD-8
2020 to 2030
GENERAL OCCUPANCY EXCESS DEMAND SUMMARY
RENVILLE COUNTY
2020 to 2030

HOUSING DEMAND ANALYSIS
MAXFIELD RESEARCH AND CONSULTING, LLC 153
Submarket
Renville 8 16 30 45 99 33 0 12 46
Olivia 12 55 41 62 171 15 5 17 38
Buffalo Lake/Hector 5 35 31 46 116 28 0 8 36
South 9 17 0 0 27 18 19 9 47
Renville County 34 124 102 153 412 95 24 46 165
Submarket
Renville 6 16 40 60 122 38 0 9 47
Olivia 8 58 43 65 173 17 15 15 47
Buffalo Lake/Hector 7 29 30 46 112 28 0 9 36
South 35 81 40 0 156 22 7 8 37
Renville County 56 184 154 171 564 104 22 42 168
Sources: Maxfield Research & Consulting, LLC
2030
Affordable
Rental
SERVICE-ENHANCED**
MR Owner
ACTIVE ADULT
TABLE HD-9
SENIOR HOUSING EXCESS DEMAND SUMMARY
RENVILLE COUNTY
2020 to 2030
MR Owner Memory Care
Assisted
Living
Affordable
Rental MR Rental
ACTIVE ADULT
2020SERVICE-ENHANCED**
TotalTotal
Independent
Living
Subsidized
Rental
** Service-enhanced demand is calculated for private pay seniors only; additional demand could be captured if Elderly Waiver and other sources of non-private
payment sources are permitted.
Independent
Living
Assisted
LivingTotal
Subsidized
Rental MR Rental Memory Care Total

HOUSING DEMAND ANALYSIS
MAXFIELD RESEARCH AND CONSULTING, LLC 154
Renville County Analysis Area – Demand by Type, 2020 – 2030
Note: Demand calculations are rounded to the nearest whole number.

RECOMMENDATIONS AND CONCLUSIONS
MAXFIELD RESEARCH AND CONSULTING, LLC 155
Introduction Based on the finding of our analysis and demand calculations, Tables HD-8 and HD-9 provides a summary of housing demand county and submarket through 2030. Demand exists in Renville County for a variety of product types. The following section summarizes housing concepts and housing types that will be demanded from various target markets. It is important to note that not all housing types will be supportable in all communities and that the demand illustrated in Tables HD-8 and HD-9 may not directly coincide with housing development due to a variety of factors (i.e. economies of scale, infrastructure capacity, land availability, etc.).
Renville County Projected General Occupancy Demand, 2020 – 2030
Renville County Projected Senior Demand, 2020 – 2030
General Occupancy
656
For-Sale414
SF331
Multifamily83
Rental656
MR160
Affordable59
Subs.25

RECOMMENDATIONS AND CONCLUSIONS
MAXFIELD RESEARCH AND CONSULTING, LLC 156
Recommended Housing Product Types Owner Occupied Single-Family Housing
Table HD-1 identified demand for just over 330 single-family housing units in Renville County through 2030. Table FS-11 summarized the vacant lot supply and indicated there are not enough vacant developed lots to meet the future long-term demand. The lot supply benchmark for growing communities is a three- to five-year lot supply, which en-sures adequate consumer choice without excessively prolonging developer-carrying costs. Given the number of existing platted lots in Renville County and the number of homes con-structed annually, the current lot supply should be adequate in the next few years for all com-munities. However, the longer-term lot supply will not meet the expected demand for many communities past 2025. Therefore, new platted lots will be needed to accommodate demand over this decade. Although there are scattered, infill lots in all of the Renville County Submar-kets, many of these lots are undesirable to today’s buyers (i.e. larger lot sizes, locations prefer-ences, etc.) The Olivia submarket has a 1.4-year supply based on the historic and projected building activity; hence this submarket will require newly platted lots sooner than other submarkets. There is a need for a wide-variety of lot sizes in the county and many buyers are attracted to Renville County for the larger-sized lots and acreages. Some communities in Renville County offer lots at no cost however, the buyer must pay for the cost of street assessments. In addition, if the construction doesn’t begin within the one-year time frame the lot is returned to the city. All construction must meet all R-1 zoning and other city code standards. Based on sales activity, home-buying demand in Renville County is strongest for homes below $150,000, but it is difficult to build new for-sale housing in that price range. One way to pro-vide entry-level for-sale housing is to generate household turnover by increasing the supply of move-up and executive housing. A move-up buyer is typically one who is selling one house and purchasing another one, usually a larger and more expensive home. The move is typically desired because of a lifestyle change, such as a new job or a growing family. The 45 to 54 and 35 to 44 age groups are target markets for move-up and executive housing.

RECOMMENDATIONS AND CONCLUSIONS
MAXFIELD RESEARCH AND CONSULTING, LLC 157
For-Sale Multifamily Housing While there is a limited supply of multifamily housing in Renville County, multifamily housing products can be an option for buyers looking for a starter home and households seeking to downsize or don’t want the responsibilities of upkeep and maintenance. As such, we estimate that 20% of the demand for new for-sale housing in the county will be multifamily units and we recommend that most for-sale multifamily units be targeted toward buyers at all price points and life stages (i.e. younger couples with or w/o kids, singles, older adults, etc.) While empty-nesters and independent seniors are, in growing numbers, seeking more flexible living arrangements, development of these types of housing units dropped off considerably dur-ing the recession. As market pressures for these products increase, it is likely that more build-ers will see an opportunity to satisfy a portion of this demand. Product types such as town-homes, detached townhomes, patio homes or villas, and twin homes fit into this category. We do not recommend a condominium component due to difficulty financing and hurdles that exist in the building code related to condominium construction. In addition to empty nesters and young seniors (65 to 74 years) who are the primary target market for twin homes and detached villas, mid-age professionals, particularly singles and cou-ples without children, will seek townhomes if they prefer not to have the maintenance respon-sibilities of a single-family home. In some housing markets, younger households also find pur-chasing an owned row home or townhome to be more affordable than purchasing a new single-family home. There is a limited supply of association-maintained housing options for sale, and there may be pent-up demand for new multifamily units in Renville County. Based on changing demographics over the next ten years and a growing demand for alternative housing products, demand was calculated for 83 new multifamily for-sale units in Renville County to 2030. Given the aging of the population and the high growth rate in the age 55+ population (especially 65-74 age cohorts), Renville County would benefit from a more diverse owner-occupied housing stock. These attached units could be developed as twin homes, detached townhomes or villas, town-homes/row homes, or any combination thereof. Because the primary target market is empty-nesters and young seniors, the majority of townhomes should be single-level, or at least have a master suite on the main level if a unit has two stories. The following provides greater detail into townhome and twin home-style housing.
• Twin homes– By definition, a townhome is two units with a shared wall with each owner owning half of the lot. Some single-level living units are designed in three-, four-, or even six-unit buildings in a variety of configurations, but these are less usual. Traditionally most twin home developments have been designed with the garage being the prominent feature of the home; Today’s newer twin homes have much more architectural detail. Many higher end twin home developments feature designs where one garage faces the street and the
RECOMMENDATIONS AND CONCLUSIONS
MAXFIELD RESEARCH AND CONSULTING, LLC 158
other to the side yard. This design helps reduce the prominence of the garage domination with two separate entrances.
Housing products designed to meet the needs of aging residents, many of whom desire to
stay in their current community if housing is available to meet their needs, will be needed into the foreseeable future. Twin homes are also a preferred for-sale product by builders in today’s market as units can be developed as demand warrants. Because twin homes bring higher density and economies of scale to the construction process, the price point can be lower than stand-alone single-family homes but are usually more expensive than rowhomes which are built in multi-unit buildings (4, 6, or 8-unit structures).
Twin homes are expected to be in demand for quite some time as older adults and seniors
will move to this housing product with substantial equity in their existing single-family home and will be willing to purchase a maintenance-free home that is priced similar to their exist-ing single-family home. Move-up townhomes are becoming popular in many mid-size and smaller size communities in the Upper Midwest.
• Detached Townhomes/Villas – A recent modern alternative to the twin home is the single-level villa product and/or rambler. This product also appeals mainly to baby boomers and empty nesters seeking a product similar to a single-family home on a smaller scale while re-ceiving the benefits of maintenance-free living. Units are often designed with a walk-out or lookout lower level if the topography warrants. We recommend lot widths ranging from 45 to 55 feet with main level living areas between 1,600 and 1,800 square feet.
The main level living area usually features a master bedroom, great room, dining room,
kitchen, and laundry room while offering a “flex room” that could be another bedroom, of-fice, media room, or exercise room. Owners should also be able to purchase the home with the option to finish the lower level (i.e. additional bedrooms, game room, storage, den/study, etc.) and some owners may want a slab-on-grade product for affordability rea-sons. Finally, builders could also provide the option to build a two-story detached product that could be mixed with the single-level villa product.
Pricing for a detached townhome/villa is traditionally more expensive than twin homes due
to larger lot sizes. Villa-style homes may often be priced equal to single-family homes in some communities where buyers prefer the lifestyle of the villa rather than a single-family home, but do not want to reduce the in-unit amenities.

RECOMMENDATIONS AND CONCLUSIONS
MAXFIELD RESEARCH AND CONSULTING, LLC 159
Renville County Median Sale Price by Submarket

RECOMMENDATIONS AND CONCLUSIONS
MAXFIELD RESEARCH AND CONSULTING, LLC 160
• Side-by-Side and Back-to-Back Townhomes – This product is designed with three or four or more separate living units in one building and can be built in a variety of configurations. With the relative affordability of these units and multi-level living, side-by-side and back-to-back townhomes have the greatest appeal among entry-level households without children, young families and singles and/or roommates across the age span. Two-story townhomes would also be attractive to middle-market, move-up, and empty-nester buyers. Many of these buyers want to downsize from a single-family home into maintenance-free housing; empty-nester and young senior households often have substantial equity from the sale of their single-family homes to dedicate toward the purchase of a new residence.
In general, side-by-side townhomes were slow to recover from the recession in terms of pricing. Many townhome developments throughout the Upper Midwest had a substantial portion of foreclosures and were, therefore, attractive for real estate investors who purchase the units and then rented them out. New construction townhomes could be considered as a viable owner-occupied product, but we recommend an initial focus on twin homes or one-level villas for the empty-nester and young senior market segment. General Occupancy Rental Housing Maxfield Research and Consulting calculated demand for over 240 general-occupancy rental units in Renville County through 2030 (160 market rate, 59 affordable, and 25 subsidized units). Over 40% of demand in the county was in the Olivia submarket (97 units). Deep-subsidy pro-jects are no longer being built as available funding is very limited from the federal government. Rural Development 515 projects would typically have rental assistance to support very low-in-come households. Our review of market conditions indicates that the general occupancy rental housing market is performing well in Renville County with vacancy rates below equilibrium. The equilibrium va-cancy rate for rental housing is considered to be 5.0%, which allows for normal turnover and an adequate supply of alternatives for prospective renters. The inventory of rental properties in the PMA was 3.2% vacant as of May 2020, including a 2.6% vacancy rate among the affordable/subsidized properties and a 4% vacancy rate in the market rate properties. Many renter households seek newer rental housing with modern features and amenities (i.e. central air conditioning, garage parking, stainless steel kitchen appliances, solid-surface coun-tertops, high ceilings, walk-in closets, in-unit laundry). Because of the older age of the rental housing stock in Renville County, modern features and amenities are not being offered at many properties, curbing demand from many potential renters. Additionally, there continues to be more lifestyle renters today, those with busy professional lives and people who prefer to spend their free time in leisure pursuits rather than on upkeep and maintenance of a home.

RECOMMENDATIONS AND CONCLUSIONS
MAXFIELD RESEARCH AND CONSULTING, LLC 161
The strongest sources of demand for new rental housing will likely be young singles or couples without children in their late-20s to early-30s who work in Renville County, or other nearby communities. Mid-age households (never-nesters or empty-nesters) could also account for a portion of demand for new rental housing. These households tend to have higher incomes and desire rental housing with modern features and higher finish levels. A rental townhome devel-opment could attract family households as well as empty-nesters, and shallow-subsidy rental housing will draw from a wide variety of population segments, including low-wage workers, sin-gle-parent households, and low-income family households. The development of new general occupancy rental housing could benefit residents of Renville County by increasing the variety of housing in the community and providing housing opportuni-ties for a market that currently has limited options available. Project recommendations are as followed:
• Market Rate Rental – We recommend a small middle- to upper-middle market rental pro-ject with 24 to 30 units that could attract a diverse resident profile; including young singles and couples across all ages. To appeal to a wide target market, we suggest a project with a mix of one- and two-bedroom units. One-bedroom units would target singles and couples while the larger two-bedrooms would target a larger renter profile from couples, families with children and empty-nesters downsizing from a single-family home. Within Renville County, we recommend pursuing new market rate rental housing in Olivia as the highest priority. Monthly rents (in 2020 dollars) should average from $650 for a one-bedroom unit to $750 for a two-bedroom unit. Average market rate rents in Renville are approximately $0.61 per square foot, however monthly rents in a new construction project should range from about $1.05 to $1.25 per square foot, depending on unit type, to be financially feasible. Monthly rents can be trended up by 2.0% annually prior to occupancy to account for inflation de-pending on overall market conditions. Because of construction and development costs, it may be difficult for a market rate apart-ment to be financially feasible with rents lower than the suggested per square foot price. Thus, for this type of project to become a reality, there may need to be a public – private partnership to reduce development costs and bring down the rents or the developer will need to provide smaller unit sizes. New market rate rental units should be designed with contemporary amenities that include open floor plans, higher ceilings, in-unit washer and dryer, full kitchen appliance package, central air-conditioning, garage parking, and outdoor recreation (fire pit, grilling area, etc.)

RECOMMENDATIONS AND CONCLUSIONS
MAXFIELD RESEARCH AND CONSULTING, LLC 162
• Market Rate General Occupancy Rental Townhomes– We believe that demand exists for rental townhome units for empty-nesters and families, including those families who are new to the community and want to rent until they find a home for purchase. In addition, townhomes are popular for younger professionals and couples.
As an alternative to an apartment-style building, we recommend a 14 to 16-unit project
with rents of approximately $1,000 for two-bedroom units to $1,200 for three-bedroom units. Units should be larger than in an apartment development and feature contemporary amenities (i.e. in-unit washer/dryer, appliances, kitchen island, high ceilings, etc.), an at-tached two car garage, and the development should provide some open/green space.
Rental townhomes are the most feasible rental product to develop as they have a broad ap-
peal to many demographic cohorts, and they can be developed in phases and delivered as demand warrants. Therefore, rental townhomes are the preferred product for most com-munities in Renville County.
• Affordable General Occupancy Multifamily Housing– We estimate that demand exists for a total of about 60 shallow-subsidy units in Renville County. Affordable housing attracts households that cannot afford market rate housing units but do not income-qualify for deep-subsidy housing. Affordable projects attract a broad group of tenants based on the unit type. One-bedroom units target singles and couples, whereas two and three-bedroom units target families. Some retired seniors would also be attracted to an affordable con-cept. Although there is an older supply of apartment units in Renville County that indirectly serves as affordable housing, we recommend a shallow-subsidy concept that would target residents in greater need. Similar to market rate rental housing; the affordable townhome concept would be well-received; especially for families with children.
• Deep-Subsidy Rental Housing– Subsidized housing receives financial assistance (i.e. operat-ing subsidies, rent payments, etc.) from governmental agencies in order to make the rent affordable to low-to-moderate income households. Although we find demand for 25 deep-subsidy rental housing units through 2030, this hous-ing is very difficult to develop financially. A new subsidized or public housing development would have pent-up demand and draw from outside of Renville County as well. But since this housing is challenging to develop, an alternative to a multifamily structure is to acquire single-site housing structures to meet a portion of this demand.
Through the Section 811 Supportive Housing for Persons with Disabilities program, HUD
provides funding to develop and subsidize rental housing with support services available for very low- and extremely low-income adults with disabilities. A Section 811 deep-subsidy project in Renville County would meet a need by providing housing for this special needs population.

RECOMMENDATIONS AND CONCLUSIONS
MAXFIELD RESEARCH AND CONSULTING, LLC 163
We believe the addition of the rental developments suggested above will provide greater hous-ing choices and will continue to serve the needs of households that live and/or currently work in Renville County. Senior Housing As illustrated in Table HD-9, demand exists for all service levels of senior housing in Renville County this decade making up 732 units of the housing units recommended. However, demand is highest in the short-term for more active adult and independent living products (both market rate and affordable). Demand is lower for assisted living and memory care due in-part to the existing senior developments that are serving these markets already. Development of additional senior housing is recommended in order to provide housing oppor-tunity to these aging residents in their stages of later life. The development of additional senior housing serves a two-fold purpose in meeting the housing needs in Renville County: older adult and senior residents are able to relocate to new age-restricted housing in Renville County, and existing homes and rental units that were occupied by seniors become available to other new households. Hence, development of additional senior housing does not mean the housing needs of younger households are neglected; it simply means that a greater percentage of hous-ing need is satisfied by housing unit turnover. The types of housing products needed to accom-modate the aging population base are discussed individually in the following section.
• Active Adult Senior Cooperative –Maxfield Research projected demand for about 154 active adult ownership units through 2030. Because demand is spread across three of the four submarkets, a new for-sale senior development could likely only be constructed in those submarkets with the highest demand as the project would attract residents from other neighboring communities. Maxfield Research recommends a cooperative development with a mix of two- and three-bedroom units with share costs starting around $55,000. The cooperative model, in particular, appeals to a larger base of potential residents in that it has characteristics of both rental and ownership housing. Cooperative developments allow
Senior Housing
732
Active Adult564
Subsidized
56
Affordable
184
Owner
154
Rental
171
Service-Enhanced
168
IL
104
AL
22
MC
42
2030 Senior Demand
RECOMMENDATIONS AND CONCLUSIONS
MAXFIELD RESEARCH AND CONSULTING, LLC 164
prospective residents an ownership option and homestead tax benefits without a substan-tial upfront investment as would be true in a condominium development or life care op-tion.
• Active Adult Rental – Because of the limited number of active adult product in Renville County and strong senior demographics, demand was calculated for over 171 active adult rentals in Renville County through 2030. Demand was spread across all four submarkets, but new active adult product shows the highest need in the Olivia, Renville, and Buffalo Lake/Hector submarkets. Because active adult senior housing is not need-driven, the demand for this product type competes to some degree with general-occupancy rental housing projects. Maxfield Re-search finds many of the existing rental buildings have an older demographic that may be attracted to an age-restricted building if more product was available. Monthly rents should be similar to other newer, market rate general-occupancy apartment buildings.
• Affordable and Subsidized Rental – Renville County demand for affordable and subsidized senior housing for over 240 units through 2030. Affordable senior housing products can also be incorporated into a mixed income building which may increase the projects finan-cial feasibility. Affordable senior housing will likely be a low-income tax credit project through the Minnesota Housing Finance Agency. Affordable housing demand is strong in all four submarkets with the Olivia Submarket having the strongest demand. Financing subsidized senior housing is difficult as federal funds have been shrinking. Therefore, a new subsidized development would likely rely on a number of funding sources; from low-income tax credits (LIHTC), tax-exempt bonds, Section 202 program, USDA 515 program, among others.
• Independent Living/Congregate – Demand was calculated for about 104 congregate units through 2030 in Renville County. Demand is strong across most submarkets; however, the Renville Submarket has the highest demand for independent senior housing. We recom-mend new congregate projects have a mix of one-bedroom, one-bedroom plus den, and two-bedroom units. In addition, meals and other support and personal care services will be available to congre-gate residents on a fee-for-service basis, such as laundry, housekeeping, etc. When their care needs increase, residents also have the option of receiving assisted living packages in their existing units. Due to economies of scale needed for congregate housing, other service levels may have to be combined to the project to increase density to be financially feasible. Alternatively, the concept called “Catered Living” may be viable as it combines independent and assisted liv-ing residents and allows them to age in place in their unit versus moving to a separate as-sisted living facility. (See the following for definition of Catered Living).

RECOMMENDATIONS AND CONCLUSIONS
MAXFIELD RESEARCH AND CONSULTING, LLC 165
• Assisted Living and Memory Care Senior Housing – There is a total of nine existing assisted living projects with a total of 133 units and a total of 16 existing memory care units in the county. Because of this supply is absorbing demand, we project new demand for only 22 assisted living and 42 memory care units in Renville County through 2030. Table S-2 shows the supply of senior housing options outside Renville County in larger communities that may compete for Renville Count residents due to proximity to health care services. There-fore, higher-acuity senior housing care is lower than other senior housing products in the short-term due to the existing supply in and near Renville County. If assisted living units were developed, we would recommend that this type of develop-ment include a mix of studio, and one-bedroom, and a few two-bedroom units with base monthly rents ranging from $2,500 to $3,750. Memory care units should be located in a secured, self-contained wing located on the first floor of a building and should feature its own dining and common area amenities including a secured outdoor patio and wandering area.
The base monthly fees should include all utilities (except telephone and basic cable/satellite television) and the following services:
• Three meals per day;
• Weekly housekeeping and linen service;
• Two loads of laundry per week;
• Weekly health and wellness clinics;
• Meal assistance;
• Regularly scheduled transportation;
• Professional activity programs and scheduled outings;
• Nursing care management;
• I’m OK program;
• 24-hour on site staffing;
• Personal alert pendant with emergency response; and
• Nurse visit every other month.
Additional personal care packages should also be available for an extra monthly charge above the required base care package. A care needs assessment is recommended to be conducted to determine the appropriate level of services for prospective residents.
Given the service-intensive nature of memory care housing and staffing ratios, typically most memory care facilities are attached to either an assisted living development or are a component of a skilled nursing facility. Therefore, new memory care units would be best suited if they were attached to an assisted living complex as demand is not high enough for a stand-alone memory complex. Alternatively, memory care could also be associated with a skilled nursing facility; however, we stress the residential approach to memory care versus the institutional feel from a nursing home.

RECOMMENDATIONS AND CONCLUSIONS
MAXFIELD RESEARCH AND CONSULTING, LLC 166
• Service-Enhanced Senior Housing or “Catered Living” –Due to economies of scale, it will be difficult to develop stand-alone facilities in the smaller Renville communities for service en-hanced senior housing products that are financially feasible. Therefore, we recommend senior facilities that allow seniors to “age in place” and remain in the same facility in the stages of later life. Catered living is a “hybrid” senior housing concept where demand will come from independent seniors interested in congregate housing as well as seniors in need of a higher level of care (assisted living). In essence, catered living provides a permeable boundary between congregate and assisted living care. The units and spatial allocations are undistinguishable between the two senior housing products, but residents will be able to select an appropriate service level upon entry to the facility and subsequently increase service levels over time. Additionally, catered living not only appeals to single seniors but also to couples; each resident is able to select a service level appropriate for his or her level of need, while still continuing to reside together. The catered living concept trend is a newer concept but tends to be developed in more ru-ral communities that cannot support stand-alone facilities for each product type. Monthly rents should include a base rent and service package with additional services provided ei-ther a la carte or within care packages. Monthly rents should start at about $1,500 for con-gregate care and $2,800 for assisted living care.
Summary by Submarket Although there is demand for a variety of housing product types in each of the submarkets, it will be difficult to develop certain housing products due to the density and economies of scale needed to be financially viable. Therefore, the lesser populated communities will experience additional challenges due to density requirements. In addition, there is likely to be cross-over demand and mobility between submarkets as new housing products are developed. Table CR-1 outlines the submarkets most likely to experience new housing based on housing demand and the number of units needed to be supportable.

RECOMMENDATIONS AND CONCLUSIONS
MAXFIELD RESEARCH AND CONSULTING, LLC 167
Demographics
Population (2010 & 2025) 3,871 | 3,748 4,809 | 4,694 3,674 3,456 3,376 3,118 15,730 | 14,300
Population Under 18 (2020 & 2025) 927 | 817 927 | 817 839 717 783 619 3,656 | 3,046
Population 65+ (2020 & 2025) 732 | 911 1107 | 963 732 894 703 847 3,045 | 3,830
Median Age (2020 & 2025) 45 | 46 44 | 46 46 48 48 49 45 | 46
Households (2010 & 2025) 1,586 | 1,541 2,035 | 2,027 1,528 | 1,454 1,415 | 1,311 6,564 | 6,336
Avg. HH Size (2010 & 2025) 2.44 | 2.47 2.36 | 2.32 2.40 | 2.20 2.39 | 2.09 2.40 | 2.26
Median Household Income (2020)
Homeownership Rate (2020)
Housing Characteristics
Median age of housing stock (2018)
Housing stock built before 1950 253 | 24% 639 | 33% 507 | 36% 596 | 45% 1,995 | 35%
Housing stock built between 1950 and 1990 651 | 62% 939 | 49% 729 | 52% 619 | 47% 2,938 | 51%
Housing stock built after 1990 150 | 14% 355 | 18% 156 | 11% 112 | 8% 773 | 14%
For-Sale Housing
Median resale price of existing homes (2019)
Median list price of actively marketing homes (May 2020)
Owner-occupied one-unit structures (2018) 1,248 | 98.1% 1,425 | 98.0% 1,128 | 98.7% 978 | 96.8% 4,730 | 96.9%
Median home value of owner-occupied units (2018)
General Occupancy Rental Housing
Renter-occupied one-unit structures (2018) 158 | 67.2% 213 | 44.5% 151 | 60.7% 155 | 62.3% 187 | 59.0%
Renter-occupied 10+ unit structures (2018) 98 | 32.8% 266 | 55.5% 98 | 39.3% 94 | 37.7% 130 | 41.0%
Median contract rent for renter-occupied units (2018)
Distribution of G.O. housing by type
Affordable/Subsidized 44 / 52.4% 89 # 58.7% 24 / 300% 29 / 58% 186 / 48%
Market Rate 40 / 47.6% 126 / 41.3% 12 / 150% 21 / 42% 199 / 52%
Senior Housing
Distribution of senior housing by type
Affordable/Subsidized Active Adult 18 / 32.7% 0 / 0.0% 0 / 0.0% 0 / 0.0% 18 / 11.5%
Independent Living 0 / 0.0% 30 / 60.0% 0 / 0.0% 0 / 0.0% 30 / 19.1%
Assisted Living 37 / 67.3% 20 / 40.0% 46 / 92.0% 0 / 0.0% 103 / 65.6%
Memory Care 0 / 0.0% 0 / 0.0% 6 / 12.0% 0 / 0.0% 6 / 3.8%
$145,000 $145,526
$555 $545
$101,000 $314,353$215,000
$159,500
$545
$88,250
$157,100
$495
$119,900
$120,433
$66,000
$478
$76,000 $87,000$98,000 $87,000
1958 1955
Demographic and Housing Characteristics Summary
Renville Sub. Renville County
$58,450 $58,269
83.2% 78.9%
Olivia Sub. Buffalo Lake/Hector
$62,704
82.1%
$58,878
75.2%
South Sub.
$52,048
76.1%
195519581953

RECOMMENDATIONS AND CONCLUSIONS
MAXFIELD RESEARCH AND CONSULTING, LLC 168

RECOMMENDATIONS AND CONCLUSIONS
MAXFIELD RESEARCH AND CONSULTING, LLC 169
Challenges and Opportunities The following were identified as the greatest challenges and opportunities for developing the recommended housing types (in no particular order).
• Affordable Housing/Naturally Occurring Affordable Housing. Tables HA-1 and HA-2 identi-fied Renville County Area Median Incomes (“AMI”) and the fair market rents by bedroom type. The average market rate rent average in Renville County is $495/month and the es-tablished rents for affordable housing are higher than many market rate rental develop-ments in Renville County. For example, at a 60% AMI the maximum gross rent for a one-bedroom unit is $734 while a two-bedroom maximum rent is $837 per month. As a result, many of the existing rental properties in the county are considered “naturally occurring af-fordable” and are mostly fulfilled by existing, older rental product in the marketplace. Ac-cording to the Harvard’s Joint Center for Housing Studies (JCHS) unsubsidized rentals ac-count for more than 75% of the affordable housing stock in the United States. It is esti-mated that over one-third of the naturally occurring affordable housing stock is composed of smaller multifamily buildings from 5 to 49 units Furthermore, based on a median list price in Renville County of $105,200, the income re-quired to afford a home at this price would be about $30,057 to $35,067, based on the standard of 3.0 to 3.5 times the median income (and assuming these households do not have a high level of debt). A household with significantly more equity (in an existing home and/or savings) could afford a higher priced home. Therefore, with good credit and funds for a down payment purchasing a home is a more desirable and potentially cheaper than renting.
• Aging Population. As illustrated in Table D-4, there is significant growth in the Renville County Analysis Area senior population, especially among seniors ages 75 to 84 (+17.3% growth through 2025). In addition, Table D-12 shows market area homeownership rates among seniors 65+ is approximately 78%. High homeownership rates among seniors indi-cate there could be lack of senior housing options, or simply that many seniors prefer to live in their home and age in place. Because of the rising population of older adults, demand for alternative maintenance-free housing products should be rising. In addition, demand for home health care services and home remodeling programs to assist seniors with retrofitting their existing homes should also increase. It is imperative to provide housing options for older adults so they may stay in their communities and Renville County.

RECOMMENDATIONS AND CONCLUSIONS
MAXFIELD RESEARCH AND CONSULTING, LLC 170
• Builders. There is a lack of builders in rural communities; interviews mentioned there are few builder options in Renville County. Hence, labor can be difficult and drives up the cost of housing. Across the Metro Area, 58% of all new homes constructed in 2018 were by the top ten production builders. The following chart summarizes the differences between pro-duction, custom, and spec builders. Production builders have increased their market share since the Great Recession in the Twin Cities and across the country, in part because compet-itors defaulted on lots and homes and smaller builders have gone out of business, while production builders were able to acquire land holdings for a fraction of the original cost to develop. The production builders have also driven new home activity from the develop-ment side as land developers are unable to absorb lot development costs for open builder developments.
• COVID-19. The current global COVID-19 pandemic is likely to have both direct and indirect effects on the housing industry. The senior housing industry has been directly impacted; Senior properties are seeing higher vacancy rates and many seniors are aging-in-place as long as possible to avoid senior living shared spaces. At the moment, rental and for sale housing is holding steady as construction is ongoing and many Realtors are conducting home visits virtually to ease fears of potential homebuyers. At the beginning of the pan-demic there were permitting delays from public agencies; however, at this time most public agencies have adopted, and city council and planning commission meetings have gone vir-tual.
Production Builder Custom Builder Spec Builder
Land
Home Plans
Volume
Pricing
Advantages
Disadvantages
Source: Maxfield Research and Consulting, LLC
Most of the decisions have already been
made and buyer may have fewer options.
Stock floor plans; however buyers have
home style and upgrade options that have
been pre-selected by builder.
BUILDER TYPES & CHARACTERISTICS
Typically built on land owned by the
builder/developer. Most production
builders develop all of the homes within
the subdivisions they plat and develop.
Built on land purchased by the home buyer
or builder. Most custom buiders do not
develop the land/lots.
Few modifications or change orders, fewer
options, lot selection based on availability
of builder.
Price per square foot is higher, more time
to build, signficantly more decision time
needed from buyers.
Varies based on builder. There are national
and regional production builders.
One-of-a-kind house. Site specific and
customized for a specific client.
Generally build for a variety of price points
from entry-level, move-up, and executive.
Tend to cater to move-up or exective-level
buyers.
Typically less than 20 or 25 per year. Varies.
Varies. Most spec homes are entry-level or
modest homes. However, spec homes can
range across all price points.
Home plan per builder. If home sells early
during construction phase; buyers have
some ability to customize the home.
Built on land purchased by the builder.
Builder "speculates" they will build and sell
a home prior to finding a buyer.
Lower costs per square foot, homes can be
built quicker, fewer decisions for home
owners.
Personal service, more creative control,
customizable, more flexible, buyer may
have more land options.
Lower cost floor plans provides economies
of scale. Homes can also be completed
relatively fast.

RECOMMENDATIONS AND CONCLUSIONS
MAXFIELD RESEARCH AND CONSULTING, LLC 171
Economically, the unemployment rate in Renville County was 6.5% in June 2020. This is down from 7.3% in May 2020; but up considerably from 5.6% in March. The economy has improved after the stay at home mandate lifted and businesses have been able to reopen; however, there is a growing concern over the growing COVID-19 cases that could shut down the economy again. Should the unemployment rate rise again, this will undoubtably affect the local rental and for-sale housing market. Despite the pandemic, the local real estate market has above expectations and strong de-mand remains for housing. Supply remains at an all-time low and there are more buyers than sellers. The pandemic has changed buyer preferences; both internally and externally. Buyers have a greater desire for outdoor features, green space, more square footage, flexi-ble spaces for home offices, and healthy living conditions. Buyers are also trading location for more home by locating further from their place of employment. There is also a prefer-ence toward new construction and the new home market has been strong in 2020 and builders have not kept the pace with demand. On the rental side, social distancing has had an impact on amenity-rich luxury apartments which tenants are unable to utilize during this time. As such, demand for smaller units has been affected if tenants are expected to remain in their unit and not utilize social spaces. With telecommuting being the norm tenants are seeking a separation of work and live spaces as well as access to balcony’s and patios to provide fresh air and extra space. There has been strong demand for townhome-style rentals or a building that has been designed with a separate entrance to eliminate the possible of interacting with others and catching the virus. These trends and preferences will likely continue until either a vaccine or therapy is developed.
• Modular Housing/Alternative Construction Methods. Modular housing, often referred to as prefab housing, is the construction of housing units in a controlled factory-like setting or on a manufacturers site or lumber yard. Modular housing is gaining steam from developers and investors to combat high construction costs, labor shortages, and speed-up the con-struction timeline. The biggest advantage modular housing provides is time and shaving months of holding costs off the consumers bottom line. Originally modular housing was mostly single-family oriented; however, developers are now constructing entire apartment buildings, hotels, senior living, man camps, and college dorms. Historically the biggest chal-lenge of modular housing is transportation and shipping costs. However, recently a new modular plant start-up has recently opened in Owatonna within an existing 150,000 square foot industrial space. Maxfield Research believes there is great opportunity in the modular construction sector that can be utilized in Renville County and southwestern Minnesota, providing a win-win scenario to the local modular builders and consumers through cost savings.
RECOMMENDATIONS AND CONCLUSIONS
MAXFIELD RESEARCH AND CONSULTING, LLC 172
Another option is to construct residential units with Structural Insulated Panels (SIPs). SIPs are a high-performance system for residential and light commercial construction. The pan-els consist of an insulating form core sandwiched between two structural facings, typically oriented over strand board (OSB). SIPs are manufactured under factory-controlled condi-tions and can be fabricated to fit nearly any building design. The result is a building system that is extremely strong, energy efficient and cost effective. Building with SIPs generally costs the same as building with wood frame construction when you factor in the labor sav-ings resulting from shorter construction time and less jobsite waste. Other savings are real-ized because smaller heating and cooling systems are required with SIP Construction. As an example, Southwest Minnesota Housing Partnership is developing single-family homes in southwestern Minnesota utilizing SIPs. Floor plans are 2,200 square feet with an attached double-car garage, and pricing ranges from $196,499 with an income restriction to $221,200 without an income restriction. Additionally, Southwest Minnesota Housing Part-nership recently developed a 48-unit three-story Low-Income Housing Tax Credit apartment building using SIPs construction for approximately $94 per square-foot.
• Lender-mediated Properties. As illustrated in the For-Sale section, lender-mediated prop-erties have declined substantially since the housing downturn and Great Recession of last decade. As of 2019, less than 1% of all transactions were lender-mediated compared to 2% in the Twin Cities. The continued decline in lender-mediated properties will enhance the overall real estate market and pricing will continue to gain from all the losses of last decade.
Due to COVID-19 pandemic and the downturn in the economy, there is a strong probability lender-mediated property could increase should the economy suffer from a second wave of infections and lockdowns. As of July 2020, mortgage forbearance equaled about 7.8% na-tionwide and foreclosures have not increased as of yet. About one-half of all mortgages in forbearance have renegotiated with their lender on an extension of the mortgage term. This pace of forbearance remains exceptionally low compared to the Great Recession last decade. However, the full effect of the pandemic is still not known, and it may be 1-2 years before mortgages coming out of forbearance agreements need assistance. We recommend counseling services for Renville County homeowners that can help navigate mortgage assis-tance plans on behalf of homeowners.
• Lot Supply and Residential Development Costs. We identified a total of 73 vacant lots in 16 subdivisions in Renville County. As such, it appears that the supply of vacant platted lots in Renville County is not sufficient to meet demand through 2030, additional subdivision activ-ity will be needed to support the projected demand for owner-occupied housing.
The value of building lots is often benchmarked against the value of the completed retail housing package (sales price). Target ratios for builders show that the cost of sales should be held to 70% of the purchase price; 50% for construction hard costs and 20% for the land (raw land, improvements, financing costs, etc.) However, these ratios vary considerably

RECOMMENDATIONS AND CONCLUSIONS
MAXFIELD RESEARCH AND CONSULTING, LLC 173
based on builder, product, topography, lot type, etc. An improved single-family lot should generally cost from 18% to 25% of the projected retail price of the home. The retail price for a new construction home would likely exceed $200,000. Approximately 86% of the homes sold in Renville County since 2017 have been priced below $200,000 and 41% of the sales were priced less than $100,000, suggesting that there is strong demand for modestly priced housing in Renville County. As such, a public-private partnership should be explored to help alleviate the carrying costs for developers, which could bring down lot costs and generate the production of new construction housing units. Several communities offer various types of lot incentive programs to stimulate new con-struction. Most lot incentive programs are offered and administered by a local economic development or housing and redevelopment agency that funds the program. In many cases, the municipalities fund the infrastructure using general obligation improvement bonds. Programs vary considerably between communities, but most have guidelines such as minimum square footages and time limits on when houses are constructed.
• Mortgage Rates. Mortgage rates play a crucial part in housing affordability. Lower mort-gage rates result in a lower monthly mortgage payment and buyers receiving more home for their dollar. Rising interest rates often require homebuyers to raise their down payment in order to maintain the same housing costs. Mortgage rates have remained at historic lows over the past decade coming out of the Great Recession. Although rates ticked-up in 2018 and early 2019, concerns about global growth pushed long-term interest rates. Due to the COVID-19 pandemic, rates plummeted and are at a new all-time low at the time low under 3% (30-year fixed). Most economists believe rates will remain low through 2020 as the Fed-eral Reserve will keep benchmark rates low to help stimulate the economy. Because rates are at all-time lows; rates are likely to remain consistent as there is little movement to go from here. The following charts illustrates historical mortgage rate averages as compiled by Freddie Mac. The Freddie Mac Market Survey (PMMS) has been tracking mortgage rates since 1972 and is the most relied upon benchmark for evaluating mortgage interest market conditions. The Freddie Mac survey is based on 30-year mortgages with a loan-to-value of 80%.

RECOMMENDATIONS AND CONCLUSIONS
MAXFIELD RESEARCH AND CONSULTING, LLC 174
• Multifamily Development Costs. It may be difficult to construct new multifamily product with amenities today’s renter’s desire given market rents and development costs. Accord-ing to construction costs data from the Craftsman 2017 National Building Cost Manual, con-struction costs in Renville County (utilizing construction averages for Southwest Minnesota) likely average about $117 per square foot (in 2017 dollars) to develop based on an excep-tional quality project with ten or more units. Based on an average unit size range of 750 to 950 square feet, a project would cost approximately $120,000 per unit to develop in 2019 (adjusted for inflation) all in.
0.00%
2.00%
4.00%
6.00%
8.00%
10.00%
12.00%
14.00%
16.00%
18.00%
19
72
19
74
19
76
19
78
19
80
19
82
19
84
19
86
19
88
19
90
19
92
19
94
19
96
19
98
20
00
20
02
20
04
20
06
20
08
20
10
20
12
20
14
20
16
20
18
20
20
Historic 30-year Mortgage Rates 1972 to 2020 YTD
2.5
2.7
2.9
3.1
3.3
3.5
3.7
3.9
4.1
4.3
4.5
1/2 1/9 1/16 1/23 1/30 2/6 2/13 2/20 2/27 3/5 3/12 3/19 3/26 4/2 4/9 4/16 4/23 4/30 5/7 5/14 5/21 5/28 6/4 6/11 6/18 6/25 7/2 7/9 7/16
2020 Weekly Mortgage Rates

RECOMMENDATIONS AND CONCLUSIONS
MAXFIELD RESEARCH AND CONSULTING, LLC 175
• Housing Programs. Many local governments offer housing programs designed to enhance, improve, or develop new housing stock. The topics in this section are designed to provide ideas and suggestions to help the public and private sector support housing programs and incentives to spur housing opportunities in Renville County. The examples presented be-low identify housing tools utilized in other communities; however, this is not an all-encom-passing list as many governmental agencies offers different programs based on their individ-ual needs. We do note that housing resources and programs have costs and require a funding source. Due to the existing housing costs and the need for economies of scale; many housing devel-opments in Renville County may not be financially feasible for housing developers. In most cases, numerous funds and financing mechanisms must be in place to support housing pro-grams. Federal funds for housing development have been declining for decades and the re-maining housing programs include the Community Development Block Grant (CDBG), the HOME Investment Partnerships Program, Housing Choice Vouchers, Low-Income Housing Tax Credits (LIHTC), and USDA rural housing programs. However, local units of government are increasingly dependent on other resources to support development such as housing trust funds and housing bonds. Many of these programs target low- to moderate income households and do not provide assistance for fix-up funds, rehab loans, infrastructure, etc. State/National Resources: Greater Minnesota Housing Fund – The Greater Minnesota Housing Fund (“GMHF”) sup-ports, preserves, and creates affordable housing in the 80 counties outside the core Twin Cities Metro Area. The GMHF provides numerous programs, financing mechanisms, tech-nical support, and research to support production of affordable housing across Greater Min-nesota.
Minnesota Housing Finance Agency (“Minnesota Housing”) – Minnesota Housing is a hous-ing finance agency whose mission is to finance affordable housing for low- and moderate-income households across Minnesota. Minnesota Housing partners with for-profit, non-profit, and governmental sectors to help develop and preserve affordable housing. The or-ganization provides numerous products and services for both the single-family and multi-family housing sectors. The organizations five strategic priorities are as follows: Preserve federally subsidized rental housing; Promote and support successful homeownership; Ad-dress specific and critical needs in rental housing markets; Prevent and end homelessness and prevent foreclosure and support community recover.
Minnesota Department of Employment and Economic Development – MN DEED offers com-munity development funding through two programs for projects that assist communities stay vital and pursue economic development.
The Small Cities Development Program offers state grant funds in three general categories.

RECOMMENDATIONS AND CONCLUSIONS
MAXFIELD RESEARCH AND CONSULTING, LLC 176
▪ Housing grants provide funds to rehabilitate local housing stock. Local governments lend the funds to projects benefiting low- and moderate-income persons and may be used for owner-occupied, rental, single-fam-ily or multifamily projects.
▪ Public facility grants are directed toward wastewater treatment projects ▪ Comprehensive grants can include housing and public facility activities.
Workforce Housing Development Program targets communities in Greater Min-nesota where housing shortages hinder the ability of businesses to attract work-ers. Program criteria are as follows:
▪ Cities located outside of the metro area with a population exceeding 500 residents or communities with a combined population of 1,500 residents located within 15 miles of a city or an area served by a joint county-city economic development authority;
▪ A vacancy rate of 5 percent or lower for at least the prior two years; ▪ One or more businesses located in the project area (or within 25 miles of
the area) that employ 20 full time equivalent employees; ▪ A statement from participating businesses that a lack of housing makes it
difficult to recruit and hire workers; and, ▪ The development must serve employees of the businesses in the project
area. United States Department of Agriculture (USDA) Rural Development – Housing support is available through the “Housing and Community Assistance” program that is part of USDA Rural Development. The program is designed to improve housing options in rural communi-ties and operates a variety of programs including: homeownership assistance, housing reha-bilitation and preservation, rental assistance, Local/Regional Resources:
• The City of Renville offers lots at no cost however, the buyer must pay for the cost of street assessments. In addition, if the construction doesn’t begin within the one-year time frame the lot is returned to the city. All construction must meet all R-1 zoning and other city code standards. Development costs of this scale will likely require rents per square foot significantly higher than the existing product in Renville County (average of $0.61 per square foot). Based on these costs, it will be difficult to develop stand-alone multifamily housing structures by the private sector based on current market rents. As a result, a private-public partnership or other financing programs will likely be required to spur development and potentially reduce rent levels to bridge some of the gap between existing older product and new product (i.e. tax abatement, Tax Increment Financing).
There are some housing programs that Renville County could consider to aid and improve their housing stock. The following is a list of potential programs that could be explored.

RECOMMENDATIONS AND CONCLUSIONS
MAXFIELD RESEARCH AND CONSULTING, LLC 177
Remodeling Advisor: Partner with local architects and/or builders to provide
ideas and general cost estimates for property owners. Construction Management Services: Assist homeowners regarding local building
codes, reviewing contractor bids, etc. Typically provided as a service by the building department.
Historic Preservation: Encourage residents to preserve historic housing stock in neighborhoods with homes with character through restoring and preserving ar-chitectural and building characteristics. Typically funded with low interest rates on loans for preservation construction costs.
Foreclosure Home Improvement Program: Low-interest loans to buyers of fore-closed homes to assist homeowners with needed home improvements while sta-bilizing owner-occupied properties. A portion of the loan could be forgivable if the occupant resides in home at least five years. Eligible participants should be based on income-guidelines (typically 80% AMI or lower).
Rent to Own: Income-eligible families rent for a specified length of time with the end-goal of buying a home. The HRA saves a portion of the monthly rent that will be allocated for a down payment on a future house.
Rental Collaboration: Host meetings on a regular basis (quarterly, bi-annually, or annually) with rental property owners, property management companies, Real-tors, etc. to discuss key issues and topics related to the rental housing industry in Renville County.
Home Fair: Provide residents with information and resources to promote im-provements to the housing stock. Typically offered on a weekend in early spring where homeowners can meet and ask questions to architects, landscapers, building contractors, lenders, building inspectors, etc.
Home-Building Trades Partnerships: Partnership between local Technical Col-leges or High Schools that offer building trades programs. Affordability is gained through reduced labor costs provided by the school. New housing production serves as the “classroom” for future trades people to gain experience in the con-struction industry. This program is contingent on proximity to these programs.
Rental License: Licensing rental properties in the communities. Designed to en-sure all rental properties meet local building and safety codes. Typically en-forced by the fire marshal or building inspection department. Should require an-nual license renewal.
Senior Housing Regeneration Program: Partnership between multiple organiza-tions that assists seniors transitioning to alternative housing options such as sen-ior housing, condominiums, townhomes, etc.
Tax Abatement: A temporary reduction in property taxes over a specific time pe-riod on new construction homes or home remodeling projects. Encourages new construction or rehabilitation through property tax incentives.
Tax Increment Financing (TIF): Program that offers communities a flexible fi-nancing tool to assist housing projects and related infrastructure. TIF enables

RECOMMENDATIONS AND CONCLUSIONS
MAXFIELD RESEARCH AND CONSULTING, LLC 178
communities to dedicate the incremental tax revenues from new housing devel-opment to help make the housing more affordable or pay for related costs. TIF funds can be used to provide a direct subsidy to a particular housing project or they can also be used to promote affordable housing by setting aside a portion of TIF proceeds into a dedicated fund from other developments receiving TIF.
Waiver or Reduction of Development Fees: There are several fees developers must pay including impact fees, utility and connection fees, park land dedication fees, etc. To help facilitate affordable housing, some fees could be waived or re-duced to pass the cost savings onto the housing consumer.
• Marketing and Promotion. We recommend that Renville County continue collecting and disseminating information on vacant residential lots as well as contact information for rental property owners and managers. This information supplements traditional residential listings being marketed by Realtors on the Multiple Listing Service and targets people seek-ing rental housing and available building lots in the County.
• Rental Housing Stock. According to the U.S. Census Bureau 3 out of 4 homes in rural com-munities are owner-occupied and, in most cases, the available rental units are occupied. Renville County lacks newer rental properties and has a shortage of available multifamily and single-family rentals. The lack of competition for landlords may results in lack of up-keep and differed maintenance as renters in need will more than likely accept what is avail-able. An increase in desirable rental units including single family rental would create compe-tition and persuade landlords into necessary upgrades to properties in need.
• Daycare. Reliable, quality child-care in a community supports local business by giving par-ents child-care they can count on. That in turn allows them to be undistracted and produc-tive. Without adequate child-care, local business are unable to recruit skilled workers and the workers they do have may be preoccupied with child care issues. Some employers are using financial incentives and considering child-care as a benefit to employees. In some cases, space has been remodeled to provide care for children of employees and from the community. Workers do not have to leave early to drive a great distance to pick up children when day-care arrangements fall through. The Minnesota Department of Human Services is an excellent resource in helping to make training more accessible and more affordable through Child Care Aware, Parent Aware and other rural human service organization (i.e. First Children’s Finance) provided on their website.
• Telecommuting. The Covid-19 pandemic has made clear how important it is for the state to support telecommuting capabilities. Becoming a Telecommuter Forward! Community would help expand the counties workforce and grow business development. In addition, the program allows communities to promote themselves as target destinations for Minnesotans interested in telecommuting. This will serve to grow the community and expand local in-vestment. https://mn.gov/deed/programs-services/broadband/telecommuter-forward/

APPENDIX
MAXFIELD RESEARCH AND CONSULTING, LLC 179
APPENDIX

APPENDIX
MAXFIELD RESEARCH AND CONSULTING, LLC 180
Definitions Absorption Period – The period of time necessary for newly constructed or renovated proper-ties to achieve the stabilized level of occupancy. The absorption period begins when the first certificate of occupancy is issued and ends when the last unit to reach the stabilized level of oc-cupancy has signed a lease. Absorption Rate – The average number of units rented each month during the absorption pe-riod. Active Adult (or independent living without services available) – Active Adult properties are similar to a general-occupancy apartment building, in that they offer virtually no services but have age-restrictions (typically 55 or 62 or older). Organized activities and occasionally a trans-portation program are usually all that are available at these properties. Because of the lack of services, active adult properties typically do not command the rent premiums of more service-enriched senior housing. Adjusted Gross Income “AGI” – Income from taxable sources (including wages, interest, capital gains, income from retirement accounts, etc.) adjusted to account for specific deductions (i.e. contributions to retirement accounts, unreimbursed business and medical expenses, alimony, etc.). Affordable Housing – The general definition of affordability is for a household to pay no more than 30% of their income for housing. For purposes of this study we define affordable housing that is income-restricted to households earning at or below 80% AMI, though individual proper-ties can have income-restrictions set at 40%, 50%, 60% or 80% AMI. Rent is not based on in-come but instead is a contract amount that is affordable to households within the specific in-come restriction segment. It is essentially housing affordable to low or very low-income ten-ants. Amenity – Tangible or intangible benefits offered to a tenant in the form of common area amenities or in-unit amenities. Typical in-unit amenities include dishwashers, washer/dryers, walk-in showers and closets and upgraded kitchen finishes. Typical common area amenities in-clude detached or attached garage parking, community room, fitness center and an outdoor pa-tio or grill/picnic area. Area Median Income “AMI” – AMI is the midpoint in the income distribution within a specific geographic area. By definition, 50% of households earn less than the median income and 50% earn more. The U.S. Department of Housing and Urban Development (HUD) calculates AMI an-nually and adjustments are made for family size. Assisted Living – Assisted Living properties come in a variety of forms, but the target market for most is generally the same: very frail seniors, typically age 80 or older (but can be much younger, depending on their particular health situation), who are in need of extensive support

APPENDIX
MAXFIELD RESEARCH AND CONSULTING, LLC 181
services and personal care assistance. Absent an assisted living option, these seniors would otherwise need to move to a nursing facility. At a minimum, assisted living properties include two meals per day and weekly housekeeping in the monthly fee, with the availability of a third meal and personal care (either included in the monthly fee or for an additional cost). Assisted living properties also have either staff on duty 24 hours per day or at least 24-hour emergency response. Building Permit – Building permits track housing starts, and the number of housing units au-thorized to be built by the local governing authority. Most jurisdictions require building permits for new construction, major renovations, as well as other building improvements. Building per-mits ensure that all the work meets applicable building and safety rules and is typically required to be completed by a licensed professional. Once the building is complete and meets the in-spector’s satisfaction, the jurisdiction will issue a “CO” or “Certificate of Occupancy.” Building permits are a key barometer for the health of the housing market and are often a leading indi-cator in the rest of the economy as it has a major impact on consumer spending. Capture Rate – The percentage of age, size, and income-qualified renter households in a given area or “Market Area” that the property must capture to fill the units. The capture rate is cal-culated by dividing the total number of units at the property by the total number of age, size and income-qualified renter households in the designated area. Comparable Property – A property that is representative of the rental housing choices of the designated area or “Market Area” that is similar in construction, size, amenities, location and/or age. Concession – Discount or incentives given to a prospective tenant to induce signature of a lease. Concessions typically are in the form of reduced rent or free rent for a specific lease term, or free amenities, which are normally charged separately, such as parking. Congregate (or independent living with services available) – Congregate properties offer sup-port services such as meals and/or housekeeping, either on an optional basis or a limited amount included in the rents. These properties typically dedicate a larger share of the overall building area to common areas, in part, because the units are smaller than in adult housing and in part to encourage socialization among residents. Congregate properties attract a slightly older target market than adult housing, typically seniors age 75 or older. Rents are also above those of the active adult buildings, even excluding the services. Contract Rent – The actual monthly rent payable by the tenant, including any rent subsidy paid on behalf of the tenant, to the owner, inclusive of all terms of the lease. Demand – The total number of households that would potentially move into a proposed new or renovated housing project. These households must be of appropriate age, income, tenure and

APPENDIX
MAXFIELD RESEARCH AND CONSULTING, LLC 182
size for a specific proposed development. Components vary and can include, but are not lim-ited to turnover, people living in substandard conditions, rent over-burdened households, in-come-qualified households and age of householder. Demand is project specific. Density – Number of units in a given area. Density is typically measured in dwelling units (DU) per acre – the larger the number of units permitted per acre the higher the density; the fewer units permitted results in lower density. Density is often presented in a gross and net format:
• Gross Density – The number of dwelling units per acre based on the gross site acreage. Gross Density = Total residential units/total development area
• Net Density - The number of dwelling units per acre located on the site, but excludes public right-of-ways (ROW) such as streets, alleys, easements, open spaces, etc. Net Density = Total residential units/total residential land area (excluding ROWs)
Detached Housing – a freestanding dwelling unit, most often single-family homes, situated on its own lot. Effective Rents – Contract rent less applicable concessions. Elderly or Senior Housing – Housing where all the units in the property are restricted for occu-pancy by persons age 62 years or better, or at least 80% of the units in each building are re-stricted for occupancy by households where at least one household member is 55 years of age or better and the housing is designed with amenities, facilities and services to meet the needs of senior citizens. Extremely Low-Income – Person or household with incomes below 30% of Area Median In-come, adjusted for respective household size. Fair Market Rent – Estimates established by HUD of the Gross Rents needed to obtain modest rental units in acceptable conditions in a specific geographic area. The amount of rental income a given property would command if it were open for leasing at any given moment and/or the amount derived based on market conditions that is needed to pay gross monthly rent at mod-est rental housing in a given area. This figure is used as a basis for determining the payment standard amount used to calculate the maximum monthly subsidy for families on at financially assisted housing.
Fair Market Rent Renville County - 2019
EFF 1BR 2BR 3BR 4BR
Fair Market Rent $572 $575 $714 $940 $1,008
Fair Market Rent

APPENDIX
MAXFIELD RESEARCH AND CONSULTING, LLC 183
Floor Area Ratio (FAR) Ratio of the floor area of a building to area of the lot on which the build-ing is located. Foreclosure – A legal process in which a lender or financial institute attempts to recover the balance of a loan from a borrower who has stopped making payments to the lender by using the sale of the house as collateral for the loan. Gross Rent – The monthly housing cost to a tenant which equals the Contract Rent provided for in the lease, plus the estimated cost of all utilities paid by tenants. Maximum Gross Rents for Renville County are shown in the figure below.
Gross Rent
Renville County – 2019
Household – All persons who occupy a housing unit, including occupants of a single-family, one person living alone, two or more families living together, or any other group of related or unre-lated persons who share living arrangements. Household Trends – Changes in the number of households for any particular areas over a measurable period of time, which is a function of new household formations, changes in aver-age household size, and net migration. Housing Choice Voucher Program – The federal government's major program for assisting very low-income families, the elderly, and the disabled to afford decent, safe, and sanitary housing in the private market. A family that is issued a housing voucher is responsible for finding a suit-able housing unit of the family's choice where the owner agrees to rent under the program. Housing choice vouchers are administered locally by public housing agencies. They receive fed-eral funds from the U.S. Department of Housing and Urban Development (HUD) to administer the voucher program. A housing subsidy is paid to the landlord directly by the public housing agency on behalf of the participating family. The family then pays the difference between the actual rent charged by the landlord and the amount subsidized by the program.
EFF 1BR 2BR 3BR 4BR
30% of median $384 $439 $495 $549 $594
50% of median $641 $495 $825 $916 $990
60% of median $769 $879 $990 $1,099 $1,188
80% of median $1,026 $1,172 $1,320 $1,466 $1,584
100% of median $1,282 $1,465 $1,650 $1,832 $1,980
120% of median $1,539 $1,758 $1,980 $2,199 $2,376
Maximum Gross Rent

APPENDIX
MAXFIELD RESEARCH AND CONSULTING, LLC 184
Housing Unit – House, apartment, mobile home, or group of rooms used as a separate living quarters by a single household. HUD Project-Based Section 8 – A federal government program that provides rental housing for very low-income families, the elderly, and the disabled in privately owned and managed rental units. The owner reserves some or all of the units in a building in return for a Federal govern-ment guarantee to make up the difference between the tenant's contribution and the rent. A tenant who leaves a subsidized project will lose access to the project-based subsidy. HUD Section 202 Program – Federal program that provides direct capital assistance and operat-ing or rental assistance to finance housing designed for occupancy by elder household who have incomes not exceeding 50% of Area Median Income. HUD Section 811 Program – Federal program that provides direct capital assistance and operat-ing or rental assistance to finance housing designed for occupancy of persons with disabilities who have incomes not exceeding 50% Area Median Income. HUD Section 236 Program – Federal program that provides interest reduction payments for loans which finance housing targeted to households with income not exceeding 80% Area Me-dian Income who pay rent equal to the greater or market rate or 30% of their adjusted income. Income Limits – Maximum household income by a designed geographic area, adjusted for household size and expressed as a percentage of the Area Median Income, for the purpose of establishing an upper limit for eligibility for a specific housing program. See income-qualifica-tions. Inflow/Outflow – The Inflow/Outflow Analysis generates results showing the count and charac-teristics of worker flows in to, out of, and within the defined geographic area. Low-Income – Person or household with gross household incomes below 80% of Area Median Income, adjusted for household size. Low-Income Housing Tax Credit – A program aimed to generate equity for investment in af-fordable rental housing authorized pursuant to Section 42 of the Internal Revenue Code. The program requires that a certain percentage of units built be restricted for occupancy to house-holds earning 60% or less of Area Median Income, and rents on these units be restricted ac-cordingly. Market Analysis – The study of real estate market conditions for a specific type of property, ge-ographic area or proposed (re)development. Market Rent – The rent that an apartment, without rent or income restrictions or rent subsi-dies, would command in a given area or “Market Area” considering its location, features and amenities.
APPENDIX
MAXFIELD RESEARCH AND CONSULTING, LLC 185
Market Study – A comprehensive study of a specific proposal including a review of the housing market in a defined market or geography. Project specific market studies are often used by de-velopers, property managers or government entities to determine the appropriateness of a pro-posed development, whereas market specific market studies are used to determine what hous-ing needs, if any, existing within a specific geography. Market Rate Rental Housing – Housing that does not have any income-restrictions. Some properties will have income guidelines, which are minimum annual incomes required in order to reside at the property. Memory Care – Memory Care properties, designed specifically for persons suffering from Alz-heimer’s disease or other dementias, is one of the newest trends in senior housing. Properties consist mostly of suite-style or studio units or occasionally one-bedroom apartment-style units, and large amounts of communal areas for activities and programming. In addition, staff typi-cally undergoes specialized training in the care of this population. Because of the greater amount of individualized personal care required by residents, staffing ratios are much higher than traditional assisted living and thus, the costs of care are also higher. Unlike conventional assisted living, however, which deals almost exclusively with widows or widowers, a higher pro-portion of persons afflicted with Alzheimer’s disease are in two-person households. That means the decision to move a spouse into a memory care facility involves the caregiver’s con-cern of incurring the costs of health care at a special facility while continuing to maintain their home. Migration – The movement of households and/or people into or out of an area. Mixed-Income Property – An apartment property contained either both income-restricted and unrestricted units or units restricted at two or more income limits. Mobility – The ease at which people move from one location to another. Mobility rate is often illustrated over a one-year time frame. Moderate Income – Person or household with gross household income between 80% and 120% of the Area Median Income, adjusted for household size. Multifamily – Properties and structures that contain more than two housing units. Naturally Occurring Affordable Housing – Although affordable housing is typically associated with an income-restricted property, there are other housing units in communities that indi-rectly provide affordable housing. Housing units that were not developed or designated with income guidelines (i.e. assisted) yet are more affordable than other units in a community are considered “naturally-occurring” or “unsubsidized affordable” units. This rental supply is avail-able through the private market, versus assisted housing programs through various governmen-tal agencies. Property values on these units are lower based on a combination of factors, such

APPENDIX
MAXFIELD RESEARCH AND CONSULTING, LLC 186
as: age of structure/housing stock, location, condition, size, functionally obsolete, school dis-trict, etc.
Net Income – Income earned after payroll withholdings such as state and federal income taxes, social security, as well as retirement savings and health insurance. Net Worth – The difference between assets and liabilities, or the total value of assets after the debt is subtracted. Pent-Up Demand – A market in which there is a scarcity of supply and as such, vacancy rates are very low or non-existent. Population – All people living in a geographic area. Population Density – The population of an area divided by the number of square miles of land area. Population Trends – Changes in population levels for a particular geographic area over a spe-cific period of time – a function of the level of births, deaths, and in/out migration. Project-Based Rent Assistance – Rental assistance from any source that is allocated to the property or a specific number of units in the property and is available to each income eligible tenant of the property or an assisted unit. Redevelopment – The redesign, rehabilitation or expansion of existing properties. Rent Burden – Gross rent divided by adjusted monthly household income. Restricted Rent – The rent charged under the restriction of a specific housing program or sub-sidy. Saturation – The point at which there is no longer demand to support additional market rate, affordable/subsidized, rental, for-sale, or senior housing units. Saturation usually refers to a particular segment of a specific market. Senior Housing – The term “senior housing” refers to any housing development that is re-stricted to people age 55 or older. Today, senior housing includes an entire spectrum of hous-ing alternatives. Maxfield Research Consulting, LLC. classifies senior housing into four catego-ries based on the level of support services. The four categories are: Active Adult, Congregate, Assisted Living and Memory Care. Short Sale – A sale of real estate in which the net proceeds from selling the property do not cover the sellers’ mortgage obligations. The difference is forgiven by the lender, or other ar-rangements are made with the lender to settle the remainder of the debt.

APPENDIX
MAXFIELD RESEARCH AND CONSULTING, LLC 187
Single-Family Home – A dwelling unit, either attached or detached, designed for use by one household and with direct street access. It does not share heating facilities or other essential electrical, mechanical or building facilities with another dwelling. Stabilized Level of Occupancy – The underwritten or actual number of occupied units that a property is expected to maintain after the initial lease-up period. Subsidized Housing – Housing that is income-restricted to households earning at or below 30% AMI. Rent is generally based on income, with the household contributing 30% of their adjusted gross income toward rent. Also referred to as extremely low-income housing. Subsidy – Monthly income received by a tenant or by an owner on behalf of a tenant to pay the difference between the apartment’s contract/market rate rent and the amount paid by the ten-ant toward rent. Substandard Conditions – Housing conditions that are conventionally considered unacceptable and can be defined in terms of lacking plumbing facilities, one or more major mechanical or electrical system malfunctions, or overcrowded conditions. Target Population – The market segment or segments of the given population a development would appeal or cater to. Tenant – One who rents real property from another individual or rental company. Tenant-Paid Utilities – The cost of utilities, excluding cable, telephone, or internet necessary for the habitation of a dwelling unit, which are paid by said tenant. Tenure – The distinction between owner-occupied and renter-occupied housing units. Turnover – A measure of movement of residents into and out of a geographic location. Turnover Period – An estimate of the number of housing units in a geographic location as a per-centage of the total house units that will likely change occupants in any one year. Unrestricted Units – Units that are not subject to any income or rent restrictions. Vacancy Period – The amount of time an apartment remains vacant and is available on the market for rent. Workforce Housing – Housing that is income-restricted to households earning between 80% and 120% AMI. Also referred to as moderate-income housing. Zoning – Classification and regulation of land use by local governments according to use catego-ries (zones); often also includes density designations and limitations.