BEVERLY, MASSACHUSETTS HOUSING NEEDS ... - Mass.gov
113
BEVERLY, MASSACHUSETTS HOUSING NEEDS ASSESSMENT Michael P. Cahill, Mayor Prepared by Karen Sunnarborg, Housing and Planning Consultant Abacus Architects + Planners, David Pollak With technical assistance from Aaron Clausen, Director of Planning & Community Development and Darlene Wynne, Assistant Planning Director With funding support from the Beverly Community Preservation Fund and the Massachusetts Department of Housing and Community Development September 2016
-
Upload
khangminh22 -
Category
Documents
-
view
2 -
download
0
Transcript of BEVERLY, MASSACHUSETTS HOUSING NEEDS ... - Mass.gov
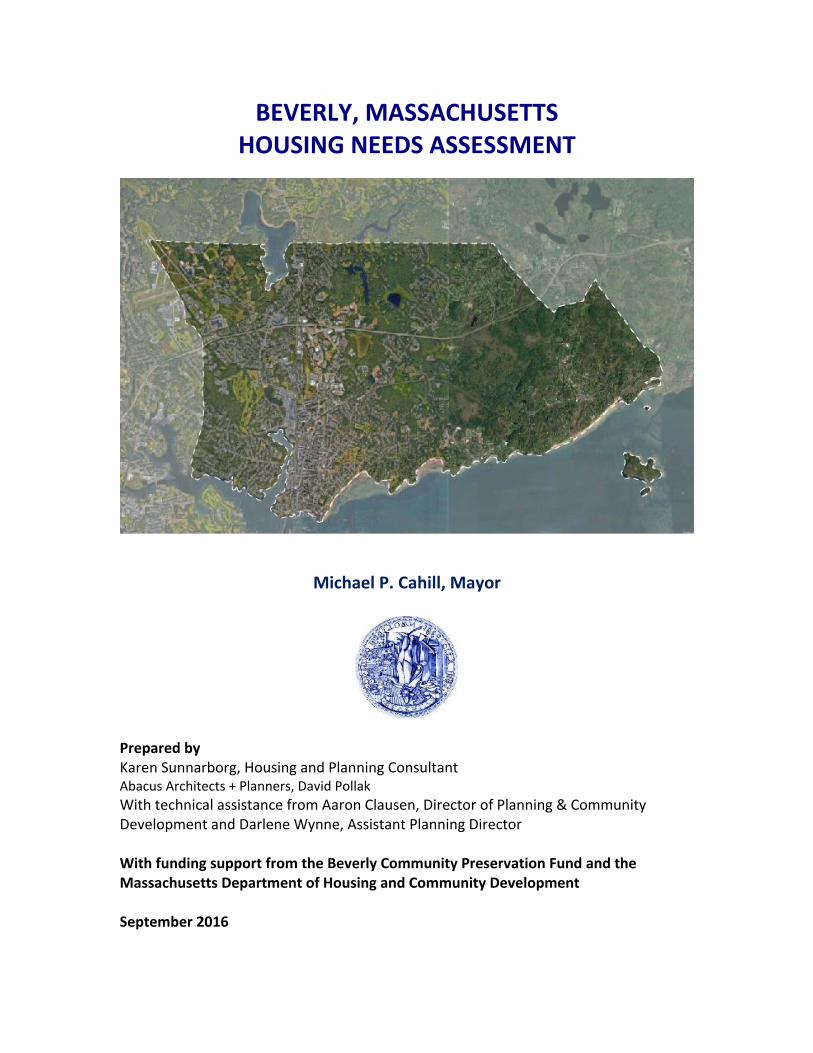
BEVERLY, MASSACHUSETTS HOUSING NEEDS ASSESSMENT
Michael P. Cahill, Mayor
Prepared by Karen Sunnarborg, Housing and Planning Consultant Abacus Architects + Planners, David Pollak
With technical assistance from Aaron Clausen, Director of Planning & Community Development and Darlene Wynne, Assistant Planning Director With funding support from the Beverly Community Preservation Fund and the Massachusetts Department of Housing and Community Development September 2016
Beverly Housing Needs Assessment Page ii
BEVERLY, MASSACHUSETTS HOUSING NEEDS ASSESSMENT
Acknowledgements Mayor Cahill, the Beverly Planning Department, and Consultants would like to thank the following individuals for their contributions to this document:
Kevin Ascolillo, Beverly Housing Authority
Bill Brauner, Massachusetts Community Economic Development Assistance Corporation (CEDAC)
Susan Carleton, Beverly Housing Authority
Kathy Churchill, North Shore YMCA
Terry DeBlasie, Assessors Office
Andrew DeFranza, Harborlight Community Partners
John Gaviglio, University of Massachusetts Donahue Institute
Dawn Goodwin, Beverly Housing Authority
Steven Hiersche, Beverly Public Schools
MaryAnn Holak, Council on Aging
Maggie Howard, Action, Inc.
Kevin Hurley, North Shore HOME Consortium
Margaux LeClair, Massachusetts Department of Housing and Community Development
Sarah MacBurnie, Keller Williams Realty
Tricia Myers, Beverly Housing Authority
Mickey Northcutt, North Shore Community Development Corporation
D. Wesley Slate, Jr., City Clerk/Clerk of City Council
Jessica Waggett, Council on Aging
BEVERLY, MASSACHUSETTS HOUSING NEEDS ASSESSMENT
Table of Contents Page
1. Executive Summary 1 1.1 Summary of Demographic, Economic and Housing Trends 1 1.2 Summary of Priority Housing Needs 6
2. Introduction 9
2.1 Background and Purpose 9 2.2 Housing Goals and Principles 10
2.3 What is Affordable Housing? 11
3. Demographic Profile 13 3.1 Population Growth 13 3.2 Age Distribution 14 3.3 Racial Composition 19 3.4 Household Composition 19
4. Economic Profile 22 4.1 Incomes 22 4.2 Poverty 25 4.3 Employment 26 4.4 Education 28 4.5 Disability Status 29
5. Housing Profile 31 5.1 Housing Growth 31 5.2 Housing Occupancy 33 5.3 Types of Units and Structures 34 5.4 Housing Market Conditions 37 5.5 Affordability Analysis 43 5.6 Subsidized Housing Inventory (SHI) 51 5.7 Summary Housing Needs 55
APPENDICES Appendix 1: Local and Regional Organizations 64 Appendix 2: Glossary of Housing Terms 70 Appendix 3: Demographic, Economic and Housing Characteristics For Beverly, Essex County and Massachusetts 76 Appendix 4: Demographic, Economic and Housing Characteristics by Census Tract 78 Appendix 5: Detailed Affordability Analysis 82 Appendix 6: Subsidized Housing Inventory (SHI) 88 Appendix 7: Beverly Housing Authority (BHA) Developments 90
Beverly Housing Needs Assessment Page iv
Appendix 8: Summary of June 16, 2016 Community Housing Meeting 95 Appendix 9: Summary of Community Housing Survey 99
List of Tables Table 1-1: Cost Burdens 6 Table 2-1: 2016 HUD Income Limits for the Boston Area 12 Table 3-1: Population Change, 1930 to 2014 13 Table 3-2: Age Distribution, 1990 to 2014 15 Table 3-3: Age Distribution, 2010 and MAPC Future Projections 16 Table 3-4: Age Distribution, 2010 and State Data Center Projections 18 Table 3-5: Racial Information, 1990 to 2014 19 Table 3-6: Household Characteristics, 1990 to 2014 20 Table 3-7: Types of Households by Size, 2000, 2010 and 2014 21 Table 4-1: Household Income Distribution, 1989 to 2014 22 Table 4-2: Income Distribution by Tenure, 2000 and 2014 24 Table 4-3: Income Distribution by Age of Householder, 2014 24 Table 4-4: Median Income by Household Type, 2014 25 Table 4-5: Poverty Status, 1989 to 2014 25 Table 4-6: Average Employment and Wages by Industry, 2014 28 Table 4-7: Disability Status, 2014 29 Table 4-8: Types of Disabilities 30 Table 5-1: Residential Building Permits, 2000 to 2014 32 Table 5-2: Housing Occupancy, 1990 to 2014 33 Table 5-3: Vacancy Rates by Tenure, 2000, 2010 and 2014 34 Table 5-4: Units in Structure, 1980 to 2014 35 Table 5-5: Units in Structure by Tenure, 2014 36 Table 5-6: Number of Rooms per Unit, 2014 36 Table 5-7: Housing Values of Owner-Occupied Units, 1990 to 2014 37 Table 5-8: Median Sales Prices/Number of Sales, 2000-March 2016 38 Table 5-9: Single-family House/Condo Sales, 5/15 to 4/16 39 Table 5-10: Assessed Values of Single-family and Condos, 2016 40 Table 5-11: Assessed Values of Multi-family Properties, 2016 41 Table 5-12: Rental Costs, 1990 to 2014 42 Table 5-13: Market Rental Listings, 5/16 42 Table 5-14: Cost Burdens, 2012 49 Table 5-15: Foreclosure Activity, 2007 to May 2016 50 Table 5-16: Beverly Residents on MassNAHRO Section 8 Waitlist 53 Table 5-17: Unmet Housing Need 62
List of Figures Figure 1-1: Population Growth, 1950 to 2010 2 Figure 1-2: Distribution of Units by Structure 4 Figure 3-1: Changes in Age Distribution, 1990 to 2014 15 Figure 3-2: Projected Changes in Age Distribution/MAPC , 2010-2030 17 Figure 3-3: Population Change Comparisons, 2010-2030 18 Figure 4-1: Change in Income Distribution, 1989, 2010 and 2014 23 Figure 4-2: Means of Commuting to Work, 2014 26
Beverly Housing Needs Assessment Page v
Figure 4-3: Occupations, 2014 27 Figure 5-1: Historic Housing Growth 31 Figure 5-2: Distribution of Units per Structure, 2014 35 Figure 5-3: Median Single-family Home Prices for Beverly and Neighboring Communities 37 Figure 5-4: Assessed Values of Single-family Units and Condos, 2016 41 Figure 5-5: Median Household Income and Median House Values, 1990-2014 44 Figure 5-6: SHI Units for Beverly and Neighboring Communities 51 Figure 5-7: Growth of Senior Population, 2010 to 2015 57
Beverly Housing Needs Assessment Page 1
BEVERLY, MASSACHUSETTS HOUSING NEEDS ASSESSMENT
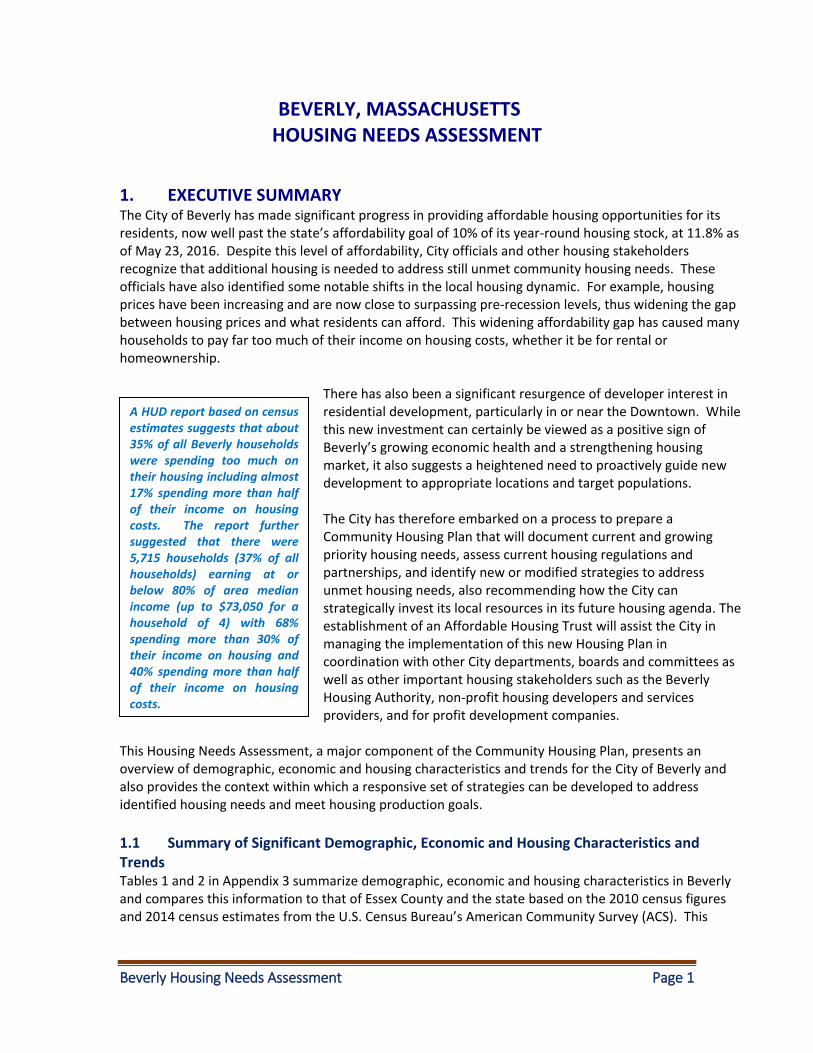
1. EXECUTIVE SUMMARY The City of Beverly has made significant progress in providing affordable housing opportunities for its residents, now well past the state’s affordability goal of 10% of its year-round housing stock, at 11.8% as of May 23, 2016. Despite this level of affordability, City officials and other housing stakeholders recognize that additional housing is needed to address still unmet community housing needs. These officials have also identified some notable shifts in the local housing dynamic. For example, housing prices have been increasing and are now close to surpassing pre-recession levels, thus widening the gap between housing prices and what residents can afford. This widening affordability gap has caused many households to pay far too much of their income on housing costs, whether it be for rental or homeownership.
There has also been a significant resurgence of developer interest in residential development, particularly in or near the Downtown. While this new investment can certainly be viewed as a positive sign of Beverly’s growing economic health and a strengthening housing market, it also suggests a heightened need to proactively guide new development to appropriate locations and target populations. The City has therefore embarked on a process to prepare a Community Housing Plan that will document current and growing priority housing needs, assess current housing regulations and partnerships, and identify new or modified strategies to address unmet housing needs, also recommending how the City can strategically invest its local resources in its future housing agenda. The establishment of an Affordable Housing Trust will assist the City in managing the implementation of this new Housing Plan in coordination with other City departments, boards and committees as well as other important housing stakeholders such as the Beverly Housing Authority, non-profit housing developers and services providers, and for profit development companies.
This Housing Needs Assessment, a major component of the Community Housing Plan, presents an overview of demographic, economic and housing characteristics and trends for the City of Beverly and also provides the context within which a responsive set of strategies can be developed to address identified housing needs and meet housing production goals.
1.1 Summary of Significant Demographic, Economic and Housing Characteristics and Trends Tables 1 and 2 in Appendix 3 summarize demographic, economic and housing characteristics in Beverly and compares this information to that of Essex County and the state based on the 2010 census figures and 2014 census estimates from the U.S. Census Bureau’s American Community Survey (ACS). This
A HUD report based on census estimates suggests that about 35% of all Beverly households were spending too much on their housing including almost 17% spending more than half of their income on housing costs. The report further suggested that there were 5,715 households (37% of all households) earning at or below 80% of area median income (up to $73,050 for a household of 4) with 68% spending more than 30% of their income on housing and 40% spending more than half of their income on housing costs.
Beverly Housing Needs Assessment Page 2
information, as well as other data from Sections 3 and 4, indicates the following notable community trends:
Demographic Trends: Relatively stable population of about 40,000 residents with significant projected demographic shifts to fewer children, more alder adults and increasing numbers of smaller, non-family households.
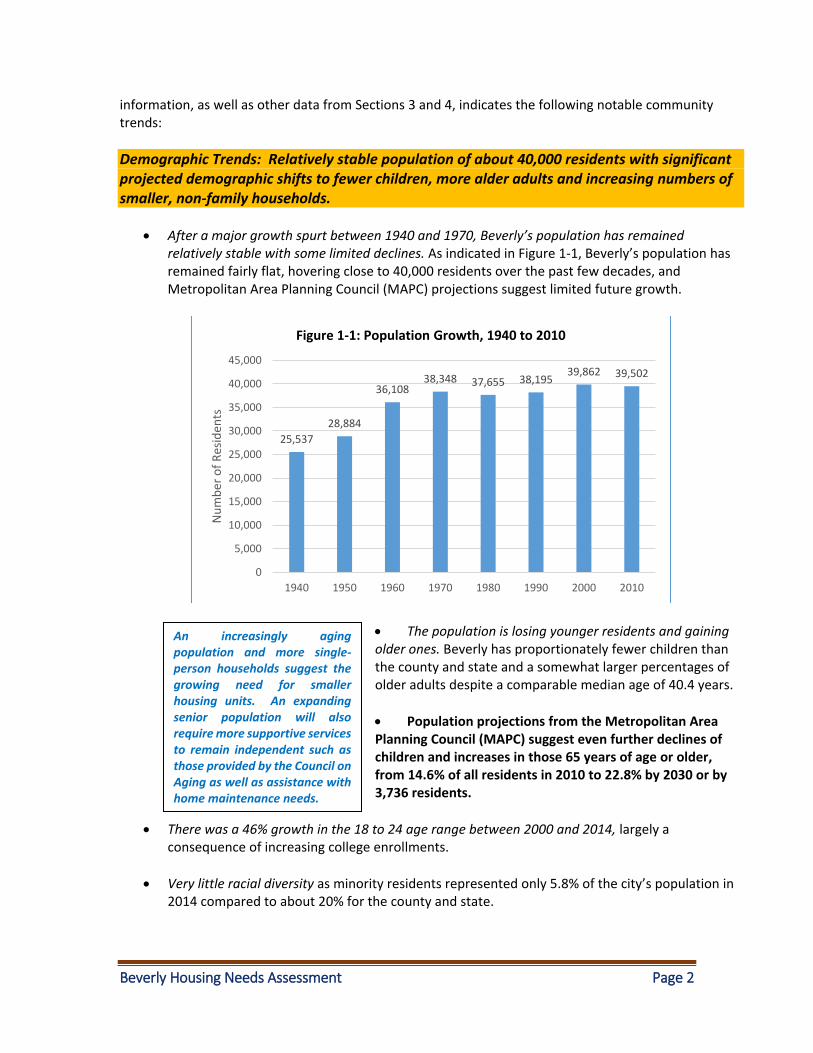
After a major growth spurt between 1940 and 1970, Beverly’s population has remained relatively stable with some limited declines. As indicated in Figure 1-1, Beverly’s population has remained fairly flat, hovering close to 40,000 residents over the past few decades, and Metropolitan Area Planning Council (MAPC) projections suggest limited future growth.
The population is losing younger residents and gaining older ones. Beverly has proportionately fewer children than the county and state and a somewhat larger percentages of older adults despite a comparable median age of 40.4 years.
Population projections from the Metropolitan Area Planning Council (MAPC) suggest even further declines of children and increases in those 65 years of age or older, from 14.6% of all residents in 2010 to 22.8% by 2030 or by 3,736 residents.
There was a 46% growth in the 18 to 24 age range between 2000 and 2014, largely a consequence of increasing college enrollments.
Very little racial diversity as minority residents represented only 5.8% of the city’s population in 2014 compared to about 20% for the county and state.
25,537
28,884
36,10838,348 37,655 38,195
39,862 39,502
0
5,000
10,000
15,000
20,000
25,000
30,000
35,000
40,000
45,000
1940 1950 1960 1970 1980 1990 2000 2010
Nu
mb
er o
f R
esid
ents
Figure 1-1: Population Growth, 1940 to 2010
An increasingly aging population and more single-person households suggest the growing need for smaller housing units. An expanding senior population will also require more supportive services to remain independent such as those provided by the Council on Aging as well as assistance with home maintenance needs.
Beverly Housing Needs Assessment Page 3
Growth in the number of households has been substantially higher than overall population growth. While Beverly’s population grew by 5.7% between 1990 and 2014, the percentage of households increased by 7.6%.
Family households decreased from 67% of all households in 1990 to 58.4% by 2014, lower than 66.7% and 63.6% for the county and state, respectively. The trend towards fewer families and more non-family households1 is more typically the norm in more affluent communities, such as Beverly, which are also experiencing increases in older adults.
Trend towards smaller households. The average household size decreased from 2.48 to 2.35 persons between 1990 and 2014, in line with expected trends towards more “child-free” and “child-delayed” families and especially increases in empty nesters. Beverly has more single-person households spread across all ages, at 31.4% of all households in 2014 compared to 27.7% for the county and 28.8% for the state.
Economic Trends: Rising income levels but also increasing income disparities, including some growth in poverty.
Somewhat higher income levels as the 2014 median household income was $73,980 in Beverly compared to $68,776 and $67,846 for the county and state, respectively. On the other hand, Beverly’s median household income level was lower in comparison to most of its neighbors including $77,404 in Danvers, $108,558 in Hamilton, $89,185 in Essex, $89,313 in Manchester, and $116,865 for Wenham, however it was significantly higher than $59,044 in Salem and $60,229 in Gloucester.
An estimated 37% of all households are earning at or below 80% of median income for the Boston area, which includes Beverly, and thus based on income alone could potentially be eligible for government housing assistance.
Significant income disparities as one-third of renters earned within $25,000 in 2014, more than three times the percentage of homeowners in this income range. On the other hand, more than half of the homeowners earned more than $100,000 compared to only about 11% of renters. The disparity of incomes from renters and homeowners is also reflected in median income levels of $37,872 and $103,098 respectively. Moreover, while the median income for owners increased by 53% between 2000 and 2014, it increased by only 7.5% for renters.
1 Includes individuals and unrelated household members, referred to by the U.S. Census Bureau as nonfamily households.
MAPC projections indicate that the number of households will increase by another 12.4% between 2010 and 2030, more than double the projected 5.8% population increase. This is due to projected increases in smaller families and non-family households, largely driven by an aging population.
Beverly Housing Needs Assessment Page 4
While the overall community has become increasingly more affluent over the past several decades, with those earning more than $100,000 increasing from 7.1% in 1989 to 36% by 2014, there remains a very vulnerable population living in Beverly with limited financial means. In 2014, 18.8% of all households earned less than $25,000, only a bit lower than 19.5% for the county and 20% for the state.
Some increases in poverty. Poverty, while comparably low to county and state levels of 11.3% and 11.6%, respectively, has fluctuated significantly over the past several decades but in general has grown from 6.4% in 1989 to 8.6% by 2014, involving 3,472 residents.2
Housing Trends: There has been a slowdown of housing growth with some remaining affordability in the private housing market, threatened by rising prices and a significant recent upsurge in development.
Very limited recent housing growth at 3.1% between 2000 and 2014, less than half the 7.2% rate for Essex County and 7.4% statewide. However, relatively recent developer interest is poised to boost the housing supply considerably, including the integration of some housing affordability because of the City’s inclusionary zoning ordinance.
Fairly comparable level of owner-occupancy at 61% of all units as opposed to 63% and 62% for the county and state, respectively.
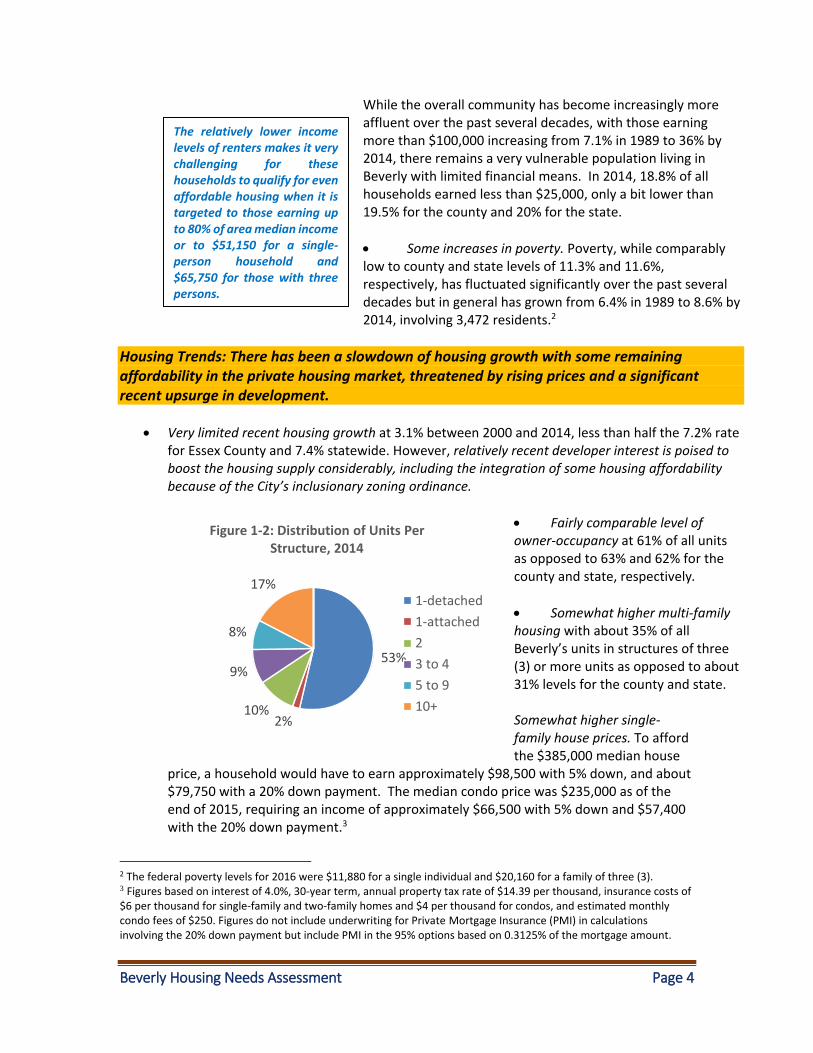
Somewhat higher multi-family housing with about 35% of all Beverly’s units in structures of three (3) or more units as opposed to about 31% levels for the county and state.
Somewhat higher single-family house prices. To afford the $385,000 median house
price, a household would have to earn approximately $98,500 with 5% down, and about $79,750 with a 20% down payment. The median condo price was $235,000 as of the end of 2015, requiring an income of approximately $66,500 with 5% down and $57,400 with the 20% down payment.3
2 The federal poverty levels for 2016 were $11,880 for a single individual and $20,160 for a family of three (3). 3 Figures based on interest of 4.0%, 30-year term, annual property tax rate of $14.39 per thousand, insurance costs of $6 per thousand for single-family and two-family homes and $4 per thousand for condos, and estimated monthly condo fees of $250. Figures do not include underwriting for Private Mortgage Insurance (PMI) in calculations involving the 20% down payment but include PMI in the 95% options based on 0.3125% of the mortgage amount.
The relatively lower income levels of renters makes it very challenging for these households to qualify for even affordable housing when it is targeted to those earning up to 80% of area median income or to $51,150 for a single-person household and $65,750 for those with three persons.
53%
2%10%
9%
8%
17%
Figure 1-2: Distribution of Units Per Structure, 2014
1-detached
1-attached
2
3 to 4
5 to 9
10+
Beverly Housing Needs Assessment Page 5
The median rent of $1,068 in 2014 is relatively comparable to those of the county and state at $1,063 and $1,088, respectively. It is also important to note that the census count includes 1,910 subsidized units, representing about 30% of all rental units in Beverly, thus making the median rent level appear more affordable than it really is.
The affordability gap for single-family homes was $88,000, based on the difference between what a median income household could afford of $297,000 (for an average household of three and 95% financing) and the median house price of $385,000. The gap decreased to $50,000 based on 80% financing and the ability to afford the upfront cash requirements for the down payment and closing costs of at least $70,000, something most first-time homebuyers are typically challenged to provide.
The affordability gap for those earning at 80% of area median income ($65,750 for a household of three for example ) widens to about $121,500, the difference between the median priced single-family home of $385,000 and what a three-person household earning at this income level can afford, or $263,500 based on 95% financing. The gap decreases to $87,000 with 80% financing but once again the purchaser must have the upfront cash of approximately $65,000 available which effectively adds to the affordability gap.
There is currently no affordability gap for condos as a median income earning household can afford the median condo price of $235,000 under both the 80% and 95% financing options. There is a small $18,000 gap however in the 95% financing example for those households earning at or below 80% AMI where a household earning at this limit could afford no more than $217,000.
There is some significant affordability in Beverly’s housing market as there were 496 single-family homes and 775 condos affordable to those earning at or below 80% of the area median income (AMI) for a total of 1,271 units or 12.9% of all these units. More than half of the condos were affordable to those within this income range. It is likely however, that many of these units are small and/or in relatively poor condition.
The lowest internet rental listing for a two-bedroom apartment was $1,300 in May 2016. This rent would require an income of about $59,000, assuming $175 in monthly utility bills and housing expenses of no more than 30% of household income. This means that the median income earning renter household ($37,872), who can afford a rent of about $772, faces a monthly affordability gap of more than $800. Landlords also often require first and last month’s rent up-front plus a security deposit that often adds to this affordability gap.
Beverly Housing Needs Assessment Page 6
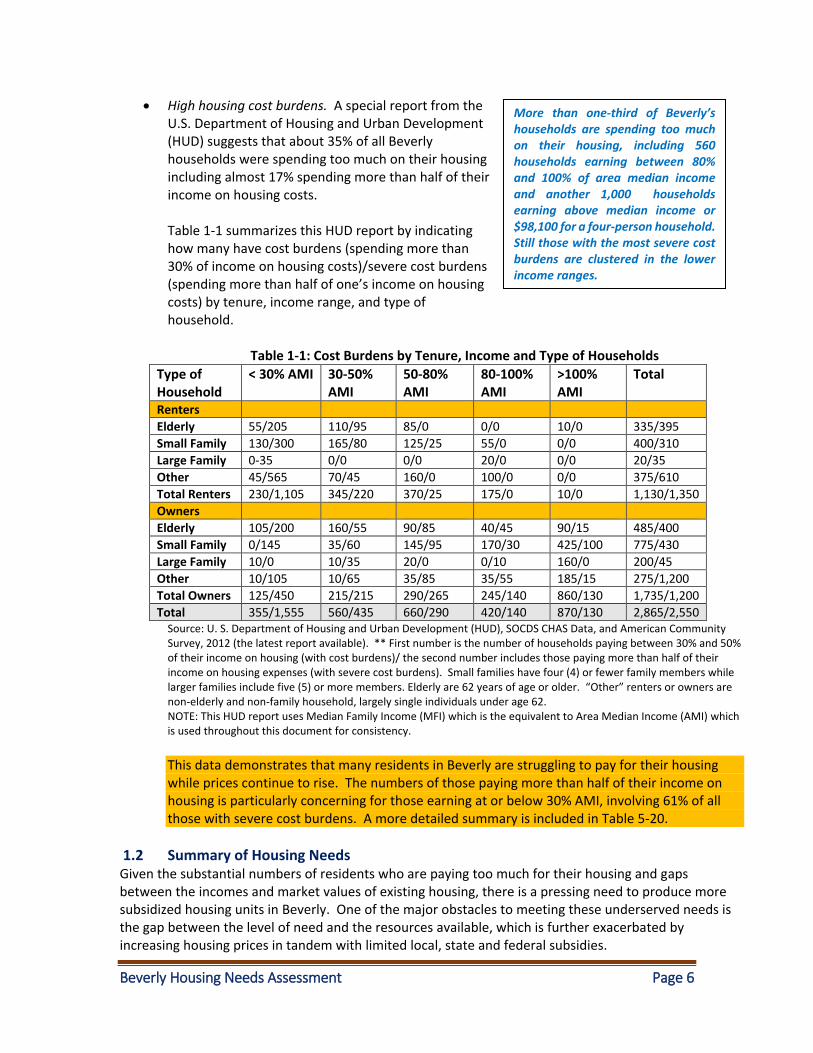
High housing cost burdens. A special report from the U.S. Department of Housing and Urban Development (HUD) suggests that about 35% of all Beverly households were spending too much on their housing including almost 17% spending more than half of their income on housing costs. Table 1-1 summarizes this HUD report by indicating how many have cost burdens (spending more than 30% of income on housing costs)/severe cost burdens (spending more than half of one’s income on housing costs) by tenure, income range, and type of household.
Table 1-1: Cost Burdens by Tenure, Income and Type of Households
Type of Household
< 30% AMI 30-50% AMI
50-80% AMI
80-100% AMI
>100% AMI
Total
Renters
Elderly 55/205 110/95 85/0 0/0 10/0 335/395
Small Family 130/300 165/80 125/25 55/0 0/0 400/310
Large Family 0-35 0/0 0/0 20/0 0/0 20/35
Other 45/565 70/45 160/0 100/0 0/0 375/610
Total Renters 230/1,105 345/220 370/25 175/0 10/0 1,130/1,350
Owners
Elderly 105/200 160/55 90/85 40/45 90/15 485/400
Small Family 0/145 35/60 145/95 170/30 425/100 775/430
Large Family 10/0 10/35 20/0 0/10 160/0 200/45
Other 10/105 10/65 35/85 35/55 185/15 275/1,200
Total Owners 125/450 215/215 290/265 245/140 860/130 1,735/1,200
Total 355/1,555 560/435 660/290 420/140 870/130 2,865/2,550 Source: U. S. Department of Housing and Urban Development (HUD), SOCDS CHAS Data, and American Community Survey, 2012 (the latest report available). ** First number is the number of households paying between 30% and 50% of their income on housing (with cost burdens)/ the second number includes those paying more than half of their income on housing expenses (with severe cost burdens). Small families have four (4) or fewer family members while larger families include five (5) or more members. Elderly are 62 years of age or older. “Other” renters or owners are non-elderly and non-family household, largely single individuals under age 62. NOTE: This HUD report uses Median Family Income (MFI) which is the equivalent to Area Median Income (AMI) which is used throughout this document for consistency.
This data demonstrates that many residents in Beverly are struggling to pay for their housing while prices continue to rise. The numbers of those paying more than half of their income on housing is particularly concerning for those earning at or below 30% AMI, involving 61% of all those with severe cost burdens. A more detailed summary is included in Table 5-20.
1.2 Summary of Housing Needs Given the substantial numbers of residents who are paying too much for their housing and gaps between the incomes and market values of existing housing, there is a pressing need to produce more subsidized housing units in Beverly. One of the major obstacles to meeting these underserved needs is the gap between the level of need and the resources available, which is further exacerbated by increasing housing prices in tandem with limited local, state and federal subsidies.
More than one-third of Beverly’s households are spending too much on their housing, including 560 households earning between 80% and 100% of area median income and another 1,000 households earning above median income or $98,100 for a four-person household. Still those with the most severe cost burdens are clustered in the lower income ranges.
Beverly Housing Needs Assessment Page 7
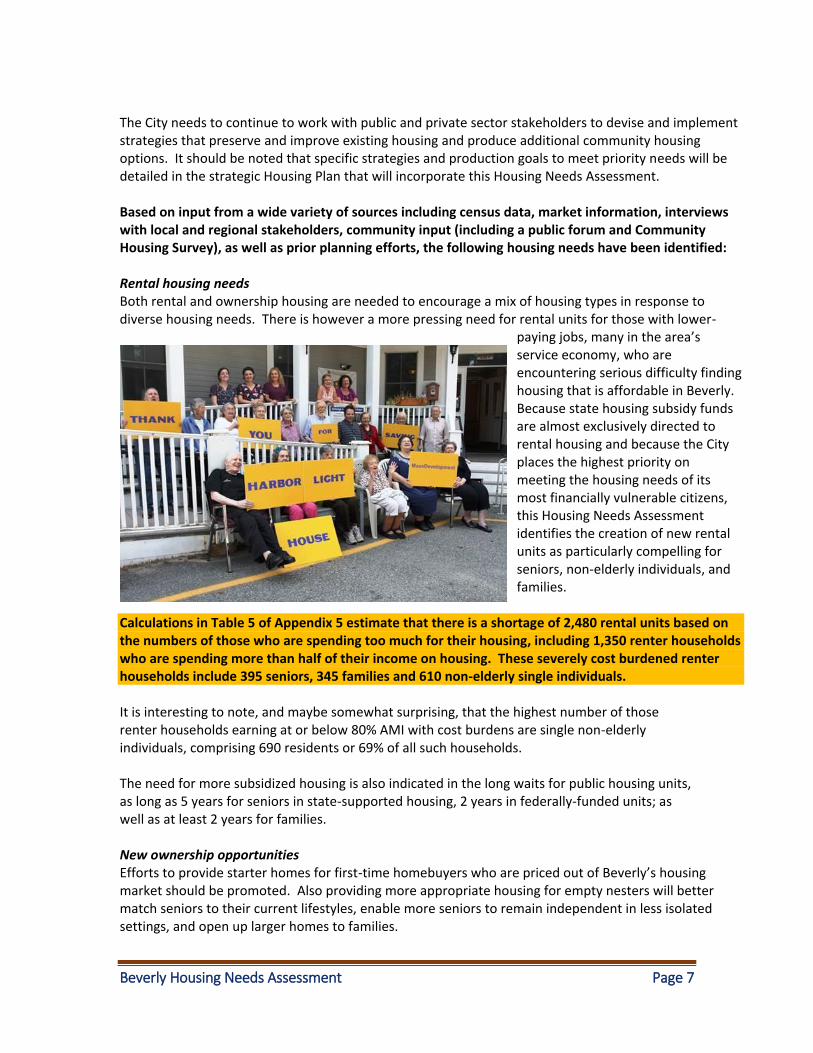
The City needs to continue to work with public and private sector stakeholders to devise and implement strategies that preserve and improve existing housing and produce additional community housing options. It should be noted that specific strategies and production goals to meet priority needs will be detailed in the strategic Housing Plan that will incorporate this Housing Needs Assessment. Based on input from a wide variety of sources including census data, market information, interviews with local and regional stakeholders, community input (including a public forum and Community Housing Survey), as well as prior planning efforts, the following housing needs have been identified: Rental housing needs Both rental and ownership housing are needed to encourage a mix of housing types in response to diverse housing needs. There is however a more pressing need for rental units for those with lower-
paying jobs, many in the area’s service economy, who are encountering serious difficulty finding housing that is affordable in Beverly. Because state housing subsidy funds are almost exclusively directed to rental housing and because the City places the highest priority on meeting the housing needs of its most financially vulnerable citizens, this Housing Needs Assessment identifies the creation of new rental units as particularly compelling for seniors, non-elderly individuals, and families.
Calculations in Table 5 of Appendix 5 estimate that there is a shortage of 2,480 rental units based on the numbers of those who are spending too much for their housing, including 1,350 renter households who are spending more than half of their income on housing. These severely cost burdened renter households include 395 seniors, 345 families and 610 non-elderly single individuals. It is interesting to note, and maybe somewhat surprising, that the highest number of those renter households earning at or below 80% AMI with cost burdens are single non-elderly individuals, comprising 690 residents or 69% of all such households. The need for more subsidized housing is also indicated in the long waits for public housing units, as long as 5 years for seniors in state-supported housing, 2 years in federally-funded units; as well as at least 2 years for families. New ownership opportunities Efforts to provide starter homes for first-time homebuyers who are priced out of Beverly’s housing market should be promoted. Also providing more appropriate housing for empty nesters will better match seniors to their current lifestyles, enable more seniors to remain independent in less isolated settings, and open up larger homes to families.
Beverly Housing Needs Assessment Page 8
Many homeowners are also struggling financially. For example, 1,200 homeowners were spending more than half their income on housing, including 400 seniors, 475 families and 325 non-elderly single individuals.
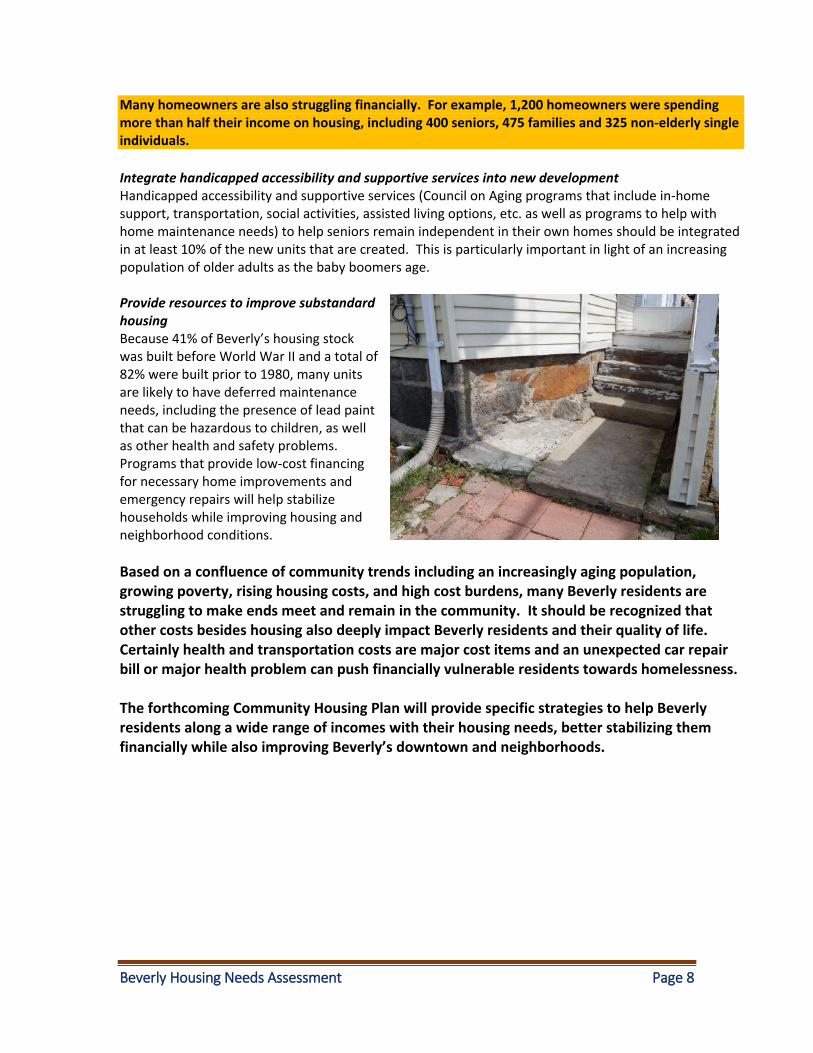
Integrate handicapped accessibility and supportive services into new development Handicapped accessibility and supportive services (Council on Aging programs that include in-home support, transportation, social activities, assisted living options, etc. as well as programs to help with home maintenance needs) to help seniors remain independent in their own homes should be integrated in at least 10% of the new units that are created. This is particularly important in light of an increasing population of older adults as the baby boomers age. Provide resources to improve substandard housing Because 41% of Beverly’s housing stock was built before World War II and a total of 82% were built prior to 1980, many units are likely to have deferred maintenance needs, including the presence of lead paint that can be hazardous to children, as well as other health and safety problems. Programs that provide low-cost financing for necessary home improvements and emergency repairs will help stabilize households while improving housing and neighborhood conditions.
Based on a confluence of community trends including an increasingly aging population, growing poverty, rising housing costs, and high cost burdens, many Beverly residents are struggling to make ends meet and remain in the community. It should be recognized that other costs besides housing also deeply impact Beverly residents and their quality of life. Certainly health and transportation costs are major cost items and an unexpected car repair bill or major health problem can push financially vulnerable residents towards homelessness. The forthcoming Community Housing Plan will provide specific strategies to help Beverly residents along a wide range of incomes with their housing needs, better stabilizing them financially while also improving Beverly’s downtown and neighborhoods.
Beverly Housing Needs Assessment Page 9
2. INTRODUCTION
2.1 Background and Purpose The historic City of Beverly is located in relatively easy access to Boston through commuter rail and Route 128. It is bordered by Danvers on the west, Wenham on the north and east, Manchester also on the east, and Beverly Harbor and the Danvers River on the south. The city has experienced substantial shifts over the years, transitioning from a major manufacturing center to a more diversified economic base of industries with rich educational, medical and cultural institutions. Certainly Beverly’s historic development can be traced through changes in the housing stock, moving from workers housing in and closer to the Downtown, to older single-family homes in those neighborhoods ringing the central core, and then to more suburban housing development in the community’s outer ring. The City prepared a Housing Plan in 2005 as part of its Executive Order 418 Community Development Plan, which is now well out of date given major changes in housing market conditions, the regulatory framework, as well as regional development patterns. This Housing Needs Assessment is a major component of the forthcoming Community Housing Plan that will enable the City to revisit prior planning under the context of the current housing dynamic. The Plan will provide a roadmap for policies, projects, initiatives, and regulatory changes that will help Beverly create additional housing opportunities for a broad range of incomes and household types. In addition to surpassing the state’s 10% affordability threshold, the Housing Plan will also build on recent City accomplishments with respect to community housing including:
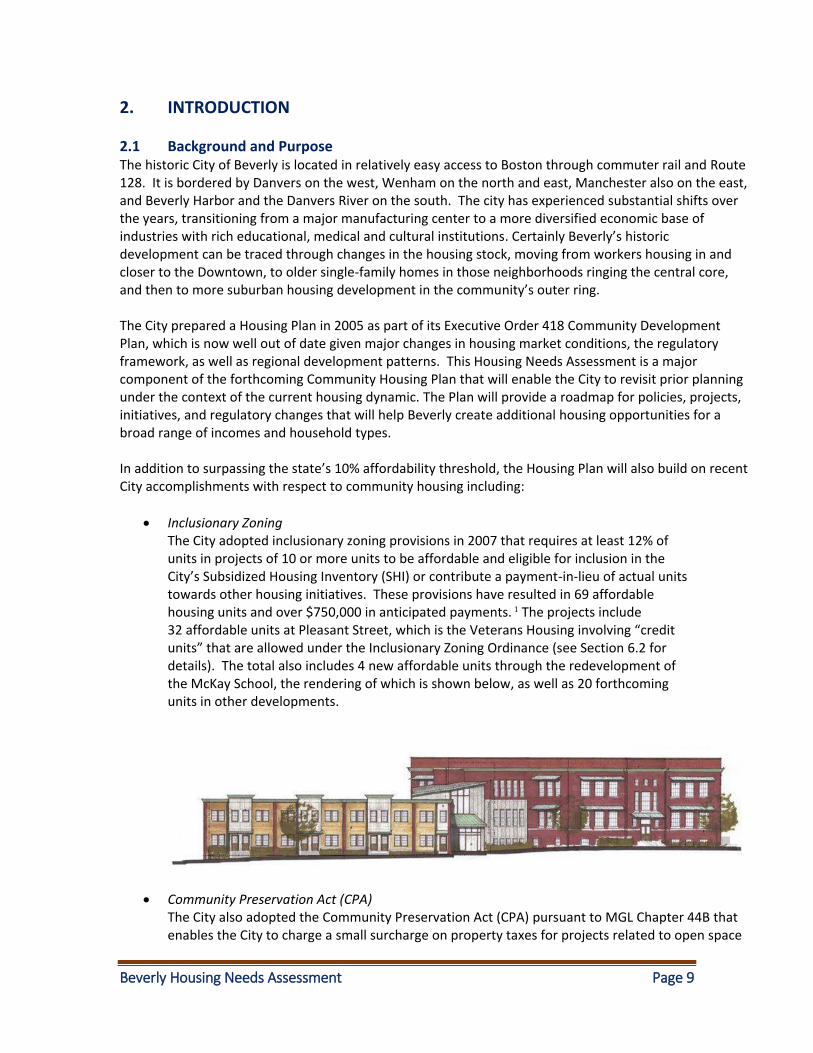
Inclusionary Zoning The City adopted inclusionary zoning provisions in 2007 that requires at least 12% of units in projects of 10 or more units to be affordable and eligible for inclusion in the City’s Subsidized Housing Inventory (SHI) or contribute a payment-in-lieu of actual units towards other housing initiatives. These provisions have resulted in 69 affordable housing units and over $750,000 in anticipated payments. 1 The projects include 32 affordable units at Pleasant Street, which is the Veterans Housing involving “credit units” that are allowed under the Inclusionary Zoning Ordinance (see Section 6.2 for details). The total also includes 4 new affordable units through the redevelopment of the McKay School, the rendering of which is shown below, as well as 20 forthcoming units in other developments.
Community Preservation Act (CPA) The City also adopted the Community Preservation Act (CPA) pursuant to MGL Chapter 44B that enables the City to charge a small surcharge on property taxes for projects related to open space
Beverly Housing Needs Assessment Page 10
preservation, recreation, historic preservation and affordable housing. Matching funding from the state enable the City to augment its Community Preservation Fund. About $200,000 has thus far been allocated in support of affordable housing.
Affordable Housing Trust The City is in the process of establishing a Municipal Affordable Housing Trust pursuant to MGL Chapter 44, Section 55C that will manage funding from the payments that have accumulated from the City’s inclusionary zoning ordinance as well as other sources of funding. This Housing Trust can also be instrumental in coordinating the implementation of the Community Housing Plan.
Smart Growth Zoning The City has recently enacted zoning to better promote mixed uses and transit-oriented development in its Downtown through the zoning of the Central Business District and Depot Parking Overlay District. The City has also been going through a planning process to redevelop an industrial area along the Bass River, encouraging mixed uses.
2.2 Housing Goals and Principles In 2002 the City completed a Master Plan that articulated a vision for Beverly’s future, including 10 guiding principles to help support this vision. Four of these principles have some relevance to housing and include:
Recognize and enhance the City’s cultural and historical assets as a means to retain a unique identity, respect the past, and enrich the present;
Protect the City’s marine and waterfront resources while providing expanded public access by promoting new mixed-use development and waterside recreational facilities;
Maintain a diverse population within vital and distinct neighborhoods by providing the needed housing and amenities that recognize the unique conditions and requirements of each neighborhood; and
Maintain and promote a vibrant downtown that is business and people friendly, and provides a distinctive, high quality atmosphere and destination point.
These principles were further adopted as part of the City’s Community Development Plan that was created under Executive Order 418 in 2005, and are also incorporated in this Housing Needs Assessment with the following housing goals to further promote housing diversity, sustainability and choice:
Provide housing opportunities to address the broad range of local housing needs across incomes and household types;
Leverage local housing resources to the greatest extent possible;
Maximize energy efficiency and other sustainability measures;
Promote home modifications for people with disabilities in new housing development and redevelopment projects;
Insure that housing design reflects the City’s historic character and improves neighborhood appeal;
Promote fair and equal access to housing including efforts to stop discrimination and spread affordable housing opportunities to neighborhoods across the City; and
Beverly Housing Needs Assessment Page 11
Encourage new housing development targeted in areas well served by public transportation thereby reducing reliance on single occupancy vehicles and associated costs.
2.3 What is Affordable Housing? Affordable housing, sometimes referred to as subsidized housing or community housing, is generally defined by the income of the household in comparison to housing costs. For example, the federal government identifies units as affordable if a household is paying no more than 30% of its income on housing, whether for ownership or rental. If households are paying more than this threshold, they are described as experiencing housing affordability problems or cost burdens; and if they are paying 50% or more for housing, they have severe housing cost burdens. A detailed analysis of affordability is included in Section 5.5 and Appendix 5 of this Housing Needs Assessment.
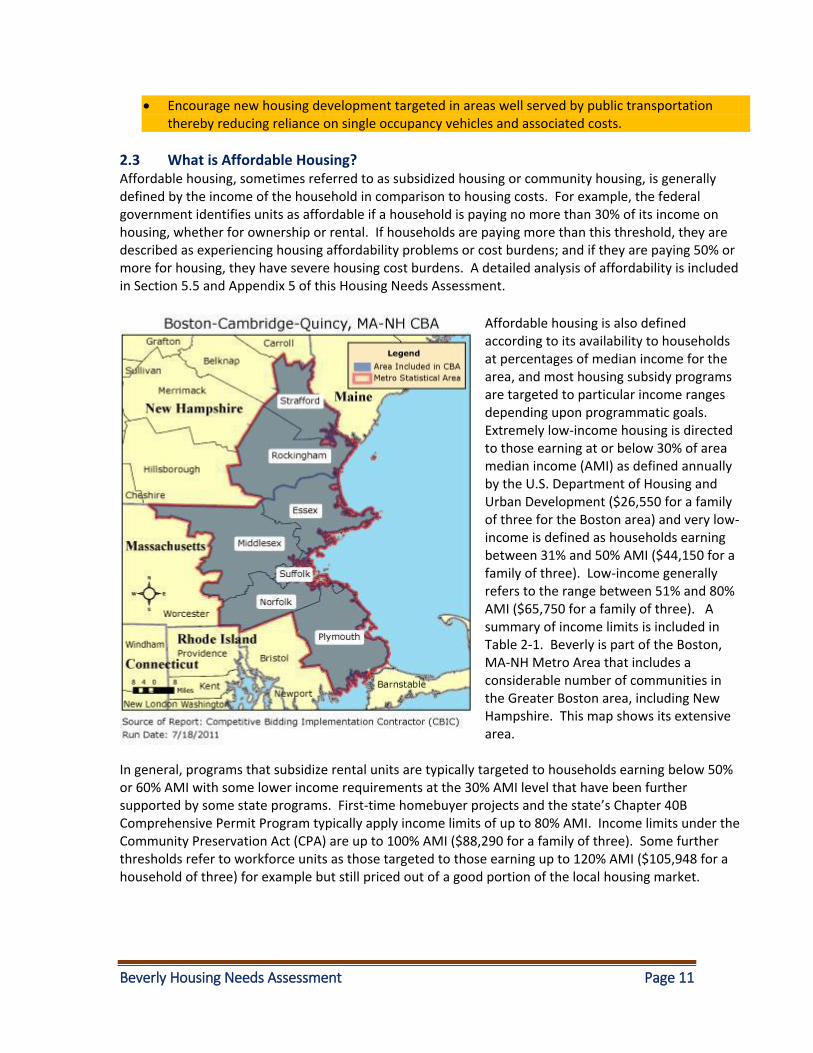
Affordable housing is also defined according to its availability to households at percentages of median income for the area, and most housing subsidy programs are targeted to particular income ranges depending upon programmatic goals. Extremely low-income housing is directed to those earning at or below 30% of area median income (AMI) as defined annually by the U.S. Department of Housing and Urban Development ($26,550 for a family of three for the Boston area) and very low-income is defined as households earning between 31% and 50% AMI ($44,150 for a family of three). Low-income generally refers to the range between 51% and 80% AMI ($65,750 for a family of three). A summary of income limits is included in Table 2-1. Beverly is part of the Boston, MA-NH Metro Area that includes a considerable number of communities in the Greater Boston area, including New Hampshire. This map shows its extensive area.
In general, programs that subsidize rental units are typically targeted to households earning below 50% or 60% AMI with some lower income requirements at the 30% AMI level that have been further supported by some state programs. First-time homebuyer projects and the state’s Chapter 40B Comprehensive Permit Program typically apply income limits of up to 80% AMI. Income limits under the Community Preservation Act (CPA) are up to 100% AMI ($88,290 for a family of three). Some further thresholds refer to workforce units as those targeted to those earning up to 120% AMI ($105,948 for a household of three) for example but still priced out of a good portion of the local housing market.
Beverly Housing Needs Assessment Page 12
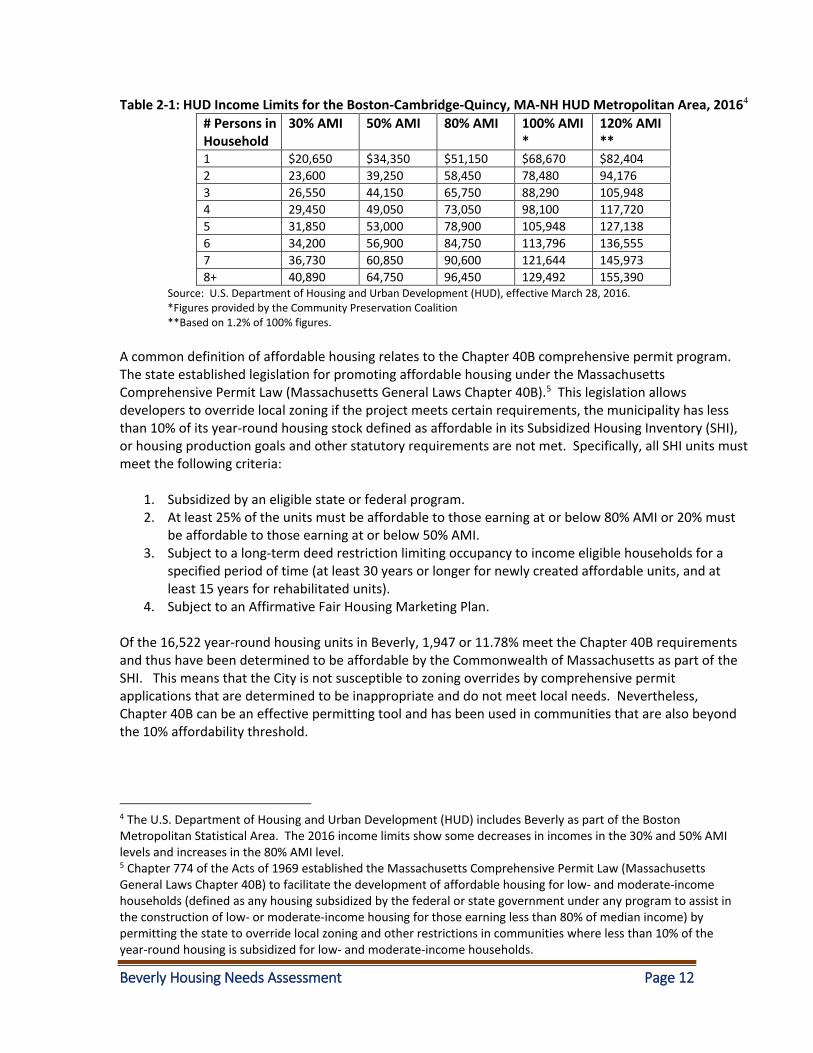
Table 2-1: HUD Income Limits for the Boston-Cambridge-Quincy, MA-NH HUD Metropolitan Area, 20164
# Persons in Household
30% AMI 50% AMI 80% AMI 100% AMI *
120% AMI **
1 $20,650 $34,350 $51,150 $68,670 $82,404
2 23,600 39,250 58,450 78,480 94,176
3 26,550 44,150 65,750 88,290 105,948
4 29,450 49,050 73,050 98,100 117,720
5 31,850 53,000 78,900 105,948 127,138
6 34,200 56,900 84,750 113,796 136,555
7 36,730 60,850 90,600 121,644 145,973
8+ 40,890 64,750 96,450 129,492 155,390 Source: U.S. Department of Housing and Urban Development (HUD), effective March 28, 2016. *Figures provided by the Community Preservation Coalition **Based on 1.2% of 100% figures.
A common definition of affordable housing relates to the Chapter 40B comprehensive permit program. The state established legislation for promoting affordable housing under the Massachusetts Comprehensive Permit Law (Massachusetts General Laws Chapter 40B).5 This legislation allows developers to override local zoning if the project meets certain requirements, the municipality has less than 10% of its year-round housing stock defined as affordable in its Subsidized Housing Inventory (SHI), or housing production goals and other statutory requirements are not met. Specifically, all SHI units must meet the following criteria:
1. Subsidized by an eligible state or federal program. 2. At least 25% of the units must be affordable to those earning at or below 80% AMI or 20% must
be affordable to those earning at or below 50% AMI. 3. Subject to a long-term deed restriction limiting occupancy to income eligible households for a
specified period of time (at least 30 years or longer for newly created affordable units, and at least 15 years for rehabilitated units).
4. Subject to an Affirmative Fair Housing Marketing Plan. Of the 16,522 year-round housing units in Beverly, 1,947 or 11.78% meet the Chapter 40B requirements and thus have been determined to be affordable by the Commonwealth of Massachusetts as part of the SHI. This means that the City is not susceptible to zoning overrides by comprehensive permit applications that are determined to be inappropriate and do not meet local needs. Nevertheless, Chapter 40B can be an effective permitting tool and has been used in communities that are also beyond the 10% affordability threshold.
4 The U.S. Department of Housing and Urban Development (HUD) includes Beverly as part of the Boston Metropolitan Statistical Area. The 2016 income limits show some decreases in incomes in the 30% and 50% AMI levels and increases in the 80% AMI level. 5 Chapter 774 of the Acts of 1969 established the Massachusetts Comprehensive Permit Law (Massachusetts General Laws Chapter 40B) to facilitate the development of affordable housing for low- and moderate-income households (defined as any housing subsidized by the federal or state government under any program to assist in the construction of low- or moderate-income housing for those earning less than 80% of median income) by permitting the state to override local zoning and other restrictions in communities where less than 10% of the year-round housing is subsidized for low- and moderate-income households.
Beverly Housing Needs Assessment Page 13
3. DEMOGRAPHIC PROFILE 6 It is important to closely examine demographic characteristics and trends to understand the composition of the population and how it relates to current and future housing needs. Key questions to be addressed include the following:
What have been the historical growth trends in the community?
What are the ramifications of increases and decreases of various age groups in regard to housing needs?
What are the variations in household size and types of households that suggest unmet or greater housing needs?
These and other issues are discussed in the following section. In essence, major findings indicate that for the past several decades the population has grown slowly, from 38,348 in 1970 to 40,370 by 2014, with declines in younger residents and significant gains in older ones, as well as increases in smaller households. The population is projected to continue to grow very little. However, those over 65 are estimated to grow more rapidly, with an increase from 14.6% of all residents in 2010 to 22.8% by 2030, representing a gain of 3,736 residents in this age category. Information in the following sections is for the city as a whole, but Appendix 4 includes data on key demographic characteristics for each of the 7 census tracts.
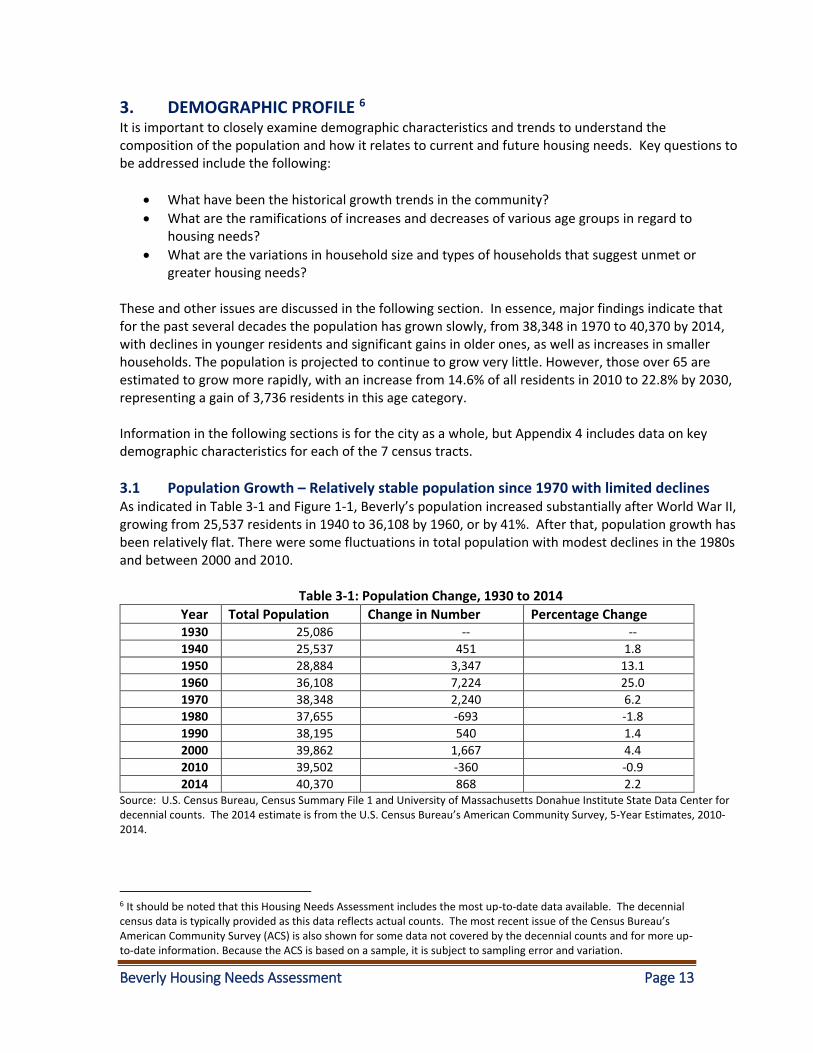
3.1 Population Growth – Relatively stable population since 1970 with limited declines As indicated in Table 3-1 and Figure 1-1, Beverly’s population increased substantially after World War II, growing from 25,537 residents in 1940 to 36,108 by 1960, or by 41%. After that, population growth has been relatively flat. There were some fluctuations in total population with modest declines in the 1980s and between 2000 and 2010.
Table 3-1: Population Change, 1930 to 2014
Year Total Population Change in Number Percentage Change 1930 25,086 -- --
1940 25,537 451 1.8
1950 28,884 3,347 13.1
1960 36,108 7,224 25.0
1970 38,348 2,240 6.2
1980 37,655 -693 -1.8
1990 38,195 540 1.4
2000 39,862 1,667 4.4
2010 39,502 -360 -0.9
2014 40,370 868 2.2 Source: U.S. Census Bureau, Census Summary File 1 and University of Massachusetts Donahue Institute State Data Center for decennial counts. The 2014 estimate is from the U.S. Census Bureau’s American Community Survey, 5-Year Estimates, 2010-2014.
6 It should be noted that this Housing Needs Assessment includes the most up-to-date data available. The decennial census data is typically provided as this data reflects actual counts. The most recent issue of the Census Bureau’s American Community Survey (ACS) is also shown for some data not covered by the decennial counts and for more up-to-date information. Because the ACS is based on a sample, it is subject to sampling error and variation.
Beverly Housing Needs Assessment Page 14
Census estimates from the American Community Survey (ACS) indicate that the population reached 40,370 by 2014. City census figures indicate a somewhat lower population total of 38,543 as of May 2016, but expect this total to increase somewhat as more census information is returned from residents. Population projections from the Metropolitan Area Planning Council (MAPC) estimate that the population will be 41,795 by 2030, 5.8% more than the 2010 census figure. The State Data Center at the University of Massachusetts’ Donahue Institute predicts a somewhat comparable increase to 41,504 residents by 2030.7
3.2 Age Distribution – Decreasing younger population but growing numbers of older residents
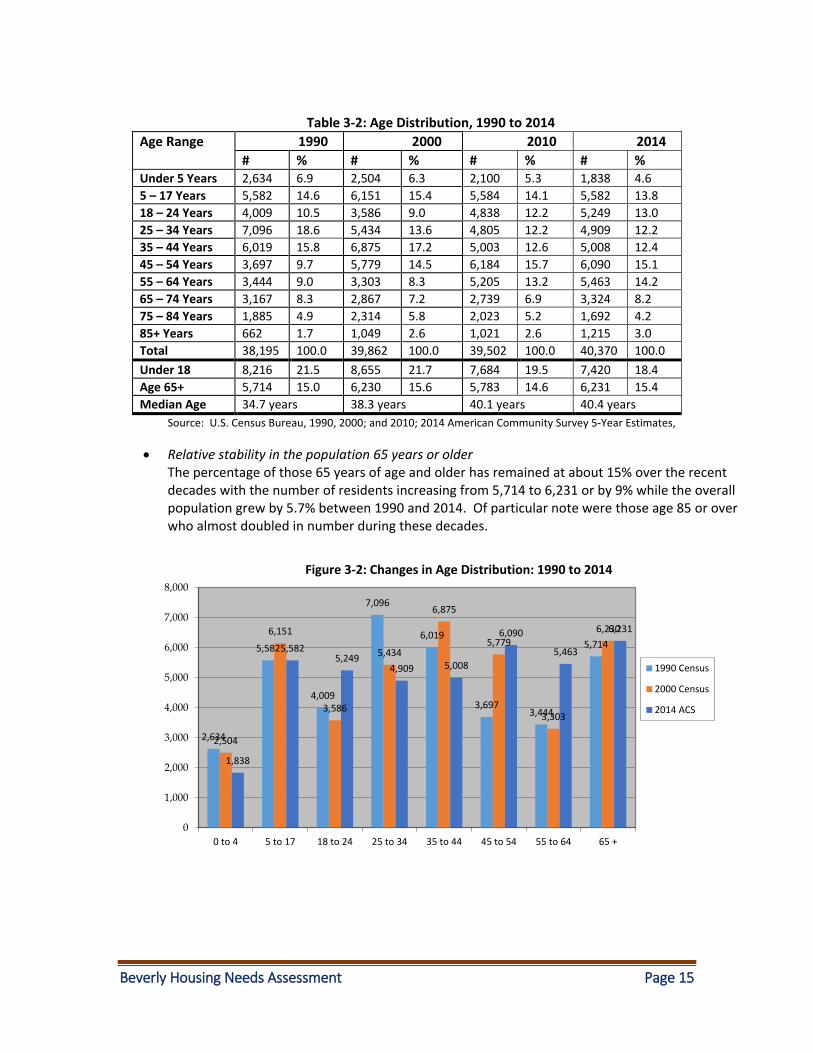
Table 3-2 presents census data on changes in the distribution of ages from 1990 through 2014, with the following major demographic shifts:
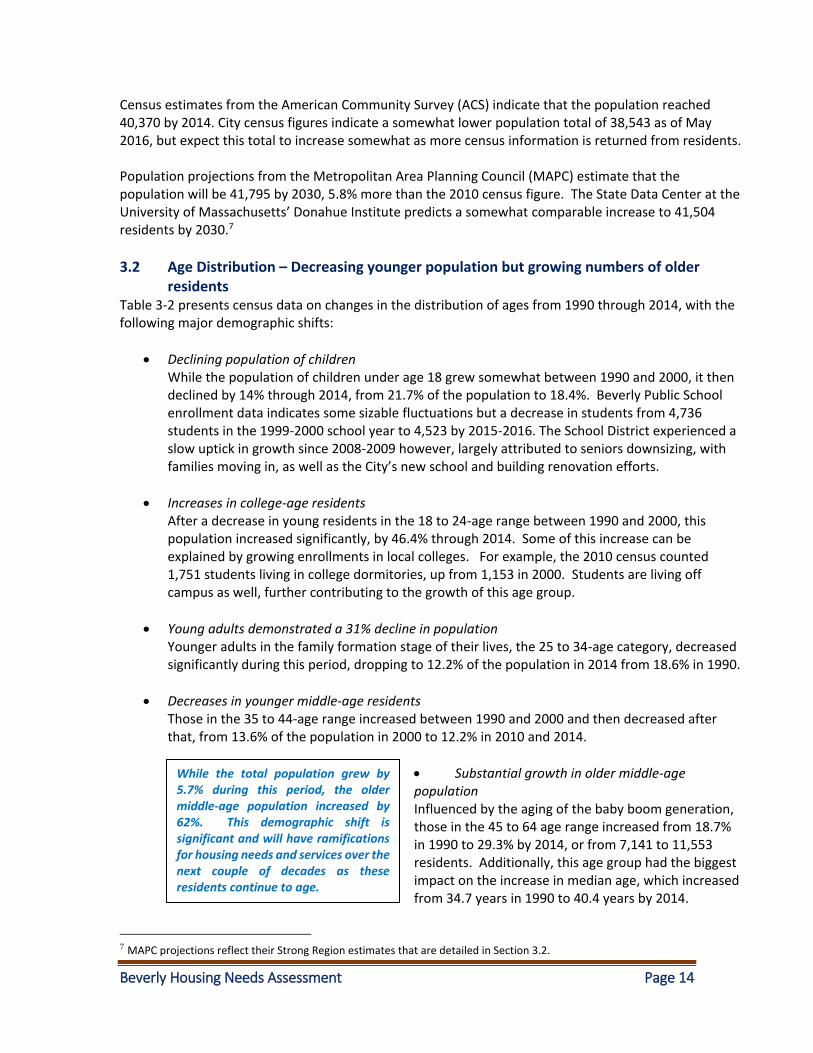
Declining population of children While the population of children under age 18 grew somewhat between 1990 and 2000, it then declined by 14% through 2014, from 21.7% of the population to 18.4%. Beverly Public School enrollment data indicates some sizable fluctuations but a decrease in students from 4,736 students in the 1999-2000 school year to 4,523 by 2015-2016. The School District experienced a slow uptick in growth since 2008-2009 however, largely attributed to seniors downsizing, with families moving in, as well as the City’s new school and building renovation efforts.
Increases in college-age residents After a decrease in young residents in the 18 to 24-age range between 1990 and 2000, this population increased significantly, by 46.4% through 2014. Some of this increase can be explained by growing enrollments in local colleges. For example, the 2010 census counted 1,751 students living in college dormitories, up from 1,153 in 2000. Students are living off campus as well, further contributing to the growth of this age group.
Young adults demonstrated a 31% decline in population Younger adults in the family formation stage of their lives, the 25 to 34-age category, decreased significantly during this period, dropping to 12.2% of the population in 2014 from 18.6% in 1990.
Decreases in younger middle-age residents Those in the 35 to 44-age range increased between 1990 and 2000 and then decreased after that, from 13.6% of the population in 2000 to 12.2% in 2010 and 2014.
Substantial growth in older middle-age population Influenced by the aging of the baby boom generation, those in the 45 to 64 age range increased from 18.7% in 1990 to 29.3% by 2014, or from 7,141 to 11,553 residents. Additionally, this age group had the biggest impact on the increase in median age, which increased from 34.7 years in 1990 to 40.4 years by 2014.
7 MAPC projections reflect their Strong Region estimates that are detailed in Section 3.2.
While the total population grew by 5.7% during this period, the older middle-age population increased by 62%. This demographic shift is significant and will have ramifications for housing needs and services over the next couple of decades as these residents continue to age.
Beverly Housing Needs Assessment Page 15
Table 3-2: Age Distribution, 1990 to 2014
Age Range 1990 2000 2010 2014
# % # % # % # % Under 5 Years 2,634 6.9 2,504 6.3 2,100 5.3 1,838 4.6
5 – 17 Years 5,582 14.6 6,151 15.4 5,584 14.1 5,582 13.8
18 – 24 Years 4,009 10.5 3,586 9.0 4,838 12.2 5,249 13.0
25 – 34 Years 7,096 18.6 5,434 13.6 4,805 12.2 4,909 12.2
35 – 44 Years 6,019 15.8 6,875 17.2 5,003 12.6 5,008 12.4
45 – 54 Years 3,697 9.7 5,779 14.5 6,184 15.7 6,090 15.1
55 – 64 Years 3,444 9.0 3,303 8.3 5,205 13.2 5,463 14.2
65 – 74 Years 3,167 8.3 2,867 7.2 2,739 6.9 3,324 8.2
75 – 84 Years 1,885 4.9 2,314 5.8 2,023 5.2 1,692 4.2
85+ Years 662 1.7 1,049 2.6 1,021 2.6 1,215 3.0
Total 38,195 100.0 39,862 100.0 39,502 100.0 40,370 100.0
Under 18 8,216 21.5 8,655 21.7 7,684 19.5 7,420 18.4
Age 65+ 5,714 15.0 6,230 15.6 5,783 14.6 6,231 15.4
Median Age 34.7 years 38.3 years 40.1 years 40.4 years
Source: U.S. Census Bureau, 1990, 2000; and 2010; 2014 American Community Survey 5-Year Estimates,
Relative stability in the population 65 years or older The percentage of those 65 years of age and older has remained at about 15% over the recent decades with the number of residents increasing from 5,714 to 6,231 or by 9% while the overall population grew by 5.7% between 1990 and 2014. Of particular note were those age 85 or over who almost doubled in number during these decades.
2,634
5,582
4,009
7,096
6,019
3,6973,444
5,714
2,504
6,151
3,586
5,434
6,875
5,779
3,303
6,230
1,838
5,5825,249
4,909 5,008
6,090
5,463
6,231
0
1,000
2,000
3,000
4,000
5,000
6,000
7,000
8,000
0 to 4 5 to 17 18 to 24 25 to 34 35 to 44 45 to 54 55 to 64 65 +
Figure 3-2: Changes in Age Distribution: 1990 to 2014
1990 Census
2000 Census
2014 ACS
Beverly Housing Needs Assessment Page 16
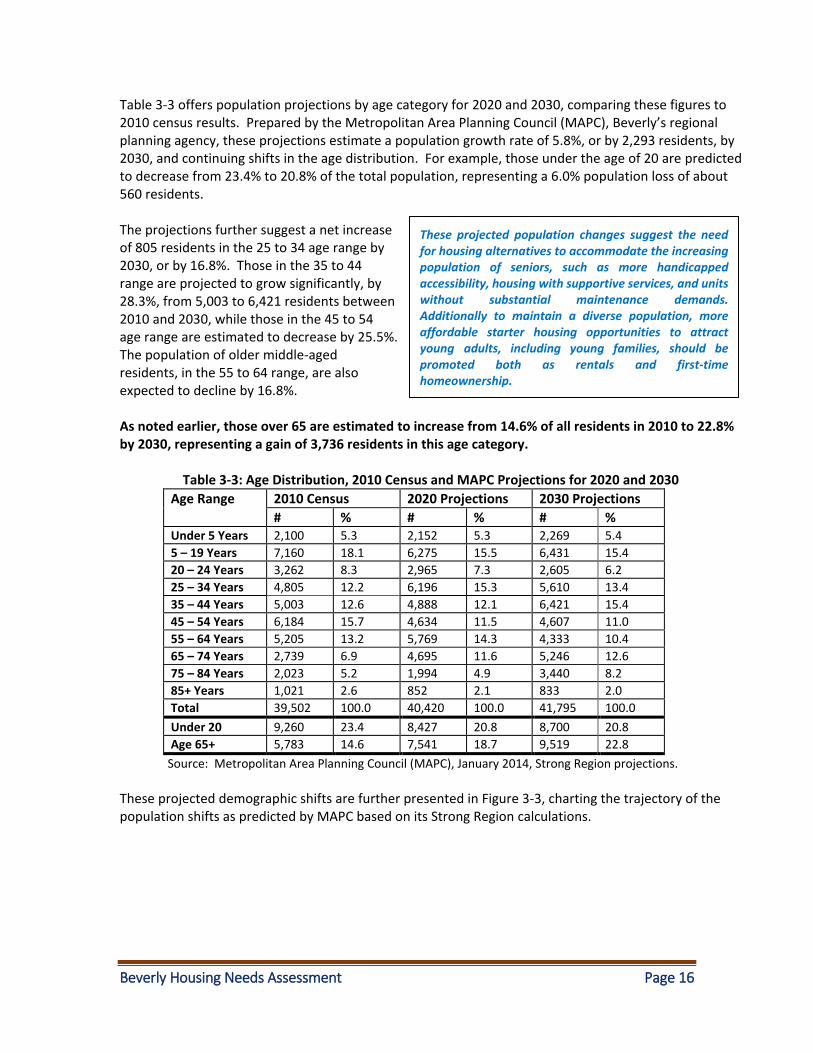
Table 3-3 offers population projections by age category for 2020 and 2030, comparing these figures to 2010 census results. Prepared by the Metropolitan Area Planning Council (MAPC), Beverly’s regional planning agency, these projections estimate a population growth rate of 5.8%, or by 2,293 residents, by 2030, and continuing shifts in the age distribution. For example, those under the age of 20 are predicted to decrease from 23.4% to 20.8% of the total population, representing a 6.0% population loss of about 560 residents. The projections further suggest a net increase of 805 residents in the 25 to 34 age range by 2030, or by 16.8%. Those in the 35 to 44 range are projected to grow significantly, by 28.3%, from 5,003 to 6,421 residents between 2010 and 2030, while those in the 45 to 54 age range are estimated to decrease by 25.5%. The population of older middle-aged residents, in the 55 to 64 range, are also expected to decline by 16.8%. As noted earlier, those over 65 are estimated to increase from 14.6% of all residents in 2010 to 22.8% by 2030, representing a gain of 3,736 residents in this age category.
Table 3-3: Age Distribution, 2010 Census and MAPC Projections for 2020 and 2030
Age Range
2010 Census 2020 Projections 2030 Projections
# % # % # % Under 5 Years 2,100 5.3 2,152 5.3 2,269 5.4
5 – 19 Years 7,160 18.1 6,275 15.5 6,431 15.4
20 – 24 Years 3,262 8.3 2,965 7.3 2,605 6.2
25 – 34 Years 4,805 12.2 6,196 15.3 5,610 13.4
35 – 44 Years 5,003 12.6 4,888 12.1 6,421 15.4
45 – 54 Years 6,184 15.7 4,634 11.5 4,607 11.0
55 – 64 Years 5,205 13.2 5,769 14.3 4,333 10.4
65 – 74 Years 2,739 6.9 4,695 11.6 5,246 12.6
75 – 84 Years 2,023 5.2 1,994 4.9 3,440 8.2
85+ Years 1,021 2.6 852 2.1 833 2.0
Total 39,502 100.0 40,420 100.0 41,795 100.0
Under 20 9,260 23.4 8,427 20.8 8,700 20.8
Age 65+ 5,783 14.6 7,541 18.7 9,519 22.8
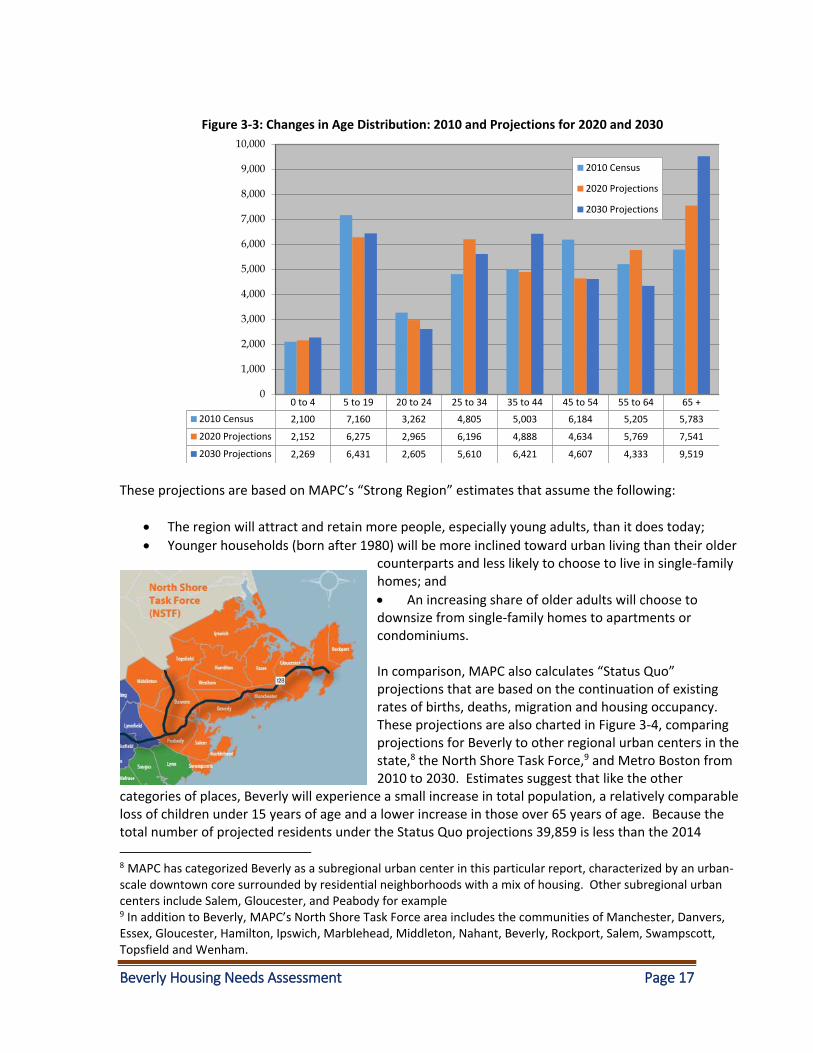
Source: Metropolitan Area Planning Council (MAPC), January 2014, Strong Region projections. These projected demographic shifts are further presented in Figure 3-3, charting the trajectory of the population shifts as predicted by MAPC based on its Strong Region calculations.
These projected population changes suggest the need for housing alternatives to accommodate the increasing population of seniors, such as more handicapped accessibility, housing with supportive services, and units without substantial maintenance demands. Additionally to maintain a diverse population, more affordable starter housing opportunities to attract young adults, including young families, should be promoted both as rentals and first-time homeownership.
Beverly Housing Needs Assessment Page 17
These projections are based on MAPC’s “Strong Region” estimates that assume the following:
The region will attract and retain more people, especially young adults, than it does today;
Younger households (born after 1980) will be more inclined toward urban living than their older counterparts and less likely to choose to live in single-family homes; and
An increasing share of older adults will choose to downsize from single-family homes to apartments or condominiums. In comparison, MAPC also calculates “Status Quo” projections that are based on the continuation of existing rates of births, deaths, migration and housing occupancy. These projections are also charted in Figure 3-4, comparing projections for Beverly to other regional urban centers in the state,8 the North Shore Task Force,9 and Metro Boston from 2010 to 2030. Estimates suggest that like the other
categories of places, Beverly will experience a small increase in total population, a relatively comparable loss of children under 15 years of age and a lower increase in those over 65 years of age. Because the total number of projected residents under the Status Quo projections 39,859 is less than the 2014
8 MAPC has categorized Beverly as a subregional urban center in this particular report, characterized by an urban-scale downtown core surrounded by residential neighborhoods with a mix of housing. Other subregional urban centers include Salem, Gloucester, and Peabody for example 9 In addition to Beverly, MAPC’s North Shore Task Force area includes the communities of Manchester, Danvers, Essex, Gloucester, Hamilton, Ipswich, Marblehead, Middleton, Nahant, Beverly, Rockport, Salem, Swampscott, Topsfield and Wenham.
0 to 4 5 to 19 20 to 24 25 to 34 35 to 44 45 to 54 55 to 64 65 +
2010 Census 2,100 7,160 3,262 4,805 5,003 6,184 5,205 5,783
2020 Projections 2,152 6,275 2,965 6,196 4,888 4,634 5,769 7,541
2030 Projections 2,269 6,431 2,605 5,610 6,421 4,607 4,333 9,519
0
1,000
2,000
3,000
4,000
5,000
6,000
7,000
8,000
9,000
10,000
Figure 3-3: Changes in Age Distribution: 2010 and Projections for 2020 and 2030
2010 Census
2020 Projections
2030 Projections
Beverly Housing Needs Assessment Page 18
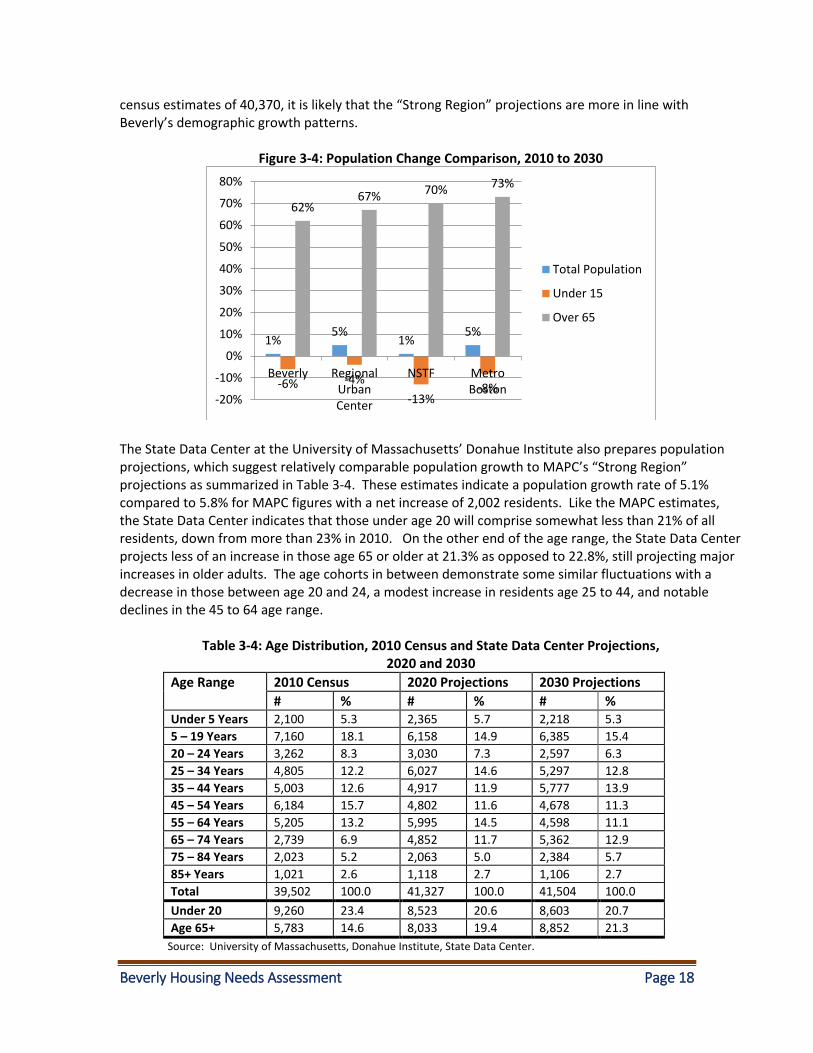
census estimates of 40,370, it is likely that the “Strong Region” projections are more in line with Beverly’s demographic growth patterns.
Figure 3-4: Population Change Comparison, 2010 to 2030
The State Data Center at the University of Massachusetts’ Donahue Institute also prepares population projections, which suggest relatively comparable population growth to MAPC’s “Strong Region” projections as summarized in Table 3-4. These estimates indicate a population growth rate of 5.1% compared to 5.8% for MAPC figures with a net increase of 2,002 residents. Like the MAPC estimates, the State Data Center indicates that those under age 20 will comprise somewhat less than 21% of all residents, down from more than 23% in 2010. On the other end of the age range, the State Data Center projects less of an increase in those age 65 or older at 21.3% as opposed to 22.8%, still projecting major increases in older adults. The age cohorts in between demonstrate some similar fluctuations with a decrease in those between age 20 and 24, a modest increase in residents age 25 to 44, and notable declines in the 45 to 64 age range.
Table 3-4: Age Distribution, 2010 Census and State Data Center Projections, 2020 and 2030
Age Range
2010 Census 2020 Projections 2030 Projections
# % # % # % Under 5 Years 2,100 5.3 2,365 5.7 2,218 5.3
5 – 19 Years 7,160 18.1 6,158 14.9 6,385 15.4
20 – 24 Years 3,262 8.3 3,030 7.3 2,597 6.3
25 – 34 Years 4,805 12.2 6,027 14.6 5,297 12.8
35 – 44 Years 5,003 12.6 4,917 11.9 5,777 13.9
45 – 54 Years 6,184 15.7 4,802 11.6 4,678 11.3
55 – 64 Years 5,205 13.2 5,995 14.5 4,598 11.1
65 – 74 Years 2,739 6.9 4,852 11.7 5,362 12.9
75 – 84 Years 2,023 5.2 2,063 5.0 2,384 5.7
85+ Years 1,021 2.6 1,118 2.7 1,106 2.7
Total 39,502 100.0 41,327 100.0 41,504 100.0
Under 20 9,260 23.4 8,523 20.6 8,603 20.7
Age 65+ 5,783 14.6 8,033 19.4 8,852 21.3
Source: University of Massachusetts, Donahue Institute, State Data Center.
1%5%
1%5%
-6% -4%
-13%-8%
62%67% 70% 73%
-20%
-10%
0%
10%
20%
30%
40%
50%
60%
70%
80%
Beverly RegionalUrbanCenter
NSTF MetroBoston
Total Population
Under 15
Over 65
Beverly Housing Needs Assessment Page 19
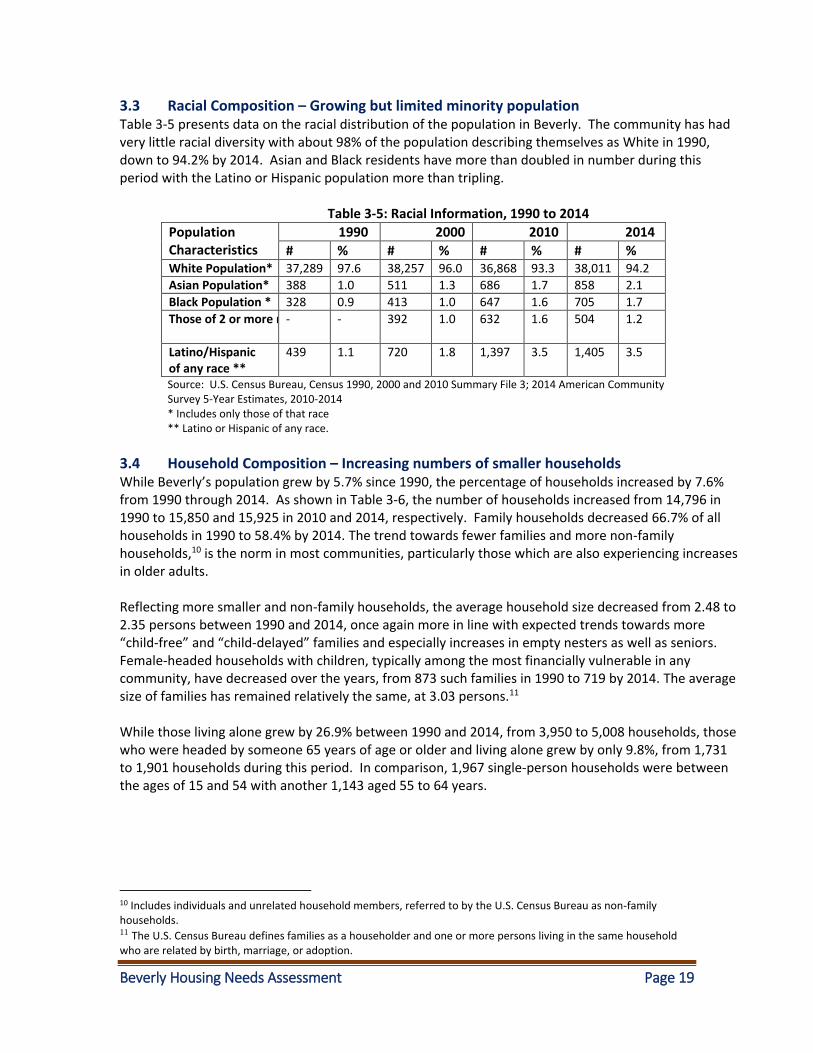
3.3 Racial Composition – Growing but limited minority population Table 3-5 presents data on the racial distribution of the population in Beverly. The community has had very little racial diversity with about 98% of the population describing themselves as White in 1990, down to 94.2% by 2014. Asian and Black residents have more than doubled in number during this period with the Latino or Hispanic population more than tripling.
Table 3-5: Racial Information, 1990 to 2014
Population Characteristics
1990 2000 2010 2014
# % # % # % # % White Population* 37,289 97.6 38,257 96.0 36,868 93.3 38,011 94.2
Asian Population* 388 1.0 511 1.3 686 1.7 858 2.1
Black Population * 328 0.9 413 1.0 647 1.6 705 1.7
Those of 2 or more races - - 392 1.0
632 1.6 504 1.2
Latino/Hispanic of any race **
439 1.1 720 1.8 1,397 3.5 1,405 3.5
Source: U.S. Census Bureau, Census 1990, 2000 and 2010 Summary File 3; 2014 American Community Survey 5-Year Estimates, 2010-2014
* Includes only those of that race ** Latino or Hispanic of any race.
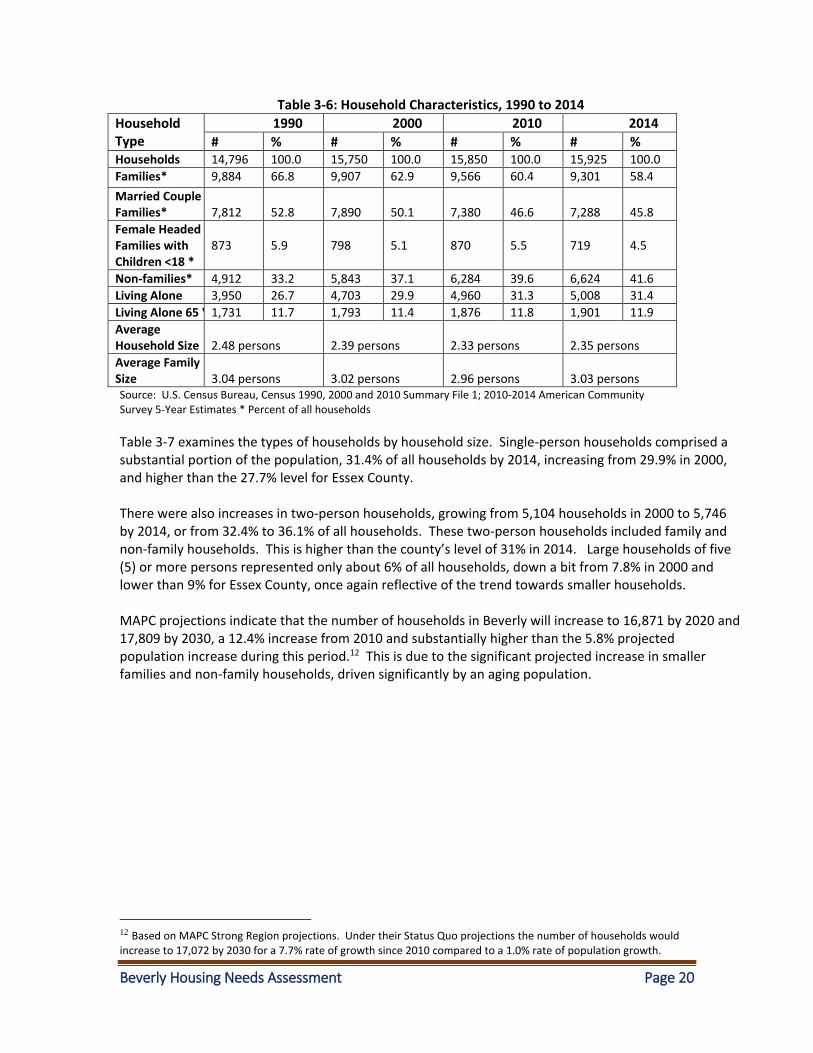
3.4 Household Composition – Increasing numbers of smaller households While Beverly’s population grew by 5.7% since 1990, the percentage of households increased by 7.6% from 1990 through 2014. As shown in Table 3-6, the number of households increased from 14,796 in 1990 to 15,850 and 15,925 in 2010 and 2014, respectively. Family households decreased 66.7% of all households in 1990 to 58.4% by 2014. The trend towards fewer families and more non-family households,10 is the norm in most communities, particularly those which are also experiencing increases in older adults. Reflecting more smaller and non-family households, the average household size decreased from 2.48 to 2.35 persons between 1990 and 2014, once again more in line with expected trends towards more “child-free” and “child-delayed” families and especially increases in empty nesters as well as seniors. Female-headed households with children, typically among the most financially vulnerable in any community, have decreased over the years, from 873 such families in 1990 to 719 by 2014. The average size of families has remained relatively the same, at 3.03 persons.11 While those living alone grew by 26.9% between 1990 and 2014, from 3,950 to 5,008 households, those who were headed by someone 65 years of age or older and living alone grew by only 9.8%, from 1,731 to 1,901 households during this period. In comparison, 1,967 single-person households were between the ages of 15 and 54 with another 1,143 aged 55 to 64 years.
10 Includes individuals and unrelated household members, referred to by the U.S. Census Bureau as non-family households. 11 The U.S. Census Bureau defines families as a householder and one or more persons living in the same household who are related by birth, marriage, or adoption.
Beverly Housing Needs Assessment Page 20
Table 3-6: Household Characteristics, 1990 to 2014
Household Type
1990 2000 2010 2014
# % # % # % # % Households 14,796 100.0 15,750 100.0 15,850 100.0 15,925 100.0
Families* 9,884 66.8 9,907 62.9 9,566 60.4 9,301 58.4
Married Couple Families*
7,812
52.8
7,890
50.1
7,380
46.6
7,288
45.8
Female Headed Families with Children <18 *
873
5.9
798
5.1
870
5.5
719
4.5
Non-families* 4,912 33.2 5,843 37.1 6,284 39.6 6,624 41.6
Living Alone 3,950 26.7 4,703 29.9 4,960 31.3 5,008 31.4
Living Alone 65 Years + 1,731 11.7 1,793 11.4 1,876 11.8 1,901 11.9
Average Household Size
2.48 persons
2.39 persons
2.33 persons
2.35 persons
Average Family Size
3.04 persons
3.02 persons
2.96 persons
3.03 persons
Source: U.S. Census Bureau, Census 1990, 2000 and 2010 Summary File 1; 2010-2014 American Community Survey 5-Year Estimates * Percent of all households
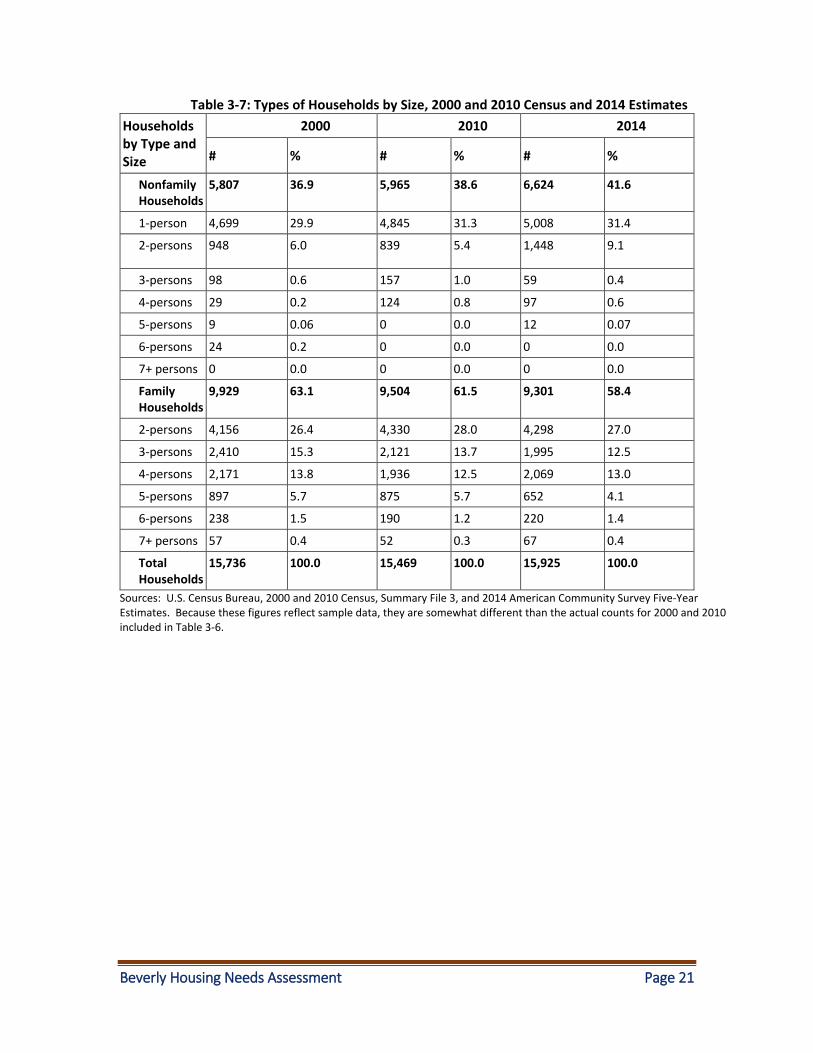
Table 3-7 examines the types of households by household size. Single-person households comprised a substantial portion of the population, 31.4% of all households by 2014, increasing from 29.9% in 2000, and higher than the 27.7% level for Essex County. There were also increases in two-person households, growing from 5,104 households in 2000 to 5,746 by 2014, or from 32.4% to 36.1% of all households. These two-person households included family and non-family households. This is higher than the county’s level of 31% in 2014. Large households of five (5) or more persons represented only about 6% of all households, down a bit from 7.8% in 2000 and lower than 9% for Essex County, once again reflective of the trend towards smaller households. MAPC projections indicate that the number of households in Beverly will increase to 16,871 by 2020 and 17,809 by 2030, a 12.4% increase from 2010 and substantially higher than the 5.8% projected population increase during this period.12 This is due to the significant projected increase in smaller families and non-family households, driven significantly by an aging population.
12 Based on MAPC Strong Region projections. Under their Status Quo projections the number of households would increase to 17,072 by 2030 for a 7.7% rate of growth since 2010 compared to a 1.0% rate of population growth.
Beverly Housing Needs Assessment Page 21
Table 3-7: Types of Households by Size, 2000 and 2010 Census and 2014 Estimates
Households by Type and Size
2000 2010 2014
# % # % # %
Nonfamily Households
5,807 36.9 5,965 38.6 6,624 41.6
1-person 4,699 29.9 4,845 31.3 5,008 31.4
2-persons 948 6.0 839 5.4 1,448 9.1
3-persons 98 0.6 157 1.0 59 0.4
4-persons 29 0.2 124 0.8 97 0.6
5-persons 9 0.06 0 0.0 12 0.07
6-persons 24 0.2 0 0.0 0 0.0
7+ persons 0 0.0 0 0.0 0 0.0
Family Households
9,929 63.1 9,504 61.5 9,301 58.4
2-persons 4,156 26.4 4,330 28.0 4,298 27.0
3-persons 2,410 15.3 2,121 13.7 1,995 12.5
4-persons 2,171 13.8 1,936 12.5 2,069 13.0
5-persons 897 5.7 875 5.7 652 4.1
6-persons 238 1.5 190 1.2 220 1.4
7+ persons 57 0.4 52 0.3 67 0.4
Total Households
15,736 100.0 15,469 100.0 15,925 100.0
Sources: U.S. Census Bureau, 2000 and 2010 Census, Summary File 3, and 2014 American Community Survey Five-Year Estimates. Because these figures reflect sample data, they are somewhat different than the actual counts for 2000 and 2010 included in Table 3-6.
Beverly Housing Needs Assessment Page 22
4. Economic Profile This section examines income, employment and educational data to address the following questions:
What changes in income levels have occurred and how does this relate to housing affordability?
Are there growing income disparities among residents?
How many residents work in the community?
What are the trends toward educational attainment that can affect employment opportunities and housing affordability?
What proportion of the population is disabled or has other special needs that limit their employment options and income?
In general incomes, educational attainment, and economic disparities are increasing. This section provides information largely on a citywide basis, but key economic characteristics by census tract are included in Appendix 4.
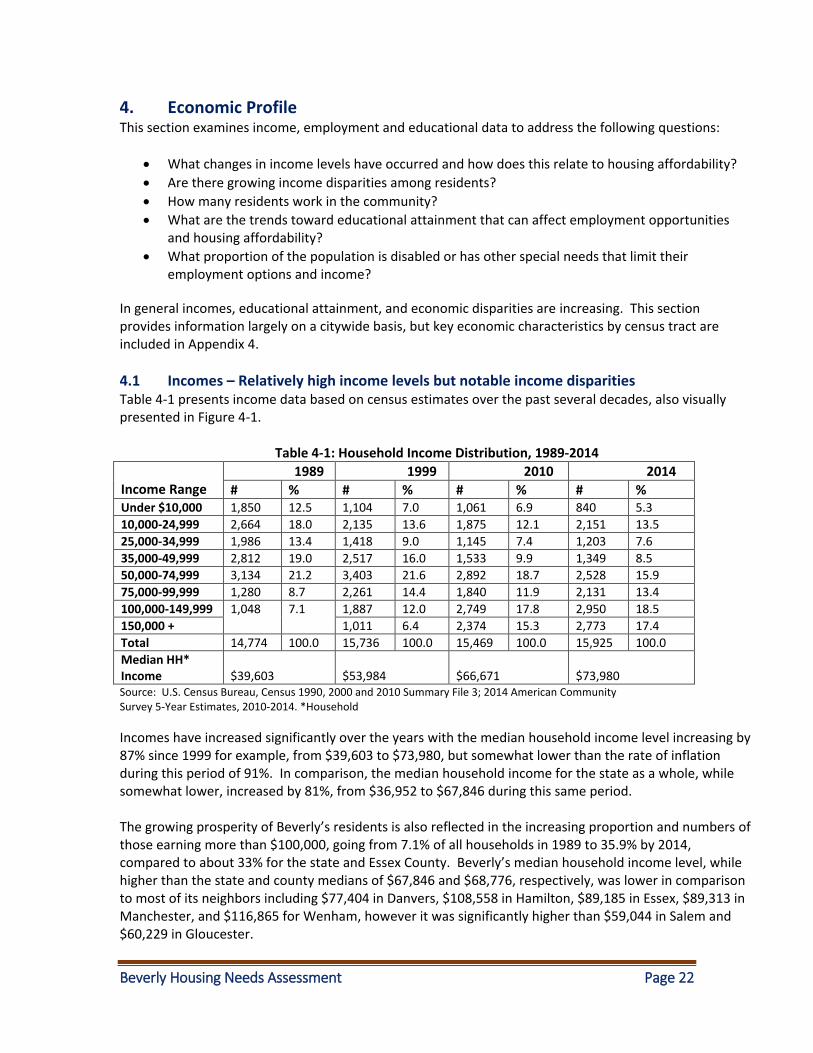
4.1 Incomes – Relatively high income levels but notable income disparities Table 4-1 presents income data based on census estimates over the past several decades, also visually presented in Figure 4-1.
Table 4-1: Household Income Distribution, 1989-2014
Income Range
1989 1999 2010 2014
# % # % # % # % Under $10,000 1,850 12.5 1,104 7.0 1,061 6.9 840 5.3
10,000-24,999 2,664 18.0 2,135 13.6 1,875 12.1 2,151 13.5
25,000-34,999 1,986 13.4 1,418 9.0 1,145 7.4 1,203 7.6
35,000-49,999 2,812 19.0 2,517 16.0 1,533 9.9 1,349 8.5
50,000-74,999 3,134 21.2 3,403 21.6 2,892 18.7 2,528 15.9
75,000-99,999 1,280 8.7 2,261 14.4 1,840 11.9 2,131 13.4
100,000-149,999 1,048 7.1 1,887 12.0 2,749 17.8 2,950 18.5
150,000 + 1,011 6.4 2,374 15.3 2,773 17.4
Total 14,774 100.0 15,736 100.0 15,469 100.0 15,925 100.0
Median HH* Income
$39,603
$53,984
$66,671
$73,980
Source: U.S. Census Bureau, Census 1990, 2000 and 2010 Summary File 3; 2014 American Community Survey 5-Year Estimates, 2010-2014. *Household
Incomes have increased significantly over the years with the median household income level increasing by 87% since 1999 for example, from $39,603 to $73,980, but somewhat lower than the rate of inflation during this period of 91%. In comparison, the median household income for the state as a whole, while somewhat lower, increased by 81%, from $36,952 to $67,846 during this same period. The growing prosperity of Beverly’s residents is also reflected in the increasing proportion and numbers of those earning more than $100,000, going from 7.1% of all households in 1989 to 35.9% by 2014, compared to about 33% for the state and Essex County. Beverly’s median household income level, while higher than the state and county medians of $67,846 and $68,776, respectively, was lower in comparison to most of its neighbors including $77,404 in Danvers, $108,558 in Hamilton, $89,185 in Essex, $89,313 in Manchester, and $116,865 for Wenham, however it was significantly higher than $59,044 in Salem and $60,229 in Gloucester.
Beverly Housing Needs Assessment Page 23
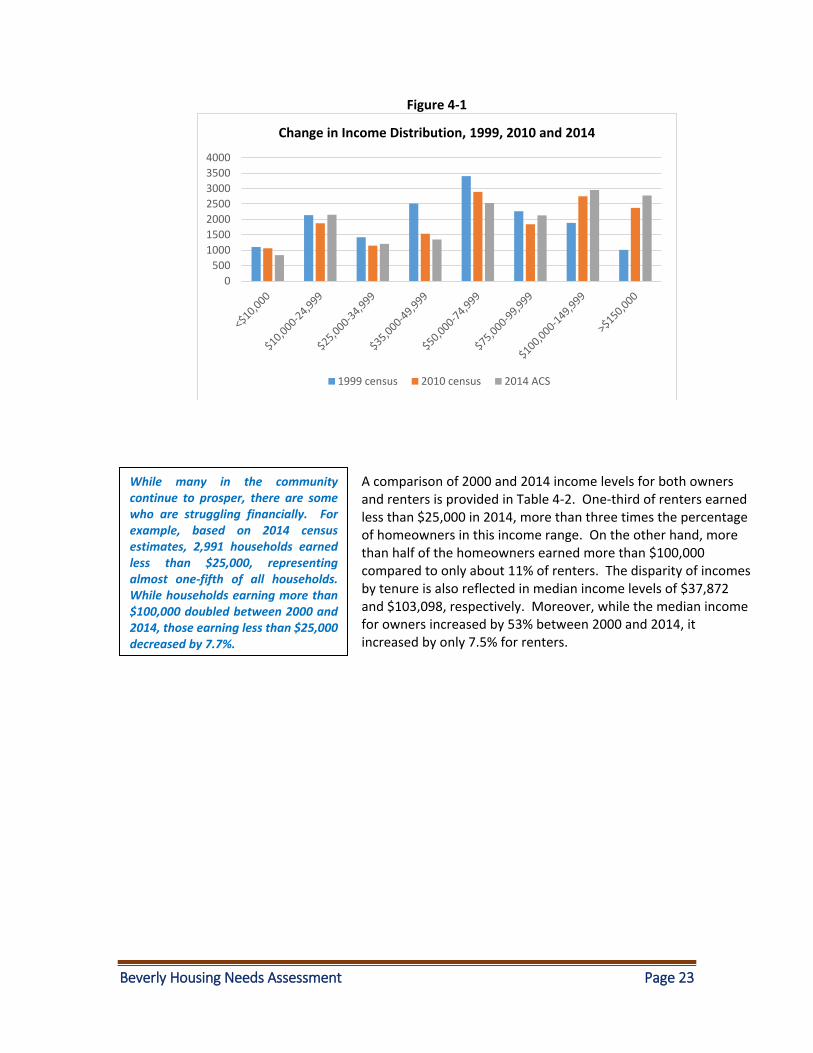
Figure 4-1
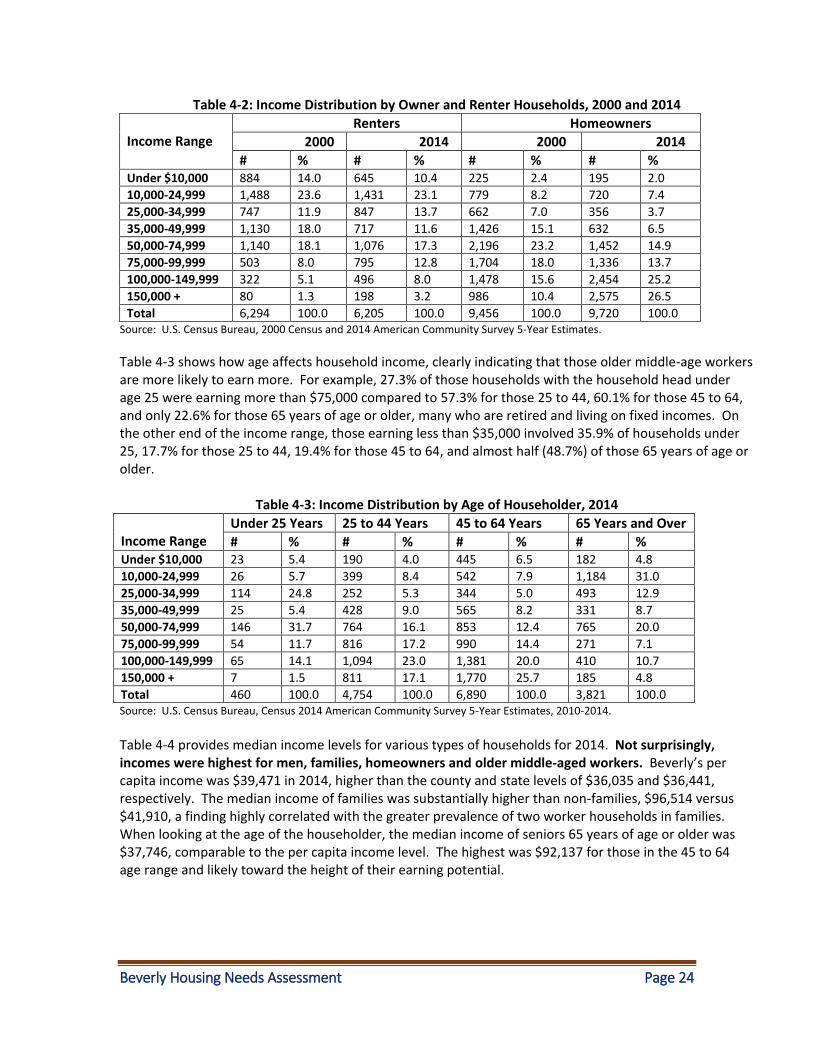
A comparison of 2000 and 2014 income levels for both owners and renters is provided in Table 4-2. One-third of renters earned less than $25,000 in 2014, more than three times the percentage of homeowners in this income range. On the other hand, more than half of the homeowners earned more than $100,000 compared to only about 11% of renters. The disparity of incomes by tenure is also reflected in median income levels of $37,872 and $103,098, respectively. Moreover, while the median income for owners increased by 53% between 2000 and 2014, it increased by only 7.5% for renters.
0
500
1000
1500
2000
2500
3000
3500
4000
Change in Income Distribution, 1999, 2010 and 2014
1999 census 2010 census 2014 ACS
While many in the community continue to prosper, there are some who are struggling financially. For example, based on 2014 census estimates, 2,991 households earned less than $25,000, representing almost one-fifth of all households. While households earning more than $100,000 doubled between 2000 and 2014, those earning less than $25,000 decreased by 7.7%.
Beverly Housing Needs Assessment Page 24
Table 4-2: Income Distribution by Owner and Renter Households, 2000 and 2014
Income Range
Renters Homeowners
2000 2014 2000 2014
# % # % # % # % Under $10,000 884 14.0 645 10.4 225 2.4 195 2.0
10,000-24,999 1,488 23.6 1,431 23.1 779 8.2 720 7.4
25,000-34,999 747 11.9 847 13.7 662 7.0 356 3.7
35,000-49,999 1,130 18.0 717 11.6 1,426 15.1 632 6.5
50,000-74,999 1,140 18.1 1,076 17.3 2,196 23.2 1,452 14.9
75,000-99,999 503 8.0 795 12.8 1,704 18.0 1,336 13.7
100,000-149,999 322 5.1 496 8.0 1,478 15.6 2,454 25.2
150,000 + 80 1.3 198 3.2 986 10.4 2,575 26.5
Total 6,294 100.0 6,205 100.0 9,456 100.0 9,720 100.0 Source: U.S. Census Bureau, 2000 Census and 2014 American Community Survey 5-Year Estimates.
Table 4-3 shows how age affects household income, clearly indicating that those older middle-age workers are more likely to earn more. For example, 27.3% of those households with the household head under age 25 were earning more than $75,000 compared to 57.3% for those 25 to 44, 60.1% for those 45 to 64, and only 22.6% for those 65 years of age or older, many who are retired and living on fixed incomes. On the other end of the income range, those earning less than $35,000 involved 35.9% of households under 25, 17.7% for those 25 to 44, 19.4% for those 45 to 64, and almost half (48.7%) of those 65 years of age or older.
Table 4-3: Income Distribution by Age of Householder, 2014
Income Range
Under 25 Years 25 to 44 Years 45 to 64 Years 65 Years and Over
# % # % # % # % Under $10,000 23 5.4 190 4.0 445 6.5 182 4.8
10,000-24,999 26 5.7 399 8.4 542 7.9 1,184 31.0
25,000-34,999 114 24.8 252 5.3 344 5.0 493 12.9
35,000-49,999 25 5.4 428 9.0 565 8.2 331 8.7
50,000-74,999 146 31.7 764 16.1 853 12.4 765 20.0
75,000-99,999 54 11.7 816 17.2 990 14.4 271 7.1
100,000-149,999 65 14.1 1,094 23.0 1,381 20.0 410 10.7
150,000 + 7 1.5 811 17.1 1,770 25.7 185 4.8
Total 460 100.0 4,754 100.0 6,890 100.0 3,821 100.0 Source: U.S. Census Bureau, Census 2014 American Community Survey 5-Year Estimates, 2010-2014.
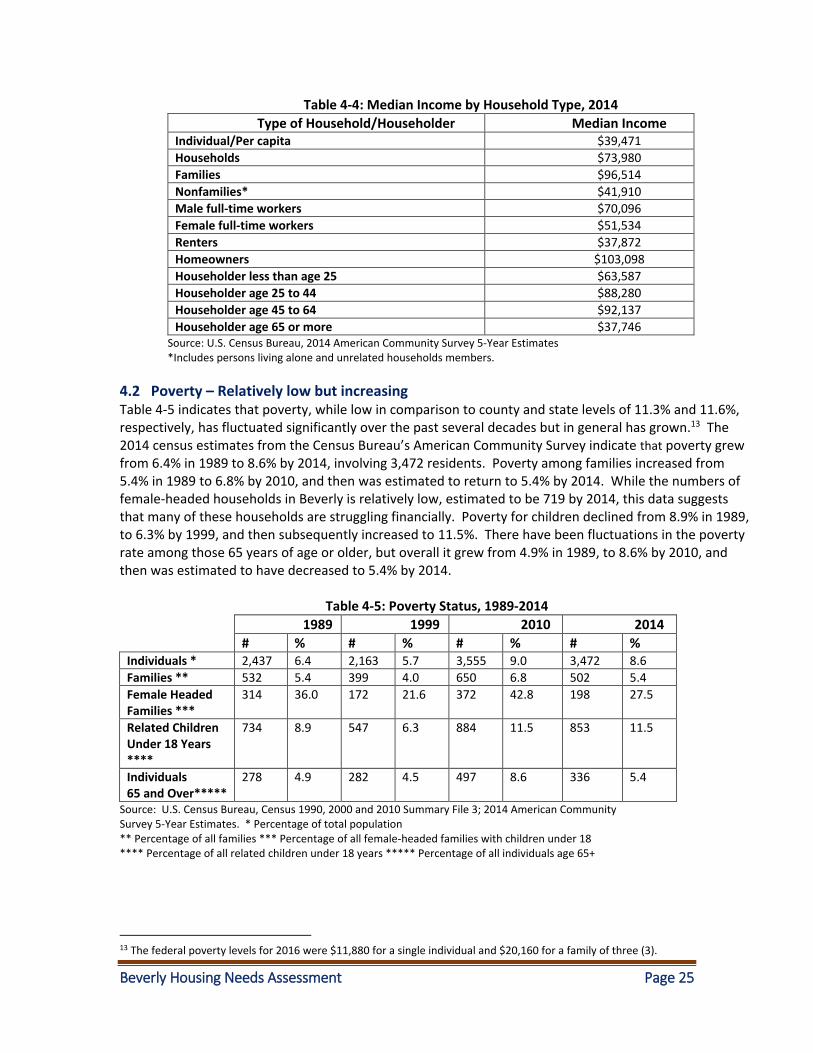
Table 4-4 provides median income levels for various types of households for 2014. Not surprisingly, incomes were highest for men, families, homeowners and older middle-aged workers. Beverly’s per capita income was $39,471 in 2014, higher than the county and state levels of $36,035 and $36,441, respectively. The median income of families was substantially higher than non-families, $96,514 versus $41,910, a finding highly correlated with the greater prevalence of two worker households in families. When looking at the age of the householder, the median income of seniors 65 years of age or older was $37,746, comparable to the per capita income level. The highest was $92,137 for those in the 45 to 64 age range and likely toward the height of their earning potential.
Beverly Housing Needs Assessment Page 25
Table 4-4: Median Income by Household Type, 2014
Type of Household/Householder Median Income Individual/Per capita $39,471
Households $73,980
Families $96,514
Nonfamilies* $41,910
Male full-time workers $70,096
Female full-time workers $51,534
Renters $37,872
Homeowners $103,098
Householder less than age 25 $63,587
Householder age 25 to 44 $88,280
Householder age 45 to 64 $92,137
Householder age 65 or more $37,746 Source: U.S. Census Bureau, 2014 American Community Survey 5-Year Estimates
*Includes persons living alone and unrelated households members.
4.2 Poverty – Relatively low but increasing Table 4-5 indicates that poverty, while low in comparison to county and state levels of 11.3% and 11.6%, respectively, has fluctuated significantly over the past several decades but in general has grown.13 The 2014 census estimates from the Census Bureau’s American Community Survey indicate that poverty grew from 6.4% in 1989 to 8.6% by 2014, involving 3,472 residents. Poverty among families increased from 5.4% in 1989 to 6.8% by 2010, and then was estimated to return to 5.4% by 2014. While the numbers of female-headed households in Beverly is relatively low, estimated to be 719 by 2014, this data suggests that many of these households are struggling financially. Poverty for children declined from 8.9% in 1989, to 6.3% by 1999, and then subsequently increased to 11.5%. There have been fluctuations in the poverty rate among those 65 years of age or older, but overall it grew from 4.9% in 1989, to 8.6% by 2010, and then was estimated to have decreased to 5.4% by 2014.
Table 4-5: Poverty Status, 1989-2014 1989 1999 2010 2014
# % # % # % # % Individuals * 2,437 6.4 2,163 5.7 3,555 9.0 3,472 8.6
Families ** 532 5.4 399 4.0 650 6.8 502 5.4
Female Headed Families ***
314 36.0 172 21.6 372 42.8 198 27.5
Related Children Under 18 Years ****
734 8.9 547 6.3 884 11.5 853 11.5
Individuals 65 and Over*****
278 4.9 282 4.5 497 8.6 336 5.4
Source: U.S. Census Bureau, Census 1990, 2000 and 2010 Summary File 3; 2014 American Community Survey 5-Year Estimates. * Percentage of total population ** Percentage of all families *** Percentage of all female-headed families with children under 18 **** Percentage of all related children under 18 years ***** Percentage of all individuals age 65+
13 The federal poverty levels for 2016 were $11,880 for a single individual and $20,160 for a family of three (3).
Beverly Housing Needs Assessment Page 26
An estimated 1,616 residents, or about 10% of all residents, received Food Stamp/Supplemental Nutritional Assistance Program (SNAP) benefits, requiring a gross income within 130% of the poverty level and a net income at the poverty level, adjusted by household size.
4.3 Employment – Diverse economic base Over the past 50 years or more, Beverly’s economy has shifted from one relying predominantly on manufacturing, including huge companies such as the United Shoe Machine Corporation, to more mixed employment opportunities including life sciences, computer and high technology firms, and a major medical center. The City is also home to significant academic and cultural facilities including Endicott College, Montserrat College of Art, as well as the North Shore Music Theater, Larcom Theater and Cabot Theater that in addition to Beverly’s beaches attract thousands of visitors annually.
Of those 33,831 Beverly residents over the age of 16 in 2014, 23,114 or approximately two-thirds were in the labor market and 11,081 or about 60% were employed in 2014 according to the Census Bureau’s American Community Survey estimates. This data suggests an unemployment rate at that time for city residents of 7% which was higher than the 5.4% rate reported by the state’s Executive Office of Labor and Workforce Development. Since 2014, the state indicates that unemployment rates have decreased to 4.5% in 2015 and then down further to 3.9% by March 2016. This level was comparable to Boston’s and lower than 4.2% for Peabody, 4.6% for Salem, and 6.6% for Gloucester, for example. Census estimates further suggest that 7,617 residents or 35% of those employed in 2014 worked in the community. Census figures further indicate that 15,448 or 72% of those employed Beverly residents worked in Essex County with 5,154 or 24% working outside of the County including 547 who worked out of state.
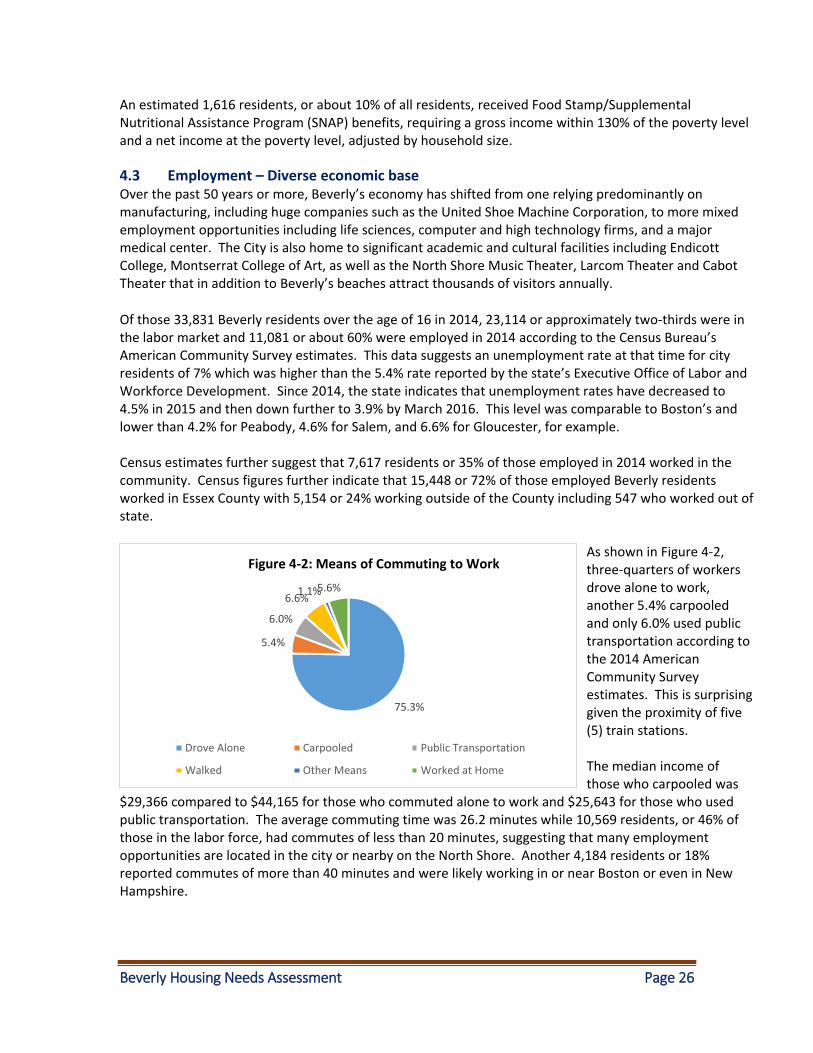
As shown in Figure 4-2, three-quarters of workers drove alone to work, another 5.4% carpooled and only 6.0% used public transportation according to the 2014 American Community Survey estimates. This is surprising given the proximity of five (5) train stations. The median income of those who carpooled was
$29,366 compared to $44,165 for those who commuted alone to work and $25,643 for those who used public transportation. The average commuting time was 26.2 minutes while 10,569 residents, or 46% of those in the labor force, had commutes of less than 20 minutes, suggesting that many employment opportunities are located in the city or nearby on the North Shore. Another 4,184 residents or 18% reported commutes of more than 40 minutes and were likely working in or near Boston or even in New Hampshire.
75.3%
5.4%
6.0%
6.6%1.1%5.6%
Figure 4-2: Means of Commuting to Work
Drove Alone Carpooled Public Transportation
Walked Other Means Worked at Home
Beverly Housing Needs Assessment Page 27
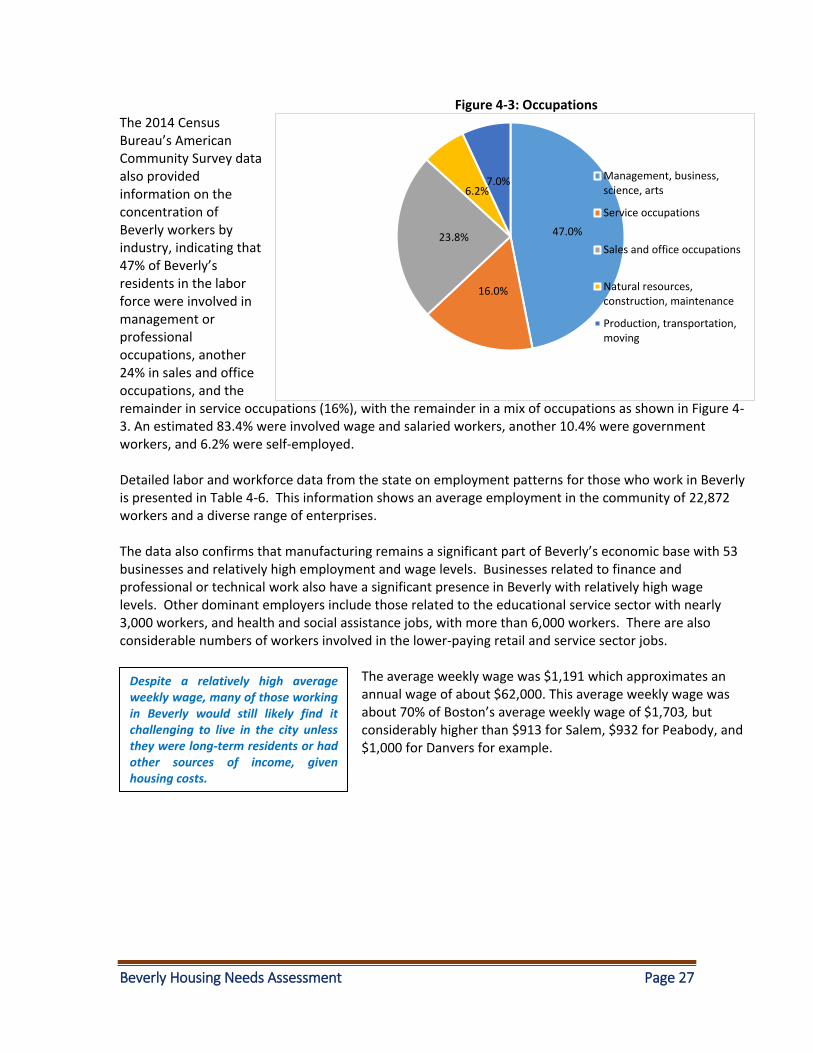
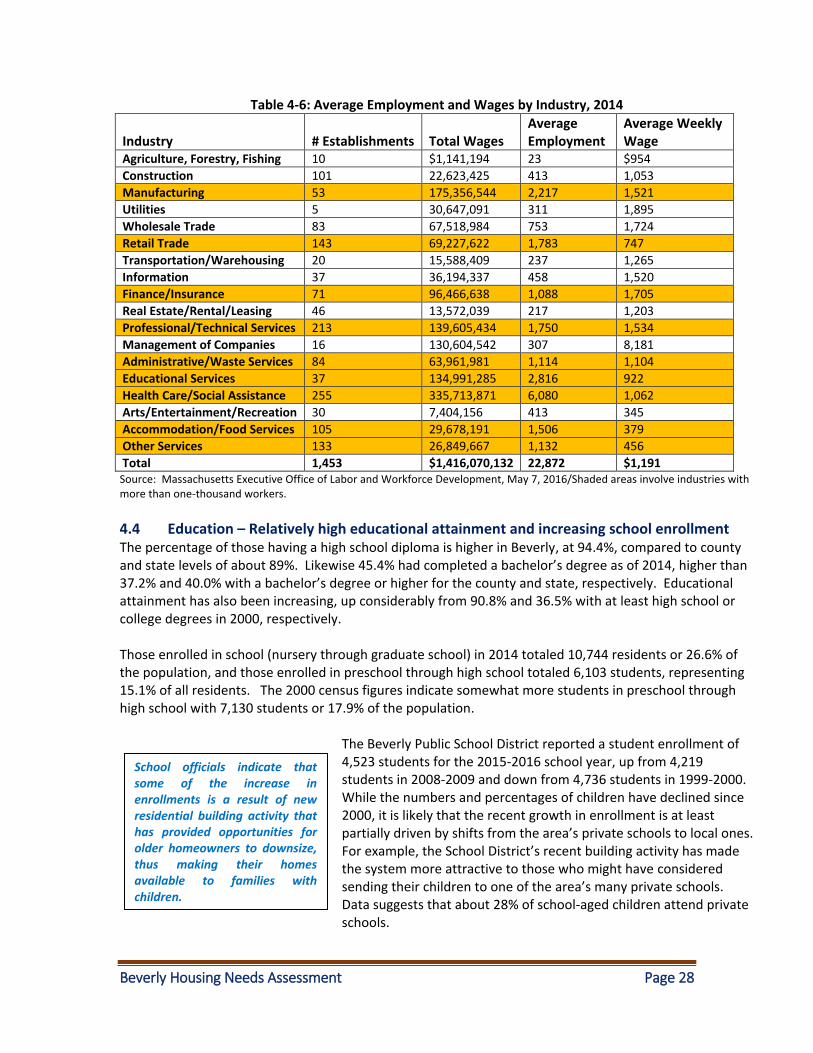
Figure 4-3: Occupations The 2014 Census Bureau’s American Community Survey data also provided information on the concentration of Beverly workers by industry, indicating that 47% of Beverly’s residents in the labor force were involved in management or professional occupations, another 24% in sales and office occupations, and the remainder in service occupations (16%), with the remainder in a mix of occupations as shown in Figure 4-3. An estimated 83.4% were involved wage and salaried workers, another 10.4% were government workers, and 6.2% were self-employed. Detailed labor and workforce data from the state on employment patterns for those who work in Beverly is presented in Table 4-6. This information shows an average employment in the community of 22,872 workers and a diverse range of enterprises. The data also confirms that manufacturing remains a significant part of Beverly’s economic base with 53 businesses and relatively high employment and wage levels. Businesses related to finance and professional or technical work also have a significant presence in Beverly with relatively high wage levels. Other dominant employers include those related to the educational service sector with nearly 3,000 workers, and health and social assistance jobs, with more than 6,000 workers. There are also considerable numbers of workers involved in the lower-paying retail and service sector jobs.
The average weekly wage was $1,191 which approximates an annual wage of about $62,000. This average weekly wage was about 70% of Boston’s average weekly wage of $1,703, but considerably higher than $913 for Salem, $932 for Peabody, and $1,000 for Danvers for example.
Despite a relatively high average weekly wage, many of those working in Beverly would still likely find it challenging to live in the city unless they were long-term residents or had other sources of income, given housing costs.
47.0%
16.0%
23.8%
6.2%7.0% Management, business,
science, arts
Service occupations
Sales and office occupations
Natural resources,construction, maintenance
Production, transportation,moving
Beverly Housing Needs Assessment Page 28
Table 4-6: Average Employment and Wages by Industry, 2014
Industry
# Establishments
Total Wages
Average Employment
Average Weekly Wage
Agriculture, Forestry, Fishing 10 $1,141,194 23 $954
Construction 101 22,623,425 413 1,053
Manufacturing 53 175,356,544 2,217 1,521
Utilities 5 30,647,091 311 1,895
Wholesale Trade 83 67,518,984 753 1,724
Retail Trade 143 69,227,622 1,783 747
Transportation/Warehousing 20 15,588,409 237 1,265
Information 37 36,194,337 458 1,520
Finance/Insurance 71 96,466,638 1,088 1,705
Real Estate/Rental/Leasing 46 13,572,039 217 1,203
Professional/Technical Services 213 139,605,434 1,750 1,534
Management of Companies 16 130,604,542 307 8,181
Administrative/Waste Services 84 63,961,981 1,114 1,104
Educational Services 37 134,991,285 2,816 922
Health Care/Social Assistance 255 335,713,871 6,080 1,062
Arts/Entertainment/Recreation 30 7,404,156 413 345
Accommodation/Food Services 105 29,678,191 1,506 379
Other Services 133 26,849,667 1,132 456
Total 1,453 $1,416,070,132 22,872 $1,191 Source: Massachusetts Executive Office of Labor and Workforce Development, May 7, 2016/Shaded areas involve industries with more than one-thousand workers.
4.4 Education – Relatively high educational attainment and increasing school enrollment The percentage of those having a high school diploma is higher in Beverly, at 94.4%, compared to county and state levels of about 89%. Likewise 45.4% had completed a bachelor’s degree as of 2014, higher than 37.2% and 40.0% with a bachelor’s degree or higher for the county and state, respectively. Educational attainment has also been increasing, up considerably from 90.8% and 36.5% with at least high school or college degrees in 2000, respectively. Those enrolled in school (nursery through graduate school) in 2014 totaled 10,744 residents or 26.6% of the population, and those enrolled in preschool through high school totaled 6,103 students, representing 15.1% of all residents. The 2000 census figures indicate somewhat more students in preschool through high school with 7,130 students or 17.9% of the population.
The Beverly Public School District reported a student enrollment of 4,523 students for the 2015-2016 school year, up from 4,219 students in 2008-2009 and down from 4,736 students in 1999-2000. While the numbers and percentages of children have declined since 2000, it is likely that the recent growth in enrollment is at least partially driven by shifts from the area’s private schools to local ones. For example, the School District’s recent building activity has made the system more attractive to those who might have considered sending their children to one of the area’s many private schools. Data suggests that about 28% of school-aged children attend private schools.
School officials indicate that some of the increase in enrollments is a result of new residential building activity that has provided opportunities for older homeowners to downsize, thus making their homes available to families with children.
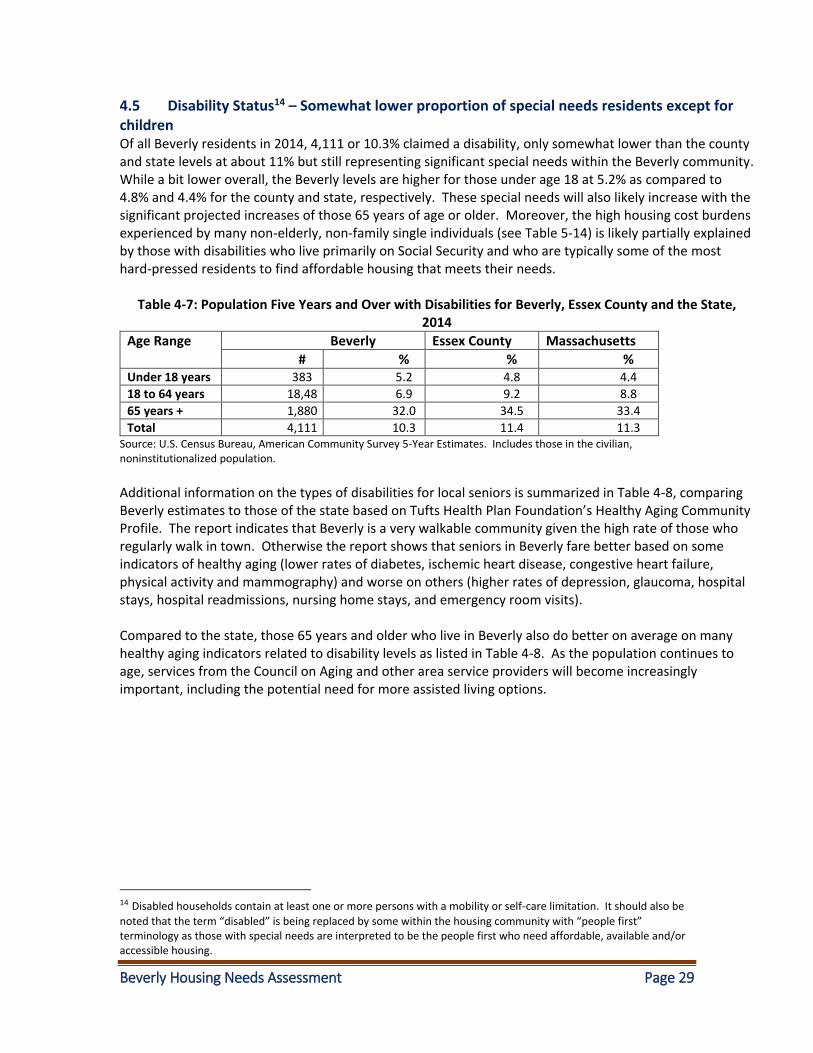
Beverly Housing Needs Assessment Page 29
4.5 Disability Status14 – Somewhat lower proportion of special needs residents except for children Of all Beverly residents in 2014, 4,111 or 10.3% claimed a disability, only somewhat lower than the county and state levels at about 11% but still representing significant special needs within the Beverly community. While a bit lower overall, the Beverly levels are higher for those under age 18 at 5.2% as compared to 4.8% and 4.4% for the county and state, respectively. These special needs will also likely increase with the significant projected increases of those 65 years of age or older. Moreover, the high housing cost burdens experienced by many non-elderly, non-family single individuals (see Table 5-14) is likely partially explained by those with disabilities who live primarily on Social Security and who are typically some of the most hard-pressed residents to find affordable housing that meets their needs.
Table 4-7: Population Five Years and Over with Disabilities for Beverly, Essex County and the State, 2014
Age Range Beverly Essex County Massachusetts
# % % % Under 18 years 383 5.2 4.8 4.4
18 to 64 years 18,48 6.9 9.2 8.8
65 years + 1,880 32.0 34.5 33.4
Total 4,111 10.3 11.4 11.3 Source: U.S. Census Bureau, American Community Survey 5-Year Estimates. Includes those in the civilian, noninstitutionalized population.
Additional information on the types of disabilities for local seniors is summarized in Table 4-8, comparing Beverly estimates to those of the state based on Tufts Health Plan Foundation’s Healthy Aging Community Profile. The report indicates that Beverly is a very walkable community given the high rate of those who regularly walk in town. Otherwise the report shows that seniors in Beverly fare better based on some indicators of healthy aging (lower rates of diabetes, ischemic heart disease, congestive heart failure, physical activity and mammography) and worse on others (higher rates of depression, glaucoma, hospital stays, hospital readmissions, nursing home stays, and emergency room visits). Compared to the state, those 65 years and older who live in Beverly also do better on average on many healthy aging indicators related to disability levels as listed in Table 4-8. As the population continues to age, services from the Council on Aging and other area service providers will become increasingly important, including the potential need for more assisted living options.
14 Disabled households contain at least one or more persons with a mobility or self-care limitation. It should also be
noted that the term “disabled” is being replaced by some within the housing community with “people first” terminology as those with special needs are interpreted to be the people first who need affordable, available and/or accessible housing.
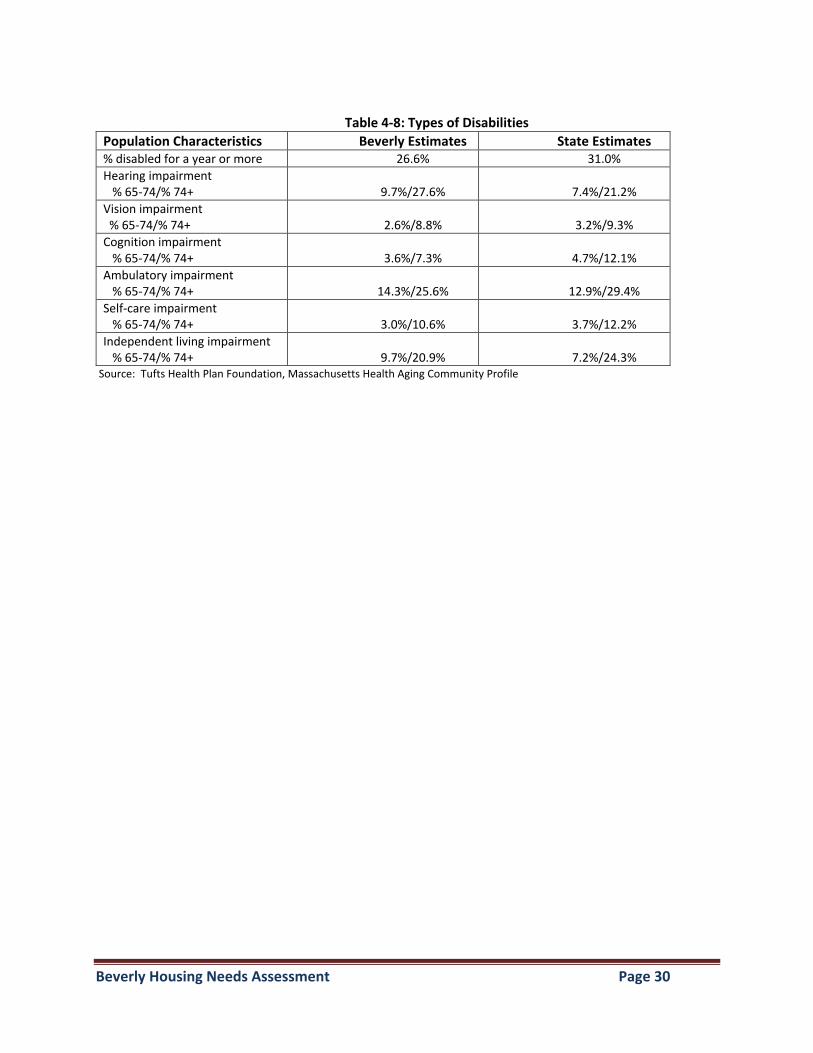
Beverly Housing Needs Assessment Page 30
Table 4-8: Types of Disabilities
Population Characteristics Beverly Estimates State Estimates % disabled for a year or more 26.6% 31.0%
Hearing impairment % 65-74/% 74+
9.7%/27.6%
7.4%/21.2%
Vision impairment % 65-74/% 74+
2.6%/8.8%
3.2%/9.3%
Cognition impairment % 65-74/% 74+
3.6%/7.3%
4.7%/12.1%
Ambulatory impairment % 65-74/% 74+
14.3%/25.6%
12.9%/29.4%
Self-care impairment % 65-74/% 74+
3.0%/10.6%
3.7%/12.2%
Independent living impairment % 65-74/% 74+
9.7%/20.9%
7.2%/24.3%
Source: Tufts Health Plan Foundation, Massachusetts Health Aging Community Profile
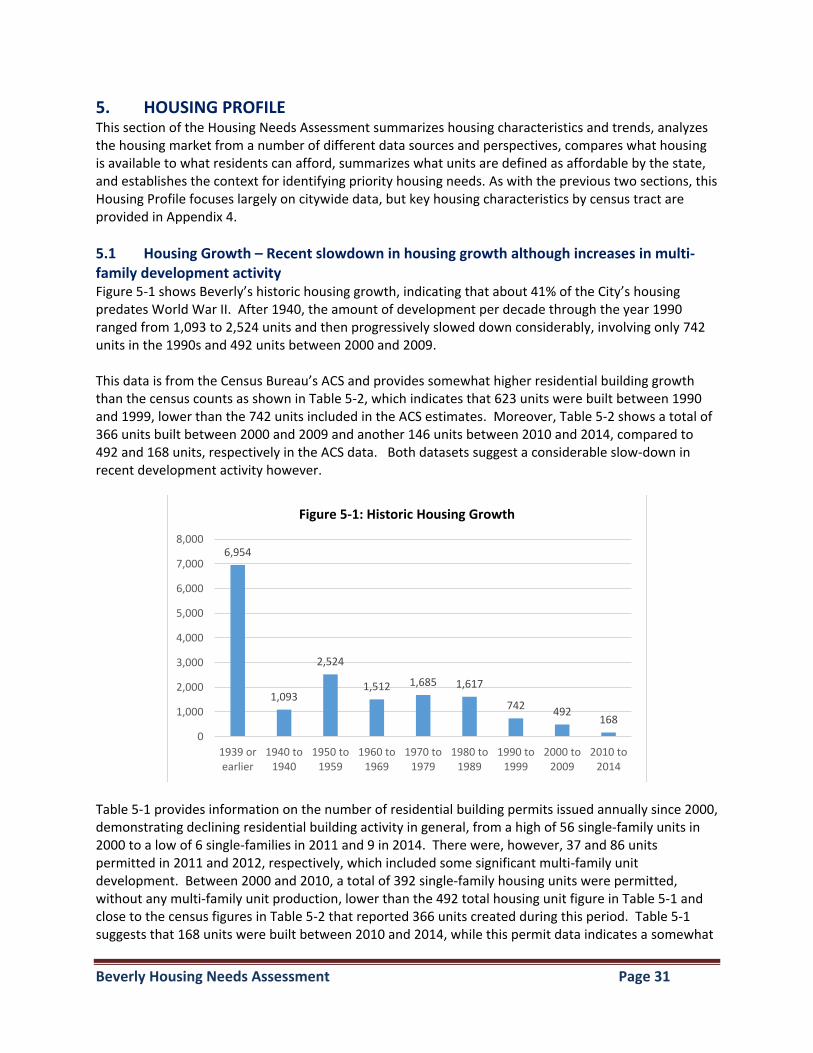
Beverly Housing Needs Assessment Page 31
5. HOUSING PROFILE This section of the Housing Needs Assessment summarizes housing characteristics and trends, analyzes the housing market from a number of different data sources and perspectives, compares what housing is available to what residents can afford, summarizes what units are defined as affordable by the state, and establishes the context for identifying priority housing needs. As with the previous two sections, this Housing Profile focuses largely on citywide data, but key housing characteristics by census tract are provided in Appendix 4.
5.1 Housing Growth – Recent slowdown in housing growth although increases in multi-family development activity Figure 5-1 shows Beverly’s historic housing growth, indicating that about 41% of the City’s housing predates World War II. After 1940, the amount of development per decade through the year 1990 ranged from 1,093 to 2,524 units and then progressively slowed down considerably, involving only 742 units in the 1990s and 492 units between 2000 and 2009. This data is from the Census Bureau’s ACS and provides somewhat higher residential building growth than the census counts as shown in Table 5-2, which indicates that 623 units were built between 1990 and 1999, lower than the 742 units included in the ACS estimates. Moreover, Table 5-2 shows a total of 366 units built between 2000 and 2009 and another 146 units between 2010 and 2014, compared to 492 and 168 units, respectively in the ACS data. Both datasets suggest a considerable slow-down in recent development activity however.
Table 5-1 provides information on the number of residential building permits issued annually since 2000, demonstrating declining residential building activity in general, from a high of 56 single-family units in 2000 to a low of 6 single-families in 2011 and 9 in 2014. There were, however, 37 and 86 units permitted in 2011 and 2012, respectively, which included some significant multi-family unit development. Between 2000 and 2010, a total of 392 single-family housing units were permitted, without any multi-family unit production, lower than the 492 total housing unit figure in Table 5-1 and close to the census figures in Table 5-2 that reported 366 units created during this period. Table 5-1 suggests that 168 units were built between 2010 and 2014, while this permit data indicates a somewhat
6,954
1,093
2,524
1,512 1,685 1,617
742492
168
0
1,000
2,000
3,000
4,000
5,000
6,000
7,000
8,000
1939 orearlier
1940 to1940
1950 to1959
1960 to1969
1970 to1979
1980 to1989
1990 to1999
2000 to2009
2010 to2014
Figure 5-1: Historic Housing Growth
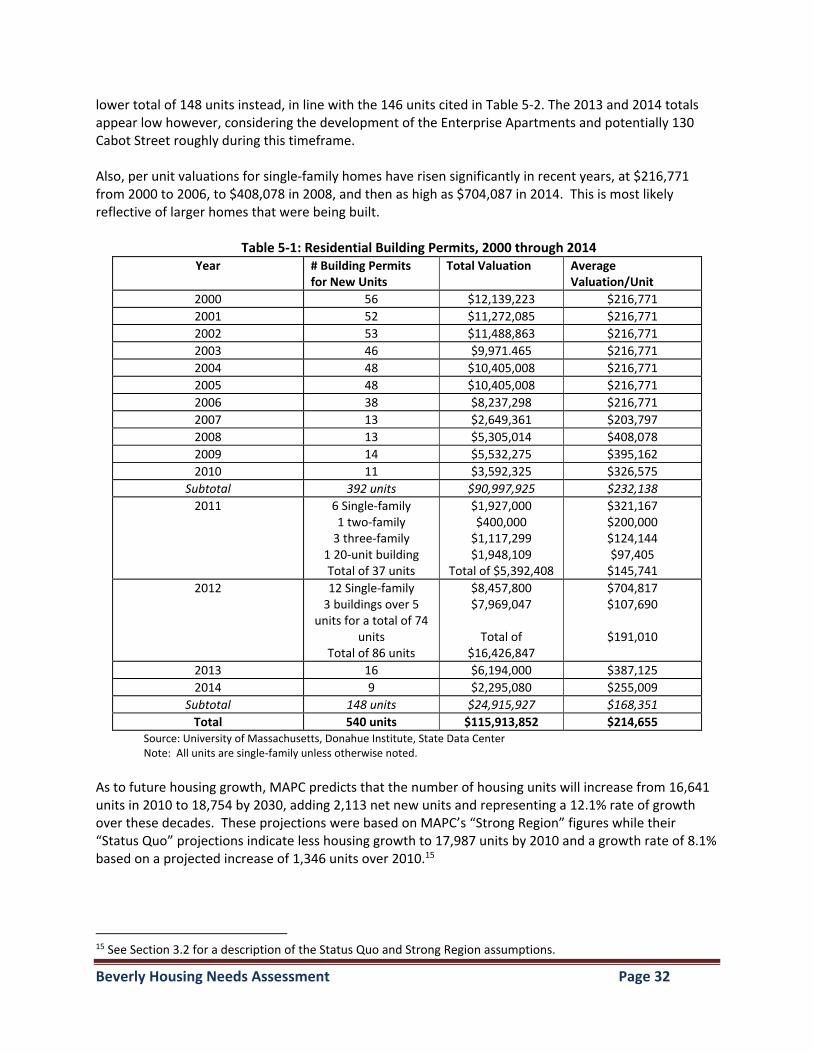
Beverly Housing Needs Assessment Page 32
lower total of 148 units instead, in line with the 146 units cited in Table 5-2. The 2013 and 2014 totals appear low however, considering the development of the Enterprise Apartments and potentially 130 Cabot Street roughly during this timeframe. Also, per unit valuations for single-family homes have risen significantly in recent years, at $216,771 from 2000 to 2006, to $408,078 in 2008, and then as high as $704,087 in 2014. This is most likely reflective of larger homes that were being built.
Table 5-1: Residential Building Permits, 2000 through 2014 Year # Building Permits
for New Units Total Valuation Average
Valuation/Unit
2000 56 $12,139,223 $216,771
2001 52 $11,272,085 $216,771
2002 53 $11,488,863 $216,771
2003 46 $9,971.465 $216,771
2004 48 $10,405,008 $216,771
2005 48 $10,405,008 $216,771
2006 38 $8,237,298 $216,771
2007 13 $2,649,361 $203,797
2008 13 $5,305,014 $408,078
2009 14 $5,532,275 $395,162
2010 11 $3,592,325 $326,575
Subtotal 392 units $90,997,925 $232,138
2011 6 Single-family 1 two-family
3 three-family 1 20-unit building Total of 37 units
$1,927,000 $400,000
$1,117,299 $1,948,109
Total of $5,392,408
$321,167 $200,000 $124,144 $97,405
$145,741
2012 12 Single-family 3 buildings over 5
units for a total of 74 units
Total of 86 units
$8,457,800 $7,969,047
Total of
$16,426,847
$704,817 $107,690
$191,010
2013 16 $6,194,000 $387,125
2014 9 $2,295,080 $255,009
Subtotal 148 units $24,915,927 $168,351
Total 540 units $115,913,852 $214,655 Source: University of Massachusetts, Donahue Institute, State Data Center
Note: All units are single-family unless otherwise noted.
As to future housing growth, MAPC predicts that the number of housing units will increase from 16,641 units in 2010 to 18,754 by 2030, adding 2,113 net new units and representing a 12.1% rate of growth over these decades. These projections were based on MAPC’s “Strong Region” figures while their “Status Quo” projections indicate less housing growth to 17,987 units by 2010 and a growth rate of 8.1% based on a projected increase of 1,346 units over 2010.15
15 See Section 3.2 for a description of the Status Quo and Strong Region assumptions.
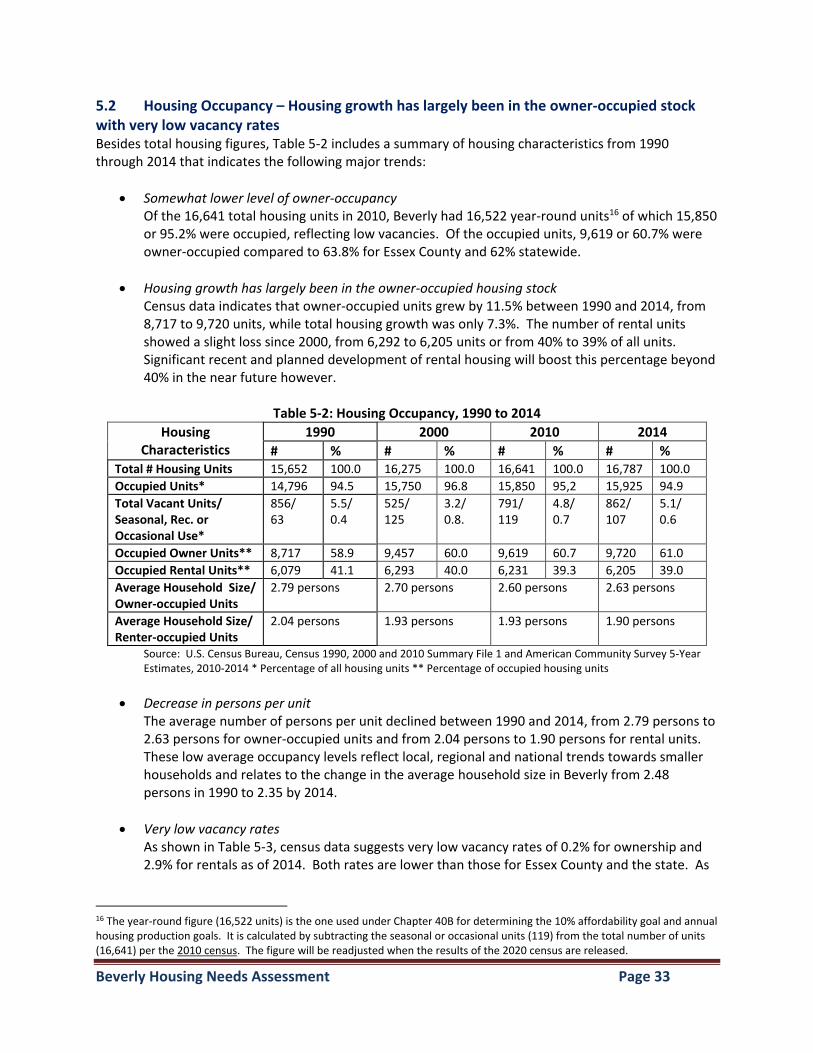
Beverly Housing Needs Assessment Page 33
5.2 Housing Occupancy – Housing growth has largely been in the owner-occupied stock with very low vacancy rates Besides total housing figures, Table 5-2 includes a summary of housing characteristics from 1990 through 2014 that indicates the following major trends:
Somewhat lower level of owner-occupancy Of the 16,641 total housing units in 2010, Beverly had 16,522 year-round units16 of which 15,850 or 95.2% were occupied, reflecting low vacancies. Of the occupied units, 9,619 or 60.7% were owner-occupied compared to 63.8% for Essex County and 62% statewide.
Housing growth has largely been in the owner-occupied housing stock Census data indicates that owner-occupied units grew by 11.5% between 1990 and 2014, from 8,717 to 9,720 units, while total housing growth was only 7.3%. The number of rental units showed a slight loss since 2000, from 6,292 to 6,205 units or from 40% to 39% of all units. Significant recent and planned development of rental housing will boost this percentage beyond 40% in the near future however.
Table 5-2: Housing Occupancy, 1990 to 2014
Housing Characteristics
1990 2000 2010 2014
# % # % # % # % Total # Housing Units 15,652 100.0 16,275 100.0 16,641 100.0 16,787 100.0
Occupied Units* 14,796 94.5 15,750 96.8 15,850 95,2 15,925 94.9
Total Vacant Units/ Seasonal, Rec. or Occasional Use*
856/ 63
5.5/ 0.4
525/ 125
3.2/ 0.8.
791/ 119
4.8/ 0.7
862/ 107
5.1/ 0.6
Occupied Owner Units** 8,717 58.9 9,457 60.0 9,619 60.7 9,720 61.0
Occupied Rental Units** 6,079 41.1 6,293 40.0 6,231 39.3 6,205 39.0
Average Household Size/ Owner-occupied Units
2.79 persons 2.70 persons 2.60 persons 2.63 persons
Average Household Size/ Renter-occupied Units
2.04 persons 1.93 persons 1.93 persons 1.90 persons
Source: U.S. Census Bureau, Census 1990, 2000 and 2010 Summary File 1 and American Community Survey 5-Year Estimates, 2010-2014 * Percentage of all housing units ** Percentage of occupied housing units
Decrease in persons per unit The average number of persons per unit declined between 1990 and 2014, from 2.79 persons to 2.63 persons for owner-occupied units and from 2.04 persons to 1.90 persons for rental units. These low average occupancy levels reflect local, regional and national trends towards smaller households and relates to the change in the average household size in Beverly from 2.48 persons in 1990 to 2.35 by 2014.
Very low vacancy rates As shown in Table 5-3, census data suggests very low vacancy rates of 0.2% for ownership and 2.9% for rentals as of 2014. Both rates are lower than those for Essex County and the state. As
16 The year-round figure (16,522 units) is the one used under Chapter 40B for determining the 10% affordability goal and annual housing production goals. It is calculated by subtracting the seasonal or occasional units (119) from the total number of units (16,641) per the 2010 census. The figure will be readjusted when the results of the 2020 census are released.
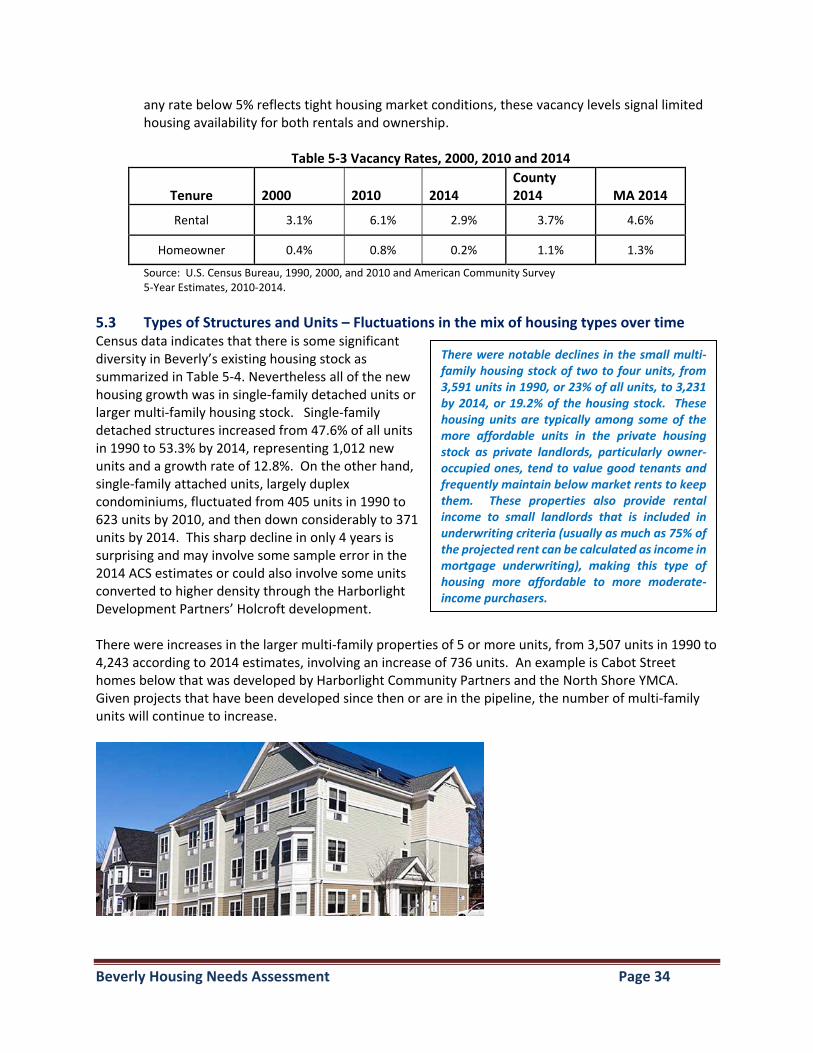
Beverly Housing Needs Assessment Page 34
any rate below 5% reflects tight housing market conditions, these vacancy levels signal limited housing availability for both rentals and ownership.
Table 5-3 Vacancy Rates, 2000, 2010 and 2014
Tenure 2000 2010 2014
County 2014 MA 2014
Rental 3.1% 6.1% 2.9% 3.7% 4.6%
Homeowner 0.4% 0.8% 0.2% 1.1% 1.3%
Source: U.S. Census Bureau, 1990, 2000, and 2010 and American Community Survey 5-Year Estimates, 2010-2014.
5.3 Types of Structures and Units – Fluctuations in the mix of housing types over time Census data indicates that there is some significant diversity in Beverly’s existing housing stock as summarized in Table 5-4. Nevertheless all of the new housing growth was in single-family detached units or larger multi-family housing stock. Single-family detached structures increased from 47.6% of all units in 1990 to 53.3% by 2014, representing 1,012 new units and a growth rate of 12.8%. On the other hand, single-family attached units, largely duplex condominiums, fluctuated from 405 units in 1990 to 623 units by 2010, and then down considerably to 371 units by 2014. This sharp decline in only 4 years is surprising and may involve some sample error in the 2014 ACS estimates or could also involve some units converted to higher density through the Harborlight Development Partners’ Holcroft development. There were increases in the larger multi-family properties of 5 or more units, from 3,507 units in 1990 to 4,243 according to 2014 estimates, involving an increase of 736 units. An example is Cabot Street homes below that was developed by Harborlight Community Partners and the North Shore YMCA. Given projects that have been developed since then or are in the pipeline, the number of multi-family units will continue to increase.
There were notable declines in the small multi-family housing stock of two to four units, from 3,591 units in 1990, or 23% of all units, to 3,231 by 2014, or 19.2% of the housing stock. These housing units are typically among some of the more affordable units in the private housing stock as private landlords, particularly owner-occupied ones, tend to value good tenants and frequently maintain below market rents to keep them. These properties also provide rental income to small landlords that is included in underwriting criteria (usually as much as 75% of the projected rent can be calculated as income in mortgage underwriting), making this type of housing more affordable to more moderate-income purchasers.
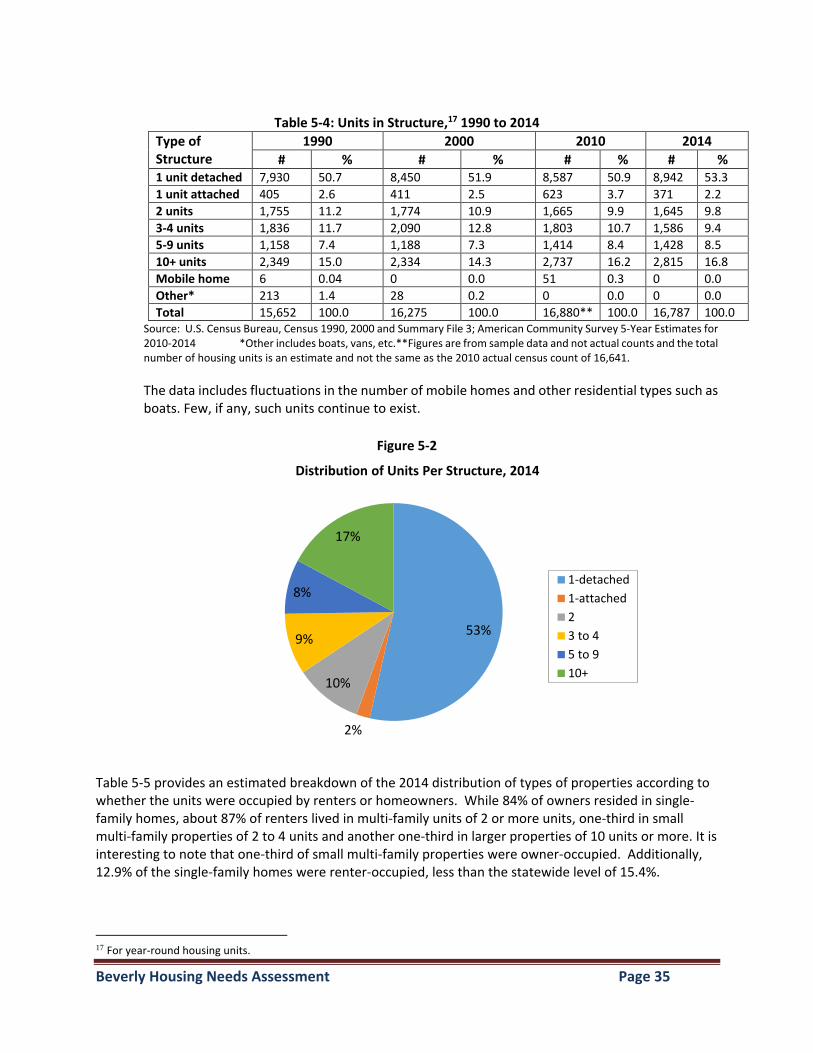
Beverly Housing Needs Assessment Page 35
Table 5-4: Units in Structure,17 1990 to 2014
Type of Structure
1990 2000 2010 2014
# % # % # % # % 1 unit detached 7,930 50.7 8,450 51.9 8,587 50.9 8,942 53.3
1 unit attached 405 2.6 411 2.5 623 3.7 371 2.2
2 units 1,755 11.2 1,774 10.9 1,665 9.9 1,645 9.8
3-4 units 1,836 11.7 2,090 12.8 1,803 10.7 1,586 9.4
5-9 units 1,158 7.4 1,188 7.3 1,414 8.4 1,428 8.5
10+ units 2,349 15.0 2,334 14.3 2,737 16.2 2,815 16.8
Mobile home 6 0.04 0 0.0 51 0.3 0 0.0
Other* 213 1.4 28 0.2 0 0.0 0 0.0
Total 15,652 100.0 16,275 100.0 16,880** 100.0 16,787 100.0 Source: U.S. Census Bureau, Census 1990, 2000 and Summary File 3; American Community Survey 5-Year Estimates for 2010-2014 *Other includes boats, vans, etc.**Figures are from sample data and not actual counts and the total number of housing units is an estimate and not the same as the 2010 actual census count of 16,641.
The data includes fluctuations in the number of mobile homes and other residential types such as boats. Few, if any, such units continue to exist.
Figure 5-2
Table 5-5 provides an estimated breakdown of the 2014 distribution of types of properties according to whether the units were occupied by renters or homeowners. While 84% of owners resided in single-family homes, about 87% of renters lived in multi-family units of 2 or more units, one-third in small multi-family properties of 2 to 4 units and another one-third in larger properties of 10 units or more. It is interesting to note that one-third of small multi-family properties were owner-occupied. Additionally, 12.9% of the single-family homes were renter-occupied, less than the statewide level of 15.4%.
17 For year-round housing units.
53%
2%
10%
9%
8%
17%
Distribution of Units Per Structure, 2014
1-detached
1-attached
2
3 to 4
5 to 9
10+
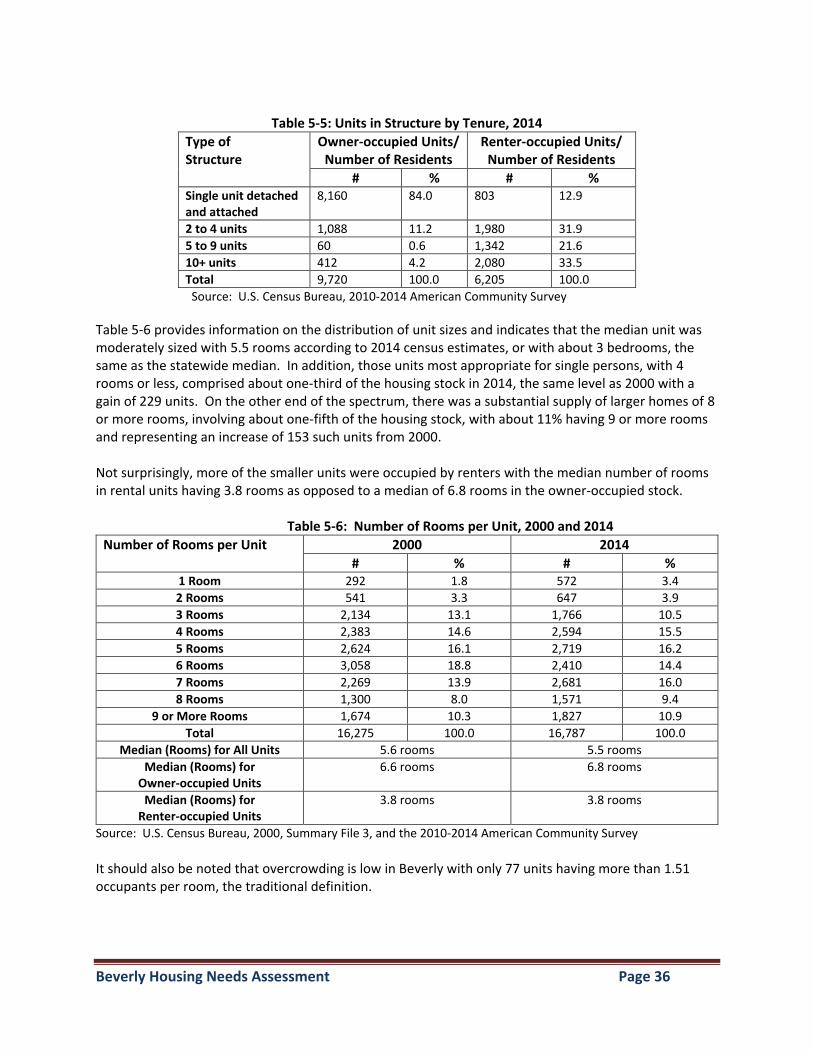
Beverly Housing Needs Assessment Page 36
Table 5-5: Units in Structure by Tenure, 2014
Type of Structure
Owner-occupied Units/ Number of Residents
Renter-occupied Units/ Number of Residents
# % # % Single unit detached and attached
8,160 84.0 803 12.9
2 to 4 units 1,088 11.2 1,980 31.9
5 to 9 units 60 0.6 1,342 21.6
10+ units 412 4.2 2,080 33.5
Total 9,720 100.0 6,205 100.0
Source: U.S. Census Bureau, 2010-2014 American Community Survey
Table 5-6 provides information on the distribution of unit sizes and indicates that the median unit was moderately sized with 5.5 rooms according to 2014 census estimates, or with about 3 bedrooms, the same as the statewide median. In addition, those units most appropriate for single persons, with 4 rooms or less, comprised about one-third of the housing stock in 2014, the same level as 2000 with a gain of 229 units. On the other end of the spectrum, there was a substantial supply of larger homes of 8 or more rooms, involving about one-fifth of the housing stock, with about 11% having 9 or more rooms and representing an increase of 153 such units from 2000. Not surprisingly, more of the smaller units were occupied by renters with the median number of rooms in rental units having 3.8 rooms as opposed to a median of 6.8 rooms in the owner-occupied stock.
Table 5-6: Number of Rooms per Unit, 2000 and 2014
Number of Rooms per Unit 2000 2014
# % # % 1 Room 292 1.8 572 3.4
2 Rooms 541 3.3 647 3.9
3 Rooms 2,134 13.1 1,766 10.5
4 Rooms 2,383 14.6 2,594 15.5
5 Rooms 2,624 16.1 2,719 16.2
6 Rooms 3,058 18.8 2,410 14.4
7 Rooms 2,269 13.9 2,681 16.0
8 Rooms 1,300 8.0 1,571 9.4
9 or More Rooms 1,674 10.3 1,827 10.9
Total 16,275 100.0 16,787 100.0
Median (Rooms) for All Units 5.6 rooms 5.5 rooms
Median (Rooms) for Owner-occupied Units
6.6 rooms 6.8 rooms
Median (Rooms) for Renter-occupied Units
3.8 rooms 3.8 rooms
Source: U.S. Census Bureau, 2000, Summary File 3, and the 2010-2014 American Community Survey
It should also be noted that overcrowding is low in Beverly with only 77 units having more than 1.51 occupants per room, the traditional definition.
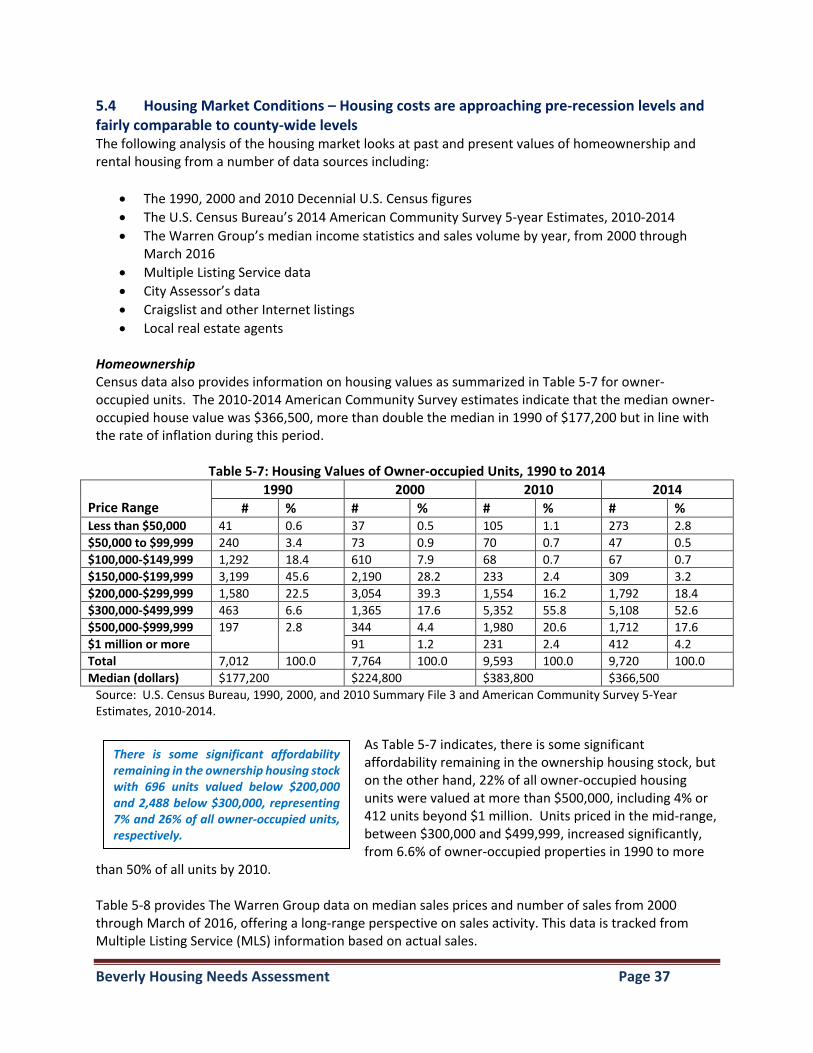
Beverly Housing Needs Assessment Page 37
5.4 Housing Market Conditions – Housing costs are approaching pre-recession levels and fairly comparable to county-wide levels The following analysis of the housing market looks at past and present values of homeownership and rental housing from a number of data sources including:
The 1990, 2000 and 2010 Decennial U.S. Census figures
The U.S. Census Bureau’s 2014 American Community Survey 5-year Estimates, 2010-2014
The Warren Group’s median income statistics and sales volume by year, from 2000 through March 2016
Multiple Listing Service data
City Assessor’s data
Craigslist and other Internet listings
Local real estate agents
Homeownership Census data also provides information on housing values as summarized in Table 5-7 for owner-occupied units. The 2010-2014 American Community Survey estimates indicate that the median owner-occupied house value was $366,500, more than double the median in 1990 of $177,200 but in line with the rate of inflation during this period.
Table 5-7: Housing Values of Owner-occupied Units, 1990 to 2014
Price Range
1990 2000 2010 2014
# % # % # % # % Less than $50,000 41 0.6 37 0.5 105 1.1 273 2.8
$50,000 to $99,999 240 3.4 73 0.9 70 0.7 47 0.5
$100,000-$149,999 1,292 18.4 610 7.9 68 0.7 67 0.7
$150,000-$199,999 3,199 45.6 2,190 28.2 233 2.4 309 3.2
$200,000-$299,999 1,580 22.5 3,054 39.3 1,554 16.2 1,792 18.4
$300,000-$499,999 463 6.6 1,365 17.6 5,352 55.8 5,108 52.6
$500,000-$999,999 197 2.8 344 4.4 1,980 20.6 1,712 17.6
$1 million or more 91 1.2 231 2.4 412 4.2
Total 7,012 100.0 7,764 100.0 9,593 100.0 9,720 100.0
Median (dollars) $177,200 $224,800 $383,800 $366,500
Source: U.S. Census Bureau, 1990, 2000, and 2010 Summary File 3 and American Community Survey 5-Year Estimates, 2010-2014.
As Table 5-7 indicates, there is some significant affordability remaining in the ownership housing stock, but on the other hand, 22% of all owner-occupied housing units were valued at more than $500,000, including 4% or 412 units beyond $1 million. Units priced in the mid-range, between $300,000 and $499,999, increased significantly, from 6.6% of owner-occupied properties in 1990 to more
than 50% of all units by 2010. Table 5-8 provides The Warren Group data on median sales prices and number of sales from 2000 through March of 2016, offering a long-range perspective on sales activity. This data is tracked from Multiple Listing Service (MLS) information based on actual sales.
There is some significant affordability remaining in the ownership housing stock with 696 units valued below $200,000 and 2,488 below $300,000, representing 7% and 26% of all owner-occupied units, respectively.
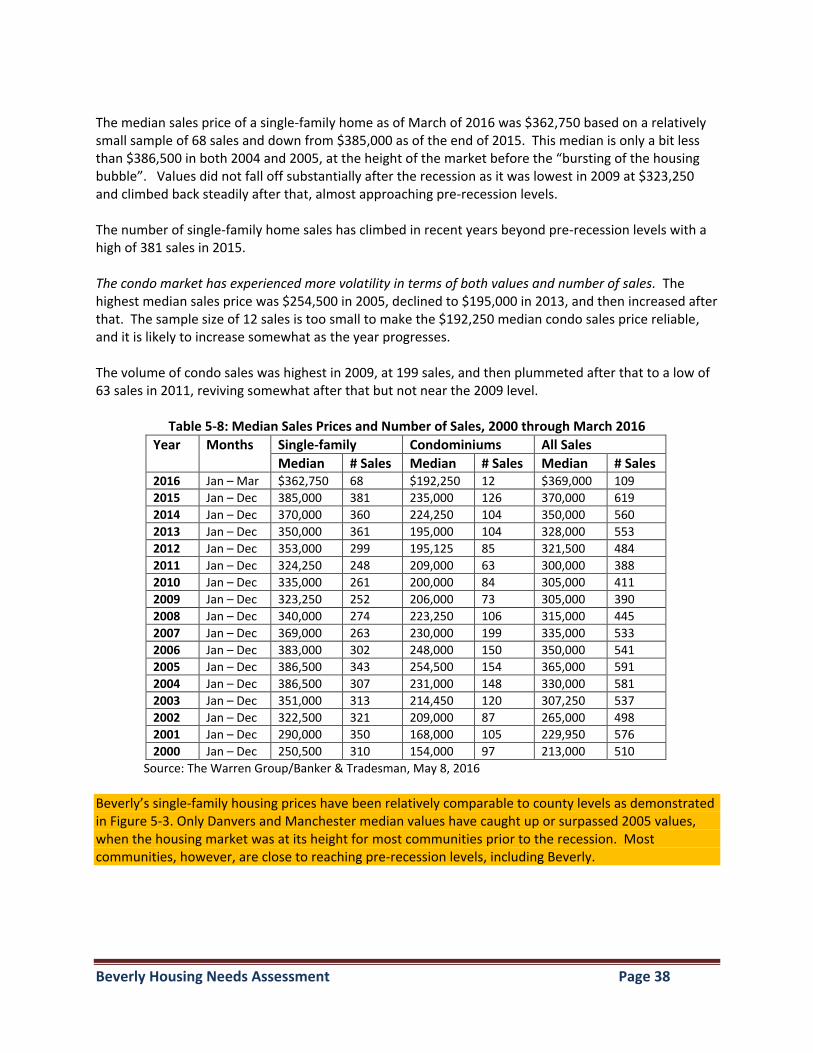
Beverly Housing Needs Assessment Page 38
The median sales price of a single-family home as of March of 2016 was $362,750 based on a relatively small sample of 68 sales and down from $385,000 as of the end of 2015. This median is only a bit less than $386,500 in both 2004 and 2005, at the height of the market before the “bursting of the housing bubble”. Values did not fall off substantially after the recession as it was lowest in 2009 at $323,250 and climbed back steadily after that, almost approaching pre-recession levels. The number of single-family home sales has climbed in recent years beyond pre-recession levels with a high of 381 sales in 2015. The condo market has experienced more volatility in terms of both values and number of sales. The highest median sales price was $254,500 in 2005, declined to $195,000 in 2013, and then increased after that. The sample size of 12 sales is too small to make the $192,250 median condo sales price reliable, and it is likely to increase somewhat as the year progresses. The volume of condo sales was highest in 2009, at 199 sales, and then plummeted after that to a low of 63 sales in 2011, reviving somewhat after that but not near the 2009 level.
Table 5-8: Median Sales Prices and Number of Sales, 2000 through March 2016
Year Months Single-family Condominiums All Sales
Median # Sales Median # Sales Median # Sales 2016 Jan – Mar $362,750 68 $192,250 12 $369,000 109
2015 Jan – Dec 385,000 381 235,000 126 370,000 619
2014 Jan – Dec 370,000 360 224,250 104 350,000 560
2013 Jan – Dec 350,000 361 195,000 104 328,000 553
2012 Jan – Dec 353,000 299 195,125 85 321,500 484
2011 Jan – Dec 324,250 248 209,000 63 300,000 388
2010 Jan – Dec 335,000 261 200,000 84 305,000 411
2009 Jan – Dec 323,250 252 206,000 73 305,000 390
2008 Jan – Dec 340,000 274 223,250 106 315,000 445
2007 Jan – Dec 369,000 263 230,000 199 335,000 533
2006 Jan – Dec 383,000 302 248,000 150 350,000 541
2005 Jan – Dec 386,500 343 254,500 154 365,000 591
2004 Jan – Dec 386,500 307 231,000 148 330,000 581
2003 Jan – Dec 351,000 313 214,450 120 307,250 537
2002 Jan – Dec 322,500 321 209,000 87 265,000 498
2001 Jan – Dec 290,000 350 168,000 105 229,950 576
2000 Jan – Dec 250,500 310 154,000 97 213,000 510
Source: The Warren Group/Banker & Tradesman, May 8, 2016
Beverly’s single-family housing prices have been relatively comparable to county levels as demonstrated in Figure 5-3. Only Danvers and Manchester median values have caught up or surpassed 2005 values, when the housing market was at its height for most communities prior to the recession. Most communities, however, are close to reaching pre-recession levels, including Beverly.
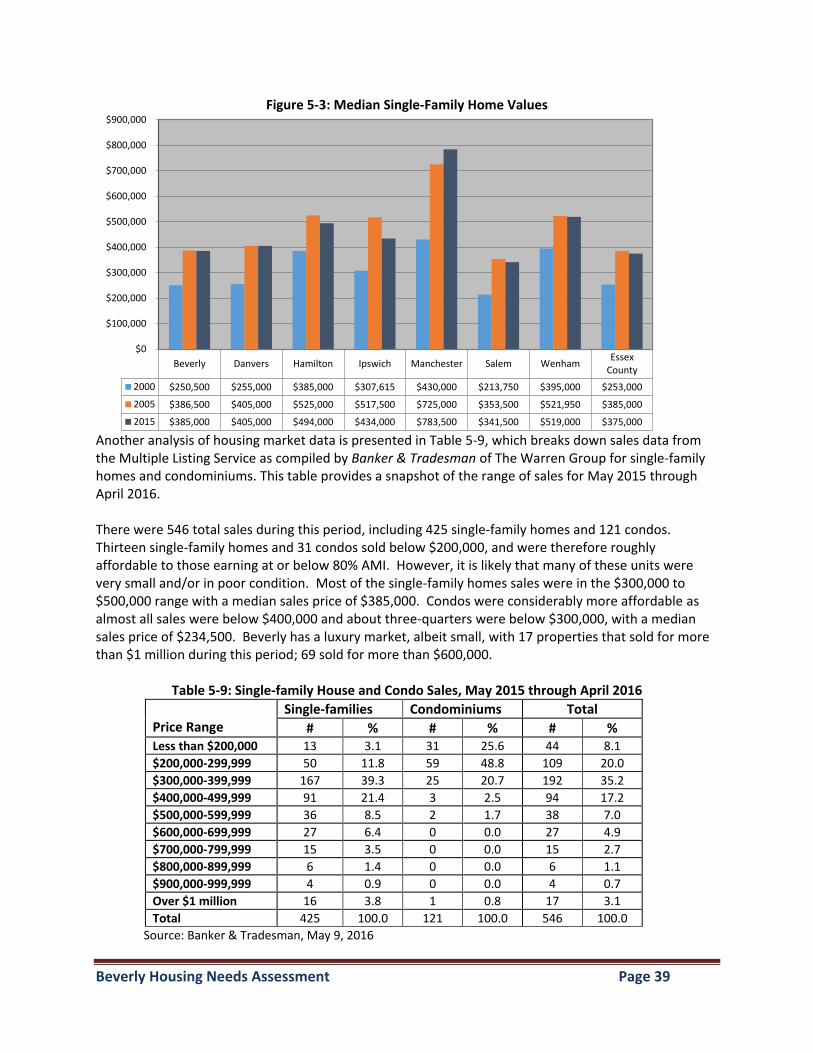
Beverly Housing Needs Assessment Page 39
Figure 5-3: Median Single-Family Home Values
Another analysis of housing market data is presented in Table 5-9, which breaks down sales data from the Multiple Listing Service as compiled by Banker & Tradesman of The Warren Group for single-family homes and condominiums. This table provides a snapshot of the range of sales for May 2015 through April 2016. There were 546 total sales during this period, including 425 single-family homes and 121 condos. Thirteen single-family homes and 31 condos sold below $200,000, and were therefore roughly affordable to those earning at or below 80% AMI. However, it is likely that many of these units were very small and/or in poor condition. Most of the single-family homes sales were in the $300,000 to $500,000 range with a median sales price of $385,000. Condos were considerably more affordable as almost all sales were below $400,000 and about three-quarters were below $300,000, with a median sales price of $234,500. Beverly has a luxury market, albeit small, with 17 properties that sold for more than $1 million during this period; 69 sold for more than $600,000.
Table 5-9: Single-family House and Condo Sales, May 2015 through April 2016
Price Range
Single-families Condominiums Total
# % # % # % Less than $200,000 13 3.1 31 25.6 44 8.1
$200,000-299,999 50 11.8 59 48.8 109 20.0
$300,000-399,999 167 39.3 25 20.7 192 35.2
$400,000-499,999 91 21.4 3 2.5 94 17.2
$500,000-599,999 36 8.5 2 1.7 38 7.0
$600,000-699,999 27 6.4 0 0.0 27 4.9
$700,000-799,999 15 3.5 0 0.0 15 2.7
$800,000-899,999 6 1.4 0 0.0 6 1.1
$900,000-999,999 4 0.9 0 0.0 4 0.7
Over $1 million 16 3.8 1 0.8 17 3.1
Total 425 100.0 121 100.0 546 100.0
Source: Banker & Tradesman, May 9, 2016
Beverly Danvers Hamilton Ipswich Manchester Salem WenhamEssex
County
2000 $250,500 $255,000 $385,000 $307,615 $430,000 $213,750 $395,000 $253,000
2005 $386,500 $405,000 $525,000 $517,500 $725,000 $353,500 $521,950 $385,000
2015 $385,000 $405,000 $494,000 $434,000 $783,500 $341,500 $519,000 $375,000
$0
$100,000
$200,000
$300,000
$400,000
$500,000
$600,000
$700,000
$800,000
$900,000
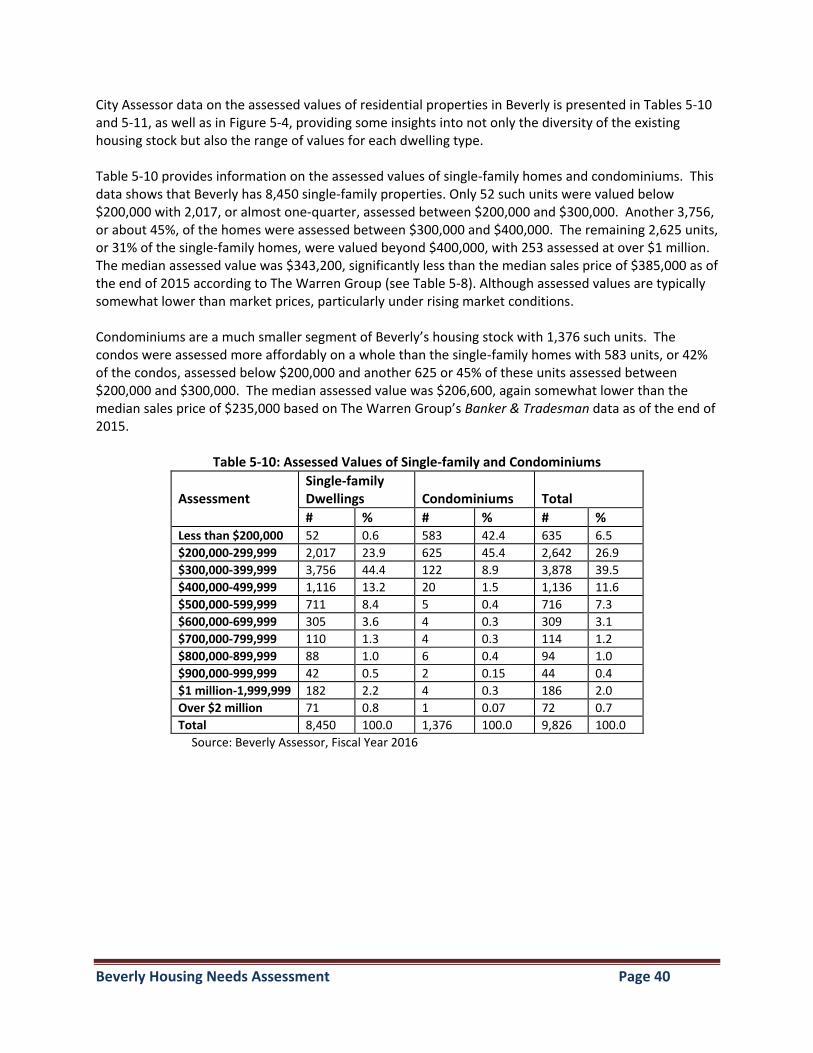
Beverly Housing Needs Assessment Page 40
City Assessor data on the assessed values of residential properties in Beverly is presented in Tables 5-10 and 5-11, as well as in Figure 5-4, providing some insights into not only the diversity of the existing housing stock but also the range of values for each dwelling type. Table 5-10 provides information on the assessed values of single-family homes and condominiums. This data shows that Beverly has 8,450 single-family properties. Only 52 such units were valued below $200,000 with 2,017, or almost one-quarter, assessed between $200,000 and $300,000. Another 3,756, or about 45%, of the homes were assessed between $300,000 and $400,000. The remaining 2,625 units, or 31% of the single-family homes, were valued beyond $400,000, with 253 assessed at over $1 million. The median assessed value was $343,200, significantly less than the median sales price of $385,000 as of the end of 2015 according to The Warren Group (see Table 5-8). Although assessed values are typically somewhat lower than market prices, particularly under rising market conditions. Condominiums are a much smaller segment of Beverly’s housing stock with 1,376 such units. The condos were assessed more affordably on a whole than the single-family homes with 583 units, or 42% of the condos, assessed below $200,000 and another 625 or 45% of these units assessed between $200,000 and $300,000. The median assessed value was $206,600, again somewhat lower than the median sales price of $235,000 based on The Warren Group’s Banker & Tradesman data as of the end of 2015.
Table 5-10: Assessed Values of Single-family and Condominiums
Assessment
Single-family Dwellings
Condominiums
Total
# % # % # % Less than $200,000 52 0.6 583 42.4 635 6.5
$200,000-299,999 2,017 23.9 625 45.4 2,642 26.9
$300,000-399,999 3,756 44.4 122 8.9 3,878 39.5
$400,000-499,999 1,116 13.2 20 1.5 1,136 11.6
$500,000-599,999 711 8.4 5 0.4 716 7.3
$600,000-699,999 305 3.6 4 0.3 309 3.1
$700,000-799,999 110 1.3 4 0.3 114 1.2
$800,000-899,999 88 1.0 6 0.4 94 1.0
$900,000-999,999 42 0.5 2 0.15 44 0.4
$1 million-1,999,999 182 2.2 4 0.3 186 2.0
Over $2 million 71 0.8 1 0.07 72 0.7
Total 8,450 100.0 1,376 100.0 9,826 100.0
Source: Beverly Assessor, Fiscal Year 2016
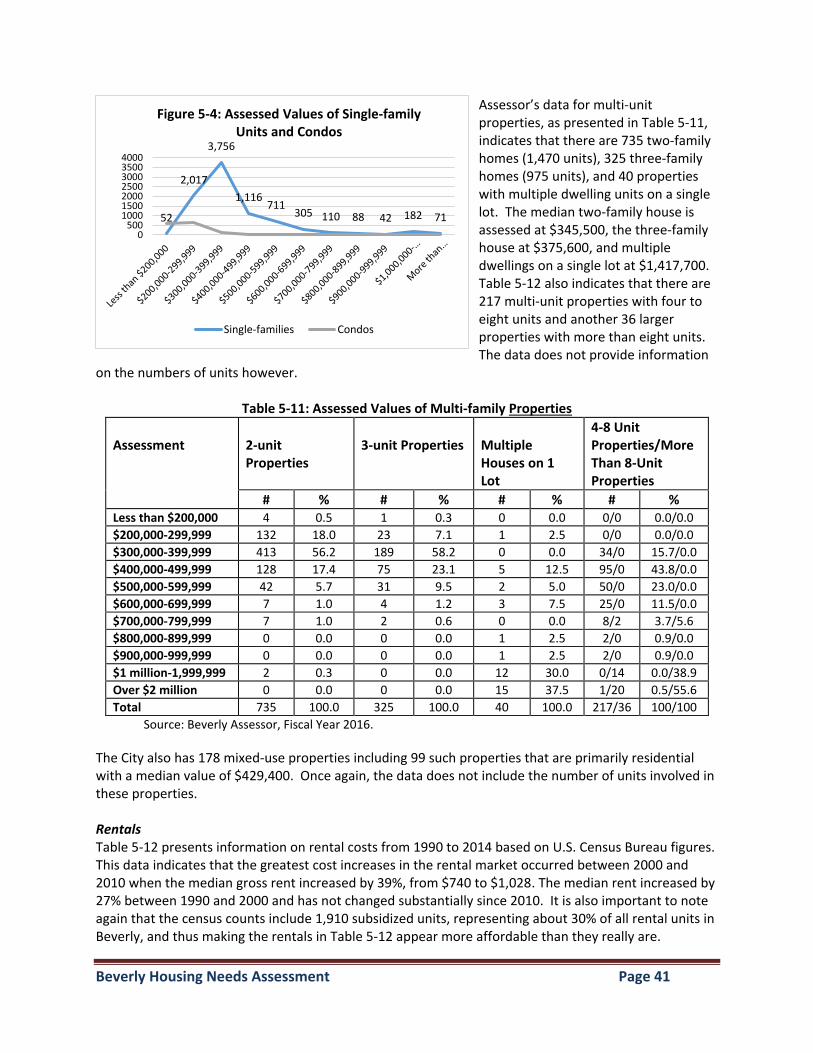
Beverly Housing Needs Assessment Page 41
Assessor’s data for multi-unit properties, as presented in Table 5-11, indicates that there are 735 two-family homes (1,470 units), 325 three-family homes (975 units), and 40 properties with multiple dwelling units on a single lot. The median two-family house is assessed at $345,500, the three-family house at $375,600, and multiple dwellings on a single lot at $1,417,700. Table 5-12 also indicates that there are 217 multi-unit properties with four to eight units and another 36 larger properties with more than eight units. The data does not provide information
on the numbers of units however.
Table 5-11: Assessed Values of Multi-family Properties
Assessment
2-unit Properties
3-unit Properties
Multiple Houses on 1 Lot
4-8 Unit Properties/More Than 8-Unit Properties
# % # % # % # % Less than $200,000 4 0.5 1 0.3 0 0.0 0/0 0.0/0.0
$200,000-299,999 132 18.0 23 7.1 1 2.5 0/0 0.0/0.0
$300,000-399,999 413 56.2 189 58.2 0 0.0 34/0 15.7/0.0
$400,000-499,999 128 17.4 75 23.1 5 12.5 95/0 43.8/0.0
$500,000-599,999 42 5.7 31 9.5 2 5.0 50/0 23.0/0.0
$600,000-699,999 7 1.0 4 1.2 3 7.5 25/0 11.5/0.0
$700,000-799,999 7 1.0 2 0.6 0 0.0 8/2 3.7/5.6
$800,000-899,999 0 0.0 0 0.0 1 2.5 2/0 0.9/0.0
$900,000-999,999 0 0.0 0 0.0 1 2.5 2/0 0.9/0.0
$1 million-1,999,999 2 0.3 0 0.0 12 30.0 0/14 0.0/38.9
Over $2 million 0 0.0 0 0.0 15 37.5 1/20 0.5/55.6
Total 735 100.0 325 100.0 40 100.0 217/36 100/100
Source: Beverly Assessor, Fiscal Year 2016.
The City also has 178 mixed-use properties including 99 such properties that are primarily residential with a median value of $429,400. Once again, the data does not include the number of units involved in these properties. Rentals Table 5-12 presents information on rental costs from 1990 to 2014 based on U.S. Census Bureau figures. This data indicates that the greatest cost increases in the rental market occurred between 2000 and 2010 when the median gross rent increased by 39%, from $740 to $1,028. The median rent increased by 27% between 1990 and 2000 and has not changed substantially since 2010. It is also important to note again that the census counts include 1,910 subsidized units, representing about 30% of all rental units in Beverly, and thus making the rentals in Table 5-12 appear more affordable than they really are.
52
2,017
3,756
1,116711
305 110 88 42 182 71
0500
1000150020002500300035004000
Figure 5-4: Assessed Values of Single-family Units and Condos
Single-families Condos
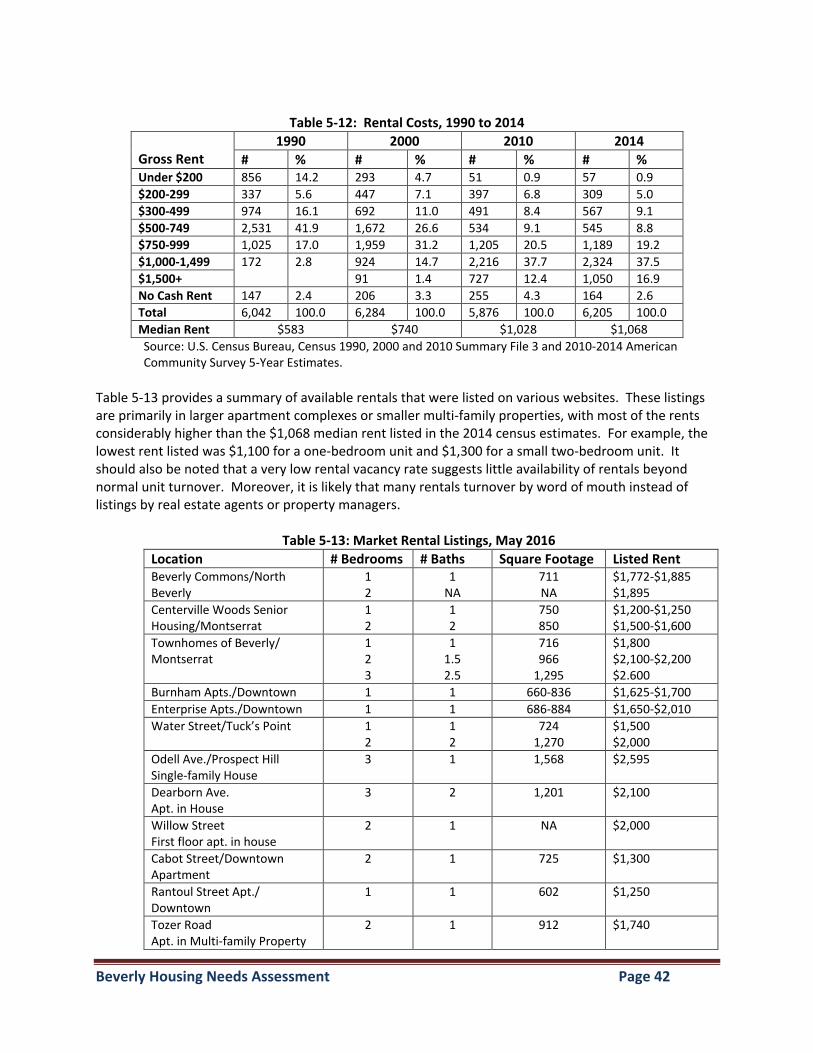
Beverly Housing Needs Assessment Page 42
Table 5-12: Rental Costs, 1990 to 2014
Gross Rent
1990 2000 2010 2014
# % # % # % # % Under $200 856 14.2 293 4.7 51 0.9 57 0.9
$200-299 337 5.6 447 7.1 397 6.8 309 5.0
$300-499 974 16.1 692 11.0 491 8.4 567 9.1
$500-749 2,531 41.9 1,672 26.6 534 9.1 545 8.8
$750-999 1,025 17.0 1,959 31.2 1,205 20.5 1,189 19.2
$1,000-1,499 172 2.8 924 14.7 2,216 37.7 2,324 37.5
$1,500+ 91 1.4 727 12.4 1,050 16.9
No Cash Rent 147 2.4 206 3.3 255 4.3 164 2.6
Total 6,042 100.0 6,284 100.0 5,876 100.0 6,205 100.0
Median Rent $583 $740 $1,028 $1,068
Source: U.S. Census Bureau, Census 1990, 2000 and 2010 Summary File 3 and 2010-2014 American Community Survey 5-Year Estimates.
Table 5-13 provides a summary of available rentals that were listed on various websites. These listings are primarily in larger apartment complexes or smaller multi-family properties, with most of the rents considerably higher than the $1,068 median rent listed in the 2014 census estimates. For example, the lowest rent listed was $1,100 for a one-bedroom unit and $1,300 for a small two-bedroom unit. It should also be noted that a very low rental vacancy rate suggests little availability of rentals beyond normal unit turnover. Moreover, it is likely that many rentals turnover by word of mouth instead of listings by real estate agents or property managers.
Table 5-13: Market Rental Listings, May 2016
Location # Bedrooms # Baths Square Footage Listed Rent Beverly Commons/North Beverly
1 2
1 NA
711 NA
$1,772-$1,885 $1,895
Centerville Woods Senior Housing/Montserrat
1 2
1 2
750 850
$1,200-$1,250 $1,500-$1,600
Townhomes of Beverly/ Montserrat
1 2 3
1 1.5 2.5
716 966
1,295
$1,800 $2,100-$2,200 $2.600
Burnham Apts./Downtown 1 1 660-836 $1,625-$1,700
Enterprise Apts./Downtown 1 1 686-884 $1,650-$2,010
Water Street/Tuck’s Point 1 2
1 2
724 1,270
$1,500 $2,000
Odell Ave./Prospect Hill Single-family House
3 1 1,568 $2,595
Dearborn Ave. Apt. in House
3 2 1,201 $2,100
Willow Street First floor apt. in house
2 1 NA $2,000
Cabot Street/Downtown Apartment
2 1 725 $1,300
Rantoul Street Apt./ Downtown
1 1 602 $1,250
Tozer Road Apt. in Multi-family Property
2 1 912 $1,740
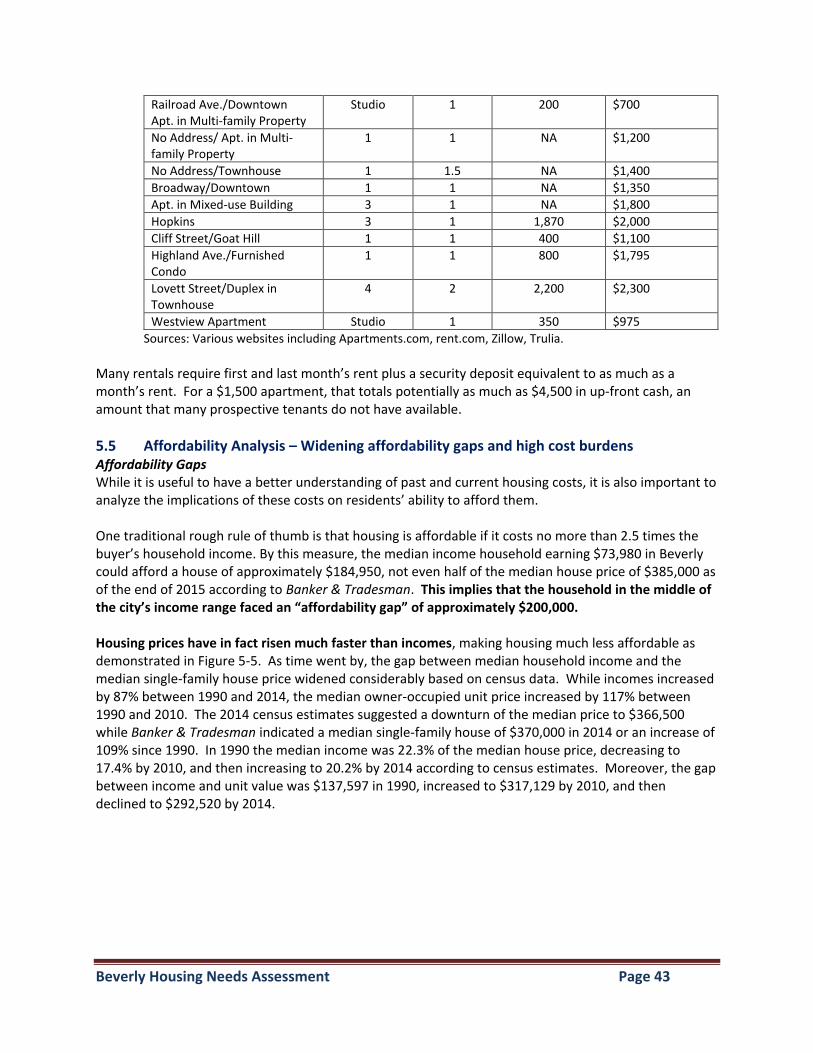
Beverly Housing Needs Assessment Page 43
Railroad Ave./Downtown Apt. in Multi-family Property
Studio 1 200 $700
No Address/ Apt. in Multi-family Property
1 1 NA $1,200
No Address/Townhouse 1 1.5 NA $1,400
Broadway/Downtown 1 1 NA $1,350
Apt. in Mixed-use Building 3 1 NA $1,800
Hopkins 3 1 1,870 $2,000
Cliff Street/Goat Hill 1 1 400 $1,100
Highland Ave./Furnished Condo
1 1 800 $1,795
Lovett Street/Duplex in Townhouse
4 2 2,200 $2,300
Westview Apartment Studio 1 350 $975
Sources: Various websites including Apartments.com, rent.com, Zillow, Trulia.
Many rentals require first and last month’s rent plus a security deposit equivalent to as much as a month’s rent. For a $1,500 apartment, that totals potentially as much as $4,500 in up-front cash, an amount that many prospective tenants do not have available.
5.5 Affordability Analysis – Widening affordability gaps and high cost burdens
Affordability Gaps While it is useful to have a better understanding of past and current housing costs, it is also important to analyze the implications of these costs on residents’ ability to afford them. One traditional rough rule of thumb is that housing is affordable if it costs no more than 2.5 times the buyer’s household income. By this measure, the median income household earning $73,980 in Beverly could afford a house of approximately $184,950, not even half of the median house price of $385,000 as of the end of 2015 according to Banker & Tradesman. This implies that the household in the middle of the city’s income range faced an “affordability gap” of approximately $200,000. Housing prices have in fact risen much faster than incomes, making housing much less affordable as demonstrated in Figure 5-5. As time went by, the gap between median household income and the median single-family house price widened considerably based on census data. While incomes increased by 87% between 1990 and 2014, the median owner-occupied unit price increased by 117% between 1990 and 2010. The 2014 census estimates suggested a downturn of the median price to $366,500 while Banker & Tradesman indicated a median single-family house of $370,000 in 2014 or an increase of 109% since 1990. In 1990 the median income was 22.3% of the median house price, decreasing to 17.4% by 2010, and then increasing to 20.2% by 2014 according to census estimates. Moreover, the gap between income and unit value was $137,597 in 1990, increased to $317,129 by 2010, and then declined to $292,520 by 2014.
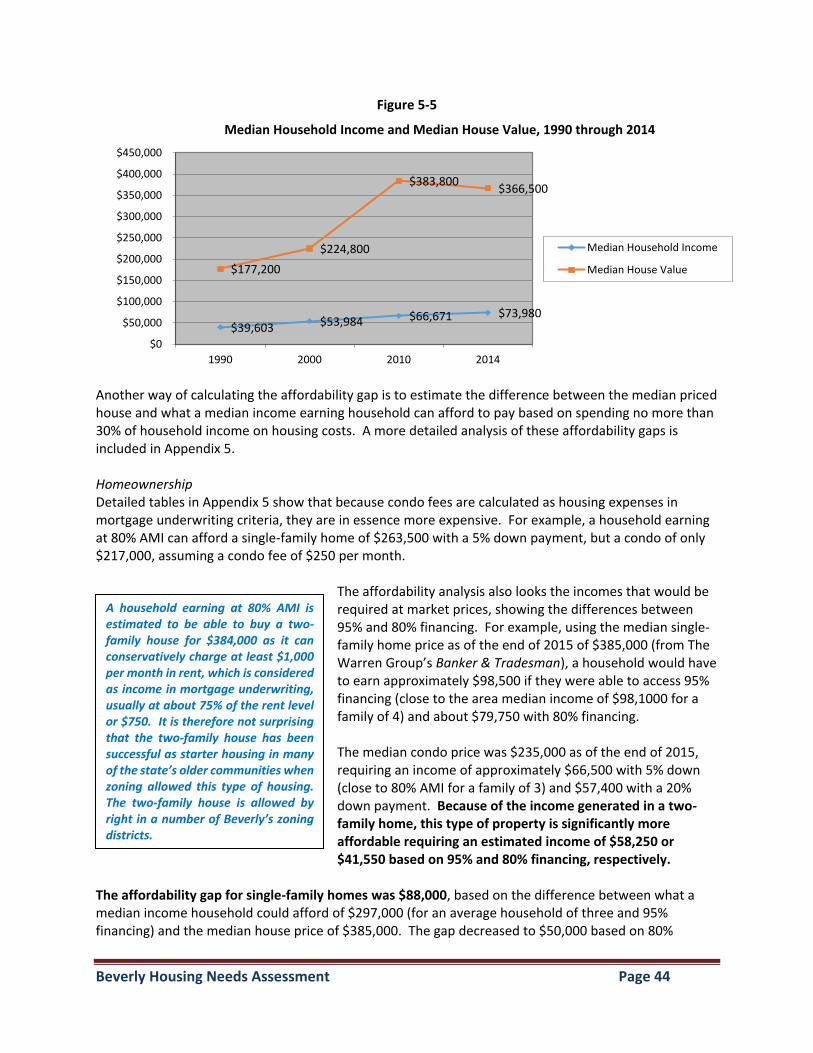
Beverly Housing Needs Assessment Page 44
Figure 5-5
Another way of calculating the affordability gap is to estimate the difference between the median priced house and what a median income earning household can afford to pay based on spending no more than 30% of household income on housing costs. A more detailed analysis of these affordability gaps is included in Appendix 5. Homeownership Detailed tables in Appendix 5 show that because condo fees are calculated as housing expenses in mortgage underwriting criteria, they are in essence more expensive. For example, a household earning at 80% AMI can afford a single-family home of $263,500 with a 5% down payment, but a condo of only $217,000, assuming a condo fee of $250 per month.
The affordability analysis also looks the incomes that would be required at market prices, showing the differences between 95% and 80% financing. For example, using the median single-family home price as of the end of 2015 of $385,000 (from The Warren Group’s Banker & Tradesman), a household would have to earn approximately $98,500 if they were able to access 95% financing (close to the area median income of $98,1000 for a family of 4) and about $79,750 with 80% financing. The median condo price was $235,000 as of the end of 2015, requiring an income of approximately $66,500 with 5% down (close to 80% AMI for a family of 3) and $57,400 with a 20% down payment. Because of the income generated in a two-family home, this type of property is significantly more affordable requiring an estimated income of $58,250 or $41,550 based on 95% and 80% financing, respectively.
The affordability gap for single-family homes was $88,000, based on the difference between what a median income household could afford of $297,000 (for an average household of three and 95% financing) and the median house price of $385,000. The gap decreased to $50,000 based on 80%
$39,603 $53,984 $66,671 $73,980
$177,200
$224,800
$383,800 $366,500
$0
$50,000
$100,000
$150,000
$200,000
$250,000
$300,000
$350,000
$400,000
$450,000
1990 2000 2010 2014
Median Household Income and Median House Value, 1990 through 2014
Median Household Income
Median House Value
A household earning at 80% AMI is estimated to be able to buy a two-family house for $384,000 as it can conservatively charge at least $1,000 per month in rent, which is considered as income in mortgage underwriting, usually at about 75% of the rent level or $750. It is therefore not surprising that the two-family house has been successful as starter housing in many of the state’s older communities when zoning allowed this type of housing. The two-family house is allowed by right in a number of Beverly’s zoning districts.
Beverly Housing Needs Assessment Page 45
financing and the ability to afford the upfront cash requirements for the down payment and closing costs of at least $70,000, something most first-time homebuyers are typically challenged to afford. There is currently no affordability gap for condos as a median income earning household can afford the median condo price of $235,000 under both the 80% and 95% financing options. There is a small $18,000 gap however in the 95% financing example for those households earning at or below 80% AMI where a household earning at this limit could afford no more than $217,000. There are no affordability gaps for the two-family house for both the median income earning household and those earning at or below 80% AMI under both the 95% and 80% financing scenarios. This confirms the relative high affordability of this type of housing. It should be noted that these estimates reflect what a household earning at the 80% AMI limit can afford, not what the state would require as the state-approved purchase price for any affordable unit which is based on 70% AMI adjusted by bedroom/household size to allow for some marketing window. Data in Appendix 5 also estimates how many single-family homes and condos exist in Beverly that were affordable within various income categories. There were 496 single-family homes and 775 condos affordable to those earning at or below 80% AMI for a total of 1,271 units or 12.9% of all units. More than half of the condos were affordable to those within this income range. It is also likely that many of these units are small and/or in relatively poor condition. Another 1,419 single-family homes and 252 condos were affordable to those earning between 80% of the Boston-area AMI and the median income level for the city of Beverly for a total of 1,751 units or 17.8% of all such units. These levels suggest some significant affordability in the community’s private housing stock. Still 70% of these units were affordable to those earning beyond the city’s median income level including 77.3% of single-families and 25.4% of condos. Additional calculations indicated that 57.5% of the single-family homes and 38.2% of the condos were affordable to those earning between 80% and 100% AMI (up to $98,100) with 36.6% and 5.5% of the single-family and condos affordable to those earning above 100% AMI, respectively.
When looking at the affordability gap for those earning at 80% AMI, the gap widens considerably to about $121,500, the difference between the median priced single-family home of $385,000 and what a three-person household earning at this income level can afford, or $263,500 based on 95% financing. The gap decreases to $87,000 with 80% financing but once again the purchaser must have the upfront cash of approximately $65,000 available, adding to the affordability gap.
Beverly Housing Needs Assessment Page 46
The affordability analysis also demonstrates the need for more affordable homeownership opportunities in Beverly, certainly for those earning at or below 80% AMI. These calculations suggest that of the 2,225 owner households who were estimated to have earned at or below 80% AMI, only 1,271 units might be affordable based on calculations, resulting in a deficit of 954 affordable ownership units. If one looks at those in this income range who are overspending (see Table 5-14), the deficit increases to 1,560 units.
Rentals In regard to rentals, using the median rent of $1,068 based on 2014 census estimates, an income of $49,720 would be required assuming $175 per month in average utility bills and housing expenses of no more than 30% of the household’s income. This income is considerably lower than 80% of the Boston area median income level of $65,750 for a household of 3, but considerably higher than the median household income for renters of $37,872. As another comparison, someone earning the minimum wage of $10.00 for 40 hours per week every week during the year would still only earn a gross income of only $20,880. Households with two persons earning the minimum wage would still fall short of the income needed to afford this rent.
The analysis also examines what renters can afford at several different income levels. For example, a three-person household earning at 50% AMI, approximately $44,150 annually, could afford an estimated monthly rental of about $929, assuming they are paying no more than 30% of their income on housing and pay utility bills that average $175 per month. A rental this low is increasingly difficult to find in Beverly, where the lowest rental advertised in early May 2016 for a two-bedroom apartment was $1,300, which most likely also required first and last month’s rent and a security deposit. This means that any household looking to rent in the private housing market must have a considerable amount of cash available, which has a significant impact on affordability. Cost Burdens As mentioned throughout this document, there are significant numbers of residents who are living beyond their means based on their housing costs. The U.S. Census Bureau provides data on how much households spend on housing whether for ownership or rental. Such information is helpful in assessing how many households are encountering housing affordability problems or cost burdens, defined as spending more than 30% of their income on housing. Based on 2014 estimates from the Census Bureau’s American Community Survey, 783 households, or 8.1% of the homeowners in Beverly, spent between 30% and 34% of their income on housing and another 2,341 owners, or 24.1%, spent more than 35% of their income on housing expenses. Therefore, about 32% of all owners overspent on housing based on these estimates.
While the City should primarily focus on those more financially vulnerable residents earning below 80% AMI, it is worth noting that when looking at cost burdens (spending more than 30% of income on housing) there are deficits in the other income categories as well including 385 households earning between 80% and 100% AMI and another 990 earning above that. Certainly the cost of housing throughout the city, in some neighborhoods in particular (Prides Crossing, Beverly Farms, Centerville, etc.), is making it difficult for even members of what might be considered the middle class to live in what’s commonly defined as affordable housing. These cost burdens also suggest the need for different income tiers within newhousing development to address a range of housing needs.
Beverly Housing Needs Assessment Page 47
In regard to renters, 538 renters who were paying rent, or 9.1%, spent between 30% and 34% of their income on housing and another 2,288, or 38.5%, spent 35% or more of their income for housing. This represents a total of 2,826 renters who overspent, or 47.6% of all renters who pay rent. This census data suggests that 5,950 households or 37% of all Beverly households were living in housing that is by common definition beyond their means and unaffordable. The Department of Housing and Urban Development (HUD) provides additional data on cost burdens through its State of the Cities Data System’s Comprehensive Housing Affordability Strategy (CHAS) report, which is summarized in Table 5-14. The table shows how many households were included in the particular category (by income, tenure and household type), how many were spending between 30% and 50% of their income on housing, and how many were spending more than half of their income on housing, referred to as having severe cost burdens. For example, the first cell indicates that 750 elderly renter households earned at or below 30% of median income with 130 spending between 30% and 50% of their income on housing and another 300 spending more than half. This means that 430 or 57% of extremely low-income elderly renters were cost burdened.
This report suggests that a substantial number of both renter and owner households are paying too much of their income on housing costs and consequently have less income available to spend on other important costs such as transportation, groceries and health care for example. The extent of these cost burdens, based on tenure, is highlighted below.
Renter Households Calculations in Table 5 of Appendix 5 estimate that there is a shortage of 2,480 rental units based on the numbers of those who are spending too much for their housing including 1,350 renter households who are spending more than half of their income on housing. These severely cost burdened renter households include 395 seniors, 345 families and 610 non-elderly single individuals.
There were 5,815 total renter households, with 2,480 or 43% spending more than 30% of their income on housing (with cost burdens), including 1,350 or 23% spending more than half of their income on housing costs (with severe cost burdens).
About two-thirds of all renters earning at or below 80% AMI were spending too much on housing including 1,350 or 39% who were spending more than 50% of their income on housing costs. Of particular concern are the 1,855 reported extremely low-income renter households earning at or below 30% AMI, of whom 1,105 or 60% were spending more than half their income on housing.
Given that the city has approximately 1,910 subsidized rentals in its SHI and another 278 or so rental vouchers that subsidize rents in privately-owned housing for qualifying households, it is surprising that the data suggests that only 1,195 renter households earning below 80% AMI were living without cost burdens.
Even some renters earning above 80% AMI were experiencing cost burdens, once again a testament to the community’s relatively high rents.
HUD’s CHAS report suggests that about 35% of all Beverly households were spending too much on their housing including almost 17% spending more than half of their income on housing costs. Of those 5,715 households earning at or below 80% of area median income, 3,855 experienced cost burdens with 2,280 or 40% spending more than half of their income on housing costs.
Beverly Housing Needs Assessment Page 48
Of the 1,250 older adults age 62 years of age or older who were earning at or below 80% AMI, 720 or 58% had cost burdens, including 395 or 32% with severe cost burdens who would be targets for new subsidized housing.
There were 940 small family renters (two to four members) earning at or below 80% AMI that included 655 or 70% who were spending too much on their housing; of these, 310 or one-third had severe cost burdens, another important target population for new affordable rental housing.
This data indicates that very few large family households (five or more members) were renting in Beverly, but all of the 35 large family renters earning at or below 30% AMI were experiencing severe cost burdens.
There were considerable numbers of “other” households (non-elderly, non-family), mostly single individuals, who were experiencing cost burdens. This included 72% of the 1,235 such households earning at or below 80% AMI and 610 or half who were paying more than half of their income on housing.
Owner Households Many homeowners are also struggling financially. For example, 1,200 homeowners were spending more than half their income on housing including 400 seniors, 475 families and 325 non-elderly single individuals.
Of the 9,600 owner households, 2,935 or 31% were overspending on their housing including 1,200 or 12.5% with severe cost burdens.
Of the 2,225 owner households earning at or below 80% AMI, 1,560 or 70% were spending too much and 930 or 42% were spending more than 50% of their earnings on housing costs.
There were 1,220 elderly owners earning at or below 80% AMI that included 695 or 57% with cost burdens and 340 or 28% with severe cost burdens. These high cost burdens likely point to a situation where seniors who are retired and living on fixed incomes are experiencing challenges affording the high housing costs in Beverly, including rising energy rates, insurance costs, and property taxes. Many of these owners are likely empty nesters living in single-family homes that cost too much for them to maintain and with more space than they require at this stage of their lives.
While a smaller portion of all owner households earning at or below 80% AMI, at only 560 households, small families were experiencing considerable cost burdens with 480 or 86% spending too much and 300 or 47% spending more than half of their income on housing.
There were only 100 large family owners, all with cost burdens except for 25 households earning within 30% who were likely living in subsidized housing.
While AMI the numbers of non-elderly, non-family owner households earning within 80% AMI are relatively low, at only 345 such households, these households were also experiencing considerable cost burdens with 310 or 90% spending too much for their housing and 255 or 74% spending more than half of their income on housing costs. Because these households are comprised largely of single individuals, their income is limited to one working household member as opposed to two in many families.
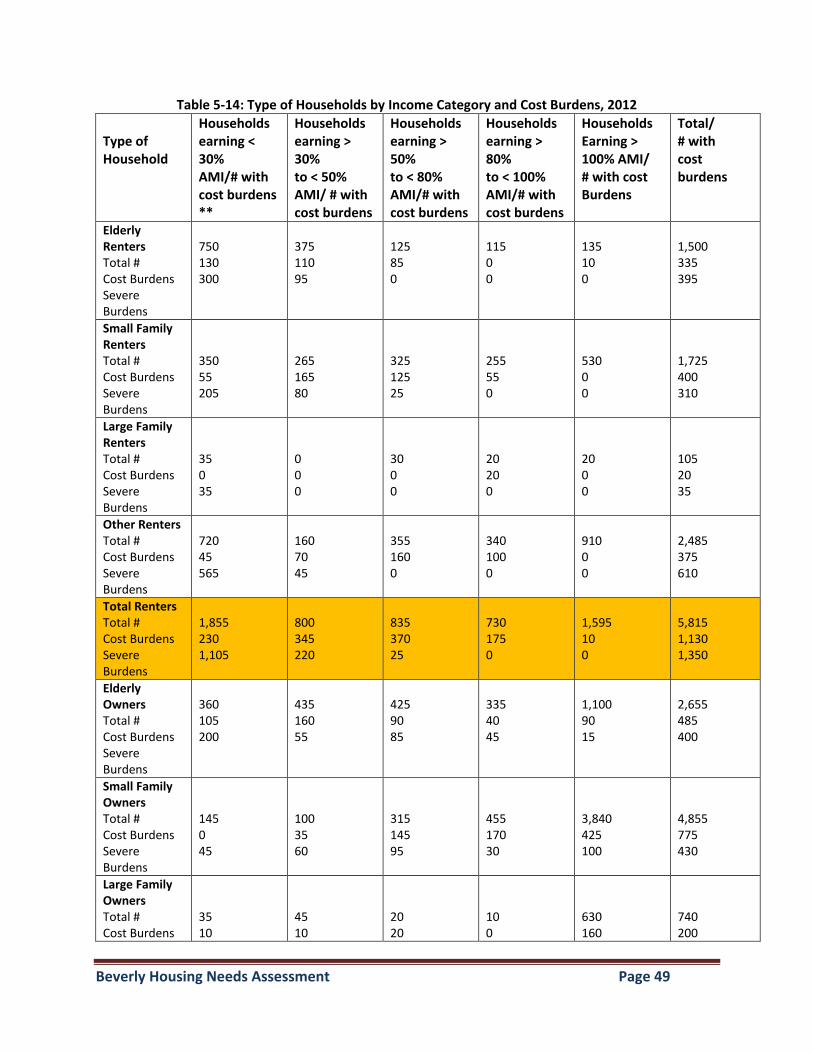
Beverly Housing Needs Assessment Page 49
Table 5-14: Type of Households by Income Category and Cost Burdens, 2012
Type of Household
Households earning < 30% AMI/# with cost burdens **
Households earning > 30% to < 50% AMI/ # with cost burdens
Households earning > 50% to < 80% AMI/# with cost burdens
Households earning > 80% to < 100% AMI/# with cost burdens
Households Earning > 100% AMI/ # with cost Burdens
Total/ # with cost burdens
Elderly Renters Total # Cost Burdens Severe Burdens
750 130 300
375 110 95
125 85 0
115 0 0
135 10 0
1,500 335 395
Small Family Renters Total # Cost Burdens Severe Burdens
350 55 205
265 165 80
325 125 25
255 55 0
530 0 0
1,725 400 310
Large Family Renters Total # Cost Burdens Severe Burdens
35 0 35
0 0 0
30 0 0
20 20 0
20 0 0
105 20 35
Other Renters Total # Cost Burdens Severe Burdens
720 45 565
160 70 45
355 160 0
340 100 0
910 0 0
2,485 375 610
Total Renters Total # Cost Burdens Severe Burdens
1,855 230 1,105
800 345 220
835 370 25
730 175 0
1,595 10 0
5,815 1,130 1,350
Elderly Owners Total # Cost Burdens Severe Burdens
360 105 200
435 160 55
425 90 85
335 40 45
1,100 90 15
2,655 485 400
Small Family Owners Total # Cost Burdens Severe Burdens
145 0 45
100 35 60
315 145 95
455 170 30
3,840 425 100
4,855 775 430
Large Family Owners Total # Cost Burdens
35 10
45 10
20 20
10 0
630 160
740 200
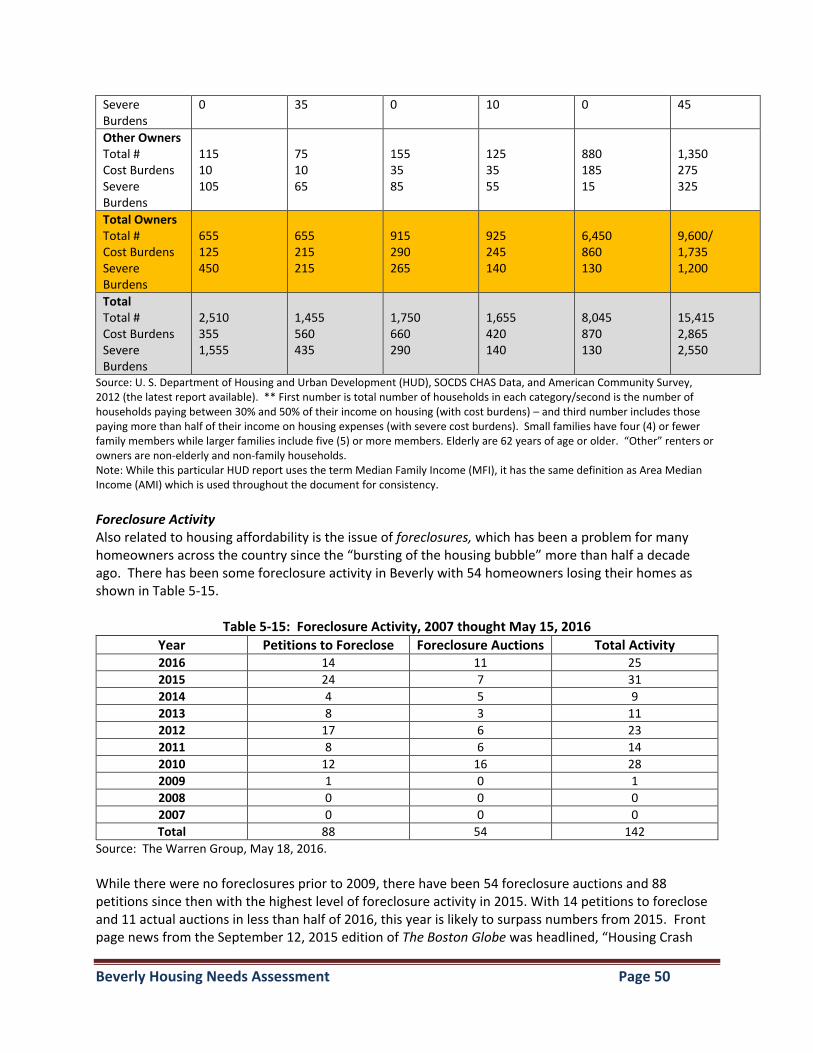
Beverly Housing Needs Assessment Page 50
Severe Burdens
0 35 0 10 0 45
Other Owners Total # Cost Burdens Severe Burdens
115 10 105
75 10 65
155 35 85
125 35 55
880 185 15
1,350 275 325
Total Owners Total # Cost Burdens Severe Burdens
655 125 450
655 215 215
915 290 265
925 245 140
6,450 860 130
9,600/ 1,735 1,200
Total Total # Cost Burdens Severe Burdens
2,510 355 1,555
1,455 560 435
1,750 660 290
1,655 420 140
8,045 870 130
15,415 2,865 2,550
Source: U. S. Department of Housing and Urban Development (HUD), SOCDS CHAS Data, and American Community Survey, 2012 (the latest report available). ** First number is total number of households in each category/second is the number of households paying between 30% and 50% of their income on housing (with cost burdens) – and third number includes those paying more than half of their income on housing expenses (with severe cost burdens). Small families have four (4) or fewer family members while larger families include five (5) or more members. Elderly are 62 years of age or older. “Other” renters or owners are non-elderly and non-family households. Note: While this particular HUD report uses the term Median Family Income (MFI), it has the same definition as Area Median Income (AMI) which is used throughout the document for consistency.
Foreclosure Activity Also related to housing affordability is the issue of foreclosures, which has been a problem for many homeowners across the country since the “bursting of the housing bubble” more than half a decade ago. There has been some foreclosure activity in Beverly with 54 homeowners losing their homes as shown in Table 5-15.
Table 5-15: Foreclosure Activity, 2007 thought May 15, 2016
Year Petitions to Foreclose Foreclosure Auctions Total Activity 2016 14 11 25
2015 24 7 31
2014 4 5 9
2013 8 3 11
2012 17 6 23
2011 8 6 14
2010 12 16 28
2009 1 0 1
2008 0 0 0
2007 0 0 0
Total 88 54 142
Source: The Warren Group, May 18, 2016.
While there were no foreclosures prior to 2009, there have been 54 foreclosure auctions and 88 petitions since then with the highest level of foreclosure activity in 2015. With 14 petitions to foreclose and 11 actual auctions in less than half of 2016, this year is likely to surpass numbers from 2015. Front page news from the September 12, 2015 edition of The Boston Globe was headlined, “Housing Crash
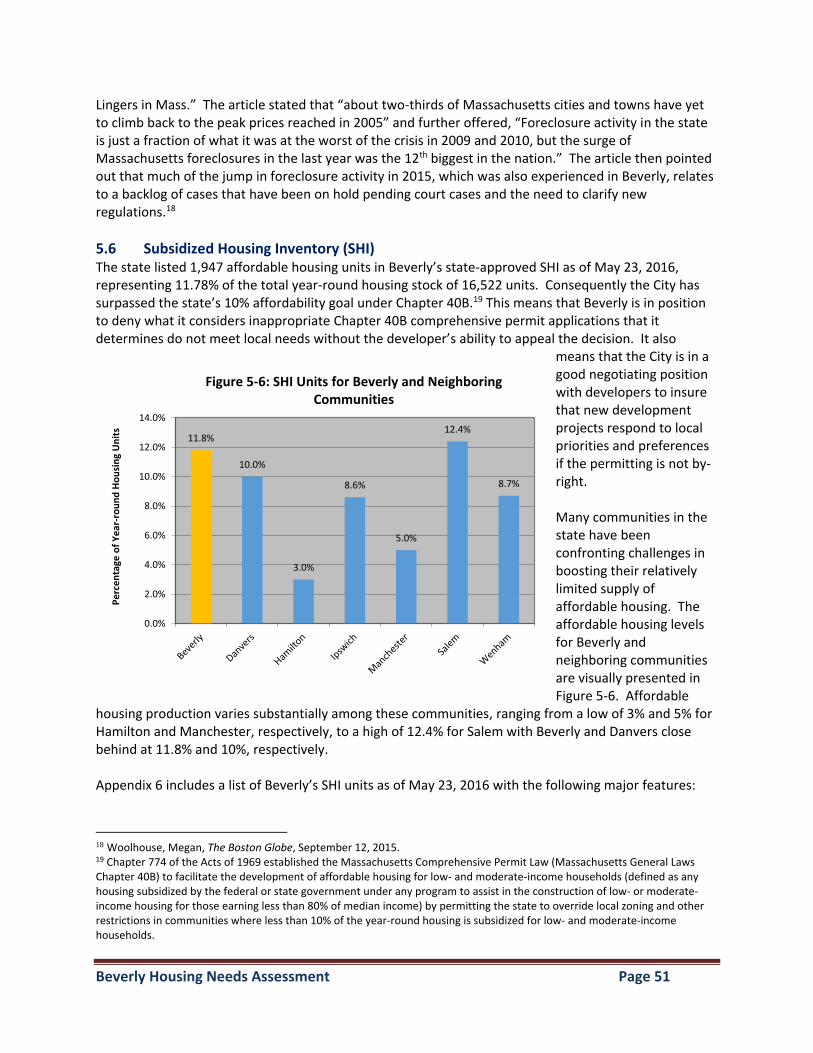
Beverly Housing Needs Assessment Page 51
Lingers in Mass.” The article stated that “about two-thirds of Massachusetts cities and towns have yet to climb back to the peak prices reached in 2005” and further offered, “Foreclosure activity in the state is just a fraction of what it was at the worst of the crisis in 2009 and 2010, but the surge of Massachusetts foreclosures in the last year was the 12th biggest in the nation.” The article then pointed out that much of the jump in foreclosure activity in 2015, which was also experienced in Beverly, relates to a backlog of cases that have been on hold pending court cases and the need to clarify new regulations.18
5.6 Subsidized Housing Inventory (SHI) The state listed 1,947 affordable housing units in Beverly’s state-approved SHI as of May 23, 2016, representing 11.78% of the total year-round housing stock of 16,522 units. Consequently the City has surpassed the state’s 10% affordability goal under Chapter 40B.19 This means that Beverly is in position to deny what it considers inappropriate Chapter 40B comprehensive permit applications that it determines do not meet local needs without the developer’s ability to appeal the decision. It also
means that the City is in a good negotiating position with developers to insure that new development projects respond to local priorities and preferences if the permitting is not by-right. Many communities in the state have been confronting challenges in boosting their relatively limited supply of affordable housing. The affordable housing levels for Beverly and neighboring communities are visually presented in Figure 5-6. Affordable
housing production varies substantially among these communities, ranging from a low of 3% and 5% for Hamilton and Manchester, respectively, to a high of 12.4% for Salem with Beverly and Danvers close behind at 11.8% and 10%, respectively.
Appendix 6 includes a list of Beverly’s SHI units as of May 23, 2016 with the following major features:
18 Woolhouse, Megan, The Boston Globe, September 12, 2015. 19 Chapter 774 of the Acts of 1969 established the Massachusetts Comprehensive Permit Law (Massachusetts General Laws Chapter 40B) to facilitate the development of affordable housing for low- and moderate-income households (defined as any housing subsidized by the federal or state government under any program to assist in the construction of low- or moderate-income housing for those earning less than 80% of median income) by permitting the state to override local zoning and other restrictions in communities where less than 10% of the year-round housing is subsidized for low- and moderate-income households.
11.8%
10.0%
3.0%
8.6%
5.0%
12.4%
8.7%
0.0%
2.0%
4.0%
6.0%
8.0%
10.0%
12.0%
14.0%
Pe
rce
nta
ge o
f Y
ear
-ro
un
d H
ou
sin
g U
nit
s
Figure 5-6: SHI Units for Beverly and Neighboring Communities
Beverly Housing Needs Assessment Page 52
1,910 or 98% of the total SHI units are rentals, with only 37 ownership units.
35 of the units were part of the City’s Housing Rehabilitation Program with affordability restrictions due to expire between 2016 and 2041.
Besides the Housing Rehabilitation Program units (HOR) mentioned above, the SHI identifies several large developments as those where affordability restrictions are due to expire within the next ten (10) years including Jaclen Tower (Beacon Companies purchased the project and converted 31 units to Project-based Section 8 Housing Choice Vouchers using the Rental Assistance Demonstration Program (RAD), also refinancing with Low Income Housing Tax Credits), Northridge Homes (project owned by a co-op where affordability is due to expire in 2018), and The Millery (financed through the SHARP program by MassHousing that was restructured in 2000 and affordability that should be extending through 2030). One affordable unit was recently lost as part of the Beverly Boot Straps Clear Point Horizon project on Rantoul Street.
464 units, or 23.8% of all SHI units, were permitted through the Chapter 40B comprehensive permit process involving five (5) major developments including Jaclen Tower, Northridge Homes, The Millery, Turtle Creek and Holcroft Park Homes. Because several of these projects are potentially vulnerable to expiring use restrictions with respect to their financing, the 40B permit conditions should at least insure some continued affordability.
99 units are part of group homes sponsored by the state’s Department of Developmental Services (DDS) with another 41 units in Department of Mental Health (DMH) group homes.
45 units were created as part of the City’s inclusionary zoning ordinance which mandates that at least 12% of all units in projects of 10 or more units be affordable and eligible for inclusion in the SHI (also provides the option for the developer to pay cash in-lieu of building the affordable units) with 2 units at 130 Cabot Street (Cabot Street Apartments), 6 units at Enterprise Apartments, 5 units at Burnham Apartments, and 32 units at Pleasant Street Apartments (are “credit units” under the Inclusionary Zoning Ordinance and includes one unit for full-time staff that is not counted on the SHI). An additional 24 units are permitted or under construction, 4 of which were recently occupied as part of the McKay School redevelopment project.
A major component of the City’s SHI units includes Beverly Housing Authority (BHA) developments that involve a total of 646 subsidized housing units or one-third of all SHI units. Appendix 7 provides a breakdown of BHA units by project including information on type of development and distribution of bedroom sizes (70% one-bedroom units, 13% two-bedrooms, and 17% three-bedroom units) and handicapped accessibility. Most of their developments were financed by the state including 132 units of family housing (Chapter 200 and 705 Programs) and 338 units for elderly (60 years of age or older) and younger disabled residents (13.5% of units targeted to these individuals) through the Chapter 667 Program, as well as an additional eight (8) special needs units (Chapter 689 Program). Federally-supported BHA developments include 50 units of family housing and 118 units for seniors (62 years of age or older). Thirty units are handicapped accessible or semi-accessible. Waits for BHA units can be long. For example, there are more than 500 applicants for elderly housing with waits of up to 5 years for state-supported units (667) and up to 2 years for the federal ones (441), including 31 applicants on the wait list for handicapped accessible units. There are about 200 families on the wait lists for family units with waits of up to 2 years. Statistics on these applicants are included in Appendix 7.
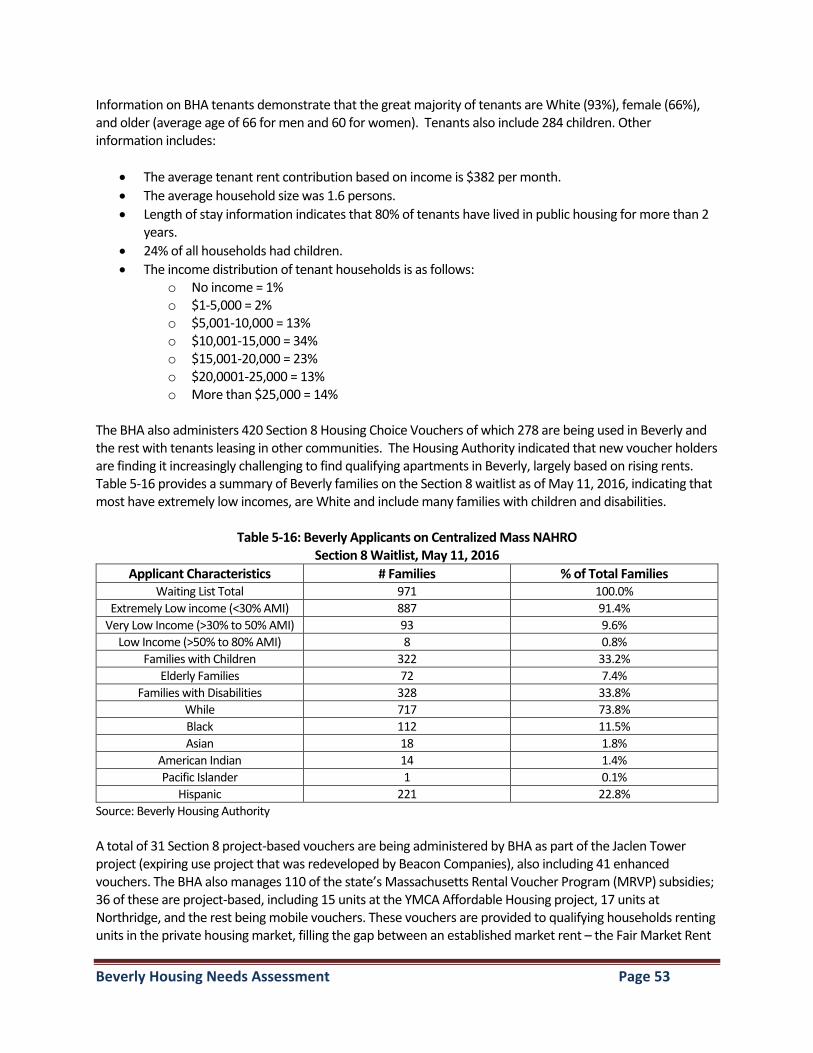
Beverly Housing Needs Assessment Page 53
Information on BHA tenants demonstrate that the great majority of tenants are White (93%), female (66%), and older (average age of 66 for men and 60 for women). Tenants also include 284 children. Other information includes:
The average tenant rent contribution based on income is $382 per month.
The average household size was 1.6 persons.
Length of stay information indicates that 80% of tenants have lived in public housing for more than 2 years.
24% of all households had children.
The income distribution of tenant households is as follows: o No income = 1% o $1-5,000 = 2% o $5,001-10,000 = 13% o $10,001-15,000 = 34% o $15,001-20,000 = 23% o $20,0001-25,000 = 13% o More than $25,000 = 14%
The BHA also administers 420 Section 8 Housing Choice Vouchers of which 278 are being used in Beverly and the rest with tenants leasing in other communities. The Housing Authority indicated that new voucher holders are finding it increasingly challenging to find qualifying apartments in Beverly, largely based on rising rents. Table 5-16 provides a summary of Beverly families on the Section 8 waitlist as of May 11, 2016, indicating that most have extremely low incomes, are White and include many families with children and disabilities.
Table 5-16: Beverly Applicants on Centralized Mass NAHRO Section 8 Waitlist, May 11, 2016
Applicant Characteristics # Families % of Total Families Waiting List Total 971 100.0%
Extremely Low income (<30% AMI) 887 91.4%
Very Low Income (>30% to 50% AMI) 93 9.6%
Low Income (>50% to 80% AMI) 8 0.8%
Families with Children 322 33.2%
Elderly Families 72 7.4%
Families with Disabilities 328 33.8%
While 717 73.8%
Black 112 11.5%
Asian 18 1.8%
American Indian 14 1.4%
Pacific Islander 1 0.1%
Hispanic 221 22.8%
Source: Beverly Housing Authority
A total of 31 Section 8 project-based vouchers are being administered by BHA as part of the Jaclen Tower project (expiring use project that was redeveloped by Beacon Companies), also including 41 enhanced vouchers. The BHA also manages 110 of the state’s Massachusetts Rental Voucher Program (MRVP) subsidies; 36 of these are project-based, including 15 units at the YMCA Affordable Housing project, 17 units at Northridge, and the rest being mobile vouchers. These vouchers are provided to qualifying households renting units in the private housing market, filling the gap between an established market rent – the Fair Market Rent
Beverly Housing Needs Assessment Page 54
(FMR) – and a portion of the household’s income.20 There is a considerable wait for these housing vouchers with the MassNAHRO Centralized Wait List of 145,000 applicants from 99 participating housing authorities, including Beverly’s. The City of Beverly is also fortunate to have a number of non-profit developers with which it has partnered in the development of affordable housing including:
Harborlight Community Partners: Harborlight was established as a non-profit organization to provide service-enriched, affordable housing, now working in nine communities in Essex County. In addition to developing and managing rental housing, including the Harborlight House and Turtle Creek, the organization provides property management and housing marketing/compliance services to other organizations. It is also undertaking the affordability monitoring for the affordable units developed in Beverly by Beverly Crossing (formerly Windover).
North Shore Community Development Corporation (CDC): With the YMCA as its co-developer, the North Shore CDC developed 43 affordable studio apartments serving extremely low-income individuals on Cabot Street and 58 apartments for families as part of the Holcroft Park Homes development (several units designated for those who were homeless or at risk of homelessness). These developments are managed by the YMCA.
Habitat for Humanity of the North Shore: The organization built an affordable home on Essex Street.
YMCA of the North Shore: In addition to its work with the North Shore CDC (see above), the YMCA also developed and manages 5 units of rental housing on Rantoul Street.
More information on these and other local and regional entities is provided in Appendix 1. Private developers have also become increasingly interested in sponsoring new residential development in Beverly, particularly in or near the Downtown. Beverly Crossing (formerly Windover), for example, has been particularly active in Beverly, completing the Burnham and Enterprise Apartments projects with another several projects either under construction or in planning such as the conversion of the McKay School into rentals, development at 131 Rantoul Street, and 480-482 Rantoul Street (the former Friendly’s site). Proposed or Potential Projects The following additional developments are in planning, development or under construction that will include affordable units or provide payments in-lieu of affordable units:
Chapman’s Corner (aka Whitehall Circle): Construction is underway on 32 single-family homes on Hale Street that will include 2 affordable condominium units in an existing two-family building to be renovated. These units pre-date the City’s current Inclusionary Housing Ordinance.
McKay School: Beverly Crossing (previously known as Windover) was the successful bidder to redevelop this vacant surplus City-owned school into 32 units of rental housing, which opened in August 2016. Harborlight Community Partners conducted the lottery on May 11, 2016 that included 9 qualified applicants for the three 1-bedroom units (one of the winners was from Beverly) and another 9 qualified applicants for the one 2-bedroom unit (one of the winners was
20 The BHA was approved to set rents at 110% of the FMR.
Beverly Housing Needs Assessment Page 55
originally from Beverly but had moved to Danvers). Of the 18 qualified applicants, 6 were from Beverly.
Essex Crossing OSRD: This 16-lot OSRD subdivision nearing completion will result in the City receiving a payment of $208,652 in-lieu of actual affordable units through the City’s inclusionary zoning ordinance. Pursuant to the OSRD Ordinance, the City has received 50% of the payment.
Elliott Landing: This 6-story residential development is under construction by Cummings Properties on Elliot Street with 73 ownership units. Prior to occupancy, a payment-in-lieu of the 9 required units ($556,605) will be paid to the City’s Housing Trust Fund.
131 Rantoul Street: Beverly Crossing began construction on a mixed-use development on Rantoul Street that will include 72 residential units, 9 of which will be affordable based on the City’s inclusionary zoning requirements.
Former Friendly’s Site: Beverly Crossing is planning to develop 90 residential units and a commercial space at this site on Rantoul Street. The 11 affordable units required by the City’s inclusionary zoning ordinance will be located on-site; however, the developer expressed interest in providing them off-site.
MBTA Development Site: Barnat Development was awarded the rights to construct a mixed-use project on this site. The plan calls for approximately 70 housing units and approximately 5,000 square feet of commercial space next to the MBTA’s existing garage and station on Rantoul Street. The City’s inclusionary zoning ordinance will require that at least 9 affordable units be created as part of this project or that a fee in-lieu of units be paid to the City’s Housing Trust Fund.
10-12-16 Congress Street: This project involved a recently modified permit to build a 60-unit structure pending environmental approval. The prior approval, in 2007, designated a $385,000 payment to a local housing organization and has since been re-designated to Beverly’s Housing Trust.
Developments recently completed, under construction or permitted would add another 24 units to Beverly’s SHI within the next year or so, bringing the City’s affordability threshold up to 12%. Projects still in the planning phase have not been included.
5.7 Summary Housing Needs Given the substantial numbers of residents who are paying too much for their housing (see Table 5-14) and growing affordability gaps, there is a pressing need to produce more subsidized housing units in Beverly. The major obstacle to meeting these underserved needs is the gap between the level of need and the resources available, which is further exacerbated by increasing housing prices in tandem with limited local, state and federal subsidies. The City will continue to work with public and private sector stakeholders to devise and implement strategies that preserve and produce additional community housing options, directing development to appropriate locations and target populations. It should be noted that specific strategies and production goals to meet priority needs will be detailed in the strategic Community Housing Plan that will incorporate this Housing Needs Assessment. Based on input from a wide variety of sources including census data, market information, interviews with local and regional stakeholders, community meetings and a survey, as well as prior planning efforts, the following housing needs have been identified:
Beverly Housing Needs Assessment Page 56
Rental housing is the most significant need Both rental and ownership housing are needed to encourage a mix of housing types in response to diverse populations and household needs. There is, however, a more compelling case for rental units based on the following important considerations:
Target the needs of the community’s most vulnerable residents with very limited financial means as rental housing is typically more affordable and requires less up-front cash.
Promote greater housing diversity as most of the more recent development has largely involved single-family homes or larger multi-family projects that are primarily directed to those who can afford market prices. More housing options are necessary to meet the needs of local workers who are priced out of the housing market, people who grew up in Beverly and want to raise their own families locally, and empty nesters, for example.
Invest local subsidy funds (e.g. CPA, Inclusionary Zoning payments and other potential Housing Trust funding, Community Compact) in support of greater numbers of households/occupants over time as rentals turnover more regularly than ownership units.
Provide more appropriately sized units for increasing numbers of small households.
Provide opportunities for some seniors who are “overhoused” and spending far too much on their housing to relocate to more affordable and less isolated settings, opening up their homes to families requiring more space.
Leverage other funds, as state and federal resources are almost exclusively directed to rental housing development, family rentals in particular.
Enhance the ability to qualify occupants for housing subsidies as state requirements for including units on the SHI make it very difficult for long-term homeowners to be eligible for subsidized housing.
Provide opportunities for mixed-income housing where several different income tiers can be accommodated within the same project.
Indicators of Need for Rental Housing As detailed throughout this Housing Needs Assessment the following issues related to limited income, high cost burdens, low vacancy rates, etc. suggest a pressing need for more subsidized rental housing:
Limited incomes - Almost one-fifth of all households earned less than $25,000, including one-third of all renters. These households can afford no more than about $500 per month, including utility costs, making it extremely difficult if not impossible to find affordable market rentals without spending too much on housing.
High cost burdens - Beverly’s renters are in fact spending too much for their housing with about two-thirds of all renter households earning at or below 80% AMI overspending including 1,350 or 39% who were spending more than 50% of their income on housing costs (with severe cost burdens).
High rents - The 2014 estimated gross median rent of $1,068 would require an income of almost $50,000, assuming $175 per month in utility bills and housing expenses of no more than 30% of the household’s income. Market rents are typically higher and tend to be beyond the reach of lower wage earners.
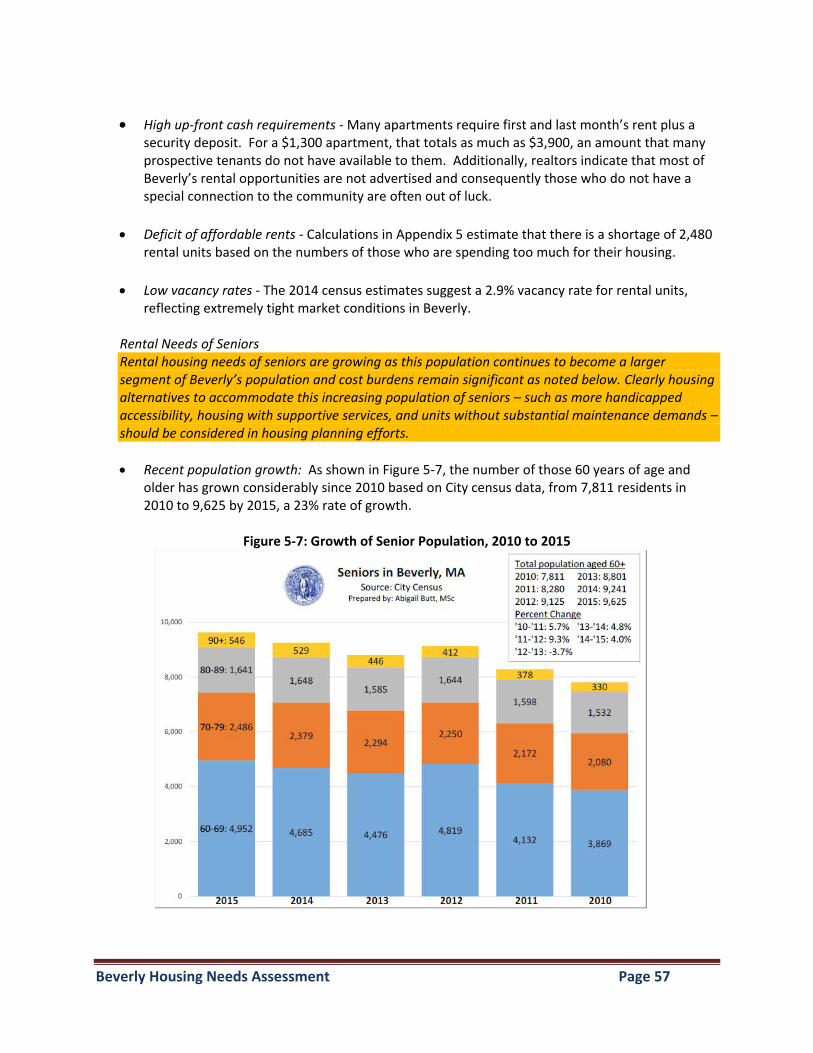
Beverly Housing Needs Assessment Page 57
High up-front cash requirements - Many apartments require first and last month’s rent plus a security deposit. For a $1,300 apartment, that totals as much as $3,900, an amount that many prospective tenants do not have available to them. Additionally, realtors indicate that most of Beverly’s rental opportunities are not advertised and consequently those who do not have a special connection to the community are often out of luck.
Deficit of affordable rents - Calculations in Appendix 5 estimate that there is a shortage of 2,480
rental units based on the numbers of those who are spending too much for their housing.
Low vacancy rates - The 2014 census estimates suggest a 2.9% vacancy rate for rental units,
reflecting extremely tight market conditions in Beverly.
Rental Needs of Seniors Rental housing needs of seniors are growing as this population continues to become a larger segment of Beverly’s population and cost burdens remain significant as noted below. Clearly housing alternatives to accommodate this increasing population of seniors – such as more handicapped accessibility, housing with supportive services, and units without substantial maintenance demands – should be considered in housing planning efforts.
Recent population growth: As shown in Figure 5-7, the number of those 60 years of age and older has grown considerably since 2010 based on City census data, from 7,811 residents in 2010 to 9,625 by 2015, a 23% rate of growth.
Figure 5-7: Growth of Senior Population, 2010 to 2015
Beverly Housing Needs Assessment Page 58
High projected growth - The Metropolitan Area Planning Council (MAPC) projects that those over 65 will increase from 14.6% of all residents in 2010 to 22.8% by 2030, representing a gain of 3,736 residents in this age category.
High cost burdens - Of the 1,250 older adults age 62 or over who were earning at or below 80% AMI, 720 or 58% had cost burdens and 395 or 32% had severe cost burdens. Those with severe cost burdens should be primary targets for new subsidized housing.
Insufficient income - Most seniors earning fixed incomes and relying substantially on Social Security find that their income may not be sufficient to afford their current housing and other expenses, particularly when they lose their spouse.
Long waits for subsidized housing - The Beverly Housing Authority has a waitlist of more than 332 elderly or near elderly applicants for senior housing with waits between 2 and 5 years.
Rental Needs of Families There are many low- and moderate-income households in Beverly that are struggling to pay their bills, housing expenses chief among them. Given an impending crisis, a family may become at risk of homelessness, some forced to double-up with friends or family and/or live in substandard conditions while waiting for subsidized housing or a Section 8 Housing Choice Voucher. Others finding themselves in emergency shelters.
High cost burdens - Families who rent were also confronting problems affording housing with 940 small family renters (2 to 4 members) earning at or below 80% AMI that included 655 or 70% who were spending too much on their housing, also including 345 or 37% with severe cost burdens. While there were very few large family households (5 or more members) renting in Beverly, all of the 35 large family renters earning at or below 30% AMI were experiencing severe cost burdens.
Fewer subsidized housing opportunities and long waits - The Beverly Housing Authority (BHA) has fewer subsidized housing units available for families, representing 182 units or 28% of its housing inventory. The current wait list for these units includes about 200 families with waits of up to 2 years. Additionally, those families looking for a Section 8 Housing Choice Voucher or Massachusetts Rental Voucher Program subsidy (MRVP) must access the MassNAHRO Centralized Wait List that includes 145,000 applicants (typically families) from 99 participating housing authorities, Beverly among them.
Female-headed households – There were 719 female-headed households with children
according to 2014 census estimates, which are typically among the most financially at risk households in any community, often requiring support services (job skills, child care, etc.) in addition to affordable housing to become stabilized.
Seniors relying primarily on Social Security are likely to have monthly incomes that fall below market rent levels as well as rents targeted to households earning at 80% AMI. Deeper subsidies are required for these households.
Beverly Housing Needs Assessment Page 59
Rental Needs of Non-elderly Individuals There are also considerable numbers of lower income non-elderly, non-family households in Beverly, mostly single individuals, experiencing cost burdens and long waits for subsidized housing that make finding appropriate affordable housing a challenge. Some of these individuals have disabilities that further complicate their housing problems as those with disabilities, many reliant on Social Security, tend to be among the most financially vulnerable residents in a community. It is no wonder that some find themselves homeless living on the streets or in shelters.
High cost burdens - 72% of the 1,235 such households earning at or below 80% AMI experienced cost burdens including 610 or half who were paying more than half of their income on housing.
Long waits for subsidized housing - 13.5% of BHA’s units in elderly developments are targeted to younger individuals who are disabled with more than 300 applicants on the waitlist and average waits of at least 5 years.
New ownership opportunities are also in need Efforts to provide starter homes for first-time homebuyers and better housing alternatives to empty nesters should be promoted to address several objectives including:
Provide opportunities for families who want to invest in Beverly but are shut-out of the current housing market;
Lend additional stability to neighborhoods as homeowners tend to become more rooted and invested in the community;
Enable children who were raised in the City to return to raise their own families locally;
Provide housing options for municipal employees;
Provide smaller homes for increasingly smaller families; and
Offer more affordable housing alternatives to empty nesters who want to downsize, thus opening their existing homes to families.
Small clustered cottage-style housing in pocket neighborhoods could be pursued as well as other infill development, mixed-uses that include mixed-income condo development, the redevelopment/reuse of previously nonresidential properties, and the integration of housing in nonresidential areas offer good options for increasing affordable homeownership opportunities in Beverly. Indicators of Need: The rising cost of housing is shutting increasing numbers of residents out of the private housing market, particularly the ownership market. For example, the median single-family house price increased from $385,000 as of the end of 2015 to $415,000 as of July 2016, with condo prices also increasing from $235,000 to $256,000 during this period. High upfront costs also challenge first-time purchasers. More affordable options are necessary that can support a range of incomes based on the indicators of need below.
Few subsidized ownership units - Only 37 units in the City’s SHI involve ownership as of May 2016.
Beverly Housing Needs Assessment Page 60
Potential pool of qualified first-time homebuyers - Approximately 30% of all renter households earned enough to potentially qualify for subsidized first-time homebuyer opportunities if they become available.
High affordability gaps for single-family home - The affordability gap for those earning 80% AMI is about $121,500 with a 20% down payment or $263,500 with a 5% down payment based on the 2015 median values. This suggests a need for subsidies to promote affordability and reduce excessive cost burdens.
Existing challenges for condos - The affordability gap for condos is smaller at about $18,000 for households earning at or below 80% AMI. Nevertheless, while condos present a more affordable alternative for new homeownership, obtaining financing since the recession has become challenging for condominiums in particular and monthly fees raise housing expenses, limiting the amount that can be borrowed.
High cost burdens - As presented in Table 4 in Appendix 5, there remains a need for more affordable homeownership opportunities in Beverly as of the 2,225 owner households who were estimated to have earned at or below 80% AMI, only 1,271 units might be affordable to them, resulting in a deficit of 954 affordable ownership units. If one looks at those in this income range who are overspending (see Table 5-14), the deficit increases to 1,560 units.
While the City should focus on those more financially vulnerable residents earning below 80% AMI, it is worth noting that when looking at cost burdens (spending more than 30% of income on housing) there are deficits in the higher income categories as well as noted earlier.
Maintain population diversity and attract young families - Younger adults in the family formation stage of their lives, the 25 to 34-age category, decreased by 31% to 12.2% of the population in 2014. Without equity from another house or subsidized starter homes, many young families are virtually shut out of the homeownership market.
Financing challenges - Without a subsidized mortgage, households have to come up with a substantial amount of cash, now more typically a down payment of 20%, thus blocking many who seek to own a home. Credit problems also pose substantial barriers to homeownership. Prior generations have had the advantage of GI loans and other favorable mortgage lending options with reasonable down payments. Also, in prior years the median home price to income ratio was much lower than it is today (see Figure 5-5), making homeownership more accessible. Given current economic conditions, the ability to obtain financing is more challenging for today’s first-time homebuyers without subsidized ownership. State-supported mortgage programs, such as the ONE Mortgage Program, can offer important financial assistance to first-time purchasers.
Extremely low vacancy rates - The 2014 vacancy rate for homeownership units was 0.2%, reflecting extremely tight market conditions.
It should be noted that it is difficult for existing homeowners to qualify for new affordable housing opportunities as there are limits on financial assets and current ownership. Nevertheless, there are still
Beverly Housing Needs Assessment Page 61
opportunities to assist low- and moderate-income owners which will be further described in the Housing Strategies that will become part of the full Community Housing Plan.
Integrate handicapped accessibility and supportive services into new development Handicapped accessibility and supportive services (such as those offered by the Council on Aging or through assisted living options as well as transportation and home maintenance programs) should be integrated into new housing production efforts. Indicators of Need:
Significant local population with disabilities - Of all Beverly residents in 2014, 4,111 or 10.3% claimed a disability, somewhat lower than the county and state levels at about 11%, but still representing significant special needs within the Beverly community.
Long waits for subsidized units reserved for the disabled – As noted earlier, there are waits of up to 5 years for those who apply for Beverly Housing Authority units that are reserved for people with disabilities, younger than age 60, in elderly developments.
Growing senior population - As the number of seniors continues to increase with the aging of the baby boomers, growing numbers of residents will need better access to housing that includes on-site supportive services and/or handicapped accessibility.
Improve substandard housing As an older city, it is not surprising that a sizable portion of Beverly’s housing stock has deferred maintenance needs if not actual health and safety hazards. It is not only important to find ways to correct housing code violations but to also improve older structures that are the foundation for preserving the historic character of the City’s neighborhoods. Indicators of Need:
Older housing stock - A considerable amount of Beverly’s housing stock is older and thus more likely to have housing code violations, including the presence of lead paint that can be hazardous to children as well as other health and safety problems. For example, 41% of all units were built before World War II and a total of 82% were built prior to 1980.
Code violations – A collaboration of the North Shore Community Development Coalition and Endicott Collage students conducted an exterior conditions survey in the Gloucester Crossing neighborhood documenting considerable building code violations in the area.
Emergency repair needs of seniors - The Senior Center regularly receives questions/assistance from seniors who have emergency repair needs (hot water heater, roof, etc.).
Housing Rehab Program - Funds generated to support the creation and preservation of affordable housing can be utilized for housing rehabilitation programs including CPA and Housing Trust Funds. A previous program was well subscribed and still in demand.
Table 5-17 provides a summary of unmet housing needs according to income level and type of household, looking at households that are paying too much of their income on housing costs. While there are more owner-occupied units than rentals in Beverly, the number of unmet housing needs is not
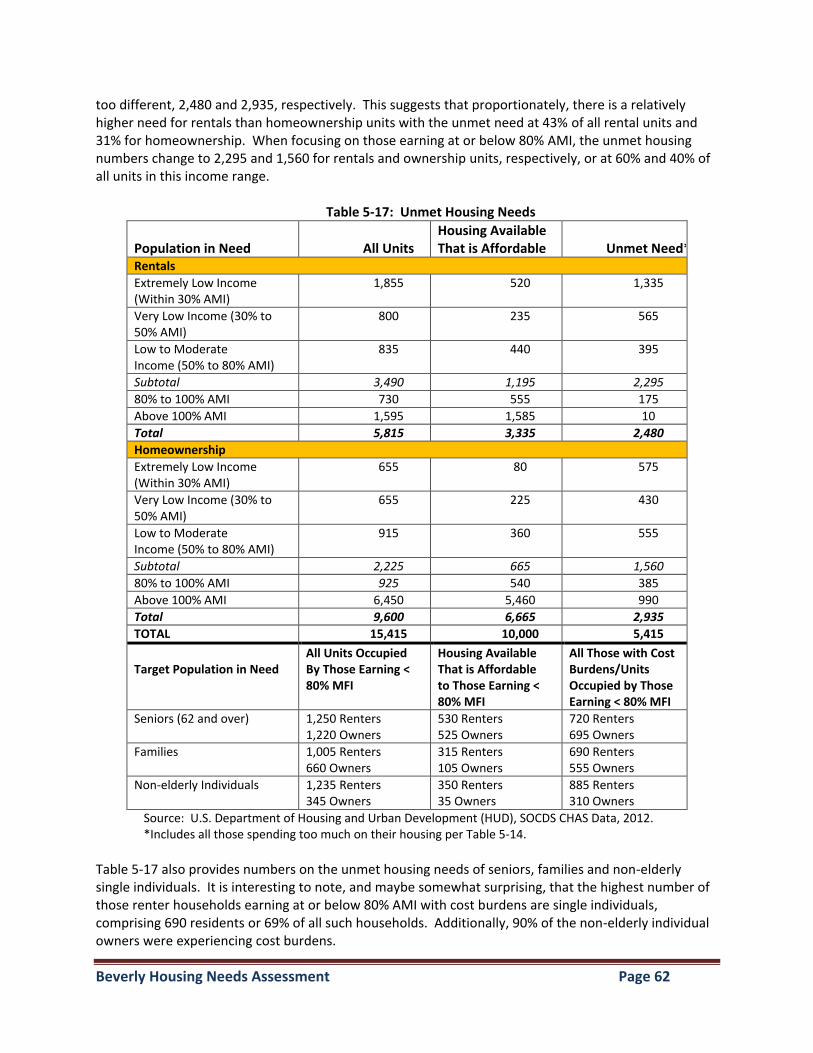
Beverly Housing Needs Assessment Page 62
too different, 2,480 and 2,935, respectively. This suggests that proportionately, there is a relatively higher need for rentals than homeownership units with the unmet need at 43% of all rental units and 31% for homeownership. When focusing on those earning at or below 80% AMI, the unmet housing numbers change to 2,295 and 1,560 for rentals and ownership units, respectively, or at 60% and 40% of all units in this income range.
Table 5-17: Unmet Housing Needs
Population in Need
All Units
Housing Available That is Affordable
Unmet Need*
Rentals
Extremely Low Income (Within 30% AMI)
1,855 520 1,335
Very Low Income (30% to 50% AMI)
800 235 565
Low to Moderate Income (50% to 80% AMI)
835 440 395
Subtotal 3,490 1,195 2,295
80% to 100% AMI 730 555 175
Above 100% AMI 1,595 1,585 10
Total 5,815 3,335 2,480
Homeownership
Extremely Low Income (Within 30% AMI)
655 80 575
Very Low Income (30% to 50% AMI)
655 225 430
Low to Moderate Income (50% to 80% AMI)
915 360 555
Subtotal 2,225 665 1,560
80% to 100% AMI 925 540 385
Above 100% AMI 6,450 5,460 990
Total 9,600 6,665 2,935
TOTAL 15,415 10,000 5,415
Target Population in Need
All Units Occupied By Those Earning < 80% MFI
Housing Available That is Affordable to Those Earning < 80% MFI
All Those with Cost Burdens/Units Occupied by Those Earning < 80% MFI
Seniors (62 and over) 1,250 Renters 1,220 Owners
530 Renters 525 Owners
720 Renters 695 Owners
Families 1,005 Renters 660 Owners
315 Renters 105 Owners
690 Renters 555 Owners
Non-elderly Individuals 1,235 Renters 345 Owners
350 Renters 35 Owners
885 Renters 310 Owners
Source: U.S. Department of Housing and Urban Development (HUD), SOCDS CHAS Data, 2012. *Includes all those spending too much on their housing per Table 5-14.
Table 5-17 also provides numbers on the unmet housing needs of seniors, families and non-elderly single individuals. It is interesting to note, and maybe somewhat surprising, that the highest number of those renter households earning at or below 80% AMI with cost burdens are single individuals, comprising 690 residents or 69% of all such households. Additionally, 90% of the non-elderly individual owners were experiencing cost burdens.
Beverly Housing Needs Assessment Page 63
In regards to seniors, 720 renter households earning less than 80% AMI were overspending and therefore had unmet housing needs, representing 58% of all such households. The unmet housing needs of elderly owners is not much different, including 695 households or 57% of all such households. In regard to families in this income range, there is a higher proportion of unmet housing needs at 69% for renters and 84% for owners, somewhat comparable to those for non-elderly individuals.
There is a need to provide support to all these types of households along a wide range of incomes. Everyone should have a right to safe and affordable housing which is so fundamental to stabilizing both individuals and families who may be living in substandard conditions and/or spending far too much for their housing. The whole community benefits when all residents have a decent and affordable place to call home.
Beverly Housing Needs Assessment Page 64
APPENDIX 1 Local and Regional Organizations/Resources
Beverly is fortunate to have a number of important resources including local government entities, local non-profit organizations, and regional agencies that have made substantial contributions to the promotion of community housing in Beverly or have the resources to contribute in the future. These entities, including their contact information, are briefly summarized below. Local Entities Beverly Housing Authority (BHA) The Beverly Housing Authority (BHA) is a quasi-public agency that was established by the state and City of Beverly to produce housing that is affordable to low- and moderate-income residents. The BHA’s developments include a total of 646 subsidized housing units or one-third of all SHI units. Most of their developments were financed by the state including 132 units of family housing (Chapter 200 and 705 Programs) and 338 units for elderly (60 years of age or older) and younger disabled residents (13.5% of units targeted to these individuals) through the Chapter 667 Program, as well as an additional 8 special needs units (Chapter 689 Program). Federally-supported BHA developments include 50 units of family housing and 118 units for seniors (62 years of age or older). Thirty units are handicapped accessible or semi-accessible. The agency also manages more than 500 rental vouchers through the Section 8 Housing Choice Voucher Program or Massachusetts Rental Voucher Program. For more information on BHA, see Section 5.7 and Appendix 7. Contact Info: 137 Bridge Street, Beverly; 978-922-3100; www.beverlyhousingauthority.com
Beverly Council on Aging The Beverly Council on Aging is a City department that supports the quality of life of Beverly elders age 60 or older through a wide variety of services. The Council’s mission is to:
Create a friendly and safe community for Beverly seniors and their families by providing social services, transportation, education, health, recreation, and leisure time activities and resources that support their well- being and independence.
Assist frail seniors by advocating for supportive services that increase their ability to remain independent.
As such, the Council on Aging provides a wide range of services including daily exercise, special trips, arts and crafts programs, meals, health and wellness screening, health care information, support groups, information and referrals, etc. In regard to housing, the agency receives many inquiries and has witnessed an increasing need and demand for subsidized housing for seniors, rental housing most importantly. Other observations on senior housing needs include:
Beverly’s older housing stock makes it challenging for retired area seniors on fixed incomes to maintain their homes and there are few options for downsizing, particularly affordable ones.
While many local seniors are aging in place, many are not aging well in place, often in very isolated situations. The Council indicates the need for greater coordination among agencies in support of providing services to seniors.
Those who are moving into elderly housing are typically doing so at a younger age.
The Council is increasing confronted with seniors who have special needs that the agency does not have the capacity to address.
Beverly Housing Needs Assessment Page 65
The agency also identified a pressing need for handyman services for area seniors who need assistance in making small home repairs to simple chores like shoveling snow or raking leaves.
There is a need for affordable housing to attract families to the area to help diversify an increasingly aging population.
Contact Info: 90 Colon Street in Beverly; 978-921-6017; www/beverlyma.gov/departments/council-on-aging
Beverly Community Preservation Committee (CPC) After a failed attempt to adopt the Community Preservation Act in 2001, Beverly subsequently passed CPA in 2012 with a 1% surcharge and an exemption of the first $100,000 of the property’s value, for qualifying moderate-income seniors, and for low and moderate-income households. Since that time, about $1.3 million has been raised by the local surcharge with an additional $400,000 from the state’s CPA Trust Fund for a total of about $1.7 million. Approximately $200,000 has been allocated to housing activities to date, most to the Beverly Housing Authority for special capital improvement projects with an additional allocation to Harborlight Community Partners to acquire a property on Monument Square for a low-income senior housing development with supportive services. Contact Info: City Hall at 191 Cabot Street; 978-921-6000 ext. 2343 or [email protected] Regional Agencies and Organizations North Shore HOME Consortium Beverly is a member of the North Shore HOME Consortium, which is administered by Peabody’s Department of Community Development and Planning. The Consortium administers federal HOME Program funding to support a wide range of housing activities with 30 participating communities that are geographically spread throughout the North Shore and Merrimack Valley. The Consortium has approximately $2 million available per year and divides its annual allocation on a formula basis among the participating communities. It also manages a competitive pool of approximately $700,000 annually to be available to those localities that have encumbered all of their funding or for special initiatives. This competitive pool is available not only to participating municipalities but to nonprofit organizations and private developers as well. Beverly received HOME funding from the Consortium for two projects in 2012 including 60 Pleasant Street Apartments (Veterans Housing/new construction), 7 Pleasant Street (rehab of 2 units), and Turtle Creek (Elderly Housing) in 2015. Contact Info: 24 Lowell Street in Peabody; 978-532-3000; www.Peabody-ma.gov/home_consortium Gloucester/Haverhill/Salem/Essex County Continuum of Care (CoC) The Continuum of Care is designated as the regional entity to provide a continuum of support from emergency shelters to transitional housing and ultimately to permanent housing serving those exiting homelessness. The Continuum of Care, like the HOME Consortium, is staffed by Peabody’s Department of Community Development and Planning and includes representatives from the major housing service providers in the area. The Executive Director of the Beverly Housing Authority is Beverly’s representative. A major component of the CoC’s work is the preparation and submission of an application to HUD for Homeless Assistance funding. The planning process associated with this application takes place throughout the year, including an annual “point in time” census count of the homeless (both sheltered and unsheltered individuals and families). Contact Info: 24 Lowell Street in Peabody; 978-532-3000; www.Peabody-ma.gov
Beverly Housing Needs Assessment Page 66
Harborlight Community Partners Harborlight was established as a non-profit organization to provide service-enriched, affordable housing, now working in nine communities in Essex County. Founded by the First Baptist Church in Beverly, the organization initially focused on the development of senior housing. It has grown considerably over the past decade, taking over several other housing-related organizations including the North Shore Housing Trust,21 We Care About Homes, and Home at Last.22 Developments include the following:
Harborlight House with 30 supportive housing units for seniors has been going through a major refinancing and renovation that includes 30 project-based MRVP vouchers, as well as other capital and subsidies for supportive services through the state’s Housing Preservation and Stabilization Trust Fund (HPSTF) Program.
Turtle Creek (109 units) and Turtle Woods (67 units), both managed by Harborlight with the former owned by the organization and the latter still owned by the First Baptist Church. These projects provide rental units for seniors with a wide array of supportive services including an on-site 24-hour staff person during the work week. Harborlight has been managing a major refinancing and renovation of this project that included a small HOME Program subsidy from the North Shore HOME Consortium in 2015 among other types of financing.
Small scattered rental properties, 16 which the organization inherited and refinanced from We Care About Homes and another four (4) from Home at Last, referred to as the Cotton Mill Coop.
A house on Chase Street that was subsidized by HOME funding and then foreclosed by the bank. Harborlight acquired the property and Habitat of Humanity of the North Shore coordinated the necessary improvements. The house was subsequently sold to a qualifying purchaser.
A duplex that the organization also inherited from We Care About Homes. It has maintained ownership of the land under a land trust type model.
The organization also provides property management and housing marketing/compliance services to non-profit organizations. It is undertaking the affordability monitoring for the affordable units developed in Beverly by Beverly Crossing (formerly Beverly Crossing). Contact Info: 978-922-1305; www.harborlightcp.org North Shore Community Development Coalition (NSCDC) The North Shore CDC, which evolved from the former Salem Harbor CDC and the Beverly Affordable Housing Coalition, is committed to building and preserving affordable housing in North Shore communities. This organization has completed 400 units to date, primarily in Salem, Beverly and Ipswich, and is developing another four (4) projects in Salem and Gloucester. It has completed 58 units for families as part of the Holcroft Park Homes development as well as 43 studio apartments for extremely low-income individuals through its Cabot Street Homes projects, both projects co-developed and managed by the YMCA of the North Shore. The CDC also operates a number of other housing-related programs and special efforts in the North Shore area. Contact Info: 102 Lafayette Street in Salem; 978-825-4009; www.northshorecdc.org
21 The North Shore Housing Trust (NSHT) was an outgrowth of the North Shore Affordable Housing Task Force that was formed by Wellspring House of Gloucester in 1998 to begin to address the issue of affordable housing on a regional basis. NSHT’s goal was to become a regional force to develop affordable housing in areas of the North Shore where local affordable housing development capacity was lacking. 22 We Care About Homes was a non-profit organization that acquired properties and rented units to very low-income families. Based in Beverly, the organization rented 20 units at seven (7) scattered-site properties.
Beverly Housing Needs Assessment Page 67
YMCA of the North Shore In addition to the wide variety of activities that support youth development, recreation and community education, the YMCA of the North Shore also owns and manages rental housing that serves approximately 385 individuals, including children, in their developments located in Beverly, Ipswich, Cape Ann and Haverhill. Through their family housing and Single Room Occupancy facilities, the YMCA provides more than shelter, also offering support services to improve the well-being of their residents. The organization was co-developer with the North Shore CDC on the Holcroft Park Homes (58 family units that include some units for families who are homeless or at risk of homelessness) and Cabot Street Homes (43 studio apartments for extremely low income individuals) developments, also managing both projects. Contact Info: 25 Cabot Street in Beverly; 978-922-0990 Habitat for Humanity of the North Shore Habitat for Humanity is an ecumenical, non-profit Christian ministry dedicated to building simple, decent homes in partnership with families in need that has grown over the past several decades into one of the largest private homebuilders in the world. The organization has almost 1,600 U.S. affiliates and over 2,100 affiliates worldwide. Habitat for Humanity of the North Shore is based in Lynn and serves a number of communities, including Beverly, and has completed one house in Beverly thus far on Essex Street. The organization worked with Harborlight Community Partners on a bank-foreclosed house on Chase Street to make necessary improvements and maintain its affordability. Contact Info: 215 Maple Street in Lynn; 781-598-0310; www.habitat.org Action, Inc. Founded in 1965, Action, Inc. provides a wide range of social services to residents of Cape Ann including fuel assistance and other programs to help conserve energy and save money on energy bills, technical assistance on accessing a variety of public benefits, programs for youth to support their education and career goals, homecare to enable seniors and people with disabilities to remain safe and independent in their own homes, and adult education programs. In regard to housing, the agency operates an emergency shelter for men and women in Gloucester and owns and manages subsidized housing units in Gloucester. With staff support and a variety of resources such as the Fund to End Homelessness, Cape Ann Interfaith Commission, Catholic Charities, and special fundraising events, the agency provides the following housing services:
- Help with eviction notices - Rent or mortgage assistance - Assistance with housing searches - Help with move-in costs - Mediation with landlord/tenant disputes - Help with subsidized housing including application issues
Contact: 180 Main Street in Gloucester; 978-282-1000 Community Action, Inc. Community Action, Inc. is a community action agency that was established to serve a wide range of education, housing, health and service needs of low-income and disadvantaged area residents. The organization, based in Haverhill, has expanded during the past three decades to include a number of cities and towns on the North Shore and Cape Ann, including some program availability in Beverly. Programs include fuel assistance, Head Start, WIC, education and training, and other services directed to
Beverly Housing Needs Assessment Page 68
area families. Housing-related services include counseling and down payment and closing cost assistance for first-time homebuyers as well as the administration of lotteries and development of small affordable housing projects. Contact Info: 145 Essex Street in Haverhill; 978-373-1971; www.communityactioninc.org Senior Care, Inc. Senior Care, Inc. is the area’s Agency on Aging that provides and coordinates a wide range of housing services to local seniors and others to enable them to remain independent in their homes or another setting of their choice in the community. These services include Meals on Wheels, visiting nurses, wellness programs, etc. Contact: 49 Blackburn Center in Gloucester; 978-281-1750 Fund to Prevent Homelessness The Fund to Prevent Homelessness is a non-profit organization that has been helping families prevent homelessness since 1989. Through a one-time grant to qualified families of up to $3,000, the organization provides support before a family loses its home to help them remain in the community. The Fund serves residents of Beverly, Essex, Gloucester, Rockport, Hamilton, Manchester, and Wenham. Intake is managed by either Action, Inc. in Gloucester or Beverly Bootstraps on a pro bono basis. Funding is raised each year by an annual appeal letter, typically in November. The Fund typically serves at least 15 families a year, averaging at least one in Beverly. Contact: [email protected] or see Beverly Bootstraps or Action, Inc. Beverly Bootstraps Founded as a food pantry in 1992, Beverly Bootstraps has grown into a social service agency serving Beverly and Manchester. The organization provides critical resources to help families and individuals achieve self-sufficiency including food assistance, a thrift shop, and support services to stabilize households by helping them maintain their current housing and overcome problems related to food insecurity, financial instability and deficits in education and job skills. In 2014 Beverly Bootstraps served 1,575 individuals and 641 households, distributing more than $102,000 in financial assistance. Contact: 371 Cabot Street in Beverly, 978-927-1561. Essex County Community Foundation (ECCF) The Essex County Community Foundation (ECCF) provides funding support to non-profit organizations serving the needs of residents in Essex County. The organization raises this funding from individuals and families who are searching for ways to donate to their communities, but until the Foundation was formed, had no means of doing so without establishing their own private foundation or moving their funds outside of the county. The Foundation works closely with donors to serve their charitable interests and manage funds that benefit specified organizations, defined purposes and provide scholarships.
Coastal Homebuyer Education, Inc. Coastal Homebuyer Education, Inc. helps prospective homebuyers in eastern Massachusetts make homeownership a reality. Certified by CHAPA and MassHousing, the organization provides homebuyer counseling, which is often a prerequisite for many mortgage financing programs. Seminars are held over four (4) evening meetings or two (2) Saturdays throughout the year for a fee of $60 per household. The organization also provides post purchase classes as well. Contact Info: www.coastalhbedu.org
Beverly Housing Needs Assessment Page 69
Citizens for Adequate Housing (CAH) Citizens for Adequate Housing is a non-profit organization whose mission is to end homelessness one family at a time, serving families from the North Shore, eastern Massachusetts, and sometimes the Merrimack Valley. In addition to providing housing, CAH offers other serves to help individuals and families find permanent solutions to ending their homelessness. Contact Info: 40 Washington Street in Peabody; 978-531-9775; [email protected]
Metropolitan Area Planning Council (MAPC) The Metropolitan Area Planning Council (MAPC) is Beverly’s regional planning agency serving 101 communities in the Greater Boston area. Guided by its regional plan, “MetroFuture: Making a Greater Boston Region”, the agency works with participating communities towards “sound municipal management, sustainable land use planning, protection of natural resources, efficient and affordable transportation, a diverse housing stock, public safety, economic development, an informed public, and equity and opportunity among people of all backgrounds”. Contact Info: 60 Temple Place, Boston 02111; 617-451-2770; www.mapc.org
Beverly Housing Needs Assessment Page 70
APPENDIX 2 Glossary of Housing Terms
Affordable Housing A subjective term, but as used in this Plan, refers to housing available to a household earning no more than 80% of area median income at a cost that is no more than 30% of total household income. Also referred to as Community Housing. See Section 1.2 for more information. Area Median Income (AMI) The estimated median income, adjusted for family size, by metropolitan area (or county in nonmetropolitan areas) that is adjusted by HUD annually and used as the basis of eligibility for most housing assistance programs. Sometimes referred to as “MFI” or median family income. See Section 1.2 for more information. Chapter 40B The state’s comprehensive permit law, enacted in 1969, established an affordable housing goal of 10% for every community. In communities below the 10% goal, developers of low- and moderate-income housing can seek an expedited local review under the comprehensive permit process and can request a limited waiver of local zoning and other restrictions, which hamper construction of affordable housing. Developers can appeal to the state if their application is denied or approved with conditions that render it uneconomic, and the state can overturn the local decision if it finds it unreasonable in light of the need for affordable housing. Chapter 40R/40S State legislation that provides cash incentives to municipalities that adopt smart growth overlay districts that also increase housing production, including affordable housing. Chapter 44B The Community Preservation Act Enabling Legislation that allows communities, at local option, to establish a Community Preservation Fund to preserve open space, historic resources and community housing, by imposing a surcharge of up to 3% on local property taxes. The state provides matching funds from its own Community Preservation Trust Fund, generated from an increase in certain Registry of Deeds’ fees. Chapter 200 Program The Chapter 200 Program was introduced by the state after WWII, providing permanent subsidized housing to returning veterans. While few veterans live in these developments today, the units continue to be supported by the state for families, annually providing operating funds on a formula basis. Chapter 667 Program The state’s Chapter 667 Program provides subsidized public housing for elderly and younger people with disabilities, annually providing operating funds on a formula basis. Chapter 705 Program The state’s Chapter 705 Program provides subsidized public housing for families, annually providing operating funds on a formula basis.
Beverly Housing Needs Assessment Page 71
Cluster Development A site planning technique that concentrates buildings in specific areas on the site to allow the remaining land to be used for other uses, most typically open space preservation. Some provisions allow density bonuses for certain conditions of development, including affordable housing. Comprehensive Permit Expedited permitting process for developers building affordable housing under Chapter 40B “anti-snob zoning” law. A comprehensive permit, rather than multiple individual permits from various local boards, is issued by the local zoning boards of appeals to qualifying developers. Conservation Development A project that conserves open space, protects site features and provides flexibility in the siting of structures, services and infrastructure. Department of Housing and Community Development (DHCD) DHCD is the state’s lead agency for housing and community development programs and policy. It oversees state-funded public housing, administers rental assistance programs, provides funds for municipal assistance, and funds a variety of programs to stimulate the development of affordable housing. Design Guidelines A set of discretionary standards, including design and performance criteria, developed as a public policy to guide the planning and land development. Easements The right to use property for specific purposes or to gain access to another property. Energy Star A voluntary labeling program of the US Environmental Protection Agency (EPA) and the US Department of Energy that identifies energy efficient products. Enhanced Single Room Occupancy (ESRO) A single-person room with a private bath and/or kitchen rather than shared facilities. Expedited Permitting The state’s Chapter 43D Program allows a community to gain state incentives for projects meeting certain criteria and permitted within a 180-day regulatory process. Fair Housing Act Federal legislation, first enacted in 1968, that provides the Secretary of HUD with investigation and enforcement responsibilities for fair housing practices. It prohibits discrimination in housing and lending based on race, color, religion, sex, national origin, handicap, or familial status. There is also a Massachusetts Fair Housing Act, which extends the prohibition against discrimination to sexual orientation, marital status, ancestry, veteran status, children, and age. The state law also prohibits discrimination against families receiving public assistance or rental subsidies, or because of any requirement of these programs.
Beverly Housing Needs Assessment Page 72
Form-based Zoning Zoning regulations that define desired building and site characteristics but do not strictly regulate the uses. Green Building A term used to describe buildings that have been designed or retrofitted to reduce energy consumption. Inclusionary Zoning Inclusionary zoning is a zoning ordinance or bylaw that requires a developer to include affordable housing as part of a development or contribute to a fund for such housing. Beverly has adopted such zoning. Infill Development Infill development is the practice of building on vacant or undeveloped parcels in dense areas, especially urban and inner suburban neighborhoods. Such development promotes compact development, which in turn allows undeveloped land to remain open and green. Jobs/Housing Balance A measure of the harmony between available jobs and housing in a specific area. LEED Leadership in Energy and Environmental Design (LEED) is a voluntary standard for developing high performance, sustainable buildings that significantly reduce energy consumption. There are various standards, including silver, gold and platinum, which are awarded to particular properties through a certification process. Local Initiative Program (LIP) LIP is a state program under which communities may use local resources and DHCD technical assistance to develop affordable housing that is eligible for inclusion on the state Subsidized Housing Inventory (SHI). LIP is not a financing program, but the DHCD technical assistance qualifies as a subsidy and enables locally supported developments that do not require other financial subsidies to use the comprehensive permit process. At least 25% of the units must be set-aside as affordable to households earning less than 80% of area median income or 20% of units set-aside for households earning at or below 50% AMI. MassHousing (formerly the Massachusetts Housing Finance Agency, MHFA) MassHousing is a quasi-public agency created in 1966 to help finance affordable housing programs. MassHousing sells both tax-exempt and taxable bonds to finance its many single-family and multi-family programs. Metropolitan Statistical Area (MSA) The term, MSA, is also used for CMSAs (consolidated metropolitan statistical areas) and PMSAs (primary metropolitan statistical areas) that are geographic units used for defining urban areas that are based largely on commuting patterns. The federal Office of Management and Budget defines these areas for statistical purposes only, but many federal agencies use them for programmatic purposes, including allocating federal funds and determining program eligibility. HUD uses MSAs as its basis for setting income guidelines and fair market rents.
Beverly Housing Needs Assessment Page 73
Mixed-Income Housing Development Mixed-income development includes housing for various income levels. Mixed-Use Development Mixed-use projects combine different types of development such as residential, commercial, office, industrial and institutional into one project. Overlay Zoning A zoning district, applied over one or more other districts that contains additional provisions for special features or conditions, such as historic buildings, affordable housing, or wetlands. Planned Development A district or project designed to provide an alternative to the conventional suburban development standards that promote a number of important public policy benefits, often including a variety of housing, including affordable housing, and creative site design alternatives. Public Housing Agency (PHA) A public entity that operates housing programs: includes state housing agencies (including DHCD), housing finance agencies and local housing authorities. This is a HUD definition that is used to describe the entities that are permitted to receive funds or administer a wide range of HUD programs including public housing and Section 8 rental assistance. Regional Non-profit Housing Organizations Regional non-profit housing organizations include nine private, non-profit housing agencies, which administer the Section 8 Program on a statewide basis, under contract with DHCD. Each agency serves a wide geographic region. Collectively, they cover the entire state and administer over 15,000 Section 8 vouchers. In addition to administering Section 8 subsidies, they administer state-funded rental assistance (MRVP) in communities without participating local housing authorities. They also develop affordable housing and run housing rehabilitation and weatherization programs, operate homeless shelters, run homeless prevention and first-time homebuyer programs, and offer technical assistance and training programs for communities. Community Teamwork, Inc., based in Lowell, serves as Beverly’s regional non-profit housing organization. Regional Planning Agencies (RPAs) These are public agencies that coordinate planning in each of thirteen regions of the state. They are empowered to undertake studies of resources, problems, and needs of their districts. They provide professional expertise to communities in areas such as master planning, affordable housing and open space planning, and traffic impact studies. With the exception of the Cape Cod and Nantucket Commissions, however, which are land use regulatory agencies as well as planning agencies, the RPAs serve in an advisory capacity only. The Metropolitan Area Planning Council (MAPC) serves as Beverly’s Regional Planning Agency. Request for Proposals (RFP) A process for soliciting applications for funding when funds are awarded competitively or soliciting proposals from developers as an alternative to lowest-bidder competitive bidding.
Beverly Housing Needs Assessment Page 74
Section 8 Housing Choice Vouchers Refers to the major federal (HUD) program – actually a collection of programs – providing rental assistance to low-income households to help them pay for housing. Participating tenants pay 30% of their income (some pay more) for housing (rent and basic utilities) and the federal subsidy pays the balance of the rent. The Program is now officially called the Housing Choice Voucher Program. Single Room Occupancy (SRO) A single room occupancy (more commonly SRO, sometimes called single resident occupancy) is a multiple tenant building that houses one or two people in individual rooms (sometimes two rooms, or two rooms with a bathroom or half bathroom), or to the single room dwelling itself. SRO tenants typically share bathrooms and /or kitchens, while some SRO rooms may include kitchenettes, bathrooms, or half-baths. Although many are former hotels, SROs are primarily rented as permanent residences. Smart Growth The term used to refer to a rapidly growing and widespread movement that calls for a more coordinated, environmentally sensitive approach to planning and development. A response to the problems associated with unplanned, unlimited suburban development – or sprawl – smart growth principles call for more efficient land use, compact development patterns, less dependence on the automobile, a range of housing opportunities and choices, and improved jobs/housing balance. Subsidy Typically refers to financial assistance that fills the gap between the costs of any affordable housing development and what the occupants can afford based on program eligibility requirements. Many times multiple subsidies from various funding sources are required, often referred to as the “layering” of subsidies, in order to make a project feasible. In the state’s Local Initiative Program (LIP), DHCD’s technical assistance qualifies as a subsidy and enables locally supported developments that do not require other financial subsidies to use the comprehensive permit process. Also, “internal subsidies” refers to those developments that do not have an external source(s) of funding for affordable housing, but use the value of the market units to “cross subsidize” the affordable ones. Subsidized Housing Inventory (SHI) This is the official list of units, by municipality, that count toward a community’s 10% goal as prescribed by Chapter 40B comprehensive permit law. Sustainability Development that includes a balanced set of integrated principles such as social equity, environmental respect, and economic viability, which preserves a high quality of life for current occupants and future generations. Transfer of Development Rights (TDR) A program that coordinates the relocation of development from environmentally sensitive areas that should be preserved as open space to areas that can accommodate higher densities. Transit Oriented Development (TOD) Development that occurs within walking distance of public transportation, usually bus or trains, to reduce the reliance on the automobile and typically accommodate mixed uses and higher densities.
Beverly Housing Needs Assessment Page 75
U.S. Department of Housing and Urban Development (HUD) The primary federal agency for regulating housing, including fair housing and housing finance. It is also the major federal funding source for affordable housing programs.
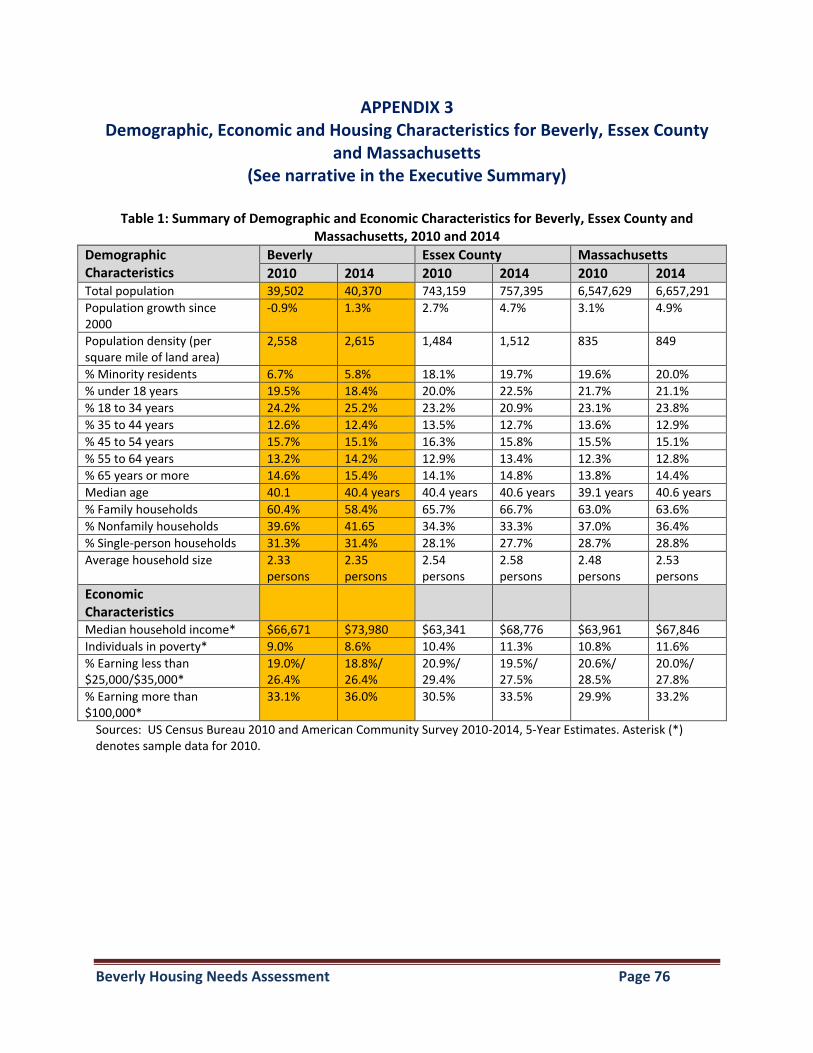
Beverly Housing Needs Assessment Page 76
APPENDIX 3 Demographic, Economic and Housing Characteristics for Beverly, Essex County
and Massachusetts (See narrative in the Executive Summary)
Table 1: Summary of Demographic and Economic Characteristics for Beverly, Essex County and
Massachusetts, 2010 and 2014
Demographic Characteristics
Beverly Essex County Massachusetts
2010 2014 2010 2014 2010 2014 Total population 39,502 40,370 743,159 757,395 6,547,629 6,657,291
Population growth since 2000
-0.9% 1.3% 2.7% 4.7% 3.1% 4.9%
Population density (per square mile of land area)
2,558 2,615 1,484 1,512 835 849
% Minority residents 6.7% 5.8% 18.1% 19.7% 19.6% 20.0%
% under 18 years 19.5% 18.4% 20.0% 22.5% 21.7% 21.1%
% 18 to 34 years 24.2% 25.2% 23.2% 20.9% 23.1% 23.8%
% 35 to 44 years 12.6% 12.4% 13.5% 12.7% 13.6% 12.9%
% 45 to 54 years 15.7% 15.1% 16.3% 15.8% 15.5% 15.1%
% 55 to 64 years 13.2% 14.2% 12.9% 13.4% 12.3% 12.8%
% 65 years or more 14.6% 15.4% 14.1% 14.8% 13.8% 14.4%
Median age 40.1 40.4 years 40.4 years 40.6 years 39.1 years 40.6 years
% Family households 60.4% 58.4% 65.7% 66.7% 63.0% 63.6%
% Nonfamily households 39.6% 41.65 34.3% 33.3% 37.0% 36.4%
% Single-person households 31.3% 31.4% 28.1% 27.7% 28.7% 28.8%
Average household size 2.33 persons
2.35 persons
2.54 persons
2.58 persons
2.48 persons
2.53 persons
Economic Characteristics
Median household income* $66,671 $73,980 $63,341 $68,776 $63,961 $67,846
Individuals in poverty* 9.0% 8.6% 10.4% 11.3% 10.8% 11.6%
% Earning less than $25,000/$35,000*
19.0%/ 26.4%
18.8%/ 26.4%
20.9%/ 29.4%
19.5%/ 27.5%
20.6%/ 28.5%
20.0%/ 27.8%
% Earning more than $100,000*
33.1% 36.0% 30.5% 33.5% 29.9% 33.2%
Sources: US Census Bureau 2010 and American Community Survey 2010-2014, 5-Year Estimates. Asterisk (*) denotes sample data for 2010.
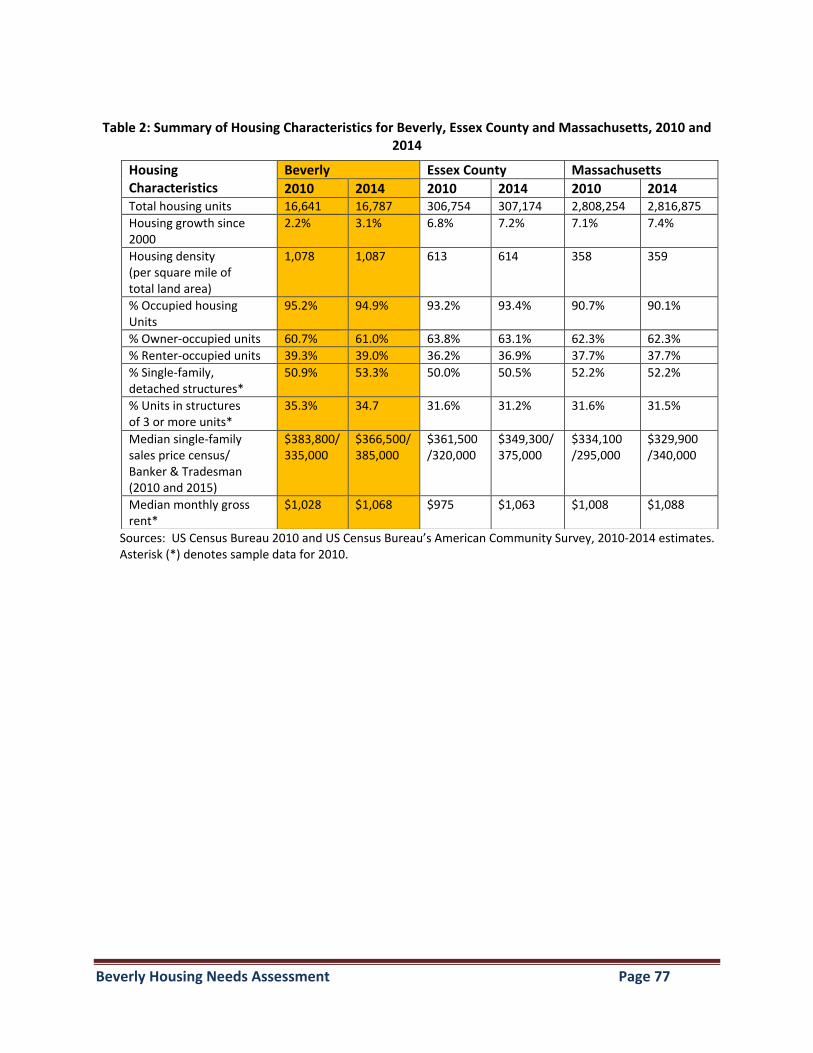
Beverly Housing Needs Assessment Page 77
Table 2: Summary of Housing Characteristics for Beverly, Essex County and Massachusetts, 2010 and
2014
Sources: US Census Bureau 2010 and US Census Bureau’s American Community Survey, 2010-2014 estimates. Asterisk (*) denotes sample data for 2010.
Housing Characteristics
Beverly Essex County Massachusetts
2010 2014 2010 2014 2010 2014 Total housing units 16,641 16,787 306,754 307,174 2,808,254 2,816,875
Housing growth since 2000
2.2% 3.1% 6.8% 7.2% 7.1% 7.4%
Housing density (per square mile of total land area)
1,078 1,087 613 614 358
359
% Occupied housing Units
95.2% 94.9% 93.2% 93.4% 90.7% 90.1%
% Owner-occupied units 60.7% 61.0% 63.8% 63.1% 62.3% 62.3%
% Renter-occupied units 39.3% 39.0% 36.2% 36.9% 37.7% 37.7%
% Single-family, detached structures*
50.9% 53.3% 50.0% 50.5% 52.2% 52.2%
% Units in structures of 3 or more units*
35.3% 34.7 31.6% 31.2% 31.6% 31.5%
Median single-family sales price census/ Banker & Tradesman (2010 and 2015)
$383,800/335,000
$366,500/385,000
$361,500 /320,000
$349,300/375,000
$334,100 /295,000
$329,900 /340,000
Median monthly gross rent*
$1,028 $1,068 $975 $1,063 $1,008 $1,088
Beverly Housing Needs Assessment Page 78
Appendix 4 Summary of Significant Demographic, Economic and Housing
Characteristics by Census Tracts
While the Housing Needs Assessment focuses on citywide information, this section provides major demographic, economic and housing characteristics for Beverly’s 7 census tracts. The data is from the U.S. Census Bureau’s 5-Year Estimates through its American Community Survey (ACS) for 2010-2014, the latest information available. See the attached map for the specific locations of these census tracts. It should be noted that there is likely considerable variability of characteristics within census tracts as these areas are not homogeneous places but possess varying development and residency patterns. In general, those census tracts closer to the water and main railroad line (tracts 2172.02, 2174 and 2175) were among the first to be developed with greater density than the more suburban areas further away from the Downtown and its surrounding neighborhoods. Table 1 summarize demographic and economic data and Table 2 provides housing characteristics. The following profiles are provided for each of these census tracts: Census Tract 2171: Census tract 2171 is located in North Beverly and includes most of Ward 5. It contains 19% of the City’s population and has the highest minority population, at almost 11% of all residents. It also has the highest percentage of those 65 years of age or older, at 18.7% compared to 15.4% citywide, reflected in the highest median age of 44.4 years. The area also has a high percentage of families and the highest average household size of 2.54 persons. Median household income is $90,677, significantly higher than the citywide level of $73,980, and further indicated by the high proportion of those earning more than $100,000, a lower level of poverty, as well as higher rents and median house values. This part of the City was developed later than the other areas with only 19.4% of housing units built before World War II compared to 41.4% citywide. Census Tract 2172.01: Census tract 2171.01 includes the residential areas of Raymond Farms/The Colleges, Shingleville, and Ryal Side North, also encompassing most of Ward 1, Precinct 1. It includes a relatively high percentage of children at 20.5% of the population compared to 18.4% citywide and not surprisingly has a somewhat higher proportion of families. The median household income was only $69,702, lower than $73,980 for the City, despite the highest educational attainment of those completing high school at 96.6%. Only 30% of the area’s housing stock was built before 1940, with more than half of units built between 1940 and 1980. These neighborhoods include a considerable portion of single-family housing, but also a relatively high level of larger multi-family buildings with about 30% of units in buildings of 5 or more units. Median values of owner-occupied units were somewhat lower at $331,200 compared to $366,500 citywide, but the area also had among the lowest levels of those who are paying too much for their housing.
Beverly Housing Needs Assessment Page 79
Census Tract 2172.02: This census tract 2172.02 includes most of the Ryal Side South neighborhood and Ward 1, Precinct 2. It has the smallest number of residents, at just 8.6% of the population, and fewest minority residents. It also has a high portion of older residents and lower percentage of young adults, with a high median age of 44.3 years. Many area residents are affluent with the highest median household income of $95,000 and lowest level of poverty of only 1.4%. Its housing stock is generally older with almost half built before 1940. It has the lowest vacancy rate, at only 1%, as well as the highest level of owner-occupancy, at 85%. More than three-quarters of the housing units are single-family detached dwellings compared to 53% for the city. The area also has the lowest percentage of those with costs burdens, with only 22% paying too much for their housing compared to 29% citywide, which might be at least partially explained by the concurrence of higher income levels and lower owner-occupied house values. Census Tract 2173: Census tract 2173 includes the areas of Kittredge Crossing and Gloucester Crossing, involving a large portion of Ward 3. It includes almost 11% of the City’s population with a somewhat higher minority population, including Hispanic residents. It also has generally more young residents and fewer older ones. The median household income is lower than the city’s, at $55,242, with more households earning below $35,000, 39% compared to 26% for the city. About 15% of residents were living below the poverty level, significantly higher than 8.6% citywide. These are older neighborhoods with 93% of all units built before 1980, with higher vacancy levels, at 8.7%, and renter occupancy, at 44%. Median housing costs were also relatively low at $904 and $320,300 for rentals and homeownership, respectively. Almost 35% of households were spending too much for their housing. This census tract also had a high level of small multi-family dwellings with about 29% of units in 2 to 4-unit structures compared to 19% for the city. Census Tract 2174: This census tract includes a good portion of Beverly’s Downtown, encompassing much of Ward 2. With 13% of the city’s population, the area has more minority residents. It also has the lowest level of children under 18 and highest percentage of young adults age 18 to 34, at 12% and 36%, respectively compared to 18% and 25% citywide. The census tract also has the lowest level of older adults in the city at only 23% of residents over 55 compared to about 30% citywide. Correlated with fewer children is a lower proportion of families, comprising only 34% of all households while those living alone included 47% of all households, lowering the average household size down to 1.91 persons. The Downtown has the lowest median household income, at $53,301, reflective of fewer two-worker households as well as large numbers of young adults in the neighborhood, either students or in the early stages of their working lives. There is also a higher level of poverty, at 18% compared to 8.6% for the city. Rental housing predominates this area at 67% of all units while 39% of all units for the city as a whole. This is the only neighborhood where owner-occupancy falls below 56%, at only 33%, with the lowest median house value of $303,700. Because of the high level of rentals, only 15% of units are single-family detached homes with about half of all units located in larger multi-family properties. This area has experienced a very high level of recent development with 22% of all units built since 1980 compared to 17% citywide. With lower incomes and relatively comparable median rents, $1,030 compared to $1,068 citywide, it is not surprising that about 38% of all households are encountering significant housing cost burdens.
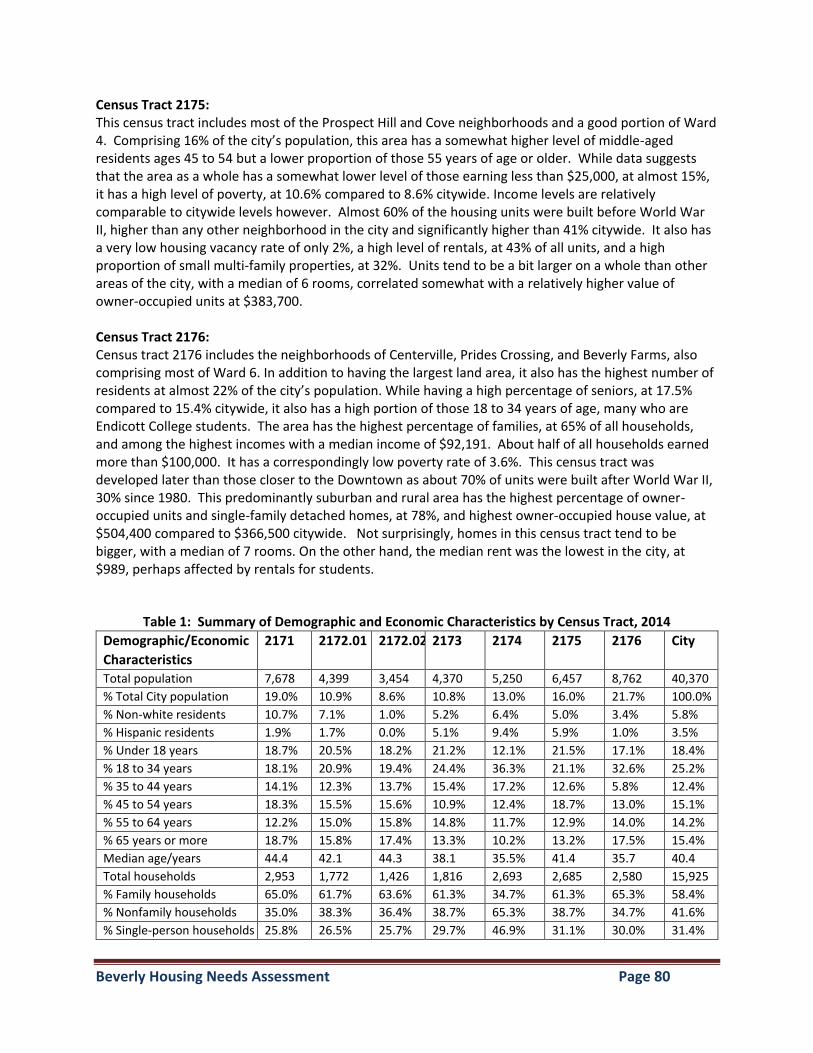
Beverly Housing Needs Assessment Page 80
Census Tract 2175: This census tract includes most of the Prospect Hill and Cove neighborhoods and a good portion of Ward 4. Comprising 16% of the city’s population, this area has a somewhat higher level of middle-aged residents ages 45 to 54 but a lower proportion of those 55 years of age or older. While data suggests that the area as a whole has a somewhat lower level of those earning less than $25,000, at almost 15%, it has a high level of poverty, at 10.6% compared to 8.6% citywide. Income levels are relatively comparable to citywide levels however. Almost 60% of the housing units were built before World War II, higher than any other neighborhood in the city and significantly higher than 41% citywide. It also has a very low housing vacancy rate of only 2%, a high level of rentals, at 43% of all units, and a high proportion of small multi-family properties, at 32%. Units tend to be a bit larger on a whole than other areas of the city, with a median of 6 rooms, correlated somewhat with a relatively higher value of owner-occupied units at $383,700. Census Tract 2176: Census tract 2176 includes the neighborhoods of Centerville, Prides Crossing, and Beverly Farms, also comprising most of Ward 6. In addition to having the largest land area, it also has the highest number of residents at almost 22% of the city’s population. While having a high percentage of seniors, at 17.5% compared to 15.4% citywide, it also has a high portion of those 18 to 34 years of age, many who are Endicott College students. The area has the highest percentage of families, at 65% of all households, and among the highest incomes with a median income of $92,191. About half of all households earned more than $100,000. It has a correspondingly low poverty rate of 3.6%. This census tract was developed later than those closer to the Downtown as about 70% of units were built after World War II, 30% since 1980. This predominantly suburban and rural area has the highest percentage of owner-occupied units and single-family detached homes, at 78%, and highest owner-occupied house value, at $504,400 compared to $366,500 citywide. Not surprisingly, homes in this census tract tend to be bigger, with a median of 7 rooms. On the other hand, the median rent was the lowest in the city, at $989, perhaps affected by rentals for students.
Table 1: Summary of Demographic and Economic Characteristics by Census Tract, 2014
Demographic/Economic
Characteristics
2171 2172.01 2172.02 2173 2174 2175 2176 City
Total population 7,678 4,399 3,454 4,370 5,250 6,457 8,762 40,370
% Total City population 19.0% 10.9% 8.6% 10.8% 13.0% 16.0% 21.7% 100.0%
% Non-white residents 10.7% 7.1% 1.0% 5.2% 6.4% 5.0% 3.4% 5.8%
% Hispanic residents 1.9% 1.7% 0.0% 5.1% 9.4% 5.9% 1.0% 3.5%
% Under 18 years 18.7% 20.5% 18.2% 21.2% 12.1% 21.5% 17.1% 18.4%
% 18 to 34 years 18.1% 20.9% 19.4% 24.4% 36.3% 21.1% 32.6% 25.2%
% 35 to 44 years 14.1% 12.3% 13.7% 15.4% 17.2% 12.6% 5.8% 12.4%
% 45 to 54 years 18.3% 15.5% 15.6% 10.9% 12.4% 18.7% 13.0% 15.1%
% 55 to 64 years 12.2% 15.0% 15.8% 14.8% 11.7% 12.9% 14.0% 14.2%
% 65 years or more 18.7% 15.8% 17.4% 13.3% 10.2% 13.2% 17.5% 15.4%
Median age/years 44.4 42.1 44.3 38.1 35.5% 41.4 35.7 40.4
Total households 2,953 1,772 1,426 1,816 2,693 2,685 2,580 15,925
% Family households 65.0% 61.7% 63.6% 61.3% 34.7% 61.3% 65.3% 58.4%
% Nonfamily households 35.0% 38.3% 36.4% 38.7% 65.3% 38.7% 34.7% 41.6%
% Single-person households 25.8% 26.5% 25.7% 29.7% 46.9% 31.1% 30.0% 31.4%
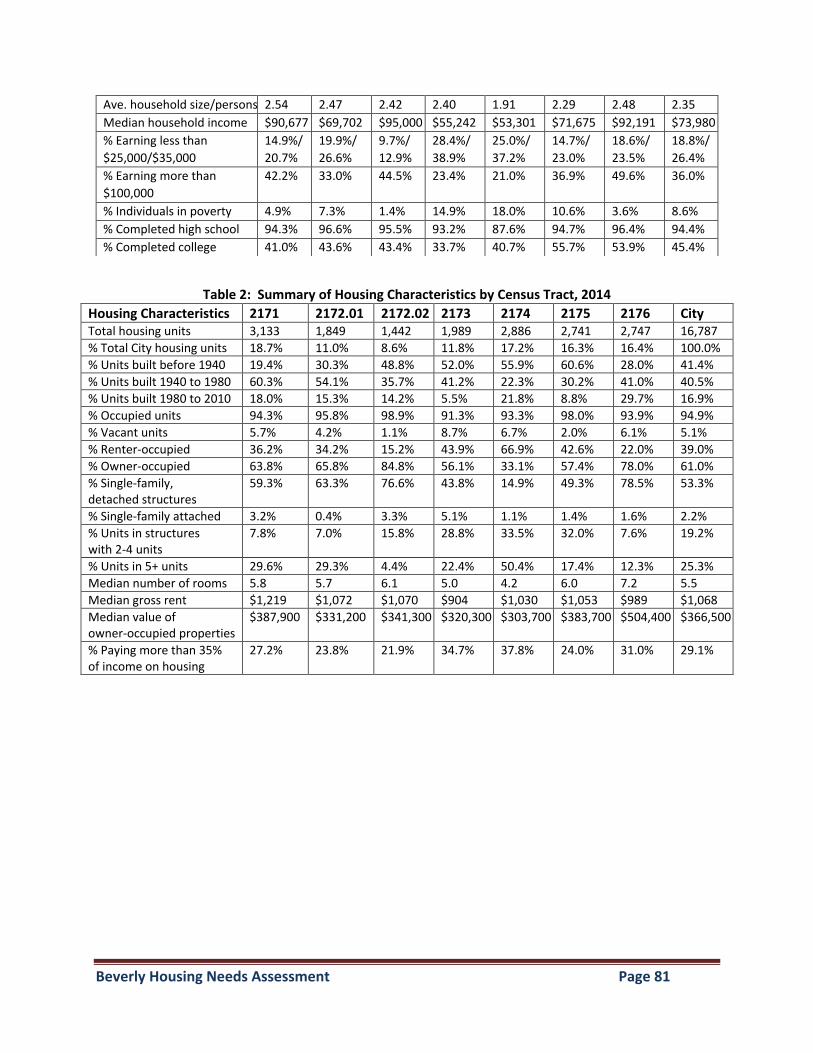
Beverly Housing Needs Assessment Page 81
Table 2: Summary of Housing Characteristics by Census Tract, 2014
Ave. household size/persons 2.54 2.47 2.42 2.40 1.91 2.29 2.48 2.35
Median household income $90,677 $69,702 $95,000 $55,242 $53,301 $71,675 $92,191 $73,980
% Earning less than
$25,000/$35,000
14.9%/
20.7%
19.9%/
26.6%
9.7%/
12.9%
28.4%/
38.9%
25.0%/
37.2%
14.7%/
23.0%
18.6%/
23.5%
18.8%/
26.4%
% Earning more than
$100,000
42.2% 33.0% 44.5% 23.4% 21.0% 36.9% 49.6% 36.0%
% Individuals in poverty 4.9% 7.3% 1.4% 14.9% 18.0% 10.6% 3.6% 8.6%
% Completed high school 94.3% 96.6% 95.5% 93.2% 87.6% 94.7% 96.4% 94.4%
% Completed college 41.0% 43.6% 43.4% 33.7% 40.7% 55.7% 53.9% 45.4%
Housing Characteristics 2171 2172.01 2172.02 2173 2174 2175 2176 City Total housing units 3,133 1,849 1,442 1,989 2,886 2,741 2,747 16,787
% Total City housing units 18.7% 11.0% 8.6% 11.8% 17.2% 16.3% 16.4% 100.0%
% Units built before 1940 19.4% 30.3% 48.8% 52.0% 55.9% 60.6% 28.0% 41.4%
% Units built 1940 to 1980 60.3% 54.1% 35.7% 41.2% 22.3% 30.2% 41.0% 40.5%
% Units built 1980 to 2010 18.0% 15.3% 14.2% 5.5% 21.8% 8.8% 29.7% 16.9%
% Occupied units 94.3% 95.8% 98.9% 91.3% 93.3% 98.0% 93.9% 94.9%
% Vacant units 5.7% 4.2% 1.1% 8.7% 6.7% 2.0% 6.1% 5.1%
% Renter-occupied 36.2% 34.2% 15.2% 43.9% 66.9% 42.6% 22.0% 39.0%
% Owner-occupied 63.8% 65.8% 84.8% 56.1% 33.1% 57.4% 78.0% 61.0%
% Single-family, detached structures
59.3% 63.3% 76.6% 43.8% 14.9% 49.3% 78.5% 53.3%
% Single-family attached 3.2% 0.4% 3.3% 5.1% 1.1% 1.4% 1.6% 2.2%
% Units in structures with 2-4 units
7.8% 7.0% 15.8% 28.8% 33.5% 32.0% 7.6% 19.2%
% Units in 5+ units 29.6% 29.3% 4.4% 22.4% 50.4% 17.4% 12.3% 25.3%
Median number of rooms 5.8 5.7 6.1 5.0 4.2 6.0 7.2 5.5
Median gross rent $1,219 $1,072 $1,070 $904 $1,030 $1,053 $989 $1,068
Median value of owner-occupied properties
$387,900 $331,200 $341,300 $320,300 $303,700 $383,700 $504,400 $366,500
% Paying more than 35% of income on housing
27.2% 23.8% 21.9% 34.7% 37.8% 24.0% 31.0% 29.1%
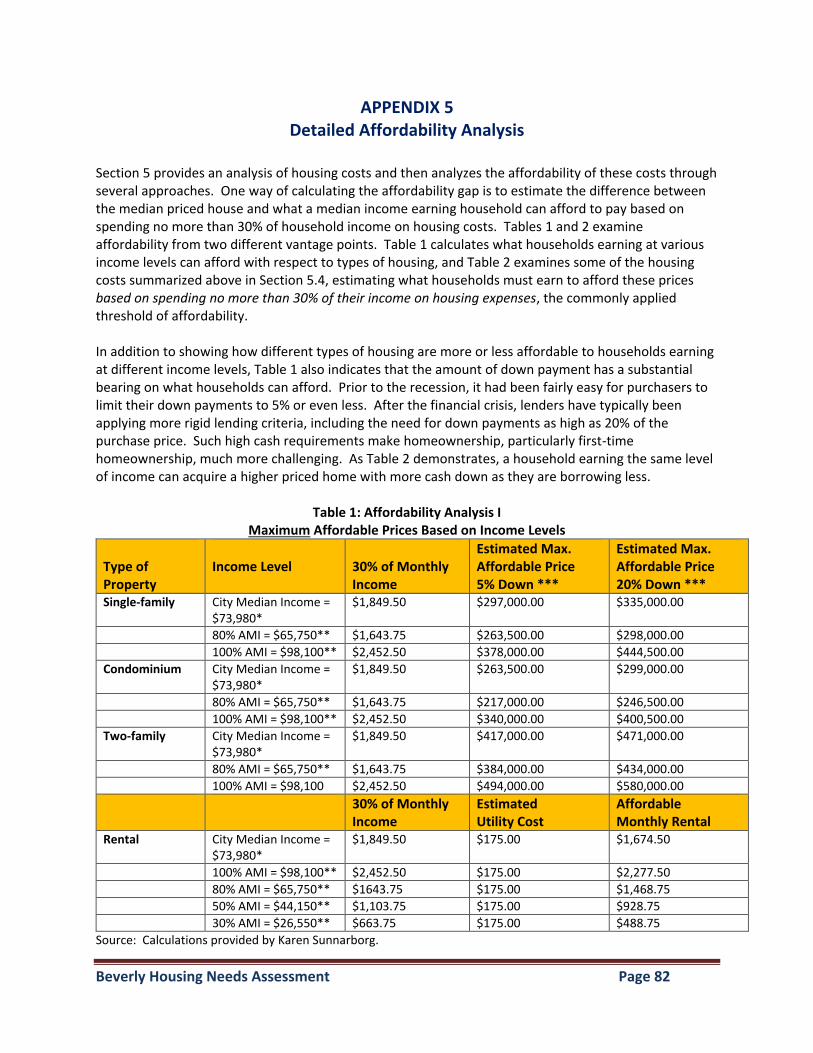
Beverly Housing Needs Assessment Page 82
APPENDIX 5 Detailed Affordability Analysis
Section 5 provides an analysis of housing costs and then analyzes the affordability of these costs through several approaches. One way of calculating the affordability gap is to estimate the difference between the median priced house and what a median income earning household can afford to pay based on spending no more than 30% of household income on housing costs. Tables 1 and 2 examine affordability from two different vantage points. Table 1 calculates what households earning at various income levels can afford with respect to types of housing, and Table 2 examines some of the housing costs summarized above in Section 5.4, estimating what households must earn to afford these prices based on spending no more than 30% of their income on housing expenses, the commonly applied threshold of affordability.
In addition to showing how different types of housing are more or less affordable to households earning at different income levels, Table 1 also indicates that the amount of down payment has a substantial bearing on what households can afford. Prior to the recession, it had been fairly easy for purchasers to limit their down payments to 5% or even less. After the financial crisis, lenders have typically been applying more rigid lending criteria, including the need for down payments as high as 20% of the purchase price. Such high cash requirements make homeownership, particularly first-time homeownership, much more challenging. As Table 2 demonstrates, a household earning the same level of income can acquire a higher priced home with more cash down as they are borrowing less.
Table 1: Affordability Analysis I Maximum Affordable Prices Based on Income Levels
Type of Property
Income Level
30% of Monthly Income
Estimated Max. Affordable Price 5% Down ***
Estimated Max. Affordable Price 20% Down ***
Single-family City Median Income = $73,980*
$1,849.50 $297,000.00 $335,000.00
80% AMI = $65,750** $1,643.75 $263,500.00 $298,000.00
100% AMI = $98,100** $2,452.50 $378,000.00 $444,500.00
Condominium City Median Income = $73,980*
$1,849.50 $263,500.00 $299,000.00
80% AMI = $65,750** $1,643.75 $217,000.00 $246,500.00
100% AMI = $98,100** $2,452.50 $340,000.00 $400,500.00
Two-family City Median Income = $73,980*
$1,849.50 $417,000.00 $471,000.00
80% AMI = $65,750** $1,643.75 $384,000.00 $434,000.00
100% AMI = $98,100 $2,452.50 $494,000.00 $580,000.00
30% of Monthly Income
Estimated Utility Cost
Affordable Monthly Rental
Rental City Median Income = $73,980*
$1,849.50 $175.00 $1,674.50
100% AMI = $98,100** $2,452.50 $175.00 $2,277.50
80% AMI = $65,750** $1643.75 $175.00 $1,468.75
50% AMI = $44,150** $1,103.75 $175.00 $928.75
30% AMI = $26,550** $663.75 $175.00 $488.75
Source: Calculations provided by Karen Sunnarborg.
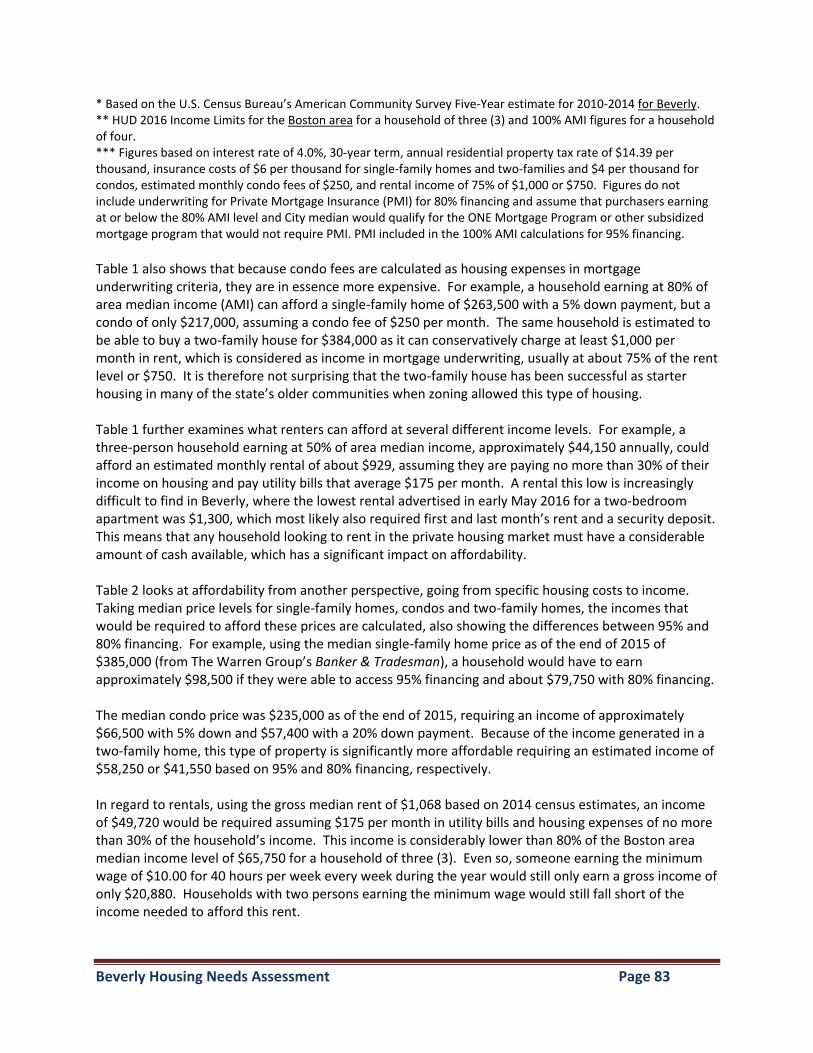
Beverly Housing Needs Assessment Page 83
* Based on the U.S. Census Bureau’s American Community Survey Five-Year estimate for 2010-2014 for Beverly. ** HUD 2016 Income Limits for the Boston area for a household of three (3) and 100% AMI figures for a household of four. *** Figures based on interest rate of 4.0%, 30-year term, annual residential property tax rate of $14.39 per thousand, insurance costs of $6 per thousand for single-family homes and two-families and $4 per thousand for condos, estimated monthly condo fees of $250, and rental income of 75% of $1,000 or $750. Figures do not include underwriting for Private Mortgage Insurance (PMI) for 80% financing and assume that purchasers earning at or below the 80% AMI level and City median would qualify for the ONE Mortgage Program or other subsidized mortgage program that would not require PMI. PMI included in the 100% AMI calculations for 95% financing.
Table 1 also shows that because condo fees are calculated as housing expenses in mortgage underwriting criteria, they are in essence more expensive. For example, a household earning at 80% of area median income (AMI) can afford a single-family home of $263,500 with a 5% down payment, but a condo of only $217,000, assuming a condo fee of $250 per month. The same household is estimated to be able to buy a two-family house for $384,000 as it can conservatively charge at least $1,000 per month in rent, which is considered as income in mortgage underwriting, usually at about 75% of the rent level or $750. It is therefore not surprising that the two-family house has been successful as starter housing in many of the state’s older communities when zoning allowed this type of housing. Table 1 further examines what renters can afford at several different income levels. For example, a three-person household earning at 50% of area median income, approximately $44,150 annually, could afford an estimated monthly rental of about $929, assuming they are paying no more than 30% of their income on housing and pay utility bills that average $175 per month. A rental this low is increasingly difficult to find in Beverly, where the lowest rental advertised in early May 2016 for a two-bedroom apartment was $1,300, which most likely also required first and last month’s rent and a security deposit. This means that any household looking to rent in the private housing market must have a considerable amount of cash available, which has a significant impact on affordability. Table 2 looks at affordability from another perspective, going from specific housing costs to income. Taking median price levels for single-family homes, condos and two-family homes, the incomes that would be required to afford these prices are calculated, also showing the differences between 95% and 80% financing. For example, using the median single-family home price as of the end of 2015 of $385,000 (from The Warren Group’s Banker & Tradesman), a household would have to earn approximately $98,500 if they were able to access 95% financing and about $79,750 with 80% financing. The median condo price was $235,000 as of the end of 2015, requiring an income of approximately $66,500 with 5% down and $57,400 with a 20% down payment. Because of the income generated in a two-family home, this type of property is significantly more affordable requiring an estimated income of $58,250 or $41,550 based on 95% and 80% financing, respectively. In regard to rentals, using the gross median rent of $1,068 based on 2014 census estimates, an income of $49,720 would be required assuming $175 per month in utility bills and housing expenses of no more than 30% of the household’s income. This income is considerably lower than 80% of the Boston area median income level of $65,750 for a household of three (3). Even so, someone earning the minimum wage of $10.00 for 40 hours per week every week during the year would still only earn a gross income of only $20,880. Households with two persons earning the minimum wage would still fall short of the income needed to afford this rent.
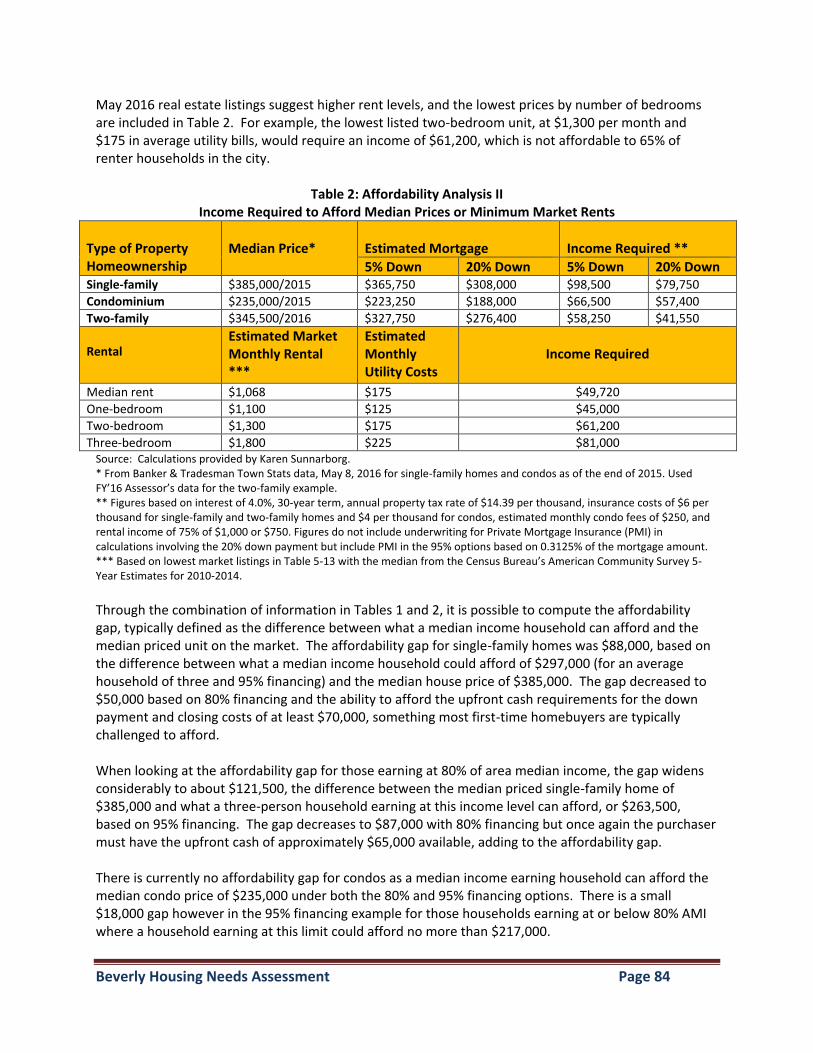
Beverly Housing Needs Assessment Page 84
May 2016 real estate listings suggest higher rent levels, and the lowest prices by number of bedrooms are included in Table 2. For example, the lowest listed two-bedroom unit, at $1,300 per month and $175 in average utility bills, would require an income of $61,200, which is not affordable to 65% of renter households in the city.
Table 2: Affordability Analysis II Income Required to Afford Median Prices or Minimum Market Rents
Type of Property Homeownership
Median Price*
Estimated Mortgage
Income Required **
5% Down 20% Down 5% Down 20% Down Single-family $385,000/2015 $365,750 $308,000 $98,500 $79,750
Condominium $235,000/2015 $223,250 $188,000 $66,500 $57,400
Two-family $345,500/2016 $327,750 $276,400 $58,250 $41,550
Rental
Estimated Market Monthly Rental ***
Estimated Monthly Utility Costs
Income Required
Median rent $1,068 $175 $49,720
One-bedroom $1,100 $125 $45,000
Two-bedroom $1,300 $175 $61,200
Three-bedroom $1,800 $225 $81,000 Source: Calculations provided by Karen Sunnarborg. * From Banker & Tradesman Town Stats data, May 8, 2016 for single-family homes and condos as of the end of 2015. Used FY’16 Assessor’s data for the two-family example. ** Figures based on interest of 4.0%, 30-year term, annual property tax rate of $14.39 per thousand, insurance costs of $6 per thousand for single-family and two-family homes and $4 per thousand for condos, estimated monthly condo fees of $250, and rental income of 75% of $1,000 or $750. Figures do not include underwriting for Private Mortgage Insurance (PMI) in calculations involving the 20% down payment but include PMI in the 95% options based on 0.3125% of the mortgage amount. *** Based on lowest market listings in Table 5-13 with the median from the Census Bureau’s American Community Survey 5-Year Estimates for 2010-2014.
Through the combination of information in Tables 1 and 2, it is possible to compute the affordability gap, typically defined as the difference between what a median income household can afford and the median priced unit on the market. The affordability gap for single-family homes was $88,000, based on the difference between what a median income household could afford of $297,000 (for an average household of three and 95% financing) and the median house price of $385,000. The gap decreased to $50,000 based on 80% financing and the ability to afford the upfront cash requirements for the down payment and closing costs of at least $70,000, something most first-time homebuyers are typically challenged to afford. When looking at the affordability gap for those earning at 80% of area median income, the gap widens considerably to about $121,500, the difference between the median priced single-family home of $385,000 and what a three-person household earning at this income level can afford, or $263,500, based on 95% financing. The gap decreases to $87,000 with 80% financing but once again the purchaser must have the upfront cash of approximately $65,000 available, adding to the affordability gap. There is currently no affordability gap for condos as a median income earning household can afford the median condo price of $235,000 under both the 80% and 95% financing options. There is a small $18,000 gap however in the 95% financing example for those households earning at or below 80% AMI where a household earning at this limit could afford no more than $217,000.
Beverly Housing Needs Assessment Page 85
There are no affordability gaps for the two-family house for both the median income earning household and those earning at or below 80% AMI under both the 95% and 80% financing scenarios. This confirms the relative high affordability of this type of housing. It should be noted that these estimates reflect what a household earning at the 80% AMI limit can afford, not what the state would require as the state-approved purchase price for any affordable unit which is based on 70% AMI adjusted by bedroom/household size to allow for some marketing window. Table 3 estimates how many single-family homes and condos exist in Beverly that were affordable within various income categories. There were 496 single-family homes and 775 condos affordable to those earning at or below 80% of the AMI for a total of 1,271 units or 12.9% of all units. More than half of the condos were affordable to those within this income range. It is also likely that many of these units are small or in relatively poor condition. Another 1,419 single-family homes and 252 condos were affordable to those earning between 80% of the Boston-area AMI and the median income level for the city of Beverly for a total of 1,751 units or 17.8% of all such units. These levels suggest some significant affordability in the community’s private housing stock. Still 70% of these units were affordable to those earning beyond the city’s median income level including 77.3% of single-families and 25.4% of condos. Additional calculations indicated that 57.5% of the single-family homes and 38.2% of the condos were affordable to those earning between 80% and 100% AMI (up to $98,100) with 36.6% and 5.5% of the single-family and condos affordable to those earning above 100% AMI, respectively.
Table 3: Affordability Analysis III Relative Affordability of Single-family and Condo Units in Beverly, 2016
Price Range Single-family/Condo
Income Range
Single-family Homes Available in Price
Range
Condominiums Available in Price
Range
Number % Number % Less than $263,500/ Less than $217,000
Less than 80% AMI
496 5.9 775 56.3
$263,501-$297,000/ $217,001-$263,500
80% AMI to City’s Median Income
1,419 16.8 252 18.3
More than $297,000/ more than $263,500
More than City’s Median Income
6,535 77.3 349 25.4
Less than $263,500/ Less than $217,000
Less than 80% AMI
496 5.9 775 56.3
$263,500 - $378,000/ $217,000 - $340,000
80% AMI to 100% AMI 4,861 57.5 526 38.2
More than $378,000/ More than $340,000
More than 100% AMI 3,093 36.6 75 5.5
Total 8,450 100.0 1,376 100.0
Source: Beverly Assessor’s Database for fiscal year 2016. Please note that as a standard practice, assessed value is assumed to be 93% of actual value or potential sale price. Figures based on the analysis included in Table 5-15 with 95% financing.
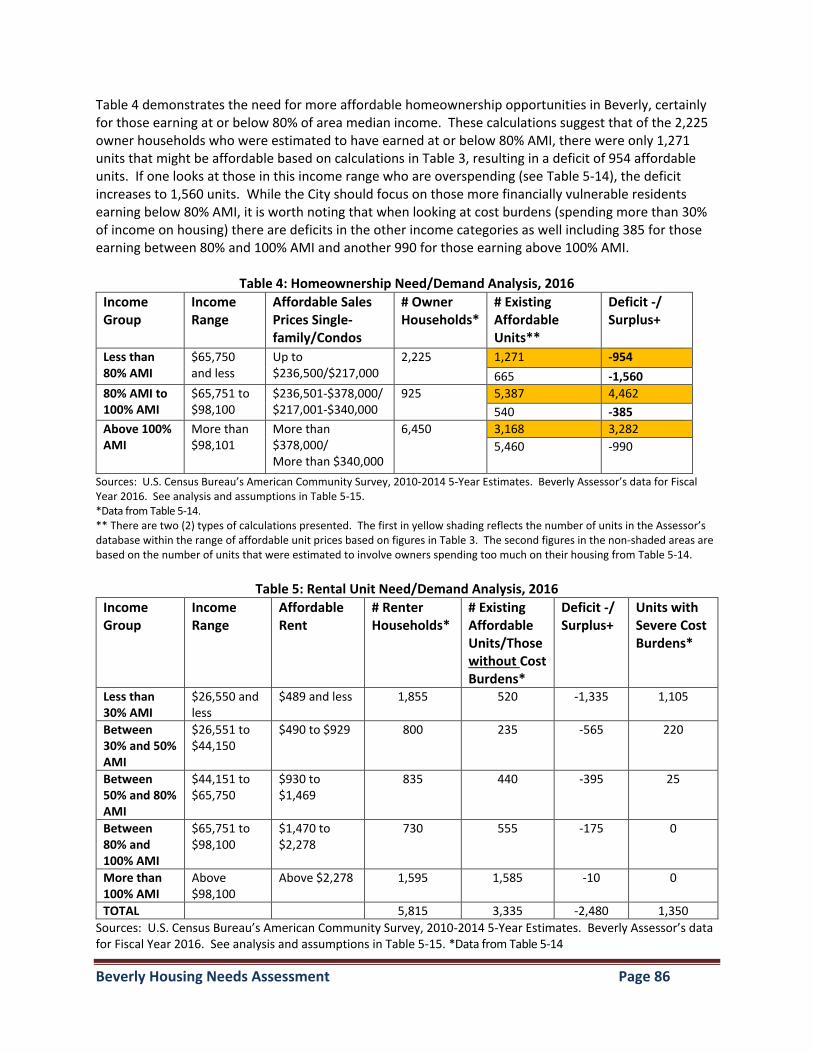
Beverly Housing Needs Assessment Page 86
Table 4 demonstrates the need for more affordable homeownership opportunities in Beverly, certainly for those earning at or below 80% of area median income. These calculations suggest that of the 2,225 owner households who were estimated to have earned at or below 80% AMI, there were only 1,271 units that might be affordable based on calculations in Table 3, resulting in a deficit of 954 affordable units. If one looks at those in this income range who are overspending (see Table 5-14), the deficit increases to 1,560 units. While the City should focus on those more financially vulnerable residents earning below 80% AMI, it is worth noting that when looking at cost burdens (spending more than 30% of income on housing) there are deficits in the other income categories as well including 385 for those earning between 80% and 100% AMI and another 990 for those earning above 100% AMI.
Table 4: Homeownership Need/Demand Analysis, 2016
Income Group
Income Range
Affordable Sales Prices Single-family/Condos
# Owner Households*
# Existing Affordable Units**
Deficit -/ Surplus+
Less than 80% AMI
$65,750 and less
Up to $236,500/$217,000
2,225 1,271 -954
665 -1,560
80% AMI to 100% AMI
$65,751 to $98,100
$236,501-$378,000/ $217,001-$340,000
925 5,387 4,462
540 -385
Above 100% AMI
More than $98,101
More than $378,000/ More than $340,000
6,450 3,168 3,282
5,460 -990
Sources: U.S. Census Bureau’s American Community Survey, 2010-2014 5-Year Estimates. Beverly Assessor’s data for Fiscal Year 2016. See analysis and assumptions in Table 5-15. *Data from Table 5-14. ** There are two (2) types of calculations presented. The first in yellow shading reflects the number of units in the Assessor’s database within the range of affordable unit prices based on figures in Table 3. The second figures in the non-shaded areas are based on the number of units that were estimated to involve owners spending too much on their housing from Table 5-14.
Table 5: Rental Unit Need/Demand Analysis, 2016
Income Group
Income Range
Affordable Rent
# Renter Households*
# Existing Affordable Units/Those without Cost Burdens*
Deficit -/ Surplus+
Units with Severe Cost Burdens*
Less than 30% AMI
$26,550 and less
$489 and less 1,855 520 -1,335 1,105
Between 30% and 50% AMI
$26,551 to $44,150
$490 to $929 800 235 -565 220
Between 50% and 80% AMI
$44,151 to $65,750
$930 to $1,469
835 440 -395 25
Between 80% and 100% AMI
$65,751 to $98,100
$1,470 to $2,278
730 555 -175 0
More than 100% AMI
Above $98,100
Above $2,278 1,595 1,585 -10 0
TOTAL 5,815 3,335 -2,480 1,350
Sources: U.S. Census Bureau’s American Community Survey, 2010-2014 5-Year Estimates. Beverly Assessor’s data for Fiscal Year 2016. See analysis and assumptions in Table 5-15. *Data from Table 5-14
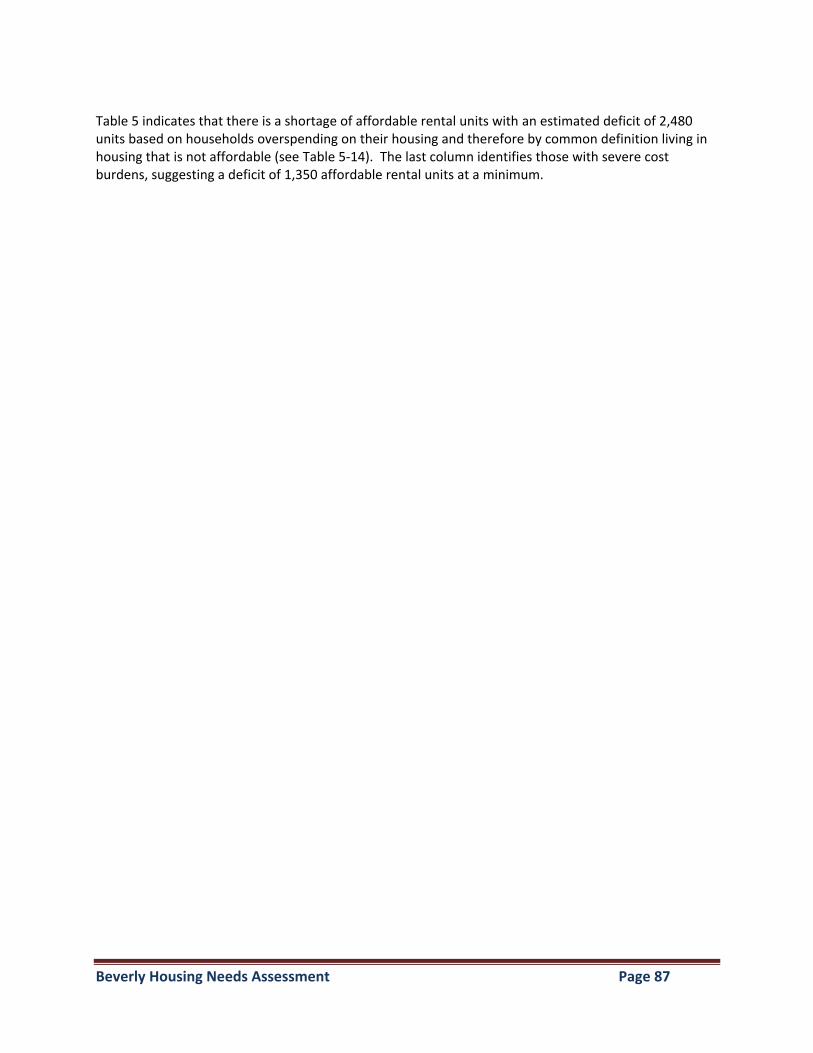
Beverly Housing Needs Assessment Page 87
Table 5 indicates that there is a shortage of affordable rental units with an estimated deficit of 2,480 units based on households overspending on their housing and therefore by common definition living in housing that is not affordable (see Table 5-14). The last column identifies those with severe cost burdens, suggesting a deficit of 1,350 affordable rental units at a minimum.
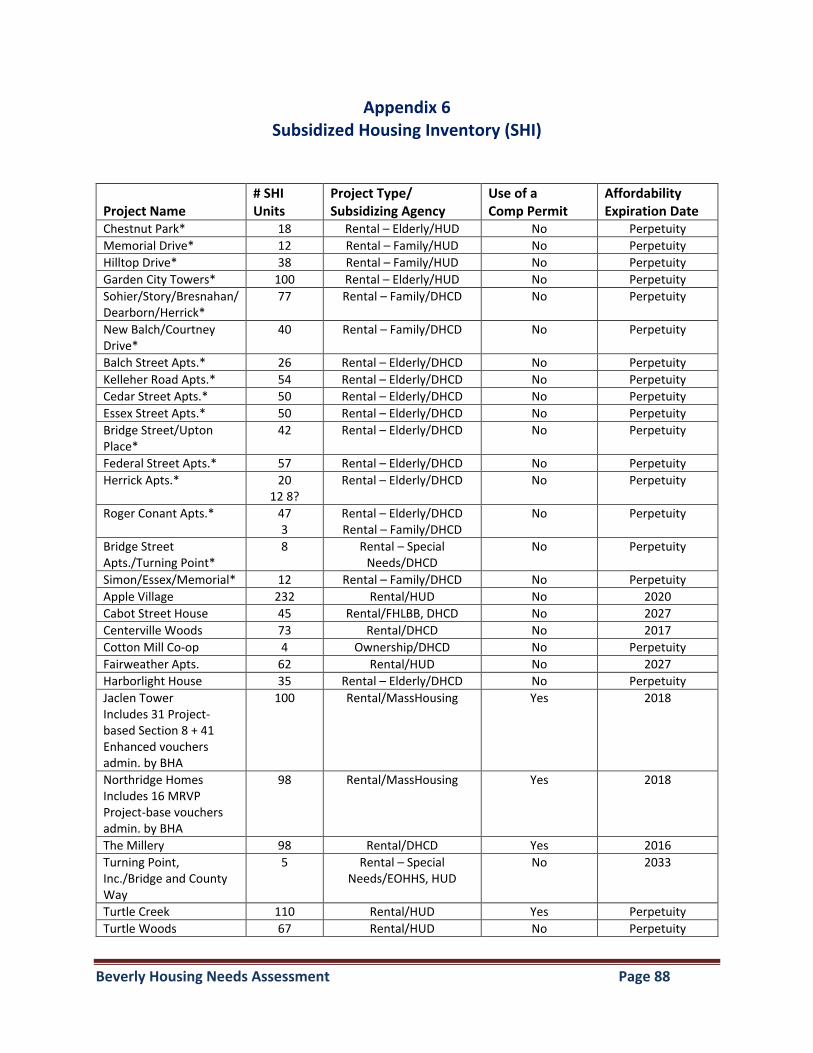
Beverly Housing Needs Assessment Page 88
Appendix 6 Subsidized Housing Inventory (SHI)
Project Name
# SHI Units
Project Type/ Subsidizing Agency
Use of a Comp Permit
Affordability Expiration Date
Chestnut Park* 18 Rental – Elderly/HUD No Perpetuity
Memorial Drive* 12 Rental – Family/HUD No Perpetuity
Hilltop Drive* 38 Rental – Family/HUD No Perpetuity
Garden City Towers* 100 Rental – Elderly/HUD No Perpetuity
Sohier/Story/Bresnahan/ Dearborn/Herrick*
77 Rental – Family/DHCD No Perpetuity
New Balch/Courtney Drive*
40 Rental – Family/DHCD No Perpetuity
Balch Street Apts.* 26 Rental – Elderly/DHCD No Perpetuity
Kelleher Road Apts.* 54 Rental – Elderly/DHCD No Perpetuity
Cedar Street Apts.* 50 Rental – Elderly/DHCD No Perpetuity
Essex Street Apts.* 50 Rental – Elderly/DHCD No Perpetuity
Bridge Street/Upton Place*
42 Rental – Elderly/DHCD No Perpetuity
Federal Street Apts.* 57 Rental – Elderly/DHCD No Perpetuity
Herrick Apts.* 20 12 8?
Rental – Elderly/DHCD No Perpetuity
Roger Conant Apts.* 47 3
Rental – Elderly/DHCD Rental – Family/DHCD
No Perpetuity
Bridge Street Apts./Turning Point*
8 Rental – Special Needs/DHCD
No Perpetuity
Simon/Essex/Memorial* 12 Rental – Family/DHCD No Perpetuity
Apple Village 232 Rental/HUD No 2020
Cabot Street House 45 Rental/FHLBB, DHCD No 2027
Centerville Woods 73 Rental/DHCD No 2017
Cotton Mill Co-op 4 Ownership/DHCD No Perpetuity
Fairweather Apts. 62 Rental/HUD No 2027
Harborlight House 35 Rental – Elderly/DHCD No Perpetuity
Jaclen Tower Includes 31 Project-based Section 8 + 41 Enhanced vouchers admin. by BHA
100 Rental/MassHousing Yes 2018
Northridge Homes Includes 16 MRVP Project-base vouchers admin. by BHA
98 Rental/MassHousing Yes 2018
The Millery 98 Rental/DHCD Yes 2016
Turning Point, Inc./Bridge and County Way
5 Rental – Special Needs/EOHHS, HUD
No 2033
Turtle Creek 110 Rental/HUD Yes Perpetuity
Turtle Woods 67 Rental/HUD No Perpetuity

Beverly Housing Needs Assessment Page 89
Source: Massachusetts Department of Housing and Community Development, May 23, 2016
* Beverly Housing Authority units ** Inclusionary zoning units
Turning Point, Inc./Mark St.
4 Rental – Special Needs/HUD, DHCD
No Perpetuity
Dane Square 4 Ownership/DHCD No 2029
Dunham Castle 16 Ownership/DHCD No Perpetuity?
Gloucester Crossing 6 Rental/DHCD, HUD No 2044
We Care About Homes, Inc./ Home Street
3 Rental/HUD No 2022
We Care About Homes, Inc./ River Street
2 Rental/HUD No Perpetuity
YMCA Affordable Housing
5 Rental/DHCD No 2037
Mill Street 3 Rental/DHCD, HUD No 2033
Habitat for Humanity North Shore
1 Ownership/HUD No 2033
Star House, Inc. 4 Rental – Special Needs/HUD
No 2031
Edwards Harborview Condominium
3 Ownership/DHCD No Perpetuity
Beverly Affordable Housing Coalition/Cabot Street
34 Rental/HUD No 2036
Beverly Affordable Housing Coalition/Chase Street
1 Ownership/HUD No 2034
Federal Heights Condos 2 Ownership/DHCD No Perpetuity
Montserrat Condos 3 Ownership/DHCD No Perpetuity
Manor Homes Development
2 Ownership/DHCD No Perpetuity
Burnham Apartments** 5 Rental/DHCD No Perpetuity
Pleasant St. Apts. 32 Rental/HUD, DHCD No 2042
Holcroft Park Homes/Phases I and II
58 Rental/DHCD, HUD, MassHousing, MHP
Yes Perpetuity
Enterprise Apts.** 6 Rental/DHCD No Perpetuity
Cabot Vestry Apts.** 2 Rental/DHCD No Perpetuity
Beverly HOR Program 31 26 Rentals 5 Ownership
No 2016-2041
DDS Group Homes 99 Rental – Special Needs/DDS
No NA
DMH Group Homes 41 Rental – Special Needs/DMH
No NA
1,947 1,910 Rentals/98.1% 37 Ownership/1.9%
464 units used 40B permitting/ 23.8%
Beverly Housing Needs Assessment Page 90
APPENDIX 7 Beverly Housing Authority (BHA) Developments and Applicant Statistics
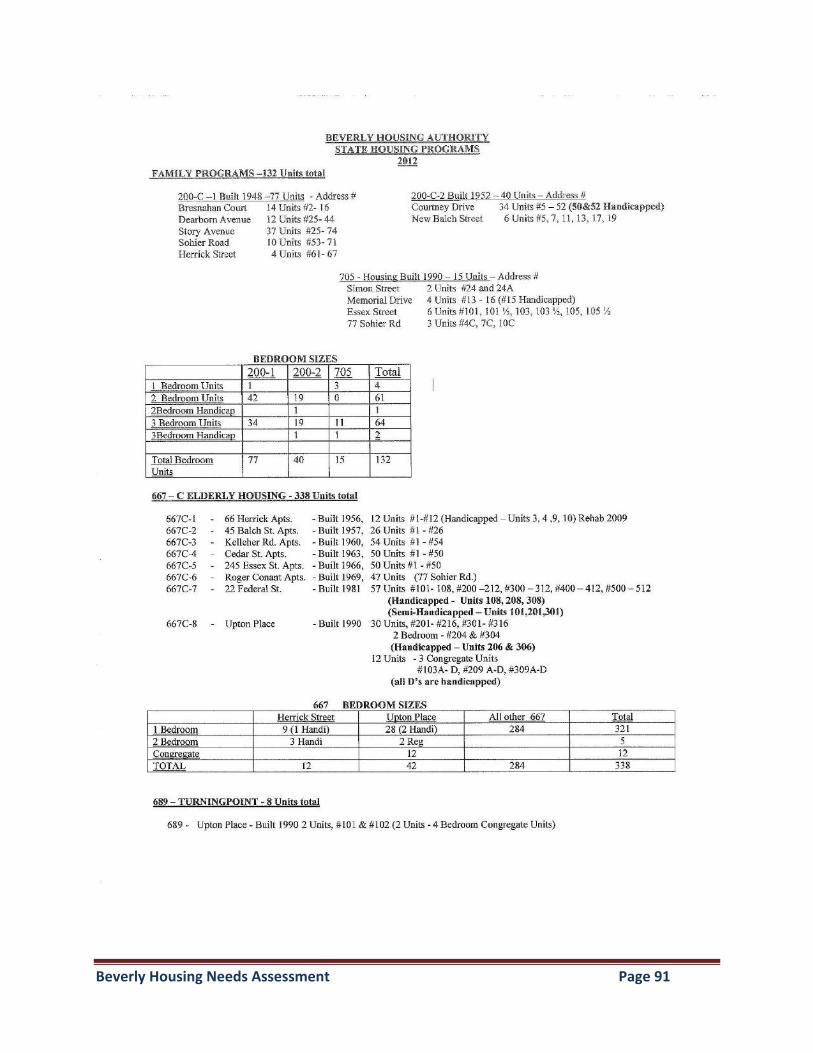
Beverly Housing Needs Assessment Page 91
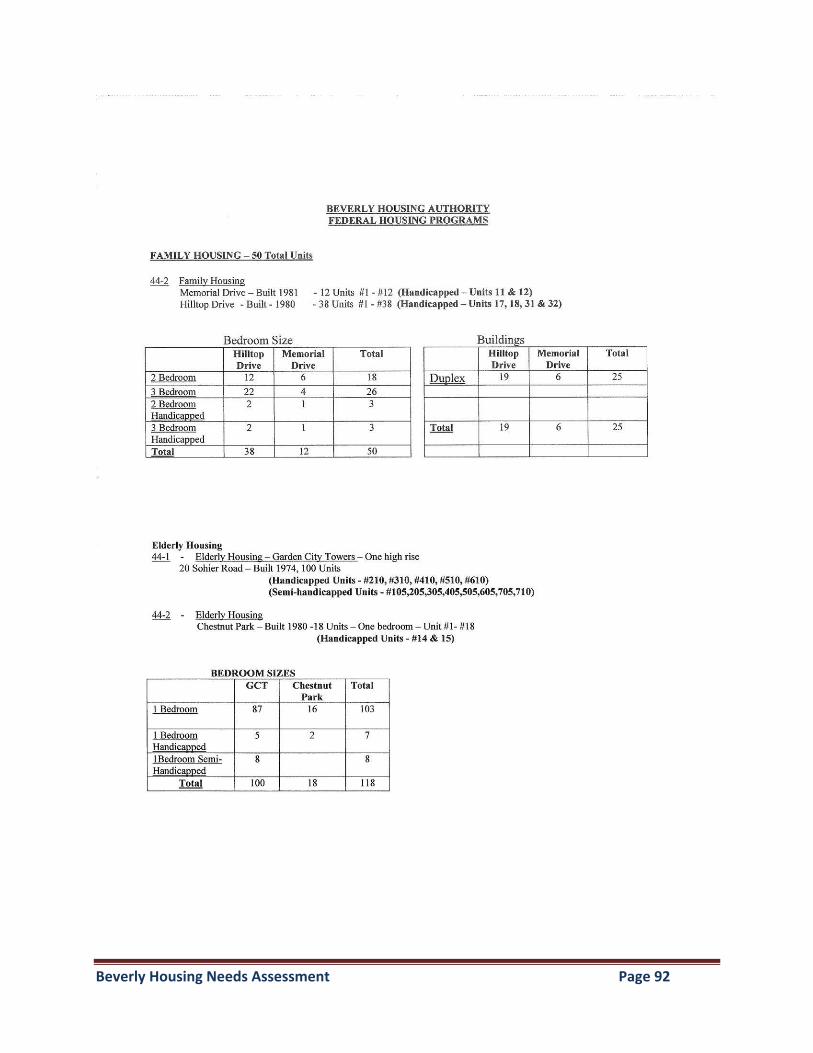
Beverly Housing Needs Assessment Page 92
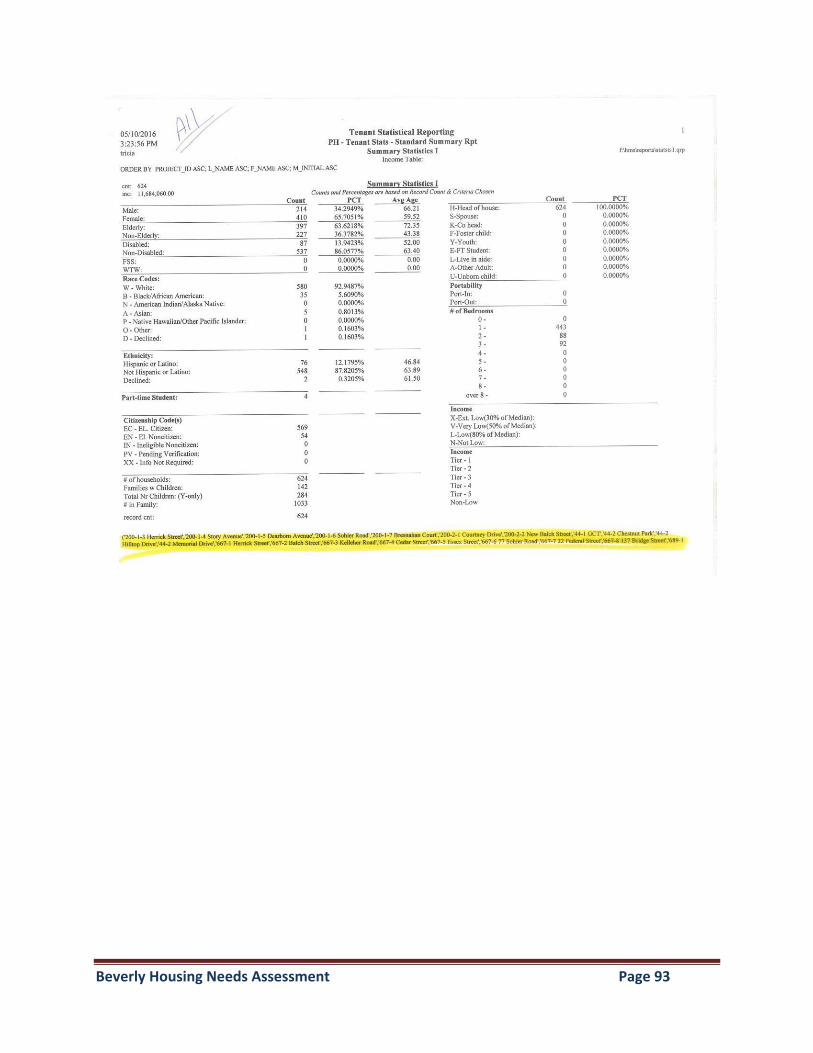
Beverly Housing Needs Assessment Page 93
Beverly Housing Needs Assessment Page 94
Beverly Housing Needs Assessment Page 95
Appendix 8 City of Beverly
Community Housing Meeting June 16, 2016
Summary Notes
The City of Beverly held a Community Housing Meeting on June 16, 2016 to present highlights of the Housing Needs Assessment and an analysis of existing development patterns and potential opportunities for new development or redevelopment to address the range of local housing needs. Following a question and comment period, the participants were randomly assigned to break-out groups. Visioning The first part of the roundtable work was to focus on a local vision for affordable housing to serve as the context for the development of priority housing strategies in the Community Housing Plan. Each participant was asked in turn to finish the following sentences with all group members answering the first question before moving on to the next one. Responses to these questions are recorded below.
1. My biggest concern regarding housing in Beverly is ____________________?
Economic diversity is down by 30 to 40%.
Not enough housing for families.
Not enough housing for more middle-aged single individuals who are empty nesters.
Need workforce housing for those earning above 80% AMI.
There are families in BHA developments that have jobs and want to transition out of public housing but can’t find other affordable rentals.
Young single individuals cannot find appropriate affordable housing.
New development is clashing with community character.
Some who need affordable housing earn too much to qualify for assistance but not enough to qualify for rent/mortgage.
Not enough nice “over 55” housing.
Concern about community opposition to greater density in the downtown.
More housing is needed in the downtown that includes all types of units and helps spur economic development.
There is too much concentration of affordable units in certain areas and such units should be available throughout the city.
Seniors are isolated in their single-family homes.
2. The City’s greatest challenge related to preserving and producing housing affordability and diversity is _______________________________________?
Market forces (imbalance of supply and demand).
High development costs.
Neighborhood opposition.
Not enough incentives.
Beverly Housing Needs Assessment Page 96
Social opposition to what is perceived as affordable housing stemming from misinformation.
Affordable housing restricted to only a few areas of the city which instead should be produced near all train stations.
Not enough funding available.
Insufficient sources of funding for the maintenance (capital improvements) of both public and private housing developments.
Not enough smaller ownership units, condos in particular.
Increasingly aging population, plus people are living longer.
Not in My Backyard (NIMBY) opposition to development.
3. An appropriate housing goal (something to strive for in the years ahead) for the City to achieve is to ________________________________________________.
Promote mixed-income housing to address all diverse housing needs.
Enable BHA tenants to move to affordable rental and ownership units.
Strive for a ratio of affordable units that matches income (reality) of current residents.
Develop incentives to approach 50/50 affordable unit development with half the units affordable and the other half market rate.
Provide housing for those who do not qualify for subsidies but are still priced out of the private housing market.
Maximize revenue streams such as grants, partnerships, etc.
Promote a community that embraces affordable housing through more education.
Create a sufficient inventory of condos for seniors.
Offer incentives for downsizing to different and more appropriate housing.
Increase 10% affordability goal to 20%.
Promote greater income diversity within developments.
4. The best locations for new housing development include ___________________________________________________________.
Promote affordable housing development throughout the city.
Adopt new zoning for the Bass River area.
Accessory apartments.
Oversized old buildings.
Near Cove and Prides Crossing areas (train stations).
Downtown.
Near public transportation and retail uses.
In walkable communities.
Near schools. Recurring themes include the concerns and challenges involved in decentralizing affordable housing throughout the community, transit-oriented development in particular; and providing mixed-income housing that includes units for those earning above 80% AMI but still priced out of the private housing market and for various types of households (seniors, families, individuals).
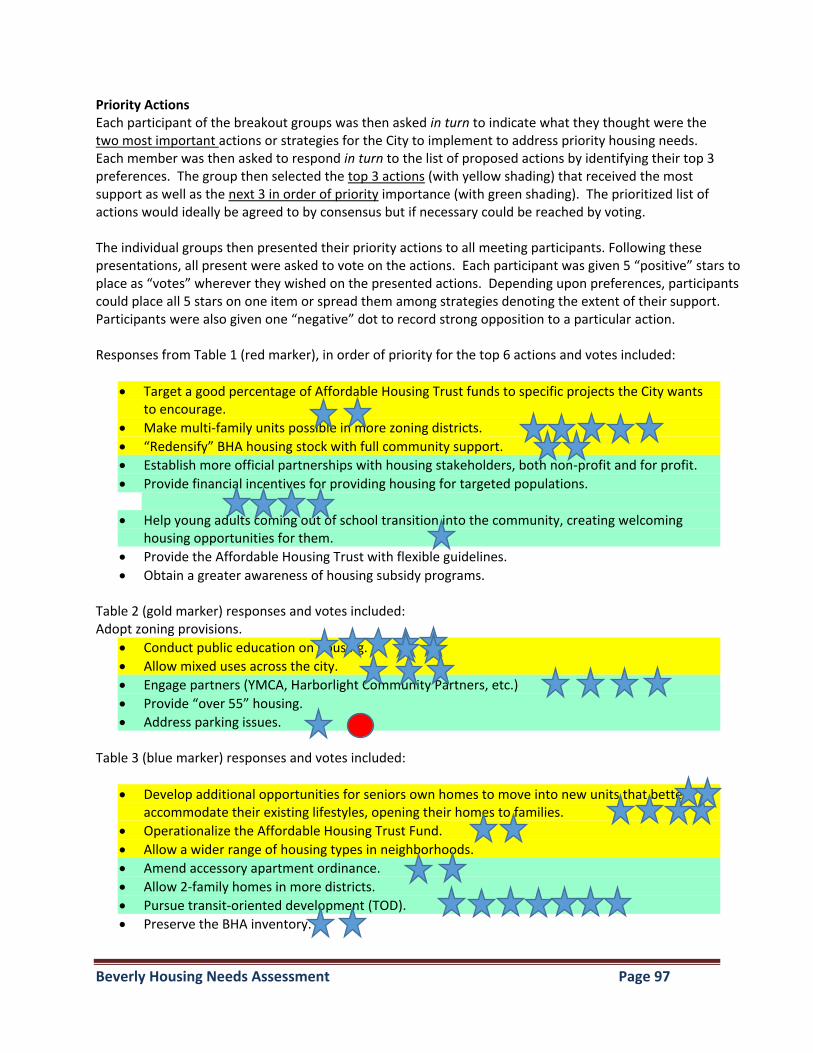
Beverly Housing Needs Assessment Page 97
Priority Actions Each participant of the breakout groups was then asked in turn to indicate what they thought were the two most important actions or strategies for the City to implement to address priority housing needs. Each member was then asked to respond in turn to the list of proposed actions by identifying their top 3 preferences. The group then selected the top 3 actions (with yellow shading) that received the most support as well as the next 3 in order of priority importance (with green shading). The prioritized list of actions would ideally be agreed to by consensus but if necessary could be reached by voting. The individual groups then presented their priority actions to all meeting participants. Following these presentations, all present were asked to vote on the actions. Each participant was given 5 “positive” stars to place as “votes” wherever they wished on the presented actions. Depending upon preferences, participants could place all 5 stars on one item or spread them among strategies denoting the extent of their support. Participants were also given one “negative” dot to record strong opposition to a particular action. Responses from Table 1 (red marker), in order of priority for the top 6 actions and votes included:
Target a good percentage of Affordable Housing Trust funds to specific projects the City wants to encourage.
Make multi-family units possible in more zoning districts.
“Redensify” BHA housing stock with full community support.
Establish more official partnerships with housing stakeholders, both non-profit and for profit.
Provide financial incentives for providing housing for targeted populations.
Help young adults coming out of school transition into the community, creating welcoming housing opportunities for them.
Provide the Affordable Housing Trust with flexible guidelines.
Obtain a greater awareness of housing subsidy programs. Table 2 (gold marker) responses and votes included: Adopt zoning provisions.
Conduct public education on housing.
Allow mixed uses across the city.
Engage partners (YMCA, Harborlight Community Partners, etc.)
Provide “over 55” housing.
Address parking issues. Table 3 (blue marker) responses and votes included:
Develop additional opportunities for seniors own homes to move into new units that better accommodate their existing lifestyles, opening their homes to families.
Operationalize the Affordable Housing Trust Fund.
Allow a wider range of housing types in neighborhoods.
Amend accessory apartment ordinance.
Allow 2-family homes in more districts.
Pursue transit-oriented development (TOD).
Preserve the BHA inventory.
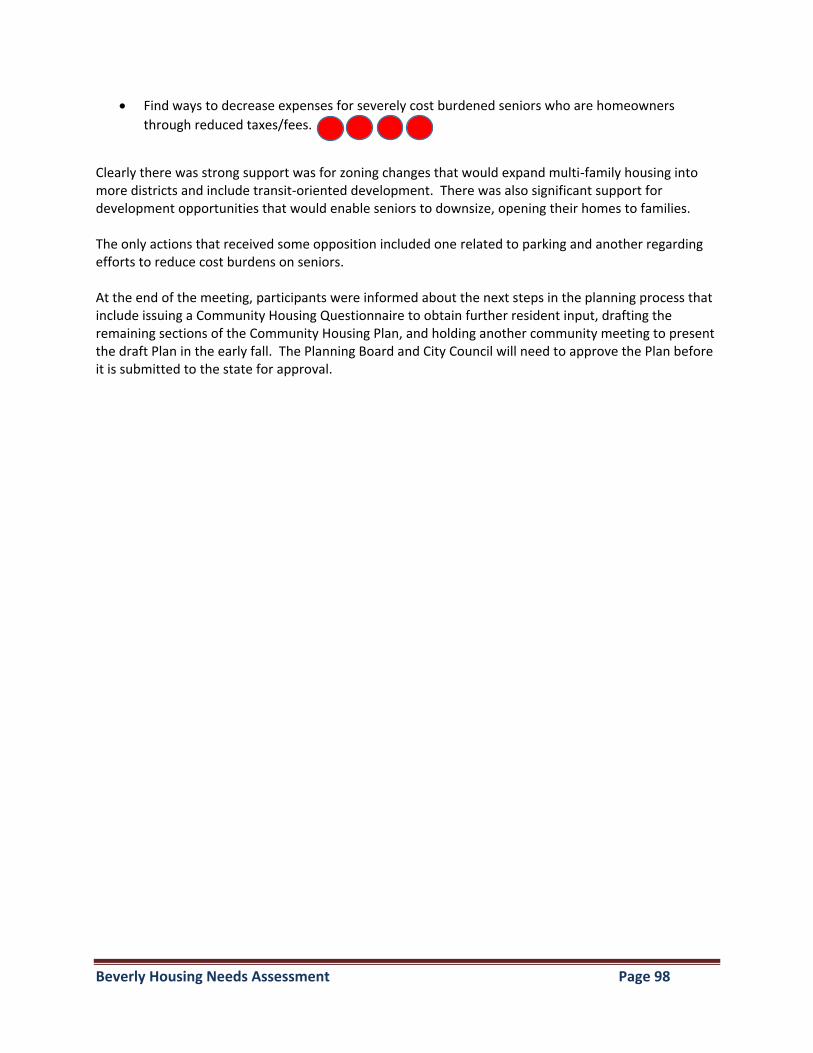
Beverly Housing Needs Assessment Page 98
Find ways to decrease expenses for severely cost burdened seniors who are homeowners
through reduced taxes/fees.
Clearly there was strong support was for zoning changes that would expand multi-family housing into more districts and include transit-oriented development. There was also significant support for development opportunities that would enable seniors to downsize, opening their homes to families. The only actions that received some opposition included one related to parking and another regarding efforts to reduce cost burdens on seniors. At the end of the meeting, participants were informed about the next steps in the planning process that include issuing a Community Housing Questionnaire to obtain further resident input, drafting the remaining sections of the Community Housing Plan, and holding another community meeting to present the draft Plan in the early fall. The Planning Board and City Council will need to approve the Plan before it is submitted to the state for approval.
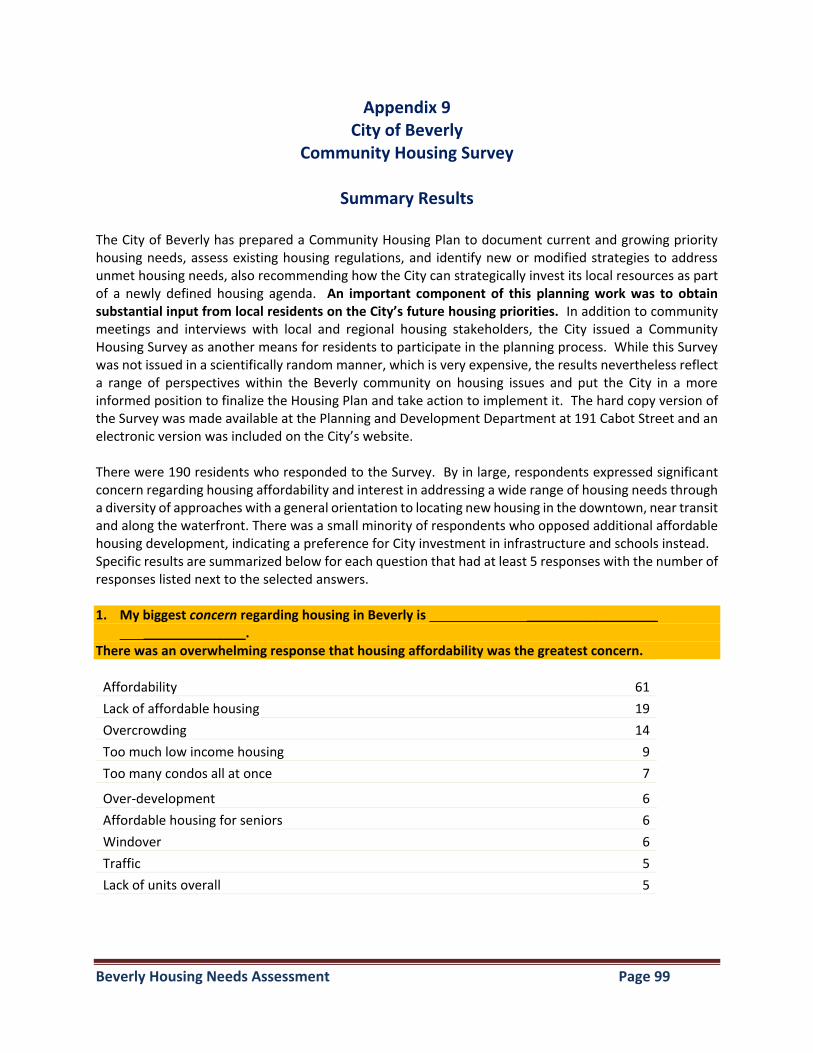
Beverly Housing Needs Assessment Page 99
Appendix 9
City of Beverly Community Housing Survey
Summary Results
The City of Beverly has prepared a Community Housing Plan to document current and growing priority housing needs, assess existing housing regulations, and identify new or modified strategies to address unmet housing needs, also recommending how the City can strategically invest its local resources as part of a newly defined housing agenda. An important component of this planning work was to obtain substantial input from local residents on the City’s future housing priorities. In addition to community meetings and interviews with local and regional housing stakeholders, the City issued a Community Housing Survey as another means for residents to participate in the planning process. While this Survey was not issued in a scientifically random manner, which is very expensive, the results nevertheless reflect a range of perspectives within the Beverly community on housing issues and put the City in a more informed position to finalize the Housing Plan and take action to implement it. The hard copy version of the Survey was made available at the Planning and Development Department at 191 Cabot Street and an electronic version was included on the City’s website. There were 190 residents who responded to the Survey. By in large, respondents expressed significant concern regarding housing affordability and interest in addressing a wide range of housing needs through a diversity of approaches with a general orientation to locating new housing in the downtown, near transit and along the waterfront. There was a small minority of respondents who opposed additional affordable housing development, indicating a preference for City investment in infrastructure and schools instead. Specific results are summarized below for each question that had at least 5 responses with the number of responses listed next to the selected answers. 1. My biggest concern regarding housing in Beverly is __________________
______________. There was an overwhelming response that housing affordability was the greatest concern.
Affordability 61
Lack of affordable housing 19
Overcrowding 14
Too much low income housing 9
Too many condos all at once 7
Over-development 6
Affordable housing for seniors 6
Windover 6
Traffic 5
Lack of units overall 5
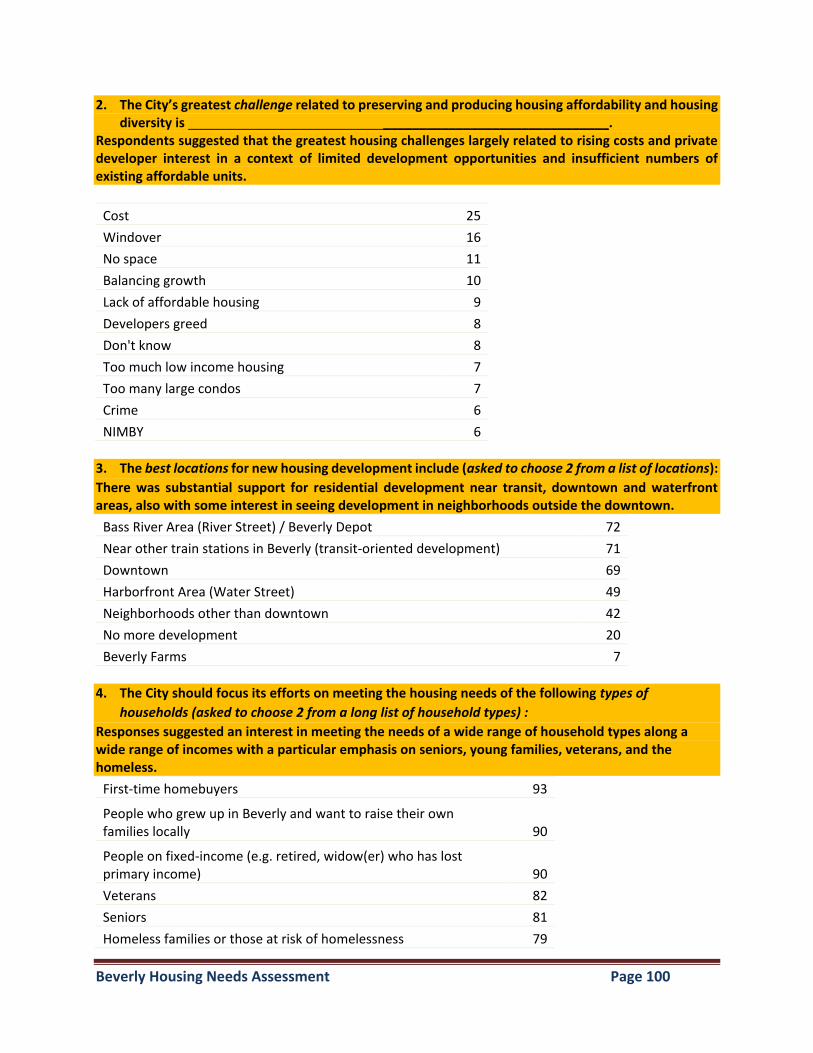
Beverly Housing Needs Assessment Page 100
2. The City’s greatest challenge related to preserving and producing housing affordability and housing diversity is _______________________________.
Respondents suggested that the greatest housing challenges largely related to rising costs and private developer interest in a context of limited development opportunities and insufficient numbers of existing affordable units.
Cost 25
Windover 16
No space 11
Balancing growth 10
Lack of affordable housing 9
Developers greed 8
Don't know 8
Too much low income housing 7
Too many large condos 7
Crime 6
NIMBY 6
3. The best locations for new housing development include (asked to choose 2 from a list of locations):
There was substantial support for residential development near transit, downtown and waterfront areas, also with some interest in seeing development in neighborhoods outside the downtown.
Bass River Area (River Street) / Beverly Depot 72
Near other train stations in Beverly (transit-oriented development) 71
Downtown 69
Harborfront Area (Water Street) 49
Neighborhoods other than downtown 42
No more development 20
Beverly Farms 7
4. The City should focus its efforts on meeting the housing needs of the following types of
households (asked to choose 2 from a long list of household types) :
Responses suggested an interest in meeting the needs of a wide range of household types along a wide range of incomes with a particular emphasis on seniors, young families, veterans, and the homeless.
First-time homebuyers 93
People who grew up in Beverly and want to raise their own families locally 90
People on fixed-income (e.g. retired, widow(er) who has lost primary income) 90
Veterans 82
Seniors 81
Homeless families or those at risk of homelessness 79
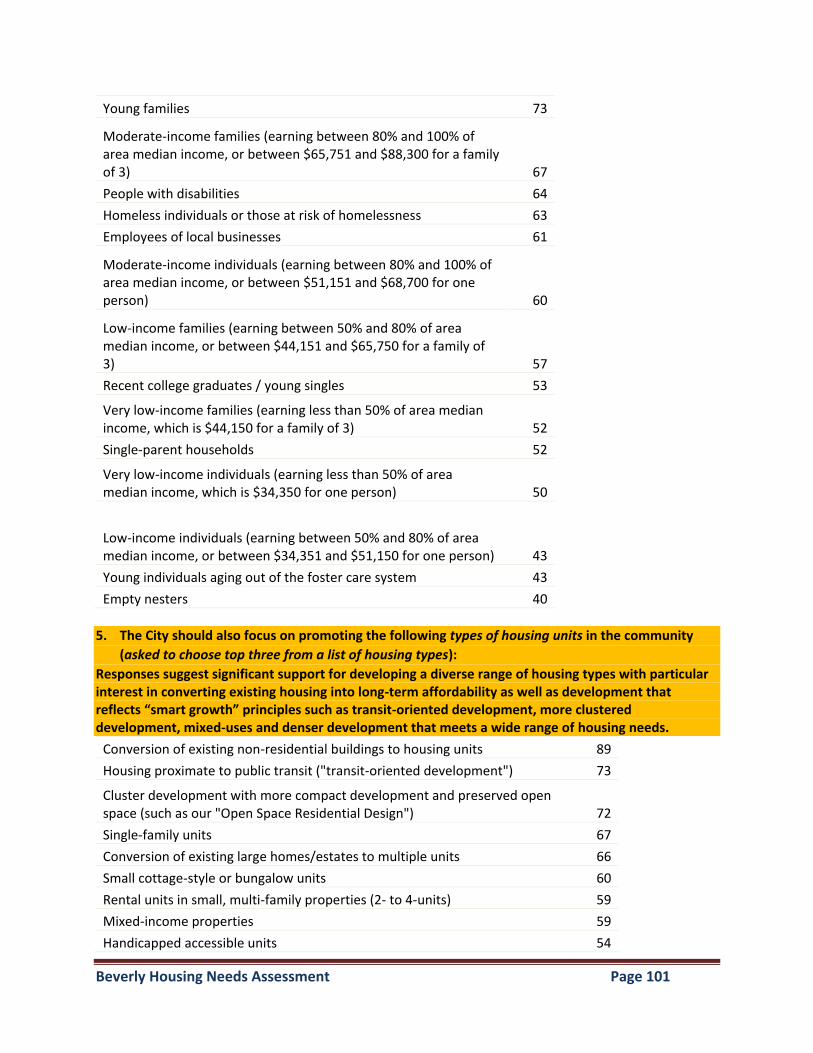
Beverly Housing Needs Assessment Page 101
Young families 73
Moderate-income families (earning between 80% and 100% of area median income, or between $65,751 and $88,300 for a family of 3) 67
People with disabilities 64
Homeless individuals or those at risk of homelessness 63
Employees of local businesses 61
Moderate-income individuals (earning between 80% and 100% of area median income, or between $51,151 and $68,700 for one person) 60
Low-income families (earning between 50% and 80% of area median income, or between $44,151 and $65,750 for a family of 3) 57
Recent college graduates / young singles 53
Very low-income families (earning less than 50% of area median income, which is $44,150 for a family of 3) 52
Single-parent households 52
Very low-income individuals (earning less than 50% of area median income, which is $34,350 for one person) 50
Low-income individuals (earning between 50% and 80% of area median income, or between $34,351 and $51,150 for one person) 43
Young individuals aging out of the foster care system 43
Empty nesters 40
5. The City should also focus on promoting the following types of housing units in the community
(asked to choose top three from a list of housing types):
Responses suggest significant support for developing a diverse range of housing types with particular interest in converting existing housing into long-term affordability as well as development that reflects “smart growth” principles such as transit-oriented development, more clustered development, mixed-uses and denser development that meets a wide range of housing needs.
Conversion of existing non-residential buildings to housing units 89
Housing proximate to public transit ("transit-oriented development") 73
Cluster development with more compact development and preserved open space (such as our "Open Space Residential Design") 72
Single-family units 67
Conversion of existing large homes/estates to multiple units 66
Small cottage-style or bungalow units 60
Rental units in small, multi-family properties (2- to 4-units) 59
Mixed-income properties 59
Handicapped accessible units 54
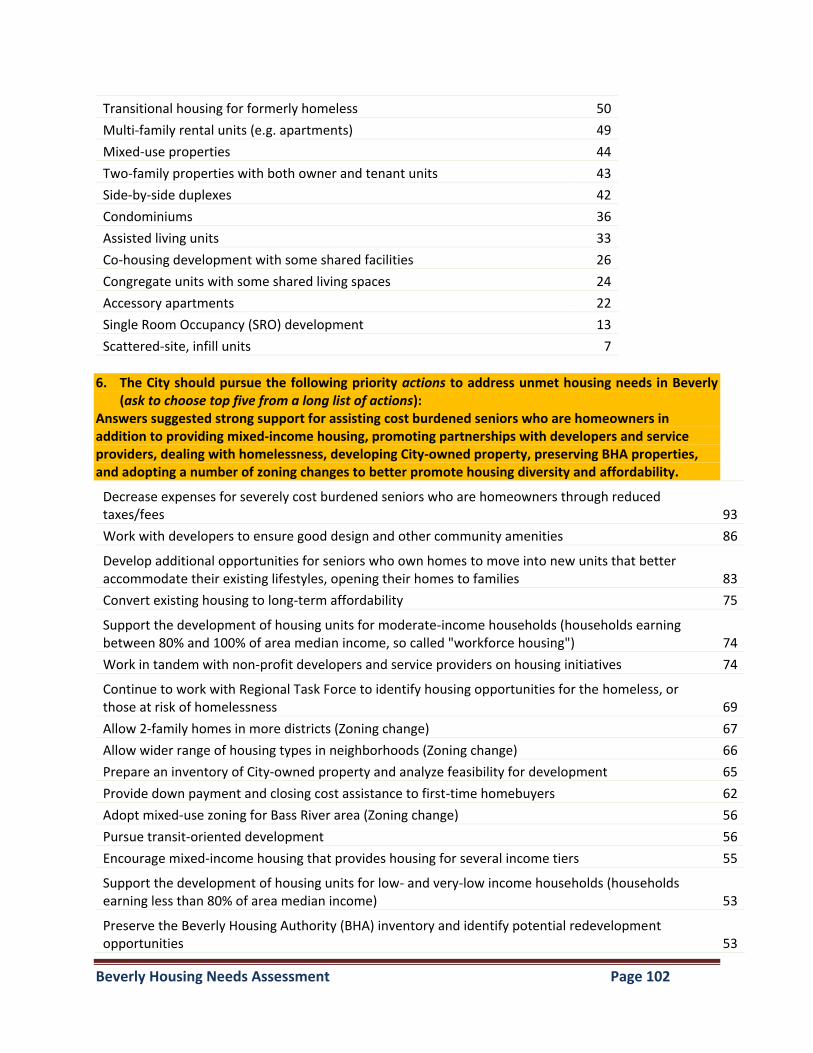
Beverly Housing Needs Assessment Page 102
Transitional housing for formerly homeless 50
Multi-family rental units (e.g. apartments) 49
Mixed-use properties 44
Two-family properties with both owner and tenant units 43
Side-by-side duplexes 42
Condominiums 36
Assisted living units 33
Co-housing development with some shared facilities 26
Congregate units with some shared living spaces 24
Accessory apartments 22
Single Room Occupancy (SRO) development 13
Scattered-site, infill units 7
6. The City should pursue the following priority actions to address unmet housing needs in Beverly
(ask to choose top five from a long list of actions): Answers suggested strong support for assisting cost burdened seniors who are homeowners in addition to providing mixed-income housing, promoting partnerships with developers and service providers, dealing with homelessness, developing City-owned property, preserving BHA properties, and adopting a number of zoning changes to better promote housing diversity and affordability.
Decrease expenses for severely cost burdened seniors who are homeowners through reduced taxes/fees 93
Work with developers to ensure good design and other community amenities 86
Develop additional opportunities for seniors who own homes to move into new units that better accommodate their existing lifestyles, opening their homes to families 83
Convert existing housing to long-term affordability 75
Support the development of housing units for moderate-income households (households earning between 80% and 100% of area median income, so called "workforce housing") 74
Work in tandem with non-profit developers and service providers on housing initiatives 74
Continue to work with Regional Task Force to identify housing opportunities for the homeless, or those at risk of homelessness 69
Allow 2-family homes in more districts (Zoning change) 67
Allow wider range of housing types in neighborhoods (Zoning change) 66
Prepare an inventory of City-owned property and analyze feasibility for development 65
Provide down payment and closing cost assistance to first-time homebuyers 62
Adopt mixed-use zoning for Bass River area (Zoning change) 56
Pursue transit-oriented development 56
Encourage mixed-income housing that provides housing for several income tiers 55
Support the development of housing units for low- and very-low income households (households earning less than 80% of area median income) 53
Preserve the Beverly Housing Authority (BHA) inventory and identify potential redevelopment opportunities 53
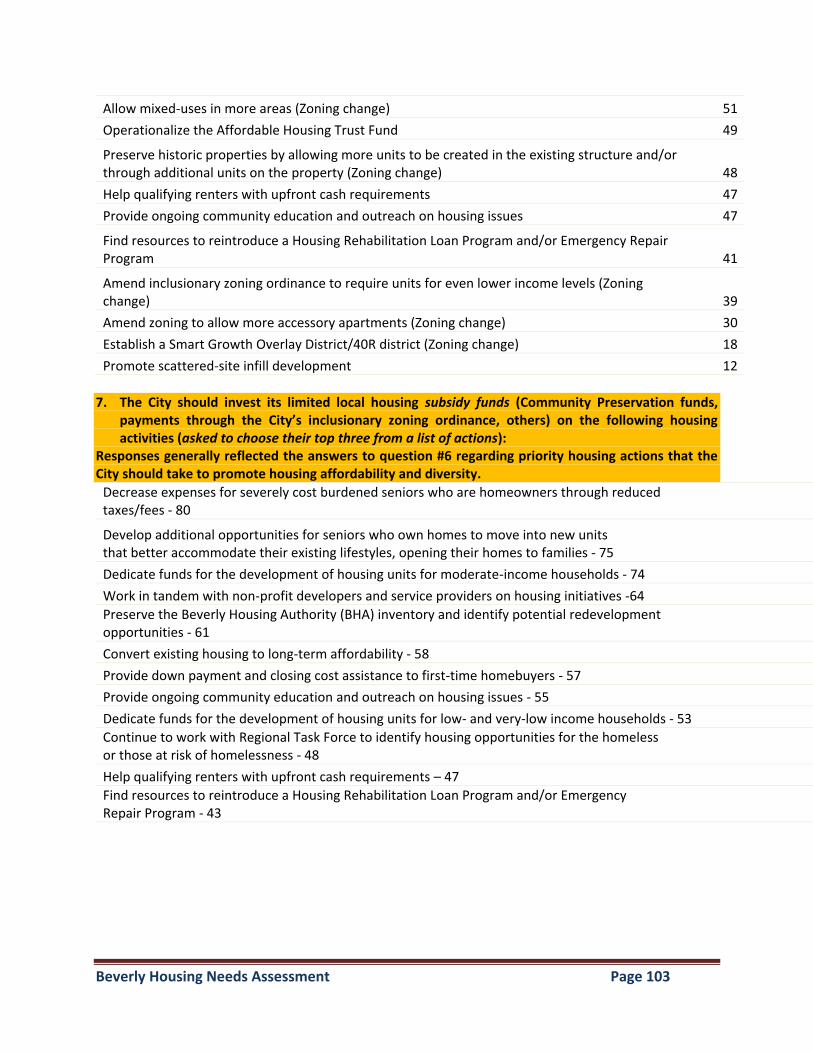
Beverly Housing Needs Assessment Page 103
Allow mixed-uses in more areas (Zoning change) 51
Operationalize the Affordable Housing Trust Fund 49
Preserve historic properties by allowing more units to be created in the existing structure and/or through additional units on the property (Zoning change) 48
Help qualifying renters with upfront cash requirements 47
Provide ongoing community education and outreach on housing issues 47
Find resources to reintroduce a Housing Rehabilitation Loan Program and/or Emergency Repair Program 41
Amend inclusionary zoning ordinance to require units for even lower income levels (Zoning change) 39
Amend zoning to allow more accessory apartments (Zoning change) 30
Establish a Smart Growth Overlay District/40R district (Zoning change) 18
Promote scattered-site infill development 12
7. The City should invest its limited local housing subsidy funds (Community Preservation funds,
payments through the City’s inclusionary zoning ordinance, others) on the following housing activities (asked to choose their top three from a list of actions):
Responses generally reflected the answers to question #6 regarding priority housing actions that the City should take to promote housing affordability and diversity.
Decrease expenses for severely cost burdened seniors who are homeowners through reduced taxes/fees - 80 /
Develop additional opportunities for seniors who own homes to move into new units that better accommodate their existing lifestyles, opening their homes to families - 75 75
Dedicate funds for the development of housing units for moderate-income households - 74 74
Work in tandem with non-profit developers and service providers on housing initiatives -64 64
Preserve the Beverly Housing Authority (BHA) inventory and identify potential redevelopment opportunities - 61 61
Convert existing housing to long-term affordability - 58 58
Provide down payment and closing cost assistance to first-time homebuyers - 57 57
Provide ongoing community education and outreach on housing issues - 55 55
Dedicate funds for the development of housing units for low- and very-low income households - 53 53
Continue to work with Regional Task Force to identify housing opportunities for the homeless or those at risk of homelessness - 48 48
Help qualifying renters with upfront cash requirements – 47 47
Find resources to reintroduce a Housing Rehabilitation Loan Program and/or Emergency Repair Program - 43 43
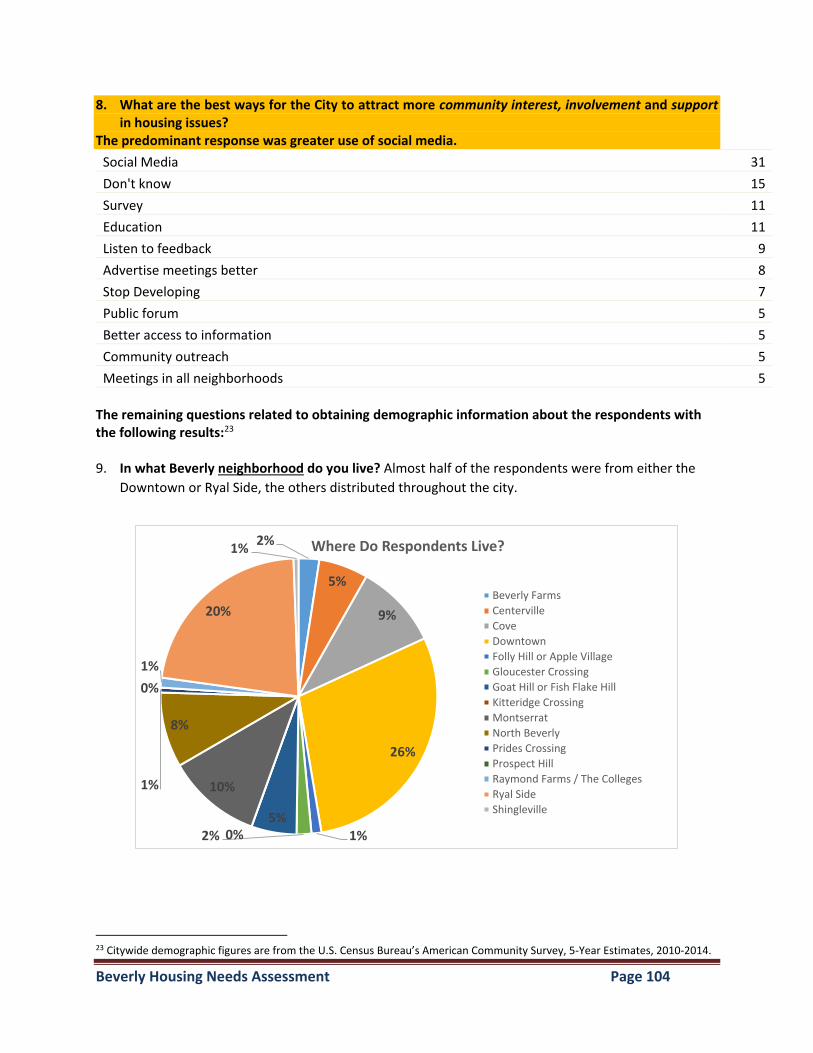
Beverly Housing Needs Assessment Page 104
8. What are the best ways for the City to attract more community interest, involvement and support in housing issues?
The predominant response was greater use of social media.
Social Media 31
Don't know 15
Survey 11
Education 11
Listen to feedback 9
Advertise meetings better 8
Stop Developing 7
Public forum 5
Better access to information 5
Community outreach 5
Meetings in all neighborhoods 5
The remaining questions related to obtaining demographic information about the respondents with the following results:23 9. In what Beverly neighborhood do you live? Almost half of the respondents were from either the
Downtown or Ryal Side, the others distributed throughout the city.
23 Citywide demographic figures are from the U.S. Census Bureau’s American Community Survey, 5-Year Estimates, 2010-2014.
2%
5%
9%
26%
1%2%5%
0%
10%
8%
1%
0%
1%
20%
1% Where Do Respondents Live?
Beverly Farms
Centerville
Cove
Downtown
Folly Hill or Apple Village
Gloucester Crossing
Goat Hill or Fish Flake Hill
Kitteridge Crossing
Montserrat
North Beverly
Prides Crossing
Prospect Hill
Raymond Farms / The Colleges
Ryal Side
Shingleville
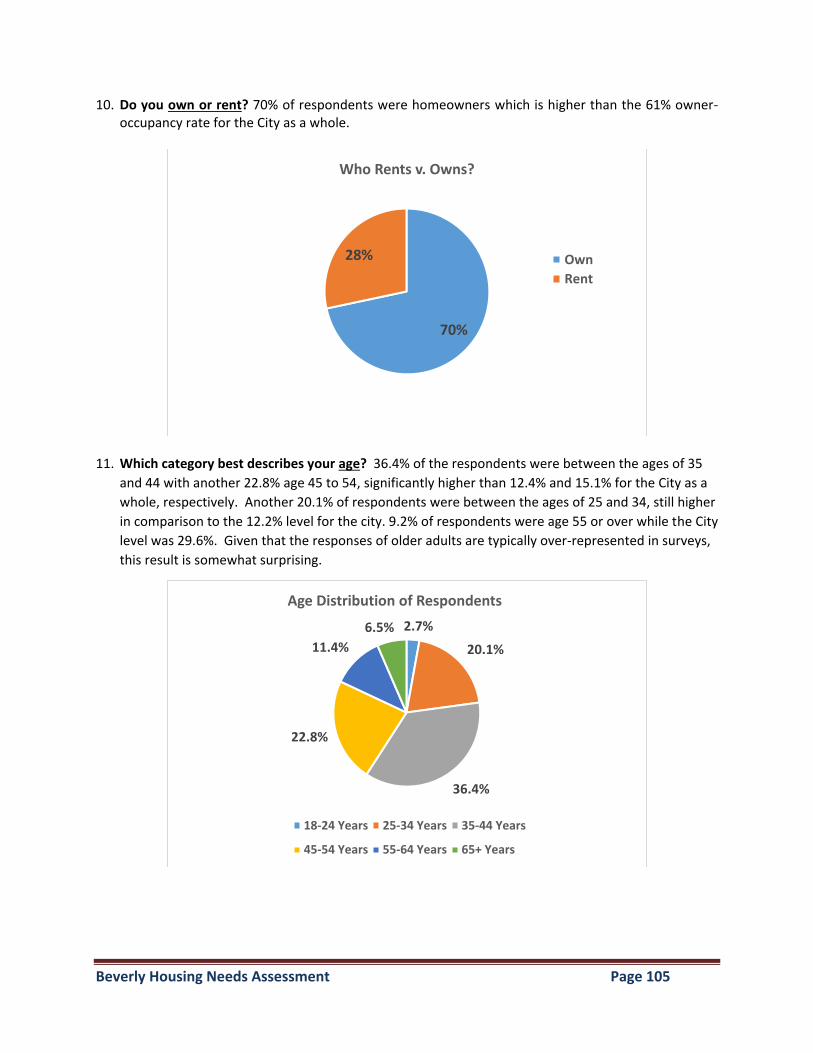
Beverly Housing Needs Assessment Page 105
10. Do you own or rent? 70% of respondents were homeowners which is higher than the 61% owner-occupancy rate for the City as a whole.
11. Which category best describes your age? 36.4% of the respondents were between the ages of 35
and 44 with another 22.8% age 45 to 54, significantly higher than 12.4% and 15.1% for the City as a
whole, respectively. Another 20.1% of respondents were between the ages of 25 and 34, still higher
in comparison to the 12.2% level for the city. 9.2% of respondents were age 55 or over while the City
level was 29.6%. Given that the responses of older adults are typically over-represented in surveys,
this result is somewhat surprising.
70%
28%
Who Rents v. Owns?
Own
Rent
2.7%
20.1%
36.4%
22.8%
11.4%
6.5%
Age Distribution of Respondents
18-24 Years 25-34 Years 35-44 Years
45-54 Years 55-64 Years 65+ Years
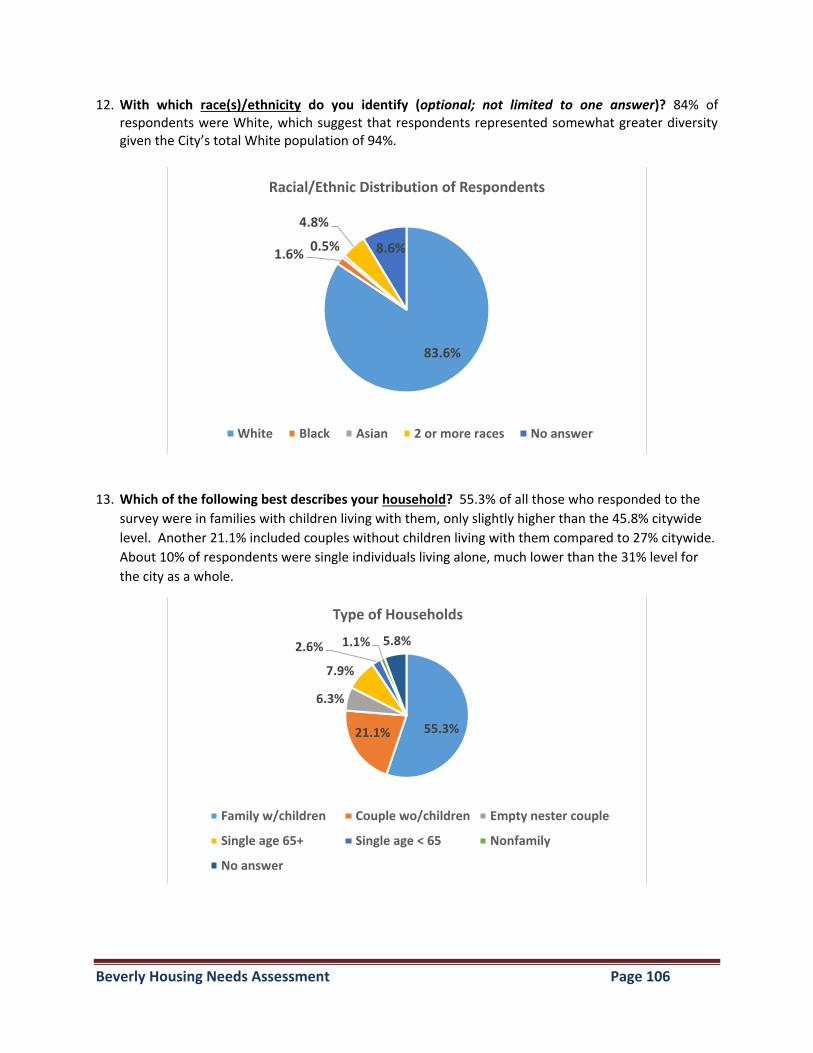
Beverly Housing Needs Assessment Page 106
12. With which race(s)/ethnicity do you identify (optional; not limited to one answer)? 84% of respondents were White, which suggest that respondents represented somewhat greater diversity given the City’s total White population of 94%.
13. Which of the following best describes your household? 55.3% of all those who responded to the
survey were in families with children living with them, only slightly higher than the 45.8% citywide
level. Another 21.1% included couples without children living with them compared to 27% citywide.
About 10% of respondents were single individuals living alone, much lower than the 31% level for
the city as a whole.
83.6%
1.6%0.5%
4.8%
8.6%
Racial/Ethnic Distribution of Respondents
White Black Asian 2 or more races No answer
55.3%21.1%
6.3%
7.9%
2.6% 1.1% 5.8%
Type of Households
Family w/children Couple wo/children Empty nester couple
Single age 65+ Single age < 65 Nonfamily
No answer
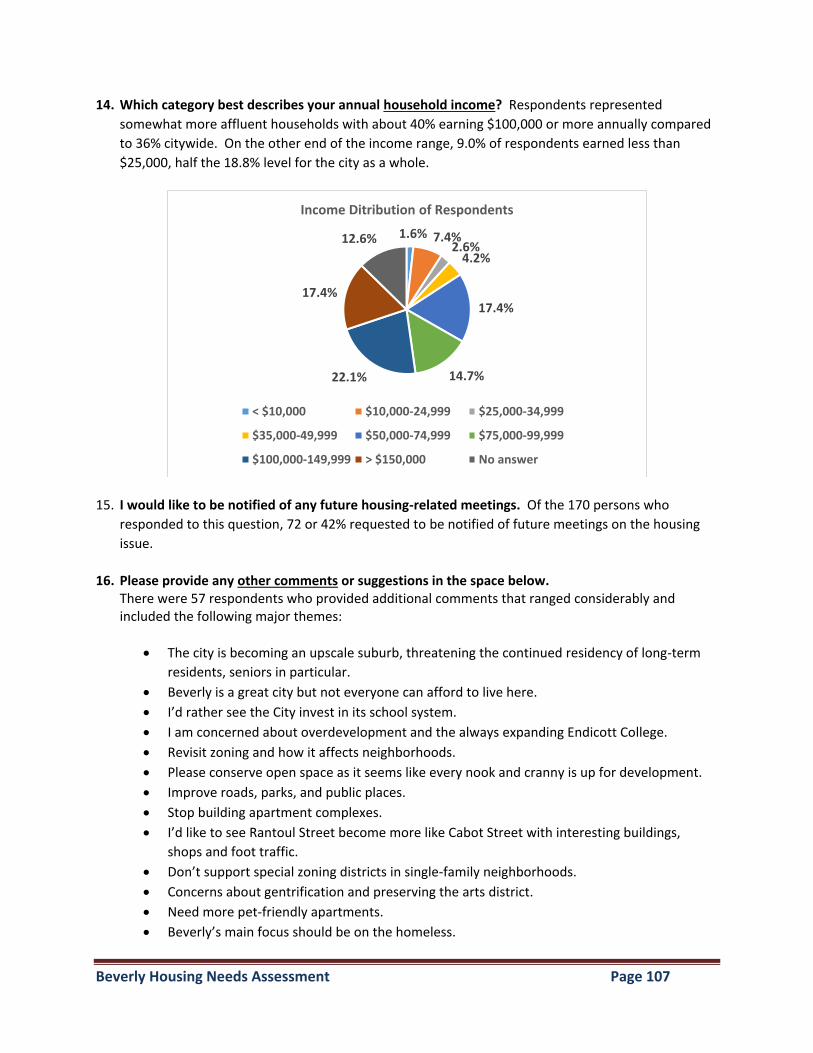
Beverly Housing Needs Assessment Page 107
14. Which category best describes your annual household income? Respondents represented
somewhat more affluent households with about 40% earning $100,000 or more annually compared
to 36% citywide. On the other end of the income range, 9.0% of respondents earned less than
$25,000, half the 18.8% level for the city as a whole.
15. I would like to be notified of any future housing-related meetings. Of the 170 persons who
responded to this question, 72 or 42% requested to be notified of future meetings on the housing
issue.
16. Please provide any other comments or suggestions in the space below.
There were 57 respondents who provided additional comments that ranged considerably and included the following major themes:
The city is becoming an upscale suburb, threatening the continued residency of long-term
residents, seniors in particular.
Beverly is a great city but not everyone can afford to live here.
I’d rather see the City invest in its school system.
I am concerned about overdevelopment and the always expanding Endicott College.
Revisit zoning and how it affects neighborhoods.
Please conserve open space as it seems like every nook and cranny is up for development.
Improve roads, parks, and public places.
Stop building apartment complexes.
I’d like to see Rantoul Street become more like Cabot Street with interesting buildings,
shops and foot traffic.
Don’t support special zoning districts in single-family neighborhoods.
Concerns about gentrification and preserving the arts district.
Need more pet-friendly apartments.
Beverly’s main focus should be on the homeless.
1.6% 7.4%2.6%
4.2%
17.4%
14.7%22.1%
17.4%
12.6%
Income Ditribution of Respondents
< $10,000 $10,000-24,999 $25,000-34,999
$35,000-49,999 $50,000-74,999 $75,000-99,999
$100,000-149,999 > $150,000 No answer
Beverly Housing Needs Assessment Page 108
Beverly is losing its small-town character given such substantial growth.
There needs to be more options for affordable housing other than Section 8.
Overdevelopment is destroying our city.
Intersperse units for veterans, seniors and special needs populations into new development.
Beverly needs housing for working class and middle income people.
There are train stations throughout the city and housing should be spread as well instead of
focused just on the downtown.
Listen to your community and use the assets on hand more productively.
Keep us informed.
Thank you for the opportunity to respond to housing issues through this survey.
This survey is a great idea if you publish the results.
If this survey impacts decision-making, host tours and other activities to discuss specific
themes and sites.
Make it easier to convert larger homes to multiple units and secure housing rehab funding
for landlords.
Consider those who really need government support.
Continue downtown development as it should be a priority for the City.
I’m unclear about why there’s a push for more housing as the city is already too congested.
We need to keep educated families in Beverly.
Spend money on schools and infrastructure instead of subsidized housing.
We should regulate changes that will discourage quality developers from doing business in
Beverly.