Massachusetts Fire Incident Reporting System - Mass.gov
154
Charles D. Baker Governor Karyn E. Polito Lieutenant Governor Daniel Bennett Secretary of Public Safety Peter J. Ostroskey State Fire Marshal Department of Fire Services Division of Fire Safety • Fire Data and Public Education Unit www.mass.gov/dfs • (978) 567-3380 The Massachusetts Fire Incident Reporting System 2014 Annual Report Massachusetts Fire Problem
-
Upload
khangminh22 -
Category
Documents
-
view
3 -
download
0
Transcript of Massachusetts Fire Incident Reporting System - Mass.gov
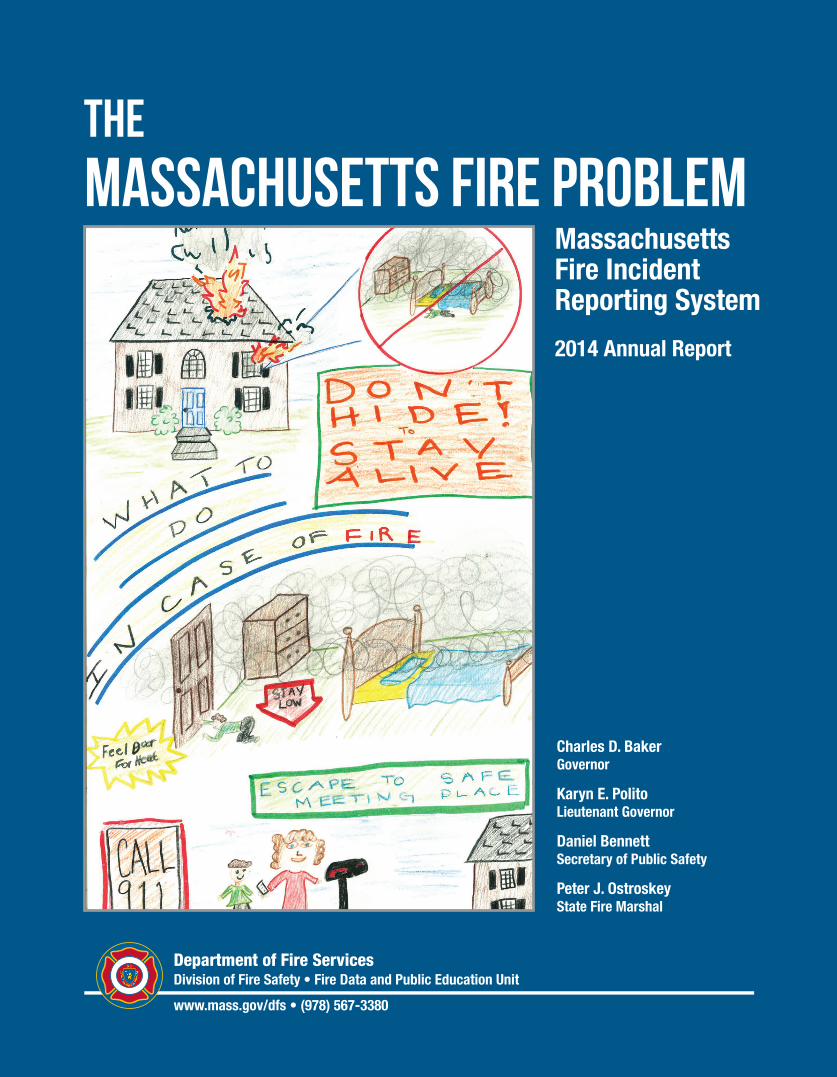
Charles D. BakerGovernor
Karyn E. PolitoLieutenant Governor
Daniel BennettSecretary of Public Safety
Peter J. OstroskeyState Fire Marshal
Department of Fire ServicesDivision of Fire Safety • Fire Data and Public Education Unit
www.mass.gov/dfs • (978) 567-3380
The
Massachusetts Fire Incident Reporting System
2014 Annual Report
Massachusetts Fire Problem

Massachusetts Fire Incident Reporting System
2014 Annual Report
Publication Number: 17 – 47 - DFS - 01 Authorized by Gary Lambert, State Purchasing Agent
Peter J. Ostroskey, State Fire Marshal Commonwealth of Massachusetts • Department of Fire Services Post Office Box 1025 State Road • Stow, Massachusetts 01775
Telephone (978) 567-3300 • Facsimile (978) 567-3199
This report is also available in an electronic format through the Fire Data section of the Department of Fires Services website:
www.mass.gov/dfs/
Fireman’s Prayer
When I am called to duty, God Wherever Flames may rage
Give me the strength to save some life Whatever Be its age
Help me embrace a little child Before it is too late
Or save an older person from The horror of that fate
Enable me to be alert and Hear the weakest shout
And quickly and efficiently To put the fire out
I want to fill my calling and To give the best in me
To guard my every neighbor And protect their property
And if according to your will I have to lose my life
Please bless with your protecting hand My children and my wife
-Unknown
Massachusetts Fire Incident Reporting System 2014 Page i
Table of Contents Executive Summary 1 Massachusetts Fire Departments 4 Fires by Incident Type 7 Structure Fires 10
Building Fires 10 2014 Massachusetts Building Fires by Property Use 15 Residential Building Fires 23
Fires in One- and Two-Family Homes 29 Multifamily Home Fires 31 All Other Residential Fires 33
Motor Vehicle Fires 35 Outside and Other Fires 39 2014 Massachusetts Fire Deaths 41
Civilian Fire Deaths 41 Structure Fire Deaths 48
Residential Building Fire Deaths 48 Fatal Motor Vehicle Fires 62 Other Fatal Fires 63 Multiple Fire Deaths 63 Civilian Fire Deaths - Conclusion 64
Civilian Injuries 65
Structure Fire Injuries 66 Motor Vehicle Fire Injuries 71 Outside and Other Fire Injuries 71
2014 Firefighter Deaths 74 Fire Service Injuries 75 Arson Fires 79
Structure Arson 81 Motor Vehicle Arson 83 Outside and Other Arson 84
Juvenile-set Fires 86 Cooking Fires 89
Massachusetts Fire Incident Reporting System 2014 Page ii
Fires Caused by Smoking 93 Heating Equipment Fires 100 Electrical Fires 103 Candle Fires 107 Fireworks Incidents 109 Grill Fires 110 Carbon Monoxide Incidents 112 Mapping the Fire Experience 114 Appendices Fire and Arson Experience by Community 122 Fires and Arsons by Incident Type 144 Fires and Arson by County 145 Fires, Arson and Deaths by County and by Population 146 Non-Fire Responses by County and by Incident Type 147

Massachusetts Fire Incident Reporting System 2014 Page 1
Executive Summary Our Mission: The mission of the Department of Fire Services, through coordinated training, education, prevention, investigation, and emergency response, to provide the citizens of Massachusetts with the ability to create safer communities; to assist and support the fire service community in the protection of life and property; to promote and enhance firefighter safety; and to provide a fire service leadership presence in the Executive Office of Public Safety and Security in order to direct policy and legislation on all fire related matters.
December 2014 This is the 2014 Annual Report of the Massachusetts Fire Incident Reporting System (MFIRS), which summarizes the Massachusetts fire experience for 2014. It is based on the 28,999 individual fire reports submitted by members of 366 fire departments and fire districts. It is this effort that makes it possible to look at the total fire experience, to identify our fire problems and to develop strategies to address these issues. One of the goals of the Division of Fire Safety is to provide the fire service and the public with accurate and complete information about the fire experience in Massachusetts. 17,403 Structure Fires, 2,496 Vehicle Fires, 9,100 Outside & Other Fires in 2014 There were 28,999 fire and explosion incidents reported by fire departments to the Massachusetts Fire Incident Reporting System (MFIRS) in 2014. The 17,403 structure fires, 2,496 motor vehicle fires, and 9,100 outside and other fires caused 54 civilian deaths, 2 fire service deaths, 310 civilian injuries, 450 fire service injuries, and an estimated dollar loss of $241.8 million in property damages. In 2014 there were 1.86 civilian deaths for every 1,000 fires. Civilian Fire Deaths Up 23% From 2013 Fifty-four (54) civilians died in 42 Massachusetts fires in 2014. Civilian deaths increased by 10, or 23%, from the 44 fire deaths in 2013. Twenty-seven (27) men, 21 women, and six children died in Massachusetts’ fires. Of the 54 civilian deaths in fires in 2014, 42 occurred in residential structures. Over half, 56%, of civilians died at night, at home, while they were sleeping and did not have working smoke alarms or residential sprinklers. Seven (7) deaths occurred in six motor vehicle fires and two people were killed in two outside fires in 2014. Electrical Problems Leading Cause of Fatal Fires in 2014 Electrical problems were the leading cause of fatal fires and civilian fire deaths in 2014. These fires caused 15, or 36%, of the residential civilian fire deaths. Smoking was the second leading cause with nine deaths or 21%; and heating equipment was the third leading cause of residential fire deaths accounting for four deaths, or 10%.
Massachusetts Fire Incident Reporting System 2014 Page 2
6 Child Fire Deaths For the second time since 2009 (and second year in a row) more than one person under the age of 18 died in a fire. Of the 54 civilian deaths in fires in 2014, six, or 11%, were children. Five (5) of these children died in two residential fires. Time for Residential Sprinklers It is time for the fire service and its partners to move forward towards enacting legislation and regulation on residential sprinklers in the Commonwealth. Sprinklers have a long history of effectively protecting people’s lives and property. We can reduce fire fatalities in the future by requiring them in newly constructed one- and two-family homes. 2 Fire-Related Firefighter Deaths in 2014 There were two fire-related fire service fatalities in the Commonwealth of Massachusetts in 2014. Boston LT Edward Walsh and FF Michael Kennedy were killed in a fire in a residential fire at 298 Beacon St. on March 26, 2014. Motor Vehicle & Outside Fires Down in 2014 The total number of reported fires decreased by 3% from 29,841 in 2013 to 28,999 in 2014. Structure fires increased by less than 1% from 2013 to 2014. From 2013 to 2014, motor vehicle fires decreased by 13%. Outside, brush, and other fires decreased by 4% during the same time period. Although the law states that only fires where a loss is sustained must be reported, many fire departments are wisely reporting all of the fire incidents that they respond to, giving a more accurate picture of the fire problem in Massachusetts. Many departments are also reporting the non-fire calls to which they respond. Emergency medical and rescue calls represent 61% of the 809,769 total responses that were reported to MFIRS in 2014. The total number of calls reported to MFIRS increased by 33,167, or 4% in 2014. Cooking Was the Leading Cause of Residential Building Fires & Injuries Seventy-two percent (72%) of all residential building fires were caused by unattended and other unsafe cooking practices in 2014. Seventy-three percent (73%) of residential fires originated in the kitchen. Cooking also caused the most fire-related civilian injuries Cooking fires caused 31% of all 2014 civilian fire injuries and two, or 5%, of residential fire deaths in 2014. Alarms Operated in 63% of Fires Smoke or heat alarms operated in 9,469, or 65%, of the residential building fires in 2014. There were no working alarms in 3% of these incidents. Based on information reported, smoke alarm performance was undetermined in 3,356 incidents, or 19%, of Massachusetts’ 2014 residential building fires. Alarms Operated in 59% of Building Fires that Caused Injuries Alarms operated in 59% of the building fires that caused injuries. When an occupant is alerted to the presence of fire, they may try to extinguish it, which could result in an injury. Or, the injury may have occurred as a result of escaping after the situation
Massachusetts Fire Incident Reporting System 2014 Page 3
worsened. When alerted to the presence of a fire, occupants should vacate the building and notify the fire department as soon as possible, letting the professionals with the proper training and gear extinguish the fire. Arson Down 12% Eight hundred and one (801) Massachusetts fires were considered arson in 2014. The 201 structure arsons, 67 motor vehicle arsons, and 533 outside and other arsons caused six civilian deaths, five civilian injuries, 16 fire service injuries, and an estimated dollar loss of $7.1 million. This is a 12% decrease in arson from the 906 reported in 2013. Structure arsons increased by 3%, while motor vehicle arsons fell by 11% from 2013 to 2014, overall motor vehicle arson has fallen by 99% since 1987. The steady decline of motor vehicle arsons can be explained by the enactment of the Burned Motor Vehicle Reporting Law. It took effect in 1987, and requires owners of burned motor vehicles to complete and sign a report that must also be signed by a fire official from the department in the community where the fire occurred, before they can collect on their fire insurance. Outside and other arsons decreased by 17%. Firefighters Injured at 1 of Every 7 Vacant Building Fires One of the most dangerous types of fires for firefighters in 2014 was vacant building fires. Vacant building fires accounted for 40, or 9%, of all firefighter injuries in 2014. These 40 injuries also represent 10% of the number of firefighter injuries at all structure fires. On average there was one firefighter injury for every seven vacant building fires. Conclusion The lack of working smoke alarms or sprinkler systems are contributing factors to these tragedies. It is important to remember that properly maintained alarms provide an early warning of a fire, and residential sprinklers provide the opportunity to safely escape. It is important to make and practice an escape plan. We would like to thank the Massachusetts Property Insurance Underwriting Association for printing this report and for their support throughout the year. We also wish to thank Governor Charles D. Baker and Public Safety and Security Secretary Daniel Bennett for their commitment and support to the Massachusetts fire service through the Department of Fire Services. We also wish to recognize the efforts of the staff of the Fire Data and Public Education Unit, Cynthia Ouellette, coordinator; Derryl Dion, research analyst and Usha Patel, data entry clerk, within the Division of Fire Safety who manage the Massachusetts Fire Incident Reporting System and prepared this report. Peter J. Ostroskey State Fire Marshal
Massachusetts Fire Incident Reporting System 2014 Page 4
Massachusetts Fire Departments Today’s firefighters do far more than fight fires. Many are emergency medical technicians or paramedics. All firefighters must be trained to offer first aid if they arrive first at an emergency. They are the first ones called to deal with hazardous materials incidents ranging from the suspected presence of carbon monoxide to a leaking propane truck. They may be called to rescue a child that fell through ice or that locked himself in the bathroom. They get people out of stuck elevators and wrecked cars. They test and maintain their equipment, ranging from self-contained breathing apparatus to hydrants to hoses and trucks. They know the basics of construction, electricity and chemistry. Some undertake the calling of fire prevention and become inspectors or public fire educators. They report their fire incidents through the Massachusetts Fire Incident Reporting System so we can spot trends, problems and successes. When most people think of the fire department, they think of fire trucks, sirens and flames. Actually, the priority of a fire department is to prevent fires. If prevention fails, then the alarm comes in and the trucks roll. Fire Department Enforces M.G.L. Chapter 148 and 527 CMR The fire department is legally required to enforce the provisions of 527 Code of Massachusetts Regulations (CMR). This contains regulation sections on fireworks, dry cleaning, oil burners, gas stations, liquid propane, plastics, transportation of flammable liquids, above ground storage tanks, electrical systems, explosives, storage of flammable substances, marine fueling, model rockets, lumber yards, bulk plants, tentage, salamanders, flammable decorations and curtains, cannon or mortar firing, fire extinguishers, smoke detectors, obstructions and hazards, combustible fibers, rubbish handling, crop ripening, pesticide storage, welding and storage, carbon monoxide, and unvented appliances. The fire department must also enforce the laws contained in Massachusetts General Law Chapter 148. Inspectors must know the regulations they are enforcing and they must know how to apply the regulations to situations in the community. They must communicate information about weaknesses in plans they review, educate people on violations and perform follow-up inspections. Just as firefighters are sent to the Massachusetts Firefighting Academy to learn the principles of suppression, fire prevention personnel must go to classes to learn the ins and outs of the regulations. These functions also produce a corresponding amount of documentation that is critical to be maintained. Firefighters Teach the Community Fire and Burn Prevention Firefighters go out in the community to teach children, seniors and interested community groups how to protect themselves from fire and burns. The statistics in this report are critical to these educators in developing injury prevention programs. As we review our reported calls it may lead to a better-rounded prevention program.
Massachusetts Fire Incident Reporting System 2014 Page 5
The S.A.F.E. Program The Student Awareness of Fire Education or S.A.F.E. program was implemented in fiscal year 1996. The Legislature appropriated $1,078,666 to fund public fire education grants. These grants provide local fire departments with funding to educate children about the dangers associated with fire, particularly fires caused by smoking. Any city or town, whose fire department is committed to working with school systems, public health or other community agencies to develop a well-conceived and coordinated fire safety education program message, is invited to apply for these grants. In fiscal year 2015, 221 fire departments shared the $1,094,813 in S.A.F.E. funding. Rutland Young Heroes – Avery & Chase Harris On Friday, May 16, 2014 at 12:30 p.m., 2 ½-year-old Avery Harris saw a fire on her porch and told her mother. Avery’s mother attempted to extinguish the fire, became frantic and didn’t know what to do when her 4-year-old son Chase Harris told her to call 9-1-1. The fire department responded and extinguished the fire. Chief Bradley Weber and Fire fighter Dan Dean, S.A.F.E. Educator for the department both agree that Avery and Chase saved their home from further damage and prevented a loss of life or injuries. The Senior S.A.F.E. Program With the success of the S.A.F.E. program, the Senior SAFE program was implemented in fiscal year 2015. The Legislature approved and $600,000 was funded through the Fire Standard Compliant program to fund public fire education grants to improve the fire and life safety of older adults throughout the Commonwealth. The primary mission of this program is to educate older adults on how to address the unique fire and life safety risks of their age group. The Senior SAFE program is designed to create a partnership between older adults and fire departments through established providers of senior support services such as councils on aging, senior centers, visiting nurse associations, or other similar agencies. In fiscal year 2015, 208 fire departments shared the $559,924 in Senior SAFE funding. Worcester Golden Hero – Susan Vancelette On September 24, 2014, 68-year-old Susan Vancelette was at home when around 5:15 p.m. a neighbor knocked on her door and asked for help. Susan followed her neighbor back to her apartment and when they arrived Susan observed smoke and flames coming from her neighbor’s oven. She sprang into action and immediately shut the oven door and turned off the stove. She then escorted her friend out of her apartment, closed the apartment door and called 9-1-1. After exiting safely she pulled the fire alarm to alert the
Massachusetts Fire Incident Reporting System 2014 Page 6
other occupants of the building. Susan’s quick thinking and ability to be calm in an emergency helped to prevent this situation from getting worse. When the fire department arrived the fire was confined to just the oven and the smoke caused minimal damage. Sandra Dionis, the resident services coordinator at Illyrian Gardens praised Susan for her efforts by stating, “We are very fortunate to have Susan living in our building”. Fire Inspector Jeffrey Spring of the Worcester Fire Department is happy to say that Susan’s actions are indicative of the lessons that she learned during her attendance at a recent fire safety seminar. And Susan was happy to say she would be showing her award to her first grade students where she volunteers to show them how important it is to listen and learn. FF Jeffrey Spring, Worcester Fire Department – 2014 Educator of the Year Firefighter Jeffery Spring is a 30-year veteran of the Worcester Fire Department whose entire world view changed when he entered the department’s Community Risk Reduction and Public Education Unit three years ago. He has worked hard to establish credibility and rapport with members of the community which has enhanced the department’s reputation. Jeff continues to improve his skills as an educator and has taken several National Fire Academy classes. His enthusiastic approach to “treat others as you would like to be treated” fits with the division’s mission: “care about people and they will listen.” Firefighter Spring brings energy to every lesson and presentation. He has been working with college campus fire safety initiatives and will visit fraternity houses off-duty to talk about fire safety. He teaches in Worcester’s many elementary schools, works with seniors, and special populations. As part of the team that responds to fatal or serious fires by conducting neighborhood sweeps, he has earned the respect of other firefighters and the community. These teams offer residents to test their smoke and CO alarms, conduct a home fire safety visit and provide individualized education. These sweeps started as lonely ventures with just the Community Risk Reduction Unit and now firefighters from the local houses and other city agencies ask to participate. These are teachable moments. FF Spring gives public education mutual aid and has volunteered at the Western MA SAFE’s booth at the Big E and a large Boy Scout event in Boston. He is also a member of the Massachusetts Public Fire and Life Safety Education Task Force. His lieutenant likes to say that he carries out each job as if someone’s life depended on it. 78 MA Departments Receive $26.2 Million in Federal Grants Seventy-eight (78) local Massachusetts fire departments received $35.4 million in federal grants during fiscal year 2014. In the twelfth year of the Federal Assistance to Firefighters Grant program, 60 Massachusetts fire departments received $9 million. Fifty-six (56) departments received $5.6 million for fire operations and firefighter safety. Seven (7) departments received $2.9 million for the purchase of firefighting vehicles. Two (2) departments received $563,804 under the regional request category. Nine (9) fire departments were awarded $25.6 million in Federal SAFER grants that allow for the hiring and recruitment of more firefighters, and three fire departments were awarded $170,271 for fire prevention programs. In addition the Massachusetts Firefighting Academy at the Department of Fire Services also received two grants of
Massachusetts Fire Incident Reporting System 2014 Page 7
$260,870 for equipment and $143,173 for Fire Prevention; and Boston EMS received an operations and safety grant for $302,469. The National Fire Protection Association (NFPA) based in Quincy, Massachusetts received two grants, one for $1.1 million for Fire Prevention and another for $829,772 for Research and Prevention. The President and Fellow of Harvard College in Boston, Massachusetts also received a $1.5 million grant for Research. 97% of Massachusetts Fire Departments Participated in MFIRS By law, fire departments are required to report any fire or explosion resulting in a human casualty or dollar loss to the Office of the State Fire Marshal. This is done through the Massachusetts Fire Incident Reporting System (MFIRS). Three hundred and forty-two (342), or 93.4%, of Massachusetts’ fire departments reported at least one incident to MFIRS during 2014. Thirteen (13), or 3.6%, certified that they had no fires that met the criteria. As an added incentive to comply with the law, a community had to be participating in MFIRS to be eligible for the federal FIRE Act, SAFER grants and state S.A.F.E. funding.
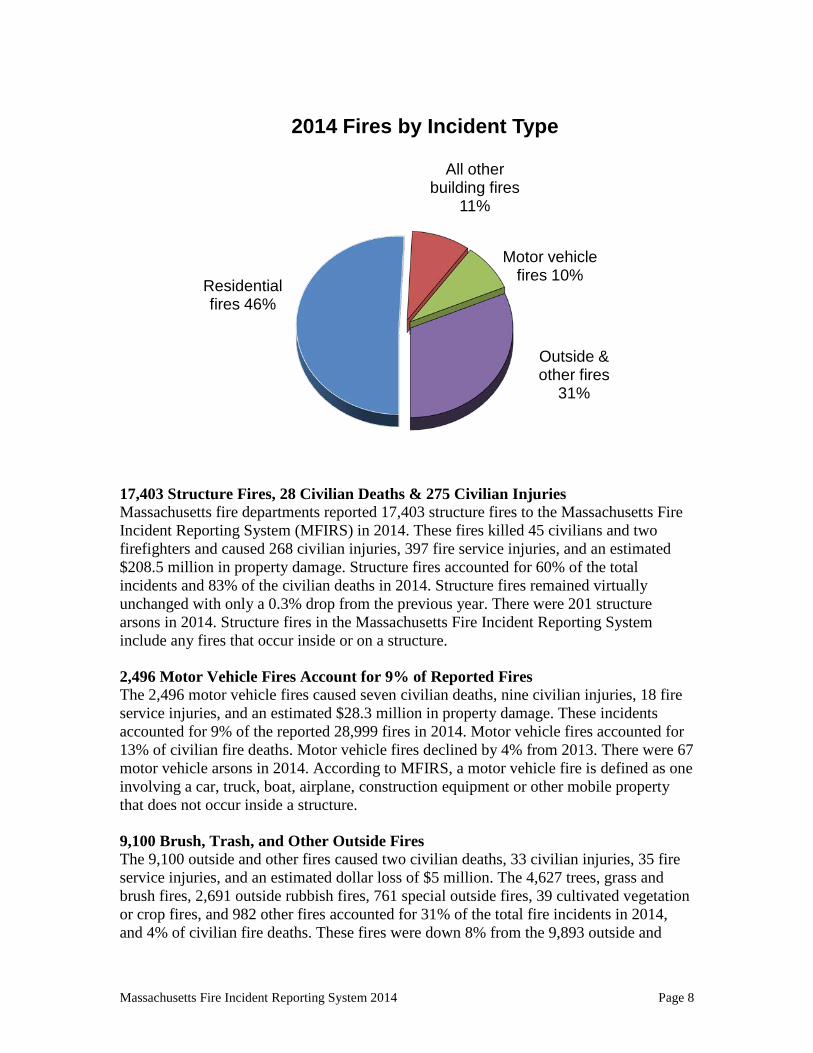
Fires by Incident Type 17,403 Structure Fires, 2,496 Vehicle Fires, 9,100 Outside & Other Fires in 2014 There were 28,999 fire and explosion incidents reported by fire departments to the Massachusetts Fire Incident Reporting System (MFIRS) in 2014. The 17,403 structure fires, 2,496 motor vehicle fires, and 9,100 outside and other fires caused 54 civilian deaths, two fire service deaths, 310 civilian injuries, 450 fire service injuries, and an estimated dollar loss of $241.8 million in property damages. The following graph depicts the percentage of the major types of fires as part of the whole Massachusetts fire problem. In 2014, 60% of all reported fires were structure fires. The majority of fires were in people’s homes. Forty-six percent (46%) of all fires in the Commonwealth and 83% of all structure fires occurred in someone’s home; only 11% of all fires, and 17% of all structure fires, occurred in a type of building other than a residence. Ten percent (10%) were reported motor vehicle fires, while 31% were classified as outside and other fires.
Massachusetts Fire Incident Reporting System 2014 Page 8
17,403 Structure Fires, 28 Civilian Deaths & 275 Civilian Injuries Massachusetts fire departments reported 17,403 structure fires to the Massachusetts Fire Incident Reporting System (MFIRS) in 2014. These fires killed 45 civilians and two firefighters and caused 268 civilian injuries, 397 fire service injuries, and an estimated $208.5 million in property damage. Structure fires accounted for 60% of the total incidents and 83% of the civilian deaths in 2014. Structure fires remained virtually unchanged with only a 0.3% drop from the previous year. There were 201 structure arsons in 2014. Structure fires in the Massachusetts Fire Incident Reporting System include any fires that occur inside or on a structure. 2,496 Motor Vehicle Fires Account for 9% of Reported Fires The 2,496 motor vehicle fires caused seven civilian deaths, nine civilian injuries, 18 fire service injuries, and an estimated $28.3 million in property damage. These incidents accounted for 9% of the reported 28,999 fires in 2014. Motor vehicle fires accounted for 13% of civilian fire deaths. Motor vehicle fires declined by 4% from 2013. There were 67 motor vehicle arsons in 2014. According to MFIRS, a motor vehicle fire is defined as one involving a car, truck, boat, airplane, construction equipment or other mobile property that does not occur inside a structure. 9,100 Brush, Trash, and Other Outside Fires The 9,100 outside and other fires caused two civilian deaths, 33 civilian injuries, 35 fire service injuries, and an estimated dollar loss of $5 million. The 4,627 trees, grass and brush fires, 2,691 outside rubbish fires, 761 special outside fires, 39 cultivated vegetation or crop fires, and 982 other fires accounted for 31% of the total fire incidents in 2014, and 4% of civilian fire deaths. These fires were down 8% from the 9,893 outside and
Residential fires 46%
All other building fires
11%
Motor vehicle fires 10%
Outside & other fires
31%
2014 Fires by Incident Type
Massachusetts Fire Incident Reporting System 2014 Page 9
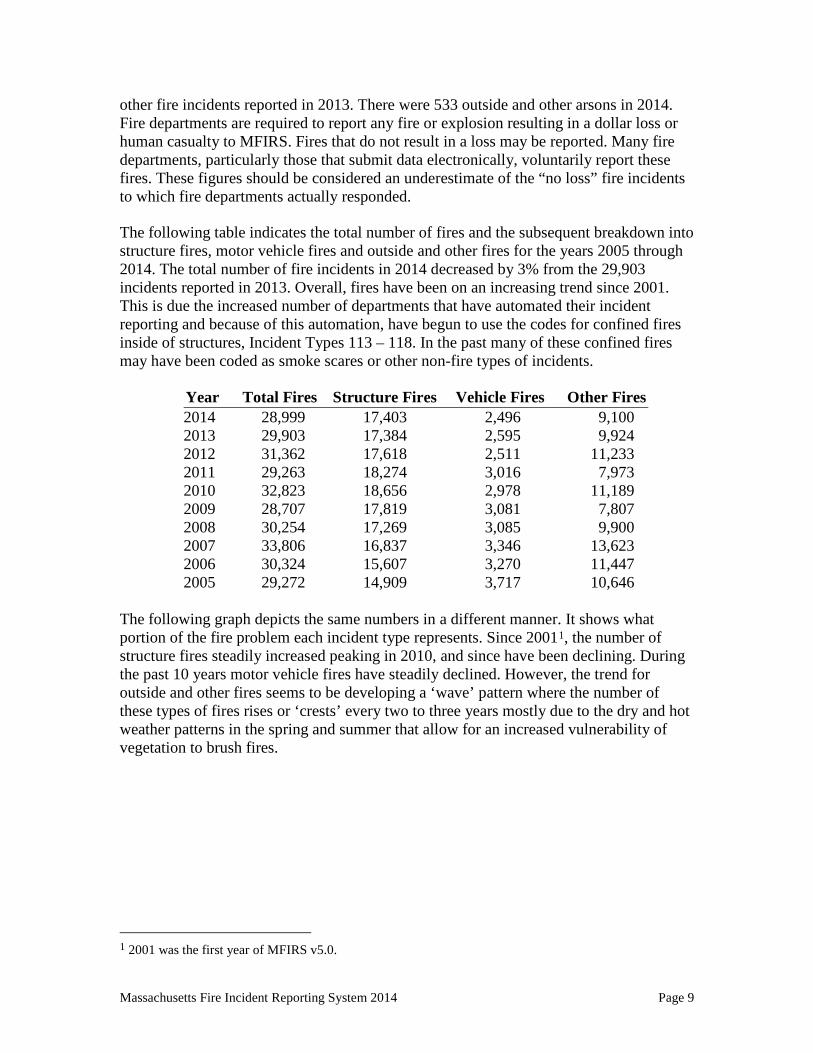
other fire incidents reported in 2013. There were 533 outside and other arsons in 2014. Fire departments are required to report any fire or explosion resulting in a dollar loss or human casualty to MFIRS. Fires that do not result in a loss may be reported. Many fire departments, particularly those that submit data electronically, voluntarily report these fires. These figures should be considered an underestimate of the “no loss” fire incidents to which fire departments actually responded. The following table indicates the total number of fires and the subsequent breakdown into structure fires, motor vehicle fires and outside and other fires for the years 2005 through 2014. The total number of fire incidents in 2014 decreased by 3% from the 29,903 incidents reported in 2013. Overall, fires have been on an increasing trend since 2001. This is due the increased number of departments that have automated their incident reporting and because of this automation, have begun to use the codes for confined fires inside of structures, Incident Types 113 – 118. In the past many of these confined fires may have been coded as smoke scares or other non-fire types of incidents.
Year Total Fires Structure Fires Vehicle Fires Other Fires 2014 28,999 17,403 2,496 9,100 2013 29,903 17,384 2,595 9,924 2012 31,362 17,618 2,511 11,233 2011 29,263 18,274 3,016 7,973 2010 32,823 18,656 2,978 11,189 2009 28,707 17,819 3,081 7,807 2008 30,254 17,269 3,085 9,900 2007 33,806 16,837 3,346 13,623 2006 30,324 15,607 3,270 11,447 2005 29,272 14,909 3,717 10,646 The following graph depicts the same numbers in a different manner. It shows what portion of the fire problem each incident type represents. Since 20011, the number of structure fires steadily increased peaking in 2010, and since have been declining. During the past 10 years motor vehicle fires have steadily declined. However, the trend for outside and other fires seems to be developing a ‘wave’ pattern where the number of these types of fires rises or ‘crests’ every two to three years mostly due to the dry and hot weather patterns in the spring and summer that allow for an increased vulnerability of vegetation to brush fires.
1 2001 was the first year of MFIRS v5.0.

Massachusetts Fire Incident Reporting System 2014 Page 10
Structure Fires 17,403 Structure Fires Account for 60% of Reported Fires, 83% of Fire Deaths The 17,403 structure fires caused 45 civilian deaths, two fire service deaths, 268 civilian injuries, 397 fire service injuries, and an estimated dollar loss of $208.5 million. The average structure fire caused $11,982 in property damage. Structure fires accounted for 60% of reported fires and 83% of the civilian fire deaths in 2014. According to the MFIRS definition, any fire occurring inside or on a structure is considered a structure fire. This includes chimney fires, cooking fires, indoor waste basket fires, fires on a back porch, exterior trim fires, and vehicle fires that occur inside a garage that extend beyond the vehicle. The number of structure fires increased slightly by 19, or 0.1%, from the 17,384 reported in 2013.
Building Fires Most, but not all structure fires occur in buildings. It is important to distinguish between the two because many structures that are not buildings, like bridges, tunnels, and towers, do not have the same fire prevention and alarm devices that many buildings are required to have, and their inclusion in this discussion could skew the figures. There were 17,342 building fires of different types in Massachusetts in 2014. These 17,342 building fires accounted for 99.6% of all structure fires in Massachusetts.
0
5,000
10,000
15,000
20,000
25,000
30,000
35,000
2005 2006 2007 2008 2009 2010 2011 2012 2013 2014
Incident Type by Year 2005 - 2014
Structure Fires
Massachusetts Fire Incident Reporting System 2014 Page 11
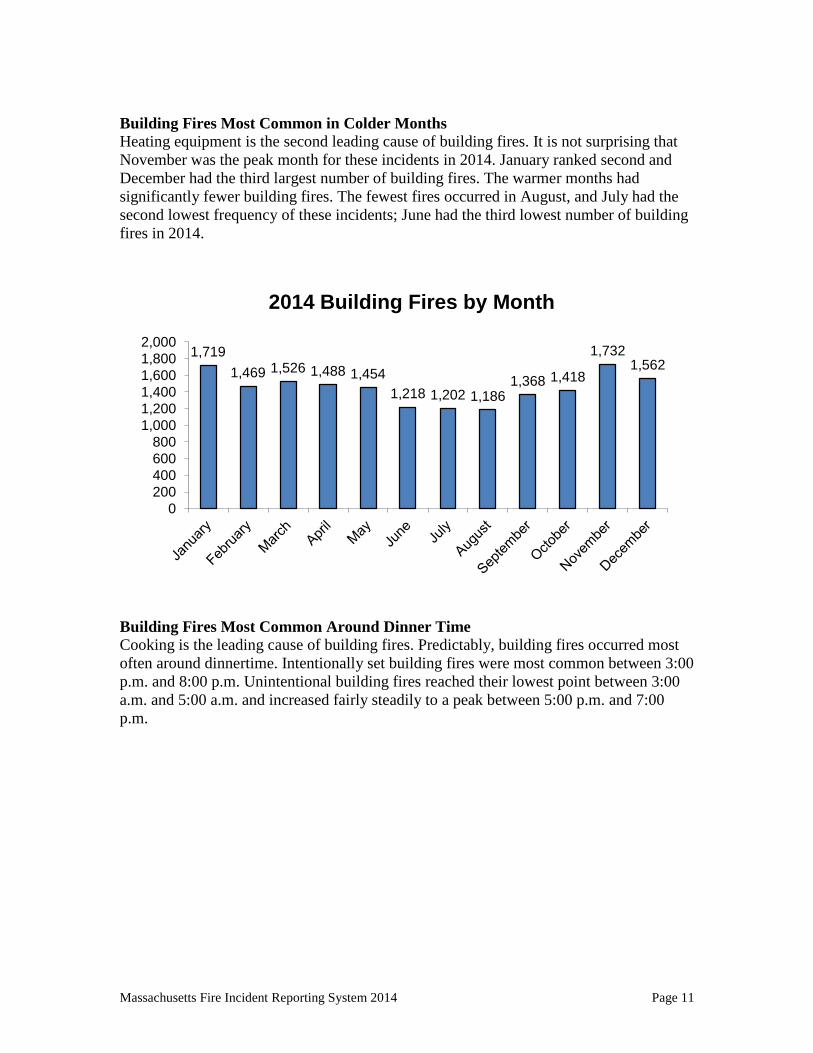
Building Fires Most Common in Colder Months Heating equipment is the second leading cause of building fires. It is not surprising that November was the peak month for these incidents in 2014. January ranked second and December had the third largest number of building fires. The warmer months had significantly fewer building fires. The fewest fires occurred in August, and July had the second lowest frequency of these incidents; June had the third lowest number of building fires in 2014.
Building Fires Most Common Around Dinner Time Cooking is the leading cause of building fires. Predictably, building fires occurred most often around dinnertime. Intentionally set building fires were most common between 3:00 p.m. and 8:00 p.m. Unintentional building fires reached their lowest point between 3:00 a.m. and 5:00 a.m. and increased fairly steadily to a peak between 5:00 p.m. and 7:00 p.m.
1,719 1,469 1,526 1,488 1,454
1,218 1,202 1,186 1,368 1,418
1,732 1,562
0 200 400 600 800
1,000 1,200 1,400 1,600 1,800 2,000
2014 Building Fires by Month
Massachusetts Fire Incident Reporting System 2014 Page 12
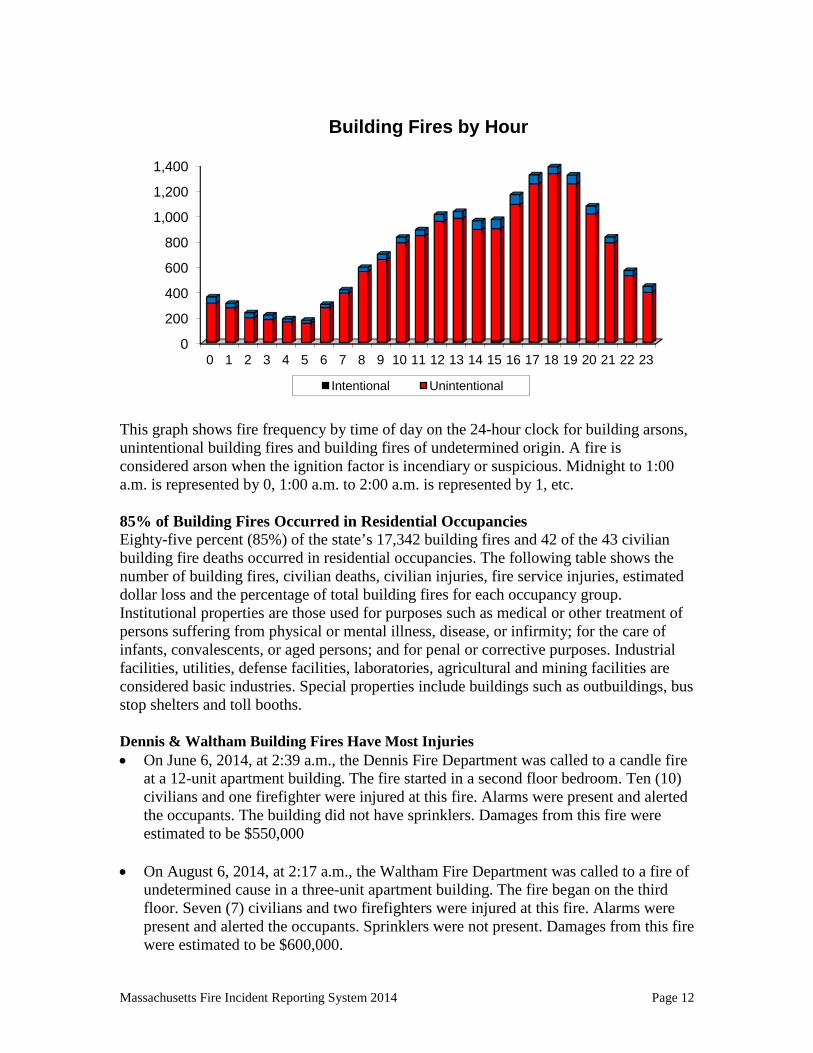
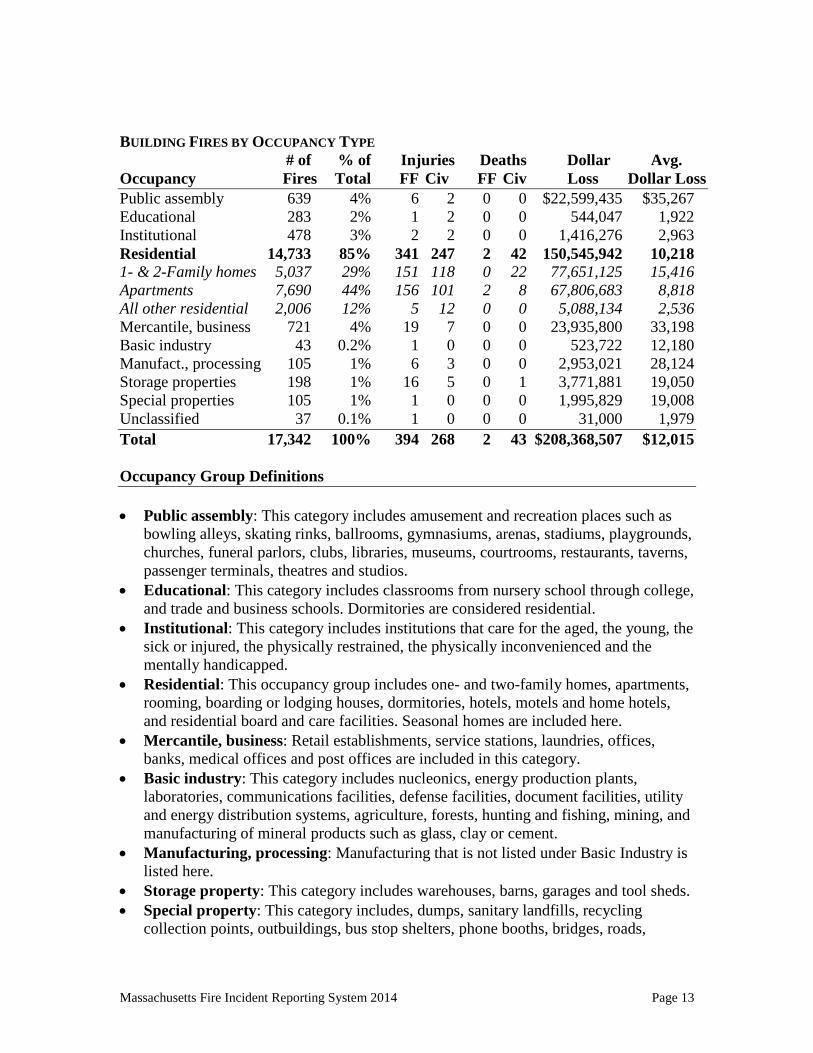
This graph shows fire frequency by time of day on the 24-hour clock for building arsons, unintentional building fires and building fires of undetermined origin. A fire is considered arson when the ignition factor is incendiary or suspicious. Midnight to 1:00 a.m. is represented by 0, 1:00 a.m. to 2:00 a.m. is represented by 1, etc. 85% of Building Fires Occurred in Residential Occupancies Eighty-five percent (85%) of the state’s 17,342 building fires and 42 of the 43 civilian building fire deaths occurred in residential occupancies. The following table shows the number of building fires, civilian deaths, civilian injuries, fire service injuries, estimated dollar loss and the percentage of total building fires for each occupancy group. Institutional properties are those used for purposes such as medical or other treatment of persons suffering from physical or mental illness, disease, or infirmity; for the care of infants, convalescents, or aged persons; and for penal or corrective purposes. Industrial facilities, utilities, defense facilities, laboratories, agricultural and mining facilities are considered basic industries. Special properties include buildings such as outbuildings, bus stop shelters and toll booths. Dennis & Waltham Building Fires Have Most Injuries • On June 6, 2014, at 2:39 a.m., the Dennis Fire Department was called to a candle fire
at a 12-unit apartment building. The fire started in a second floor bedroom. Ten (10) civilians and one firefighter were injured at this fire. Alarms were present and alerted the occupants. The building did not have sprinklers. Damages from this fire were estimated to be $550,000
• On August 6, 2014, at 2:17 a.m., the Waltham Fire Department was called to a fire of
undetermined cause in a three-unit apartment building. The fire began on the third floor. Seven (7) civilians and two firefighters were injured at this fire. Alarms were present and alerted the occupants. Sprinklers were not present. Damages from this fire were estimated to be $600,000.
0
200
400
600
800
1,000
1,200
1,400
0 1 2 3 4 5 6 7 8 9 10 11 12 13 14 15 16 17 18 19 20 21 22 23
Building Fires by Hour
Intentional Unintentional
Massachusetts Fire Incident Reporting System 2014 Page 13
BUILDING FIRES BY OCCUPANCY TYPE # of % of Injuries Deaths Dollar Avg. Occupancy Fires Total FF Civ FF Civ Loss Dollar Loss Public assembly 639 4% 6 2 0 0 $22,599,435 $35,267 Educational 283 2% 1 2 0 0 544,047 1,922 Institutional 478 3% 2 2 0 0 1,416,276 2,963 Residential 14,733 85% 341 247 2 42 150,545,942 10,218 1- & 2-Family homes 5,037 29% 151 118 0 22 77,651,125 15,416 Apartments 7,690 44% 156 101 2 8 67,806,683 8,818 All other residential 2,006 12% 5 12 0 0 5,088,134 2,536 Mercantile, business 721 4% 19 7 0 0 23,935,800 33,198 Basic industry 43 0.2% 1 0 0 0 523,722 12,180 Manufact., processing 105 1% 6 3 0 0 2,953,021 28,124 Storage properties 198 1% 16 5 0 1 3,771,881 19,050 Special properties 105 1% 1 0 0 0 1,995,829 19,008 Unclassified 37 0.1% 1 0 0 0 31,000 1,979 Total 17,342 100% 394 268 2 43 $208,368,507 $12,015 Occupancy Group Definitions • Public assembly: This category includes amusement and recreation places such as
bowling alleys, skating rinks, ballrooms, gymnasiums, arenas, stadiums, playgrounds, churches, funeral parlors, clubs, libraries, museums, courtrooms, restaurants, taverns, passenger terminals, theatres and studios.
• Educational: This category includes classrooms from nursery school through college, and trade and business schools. Dormitories are considered residential.
• Institutional: This category includes institutions that care for the aged, the young, the sick or injured, the physically restrained, the physically inconvenienced and the mentally handicapped.
• Residential: This occupancy group includes one- and two-family homes, apartments, rooming, boarding or lodging houses, dormitories, hotels, motels and home hotels, and residential board and care facilities. Seasonal homes are included here.
• Mercantile, business: Retail establishments, service stations, laundries, offices, banks, medical offices and post offices are included in this category.
• Basic industry: This category includes nucleonics, energy production plants, laboratories, communications facilities, defense facilities, document facilities, utility and energy distribution systems, agriculture, forests, hunting and fishing, mining, and manufacturing of mineral products such as glass, clay or cement.
• Manufacturing, processing: Manufacturing that is not listed under Basic Industry is listed here.
• Storage property: This category includes warehouses, barns, garages and tool sheds. • Special property: This category includes, dumps, sanitary landfills, recycling
collection points, outbuildings, bus stop shelters, phone booths, bridges, roads,

Massachusetts Fire Incident Reporting System 2014 Page 14
railroad properties, outdoor properties, water areas, aircraft areas and equipment operating areas outbuildings.
Vacant Properties Have Highest Average Dollar Loss Per Fire Vacant properties2 had the highest dollar loss per fire of any property type. In 2014, the average dollar loss for a building fire at a vacant property was $94,384. This is a 13% increase over the 2013 average dollar loss per vacant property fire at $83,675 per fire. Public assembly properties had the second highest dollar loss per fire for any property type. In 2014, the average dollar loss for a building fire at a public assembly property was $35,3673.
2 Vacant property is not an occupancy type. Any property use can be a vacant property if certain conditions are met. It is included here with the other property use categories to illustrate how dangerous and destructive fires in these types of buildings can be. 3 This was mainly due to the Burlington fire in a bowling alley that was under construction and had a $12 million dollar loss.
$1,714 $1,922 $2,963
$10,218 $12,180
$19,008 $19,050
$28,124 $33,198
$35,367 $94,384
Unclassified Educational Institutional Residential
Industrial, Utility, … Special Properties
Storage Manufacturing, …
Mercantile, business Assembly
Vacant Properties
Average Dollar Loss Per Fire by Occupancy Type
Massachusetts Fire Incident Reporting System 2014 Page 15
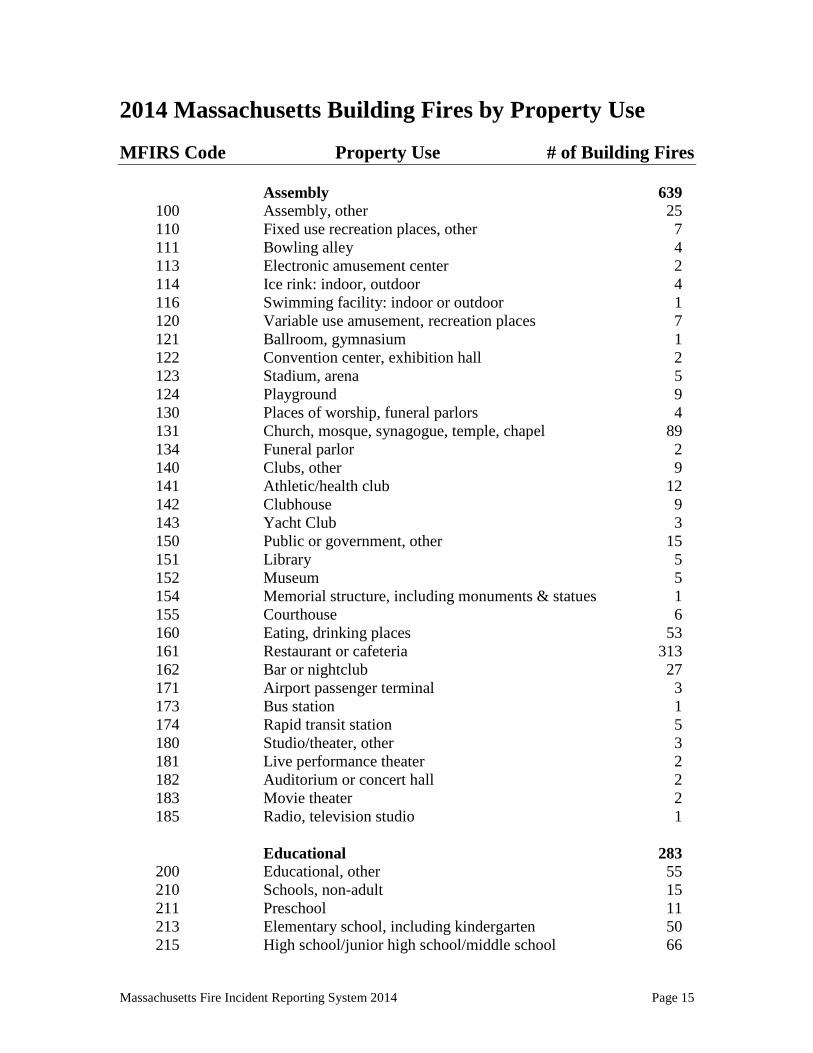
2014 Massachusetts Building Fires by Property Use MFIRS Code Property Use # of Building Fires
Assembly 639 100 Assembly, other 25 110 Fixed use recreation places, other 7 111 Bowling alley 4 113 Electronic amusement center 2 114 Ice rink: indoor, outdoor 4 116 Swimming facility: indoor or outdoor 1 120 Variable use amusement, recreation places 7 121 Ballroom, gymnasium 1 122 Convention center, exhibition hall 2 123 Stadium, arena 5 124 Playground 9 130 Places of worship, funeral parlors 4 131 Church, mosque, synagogue, temple, chapel 89 134 Funeral parlor 2 140 Clubs, other 9 141 Athletic/health club 12 142 Clubhouse 9 143 Yacht Club 3 150 Public or government, other 15 151 Library 5 152 Museum 5 154 Memorial structure, including monuments & statues 1 155 Courthouse 6 160 Eating, drinking places 53 161 Restaurant or cafeteria 313 162 Bar or nightclub 27 171 Airport passenger terminal 3 173 Bus station 1 174 Rapid transit station 5 180 Studio/theater, other 3 181 Live performance theater 2 182 Auditorium or concert hall 2 183 Movie theater 2 185 Radio, television studio 1 Educational 283 200 Educational, other 55 210 Schools, non-adult 15 211 Preschool 11 213 Elementary school, including kindergarten 50 215 High school/junior high school/middle school 66
Massachusetts Fire Incident Reporting System 2014 Page 16
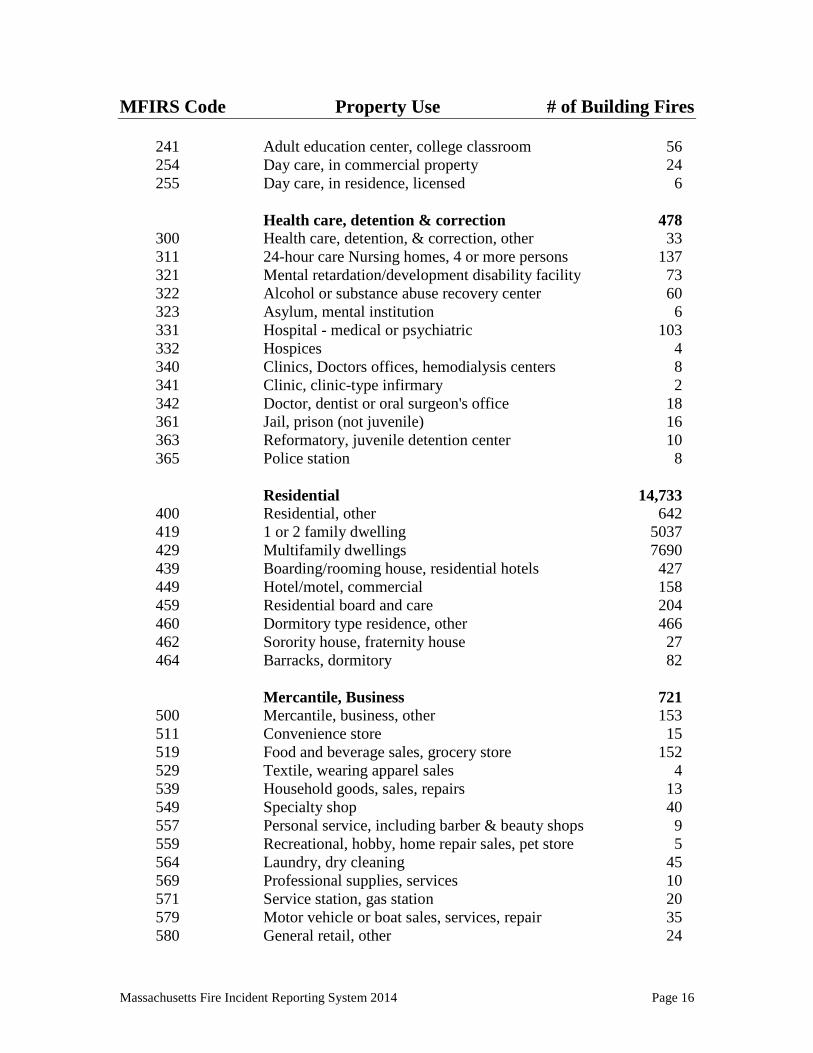
MFIRS Code Property Use # of Building Fires
241 Adult education center, college classroom 56 254 Day care, in commercial property 24 255 Day care, in residence, licensed 6 Health care, detention & correction 478 300 Health care, detention, & correction, other 33 311 24-hour care Nursing homes, 4 or more persons 137 321 Mental retardation/development disability facility 73 322 Alcohol or substance abuse recovery center 60 323 Asylum, mental institution 6 331 Hospital - medical or psychiatric 103 332 Hospices 4 340 Clinics, Doctors offices, hemodialysis centers 8 341 Clinic, clinic-type infirmary 2 342 Doctor, dentist or oral surgeon's office 18 361 Jail, prison (not juvenile) 16 363 Reformatory, juvenile detention center 10 365 Police station 8 Residential 14,733 400 Residential, other 642 419 1 or 2 family dwelling 5037 429 Multifamily dwellings 7690 439 Boarding/rooming house, residential hotels 427 449 Hotel/motel, commercial 158 459 Residential board and care 204 460 Dormitory type residence, other 466 462 Sorority house, fraternity house 27 464 Barracks, dormitory 82 Mercantile, Business 721 500 Mercantile, business, other 153 511 Convenience store 15 519 Food and beverage sales, grocery store 152 529 Textile, wearing apparel sales 4 539 Household goods, sales, repairs 13 549 Specialty shop 40 557 Personal service, including barber & beauty shops 9 559 Recreational, hobby, home repair sales, pet store 5 564 Laundry, dry cleaning 45 569 Professional supplies, services 10 571 Service station, gas station 20 579 Motor vehicle or boat sales, services, repair 35 580 General retail, other 24
Massachusetts Fire Incident Reporting System 2014 Page 17
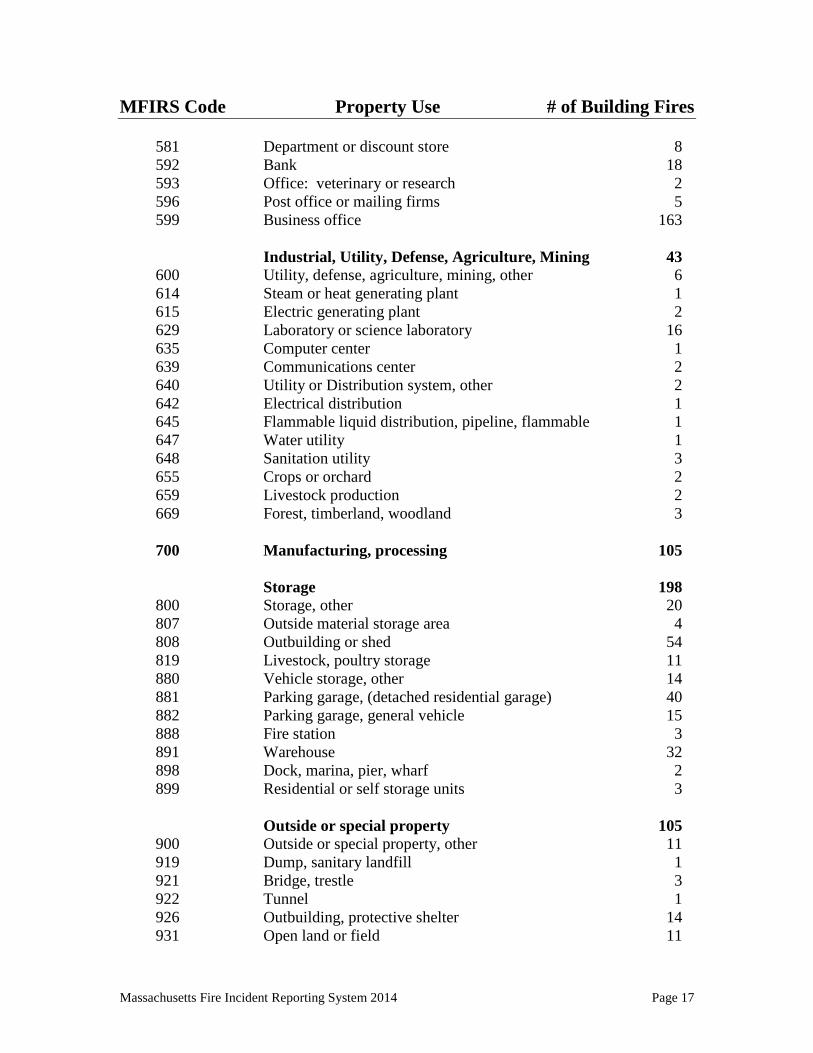
MFIRS Code Property Use # of Building Fires
581 Department or discount store 8 592 Bank 18 593 Office: veterinary or research 2 596 Post office or mailing firms 5 599 Business office 163 Industrial, Utility, Defense, Agriculture, Mining 43 600 Utility, defense, agriculture, mining, other 6 614 Steam or heat generating plant 1 615 Electric generating plant 2 629 Laboratory or science laboratory 16 635 Computer center 1 639 Communications center 2 640 Utility or Distribution system, other 2 642 Electrical distribution 1 645 Flammable liquid distribution, pipeline, flammable 1 647 Water utility 1 648 Sanitation utility 3 655 Crops or orchard 2 659 Livestock production 2 669 Forest, timberland, woodland 3 700 Manufacturing, processing 105 Storage 198 800 Storage, other 20 807 Outside material storage area 4 808 Outbuilding or shed 54 819 Livestock, poultry storage 11 880 Vehicle storage, other 14 881 Parking garage, (detached residential garage) 40 882 Parking garage, general vehicle 15 888 Fire station 3 891 Warehouse 32 898 Dock, marina, pier, wharf 2 899 Residential or self storage units 3 Outside or special property 105 900 Outside or special property, other 11 919 Dump, sanitary landfill 1 921 Bridge, trestle 3 922 Tunnel 1 926 Outbuilding, protective shelter 14 931 Open land or field 11
Massachusetts Fire Incident Reporting System 2014 Page 18
MFIRS Code Property Use # of Building Fires
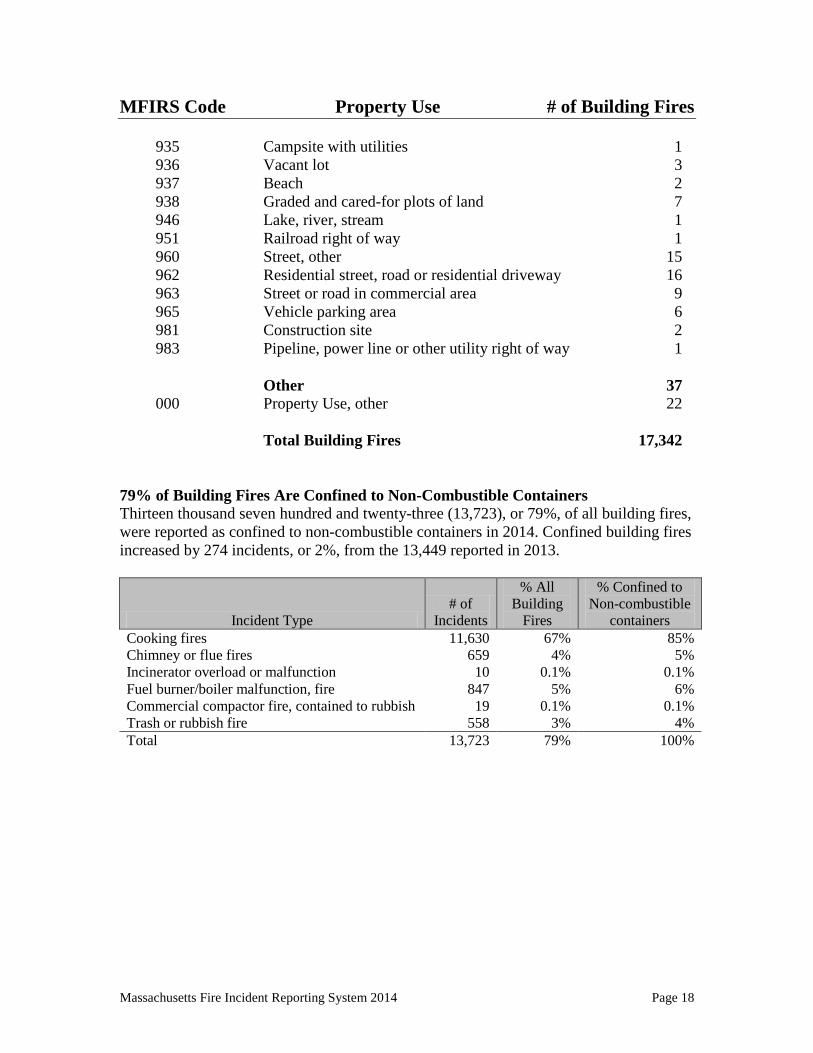
935 Campsite with utilities 1 936 Vacant lot 3 937 Beach 2 938 Graded and cared-for plots of land 7 946 Lake, river, stream 1 951 Railroad right of way 1 960 Street, other 15 962 Residential street, road or residential driveway 16 963 Street or road in commercial area 9 965 Vehicle parking area 6 981 Construction site 2 983 Pipeline, power line or other utility right of way 1 Other 37 000 Property Use, other 22
Total Building Fires 17,342
79% of Building Fires Are Confined to Non-Combustible Containers Thirteen thousand seven hundred and twenty-three (13,723), or 79%, of all building fires, were reported as confined to non-combustible containers in 2014. Confined building fires increased by 274 incidents, or 2%, from the 13,449 reported in 2013.
Incident Type # of
Incidents
% All Building
Fires
% Confined to Non-combustible
containers Cooking fires 11,630 67% 85% Chimney or flue fires 659 4% 5% Incinerator overload or malfunction 10 0.1% 0.1% Fuel burner/boiler malfunction, fire 847 5% 6% Commercial compactor fire, contained to rubbish 19 0.1% 0.1% Trash or rubbish fire 558 3% 4% Total 13,723 79% 100%

Massachusetts Fire Incident Reporting System 2014 Page 19
Detectors Operated in 63% of Building Fires Smoke or heat detectors operated in 10,946, or 63%, of the building fires in 2014. In 7% of these fires4, the detectors did not alert the occupants. Detectors were present but did not operate in 1% of these incidents. In 3% of these fires, no detectors were present at all.
4 These represent confined fires where it was reported that the detector did not alert the occupants.
0.1%
0.1%
3%
4%
5%
67%
-10% 0% 10% 20% 30% 40% 50% 60% 70%
Incinerator overload or malfunction
Commercial compactor fire, contained to rubbish
Trash or rubbish fire
Chimney or flue fires
Fuel burner/boiler malfunction, fire
Cooking fires
Building Fires Confined to Non-combustible Containers
Operated 63%
None 3% Failed to
operate 1%
Didn't alert (confined fires)
7%
Fire too small 3%
Undetermined 23%
Smoke Detector Operation in Building Fires
Massachusetts Fire Incident Reporting System 2014 Page 20
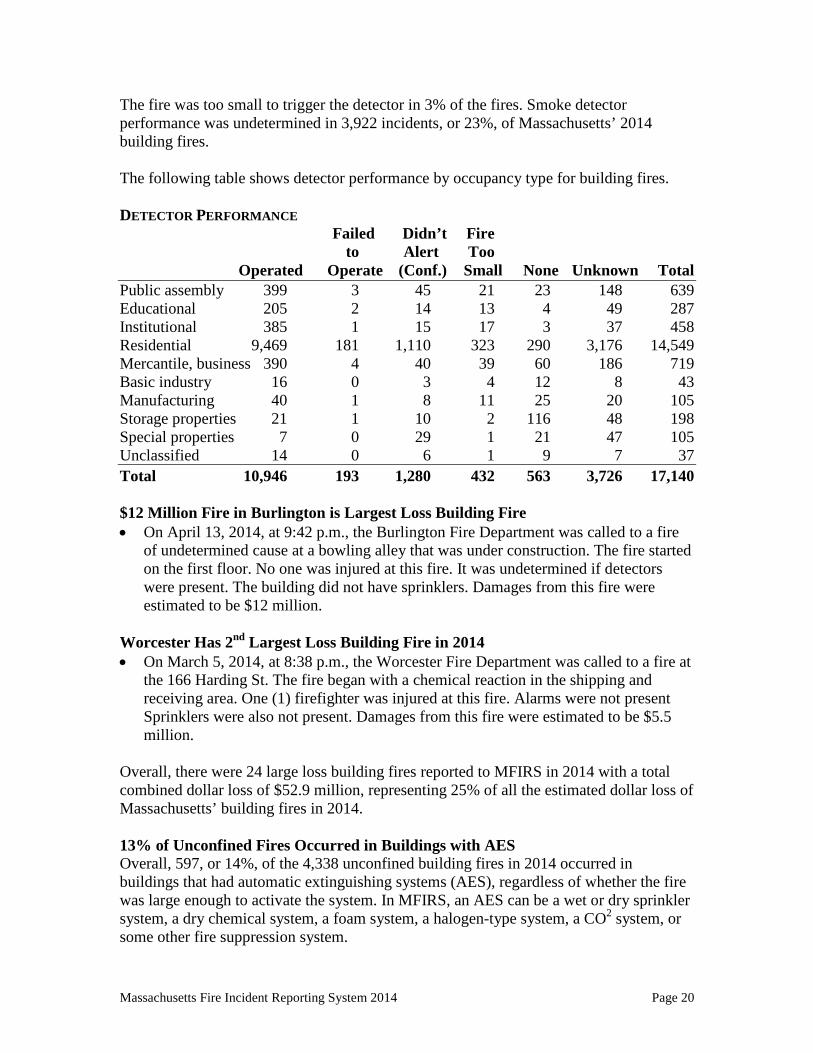
The fire was too small to trigger the detector in 3% of the fires. Smoke detector performance was undetermined in 3,922 incidents, or 23%, of Massachusetts’ 2014 building fires. The following table shows detector performance by occupancy type for building fires. DETECTOR PERFORMANCE Failed Didn’t Fire to Alert Too Operated Operate (Conf.) Small None Unknown Total Public assembly 399 3 45 21 23 148 639 Educational 205 2 14 13 4 49 287 Institutional 385 1 15 17 3 37 458 Residential 9,469 181 1,110 323 290 3,176 14,549 Mercantile, business 390 4 40 39 60 186 719 Basic industry 16 0 3 4 12 8 43 Manufacturing 40 1 8 11 25 20 105 Storage properties 21 1 10 2 116 48 198 Special properties 7 0 29 1 21 47 105 Unclassified 14 0 6 1 9 7 37 Total 10,946 193 1,280 432 563 3,726 17,140 $12 Million Fire in Burlington is Largest Loss Building Fire • On April 13, 2014, at 9:42 p.m., the Burlington Fire Department was called to a fire
of undetermined cause at a bowling alley that was under construction. The fire started on the first floor. No one was injured at this fire. It was undetermined if detectors were present. The building did not have sprinklers. Damages from this fire were estimated to be $12 million.
Worcester Has 2nd Largest Loss Building Fire in 2014 • On March 5, 2014, at 8:38 p.m., the Worcester Fire Department was called to a fire at
the 166 Harding St. The fire began with a chemical reaction in the shipping and receiving area. One (1) firefighter was injured at this fire. Alarms were not present Sprinklers were also not present. Damages from this fire were estimated to be $5.5 million.
Overall, there were 24 large loss building fires reported to MFIRS in 2014 with a total combined dollar loss of $52.9 million, representing 25% of all the estimated dollar loss of Massachusetts’ building fires in 2014. 13% of Unconfined Fires Occurred in Buildings with AES Overall, 597, or 14%, of the 4,338 unconfined building fires in 2014 occurred in buildings that had automatic extinguishing systems (AES), regardless of whether the fire was large enough to activate the system. In MFIRS, an AES can be a wet or dry sprinkler system, a dry chemical system, a foam system, a halogen-type system, a CO2 system, or some other fire suppression system.

Massachusetts Fire Incident Reporting System 2014 Page 21
The following chart lists the percentage of unconfined fires in buildings that were at least partially protected by an AES for that specific property use. Manufacturing and processing facilities and institutional properties were the most likely to have an AES. Eighty percent (80%) of the fires in manufacturing or processing facilities and 77% of the fires in health care, detention and correctional facilities occurred in an AES protected structure. Nine percent (9%) of residential fires occurred in buildings with an automatic extinguishing system and 8% of fires in storage facilities occurred in buildings protected by an automatic extinguishing system.
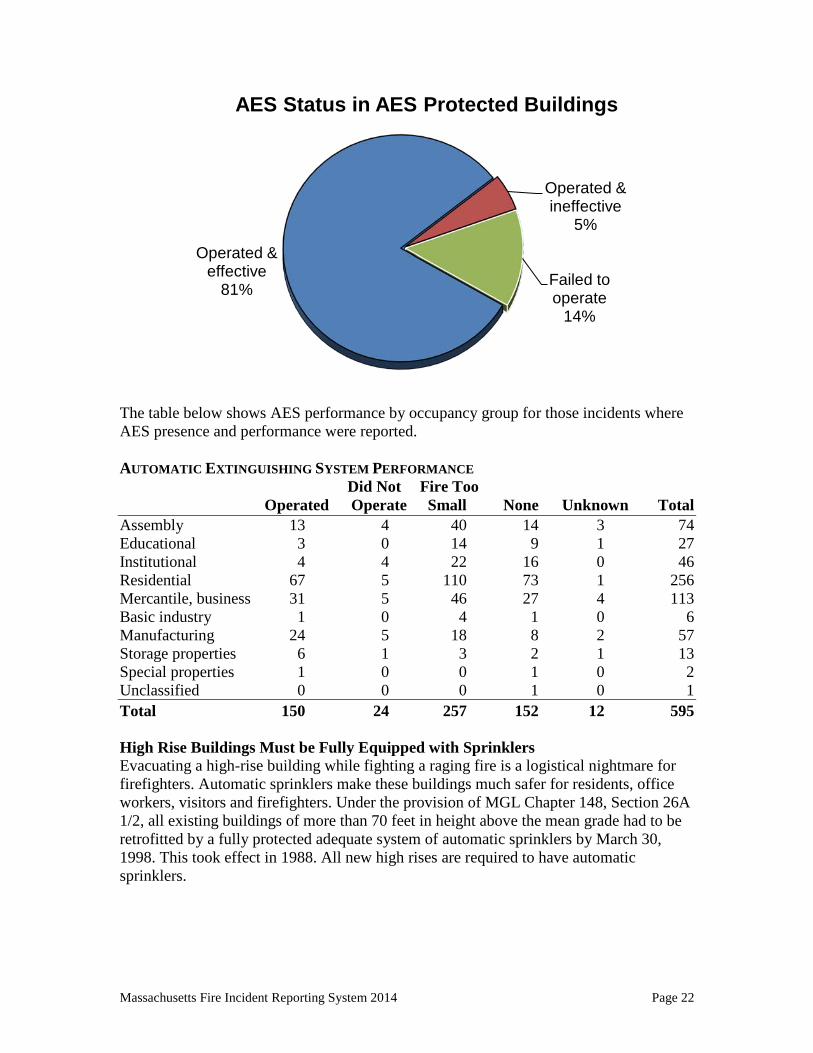
AES Work in 81% of Building Fires When Installed & Maintained AES were present and operated in 150, or 86%, of the 174 building fires in buildings protected by an automatic extinguishing system, which had a reported fire large enough for the AES to activate in Massachusetts in 2014. Of these 150 fires, the systems were effective in 141, or 81%, and ineffective in nine, or 5%, of these incidents. AES were present but failed to operate in 24, or 14%, of these 174 building fires. Some of the reasons for the automatic extinguishing system failures were reported to be: the fire was started in an area not protected by the system; the system was shut off; a lack of maintenance to the system; and manual intervention.
8% 9%
14% 27%
42% 48%
59% 77%
80%
0% 20% 40% 60% 80% 100%
Storage
Residential
Unclassified
Industrial, Utility, Defense, …
Mercantile, Business
Educational
Assembly
Health Care, Detention & …
Manufacturing, Processing
Fires in AES Protected Buildings by Property Use
Massachusetts Fire Incident Reporting System 2014 Page 22
The table below shows AES performance by occupancy group for those incidents where AES presence and performance were reported. AUTOMATIC EXTINGUISHING SYSTEM PERFORMANCE Did Not Fire Too Operated Operate Small None Unknown Total Assembly 13 4 40 14 3 74 Educational 3 0 14 9 1 27 Institutional 4 4 22 16 0 46 Residential 67 5 110 73 1 256 Mercantile, business 31 5 46 27 4 113 Basic industry 1 0 4 1 0 6 Manufacturing 24 5 18 8 2 57 Storage properties 6 1 3 2 1 13 Special properties 1 0 0 1 0 2 Unclassified 0 0 0 1 0 1 Total 150 24 257 152 12 595 High Rise Buildings Must be Fully Equipped with Sprinklers Evacuating a high-rise building while fighting a raging fire is a logistical nightmare for firefighters. Automatic sprinklers make these buildings much safer for residents, office workers, visitors and firefighters. Under the provision of MGL Chapter 148, Section 26A 1/2, all existing buildings of more than 70 feet in height above the mean grade had to be retrofitted by a fully protected adequate system of automatic sprinklers by March 30, 1998. This took effect in 1988. All new high rises are required to have automatic sprinklers.
Operated & effective
81%
Operated & ineffective
5%
Failed to operate
14%
AES Status in AES Protected Buildings
Massachusetts Fire Incident Reporting System 2014 Page 23
Written Permit Required from Fire Department before Disconnecting Sprinklers Under the provisions of MGL Chapter 148, Section 27A, it is illegal to “…shut off, disconnect, obstruct, remove or destroy…any part of any sprinkler system, water main, hydrant, or other device used for fire protection…without first procuring a written permit from the head of the fire department.” The head of the fire department is authorized to issue conditions necessary to provide protection from fire and the preservation of public safety. In the event of an emergency, the system may be shut down as long as the fire department head is immediately notified of the action and when the system is back in service. Violators may be punished by imprisonment for not more than one year and/or a fine of not more than $1,000.
Residential Building Fires
85% of Building Fires Occurred in Residential Occupancies Massachusetts fire departments reported that 14,733, or 85%, of the 17,327 building fires occurred in residential occupancies. These fires caused 42 civilian deaths, two fire service deaths, 247 civilian injuries, 341 fire service injuries and an estimated dollar loss of $150.5 million. The average dollar loss per fire was $10,218. The total number of reported residential building fires increased by 227, or 2%, from the 14,506 reported in 2013. Over 1/2 of All Residential Fires Occur in Apartments Over half, or 52%, of all residential building fires in 2014 occurred in multifamily apartment buildings. Thirty-four percent (34%) of these fires happened in one- or two-family homes. Dormitories and unclassified residences each accounted for 4% of residential fires in Massachusetts. Three percent (3%) occurred in rooming houses, residential board and care facilities; and hotels or motels each accounted for 1% of the residential building fires in 2014.

Massachusetts Fire Incident Reporting System 2014 Page 24
The following table shows the statistics for fires, firefighter and civilian casualties and the estimated dollar loss by residential occupancy. RESIDENTIAL BUILDING FIRES # of % of Injuries Deaths Dollar Occupancy Fires Total FF Civ FF Civ Loss 1- & 2-Family homes 5,037 34% 151 118 0 22 $77,651,125 Multifamily 7,690 52% 181 120 2 19 67,806,683 Rooming houses 427 3% 2 3 0 0 907,139 Hotels & motels 158 1% 2 3 0 0 1,438,523 Residential board & care 204 1% 0 2 0 1 135,964 Dormitories 575 4% 1 2 0 0 78,708 Unclassified 642 4% 4 1 0 0 2,527,800 Total 14,733 100% 341 247 2 27 $150,545,942 Residential Occupancy Sub-Group Definitions • 1- & 2-Family: This category includes one- or two-family homes, detached,
manufactured homes, mobile homes and duplexes. • Multifamily dwellings: This category includes apartments, condominiums,
townhouses, rowhouses and tenements. • Boarding, rooming houses: This category includes residential hotels and shelters. • Hotels, motels: This occupancy group includes commercial hotels, motels or inns. • Residential board and care: This category includes long-term care and half-way
houses. Excluded are nursing facilities (Property Use code = 311). • Dormitories: This category includes dormitory type residences and sorority or
fraternity houses. It also includes nurses’ quarters, military barracks, monasteries/convents, dormitories, bunk houses and workers’ barracks.
• Residential, other: Any type of residential occupancy that is not defined above.
1%
1%
3%
4%
4%
34%
52%
0% 20% 40% 60%
Hotel/motel
Residential board & care
Boarding/rooming houses
Dormitories
Residential, other
1- & 2-Family homes
Multifamily
Residential Structure Fire by Occupancy Type

Massachusetts Fire Incident Reporting System 2014 Page 25
Cooking Causes Almost 3/4 of Residential Building Fires The leading causes of residential building fires in 2014 were cooking, heating, electrical problems, indoor rubbish fires, smoking, arson, candles, clothes dryer fires, juvenile firesetting, Christmas tree fires, and fireworks. Cooking was the leading cause of residential building fires, accounting for 10,630, or 72%, of the 14,733 incidents. Heating equipment accounted for 1,763, or 12%, of the total fires. Electrical problems caused 544, or 4%, of incidents. Indoor rubbish fires were the cause of 368, or 2%, of residential building fires. The unsafe use and disposal of smoking materials accounted for 364, or 2%, of these incidents. Arson accounted for 126, or 1%, of residential building fires. Clothes dryer fires were the cause for 98, or 1%, of these incidents. One percent (1%), or 91, were caused by candles. Juvenile firesetting accounted for 20, or less than 1%, of residential building fires. There were two Christmas tree fires in Massachusetts homes in 2014, causing less than 1% of these fires. Fireworks caused one, accounting for less than 1% of these fires in Massachusetts in 2014.
0.01%
0.01%
0.1%
1%
1%
1%
2%
2%
4%
12%
72%
0% 20% 40% 60% 80%
Fireworks Christmas tree fires Juvenile firesetting
Candles Clothes dryers
Arson Smoking
Indoor rubbish fires Electrical
Heating Cooking
Leading Causes of Residential Building Fires
Massachusetts Fire Incident Reporting System 2014 Page 26
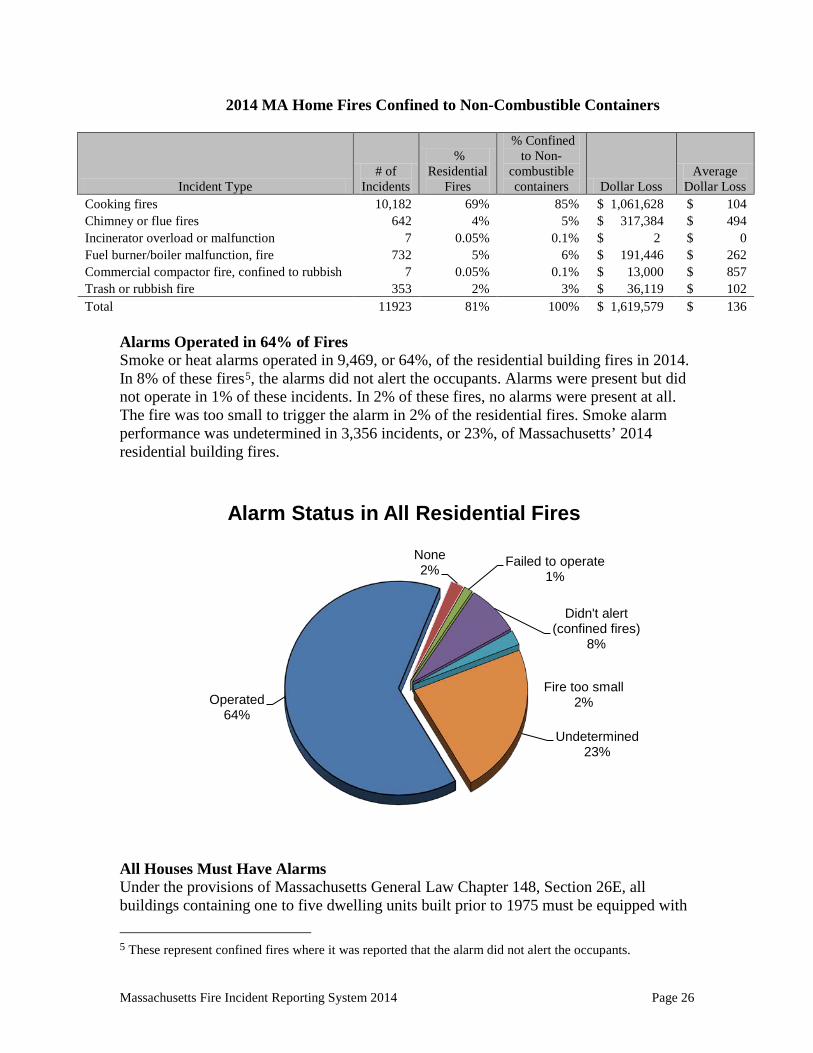
2014 MA Home Fires Confined to Non-Combustible Containers
Incident Type # of
Incidents
% Residential
Fires
% Confined to Non-
combustible containers Dollar Loss
Average Dollar Loss
Cooking fires 10,182 69% 85% $ 1,061,628 $ 104 Chimney or flue fires 642 4% 5% $ 317,384 $ 494 Incinerator overload or malfunction 7 0.05% 0.1% $ 2 $ 0 Fuel burner/boiler malfunction, fire 732 5% 6% $ 191,446 $ 262 Commercial compactor fire, confined to rubbish 7 0.05% 0.1% $ 13,000 $ 857 Trash or rubbish fire 353 2% 3% $ 36,119 $ 102 Total 11923 81% 100% $ 1,619,579 $ 136
Alarms Operated in 64% of Fires Smoke or heat alarms operated in 9,469, or 64%, of the residential building fires in 2014. In 8% of these fires5, the alarms did not alert the occupants. Alarms were present but did not operate in 1% of these incidents. In 2% of these fires, no alarms were present at all. The fire was too small to trigger the alarm in 2% of the residential fires. Smoke alarm performance was undetermined in 3,356 incidents, or 23%, of Massachusetts’ 2014 residential building fires.
All Houses Must Have Alarms Under the provisions of Massachusetts General Law Chapter 148, Section 26E, all buildings containing one to five dwelling units built prior to 1975 must be equipped with 5 These represent confined fires where it was reported that the alarm did not alert the occupants.
Operated 64%
None 2% Failed to operate
1%
Didn't alert (confined fires)
8%
Fire too small 2%
Undetermined 23%
Alarm Status in All Residential Fires
Massachusetts Fire Incident Reporting System 2014 Page 27
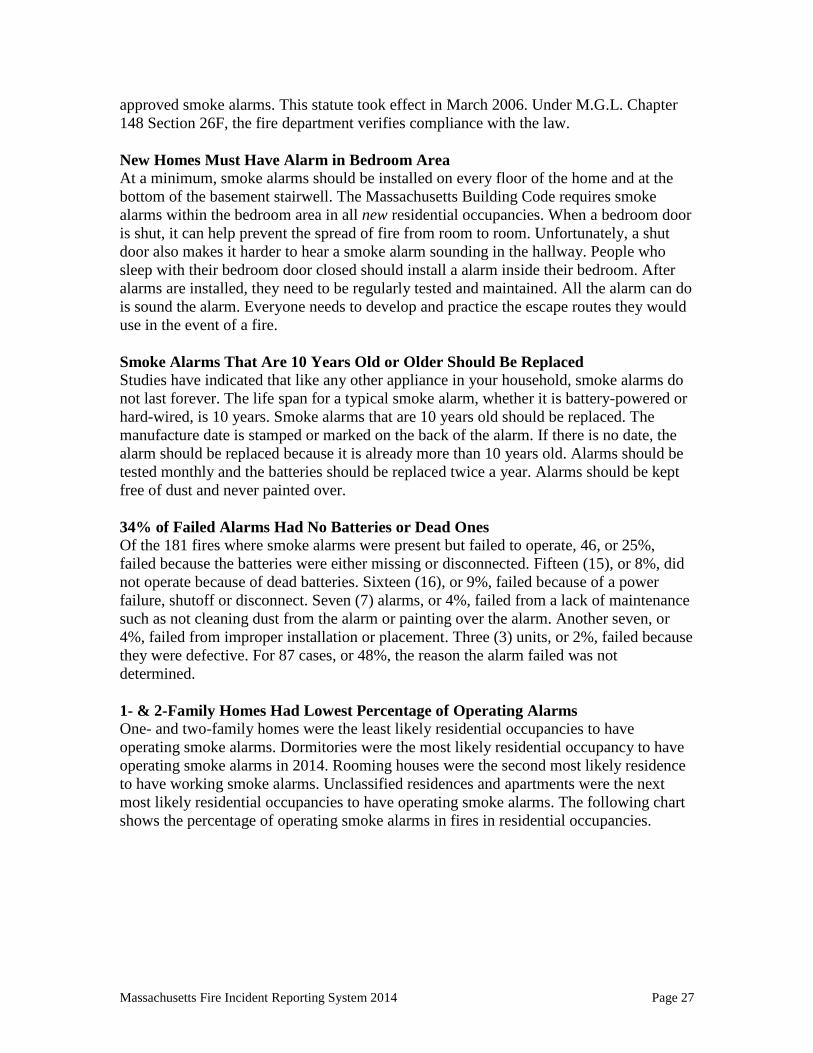
approved smoke alarms. This statute took effect in March 2006. Under M.G.L. Chapter 148 Section 26F, the fire department verifies compliance with the law. New Homes Must Have Alarm in Bedroom Area At a minimum, smoke alarms should be installed on every floor of the home and at the bottom of the basement stairwell. The Massachusetts Building Code requires smoke alarms within the bedroom area in all new residential occupancies. When a bedroom door is shut, it can help prevent the spread of fire from room to room. Unfortunately, a shut door also makes it harder to hear a smoke alarm sounding in the hallway. People who sleep with their bedroom door closed should install a alarm inside their bedroom. After alarms are installed, they need to be regularly tested and maintained. All the alarm can do is sound the alarm. Everyone needs to develop and practice the escape routes they would use in the event of a fire. Smoke Alarms That Are 10 Years Old or Older Should Be Replaced Studies have indicated that like any other appliance in your household, smoke alarms do not last forever. The life span for a typical smoke alarm, whether it is battery-powered or hard-wired, is 10 years. Smoke alarms that are 10 years old should be replaced. The manufacture date is stamped or marked on the back of the alarm. If there is no date, the alarm should be replaced because it is already more than 10 years old. Alarms should be tested monthly and the batteries should be replaced twice a year. Alarms should be kept free of dust and never painted over. 34% of Failed Alarms Had No Batteries or Dead Ones Of the 181 fires where smoke alarms were present but failed to operate, 46, or 25%, failed because the batteries were either missing or disconnected. Fifteen (15), or 8%, did not operate because of dead batteries. Sixteen (16), or 9%, failed because of a power failure, shutoff or disconnect. Seven (7) alarms, or 4%, failed from a lack of maintenance such as not cleaning dust from the alarm or painting over the alarm. Another seven, or 4%, failed from improper installation or placement. Three (3) units, or 2%, failed because they were defective. For 87 cases, or 48%, the reason the alarm failed was not determined. 1- & 2-Family Homes Had Lowest Percentage of Operating Alarms One- and two-family homes were the least likely residential occupancies to have operating smoke alarms. Dormitories were the most likely residential occupancy to have operating smoke alarms in 2014. Rooming houses were the second most likely residence to have working smoke alarms. Unclassified residences and apartments were the next most likely residential occupancies to have operating smoke alarms. The following chart shows the percentage of operating smoke alarms in fires in residential occupancies.
Massachusetts Fire Incident Reporting System 2014 Page 28
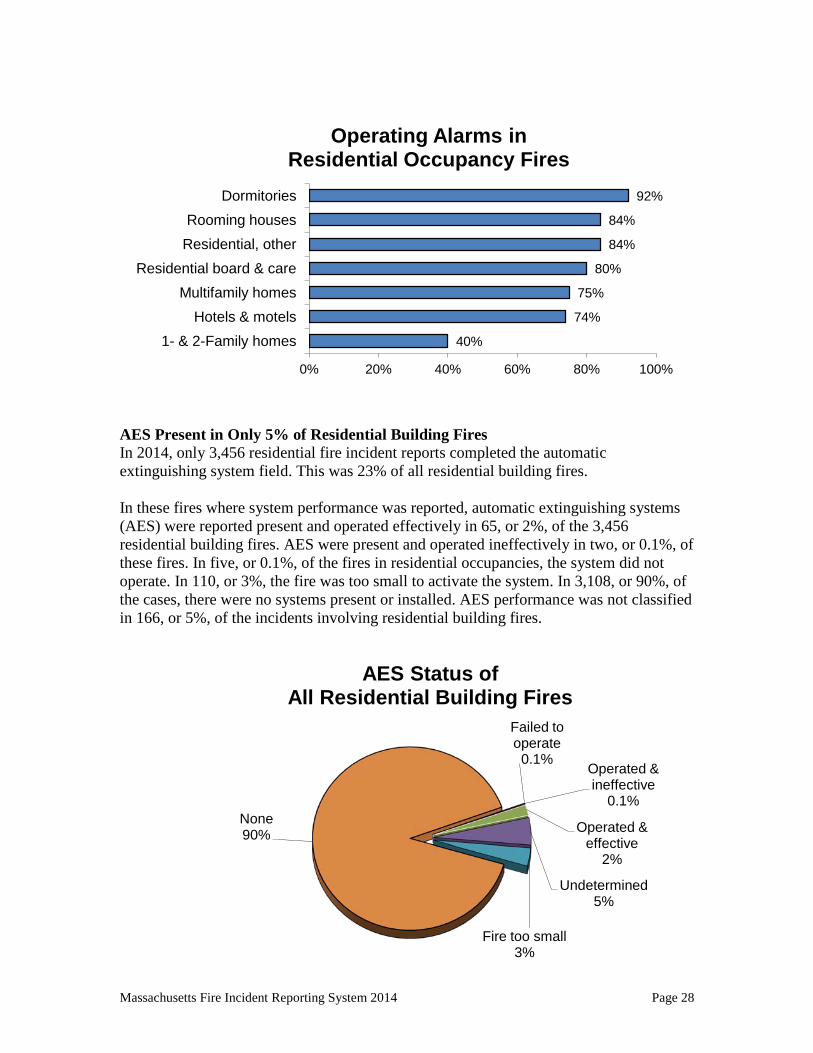
AES Present in Only 5% of Residential Building Fires In 2014, only 3,456 residential fire incident reports completed the automatic extinguishing system field. This was 23% of all residential building fires. In these fires where system performance was reported, automatic extinguishing systems (AES) were reported present and operated effectively in 65, or 2%, of the 3,456 residential building fires. AES were present and operated ineffectively in two, or 0.1%, of these fires. In five, or 0.1%, of the fires in residential occupancies, the system did not operate. In 110, or 3%, the fire was too small to activate the system. In 3,108, or 90%, of the cases, there were no systems present or installed. AES performance was not classified in 166, or 5%, of the incidents involving residential building fires.
40%
74%
75%
80%
84%
84%
92%
0% 20% 40% 60% 80% 100%
1- & 2-Family homes Hotels & motels
Multifamily homes Residential board & care
Residential, other Rooming houses
Dormitories
Operating Alarms in Residential Occupancy Fires
Operated & ineffective
0.1%
Failed to operate
0.1%
Operated & effective
2%
Undetermined 5%
Fire too small 3%
None 90%
AES Status of All Residential Building Fires
Massachusetts Fire Incident Reporting System 2014 Page 29
Only You Can Make Your Home Safer for You and Your Family Efforts to reduce the incidence of fire and fire deaths must be focused on home fire safety to have the greatest impact. Increased maintenance of smoke alarms, installation of residential sprinklers, practice of home escape plans coupled with safer products such as self-extinguishing cigarettes, upholstered furniture that meets the California flammability standard, and flame resistant sleepwear for all ages can help make homes and the families who live in them safer from fire. Fires in One- and Two-Family Homes 5,037 Fires, 22 Civilian Deaths & $77.7 Million in Damage Five thousand and thirty-seven (5,037) building fires in one- and two-family homes caused 22 civilian deaths, 118 civilian injuries, 151 fire service injuries, and an estimated $77.7 million in property damage. In 2014, 34% of the Commonwealth's 14,733 residential building fires occurred in one- and two-family homes. The average dollar loss from these types of fires was $15,416. Fires in one- and two-family homes were down by 310, or 6%, from 5,347 in 2013. More fire deaths occurred in one- and two-family homes than all the other residential occupancies combined. Cooking & Heating Were the Leading Causes of Fires in 1- & 2-Family Homes Cooking caused 47% of incidents occurring in one- and two-family homes. Heating equipment caused 26% of these fires. Seven percent (7%) of one- and two-family residential building fires were caused by electrical problems. The unsafe and improper use of smoking materials and indoor rubbish fires each caused 3% of these fires. Clothes dryers, candles and arson each caused 1% of these fires. Juvenile-set fires, Christmas trees and fireworks each accounted for less than 1% of the fires in one- and two-family homes in 2014. Cooking is the leading cause of fires overall in every residential occupancy. Since 2008 cooking has overtaken heating equipment as the leading cause of fires in one- and two-family homes.

Massachusetts Fire Incident Reporting System 2014 Page 30
1- & 2-Family Home Fires Confined to Non-Combustible Containers
Incident Type # of
Incidents
% 1- & 2-Family
Home Fires
% Confined to Non-
combustible containers Dollar Loss
Avg. Dollar Loss
Cooking fires 2,146 43% 62% $ 321,330 $ 150 Chimney or flue fires 613 12% 18% $ 311,464 $ 508 Incinerator overload or malfunction 4 0.1% 0.1% $ 2 $ 1 Fuel burner/boiler malfunction, fire 558 11% 16% $ 137,772 $ 247 Commercial compactor fire, confined 0 0% 0% $ $ Trash or rubbish fire 137 3% 4% $ 6,054 $ 44 Total 3,458 69% 100% $ 776,622 $ 225
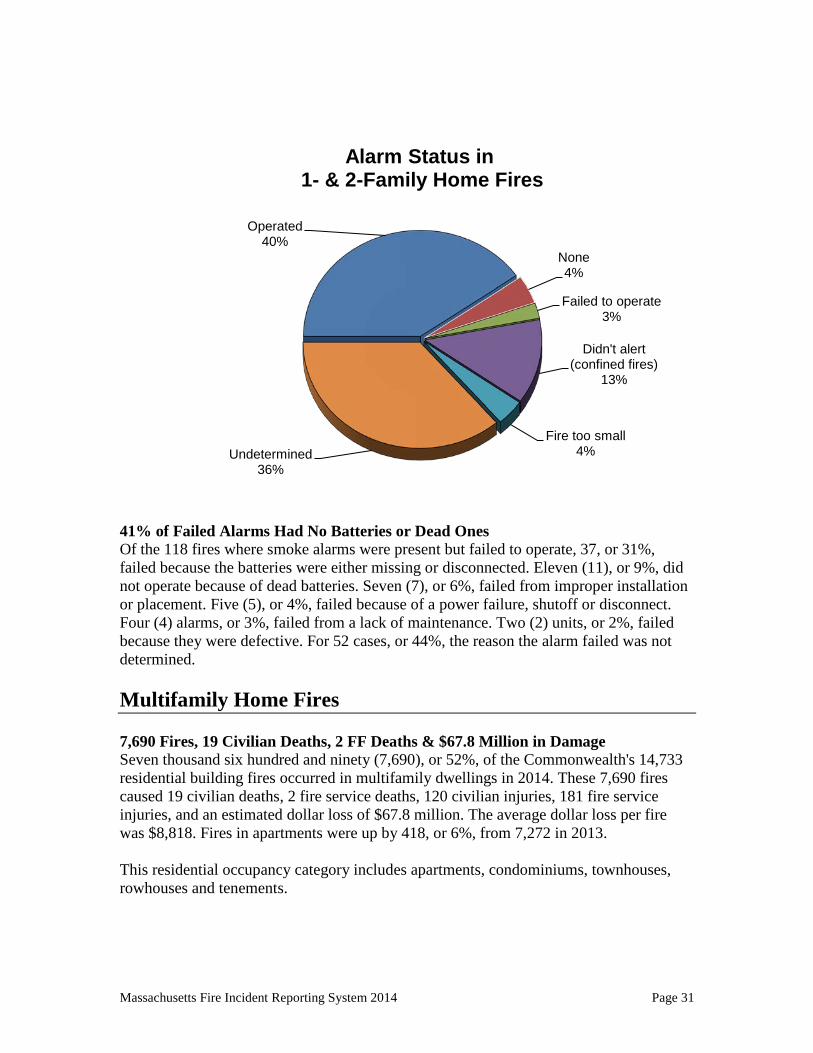
Alarms Alerted Occupants in 40% of Fires Alarms alerted occupants in 40% of one- and two-family residential fires. Smoke or heat alarms operated and alerted the occupants in 2,030, or 40%, of the one- and two-family home fires in 2014. In 13% of these fires6, the alarms did not alert the occupants. Alarms were present but did not operate in 2% of these incidents. In 4% of these fires, no alarms were present at all. The fire was too small to trigger the alarm in 4% of these residential fires. Smoke alarm performance was undetermined in 1,830 incidents, or 36%, of Massachusetts’ 2014 one- and two-family fires. 6 These represent confined fires where it was reported that the alarm did not alert the occupants.
0.02% 0.04% 0.2% 1% 1% 1%
3% 3%
7% 26%
47%
0% 10% 20% 30% 40% 50%
Fireworks Christmas tree fires Juvenile firesetting
Arson Candles
Clothes dryers Indoor rubbish fires
Smoking Electrical
Heating Cooking
Leading Causes of Fires in 1- & 2-Family Homes
Massachusetts Fire Incident Reporting System 2014 Page 31
41% of Failed Alarms Had No Batteries or Dead Ones Of the 118 fires where smoke alarms were present but failed to operate, 37, or 31%, failed because the batteries were either missing or disconnected. Eleven (11), or 9%, did not operate because of dead batteries. Seven (7), or 6%, failed from improper installation or placement. Five (5), or 4%, failed because of a power failure, shutoff or disconnect. Four (4) alarms, or 3%, failed from a lack of maintenance. Two (2) units, or 2%, failed because they were defective. For 52 cases, or 44%, the reason the alarm failed was not determined. Multifamily Home Fires 7,690 Fires, 19 Civilian Deaths, 2 FF Deaths & $67.8 Million in Damage Seven thousand six hundred and ninety (7,690), or 52%, of the Commonwealth's 14,733 residential building fires occurred in multifamily dwellings in 2014. These 7,690 fires caused 19 civilian deaths, 2 fire service deaths, 120 civilian injuries, 181 fire service injuries, and an estimated dollar loss of $67.8 million. The average dollar loss per fire was $8,818. Fires in apartments were up by 418, or 6%, from 7,272 in 2013. This residential occupancy category includes apartments, condominiums, townhouses, rowhouses and tenements.
Operated 40%
None 4%
Failed to operate 3%
Didn't alert (confined fires)
13%
Fire too small 4% Undetermined
36%
Alarm Status in 1- & 2-Family Home Fires
Massachusetts Fire Incident Reporting System 2014 Page 32
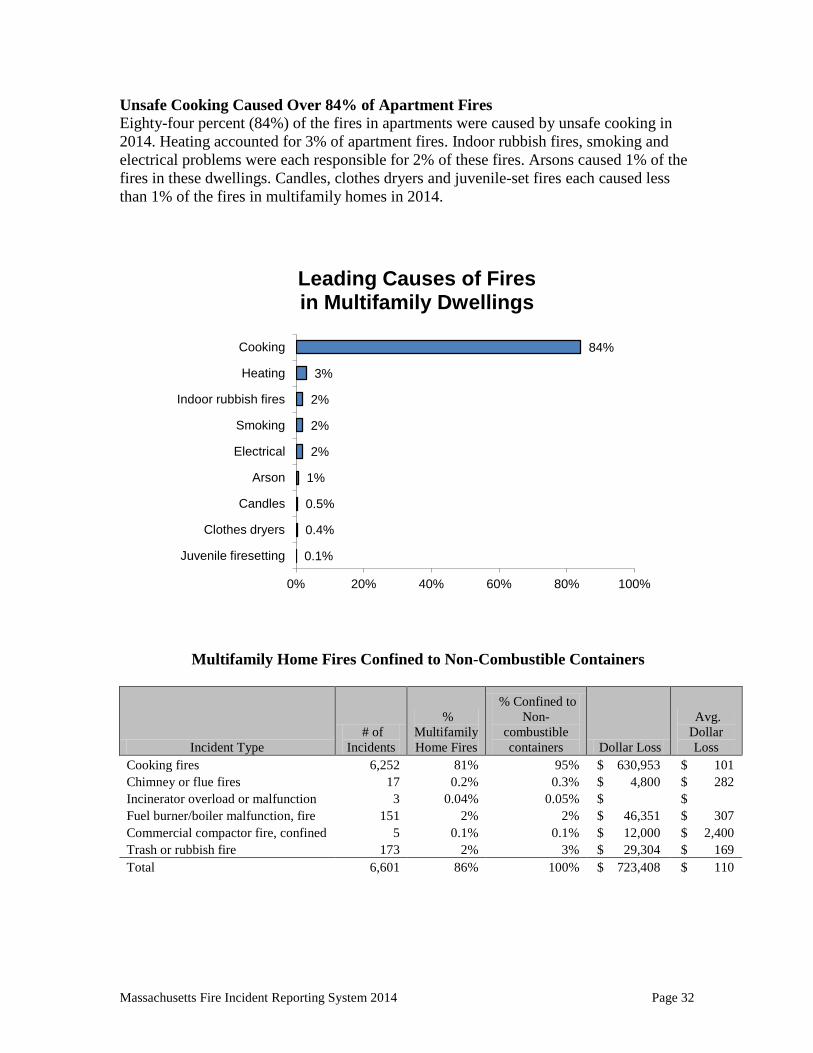
Unsafe Cooking Caused Over 84% of Apartment Fires Eighty-four percent (84%) of the fires in apartments were caused by unsafe cooking in 2014. Heating accounted for 3% of apartment fires. Indoor rubbish fires, smoking and electrical problems were each responsible for 2% of these fires. Arsons caused 1% of the fires in these dwellings. Candles, clothes dryers and juvenile-set fires each caused less than 1% of the fires in multifamily homes in 2014.
Multifamily Home Fires Confined to Non-Combustible Containers
Incident Type # of
Incidents
% Multifamily Home Fires
% Confined to Non-
combustible containers Dollar Loss
Avg. Dollar Loss
Cooking fires 6,252 81% 95% $ 630,953 $ 101 Chimney or flue fires 17 0.2% 0.3% $ 4,800 $ 282 Incinerator overload or malfunction 3 0.04% 0.05% $ $ Fuel burner/boiler malfunction, fire 151 2% 2% $ 46,351 $ 307 Commercial compactor fire, confined 5 0.1% 0.1% $ 12,000 $ 2,400 Trash or rubbish fire 173 2% 3% $ 29,304 $ 169 Total 6,601 86% 100% $ 723,408 $ 110
0.1%
0.4%
0.5%
1%
2%
2%
2%
3%
84%
0% 20% 40% 60% 80% 100%
Juvenile firesetting
Clothes dryers
Candles
Arson
Electrical
Smoking
Indoor rubbish fires
Heating
Cooking
Leading Causes of Fires in Multifamily Dwellings

Massachusetts Fire Incident Reporting System 2014 Page 33
Alarms Alerted Occupants in 3/4 of Fires Smoke or heat alarms operated and alerted the occupants in 5,736, or 75%, of the multifamily fires in 2014. In 5% of these fires7, the alarms did not alert the occupants. Alarms were present but did not operate in 1% of these incidents. In 1% of these fires, no alarms were present at all. The fire was too small to trigger the alarm in 2% of these residential fires. Smoke alarm performance was undetermined in 1,312 incidents, or 17%, of Massachusetts’ 2014 multifamily fires.
19% of Failed Alarms Failed Due to Power Failure, Shutoff or Disconnect Of the 59 fires where smoke alarms were present but failed to operate, 11, or 19%, failed because of a power failure, shutoff or disconnect. Eight (8), or 14%, failed because the batteries were either missing or disconnected. Three (3), or 5%, did not operate because of dead batteries. Three (3), or 5%, didn’t operate because of a lack of maintenance. One (1), or 2%, failed because it was defective. For 33 cases, or 56%, the reason the alarm failed was not classified or undetermined. All Other Residential Fires 2,006 Fires, 1 Civilian Death, 9 Civilian Injuries & $5 Million in Damages There were 2,006 reported fires in all the other residential property types in 2014. These 2,006 fires caused one civilian death, nine civilian injuries, nine fire service injuries and an estimated $5 million in damages. The average dollar loss per fire was $2,536. Only 6% of the 14,733 residential building fires in 2014 occurred in rooming houses, hotels or 7 These represent confined fires where it was reported that the alarm did not alert the occupants.
Operated 75%
None 1% Failed to
operate 1%
Didn't alert (confined fires)
5%
Fire too small 1%
Undetermined 17%
Alarm Status in Multifamily Fires
Massachusetts Fire Incident Reporting System 2014 Page 34
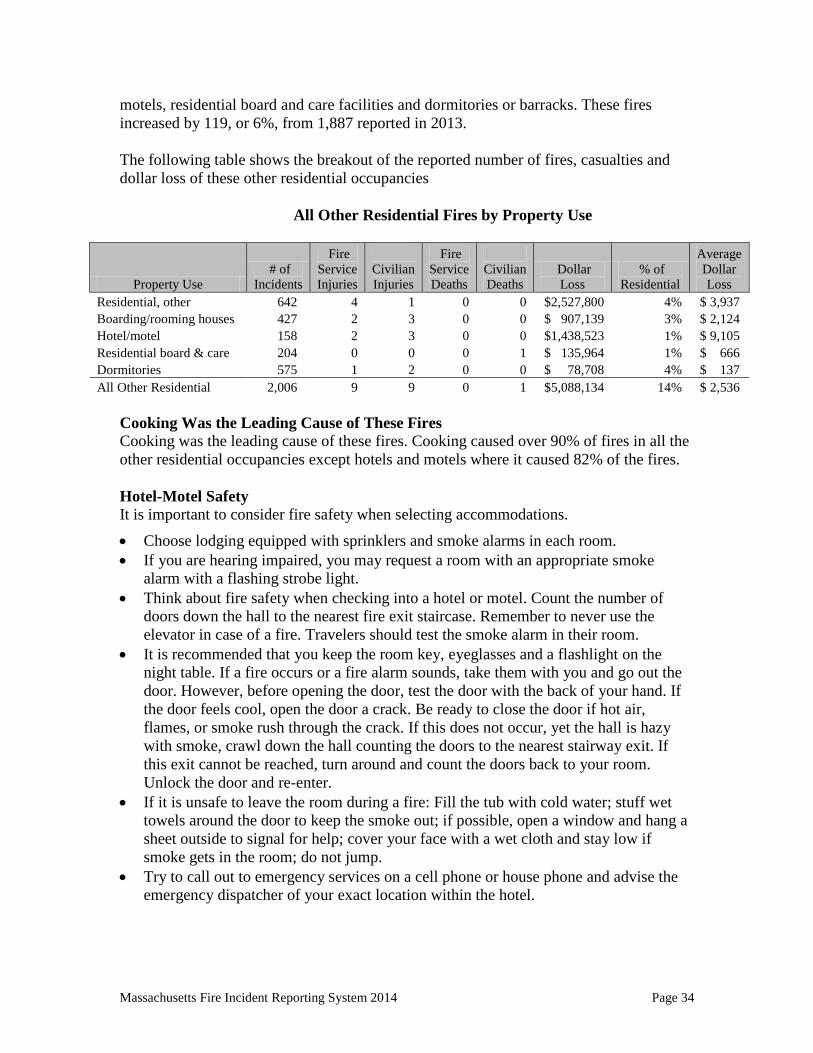
motels, residential board and care facilities and dormitories or barracks. These fires increased by 119, or 6%, from 1,887 reported in 2013. The following table shows the breakout of the reported number of fires, casualties and dollar loss of these other residential occupancies
All Other Residential Fires by Property Use
Property Use # of
Incidents
Fire Service Injuries
Civilian Injuries
Fire Service Deaths
Civilian Deaths
Dollar Loss
% of Residential
Average Dollar Loss
Residential, other 642 4 1 0 0 $2,527,800 4% $ 3,937 Boarding/rooming houses 427 2 3 0 0 $ 907,139 3% $ 2,124 Hotel/motel 158 2 3 0 0 $1,438,523 1% $ 9,105 Residential board & care 204 0 0 0 1 $ 135,964 1% $ 666 Dormitories 575 1 2 0 0 $ 78,708 4% $ 137 All Other Residential 2,006 9 9 0 1 $5,088,134 14% $ 2,536
Cooking Was the Leading Cause of These Fires Cooking was the leading cause of these fires. Cooking caused over 90% of fires in all the other residential occupancies except hotels and motels where it caused 82% of the fires. Hotel-Motel Safety It is important to consider fire safety when selecting accommodations.
• Choose lodging equipped with sprinklers and smoke alarms in each room. • If you are hearing impaired, you may request a room with an appropriate smoke
alarm with a flashing strobe light. • Think about fire safety when checking into a hotel or motel. Count the number of
doors down the hall to the nearest fire exit staircase. Remember to never use the elevator in case of a fire. Travelers should test the smoke alarm in their room.
• It is recommended that you keep the room key, eyeglasses and a flashlight on the night table. If a fire occurs or a fire alarm sounds, take them with you and go out the door. However, before opening the door, test the door with the back of your hand. If the door feels cool, open the door a crack. Be ready to close the door if hot air, flames, or smoke rush through the crack. If this does not occur, yet the hall is hazy with smoke, crawl down the hall counting the doors to the nearest stairway exit. If this exit cannot be reached, turn around and count the doors back to your room. Unlock the door and re-enter.
• If it is unsafe to leave the room during a fire: Fill the tub with cold water; stuff wet towels around the door to keep the smoke out; if possible, open a window and hang a sheet outside to signal for help; cover your face with a wet cloth and stay low if smoke gets in the room; do not jump.
• Try to call out to emergency services on a cell phone or house phone and advise the emergency dispatcher of your exact location within the hotel.
Massachusetts Fire Incident Reporting System 2014 Page 35
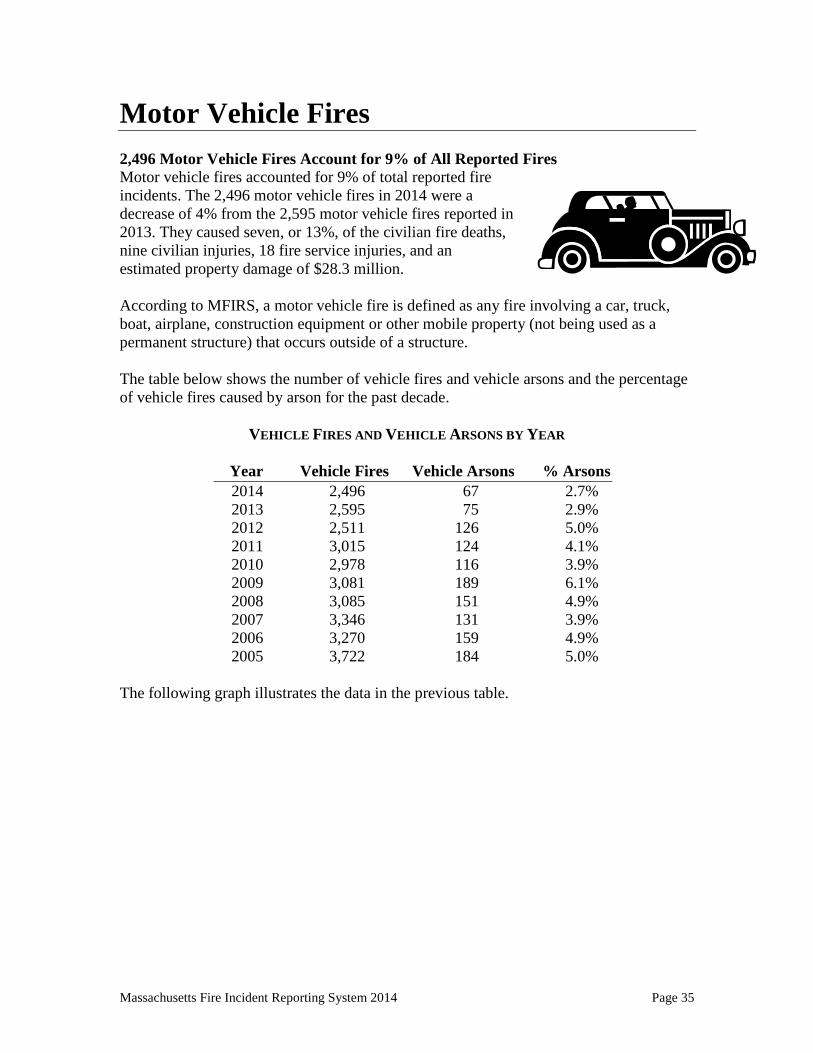
Motor Vehicle Fires 2,496 Motor Vehicle Fires Account for 9% of All Reported Fires Motor vehicle fires accounted for 9% of total reported fire incidents. The 2,496 motor vehicle fires in 2014 were a decrease of 4% from the 2,595 motor vehicle fires reported in 2013. They caused seven, or 13%, of the civilian fire deaths, nine civilian injuries, 18 fire service injuries, and an estimated property damage of $28.3 million. According to MFIRS, a motor vehicle fire is defined as any fire involving a car, truck, boat, airplane, construction equipment or other mobile property (not being used as a permanent structure) that occurs outside of a structure. The table below shows the number of vehicle fires and vehicle arsons and the percentage of vehicle fires caused by arson for the past decade.
VEHICLE FIRES AND VEHICLE ARSONS BY YEAR
Year Vehicle Fires Vehicle Arsons % Arsons 2014 2,496 67 2.7% 2013 2,595 75 2.9% 2012 2,511 126 5.0% 2011 3,015 124 4.1% 2010 2,978 116 3.9% 2009 3,081 189 6.1% 2008 3,085 151 4.9% 2007 3,346 131 3.9% 2006 3,270 159 4.9% 2005 3,722 184 5.0% The following graph illustrates the data in the previous table.

Massachusetts Fire Incident Reporting System 2014 Page 36
7 Motor Vehicle Fire Deaths8 There were seven civilian fire deaths in six motor vehicle fires in 2014. There were three deaths in two motor vehicle crashes with ensuing fire. Three (3) of these deaths were self-immolations in three separate fires. The cause of the other motor vehicle fire that killed one person was undetermined. Mechanical Failures Caused 1/4 of Massachusetts Motor Vehicle Fires Of the 2,496 motor vehicle fires in 2014, 25% were caused by some type of mechanical failure or malfunction; 3% were considered intentionally set; and 36% resulted from other accidental causes. The cause was undetermined or not reported in 36% of the motor vehicle fires. Motor Vehicle Arsons Decreased by 11% In 2014, there were 67 reported motor vehicle arsons. This is a decrease of 11% from the 75 reported in 2013. These 67 arsons caused three civilian deaths, which were suicides, three fire service injuries and an estimated dollar loss of $458,446. 8 On May 31, 2014, a private business jet crashed while taking off from Hanscom Field in Bedford, MA. Since the Dept. of Defense (DOD) has jurisdiction of Hanscom Field as it is part of Hanscom AFB, the 7 civilian deaths, 4 passengers & 3 crew members are attributed to the DOD as civilian fire deaths and not the Commonwealth of MA.
0
500
1,000
1,500
2,000
2,500
3,000
3,500
4,000
2005 2006 2007 2008 2009 2010 2011 2012 2013 2014
Motor Vehicle Fires & Arsons by Year
# of Fires # of Arsons Linear (# of Fires) Linear (# of Arsons)
Massachusetts Fire Incident Reporting System 2014 Page 37
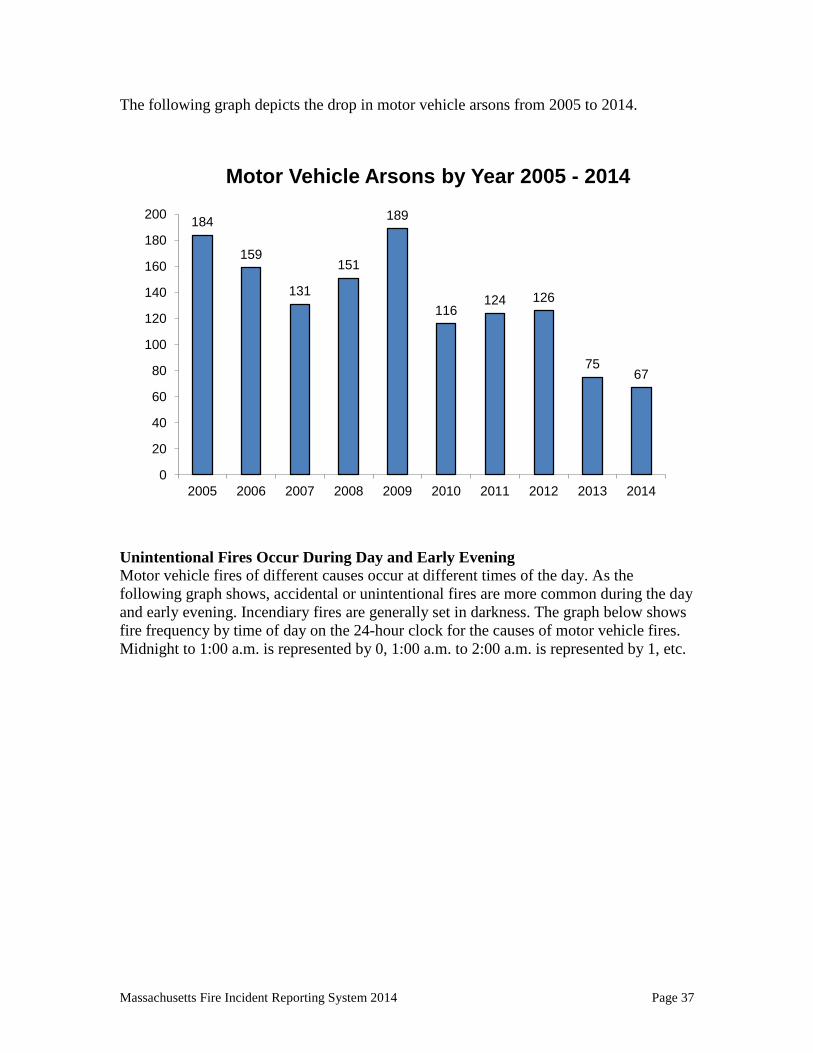
The following graph depicts the drop in motor vehicle arsons from 2005 to 2014.
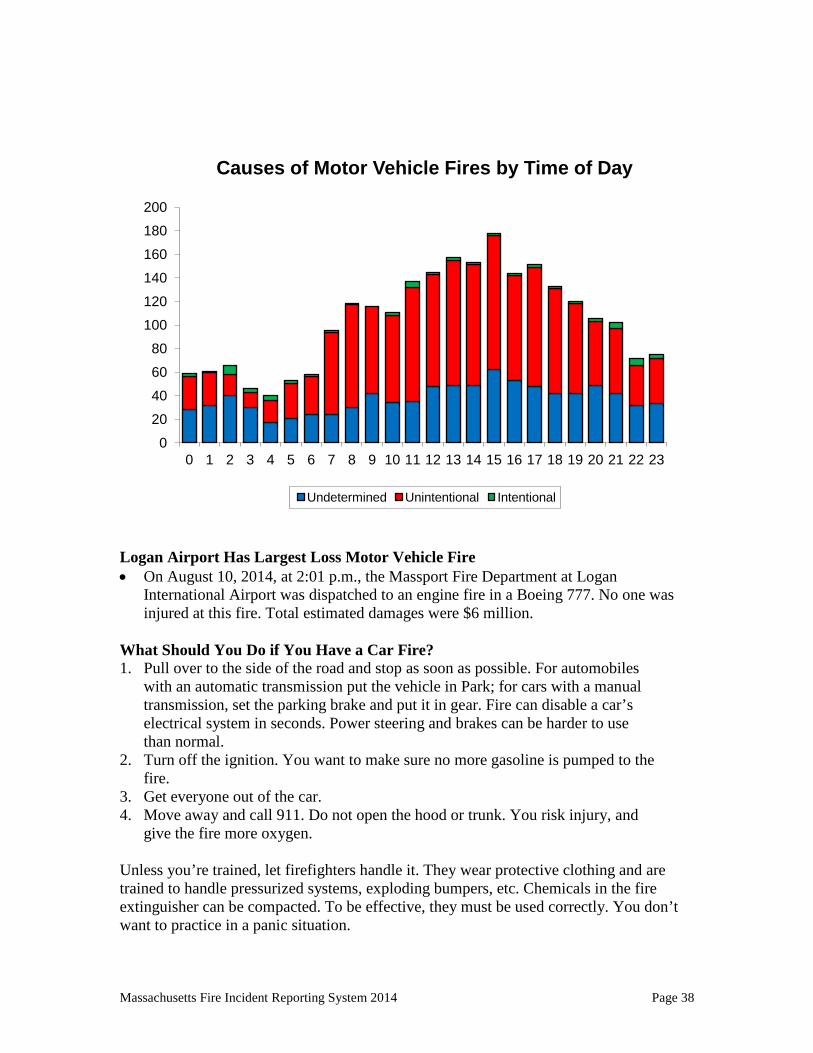
Unintentional Fires Occur During Day and Early Evening Motor vehicle fires of different causes occur at different times of the day. As the following graph shows, accidental or unintentional fires are more common during the day and early evening. Incendiary fires are generally set in darkness. The graph below shows fire frequency by time of day on the 24-hour clock for the causes of motor vehicle fires. Midnight to 1:00 a.m. is represented by 0, 1:00 a.m. to 2:00 a.m. is represented by 1, etc.
184
159
131
151
189
116 124 126
75 67
0
20
40
60
80
100
120
140
160
180
200
2005 2006 2007 2008 2009 2010 2011 2012 2013 2014
Motor Vehicle Arsons by Year 2005 - 2014
Massachusetts Fire Incident Reporting System 2014 Page 38
Logan Airport Has Largest Loss Motor Vehicle Fire • On August 10, 2014, at 2:01 p.m., the Massport Fire Department at Logan
International Airport was dispatched to an engine fire in a Boeing 777. No one was injured at this fire. Total estimated damages were $6 million.
What Should You Do if You Have a Car Fire? 1. Pull over to the side of the road and stop as soon as possible. For automobiles
with an automatic transmission put the vehicle in Park; for cars with a manual transmission, set the parking brake and put it in gear. Fire can disable a car’s electrical system in seconds. Power steering and brakes can be harder to use than normal.
2. Turn off the ignition. You want to make sure no more gasoline is pumped to the fire.
3. Get everyone out of the car. 4. Move away and call 911. Do not open the hood or trunk. You risk injury, and
give the fire more oxygen. Unless you’re trained, let firefighters handle it. They wear protective clothing and are trained to handle pressurized systems, exploding bumpers, etc. Chemicals in the fire extinguisher can be compacted. To be effective, they must be used correctly. You don’t want to practice in a panic situation.
0
20
40
60
80
100
120
140
160
180
200
0 1 2 3 4 5 6 7 8 9 10 11 12 13 14 15 16 17 18 19 20 21 22 23
Causes of Motor Vehicle Fires by Time of Day
Undetermined Unintentional Intentional
Massachusetts Fire Incident Reporting System 2014 Page 39
Gasoline Deserves Respect There were 74 motor vehicle fires at gas and service stations in 2014. There were 115 motor vehicle fires at facilities used for motor vehicle or boat sales, service or repairs. Many of these fires were started by gasoline or gasoline fumes. Gasoline is so much a part of our lives that we don’t think about it. However, it is a very dangerous substance and certain measures should be taken to minimize the chances of an incident. Gas Station Safety ♦ Turn off your car when you get gas. ♦ At self-service stations, remember to put the nozzle back and
your gas cap on before driving off. Monitor the fueling; do not get back in the vehicle.
♦ Gasoline vapors burn at a very low temperature. These fumes are heavier than air, and can travel a distance to find a spark. Keep anything that could provide heat to start a fire away from gasoline. A spark or a lit cigarette is enough to ignite the invisible fumes that may linger on clothing.
♦ If you need to carry or store gasoline, use an approved container. ♦ When filling an approved container, place it on the ground to prevent static electricity
build–up which could ignite the gasoline vapors. Make sure that the nozzle is always in contact with the container when filling.
♦ Make sure the approved container is in a secured, upright position away from passenger areas, and that the fill and vent openings are tightly closed. At home, always store these containers in safe, secure areas − outside of living areas − away from ignition sources such as pilot lights.
Outside and Other Fires
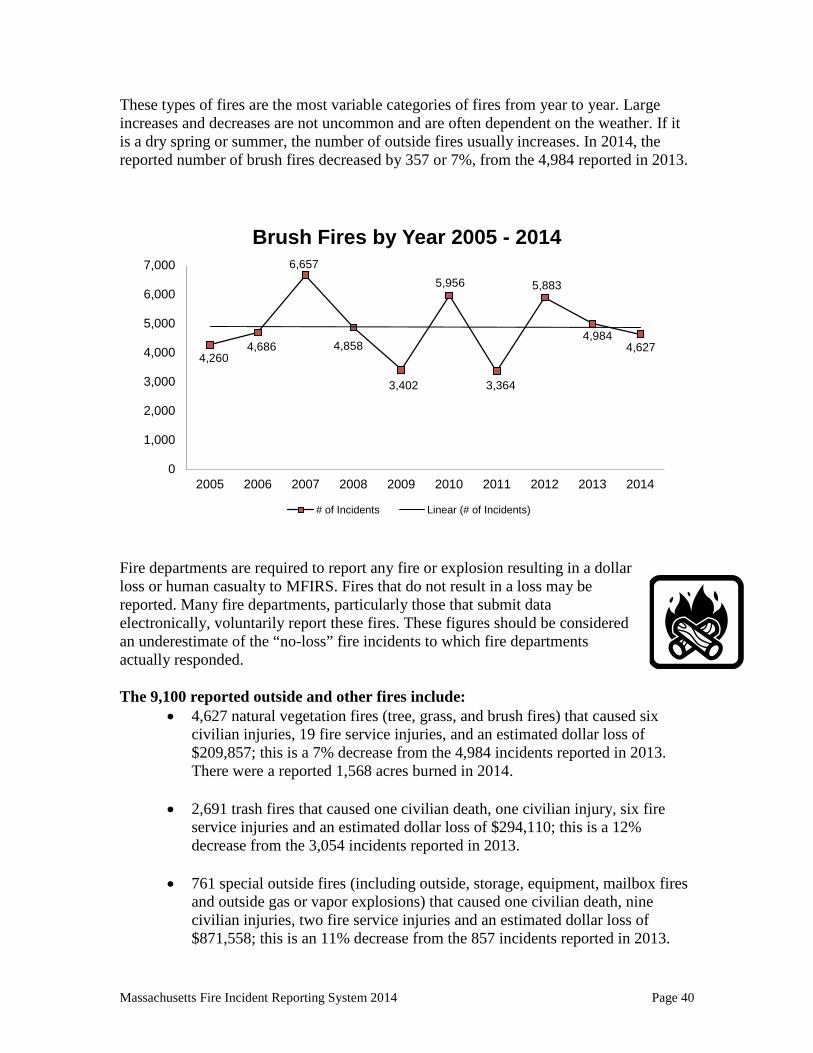
9,100 Brush, Trash, & Other Outside Fires Down 8% The 9,100 outside and other fires and explosions caused two civilian deaths, 33 civilian injuries, 35 fire service injuries, and an estimated dollar loss of $5 million. The 4,627 trees, grass and brush fires, 2,691 outside trash fires, 761 special outside fires, 39 cultivated vegetation or crop fires, and 982 other fires accounted for 31% of the total fire incidents in 2014. These fires decreased by 8% from the 9,924 incidents reported in 2013.
Massachusetts Fire Incident Reporting System 2014 Page 40
These types of fires are the most variable categories of fires from year to year. Large increases and decreases are not uncommon and are often dependent on the weather. If it is a dry spring or summer, the number of outside fires usually increases. In 2014, the reported number of brush fires decreased by 357 or 7%, from the 4,984 reported in 2013.
Fire departments are required to report any fire or explosion resulting in a dollar loss or human casualty to MFIRS. Fires that do not result in a loss may be reported. Many fire departments, particularly those that submit data electronically, voluntarily report these fires. These figures should be considered an underestimate of the “no-loss” fire incidents to which fire departments actually responded. The 9,100 reported outside and other fires include:
• 4,627 natural vegetation fires (tree, grass, and brush fires) that caused six civilian injuries, 19 fire service injuries, and an estimated dollar loss of $209,857; this is a 7% decrease from the 4,984 incidents reported in 2013. There were a reported 1,568 acres burned in 2014.
• 2,691 trash fires that caused one civilian death, one civilian injury, six fire
service injuries and an estimated dollar loss of $294,110; this is a 12% decrease from the 3,054 incidents reported in 2013.
• 761 special outside fires (including outside, storage, equipment, mailbox fires
and outside gas or vapor explosions) that caused one civilian death, nine civilian injuries, two fire service injuries and an estimated dollar loss of $871,558; this is an 11% decrease from the 857 incidents reported in 2013.
4,260 4,686
6,657
4,858
3,402
5,956
3,364
5,883
4,984 4,627
0
1,000
2,000
3,000
4,000
5,000
6,000
7,000
2005 2006 2007 2008 2009 2010 2011 2012 2013 2014
Brush Fires by Year 2005 - 2014
# of Incidents Linear (# of Incidents)
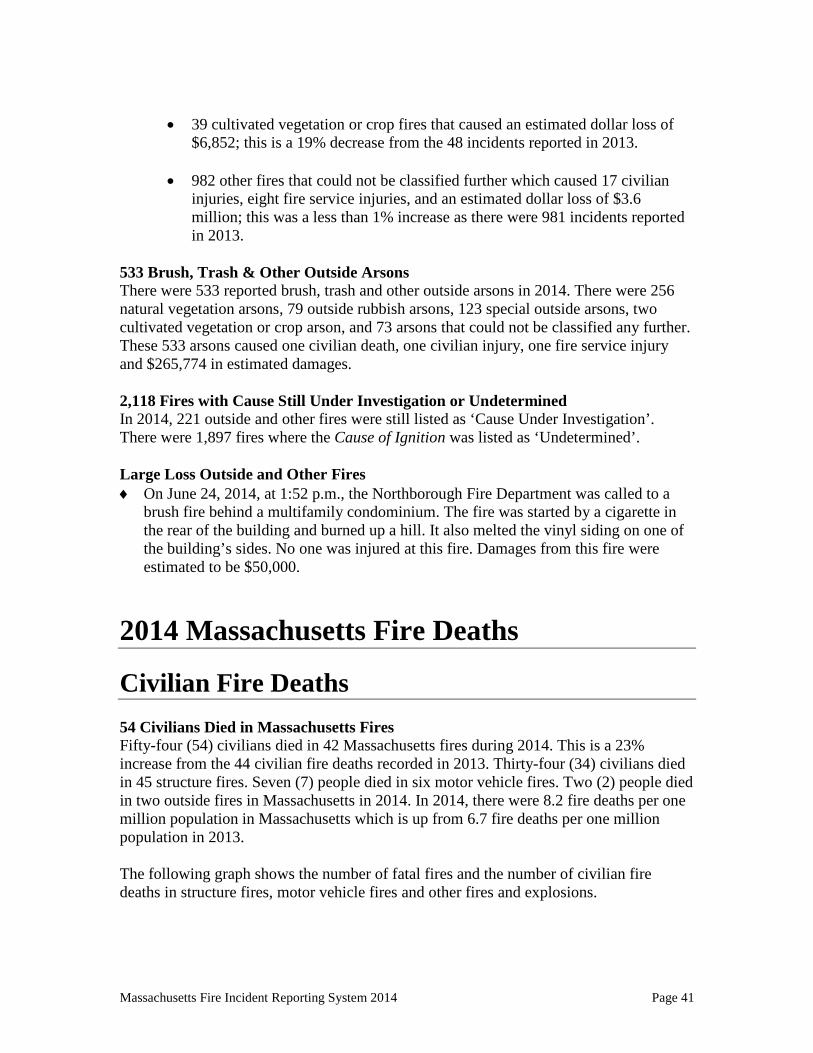
Massachusetts Fire Incident Reporting System 2014 Page 41
• 39 cultivated vegetation or crop fires that caused an estimated dollar loss of
$6,852; this is a 19% decrease from the 48 incidents reported in 2013. • 982 other fires that could not be classified further which caused 17 civilian
injuries, eight fire service injuries, and an estimated dollar loss of $3.6 million; this was a less than 1% increase as there were 981 incidents reported in 2013.
533 Brush, Trash & Other Outside Arsons There were 533 reported brush, trash and other outside arsons in 2014. There were 256 natural vegetation arsons, 79 outside rubbish arsons, 123 special outside arsons, two cultivated vegetation or crop arson, and 73 arsons that could not be classified any further. These 533 arsons caused one civilian death, one civilian injury, one fire service injury and $265,774 in estimated damages. 2,118 Fires with Cause Still Under Investigation or Undetermined In 2014, 221 outside and other fires were still listed as ‘Cause Under Investigation’. There were 1,897 fires where the Cause of Ignition was listed as ‘Undetermined’. Large Loss Outside and Other Fires ♦ On June 24, 2014, at 1:52 p.m., the Northborough Fire Department was called to a
brush fire behind a multifamily condominium. The fire was started by a cigarette in the rear of the building and burned up a hill. It also melted the vinyl siding on one of the building’s sides. No one was injured at this fire. Damages from this fire were estimated to be $50,000.
2014 Massachusetts Fire Deaths
Civilian Fire Deaths 54 Civilians Died in Massachusetts Fires Fifty-four (54) civilians died in 42 Massachusetts fires during 2014. This is a 23% increase from the 44 civilian fire deaths recorded in 2013. Thirty-four (34) civilians died in 45 structure fires. Seven (7) people died in six motor vehicle fires. Two (2) people died in two outside fires in Massachusetts in 2014. In 2014, there were 8.2 fire deaths per one million population in Massachusetts which is up from 6.7 fire deaths per one million population in 2013. The following graph shows the number of fatal fires and the number of civilian fire deaths in structure fires, motor vehicle fires and other fires and explosions.
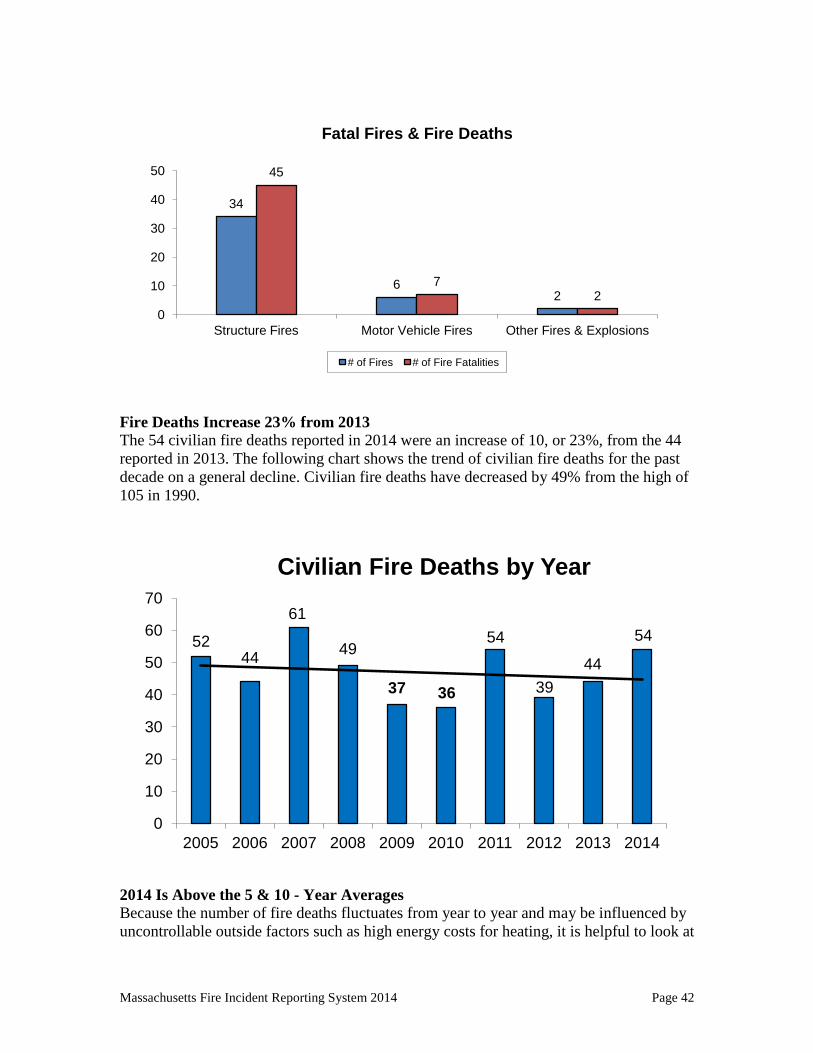
Massachusetts Fire Incident Reporting System 2014 Page 42
Fire Deaths Increase 23% from 2013 The 54 civilian fire deaths reported in 2014 were an increase of 10, or 23%, from the 44 reported in 2013. The following chart shows the trend of civilian fire deaths for the past decade on a general decline. Civilian fire deaths have decreased by 49% from the high of 105 in 1990.
2014 Is Above the 5 & 10 - Year Averages Because the number of fire deaths fluctuates from year to year and may be influenced by uncontrollable outside factors such as high energy costs for heating, it is helpful to look at
34
6 2
45
7 2
0
10
20
30
40
50
Structure Fires Motor Vehicle Fires Other Fires & Explosions
Fatal Fires & Fire Deaths
# of Fires # of Fire Fatalities
52 44
61
49
37 36
54
39 44
54
0
10
20
30
40
50
60
70
2005 2006 2007 2008 2009 2010 2011 2012 2013 2014
Civilian Fire Deaths by Year
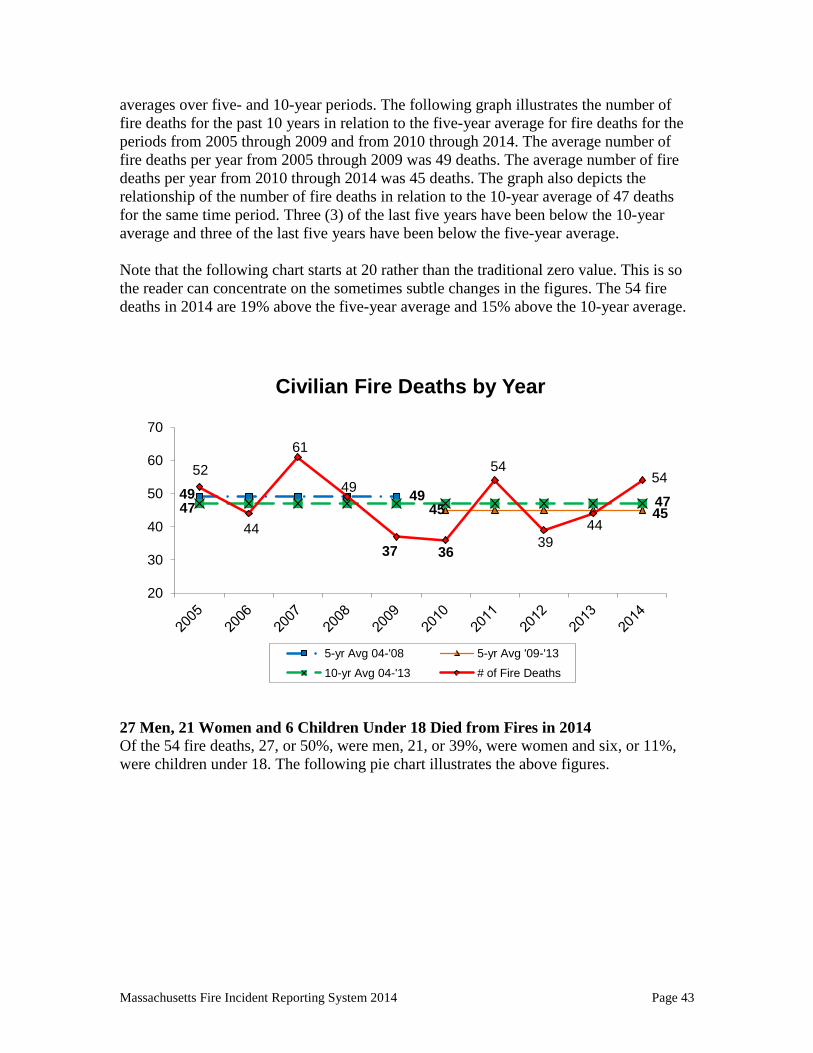
Massachusetts Fire Incident Reporting System 2014 Page 43
averages over five- and 10-year periods. The following graph illustrates the number of fire deaths for the past 10 years in relation to the five-year average for fire deaths for the periods from 2005 through 2009 and from 2010 through 2014. The average number of fire deaths per year from 2005 through 2009 was 49 deaths. The average number of fire deaths per year from 2010 through 2014 was 45 deaths. The graph also depicts the relationship of the number of fire deaths in relation to the 10-year average of 47 deaths for the same time period. Three (3) of the last five years have been below the 10-year average and three of the last five years have been below the five-year average. Note that the following chart starts at 20 rather than the traditional zero value. This is so the reader can concentrate on the sometimes subtle changes in the figures. The 54 fire deaths in 2014 are 19% above the five-year average and 15% above the 10-year average.
27 Men, 21 Women and 6 Children Under 18 Died from Fires in 2014 Of the 54 fire deaths, 27, or 50%, were men, 21, or 39%, were women and six, or 11%, were children under 18. The following pie chart illustrates the above figures.
49 49 45 45 47 47
52
44
61
49
37 36
54
39 44
54
20
30
40
50
60
70
Civilian Fire Deaths by Year
5-yr Avg 04-'08 5-yr Avg '09-'13
10-yr Avg 04-'13 # of Fire Deaths
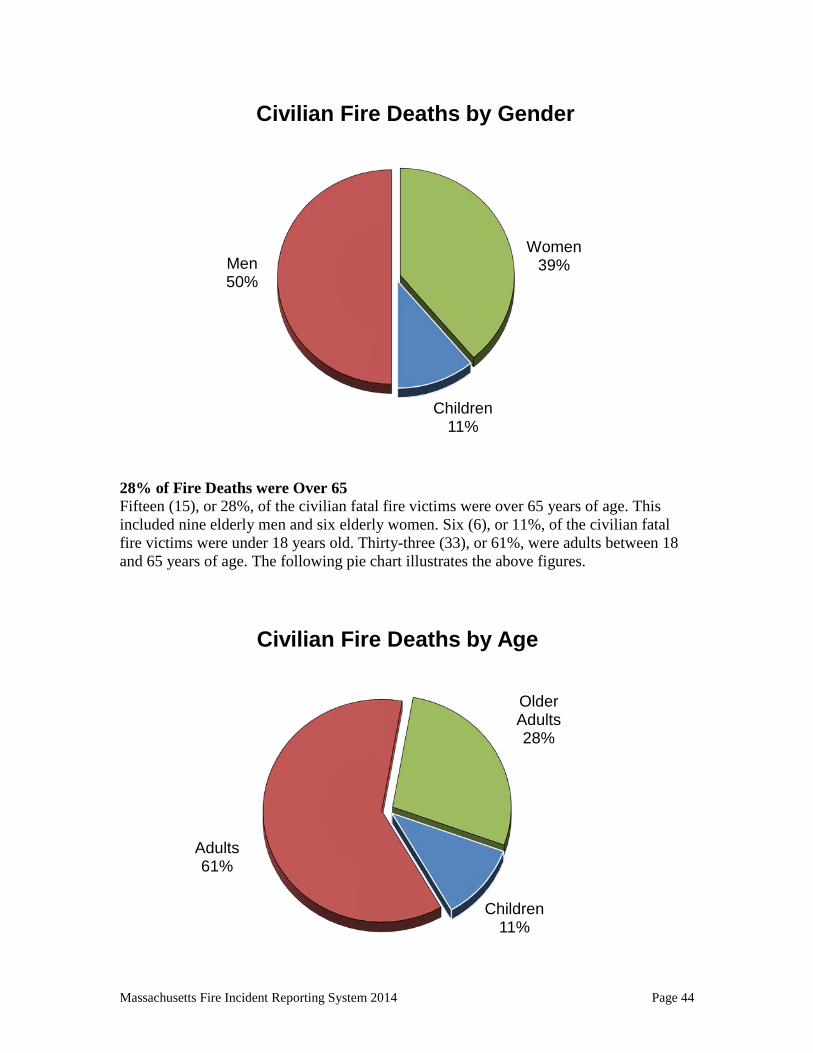
Massachusetts Fire Incident Reporting System 2014 Page 44
28% of Fire Deaths were Over 65 Fifteen (15), or 28%, of the civilian fatal fire victims were over 65 years of age. This included nine elderly men and six elderly women. Six (6), or 11%, of the civilian fatal fire victims were under 18 years old. Thirty-three (33), or 61%, were adults between 18 and 65 years of age. The following pie chart illustrates the above figures.
Children 11%
Men 50%
Women 39%
Civilian Fire Deaths by Gender
Children 11%
Adults 61%
Older Adults 28%
Civilian Fire Deaths by Age
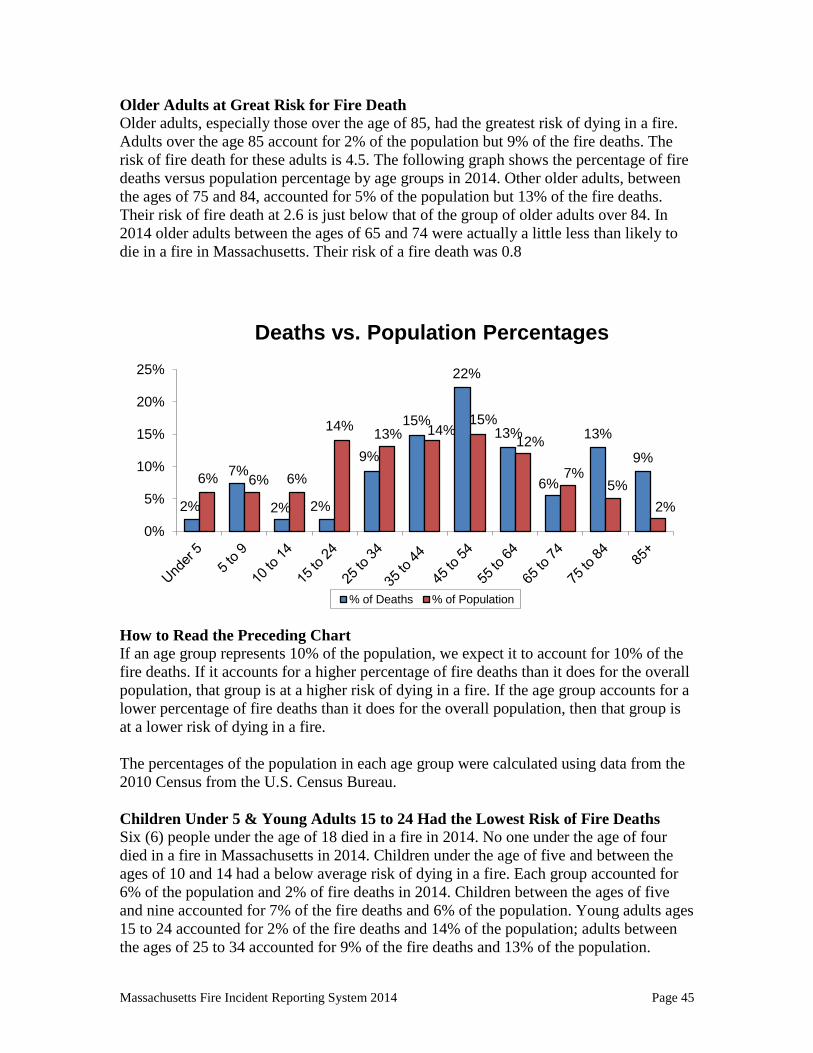
Massachusetts Fire Incident Reporting System 2014 Page 45
Older Adults at Great Risk for Fire Death Older adults, especially those over the age of 85, had the greatest risk of dying in a fire. Adults over the age 85 account for 2% of the population but 9% of the fire deaths. The risk of fire death for these adults is 4.5. The following graph shows the percentage of fire deaths versus population percentage by age groups in 2014. Other older adults, between the ages of 75 and 84, accounted for 5% of the population but 13% of the fire deaths. Their risk of fire death at 2.6 is just below that of the group of older adults over 84. In 2014 older adults between the ages of 65 and 74 were actually a little less than likely to die in a fire in Massachusetts. Their risk of a fire death was 0.8
How to Read the Preceding Chart If an age group represents 10% of the population, we expect it to account for 10% of the fire deaths. If it accounts for a higher percentage of fire deaths than it does for the overall population, that group is at a higher risk of dying in a fire. If the age group accounts for a lower percentage of fire deaths than it does for the overall population, then that group is at a lower risk of dying in a fire. The percentages of the population in each age group were calculated using data from the 2010 Census from the U.S. Census Bureau. Children Under 5 & Young Adults 15 to 24 Had the Lowest Risk of Fire Deaths Six (6) people under the age of 18 died in a fire in 2014. No one under the age of four died in a fire in Massachusetts in 2014. Children under the age of five and between the ages of 10 and 14 had a below average risk of dying in a fire. Each group accounted for 6% of the population and 2% of fire deaths in 2014. Children between the ages of five and nine accounted for 7% of the fire deaths and 6% of the population. Young adults ages 15 to 24 accounted for 2% of the fire deaths and 14% of the population; adults between the ages of 25 to 34 accounted for 9% of the fire deaths and 13% of the population.
2%
7%
2% 2%
9%
15%
22%
13%
6%
13%
9% 6% 6% 6%
14% 13% 14% 15%
12%
7% 5%
2%
0%
5%
10%
15%
20%
25%
Deaths vs. Population Percentages
% of Deaths % of Population

Massachusetts Fire Incident Reporting System 2014 Page 46
Adults between the ages of 35 and 44 accounted for 15% of the fire fatalities and account for 14% of the population; people ages 45 to 54 accounted for 22% fatal fire victims and 15% of the Massachusetts population. Victims between the ages of 55 to 64 accounted for 13% of the fatal fire deaths and 12% of the population; and older adults between the ages of 65 and 74 accounted for 7% of the fire fatalities in Massachusetts in 2014, but only 7% of the population. Older adults between the ages of 75 and 84 had the second greatest risk of dying in a fire; they accounted for 13% of the fire deaths in 2014, and only 5% of the population, making them just over two and a half (2.6) times more likely to die in a fire, and adults over the age of 84 represent 2% of the total population but accounted for 9% of the deaths making them four and a half times more likely to die in a fire. Children Now at Lower Risk of Dying in Fires in the Commonwealth Contrary to national trends, children are no longer at a disproportionate risk of dying in fires in Massachusetts. The following graph illustrates the number of child (age <18) fire fatalities in Massachusetts from 1988 through 2014. You can see a definite downward trend in the number of fire related deaths to children from a high of 25 in 1994 to a low of one in 2006, 2010, 2011 and 2012. According to United States Fire Administration statistics, children under 10 accounted for an estimated 10% of all fire-related deaths nationally in 2010.9 In 2014, children under 10 accounted for three of the Massachusetts fire-related deaths. Child Fire Deaths Drop 50% Since the Start of the S.A.F.E. Program Fire deaths of children under age 18 have fallen by 50% since the start of the S.A.F.E. Program in the fall of 1995.
9 Source: United States Fire Administration’s Fire Risk in 2011, Topical Fire Research Series, Vol. 15 – Issue 8 January 2015 and Fire Risk to Children in 2010, Topical Fire Research Series, Vol. 14 – Issue 8 August 2014. Most recent national data available.
25
12
9 8 10
6
11
4 7
4 4 5
1
7 5 5
1 1 1 3 6
0
5
10
15
20
25
30
1994
1995
1996
1997
1998
1999
2000
2001
2002
2003
2004
2005
2006
2007
2008
2009
2010
2011
2012
2013
2014
Child Fire Deaths by Year
S.A.F.E. Program Started Fall 1995
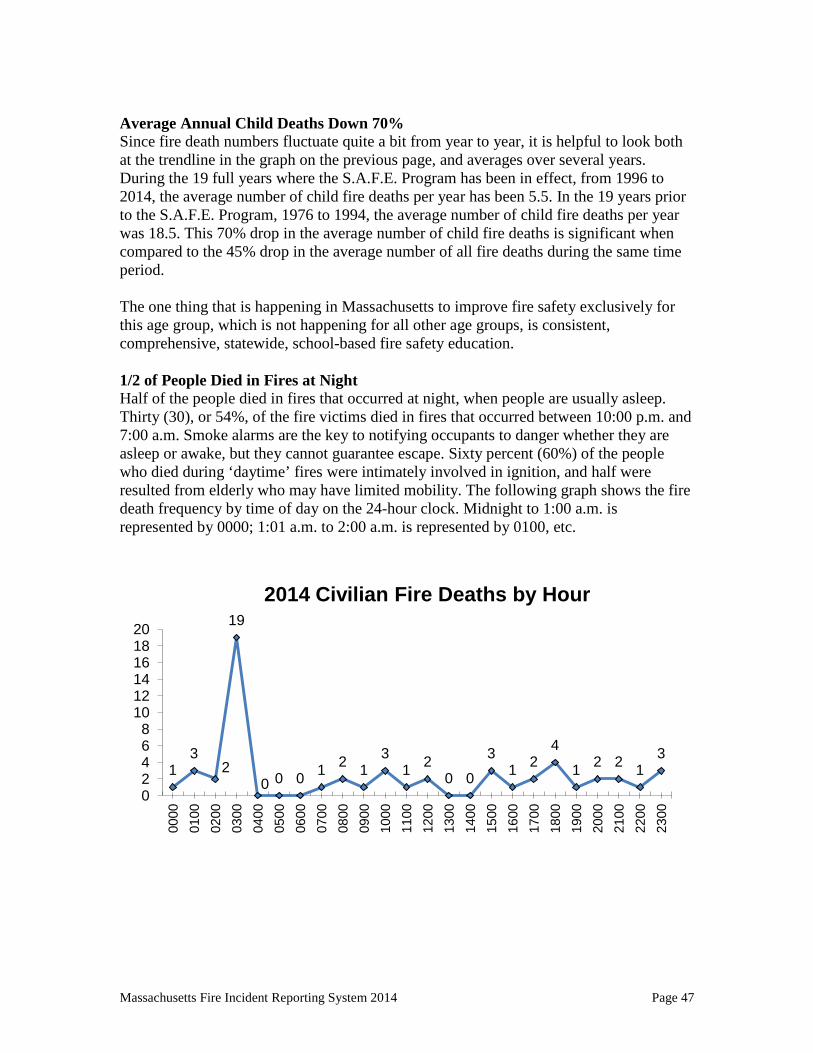
Massachusetts Fire Incident Reporting System 2014 Page 47
Average Annual Child Deaths Down 70% Since fire death numbers fluctuate quite a bit from year to year, it is helpful to look both at the trendline in the graph on the previous page, and averages over several years. During the 19 full years where the S.A.F.E. Program has been in effect, from 1996 to 2014, the average number of child fire deaths per year has been 5.5. In the 19 years prior to the S.A.F.E. Program, 1976 to 1994, the average number of child fire deaths per year was 18.5. This 70% drop in the average number of child fire deaths is significant when compared to the 45% drop in the average number of all fire deaths during the same time period. The one thing that is happening in Massachusetts to improve fire safety exclusively for this age group, which is not happening for all other age groups, is consistent, comprehensive, statewide, school-based fire safety education. 1/2 of People Died in Fires at Night Half of the people died in fires that occurred at night, when people are usually asleep. Thirty (30), or 54%, of the fire victims died in fires that occurred between 10:00 p.m. and 7:00 a.m. Smoke alarms are the key to notifying occupants to danger whether they are asleep or awake, but they cannot guarantee escape. Sixty percent (60%) of the people who died during ‘daytime’ fires were intimately involved in ignition, and half were resulted from elderly who may have limited mobility. The following graph shows the fire death frequency by time of day on the 24-hour clock. Midnight to 1:00 a.m. is represented by 0000; 1:01 a.m. to 2:00 a.m. is represented by 0100, etc.
1 3
2
19
0 0 0 1 2 1 3
1 2 0 0
3 1 2
4
1 2 2 1 3
0 2 4 6 8
10 12 14 16 18 20
0000
01
00
0200
03
00
0400
05
00
0600
07
00
0800
09
00
1000
11
00
1200
13
00
1400
15
00
1600
17
00
1800
19
00
2000
21
00
2200
23
00
2014 Civilian Fire Deaths by Hour
Massachusetts Fire Incident Reporting System 2014 Page 48
Structure Fire Deaths In 2014, there were 45 structure fire deaths in 34 fatal fires. All but three of the structure fire deaths occurred in residential occupancies. All (6) children under the age of 18 died in structure fires in Massachusetts. In 2014, two non-residential structure fires killed three civilians. • On May 5, 2014, at 6:15 p.m., the Brockton Fire Department responded to a fatal fire
in a wooded area. It is believed that the two homeless victims, a 55-year old woman and her 48-year old male companion where living in a tent and using a camping stove to keep warm. No one else was injured at this fire. The most probably cause was that the stove somehow ignited the tent and the victims were unable to escape.
• On September 22, 2014, at 5:26 p.m., the Hyannis Fire Department responded to a
fatal fire in a shed in backyard of a 1-family home. Three (3) young boys were playing in the shed. They were playing with a cigarette lighter and started a small fire. It is believed that one of the boys used gasoline thinking it was water to try and extinguish the, but in turn this just caused the fire to grow. One (1) of the boys was trapped by the fire while the other two were able to escape the shed. The victim, an eight-year old boy was killed in the fire. His two friends were injured in this fire.
Residential Building Fire Deaths Most Fire Deaths Occur in the Home The majority of fire deaths occur in residential occupancies. We focus our analysis on these deaths because it is where prevention can yield the greatest results or have the most impact. In 2014, there were 42 fire deaths in 32 fatal residential building fires. This represents 93% of the structure fire deaths and 78% of all fire deaths. Twenty-two (22) fire deaths occurred in 19 fires in one- and two-family dwellings; 19 fire deaths occurred in 12 apartment fires; and one fire death occurred in a fire at residential board and care facility. Typically more fatal fires and associated deaths occur in one- and two-family homes than occur in apartment fires or other residential occupancies. Electrical Fires Are Leading Cause of Fire Deaths In 2014, electrical problems were the leading cause of residential fire deaths and fatal residential fires. These fires accounted for 15, or 36%, of residential fire deaths. Careless disposal of smoking materials was the second leading cause of fire deaths, accounting for nine, or 21%, of residential fire deaths. Heating caused four deaths, or 10% of residential fire deaths. Arson10, candles and cooking each caused two, or 5%, of these fire deaths.
10 One of these arson fire deaths was a self-immolation.

Massachusetts Fire Incident Reporting System 2014 Page 49
Eight (8), or 19%, of these deaths occurred in fires where no cause could be determined or multiple causes could not be ruled out. The following graph illustrates the number of residential building fire deaths and the number of fatal residential building fires by cause. The classifications are ranked by the percentage of fire deaths that they caused.
8 Fatal Electrical Fires Cause 15 Deaths Fifteen (15) people died in eight residential electrical fires in 2014. Electrical fires accounted for 36% of residential fire deaths and 25% of fatal residential fires. • On January 25, 2014, at 7:54 p.m., the Boston Fire Department was called to a fatal
electrical fire in a single-family home. The fire was started by an extension cord in the basement. The victim, an 81-year old woman was found inside the home by a neighbor and brought outside. Efforts to resuscitate her failed. No one else was injured at this fire. There were no alarms present in the building. There were no sprinklers. The fire caused an estimated $150,000 worth of damage.
• On February 22, 2014, at 9:07 p.m., the Boston Fire Department was called to a fatal
electrical fire in a three-unit apartment building. Electrical wiring in a second floor bedroom was the cause of the fire. The victim, a 90-year old man, was overcome by smoke inhalation. His 88-year old wife was also injured at this fire. Alarms were
19
12
1
22 19
1 0
5
10
15
20
25
1- or 2-Family dwellings Multi-family dwellings Residential board & care
Residential Fire Deaths By Occupancy
# of Incidents
22%
6%
6%
6%
9%
25%
25%
19%
5%
5%
5%
10%
21%
36%
0% 10% 20% 30% 40%
Undetermined
Cooking
Candles
Arson
Heating
Smoking
Electrical
Causes of Residential Fatal Fires and Fire Deaths
% of Deaths % of Fatal Fires

Massachusetts Fire Incident Reporting System 2014 Page 50
present but it was undetermined if they operated. There were no sprinklers in the home. The fire caused an estimated $100,000 worth of damage.
• On May 5, 2014, at 11:57 p.m., the Weston Fire Department was called to a fatal
electrical fire in a single-family home. The fire began in a detached garage with an apartment in the back. The cause of the fire was an overheated extension cord that was being used to power a ‘trickle’ charger for a pickup truck that was parked nearby. The cord ran under several pieces of heavy equipment inside the garage. The victim, a 68-year old man, was not able to escape and was overcome by the heat and smoke of the fire. No one else was injured at this fire. It was undetermined if alarms were present in the garage. There were no sprinklers. The fire caused an estimated $150,000 worth of damage. It also spread to the nearby pickup truck causing $10,000 in estimated damages.
• On July 10, 2014, at 3:59 a.m., the Lowell Fire Department was called to a fatal
electrical fire in a nine-unit apartment building. The fire began in a concealed wall space between the second and third floors caused by arcing in the building’s wiring. There were seven victims of this fire living in two different apartments. A 7-year old girl, a 9-year old boy, a 12-year old boy, a 32-year old man, a 37-year old woman, a 44-year old woman, and a 72-year old man all died in this fire because their exits were blocked by the ferocity of the fire and they were trapped above the fire. No one else was injured at this fire. Alarms were present in the home but it was undetermined if they operated. Sprinklers were not present. Damages were estimated to be $500,000.
• On August 3, 2014, at 3:52 a.m., the Springfield Fire Department was called to a fatal
electrical fire in a 13-unit apartment building. The fire was started by an electrical arcing in the structural area of a third floor bathroom. The victim, a 49-year old woman was overcome by the heat and smoke while she was escaping. She was transported to a local hospital where she succumbed to her injuries. One (1) other civilian was injured at this fire. There were alarms present in the building but they failed to operate because of dead batteries. There were no sprinklers. The fire caused an estimated $30,000 worth of damage.
• On August 21, 2014, at 7:32 a.m., the Boston Fire Department was called to a fatal
electrical fire in a three-unit apartment building. The fire was started by an electrical cord or plug in the first floor kitchen. The victim, a 40-year old man was found in the basement. Neighbors said that they saw him helping others escape the fire. No one else was injured at this fire. Alarms were present and operated. There were no sprinklers. The fire caused an estimated $700,000 worth of damage. It also spread to an adjacent building and caused an estimated $150,000 in damages.
• On September 26, 2014, at 5:37 p.m., the Ashburnham Fire Department was called to
a fatal electrical fire in a single-family home. The fire was started by an electrical outlet that had a power strip plugged into it in a children’s bedroom. The victim, an 88-year old physically disabled woman was overcome by the heat and smoke. Three

Massachusetts Fire Incident Reporting System 2014 Page 51
(3) other civilians were injured at this fire. It was undetermined if there were alarms present in the building. There were no sprinklers. The fire caused an estimated $500,000 worth of damage.
• On October 21, 2014, at 3:40 a.m., the Lawrence Fire Department was called to a
fatal electrical fire in a six-unit apartment building. The fire was started by arcing of a circuit in the ceiling and floor assembly. The victims, a 4-year old boy and his 9-year old brother were sleeping and trapped by the fire. One (1) civilian and two firefighters were injured at this fire. It was undetermined if alarms were present. There were no sprinklers. The fire caused an estimated $525,000 worth of damage.
8 Fatal Smoking Fires Cause 9 Deaths in Homes In 2014, the improper use and disposal of smoking materials caused nine, or 21%, of residential building fire deaths and eight, or 25%, of fatal residential building fires. 1 Elderly Fire Death Caused by Smoking In 2014, only one of the older adult fire deaths were caused by the improper disposal of smoking materials while at home. In 2013, three older adults were killed in fatal fires. In 2012 no one over the age of 65 died in a smoking fire. In 2010 six older adults died in smoking-related fires. In 2009, seven older adults died in smoking-related fires. In 2008, four older adults died in smoking fires and in 2007, nine older adults died in a smoking-related fire. In 2006 only one older adult died in one of these fires; in 2005 there were two of these deaths; and in 2004 there were no fire deaths to older adults caused by smoking at home. You will note some common threads as you read the following summaries of the fatal fires caused by smoking materials, such as people falling asleep in the living room on upholstered furniture, or in bed while smoking, and with no working smoke alarms in the building. • On February 4, 2014, at 1:49 a.m., the Lowell Fire Department was called to a fatal
smoking fire in a six-unit apartment building. The victim, a 41-year old woman, fell asleep while she was smoking in bed. No one else was injured at this fire. Alarms were present but they failed to operate because of dead batteries. Sprinklers were not present. Damages were estimated to be $30,000.
• On March 30, 2014, at 11:21 p.m., the Fitchburg Fire Department was called to a fatal
smoking fire in a single-family home. The victims, a 40-year old woman and a 22-year old man were sleeping at the time of the fire. Another civilian was injured at this fire. There alarms were present. There were no sprinklers. Damages from this fire were estimated to be $110,000. The fire spread to a neighboring building caused $20,000 in damages.
• On April 4, 2014, at 3:08 p.m., the Waltham Fire Department was called to a fatal
smoking fire in a 12-unit rooming house. The 51-year old male victim fell asleep and his cigarette started the fire. There were no other injuries at this fire. The alarm in the

Massachusetts Fire Incident Reporting System 2014 Page 52
victim’s room was dismantled but the hard-wired alarms in the common areas were present and alerted the other occupants of the building. There were no sprinklers. Damages from this fire were estimated to be $70.
• On May 31 2014, at 10:48 a.m., the Dartmouth District #1 Fire Department was
called to a fatal smoking fire in a single-family home. The victim was a 64-year old woman. The fire was caused by an abandoned cigarette in a bedroom on a non-upholstered chair. No one else was injured at this fire. Battery powered smoke alarms were present but failed to operate because of dead batteries. There were no sprinklers. Damages from this fire were estimated to be $35,000.
• On September 18 2014, at 10:35 p.m., the North Attleboro Fire Department was
called to a fatal smoking fire in a single-family home. The fire was caused by an abandoned cigarette on a living room sofa. The victim, a 39-year old man, was found in the kitchen with the faucet running. No one else was injured at this fire. It was undetermined if alarms were present There were no sprinklers. Damages from this fire were estimated to be $99,500.
• On December 9, 2014, at 9:23 a.m., the Waltham Fire Department was called to a
fatal smoking fire in a single-family home. The fire was started by a cigarette on the living room couch. The victim, a 53-year old man, was overcome while trying to escape the fire. There were no other injuries at this fire. There were no alarms, and the home did not have any sprinklers. Damages from this fire were estimated to be $250,000.
• On December 28, 2014, at 8:18 a.m., the Taunton Fire Department was called to a
fatal smoking fire in a three-unit apartment building. The fire was started by a cigarette. The victim, a 48-year old man, was sleeping and was overcome while trying to return to the vicinity of the fire. There were no other injuries at this fire. Alarms were in the building and operated, but the home did not have any sprinklers. Damages from this fire were estimated to be $110,000.
• On December 29, 2014, at 8:58 p.m., the Chelmsford Fire Department was called to a
fatal smoking fire at a residential board and care facility. The fire was started by a cigarette on the living room couch. The victim, a 76-year old man, was smoking in bed when he ignited his bedding. There were no other injuries at this fire. Alarms were present and alerted the other occupants to the fire. The building did have sprinklers and they suppressed the fire until firefighters could arrive and fully extinguish it. Damages from this fire were estimated to be $70,000.
Smoking on Oxygen Using home oxygen increases the risk of fires and burns. When more oxygen is in the air, fires will burn hotter and faster. In 2014, no one died in a fire that was using oxygen while smoking. In 2013, one person was killed in a smoking fire while home oxygen was in use.
Massachusetts Fire Incident Reporting System 2014 Page 53
3 Fatal Heating Fires Caused 4 Deaths Three (3) fatal heating fires, or 9% of fatal residential building fires, caused four, or 10%, of the residential building fire deaths in 2014. • On February 12, 2014, at 3:56 a.m., the Cambridge Fire Department responded to a
fatal heating fire at a three-unit apartment building. The fire began with an electrical malfunction of an electrical baseboard heater in a bedroom on the second floor. The victim, a 40-year old woman was trapped by the fire. No one else was injured at this fire. Alarms were present but it was undetermined if they operated. The building was not sprinklered. Damages from this fire were estimated to be $900,000.
• On February 26, 2014, at 3:10 a.m., the Methuen Fire Department responded to a
fatal heating fire at a single-family home. The cause of the fire was the ignition of combustible materials too close to the fireplace. The victims, an 82-year old man and his 78-year old wife, were asleep at the time of the fire and were overcome by the heat and smoke when they attempted to escape. No one else was injured at this fire. It was undetermined if alarms were present, and the building was not sprinklered. Damages from this fire were not estimated.
• On November 2, 2014, at 4:27 p.m., the Chatham Fire Department responded to a
fatal heating fire at a single-family home. Embers from the fireplace ignited combustibles that were placed too close to it. The victim, an 80-year old physically disabled man was overcome while he was trying to escape the fire. He was transported to a Boston hospital where he succumbed to his injuries. No one else was injured at this fire. Alarms were present, but it was undetermined if they operated. The building did not have any sprinklers. Damages from this fire were estimated to be $300,000.
2 Fatal Arson Fires Caused 2 Deaths Two (2) fatal arson fires, or 6% of fatal residential building fires, caused two, or 5%, of the residential building fire deaths in 2014. One (1) of these two fires was a self-immolation. • On April 15, 2014, at 8:26 a.m., the New Bedford Fire Department was called to a
fatal arson fire in a single-family home. An incendiary device was ignited in a second floor bedroom. The victim, a 29-year old man, was physically restrained at the time of the fire. No one else was injured at this fire. It was undetermined if alarms were present. The home was not sprinklered. Damages from this fire were estimated to be $40,000.
• On October 26, 2014, at 12:10 p.m., the Holden Fire Department was called to a fatal
self-immolation fire in a single-family home. The victim, a 51-year old man, went into a basement closet and ignited gasoline that he had poured around himself. One (1) firefighter was injured at this fire. Alarms were present and they did operate, but the victim was intimately involved with the ignition of the fire. The home was not sprinklered. Damages from this fire were estimated to be $336,400.
Massachusetts Fire Incident Reporting System 2014 Page 54
2 Fatal Candle Fires Caused 2 Deaths Two (2) fatal candle fires, or 6% of fatal residential building fires, caused two, or 5%, of the residential building fire deaths in 2014. • On March 24, 2014, at 1:49 a.m., the Fall River Fire Department was dispatched to a
fatal candle fire in a single-family home. A candle had ignited a chair in the living room. The victim, a 41-year old woman, was transported to a Rhode Island hospital where she succumbed to her injuries during the following week. No one else was injured at this fire. It was undetermined if alarms were present. The home did not have any sprinklers Damages from this fire were estimated to be $65,000.
• On October 23, 2014, at 3:32 p.m., the Springfield Fire Department was called to a
fatal candle fire in a single-family home. The candle ignited a living room chair. The victim, a 64-year old physically disabled woman, was overcome by the smoke generated by the fire. She was transported to a local hospital where she succumbed to her injuries. No one else was injured at this fire. Alarms were present but did not operate because of missing batteries. The building was not sprinklered. Damages from the blaze were estimated to be $75,000.
2 Killed in 2 Cooking Fires Two (2) people died in two fatal residential cooking fires in 2014. Cooking fires accounted for 5% of residential fire deaths and 6% of fatal fires in residential buildings. Cooking was the leading cause of fire deaths in 2013. • On May 27, 2014, at 12:50 p.m., the Everett Fire Department was called to a fatal
cooking fire in an apartment building. The victim, a 91-year old woman, was cooking on the stove when the clothes she was wearing ignited. No one else was injured at this fire. She was transported to a local hospital where she succumbed to her injuries about a month later. Alarms were present but the fire was too small to activate them. The home was not sprinklered. Damages from this fire were not estimated.
• On December 3, 2014, at 10:19 a.m., the Winchester Fire Department was called to a
fatal cooking fire in a 300-unit apartment building. The victim, a 63-year old woman, was most likely cooking when her clothing ignited. No one else was injured at this fire. Alarms were present and alerted the other occupants of the building. The building was sprinklered but the fire was too small to activate them. Damages from this fire were estimated to be $10,000.
7 Fatal Fires of Undetermined Cause Seven (7) fatal residential building fires that took the lives of eight Massachusetts residents in 2014 remain undetermined. These represent 22% of the fatal residential fires, and 19% of the residential fire deaths in 2014. The cause of over one-third of all residential fire deaths could not be definitely determined after investigation. According to the National Fire Protection Association (NFPA) standard 921, Chapter 16.2.4, whenever the cause of a fire cannot be proven, the proper classification is “undetermined.” NFPA
Massachusetts Fire Incident Reporting System 2014 Page 55
921, Chapter 16.2.5 advises that, “Undetermined is also acceptable when multiple fire causes or ignition factors cannot be eliminated, leaving the investigator with most probable causes.” • On January 9, 2014, at 11:6 a.m., the Lunenburg Fire Department was dispatched to a
fire in a single-family home of undetermined cause. The fire began in the first floor living room. The victim, an 85-year old physically disabled man, was overcome while he tried to escape. There were no other injuries associated with this fire. Smoke alarms were present but failed to operate due to a missing battery. The building was not sprinklered. Damages from this fire were estimated to be $105,000.
• On January 22, 2014, at 1:04 a.m., the Springfield Fire Department was called to a
fatal fire in a two-family home of undetermined cause. The fire originated on the second floor. The victim, a 70-year old woman, was overcome by the heat and smoke while she was escaping when her escape route was blocked by the fire. No one else was injured at this fire. It was undetermined if alarms were present and the building was not sprinklered. Damages from the blaze were estimated to be $140,000.
• On February 14, 2014, at 3:13 a.m., the Concord Fire Department was dispatched to a
fire in a single-family home of undetermined cause. The victims, an 89-year old man, and his 83-year old wife were trapped inside their home. There were no other injuries associated with this fire. It was undetermined if alarms were present and the building was not sprinklered. Damages from this fire were estimated to be $500,000.
• On March 4, 2014, at 9:07 p.m., the Gardner Fire Department was called to a fatal
fire in a 30-unit apartment building of undetermined cause. The fire started in a third floor living room. It is believed that the victim, a 58-year old man, was intimately involved with the ignition of the fire. He was transported to a local hospital where he succumbed to his injuries. No one else was injured at this fire. Alarms were present and alerted the other occupants of the building. The building was not sprinklered. Damages from the blaze were estimated to be $175,000.
• On April 14, 2014, at 3:35 a.m., the Methuen Fire Department was called to a fatal
fire in a single-family home of undetermined cause. The fire originated in the first floor living room where the victim, a 48-year old woman, was asleep at the time of the fire. No one else was injured at this fire. An alarm that was on a piece of furniture was present and operated. The building was not sprinklered. Damages from the blaze were not estimated.
• On April 21, 2014, at 2:24 a.m., the Marlborough Fire Department was dispatched to
a fire in a single-family home of undetermined cause. The fire began in a first floor bedroom. The victim, a 45-year old physically disabled woman, was in the area of fire origin. She was transported to a local hospital where she later succumbed to her injuries. There were three other civilian injuries and one firefighter injury associated with this fire. Alarms were present and alerted the occupants to the fire. The building was not sprinklered. Damages from this fire were estimated to be $250,000.

Massachusetts Fire Incident Reporting System 2014 Page 56
• On August 9, 2014, at 10:42 p.m., the Revere Fire Department was called to a fatal
fire in an 8-unit apartment building of undetermined cause. The most probable cause was either the careless disposal of smoking materials or an electrical problem in the room of origin. The fire started on the third floor. The victim, a 64-year old man, was in the area of origin when the fire began. One other civilian and six firefighters were also injured at this fire. Alarms were present and alerted the other occupants of the building. The building was not sprinklered. Damages from the blaze were estimated to be $700,000. The fire spread to two other buildings causing $700,000 and $12,000 in estimated damages.
Bedroom or Living Room is the Area of Origin for 43% of Fire Victims Given that most fatal fires occur at night, and that many people fall asleep in their living rooms, it is not surprising that 43% were killed in fires that started in the bedroom or living room. 20, or 43%, of residential fire victims died in a fire originating in the bedroom or living room. 11 victims, or 26%, died in fires that began in the bedroom, and nine, or 17%, succumbed to fires that originated in the living room. Fires that started in the ceiling and floor assembly areas killed 9 civilians, or 21%. Three (3) victims, or 7%, died when the area of origin was the kitchen. Unclassified function rooms and unclassified structural areas were each the area of origin of the fire for two, or 5%, of the residential fire deaths in 2014. A closet and an unclassified area of origin were each the area of origin of the fire for one, or 2%, of the residential fire deaths in 2014. Six (6) victims, or 14%, died in fires where the area or origin was undetermined. 1/2 of Deaths Involved Operating Equipment as a Heat Source Of the 42 residential building fire deaths, 50% were classified as heat from operating equipment; 31% from arcing, 12% from undetermined operating equipment, and 7% from sparks, embers or flames from operating equipment. Twenty-one percent (21%) involved smoking materials; 19% from cigarettes and 2% from undetermined smoking materials. Candles caused 5%; and an incendiary device was the heat source in 2% of these deaths. The Heat Source was undetermined or unclassified in nine deaths, or 21%, of the residential building fire deaths in 2014. Structural Member Was the Leading Item 1st Ignited in Residential Fire Deaths Of the 42 residential building fire deaths, structural member or framing was the item first ignited in 21% of these deaths. Bedding was the item first ignited in 14% and an upholstered sofa or chair in 10% of residential fire deaths. Electrical wire or cable insulation, an uncontained flammable liquid, a non-upholstered sofa or chair, an empty pallet, a rug, carpet or mat, soft goods or wearing apparel, an unclassified structural component, and wearing apparel on a person were each the item first ignited in 2% of these fire deaths. Multiple items first ignited were involved in one, or 2% of these deaths. The item first ignited was undetermined or unclassified in 14, or 34%, of the residential building fire deaths in 2014. The National Association of State Fire Marshals (NASFM) has supported mandatory national fire safety standards for mattresses and upholstered furniture. NASFM and
Massachusetts Fire Incident Reporting System 2014 Page 57
CPSC have recommended the adoption of 16 CFR 1634 – Standard for the Flammability of Residential Upholstered Furniture (Proposed Rule). This is based on the revised California standard (California Technical Bulletins 116 & 117) for upholstered furniture that addresses both small open flame (match, lighter, candle) and cigarette ignitions These standards make the average piece of furniture less likely to ignite rapidly, and if ignited, less likely to burn quickly or sustain burning11. The CPSC has adopted 16 CFR 1632 – Standard for the Flammability of Mattresses and Mattress Pads, and 16 CFR 1633 – Standard for the Flammability (Open Flame) of Mattress Sets. Although many buildings and building materials help contain fires, the problem is that all of the contents we have inside our homes are more flammable than ever and create ever increasing levels of toxic gases when they burn. Alarms Operation Undetermined for 52% of Residential Fire Victims Of the 42 people who died in residential building fires in 2014, the smoke alarm performance was reported for 20 of the victims. Victims were not alerted by smoke alarms in eight fires that killed nine people, or 22% of the victims. No alarms were present at all in three fires that were responsible for four, or 10%, of the deaths. In five deaths, or 12%, there were alarms present but they failed to operate. Ten (10) people died in 10 separate residential fires with alarms that did operate, accounting for 24% of fatal fire victims. It is important to remember that alarms provide an early warning of a fire. They do not guarantee an escape if exits are blocked or an individual’s clothing ignites. A fire that appears small when discovered can quickly grow beyond an individual’s ability to control or escape it. There was one fatal fire where the fire was too small to activate the alarm. That accounted for one death, or 2% of the residential fire deaths in 2014. In 2014, eight of the 10 fatal residential fire victims whose smoke alarms operated were in the area of origin. All eight of these victims were intimately involved with ignition; two were smoking, one was cooking, one committed suicide and the cause of the other four was undetermined. Two (2) other victims were not in the area of origin and not involved in the ignition of the fires. While smoke alarms cannot by themselves save a person who is directly involved in the ignition, they can alert other occupants to the danger and give them precious time to escape to safety. 11 There has been some debate about the use of certain types of flame retardant used to make products conform to these standards. The issue is about using polybrominated diphenyl ethers (PBDEs) that have caused health concerns in animals in lab tests. According to the U.S. Environmental Protection Agency (EPA) production of these chemicals ceased in 2004 and their use will end when existing stocks are exhausted. The National Association of State Fire Marshals (NASFM) is working with health and environment toxicologists, the EPA and the U.S. Consumer Product Safety Commission (CPSC) in assuring that there are many other fire retardant chemicals that can be used with confidence on upholstered furniture.

Massachusetts Fire Incident Reporting System 2014 Page 58
Alarm performance was undetermined in 13 residential building fires that killed 22 people12, accounting for 52% of the residential building fire deaths in 2014. In one of these, fires alarms were present but it was undetermined if they operated. The pie chart shows the smoke alarm status as a percentage of the civilian residential building fire deaths in 2014.
No Working Smoke Alarms in 36% of Fire Deaths in 1 & 2-Family Homes In 2014, you were more likely to die in a fire in a one- and two-family home than in any other residence and one without a working smoke alarm. There were 10% more fire deaths in one- and two-family homes than all other residential occupancies combined. Twenty-two (22) people died in 19 one- and two-family dwelling fires in 2014. Eight (8), or 36%, of the fire deaths in one- and two-family homes occurred in fires with no alarms at all or with alarms that failed to operate. Of these three deaths, four occurred in homes where smoke alarms failed to work while the other four deaths were in homes where there were no smoke alarms present. Three (3) deaths, or 14%, occurred in homes where the smoke alarms operated. Eleven (11) deaths, or 50%, occurred in four fires where smoke alarm performance was undetermined. Other Residential Occupancies More Likely to be Protected by Smoke Alarms Twenty (20) people died in 13 apartment fires in 2014. The alarm performance was known for nine of the victims. Seven (7) people died in fires where smoke alarms were present and working. One person was killed in a fire where the alarm failed to operate because of a dead battery. Alarms were present but the fire was too small to activate them in one fire that killed one person. Eleven (11) people died in nine fires where alarm operation was undetermined. 12 One of these fires was the Lowell electrical fire that killed seven occupants of the apartment building.
Operated 24%
Fire too small 2%
Failed to operate 12%
None 10%
Undetermined 52%
Smoke Detector Operation for Fatal Residential Fires
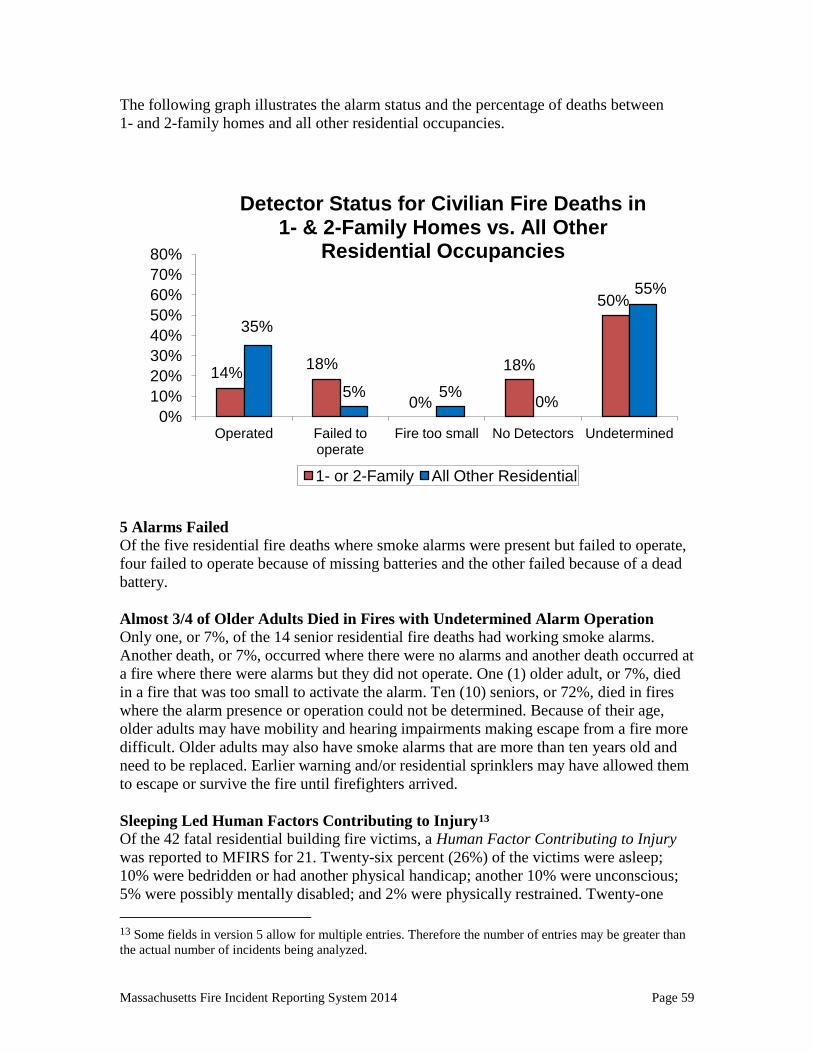
Massachusetts Fire Incident Reporting System 2014 Page 59
The following graph illustrates the alarm status and the percentage of deaths between 1- and 2-family homes and all other residential occupancies.
5 Alarms Failed Of the five residential fire deaths where smoke alarms were present but failed to operate, four failed to operate because of missing batteries and the other failed because of a dead battery. Almost 3/4 of Older Adults Died in Fires with Undetermined Alarm Operation Only one, or 7%, of the 14 senior residential fire deaths had working smoke alarms. Another death, or 7%, occurred where there were no alarms and another death occurred at a fire where there were alarms but they did not operate. One (1) older adult, or 7%, died in a fire that was too small to activate the alarm. Ten (10) seniors, or 72%, died in fires where the alarm presence or operation could not be determined. Because of their age, older adults may have mobility and hearing impairments making escape from a fire more difficult. Older adults may also have smoke alarms that are more than ten years old and need to be replaced. Earlier warning and/or residential sprinklers may have allowed them to escape or survive the fire until firefighters arrived. Sleeping Led Human Factors Contributing to Injury13 Of the 42 fatal residential building fire victims, a Human Factor Contributing to Injury was reported to MFIRS for 21. Twenty-six percent (26%) of the victims were asleep; 10% were bedridden or had another physical handicap; another 10% were unconscious; 5% were possibly mentally disabled; and 2% were physically restrained. Twenty-one 13 Some fields in version 5 allow for multiple entries. Therefore the number of entries may be greater than the actual number of incidents being analyzed.
14% 18%
0%
18%
50% 35%
5% 5% 0%
55%
0% 10% 20% 30% 40% 50% 60% 70% 80%
Operated Failed to operate
Fire too small No Detectors Undetermined
Detector Status for Civilian Fire Deaths in 1- & 2-Family Homes vs. All Other
Residential Occupancies
1- or 2-Family All Other Residential
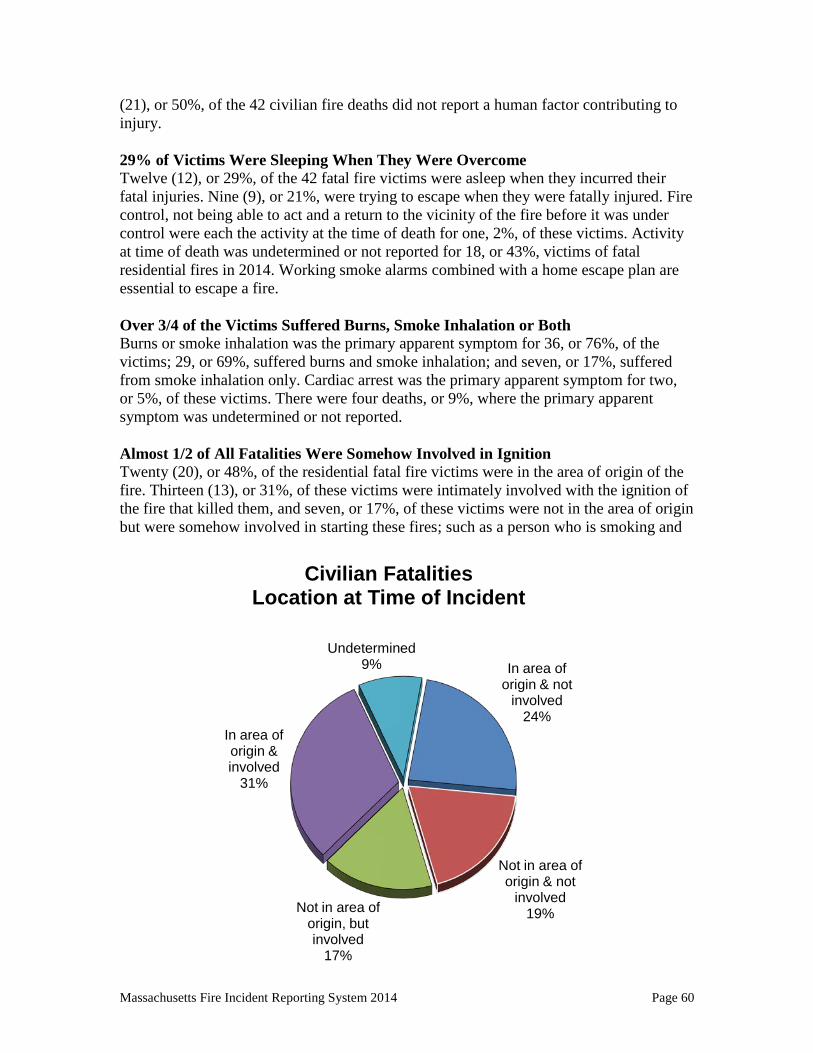
Massachusetts Fire Incident Reporting System 2014 Page 60
(21), or 50%, of the 42 civilian fire deaths did not report a human factor contributing to injury. 29% of Victims Were Sleeping When They Were Overcome Twelve (12), or 29%, of the 42 fatal fire victims were asleep when they incurred their fatal injuries. Nine (9), or 21%, were trying to escape when they were fatally injured. Fire control, not being able to act and a return to the vicinity of the fire before it was under control were each the activity at the time of death for one, 2%, of these victims. Activity at time of death was undetermined or not reported for 18, or 43%, victims of fatal residential fires in 2014. Working smoke alarms combined with a home escape plan are essential to escape a fire. Over 3/4 of the Victims Suffered Burns, Smoke Inhalation or Both Burns or smoke inhalation was the primary apparent symptom for 36, or 76%, of the victims; 29, or 69%, suffered burns and smoke inhalation; and seven, or 17%, suffered from smoke inhalation only. Cardiac arrest was the primary apparent symptom for two, or 5%, of these victims. There were four deaths, or 9%, where the primary apparent symptom was undetermined or not reported. Almost 1/2 of All Fatalities Were Somehow Involved in Ignition Twenty (20), or 48%, of the residential fatal fire victims were in the area of origin of the fire. Thirteen (13), or 31%, of these victims were intimately involved with the ignition of the fire that killed them, and seven, or 17%, of these victims were not in the area of origin but were somehow involved in starting these fires; such as a person who is smoking and
In area of origin & not
involved 24%
Not in area of origin & not
involved 19% Not in area of
origin, but involved
17%
In area of origin & involved
31%
Undetermined 9%
Civilian Fatalities Location at Time of Incident
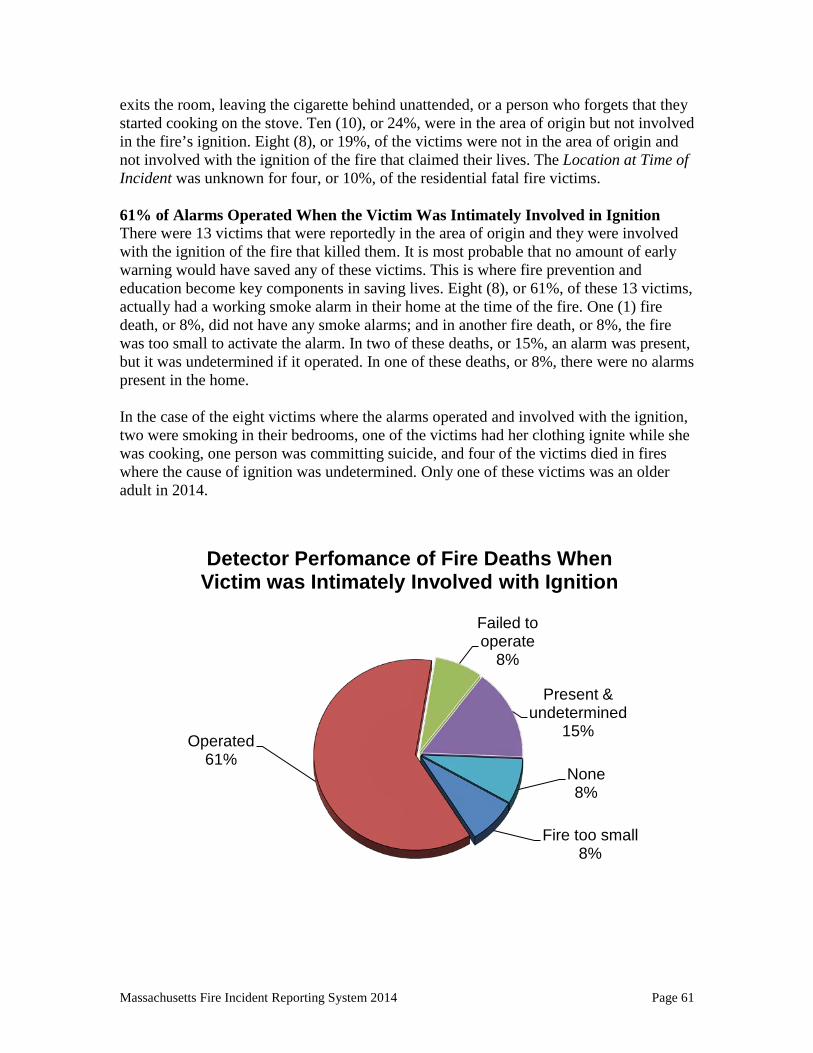
Massachusetts Fire Incident Reporting System 2014 Page 61
exits the room, leaving the cigarette behind unattended, or a person who forgets that they started cooking on the stove. Ten (10), or 24%, were in the area of origin but not involved in the fire’s ignition. Eight (8), or 19%, of the victims were not in the area of origin and not involved with the ignition of the fire that claimed their lives. The Location at Time of Incident was unknown for four, or 10%, of the residential fatal fire victims. 61% of Alarms Operated When the Victim Was Intimately Involved in Ignition There were 13 victims that were reportedly in the area of origin and they were involved with the ignition of the fire that killed them. It is most probable that no amount of early warning would have saved any of these victims. This is where fire prevention and education become key components in saving lives. Eight (8), or 61%, of these 13 victims, actually had a working smoke alarm in their home at the time of the fire. One (1) fire death, or 8%, did not have any smoke alarms; and in another fire death, or 8%, the fire was too small to activate the alarm. In two of these deaths, or 15%, an alarm was present, but it was undetermined if it operated. In one of these deaths, or 8%, there were no alarms present in the home. In the case of the eight victims where the alarms operated and involved with the ignition, two were smoking in their bedrooms, one of the victims had her clothing ignite while she was cooking, one person was committing suicide, and four of the victims died in fires where the cause of ignition was undetermined. Only one of these victims was an older adult in 2014.
Fire too small 8%
Operated 61%
Failed to operate
8%
Present & undetermined
15%
None 8%
Detector Perfomance of Fire Deaths When Victim was Intimately Involved with Ignition
Massachusetts Fire Incident Reporting System 2014 Page 62
Fatal Motor Vehicle Fires In 2014, six motor vehicle fires killed seven civilians. Motor vehicle fire deaths are determined subsequent to the autopsy of the victim. When smoke is found in the lungs of the victim, it is an indication the victim survived the impact of the collision and was killed by the fire and not the crash. Two (2) of these fires and three accompanying deaths involved motor vehicle crashes. Three (3) involved the lone victims committing suicide. It was undetermined in one motor vehicle fire and subsequent fatality how the car fire started. 2 Motor Vehicle Crashes Kill 3 Occupants14 Two (2) motor vehicle fires and the subsequent three deaths were caused by motor vehicle crashes. These incidents accounted for 5% of the fatal fires and 6% of the fire fatalities in the Commonwealth in 2014. • On August 24, 2014, at 3:03 p.m., the Duxbury Fire Department was called to a fatal
motor vehicle crash with ensuing fire on Route 3. The vehicle hit a tree head on in the median. The driver and only occupant of the vehicle, a 33-year old woman, was trapped in the vehicle and died in the fire. Damages from this fire were estimated to be $15,500.
• On October 19, 2014, at 6:04 p.m., the Middleton Fire Department was called to a
fatal motor vehicle crash with ensuing fire. The car, a Ferrari 458 Italia, crashed into a tree and ignited. Neither the driver nor his passengers were able to escape the car. The victims, a 50-year old man and a 40-year old man died at the scene. Damages were estimated to be $257,000.
3 Suicides Kill 3 Occupants Three (3) motor vehicle fires and the subsequent three deaths were suicide by fire. These incidents accounted for 7% of the fatal fires and 6% of the fire fatalities in the Commonwealth in 2014. • On August 28, 2014, at 3:56 p.m., the Norwood Fire Department was dispatched to a
motor vehicle fire on the side of the road. The driver and only occupant of the vehicle had poured gasoline inside his pick-up truck and then ignited it in a suicide attempt. The victim, a 75-year old man, was transported to a local hospital where he succumbed to his injuries. No one else was injured in this fire. Damages from this fire were estimated to be $45,000
• On October 30, 2014, at 10:05 a.m., the Nantucket Fire Department was dispatched to
a fatal motor vehicle fire in a parking lot near Low Beach. The victim, a 63-year old
14 On May 31, 2014, a private business jet crashed while taking off from Hanscom Field in Bedford, MA. Since the Dept. of Defense (DOD) has jurisdiction of Hanscom Field as it is part of Hanscom AFB, the 7 civilian deaths, 4 passengers & 3 crew members, are attributed to the DOD as civilian fire deaths and not the Commonwealth of MA.
Massachusetts Fire Incident Reporting System 2014 Page 63
man, parked his van and ignited it in an apparent suicide attempt. No one else was injured at this fire.
• On November 11, 2014, at 3:11 a.m., the Danvers Fire Department was dispatched to
a fatal motor vehicle fire in a parking lot at the Double Tree Hotel. The victim, a 45-year old man, parked his car and ignited it in a suicide attempt. No one else was injured at this fire. Damages from this fire were estimated to be $11,000.
1 Undetermined MV Fire Kills 1 Person The cause of one motor vehicle fire and the subsequent death was undetermined. This incident accounted for 2% of the fatal fires and 2% of the fire fatalities in the Commonwealth in 2014. • On April 8, 2014 at 3:29 a.m., the Boston Fire Department was dispatched to car on
fire on the side of the road. After extinguishing the fire, they found the victim, a 25-year old man, inside the vehicle. Damages were estimated to be $15,000. The fire spread to a nearby vehicle and caused another $15,000 in estimated damages.
Other Fatal Fires In 2014, two outside fire incidents killed two civilians. These incidents accounted for 5% of the fatal fires and 4% of the fire fatalities in Massachusetts in 2014. 1 Outside Fire for Warmth Kills a Homeless Man • On February 2, 2014, at 2:40 a.m., the Quincy Fire Department was called to a fatal
fire in a small wooded lot. The victim, a 50-year old homeless man, was using a fire to cook with and keep warm when he slipped or tripped too close to the fire and his clothing ignited. His body was discovered while firefighters extinguished the fire.
1 Outside Suicide Fire Kills 1 Massachusetts Resident • On September 6, 2014, at 12:58 a.m., the Springfield Fire Department was called to a
fatal outside fire in a backyard. The victim, a 33-year old woman, poured gasoline on herself and lit her clothing on fire in a suicide attempt. She was transported to a local hospital where she later succumbed to her injuries. No one else was injured in this fire.
Multiple Fire Deaths For statistical purposes, a fire is considered a multiple death fire if it kills three or more people. In 2014, there was one multiple death fire in Massachusetts. This was the electrical fire that killed seven people in an apartment building on July 10, 2014. This was the largest single amount of civilian deaths in a fire since seven civilians died in a residential fire in North Attleboro on Christmas Eve in 1994.
Massachusetts Fire Incident Reporting System 2014 Page 64
Civilian Fire Deaths - Conclusion 54 Civilians Died in Massachusetts Fires – 23% Increase In 2014, there were 42 fatal fires in Massachusetts with 54 accompanying fatalities. This is a 23% increase from the 44 deaths reported in 2013. Of these 54 deaths, 42 occurred in residential fires. Majority of Fire Deaths Occur in Residential Occupancies We focus our analysis on residential fire deaths because it is where prevention can have the most impact. Forty-two (42) of the 45 fatal structure fire victims died in residential building fires. Twenty-two (22) of these deaths occurred in one- or two-family homes, accounting for 41% of all fire deaths. Electrical Fires Are Leading Cause of Fire Deaths Continuing a trend started in 2011, smoking was not the leading cause of residential fire deaths and fatal residential building fires. In 2014, electrical fires were the leading cause of residential fire deaths and fatal residential fires. These fires accounted for 15, or 36%, of residential fire deaths. The careless disposal of smoking materials was the second leading cause of fire deaths, accounting for nine, or 21%, of residential fire deaths. Heating fires accounted for four, or 10%, of these deaths, arson, candles, and cooking each caused two, or 5% of residential fire deaths. 6 Children Died in a Fire Six (6) children under the age of 18 died in fires in Massachusetts in 2014. Five (5) died in two residential electrical fires and a one died in a shed fire when a group of boys were playing with a lighter. Older Adults at Significant Risk for Fire Death Older adults, especially those over the ages of 75 had a significant risk of dying in a fire. The risk of fire death for adults over the age of 85 is 4.6 and those adults between the ages of 75 and 84 is 2.6. This means that they were four and a half times and over two and a half times as likely to become a fire-related fatality. 28% of All Fire Deaths are Older Adults Fifteen (15) older adults died in fires, accounting for 28% of all fire deaths in Massachusetts in 2014. Only (1) of these victims died in a smoking fire. Five (5) died in electrical fires, three died in heating fires, one older adult died in a cooking fire, one committed suicide in a car fire, and four died in fires where the cause could not be determined. Historically, the lack of working smoke alarms is a significant factor in senior fire deaths. In 2014, only one of the 14 senior residential fire deaths had working smoke alarms, one of the deaths occurred in a fire with no alarms at all, one death happened at a fire where the fire was too small to activate the alarm, and in the other 10 deaths it was undetermined if alarms were present or if they operated.
Massachusetts Fire Incident Reporting System 2014 Page 65
Over 1/2 of People Died in Fires While They Slept Over half of the people who died in fires died while they slept. Thirty (30), or 56%, of the fire victims died in fires that occurred between 10:00 p.m. and 7:00 a.m. Almost 1/4 of Fatalities Had Working Smoke Alarms Only 24% of the residential fire victims had working smoke alarms. Many of these victims could have possibly survived if they had residential sprinklers to help them. Forty-three percent (43%) of the victims died in fires that began in either the bedroom or living room. A structural member or framing was the leading item first ignited. Also, when Primary Apparent Symptom was reported, all but two victims suffered burns, smoke inhalation or both. Over 1/2 of Fatalities Were in the Area of Origin Twenty-three (23), or 55%, of all the civilians that died in residential fires were reported to be in the area of fire origin. Thirteen (13) victims were intimately involved in the ignition of the fire that killed them. It is most probable that no amount of early warning would have saved any of these victims. This is where fire prevention and education become key components in saving lives. 5 Suicides – Continues Tragic Trend In past years there were a tragic number of people who used fire to take their own lives. In 2014, there were five confirmed suicides. All five were by self-immolation, three in motor vehicles, one outside and another in his home. In 2013 there were 4 self-immolations and in 2012 there were 12 self-immolations. In 2011 there were four self-immolations and in 2010 there were five self-immolations. In 2009 there were six self-immolations, in 2008 there were three self-immolations, five in 2007, two in 2006, and four in 2005. In 2004, there were eight suicides by self-immolation.
Civilian Injuries 310 Civilians Injured in Fires in 2014 – Mostly at Home Massachusetts’ fires injured 310 civilians in 2014. Two hundred and sixty-eight (268), or 86%, of civilian injuries occurred in structure fires. Two hundred and forty-seven (247) injuries occurred in residential building fires, accounting for 80% of all injuries and 92% of all structure fire injuries. Nine (9), or 3%, occurred in motor vehicle fires. Thirty-three (33), or 11%, of civilian injuries occurred in outside and other fires. Special outside fires accounted for nine, or 3%, of all civilian injuries. Brush fires accounted for six, or 2%, of civilian fire injuries; and outside rubbish fires accounted for one, or less than 1% of all civilian fire injuries. Seventeen (17), or 5%, of civilian injuries were caused by unclassified fires.
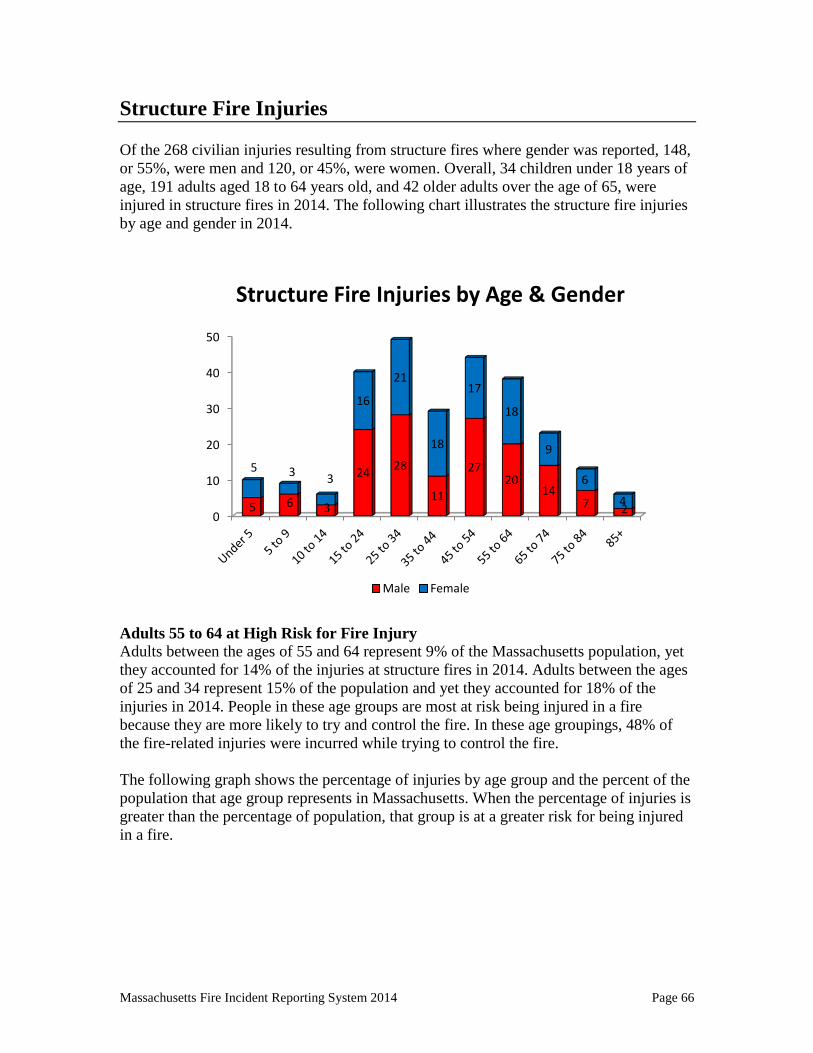
Massachusetts Fire Incident Reporting System 2014 Page 66
Structure Fire Injuries Of the 268 civilian injuries resulting from structure fires where gender was reported, 148, or 55%, were men and 120, or 45%, were women. Overall, 34 children under 18 years of age, 191 adults aged 18 to 64 years old, and 42 older adults over the age of 65, were injured in structure fires in 2014. The following chart illustrates the structure fire injuries by age and gender in 2014.
Adults 55 to 64 at High Risk for Fire Injury Adults between the ages of 55 and 64 represent 9% of the Massachusetts population, yet they accounted for 14% of the injuries at structure fires in 2014. Adults between the ages of 25 and 34 represent 15% of the population and yet they accounted for 18% of the injuries in 2014. People in these age groups are most at risk being injured in a fire because they are more likely to try and control the fire. In these age groupings, 48% of the fire-related injuries were incurred while trying to control the fire. The following graph shows the percentage of injuries by age group and the percent of the population that age group represents in Massachusetts. When the percentage of injuries is greater than the percentage of population, that group is at a greater risk for being injured in a fire.
0
10
20
30
40
50
5 6 3
24 28
11
27 20
14 7 2
5 3 3
16
21
18
17
18
9
6
4
Structure Fire Injuries by Age & Gender
Male Female
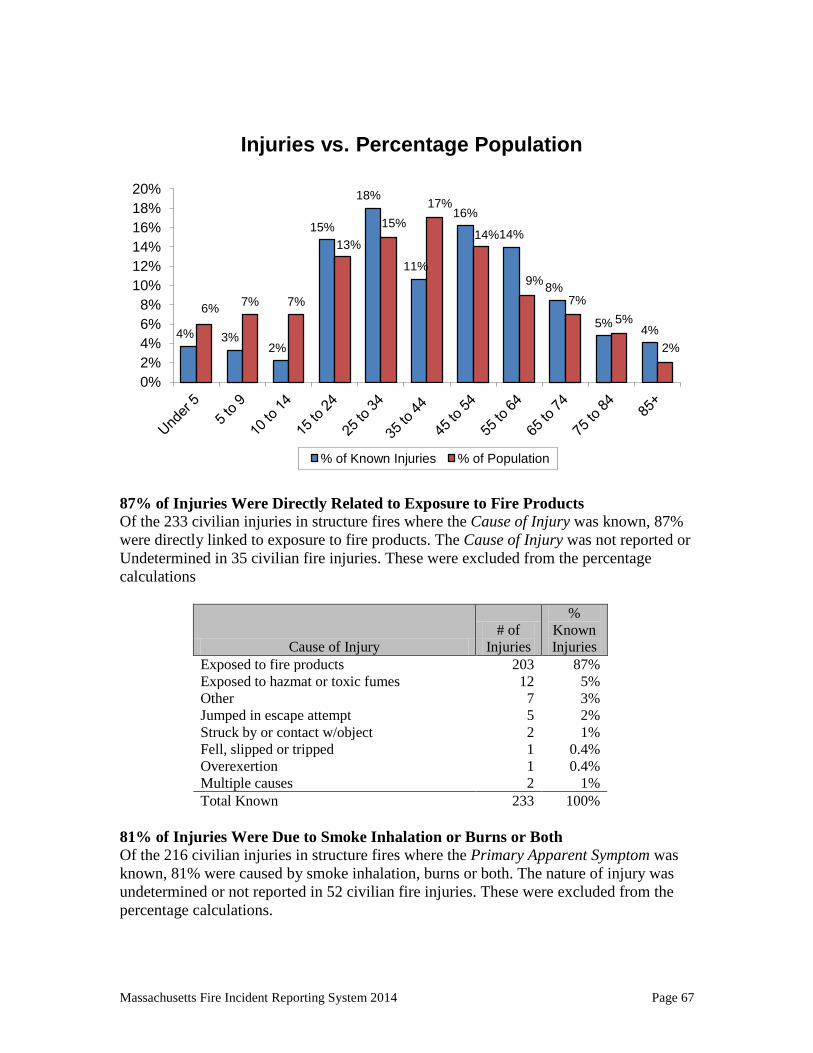
Massachusetts Fire Incident Reporting System 2014 Page 67
87% of Injuries Were Directly Related to Exposure to Fire Products Of the 233 civilian injuries in structure fires where the Cause of Injury was known, 87% were directly linked to exposure to fire products. The Cause of Injury was not reported or Undetermined in 35 civilian fire injuries. These were excluded from the percentage calculations
Cause of Injury # of
Injuries
% Known Injuries
Exposed to fire products 203 87% Exposed to hazmat or toxic fumes 12 5% Other 7 3% Jumped in escape attempt 5 2% Struck by or contact w/object 2 1% Fell, slipped or tripped 1 0.4% Overexertion 1 0.4% Multiple causes 2 1% Total Known 233 100%
81% of Injuries Were Due to Smoke Inhalation or Burns or Both Of the 216 civilian injuries in structure fires where the Primary Apparent Symptom was known, 81% were caused by smoke inhalation, burns or both. The nature of injury was undetermined or not reported in 52 civilian fire injuries. These were excluded from the percentage calculations.
4% 3% 2%
15%
18%
11%
16%
14%
8%
5% 4%
6% 7% 7%
13%
15% 17%
14%
9% 7%
5%
2%
0% 2% 4% 6% 8%
10% 12% 14% 16% 18% 20%
Injuries vs. Percentage Population
% of Known Injuries % of Population
Massachusetts Fire Incident Reporting System 2014 Page 68
Primary Apparent Symptom # of
Injuries % Known Injuries
Smoke inhalation 69 32% Burns only, thermal 63 29% Burns & smoke inhalation 43 20% Breathing difficulty, shortness of breath 10 5% Burn, scald 7 3% Hazardous fumes inhalation 5 2% Cut or laceration 5 2% Pain only 3 1% Emotional/psychological stress 3 1% Cardiac symptoms 2 1% Crushing 1 0.5% Strain or sprain 1 0.5% Chills 1 0.5% Vomiting 1 0.5% Internal trauma 1 0.5% Contusion/bruise, minor trauma 1 0.5% Total Known 216 100%
36% Injured While Trying to Control the Fire Of the 205 victims for whom Activity at Time of Injury was known, 36%% were attempting to control the fire. There were 63 injuries where the activity at time of injury was unknown; these were excluded from the percentage calculations.
Activity When Injured # of
Injuries % Known Injuries
Fire control 74 36% Escaping 52 25% Other 20 10% Rescue attempt 17 8% Sleeping 14 7% Return to vicinity of fire before control 11 5% Unable to act 10 5% Irrational Act 7 3% Total known 205 100%
The key to preventing these injuries is to make and practice a home escape plan, remember to get out and stay out, and leave firefighting to the professionals. They have the training, equipment and protective clothing to do the job. Over 1/3 of Victims Were Asleep Just Before the Injury Of the 46 victims for which the Human Factor Contributing to the Injury was known, 35% were asleep. Fire sprinklers can provide the extra time to escape to safety for people who are impaired, have a disability, are very young or are very old. The following table is a cross tabulation which allows us to know what the person was doing when injured and what was either their physical or mental state shortly before
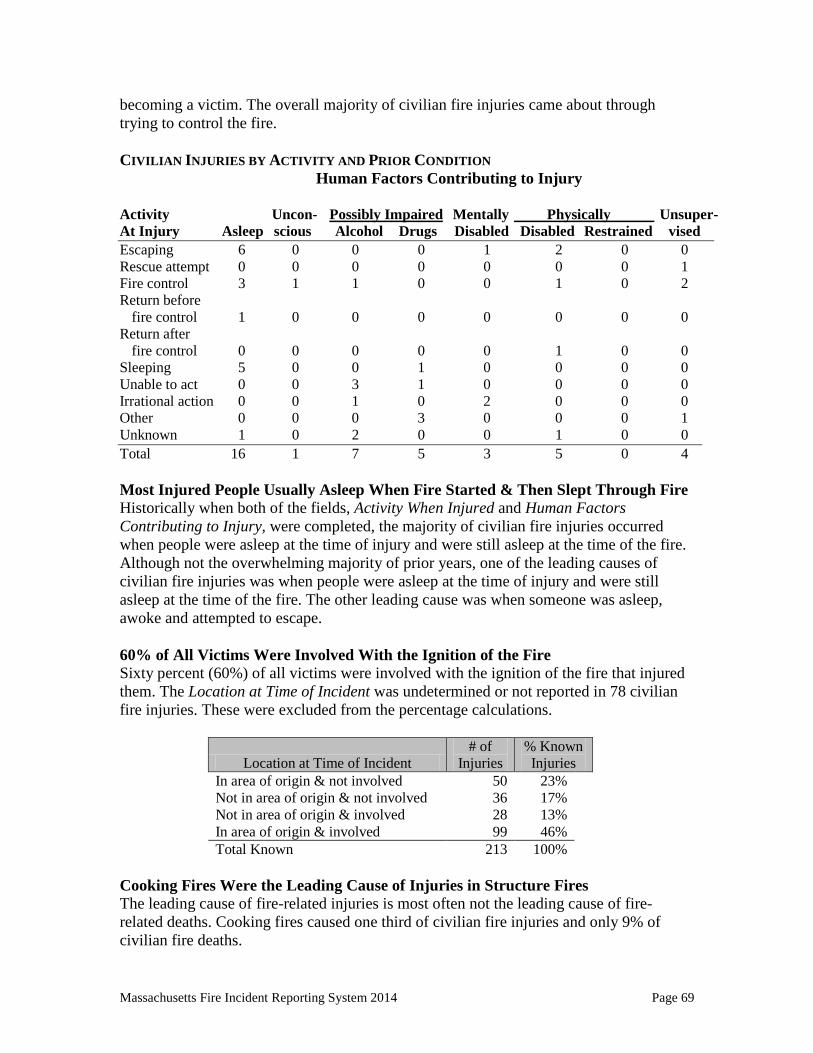
Massachusetts Fire Incident Reporting System 2014 Page 69
becoming a victim. The overall majority of civilian fire injuries came about through trying to control the fire. CIVILIAN INJURIES BY ACTIVITY AND PRIOR CONDITION Human Factors Contributing to Injury Activity Uncon- Possibly Impaired Mentally Physically Unsuper- At Injury Asleep scious Alcohol Drugs Disabled Disabled Restrained vised Escaping 6 0 0 0 1 2 0 0 Rescue attempt 0 0 0 0 0 0 0 1 Fire control 3 1 1 0 0 1 0 2 Return before fire control 1 0 0 0 0 0 0 0 Return after fire control 0 0 0 0 0 1 0 0 Sleeping 5 0 0 1 0 0 0 0 Unable to act 0 0 3 1 0 0 0 0 Irrational action 0 0 1 0 2 0 0 0 Other 0 0 0 3 0 0 0 1 Unknown 1 0 2 0 0 1 0 0 Total 16 1 7 5 3 5 0 4 Most Injured People Usually Asleep When Fire Started & Then Slept Through Fire Historically when both of the fields, Activity When Injured and Human Factors Contributing to Injury, were completed, the majority of civilian fire injuries occurred when people were asleep at the time of injury and were still asleep at the time of the fire. Although not the overwhelming majority of prior years, one of the leading causes of civilian fire injuries was when people were asleep at the time of injury and were still asleep at the time of the fire. The other leading cause was when someone was asleep, awoke and attempted to escape. 60% of All Victims Were Involved With the Ignition of the Fire Sixty percent (60%) of all victims were involved with the ignition of the fire that injured them. The Location at Time of Incident was undetermined or not reported in 78 civilian fire injuries. These were excluded from the percentage calculations.
Location at Time of Incident # of
Injuries % Known Injuries
In area of origin & not involved 50 23% Not in area of origin & not involved 36 17% Not in area of origin & involved 28 13% In area of origin & involved 99 46% Total Known 213 100%
Cooking Fires Were the Leading Cause of Injuries in Structure Fires The leading cause of fire-related injuries is most often not the leading cause of fire-related deaths. Cooking fires caused one third of civilian fire injuries and only 9% of civilian fire deaths.
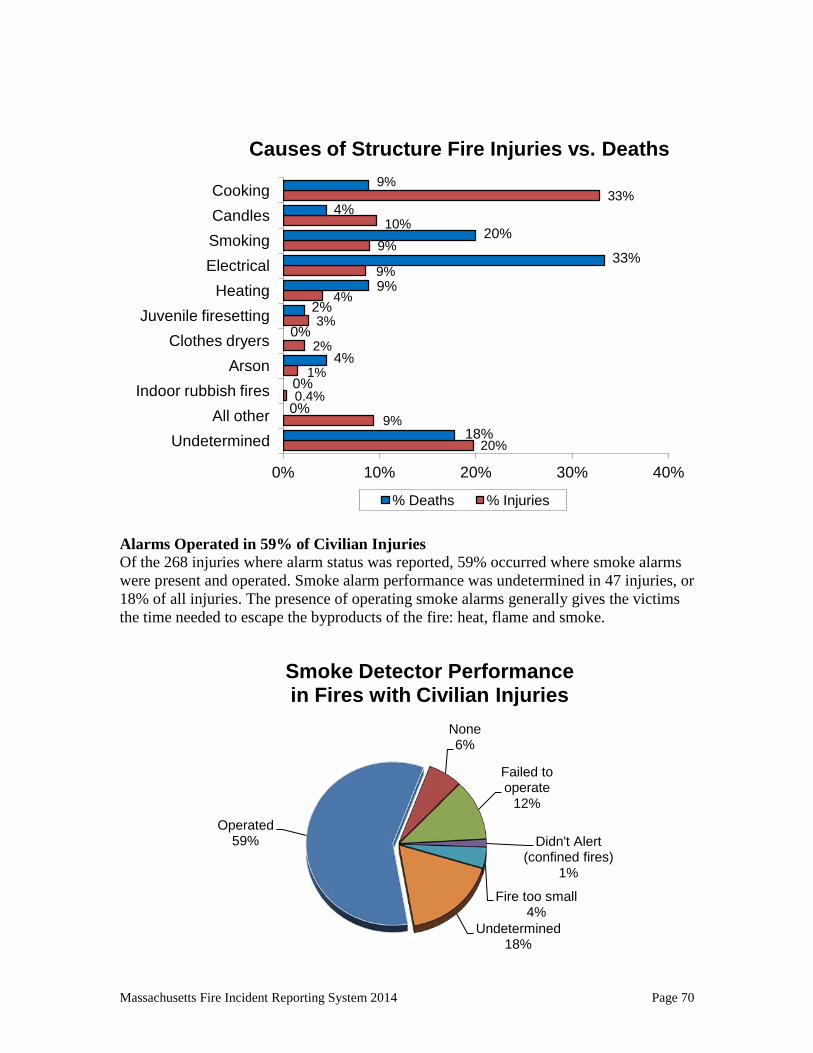
Massachusetts Fire Incident Reporting System 2014 Page 70
Alarms Operated in 59% of Civilian Injuries Of the 268 injuries where alarm status was reported, 59% occurred where smoke alarms were present and operated. Smoke alarm performance was undetermined in 47 injuries, or 18% of all injuries. The presence of operating smoke alarms generally gives the victims the time needed to escape the byproducts of the fire: heat, flame and smoke.
20%
9%
0.4%
1%
2%
3%
4%
9%
9% 10%
33%
18%
0%
0%
4%
0%
2% 9%
33%
20%
4%
9%
0% 10% 20% 30% 40%
Undetermined All other
Indoor rubbish fires Arson
Clothes dryers Juvenile firesetting
Heating Electrical Smoking Candles Cooking
Causes of Structure Fire Injuries vs. Deaths
% Deaths % Injuries
Operated 59%
None 6%
Failed to operate
12%
Didn't Alert (confined fires)
1%
Fire too small 4%
Undetermined 18%
Smoke Detector Performance in Fires with Civilian Injuries
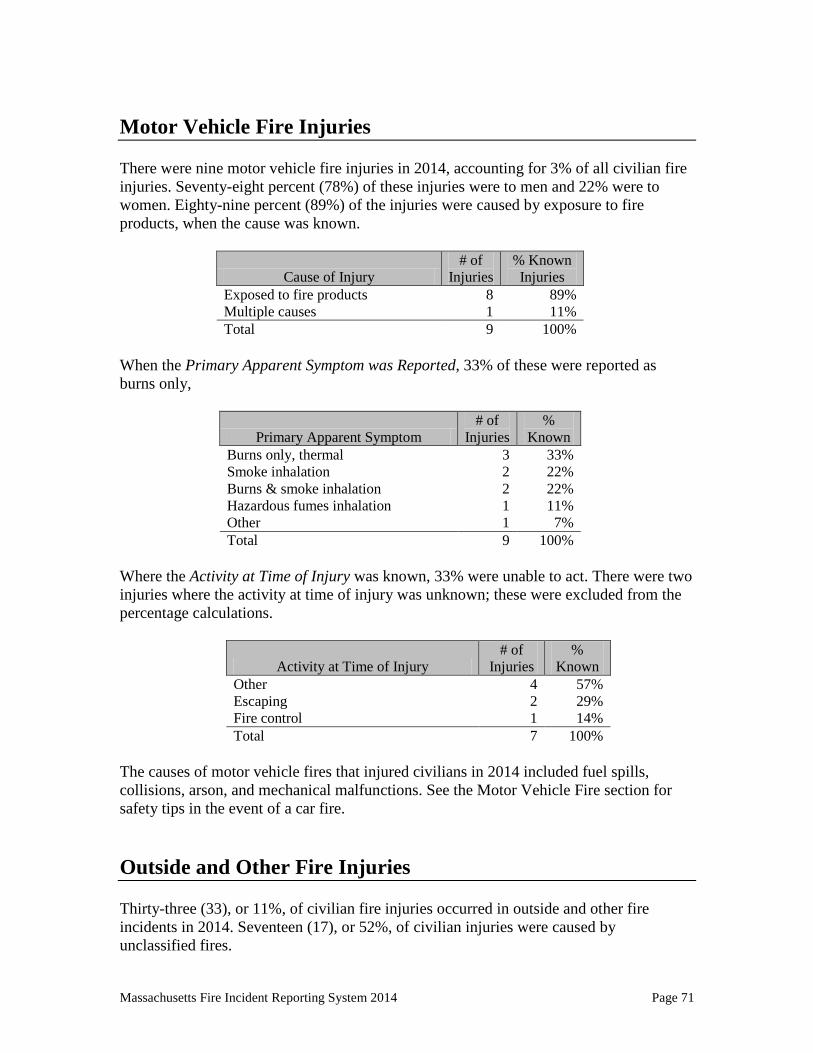
Massachusetts Fire Incident Reporting System 2014 Page 71
Motor Vehicle Fire Injuries There were nine motor vehicle fire injuries in 2014, accounting for 3% of all civilian fire injuries. Seventy-eight percent (78%) of these injuries were to men and 22% were to women. Eighty-nine percent (89%) of the injuries were caused by exposure to fire products, when the cause was known.
Cause of Injury # of
Injuries % Known Injuries
Exposed to fire products 8 89% Multiple causes 1 11% Total 9 100%
When the Primary Apparent Symptom was Reported, 33% of these were reported as burns only,
Primary Apparent Symptom # of
Injuries %
Known Burns only, thermal 3 33% Smoke inhalation 2 22% Burns & smoke inhalation 2 22% Hazardous fumes inhalation 1 11% Other 1 7% Total 9 100%
Where the Activity at Time of Injury was known, 33% were unable to act. There were two injuries where the activity at time of injury was unknown; these were excluded from the percentage calculations.
Activity at Time of Injury # of
Injuries %
Known Other 4 57% Escaping 2 29% Fire control 1 14% Total 7 100%
The causes of motor vehicle fires that injured civilians in 2014 included fuel spills, collisions, arson, and mechanical malfunctions. See the Motor Vehicle Fire section for safety tips in the event of a car fire. Outside and Other Fire Injuries Thirty-three (33), or 11%, of civilian fire injuries occurred in outside and other fire incidents in 2014. Seventeen (17), or 52%, of civilian injuries were caused by unclassified fires.

Massachusetts Fire Incident Reporting System 2014 Page 72
Incident Type # of
Injuries % of Outside & Other
Fire Injuries % Total Injuries
Fire - Other 17 52% 5% Brush Fire 6 18% 2% Outside rubbish fire 1 3% 0.3% Special outside fire 9 27% 3% Total 33 100% 11%
Sixty-four percent (64%) of the civilian victims were men and 36% were women. Burns accounted for 53%, of the injuries to this group, when the Primary Apparent Symptom was known. There were eight injuries where the activity at time of injury was unknown; these were excluded from the percentage calculations.
Primary Apparent Symptom # of
Injuries % Known Burns only: thermal 15 60% Burns and smoke inhalation 4 16% Smoke inhalation 3 12% Breathing difficulty, shortness of breath 1 4% Strain or sprain 1 4% Swelling 1 4% Total 25 100%
The victims were intimately involved with the ignition in 81% of these injuries where Location at Ignition was known. There were nine injuries where the activity at time of injury was unknown; these were excluded from the percentage calculations.
Location at Ignition # of
Injuries
% Known Injuries
In area of origin & involved 17 71% In area of origin & not involved 7 29% Total 24 100%
Safety Practices Are the Best Prevention Methods In a typical nighttime fire, there is a window of 1-3 minutes in the average home after the smoke alarm sounds for the family to get out safely. In a few minutes, heat and toxic gases make escape impossible. To survive a fire, one must install and maintain smoke alarms as well as make and practice an escape plan. These types of basic fire safety practices are ignored by too many Massachusetts residents and result in fires, injuries, and deaths.
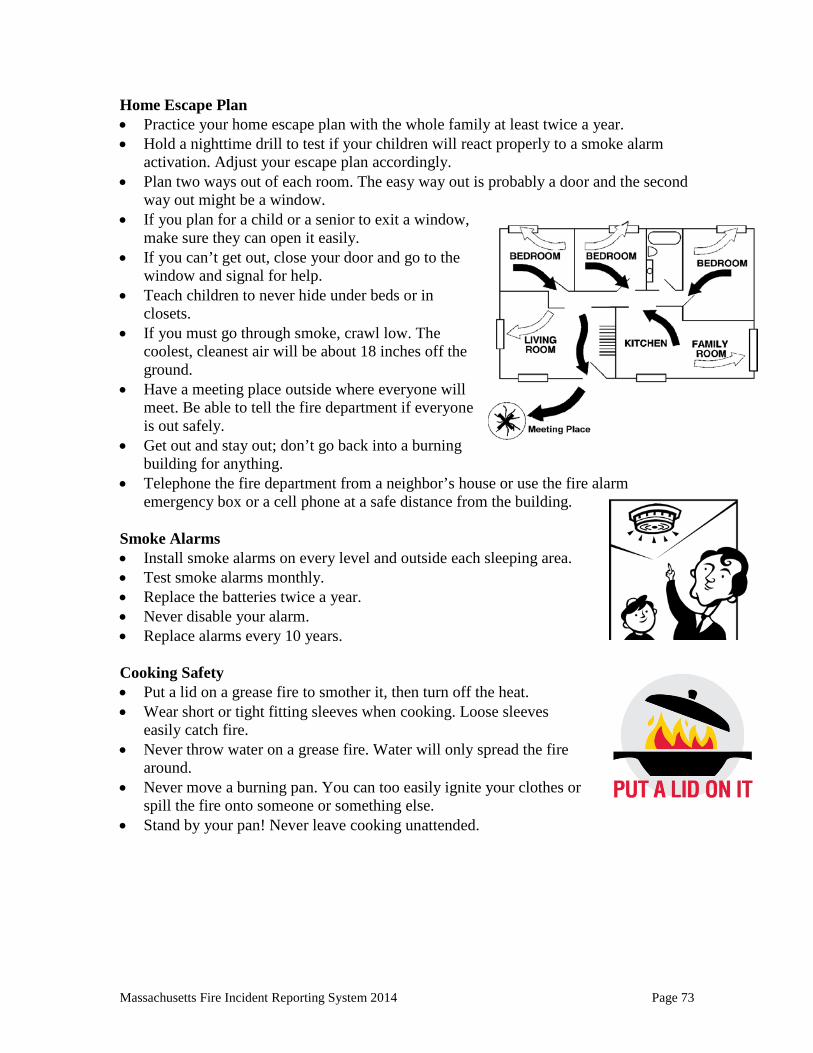
Massachusetts Fire Incident Reporting System 2014 Page 73
Home Escape Plan • Practice your home escape plan with the whole family at least twice a year. • Hold a nighttime drill to test if your children will react properly to a smoke alarm
activation. Adjust your escape plan accordingly. • Plan two ways out of each room. The easy way out is probably a door and the second
way out might be a window. • If you plan for a child or a senior to exit a window,
make sure they can open it easily. • If you can’t get out, close your door and go to the
window and signal for help. • Teach children to never hide under beds or in
closets. • If you must go through smoke, crawl low. The
coolest, cleanest air will be about 18 inches off the ground.
• Have a meeting place outside where everyone will meet. Be able to tell the fire department if everyone is out safely.
• Get out and stay out; don’t go back into a burning building for anything.
• Telephone the fire department from a neighbor’s house or use the fire alarm emergency box or a cell phone at a safe distance from the building.
Smoke Alarms • Install smoke alarms on every level and outside each sleeping area. • Test smoke alarms monthly. • Replace the batteries twice a year. • Never disable your alarm. • Replace alarms every 10 years. Cooking Safety • Put a lid on a grease fire to smother it, then turn off the heat. • Wear short or tight fitting sleeves when cooking. Loose sleeves
easily catch fire. • Never throw water on a grease fire. Water will only spread the fire
around. • Never move a burning pan. You can too easily ignite your clothes or
spill the fire onto someone or something else. • Stand by your pan! Never leave cooking unattended.
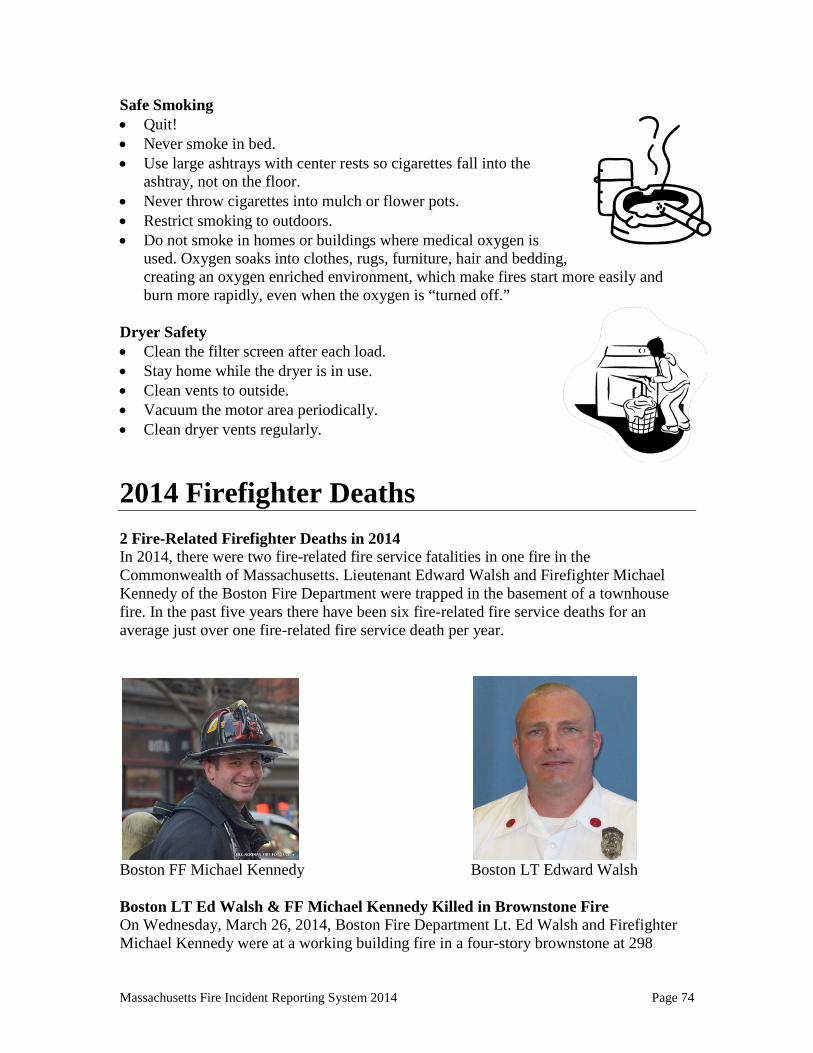
Massachusetts Fire Incident Reporting System 2014 Page 74
Safe Smoking • Quit! • Never smoke in bed. • Use large ashtrays with center rests so cigarettes fall into the
ashtray, not on the floor. • Never throw cigarettes into mulch or flower pots. • Restrict smoking to outdoors. • Do not smoke in homes or buildings where medical oxygen is
used. Oxygen soaks into clothes, rugs, furniture, hair and bedding, creating an oxygen enriched environment, which make fires start more easily and burn more rapidly, even when the oxygen is “turned off.”
Dryer Safety • Clean the filter screen after each load. • Stay home while the dryer is in use. • Clean vents to outside. • Vacuum the motor area periodically. • Clean dryer vents regularly.
2014 Firefighter Deaths 2 Fire-Related Firefighter Deaths in 2014 In 2014, there were two fire-related fire service fatalities in one fire in the Commonwealth of Massachusetts. Lieutenant Edward Walsh and Firefighter Michael Kennedy of the Boston Fire Department were trapped in the basement of a townhouse fire. In the past five years there have been six fire-related fire service deaths for an average just over one fire-related fire service death per year.
Boston FF Michael Kennedy Boston LT Edward Walsh Boston LT Ed Walsh & FF Michael Kennedy Killed in Brownstone Fire On Wednesday, March 26, 2014, Boston Fire Department Lt. Ed Walsh and Firefighter Michael Kennedy were at a working building fire in a four-story brownstone at 298
Massachusetts Fire Incident Reporting System 2014 Page 75
Beacon St. The fire started in the basement and members of the crews from Engine 33 and Ladder 15 went in to attack the fire. Extremely high winds and below average temperatures complicated suppression and rescue efforts. Lt. Walsh and FF Kennedy became trapped in the basement as the fire flared up around them and they initiated a “May Day” call. FF Kennedy was pulled from the building and transported to Massachusetts General Hospital where he succumbed to his injuries. Lt. Walsh’s body was recovered hours later.
Fire Service Injuries 450 Firefighters Injured in 2014 In 2014, 450 firefighters were injured while fighting the 28,999 reported fires in Massachusetts. On average, one firefighter was injured at one of every 66 fires in 2014. Three hundred and ninety-seven (397) firefighters were injured at structure fires. Eighteen (18) firefighters were injured at motor vehicle fires. Thirty-five (35) firefighters were injured at outside and other fires. This is a decrease of 22, or 5%, from the 472 fire-related fire service injuries reported in 2013. 88% of Firefighter Injuries Occurred at Structure Fires Firefighters were injured more frequently at structure fires than any other fire incident type. Eighty-eight percent (88%) of firefighter injuries occurred at structure fires, while structure fires only accounted for 60% of all fires. Electrical Fires Caused the Most Injuries at Structure Fires The largest number of firefighter injuries took place at structure fires caused by electrical problems. Seventy-two (72), or 18%, of structure fire firefighter injuries occurred at electrical fires. Heating equipment fires accounted for 34, or 9%, of structure fire firefighter injuries. Even though cooking fires are the leading cause of structure fires and civilian fire injuries, fires caused by cooking accounted for 28, or 7%, of fire service injuries at structure fires. Firefighters Injured at 1 of Every 7 Vacant Building Fires One of the most dangerous types of fires for firefighters in 2014 were vacant building fires. Vacant building fires accounted for 40, or 9%, of all firefighter injuries. These 56 injuries also represent 10% of the number of firefighter injuries incurred fighting structure fires in 2014. On average there was one firefighter injury for every seven vacant building fires; one firefighter injury for every 17 structure arsons; and one firefighter injury for every 44 structure fires15.
15 On average there were 0.15 firefighter injuries at every vacant building fire; there were only 0.06 reported firefighter injuries per structure arson in 2014; and there were 0.02 reported firefighter injuries per structure fire in the Commonwealth in 2014.
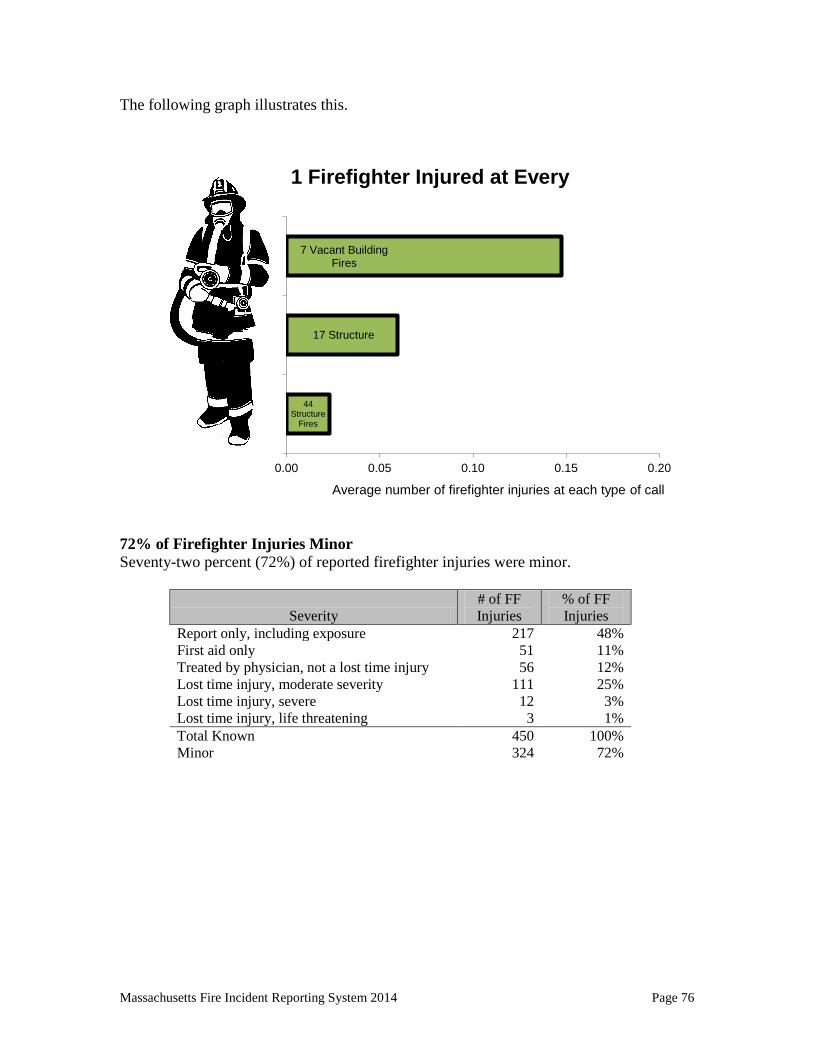
Massachusetts Fire Incident Reporting System 2014 Page 76
The following graph illustrates this.
72% of Firefighter Injuries Minor Seventy-two percent (72%) of reported firefighter injuries were minor.
Severity # of FF Injuries
% of FF Injuries
Report only, including exposure 217 48% First aid only 51 11% Treated by physician, not a lost time injury 56 12% Lost time injury, moderate severity 111 25% Lost time injury, severe 12 3% Lost time injury, life threatening 3 1% Total Known 450 100% Minor 324 72%
0.00 0.05 0.10 0.15 0.20
Structure Fires
Structure Arson
Vacant Building Fires
Average number of firefighter injuries at each type of call
1 Firefighter Injured at Every
44 Structure
Fires
7 Vacant Building Fires
17 Structure
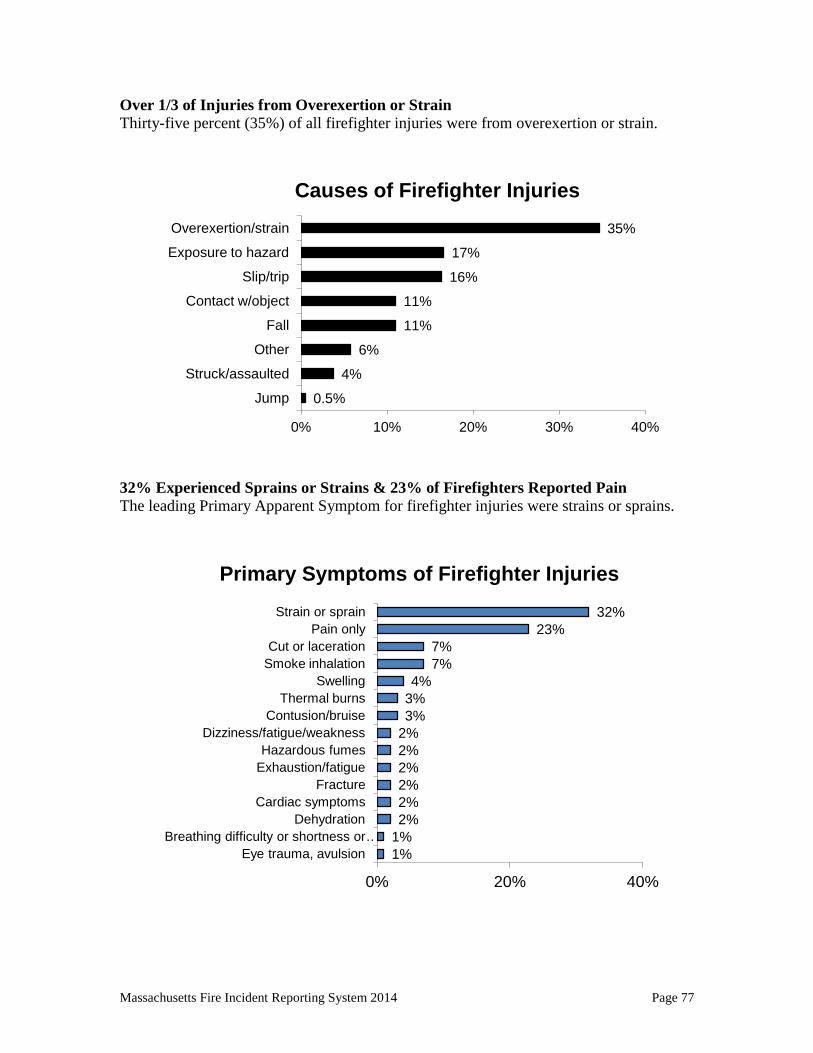
Massachusetts Fire Incident Reporting System 2014 Page 77
Over 1/3 of Injuries from Overexertion or Strain Thirty-five percent (35%) of all firefighter injuries were from overexertion or strain.
32% Experienced Sprains or Strains & 23% of Firefighters Reported Pain The leading Primary Apparent Symptom for firefighter injuries were strains or sprains.
0.5%
4%
6%
11%
11%
16%
17%
35%
0% 10% 20% 30% 40%
Jump
Struck/assaulted
Other
Fall
Contact w/object
Slip/trip
Exposure to hazard
Overexertion/strain
Causes of Firefighter Injuries
1% 1% 2% 2% 2% 2% 2% 2% 3% 3% 4%
7% 7%
23% 32%
0% 20% 40%
Eye trauma, avulsion Breathing difficulty or shortness or …
Dehydration Cardiac symptoms
Fracture Exhaustion/fatigue Hazardous fumes
Dizziness/fatigue/weakness Contusion/bruise
Thermal burns Swelling
Smoke inhalation Cut or laceration
Pain only Strain or sprain
Primary Symptoms of Firefighter Injuries
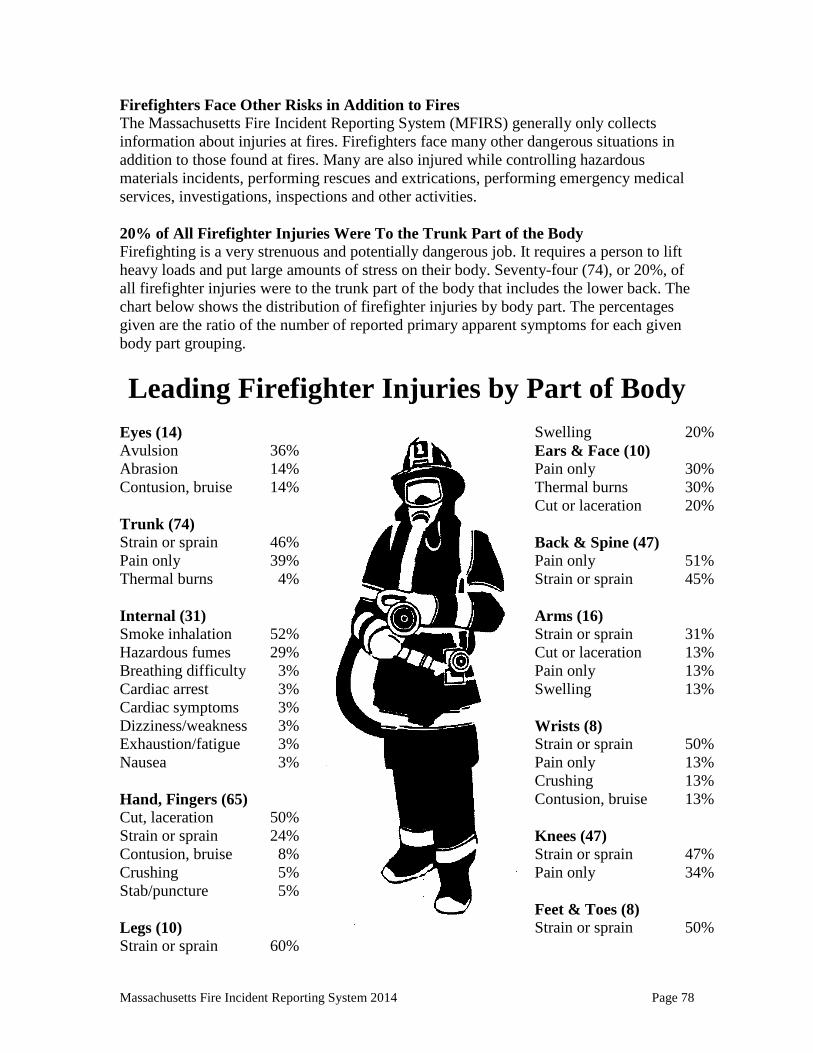
Massachusetts Fire Incident Reporting System 2014 Page 78
Firefighters Face Other Risks in Addition to Fires The Massachusetts Fire Incident Reporting System (MFIRS) generally only collects information about injuries at fires. Firefighters face many other dangerous situations in addition to those found at fires. Many are also injured while controlling hazardous materials incidents, performing rescues and extrications, performing emergency medical services, investigations, inspections and other activities. 20% of All Firefighter Injuries Were To the Trunk Part of the Body Firefighting is a very strenuous and potentially dangerous job. It requires a person to lift heavy loads and put large amounts of stress on their body. Seventy-four (74), or 20%, of all firefighter injuries were to the trunk part of the body that includes the lower back. The chart below shows the distribution of firefighter injuries by body part. The percentages given are the ratio of the number of reported primary apparent symptoms for each given body part grouping.
Leading Firefighter Injuries by Part of Body
Eyes (14) Avulsion 36% Abrasion 14% Contusion, bruise 14% Trunk (74) Strain or sprain 46% Pain only 39% Thermal burns 4% Internal (31) Smoke inhalation 52% Hazardous fumes 29% Breathing difficulty 3% Cardiac arrest 3% Cardiac symptoms 3% Dizziness/weakness 3% Exhaustion/fatigue 3% Nausea 3% Hand, Fingers (65) Cut, laceration 50% Strain or sprain 24% Contusion, bruise 8% Crushing 5% Stab/puncture 5% Legs (10) Strain or sprain 60%
Swelling 20% Ears & Face (10) Pain only 30% Thermal burns 30% Cut or laceration 20% Back & Spine (47) Pain only 51% Strain or sprain 45% Arms (16) Strain or sprain 31% Cut or laceration 13% Pain only 13% Swelling 13% Wrists (8) Strain or sprain 50% Pain only 13% Crushing 13% Contusion, bruise 13% Knees (47) Strain or sprain 47% Pain only 34% Feet & Toes (8) Strain or sprain 50%
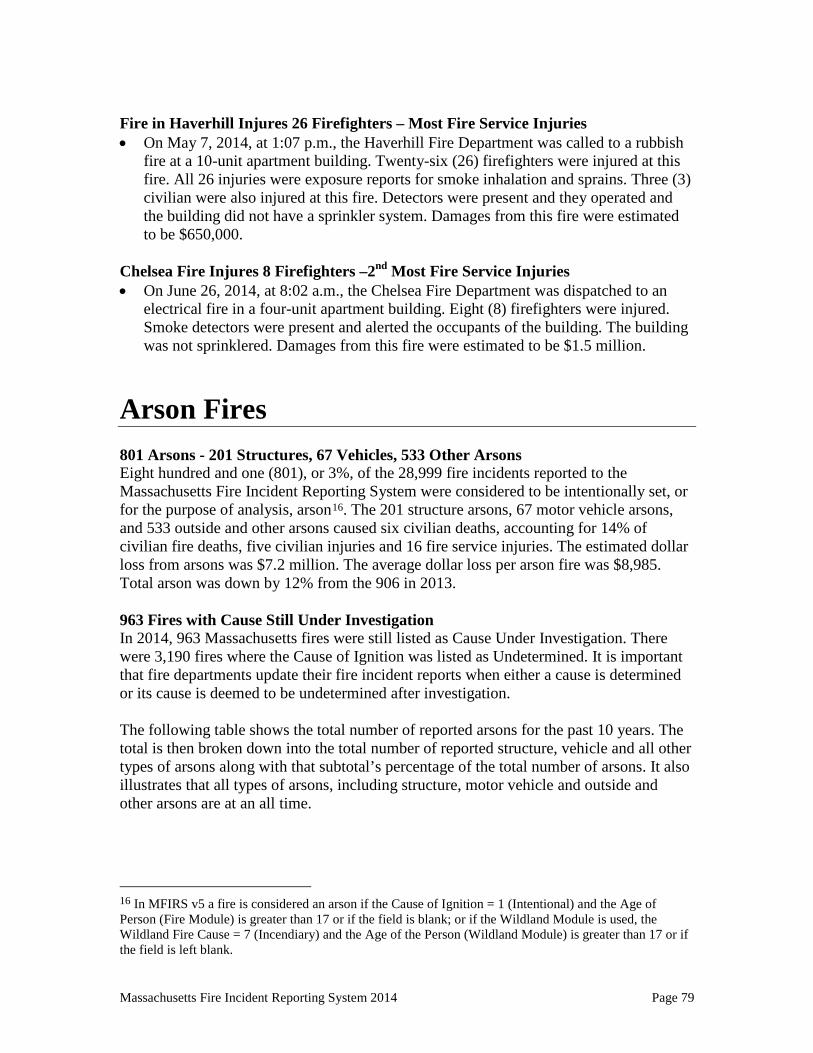
Massachusetts Fire Incident Reporting System 2014 Page 79
Fire in Haverhill Injures 26 Firefighters – Most Fire Service Injuries • On May 7, 2014, at 1:07 p.m., the Haverhill Fire Department was called to a rubbish
fire at a 10-unit apartment building. Twenty-six (26) firefighters were injured at this fire. All 26 injuries were exposure reports for smoke inhalation and sprains. Three (3) civilian were also injured at this fire. Detectors were present and they operated and the building did not have a sprinkler system. Damages from this fire were estimated to be $650,000.
Chelsea Fire Injures 8 Firefighters –2nd Most Fire Service Injuries • On June 26, 2014, at 8:02 a.m., the Chelsea Fire Department was dispatched to an
electrical fire in a four-unit apartment building. Eight (8) firefighters were injured. Smoke detectors were present and alerted the occupants of the building. The building was not sprinklered. Damages from this fire were estimated to be $1.5 million.
Arson Fires 801 Arsons - 201 Structures, 67 Vehicles, 533 Other Arsons Eight hundred and one (801), or 3%, of the 28,999 fire incidents reported to the Massachusetts Fire Incident Reporting System were considered to be intentionally set, or for the purpose of analysis, arson16. The 201 structure arsons, 67 motor vehicle arsons, and 533 outside and other arsons caused six civilian deaths, accounting for 14% of civilian fire deaths, five civilian injuries and 16 fire service injuries. The estimated dollar loss from arsons was $7.2 million. The average dollar loss per arson fire was $8,985. Total arson was down by 12% from the 906 in 2013. 963 Fires with Cause Still Under Investigation In 2014, 963 Massachusetts fires were still listed as Cause Under Investigation. There were 3,190 fires where the Cause of Ignition was listed as Undetermined. It is important that fire departments update their fire incident reports when either a cause is determined or its cause is deemed to be undetermined after investigation. The following table shows the total number of reported arsons for the past 10 years. The total is then broken down into the total number of reported structure, vehicle and all other types of arsons along with that subtotal’s percentage of the total number of arsons. It also illustrates that all types of arsons, including structure, motor vehicle and outside and other arsons are at an all time.
16 In MFIRS v5 a fire is considered an arson if the Cause of Ignition = 1 (Intentional) and the Age of Person (Fire Module) is greater than 17 or if the field is blank; or if the Wildland Module is used, the Wildland Fire Cause = 7 (Incendiary) and the Age of the Person (Wildland Module) is greater than 17 or if the field is left blank.

Massachusetts Fire Incident Reporting System 2014 Page 80
ARSONS BY YEAR
Total Structure % All Vehicle %All Other % All Year Arsons Arsons Arsons Arsons Arsons Arsons Arsons
2014 801 201 25% 67 8% 533 67% 2013 906 196 22% 75 8% 635 70% 2012 1,165 281 24% 126 11% 758 65% 2011 962 223 23% 124 10% 615 67% 2010 1,171 269 23% 116 10% 786 66% 2009 1,185 295 25% 189 16% 701 59% 2008 1,182 283 24% 151 13% 748 64% 2007 1,215 350 28% 131 11% 734 61% 2006 1,265 325 26% 159 13% 781 62% 2005 1,234 343 28% 184 15% 707 57%
The following chart illustrates the types of arsons by the time of day they occur. Midnight to 1:00 a.m. is represented by 0, 1:00 a.m. to 2:00 a.m. is represented by 1, etc. Arson is most likely to occur between the hours of 4:00 p.m. to 10:00 p.m. The peak times for structure arsons were 4:00 p.m. and 10:00 p.m. Motor vehicle arsons were most likely to occur between 10:00 p.m. and 2:00 a.m. Outside and other arsons peaked from 4:00 p.m. to 10:00 p.m.
0
200
400
600
800
1000
1200
1400
2005 2006 2007 2008 2009 2010 2011 2012 2013 2014
Arson by Incident Type 2005 - 2014
Structure Vehicle Other
Massachusetts Fire Incident Reporting System 2014 Page 81
Structure Arson 201 Arsons, 2 Civilian Deaths, 4 Civilian Injuries, 12 Fire Service Injuries In 2014, there were 201 reported structure arsons. They caused two civilian deaths, four civilian injuries, 12 fire service injuries and an estimated dollar loss of $6.5 million. These 201 incidents accounted for 1% of the 17,403 structure fires in 2014, and were up by 3% from the 196 reported structure arsons in 2013. There were two civilian deaths in structure arsons in 2014. One (1) of these deaths was a suicide. The four civilian injuries accounted for 1% of the overall civilian injuries and 1% of all civilian injuries at structure fires. The 12 fire service injuries accounted for 3% of the total fire service injuries and 3% of the injuries firefighters sustained at all structure fires in 2014. The estimated dollar loss for structure arsons was $6,472,792, accounting for 4% of the overall dollar loss and 4% of the estimated dollar loss in all reported structure fires. The average loss per structure arson was $32,203. In 2014, 499 Massachusetts structure fires were still listed as Cause Under Investigation. There were 640 structure fires where the Cause of Ignition was listed as Undetermined. Structure Arsons Increase Slightly Structure arsons increased by five, or 3%, from the 196 reported in 2013.
0
10
20
30
40
50
60
70
80
0 1 2 3 4 5 6 7 8 9 10 11 12 13 14 15 16 17 18 19 20 21 22 23
Type of Arson by Time of Day
Structure Vehicle Outside & Other
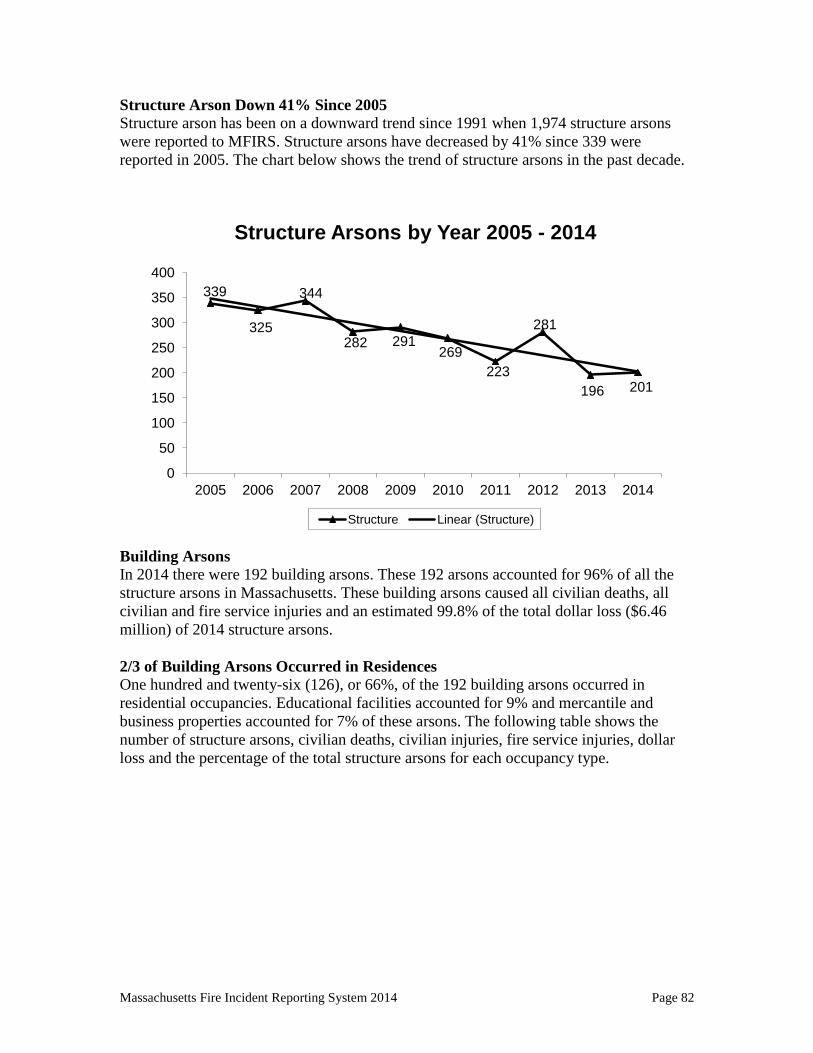
Massachusetts Fire Incident Reporting System 2014 Page 82
Structure Arson Down 41% Since 2005 Structure arson has been on a downward trend since 1991 when 1,974 structure arsons were reported to MFIRS. Structure arsons have decreased by 41% since 339 were reported in 2005. The chart below shows the trend of structure arsons in the past decade.
Building Arsons In 2014 there were 192 building arsons. These 192 arsons accounted for 96% of all the structure arsons in Massachusetts. These building arsons caused all civilian deaths, all civilian and fire service injuries and an estimated 99.8% of the total dollar loss ($6.46 million) of 2014 structure arsons. 2/3 of Building Arsons Occurred in Residences One hundred and twenty-six (126), or 66%, of the 192 building arsons occurred in residential occupancies. Educational facilities accounted for 9% and mercantile and business properties accounted for 7% of these arsons. The following table shows the number of structure arsons, civilian deaths, civilian injuries, fire service injuries, dollar loss and the percentage of the total structure arsons for each occupancy type.
339
325
344
282 291 269
223
281
196 201
0
50
100
150
200
250
300
350
400
2005 2006 2007 2008 2009 2010 2011 2012 2013 2014
Structure Arsons by Year 2005 - 2014
Structure Linear (Structure)
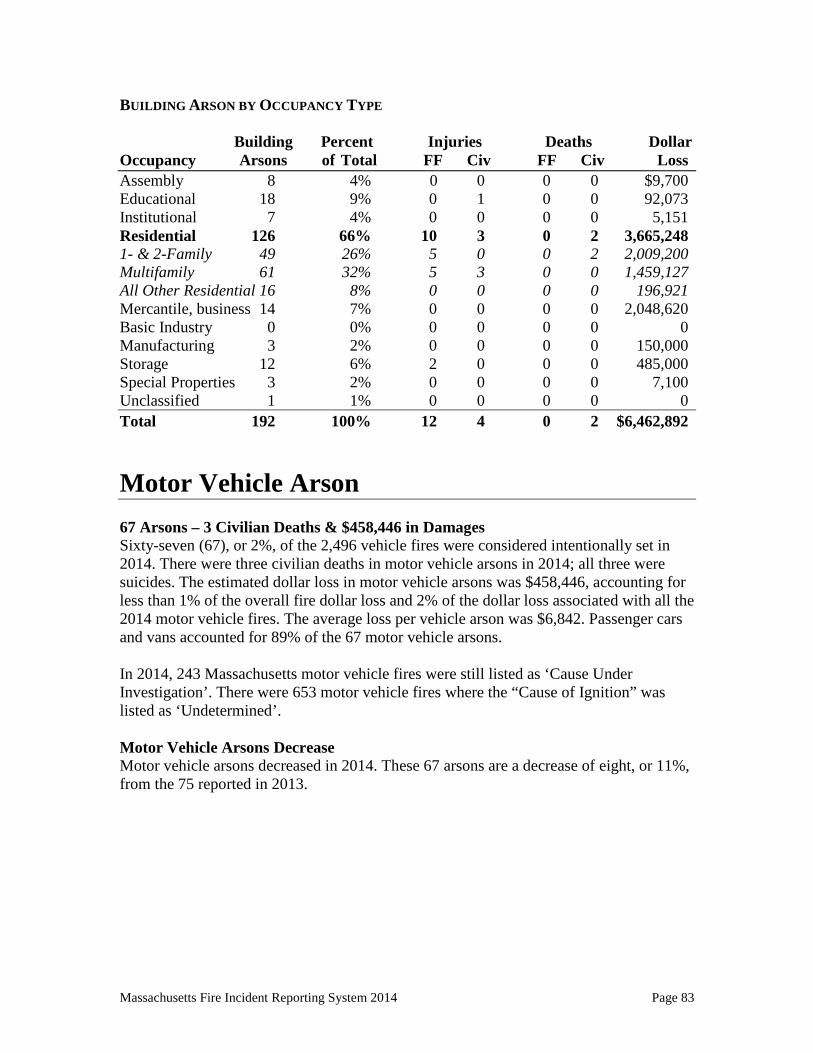
Massachusetts Fire Incident Reporting System 2014 Page 83
BUILDING ARSON BY OCCUPANCY TYPE Building Percent Injuries Deaths Dollar Occupancy Arsons of Total FF Civ FF Civ Loss Assembly 8 4% 0 0 0 0 $9,700 Educational 18 9% 0 1 0 0 92,073 Institutional 7 4% 0 0 0 0 5,151 Residential 126 66% 10 3 0 2 3,665,248 1- & 2-Family 49 26% 5 0 0 2 2,009,200 Multifamily 61 32% 5 3 0 0 1,459,127 All Other Residential 16 8% 0 0 0 0 196,921 Mercantile, business 14 7% 0 0 0 0 2,048,620 Basic Industry 0 0% 0 0 0 0 0 Manufacturing 3 2% 0 0 0 0 150,000 Storage 12 6% 2 0 0 0 485,000 Special Properties 3 2% 0 0 0 0 7,100 Unclassified 1 1% 0 0 0 0 0 Total 192 100% 12 4 0 2 $6,462,892
Motor Vehicle Arson 67 Arsons – 3 Civilian Deaths & $458,446 in Damages Sixty-seven (67), or 2%, of the 2,496 vehicle fires were considered intentionally set in 2014. There were three civilian deaths in motor vehicle arsons in 2014; all three were suicides. The estimated dollar loss in motor vehicle arsons was $458,446, accounting for less than 1% of the overall fire dollar loss and 2% of the dollar loss associated with all the 2014 motor vehicle fires. The average loss per vehicle arson was $6,842. Passenger cars and vans accounted for 89% of the 67 motor vehicle arsons. In 2014, 243 Massachusetts motor vehicle fires were still listed as ‘Cause Under Investigation’. There were 653 motor vehicle fires where the “Cause of Ignition” was listed as ‘Undetermined’. Motor Vehicle Arsons Decrease Motor vehicle arsons decreased in 2014. These 67 arsons are a decrease of eight, or 11%, from the 75 reported in 2013.

Massachusetts Fire Incident Reporting System 2014 Page 84
Outside and Other Arson 533 Arsons – 1 Civilian Death & 1 Civilian Injury Five hundred and thirty-three (533), or 6%, of the total outside and other fires were considered intentionally set in 2014. These arsons caused one civilian death as a result of a self-immolation. The civilian injury accounted for less than 1% of the total civilian injuries and 3% of civilian injuries in all outside and other fires. The fire service injury accounted for less than 1% of all fire-related fire service injuries and 3% of all fire service injuries in outside in other fires. The estimated dollar loss for these arsons was $265,774. The average loss per outside and other arson was $499. In 2014, 221 outside and other fires were still listed as ‘Cause Under Investigation.’ There were also 1,897 outside and other fires where the “Cause of Ignition” was listed as ‘Undetermined’.
176
159
130 151
188
116
124 126
75 67
0 20 40 60 80
100 120 140 160 180 200
2005 2006 2007 2008 2009 2010 2011 2012 2013 2014
Motor Vehicle Arsons by Year 2005 - 2014
Vehicle Linear (Vehicle)
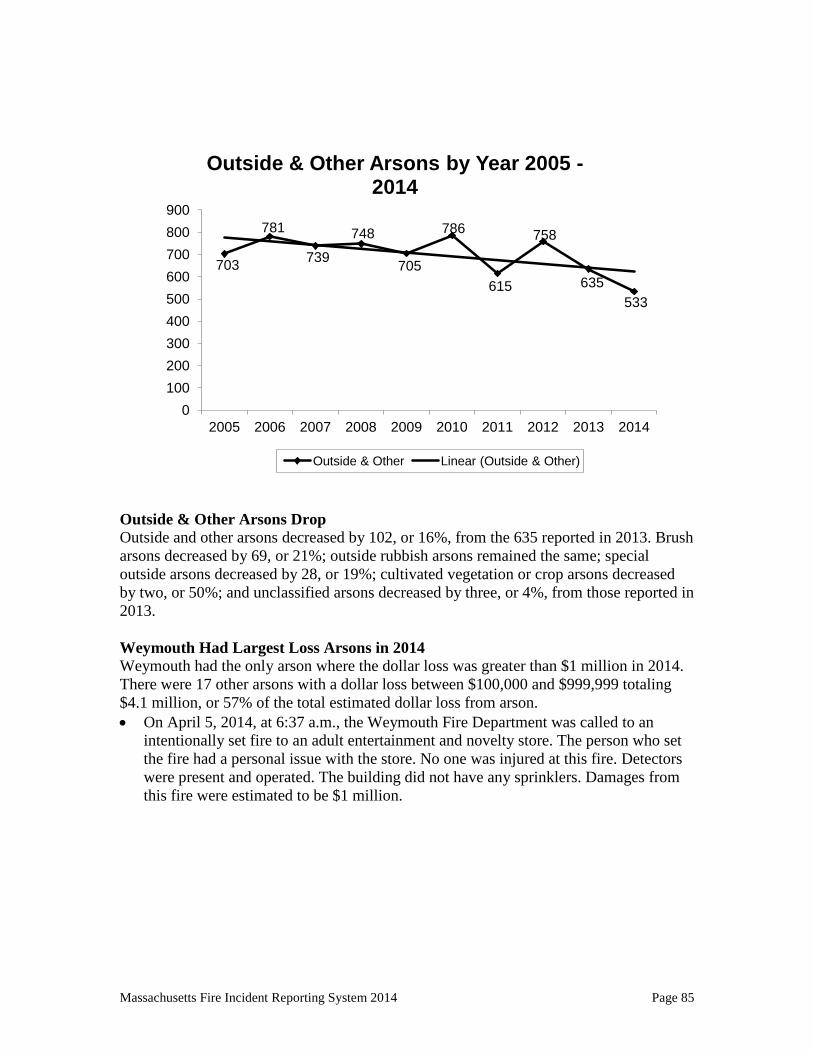
Massachusetts Fire Incident Reporting System 2014 Page 85
Outside & Other Arsons Drop Outside and other arsons decreased by 102, or 16%, from the 635 reported in 2013. Brush arsons decreased by 69, or 21%; outside rubbish arsons remained the same; special outside arsons decreased by 28, or 19%; cultivated vegetation or crop arsons decreased by two, or 50%; and unclassified arsons decreased by three, or 4%, from those reported in 2013. Weymouth Had Largest Loss Arsons in 2014 Weymouth had the only arson where the dollar loss was greater than $1 million in 2014. There were 17 other arsons with a dollar loss between $100,000 and $999,999 totaling $4.1 million, or 57% of the total estimated dollar loss from arson. • On April 5, 2014, at 6:37 a.m., the Weymouth Fire Department was called to an
intentionally set fire to an adult entertainment and novelty store. The person who set the fire had a personal issue with the store. No one was injured at this fire. Detectors were present and operated. The building did not have any sprinklers. Damages from this fire were estimated to be $1 million.
703
781
739
748
705
786
615
758
635 533
0 100 200 300 400 500 600 700 800 900
2005 2006 2007 2008 2009 2010 2011 2012 2013 2014
Outside & Other Arsons by Year 2005 - 2014
Outside & Other Linear (Outside & Other)
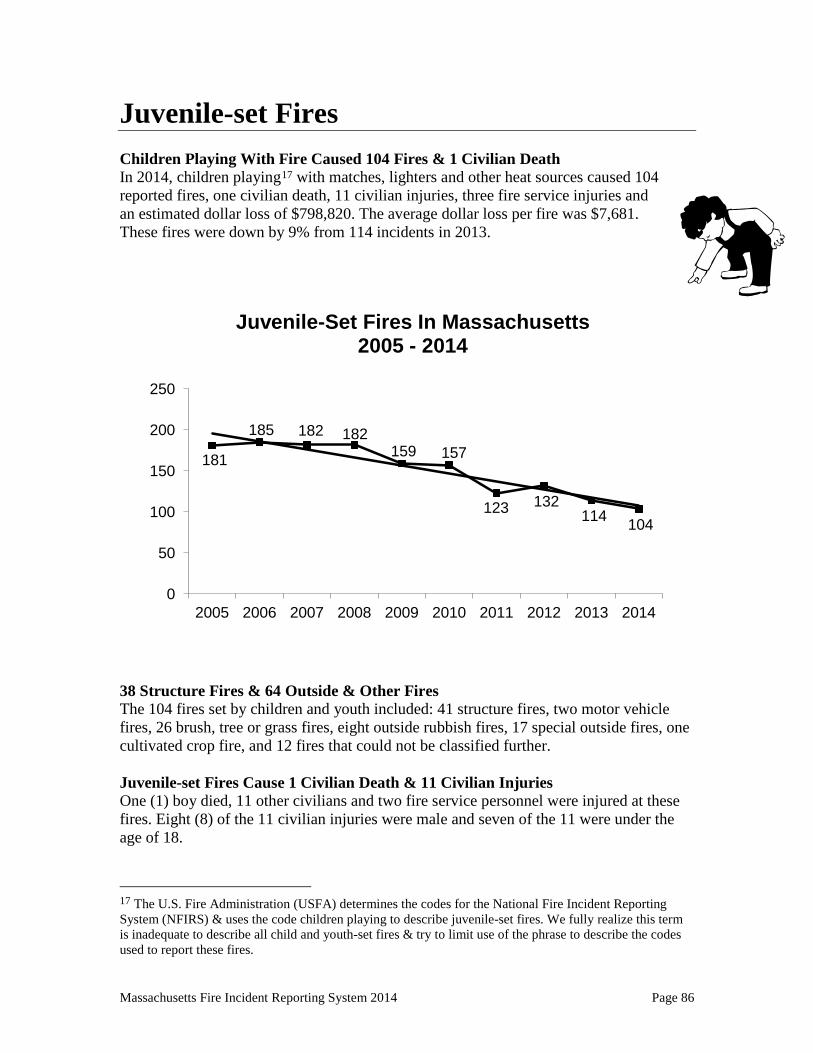
Massachusetts Fire Incident Reporting System 2014 Page 86
Juvenile-set Fires Children Playing With Fire Caused 104 Fires & 1 Civilian Death In 2014, children playing17 with matches, lighters and other heat sources caused 104 reported fires, one civilian death, 11 civilian injuries, three fire service injuries and an estimated dollar loss of $798,820. The average dollar loss per fire was $7,681. These fires were down by 9% from 114 incidents in 2013.
38 Structure Fires & 64 Outside & Other Fires The 104 fires set by children and youth included: 41 structure fires, two motor vehicle fires, 26 brush, tree or grass fires, eight outside rubbish fires, 17 special outside fires, one cultivated crop fire, and 12 fires that could not be classified further. Juvenile-set Fires Cause 1 Civilian Death & 11 Civilian Injuries One (1) boy died, 11 other civilians and two fire service personnel were injured at these fires. Eight (8) of the 11 civilian injuries were male and seven of the 11 were under the age of 18.
17 The U.S. Fire Administration (USFA) determines the codes for the National Fire Incident Reporting System (NFIRS) & uses the code children playing to describe juvenile-set fires. We fully realize this term is inadequate to describe all child and youth-set fires & try to limit use of the phrase to describe the codes used to report these fires.
181
185 182 182 159 157
123 132 114 104
0
50
100
150
200
250
2005 2006 2007 2008 2009 2010 2011 2012 2013 2014
Juvenile-Set Fires In Massachusetts 2005 - 2014

Massachusetts Fire Incident Reporting System 2014 Page 87
Age Gender Activity When
Injured Location at Incident Location When
Injured Severity 6 Male Not reported In area & not involved In area of origin Undetermined 8 Male Unable to act In area & involved In area of origin Death 9 Male Escaping In area & not involved In area of origin Undetermined 9 Male Escaping In area & involved In area of origin Minor
11 Male Undetermined In area & involved In area of origin Severe 12 Male Fire control In area & not involved In area of origin Minor 13 Male Undetermined In area & involved In area of origin Severe 16 Male Irrational act In area & involved In area of origin Moderate 36 Female Undetermined Undetermined Undetermined Minor 39 Female Fire control In area & involved In area of origin Minor 65 Female Other Not in area & not involved In area of origin Minor 66 Male Not reported Not reported Not reported Moderate
Both of the fire service injuries occurred at a single building fire and were strains or sprains. 21% of All Juvenile-set Building Fires Occur in 1- or 2-Family Homes Twenty-one percent (21%) of the 38 building fires caused by juveniles occurred in one or two-family homes; 18% occurred in multi-family homes; 11% occurred in high schools, junior high schools or middle schools. Twenty-one percent (21%) of the juvenile-set fires started in bedrooms; 16% began in bathrooms; and 11% began in closets. 79% of Fires Set by Juveniles Using Smoking Materials Seventy-nine percent (79%) of juvenile-set fires were started by smoking materials18. Forty-three percent (43%) of the structure fires set by children were started with lighters. Twenty-five percent (25%) of the structure fires were started using matches. Heat from other open flames or smoking materials caused 11% of these fires. This demonstrates a need for education to both parents and children on the danger of matches and lighters, the use of illegal fireworks and safe candle use.
18 Smoking materials includes cigarettes, pipes, cigars, cigarette lighters, matches, and heat from unspecified smoking materials.

Massachusetts Fire Incident Reporting System 2014 Page 88
Heat Source # of
Incidents % Known Lighter 37 43% Match 22 25% Heat from other open flame or smoking materials 10 11% Explosives, fireworks, other 3 3% Hot ember or ash 3 3% Flame/torch used for lighting 2 2% Fireworks 2 2% Hot or smoldering object, other 2 2% Radiated or conducted heat from operating equipment 2 2% Multiple 1 1% Heat from direct flame (from another fire) 1 1% Cigarette 1 1% Other 1 1%
Child with Lighter Sets Own Apartment Building on Fire in Haverhill In 2014 there were three juvenile-set fires that caused over a $100,000 in estimated damages. These three fires caused two fire service injuries and a dollar loss of $540,000, or 68%, of the total dollar loss for all juvenile-set fires. ♦ On November 10, 2014, at 1:47 p.m., the Haverhill Fire Department was called to a
fire at a 6-unit apartment building caused by a youth playing with a cigarette lighter. The fire was started by a 6-year old playing with matches in a third-story bedroom. Two (2) firefighters were injured at this fire. Smoke detectors were present and alerted the occupants of the building. The building was not sprinklered. Total damages were estimated to be $300,000.
Parents and Caregivers Must Protect Children from Themselves Parents and caregivers must take steps to protect their children from the dangers of fire.
• Make sure that all matches and lighters are stored out of children's reach. • If you need a lighter, buy one that is child resistant. Since 1994, all disposable butane
lighters and most novelty lighters are required to be able to resist the efforts of 85% of children under five who try to operate them in a specified test. Some are easier to use than others. If one brand is cumbersome, switch to another. Do not disable the child-resistant feature.
• Supervise young children at all times. Teach children the safe uses of fire, including birthday candles and barbecuing. When a child is old enough, let him or her light the candles while you watch. It is only safe for children to use fire when adults are present.
• If your child seems overly curious about fire or has set a fire, call your local fire department and ask if they have a juvenile firesetting intervention program. Don’t assume the child will ‘grow out of it.’ Juvenile firesetting is dangerous and must be addressed by trained professionals.
• Parents who smoke should keep their lighters on their person at all times, not on the table or in a purse.
Massachusetts Fire Incident Reporting System 2014 Page 89
• Fireworks are illegal in Massachusetts. Adults should leave the fireworks to the professionals in order to protect everyone’s children.
Tip of the Iceberg These fires should be considered just the tip of the iceberg. Juvenile firesetting programs have found that only one in 10 juvenile-set fires are actually reported to the fire department.
Cooking Fires Cooking Caused 12,356 Fires, 2 Civilian Deaths & 96 Civilian Injuries Unattended cooking, other unsafe cooking practices and defective cooking equipment caused 12,356 fires, two civilian deaths, 96 civilian injuries, 29 firefighter injuries and an estimated dollar loss of $14.5 million. The average dollar loss per fire was $1,171. Cooking fires accounted for 40% of the total 28,999 fires that occurred in 2014. Ninety-eight percent (98%) of the fires caused by cooking occurred in structures. The 12,356 fires included: 12,151 structure fires, 60 special outside fires, one outside rubbish fire, and 144 fires that could not be classified further. Confined Cooking Fires Account for 40% of Total Fires There were 11,630 cooking fires confined to a non-combustible container. These fires represent 40% of the total fires that occurred and is the largest single cause of fires in Massachusetts. Confined cooking fires increased by 6% from the 10,995 reported in 2013. 77% of Cooking Fires in Buildings Were Unintentional In 1,250, or 77%, of the 1,626 cooking fires in building fires where the ‘Cause of Ignition’ was reported, it was reported as unintentional. The 10,744, or 87%, of all cooking fires were fires contained to non-combustible containers that did not require having a cause reported.19
19 A fire contained to a non-combustible container has a special incident type code. If one of these codes is used then only a Basic Form is completed and the Cause of Ignition field on the Fire Module does not have to be populated. A fire department may still elect to complete the Fire & Structure Fire Modules and all associated fields if it wants to.

Massachusetts Fire Incident Reporting System 2014 Page 90
Cause of Ignition # of
Incidents % of Total % Completed
Confined fire, no fire module completed 10,744 87% Other 2 0.02% 0.1%
Intentional 25 0.2% 2% Unintentional 1,250 10% 77% Failure of equipment or heat source 100 0.8% 6% Act of Nature 1 0.01% 0% Under investigation 28 0.2% 2% Undetermined 220 2% 14% Total 12,370 100% 13% Total completed 1,626
100%
Unattended Cooking Starts 8% − Stand by Your Pan! Human error was responsible for the majority of cooking fires. Eight percent (8%) of cooking fires, where ‘Factors Contributing to Ignition’ was completed, were caused by unattended cooking. Eighty-seven percent (87%) of cooking fires were confined fires where this data is not collected. This data has led to our “Stand By Your Pan” cooking safety campaign.
Factor Contributing to Ignition
# of Cooking
Fires %
Known Confined fire, no fire module completed 10,744
None 1,059 66% Equipment unattended 127 8% Failure to clean 62 4% Too close to combustibles 55 3% Accidentally turned on, not turned off 48 3% Misuse of material or product, other 44 3% Other 33 2% Abandoned materials 23 1% Mechanical failure, malfunction, other 23 1% Electrical failure, malfunction, other 20 1% Equipment not operated properly 17 1% Operational deficiency, other 16 1%
Cooking Was the Leading Cause of Injury in Fires in 2014 Cooking was the leading cause of injury in all types of fires in 2014. This is not surprising considering that almost three-fourths, or 73%, of residential fires start in the kitchen. Of the 96 cooking fire injuries, 52% of victims were male and 48% were female. Six percent (6%) of victims were under age 10. People aged 25 to 54 accounted for 51% of the people injured in cooking fires.

Massachusetts Fire Incident Reporting System 2014 Page 91
Age
% of Cooking Injuries
% of Population Difference
Under 5 4% 6% -2% 5 to 9 2% 7% -5% 10 to 14 2% 7% -5% 15 to 24 10% 13% -3% 25 to 34 20% 15% 5% 35 to 44 16% 17% -1% 45 to 54 21% 14% 7% 55 to 64 10% 9% 1% 65 to 74 6% 7% -1% 75 to 84 5% 5% 0% 85+ 3% 2% 1%
79% of Victims in Room or Area of Fire Origin Of the 77 cooking fire injuries where location at ignition is known, 79% of the victims were injured in the room or area of fire origin.
Location at Time of Incident
# of Cooking
Fire Injuries
% Known
Cooking Injuries
Not reported 9 In area of origin and not involved 19 25%
Not in area of origin and not involved 11 14% Not in area of origin but involved 5 6% In area of origin and involved 42 55% Undetermined 10 Total 96
Total Known 77 100% 68% of Cooking Injuries Occurred When Trying to Control Fire Of the 74 cooking fire injuries for which activity at time of injury was known, 68% of victims were attempting to control the fire; of the 50 victims injured while attempting to control the fire, 54% were male. This data has lead to our “Put A Lid On It” cooking safety campaign.
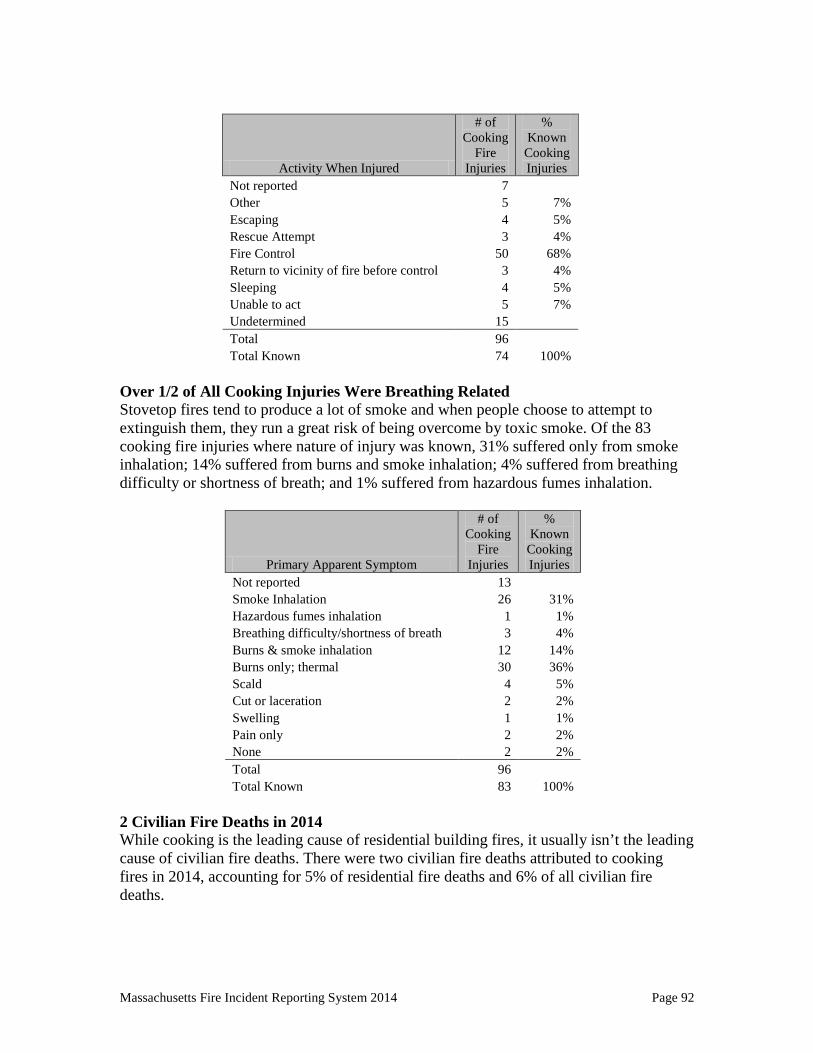
Massachusetts Fire Incident Reporting System 2014 Page 92
Activity When Injured
# of Cooking
Fire Injuries
% Known Cooking Injuries
Not reported 7 Other 5 7%
Escaping 4 5% Rescue Attempt 3 4% Fire Control 50 68% Return to vicinity of fire before control 3 4% Sleeping 4 5% Unable to act 5 7% Undetermined 15 Total 96
Total Known 74 100% Over 1/2 of All Cooking Injuries Were Breathing Related Stovetop fires tend to produce a lot of smoke and when people choose to attempt to extinguish them, they run a great risk of being overcome by toxic smoke. Of the 83 cooking fire injuries where nature of injury was known, 31% suffered only from smoke inhalation; 14% suffered from burns and smoke inhalation; 4% suffered from breathing difficulty or shortness of breath; and 1% suffered from hazardous fumes inhalation.
Primary Apparent Symptom
# of Cooking
Fire Injuries
% Known
Cooking Injuries
Not reported 13 Smoke Inhalation 26 31%
Hazardous fumes inhalation 1 1% Breathing difficulty/shortness of breath 3 4% Burns & smoke inhalation 12 14% Burns only; thermal 30 36% Scald 4 5% Cut or laceration 2 2% Swelling 1 1% Pain only 2 2% None 2 2% Total 96
Total Known 83 100% 2 Civilian Fire Deaths in 2014 While cooking is the leading cause of residential building fires, it usually isn’t the leading cause of civilian fire deaths. There were two civilian fire deaths attributed to cooking fires in 2014, accounting for 5% of residential fire deaths and 6% of all civilian fire deaths.
Massachusetts Fire Incident Reporting System 2014 Page 93
The importance of responding correctly to a clothing ignition – Stop, Drop and Roll – cannot be overemphasized. Older adults, who often are more afraid of falling than of fire, are historically the age group with the highest risk of being injured in a cooking fire. They must be persuaded that they can indeed safely lower themselves to the ground and roll to smother the flames. • Stand by your pan! Never leave cooking, boiling, broiling, or frying
unattended. • Put a lid on a grease fire to smother it, and then turn off the heat. • Never move a burning pan. You can too easily ignite your clothes or spill
the fire onto someone or something else. • Wear short or tight fitting sleeves when cooking. Loose sleeves can easily catch fire. • Stop, Drop and Roll if clothing ignites, no matter how young or old. • Never throw water on a grease fire. Water will only spread the fire around.
Fires Caused by Smoking Smoking Caused 5% of Fires and 19% of Deaths During 2014, 1,569, or 5%, of the 28,999 reported fire incidents were caused by the improper use or disposal of smoking materials. These 1,570 fires caused nine, or 17%, of the 54 civilian deaths and nine, or 20%, of the 45 structure fire deaths, 26 civilian injuries, 23 fire service injuries, and an estimated dollar loss of $13.5 million. The average dollar loss per fire was $8,588. The number of smoking fires decreased by 268, or 15%, from 1,837 in 2014. 421 Structure Fires – Down 18% From 2013 The 1,569 fires caused by smoking included: 421 structure fires, down 95 from 517, or 18%, in 2013.
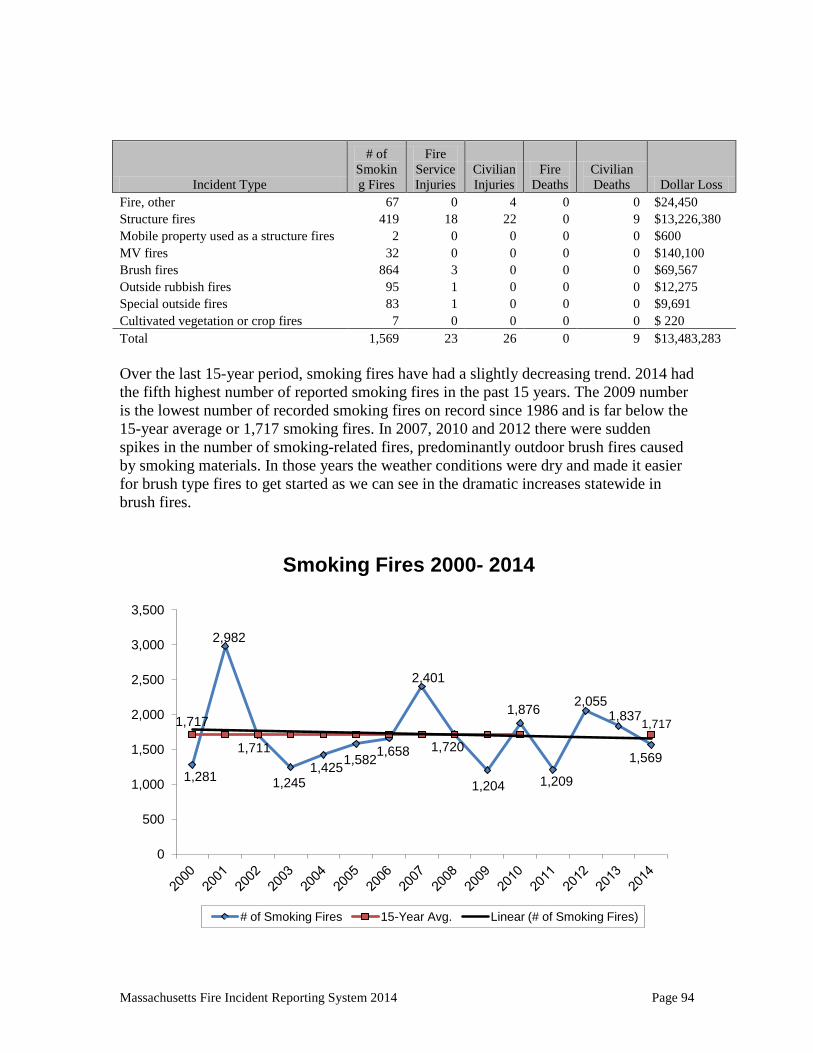
Massachusetts Fire Incident Reporting System 2014 Page 94
Over the last 15-year period, smoking fires have had a slightly decreasing trend. 2014 had the fifth highest number of reported smoking fires in the past 15 years. The 2009 number is the lowest number of recorded smoking fires on record since 1986 and is far below the 15-year average or 1,717 smoking fires. In 2007, 2010 and 2012 there were sudden spikes in the number of smoking-related fires, predominantly outdoor brush fires caused by smoking materials. In those years the weather conditions were dry and made it easier for brush type fires to get started as we can see in the dramatic increases statewide in brush fires.
Incident Type
# of Smoking Fires
Fire Service Injuries
Civilian Injuries
Fire Deaths
Civilian Deaths Dollar Loss
Fire, other 67 0 4 0 0 $24,450 Structure fires 419 18 22 0 9 $13,226,380 Mobile property used as a structure fires 2 0 0 0 0 $600 MV fires 32 0 0 0 0 $140,100 Brush fires 864 3 0 0 0 $69,567 Outside rubbish fires 95 1 0 0 0 $12,275 Special outside fires 83 1 0 0 0 $9,691 Cultivated vegetation or crop fires 7 0 0 0 0 $ 220 Total 1,569 23 26 0 9 $13,483,283
1,281
2,982
1,711
1,245 1,425 1,582 1,658
2,401
1,720
1,204
1,876
1,209
2,055 1,837
1,569
1,717 1,717
0
500
1,000
1,500
2,000
2,500
3,000
3,500
Smoking Fires 2000- 2014
# of Smoking Fires 15-Year Avg. Linear (# of Smoking Fires)

Massachusetts Fire Incident Reporting System 2014 Page 95
86% of All Smoking Building Fires Occurred in Residences Eighty-six percent (86%) of all smoking-related building fires occurred in residential occupancies. The occupancies with the next highest percentages of smoking-related structure fires in Massachusetts in 2014 were businesses at 5. There are statutes that prohibit smoking in public places. These laws have forced smokers to smoke outside where they may not be as careful disposing of their cigarettes or cigars.
Property Use
# of Smoking
Fires
% of Smoking
Fires
Fire Service Injuries
Civilian Injuries
Fire Deaths
Civilian Deaths Dollar Loss
Assembly 12 3% 0 0 0 0 $ 17,400 Educational 2 0.5% 0 0 0 0 $ 1,600 Institutional 2 0.5% 0 0 0 0 $ - Residential 364 86% 16 21 0 9 $ 12,159,830 Mercantile, business 23 5% 0 1 0 0 $ 835,200 Basic Industry 1 0.2% 1 0 0 0 $ 50,000 Manufacturing, processing 1 0.2% 0 0 0 0 $ 1,000 Storage properties 9 2% 0 2 0 1 $ 141,800 Special properties 7 2% 1 0 0 0 $ 150 Total Known 421 100% 18 24 0 10 $ 13,206,980 Smoking the 2nd Leading Cause of Fire Deaths - Elders at Risk The 422 smoking-related structure fires caused all nine of the smoking-related fire deaths, 22 civilian injuries, 18 fire service injuries, an estimated dollar loss of $13.2 million and an average dollar loss of $31,344. Smoking fires accounted for 12% of the fatal structure fires and 22% of structure fire deaths in 2014. The unsafe and improper use of smoking materials caused 21% of residential structure fire deaths and 25% of fatal residential structure fires. Only one, or 5%, of the 19 home fire deaths to seniors (over 65) were caused by smoking. 2014 Smoking Fire Deaths In 2014, nine people died in smoking-related fires of all types. These nine deaths are equal the 10-year average of nine smoking-related fire deaths per year since 2003. After a high-water mark of 18 deaths in 2003, smoking-related fire deaths dropped drastically, except for the sharp spike of 19 deaths in 2007. In 2011 and 2013 there were four smoking-related fire deaths, the lowest recorded number on record.
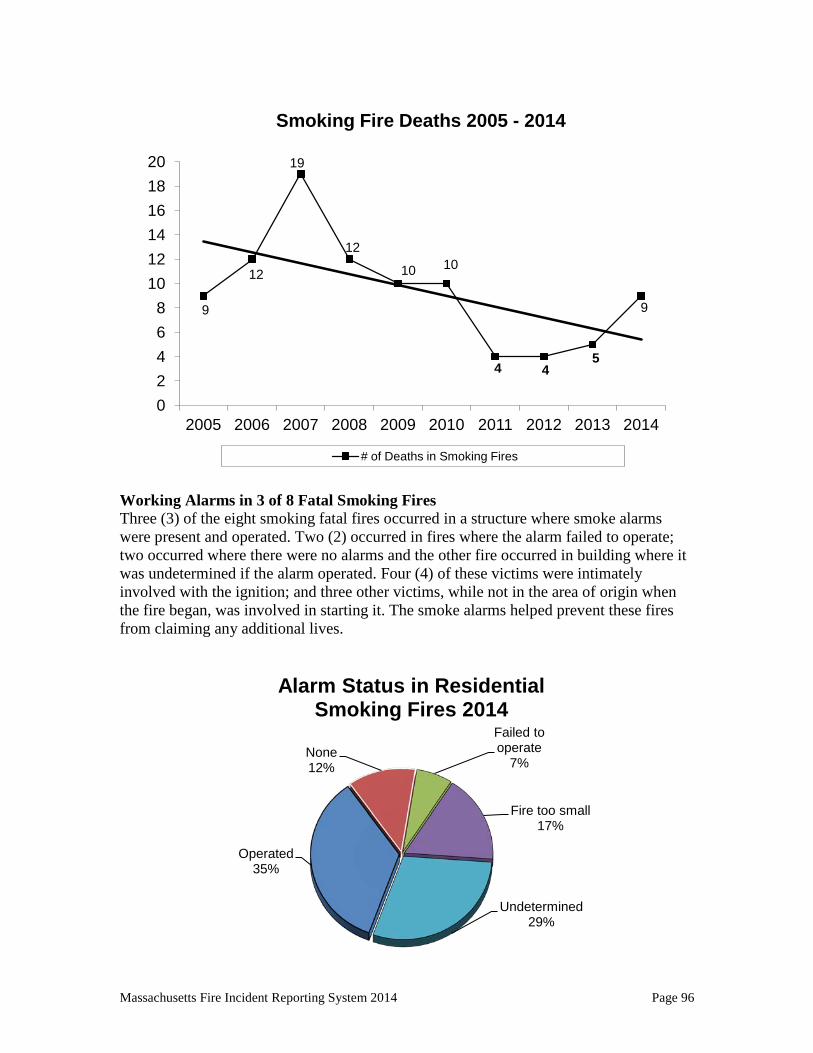
Massachusetts Fire Incident Reporting System 2014 Page 96
Working Alarms in 3 of 8 Fatal Smoking Fires Three (3) of the eight smoking fatal fires occurred in a structure where smoke alarms were present and operated. Two (2) occurred in fires where the alarm failed to operate; two occurred where there were no alarms and the other fire occurred in building where it was undetermined if the alarm operated. Four (4) of these victims were intimately involved with the ignition; and three other victims, while not in the area of origin when the fire began, was involved in starting it. The smoke alarms helped prevent these fires from claiming any additional lives.
9
12
19
12
10 10
4 4 5
9
0 2 4 6 8
10 12 14 16 18 20
2005 2006 2007 2008 2009 2010 2011 2012 2013 2014
Smoking Fire Deaths 2005 - 2014
# of Deaths in Smoking Fires
Operated 35%
None 12%
Failed to operate
7%
Fire too small 17%
Undetermined 29%
Alarm Status in Residential Smoking Fires 2014

Massachusetts Fire Incident Reporting System 2014 Page 97
For a listing of all the smoking-related fire deaths in 2014, please refer to the 2014 Massachusetts Fire Deaths section of this report. Smoking on Oxygen There were no fire deaths in 2014 that involved the use of oxygen while smoking. Over 1/3 of Building Smoking Fires Occurred had Operating Alarms Of the 422 smoking-related building fires, 364, or 86%, occurred in residences. Smoke alarms operated in 35% of the smoking-related residential structure fires. Over 1/2 of Smoking Fires in the Home Start in the Exterior It is interesting to note that over half (56%) of all residential smoking fires started outside the home, not inside. Historically the bedroom and living room are where most smoking fires have started. As more people smoke outside the home in areas like balconies, exterior stairways or enclosed porches, we see more smoking fires starting in these areas. The number of exterior areas of origin in residential smoking fires continued this trend in 2014. These exterior area of origins accounted for 203, or 56%, of all residential smoking fires.
Fire Standard Compliant Cigarettes In January 2007, the Fire Standard Compliant (FSC) Cigarette legislation or ‘fire safe cigarette’ law, making it mandatory for cigarette manufacturers to start selling only the fire standard compliant type of cigarettes in Massachusetts, took effect. There is no
1%
1%
2%
2%
2%
5%
20%
56%
0% 10% 20% 30% 40% 50% 60%
Egress, exit, other
Interior stairway or ramp
Bathroom
Chute/container: trash, rubbish, waste
Vehicle storage area: garage, carport
Kitchen
Bedroom/living room/function room
Exterior areas
2014 Residential Smoking Fires Area of Origin
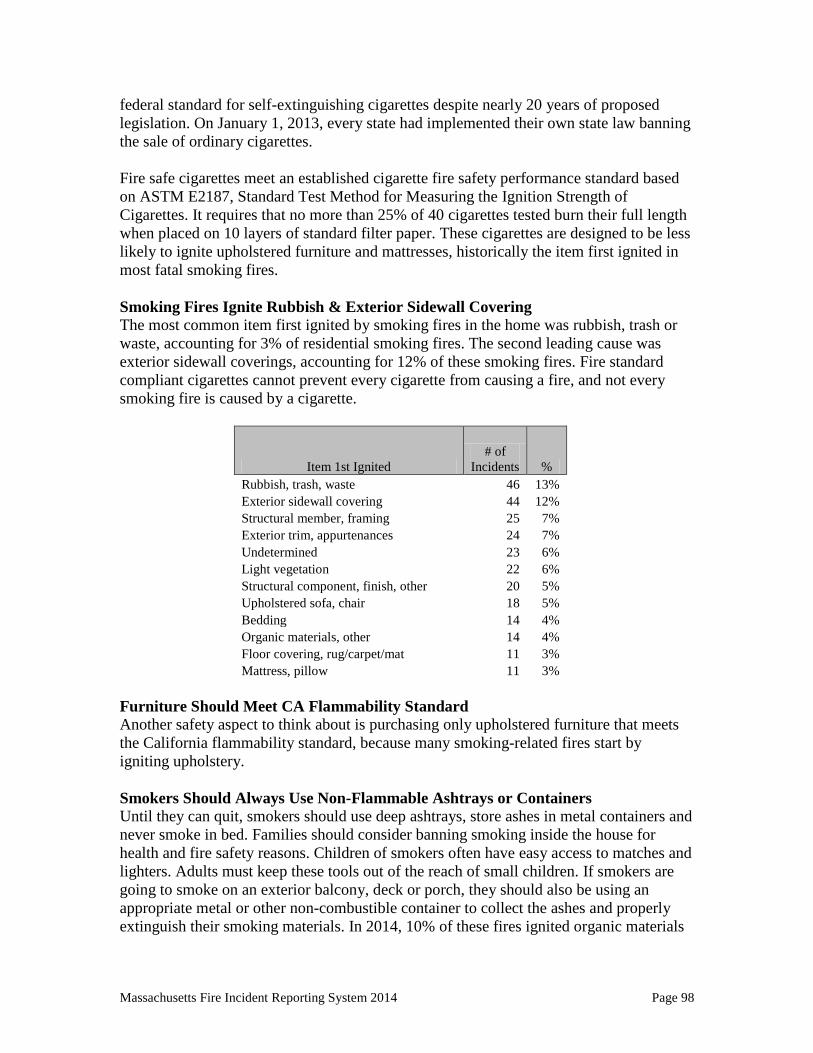
Massachusetts Fire Incident Reporting System 2014 Page 98
federal standard for self-extinguishing cigarettes despite nearly 20 years of proposed legislation. On January 1, 2013, every state had implemented their own state law banning the sale of ordinary cigarettes. Fire safe cigarettes meet an established cigarette fire safety performance standard based on ASTM E2187, Standard Test Method for Measuring the Ignition Strength of Cigarettes. It requires that no more than 25% of 40 cigarettes tested burn their full length when placed on 10 layers of standard filter paper. These cigarettes are designed to be less likely to ignite upholstered furniture and mattresses, historically the item first ignited in most fatal smoking fires. Smoking Fires Ignite Rubbish & Exterior Sidewall Covering The most common item first ignited by smoking fires in the home was rubbish, trash or waste, accounting for 3% of residential smoking fires. The second leading cause was exterior sidewall coverings, accounting for 12% of these smoking fires. Fire standard compliant cigarettes cannot prevent every cigarette from causing a fire, and not every smoking fire is caused by a cigarette.
Item 1st Ignited # of
Incidents % Rubbish, trash, waste 46 13% Exterior sidewall covering 44 12% Structural member, framing 25 7% Exterior trim, appurtenances 24 7% Undetermined 23 6% Light vegetation 22 6% Structural component, finish, other 20 5% Upholstered sofa, chair 18 5% Bedding 14 4% Organic materials, other 14 4% Floor covering, rug/carpet/mat 11 3% Mattress, pillow 11 3%
Furniture Should Meet CA Flammability Standard Another safety aspect to think about is purchasing only upholstered furniture that meets the California flammability standard, because many smoking-related fires start by igniting upholstery. Smokers Should Always Use Non-Flammable Ashtrays or Containers Until they can quit, smokers should use deep ashtrays, store ashes in metal containers and never smoke in bed. Families should consider banning smoking inside the house for health and fire safety reasons. Children of smokers often have easy access to matches and lighters. Adults must keep these tools out of the reach of small children. If smokers are going to smoke on an exterior balcony, deck or porch, they should also be using an appropriate metal or other non-combustible container to collect the ashes and properly extinguish their smoking materials. In 2014, 10% of these fires ignited organic materials
Massachusetts Fire Incident Reporting System 2014 Page 99
or light vegetation, mostly potted plants on balconies or porches or mulch used for landscaping. Think of Flame Retardant Sleepwear for Adults State and federal regulations require most children’s sleepwear to be flame-retardant. However, no such requirements apply to adult clothing. Physically disabled and elderly people may not be able to easily ‘Stop, Drop and Roll’ if their clothing ignites. Everyone Needs a Working Smoke Alarm at Home While everyone needs at least one working smoke alarm on every level of their home, this is even more important for smokers and their families because of the high risk of fire death. Placing a alarm inside every bedroom increases the probability that if a fire occurs, residents will wake up in time to escape. A cigarette accidentally left on a sofa places the smoker and everyone else in the building at risk. A smoke alarm's warning may enable a smoker to live long enough to quit. Never Smoke Where Oxygen is in Use Smoking should never be permitted in a home where oxygen is in use. The oxygen-enriched environment increases the speed at which the fire will burn once it starts. “Most materials will ignite at considerably lower temperatures in oxygen-enriched environments than in air, and once ignited, combustion rates are greater in oxygen-enriched environments.”20 Oxygen can saturate clothing, rugs, upholstery, and facial hair thus increasing the fire danger even when the home oxygen system is “turned off”. Illegal to Throw Cigarettes Out Car Window The improper disposal of smoking materials has been a major problem for the fire service for years. Massachusetts General Law Chapter 148 Section 54 states, “Whoever drops or throws from any vehicle while the same is upon a public or private way running along or near forest land or open fields, or, except as permitted by law, drops, throws, deposits or otherwise places in or upon forest land, any lighted cigarette, cigar, match, live ashes or other flaming or glowing substance, or any substance or thing which in and of itself is likely to cause a fire, shall be punished by a fine of not more than one hundred dollars or by imprisonment for not more than thirty days.” Mulch Regulation Implemented in 2012 Since more people are being forced to smoke in outside areas of their homes and other buildings, cigarettes are finding their way into adjacent landscaped areas; most of which are filled with mulch, a combustible material. On September 1, 2013 a new regulation on mulch safety took effect in the Commonwealth that prohibits the new application of mulch within 18 inches around combustible exteriors of buildings (such as wood or vinyl but not brick or concrete). Residential buildings with less than six units are exempted from this regulation, but all homeowners may also wish to adopt this safety practice. It is 20 Fire Protection Handbook, 19th edition, 2003, National Fire Protection Association, pg. 8-134, Quincy, MA.
Massachusetts Fire Incident Reporting System 2014 Page 100
also beneficial to note that FSC cigarettes were not designed to prevent igniting mulch-type materials.
Heating Equipment Fires 1,763 Fires, 4 Civilian Deaths & 11 Civilian Injuries Massachusetts fire departments reported that some form of heating equipment was involved in 1,763, or 10%, of the 17,342 building fires in 2014. These heating equipment fires caused four civilian deaths, 11 civilian injuries, 34 fire service injuries, and an estimated dollar loss of $11.6 million. The average loss per fire was $6,597. This is a 16% decrease from the 2,107 fires reported in 2013. 85% of All Heating Fires Were Confined Fires In 2014, 85% of heating fires were confined to the container of origin. Eight hundred and forty-seven (847), or 48%, of all heating related building fires in Massachusetts were coded as ‘fuel burner/boiler malfunction, fire contained’. Six hundred and fifty-nine (659), or 37%, were determined to be chimney or flue fires, confined to the chimney or flue. The number of contained heating fires fell in 2014. Confined heating equipment fires decreased by 305 incidents, or 17%, from the 1,811 reported in 2013. Types of Heating Equipment Only one type of equipment per fire incident may be reported to MFIRS. Consequently, the totals for specific types of equipment should, in many cases, be considered underestimates. For example, sparks from a wood stove may ignite a fire in the chimney. The recorded equipment involved might be either the chimney or the wood stove, but not both. When a fire results from an extension cord overloaded by the demands of a portable heater, the extension cord might be recorded instead of the heater. The following table shows the number of fires caused by each of the leading types of heating equipment, the percentage of heating equipment fires for each type of equipment, the number of civilian and fire service deaths and injuries, and the estimated dollar loss for each type of heating equipment.

Massachusetts Fire Incident Reporting System 2014 Page 101
HEATING EQUIPMENT FIRES
Heating Equipment Involved
# of Heating
Fires
% of Heating
Fires
Fire Service Injuries
Civilian Injuries
Fire Service Deaths
Civilian Deaths Dollar Loss
Central heating units 864 49% 3 0 0 0 $ 544,397 Confined 847 48% 2 0 0 0 $ 260,097 Furnace, central heating unit 10 1% 1 0 0 0 $ 202,300 Boiler (power, process, heating) 7 0.4% 0 0 0 0 $ 82,000 Chimney, flue 692 39% 5 3 0 0 $ 1,259,984 Confined 659 37% 4 1 0 0 $ 353,884 Fireplace, chimney, other 6 0.3% 0 0 0 0 $ 98,600 Chimney connector, vent connection 3 0.2% 0 0 0 0 $ 243,000 Chimney, brick, stone, masonry 12 1% 1 2 0 0 $ 440,000 Chimney, metal, incl. stovepipe 12 1% 0 0 0 0 $ 124,500 Space heaters 34 2% 14 4 0 1 $ 2,561,310 Portable space heaters 16 1% 5 4 0 0 $ 1,009,600 Fireplace 28 2% 2 0 0 3 $ 1,096,368 Fireplace, masonry 13 1% 0 0 0 3 $ 607,100 Fireplace insert/stove 1 0.1% 1 0 0 0 $ 18,000 Fireplace factory built 14 1% 1 0 0 0 $ 471,268 Water heater 14 1% 0 0 0 0 $ 1,077,866 Heating, vent. & air cond,. other 45 3% 4 0 0 0 $ 3,370,000 All other reported equipment 12 1% 1 1 0 0 $ 324,300 Total 1,763 100% 34 11 0 4 $11,630,200
Most Heating Fires Occur During Colder Months Almost two-thirds (65%) of all heating equipment fires occurred during the months of January through April, and December.
330
230 262
111
65 37
57 37
68
130
222 214
0
50
100
150
200
250
300
350
MA Heating Equipment Fires in 2014 by Month
Massachusetts Fire Incident Reporting System 2014 Page 102
Furnaces Should Be Cleaned and Checked Annually • Homeowners should have furnaces cleaned and checked annually to ensure that
they are working well. • Combustible materials such as trash or supplies should never be stored near
heating equipment. • Keep a 3-foot clear space around the furnace. • Only licensed trades people may install oil, gas, or electric heating units. • Regulations about oil burners may be found in 527 CMR 4.
Have Chimneys Cleaned Annually to Remove Creosote Creosote is a black, tar-like by-product of fire. It can accumulate in a chimney and cause a fire. Chimneys should be cleaned at the start of each heating season and checked monthly for soot build-up. They should also be checked for loose mortar. Keep the temperature in the recommended range when using wood or coal stoves. Use chimney guards to prevent animals from nesting in your chimney. Have the chimney inspected by a professional after a fire before using your chimney again. Install Wood Stoves According to Building Code Standards A homeowner must obtain a building permit prior to installing a wood, pellet or coal stove and the installation must be inspected upon completion. In general, the stove should be at least three feet away from walls, ceilings and furnishings. If the flue does not draw properly, deadly levels of carbon monoxide may accumulate in the home.
• Keep the temperature within the manufacturer’s suggested range. Wood and coal stoves should be operated at moderate heat. If the fire is too low, creosote may accumulate in the chimney and eventually cause a fire. If the fire is too hot, nearby combustibles or creosote in the chimney could ignite.
• Only burn fuels intended for use in these stoves. Other items may cause overheating and the release of toxic gases. Never use gasoline or flammable liquids to stoke the fire — doing so could cause a flash fire or explosion.
• Install and regularly test smoke and carbon monoxide alarms. • Have your chimney cleaned and inspected for creosote build-up before each
heating season, and check it at least once a month during the season. • Place ashes in a covered metal container until they are completely cool. Store
them outdoors, away from the house, porch or other outside buildings. Hot ashes may stay “live” for 24 hours or longer.
Space Heater Safety
• When buying a heater, look for one that has been tested and labeled by a nationally recognized testing company.
• Keep the heater 3 feet away from drapes, furniture or other things that can burn. Place it on a level surface away from areas where a person or a pet might bump it and knock it over.
• If you must use an extension cord, make sure it is a heavy-duty cord marked with a power rating as least as high as that on the label of the heater itself.
• Never leave a space heater unattended or running while you sleep.

Massachusetts Fire Incident Reporting System 2014 Page 103
• Keep electric heaters away from water. Never use them near a sink or in the bathroom.
• Do not use space heaters to thaw pipes. They were not designed for this task. Space heaters must be kept at least 3 feet away from any combustibles including walls and wall coverings.
Electrical Fires 716 Electrical Fires Caused 15 Civilian Deaths Local fire departments reported that there were 716 structure fires caused by electrical problems in Massachusetts in 2014. These fires caused 15 civilian deaths, 23 civilian injuries, 72 fire service injuries and an estimated dollar loss of $42.6 million, accounting for 18% of the total dollar loss to fire in 2014. The average loss per fire was $59,496. Electrical Fires Were the Leading Cause of Fire Deaths Electrical fires were the leading cause of structure fire deaths in 2014. Eight (8) fatal electrical fires, or 25%, of fatal structure fires caused 15, or 36%, of structure fire deaths in 2014. In 2011 electrical fires were also the leading cause of fire deaths, and in 2012 and 2013 it was the second leading cause of fire deaths. The criteria to qualify for an electrical equipment fire includes all fires caused by electrical problems or malfunctions. Specifically, it is to have Heat Source – arcing or - Factors Contributing to Ignition – equipment overloaded or – electrical failure malfunction or to have Equipment Involved in Ignition in the 200 series – electrical distribution, lighting and power transfer equipment. Unspecified Electrical Failure Responsible for Over 1/5 of Electrical Fires21 One hundred and forty-eight (148), or 21%, of electrical fires were caused by an unclassified electrical failure or malfunction.
21 Factors Contributing to Ignition is one of the fields in version 5 that allows for multiple codes. Two factors contributing to ignition may be coded. For example, in the case of a malfunctioning electrical heater, we can capture not only the electrical malfunction, but also a contributing factor such as: was the heater too close to combustibles; did the automatic control fail; was it knocked over; was it worn out; or was the equipment overloaded. This field also is not a mandatory field, although fire departments are strongly encouraged to complete it, should it apply to the incident. Because of these factors, the percentages may not add up to 100%.
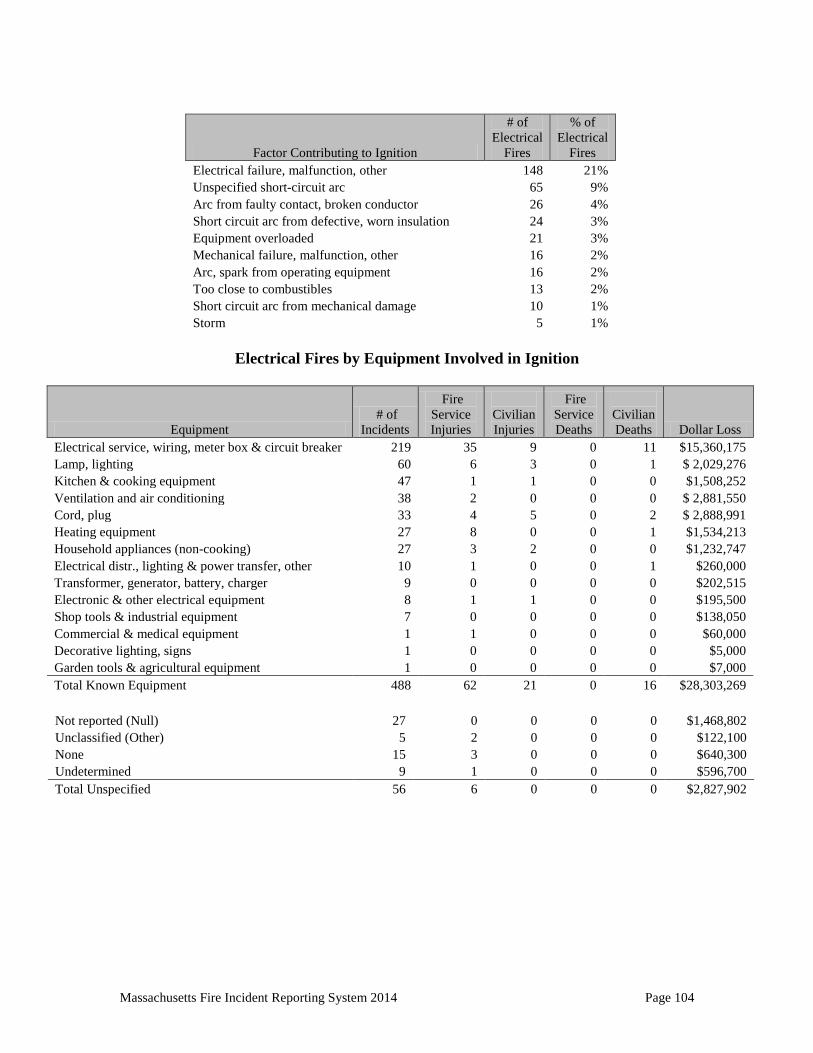
Massachusetts Fire Incident Reporting System 2014 Page 104
Factor Contributing to Ignition
# of Electrical
Fires
% of Electrical
Fires Electrical failure, malfunction, other 148 21% Unspecified short-circuit arc 65 9% Arc from faulty contact, broken conductor 26 4% Short circuit arc from defective, worn insulation 24 3% Equipment overloaded 21 3% Mechanical failure, malfunction, other 16 2% Arc, spark from operating equipment 16 2% Too close to combustibles 13 2% Short circuit arc from mechanical damage 10 1% Storm 5 1%
Electrical Fires by Equipment Involved in Ignition
Equipment # of
Incidents
Fire Service Injuries
Civilian Injuries
Fire Service Deaths
Civilian Deaths Dollar Loss
Electrical service, wiring, meter box & circuit breaker 219 35 9 0 11 $15,360,175 Lamp, lighting 60 6 3 0 1 $ 2,029,276 Kitchen & cooking equipment 47 1 1 0 0 $1,508,252 Ventilation and air conditioning 38 2 0 0 0 $ 2,881,550 Cord, plug 33 4 5 0 2 $ 2,888,991 Heating equipment 27 8 0 0 1 $1,534,213 Household appliances (non-cooking) 27 3 2 0 0 $1,232,747 Electrical distr., lighting & power transfer, other 10 1 0 0 1 $260,000 Transformer, generator, battery, charger 9 0 0 0 0 $202,515 Electronic & other electrical equipment 8 1 1 0 0 $195,500 Shop tools & industrial equipment 7 0 0 0 0 $138,050 Commercial & medical equipment 1 1 0 0 0 $60,000 Decorative lighting, signs 1 0 0 0 0 $5,000 Garden tools & agricultural equipment 1 0 0 0 0 $7,000 Total Known Equipment 488 62 21 0 16 $28,303,269
Not reported (Null) 27 0 0 0 0 $1,468,802 Unclassified (Other) 5 2 0 0 0 $122,100 None 15 3 0 0 0 $640,300 Undetermined 9 1 0 0 0 $596,700 Total Unspecified 56 6 0 0 0 $2,827,902
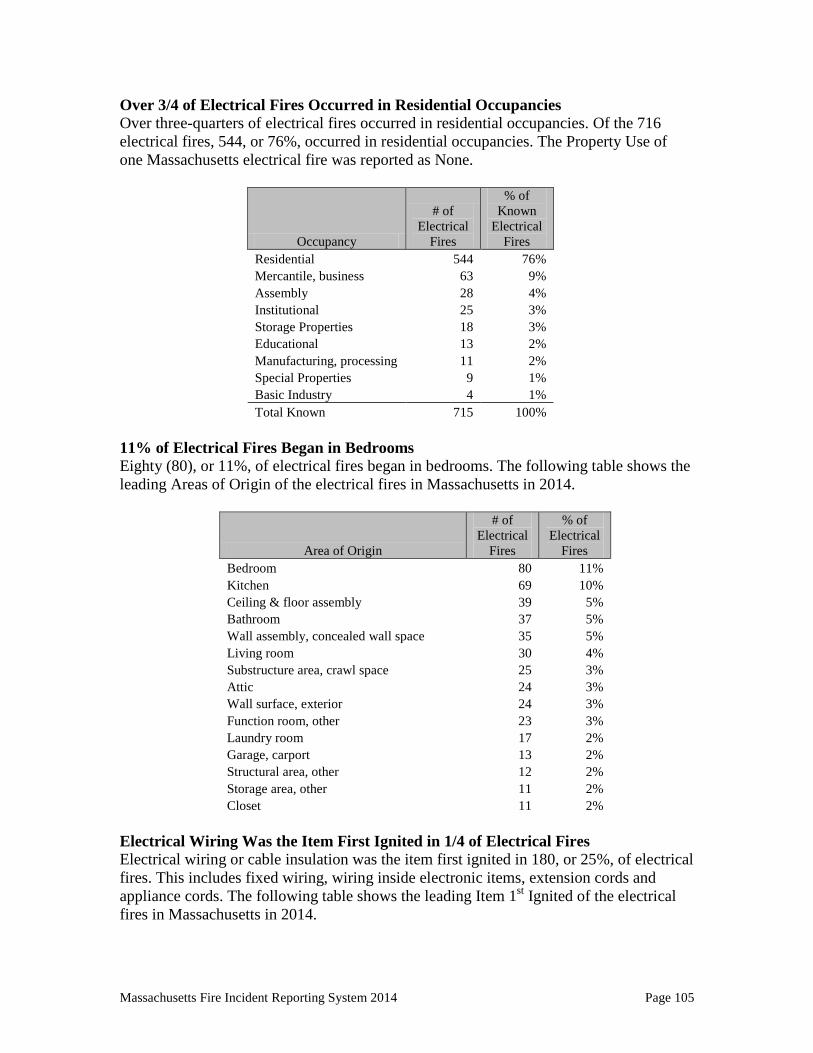
Massachusetts Fire Incident Reporting System 2014 Page 105
Over 3/4 of Electrical Fires Occurred in Residential Occupancies Over three-quarters of electrical fires occurred in residential occupancies. Of the 716 electrical fires, 544, or 76%, occurred in residential occupancies. The Property Use of one Massachusetts electrical fire was reported as None.
Occupancy
# of Electrical
Fires
% of Known
Electrical Fires
Residential 544 76% Mercantile, business 63 9% Assembly 28 4% Institutional 25 3% Storage Properties 18 3% Educational 13 2% Manufacturing, processing 11 2% Special Properties 9 1% Basic Industry 4 1% Total Known 715 100%
11% of Electrical Fires Began in Bedrooms Eighty (80), or 11%, of electrical fires began in bedrooms. The following table shows the leading Areas of Origin of the electrical fires in Massachusetts in 2014.
Area of Origin
# of Electrical
Fires
% of Electrical
Fires Bedroom 80 11% Kitchen 69 10% Ceiling & floor assembly 39 5% Bathroom 37 5% Wall assembly, concealed wall space 35 5% Living room 30 4% Substructure area, crawl space 25 3% Attic 24 3% Wall surface, exterior 24 3% Function room, other 23 3% Laundry room 17 2% Garage, carport 13 2% Structural area, other 12 2% Storage area, other 11 2% Closet 11 2%
Electrical Wiring Was the Item First Ignited in 1/4 of Electrical Fires Electrical wiring or cable insulation was the item first ignited in 180, or 25%, of electrical fires. This includes fixed wiring, wiring inside electronic items, extension cords and appliance cords. The following table shows the leading Item 1st Ignited of the electrical fires in Massachusetts in 2014.

Massachusetts Fire Incident Reporting System 2014 Page 106
Item 1st Ignited
# of Electrical
Fires
% of Electrical
Fires Electrical wire, cable insulation 180 25% Structural member, framing 79 11% Undetermined 51 7% Structural component, finish, other 29 4% Exterior sidewall covering, surface, finish 22 3% Appliance housing or casing 19 3% Thermal, acoustical insulation w/in wall, partition, floor/ceiling 15 2% Other 14 2% Interior wall covering 14 2% Floor covering or rug/carpet/mat 11 2% Interior ceiling cover or finish 11 2% Upholstered sofa, chair 9 1% Linen, other than bedding 9 1%
Large Loss Electrical Fires There were four large loss ($1 million+) electrical fires in 2014. These fires caused an estimated $6.25 million in damages, accounting for 15% of the total dollar loss from electrical structure fires in 2014. There were also 90 fires with estimated damages between $100,000 and $999,999. ♦ On November 2, 2014, at 1:22 a.m., the Boston Fire Department was called to an
electrical fire in a four-story office building. The fire was started by arcing in a wall switch in the lobby. There were no injuries associated with this fire. It was undetermined if detectors were present. The building was not sprinklered. Damages were estimated to be $3.25 million.
Electrical Fire with Most Fire Service Injuries ♦ On June 26, 2014, at 8:02 a.m., the Chelsea Fire Department was called to an
electrical fire in a four-unit apartment building. The fire was caused by arcing of the electrical wire in the first floor living room. Seven (7) firefighters were injured at this fire. Detectors were present and alerted the occupants. Sprinklers were not present. Damages from this fire were estimated at $1.5 million.
Watch For Warning Signs People should watch for warning signs of electrical problems. These include:
♦ Fuses blowing or circuit breakers tripping frequently. ♦ Unusually warm or faulty outlets or switches. ♦ A vague smell of something burning. ♦ A sizzling sound in the wall.
Any of these signs may indicate a potential problem. Contact a licensed electrician if you notice any of these signs, or contact the local fire department. Many departments now have new technologies such as thermal imaging cameras that can ‘see’ heat inside walls to detect potential problems before they expand and extend to other parts of the building.
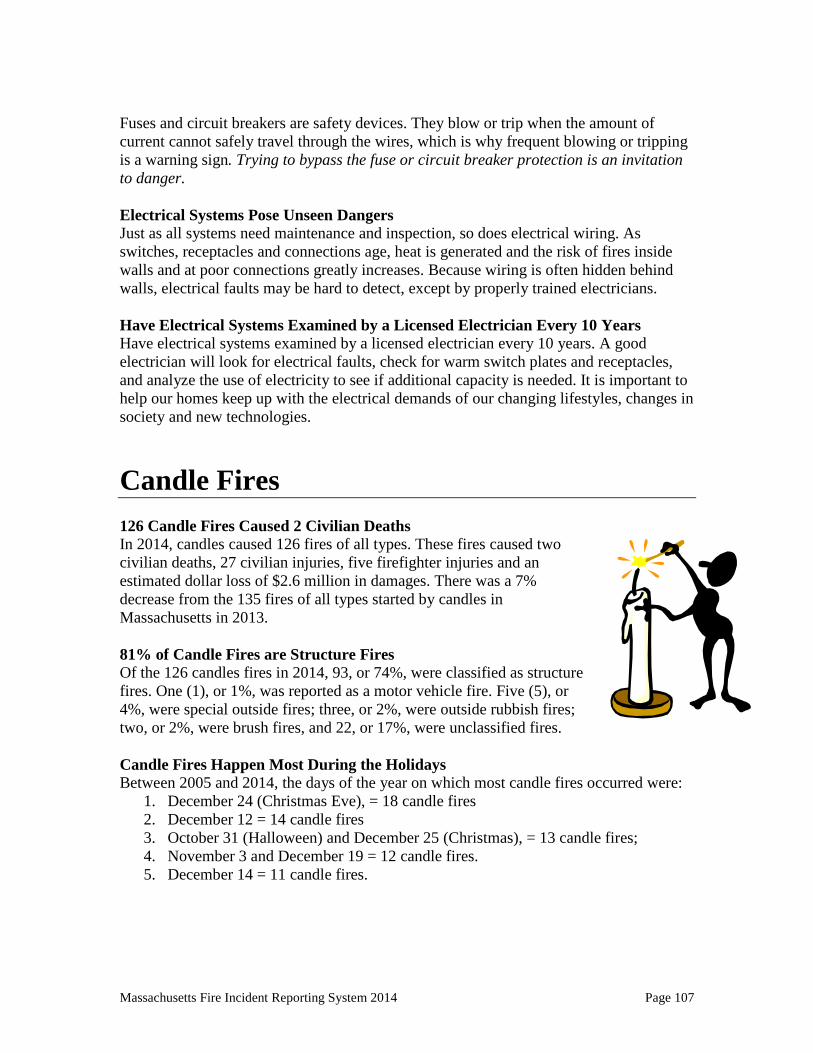
Massachusetts Fire Incident Reporting System 2014 Page 107
Fuses and circuit breakers are safety devices. They blow or trip when the amount of current cannot safely travel through the wires, which is why frequent blowing or tripping is a warning sign. Trying to bypass the fuse or circuit breaker protection is an invitation to danger. Electrical Systems Pose Unseen Dangers Just as all systems need maintenance and inspection, so does electrical wiring. As switches, receptacles and connections age, heat is generated and the risk of fires inside walls and at poor connections greatly increases. Because wiring is often hidden behind walls, electrical faults may be hard to detect, except by properly trained electricians. Have Electrical Systems Examined by a Licensed Electrician Every 10 Years Have electrical systems examined by a licensed electrician every 10 years. A good electrician will look for electrical faults, check for warm switch plates and receptacles, and analyze the use of electricity to see if additional capacity is needed. It is important to help our homes keep up with the electrical demands of our changing lifestyles, changes in society and new technologies.
Candle Fires 126 Candle Fires Caused 2 Civilian Deaths In 2014, candles caused 126 fires of all types. These fires caused two civilian deaths, 27 civilian injuries, five firefighter injuries and an estimated dollar loss of $2.6 million in damages. There was a 7% decrease from the 135 fires of all types started by candles in Massachusetts in 2013. 81% of Candle Fires are Structure Fires Of the 126 candles fires in 2014, 93, or 74%, were classified as structure fires. One (1), or 1%, was reported as a motor vehicle fire. Five (5), or 4%, were special outside fires; three, or 2%, were outside rubbish fires; two, or 2%, were brush fires, and 22, or 17%, were unclassified fires. Candle Fires Happen Most During the Holidays Between 2005 and 2014, the days of the year on which most candle fires occurred were:
1. December 24 (Christmas Eve), = 18 candle fires 2. December 12 = 14 candle fires 3. October 31 (Halloween) and December 25 (Christmas), = 13 candle fires; 4. November 3 and December 19 = 12 candle fires. 5. December 14 = 11 candle fires.

Massachusetts Fire Incident Reporting System 2014 Page 108
Dennis Has Largest Loss Candle Fire & Most Civilian Injuries from Candle Fire • On June 6, 2014, at 2:39 a.m., the Dennis Fire Department was called to a candle fire
in a 12-unit apartment building. The candle ignited clothes that were not being worn in a second floor bedroom. Ten (10) civilians and one firefighter were injured at this fire. Alarms were present and alerted the other occupants. The building was not sprinklered. Damages from the blaze were estimated to be $550,000.
98% of Candle Fires Occurred in Homes Of the 93 candle fires that occurred in buildings, all but two, or 98% were residential fires. Candles caused 91 residential building fires, two civilian deaths, 26 civilian injuries, five firefighter injuries and an estimated dollar loss of $2.5 million. One (1) candle fire, or 1%, occurred in a public assembly property; and another candle fire, or 1%, occurred in an institutional property. 39% of Candle Fires in Homes Occurred in the Bedroom Of the 91 candle fires in residential structures, 39% occurred in the bedroom and 19% occurred in the kitchen. The following table is a list of the leading Area of Origin for residential candle fires.
Area of Origin
# of Residential
Candle Fires
% of Residential
Candle Fires
Bedroom 36 39% Kitchen 17 18% Living room 10 11% Bathroom 8 9% Wall assembly, concealed wall space 4 4% Bar area 4 4%
Smoke Alarms Operated in Over 2/3 of Candle Fires in Homes Of the 91 candle fires in homes, smoke alarms operated in 68% of these fires.
Operated 68%
None 3%
Failed to operate
7%
Fire too small 8%
Undetermined 14%
Alarm Status in Residential Structure Candle Fires 2014

Massachusetts Fire Incident Reporting System 2014 Page 109
If you are going to be burning candles with an open flame in your home make sure that your smoke alarms are working properly. Candle Safety Tips • Burn candles in the center of a 1-foot Circle of Safety, free of anything that can burn. • Stay in the same room with burning candles; do not leave unattended. • Burn candles on a non-combustible surface such as a ceramic saucer or plate. • Be sure to snuff out candles before falling asleep, going out, or leaving the room. • Teach everyone in the family the rules of safe candle use. • Keep candles out of reach of small children and pets.
More information on candle fire safety can be found on our webpage at http://www.mass.gov/dfs.htm.
Fireworks Incidents 74 Incidents Involving Fireworks Caused 2 Fire Service Injuries There were 74 fire and explosion incidents reported that involved fireworks in 2014. This is the same number of fire and explosion incidents reported in 2013. Incidents involving fireworks caused an estimated $18,196 in property damages. The average dollar loss per fireworks incident was $728. Seventy-six percent (76%) of the fireworks incidents were brush fires. A fireworks explosion without fire is coded as an Incident Type 243 – Fireworks explosion (no fires). In 2014, 49 such incidents were reported.
Massachusetts Fire Incident Reporting System 2014 Page 110
36% of Fireworks Fires Occurred the Week of July 4th Nine (9), or 36%, of the 25 fireworks-caused fires in 2014 took place during the week of the 4th of July. Largest Loss Fireworks Fire –Peabody House Fire
• On July 5, 2014, at 9:49 p.m., the Peabody Fire Department was dispatched to a fireworks fire in a mobile home. The fire was caused by fireworks landing on top of the roof. No one was injured at this fire. Detectors were present but it was undetermined if they operated and the home was not sprinklered. Damages were estimated at $10,000.
Refer to M−BIRS Annual Report for More Information about Fireworks Injuries For more information about the causes of burn injuries, please refer to the Massachusetts Burn Injury Reporting System — 2014 Annual Report. According to Massachusetts General Law (MGL) Chapter 112, Section 12A, the treatment of all burn injuries extending over 5% or more of a person’s body surface area must be reported immediately to the State Fire Marshal. All burn reports received by the Division Fire Safety are reviewed for possible suspicious circumstances. Gasoline burns, burns on the hands and arms or other unusual scenarios are referred for further investigation. There were four fireworks-related burn injuries reported to M-BIRS in 2014. These four victims were between eight and 38-years old. Since we started collecting burn injury reports in M-BIRS in 1984, the average number of fireworks-related burns per year is 10. The highest number of reported fireworks-related burns occurred in 1989, with 45 reported burn injuries.
Grill Fires 105 Incidents Involving Grills in 2014 Caused 3 Civilian Injuries In 2014, there were 105 fires and explosion incidents reported to the Massachusetts Fire Incident Reporting System (MFIRS) involving open fired grills. These incidents caused five civilian injuries, two fire service injuries and an estimated dollar loss of $1.5 million. This is a 13% increase from the 93 grill fires in 2013. More than three-quarters, or 80%, of these incidents occurred in the months of May to September when people are most likely to use their outdoor grills. Gas Grill Fires Of the 105 grill incidents, 92, or 88%, of the grills were gas grills. Solid fuels such as charcoal briquettes powered four grills, or 8% of these fires. Three (3), or 3%, were electrically powered; and for two grill fires the power source was
Massachusetts Fire Incident Reporting System 2014 Page 111
undetermined. The 92 gas grill incidents caused four civilian injuries, one fire service injury and $1.3, or 85% of the total damages. Boston Had Largest Loss Grill Fire Five (5) incidents caused $1.3 million, or 86% of the total damages caused by grill fires in 2014. • On June 30, 2014, at 10:06 p.m., the Boston Fire Department was called to a gas grill
fire on the roof of a 9-unit apartment building. No one was injured in this fire. Detectors were present and alerted the occupants. The building was not sprinklered. Damages from the blaze were estimated to be $500,000. The fire spread to the building next door causing $50,000 in estimated damages.
• On August 23, 2014, at 4:01 p.m., the Wareham Fire Department was called to a charcoal grill fire at a single-family home. The heat from the grill ignited the exterior wall and the fire spread. One (1) civilian was injured at this fire. Detectors were present and alerted the occupants. The building was not sprinklered. Damages from the blaze were estimated to be $200,000.
Refer to MBIRS Annual Report for More Information about Grill Injuries For more information about the causes of burn injuries, please refer to the Massachusetts Burn Injury Reporting System — 2014 Annual Report. According to Massachusetts General Law (MGL) Chapter 112, Section 12A, the treatment of all burn injuries extending over 5% or more of a person’s body surface area must be reported immediately to the State Fire Marshal. Three (3) civilians, including a 24-year old man, a 31-year old man and a 47-year old man were reported to M-BIRS in 2014 with burn injuries from a grill. Two (2) of the injuries occurred in June, and the other happened in July. Grill Safety Follow these safety tips when using a grill:
• Use all barbecue grills away from the house in the backyard. • Supervise children whenever any grill is in use. • Never use gasoline on any grill! Gas Grill Safety • Keep all LP-gas outside, 10 feet away from building
openings such as doors, windows, and dryer vents and 20 feet from air intake vents. Gas grill containers must be kept at least five feet away from possible ignition sources such as air conditioners, compressors, cars, and pilot lights.
• LP-gas grills are not permitted inside or on balconies above the first floor of any building where people live. LP-gas is heavier than air and sinks. A leaky grill could pose a hazard to people below.
• Make sure all connections are tight and secure.
Massachusetts Fire Incident Reporting System 2014 Page 112
Charcoal Grill Safety • Use only charcoal lighter fluid to start charcoal grills. • Once the coals have been lighted, never add more lighter fluid to the fire — flames
may travel up the stream of lighter fluid resulting in serious burns. • Only use charcoal grills outside.
Carbon Monoxide Incidents In 2014, 294 fire departments voluntarily reported 15,309 carbon monoxide (CO) incidents: hazards22, carbon monoxide alarm activation due to malfunction23 and carbon monoxide alarm activation – no CO24. A CO hazard is an identifiable carbon monoxide emergency whether or not a CO alarm activated, the presence of CO was confirmed, and some corrective action was indicated. Fire departments responded to some 4,220 confirmed CO hazard incidents. 23% Decrease from 2013 In 2014, the number of reported carbon monoxide incidents decreased by 4,483 calls, or 23%, from the 19,792 calls reported in 2013. Overall, since the institution of Nicole’s Law in 2006, which made CO alarms mandatory in most residential occupancies throughout the Commonwealth, all three types of CO calls have increased. Since the inception of Nicole’s Law in 2006 when 9,654 CO calls were reported, total CO calls have increased. CO calls of all types increased in 2006 to a high of 19,770 in 2013. This confirms the need to have these life-saving devices in people’s homes as a way to avert potential lethal calls. The chart below illustrates the number of calls where carbon monoxide was discovered by responding fire service personnel and the increasing trend in the number of these calls.
22 Carbon monoxide hazards = Incident Type – 424. 23 Carbon monoxide detector activation due to a malfunction = Incident Type – 736. 24 Carbon monoxide detector activation, no CO = Incident Type – 746.
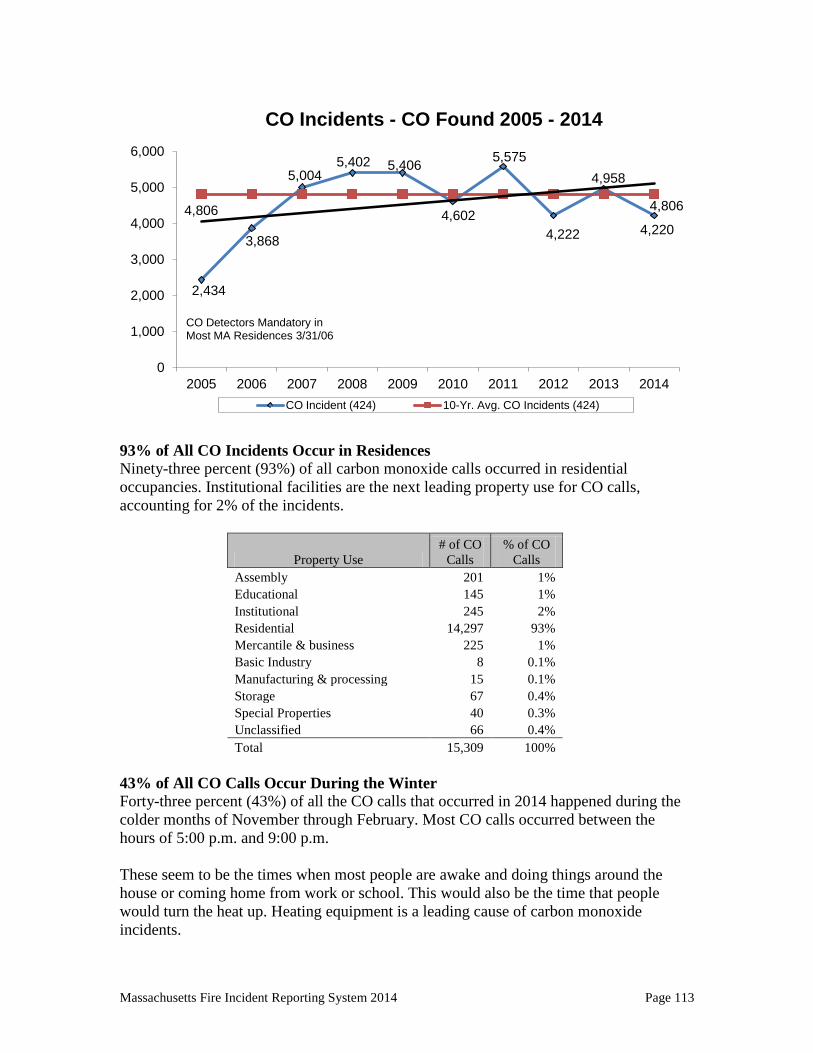
Massachusetts Fire Incident Reporting System 2014 Page 113
93% of All CO Incidents Occur in Residences Ninety-three percent (93%) of all carbon monoxide calls occurred in residential occupancies. Institutional facilities are the next leading property use for CO calls, accounting for 2% of the incidents.
Property Use # of CO
Calls % of CO
Calls Assembly 201 1% Educational 145 1% Institutional 245 2% Residential 14,297 93% Mercantile & business 225 1% Basic Industry 8 0.1% Manufacturing & processing 15 0.1% Storage 67 0.4% Special Properties 40 0.3% Unclassified 66 0.4% Total 15,309 100%
43% of All CO Calls Occur During the Winter Forty-three percent (43%) of all the CO calls that occurred in 2014 happened during the colder months of November through February. Most CO calls occurred between the hours of 5:00 p.m. and 9:00 p.m. These seem to be the times when most people are awake and doing things around the house or coming home from work or school. This would also be the time that people would turn the heat up. Heating equipment is a leading cause of carbon monoxide incidents.
2,434
3,868
5,004 5,402 5,406
4,602
5,575
4,222
4,958
4,220 4,806 4,806
0
1,000
2,000
3,000
4,000
5,000
6,000
2005 2006 2007 2008 2009 2010 2011 2012 2013 2014
CO Incidents - CO Found 2005 - 2014
CO Incident (424) 10-Yr. Avg. CO Incidents (424)
CO Detectors Mandatory in Most MA Residences 3/31/06

Massachusetts Fire Incident Reporting System 2014 Page 114
According to the U.S. Consumer Product Safety Commission (CPSC), an acceptable level of CO is a 15 PPM average over a time span of eight hours or a 22 PPM average for an hour. If you have 1,000 PPM for over thirty minutes, it puts you at a high level of danger in the form of a collapse into a coma or permanent brain damage. Power Outages = Low Batteries Whenever there is a prolonged power outage, you should change the battery in plug-in CO alarms. When the power goes out the backup battery powers the unit for a couple of days. Many people misinterpret the low battery warning ‘beep’ as an active detection of CO and call the fire department tying up emergency resources that may be needed elsewhere. After two of the latest major disasters to hit Massachusetts, the 2011 Halloween snowstorm, and the 2013 February blizzard, all CO calls increased by 345% and 621% respectively from the previous year. Specifically, CO Alarm Activation and Malfunction calls increased by 279% in the days following the Halloween snowstorm and by 414% following the blizzard.
Mapping the Fire Experience Boston & Worcester Had the Most Reported Fires Boston reported having the most fires, with 5,737 in 2014. Worcester had the second highest number of reported fires at 1,273. Cambridge (824), Springfield (779), Quincy (699), and Brockton (561) rounded out the top six communities in the Commonwealth in terms of reported fires. However if we look at the number of reported fires compared to the total population of the individual community we get a different picture. One would expect that the bigger cities and towns to have more fires because of their populations. When we calculate the rate of reported fires for every 10,000 people in a given municipality, the ranking changes. Usually the top communities in terms of number of reported fires fall towards the bottom of the rankings. Communities with one, two or three reported fires take over the top spots. These communities may have a rate that far exceeds that actual number of fires that they reported. For example towns like Peru, New Salem and Heath all reported less than 10 fires in 2014 but their small populations cause them to have a high fires per 10,000 population. For a listing and breakdown of the number of reported fires and arsons by community, please go to the appendix. The map titled, 2014 Fires per 10,000 Population by Community, on page 117, displays the rate of reported fires by community for every 10,000 of that community’s population. The map’s legend indicates to which group a municipality belongs. Cities and towns that are blank reported no fires or failed to report at all. Communities with diamonds have the next highest, followed by straight lines, diagonal lines, towns shaded gray and finally towns colored black show the more fires per 10,000 people were reported from that municipality. These legend symbols are consistent through the other three maps.
Massachusetts Fire Incident Reporting System 2014 Page 115
Topsfield, with 106 total fires, had the highest rate of 174 reported fires per 10,000 population. Middleton was the next highest with 119 total fires and 132 fires per 10,000 population; Great Barrington had 115 fires per 10,000 population; Fitchburg had 108, and Chelsea had 100 fires per 10,000 population. Rates may exceed total actual reported fires. Boston & Worcester Had the Most Reported Structure Fires Boston reported having the most structure fires, with 4,247 in 2014. Worcester had the second highest number of reported structure fires at 491. Cambridge (741), Springfield (439), Framingham (401), and Quincy (389) rounded out the top six communities in the Commonwealth in terms of reported structure fires. The map titled 2014 Structure Fires per 10,000 Population by Community, on page 118, displays the rate of reported structure fires by community for every 10,000 of that community’s population. Cities and towns that are blank did not report any structure fires or failed to report at all. Topsfield, with 90 structure fires, had the highest rate of 148 structure fires per 10,000 population. Middleton was the next highest with 97 structure fires and 108 structure fires per 10,000 population; Great Barrington had 96; Fitchburg had 82; and Chelsea had 76 structure fires per 10,000 population. Boston & Worcester Had the Most Reported Residential Building Fires Boston reported having the most residential building fires, with 3,661 in 2014. Worcester had the second highest number of reported building fires at 694. Cambridge (618), Springfield (393), Lynn (342), and Quincy (332) rounded out the top six communities in the Commonwealth in terms of reported residential building fires. The map titled 2014 Residential Building Fires per 10,000 Population by Community, on page 119, displays the rate of reported building fires by community for every 10,000 of that community’s population. Cities and towns that are blank did not report any residential building fires or failed to report at all. Topsfield, with 80 residential building fires, had the highest rate of 131 residential building fires per 10,000 population. Next highest was Middleton with 92 residential building fires per 10,000 population; Shirley had 80; Shutesbury had 73; Fitchburg had 72; and Great Barrington had 72 residential building fires per 10,000 population. Boston & Taunton Had the Most Reported Arsons Boston reported having the most arsons, with 152 in 2014. Taunton had the second highest number of reported arsons at 24. Brockton (23), Worcester (21), Fall River (19), and New Bedford (22) rounded out the top six communities in the Commonwealth in terms of reported arsons. The map titled 2014 Arsons per 10,000 Population by Community, on page 120, displays the rate of the total reported arsons by community for every 10,000 of that community’s

Massachusetts Fire Incident Reporting System 2014 Page 116
population. Cities and towns that are blank had no reported of arsons or failed to report at all. Ware, with 11 arsons, had the highest rate of any department reporting more than five arsons, with 11 reported arsons per 10,000 population. Next highest was Merrimac with nine arsons per 10,000 population; Dennis had nine, Montague had eight; and Medfield had seven arsons per 10,000 population.

2014 Fires by 10,000 Population by Community
Massachusetts Fire Incident Reporting System 2014
.
0 10 20 30 405Miles
Fires Per 10,000 Population01 - 2526 - 5051 - 7576 - 100101 - 175
Page 117*These departments reported 15 fires or less in 2014.
Great Barrington
FitchburgMiddleton Topsfield
Revere
Boston
Cambridge
Chelsea
Brookline
Dedham
Quincy
Cohasset
GardnerNew Salem*Gill*Heath*Peru*
West Stockbridge* Holyoke
Ashfield
Nantucket

2014 Structure Fires by 10,000 Population by Community
Massachusetts Fire Incident Reporting System 2014
.
0 10 20 30 405Miles
Page 118
Structure Fires Per 10,000 Population01 - 1011 - 2526 - 5051 - 100101 - 183
*These departments reported 15 or less structure fires in 2014.
FitchburgMiddleton
Topsfield
Great Barrington
Chelsea
Cambridge
Heath*
Framingham
Boston
Brookline
Revere
Hampden
GardnerGeorgetown
Cohasset
Lincoln

2014 Residential Fires by 10,000 Population by Community
Massachusetts Fire Incident Reporting System 2014
.
0 10 20 30 405Miles
Page 119*These departments reported 15 or less residential fires in 2014.
Residential Fires Per 10,000 Population01 - 2021 - 3031 - 5051 - 100101 - 131
Great Barrington
Fitchburg
Middleton
Topsfield
Boston
Brookline
Cambridge
Chelsea
Heath*
Revere
LincolnGardnerShutesbury* Shirley
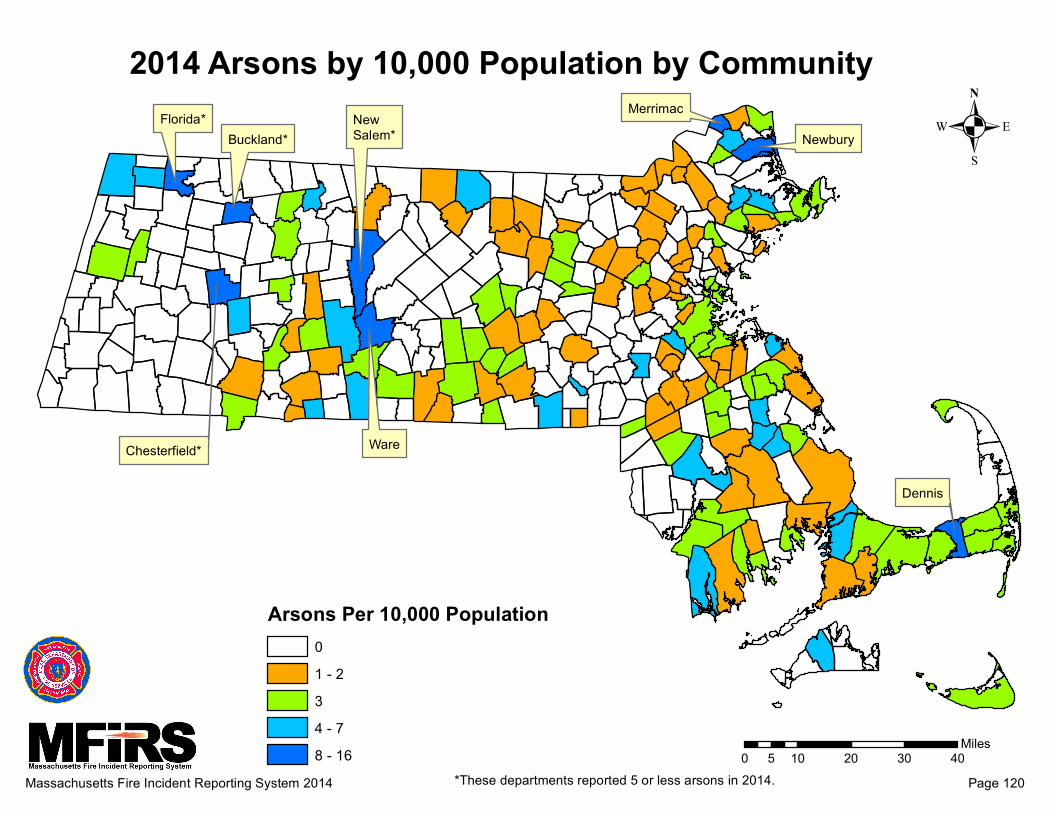
2014 Arsons by 10,000 Population by Community
Massachusetts Fire Incident Reporting System 2014
.
0 10 20 30 405Miles
Page 120
Arsons Per 10,000 Population01 - 234 - 78 - 16
*These departments reported 5 or less arsons in 2014.
New Salem*
MerrimacFlorida*Buckland*
Chesterfield* Ware
Dennis
Newbury

Massachusetts Fire Incident Reporting System 2014 Page 121
Appendix

Massachusetts Fire Incident Reporting System 2014 Page 122
2014 Fire Experience By Community Total Structure Vehicle Other Civilian Fire Service Dollar Community Fires Fires Fires Fires Deaths Injuries Deaths Injuries Loss Abington 86 18 8 60 0 0 0 1 $989,350 Acton 38 18 3 17 0 0 0 0 $610,993 Acushnet 11 7 1 3 0 0 0 0 $180,150 Adams 29 22 2 5 0 2 0 0 $393,908 Agawam 87 38 12 37 0 6 0 1 $2,009,220 Alford 2 1 0 1 0 0 0 0 $6,000 Amesbury 74 43 8 23 0 2 0 0 $56,522 Amherst 80 44 9 27 0 0 0 2 $466,390 Andover 55 21 12 22 0 0 0 0 $671,263 Aquinnah 1 0 0 1 0 0 0 0 $0 Arlington 62 32 7 23 0 1 0 0 $170,522 Ashburnham 23 8 1 14 1 3 0 0 $535,200 Ashby 3 3 0 0 0 0 0 0 $0 Ashfield 17 8 1 8 0 0 0 0 $483,500 Ashland 1 1 0 0 0 0 0 0 $0 Athol 42 19 4 19 0 4 0 0 $50,000 Attleboro 114 45 19 50 0 1 0 0 $530,850 Auburn 53 23 12 18 0 0 0 0 $699,850 Avon 3 2 1 0 0 0 0 1 $122,300 Ayer 14 8 0 6 0 0 0 0 $433,000 Barnstable Fire Districts Barnstable 24 9 6 9 0 1 0 0 $34,700 Cotuit 10 3 0 7 0 0 0 0 $0 C.O.M.M. 71 43 2 26 0 0 0 0 $705,177 Hyannis 152 72 11 69 1 12 0 0 $1,819,801 West Barnstable 10 4 1 5 0 0 0 0 $214,000 Barre 8 4 3 1 0 0 0 0 $8,600 Becket 3 3 0 0 0 0 0 0 $0 Bedford 23 12 3 8 0 2 0 0 $105,860 Belchertown 37 14 2 21 0 0 0 0 $25,000 Bellingham 50 25 4 21 0 0 0 2 $1,138,745 Belmont 97 74 5 18 0 0 0 2 $1,186,900 Berkley 10 5 4 1 0 1 0 0 $78,000 Berlin 21 10 5 6 0 0 0 2 $332,635 Bernardston 4 1 0 3 0 0 0 0 $0 Beverly 93 35 3 55 0 0 0 3 $412,550
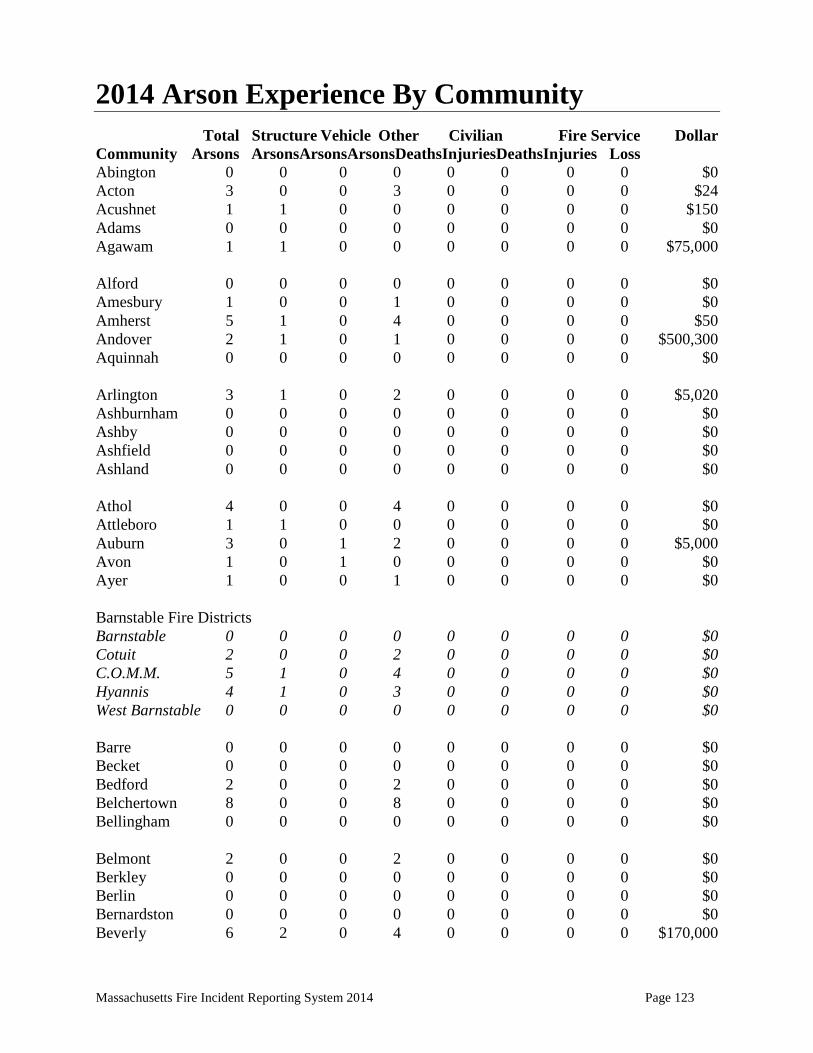
Massachusetts Fire Incident Reporting System 2014 Page 123
2014 Arson Experience By Community Total Structure Vehicle Other Civilian Fire Service Dollar Community Arsons ArsonsArsonsArsonsDeathsInjuriesDeathsInjuries Loss Abington 0 0 0 0 0 0 0 0 $0 Acton 3 0 0 3 0 0 0 0 $24 Acushnet 1 1 0 0 0 0 0 0 $150 Adams 0 0 0 0 0 0 0 0 $0 Agawam 1 1 0 0 0 0 0 0 $75,000 Alford 0 0 0 0 0 0 0 0 $0 Amesbury 1 0 0 1 0 0 0 0 $0 Amherst 5 1 0 4 0 0 0 0 $50 Andover 2 1 0 1 0 0 0 0 $500,300 Aquinnah 0 0 0 0 0 0 0 0 $0 Arlington 3 1 0 2 0 0 0 0 $5,020 Ashburnham 0 0 0 0 0 0 0 0 $0 Ashby 0 0 0 0 0 0 0 0 $0 Ashfield 0 0 0 0 0 0 0 0 $0 Ashland 0 0 0 0 0 0 0 0 $0 Athol 4 0 0 4 0 0 0 0 $0 Attleboro 1 1 0 0 0 0 0 0 $0 Auburn 3 0 1 2 0 0 0 0 $5,000 Avon 1 0 1 0 0 0 0 0 $0 Ayer 1 0 0 1 0 0 0 0 $0 Barnstable Fire Districts Barnstable 0 0 0 0 0 0 0 0 $0 Cotuit 2 0 0 2 0 0 0 0 $0 C.O.M.M. 5 1 0 4 0 0 0 0 $0 Hyannis 4 1 0 3 0 0 0 0 $0 West Barnstable 0 0 0 0 0 0 0 0 $0 Barre 0 0 0 0 0 0 0 0 $0 Becket 0 0 0 0 0 0 0 0 $0 Bedford 2 0 0 2 0 0 0 0 $0 Belchertown 8 0 0 8 0 0 0 0 $0 Bellingham 0 0 0 0 0 0 0 0 $0 Belmont 2 0 0 2 0 0 0 0 $0 Berkley 0 0 0 0 0 0 0 0 $0 Berlin 0 0 0 0 0 0 0 0 $0 Bernardston 0 0 0 0 0 0 0 0 $0 Beverly 6 2 0 4 0 0 0 0 $170,000
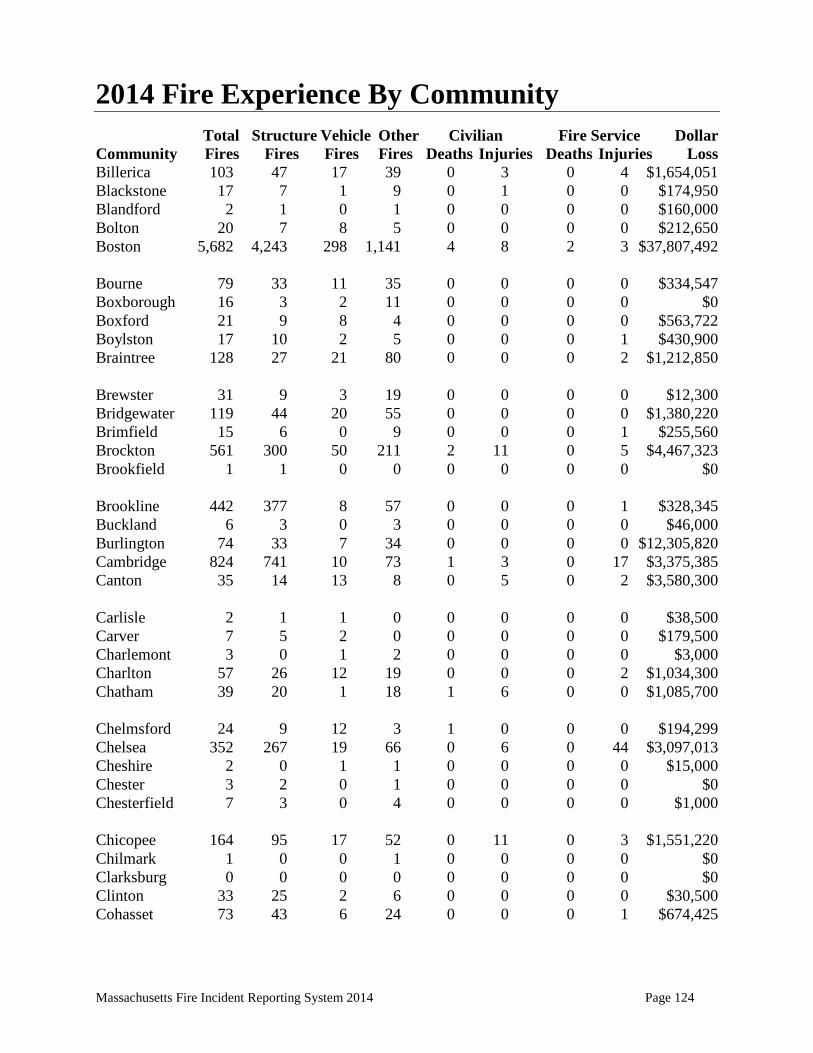
Massachusetts Fire Incident Reporting System 2014 Page 124
2014 Fire Experience By Community Total Structure Vehicle Other Civilian Fire Service Dollar Community Fires Fires Fires Fires Deaths Injuries Deaths Injuries Loss Billerica 103 47 17 39 0 3 0 4 $1,654,051 Blackstone 17 7 1 9 0 1 0 0 $174,950 Blandford 2 1 0 1 0 0 0 0 $160,000 Bolton 20 7 8 5 0 0 0 0 $212,650 Boston 5,682 4,243 298 1,141 4 8 2 3 $37,807,492 Bourne 79 33 11 35 0 0 0 0 $334,547 Boxborough 16 3 2 11 0 0 0 0 $0 Boxford 21 9 8 4 0 0 0 0 $563,722 Boylston 17 10 2 5 0 0 0 1 $430,900 Braintree 128 27 21 80 0 0 0 2 $1,212,850 Brewster 31 9 3 19 0 0 0 0 $12,300 Bridgewater 119 44 20 55 0 0 0 0 $1,380,220 Brimfield 15 6 0 9 0 0 0 1 $255,560 Brockton 561 300 50 211 2 11 0 5 $4,467,323 Brookfield 1 1 0 0 0 0 0 0 $0 Brookline 442 377 8 57 0 0 0 1 $328,345 Buckland 6 3 0 3 0 0 0 0 $46,000 Burlington 74 33 7 34 0 0 0 0 $12,305,820 Cambridge 824 741 10 73 1 3 0 17 $3,375,385 Canton 35 14 13 8 0 5 0 2 $3,580,300 Carlisle 2 1 1 0 0 0 0 0 $38,500 Carver 7 5 2 0 0 0 0 0 $179,500 Charlemont 3 0 1 2 0 0 0 0 $3,000 Charlton 57 26 12 19 0 0 0 2 $1,034,300 Chatham 39 20 1 18 1 6 0 0 $1,085,700 Chelmsford 24 9 12 3 1 0 0 0 $194,299 Chelsea 352 267 19 66 0 6 0 44 $3,097,013 Cheshire 2 0 1 1 0 0 0 0 $15,000 Chester 3 2 0 1 0 0 0 0 $0 Chesterfield 7 3 0 4 0 0 0 0 $1,000 Chicopee 164 95 17 52 0 11 0 3 $1,551,220 Chilmark 1 0 0 1 0 0 0 0 $0 Clarksburg 0 0 0 0 0 0 0 0 $0 Clinton 33 25 2 6 0 0 0 0 $30,500 Cohasset 73 43 6 24 0 0 0 1 $674,425
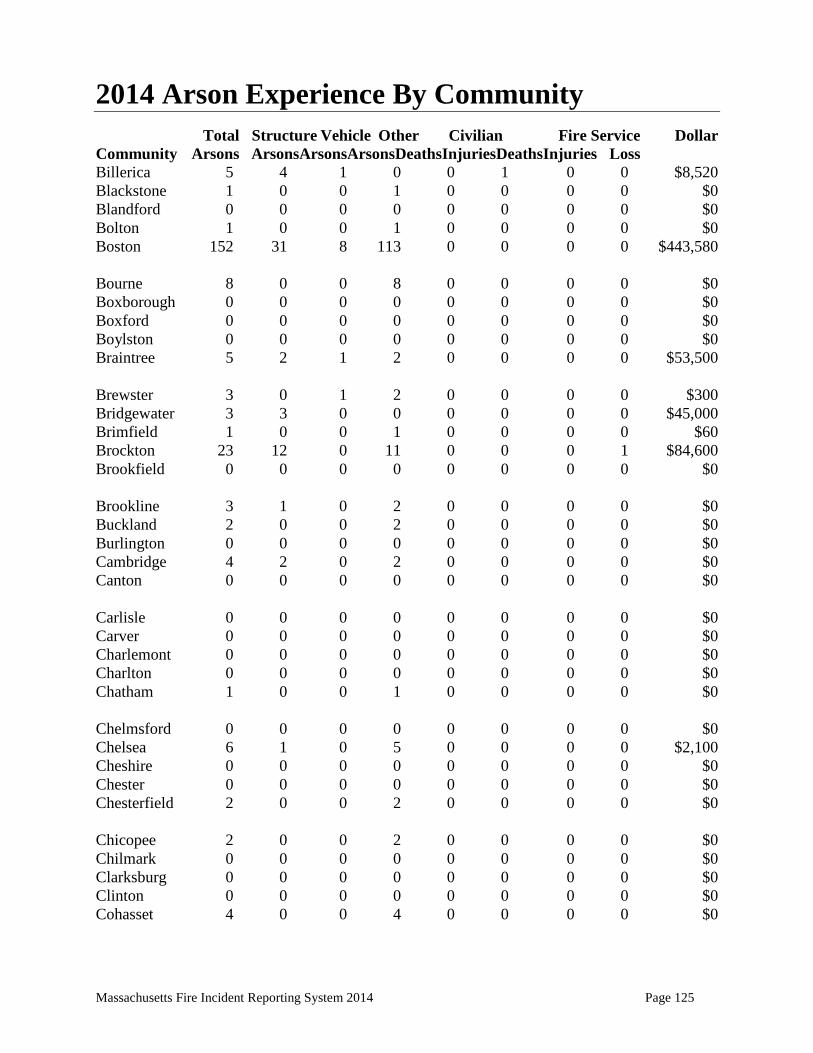
Massachusetts Fire Incident Reporting System 2014 Page 125
2014 Arson Experience By Community Total Structure Vehicle Other Civilian Fire Service Dollar Community Arsons ArsonsArsonsArsonsDeathsInjuriesDeathsInjuries Loss Billerica 5 4 1 0 0 1 0 0 $8,520 Blackstone 1 0 0 1 0 0 0 0 $0 Blandford 0 0 0 0 0 0 0 0 $0 Bolton 1 0 0 1 0 0 0 0 $0 Boston 152 31 8 113 0 0 0 0 $443,580 Bourne 8 0 0 8 0 0 0 0 $0 Boxborough 0 0 0 0 0 0 0 0 $0 Boxford 0 0 0 0 0 0 0 0 $0 Boylston 0 0 0 0 0 0 0 0 $0 Braintree 5 2 1 2 0 0 0 0 $53,500 Brewster 3 0 1 2 0 0 0 0 $300 Bridgewater 3 3 0 0 0 0 0 0 $45,000 Brimfield 1 0 0 1 0 0 0 0 $60 Brockton 23 12 0 11 0 0 0 1 $84,600 Brookfield 0 0 0 0 0 0 0 0 $0 Brookline 3 1 0 2 0 0 0 0 $0 Buckland 2 0 0 2 0 0 0 0 $0 Burlington 0 0 0 0 0 0 0 0 $0 Cambridge 4 2 0 2 0 0 0 0 $0 Canton 0 0 0 0 0 0 0 0 $0 Carlisle 0 0 0 0 0 0 0 0 $0 Carver 0 0 0 0 0 0 0 0 $0 Charlemont 0 0 0 0 0 0 0 0 $0 Charlton 0 0 0 0 0 0 0 0 $0 Chatham 1 0 0 1 0 0 0 0 $0 Chelmsford 0 0 0 0 0 0 0 0 $0 Chelsea 6 1 0 5 0 0 0 0 $2,100 Cheshire 0 0 0 0 0 0 0 0 $0 Chester 0 0 0 0 0 0 0 0 $0 Chesterfield 2 0 0 2 0 0 0 0 $0 Chicopee 2 0 0 2 0 0 0 0 $0 Chilmark 0 0 0 0 0 0 0 0 $0 Clarksburg 0 0 0 0 0 0 0 0 $0 Clinton 0 0 0 0 0 0 0 0 $0 Cohasset 4 0 0 4 0 0 0 0 $0
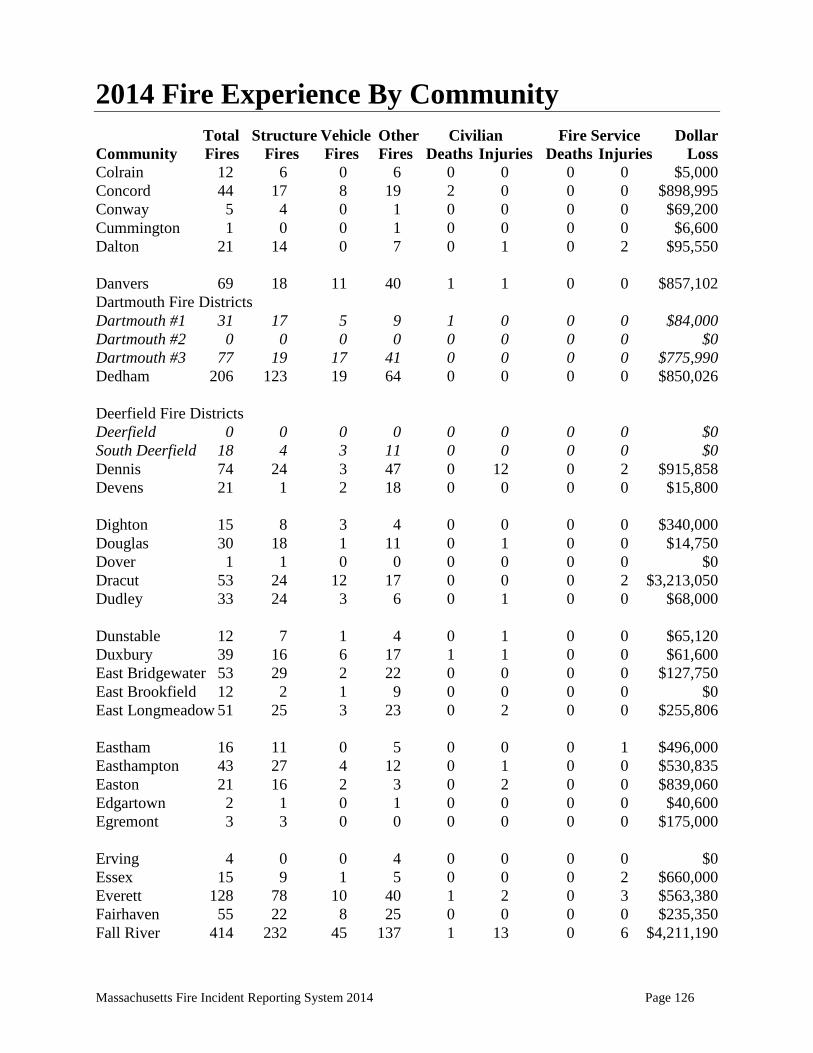
Massachusetts Fire Incident Reporting System 2014 Page 126
2014 Fire Experience By Community Total Structure Vehicle Other Civilian Fire Service Dollar Community Fires Fires Fires Fires Deaths Injuries Deaths Injuries Loss Colrain 12 6 0 6 0 0 0 0 $5,000 Concord 44 17 8 19 2 0 0 0 $898,995 Conway 5 4 0 1 0 0 0 0 $69,200 Cummington 1 0 0 1 0 0 0 0 $6,600 Dalton 21 14 0 7 0 1 0 2 $95,550 Danvers 69 18 11 40 1 1 0 0 $857,102 Dartmouth Fire Districts Dartmouth #1 31 17 5 9 1 0 0 0 $84,000 Dartmouth #2 0 0 0 0 0 0 0 0 $0 Dartmouth #3 77 19 17 41 0 0 0 0 $775,990 Dedham 206 123 19 64 0 0 0 0 $850,026 Deerfield Fire Districts Deerfield 0 0 0 0 0 0 0 0 $0 South Deerfield 18 4 3 11 0 0 0 0 $0 Dennis 74 24 3 47 0 12 0 2 $915,858 Devens 21 1 2 18 0 0 0 0 $15,800 Dighton 15 8 3 4 0 0 0 0 $340,000 Douglas 30 18 1 11 0 1 0 0 $14,750 Dover 1 1 0 0 0 0 0 0 $0 Dracut 53 24 12 17 0 0 0 2 $3,213,050 Dudley 33 24 3 6 0 1 0 0 $68,000 Dunstable 12 7 1 4 0 1 0 0 $65,120 Duxbury 39 16 6 17 1 1 0 0 $61,600 East Bridgewater 53 29 2 22 0 0 0 0 $127,750 East Brookfield 12 2 1 9 0 0 0 0 $0 East Longmeadow 51 25 3 23 0 2 0 0 $255,806 Eastham 16 11 0 5 0 0 0 1 $496,000 Easthampton 43 27 4 12 0 1 0 0 $530,835 Easton 21 16 2 3 0 2 0 0 $839,060 Edgartown 2 1 0 1 0 0 0 0 $40,600 Egremont 3 3 0 0 0 0 0 0 $175,000 Erving 4 0 0 4 0 0 0 0 $0 Essex 15 9 1 5 0 0 0 2 $660,000 Everett 128 78 10 40 1 2 0 3 $563,380 Fairhaven 55 22 8 25 0 0 0 0 $235,350 Fall River 414 232 45 137 1 13 0 6 $4,211,190
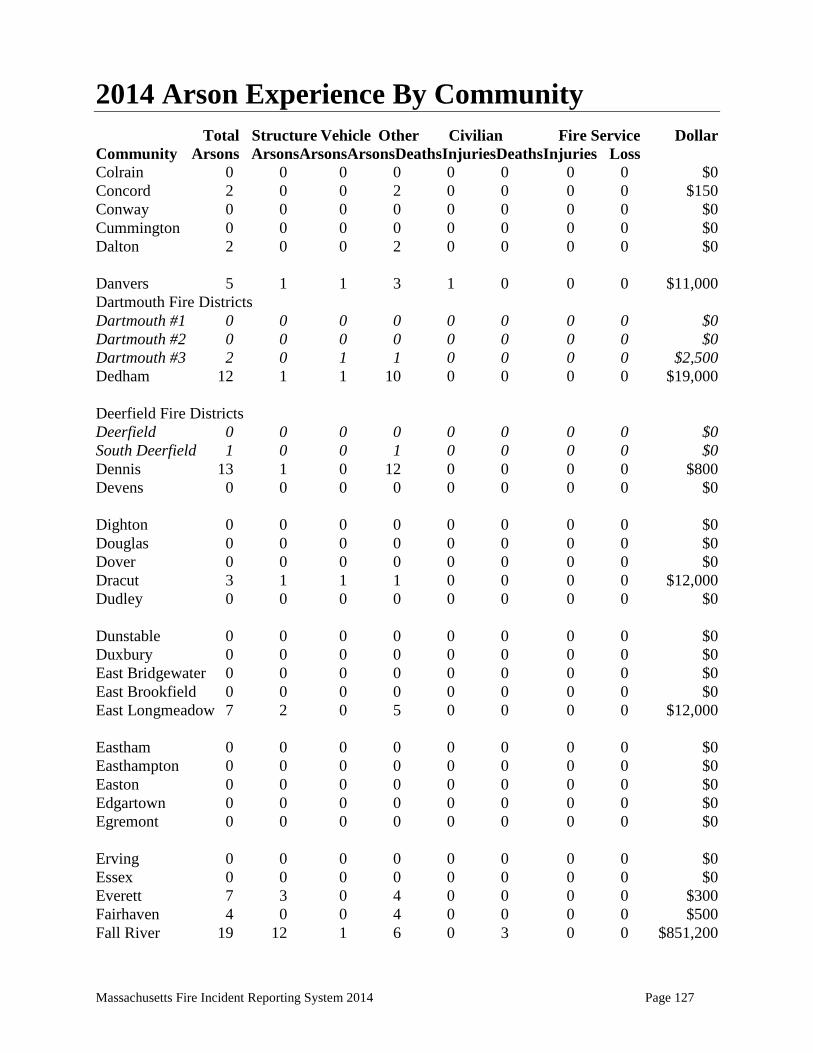
Massachusetts Fire Incident Reporting System 2014 Page 127
2014 Arson Experience By Community Total Structure Vehicle Other Civilian Fire Service Dollar Community Arsons ArsonsArsonsArsonsDeathsInjuriesDeathsInjuries Loss Colrain 0 0 0 0 0 0 0 0 $0 Concord 2 0 0 2 0 0 0 0 $150 Conway 0 0 0 0 0 0 0 0 $0 Cummington 0 0 0 0 0 0 0 0 $0 Dalton 2 0 0 2 0 0 0 0 $0 Danvers 5 1 1 3 1 0 0 0 $11,000 Dartmouth Fire Districts Dartmouth #1 0 0 0 0 0 0 0 0 $0 Dartmouth #2 0 0 0 0 0 0 0 0 $0 Dartmouth #3 2 0 1 1 0 0 0 0 $2,500 Dedham 12 1 1 10 0 0 0 0 $19,000 Deerfield Fire Districts Deerfield 0 0 0 0 0 0 0 0 $0 South Deerfield 1 0 0 1 0 0 0 0 $0 Dennis 13 1 0 12 0 0 0 0 $800 Devens 0 0 0 0 0 0 0 0 $0 Dighton 0 0 0 0 0 0 0 0 $0 Douglas 0 0 0 0 0 0 0 0 $0 Dover 0 0 0 0 0 0 0 0 $0 Dracut 3 1 1 1 0 0 0 0 $12,000 Dudley 0 0 0 0 0 0 0 0 $0 Dunstable 0 0 0 0 0 0 0 0 $0 Duxbury 0 0 0 0 0 0 0 0 $0 East Bridgewater 0 0 0 0 0 0 0 0 $0 East Brookfield 0 0 0 0 0 0 0 0 $0 East Longmeadow 7 2 0 5 0 0 0 0 $12,000 Eastham 0 0 0 0 0 0 0 0 $0 Easthampton 0 0 0 0 0 0 0 0 $0 Easton 0 0 0 0 0 0 0 0 $0 Edgartown 0 0 0 0 0 0 0 0 $0 Egremont 0 0 0 0 0 0 0 0 $0 Erving 0 0 0 0 0 0 0 0 $0 Essex 0 0 0 0 0 0 0 0 $0 Everett 7 3 0 4 0 0 0 0 $300 Fairhaven 4 0 0 4 0 0 0 0 $500 Fall River 19 12 1 6 0 3 0 0 $851,200
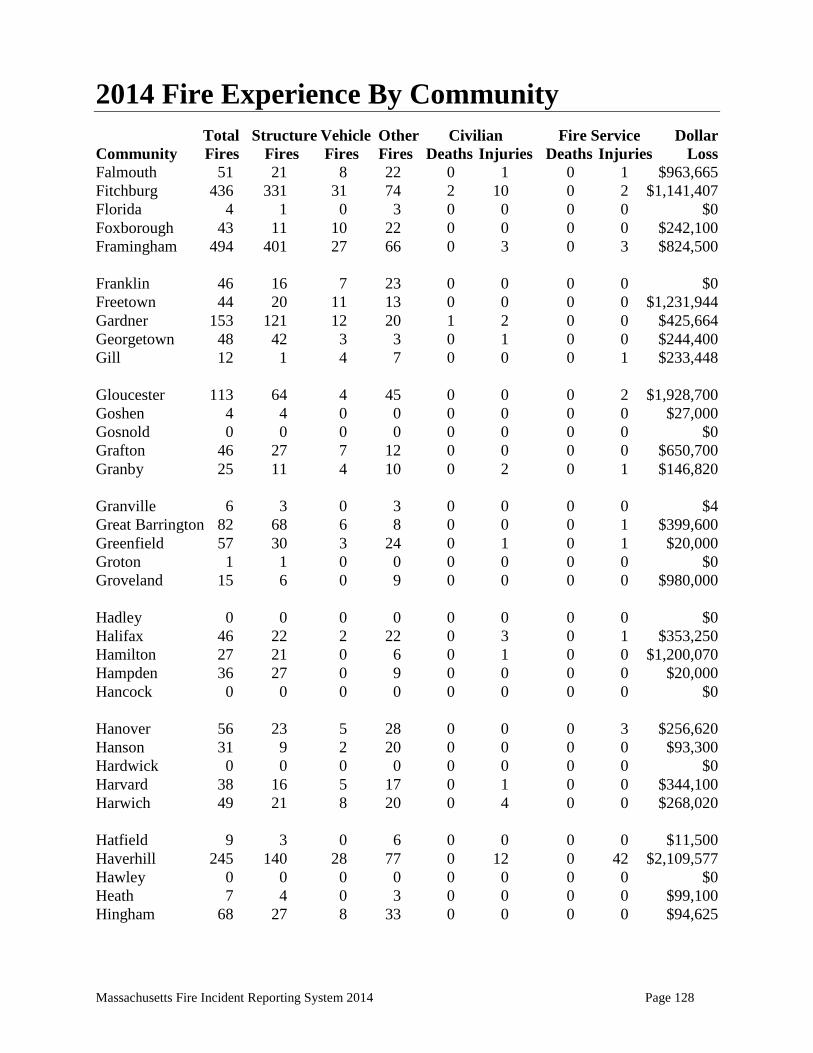
Massachusetts Fire Incident Reporting System 2014 Page 128
2014 Fire Experience By Community Total Structure Vehicle Other Civilian Fire Service Dollar Community Fires Fires Fires Fires Deaths Injuries Deaths Injuries Loss Falmouth 51 21 8 22 0 1 0 1 $963,665 Fitchburg 436 331 31 74 2 10 0 2 $1,141,407 Florida 4 1 0 3 0 0 0 0 $0 Foxborough 43 11 10 22 0 0 0 0 $242,100 Framingham 494 401 27 66 0 3 0 3 $824,500 Franklin 46 16 7 23 0 0 0 0 $0 Freetown 44 20 11 13 0 0 0 0 $1,231,944 Gardner 153 121 12 20 1 2 0 0 $425,664 Georgetown 48 42 3 3 0 1 0 0 $244,400 Gill 12 1 4 7 0 0 0 1 $233,448 Gloucester 113 64 4 45 0 0 0 2 $1,928,700 Goshen 4 4 0 0 0 0 0 0 $27,000 Gosnold 0 0 0 0 0 0 0 0 $0 Grafton 46 27 7 12 0 0 0 0 $650,700 Granby 25 11 4 10 0 2 0 1 $146,820 Granville 6 3 0 3 0 0 0 0 $4 Great Barrington 82 68 6 8 0 0 0 1 $399,600 Greenfield 57 30 3 24 0 1 0 1 $20,000 Groton 1 1 0 0 0 0 0 0 $0 Groveland 15 6 0 9 0 0 0 0 $980,000 Hadley 0 0 0 0 0 0 0 0 $0 Halifax 46 22 2 22 0 3 0 1 $353,250 Hamilton 27 21 0 6 0 1 0 0 $1,200,070 Hampden 36 27 0 9 0 0 0 0 $20,000 Hancock 0 0 0 0 0 0 0 0 $0 Hanover 56 23 5 28 0 0 0 3 $256,620 Hanson 31 9 2 20 0 0 0 0 $93,300 Hardwick 0 0 0 0 0 0 0 0 $0 Harvard 38 16 5 17 0 1 0 0 $344,100 Harwich 49 21 8 20 0 4 0 0 $268,020 Hatfield 9 3 0 6 0 0 0 0 $11,500 Haverhill 245 140 28 77 0 12 0 42 $2,109,577 Hawley 0 0 0 0 0 0 0 0 $0 Heath 7 4 0 3 0 0 0 0 $99,100 Hingham 68 27 8 33 0 0 0 0 $94,625

Massachusetts Fire Incident Reporting System 2014 Page 129
2014 Arson Experience By Community Total Structure Vehicle Other Civilian Fire Service Dollar Community Arsons ArsonsArsonsArsonsDeathsInjuriesDeathsInjuries Loss Falmouth 3 2 0 1 0 0 0 0 $400,000 Fitchburg 5 3 0 2 0 0 0 0 $2,000 Florida 1 0 0 1 0 0 0 0 $0 Foxborough 1 0 0 1 0 0 0 0 $0 Framingham 2 0 1 1 0 0 0 1 $0 Franklin 1 0 0 1 0 0 0 0 $0 Freetown 2 2 0 0 0 0 0 0 $20,000 Gardner 2 1 0 1 0 0 0 0 $500 Georgetown 0 0 0 0 0 0 0 0 $0 Gill 1 0 0 1 0 0 0 0 $0 Gloucester 5 1 0 4 0 0 0 0 $0 Goshen 0 0 0 0 0 0 0 0 $0 Gosnold 0 0 0 0 0 0 0 0 $0 Grafton 0 0 0 0 0 0 0 0 $0 Granby 1 0 0 1 0 0 0 0 $0 Granville 0 0 0 0 0 0 0 0 $0 Great Barrington 0 0 0 0 0 0 0 0 $0 Greenfield 5 1 0 4 0 0 0 0 $0 Groton 0 0 0 0 0 0 0 0 $0 Groveland 2 0 0 2 0 0 0 0 $0 Hadley 0 0 0 0 0 0 0 0 $0 Halifax 3 2 0 1 0 0 0 0 $150 Hamilton 3 1 0 2 0 0 0 0 $80,000 Hampden 0 0 0 0 0 0 0 0 $0 Hancock 0 0 0 0 0 0 0 0 $0 Hanover 3 3 0 0 0 0 0 0 $0 Hanson 4 0 0 4 0 0 0 0 $0 Hardwick 0 0 0 0 0 0 0 0 $0 Harvard 2 0 0 2 0 0 0 0 $0 Harwich 2 1 0 1 0 0 0 0 $400 Hatfield 1 0 0 1 0 0 0 0 $0 Haverhill 2 1 0 1 0 0 0 0 $500 Hawley 0 0 0 0 0 0 0 0 $0 Heath 0 0 0 0 0 0 0 0 $0 Hingham 1 0 0 1 0 0 0 0 $0
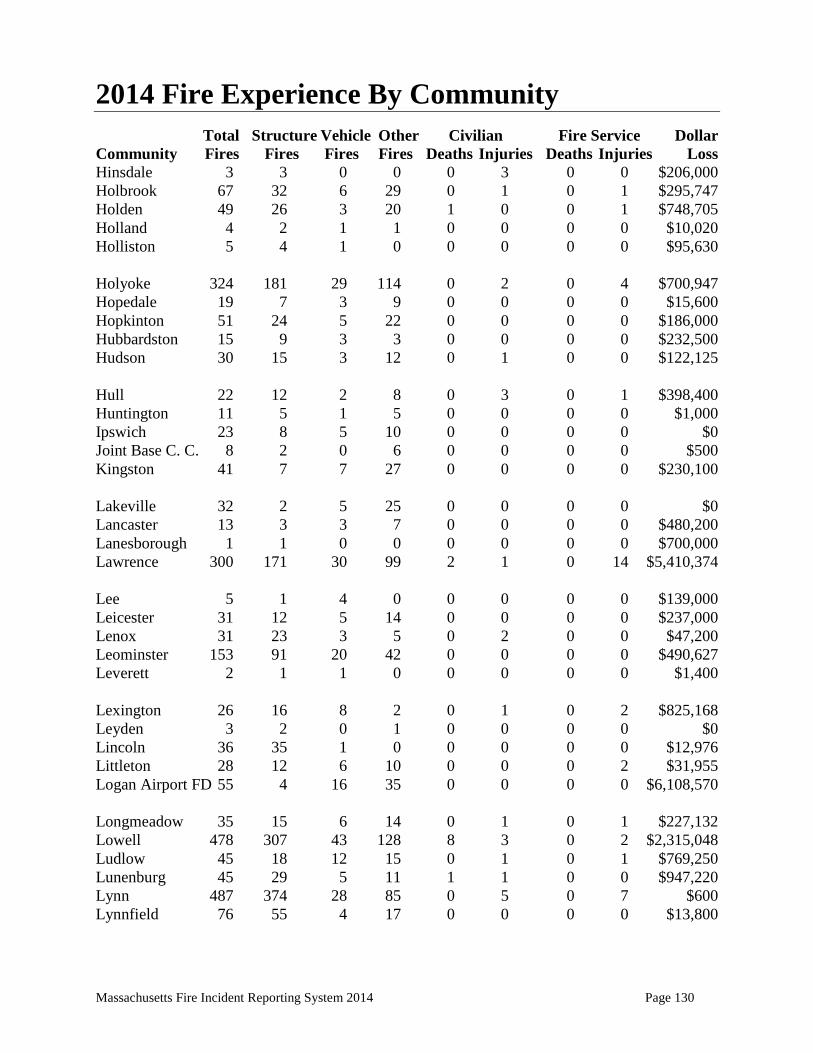
Massachusetts Fire Incident Reporting System 2014 Page 130
2014 Fire Experience By Community Total Structure Vehicle Other Civilian Fire Service Dollar Community Fires Fires Fires Fires Deaths Injuries Deaths Injuries Loss Hinsdale 3 3 0 0 0 3 0 0 $206,000 Holbrook 67 32 6 29 0 1 0 1 $295,747 Holden 49 26 3 20 1 0 0 1 $748,705 Holland 4 2 1 1 0 0 0 0 $10,020 Holliston 5 4 1 0 0 0 0 0 $95,630 Holyoke 324 181 29 114 0 2 0 4 $700,947 Hopedale 19 7 3 9 0 0 0 0 $15,600 Hopkinton 51 24 5 22 0 0 0 0 $186,000 Hubbardston 15 9 3 3 0 0 0 0 $232,500 Hudson 30 15 3 12 0 1 0 0 $122,125 Hull 22 12 2 8 0 3 0 1 $398,400 Huntington 11 5 1 5 0 0 0 0 $1,000 Ipswich 23 8 5 10 0 0 0 0 $0 Joint Base C. C. 8 2 0 6 0 0 0 0 $500 Kingston 41 7 7 27 0 0 0 0 $230,100 Lakeville 32 2 5 25 0 0 0 0 $0 Lancaster 13 3 3 7 0 0 0 0 $480,200 Lanesborough 1 1 0 0 0 0 0 0 $700,000 Lawrence 300 171 30 99 2 1 0 14 $5,410,374 Lee 5 1 4 0 0 0 0 0 $139,000 Leicester 31 12 5 14 0 0 0 0 $237,000 Lenox 31 23 3 5 0 2 0 0 $47,200 Leominster 153 91 20 42 0 0 0 0 $490,627 Leverett 2 1 1 0 0 0 0 0 $1,400 Lexington 26 16 8 2 0 1 0 2 $825,168 Leyden 3 2 0 1 0 0 0 0 $0 Lincoln 36 35 1 0 0 0 0 0 $12,976 Littleton 28 12 6 10 0 0 0 2 $31,955 Logan Airport FD 55 4 16 35 0 0 0 0 $6,108,570 Longmeadow 35 15 6 14 0 1 0 1 $227,132 Lowell 478 307 43 128 8 3 0 2 $2,315,048 Ludlow 45 18 12 15 0 1 0 1 $769,250 Lunenburg 45 29 5 11 1 1 0 0 $947,220 Lynn 487 374 28 85 0 5 0 7 $600 Lynnfield 76 55 4 17 0 0 0 0 $13,800
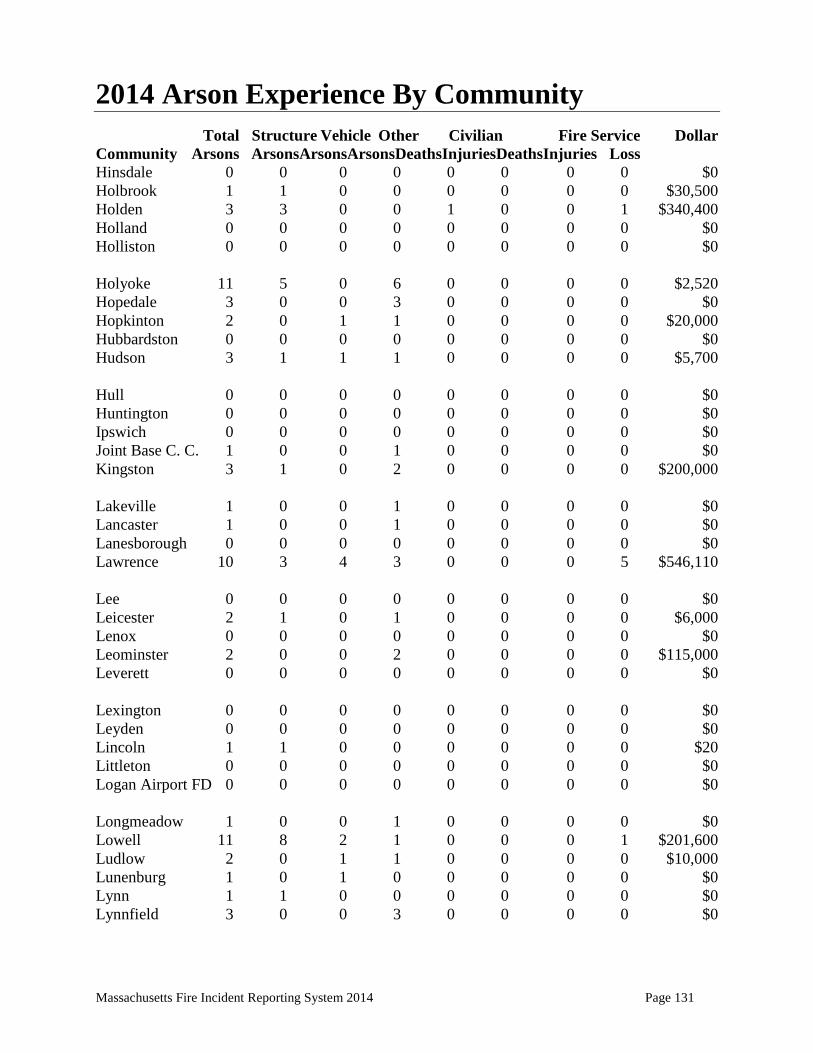
Massachusetts Fire Incident Reporting System 2014 Page 131
2014 Arson Experience By Community Total Structure Vehicle Other Civilian Fire Service Dollar Community Arsons ArsonsArsonsArsonsDeathsInjuriesDeathsInjuries Loss Hinsdale 0 0 0 0 0 0 0 0 $0 Holbrook 1 1 0 0 0 0 0 0 $30,500 Holden 3 3 0 0 1 0 0 1 $340,400 Holland 0 0 0 0 0 0 0 0 $0 Holliston 0 0 0 0 0 0 0 0 $0 Holyoke 11 5 0 6 0 0 0 0 $2,520 Hopedale 3 0 0 3 0 0 0 0 $0 Hopkinton 2 0 1 1 0 0 0 0 $20,000 Hubbardston 0 0 0 0 0 0 0 0 $0 Hudson 3 1 1 1 0 0 0 0 $5,700 Hull 0 0 0 0 0 0 0 0 $0 Huntington 0 0 0 0 0 0 0 0 $0 Ipswich 0 0 0 0 0 0 0 0 $0 Joint Base C. C. 1 0 0 1 0 0 0 0 $0 Kingston 3 1 0 2 0 0 0 0 $200,000 Lakeville 1 0 0 1 0 0 0 0 $0 Lancaster 1 0 0 1 0 0 0 0 $0 Lanesborough 0 0 0 0 0 0 0 0 $0 Lawrence 10 3 4 3 0 0 0 5 $546,110 Lee 0 0 0 0 0 0 0 0 $0 Leicester 2 1 0 1 0 0 0 0 $6,000 Lenox 0 0 0 0 0 0 0 0 $0 Leominster 2 0 0 2 0 0 0 0 $115,000 Leverett 0 0 0 0 0 0 0 0 $0 Lexington 0 0 0 0 0 0 0 0 $0 Leyden 0 0 0 0 0 0 0 0 $0 Lincoln 1 1 0 0 0 0 0 0 $20 Littleton 0 0 0 0 0 0 0 0 $0 Logan Airport FD 0 0 0 0 0 0 0 0 $0 Longmeadow 1 0 0 1 0 0 0 0 $0 Lowell 11 8 2 1 0 0 0 1 $201,600 Ludlow 2 0 1 1 0 0 0 0 $10,000 Lunenburg 1 0 1 0 0 0 0 0 $0 Lynn 1 1 0 0 0 0 0 0 $0 Lynnfield 3 0 0 3 0 0 0 0 $0
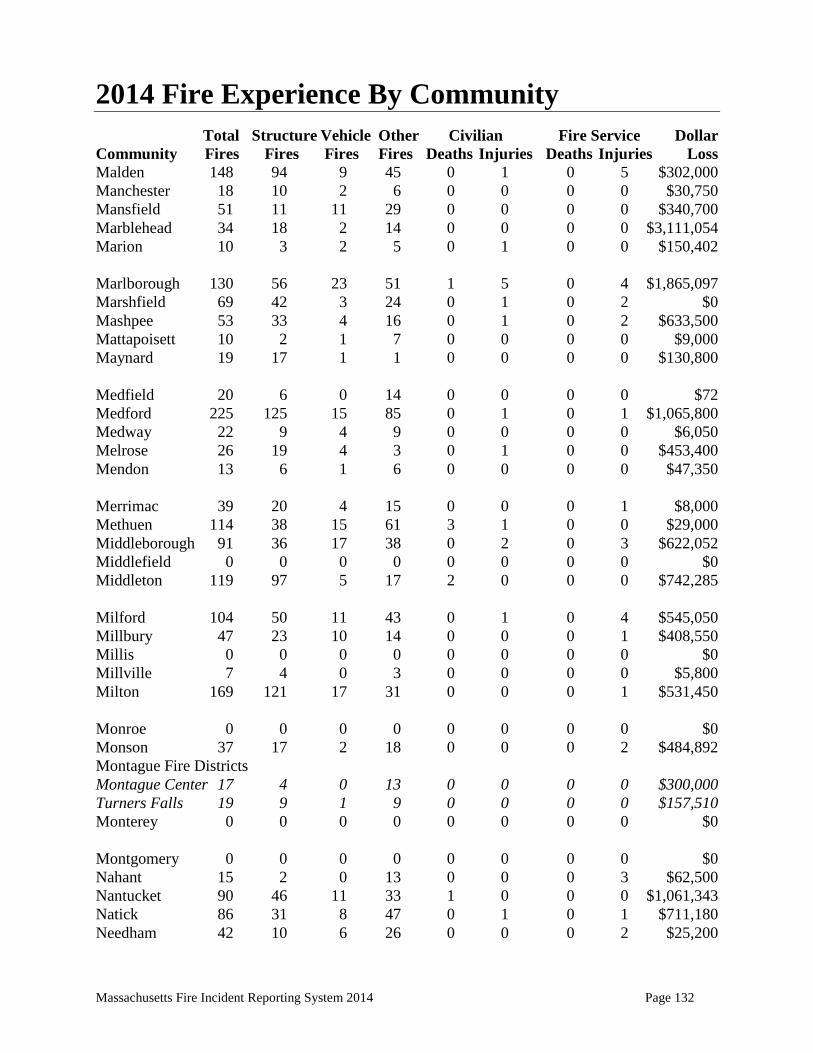
Massachusetts Fire Incident Reporting System 2014 Page 132
2014 Fire Experience By Community Total Structure Vehicle Other Civilian Fire Service Dollar Community Fires Fires Fires Fires Deaths Injuries Deaths Injuries Loss Malden 148 94 9 45 0 1 0 5 $302,000 Manchester 18 10 2 6 0 0 0 0 $30,750 Mansfield 51 11 11 29 0 0 0 0 $340,700 Marblehead 34 18 2 14 0 0 0 0 $3,111,054 Marion 10 3 2 5 0 1 0 0 $150,402 Marlborough 130 56 23 51 1 5 0 4 $1,865,097 Marshfield 69 42 3 24 0 1 0 2 $0 Mashpee 53 33 4 16 0 1 0 2 $633,500 Mattapoisett 10 2 1 7 0 0 0 0 $9,000 Maynard 19 17 1 1 0 0 0 0 $130,800 Medfield 20 6 0 14 0 0 0 0 $72 Medford 225 125 15 85 0 1 0 1 $1,065,800 Medway 22 9 4 9 0 0 0 0 $6,050 Melrose 26 19 4 3 0 1 0 0 $453,400 Mendon 13 6 1 6 0 0 0 0 $47,350 Merrimac 39 20 4 15 0 0 0 1 $8,000 Methuen 114 38 15 61 3 1 0 0 $29,000 Middleborough 91 36 17 38 0 2 0 3 $622,052 Middlefield 0 0 0 0 0 0 0 0 $0 Middleton 119 97 5 17 2 0 0 0 $742,285 Milford 104 50 11 43 0 1 0 4 $545,050 Millbury 47 23 10 14 0 0 0 1 $408,550 Millis 0 0 0 0 0 0 0 0 $0 Millville 7 4 0 3 0 0 0 0 $5,800 Milton 169 121 17 31 0 0 0 1 $531,450 Monroe 0 0 0 0 0 0 0 0 $0 Monson 37 17 2 18 0 0 0 2 $484,892 Montague Fire Districts Montague Center 17 4 0 13 0 0 0 0 $300,000 Turners Falls 19 9 1 9 0 0 0 0 $157,510 Monterey 0 0 0 0 0 0 0 0 $0 Montgomery 0 0 0 0 0 0 0 0 $0 Nahant 15 2 0 13 0 0 0 3 $62,500 Nantucket 90 46 11 33 1 0 0 0 $1,061,343 Natick 86 31 8 47 0 1 0 1 $711,180 Needham 42 10 6 26 0 0 0 2 $25,200
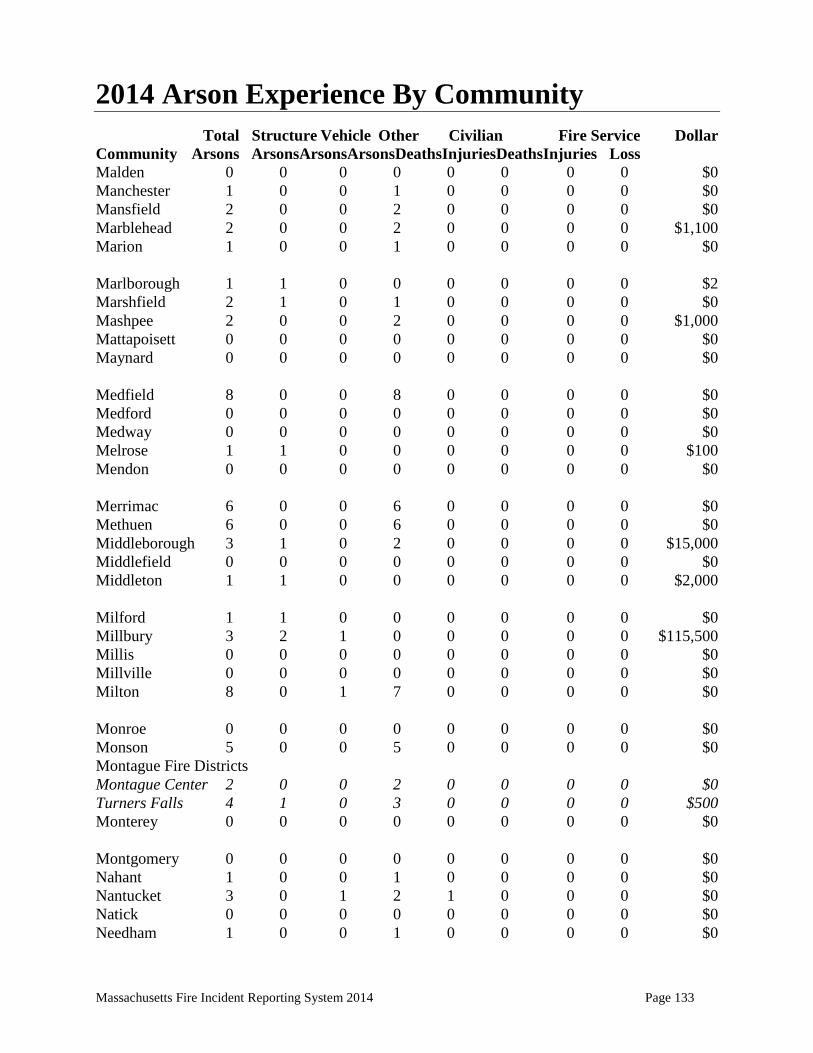
Massachusetts Fire Incident Reporting System 2014 Page 133
2014 Arson Experience By Community Total Structure Vehicle Other Civilian Fire Service Dollar Community Arsons ArsonsArsonsArsonsDeathsInjuriesDeathsInjuries Loss Malden 0 0 0 0 0 0 0 0 $0 Manchester 1 0 0 1 0 0 0 0 $0 Mansfield 2 0 0 2 0 0 0 0 $0 Marblehead 2 0 0 2 0 0 0 0 $1,100 Marion 1 0 0 1 0 0 0 0 $0 Marlborough 1 1 0 0 0 0 0 0 $2 Marshfield 2 1 0 1 0 0 0 0 $0 Mashpee 2 0 0 2 0 0 0 0 $1,000 Mattapoisett 0 0 0 0 0 0 0 0 $0 Maynard 0 0 0 0 0 0 0 0 $0 Medfield 8 0 0 8 0 0 0 0 $0 Medford 0 0 0 0 0 0 0 0 $0 Medway 0 0 0 0 0 0 0 0 $0 Melrose 1 1 0 0 0 0 0 0 $100 Mendon 0 0 0 0 0 0 0 0 $0 Merrimac 6 0 0 6 0 0 0 0 $0 Methuen 6 0 0 6 0 0 0 0 $0 Middleborough 3 1 0 2 0 0 0 0 $15,000 Middlefield 0 0 0 0 0 0 0 0 $0 Middleton 1 1 0 0 0 0 0 0 $2,000 Milford 1 1 0 0 0 0 0 0 $0 Millbury 3 2 1 0 0 0 0 0 $115,500 Millis 0 0 0 0 0 0 0 0 $0 Millville 0 0 0 0 0 0 0 0 $0 Milton 8 0 1 7 0 0 0 0 $0 Monroe 0 0 0 0 0 0 0 0 $0 Monson 5 0 0 5 0 0 0 0 $0 Montague Fire Districts Montague Center 2 0 0 2 0 0 0 0 $0 Turners Falls 4 1 0 3 0 0 0 0 $500 Monterey 0 0 0 0 0 0 0 0 $0 Montgomery 0 0 0 0 0 0 0 0 $0 Nahant 1 0 0 1 0 0 0 0 $0 Nantucket 3 0 1 2 1 0 0 0 $0 Natick 0 0 0 0 0 0 0 0 $0 Needham 1 0 0 1 0 0 0 0 $0
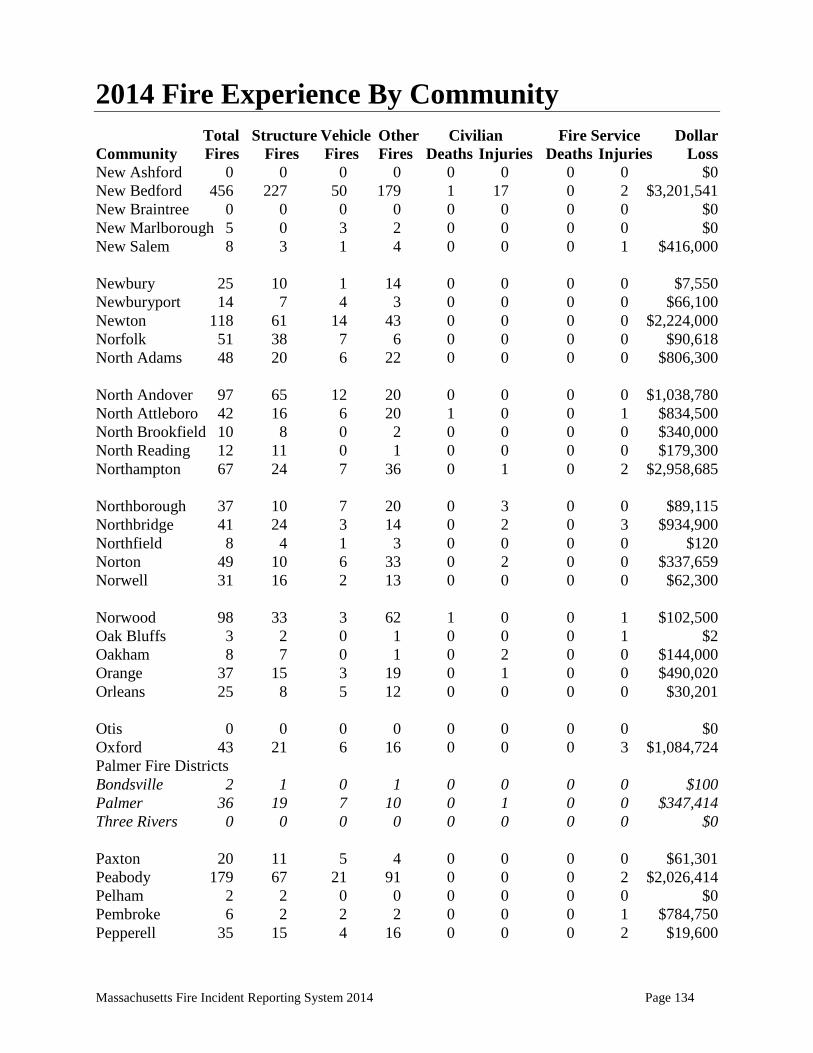
Massachusetts Fire Incident Reporting System 2014 Page 134
2014 Fire Experience By Community Total Structure Vehicle Other Civilian Fire Service Dollar Community Fires Fires Fires Fires Deaths Injuries Deaths Injuries Loss New Ashford 0 0 0 0 0 0 0 0 $0 New Bedford 456 227 50 179 1 17 0 2 $3,201,541 New Braintree 0 0 0 0 0 0 0 0 $0 New Marlborough 5 0 3 2 0 0 0 0 $0 New Salem 8 3 1 4 0 0 0 1 $416,000 Newbury 25 10 1 14 0 0 0 0 $7,550 Newburyport 14 7 4 3 0 0 0 0 $66,100 Newton 118 61 14 43 0 0 0 0 $2,224,000 Norfolk 51 38 7 6 0 0 0 0 $90,618 North Adams 48 20 6 22 0 0 0 0 $806,300 North Andover 97 65 12 20 0 0 0 0 $1,038,780 North Attleboro 42 16 6 20 1 0 0 1 $834,500 North Brookfield 10 8 0 2 0 0 0 0 $340,000 North Reading 12 11 0 1 0 0 0 0 $179,300 Northampton 67 24 7 36 0 1 0 2 $2,958,685 Northborough 37 10 7 20 0 3 0 0 $89,115 Northbridge 41 24 3 14 0 2 0 3 $934,900 Northfield 8 4 1 3 0 0 0 0 $120 Norton 49 10 6 33 0 2 0 0 $337,659 Norwell 31 16 2 13 0 0 0 0 $62,300 Norwood 98 33 3 62 1 0 0 1 $102,500 Oak Bluffs 3 2 0 1 0 0 0 1 $2 Oakham 8 7 0 1 0 2 0 0 $144,000 Orange 37 15 3 19 0 1 0 0 $490,020 Orleans 25 8 5 12 0 0 0 0 $30,201 Otis 0 0 0 0 0 0 0 0 $0 Oxford 43 21 6 16 0 0 0 3 $1,084,724 Palmer Fire Districts Bondsville 2 1 0 1 0 0 0 0 $100 Palmer 36 19 7 10 0 1 0 0 $347,414 Three Rivers 0 0 0 0 0 0 0 0 $0 Paxton 20 11 5 4 0 0 0 0 $61,301 Peabody 179 67 21 91 0 0 0 2 $2,026,414 Pelham 2 2 0 0 0 0 0 0 $0 Pembroke 6 2 2 2 0 0 0 1 $784,750 Pepperell 35 15 4 16 0 0 0 2 $19,600

Massachusetts Fire Incident Reporting System 2014 Page 135
2014 Arson Experience By Community Total Structure Vehicle Other Civilian Fire Service Dollar Community Arsons ArsonsArsonsArsonsDeathsInjuriesDeathsInjuries Loss New Ashford 0 0 0 0 0 0 0 0 $0 New Bedford 19 8 7 4 1 0 0 0 $308,650 New Braintree 0 0 0 0 0 0 0 0 $0 New Marlborough 0 0 0 0 0 0 0 0 $0 New Salem 1 0 0 1 0 0 0 0 $0 Newbury 6 0 0 6 0 0 0 0 $0 Newburyport 0 0 0 0 0 0 0 0 $0 Newton 0 0 0 0 0 0 0 0 $0 Norfolk 0 0 0 0 0 0 0 0 $0 North Adams 6 1 1 4 0 0 0 0 $5,500 North Andover 4 0 0 4 0 0 0 0 $525 North Attleboro 1 1 0 0 0 0 0 0 $110,000 North Brookfield 0 0 0 0 0 0 0 0 $0 North Reading 0 0 0 0 0 0 0 0 $0 Northampton 0 0 0 0 0 0 0 0 $0 Northborough 1 1 0 0 0 0 0 0 $2,500 Northbridge 0 0 0 0 0 0 0 0 $0 Northfield 0 0 0 0 0 0 0 0 $0 Norton 3 0 1 2 0 0 0 0 $2 Norwell 3 0 0 3 0 0 0 0 $0 Norwood 2 1 1 0 1 0 0 0 $46,500 Oak Bluffs 0 0 0 0 0 0 0 0 $0 Oakham 0 0 0 0 0 0 0 0 $0 Orange 1 0 0 1 0 0 0 0 $0 Orleans 1 0 1 0 0 0 0 0 $0 Otis 0 0 0 0 0 0 0 0 $0 Oxford 1 1 0 0 0 0 0 0 $215 Palmer Fire Districts Bondsville 0 0 0 0 0 0 0 0 $0 Palmer 2 1 0 1 0 0 0 0 $0 Three Rivers 0 0 0 0 0 0 0 0 $0 Paxton 0 0 0 0 0 0 0 0 $0 Peabody 2 0 0 2 0 0 0 0 $0 Pelham 0 0 0 0 0 0 0 0 $0 Pembroke 0 0 0 0 0 0 0 0 $0 Pepperell 0 0 0 0 0 0 0 0 $0
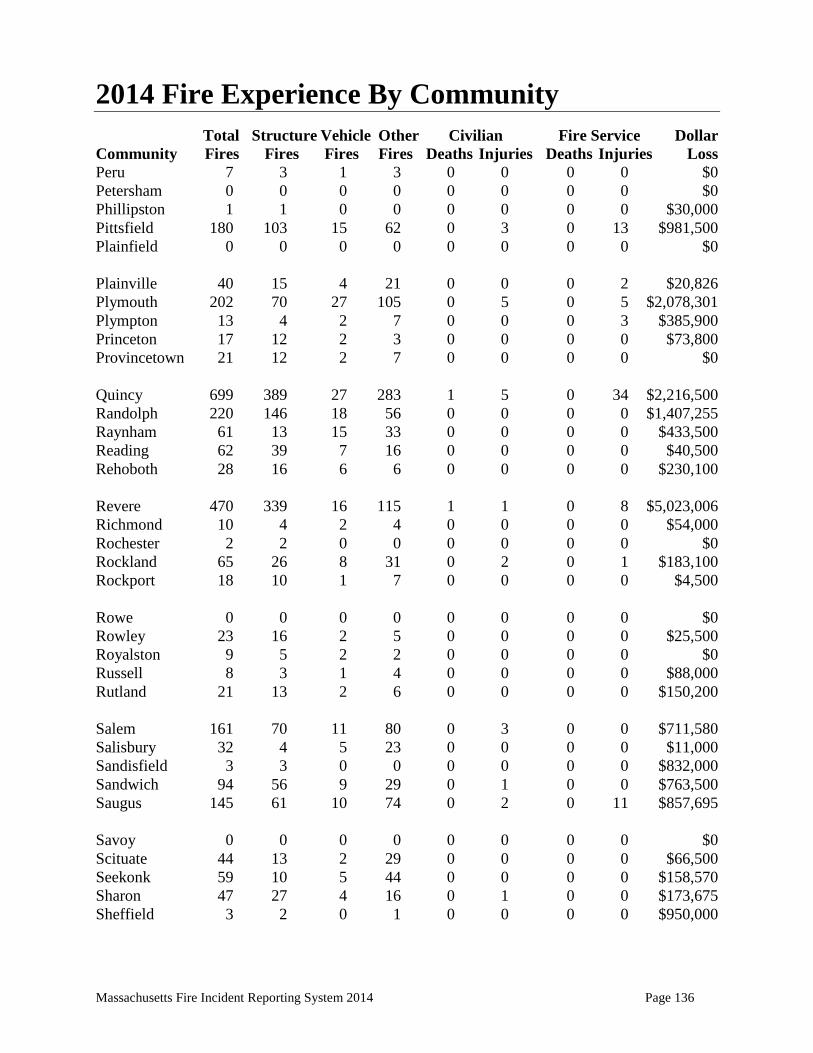
Massachusetts Fire Incident Reporting System 2014 Page 136
2014 Fire Experience By Community Total Structure Vehicle Other Civilian Fire Service Dollar Community Fires Fires Fires Fires Deaths Injuries Deaths Injuries Loss Peru 7 3 1 3 0 0 0 0 $0 Petersham 0 0 0 0 0 0 0 0 $0 Phillipston 1 1 0 0 0 0 0 0 $30,000 Pittsfield 180 103 15 62 0 3 0 13 $981,500 Plainfield 0 0 0 0 0 0 0 0 $0 Plainville 40 15 4 21 0 0 0 2 $20,826 Plymouth 202 70 27 105 0 5 0 5 $2,078,301 Plympton 13 4 2 7 0 0 0 3 $385,900 Princeton 17 12 2 3 0 0 0 0 $73,800 Provincetown 21 12 2 7 0 0 0 0 $0 Quincy 699 389 27 283 1 5 0 34 $2,216,500 Randolph 220 146 18 56 0 0 0 0 $1,407,255 Raynham 61 13 15 33 0 0 0 0 $433,500 Reading 62 39 7 16 0 0 0 0 $40,500 Rehoboth 28 16 6 6 0 0 0 0 $230,100 Revere 470 339 16 115 1 1 0 8 $5,023,006 Richmond 10 4 2 4 0 0 0 0 $54,000 Rochester 2 2 0 0 0 0 0 0 $0 Rockland 65 26 8 31 0 2 0 1 $183,100 Rockport 18 10 1 7 0 0 0 0 $4,500 Rowe 0 0 0 0 0 0 0 0 $0 Rowley 23 16 2 5 0 0 0 0 $25,500 Royalston 9 5 2 2 0 0 0 0 $0 Russell 8 3 1 4 0 0 0 0 $88,000 Rutland 21 13 2 6 0 0 0 0 $150,200 Salem 161 70 11 80 0 3 0 0 $711,580 Salisbury 32 4 5 23 0 0 0 0 $11,000 Sandisfield 3 3 0 0 0 0 0 0 $832,000 Sandwich 94 56 9 29 0 1 0 0 $763,500 Saugus 145 61 10 74 0 2 0 11 $857,695 Savoy 0 0 0 0 0 0 0 0 $0 Scituate 44 13 2 29 0 0 0 0 $66,500 Seekonk 59 10 5 44 0 0 0 0 $158,570 Sharon 47 27 4 16 0 1 0 0 $173,675 Sheffield 3 2 0 1 0 0 0 0 $950,000

Massachusetts Fire Incident Reporting System 2014 Page 137
2014 Arson Experience By Community Total Structure Vehicle Other Civilian Fire Service Dollar Community Arsons ArsonsArsonsArsonsDeathsInjuriesDeathsInjuries Loss Peru 0 0 0 0 0 0 0 0 $0 Petersham 0 0 0 0 0 0 0 0 $0 Phillipston 0 0 0 0 0 0 0 0 $0 Pittsfield 7 2 1 4 0 0 0 1 $84,000 Plainfield 0 0 0 0 0 0 0 0 $0 Plainville 2 0 0 2 0 0 0 1 $2 Plymouth 4 1 2 1 0 0 0 0 $10,300 Plympton 2 0 0 2 0 0 0 0 $0 Princeton 0 0 0 0 0 0 0 0 $0 Provincetown 1 0 0 1 0 0 0 0 $0 Quincy 17 0 0 17 0 0 0 0 $4,000 Randolph 2 0 0 2 0 0 0 0 $0 Raynham 0 0 0 0 0 0 0 0 $0 Reading 2 0 0 2 0 0 0 0 $0 Rehoboth 0 0 0 0 0 0 0 0 $0 Revere 1 1 0 0 0 0 0 0 $550 Richmond 0 0 0 0 0 0 0 0 $0 Rochester 0 0 0 0 0 0 0 0 $0 Rockland 5 0 1 4 0 0 0 0 $6,000 Rockport 0 0 0 0 0 0 0 0 $0 Rowe 0 0 0 0 0 0 0 0 $0 Rowley 0 0 0 0 0 0 0 0 $0 Royalston 0 0 0 0 0 0 0 0 $0 Russell 0 0 0 0 0 0 0 0 $0 Rutland 0 0 0 0 0 0 0 0 $0 Salem 0 0 0 0 0 0 0 0 $0 Salisbury 2 0 0 2 0 0 0 0 $0 Sandisfield 0 0 0 0 0 0 0 0 $0 Sandwich 4 0 1 3 0 0 0 0 $0 Saugus 2 1 1 0 0 0 0 0 $38,400 Savoy 0 0 0 0 0 0 0 0 $0 Scituate 1 0 0 1 0 0 0 0 $0 Seekonk 0 0 0 0 0 0 0 0 $0 Sharon 2 1 0 1 0 0 0 0 $0 Sheffield 0 0 0 0 0 0 0 0 $0
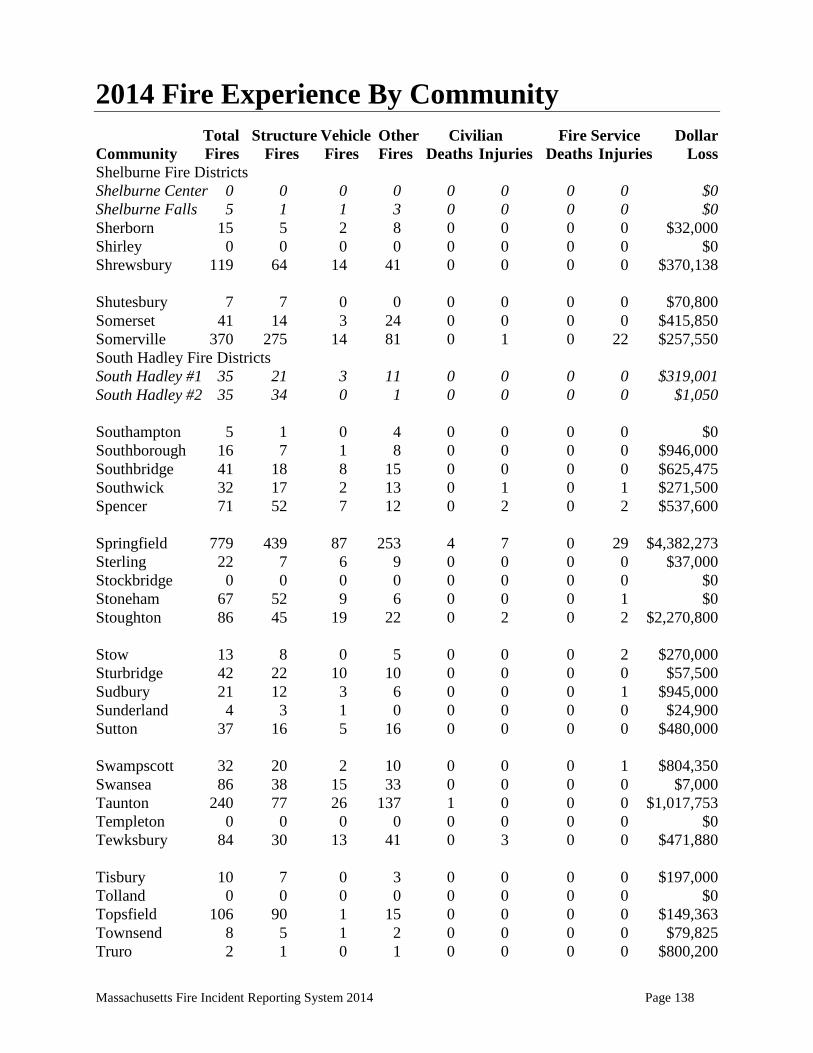
Massachusetts Fire Incident Reporting System 2014 Page 138
2014 Fire Experience By Community Total Structure Vehicle Other Civilian Fire Service Dollar Community Fires Fires Fires Fires Deaths Injuries Deaths Injuries Loss Shelburne Fire Districts Shelburne Center 0 0 0 0 0 0 0 0 $0 Shelburne Falls 5 1 1 3 0 0 0 0 $0 Sherborn 15 5 2 8 0 0 0 0 $32,000 Shirley 0 0 0 0 0 0 0 0 $0 Shrewsbury 119 64 14 41 0 0 0 0 $370,138 Shutesbury 7 7 0 0 0 0 0 0 $70,800 Somerset 41 14 3 24 0 0 0 0 $415,850 Somerville 370 275 14 81 0 1 0 22 $257,550 South Hadley Fire Districts South Hadley #1 35 21 3 11 0 0 0 0 $319,001 South Hadley #2 35 34 0 1 0 0 0 0 $1,050 Southampton 5 1 0 4 0 0 0 0 $0 Southborough 16 7 1 8 0 0 0 0 $946,000 Southbridge 41 18 8 15 0 0 0 0 $625,475 Southwick 32 17 2 13 0 1 0 1 $271,500 Spencer 71 52 7 12 0 2 0 2 $537,600 Springfield 779 439 87 253 4 7 0 29 $4,382,273 Sterling 22 7 6 9 0 0 0 0 $37,000 Stockbridge 0 0 0 0 0 0 0 0 $0 Stoneham 67 52 9 6 0 0 0 1 $0 Stoughton 86 45 19 22 0 2 0 2 $2,270,800 Stow 13 8 0 5 0 0 0 2 $270,000 Sturbridge 42 22 10 10 0 0 0 0 $57,500 Sudbury 21 12 3 6 0 0 0 1 $945,000 Sunderland 4 3 1 0 0 0 0 0 $24,900 Sutton 37 16 5 16 0 0 0 0 $480,000 Swampscott 32 20 2 10 0 0 0 1 $804,350 Swansea 86 38 15 33 0 0 0 0 $7,000 Taunton 240 77 26 137 1 0 0 0 $1,017,753 Templeton 0 0 0 0 0 0 0 0 $0 Tewksbury 84 30 13 41 0 3 0 0 $471,880 Tisbury 10 7 0 3 0 0 0 0 $197,000 Tolland 0 0 0 0 0 0 0 0 $0 Topsfield 106 90 1 15 0 0 0 0 $149,363 Townsend 8 5 1 2 0 0 0 0 $79,825 Truro 2 1 0 1 0 0 0 0 $800,200

Massachusetts Fire Incident Reporting System 2014 Page 139
2014 Arson Experience By Community Total Structure Vehicle Other Civilian Fire Service Dollar Community Arsons ArsonsArsonsArsonsDeathsInjuriesDeathsInjuries Loss Shelburne Fire Districts Shelburne Center 0 0 0 0 0 0 0 0 $0 Shelburne Falls 0 0 0 0 0 0 0 0 $0 Sherborn 0 0 0 0 0 0 0 0 $0 Shirley 0 0 0 0 0 0 0 0 $0 Shrewsbury 5 2 0 3 0 0 0 0 $1,600 Shutesbury 0 0 0 0 0 0 0 0 $0 Somerset 0 0 0 0 0 0 0 0 $0 Somerville 2 0 1 1 0 0 0 0 $0 South Hadley Fire Districts South Hadley #1 1 1 0 0 0 0 0 0 $15,000 South Hadley #2 0 0 0 0 0 0 0 0 $0 Southampton 0 0 0 0 0 0 0 0 $0 Southborough 0 0 0 0 0 0 0 0 $0 Southbridge 2 1 0 1 0 0 0 0 $500 Southwick 2 0 0 2 0 0 0 0 $0 Spencer 2 1 0 1 0 0 0 0 $40,100 Springfield 18 6 5 7 1 0 0 0 $176,601 Sterling 0 0 0 0 0 0 0 0 $0 Stockbridge 0 0 0 0 0 0 0 0 $0 Stoneham 0 0 0 0 0 0 0 0 $0 Stoughton 2 0 0 2 0 0 0 0 $0 Stow 0 0 0 0 0 0 0 0 $0 Sturbridge 1 0 0 1 0 0 0 0 $0 Sudbury 2 1 0 1 0 0 0 1 $245,000 Sunderland 0 0 0 0 0 0 0 0 $0 Sutton 1 0 0 1 0 0 0 0 $0 Swampscott 0 0 0 0 0 0 0 0 $0 Swansea 0 0 0 0 0 0 0 0 $0 Taunton 24 7 1 16 0 0 0 0 $7,000 Templeton 0 0 0 0 0 0 0 0 $0 Tewksbury 2 0 0 2 0 0 0 0 $300 Tisbury 0 0 0 0 0 0 0 0 $0 Tolland 0 0 0 0 0 0 0 0 $0 Topsfield 3 0 0 3 0 0 0 0 $0 Townsend 0 0 0 0 0 0 0 0 $0 Truro 0 0 0 0 0 0 0 0 $0

Massachusetts Fire Incident Reporting System 2014 Page 140
2014 Fire Experience By Community Total Structure Vehicle Other Civilian Fire Service Dollar Community Fires Fires Fires Fires Deaths Injuries Deaths Injuries Loss Tyngsborough 35 6 5 24 0 0 0 0 $1,079,000 Tyringham 0 0 0 0 0 0 0 0 $0 Upton 9 2 2 5 0 0 0 0 $12,000 Uxbridge 69 24 9 36 0 1 0 1 $514,900 Wakefield 46 38 7 1 0 1 0 0 $151,000 Wales 0 0 0 0 0 0 0 0 $0 Walpole 83 43 9 31 0 2 0 1 $343,500 Waltham 167 73 16 78 2 9 0 6 $1,842,520 Ware 36 7 3 26 0 0 0 0 $232,528 Wareham Fire Districts Onset 30 20 3 7 0 1 0 2 $0 Wareham 58 32 8 18 0 3 0 0 $1,410,150 Warren 18 8 8 2 0 0 0 0 $165,600 Warwick 1 1 0 0 0 0 0 0 $13,300 Washington 1 1 0 0 0 0 0 0 $270,000 Watertown 63 16 5 42 0 2 0 1 $269,235 Wayland 20 8 3 9 0 0 0 0 $48,101 Webster 57 31 6 20 0 1 0 1 $832,123 Wellesley 50 30 6 14 0 1 0 0 $481,500 Wellfleet 19 6 1 12 0 0 0 0 $7,150 Wendell 2 1 0 1 0 0 0 0 $2,000 Wenham 13 9 0 4 0 0 0 0 $752,660 West Boylston 19 6 6 7 0 0 0 0 $110,200 West Bridgewater 45 12 8 25 0 0 0 3 $522,000 West Brookfield 2 2 0 0 0 0 0 0 $3,500 West Newbury 13 9 1 3 0 0 0 0 $8,240 West Springfield 124 67 20 37 0 2 0 2 $914,249 West Stockbridge 11 5 1 5 0 0 0 0 $65,000 West Tisbury 5 0 1 4 0 0 0 0 $0 Westborough 110 82 9 19 0 1 0 0 $150,487 Westfield 141 89 17 35 0 0 0 1 $1,790,450 Westford 29 5 3 21 0 0 0 0 $19,550 Westhampton 6 3 0 3 0 0 0 0 $15,000 Westminster 34 15 5 14 0 0 0 0 $579,900 Weston 38 20 11 7 1 0 0 0 $1,583,575 Westport 71 25 4 42 0 1 0 4 $568,050
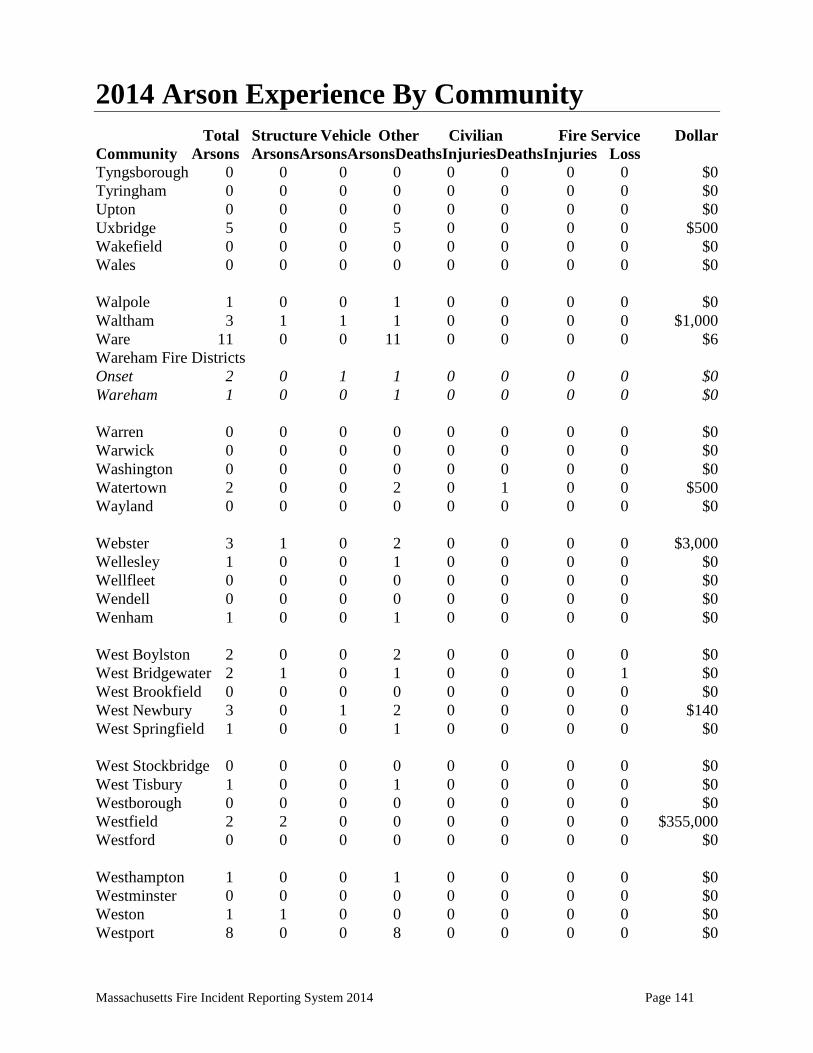
Massachusetts Fire Incident Reporting System 2014 Page 141
2014 Arson Experience By Community Total Structure Vehicle Other Civilian Fire Service Dollar Community Arsons ArsonsArsonsArsonsDeathsInjuriesDeathsInjuries Loss Tyngsborough 0 0 0 0 0 0 0 0 $0 Tyringham 0 0 0 0 0 0 0 0 $0 Upton 0 0 0 0 0 0 0 0 $0 Uxbridge 5 0 0 5 0 0 0 0 $500 Wakefield 0 0 0 0 0 0 0 0 $0 Wales 0 0 0 0 0 0 0 0 $0 Walpole 1 0 0 1 0 0 0 0 $0 Waltham 3 1 1 1 0 0 0 0 $1,000 Ware 11 0 0 11 0 0 0 0 $6 Wareham Fire Districts Onset 2 0 1 1 0 0 0 0 $0 Wareham 1 0 0 1 0 0 0 0 $0 Warren 0 0 0 0 0 0 0 0 $0 Warwick 0 0 0 0 0 0 0 0 $0 Washington 0 0 0 0 0 0 0 0 $0 Watertown 2 0 0 2 0 1 0 0 $500 Wayland 0 0 0 0 0 0 0 0 $0 Webster 3 1 0 2 0 0 0 0 $3,000 Wellesley 1 0 0 1 0 0 0 0 $0 Wellfleet 0 0 0 0 0 0 0 0 $0 Wendell 0 0 0 0 0 0 0 0 $0 Wenham 1 0 0 1 0 0 0 0 $0 West Boylston 2 0 0 2 0 0 0 0 $0 West Bridgewater 2 1 0 1 0 0 0 1 $0 West Brookfield 0 0 0 0 0 0 0 0 $0 West Newbury 3 0 1 2 0 0 0 0 $140 West Springfield 1 0 0 1 0 0 0 0 $0 West Stockbridge 0 0 0 0 0 0 0 0 $0 West Tisbury 1 0 0 1 0 0 0 0 $0 Westborough 0 0 0 0 0 0 0 0 $0 Westfield 2 2 0 0 0 0 0 0 $355,000 Westford 0 0 0 0 0 0 0 0 $0 Westhampton 1 0 0 1 0 0 0 0 $0 Westminster 0 0 0 0 0 0 0 0 $0 Weston 1 1 0 0 0 0 0 0 $0 Westport 8 0 0 8 0 0 0 0 $0
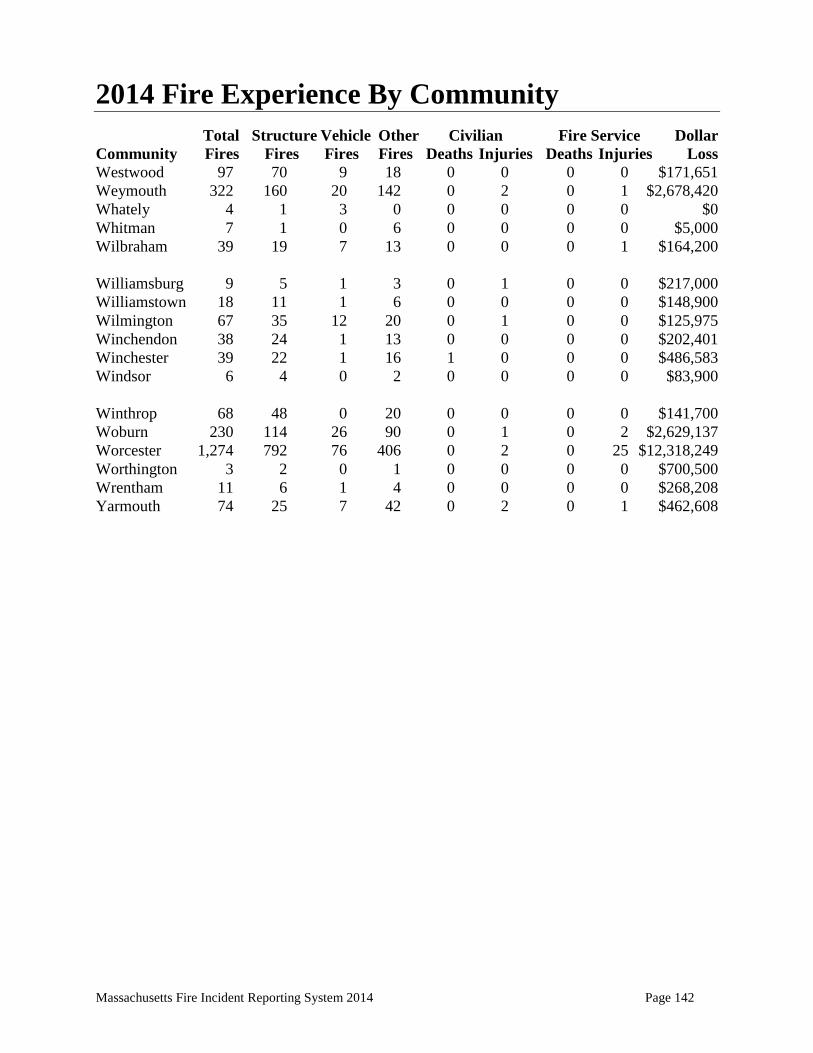
Massachusetts Fire Incident Reporting System 2014 Page 142
2014 Fire Experience By Community Total Structure Vehicle Other Civilian Fire Service Dollar Community Fires Fires Fires Fires Deaths Injuries Deaths Injuries Loss Westwood 97 70 9 18 0 0 0 0 $171,651 Weymouth 322 160 20 142 0 2 0 1 $2,678,420 Whately 4 1 3 0 0 0 0 0 $0 Whitman 7 1 0 6 0 0 0 0 $5,000 Wilbraham 39 19 7 13 0 0 0 1 $164,200 Williamsburg 9 5 1 3 0 1 0 0 $217,000 Williamstown 18 11 1 6 0 0 0 0 $148,900 Wilmington 67 35 12 20 0 1 0 0 $125,975 Winchendon 38 24 1 13 0 0 0 0 $202,401 Winchester 39 22 1 16 1 0 0 0 $486,583 Windsor 6 4 0 2 0 0 0 0 $83,900 Winthrop 68 48 0 20 0 0 0 0 $141,700 Woburn 230 114 26 90 0 1 0 2 $2,629,137 Worcester 1,274 792 76 406 0 2 0 25 $12,318,249 Worthington 3 2 0 1 0 0 0 0 $700,500 Wrentham 11 6 1 4 0 0 0 0 $268,208 Yarmouth 74 25 7 42 0 2 0 1 $462,608
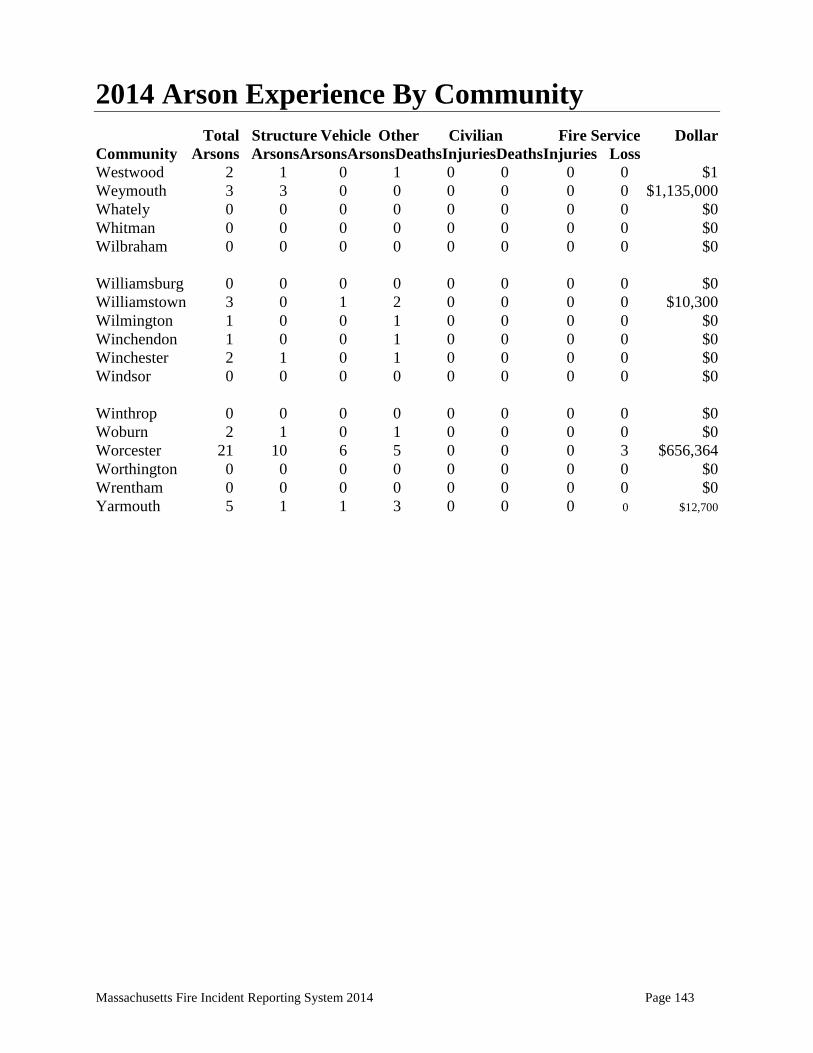
Massachusetts Fire Incident Reporting System 2014 Page 143
2014 Arson Experience By Community Total Structure Vehicle Other Civilian Fire Service Dollar Community Arsons ArsonsArsonsArsonsDeathsInjuriesDeathsInjuries Loss Westwood 2 1 0 1 0 0 0 0 $1 Weymouth 3 3 0 0 0 0 0 0 $1,135,000 Whately 0 0 0 0 0 0 0 0 $0 Whitman 0 0 0 0 0 0 0 0 $0 Wilbraham 0 0 0 0 0 0 0 0 $0 Williamsburg 0 0 0 0 0 0 0 0 $0 Williamstown 3 0 1 2 0 0 0 0 $10,300 Wilmington 1 0 0 1 0 0 0 0 $0 Winchendon 1 0 0 1 0 0 0 0 $0 Winchester 2 1 0 1 0 0 0 0 $0 Windsor 0 0 0 0 0 0 0 0 $0 Winthrop 0 0 0 0 0 0 0 0 $0 Woburn 2 1 0 1 0 0 0 0 $0 Worcester 21 10 6 5 0 0 0 3 $656,364 Worthington 0 0 0 0 0 0 0 0 $0 Wrentham 0 0 0 0 0 0 0 0 $0 Yarmouth 5 1 1 3 0 0 0 0 $12,700
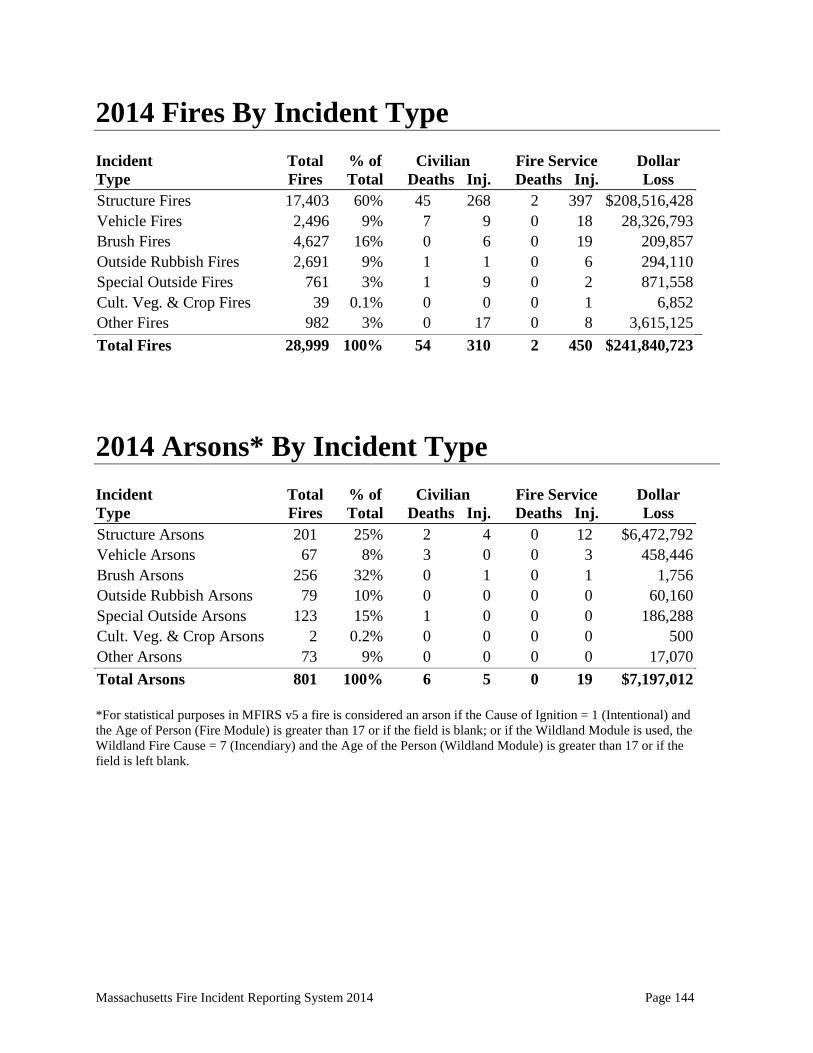
Massachusetts Fire Incident Reporting System 2014 Page 144
2014 Fires By Incident Type Incident Total % of Civilian Fire Service Dollar Type Fires Total Deaths Inj. Deaths Inj. Loss Structure Fires 17,403 60% 45 268 2 397 $208,516,428 Vehicle Fires 2,496 9% 7 9 0 18 28,326,793 Brush Fires 4,627 16% 0 6 0 19 209,857 Outside Rubbish Fires 2,691 9% 1 1 0 6 294,110 Special Outside Fires 761 3% 1 9 0 2 871,558 Cult. Veg. & Crop Fires 39 0.1% 0 0 0 1 6,852 Other Fires 982 3% 0 17 0 8 3,615,125 Total Fires 28,999 100% 54 310 2 450 $241,840,723
2014 Arsons* By Incident Type Incident Total % of Civilian Fire Service Dollar Type Fires Total Deaths Inj. Deaths Inj. Loss Structure Arsons 201 25% 2 4 0 12 $6,472,792 Vehicle Arsons 67 8% 3 0 0 3 458,446 Brush Arsons 256 32% 0 1 0 1 1,756 Outside Rubbish Arsons 79 10% 0 0 0 0 60,160 Special Outside Arsons 123 15% 1 0 0 0 186,288 Cult. Veg. & Crop Arsons 2 0.2% 0 0 0 0 500 Other Arsons 73 9% 0 0 0 0 17,070 Total Arsons 801 100% 6 5 0 19 $7,197,012 *For statistical purposes in MFIRS v5 a fire is considered an arson if the Cause of Ignition = 1 (Intentional) and the Age of Person (Fire Module) is greater than 17 or if the field is blank; or if the Wildland Module is used, the Wildland Fire Cause = 7 (Incendiary) and the Age of the Person (Wildland Module) is greater than 17 or if the field is left blank.

Massachusetts Fire Incident Reporting System 2014 Page 145
2014 Fires By County
Total Structure Vehicle Other Civilian Fire Service Dollar County Fires Fires Fires Fires Deaths Injuries Deaths Injuries Loss Barnstable 881 403 82 396 2 40 0 7 $9,466,227 Berkshire 475 293 45 137 0 11 0 15 6,208,858 Bristol 1,976 847 262 867 5 37 0 13 16,051,757 Dukes 22 10 1 11 0 0 0 1 237,602 Essex 2,854 1,635 244 975 8 29 0 88 25,047,501 Franklin 263 115 24 124 0 2 0 3 2,435,298 Hampden 1,965 1,081 223 661 4 34 0 47 14,402,137 Hampshire 401 204 34 168 0 5 0 5 5,659,909 Middlesex 4,860 3,115 410 1,335 18 47 0 85 46,522,485 Nantucket 82 41 11 30 1 0 0 0 472,543 Norfolk 3,130 1,812 245 1,073 2 19 0 54 19,227,021 Plymouth 1,840 793 203 844 3 33 0 30 14,135,493 Suffolk 6,627 4,901 349 1,377 5 15 2 54 52,177,781 Worcester 3,618 2,153 363 1,102 6 38 0 48 29,796,111 Total 28,999 17,403 2,496 9,100 54 310 2 450 $241,840,723
2014 Arsons By County
Total Structure Vehicle Other Civilian Fire Service Dollar County Arsons Arsons Arsons Arsons Deaths Injuries Deaths Injuries Loss Barnstable 52 7 4 41 0 0 0 0 $415,200 Berkshire 19 3 3 13 0 0 0 1 99,800 Bristol 86 32 11 43 1 3 0 0 1,300,002 Dukes 1 0 0 1 0 0 0 0 0 Essex 79 12 7 60 1 0 0 5 850,075 Franklin 18 3 0 15 0 1 0 0 500 Hampden 55 17 6 32 1 0 0 0 631,181 Hampshire 30 2 0 28 0 0 0 0 15,056 Middlesex 72 28 9 35 0 2 0 3 500,236 Nantucket 3 0 1 2 2 1 0 0 0 Norfolk 78 11 5 62 1 0 0 1 1,288,503 Plymouth 67 25 4 38 0 0 0 2 361,050 Suffolk 159 33 8 118 0 0 0 0 446,230 Worcester 82 28 9 45 1 0 0 4 1,289,179 Total 801 201 67 533 6 5 0 16 $7,197,012
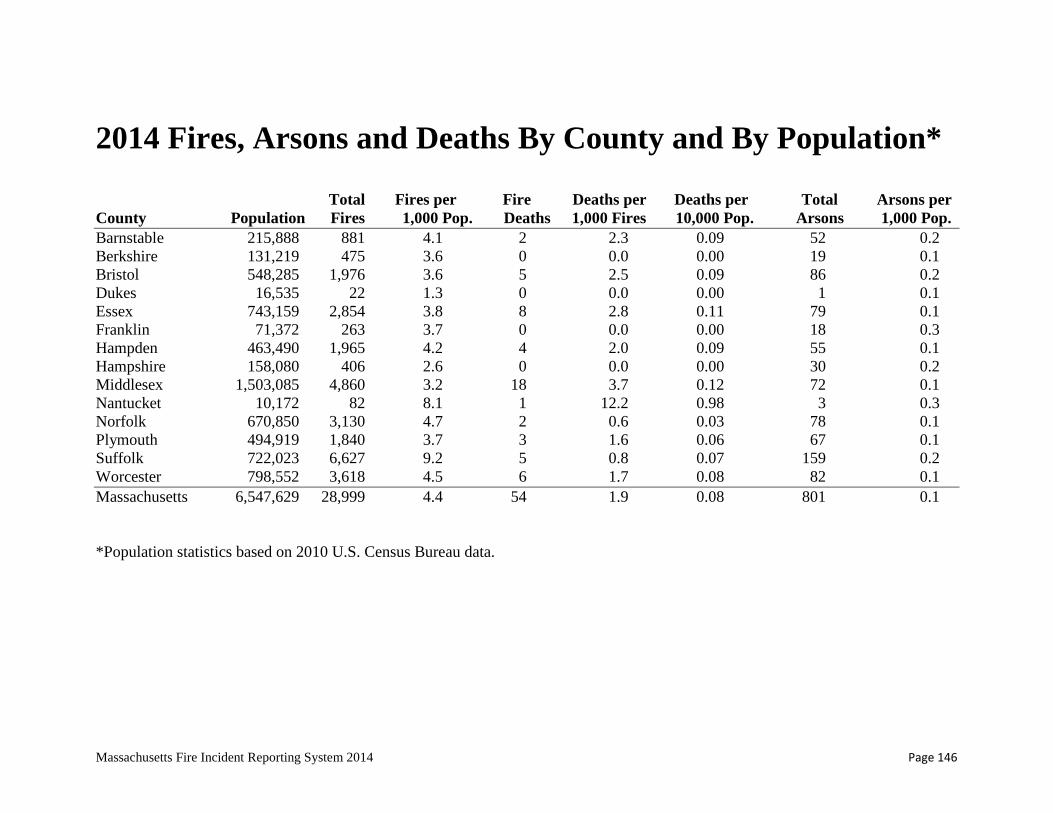
Massachusetts Fire Incident Reporting System 2014 Page 146
2014 Fires, Arsons and Deaths By County and By Population*
Total Fires per Fire Deaths per Deaths per Total Arsons per County Population Fires 1,000 Pop. Deaths 1,000 Fires 10,000 Pop. Arsons 1,000 Pop. Barnstable 215,888 881 4.1 2 2.3 0.09 52 0.2 Berkshire 131,219 475 3.6 0 0.0 0.00 19 0.1 Bristol 548,285 1,976 3.6 5 2.5 0.09 86 0.2 Dukes 16,535 22 1.3 0 0.0 0.00 1 0.1 Essex 743,159 2,854 3.8 8 2.8 0.11 79 0.1 Franklin 71,372 263 3.7 0 0.0 0.00 18 0.3 Hampden 463,490 1,965 4.2 4 2.0 0.09 55 0.1 Hampshire 158,080 406 2.6 0 0.0 0.00 30 0.2 Middlesex 1,503,085 4,860 3.2 18 3.7 0.12 72 0.1 Nantucket 10,172 82 8.1 1 12.2 0.98 3 0.3 Norfolk 670,850 3,130 4.7 2 0.6 0.03 78 0.1 Plymouth 494,919 1,840 3.7 3 1.6 0.06 67 0.1 Suffolk 722,023 6,627 9.2 5 0.8 0.07 159 0.2 Worcester 798,552 3,618 4.5 6 1.7 0.08 82 0.1 Massachusetts 6,547,629 28,999 4.4 54 1.9 0.08 801 0.1 *Population statistics based on 2010 U.S. Census Bureau data.
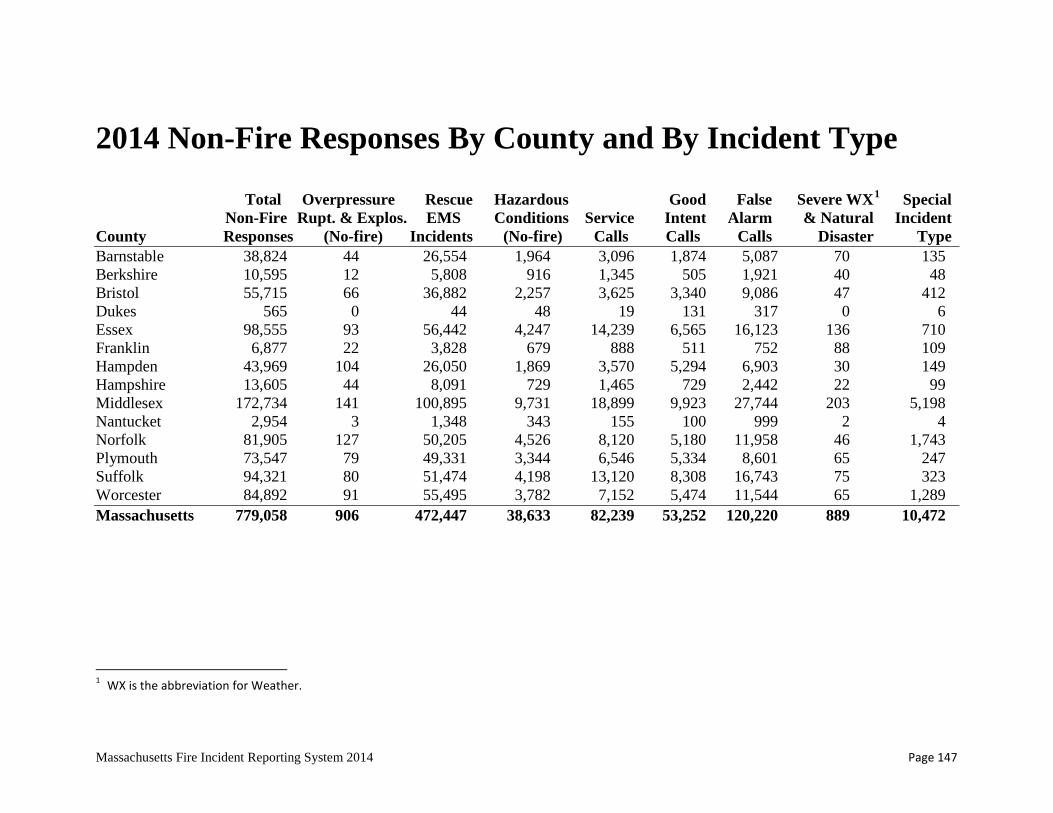
Massachusetts Fire Incident Reporting System 2014 Page 147
2014 Non-Fire Responses By County and By Incident Type
Total Overpressure Rescue Hazardous Good False Severe WX1 Special Non-Fire Rupt. & Explos. EMS Conditions Service Intent Alarm & Natural Incident County Responses (No-fire) Incidents (No-fire) Calls Calls Calls Disaster Type Barnstable 38,824 44 26,554 1,964 3,096 1,874 5,087 70 135 Berkshire 10,595 12 5,808 916 1,345 505 1,921 40 48 Bristol 55,715 66 36,882 2,257 3,625 3,340 9,086 47 412 Dukes 565 0 44 48 19 131 317 0 6 Essex 98,555 93 56,442 4,247 14,239 6,565 16,123 136 710 Franklin 6,877 22 3,828 679 888 511 752 88 109 Hampden 43,969 104 26,050 1,869 3,570 5,294 6,903 30 149 Hampshire 13,605 44 8,091 729 1,465 729 2,442 22 99 Middlesex 172,734 141 100,895 9,731 18,899 9,923 27,744 203 5,198 Nantucket 2,954 3 1,348 343 155 100 999 2 4 Norfolk 81,905 127 50,205 4,526 8,120 5,180 11,958 46 1,743 Plymouth 73,547 79 49,331 3,344 6,546 5,334 8,601 65 247 Suffolk 94,321 80 51,474 4,198 13,120 8,308 16,743 75 323 Worcester 84,892 91 55,495 3,782 7,152 5,474 11,544 65 1,289 Massachusetts 779,058 906 472,447 38,633 82,239 53,252 120,220 889 10,472
1 WX is the abbreviation for Weather.

Massachusetts Fire Incident Reporting System 2014 Page 148

14 Annual Report
Department of Fire Serviceswww.mass.gov/dfs
(978) 567-3380Massachusetts Fire Incident Reporting System