
MASSACHUSETTS WATER RESOURCES AUTHORITY
258
MASSACHUSETTS WATER RESOURCES AUTHORITY Charlestown Navy Yard 100 First Avenue, Building 39 Boston, MA02129 Frederick A. Laskey Executive Director Telephone: (617) 242·6000 Fax: (617) 788·4899 TTY: (617) 788·4971 ADMINISTRATION, FINANCE & AUDIT COMMITTEE MEETING Chair: H. Vitale Vice-Chair: J. Foti Committee Members: A. Blackmon 1.Carroll K. Cotter A. Pappastergion B. Pefia 1.Walsh to be held on Wednesday, February 15, 2017 Location: 100 First Avenue, 2nd Floor Charlestown Navy Yard Boston, MA 02129 Time: 10:00 a.m. AGENDA A. Information 1. Second Quarter FY17 Orange Notebook 2. Delegated Authority Report - January 2017 3. FY17 Financial Update and Summary as of January 2017 4. FY2017 Mid-Year Capital Project Spending Report 5. FY2017 Sewer Assessment Adjustments 6. Preliminary FY18 Water and Sewer Assessments B. Approvals 1. Transmittal of the FY18 Proposed Current Expense Budget to the MWRA Advisory Board 2. Appointment of Proxy for Fore River Railroad Corporation @ Printed on 100% Recycled Paper
-
Upload
khangminh22 -
Category
Documents
-
view
0 -
download
0
Transcript of MASSACHUSETTS WATER RESOURCES AUTHORITY

MASSACHUSETTS WATER RESOURCES AUTHORITYCharlestown Navy Yard
100 First Avenue, Building 39Boston, MA 02129
Frederick A. LaskeyExecutive Director
Telephone: (617) 242·6000Fax: (617) 788·4899TTY: (617) 788·4971
ADMINISTRATION, FINANCE & AUDIT COMMITTEE MEETING
Chair: H. VitaleVice-Chair: J. FotiCommittee Members:A. Blackmon1. CarrollK. CotterA. PappastergionB. Pefia1. Walsh
to be held on
Wednesday, February 15, 2017
Location: 100 First Avenue, 2nd FloorCharlestown Navy YardBoston, MA 02129
Time: 10:00 a.m.
AGENDA
A. Information
1. Second Quarter FY17 Orange Notebook
2. Delegated Authority Report - January 2017
3. FY17 Financial Update and Summary as of January 2017
4. FY2017 Mid-Year Capital Project Spending Report
5. FY2017 Sewer Assessment Adjustments
6. Preliminary FY18 Water and Sewer Assessments
B. Approvals
1. Transmittal of the FY18 Proposed Current Expense Budget to the MWRAAdvisory Board
2. Appointment of Proxy for Fore River Railroad Corporation
@ Printed on 100% Recycled Paper

,,..,.AF&A(i)2/15/17
Meeting of theAdministration, Finance and Audit Committee
December 14, 2016
A meeting of the Administration, Finance and Audit Committee was held onDecember 14, 2016 at the Authority headquarters in Charlestown. Chairman Vitalepresided. Present from the Board were Messrs. Blackmon, Carroll, Cotter, Flanagan,Foti, and Walsh. Among those present from the Authority staff were Fred Laskey, SteveRemsberg, Mike Hornbrook, Tom Durkin, Michele Gillen, Cori Barrett, CarolynFrancisco Murphy, Karen Gay-Valente, Kathy Soni, John Vetere, Mary Flynn, VictorL'Esperance, Andrew Hildick-Smith and Linda D'Addario.The meeting was called toorder at 10:25 a.m.
Information
MWRA's Climate Change Strategy
This item was referred to the full Board for discussion.
Construction Site Safety
Staff provided information on construction site safety, both by MWRA staff andcontractors, including: OSHA 10 and OSHA 40 certifications, confined space entry;lockout/tag out; safety awareness; construction zone traffic safety; employee right toknow; and excavation safety. There was general discussion and question and answer.
Delegated Authority Report - November 2016
There was question and answer on a couple of items contained in the report.
FY17 Financial Update and Summary - November 2016
Staff gave a presentation on the financiais, and there was general discussion andquestion and answer.

Administration. Finance and Audit Committee. December 14. 2016 Page 2
Approvals
*Approval of the Transmittal of the FY18 Proposed Capital Improvement Program to theMWRA Advisory Board
Staff gave a presentation on the FY18 Proposed CIP, and there was generaldiscussion and question and answer. The Committee recommended approval oftransmittal of the FY18 Proposed Capital Improvement Program to the Advisory Boardfor its 60 day review and comment period. (ref. agenda item B.1).
Contract Awards
* Janitorial Services at the Chelsea Facility: S.J. Services, Inc., Contract WRA-4302Q
There was general discussion and question and answer. The Committeerecommended approval of the contract award (ref. agenda item C.1).
Contract Amendments/Change Orders
*Assignment and Assumption of Contract EXE-033 Security Guard Services for VariousMWRA Facilities from AlliedBarton Security Services. Inc. to Universal ProtectionService. LLC d/b/a Allied Universal Security; and Contract EXE-033, Amendment 1
There was general discussion and question and answer. The Committeerecommended approval of the contract assignment and Amendment 1.
The meeting adjourned at 11:30 a.m.
* Approved as recommended at December 14, 2016 Board of Directors meeting.

Meeting of theAdministration, Finance and Audit Committee
January 18, 2017
A meeting of the Administration, Finance and Audit Committee was held onJanuary 18, 2017 at the Authority headquarters in Charlestown. Chairman Vitalepresided. Present from the Board were Messrs. Blackmon, Cotter, Pappastergian,Peña, and Walsh; Messrs. Fati and Carroll joined the meeting in progress. Amongthose present from the Authority staff were Fred Laskey, Steve Remsberg, MikeHornbrook, Rick Adams, Michele Gillen, Carolyn Francisco Murphy, Laurie Allen, TomDurkin, Kathy Sani, Emily Dallman, Robert Belkin, Steve Perry, and Bonnie Hale. Themeeting was called to order at 10:15 a.m.
Information
Delegated Authority Report - December 2016
There was question and answer on one of the items in the report.
(Mr. Fati joined the meeting.)
MWRA Compliance with the Amended Massachusetts Public Records Law
Staff summarized the amended law and MWRA's compliance with it.
FY17 Financial Update and Summary
Staff summarized the financial update and gave a report on the status of thecross-harbor cable work. (Mr. Carroll joined the meeting.) There was general discussionand question and answer.
Contract Awards
*Audit Services: CliftonLarsonAlien LLP, Contract F242
Staff summarized the history of previous audit services providers and the currentRFP and selection recommendation. The Committee recommended approval of thecontract award (ref. agenda item B.1).
* Approved as recommended at January 18, 2017 Board of Directors meeting.
AF&A(ii)2/15/17

Administration. Finance and Audit Committee. January 18. 2017 Page 2
*Drug and Alcohol Testing Program: Advantage Drug Testing, Contract A61O
There was brief discussion, and the Committee recommended approval of thecontract award (ref. agenda item B.2).
The meeting adjourned at 11:00 a.m.
Approved as recommended at January 18, 2017 Board of Directors meeting.*

AF&A A.l2/15/17
STAFF SUMMARY
TO:FROM:DATE:SUBJECT:
Board of Directors .__-;' ßFrederick A. Laskey, Executive Director ~../February 15, 2017FY17 Second Quarter Orange Notebook
COMMITTEE: Administration, Finance & Audit .x. INFORMATIONVOTE ,t
tUl.4~Chief Operating Officer
Carolyn M. Fiore, Deputy Chief Operating OfficerStephen Estes-Smargiassi, Director, Planning & SustainabilityPreparer/Title
RECOMMENDATION:
Forinformation only. The Board of Directors Report on Key Indicators of MWRA Performance(the Orange Notebook) is prepared at the close of each quarter of the fiscal year.
DISCUSSION:
The Orange Notebook presents performance indicators for operational, financial, workforce, andcustomer service parameters tracked by MWRA management each month. Significant outcomesfor the second quarter are highlighted below.
Lower Flows and Impacts at Deer Island WWTP
The extreme dry weather has affected both water and wastewater systems. A detailed discussionof the drought's impact on the water system during calendar year 2016 was presented to theBoard in January. At the Deer Island Wastewater Treatment Plant, the continued dry weather andlow groundwater levels, continued to result in record setting low average day plant flows.Calendar year low flow records for 2016 included:
• Total Plant Average Day Flow - 282.34 MOD (previous calendar year record was 295.30MOD in CYIS);
• North System Flow - 188.11 MOD (previous calendar year record was 192.62 MOD inCYlS); and
• South System Flow - 94.23 MOD (previous calendar year record was 99.05 MOD in CYI2).
CY16 precipitation was the second lowest amount of precipitation post Secondary startup (July1998) with a total of 33.05 inches of precipitation. As indicated on page 1, 2 and 27, the plantperformed well despite the lower flows and stronger influent concentrations.

I
r
2
Deer Island Cross-Harbor Power Cable Work
The combustion turbine generators (CTGs) which provide backup power to the cross harborpower cable were used extensively in November and December (and continued into January) asthe cable was de-energized to allow Eversource to perform cable location work under the harborin preparation for protection work later in 2017. This can be seen in the self-generation graphs onPage 1, with the CTG's generating 456 megawatt hours (MWh) in November, and 3,388 MWhin December, offsetting purchased power.
Using the CTGs for extended periods of time, and disconnecting and then later re-connecting theplant to grid power at the end of each work day required additional staff hours and overtime.(Pages 5 and 42)
The additional diesel fuel need to power the CTGs is not reflected directly in the OrangeNotebook charts, but is being tracked. This will impact MWRA's greenhouse gas inventory forCY2016 and 2017, interrupting the downward trend resulting from MWRA's efficiency andgreen power generation efforts, as reported to thé Board in November and December of 2106.
MWRA staff are tracking each of the impacts of the Eversource cable interruptions as reported tothe Board in January.
Workforce Management
The staffturnover during the first half ofFY17 has been higher than recent years, with 120vacancies filled (including promotions and external hires) so far this year. That represents aboutten percent of current filled positions. If the CUITentrate continues through the second half of thefiscal year, turnover will be about 67 percent higher than the average of the past five years. Ashas been the case in recent years, approximately two-thirds are being filled internally bypromotions and transfers and approximately one-third of positions are being filled with outsidehires. (Page 42)

MASSACHUSETTS WATER RESOURCES AUTHORITY
Board of Directors ReportOn
Key Indicators of MWRA PerformanceFor
Second Quarter FY2017
Frederick A. Laskey, Executive DirectorMichael J. Hornbrook, Chief Operating Officer
February 15, 2017
Q1 Q2
Q3 Q4

Board of Directors Report on Key Indicators of MWRA Performance Second Quarter FY17
Table of Contents Operations and Maintenance DITP Operations- 1 Total Power Use/Self-Generation Plant Flow & Precipitation Total Cost of Electricity/Pricing DITP Operations- 2 DI Sodium Hypochlorite Use Disinfection Dosage Secondary Blending Events DI Operations & Maintenance Report 3 Residuals Processing 4
Sludge Detention Time in Digesters & Total Solids Destruction
Digester Gas Production & % Utilized Sludge Pumped From Deer Island Monthly Average % Capture of Processed Sludge
DITP Maintenance 5 Operations Division–Metering & Leak Detection 6 Water Distribution System–Valves 7 Wastewater Pipeline/Structures 8 FOD Metro Facility & Equipment Maintenance 9 Renewable Electricity Generation-1 10 Renewable Electricity Generation-2 11 Toxic Reduction and Control 12 Field Operations– Narrative Topics 13 Laboratory Services 15 Construction Programs Projects in Construction 16 CSO Control Update 18 CIP Expenditures 19 Drinking Water Quality and Supply Source Water – Microbial Results 20 Source Water – Turbidity, pH and Alkalinity 21 Treated Water – Disinfection Effectiveness 22 Source Water – Algae, Complaints 23 Bacteria and Chlorine Residual Results 24 Disinfection By-Products, UV 254 25 Water Supply/Source Water Management 26
Wastewater Quality NPDES Permit Compliance -Deer Island TP 27 -Clinton TP 28 Community Flows and Programs Total Water Use Revenue Customers 29 Community Wastewater Flows 30 Community Support Programs
-Infiltration/Inflow Local Financial Assist. Progr. 31 -Water-Local Pipeline & System Assist. Progr. 32 -Lead Service Line Replacement Loan Progr. 33 -Community Water System Leak Detection 34 and Conservation Outreach
Business Services Procurement 35 Materials Management 36 MIS Program 37 Legal Matters 38 Internal and Contract Audits 41 Other Management Workforce Management 42 Workplace Safety Program 43 Job Group Representation 44 MBE/WBE Expenditures 45 CEB Expenses 46 Cost of Debt 47 Investment Income 48
This quarterly report is prepared by MWRA staff to track a variety of MWRA performance measures for routine review by MWRA’s board of directors. The content and format of this report is expected to develop as time passes. Information is reported on a preliminary basis as appropriate and available for internal management use and is subject to correction and clarification.
Frederick A. Laskey, Executive Director
Michael J. Hornbrook, Chief Operating Officer February 15, 2017

OPERATIONS AND MAINTENANCE

1
Deer Island Operations2nd Quarter - FY17
Page 1 of 4
Total power usage in the 2nd Quarter was 4.9% below target asTotal Plant Flow was 10.7% below target with the 3 year average plant flow. Power usage throughout the plant has been at our below target for the entire quarter.
Note: Power usage projections are based on 3 year averages.
0
1
2
3
4
5
6
7
0
100
200
300
400
500
J A S O N D J F M A M J
Inches(W
ater Equivalent)
MG
D
Plant Flow & Precipitation
Total Plant Flow, MGD 10 Yr Avg Flow, MGDTotal Precipitation, inches rain 10 Yr Avg Precipitation, inches rain
Total Plant Flow for the 2nd Quarter was 22.0% below target with the 10 year average plant flow (268.2 MGD actual vs. 343.6 MGD expected) as precipitation for the quarter was 8.3% lower than target (11.41 inches actual vs. 12.44 inches expected).
J A S O N D J F M A M J
Pow
er G
ener
atio
n, M
Wh
Self-Generation
Wind Solar Hydro CTGs STGs On-site Generation Target
Power generated on-site during the 2nd Quarter was 16.6% above target. While generation by the Solar Panels and Wind Turbines exceeded their targets, generation by the STGs was below target due to scheduled annual maintenance in October and generation by the Hydro Turbines was below target due to mechanical issues and lower than expected plant flow. The CTGs generated significantly more power than expected during the quarter as the CTGs were operated for extended periods of time in November and December as DITP was taken off utility power to allow Eversource to de-energize the cross-harbor power cable in order to perform cable location work in the Reserved Channel.
Note: Power generation data for the Solar Panels and the Wind Turbines may be difficult to see as the amount of power generated is low within the current scale of this graph; a total of 135.6 MWh was generated by the Solar Panels and 566.6 MWh was generated by the Wind Turbines in the 2nd Quarter.
0%10%20%30%40%50%60%70%80%90%
100%
J A S O N D J F M A M J
Self-Generation Equipment On-Line(% of Time in Operation)
DiGas, % of time STGs, % of timeHydro, % of time Wind Turbines, % of timeAvailability Target
The DiGas system met the 95% availability target for the 2nd Quarter. However, the STGs, fell below target due to scheduled annual maintenance outage of the Thermal Power Plant in October. The Hydro Turbines and Wind Turbines fell below target due to electrical and mechanical issues.
$0.000
$0.020
$0.040
$0.060
$0.080
$0.100
$0.120
$0.140
J A S O N D J F M A M J
Uni
t Pric
e ($
/kw
h)
Total Electricity Pricing(includes spot energy price, ancillary costs, and
NSTAR's transmission & distribution costs)
FY17 Energy Unit Price FY17 Energy Budget Unit PriceFY16 Energy Unit Price
Under the current energy supply contract, a block portion of DI's energy is a fixed rate and the variable load above the block is purchased in real time. The actual Total Energy Unit Price in the 2nd Quarter (actuals for October only) was 7.4% lower than the FY17 budget estimate for the same period. The Total Energy Unit Price includes a fixed block price, spot energy price, transmission & distribution charges, and ancillary charges.
Note: Only the actual energy prices are reported. Therefore, the dataset lags by two (2) month due to the timing of invoice receipt.
J A S O N D J F M A M J
Pow
er U
se, M
Wh
Total Power Use
Support Primary Secondary ResidualsPumping FY17 Target FY16 Actual
J A S O N D J F M A M J
Elec
tric
ity P
urch
ased
($)
Total Cost of Electricity
FY17 Total Energy Purchased FY17 Energy Purchased BudgetFY16 Total Energy Purchased
The total cost of Electricity Purchased during the 2nd Quarter (actuals for October only) was 4.1% higher than budget due to higher than expected volume of electricity purchased as a result of lower than expected generation during the month of October. Year-to-date costs however, are $284,225 lower than budgeted through October as the Total Energy Unit Price is lower than budgeted by 12.6% through October. The cost data for Electricity Purchased in November and December are not yet available as of reporting time.
Note: Only months with complete Electricity Purchased data are reported. Therefore, the dataset lags by two (2) months due to the timing of invoice receipt.

2
Month
JASONDJFMAMJ
Total
Deer Island Operations2nd Quarter - FY17
0 0 100.0% 0.00
Page 2 of 4
0
0 0 0 100.0% 0.00
2 2 0 99.7% 4.502 2 0 99.7% 3.94
1 1 0 99.9% 2.30
5 5 0 99.9% 10.74
Deer Island Operations & Maintenance Report
Secondary Blending Events
0 0 0 100.0% 0.00
Count of Blending Events
Count of Blending Events
Due to Rain
Count of Blending Events Due to Non-Rain-Related Events
Secondary, as a Percent of Total
Plant Flow
Total Hours Blended During
Month
Environmental/Pumping:The continued low flows, due mainly to ongoing drought conditions, produced a number of calendar year low flow records for 2016 (since plant startup, July 1998). Precipitation in 2016 was the second lowest post plant startup with a total of 33.05 inches ofprecipitation. The lowest calendar year total precipitation post plant startup was 31.71 inches set in 2001. The following are the new calendar year low flow records -
Average Total Plant Flow – 282.34 MGD set in CY16 (previous calendar year record was 295.30 MGD in CY15),Average North System Flow – 188.11 MGD set in CY16 (previous calendar year record was 192.62 MGD in CY15),Average South System Flow – 94.23 MGD set in CY16 (previous calendar year record was 99.05 MGD in CY12).
The plant achieved a peak flow rate of 959.9 MGD at midnight on October 22 during a rain event that produced 1.34 inches of precipitation. Overall, Total Plant Flow in the 2nd Quarter was 22.0% below the 10 year average plant flow target for the quarter.
Essential maintenance and rehabilitation activities involving the replacement of butterfly flow control valves, discharge isolation valves, flow meters, and associated piping for each of the 10 wastewater pumps in the North Main Pump Station (NMPS) continued in Quarter 2. All equipment is original and dates back to the facility upgrades in 1995. Over time, the valves in these facilities have sustained damage from age and wear and must be replaced to allow proper isolation of pumps and equipment for maintenance. There were a total of five (5) force main isolation events during the second quarter of FY17, to remove and install the new equipment for Pumps #1 and #4, and to remove the old equipment for Pump #3.
99.8% of all flows were treated at full secondary during the 2nd Quarter. There were a total of five (5) secondary blending events that were all due to high plant flow resulting from heavy rain. The five (5) combined blending events resulted in a total of 10.74 hours of blending and 57.63 Mgal of flow blended with secondary effluent. The Maximum Secondary Capacity for the entire month was 700 MGD.
Secondary permit limits were met at all times during the 2nd Quarter.
The disinfection dosing rate in the 2nd Quarter was 15% higher than the target. DITP maintained an average disinfection chlorine residual of 0.48 mg/L this quarter with an average dosing rate of 2.13 mg/L (as chlorine demand was 1.64 mg/L). Chlorine dosing was higher than expected due to lower than expected plant flow resulting in a higher chlorine demand. However, actual sodium hypochlorite usage in pounds of chlorine was 9.9% below target this quarter.
The overall disinfection dosing rate (target and actual) is dependent on plant flow, target effluent total chlorine residual levels, effluent quality and NPDES permit levels for fecal coliform.
0.000.250.500.751.001.251.501.752.002.252.502.753.003.253.50
J A S O N D J F M A M J
mg/
L
Deer Island Sodium Hypochlorite UseDisinfection Dosage
Chlorine Demand, mg/L Residual Chlorine, mg/L
FY17 Target Dosage FY16 Actual Dosage
J A S O N D J F M A M J
Poun
ds o
f Chl
orin
e
Deer Island Sodium Hypochlorite UsageActual Usage in Pounds
FY17 Chlorine Usage, pounds FY17 Budget Usage, pounds
FY16 Actual Usage, pounds

3
Page 3 of 4
Deer Island Operations & Maintenance Report (continued)
Deer Island Operations2nd Quarter - FY17
Environmental/Pumping (continued): NMPS, Winthrop Terminal Headworks Facility, and South System Pump Station continued to operate during these events. No interruptions or restrictions in flow occurred during this work as all north system flow was handled through the other force main in the facility. Flow through the isolated force main in NMPS was suspended at approximately 3:30 a.m. and was restored before 3:00 p.m. once this portion of the work was completed each day. Secondary Treatment: Annual turnaround maintenance was performed on Train #1 in the Cryogenic Oxygen Facility in mid-October. This turnaround maintenance is performed on roughly half of the components and systems in the Cryo Facility and allows the remaining half of the facility to continue to operate and produce oxygen uninterrupted. During this turnaround maintenance, the contractor calibrated all the instrumentation on Cold Box unit #1 as well as, a number of other components of the oxygen plant. Energy and Thermal Power Plant: Overall, total power generated on-site accounted for 35.1% of Deer Island's total power use for the 2nd Quarter. Renewable power generated on-site (by Solar, Wind, STGs, and Hydro Turbines) accounted for 23.5% of Deer Island's total electrical power use for the quarter. The annual maintenance at the Thermal Power Plant took place starting on October 2 and continued through October 14. Various maintenance activities on both Steam Turbine Generators (STGs), the two Zurn boilers, and the common systems occurred and involved maintenance on various pumps, valves, and instruments throughout the power plant. Eversource and its subsidiary Harbor Electric Energy Company ("HEEC") is currently undertaking a project to more precisely locate the depth of the Reserved Channel portion of HEEC's 115kV power line which is used to provide primary power to the DITP. The HEEC project consists of Phase 1 and Phase 2. The first part of Phase 1 consisted of precisely locating the cable in the Reserved Channel, which took place November 2 to November 5 and required DITP to be isolated from the grid and operate using backup CTG power from approximately 6:00 a.m. to 7:00 p.m. each day while the cable was de-energized to safely carry out this work. The second part of Phase 1, which began December 8 and continued into January, involves test pit dredging to verify the location of the cable. The CTGs were operated for various periods of time on 12 days in December for this portion of the work. Phase 2 will involve dredging and installing protective mats over the 1,200 foot section of cable in the Reserved Channel, currently planned for the summer of 2017. An unanticipated plant-wide power outage occurred at 9:06 a.m. on December 8 as a result of CTG #2 tripping offline while DITP was disconnected from utility power for an Eversource power cable outage. Power was restored within 8 minutes of the outage when CTG #1 was placed into operation. DITP reconnected to the grid (utility power) later in the afternoon once Eversource was able to re-energize the power cable. Staff and the CTG service contractor were able to pinpoint and correct the cause of the issue, and the Eversource cable work resumed on December 13. Regulatory: Based on the treatment plant's performance in 2016, Deer Island is expected to receive NACWA’s (National Association of Clean Water Agencies) Platinum Award for Peak Performance which recognizes member agency facilities for outstanding compliance of their National Pollutant Discharge Elimination System (NPDES) permit limits. The Platinum award is given to agencies in recognition of 100% compliance with NPDES permits over a consecutive five year period. Deer Island is qualified for a Platinum Award10 for having operated with no permit violations from 2007 through 2016. Deer Island’s last permit violation occurred in August 2006 due to an acute toxicity test result that failed to meet the permit limits. Clinton AWWTP: Based on the treatment plant's performance in 2016, Clinton Treatment Plant is expected to receive NACWA’s (National Association of Clean Water Agencies) Gold Award for Peak Performance which recognizes member agency facilities for compliance of their National Pollutant Discharge Elimination System (NPDES) permit limits. The Gold Award is given to facilities with no NPDES permit violations for the entire calendar year. Clinton Treatment Plant is qualified for its second consecutive Gold Award for having operated with no permit violations in 2015 and 2016. Phosphorus Reduction Facility: Work completed or in progress during the second quarter: Placed concrete for mix tank outlet channel slab, electric room floor slab, roof deck, girders and beams; installed new plant water line, yard hydrant, and channel slide gates; prepared wet well and applied epoxy base coats; installed floor drains and vent piping in bathroom area; Mason constructed “mock-up” panel; preparing for coatings in rapid mix tank; mobilized and erected staging and enclosure and completed block work; placed waterproofing and commenced exterior brick work. Trickling Filter # 3: Assembled machined components on trickling filter center column. Crane was used to lift column onto center pedestal. Reattached distribution arms and adjusted support cables to level arms. Outfall Composite Sampler Shed: Purchased and installed sampling shed for outfall composite samplers. Electricians pulled wiring and instrumentation technician installed flow paced signal splitter to accommodate central lab composite samplers and Toxic Reduction and Control samplers. Removing scale in Soda Ash Feed Line: Chelsea Vactor truck was used to dispense high pressure water in soda ash line to remove build-up and flush debris from line reducing back pressure to feed pump. Clariflocculator #3: Replaced 12 existing 4 inch ground water relief valves with new Tideflex EPDM check valves. Valves are used to relieve ground water pressure from the outside of the tank when it is empty.

4
Residuals Pellet Plant
Deer Island Operations and Residuals2nd Quarter - FY17
Page 4 of 4
75%
78%
80%
83%
85%
88%
90%
93%
95%
98%
100%
140,000
150,000
160,000
170,000
180,000
190,000
200,000
210,000
220,000
J A S O N D J F M A M J
% U
tilized
DiG
as, S
CFH
Digester Gas Production and % Utilized
Avg Daily DiGas Produced, SCFH 3 Yr Avg Daily DiGas Produced, SCFH
% DiGas Utilized
The Avg Daily DiGas Production in the 2nd Quarter was 0.9% above target with the 3 Year Avg Daily DiGas Production for the same period even though sludge production was lower than expected. On average, 93.9% of all the DiGas produced in the quarter was utilized at the Thermal Power Plant. DiGas utilization was a low of 85.8% in October due to a scheduled annual maintenance outage of the Thermal Power Plant.
Total solids (TS) destruction following anaerobic sludge digestion averaged 51.5% during the 2nd Quarter, lower than the 3 year average of 53.4% for the same period, as the sludge detention time in the digesters was 20.9 days, slightly lower than the 3 year average of 21.6 days. DI operated with an average of 8.0 digesters during the 2nd Quarter in comparison to the 3 year average of 7.8 digesters.
The lower sludge detention time, and therefore the lower solids destruction, was a result of thinner sludge and a higher sludge volume in November, a side effect of several rain events during the month. Sludge detention times and solids destruction in October and December were more typical based on historical trends.
Total solids (TS) destruction is dependent on sludge detention time which is determined by primary and secondary solids production, plant flow, and the number of active digesters in operation. Solids destruction is also significanty impacted by changes in the number of digesters and the resulting shifting around of sludge.
40.0%
42.5%
45.0%
47.5%
50.0%
52.5%
55.0%
57.5%
60.0%
0358
101315182023252830
J A S O N D J F M A M J
% TS D
estroyed# D
ays
Sludge Detention Time in Digestersand Total Solids Destruction
Detention Time, #Days 3 Yr Avg Detention Time, #Days
Total Solids Destroyed, % 3 Yr Avg Total Solids Destroyed, %
MWRA pays a fixed monthly amount for the calendar year to process up to 92.5 DTPD/TSS as an annual average. The monthly invoice is based on 92.5 DTPD/TSS (Dry Tons Per Day/Total Suspended Solids) times 365 days divided by 12 months. At the end of the year, the actual totals are calculated and additional payments are made on any quantity above the base amount. The base quantity of 90.0 DTPD/TSS was changed to 92.5 DTPD/TSS starting on January 1, 2016 with the terms of the new contract. On average, MWRA processes more than 92.5 DTPD/TSS each year (FY16's budget was 100.2 DTPD/TSS and FY17's budget is 100.6 DTPD/TSS).
The average total quantity of sludge pumped to the Pellet Plant in the 2nd Quarter of FY17 was 100.0 DTPD - on target with FY17's average budget of 100.6 DTPD.
The contract requires NEFCo to capture at least 90.0% of the solids delivered to the Biosolids Processing Facility in Quincy. The CY16 average capture is 92.06%.
80%
85%
90%
95%
100%
J F M A M J J A S O N D
TSS
Monthly Average % Capture of Processed Sludge
Monthly Avg % Capture Contract Minimum CaptureCY16 YTD Avg % Capture
FY17 FY16
55
65
75
85
95
105
115
125
J F M A M J J A S O N D
Avg
DTP
D T
SS
Sludge Pumped From Deer Island
CY16 Actual Tons Pumped CY15 Actual Tons PumpedContract Base Quantity (92.5) Monthly Budget Average FYTDCY16 Actual Average CYTD
FY16 FY17

5
Deer Island Maintenance2nd Quarter FY17
70%
75%
80%
85%
90%
95%
100%
J A S O N D J F M A M J
% o
f WO
's C
ompl
eted
Preventive Maintenance Compliance
Best in Class Target
Industry Benchmark
70%
75%
80%
85%
90%
95%
100%
J A S O N D J F M A M J
% o
f WO
's C
ompl
eted
Predictive Maintenance Compliance
$18,000
$38,000
$58,000
$78,000
$98,000
J A S O N D J F M A M J
Ove
rtim
e ($
1,00
0)
Overtime Spending
FY17 OT Budget
Proactive InitiativesProductivity Initiatives
FY17 Goal
5000
10000
15000
20000
25000
30000
J A S O N D J F M A M J
Cre
w H
ours
Maintenance Backlog in Crew Hours
Industry Standard range for Backlog
0%
5%
10%
15%
20%
25%
30%
J A S O N D J F M A M J
% o
f tot
al W
ork
Ord
ers
Predictive Maintenance
0%
20%
40%
60%
80%
J A S O N D J F M A M J
% o
f wor
k or
ders
Maintenance Kitting
FY17 GoalFY17 Goal
Maintenance overtime was over budget by $20K thisquarter and $22k under for the year. Management continues to monitor backlog and to ensure all critical equipment and systems are available. This quartersovertime was predominately used for Island Wide HVAC work, Eversource Cable Outage, Maintenance Warehouse H eating Coil Replacement, Rebuild Residuals Odor Control Fan #4, and Winthrop Terminal Facility VFD #6.
DITP's maintenance backlog at Deer Island is 17, 043 hoursthis quarter. DITP is within the industry average for backlog. The industry Standard for maintenance backlog with 97 staff (currently planned staffing levels) is between 8,730 hours and 17,460 hours. Backlog is affected by five vacancies; two M&O Specialists, Instrument Technician, Electrician and a HVAC Specialist. Management continues to monitor backlog and to ensure all critical systems and equipment are available.
Productivity initiatives include increasing predictive maintenance compliance and increasing PdM work orders. Accomplishing these initiatives should result in a decrease in overall maintenance backlog.
Proactive initiatives include completing 100% of all preventative maintenance tasks and increasing preventative maintenance kitting. These tasks should result in lower maintenance costs.
Deer Island's FY17 predictive maintenance goal is 100%.DITP completed 100% of all PdM work orders this quarter. DITP is continuing with an aggressive predictive maintenance program.
Deer Island's FY17 preventative maintenance goal is 100% completion of all work orders from Operations and Maintenance. DITP completed 100% of all PM work orders this quarter.
Deer Island's FY17 predictive maintenance goal is 21% of all work orders to be predictive. 21% of all work orders were predictive maintenance this quarter. The industry is moving toward increasing predictive maintenance work to reduce downtime and better predict when repairs are needed.
Deer Island's FY17 maintenance kitting goal is 48% of all work orders to be kitted. 51% of all work orders were kitted this quarter. Kitting is staging of parts or material necessary to complete maintenance work. This has resulted in more wrench time and increased productivity.
FY17 OT Actual

6
Month J A S O N D J F M A M JLeaks Detect 3 2 2 3 3 0Leaks Repair 1 1 1 4 2 2Backlog 7 8 9 8 9 7
Avg. Lag Tim 24.9 42.3 36.7 41.3 45.2 58.6
Date Detected
Date Detected
7/22/2016 6/8/2015
1/11/2015 6/17/2015
9/15/2016 7/16/2015
10/12/2016 7/1/2016
10/13/2016 7/26/2016
8/11/2016 8/30/2016
10/18/2016 9/28/2016
11/2/2016
6/1/2016
11/6/2016
11/6/2016
10/20/2016
Morton St at Blue Hill Ave, Dorchester
2 Lynn Fells Parkway, Near W. Wyoming, Stoneham
122 Lynn Fells Parkway at Youle St, Melrose
11/7/2016
11/30/2016
12/22/2016
Commonwealth Ave at Oakland Ave, Newton
12/30/2016
Lee St at Boylston St, (Rte 9), Brookline
7/29/2016
8/15/2016
West Squantum @ Amsterdam Ave., Quincy
West St at Lagrange St, West Roxbury
241 Forest St., Winchester - Late Winter 2017 - difficult Main to close.
Allandale Rd. @ Grove St., Brookline. This leak will be addressed early spring, 2017 and to be coordinating with CIP and 8M permit water main isolations.
Washington St at East St, Dedham; Single main in SEH sevice area.
#56 Capt Robert Cook Dr, Needham - Sched for late Winter early Spring.
69 Riverside Avenue, Medford
Arborway @ St. Joseph St., West Roxbury
Prospect St at Sun St, Waltham
9/20/2016
10/26/2016
10/13/2016
1025 West Roxbury Parkway, Brookline 10/17/2016
Operations Division Metering2nd Quarter - FY17
WASTEWATER METERS
WATER DISTRIBUTION SYSTEM PIPELINES
FY17 Leak Report as of 2nd Q FY17
WATER METERS
Leak Backlog Summary
Location of Leaks Repaired Location of Leaks/Unrepaired
Res Playground Cleveland Cir., - Dec/Jan/Feb Pipe is in Ball Pk, wait until frozen.Morton Street @ American Legion, W. Roxbury - repair scheduled during January.
Quinobequin Road @ Rt 128, Newton - scheduled for Winter
85%
90%
95%
100%
J A S O N D J F M A M J
Percent of Total Revenue Water Deliveries Calculated Using Meters
Target % of Flow Metered
85%
90%
95%
100%
J A S O N D J F M A M J
Percent of Total Wastewater Transport Calculated Using Meters
Target % of Flow Metered
0
50
100
150
200
250
J A S O N D J F M A M J
Miles Surveyed for Leaks
Monthly Cumulative Target
The target for revenue water deliveries calculated using meters is 100%. Estimates are generated for meters that are out of service due to instrumentation problems or in-house and capital construction projects. During the 2nd quarter of FY17, meter actuals accounted for 99.96% of flow; only 0.04% of total revenue water deliveries were estimated. The following is the breakdown of reasons for estimations: In-house and Capital Construction Projects - 0.01% Instrumentation Failure - 0.03%
The target for revenue wastewater transport calculated using meters is 95%. Estimates are generated for meters missing data due to instrument failure and/or erratic meter behavior. Estimates are produced using data from previous time periods under similar flow conditions. During the 2nd quarter of FY17, meter actuals accounted for 97.05% of flow; only 2.95% of wastewater transport was estimated.
Target = 210 annually
During the second quarter, 59.49 miles of water mains were inspected. The total inspected for the fiscal year to date is 104.22 miles. Miles surveyed is below target due to training of new staff.
During the second quarter, six new leaks were detected. All six leaks detected during the second quarter were repaired, as well as one detected in June and one in July. Refer to FY17 Leak Report below for details. Also, community service ranging from individual leak location to hydrant surveys were conducted for: Arlington, Boston, Malden, Medford, Milton, Lynn, Newton, Somerville, and Waltham.

7
FY17 to Date FY17 TargetsMain Line Valves 2,159 97.2% 95%Blow-Off Valves 1,317 95.7% 95%Air Release Valves 1,380 94.3% 95%Control Valves 49 100.0% 95%
Operable PercentageType of Valve Inventory #
Water Distribution System Valves2nd Q FY17
BackgroundValves are exercised, rehabilitated, or replaced in order to improve their operating condition. This work occurs year round. Valvereplacements occur in roadway locations during the normal construction season, and in off-road locations during the winter season. Valveexercising can occur year round but is often displaced during the construction season. This is due to the fact that a large number ofconstruction contracts involving rehabilitation, replacement, or new installation of water lines, requires valve staff to operate valves and assistwith disinfection, dechlorination, pressure-testing, and final acceptance. Valve exercising can also be impacted due to limited redundancy inthe water system; valve exercising cannot be performed in areas where there is only one source of water to the community meters or flowdisruptions will occur.
0
5
10
15
20
25
30
35
J A S O N D J F M A M J
# of
Val
ves
Main Line Valves Replaced
Target = 20 main line valves annually
0
5
10
15
J A S O N D J F M A M J
# of
Val
ves
Blow-Off Valves Replaced
Key to Symbols: FY17 Monthly Total
FY17 Cumulative Total
During the second quarter, 163 main line valves were exercised. The total exercised for the fiscal year is 405. Below target due to staffing vacancies and CIP/8M permit construction contract support.
During the second quarter, four main line valves were replaced. The total replaced for the fiscal year is seven.
During the second quarter, 76 blow off valves were exercised. The total exercised for the fiscal year is 211. During the second quarter, 3 blow off valves were
replaced. The total replaced for the fiscal year is five.
0
100
200
300
400
500
600
J A S O N D J F M A M J
# of
Val
ves
Blow-Off Valves Exercised
0
250
500
750
1000
1250
1500
J A S O N D J F M A M J
# of
val
ves
Main Line Valves Exercised
Target = 1,100 main line valves annually
FY17 Target
Target = 10 blow off valves annually
Target = 500 blow off valves annually

8
Inspections Maintenance
Wastewater Pipeline and Structure Inspections and Maintenance 2nd Quarter - FY 17
0
5
10
15
20
25
30
35
40
J A S O N D J F M A M J
Mile
s
Pipeline Inspections
Monthly Inspections
0
5
10
15
20
25
30
35
40
J A S O N D J F M A M J
Mile
s
Pipeline Cleaning
Hydraulic Cleaning Mechanical Cleaning
YTD Actual
Target = 3 miles monthly or 36 miles annually
0
100
200
300
400
500
600
700
J A S O N D J F M A M J
# of
Str
uctu
res
Structure Inspections
Monthly Inspections
YTD Actual
Target = 54 monthly or 650 annually
0
20
40
60
80
100
120
J A S O N D J F M A M J
# of
Man
hole
s Manhole Rehabilitation
Monthly Inspections
YTD Actual
F&C Target = 15 monthly(except N,D,J,F,M)or 105/10% of the system annually
0
10
20
30
40
50
60
J A S O N D J F M A M J
# of
Sip
hon
Bar
rels
Inverted Siphon Inspections
Monthly Inspections
Target = 4 monthly or 48 / 38% of the system annually
YTD Actual
0
5
10
15
20
25
30
35
40
J A S O N D J F M A M J
# of
Sip
hon
Bar
rels
Inverted Siphon Cleaning
Monthly Cleaning
YTD Actual
Target = 3 monthly or 36 / 33% of the system annually
YTD Actual
Target = 2.67 miles monthly or 32 miles/13% of the system annually
Staff inspected 5 siphon barrels during the second quarter. Year to date total is 17 inspections.
Staff internally inspected 8.06 miles of MWRA sewer pipeline during the second quarter. The year to date total is 16.94 miles. No Community Assistance was provided this quarter.
Staff inspected 36 CSO structures and performed 239 additional manhole/structure inspections during the second quarter. The year to date total is 492 inspections.
Staff cleaned 9.19 miles of MWRA's sewer system and removed 54 yards of grit and debris during the second quarter. The year to date total is 18.28 miles. Community Assistance was provided to the city of Malden. Staff cleaned 1,410 linear feet of a 10" diameter sewer line that was blocked with debris this quarter.
Staff replaced 35 frames & covers during the second quarter.The year to date total is 94.
Staff cleaned 16 siphon barrels during the second quarter. Year to date total is 36.

9
Field Operations' Metropolitan Equipment & Facility Maintenance2nd Quarter - FY17
40%
50%
60%
70%
80%
90%
100%
% o
f WO
s C
ompl
eted
Overall Preventive Maintenance
Industry Benchmark = 100%
0
100
200
300
400
500
600
700
# of
Tot
al H
ours
Operations Light Maintenance PM Hours
Actual 10% 15%
$0
$50,000
$100,000
$150,000
$200,000
$250,000
$300,000
Ove
rtim
e ($
$)
Overtime Spending
FY16 OT Budget
5000 6000 7000 8000 9000
10000 11000 12000 13000 14000 15000 16000
Cre
w H
ours
Maintenance Backlog in Crew Hours
0
50
100
150
200
250
300
# of
Item
s K
itted
Items Kitted Utilizing Maximo
Items Kitted
Kit Items Goal=50
Several maintenance and productivity initiatives are in progress. The goal for the Overall PM completion and the Operator PM completion was raised to 100% for Fiscal Year 2010. The Operator PM and kitting initiatives frees up maintenance staff to perform corrective maintenance and project work, thus reducing maintenance spending. Backlog and overtime metrics monitor the success of these maintenance initiatives.
OT Actual
40%
50%
60%
70%
80%
90%
100%
% o
f WO
s C
ompl
eted
Operations Light Maintenance % PM Completion
PM Actual
FY17 Goal = 100%
Backlog Industry Standard for Backlog with 79 staff
Operations staff averaged 312 hours of preventive maintenance during the 2nd Quarter, an average of 15% of the total PM hours for the 2nd Quarter, which is within the industry benchmark of 10% to 15%.
In an effort to more efficiently complete work, maintenance staff and work coordination staff have utilized the Lawson/Maximo interface to better kit stock and non stock material. The goal for FY17 is to "kit" 50 stock and non stock items total per month. An average of 267 items were kitted during the 2nd Quarter
The Field Operations Department (FOD) preventive maintenance goal for FY17 is 100% of all PM work orders. Staff completed an average of 100% of all PM work orders in the 2nd Quarter.
Wastewater Operators complete light maintenance PM's which frees up maintenance staff to perform corrective maintenance. Operations' FY17 PM goal is completion of 100% of all PM work orders assigned. Operations completed an average of 100% of PM work orders in the 2nd Quarter.
The 2nd Quarter backlog average is 9902 hours. Management's goal is to continue to control overtime and still stay within the industry benchmark of 6450 to 12,940 hours.
Maintenance overtime was $61k over budget for the 2nd Quarter. Overtime was used for staging weather events and performing critical maintenance repairs.

Renewable Electricity Generation: Savings and Revenue2nd Quarter - FY17
J A S O N D J F M A M J
Elec
tric
ity fr
om R
enew
able
s (%
)
Renewable Electricity Production as % of MWRA Total Electricity Usage
% Renewable Electricity Used On-Site% Renewable Electricity Exported to GridFY16 % Renewables Total
J A S O N D J F M A M J
Pow
er G
ener
atio
n, M
Wh
Wind Production
Charlestown Wind Deer Island WindMonthly Wind Generation Budget,MWh FY16 Monthly Actual Generation
J A S O N D J F M A M J
Pow
er G
ener
atio
n, M
Wh
Hydro Production
Oakdale CosgroveDeer Island Loring RdMonthly Hydro Generation Budget,MWh FY16 Monthly Actual Generation
J A S O N D J F M A M J
Pow
er G
ener
atio
n, M
Wh
Solar Production
CWTP PV Deer Island PVMonthly Solar Generation Budget,MWh FY16 Monthly Actual Generation
J A S O N D J F M A M J
Pow
er G
ener
atio
n, M
Wh
Steam Turbine Generator Production
Deer Island STGs Monthly Steam Generation Budget,MWhFY16 Monthly Actual Generation
J A S O N D J F M A M J
Elec
tric
ity, M
Wh
MWRA Total Electricity Usage vs. Renewable Production
FY17 Total Renewable Electricity Production, MWhFY17 Total Electricity Usage Actual, MWhFY16 Total Renewable Electricity Production, MWh
In the first 6 months of FY17, MWRA's electricity generation by renewable resources totaled 29,029 MWh. Oakdale hydro generation data was underestimated by the utility for September and will be reconciled in later months; this will be reflected in future reporting. MWRA’s total electricity usage was approximately 91,410 MWh. The MWRA total electricity usage is the sum of all electricity purchased for Deer Island and FOD plus electricity produced and used on-site at these facilities. Approximately 99% of FOD electrical accounts are accounted for by actual billing statements; minor accounts that are not tracked on a monthly basis such as meters and cathodic protection systems are estimated based on this year's budget. In the first 6 months of FY17, green power generation represented approximately 32% of total electricity usage. All renewable electricity generated on DI is used on-site (this accounts for more than 50% of MWRA renewable generation). Almost all renewable electricity generated off-DI is exported to the grid.
In the 2nd quarter, the renewable energy produced from all hydroelectric facilities totaled 4,835 MWh; 2% below budget3. The total energy produced to date in FY17 is 11,238 MWh; 21% below budget3, partly due to Oakdale generation values being underestimated by the utility for September; the utility data corrections will be reconciled in later months. Also, Cosgrove was operating at a lower rate for scheduled testing, and both Deer Island hydro turbines were temporarily off-line due to mechanical issues. The total savings and revenue2 to date in FY17 (actuals through October1) is $259,976; 55% below budget3, partly due to the fact that the actual electricity unit price for Deer Island has been 12% below the budgeted3 estimate for the same period and due to the three reasons stated above. The savings and revenue value does not include RPS REC revenue (see next page).
In the 2nd quarter, the renewable energy produced from all wind turbine generators totaled 1,135 MWh; 2% above budget3. The total energy produced to date in FY17 is 1,788 MWh; 7% above budget3. The total savings and revenue2 to date in FY17 (actuals through October1) is $136,095; 4% above budget3.The savings and revenue value does not include RPS REC revenue (see next page).
In the 2nd quarter, the renewable energy produced from all solar PV systems totaled 237 MWh, 8% above budget3. The total energy produced to date in FY17 is 721 MWh; 2% above budget3. The total savings and revenue2 to date in FY17 (actuals through October1) is $64,646; 3% below budget3.The savings and revenue value does not include RPS REC revenue (see next page).
In the 2nd quarter, the renewable energy produced from all steam turbine generators totaled 6,224 MWh, 15% below budget3, due to STGs peforming 40% below budget in October due to annual maintenatce work on both STGs and the entire Thermal Power Plant. The total energy produced to date in FY17 is 15,282 MWh; 7% below budget3. The total savings and revenue2 to date in FY17 (actuals through October1) is $775,465; 21% below budget3,partly due to the fact that the actual electricity unit price for Deer Island has been 12% below the budgeted3 estimate for the same period. The savings and revenue value does not include RPS REC revenue (see next page).
Notes: 1. Only the actual energy prices are being reported. Therefore, some of the data lags up to 3 months due to timing of invoice receipt. 2. Savings and Revenue: Savings refers to any/all renewable energy produced that is used on-site therefore saving the cost of purchasing that electricity, and revenue refers to any value of renewable energy produced that is sold to the grid. 3. Budget values are based on historical averages for each facility and include operational impacts due to maintenance work.

Renewable Electricity Generation: Savings and Revenue2nd Quarter - FY17
J A S O N D J F M A M J
Savi
ngs
and
Rev
enue
Savings and Revenue from Renewable Electricity Generation
FY17 Total Monthly Savings/Revenue FY17 Savings/Revenue Budget FY16 Total Monthly Savings/Revenue
J A S O N D J F M A M J
Savi
ngs
and
Rev
enue
Cumulative Savings and Revenue from Renewable Electricity Generation
FY17 Cumulative Savings Actual FY17 Cumulative Savings Budget FY16 Cumulative Savings
$0
$200,000
$400,000
$600,000
$800,000
$1,000,000
$1,200,000
$1,400,000
J A S O N D J F M A M J
Cum
ulat
ive
Savi
ngs
(Cap
acity
Pay
men
ts)
DI Demand Response Program
FY17 Cumulative Savings Actual FY17 Cumulative Savings Budget FY16 Cumulative Savings
$0
$20,000
$40,000
$60,000
$80,000
J A S O N D J F M A M J
Cum
ulat
ive
Savi
ngs
(Cap
acity
Pay
men
ts)
FOD Demand Response Program
FY17 Cumulative Savings Actual FY17 Cumulative Savings Budget FY16 Cumulative Savings
11
Savings and revenue from MWRA renewable electricity generation in the first 4 months of FY17 (actuals only through October1) is $1,236,181; which is 30% below the budget3, partly due to the fact that the actual electricity unit price for Deer Island has been 12% below the budgeted3 estimate for the same period. Also due to Oakdale hydro generation data being underestimated by the utility (this will be reconciled in later months and will be reflected in future reporting), and DI STGs peforming 40% below budget in October due to annual maintenatce work on both STGs and the entire Thermal Power Plant. Savings and revenue2 from all renewable energy sources include wind turbines, hydroelectric generators, solar panels, and steam turbines (DI). This includes savings and revenue due to electricity generation (does not include avoided fuel costs and RPS RECs). The use of DITP digester gas as a fuel source provides the benefit of both electricity generation from the steam turbine generators, and provides thermal value for heating the plant, equivalent to approximately 5 million gallons of fuel oil per year (not included in charts above).
Currently Deer Island, JCWTP, and Loring Rd participate in the ISO-New England Demand Response Programs4. By agreeing to reduce demand and operate the facility generators to help reduce the ISO New England grid demand during periods of high energy demand, MWRA receives monthly Capacity Payments from ISO-NE. When MWRA operates the generators during an ISO-NE called event, MWRA also receives energy payments from ISO-NE. FY17 Cumulative savings (Capacity Payments only) through December1 total $445,966 for Deer Island and $12,647 for FOD through October1.
Notes: 1. Only the actual energy prices are being reported. Therefore, some of the data lags up to 3 months due to timing of invoice receipt. 2. Savings and Revenue: Savings refers to any/all renewable energy produced that is used on-site therefore saving the cost of purchasing that electricity, and revenue refers to any value of renewable energy produced that is sold to the grid. 3. Budget values are based on historical averages for each facility and include operational impacts due to maintenance work. 4. Chelsea Creek, Columbus Park, Ward St., and Nut Island participated in the ISO Demand Response Program through May 2016, until an emissions related EPA regulatory change resulted in the disqualification of these emergency generators, beginning June 2016. MWRA is investigating the cost- benefit of emissions upgrades for future possible participation.
Q1 Q2 Q3 Q4
Bid
Pric
e
MA Renewable Portfolio Standard
FY17 Bid Value Actual FY17 Bid Value Budget FY16 Bid Value
Q1 Q2 Q3 Q4
Cum
ulat
ive
Bid
Pric
e
Cumulative MA Renewable Portfolio Standard
FY17 Cumulative Bid Value Actual FY17 Cumulative Bid Value Budget FY16 Cumulative Bid Value
Bids were awarded during the 2nd Quarter1 from MWRA's renewable energy assets; 6,073 Q2 CY2016 Class I Renewable Energy Certificates (RECs), 1,005 Q2 CY2016 Class II RECs, and 104 Q2 CY2016 Solar RECs were sold for a total value of $230,776 RPS revenue; which is 26% below budget3 for the Quarter. REC values reflect the bid value on the date that bids are accepted, even though the RECs were produced during Q2 of CY2016. Cumulative bid values reflects the total value of bids received to date. Note: Only Class I and Solar RECs were sold for Q1 CY2016 sales. All of the available Q1 CY2016 Class II RECS were transferred to the electricity supplier (Direct Energy) to meet MWRA's obligation to them.

12
EPA Required SIU Monitoring Eventsfor FY17: 184YTD : 149
Required Non-SIU Monitoring Eventsfor FY17: 36YTD : 32
SIU Connections to be SampledFor FY17: 397YTD: 318
EPA Required SIU Inspectionsfor FY17: 199YTD: 144
SIU Permits due to ExpireIn FY17: 56YTD: 15
Non-SIU Permits due to Expirefor FY17: 152YTD: 96
SIU Non-SIU SIU Non-SIU SIU Non-SIU SIU Non-SIUJul 0 23 0 0 0 0 0 23Aug 4 14 0 1 0 0 4 15Sep 2 15 0 1 1 1 3 17Oct 0 9 0 1 0 0 0 10Nov 2 9 0 2 0 1 2 12Dec 6 17 0 1 0 1 6 19JanFebMarAprMayJun
% YTD 93% 91% 0% 6% 7% 3% 15 96
14 87 0 6 1 3 15 96
Toxic Reduction and Control2nd Quarter - FY17
Number of Days to Issue a Permit0 to 120 121 to 180 181 or more Total Permits Issued
Significant Industrial Users (SIUs) are MWRA's highest priority industries due to their flow, type of industry, and/or their potential to violate limits. SIUs are defined by EPA and require a greater amount of oversight. EPA requires that all SIUs with flow be monitored at least once during the fiscal year. The “SIU Monitored” data above, reflects the number of industries monitored in the month. However, many of these industries have more than one sampling point and the “SIU Connections Sampled” data reflect samples taken from multiple sampling locations at these industries.
Copper, lead, and molybdenum are metals of concern for MWRA as their concentrations in its biosolids have, at times, exceeded regulatory standards for unrestricted use as fertilizer. Cooling tower usage typically causes a seasonal spike in molybdenum concentrations due to the blowdown on large AC systems that use corrosion inhibitors containing molybdenum. Levels drop again following the end of the cooling season, although this is delayed due to biosolids processing time. With the September 2016 change in theMassDEP regulations, increasing the molybdenum limits to 40 mg/kg for land use application, the MWRA may more often be able to sell its pellets in-state whereas the previous limits forced several months’ worth of pellets to be shipped out of state. This made it an impractical source of fertilizer for local Massachusetts farms. In the last three months, the level of molybdenum has been hovering around the new higher DEP limits, possibly a consequence of the hot days of 2016. MWRA and its contractor, NEFCO, do not distribute product that does not meet the suitability standards.
EPA requires MWRA to issue or renew 90% of SIU permits within 120 days of receipt of the application or the permit expiration date - whichever is later. EPA also requires the remaining 10% of SIU permits to be issued within 180 days. So far, for this fiscal year, the guidelines have been met regarding the timely issuing of SIU permits within 120 days.
In the 2nd Quarter of FY17, forty-nine permits were issued, eight of which were SIUs. All of the eight SIU permits were issued in the 120-day timeframe. There were four non-SIU permits issued in the 120-day to 180-day timeframe and another two non-SIU permits issued beyond the180-day period. The TRAC department was undergoing personnel assignment changes which resulted in a few delays in permit processing. Delays also are attributable to late payment of permit fees and processing issues.
0
500
1000
J F M A M J J A S O N D
Copper Concentrations in Biosolids (mg/kg)
Copper DEP Type 1 Limit Previous 12 Months
0
10
20
30
40
50
60
70
80
J F M A M J J A S O N D
Molybdenum Concentrations in Biosolids (mg/kg)
Molybdenum DEP Type 1 Limit
EPA Interim Limit Previous 12 Months
0
50
100
150
200
250
300
350
J F M A M J J A S O N D
Lead Concentrations in Biosolids (mg/kg)
Lead DEP Type 1 Limit Previous 12 Months
184
36
397
199
56
152
0
50
100
150
200
250
300
350
400
450
SIUs Monitored Non-SIUs Monitored
SIU Connections Sampled
SIUs Inspected SIU Permits Issued Non-SIU Permits Issued
Inspections, Monitoring Events, Permits Issued, Year to Date
TRAC's annual monitoring and inspection goals are set at the beginning of each fiscal year but they can fluctuate due to the actual number of SIUs at any given time. During the course of the year, some SIUs do not discharge and cannot be monitored. TRAC also monitors one-third of the non-SIUs each year. SIU and Non-SIU permits are issued with durations of two to five years, depending on the category of industry, varying the number of permits that expire in a given year.

13
Field Operations Highlights 2nd Quarter – FY17
Western Water Operations and Maintenance Carroll Water Treatment: Operations Staff initiated half plant operations by shutting down flow to the A Side of the treatment process. This annual shutdown allows for Operations and Maintenance staff to complete annual maintenance and cleaning tasks that cannot be completed during full plant operation. Staff cleaned and inspected the primary contactors as well as the A Side Storage Tank and the post treatment chemical tanks. Tasks during half plant also include replacing the rupture discs on the primary contactors and replacing all of the check valves in the chemical feed systems. Plant staff also supported the pump station work that coincides with the treatment plant process. This work included installing new larger ozone destruct fans that remove the ozone from head space of the primary contactors. A weir wall was also installed downstream of the primary contactors in the effluent chamber for flow control purposes when the pump station comes on line. The reactors on the A Side Ultra Violet Treatment Plant also received the annual maintenance. This included replacing the UV Lamps that had reached the service life as well cleaning of the quartz sleeves, inspection of the wiper assemblies and calibration of all of the sensors. Metro Water Operations and Maintenance Community Assistance - Canton Storage Tank Issue: On Tuesday, December 20th, Canton Water called to report that they were having an issue with the booster pump at the base of their Indian Hill Tank. Water Pipeline and Valve Staff responded to the site to assist in diagnosing the problem. The Mobile Pump Unit (MPU) was deployed and assembled to pump water in the service area. The root cause of the problem turned out to be a broken valve at the base of the tank. MWRA Staff assisted Canton with the replacement of the valve, which then allowed their booster pump to function normally.
Operations Engineering Larz Anderson Bridge: The contractor isolated the 30-inch main on the Larz Anderson Bridge at Section 10 to conduct another pressure test. The test again failed and Barletta is discussing helium testing to help determine the location of the loss on the pipe. Section 56: Staff coordinated isolation of Section 56 after a contractor working for DCAM drilled into the water main mistakenly thinking it was a gas main. This was on Broad Street in Lynn in front of North Shore Community College. Sections 19 and 58: Staff coordinated the isolation of Section 58 and 19. DOT has demolished the Arborway Bridge near the Forest Hills Station and has rerouted a portion of MWRA Section 58 and 20. Portions of Sections 19, 20 and 58 are isolated to allow the Contractor, Barletta, to connect the new pipeline sections to the existing sections. Community Support: Continued working with Lexington developing a system hydraulic grade line. Lexington and Bedford have areas within the community that have experienced very low pressures, due to the drought and increased summer demands. The development of the grade line may help determine what may be done within their system to help increase the pressures. In September, when the water demand dropped off, both Lexington’s and Bedford’s pressures increased. Also, due to the drought and increased summer demand, Winchester experienced areas with low pressures, in areas are supplied by MWRA Meter 130 located on Forest Street. Testing determined that the meter will need to be increased in size. Operations Engineering is working with Engineering on the meter design and the Pipeline Group during the installation. The new meter has been ordered and construction is tentatively scheduled for March. Staff continued working with the Lynn to create a plan to supply their reservoirs during a drought period. Operations Engineering coordinated with the Pipeline Section to retrofit two emergency connections, to allow the MWRA to supply Lynn’s Reservoirs directly at their required flow rate. Wastewater Operations & Maintenance Alewife Brook Pump Station Rehabilitation-Contract #6797: Wastewater Operations staff is working with Construction staff and the Contractor for this project. The contractor installed one of the bypass pumping discharge pits and poured the walls for the discharge chamber. Operations staff attended multiple meetings to review the Contractor’s Bypass Pumping Plan for this project. Operations Staff attended monthly Project Coordination Meetings onsite at the facility. Staff also attended several PCB Abatement Coordination Meetings in December with Union Leadership, the Contractor, Subcontractor (PCB Abatement), the Consultant and Authority Engineering & Construction Staff. Operations locked out/tagged out the Dry Weather Pump #4 on 12/22/16 so the contractor could inspect the downstream 24-inch sewer line.

14
Wastewater Operations & Maintenance (cont.)
Nut Island Standard Operating Procedures (SOPs): Operations staff wrote updated SOPs for putting screening channels and grit vortexes online and offline in remote control (via SCADA) and manual control (local controls). All Operations Staff will be trained on the updated SOPs. Training was ongoing during the month of December. Metering Meter Systems: Staff continues to work with Newton to assist with their leak detection efforts. Notified Chelsea, Everett (3), Milton, Nahant, Northboro, Norwood and Westwood of increases in flow. Staff continued to work with Arlington, Newton and Waltham to deal with their water loss issues. TRAC Compliance and Enforcement: TRAC previously issued a Penalty Assessment Notice (PAN) to Absolute Metal in response to their discharge of wastewater containing excessive levels of cyanide into the MWRA sanitary sewer in violation of EPA Limits, MWRA Sewer Use Regulations, Absolute Metal’s MWRA Sewer Use Discharge Permit and the April 15, 2015 Notice of Noncompliance and Order issued to Absolute Metal by the MWRA. Absolute paid the $15,500 penalty in full on November 29, 2016. The facility has returned to compliance. Environmental Quality-Water Community Support: Staff, in coordination with Operations Engineering and the Planning Department, continued to meet with Community Water Department staff in October. Discussions focus on a review of water meter data, total coliform sampling plans, chlorine residual data, storage tank monitoring and system hydraulics. During the Quarter, MWRA Staff met with Representatives from Brookline, Norwood, Reading, Lexington and Waltham. Staff provided Emergency Response Training to communities that attended training in November and December. Presentations focused on ways in which communities can troubleshoot low chlorine residuals within their community and what parameters can be tested to possibly diagnose high water age or nitrification. Staff provided drinking water sampling and testing support to Malden on December 9th. Staff sampled chlorine residual, pH and alkalinity from several samples throughout the community. Results were forwarded to the Malden Water Department and DEP-NERO.
Environmental Quality-Wastewater
Ambient Monitoring: Ambient monitoring field work for 2016 was completed and results are being delivered on an ongoing basis. All Contingency Plan (CP) Thresholds Tests for 2016 Ambient Monitoring are completed. There was only one exceedance of an Ambient Monitoring CP Threshold in 2016 for a potential nuisance algae. Evaluation of the data indicates that this was caused by natural factors unrelated to outfall discharge. Staff are preparing a proposal to regulators to eliminate this CP Threshold, as recommended to and approved by EPA’s Outfall Monitoring Science Advisory Panel in October.
Monitoring results from 2014 and 2015 were summarized at a meeting of the EPA's Outfall Monitoring Science Advisory Panel in October. The Permit-Required Outfall Monitoring Overview , summarizing the results of 2015 monitoring, was presented to the Board in October and submitted to regulators in November as required by the permit.
Harbor/Beach/CSO Monitoring: Completed CSO receiving water sampling for the year included post-monitoring-season sampling of two storms. The CSO receiving water monitoring scope of work was submitted to DEP as required by the Variances for the Charles and Alewife/Mystic. In 2017 the monitoring will be further enhanced by weekend sampling following a limited number of storms. Completed a statistical analysis of the beach water quality data for summer 2016.
Coordination with Other MWRA Departments: Worked with Engineering & Construction, Planning, and Real Property & Environmental Management to assess NPDES permit requirements applicable to the Wachusett Aqueduct Pump Station which is currently under construction.
Cooperation with Other Agencies: Staff participated in meetings of the Massachusetts Bays Program and (with DLS) held a coordination meeting with Technical Staff from the four local watershed associations for which DLS provides laboratory support.

15
Laboratory Services2nd Quarter - FY17
70%
75%
80%
85%
90%
95%
100%
J A S O N D J F M A M J
Percent On-Time Results
3-Year Average Goal FY17
0 2 4 6 8
10 12 14
J A S O N D J F M A M J
Day
s
Turnaround Time
3-Year Average Goal FY17
$0 $100 $200 $300 $400 $500 $600 $700 $800 $900
$1,000
J A S O N D J F M A M J
Thou
sand
s
Value of Services Rendered
Budget 3-Year Average FY17
The Percent On-Time measurement was below the 95% goal due to the School Lead samples. Without these we were 96% on-time. Our goal for school samples is 14 days; due to the high volume, actual turn-around for school samples averaged samples was 25 days.
Percent of QC tests meeting specifications was below the 98% in-house goal due to the learning curve for the new automated solid phase extraction sample preparation for semivolatile organics. While this didn't affect regulatory reporting, it did require some re-work to obtain acceptable QC.
Turnaround Time was faster than the 9-day goal. Our TAT for the non-School Lead samples was 5.3 days.
Value of Services Rendered was above the seasonally adjusted budget projection due to the School Lead project.
90%
92%
94%
96%
98%
100%
J A S O N D J F M A M J
Percent QC Within Specifications
3-Year Average Goal FY17
Highlights: Southboro Lab: Completed the move back into the renovated Southboro Lab on December 11th. School Lead: Continued to test school lead samples from communities as quickly as they came in. In December we received 2,049 lead and copper tests and completed 3,728 tests. By the end of December the heavy backlog had been reduced to 1,337. Staff have been consistently meeting or exceeding our target of completing at least 500 tests per week. In December the average turnaround time for School Lead samples was 25 days, so many of the samples weren't meeting the target turnaround time of 14 days. Through December we have completed 21,600 school and non-school lead and copper tests this calendar year. Percent QC Within Specifications: In December, 484 of 11,174 QC checks didn't meet in-house requirements, so our percentage of QC within specifications dipped below our goal of 98%. While this didn't affect regulatory reporting, it did require re-work for 199 of these QC results. Most of these were associated with a new automatic sample extraction system for semivolatile organic chemicals that is resulting in reduced solvent use and solvent emissions.

CONSTRUCTION PROGRAMS

Projects In Construction 2nd Quarter – FY17
NIH Section 110 Reading & Woburn Project Summary: This project involves the construction of 8,800 linear feet of 36-inch water transmission main in the City of Woburn and the Town of Reading.
Notice to Proceed: 12-Jan-2016 Contract Completion: 30-Mar-2018
Status and Issues: As of December, the Contractor completed pipeline testing of the 36” mainline from West Street Sta. 100+00 to Sta. 115+58.5. Through December approximately 98% of the mainline pipe was installed. Contractor will work on meter vaults during winter months.
Wachusett Aqueduct Pumping Station Project Summary: This project involves the construction of a 240 MGD pump station to supply water from the Wachusett Aqueduct to the Carroll Water Treatment Plant.
Notice to Proceed: 1-Mar-2016 Contract Completion: 14-Feb-2019
Status and Issues: As of December, the Contractor continued with formwork, steel and concrete for the wet well walls, BFV vault walls and the bottom of the roof slab.
81%
Money
Amount Remaining Billed to Date
Chelsea Creek Headworks Upgrade Project Summary: This project involves a major upgrade to the entire facility including: automation of screening collection & solids conveyance, replacement of the odor control, HVAC and electrical systems.
Notice to Proceed: 22-Nov-2016 Contract Completion: 21-Nov-2020
Status and Issues: As of December no physical work has begun. The Contractor and RE are now working out of their field office.
Alewife Brook Pump Station Improvements Project Summary: This project involves the replacement of wet-weather pumps, motors, gear drives, VFD’s, MCC, screens, sluice gates, standby generator, roof, PLC’s and HVAC. Also, the remediation of PCB’s and asbestos and the installation of a flow meter on the 66-inch downstream Alewife Brook Conduit.
Notice to Proceed: 29-Jan-2016 Contract Completion: 31-May-2018
Status and Issues: As of December, the Contractor completed the construction of the Bypass Chamber/ Metering Vault. They continued installing electrical conduit for temporary construction/bypass pumping power.
44%
Time
Days Remaining Days Expended
Money
Amount Remaining Billed to Date
Time
Days Remaining Days Expended
29%
Money
Amount Remaining Billed to Date
28%
Time
Days Remaining Days Expended
21%
Money
Amount Remaining Billed to Date
40%
Time
Days Remaining Days Expended
16

Projects In Construction 2nd Quarter – FY17
Caruso Pump Station Improvements Project Summary: This project involves the replacement of the stand-by emergency generator and improvements to the HVAC, fire suppression and security systems at the Caruso Pump Station.
Notice to Proceed: 24-Mar-2016 Contract Completion: 24-Mar-2017
Status and Issues: As of December, the Contractor completed the installation of high roof and elevator penthouse. They replaced the existing generator exhaust and muffler. They cored a new opening and provided additional structural support at the generator roof.
DITP Valves and Piping Replacements Project Summary: This project involves the replacement of the twenty 60” butterfly valves and ten 60” flow meters in the NMPS; three 48”, twelve 36” plug/check valves, six 30” flow meters and six 30-36” gate valves in the WTF.
Notice to Proceed: 23-Jun-2014 Contract Completion: 22-Jun-2017
Status and Issues: The Contractor nearly completed the demolition and replacement of existing 14” PSL-B glass lined piping in the Residual Galleries; only needs to make the final tie in at the Gravity Thickener Distribution Box.
Winthrop Terminal VFD and Motor Project Summary: This project involves the replacement of 6, 600-HP motors, VFDs and associated electrical components in the Winthrop Terminal Facility.
Notice to Proceed: 16-Jun-2016 Contract Completion: 12-Mar-2020 Status and Issues: The Contractor, JFW has begun preparing major equipment submittals. No physical work took place.
DITP Replacement of Scum Skimmers Project Summary: This project involves the replacement of the existing carbon steel tip tubes with 316 stainless steel in 48 primary and 54 secondary clarifiers to improve reliability and increase longevity.
Notice to Proceed: 9-Oct-2013 Contract Completion: 10-Oct-2016 Status and Issues: The punchlist work is on-going. The Contractor has submitted the necessary documentation required for a Partial Release of Retainage.
53%
Money
Amount Remaining Billed to Date
77%
Time
Days Remaining Days Expended
62%
Money
Amount Remaining Billed to Date
84%
Time
Days Remaining Days Expended
99%
Money
Amount Remaining Billed to Date
100%
Time
Days Remaining Days Expended
5%
Money
Amount Remaining Billed to Date
12 %
Time
Days Remaining Days Expended
17

18
CSO CONTROL PROGRAM 2nd Quarter – FY17
All 35 projects in the Long-Term CSO Control Plan are complete, in compliance with Schedule Seven. Remaining CSO related capital spending totaling $12.8 million is authorized and scheduled through December 2020. Remaining work includes Cambridge’s completion of surface restoration work associated with the Alewife/CAM004 sewer separation contracts, BWSC’s removal of additional inflow from its sewers in the South Dorchester Bay sewer separation areas of Dorchester, and the federal court mandated three-year CSO post-construction monitoring and performance assessment (2018-2020).
Project/Item Status as of December 31, 2016
BWSC Memorandum of Understanding and Financial Assistance Agreement
BWSC attained substantial completion of its last project, Reserved Channel Sewer Separation, in December 2015 in compliance with Schedule Seven. MWRA staff are conducting final eligibility reviews of the BWSC construction contracts that were administered and managed by BWSC with MWRA funding. On December 14, 2016, the Board of Directors authorized Amendment 16 to the Financial Assistance Agreement extending the term of MWRA financial assistance by six months to June 2017 with no increase to the award amount. The amendment provides for BWSC use of CSO account funds as its staff continue to support and respond to the remaining MWRA final eligibility reviews.
South Dorchester Bay Sewer Separation Post-Construction Inflow Removal
As previously reported, BWSC has completed its investigation of alternatives for removing additional stormwater inflow from its Dorchester Interceptor, following completion of sewer separation and the closing of CSOs several years ago. MWRA’s CIP includes $5.4 million for the inflow removal effort, of which $2.7 million has been transferred to the BWSC CSO account and $1.6 million of that has been withdrawn by BWSC to fund related design and construction work. Staff plan to remove the remaining $3.8 million from the BWSC MOU/FAA, develop a separate financial agreement with BWSC for its use of these remaining funds, and close out the MOU/FAA when its term ends on June 30, 2017. Staff expect to seek Board approval for the new agreement this spring.
City of Cambridge Memorandum of Understanding and Financial Assistance Agreement
The City of Cambridge attained substantial completion of its last project, CAM004 Sewer Separation, in December 2015 in compliance with Schedule Seven. On December 14, 2016, the Board of Directors approved Amendment 13 to the MOU/FAA increasing the award amount by $1,509,899 from $98,668,856 to $100,178,755 and extending the terms of the agreements by six months to June 30, 2018. Extensive surface restoration work eligible for MWRA funding at a remaining award amount of $5.7 million is currently scheduled to continue through December 2017.
MWRA CSO Performance Assessment
Staff are evaluating system wet weather performance and performance predictions, including comparisons of MWRA and community meter data to MWRA model predictions, and are currently developing a supplemental metering approach that staff plan to implement during the assessment period 2018-2020. The Charles River and Alewife Brook/Upper Mystic River CSO variances recently extended by DEP to 2019 include a requirement that MWRA submit a draft scope of the post-construction monitoring program and performance assessment to DEP by May 2017. MWRA’s FY17 CIP includes funds for the three-year performance assessment.

CIP Expenditures 2nd Quarter FY17
FY17 Capital Improvement Program
Expenditure Variances through December by Program ($ in thousands)
Program FY17 Budget Through December
FY17 Actual Through December
Variance Amount
Variance Percent
Wastewater 27,702 24,281 (3,422) -12%
Waterworks 28,023 29,554 1,531 5%
Business and Operations Support 3,374 2,848 (526) -15%
Total $59,099 $56,682 ($2,417) -4%
Underspending within Wastewater is primarily due to a delay for final restoration work for the Cambridge Sewer Separation, and construction issues with the Caruso Pump Station Improvements, delay in the award of the Chelsea Creek Upgrade Construction, fewer than anticipated community requests for loans and grants for the Infiltration/Inflow (I/I) program and equipment delays for the Deer Island North Main Pump Station and Winthrop Terminal Facility Butterfly Valve Replacement. This was partially offset by construction progress on the Deer Island Fuel Oil System Upgrades, Alewife Brook Pump Station Rehabilitation, Winthrop Terminal Facility Variable Frequency Drives Replacement Construction, Clinton Phosphorus Reduction Construction, and timing of final work on the Chelsea Screenhouse and DI Electrical Upgrades contracts. Overspending in Waterworks is primarily due to contractor progress on Section 89/29 Redundancy Phase 1B Construction, Southern Extra High Section 111 Construction, Quabbin Release Pipeline Construction, and additional work for the Webster Avenue Bridge Pipe Replacement Construction. This was partially offset by construction issues resulting in less than anticipated progress for the Wachusett Aqueduct Pump Station Construction, Rosemary Brook Building Repairs, and Beacon Street Line Construction contracts.
Budget vs. Actual CIP Expenditures
($ in thousands) Total FY17 CIP Budget of $155,702,000.
Construction Fund Management
All payments to support the capital program are made from the Construction Fund. Sources of fund in-flows include bond proceeds, commercial paper, SRF reimbursements, loan repayments by municipalities, and current revenue. Accurate estimates of cash withdrawals and grant payments (both of which are derived from CIP spending projections) facilitate planning for future borrowings and maintaining an appropriate construction fund balance.
* Cash based spending is discounted for construction retainage.
Cash Balance 12/24/2016 $64.9 million Unused capacity under the debt cap:
$1.243 billion
Estimated date for exhausting construction fund without new borrowing: MAR-17
Estimated date for debt cap increase to support new borrowing: Not anticipated at this time
Commercial paper/Revolving loan outstanding: Commercial paper capacity:
$128 million $ 350 million
Budgeted FY17 capital spending*: $136 million
-25%
-20%
-15%
-10%
-5%
0%
5%
10%
15%
20%
25%
Q1 Q2 Q3 Q4
YTD
Variance %
+ 20 Percent
Zero Percent
- 20 Percent
Actual

DRINKING WATER QUALITY AND SUPPLY

Source Water – Microbial Results and UV Absorbance2nd Quarter – FY16
Source Water – Microbial Results
Total coliform bacteria are monitored in both source and treated water to provide an indication of overall bacteriologicalactivity. Most coliforms are harmless. However, fecal coliform, a subclass of the coliform group, are identified by theirgrowth at temperatures comparable to those in the intestinal tract of mammals. They act as indicators of possible fecalcontamination. The Surface Water Treatment Rule for unfiltered water supplies allows for no more than 10% of sourcewater samples prior to disinfection over any six-month period to have more than 20 fecal coliforms per 100mL.
Sample Site: Quabbin ReservoirQuabbin Reservoir water is sampled at the William A.
(f 30
Quabbin Reservoir Fecal Coliform Levels Before Disinfection
Brutsch Water Treatment Facility (formerly WareDisinfection Facility) raw water tap before being treatedand entering the CVA system.
All samples collected during the 2nd Quarter were below20 cfu/100ml. For the current six-month period, 0.0% ofthe samples have exceeded a count of 20 cfu/100mL,compared to the allowable 10%.
10
20
30
Fec
al C
olif
orm
(cfu
/100
mL)
Maximum Standard
Sample Site: Wachusett ReservoirWachusett Reservoir water is sampled at the CWTP rawwater tap in Marlborough before being treated andentering the MetroWest/Metropolitan Boston systems.
In the wintertime when smaller water bodies nearWachusett Reservoir freeze up, many waterfowl will roostin the main body of the reservoir - which freezes later.
0Dec-15 Mar-16 Jun-16 Sep-16 Dec-16
20
30
00 m
L)Wachusett Reservoir
Fecal Coliform Levels Before Disinfection
Maximum Standardin the main body of the reservoir which freezes later.This increased bird activity tends to increase fecal coliformcounts. DCR has an active bird harassment program tomove the birds away from the intake area.
All samples collected during the 2nd Quarter were below 20 cfu/100ml. For the current six-month period, 0.0% of the samples exceeded a count of 20 cfu/100mL. 0
10
20
Dec-15 Mar-16 Jun-16 Sep-16 Dec-16
Fec
al C
olif
orm
(cfu
/1
Source Water – UV Absorbance
UV Absorbance at 254nm wavelength (UV-254), is ameasure of the amount and reactivity of natural organicmaterial in source water. Higher UV-254 levels causeincreased ozone and chlorine demand resulting in theneed for higher ozone and chlorine doses, and canincrease the level of disinfection by-products. UV-254 isimpacted by tributary flows water age sunlight and other
0.06
0.08
0.10
0.12
A/cm
UV 254Reservoir Source Water
Grab Data
Wachusett
Quabbin
impacted by tributary flows, water age, sunlight and otherfactors.
Quabbin Reservoir UV-254 levels are currently around0.017 A/cm.
Wachusett Reservoir UV-254 levels are currently around0.030 A/cm.
0.00
0.02
0.04
Dec-15 Mar-16 Jun-16 Sep-16 Dec-16
20

Source Water – Turbidity 2nd Quarter – FY16
Turbidity is a measure of suspended and colloidal particles including clay, silt, organic and inorganic matter, algae andmicroorganisms. The effects of turbidity depend on the nature of the matter that causes the turbidity. High levels of particulatematter may have a higher disinfectant demand or may protect bacteria from disinfection effects, thereby interfering with they g y p y gdisinfectant residual throughout the distribution system.
There are two standards for turbidity: all water must be below 5 NTU (Nephelometric Turbidity Units), and water only can be above1 NTU if it does not interfere with effective disinfection.
Turbidity of Quabbin Reservoir water is monitored continuously at the Brutsch Water Treatment Facility (BWTF) before UV andchlorine disinfection. Turbidity of Wachusett Reservoir is monitored continuously at the Carroll Water Treatment Plant (CWTP)before ozonation and UV disinfection.
M i t bidit lt t Q bbi d W h tt ithi DEP t d d f th tMaximum turbidity results at Quabbin and Wachusett were within DEP standards for the quarter.
1.0
1.5
2.0
y (N
TU)
)
Quabbin Reservoir Average and Maximum Daily Turbidity Levels Leaving
Quabbin Reservoir
Daily Maximum
Daily Average
Maximum Standard1.0
1.5
2.0
y (N
TU)
)
Wachusett ReservoirAverage and Maximum Daily Turbidity Levels Leaving
Wachusett Reservoir
Daily Maximum
Daily Average
Maximum Standard
0.0
0.5
Dec-15 Mar-16 Jun-16 Sep-16 Dec-16
Turb
idity
0.0
0.5
Dec-15 Mar-16 Jun-16 Sep-16 Dec-16
Turb
idity
Treated Water – pH and Alkalinity Compliance
MWRA adjusts the alkalinity and pH of Wachusett water at CWTP to reduce its corrosivity, which minimizes the leaching of leadand copper from service lines and home plumbing systems into the water. MWRA tests finished water pH and alkalinity daily at theCWTP’s Fin B sampling tap. MWRA’s target for distribution system pH is 9.3; the target for alkalinity is 40 mg/l. Per DEPrequirements, CWTP finished water samples have a minimum compliance level of 9.1 for pH and 37 mg/L for alkalinity. Samplesfrom 27 distribution system locations have a minimum compliance level of 9.0 for pH and 37 mg/L for alkalinity. Results must notbe below these levels for more than nine days in a six month period. Distribution system samples are collected in March, June,September, and December.
Each CVA community provides its own corrosion control treatment. See the CVA report: www.mwra.com/water/html/awqr.htm.
9.8
10.0
pH Daily Average at CWTP Finished Water TapAverage of On-line and Grab Sample Results
43
46
Alkalinity at CWTP Finished WaterTapAverage of Operator and QA Grab Samples
y p p q
Distribution system samples were collected on December 7 and 8, 2016. Distribution system sample pH ranged from 9.3 to 9.6and alkalinity ranged from 40 to 44 mg/L. No sample results were below DEP limits for this quarter.
9.0
9.2
9.4
9.6
Jan/16 Mar/16 May/16 Jul/16 Sep/16 Nov/16 Jan/17
pH H
Minimum Compliance Level (9.1)
34
37
40
43
Jan/16 Mar/16 May/16 Jul/16 Sep/16 Nov/16 Jan/17
mg/
L
Minimum Compliance Level (37 mg/L)
21

Treated Water – Disinfection Effectiveness2nd Quarter – FY16
At the Carroll Water Treatment Plant (CWTP), MWRA meets the required 99.9% (3-log) inactivation of Giardia using ozone( ), q ( g) g(reported as CT: concentration of disinfectant x contact time) and the required 99% (2-log) inactivation of Cryptosporidium using UV(reported as IT: intensity of UV x time). MWRA calculates inactivation rates hourly and reports Giardia inactivation at maximum flowand Cryptosporidium inactivation at minimum UV dose. MWRA must meet 100% of required CT and IT.
CT achievement for Giardia assures CT achievement for viruses, which have a lower CT requirement. For Cryptosporidium, there isalso an “off-spec” requirement. Off-spec water is water that has not reached the full required UV dose or if the UV reactor isoperated outside its validated ranges. No more than 5% off-spec water is allowed in a month.
Wachusett Reservoir – MetroWest/Metro Boston Supply:Ozone dose at the CWTP varied between 0 9 to 1 1 mg/L for the quarterOzone dose at the CWTP varied between 0.9 to 1.1 mg/L for the quarter.Giardia CT was maintained above 100% at all times the plant was providing water into the distribution system this quarter, as well
as every day for the last fiscal year.Cryptosporidium IT was maintained above 100% during the month. Off-spec water was less than 5%.
300%
400%
ed
Giardia CT Percent Achievement- 12 MonthsCarroll Water Treatment Plant
300%
400%
ed
Giardia CT Percent Achievement - Current MonthCarroll Water Treatment Plant
0%
100%
200%
Dec-15 Apr-16 Aug-16 Dec-16
% C
T Ac
hiev
e
Regulatory Minimum Standard
0%
100%
200%
1-Dec-16 9-Dec-16 17-Dec-16 25-Dec-16
% C
T Ac
hiev
e
Regulatory Minimum Standard
Quabbin Reservoir (CVA Supply) at: Brutsch Water Treatment FacilityThe chlorine dose at BWTF is adjusted in order to achieve
MWRA’s seasonal (June 1 – October 31) target of >1.0 mg/L at Ludlow Monitoring Station. The chlorine dose at BWTF ranged from 1.3 to 1.7 mg/L for
the quarter.Giardia CT was maintained above 100% at all times the
plant was providing water into the distribution system for the 100%
200%
300%
%IT
Ach
ieve
d
Cryptosporidium IT Percent Achieved - Current Month
Brutsch Water Treatment Facility
Carroll Water Treatment Plant
Regulatory Minimum Standardplant was providing water into the distribution system for the quarter. Cryptosporidium IT was maintained above 100% during the
month. Off-spec water was less than 5%.
1500%
Giardia CT Percent Achievement - 12 MonthsBrutsch Water Treatment Facility 1500%
Giardia CT Percent Achievement - Current MonthBrutsch Water Treatment Facility
0%
100%
1-Dec-16 9-Dec-16 17-Dec-16 25-Dec-16
0%
300%
600%
900%
1200%
% C
T Ac
hiev
ed
Regulatory Minimum Standard300%
600%
900%
1200%
% C
T A
chie
ved
Regulatory Minimum Standard
22
0%Dec-15 Apr-16 Aug-16 Dec-16
0%1-Dec-16 9-Dec-16 17-Dec-16 25-Dec-16

Source Water - Algae2nd Quarter – FY16
Algae levels in Wachusett Reservoir are monitored by DCR and MWRA. These results, along with taste and odor complaints, areused to make decisions on source water treatment for algae control
Total Algae at Wachusett Reservoir
used to make decisions on source water treatment for algae control.
Taste and odor complaints at the tap may be due to algae, which originate in source reservoirs, typically in trace amounts.Occasionally, a particular species grows rapidly, increasing its concentration in water. When Synura, Anabaena, or other nuisancealgae bloom, MWRA may treat the reservoir with copper sulfate, an algaecide. During the winter and spring, diatom numbers mayincrease. While not a taste and odor concern, consumers that use filters may notice a more frequent need to change their filters.
In the 2nd Quarter, one complaint which may be related to algae was reported from a local water department.
Total Diatoms at Wachusett Reservoir
0
600
1200
1800
2400
3000
asu/
mL
gMaximum Level
0
600
1200
1800
2400
3000
asu/
ml
Maximum Level
0Dec-15 Mar-16 Jun-16 Sep-16 Dec-16
Drinking Water Quality Customer Complaints: Taste, Odor, or Appearance
MWRA collects information on water quality complaints that typically fall into four categories: 1.) discoloration due to MWRA or localpipeline work; 2.) taste and odor due to algae blooms in reservoirs or chlorine in the water; 3.) white water caused by changes inpressure or temperature that traps air bubbles in the water; or 4.) “other” complaints including no water, clogged filters or other
0Dec-15 Mar-16 Jun-16 Sep-16 Dec-16
issues.
MWRA routinely contacts communities to classify and tabulate water complaints from customers. This count, reflecting onlytelephone calls to towns, probably captures only a fraction of the total number of customer complaints. Field Operations staff haveimproved data collection and reporting by keeping track of more kinds of complaints, tracking complaints to street addresses andcirculating results internally on a daily basis.
Communities reported 232 complaints during the quarter compared to 11 complaints for 2nd Quarter of FY15. Of these complaints,58 were for “discolored water”, 3 were for “taste and odor”, 6 were for “white water”, and 165 were for “other”. Of these complaints,219 were local community issues, 5 were seasonal in nature, and 8 were unknown in origin.O 10/25/2106 M lb h t d fift di l d t l i t d t l l t i b k•On 10/25/2106, Marlborough reported fifty discolored water complaints due to a local water main break.
•On10/25/2016, Winchester reported one hundred no water complaints which may be related to an ongoing local Flushing programinitiated in early October 2016.•On 11/1/2106, Brookline reported a combined fifty-five ‘no water’ and ‘discolored water’ complaints when a water main breakoccurred along West Roxbury Parkway. The Brookline WD was able to repair the break and have service restored to the area.•On 11/1/2106, Quincy reported one hundred ‘no water’ complaints when a valve was blown during preventive maintenance workon a hydrant branch gate valve. The Quincy WD notified the customers of this event as they isolated and repaired the branch.•On 11/10/2106, Swampscott reported a combined thirty-five ‘no water’ and ‘discolored water’ complaints when a water main breakoccurred. Swampscott WD was able to repair the break and have service restored to the area.
20406080
100120140160180200220
# of C
ompla
ints
Water Quality Complaints By Responsible Party
406080
100120140160180200220
# of C
ompla
ints
Water Quality Complaints
23
020
Dec-15 Feb-16 Apr-16 Jun-16 Aug-16 Oct-16 Dec-16
MWRA Local Shared Seasonal Unknown
020
Dec-15 Feb-16 Apr-16 Jun-16 Aug-16 Oct-16 Dec-16
Taste and Odor Discolored White Water Other

Bacteria & Chlorine Residual Results for Communities in MWRA Testing Program2nd Quarter – FY17
While all communities collect bacteria samples and chlorine residual data for the Total Coliform Rule (TCR), data from the 44systems that use MWRA’s Laboratory are reported belowsystems that use MWRA s Laboratory are reported below.
The MWRA TCR program has 141 sampling locations. These locations include sites along MWRA’s transmission system, waterstorage tanks and pumping stations, as well as a subset of the community TCR locations.
The TCR requires that no more than 5% of all samples in a month may be total coliform positive (or that no more than one sample bepositive when less than 40 samples are collected each month). Public notification is required if this standard is exceeded.
Escherichia coli (E.coli) is a specific coliform species whose presence likely indicates potential contamination of fecal origin. If E.coliare detected in a drinking water sample, this is considered evidence of a potential public health concern. Public notification isrequired if follow-up tests confirm the presence of E.coli or total coliform.
A disinfectant residual is intended to maintain the sanitary integrity of the water; MWRA considers a residual of 0.2 mg/L a minimumtarget level at all points in the distribution system.
HighlightsIn the 2nd Quarter, 14 of the 6,207 community (0.21% system-wide) samples submitted to MWRA labs for analysis tested positive fortotal coliform. Three of the 1,901 MWRA samples (0.16%) tested positive for total coliform (Bedford, Somerville, South Hadley FD1 –October; Boston, Framingham, Malden - November; Malden, Melrose, Marlborough - December). Bedford was required to conduct aLevel 2 as this was their second exceedance in twelve months Only 2 2% of the samples had a chlorine residual lower than 0 2Level 2 as this was their second exceedance in twelve months. Only 2.2% of the samples had a chlorine residual lower than 0.2mg/L for the quarter.
# Coliform Samples (a)
Total Coliform # (%) Positive
E.coli # Positive
Minimum Chlorine Residual
(mg/L)
Average Chlorine Residual (mg/L)
MWRA Locations 333 0 (0%) 0 1.99 2.54d Shared Community/MWRA sites 1568 3 (0.19%) 0 0.01 2.13
Total: MWRA 1901 3 (0.16%) 0 / 0.01 2.21
ARLINGTON 156 0 (0%) 0 / 0.21 1.91BELMONT 104 0 (0%) 0 / 0.01 1.49BOSTON 783 1 (0.13%) 0 / 1.02 2.31
BROOKLINE 224 0 (0%) 0 / 0.58 2.10CHELSEA 169 0 (0%) 0 / 1.60 2.51
DEER ISLAND 52 0 (0%) 0 / 1 94 2 24
Assessment
Required e
MW
RA Level
1 / 2
Violation
f
DEER ISLAND 52 0 (0%) 0 / 1.94 2.24EVERETT 169 0 (0%) 0 / 0.25 2.23
FRAMINGHAM 237 1 (0.42%) 0 / 0.40 2.24LEXINGTON 117 0 (0%) 0 / 0.10 2.19LYNNFIELD 18 0 (0%) 0 / 0.32 1.11
MALDEN 243 3 (1.23%) 0 / 0.00 1.89MARBLEHEAD 72 0 (0%) 0 / 0.19 2.01
MEDFORD 204 0 (0%) 0 / 1.27 1.92MELROSE 123 2 (1.63%) 0 / 0.89 1.90
MILTON 102 0 (0%) 0 / 0.11 1.90NAHANT 30 0 (0%) 0 / 1.12 1.96NEWTON 277 0 (0%) 0 / 0.06 2.09
NORTHBOROUGH 48 0 (0%) 0 / 0.11 1.61NORWOOD 99 0 (0%) 0 / 0.08 1.98
QUINCY 299 0 (0%) 0 / 0.29 1.93READING 130 0 (0%) 0 / 0.18 1.61
Fully
Ser
ved
REVERE 180 0 (0%) 0 / 1.61 2.19SAUGUS 104 0 (0%) 0 / 1.37 1.82
SOMERVILLE 276 1 (0.36%) 0 / 0.58 2.32SOUTHBOROUGH 30 0 (0%) 0 / 0.14 1.91
STONEHAM 91 0 (0%) 0 / 1.51 2.27SWAMPSCOTT 54 0 (0%) 0 / 0.24 1.63
WALTHAM 216 0 (0%) 0 / 0.75 2.32WATERTOWN 120 0 (0%) 0 / 0.63 2.00
WESTBORO HOSPITAL 15 0 (0%) 0 / 0.05 0.17WESTON 45 0 (0%) 0 / 2.20 2.56
WINTHROP 73 0 (0%) 0 / 0.36 1.96Total: Fully Served 4860 8 (0.16%)
BEDFORD 66 4 (6.06%) 0 / 0.59 1.65CANTON 87 0 (0%) 0 / 0.04 1.31
HANSCOM AFB 27 0 (0%) 0 / 0.24 1.64
erve
d
MARLBOROUGH 129 1 (0.78%) 0 / 0.06 2.21NEEDHAM 123 0 (0%) 0 / 0.04 0.49PEABODY 234 0 (0%) 0 / 0.36 2.01
WAKEFIELD 146 0 (0%) 0 / 0.97 2.07WELLESLEY 112 0 (0%) 0 / 0.02 0.67
WILMINGTON 86 0 (0%) 0 / 0.22 1.79WINCHESTER 91 0 (0%) 0 / 0.10 1.62
WOBURN 195 0 (0%) 0 / 0.13 0.91c SOUTH HADLEY FD1 51 1 (1.96%) 0 / 0.15 0.50
Total: CVA & Partially Served 1347 6 (0.37%)
Total: Community Samples 6207 14 (0.21%)(a) The number of samples collected depends on the population served and the number of repeat samples required.(b) These communities are partially supplied, and may mix their chlorinated supply with MWRA chloraminated supply.(c) Part of the Chicopee Valley Aqueduct System. Free chlorine system.
CVA
& P
artia
lly S
e
b
(d) MWRA total coliform and chlorine residual results include data from 125 community pipe locations as described above. In most cases these community
24
results are accurately indicative of MWRA water as it enters the community system; however, some are clearly strongly influenced by local pipe conditions. Residuals in the MWRA system are typically between 1.0 and 2.8 mg/L.(e) The TCR requires an assesment be completed if more than 5% of all samples in a month are total coliform positive (or two or more samples are positive when fewer than 40 samples are collected each month). (f) Some reasons a violation may occur: the required # of TCR samples is not collected; failure to report; an E.coli MCL violation; coliform treatment techninque not followed properly; failure to conduct a level 1 or level 2 assessment within 30 days of trigger.

Treated Water Quality: Disinfection By-Product (DBP) Levels in Communities 2nd Quarter – FY16
Total Trihalomethanes (TTHMs) and Haloacetic Acids (HAA5s) are by-products of disinfection treatment with chlorine.TTHMs and HAA5s are of concern due to their potential adverse health effects at high levels. EPA’s locational runningp g gannual average (LRAA) standard is 80 µg/L for TTHMs and 60 µg/L for HAA5s.
The locational running annual average at each individual sampling location must be below the standard. The chartsbelow show the highest and lowest single values for all sites, and the LRAA of the highest location each quarter.
Partially served and CVA communities are responsible for their own compliance monitoring and reporting, and must becontacted directly for their individual results. The chart below combines all three CVA communities data (Chicopee,Wilbraham and South Hadley FD1).
Bromate is tested monthly per DEP requirements for water systems that treat with ozone. Bromide in the raw watermay be converted into bromate following ozonation. EPA’s RAA MCL standard for bromate is 10 ug/L.
The LRAA for TTHMs and HAA5s for MWRA’s Compliance Program (represented as the line in the top two graphsbelow) remain below current standards. The Max LRAA in the quarter for TTHMs = 9.8 ug/L; HAA5s = 9.0 ug/L. Thecurrent RAA for Bromate = 0.0 ug/L. CVA’s DBP levels continue to be below current standards.
MetroBoston Disinfection By-Products
40
50
60
70
ug/L
HAA5 (ug/L) min result of all sites
HAA5 (ug/L) max result of all sites
MCL Limit for LRAA
Min Max Quarterly Results for HAA5
40
50
60
70
80
90
ug/L
TTHM (ug/L) min result of all sites
TTHM (ug/L) max result of all sites
LRAA Max based on 32 quarterly results
MCL Limit for LRAA
Min Max Quarterly Results for TTHM
0
10
20
30
Q4 2014
Q1 2015
Q2 2015
Q3 2015
Q4 2015
Q1 2016
Q2 2016
Q3 2016
Q4 2016
LRAA Max based on 32 quarterly results
0
10
20
30
40
Q4 2014
Q1 2015
Q2 2015
Q3 2015
Q4 2015
Q1 2016
Q2 2016
Q3 2016
Q4 2016
CVA Disinfection By-Products (Combined Results)
50
60
70
80
90
/L
MCL Limit for LRAA
Min Max Quarterly Results for TTHM
40
50
60
70
HAA5 (ug/L) min result of all sites
HAA5 (ug/L) max result of all sites
LRAA Max based on 14 quarterly results
MCL Limit for LRAA
Min Max Quarterly Results for HAA5
0
10
20
30
40
50
Q4 2014
Q1 2015
Q2 2015
Q3 2015
Q4 2015
Q1 2016
Q2 2016
Q3 2016
Q4 2016
ug/
TTHM (ug/L) min result of all sitesTTHM (ug/L) max result of all sitesLRAA Max based on 14 quarterly results
0
10
20
30
40
Q4 2014
Q1 2015
Q2 2015
Q3 2015
Q4 2015
Q1 2016
Q2 2016
Q3 2016
Q4 2016
ug/L
25

Water Supply and Source Water Management2nd Quarter – FY16
BackgroundA reliable supply of water in MWRA’s reservoirs depends on adequate precipitation during the year and seasonal hydrologic inputsfrom watersheds that surround the reservoirs. Demand for water typically increases with higher summer temperatures and thendecreases as temperatures decline. Quabbin Reservoir was designed to effectively supply water to the service areas under a rangeof climatic conditions and has the ability to endure a range of fluctuations Wachusett Reservoir serves as a terminal reservoir toof climatic conditions and has the ability to endure a range of fluctuations. Wachusett Reservoir serves as a terminal reservoir tomeet the daily demands of the Greater Boston area. A key component to this reservoir's operation is the seasonal transfer ofQuabbin Reservoir water to enhance water quality during high demand periods. On an annual basis, Quabbin Reservoir accounts fornearly 50% of the water supplied to Greater Boston. The water quality of both reservoirs (as well as the Ware River, which is also partof the System Safe Yield) depend upon implementation of DCR's DEP-approved Watershed Protection Plans. System Yield isdefined as the water produced by its sources, and is reported as the net change in water available for water supply and operatingrequirements.
OutcomeQuabbin Reservoir level went into the Below Normal operating range in the month of November. The volume of the QuabbinQuabbin Reservoir level went into the Below Normal operating range in the month of November. The volume of the Quabbin Reservoir was at 79.1% as of December 31, 2016; a 3.4% decrease for the quarter, which represents a loss of about 14 billion gallons of storage. Yield and precipitation for the quarter were below their respective quarterly long term averages. System withdrawals for the quarter were below the 10 year monthly average.
300
350 System Withdrawals
700
950System Yield
150
200
250
Dec-15 Mar-16 Jun-16 Sep-16 Dec-16
MG
D
Monthly Avg Safe Yield 10 Year Monthly Avg
-50
200
450
Dec-15 Mar-16 Jun-16 Sep-16 Dec-16
MG
D
Monthly Yield Long-Term Average
2
3
4
5
6
CH
ES
Monthly Precipitation
y g y g
60
80
100
120
140
MG
D
River Releases
y g g
0
1
2
Dec-15 Mar-16 Jun-16 Sep-16 Dec-16
INC
Actual Long-Term Average
Quabbin Reservoir Levels
0
20
40
Dec-15 Mar-16 Jun-16 Sep-16 Dec-16
M
Swift River Release Nashua River Release
Water Transfers/Diversions
40
60
80
100
Perc
ent F
ull
With Drought Emergency Planning Stages
Current % Capacity
Below Normal
Below 38% Drought Emergency Stage 2
Below ~55% Drought Emergency Stage 1
Warning
100
200
300
400
MG
D
/
0
20
Jan-00 Jan-02 Jan-04 Jan-06 Jan-08 Jan-10 Jan-12 Jan-14 Jan-16
Below 25% Drought Emergency Stage 3
0Dec-15 Mar-16 Jun-16 Sep-16 Dec-16
Quabbin to Wachusett (Transfer) Ware to Quabbin (Diversion)
26

WASTEWATER QUALITY

27
2nd Quarter FY17 YTDViolations
Dry Day Flow: mgd 254.2 255.0 256.1 0cBOD: Monthly Average mg/L 6.4 6.4 7.1 0 Weekly Average mg/L 8.4 6.5 8.2 0TSS: Monthly Average mg/L 7.4 8.2 7.9 0 Weekly Average mg/L 10.5 10.0 12.8 0TCR: Monthly Average ug/L <40 <40 <40 0
Daily Maximum ug/L <40 <40 <40 0Fecal Coliform: Daily Geometric Mean col/100mL 7 6 7 0
Weekly Geometric Mean col/100mL 17 8 16 0% of Samples >14000 % 0 0 0 0Consecutive Samples >14000 # 0 0 0 0
pH: SU 6.6-7.0 6.6-6.9 6.5-6.9 0PCB, Aroclors: Monthly Average ug/L 0Acute Toxicity: Mysid Shrimp % >100 >100 >100 0
Inland Silverside % >100 >100 >100 0Chronic Toxicity: Sea Urchin % 100 100 100 0
Inland Silverside % 50 100 100 0
6.0-9.0 0
≥1.5 0≥1.5 0
0.000045 UNDETECTED 0≥50 0≥50 0
14000 010 03 0
456 0631 0
14000 0
30 045 0
40 0
436 025
NPDES Permit Compliance: Deer Island Treatment Plant2nd Quarter - FY17
NPDES Permit Limits
Effluent Characteristics Units Limits October November December Violations
0
The acute toxicity test simulates the short-term toxic effects of chemicals in wastewater effluent on marine animals. The test measures the concentration (percent) of effluent that kills half the test organisms within four days. The higher the concentration of effluent required, the less toxic the effluent. For permit compliance, the effluent concentration that causes mortality to mysid shrimp and inland silverside must be at least 50%. Acute toxicity permit limits were met for the 2nd Quarter for both the inland silverside and mysid shrimp.
Typically, effects of chronic exposures differ from those of acute exposures. Because of this, chronic toxicity responses are not necessarily related to acute toxicity. The chronic toxicity test simulates the long-term toxic effects of chemicals in wastewater effluent on marine animals. To meet permit limits, a solution of 1.5% effluent and 98.5% dillution water must show no observed effect on the growth and reproduction of the test species. Chronic toxicity permit limits were met for the 2nd Quarter for both the inland silverside and sea urchin.
5
6
7
8
9
J A S O N D J F M A M J
pH
pH
Maximum Daily Limit (9.0) Minimum Daily Limit (6.0)
0.0
5.0
10.0
15.0
20.0
J A S O N D J F M A M J Con
cent
ratio
n (µ
g/L)
Organic Compounds
VOA PCB (Arocholor) Pesticides
pH is a measure of alkalinity or acidity. Fluctuations in effluent pH are unlikely to impact on marine environments, which have significant buffering capacity. Because of the pure oxygen used in the activated sludge process, effluent pH tends to be at the lower end of the permit-required range. All pH measurements for the 2nd Quarter were within the daily permit limits.
An important wastewater component monitored in the effluent is organic compounds, such as volatile organic acids, pesticides, and polychlorinated biphenyls, which are all sampled monthly. The secondary treatment process significantly reduces organic compounds in the effluent stream. In the 2nd Quarter, all organic compounds were below the detection limit for the quarter.
0
20
40
60
80
100
J A S O N D J F M A M J Efflu
ent c
once
ntra
tion
(%)
Acute Toxicity
Inland Silverside Mysid Shrimp (Americamysis) Monthly Avg Minimum Limit (50%)
0
20
40
60
80
100
J A S O N D J F M A M J Efflu
ent c
once
ntra
tion
(%)
Chronic Toxicity
Inland Silverside (Menidia) Sea Urchin (Arbacia) Monthly Avg Minimum Limit (1.5%)
There have been no permit violations in FY17 to date at the Deer Island Treatment Plant.

28
NPDES Permit Compliance: Clinton Wastewater Treatment Plant2nd Quarter - FY17
NPDES Permit Limits
Effluent Characteristics Units LimitsOcto
ber
November
Decem
ber 2nd Quarter FY17 YTD
Violations
Flow: mgd 2.30 2.27 2.24 0BOD: Monthly Average: mg/L 3.1 3.7 4.9 0
Weekly Average: mg/L 3.2 4.0 8.3 0TSS: Monthly Average: mg/L 3.4 3.6 4.5 0
Weekly Average: mg/L 3.8 4.4 5.3 0pH: SU 7.2-7.9 7.3-7.6 7.0-7.6 0Dissolved Oxygen: Daily Minimum: mg/L 7.4 8.6 9.5 0Fecal Coliform: Daily Geometric Mean: col/100mL 10 18 6 0
Monthly Geometric Mean: col/100mL 4 3 4 0TCR: Monthly Average: ug/L 0 0.0 0.0 0
Daily Maximum: ug/L 0.0 0.0 0.0 0Total Ammonia Nitrogen: November 1st - March 31st
Monthly Average: mg/L 0.00 0.00 0.02 0Daily Maximum: mg/L 0.00 0.00 0.04 0
Copper: Monthly Average: ug/L 7.6 7.7 6.9 0Phosphorus: May 1 - Oct 31
Monthly Average: mg/L 0.29 N/A N/A 0Acute Toxicity: Daily Minimum: % *N/A *N/A >100 0Chronic Toxicity: Daily Minimum: % *N/A *N/A 100 0
2.0 0
100 062.5 0
3.0 020 0
1.0 0
200 050 050 0
6.5-8.3 06 0
400 0
20 020 0
20 0
3.01 020
Effluent Characteristics Units LimitsOcto
ber
November
Decem
ber
Violations
0
There have been no permit violations in FY17 at the Clinton Treatment Plant.1st Quarter: There were no permit violations in the first quarter.2nd Quarter: There were no permit violations in the second quarter.*Toxicity testing at the Clinton Treatment Plant is conducted on a quarterly basis.
Acute and chronic toxicity testing simulates the short- and long-term toxic effects of chemicals in wastewater effluent on aquatic animals. For permit compliance, the effluent concentration that causes mortality to the daphnid in acute and chronic testing must be at least >100% and 62.5%, respectively. Toxicity limits were met during the 2nd Quarter.
The 2nd Quarter's monthly average and daily maximum concentrations were below the permit limits. The monthly average and daily maximum limits for the 2nd Quarter are 0.02 mg/L and 0.06 mg/L, respectively. The permit limits are most stringent from June to October when warm weather conditions are most conducive to potential eutrophication.
6
7
8
9
J A S O N D J F M A M J
pH
pH
Maximum Daily Limit (8.3) Minimum Daily Limit (6.5)
3.01
1.5
2.5
3.5
4.5
J A S O N D J F M A M J
mgd
Monthly Average Flow
Measured Flow (FY17) Measured Flow (FY16)Running Average Flow Monthly Avg Limit
pH is a measure of the alkalinity or acidity of the effluent. All daily pH results for the 2nd Quarter were within the range set by the permit.
The graph depicts the running annual average monthly flow, measured in million gallons per day, exiting the plant. The average monthly flows during this Quarter were below the NPDES permit limit.
0
20
40
60
80
100
1st Quarter 2nd Quarter 3rd Quarter 4th QuarterEfflu
ent c
once
ntra
tion
(%)
Toxicity
Acute Chronic
0
2
4
6
8
10
12
J A S O N D J F M A M J
mg/
L
Ammonia
Monthly Avg Monthly Avg Limit Daily Max Limit Daily Max

COMMUNITY FLOWS AND PROGRAMS

Total Water UseMWRA Revenue Customers
2nd Quarter - FY17
29
MGD Jan Feb Mar Apr May Jun Jul Aug Sep Oct Nov DecYTD
AverageAnnual
AverageCY2014 179.212 176.987 175.736 176.536 188.974 214.660 223.544 220.734 219.049 184.918 172.333 167.145 191.729 191.729CY2015 170.874 177.386 178.975 179.653 217.221 217.619 228.484 230.316 232.125 189.905 170.763 163.550 196.522 196.522CY2016 170.144 175.389 169.319 173.256 198.133 236.921 254.203 247.944 230.859 203.031 182.197 166.310 200.724 200.724
MG Jan Feb Mar Apr May Jun Jul Aug Sep Oct Nov Dec YTD Total Annual CY2014 5,555.575 4,955.629 5,447.807 5,296.068 5,858.182 6,439.790 6,929.849 6,842.752 6,571.479 5,732.472 5,169.979 5,181.506 69,981.088 69,981.088CY2015 5,297.089 4,966.801 5,548.216 5,389.596 6,733.842 6,528.559 7,082.997 7,139.787 6,963.760 5,887.062 5,122.884 5,070.040 71,730.633 71,730.633CY2016 5,274.454 5,086.269 5,248.893 5,197.675 6,142.124 7,107.637 7,880.290 7,686.259 6,925.757 6,293.965 5,465.920 5,155.620 73,464.863 73,464.863
Water Supplied: All Revenue Customers
YTD CHANGES (CY16 vs. CY15)
Water Supplied
2.1%
160 170 180 190 200 210 220 230 240 250 260
Jan Feb Mar Apr May Jun Jul Aug Sep Oct Nov Dec
MG
D
MWRA Water Supplied: All Revenue Customers
CY2014 CY2015 CY2016
The December 2016 Community Water Use Report recently distributed to communities served by the MWRA waterworks systems. Each community's annual water use relative to the system as a whole is the primary factor in allocating the annual water rate revenue requirement to MWRA water communities. Calendar year 2016 water use will be used to allocate the FY18 water utility rate revenue requirement. December 2016 water supplied of 166.3 mgd (for revenue generating users) is up 2.8 mgd or 1.7% compared to December 2015. December 2016 water use includes 1.2 mgd provided to the City of Cambridge and 0.6 mgd provided to the City of Worcester. System-wide year to date consumption for CY16 was higher than CY15 with 200.7 mgd being supplied to MWRA customers through December. This is 4.2 mgd higher than CY15, and is an increase of 2.1%.
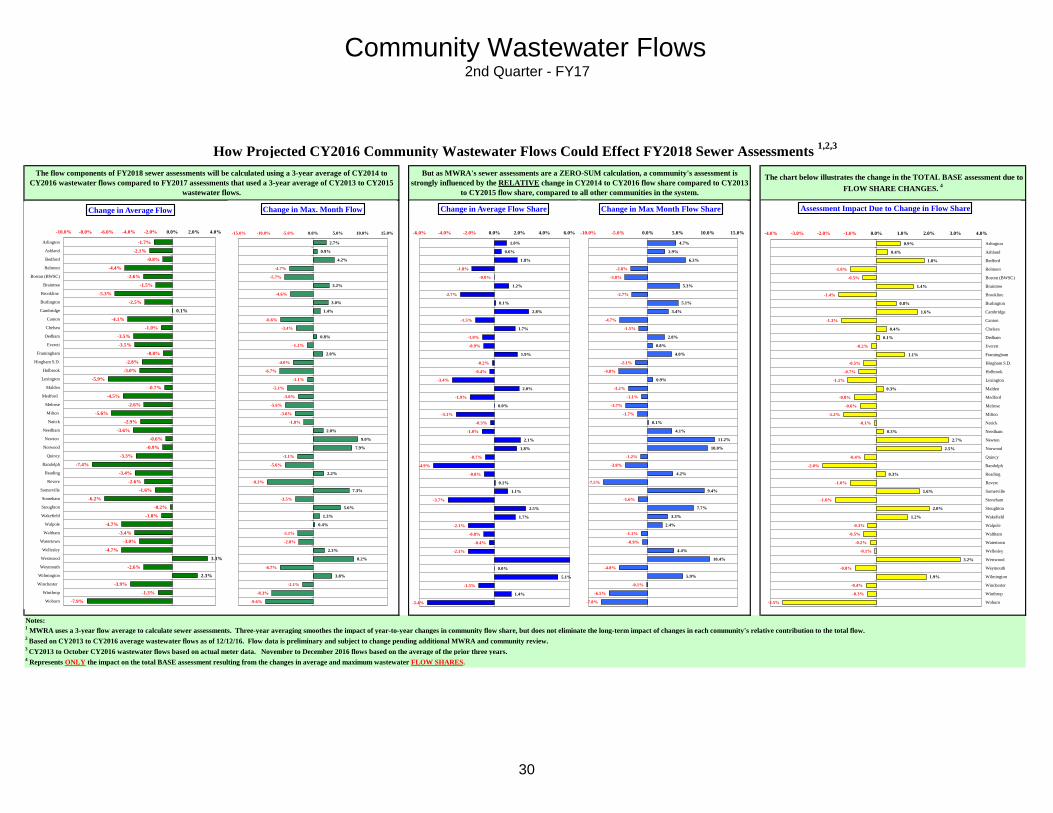
Community Wastewater Flows 2nd Quarter - FY17
30
How Projected CY2016 Community Wastewater Flows Could Effect FY2018 Sewer Assessments 1,2,3
2 Based on CY2013 to CY2016 average wastewater flows as of 12/12/16. Flow data is preliminary and subject to change pending additional MWRA and community review.
The flow components of FY2018 sewer assessments will be calculated using a 3-year average of CY2014 to CY2016 wastewater flows compared to FY2017 assessments that used a 3-year average of CY2013 to CY2015
wastewater flows.
But as MWRA's sewer assessments are a ZERO-SUM calculation, a community's assessment is strongly influenced by the RELATIVE change in CY2014 to CY2016 flow share compared to CY2013
to CY2015 flow share, compared to all other communities in the system.
The chart below illustrates the change in the TOTAL BASE assessment due to FLOW SHARE CHANGES. 4
4 Represents ONLY the impact on the total BASE assessment resulting from the changes in average and maximum wastewater FLOW SHARES.
Notes:1 MWRA uses a 3-year flow average to calculate sewer assessments. Three-year averaging smoothes the impact of year-to-year changes in community flow share, but does not eliminate the long-term impact of changes in each community's relative contribution to the total flow.
3 CY2013 to October CY2016 wastewater flows based on actual meter data. November to December 2016 flows based on the average of the prior three years.
1.0%
0.6%
1.8%
-1.8%
-0.0%
1.2%
-2.7%
0.1%
2.8%
-1.5%
1.7%
-1.0%
-0.9%
1.9%
-0.2%
-0.4%
-3.4%
2.0%
-1.9%
0.0%
-3.1%
-0.3%
-1.0%
2.1%
1.8%
-0.7%
-4.9%
-0.8%
0.1%
1.1%
-3.7%
2.5%
1.7%
-2.1%
-0.8%
-0.4%
-2.1%
0.0%
5.1%
-1.3%
1.4%
-5.4%
-6.0% -4.0% -2.0% 0.0% 2.0% 4.0% 6.0%
Change in Average Flow Share
0.9%
0.4%
1.8%
-1.0%
-0.5%
1.4%
-1.4%
0.8%
1.6%
-1.3%
0.4%
0.1%
-0.2%
1.1%
-0.5%
-0.7%
-1.1%
0.3%
-0.8%
-0.6%
-1.2%
-0.1%
0.3%
2.7%
2.5%
-0.4%
-2.0%
0.3%
-1.0%
1.6%
-1.6%
2.0%
1.2%
-0.3%
-0.5%
-0.2%
-0.1%
3.2%
-0.8%
1.9%
-0.4%
-0.3%
-3.5%
-4.0% -3.0% -2.0% -1.0% 0.0% 1.0% 2.0% 3.0% 4.0%
Arlington
Ashland
Bedford
Belmont
Boston (BWSC)
Braintree
Brookline
Burlington
Cambridge
Canton
Chelsea
Dedham
Everett
Framingham
Hingham S.D.
Holbrook
Lexington
Malden
Medford
Melrose
Milton
Natick
Needham
Newton
Norwood
Quincy
Randolph
Reading
Revere
Somerville
Stoneham
Stoughton
Wakefield
Walpole
Waltham
Watertown
Wellesley
Westwood
Weymouth
Wilmington
Winchester
Winthrop
Woburn
Assessment Impact Due to Change in Flow Share
-1.7%
-2.1%
-0.8%
-4.4%
-2.6%
-1.5%
-5.3%
-2.5%
0.1%
-4.1%
-1.0%
-3.5%
-3.5%
-0.8%
-2.8%
-3.0%
-5.9%
-0.7%
-4.5%
-2.6%
-5.6%
-2.9%
-3.6%
-0.6%
-0.9%
-3.3%
-7.4%
-3.4%
-2.6%
-1.6%
-6.2%
-0.2%
-1.0%
-4.7%
-3.4%
-3.0%
-4.7%
3.3%
-2.6%
2.3%
-3.9%
-1.3%
-7.9%
-10.0% -8.0% -6.0% -4.0% -2.0% 0.0% 2.0% 4.0%
Arlington
Ashland
Bedford
Belmont
Boston (BWSC)
Braintree
Brookline
Burlington
Cambridge
Canton
Chelsea
Dedham
Everett
Framingham
Hingham S.D.
Holbrook
Lexington
Malden
Medford
Melrose
Milton
Natick
Needham
Newton
Norwood
Quincy
Randolph
Reading
Revere
Somerville
Stoneham
Stoughton
Wakefield
Walpole
Waltham
Watertown
Wellesley
Westwood
Weymouth
Wilmington
Winchester
Winthrop
Woburn
Change in Average Flow
2.7%
0.9%
4.2%
-4.7%
-5.7%
3.2%
-4.6%
3.0%
1.4%
-6.6%
-3.4%
0.8%
-1.2%
2.0%
-4.0%
-6.7%
-1.1%
-5.1%
-3.0%
-5.6%
-3.6%
-1.8%
2.0%
9.0%
7.9%
-3.1%
-5.6%
2.2%
-9.3%
7.3%
-3.5%
5.6%
1.3%
0.4%
-3.1%
-2.8%
2.3%
8.2%
-6.7%
3.8%
-2.1%
-8.3%
-9.6%
-15.0% -10.0% -5.0% 0.0% 5.0% 10.0% 15.0%
Change in Max. Month Flow
4.7%
2.9%
6.3%
-2.8%
-3.8%
5.3%
-2.7%
5.1%
3.4%
-4.7%
-1.5%
2.8%
0.8%
4.0%
-2.1%
-4.8%
0.9%
-3.2%
-1.1%
-3.7%
-1.7%
0.1%
4.1%
11.2%
10.0%
-1.2%
-3.8%
4.2%
-7.5%
9.4%
-1.6%
7.7%
3.3%
2.4%
-1.1%
-0.9%
4.4%
10.4%
-4.8%
5.9%
-0.1%
-6.5%
-7.8%
-10.0% -5.0% 0.0% 5.0% 10.0% 15.0%
Change in Max Month Flow Share

31
Community Support Programs2nd Quarter – FY17
Infiltration/Inflow Local Financial Assistance Program
MWRA’s Infiltration/Inflow (I/I) Local Financial Assistance Program provides $460.75 million in grants and interest-free loans (average of about $14 million per year from FY93 through FY25) to member sewer communities to perform I/I reduction and sewer system rehabilitation projects within their locally-owned collection systems. Eligible project costs include: sewer rehabilitation construction, pipeline replacement, removal of public and private inflow sources, I/I reduction planning, engineering design, engineering services during construction, etc. I/I Local Financial Assistance Program funds are allocated to member sewer communities based on their percent share of MWRA’s wholesale sewer charge. Phase 1-8 funds (total $300.75 million) were distributed as 45% grants and 55% loans with interest-free loans repaid to MWRA over a five-year period. Phase 9 and 10 funds (total $160 million) are distributed as 75% grants and 25% loans with interest-free loans repaid to MWRA over a ten-year period.
During the 2nd Quarter of FY17, $6.6 million in financial assistance (grants and interest-free loans) was distributed to fund localsewer rehabilitation projects in Ashland, Burlington, Framingham, Melrose, Quincy, Watertown and Wilmington. Total grant/loan distribution for FY17 is $8.9 million. From FY93 through the 2nd Quarter of FY17, all 43 member sewer communities have participated in the program and more than $319 million has been distributed to fund 518 local I/I reduction and sewer system rehabilitation projects. Distribution of the remaining funds has been approved through FY25 and community loan repayments will be made through FY36. All scheduled community loan repayments have been made.
FY17 Quarterly Distributions of Sewer Grant/Loans
I/I Local Financial Assistance Program Distribution FY93-FY25
0
50
100
150
200
250
300
350
400
450
500
May
199
3
May
199
5
May
199
7
May
199
9
May
200
1
May
200
3
May
200
5
May
200
7
May
200
9
May
201
1
May
201
3
May
201
5
May
201
7
May
201
9
May
202
1
May
202
3
May
202
5
May
202
7
May
202
9
May
203
1
May
203
3
May
203
5
$ in
Mill
ions
Distributions (Projected)
Distributions (Actual)
FY25 Target=$460.75M
2.4
8.9
0
5
10
15
20
25
30
Q1 Q2 Q3 Q4
$ in
mill
ions
FY17 Qrtly Distribution FY17 Cumulative Distributions FY17 Qtrly Target
FY17 Target=$28.2M

32
Community Support Programs2nd Quarter – FY17
cal Water System Assistance Program
MWRA’s Local Water System Assistance Programs (LWSAP) provides $432 million in interest-free loans (an average of about $22 million per year from FY01 through FY20) to member water communities to perform water main rehabilitation projects within their locally-owned water distribution systems. Eligible project costs include: water main cleaning/lining, replacement of unlined water mains, lead service replacements, valve, hydrant, water meter, tank work, engineering design, engineering services during construction, etc. MWRA partially-supplied communities receive pro-rated funding allocations based on their percentage use of MWRA water. Interest-free loans are repaid to MWRA over a ten-year period beginning one year after distribution of the funds. The Phase 1 water loan program concluded in FY13 with $222 million in loan distributions. ThePhase 2 - LWSAP continues distributions through FY20.
During the 2nd Quarter of FY17, $4.2 million in interest-free loans was distributed to fund local water projects in Chelsea, Framingham, Newton and Watertown. Total loan distribution for FY17 is $12.4 million. From FY01 through the 2nd Quarter of FY17, more than $334 million has been distributed to fund 377 local water system rehabilitation projects in 38 MWRA member water communities. Distribution of the remaining funds has been approved through FY20 and community loan repayments will be made through FY30. All scheduled community loan repayments have been made.
0
100
200
300
400
500
Aug
-00
Feb-
02
Aug
-03
Feb-
05
Aug
-06
Feb-
08
Aug
-09
Feb-
11
Aug
-12
Feb-
14
Aug
-15
Feb-
17
Aug
-18
Feb-
20
$ in
Mill
ions
Distributions (Projected)
Distributions (Actual)
FY20 Target=$432M
500
Local Water System Assistance Program Distribution FY01-FY20
FY17 Quarterly Distributions of Water Loans
8.212.4
0
5
10
15
20
25
30
35
40
Q1 Q2 Q3 Q4
$ in
milli
ons
FY17 Qrtly Distribution FY17 Cumulative Distributions FY17 Qtrly Target
FY17 Target=$20.1M
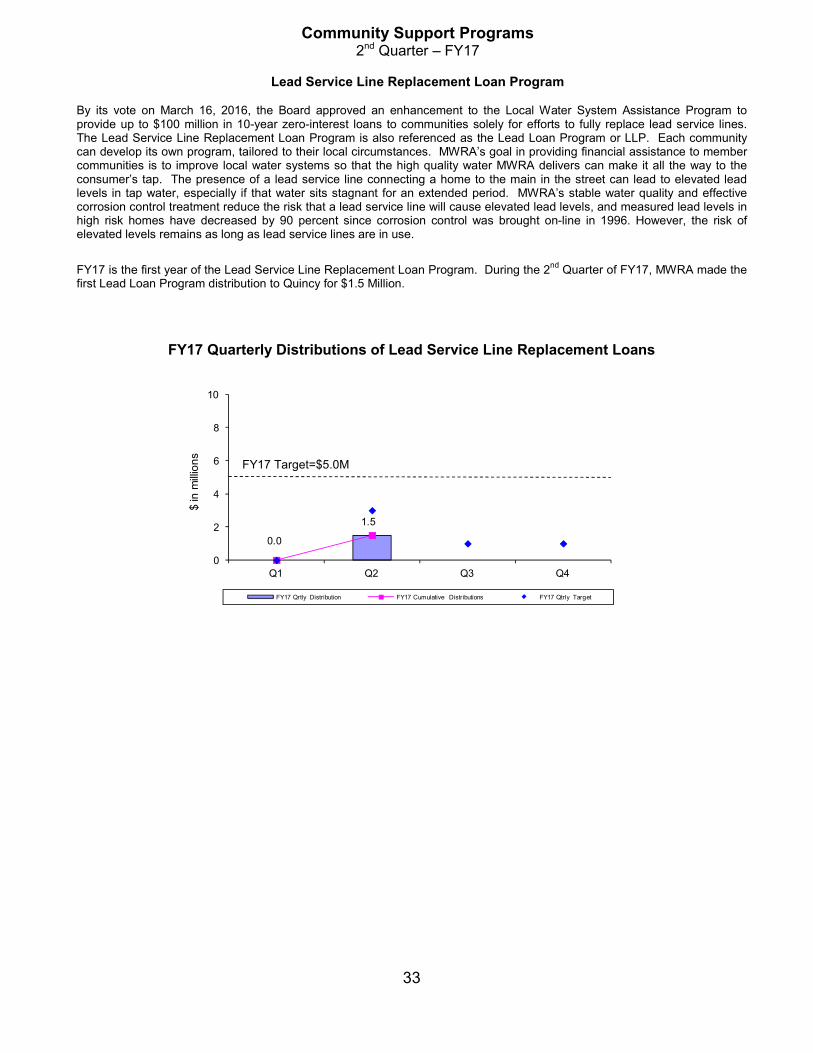
33
Community Support Programs2nd Quarter – FY17
Lead Service Line Replacement Loan Program
By its vote on March 16, 2016, the Board approved an enhancement to the Local Water System Assistance Program to provide up to $100 million in 10-year zero-interest loans to communities solely for efforts to fully replace lead service lines. The Lead Service Line Replacement Loan Program is also referenced as the Lead Loan Program or LLP. Each community can develop its own program, tailored to their local circumstances. MWRA’s goal in providing financial assistance to member communities is to improve local water systems so that the high quality water MWRA delivers can make it all the way to the consumer’s tap. The presence of a lead service line connecting a home to the main in the street can lead to elevated lead levels in tap water, especially if that water sits stagnant for an extended period. MWRA’s stable water quality and effective corrosion control treatment reduce the risk that a lead service line will cause elevated lead levels, and measured lead levels in high risk homes have decreased by 90 percent since corrosion control was brought on-line in 1996. However, the risk of elevated levels remains as long as lead service lines are in use.
FY17 is the first year of the Lead Service Line Replacement Loan Program. During the 2nd Quarter of FY17, MWRA made the first Lead Loan Program distribution to Quincy for $1.5 Million.
FY17 Quarterly Distributions of Lead Service Line Replacement Loans
0.0
1.5
0
2
4
6
8
10
Q1 Q2 Q3 Q4
$ in
milli
ons
FY17 Qrtly Distribution FY17 Cumulative Distributions FY17 Qtrly Target
FY17 Target=$5.0M

34
0 5 10 15 20 25
Survey performed more than two years ago
Survey completed less than two years but more than one year ago
Survey completed less than one year ago
New survey ongoing
# of surveys performed under MWRA Task-Order Contract # of surveys performed by Community Contract
3
23
21
0
Community Support Programs 2nd Quarter – FY17
Community Water System Leak Detection
To ensure member water communities identify and repair leaks in locally-owned distribution systems, MWRA developed leak detection regulations that went into effect in July 1991. Communities purchasing water from MWRA are required to complete a leak detection survey of their entire distribution system at least once every two years. Communities can accomplish the survey using their own contractors or municipal crews; or alternatively, using MWRA’s task order leak detection contract. MWRA’s task order contract provides leak detection services at a reasonable cost that has been competitively procured (3-year, low-bid contract) taking advantage of the large volume of work anticipated throughout the regional system. Leak detection services performed under the task order contract are paid for by MWRA and the costs are billed to the community the following year. During the 2nd Quarter of FY17, all member water communities were in compliance with MWRA’s Leak Detection Regulation.
Community Water Conservation Outreach
MWRA’s Community Water Conservation Program helps to maintain average water demand below the regional water system’s safe yield of 300 mgd. Current 5-year average water demand is less than 205 mgd. The local Water Conservation Program includes distribution of water conservation education brochures (indoor and outdoor bill-stuffers) and low-flow water fixtures and related materials (shower heads, faucet aerators, toilet leak detection dye tabs, and instructions), all at no cost to member communities or individual customers. The Program’s annual budget is $25,000 for printing and purchase of materials. Annual distribution targets and totals are provided in the table below. Distributions of water conservation materials are made based on requests from member communities and individual customers.
Annual Target Q1 Q2 Q3 Q4
Annual Total
Educational Brochures 100,000 324 20,778 21,102Low-Flow Fixtures (showerheads and faucet aerators) 10,000 3,162 1,944 5,106Toilet Leak Detection Dye Tablets ------ 2,265 2,814 5,079

BUSINESS SERVICES

Purchasing
No. TARGET PERCENT IN TARGET
$0 - $500 734 3 DAYS 87.6%$500 - $2K 752 7 DAYS 94.9%$2K - $5K 397 10 DAYS 94.2%$5K - $10K 69 25 DAYS 89.8%$10K - $25K 67 30 DAYS 82.0%$25K - $50K 15 60 DAYS 80.0%Over $50K 29 90 DAYS 86.2%
Contracts, Change Orders and Amendments
Procurement: Purchasing and ContractsSecond Quarter - FY17
Four contracts were not processed within the target timeframes. One due to extensive revisions of the contract documents prior to bid required to address design issues and numerous bidder questions; another due to requirements to align the contract with the start of the associated construction contract as this contract provided the Resident Engineer/Inspector for the project; a third due to prolonged consultant turnover time for requested revisions to the contract specifications; and the fourth due to extended contract negotiations with the consultant (new contract in place prior to the expiration of the existing contract). Procurement processed seventeen contracts with a value of $84,068,927 and nine amendments with a value of $591,144. Twenty three change orders were executed during the period. The dollar value of all non-credit change orders during the 2nd quarter FY17 was $1,419,910 and the value of credit change orders was ($19,686). Staff reviewed 55 proposed change orders and 33 draft change orders.
Background: Goal is to process 85% of Purchase Orders and 80% of Contracts within Target timeframes. Outcome: Processed 94% of purchase orders within target; Average Processing Time was 4.97 days vs. 4.92 days in Qtr 2 of FY16. Processed 76% (13 of 17) of contracts within target timeframes; Average Processing Time was 122 days vs. 72 days in Qtr 2 of FY16.
The Purchasing Unit processed 2063 purchase orders, 297 less than the 2360 processed in Qtr 2 of FY16, for a total value of $14,165,441 versus a dollar value of $21,846,994 in Qtr 2 of FY16. The purchase order processing target was not met for the $10K -$25K category due to sole source documentation requirements and extensions of the bid date; and the $25K - $50K category due to end user bid evaluations.
0
10
20
30
40
50
60
70
80
90
100
OCTOBER NOVEMBER DECEMBER
Purchase Orders - Percent in Target
35
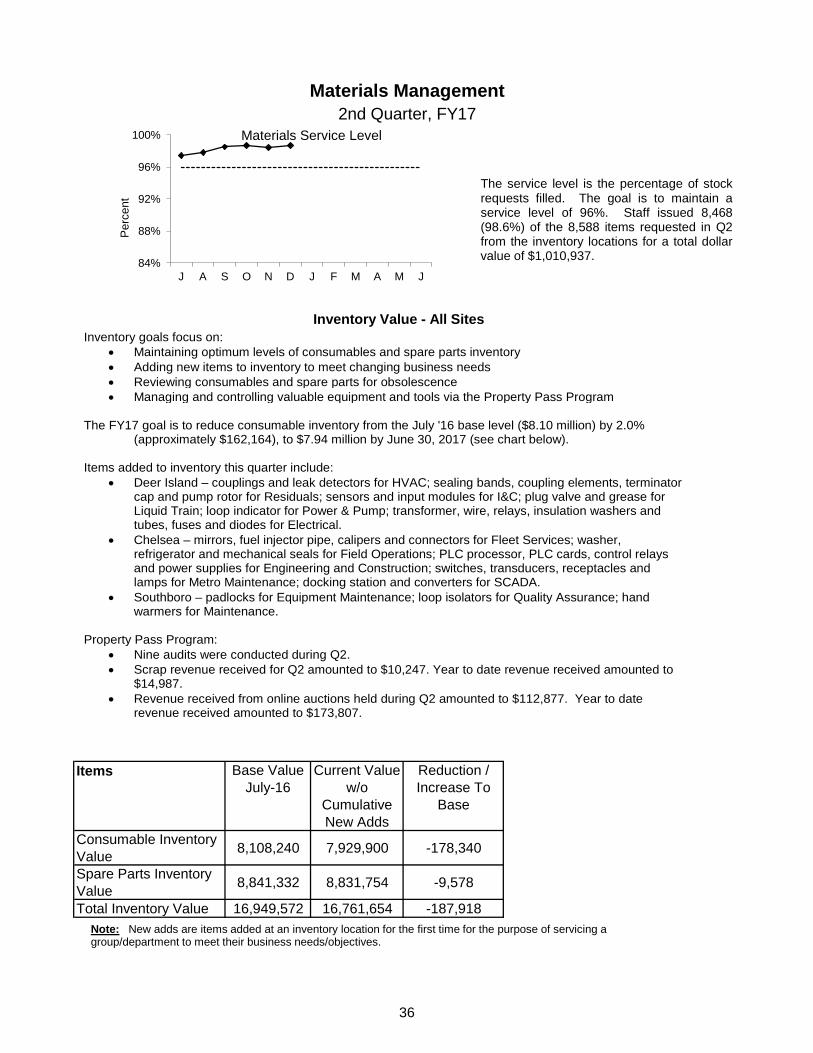
36
Items Base Value July-16
Current Value w/o
Cumulative New Adds
Reduction / Increase To
Base
Consumable Inventory Value 8,108,240 7,929,900 -178,340
Spare Parts Inventory Value 8,841,332 8,831,754 -9,578
Total Inventory Value 16,949,572 16,761,654 -187,918
2nd Quarter, FY17Materials Management
Inventory Value - All Sites
The service level is the percentage of stock requests filled. The goal is to maintain a service level of 96%. Staff issued 8,468 (98.6%) of the 8,588 items requested in Q2 from the inventory locations for a total dollar value of $1,010,937. 84%
88%
92%
96%
100%
J A S O N D J F M A M J
Per
cent
Materials Service Level
Note: New adds are items added at an inventory location for the first time for the purpose of servicing a group/department to meet their business needs/objectives.
Inventory goals focus on: • Maintaining optimum levels of consumables and spare parts inventory • Adding new items to inventory to meet changing business needs • Reviewing consumables and spare parts for obsolescence • Managing and controlling valuable equipment and tools via the Property Pass Program
The FY17 goal is to reduce consumable inventory from the July '16 base level ($8.10 million) by 2.0%
(approximately $162,164), to $7.94 million by June 30, 2017 (see chart below). Items added to inventory this quarter include:
• Deer Island – couplings and leak detectors for HVAC; sealing bands, coupling elements, terminator cap and pump rotor for Residuals; sensors and input modules for I&C; plug valve and grease for Liquid Train; loop indicator for Power & Pump; transformer, wire, relays, insulation washers and tubes, fuses and diodes for Electrical.
• Chelsea – mirrors, fuel injector pipe, calipers and connectors for Fleet Services; washer, refrigerator and mechanical seals for Field Operations; PLC processor, PLC cards, control relays and power supplies for Engineering and Construction; switches, transducers, receptacles and lamps for Metro Maintenance; docking station and converters for SCADA.
• Southboro – padlocks for Equipment Maintenance; loop isolators for Quality Assurance; hand warmers for Maintenance.
Property Pass Program:
• Nine audits were conducted during Q2. • Scrap revenue received for Q2 amounted to $10,247. Year to date revenue received amounted to
$14,987. • Revenue received from online auctions held during Q2 amounted to $112,877. Year to date
revenue received amounted to $173,807.

0
200
400
6 00
800
1000
1200
J A S O N D J F M A M J
Monthly Call Volume
FY16
FY17
0.0%
5.0%
10.0%
15.0%
20.0%
25.0%
3 0.0%
3 5.0%
40.0%
45.0%
50.0%
J A S O N D J F M A M J
Back
log
as %
of
Mon
thly
Cal
l Vol
ume
Work Load Backlog
FY16
FY17
Target
Block ed ( Black listed or
V irus) 5,020,06 1
78%
Allowed 1,412,226
22%
Q uarantined 7,474
0%
Emails Received in Q2= 6,439,761
0
200
400
6 00
800
1000
J A S O N D J F M A M J
Internet Vulnerabilities
Bulletins Received Bulletins Researched Possible MWRA Threat
Infrastructure: Citrix Mobile Application Design and Development: Upgraded XenMobile infrastructure to support iOS10. Expanding use of Sharefile to Procurement. Began build out of Virtual Desktop Infrastructure
Applications/Training/Records Center:
Library Catalog Replacement Project (InMagic): Went live with the new Library Resources Portal and ran brown bag user training sessions at various locations. Installed a development server and synchronized the development and production servers. Adjusted Library location values across newly merged record types to suit display and label requirements and made various configuration changes to fine-tune the user experience. Ordered new barcode scanner, selected label stock and designed label layouts for book spine and card printing to re-label and re-shelve books. Created a 2 page Quick Reference Card for the go-live announcement based on the 27 page user guide.
Miscellaneous Lawson Support: Installed/tested a new Disaster Recovery micro check printer for the Payroll and AP check applications on Deer Island. Upgraded the MUNEASE Bond Tracking application and SQL Server database. Scheduled and held six days of training and configuration workshops with the Portia vendor and users. Lawson-Maximo Interface: MWRA and Vendor integration testing results have 50 of 51 interfaces and 10 of 12 bulk load import programs successfully passing; the remaining program/interface testing continues. User Interface Acceptance testing is underway.
Information Security Program: Concluded User Security Awareness Training. 76% of all employees completed all training modules. A second phishing assessment was conducted. 30% fewer employees fell victim to this phishing attempt than the prior year. As a result, MIS will pursue continuing this training along with revising and enhancing internal procedures.
Maximo Upgrade Project: Maximo 7.6 Go-live date scheduled in January 2017. Conducted IBM Control Desk (ICD) workshops for end users and completed Integration Testing of the Lawson interface.
Electronic Library Notebook (ELN): Deployed 15 ELN logs in production for Chelsea Laboratory Experiment. Began work on ELN logs Quabbin Laboratory.
LIMS: Prepared responses for LIMS Data Reliability Assessment conducted by State Auditor’s office.
PIMS/CromERR: Discussed next steps to implement PIMS CromERR internally and with EPA.
Library & Records Center: The Library fulfilled 58 research requests, and provided 266 periodicals, standards, books & reports. Research topics included chlorate, bromated and estrogens in drinking water and historic navigation. The Records Center added 243 boxes, handled 350 boxes, disposed of 342 boxes and attended three Records Conservation Board Meetings.
IT Training: For the quarter, 639 staff attended 62 classes. 47% of the workforce has attended at least one class year-to-date. 492 staff completed Maximo 7.6 training. A new Maximo Self Service Quick Reference Card was developed and published and a brown bag demo was presented to Chelsea Operations field staff. A new Introduction to Maximo class is under development.
MIS Program2nd Quarter FY17
Performance and Backlog
Call Volume: Peaked in November. FY17-Q2 call volume increased by 29% from FY16-Q2.Call Backlog: Peaked in November. FY17-Q2 backlog average is 23.7% above the targeted benchmark of 20%. There were 193 additional helpcalls vs. Nov 2015. Backlog also attributed to Laptop Validation, iPhone Rollout and Surface Tablet projects.
Information Security
During Q2, pushed security fixes/updates to desktops/ servers to protect against 318 vulnerabilities. LANDesk Antivirus quarantined 20 distinct viruses from 13 PCs. PCs are current with anti-virus providers' signatures for all known malware.
37

38
Legal Matters 2nd Quarter - FY17
PROJECT ASSISTANCE COURT AND ADMINISTRATIVE ORDER
· Boston Harbor Litigation and CSO: Reviewed and Filed Semi-Annual Compliance and Progress Report.
· Administrative Consent Order (DITP power outages): Reviewed and submitted updated semi-annual Consultant's Deer Island Energy Recommendations Tracking Sheet to DEP and EPA for ACOP-NE-04-1N003-SEP. REAL ESTATE, CONTRACT AND OTHER SUPPORT
· Regulations: Reviewed and provided comments on Mass DAR’s revised 330 CMR 31.00 regulations relating to plant and nutrient application requirements for agricultural land for non agricultural land and non agricultural turf and lawn. Reviewed and revised comments on EPA’s proposed information collection request for the national study on nutrients removal and secondary technologies. Reviewed Massachusetts Contingency Plan notification provisions relative to sampling results from a DEP monitoring well near the Wachusett Aqueduct in Northborough.
· Real Property: Drafted letter notifying MassDOT that MWRA was vacating the Commercial Point CSO Facility chemical building
site and returning it to MassDOT. Coordinated with MBTA to access two MWRA manholes within MWRA easement on MBTA property. Confirmed that proposed taking by MassDOT along Route 9 in Wellesley did not affect property under MWRA’s care custody and control. Reviewed MWRA’s property rights for parcels of land located at Marginal and Chelsea Street in Chelsea and for 51 Fairmont Court in Hyde Park. Drafted easement language needed for the relocation of a portion MWRA’s Northern High Service Pipeline Section 14 water main from Pleasant Street Extension to Pleasant Street in Malden. Reviewed and provided comments on draft estoppel certificate and subordination, attornment and non-disturbance agreement relative to MWRA’s lease of a portion of Building 39 in CNY.
· NPDES: Reviewed and provided comments on letter to EPA seeking revisions to MWRA’s outfall contingency plan. Reviewed
and provided comments on letter transmitting scope of CSO variance monitoring in the Lower Charles River/Charles Basin and the Alewife Brook/Upper Mystic River to EPA and DEP. Reviewed and provided comments on notification letter to EPA relative to DITP’s operation of its back up power during periods when the HEEC power cable, which provides primary power to DITP, is off-line. Reviewed applicability of noncontact cooling water NPDES permit to MWRA’s Wachusett Aqueduct pumping station future geothermal discharge to forebay. Reviewed and provided comments on notification letter to EPA relative to DITP’s operation of its back up power during periods when the HEEC power cable, which provides primary power to DITP, is off-line.
· Watershed Preservation Restriction: Reviewed Wachusett Reservoir Watershed Acquisition W-000494 located at Upper North Row Road and Hardscrabble Road, in Sterling, MA. Reviewed Quabbin Reservoir Watershed Acquisition W-0001175 located at Hardwick Road in Petersham, MA.
· Order of Conditions: recorded extension permit for order of conditions DEP 297-0353 related to MWRA Spot Pond Covered
Storage contract 6457.
· Licenses: Finalized Mass DOT license for MWRA’s use of land in Weston near shaft 5 and shaft 5A for parking and a lay down area needed for the repair of water line Section 80. Finalized MIT Sea Grant College Program for MIT’s use of the Deer Island Wastewater Treatment Plant (DITP) Pier. Reviewed and revised draft license agreement related to Boston Gas’s (NGRID) gas line and meters being installed at MWRA’s Clinton Wastewater Treatment Plant.
· 8(m) Permits: Reviewed and approved fifty-seven (57) 8(m) permits. · Public Records Requests: Provided responses to one public records request.
· Greater Esker Park: Filed MWRA’s Third/Final Annual Compliance/Monitoring Report.
· FST/Stantec Cost Recovery: Assisted staff with structuring cost recovery settlement to permit set-off against FST claims for
additional work. Obtained extension to tolling agreement.
· CNY Lease: Provided documentation to CNY landlord concerning landlord’s property refinancing.
· Amended Public Records Law: Provided assistance to MIS, Operations and Executive Office in implementing amended Public Records Law which became effective on January 1, 2017. Revised MWRA Admin. Policy #19.
· West Boylston Municipal Lighting Plant: Met with energy consultant and answered WBMLP’s offer to enter into a long term agreement for the purchase of Oakdale output. MISCELLANEOUS LABOR, EMPLOYMENT AND ADMINISTRATIVE New Matters -- One demand for arbitration was filed.

39
LABOR, EMPLOYMENT AND ADMINISTRATIVE (cont.) Matters Concluded · Received an arbitrator’s decision in favor of MWRA finding that the MWRA did not violate a collective bargaining agreement when an employee claimed to be working out of title. · Received an arbitrator’s decision in favor of MWRA finding that the MWRA did not violate a collective bargaining agreement when an employee claimed to be working out of title. · Received a dismissal from the MCAD for lack of probable cause of a charge of discrimination on the basis of race, color. · Received a dismissal from the MCAD for lack of probable cause of a charge of discrimination on the basis of retaliation. LITIGATION/TRAC New Matters
· Joel Chiet (Motor Vehicle Accident): Mr. Chiet, an 80-year old resident of Everett, has initiated a claim arising out of an auto accident that occurred on June 29, 2015 on the Fellsway in Medford. Chiet alleges that he was stopped at a red light when his vehicle was rear ended by an MWRA truck operated by MWRA employee Mark Cataldo. Mr. Cataldo had also been stopped at the light, but reportedly his vehicle rolled approximately ten feet into the rear of Chiet’s vehicle. Chiet alleges hip, shoulder and back pain and received medical treatment as well as physical therapy. No lawsuit has yet been filed, but Chiet has legal counsel with whom Law Division will pursue settlement discussions.
· Besnick Lalaj and Violeta Lalaj (Motor Vehicle Accident): Mr. and Mrs. Lalaj are represented by Attorney William Reitzell in
connection with an auto accident that occurred on November 10, 2015, at approximately 6:15 a.m., on Mystic Avenue in Somerville, near MWRA’s CSO facility. Mr. Lalaj contends that he was traveling on Mystic Avenue, when an MWRA vehicle pulled out of a “construction area” and hit the driver’s side of Mr. Lalaj’s vehicle. Mr. Lalaj saw the license plate and reported the incident by telephone to the Somerville Police. Mr. Lalaj, who is 47 years old, alleges injuries to his neck and back, and medical expenses of approximately $5,000.00. Mrs. Lalaj, the passenger, who is 41 years old, alleges injuries to her neck, back and right knee, and medical expenses of $4,757.00.Settlement discussions will be pursued in this matter.
· Thang Viet Vu and Oanh Vu (Motor vehicle Accident): On December 1, 2015, MWRA employee Mark Enos was travelling in
an MWRA vehicle on Gallivan Boulevard, approaching Granite Avenue in Quincy, when he collided with the vehicle in front of him, operated by Mr. Vu. Mr. Vu’s vehicle had stopped abruptly to avoid hitting the vehicle in front of him that had suddenly attempted an illegal left turn onto Granite Avenue. Mr. Vu is 65 years old; Ms. Vu, the passenger, is 27 years old. Both claimants are represented by Attorney Brian Gunning of Dorchester and settlement discussions will be pursued.
· Service of Process Matter: On December 13, 2016, the Law Division received a telephone call from a woman who claimed to
be a process server, employed by a California attorney, who was attempting to contact an MWRA employee before possibly serving the employee with legal process at MWRA. She stated that she had tried unsuccessfully three times to serve the employee at his home. The process server would not divulge her last name or the nature of the matter about which she was calling. Law Division contacted the employee and relayed the substance of the telephone call. The employee said he had received calls at home concerning an unspecified account, with directives to pay, but he has never received any documents substantiating the allegedly past due account and otherwise is not aware of any account on which he is indebted. The employee knows not to make any payments solicited in this manner. Law Division advised the employee that he would be notified in the event of any further contact from the process server or the alleged creditor, including service on MWRA of any legal papers pertaining to him.
Significant Claim Not in Court There are no Significant Claims. Significant Developments
· Daniel O’Connell’s Sons v. MWRA v Allied-Locke Industries, Inc.: In late December 2016 following Board authorization to settle, this matter was settlement for a payment to O’Connell’s of $2.65 million. A memorandum agreement was signed on December 22, 2016.
· United States (Army Corps) v. NSTAR, HEEC and MWRA: MWRA prevailed on the motion, brought by HEEC and NSTAR, to dismiss MWRA’s cross-claims. In particular, MWRA’s indemnification claims in its cross-claims will be the primary basis upon which MWRA will proceed to argue that NSTAR and HEEC have responsibility for all expenses arising out of the mis-positioned cable. MWRA also prevailed on the motion, brought by the United States, for summary judgment on issues of liability for the alleged failure to comply with the depth requirements of the ACoE dredging permit. That denial, which was without prejudice, allows all parties to pursue discovery. Finally, MWRA substantially prevailed in the DPU tariff proceeding in that DPU rejected HEEC’s theory that the expiration of the 1990 Interconnection Agreement meant that its provisions relating to construction cost caps would no longer have any application under the new tariff. DPU re-drafted many of the tariff terms and conditions proffered by HEEC to make them neutral relative to future cable expenditures. DPU also indicated that either a court or the DPU could decide any dispute about cable protection costs.
· MWRA Law Division staff completed review of Boston Harbor Project archived files and culled out approximately 4,500 pages
of documents in response to the document request of HEEC/NStar. Reviewed and filed MWRA’s Answer to HEEC/NStar’s cross-claims against MWRA.
· HEEC Tariff Proceeding (MA DPU 15-157): DPU issued its lengthy decision on most open tariff issues ruling substantially in
MWRA’s favor on disputed issues including the term and conditions of service and prohibiting HEEC from charging MWRA for any extraordinary cable protection costs, and ruling that the disputes underlying such costs could be adjudicated by a court, by DPU or could be resolved by the future agreement of MWRA and HEEC.

40
Significant Developments (cont.)
· Bay State Regional Contractors, Inc. v. MWRA: Concluded agreement to allow MWRA to disburse payment to J.F. White from amounts withheld under contract 7260 and to treat the payment as a credit against sums claimed to be due to Bay State in Superior Court suit.
Matters Concluded · OPK Biotech LLC: On December 9, this Chapter 7 Bankruptcy matter closed once a dividend payment on MWRA’s claim
from the Interim Distribution was filed. MWRA received a payment in the amount of $1,077.90.
· Implant Services: This was a small TRAC customer that filed for Chapter 11 Bankruptcy in October 2016. It was determined that MWRA did not have a claim.
Subpoenas - · During the Second Quarter of FY 2017, no new subpoenas were received and no subpoenas were pending at the end of the
Second Quarter FY 2017.
Public Records · During the Second Quarter of FY 2017, eight public records requests were received, two were withdrawn and four public
records requests were closed.
SUMMARY OF PENDING LITIGATION MATTERS
TYPE OF CASE/MATTER
As of Dec 2016
As of Sept 2016
As of June 2016
Construction/Contract/Bid Protest (other than BHP) 3 3 5 Tort/Labor/Employment 1 1 1
Environmental/Regulatory/Other 2 2 2 Eminent Domain/Real Estate 0 0 0 total – all defensive cases 6 6 8
Other Litigation matters (restraining orders, etc.) MWRA v. Thomas Mercer MWRA v. NSTAR and HEEC
2 2 2
total – all pending lawsuits 8 8 10 Claims not in suit: Joel Chiet Claim Besnick Lalaj and Violeta Lalaj Claim Thang Viet Vu and Oanh Vu Claim
3 0 0
Bankruptcy 1 2 2 Wage Garnishment 14 14 14 TRAC/Adjudicatory Appeals 0 0 2 Subpoenas 0 0 0
TOTAL – ALL LITIGATION MATTERS 26 24 28
TRAC/MISC. New Appeals No new cases were received. Settlement by Agreement of Parties No Settlements by Agreement of Parties. Stipulation of Dismissal No Stipulation of Dismissals. Notice of Dismissal Fine paid in full
No cases of Notices of Dismissal, Fine paid in full. Tentative Decisions No Tentative Decisions were issued in the 2nd Quarter FY 2017. Final Decisions No Final Decisions was issued in the 2nd Quarter FY 2017.

41
INTERNAL AUDIT AND CONTRACT AUDIT ACTIVITIES 2nd Quarter - FY17
Highlights During the 2nd quarter, Internal Audit (IA) completed 5 construction labor burden reviews, 1 consultant preliminary review and 5 incurred cost audits. A change order pricing analysis and a vendor review were also completed. An audit of the Wright Express Retail Fuel Card Program was performed to determine if current controls over fuel purchases and invoice payments are adequate and comply with current policies and procedures. General management advisory services included sole source award analysis, labor rates on professional services contracts and assistance in contract negotiations. Status of Recommendations There were 25 recommendations made in FY17 and 14 of these have been closed year to date. An additional 11 recommendations were closed from prior fiscal year audits. IA follows-up on open recommendations on a continuous basis. All open recommendations have target dates for implementation. When a recommendation has not been acted on within 48 months, the appropriateness of the recommendation is re-evaluated during a subsequent audit. On closed assignments 98% of recommendations have been implemented.
Report Title (issue dates) Audit Recommendations
Total Closed Open Hardware Equipment Management Report (5/22/13) 36 32 4 Follow-Up Report on Fleet Services Activities (12/31/13) 17 13 4 8(m) Permit Fees (11/17/14) 6 4 2 Records Management (12/5/14) 8 6 2 Unmatched Receipts and Accruals (6/30/15) 10 5 5 Halon Inspections at DITP (9/30/15) & Caruso and DeLauri (12/31/15) 18 16 2 Warehouse Cycle Counts at DITP (11/5/15), Southboro (11/6/15) and Chelsea (12/4/15) 25 20 5
Security System Alarms (3/3/16) 3 1 2 AVL Tracking 2016 (5/6/16) 9 7 2 MIS Mobile Equipment Asset Tracking (9/26/16) 12 11 1 Wright Express (WEX) Fuel Card Purchases (11/16/16) 13 3 10
Total Recommendations 157 118 39 Cost Savings IA’s target is to achieve at least $1 million in cost savings each year. Cost savings vary each year based upon many factors. In some cases, cost savings for one year may be the result of work in prior years.
Cost Savings FY13 FY14 FY15 FY16 FY17 (2Q) TOTAL Consultants $587,314 $294,225 $87,605 $88,312 $93,349 $1,150,805 Contractors & Vendors $2,153,688 $415,931 $1,146,742 $1,772,422 $2,141,609 $7,630,392
Internal Audits $391,083 $923,370 $543,471 $220,929 $109,452 $2,188,305 Total $3,132,085 $1,663,526 $1,777,818 $2,081,663 $2,344,410 $10,969,502

OTHER MANAGEMENT

42
Pr/Trns Hires TotalFY14 111 (69%) 51 (31%) 162FY15 133 (67%) 65 (33%) 198FY16 99 (62%) 60 (38%) 159FY17 82 (68%) 38 (32%) 120
YTD FY16
Admin 140 3.76 7.51 13.9% 8.29Aff. Action 5 2.91 5.83 0.0% 8.05Executive 5 9.07 18.13 57.4% 10.97Finance 35 4.27 8.54 32.5% 9.70Int. Audit 7 2.84 5.69 69.1% 4.44Law 16 4.62 9.25 5.9% 11.41OEP 8 3.10 6.20 57.1% 6.62Operations 930 4.42 8.83 18.6% 9.06Pub. Affs. 14 3.54 7.08 9.7% 9.16MWRA Avg 1160 4.32 8.64 18.9% 8.99
Percent of sick leave usage for FY17, attributable to Family and Medical Leave Act (FMLA) is 18.9% .
Ave. FTE's for FY15=1,144
FY17 Target for FTE's = 1150
Workforce Management2nd Quarter - FY17
FTE's as of Dec 2016 = 1144.8
Average monthly sick leave for the 2nd Quarter of FY17 decreased as compared to the 2nd Quarter of FY16 (9.42 to 8.98 days)
Number of Employees
Annualized Total
In Q2 of FY17, the average quarterly sick leave usage decreased 4.7% from thesame time last year.
Annual FMLA %
32% 68%
Positions Filled by Hires/Promotions FY17-YTD
Promotions / Transfers (82)
0.4
0.5
0.6
0.7
0.8
0.9
1.0
1.1
J A S O N D J F M A M J
Average Monthly Sick Leave Usage Per Employee
FY17
FY16
Hires (38)
Total Overtime for Field Operations for The Second Quarter of 2016 was $769,290 which is $109k over budget. Emergency overtime was $290k, which was ($9k) under budget. Rain events totaled $147, emergency maintenance was $42k, emergency operations was $27k, and snow removal was $15k. Coverage overtime was $147k, which was $25k over budget, reflecting the shift coverage requirements for the quarter. Planned overtime was $332k or $83k over budget. Spending for the quarter includes maintenance off-hours work at $117k, maintenance work completion at $36k, Planned operations at $30k, half-plant at Carroll at $40k. YTD, FOD has spent $1,371,643 on overtime which is $30k over budget.
1125 1130 1135 1140 1145 1150 1155 1160 1165 1170
J A S O N D J F M A M J
FTE Tracking
Target
Filled
Total overtime for Deer Island for the second quater of FY17 $410K, which was $107K over budget. A combination of planned/unplanned overtime which was $155K over budget mainly due to maintenance and operations activities involving the Eversource cable outage and HVAC work during the power plant outage, and higher shift coverage overtime, $43K over budget, due to several vacant operator positions. This is offset in part by, less than anticipated storm coverage overtime, ($91K) or (1,756) fewer hours. YTD, Deer Island has spent $640,098 on overtime which is $78K over budget.
50000
150000
250000
350000
450000
550000
J A S O N D J F M A M J
Field Operations Current Month Overtime $
Budget
Actual
0 20000 40000 60000 80000
100000 120000 140000 160000
J A S O N D J F M A M J
Deer Island Treatment Plant Current Month Overtime $
Actual
Budget

43
Workplace Safety2nd Quarter - FY17
1
2
3
Workers Compensation Claims Highlights - 2nd Quarter FY17
New Closed Open ClaimsLost Time 4 9 60Medical Only 23 16 23Report Only 5 9
NewRegular Duty Returns 8 8Light Duty Returns 2 5
Highlights/Comments:● Light Duty Returns
October November Two employees Returned to Light DutyDecember
● Regular Duty returns
October NovemberDecember
Note: Claims may initially be counted in one category and changed to another category at a later date.
Examples include a medical treatment only claim (no lost time from work) but the employee may require surgery at a later date resulting in the claim becoming a lost time claim. At that time we would onlycount the claim as opened but not as a new claim.
*Report only claims are closed the month they are filed.
“Recordable" incidents are all work-related injuries and illnesses which result in death, loss of consciousness, restriction of work or motion, transfer to another job, or require medical treatment beyond first aid.
"Lost-time" incidents, a subset of the recordable incidents, are only those incidents resulting in any days away from work, days of restricted work activity or both - beyond the first day of injury or onset of illness.
The “Historical Average” is computed using the actual MWRA monthly incident rates for FY99 through FY14. The “Upper” and “Lower Historical Ranges” are computed using these same data – adding and subtracting two standard deviations respectively. FY15 actual incident rates can be expected to fall within this historical range.
YTD Light Duty Returns
One employee returned to regular duty from IA
0
2
4
6
8
10
12
1 2 3 4 5 6 7 8 9 10 11 12 Inci
dent
s pe
r 200
,000
hou
rs w
orke
d
Lost Time Injury & Illness Rates
Historical Average Lower Historical Range
Upper Historical Range FY17 Actual Lost Time
0
2
4
6
8
10
12
1 2 3 4 5 6 7 8 9 10 11 12
Inci
dent
s pe
r 200
,000
hou
rs w
orke
d
Recordable Injury & Illness Rates
Historical Average Lower Historical Range Upper Historical Range FY17 Actual Recordable

44
Underutilized Job Groups - Workforce Representation Employees Minorities Minority Females Female
as of as of Achievement Over or Under As of Achievement Over or UnderJob Group 12/31/2016 12/31/2016 Level Underutilized 12/31/2016 Level UnderutilizedAdministrator A 21 2 2 0 6 6 0Administrator B 22 1 3 -2 2 6 -4Clerical A 36 13 5 8 31 32 -1Clerical B 29 7 7 0 11 15 -4Engineer A 83 20 14 6 15 12 3Engineer B 57 17 11 6 12 7 5Craft A 111 17 14 3 0 7 -7Craft B 142 29 17 12 4 4 0Laborer 69 19 16 3 5 3 2Management A 99 13 16 -3 36 25 11Management B 48 10 4 6 11 12 -1Operator A 67 4 10 -6 1 9 -8Operator B 63 11 1 10 3 1 2Professional A 34 5 6 -1 22 14 8Professional B 163 46 35 11 83 67 16Para Professional 60 18 12 6 28 32 -4Technical A 51 13 10 3 5 10 -5Technical B 6 1 1 0 0 2 -2
Total 1161 246 184 74/-12 275 264 47/-36
Job Group # of Vac Requisition Int. / Ext.
Promotions/ Transfers
AACU Ref. External Position Status
Craft B 1 Int 0 2 Promo = WMClerical B 1 Int/Ext 0 2 NH = WF
Engineer B 1 Int/Ext 1 1 Trans = WMLaborers 3 Int/Ext 0 0 (3)NH = WMLaborers 3 Int/Ext 1 1 Promo = WM
Management B 1 Int 1 0 Promo = WMOperator A 1 Int/Ext 0 0 NH = WMOperator B 2 Int 1 0 Promo = BM & WM
Professional A 1 Int 1 0 Promo = WMProfessional B 2 Int 1 0 Trans & Promo = WF
Professional B 3 Int/Ext 0 0 (2)NH = WF & Rehire = WM
Professional B 2 Int 2 0 Promo = BF & WFProfessional B 1 Int/Ext 0 0 Promo = WFProfessional B 1 Int 1 0 Promo = WMProfessional B 1 Int/Ext 0 0 NH = HMProfessional B 1 Int/Ext 0 0 NH = AFProfessional B 1 Int/Ext 0 1 NH = WMProfessional B 1 Int 1 0 Promo = BF
Technical A 1 Int 1 0 Promo = WMTechnical A 1 Int 1 0 Promo = WM
MWRA Job Group Representation
Lab Supervisor
Sr Financial Analyst
Systens Analyst Programmer II
Chemist I
Senior Laboratory Technician
Title
Buildings & Grounds Worker
Messenger/CourierHVAC Technician
Operator
Staff Engineer
Asset Control SupervisorResearch Vessel Operator
Chemist II
BuyerSenior SCADA Technician
Communication and Control
OMC Laborer
2nd Quarter - FY17
AACU Candidate Referrals for Underutilized Positions
Security Services AdministratorNetwork Administrator III
Chemist I
0 50
100 150 200 250 300 350 400 450 500
J A S O N D J F M A M J
Total minorities employed at MWRA
Shortfall of minorities in underutilized job groups
0 50
100 150 200 250 300 350 400 450 500
J A S O N D J F M A M J
Number of females to match 2-factor analysis
Total females employed Shortfall of females in underutilized job groups
Female - Affirmative Action Plan Goals Minority - Affirmative Action Plan Goals
Highlights: At the end of Q2 FY17, 4 job groups or a total of 12 positions are underutilized by minorities as compared to 11 job groups or a total of 44 positions at the end of Q2 FY16; for females 9 job groups or a total of 36 positions are underutilized by females as compared to 10 job groups or a total of 43 positions at the end of Q2FY16. During Q2, 6 minority and 6 female were hired. During this same period 3 minorities and 4 female terminated.
Number of minorities to match 2-Factor analysis

45
Professional Services
FY17 YTD FY16 FY17 YTD FY16Amount Percent Amount Percent Amount Percent Amount Percent
502,903 8.9% 1,805,604 37.9% Construction 1,021,956 36.3% 1,114,916 47.1%211,030 37.3% 828,841 55.3% Prof Svcs 121,443 26.7% 314,752 26.1%71,125 11.8% 255,324 40.6% Goods/Svcs 756,877 88.5% 1,124,374 160.7%
785,058 11.5% 2,889,769 41.9% Totals 1,900,276 46.1% 2,554,042 59.8%
2nd Quarter - FY17MBE/WBE Expenditures
FY17 spending and percentage of goals achieved, as well as FY16 performance are as follows:
FY16 MBE/WBE dollar totals do not include MBE and WBE payments to prime contractors and consultants.
Construction
Goods/Services
MBE WBE
MBE/WBE targets are determined based on annual MWRA expenditure forecasts in the procurement categories noted below. The goals for FY17 are based on 85% of the total construction and 75% of the total professional projected spending for the year. Certain projects have been excluded from the goals as they have no MBE/WBE spending goals. MBE/WBE percentages are the results from a 2002 Availability Analysis, and MassDEP’s Availability Analysis. As a result of the Availability Analyses, the category of Non-Professional Services is included in Goods/Services. Consistent with contractor reporting requirements, MBE/WBE expenditure data is available through December.

FY17 CEB Expenses through 2nd Quarter – FY17
As of December 2016, total expenses are $331.3 million, $8.9 million or 2.6% lower than budget and total revenue was $361.8 million, $1.3 million or 0.4% over budget, for a net variance of $10.2 million. Expenses – Direct Expenses are $105.3 million, $2.3 million or 2.2% below budget.
· Wages & Salaries are under budget by $1.8 million or 3.7%. At the end of December, the average Full Time Equivalent (FTE) positions were 1,137, 13 positions fewer than the 1,150 budgeted FTE's.
· Maintenance is over budget by $713k or 4.8%. Services are overspent by $849k and Materials are underspent by $135k. Over spending includes $410k for Nut Island fire repairs and the remaining variance reflects timing of work budgeted in later months.
· Other Services are under budget by $667k or 5.7% mainly due to lower Sludge Pelletization expense of $264k reflecting lower year
to date quantities, lower Space Lease/Rentals of $195k due to lower escrow payments at the Chelsea Facility for taxes and insurance, and lower pass through maintenance cost at the Charlestown Navy Yard Facility, and $128k for Grit and Screenings disposal services primarily due to lower quantities.
· Utilities are under budget by $478k or 4.7% mainly due to electricity costs of $268k, primarily for favorable pricing at DITP and lower
diesel fuel cost of $183k.
· Workers’ Compensation is underspent by $399k or 34.1% due to lower than budgeted Medical Payments of $226k and Compensation Payments of $193k, due mostly to reserve adjustments.
· Chemicals expenses were higher than budgeted by $306k or 6.4% primarily for Activated Carbon of $165,000 at DITP due to
increased odor control via carbon as opposed to wet scrubbers; and Sodium Hypochlorite of $76k.
· Other Materials are over budget by $278k or 14.6% mainly due to timing of vehicle purchases of $245k, Other Materials of $58k, and Computer Hardware of $59k, partially offset by lower Vehicle Expenses of $135k reflecting lower than budgeted gasoline pricing and computer software expense $56k.
· Fringe Benefits are under budget by $315k or 3.1% mainly due to fewer than budgeted participants.
Indirect Expenses are $18.7 million, $124k under budget or 0.7%. Debt Service Expenses totaled $207.3 million, which was $6.4 million or 3.0% under budget due mainly to lower than budgeted variable interest rates of $5.5 million and savings from the August 2016 refunding. Revenue and Income – Total Revenue / Income for December is $361.8 million, $1.3 million higher than budget as non-rate revenue including $1.3 million for water sales related to the summer drought, $299k for a favorable class action settlement related to derivatives, surplus equipment sales $186k, and TRAC penalty $115k, were partially offset by lower investment Income of $270k due to unexpected calls and lower reinvestment rates.
Period 6 YTDBudget
Period 6 YTDActual
Period 6 YTDVariance %
FY17Approved
%Expended
EXPENSESWAGES AND SALARIES 47,811,157$ 46,048,316$ (1,762,841)$ -3.7% 101,588,897$ 45.3%OVERTIME 2,081,423 2,183,804 102,381 4.9% 4,192,676 52.1%FRINGE BENEFITS 10,004,307 9,689,604 (314,703) -3.1% 20,242,323 47.9%WORKERS' COMPENSATION 1,172,095 772,812 (399,283) -34.1% 2,344,190 33.0%CHEMICALS 4,790,837 5,096,351 305,514 6.4% 9,110,407 55.9%ENERGY AND UTILITIES 10,081,280 9,603,644 (477,636) -4.7% 21,541,077 44.6%MAINTENANCE 14,795,053 15,508,221 713,168 4.8% 31,080,642 49.9%TRAINING AND MEETINGS 214,812 173,218 (41,594) -19.4% 435,481 39.8%PROFESSIONAL SERVICES 3,145,892 3,088,463 (57,429) -1.8% 6,531,939 47.3%OTHER MATERIALS 1,901,902 2,179,799 277,897 14.6% 6,219,630 35.0%OTHER SERVICES 11,652,788 10,985,916 (666,872) -5.7% 22,974,855 47.8%TOTAL DIRECT EXPENSES 107,651,546$ 105,330,148$ (2,321,399)$ -2.2% 226,262,117$ 46.6%
INSURANCE 998,949$ 933,479$ (65,470)$ -6.6% 1,997,898$ 46.7%WATERSHED/PILOT 12,145,634 12,090,314 (55,320) -0.5% 24,291,268 49.8%BECo PAYMENT 386,930 391,314 4,384 1.1% 773,859 50.6%MITIGATION 779,000 771,400 (7,600) -1.0% 1,558,000 49.5%ADDITIONS TO RESERVES (83,871) (83,871) - 0.0% (167,742) 50.0%RETIREMENT FUND 4,632,624 4,632,624 - 0.0% 4,632,624 100.0%POST EMPLOYEE BENEFITS - - - --- 4,876,050 0.0%TOTAL INDIRECT EXPENSES 18,859,266$ 18,735,260$ (124,006)$ -0.7% 37,961,957$ 49.4%
STATE REVOLVING FUND 40,168,407$ 39,760,853$ (407,554)$ -1.0% 86,971,915$ 45.7%SENIOR DEBT 131,424,056 130,896,551 (527,505) -0.4% 268,472,556 48.8%CORD FUND - - - --- - ---DEBT SERVICE ASSISTANCE - - - --- (873,804) ---CURRENT REVENUE/CAPITAL 6,100,000 6,100,000 - 0.0% 12,200,000 50.0%SUBORDINATE MWRA DEBT 32,313,338 32,313,338 - 0.0% 69,997,992 46.2%LOCAL WATER PIPELINE CP 2,074,621 2,074,621 - 0.0% 4,149,242 50.0%CAPITAL LEASE 1,608,530 1,608,530 - 0.0% 3,217,060 50.0%DEBT PREPAYMENT - - - --- 10,994,960 0.0%VARIABLE DEBT - (5,501,286) (5,501,286) --- - 0.0%DEFEASANCE ACCOUNT - - - --- - ---TOTAL DEBT SERVICE 213,688,952$ 207,252,607$ (6,436,346)$ -3.0% 455,129,921$ 45.5%
TOTAL EXPENSES 340,199,764$ 331,318,015$ (8,881,751)$ -2.6% 719,353,995$ 46.1%
REVENUE & INCOMERATE REVENUE 347,439,250$ 347,439,250$ -$ 0.0% 694,878,500$ 50.0%OTHER USER CHARGES 4,197,247 4,255,408 58,161 1.4% 8,752,834 48.6%OTHER REVENUE 4,316,123 5,865,957 1,549,834 35.9% 6,519,171 90.0%RATE STABILIZATION - - - --- - ---INVESTMENT INCOME 4,508,943 4,239,123 (269,820) -6.0% 9,473,490 44.7%TOTAL REVENUE & INCOME 360,461,563$ 361,799,738$ 1,338,175$ 0.4% 719,623,995$ 50.3%
December 2016Year-to-Date
46

Cost of Debt 2nd Quarter – FY17
MWRA borrowing costs are a function of the fixed and variable tax exempt interest rate environment, the level of MWRA’s variable interest rate exposure and the perceived creditworthiness of MWRA. Each of these factors has contributed to decreased MWRA borrowing costs since 1990.
Average Cost of MWRA Debt FYTD
Fixed Debt ($3,621) 3.95% Variable Debt ($481.2) 1.00% SRF Debt ($980.1) 1.38%
Weighted Average Debt Cost ($5,083) 3.17%
Most Recent Senior Fixed Debt Issue August 2016
2016 Series D ($104.3) 2.99%
Weekly Average Variable Interest Rates vs. Budget
MWRA currently has eleven variable rate debt issues with $903 million outstanding, excluding commercial paper. Of the eleven outstanding series, five have portions which have been swapped to fixed rate. Variable rate debthas been less expensive than fixed rate debt in recent years as short-term rates have remained lower than long-term rates on MWRA debt issues. In December, SIFMA rates ranged from a high of 0.73% to a low of 0.56% for the month. MWRA’s issuance of variable rate debt, although consistently less expensive in recent years, results in exposure to additional interest rate risk as compared to fixed rate debt.
90A
91A 92A
92B
93B93C
94A
95B 96A97D
98AB
00A
00D 02B
02J 03D04A
04B05A
06AB07AB 09AB
10AB11B
11C12AB
13A
14DE
1.00%
2.00%
3.00%
4.00%
5.00%
6.00%
7.00%
8.00%
Inte
rest
Rat
e
MWRA Fixed Rate Debt vs. 10 and 20 Year MMD Rates
10-Year AAA MMD 20-Year AAA MMD MWRA Deals 10-Year AAA MMD
16BC16D
Bond Deal 1992A 1992B 1993B 1993C 1994A 1995B 1996A 1997D 1998AB 2000A 2000D 2002B 2002J 2003DRate 6.98% 6.58% 5.89% 5.66% 6.15% 5.34% 5.78% 5.40% 5.04% 6.11% 5.03% 5.23% 4.71% 4.64%
Avg Life 22.6 yrs 6.3 yrs 19.8 yrs 19.1 yrs 19.5 yrs 20.5 yrs 19.5 yrs 21.6 yrs 24.4 yrs 26.3 yrs 9.8 yrs 19.9 yrs 19.6 yrs 18.4 yrs
Bond Deal 2004A 2004B 2005A 2006AB 2007AB 2009AB 2010AB 2011B 2011C 2012AB 2013A 2014DEF 2016BC 2016DRate 5.05% 4.17% 4.22% 4.61% 4.34% 4.32% 4.14% 4.45% 3.95% 3.93% 2.45% 3.41% 3.12% 2.99%
Avg Life 19.6 yrs 13.5 yrs 18.4 yrs 25.9 yrs 24.4 yrs 15.4 yrs 16.4 yrs 18.8 yrs 16.5 yrs 17.9 yrs 9.9 yrs 15.1 yrs 17.4 yrs 18.8 yrs
0.00%
0.50%
1.00%
1.50%
2.00%
2.50%
3.00%
3.50%
7/7 8/4 9/1 9/29 10/27 11/24 12/22 1/19 2/16 3/16 4/13 5/11 6/8 7/6
Intere
st Rate
Week Ending
Weekly Average Interest Rate on MWRA Variable Rate Debt(Includes liquidity support and remarketing fees)
FY17 Budget
FY17 Actual
FY16 Actual
SIFMA 20yr. Average
47

Investment Income 2nd Quarter – FY17
Year To Date
Monthly
-14.8%
-13.9 %-10.8%
-9.6% -7.5% -6.0%
-30%
-20%
-10%
0%
10%
20%
30%
J A S O N D J F M A M J
YTD Variance %
Total Variance Zero Variance
YTD BUDGET VARIANCE ($000)
BALANCES
IMPACTRATES
IMPACT TOTAL %
Combined Reserves ($0) ($165) (166) -19.8%Construction $38 $63 101 40.6%Debt Service $7 $94 102 26.0%Debt Service Reserves $14 ($339) (325) -15.2%
Operating $20 ($220) (200) -40.2%Revenue ($5) $71 65 26.2%Redemption ($0) $154 154 106.3%
Total Variance $73 ($343) ($270) -6.0%
$0 $20 $40 $60 $80
$100 $120 $140 $160
$ in
Mill
ions
YTD Average BalancesBudgeted vs. Actual
Actual
Budgeted
0%
1%
2%
3%
4%
YTD Average Interest RateBudgeted vs. Actual
Actual
Budgeted
0.00%
0.20%
0.40%
0.60%
0.80%
1.00%
J A S O N D J F M A M J
Short -Term Interest Rates
Actual Budget
0%
1%
2%
3%
4%
5%
6%
J A S O N D J F M A M J
Long -Term Interest Rates
Actual Budget
$0
$100
$200
$300
$400
$500
$600
J A S O N D J F M A M J
$ in
Mill
ions
Short-Term Average Balances
Actual Budget
$0
$100
$200
$300
$400
$500
$600
J A S O N D J F M A M J
$ in
Mill
ions
Long-Term Average Balances
Actual Balances
48

AF&A A.22/15/17
STAFF SUMMARY
TO:FROM:DATE:SUBJECT:
Board of Directors ......:7 /) JC'Frederick A. Laskey, Executive Director ~February 15,2017Delegated Authority Report - January 2017
COMMITTEE: Administration, Finance & Audit X INFORMATIONVOTE
('W¿_, _/ ld:L Å ~./:)4-L ~~MiÉ'iíëíe S. Gillen
Barbara Aylward, Administrator A & FPreparer/Title
ñector, ~~n:~ ~ A\':=ancisco ~hVVft¡----Director of Procurement
RECOMMENDATION:
For information only. Attached is a listing of actions taken by the Executive Director under delegatedauthority for the period January l - 31, 2017.
This report is broken down into three sections:
Awards of Construction, non-professional and professional services contracts and changeorders and amendments in excess of $25,000, including credit change orders and amendmentsin excess of $25,000;Awards of purchase orders in excess of$25,000; andAmendments to the Position Control Register, if applicable.
BACKGROUND:
The Board of Directors' Management Policies and Procedures, as amended by the Board's vote onOctober 14,2009, delegate authority to the Executive Director to approve the following:
Construction Contract Awards:
Up to $1 million if the award is to the lowest bidder; or up to $500,000 if the award is to otherthan the lowest bidder.
Change Orders:
Up to 25% of the original contract amount or $250,000, whichever is less, where the changeincreases the contract amount, and for a term not exceeding an aggregate of six months; and forany amount and for any term, where the change decreases the contract amount. Thedelegations for cost increases and time can be restored by Board vote.

I ~
Amendments which result only in a change in cost center.
Professional Service Contract Awards:
Up to $100,000 and one year with a firm; or up to $50,000 and one year with an individual.
Non-Professional Service Contract Awards:
Up to $250,000 if a competitive procurement process has been conducted, or up to $100,000 ifa procurement process other than a competitive process has been conducted.
Purchase or Lease of Equipment, Materials or Supplies:
Up to $1 million if the award is to the lowest bidder; or up to $500,000 if the award is to otherthan the lowest bidder.
Amendments:
Up to 25% of the original contract amount or $250,000, whichever is less, and for a term notexceeding an aggregate of six months.
Amendments to the Position Control Register:
BUDGETlFISCAL IMPACT:
Recommendations for delegated authority approval include information on the budget/fiscal impactrelated to the action. For items funded through the capital budget, dollars are measured against theapproved capital budget. If the dollars are in excess of the amount authorized in the budget, theamount will be covered within the five-year CIP spending cap. For items funded through the CurrentExpense Budget, variances are reported monthly and year-end projections are prepared at least twiceper year. Staff review all variances and projections so that appropriate measures may be taken toensure that overall spending is within the MWRA budget.

PURCHASING DELEGATED AUTHORITY ITEMS JANUARY 1- 31, 2017
NO. DATE OF AWARD:::::::::::;:;;;;;:::;;;==:;:;;;;;;:::====
P-l. 01/03/17
P-2. 01/03/17
P-3. 01/09/17
P-4. 01/11/17
P-S. 01/20/17
P-6. 01/20/17
P-7. 01/20/17
P-8. 01/27/17
P-9. 01/27/17
P-IO. 01/30/17
P-11 12/23/16
BOLTED MANHOLE FRAME AND COVER ASSEMBLIESAWARD OF SOLE SOURCE PURCHASE ORDER FOR THE PURCHASE OF 150 BOLTED MANHOLE FRAME AND COVER ASSEMBLIES.
TITLE AND EXPLANATION CONTRAa AMENDMENT COMPANY FINANCIAL IMPAa
E.J. USA, INC. $80,345.00
UPGRADE THE MWRA WIRELESS INFRASTRuaUREAWARD OF A PURCHASE ORDER UNDER STATE BLANKET CONTRACT TO THE lOWEST RESPONSIVE BIDDER FOR THE UPGRADE OFTHE MWRAWIRELESS INFRASTRUCTURE.
ONE NEW TRAilER MOUNTED 1,000 KW GENERATORAWARD OF A PURCHASE ORDER TO THE lOWEST RESPONSIVE BIDDER FOR THE PURCHASE OF ONE NEW TRAilER MOUNTED 1,000 KWGENERATOR.
SUPPLY AND DELIVERY OF CATION AND ANION EXCHANGE RESIN TO THE DEER ISLAND TREATMENT PLANTAWARD OF A PURCHASE ORDER TO THE LOWEST RESPONSIVE BIDDER FOR THE SUPPLY AND DELIVERY OF CATION AND ANION EXCHANGERESIN FOR THE THERMAL POWER PLANT AT THE DEER ISLAND TREATMENT PLANT.
THREE LASER ALIGNMENT TOOLSAWARD OF A PURCHASE ORDER TOTHE lOWEST RESPONSIVE BIDDER FOR THREE LASER ALIGNMENT MACHINES FOR DEER ISLANDMAINTENANCE OF ROTATING MACHINERY.
DIVER ASSISTED suenes HARVESTING SERVICES FOR CONTROL OF INVASIVE AQUATIC PLANTS AT WACHUSETT RESERVOIR STILLWATER BASINAWARD OF A PURCHASE ORDER TO THE LOWEST RESPONSIVE BIDDER FOR DIVER ASSISTED SUCTION HARVESTING OF INVASIVE AQUATIC PLANTSAT STilLWATER BASIN WACHUSETT RESERVOIR FOR THE 2017 SEASON.
SUPPLY AND DELIVERY OF RIP RAP DEER ISLAND TREATMENT PLANTAWARD OF A PURCHASE ORDER TO THE LOWEST RESPONSIVE BIDDER FOR THE PURCHASE OF 6,400 TONS OF RIP RAP FOR THE DEER ISLANDTREATMENT PLANT.
SUPPLY AND DELIVERY OF CARBON DIOXIDE TO THE JOHN J. CARROLL WATER TREATMENT PLANTAPPROVE AMENDMENT NO.1 TO INCREASE CARBON DIOXIDE BY 200 TONS TO ENSURE AN UNINTERRUPTED SUPPLY THROUGH THE END OFTHE CONTRACTTERM.
DIVER ASSISTED suenon HARVESTING OF INVASIVE AQUATIC PLANTS AT WACHUSETT RESERVOIR LOWER BASINS AND COVESAWARD OF A PURCHASE ORDER TOTHE LOWEST RESPONSIVE BIDDER FOR DIVER ASSISTED SUCTION HARVESTING OF INVASIVE AQUATIC PLANTSATWACHUSETT RESERVOIR LOWER BASINS AND COVES FOR THE 2017 SEASON.
APC SMART U PSsAWARD OF A PURCHASE ORDER TO THE LOWEST RESPONSIVE BIDDER FOR THE PURCHASE OF 61 APC SMART UNINTERRUPTIBlE POWERSUPPLIES (UPSs) AT VARIOUS lOCATIONS.
SUPPLY AND DELIVERY OF UlTRA-LOW-SULFUR #2 DIESEL FUEL FOR DEER ISLAND TREATMENT PLANTAWARD OF CRITICAL NEED PURCHASE ORDER FOR THE SUPPLY AND DELIVERY OF UPTO 405,000 GALLONS OF FUEL FOR CONTINUOUS ANDRELIABLE OPERATION OF CTGS DURING EVERSOURCE CROSS HARBOR CABLE OPERATIONS.
WRA-4284Q INTEGRATION PARTNERS, INC. $89,984.16
WRA-4296 SOUTHWORTH-MilTON, INC. $409,000.00
WRA-4304Q ML BALL CO., INC. $36,393.00
WRA-43l9Q VIBRALlGN, INC. $45,000.00
WRA-4317 AE COMMERCIAL DIVING $192,096.00SERVICES
WRA-4297 LORUSSO CORPORATION $227,200.00
WRA-4l73 1 PRAXAIR, INC. $33,994.00
WRA-4316 AE COMMERCIAL DIVING $87,000.00SERVICES
WRA-4322Q COMPUTER HUT OF $36,914.15NEW ENGLAND, INC.
GLOBAL MONTEllO $705,996.00GROUP CORP.

CONSTRUCTION/PROFESSIONAL SERVICES DELEGATED AUTHORITY ITEMS JANUARY 1- 31, 2017
NO. DATE OF AWARD;;:;;;:;;;;: =::;:;::;:::========C-l. 01/04/17
C-2. 01/06/17
C-3. 01/11/17
C-4. 01/27/17
C-S. 01/21/17
C-6. 01/30/17
•
'\
TITLE AND EXPLANATION
COMBUSTION TURBINE GENERATOR MAINTENANCE DEER ISLAND TREATMENT PLANTINCREASE ESTIMATED NON-EMERGENCY MAINTENANCE AND REPAIR SERVICES HOURS; EXTEND CONTRACT TERM BY 100 CALENDAR DAYS FROMDECEMBER 20, 2016 TO MARCH 30, 2017.
WORKERS' COMPENSATION lEGAL SERVICESAWARD OF A CONTRACT TO THE lOWEST RESPONSIVE BIDDER FOR lEGAL REPRESENTATION SERVICES BEFORE THE MASSACHUSETTS DEPARTMENTOF INDUSTRIAL ACCIDENTS FOR WORKERS' COMPENSATION CLAIMS FOR THE PERIOD OF JANUARY 5, 2017TO DECEMBER 31, 2017.
HATCHERY PIPELINE AND HYDROELECTRIC PROJECTREDESIGN, FURNISH AND INSTAll ADDITIONAL STAGING AND WELDING RELATED TO THE SWIFT RIVER BRIDGE CROSSING; FURNISH AND INSTALLEPOXY COATED REINFORCING STEEL
ADAMS STREET CROSSING/CATTLE PASS BRIDGE REMOVALDELETE THE REQUIREMENTTO MANAGE, TRANSPORT AND DISPOSE OF CONTAMINATED SOIL AT AN ASPHALT BATCH PLANT; DECREASE ESTIMATEDQUANTITIES FOR ADDITIONAL TRAFFIC CONTROL, BRAINTREE ELECTRICAL LIGHT DEPARTMENT ON-SITE SAFETY PERSONNEL; BRAINTREE FIREDEPARTMENT FIRE WATCH.
DEER ISLAND TREATMENT PLANT CLARIFIER REHABILITATION PHASE" DESIGN/ESDCINCREASE LEVEL OF EFFORT FOR THE INSTALLATION OF DENSITY CURRENT BAFFLES ATTHE EFFLUENT LAUNDERS IN SECONDARY BATTERY A AND BAND REPLACEMENT OF CORRODED CONDUIT AND CONDUCTORS THAT PROVIDE POWER AND CONTROLS TOTHE FLIGHT DRIVE SYSTEM INPRIMARY BATTERY A, B C AND D.
OAKDALE POWER LINES EASEMENT TREE REMOVALAWARD OF A CONTRACT TO THE LOWEST RESPONSIVE BIDDER FOR THE OAKDALE POWER LINES EASEMENT TREE REMOVAL FOR A TERM OF90 CALENDAR DAYS .
CONTRACT AMEND/CO COMPANY
S524 1 O'CONNOR CONSTRUCTORS, INC.
A611 AWARD TENTINOO KENDALLCANNIFF & KEEFE, llP
7235 1 WATERLINE INDUSTRIES CORP.
FRR29 lM HEAVY CIVILCONSTRUCTION, LlC
FINANCIAL IMPACT
$55,056.00
$95,000.00
$29,557.45
($104,610.66)
$43,116.00
$58,750.00
7394 1 COM SMITH, INC.
OP-343 AWARD ANDERSON TIMBERHARVESTING, INe.

· .AF&A A.32/15/17
STAFF SUMMARY
TO:FROM:DATE:SUBJECT:
Board of DirectorsFrederick A. Laskey, Executive Director ~February 15,2017FYI7 Financial Update and Summary
.~
_K_INFORM'}TION_v É~~
"'fiiomas J.ZkinDirector, Finance
RECOMMENDATION:
For information only. This staff summary provides the financial update and variance highlightsthrough January 2017, comparing actual spending and revenue to the FY 17 budget.
DISCUSSION:
Starting this month the Authority is continuing the practice of setting aside favorable CapitalFinance variances into the Defeasance Account with the intention of using these funds to defeasedebt and provide rate relief in future years. Targeted defeasances are a critical component of theAuthority's multi-year rate management strategy. As such, in January the year-to-date debtrelated savings of $7.5 million was transferred to the Defeasance Account. This favorablevariance is the result of the continued low variable rate environment, the lower than planned SRFfunding, the August 2016 refunding, and the timing of new money borrowing.
Staff already identified candidates for year-end defeasance and plans to include the impact of theFYI7 defeasance in the FYI8 planning estimates.
Without the transfer of the $7.5 million in debt service savings to the Defeasance Account, thetotal year-to-date budget variance through January would have been $16.0 million. After thetransfer, the net variance is $8.5 million, with total expenses lower than budgeted by $3.3 millionor 2.5% and total revenues higher than budgeted by $5.2 million or 1.3%.
Should these favorable trends continue, the year-end favorable variance is projected at $33.7million, of which $22.3 million is related to debt service. Beyond debt service savings, staffproject a surplus of approximately $11.4 million at year-end of which $3.9 million would befrom lower direct expenses, $472,000 from lower indirect expenses, and $7.0 million fromgreater than budgeted revenues, mostly related to additional unbudgeted water revenue due to thedrought.
As the year progresses and more actual spending information becomes available, staff willcontinue to refine the year-end projections and update the Board accordingly.

Totals may not add due to rounding
FYI7 Current Expense Budget
The expense variances through January 2017 by major budget category were:
• Net Lower Direct Expenses of $3.2 million or 2.5%. Spending is lower for Wages andSalaries, Other Services, Worker's Compensation, Utilities, Fringe Benefits, ProfessionalServices, and Training & Meetings. This is offset by higher spending for Maintenance,Other Materials, Chemicals, and Overtime.
• Lower Indirect Expenses of $123,000 or 0.6% for lower Insurance costs and Watershedreimbursements.
FY17 Budget and FY17 Actual Year to Date Variance by Expenditure Category
FY17 Budget FY17 Actual$ Variance % Variance
YTD YTD
Direct Expenses $125.1 $122.0 -$3.2 -2.5%
Indirect Expenses $21.0 $20.9 -$0.1 -0.6%
Debt Service $248.4 $248.4 $0.0 0.0%
Total $394.6 $391.3 -$3.3 -0.8%
Total Revenues of $421.8 million were $5.2 million over budget reflecting primarily $4.8 millionreceipt for water usage related to the ongoing drought and $299,000 for a class action lawsuitsettlement for derivative agreements, offset by lower Investment Income of $250,000 forunanticipated calls re-invested at lower rates.
Please refer to Attachment J for a more detailed comparison by line item of the budget variancesfor the year to date.
Eversource Cross-Harbor Cable Location Project
As reported in December, staff are tracking MWRA's costs for the Eversource Cross-HarborCable (HEEC cable) location work which started on November 2, 2016. The investigatory workof the project was defined as two phases (Phase lA and Phase IB), followed by remediationwork Phase 2 to take place in the summer of20l7 (FY18). Phase lA and IB, which consisted oflocating the cable in the Reserved Channel and of excavating four test pits over the path of thecable to verify the precise location and depth was completed on January 23,2017.
During this work the HEEC cable was de-energized and MWRA was required to utilize itsCombustion Turbine Generators (CTOs) to power the Deer Island wastewater treatment plant.By doing so, MWRA incurred significant costs related to diesel fuel use, third party labor, andsignificant overtime. These costs are partially offset by the avoided cost of energy and
2

distribution charges. The total MWRA estimated net unbudgeted costs for the investigatoryPhases are in the range of $1.0-$1.2 million.
Direct Expenses
Year-to-date direct expenses totaled $122.0 million, $3.2 million or 2.5% less than budgeted.
FY17 Direct Expenses(in millions)
Other Other Services
Materials $12.6
Professional $2.5Services$3.5
Fringe OvertimeCompensation Benefits $2.6
$0.8 $11.3
Maintenance$17.5
Less than budgeted spending in Wages and Salaries, Other Services, Worker's Compensation,Utilities, Fringe Benefits, Professional Services, and Training & Meetings was offset by higherspending for Maintenance, Other Materials, Chemicals, and Overtime.
FY17 Direct Expense Variance(in OOO's)
$1,000
$0
Maintenance$422.0$500
-$500
-$1,000Other Services
-$808.6
-$1,500
-$2,000
-$2,500
3

Budgeted FTEs: l, 150Avg.Filled FTEs: l, 137
Wages and Salaries
Wages and Salaries were underspent by $2.0 million or 3.7% mainly as a result of lower averageFull Time Equivalent positions (FTEs) than budgeted, the timing of backfilling vacant positions,and the salary mix differential between staff retiring and new hires. The average FTEs throughDecember were 1,137, which was 13 positions lower than the 1,150 FTEs budgeted.
FY17 MWRA Full Time Equivalent (HE) Position Trend
M A M
Other Services
Other Services spending was lower than budget by $809,000 or 6.0% due to lower spending of$338,000 for sludge pelletization services because of lower year to date quantities; $215,000 forSpace/Lease Rentals due to lower escrow payments at the Chelsea Facility for taxes andinsurance, and lower pass-through maintenance cost at the Charlestown Navy Yard Facility;$149,000 for Grit and Screenings disposal services primarily due to lower quantities; and$122,000 for Other Services primarily for timing of community lead testing assistance.
Workers' Compensation
Workers' Compensation expenses were lower than budget by $543,000 or 39.7% based on lowermedical expenses of $292,000 and compensation payments of $267,000. In January, actualspending was $143,000 under budget. The majority of lower expenses are due to reservedecreases earlier in the fiscal year associated with a few cases.
Utilities
Utilities were underspent by $416,000 or 3.4%, due to lower electricity costs of $909,000,primarily for lower than budgeted pricing at the Deer Island Treatment Plant and being offlineduring the HEEC cable location work. This is offset by higher net spending of $473,000 forDiesel Fuel. Deer Island had two deliveries of diesel fuel during FY17 versus one budgeted,resulting in $673,000 overspending. However, Field Operations was underspent by $200,000
4

5
related to lower pricing. The average price of fuel at Deer Island was $1.66/gal versus thebudgeted $2.1O/gal. The second delivery at Deer Island is related to running the CTGs during theHEEC cable location work.
Fringe Benefits
Fringe Benefits spending was lower than budgeted by $356,000 or 3.0% primarily for lowerHealth Insurance costs of $310,000 due to fewer employees and retirees than budgetedparticipating, and the change between family vs. individual plans.
Professional Services
Professional Services were underspent by $98,000 or 2.7% for Lab and Testing Analysis inEnQual - Wastewater for harbor monitoring; Other Services primarily in Finance forfinance/investment services; Engineering Services primarily in Office of EmergencyPreparedness for Dam Emergency Action Plan updates; Resident Inspection for DASH(invasives) quality assurance diver services. This is offset by higher spending for Legal Servicesin Law.
Maintenance
Maintenance expenses were higher than budgeted by $422,000 or 2.5%. The Nut Island fireincident accounts for $410,000 of the variance.
Other Materials
Other Materials were higher than budget by $317,000 or 14.8% mainly due to timing of VehiclePurchases of $266,000; Lab & Testing Supplies of $68,000; Other Materials of $61,000primarily for gravel at the Clinton Landfill; and Health & Safety of $56,000. This is offset bylower Vehicle Expenses of $157,000 due to lower than budgeted fuel prices and ComputerSoftware of $58,000.
Chemicals
Chemicals expenses were higher than budgeted by $239,000 or 4.4% primarily for ActivatedCarbon of $165,000 at Deer Island Treatment Plant and Sodium Hypochlorite of $108,000 due tohigher than budgeted price for new contracts.
Overtime
Overtime was higher than budget by $160,000 or 6.6% mainly at the Deer Island TreatmentPlant for the HEEC cable location project by Eversource. This is offset by lower than expectedspending in Wastewater Operations related to the North Main Pump Station project at DeerIsland.

Local Water
Indirect Expenses
For the fiscal year to date, Indirect Expenses totaled $20.9 million, $123,000 or 0.6% lower thanbudget, related to lower than budgeted insurance claims and an over-accrual in FY16 forWatershed management operating expenses.
FYl7 Indirect Expenses-YTD(in millions)
InsurancePension$4.6
Mitigation$0.9
HEEC$0.5
Addition toReserves-$0.1
Debt Service
Debt Service expenses include the principal and interest payment for fixed debt, the variablesubordinate debt, the Massachusetts Clean Water Trust (SRF),obligation, the commercial paperprogram for the local water pipeline projects, current revenue for capital, and the Chelsea facilitylease payment.
FY17 Debt Expenses-YTD(in millions)
Senior Debt$151.9
MCWT(SRF)$45.9
CurrentRevenue/Capital$7.0
Pipeline$2.4
Capital Lease$1.9
DefeasanceAccount
$7.5
6

7/7 8/4 9/1 9/29 10/27 11/24 12/22 1/19
Week Ending
2/16 3/16 4/13 5/11 6/8 7/6
Debt Service expenses for the fiscal year totaled $248.4 million, which is at the budgeted levelafter the transfer of $7.5 million of a favorable year-ta-date variance to the Defeasance Account.The short-term rates related variance is $6.3 million year-ta-date. Additionally, the Authorityrecognized $1.2 million in year-ta-date underspending that is the result of the favorable impactofthe August 2016 defeasance, lower SRF funding than planned, and not bon-owing senior debtscheduled for November.
The graph below reflects the FY 17 actual variable rate trend by week over the past year and theFY17 Budget.
Weekly Average Interest Rate on MWRA Variable Rate Debt(Includes liquidity support and remarketing fees)
3.50%
3.00%
2.50%
~.* ...*-~._*.**** •• ~** • ......_ * iIIa*a*• • • '*0.50%
- --- FYl7 Budget ~FY17Actual ......- FY16 Actual - - 51FMA 20yr. Average
Revenue & Income
Total Revenue for the fiscal year totaled $421.8 million, $5.2 million or 1.3% higher thanbudget.
J
The higher than budgeted non-rate Revenue was driven by the receipt of $4.8 million for waterusage related to the summer drought and $299,000 for a class action lawsuit settlement forderivative agreements. This is offset by lower Investment Income of $250,000 for unanticipatedcalls re-invested at lower rates.
Please refer to Attachment 2 for a more detailed variance explanation by line item.
7

FY17 Capital Improvement Program
Capital expenditures in FY17 total $63.9 million through the end of January, $l.8 million or2.7% less than budget.
After accounting for programs which are not directly under MWRA's control, most notably theInflow and Infiltration (I/I) program, the Local Water Pipeline program, and the communitymanaged Combined Sewer Overflow (CSOs) projects, capital spending totaled $55.2 million,$2.3 million or 4.4% over budget.
FY17 CIP SpendingYear-To-Date January
!iii Budget~":- ?>'?J$70.0 t:¡1'0
t:¡1'0
$60.0
$50.0<flc.Q $40.0
~$30.0c
<fl.
$20.0
$10.0
$0.0
MWRATotal
ti Actual
Business & OperationsSupport
Waterworks SystemImprovements
Wastewater SystemImprovements
Totals may nol add due to rounding
Overall underspending reflects the underspending of Wastewater Improvements and Businessand Operations Support of $l.9 million and $0.5 million, respectively, partially offset byWaterworks Improvements overspending of$0.6 million.
Also being presented to the Board of Directors at this meeting is the FY17 mid-year CapitalImprovement Program Spending Report, which includes details for the first six months of thefiscal year.
8

9
FYI7 Year-to-date Spending By Program:
_$ in Millions Budget Actuals $ Var. % Var.Wastewater System ImprovementsInterception & Pumping 11.7 8.6 (3.1) -26.5%Treatment 8.5 13.9 5.4 63.7%Residuals 0.0 0.0 0.0 N/Aeso 5.9 3.1 (2.9) -48.1%Other 4.8 3.5 (1.3) -27.5%Total Wastewater System Improvements $30.9 $29.0 -$1.9 -6.1%Waterworks System ImprovementsDrinking Water Quality Improvements 1.3 0.6 (0.7) -54.3%Transmission 15.4 14.1 (1.3) -8.2%Distribution & Pumping 8.4 11.3 2.9 34.4%Other 5.9 5.6 (0.3) N/ATotal Waterworks System Improvements $31.0 $31.6 $0.6 1.9%Business & Operations Support $3.7 $3.2 ($0.5) -13.2%
Total MWRA $65.7 $63.9 -$1.8 -2.7%
To/als may no/ add due to rounding
The main reasons for the project spending variances in order of magnitude are:
Wastewater Treatment: Net overspending of$5.4 million• $1.8 million for Deer Island Primary/Secondary Clarifier Rehabilitation legal
settlement.• $1.5 million for Deer Island Power System Improvements, $0.9 million for
Winthrop Terminal Facility Variable Frequency Drives ReplacementConstruction, $0.7 million for Clinton Phosphorus Reduction Construction, and$0.5 million for Digester Sludge Pump Phase 2 due to contractor progress.
• $0.6 million for Electrical Upgrades Construction 4 due to timing of final work.• The overspending was partially offset by underspending on Personnel Dock
Rehabilitation due to later than anticipated award and less than anticipated designexpenditures for Clarifier Rehabilitation Phase 2.
Interception & Pumping: Net underspending of $3.1 million• $2.8 million for Chelsea Creek Headworks Upgrades Construction and
Engineering Services for a later Notice-to-Proceed date than budgeted.• $1.6 million on Caruso Pump Station Improvements Construction due to
construction delays.• The underspending was partially offset by $1.3 million for Alewife Brook Pump
Station Rehabilitation Construction due to contractor progress and $0.5 millionfor Chelsea Screenhouse Upgrades due to timing of final work.
Water Distribution and Pumping: Net overspending of $2.9 million• $1.5 million for Section 89/29 Redundancy Phase IB Construction, and $0.7
million for Southern Extra High Section 111 Construction 1 due to contractorprogress.

10
• $1.3 million for Spot Pond Supply Mains due to additional work for WebsterAvenue Bridge Pipe Rehabilitation.
• The overspending was partially offset by underspending on Weston AqueductSupply Mains Section 36/C/S9-AII Valve of $0.4 million due to anticipatedbalancing credit change order for underspent items.
Combined Sewer Overflow: Net underspending of $2.9 million• $2.8 million for Cambridge Sewer Separation Project due to less than anticipated
progress on final restoration work.
Other Wastewater: Net underspending of$1.3 million• $1.3 million for Community Infiltration/Inflow (1/1) due to less than anticipated
requests for loans and grants.
Waterworks Transmission: Net underspending of$1.3 million• $0.8 million for Cosgrove Tunnel Redundancy primarily due to less than
anticipated progress with the guard shack for the Wachusett Aqueduct PumpStation Construction.
• $0.6 million caused by less than anticipated progress for the Rosemary BrookSiphon Building Repairs due to delays in obtaining specialty items for work.
• The underspending was partially offset by overspending of $0.6 million for theHatchery Pipeline Construction due to contractor progress.
Drinking Water Quality Improvements: Net underspending of$0.7 million• Spot Pond Covered Storage Facility Design/Build of $0.4 million due to
construction delays, and $0.2 million for Southborough Water Quality Upgradespending a final balancing change order.
Waterworks Other: Net underspending of $0.3 million• $0.4 million for Beacon Street Line Repair due to construction issues with vaults
at access pits.
Construction Fund Balance
The construction fund balance was at $54.4 million as of the end of January. Commercial Paperavailability was at $222.0 million to fund construction projects.
Attachment I-Variance Summary January 2017Attachment 2 - Current Expense Variance ExplanationsAttachment 3 - Capital Improvement Program Variance ExplanationsAttachment 4 - FYl7 Budget vs. FYI7 Projections

ATTACHMENT 1
January 2017Year-to-Date
Period7 YrD
IPeriod7 YrD
IPeriod7 YrD
IFY17
I%
Budget Actual Variance % Approved Expended
EXPENSESWAGES AND SALARIES $ 55,752,807 $ 53,708,550 $ (2,044,257) -3.7% $ 101,588,897 52.9%OVERTIME 2,438,135 2,598,381 160,246 6.6% 4,192,676 62.0%FRINGE BENEFITS 11,680,411 11,324,825 (355,586) -3.0% 20,242,323 55.9%WORKERS' COMPENSA TION 1,367,444 824,935 (542,509) -39.7% 2,344,190 35.2%CHEM[CALS 5,409,177 5,647,910 238,733 4.4% 9,110,407 62.0%ENERGY AND UTILITIES 12,058,689 11,643,093 (415,596) -3.4% 21,541,077 54.1%MAINTENANCE 17,083,083 17,505,044 421,961 2.5% 31,080,642 56.3%TRAINING AND MEETINGS 238,205 207,881 (30,324) -12.7% 435,481 47.7%PROFESSIONAL SERVICES 3,557,829 3,460,041 (97,788) -2.7% 6,531,939 53.0%OTHERMA TERlALS 2,146,133 2,462,843 316,710 14.8% 6,219,630 39.6%OTHER SERVICES 13,417,563 12,608,966 (808,597) -6.0% 22,974,855 54.9%TOTAL DIRECT EXPENSES s 125,149,476 / s 121,992,469 / s (3,157,006)/ -2.5% s 226,262,117 / 53.9%
INSURANCE $ 1,152,633 $ 1,082,748 $ (69,885) -6.1% $ 1,997,898 54.2%WATERSHEDlPILOT 14,014,193 13,958,873 (55,320) -0.4% 24,291,268 57.5%BECo PA YMENT 446,457 457,638 11,181 2.5% 773,859 59.1%MITIGATION 898,846 890,077 (8,769) -1.0% 1,558,000 57.1%ADDITIONS TO RESERVES (96,774) (96,774) - 0.0% (167,742) 57.7%RETIREMENT FUND 4,632,624 4,632,624 - 0.0% 4,632,624 100.0%POST EMPLOYEE BENEFITS - - - --- 4,876,050 0.0%TOTAL INDIRECT EX I)ENS ES s 21,047,9791$ 20,925,186 / s (122,793)1 -0.6% s 37,961,957 / 55.1%
STA TE REVOLVING FUND $ 46,466,596 $ 45,877,907 $ (588,689) -1.3% $ 86,971,915 52.8%SENlORDEBT 152,508,441 151,879,892 (628,549) -0.4% 268,472,556 56.6%CORD FUND - - - --- - ---DEBT SERVICE ASSISTANCE - - - --- (873,804) ---CURRENT REVENUE/CAPITAL 7,038,462 7,038,462 - 0.0% 12,200,000 57.7%SUBORDINA TE MWRA DEBT 38,115,855 38,115,855 - 0.0% 69,997,992 54.5%LOCAL WATER PIPELINE CP 2,393,793 2,393,793 - 0.0% 4,149,242 57.7%CAPlTALLEASE 1,855,997 1,855,997 - 0.0% 3,217,060 57.7%DEBT PREPA YMENT - - - --- 10,994,960 0.0%VARlABLE DEBT - (6,274,402) (6,274,402) --- - 0.0%DEFEASANCE ACCOUNT - 7,491,641 7,49[,641 --- - 0.0%TOTAL DEBT SERVICE s 248,379,143 / s 248,379,143 / s - / 0.0% s 455,129,921 / 54.6%
TOTALEXPENS ES s 394,576,5981 $ 391,296,798J s (3,279,799)/ -0.8% s 719,353,995 / 54.4%
REVENUE& INCOMERA TE REVENUE $ 400,891,443 $ 400,891,443 $ - 0.0% $ 694,878,500 57.7%OTHER USER CHARGES 5,858,328 5,915,636 57,308 1.0% 8,752,834 67.6%OTHER REVENUE 4,583,335 10,000,942 5,417,607 118.2% 6,519,17l 153.4%RA TE STABILlZA TION - - - --- - ---INVESTMENT INCOME 5,221,619 4,971,523 (250,096) -4.8% 9,473,490 52.5%TOTALREVENUE& INCOME s 416,554,725 / s 421,779,543 / s 5,224,819 / 1.3% s 719,623,995 1 58.6%
11

ATTACHMENT 2Current Expense Variance Explanations
FY17 YTD Actual vs. FY17
TotalMWRAFY17 Budget FY17 Actuals Budget ExplanationsYTDJanuary YTDJanuary
$ %Direct Expenses
Underspending is mainly the result of lower average Full Time Equivalent positions
Wages & Salaries 55,752,807 53,708,550 (2,044,257) -3.7%(FTEs) than budgeted, the timing of backfilling vacant positions and the salary mixdifferential between staff retiring and new hires. The average FTEs for the fiscal year was1,137, which was 13 positions lower than the 1,150 FTEs budgeted.
Higher spending at DITP related to the HEEC cable relocation project and Metro
Overtime 2,438,135 2,598,381 160,246 6.6%Maintenance due to off-hour maintenance work. This if offset by lower spending inWastewater Operations due to lower than anticipated OT associated with the NMPS workat DITP.
Fringe Benefits 11,680,411 11,324,825 (355,586) -3.0%Lower than budget mainly due to Health Insurance of $31 0,000, due to fewer thanbudgeted participation and the change between family and individual plans.
Underspending due to lower medical payments of$292,000 and compensation payments of
Worker's Compensation 1,367,444 824,935 (542,509) -39.7%$267,000. In January actual spending was $143,000 under budget. It is important to notethat spending on this line item can change significantly depending on future claims andseverity of cases.
Overspending on Activated Carbon of $165,000 at DITP for odor control; SodiumHypochlorite of$108,000 (higher than budgeted cost for new contracts); Polymer of
Chemicals 5,409,177 5,647,910 238,733 4.4%$38,000; Other Oxidizers of$25,000; Carbon Dioxide of$24,000; Hydrogen Peroxideof$21,000; and Ferric Chloride of$20,000. This is offset by lower spending on LiquidOxygen of$43,000; Soda Ash of$36,000; Hydrofluosilic Acid of$26,000; Other of$22,000; and Aqua Ammonia of$19,000.
10f3

ATTACHMENT 2Current Expense Variance Explanations
FY17 YTD Actual vs. FY17
TotalMWRAFY17 Budget FY17 Actuals Budget ExplanationsYTDJanuary YTDJanuary
$ %
Underspending in Electricity of$909,000 primarily at DITP due to lower prices and beingoff grid during the HEEC cable location work; and Wastewater facilities partially for notusing wet scrubbers at NI and lower flows throughout the system. This is offset by higherspending at waterworks facilities attributed to pumping more water to Bedford and higher
Utilities 12,058,689 11,643,093 (415,596) -3.4% than anticipated demand charges at the new Spot Pond Pump Station. Diesel Fuel isoverspent by $473,000 primarily related to running the CTGs at DITP during the HEECcable location work. This is offset by lower spending in Wastewater Operations. Water isoverpsent by $81,000 at DITP and the Carroll Plant. Natural Gas is underspent $49,000primarily at the Carroll Plant and the Chelsea Facility.
Services were overspent by $868,000 and Materials were underspent by $446,000. NutMaintenance 17,083,083 17,505,044 421,961 2.5% Island fire remediation efforts have costs $410,000 in FY 17 for both materials and
services.
Training & Meetings 238,205 207,881 (30,324) -12.7% Underpending primarily in Fleet Services due to timing.----
Lower spending on Lab & Testing Analysis of$96,000 primarily in EnQual -
Professional Services 3,557,829 3,460,041 (97,788) -2.7%Wastewater; Other Services of $95,000 primarily in Treasury and HR; and Engineeringof$48,000 in SCADA. This is offset by higher spending for Legal Services of$167,000in the Law Department.
Higher than budget spending for Vehicle Purchases/ Replacements of$266,000 due totiming; Lab & Testing of$68,000 in Operations; Other Materials of$61,000 primarily
Other Materials 2,146,133 2,462,843 316,710 14.8%for gravel for Clinton landfill; Health/Safety of$34,000; and Computer Hardware of$34,000 in MIS. This is offset by underspending of $157,000 in Vehicle Expensesprimarily due to lower fuel prices and $58,000 for Computer Software in Operations -SCADA.
Lower than budgeted Sludge Pelletization of$2338,000 due to lower year to datequantities; Space LeaseIRentals of $214,000 due to lower escrow for Chelsea taxes and
Other Services 13,417,563 12,608,966 (808,597) -6.0% insurance, and pass through maintenance cost at CNY; Grit and Screenings of$149,000due to lower quantities; and Other Services of $122,000 primarily for timing ofcommunity lead testing assistance.
_Io_!alJ)irect Expenses 125149476 121992469 (3 157:007) -2.5%- -
20f3

ATTACHMENT 2Current Expense Variance Explanations
FY17 YTD Actual vs. FY17TotalMWRA
FYI7 Budget FY17 Actuals Budget ExplanationsYTDJanuary YTDJanuary$ O/o
Indirect ExnensesInsurance 1,152,633 1,082,748 (69,885) -6.1% Lower Claims than budgeted of$78,000 offset by higher premiums of$8,000.
Watershed/PILOT 14,014,193 13,958,873 (55,320) -0.4% Lower Watershed Reimbursement due to over accrual at the end ofFYI6 as compared toactual invoiced paid.
HEEC Payment 446,457 457,638 11,181 2.5%Mitigation 898846 890,077 (8,769) -1.0% Actual inflation rate was 1.5% vs. 2.5% used for the budget.Addition to Reserves (96774)
I
(96,774} - 0.0%Pension Expense 4,632624 4,632,624 - 0.0%Post Employee Benefits - - -Total Indirect Exnenses 21047979 20925186 (122793) -0.6%Debt Service
Debt Service 248,379,143 248,379,143 - 0.0% Through January staff have transferred $7.5 million ofa favorable YTD variance to theDefeasance Account. The short-term rates related variance is $6.3 million lower YTD.
Debt Service Assistance - - -Total Debt Service Expenses 248,379,143 248,379,143 - 0.0%
Total Expenses 394576598 391296798 (3279800) -0.8%Revenue & IncomeRate Revenue 400891443 400891442 (I} 0.0%Other User Charges 5858328 5,915,636 57,308 1.0%
Other Revenue 4,583,335 10,000,942 5,417,607 118.2% $4.8 M for sale of water due to the drought; $299k for settlement of class action lawsuit for:derivative agreements; $195k from sale of surplus equipment; and $116k TRAC penalty. I
Rate Stabilization - - - 1
lnvestmentlncome 5,221,619 4,971,523 (250,096) -4.8% Investment Income is under budget for unanticipated calls re-invested at lower rates.
Total Revenue 416,554725 421779,543 5224818 1.3%
Net Revenue in Excess of 1 21,978,127 1 30,482,745 1 8,504,618 ~Exnenses
3013

ATTACHMENT 3Capital Improvement Program Variance Explanations
(000'5)
FY17 FY17 YTD Actuals vs. BudaetBudgetYTD Actuals YTD $ %
ExplanationsJanuarv Januarv
Wastewater
UnderspendingChelsea Creek Headworks Upgrades Construction: $2.8M (NTP shifted 3 months;contract is currently in submittals and Request For Information status)
ICaruso Pump Station Improvements Construction: $1.6M (delayed installation ofInterception & Pumping $11,697 $8,592 ($3,105) -26.5% HVAC equipment due to unforeseen roof replacement)(l&P) Offset Overspending
Alewife Brook Pump Station Rehab Construction: $1.3M (project progress)Chelsea Screenhouse Upgrades: $0.5M (work scheduled for FY16 performed inFYI7)
OverspendingPrimary & Secondary Clarifier Rehab - Construction: $1.8M (Portion of$2.65Msettlement with contractor. Remainder was retainage payment.)Power System Improvements - Construction: $1.5M (project progress)WTF VFD Replacement - Construction: $0.9M (spending for bonds and insurances)
Treatment $8,462 $13,855 $5,393 63.7% Clinton Wastewater Treatment Plant Phosphorus Reduction - Construction: $0.7M(project progress)Electrical Equipment Upgrades Construction 4: $0.6M (work scheduled and budgetedfor FY16 performed in FY 17)Digested Sludge Pump Replacement - Phase 2: $0.5M (project progress)Offset Underspending Other smaller projects totaling $0.6M.
Residuals $0 $0 $0 -UnderspendingCambridge Sewer Separation: $2.8M (delay in work due to Huron Avenue water main
CSO $5,924 $3,074 ($2,850) -48.1% replacement by the City of Cambridge that required a six month time extension)Reserved Channel Sewer Separation Design and Construction: $O.4M (pendingreconciliation of final costs; expected in June 2017)
Other Wastewater $4,846 $3,513 ($1,333) -27.5% III Local Financial Assistance: $1.3M (less than anticipated requests for grants andloans)
Total Wastewater $30,929 $29,034 ($1,895) -6.1%--
10f3

-
ATT ACHMENT 3Capital Improvement Program Variance Explanations
(000'5)
FY17 FY17 YTD Actuals vs. BudaetBudgetYTD Actuals YTD $ %
ExplanationsJanuary January
WaterworksI
UnderspendingDrinking Water Quality $1,348 $616 ($732) -54.3%
Spot Pond Storage Facility: $O.4M (Microwave tower installed. Awaiting deliveryImprovements and installation of communication shelter.)
CP7 Existing Facilities: $0.2M (pending balancing change order)
UnderspendingWachusett Aqueduct Pump Station: $0.8M (pending redesign of work adjacent toCity of Marlborough water pipe and progress less than anticipated at the pump
Transmission $15,354 $14,098 ($1,255) -8.2% station)Rosemary Brook Building Repair: $0.7M (anticipated time extension due toadditional restoration work)Offset OverspendingHatchery Pipeline construction: $0.7M (project progress)OverspendingSection 4 Webster Ave Bridge Pipe Rehab - Construction: $l.4M (additional changeorder work based on redesign)Nlli Section 89/29 Redundancy Phase IB Construction: $1.5M (project progress)
Distribution & Pumping $8,411 $11,304 $2,893 34.4%SEH Redundancy Pipeline Section 111 Phase I Construction: $0.7M (projectprogress)Offset UnderspendingWeston Aqueduct Supply Mains Section 36/C/S9 - All Valve: $O.4M (anticipatedcredit change order for less than estimated quantities of rock and contaminated soil,and timing of valve installation work)
Other Waterworks $5,919 $5,611 ($308) -5.2%Beacon Street Line Repair - Construction: $O.4M (delay due to redesign of vaults toaccommodate existing trees.)
Total Waterworks $31,031 $31,629 $598 1.9%
20f3

-- - - -
ATTACHMENT 3Capital Improvement Program Variance Explanations
(000'5)
FY17 FY17 YTD Actuals vs. BudaetBudgetYTD Actuals YTD $ %
ExplanationsJanuary Januarv
I
Business & Operations Support
UnderspendingTotal Business & $3,728 $3,235 ($493) -13.2%
As-Needed Design: ($O.9M) (less than budgeted use of these contracts)Operations Support Offset Overspending
Equipment Purchase: $O.5M (timing of vehicle purchases)
TotalMWRA $65,688 $63,897 ($1,791) -2.7%---
30f3

ATTACHMENT 4
FY17Change
TOTALMWRA FY17 BudgetProjection
FY17 Budget vsFY17 ProjectionII; I O/n
lEXPENSESWAGES AND SALARIES $ 101,858,897 $ 98,693,997 $ (3,164,900) -3.1%OVERTIME 4,192,676 4,353,199 160,523 3.8%FRINGE BENEFITS 20,242,324 19,688,233 (554,091) -2.7%WORKERS' COMPENSATION 2,344,190 2,144,190 (200,000) -8.5%CHEMICALS 9,110,407 9,479,801 369,394 4.1%ENERGY AND UTILITIES 21,541,078 20,825,402 (715,676) -3.3%MAINTENANCE 31,080,642 32,004,057 923,415 3.0%TRAINING AND MEETINGS 435,481 414,086 (21,395) -4.9%PROFESSIONAL SERVICES 6,531,939 6,818,941 287,002 4.4%OTHER MA TERIALS 6,219,630 6,156,271 (63,359) -1.0%OTHER SERVICES 22,974,855 22,065,308 (909,547) -4.0%ITOTAL DIRECT EXPENSES 1$ 226,532,117 1$ 222,643,485 1$ (3,888,632) 1 -1.7%1
INSURANCE $ 1,997,898 $ 1,932,428 (65,470) -3.3%WATERSHEDIPILOT 24,291,268 23,900,159 (391, I09) -1.6%HEEC PAYMENT 773,859 773,859 0.0%MITIGATION 1,558,000 1,542,800 (15,200) -1.0%ADDITIONS TO RESERVES (167,742) (167,742) 0.0%RETIREMENT FUND 3,132,624 3,132,624 0.0%ADDITIONAL PENSION DEPOSIT 1,500,000 1,500,000 0.0%POSTEMPLOYMENT BENEFITS 4,876,050 4,8762050 0.0%ITOTAL INDIRECT EXPENSES 1$ 37,961,957 1$ 37,490,178 1$ (471,779)1 -1.2%1
STATE REVOLVING FUND $ 86,971,915 $ 82,906,636 (4,065,279) -4.7%SENIOR DEBT 268,4 72,557 263,027,504 (5,445,053) -2.0%SUBORDINA TE DEBT 69,997,992 69,997,992 0.0%LOCAL WATER PIPELINE CP 4,149,242 1,011,093 (3,138,149) -75.6%CURRENT REVENUE/CAPIT AL 12,200,000 12,200,000 0.0%CAPITAL LEASE 3,217,060 3,217,060 0.0%DEBT PREPAYMENT 10,994,960 10,994,960VARIABLE RA TE SAVINGS (9,643,716) (9,643,716)DEFEASANCE ACCOUNT 22,292,195 22,292,195DEBT SERVICE ASSISTANCE (873,804) (873,804) 0.0%ITOTAL DEBT SERVICE 1$ 455,129,920 1$ 455,129,920 1$ 0.0%1
ITOTAL EXPENSES 1$ 719,623,994 1$ 715,263,583 1$ (4,360,411)1 -0.6%1
IREVENUE & INCOME 1RA TE REVENUE $ 694,878,500 $ 694,878,500 0.0%1OTHER USER CHARGES 8,752,834 8,752,834 0.0%OTHER REVENUE 6,519,171 13,719,271 7,200,100 110.4%RATE STABILIZATIONINVESTMENT INCOME 9,473,490 9,309,490 (164,000) -1.7%ITOTAL REVENUE & INCOME 1$ 719,623,996 1$ 726,660,095 1$ 7,036,100 1 1.0%1
VARIANCE: $ (11,396,512) $ (11,396,512)

AF&A AA2/15/17
STAFF SUMMARY
TO:FROM:DATE:SUBJECT:
Board of DirectorsFrederick A. Laskey, Executive Director --;;z_.tJ .Z>;February 15,2017 -0_ ..Fiscal Year 2017 Mid-Year Capital Improvement Program Spending Report
FY17 actual spending for the first half of the year is $56.7 million compared to a budgetedamount of$59.1 million which is $2.4 million or 4.1% below budget. The projected spendingforFY17 is estimated at $133.4 million versus the budget of$155.3 millionfor an underspending o$21.9 million or 14.1% which is better than the historical 23-24% below budget spending pattern.
COMMITTEE: Administration, Finance & Audit
~ÇAire~torLouise Mi er ~:~iMana erPreparer/ itle Director, Finance
At the mid-point of each fiscal year, staff present the Board with a spending recap of the year-to-date Capital Improvement Program (CIP).
MWRA continues to make progress on several major projects including North Main Pump Stationand Winthrop Terminal Facility Butterfly Valve Replacement and Winthrop Terminal FacilityVariable Frequency Drives Construction, both at Deer Island, Wachusett Aqueduct Pump Station,Alewife Brook Pump Station Rehabilitation, Hatchery Pipeline and Hydroelectric project, ClintonPhosphorus Reduction, and redundancy projects in both the Northern Intermediate High andSouthern Extra High Service areas.
Several projects were completed in the first half of the fiscal year, including Upgrades to ChelseaScreenhouse, Section 4 Webster Avenue Pipe and Utility Bridge Replacement, SouthboroughWater Quality Laboratory Upgrades, Section 36 Water Mains in Arlington and Medford, DeerIsland Secondary Reactor Variable Frequency Drives, Deer Island Cryogenics ChillersReplacement; and Deer Island Thermal Power Plant Boiler Controls Replacement.
New contracts valued at $113.2 million were awarded in the first half of the fiscal year includingthe Chelsea Creek Headworks Upgrades Contruetion and the third construction contract forNorthern Intermediate High Service area Section 89 and 29 Redundancy.

RECOMMENDATION:
For information only. The Fiscal Year 2017 Mid-Year Capital Improvement Program SpendingReport highlights major capital program accomplishments and provides explanations for spendingvariances and schedule changes versus the budget.
DISCUSSION:
Overall MWRA Capital Spending
Spending through FYI7 second quarter totals $56.7 million, $2.4 million or 4.1% lower thanbudget. After accounting for programs which are not directly under MWRA's control, mostnotably the Inflow and Infiltration (III) program, the Local Water Pipeline program, and thecommunity managed Combined Sewer Overflow (CSOs) projects, capital spending totaled $48.0million, $1.7 million or 3.7% over budget.
FY17 CIPSpending(Year-To-Date December)
$120.0
$100.0
$80.0 ¡>,'" !o':lc .,<;~ .,<;:i' $60.0cV> $40.0
$20.0
$0.0MWRATotal Wastewater System
Improvements
weterwcrks System Business &Operations Support
Improvements
o Budget .Actual
FY17CIP Cumulative Spending
$180.0
$160.0
$140.0
$120.0
'" $100.0c~~ $80.0.:'" $60.0
$40.0
$20.0
$0.0Jul Aug Sep Oct Nov Dec Jan Feb Mar Apr May Jun
-- Budget ---.-_. Actual
2

3
Projects that were completed or reached substantial completion in the first half of FYI7included:
Deer Island Treatment Plant Scum Skimmer Replacemento Total Project Cost: $20.4 milliono Completion Date: October 2016o Total Project Duration: 3 years
Weston Aqueduct Supply Mains Section 36 Water Mains Arlington & Medfordo Total Project Cost: $11.6 milliono Completion Date: December 2016o Total Project Duration: 2 years
Chelsea Screenhouse Upgradeso Total Project Cost: $5.0 milliono Completion Date: September 2016o Total Project Duration: 1 year
Webster Avenue Bridge Pipe Replacemento Total Project Cost: $3.9 milliono Completion Date: December 2016o Total Project Duration: 1.5 years
Southborough Water Quality Laboratory Upgradeso Total Project Cost: $3.5 milliono Completion Date: November 2016o Total Project Duration: 1.3 years
Deer Island Secondary Reactor Variable Frequency Drives Constructiono Total Project Cost: $2.3 milliono Completion Date: August 2016o Total Project Duration: 1.5 years
Deer Island Cryogenics Chillers Replacemento Total Project Cost: $3.2 milliono Completion Date: October 2016o Total Project Duration: 2 years
Deer Island Thermal Power Plant Boiler Controls Replacemento Total Project Cost: $1.6 milliono Completion Date: November 2016o Total Project Duration: 2 years
MWRA also has a number of water and wastewater projects currently in design or underconstruction. Life-to-date expenditures for some of the larger active contracts are:
Deer Island North Main Pump Station and Winthrop Terminal Facility Butterfly ValveReplacement - 61% complete
o Total budget: $17.2 million, $10.5 million spent

Deer Island Winthrop Terminal Facility Variable Frequency Drives Construction - 7%complete
o Total budget: $15.2 million, $0.8 million spentAlewife Brook Pump Station Rehabilitation - 24% complete
o Total budget: $12.6 million, $3.0 million spentWachusett Aqueduct Pump Station - 29% complete
o Total budget: $45.5 million, $13.2 million spentClinton Phosphorus Reduction Construction - 36% complete
o Total budget: $7.3 million, $2.6 million spentHatchery Pipeline and Hydroelectric Construction - 72% complete
o Total budget $3.7 million, $2.6 million spentNorthern Intermediate High Section 89 & 29 Redundancy Phase IB Construction - 81%complete
o Total budget: $9.9 million, $8.0 million spentSouthern Extra High Section 111 Phase 1 Construction - 10% complete
o Total budget: $13.5 million, , $1.3 million spentQuabbin Power Communications and Security Improvements - 99% complete
o Total budget: $3.2 million, $3.2 million spentBeacon Street Water Line Repair -73% complete
o Total budget: $1.6 million, $1.1 million spentDI Fuel Oil System Upgrades - 84% complete
o Total budget: $4.6 million, $3.8 million total spentRosemary Brook Building Repair - 87% complete
o Total budget: $1.7 million, $1.5 million spentCaruso Pump Station Improvements - 53% complete
o Total budget: $4.1 million, $2.2 million spentSouthern Extra High Redundancy Pipeline Phase 1 Design/ConstructionAdministration/Resident Inspection - 36% complete
o Total budget: $7.7 million, $2.8 million spentNorthern Intermediate High Section 89/29 Redundancy Design/ConstructionAdministration/Resident Inspection - 59% complete
o Total budget: $6.2 million, $3.7 million spentDeer Island HVAC Equipment Replacement Design/Engineering Services DuringConstruction - 65% complete
o Total budget $2.0 million, $1.3 million spent
Community Financial Assistance
In the first half of FY17, MWRA continued support for the community financial assistanceprograms by providing funding distributions of $22.8 million for wastewater infiltration and
4

5
inflow (I/I) removal ($8.9 million) and water pipeline improvements ($13.9 million, including a$1.5 million for lead service replacement).
Major Variances to FY17 Budget
Spending by program is represented below:
FY17 Capital Improvement Program Spending Through December 2016 ($OOOs)
Budgeted Actual Variance to Budget % of Total YTDProgram Spending Spending Actual Spending$ 0/0
Total Wastewater System $27,702 $24,281 ($3,422) -12% 43%
Interception & Pumping $9,723 $7,439 ($2,284) -23% 13%
Treatment $7,210 $10,313 $3,103 43% 18%
Residuals $0 $0 $0 0% 0%
Combined Sewer Overtlow $5,924 $3,016 ($2,908) -49% 5%
Other Wastewater Programs $4,846 $3,513 ($1,333) -28% 6%
Total Wate rwo rks System $28,023 $29,554 $1,531 5% 52%
Drinking Water Quality Improvements $1,272 $560 ($712) -56% 1%
Transmission $13,549 $12,626 ($923) -7% 22%
Distribution and Pumping $7,523 $11,039 $3,516 47% 19%
Other Waterworks Programs $5,678 $5,328 ($350) -6% 9%
Business & Operations Support $3,374 $2,848 ($526) -16% 5%
Total MWRA (without Contingency) $59,099 $56,682 ($2,417) -4% 100%
Wastewater System Improvements
Wastewater actual spending was $24.3 million, $3.4 million or 12.4% less than budget. The graphon next page reflects the project variances:

WastewaterSpending$5.0,----------------------------
$4.0DIFuelOil$3.01---------------------.:c.:..:..c=-:'-"-------!
SystemUpgrades, WTFVFD$2.01---------·------------------$1 ..;5---Replacements¡-
r---- $0.8$1.01-----------------1 Il$0.0+--r----r--r----r-_r---..,...----,I---:".,..--'---1-..I......----1-..I.-.I
..$1.0 -
..$2.0 ..__ L..--- '---- ..___Jnfiltration/'-- ._l..-----.. CarusoPump ChelseaHeadworks Inflow(I/I),
..$3.0-1---. Station .pgFade -$[3---.----------CambndgeSewer Construction,
-$4.0--Separation--Improv.ements,---'l'---------------------·---I, -~1.7-$2.8 -$2.0..$5.0.J.....__..!..::.:.::;__ _J
Spending is under budget for the following projects:
• Cambridge Sewer Separation: $2.8 million - due to delays in surface restoration work.• Caruso Pump Station Improvements: $2.0 million - due to delays with HVAC installation
as a result of an unforeseen roof replacement.• Chelsea Creek Headworks Upgrades Construction: $1.7 million - due to later than
budgeted award of contract.• Infiltration/Inflow (III): $1.3 million - due to community requests for grants and loans
being less than anticipated.
Spending is over budget for the following projects:
• Deer Island Treatment Plant Fuel Oil System Upgrades: $1.5 million - due to contractorprogress
• Deer Island Winthrop Terminal Facility Variable Frequency Drives Replacement: $0.8million - primarily due to contractor progress.
Waterworks System Improvements
Waterworks actual spending was $29.6 million, $1.5 million or 5.5% greater than budget. Themajor spending variances are shown in the graph on next page:
6

$4.0 ,.------:-----------------------------~NIHSect 89/29 .
Section 4 Websteredundanc.y.J~.hase-Ävenue ri ge atcher.y..Pjpeline:;EH'Sl!-ctlllnJ.1:1------------I
lB Constr., p' C t and Hydroelectric Phase 1-----------$1~6 Ipe ons r., .-;;----,==:~c::--------------l
$1.3
Waterworks Spending
$3.0
$2.0
$1.0
-$1.0 _ ..-- .. --·---------------------------WachusetCAqueductRösemary Brook
-$2.0 -I __:_P_::um:.:..:J:..:::.:St:=_at::_:io:.:_n:____....:B::.:u:_::il-=.di:.:.:_nge..__1Constr., Repairs,
-$3.0 ~----- ------------------~- 0.1 -$0.1-..------'
-$4.0 J__ __j
Spending is over budget for the following projects:
• Northern Intermediate High Section 89/29 Redundancy Construction Phase IB: $1.6million - due to contractor progress.
• Section 4 Webster Avenue Bridge Pipe Construction: $1.3 million - due to additionalchange order work.
• Hatchery Pipeline: $1.0 million - due to contractor progress for Phase 1 completed aheadof schedule.
• Southern Extra High Section 111 Phase 1 Construction: $0.9 million - due to contractorprogress.
Spending is under budget for the following projects:• Wachusett Aqueduct Pump Station: $0.7 million - due to construction issues encountered• Rosemary Brook Building Repairs of $0.7 million - due to construction delays and time
extension.
Business and Operations Support
Business and Operations Support spending is $2.8 million, $0.5 million or 15.6% less thanbudget. The actual project underspending is due to timing of MIS-related projects which werebudgeted for implementation in the first half of FY17 but will implement in the second half.
Please refer to Attachment A ofthe report for detailed FY17 CIP variance explanations.
Status of Contract Awards Planned for FY17
MWRA's FY17 Final CIP forecast 41 contract awards valued at $241.6 million. Through mid-year, MWRA has awarded 17 contracts with a value of $113.2 million or nearly 65% of the$174.1 million planned.
7

18
$250 $241.7 16$215.7 14 14
$174.1$200
As part of the FY18 Proposed CIP development, staff revisited planned work identified in theFYI7 Final CIP and updated assumptions based on new information. By the end of FYI7, staffexpect to award 18 additional contracts valued at $107.9 million for a total of 35 contracts valuedat $221.2 million.
The primary reasons for not expecting to award all contracts in FY17 are:
• Five projects have been delayed due to changes in scope that has required additional work;• Four projects whose schedules have been reprioritized; and• One project where the project/phase has been eliminated or being performed in-house or
in the CUITentExpense Budget.
The table below summarizes the total number of capital contract awards planned for FYI7 andhighlights the number planned for award during the second half ofFYI7.
Recap of Planned FY17 Contract Awards
# of projects Budget/Award
41 $241.6
$91.0$22.3
$107.9$37.5$0.4
$221.2
Total Planned Awards per FY17 CIP
Actual Awards in First Half FY17Actual Unplanned Awards in First Half FYl7Planned Awards in Second Half of FY17Shifted Beyond FYl7 - Scope or Priority ChangeDeleted/Transferred from ClP/Project on hold
Total Projects Planned to be awarded in FYl7
12518101
35
Please refer to Attachment B for project level detail.
8

Project ContractFY17
Budget inMillions
The MWRA awarded the following contracts in the first half of FY17:
Chelsea Creek Headworks Upgrades Construction - $72.9 millionNorthern Intermediate High Section 89 & 29 Redundancy Construction Phase IC - $17.8millionChelsea Headworks Upgrades Resident Engineering/Inspection - $3.6 millionNew Connecting Mains Shaft 7 to WASM 3 CP3 (Section 23,24,47 FinalDesign/Construction Administration/Resident Inspection - $3.5 millionPrison Point Rehabilitation Design/Construction Administration/Resident Inspection -$2.8 millionCommonwealth Avenue Pump Station Redundancy Design/ConstructionAdministration/Resident Inspection - $2.8 millionNorth Main Pump Station Motor Control Center Phase 2 Design/Engineering ServicesDuring Construction/Resident Inspection - $2.5 millionSection 80 Replacement - $1.8 millionDI Personnel Dock Rehabilitation - $1.3 millionSewer Sections 4,5,6,186 Study - $1.2 millionChicopee Valley Aqueduct Motorized Screens Replacement - $1.0 millionCambridge Branch 23, 24, 26, 27 Study - $0.7 millionPrison Point Piping Rehabilitation - $0.5 millionEvaluation of Farm Pond Buildings - Waban Arches - $0.3 millionQuabbin Utility - $0.2 millionShaft 5A15 Surface Piping Cathodic Protection - $0.1 million
Major Initiatives for the 2nd Half of FY17
Looking ahead to the second half of FY17, the MWRA anticipates awarding several majorconstruction contracts. The largest ofthese projects are listed below:
Major Planned Construction Contract Awards for Second Half of FY17
DI Treatment Plant Asset ProtectionNIH Redundancy and StorageSEHRedundancy and StorageResiduals Asset ProtectionSEHRedundancy and Storage
DI Treatment Plant Asset Protection
DI Treatment Plant Asset ProtectionFacility Asset protection
HVACEquipment Replacement ConstructionSection 89/29 Redundancy Construction Phase 2Redundancy Pipeline Section 111 Construction 2Residuals Facility Upgrade ConstructionRedundancy Pipeline Section 111 Construction 3Future Miscellaneous Variable Frequency Drives ReplacementsConstructionSodium Hypochlorite and Bisulfite Tanks Rehabilitation
$ 29.518.210.810.07.4
5.3
5.0Interceptor Renewall, Reading Extension Sewer Construction 4.3
Total s 90.5
9

Winsor Station Pipeline Improvements 2.2
MWRA also anticipates awarding several significant professional services contracts. The largestcontracts are listed below:
Major Planned Professional Services Awards for Second Half of FY17
Project ContractFY17
Budget inMillions
DI Treatment Plant Asset Protection
Nut Island Headworks Odor Control and HVACImprovementsDesign/Construction Administration/Resident InspectionShaft 12 Isolation Gate Design/ConstructionAdministration/Resident InspectionHVACEquipment Replacement Resident Engineering InspectionInterceptor Renewal 3 Dorchester Interceptor SewerDesign/Construction Admi nistration/Resident InspectionCathodic Protection Design/Engineering Services DuringConstruction
$ 2.8Corrosion & Odor Control
2.0
Facility Asset Protection 1.0
DI Treatment Plant Asset Protection 1.0
Total s 9.0
In the second half of the FYI7, MWRA also anticipates substantial completion on major contractsincluding Caruso Pump Station Improvements, Quabbin Power, Communications and Security,Rosemary Brook Building Repair, and Beacon Street Water Line.
Attachments:
A. FYl7 CIP Variance Explanations through December 2016B. FYl7 Planned Capital Contract Awards
10

ATTACHMENT A
FY17 CIP VARIANCE EXPLANATIONS THROUGH DECEMBER (Q2) - PROGRAM SUMMARY ($0005)
VARIANCEMAJOR PROJECTBUDGET ACTUALS
($) %
Total MWRA $ 59,100 $ 56,682 $ (2,417) -4%
Variance by Program
Total Wastewater $ 27,702 $ 24,281 $ (3,422) -12%
Interception and Pumping $ 9,723 $ 7,439 $ (2,284) -23% Interception & Pumping Facility Asset Protection ($2.2M).
Treatment $ 7,210 $ 10,313 $ 3,103 43%Deer Island Treatment Plant Asset Protection ($2.7M) and ClintonWastewater Treatment Plant ($O.4M).
Residuals $ - $ - $ - -csa $ 5,924 $ 3,016 $ (2,908) -49%
MWRA Managed $ 6 $ 84 $ 78 1307%
Community-Managed $ 5,918 $ 2,932 $ (2,987) -50%Cambridge Sewer Separation ($2.8M) and Reserved Channel SewerSeparation ($O.4M).
Planning & Support $ 2 $ - $ (2) 0%
Other $ 4,846 $ 3,513 $ (1,333) -28% 1/1 Local Financial Assistance ($l.3M).
Total Waterworks System Improvements $ 28,024 $ 29,554 $ 1,531 5%
Drinking Water Quality Improvements $ 1,272 $ 560 $ (712) -56%Spot Pond Storage Facility ($0.4M) and Carroll Water Treatment Plant(0.3M).Sudbury/Weston Aqueduct Repairs ($0.6M), Cosgrove Tunnel
Transmission $ 13,549 $ 12,626 $ (923) -7% Redundancy ($O.5M) and Watershed Land ($0.3M). Offset by Winsor
Station/Pipeline Improvements +j_0.6M.NIH Redundancy & Storage +$1.6M, Spot Pond Supply Mains Rehab
Distribution and Pumping $ 7,523 $ 11,039 $ 3,515 47%+$l.4M, SEH Redundancy & Storage +$0.9M and New Connecting Mains -Shaft 7 to WASM +$0.2M. Offset by Weston Aqueduct Supply Mains($0.3M).Waterworks Facility Asset Protection ($O.4M) and Central Monitoring
Other $ 5,678 $ 5,328 $ (350) -6% System ($O.lM). Offset by Local Water Pipeline Improvement Loan
Program +$0.2M.Capital Maintenance Planning & Development ($0.8M), Application
Business and Operations Support $ 3,374 $ 2,848 $ (526) -16%Improvement Program ($0.5M) and IT Infrastructure Program ($0.4).Offset by Alternative Energy Initiatives +$O.4M, Information SecurityProgram +$O.4M and Equipment Purchase +$0.3M.
Total Variance by Program $ 59,100 $ 56,682 $ (2,416) -4%
lof4

ATTACHMENT AFY17 CIP VARIANCE EXPLANATIONS THROUGH DECEMBER (Q2) - BY PROJECT ($OOOS)
VARIANCEVARIANCEEXPLANATIONSBUDGET ACTUALS
($) %
Total MWRA $ 59,099 s 56,682 s (2,417) -4%
Wastewater System Improvements $ 27,702 $ 24,281 $ (3,422) -12%
Interception & Pumping $ 9,723 $ 7,439 $ (2,284) -23%Corrosion & Odor Control $ 133 $ 71 $ (63) -47%Interception & Pumping (I&P) Facility Asset Protection $ 9,589 $ 7,369 $ (2,221) -23%
Caruso Pump Station Improvements - Construction $ 3,575 $ 1,597 $ (1,978) -55%Delayed installation of HVACequipment due to unforeseen roof replacement.
Chelsea Creek Headworks Upgrades Construction $ 1,663 $ - $ (1,663) -Notice to proceed schedule shift of three months. Contract is currently insubmittals and Requests For Information.
Alewife Brook Pump Station Rehab Construction $ 1,850 $ 3,023 $ 1,173 63% Project progress.Chelsea Screenhouse Upgrades $ 1,045 $ 1,562 $ 516 49% Work scheduled and budgeted for FY16performed in FY17.
Treatment $ 7,210 $ 10,313 $ 3,103 43%DITPAsset Protection $ 5,730 s 8,396 $ 2,667 47%
Power System Improvements - Construction $ 718 $ 2,264 $ 1,546 215% Project progress.WTF VFD Replacement - Construction $ - $ 824 $ 824 - Current spending for bonds and insurance.
Electrical Equipment Upgrades - Construction 4 $ - $ 500 $ 500 - Work scheduled and budgeted for FY16performed in FY17.Digested Sludge Pump Replacement - Phase 2 s 638 $ 964 s 326 51% Project progress.
NMPS & WTF Butterfly Valve Replacement $ 2,279 $ 1,730 $ (549) -24% Longer than anticipated lead time for valves as a result of coating issues.Clinton Wastewater Treatment Plant $ 1,480 $ 1,916 $ 436 29%
Phosphorous Reduction - Construction s 1,333 $ 1,727 $ 394 30% Project progress.Residuals s - $ - s - -
eso $ 5,924 s 3,016 $ (2,908) -49%MWRA-Managed s 6 $ 84 $ 78 -MWR003 Gate & Siphon $ 6 $ 84 s 78 -
Community-Managed $ 5,918 $ 2,932 $ (2,987) -50%Dorchester Bay Sewer Separation (Commercial Point) $ (127) $ - $ 127 -Cambridge Sewer Separation $ 5,691 $ 2,932 $ (2,759) -48%
Design/CS/RI $ 1,311 $ 739 s (572) -44% Delay in work due to Huron Avenue water main replacement by the City ofConstruction s 4,380 $ 2,192 $ (2,188) -50% Cambridge that required a six month time extension.
Morrissey Boulevard Drain $ (2) $ - $ 2 -
Reserved Channel Sewer Separation $ 354 $ - $ (354) - Pending reconciliation of final costs. Expected in June 2017.Planning and Support $ 2 s - $ (2) -
2 of 4

ATTACHMENT AFY17 CIP VARIANCE EXPLANATIONS THROUGH DECEMBER (Q2) - BY PROJECT ($OOOs)
VARIANCEVARIANCE EXPLANATIONSBUDGET ACTUALS ($) %
Other $ 4,846 $ 3,513 $ (1,333) -28%I/I Local Financial Assistance $ 4,846 $ 3,513 $ (1,333) -28%
Grants S 6,939 $ 6,034 S (904) -13%Lessthan anticipated requests for grants and loans.
Loans S 3,213 2,871 s (342) -11%Repayments (5,306) (5,393) S (87) 2%
Waterworks System Improvements s 28,023 $ 29,554 $ 1,531 5%
Drinking Water Quality Improvements $ 1,272 $ 560 $ (712) -56%Carroll Water Treatment Plant $ 652 $ 306 $ (346) -53%
Existing Facilities Modifications - CP7 $ 517 $ 275 $ (242) -47% Pending balancing change order for asbestos removal.Spot Pond Storage Facility $ 620 S 255 S (365) -59%
Design / Build $ 620 $ 242 $ (378) -61%Microwave tower installed. Awaiting delivery and installation ofcommunication shelter.
Transmission $ 13,549 $ 12,626 $ (923) -7%Cosgrove Tunnel Redundancy s 9,311 S 8,794 S (517) -6%
Wachusett Aqueduct Pump Station - Construction $ 9,000 S 8,258 S (742) -8%Pending redesign of work adjacent to City of Marlborough water pipe andprogress less than anticipated at the pump station.
Watershed Land S 1,000 S 731 S (269) -27%Long Term Redundancy S 354 S 292 $ (62) -18%Sudbury/Weston Aqueduct Repairs $ 1,474 S 828 s (646) -44%
Rosemary Brook Building Repair $ 1,450 $ 767 $ (683) -47% Anticipated time extension.Winsor Station/Pipeline Improvements s 1,292 s 1,913 S 621 48%
Hatchery Pipeline - Construction $ 1,258 $ 1,840 $ 582 46% Project progress.MetroWest Tunnel $ 68 S (6) S (74) -
Metropolitan Redundancy Interim Improvement S 50 S 74 $ 24 49%Distribution And Pumping $ 7,523 $ 11,039 $ 3,516 47%
NIH Redundancy & Storage $ 4,205 s 5,757 $ 1,552 37%Section 89/29 Redundancy Phase lB Construction S 3,600 S 5,217 $ 1,617 45% Project progress.
Spot Pond Supply Mains Rehab $ 605 S 2,005 S 1,400 231%Section 4 Webster Avenue Bridge Pipe Rehab - Construct. S 569 S 1,888 $ 1,318 232% Additional change order work based on redesign.
SEHRedundancy & Storage S 1,086 s 1,939 S 852 78%Redundancy Pipeline Section 111 Phase 1 - Construction $ 400 S 1,313 S 913 228% Project progress.
New Connecting Mains - Shaft 7 to WASM 3 S 287 S 511 $ 225 78%CP3,Sections 23,24 & 47 - Final DeSign/CA/RI S 282 S 511 S 230 81% Project progress.
Weston Aqueduct Supply Mains $ 1,060 S 754 $ (306) -29%
Section 36/C/S9 - All Valve S 930 S 557 S (373) -40% Anticipated credit change order for less than estimated quantities of rock andcontaminated soil, and timing of valve installation work.
Valve Replacement $ 120 $ - $ (120) -NHS- Revere & Malden Pipeline Improvements s 99 S 49 s (50) -51%
3 of 4

ATTACHMENT A
FY17 CIP VARIANCE EXPLANATIONS THROUGH DECEMBER (Q2) - BY PROJECT ($0005)
BUDGET ACTUALSVARIANCE
($) VARIANCE EXPLANATIONS%
Northern Extra High Service - New Pipelines $ 11 $ - $ (11) -
Cathodic Protection of Distribution Mains $ 34 $ 25 $ (9) -27%Northern Low Service Rehabilitation - Section 8 & 57 $ 8 $ - $ (8) -
Northern High Service - Section 27 Improvements $ 7 $ - $ (7) -Southern Spine Distribution Mains $ 1 $ - $ (1) -
Section 80 Rehabilitation $ 1 $ 1 $ (1) -50%
Other $ 5,678 $ 5,328 s (350) -6%
Local Water Pipeline Improvement Loan Program $ 2,037 $ 2,221 $ 184 9%
Community Loans $ 10,725 $ 12,410 $ 1,685 16% Greater community requests for Local Water System Loans.Lead Service Line Replacement Loans $ 3,000 $ 1,500 $ (1,500) -50% Lesscommunity requests for the Lead Loan Program.
Repayments $ (11,688) $ (11,689) $ (1) 0%Central Monitoring System $ 1,993 $ 1,856 $ (137) -7%
Quabbin Power Utility Feesand Permits $ 170 $ - $ (170) -
Waterworks Facility Asset Protection $ 1,648 $ 1,251 $ (397) -24%Beacon Street Line Repair - Construction $ 1,536 $ 1,146 $ (390) -25% Delay due to trees relocation and MBTA permits.
Business & Operations Support $ 3,374 $ 2,848 s (526) -16%
BusinessSystems Plan $ - $ 35 $ 35 -
Alternative Energy Initiatives $ 50 $ 431 $ 381 762%Application Improvement Program $ 1,098 $ 645 $ (453) -41%IT Infrastructure Program $ 445 $ 6 $ (439) -99% Timing of IT Strategic Plan implementation.Information Security Program $ 44 $ 477 $ 433 985%Equipment Purchase $ 657 $ 1,000 $ 343 52%
FY14-18 Vehicle Purchases $ 325 $ 841 $ 516 159% Timing of vehicle purchases.MWRA Facility o Chelsea $ - $ (1) $ (1) -
Capital Maintenance Planning & Development $ 1,081 $ 255 $ (826) -76%
4 of 4

ATTACHMENT BFY17 PLANNED CAPITAL CONTRACT AWARDS ($ in Millions)
Schedule
Project Subphase NTPFYI8
FYI7 Budget Award Amount VendorChange
Revised ReasonCode*
Facility Asset ProtectionPrison Point Rehabilitation - Design/Construction
Jul-16 Jul-16 $ 2.5 $ 2.8 Areadis ll.S., Inc. IAdministrationlResident Inspection
Barletta HeavyDivision/Barletta
Facility Asset Protection Chelsea Creek Upgrades - Construction Jul-t6 Nov-IG G2.0 72.9 Engineering tCorporation, AJoint Venture
CP3 (Sect 23,24,47) - Final Design/Construction GreenNew Connect Mains-Shaft 7 to WASM 3 Jul-16 Jul-t6 3.0 3.5 International IAdministration/Resident Inspection
Affiliates, Inc.Chestnut Hill Connecting Mains Chestnut Hill Gatehouse # I Repairs Construction Jul-16 Sep-17 1.0 6
NIH Redundancy & Storage Section 89 & 29 Redundancy Construction Phase 2 lul-16 May-17 18.2 3&4
Winsor Station Pipeline Improvements Quabbin Aqueduct Final Design CAIRJ (Shaft 12 Isolation GateJul-16 Apr-I? 2.2 3Design CAIRJ now)
Project beingSudbury/Weston Aqueduct Repairs Weston Aqueduct Flow Control Valve Jul-16 done in the 0.4 2
CEB.Green
Sudbury/Weston Aqueduct Repairs Evaluation of Farm Pond Buildings-Waban Arches Jul-t6 Jul-t6 0.1 0.3 International tAffiliates, Inc.
Application Improvements Program Pre-Treatment Information Management Systems (PIMS)Sep-16 Feb-17 0.4 3Enhancements
Facility Asset Protection Cambridge Branch 23,24,26,27 - Study Sep-16 Oct-t6 1.0 0.7 Hazen andI
Sawyer, P.c.NHS - Revere & Malden Pipeline
Section 53 and 99 Improvements Study (now Design CA/RI) Sep-16 lun-17 0.4 3Improvements
Rehabilitation of Other Pump Stations Commonwealth Ave Pump Station Redundancy-Sep-If Dec-t6 0.8 2.8
Black & VeatchIDesign/Construction AdministrationlResident Inspection Corporation
SEH Redundancy & Storage Redundancy Pipeline Sect III - Construction 2 Sep-16 lun-17 10.8 3&4
Quabbin Transmission System Chicopee Valley Aqueduct Motorized Screens Replacement-Sep-16 Nov-16 1.0 1.0
W.M. SchultzlConstruction Construction, Inc .
. - L. ____
10f3

ATTACHMENT BFY17 PLANNED CAPITAL CONTRACT AWARDS ($ in Millions)
Schedule
Project Subphase NTPFY18
FY17 Budget Award Amount VendorChange
Revised ReasonCode*
Wastewater Meter System-Equipment Planning / Study / Design Oct-16 Jul-l7 2.7 5ReplacementResiduals Asset Protection Residuals Facility Upgrades - Construction Oct-16 Jun-17 10.0 3
Waterworks Supervisory Control and Data AcquisitionMcInnis
Central Monitoring SystemSystem (SCADA)/Program Logic Controller (PLC) Upgrades
Oct-16 Oct-16 18.5 0.1 Consulting 1(Comm. Ave PS Programming and Configuration initial[phase awarded)
Services, Inc.
Section 80 Rehabilitation Section 80 Replacement Oct-16 Nov-16 0.7 1.8P. CaliaccoCorporation
1
Nut Island Headworks Odor Control and HVAC ImprovementsCorrosion & Odor Control Design/Construction AdministrationIResident Engineer Nov-16 Apr-17 2.8 3
Inspection
Facility Asset Protection Sections 4,5,6, 186 - Study Nov-16 Jan-17 l.S 1.2Hazen and l
Sawyer, P.c.Facility Asset Protection Hingham/Quincy PS Fuel Storage Upgrades Const Nov-16 Mar-17 0.5 3DI Treatment Plant Asset Protection Cathodic Protection - DesignlESDC Nov-16 May-17 1.0 3
DI Treatment Plant Asset Protection Barge Berth and Facility Replacement Nov-16 Dec-16 2.3 1.3Coastal Marine
lConstruction LLC
North Main Pump Station Motor Control Center Phase 2DI Treatment Plant Asset Protection DesignIEngineering Services During Construction/Resident Nov-16 Feb-17 2.5 2.5 AECOM 1
InspectionDI Treatment Plant Asset Protection Gravity Thickener Rehabilitation Nov-16 Apr-18 14.1 5DI Treatment Plant Asset Protection Combined Heat & Power Alternatives Design (Study now) Dec-16 Apr-17 6.0 3Clinton Wastewater Treatment Plant Clinton Roofing Rehabilitation Dec-16 Mar-17 1.2 3SEH Redundancy & Storage Redundancy Pipeline Section III - Construction 3 Dec-16 Jun-l7 7.4 3July 2016 - December 2016 28 Contracts Planned $ 174.9 $ 91.0
Facility Asset ProtectionInterceptor Renewal 3 Dorchester Interceptor Sewer Design Jan-l7 Apr-17 1.0 3Construction AdministrationIResident Inspection
DI Treatment Plant Asset Protection Eastern Seawall Design - I Jan-l7 Jul-17 0.6 6DI Treatment Plant Asset Protection HVAC Equipment Replacement - Construction Jan-17 Jun-17 29.5 3NIH Redundancy & Storage Section 89 & 29 Rehabilitation - Design Jan-17 Jul-17 i.s 6
Winsor Station Pipeline ImprovementsWinsor Power Station Final Design/Construction Jan-l7 Aug-17 1.9 5Administration/Resident Inspection
Facility Asset Protection Interceptor Renewal I, Reading Extension Sewer - Construction Mar-17 Apr-17 4.3 3
Dl Treatment Plant Asset Protection HVAC Equipment Replacement Resident Engineer Inspection Mar-17 Jun-l7 2.0 3DI Treatment Plant Asset Protection Switchgear Replacement - Construction Apr-17 Oct-17 8.0 5Distribution Systems Facilities Mapping Update of Record Drawings Apr-17 Apr-18 0.5 5~-'---
2 of 3

ATTACHMENT BFYI7 PLANNED CAPITAL CONTRACT AWARDS ($ in Millions)
Schedule I!
Project Sub phase NTPFYI8
FYI7 Budget Award Amount VendorChange
Revised ReasonCode*
DI Treatment Plant Asset Protection Expansion Joint Repair - Construction 3 May-17 Oct-17 1.9 6
DI Treatment Plant Asset ProtectionFuture Miscellaneous Variable Frequency Drives Replacements-
May-17 May-17 5.3 3Construction
DI Treatment Plant Asset ProtectionOdor Control Rehabilitation - DesignJEngineering Services
Jun-17 May-19 5.2 5During Construction
DI Treatment Plant Asset Protection Sodium Hypochlorite and Bisulfite Tanks Rehabilitation Jun-17 Jun-17 5.0 3-
January 2017 - June 201741 FYI7 Contract Awards Planned
13 Contracts Planned $
$66.8
241.6
Unplanned Awards
Facility Asset Protection Prison Point Piping Rehabilitation Jun-I6 Oct-16 $ 0.4 $ 0.5John Danforth,
IInc.
Facility Asset Protection Chelsea Headworks Resident Engineering/Inspection Jun-16 Oct-I6 3.7 3.6 CDM Smith, Inc. I
Central Monitoring Utility Fees and Permits Jul-I6 Jul-16 0.7 0.2Verizon Business
1Network Services
MetroWest Tunnel Shaft SA/S Surface Piping Cathodic Protection May-I6 Nov-16 0.2 o.i CorrTech Inc. I
NIH Redundancy & Storage Section 89 & 29 Redundancy Construction Phase IC Jun-16 Jan-17 17.2 17.8Albanese D&S,
IInc.
Total Unplanned $ 22.3 $ 22.3
* Reason Codes:I. NTP issued in first halfofFYl7.2. Project/Phase eliminated or being performed in-house; or phase completed but on hold.3. NTP expected January 2017 - June 2017.4. Schedule change due to permitting.5. Scope changes.6. Changes in priorities.
3 of 3

,
STAFF SUMMARY
TO:FROM:DATE:SUBJECT:
Board of DirectorsFrederick A. Laskey, Executive DirectorFebruary 15,2017FY2017 Sewer Assessment Adjustments
AF&A A.52/15/17
COMMITTEE: Administration, Finance & Audit
Stephen Estes-Sm~rgiaSSi ~1êF'--~Director, Planning an ust~~~'lityKathy Soni, Bud l to/~.eo Norton Asst. M r. tes Revenue & Financereparer/Title
RECOMMENDA TION:
X INFORMATION
Chief Operating Officer
-Th0,u~Director, Finance
For information only. This staff summary provides information on changes to CY2015 sewermeter data used to calculate FY2017 community sewer assessments. The assessmentadjustments resulting from this change are included in the preliminary FY2018 assessmentsbeing presented at today's Board of Directors' meeting.
DISCUSSION:
MWRA annually determines preliminary water and sewer assessments in February and finalassessments in June. As part of MWRA's Rate Basis Review and Comment Process, approvedby the Board of Directors in 1996, water and sewer customers can challenge rate basis datathrough the current fiscal year. MWRA staff also conduct supplementary quality assurancereviews of meter data during this time period which could result in changes to the rate basis data.
Following a review of calendar year 2015 sewer flows, MWRA staff has made the adjustmentslisted in the following table. Also included are the corresponding adjustments to the FY2017sewer assessment for each community. Assessment adjustments take into account the revisedsewer flows and flow shares for all MWRA communities.
MWRA staff regularly perform a variety of quality assurance checks on the flow data used todevelop community assessments. In addition to reviewing MWRA Meter Maintenance quarterlyconfirmations staff continuously review data for data gaps or irregularities which require metermaintenance, such as cleaning the sensors of debris, parts replacement or meter replacement. Thepercentage of meter uptime is tracked for each meter, and percent estimation is reported in themonthly and quarterly reports. Data gaps are filled using data from working meters or by othermeans of interpolation. The types of issues typically addressed include velocity or depthmeasurements which do not correlate well with similar meters or with historical flow patterns,

the presence of sediment or other factors influencing flow depth, changes in flow patterns due topiping or connection alternations. On a regular basis, MWRA uses the services of a specialtysubcontractor (currently EST) to perform temporary metering to check the accuracy of thepermanent metering. In some cases, review of a particular calendar year will suggest a re-assessment of the previous year's data. In all cases where a flow data correction is appropriate,MWRA metering data staff provide that information to Finance staff for inclusion in theassessment process.
2
In addition to the summary level flow data routinely provided to each community by Financestaff, detailed meter specific data is frequently provided upon request to community staff.Communities will also use temporary metering for a variety of purposes, including masterplanning and I/I assessments, and MWRA staff will use that data for comparison purposes ifappropriate.
In addition to the communities listed, the FY2017 sewer assessment has also been adjusted forthe other communities served by the MWRA sewer system, with most adjustments being lessthan $3,000. The assessment adjustments will be applied to each community's FY2018 sewerassessment.
FY2017 SewerCommunity Sewer Flow Adjustment Assessment
Adjustment
Boston Decrease CY15 flow by 0.02 million gallons per day (mgd) +$46,050Increase Maximum flow by 0.02 mgdBraintree Increase CY15 flow by 0.13 mgd +$34,632Brookline Decrease CY15 flow by 0.08 mgd -$10,048Chelsea Decrease CY15 flow by 0.16 mgd -$26,593Framingham Decrease CY15 flow by 0.49 mgd -$l37,424Waltham Increase CY15 flow by 0.11 mgd +25,004Watertown Decrease CY15 flow by 0.11 mgd -$18,851
Reason for Flow Adjustments
BOSTON: MWRA was unable to record accurate meter depth and velocity for one meter for theperiod of August 1-18,2015. The original flow estimate was based on another Boston meter, butwas later revised based on a different meter from a more appropriate area of Boston.
BRAINTREE: One of Braintree's direct meters was consistently recording depth of flow lowerthan that measured by MWRA on site. MWRA wastewater meter Quality Assurance/QualityControl testing contractor EST confirmed the higher depth, resulting in adjusted flows fromJanuary 1, 2015 to present.
BROOKLINE: Staff determined that a flow meter formula for meter BK-2C should be revisedto account for depth of flow differential, resulting in a flow reduction.
CHELSEA: One of Chelsea's direct meters was consistently recording depth of flows that werehigher than that measured by MWRA on site. MWRA wastewater meter testing contractor EST

confirmed the lowered depth during twice (in March and November 20 16) in separate temporarymetering checks resulting in adjusted flows from May 7, 2015 to present.
FRAMINGHAM: Following a review of CY2015 flow through Framingham's main directmeter, MWRA staff determined that the meter's performance over this time period wasunreliable due to meter mounting issues. Separate temporary metering reviews conducted byFramingham (for their master plan) and MWRA's meter testing contractor confirmed theproblem. CY20 15 flows are reduced by 490,000 gallons per day, and the meter was relocated toan improved location.
WALTHAM & WATERTOWN: An improved estimate of flow from a section of Watertownthat flows into Waltham resulted in two changes. Staff has increased Waltham's flow, anddecreased Watertown's flow 11,000 gallons per day.
Attachment l summarizes the FY20 17 sewer assessment adjustment and the impact for eachcommunity.
BUDGETlFISCAL IMPACT:
Based on MWRA's zero based assessment methodology, FY2017 sewer assessments for allother sewer communities will change proportionally and will be applied to each community'sFY20 18 sewer assessment.
ATTACHMENTS:
1. Attachment 1: Sewer Utility: Fiscal Year 2017 Assessment Adjustments
3

Massachusetts Water Resources AuthorityWholesale Water & Sewer AssessmentsSewer Utility: Fiscal Year 2017 Assessment Adjustments
Budget Status: I Proposed ICEB Model No.: PFY18 #5.0
Run Date:Print Date: 1----T.=:7-;':;"'-jPrint Time: c_...:..:.==--,
..2018201720162016
Budget Fiscal YearCurrent Fiscal Year
Prior Fiscal YearPrior Calendar Year
FINAL 2017 AssessmentsBase Sewer Base Sewer Base SewerCharges Charges Charges
MWRA Sewer Customer (O&Ml (CaDitaI) !Total)Arlington $2,220,282 $5,772,831 $7,993,113Ashland 606,560 1,878,612 2,485,172Bedford 1,266,853 2,101,475 3,368,327Belmont 1,393,339 3,432,135 4,825,474Boston (BWSC) 44,824,388 87,447,321 132,271,709Braintree 3,452,051 5,648,209 9,100,260Brookline 4,424,695 8,469,711 12,894,405Burlington 1,645,225 3,433,231 5,078,456Cambridge 8,775,160 14,970,508 23,745,668Canton 1,453,450 2,683,707 4,137,157Chelsea 2,567,364 5,095,944 7,663,307Dedham 1,789,190 3,522,377 5,311,566Everett 2,516,629 5,607,465 8,124,094Framingham 3,841,728 8,983,223 12,824,952Hingham S.D. 677,517 1,120,510 1.798,026Holbrook 456,276 1,303,718 1,759,994Lexington 2,467,869 4,797,993 7,265,862Malden 4,474,755 8,466,304 12,941,059Medford 3,946,830 7,931,947 11,878,777Melrose 2,175,696 4,076,249 6,251,946Milton 1,585,777 3,776,274 5,362,051Natick 1,529,657 4,227,043 5,756,700Needham 1,721,037 3,962,873 5,683,910Newton 7,443,599 13,074,620 20,518,219Norwood 2,628,212 4,394,946 7,023,158Quincy 6,905,593 13,066,364 19,971,957Randolph 1,784,180 4,488,000 6,272,181Reading 1,405,015 3,364,909 4,769,924Revere 3,362,126 7,249,412 10,611,538Somerville 5,299,093 10,618,926 15,918,019Stoneham 1,500,225 3,041,819 4,542,044Stoughton 1,473,112 3,274,225 4,747,336Wakefield 1,985,209 3,828,482 5,813,691Walpole 1,001,179 2,712,696 3,713,875Waltham 4,474,990 8,647,118 13,122,109Watertown 1,692,333 4,279,039 5,971,372Wellesley 1,607,959 3,851,787 5,459,745Westwood 725,943 1,872,320 2,598,263Weymouth 3,886,156 7,880,106 11,766,262Wilmington 845,894 1,749,705 2,595,599Winchester 1,104,793 2,928,974 4,033,767Winthrop 978,118 2,341,947 3,320,066Woburn 3,515,997 5,808,654 9,324,652
TOTAL FY15 I 5153,432,053 $307,183,71öT $460,615,763
REVISED 2017 AssessmentsBase Sewer Base Sewer Base SewerCharges Charges Charges(O&M) (Capital) (Total)$2,221,988 $5,773,624 $7,995,611
607,024 1,878,805 2,485,8291,267,826 2,101,907 3,369,7331,394,409 3,432,675 4,827,084
44,856,142 87,461,617 132,317,7593,476,360 5,658,532 9,134,8934,414,086 8,470,271 12,884,3571,646,489 3,433,776 5,080,2658,781,903 14,973,041 23,754,9441,454,567 2,684,205 4,138,7722,541,912 5,094,802 7,636,7151,790,564 3,523,041 5,313,6052,518,563 5,608,226 8,126,7883,759,556 8,927,972 12,687,528678,037 1,120,768 1,798,806456,627 1,303,871 1,760,498
2,469,765 4,798,928 7,268,6944,468,371 8,467,064 12,935,4353,949,863 7,933,264 11,883,1262,176,491 4,076,975 6,253.4661,586,995 3,776,918 5,363,9131,530,832 4,227,555 5,758,3881,722,349 3,963,507 5,685,8567,449,318 13,077,264 20,526,5822,630,220 4,395,864 7,026,0846,910,804 13,068,598 19,979,4011,785,551 4,488,675 6,274,2261,406,093 3,365,411 4,771,5043,364,710 7,250,513 10,615,2235,303,165 10,620,554 15,923,7191,501,378 3,042,347 4,543,7251,474,240 3,274,768 4,749,0081,988,050 3,829,311 5,817,3611,001,918 2,713,025 3,714,9424,497,205 8,649,908 13,147,1131,674,273 4,278,248 5,952,5211,609,194 3,852,362 5,461,556726,501 1,872,576 2,599,077
3,889,140 7,881,569 11,770,708846,359 1,749,892 2,596,251
1,105,642 2,929,393 4,035,035978,870 2,342,250 3,321,120
3,518,704 5,809,839 9,328,544
2017 Assessment AdjustmentsBase Sewer Base Sewer Base SewerCharges Charges Charges(O&M) (Capital) (Total)
$1,706 $792 $2,498465 193 657973 433 1,406
1,070 539 1,61031,754 14,296 46,05024,309 10,323 34,632-10,609 561 -10,048
1,264 544 1,8096,742 2,533 9,2751,117 498 1,615
-25,451 -1,141 -26,5931,375 664 2,0391,934 761 2,695
-82,172 -55,252 -137,424521 259 779351 153 503
1,896 935 2,831-6,383 759 -5,6243,033 1,317 4,350795 726 1,520
1,218 644 1,8631,175 512 1,6871,312 635 1,9465,719 2,644 8,3632,008 918 2,9265,211 2,234 7,4441,371 675 2,0451,078 502 1,5802,583 1,101 3,6854,072 1,628 5,7001,153 528 1,6811,129 543 1,6722,841 829 3,670739 329 1,068
22,214 2,790 25,004-18,060 -791 -18,851
1,235 575 1,811558 256 814
2,984 1,462 4,446465 187 652;849 419 1,268'752 302 1,054
2.707 1,185 3,892
I $153,432,0531 $307,183,7101 $460,615,7631 I $01 $01 $01
Comments
Revised CY15 annual AOF & Max Month Flow.Revised CY15 annual AOF & Max Month Flow.Revised CY15 annual AOF
Revised CY15 annual AOF I
Revised CY15 annual AOF & Max Month Flow.
Revised CY15 annual AOF
Revised CY15 annual AOF
I
I
Revised CY15 annual AOF
Revised CY15 annual AOFRevised CY15 annual AOF
Attachment 1

STAFF SUMMARY
TO:FROM:DATE:SUBJECT:
Board of Directors -----; ¿Frederick A. Laskey, Executive Director ~ - f-:x----February 15,2017 UPreliminary FY 18 Water and Sewer Assessments
COMMITTEE: Administration, Finance & Audit
KafuYS~Ç~Leo Norton, A;;;r;~1gr~!~~s~ Revenue and FinancePreparer/Title
..x. INFORMATION
d~'lbomas ~urkin,Director, Finance
Consistent with the Proposed FYl8 Current Expense Budget (CEB), preliminary FY18 waterand sewer assessments are based on a Rate Revenue Requirement of $721,238,000, a 3.8%increase over the FYl7 Rate Revenue Requirement.
The FY18 Rate Revenue Requirement will be allocated to MWRA communities based on theirrespective shares of CY16 MWRA water use, the average of CY14-CY16 wastewater flows,corresponding strength of flows, and population.
RECOMMENDA TION:
For information only. This staff summary provides information on preliminary FY18 wholesalewater and sewer assessments. Staff plan to transmit preliminary FY18 assessments to MWRAcommunities on or before Thursday, February 16,2017.
DISCUSSION:
The Proposed FY18 CEB recommends a Rate Revenue Requirement of $721,238,000, anincrease of 3.8% over the final FY17 requirement.
FY18 FY17 Approved $ Change from % Change fromPreliminary FY16 FY17
Water $243,393,874 $234,262,737 $ 9,131,137 3.9%Sewer $477,844,126 $460,615,763 $17,228,363 3.7%Total $721,238,000 $694,878,500 $26,359,500 3.8%
Attachment l summanzes preliminary FY18 wholesale water and sewer charges for eachMWRA community.
The estimated impact of the FY18 assessment increase on the MWRA portion of the averagehousehold bill for water and sewer service in a fully served MWRA community that uses close tothe system average of 61,000 gallons of water per year is approximately $20.
AF&A A.62/15/17

FY16 FY17 PFY18
Water Assessments
MWRA calculates water assessments for customer communities by apportioning the water raterevenue requirement according to each community's share of total water use for the most recentcalendar year. Preliminary FY18 assessments are based on each community's share of CY16water use of 67.680 billion gallons, a 0.3% increase compared to CY15 water use of 67.479billion gallons. Changes in FY18 water assessments for customer communities compared toFY17 assessments will vary considerably, depending on each community's use of water and howthat use factors into their share of the water system in CY16 compared to CY 15. This isparticularly true for communities that receive only part of their water from MWRA.
The graph below illustrates the water Rate Revenue Requirement for the past 5 years. Thechanges from FY 17 to PFY 18 are primarily the result of increased debt service related to waterutility rehabilitation and improvements.
MWRA Water Rate Revenue Requirement
$260$250$240$230
'"c: $220.S!:?!
$210$200$190$180$170
FY14 FY15
Sewer Assessments
MWRA allocates sewer assessments based on each community's share of the followingallocation parameters: annual wastewater flow, maximum month flow, strength of flow, censuspopulation, and sewered population.
On average, approximately 51% of a community's preliminary FY18 sewer assessment is basedon each community's share of wastewater flow and strength of flow (total suspended solids-TSSand biochemical oxygen demand-BOD), and approximately 49% is based on population asillustrated in the next graph.
2

FY14 FY15 FY16 FY17 PFY18
Allocation of Total MWRA Sewer Utility Assessment
Population49.2%
AverageWastewater
Flow22.7%
WastewaterFlow14.2%
7.6%BOD
6.3%
Both the preliminary and final FY18 assessment for population will be calculated using the mostrecent (July 2015) community population estimates from the U.S. Census Bureau, as well as thepercentage of total population receiving municipal sewer service reported by each MWRAcommunity.
Preliminary FY18 assessments have been calculated using the average of CYI4, CY15 andCY16 wastewater flows. Ongoing review of meter data may result in revised flows prior toissuing final assessments in June.
The graph below illustrates the sewer Rate Revenue Requirement for the past 5 years. As withthe water utility, the annual changes continue to be primarily the result of increased debt servicerelated to sewer utility rehabilitation and improvements.
MWRASewer Rate Revenue Requirement
'"c:.S!
$520$500$480$460$440$420$400$380$360$340$320
3

Clinton and Lancaster Sewer Assessments
Proposed FY18 operating and maintenance (O&M) and capital expenses attributable to theClinton Wastewater Treatment Plant are $3,776,682, an increase of 14.6% over FY17 expenses.This includes an 8.1% increase in operating costs, and a 31.5% increase in capital expensesrelated primarily to the phosphorous removal, roofing rehabilitation projects.
In accordance with the agreement that allows the City of Worcester to take water from theWachusett watershed, Worcester is charged approximately 7.9% of the direct operating expensesfor the Clinton Wastewater Treatment Plant. Proposed FY 18 direct operating expenses for theplant total $2,078,355, resulting in a preliminary FY18 charge of $164,418 for the City ofWorcester. Worcester has been paying this annual charge to MWRA or its predecessors since1914.
The Town of Clinton and the Lancaster Sewer District are allocated proportional shares of theremaining expenses based on annual metered wastewater flow to the Clinton Plant. Based onproposed FY18 expenses and CY16 wastewater flows, preliminary FY18 charges are $407,167for the Lancaster Sewer District and $3,143,917 for the Town of Clinton. However, pursuant toChapter 307, Section 8 of the Acts of 1987, Clinton is only liable for the first $500,000 of itsshare of O&M and capital costs.
Attachment 2 details the expenses and corresponding charges for the Clinton Sewer ServiceArea.
eVA Water Assessments
Based on the Proposed FY18 CIP and CEB for the Chicopee Valley Aqueduct (CVA) watersystem, the preliminary FY 18 system assessment is $4,914,231, an increase of O. 01% from FY 17assessments.
MWRA's CVA water assessment methodology allocates eVA assessments to the threecommunities served by the CVA system based on their share of prior calendar year water use.Based on CY16 water use, preliminary FY18 assessments are as follows:
• City of Chicopee:• South Hadley Fire District # 1:• Town of Wilbraham:
$3,400,877 (-0.7%)$ 721,344 (+1.9%)$ 792,011 (+1.4%)
As with the metropolitan water system, changes in preliminary FY18 water assessments for eachCVA community compared to FY 17 assessments vary depending on their water use and how thatuse factors into their share of the CVA water system in CY16 compared to CY15.
Attachment 3 details the expenses and corresponding assessments for the CVA Water ServiceArea. .
4

Wholesale Water Rate
MWRA's wholesale water rate per million gallons is applied to customers purchasing MWRAwater on a pay-as-you-go basis (including customers with emergency agreements). Examplesinclude the Department of Conservation and Recreation and the Department of Youth Services.The preliminary wholesale water rate for FY18 is $3,596.26 per million gallons. The proposedFY18 CEB includes revenue of$107,832 from these customers.
Retail Sewer Rate
MWRA provides direct retail sewer service to Regis College in Weston and the New EnglandCenter for Children in Southborough. In accordance with MWRA Policy #OP.ll, "Admissionof New Community to MWRA Sewer System and Other Requests for Sewer Service toLocations Outside MWRA Sewer Service Area", both entities are charged a modified per milliongallon "retail" rate that captures both sanitary and non-sanitary flows. Based on preliminaryFY18 sewer assessments, the FY18 retail sewer rate will be $7,671.59 per million gallons. TheProposed FY18 CEB includes revenue of $92,823 from these customers.
ATTACHMENTS:
1. Preliminary FY 18 Water and Sewer Assessments2. Clinton Wastewater Treatment Plant Sewer User Charge Determination3. Chicopee Valley Aqueduct System Assessment
5

Massachusetts Water Resources AuthorityPreliminary FY18 Water and Sewer Assessments
MWRA Fully Served Water and SewerCustomers
Final FY17Water
Percent:::~~rr;!~:~:~!~tChange fromFY17Assessment
ARLINGTON S4,976,564 S5,239,376
Final FY17Sewer
Assessment
S7,993,120
Preliminary FY18 PercentSewer Change from
Assessment FY17
S8,368,475 4.7% $12,969,684
Preliminary FY18 Dollar PercentCombined Change from Change from
Assessment FY17 FY17
Final FY17Combined
Assessment
SI3,607,851 5638,167
8-Feb-17
4.9%IBELMONT 2,828,456
3,8%
2,918,249 3.2% 4,825,479 4,942,787 2.4% 7,653,935 7,861,036 207,101
BOSTON (BWSC) 82,771,709
IBROOKLINE 7,046,691
86,245,262
6,833,777
4.2% 132,271,845 136,988,619
13,070,164
3.6% 215,043,554 223,233,881
19,903,941
8,190,327
(37,169)
CHELSEA 4,215,080
lEVERETT 4,948,191
1.5%
4,310,799
5,202,970
-3.0% 12,894,419
7,774,066
8,425,809
1.4% 19,941,110
12,084,865
13,628,779
206,470
556,487
1.7%
4.3·/.1FRAMINGHAM 8,159,808
3,0,/.1
ILEXINGTON 7,349.661
4.3%
MALDEN 6,950,768
IMEDFORD 6,432.219
3.9%
MELROSE 2,915.635
IMILTON 3,360.396
1.3%
NEWTON 12,950.552
INORWOOD 3,652.867
4.3·/.1
QUINCY 11,776.311
IREADING 2,109.549
8.034.710
7.275.204
6.789.727
6,408,548
2,865,865
3,509,472
12,942,568
3,718,045
12,247,825
2,219,983
2.3% 7.663.315
13.125.770
7,453.886
13.414,561
12.202.584
6,438.677
5,473.036
21.949,686
7,507.430
20.724,145
4.962.610
1.4% 11.878.395
21.160.480
14.729.090
20.204.288
18.611.132
9,304.542
8,982.508
34,892.254
11,225,475
32.971.970
7.182,593
175,710
113,559
312,447
300,124
136,955
260,057
1,423,461
549,442
1,223,681
303,116
0.8%
0.8·/.1
1.6%
5.1'/.1
4.4%1REVERE 4,943.964
ISOMERVILLE 7,658.290
4.916.091
7.960,067
5.1% 8.124,101
10.845.129
16,624,447
3.7% 13.072.292
15.761,220
24.584,514
205.707
1,008,189STONEHAM 3,174.690 3,039,459
·1.5% 12.824,962
4.628.916
2.3% 20.984.770
7.668,375 (48,364) -0.6%
IWINTHROP 1,643.615
IWALTHAM 9,384.159 9.074.300
-1.0% 7.265.870
13.622.399
2.6% 14.615.531
22.696,699 190,418 0.8%1WATERTOWN 3,290.986
TOTAL $202,540,161
MWRA Sewer and Partial WaterCustomers
Final FY17
3,401,796
1.622,216
$206,776,309
WaterPercent::~~~~:~:!~tChange fromFY17Assessment
CANTON SI.673.754 52.548.346
-2.3% 12,941,073
6,126.647
3.412.713
5348,082,556
Preliminary FY18 PercentSewer Change from
Assessment FY17
54,244,707
3.7% 19,891,841
9,528,443
5.034.929
266,080
$554,858,865 $16,253,210
71,245
$6.793.053 $982,1372.6% S5,810,916
Preliminary FY18 Dollar PercentCombined Change from Change from
Assessment FY17 FY17
2.9%
1.4%1
3.0%
16.9%¡NEEDHAM 1,039,372
-9.8%
1,114,185
-0.4% 11.878,789
5,918,642
2.7% 18.311.008
7,032,827 309,540 4.6·/.1STOUGHTON 1.144,245
IWAKEFIELD 1,852,218
254,814
2,181,150
6,251,952
4.4% 5,362.055
5.059,137
6.122.307
3.0% 9,167,587
5,313,951
8.303,457
(577,635)
637,542 8.3·/.1
IWILMINGTON 703,075 9.4%1
WELLESLEY 1.056,294 1,749,172
779,298
·0.1% 20,518.241
5,625.596
2,830,863
2.1% 8,722.451
7.374,768
3,610,161
858,724
6,287.734 709,615
311,485
13.2%
WINCHESTER 1.544,349
IWOBURN 3.355,306
TOTAL 512,368,613
Final FY17
2,130,222
3,650,561
514,407,748
MWRA Sewer-only Customers WaterPercent
Preliminary FY18 Change fromWater Assessment FY11Assessment
ASHLAND
1.8% 7,023,166
4.157.512
9,427,691
$43,386,455
Preliminary FY18 PercentSewer Change from
Assessment FY17
S2.594,722
7.0% 33,468,793
13,078,252 398,284
557,794,203 $3,629,692
Preliminary FY18Combined
Assessment
S2.594,722
Dollar PercentChange from Change from
FY17 FY17
$109,548
6.7%
4.4~.
IBEDFORD
4.0% 19,971.978
3.580,904
6.9% 10,676.033
3,580,904 212,573 6.3·/.1
5.1%
BRAINTREE
IBURLINGTON
5.2% 4.769.928
9.692,938
5.319,835
3.8% 31,748,289
9.692.938
5.319,835
592,668
241,374
6.5%
4.8·/.1
3.7%
CAMBRIDGE
IDEDHAM
·0.6% 10,611,549
24.952,536
5,518.993
4.0% 6,879.477
24.952,536
5,518.993
1,206,841
207,421 3.9%1HINGHAM SEWER DISTRICT
3.2%IHOLBROOK
3.9% 15,918,035
1,863,727
1,809,042
2.21% 15,555.513
1,863,727
1,809,042
65,699
49,046 2.8·/.1NATICK
·4.3% 4.542,049
5.940,655
4.4% 23,576.325
5,940.655 183,950
IRANDOLPH
-3.3% 13.122,122
6.361.335
1.9% 7.716.739
6,361.335 89,149
WALPOLE
3.4% 5,971.377
3,831.925
3.8% 22.506,281
3.831,925 118,048 3.2%
TOTAL
3.Dt/.
4.4%
IWESTWOOD
WEYMOUTH
Final FY17
LYNNFIELD WATER DISTRICT S643.348
Percent;::~~~::~:!~tChange fromFY17
MWRAWater-only Customers WaterAssessment
5752.424
-1.3% 3.320,069
2,789,172
12,119.331
$86,375.115
Final FY17Sewer
Assessment
Preliminary FY18 PercentSewer Change from
Assessment FY11
2.6% 9.262.363
2.789,172
12.119.331 353,520
$86,375,115 $3,620,744
190,907
5752,424 $109,076S643,348
Preliminary FY18 Dollar PercentCombined Change from Change from
Assessment FY17 FY17
2,341.415
476,532
3,692,889
948.422
1.834.151
2.445,970
$12,382,727
Final FY17Combined
Assessment
2,479,532
539,824
3.969,580
138,117
63,292
1.001.153 52,731
276,691
1.900.046 65,895
2.830,058 384,088
$13,472,617 $1,089,890
NAHANT 476,532
2,479.532
539.824
3,969.580
1.001.153
1.900,046
2.830.058
$13,472,617
DEDHAM-WESTWOOD WATER DISTRICT $196,381
Percent:;~~~n;:~:~:~!~tChange IromFY17
MWRA Partial Water-only Customers Water
IMARBLEHEAD 2.341.415
2.1% $336,065,494
Final FY17Sewer
Assessment
52.3% 54.137.162
2.8% 4.963,684
7.3·/.1
7.2% 5,683,915
3.6% $538,605,655
13.3%
ISAUGUS 3.692,889
SOUTHBOROUGH 948,422
-77.7% 4,747.341
Final FY17Combined
Assessment
4.1% 6,723,287
7.5·/.1
5.6%
ISWAMPSCOTT 1.834.151
WESTON 2,445.970
TOTAL $12,382,727
Final FY17
Assessment
S296.964
17.8% 5,813,697
Final FY17Sewer
Assessment
Preliminary FY18 PercentSewer Change from
Assessment FY17
6.6% 5.891,586
5296,964 5100,5835196,381
Preliminary FY18 Ool1ar PercentCombined Changefrom Change from
Assessment FY17 FY17
3.6·/.1
15.7%
8.8%
51.2%
!LYNN (LWSC) 243,938
26.6%
327.659
65.6% 5,459,750
5.3% 7,665,915
327.659 83,721 34.3%1MARLBOROUGH 3.887,876 4,921.458
10.8% 2,595,601
3.0% 6,516.044
4,921.458 1,033,582
INORTHBOROUGH 1.135.772
PEABODY 1.507,269
$6,971,236
$234,262,737
TOTAL
SYSTEMS TOTAL
1,245,202
1.945.917
$8,737,200
$243,393,874
37.9% 4.033,770
8.8% 9.324,862
16.5% $41,795,898
Final FY17Sewer
Assessment
S2,485,174
3.368.331
9,100.270
5,078.461
23,745.695
5.311.5721,798,028
1,759,996
5,756.705
6,272,186
3,713.877
2.598.265
11,765.811
$82,754,371
17.0%
5.9%
13.3%
7.5%
5.6%
3.6%
15.7%
8.8%
51.2%
34.3%
26.6%
9.6%
29.1%
25.3%
3.9% 5460,615,763 $477 ,844, 126
9.1% 3,298.676
3.1% 5,578.119
1.1% 12.679.968
3.8% $54,164,511
Final FY17Combined
Assessment
4.4% S2.485,174
6.3% 3.368.331
6.5% 9,100,270
4.8% 5.078,461
5.1% 23,745.695
3,9% 5,311.572
3,7% 1,798,028
2.8% 1,759.996
3.2% 5,756.705
1.4% 6,272,186
3.2% 3.713,877
7.3% 2,598,265
3,0%
4.4%
11.765,811
$82,754,371
Final FY17Combined
Assessment
243,938
3.887,876
1.135.772
3.7%
1.507.269
56,971,236
$694,878,500
1,245,202
1,945.917
$8,737,200
109,430
$721,238,000 $26,359,500
438,648
$1,765,964
Attachment 1
9.6·/.1
29.1%
25.3%
3.8%

Massachusetts Water Resources AuthorityClinton Wastewater Treatment PlantSewer User Charge Determination
WASTEWATER FLOW and FLOW SHARES: CY2016Lancaster Total
Town of Sewer District WastewaterClinton Flow Flow Flow
Average Daily Flow (MGD) 2.048 0.305 2.353Average Flow (MG/YR) 747.369 111.335 858.704
Proportional Share of Flow 87.03% 12.97% 100.0%
IBUDGETED EXPENSES: Proposed FY2018Clinton Direct Operating Expenses:wrNRA Support Allocation:
$2,078,355503,275
Subtotal O&M Expenses:Total Debt Service Expenses:
$2,581,630$1,195,052
Total Clinton Service Area ExpensesLess Revenue (City of Worcester Payment)
$3,776,682·164,418
$3,612,264Clinton WWTP Rate Revenue Requirement:
TOWN OF CLINTON
Sewer User Charge Determination
O&M ExpensesLess Revenue (City of Worcester Payment)
$2,581,630·164,418
O&M Expenses to be RecoveredClinton's Share of FlowClinton's Share of O&M Costs
$2,417,21287.03%
$2,103,809
I Total Clinton O&M Charge $2,103,8091
Debt Service Costs to be RecoveredClinton's Share of Wastewater Flow
$1,195,05287.03%
I Total Clinton Debt Service Charge $1,040,1081
I Total Clinton O&M and Debt Service Charge $3,143,9171
Less MWRA Water Ratepayer Subsidy ·$2,643,917Billable Charge to the Town of Clintonas er CH. 307, Section 8 The Acts of 1987
$500,000
LANCASTER SEWER DISTRICTO&M Expenses
Less Revenue (City of Worcester Payment)$2,581,630
·164,418O&M Expenses to be RecoveredLancaster's Share of FlowLancaster's Share of O&M Costs
$2,417,21212.97%
$313,403
I Total Lancaster Sewer District O&M Charge $313,4031
Debt Service Costs to be RecoveredLancaster's Share of Wastewater Flow
$1,195,05212.97%
I Total Lancaster Sewer District Debt Service Charge $154,9441
I Total Lancaster O&M and Debt Service Charge $468,3471
Billable Charge to Lancaster Sewer District $468,347
Billable Sewer User Charges and Payment Schedule
Sewer Customer BillableCharges
Town of Clinton (billable) $500,000Lancaster Sewer District (before adj.) $468,347Lancaster Sewer District (prior period adj.) ·$61,180Lancaster Sewer District (billable) $407,167
Total Billable Sewer Charges $907,1671
Payment 1 Payment2 Payment 3 Payment4on or before on or before on or before on or beforeSept 15, 2017 Nov 15,2017 Feb 15, 2018 May 15, 2018
$125,000 $125,000 $125,000 $125,000
$117,087 $117,087 $117,087 $117,087
$242,0871 $242,0871 $242,0871$242,0871
Attachment2
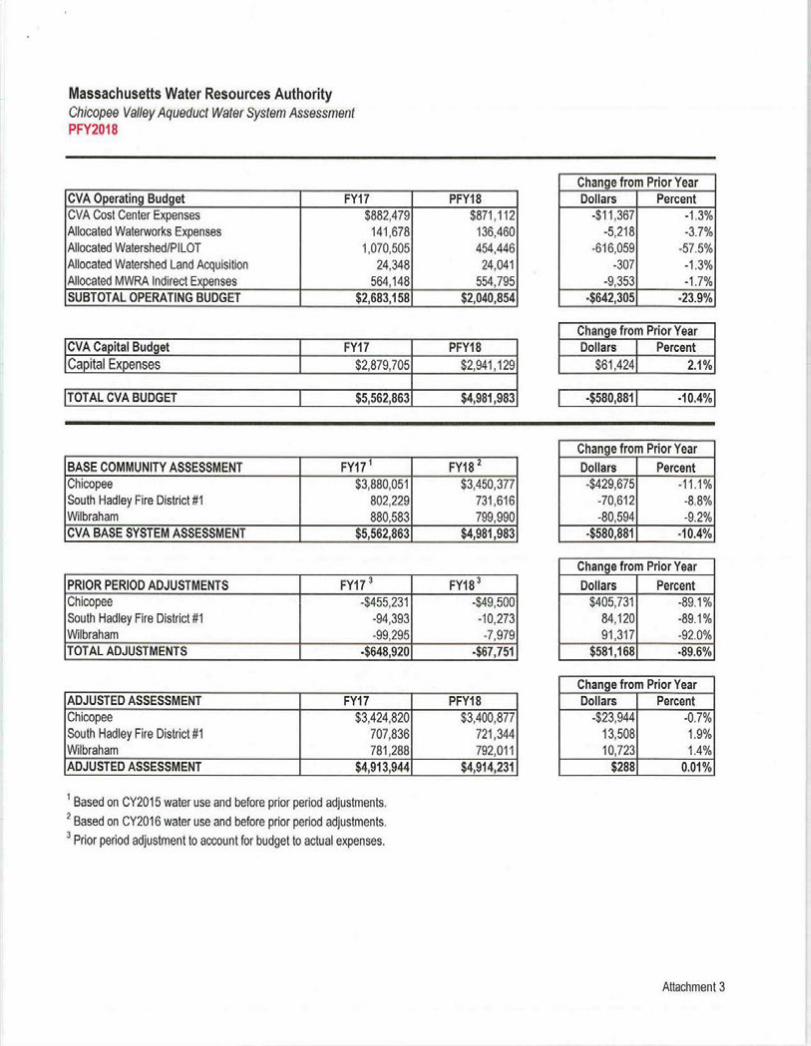
Massachusetts Water Resources AuthorityChicopee Valley Aqueduct Water System AssessmentPFY2018
Change from Prior YearDollars Percent
-$11,367 -1.3%-5,218 -3.7%
-616,059 -57.5%-307 -1.3%
-9,353 -1.7%-$642,305 -23.9%
CVA Operating Budget FY17 PFY18CVA Cost Center Expenses $882,479 $871,112Allocated Waterworks Expenses 141,678 136,460Allocated Watershed/PILOT 1,070,505 454,446Allocated Watershed Land Acquisition 24,348 24,041Allocated MWRA Indirect Expenses 564,148 554,795SUBTOTAL OPERATING BUDGET $2,683,158 $2,040,854
leVA Capital Budget I FY17 PFY18[Capital Expenses 1 $2,879,705 $2,941,129
ITOTAL CVA BUDGET I $5,562,863 $4,981,983
Change from Prior YearDollars I Percent
$61,4241 2.1%
-$580,881 [ -10.4%1
BASE COMMUNITY ASSESSMENT FY171 FY182
Chicopee $3,880,051 $3,450,377South Hadley Fire District #1 802,229 731,616Wilbraham 880,583 799,990CVA BASE SYSTEM ASSESSMENT $5,562,863 $4,981,983
PRIOR PERIOD ADJUSTMENTS FY17 3 FY183
Chicopee -$455,231 -$49,500South Hadley Fire District #1 -94,393 -10,273Wilbraham -99,295 -7,979TOT AL ADJUSTMENTS -$648,920 -$67,751
ADJUSTED ASSESSMENT FY17 PFY18Chicopee $3,424,820 $3,400,877South Hadley Fire District #1 707,836 721,344Wilbraham 781,288 792,011ADJUSTED ASSESSMENT $4,913,944 $4,914,231
1 Based on CY2015 water use and before prior period adjustments.2 Based on CY2016 water use and before prior period adjustments.3 Prior period adjustment to account for budget to actual expenses.
Change from Prior YearDollars Percent-$429,675 -11.1%
-70,612 -8.8%-80,594 -9.2%
-$580,881 -10.4%
Change from Prior YearDollars Percent$405,731 -89.1 %
84,120 -89.1%91,317 -92.0%
$581,168 -89.6%
Change from Prior YearDollars Percent
-$23,944 -0.7%13,508 1.9%10,723 1.4%$288 0.01%
Attachment 3
STAFF SUMMARY
TO:FROM:DATE:SUBJECT:
Board of DirectorsFrederick A. Laskey, Executive DirectorFebruary 15,2017Transmittal of the FY18 Proposed Current Expense Budget
_ INFORM~TIOx_ VOTz?
....<~/.I,.ThomasÆ.' Durkin
Preparer/Title Director, Finance
The FY18 Proposed Budget reflects the benefits of a planned $20.0 million defeasance inFY17 with targeted savings primarily in FY22. Besides the planned defeasances, the Authorityis continuing to address the significant Other Post Employment Benefits (OPEB) and Pensionobligations by including $1.8 million optional pension payment in the Proposed Budget.
MWRA 's long-term goal has been to provide sustainable and predictable assessmentincreases to its member communities. In the past years, MWRA has been very successful inattaining this goal by utilizing a multi-year rates management strategy, which includedcontrolled spending and the use of historical variable rate assumptions. In agreement with theAdvisory Board, this strategy allowed the practice of targeted debt dejèasance in the mostchallenging years, given that the debt service represents the largest component of the budget.
However, the recent increase in the variable short-term rates, higher health insurance, higherutility chemicals and construction costs, coupled with potential tax code changes mayrepresent a higher uncertainty than in recent years.
To ensure that the MWRA's long-term goals will continue to be met in future years, it isimperative to continue the conservative fiscally responsible budgeting practices whileaddressing all outstanding long-term liabilities.
The FY18 Proposed Budget puts forth a 3.79% combined assessment increase, matching theincrease projectedfor FY18 last year. At the same time, the nextfour-year planning estimates,through FY22 (the most challenging year facing the Authority) also project assessmentincreases at 3.8%.
AF&A B.1IVA.1
2/15/17

2
RECOMMENDATION:
To approve transmittal of the FY 18 Proposed Current Expense Budget to the MWRA AdvisoryBoard for its 60 day review and comment period.
DISCUSSION:
TIlis staff summary presents an overview of the FY18 Proposed Current Expense Budget (CEB)and projects the Rate Revenue Requirement for the next ten years.
Summary
The FY18 Proposed Budget recommends a combined increase in rates and charges of 3.79%.Capital financing costs remain the largest component of the CEB and account for 62.6% of totalexpenses. Total expenses are $749.1 million, an increase of $29.5 million or 4.1% over the FY17Budget. There are no offsets from Debt Service Assistance (DSA) assumed for FY18 or in anyfuture years.
Total expenses include $469.1 million for Capital Financing costs and $280.0 million foroperating expenses, of which $238.4 million is for Direct Expenses and $41.6 million is forIndirect Expenses. Total expenses increased $29.5 million or 4.1% from the FY 17 Budgetmainly due to a higher debt service requirement of $14.0 million, higher Direct Expenses of$11.9 million due to inclusion of costs associated with the cross harbor electrical cable project(Table 1), Cost of Living Adjustments (COLA) for staff, higher chemical costs - including sixmonths of cost associated with enterococcus removal, higher healthcare costs, and higherprojected maintenance expenses.
The FY18 Proposed Budget revenues, excluding rate revenue, total $27.9 million, an increase of$3.1 million or 12.7% from the FY17 Budget. The FY18 Proposed Budget non-rate revenuebudget includes $16.6 million in Other User Charges and Other Revenue and $11.3 million forInvestment Income.
The FY18 Proposed Rate Revenue Requirement is $721.2 million, an increase of $26.3 millionor 3.79% over the FY17 Budget.
Table I on the following page provides a comparison of the FYI8 Proposed CEB and FY17Budget by major categories. Additional detail by line item and by Division is provided inAttachments A and B.

Table 1 MWRA Current Expense BudgetProposed FY18 Budget versus FY17 Approved Budget
FY17Proposed $ %
($ in Millions) ApprovedFY18 Budget Change Change
Budget
Directs $ 226.5 $ 238.4 $ 11.9 5.2%Indirects 38.0 41.6 3.6 9.5%
Sub-Total Operating Expenses $ 264.5 $ 280.0 $ 15.5 5.9%
Capital Financing (before Offsets) 455.1 469.1 14.0 3.1%
Offsets: Bond Redernptlon ' - - -
Variable Debt Savings - - -Debt Service Assistance - - - 0.0%
Sub-Total Capital Financing $ 455.1 $ 469.1 $ 14.0 3.1%
Total Expenses $ 719.6 $ 749.1 $ 29.5 4.1%
Investment Income $ 9.5 $ 11.3 $ 1.8 18.8%
Non-Rate Revenue 15.3 16.6 1.4 8.8%
Rate Stabilization ' - - -
Sub-Total Non-Rate Revenue $ 24.7 $ 27.9 $ 3.1 12.7%
Rate Revenue 694.9 721.2 26.4 3.8%
Total Revenue & Income $ 719.6 $ 749.1 $ 29.5 4.1%
FY18 Rate Revenue Increase 3.79%
Combined Use of Reserves $ - $ -
1MWRA has two reserve funds (Bond Redemption and Rate Stabilization) which can be used at the discretion of the Authorityto manage the rate revenue requlrement. Use of the Bond Redemption Fund reduces total expenses and Rate StabilizationFund increases total revenue. Under the terms of the General Bond Resolution the annual use of Rate Stabilization fundscannot exceed 10% of the year's senior debt service. Bond Redemption funds can be used only to retire or prepay outstandingdebt. There is no annual limit on the amount of Bond Redemption funds used in a year, however the use is tied to the bonds'maturity dates and it is utility specific.
3

4
EXPENSES:
Direct Expenses
In FY 17, Eversource began work to determine the work required to be done to protect the Cross-Harbor Cable (HEEC cable) that provides electricity to the Deer Island wastewater treatmentplant during the dredging of the Boston Harbor. The investigatory phase of the project to verifythe precise location and depth of the cable was completed in FYI7. The remediation work,Phase 2, will take place in the summer of 2017 (FYI8). During this work the HEEC cable mustbe de-energized and MWRA is required to utilize its Combustion Turbine Generators (CTGs) topower the plant. By doing so, MWRA will incur significant costs related to diesel fuel use, in-house and third party labor, and significant overtime. These additional costs are partially offsetby the avoided cost of energy and distribution charges.
Table 2 below shows the costs to MWRA associated with the project. The costs have beenincorporated in the operating budget line items as indicated.
Table 2Deer Island Cross Harbor Cable Project Costs
Item Proposed FY18 DescriptionOvertime - Planned $ 407,864 Estimated overtime of a 2nd class engineer 24x7 and 2 Medium Voltage
Electrician weekdays 3 PM to 7 AM and 24x7 on the weekends, Julythrough October 2017.
Electrictiy $ (2,523,830) Estimated savings in electricty cost while offline.Diesel Fuel $ 6,232,506 Estimated fuel cost to run the CTGs when DITP is off the electrical grid.Utilities Sub-total $ 3,708,676
Maintenance $ 302,600 Estimated constractor costs for eTG third-party contractor, 8 hours perweekday.
Total $ 4,419,140
FY18 Direct Expenses total $238.4 million, an increase of $11.9 million, or 5.2%, from theFYl7 Budget.
• Wages and Salaries - The budget includes $104.8 million for Wages and Salaries ascompared to $101.9 million in the FYl7 Budget, an increase of$2.9 million or 2.9%.Regular Pay which is 98.3% of total Wages and Salaries, increased $3.0 millionprimarily for COLA increases. The FYl8 Proposed Budget funds 1,150 positions, thesame as FYI7 and the goal recommended in the May 2012 staffing study by theAmawalk Consulting Group, LLC, to be reached in a five year timeframe. As always,new hires and backfilling of vacant positions will be managed at the agency level andaddressed on a case-by-case basis by senior management.

5
• Overtime - The budget includes $4.5 million for Overtime, an increase of $315,000or 7.5% for overtime, including the overtime associated with the HEEC cable project.Without the anticipated cable project, overtime is $93,000 or 2.2% below FYI7.
• Fringe Benefits - The budget includes $21.5 million for Fringe Benefits, an increaseof $1.3 million or 6.3% from the FY17 Budget. Health Insurance premiums total$18.6 million, an increase of$l.1 million or 6.3% from the FY17 Budget largely dueto an anticipated 8% increase in rate structure.
• Workers' Compensation - The budget includes $2.3 million for Workers'Compensation, a decrease of $21,000 or 0.9% from the FY17 Budget and is based ona three-year average of actual spending.
• Chemicals - The budget includes $10.4 million for Chemicals, an increase of $1.3million or 14.3% from the FY17 Budget mainly due to a half year funding for theDeer Island National Pollutant Discharge Elimination System (NPDES) permit whichis projected to have more stringent requirements for enterococcus treatmentcompliance and increased pricing primarily for Sodium Hypochlorite and Soda Ash.
• Utilities - The budget includes $25.8 million for Utilities, which is an increase of$4.2 million or 19.6% from the FY17 Budget. The increase is for diesel fuel of $6.2million to run the CTG's during work associated with the cross harbor electrical cableproject. This is offset by a reduction of electricity of $2.5 million. The budget funds$14.2 million for Electricity, $8.7 million for Diesel Fuel, $2.2 million for Water, and$590,000 for Natural Gas. Without the anticipated cable project, utilities in total are$500,000 or 2.3% higher than FYI7.
• Maintenance - The budget includes $32.5 million for Maintenance projects, anincrease of $1.4 million or 4.6% from the FY17 budget. The increase is for one timeprojects and for the contractor services necessary to support DITP operations whileCTGs are operating during the HEEC cable project. The FY18 Maintenance requestis $1.5 million above FY16 actuals. Without the anticipated cable project,maintenance is $1.1 million or 3.6% higher than FY17.
• Training and Meetings - The budget includes $406,000 for Training and Meetings, adecrease of $29,000 or 6.7% from the FY17 Budget.
• Professional Services - The budget includes $6.7 million for Professional Services,an increase of $154,000 or 2.4% from the FY17 Budget. The budget reflects fundingof $1.8 million for Security, $1.7 million for Regulatory Monitoring, and $1.7 millionfor Other Professional Services to support items such as professional staffdevelopment, 24/7 monitoring of the MWRA MIS network, and as-neededengineering services.
• Other Materials - The budget includes $6.7 million for Other Materials, an increaseof$478,000 or 7.7% from the FY17 Budget. $300,000 of the increase is for hardware

6
replacement, mostly laptops; and $140,000 is for water quality testing equipment. Thebudget includes funding of $1.9 million for Vehicle Purchases, $908,000 for Lab andTesting Supplies, $833,000 for Computer Hardware needs, $771,000 for VehicleExpenses mostly for fuel purchases for the MWRA fleet, $599,000 forEquipment/Furniture, $451,000 for Health and Safety, and $448,000 for WorkClothes.
• Other Services - The budget includes $22.8 million for Other Services, a decrease of$142,000 or 0.6% from the FY17 Budget. The budget includes funding of $12.8million for Sludge Pelletization, $3.7 million for Space/Lease Rentals and relatedexpenses for the Charlestown Navy Yard, and Chelsea facilities, $2.0 million forVoice and Data costs, $1.4 million for Other Services, and $1.2 million for Grit &Screenings removal. The largest decrease is for Sludge Pelletization of $298,000 dueto deflation. This is offset by increases in Membership/Dues/Subscriptions, Printing& Duplicating, Space/Lease Rentals, and Other Services.
Indirect Expenses
Indirect Expenses for FY18 total $41.6 million, an increase of $3.6 million or 9.5% from theFY17 Budget. Below are the highlights of major changes:
• The budget includes $25.0 million for the Watershed Management budget, anincrease of $733,000 or 3.0% over the FY17 Budget. The budget includes $16.4million for reimbursement of operating expenses net of revenues, and $8.6 million forPayment in Lieu of Taxes (PILOT). The largest increases are for operating expensesnet of revenues of $505,000 mainly for healthcare costs and contractual increases. Inaddition there is an increase of $228,000 for PILOT payments.
• The budget includes $5.1 million for the Retirement Fund, an increase of $445,000million or 9.6% over the FY17 budget. The minimum required contribution for FY18is $3.3 million based on the January 1, 2015 actuarial report. An additional pensiondeposit of $1.8 million was also included in the Proposed FY18 Budget in recognitionof lower than assumed returns on pension investments in CY 16.
• The budget includes $671,000 for the Harbor Energy Electric Company (HEEC), adecrease of $103,000 or 13.3% from the FY17 Budget to reflect updated calculationsfor the Operations and Maintenance component of the HEEC payment obligations.
• The budget includes $2.1 million for Insurance, an increase of $116,000 or 5.8% fromthe FY17 Budget. The FY18 Budget was based on actual average spending for thepast five years, FYI2-16.
• The Authority has complied with the GASB 45, Accounting and Financial Reportingby Employers for Postemployment Benefits Other than Pensions (OPEB), bydisclosing this liability in the year-end Financial Statements. As part of the multi-yearstrategy to address its unfunded liabilities for OPEB and pension holistically, the

7
Board approved a plan to pay down our pension liability and upon reaching fullfunding, move to address the OPEB obligation. Based on the latest actuarialevaluation, MWRA's pension fund is at 98.3% funding level. In the FYl8 Budget theAuthority is proposing to fund its OPEB liability at $5.0 million. To maximize thebenefits in terms of returns and accounting treatment, an irrevocable OPEB Trust wasestablished after Board approval and funding started on April 23rd
, 2015. The currentTrust balance is $16.5 million. The $5.0 million contribution is 50% of the AnnualRequired Contribution (ARC) after the reduction of the pay-as-you-go portionbudgeted under the Fringe line item, based on the January 1, 2014 actuarial report.
• Funding for the Operating Reserve for FYI8 is $2.1 million. The Operating Reservebalance is in compliance with MWRA General Bond Resolution which requires abalance of one-sixth of annual operating expenses. Based on the FYI8 ProposedBudget the required balance is $41.3 million versus the $39.2 million required inFYI7.
Capital Financing
As a result of the Authority's Capital Improvement Program, capital financing as a percent oftotal expenses (before offsets) has increased steadily from 36% in 1990 to 62.6% in the FYl8Current Expense Budget. Much of this debt service is for completed projects, primarily theBoston Harbor Project and the Integrated Water Supply Improvement Program. The MWRA'scapital spending, from its inception, had been dominated by projects mandated by court orderedor regulatory requirements, which in total have accounted for ~80% of capital spending to date.Going forward, and as the Combined Sewer Overflow (CSO) projects reached substantialcompletion in December 2015, the majority of spending will be focused on asset protection andwater redundancy initiatives. The projected capital spending scheduled for fiscal year 2018 isless than scheduled principal payments which will contribute to decrease MWRA's outstandingindebtedness.
The Authority has actively managed its debt structure to take advantage of favorable interestrates. Tools used by the MWRA to lower borrowing costs and manage rates include current andadvanced refunding of outstanding debt, maximizing the use of the subsidized State RevolvingFund (SRF) debt, issuance of variable rate debt, swap agreements, and the use of surplusrevenues to defease debt. The MWRA also uses tax exempt commercial paper to minimize thefinancing cost of construction in process.
The FYI8 Proposed Budget capital financing costs total $469.1 million and remain the largestportion of the MWRA's budget, accounting for 62.6% of total expenses.
The FYI8 Proposed Budget includes a planned defeasance of $20.0 million which will reducedebt service by approximately $21.1 million in FY22, and $1,050,000 in years FYI8-21.
The FYl8 Budget assumes a 3.5% interest rate for variable rate debt which is 0.25% higher thanthe rate in FYI7. The Authority's variable rate debt assumption is comprised of three separateelements: the interest rate for the daily and weekly series; liquidity fees for the Standby Bond

8
Purchase Agreement, Letter of Credit, and Direct Purchase providers; and remarketing fees.While MWRA continues to experience unusually low interest rates, they are not reflective ofhistorical averages and there are projected increases in the future.
The FY18 Proposed Budget capital financing costs increased by $14.0 million or 3.1% comparedto the FY17 Budget. This increase in the MWRA's debt service is the result of projected FY18borrowings and the structure of the existing debt, partially offset by the impact of the projecteddefeasance. The FY18 capital financing budget includes:
• $263.1 million in principal and interest payments on MWRA's senior fixed rate bonds.This amount includes $5.7 million to support issuances of $100 million in May 2017 and$3.5 million to support issuances of $100 million of new money in May 2018. Also itincludes a reduction of $1,050,000 for the effect of the planned FY 17 defeasance;
• $87.6 million in principal and interest payments on subordinate bonds;
• $87.0 million in principal and interest payments on SRF loans. This amount includes $8.8million to support issuances of $105.0 million of replacement loans during 2017 and2018;
• $13.2 million to fund ongoing capital projects with current revenue and to meet coveragerequirements;
• $4.1 million to fund the interest expense related to the Local Water Pipeline AssistanceProgram; and,
• $3.2 million for the Chelsea Lease.
Revenue
FY18 non-rate revenue totals $27.9 million, which is an increase of$3.1 million or 12.7% versusthe FY17 Budget. The FY18 non-rate revenue budget includes:
• $7.7 million in Other Revenue including, $4.4 million from the sale of the Authority'sRenewable Portfolio Credits, revenue from participating in load response program andsale of generated power to the grid, as well as $2.2 million in permit fees and penalties.Other Revenue increased $1.1 million from the FY17 Budget due to an increase in theload response program.
• $11.3 million in Investment Income, an increase of $1.8 million or 18.8% from the FY17Budget, reflecting higher interest rate assumptions. The short-term interest rateassumption is at 1.25% which is at the 65 basis points above the FY17 Budget level.
• $9.0 million in Other User Charges, including $4.9 million for Chicopee ValleyAqueduct (CVA) communities, $1.7 million for Deer Island water usage, $727,000 forentrance fees from member communities, and $500,000 for the Commonwealth's partial

9
reimbursement for Clinton Wastewater Treatment Plant expenses. Other User Chargesare $212,000 or 2.4% more than the FY17 Budget which is mainly due to assessmentincreases related to increases for Lancaster and Water Treatment Plants Residualsassessments.
The Rate Revenue Requirement for FY18 is $721.2 million, an increase $26.4 million or 3.79%over the FY17 Budget. The Rate Revenue Requirement is the difference between total expensesof$749.1 million, less non-rate revenue of$27.9 million.
Planning Estimates and Future Rate Projections
MWRA's planning estimates are projections based on a series of assumptions about futurespending (operating and capital), interest rates, inflation, and other factors. MWRA uses theplanning estimates to model and project what future rate increases might be based upon theseassumptions, as well as to test the impact of changes to assumptions on future rate increases. Theplanning estimates are not predictions of what rate increases will be but rather they provide thecontext and framework for guiding MWRA financial policy and management decision makingthat ultimately determine the level of actual rate increases on an annual basis. Historically, theplanning estimates were based on conservative financial assumptions. Conservative projectionsof future rate increases benefit the MWRA by providing assurance to the rating agencies thatMWRA anticipates to raise revenues sufficient to pay for its operations and outstanding debtobligations now and over the long-term. Additionally, conservative forecasts of rate revenueincreases enable member communities to adequately plan and budget for future payments toMWRA. In FY14 the Authority tightened certain planning estimate assumptions such as inflationon direct expenses and limiting the annual capital improvement spending.
Table 3 below presents the combined estimated future rate increases and household chargesbased on the Proposed FY18 Budget. The planning estimates shown below assume no DebtService Assistance from the Commonwealth and use of Rate Stabilization and Bond Redemptionreserves through FY27.
Table 3
Rates & Budget ProjectionsPr. rosed FYI8 CEß FY2017 FY2018 FY2019 FY2020 FY2021 FY2022 FY2023 FY2024 FY2025 FY2026 FY2027Total Rate Revenue SaDD s 694 879 s 721238 s 748 379 S777 081 S8068S1 s 837 644 s 858538 $851261 S 853 809 S 863976 S871071Rate Revenue Channe from Prior Year SOOO) s 22438 S 26359 S 27141 S 28701 S 29770 S 30793 S 20894 S _f7 277 S 2549 S IO 167 S 7094Rate Revenue Increase 3.4% 3.8% 3.8% 3.8% 3.8% 3.8% 2.5% ·0.8% 0.3% 1.2% 0.8%Use of Reserves $000 S S S S S 4197 S 10910 S S s S 33 596 S 13 917
Attachment AAttachment BAttachment C
FY18 Proposed Current Expense Budget compared to FY17 BudgetFY18 Proposed Current Expense Budget by Division vs. FY17 BudgetFY18 Proposed Current Expense Budget compared to FY17 Projection
CEB Review and Adoption Process
The Advisory Board has 60 days from the transmittal of the FY18 Proposed Budget to review thebudget and prepare comments and recommendations. During the review period, Advisory Boardand MWRA staff will continue to meet and evaluate the impact of changing circumstances asthey arise. Following the receipt of the Advisory Board's comments and recommendations,MWRA presents its official responses to the Board of Directors at budget hearings. Staff willpresent the final budget and the final assessments and for Fiscal Year 2018 to the Board forapproval in June 2017.
Attachments
10

ATTACHMENT A
FY18 Proposed Budget vs FY17 Approved Budget
FYI7 FYI8 ChangeTOTALMWRA FYI6 Actuals Approved Proposed FY18 Proposed Budget vs
Budget Budget FY17 Approved Budget$ I • %
¡EXPENSES
WAGES AND SALARIES $ 96,118,427 $ IO I ,858,897 $ 104,781,848 $ 2,922,951 2.9%OVERTIME 4,355,586 4,192,676 4,507,278 314,602 7.5%FRINGE BENEFITS 19,131,139 20,242,324 21,515,134 1,272,810 6.3%WORKERS' COMPENSATION 2,350,369 2,344,190 2,322,980 (21,210) -0.9%CHEMICALS 9,297,550 9,110,407 10,414,788 1,304,381 14.3%ENERGY AND UTILITIES 18,744,867 21,541,078 25,750,207 4,209,129 19.5%MAINTENANCE 30,978,045 31,080,642 32,496,381 1,415,739 4.6%TRAINING AND MEETINGS 370,752 435,481 406,181 (29,300) -6.7%PROFESSIONAL SERVICES 5,886,717 6,531,939 6,685,715 153,776 2.4%OTHER MATERIALS 6,186,216 6,219,630 6,697,290 477,660 7.7%OTHER SERVICES 22,628,385 22,974,855 22,833,106 (141,749) -0.6%ITOTAL DIRECT EXPENSES 1$ 216,048,053 1$ 226,532,1l7 1$ 238,410,908 1$11,878,791 1 5.2%1
INSURANCE $ 1,953,053 $ 1,997,898 $ 2,113,452 115,554 5.8%WATERSHED/PILOT/DEBT 27,469,847 24,291,268 25,024,006 732,738 3.0%COMMONWEAL TH DEBT PREPAYMEN1 32,000,000HEEC PAYMENT 1,342,141 773,859 670,978 (102,881) -13.3%MITIGATION 1,520,000 1,558,000 1,596,950 38,950 2.5%ADDITIONS TO RESERVES (34,927) (167,742) 2,062,526 2,230,268 N/ARETIREMENT FUND 8,159,521 3,132,624 3,277,369 144,745 4.6%ADDITIONAL PENSION DEPOSIT 1,500,000 1,800,000 300,000 20.0%POSTEMPLOYMENT BENEFITS 5,224,848 4,876,050 5,035,422 159,372 3.3%ITOTAL INDIRECT EXPENSES 1$ 77,634,483 1$ 37,961,956 1$ 41,580,703 1$ 3,618,746 1 9.5%1
STATE REVOLVING FUND $ 78,131,559 $ 86,971,915 $ 87,044,610 72,695 0.1%SENIOR DEBT 275,085,817 268,472,557 263,121,111 (5,351,446) -2.0%SUBORDINATE DEBT 49,222,442 69,997,992 87,554,667 17,556,675 25.1%LOCAL WATER PIPELINE CP 262,498 4,149,242 4,086,863 (62,379) -1.5%CURRENT REVENUE/CAPITAL 11,200,000 12,200,000 13,200,000 1,000,000 8.2%CAPITAL LEASE 3,217,060 3,217,060 3,217,060 0.0%DEBT PREPAYMENT 10,994,960 10,900,000 (94,960) -0.9%VARIABLE RATE SAVINGS (12,873,173)DEFEASANCE ACCOUNTDEBT SERVICE ASSISTANCE (873,804) (873,804) 873,804 -100.0%ITOT AL DEBT SERVICE 1$ 403,372,399 1$ 455,129,922 1$ 469,124,311 1$ 13,994,389 1 3.1%1
ITOTAL EXPENSES 1$ 697,054,934 1$ 719,623,995 1$ 749,115,922 1$ 29,491,926 1 4.1%1
IREVENUE & INCOME
RATE REVENUE $ 672,440,000 $ 694,878,500 $ 721,238,000 26,359,501 1 3.79%1OTHER USER CHARGES 8,783,469 8,752,834 8,964,366 211,532 2.4%OTHER REVENUE 15,749,464 6,519,171 7,658,774 1,139,603 17.5%RATE STABILIZATIONINVESTMENT INCOME 10,303,841 9,473,490 11,254,782 1,781,292 18.8%ITOTAL REVENUE & INCOME 1$ 707,276,774 1$ 719,623,995 1$ 749,115,922 1$ 29,491,928 1 4.1%1

ATTACHMENT B
FY18 Proposed Direct Expense Budget by Division
FY17 Final FY18 ProposedChange
Division FY18 Proposed Budget vs.Budget Budget FY17 Final Budget
$ I %
Executive $1,315,196 $1,348,637 $33,441 2.5%
Emergency Preparedness 3,180,579 3,627,257 $446,678 14.0%
Administration 46,636,917 48,568,083 $1,931,166 4.1%
Finance 4,267,780 4,146,902 -$120,877 -2.8%
Law 1,967,409 2,111,728 $144,319 7.3%
Affirmative Action 555,259 558,363 $3,104 0.6%
Internal Audit 654,825 686,914 $32,089 4.9%
Public Affairs 1,220,789 1,266,464 $45,675 3.7%
Operations 166,733,363 176,096,561 $9,363,198 5.6%
Total Authority $226,532,117 $238,410,908 $11,878,791 5.2%

ATTACHMENT C
FY18 Proposed vs FY17 Projection
FY17Change
TOTALMWRA FY17 BudgetProjection
FY18 Proposed FY18 Proposed Budget vsFY17 Projection$ I %
IEXPENSESWAGES AND SALARIES $ 101,858,897 $ 98,693,997 $ 104,781,848 $ 6,087,851 6.2%OVERTIME 4,192,676 4,353,199 4,507,278 154,079 3.5%FRINGE BENEFITS 20,242,324 19,688,233 21,515,134 1,826,901 9.3%WORKERS' COMPENSA TION 2,344,190 2,144,190 2,322,980 178,790 8.3%CHEMlCALS 9,110,407 9,479,801 10,414,788 934,987 9.9%ENERGY AND UTILITIES 21,541,078 20,825,402 25,750,207 4,924,805 23.6%MAINTENANCE 31,080,642 32,004,057 32,496,381 492,324 1.5%TRAINING AND MEETINGS 435,481 414,086 406,181 (7,905) -1.9%PROFESSIONAL SERVICES 6,531,939 6,818,941 6,685,715 (133,226) -2.0%OTHER MATERIALS 6,219,630 6,156,271 6,697,290 541,019 8.8%OTHER SERVICES 22,974,855 22,065,308 22,833,106 767,798 3.5%ITOTAL DIRECT EXPENSES 1$ 226,532,117 I $ 222,643,485 I $ 238,410,908 I $ 15,767,423 I 7.1%1
INSURANCE $ 1,997,898 $ 1,932,428 $ 2,113,452 181,024 9.4%WATERSHEDIPILOT 24,291,268 23,900,159 25,024,006 1,123,847 4.7%HEECPAYMENT 773,859 773,859 670,978 (102,881) -13.3%MlTIGATION 1,558,000 1,542,800 1,596,950 54,150 3.5%ADDITIONS TO RESERVES (167,742) (167,742) 2,062,526 2,230,268 -1329.6%RETIREMENT FUND 3,132,624 3,132,624 3,277,369 144,745 4.6%ADDITIONAL PENSION DEPOSIT 1,500,000 1,500,000 1,800,000 300,000 20.0%POSTEMPLOYMENT BENEFITS 4,876,050 4,876,050 5,035,422 159,372 3.3%ITOTAL INDIRECT EXPENSES 1$ 37,961,957 I $ 37,490,179 I $ 41,580,703 I $ 4,090,525 I 10.9%1
STATE REVOLVING FUND $ 86,971,915 $ 82,906,636 $ 87,044,610 4,137,974 5.0%SENlORDEBT 268,472,557 263,027,504 263,121,111 93,607 0.0%SUBORDINATE DEBT 69,997,992 69,997,992 87,554,667 17,556,675 25.1%LOCAL WATER PIPELINE CP 4,149,242 1,011,093 4,086,863 3,075,770 304.2%CURRENT REVEN1Æ/CAPIT AL 12,200,000 12,200,000 13,200,000 1,000,000 8.2%CAPITAL LEASE 3,217,060 3,217,060 3,217,060 0.0%DEBT PREPAYMENT 10,994,960 10,994,960 10,900,000 (94,960) -0.9%VARIABLE RATE SAVINGS (9,643,716) 9,643,716 -100.0%DEFEASANCE ACCOUNT 22,292,195 (22,292,195) -100.0%DEBT SERVICE ASSISTANCE (873,804) (873,804) 873,804 -100.0%ITOTAL DEBT SERVICE 1$ 455,129,920 I $ 455,129,920 I $ 469,124,311 I $ 13,994,391 I 3.1%1
ITOT AL EXPENSES 1$ 719,623,994 I $ 715,263,584 I $ 749,115,922 I $ 33,852,339 I 4.7%1
IREVENUE & INCOME I
RATE REVEN1Æ $ 694,878,500 $ 694,878,500 $ 721,238,000 26,359,500 I 3.79%1OTHER USER CHARGES 8,752,834 8,752,834 8,964,366 211,532 2.4%OTHER REVEN1Æ 6,519,171 13,719,271 7,658,774 (6,060,497) -44.2%RATE STABILIZATIONINVESTMENT INCOME 9,473,490 9,309,490 11,254,782 1,945,292 20.9%ITOTAL REVENUE & INCOME 1$ 719,623,996 I $ 726,660,096 I $ 749,115,922 I $ 22,455,827 I 3.1%1
VARIANCE: $ 11,396,512 $ (11,396,512)
II

AF&A B.2IVA.2
2/15/17
STAFF SUMMARY
TO:FROM:DATE:SUBJECT:
Board of Directors ~ /J YFrederick A. Laskey, Executive Director ~.February 15,2017Appointment of Proxy for Fore River Railroad Corporation
_x_ VOTECOMMITTEE: Administration, Finance & Audit
Sean R. Cordy, Senior Financial Analyst )Rc_.,Matthew R. Horan, Treasurer 1H1J.Preparer/Title
RECOMMENDATION:
That the MWRA Board of Directors, as holder of all voting rights of all the issued andoutstanding shares of stock of the Fore River Railroad Corporation, vote to appoint Kathy Soni,with the power of substitution, to vote as proxy at the next annual meeting and any specialmeeting of the stockholders for the Fore River Railroad Corporation in accordance with the formof proxy attached hereto and filed with the records of this meeting. In addition, the MWRABoard of Directors directs the proxy to elect the following board members:
Thomas J. DurkinLisa R. GrollmanBrian PeñaJohn J. Walsh
Godfrey O. EzeigweMichael 1. HombrookSteven A. Remsberg
Michele S. GillenFrederick A. LaskeyJohn P. Vetere
DISCUSSION:
In 1987, MWRA purchased the Fore River Staging Area from General Dynamics. Included inthe sale was the purchase of the Fore River Railroad Corporation (FRRC). The railroad operatesduring weekdays and services MWRA's Residuals Plant and Twin Rivers Technologies, Inc.Since July 2001, FRRC has leased its operating rights to Fore River Transportation Corp., ashort-line railroad operator. Pursuant to the by-laws of the FRRC, an annual meeting of theshareholders must be held in the first quarter of each calendar year to elect the Board ofDirectors. MWRA is the sole stockholder of the Fore River Railroad Corporation.
The primary purpose of the proxy for the stockholders at the Annual Stockholders' meeting is toelect the FRRC Board of Directors as set forth on the Shareholder's Annual Meeting Agenda.Each Director's term extends until the next annual meeting. The FRRC by-laws state that the

Board shall consist of a minimum of five members.
The current Board Members are listed below:
Thomas J. DurkinLisa R. GrollmanBrian PeñaJohn 1. Walsh
Godfrey O. EzeigweMichael J. HornbrookSteven A. Remsberg
Michele S. GillenFrederick A. LaskeyJolm P. Vetere
Staff recommend that all current members be reappointed to serve on the FRRC Board in 2017.
Attachment: Form of Proxy

FORE RIVER RAILROAD CORPORATIONPROXY
The undersigned, on behalf of MWRA's Board of Directors and duly representing the holder ofall the issued and outstanding shares of stock of the Fore River Railroad Corporation herebyappoints Kathy Soni to vote as proxy for the undersigned at the upcoming Annual Meeting of theStockholders and at any Special Meeting of the Stockholders of the Fore River RailroadCorporation. The proxy is instructed to vote on all business as may properly come before thestockholders meetings and to sign any waivers of notice to be taken thereat, with all the powersthe undersigned would possess if personally present.
Thomas 1. DurkinLisa R. GrollmanBrian PeñaJohn J. Walsh
Godfrey O. EzeigweMichael J. HornbrookSteven A. Remsberg
Michele S. GillenFrederick A. LaskeyJohn P. Vetere
MASSACHUSETTS WATER RESOURCESAUTHORITY
By: _Matthew A. BeatonChairmanBoard of Directors
Massachusetts Water Resources Authority: 1,470 Shares
Dated: Boston, MassachusettsFebruary 15,2017

MASSACHUSETTS WATER RESOURCES AUTHORITYCharlestown Navy Yard
100 First Avenue, Building 39Boston, MA 02129
Frederick A. LaskeyExecutive Director
Telephone: (617) 242-6000Fax: (617) 788-4899TTY: (617) 788-4971
WASTEWATER POLICY & OVERSIGHT COMMITTEE MEETINGChair: P. FlanaganVice-Chair: J. WalshCommittee Members:A. BlackmonJ. Carroll1. FotiA. PappastergionB. PeñaH. Vitale
to be held on
Wednesday, February 15, 2017
Location: 100 First Avenue, 2nd FloorCharlestown Navy YardBoston, MA 02129
Time: Immediately following AF&A Comm.
AGENDA
A. Contract Awards
1. Long-Term Energy Supply Alternatives Analysis, Deer Island Treatment Plant:Burns & McDonnell, Contract 6963
2. Oxygen Generation Services, Deer Island Treatment Plant: Solutionwerks, Inc.,Contract S562
3. Nut Island Headworks Odor Control and HVAC Improvements Inspections,Evaluations, Design, Construction Administration and Resident EngineeringServices: Hazen & Sawyer, PC, Contract 7517
® Printed on 100% Recycled Paper

WW{i)2/15/17
Meeting of theWastewater Policy and Oversight Committee
December 14, 2016
A meeting of the Wastewater Policy and Oversight Committee was held onDecember 14,2016 at the Authority headquarters in Charlestown. Vice-ChairmanWalsh presided. Present from the Board were Messrs. Blackmon, Carroll, Cotter,Flanagan, Fati, and Vitale. Among those present from the Authority staff were FredLaskey, Steve Remsberg, Mike Hornbrook, Carolyn Fiore, John Vetere, Dave Kubiak,Steve Cullen, Kathleen Cullen, Nava Navanandan, Ted Regan, David Ouest, RickAdams and Linda D'Addario. The meeting was called to order at 11:30 a.m.
Approvals
*Memorandum of Understanding and Financial Assistance Agreement with the City ofCambridge for the Implementation of CSO Control Projects, Amendment 13 andProgress of Cambridge Implemented CSO Projects and Financial Assistance throughMarch 2017
There was general discussion and question and answer. The Committeerecommended approval (ref. agenda item A.1)
*Financial Assistance Agreement with BWSC for Implementation of CSO Projects,Amendment 16
There was general discussion and question and answer. The Committeerecommended approval of Amendment 16 (ref. agenda item A.2)
Contract Awards
* Management, Operations and Maintenance of the Union Park Pump Station/CSOProjects: Woodard & Curran, Inc., Contract S559
The Committee recommended approval of the contract award (ref. agenda itemB.1).
*Sewer Section 4,5,6 and 186 Study: Hazen and Sawyer, P.C. Contract 7423
Staff gave a presentation about the project. The Committee recommendedapproval of the contract award (ref. agenda item B.2).
* Approved as recommended at December 14, 2016 Board of Directors meeting.

Wastewater Policy and Oversight Committee, December 14, 2016 Page 2
*Janitorial Services at the Deer Island Treatment Plant: Star Building Services, Inc.
Representatives of SEIU attended the meeting and through the ExecutiveDirector, submitted a letter to the Committee regarding the retention of current janitorialemployees, wages and health insurance. Staff had previously addressed these issues.The Committee recommended approval of the contract award (ref. agenda item B.3).
*Deer Island Treatment Plant Motor Control Center and Switchgear ReplacementDesign, Engineering Services During Construction, and ResidentEngineering/Inspection Services: AECOM, Contract 7419
The Committee recommended approval of the contract award (ref. agenda itemBA).
*Deer Island Treatment Plant Personnel Dock Rehabilitation: Coastal MarineConstruction, Contract 7168
Staff gave a presentation about the project. The Committee recommendedapproval of the contract award (ref. agenda item B.5).
The meeting adjourned at 11:15 a.m.
* Approved as recommended at November 16, 2016 Board of Directors meeting.

Meeting of theWastewater Policy and Oversight Committee
January 18, 2017
A meeting of the Wastewater Policy and Oversight Committee was held onJanuary 18, 2017 at the Authority headquarters in Charlestown. Vice-Chairman Walshpresided. Present from the Board were Messrs. Blackmon, Carroll, Cotter, Fati,Pappastergian, Peña, and Vitale. Among those present from the Authority staff wereFred Laskey, Steve Remsberg, Carolyn Fiore, Betsy Reilly, Carolyn Francisco Murphy,Mike Hornbrook, Dave Ouest, Rick Adams, and Bonnie Hale. The meeting was calledto order at 11:00 a.m.
Information
Clinton Wastewater Treatment Plant Reissued NPOES Permit
Staff summarized the provisions of the permit, and there was general discussionand question and answer.
Contract Awards
*Electrical Equipment Testing, Deer Island Treatment Plant: American Electrical TestingCompany, Contract S561
There was general discussion and question and answer. The Committeerecommended approval of the contract award (ref. agenda item B.1).
The meeting adjourned at 11:25 a.m.
* Approved as recommended at January 18, 2017 Board of Directors meeting.
WW(ii)2/15/17

STAFF SUMMARY
WWA.lIV B.l
2/15/17
TO:FROM:DATE:SUBJECT:
Board of Directors , ~ IFrederick A. Laskey, Executive Director T",~ .-February 15,2017Long- Term Energy Supply Alternatives AnalysisDeer Island Treatment PlantBurns & McDonnell Engineering Company, Inc.Contract 6963
COMMITTEE: Wastewater Policy & Oversight INFORMATION.x. VOTE
David F. Duest, Director, Deer Island WWTPRichard 1.Adams, Manager, Engineering ServicesPreparer/Title
Contract 6963 is an engineering contract that will evaluate existing energy assets on DeerIsland, perform a condition assessment to better understand remaining asset life, perform apower and economics analysis into the next 25 years, then develop and evaluate energy systemalternatives that will provide Deer Island with a roadmap to obtaining the most cost effective,reliable energy operations for Deer Island's future. An alternative combined heat and powersystem will be further evaluated together with a natural gas line and/or second electric cable.These and other alternatives will be studied and a recommended comprehensive Deer IslandEnergy Master Plan will be recommended to increase energy efficiency and maximize our useand value of digester gas with the ultimate goal of operating at net zero energy.
RECOMMENDATION:
To approve the recommendation of the Consultant Selection Committee to award Contract No.Contract 6963, Long-Term Energy Supply Alternatives Analysis, Deer Island Treatment Plant, toBurns & McDonnell Engineering Company, Inc., and to authorize the Executive Director, onbehalf of the Authority, to execute said contract for a guaranteed maximum price of $829,500,for a contract term of 12 months from the Notice to Proceed.
BACKGROUND:
The Deer Island Wastewater Treatment Plant is one of the largest wastewater treatment facilitiesin North America. The facility provides primary and secondary treatment of wastewatercollected from 43 member sewer communities in the Greater Boston area. The facility systemscame on-line sequentially beginning in 1992 and were completed in 2001 at a cost of $3.8
ITEM POSTPONED

billion. Deer Island consists of a number of complex wastewater treatment processes thatconsume a significant amount of energy in the form of both heat and electricity.
The main source of electrical power required to operate Deer Island is transmitted from a 115 kVsubmarine cable which spans approximately six miles from Eversource's K Street Substation inSouth Boston, buried below the sea bed in Boston Harbor, to the HEEC Substation on DeerIsland. The cable was constructed and is owned by Harbor Electric Energy Company (HEEC), asubsidiary of Eversource. The HEEC cable has been the subject of numerous staff summaries tothe Board principally dealing with the cable's location and impacts associated with Massport'sBoston Harbor dredging proj ect.
The voltage in the cable is lowered from 115 kV to 13.8 kV through two transformers in theHEEC substation on Deer Island. This power is distributed to and fulfills the power requirementson Deer Island. The cable was placed into service in 1990, and has a projected life expectancy ofwell over 40 years.
Should the connection to the electrical grid through the HEEC cable be lost, Deer Island canmeet all of its on-island electrical demand by operating two 26 MW Pratt & Whitney FT-8combustion turbine generators (CTGs) which are located inside the On Site Thermal/Power Plant(Power Plant). The CTGs, which operate on NO.2 ultra low sulfur diesel fuel, are "black start"capable and can reach Deer Island's nominal load in 10 to 15 minutes. Deer Island is requiredby federal and state permits to have sufficient back-up power to operate the treatment plant atfull operation.
Combustion Turbine Generator (1 of 2)
2

Deer Island also generates a significant portion of its energy requirements through on-sitegeneration. The plant collects sludge from its primary and secondary treatment processes andtransports it to twelve 3-million gallon egg-shaped digesters for further processing by anaerobicmicroorganisms. The biogas generated within the digesters (primarily methane and carbondioxide) is then piped into two 3-million gallon capacity gas and digested sludge holding tanks.The gas is compressed and then piped to the Power Plant. A digester gas purification system inthe Power Plant removes hydrogen sulfide from the digester gas before it is fired in one of thetwo high pressure boilers to create steam. Each boiler is designed to produce 150,000 pounds perhour of 7000 superheated steam at 600 psig, which is passed through an 18 MW Steam TurbineGenerator (STG) and a 1.2 MW Back Pressure Steam Turbine Generator (BPSTG) to generateelectricity. The low-pressure steam discharged from the STG and BPSTG also provides the heatrequired throughout the Deer Island for the anaerobic digestion process and all other buildingheat demands, through a system of heat exchangers connected to the continuously-operatinghydronie heat loop distribution system. The boilers can also operate on NO.2 ultra low-sulfurdiesel fuel if, for any reason, digester gas is not available or during sustained extreme coldperiods during the winter months when digester gas alone cannot meet the heating demand. Thefuel is stored in two 750,000 gallon tanks located adjacent to the Power Plant.
High Pressure Boiler (1 of 2)
The current Deer Island Combined Heat and Power (CHP) system utilizes the methane gas fromthe digesters to meet the heat demands of the plant and the treatment process. As an additionalbenefit, electricity is generated. The current use of digester gas in the existing CHP system meets
3

greater than 98% of the heat needs of the plant and over 20% of the electrical demand of theplant and provides between $16 and $24 million dollars in energy savings annually.
In 2013, MWRA contracted with CDM Smith to conduct a Residuals Technology OptionsAssessment (MWRA Contract 7147A). CDM Smith also did a conceptual level evaluation ofDITP's existing CHP to evaluate ways to improve its operation by gaining efficiencies in the useof its digester gas. CDM Smith concluded it was possible for Deer Island to basically change theconcept of how it produced electricity and heat. CDM recommended MWRA replace its existingCHP system with a new CHP that would first generate electricity and then perform heatrecovery. This would maintain the ability to meet the plant's heat needs but also increase itselectric power generation by a factor of 3-4 times bringing electrical generation by digester gasabove 70% of Deer Island energy demand. The new CHP concept offered paybacks in the orderof 7-9 years.
DISCUSSION:
Staff have determined that there is a need to initiate a process to ensure Deer Island's long-termenergy needs are reliably and economically met. The first step in this process is to conduct along-term energy supply alternatives analysis to identify options for implementation. The scopeof Contract 6963 consists of evaluating the existing energy infrastructure of Deer Island andperforming a comprehensive evaluation of multiple long-term energy supply and on-sitegeneration alternatives to cost-effectively meet the demands of Deer Island while also satisfyingthe critical regulatory requirement for an independent backup power system. The majorcomponents of the alternatives analysis include:
• Information Review & Site Visits: The Consultant will visit the site to become familiarwith the operation of the plant's energy systems and obtain pertinent operational datawhich will be used in the alternatives analysis;
• Existing Energy System Asset Condition Evaluation: The expected remaining useful lifeof energy system assets will be estimated for use in subsequent economic evaluationsperformed under this contract;
• Existing Power Asset Economic Analysis: An economic analysis of the existing energysystem assets will be performed and used as a baseline for comparing the futureperformance of the alternatives that will be evaluated under this contract;
• Background Information Analyses: An analysis of 24 discrete topics requiring researchwill be performed which will factor into the alternatives analysis. Topics include ananalysis of future electricity, natural gas and oil markets, identifying potential grants andfinancial incentive opportunities and evaluating air emissions regulatory and permittingrequirements as they relate to each alternative;
• Long- Term Energy Supply Alternatives Analysis: A total of twelve alternatives, whichare broken-out into four groups, will be evaluated by the Consultant and are describedbriefly below.
- Alternative Group 1 contains four alternatives. One alternative will evaluate DeerIsland's existing power assets, including in-kind replacement of the equipment atthe end of its useful life. This alternative will serve as a "base case" and will beused to compare the performance and economics of the other alternatives that willbe evaluated. Two of these alternatives will be similar to the base case except that
4

they will evaluate the installation of a new submarine cable from Eversource'sproposed switchyard in East Boston. One alternative within this group will alsoevaluate the modification of the existing boilers and CTGs to be fed via a newnatural gas supply to Deer Island.
- Alternative Group 2, which contains two alternatives, will evaluate the addition ofcombined heat and power (CHP) equipment that is designed to operate on DeerIsland's digester gas supply.
- Alternative Group 3, which contains four alternatives, will evaluate the additionof CHP equipment that is sized to meet all of the Deer Island's electrical needsusing a combination of digester gas and natural gas. One of these alternatives willsize the CHP equipment to supply all of the Deer Island's electrical and thermalloads while providing electrical redundancy from a new submarine cable.Another alternative in this group will size the CHP equipment to meet the DeerIsland's electrical and thermal loads while also including full redundancy so that asubmarine cable is not required. The third alternative will size the CHP equipmentto meet Deer Island's electrical and thermal loads while also having the ability toexport electricity for sale to other users. The fourth alternative will evaluaterepurposing the existing CTGs into CHP units to provide full electricalredundancy.
- Alternative Group 4 contains two additional Consultant-proposed alternatives thatwill be a variation of the alternatives listed above.
Attachment A inc/udes additional information regarding the alternatives to be evaluatedunder this contract.
• The analysis performed for each alternative will consist of the following activities:
- Conceptual Design: Prepared to confirm the engineering viability of eachalternative and show how the proposed equipment will be connected to existingDeer Island systems. The conceptual design will also determine the installed costof each alternative for input into the economic analysis.
- Performance Simulation: Performed to simulate the operation of the power systemassets as part of a complete system in order to determine the performance of eachalternative and to enable comparisons to other alternatives. The results of theperformance simulation will be input into the economic analysis.
- Economic Analysis: Performed to determine the economic benefit of eachalternative, including payback period, and to enable comparisons between eachalternative.
The Consultant will also be required to conduct a number of workshops with staff as the workprogresses.
The Consultant will prepare a report which will provide a detailed discussion of the performanceand economic analyses that were performed for each of the twelve alternatives. The Consultantis also required to include in the report a recommendation for the alternative that most reliablyand economically meets Deer Island's long-term energy needs and goals to maximize on-sitegeneration and reduce the purchase of electricity. This information will be used by staff todevelop Deer Island's long term capital budget.
5

Procurement Process
Staff issued a one-step Request for Qualifications/Proposal (RFQIP) on October 19, 2016. Apre-proposal meeting and site visit was held on October 28, 2016 and attended by representativesfrom ten different companies. On December 2, 2016, MWRA received proposals from twofirms: Burns & McDonnell Engineering Company, Inc. (Bums & McDonnell) and Black &Veatch Corporation (Black & Veatch). Each of the proposals included teaming arrangementswith additional consultant firms. Staff contacted the other firms who received the RFQIP andattended the site visit to find out why they did not submit a proposal. The reasons offered for notsubmitting a proposal included: the inability of energy consulting firms to meet the mandatoryprofessional engineering staff requirements in-house and the lack of resources in the engineeringfirms to fully meet the project's complexity.
Proposals were evaluated in accordance with weighted criteria and the recommendation foraward is to the proposer that had the highest overall ranking. Proposals were evaluated by usingthe following criteria: Cost (25 points), Qualifications and Key Personnel (25 points),Experience/Past Performance on Similar Non-Authority Projects (25 points), TechnicalApproach/Capacity / Organization and Management Approach (15 points) and Past Performanceon Authority Projects (10 points).
The Burns & McDonnell and the Black & Veatch cost proposals with level of effort arepresented below:
ProposerEngineer's Estimate 1)
r
Bums & McDonnellBlack & Veatch
ProposedContract Cost$767,524.00$829,500.00$972,093.38
Level ofEffort
4,146 hours3,981 hours5,887 hours
l) The original Engineer's Estimate was adjusted prior to issuing the RPQ/P to incorporate scope of serviceschanges requested by the Selection Committee.
The five voting members on the Selection Committee scored and ranked the proposals asfollows:
Proposers Points Total Rank* Final RankingBurns & McDonnell 396 7 1Black & Veatch 381 8 2
* Total Rank represents the sum of the individual Selection Committee members' rankings. The firm receiving thehighest number of points is assigned a "l"; the firm receiving the next highest number of points is assigned a "2,"and so on.
The Selection Committee voted unanimously to rank Burns & McDonnell first. Burns &McDonnell has a dedicated energy and power group which specializes in utility planning anddesign. The firm proposed an excellent project team with significant relevant experience andpast performance on several non-MWRA projects. While the firm has no prior experience withMWRA, it is utilizing Hazen & Sawyer as a subconsultant, a firm with whom MWRA has
6

frequently contracted. The Selection Committee was in agreement that Burns & McDonnell'stechnical approach was comprehensive and provided relevant details on how evaluate thealternatives. Burns & McDonnell's proposal included an acceptable number of total hours,which was distributed appropriately among a very experienced staff.
The Selection Committee concluded that Black & Veatch proposed a highly qualified projectteam with excellent past performance on non-MWRA projects and very good experience onMWRA projects. However, the Selection Committee determined that Black & Veatch'stechnical approach was lacking in detail and did not provide adequate detail on its plannedexecution of the scope of services. In addition, the Selection Committee opined that Black &Veatch's proposed level of effort was excessive for both project management and certainportions of the alternatives analysis scope of services.
The Selection Committee determined that Burns & McDonnell's proposal represents the bestoverall value (total cost and level of effort by a highly qualified team) of the two proposals. TheSelection Committee was of the opinion that Burns & McDonnell included the best team and theappropriate number of hours, by category, with the proper staffing mix (senior and junior level)to successfully complete the scope of services. The Selection Committee concluded that Burns &McDonnell's past experience on several similar non-Authority projects was excellent.
Subsequent to the Selection Committee meeting, Staff conducted a series of telephone interviewswith representatives of Burns & McDonnell to confirm that they understood the requirements ofthe RFQ/P and that they were confident that their proposed level of effort was sufficient toexecute the scope of services. Burns & McDonnell confirmed that it fully understood therequirements of the RFQ/P and that the proposed level of effort and budget was sufficient toexecute the scope of services. Burns & McDonnell further agreed to complete the specifiedservices on the basis of a guaranteed maximum price given the detail contained in the scope ofservices and its ability to successfully execute the project.
Therefore, the Selection Committee recommends approval of Contract 6963 to Burns &McDonnell in a guaranteed maximum price of $829,500.00.
BUDGET /FISCAL IMPACT:
The Final FYI7 CIP includes $6,000,000 for Contract 6963, the Combined Heat and PowerDesign project. This Long Term Energy Supply Alternatives Analysis project was added to theCHP scope, in order to determine the most feasible and beneficial option for the Authority topursue for subsequent design and construction of a new CHP facility. The Final FYI7 CIPcontains adequate funding for the energy alternatives analysis.
MBEIWBE PARTICIPATION:
There are no MBE and WBE participation requirements for this project due to the specializednature of the services.
ATTACHMENT:
Attachment A - Summary of Long-Term Energy Supply Alternatives
7

ATTACHMENT ASUMMARY OF LONG-TERM ENERGY SUPPLY ALTERNATIVES
Alternative Group I
Alternative Group l evaluates Deer Island's existing power assets, including replacement in-kindat the end of their useful life. Alternative Group 1 consists of the following four alternatives:
1. Alternative lA - Maintain Existing EquipmentAlternative lA will evaluate the expected costs of operating the existing energy systemover the next 25 years. Depending upon the expected equipment life (which will beestimated by the Consultant), this will include potential replacement of the existing crossharbor cable, CTGs, boilers, etc. As this case represents continuing to operate the systemas it currently exists, this is the "base case." When determining how other alternativescompare to the current system, this is the alternative that captures the current systemperformance.
2. Alternative IB - Maintenance of Existing Equipment with New Utility CableAlternative 1B is identical to Alternative 1A except with the addition of keeping theexisting HEEC cable until the end of its useful life and replacing it with a new 115 kVutility cable.
3. Alternative IC - Maintenance of Existing Equipment with Redundant Utility FeedAlternative 1C is similar to Alternative lA in that all the existing thermal equipment isretained or replaced in-kind at the end of its useful life and the existing HEEC cable ismaintained or replaced. However, Alternative 1C includes the addition of a second new115 kV utility cable. The evaluation will include a determination if the added redundancyprovided by the second cable will allow for the removal of the CTGs as on-site standbypower.
4. Alternative ID - Maintenance of Existing Equipment with addition of Natural GasAlternative ID includes the evaluation of modifying the existing CTGs and/or boiler tobe fed with natural gas. As the CTGs currently run on fuel oil only, they would have tobe converted to operate on natural gas. The boilers would be modified to blend naturalgas and digester gas.
Alternative Group 2
Alternative Group 2 evaluates the addition of combined heat and power (CHP) that runs off ofthe Deer Island's digester gas supply and is supplemented with diesel fuel in accordance withAlternative 2B. Alternative Group 2 consists of the following two alternatives:
1. Alternative 2A - New Digester Gas CHP - Sized for Digester Gas SupplyAlternative 2A includes the evaluation of a new CHP system that is sized to burn all theexisting digester gas produced at Deer Island.
2. Alternative 2B - New Digester GasIDiesel CHP - Sized for Heat Load
8
Alternative 2B includes the evaluation of a new CHP system that is sized to supply all theheating demands of the Deer Island facility burning primarily digester gas, but it can alsorun off of diesel fuel. Full redundancy for the CHP system will be provided to fulfill thefacility heating demand.
Alternative Group 3
Alternative Group 3 evaluates the addition of CHP that is sized to supply all ofthe electricalneeds of the DITP using a combination of natural gas and digester gas. Each alternative includesthe installation of a new natural gas service to Deer Island of a size sufficient to serve thealternative's thermal and electrical load. Alternative Group 3 consists of the following four (4)alternatives:
1. Alternative 3A - CHP Sized For the Deer Island Electrical and Thermal DemandAlternative 3A includes the evaluation of retaining the CTGs and sizing the new CHP tosupply all the electrical and thermal loads ofDITP while retaining one boiler for thermalredundancy.
2. Alternative 3B - Full Islanded OperationAlternative 3B includes the evaluation of installing a new CHP to supply all the electricaland thermal loads of Deer Island with full redundancy and constant islanded operation.Deer Island would separate from the utility keeping the HEEC cable installed, but notmaintaining it or drawing power over it. Deer Island would generate all of its electricaland thermal energy from digester gas and natural gas on site and not require an electricalutility connection.
3. Alternative 3C - New CHP Sized for Electrical ExportAlternative 3C includes the evaluation of installing a new CHP to supply all the thermalloads of Deer Island with full redundancy. The CHP system will also be designed toexport electricity for sale to other users. The economic analysis shall evaluate sellingexcess electrical power to other users and recommend the optimal transaction means.
4. Alternative 3D - Repurpose CTGs into CHPAlternative 3D includes the evaluation of repurposing the existing CTGs into CHP unitswith full electrical redundancy. As the CTGs currently run on fuel oil only, they wouldhave to be converted to operate on natural gas and digester gas.
Alternative Group 4
The Consultant will propose two additional long-term energy supply alternative for analysis.The proposed alternative will be a variation of the alternatives listed in Alternative Groups 1,2 or 3. The proposed alternatives will require approval from staff before the Consultant isallowed to proceed.
9

WWA.2IV B.2
2/15/17
STAFF SUMMARY
TO:FROM:DATE:SUBJECT:
Board of Directors '\..____.-.,JFrederick A. Laskey, Executive Director ~"~February 15,2017 (J~.Oxygen Generation Facility Services, Deer Island Treatment PlantSolutionwerks, Inc.Contract S562
COMMITTEE: Wastewater Policy & Oversight
Ethan Wenger, Deputy Director, Deer Island WWTPDavid Duest, Director, Deer Island WWTPPreparer/Title
RECOMMENDATION:
To approve the award of Contract S562, Oxygen Generation Facility Services, Deer IslandTreatment Plant, to the lowest responsive bidder, Solutionwerks, Inc., and to authorize theExecutive Director, on behalf of the Authority, to execute said contract in the bid amount of$1,929,750, for a contract term of 1,095 calendar days from the Notice to Proceed.
DISCUSSION:
Secondary wastewater treatment at the Deer Island Treatment Plant is an aerobic process. Abiomass of aquatic microorganisms is developed and maintained to help reduce the organicsolids and other undesirable compounds present in primary effluent. These microorganismsrequire oxygen in order to thrive and complete the task of improving the wastewater quality. Tominimize the size of the reactor tanks where the microorganisms and primary effluent are firstmixed, 97% pure oxygen is piped into the headspace above the wastewater (rather thanatmospheric air, which contains approximately 21% oxygen). Large mixers/aerators in thereactor tanks prevent solids from settling and facilitate the gas transfer process necessary to keepthe microorganisms alive.
The Oxygen Generation Facility, also referred to as the Cryogenics Plant (due to the freezingtemperatures employed) or simply the "Cryo Plant," produces the required quantities of pureoxygen. The facility is actually comprised of one building, the Air Compressor Building, andseveral other large integrated equipment systems (see pictures on the following page). The totalestimated value of the Cryo Plant and all of the associated equipment to be maintained under thiscontract is approximately $30 million.
The Cryo Plant consists of two process trains, individually capable of producing approximately90-150 tons of 97% pure gaseous oxygen per day via a process known as fractional distillation.

This process separates atmospheric air into the oxygen and nitrogen components at subzerotemperatures. Nitrogen is discharged to the atmosphere, while the oxygen is utilized for theprocess. Depending on operating parameters, each train can also produce up to 12 tons per dayof liquid oxygen. Any excess liquid oxygen produced during the generation process flows to atransfer tank and then into a 1,000-ton storage tank. Stored liquid oxygen can be vaporizedthrough one of two vaporizers. On average, 120 tons per day of oxygen are required for thewastewater treatment process.
Air Compressor Building with Air Intake Ducts Two Mole Sieves
Six-Ton Liquid Oxygen (LOX) Transfer Tank 1,000-Ton LOX Storage Tank (inbackground) and two "Cold Boxes"
Most of the time, because of improvements implemented by MWRA staff, only one process trainneeds to be in operation continuously to meet the oxygen demand of the treatment plant;occasionally, during short periods of high oxygen demand, both trains are needed. If a problemarises causing both oxygen generation trains to be shut down, a full liquid oxygen storage tank
2

can provide enough oxygen for approximately seven days of operation. It takes three to fourdays to start up one oxygen process train.
The Cryo Plant is very complex, with unique safety concerns due to the extreme high and lowtemperatures required to generate liquid oxygen (350°F to -300°F) and the hazards inherent inhigh concentrations of oxygen and nitrogen. There are hundreds of instrumentation and controlpoints, numerous safety valves, and other specialized equipment. The knowledge and experiencenecessary to keep all of the process monitoring equipment calibrated while continuouslyoperating the facility requires highly trained and skilled technicians.
MWRA requires a service contract with a firm that possesses the expertise necessary to ensurethat the Cryo Plant operates reliably and as designed at all times. A constant supply of oxygen isnecessary for the operation of the wastewater plant and compliance with Deer Island's NationalPollution Discharge Elimination System (NPDES) permit.
The scope of work under Contract S562 includes two scheduled annual service visits per year(one for each oxygen train), twelve scheduled monthly service visits per year, as-needed trainingfor MWRA staff, emergency and non-emergency on-call assistance, and servicing of ancillaryequipment, such as four main air compressors and three air chillers. Allowances have beenincluded for consumable parts and materials and factory-authorized service technicians. Theseallowances will only be expended based on actual costs incurred.
The procurement history of this contract has shown that there are few companies capable ofproviding these services. From August 2002 until February 2005, Mixing and Mass TransferTechnologies, LLC, d/b/a LOTEPRO (Mixing and Mass Transfer), the original design and start-up contractor, serviced the oxygen generation facility under MWRA's first contract. In 2005,Solutionwerks, Inc. was the low bidder (of two) and provided the required services for threeyears. In 2008, Mixing and Mass Transfer again was low bidder on the contract which ran forthree years and ended in February 2011. Solutionwerks won the next three year contract whichended in 2014. Solutionwerks again won the contract in 2014, which will expire on March 14,2017. Mixing and Mass Transfer left the oxygen plant support business entirely, and did notsubmit a bid in 2014.
Procurement Process
Contract S562 was advertised and publicly bid as a non-professional services contract. A pre-bidsite visit and walkthrough was conducted and bids were opened on Feb 2,2017. Two bids werereceived as follows:
CONTRACTOR BID PRICE
$1,722,825$1,929,750$2,185,845*
Engineer's EstimateSolutionwerks, Inc.Ranch Cryogenics, Inc.
* corrected clerical error in amount included in bid for allowance
Ranch Cryogenics has been in the plant construction and start-up business for a number of years,and has now entered the equipment servicing business as well.
3

The value ofthe previous contract, S529, is $1,474,400. Staff increased the Engineer's Estimatefor Contract S562 to $1,722,825 to provide for a higher parts allowance, and increased supportdue the aging facility. Solutionwerks' bid is 12% higher than the Engineer's Estimate. Whenasked about the cost difference, Solutionwerks stated that higher labor cost was the primaryreason. Staff reviewed Solutionwerks' bid and determined that it is reasonable, complete, andcomplies with all of the requirements of the bid specifications.
In an attempt to increase competition for this contract in pnor bids, staff contactedrepresentatives at other companies that operate oxygen plants. However, none have eversubmitted a bid. The firms contacted indicated that they only had sufficient personnel to operateand maintain their own oxygen generation facilities and were not in the business of providingtechnicians to service other plants.
References were checked and found to be favorable. As discussed above, Solutionwerks hassuccessfully performed this work for MWRA under prior contracts. Staff have been satisfiedwith the firm's past performance on the current and previous contracts. Staff are of the opinionthat Solutionwerks possesses the skill, ability, and integrity necessary to perform the work underthis contract and is qualified to do so. Therefore, staff recommend the award of this contract toSolutionwerks as the lowest responsive bidder.
BUDGET /FISCAL IMPACT:
There are sufficient funds available for the first portion of this contract in Deer Island's FY17Current Expense Budget. Appropriate funding will be included in subsequent CEB requests forthe remaining term of the contract.
MBEIWBE PARTICIPATION:
Due to the limited opportunities for subcontracting, there were no MBE or WBE participationrequirements established for this contract.
4

TO: FROM: DATE: SUBJECT:
STAFF SUMMARY
Board of Directors dv-y Frederick A. Laskey, Executive Director /---(? , February 15, 2017 Nut Island Headworks Odor Control and HV AC Improvements
WWA.3 IV 8.3
2/ 15/17
Inspections, Evaluations, Design, Construction Administration and Resident Engineering Services Hazen and Sawyer, P.C. Contract 7 51 7
COMMITTEE: Wastewater Policy & Oversight
David K. Pottle, P.E., Program Manager A. Navanandan, P.E., Chief Engineer John P. Vetere, Deputy Chief Operating Officer Preparer/Title
RECOMMENDATION:
INFORMATION __x_ VOTE
~A./k.ft?'. ieleS.Gillen
Chief Operating Officer
To approve the recommendation of the Consultant Selection Committee to award Contract 751 7, Nut Island Headworks Odor Control and HVAC Improvements to Hazen and Sawyer, P.C., and to authorize the Executive Director, on behalf of the Authority, to execute said contract in an amount not to exceed $5,736,900.77, for a contract term of 57 months from the Notice to Proceed.
BACKGROUND:
The Nut Island Headworks, located in the Hough's Neck section of Quincy, was placed into operation in 1998. The facility provides screening and grit removal, flow metering, and flow control for Deer Island's Lydia Goodhue (South System) Pump Station. The facility receives flow from almost the entire MWRA south collection system. The Nut Island Headworks serves 22 communities and has a peak hydraulic capacity of 360 million gallons per day. The odor control area of the

facility includes carbon absorbers and wet scrubbers.
Odor Control Room Fire
Following the January 25-26, 2016 fire that consumed wet Scrubber 4 and damaged equipment throughout the odor control area, significant recovery work was undertaken to restore operation of the odor control system. Demolition, cleaning, testing and repair of electrical and instrumentation systems, rebuilding fan motors, and repair and reconfiguration of ductwork has been performed. Smoke and water damage throughout the facility has been addressed. The odor control system was returned to operation in April 2016 and has been in continuous operation since. The current odor control configuration consists of Fans 1, 2 and 3 drawing air from process areas for treatment through activated carbon Adsorbers 1-5. Scrubber 4 and Fan 4 have been removed, and Scrubbers 1-3 now serve as extensions of the inlet ductwork, having been emptied of their media and mist eliminators and cleaned. An interconnection between the inlets to Scrubbers 2 and 3 has been added for redundancy and flexibility. The system is shown in the figure below:
Grit facility Exhaust
Tunnel Shalt & Areated Channers
Exhaust
DISCUSSION:
Nut Island Headworks Odor Control Facility
SodiUm Hydroxide Tanks
[] [LTI SodiUm Hypochlorite Tanka
Tankolfll1 Tankil2
Wet Scrubbers ReclrculaUon Pumps Chemical feed Pumps
Contract 7517 provides inspections, evaluations, preliminary and final design, construction administration and resident inspection services for long-term improvements to the odor control and HVAC systems and other equipment of the facility, some of which was damaged by the
2

January 2016 fire. Required work was identified in the Contract 7494 Nut Island Headworks Odor Control, HV AC and Energy Management System Study completed in ' December 2016 and by staff over the course of the fire recovery.
Improvements to the odor control system include, but are not limited to, replacement of carbon adsorbers 1-5, fans 1-4, ductwork dampers, and the odor control SCADA system including PLC and sensors; installation of a sixth carbon adsorber, ductwork to bypass the Scrubbers, roof hatches to provide maintenance Outline of Odor Control Room showing Locations for Hatches
and emergency access into the odor control room, and static eliminators within odor control ductwork. Scrubbers 1-3, chemical tanks and associated equipment will also be replaced and maintained ready to return to service.
Improvements to the HV AC system include replacement of all air handling units and unit heaters, the energy management system, boiler burners, and corroded segments of ductwork; and installation of equipment to provide ventilation setbacks and recirculation as allowed by code.
----.. 1 l ;::GIS
. c - ~ ~ ....,..,.
-- .
~ ~- j AHU-11 in g!
Contract 7517 also includes replacement of the underground fuel oil storage tanks serving the standby generator and boilers; replacement of portions of the structural steel fireproofing in the odor control room; improvements to the dewatering system serving the bottom level; and improvements to the emergency spillway isolation sluice gates, grit channels and grit channel slide gates.
Design and bidding of the construction contract is estimated to take 21 months. Construction is estimated to take 24 months due to equipment lead times and required sequencing of portions of
3

the work, followed by 12 months of warranty period.
Procurement Process
On December 6, 2016, MWRA issued a one-step Request for Qualifications Statements/Proposals (RFQ/P) that was publically advertised in the Central Register, Boston Herald, Banner Publication and El Mundo. In addition, notice was sent directly to fourteen firms. Thirteen firms requested the RFQ/P documents; five of which were potential prime consultants.
The RFQ/P included the following evaluation criteria: Cost - 25 points; Qualifications and Key Personnel - 20 points; Technical Approach - 15 points; Capacity/Organization and Management Approach - 15 points; Past Performance on Authority Projects - 15 points; Experience/Past Performance on Similar Non-Authority Projects - 5 points; and MBE/WBE participation - 5 points.
A pre-proposal meeting and site visit was held on December 13, 2016 and was attended by representatives from four firms. On January 20, 2017, MWRA received proposals from two firms: Hazen and Sawyer, P.C. and RDK Engineers. One of the firms that attended the site visit subsequently notified staff that it was too busy with other projects to respond to the solicitation. As detailed below, of the three remaining firms that attended the site visit, two submitted a proposal as a team and one submitted on its own. The proposed cost and level of effort by Hazen and Sawyer and RDK are as follows:
PROPOSED LEVEL OF PROPOSER CONTRACT COST EFFORT
Engineer's Estimate $2,774,435.00 20,869 hours Hazen and Sawyer, P.C. $5,736,900.77 36,784 hours RDK Engineers $7,422,191.10 45,779 hours
The Selection Committee reviewed, scored, and ranked the proposals as follows:
PROPOSER TOTAL POINTS *ORDER OF FINAL PREFERENCE/ RANKING TOTAL SCORE
Hazen and Sawyer, P .C. 377.55 5 1 RDK Engineers 280.65 10 2
*Order of Preference represents the sum ofthe individual Selection Committee members' rankings where the firm receiving the highest number of points is assigned a "I;" the firm receiving the next highest number of points is assigned a "2," and so on.
Hazen and Sawyer presented very strong qualifications, experience, past performance, technical 4

approach and capacity. The Hazen and Sawyer team will be led by a project manager and project engineer with significant, recent experience working together on the evaluation of the odor control, HVAC and energy management systems at the Nut Island facility. The project manager and project engineer are based in Boston and are at appropriate levels in their organization for their assignments. The qualifications of Hazen and Sawyer's technical staff are very high and Hazen and Sawyer's demonstrated odor control systems experience is very applicable to this project. Hazen and Sawyer is using Arcadis as a primary subconsultant on this project for electrical design and SCADA integration. The pairing of Hazen and Sawyer and Arcadis provides a very strong team with both firms having previously worked on Nut Island projects. Previous experience with Hazen and Sawyer and Arcadis has been good. Internal and external references were found to be favorable and all respondents indicated they would rehire the firm. Hazen and Sawyer's technical approach demonstrated thorough understanding of the project and appropriately identified key project issues and discussed solutions.
Hazen and Sawyer's cost is the lowest of the two proposals, but is $2.96 million higher than the Engineer's Estimate. In accordance with MWRA's procurement procedures, staff entered into discussions with Hazen and Sawyer to confirm and gain a better understanding of the proposed costs and level of effort. Hazen and Sawyer proposed higher hourly rates that were higher (by approximately 10%) than in the Engineer's Estimate. Hazen and Sawyer's proposed hourly rates reflect the experience and quality of staff proposed for this project with the technical staff having 25-40 years of engineering experience. Also, Hazen and Sawyer's proposal includes a greater level of effort for design work and other tasks than the Engineer's Estimate. Considerations by Hazen and Sawyer in estimating its proposed level of effort included the design of numerous temporary construction-phase installations of HV AC equipment, odor control equipment, ductwork, and power and control systems that are required to maintain airflows and treatment of process air throughout construction, design of temporary wastewater bulkheading and flow diversions required to access flow channels to perform slide gate replacements and grit channel repairs, and the modifications of approximately two thirds of all original Nut Island engineering drawings (200 drawings). Staff agree these design efforts are necessary to allow construction to occur and maintain continuous operation of the facility. The Engineer's Estimate did not, but should have, assumed temporary construction-phase air handling and air treatment and wastewater flow handling systems that will be explicitly designed by the consultant, or the development and detailing of numerous configurations for such phasing and the resulting impact on the preparation of the associated engineering drawings. Hazen and Sawyer's design and construction engineering proposal is 21% of a rough Hazen and Sawyer construction cost estimate ($27.5 million) for the facility improvements, which is within MWRA's normal range. Due to complexity of the design and experience with this type of work, staff are of the opinion that Hazen and Sawyer's estimate more accurately reflects the costs and hours required for this project, and the Engineer's Estimate underestimated such costs and hours. The second proposal for this project from RDK also greatly exceeded MWRA's engineering estimate in both hours and cost further indicating MWRA's engineering estimate was too low.
RDK presented good qualifications and experience, and average past performance, technical
5

approach and capacity. RDK's proposed project manager and project engineer have relevant experience, including design of HV AC, plumbing and fire protection systems for the original Nut Island Headworks design during the Boston Harbor Project. RDK has less odor control design experience than Hazen and Sawyer. RDK's technical approach was generic and failed to include sufficient discussion on project challenges and solutions. Internal references for the one current MWRA project was only fair. External references cited good electrical engineering work, but not as good mechanical engineering work. In general, RDK's proposal was not of a high quality, and included many typographical errors and a lack of detail.
RDK proposed a significantly higher cost, nearly $1.69 million higher than Hazen and Sawyer and $4.65 million higher than MWRA's estimate. RDK's proposed project manager and project engineer are principals of the firm, Executive Principal and President respectively. The Selection Committee concluded that this was inappropriate for their proposed project assignments, especially since both carry very high hourly rates. RDK's proposed level of effort is was significantly higher than Hazen and Sawyer.
Staff determined that Hazen and Sawyer submitted a high quality proposal with the best engineering team, excellent technical approach, and proven prior experience working at Nut Island and non-MWRA odor control systems installations, and an appropriate level of effort for this project. Hazen and Sawyer agreed to complete the specified administrative, management, design and resident engineering services on the basis of a guaranteed maximum price.
Based on final rankings and for the reasons set forth above, the Selection Committee recommends the award of this contract to Hazen and Sawyer, P.C., in an amount not to exceed $5,736,900.77.
BUDGET/FISCAL IMPACT:
The FY17 CIP includes a budget of $2,750,000 for Contract 7517. The contract award amount is $5,736,900.77 or $2,986,900.77 over budget. The FY18 Proposed CIP budget will reflect the new amount for this contract.
MBE/WBE PARTICIPATION:
The minimum MBE and WBE participation requirements for this project were established at 7.18% and 5.77% respectively. Hazen and Sawyer has committed to 7.19% MBE and 5. 78% WBE participation.
6

Frederick A. LaskeyExecutive Director
Telephone: (617) 242-6000Fax: (617) 788-4899TTY: (617) 788-4971
MASSACHUSETTS WATER RESOURCES AUTHORITYCharlestown Navy Yard
100 First Avenue, Building 39Boston, MA 02129
WATER POLICY AND OVERSIGHT COMMITTEE MEETING
Chair: A. BlackmonVice-Chair: B. PeñaCommittee Members:1. Carroll1. FotiA. Pappastergien1-1. VitaleJ. WalshJ. Wolowicz
to be held on
Wednesday, February 15, 2017
Location: 100 First Avenue, 2nd FloorCharlestown Navy YardBoston, MA 02129
Time: Immediately following Wastewater Comm.
AGENDA
A. Information
1. Update on Lead and Copper Local and National Activities
B. Approvals
1. Redundancy for the Metropolitan Tunnel System
C. Contract Awards
1. Slide Gate Installation, Quabbin Aqueduct at Shaft 12: Arcadis, U.S., Inc.,Contract 7509
® Printed on 100% Recycled Paper

W(i)2/15/17
Meeting of theWater Policy and Oversight Committee
December 14,2016
A meeting of the Water Policy and Oversight Committee was held on November16,2016 at the Authority headquarters in Charlestown. Chairman Blackmon presided.Present from the Board were Messrs. Carroll, Cotter, Flanagan, Foti, Vitale, and Walsh,.Among those present from the Authority staff were Fred Laskey, Steve Remsberg, PamHeidelI, Carolyn Fiore, Nava Navanandan, Bill Sullivan, Vincent Spada, Cori Barrett andLinda D'Addario. The meeting was called to order at 12:00 p.m.
Approvals
*Water Suppy Contract Renewals - Southborough, Stoughton, Wakefield andWorcester
The Committee recommended approval of the Water Supply Contract Renewals(ref. agenda item A.1).
Contract Amendments/Change Orders
*Wachusett Aqueduct Pumping Station Design, Construction Administration andResident Inspection Services; Stantec Consulting Services, Inc., Contract 7156,Amendment 3
Staff gave a presentation and there was general discussion and question andanswer. The Committee recommended approval of Amendment 3 (ref. agenda itemB.1).
*Wachusett Aqueduct Pumpinq Station: BHD/BEC JV 2015, Joint Venture, Contract7157, Change Order 5
Staff gave a presentation and there was general discussion and questions andanswers. The Committee recommended approval of Change Order 5 (ref. agenda itemB.2).
The meeting adjourned at 12:15 p.m.
* Approved as recommended at December 14, 2016 Board of Directors meeting.

W(ii)2/15/17
Meeting of theWater Policy and Oversight Committee
January 18, 2017
A meeting of the Water Policy and Oversight Committee was held on January 18,2017at the Authority headquarters in Charlestown. Chairman Blackmon presided. Present fromthe Board were Messrs. Carroll, Cotter, Fati, Pappastergion, Peña, Vitale and Walsh. Amongthose present from the Authority staff were Fred Laskey, Steve Remsberg, Steve Estes-Smargiassi, Daniel Nvule, Pam HeidelI, Tom Durkin, John Vetere, Maureen McAvoy, NavaNavanandan, Carolyn Francisco Murphy, Pat Barrett, Cori Barrett, Jerry Sheehan, and BonnieHale. The meeting was called to order at 11:25 a.m.
Information
Report on 2016 Water Use Trends and Reservoir/Drought Status
Staff gave a presentation on the previous year's water use data and discussed trends.
Update on EPA Unregulated Contaminant Monitoring Rule
Staff provided a brief update.
Approvals
*First Amended and Restated Water Supply Continuation Agreement with Town of Wilmington
The Committee recommended approval of the amended and restated agreement (ref.agenda item B.1).
Contract Amendments/Change Orders
*Settlement Agreement for Various Design Contracts and Hatchery Pipeline and HydroelectricProject Design, Construction Administration and Resident Inspection Services: StantecConsu Iting Services, Inc., Contract 7017A, Amendment 2
Staff gave a presentation describing the settlement agreement which would reimburseMWRA $70,000 for claims associated with designer error and omissions on three designcontracts and apply those funds to Contract 7017A. There was general discussion andquestion and answer. The Committee recommended approval of the settlement agreementand Amendment 2 to extend the contract by three months (ref. agenda item C.1).
* Approved as recommended at January 18, 2017 Board of Directors meeting.
Water Policy and Oversight Committee. January 18, 2017 Page 2
*Northern Intermediate High Redundant Pipeline Design, Construction Administration andResident Inspection Services: Stantec Consulting Services, Inc., Contract 6906,Amendment 2
Staff gave a presentation on the project and the components of the amendment. Therewas general discussion and question and answer. The Committee recommended approval ofAmendment 2 (ref. agenda item C.2).
*Northern Intermediate High Section 110 - Reading and Woburn: Albanese D&S, Inc.,Contract 7471, Change Order 7
Staff gave a presentation on the project and the Committee recommended approval ofChange Order 7 (ref. agenda item C.3).
The meeting adjourned at 12:20 p.m.
* Approved as recommended at January 18, 2017 Board of Directors meeting.
WA.12/15/17
STAFF SUMMARY
TO:FROM:DATE:SUBJECT:
Board of Directors ~ I ífFrederick A. Laskey, Executive Director - pt.._A....February 15,2017Update on Lead and Copper Local and National Activiti
COMMITTEE: Water Policy & Oversight .x INFORMATIONVOTE
Joshua Das, Project Manager, Public HealthSteve Rhode, Laboratory ManagerCarl Leone, Senior Program ManagerStephen Estes-Smargiassi, Director, PlanningPreparerITitle
~4iJØ1Chief Operating Officer
RECOMMENDATION:
For information only.
DISCUSSION:
Staff most recently updated the Board on lead related issues in November 2016. This staffsummary provides a brief overview of each of the current on-going efforts related to lead indrinking water.
Lead and Copper Rule Sampling
The next sampling round is in March 2017 for the two communities that were over the Lead ActionLevel in September 2016: Malden and Quincy. Quincy and Malden will stay on twice a yearmonitoring until they have two rounds with results under the Action Level. DEP is working withboth communities to develop more comprehensive programs for replacing lead services, as well aseducating their customers about the lead in drinking water. MWRA staff had provided assistance toboth communities.
All communities will sample again in September 2017. Staff will be working with all communitiesto ensure that their sampling plans are up to date and meet current regulatory expectations.
Update on School Testing Program
MWRA is continuing to work with MWRA communities on testing school fixtures used fordrinking or cooking. DEP created a technical assistance and laboratory analysis program to testschools throughout the state, and MWRA offered lab services in parallel of the DEP program. FromApril 2016 through the end of January, the MWRA Laboratory has performed 23,716 tests onsamples from 285 schools in 35 different MWRA communities. Approximately 5.0% of all leadsamples were above the Action Level, similar to the results of recent community LCR sampling.102 of the 285 schools had at least one sample test over the Action Level.

2
,
All of these communities and schools have been contacted and provided with technical assistancematerials. All test results from all the schools across the state that have participated in the DEP andMWRA programs have been posted on-line by DEP, and most communities have developed localoutreach efforts.
School systems have been taking remedial actions in schools with any fixtures with elevated leadlevels. These have included shutting off fixtures and providing bottled water; replacing olderfixtures with new lead free ones; conducting regular flushing each morning; and doing moreextensive plumbing improvements. The DEP web site is set up to allow schools systems to provideinformation on what actions they have taken at each school.
The DEP Program is coming to an end, and the number of samples the MWRA laboratory isreceiving is beginning to slow down. DEP is recommending that communities test one-third ofschools, particularly older schools with higher results, on an annual basis, in line with the nationalguidance contained in the Lead Contamination and Control Act (LCCA) which governs lead controlefforts in schools. Therefore, MWRA expects to continue to receive an increased number ofsamples for the foreseeable future.
Update on Lead Service Line Replacement Loan Program
In March 2016, the Board approved an enhancement to the Local Water System Assistance Programto provide up to $100 million in 10-year zero-interest loans to communities solely for efforts tofully replace lead service lines, and approved the Program Guidelines for the Lead Loan Program inMay 2016. Each community can develop its own program, tailored to their local circumstances.
MWRA staff continue to work with communities to develop their lead service line replacementprograms, and interest has continued to increase. Four communities have progressed as far assubmitting loan applications to MWRA. So far, MWRA has distributed funds for one communityprogram: $1.5 million for Quincy for complete replacement of all their lead services from main tohouse at city expense. Quincy is continuing to review their records to develop an inventory of anylead-lined steel service lines. Staff anticipate that a loan disbursement of $4 million will be made toNewton shortly, as the city is finalizing their approach to replacement of the portion of the leadservice line on private property. Two other communities, Winchester and Somerville, havesubmitted applications for programs. Winchester is planning a multi-phase project for both servicelines and lead goose necks. The first disbursement is expected in Winter 2017. Somerville isplanning a phased program - with an estimated $1.2 million for the first phase. Disbursement isexpected in Spring 2017.
Based on staff contacts, six other MWRA communities seem likely to participate and start areplacement program in the near future: Malden, Medford, Marlborough, Needham, Revere, andWinthrop. Staff anticipate applications under the Lead Loan Program are likely to begin withsmaller distributions and ramp up as communities develop their individual programs, enhanceexisting inventories/records, and engage individual customers via outreach and education. FutureEPA requirements may stimulate lead service line removal work over the next few years.
Staff are developing plans for a regional forum for local water department staff on lead issues thisSpring, including regulatory updates, current scientific findings, results of school testing, and whathas been learned over the past year on lead service line replacement programs.

The joint research effort using an experienced research team may result in the production of apractical method to non-invasively and reliably determine if a particular property had a lead line.Bench scale methods development would be followed by field scale verification at specificproperties identified and made available by BWSC.
MWRA staff have been participating in a national Lead Service Line Replacement Collaborativewith representatives from about two dozen public health, environmental, water supply and othergroups. While the various groups typically do not share common agendas, they all agreed to worktogether on efforts to accelerate the replacement of lead service lines. The Collaborative completedits first product, an extensive web site designed to provide information to individuals andcommunities on lead service lines in January. USA Today ran a national story on the launch of theweb site. A link to the Collaborative's website is on MWRA's web site.
Update on MWRA Coordination with MDPH on Testing Homes
Massachusetts Department of Public Health (MDPH) has now moved ahead with their partnershipwith MWRA to sample for lead in the tap water at homes where a child has an elevated blood leadlevel, and identify if there is a lead service line at that home. MWRA staff assisted in training theMDPH field staff that visit homes, and coordinated how to perform the sampling. Sample bottles,appropriate chain of custody forms, as well as boxes with return postage were also provided toMDPH staff for use in home within the MWRA service area (Samples from homes outside theMWRA service area are analyzed by a MDPH contract laboratory). MDPH staffers were trained toevaluate whether there was a lead service line present, and provided information and materials toencourage its removal.
Samples began to arrive in October. So far, all of the test results from the MWRA locations havebeen below the EPA Lead Action Level, and most have been below the detection level. MWRA hasreported the test results back to MDPH which then provides the results to the residents, preservingthe required confidentiality. MWRA staff currently do not have information on how many leadservice lines are being found.
Staff from MWRA and MDPH will be meeting later in February to review current program results,including any information gathered by MDPH on lead service lines, and evaluate if any adjustmentsto the program are needed to improve its effectiveness.
Lead Service Line Detection Research
MWRA and BWSC staff are working with the Water Research Foundation to develop a project toevaluate the potential feasibility of detecting the presence of a lead service line through non-invasive testing using precision electrical resistance or other electrical properties. A major obstacleto an effective program to replace lead service lines has been that existing inventories areincomplete and inaccurate due to their age, and methods or opportunities to determine thecomposition of buried service lines without excavating down to the line are not available.
3

National Issues that MWRA Staff are Tracking
Change in CDC Reference Level: As discussed in previous Board updates, the Centers for DiseaseControl and Prevention (CDC), has periodically lowered its benchmark for action on children'sblood lead levels, as additional information on health risks have become available, and as nationallychildren's blood lead levels have decreased dramatically, as shown on the chart at right.
Blood Lead ConcentrationsConsidered Harmful by the CDC:J'
~ 70¿
60Ulco 50~c 40Gluc 30oU
" 20CIlGl...J
" 10oOiii O
1950
In 2012, the CDCeliminated the term,
"blood lead levelof concern" and
declared there is nosafe level of lead in
children's blood.
1960 1970 1980 1990 2000 2010 2020
Given that CDC believes that there is no safe level for lead, it has shifted its language from "level ofconcern" to "reference level," as shown in the left hand chart above. In 2012, CDC lowered thelevel from 10 to 5 ug/dl, and announced that it would periodically reset the level at the 97.5percentile level for all tested children l. CDC is essentially saying that the level where some actionshould be taken would be set so that no more than 2.5 percent of children would be above it. Aslead levels continue to decline, it has been reported that CDC is about to reset the "reference level"to 3.5 ug/dl. While this is very good news in that it recognizes continued progress on children'shealth, it does mean that there will be increased pressure on reducing exposures for all sourcesincluding water to maintain that continued progress.
Revisions to the Lead and Copper Rule: EPA is continuing to work on revisions to the Lead andCopper Rule. In addition to the recommendations of the National Drinking Water Advisory Council(previously described to the Board), EPA has received extensive comments from Congressionalcommittees and other groups investigating the Flint situation, as well as many comments from thepublic and other interested parties. In October 2016, EPA issued a White Paper providing anoverview of the issues and approaches they are considering as they draft the revisions.
The White Paper provided few specifics beyond what had already been discussed in the NationalDrinking Water Advisory Council (NDWAC) recommendations. MWRA staff will continue totrack EPA's efforts, evaluating their potential impact on MWRA or MWRA communities, and willbe involved in commenting as appropriate.
EPA Health Based Benchmark: In January 2017, EPA released a paper on modeling approaches fordeveloping a health based benchmark for lead in drinking water. EPA will be undertaking a formalexternal peer review of the various approaches. This is the first step necessary to propose in the
I There is no direct relationship between the level of lead in water, usually reported in ug/l (micrograms per liter or partsper billion) and the level of lead in a child's blood, usually measured in ug/dl (micrograms per deciliter (1/1 oth of aliter)). The EPA effort described above in developing a health-based benchmark is attempting to establish somemathematical relationship between the two based on various assumptions.
4

5
draft rule some type of individual health-based benchmark or standard to be used is assessingwhether the water in a particular home is "safe." The end product will be a concentration of lead inwater above which a child's blood lead level might be increased by some "significant level" orwould increase the percentage of children with blood lead levels above the then current CDCreference level by a significant amount. These benchmarks could be used to prioritize homes forlead service line replacement or to refer residents to local health officials, in line with one of theNDW AC recommendations to EPA.
Unfortunately, there is substantial opportunity for mis-application of the proposed modelingapproaches or the benchmarks that arise out of them. The first issue is that the input to the modelswill be the level of lead in water that is actually consumed: this is very different from levels in theworst case stagnant water samples which are required by the current rule, and few water systemshave data appropriate for use with the models. Thus, using the current sampling data will grosslyoverestimate the potential impact on children's blood lead levels. The second is that all themodeling approaches have layers of safety factors built in which will make it difficult to understandthe actual impact on any particular individual.
Both issues could tend to unnecessarily alarm consumers. MWRA staff are working with theAmerican Water Works Association (AWWA) and other groups to participate in the peer reviewprocess and develop materials to assist communities in understanding and explaining the ultimatebenchmarks.
Health Canada Report on Lead in Drinking Water: Health Canada, essentially the Canadianequivalent of EPA and CDC, released a report for public review in late 2016 on lead in drinkingwater as part of its efforts to review and revise their drinking water guidelines. Given the substantialoverlap among the scientists and advocacy groups between the two countries, and the fact that bothrely on the same published research, analyses and actions taken by either EPA or Health Canadaoften influence the actions of the other.
The Health Canada report suggests a different sampling approach than the current EPA LCRapproach, as well as a different regulatory benchmark. Testing in the US is currently based ontaking worst case samples - stagnant water - in high risk homes to understand whether the water iscorrosive to lead, and whether corrosion control treatment is being effectively implemented. Nomore than 10 percent of those samples can be above the EPA Action Level of 15 ppb.
Health Canada appears to be moving toward an approach of using "random daytime samples"designed to more nearly capture actual exposure levels in water consumers are likely to be drinking,and comparing that to a benchmark of 5 ppb'. As with the EPA peer review of their modelingapproaches, a potential issue associated with this recommendation is that almost all of the datacurrently collected in the US is not comparable with the Canadian approach, and may lead toconsumer and press confusion. As with the EPA report, staff are working closely with AWWA andothers to track the Health Canada review process and develop appropriate communication materialsto reduce consumer confusion.
2 In Great Britain the random day time sampling is conducted across all homes. The Health Canada report considersrandom daytime sampling either targeted to certain higher risk homes or across all homes.

W B.1IVA.3
2/15/17
The following provides a summary of recent efforts towards advancing a program to provideredundancy for the Metropolitan Tunnel System (the City Tunnel, City Tunnel Extension, andthe Dorchester Tunnels) for future maintenance and rehabilitation, and requests approval ofthe project to allow staff to proceed with preliminary design, geotechnical investigations andMassachusetts Environmental Policv Act (MEPAJ review of the oroteet.
STAFF SUMMARY
TO:FROM:DATE:SUBJECT:
Board of Directors --:J /Frederick A. Laskey, Executive Director ~ .February 15,2017Redundancy for the Metropolitan Tunnel System
COMMITTEE: Water Policy & Oversight INFORMATION..x VOTE
Frederick Brandon, P .E. Assistant Director of EngineeringA. Navanandan, P.E., Chief EngineerDavid Coppes, P.E., Director, WaterworksPreparer IT itIe Chief Operating Officer
RECOMMENDATION:
To approve staffs preferred alternative of construction of northern and southern deep rocktunnels from the Hultman Aqueduct and MetroWest Water Supply Tunnel to the WestonAqueduct Supply Main (WASM) 3 and to the Southern Spine water mains for the purpose ofproviding redundancy for the Metropolitan Tunnel System (City Tunnel, City Tunnel Extensionand Dorchester Tunnel) and to direct staff to proceed with preliminary design, geotechnicalinvestigations and Massachusetts Environmental Policy Act (MEPA) review of the proj ect.
DISCUSSION:
At the October 6, 2016 Special Meeting of the Board of Directors on Redundancy for theMetropolitan Tunnel System, staff provided a briefing to the Board of Directors on the status ofthe existing MWRA water transmission system and the lack of redundancy for the City Tunnel(1950), City Tunnel Extension (1963), and the Dorchester Tunnel (1976) with an accompanyingbinder of supporting materials. A summary of the briefing and staff recommendations follows:
• While the tunnels and shafts require little or no maintenance and represent a low risk offailure, staff have determined that the cast iron and steel pipe and valves at the tops of theshafts are in poor condition and in need of rehabilitation and maintenance. Failure at thetops of shafts in the existing system could result in wide-spread outages of water serviceimpacting 60% of the service area which would require activation of emergency back-up

sources of supply, water-use restnctions, pressure swings, and a boil order. Theeconomic impact to the metropolitan region was determined through Federal EmergencyManagement Agency (FEMA) methodology to be on the order of $300 million per day.
• After discussion of staff efforts to develop and analyze many alternative approaches overseveral years, staff presented on the advantages and disadvantages of long distance largediameter surface pipelines through dense urban areas and pump station alternativesversus deep rock tunnel alternatives. Staff concluded that:
- Large diameter long distance surface pipeline options present significant communitydisruption and have serious implementation challenges;
- There are operational reliability problems associated with use of Chestnut HillEmergency Pump Station and other possible pump station options;
- Tunnel alternatives would allow planned maintenance of the existing tunnel systeminfrastructure
- Tunnel alternatives allow emergency response at normal levels of service; and
- Tunnel alternatives are constructible with reduced impacts to communities.
• Staff presented financial considerations of advancing a capital program to addressmetropolitan tunnel redundancy with the goal of: preserving sustainable and predictablerates at the water utility level; ensuring adequate capital is available when necessary; andminimizing the cost of bon-owing.
• Staff outlined plans for interim improvements to reduce the risk of failure and improvesystem operating conditions in the event that an emergency occurs. The preferred long-term alternative consists of two deep rock tunnels beginning in the vicinity of theMassPike/Route 128 interchange (see Attachment 1). The Northern Tunnel would beapproximately 4.5 miles in length and would connect to the mid-point of MWRA'sWASM 3 pipeline. The Southern Tunnel would be approximately 9.5 miles in length andwould connect to the southern surface mains at Shaft 7C ofthe Dorchester Tunnel.
At the conclusion of the Special Meeting, staff were directed to brief member communities andstate and local officials on the Metropolitan Tunnel Redundancy initiative in order to buildconsensus and support for staffs preferred project approach.
On December 8, 2016, staff took part in a Long-Term Water Redundancy Forum hosted by theMWRA Advisory Board at Boston College. MWRA staff presented the history of the MWRAwaterworks system, the need for Metropolitan Tunnel redundancy and the challenges, bothimplementation and financial, of building redundancy. The Honorable Jeanette A. McCarthy,Mayor of Waltham provided the perspective of local communities on the potential for impactsand disruption. The meeting was well attended; with 130 people present. Tours of the nearbyShaft 7, Shaft 7B, and Chestnut Hill Emergency Pump Station facilities were given following the

Budget for the Metropolitan Tunnel redundancy plan in the amount of $1.4 billion has beenincluded in the Draft FY18 CIP as a placeholder.
presentations and the question and answer period.
On January 19, 2017, the MWRA Advisory Board met and voted to support moving forwardwith a deep-rock, two-tunnel project versus surface piping alternatives. They voted also torecommend: a Program Management Division Approach, similar to the model used for theBoston Harbor Project; concurrent construction of both tunnels, rather than a phased approach;and use of revenue from non-typical or one time water users (e.g. drought connections) for theprogram.
The Utilities Contractors' Association of New England (UCANE), an organization comprised ofcontractors who perform underground utility construction projects wrote in opposition of thetunnel option. MWRA staff met with UCANE on February 1, 2017 at the Board's direction toprovide information and context on the MWRA program and satisfied the concerns of theorganization. UCANE's main concern was that the tunnel program would not divert MWRAfunds and staffing resources away from other MWRA necessary pipeline replacement orrehabilitation projects. Staff informed UCANE that would not be the case.
Staff now request approval from the Board of Directors for the preferred alternative which wouldinclude construction of a northern and a southern deep-rock tunnel, as presented to the Board ofDirectors on October 6, 2016 and as recently endorsed by the MWRA Advisory Board. Staff arenow evaluating project staffing and alternative organizational structures to oversee planning,design and construction phases of the project and will make a recommendation to the Board infuture meetings.
The next step will be development of a scope of services and procurement of a consultant(s) toprovide preliminary design, geotechnical investigations, and Massachusetts EnvironmentalPolicy Act (MEPA) environmental review for the project. These services would be undertakenover the next couple of years and will provide opportunities for staff briefings and direction fromthe Board before proceeding with final design of the project.
BUDGET/FISCAL IMPACT:
ATTACHMENT:
Metropolitan Redundancy - Preferred Alternative

·II... Convert Service-New-Rehab
Replace
_\N
'.
._--.,
Attachment 1. Metropolitan Redundancy - Preferred Alternative

WUIV 8.4
2/15/17
STAFF SUMMARY
TO: Board of Directors ~ JFROM: Frederick A. Laskey, Executive Director ~I_
DATE: February 15,2017SUBJECT: Shaft 12 Isolation Gate
Design, Engineering Services during Construction andResident Engineering ServicesArcadis, U.S., Inc.Contract 7509
COMMITTEE: Water Policy & Oversight
A. Navanandan, P.E., Chief EngineerMaureen K. McAvoy, P.E., Program ManagerPreparer/Title
RECOMMENDATION:
To approve the recommendation of the Consultant Selection Committee to award Contract 7509,Design, Engineering Services during Construction and Resident Engineering Services for theShaft 12 Isolation Gate to Areadis U.S., Inc., and to authorize the Executive Director, on behalfof the Authority, to execute said contract in an amount not-to-exceed $1,706,312, for a contractterm of 40-months from the Notice To Proceed.
BACKGROUND:
The Quabbin Aqueduct is a concrete lined rock aqueduct that is 24.6 miles long with a typicalsection that has the shape of a horseshoe. At its largest dimension, the aqueduct is 11 feet wideand 12 feet 9 inches tall. With the piping restrictions at Oakdale Power Station the hydrauliccapacity is reduced to 550 MGD due to a bypass and hydropower generation.
The Quabbin Aqueduct is used to transfer water from the Quabbin Reservoir at the Shaft 12Intake to the Wachusett Reservoir at Shaft 1 of the Oakdale Power Station which ultimatelysupplies the water to metropolitan Boston. The Quabbin Aqueduct is also used to transfersupplemental water in the opposite direction from the Ware River Intake at Shaft 8 in Barre toShaft lIA at the Quabbin Reservoir in Hardwick. If the isolation valves at Shaft 1 in Oakdalefail, there is currently no way to stop flow from the Quabbin Aqueduct to Wachusett Reservoir.Another method of isolation is recommended to prevent potential flooding at the WachusettReservoir. This contract provides engineering services for a future construction contract to addan isolation gate at the Shaft 12 Intake to provide backup isolation of the Quabbin Aqueduct.

/HUBBARDSTON
WESTMINSTER I'-t
\PRINCETON ~
l / ~UNENeURrFITCHBUR~ ""\ '} I
I JlEOI.HNSTER I
LANCASTER
","U,. - J I
ORANGE
wENDeL
ATHOL / \ 'I GARDNER'PHILLIPSTON
TEMPLETON l'
<;,
, "
'l BARRE / OakdaleShaft2 Power
Quabbin Aqueduct RUTLAND "'-. Station..._- -:_ - - - _:~ _..o Wachusett_'-':-- 1 - ) wèv Reservoir
\
HARDWICK (eOYlS'D
/.
OAKHAM __.).? HOLDEN BOYLSTON
Shaft12 NE~haft9 ~./ \ Shaft1 \ .iIntake BRAINTREE {
t> 'r PAXTON • \
~- 1 / \.., \
( L l L ~ - ~ I,SHREWSeURY\... WEST BR~g~~~LD SPENCER \ WORCESTER •~l. BROOKFIELD \ (CVA Intake & __ \ \ LEleES TER \
Winso .. Dam •PALMER WARREN
WARE
Quabbin Aqueduct
DISCUSSION
This professional services contract will provide design, engineering services during constructionand resident engineering services for two 4-foot x 12-foot motorized isolation slide gates at theShaft 12 Intake on the Quabbin Aqueduct. The installation of the slide gates requires significantmodifications to the Shaft 12 Intake components and underwater construction activities. Theslide gates will be designed to close during all potential flow conditions. The scope of theimprovements includes:
• Dive inspections to verify existing and post construction conditions;
• Remove existing bar racks and shutter gates/stop logs and then clean and rehabilitate allthree sets of vertical notched grooves;
• Install bar racks in the upstream set of grooves;
• Install new stop logs and shutters in the most upstream set of grooves;
• Complete Shaft modifications to accommodate new slide gate;
• Assemble and install new slide gates in the downstream set of grooves; and
• Complete repairs to Shaft 12 Upper Intake.
Of the total 40-month contract duration, l ô-months is for design services, I2-months forengineering services during construction and resident engineering services, and I2-months forthe construction warranty period.
2

3
Shaft 12 Intake-Exterior Shaft 12 Intake-Interior
Procurement Process
On November 9, 2016, MWRA issued a one-step Request for QualificationsStatements/Proposals (RFQ/P) and was publically advertised in the Central Register, BostonHerald, Banner Publication and El Mundo. In addition, notice of the advertisement was sentdirectly to 20 firms and 11 firms requested the RFQ/P documents. On December 1,2016 a non-mandatory pre-proposal conference/site visit was held. Three firms attended the site visit.
The RFQ/P utilized the following criteria and points: Cost - 25 points; Qualifications and KeyPersonnel - 20 points; Technical Approach/Capacity/Organization and Management Approach -20 points; Past Performance on Authority Projects - 20 points; and Experience Past Performanceon similar Non-Authority Projects - 15 points.
On December 22, 2016, MWRA received one proposal from Areadis U.S., Inc. Staff contactedthe other two firms that had attended the pre-proposal conference/site visit to determine why theydid not submit proposals. Reasons offered included: the highly specialized nature of the project;inability to be competitive with firms with more relevant experience and more qualified keypeople; not having the appropriate team qualifications for this specific project; conflictingresources; and a business decision to propose on a different MWRA project. Staff are of theopinion that additional deterrents to proposing on this project include not only the remotelocation of the work site in Hardwick, but the risk firms would be undertaking as the primeconsultant for the project. The prime consultant is required to hire a diving subconsultant toperform shaft inspections of the existing shaft structure and concrete at a cost of $300,000, aconsiderable percentage of the work when also factoring in other subconsultants typically hiredfor this type of project (e.g., structural consultant, RE/RI services).

The proposal costs are presented below:
CONSULTANT FIRM LEVEL OFEFFORT
6,658 hours10,730 hours
Engineer's EstimateAreadis
PROPOSEDCONTRACT COST
$1,000,000$1,706,312
Upon a thorough review of the proposal, the Section Committee determined that the Areadisproposal more accurately represented the level of effort necessary to complete the tasks whencompared to the Engineer's Estimate. MWRA reviewed Arcadis' cost proposal to determinethose factors that contributed to the proposal being $706,312 over the Engineer's Estimate. Stafffound that the primary reasons for the cost variance is the additional level of effort necessarywith the specialized nature of this design work, which involves large slide gates and underwaterconstruction and design specialists with higher salary rates. Additional level of effort toaddress uncertainty of the existing Shaft 12 conditions, which may significantly impact thedesign, was also not included in Engineer's Estimate. Areadis identified 39 drawings that arerequired for this installation due to the sequencing of work and detailed installation details wherethe Engineer's Estimate assumed only 10 drawings. The preparation of each additional drawingrequires engineering design time and resources that result in additional level of effort. The levelof effort and cost variation was also due to the significant effort required for hydraulic modelingto ensure that the facility will operate under a range of flow conditions. The Engineer's Estimateunderestimated the level of effort required for specialized design services for the underwaterconstruction of the slide gates, the number of drawings required for this project, and thehydraulic modeling.
The Selection Committee was in agreement that Arcadis's proposal presented an appropriatelevel of effort, distribution of work and cost. Arcadis's Technical Approach demonstrated a goodunderstanding of the project issues. Arcadis's Qualifications and Key Personnel were viewed asexperienced and knowledgeable and as having specific experience in the design and installationof slide gates. All non-MWRA references were highly favorable; these projects included threesimilar projects conducted for the New York City Department of Environmental Protection.Arcadis's received mostly favorable reviews on reference checks conducted for its work onMWRA projects.
Staff entered into discussions with Areadis to confirm costs, scope of services and staffing.Areadis agreed to complete the specified design services on the basis of a guaranteed maximumprice. Given the level of effort proposed and Arcadis' understanding of the complexities of theproject staff are confident that Areadis can complete the specified design services for theproposed cost of $1,706,312.
Based on the Selection Committee's review of the proposal, the selection criteria and theappropriateness of the cost, the Selection Committee recommends awarding this contract toAreadis in an amount not to exceed of $1,706,312.
4

BUDGETlFISCAL IMPACT:
The FY17 CIP includes a budget of $2,220,000 for Contract 7509. In addition to Shaft 12 workthis contract initially included design and construction phase services for Shaft 2 rehabilitation.This contract (Contract 7509), in the amount of$I,706,312, is for Shaft 12 work only.
MBE/WBE PARTICIPATION:
Due to the highly specialized nature of this work and limited subcontracting opportunities, noMBE or WBE participation requirements were included for this project.
5

Frederick A. LaskeyExecutive Director
Chair: J. WolowiczVice-Chair: K. CotterCommittee Members:1. CarrollP. FlanaganJ. FotiA. PappastergionH. Vitale1. Walsh
MASSACHUSETTS WATER RESOURCES AUTHORITYCharlestown Navy Yard
100 First Avenue, Building 39Boston, MA 02129
PERSONNEL & COMPENSATION COMMITTEE MEETING
to be held on
Wednesday, February 15, 2017
Location: 100 First Avenue, 2nd FloorCharlestown Navy YardBoston, MA 02129
Time: Immediately following Water Comm.
AGENDA
A. Approvals
1. Approval of the Affirmative Action Plan
2. PCR Amendments - February 2017
Telephone: (617) 242-6000Fax: (617) 788-4899TTY: (617) 788-4971
3. Appointment of Project Manager, Process Monitoring, Deer Island TreatmentPlant
4. Appointment of Business Systems Analyst III, MIS
® Printed on 100% Recycled Paper

P&C (i)2/15/17
Meeting of thePersonnel and Compensation Committee
December 14, 2016
A meeting of the Personnel and Compensation Committee was held onDecember 14, 2016 at the Authority headquarters in Charlestown. Vice-ChairmanCotter presided. Present from the Board were Messrs. Blackmon, Carroll, Flanagan,Fati, Vitale, and Walsh,. Among those present from the Authority staff were FredLaskey, Steve Remsberg, Michele Gillen, Karen Gay-Valente and Linda D'Addario. Themeeting was called to order at 12:15 p.m.
Approvals
*PCR Amendment - December 2016
The Committee recommended approval of an amendment to the Position ControlRegister (ref. agenda item A.1).
*Appointment of Program Manager Security/Safety
The Committee recommended approval of the appointment of Mr. Joseph Bibbo(ref. agenda item A.2).
The meeting adjourned at 12:20 p.m.
* Approved as recommended at December 14, 2016 Board of Directors meeting.

Meeting of thePersonnel and Compensation Committee
January 18, 2017
A meeting of the Personnel and Compensation Committee was held on January18,2017 at the Authority headquarters in Charlestown. Vice-Chair Cotter presided.Present from the Board were Messrs. Blackmon, Carroll, Foti, Peña, Vitale, and Walsh.Among those present from the Authority staff were Fred Laskey, Steve Remsberg, MikeHornbrook, Michele Gillen, and Bonnie Hale. The meeting was called to order at 12:20p.m.
*PCR Amendments - January 2017
The Committee recommended approval of amendments to the Position ControlRegister (ref. agenda item A.1).
*Appointment of Program Manager, Process Engineering, Deer Island
The Committee recommended approval of the appointment of Mr. TimothyBeaulieu (ref. agenda item A.2).
The meeting adjourned at 12:25 p.m.
* Approved as recommended at January 18, 2017 Board of Directors meeting.
P&C (ii)2/15/17
·,
STAFF SUMMARY
To:From:Date:Subject:
Board of DirectorsPatterson Riley, Special Assistant, Affirmative Action & Compliance UnitFebruary 15,2017Approval of the Affirmative Action Plan
COMMITTEE: Personnel & Compensation
~~~Patterson Riley, Spe~ial Ass~ant, AACUPreparer/Title
___ INFORMA TIONX VOTE
RECOMMENDATION:
That the Board of Directors approve the Massachusetts Water Resources Authority's(MWRA) Affirmative Action Plan effective for a one-year period from January 1, 2017through December 31, 20 17.
DISCUSSION:
The Affirmative Action Plan sets out the basic parameters of MWRA's commitment toEqual Opportunity in the areas of Employment (EEO) and Minority/Women BusinessEnterprise (M/WBE) participation in MWRA procurements and contracted services. ThePlan has been prepared pursuant to Section 7(g) of the Authority's Enabling Act, whichstates:
"The Authority shall develop policies and plans for affirmative action inemployment, procurement, and contracting in accordance with laws andconsistent with general policies and plans for the Commonwealth."
MWRA updates its Affirmative Action Plan annually and provides information on thedevelopment, implementation and monitoring of the various plan elements in accordancewith guidelines of the U.S. Department of Labor, Office of Federal Contract CompliancePrograms (OFCCP). Since 2002, MWRA has utilized PeopleClick, a nationally knowncomputer software package, to produce the required workforce staffing summary reportsfor each Affirmative Action Plan. Affirmative Action and Compliance Unit staff workswith staff from the MIS and Human Resources departments to convert personneltransaction data from the MWRA's Human Resources Information System and tovalidate the proposed workforce goals for CY20 16
The text of the plan is attached (Attachment A). Copies of the full plan includingappendices will be available in the Board Lounge on February 15,2017. Attachment B,"MWRA Job Group Representation," shows the actual number of minority and femaleemployees currently, along with the numbers over-and under-utilized. The underutilizedjob groups denote areas for AACU recruitment focus if positions become available. Thisreport is included in the MWRA Orange Notebook presented to the Board on a quarterlybasis.
P&CA.1IV A.4
2/15/17

Table A
During the 2016 Affirmative Action Plan year, MWRA hired a total of 75 newemployees, including 21 (28%) females and 22 (29%) minorities. There were 79employees promoted during this period, including 16 (20%) females and 27 (34%)minorities. MWRA is in full compliance with all aspects and requirements of itsfederally approved affirmative action program and in following those strict guidelineswith its Affirmative Action Plan, a promotion only occurs when the individual employeemoves from a position within one job group to a new position within a different jobgroup. However, as an employer, the MWRA considers an employee to be promoted atsuch time that the individual moves into a new position within the same job group, withan increase in pay, grade, different and new job duties. In addition, to enhance upwardmobility and avail all employees of a career track where one exists, there were 27 suchpromotions during the 2016 Affirmative Action Plan year and of these, 12 (15%) wereminorities and 8 (10%) were females.
A total of 71 terminations occurred during CY 2016. Of the total number of terminations,11 (15%) were females and 16 (23%) were minorities. Of the total number ofterminations, 93% left voluntarily, and of those, 72% were employees who retired and21% were employees who resigned.
In comparison, during the 2015 Affirmative Action Program year, a total of 55terminations occurred, including 21 (22%) females and Il (20%) minorities. Of the totalnumber of terminations, 26% were employees who resigned and 56% were employeeswho retired. A review of the total number of termination statistics for calendar years2014,2015 and 2016 is included in Table A below.
Termination Statistics Employee Count Minority FemaleTotal Terminations CY2014 66 19 29% Il 17%Total Terminations CY2015 55 Il 20% 12 22%Total Terminations CY2016 71 16 23% Il 15%
The race/sex composition of the workforce did not change significantly during the 2016Affirmative Action Plan year, particularly as compared to Plan years 2014 and 2015.
The current overall MWRA affirmative action workforce staffing goal for females is23.0% in the aggregate and workforce staffing at the end of the 2016 Plan Year was22.9% for females. The current overall MWRA affirmative action workforce staffinggoal for minorities is 16.0% in the aggregate and workforce staffing at the end of 2016Plan Year was 21.1%.
2

A review of MWRA workforce staffing statistics for calendar years 2014, 2015, and2016 is included in Table B below:
Table B
Calendar Year Minority Female12/31/14 20.1% 22.8%12/31/15 20.2% 23.0%12/31/16 21.1% 23.8%
The 2016 Affinnative Action Plan documents include detailed workforce data for thereporting period December 1,2015 through November 30, 2016. The data indicate thatthe number of underut ilized job groups for females has increased. In calendar year 2016,there were 6 job groups underutilized by women and this number has increased to 9 jobgroups for 2017. In calendar year 2016, there were 9 job groups underutilized byminorities and this number has decreased to 8 job groups for 2017.
MWRA will continue its good faith efforts to maintain minority and female workforcestaffing representation and to further reduce the number of job groups underutilized bywomen and minorities. There may be opportunities to fill critical positions throughpromotions of qualified internal candidates, including women and minority employees.The Affinnative Action and Compliance Unit will continue to focus its efforts to assistsenior management to fill vacancies through the promotion of qualified women andminorities in the Management, Skilled Crafts, Operator, and Professional job groups. Inaddition, where external recruitment efforts are necessitated by the absence of qualifiedinternal candidates, and senior management deem that the need exists to fill criticalposition vacancies, AACU will work with MWRA hiring managers and HumanResources to source qualified minority and female candidates.
It is the policy of the Massachusetts Water Resources Authority (MWRA) to ensure theequitable participation of Minority Business Enterprises (MBEs) and Women BusinessEnterprises (WBEs) in the award of all contracts including contracts for construction,goods/non-professional services and professional services. As required by MassachusettsDepartment of Environmental Protection via Environmental Protection Agency, theprogram will also include Disadvantaged Business Enterprises (DBEs) which means anongoing, independent small business concern which is at least 51% owned and controlledby one or more individualïs) who are both socially and economically disadvantaged andmeets the U.S. Department of Transportation eligibility criteria specified under 49 CFRPart 23 and 26 and has certification issued by the federal government or theMassachusetts Supplier Diversity Office. The D/MBE and D/WBE goals are 3.4% and3.8% respectively in both the construction and professional services categories.
The Plan also includes information on the MBE/WBE/DBE Procurement Program. TheMWRA spent $2.9 million and $2.6 million respectively with minority and womenowned businesses in the last fiscal year. These amounts were 42% and 60% of therespective MBE and WBE targets, which reflect the achievements of the last fiscal year.
3

MASSACHUSETTS WATER RESOURCES AUTHORITY
Frederick A. LaskeyExecutive Director
Patterson A. RileySpecial AssistantAffirmative Action & Compliance Unit
AFFIRMATIVE ACTION PROGRAM
JANUARY 1,2017 - DECEMBER 31,2017

Approved by:
Affirmative Action Program
Massachusetts Water Resources AuthorityCharlestown Navy Yard
100 First AvenueBoston, Massachusetts 02129
AAP Completed by:Patterson A. Riley ate(Special Assistant for Affirma ive Action)
Telephone Number: (617) 788-4070
Frederick A. Laskey(Executive Director)
Inclusive Dates of the AAP: January 1,2017 - December 31, 2017

Section
I
II
III
IV
V
Massachusetts Water Resources AuthorityAffirmative Action Plan
Table of Contents
IntroductionLegal SectionsDescription of Organization
Page1
2
Policy StatementExecutive Director's StatementBoard of Directors'Statement
34
Responsibility for Implementation 5
Egual Employment OpportunityDissemination of the PlanInternal .External
6
Development and Execution of the Plan 8
Development: Workforce AnalysisEmployment Activities 12/1 -11/30 9Availability AnalysisAction-Oriented ProgramIdentification af Areas for SpecialAttention/Goals
Execution: Recruitment and Advertising 12Training/Career Development 13Consideration of Minorities and Femalesnot Currently in the WorkforceSupport of Community Action Programs 14
Sex Discrimination Guidelines 15
Religion and National Origin Discrimination Guidelines 17
Affirmative Action Program For Individuals With Disabilities 18
Affirmative Action Program for Protected Veterans 21
Internal Audit and Reporting Systems 23
Internal Complaint Procedure
MBE/WBE/DBE Program 25
1
INTRODUCTION
The Affirmative Action Plan for the Massachusetts Water Resources Authority (the"MWRA" or "Authority"), is prepared and adopted under Section 7(g) of the EnablingAct, which states:
"The Authority shall develop policies and programs for AffirmativeAction in employment, procurement and contracting in accordancewith law and consistent with general policies and programs of theCommonwealth. "
The AA Plan was developed to be consistent with federal and state laws and regulations:
Federal Executive Order 11246, as amended.
41 CFR Parts 60-1, 60-2, 60-20, 60-50, 60-250, 60-300, 60-741; Office of FederalContract Compliance Programs (OFCCP): Affirmative Action Requirements.
The Rehabilitation Act of 1973, as amended.
The Vietnam-era Veterans' Readjustment Assistance Act of 1974, as amended.
In addition, MWRA's policies and personnel practices adhere to the nondiscriminationprovisions of all applicable federal and state laws, as amended, including the following:
• Title VII of the Civil Rights Act of 1964.
• Civil Rights Act of 1991.
• Age Discrimination in Employment Act of 1967.
• Equal Pay Act of 1963.
• Americans with Disabilities Act of 1990.
• Massachusetts General Laws, Chapter 151B.
• Massachusetts Comparable Pay Act.
The AA Plan has been developed by the Affirmative Action and Compliance Unit(AACU) to cover the time period January 1,2017 through December 31,2017. The Planincludes a results-oriented set of procedures designed to achieve the full utilization ofminorities and women in all levels of the MWRA's workforce and to promote jobopportunities for individuals with disabilities and covered veterans. The Plan has beenreviewed by the MWRA Board of Directors, voted on and approved for fullimplementation.

The Massachusetts Legislature created the Massachusetts Water Resources Authority inDecember 1984 to manage water and sewer services for 2.5 million people and 5,500businesses in 61 communities. While the Boston Harbor Clean-up is the best known ofits projects, MWRA has also completed a modernization of the drinking water system.MWRA also maintains 400 miles of water pipes, aqueducts, and tunnels and 228 miles ofsewers. Also, nearly completed are projects to control combined sewer overflows,provide adequate water delivery and meet all federal, state and local water andwastewater standards.
2

Frederick A. LaskeyExecutive Director
II. POLICY STATEMENT
Executive Director's Statement
Our agency serves citizens in every neighborhood, economic class and cultural group inour service area. MWRA will be in harmony with its social role only when our workenvironment reflects our broader social aspirations for equal opportunity, justice,personal dignity and cross-cultural respect. To that end, we must take personalresponsibility for diversity in our organization and in our community.
All of us at the Massachusetts Water Resources Authority recognize that we must takeaffirmative action to prevent and to remedy any discriminatory effects of business oremployment practices based on race, color, religion, sex, sexual orientation, genderidentity and expression, genetic information, national origin, age, ancestry, citizenship,disability, veteran and marital status.
On behalf of the MWRA, its managers and employees, I aI11 committed to taking thosesteps which ensure equitable participation in our employment opportunities by themembers of any protected class group without regard to race, color, religion, sex, sexualorientation, gender identity and expression, genetic information, national origin, age,ancestry, citizenship, disability, veteran status and marital status. We are committed toachieving equal opportunity for all through fair and effective implementation of ouraffirmative action plan.
3

Board of Directors' Statement
We, the Board of Directors of the Massachusetts Water Resources Authority, take greatpride in our diverse and talented workforce. We recognize that our continued successdepends largely on the collective strengths of our employees. Developing the right mixof skills, ideas and individuals requires an unwavering commitment to EqualEmployment Opportunity and Affirmative Action. Accordingly, it is our policy torecruit, hire, and advance individuals without regard to their race, color, religion, sex,sexual orientation, gender identity and expression, genetic information, national origin,age, ancestry, citizenship, disability, veteran and marital status.
Our commitment to the principles of Affirmative Action and Equal EmploymentOpportunity is reflected in all of our policies and procedures from recruitment and hiringto training, compensation, benefits, transfers and promotions. This commitment is basedon sound management and business practices, as well as legal requirements.
In keeping with fair employment practices, we will maintain a positive and productivework environment which calls for the highest standard of personal conduct. Inaccordance with this standard, any type of harassment or discrimination directed towardany employee or applicant for employment on the basis of race, color, religion, sex,sexual orientation, gender identity and expression, genetic information, national origin,age, ancestry, citizenship, disability, veteran and marital status will not be tolerated.
MWRA is committed to Equal Employment Opportunity and Affirmative Action. Weexpect each employee to be an active partner in this effort by supporting, in word anddeed, the spirit and principles of Equal Employment Opportunity and Affirmative Action.Further, we expect that these values will govern the relationships we establish withcommunities we serve and others with whom we do business. Working together, we canbuild upon this commitment and create an environment that reflects diversity in its fullestand truest sense.
4
The Special Assistant, Affirmative Action and Compliance Unit, has responsibility forimplementing and monitoring the Authority's Affirmative Action and Compliance Plan.Employees are encouraged to contact the Affirmative Action & Compliance Unit directlyin order to obtain a copy of the Authority's Policy on Equal Employment Opportunityand Affirmative Action.

RecruitingHiringPromotions
- Transfer- Terminations- Demotions
III. RESPONSIBILITY FOR IMPLEMENTATION
Senior Management Responsibilities
The responsibility for achieving affirmative action goals and objectives rests with theExecutive Director, the Special Assistant of Affirmative Action and Compliance Unit, theDirector of Human Resources, Division/Department Directors and other managers andsupervisors.
Affirmative Action and Compliance Staff
The Special Assistant, AACU is provided with sufficient authority, senior managementsupport, and staff to execute these responsibilities, and is identified in all internal andexternal communications regarding the AAP. The Special Assistant may proposeadditional programs and activities to strengthen the MWRA's commitment to equalemployment opportunity and affirmative action and to effectively address AAP/EEOmatters.
The Special Assistant, AACU in conjunction with the appropriate staff, is responsible for:
• Implementing affirmative action programs.
• Developing policy statements.
• Designing and conducting audit and reporting systems to monitor protected classstatus for the following:
• Periodically reviewing, with the Chairman of the Board of Directors and theExecutive Director, the progress of senior managers in furthering the achievement ofthe Authority's goals.
• Serving as a liaison between MWRA and enforcement agencies.
• Acting as a liaison between MWRA and minority organizations, women'sorganizations and community action groups concerned with employmentopportunities of minorities and women.
• Reviewing the MWRA's AAP with managers and supervisors to ensure the policy isunderstood and followed.
The MBE/WBE Program Manager in conjunction with the appropriate staff IS
responsible for:
• Administration and monitoring of the MWRA's MBE/WBE/DBE Plan.
• Assisting divisions in the implementation of the MWRA's MBE/WBE/DBE Program.S

6
• Ensming that the program is consistent with the MWRA's Supplementary Provisionfor Equal Employment Opportunity, Anti-Discrimination, and Affirmative Action.
Line Management Responsibilities
Managers and supervisors will implement the program in the following ways:
• Assist in identifying problem areas, establishing goals, and developing time lines.
• Maintain open door policy for employees to discuss issues of equal opportunity andaffirmative action.
• Meet with other managers, supervisors, and employees to adhere to MWRA EEO/AApolicies.
• Assist in the performance of internal audits to determine compliance.
• Evaluate the performance of subordinate managers and supervisors In achievingaffirmative action plan objectives.
Other Key Staff
The Director, Human Resources, has developed and implemented appropriatemechanisms to ensure equal employment opportunity for all applicants and employees.
The General Counsel and the Associate General Counsel for Labor & Employmentprovide legal advice regarding equal employment opportunity and affirmative action asthey affect the Authority.
IV. EQUAL EMPLOYMENT OPPORTUNITY
Dissemination of the Plan
MWRA will communicate its equal employment opportunity policies and affirmativeaction programs to all relevant audiences in the following manner:
Internally
Communicate to employees the existence of the Affirmative Action Plan and make itavailable for inspection. Prominently display EEO/ AA posters throughout all businesslocations identifying appropriate staff to contact.
Conduct special meetings with managers, supervisors and employees to explain the intentof the equal employment opportunity policies, discuss individual responsibility forimplementation and make clear the Executive Director's support of the policies.
Discuss the policies in employee orientation sessions and reference it in managementtraining sessions.

7
Include the policies in the Policies and Procedures Manual.
Publicize the policy on the MWRA' s internal and external websites, reports and othermedia.
Publish articles covering EEO programs, updates, and promotions in newsletters andother publications.
Include non-discrimination clauses in union agreements, and work to eliminate contractprovisions that may have discriminating effects.
Externally
Communicate to applicants for employment the existence of the Affirmative Action Plan,and make it available for review if requested.
Incorporate the EEO clause in all purchase orders, leases and contracts.
Ensure that both minority and non-minority men and women, Veterans, and persons withdisabilities are represented in recruitment advertisements.
Communicate to all recruitment sources the existence of the Affirmative Action Plan.

Board of DirectorsExecutive - Office of the Executive
DirectorExecutive - Affirmative ActionExecutive - Office of Emergency
Preparedness ServicesExecutive - Internal AuditExecutive - Public AffairsAdministration - MISAdministration - FacilitiesAdministration - Fleet ServicesAdministration - Human ResourcesAdministration - ProcurementAdministration - Real Property &
EnvironmentalFinance - Director's OfficeFinance - Rates & BudgetFinance - TreasuryFinance- ControllerFinance - Risk ManagementLaw
Operations - AdministrationOperations - ENQUALOperations - Facilities ManagementOperations - Laboratory ServicesOperations - PlanningOperations - Toxic Reduction &
ControlOperations - Engineering &
ConstructionOperations - Wastewater
OperationsOperations - Water Distribution &
PumpingOperations - Water & Wastewater O&MOperations - Water Treatment &
TransmissionOperations - Operation Support
Development and Execution of the Plan
Development
Workforce Analysis
As of November 30, 2016, MWRA employed 1162 people. The MWRA divides itsworkforce into 30 organizational units in Executive, Administration, Finance, Law, andOperations as follows:
Office of Federal Contract Compliance Programs requires that non-construction contractsmaintain an organizational profile or a workforce analysis to depict staffing patterns. It isa method to determine whether barriers to equal opportunity exist within an organization.
Pursuant to 41 C.F.R. § 60-2.11(a), the Workforce Analysis Report (Appendix A) lists eachjob title as it appears in the applicable collective bargaining agreements or payroll records,ranked from the highest paid to the lowest paid within each of the 30 organizational units.
The reports display within each organizational unit for each job title, the total number ofincumbents, the total number of male and female incumbents, and the total number ofmale and female incumbents who are White, Black, Hispanic, Asian, American Indian,Native Hawaiian and Other, and Two or More Races. Finally, the reports also supply awage rate code for each job title.
8

Employment Activities December, 2015 - November, 2016
Management AManagement BOperator AOperator BParaProfessionalProfessional AProfessional BTechnical ATechnical B
From December 1,2015 through November 30,2016, there were a total of75 new hiresat the MWRA, including 21 (28%) females and 22 (29%) minorities. The currentrace/sex composition of the workforce for minorities of 20.0% is less than the overall2015 MWRA workforce staffing goal of 21.5%; however, the current race/sexcomposition of the workforce for females of 22.9% is above the overa1l2015 workforcestaffing goal of22.4%.
A total of 79 promotions occurred during this reporting period, including 16 (20%)females and 27 (34%) minorities. For Affirmative Action Plan reporting purposes 52 ofthese promotions reflect employee promotions where there has been a change in JobGroup as described herein under "Availability Analysis". In addition, to enhance upwardmobility and avail all employees of a career track where one exists, there were 27 suchpromotions during the 2016 Affirmative Action Plan year and of these 12 (15%) wereminorities and 8 (10%) were females.
A total of 71 terminations occurred within the period, and of these, 11 (15%) werefemales and 16 (23%) were minorities. Of the total number of terminations, 93% leftvoluntarily, and of those, 72% were employees who retired and 21% were employeeswho resigned.
Availability Analysis
Pursuant to 41 C.F. R. 60-2.11(b), an analysis of all major Job Groups is included in thePlan (see Appendix B Job Group Analysis Report). Those jobs having similar content,wage rates and opportunities had been grouped together into 18 Job Groups:
Moreover, the 18 Job Groups have been kept sufficiently large enough to make formeaningful statistical analyses. The grouping avoids placing job titles from differentEEO-4 categories within the same Job Group, wherever possible. Alternative jobgroupings were reflected because they do not make substantial differences and do notmask any potential underutilization of minorities or women. This analysis of the majorJob Groups on the Availability Analysis forms is shown in Appendix C.
Administrator AAdministrator BClerical AClerical BEngineers AEngineers BCraft ACraft BLaborers
Action-Oriented Program for Affirmative Employment Opportunities
MWRA is committed to a strong policy of equal employment opportunity and affirmativeaction and this commitment is clearly expressed in its Affirmative Action Plan, whichcovers all aspects of the employment process from recruiting and hiring to training andpromotion.
9

MWRA takes affirmative action to ensure that applicants for employment and employeesare treated fairly during employment, without regard to their race, color, religion, sex andnational origin. MWRA also takes affirmative action steps and make good faith efforts todevelop and implement action-oriented programs designed to remove any employmentbarriers, expand employment opportunities and strive to achieve established workforcestaffing goals and objectives.
During the 2017 Affirmative Action Plan year and continuing, MWRA will make goodfaith efforts to continue to develop and implement an action-oriented program designedto increase employment opportunities, while tailoring the size of its workforce to meet itsfuture mission and maintain organizational efficiency,
The Special Assistant of the Affirmative Action and Compliance Unit, working inconjunction with MWRA Division Directors, will take affirmative steps to establish thefollowing joint accountability good faith efforts to direct their attention toward employeedevelopment programs and career counseling initiatives to prepare all interestedemployees including individuals in targeted EEO groups for consideration of futurepromotional opportunities, as follows:
• Assist Divisions in efforts to promote qualified employees including minorities andfemales to fill current or unanticipated vacancies, particularly those positions inunderutilized job groups.
• Review the appropriate education, experience and skill requirements for successfuljob performance.
• Participate in programs, which may impact protected group members, especially inthe areas of the development of training and recruitment.
• Schedule confidential meetings with employees who request information on MWRAaffirmative action policies, including promotion and training.
• Encourage current employees to take advantage of the above listed training anddevelopmental opportunities, as well as opportunities for promotion.
• Monitor and review, where appropriate, the qualifications of all employees to assurethat protected group members are given full opportunities for training and promotion.
• Implement strategic recruitment strategies for underutilized positions likely to requireexternal recruitment.
• Ensure that all promotional opportunities are posted.
la

11
Identification af Areas for Special Attention/Goals
Underutilization exists in the following job groups: Administrator B, Engineer A,Engineer B, Craft A, Craft B, Laborers, Management B, Operator A, Operator B, andProfessional A. Special attention is required to increase the representation of minorityand/or females in these job groups by the following:
• Identify any applicable barriers to equal employment opportunity.• Conduct training/awareness sessions with managers and continue to make
them aware of the Affirmative Action Plan elements designed to ensure thatthe Authority policy and affirmative action program objectives are beingfollowed.
During this affirmative action plan period, there may be 107 opportunities to fill vacantpositions. These positions may be filled by new hires, promotions or transfers. Forunanticipated position vacancies that occur in other job groups, good faith efforts will bemade to attain the established goals for women and minorities. Based on the two-factoravailability analysis, the following goals have been set. The chart listed below identifiesthe goals for those projected vacancies.
Goals for Projected Vacancies
# Opportunities % Availability % Workforce GoalJOB GROUP ENGINEER A Minority Female Minority Female Minority Female
Total 12 0.00 I 20.40 0.00 I 18.10 O I 5
# Opportunities% Availability % Workforce Goal
JOB GROUP CRAFT A Minority Female Minority Female Minority Female
Total 18 23.63 I 6.77 15.20 I 0.00 4 I 3
# Opportunities % Availability % Workforce GoalJOB GROUP CRAFT B Minority Female Minority Female Minority Female
Total 30 22.11 I 5.67 20.90 I 2.90 8 I 5
# Opportunities % Availability % Workforce GoalJOB GROUP MANAGEMENT A Minority Female Minority Female Minority Female
Total 8 24.57 I 41.14 13.10 I 36.40 2 I 2
# Opportunities % Availability % Workforce GoalJOB GROUP OPERA TOR A Minority Female Minority Female Minority Female
Total 8 16.39 I 4.92 6.00 I 1.50 2 I 2
# Opportunities % Availability % Workforce GoalJOB GROUP OPERATOR B Minority Female Minority Female Minority Female
Total IO 19.76 I 27.92 17.70 I 4.80 3 I 2
# Opportunities % Avai lability % Workforce GoalJOB GROUP PARAPROFESSIONAL Minority Female Minority Female Minority Female
Total 7 36.11 I 86.11 30.00 I 48.30 l I 2
# Opportunities % Availability % Workforce GoalJOB GROUP PROFESSIONAL A Minority Female Minority Female Minority Female
Total 2 22.62 I 0.00 15.20 I 0.00 I I O

12
Execution
Adveltising and Recruitment
• The Special Assistant, AACU, annually submits an ad specifically targeted at apublication that has a high minority and female readership.
• The Director, Human Resources ensures that reasonable recruiting and advertisingdollars are being targeted to reach minority and female candidates and conducts ananalysis to determine the effectiveness of the employment advertisements.
• Recruiters send vacancy announcements to over 30 public and private recruitmentsources. The sources included state employment offices, community organizations,interest groups, and other sources.
• Recruiters distribute literature, attend career fairs, and maintain contact with referralsources to assure a steady flow of qualified protected class applicants.
Selection
• Human Resources and Affirmative Action staff review existing promotion, transfer,training and selection procedures to ensure equal opportunity.
• Human Resources, Affirmative Action, and Division staff develop selection criteriathat do not discriminate or tend to screen out women, minorities, covered veteransand/or individuals with disabilities.
• Human Resources and Affirmative Action staff monitor the selection process toensure equal opportunity and the absence of adverse impact on protected classapplicants.
• Human Resources and Affirmative Action staff review application forms to ensurenon-discrimination.
• Managers and Supervisors ensure that employees in protected classes receive equalconsideration in all selections.
Promotion, Transfer, Layoff and Recall
Promotions and transfer policies are designed to provide equal opportunity to allemployees regardless of race, color, religion, sex, sexual orientation, gender identity andexpression, national origin, age, ancestry, citizenship, disability, veteran and maritalstatus. All employees who demonstrate management potential are encouraged to seekadvancement into supervisory or other managerial positions. All employees areencouraged to take advantage of the benefits and financial support provided to them forprofessional development and continuing education, which may enhance theirpromotional opportunities.

13
Compensation
The principle of equal pay for equal work for all employees is a reality. All employees,including females and minorities, receive compensation in accordance with the samestandards. Opportunities for overtime work or otherwise earning increasedcompensation, when available, is afforded to qualified employees without discriminationbased on race, color, religion, sex, sexual orientation, gender identity and expression,genetic information, national origin, age, ancestry, citizenship, disability, veteran andmarital status. MWRA does not reduce the amount of compensation offered because ofany disability income, pension or other benefit the applicant or employee receives fromanother source.
Facilities
MWRA maintains all of its facilities on a non-segregated basis. MWRA maintainsappropriate facilities for both sexes and handicapped individuals unless the constructionof such facilities would create an undue burden on the Authority, its facilities or itsoperations.
Training/Career Development
MWRA assures that training programs and seminars are offered to all employees,including members of protected classes on the basis of appropriate and realistic need. Alleligible employees are encouraged to participate in the Authority's tuition reimbursementand tuition remission benefit for continued education, career development and jobadvancement. Training programs are monitored to assure equal opportunity for protectedclass employees in all training opportunities.
Training needs are re-evaluated annually to determine the areas of highest priority.Emphasis is on programs to increase productivity and meet job requirements.
Human Resources and Division staff have conducted cross-functional training, tofacilitate reorganizations and reassignments. This training often requires new skills,licenses and/or certifications.
During calendar year 2017, the Authority will continue to offer, as needed, a series of 6classes which make up the training component of the Unit 2 and Unit 3 ProductivityImprovement Program (PIP) and a series of 12 classes which make up the Unit 1Administrative Certificate Program (ACP). While PIP and ACP classes are required foremployees in designated job titles, classes are available for general enrollment byindividuals developing their qualifications for future job openings.

Consideration of Minorities and Females not Currently in the Workforce
MWRA recruits minorities and women, not currently in our workforce, who have thequalifications and requisite skill for employment. All employees engaged in recruitingare committed to the development of sources of minorities and females fromorganizations, institutions, community agencies, training schools and colleges.
Support for Community Action Programs
School Education Program
The MWRA offers School Education Program presentations for grades K-12. TheMWRA School Education Program has provided meaningful educational experiences to anumber of students of the MWRA service community, including those in the urbancommunities of the metropolitan area.
Subjects range from the Quabbin Reservoir and the water distribution system to DeerIsland and the transformation of wastewater into effluent. One of the School EducationProgram's goals and objectives is to increase outreach to the schools in the communitiesthat reflect the diverse population of the MWRA service area. The School EducationProgram has been instrumental in informing students, and by extension, the generalpublic of these communities, of the operation and work of the MWRA.
14

15
Sex Discrimination Guidelines
MWRA does not discriminate against any applicant or employee on the basis of sex inhiring, recruiting, promoting, transferring, layoff, termination, compensation or inselecting employees for training or other related programs.
Recruiting and Advet1ising
Job advertisements placed by the MWRA in newspapers and other media for employmentdo not express a sex preference.
Job Policies and Practices
• Written personnel policies for affirmative action expressly indicate that there shall beno discrimination against employees on account of sex.
• Employees of both sexes have equal opportunity to any available position which theindividuals are qualified to perform.
• MWRA does not make any distinction based upon sex in employment opportunities,wages, hours or other conditions of employment. MWRA contribution for insurance,pension, welfare programs and other fringe benefits is the same for men and women,resulting in equal benefits.
• MWRA does not support distinctions between married and unmarried persons of onesex that are not made between married and unmarried persons of the other sex.
• MWRA provides appropriate and comparable physical facilities to both sexes.
• MWRA does not deny a female employee the right to any job which she is qualifiedto perform.
• MWRA does not penalize women in their conditions of employment because theyrequire time away from work on account of child bearing.
• MWRA does not specify differences for male or female employees on the basis of sexin either involuntary or optional retirement age.
Wages
• MWRA's wage schedules do not relate to and are not based on the sex of itsemployees.
• MWRA does not discriminatorily restrict one sex to certain job classifications.

Sexual Harassment
Acts of harassment by employees are prohibited employment practices under Title VII ofthe Civil Rights Act of 1964, Massachusetts General Laws, Chapter 151 (B) and MWRApolicy and are subject to sanctions and disciplinary measures.
It is the goal of the MWRA to promote a workplace that is free from sexual harassment.Sexual harassment means sexual advances, requests for sexual favors, and verbal orphysical conduct of a sexual nature when:
• Submission to or rejection of such advances, requests or conduct is made explicitly orimplicitly a term or condition of employment or as a basis for employment decisions;or
• Such advances, requests or conduct have the purpose or effect of unreasonablyinterfering with an individual's work performance by creating an intimidating,hostile, humiliating or sexually offensive work environment.
MWRA's Harassment Prevention Policy, policy HR.21, re-issued January 1, 2014, setsforth procedures for employees to follow and notify management of any sexualharassment violations.
MWRA personnel investigate complaints of sexual harassment in a prompt, thorough andconfidential manner, and recommend appropriate discipline up to and includingtermination for offenders. Employees should feel confident that retaliation against anindividual who has complained about sexual harassment and retaliation againstindividuals for cooperating with an investigation of a sexual harassment complaint isunlawful and will not be tolerated by this organization.
16

17
Religion and National Origin Discrimination Guidelines
MWRA's affirmative action policy prohibits discrimination against employees orapplicants for employment on the basis of religion or national origin.
MWRA makes every effort to accommodate the religious observances and practices ofemployees and prospective employees who regularly observe Friday evening or someother day of the week as their day of religious observance, and/or who observe certainreligious holidays during the year and who are conscientiously opposed to performingwork or engaging in similar activity on such days when such accommodations can bemade without undue hardship on the operation of the Authority's business.
In determining the extent of its obligations under this section, MWRA considers thefollowing factors:
• Business necessity;• Financial cost and expenses; and• Resultant personnel problems.
To assure non-discrimination based on religion or national origin, MWRA is engaged inthe following activities:
• Internal communications;• Development of internal procedures described previously;• Regular notification to employees of EEO policy regarding religion or
national origin;• Utilization of external recruitment sources, including those educational
institutions with substantial enrollments of students from various religious andethnic groups;
• Utilization of religious and ethnic media for institutional and employmentadvertising.

18
Affirmative Action Program for Individuals with Disabilities
Policy Statement
The MWRA is committed to take affirmative action to assure equal employmentopportunity for qualified individuals with disabilities.
Definition of Qualified Individual with Disability
A "qualified individual with a disability" is a person who:
• Has a physical or mental impairment that substantially limits a "major life activity",• Has a record of such an impairment, or• Is regarded as having such an impairment and• Is capable of performing the essential functions of the job with or without reasonable
accommodation to his or her disability.
Pregnancy and Childbirth
Disabilities caused or contributed to by pregnancy, childbirth or other related medicalconditions, will be treated the same as disabilities caused or contributed to by othermedical conditions.
Definition of Reasonable Accommodation
A "reasonable accommodation" for a qualified individual with a disability may include,but is not limited to,
• Making existing facilities readily accessible;• Job restructuring; part-time or modified work schedules; reassignment to a vacant
position; modification of equipment or devices; or other similar accommodations.
Note: An accommodation must be reasonable and is not required if it would impose an"undue hardship" on the MWRA.
Request for Reasonable Accommodations
MWRA commits to making reasonable accommodations to the limitations of qualifiedindividuals with disabilities and qualified disabled veterans, unless such anaccommodation would impose on undue hardship on the MWRA's business.
An employee with a disability may make a request for reasonable accommodations at anytime to their supervisor or directly to the Affirmative Action and Compliance Unit or theDirector of Human Resources. The Special Assistant of Affirmative Action &Compliance or his or her designee shall be notified of all reasonable accommodationrequests by supervisors or managers and shall ensure that reasonable accommodationrecords are kept separate from individual employee files.

19
Communication of Policy
• The Executive Director or his designee will communicate to Division and DepartmentDirectors and other managers the MWRA's policy statement concerning employmentof qualified individuals with disabilities.
• Where the MWRA conducts employment activities, posters will be prominentlydisplayed setting forth such information regarding the employment of individualswith disabilities as may be required by government agencies.
• The MWRA will ensure that a list of schools, private and state placement agenciesand community and social service organizations receive job listings which areexternally posted and advertised by the Authority and that the list is reviewedannually.
• The MWRA will continue to notify relevant organizations as well as appropriatepublic employment agencies and unions, of MWRA's commitment to equalemployment opportunity and affirmative action for individuals with disabilities,including veterans.
• A clause concerning the commitment to equal employment opportunity andaffirmative action for individuals with disabilities will continue to be included incontracts and purchase orders of $2,500 or more.
• The MWRA will continue to notify labor unions and (sub) contractors of thecommitment to equal employment opportunity and affirmative action for individualswith disabilities and will seek their cooperation and assistance.
Voluntary Disclosure
An individual may voluntarily self-identify himself/herself as an individual withdisabilities by completing the Affirmative Action Data Form, at any time.
Information submitted will be kept confidential, except that (i) supervisors and managersmay be informed regarding restrictions on the work or duties of individuals withdisabilities, and regarding necessary accommodations; (ii) first aid and safety personnelmay be informed, when and to the extent appropriate, if the individual has a conditionthat might require emergency treatment; and (iii) Government officials engaged inenforcing laws administered by OFCCP, or enforcing the Americans with DisabilitiesAct, as amended, may be informed,
Review of Selection Process
All human resources processes shall be reviewed to determine whether presentprocedures assure careful, thorough and systematic consideration of the job qualificationsof disabled applicants and employees for job vacancies filled either by hiring orpromotion, and for all training opportunities offered or available.

20
Consideration of Qualifications
Records are kept by the Human Resources Department identifying those vacancies,including promotions, for which known disabled persons has been considered. Shouldany known disabled person be rejected for employment, promotion, or training, a recordis made and kept of the reason. If such reason is medically related, the record is treatedas a confidential medical record.
Where applicants or employees are selected for hire, promotion, or training, MWRA willundertake any reasonable accommodation which makes it possible to place a disabledperson on the job. Records are maintained to describe the accommodation; such recordsare treated as confidential medical records.
Miscellaneous
• All MWRA job descriptions reflect the essential qualifications and requirements ofeach job.
• When an opportunity for hiring or promotion occurs, the MWRA will review theapplicable job descriptions to ensure that the qualifications are job related andconsistent with business necessity and the safe performance of the job.

21
Affirmative Action Program for Protected Veterans
Policy Statement
The Authority is committed to take affirmative action to assure equal employmentopportunity in every respect for disabled veterans, Armed Forces service medal veterans,recently separated veterans, or other veterans who served during a war, or in a campaignor expedition for which a badge has been authorized.
Communication of Policy
• The Executive Director or his designee will communicate to Division and DepartmentDirectors and other managers the Authority's policy statement concerningemployment of qualified protected veterans.
• The MWRA will ensure that a list of established veteran's organizations and publicand private recruitment services, included in Appendix D of this Plan, including theappropriate local employment service offices, will receive copies of all positions,which are externally posted and advertised by the MWRA, and that this list will bereviewed annually and MWRA will continue to notify veteran's service organizationsas well as appropriate public employment agencies of the commitment to equalemployment opportunity and affirmative action for protected veterans.
• A clause concerning the commitment to equal employment opportunity andaffirmative action for protected veterans will continue to be included in contracts andpurchase orders of $10,000 or more.
• The MWRA will continue to notify labor unions and contractors of the commitmentto equal employment opportunity and affirmative action for protected veterans andwill seek their cooperation and assistance.
• The MWRA will use the outreach measures it uses for others covered by MWRA'sAffirmative Action Program to recruit and employ veterans also covered by thisprogram.
• The MWRA will submit to the Office of the Assistant Secretary of VeteransEmployment and Training no later than March 31 st of each year, a form titled FederalContract Veterans Employment Report, which shall contain a list of new employees,and those individuals who have self-identified as protected veterans hired during theperiod covered by the Report.

Voluntary Disclosure
• Subsequent to making ajob offer, but prior to commencing duties, a prospectiveemployee will be offered the opportunity to self-identify as a special disabled veteran,disabled veteran, a veteran of the Vietnam Era or other protected veteran. The MWRAwill consider only that portion of the veteran's military record that is relevant to the jobfor which the veteran is being considered. After beginning employment, an employeemay voluntarily self-identify him/herself at any time as a protected veteran.
• Information submitted will be kept confidential, except that (i) supervisors andmanagers may be informed regarding restrictions on the work or duties of disabledveterans, and regarding necessary accommodations; (ii) first aid and safety personnelmay be informed, when and to the extent appropriate, if a veteran has a condition thatmight require emergency treatment; and (iii) Government officials engaged inenforcing laws administered by OFCCP, or enforcing the Americans with DisabilitiesAct, as amended, may be informed.
Review of Selection Process
All human resources processes shall be reviewed to determine whether presentprocedures assure careful, thorough and systematic consideration of the job qualificationsof protected veteran applicants and employees for job vacancies filled either by hiring orpromotion, and for all training opportunities offered or available.
Consideration of Qualifications
In determining the qualifications of a covered veteran, MWRA will consider only thatportion of the military record, including discharge papers, relevant to the specific jobqualifications for which the veteran is being considered.
Records are kept by the Human Resources Department identifying those vacancies,including promotions, for which known disabled persons and protected veterans havebeen considered. Should any known disabled person or protected veteran be rejected foremployment, promotion, or training, a record is made and kept of the reason. If suchreason is medically related, the record is treated as a confidential medical record.
Where applicants or employees are selected for hire, promotion, or training, MWRA willundertake any reasonable accommodation which makes it possible to place a disabledperson or veteran on the job, that is not an undue hardship. Records are maintained todescribe the accommodation; such records are treated as confidential medical records.
Miscellaneous
• All MWRA job descriptions reflect the essential qualifications and requirements ofeach job.
• When an opportunity for hiring or promotion occurs, the MWRA will review theapplicable job descriptions to ensure that the qualifications are job related andconsistent with business necessity and the safe performance of the job.
22

23
• The MWRA will not reduce the amount of compensation to veterans by the amountthe veteran receives from disability income, pension or other benefits related to his orher status as a veteran.
Internal Auditing and Reporting Systems
Internal auditing and reporting for Affirmative Action is managed through the use ofmonthly, quarterly, and annual reports generated by AACU and shared with management.Reports reflecting workforce compensation, promotions, transfers and terminations arereviewed to ensure that the policy of non-discrimination and equal employmentopportunity is carried out. State and local govermnent information reports (EEO-4) areprepared and submitted in accordance with regulation and written instructions.
Internal Complaint Procedure
The internal complaint procedure provides the opportunity for any individual(employee or applicant) who believes that she or he has been harassed,discriminated against or unfairly treated by the MWRA to file a complaint usingthe procedures set forth below.
Filing a Complaint
• The individual alleging discrimination should file a written and signedcomplaint with the Special Assistant of Affirmative Action and ComplianceUnit (form available in AACU), or the Director of Human Resources.Detailed and specific allegations must be provided along with an indication ofthe action(s) or resolution the individual is seeking.
• The complaint must be filed in as timely a fashion as possible.
Procedure
-. The Special Assistant of Affirmative Action and Compliance Unit and/orDirector of Human Resources, will be responsible for accepting complaints ofdiscrimination in writing.
• Upon receiving a complaint of discrimination, a complaint investigator will beassigned, who shall attempt to determine through preliminary fact finding if a formalinvestigation is warranted.
• Upon determination that an investigation is wan-anted, a date will bescheduled for an in-depth interview with the complainant and other relevantparties. The complaint investigator shall attempt to bring about a satisfactoryresolution with the complainant and appropriate management and makerecommendations accordingly.

e Any agreement or resolution may be in writing and if in writing, copiesprovided to all appropriate parties.
• The complaint resolution process shall be concluded in an expeditious manner. It isthe MWRA's intention to resolve all complaints internally and every effort will bemade to maintain confidentiality to the extent practicable.
• The complaint investigator will advise the complainant of his or her administrativerights and the right to file a formal charge with a state or federal agency and the timelimits imposed on the exercise of these rights.
Rejection or Cancellation of the Complaint
The MWRA will indicate when a complaint has been rejected for further processing.
In the event an individual files an external complaint, the MWRA's legal counsel willhandle all communications. All investigations shall be conducted in a confidentialmanner to the extent practicable.
In addition to the above, you may file a formal complaint with the government agencieslisted below. Using MWRA's complaint process does not prohibit you from filing acomplaint with these agencies.
Massachusetts Commission AgainstDiscrimination (MCAD)One Ashburton Place, 6th FloorBoston, MA 02108
Massachusetts Office of Diversity and EqualOpportunityOne Ashburton Place - Rm. 213Boston, MA 02108
Springfield OfficeMCAD436 Dwight Street - Rm. 220Springfield, MA 01103
U.S. Equal Employment OpportunityCommissionJFK Federal Building475 Government CenterBoston, MA 02203
Worcester OfficeMCAD455 Main Street - Rm. 1O 1Worcester, MA 01608
U.S. Department of LaborOffice of Federal ContractCompliance ProgramsJFK Federal Building - Rm. E235Boston, MA 02203
New Bedford OfficeMCAD800 Purchase Street - Rm. 501New Bedford, MA 02740
24

• Disadvantaged Business Enterprise (DBE) means an ongoing, independent smallbusiness concern which is at least 51% owned and controlled by one or moreindividualis) who are both socially and economically disadvantaged and meets theU.S. DOT eligibility criteria specified under 49 CFR Part 23 and 26 and hascertification issued by the federal government or the SDO.
V. MBE/WBE/DBE Program
Policy Statement
It is the policy of the Massachusetts Water Resources Authority (Authority) to ensure theequitable participation of Minority Business Enterprises (MBEs) and Women BusinessEnterprises (WBEs) and Disadvantaged Business Enterprise (DBEs) in the award of allcontracts including contracts for construction, goods/non-professional services (suppliesand equipment) and professional services (design selection and consultants).
Definitions
• Minority Business Enterprise (MBE) means an ongoing and independent businessenterprise which is owned and controlled by one or more minority persons and meetsthe Massachusetts Supplier Diversity Office (SDO) criteria specified under 425 CMR2.03 (d) (and, if applicable, one or more of the provisions of 425 CMR 2.06).
• Women Business Enterprise (WBE) means an ongoing and independent businessenterprise which is owned and controlled by one or more women and meets SDOcertification criteria specified under 425 CMR 2.03 (d) (and, if applicable, one ormore of the provisions of 425 CMR 2.06).
Outreach
The Authority communicates with appropriate advocacy groups and representatives suchas SDO, New England Minority Supplier Development Council, Massachusetts MinorityContractors, and National Association of Minority and Women Owned Law Firms, aswell as others, to develop new sources of supply, discuss the M/W/DBE Program anddevelop initiatives designed to enhance the Plan's effectiveness.
Monitoring and Reporting
The Affirmative Action and Compliance Unit will maintain such records, data andinformation as may be required to document compliance with Authority policies andprocedures, and applicable federal, state and local laws and regulations.
25

p t C t
MassDEP Procurement Goals
Based upon the Massachusetts Department of Environmental Protection and theMassachusetts Water Pollution Abatement Trust's 2010 Availability Study, the D/MBEand D/WBE procurement goals for EPA assisted contracts are as follows:
rocurernen a egerresConstruction Goals Professional Goals
D/MBE 3.4% 3.4%D/WBE 3.8% 3.8%
Nearly 90 percent of EPA-assisted contracts were for construction with the balancerelated to engineering, environmental consulting and other services. On this basisMassDEP has utilized the same goals for both construction and professional services.The specific sub-industries such as water and wastewater engineering, etc. accounted formost of the dollars of these prime contracts and subcontracts.
MWRA Procurement Goals
Based upon the Authority's 2002 Availability Study, the MBE and WBE procurementgoals are as follows:
rocurernen a egerresConstruction Goals Professional Goals NonProfessional Goals
MBE 7.24% 7.18% 5.61%WBE 3.60% 5.77% 4.88%
p t C t
For FYl5 the MWRA spent $2.9 million and $2.6 million respectively with minority andwomen owned business. These amounts were 42% and 60% of the respective MBE andWBE targets.
26

Attachment BMWRA Job Group Representation
CY17
Underutilized Job Groups· Workforce Representation
Minority --Affirmative Action Plan Goals
50045040035030025020015010050o ~-,--'--'---'--r--r--'--.--'--'--'--
Total minorities employed~ at MWRA (246)
- - -- -~ ---- -- -- - - --- - - - - - ---------- - -- - - - - -- - - -~--'_____Number of minorities to
match 2 - Factor analysis(266)
Shortfall of minorities inunderutilized Job groups(40)
J F M A M J J A S O N D
Total Actual
Employees Minorities
as of as of
Job Group 1/1/2017 1/1/2017
Administrator A 21 2Administrator B 22Clerical A 36 13Clerical B 29 7Engineer A 83 20Engineer B 57 17Craft A 111 17Craft B 142 29Laborer 69 19Management A 99 13Management B 48 10Operator A 67 4Operator B 63 11Professional A 34 5Professional B 163 46Para Professional 60 18Technical A 51 13Technical B 6 1Total 1161 246
Achievement
Level
50045040035030025020015010050O
266.0
Female - Affirmative Action Plan Goals
____________ Total females employed at.--------- MWRA (276)
~---------------------------------------------
-----Number of females to match 2-Factoranalysis (280)
Shortfall of females in~ underutilized job groupss-: (71)
J F M A M J J A S O N D
Minority
Over or
Under
utilized
Actual
Females
As of
1/1/2017
72
31111512O45
361113
2283285O
276
Achievement
Level
Female
Over or
Under
utilized
62 O)0:,., \4 l.'_ ~J,'. ~~f -3
10 37 o
19
16 158 3
13 4 6 6
15 4 3 2
7 3 6 5
16 643 3 54 29
11 2
280 67/-7120/-40

STAFF SUMMARY
TO:FROM:DATE:SUBJECT:
Board of DirectorsFrederick A. Laskey, Executive DirectorFebruary 15,2017February PCR Amendments
COMMITTEE: PersOlmel and Compensation
v, n.. I/~Karen Gay-Valente, 'DIrectorat' Hllman RësourcesJoan C. CalTolL Manager CompensationPreparerIT itle
INFORMATIONX VOTE
~ll~~d-RDirector, Administration
RECOMMENDATION:
To approve the amendments to the Position Control Register (PCR) included in the attachedchart.
DISCUSSION:
The Position Control Register lists all positions of the Authority, filled and vacant. It is updatedas changes occur and it is published at the end of each month. Any changes to positions duringthe year are proposed as amendments to the PCR. All amendments to the PCR must be approvedby the Personnel Committee of the Board of Directors. All amendments resulting in an upgradeof a position by more than one grade level, and/or an amendment which creates a positionincreasing annual cost by $10,000 or more, must be approved by the Board of Directors afterreview by the Personnel Committee.
February PCR Amendments
There are three PCR amendments related to changes in the Operations Division.
The amendments are:
1. Title change to a vacant pOSItIOn in the Engineering & Construction Department,Operations Division, Program Manager, Unit 9, Grade 29, to Program Manager,Electrical, Unit 9, Grade 29, to align title with current needs in the department.
2. Title and grade change to a vacant position in the Clinton Department, OperationsDivision, Operator, Unit 3, Grade 16, to Heavy Equipment Operator I, Unit 3, Grade 17,to address current needs in the department.
3. A new position, HV AC Technician, Unit 2, Grade 15, to be assigned to the ChelseaFacility, Operation Division, to address staffing needs at the Chelsea Facility.
The first two amendments require approval by the Personnel and Compensation Committee. Thethird requires Board approval after review by the Personnel and Compensation Committee.
IV A.S2/15/17

BUDGETlFISCAL IMPACT:
The annualized budget impact of these PCR amendments is between a savings of $31,461 and acost of $70,070 depending on the individuals selected for the vacant positions upon thecompletion of the hiring processes. Staff will ensure that any cost increase associated with thesePCR amendments will not result in spending over the approved FY 17 Wages and Salary budget.
ATTACHMENTS:
New/Old Job Descriptions
2
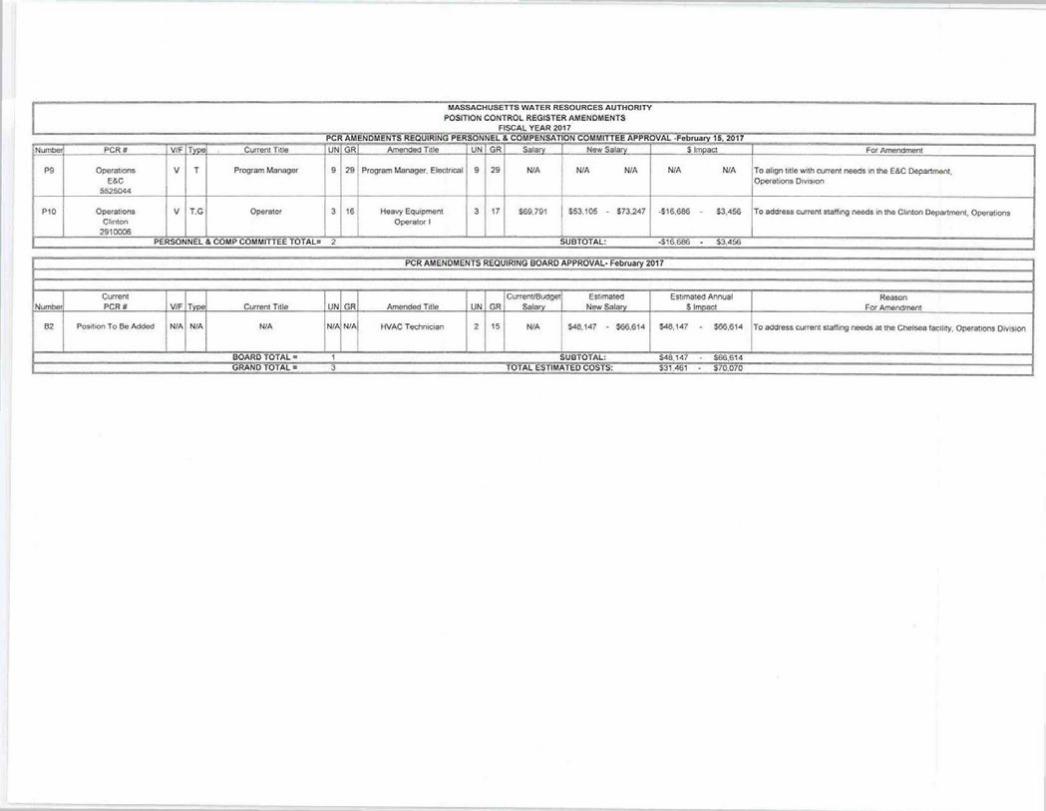
MASSACHUSETTS WATER RESOURCES AUTHORITYPOSITION CONTROL REGISTER AMENDMENTS
FISCAL YEAR 2017PCR AMENDMENTS REQUIRING PERScfNNEL & COMPENSATIOllrCOMMITTEE APP-ROVAL -February 15, 2017
;Numbe PCR# VIF Type Current Title UN GR I Amended Title UN GR Salary J New Salary s írnoact For Amendment
291 Program Manager, Electrical l iP9 Operations V T Program Manager 9 9 29 NIA NIA NIA NIA NIA ¡TO align title with current needs in the E&C Department,
IE&C I I ;Operations Division
5525044 I! I
P10 Operations V T,G Operator 3 16 f Heavy Equipment 3 17 $69,791 I $53,105 $73,247 -$16,686 $3,456 To address current staffing needs in the Clinton Department, OperationsClinton l Operator I
2910006 I IPERSONNEL & COMP COMMITTEE TOTAL 2 SUBTOTAL: -$16,686 $3,456
PCR AMENDMENTS REQUIRING BOARD APPROVAL- February 2017
CurrentGRl
currenVBudgetl Estimated Estimated Annual I ReasonNumbe PCR# VIF Type Current Title UN Amended Title UN GR Salary New Salary $ Impact For Amendment
B2 Position To Be Added NIA NIA NIA NIA NIAI HVAC Technician 2 15 NIA I $48,147 $66,614 $48,147 $66,614 ITO address current staffing needs at the Chelsea facility, Operations Division
I! I
BOARD TOTAL- 1 SUBTOTAL: $48,147 $66,614GRAND TOTAL - 3 TOTAL ESTIMATED COSTS: $31,461 $70,070

MWRA
POSITION DESCRIPTION
POSITION: Program Manager
PCR#:
DIVISION: Operations
DEPARTMENT: Engineering and Construction
BASIC PURPOSE:
Supervises project teams in the department to oversee professional engineering and designprojects related to the rehabilitation and capital improvement of waterworks and wastewaterfacilities and infrastructure from conceptual planning through construction. Additionally,manages engineering and design projects related to the rehabilitation and capital improvement ofwater and wastewater facilities and infrastructure.
SUPERVISION RECEIVED:
Works under the general supervision of a senior manager in the Engineering and ConstructionDepartment.
SUPERVISION EXERCISED:
Exercises close supervision of a staff of professional and technical employees and or consultants.
ESSENTIAL DUTIES AND RESPONSIBILITIES:
• Oversees projects, including the planning and design of rehabilitation and capital engineeringprojects for waterworks and wastewater facilities and pipelines. Additionally, manages theplanning and design phases of assigned water and wastewater engineering and ormaintenance projects including, feasibility and environmental impact reports, detailed plansand specifications, permitting, project schedules, technical assistance, progress review andevaluation.
Page 1 of 4Program Manager - Old

SECONDARY DUTIES:
• Oversees the work of professional engineering consultants, including all work products forquality of work, budget, schedule, and compliance with contractual terms and MWRAobjectives and policies.
• Supervises and manages professional staff, including assignment of projects, evaluation ofperformance, and staff development planning. Provides technical and administrativeassistance to staff in the development and management of projects which include design andengineering services during construction of new and rehabilitation water and wastewaterprojects, development of maintenance and operations procedures and working closely withMWRA Safety staff, development of safety procedures.
• Supervises professional multi-discipline engineering work of substantial difficulty andimportance, requiring application of professional engineering principles and the exercise ofindependent engineering judgment.
• Oversees and coordinates cooperative project development with other MWRA divisions anddepartments to ensure complete and coordinated projects. Coordinates projects withcommunities, government agencies and other MWRA departments. Provides technicalinformation and assistance. Addresses professional and community groups and initiatesoutreach projects as required.
• Participates in consultant selection procedures and contract negotiations for projects.Additionally, oversees all phases of consultant selection for assigned projects includingdevelopment of scope of services, specifications, cost estimates, work schedules,negotiations, and preparations of contract award recommendations. Ensures compliance withcontract budgets, schedules and terms.
• Prepares annual and supplementary budget requests for the projects in the CapitalImprovement Program. Oversees and reviews projects' budgets and schedules forcompliance with established department, division, and MWRA program goals.
• Ensures compliance with MWRA procedures and policies, regulatory requirements andapplicable engineering standards. Ensures all project activities are coordinated with MWRAdivisions and departments, outside regulatory and permitting agencies and communities, asappropriate.
• Performs related duties as required.
Page 2 of 4Program Manager - Old

MINIMUM QUALIFICATIONS:
Education and Experience:
(A) Completion of a four (4) year college program in civil or related engineering field; and
(B) Seven (7) to nine (9) years of civil engineering experience of which three (3) years mustbe in a supervisory capacity and three (3) years in project management; or
(C) Any equivalent combination of education and experience.
Necessary Knowledge, Skills and Abilities:
(A) Knowledge of principles and practices of engineering.
(B) Understanding of issues related to design, construction and operation of water andwastewater facilities and infrastructure.
(C) Demonstrated ability to work effectively as part of a project team and also to functionindependently with minimal supervision.
(D) Knowledge of Massachusetts bidding laws, including M.G.L Chapter 30 and Chapter 149construction bidding regulations.
CE) Familiarity with computer software such as Word and Excel
(F) Proven interpersonal, managerial, written and oral communications skills are required.
SPECIAL REQUIREMENTS:
Registered Massachusetts Professional Engineer preferred.
TOOLS AND EQUIPMENT USED:
Office machines as normally associated with the use of telephone, personal computer, includingword processing and other software, copy fax machine, measuring equipment, light tools andmobile radio.
PHYSICAL DEMANDS:
The physical demands described here are representative of those that must be met by an
Page 3 of 4Program Manager - Old

Page 4 of 4Program Manager - Old
employee to successfully perform the essential functions of this job. Reasonableaccommodations may be made to enable individuals with disabilities to perform the essentialfunctions.
While performing the duties of this job, the employee is regularly required to' sit and to use handsto finger, handle, feel or operate objects, tools or controls. The employee is frequently requiredto talk or hear. The employee is occasionally required to stand, walk, and reach with hands andarms.
The employee must occasionally lift and/or move up to 10 pounds. There are no special visualrequirements for this job.
WORK ENVIRONMENT:
The work environment characteristics described here are representative of those an employeeencounters while performing the essential functions of this job.
While performing the duties of this job, the employee is not exposed to any unusualenvironmental conditions.
The noise level in the work environment is loud in field setting and moderately quiet in an officesetting.
January 2013

MWRA
POSITION DESCRIPTION
DIVISION: Operations
POSITION: Program Manager, Electrical
PCR#:
DEPARTMENT: Engineering - Chelsea
BASIC PURPOSE:
Provides electrical engineering support to operation and maintenance departments. Supervisesproject teams in the department to oversee professional engineering and design projects related tothe rehabilitation and capital improvement of waterworks and wastewater facilities andinfrastructure from conceptual planning through construction. Additionally, managesengineering and design projects related to the rehabilitation and capital improvement of waterand wastewater facilities and infrastructure.
SUPERVISION RECEIVED:
Works under the general supervision of a Senior Program Manager
SUPERVISION EXERCISED:
Supervises electrical engineering staff, medium voltage technicians, and electrical distributionstaff as needed.
ESSENTIAL DUTIES AND RESPONSIBILITIES:
• Performs design, engineering and finalization of in-house projects involvingrepair/replace/modification activities, layout changes for shops, laboratories, offices andwarehouses, lighting systems, and power distribution, including substation & powergeneration equipment.
Page 1 of 4Program Manager, Electrical - New

• Assists with the coordination of project activities with engineering consultants asrequired.
• Develops preliminary designs, detailed designs and the preparation of plans andspecifications for proposed electrical modifications/replacement and constructionprojects.
• Oversees installation, operation, maintenance and repair of complex electrical equipmentincluding generation, transmissions, distribution systems.
• Oversees the preparation of plans and specifications for vendor contracts for proposedelectrical modifications.
• Oversees reviews of and modifications to all operations and maintenance documentationwith respect to electrical design changes.
• Assists the operations staff with engineering resolution and recommendations to electricalengineering problems, which arise during normal operations.
• Assists the maintenance staff with complex work orders and with the development ofcontract maintenance contracts.
• Provides on-site engineering inspection of construction projects generated by theTechnical Services group, central engineering and outside consultants.
• Develops and maintains files and familiarity with all codes, code addends, code cases,and industry standards applicable to the electrical field and ensure that facilityspecifications comply.
• Performs periodic inspections to ensure facility-wide compliance with local and nationalelectrical codes and other rules of safe electrical practice are enforced.
• Reviews electrical and related portions of design plans by outside firms who have beenhired to design improvements or additions to facilities and infrastructure.
• Supervises the updating of electrical engineering drawings and records, and thesubsequent forwarding (in accordance with established procedures) to the TechnicalServices Center.
• Provides oral and written reports to the Senior Program Manager detailing results ofproblem investigations, proposed resolution, and economic justification for the proposed
Page 2 of 4Program Manager, Electrical - New

changes.
• Evaluates assigned employees performance according to MWRA procedures.
SECONDARY DUTIES:
• Performs related duties as required.
MINIMUM QUALIFICATIONS:
Education and Experience:
(A) Knowledge of general and specific engineering and design principles and practices asattained through a accredited four (4) or (5) year college program in electricalengineering; and
(B) Experience in design, installation and maintenance of a wide variety of electrical powerand control equipment as normally acquired through seven (7) to nine (9) years of relatedelectrical engineering experience; and
(C) Experience with a complex processing facility and water or wastewater treatmentoperations and utility systems are desirable; or
(D) Any equivalent combination of education and experience.
Necessary Knowledge, Skills and Abilities:
(A) Personal computer skills including spreadsheet, database, word processing, projectmanagement and GDS, CADD and AutoCADD desired.
(B) Knowledge of Massachusetts bidding laws, including M.G.L Chapter 30, Chapter 149,and Chapter 25A construction bidding regulations.
(C) Excellent interpersonal, written and oral communication skills.
SPECIAL REQUIREMENTS:
Possession of Engineer-in- Training certification preferred.
A valid Massachusetts Licensed Professional Engineering certificate preferred.
A valid Massachusetts Drivers License required.
Page 3 of 4Program Manager, Electrical - New

October 2015
TOOLS AND EQUIPMENT USED:
Office equipment as normally associated with the use of telephone, personal computer includingword processing and other software, copy and fax machine.
PHYSICAL DEMANDS:
The physical demands described here are representative of those that must be met by anemployee to successfully perform the essential functions of this job. Reasonableaccommodations may be made to enable individuals with disabilities to perform the essentialfunctions.
While performing the duties of this job, the employee is regularly required to use hands to finger,handle, feel or operate objects, tools or controls and reach with hands and arms. The employeefrequently is required to sit and talk or hear. The employee is occasionally required to stand,walk, climb or balance, stoop, kneel, crouch, or crawl, taste or smell.
The employee must frequently lift and/or move up to 10 pounds and occasionally lift and/ormove up to 50 pounds. Specific vision abilities required by this job include close vision,distance vision, color vision, depth perception, peripheral vision and the ability to adjust focus.
WORK ENVIRONMENT:
The work environment characteristics described here are representative of those an employeeencounters while performing the essential functions of this job.
While performing the duties of this job, the employee occasionally works in outside weatherconditions. The employee occasionally works near moving mechanical parts, and is occasionallyexposed to wet and/or humid conditions and vibration. The employee occasionally works in highprecarious places and is occasionally exposed to fumes or airborne particles, toxic or causticchemicals and risk of electrical shock.
The noise level in the work environment is usually loud in field settings and moderately quiet inan office setting. .
Page 4 of 4Program Manager, Electrical - New

POSITION DESCRIPTION
MWRA
POSITION: Operator
PCR#:
Division: Operations
Department: Clinton, DI
BASIC PURPOSE:
Operates, monitors, and inspects assigned wastewater facilities and water treatment plantoperational equipment, processes, and systems on an assigned shift in a designated area.Performs assigned maintenance functions as pmi of a team under the direction of the assignedUnit or Area Supervisor.
SUPERVISION RECEIVED:
Works under the general supervision of the Unit/Area Supervisor.
SUPERVISION EXERCISED:
May supervise or direct assigned employees at a lower grade.
ESSENTIAL DUTIES AND RESPONSIBILITIES:
• Operates equipment manually and through instrument panel and programmable logic controlunits, system flows and levels in assigned process area. Equipment may include, but will notbe limited to the following; pumps, valves, gates, meters, gauges, controllers, motor controlcenters, level controls devices, mixers, oxygen generation, chemical feed, odor control andhydroelectric equipment.
• Monitors and inspects operating conditions; records observations and data in area shift log.
• Provides oversight for all barge and truck loading/unloading operation.
Page 1 of6Operator - Old

• Provides oversight for chemical and fuel oil unloading to tank farm.
• Takes initial action to correct malfunctions of equipment and reports malfunctions andvariances to the Area SupervisorlUnit Supervisor.
• Operators may be dispatched to critical facilities to make operational changes as directed orto investigate alarms.
e Samples various process fluids and gases (odor control), analyzes, records, and labelsaccording to schedule.
a Prepares chemical solutions.
• Operates equipment through programmable logic control units.
• Operates the Processes Instrumentation and Control System (PICS), TELOG or SCADA andfills-in for the ArealUnit Supervisor as required.
• Calibrates critical process control equipment.
• Follows established safety, operating, and emergency response procedures and policiesestablisbed by MWRA.
• Communicates with otber operators regarding operational and process control conditions.
• Performs work in compliance witb Autbority established Integrated Contingency Plan.
• Inspects and troublesboots mechanical, electromecbanical, pneumatic or hydraulic equipmentusing tools and gauges oftbe trade. Performs preventive maintenance on operationsequipment as directed by MAXIMO, such as but not limited to: greasing and lubrication,minor packing adjustments, opening hatches and installing safety rails, changing light bulbs,HVAC filters and performing minor maintenance during shift work as required.
• Performs, documents and reports results in the MAXIMO database of inspections and workperformed.
• Assists other trades in the performance of their work, as required, or as assigned.
• Operates motor vebicles such as vans and pick-up trucks to transport materials to work sites,and pickup and deliver supplies and equipment.
Page 2 of 6Operator - Old

e Performs light maintenance independently or as part of a team. Light maintenance shallinclude but not limited to:
• Operates forklift or other light equipment that does not require a speciállicense.
ø Generates inspection lists and maintenance reporting through the ComputerizedMaintenance Management System.
• Inspects and troubleshoots various systems and equipment.
e Installs and retrofits/new equipment related to plant systems.
• Modifies and/or aligns existing equipment to specifications.
• With proper safety training sets up ladders, staging and rigging and utilizes hoists,jacks, dollies, lifts, etc. for proper access to job and to remove and installequipment.
• Operates portable pumping, ventilation and other equipment necessary to supportand accomplish assigned tasks.
e Greases and lubricates, replaces oil reserves, minor packing adjustments and openshatches.
• Installs safety rails, changes light bulbs and replaces HVAC filters.
• Removes snow from immediate work area in order to perform tasks.
• Conducts routine testing, lockout/tagout, operation (startup/shutdown) andadjustment of process equipment.
• Performs necessary cleanup and housekeeping for work area and other lightmaintenance tasks.
SECONDARY DUTIES:
• Promotes and participates in the productivity improvement plan.
• Trains peers and subordinates as requested.
Page 3 of 6Operator - Old

(G) Experience in operating distributive control systems preferred.
• Performs related duties as required.
MINIMUM QUALIFICA TIONS:
Education and Experience:
(A) A high school diploma or GED; and
(B) Two (2) to three (3) years experience with a working knowledge of water/wastewatertreatment and treatment plant equipment; and
(C) Satisfactory completion of competency-based training program in accordance with theproductivity improvement plan training program established at MWRA; or
(D) Any equivalent combination of education and experience.
Necessary Knowledge, Skills and Abilities:
(A) Basic reading, writing, mathematical, scientific and oral communication skills.
(B) A working knowledge of treatment plant processes, systems and operation of relatedequipment, such as instrument panels, programmable logic control units, pumps, valves,motor control centers, level control devices, mixers, oxygen generation, chemical feedand odor control equipment.
(C) Knowledge in safety practices in operation of water/wastewater equipment and the watertreatment plant facility.
(D) Ability to interpret data from meters, gauges and other equipment to operate manuallyand through instrument panels, all kinds of wastewater treatment equipment to controltreatment processes.
(E) Ability to work as a team to support the goals of Operations.
(F) Ability to communicate orally and in writing, and maintain accurate logs and records.
(H) Computer skills necessary to access and use the MAXIMO and Lawson database.
Page 4 of 6Operator - Old

(I) Trained in Confined Space Entry, CPR and First Aid, and be capable of entering, settingup, installing, disassembling confined space equipment and ability to work in a confinedspace.
(J) Ability to attain knowledge & work processes required to perform maintenance tasksrequired by Reliability Centered Maintenance or similar Maintenance ManagementProgram.
SPECIAL REQUIREMENTS:
• A valid Massachusetts Wastewater Treatment Plant Operator Grade 4 license.
• A valid Massachusetts Class D motor vehicle Operator's license
• Complete productivity improvement competency-based training program related toESSENTIAL DUTIES AND RESPONSIBILITIES as outlined above and successfullydemonstrates required competencies.
TOOLS AND EQUIPMENT USED:
Office equipment as normally associated with the use of telephone, mobile radio, beeper,personal computer including word processing and other software, copy and fax machine.
PHYSICAL DEMANDS:
The physical demands described here are representative of those that must be met by anemployee to successfully perform the essential functions ofthis job. Reasonableaccommodations may be made to enable individuals with disabilities to perform the essentialfunctions.
While performing the duties of this job, the employee is regularly required to use hands to finger,handle, feel or operate objects, tools or controls and reach with hands and arms. The employeefrequently is required to stand and talk or hear. The employee is occasionally required to walk;sit; climb or balance; stoop, kneel, crouch, or crawl; taste or smell.
The employee must frequently lift and/or move up to 25 pounds and occasionally lift and/ormove more than 50 pounds. Specific vision abilities required by this job include close vision,distance vision, color vision, depth perception, peripheral vision and the ability to adjust focus.
WORK ENVIRONMENT:
Page 5 of6Operator - Old
The work environment characteristics described here are representative of those an employeeencounters while performing the essential functions of this job.
While performing the duties of this job, the employee regularly works in outside weatherconditions. The employee occasionally works near moving mechanical parts and is occasionallyexposed to wet and/or humid conditions and vibration. The employee occasionally works inhigh, precarious places and is occasionally exposed to fumes or airborne particles, toxic orcaustic chemicals.
The noise level in the work environment is usually loud in field settings, and moderately quiet inan office setting.
February,2001
Page 6 of 6Operator - Old

MWRA
POSITION DESCRIPTION
POSITION: Heavy Equipment Operator I
PCR#:
DIVISION: Operations
DEPARTMENT: Field Operations
BASIC PURPOSE:
Operates heavy equipment and vehicles.
SUPERVISION RECEIVED:
Works under the general supervision of the departmental Manager or Supervisor.
SUPERVISION EXERCISED:
Exercises close supervision of skilled laborers and laborers as assigned.
ESSENTIAL DUTIES AND RESPONSIBILITIES:
• Operates a variety of heavy equipment such as, but not limited to, backhoe, front-end loader,cranes, tractor cab and trailers, excavators, pumps, generators, and pneumatic tools.
• Operates equipment for excavations for valve replacement, pipeline installation, leak repair,and other miscellaneous excavations.
• Installs trench boxes, mechanical shoring systems, and other support systems for the safety ofexcavations.
• Assists mechanics in the maintenance and repair of heavy vehicles and equipment as needed.
SECONDARY DUTIES:
Page 1 of 4Heavy Equipment Operator I - New

(D) Any equivalent combination of education and experience.
ct Promotes and participates in the cross-functional work practices.
• Trains peers and subordinates as requested.
• Performs related duties as required.
MINIMUM QUALIFICATIONS:
Education and Experience:
(A) Basic reading, writing, mathematical, scientific and oral communication skills normallyattained through a high school education or the equivalent: and
(B) Considerable knowledge of the methods and techniques used in the maintenance and safeoperation of a wide variety of heavy and/or specialized maintenance and constructionequipment and vehicles as acquired through five (5) years experience; or
(C) Experience in urban utility excavation, construction, and installation.
Necessary Knowledge, Skills and Abilities:
(A) Ability to follow oral and written instructions.
(B) Skill in the operation of listed tools and equipment.
(C) Ability to operate heavy equipment for extended periods in a variety of climaticconditions.
SPECIAL REQUIREMENTS:
Valid Massachusetts Class A Commercial Driver's License.
Department of Public Safety Hoisting Engineer's License, 1A, 2A, 3A and 4A.
Must demonstrate proficiency for operating heavy equipment including but not limited to:• 50 ton Linkbelt crane• Volvo tracked excavator• Tractor cab and lowboy trailer
Page 2 of 4Heavy Equipment Operator I - New

• 10 wheel dumps with tagalong trailer• Various types of backhoes (JCB, Caterpillar, John Deer)• Front End Loader• Truck Mounted crane
Complete productivity improvement competency-based training program related toESSENTIAL DUTIES AND RESPONSIBILITIES as outlined above and successfullydemonstrates required competencies.
TOOLS AND EQUIPMENT USED:
Motor vehicle, specialized maintenance and construction equipment, hand tools, hoist, mobileradio.
PHYSICAL DEMANDS:
The physical demands described here are representative of those that must be met by anemployee to successfully perform the essential functions of the job. Reasonableaccommodations may be made to enable individuals with disabilities to perform the essentialfunctions.
While performing the duties of this job, the employee is regularly required to use hands to finger,handle, feel or operate object, tools or controls and reach with hands and arms. The employee isfrequently required to stoop, kneel, crouch or crawl. The employee is frequently required tostand, walk, talk, hear, sit, climb or balance.
The employee must regularly lift and/or move up to 60 pounds, frequently lift and/or move up to100 pounds. Specific vision abilities required by this job include close, distance and peripheralvision, depth perception and the ability to adjust focus.
WORK ENVIRONMENT:
The work environment characteristics described here are representative of those an employeeencounters while performing the essential functions of this job.
While performing the duties of this job, the employee regularly works near moving mechanicalparts, is frequently exposed to wet and/or humid conditions and is occasionally exposed to fumesand airborne particles, toxic or caustic chemicals and risk of electric shock, and vibration.
The noise level in the work environment is usually very loud in field settings and loud at other
Page 3 of 4Heavy Equipment Operator I - New

work locations.
March 2012
Page 4 of 4Heavy Equipment Operator I - New

MWRA
POSITION DESCRIPTION
POSITION: HVAC Technician
DIVISION: Operations
DEPARTMENT: Deer Island Maintenance, Metropolitan Maintenance
BASIC PURPOSE:
Inspects, maintains, repairs and installs heating, ventilation, air conditioning and odor controlequipment and other light maintenance tasks.
SUPERVISION RECEIVED:
Works under the general supervision of a HVAC Specialist or Unit Supervisor.
SUPERVISION EXERCISED:
Exercises supervision of entry level staff.
ESSENTIAL DUTIES AND RESPONSIBILITIES:
• Installs, modifies, troubleshoots, repairs and tests new and existing heating, ventilation, airconditioning and odor control systems, equipment, and fixtures.
• Performs HVAC related activities specified by work order.
• Inspects and troubleshoots heating, ventilating, air conditioning and odor controlequipment using tools and instrumentation and techniques of the trade.
• Performs preventative, predictive and corrective maintenance on heating, ventilation, airconditioning and odor control equipment according to vendor specifications.
• Installs duct work, hoods, ventilation devices and assemblies using manual and poweredtools.
• Obtains necessary parts through established procedures.
• Follows established safety, operating, and emergency response procedures and policiesestablished by MWRA.
Page I of 4HVAC Technician - New
o Installs safety rails.
• Operates motor vehicles, such as vans and pick-up trucks to pick-up and deliver suppliesand equipment to work sites.
• Performs work in a safe and professional manner.
• Performs, documents and reports results of inspections and work performed.
• Perform work in compliance with Authority Integrated Contingency Plan.
• Operates equipment manually and through instrument panels and programmable logiccontrol units as required in performance of maintenance tasks. Equipment may include,but will not be limited to pumps, valves, gates, meters, gauges, controllers, motor controlcenters and level control devices.
• Troubleshoots & corrects equipment/systems through the use of condition monitoringmethods & equipment.
• Works from manufacturer's manuals and specifications, blueprints, schematics and verbalinstructions to install, repair, troubleshoot, inspect, check & maintain mechanical,electrical-mechanical & hydraulic systems.
• Assists other trades in the performance of their work, as required, or as assigned.
• Performs light maintenance independently or as palt of a team. Light maintenance shallinclude but not limited to:
o Operates forklift or other light equipment not requiring a special license.
o Inspects and troubleshoots various systems and equipment.
o Installs and retrofits/new equipment related to plant systems.
o Modifies and/or aligns existing equipment to specifications.
o With proper training sets up ladders, staging and rigging and utilizes hoists,jacks, dollies, lifts, etc. for proper access to job and to remove and installequipment.
o Operates portable pumping, ventilation & other equipment necessary tosupport assigned task.
o Greases and lubricates, replaces oil reserves, minor packing adjustments andopens hatches.
Page 2 of4I-IVAC Technician - New

o Removes snow from immediate work area in order to perform tasks.
o Routine testing, lockout/tagout, operation (startup/shutdown) and adjustmentof process equipment.
o Performs necessary cleanup and housekeeping for work areas and other lightmaintenance tasks.
o Performs related duties as required.
SECONDARY DUTIES:
• Promotes and participates in productivity improvement plan.
• Trains peers and subordinates as requested.
MINIMUM QUALIFICATIONS:
Education and Experience:
(A) Basic reading, writing, mathematical and oral communication skills as normallyattained through a high school education or equivalent; and
(B) Certification in HVAC from a recognized vocational or technical training school; and
(C) Three (3) to five (5) years experience in the operation, repair and maintenance ofindustrial HVAC & related equipment; or
(D) Any equivalent combination of education and experience.
Necessary Knowledge, Skills and Abilities:
(A) Thorough knowledge of the standard practices, materials, tools, occupational hazardsand safety practices common to the trade.
(B) Skills in the operation of tools, instruments and equipment of the trades.
(C) Thorough knowledge of the standard practices, material, tools, occupational hazardsand safety practices common in the trade.
(D) Trained in Confined Space Entry, CPR and First Aid, and be capable of entering,setting-up, installing, disassembling confined space equipment and ability to work in aconfined space.
Page 3 of 4HVAC Technician - New

(E) Ability to attain knowledge & work processes required to perform maintenance taskrequired by Reliability Centered Maintenance or similar Maintenance ManagementProgram.
SPECIAL REQUIREMENTS:
• Possession of a Valid Massachusetts Class D Operator's License.
• Chlorofluorocarbon (CFC) certificate (Type 1) or the ability to obtain within 6 months.
TOOLS AND EQUIPMENT USED:
Motor vehicle, power and hand tools, hoist, mobile truck radio.
PHYSICAL DEMANDS:
The physical demands described here are representative of those that must be met by anemployee to successfully perform the essential functions of this job. Reasonableaccommodations may be made to enable individuals with disabilities to perform the essentialfunctions.
While performing the essential functions the employee is regularly required to use hands tofinger, handle, feel or operate objects, tools or controls and reach with hands and arms. Theemployee is frequently required to stoop, kneel, crouch or crawl. The employee isoccasionally required to stand, walk, talk, hear, sit, climb or balance.
WORK ENVIRONMENT:
The work environment described here are representative of those an employee encounterswhile performing the essential functions of this job. While performing the duties of this job,the employee regularly works in outside weather conditions. The employee regularly worksnear moving mechanical parts, and is occasionally exposed to fumes and airborne particles,toxic or caustic chemicals and risk of electric shock. This job is hearing protection requiredand the noise level in the work environment is very loud in field settings and moderately loudat pumping stations.
August 2016
Page 4 of 4HVAC Technician - New

P&C A.3IVA.62/15/17
STAFF SUMMARY
TO:FROM:DATE:SUBJECT:
Board of Directors '--::1 /}Frederick A. Laskey, Executive Director ¡;<...__:/,February 15,2017Appointment of Project Manager, Process MonitoringDeer Island Treatment PlantOperations Division
COMMITTEE: Personnel & Compensation INFORMA TION_X_ VO
Karen Gay-Valente, Director, Human ResourcesDavid F. Duest Director, Deer Island WWTPPreparer/Title
RECOMMENDATION:
To approve the appointment of Mr. Nicholas Zechello, to the position of Project Manager,Process Monitoring (Unit 9, Grade 25), at an annual salary of $89,433.09, commencing on a dateto be determined by the Executive Director.
DISCUSSION:
The position of Project Manager, Process Monitoring, became vacant upon the recent promotionof the incumbent. This position reports to the Program Manager, Process Monitoring, and willmanage technical projects for process monitoring and compliance at the Deer Island TreatmentPlant, including sampling and testing projects (for wastewater, air, and landfill groundwater).This includes coordinating projects directly with the Central Laboratory, Deer Island Operations,and the ENQUAL group as needed. This position is responsible for managing plant process datacollection, collation, evaluation, and report generation. The Project Manager, Process Monitoringwill also work directly to support operations and process control to ensure sufficient informationis available to evaluate plant performance versus NPDES permit requirements, process goals andplant efficiencies.
Selection Process
The Project Manager, Process Monitoring position was posted internally and fourteen candidatesapplied. One candidate withdrew and thirteen candidates were interviewed for the position. TheManager Process Control, the Program Manager, Process Monitoring, and a representative fromMWRA's Affirmative Action and Compliance Unit interviewed the thirteen candidates. Uponcompletion of those interviews, Nicholas Zechello was identified as the most qualified candidatebased on his education, experience, and knowledge of the requirements of the position.

Mr. Zechello currently holds the position of Project Engineer, Process Monitoring in the ProcessControl Department. Mr. Zechello has more than twenty years experience working with theMWRA in positions of increasing responsibility. He was hired to be the Project Engineer,Process Monitoring in February 2015, a position that has enabled him to further his knowledgeof wastewater and odor control treatment processes and to improve his breadth of knowledge indata generation and reporting. Prior to being promoted to the Project Engineer position, Mr.Zechello had been the Technical Assistant, Operations in the Deer Island Thermal/Power Plantsince 1999 and has a thorough understanding of all aspects of the Thermal/Power Plant. Heremains a vital part of the daily operational review of the Thermal Power/Plant in his currentcapacity as Project Engineer; in addition to overseeing all the required regulatory emissionsmonitoring and reporting. In both positions, Mr. Zechello has taken the lead on numerousmaintenance and process optimization projects, some of which have led to significantimprovements in the availability of equipment and a reduction in fuel costs.
Mr. Zechello has a Bachelor of Science Degree in Industrial Technology, Electronic EngineeringTechnology from Fitchburg State College. Mr. Zechello also holds a Massachusetts Grade 4Wastewater Operator's License.
BUDGET/FISCAL IMPACT:
There are sufficient funds for this position in the FY17 Current Expense Budget.
ATTACHMENTS:
Resume of Nicholas ZechelloPosition DescriptionOrganization Chart
2

PROFESSIONAL EXPERIENCE
"
Nicholas Zechello
Massachusetts Water Resources Authority
Project Engineer, Operations, Deer Island Treatment Plant, 2015 to Present• Manages the operation and maintenance of the continuous emissions monitoring system
for high pressure boilers. Ensures validation of all emissions data and air permitcompliance requirements.
• Schedules and coordinates all regulatory compliance testing and reporting for all ThermalPower Plant equipment.
• Assists in Odor Control H2S sampling and testing program.• Identified and implemented additional online monitoring equipment to improve Thermal
Plant performance.
Technical Assistant, Operations, Deer Island Treatment Plant, 1999 - Feb 2015• Assisted in the Thermal Power Plant optimization and energy efficiency initiatives
including reducing annual boiler fuel oil consumption from 2,600,000 to less than 200,000gallons and increasing steam turbine generator uptime from 60% to greater than 95%.
• Managed all phases of the boiler water treatment program.• Identified critical generator components and maintained spare part inventory of all
Thermal Power Plant generators.• Managed the continuous emissions monitoring maintenance service contract.• Monitored the ISO-NE regional electrical grid pricing and system demand for operation of
combustion turbine generators during peak days and demand response to reduce energycosts.
• Monitored performance of combustion turbine and steam turbine generators. Performedperformance evaluations to maximize equipment availability and reliability andrecommended maintenance projects to improve performance.
• Assisted in the development and management of all Thermal Power Plant maintenanceservice contracts including the coordination and scheduling of maintenance outages.
• Assisted in the training of the Thermal Power Plant Operators on the combustion gasturbine generators for both normal and emergency operations and synchronization to theDeer Island electrical distribution system.
• Assisted in all combustion turbine generator troubleshooting activities.• Deer Island Safety Board member representing the Thermal Power Plant.• Acted as a direct link to the Program Manager to operate and manage all combustion
turbine generator activities when on vacation or out of the office.
Staff Engineer/Contract, Operations, Deer Island Treatment Plant, 1995 - 1999 •• Assisted in the functional and compliance testing of all plant equipment associated with
the Thermal Power Plant. Major equipment included: high pressure boilers, steam andcombustion turbine generators.
• Developed and implemented a water treatment program for the power generationequipment. Program included training, sampling, monitoring and corrective actionprocedures.
Administrative Intern, Operations, Charlestown Navy Yard, 1993 - 1995• Assisted the Director, Deputy Director and Employee Relations Director of the Sewerage
Division in day to day activities.

Engineering Intern, Operations, Charlestown Navy Yard, 1992 -1993• Performed site preparation for the I/I Management Program's system-wide wastewater
metering project.• Assisted in the delineation of wetlands and construction easements for the New
Neponset Valley Relief Sewer Project.
EDUCATIONFitchburg State College, Fitchburg, MassachusettsBachelor of Science, Industrial Technology, Electronic Engineering Technology
CERTIFICATIONMassachusetts Wastewater Treatment Plant Operator License Grade IV #8105
COMMUNITY ACTIVITESTown of Pembroke Energy Committee, Chair, 2007 to Present
• Leads the committee in the development and implementation of a comprehensive energyprogram that includes energy conservation, energy commodity procurement anddevelopment of a 3 MW solar project at the town landfill.
• Achieved MA Department of Energy Resources Green Community designation for thetown of Pembroke.
Cross Creek Homeowners Association, President

MWRAPOSITION DESCRIPTION
. ,
POSITION: Project Manager, Process Monitoring
DIVISION: Operations
DEPARTMENT: Wastewater Treatment/Deer Island/Process Control
BASIC PURPOSE:
Manages technical projects for process monitoring at the Deer Island Treatment Plant, includingsampling and testing projects, plant process data collection, collation, evaluation and reportgeneration. Works directly to support operations and process control to ensure sufficientinformation is available to evaluate plant performance versus NPDES permit requirements,process goals and plant efficiencies.
SUPERVISION RECEIVED:
Works under the general supervision of the Program Manager, Process Monitoring
SUPERVISION EXERCISED:
May include supervision of Project Engineers, or other staff as assigned on a project basis.
ESSENTIAL DUTIES AND RESPONSIBILITIES:
• Responsible for managing DITP sampling and testing projects (currently wastewater, air,and landfill groundwater). Coordinate projects directly with the Central Laboratory,DITP Operations, and the NPDES group as needed.
• Responsible for the DITP process laboratories (for quick turnaround-time testing tosupport daily plant operational changes) including managing inventory and analyticalprocedures.
• Collects, reviews, presents, and archives operational and laboratory test data from allavailable sources ensuring data is available to staff in/through the DITP ProcessInformation System (PI) and/or DITP Operations Management System (DITP OMS).Current data sources include the DITP Operations Process Information and ControlSystem (PICS), the Central Laboratory Information Management System (LIMS), Process
Page 1 of3

Laboratory Information System (PUS) and the transport SCADA system, under thedirection of the Program Manager, Process Monitoring.
• Responsible for all DITP Operational reporting. Reports must be generated regularly andin a timely fashion for Operations to make process adjustment and evaluate plantperformance. Reporting will be both short term (e.g. real-time evaluation of PI data, dailyreports) and long term (e.g. monthly operational summaries, annual reports) tailored tothe need of DITP Operations. The candidate is responsible for maintaining DITP OMS tomeet the needs of operations over time.
• Assists in preparing data reports or evaluations as needed for budgetary review, processimprovement, or any other business purpose as requested by the Manager, ProcessControl or senior management.
• Trains staff in the procedures used by the department to collect, input, review, report andanalyze data.
SECONDARY DUTIES:
• Performs related duties as required.
MINIMUM QUALIFICATIONS:
Education and Experience:
Knowledge of wastewater unit operations, process control theory, practices and principles andcomputer applications as normally attained through a four-year Bachelor of Science Degree.
(A) Four (4) to six (6) years experience in wastewater treatment process data generation,collation, analysis and presentation.
(B) Two (2) to four (4) years in Microsoft Excel and Microsoft Access, or equivalentdatabase applications. Two (2) years of environmental laboratory experience inwastewater sampling, chemical and microbiological analysis preferred
(C) Demonstrated written and communication skills.
(D) Any equivalent combination of education or experience.
SPECIAL REQUIREMENTS:
Page 2 of3

Massachusetts Wastewater Treatment Plant Operator Grade VI certification, or ability to obtainwithin one (1) year.
TOOLS AND EQUIPMENT USED:
Laboratory test equipment. Office equipment as normally associated with the use of telephone,personal computer including word processing and other software, copy and fax machine.
PHYSICAL DEMANDS:
The physical demands described here are representative of those that must be met by anemployee to successfully perform the essential functions of this job. Reasonableaccommodations may be made to enable individuals with disabilities to perform the essentialfunctions.
Whi Ie performing the duties of this job, the employee is regularly required to use hands to finger,handle, feel or operate objects, tools or controls and reach with hands and arms. The employeefrequently is required to sit and talk or hear. The employee is occasionally required to stand,walk, climb or balance, stoop, kneel, crouch, or crawl, taste or smell.
The employee must frequently Iift and/or move up to 10 pounds. Specific vision abilitiesrequired by this job include close vision, distance vision, color vision, depth perception,peripheral vision and the ability to adjust focus.
WORK ENVIRONMENT:
The work environment characteristics described here are representative of those an employeeencounters while performing the essential functions of this job.
While performing the duties of this job, the employee occasionally works in outside weatherconditions. The employee occasionally works near moving mechanical parts, and is occasionallyexposed to wet and/or humid conditions and vibration. The employee can occasionally work inhighly precarious places and is occasionally exposed to fumes or airborne particles, toxic orcaustic chemicals and risk of electrical shock.
The noise level in the work environment is usually loud in field settings and moderately quiet inan office setting.
Page 3 of3
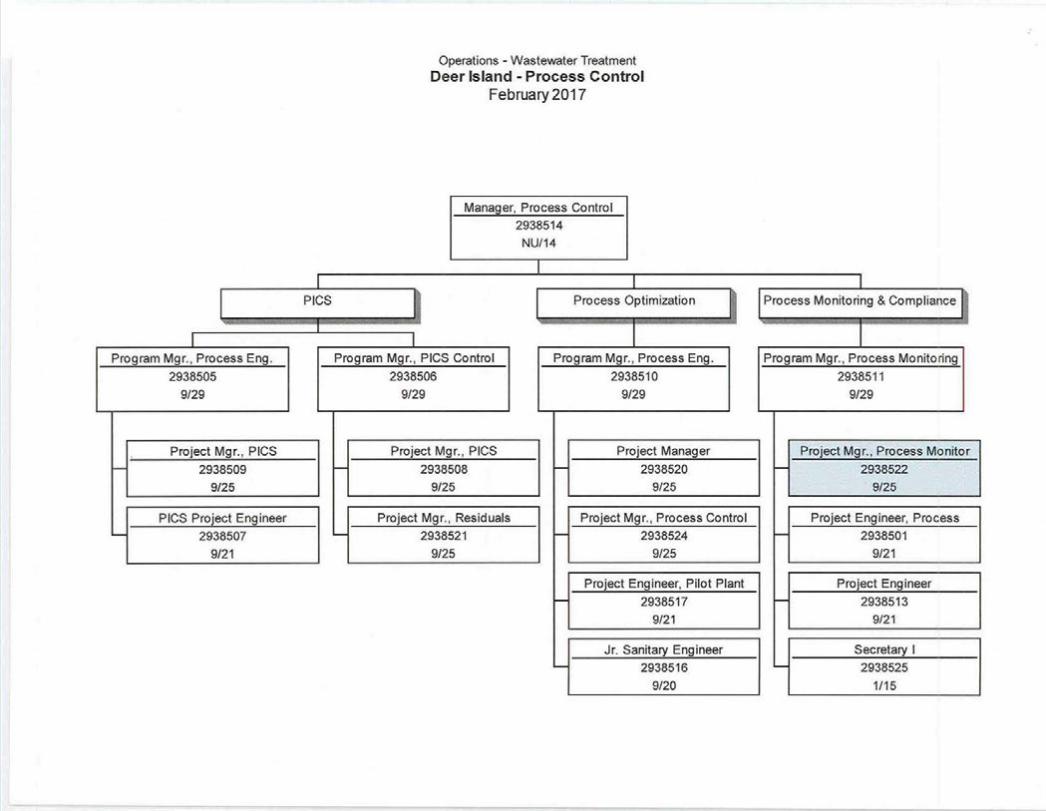
Operations - Wastewater TreatmentDeer Island - Process Control
February 2017
Manager, Process Control2938514NU/14
I I
I PICS II Process Optimization Process Monitoring & Compliance" - " ""Jr '~_Y'.' .. -_., o"" .,
"0'-- ,,_. ," " ." ,'-' "., '.-
I I I IProgram Mgr., Process Eng. Program Mgr., PICS Control Program Mgr., Process Eng. Program Mgr., Process Monitoring
2938505 2938506 2938510 29385119/29 9/29 9/29 9/29
Project Mgr., PICS Project Mgr., PICS Project Manager Project Mgr., Process Monitor- 2938509 I- 2938508 - 2938520 I- 2938522
9/25 9/25 9/25 . 9/25
PICS Project Engineer Project Mgr., Residuals Project Mgr., Process Control Project Engineer, Process- 2938507 '-- 2938521 - 2938524 I- 2938501
9/21 9/25 9/25 9/21
Project Engineer, Pilot Plant Project Engineer- 2938517 I- 2938513
9/21 9/21
Jr. Sanitary Engineer Secretary I- 2938516 '-- 2938525
9/20 1/15

STAFF SUMMARY
TO:FROM:DATE:SUBJECT:
Board of DirectorsFrederick A. Laskey, Executive DirectorFebruary 15,2017Appointment of Business Systems Analyst III, MIS Department
COMMITTEE: Personnel and Compensation INFORMATION.x.VOTE
q;z~e~' /)d-fL-Administration Division Director
Karen Gay-Valente, Director Human ResourcesRussell 1. Murray, Jr., MIS DirectorJoe Barrett, IS Custom Support ManagerPreparer/Tide
RECOMMENDATION:
To approve the appointment of Ms. Janice Costa to the position of Business Systems Analyst III(Unit 6, Grade 12), MIS Department, at an annual salary of $107,851.37 commencing on a datedetermined by the Executive Director.
DISCUSSION:
The MIS Business Systems Analyst III position, reports to the Program Manager, MIS in theMIS Custom Support group. This position works with all MWRA divisions and departments toassess, develop and implement IT application needs and requirements to support theiroperational and business needs.
The position serves as the primary liaison between the IT development team and MWRA'sdepartments to ensure work processes are documented and understood, enhanced or revised asappropriate, and translated into IT system/application requirements used to develop or procuretechnology-based solutions.
The position's responsibilities include working collaboratively with MWRA staff to understandbusiness needs and to identify appropriate technology improvements and solutions to satisfythose needs and to improve operations. The majority of these applications are Commercial-Off-The-Shelf (COTS) applications which are typically less expensive than custom developedapplications and are more easily supported by staff. The Business Systems Analyst positiondetermines how COTS applications need to be configured to support the MWRA specificbusiness needs and serves as the technology implementation lead.
P&C AAIVA.7
2/15/17

2
Selection Process
This position was posted internally and there were four applicants. Staff from MIS and HumanResources interviewed all four candidates. Ms. Costa was recommended for selection as the bestcandidate for the position based on her qualifications and experience.
Ms. Costa has 25 years of experience at MWRA in positions with increasing responsibility. Shebegan working at MWRA in 1991 as a Technical Writer in the MIS Department and waspromoted to Senior Systems Analyst in 1998. Prior to MWRA, Ms. Costa worked for severalyears at Wang Laboratories in a variety of positions including Technical Writer, ProductionController and Computer Operator.
Ms. Costa has strong working relationships across a variety of MWRA functional units and hasled several important application improvement projects. She is highly regarded by her peers andher managers and is often requested to lead these efforts. Ms. Costa has successfully assisted inthe implementation of electronic procurement application, the on-line employment application,and the Everbridge reverse all and notification tool. These applications have providedoperational efficiencies and improved productivity. She has outstanding analytical and writtencommunications skills and a proven track record of influencing business process changes andidentifying application configurations that support the implementation of Commercial-Off-the-Shelf packages.
Ms. Costa has extensive IT business analysis training and strong HTML, browser screen andnavigation skills. She is certified to teach Information Mapping Methodology® courses toMWRA staff. In addition, she possesses an Information Technology Infrastructure LibraryFoundation Certification as well as formal training on System Development Life Cycle. Sheattended Rivier College.
BUDGET/FISCAL IMPACT:
There are sufficient funds in the MIS Department FY17 Current Expense Budget to fund thisposition.
ATTACHMENTS:
Resume of Janice CostaPosition DescriptionOrganization Chart

JANICE A. COSTA
SUMMARY
Over thirty-five years' experience in an IT environment with a proven ability to:
• Identity business needs• Streamline business processes• Define project scope, requirements,
and gap analysis
• Assess third-party software to meet businessneeds
• Create end-user and system documentation• Support acceptance tests and system rollouts
EXPERIENCE
1991 toPresent
Massachusetts Water Resources Authority, Boston MA
Senior Systems Analyst 1998 - Present• Analyze business requirements using various techniques such as interviews, workshops,
brainstorm sessions, and user shadowing to find appropriate third party software solutions.• Create project artifacts such as requirements documents, workflows, gap and risk analysis
reports, use cases, and system and user documentation.• Design and configure third party solutions to best fit user stakeholder needs.• Develop test plans.• Coordinate and manage user acceptance testing and when applicable; relate changes to internal
programming staff or third party vendors.• Coordinate and manage go live activities; train users as required.• Maintain communication within the project team to ensure that system rollout is successful
and user stakeholders are satisfied.• Provide support to end users after implementation. Most recent projects included:
o Everbridge - MWRA's reverse 911 and subscription-based communication systemo Strategic Sourcing and Contract Management - Procurement's bid solicitation and
contract award and tracking systemo ApplicantPro - HR's online job posting and applicant tracking system
Technical Writer 1991 -1998Designed, wrote, edited, and published end-user documentation and training materials for MWRAbusiness systems.• Delivered stand-up training for office products and business systems.• Became a certified instructor of the Information Mapping Methodology®.• Served as an integral member ofthe MWRA Policies Group whose chalier was to review and
update current policies or write new ones using Information Mapping Methodology®.• Prototyped the internal and external MWRA websites. Successfully turned over the ownership
of the websites and trained staff in html programming.

JANICE A. COSTA
EXPERIENCE, continued
1980 to Wang Laboratories Incorporated, Lowell MA1991
Technical Writer, Corporate Information Services 1986 - 1991
• Designed, wrote, and edited business-oriented documentation such as User Guides,Brochures, Policies and Procedures, and online help text for Purchasing, Marketing,Financial, Inventory, Manufacturing, and Distribution applications.
• Analyzed applications for user-apparent features such as screen design and ease of use.Recommended changes to improve application flow and usability.
• Worked in various capacities: as project leader, user advocate, technical consultant, andmentor to many junior writers.
Production Controller (I & II), Manufacturing Information Systems 1985 - 1986
Reviewed, edited, revised, and tested all new operations documentation. Scheduled regular and on-request batch jobs. Installed new software and upgrades. Acted as a liaison between operations,production support, development, and the user community.
Computer Operator (I, II, & III), Manufacturing Information Systems 1982 -1985
Used various computer hardware and telecommunications devices. Trained junior operators. Wrotedocumentation for the operations staff. Performed routine operation's functions such as systembackup and recovery. Executed batch jobs for various business applications such as Purchasing,Inventory Control, and Financial Reporting. Provided technical support to user community.
Group Leader, Incoming Quality Control 1982 - 1985
Responsible for teams of up to 22 staff in the Quality Control Department. Managed inventory fromdelivery, electrical/mechanical testing, manufacturer returns, stockroom, to issues (Dock-ta-Stockapplication). Reconciled the department's physical inventory counts to system counts. Trained newemployees, maintained personnel records, wrote office and application procedures, supervised dataentry, determined system job priorities, and created Quality Control reports,
STRENGTHS
• Research, analysis, writing, and editing skills• Problem detection and resolution skills• Web page design and development with specific attention to usability factors• Organization and planning• Human factor and ease of use consideration• Proficient in MS Office products
CERTI FICATIONS
• Certified to teach Information Mapping Methodology® 1993• Certified in Information Technology Infrastructure Library (ITIL) Foundation 2012
RECENT TRAINING/SEMINARS
• Rapid Application Development SDLC Methodology 2016• Requirements, Development, Documentation, and Management 2016• Project Summit - Business Analysis Seminar sponsored by lIBA 2013, 20 15,2016

MWRAPOSITION DESCRIPTION
POSITION: Business Systems Analyst III
DIVISION: Administration
DEPARTMENT: Management Information System (MIS)
BASIC PURPOSE:
The Business Systems Analyst III works with business unit staff to understand businessprocesses and to document and prioritize user requirements and functional specifications for newand existing systems that support the organizational needs. Serves as the conduit between thedevelopment team and the rest of the organization. Facilitates communications to expeditiouslytranslate business requirements to help develop technical specifications as well as translatetechnical specification into language accessible to user and management audiences.Communicates and consults with end users or management to provide information regarding thecosts and ramifications of the decisions made.Evaluates MWRA application and business workflows, identifies improvements, documentsrequirements, prototyping, quality assurance and makes recommendations on how businessprocesses can be improved through better implementation of technology. Identifies stake holdersand develops Requirements Development Work Plans.In addition, the Business Systems Analyst III will serve as Business Systems Analyst team leadand will update and maintain Business Systems Analysis specific project plans and schedules.
SUPERVISION RECEIVED:
Works under the general supervision of the Manager II, Business Systems Analysis
SUPERVISION EXERCISED:
Exercises supervision of assigned vendor resources and IT project team.
ESSENTIAL DUTIES AND RESPONSIBILITIES:
• Use proven business analysis methodologies and elicitation techniques to:• Gather and document business, functional and technical requirements
from business leaders, end users, and vendors for new and upgradedsoftware applications (in-house and third party software).
• Document project scope and vision documents.
• Support Quality Assurance/Quality Control activities including developing functional anduser test acceptance test plans in conjunction with IT and user stakeholders.
Page 1 of 4

• Research new approaches to improve business and system processes and develop reportsand/or proposals for new or enhanced solutions.
• Identify and document documents gaps between the current as-is and recommended to-beprocesses.
• Collaborate with IT Department engineering staff contractors and vendors to supportdevelopment of technical specification for appropriate system infrastructure hardwareand software.
• Research, design, and test interfaces between existing and new system applications andplatforms to produce seamless integration that complies with business requirements.
• Maintain professional interaction with the IT staff and user community to ensureadequate system functionality, promote team participation and encourage user confidencein the applications staff quality of service.
• Develop and maintains design documentation, report requirements and test plans ofapplications throughout the design process.
• Support user acceptance testing and release management activities.
• Coordinate vendor access and resources as assigned.
• Documents and communicates issues and risks.
• Develops and maintains Business Systems Analyst functional unit's business continuitydocumentation as appropriate.
• Maintains professional interaction with the Business Systems Analyst staff, user andextended IT community (i.e. project teams) to ensure adequate system functionality,promotes team participation and encourages user confidence in the IT Department'squality of service.
• Conducts stakeholder analyses by gathering and assessing information to determinewhose interests should be taken into account for each project. Based on this analysis,identifies the stake holders for each project.
• Develops Requirements Work Plan.
• Manages Issue & Risk Lists as assigned.
• Coordinates project team testing and user acceptance testing for assigned projectsensuring testing is formalized, adheres to department standards and best practices.
Page 2 of 4

(B) Analytical and interpersonal skills.
SECONDARY DUTIES:
Performs related duties as required.
MINIMUM QUALIFICATIONS:
Education and Experience:
(A) A four (4) year college program in management science, engineering management,computer science or related fields; and
(B) Five (5) to seven (7) years experience gathering functional requirements, analyzing andaccurately documenting requirements specifications, workflow diagrams, data flowdiagrams, etc. to effectively communicate needs to internal and external developmentteams and/or developing and testing prototypes.
(C) Any equivalent combination of education or experience.
Necessary Knowledge, Skills and Abilities:
A) Formal training or certification on methodologies/frameworks for business systemsanalysis, project management, software development and IT Service Management suchas:• Rapid Application Development SDLC methodologies such as Agile.• Project Management concepts and tools.
(C) Written and oral communication skills.
(D) Knowledge of the following is desirable: MS Project, MS Visio, MS .Net, J2EE, CrystalReporting, ORACLE, SQL Server and PLISQL.
SPECIAL REQUIREMENTS:
Information Technology Infrastructure Library (lIlL) Foundation Certification is required or theability to obtain within 6 months.
International Institute of Business Analysis (liBA) Certification or formal lIBA Training or theability to obtain within one year.
TOOLS AND EQUIPMENT USED:
Office equipment as normally associated with the use of telephone, personal computers includingword processing and other software, copy and fax machines.
Page 3 of4

Page 4 of 4
PHYSICAL DEMANDS:
The physical demands described here are representative of those that must be mel by anemployee to successfully perform the essential functions of this job. Reasonableaccommodations may be made to enable individuals with disabilities to perform essentialfunctions.
While performing the duties of this job, the employee is regularly required to use hands to finger,handle, feel or operate objects, tools or controls and reach with hands and arms. The employeefrequently is required to sit and talk or hear. The employee is occasionally required to walk andstand.
The employee must frequently lift and/or move up to 25 pounds and occasionally lift and/ormove up to 50 pounds. Specific vision abilities required by this job include close vision andcolor vision, and the ability to adjust focus.
WORK ENVIRONMENT:
The work characteristics described here are representative of those an employee encounterswhile performing the essential functions of this job.
While performing the duties of this job, the employee occasionally works in various fieldsettings and in an office environment. The employee regularly works near moving mechanicalparts, and is occasionally exposed to risk of vibration.
The noise level in the work environment is very loud in field settings, moderately loud at otherwork locations and moderately quiet at office settings.

Business Systems Analyst III Organization Hierarchy(February 2017)
Director, MISNU Grade - 16
8610001
IIS Custom Support Manager
U6 Grade-148610012
lI I I I
IS Development SpecialistU6 Grade-98610028
IT Project Manager IIIU6 Grade-128610082
Program Manager, MISU6 Grade-128610053
Librarian/Records ManagerU6 Grade-118610072
--- -
Business Systems Analyst IIIInformation Specialist l 11 U6 Grade-12f---I U1 Grade-14
86100788610071
Public,"rOM.t;O"T"h"id'"J Systems Anlyst Progammer III
f-------I U1 Grade-15 U6 Grade 118610063 8610010
--
Lib~'Y s"peN.O~ Database Analyst/programmerc___¡ U6 Grade-9 U6 Grade-11
8610073 8610067
l_Library Specialist Sr Systems Analyst
U6 Grade- 8 U6 Grade-108610096 8610015
- - -

Frederick A. LaskeyExecutive Director
Chair: M. BeatonVice-Chair: J. CarrollSecretary: A. PappastergionBoard Members:A. BlackmonK. CotterP. FlanaganJ. Fotiß. PellaH. VitaleJ. WalshJ. Wolowicz
MASSACHUSETTS WATER RESOURCES AUTHORITYCharlestown Navy Yard
100 First Avenue, Building 39Boston, MA 02129
BOARD OF DIRECTORS' MEETING
to be held on
Wednesday, February 15,2017
Location: 100 First Avenue, 2nd FloorCharlestown Navy YardBoston, MA 02129
Time: 1:00 p.m.
AGENDA
I. APPROVAL OF MINUTES
II. REPORT OF THE CHAIR
III. REPORT OF THE EXECUTIVE DIRECTOR
A. PRESENTATION: 2016 Extraordinary Service Awards
IV. BOARD ACTIONS
A. Approvals
Telephone: (617) 242-6000Fax: (617) 788-4899TTY: (617) 788-4971
1. Transmittal of the FY18 Proposed Current Expense Budget to theMWRAAdvisory Board (ref. AF&A B.1)
® Printed on t00% Recycled Paper
2. Appointment of Proxy for Fore River Railroad Corporation (ref. AF&AB.2)
3. Redundancy for the Metropolitan Tunnel System (ref. W B.1)
4. Approval of the Affirmative Action Plan (ref. P&C A.1)
5. PCR Amendments - February 2017 (ref. P&C A.2)

Meeting of the Board of Directors, February 15, 2017 Page 2
A, Approvals (cont'd.)
6. Appointment of Project Manager, Process Monitoring, Deer IslandTreatment Plant (ref. P&C A.3)
7. Appointment of Business Systems Analyst III, MIS (ref. P&C AA)
B. Contract Awards
1. Long-Term Energy Supply Alternatives Analysis, Deer Island TreatmentPlant: Burns & McDonnell, Contract 6963 (ref. WW A.1)
2. Oxygen Generation Services, Deer Island Treatment Plant:Solutionwerks, Inc., Contract S562 (ref. WW A.2)
3. Nut Island Headworks Odor Control and HVAC ImprovementsInspections, Evaluations, Design, Construction Administration andResident Engineering Services: Hazen & Sawyer, PC, Contract 7517(ref. WW A.3)
4. Slide Gate Installation, Quabbin Aqueduct at Shaft 12: Arcadis, U.S.,Inc., Contract 7509 (ref. W C.1)
V. CORRESPONDENCE TO THE BOARD
VI. OTHER BUSINESS
VII. EXECUTIVE SESSION
A. Real Estate:
1. Watershed Land Acquisition
B. Litigation:
1. Settlement Agreement with Barclay's Bank PLC and Barclays CapitalInc.
2. Cross Harbor Cable Litigation
C. Security:
1. Wachusett Reservoir Railroad
VIII. ADJOURNMENT

I2/15/17
Meeting of the Board of Directors
January 18, 2017
A meeting of the Board of Directors of the Massachusetts Water Resources Authority
was held on January 18, 2017 at the Authority headquarters in Charlestown. Chairman
Beaton presided. Present from the Board were Messrs. Blackmon, Carroll, Cotter, Fati,
Pappastergian, Peña, Vitale and Walsh. Ms. Wolowicz and Mr. Flanagan were absent.
Among those present from the Authority staff were Frederick Laskey, Executive Director,
Steven Remsberg, General Counsel, Michael Hornbrook, Chief Operating Officer, Thomas
Durkin, Director of Finance, Michele Gillen, Director of Administration, and Bonnie Hale,
Assistant Secretary. The meeting was called to order at 1:15 p.m.
APPROVAL OF MINUTES
Upon a motion duly made and seconded, it was
Voted to approve the minutes of the Board of Directors' meeting of December 14,
2016, as presented and filed with the records of the meeting.
REPORT OF THE CHAIR
Annual Meeting: Election and Appointment of MWRA Officers and Committee Assignments
Upon a motion duly made and seconded, it was
Voted to: (1) designate this January 18, 2017 meeting as the Annual Meeting
which, as provided in the Authority's by-laws, will be deemed a special meeting of the
Board for the purpose of election of officers; (2) elect John Carroll as Vice-Chairman of
the Board; (3) appoint Andrew Pappastergian as Secretary of the Board and Bonnie
Hale and Rosemarie Convery as Assistant Secretaries; Matthew Horan as Treasurer

Meeting of the Board of Directors, January 18, 2017 Page 2
and Robert Belkin and Kathy Sani as Assistant Treasurers; and (4) ratify the
appointment of Board members to standing Committees, as presented and filed with the
records of the meeting. New Committee Chairs will be appointed approximately every
two years.
APPROVALS
First Amended and Restated Water Supply Continuation Agreement with Town of Wilmington
Upon a motion duly made and seconded, it was
Voted to authorize the Executive Director, on behalf of the Authority, to execute
the First Amended and Restated Water Supply Continuation Agreement between
MWRA and the Town of Wilmington, substantially in the form presented and filed with
the records of the meeting.
PCR Amendments - January 2017
Upon a motion duly made and seconded, it was
Voted to approve amendments to the Position Control Register, as presented
and filed with the records of the meeting.
Appointment of Program Manager, Process Engineering, Deer Island
Upon a motion duly made and seconded, it was
Voted to approve the Executive Director's recommendation to appoint Mr.
Timothy Beaulieu to the position of Project Manager, Process Control (Unit 9, Grade 25)
at an annual salary of $108,599.56, to be effective on the date designated by the
Executive Director.

Meeting of the Board of Directors, Januarv 18, 2017 Page 3
CONTRACT AWARDS
Audit Services: CliftonLarsonAllen LLP, Contract F242
Upon a motion duly made and seconded, it was
Voted to approve the recommendation of the Consultant Selection Committee to
select CliftonLarsonAllen LLP to provide Audit Services to the Authority, and to
authorize the Executive Director, on behalf of the Authority, to execute and deliver
Contract F242 with CliftonLarsonAllen LLP in an amount not to exceed $499,000 for a
term of four years, from April1, 2017 to March 31,2021,
Drug and Alcohol Testing Program: Advantage Drug Testing LLC, Contract A610
Upon a motion duly made and seconded, it was
Voted to approve the recommendation of the Consultant Selection Committee to
select Advantage Drug Testing LLC for the provision of Drug and Alcohol Testing
Services, and to authorize the Executive Director, on behalf of the Authority, to execute
Contract A610 with Advantage Drug Testing LLC in an amount not to exceed $32,050
for a term of 36 months from the Notice to Proceed,
Electrical Equipment Testing, Deer Island Treatment Plant: American Electrical TestingCompany, Contract S561
Upon a motion duly made and seconded, it was
Voted to approve the award of Contract S561, Electrical Equipment Testing -
Deer Island Treatment Plant, to the lowest eligible and responsible bidder, American
Electrical Testing Company, Inc., and to authorize the Executive Director, on behalf of
the Authority, to execute and deliver Contract S561 in an amount not to exceed
$1,972,160, for a term of 1,095 calendar days from the Notice to Proceed.

Meeting of the Board of Directors. January 18. 2017 Page 4
CONTRACT AMENDMENTS/CHANGE ORDERS
Settlement Agreement for Various Design Contracts and Hatchery Pipeline and HydroelectricProject Design, Construction Administration and Resident Inspection Services: StantecConsulting Services, Inc., Contract 7017A, Amendment 2
Voted to authorize the Executive Director, on behalf of the Authority, to execute a
Upon a motion duly made and seconded, it was
settlement agreement with Stantec Consulting Services Inc. in the amount of $70,000,
which represents reimbursement to MWRA for claims associated with designer error
and omissions in the following Stantec design contracts: Contract 6854, Lynnfield/
Saugus Pipelines Project; Contract 7259, North Dorchester Bay Ventilation Building;
and Contract 7085A, Installation of Second Gaseous Oxygen Line at the John J. Carroll
Water Treatment Plant. Further, to authorize the Executive Director, on behalf of the
Authority, to approve Amendment 2 to extend the term of Contract 7017A with Stantec
Consulting Services Inc., Hatchery Pipeline and Hydroelectric Design, Construction
Administration and Resident Inspection Services, by three months to September 1,
2018 with no increase in the contract amount.
Northern Intermediate High Redundant Pipeline Design, Construction Administration andResident Inspection Seryices: Stantec Consulting Services, Inc., Contract 6906, Amendment 2
Upon a motion duly made and seconded, it was
Voted to authorize the Executive Director, on behalf of the Authority, to approve
Amendment 2 to increase the amount of Contract 6906 with Stantec Consulting
Services, Inc., Northern Intermediate High Redundant Pipeline Design, Construction
Administration and Resident Inspection Services, in the amount of $900,854.00 and to
extend the term by 39 months to December 23, 2020.

Meeting of the Board of Directors. January 18. 2017 Page 5
Northern Intermediate High Section 110 - Reading and Woburn: Albanese D&S, Inc., Contract7471, Change Order 7
Upon a motion duly made and seconded, it was
Voted to authorize the Executive Director, on behalf of the Authority, to approve
Change Order 7 to increase the amount of Contract 7471 with Albanese D&S, Inc.,
Northern Intermediate High Section 110 - Reading and Woburn, in an amount not to
exceed $564,239, with no increase in contract term. Further, to authorize the Executive
Director to approve additional change orders as may be needed to Contract 7471 in
amounts not to exceed the aggregate of $250,000, in accordance with the Management
Policies and Procedures of the Board of Directors.
CORRESPONDENCE TO THE BOARD
Letter from Utility' Contractors of New England, Inc. (UCANE)
There was general discussion of the above-referenced January 11, 2017 letter
expressing UCANE'S concerns regarding the recent MWRA staff recommendation to utilize
deep tunnels vs. surface piping to create redundancy for the existing Metropolitan Tunnels. By
general consensus, the Board authorized the Executive Director to meet with UCANE to
explain the reasoning why the construction of tunnels was the preferred alternative. Mr.
Favaloro indicated that the Advisory Board Executive Committee had endorsed the deep rock
tunnel approach, and it was expected that the full Advisory Board would endorse it as well at
its January 19, 2017 meeting. Mr. Laskey stated that further discussion on Metropolitan Tunnel
Redundancy Planning would occur at the next Board meeting scheduled for February 15,
2017.
EXECUTIVE SESSION
It was moved to enter Executive Session to discuss security and collective bargaining.

Meeting of the Board of Directors. January 18. 2017 Page 6
Upon a motion duly made and seconded, it was, upon a roll call vote in which the
members were recorded as follows:
Yes Abstain
BlackmonCarrollCotterFatiPappastergianPeñaVitaleWalshBeaton
Voted to enter executive session to discuss collective bargaining, in that such
discussion may have a detrimental effect on the negotiating position of the Authority,
and to consider the deployment of security personnel or devices, or strategies with
respect to security.
It was stated that the meeting would return to open session solely for the consideration
of adjournment.
* * * *
EXECUTIVE SESSION
* * * *
The meeting returned to open session at 2:00 p.m. and adjourned.