Town of Sheffield, Massachusetts
105
Housing Needs Assessment October 21 st , 2021 Town of Sheffield, Massachusetts
-
Upload
khangminh22 -
Category
Documents
-
view
7 -
download
0
Transcript of Town of Sheffield, Massachusetts

Housing Needs Assessment
October 21st, 2021
Town of Sheffield, Massachusetts

Acknowledgements
Town of Sheffield
Rene Wood - Select Board, Chairperson
Berkshire Regional Planning Commission
Philip V. Arnold - Community Planner
Alexander Valentini - Economic Development Researcher
Mark Maloy - GIS, Data, & IT Manager
Funding for the Town of Sheffield, Massachusetts: Housing Needs Assessment was provided
through the District Local Technical Assistance program.

Table of Contents 1. Executive Summary............................................................................. 1
1.1 Background and Purpose ....................................................................... 1
1.2 Summary of Key Demographics & Findings .................................................. 1
1.3 Summary of Recommendations ............................................................... 3
1.4 Methodology ...................................................................................... 4
1.5 Preface ............................................................................................ 4
2. Demographic Profile ............................................................................. 6
2.1 Population ......................................................................................... 6
2.2 Race ............................................................................................... 9
2.3 Poverty and Homelessness ..................................................................... 9
2.4 Employment and Income ...................................................................... 11
2.5 Housing Overview .............................................................................. 19
2.6 Affordable Housing Supply Analysis .......................................................... 26
Conclusions and Implications ...................................................................... 29
3. Rental Housing Conditions .................................................................... 32
3.1 Overview of Rental Units ...................................................................... 32
3.2 Rental Cost Analysis ............................................................................ 35
3.3 Affordable Rental Housing Stock .............................................................. 37

Conclusions and Implications ...................................................................... 39
4. Owner Housing Conditions .................................................................... 40
4.1 Homes for Sale .................................................................................. 40
4.2 Value of Homes ................................................................................. 42
4.3 Seasonal Housing ............................................................................... 43
4.4 Affordability of Home Ownership ............................................................. 44
Conclusions and Implications ...................................................................... 48
5. Senior Housing Profile and Need ............................................................. 50
Conclusions and Implications ...................................................................... 54
6. Special-Needs Housing ........................................................................ 56
Conclusions and Implications ...................................................................... 56
7. Foreclosures, Blighted, and Sub-Standard Properties ..................................... 58
Conclusions and Implications ...................................................................... 60
8. Seasonal Housing Needs ...................................................................... 61
Conclusions and Implications ...................................................................... 61
9. Review of Town-Related Housing Efforts .................................................... 62
Financial Assistance ................................................................................. 62
Housing Production .................................................................................. 62
Organizational Capacity ............................................................................ 63
Zoning By-Laws ...................................................................................... 63

10. Implementation Recommendations ........................................................ 65
11. Resource Guide ................................................................................ 66
11.1 Housing Partnerships ......................................................................... 66
11.2 Federal Resources ............................................................................. 74
11.3 State Resources ............................................................................... 83
11.4 Private & Non-Profit Opportunities .......................................................... 92
12. Appendices ................................................................................... 100
Appendix A: Berkshire Realtors: South Berkshire County, MA - Residential Real Estate
Report ............................................................................................... 100

Berkshire Regional Planning Commission 1
Town of Sheffield, Massachusetts: Housing Needs Assessment 2021
1. Executive Summary 1.1 Background and Purpose
The Town of Sheffield requested the assistance of Berkshire Regional Planning Commission to
perform an assessment of the current state of housing in the Town in preparation for the
development of a Housing Production Plan. This report provides detailed information about the
existing housing stock and will assist in clarifying the need for senior, accessible, and affordable
housing in Sheffield. Funding for this report and the upcoming Housing Production Plan was
provided through the District Local Technical Assistance program. While the most recently
available data is used throughout this assessment, it is important to note the 2020 Decennial
Census data was not yet available and much of the data used does not reflect housing changes
that have taken place since the onset of the COVID-19 pandemic in February of 2020.
1.2 Summary of Key Demographics & Findings
Sheffield is the second most populous municipality in southern Berkshire County. As of the 2019
American Community Survey, the population of Sheffield was estimated at 3,160 but between
2000 and 2019, the Town experienced a 5% decline in population. During the same time, the
median age of Sheffield residents increased from 40.5 years old to 52.3 years old, making
Sheffield an aging community.
The most recent data (May 2021) shows that Sheffield’s labor force consists of 1,837 and the
unemployment rate was 4.4% which is lower than the rate for Berkshire County (7.0%) and the
State (6.1%).1 Seventy percent (70%) of the average monthly employment in Sheffield is in
service-providing jobs. The industries with the highest share of employment were Education and
Health Services (29%), Trade, Transportation, and Utilities (14%), and Manufacturing (13%).
Together, these industries accounted for 56% of all employment.2
1 Massachusetts Department of Unemployment Assistance
https://lmi.dua.eol.mass.gov/LMI/LaborForceAndUnemployment# 2 Massachusetts Department of Unemployment Assistance: Employment and Wages Report (ES-202)
https://lmi.dua.eol.mass.gov/lmi/EmploymentAndWages#

Berkshire Regional Planning Commission 2
Town of Sheffield, Massachusetts: Housing Needs Assessment 2021
From 2010 to 2019, per capita income in Sheffield increased by 52%: from $32,000 to $48,782.
It should be noted that per capita income is calculated by dividing the sum of all residents’
incomes by the total number of residents and many residents do not earn income, so this figure
tends to be low. For this reason, this assessment focuses on median household income because
it has a higher degree of accuracy. Median household income in Sheffield is estimated at
$86,184. Owner-occupied households have a higher median household income ($92,357) when
compared to renter-occupied households ($34,861).3
There are a total of 1,859 housing units, with the highest percentage having 3 bedrooms (791).
Sheffield’s housing stock, which includes both houses and apartments, is aging as 56% of
homes were built prior to 1970 making them over fifty years old.4
Eighty-four percent (84%) of occupied housing units are owner-occupied, and owner-occupied
housing is primarily single-family detached dwellings (84%). The average listed home price
(accessed 6/23/21 through www.zillow.com) was $1,190,745 and the median listed home price
was $617,000. Two of the total 20 active listing are in excess of $1,000,000 and one of them is
over $11,000,000. When these homes are removed from the equation, the average listed price
is reduced to $581,939 and the median listed price is $597,000.
There were an estimated 514 householders that experienced a cost burden in 2019, and it is
likely to have risen given the information cited above. This figure comprises 37% of the total
1,384 occupied housing units. Housing cost burden means that housing costs are at least 30%
of household income and is viewed as a sign of economic stress on households.5 Ideally, no
more than 30% should be allocated towards housing costs to allow for balanced household
spending.
Sixteen percent (16%) of the occupied housing units are renter-occupied. Fifty percent (50%) of
renter households earn less than $35,000 annually, and with the median gross rent estimated at
$968, many workers cannot afford housing in Sheffield without being cost burdened. In fact,
3 2019 American Community Survey, Table B25119 4 2019 American Community Survey, Table DP04 5 2019 American Community Survey, Table S2503

Berkshire Regional Planning Commission 3
Town of Sheffield, Massachusetts: Housing Needs Assessment 2021
59% of renters are housing cost burdened.6 A quick search for rental properties on
www.zillow.com on June 23rd, 2021, yielded no available rental properties in Sheffield. This is not
the only available source to search for rental properties, but it provides an indication of how
limited the overall rental stock is.
The vast majority of seniors (age 65+) in Sheffield own their home (89%). About half of senior
owners moved into their home in 1989 or earlier, indicating long-term homeownership and
equity appreciation.7 Fifty-six percent (56%) of all senior householders have annual incomes
above $60,000 per year, with 45% senior householders earning more than $100,000 annually.8
Senior renters are relatively new to their homes; 56% moved in since the year 2000. In
Sheffield, 41% of senior renters are cost burdened.9
1.3 Summary of Recommendations
• Form a Sheffield Housing Production Plan Committee, which working with Berkshire Regional Planning
Commission, the Select Board and Town residents, will develop a housing production plan. The 5-7
Committee members should have representation by the Planning Board, Housing Commission, Select Board,
and volunteers, and ad hoc advisors. Provide opportunities for public input.
• Ensure the final Housing Production Plan, which requires adopted by the Planning Board and the Select
Board, meets all MA housing production plan requirements.
• Investigate available state and other housing grants and develop a grant calendar, with benefits of each
grant to be applied for, in line with housing production plan; apply for 1 or more grants in FY22/FY23.
• Continue applications for Community Development Block Grant (CDBG) housing rehabilitation funding.
• Review Zoning By-Laws for additional housing related uses or changes recommended by the housing
production plan committee.
• Review and possibly revise current Zoning By-Law to regulate short-term rentals.
• Direct short-term rental tax revenue towards housing production plan goals.
6 2019 American Community Survey, Tables B25003, B25118, B25064 7 2019 American Community Survey, Table B25128 8 2019 American Community Survey, Table B19037 9 2019 American Community Survey, Table B25072

Berkshire Regional Planning Commission 4
Town of Sheffield, Massachusetts: Housing Needs Assessment 2021
• Review adoption of a 1% Community Preservation Act (CPA) tax to be directed toward implementation of
the housing production plan.
• Evaluate blighted housing properties for inclusion in the MA AG’s blighted housing program.
• Identify and qualify housing production non-profits to implement the housing production plan.
• Identify opportunities to work with non-profits, including land conservancy organizations, on housing in
Sheffield.
• Upgrade existing broadband build out or install fiber optic broadband internet throughout town, which
could enable more work-from-home options.
1.4 Methodology
This assessment was compiled using a model provided by Massachusetts Housing Partnership as
outlined in the Housing Needs Workbook: Assessing Community Needs. For more information,
visit: https://www.housingtoolbox.org/writable/files/resources/mhphousingneeds.pdf.
Data for this assessment came from various sources, including:
• United States Decennial Census
• American Community Survey
• United States Department of Housing and Urban Development, www.huduser.gov
• Massachusetts Department of Labor and Workforce Development
• Massachusetts Department of Housing and Community Development
• University of Massachusetts Donahue Institute
• Banker and Tradesman and Zillow
• Berkshire County Board of Realtors & MLS
• Massachusetts Department of Revenue
• Community Software Consortium (Assessors’ data)
• Berkshire Regional Planning Commission: Fair Housing Equity Assessment
1.5 Preface
A Housing Needs Assessment is largely a data-driven document. For this reason, it is important
to explain the data sources used in this assessment. The majority of the information presented

Berkshire Regional Planning Commission 5
Town of Sheffield, Massachusetts: Housing Needs Assessment 2021
has been collected from the United States Census Bureau. The Census Bureau is the largest
statistical agency in the country and provides data on America’s people, places, and economy.
The Census Bureau conducts a host of surveys and programs, but this report relies heavily on
the Decennial Census and the American Community Survey. The Decennial Census is mandated
by the U.S. Constitution to count each resident of the country every ten years on the year
ending in zero. The Decennial Census questions account for population, age, gender, race, and
some basic questions about housing. Since the goal is to reach every resident and the questions
asked are easily quantifiable, the information gathered comes with a high degree of accuracy.
The results of the Decennial Census determine the number of seats for each state in the U.S.
House of Representatives and are used to draw congressional and state legislative districts and
to distribute more than $675 billion in federal funds each year.
The American Community Survey is an ongoing survey that provides vital information on a
yearly basis. This survey is sent to approximately 295,000 addresses on a monthly basis, which
equates to about 3.5 million addresses per year. Since the number of people surveyed is less
than during the Decennial Census and much more extensive questions are included, the results
come with a lesser degree of accuracy compared to the Decennial Census. The 2020 Decennial
Census data was not release in time for use in this assessment.
It should also be noted that this report was developed during the COVID-19 pandemic which
began impacting the United States in the beginning of 2020. COVID-19 has affected virtually
every aspect of the socio-economic milieu on a global scale. Despite the widespread impacts,
the data sources that track short-term changes caused by the pandemic especially as relates to
housing are limited. While this assessment accounts for fluctuations in unemployment and home
sales, aside from these topics, the data presented in this assessment treats COVID-19 as a
statistical anomaly.

Berkshire Regional Planning Commission 6
Town of Sheffield, Massachusetts: Housing Needs Assessment 2021
2. Demographic Profile 2.1 Population
As of the 2019 American Community Survey, the population of Sheffield was 3,160. Between
1960 and 2019, Sheffield’s population increased by 48%, but between 2000 and 2019 it had
decreased by 5%. The only other towns in southern Berkshire County that experienced a
decrease in population over the same time were Great Barrington and Monterey. Berkshire
County as a whole experienced a decline in population over the same time.
Table 2.1 - Southern Berkshire County: Population Change (1960 - 2019)
Town/County 1960 1970 1980 1990 2000 2010 2019
Sheffield 2,138 2,374 2,743 2,903 3,335 3,257 3,160
Alford 256 302 394 413 399 494 431
Egremont 895 1,138 1,311 1,177 1,345 1,225 1,402
Great Barrington 6,624 7,537 7,405 7,841 7,527 7,104 6,901
Monterey 480 600 818 774 934 961 774
Mount Washington 34 52 93 135 130 167 148
New Marlborough 1,083 1,031 1,160 1,233 1,494 1,509 1,544
Otis 473 820 963 1,067 1,365 1,612 1,393
Sandisfield 536 547 720 667 824 915 891
Berkshire County 142,135 149,402 145,110 139,352 134,953 131,219 126,425
Source: United States Decennial Census, 2019 American Community Survey Table DP05
The population of Sheffield grew older between 2000 and 2019, with the median age increasing
from 40.5 to 52.3 years old. The oldest age cohort increased in population by 65% and the
second oldest cohort (ages 55-64 years old) increased by 40%. Furthermore, the 0-19 age
cohort declined by 41% and the 35-54 age cohort declined by 34%. Overall, the population in
Sheffield has experienced a decline in younger age groups and an increase in older age groups,
which has led to the overall increase of the median age.

Berkshire Regional Planning Commission 7
Town of Sheffield, Massachusetts: Housing Needs Assessment 2021
Table 2.2 - Sheffield: Population Distribution by Age (2000 - 2019)
Age Cohort Total Population
(2000)
Percent of
Total Population (2000)
Total Population
(2019)
Percent of
Total Population (2019)
Percent Change
0-19 years old
860 26% 505 16% -41%
20-34 years old
412 12% 477 15% +16%
35-54 years old
1,149 34% 763 24% -34%
55-64 years old
384 12% 539 17% +40%
65+ years old 530 16% 876 28% +65%
Total
Population 3,335 100% 3,160 100% -5%
Median Age 40.5 - 52.3 - +29%
Source: 2010 United States Decennial Census Table P12, 2019 American Community Survey Table DP05
While it is beyond this assessment to analyze reasons for change in population distribution, it is
clear from the above table that fewer children are being born in Sheffield, which may also be
due to the declining 35-54 year old cohort. Many residents do point to the high cost of land and
construction costs, as well as high prices for already built homes and lack of rentals, as a
reason why their children cannot stay in Sheffield upon completion of high school or return until
later in their lives. However, it is hopeful to see the 16% increase in the 20-34 year old cohort
between 2000 and 2019.
Berkshire Regional Planning Commission 8
Town of Sheffield, Massachusetts: Housing Needs Assessment 2021
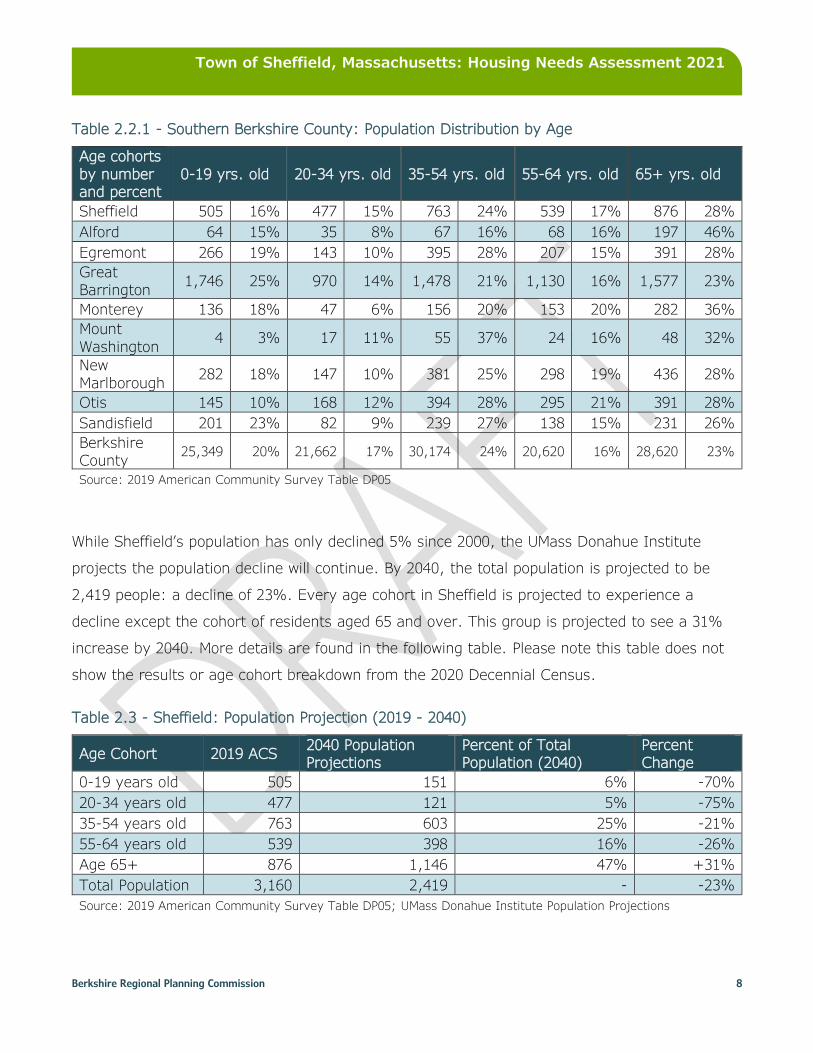
Table 2.2.1 - Southern Berkshire County: Population Distribution by Age
Age cohorts
by number and percent
0-19 yrs. old 20-34 yrs. old 35-54 yrs. old 55-64 yrs. old 65+ yrs. old
Sheffield 505 16% 477 15% 763 24% 539 17% 876 28%
Alford 64 15% 35 8% 67 16% 68 16% 197 46%
Egremont 266 19% 143 10% 395 28% 207 15% 391 28%
Great
Barrington 1,746 25% 970 14% 1,478 21% 1,130 16% 1,577 23%
Monterey 136 18% 47 6% 156 20% 153 20% 282 36%
Mount
Washington 4 3% 17 11% 55 37% 24 16% 48 32%
New
Marlborough 282 18% 147 10% 381 25% 298 19% 436 28%
Otis 145 10% 168 12% 394 28% 295 21% 391 28%
Sandisfield 201 23% 82 9% 239 27% 138 15% 231 26%
Berkshire County
25,349 20% 21,662 17% 30,174 24% 20,620 16% 28,620 23%
Source: 2019 American Community Survey Table DP05
While Sheffield’s population has only declined 5% since 2000, the UMass Donahue Institute
projects the population decline will continue. By 2040, the total population is projected to be
2,419 people: a decline of 23%. Every age cohort in Sheffield is projected to experience a
decline except the cohort of residents aged 65 and over. This group is projected to see a 31%
increase by 2040. More details are found in the following table. Please note this table does not
show the results or age cohort breakdown from the 2020 Decennial Census.
Table 2.3 - Sheffield: Population Projection (2019 - 2040)
Age Cohort 2019 ACS 2040 Population Projections
Percent of Total Population (2040)
Percent Change
0-19 years old 505 151 6% -70%
20-34 years old 477 121 5% -75%
35-54 years old 763 603 25% -21%
55-64 years old 539 398 16% -26%
Age 65+ 876 1,146 47% +31%
Total Population 3,160 2,419 - -23%
Source: 2019 American Community Survey Table DP05; UMass Donahue Institute Population Projections

Berkshire Regional Planning Commission 9
Town of Sheffield, Massachusetts: Housing Needs Assessment 2021
2.2 Race
Like all Berkshire County municipalities, Sheffield is predominantly white. Estimates from the
Census Bureau show that Sheffield is less racially diverse than any other town in southern
Berkshire County, with 99.6% of the population being white.
Table 2.4 - Southern Berkshire County: Race
Race White Black or African
American
American
Indian and Alaska
Native
Asian
Native Hawaiian and Other
Pacific Islander
Some other
race
Two or more
races
Sheffield 99.6% 0.0% 0.2% 0.0% 0.0% 0.3% 0.0%
Alford 96.1% 0.0% 0.0% 1.9% 0.0% 0.0% 2.1%
Egremont 93.3% 1.1% 2.6% 1.4% 0.2% 1.1% 0.4%
Great
Barrington 89.5% 3.8% 0.1% 2.8% 0.0% 2.8% 1.1%
Monterey 97.5% 0.4% 0.0% 0.4% 0.0% 1.4% 0.3%
Mount Washington
94.6 0.0% 2.7% 1.4% 0.7% 0.0% 0.7%
New
Marlborough 97.5% 1.4% 0.0% 0.3% 0.4% 0.2% 0.3%
Otis 98.6% 0.0% 0.4% 0.0% 0.0% 0.0% 1.0%
Sandisfield 96.4 0.9% 0.0% 0.3% 0.0% 0.6% 1.8%
Berkshire County
90.6% 2.8% 0.3% 1.8% 0.1% 1.7% 2.8%
Source: 2019 American Community Survey Table DP05
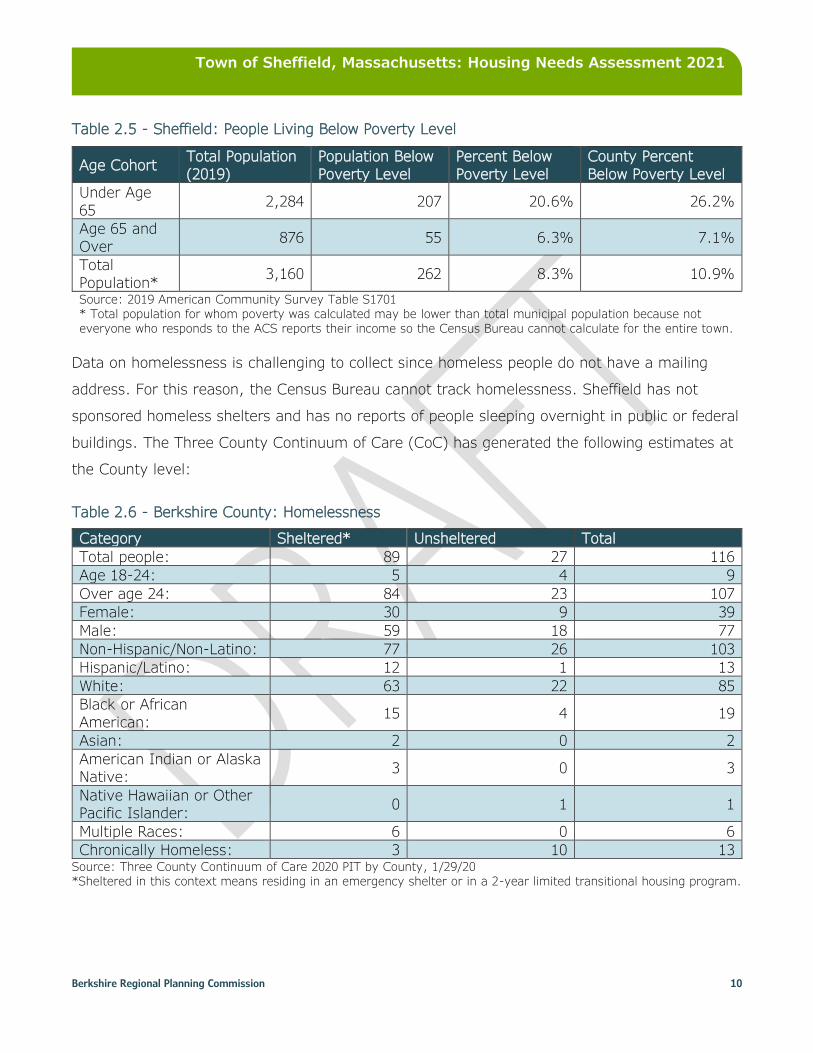
2.3 Poverty and Homelessness
As of 2019, 262 or 8.3% of Sheffield’s residents lived below the poverty level. This was slightly
lower than the countywide rate of 10.9%. Of those Sheffield residents living below the poverty
level, 207 or 20.6% were below the age of 65. This meant that 9% of the total 65 and under
population lived below the poverty line.
Berkshire Regional Planning Commission 10
Town of Sheffield, Massachusetts: Housing Needs Assessment 2021
Table 2.5 - Sheffield: People Living Below Poverty Level
Age Cohort Total Population
(2019)
Population Below
Poverty Level
Percent Below
Poverty Level
County Percent
Below Poverty Level
Under Age
65 2,284 207 20.6% 26.2%
Age 65 and
Over 876 55 6.3% 7.1%
Total
Population* 3,160 262 8.3% 10.9%
Source: 2019 American Community Survey Table S1701 * Total population for whom poverty was calculated may be lower than total municipal population because not everyone who responds to the ACS reports their income so the Census Bureau cannot calculate for the entire town.
Data on homelessness is challenging to collect since homeless people do not have a mailing
address. For this reason, the Census Bureau cannot track homelessness. Sheffield has not
sponsored homeless shelters and has no reports of people sleeping overnight in public or federal
buildings. The Three County Continuum of Care (CoC) has generated the following estimates at
the County level:
Table 2.6 - Berkshire County: Homelessness
Category Sheltered* Unsheltered Total
Total people: 89 27 116
Age 18-24: 5 4 9
Over age 24: 84 23 107
Female: 30 9 39
Male: 59 18 77
Non-Hispanic/Non-Latino: 77 26 103
Hispanic/Latino: 12 1 13
White: 63 22 85
Black or African
American: 15 4 19
Asian: 2 0 2
American Indian or Alaska Native:
3 0 3
Native Hawaiian or Other Pacific Islander:
0 1 1
Multiple Races: 6 0 6
Chronically Homeless: 3 10 13 Source: Three County Continuum of Care 2020 PIT by County, 1/29/20 *Sheltered in this context means residing in an emergency shelter or in a 2-year limited transitional housing program.

Berkshire Regional Planning Commission 11
Town of Sheffield, Massachusetts: Housing Needs Assessment 2021
2.4 Employment and Income
In May of 2021, Sheffield’s unemployment rate was 4.4%. This was lower than the state’s rate
of 6.1%, and lower than the countywide rate of 7.0%, and was average among neighboring
municipalities. Between May 2020 and May 2021, Sheffield’s unemployment rate decreased
5.8%, from 10.2% to 4.4%. The spike in the unemployment rates is one of the many impacts of
COVID-19, as reflected in the 2020 figures, but the unemployment rates of 2021 have returned
to the typical percentages seen in each municipality listed.
Table 2.7 - Southern Berkshire County: Unemployment Rates & Labor Force
Municipality Unemployment
Rate (5/2020)
Unemployment
Rate (5/2021)
Labor
Force (5/2021)
Population
Employed (5/2021)
Population
Unemployed (5/2021)
Sheffield 10.2% 4.4% 1,837 1,756 81
Alford 5.1% 2.1% 235 230 5
Egremont 6.2% 3.9% 717 689 28
Great
Barrington 14.9% 6.0% 3,741 3,517 224
Monterey 9.4% 5.1% 434 412 22
Mount Washington
10.1% 1.2% 81 80 1
New Marlborough
11.8% 5.0% 813 772 41
Otis 12.4% 3.3% 750 725 25
Sandisfield 8.6% 7.3% 478 443 35
Berkshire
County 14.9% 7.0% 62,212 57,872 4,340
Massachusetts 15.4% 6.1% 3,833,200 3,518,600 229,000 Source: Massachusetts Department of Unemployment Assistance https://lmi.dua.eol.mass.gov/LMI/LaborForceAndUnemployment# Note: Unemployment rates do not reflect seasonal adjustments.
Twelve percent (12%) of Sheffield households earned under $25,000 in 2019; 22% earned
between $25,000 and $49,999; 10% earned between $50,000 and $74,999; and 56% earned
$75,000 or more.
Between 2010 and 2019, the share of Sheffield households earning under $25,000 decreased by
53%; the share earning between $25,000 and $49,999 decreased by 32%; the share earning
between $50,000 and $74,999 decreased by 30%; and the share earning $75,000 or more

Berkshire Regional Planning Commission 12
Town of Sheffield, Massachusetts: Housing Needs Assessment 2021
increased by 47%. Part of these income level changes may be explained by the self-employed
workforce, many of whom have seasonal businesses; the low population of 35-54 year olds; and
the increasing numbers of second-home owners and out-of-town retirees.
Table 2.8 - Sheffield: Households by Income Level
Income Level Number of Households (2010 ACS)
Number of Households (2019 ACS)
% of Total Households (2019 ACS)
Percent
Change
Less than $10,000 116 59 4.3% -49%
$10,000 to $14,999 39 48 3.5% +23%
$15,000 to $24,999 196 58 4.2% -70%
$25,000 to $34,999 244 165 11.9% -32%
$35,000 to $49,999 202 138 10.0% -32%
$50,000 to $74,999 200 141 10.2% -30%
$75,000 to $99,999 241 195 14.1% -19%
$100,000 to $149,999 120 318 23.0% +165%
$150,000 to $199,999 125 121 8.7% -3%
$200,000 or More 42 141 10.2% +236%
Total Households 1,525 1,384 100% -9% Source: 2010, 2019 American Community Survey Table DP03
Figure 2.1 - Sheffield: Households by Income (2010 - 2019)
Source: 2010, 2019 American Community Survey Table DP03
0
50
100
150
200
250
300
350
Less than$10,000
$10,000 to$14,999
$15,000 to$24,999
$25,000 to$34,999
$35,000 to$49,999
$50,000 to$74,999
$75,000 to$99,999
$100,000to
$149,999
$150,000to
$199,999
$200,000or More
Number of Households (2010 ACS) Number of Households (2019 ACS)

Berkshire Regional Planning Commission 13
Town of Sheffield, Massachusetts: Housing Needs Assessment 2021
In 2019, Sheffield experienced average economic distress when compared to the surrounding
communities as measured by households earning below the area median income. Thirty-five
percent (35%) of households in Sheffield earned 80% or less of the area median income. This
was higher than the rate for Alford, Egremont, Otis and Sandisfield and lower than the rate for
Great Barrington, Monterey, Mount Washington, New Marlborough, and Berkshire County as a
whole. Thirteen (13%) of Sheffield households earned between 50.1% and 80% of the area
median income; 12% earned between 30.1% and 50%; and 10% earned less than 30%.
The changes in income from 2010 to 2019 are not adjusted for inflation by the Census Bureau.
While inflation, increases in cost of living, higher paying jobs, and an influx of more affluent
residents are national trends, they had a significant impact on Sheffield. The changes shown in
the previous chart on household incomes are not an indication of significant changes in types of
jobs, but rather these aforementioned economic variables.
Table 2.9 - Southern Berkshire County: Percentage of Households by Area Median Income
Municipality Total
Households
Extremely Low Income (<30%
AMI) Households
Very Low Income (30-50%)
Households
Low Income (50.1-80% AMI)
Households
Number Percent Number Percent Number Percent
Sheffield 1,384 137 9.9% 170 12.3% 182 13.2%
Alford 198 21 10.6% 3 1.5% 23 11.6%
Egremont 614 26 4.2% 76 12.4% 98 16.0%
Great Barrington
2,813 420 14.9% 429 15.3% 501 17.8%
Monterey 362 28 7.7% 45 12.4% 54 14.9%
Mount Washington
86 15 17.4% 7 8.1% 19 22.1%
New Marlborough
683 61 8.9% 41 6.0% 144 21.1%
Otis 691 67 9.7% 63 9.1% 96 13.9%
Sandisfield 353 31 8.8% 31 8.8% 53 15.0%
Berkshire
County 54,813 8,549 15.6% 7,209 13.2% 9,347 17.1%
Source: 2019 American Community Survey Table DP03; US Department of Housing and Urban Development 2021 Income Limits Note: Calculated using AMI income limits for a 2-person household because average household size for the County
is 2.2

Berkshire Regional Planning Commission 14
Town of Sheffield, Massachusetts: Housing Needs Assessment 2021
Figure 2.2 - Southern Berkshire County: Percentage of Households by Area Median Income
Source: 2019 American Community Survey Table DP03; US Department of Housing and Urban Development 2021 Income Limits
Seventy-three percent (73%) of all jobs in Sheffield were service-providing and 27% were
goods-producing. An example of a service-providing job is working in a restaurant and an
example of a goods-producing job is working on an agricultural farm that produces crops. The
average weekly wage for all jobs was $957, while goods-producing jobs’ average weekly wage of
$1,225 was 43% higher than that of service-providing jobs. Although the number of average
monthly employment has not notably changed by job type since 2010, there has been an
increase in average weekly wages across all industries seen in Sheffield, Berkshire County, and
Massachusetts as a whole.
0 5 10 15 20 25
Berkshire County
Sandisfield
Otis
New Marlborough
Mount Washington
Monterey
Great Barrington
Egremont
Alford
Sheffield
Percent Low (50.1-80% AMI) Percent Very Low (30.1-50% AMI) Percent Extremely Low (<30% AMI)

Berkshire Regional Planning Commission 15
Town of Sheffield, Massachusetts: Housing Needs Assessment 2021
Table 2.10 - Sheffield: Average Weekly Wage by Job Type (2010 - 2019)
Job Type Average Weekly Wage (2010)
Average Weekly Wage (2019)
Average Monthly
Employment (2010)
Average Monthly
Employment (2019)
Percent of
Average Total Monthly Employment
(2019)
Service-
providing Jobs
$658 $856 1,053 1,093 73%
Goods-producing
Jobs
$977 $1,225 451 414 27%
Total (all
industries) $756 $957 1,504 1,507 100%
Source: Massachusetts Department of Unemployment Assistance: Employment and Wages Report (ES-202) 2010 and 2019, https://lmi.dua.eol.mass.gov/lmi/EmploymentAndWages#
On average, service-providing employees in Sheffield earned less than employees throughout
Berkshire County and Massachusetts. However, the wages paid for service-providing jobs in
both Sheffield and Berkshire County as a whole are comparable.
Table 2.11 - Sheffield, Berkshire County, and Massachusetts: Average Weekly Wages (2010 - 2019)
Job Type
Sheffield Average Weekly
Wage (2010)
Sheffield Average Weekly
Wage (2019)
Berkshire County
Average Weekly
Wage (2010)
Berkshire County
Average Weekly
Wage (2019)
MA Average Weekly
Wage (2010)
MA Average Weekly
Wage (2019)
Sheffield Percent of MA
Average (2019)
Service-providing Jobs
$658 $856 $699 $891 $1,079 $1,426 66%
Goods-producing
Jobs
$977 $1,225 $1,052 $1,174 $1,350 $1,645 34%
Source: Massachusetts Department of Unemployment Assistance: Employment and Wages Report (ES-202) 2010
and 2019 https://lmi.dua.eol.mass.gov/lmi/EmploymentAndWages#

Berkshire Regional Planning Commission 16
Town of Sheffield, Massachusetts: Housing Needs Assessment 2021
In 2019, the industries in Sheffield with the highest share of employment were Educational
Services, Health Care, and Social Assistance (23%), Professional, Scientific, Management,
Administrative & Waste Management Services (12%), and Construction (12%). Together, these
industries accounted for 47% of all employment.
Data on the top employers in Sheffield has been sourced from the Hoovers database which is a
tool available via subscription to Dun & Bradstreet (D&B). D&B is a private corporation that
offers information on commercial credit as well as reports on businesses. D&B uses the Data
Universal Numbering System (DUNS) which is often required for grant applications and other
financial activity. The following is a list of the top employers in Sheffield:
• Southern Berkshire Regional School District (180 employees)
• Berkshire School (160 employees)
• Sheffield Plastics (140 employees)
Between 2010 and 2019, overall employment in Sheffield increased by 3%. However, several
industries experienced significant declines. The largest declines were in Information (-100%) and
Transportation & Warehousing, and Utilities (-86%). By contrast, the largest increases were in
Other Services, except Public Administration (166%), Wholesale Trade (35%), and Public
Administration (35%). The reduction of jobs in retail trade is likely due to seasonal fluctuations
and a higher number of residents working retail jobs outside of Sheffield.

Berkshire Regional Planning Commission 17
Town of Sheffield, Massachusetts: Housing Needs Assessment 2021
Table 2.12 - Sheffield: Industry Distribution (2010 - 2019)
Industry Sheffield
(2010)
Sheffield
(2019)
Percent of Total Jobs (2019)
Percent
Change
Civilian Employed population 16 years & older
1,764 1,810 - +3%
Agriculture, Forestry, Fishing & Hunting, and Mining
88 86 4.8% -2%
Construction 196 209 11.5% +7%
Manufacturing 107 85 4.7% -21%
Wholesale Trade 20 27 1.5% +35%
Retail Trade 233 198 10.9% -15%
Transportation & Warehousing, and
Utilities 69 10 0.6% -86%
Information 18 0 0.0% -100%
Finance & Insurance, Real Estate, Rental & Leasing
127 122 6.7% -4%
Professional, Scientific, Management, Administrative &
Waste Management Services
195 216 11.9% +11%
Educational Services, Health Care,
and Social Assistance 406 420 23.2% +3%
Arts, Entertainment, Recreation, and Accommodation & Food
Service
180 167 9.2% -7%
Other Services, except Public
Administration 77 205 11.3% +166%
Public Administration 48 65 3.6% +35% Sources 2010, 2019 American Community Survey Table DP03

Berkshire Regional Planning Commission 18
Town of Sheffield, Massachusetts: Housing Needs Assessment 2021
Table 2.12.1 - Sheffield, Berkshire County, and Massachusetts: Industry Distribution (2010 - 2019)
Industry Sheffield (2010)
Sheffield (2019)
Berkshire County
(2010)
Berkshire County
(2019)
MA (2010)
MA (2019)
Civilian Employed
population 16 years & older
1,764 1,810 63,416 64,008 3,271,535 3,612,375
Agriculture, Forestry, Fishing &
Hunting, and Mining
88 86 639 634 12,821 14,795
Construction 196 209 4,594 4,209 191,971 205,718
Manufacturing 107 85 5,990 5,021 323,351 317,827
Wholesale Trade 20 27 1,286 835 87,944 78,806
Retail Trade 233 198 8,007 7,778 350,202 370,824
Transportation &
Warehousing, and Utilities
69 10 1,843 2,256 123,187 140,484
Information 18 0 1,437 1,242 88,659 82,102
Finance &
Insurance, Real Estate, Rental &
Leasing
127 122 3,364 3,230 264,145 265,085
Professional,
Scientific, Management, Administrative &
Waste Management Services
195 216 5,301 6,241 416,530 506,967
Educational Services, Health
Care, and Social Assistance
406 420 18,596 20,142 872,032 1,018,564
Arts, Entertainment, Recreation, and
Accommodation & Food Service
180 167 6,982 6,860 261,420 312,504
Other Services, except Public
Administration
77 205 2,714 3,408 146,731 161,589
Public
Administration 48 65 2,663 2,152 132,542 137,110
Sources 2010, 2019 American Community Survey Table DP03

Berkshire Regional Planning Commission 19
Town of Sheffield, Massachusetts: Housing Needs Assessment 2021
2.5 Housing Overview
Sheffield’s housing stock is significantly older, with over half of the entire stock built before 1970
(50 years old or more) and over a third of all units were built prior to 1940 (80 years old or
more). However, almost 10% of the housing stock was built since 2000. The following table
categorizes homes based on age as estimated by the American Community Survey.
Table 2.13 - Sheffield: Age of Housing Units
Year structure built Number of housing units (2019 ACS)
Percent of total housing units
Age of Housing Unit
Built 2014 or later 38 2.0% 5 years or less
Built 2010 to 2013 11 0.6% 6-9 years
Built 2000 to 2009 116 6.2% 10-19 years
Built 1990 to 1999 193 10.4% 20-29 years
Built 1980 to 1989 203 10.9% 30-39 years
Built 1970 to 1979 260 14.0% 40-49 years
Built 1960 to 1969 114 6.1% 50-59 years
Built 1950 to 1959 167 9.0% 60-69 years
Built 1940 to 1949 126 6.8% 70-79 years
Built 1939 or earlier 631 33.9% 80 years +
Total Units 1,859 100% Source: 2019 American Community Survey Table DP04
The majority of Sheffield’s housing units (84%) are owner-occupied. These homes tended to
have a slightly larger household size (2.38 members) compared to that of renter-occupied units
(1.73). Additionally, the median household income of an owner-occupied unit was $92,357 or
165% higher than that of a renter-occupied unit ($34,861). This discrepancy translated to fewer
homeowner households (33%) being cost burdened than renter households (56%).

Berkshire Regional Planning Commission 20
Town of Sheffield, Massachusetts: Housing Needs Assessment 2021
Table 2.14 - Sheffield: Homeowner-Occupied vs. Renter-Occupied Housing (2010 - 2019)
Type of Housing (2019)
Number of
Occupied Housing Units
Percent of Total
Occupied Housing Units
Average
Household Size
Median
Household Income
Percent
Housing Cost Burdened
Owner-occupied 1,165 84% 2.38 $92,357 33%
Renter-occupied 219 16% 1.73 $34,861 56%
Type of Housing (2010)
Owner-occupied 1,156 76% 2.34 $71,240 42%
Renter-occupied 369 24% 1.50 $25,846 50% Source: 2010, 2019 American Community Survey Tables DP04, S2503 Note: There is a high margin of error associated with calculating housing cost burden.
In 2019, the majority (73%) of vacant units in Sheffield were for seasonal, recreational, or
occasional use, which may reflect the increase income to be earned from short-term rentals
rather than year-round rentals. Twenty-one percent (21%) of vacant units were listed as other
vacant. This includes homes that were vacant due to being foreclosed upon, being under repair,
being abandoned, being involved in legal proceedings, and for other/unknown reasons. The
remaining 6% of vacant housing units were for rent. As stated earlier in this assessment, the
vacancy rate changed after the immergence of COVID-19, with a search of rental units
conducted in May 2021 yielding no available rentals.
Table 2.15 - Sheffield: Vacancy Status
Vacancy Status Number of Housing
Units Margin of Error
Percent of Total
Vacant Units
For rent 27 ±42 0%
Rented, not occupied 0 ±12 0%
For sale only 0 ±12 5%
Sold, not occupied 0 ±12 0%
For seasonal, recreational,
or occasional use 347 ±118 67%
For migrant workers 0 ±12 0%
Other vacant 101 ±77 28%
Total 475 ±123 100% Source: 2019 American Community Survey Table B25004
According to the Sheffield Town Assessors, and as indicated in Table 2.16 below, the majority of
Sheffield residential properties (74%) are used for single-family homes. The next largest

Berkshire Regional Planning Commission 21
Town of Sheffield, Massachusetts: Housing Needs Assessment 2021
residential use type was multi-use properties for both residential and Chapter 61 lands. It should
be noted that residential properties accounted for by the Town Assessors is lower than the
number of residential properties estimated by the Census Bureau. This is because there are
properties in town that have not yet been assessed or re-assessed due to a sale or other
financial transaction.
Table 2.16 - Sheffield: Residential Use Type
Residential Use Type Quantity
Single-family 1,371
Two-family 31
Three-family 4
Mobile home 22
Multiple houses on one parcel 56
Four to eight units 51
Multi-use, primarily residential 60
Multi-use, residential and commercial 26
Multi-use, residential and Chapter 61 202
Multi-use, residential and industrial 1
Accessory land w/ improvement, i.e. garage, etc. 19
Total 1,843 Source: Sheffield Town Assessors data accessed 8/3/21
The Census Bureau estimates 84% of housing units were in single-family, detached structures.
The second most common structure type of a home in Sheffield contained 3 or 4 units.
Table 2.17 - Sheffield: Number of Units in Structure (Rent or Own, 2010 - 2019)
Structure Type 2010 ACS 2019 ACS Percent of Total Housing (2019 ACS)
1 unit, detached 1,615 1,561 84%
1 unit, attached 0 56 3%
2 units 145 80 4%
3 or 4 units 59 94 5%
5 to 9 units 87 19 1%
10 to 19 units 0 0 0%
20 or more units 42 27 1%
Mobile Home 17 22 1%
Boat, RV, van, etc. 0 0 0%
Total units 1,965 1,859 100 Source: 2010, 2019 American Community Survey Table DP04

Berkshire Regional Planning Commission 22
Town of Sheffield, Massachusetts: Housing Needs Assessment 2021
Most homes in Sheffield had between two and three bedrooms (66%), with the most common
being three-bedroom homes, which comprised 43% of Sheffield’s housing stock in 2019.
Between 2010 and 2019, homes with two bedrooms experienced the largest percent change,
decreasing by 7%. Homes with 4 bedrooms and 5 or more bedrooms increased over the same
period which indicated that larger homes are being built over the last decade.
Table 2.18 - Sheffield: Housing Stock by Number of Bedrooms (2010 - 2019)
Number of Bedrooms Percent of Total Housing (2010) Percent of Total Housing (2019)
No bedroom 2% 1%
1 bedroom 10% 12%
2 bedrooms 30% 23%
3 bedrooms 44% 43%
4 bedrooms 8% 14%
5+ bedrooms 6% 8%
Total units 1,965 1,859 Source: 2010, 2019 American Community Survey Table DP04
There were an estimated 1,165 owner-occupied housing units in Sheffield and 219 renter-
occupied units in 2019. The majority of renters (71%) were below the age of 65, with 26% under
the age of 35. Homeowners tended to be older, with 83% being age 45 and over.
Table 2.19 - Sheffield: Age of Householder
Age of
Householder
Percent of Occupied
Housing Units
Renter-occupied
Housing Units
Percent
Renter-occupied Housing
Units
Owner-occupied
Housing Units
Percent
Owner-occupied Housing
Units
Under 35 years
old 11% 57 26% 91 8%
35-44 years old 9% 14 6% 115 10%
45-54 years old 14% 44 20% 146 13%
55-64 years old 24% 41 19% 286 25%
65-74 years old 27% 44 20% 330 28%
75-84 years old 10% 0 0% 136 12%
85 years old and
older 6% 19 9% 61 5%
Total - 219 - 1,165 - Source: 2019 American Community Survey Table S2502

Berkshire Regional Planning Commission 23
Town of Sheffield, Massachusetts: Housing Needs Assessment 2021
In 2019, most households (56%) had occupied their homes since at least 2000, with the largest
cohort being householders who moved into their homes before 1990 (29%). Renter households
tended to have shorter housing tenures, with 38% having moved into their homes in 2017 or
after, for less than a 2-year tenure. By contrast, homeowner households tended to have longer
housing tenures, with 91% having occupied their homes since before 2017.
Table 2.20 - Sheffield: Household Tenure
Year Householder
Moved into Home
Percent of Occupied
Housing Units
Number of Renter-occupied Units
Percent of Renter-
occupied Units
Number of Owner-occupied Units
Percent of Owner-
occupied Units
2017 or later 13% 83 38% 100 9%
2015 to 2016 5% 32 15% 38 3%
2010 to 2014 16% 65 30% 156 13%
2000 to 2009 22% 20 9% 279 24%
1990 to 1999 16% 9 4% 208 18%
1989 and
earlier 29%
10 5%
384 33%
Source: 2019 American Community Survey Table S2502
Table 2.21 denotes the HUD income limits used to determine eligibility for assisted housing
programs including the Public Housing, Section 8 project-based, Section 8 Housing Choice
Voucher, Section 202 housing for seniors, and Section 811 housing for persons with disabilities
programs. HUD develops income limits based on Median Family Income estimates and Fair
Market Rent area definitions for each metropolitan area, parts of some metropolitan areas, and
each non-metropolitan county.10 Income limits vary from geographic area to geographic area so
you may be eligible in one area but not in another. The income limit depends on both the
income limit category and family size. Most state and federal housing subsidy programs limit
family income to 80% of AMI.
10 https://www.huduser.gov/portal/datasets/il.html

Berkshire Regional Planning Commission 24
Town of Sheffield, Massachusetts: Housing Needs Assessment 2021
Table 2.21 - Berkshire County: Fiscal Year 2021 Income Limits
Median
Family
Income
FY 2021
Income
Limit
Category
Persons in Family
1 2 3 4 5 6 7 8
$83,900
Extremely
Low (30%)
Income
Limits
$17,700 $20,200 $22,750 $26,500 $31,040 $35,580 $40,120 $44,660
Very Low
(50%)
Income
Limits
$29,450 $33,650 $37,850 $42,050 $45,450 $48,800 $52,150 $55,550
Low (80%)
Income
Limits
$47,150 $53,850 $60,600 $67,300 $72,700 $78,100 $83,500 $88,850
Source: US Department of Housing and Urban Development FY 2021 Income Limits https://www.huduser.gov/portal/datasets/il/il2021/2021summary.odn
Fifty-nine percent (59%) of Sheffield renter householders were cost burdened. This figure is
significant because it is a higher rate than all other southern Berkshire County towns and higher
than the rate for the County as a whole. Similarly, 33% of Sheffield’s homeowners experience
housing cost burden, which is slightly higher than the average for other towns in southern
Berkshire County. The only town in southern Berkshire County where a higher percentage of
homeowners experienced a cost burden was in Great Barrington (37%).

Berkshire Regional Planning Commission 25
Town of Sheffield, Massachusetts: Housing Needs Assessment 2021
Table 2.22 - Southern Berkshire County: Housing Cost Burden
Municipality
Number of
Rental Households
Renters Burdened
Percent
Renters Burdened
Number of
Owner Households
Owners Burdened
Percent
Owners Burdened
Sheffield 219 128 59% 1,165 386 33%
Alford 7 0 0% 191 43 23%
Egremont 102 54 53% 512 153 30%
Great
Barrington 897 416 46% 1,916 698 37%
Monterey 46 19 41% 316 93 30%
Mount Washington
8 0 0% 78 26 33%
New Marlborough
81 29 36% 602 192 32%
Otis 96 37 39% 595 106 20%
Sandisfield 5 2 40% 348 83 24%
Berkshire County
16,885 8,014 47% 37,928 9,891 26%
Source: 2019 American Community Survey Tables DP04, S2503
Figure 2.3 - Southern Berkshire County: Prevalence of Housing Cost Burden
Source: 2019 American Community Survey Table S2503
0% 10% 20% 30% 40% 50% 60% 70%
Berkshire County
Sandisfield
Otis
New Marlborough
Mount Washington
Monterey
Great Barrington
Egremont
Alford
Sheffield
Percent of Housing Cost Burdened - Owners Percent of Housing Cost Burdened - Renters

Berkshire Regional Planning Commission 26
Town of Sheffield, Massachusetts: Housing Needs Assessment 2021
2.6 Affordable Housing Supply Analysis
This section explores the affordability of housing for Sheffield residents and the availability of
housing at different price points within the municipality. This is achieved by categorizing the
municipality’s population based on their annual income, calculating affordable housing costs for
each category, and estimating the number of housing units available at, or below, these
affordable cost thresholds.
Table 2.23 defines the five income categories Sheffield’s population is divided into. Note that
these categories do not comprise Sheffield’s entire population, but only those households which
make up to 120% of the area median income (AMI); those households at 121% of AMI, or
above a $80,801 income (730 households) are not included. Also note that as Sheffield’s average
household size is approximately two people, the AMI for a two-person household has been used.
Table 2.23 Definition of Income Categories
Income Category Percent of Area Median Income
Income Range
Middle Income 101% - 120% $67,334 - $80,800
Moderate Income 81% - 100% $53,867 - $67,333
Low Income 51% - 80% $33,668 -$53,866
Very Low Income 30% - 50% $20,201 - $33,667
Extremely Low Income Under 30% $20,200 and below Source: U.S. Department of Housing and Urban Development 2021 income limits
Table 2.24 estimates the number of Sheffield households that are in each income category
based on the income categories described in table 2.23.
Table 2.24 Affordable Housing Supply Analysis
Income Category Sheffield Households
Middle Income 88
Moderate Income 76
Low Income 182
Very Low Income 171
Extremely Low Income 137 Source: Berkshire Regional Planning Commission

Berkshire Regional Planning Commission 27
Town of Sheffield, Massachusetts: Housing Needs Assessment 2021
Housing costs are considered affordable if they account for 30% or less of a household’s income.
Table 2.25 defines the maximum affordable housing cost for each income category by
calculating 30% of each income category’s maximum monthly income.
Table 2.25 Affordable Monthly Housing Costs
Income Category Sheffield Households
Middle Income $1,684 - $2,020
Moderate Income $1,348 - $1,683
Low Income $843 - $1,347
Very Low Income $506 - $842
Extremely Low Income $505 and below Source: Berkshire Regional Planning Commission
Table 2.26 and Figure 2.4 show Sheffield housing units at different affordable cost brackets and
compare this distribution to the number of households in the associated income categories.
The number of existing housing units is calculated by estimating the number of rental and
homeowner units with monthly costs that fell within each affordable monthly housing cost range.
Note that “existing” should not be confused with “available”, as the units in this analysis are
occupied and not on the market.
Also, although housing units with monthly costs below the affordable range for any given income
segment would clearly be affordable for that segment – for example housing units with monthly
costs falling in the affordable monthly housing cost range for extremely low income households
would obviously be affordable for middle income households – for the purpose of this analysis,
only units that fall within the boundaries of the affordable monthly housing cost range for any
one income category are considered.
As can be seen from the table and chart below, the distribution of Sheffield housing unit costs is
greater than the availability of household income in every income category except for the
extremely low income segment, where there is a lack of units relative to households.
Additionally, while it appears there is adequate housing, the majority of housing is composed of
homeowner units, with few rental units available, especially in the moderate and middle income
cost brackets.

Berkshire Regional Planning Commission 28
Town of Sheffield, Massachusetts: Housing Needs Assessment 2021
Table 2.26 - Sheffield: Housing Cost Distribution
Income Category
Sheffield Households
Rental Units
within Cost Bracket
Homeowner
Units within Cost Bracket
Total Housing
Units within Cost Bracket
Difference
Middle 88 16 88 104 +16
Moderate 76 15 116 131 +55
Low 182 76 273 349 +167
Very Low 171 31 259 290 +119
Extremely Low 137 38 97 134 -3 Source: Berkshire Regional Planning Commission
Figure 2.4 - Sheffield: Housing Cost Distribution
Source: Berkshire Regional Planning Commission
Table 2.27 shows existing affordable housing units in Sheffield for each of the income category.
While the data is largely the same as in the above paragraphs, the key difference is that now
each income category encompasses those below it.
For instance, the number of households in the very low income segment also includes those in
the extremely low income segment. This methodology is the same for the number of affordable
rental units, affordable homeowner units, and total affordable units. This has been done to
calculate a difference column that more accurately represents the surplus or deficit of affordable
0
50
100
150
200
250
300
350
400
Extremely Low Very Low Low Moderate Middle
Households Total Units Rental Units Homeowner Units

Berkshire Regional Planning Commission 29
Town of Sheffield, Massachusetts: Housing Needs Assessment 2021
housing units for households earning at, or below, a certain income limit. This is necessary to
avoid overstating the existence of affordable units for a given income segment by failing to
account for housing needs of households in lower income segments.
For every income category except the extremely low income segment, there exists a sizable
surplus of affordable housing units in Sheffield, at least on paper. Additionally, for each higher
income segment, the surplus increases, indicating that a household’s ease of finding affordable
housing in Sheffield is positively, and negatively, correlated to its income.
Table 2.27 - Sheffield: Housing Affordability
Income Category
Sheffield Households
Affordable Rental Units
Affordable
Homeowner Units
Total
Affordable Units
Difference
Middle 654 175 833 1,009 +354
Moderate 566 159 745 904 +339
Low 490 145 629 773 +284
Very Low 308 69 355 424 +116
Extremely Low 137 38 97 134 -3 Source: Berkshire Regional Planning Commission
The Department of Housing and Community Development (DHCD) used the 2010 Decennial
Census data to tally year-round housing units. Sheffield had 1,507 year-round units that year
and only 30 of them are on the subsidized housing inventory from DHCD. This means only 2%
of the housing stock are considered affordable housing units. This is under the 10% threshold
which is mandated by the state. Municipalities have little power to deny 40B development if they
are under the 10% threshold. This means that developers can bypass some local planning and
zoning regulations if at least 20% of the units they build are deemed affordable. In
Massachusetts, more than 80% of cities and towns do not exceed 10% affordable units.
Conclusions and Implications
The key takeaways from this section are that Sheffield’s population has declined in recent
decades and this decline is projected to continue; an additional 23% decline by the year 2040.
Beyond the overall decline in population, the population is aging, meaning that the median age
has risen over time. Sheffield has the second largest workforce in southern Berkshire County

Berkshire Regional Planning Commission 30
Town of Sheffield, Massachusetts: Housing Needs Assessment 2021
and experienced high rates of unemployment in the wake of the COVID-19 pandemic. However,
the unemployment rates have drastically reduced throughout the past year. There has been an
increase in higher earning households in Sheffield which has contributed to the already limited
housing market. Homes in Sheffield tend to be at least 3 bedrooms and sell at high price points.
The percentage of cost burdened homeowners is higher in Sheffield than the percentage for
Berkshire County as a whole. Unless more affordable homes are developed in Sheffield these
trends will continue and living in Sheffield will become even less attainable that it is now. In
addition:
• Sheffield has major housing supply and housing cost issues.
• The Town’s population is older and aging; those age cohorts needed to provide labor and
population viability are less than state averages.
• Sheffield’s housing market continues to be a split market, with high-end homes and since
COVID-19, few affordable homes or rentals.
• Sheffield has extensive acreage not available for housing, such as land in APRs, for which
the development rights have been sold, or federal, state, town, or private land in
conservancy organizations.
• Buildable land is limited. Land required for a home varies from ½ acre to 4 acres
depending on the District.
• Land is expensive in Sheffield, relative to mid-and north-Berkshire County and many
parts of Columbia County, NY. Sheffield has had 1 subdivision – Glennanna Way; no 40B
overtures to date; and no buildings, such as an old or former school, mills, or town
building to reclaim and build into apartments, condos, or other living spaces.
• Sheffield has no sewage system, and a private water company serving a limited area of
Sheffield, none of Ashley Falls. All housing units require their own septic and many,
outside of the private water company’s service area, their own wells. Both limit in-fill
possibilities and increase the cost of building.

Berkshire Regional Planning Commission 31
Town of Sheffield, Massachusetts: Housing Needs Assessment 2021
• Despite Zoning By-Laws encouraging the construction of accessory apartments and
another housing units on land, few if any such units have been built.
• Many residents would identify the lack of affordable housing, including rentals, as a main
reason Sheffield’s young people leave town; Sheffield has a lower than average
percentage of 21-40 year-olds.
• Since COVID-19, housing costs have risen substantially, and many homes are being
bought by out-of-towners or second homeowners. It is too early to say if this is a trend
or a temporary reaction to COVID-19.
Berkshire Regional Planning Commission 32
Town of Sheffield, Massachusetts: Housing Needs Assessment 2021
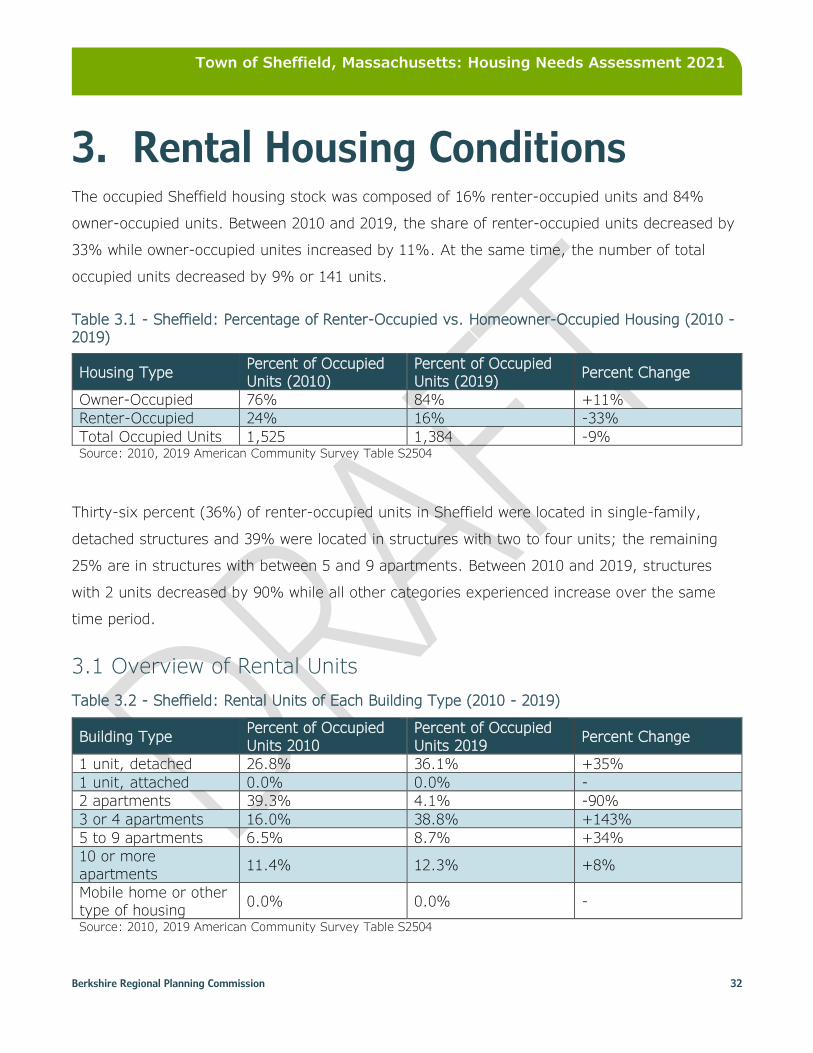
3. Rental Housing Conditions The occupied Sheffield housing stock was composed of 16% renter-occupied units and 84%
owner-occupied units. Between 2010 and 2019, the share of renter-occupied units decreased by
33% while owner-occupied unites increased by 11%. At the same time, the number of total
occupied units decreased by 9% or 141 units.
Table 3.1 - Sheffield: Percentage of Renter-Occupied vs. Homeowner-Occupied Housing (2010 - 2019)
Housing Type Percent of Occupied
Units (2010)
Percent of Occupied
Units (2019) Percent Change
Owner-Occupied 76% 84% +11%
Renter-Occupied 24% 16% -33%
Total Occupied Units 1,525 1,384 -9% Source: 2010, 2019 American Community Survey Table S2504
Thirty-six percent (36%) of renter-occupied units in Sheffield were located in single-family,
detached structures and 39% were located in structures with two to four units; the remaining
25% are in structures with between 5 and 9 apartments. Between 2010 and 2019, structures
with 2 units decreased by 90% while all other categories experienced increase over the same
time period.
3.1 Overview of Rental Units
Table 3.2 - Sheffield: Rental Units of Each Building Type (2010 - 2019)
Building Type Percent of Occupied
Units 2010
Percent of Occupied
Units 2019 Percent Change
1 unit, detached 26.8% 36.1% +35%
1 unit, attached 0.0% 0.0% -
2 apartments 39.3% 4.1% -90%
3 or 4 apartments 16.0% 38.8% +143%
5 to 9 apartments 6.5% 8.7% +34%
10 or more
apartments 11.4% 12.3% +8%
Mobile home or other
type of housing 0.0% 0.0% -
Source: 2010, 2019 American Community Survey Table S2504

Berkshire Regional Planning Commission 33
Town of Sheffield, Massachusetts: Housing Needs Assessment 2021
Of the 219 occupied rental units in Sheffield, only 5%, or 10 units, have been built since 2000.
The vast majority of occupied rental units were built prior to 1980 (89%) and are in structures
that are thirty years old or more. Older homes, and rental units, tend to be more expensive to
maintain and heat, especially if routine maintenance has been neglected in previous decades.
Older homes are also more likely to contain toxins, such as lead and asbestos. It is common for
rental tenants to pay for all utilities, in addition to their monthly rent.
Table 3.3 - Sheffield: Age of Renter-Occupied Housing
Year Rental Unit Built Number of Units Percent of Renter-occupied Units
Built 2014 or later 0 0%
Built 2010 to 2013 0 0%
Built 2000 to 2009 10 5%
Built 1990 to 1999 9 4%
Built 1980 to 1989 8 4%
Built 1970 to 1979 41 19%
Built 1960 to 1969 10 5%
Built 1950 to 1959 43 20%
Built 1940 to 1949 34 16%
Built 1939 or earlier 64 29%
Total Units 219 100% Source: 2019 American Community Survey Table B25036
As shown in Table 2.19, renter households tended to have shorter housing tenures compared to
owner-occupied households, with 83% having moved into their homes after 2009. The following
table shows when renters moved into their homes.
Table 3.4 - Sheffield: Household Tenure for Renters
Year Renter Moved In Number of Renters Percent of Total Renters
Moved in 2017 or later 83 38%
Moved in 2015 to 2016 32 15%
Moved in 2010 to 2014 65 30%
Moved in 2000 to 2009 20 9%
Moved in 1990 to 1999 9 4%
Moved in 1989 or earlier 10 5% Source: 2019 American Community Survey Table B25038

Berkshire Regional Planning Commission 34
Town of Sheffield, Massachusetts: Housing Needs Assessment 2021
Recent estimates from www.airdna.co show 41 active short-term rentals in the 01257 zip code
which is primarily Sheffield, while others have the 01230 zip code. Of the available rentals listed
through either Airbnb or Vrbo, 78% were rentals for an entire home. The remaining 22% were
for private rooms. Twenty-eight percent (28%) of the available rentals are for 3-bedroom homes
and the average number of guests is seven.
The most recent report from the Department of Revenue (accessed 8/4/21) shows a total of 39
short-term rentals in Sheffield. This number includes the following categories: short-term rentals
(such as Airbnb), hotels, Bed and Breakfast Establishments, and lodging houses. Of all the
categories, 85% are considered “short-term rentals” by the Department of Revenue.
A note about room occupancy tax:
Massachusetts has a state room occupancy excise tax rate of 5.7%. Depending on the city or
town, a local option room occupancy tax and other taxes and fees may also apply. The room
occupancy excise tax applies to room rentals of 90 days or less in hotels, motels, bed and
breakfast establishments, and lodging houses. Beginning July 1, 2019, the room occupancy
excise also applies to short-term rentals of property for 31 days or less.
For all types of rental accommodations, if the total amount of rent is less than $15 per day, no
tax is due. Generally, the room occupancy excise is collected and paid to DOR by a person or
business called an operator. As of July 1, 2019, new rules require an intermediary or other agent
collecting rent to file returns and pay taxes to DOR. All operators and intermediaries must
register with DOR on MassTaxConnect.
For Fiscal Year 2021, Sheffield received $72,966 from the local rooms tax option.11
11 https://dlsgateway.dor.state.ma.us/reports/rdPage.aspx?rdReport=Local_Option_Meals_Rooms

Berkshire Regional Planning Commission 35
Town of Sheffield, Massachusetts: Housing Needs Assessment 2021
Table 3.5 - Sheffield: Rental Vacancy Rate (2010 - 2019)
Rental Vacancy Rate 2010 ACS 2019 ACS
Total vacant rental units 73 units 27 units
Rental vacancy rate 16.5% 11% Source: 2010 and 2019 American Community Survey Table B25004, DP04
3.2 Rental Cost Analysis
Forty-two percent (42%) of Sheffield renter households earned less than $25,000; 31% earned
between $25,000 and $49,999; 6% earned between $50,000 and $74,999; and 20% earned
$75,000 or more.
Table 3.6 - Sheffield: Renter Household Income
Household Income Number of Renter-occupied Households (2019 ACS)
Percent of Total Renter-occupied Households
Less than $5,000 28 13%
$5,000 to $9,9999 0 0%
$10,000 to $14,999 26 12%
$15,000 to $19,999 9 4%
$20,000 to $24,999 29 13%
$25,000 to $34,999 18 8%
$35,000 to $49,999 51 23%
$50,000 to $74,999 14 6%
$75,000 to $99,0000 13 6%
$100,000 to $149,999 31 14%
$150,000 or more 0 0% Source: 2019 American Community Survey Tables B25118
Ninety-five percent (95%) of Sheffield renter households paid some cash rent, rather than
providing some services in lieu of cash rent. Fifty-eight percent (58%) paid less than $1,000 per
month, 24% paid between $1,000 and $1,999 per month, and 17% paid $2,000 or more per
month. The median monthly rent paid was $968.

Berkshire Regional Planning Commission 36
Town of Sheffield, Massachusetts: Housing Needs Assessment 2021
Table 3.7 - Sheffield: Monthly Housing Costs for Renters
Monthly Housing Costs Total Renter-Occupied Households Percent
Less than $500 37 17.7%
$500 to $999 84 40.2%
$1,000 to $1,499 30 14.4%
$1,500 to $1,999 23 11.0%
$2,000 to $2,499 35 16.7%
$2,500 to $2,999 0 0.0%
$3,000 or more 0 0.0%
Median (dollars) $968 -
No rent paid 10 4.6% Source: 2019 American Community Survey Table DP04
Between 2010 and 2019, Sheffield renter households paid more in rent. In 2010, it was
estimated that no rental households in Sheffield paid over $1,500 but by 2019 that number had
increased to 58 households.
Table 3.8 - Sheffield: Change in Gross Rent Paid (2010 - 2019)
Gross Rent Number of Renters (2010) Number of Renters (2019) Percent Change
No Rent Paid 43 10 -77%
$1 to $499 54 37 -31%
$500 to $999 236 84 -64%
$1,000 to $1,499 36 30 -17%
$1,500 or more 0 58 - Source: 2010, 2019 American Community Survey Table DP04
The most cost burdened age cohort of Sheffield’s renter householders was the 25-34 age cohort,
in which all of householders were cost burdened (57 renters). Of the cohort age 65 and over,
42% of renters experienced housing cost burden (26 renters).

Berkshire Regional Planning Commission 37
Town of Sheffield, Massachusetts: Housing Needs Assessment 2021
Table 3.9 - Sheffield: Age of Rental Householder Paying 30% or More for Rent
Age of Rental Householder
Number of Renters
Paying 30-34.9% of Income in Rent
Number of Renters
Paying 35%+ of Income in Rent
Percent of Renters
Paying 30%+ of Income in Rent*
15-24 years old 0 0 -
25-34 years old 31 26 100%
35-64 years old 11 34 45%
65+ years old 9 17 42% Source: 2019 American Community Survey Table B25072 *These percentages represent the percent of renters by age cohort, not a percent of total renters.
3.3 Affordable Rental Housing Stock
The Massachusetts Department of Housing and Community Development (DHCD) estimated
Sheffield had 30 subsidized rental units, representing 14% of the total renter-occupied housing
stock.
Table 3.10 - Sheffield: Subsidized Rental Housing Stock
Subsidized Rental Housing Stock Number of Units Percent of Renter-occupied Units
Renter-occupied Units (2019 ACS) 219 100%
Subsidized Rentals (DHCD 2020 SHI) 30 14% Source: 2019 American Community Survey Table S2504; Massachusetts Department of Housing and Community Development Subsidized Housing Inventory as of 12/21/2020
An indicator of need is an increase of more than 50% in median market rents. Between 2010
and 2019, the median gross rent in Sheffield increased by 32%. This was a greater change than
the increases of 22% and 27% for Berkshire County and Massachusetts, respectively. However,
while Sheffield’s median rent of $968 was below that of Massachusetts, it was higher than that of
Berkshire County.
Table 3.11 - Sheffield, Berkshire County, and Massachusetts: Rental Expense (2010 - 2019)
Municipality Median Rent 2010 Median Rent 2019 Percent Change
Sheffield $735 $968 +32%
Berkshire County $715 $872 +22%
Massachusetts $1,006 $1,282 +27% Source: 2019 American Community Survey Table DP04

Berkshire Regional Planning Commission 38
Town of Sheffield, Massachusetts: Housing Needs Assessment 2021
As of July 2021, there were no rental units in Sheffield listed on Zillow.com or Craigslist.com.
These two sites are not the only means of finding rental housing opportunities, but they provide
an indication of how limited rental housing in Sheffield was as of this date.
An indicator of need is when more than 50% of renters pay at least 30% of their income in rent.
In Sheffield in 2019, 61% of renter households were considered cost burdened.
Table 3.12 - Sheffield: Rent as a Percentage of Income (2010 - 2019)
Rents as a Percentage of Income
2010 ACS Percent of Total (2010 ACS)
2019 ACS Percent of Total (2019 ACS)
Occupied units paying rent 326 100% 209 100%
Paying 30% or more of
income in rent 184 56% 128 61%
Source: 2010 and 2019 American Community Survey Table DP04
Another major indicator of housing costs to affordability is to compare the median-cost rental in
a municipality to what is 30% of a municipality’s average wage; any number above this 30%
indicates rental costs are not affordable. The median rental amount is subtracted from the
affordable rent to reach the affordability gap. As shown in Table 3.13, Sheffield as a municipality
does not demonstrate need by this first indicator, as the affordable rent at 30% of income is
higher than the median gross income for all jobs, service-providing jobs, and goods-producing
jobs. The affordability gap for all job types is positive.

Berkshire Regional Planning Commission 39
Town of Sheffield, Massachusetts: Housing Needs Assessment 2021
Table 3.13 - Sheffield: Rent Compared to Local Wages
Job Type Average Monthly
Wage
Affordable Rent at
30% of Income
Median Gross
Rent
Affordability
Gap
All Jobs $957 x 4 weeks =
$3,828 $1,148 $968 $180
Service-
Providing Jobs
$856 x 4 weeks =
$3,424 $1,027 $968 $59
Goods-
Producing Jobs
$1,225 x 4 weeks
= $4,896 $1,469 $968 $501
Source: 2019 American Community Survey Table DP04; 2019 Massachusetts Department of Labor and Workforce Development ES-202 Annual Report https://lmi.dua.eol.mass.gov/lmi/EmploymentAndWages/EAWResult?A=05&GA=000392&Y=2019&P=00&O=00&I=1
0~0&Iopt=2&Dopt=TEXT
Note: A positive affordability gap indicates that the affordable rent at 30% of income is higher than the median gross rent, and a negative affordability gap indicates the opposite
Conclusions and Implications
The most common type of housing structure containing apartments in Sheffield were structures
with three or four apartments (39%). Few rental units have been built in the last twenty years –
only 5% of the total rental units. A quick search on Zillow.com and Craigslist.com yields no
available rentals which demonstrates how limited rental housing options are in Sheffield. To
combat some of the negative trends shown earlier in this assessment, such as an aging
population, more rental options need to be available. This will attract younger people and
families of modest means who cannot afford to buy a home in Sheffield. In addition:
• Few if any new rentals are on the market; the available supply is limited and expensive.
• Sheffield has one affordable housing/Section 8 housing development -Dewey Court; it is
managed by the Great Barrington Housing Committee. Sheffield is well below the state
target of 10% affordable units
• The financial burdens of renting have risen, denying many renters the likely ability to
have financial security.
• Former rental stock is being taken off the market, possible for home ownership or sale or
use as seasonal or short-term rentals.

Berkshire Regional Planning Commission 40
Town of Sheffield, Massachusetts: Housing Needs Assessment 2021
4. Owner Housing Conditions In both 2010 and 2019, the vast majority of Sheffield’s homeownership housing stock was
single-family residences (95%). The remaining homeownership housing stock was in 2-4 unit
structures (1%), 3-4 unit structures (1%), and mobile homes (2%).
Table 4.1 - Sheffield: Building Type of Owner-Occupied Housing Units (2010 - 2019)
Building Type 2010 ACS 2019 ACS Percent of Total (2019 ACS)
Percent Change
Single-Family Detached
1,139 1,085 93% -5%
Single-Family Attached
0 29 2% -
2 Units 0 20 1% -
3 or 4 Units 0 9 1% -
5-9 Units 0 0 0% -
10-19 Units 0 0 0% -
20-49 Units 0 0 0% -
50+ Units 0 0 0% -
Mobile Home 17 22 2% +29%
Boat, RV, van, etc.
0 0 0% -
Owner-occupied Units
1,156 1,165 100% +1%
Source: 2010, 2019 American Community Survey Table B25032
4.1 Homes for Sale
As of July 2021, there were 20 homes listed for sale in Sheffield found on www.Zillow.com which
ranged in price from $216,700 to $11,890,000. Additionally, there were ten buildable lots
available for purchase. One of the total 20 active listings was in excess of $11,000,000. When
this outlying property is removed from the equation, the average listed price for a home was
$530,311 and the median listed price was $502,500.

Berkshire Regional Planning Commission 41
Town of Sheffield, Massachusetts: Housing Needs Assessment 2021
Table 4.2 - Sheffield: Homes Listed for Sale (July, 2021)
Address Number of Bedrooms List Price
356 Miller Ave 3 $449,000
305 S. Undermountain Rd 3 $635,000
42 Ok St. 2 $395,000
347 S. Undermountain Rd. 3 $495,000
246 County Rd. 3 $795,000
181 Hulett Hill Rd. 3 $595,000
793 Salisbury Rd. 3 $715,000
59 Main St. 9 $875,000
2080 S. Undermountain Rd. 11 $11,890,000
481 Shunpike Rd. 1 $995,000
52 Cedar St. 3 $219,900
119 Main St. 6 $525,000
169 Ashley Falls Rd. 3 $599,000
41 S. Main St. 3 $359,000
25 S. Main St. 4 $510,000
28 Ashley Falls Rd. 3 $399,000
254 S. Undermountain Rd. 10 $493,000
119 S. Main St. 6 $525,000
1602 Hewins St. 2 $216,700
194 Main St. 5 $280,300 Source: Zillow.com accessed on 7/30/2021
Table 4.3 - Sheffield: Listed Homes by Number of Bedrooms (July, 2021)
Number of Bedrooms in Home Number of Homes Listed Average List Price
11 1 $11,890,000
10 1 $493,000
9 1 $875,000
6 2 $525,000
5 1 $280,300
4 1 $510,000
3 10 $526,090
2 2 $305,850
1 1 $995,000 Source: Zillow.com accessed on 7/30/2021
The South Berkshire County, MA - Residential Real Estate Report from Berkshire Realtors
compared real estate metrics from February of 2020 with February of 2021, which showed some
of the impacts of COVID-19 on the housing market. The report summary showed increased
number of listings, active listing count, and active listing volume and decreased median listing

Berkshire Regional Planning Commission 42
Town of Sheffield, Massachusetts: Housing Needs Assessment 2021
price and new listing volume. Additionally, homes were staying on the market longer than in
February of 2020. A copy of the report is attached as Appendix A.
4.2 Value of Homes
In 2020, the median home price in Sheffield was $299,000, the median single-family home price
was $365,000, and the median condominium price was not tabulated for that year, as it is not
clear Sheffield has any condominiums. These figures were 36% and 46% higher than the
respective overall Berkshire County prices.
Table 4.4 - Southern Berkshire County: Median Home Value (2020)
Municipality Median Sales Price: All
Median Sales Price: Single-Family Home
Median Sales Price: Condominium
Sheffield $299,000 $365,000 -
Alford $630,000 $714,000 -
Egremont $457,500 $680,000 -
Great Barrington $376,000 $425,000 $355,000
Monterey $492,000 $522,000 -
Mount Washington $475,000 $500,000 -
New Marlborough $451,500 $460,000 -
Otis $202,450 $339,999 -
Sandisfield $172,100 $285,500 -
Berkshire County $220,000 $249,450 $285,000 Source: Banker and Tradesman
Figure 4.1 shows median sales prices from 2010 to 2019 compared to household income. In
Sheffield, median household income has increased 83% since 2010 while the median sales price
has increased 57% from $190,000 to $299,000.

Berkshire Regional Planning Commission 43
Town of Sheffield, Massachusetts: Housing Needs Assessment 2021
Figure 4.1 - Sheffield: Median Sales Price Compared to Household Income (2010-2019)
Source: Banker and Tradesman, 2010-2019 American Community Survey Table S2503
4.3 Seasonal Housing
The number of seasonal housing units increased by 141% between 1990 and 2018, but it is
worth noting that most of this increase came between 1990 and 2010, as the number of
seasonal housing units increased by only 4% between 2010 and 2018.
Seasonal Vacant Units. Seasonal housing units are those intended for occupancy only during
certain seasons of the year and are found primarily in resort areas. Housing units held for
occupancy by migratory labor employed in farm work during the crop season are tabulated as
seasonal. As of the first quarter 1986, vacant seasonal mobile homes are being counted as a
part of the seasonal housing inventory.
Source: https://www.census.gov/housing/hvs/definitions.pdf
Table 4.5 - Sheffield: Seasonal Housing (1990 - 2019)
1990 Census
2000 Census
2010 Census
2019 ACS
Percent Change since 1990
Percent Change since 2010
Number of Units
205 212 325 347 +69% +7%
Source: 1990, 2000, https://www.nhgis.org/ ; 2010 and 2019 American Community Survey Table B25004
$0
$50,000
$100,000
$150,000
$200,000
$250,000
$300,000
$350,000
$400,000
$450,000
2019201820172016201520142013201220112010
Median Household Income Sheffield Median Sale Price Sheffield
Median Sale Price Berkshire County Median Sale Price Massachusetts

Berkshire Regional Planning Commission 44
Town of Sheffield, Massachusetts: Housing Needs Assessment 2021
Figure 4.2. - Sheffield: Seasonal Housing (1990 - 2019)
Source: 1990, 2000, 2010 Decennial Census Table SF1; 2019 American Community Survey Table B25004
4.4 Affordability of Home Ownership
Table 4.6 uses the median household income of Sheffield and the surrounding municipalities to
derive an affordable home price for each municipality; this affordable home price for each
municipality is then compared to the median sales price of a home in each municipality.
The affordable home price is calculated using a utility provided by Nerdwallet.com, and the input
parameters are as follows: a target debt-to-income ratio of 30%, a 30-year loan term, a credit
score between 690 and 719, and minimum monthly debt payments of $500. Additionally, the
utility generated the following assumptions based on the municipality: property taxes of 1.18%
($348 a month/$4,176 a year), and homeowners’ insurance of $96 a month/$1,152 a year. The
median sales price is then subtracted from the affordable price to get the affordability gap. A
positive affordability gap indicates that the median sale price is below the affordable price, and a
negative affordability gap indicates that the median sales price is above the affordable price.
Sheffield had a positive affordability gap of $54,540. This was much higher than all of the
0
50
100
150
200
250
300
350
400
1990 2000 2010 2019
Nu
mb
er o
f Se
aso
nal
Ho
usi
ng
Un
its

Berkshire Regional Planning Commission 45
Town of Sheffield, Massachusetts: Housing Needs Assessment 2021
surrounding municipalities listed in Table 4.6, which had negative affordability gaps of greater
than $100,000. Furthermore, this was in contrast to Berkshire County, which had a negative
affordability gap of $19,294. This, however, may be skewed by the number of households
reporting incomes greater than $100,000. At main income levels, it is clear that an affordability
gap exists. Housing/rental affordability depends on one’s household income, not the median
income. With median income calculations, 50% of household incomes are below this level, while
50% are above. Affordability depends on each household’s income, not their position relative to
median household income.
Table 4.6 - Southern Berkshire County: Affordability of Homes
Municipality Median Household Income
Affordable Price Median Sale Price Affordability Gap
Sheffield $86,184 $353,540 $299,000 +$54,540
Alford $106,667 $469,982 $630,000 -$160,018
Egremont $71,528 $270,438 $457,500 -$187,062
Great Barrington $55,478 $179,432 $376,000 -$196,568
Monterey $79,038 $313,021 $492,000 -$178,979
Mount Washington
$66,250 $240,511 $475,000 -$234,489
New Marlborough $71,250 $268,861 $451,500 -$182,639
Otis $87,868 $310,198 $202,450 $107,748
Sandisfield $71,023 $363,088 $172,100 $190,988
Berkshire County $59,230 $200,706 $220,000 -$19,294 Source: 2019 American Community Survey Table S1901; Banker and Tradesman; Nerdwallet.com house affordability calculator https://www.nerdwallet.com/mortgages/how-much-house-can-i-afford/calculate-affordability Note: A positive affordability gap indicates that the affordable price is higher than the median sales price, and a
negative affordability gap indicates the opposite.
In 2010, 54% of Sheffield homeowner households with a mortgage paid more than 30% of their
income towards housing costs. By 2019, this share had increased to 61% for all housing units
with a mortgage.

Berkshire Regional Planning Commission 46
Town of Sheffield, Massachusetts: Housing Needs Assessment 2021
Table 4.7 - Sheffield: Mortgage Status by Selected Monthly Owner Costs as a Percentage of Household Income (2010 - 2019)
Percent of Income Paid Towards Housing Costs
2010 2019 Percent of Total (2019)
Percent Change
Less than 10.0 percent 41 97 6% +137%
10.0 to 14.9 percent 79 94 11% +19%
15.0 to 19.9 percent 109 63 15% -42%
20.0 to 24.9 percent 89 126 12% +42%
25.0 to 29.9 percent 51 47 7% -8%
30.0 to 34.9 percent 74 72 10% -3%
35.0 to 39.9 percent 85 19 12% -78%
40.0 to 49.9 percent 100 93 14% -7%
50.0 percent or more 179 105 25% -41%
Not computed 0 0 0% -
Housing Units with a Mortgage
807 716 - -11%
Source: 2010, 2019 American Community Survey B25091
Seven percent (7%) of Sheffield owner-occupied households earned less than $25,000, 20%
earned between $25,000 and $49,999, 11% earned between $50,000 and $74,999, and 63%
earned $75,000 or more.
Table 4.8 - Sheffield: Household Incomes of Householders
Household Income Number of Renter-occupied Households
Percent of Total Renter-occupied Households
Less than $5,000 0 0%
$5,000 to $9,999 31 3%
$10,000 to $14,999 22 2%
$15,000 to $19,999 11 1%
$20,000 to $24,999 9 1%
$25,000 to $34,999 147 13%
$35,000 to $49,999 87 7%
$50,000 to $74,999 127 11%
$75,000 to $99,999 182 16%
$100,000 to $149,999 287 25%
$150,000 or more 262 22%
Total 1,165 100% Source: 2019 American Community Survey Table B25118

Berkshire Regional Planning Commission 47
Town of Sheffield, Massachusetts: Housing Needs Assessment 2021
Tables 4.9 and 4.10 calculate the monthly mortgage payments needed at various interest rates,
along with a 10% or 20% down payment to purchase a home at the Sheffield median sale price
found in Table 4.6. The tables then estimate the percent of renter households in Sheffield who
could afford these payments without incurring a housing cost burden, that is paying more than
30% of household income in payments.
The monthly mortgage payment is calculated using a utility provided by Zillow.com, and the
input parameters are as follows: 30-year fixed loan program, 1.18% property tax rate (taken
from Nerdwallet.com utility used for Table 4.6), and $1,152 in annual home insurance costs
(taken from Nerdwallet.com utility used for Table 4.6)
The monthly income needed to afford the payment without incurring a housing cost burden is
calculated by dividing the monthly mortgage payment by 30% to find the income level at which
the payment would equal only 30%.
The percent of Sheffield renters who could afford the mortgage payment is found by estimating
how many renter households have monthly incomes greater than the monthly income needed to
afford the payment without incurring a housing cost burden.
Table 4.9 - Sheffield: Mortgage Payment Affordability with 10% Down Payment
Interest
Rate
Monthly mortgage
payment
Monthly income needed to afford
payment without housing cost burden
Percent of Sheffield
renters who can afford
2% $1,517 $5,057 23.7%
3% $1,657 $5,523 22.4%
4% $1,807 $6,023 21.0%
5% $1,967 $6,557 19.2%
6% $2,136 $7,120 17.8%
7% $2,313 $7,710 16.0%
8% $2,497 $8,323 14.2% Source: Zillow.com mortgage payment calculator https://www.zillow.com/mortgage-calculator/; 2019 American Community Survey B25118, Banker & Tradesman

Berkshire Regional Planning Commission 48
Town of Sheffield, Massachusetts: Housing Needs Assessment 2021
Table 4.10 - Sheffield: Mortgage Payment Affordability with 20% Down Payment
Interest Rate
Monthly mortgage payment
Monthly income needed to afford payment without housing cost burden
Percent of Sheffield renters who can afford
2% $1,274 $4,247 26.0%
3% $1,398 $4,660 25.1%
4% $1,532 $5,107 23.7%
5% $1,674 $5,580 22.4%
6% $1,824 $6,080 20.6%
7% $1,981 $6,603 19.2%
8% $2,145 $7,150 17.4% Source: Zillow.com mortgage payment calculator https://www.zillow.com/mortgage-calculator/; 2019 American
Community Survey B25118, Banker & Tradesman
Conclusions and Implications
There is a discrepancy between the estimated median home sale price from Banker and
Tradesman ($299,000) and the median home sale price found on Zillow.com of homes that are
currently listed ($502,500). Since the information from Zillow.com uses active listings, this will
be the focus of this summary. Most of the active listings are in excess of $400,000 which greatly
limits prospective home buyers. However, there are thirty homes that are part of the
Department of Housing and Urban Development’s subsidized housing inventory. This shows that
there are some affordable homes in Sheffield but only about 2% of the total housing stock.
Being under the date mandated 10% affordable units makes the Town vulnerable to unfriendly
40B development.
• Much of Sheffield’s housing stock is older, 50years+ in age, and likely in need of some
level of repair.
• Few if any homes are being built other than for individual usage and these tend to be
“high-end” homes; many of these are being built by 2nd homeowners or new retirees to
the area.
• The number of homes for sale has dropped substantially with few homes priced in the
middle range. During COVID-19, homes have been bought unseen and for over asking
price. It is unclear if this price increase and buying behavior will continue.

Berkshire Regional Planning Commission 49
Town of Sheffield, Massachusetts: Housing Needs Assessment 2021
• The financial burdens of homeowners have risen, denying many homeowners the likely
ability to have financial security.
• 40% of Sheffield residents are classified as Low-to-Moderate Income (LMI) making self-
funding of an accessory apartment or home unlikely without financial assistance.
• There are no mechanisms in Sheffield, such as the CPA, Housing Trust, Housing
Authority, etc. to provide management and/or financial support increasing the Town’s
available housing/rental stock.

Berkshire Regional Planning Commission 50
Town of Sheffield, Massachusetts: Housing Needs Assessment 2021
5. Senior Housing Profile and Need In 2019, there was a total of 876 residents age 65 and over. Of this age cohort, 590 residents
were householders. Eighty-nine percent (89%) of these householders were homeowners and the
remaining 11% were renters.
Table 5.1 - Sheffield: Age Distribution of Senior Householders by Home Type
Householder Age Number of Renters
Percent of Total Seniors
Number of Owners
Percent of Total Seniors
65-74 years old 44 5% 330 38%
75-84 years old 0 0% 136 16%
85 years old and older 19 2% 61 7%
Total 63 7% 527 60% Source: 2019 American Community Survey Table B25007, 2019 American Community Survey Table DP05
The population age 65 and over increased by 47% between 2010 and 2019 and is projected to
grow an additional 33% over 2019 levels by 2035. This will result in the 65 and over age cohort
comprising 45% of Sheffield’s total population.
Table 5.2 - Sheffield: Senior Population and Projections (2010 - 2035)
Age Group 2010
ACS
2019
ACS
2035 Population
Projections
Percent of Total
Population (2035)
Percent Change
2019 - 2035
65-74 years old
328 562 578 22% +3%
75-84 years old
192 167 406 16% +143%
85 years old and older
74 147 186 7% +27%
Total 594 876 1,169 45% +33% Source: 2010 United States Decennial Census Table SF1; 2019 American Community Survey Table DP05; UMASS Donahue Institute Population Projections
Nine (9%) of Sheffield senior households earned less than $25,000; 19% earned between
$25,000 and $49,999; 4% earned between $50,000 and $74,999; 35% earned $75,000 or more;
and 31% had incomes of $100,000 or more.

Berkshire Regional Planning Commission 51
Town of Sheffield, Massachusetts: Housing Needs Assessment 2021
Table 5.3 - Sheffield: Household Incomes of Senior Households
Income & Benefits 2019 Percent of Total Seniors
Less than $10,000 27 3%
$10,000 to $14,999 18 2%
$15,000 to $19,999 20 2%
$20,000 to $24,999 18 2%
$25,000 to $29,999 60 7%
$30,000 to $34,999 19 2%
$35,000 to $39,999 34 4%
$40,000 to $44,999 27 3%
$45,000 to $49,999 22 3%
$50,000 to $59,999 12 1%
$60,000 to $74,999 29 3%
$75,000 to $99,999 37 4%
$100,000 to $124,999 40 5%
$125,000 to $149,999 115 13%
$150,000 to $199,999 32 4%
$200,000 or more 80 9% Source: 2019 American Community Survey Table B19037
The National Investment Center for Seniors Housing & Care (NIC) provided a grant to NORC at
the University of Chicago12 to fund research on senior housing. The resulting report, The
Forgotten Middle: Many Middle-Income Seniors Will Have Insufficient Resources For Housing And
Health Care13, focuses on baby boomers who, when age of 75 and older, will neither qualify for
Medicaid nor be able to afford today’s private-pay seniors housing and care options. The
minimum amount that such a senior will need in order to afford assisted living as it is priced
today, as well as out-of-pocket medical expenses is $60,000. Here are a few key findings:
• The number of middle-income seniors will nearly double to 14.4 million by 2029 (43% of
all seniors)
• Seniors will be more diverse and more educated than today’s senior cohorts
12 “the nonpartisan and objective research organization NORC and the University of Chicago” 13 https://www.healthaffairs.org/doi/full/10.1377/hlthaff.2018.05233

Berkshire Regional Planning Commission 52
Town of Sheffield, Massachusetts: Housing Needs Assessment 2021
• 67% will have 3 or more chronic conditions
• 60% will have mobility limitations
• 20% will be defined as “high needs”
• 7.8 million (54%) will have less than $60,000 annual financial resources, even when
including housing equity. This group grows to 11.6 million (81%) when excluding housing
equity.14
Currently, in Massachusetts, a single-person household must have an annual income of $16,971
or less to be eligible for Medicaid; a two-person household must have an annual income of
$22,930 or less to be eligible. Medicaid can provide long-term care for seniors who earn low
income, but there is a large gap between those who earn income low enough to be eligible and
the number of seniors who can pay for out-of-pocket medical expenses. In this regard, the
“forgotten middle” are currently seniors earning between $16,972 and $60,000 annually. In
Sheffield, an estimated 174 seniors would be in this income category, which comprises 20% of
the total senior population.
Senior homeowners in Sheffield are likely to have longer housing tenures, with 52% having
moved into their homes before 1990 and 66% having moved into their homes before 2000. In
today’s housing market, long tenure likely means appreciated home values. Most senior renters
(56%) moved into their homes since 2015.
14 https://www.nic.org/blog/health-affairs-launches-the-forgotten-middle/
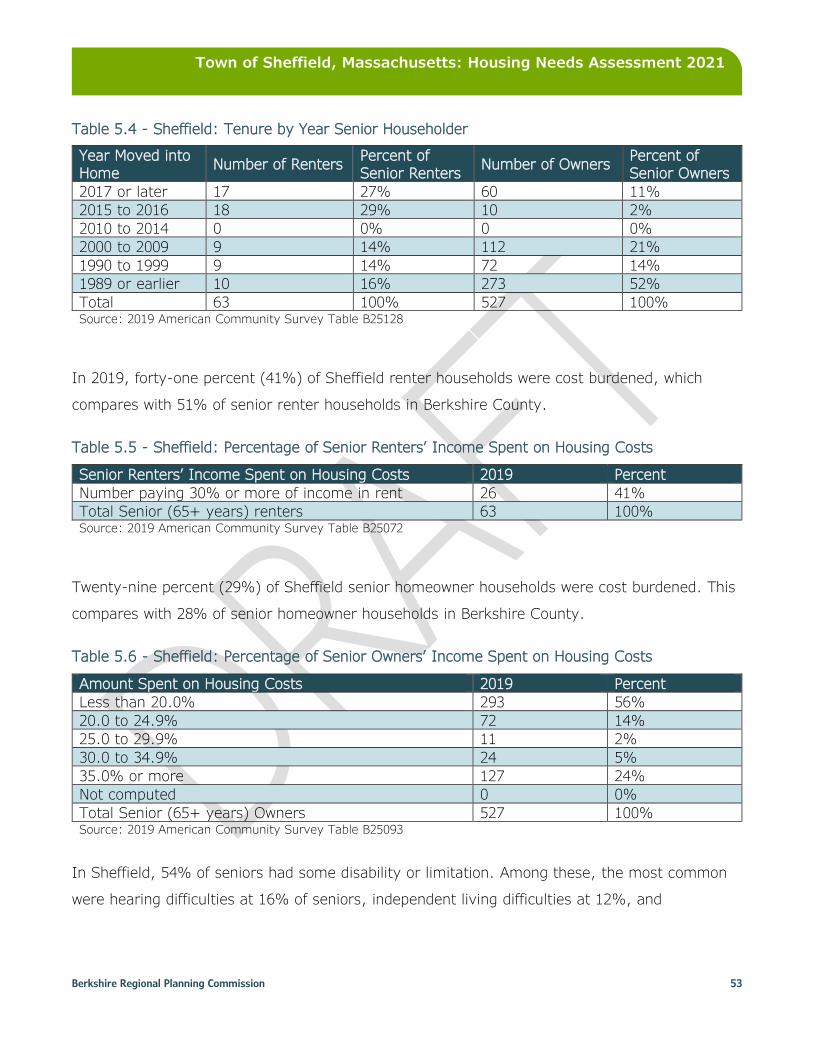
Berkshire Regional Planning Commission 53
Town of Sheffield, Massachusetts: Housing Needs Assessment 2021
Table 5.4 - Sheffield: Tenure by Year Senior Householder
Year Moved into Home
Number of Renters Percent of Senior Renters
Number of Owners Percent of Senior Owners
2017 or later 17 27% 60 11%
2015 to 2016 18 29% 10 2%
2010 to 2014 0 0% 0 0%
2000 to 2009 9 14% 112 21%
1990 to 1999 9 14% 72 14%
1989 or earlier 10 16% 273 52%
Total 63 100% 527 100% Source: 2019 American Community Survey Table B25128
In 2019, forty-one percent (41%) of Sheffield renter households were cost burdened, which
compares with 51% of senior renter households in Berkshire County.
Table 5.5 - Sheffield: Percentage of Senior Renters’ Income Spent on Housing Costs
Senior Renters’ Income Spent on Housing Costs 2019 Percent
Number paying 30% or more of income in rent 26 41%
Total Senior (65+ years) renters 63 100% Source: 2019 American Community Survey Table B25072
Twenty-nine percent (29%) of Sheffield senior homeowner households were cost burdened. This
compares with 28% of senior homeowner households in Berkshire County.
Table 5.6 - Sheffield: Percentage of Senior Owners’ Income Spent on Housing Costs
Amount Spent on Housing Costs 2019 Percent
Less than 20.0% 293 56%
20.0 to 24.9% 72 14%
25.0 to 29.9% 11 2%
30.0 to 34.9% 24 5%
35.0% or more 127 24%
Not computed 0 0%
Total Senior (65+ years) Owners 527 100% Source: 2019 American Community Survey Table B25093
In Sheffield, 54% of seniors had some disability or limitation. Among these, the most common
were hearing difficulties at 16% of seniors, independent living difficulties at 12%, and

Berkshire Regional Planning Commission 54
Town of Sheffield, Massachusetts: Housing Needs Assessment 2021
ambulatory difficulties at 11% of seniors. There are seniors who have more than one disability
or limitation.
Table 5.7 - Sheffield: Seniors with Disabilities or Limitation
Disability or Limitation 2019 Percent of All Seniors
Hearing Difficulty 143 16%
Vision Difficulty 38 4%
Cognitive Difficulty 70 8%
Ambulatory Difficulty 99 11%
Self-Care Difficulty 17 2%
Independent Living Difficulty 107 12% Source: 2019 American Community Survey Table S1810
Note: The total figure, a sum of the distinct disability categories, may be overstated as some residents may belong to more than one category.
Conclusions and Implications
In Sheffield, almost a third of the total population are senior citizens age 65 and over. This
number is projected to increase to approximately 45% of the total population by the year 2035.
The vast majority of this age cohort are homeowners (89%). A common trend seen throughout
Berkshire County is seniors who want to “age in place” but due to physical limitations cannot
maintain their homes so they are forced to relocate. As mentioned earlier in this assessment,
most home in Sheffield are 3-bedrooms which is beyond the needs of most seniors. And, there
are no current rental options available for seniors who may want to relocate to a smaller, more
manageable home. Only 11% of seniors rent homes but out of that population, almost half are
cost burdened. Sheffield has adopted several Zoning By-Law amendments to allow for greater
housing diversity in town. Current zoning allows for housing options that have currently not
been implemented but which could better accommodate seniors and those with special needs.
• Many residents, especially seniors, own their own homes and have done so for years.
With increases in home values, it is likely their home may be their major financial asset.
However, federal tax laws may make it a financial burden to sell and move into a smaller
home, if one were available.

Berkshire Regional Planning Commission 55
Town of Sheffield, Massachusetts: Housing Needs Assessment 2021
• The financial burdens of homeownership have risen, denying such owners the likely
ability to have financial security, especially if a senior is has limited income based
primarily on Social Security.
• The Town has been successful in getting Community Development Block Grants (CDBG)
for LMI owner-occupied housing rehabilitation, covering a variety of home repair needs
up to $40,000 per CDBG round. This same money may also be used for rental units, in
certain circumstances.

Berkshire Regional Planning Commission 56
Town of Sheffield, Massachusetts: Housing Needs Assessment 2021
6. Special-Needs Housing Twenty-one percent (21%) of Sheffield residents had some disability or limitation. Among these,
the most common were hearing difficulties at 6% of the population and ambulatory difficulties at
5% of the population. Among these, the most common were hearing difficulties at 16% of
seniors, in dependent living difficulties, at 12%, and ambulatory difficulties at 11% of seniors.
There are seniors who have more than one disability or limitation . These numbers to don’t
include temporary disabilities, such as a broken wrist from a slip on ice or broken ribs from a
fall.
Table 6.1 - Sheffield: Residents with Disabilities or Limitations
Disability or Limitation 2019 Percent of Total Population
Hearing Difficulty 196 6%
Vision Difficulty 42 1%
Cognitive Difficulty 125 4%
Ambulatory Difficulty 144 5%
Self-Care Difficulty 29 1%
Independent Living Difficulty 139 4% Source: 2019 American Community Survey Table S1810 Note: The total figure, a sum of the distinct disability categories, may be overstated as some residents may belong
to more than one category.
Sheffield’s housing stock is older and is primarily single-family homes, typically having two floors
with stairs. Such housing is likely to be unsuitable for residents with certain special needs,
without modifications, retrofitting with some adaptive equipment, and/or restricting living space
to the first floor.
Conclusions and Implications
Housing in Sheffield is predominantly 3-bedroom, single family, detached dwellings. Many
containing stairs to multiple levels of the home or require living within restrictive spaces, such
as first floor. There is a shortage of homes that are ADA compliant which will force some
residents to leave Sheffield when their homes are no longer conducive to their needs. This is
especially prevalent in the senior population.

Berkshire Regional Planning Commission 57
Town of Sheffield, Massachusetts: Housing Needs Assessment 2021
• Sheffield has one affordable housing/Section 8 housing development -Dewey Court; it is
managed by the Great Barrington Housing Committee. Sheffield is well below the state
target of 10% affordable units.
• Community Development Block Grants (CDBG) for LMI owner-occupied housing
rehabilitation, covering a variety of home repair needs up to $40,000 per CDBG round,
have address owner-occupied special need renovations.

Berkshire Regional Planning Commission 58
Town of Sheffield, Massachusetts: Housing Needs Assessment 2021
7. Foreclosures, Blighted, and Sub-Standard Properties
As of August 2021, there were no foreclosed or pre-foreclosed homes in Sheffield listed on
Zillow.com, RealtyTrac.com, and HomePath.com.
Sheffield Town Assessors have assigned an assessed condition for 1,854 residential properties
out of the estimated 1,859 accounted for by the 2019 American Community Survey.
Additionally, the Assessors have two categories for properties with no description which makes
the total property count 2020. As noted in Table 7.1 and Figure 7.1, less than 1% of homes in
Sheffield are in Unsound condition*.
*Grade and condition ranking are entirely subjective and are relative to other homes in
Sheffield. For example: Average condition is what the Assessor deems “average” for the Town
whereas Fair and Poor would be a lesser condition than what is deemed Average.
Table 7.1 - Sheffield: Assessed Property Conditions of Residential Homes
Property Condition Number of Properties Percent of Properties
Excellent: EX 173 9%
Very Good: VG 123 6%
Good: GD 681 34%
Average: AV 661 33%
Fair: FR 149 7%
Poor: PR 54 3%
Unsound: UN 13 1%
No Description: P- (poor) 124 6%
No Description: V- (very good) 42 2%
Total 2,020 100% Source: Sheffield Town Assessors (accessed 8/3/2021)

Berkshire Regional Planning Commission 59
Town of Sheffield, Massachusetts: Housing Needs Assessment 2021
Figure 7.1 - Sheffield: Assessed Condition of Residential Homes
Source: Sheffield Town Assessors (accessed 8/3/2021)
A property grade refers to the quality of the components within the home. For example,
linoleum flooring would have a lower property grade than tile flooring, while a slate roof would
have a higher grade than an asphalt shingled roof. The grade of a home generally stays
constant, whereas the condition, or property grade, of the home may vary over time. In
Sheffield, the most common property grade was a C (37% of homes).
173
123
681
661
149
54
13
124
42 Excellent
Very Good
Good
Average
Fair
Poor
Unsound
No Description: P-
No Description: V-
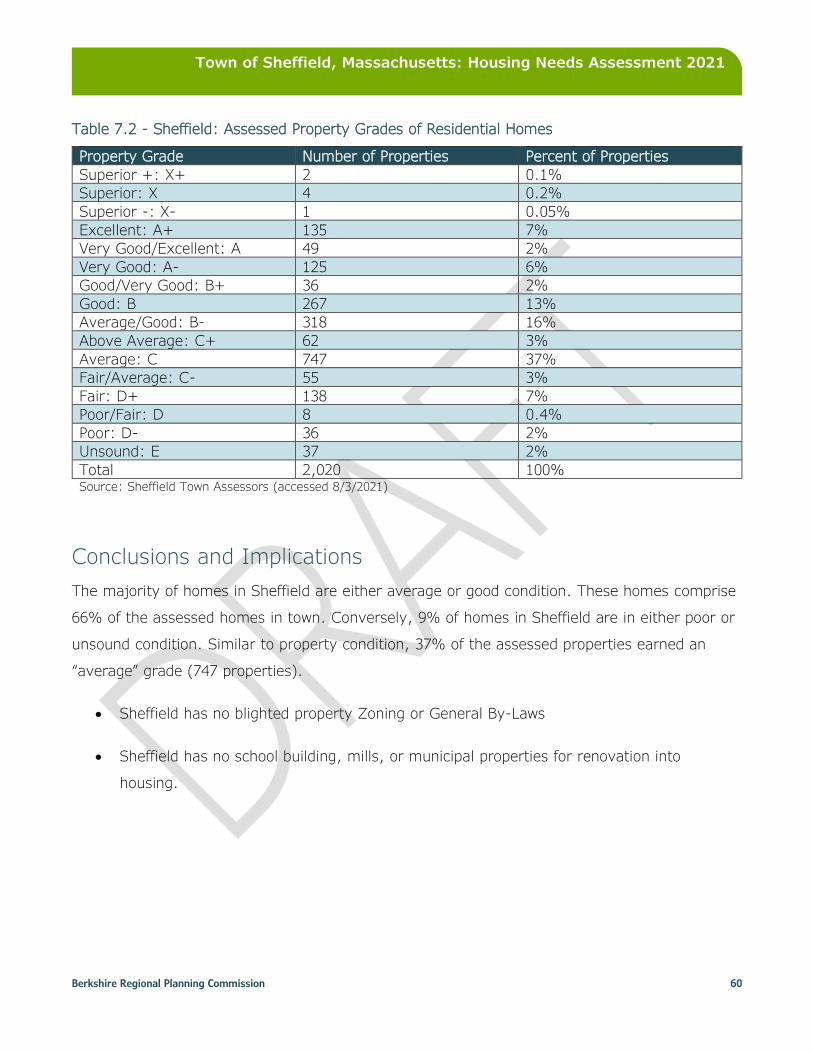
Berkshire Regional Planning Commission 60
Town of Sheffield, Massachusetts: Housing Needs Assessment 2021
Table 7.2 - Sheffield: Assessed Property Grades of Residential Homes
Property Grade Number of Properties Percent of Properties
Superior +: X+ 2 0.1%
Superior: X 4 0.2%
Superior -: X- 1 0.05%
Excellent: A+ 135 7%
Very Good/Excellent: A 49 2%
Very Good: A- 125 6%
Good/Very Good: B+ 36 2%
Good: B 267 13%
Average/Good: B- 318 16%
Above Average: C+ 62 3%
Average: C 747 37%
Fair/Average: C- 55 3%
Fair: D+ 138 7%
Poor/Fair: D 8 0.4%
Poor: D- 36 2%
Unsound: E 37 2%
Total 2,020 100% Source: Sheffield Town Assessors (accessed 8/3/2021)
Conclusions and Implications
The majority of homes in Sheffield are either average or good condition. These homes comprise
66% of the assessed homes in town. Conversely, 9% of homes in Sheffield are in either poor or
unsound condition. Similar to property condition, 37% of the assessed properties earned an
“average” grade (747 properties).
• Sheffield has no blighted property Zoning or General By-Laws
• Sheffield has no school building, mills, or municipal properties for renovation into
housing.

Berkshire Regional Planning Commission 61
Town of Sheffield, Massachusetts: Housing Needs Assessment 2021
8. Seasonal Housing Needs In 2019, Sheffield’s peak employment month was January with 1,636 people employed. The
lowest number of employees was recorded in August with 1,437 employed. This contrasts with
an increase in Berkshire County employment of 5% over the same period, indicating that
seasonal industries are less important to Sheffield’s employment than that of Berkshire County
as a whole. Furthermore, the Census Bureau tracks seasonal housing units by vacancy rate,
which made up 19% of Sheffield’s vacant housing stock in 2019.
Table 8.1 - Sheffield and Berkshire County: Seasonal Employment
Seasonal Employment Sheffield 2019 Berkshire County 2019
January Employment 1,636 59,638
August Employment 1,437 62,690
Percent Change -12% 5% Source: Massachusetts Department of Labor and Workforce Development ES-202 https://lmi.dua.eol.mass.gov/lmi/EmploymentAndWages/EAWResult?A=05&GA=000392&Y=2019&P=00&O=00&I=1
0~0&Iopt=1&Dopt=TEXT
Table 8.2 - Sheffield and Berkshire County: Seasonal Housing
Seasonal Housing Sheffield 2019 Berkshire County 2019
Total Housing Units 1,859 69,079
Seasonal, Recreational, or
Occasional Use (vacant) 347 8,551
Percent Seasonal 19% 12% Source: 2019 American Community Survey Table B25004, DP04
Conclusions and Implications
• Some homes, when purchased, rather than rented or used for the individual’s usage, are
removed from the long-term rental stock, and rented as vacation rentals and/or short-
term rentals (STRs). This assessment identifies 39 such homes.
• The Town assesses a STR tax but has no regulations on STR.
Berkshire Regional Planning Commission 62
Town of Sheffield, Massachusetts: Housing Needs Assessment 2021
9. Review of Town-Related Housing Efforts
Financial Assistance
Through three different grants, fiscal year ’14, fiscal year ’16, and fiscal year ’19, Berkshire
Regional Planning Commission (BRPC) has done twenty housing rehabilitation projects in
Sheffield, using approximately $668,500 in Community Development Block Grant (CDBG)
funding. For fiscal year ’14, the Department of Housing and Community Development
recognized Great Barrington as the lead for the grant. The Town, in partnership with BRPC, did
not submit a 2021 application for housing rehabilitation funding, as BRPC is completing past
CDBG grants disrupted by COVID-19.
While not directly related to housing, Sheffield has successfully partnered with BRPC and
received CDBG grants for architectural barrier removal at Town Hall (design and construction)
and for the Bushnell-Sage Library, Police Station and Town Park restrooms (design). An
$800,000 grant application was just submitted for construction funding to implement the
majority of design work done at these three facilities. The focus of this work has been to provide
an inclusive and welcoming environment for all residents at all Town buildings and properties.
The Community Preservation Act (CPA) has not been adopted by Sheffield voters. The CPA has
the potential, if adopted, to provide funds for affordable/workforce housing projects.
Housing Production
The Town is not aware of any new affordable housing units created since 2000. At present, the
Town’s subsidized housing inventory is 30 units or 2%, far below the 10% minimum state
standard and the safe harbor against unfriendly 40B developments.
Market rate housing supply has not increased during this same timeframe as construction has
focused on home-owner constructions for single-family residences.

Berkshire Regional Planning Commission 63
Town of Sheffield, Massachusetts: Housing Needs Assessment 2021
Organizational Capacity
In 2008, Town voters created a Housing Commission to support and encourage the creation of
sufficient workforce housing in Sheffield. Primary tasks are to: review existing By-Laws and
provide recommendations that promote workforce housing in Sheffield; identify and prioritize
appropriate areas for new housing to complement the recommendations of the Open Space Five
Year Action Plan; and to utilize a regional approach to meeting housing needs in Sheffield in
order to access resources and funding not readily available to small towns.
In 2020, the Select Board made affordable/workforce housing one of its top four priorities for the
year and receive a District Local Technical Local Assistance grant from BRPC to develop a
Housing Plan, designed specifically for Sheffield. However, the pandemic required all DLTA
funds be shifted to meeting the healthcare and economic challenges; Sheffield received a 2021
DLTA to accomplish this goal. This housing assessment is part of that work.
Zoning By-Laws
Beginning with the adoption of Zoning By-Laws in 1995, Town voters have approved multiple
zoning amendments designed to increase housing, including:
• Single family, two-family and three-family dwelling by right in all districts
• Multi-family dwelling containing up to 4 dwelling units by Special Permit in the Village
Center and Rural Districts
• Multi-family dwelling containing up to 6 dwelling units by Special Permit in the Village
Center District
• Boarding House by Special Permit in the Village Center District
• Accessory single-family dwelling unit by right in the Village Center District
• Accessory single-family dwelling by Special Permit in the Commercial and General
Business Districts
• Accessory Apartment by right in the Village Center and Rural Districts
Berkshire Regional Planning Commission 64
Town of Sheffield, Massachusetts: Housing Needs Assessment 2021
Sheffield’s Zoning By-Law and Zoning Map may be found online at:
https://www.sheffieldma.gov/sites/g/files/vyhlif3806/f/uploads/zoningbylawmay2021final.pdf
Sheffield’s Rules & Regulations Governing the Subdivision of Land in Sheffield may be found
online at:
https://www.sheffieldma.gov/sites/g/files/vyhlif3806/f/uploads/subdivisionregs_ver5_06.pdf

Berkshire Regional Planning Commission 65
Town of Sheffield, Massachusetts: Housing Needs Assessment 2021
10. Implementation Recommendations
This section will be completed during the development of Sheffield’s Housing Production Plan.
Berkshire Regional Planning Commission 66
Town of Sheffield, Massachusetts: Housing Needs Assessment 2021
11. Resource Guide 11.1 Housing Partnerships
Berkshire County Regional Housing Authority
Berkshire County Regional Housing Authority has programs for rental tenants, landlords, and
homeowners. The Authority’s services include:
Legal, Housing, and Consumer Counseling – Includes counseling on landlord/tenant law, fair
housing laws, foreclosure laws, lead paint law, housing rehabilitation law, financial assistance,
subsidized and public housing resources, budgeting and financial planning assistance, and
housing search strategies.
Tenancy Preservation Program (TPP) – Homeless prevention program that works with individuals
and families facing eviction as a result of behaviors related to a disability. TPP assists the tenant
and the property owner to determine whether the disability can be reasonably accommodated,
and the tenancy preserved. If tenancy cannot be preserved, TPP coordinates the tenant’s
transition to a more appropriate placement.
Dispute Resolution/Mediation Program – Provides community-based and court-connected dispute
resolution services for tenants, landlords, homeowners, neighborhoods, consumers, and other
stakeholders including mediation, conflict coaching, conciliation and facilitation. The program
also offers dispute resolution training courses.
Foreclosure Prevention Counseling/Negotiation/Mediation – Provided in conjunction with the
Attorney General’s Office of Massachusetts, CHAPA, and the Western Massachusetts Foreclosure
Prevention Center. Applicable areas include foreclosure laws, reinstatement and payment plans,
budgeting and financial literacy classes, credit restoration, and loan modification options.
Affordable Housing Programs – Administers housing subsidies for 41 Section 8 SRO units in two
connected buildings in North Adams.

Berkshire Regional Planning Commission 67
Town of Sheffield, Massachusetts: Housing Needs Assessment 2021
SSVF – Partnership with Solder On to provide housing assistance to veterans struggling with
homelessness or other issues related to housing, health care, or substance abuse.
Contact Information
Brad Gordon, Executive Director
Phone: 413-443-7138 x216
Email: [email protected]
Webpage(s): http://www.bcrha.com/
Applicable to: residents
Berkshire Housing Development Corporation (BHDC)
Serving all of Berkshire County, BHDC seeks to “improve the quality of life for residents of
Berkshire County by increasing affordable housing opportunities; delivering community
development programs and projects; and operating a professional management company.”
BHCD is the most prominent housing development organization in the region. The organization
has the experience and development capacity to provide technical assistance to less
experienced groups and developers.
Contact Information
Eileen Peltier, President/CEO
Phone: 413-344-4852
Email: [email protected]
Webpage(s): http://www.berkshirehousing.com/
Applicable to: municipalities; residents
Berkshire Taconic Community Foundation
Berkshire Taconic Community Foundation works to “strengthen communities through
philanthropy and leadership” and ensure “all residents have opportunity for economic mobility
and a high quality of life” throughout Berkshire County as well as several regions in Connecticut
and New York. The foundation’s HousingUs initiative is a “tri-state collaborative effort of

Berkshire Regional Planning Commission 68
Town of Sheffield, Massachusetts: Housing Needs Assessment 2021
nonprofit organizations and community leaders to promote affordable housing options in towns
throughout our region.” The Accessory Apartment Program provides technical assistance as well
as funding opportunities in order to promote, package, and build affordable housing.
Contact Information
Peter Taylor, Executive Director
Phone: 413-229-0370 x121
Email: [email protected]
Webpage(s):
https://www.berkshiretaconic.org/bGivebCurrentFutureDonors/DonatetoaFund/HousingUs
/AccessoryApartmentProgram.aspx
Applicable to: municipalities; residents; affordable housing developers
Habitat for Humanity
Habitat for Humanity “partners with people in [local communities], and all over the world, to
help them build or improve a place they can call home. Habitat for Humanity’s local affiliates
within Berkshire County are the Central Berkshire Habitat for Humanity located in Pittsfield and
Northern Berkshire Habitat for Humanity located in North Adams. Programs provided by Habitat
and its affiliates include:
Volunteer Income Tax Assistance (VITA) Program – Free federal and state tax preparation for
those with household incomes under $56,000. VITA is funded by the Berkshire United Way and
administered by the Central Berkshire Habitat for Humanity.
Neighborhood Revitalization Program – Projects include Brush with Kindness Program (exterior
painting and minor repairs), critical home repairs (repairs to alleviate health, life, and
safety/code issues), and weatherization (improvements in energy efficiency and indoor air
quality).
Contact information
Central Berkshire Habitat for Humanity
Carolyn Valli, CEO
Berkshire Regional Planning Commission 69
Town of Sheffield, Massachusetts: Housing Needs Assessment 2021
Email: [email protected]
Phone: 413-442-3181
Webpage(s): https://berkshirehabitat.org/
Applicable to: residents
Northern Berkshire Habitat for Humanity
Elisabeth Goodman, President
Email: http://northberkshirehabitat.org/contact
Phone: 413-664-4440
Webpage(s): http://northberkshirehabitat.org/
Applicable to: residents
Habitat for Humanity International
Phone: 800-422-4828
Email: https://www.habitat.org/contact/form
Webpage(s): https://www.habitat.org/
Applicable to: residents
Community Development Corporation of South Berkshire
The Community Development Corporation of South Berkshire builds affordable housing and
create living-wage jobs by working collaboratively with town governments, open space
organizations, and other local nonprofits.
Contact information
Email: [email protected]
Phone: 413-528-7788
Webpage(s): https://cdcsb.org/

Berkshire Regional Planning Commission 70
Town of Sheffield, Massachusetts: Housing Needs Assessment 2021
Construct Inc. – Great Barrington
“For over fifty years, Construct has been the leader in the fight against homelessness and
housing insecurity in the southern Berkshires.
We have over 80 affordable permanent housing options: This includes 20 units that prioritize
homeless families and individuals. Of which, 13 are for homeless who need supportive
services. In addition, we have 10 units (bedrooms) of transitional housing for homeless men
and women.
Construct also provides support services through Cara Davis Project Home – everything from
emergency assistance, transitional housing, workforce development, housing, and financial
counseling.
Our Board of Directors meets monthly, on the third Wednesday of every month, and annually on
the second Wednesday in June. Please contact us for more information if you would like to
attend one of these meetings.
Construct is a 501 (3) (c) not for profit organization.”
Contact information
Email: [email protected]
Phone: 413-528-1985
Webpage(s): https://constructinc.org/
Local Housing Authorities
Adams Housing Authority
Patti Volpi, Executive Director
Phone: 413-743-5924
Email: [email protected]
Webpage(s): http://www.ahauthority.com/Home.aspx

Berkshire Regional Planning Commission 71
Town of Sheffield, Massachusetts: Housing Needs Assessment 2021
Dalton Housing Authority
Susan Gregor, Executive Director
Phone: 413-684-2493
Email: [email protected]
Webpage(s): https://www.daltonha.com/
Great Barrington Housing Authority
Tina Danzy, Executive Director
Phone: 413-274-1142
Email: https://www.townofgb.org/user/2543/contact
Webpage(s): https://www.townofgb.org/housing-authority
Lee Housing Authority
Deborah Pedercini, Executive Director
Phone: 413-243-3464
E-mail: [email protected]
Lenox Housing Authority
Barbara Heaphy, Executive Director
Phone: 413-637-5585
E-mail: [email protected]
Webpage(s): https://www.townoflenox.com/housing-authority
North Adams Housing Authority
Jennifer Hohn, Executive Director
Phone: 413-663-5379, ext. 105
Webpage(s): https://northadamsha.com/
Pittsfield Housing Authority
Sharon LeBarnes, Executive Director
Phone: 413-443-5936

Berkshire Regional Planning Commission 72
Town of Sheffield, Massachusetts: Housing Needs Assessment 2021
Email: [email protected]
Webpage(s): http://pittsfieldhousing.org/
Stockbridge Housing Authority
Andrea Lindsay, Executive Director
Phone: 413-298-3222
Email: [email protected]
Webpage(s): http://www.stockbridgehousing.com/
Williamstown Housing Authority
Tammy Andrews, Executive Director
Phone: 413-458-8282
E-mail: [email protected]
Webpage(s): http://www.williamstownha.com/Home.aspx
Women’s Institute for Housing and Economic Development
The Women’s Institute is a national affordable housing development organization, whose mission
is to “promote economic resilience and stable homes by developing and preserving high quality
affordable and supportive housing, with an emphasis on under-served populations.” The
Women’s Institute serves as the developer or development consultant for projects relating to
creation of affordable housing, permanent supportive housing, permanent supportive housing for
veterans, congregate housing, workforce housing, and mixed-use development. The
organization is also interested in preserving and stabilizing existing housing that might otherwise
be converted to higher market-rate rents or deteriorate as the properties age. The Women’s
Institute can provide expertise in the following areas: pre-development, pre-construction,
construction, operations and asset management, and general project management.
Contact information
Loni Willey, COO
Phone: 800-720-1195 x104

Berkshire Regional Planning Commission 73
Town of Sheffield, Massachusetts: Housing Needs Assessment 2021
Email: [email protected]
Webpage(s): http://www.wihed.org

Berkshire Regional Planning Commission 74
Town of Sheffield, Massachusetts: Housing Needs Assessment 2021
11.2 Federal Resources
United States Department of Housing and Urban Development
Making Home Affordable (MHA)
Under the MHA umbrella there exist a number of programs to assist homeowners who are at
risk of foreclosure and otherwise struggling with their monthly mortgage payments. The majority
of these programs are administered through the US Department of Housing and Urban
Development’s Federal Housing Administration (FHA). Distressed homeowners are encouraged to
contact their lenders and loan servicers directly to inquire about foreclosure prevention options
that are available.
Modify or Refinance Your Loan for Lower Payments
Home Affordable Modification Program (HAMP) – HAMP lowers monthly mortgage payment to 31
percent of the homeowners verified monthly gross (pre-tax) income to make payments more
affordable. The typical HAMP modification results in a 40 percent drop in a monthly mortgage
payment. Eighteen percent of HAMP homeowners reduce their payments by $1,000 or more.
Principal Reduction Alternative (PRA) – PRA helps homeowners whose homes are worth
significantly less than they owe by encouraging servicers and investors to reduce the amount
you owe on your home.
Second Lien Modification Program (2MP) – Mortgage modification or principal reduction on
second mortgage, home equity loan, HELOC, or some other second lien for homeowners whose
primary mortgage has been modified through HAMP.
Home Affordable Refinance Program (HARP) – Mortgage refinancing available to homeowners
who are current on their mortgage but are unable to obtain a traditional refinance due to a
decline in home value.
“Underwater” Mortgages
Home Affordable Refinance Program (HARP) – See above.

Berkshire Regional Planning Commission 75
Town of Sheffield, Massachusetts: Housing Needs Assessment 2021
Principal Reduction Alternative – See above.
Treasury/FHA Second Lien Program (FHA2LP) – Second mortgage reduction or elimination for
homeowners who primary mortgage has been modified through FHA Short Refinance. Total
amount of modified mortgage debt cannot exceed 115% of home’s current value.
Assistance for Unemployed Homeowners
Home Affordable Unemployment Program (UP) – Temporary reduction or suspension of
mortgage payments for at least twelve months for unemployed homeowners seeking re-
employment.
FHA Special Forbearance – Extension of forbearance period by either reducing or suspending
mortgage payments for up to twelve months for homeowners who have become unemployed
and have no other sources of income.
Managed Exit for Borrowers
Home Affordable Foreclosure Alternatives (HAFA) – Short sale or deed-in-lieu of foreclosure for
homeowners who cannot afford their mortgage payments and are interested in transitioning to
more affordable housing.
“Redemption” – Period after home has been sold at foreclosure sale when it may still be
reclaimed through the payment of the outstanding mortgage balance and all costs incurred
during the foreclosure process.
Loss Mitigation for FHA-Insured Homeowners
FHA Home Affordable Modification Program (HAMP) – See above.
HOPE for Homeowners (H4H) – Mortgage refinancing for homeowners who cannot make their
payments but can afford a new FHA-insured loan.
Contact information
National Servicing Center (NSC)
Phone: 877-622-8525

Berkshire Regional Planning Commission 76
Town of Sheffield, Massachusetts: Housing Needs Assessment 2021
Webpage(s): https://www.hud.gov/program_offices/housing/sfh/nsc/
Federal Housing Administration (FHA) Outreach Center
Phone: 1-800-CALL FHA / 800-225-5342
Email: [email protected]
Webpage(s): https://www.hud.gov/program_offices/housing/fhahistory
Applicable to: residents
Community Development Block Program (administered at state level)
CDBG provides annual block grants to larger cities (entitlement communities) and to non-
entitlement communities through a competitive proposal process. States also receive annual
grants for re-distribution to non-entitlement communities. Currently, 37 entitlement
communities in Massachusetts receive annual allocations directly from HUD, and DHCD receives
an annual allocation that it awards through a once-a-year grant competition open to all non-
entitlement communities.
CDBG funds can be used for a wide range of activities, including housing. Recipient communities
may choose from a wide array of program eligible projects and planning activities. Income
targeting is flexible. At least 51 percent of the beneficiaries of a CDBG-funded activity must be
low- or moderate-income households, or the activity must remove slums or blight or fill an
urgent community need.
Eligible housing activities include project planning, rental development and rehabilitation, first-
time homebuyer assistance, and homeowner rehabilitation loan and grant programs.
Homeowner rehabilitation programs are particularly popular. New construction of housing is not
eligible, except under very limited circumstances. CDBG loan repayments can support additional
CDBG-eligible activities. Entitlement communities and DHCD each publish an annual action plan
that outlines how they plan to spend CDBG funds in the coming year. The annual plan must be
consistent with their Consolidated Plan.

Berkshire Regional Planning Commission 77
Town of Sheffield, Massachusetts: Housing Needs Assessment 2021
Non-entitlement communities can apply to DHCD for CDBG funding for local activities under the
Community Development Fund (CDF), which accepts applications in an annual competition for
almost any CDBG-eligible activity. Funds are awarded based on a community’s needs score,
however, meaning more affluent communities have a low chance of receiving an award.
Frequently funded housing activities include housing rehabilitation loan programs and grants for
planning or acquisition costs, as well as housing authority property improvements.
To take advantage of state CDBG funding, a community with limited staff may need to hire a
consultant or enlist the services of an experienced housing agency. Regional planning agencies
often help small towns apply for and manage CDBG funds. DHCD also accepts regional
applications to enable smaller communities to partner with an experienced neighbor to offer
housing rehabilitation programs.
Contact information
Webpage(s):
https://www.hud.gov/states/massachusetts/community/cdbg
https://www.hud.gov/program_offices/comm_planning/communitydevelopment/program
s
Applicable to: municipality
Foreclosure Avoidance Counseling
HUD-approved housing counseling agencies are available to provide information and assistance
needed to avoid foreclosure. As part of President Obama's comprehensive Homeowner
Affordability and Stability Plan (HASP), there is eligibility for special Making Home Affordable loan
modification or refinance, to reduce monthly payments and maintain home ownership. Those
eligible for the loan modification or refinance program can work with a counselor to compile an
intake package for their servicer.
Foreclosure prevention counseling services are provided free of charge by non-profit housing
counseling agencies working in partnership with the Federal Government. These agencies are

Berkshire Regional Planning Commission 78
Town of Sheffield, Massachusetts: Housing Needs Assessment 2021
funded, in part, by HUD and NeighborWorks® America. There is no need to pay a private
company for these services.
Contact information
Webpage(s):
https://apps.hud.gov/offices/hsg/sfh/hcc/fc/index.cfm?&webListAction=search&searchsta
te=MA&filterSvc=dfc
Applicable to: residents
Good Neighbor Next Door
Law enforcement officers, pre-Kindergarten through 12th grade teachers and
firefighters/emergency medical technicians can contribute to community revitalization while
becoming homeowners through HUD's Good Neighbor Next Door Sales Program. HUD offers a
substantial incentive in the form of a discount of 50% from the list price of the home. In return
the homeowner must commit to live in the property for 36 months as his or her sole residence.
Contact information
Phone: 1-800-CALL FHA / 800-225-5342
Email: [email protected]
Webpage(s): https://www.hud.gov/program_offices/housing/sfh/reo/goodn/gnndabot
Applicable to: residents living in designated “revitalization areas”
HOME Investment Partnership Program
HOME is a federally funded program that assists in the production and preservation of affordable
housing for low and moderate-income families and individuals. The program funds a broad range
of activities including new construction, acquisition and rehabilitation of rental properties. Zero
or low interest loans are available for housing developers who pass these loans on to
homebuyers and renters. This program targets very low and low-income households. In a rental
program, 20% of units must be set aside for households earning 50% or less of the area median

Berkshire Regional Planning Commission 79
Town of Sheffield, Massachusetts: Housing Needs Assessment 2021
income. In a home ownership program, it is necessary that all households are at 80% or less of
the area median income without regard to proportions.
Contact information
Webpage(s):
https://www.hud.gov/program_offices/comm_planning/affordablehousing/programs/hom
e/
Applicable to: affordable housing developers (for-profit and nonprofit), community
housing development organizations, and municipalities in cooperation with any of the
above
Low-Income Housing Tax Credit Program
Federal tax credits are available for developers of affordable rental housing. At least 20% must
be for very low-income households. As an alternative, 40% of the units may be set aside for
households at 60% or less of the area median income.
Contact information
Websites:
https://www.huduser.gov/portal/datasets/lihtc.html
https://www.mhp.net/rental-financing/loan-products
Applicable to: affordable housing developers
Property Improvement Loan Insurance (Title I)
FHA insurance on loans made by private lenders to improve properties that meet certain
requirements. Lending institutions make loans from their own funds to eligible borrowers to
finance these improvements. The Title I program insures loans to finance the light or moderate
rehabilitation of properties, as well as the construction of nonresidential buildings on the
property. This program may be used to insure such loans for up to 20 years on either single- or
multifamily properties. The maximum loan amount is $25,000 for improving a single-family

Berkshire Regional Planning Commission 80
Town of Sheffield, Massachusetts: Housing Needs Assessment 2021
home and $60,000 for a multifamily structure, with a maximum per-unit loan amount of
$12,000.
Contact information
Boston Office Phone: 617-994-8200
Toll-Free Phone: 800-CALL-FHA / 800-225-5342
Email: [email protected]
Webpage(s): https://www.hud.gov/program_offices/housing/sfh/title/title-i
Applicable to: affordable housing lenders, residents
203(K) Rehabilitation Mortgage Insurance
FHA’s primary program for the rehabilitation and repair of single-family properties. Homebuyers
and homeowners may finance up to $35,000 into their mortgage to repair, improve, or upgrade
their home. Homebuyers and homeowners can quickly and easily tap into cash to pay for
property repairs or improvements, such as those identified by a home inspector or an FHA
appraiser. Homeowners can make property repairs, improvements, or prepare their home for
sale. Homebuyers can make their new home move-in ready by remodeling the kitchen, painting
the interior or purchasing new carpet.
Contact information
Phone: 800-CALL-FHA / 800-225-5342
Email: [email protected]
Webpage(s): https://www.hud.gov/program_offices/housing/sfh/203k
Applicable to: affordable housing lenders
United States Department of Agriculture
The USDA’s Rural Development program offers a variety of initiatives. Grants are highly
competitive. Listed below are several of their most relevant programs. Visit their website for the
complete list.

Berkshire Regional Planning Commission 81
Town of Sheffield, Massachusetts: Housing Needs Assessment 2021
Single-Family Housing Direct Home Loans
Section 502 direct loans are primarily used to help low-income individuals or households
purchase homes in rural areas. Funds can be used to build, repair, renovate or relocate a home,
or to purchase and prepare sites, including providing water and sewage facilities.
Contact information
Area Office
195 Russell St
Hadley, MA 01035-9521
Phone: 413-585-1000 Ext. 4
Webpage(s): https://www.rd.usda.gov/programs-services/single-family-housing-direct-
home-loans
Applicable to: residents
Single-Family Housing Guaranteed Loan Program
Section 502 guaranteed loans assist approved lenders in providing households earning less than
115% of the area median household income the opportunity to own adequate, modest, decent,
safe, and sanitary dwellings as their primary residence in eligible rural areas.
Contact information
Area Office
195 Russell St
Hadley, MA 01035-9521
Phone: 413-585-1000 Ext. 4
Webpage(s): http://www.rurdev.usda.gov/HAD-Guaranteed_Housing_Loans.html
Applicable to: residents
Single-Family Housing Repair Loans & Grants

Berkshire Regional Planning Commission 82
Town of Sheffield, Massachusetts: Housing Needs Assessment 2021
Section 504 funds are loans and grants to very-low-income homeowners to repair, improve or
modernize their homes or grants to elderly very-low-income homeowners to remove health and
safety hazards. The maximum grant amount is $7,500 and the maximum loan amount is
$20,000.
Contact information
Area Office
195 Russell St
Hadley, MA 01035-9521
Phone: 413-585-1000 Ext. 4
Webpage(s): https://www.rd.usda.gov/programs-services/single-family-housing-repair-
loans-grants
Applicable to: residents

Berkshire Regional Planning Commission 83
Town of Sheffield, Massachusetts: Housing Needs Assessment 2021
11.3 State Resources
Massachusetts Department of Housing and Community Development & Executive Office of
Housing and Economic Development
Chapter 40R / Smart Growth Zoning
The Smart Growth Zoning Overlay District Act, Chapter 149 of the Acts of 2004, codified as MGL
ch. 40R, encourages communities to create dense residential or mixed-use smart growth zoning
districts, including a high percentage of affordable housing units, to be located near transit
stations, in areas of concentrated development such as existing city and town centers, and in
other highly suitable locations. Projects must be developable under the community's smart
growth zoning adopted under Chapter 40R, either as-of-right or through a limited plan review
process akin to site plan review. Upon state review and approval of a local overlay district,
communities become eligible for payments from a Smart Growth Housing Trust Fund, as well as
other financial incentives. Chapter 40R seeks to substantially increase the supply of housing and
decrease its cost, by increasing the amount of land zoned for dense housing. It targets the
shortfall in housing for low- and moderate-income households, by requiring the inclusion of
affordable units in most private projects.
Webpage(s): http://www.mass.gov/hed/community/planning/chapter-40-r.html
Applicable to: municipalities
Chapter 43D for Housing
Chapter 43D has been available for expedited economic development since 2006—but now
residential zoning has been added. To be eligible, a municipality must provide for local
permitting decisions on its designated priority development sites within 180 days of a complete
application. This expedited permitting is attractive to developers, increases municipal visibility
and is rewarded by preference in discretionary funding.
Contact information
Victoria Maguire, Permit Omsbudman/Director, Massachusetts Permit Regulatory Office
Phone: 617-788-3649

Berkshire Regional Planning Commission 84
Town of Sheffield, Massachusetts: Housing Needs Assessment 2021
Webpage(s): https://www.mass.gov/service-details/chapter-43d-expedited-local-
permitting
Applicable to: municipalities
Community Based Housing
The CBH Program provides funding for the development of integrated housing for people with
disabilities, including elders, with priority for individuals who are in institutions or nursing
facilities or at risk of institutionalization. CBH Program excludes clients of the DMH and DMR but
includes many other people with disabilities who are institutionalized or at risk of
institutionalization. Eligible populations include adults with a broad range of disabilities including
mobility impairments, cerebral palsy, multiple sclerosis, muscular dystrophy, epilepsy,
HIV/AIDS, brain or spinal cord injuries, sensory disabilities, emotional disabilities and cognitive
disabilities.
Contact information
Bradley Day, CEDAC
Phone: 617-727-5944
Email: [email protected]
Webpage(s): https://cedac.org/
Andrew Nelson, DHCD
Phone: 617-573-1305
Email: [email protected]
Webpage(s): https://www.mass.gov/service-details/community-based-housing-cbh
Applicable to: nonprofit entities or entities controlled by nonprofits
The Community Preservation Act
This state law allows communities to create a local Community Preservation Fund for open
space protection, historic preservation, affordable housing and outdoor recreation. Community
preservation monies are raised locally through the imposition of a surcharge of not more than

Berkshire Regional Planning Commission 85
Town of Sheffield, Massachusetts: Housing Needs Assessment 2021
3% of the tax levy against real property, and municipalities must adopt CPA by ballot
referendum.
More information: http://www.communitypreservation.org/
Applicable to: municipalities
Compact Neighborhoods
This is a tool similar to Smart Growth Zoning (40R) in its eligible locations and as-of-right
zoning, but with different residential density and affordability requirements. Participating
communities are eligible for preference in discretionary funding and possible Chapter 40B relief.
For communities that are interested in maintaining control over land use decisions by planning
ahead and getting credit for denser, as-of-right zoning, this tool provides another choice. There
are two specified density thresholds under Compact Neighborhoods which must allow for: a
minimum of 4 units per acre for single-family development and a minimum of 8 units an acre
for multi-family (any structure with more than one unit).
Contact information
William Reyelt
Phone: 617-573-1355
Email: [email protected]
Webpage(s):
https://www.mass.gov/service-details/compact-neighborhoods
http://www.mass.gov/hed/docs/dhcd/cd/ch40r/compact-neighborhoodspolicy.pdf
Applicable to: municipalities
Emergency Solutions Grant Program
The Homeless Emergency Assistance and Rapid Transition to Housing Act of 2009 (HEARTH Act)
amended the McKinney-Vento Homeless Assistance Act, including major revisions to what is
now titled the Emergency Solutions Grant (ESG) program. The ESG program assists homeless

Berkshire Regional Planning Commission 86
Town of Sheffield, Massachusetts: Housing Needs Assessment 2021
households and households at risk of homelessness by providing the services necessary to help
them quickly regain stable housing after experiencing a housing crisis and/or homelessness.
ESG services are procured on an annual basis. Therefore, the services provided may change
each year. Currently, DHCD funds ESG services under the following components: Shelter
Support; Rapid Re-housing; and Homelessness Prevention.
More information: https://www.mass.gov/service-details/emergency-solutions-grant-
program-esg
Available to: residents
Historic Owner-Occupied Residences
Municipalities have the option of adopting a special assessment that captures the increased
value of substantially rehabilitated historic residences over a period of five years, with 20% of
the increased assessed value added each year until the full value is reached. This can be an
additional incentive for historic homeowners to continue to occupy and make appropriate
renovations that may contribute to preserving the character of the community.
More information:
https://malegislature.gov/Laws/GeneralLaws/PartI/TitleIX/Chapter59/Section5j
Applicable to: municipalities; residents
HomeBASE
HomeBASE is a flexible financial resource that is available to families who are eligible for the
state’s emergency Assistance (EA) Program. Families can get up to $4,000 of Household
Assistance to help in finding apartments, co-house by living with someone else and sharing
household costs, pay for moving expenses to another state or location in-state, and other costs,
such as child care to help secure or maintain employment or job training. HomeBASE helps to
avoid a shelter placement, and instead find families housing solutions that that make families
feel more stable.

Berkshire Regional Planning Commission 87
Town of Sheffield, Massachusetts: Housing Needs Assessment 2021
More information: https://www.mass.gov/service-details/homebase
Applicable to: residents
Housing Innovations Fund
The Housing Innovations Fund was created to support alternative forms of rental and ownership
housing such as a specialized level of management or social services, an innovative financing or
ownership structure or other features such as transitional housing types, limited equity
cooperatives, and preservation of expiring use properties. They are available on a competitive
basis to non-profit developers only (e.g. Construct Inc., CDCs, housing trusts, etc.). Rental
units must remain affordable for at least 30 years. Of the total units, at least 50% must be
occupied by households earning below 80% of the area median income. Of the lower income
group, at least 50% (or 25% of the total units) must be occupied by households earning below
30% of the area median income.
More information: https://www.mass.gov/service-details/housing-innovations-fund-hif
Applicable to: affordable housing developers (non-profit)
Housing Stabilization Fund
The Housing Stabilization Fund was created to stabilize communities by providing financial
support for the acquisition, preservation and rehabilitation of affordable housing with a specific
emphasis on reuse of distressed properties. It can also be used to allow new construction on
infill sites created by demolition of distressed properties. Both profit and non-profit developers
are eligible for the program, which can be used for both rental and project-based home
ownership.
More information: https://www.mass.gov/service-details/housing-stabilization-fund-hsf
Applicable to: affordable housing developers
Lead Paint Removal Credit

Berkshire Regional Planning Commission 88
Town of Sheffield, Massachusetts: Housing Needs Assessment 2021
The State provides a state income tax credit for up to $1,500 for each housing unit where lead
paint is removed in compliance with state regulations. Unused credits may be carried over for
up to 7 years.
More information: https://www.mass.gov/service-details/view-residential-property-tax-
credits
Applicable to: residents (homeowners only)
Local Initiative Program
The Local Initiative Program is a state program that encourages the creation of affordable
housing by providing technical assistance to communities and developers who are working
together to create affordable rental opportunities for low- and moderate-income households.
More information: https://www.mass.gov/service-details/local-initiative-program
Applicable to: municipalities; affordable housing developers
Senior Circuit Breaker Tax Credit
Municipalities have the option of providing a property tax credit to low- and moderate-income
senior citizens homeowners and renters.
More information: https://www.mass.gov/service-details/senior-circuit-breaker-tax-credit
Applicable to: residents (senior citizens only)
Massachusetts Affordable Housing Trust Fund
The Massachusetts Affordable Housing Trust Fund (AHTF) provides resources to create or
preserve affordable housing throughout the state for households whose incomes are not more
than 110% of area median income. Funds are available for rental, home ownership and mixed-
use projects as well as housing for the disabled and homeless but may be applied only to the
affordable units. AHTF funds are used primarily to support private housing projects that provide

Berkshire Regional Planning Commission 89
Town of Sheffield, Massachusetts: Housing Needs Assessment 2021
for the acquisition, construction or preservation of affordable housing. MassHousing and DHCD
jointly administer AHTF.
Types of assistance include:
• Deferred payment loans
• Low- or no-interest amortizing loans
• Down-payment and closing cost assistance for first-time home buyers
• Credit enhancements and mortgage insurance guarantees
• Matching funds for municipalities that sponsor affordable housing projects
• Matching funds for employer-based housing
Funding threshold criteria include:
• Consistency with the Commonwealth's Sustainable Development Principles
• Minimum term of affordability of 30 years
• Affordability of all AHTF units to households earning no more than 110% of area median
income
• Financial feasibility.
Funding preferences include projects/developments that:
• Produce new affordable housing units
• Create units affordable to households with a range of incomes, particularly units for
households with incomes below 80% of area median income
• Include affordable units for families, the disabled and the homeless
• Propose the longest term of affordability
• Use private funding sources and non-state funding sources to leverage the least amount
of AHTF funds
More information:
https://www.mass.gov/service-details/affordable-housing-trust-fund-ahtf
http://www.mass.gov/hed/docs/dhcd/hd/aht/ahtfguide.pdf

Berkshire Regional Planning Commission 90
Town of Sheffield, Massachusetts: Housing Needs Assessment 2021
Applicable to: governmental subdivisions; community development corporations; local housing
authorities; community action agencies; community-based or neighborhood-based non-profit
housing organizations; other non-profit organizations; for-profit entities; and private employers
MassWorks Infrastructure Program
The MassWorks Infrastructure Program provides a one-stop shop for municipalities and other
eligible public entities seeking public infrastructure funding to support economic development
and job creation and retention, housing development at density of at least 4 units to the acre
(both market and affordable units) and transportation improvements to enhance safety in small,
rural communities. The MassWorks Infrastructure Program is the administrative consolidation of
six former grant programs (Public Works Economic Development, Community Development
Action Grant, Growth Districts Initiative Grant Program, Massachusetts Opportunity Relocation
and Expansion Program, Small Town Rural Assistance Program, and the Transit Oriented
Development Program), and is administered by the state’s Executive Office of Housing and
Economic Development, in cooperation with the Department of Transportation and Executive
Office for Administration & Finance.
Contact information
Phone: 617-788-3649
Email: [email protected]
Webpage(s): https://www.mass.gov/service-details/massworks-infrastructure-grants
Applicable to: municipalities and other eligible public entities15
Senior Citizen Property Tax Work-Off Program
15 Eligible applicants: A city or town, or other public agency with a charter that enables them to accept state
grants on behalf of the municipality, and where the public agency has been designated by municipal officers to
apply for grants on behalf of that city or town. Any eligible public agency acting on behalf of a municipality must
submit a letter of support from the chief administrative officer of that municipality.

Berkshire Regional Planning Commission 91
Town of Sheffield, Massachusetts: Housing Needs Assessment 2021
The municipality may adopt a program authorizing residents aged 60 or older to volunteer their
services to the community in exchange for a property tax reduction. The maximum allowed is
$1,500, and the rate of service cannot exceed the state’s minimum wage.
More information:
https://malegislature.gov/Laws/GeneralLaws/Parti/TitleiX/Chapter59/Section5k
Applicable to: residents (60+ years old)

Berkshire Regional Planning Commission 92
Town of Sheffield, Massachusetts: Housing Needs Assessment 2021
11.4 Private & Non-Profit Opportunities
FRAMEWORK™ Online Home-buying Course
Offered through the Massachusetts Affordable Housing Alliance, FRAMEWORK is a high quality
online course; a fun way to become an informed, confident, and successful homeowner. It
provides the facts you need to become well-informed about every step in the process. Many
lenders have approved FRAMEWORK™ to meet their requirements for homebuyer education.
Total cost for the FRAMEWORK™ online course plus an information packed, follow up in-person
session at MAHA is $100. You will pay $75 for the online course through FRAMEWORK™ and $25
for the MAHA session. Upon completion of the in-person session, you will receive a certificate
that local lenders and mortgage programs will accept.
MAHA's FRAMEWORK™ follow-up classes include:
Information about the state's most affordable mortgage programs;
Presentations from a loan officer, home inspector, attorney, real estate agent, and insurance
agent;
Opportunity to get answers to your home buying questions.
Contact information
Massachusetts Affordable Housing Alliance
1803 Dorchester Avenue
Dorchester, MA 02124
Phone: 617-822-9100
Email: [email protected]
Webpage(s): https://mahahome.org/buyingahome_online
Applicable to: residents
Limited Equity Cooperatives
In this structure, each resident in a housing development is a shareholder in a member-
controlled management corporation, which holds title to the property. Residents lease the units
Berkshire Regional Planning Commission 93
Town of Sheffield, Massachusetts: Housing Needs Assessment 2021
from the coop and elect a board of directors. Purchase of the stock is similar to a down-payment
but usually costs less. Members pay a proportional share of coop’s mortgage, taxes,
maintenance, and operating expenses. To preserve the housing as affordable, a formula
determines the resale value of the stock. The formula is geared to provide a fair return on
members’ investment while keeping resale value in a price range accessible to low and
moderate-income members.
Limited equity co-ops offer specific advantages over rental housing, including security, tax
deductions, and some equity build-up, while housing costs remain lower in the long run. The
cooperative is eligible for government subsidies that can reduce purchase costs or provide
financing for the building.
Limited equity homeownership limits the resale prices of condos or single-family units, in a
manner similar to limited equity coops. This approach is required through some state and
federal subsidized programs and could be built into any locally developed program to preserve
affordability. Typically, the length of deed restrictions used to limit equity remains in place no
longer than 40 years.
More information:
https://www.uhab.org/sites/default/files/doc_library/Limited_Equity_Cooperatives_A_Leg
al_Handbook_0.pdf
Applicable to: residents (must live in a housing development)
Massachusetts Housing Partnership
Massachusetts Housing Partnership (MHP) is a statewide public non-profit affordable housing
organization that works in concert with the Governor and the state Department of Housing and
Community Development to help increase the supply of affordable housing in Massachusetts.
MHP administers the ONE Mortgage Program, provides permanent financing, and offers technical
assistance to communities, non-profits and housing authorities. MHP programs are listed below.
ONE Mortgage Program

Berkshire Regional Planning Commission 94
Town of Sheffield, Massachusetts: Housing Needs Assessment 2021
The ONE Mortgage Program offers first-time homebuyers a discounted fixed interest rate and a
low down-payment, without requiring the homebuyer to purchase costly private mortgage
insurance.
Contact information
Phone: 800-752-7131
Email: [email protected]
Webpage(s): https://www.mhp.net/one-mortgage
Applicable to: residents
MassDocs
MassDocs makes affordable rental housing development more efficient by offering one set of
loan documents to developers receiving loans from multiple public funding programs. This
means that review work can be coordinated by a single joint counsel for all subordinate public
loans in a project. This is a plus for MHP borrowers, who often receive MHP financing in
combination with other public funds. MassDocs is a collaborative effort of the state Department
of Housing and Community Development (DHCD), MassHousing, the Massachusetts Housing
Partnership (MHP) and the Community Economic Development Assistance Corporation (CEDAC).
Contact information
Email: [email protected]
Webpage(s): https://www.massdocs.com/
Applicable to: affordable housing developers
Great Barrington Affordable Housing Trust Fund
A local housing trust allows municipalities to collect funds for affordable housing, segregate
them out of the general municipal budget into a trust fund, and use the funds for local initiatives
to create and preserve affordable housing.
Examples of what a local affordable housing trust can do include:

Berkshire Regional Planning Commission 95
Town of Sheffield, Massachusetts: Housing Needs Assessment 2021
• Provide financial support for the construction of affordable homes by private developers
• Rehabilitate existing homes to convert to affordable housing
• Increase affordability in new housing development projects
• Develop surplus municipal land or buildings
• Preserve properties faced with expiring affordability restrictions
• Create programs to assist low- and moderate-income homebuyers
• Create programs to help low- and moderate-income families make health and safety
repairs
• Educate and advocate to further affordable housing initiatives
More information: https://www.gbhousing.org/
OneSource
OneSource was developed by MHP and the Massachusetts Housing Investment Corporation
(MHIC) to provide borrowers with construction and permanent financing, using a single set of
loan documents and one attorney, saving the borrower time and money. MHP has done
OneSource with MHIC and other lenders such as Bank of America, Citizens Bank, Wainwright
Bank, Cape Cod Five, and Boston Community Capital. With OneSource, there's a coordinated
closing between the construction lender and MHP, with one attorney reviewing a single set of
construction and permanent loan documents. At the end of construction, there is a highly
simplified "mini-closing" that allows MHP to take over the lender's role from the construction
lender.
Contact information
David Rockwell, Director of Lending
Phone: 617-330-9944 x222
Email: [email protected]
Webpage(s): http://www.mhp.net/rental_financing/one_source.php
Applicable to: borrowers

Berkshire Regional Planning Commission 96
Town of Sheffield, Massachusetts: Housing Needs Assessment 2021
Tax-exempt financing
Through a program called MATCH, MHP provides triple-A credit enhancement for bonds,
resulting in lower interest rates. MHP can also arrange for the direct placement of a bond
issuance with one of their funding banks so that you can avoid the cost of a public offering.
More information: http://www.mhp.net/uploads/resources/match_term_sheet.pdf
Applicable to: affordable housing developers
Technical Assistance
MHP's Community Housing Initiatives team supports communities, local housing authorities and
developers in their efforts to create affordable housing for low and moderate-income families. In
addition to providing broad-based informational support to communities through workshops and
publications, MHP provides staff and financial support.
More information: http://www.mhp.net/community_initiatives/programs/index.php
Applicable to: municipalities; local housing authority; affordable housing developers
MassHousing Mortgage Programs
Home for the Brave
MassHousing's Home for the Brave program offers affordable, no down-payment mortgage
financing for veterans of the U.S. Armed Services. In conjunction, grants from the Veterans
Administration are available to help disabled veterans make accessibility upgrades to properties
they are interested in purchasing.
Program Features:
• Three percent down required
• Loans feature MI Plus, which covers principal and interest payments for up to six months
in case of unemployment or deployment

Berkshire Regional Planning Commission 97
Town of Sheffield, Massachusetts: Housing Needs Assessment 2021
• Closing cost assistance is available through MassHousing grants
Home for the Brave loans are made through approved community banks and are made possible
by MassHousing. To apply, contact a participating lender.
Home for the Brave loans are available to:
• Veterans of the U.S. Armed Services
• Active-duty military
• Spouses of soldiers, sailors or marines killed while on active duty
To qualify for a Home for the Brave mortgage, you must:
• Borrowers must meet income limits
• No maximum loan amount or sales price
• Have a total housing debt of less than 45% and a total monthly debt of less than 41%
More information:
https://www.emasshousing.com/portal/server.pt/community/products/306/home_for_the
_brave/10210
Applicable to: residents
MassHousing Mortgage with no Mortgage Insurance offers:
• Affordable interest rates, fixed for the life of the loan
• 30-year repayment terms
• Up to 97% financing on single-family homes and condominiums; 95% financing on 2-, 3-
and 4-family homes
• No hidden fees or other surprises
To qualify for a MassHousing Mortgage with no MI, borrowers must:
• Meet income and loan limit guidelines

Berkshire Regional Planning Commission 98
Town of Sheffield, Massachusetts: Housing Needs Assessment 2021
• Purchase a 1- to 4-family property
• Have good credit
• Complete a homebuyer education course
More information: https://www.masshousing.com/en/home-
ownership/homebuyers/homebuyer-loans
Applicable to: residents
Purchase and Renovation Loans
MassHousing Purchase and Rehab loans help borrowers cover both the cost of purchasing a
home in need of repairs, as well as the expense of rehabilitating that property. The maximum
loan amount for a Purchase and Rehab mortgage is 97% of the purchase price plus rehabilitation
costs or the estimated value of the home after rehabilitation (whichever is less). A 3% down-
payment is required.
To qualify for a Purchase and Rehab mortgage, you must:
• Have a signed Purchase and Sales Agreement for a 1- to 4-family home
• Be creditworthy
• Have housing debt of less than 33% of your income and total monthly debt of less than
41% of your income
Loan Terms
The minimum rehabilitation amount for all property types is $7,500
Rehabilitation costs include the cost of repairs, as well as such expenses as inspection fees, title
update fees, and a required contingency reserve equal to 10% of the total rehabilitation cost
A mortgage payment reserve not to exceed four mortgage payments may be included in the
cost of rehabilitation if the property will not be occupied during rehabilitation

Berkshire Regional Planning Commission 99
Town of Sheffield, Massachusetts: Housing Needs Assessment 2021
The lender may charge fees as high as $900 based on the cost of rehabilitation
Licensed contractors must complete all rehabilitation work
At the time of loan closing, the borrower will be responsible for the full mortgage payment on
the total principal amount
More information: https://www.masshousing.com/en/home-
ownership/homebuyers/homebuyer-loans
Applicable to: residents
Berkshire Regional Planning Commission 100
Town of Sheffield, Massachusetts: Housing Needs Assessment 2021
12. Appendices Appendix A: Berkshire Realtors: South Berkshire County, MA -
Residential Real Estate Report